A BRIEF REVIEW ON THE APPLICATIONS OF SOME METHODOLOGIES IN BIOLOGY AND MEDICINE
14
IJRRAS 16 (4) ● October 2013 www.arpapress.com/Volumes/Vol16Issue4/IJRRAS_16_4_13.pdf 141 A BRIEF REVIEW ON THE APPLICATIONS OF SOME METHODOLOGIES IN BIOLOGY AND MEDICINE Ana María Sánchez Peralta University of Granada, Pharmacy Faculty, Campus Universitario de Cartuja S/N 18071 Granada, Spain ABSTRACT Medical Physics has developed significantly in recent years to be an essential service in the health sciences. The hospital development in the past two decades has led to the introduction of Electro Medical Service, due to some modifications of the patterns in the diagnostic, analytics, treatments in recovery and in maintaining the patient's health. All this has led to large increases have technical equipment giving rise to a large hospital engineering, through the maintenance and rational use of electromedical equipments. The nature of physiological signs is complex. The methods of non-linear analysis can provide some elements for understanding the functions and dysfunctions of organs or systems, being useful for the characterization of their behavior or as a diagnostic aid in pathologies. A lineal relation is considered as variable when data is distributed approximately along a straight line on a scatter diagram. Figure 1. Example of a lineal scatter diagram. In an attempt to establish the relationship between a dependent variabl e or “response” and a set of independent variables or “predictors”, we can find linear or nonlinear relationship. A relationship is not linear when, between the response and independent variables, the relationship is not a linear or linearizable function. Biomedical signals require non-linear analysis. [1] BIOMEDICAL SIGNALS Biomedical signals that the human body may show include all signals used in the diagnosis, recovery, maintenance of life and in medical research. Depending on the origin of the bio-signals, they can be classified as: - Bio-impedance signals: The electrical impedance contains important information on the composition, distribution and volume of blood, nervous system information, etc. And its measurements are usually performed with two types of electrodes, each giving electrical currents into the tissue and others are placed in the tissue to be studied, measuring the voltage drop generated by the current and tissue impedance. - Bio-acoustic signals: They are due to acoustic phenomena produced by normal body functions, from the flow of blood, the heartbeat, to the movement of muscles. These functions generate sounds that can aid in medical diagnosis, which are picked from the surface using acoustic transducers. - Bio-magnetic signals: Several organs, such as the brain, heart and lungs, produce extremely weak magnetic fields. These signals provide information that no other sign can offer. The relation between response and (dependent variable) and the independent variables xi is linear. The regression of y on x is given by the equation y = a + bx (where a is the intercept and b is dependent on the line).
Transcript of A BRIEF REVIEW ON THE APPLICATIONS OF SOME METHODOLOGIES IN BIOLOGY AND MEDICINE
IJRRAS 16 (4) ● October 2013 www.arpapress.com/Volumes/Vol16Issue4/IJRRAS_16_4_13.pdf
141
A BRIEF REVIEW ON THE APPLICATIONS OF SOME
METHODOLOGIES IN BIOLOGY AND MEDICINE
Ana María Sánchez Peralta
University of Granada, Pharmacy Faculty, Campus Universitario de Cartuja S/N 18071 Granada, Spain
ABSTRACT
Medical Physics has developed significantly in recent years to be an essential service in the health sciences.
The hospital development in the past two decades has led to the introduction of Electro Medical Service, due to
some modifications of the patterns in the diagnostic, analytics, treatments in recovery and in maintaining the
patient's health. All this has led to large increases have technical equipment giving rise to a large hospital
engineering, through the maintenance and rational use of electromedical equipments.
The nature of physiological signs is complex. The methods of non-linear analysis can provide some elements for
understanding the functions and dysfunctions of organs or systems, being useful for the characterization of their
behavior or as a diagnostic aid in pathologies.
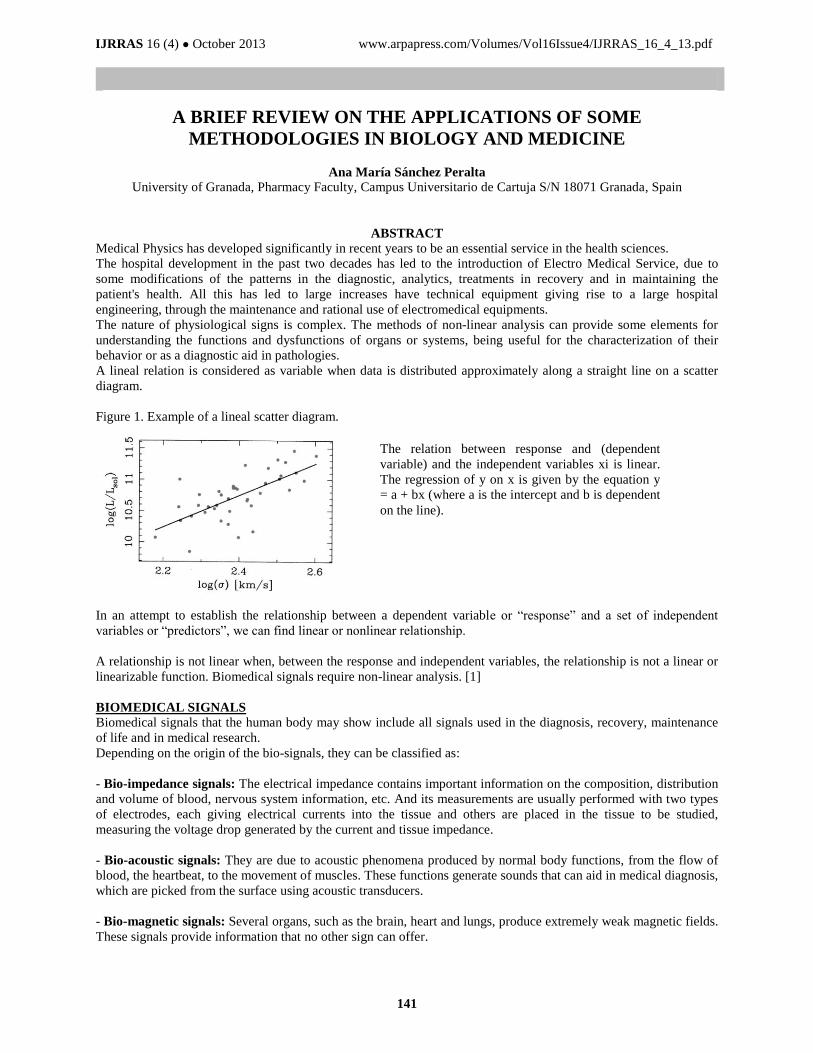
A lineal relation is considered as variable when data is distributed approximately along a straight line on a scatter
diagram.
Figure 1. Example of a lineal scatter diagram.
In an attempt to establish the relationship between a dependent variable or “response” and a set of independent
variables or “predictors”, we can find linear or nonlinear relationship.
A relationship is not linear when, between the response and independent variables, the relationship is not a linear or
linearizable function. Biomedical signals require non-linear analysis. [1]
BIOMEDICAL SIGNALS
Biomedical signals that the human body may show include all signals used in the diagnosis, recovery, maintenance
of life and in medical research.
Depending on the origin of the bio-signals, they can be classified as:
- Bio-impedance signals: The electrical impedance contains important information on the composition, distribution
and volume of blood, nervous system information, etc. And its measurements are usually performed with two types
of electrodes, each giving electrical currents into the tissue and others are placed in the tissue to be studied,
measuring the voltage drop generated by the current and tissue impedance.
- Bio-acoustic signals: They are due to acoustic phenomena produced by normal body functions, from the flow of
blood, the heartbeat, to the movement of muscles. These functions generate sounds that can aid in medical diagnosis,
which are picked from the surface using acoustic transducers.
- Bio-magnetic signals: Several organs, such as the brain, heart and lungs, produce extremely weak magnetic fields.
These signals provide information that no other sign can offer.
The relation between response and (dependent
variable) and the independent variables xi is linear.
The regression of y on x is given by the equation y
= a + bx (where a is the intercept and b is dependent
on the line).
IJRRAS 16 (4) ● October 2013 Peralta ● Some Methodologies in Biology and Medicine
142
- Biomechanical Signals: These signals are generated by mechanical processes, such as body movement, walking,
pressure flow. Since these are signals with mechanical character, they do not propagate as easily in the body,
therefore the measurement is made on the original spot. It requires a variety of transducers.
- Biochemical Signals: These are usually the result of chemical measurements in living tissues or samples analyzed
in a laboratory.
- Bio-optical signals: These are a result of optical reactions that occur naturally or are induced for measurement. For
example, important information can be obtained from a fetus from amniotic fluid fluorescence or optical information
captured on a photographic plate that we generate with the X-rays.
- Bioelectric signals: These are characteristic signals in biological systems and its source is the membrane potential
which, depending on the physiological conditions, generates a potential difference, both in isolated cells and in cell
associations. If we use surface electrodes, the electric field the cells accumulate form the bioelectrical signal. This
group of signals is one of the most important groups, since every biological system has excitable cells.
The application of physics in medicine nowadays occurs primarily in the areas of diagnostic and interventional
radiology, nuclear medicine, radiotherapy and radiactive metrology, biomagnetism, electromedicine, radio-biology
and signal processing; with great contributions in clinical medicine and research. [2]
X RAYS
Radiology is the imaging diagnose, caused by ionizing radiation passing through a body, where the visual
characteristics of different tissues are reflected on a photographic plate.
Radiation is a form of energy caused by electromagnetic waves, such as gamma rays, X-rays, ultraviolet rays, visible
spectrum, infrared radiation, microwaves and radio waves. There are also corpuscular radiation sources, caused by
subatomic particles, such as alpha particles and neutrons.
A radiation is ionizing when it causes ionization in the environment it goes through, removing electrons from atoms
and resulting in ionized forms. Gamma rays, X rays, alpha particles and part of the ultraviolet spectrum have this
property.
Substances with a relative excess of protons or neutrons may be radioactive. If the number of neutrons differs from
the number of protons the activity of the strong nuclear force becomes difficult. This keeps the nucleus joint, despite
the positive charge of its protons. This occurs in the heavier elements with atomic number (Z) ≥ 83. These atomic
nuclei are unstable and cause a release of excess protons or neutrons in the form of alpha, beta or gamma (α, β or γ)
radiations.
Αlpha radiation is an helium nucleus (2He4), the atomic number can vary in two units.
Βeta radiation emits an electron (e-). This occurs when the relative number of neutrons is higher than the number of
protons in the nucleus. It may happen that the relative number of neutrons is less than the number of protons. In this
case, there is a positron emission (e+), where a proton becomes a neutron. An orbital electron may also be absorved
by the nucleus.
Gamma radiation is formed by high energy electromagnetic waves and only photons are emmited. These rays are
very similar to X-rays. This may happen when there is a beta particle decay, annihilation of a positron-electron pair,
or in positrons emission. [3]
X-rays are electromagnetic wave radiations, thus traveling at light speed (c = 300,000 km / sec approximately). They
have a frequency of 30-3000 petahercios (PHz) and a wavelength of 10 to 0, 01 nanometers (nm). This is an
invisible radiation which is able to penetrate into opaque bodies and to print on photographic films. X-ray tubes are
used to produce X-rays in laboratories or hospitals. These can be of two kinds, tubes with filaments or gas. X-ray
photons are high energy with ionizing nature and, therefore, must be applied for a short time.
IJRRAS 16 (4) ● October 2013 Peralta ● Some Methodologies in Biology and Medicine
143
X-rays are well reflected in tissues such as bones, but soft tissues are not reflected clearly. In order to be focused on
organs or blood vessels, a contrast dye must be inoculated into the body. Contrast elements are liquids that absorb
X-rays more efficiently than the surrounding tissue. In the case of digestive or endocrine organs, the patient must
swallow a mixture of contrast elements, usually a barium compound. If blood vessels are to be examined, then the
dye is injected into the patient's bloodstream. [4]
When X-rays strike the atoms of the body, they can remove atom electrons to create an ion, which is an electrically
charged atom. The free electrons collide with other atoms and create more ions. Electric charges of the ions can lead
to unnatural chemical reactions within cells. Even with these risks, sporadic exposure to X-rays is safer than surgery
and, nowadays, they are not only used in diagnostic application, but also as security detectors at airports, etc.
ELECTROCARDIOGRAPHY
The heart tissue is an excitable tissue, as well as nerve tissue is but, unlike the latter, its excitation results in a
contraction. When a depolarization wave (activation) spreads through the heart tissue, the chemical processes
leading to contraction start. The heart electrical activity is generated within the organ itself. It is generated by
specialized cells with self-excitable properties, which operate on a regular basis. They generate action potentials
themselves with some regularity. Thus, we can see that the heart is a relatively autonomous organ, independent from
the nervous system.
Electrocardiographic Noise: Since these are invading signals of 1 mV or maybe less, the "noise" becomes a
significant factor. Its origin may be multiple, from equipments, or physiologically generated. Each type of noise
must be fought with a specific algorithm, to attempt to keep intact the bioelectrical signal properties.
Cardiac Cycle: It has three phases.
- Auricular systole: Blood accumulates in the atriums, increasing pressure, and passes to the ventricles (auricular
contraction).
- Ventricular systole: At first, the pressure in the artery is higher than in the interior of the ventricles and the sigmoid
valves remain closed. When the pressure in the ventricle exceeds the arterial system, the sigmoid valves open and
blood is expelled (ventricular contraction).
- Ventricular diastolic: This begins when the ventricle is emptied. Sigmoid valves are closed, the myocardium
relaxes (relaxation) and the ventricle fills with blood from the atria again.
In a person at rest, the cycle lasts about 0.8 seconds, 0.3 of systole and diastole 0.5.
The cells forming the pacemaker, from where the nerve impulse spread, start the activation. The coordinated
contraction of the atria and ventricles fibers requires the presence of specialized cells that generate and distribute
electrical impulse to the myocardial tissue of the cameras in the proper sequence and at the right time. These
specialized fibers form the conduction system.
In the conduction system, we find the sinus node (SN), the atrio-ventricular (AV), the His Fascicle, right and left
branches, and the Purkinje Tissues. The sinus node, a semicircle of about 75 mm2 that is in the right atrial wall at its
junction with the vena cava, generates action potentials at an approximate rate of 70 per minute. This is what makes
the heart pace. From here, the excitation is transmitted to a speed of approximately 0.3 m / sec to neighboring cells.
Then, it is transmitted, through the internodal tracts, to the atrioventricular node. This is in the interatrial septum, the
only communication between the atrial and ventricular cavities. It has a frequency of about 50 beats per minute
under normal conditions and it abides by the frequency imposed by the sinus node (SN). Its propagation speed is
slow, 0.05 m / s, and gives rise to a delay in the progress of activation, which allows optimal ventricular filling
during the atrial contraction.
Next, the His Bundle activates in two branches. On each side of the interventricular septum a network of fibers,
called Purkinje fibers, spread. The speed of ventricular conduction system is from 1 to 4 m / sec, and it immediately
spreads over the entire surface.

IJRRAS 16 (4) ● October 2013 Peralta ● Some Methodologies in Biology and Medicine
144
All cardiac cells are able to generate electric dipoles when receiving the activation signal (depolarization). These
dipoles are those that are monitored using the ECG machine and electrode positions. Each pair of electrodes, i.e.
every branch, gives the record. There are a number of recommended leads:
- Limb Leads: DI, DII, DIII; are bipolar: DI (connection between electrodes left arm right arm). DII (connection
between left leg and right arm). DIII (connection between left leg and left arm).
- Limb increased leads: these are unipolar, recording what happens at one spot. There are leads to VR and to VL, to
left and right arm respectively.
- Precordial leads: these are unipolar too and monitor the registration in the chest from position 1 to 6. These are the
leads V1-6, or 5 cms higher than the usual positions, such as EV1 and EV2, or positions 5 cms lower than usual,
such as LV1 and LV2.
Thus, different characteristic segments of the ECG wave are established:
Waves forming the ECG:
Figure 2. ECG waves:
P Wave: In normal conditions, this is the first examinable mark in the ECG. It corresponds to the arrival of
activation to the atria (atrial depolarization).
PR Interval: It displays the electrical downtime for the physiological delay suffered by the stimulation in the
atrioventricular node.
QRS complex: This is the most striking characteristic of the record, representing the arrival of the activation signal
to both ventricles (ventricular depolarization).
ST segment: This is the stage between ventricular depolarization and repolarization. It is usually isoelectric and
feature a slight upward deflection. (In case of ischemia, the tissue cannot maintain the membrane potential, resulting
in a deviation downwards or upwards. Downward sub-endocardial lesion and upward sub-epicardial lesion).
T Wave: It represents ventricular repolarization.
Interval QT: It represents ventricular depolarization and repolarization. [5,6]
IJRRAS 16 (4) ● October 2013 Peralta ● Some Methodologies in Biology and Medicine
145
A database of different pathologies records with the different ECG records has been created. It is available for
consultation on the MIT (Massachusetts Institute of Technology) website: http://www.physionet.org/
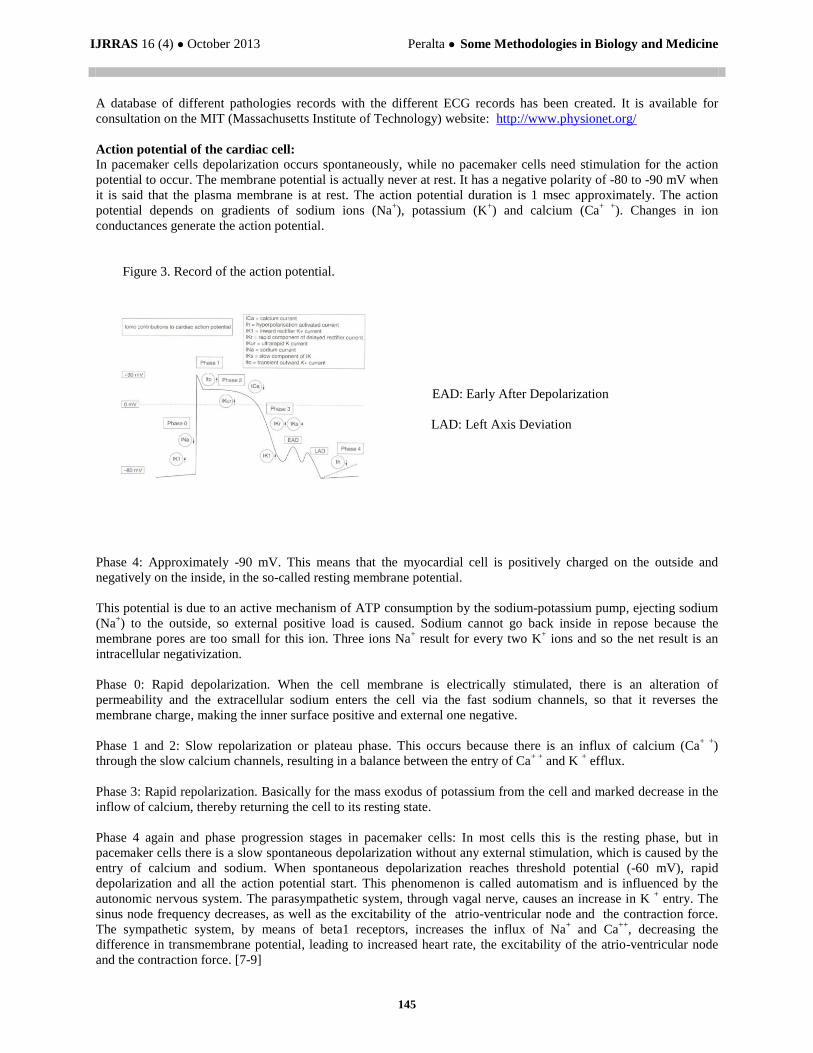
Action potential of the cardiac cell:
In pacemaker cells depolarization occurs spontaneously, while no pacemaker cells need stimulation for the action
potential to occur. The membrane potential is actually never at rest. It has a negative polarity of -80 to -90 mV when
it is said that the plasma membrane is at rest. The action potential duration is 1 msec approximately. The action
potential depends on gradients of sodium ions (Na+), potassium (K
+) and calcium (Ca
+ +). Changes in ion
conductances generate the action potential.
Figure 3. Record of the action potential.
EAD: Early After Depolarization
LAD: Left Axis Deviation
Phase 4: Approximately -90 mV. This means that the myocardial cell is positively charged on the outside and
negatively on the inside, in the so-called resting membrane potential.
This potential is due to an active mechanism of ATP consumption by the sodium-potassium pump, ejecting sodium
(Na+) to the outside, so external positive load is caused. Sodium cannot go back inside in repose because the
membrane pores are too small for this ion. Three ions Na+ result for every two K
+ ions and so the net result is an
intracellular negativization.
Phase 0: Rapid depolarization. When the cell membrane is electrically stimulated, there is an alteration of
permeability and the extracellular sodium enters the cell via the fast sodium channels, so that it reverses the
membrane charge, making the inner surface positive and external one negative.
Phase 1 and 2: Slow repolarization or plateau phase. This occurs because there is an influx of calcium (Ca+ +
)
through the slow calcium channels, resulting in a balance between the entry of Ca+ +
and K + efflux.
Phase 3: Rapid repolarization. Basically for the mass exodus of potassium from the cell and marked decrease in the
inflow of calcium, thereby returning the cell to its resting state.
Phase 4 again and phase progression stages in pacemaker cells: In most cells this is the resting phase, but in
pacemaker cells there is a slow spontaneous depolarization without any external stimulation, which is caused by the
entry of calcium and sodium. When spontaneous depolarization reaches threshold potential (-60 mV), rapid
depolarization and all the action potential start. This phenomenon is called automatism and is influenced by the
autonomic nervous system. The parasympathetic system, through vagal nerve, causes an increase in K + entry. The
sinus node frequency decreases, as well as the excitability of the atrio-ventricular node and the contraction force.
The sympathetic system, by means of beta1 receptors, increases the influx of Na+ and Ca
++, decreasing the
difference in transmembrane potential, leading to increased heart rate, the excitability of the atrio-ventricular node
and the contraction force. [7-9]
IJRRAS 16 (4) ● October 2013 Peralta ● Some Methodologies in Biology and Medicine
146
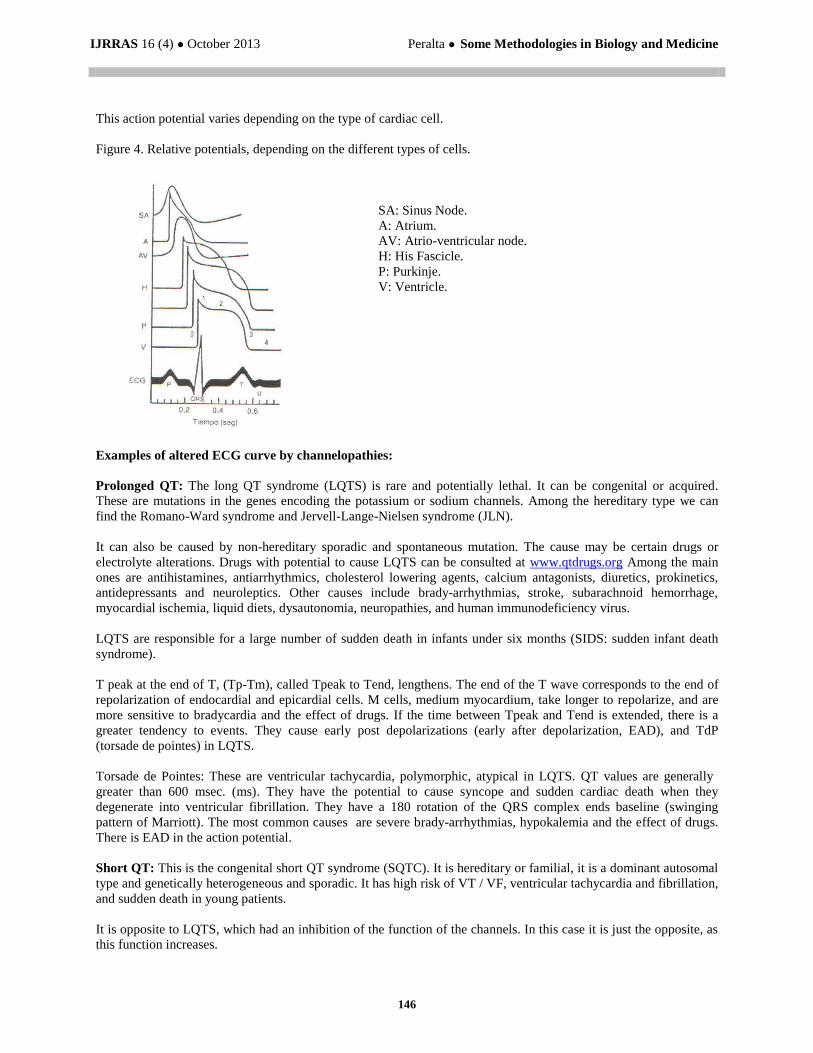
This action potential varies depending on the type of cardiac cell.
Figure 4. Relative potentials, depending on the different types of cells.
SA: Sinus Node.
A: Atrium.
AV: Atrio-ventricular node.
H: His Fascicle.
P: Purkinje.
V: Ventricle.
Examples of altered ECG curve by channelopathies:
Prolonged QT: The long QT syndrome (LQTS) is rare and potentially lethal. It can be congenital or acquired.
These are mutations in the genes encoding the potassium or sodium channels. Among the hereditary type we can
find the Romano-Ward syndrome and Jervell-Lange-Nielsen syndrome (JLN).
It can also be caused by non-hereditary sporadic and spontaneous mutation. The cause may be certain drugs or
electrolyte alterations. Drugs with potential to cause LQTS can be consulted at www.qtdrugs.org Among the main
ones are antihistamines, antiarrhythmics, cholesterol lowering agents, calcium antagonists, diuretics, prokinetics,
antidepressants and neuroleptics. Other causes include brady-arrhythmias, stroke, subarachnoid hemorrhage,
myocardial ischemia, liquid diets, dysautonomia, neuropathies, and human immunodeficiency virus.
LQTS are responsible for a large number of sudden death in infants under six months (SIDS: sudden infant death
syndrome).
T peak at the end of T, (Tp-Tm), called Tpeak to Tend, lengthens. The end of the T wave corresponds to the end of
repolarization of endocardial and epicardial cells. M cells, medium myocardium, take longer to repolarize, and are
more sensitive to bradycardia and the effect of drugs. If the time between Tpeak and Tend is extended, there is a
greater tendency to events. They cause early post depolarizations (early after depolarization, EAD), and TdP
(torsade de pointes) in LQTS.
Torsade de Pointes: These are ventricular tachycardia, polymorphic, atypical in LQTS. QT values are generally
greater than 600 msec. (ms). They have the potential to cause syncope and sudden cardiac death when they
degenerate into ventricular fibrillation. They have a 180 rotation of the QRS complex ends baseline (swinging
pattern of Marriott). The most common causes are severe brady-arrhythmias, hypokalemia and the effect of drugs.
There is EAD in the action potential.
Short QT: This is the congenital short QT syndrome (SQTC). It is hereditary or familial, it is a dominant autosomal
type and genetically heterogeneous and sporadic. It has high risk of VT / VF, ventricular tachycardia and fibrillation,
and sudden death in young patients.
It is opposite to LQTS, which had an inhibition of the function of the channels. In this case it is just the opposite, as
this function increases.

IJRRAS 16 (4) ● October 2013 Peralta ● Some Methodologies in Biology and Medicine
147
Table 1. QT values: [10,11]
QT Child 1-15 years Man Woman
Normal < 440 ms < 430 ms < 450 ms
Limit 440-460 ms 430-450 ms 450-460 ms
Long > 460 ms > 450 ms > 460 ms
ELECTROENCEPHALOGRAPHY
Electroencephalography is the recording and evaluation of the electrical potentials generated by the brain and
obtained by electrodes placed on the scalp surface. This register is complex, it varies depending on the position of
the electrodes and each individual. This is due to the large number of interconnections among the neurons and the
non-uniform structure of the brain.
When neurons communicate one another, they do it through neurotransmitters. These are generated in the region
between two neighboring neurons called synapses. Neurotransmitters released by a neuron reach their neighbor and
alter its permeability, allowing a flow of ions through its cell wall. The said ion flow breaks the electric cellular
balance, generating the so called action potential. The proper electrical impulse transmission in the neuron is due to
myelin (lipoprotein materials in layers). The addition of the activity of many neurons is what is recorded in the
electroencephalogram (EEG).
The brain contains about 90% of neurons in the body, that means there are about 10,000-15,000 million neurons. It
weights about 1.5 kg, which is approximately 2 to 3% of the total weight of an adult. It uses 20% of the body's
oxygen supply and has an area of two square metres, which fits into the skull since it is folded. The layers of the
cerebral cortex are six, from the outermost to the innermost, they are:
1. Molecular layer (plexiform)
2. External granular layer
3. External pyramidal layer
4. Internal granular layer
5. Internal pyramidal layer (ganglion)
6. Multiform layer
Table 2. Origin of neurons in different layers: (Cell bodies).
b, g, h, i, j:
Reach the other layers with axons
and dendrites.
a. Horizontal cell f. Stellate (granule) cell
b. Cell of Martinotti g. Small pyramidal cell of layers II, III
c. Chandelier cell h. Small pyramidal association cell
d. Aspiny granule cell i. Small pyramidal association and projection cells of layer V
e. Spiny granule cell j. Large pyramidal projection cell (Betz cell)
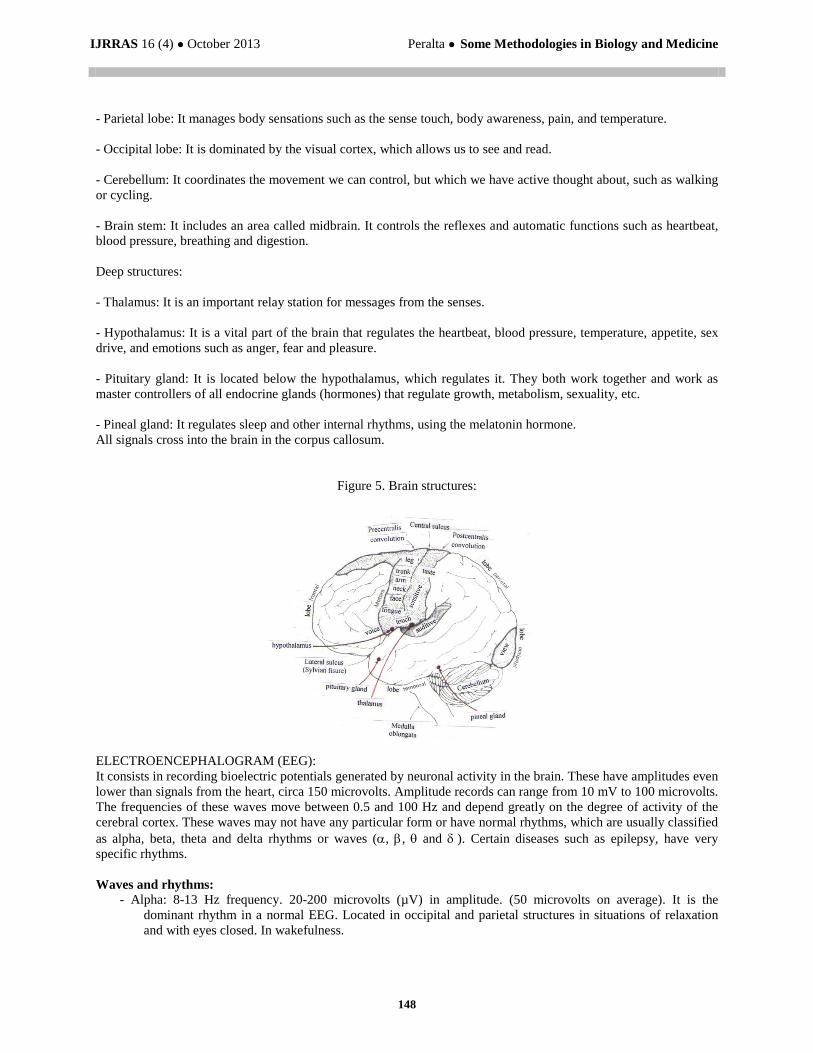
Structures of the brain: The brain, or cortex, is where thoughts and complicated processing occur.
- Frontal lobe: It controls personality, planning, speech, voluntary movement, intelligence, memory and writing.
- Temporal lobe: It is related to speech, hearing, memory and the sense of smell.
I a
II g
III c h
IV e f d
V i j
VI b
Cortical interneuron Cortical association
neurons
Efferent neuron
IJRRAS 16 (4) ● October 2013 Peralta ● Some Methodologies in Biology and Medicine
148
- Parietal lobe: It manages body sensations such as the sense touch, body awareness, pain, and temperature.
- Occipital lobe: It is dominated by the visual cortex, which allows us to see and read.
- Cerebellum: It coordinates the movement we can control, but which we have active thought about, such as walking
or cycling.
- Brain stem: It includes an area called midbrain. It controls the reflexes and automatic functions such as heartbeat,
blood pressure, breathing and digestion.
Deep structures:
- Thalamus: It is an important relay station for messages from the senses.
- Hypothalamus: It is a vital part of the brain that regulates the heartbeat, blood pressure, temperature, appetite, sex
drive, and emotions such as anger, fear and pleasure.
- Pituitary gland: It is located below the hypothalamus, which regulates it. They both work together and work as
master controllers of all endocrine glands (hormones) that regulate growth, metabolism, sexuality, etc.
- Pineal gland: It regulates sleep and other internal rhythms, using the melatonin hormone.
All signals cross into the brain in the corpus callosum.
Figure 5. Brain structures:
ELECTROENCEPHALOGRAM (EEG):
It consists in recording bioelectric potentials generated by neuronal activity in the brain. These have amplitudes even
lower than signals from the heart, circa 150 microvolts. Amplitude records can range from 10 mV to 100 microvolts.
The frequencies of these waves move between 0.5 and 100 Hz and depend greatly on the degree of activity of the
cerebral cortex. These waves may not have any particular form or have normal rhythms, which are usually classified
as alpha, beta, theta and delta rhythms or waves (, , and ). Certain diseases such as epilepsy, have very
specific rhythms.
Waves and rhythms:
- Alpha: 8-13 Hz frequency. 20-200 microvolts (µV) in amplitude. (50 microvolts on average). It is the
dominant rhythm in a normal EEG. Located in occipital and parietal structures in situations of relaxation
and with eyes closed. In wakefulness.

IJRRAS 16 (4) ● October 2013 Peralta ● Some Methodologies in Biology and Medicine
149
- Beta: > 13 Hz frequency. 5 to 30 microvolts in amplitude. (10 microvolts on average). It appears in 20% of
normal individuals, being more evident in patients undergoing sedatives. In wakefulness.
- Theta: 4-7 Hz frequency. Low amplitude. In stages 1 and 2 of sleep, drowsiness and light sleep. It can also
occur in childhood or in adults during periods of emotional stress and frustration. Located in parietal and
temporal area.
- Delta: <3.5 Hz frequency. It begins in stage 3 of sleep, occurring especially in stage 4. In deep sleep. It can
also occur in childhood and severe organic brain disease.
- Mu: 7-12 Hz frequency, amplitude 20-60 microvolts. They last a few second. Rhythm is less frequent in
normal registration rhythms. It occurs in 10% of normal individuals. Located in central regions. It is deleted
if you move the contralateral upper extremity. (No related to the visual or mental activity).
- Lambda: In the occipital region. Waves related to visual activity. Visual evoked potentials. They appear when
moving eyes in search of details. Flicker effect is related to it.
Figure 6. Normal waves.
Picture 7. EEG during different sleep stages.
Figure 7. Different phases of dream.
Figure 8. Different types of epilepsy.
IJRRAS 16 (4) ● October 2013 Peralta ● Some Methodologies in Biology and Medicine
150
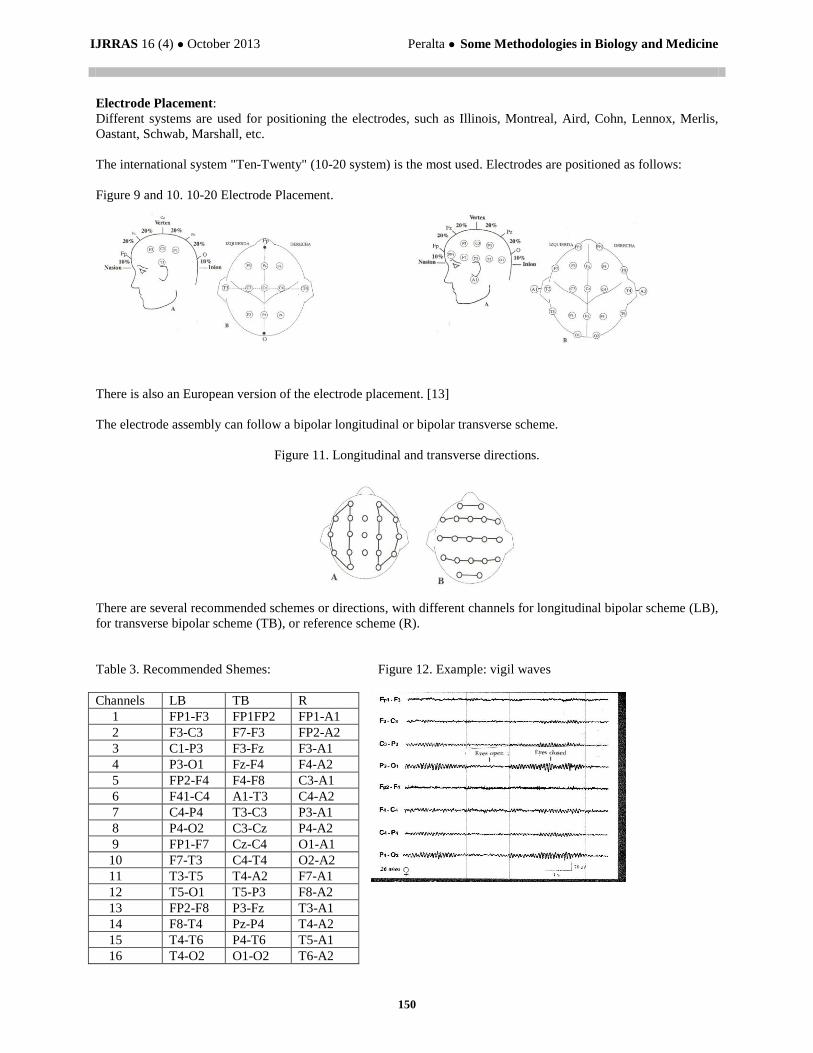
Electrode Placement:
Different systems are used for positioning the electrodes, such as Illinois, Montreal, Aird, Cohn, Lennox, Merlis,
Oastant, Schwab, Marshall, etc.
The international system "Ten-Twenty" (10-20 system) is the most used. Electrodes are positioned as follows:
Figure 9 and 10. 10-20 Electrode Placement.
There is also an European version of the electrode placement. [13]
The electrode assembly can follow a bipolar longitudinal or bipolar transverse scheme.
Figure 11. Longitudinal and transverse directions.
There are several recommended schemes or directions, with different channels for longitudinal bipolar scheme (LB),
for transverse bipolar scheme (TB), or reference scheme (R).
Table 3. Recommended Shemes: Figure 12. Example: vigil waves
Channels LB TB R
1 FP1-F3 FP1FP2 FP1-A1
2 F3-C3 F7-F3 FP2-A2
3 C1-P3 F3-Fz F3-A1
4 P3-O1 Fz-F4 F4-A2
5 FP2-F4 F4-F8 C3-A1
6 F41-C4 A1-T3 C4-A2
7 C4-P4 T3-C3 P3-A1
8 P4-O2 C3-Cz P4-A2
9 FP1-F7 Cz-C4 O1-A1
10 F7-T3 C4-T4 O2-A2
11 T3-T5 T4-A2 F7-A1
12 T5-O1 T5-P3 F8-A2
13 FP2-F8 P3-Fz T3-A1
14 F8-T4 Pz-P4 T4-A2
15 T4-T6 P4-T6 T5-A1
16 T4-O2 O1-O2 T6-A2

IJRRAS 16 (4) ● October 2013 Peralta ● Some Methodologies in Biology and Medicine
151
Neuronal action potential:
The neuron is formed by a neuronal body, the axon and the dendrites. In the neuronal body we can find the large
core (widespread chromatin), Nissl corpuscles, melanin, colloidal iron, and lipofusina. The axon is an extension that
leads nerve impulses in centrifugal direction, taking them away from the neuronal body. It is formed by the
axolemma and the axoplasm. The dendrites are small extensions that lead nerve impulses in centripetal direction
towards the center of the neuronal body or soma. Neurons sizes are variable, they are within a range from 4 microns
to 100 microns in the cerebral cortex. They have a large number of mitochondria and ribosomes, with considerable
protein synthesis.
We can also find the Golgi apparatus, neurofibrils, microtubules, lysosomes and centrioles.
We can find myelin over the axolema, both in the peripheral and central nervous systems. Myelin is a lipoprotein
nature substance (cholesterol, phosphatides, sphingomyelin, cephalin) which, among other functions, is able to
increase the speed of nerve impulse propagation. Myelinogenesis process starts from the fourth month of fetal
growth, starting earlier in the sensory fibers. The motor fibers take longer and the pyramidal tract is the latest, up to
two years of age, when the child has more motion control.
Myelin is an insulating material that is not continuously found, but interruptibly, in the so-called Nodes of Ranvier,
where it contacts the extracellular fluid, thereby causing the nerve transmission skip node to node, speeding
propagation (saltatory propagation). Communication with neighboring neurons can be of many types. In reflex arch,
which is when a sensory pathway communicates with a motor pathway and the latter with the effector. The sensory
lead communication with central neurons and these with the motor lead and then the effector is more complex.
There may be a relationship in series, from neuron to neuron, a convergent circuit (modulator) when several neurons
converge on one, or divergent circuit (amplifier) when one neuron simultaneously communicates with some more.
There may be repeated or prolonged responses: through parallel circuits, which causes the same response (repetitive)
through different routes, or through oscillating circuits, where a neuron spreads information to the next one and also
to itself, prolonging the effect. [7]
Figure 13. Neuron.
Figure 14. Synapsis.

IJRRAS 16 (4) ● October 2013 Peralta ● Some Methodologies in Biology and Medicine
152
Neuronal action potential:
The set of action potentials of neurons, gives the electric potentials which can be recorded on the EEG. As this low
amplitudes, noise introduced into the signals is loud and must be treated by processing algorithms. Flicker noise,
inversely proportional to frequency, due to frequencies below 100 Hz, is avoided by using resistors different to coal,
such as rolled filament or metal film.
Complex biosignals are processed using codes, resulting in a processed signal, which can then be interpreted. [2,7]
Figure 15. Action potential of the neuronal membrane.
The membrane action potential is due to ionic content on both its sides. Diffusion forces, electrical forces,
permeability forces, the Gibbs-Donnan equilibrium for non-diffusible ions, and sodium potassium pump interact.
The ions that interact are Na+, K
+, Cl
- and organic ions (A
-) negatively charged. These channels are selective: the K
+
has an easy diffusion, while Na+ and Cl
- are less diffusible, and A
- protein molecules inside the neuron cannot go
through the membrane. The stimulation opens the sodium channels.
This membrane, at rest, has a voltage of -70 mV, which means that the cell interior is negatively charged with regard
to the outside by introducing more Na + outside in the extracellular fluid by the sodium-potassium pump. The
neuron is at a latency period and, until -55 mV are reached by a slow depolarization, the threshold of the action
potential is not reached either and the level of discharge is not achieved. Once the action threshold is reached, there
is a rapid depolarization, as the stimulation makes the sodium channels open and it enters reversing the charge up to
+30 mV. Since before there are more sodium ions on the outside, and the inside of the neuron is negative in relation
to the outside, the sodium ions rapidly get into the neuron. During depolarization the sodium-potassium pump
remains inactive.
The rapid depolarization causes the nerve impulse, causing the electrical changes that propagate through the axon.
Then ions return to their initial position, finally resulting in a refractory period.
Sodium channels close during the repolarization and potassium channel open (slower). Again, the charge reverses,
reaching even more negative voltage values, -70 to - 90 mV (hyperpolarization). This is a refractory period in which
a new potential cannot be generated, even with a stronger stimulus. (This is because voltage-sensitive channels for
sodium are disabled and cannot be reopened yet).
Nonlinear analysis example of EEG signals:
In a study of Alzheimer's patients, there is a different electrical activity with a typical biomedical signal.
Among these nonlinear analysis, is the "entropy", in the study, approximate entropy, sample entropy, and Lempel-
Ziv complexity, being analized. Entropies, approximate and sample, measure the regularity of a time series, while
the Lempel-Ziv complexity is an estimate of the complexity of a signal.
The results showed a significant decrease in irregularity and complexity, in EEG activity, of Alzheimer's patients.
[15]
A neuronal network, such as the brain, has nonlinearity, even at the cellular level, in the behavior of neurons. But the
brain can perform cognitive tasks of high complexity, thereby completely stochastic behavior seems unlikely.
Therefore, the 1011
brain neurons can no longer completely random activity, but a collective behavior. This
behavior is sensitive to the initial conditions, so it is not a completely deterministic system.
IJRRAS 16 (4) ● October 2013 Peralta ● Some Methodologies in Biology and Medicine
153
Other physical applications in medicine are:
- MEG: Magneto EEG: It registers a magnetic field generated by neuronal activity. It has a high spatial resolution,
surface location accuracy, and depth. It uses a magnetic field of 50-500 fT (femto Teslas). Superconducting
materials are needed. Also temperatures circa absolute zero. SQUIDS (superconductive quantum interferente
devices) is an expensive method.
- Computerized Tomography: CAT (Computerized AxialTomography) or CT (Computerized tomography), also
called scanner. It is a medical imaging technique that uses X-radiation to get cuts or sections of anatomical objects
for diagnostic purposes.
- MRI scan: is a medical imaging technique that uses magnets and radio waves to create images of the body. It
generates a detectable rotational magnetic field of certain atomic nuclei. 2D or 3D images are generated by means of
the Fourier analysis.
- PET (Positron Emission Tomography): It is used to measure the metabolic activity by means of ultrashort average
life radiopharmaceuticals, detecting the photons they generate.
(GEANT is a software toolkit for the simulation of the interaction of particles with matter, developed by an
international collaboration of physicists, engineers and computer scientists. Its application areas include high energy
physics experiments, nuclear physics, astrophysics and astroparticle physics, space science, medical physics and
medical imaging, radiation protection, and education. It exploits advanced software engineering techniques and the
Object Oriented technology to achieve transparency of the physics implementation, as well as openness to extension
and evolution).
- Ultrasound: It uses ultrasound to obtain two-dimensional or three-dimensional images of structures inside the
body.
- Laser Surgery: It uses an amplified light beam (laser: light amplification by stimulated emission of radiation) to cut
and make the necessary incisions in surgery, without needing a scalpel. This is a device that uses a quantum
mechanical effect, being an application thereof. [16-19]
The equations governing the phenomena in electrophysiology are reaction-diffusion equations with anisotropic
highly nonlinear reactive term, defined by a set of stiff ordinary differential equations. This implies the need of very
fine time-space meshes to capture the propagation front, avoiding the appearance of spurious oscillations in the
wave front.
It is necessary to develop efficient algorithms for solving such problems in parallel programming environment, with
high-performance computing applications.
These algorithms must take into account the anisotropy of the cell tissue. [17]
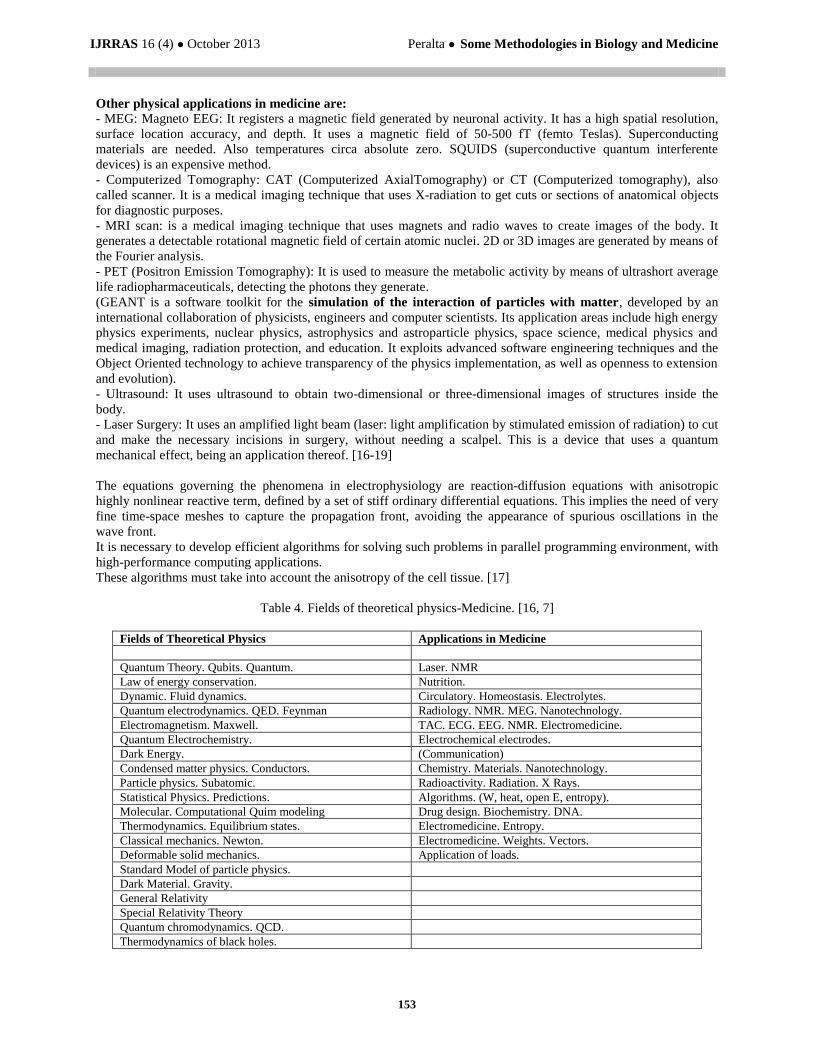
Table 4. Fields of theoretical physics-Medicine. [16, 7]
Fields of Theoretical Physics Applications in Medicine
Quantum Theory. Qubits. Quantum. Laser. NMR
Law of energy conservation. Nutrition.
Dynamic. Fluid dynamics. Circulatory. Homeostasis. Electrolytes.
Quantum electrodynamics. QED. Feynman Radiology. NMR. MEG. Nanotechnology.
Electromagnetism. Maxwell. TAC. ECG. EEG. NMR. Electromedicine.
Quantum Electrochemistry. Electrochemical electrodes.
Dark Energy. (Communication)
Condensed matter physics. Conductors. Chemistry. Materials. Nanotechnology.
Particle physics. Subatomic. Radioactivity. Radiation. X Rays.
Statistical Physics. Predictions. Algorithms. (W, heat, open E, entropy).
Molecular. Computational Quim modeling Drug design. Biochemistry. DNA.
Thermodynamics. Equilibrium states. Electromedicine. Entropy.
Classical mechanics. Newton. Electromedicine. Weights. Vectors.
Deformable solid mechanics. Application of loads.
Standard Model of particle physics.
Dark Material. Gravity.
General Relativity
Special Relativity Theory
Quantum chromodynamics. QCD.
Thermodynamics of black holes.

IJRRAS 16 (4) ● October 2013 Peralta ● Some Methodologies in Biology and Medicine
154
REFERENCES
[1]. Simple linear regression. Item 4. Year 2010-2011. Data analysis and advanced statistics. Javier Gorgas and
Nicolas Cardiel. Department of Astrophysics and Atmospheric Sciences. Faculty of Physical Sciences.
Complutense University of Madrid.
[2]. Biomedical signal processing electrocardiograms and electroencephalograms. www.monografias.com 2010.
[3]. Basic elements of nuclear physics.
[4]. http://www.gobiernodecanarias.org/educacion/3/usrn/lentiscal/2-CD-Fiisca-TIC/2-9Nuclear/Nuclear-Teoria-
rWeb/ELEMENTOS%20BASICOS%20DE%20FISICA%20NUCLEAR.htm
[5]. Pharmaceutical Specialties catalog. General Council of Official Colleges of Pharmacists. 2012. Spain.
http://www.electrocardiografia.es/
[6]. Bioengineering. Virtual Journal for professionals in bioengineering. Issue 2. Winter 2001.
[7]. Human Physiology. Based medicine. Gillian Pocock. Christofer D Richards.
[8]. Tutorial of electrocardiogram. Dr. José Ramón González Junate. Service of Cardiology. UCC. University
Hospital of Santiago de Compostela.
https://docs.google.com/viewer?a=v&pid=gmail&attid=0.3&thid=13df99911d1009b2&mt=application/pdf&
url=https://mail.google.com/mail/u/0/?ui%3D2%26ik%3D3185770c47%26view%3Datt%26th%3D13df9991
1d1009b2%26attid%3D0.3%26disp%3Dsafe%26zw&sig=AHIEtbTC4ldwG4GmBbN_ZvLDucRH9mrZEQ
[9]. Anatomy and physiology heart: the cardiac action potential. All of Books. 1.3. Cardiac action potential.
[10]. Review articles. The value of the electrocardiogram in the diagnosis of primary electrical diseases or
channelopathies without apparent structural heart disease. Second part: description of long QT syndrome,
short QT, and catecholaminergic polymorphic ventricular tachycardia. Andrés Ricardo Pérez Riera, Edgardo
Schapachnik, Sergio Dubner, Adrian Baranchuk. Rev.Fed.Arg. Cardio/2010, 39 (2) :69-80.
[11]. Early afterdepolarization, or waves, and Torsades de Pointes. Jiashin Wu, Jianyi Wu, Douglas P. Zipes.
Circulation 2002. 105:675-676.
[12]. Netter's Concise Neuroanatomy. Author: Michael Rubin and Joseph E. Satdieh. Chapter: cerebral cortex.
Page 169.
[13]. University of Alcalá. Department of electronics. Electronic Engineering. Biomedical Instrumentation. Item 5.
Electroencephalography. Rafael Barea Navarro.
[14]. EEG. Engineer Beltramone Diego.
https://docs.google.com/viewer?a=v&pid=gmail&attid=0.2&thid=13df99a254f46c46&mt=application/pdf&u
rl=https://mail.google.com/mail/u/0/?ui%3D2%26ik%3D3185770c47%26view%3Datt%26th%3D13df99a25
4f46c46%26attid%3D0.2%26disp%3Dsafe%26zw&sig=AHIEtbQnbnWvfRnViNWoStEAvPYj2Dcsaw
[15]. Non-linear analysis of the EEG signal (EEG) for help in diagnosing Alzheimer's disease. Daniel Abásolo Baz,
Roberto Hornero Sánchez, Pedro Espino Hurtado, Alonso Alonso Alonso.
[16]. Wikipedia. Theoretical physics. 2013.
[17]. PhD thesis. Algorithms for reaction diffusion equations applied to electrophysiology. Author: Heidenreich,
Elvio Alberto. University of Zaragoza. Spain. (2009).
[18]. http://www.ge.infn.it/geant4/events/nss2013/geant4course.html
[19]. Aplication Monte Carlo methods in Medical Physics. PET introduction. Esther.
http://www.google.es/url?sa=t&rct=j&q=&esrc=s&source=web&cd=2&sqi=2&ved=0CEkQFjAB&url=http
%3A%2F%2Fwww.gae.ucm.es%2Ffisatom%2Fdocencia%2Ftrabajos%2Festher%2Ftrabajo-
esther.pdf&ei=njGKUZfqDvDe7Ab_8oDYBw&usg=AFQjCNEnv-0Ls1BBpLxGkrtM90tMA6d2nA&sig2=-
7rWhnWWfpC93QU9v_LnQw&bvm=bv.46226182,d.d2k