A basis water quality monitoring plan for rehabilitation and ...
14
Global J. Environ. Sci. Manage. 8(2): 237-250, Spring 2022, Serial #30 *Corresponding Author: Email: [email protected] Phone: +63 9988 525342 ORCID: 0000-0002-1618-6335 Global Journal of Environmental Science and Management (GJESM) Homepage: hps://www.gjesm.net/ CASE STUDY A basis water quality monitoring plan for rehabilitaon and protecon M.D. Enriquez * , R.M. Tanhueco Gokongwei College of Engineering, De La Salle University, 524-4611 Philippines BACKGROUND AND OBJECTIVES: Safeguarding water resources became a major concern in many parts of the world as it aims to provide safe and healthy water for humans. Water quality monitoring is a popular tool in ensuring water quality is safe and within the allowable limits and standards for the health of the community. To provide intervenons and strategies for the rehabilitaon, a water quality monitoring plan was conducted to describe the water quality and the classificaon of the river. METHODS: This study conducted an environmental analysis to determine exisng condions and processes in the surrounding environment such as the land use, drainage paern, reconnaissance survey of the river, and a key interview to describe the barangay profile and the community’s water use and pracces. The water quality monitoring covers the evaluaon of ten water quality parameters: temperature, pH, dissolved oxygen, total dissolved solids, total suspended solids, phosphate, nitrate, oil and grease, chloride, and E. coli. FINDINGS: Results of the study presents the water quality against the ten water quality criteria. Phosphate measured on four staons ranges between 2.40-4.50 mg/L exceeding the allowable 0.50mg/L; the oil and grease exceeds the standards 2 mg/L with measured values of 2.40-4.60 mg/L in staons 2, 3, and 4; while measured chloride in all staons prove that the water is salty with values exceeding the freshwater requirement of 250mg/L; and the measured TSS in staons 2, 3 and 4 ranges from 32.30 to 49.3 mg/L exceeds the standards of 30 mg/L. E. coli was also detected in water samples collected in all sampling staons. The computed water quality index of 39.02 described water as poor, always impaired, and threatened by the surrounding environment. CONCLUSION: The measured concentraons for phosphate, oil/ grease, chloride, and TSS exceeds the water quality requirement suggesng that the water is contaminated. The E. coli detected in all water samples, further recommends prohibion of recreaonal acvies to avoid accidental intakes and skin contact on the polluted water. The exisng acvies in the surrounding residenal, commercial and agricultural areas contributed to water contaminaon as aggravated by the unreliable drainage system, absence of proper sanitaon facilies, and collecon and disposal behavior of the community. From this, a scienfic basis can be drawn on how the river can be rehabilitated and protected and serve as guide for policymakers and water managers on implemenng strategies to achieve sustainable water resources. ARTICLE INFO Arcle History: Received 22 May 2021 Revised 28 July 2021 Accepted 02 September 2021 Keywords: Environmental analysis Pandurucan River Water quality analysis (WQA) Water quality index (WQI) Water quality management plan (WQMP) ABSTRACT DOI: 10.22034/gjesm.2022.02.07 NUMBER OF REFERENCES 39 NUMBER OF FIGURES 5 NUMBER OF TABLES 4 Note: Discussion period for this manuscript open unl July 1, 2022 on GJESM website at the “Show Arcle.
-
Upload
khangminh22 -
Category
Documents
-
view
0 -
download
0
Transcript of A basis water quality monitoring plan for rehabilitation and ...

Global J. Environ. Sci. Manage. 8(2): 237-250, Spring 2022, Serial #30
*Corresponding Author:Email: [email protected]: +63 9988 525342ORCID: 0000-0002-1618-6335
Global Journal of Environmental Science and Management (GJESM)
Homepage: https://www.gjesm.net/
CASE STUDY
A basis water quality monitoring plan for rehabilitation and protectionM.D. Enriquez *, R.M. Tanhueco
Gokongwei College of Engineering, De La Salle University, 524-4611 Philippines
BACKGROUND AND OBJECTIVES: Safeguarding water resources became a major concern in many parts of the world as it aims to provide safe and healthy water for humans. Water quality monitoring is a popular tool in ensuring water quality is safe and within the allowable limits and standards for the health of the community. To provide interventions and strategies for the rehabilitation, a water quality monitoring plan was conducted to describe the water quality and the classification of the river. METHODS: This study conducted an environmental analysis to determine existing conditions and processes in the surrounding environment such as the land use, drainage pattern, reconnaissance survey of the river, and a key interview to describe the barangay profile and the community’s water use and practices. The water quality monitoring covers the evaluation of ten water quality parameters: temperature, pH, dissolved oxygen, total dissolved solids, total suspended solids, phosphate, nitrate, oil and grease, chloride, and E. coli. FINDINGS: Results of the study presents the water quality against the ten water quality criteria. Phosphate measured on four stations ranges between 2.40-4.50 mg/L exceeding the allowable 0.50mg/L; the oil and grease exceeds the standards 2 mg/L with measured values of 2.40-4.60 mg/L in stations 2, 3, and 4; while measured chloride in all stations prove that the water is salty with values exceeding the freshwater requirement of 250mg/L; and the measured TSS in stations 2, 3 and 4 ranges from 32.30 to 49.3 mg/L exceeds the standards of 30 mg/L. E. coli was also detected in water samples collected in all sampling stations. The computed water quality index of 39.02 described water as poor, always impaired, and threatened by the surrounding environment. CONCLUSION: The measured concentrations for phosphate, oil/ grease, chloride, and TSS exceeds the water quality requirement suggesting that the water is contaminated. The E. coli detected in all water samples, further recommends prohibition of recreational activities to avoid accidental intakes and skin contact on the polluted water. The existing activities in the surrounding residential, commercial and agricultural areas contributed to water contamination as aggravated by the unreliable drainage system, absence of proper sanitation facilities, and collection and disposal behavior of the community. From this, a scientific basis can be drawn on how the river can be rehabilitated and protected and serve as guide for policymakers and water managers on implementing strategies to achieve sustainable water resources.
ARTICLE INFO
Article History:Received 22 May 2021Revised 28 July 2021Accepted 02 September 2021
Keywords:Environmental analysis Pandurucan River Water quality analysis (WQA)Water quality index (WQI) Water quality management plan
(WQMP)
ABSTRAC T
DOI: 10.22034/gjesm.2022.02.07
NUMBER OF REFERENCES
39NUMBER OF FIGURES
5NUMBER OF TABLES
4
Note: Discussion period for this manuscript open until July 1, 2022 on GJESM website at the “Show Article.
238
M.D. Enriquez and R.M. Tanhueco
INTRODUCTIONRivers play a significant role in agriculture,
human consumption and recreational activities, and industries. But population growth, climate change impacts, industrial processes, transportations emissions, agricultural and industrial wastes, urban runoff (Wei and Yang, 2010; Mohiuddin et al., 2011) physical and chemical processes such as weathering and dissolution of minerals, parent rocks, and soils (Adamu et al., 2011; Skordas et.al., 2015; Purushothaman and Chakrapani, 2007) gradually impact the natural water ecosystem impairing the water quality (Parry et al., 2007; Razzaghmanesh et al, 2005). It is therefore important to safeguard the water resources to ensure that water quality conforms within the acceptable limits to protect the water resources and the public health (Said et al., 2004; Neri et al. 2012; WHO, 2012). To safeguard water resources, water quality monitoring is designed to determine the physical, chemical, and biological characters of water for human health and consumption (US EPA, 2005). Moreover, water quality monitoring is designed to confirm the water quality suitable for its intended use (Azizi et al., 2016). In addition, monitoring is done to determine the trends in the aquatic environment and describe how the contaminants enter and affect the natural aquatic environment (Bartram and Balance, 1996). Therefore, water quality monitoring has become an important activity in assessing and evaluating the conformity of water for drinking and recreational activities. Taal Lake in Talisay, Batangas, Philippines was declared safe for bathing, swimming, and skin diving, and aquaculture after monitoring and evaluating nine water quality parameters (Martinez and Galera, 2011). Monitoring of Mangonbangon River in Tacloban City, Philippines revealed that the river is unpolluted from the total heavy metal content (Decena et al., 2018). The study conducted on Pasig River, Philippines revealed that the river is very poor and degrading from the presence of stagnant, blackish, and stinking water (Gorme et al, 2010). While, the monitoring and assessment of water quality conducted in Buhisan River, Cebu Philippines revealed that the mean midstream and downstream did not conform to class D surface water (Maglangit et al., 2014). More so, the 36 river monitoring stations in Palawan, Philippines using nine parameters and water quality index showed
good to excellent water quality for agriculture, irrigation, and other purposes; while five (5) river monitoring stations showed good to excellent ratings after treatment and suited for class A (Martinico-Perez et al., 2019). Evaluation and assessment of water quality parameters provide direction to a water quality monitoring plan. The ten primary water quality parameters as mandated by the Department of Natural Resources-Environmental Management Bureau is used in this study for the evaluation of the water quality standards of the study area. The sample collection and method of analysis of previous studies were considered and followed to achieve the objectives of the study. To aid the water quality monitoring plan, a popular tool known as Water Quality Index (WQI) was developed. WQI was described as the most effective way to describe the quality of water (Regmi and Mishra, 2016; Akter et al., 2016). With the aid of WQI, descriptions such as generally moderate water quality of Lake Taihu Basin (Wu et al., 2018); good water quality in the upstream and midstream of the Chillan River (Debels et al., 2005), the average water quality of Mantayupan falls at the headwater down the river channel (Neri et al., 2012) and poor water quality of Pasig River in Metro Manila, Philippines (Regmi and Mishra, 2016) were used to describe the general water quality. Since the rating scores of WQI of the Canadian Council of Ministers of Environment provide a simple description of water quality, this study adopted the same methodology for the understanding of the local community. In the Philippines, RA 9275 or the Philippine Clean Water Act of 2004 defines water quality in terms of physical, chemical, biological, or radiological characteristics by which the acceptability of the water is evaluated to conform with Administrative Order: 2016-08 or the Water Quality Guidelines and General Effluents Standards of 2016 (DENR-EMB, 2016). In general, drinking water of good quality should be clear and free of harmful substances and must conform to the Philippine National Standards for Drinking Water. While recreational waters must be free from any contaminants as accidental drinking and skin contact is expected during bathing and swimming. The Department of Environment and Natural Resources identified that almost half of the classified rivers in the country did not meet the minimum standards for beneficial use as impaired by domestic, industrial,
239
Global J. Environ. Sci. Manage., 8(2): 237-250, Spring 2022
and agricultural sources; and almost 50 out of 427 rivers are considered biologically dead (Cabacungan, 2016). One of the rivers in San Jose, Occidental Mindoro is the Pandurucan River and is believed to be impaired and degrading; however, there is no substantial evidence on the water quality and no scientific study has been carried out to investigate the characteristic of water and the possible sources of contamination. This study aims to present a water quality monitoring plan to provide information on the water quality conditions of Pandurucan River. The river has a plan to be rehabilitated as a tourist destination and the information obtained from this undertaking intends to provide scientific bases to support sound decision-making for San Jose water managers and policymakers. Results of the study can provide significant proof on water quality conditions, sources of contaminants, level of pollution and understand how human activities impaired the natural water ecosystem. Specifically, this study aims to present the physical/chemical and microbial analysis of water; conduct environmental analysis considering all present situations of the surrounding areas; characterize the water quality condition using Water Quality Index; determine the significant differences between water quality at different sites
and different seasons; and recommend strategies for water quality management plan of Pandurucan River, San Jose, Occidental Mindoro. The water quality monitoring covers the period of 2019 to 2020.
MATERIALS AND METHODSStudy area
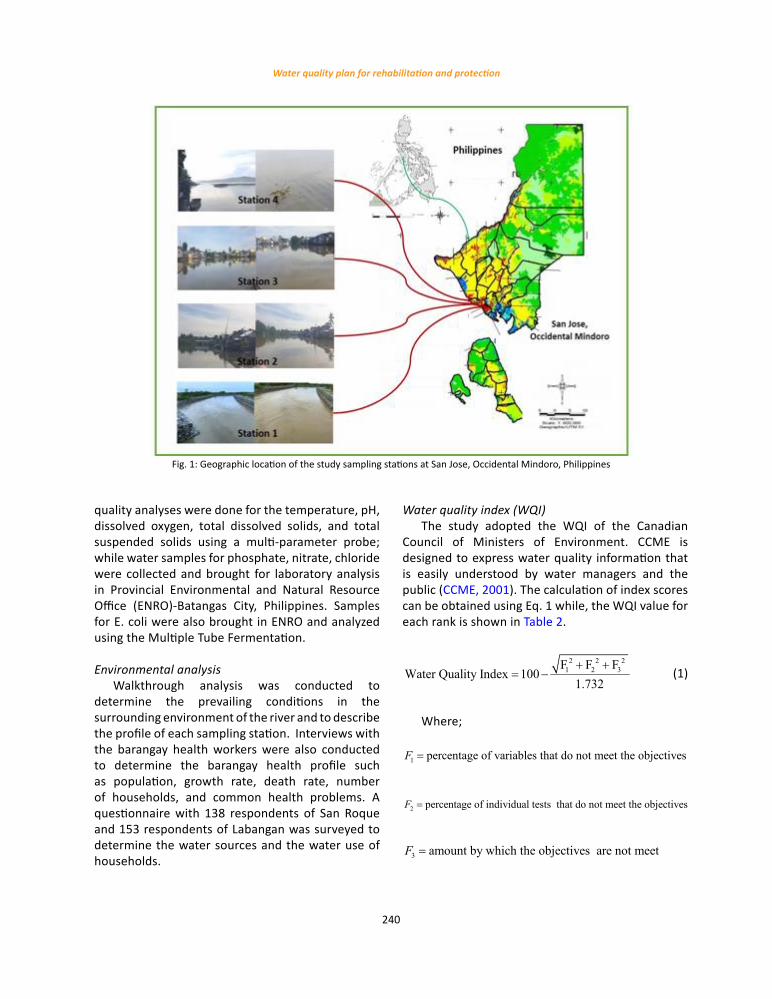
Pandurucan River is located at San Jose, Occidental Mindoro covering San Roque and Labangan Poblacion on its midstream and downstream sections. The river is generally used for recreational purposes as swimming and bathing which are commonly observed and enjoyed. Four sampling stations were selected based on the drainage pattern and probable point sources and the center of commercial and residential areas. Table 1 shows the descriptions of the sampling stations.
Sampling method and data collectionOne grab sample was taken every month
in the four identified stations from September 2019 to February 2021. Water samples were collected simultaneously on the four sampling sites following the standard procedures recommended by Administrative Order 2016-08. In situ, water
Table 1: Description and profile of sampling station sites (PAG-ASA, 2021)
Stations Description Station 1: Labangan Poblacion
The station is located at 12˚ 21' 55"N 121˚04'36''E at Labangan, San Jose, Occidental Mindoro. It is located in mangrove areas with riverbanks riprapped with nearby salt farm. The station is characterized by clear water during the dry season and muddy water during the wet season while the river bed is covered with pebble stones. Under the Type A climatic conditions, average temperature in the site is 27.96ºC with rainfall amount 113.23 mm. Most of the land cover is agricultural use and generally residential and commercial areas.
Station 2: San Roque
The station is located at 12˚ 21' 54"N 121˚04'00''E of San Roque, San Jose, Occidental Mindoro. At the station is the Pandurucan Bridge with river water characterized by scattered garbage in the river banks and surrounding mangrove. The water is typically greenish to brownish and a foul smell can be observed. The river bed is covered with muddy clay. The station is also covered of Type A climate conditions with average temperature of 28.29ºC and accumulated rainfall amount during the study period of 3,634.90 mm. Most of the land cover surrounding the station is categorized as highly dense residential, residential and commercial areas.
Station 3: Market area
The station can be found in 12˚ 21' 20"N 121˚03'52'' E with visible residential houses, garbage and waste on the riversides, snail shells in the river banks with greenish to brownish water. A foul smell can also be observed. The river bed is also covered with muddy clay. The station is generally surrounded by residential areas and commercial establishments. The rainfall pattern is the same as Station 2 with an average temperature of 28.32ºC.
Station 4: Downstream-outlet
The station is situated at 12˚ 21' 01"N 121˚03'41''E of Brgy 5, San Jose, Occidental Mindoro. The station point is characterized by residential houses with garbage (diapers and plastics); a mass of soil that separates the river and the sea. There are swimming children can be seen, and the river bed is covered with a sandy bottom. The water is bluish during sunny weather. The station is considered as the outlet of the river since it faces an opening to Mindoro Strait. Average temperature in the station is 28.42ºC.
Table 1: Description and profile of sampling station sites (PAG-ASA, 2021)
240
Water quality plan for rehabilitation and protection
quality analyses were done for the temperature, pH, dissolved oxygen, total dissolved solids, and total suspended solids using a multi-parameter probe; while water samples for phosphate, nitrate, chloride were collected and brought for laboratory analysis in Provincial Environmental and Natural Resource Office (ENRO)-Batangas City, Philippines. Samples for E. coli were also brought in ENRO and analyzed using the Multiple Tube Fermentation.
Environmental analysis Walkthrough analysis was conducted to
determine the prevailing conditions in the surrounding environment of the river and to describe the profile of each sampling station. Interviews with the barangay health workers were also conducted to determine the barangay health profile such as population, growth rate, death rate, number of households, and common health problems. A questionnaire with 138 respondents of San Roque and 153 respondents of Labangan was surveyed to determine the water sources and the water use of households.
Water quality index (WQI)The study adopted the WQI of the Canadian
Council of Ministers of Environment. CCME is designed to express water quality information that is easily understood by water managers and the public (CCME, 2001). The calculation of index scores can be obtained using Eq. 1 while, the WQI value for each rank is shown in Table 2.
( )
2 2 21 2 3F F F
Water Quality Index 100 11.732+ +
= − (1)
Where;
1 percentage of variables that do not meet the objectives F =
2 percentage of individual tests that do not meet the objectives F =
3 amount by which the objectives are not meet F =
1
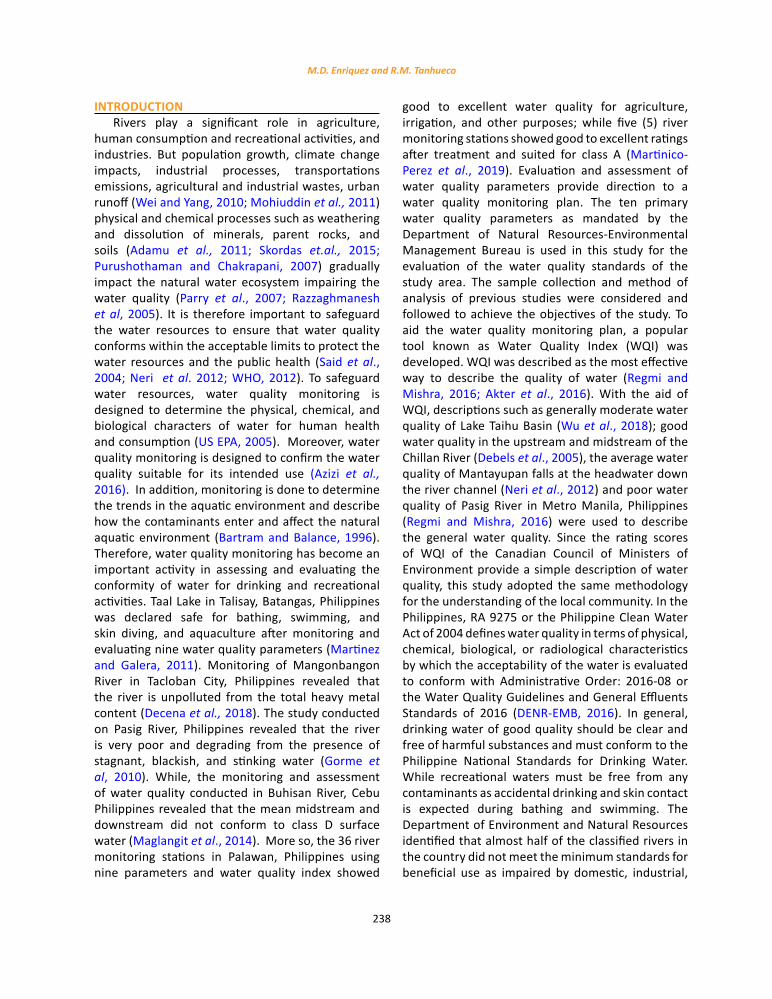
Fig. 1. Geographic location of the study sampling stations at San Jose, Occidental Mindoro, Philippines
Fig. 1: Geographic location of the study sampling stations at San Jose, Occidental Mindoro, Philippines
241
Global J. Environ. Sci. Manage., 8(2): 237-250, Spring 2022
RESULTS AND DISCUSSIONExisting environmental conditions and processes
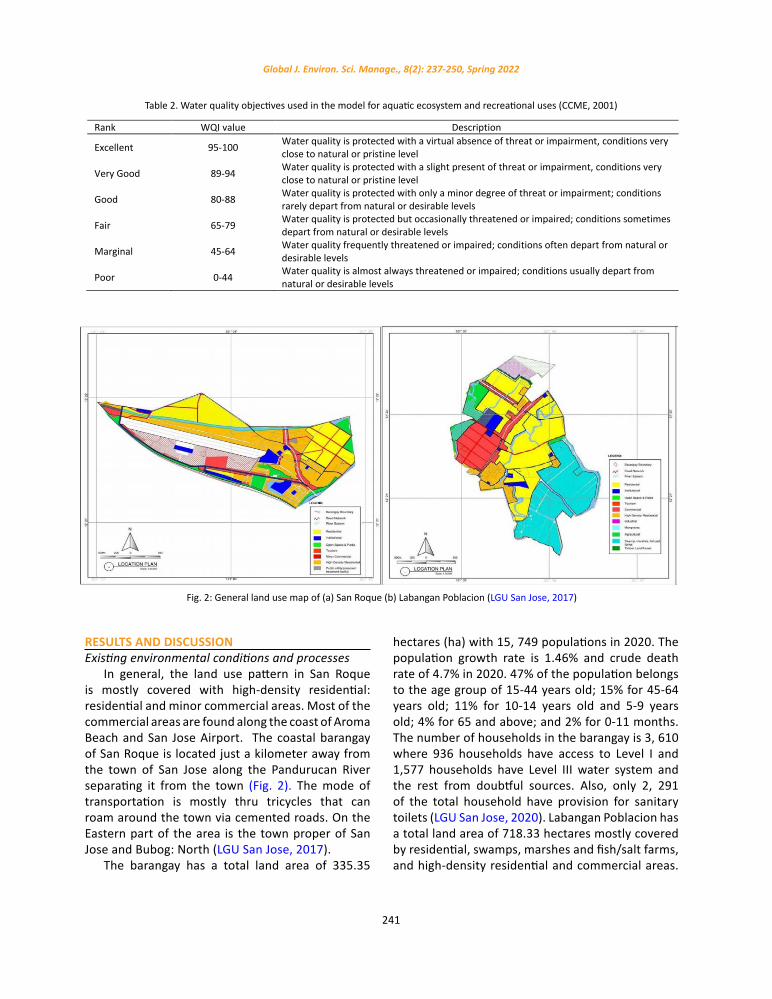
In general, the land use pattern in San Roque is mostly covered with high-density residential: residential and minor commercial areas. Most of the commercial areas are found along the coast of Aroma Beach and San Jose Airport. The coastal barangay of San Roque is located just a kilometer away from the town of San Jose along the Pandurucan River separating it from the town (Fig. 2). The mode of transportation is mostly thru tricycles that can roam around the town via cemented roads. On the Eastern part of the area is the town proper of San Jose and Bubog: North (LGU San Jose, 2017).
The barangay has a total land area of 335.35
hectares (ha) with 15, 749 populations in 2020. The population growth rate is 1.46% and crude death rate of 4.7% in 2020. 47% of the population belongs to the age group of 15-44 years old; 15% for 45-64 years old; 11% for 10-14 years old and 5-9 years old; 4% for 65 and above; and 2% for 0-11 months. The number of households in the barangay is 3, 610 where 936 households have access to Level I and 1,577 households have Level III water system and the rest from doubtful sources. Also, only 2, 291 of the total household have provision for sanitary toilets (LGU San Jose, 2020). Labangan Poblacion has a total land area of 718.33 hectares mostly covered by residential, swamps, marshes and fish/salt farms, and high-density residential and commercial areas.
Table 2. Water quality objectives used in the model for aquatic ecosystem and recreational uses (CCME, 2001)
Rank WQI value Description
Excellent 95-100 Water quality is protected with a virtual absence of threat or impairment, conditions very close to natural or pristine level
Very Good 89-94 Water quality is protected with a slight present of threat or impairment, conditions very close to natural or pristine level
Good 80-88 Water quality is protected with only a minor degree of threat or impairment; conditions rarely depart from natural or desirable levels
Fair 65-79 Water quality is protected but occasionally threatened or impaired; conditions sometimes depart from natural or desirable levels
Marginal 45-64 Water quality frequently threatened or impaired; conditions often depart from natural or desirable levels
Poor 0-44 Water quality is almost always threatened or impaired; conditions usually depart from natural or desirable levels
Table 2. Water quality objectives used in the model for aquatic ecosystem and recreational uses (CCME, 2001)
2
Fig. 2: General land use map of (a) San Roque (b) Labangan Poblacion
(LGU San Jose, 2017)
Fig. 2: General land use map of (a) San Roque (b) Labangan Poblacion (LGU San Jose, 2017)

242
M.D. Enriquez and R.M. Tanhueco
Commercial areas include educational institutions, government, and private offices, cockpit, and business establishments. The inland barangay is also a kilometer away from the town proper of San Jose. The barangay is bounded by agricultural barangays at the south; the town of San Jose at the north; Bagong Sikat at the east and the municipality of Magsaysay at the west. Barangay Labangan Poblacion has a total population of 9,744 in 2020. The population growth rate is 1.68% and crude death rate of 3.2% in 2020. 47% of the population belongs to the age group of 15-44 years old; 16% for 45-59 years old; 10% for 10-14 years old and 5-9 years old; 9% for 60 and above; 7% for 1-4 years old; and 2% for 0-11 months. The number of households in the barangay is 2,397 where 622 households have access to Level I, 1,047 households have Level III water systems and the remaining have doubtful sources. Also, only 1,522 of the total household have provision for complete basic sanitation facilities (LGU San Jose, 2020).
Water supply and water use From the survey conducted to 138 households
and 153 households in Brgy. San Roque and Labangan, the general water use is primarily for domestic purposes. 82% of the respondents showed that the major water source is being supplied by the Prime Waters while 18% uses deep wells dug in their backyard. Prime Waters is the only identified water service provider in the municipality of San Jose that uses one deep well and 15 shallow wells (16 pumping houses) as its water sources with one reservoir situated at Brgy. Labangan and has 500 cum capacity. The pumping house located at the municipal hall of San Jose supplies water in Barangays 6, 7, 8, Pag-asa, and Caminawit supported by another pumping house in Doña Consuelo Subdivision. The pumping house is located in Brgy. Bagong Sikat supplies water for the barangays and San Roque area. The distribution line is mainly composed of 150mm PVC, 100mm PVC, and 75 mm PVC. The water supply is treated using chlorination where the dosage of chlorine oxide depends on the capacity of each pump (LGU San Jose, 2020). Most of the households experience unreliable water supply and undesirable water quality. 89% of the respondents used drinking water from the refilling station as the majority complains about the water quality being compromised by the presence of
corrosive particles and bad smell due to too much chlorine. The 11% fetched their drinking water from the well; stored in bottled; and the majority drank water directly without any treatment. However, 83 experienced diarrhea where 32 were taken to a health facility while the rest took home remedies.
Drainage patternDrainage pattern can also affect the river system
as it determines contributing factors and possible sources of contamination. In general, drainage in San Jose is composed of curb type and steel grated box type. However, there are still some areas in the municipality that do not have a reliable drainage system. All existing curbs and gutters in the municipality drain water to the Pandurucan River. While those that are in the area of San Roque drain water in the Bubog River. Fig. 3 shows the drainage system in the study area.
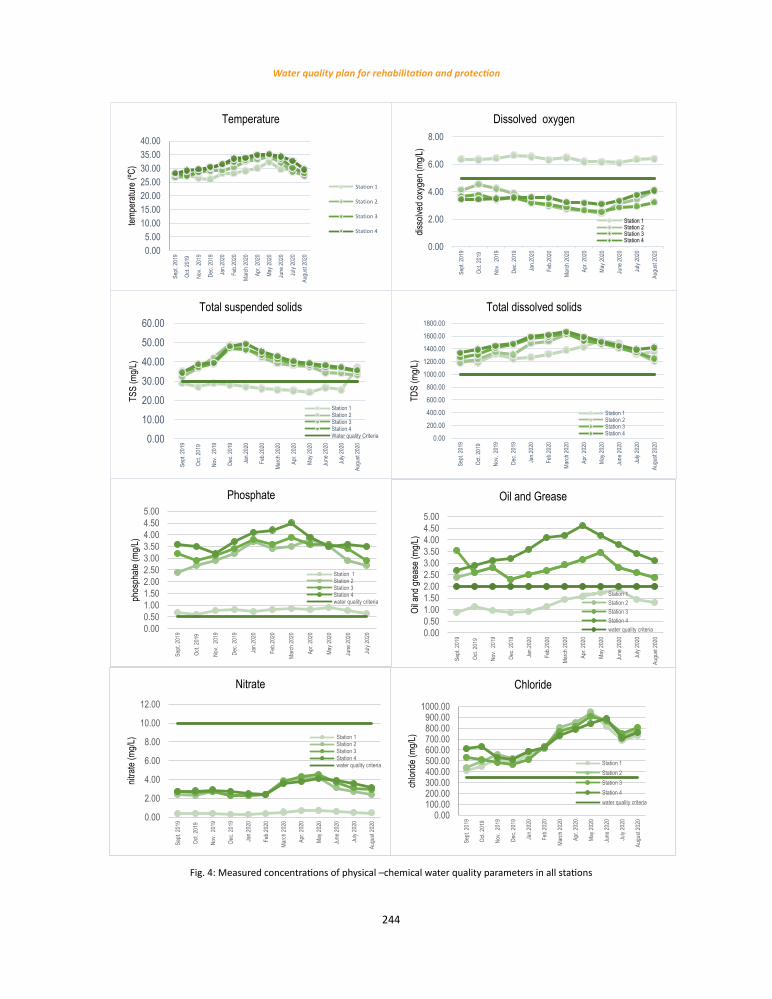
Physical-chemical and E. coli results Following the procedures for in situ and
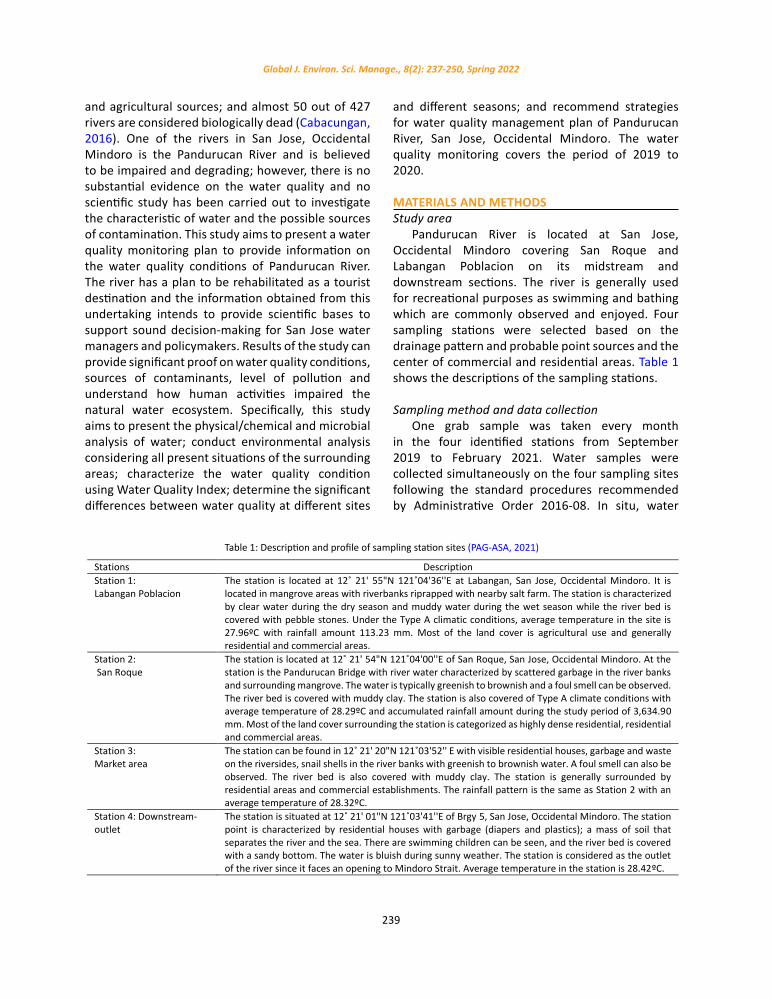
laboratory analysis, the following results were observed. Water samples consider the wet season and dry season from September 2019 to August 2020 (Table 3). While, Fig. 4 shows the measured concentrations of each sampling station.
Water temperature is one of the most important physical characteristics of aquatic systems as it affects the biological, physical, and chemical processes for plants and animals. As temperature increases, photosynthesis and other chemical and metabolic reactions increase providing adequate nutrients for aquatic life (FOEN, 2012). Measured water temperature in sampling sites ranges from 27.87°C to 33.8°C and is acceptable for all classes of water use and suitable for some fishes and aquatic life as the standards require 26-30ºC for recreational waters. Potential hydrogen or pH indicates the acidity or alkalinity of water with 6.5 to 8.5 as the ideal value. The measured pH in the sampling stations ranges from 7.29 to 7.89. Based on the standards, the values are good for aquatic plants like algae and some fishes. Dissolved oxygen reflects the amount of oxygen dissolved in an aqueous solution as affected by the velocity of water flow, prevailing climate, type and the number of water organisms, amount of water nutrients, and the presence of organic waste and vegetation in the water. DO

243
Global J. Environ. Sci. Manage., 8(2): 237-250, Spring 2022
level below 5.0 mg/L compromises aquatic life and significantly indicates poor water quality (Liu et al., 2009; Li and Bishop, 2004). Measured DO in stations 2, 3, and 4 showed higher values and beyond the allowable limit. Lower DO in the sampling station is manifested by limited aquatic life with only spire snail shells and other small crustaceans are present. While DOs measured in station 1 were higher than 5.0 mg/L indicating healthy water as fishes and other crustaceans are observed in the site. Suspended solids containing much organic matter may cause
putrefaction and consequently lacks dissolved oxygen. The Total suspended solids found in water may include particles of clay, silt, decaying plant and animals, wastes, and sewage caused by water turbidity, high flow rate, and velocity of runoff. Based on the water quality criteria, TSS should not exceed 30 mg/L. The measured TSS on the sampling stations except Station 1 was higher during November and December 2019. TSS tends to increase during wet seasons and decreases during dry months. While Total dissolved solids (TDS) measures the inorganic
3
Fig. 3: Geographic location of the study area along with the existing drainage system
in San Jose, Occidental Mindoro, Philippines
Fig. 3: Geographic location of the study area along with the existing drainage system in San Jose, Occidental Mindoro, Philippines
Table 3: Average concentrations of physical-chemical parameters
Physical-chemical parameters Wet season Dry season 1 2 3 4 1 2 3 4
Temperature (˚C) 27.87 28.53 29.49 30.61 29.64 32.04 33.3 33.8 pH (units) 7.29 7.57 7.49 7.89 7.44 7.41 7.34 7.42 Dissolved oxygen (mg/L) 6.39 3.92 3.35 3.61 6.35 2.82 2.88 3.34 Total dissolved oxygen (mg/L) 1311 1291 1355 1417 1386 1544 1562 1596 Total suspended solids (mg/L) 28.93 37.43 38.22 38.86 25.63 41.00 41.88 43.46 Phosphate (mg/L) 0.70 2.74 3.07 3.50 0.822 3.58 3.7 4.04 Oil and grease (mg/L) 1.22 2.56 2.72 3.17 1.36 2.94 2.94 4.14 Nitrate (mg/L) 0.44 2.58 2.86 3.11 0.53 3.39 3.47 3.26 Chloride (mg/L) 585.71 623.57 632.14 662.86 744.00 760.00 728.00 714.00 E. coli (MPN/100 mL) 234.71 414.86 442.86 306.57 201.80 242.20 265.4 222.00
Table 3: Average concentrations of physical-chemical parameters
244
Water quality plan for rehabilitation and protection
4
Fig. 4: Measured concentrations of physical –chemical water quality parameters in all stations
0.00
2.00
4.00
6.00
8.00
10.00
12.00
Sept.
2019
Oct. 2
019
Nov.
2019
Dec.
2019
Jan.2
020
Feb.2
020
March
2020
Apr.
2020
May 2
020
June
2020
July
2020
Augu
st 20
20
nitra
te (m
g/L)
Nitrate
Station 1Station 2Station 3Station 4water quality criteria
0.000.501.001.502.002.503.003.504.004.505.00
Sept.
2019
Oct. 2
019
Nov.
2019
Dec.
2019
Jan.2
020
Feb.2
020
March
2020
Apr.
2020
May 2
020
June
2020
July
2020
Augu
st 20
20
Oil a
nd gr
ease
(mg/L
)
Oil and Grease
Station 1Station 2Station 3Station 4water quality criteria0.00
0.501.001.502.002.503.003.504.004.505.00
Sept.
2019
Oct. 2
019
Nov.
2019
Dec.
2019
Jan.2
020
Feb.2
020
March
2020
Apr.
2020
May 2
020
June
2020
July
2020
phos
phate
(mg/L
)
Phosphate
Station 1Station 2Station 3Station 4water quality criteria
0.005.00
10.0015.0020.0025.0030.0035.0040.00
Sept.
2019
Oct. 2
019
Nov.
2019
Dec.
2019
Jan.2
020
Feb.2
020
March
2020
Apr.
2020
May 2
020
June
2020
July
2020
Augu
st 20
20
tempe
ratur
e (ºC
)Temperature
Station 1
Station 2
Station 3
Station 4
0.00
2.00
4.00
6.00
8.00
Sept.
2019
Oct. 2
019
Nov.
2019
Dec.
2019
Jan.2
020
Feb.2
020
March
2020
Apr.
2020
May 2
020
June
2020
July
2020
Augu
st 20
20
disso
lved o
xyge
n (mg
/L)
Dissolved oxygen
Station 1Station 2Station 3Station 4
0.00
10.00
20.00
30.00
40.00
50.00
60.00
Sept.
2019
Oct. 2
019
Nov.
2019
Dec.
2019
Jan.2
020
Feb.2
020
March
2020
Apr.
2020
May 2
020
June
2020
July
2020
Augu
st 20
20
TSS
(mg/L
)
Total suspended solids
Station 1Station 2Station 3Station 4Water quality Criteria 0.00
200.00400.00600.00800.00
1000.001200.001400.001600.001800.00
Sept.
2019
Oct. 2
019
Nov.
2019
Dec.
2019
Jan.2
020
Feb.2
020
March
2020
Apr.
2020
May 2
020
June
2020
July
2020
Augu
st 20
20
TDS
(mg/L
)
Total dissolved solids
Station 1Station 2Station 3Station 4
0.00100.00200.00300.00400.00500.00600.00700.00800.00900.00
1000.00
Sept.
2019
Oct. 2
019
Nov.
2019
Dec.
2019
Jan.2
020
Feb.2
020
March
2020
Apr.
2020
May 2
020
June
2020
July
2020
Augu
st 20
20
chlor
ide (m
g/L)
Chloride
Station 1Station 2Station 3Station 4water quality criteria
Fig. 4: Measured concentrations of physical –chemical water quality parameters in all stations

245
Global J. Environ. Sci. Manage., 8(2): 237-250, Spring 2022
salts like calcium, magnesium, and chloride dissolved in water (Bodzin, 2004). TDS affects the taste of water (WHO, 2003), and measured values must not exceed 1000 mg/L to meet the water quality criteria (DENR-EMB, 2016). The measured TSS ranges between 28.93 to 38.86 mg/L during the dry season and 25.63 to 43.46 mg/L during the wet season with only water from station 1 conforms to the water quality criteria. While the measured TDS in all stations exceed the allowable limits with higher values observed during the dry seasons. Higher phosphate can be dangerous to marine organisms causing tremendous development on aquatic bloom and lessen the amount of light in the water thus, decreasing the amount of dissolved oxygen. When algae grow quickly, they die quickly contributing to the organic waste and decomposition of bacteria. The acceptable range of phosphate concentration in river water is 0.50 mg/L (DENR-EMB, 2016). The measured phosphate in four sampling stations ranges between 0.70 to 3.5 mg/L during the wet months and 0.82 to 4.04 mg/L during the dry months. The algae are commonly observed in the river banks and with higher phosphate concentrations, limited aquatic life is observed and deprived of sufficient oxygen (Khan et al., 2006). Oil and grease can damage the aquatic environment and interfere
with aerobic and anaerobic biological processes. Measured concentrations for oil and grease were higher during the dry months as it ranges between 1.08 to 3.5 mg/L with water samples from Station 1 conforms to the acceptable limit of 2 mg/L. Oil films are also observed in water surfaces of stations, 2, 3, and 4 indicating the presence of contaminants (Moslem et al., 2013) comprising the usability of the river system (US EPA, 1999). The allowable limit for nitrates concentration is 10 mg/L and an excessive amount may lead to algal bloom causing depletion of oxygen affecting the aquatic life (DENR-EMB, 2016). The measured concentrations of nitrate in the four sampling stations do not exceed the allowable limit but higher values were measured during March and May where agricultural activities are dominant in the surrounding environment as runoff from nitrogen fertilizers, domestic wastewater, human and animal waste are commonly observed (Wright et al., 2004). Chloride is a measure of sodium and potassium content of the water samples and must be less than 350 mg/L for freshwater (DENR-EMB, 2016). High chloride in the water body indicates saltwater intrusion. All water samples in all stations exceed the normal value for the freshwater significantly describing that the water is salty.
E. coli is a common bio-indicator of water
5
Fig. 5: Measured E. coli in the four sampling stations
0
100
200
300
400
500
600
700
Sept.
2019
Oct. 2
019
Nov.
2019
Dec.
2019
Jan.2
020
Feb.2
020
March
2020
Apr.
2020
May 2
020
June
2020
July
2020
Augu
st 20
20
E.co
li (MP
N)
E. coli Station 1Station 2Station 3Station 4water quality criteria
Fig. 5: Measured E. coli in the four sampling stations
WQ Criteria
246
M.D. Enriquez and R.M. Tanhueco
pollution and indicator of contamination, diseases, and unsafe drinking (Ram et al., 2008; Yogendra et al., 2008). The E. coli is measured by the Most Probable Number per 100 mL of water sample (MPN/100 mL) and must not exceed 100MPN/100 mL for recreational uses (DENR-EMB, 2016). Results of the microbial analysis show the presence of E. coli in all water samples (Fig. 5). Higher values were measured in Station 3 particularly from November to December 2019 and from June to August 2020.
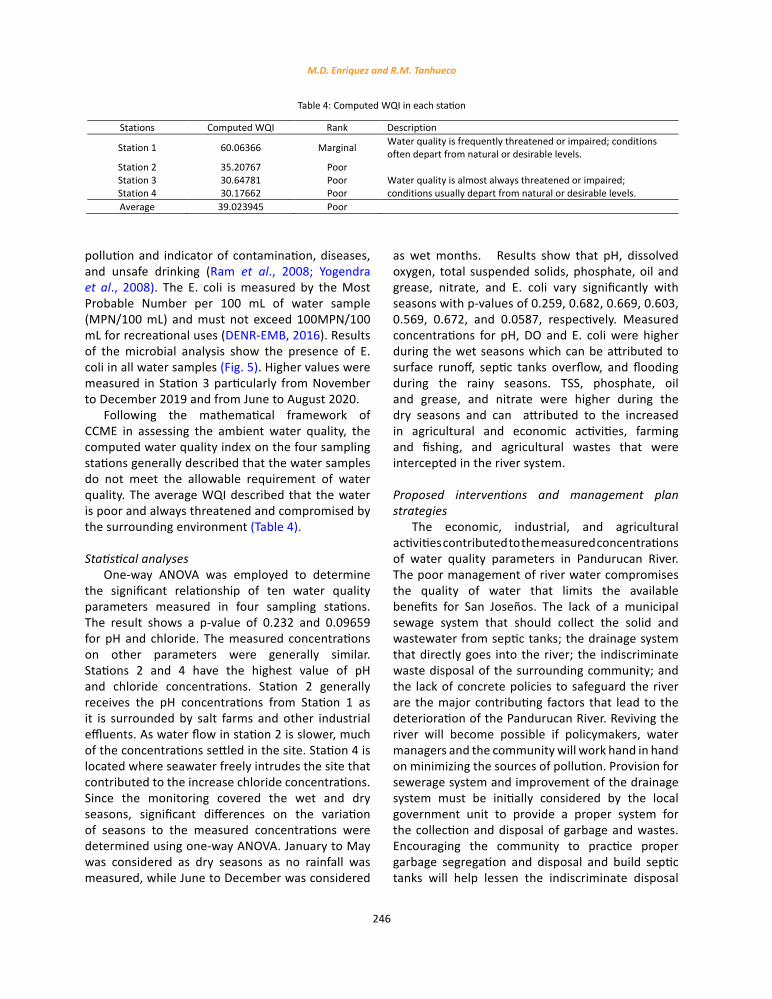
Following the mathematical framework of CCME in assessing the ambient water quality, the computed water quality index on the four sampling stations generally described that the water samples do not meet the allowable requirement of water quality. The average WQI described that the water is poor and always threatened and compromised by the surrounding environment (Table 4).
Statistical analyses One-way ANOVA was employed to determine
the significant relationship of ten water quality parameters measured in four sampling stations. The result shows a p-value of 0.232 and 0.09659 for pH and chloride. The measured concentrations on other parameters were generally similar. Stations 2 and 4 have the highest value of pH and chloride concentrations. Station 2 generally receives the pH concentrations from Station 1 as it is surrounded by salt farms and other industrial effluents. As water flow in station 2 is slower, much of the concentrations settled in the site. Station 4 is located where seawater freely intrudes the site that contributed to the increase chloride concentrations. Since the monitoring covered the wet and dry seasons, significant differences on the variation of seasons to the measured concentrations were determined using one-way ANOVA. January to May was considered as dry seasons as no rainfall was measured, while June to December was considered
as wet months. Results show that pH, dissolved oxygen, total suspended solids, phosphate, oil and grease, nitrate, and E. coli vary significantly with seasons with p-values of 0.259, 0.682, 0.669, 0.603, 0.569, 0.672, and 0.0587, respectively. Measured concentrations for pH, DO and E. coli were higher during the wet seasons which can be attributed to surface runoff, septic tanks overflow, and flooding during the rainy seasons. TSS, phosphate, oil and grease, and nitrate were higher during the dry seasons and can attributed to the increased in agricultural and economic activities, farming and fishing, and agricultural wastes that were intercepted in the river system.
Proposed interventions and management plan strategies
The economic, industrial, and agricultural activities contributed to the measured concentrations of water quality parameters in Pandurucan River. The poor management of river water compromises the quality of water that limits the available benefits for San Joseños. The lack of a municipal sewage system that should collect the solid and wastewater from septic tanks; the drainage system that directly goes into the river; the indiscriminate waste disposal of the surrounding community; and the lack of concrete policies to safeguard the river are the major contributing factors that lead to the deterioration of the Pandurucan River. Reviving the river will become possible if policymakers, water managers and the community will work hand in hand on minimizing the sources of pollution. Provision for sewerage system and improvement of the drainage system must be initially considered by the local government unit to provide a proper system for the collection and disposal of garbage and wastes. Encouraging the community to practice proper garbage segregation and disposal and build septic tanks will help lessen the indiscriminate disposal
Table 4: Computed WQI in each station
Stations Computed WQI Rank Description
Station 1 60.06366 Marginal Water quality is frequently threatened or impaired; conditions often depart from natural or desirable levels.
Station 2 35.20767 Poor Water quality is almost always threatened or impaired; conditions usually depart from natural or desirable levels.
Station 3 30.64781 Poor Station 4 30.17662 Poor Average 39.023945 Poor
Table 4: Computed WQI in each station
247
Global J. Environ. Sci. Manage., 8(2): 237-250, Spring 2022
of garbage into bodies of water. Cleaning activities on river beds and banks will help improve the river’s flow pattern and velocity. More importantly, implementation of policies and ordinances that will promote preservation and restoration of the river water to enlighten the community to become aware, participate, and support all intervention measures.
CONCLUSIONThe water quality management plan of
Pandurucan River presents the physical-chemical and microbiological characteristics of the water quality standards of DAO 2016-08. From the four sampling stations, grab water samples were taken and in-situ and laboratory tests were performed to obtain the desired objectives. Four of nine physical-chemical parameters failed to meet the water quality standards: phosphate measured ranges between 2.40-4.50 mg/L exceeding the allowable 0.50mg/L; oil and grease measured were found to exceed the standards of 2 mg/L with measured values of 2.40-4.60 mg/L in stations 2, 3 and 4; while measured chloride in all stations exceeds the freshwater requirement of 250mg/L; and the measured TSS in stations 2, 3 and 4 ranging from 32.30 to 49.3 mg/L exceeds the 30mg/L standards. The detected E. coli in all sampling stations indicates the presence of contaminants in the river. The results show that river water is not safe for recreational purposes like swimming and bathing as accidental intakes and skin contact on contaminated water can cause health problems. The garbage collection and disposal of the surrounding community contributed to the sources of pollution in the river as most of the households do not have reliable sanitation facilities. The lack of a dependable drainage system in the municipality also contributed to the source of contaminants as collected water in the curb and box-type drainages drain directly in the river. These practices and activities contribute to the Poor water quality index computed in the study area. As the local government unit aims to rehabilitate the Pandurucan River to become a tourist destination, this study can serve as a framework in the water quality management plan and provide a scientific basis to establish policies and guidelines in the surrounding community. The interventions, management, and rehabilitation strategies must be first initiated by the policymakers and should
involve the stakeholders, water managers, and the community in improving and protecting the water quality. As an initial undertakings in the study area; the water quality parameters; calculated WQI, sources of contaminants determined in this study will serve as input data on the study related to the fate and transport of bacteria and calculate the associated heath risk if water is ingested or accidentally taken.
AUTHOR CONTRIBUTIONSM. Enriquez performed the experimental design,
analyzed and interpreted the data, prepared the manuscript text and manuscript revision. R. Tanhueco checked the experimental design, interpretation of data, manuscript text and manuscript revision.
ACKNOWLEDGEMENTThe authors would like to thank the Department
of Science and Technology-Engineering Research and Development for Technology for the research grant (ERDT Project: RPSM 19-20 1344); the Local Government Unit of San Jose, Occidental Mindoro Philippines for the Comprehensive Land and Water Use Plan used in the study; Department of Science and Technology-San Jose, Occidental Mindoro, Philippines for the weather data; Ms. Myra Maniago and Ms. Rose Real- Barangay Health Center of Labangan Poblacion and San Roque for the barangay health profile; and the respondents of the survey for their valuable time in answering the survey.
CONFLICT OF INTERESTThe authors declare no potential conflict of
interest regarding the publication of this work. In addition, ethical issues including plagiarism, informed consent, misconduct, data fabrication and, or falsification, double publication and, or submission, and redundancy have been completely witnessed by the authors.
OPEN ACCESSThis article is licensed under a Creative Commons
Attribution 4.0 International License, which permits use, sharing, adaptation, distribution and reproduction in any medium or format, as long as you give appropriate credit to the original author(s) and the source, provide a link to the Creative Commons license, and indicate if changes were made. The

248
M.D. Enriquez and R.M. Tanhueco
images or other third party material in this article are included in the article’s Creative Commons license, unless indicated otherwise in a credit line to the material. If material is not included in the article’s Creative Commons license and your intended use is not permitted by statutory regulation or exceeds the permitted use, you will need to obtain permission directly from the copyright holder. To view a copy of this license, visit: http://creativecommons.org/licenses/by/4.0/
PUBLISHER’S NOTEGJESM Publisher remains neutral with regard
to jurisdictional claims in published maps and institutional affiliations.
ABBREVIATIONS% Percent
ANOVA Analysis of variance
Brgy. Barangay
CCME Canadian Council of Ministers and Environment
ºC Degree Celsius
DAO Department of Environment and Natural Resources Administrative Order
DENR-EMB
Department of Environment and Natural Resources- Environmental Management Bureau
DO Dissolved oxygen
E. coli Escherichia coli
ENRO Environment and Natural Resources Office
Eq. Equation
Fig. Figure
ha Hectare
LGU Local Government Unit
mg/L Milligrams per liter
mL Milliliter
mm Millimeter
MPN Most Probable Number
OMSC Occidental Mindoro State College
PAG-ASA
Philippine Atmospheric Geophysical and Astronomical Services Administration
pH Potential Hydrogen
p-value Probability value
PVC Polyvinyl chloride
RA 9275 Republic Act 9275
TDS Total dissolved solids
TSS Total suspended solids
WHO World Health Organization
WQA Water Quality Analysis
WQI Water Quality Index
WQMP Water Quality Management Plan
US EPA United States Environmental Protection Agency
REFERENCESAdamu C.I.; Nganje T.N.; & Edet A., (2015). Heavy metal
contamination and health risk assessment associated with abandoned barite mines in Cross River State, Southeastern Nigeria. Environ. Nanotechnol. Monit. Manage. 3: 10-21 (12 pages).
Akter T.; Jhohura F.T.; Akter F.; Chowdhury T.R.; Mistry S.K.; Dey D.; Barua MK.; Islam MA ; Rahman M., (2016). Water Quality Index for measuring drinking water quality in rural Bangladesh: a cross-sectional study. J Health Popul Nutr., 35(4), (12 pages).
Azizi, A.; Malakmohamadi, B.; Jafari, H.R., (2016). Land use and land cover spatiotemporal dynamic pattern and predicting changes using integrated CA-Markov model. Global J. Environ. Sci. Manage., 2(3): 223-234 (12 pages).
Bartram J.; Ballance R., (1996). Water quality monitoring- a practical guide to the design and implementation of freshwater quality studies and monitoring programs. UNEP and WHO.
Bodzin A., (2004). Phosphates in the stream. Pennsylvania, USA.
CCME, (2001). Canadian Water Quality Index 1.0 Technical report and user’s manual. Canadian Council of Ministers of the Environment. Canadian Environmental Quality Guidelines Water Quality Index Technical Subcommittee, Gatineau, QC, Canada.
Debels P.; Figueroa R.; Urrutia R.; Barra R.; Nielle X., (2005). Evaluation of water quality in the Chillan River ´ (Central Chile) using physicochemical parameters and a modified water quality index. Environ. Monit. Assess., 110: 301–322 (22 pages).
Decena S.C.; Arguelles M.S.; Robel L.L., (2018). Assessing heavy metal contamination in surface sediments in an urban river in the Philippines. Pol. J. Environ. Stud., 27(5): 1983-1995 (13 pages).
DENR-EMB, (2016). Water quality guidelines and general effluents standards of 2016. Department of Environment and Natural Resources-Environmental Management Bureau.
FOEN, (2012). Indicator water temperature of surface waters.
249
Global J. Environ. Sci. Manage., 8(2): 237-250, Spring 2022
Department of the Environment, Transport, Energy and Communications. Federal Office for the Environment.
Cabacungan G.C., (2016). Water crisis looms in Metro Manila. Philippine Daily Inquirer, Philippines.
Gorme J.B.; Maniquiz M.C.; Pum S.; Lee-Hyung K., (2010). The water quality of the Pasig River in the city of Manila, Philippines: Current Status, Management and Future Recovery. Environ. Eng. Res., 15(3): 173-179 (7 pages).
Khan S.; Lau S.L.; Kayhania M.M.; Stenstrom M.K., (2006). Oil and grease measurement in highway runoff sampling time and event mean concentration. J. Environ. Eng., 132: 415-422 (8 pages).
Liu J.; Dong H.W.; Tang X.L., (2009). Genotoxicity of water from the Songhua River, China, in 1994– 1995 and 2002–2003: potential risks for human health. Environ. Pollut., 157(2): 357- 364 (8 pages).
Li B.K.; Bishop P.L., (2004). Oxidation-reduction potential changes in aeration tanks and micro profiles of activated sludge floc in medium- and low-strength wastewaters. Water Environ. Res., 76(5): 394–403 (10 pages).
LGU San Jose, (2017). Municipal disaster risk reduction plan 2017-2021. LGU-San Jose, Occidental Mindoro. Local Government Unit of San Jose, Occidental Mindoro.
LGU San Jose, (2020). Barangay Health Profile. LGU-San Jose, Occidental Mindoro. Local Government Unit of San Jose, Occidental Mindoro.
Maglangit F.F.; Galapate R.P.; Bensig E.O., (2014). Physicochemical-assessment of the water Quality of Buhisan River, Cebu, Philippines. Int. J. Res. Environ. Sci. Tech., 4(2): 83-87 (5 pages).
Martinico-Perez M.G.; Hara J.P.; Cabrestante M.P., (2019). Evaluation of Water Quality of Major Rivers in Palawan, Philippines Using Physico-Chemical Parameters and Water Quality Index. NSO.
Martinez F.B.; Galera, I.C., (2011). Monitoring and evaluation of the water quality of Taal Lake, Talisay, Batangas, Philippines. Acad. Res. Int., 1(1): 229-236 (8 pages).
Mohiuddin K.M.; Ogawa Y.; Zakir H.M.; Otomo K.; Shikazono N., (2011) Heavy metals contamination in water and sediments of an urban river in a developing country. J. Environ. Sci. Tech., 8 (4): 723-736 (13 pages).
Moslem S.; Ramezanpour Z.; Imanpour J.; Mahmoudifard A.; Rahmani T., (2013). Water quality assessment of the Zarivar Lake using physico-chemical parameters and NSF- WQI indicator, Kurdistan Province-Iran. Int. J. Adv. Biol. Biomed. Res., 1(3): 302-312 (11 pages).
Neri A.C.; Wee V.P.; Hoyohoy G.B., (2012). Water Quality of Mantayupan River in Barili, Cebu, Philippines. Ann. Trop. Res., 34(2): 95-111(17 pages).
PAG-ASA, (2021). Meteorological data of San Jose, Occidental Mindoro. Philippine Atmospheric Geophysical and Astronomical Services Administration.
Parry M.; Canziani, O.; Palutikof J.; Van Der Linden P.; Hanson C., (2007). Climate Change 2007: Impacts, Adaptation
and Vulnerability Contribution of Working Group II to the Fourth Assessment Report of the Intergovernmental Panel on Climate Change. Cambridge University Press. Printed in USA at the University Press, New York.
Purushothaman P.; Chakrapani G.J., (2007). Heavy metals fractionation in Ganga River sediments, India. Environ. Monit. Assess., 132(1-3): 475-489 (15 pages).
Ram S.; Vajpayee P.; Shanker, R., (2008). Contamination of potable water distribution systems by multi antimicrobial-resistant enterohemorrhagic Escherichia coli. Environ. Health Perspect., 116 (4): 448-452 (5 pages).
Razzaghmanesh M.; Mohammai K.; Samani J.M.V., (2005). A river quality simulation using WASP6: case study. 9th Environmental Engineering Specialty Conference, Toronto, Ontario, Canada. 2nd-4th June.
Regmi R.K.; Binaya K.M., (2016). Use of water quality index in water quality assessment: A case study in the Metro Manila. Water and Urban Initiative Working Paper Series.
Said, A.; Steven, D.K.; Sehlke, G., (2004). Environmental assessment: An innovative index for evaluating water quality in streams. Environ. Manage., 34 (3): 406-414 (9 pages).
Skordas K., Kelepertzis E., Kosmidis D., Panagiotaki P., Vafidis D., (2015). Assessment of nutrients and heavy metals in the surface sediments of the artificially lake water reservoir Karla,Thessaly, Greece. Environ. Earth. Sci., 73: 4483-4493 (11 pages).
USEPA, (1999.) Understanding oil spills and oil spill response. United States Environmental Protection Agency.
US EPA, (2005). Designing water quality monitoring programs for watershed projects. United States Environmental Protection Agency.
Wei B.; Yang L., (2010). A review of heavy metal contaminations in urban soils, urban road dusts and agricultural soils from China. Microchem. J. 94: 99-107 (9 pages).
Wright J.; Gundry S.; Conroy R., (2004). Household drinking water in developing countries: a systematic review of microbiological contamination between source and point-of-use. Med. Int. Health. 9(1): 106-117 (9 pages).
WHO, (2012). Guidelines for Drinking-water Quality, Fourth Edition, World Health Organization.
WHO, (2003). Total dissolved solids in drinking-water: Background document for development of WHO Guidelines for drinking-water quality. Originally published in guidelines for drinking-water quality, 2nd ed. Vol. 2. Health criteria and other supporting information. World Health Organization, Geneva.
Wu Z.; Wang X.; Chen Y.; Cai Y.; Deng J., (2018). Assessing river water quality using water quality index in Lake Taihu Basin, China. Sci., Total Environ. 612: 914-922 (9 pages).
Yogendra K.; Puttaiah E.T., (2008). Determination of water quality index and suitability of an urban water body in Shimoga Town, Karnataka. Proceedings of Taal 2007. The 12th World Lake Conference. 342-346 (5 pages).
https://www.researchgate.net/publication/263506592_A_River_Quality_Simulation_Using_WASP6_Case_Study
https://www.researchgate.net/publication/263506592_A_River_Quality_Simulation_Using_WASP6_Case_Study
https://www.researchgate.net/publication/263506592_A_River_Quality_Simulation_Using_WASP6_Case_Study
250
M.D. Enriquez and R.M. Tanhueco
AUTHOR (S) BIOSKETCHES
Enriquez, M.D., Ph.D. Candidate, Instructor, Gokongwei College of Engineering, De La Salle University, 524-4611 Philippines.Email: [email protected]: 0000-0002-1618-6335
Tanhueco, R.M., Ph.D., Professor, Gokongwei College of Engineering, De La Salle University, 524-4611 Philippines.Email: [email protected] ORCID: 0000-0001-5792-9871
HOW TO CITE THIS ARTICLE
Enriquez, M.D.; Tanhueco, R.M., (2022). A basis water quality monitoring plan for rehabilitation and protection. Global J. Environ. Sci. Manage., 8(2): 237-250.
DOI: 10.22034/gjesm.2022.02.07
url: https://www.gjesm.net/article_245946.html