Collective judgment predicts disease-associated single nucleotide variants

Neuwirt et al. BMC Medical Genomics (2014) 7:75 DOI 10.1186/s12920-014-0075-8
RESEARCH ARTICLE Open Access
A 3-biomarker-panel predicts renal outcome inpatients with proteinuric renal diseasesHannes Neuwirt1*, Paul Perco2, Alexander Kainz3, Irmgard Mühlberger2, Johannes Leierer1, Suzie-Jane Braniff1,Bernd Mayer2, Gert Mayer1 and Michael Rudnicki1
Abstract
Background: Clinical and histological parameters are valid prognostic markers in renal disease, although they mayshow considerable interindividual variability and sometimes limited prognostic value. Novel molecular markers andpathways have the potential to increase the predictive prognostic value of the so called “traditional markers”.
Methods: Transcriptomics profiles from laser-capture microdissected proximal tubular epithelial cells from routinekidney biopsies were correlated with a chronic renal damage index score (CREDI), an inflammation score (INSCO),and clinical parameters. We used data from 20 renal biopsies with various proteinuric renal diseases with a medianfollow-up of 49 months (discovery cohort). For validation we performed microarrays from whole kidney biopsiesfrom a second cohort consisting of 16 patients with a median follow-up time of 28 months (validation cohort).
Results: 562 genes correlated with the CREDI score and 285 genes correlated with the INSCO panel, respectively.39 CREDI and 90 INSCO genes also correlated with serum creatinine at follow-up. After hierarchical clustering weidentified 5 genes from the CREDI panel, and 10 genes from the INSCO panel, respectively, which showed kidneyspecific gene expression. After exclusion of genes, which correlated to each other by > 50% we identified VEGF-Cfrom the CREDI panel and BMP7, THBS1, and TRIB1 from the INSCO panel. Traditional markers for chronic kidneydisease progression and inflammation score predicted 44% of the serum creatinine variation at follow-up. VEGF-Cdid not further enhance the predictive value, but BMP7, THBS1 and TRIB1 together predicted 94% of the serumcreatinine at follow up (p < 0.0001). The model was validated in a second cohort of patients yielding also asignificant prediction of follow up creatinine (48%, p = 0.0115).
Conclusion: We identified and validated a panel of three genes in kidney biopsies which predicted serumcreatinine at follow-up and therefore might serve as biomarkers for kidney disease progression.
Keywords: Histogenomics, Transcriptomics, Microarray, Biomarker, Chronic kidney disease, Prognosis, Bioinformatics
BackgroundIn biopsy-proven renal diseases several clinical and histo-pathological features have been established as markersindicative of progression [1-5]. Nonetheless, most of thesetraditional risk markers have limited accuracy and reliability,which may be improved by including further molecularmarkers. Microarray technology and integrative bioinfor-matics strategies resulted in the identification of novelmolecular features, multi-gene expression patterns, and bio-logical pathways being associated with renal disease
* Correspondence: [email protected] of Internal Medicine IV - Nephrology and Hypertension, MedicalUniversity Innsbruck, Anichstrasse 35, 6020 Innsbruck, AustriaFull list of author information is available at the end of the article
© 2014 Neuwirt et al.; licensee BioMed CentraCommons Attribution License (http://creativecreproduction in any medium, provided the orDedication waiver (http://creativecommons.orunless otherwise stated.
progression. In native kidney disease, Reich and colleaguesidentified a panel of eleven genes expressed in kidney biop-sies which were related to the degree of proteinuria andallowed to distinguish biopsies from patients with IgA neph-ritis (IgAN) from control subjects [6]. Boettinger and co-workers identified a panel of 30 TGF-beta 1-relatedtranscripts expressed in the renal tubulointerstitial compart-ment which correlated significantly with eGFR in patientswith CKD I-V [7]. Our group showed that diminished renaltubular expression of VEGF-A and increased expression ofhypoxia response genes at time of biopsy better predict renaloutcome in CKD patients than serum creatinine and pro-teinuria [8]. In zero-hour renal allograft biopsies Perco et al.reported a panel of three genes enhancing the predictive
l. This is an Open Access article distributed under the terms of the Creativeommons.org/licenses/by/4.0), which permits unrestricted use, distribution, andiginal work is properly credited. The Creative Commons Public Domaing/publicdomain/zero/1.0/) applies to the data made available in this article,

Neuwirt et al. BMC Medical Genomics (2014) 7:75 Page 2 of 14
value for allograft function one year after kidney transplant-ation by 2-fold as compared to traditional markers of allo-graft function [9]. Einecke et al. published a panel of 30genes from “for cause”-kidney transplant biopsies whichpredicted graft loss better than pathohistological features orfunction at time of biopsy [10]. More recently, Sellareset al. developed a molecular score for antibody-mediatedrejection in kidney grafts consisting of the expression valuesof 30 specific genes, which significantly predicted futuregraft failure [11]. Pathways that have been identified ashighly affected in high-throughput Omics studies in thecontext of progressive native kidney disease included forexample the VEGF-signaling and hypoxia response path-ways in various glomerulonephritis [8], or the NF-κB mod-ule NFKB_IRFF_01 pathway in diabetic nephropathy [12].These studies further underline a substantial benefit ofmulti-gene over single-gene patterns. However, most geneexpression studies on the association of renal transcripto-mics and kidney function decline are cross-sectional withonly a limited number of longitudinal studies available.The condition of the tubulointerstitial compartment and
in particular of proximal tubular epithelial cells (PTECs)plays a pivotal role in the progression of chronic renal fail-ure. A variety of mechanisms possibly responsible for renalfunction decline have been identified in this context, such astubular atrophy, intersititial fibrosis, tubulointerstitial hyp-oxia, capillary rarefaction, impaired angiogenesis, epithelial-mesenchymal transition and inflammation [13]. Importantly,these histopathological features can be found in variousrenal diseases, such as FSGS, minimal change disease, lupusnephritis or IgA nephropathy, independently from diagnosisand correlate with poor renal prognosis. Therefore, we andothers focused on gene-expression profiles derived from mi-crodissected PTECs or from the tubulointerstitial compart-ment [8,12].In this project we followed a longitudinal study setup
utilizing transcriptomics data from two of our recent stud-ies [8,14]. The given gene expression sets derived fromlaser-capture micro dissected (LCM) human renal prox-imal tubule cells were correlated to histological character-istics and to renal function after a median follow up of49 months to identify candidate markers for the predic-tion of renal disease progression. The results from the firstcohort were validated in an independent cohort of wholekidney biopsies.
MethodsRenal biopsies, RNA isolation and microarrayhybridizationIn the current study we analyzed pre-existing microarrayexpression data of laser-capture microdissected (LCM)PTECs from 50 renal biopsy samples from patients withproteinuric kidney diseases (discovery cohort) from two ofour previous studies [8,14]. Of these samples those with
insufficient material for detailed histological assessment ofrenal damage and inflammation score (see below) wereexcluded. Additionally, we excluded those that were noton a stable dosing of immunosuppression, where applic-able (e.g. Lupus nephritis), prior to biopsy or developedAKI within 1 week after biopsy. Finally, 27 renal biopsysamples (discovery cohort) fulfilled these criteria and werein depth analysed for histological signs of damage and in-flammation (see below).The degree of glomerular sclerosis (gs), interstitial fibrosis
and tubular atrophy (ifta) as well as interstitial inflamma-tion (ii) was assessed for each of the biopsies as follows: 0 =0% (none), 1 = 1 – 10% (slight), 2 = 11 – 25%, 3 = 26 – 50%(moderate) and 4 > 50% (severe). The chronic renal damageindex (CREDI) for each biopsy was derived from the sumscore of gs and ifta. The degree of interstitial inflammationresulted directly in the inflammation score (INSCO).Follow-up laboratory data was available for 20 of these pa-tients, with a median follow-up time of 49 months (range:29 – 68 months).A second group of patients with proteinuric kidney
diseases was used for validation. We analyzed microarrayexpression data of whole kidney biopsies from 16 renal bi-opsy samples from patients with proteinuric kidney diseases(validation cohort). The degree of gs, ifta and ii was assessedfor each of the biopsies as stated above. The median follow-up time was 28 months (range: 1 – 72 months).In the discovery and the validation cohort progressive
disease was defined as either doubling of serum creatin-ine or reaching end-stage renal disease during follow-up,all other patients were defined as stable. For data secur-ity purposes individual ages are not stated in the tables;instead age groups have been defined: group 1 = age<30 years, group 2 = age 30–45 years, group 3 = age 46–60 years, group 4 = age > 60 years. However, we used in-dividual ages for statistics concerning age comparingprogressive and stable patients.The LCM, RNA isolation, and microarray hybridization
have been described in detail in previous work [14,15]. Inbrief, PTECs were stained for alkaline phosphataseusing 4-nitro blue tetrazolium chloride/5-bromo-4-chloro-3-indolyl phosphate under RNase-free condi-tions, and the cells were isolated using the PixCell IIsLaser Capture Microdissection System and CapSure™LCM Caps (Arcturus, Mountain View, CA, USA). TotalRNA was isolated using the Pico Pure™ RNA IsolationKit (Arcturus, Mountain View, CA, USA). Owing to lowRNA amounts, we performed two rounds of linear RNAamplification using the RiboAmp™ RNA AmplificationKit (Arcturus, Mountain View, CA, USA). The qualityof the amplified RNA was assessed by spectrophotom-etry (A260/280) and with the Agilent Bioanalyzer andRNA6000 LabChip™ Kit (Agilent, Palo Alto, CA, USA).cDNA-microarrays were obtained from the Stanford

Neuwirt et al. BMC Medical Genomics (2014) 7:75 Page 3 of 14
Functional Genomics Facility (https://microarray.org/sfgf/). The arrays contained 41 792 spots, representing30 325 genes assigned to a UniGene cluster and 11467ESTs. Arrays were scanned using a GenePix 4000Bmicroarray scanner, and the images were analyzedwith the GenePix Pro 4.0 software (Axon Instruments,Union City, CA, USA). All samples were processed intechnical duplicates and gene expression values wereaveraged.The Institutional Review Board (IRB) of the Medical
University of Innsbruck (Ethikkommittee MedizinischeUniverstität Innsbruck) accredited the use of surplus ma-terial from routine for-cause renal biopsies for researchpurposes. A written consent was not obtained (and not re-quired from the IRB) as the biospies were performed inthe context of clinical routine and have been analyzedafter patient treatment and hospitalization were ultimatelycompleted. All other patient records have been anon-ymized and de-identified prior to analysis.
Establishment and validation of a biomarker modelpredictive for follow-up creatinineCorrelation of genome-wide gene expression with histologicalscoresWe included genes with intensity values of more than 2.5over background and a valid signal in more than 80% ofthe processed arrays in further analysis. Pearson correl-ation coefficients were calculated between gene expressionvalues and the CREDI as well as the INSCO scores,respectively.Significantly correlated genes (p-value < 0.01) with at
least one of the two histological scores were functionallyannotated using gene ontology terms as provided by theSOURCE tool (http://source.stanford.edu). We further-more searched for biological pathways being enriched ordepleted with respect to the set of significantly correlatedgenes using the PANTHER (Protein ANalysis THroughEvolutionary Relationships) Classification System [16-18].
Linear regression model for prediction of creatinine atfollow-upUnivariate linear regression models including expres-sion values of candidate genes were computed to predictserum creatinine values at follow-up. For genes showinga significant prediction (p < 0.05) kidney-specific geneexpression was evaluated using information as providedby the SOURCE tool. We focused on kidney-specificgenes by purpose as microarray data derived from laser-capture microdissected renal proximal tubule cells.From the set of candidate genes, the ones showing highcorrelation to serum creatinine but low Pearson correl-ation coefficients in their pairwise comparison (PearsonR < 0.5 and > −0.5, respectively) were selected for build-ing multivariate regression models. This procedure was
applied for avoiding the inclusion of highly correlatedvariables into one model. Multiple linear regressionmodels for the prediction of kidney function were estab-lished using a combination of genes based on either theCREDI or the INSCO panel along with the gold stand-ard parameters INSCO, CREDI, creatinine and protein-uria at time of biopsy. The best model was generated ina step-wise selection procedure. In order to get a 95%confidence interval for the coefficient of determinationwe applied a bootstrap sampling using 2000 caseresampled datasets. The confidence interval was com-puted by the bias corrected algorithm [19].For validation of the model found in the discovery co-
hort we performed linear regression analysis for the pre-dictive value in a second cohort of patients (validationcohort).For a better comparison of our data with published lit-
erature we also calculated sensitivity and specificity foreach biomarker candidate using the renal endpoints“end stage renal disease (ESRD)” and “doubling of serumcreatinine” for definition of progressive kidney disease(see Tables 1 and 2). Using Youden’s J statistics [20] (J =Sensitivity + Specificity – 1) we calculated the optimalcut-off values [micro array fluorescence intensity values]for each biomarkers with respect to maximized sensitiv-ity and specificity.
General statisticsThe following procedure was carried out to test signifi-cance of findings: Values from stable and progressivepatients were tested for Gaussian distribution usingKolmogorov-Smirnov- Test unless categorical data. Incase of non-Gaussian distribution non-parametric un-paired Kruskal-Wallis test was applied. In all other casesStudent’s T-Test was used. P values below 5% were de-fined as statistically significant.
ResultsEstablishment of a biomarker model predictive for follow-upcreatinine – discovery cohortPatient characteristicsDetailed patient characteristics were published previouslyand are summarized in Table 1 [8,14]. The proportion offemale patients was 37%. Ten patient samples showed aCREDI of less than or equal to 2, seven samples had aCREDI of 3 to 4, and ten samples showed severe damagewith a CREDI score above 4. Twenty-three samples hadINSCO values of 0 or 1, three samples had a score of 2,and one patient sample was scored with a value of 3.There was a significant correlation between CREDI andINSCO (R = 0.57, p < 0.05). Twenty patients with sufficientclinical follow-up data were included in the subsequentcorrelation analysis of CREDI and INSCO associatedgenes with kidney function during follow-up. There were

Table 1 Patient characteristics – discovery cohort
Patient Agegroup
Follow-uptime[months]
Creatinineat time ofbiopsy [mg/dl]
Creatinineat follow-up[mg/dl]
eGFR (MDRD) attime of biopsy[ml/min/1.73 m2]
eGFR (MDRD)at follow-up[ml/min/1.73 m2]
Proteinuriaat time ofbiopsy [g/d]
Proteinuriaat follow-up[g/d]
Histologicaldiagnosis
SD/PD Endpoint IFTA GS IFTA +GS =CREDI
II =INSCO
1 2 62 0.84 0.88 >60 >60 1.9 3.2 FSGS Stable - 2 2 4 0
2 2 49 0.76 0.84 >60 >60 4.7 4.7 mg/dl MCD Stable - 0 0 0 0
3 4 63 0.79 0.75 >60 >60 500 mg/dl 0.0 MCD Stable - 1 1 2 1
4 2 43 1.34 1.09 58.1 >60 0.4 45.1 mg/dl IGAN Stable - 1 2 3 1
5 1 49 0.77 0.76 >60 >60 7.4 43.0 FSGS Stable - 0 2 2 0
6 2 39 0.8 0.75 >60 >60 1.6 0.2 MCD Stable - 1 1 2 0
7 1 31 1.0 0.96 >60 >60 1.3 14.8 mg/dl IGAN Stable - 1 1 2 1
8 3 52 0.93 0.97 >60 >60 1.3 263.3 mg/dl IGAN Stable - 1 1 2 0
9 1 51 1.89 0.91 44.8 >60 42.0 42.0 FSGS Stable - 3 2 5 0
10 2 49 1.43 1.43 40.2 39.5 1.0 0.8 IGAN Stable - 3 3 6 1
11 2 50 1.56 1.8 51.8 42.9 1.2 NA IGAN Stable - 2 2 4 0
12 3 67 1.42 2.28 51.6 29.3 2.7 4.6 FSGS Stable - 2 2 4 1
13 2 68 1.71 3.63 46.9 20.9 1.6 3.6 IGAN Progressive 2xCrea 3 2 5 1
14 1 51 1.02 3.5 >60 21 12.0 17.5 FSGS Progressive 2xCrea 2 3 5 2
15 1 29 1.20 1.81 54.3 33.3 7.5 3.2 IGAN Stable - 2 3 5 0
16 4 42 1.50 7.02 34.5 <20 8.5 8.0 MGN Progressive ESRD 2 2 4 1
17 1 49 1.87 10.1 33.4 <20 6.5 NA RPGN Progressive ESRD 2 1 3 2
18 2 48 1.27 4.02 47.9 <20 6.5 1.3 LN4 Progressive 2xCrea 4 4 8 3
19 4 56 3.13 3.37 <20 <20 4.0 1.0 MPGN II Stable - 2 3 5 1
20 3 31 5.07 6.03 <20 <20 3.4 2.9 MPA Progressive ESRD 3 2 5 2
21 3 n.a. 4.67 NA <20 NA 10.6 NA IGAN NA NA 1 4 5 1
22 2 n.a. 0.71 NA >60 NA 10.2 NA FSGS NA NA 1 1 2 0
23 2 n.a. 1.12 NA >60 NA 0.5 NA IGAN NA NA 3 2 5 1
24 2 n.a. 1.09 NA >60 NA 6.3 NA FSGS NA NA 1 1 2 1
25 1 n.a. 1.0 NA >60 NA 1.2 NA IGAN NA NA 0 0 0 0
26 3 n.a. 1.4 NA 52.6 NA 10.0 NA MCD NA NA 1 1 2 0
27 4 n.a. 2.44 NA <20 NA 18.0 NA MCD NA NA 2 1 3 1
Median 33 49 1.42 1.26 2.7 3.4 2.0 2.0 4.0 1.0
Mean 39 49 1.66 2.64 4.0 5.5 1.9 2.0 3.8 0.9
SD 17 11 1.12 2.65 2.9 6.0 1.0 0.9 1.8 0.9
Median S 33 50 1.38 0.96 1.9 3.9 1.5 2.0 3.5 0.0
Neuw
irtet
al.BMCMedicalG
enomics
(2014) 7:75 Page
4of
14

Table 1 Patient characteristics – discovery cohort (Continued)
Median P 33 49 1.71 6.03 6.5 3.3 2.5 2.0 5.0 2.0
Mean S 39 49 1.4 1.29 3.2 3.9 1.5 1.8 3.3 0.4
Mean P 40 48 2.19 6.15 5.8 6.3 2.7 2.3 5.0 1.8
SD S 17 11 0.72 0.78 2.7 1.0 NA NA NA NA
SD P 19 12 1.65 2.59 2.9 7.5 NA NA NA NA
p-value n.s. n.s. n.s. 0.01 n.s. n.s. n.s. n.s.
n.s. 0.004
FSGS Focal-segmental glomerulosclerosis, MCD Minimal change disease, IGAN IgA-Nephropathy, MGN Membranous glomerulonephritis, RPGN Rapid progressive glomerulonephritis, LN4 Lupus nephritis WHO IV, MPGNII Membranoproliferative glomerulonephritis type II, MPA Microscopic polyangiitis, NA not applicable/ not assessed, IFTA interstitial fibrosis/tubular atrophy, GS glomerular sclerosis, II interstitial inflammation. Median,Mean and standard deviation (SD) for the patients with follow-up and from stable (S) and progressive (P) patients are shown at the bottom of the table. Age groups have been defined as follows: group 1 = age<30 years, 2 = 30–45, 3 = 46–60, 4 = age >60 years. p-values indicate statistical significance comparing clinical data (age, follow-up, creatinine, proteinuria) from stable and progressive patients.
Neuw
irtet
al.BMCMedicalG
enomics
(2014) 7:75 Page
5of
14
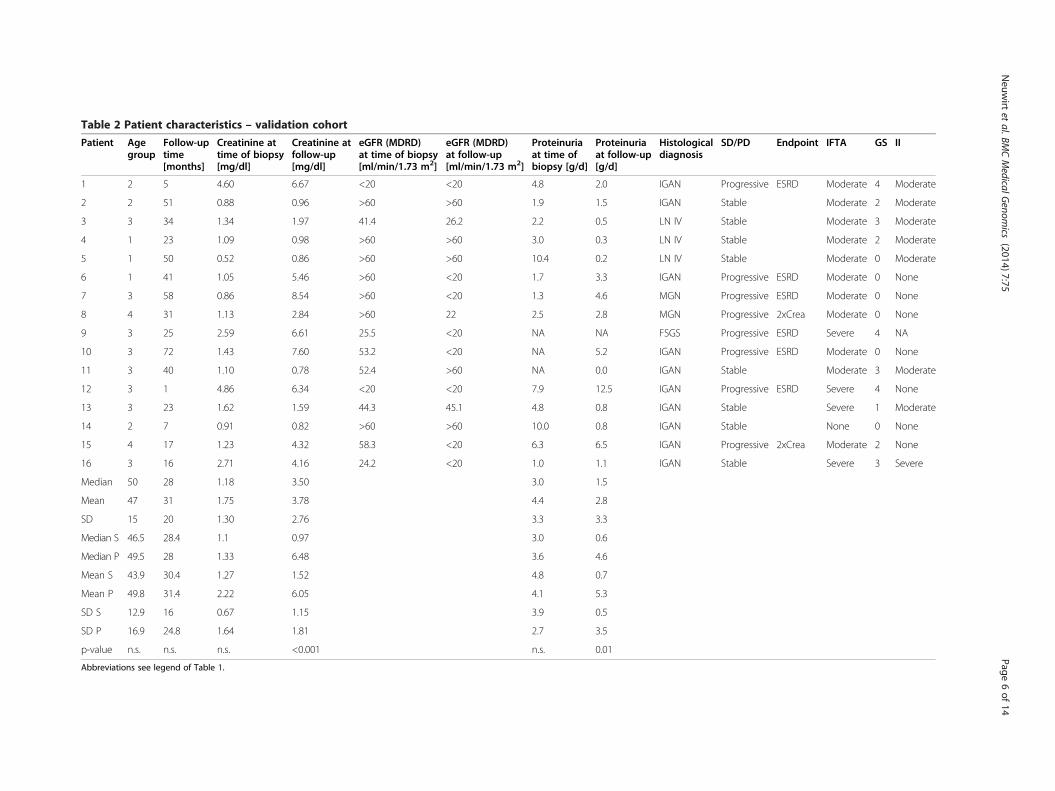
Table 2 Patient characteristics – validation cohort
Patient Agegroup
Follow-uptime[months]
Creatinine attime of biopsy[mg/dl]
Creatinine atfollow-up[mg/dl]
eGFR (MDRD)at time of biopsy[ml/min/1.73 m2]
eGFR (MDRD)at follow-up[ml/min/1.73 m2]
Proteinuriaat time ofbiopsy [g/d]
Proteinuriaat follow-up[g/d]
Histologicaldiagnosis
SD/PD Endpoint IFTA GS II
1 2 5 4.60 6.67 <20 <20 4.8 2.0 IGAN Progressive ESRD Moderate 4 Moderate
2 2 51 0.88 0.96 >60 >60 1.9 1.5 IGAN Stable Moderate 2 Moderate
3 3 34 1.34 1.97 41.4 26.2 2.2 0.5 LN IV Stable Moderate 3 Moderate
4 1 23 1.09 0.98 >60 >60 3.0 0.3 LN IV Stable Moderate 2 Moderate
5 1 50 0.52 0.86 >60 >60 10.4 0.2 LN IV Stable Moderate 0 Moderate
6 1 41 1.05 5.46 >60 <20 1.7 3.3 IGAN Progressive ESRD Moderate 0 None
7 3 58 0.86 8.54 >60 <20 1.3 4.6 MGN Progressive ESRD Moderate 0 None
8 4 31 1.13 2.84 >60 22 2.5 2.8 MGN Progressive 2xCrea Moderate 0 None
9 3 25 2.59 6.61 25.5 <20 NA NA FSGS Progressive ESRD Severe 4 NA
10 3 72 1.43 7.60 53.2 <20 NA 5.2 IGAN Progressive ESRD Moderate 0 None
11 3 40 1.10 0.78 52.4 >60 NA 0.0 IGAN Stable Moderate 3 Moderate
12 3 1 4.86 6.34 <20 <20 7.9 12.5 IGAN Progressive ESRD Severe 4 None
13 3 23 1.62 1.59 44.3 45.1 4.8 0.8 IGAN Stable Severe 1 Moderate
14 2 7 0.91 0.82 >60 >60 10.0 0.8 IGAN Stable None 0 None
15 4 17 1.23 4.32 58.3 <20 6.3 6.5 IGAN Progressive 2xCrea Moderate 2 None
16 3 16 2.71 4.16 24.2 <20 1.0 1.1 IGAN Stable Severe 3 Severe
Median 50 28 1.18 3.50 3.0 1.5
Mean 47 31 1.75 3.78 4.4 2.8
SD 15 20 1.30 2.76 3.3 3.3
Median S 46.5 28.4 1.1 0.97 3.0 0.6
Median P 49.5 28 1.33 6.48 3.6 4.6
Mean S 43.9 30.4 1.27 1.52 4.8 0.7
Mean P 49.8 31.4 2.22 6.05 4.1 5.3
SD S 12.9 16 0.67 1.15 3.9 0.5
SD P 16.9 24.8 1.64 1.81 2.7 3.5
p-value n.s. n.s. n.s. <0.001 n.s. 0.01
Abbreviations see legend of Table 1.
Neuw
irtet
al.BMCMedicalG
enomics
(2014) 7:75 Page
6of
14

Neuwirt et al. BMC Medical Genomics (2014) 7:75 Page 7 of 14
no significant differences in serum creatinine and protein-uria at time of biopsy, and neither in the CREDI nor inthe INSCO values between subjects with and withoutfollow-up data. The same non-significant results were ob-tained comparing stable versus progressive patients (in-cluding follow-up time), despite a significant difference inthe creatinine at follow-up and INSCO values (MedianINSCO(progressive) = 2, INSCO(stable) = 0, p = 0.004).
Correlation of gene expression with chronic renal damageindexTranscriptomics profiles from the 20 samples were corre-lated to CREDI. The expression status of 562 unique genescorrelated significantly with CREDI. Of these 562 genes222 showed a positive correlation (i.e. being upregulated)with increasing damage score, and 340 genes showed anegative correlation (i.e. being downregulated) with increas-ing damage score, respectively (Additional file 1: Table S1).Pathways found to be enriched either in positively or nega-tively correlated genes are summarized in Table 3. Amongothers the insulin-like growth factor-, the transforminggrowth factor-, and the integrin signaling-pathway were sig-nificantly enriched with genes in the list of 222 positivelycorrelated genes. Using the 340 downregulated genes weidentified 27 significantly enriched pathways. These path-ways included, among others, metabolism (e.g. ATP synthe-sis) signaling (e.g. FGF-signaling, EGF receptor signaling,VEGF-signaling, angiogenesis), and inflammation (e.g. T-cellactivation, B-cell activation).
Correlation of gene expression with inflammation scoreNext, we correlated gene expression data from the same20 samples to INSCO. The expression values of 285genes correlated with INSCO, of which 150 showeda positive and 135 showed a negative correlation(Additional file 1: Table S2). In the 150 genes threepathways were significantly overrepresented, namely thechorismate biosynthesis-, the nicotinic acetylcholine re-ceptor signaling-, and the mannose metabolism-path-way. Thirteen pathways were identified on the basis ofthe 135 negatively correlated genes (Table 3). Severalpathways linked to amino-acid synthesis such asleucine-, alanine-, valine-, isoleucine- and serine glycinebiosynthesis-pathways. Furthermore, mRNA splicing-and general transcription by RNA polymerase I-path-ways were identified as being enriched with downregulated genes.
2-step approach for identification of candidate genes forprediction of renal outcomeWe correlated the expression values of genes showing sta-tistically significant association to CREDI (562 genes) andINSCO (285 genes) with follow-up creatinine. Significantcorrelation (p < 0.05) was identified for 39 genes from the
CREDI group, and for 90 genes from INSCO set of genes,respectively. To maximize the predictive value of selectedgenes we applied a 2-step approach: Kidney specificity of thegenes was evaluated using information as provided by theSOURCE tool (http://source.stanford.edu). Five (CREDI)and ten (INSCO) genes were found to be highly expressedin human kidney (Table 4). We further evaluated the pair-wise correlation of expression to identify those candidategenes showing the lowest correlation in expression, thushaving an independent predictive value for follow-up cre-atinine. Four CREDI genes (vascular endothelial growthfactor C (VEGF-C), podoplanin (PDPN), semaphorin 6A(SEMA6A), integrin beta 6 (ITGB6)), and six INSCO genes(thrombospondin 1 (THBS1), tribbles homolog 1 (TRIB1),bone morphogenetic protein 7 (BMP7), chordin-like 1(CHRDL1), apoptosis-inducing factor 1 (AIFM), syntaxin 7(STX7)) were identified following this approach.
Linear regression analysisThe predictive value of classical markers, creatinine attime of biopsy and histopathological grading, was calcu-lated, and the additive predictive value of a gene-panelof CREDI or INSCO genes was calculated. Adjusted R2
values of the classical markers, creatinine at time of bi-opsy, CREDI and INSCO were 0.18, 0.02 and 0.44 withp-values of 0.0391, 0.2699 and 0.0012, respectively.Hence, only INSCO but not CREDI classification wasable to predict 44% of variation of follow-up creatininewith statistical significance. The best model based solelyon traditional markers consisted of creatinine at time ofbiopsy and INSCO with an adjusted R2 of 0.51 (p =0.0014) (Table 5). The best model after a step-wise selec-tion using all traditional markers and the CREDI genesresulted in a model consisting of VEGF-C and INSCOwith a comparable predictive value of 0.51 (p = 0.0009).Using the INSCO genes together with the traditional pa-rameters resulted in a model consisting of the threegenes thrombospondin 1 (THBS1), bone morphogeneticprotein 7 (BMP7), and tribbles homolog 1 (TRIB1). Thepredictive value of this model was 0.94 (p < 0.0001), thuspredicting 94% of the variation of follow-up creatininefor the given sample set with a median follow-up time of49 months (Table 5). The bias corrected bootstrap confi-dence interval for the coefficient of determination was0.558 – 0.987.These three genes were found to be significantly differ-
entially expressed when comparing array data from stableand progressive patients. In progressive patients we founda significantly higher expression of THBS1 (p = 0.009) andTRIB1 (p = 0.011), whereas the expression levels of BMP7were significantly lower (p = 0.007) as compared to stablepatients.Using hard renal endpoints (see Table 1), e.g. doubling
of serum creatinine or ESRD, for definition of progressive

Neuwirt et al. BMC Medical Genomics (2014) 7:75 Page 8 of 14
kidney disease we have calculated sensitivity and specificityfor each marker using ROC analysis. Sensitivity/specificitywas 1.00/1.00 for THBS1 (cut-off: 1.17), 0.67/0.83 for TRIB1(cut-off: 2.42) and 0.93/0.68 for BMP7 (cut-off: −1.15),respectively.
Validation cohortPatient characteristicsIn order to validate the established biomarker model micro-arrays were performed using whole kidney biopsies of a 2nd
cohort of patients with proteinuric kidney diseases (n = 16).The patient characteristics are shown in detail in Table 2.This cohort consisted of 25% females. There was no signifi-cant difference in age, follow-up time, creatinine/proteinuriaat time of biopsy comparing stable and progressive patients.Comparing the clinical data with those from the discoverycohort we found also no significant difference, except ashorter follow-up time (49 vs. 28 months).
Linear regression analysisThe predictive value of the model creatinine at time ofbiopsy plus the three biomarkers of the INSCO-panelwas calculated. The predictive value of this model was0.4852 (p = 0.0115), thus predicting 48% of the variationof follow-up creatinine for the given sample set with amedian follow-up time of 28 months. Comparing thepredictive value of the traditional parameter creatinineat time of biopsy with the 3-biomarker panel yielded ina significantly better prediction of follow-up creatinineusing the 3 biomarkers (p = 0.0236).Again, these three genes were found to be differentially
expressed when comparing array data from stable andprogressive patients; however only TRIB1 reached statis-tical significance (p = 0.023).We have calculated sensitivity and specificity for each
marker using ROC analysis in this cohort. Sensitivity/specifi-city was 1.000/0.625 for THBS1 (cut-off: 10.09), 0.625/0.750for TRIB1 (cut-off: 8.03) and 0.875/0.625 for BMP7 (cut-off:6225), respectively.
DiscussionIn this project we performed a transcriptomics approachto identify tubular gene expression profiles associatedwith (i) glomerulosclerosis, tubular atrophy or intersti-tial fibrosis, or (ii) interstitial inflammatory infiltration.The histopathological features of tubular atrophy andinterstitital fibrosis correlate better with poor renalprognosis compared to glomerular lesions, which is ac-cordance with previously published data. The identifiedactivation of features assigned to IGF-, PDGF-, TGFbeta- and integrin-pathways in fibrotic tissue is in linewith data from various groups [21-23]. More interest-ingly, a number of downregulated features was enrichedin specific pathways including several receptor- and
intracellular signaling-, metabolism-, cell cycle- andangiogenesis-pathways. The impact on ATP-synthesis-and cell cycle-pathways is in accordance with data show-ing that hypoxia in particular in proximal tubule cellsdepletes the cells of ATP, induces mitochondrial frag-mentation, and finally leads to apoptosis [24].We next correlated tubular gene expression with the
presence of interstitial inflammation. Several pathwayslinked to amino acid synthesis, mRNA-splicing, transcrip-tion, PDGF-signaling, apoptosis and p53-signaling showedenrichment in downregulated genes. Seven of the 13 path-ways were defined as significantly overrepresented becauseof the presence of two genes: phosphoserine aminotransfer-ase 1 (PSAT1) and branched chain amino-acid transamin-ase 2, mitochondrial (BCAT2) (data not shown). PSAT1 asa member of the PLP biosynthesis and the serine glycinebiosynthesis pathway is involved in serine, glycine andthreonine metabolic pathways, and also in the biosynthesisof vitamin B6 (pyridoxine). BCAT2 is expressed in mito-chondria and catalyzes the first step in the production ofthe branched amino-acids leucine, isoleucine and valine.These results may emphasize the role of mitochondrial dys-regulation in CKD [24-26].In the next step we aimed at the identification of novel
molecular markers indicative for progression of chronicrenal failure. Since the extent of tubulointerstitial fibrosisrepresents an established risk factor for kidney disease pro-gression, we hypothesized that genes from the CREDI panelwill outperform genes from the INSCO panel regarding thepredictive value. Surprisingly, only 39 of 562 (7%) CREDIgenes also correlated with serum creatinine during followup, while 90 of 285 (32%) INSCO genes showed a signifi-cant correlation. Furthermore, INSCO itself predicted 44%of follow-up creatinine variation (p = 0.0012), while the pre-dictive value of CREDI was not significant. It has been gen-erally accepted that tissue fibrosis and inflammation bothcontribute to progressive renal scarring and are finallyassociated with renal function decline [27]. Although someuncertainty exists about details of the causal and chrono-logical relationship, it has been generally proposed thatrenal injury is followed by recruitment of inflammatorycells, release of fibrogenic cytokines, and finally the activa-tion of collagen-producing cells [28]. Our results of signifi-cant correlation of inflammation but not fibrosis with renalfunction decline point towards a biopsy bias favouringacute inflammatory glomerulonephritis rather than slowlyprogressing fibrosing renal disease. On the other hand thesefindings might also be compatible with the chronologicalsequence of inflammation followed by fibrosis processes.We identified a panel of three genes which were highly
predictive for the variation of follow-up creatinine after amedian follow up time of more than 4 years. Using the ex-pression values of THBS1, BMP7 and TRIB1 we were ableto predict an additional 43% of creatinine variance on top

Table 3 Pathways enriched/depleted in differentially regulated genes correlating with CREDI and INSCO
Pathways enriched/depleted in differentially regulated genes correlating with CREDI
Upregulated genes (n = 222)
Pathways # Genes P value
Hedgehog signaling pathway 3 0.002
Insulin/IGF pathway-mitogen activated protein kinase kinase/MAP kinase cascade 3 0.006
Formyltetrahydroformate biosynthesis 2 0.006
PDGF signaling pathway 6 0.006
TGF-beta signaling pathway 5 0.018
Transcription regulation by bZIP transcription factor 3 0.018
Muscarinic acetylcholine receptor 2 and 4 signaling pathway 3 0.027
Ornithine degradation 1 0.030
Integrin signaling pathway 5 0.040
Serine glycine biosynthesis 1 0.050
Downregulated genes (n = 340)
Pathways # genes P value
ATP synthesis 4 0.000
FGF signaling pathway 8 0.001
EGF receptor signaling pathway 8 0.002
GABA-B_receptor_II_signaling 4 0.004
Alzheimer disease-amyloid secretase pathway 5 0.006
T cell activation 6 0.006
Endogenous_cannabinoid_signaling 3 0.007
Histamine H1 receptor mediated signaling pathway 4 0.007
Metabotropic glutamate receptor group II pathway 4 0.009
B cell activation 5 0.010
Axon guidance mediated by netrin 3 0.012
Endothelin signaling pathway 5 0.015
Oxytocin receptor mediated signaling pathway 4 0.016
Thyrotropin-releasing hormone receptor signaling pathway 4 0.018
Muscarinic acetylcholine receptor 2 and 4 signaling pathway 4 0.018
Cholesterol biosynthesis 2 0.018
Metabotropic glutamate receptor group I pathway 3 0.020
5HT2 type receptor mediated signaling pathway 4 0.025
Succinate to proprionate conversion 1 0.031
VEGF signaling pathway 4 0.032
5HT1 type receptor mediated signaling pathway 3 0.033
Angiogenesis 7 0.033
Inflammation mediated by chemokine and cytokine signaling pathway 9 0.037
PDGF signaling pathway 6 0.042
DNA replication 2 0.044
Cell cycle 2 0.048
Heterotrimeric G-protein signaling pathway-Gi alpha and Gs alpha mediated pathway 6 0.050
Pathways enriched/depleted in differentially regulated genes correlating with INSCO
Upregulated genes (n = 150)
Pathways # Genes P value
Neuwirt et al. BMC Medical Genomics (2014) 7:75 Page 9 of 14
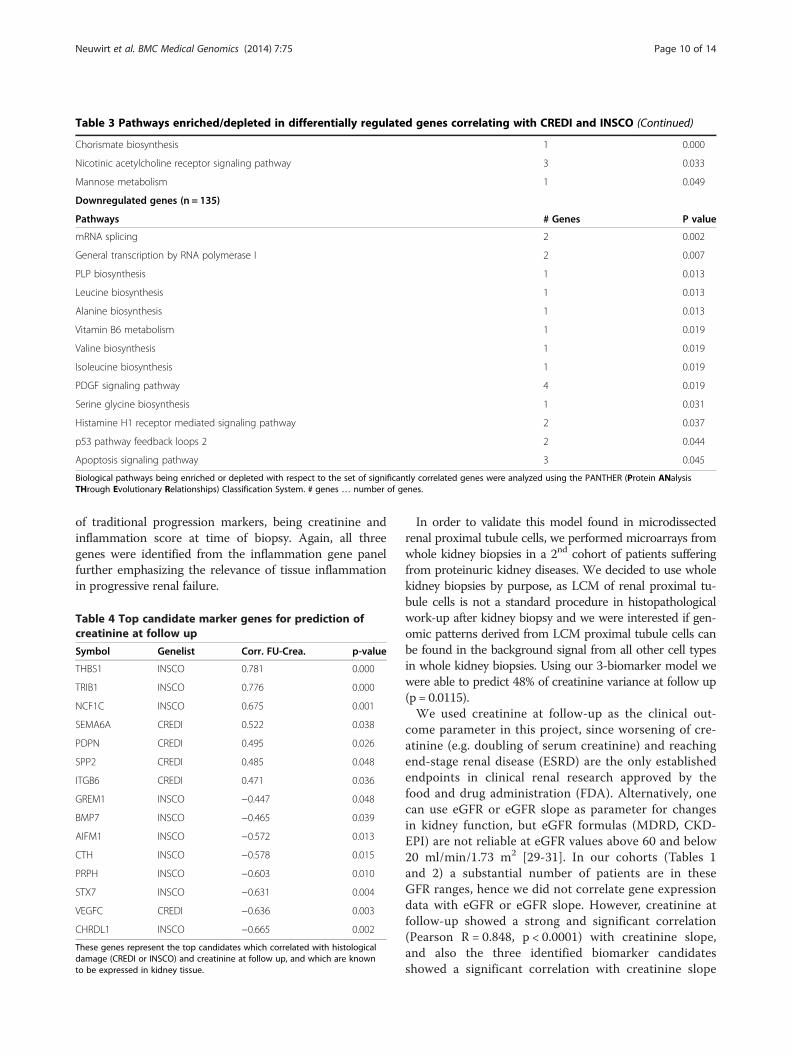
Table 3 Pathways enriched/depleted in differentially regulated genes correlating with CREDI and INSCO (Continued)
Chorismate biosynthesis 1 0.000
Nicotinic acetylcholine receptor signaling pathway 3 0.033
Mannose metabolism 1 0.049
Downregulated genes (n = 135)
Pathways # Genes P value
mRNA splicing 2 0.002
General transcription by RNA polymerase I 2 0.007
PLP biosynthesis 1 0.013
Leucine biosynthesis 1 0.013
Alanine biosynthesis 1 0.013
Vitamin B6 metabolism 1 0.019
Valine biosynthesis 1 0.019
Isoleucine biosynthesis 1 0.019
PDGF signaling pathway 4 0.019
Serine glycine biosynthesis 1 0.031
Histamine H1 receptor mediated signaling pathway 2 0.037
p53 pathway feedback loops 2 2 0.044
Apoptosis signaling pathway 3 0.045
Biological pathways being enriched or depleted with respect to the set of significantly correlated genes were analyzed using the PANTHER (Protein ANalysisTHrough Evolutionary Relationships) Classification System. # genes … number of genes.
Neuwirt et al. BMC Medical Genomics (2014) 7:75 Page 10 of 14
of traditional progression markers, being creatinine andinflammation score at time of biopsy. Again, all threegenes were identified from the inflammation gene panelfurther emphasizing the relevance of tissue inflammationin progressive renal failure.
Table 4 Top candidate marker genes for prediction ofcreatinine at follow up
Symbol Genelist Corr. FU-Crea. p-value
THBS1 INSCO 0.781 0.000
TRIB1 INSCO 0.776 0.000
NCF1C INSCO 0.675 0.001
SEMA6A CREDI 0.522 0.038
PDPN CREDI 0.495 0.026
SPP2 CREDI 0.485 0.048
ITGB6 CREDI 0.471 0.036
GREM1 INSCO −0.447 0.048
BMP7 INSCO −0.465 0.039
AIFM1 INSCO −0.572 0.013
CTH INSCO −0.578 0.015
PRPH INSCO −0.603 0.010
STX7 INSCO −0.631 0.004
VEGFC CREDI −0.636 0.003
CHRDL1 INSCO −0.665 0.002
These genes represent the top candidates which correlated with histologicaldamage (CREDI or INSCO) and creatinine at follow up, and which are knownto be expressed in kidney tissue.
In order to validate this model found in microdissectedrenal proximal tubule cells, we performed microarrays fromwhole kidney biopsies in a 2nd cohort of patients sufferingfrom proteinuric kidney diseases. We decided to use wholekidney biopsies by purpose, as LCM of renal proximal tu-bule cells is not a standard procedure in histopathologicalwork-up after kidney biopsy and we were interested if gen-omic patterns derived from LCM proximal tubule cells canbe found in the background signal from all other cell typesin whole kidney biopsies. Using our 3-biomarker model wewere able to predict 48% of creatinine variance at follow up(p = 0.0115).We used creatinine at follow-up as the clinical out-
come parameter in this project, since worsening of cre-atinine (e.g. doubling of serum creatinine) and reachingend-stage renal disease (ESRD) are the only establishedendpoints in clinical renal research approved by thefood and drug administration (FDA). Alternatively, onecan use eGFR or eGFR slope as parameter for changesin kidney function, but eGFR formulas (MDRD, CKD-EPI) are not reliable at eGFR values above 60 and below20 ml/min/1.73 m2 [29-31]. In our cohorts (Tables 1and 2) a substantial number of patients are in theseGFR ranges, hence we did not correlate gene expressiondata with eGFR or eGFR slope. However, creatinine atfollow-up showed a strong and significant correlation(Pearson R = 0.848, p < 0.0001) with creatinine slope,and also the three identified biomarker candidatesshowed a significant correlation with creatinine slope

Table 5 Linear regression analysis
Creatinine at follow-up
Best single clinical parameter Parameter estimate p-value adj R2
INSCO 1.799 0.0012
Total 0.0012 0.44
Creatinine at follow-up
Best clinical parameter combination Parameter estimate p-value adj R2
INSCO 1.472 0.0065
Crea_biopsy 0.755 0.0834
Total 0.0014 0.51
Creatinine at follow-up
Clinical parameters + CREDI genes Parameter estimate p-value adj R2
INSCO 1.277 0.0248
VEGFC −0.812 0.0268
Total 0.0009 0.51
Creatinine at follow-up
Clinical parameters + INSCO genes Parameter estimate p-value adj R2
BMP7 −0.67 0.0015
THBS1 1.160 0.0035
TRIB1 0.534 0.0007
Total < 0.0001 0.94
Adjusted R2- and p-values for different models for prediction of follow-up creatinine are shown.
Neuwirt et al. BMC Medical Genomics (2014) 7:75 Page 11 of 14
(Pearson R = 0.722 (THBS1, p = 0.038), 0.685 (TRIB1, p =0.026), −0.562 (BMP7, p = 0.010)). These results furtherunderline the validity of these three marker candidates.The primary approach of this study was to establish a
model to predict serum creatinine levels at the follow-uptime point. By establishing multiple linear regressionmodels using continuously distributed biomarker candi-dates and gold standard parameters (e.g. creatinine orproteinuria at time of biopsy), we identified a modelconsisting of 3 biomarkers (THBS1, TRIB1 and BMP7).In addition we calculated sensitivity and specificity ofeach of these markers to facilitate the interpretation ofour data in the context of published literature [32,33].For this purpose we defined progression of chronic kid-ney disease using established parameters, i.e. doubling ofserum creatinine and ESRD. Furthermore, best cut-offvalues for the single markers were calculated usingYouden’s statistics [20]. We found that THBS1 was thebest marker, followed by BMP7 and TRIB1. It was sur-prising that THBS1, providing a sensitivity and specifi-city of 1.00 in the discovery cohort, performed that well.However, given the limited number of patients investi-gated these results should not be generalized to otherpopulations without caution. We are currently planningto establish a staining of our three biomarkers in patientkidney biopsy samples in order to prospectively addressthe predictive value of this biomarker.
Concerning the role of TRIB1, Kiss-Toth and co-workers first described tribbles homologes as MAPK ac-tivity controlling proteins [34]. Recently, it was shown thatTRIB1 might be utilized in renal allografts as biomarkerfor chronic antibody-mediated rejection [35]. Further-more, TRIB1 expression was correlated to non-diabeticend-stage renal disease [36]. BMP7 is a member of theTGF-beta superfamily and has been shown to be impli-cated in regulation of renal function and determination ofthe number of renal progenitor cells [37]. In particular,various groups have described the pivotal role of BMP7 inEMT, but results are controversial. Xu et al. [38,39] pub-lished data providing evidence that BMP7 exerts antifibro-tic effects via blocking and reversing TGF-beta 1 inducedEMT, whereas Dudas and colleagues did not find an in-hibitory effect of BMP7 on TGF-beta 1 mediated EMT[40]. In a previous project we were able to show increasedexpression of BMP7 mRNA and protein in renal tubulecells in biopsies from proteinuric renal diseases as com-pared to controls [14]. However, most of the patients in-cluded in this former study showed a stable course ofkidney disease with virtually no decline of kidney functionover time. Recently, a low BMP7 RNA levels were pro-posed to be an early marker of renal allograft dysfunction[41]. In amyloidosis patients Denizli et al. described anon-significant correlation of high levels of BMP7 andCKD progression [42].

Neuwirt et al. BMC Medical Genomics (2014) 7:75 Page 12 of 14
Thrombospondin 1 is a subunit of a disulfide-linkedhomotrimeric protein. This protein is an adhesive glycopro-tein that mediates cell-to-cell and cell-to-matrix interactions.Hugo et al. [43] have shown that THBS1 precedes and is anearly marker for the development of tubulointerstitial kidneydisease, which might be explained by its role as an endogen-ous activator of TGF-beta in type 1 diabetes [44] and fibroticrenal disease [45]. Cui et al. have shown that THBS1 is animportant mediator of obesity-induced kidney dysfunction[46]. Recently, a THBS1 short hairpin RNA suppressedperitubular capillary injury and tubulointerstitial fibrosisin unilateral ureteral obstruction (UUO)-induced renal fi-brosis [47].To summarize, THBS1 and BMP7 are involved in TGF
beta pathways, which have been shown to be activated inprogressive CKD.This paper has several limitations. More clinical and
demographic data are needed to adjust the calculatedmodels to confounders, such as hypertension or hyper-cholesterolemia. However, it was not possible to assessthis information from the patients’ records. Another inter-esting issue would have been to analyse the gene expres-sion patterns in response to therapeutic interventions.First, the cohorts and the interventions (if there were anyat all) were to heterogenous to collect and to analyze datain a reliable manner. Second, some of the patients werenot treated at our center, so a significant proportion ofintermediate follow-up data is missing. And third, we didnot continuously perform kidney biospies during thefollow-up, so the outcome of the interventions on thehistological and genomic level is unclear. Hence, it wasnot possible to investigate the predictive value of changesof gene expression in response to treatment.We correlated gene expression data with the variability of
creatinine at follow-up, which might be a very hard endpointand thus more subtle transcriptomic changes are missed.Due to the limitations of eGFR mentioned above we did notcorrelate the expression of the transcripts with delta eGFR.However, the significant correlation between creatinine atfollow-up and creatinine slope, and between the expressionvalues of the three biomarker candidates and creatinineslope corroborates our results.Certainly, the degree to which the 3-gene panel can be
generalised to other chronic kidney disease cohorts needs tobe tested in further studies in larger validation sample sets,as the predictive power delineated on the given cohort isprobably an overestimation of the true predictive value dueto the small size of the 1st study cohort. However, the boot-strap sampling using 2000 case resampled datasets resultedin a bias corrected confidence interval of 0.558 – 0.987, sug-gesting nevertheless a higher predictive value of these 3genes than a combination of traditional parameters such ascreatinine and INSCO. The procedure for delineating suchgene sets as presented in this work might well be applicable
for larger cohorts. Additionally, we have analysed the 3-biomarker model in a 2nd validation cohort of patients andalso found a predictive value, which was statistically signifi-cant, for follow-up creatinine.
ConclusionWe identified distinct gene expression profiles from laser-capture microdissected renal tubule cells associated withchronic renal damage or inflammation. The 3-gene panelTHBS1, BMP7 and TRIB1 from the inflammation genepanel predicted follow-up creatinine significantly better thantraditional markers such as serum creatinine at time of bi-opsy and the presence of inflammatory infiltrates in the bi-opsy. These data were validated using gene expressionprofiles from whole kidney biopsies in a second cohort ofpatients.
Additional file
Additional file 1: Tables S1 and S2. Show the 562 and 285 genes thatwere either negatively or positively correlated with CREDI and INSCO,respectively. Gene names, accession numbers, UniProt ID, Gene IDs,GO-Terms (abbreviated) and a few other possible important informationconcerning the respective genes are listed in the first 12 collumns.Diagnosis and CREDI/INSCO – values are listed in the first 2 lines aboveeach patient (patient numbers (as in Table 1) are listed in the third lineabove expression values). The last 5 collumns show the number ofmissing expression values per transcript (blanks) and if at least 80% ofsignals in the microarray per gene met our quality standards (80% filter;1=yes, 0=no); furthermore correlation coefficient (Pearson) and t- andp-values are listed for each gene.
Competing interestsThe authors declare that they have no competing interests.
Authors’ contributionsHN, GM and MR made the study concept and design; HN, JL, SB and MRperformed experiments and drafted the manuscript; HN, PP, AK, BM and IMperformed statistics; All authors read and approved the final manuscript.
AcknowledgementsWe kindly thank Paul König and Karl Lhotta for establishing the renal biopsyrepository, and we are grateful to Dorothea Heininger for scoring the histologicalchanges in the previous projects. Help on gene expression data preparation in theearly stages of the projects by Martin Wiesinger is also kindly acknowledged.This project has been funded by the MFF (Medizinischer Forschungsfond),project-no: 241, given to HN.
Author details1Department of Internal Medicine IV - Nephrology and Hypertension, MedicalUniversity Innsbruck, Anichstrasse 35, 6020 Innsbruck, Austria. 2Emergentecbiodevelopment GmbH, Vienna, Austria. 3Department of Internal Medicine III –Nephrology, KH Elisabethinen, Linz, Austria.
Received: 22 June 2014 Accepted: 17 December 2014
References1. D’Amico G: Natural history of idiopathic IgA nephropathy and factors
predictive of disease outcome. Semin Nephrol 2004, 24:179–196.2. Donadio JV, Bergstralh EJ, Grande JP, Rademcher DM: Proteinuria patterns and
their association with subsequent end-stage renal disease in IgA nephropathy.Nephrol Dial Transplant 2002, 17:1197–1203.

Neuwirt et al. BMC Medical Genomics (2014) 7:75 Page 13 of 14
3. Ibels LS, Gyory AZ: IgA nephropathy: analysis of the natural history,important factors in the progression of renal disease, and a review ofthe literature. Medicine (Baltimore) 1994, 73:79–102.
4. Nicholls KM, Fairley KF, Dowling JP, Kincaid-Smith P: The clinical course ofmesangial IgA associated nephropathy in adults. Q J Med 1984,53:227–250.
5. Reich HN, Troyanov S, Scholey JW, Cattran DC: Remission of proteinuria improvesprognosis in IgA nephropathy. J Am Soc Nephrol 2007, 18:3177–3183.
6. Reich HN, Tritchler D, Cattran DC, Herzenberg AM, Eichinger F, Boucherot A,Henger A, Berthier CC, Nair V, Cohen CD, Scholey JW, Kretzler M: Amolecular signature of proteinuria in glomerulonephritis. PLoS One 2010,5:e13451.
7. Bottinger EP, Bitzer M: TGF-beta signaling in renal disease. J Am SocNephrol 2002, 13:2600–2610.
8. Rudnicki M, Perco P, Enrich J, Eder S, Heininger D, Bernthaler A, WiesingerM, Sarkozi R, Noppert SJ, Schramek H, Mayer B, Oberbauer R, Mayer G:Hypoxia response and VEGF-A expression in human proximal tubularepithelial cells in stable and progressive renal disease. Lab Invest 2009,89:337–346.
9. Perco P, Kainz A, Wilflingseder J, Soleiman A, Mayer B, Oberbauer R:Histogenomics: association of gene expression patterns withhistological parameters in kidney biopsies. Transplantation 2009,87:290–295.
10. Einecke G, Reeve J, Sis B, Mengel M, Hidalgo L, Famulski KS, Matas A, KasiskeB, Kaplan B, Halloran PF: A molecular classifier for predicting future graftloss in late kidney transplant biopsies. J Clin Invest 2010, 120:1862–1872.
11. Sellares J, Reeve J, Loupy A, Mengel M, Sis B, Skene A, de Freitas DG, Kreepala C,Hidalgo LG, Famulski KS, Halloran PF:Molecular diagnosis of antibody-mediatedrejection in human kidney transplants. Am J Transplant 2013, 13:971–983.
12. Schmid H, Boucherot A, Yasuda Y, Henger A, Brunner B, Eichinger F, Nitsche A, KissE, Bleich M, Grone HJ, Nelson PJ, Schlondorff D, Cohen CD, Kretzler M:Modularactivation of nuclear factor-kappaB transcriptional programs in human diabeticnephropathy. Diabetes 2006, 55:2993–3003.
13. Mayer G: Capillary rarefaction, hypoxia, VEGF and angiogenesis inchronic renal disease. Nephrol Dial Transplant 2011, 26:1132–1137.
14. Rudnicki M, Eder S, Perco P, Enrich J, Scheiber K, Koppelstatter C,Schratzberger G, Mayer B, Oberbauer R, Meyer TW, Mayer G: Geneexpression profiles of human proximal tubular epithelial cells inproteinuric nephropathies. Kidney Int 2007, 71:325–335.
15. Rudnicki M, Eder S, Schratzberger G, Mayer B, Meyer TW, Tonko M, Mayer G:Reliability of t7-based mRNA linear amplification validated by gene expressionanalysis of human kidney cells using cDNA microarrays. Nephron Exp Nephrol2004, 97:e86–e95.
16. Thomas PD, Campbell MJ, Kejariwal A, Mi H, Karlak B, Daverman R, Diemer K,Muruganujan A, Narechania A: PANTHER: a library of protein families andsubfamilies indexed by function. Genome Res 2003, 13:2129–2141.
17. Thomas PD, Kejariwal A, Guo N, Mi H, Campbell MJ, Muruganujan A, Lazareva-Ulitsky B: Applications for protein sequence-function evolution data: mRNA/protein expression analysis and coding SNP scoring tools. Nucleic Acids Res 2006,34:W645–W650.
18. Mi H, Dong Q, Muruganujan A, Gaudet P, Lewis S, Thomas PD: PANTHER version7: improved phylogenetic trees, orthologs and collaboration with the GeneOntology Consortium. Nucleic Acids Res 2010, 38:D204–D210.
19. Efron B: Better bootstrap confidence intervals. J Am Stat Assoc 1987,82:171–185.
20. Youden WJ: Index for rating diagnostic tests. Cancer 1950, 3:32–35.21. Goumenos DS, Kalliakmani P, Tsakas S, Papachristou E, Vlachojannis JG: Growth
factors and apoptosis-related protein expression in human crescentic nephritis.Med Sci Monit 2008, 14:BR243–BR248.
22. Floege J, Eitner F, Alpers CE: A new look at platelet-derived growth factorin renal disease. J Am Soc Nephrol 2008, 19:12–23.
23. Yeh YC, Wei WC, Wang YK, Lin SC, Sung JM, Tang MJ: Transforming growthfactor-{beta}1 induces Smad3-dependent {beta}1 integrin gene expression inepithelial-to-mesenchymal transition during chronic tubulointerstitial fibrosis.Am J Pathol 2010, 177:1743–1754.
24. Cho SG, Du Q, Huang S, Dong Z: Drp1 dephosphorylation in ATP depletion-induced mitochondrial injury and tubular cell apoptosis. Am J Physiol RenalPhysiol 2010, 299:F199–F206.
25. Granata S, Zaza G, Simone S, Villani G, Latorre D, Pontrelli P, Carella M, Schena FP,Grandaliano G, Pertosa G:Mitochondrial dysregulation and oxidative stress inpatients with chronic kidney disease. BMC Genomics 2009, 10:388.
26. Weinberg JM: Mitochondrial biogenesis in kidney disease. J Am SocNephrol 2011, 22:431–436.
27. Anders HJ, Ryu M: Renal microenvironments and macrophagephenotypes determine progression or resolution of renal inflammationand fibrosis. Kidney Int 2011, 80:915–925.
28. Lee SB, Kalluri R: Mechanistic connection between inflammation andfibrosis. Kidney Int Suppl 2010, S22–S26.
29. Levey AS, Bosch JP, Lewis JB, Greene T, Rogers N, Roth D: A more accuratemethod to estimate glomerular filtration rate from serum creatinine: a newprediction equation. modification of diet in Renal Disease Study Group.Ann Intern Med 1999, 130:461–470.
30. Levey AS, Stevens LA, Schmid CH, Zhang YL, Castro AF 3rd, Feldman HI,Kusek JW, Eggers P, Van Lente F, Greene T, Coresh J: A new equationto estimate glomerular filtration rate. Ann Intern Med 2009,150:604–612.
31. Kidney Disease: Improving Global Outcomes (KDIGO) CKD Work Group.KDIGO 2012 clinical practice guideline for the evaluation andmanagement of chronic kidney disease. Kidney Int Suppl 2013,3:1–150.
32. Steubl D, Hettwer S, Vrijbloed W, Dahinden P, Wolf P, Luppa P, Wagner CA,Renders L, Heemann U, Roos M: C-terminal agrin fragment–a new fastbiomarker for kidney function in renal transplant recipients. Am J Nephrol 2013,38:501–508.
33. Zubowska M, Wyka K, Fendler W, Mlynarski W, Zalewska-Szewczyk B:Interleukin 18 as a marker of chronic nephropathy in children afteranticancer treatment. Dis Markers 2013, 35:811–818.
34. Kiss-Toth E, Bagstaff SM, Sung HY, Jozsa V, Dempsey C, Caunt JC, Oxley KM, WyllieDH, Polgar T, Harte M, O'Neill L A, Qwarnstrom EE, Dower SK: Human tribbles, aprotein family controlling mitogen-activated protein kinase cascades. J BiolChem 2004, 279:42703–42708.
35. Ashton-Chess J, Giral M, Mengel M, Renaudin K, Foucher Y, Gwinner W,Braud C, Dugast E, Quillard T, Thebault P, Chiffoleau E, Braudeau C,Charreau B, Soulillou JP, Brouard S: Tribbles-1 as a novel biomarker ofchronic antibody-mediated rejection. J Am Soc Nephrol 2008,19:1116–1127.
36. Divers J, Palmer ND, Lu L, Langefeld CD, Rocco MV, Hicks PJ, Murea M, MaL, Bowden DW, Freedman BI: Gene-gene interactions in APOL1-associatednephropathy. Nephrol Dial Transplant 2013, 29:587–594.
37. Tomita M, Asada M, Asada N, Nakamura J, Oguchi A, Higashi AY, Endo S,Robertson E, Kimura T, Kita T, Economides AN, Kreidberg J, Yanagita M: Bmp7maintains undifferentiated kidney progenitor population and determinesnephron numbers at birth. PLoS One 2013, 8:e73554.
38. Xu Y, Wan J, Jiang D, Wu X: BMP-7 counteracts TGF-beta1-inducedepithelial-to-mesenchymal transition in human renal proximal tubularepithelial cells. J Nephrol 2009, 22:403–410.
39. Xu YF, Wan JX, Jiang DW: Effects of bone morphogenic protein-7 ontransdifferentiation and the expression of connective tissuegrowth factor of human renal tubular epithelial cells induced bytransforming growth factor-beta1. Zhonghua Yi Xue Za Zhi 2009,89:1639–1644.
40. Dudas PL, Argentieri RL, Farrell FX: BMP-7 fails to attenuate TGF-beta1-induced epithelial-to-mesenchymal transition in human proximal tubuleepithelial cells. Nephrol Dial Transplant 2009, 24:1406–1416.
41. Gomez-Alamillo C, Ramos-Barron MA, Benito-Hernandez A, Rodrigo E, RuizJC, Agueros C, Sanchez M, Arias M: Relation of urinary gene expression ofepithelial-mesenchymal transition markers with initial events and 1-yearkidney graft function. Transplant Proc 2012, 44:2573–2576.
42. Denizli N, Azak A, Sakaci M, Huddam B, Kocak G, Akdogan MF, Demirci R,Gucun M, Ortabozkoyun L, Fidan Y, Akdag I, Duranay M: Bonemorphogenetic protein-7 and disease progression in renal amyloidosispatients. Ren Fail 2013, 35:1112–1115.
43. Hugo C, Shankland SJ, Pichler RH, Couser WG, Johnson RJ:Thrombospondin 1 precedes and predicts the development oftubulointerstitial fibrosis in glomerular disease in the rat. Kidney Int 1998,53:302–311.
44. Daniel C, Schaub K, Amann K, Lawler J, Hugo C: Thrombospondin-1 is anendogenous activator of TGF-beta in experimental diabetic nephropathyin vivo. Diabetes 2007, 56:2982–2989.
45. Daniel C, Wiede J, Krutzsch HC, Ribeiro SM, Roberts DD, Murphy-Ullrich JE,Hugo C: Thrombospondin-1 is a major activator of TGF-beta in fibroticrenal disease in the rat in vivo. Kidney Int 2004, 65:459–468.

Neuwirt et al. BMC Medical Genomics (2014) 7:75 Page 14 of 14
46. Cui W, Maimaitiyiming H, Qi X, Norman H, Wang S: Thrombospondin 1mediates renal dysfunction in a mouse model of high-fat diet-inducedobesity. Am J Physiol Renal Physiol 2013, 305:F871–F880.
47. Sun D, Ma Y, Han H, Yin Z, Liu C, Feng J, Zhou X, Li X, Xiao A, Yu R:Thrombospondin-1 short hairpin RNA suppresses tubulointerstitialfibrosis in the kidney of ureteral obstruction by ameliorating peritubularcapillary injury. Kidney Blood Press Res 2012, 35:35–47.
Submit your next manuscript to BioMed Centraland take full advantage of:
• Convenient online submission
• Thorough peer review
• No space constraints or color figure charges
• Immediate publication on acceptance
• Inclusion in PubMed, CAS, Scopus and Google Scholar
• Research which is freely available for redistribution
Submit your manuscript at www.biomedcentral.com/submit
Copyright © 2022 FDOKUMEN