Renal growth hormone—Insulin-like growth factor-I system in acute renal failure
Upload
khangminh22Category
view
0download
0
© 2019 The Author(s)Published by S. Karger AG, Basel
Research Article
Kidney Blood Press Res 2019;44:245–263
5-Hydroxyhexanoic Acid Predicts Early Renal Functional Decline in Type 2 Diabetes Patients with MicroalbuminuriaXiaofang Tang Jing You Di Liu Ming Xia Liyu He Hong Liu
Department of Nephrology, The Second Xiangya Hospital, Central South University, Key Lab of Kidney Disease and Blood Purification in Hunan, Changsha, PR China
KeywordsDiabetic nephropathy · Renal function decline · Metabolomics · 5-hydroxyhexanoic acid
AbstractBackground/Aims: Diabetic nephropathy (DN) is a leading cause of end-stage renal disease. Microalbuminuria (MA) is widely used to predict early progressive renal function decline (ERFD) of DN in type 2 diabetes mellitus (T2D) patients, but the sensitivity and specificity of MA have been questioned. Here, we determined the urine metabolites differences between T2D patients with MA who maintained stable renal function and those who progressed to ERFD in order to identify specific biomarkers of the progression of renal dysfunction. Meth-ods: A total of 102 T2D patients with MA and normal renal function at baseline were followed up for 5–6 years. Of these, 52 patients were selected and classified into two groups according to the later renal function; 25 patients who experienced ERFD were regarded as the progres-sive group, while 27 patients who maintained stable renal function were considered as the stable group. In the pilot study, untargeted, broad-spectrum urine metabolomics was per-formed on the urine of 12 subjects from the progressive group (5 patients as “progressors”) and stable group (7 patients as “non-progressors”) to discover candidate markers. We then used a targeted metabolomics analysis to identify the selected markers in the urine of an ad-ditional 40 patients (20 from the progressive group as cases, and 20 from the stable group as controls) in the validation study. Results: A total of 318 known metabolites were detected in
Received: September 10, 2018Accepted: January 14, 2019Published online: May 9, 2019
Liyu He or Hong LiuDepartment of Nephrology, The Second Xiangya HospitalCentral South University, Key Lab of Kidney Disease and Blood Purification in Hunan139 Renmin Road, Changsha, Hunan 410011 (PR China)E-Mail liuhong618 @ csu.edu.cn
www.karger.com/kbr
This article is licensed under the Creative Commons Attribution-NonCommercial-NoDerivatives 4.0 Interna-tional License (CC BY-NC-ND) (http://www.karger.com/Services/OpenAccessLicense). Usage and distribu-tion for commercial purposes as well as any distribution of modified material requires written permission.
DOI: 10.1159/000498962
246Kidney Blood Press Res 2019;44:245–263
Tang et al.: 5-Hydroxyhexanoic in Diabetic Nephropathy
www.karger.com/kbr© 2019 The Author(s). Published by S. Karger AG, BaselDOI: 10.1159/000498962
the pilot study and 6 metabolites with significant difference between progressors and non-progressors were identified. The levels of 4 metabolites, including azelaic acid, adipic acid, 5-hydroxyhexanoic acid, and L-tryptophan decreased significantly, while levels of L-pyroglu-tamic acid and D-norvaline increased observably in the progressors compared with non-pro-gressors. Furthermore, in the validation study, 6 metabolites were confirmed by quantitative measurements and their concentrations were consistent with the changes in the pilot study. Concentrations of L-pyroglutamic acid and D-norvaline still increased in the cases, but were not statistically significant. Of the 4 metabolites with decreased concentrations among the cases, only 5-hydroxyhexanoic acid remained statistically significant while the other 3 me-tabolites did not differ between cases and controls. Conclusion: We have identified urine metabolites and shown that 5-hydroxyhexanoic acid can be used as a predictor of progres-sion of ERFD in T2D patients with MA. This finding provides the new perspective that 5-hy-droxyhexanoic acid may be useful to identify T2D patients with MA who are at risk of ERFD.
© 2019 The Author(s)Published by S. Karger AG, Basel
Introduction
Diabetic nephropathy (DN) is a late complication of diabetes mellitus and has become more prevalent globally due to the growing incidence of type 2 diabetes mellitus (T2D). DN is also the most common leading cause of end-stage renal disease (ESRD) worldwide [1–3]. Conventionally, microalbuminuria (MA; 30–300 mg/24 h) is considered a biomarker and a risk for DN and progressive renal dysfunction [4–10]. However, several studies have questioned the sensitivity and the specificity of MA for renal dysfunction [11]. Some patients with MA will develop normoalbuminuria [12], while many diabetic patients have already experienced early progressive renal function decline (ERFD) before MA onset [13, 14]. Even though much research has been made over the past years in diagnosing and predicting DN [15–19], there is still a lack of powerful markers and predictors to identify T2D patients with MA who will have a high risk of progressive renal dysfunction in a few years, and a subset of those with MA will maintain stable renal function for a long time. Thus, there is a pressing need for further studies to find novel biomarkers linked with the pathophysiological progress of DN and to identify the risk for early renal damage in T2D patients with MA.
Metabolomics is the latest tool which focuses on qualitative and quantitative analysis of low-molecular-weight molecules related to the pathogenesis of disease. Metabolomics has been used to discover novel biomarkers for the diagnosis and monitoring of renal progression [20]. Previous studies have measured plasma metabolomics in diabetes and DN patients with the aim of revealing changed metabolites as potential biomarkers of the risk for progressive renal function loss and progressive ESRD [21–24]. Compared with plasma metabolomics, urine metabolomics may provide direct understanding of biochemical pathways linked to kidney dysfunction since urine metabolites are directly excreted by the kidney [25]. However, the urine metabolomics in T2D patients with MA in the follow-up of subjects has not been evaluated. Therefore, we are extending metabolic analysis to urine samples. In the present study, we evaluated and compared the metabolomic profile of urine in T2D subjects who retained stable renal function with those who developed ERFD during 5–6 years of follow-up. The differences in urine metabolomics might provide new insight into the etiology of ERFD and serve as candidate biomarkers and predictors of early renal dysfunction in T2D patients with MA.
247Kidney Blood Press Res 2019;44:245–263
Tang et al.: 5-Hydroxyhexanoic in Diabetic Nephropathy
www.karger.com/kbr© 2019 The Author(s). Published by S. Karger AG, BaselDOI: 10.1159/000498962
Materials and Methods
Patient Recruitment and Urine Collection A total of 102 T2D patients with MA and eGFR > 90 mL/min/1.73 m2 who referred to
outpatient clinics of The Second Xiangya Hospital of Central South University between January 2010 and March 2011 were recruited. Patients were followed for 5–6 years until March to November 2017, with outpatients visited regularly at least every 6 months. The inclusion criteria were: (1) being diagnosed with T2D (WHO criteria); (2) age ≥35 years and < 75 years; (3) duration of T2D > 5 years; (4) HbA1c ≥6.5% and < 13%, and (5) having MA. The exclusion criteria were: (1) being diagnosed with type 1 diabetes mellitus (WHO criteria); (2) a history of hematuria; (3) pregnant or lactating women; (4) malignancy; (5) acute and chronic inflam-mation of the urinary system or other systems, and (6) severe heart failure, blood system diseases, autoimmune diseases, cancer patients, AIDS, etc. Patients were classified into two groups according to their eGFR (CKD-EPI formula) during follow-up: 27 patients with stable renal function (eGFR > 60 mL/min/1.73 m2) formed the stable group, and 25 patients with ERFD (at least a 33.3% decline of eGFR and eGFR < 60 mL/min/1.73 m2) comprised the progressive group. The second morning urines were collected in sterile tubes (Corning Incor-porated, Corning, NY, USA) at the time patients came to the hospital between March and November 2017. These urines were then centrifuged at 10,000 rpm at 4 ° C for 15 min and the supernatants of the samples were stored at –80 ° C in equal aliquots until urine extraction before metabolome analysis.
Chemicals and ReagentsMethyl alcohol, acetonitrile, and ethyl alcohol were purchased from Merck Company
(Germany). Authentic standards were purchased from BioBioPha (China) and Sigma-Aldrich (USA). Five standards of metabolites (azelaic acid, adipic acid, L-tryptophan, L-pyroglutamic acid, and D-norvaline) were purchased from Sigma-Aldrich. 5-hydroxyhexanoic acid was sourced from Toronto Research Chemicals (Canada). Milli-Q System (Millipore Corp, Bedford, MA, USA) ultrapure water was used throughout the study.
Urine Preparation and ExtractionThe stored urine samples from –80 ° C were dissolved on ice and then homogenized using
a mixer mill (MM 400, Retsch, Germany) with a zirconia bead for 1.5 min at 30 Hz. Then, 1,000 μL of urine was centrifugated at 12,000 rpm for 5 min and extracted with 500 μL of 70% methanol at 4 ° C in 1 min. Following centrifugation at 10,000 g for 10 min, the supernatants were kept and filtrated (SCAA-104, 0.22-μm pore size; ANPEL, Shanghai, China). Before LC-MS/MS analysis, each sample was mixed with 10 µL of liquid as quality control (QC) samples.
Untargeted Metabolomics Analysis of the Pilot StudyLC-MS/MS AnalysisThe extracted urine samples of 5 patients from the progressive group as “progressors”
and 7 subjects from the stable group as “non-progressors” were used in the pilot study. The compounds extracted were analyzed using an LC- MS/MS system (UPLC, Shim-pack UFLC SHIMADZU CBM20A; MS/MS; Applied Biosystems 4500 QTRAP). From the samples, 5 μL were injected onto a Waters ACQUITY UPLC HSS T3 C18 column (2.1 × 100 mm, 1.8 µm) oper-ating at 40 ° C and a flow rate of 0.4 mL/min. The acidified water (0.04% acetic acid; phase A) and acidified acetonitrile (0.04% acetic acid; phase B) were used for the mobile phases. Compounds were separated after the following gradient: (1) 95: 5 phase A/phase B at 0 min; (2) 5: 95 phase A/phase B at 11.0 min; (3) 5: 95 phase A/phase B at 12.0 min; (4) 95: 5 phase
248Kidney Blood Press Res 2019;44:245–263
Tang et al.: 5-Hydroxyhexanoic in Diabetic Nephropathy
www.karger.com/kbr© 2019 The Author(s). Published by S. Karger AG, BaselDOI: 10.1159/000498962
A/phase B at 12.1 min; (5) 95: 5 phase A/phase B at 15.0 min. The following parameters were useful for LC-MS/MS analysis: the ESI source temperature was 550 ° C; ion spray voltage was 5,500 V; curtain gas was 25 psi; the collision-activated dissociation was set to the highest. The declustering potential and collision energy for each individual multiple reaction monitoring (MRM) transition were optimized. The m/z range was set between 50 and 1,000 m/z.
Data Pre-Processing and Metabolites IdentificationData filtering, peak detection, alignment, and calculations were performed with Analyst
1.6.1 software (AB Sciex). Briefly, the redundant signals were removed by in-house software written in perl and the peaks were checked manually for signal/noise. For facilitation of the identification/annotation of metabolites, an accurate m/z for each Q1 was obtained. Total ion current (TIC) chromatograms and extracted ion chromatograms (EICs or XICs) of QC samples were exported, giving an overview of metabolite profiles of all samples. Internal database and public databases including MassBank, KNApSAcK, HMDB [26], MoTo DB, and METLIN [27] were used to identify metabolites by searching and comparing the m/z values, the RT, and the frag-mentation patterns with the standards. Multivariate statistical analysis and differential metab-olite analysis were used to distinguish metabolic biomarkers related to renal function decline.
Targeted Metabolomics Analysis of the Validation StudyLC-MS/MS AnalysisThe extracted urine samples from 20 subjects from the progressive group as cases and
20 patients from the stable group as controls were used in the validation study. Extract metabolites came from the urine samples. An LC-MS/MS system (HPLC, Shim-pack UFLC SHIMADZU CBM30A system; MS, Applied Biosystems6500 QTRAP) was used to establish standard curves. The sample extracts were then analyzed using a QTRAP system. The identi-fication of target metabolites was based on the spectral pattern and retention time.
Data AnalysisValues are shown as the mean ± standard deviation (SD), while the urinary albumin
excretion rate (UAER) with its skewed distribution is expressed as the median and interquartile range. The clinical characteristics of patients in the pilot study phase and validation study phase were compared using the non-parametric Mann-Whitney or t test with SPSS 21.0 software to calculate statistically significant differences of the values between the two groups. Data filtering, peak detection, alignment, and calculations were performed using Analyst 1.6.1 software. Metabolomic data were analyzed by multivariate principal component analysis (PCA), partial least squares discriminant analysis (PLS-DA), orthogonal projection to latent structures-discriminant analysis (OPLS-DA), loadings plot and t test, and univariate ANOVA to identify the metabolites differentially between the two groups. A variable importance in projection (VIP) score of the (O)PLS model with values greater than 1 was applied to rank the metabolites that best distinguished between the two groups. The t test was also used as a univariate analysis for screening differential metabolites. Those with a t test p value < 0.05 and VIP ≥1 were considered differential metabolites between the two groups for differentiating the selection and validation of variables. Receiver operating characteristic (ROC) curves to calculate the area under the curve (AUC) of selected metabolites were based on logistic models using GraphPad Prism 6 software with a value ≤0.5 for movement both up and down in both the cases and controls.
KEGG Pathway AnalysisThe Kyoto Encyclopedia of Genes and Genomes (KEGG) is the major public pathway-
related database that includes not only genes but also metabolites [28]. Metabolites were mapped to KEGG metabolic pathways for pathway analysis and enrichment analysis. Pathway
249Kidney Blood Press Res 2019;44:245–263
Tang et al.: 5-Hydroxyhexanoic in Diabetic Nephropathy
www.karger.com/kbr© 2019 The Author(s). Published by S. Karger AG, BaselDOI: 10.1159/000498962
enrichment analysis identified significantly enriched metabolic pathways or signal trans-duction pathways in differential metabolites in comparison with the whole background. The calculated p value was processed through false discovery rate (FDR) correction, taking FDR ≤0.05 as a threshold. Pathways meeting this condition were defined as significantly enriched pathways in differential metabolites.
Results
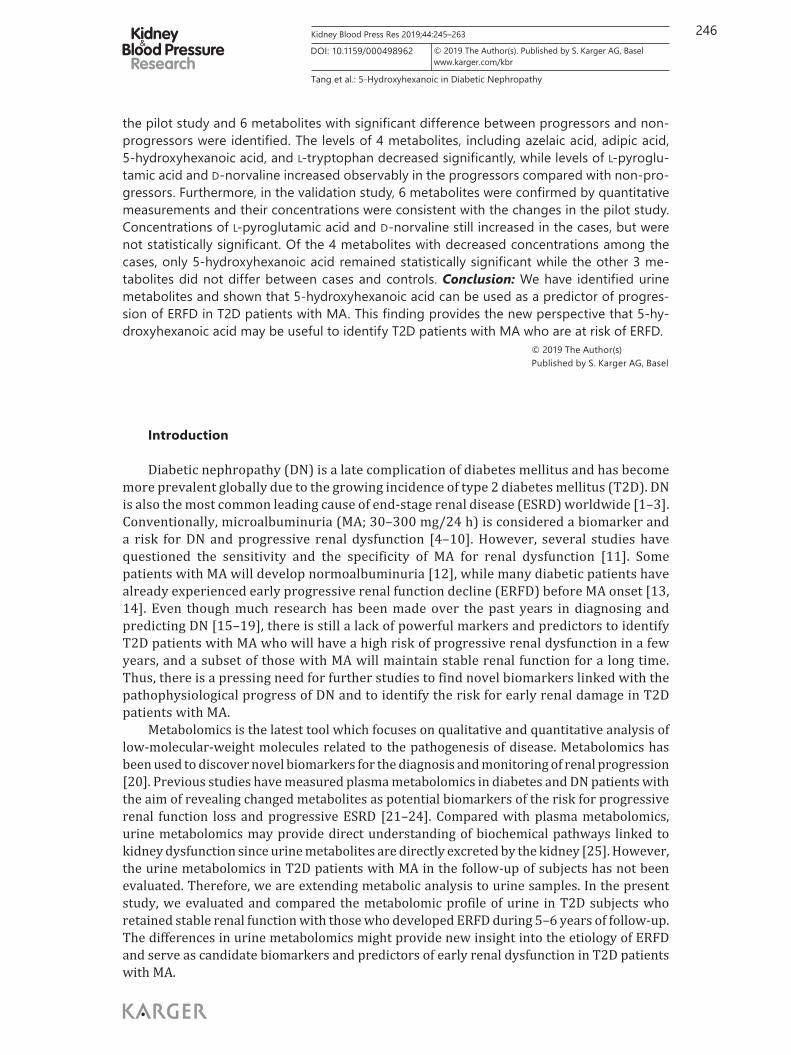
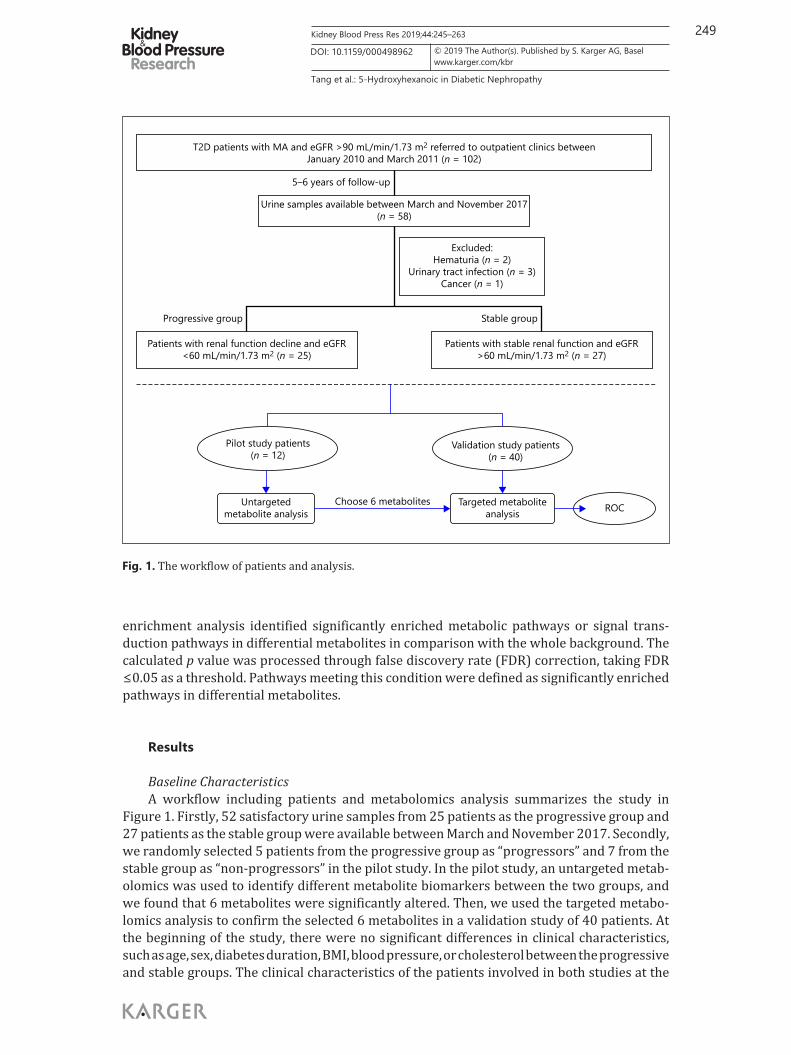
Baseline CharacteristicsA workflow including patients and metabolomics analysis summarizes the study in
Figure 1. Firstly, 52 satisfactory urine samples from 25 patients as the progressive group and 27 patients as the stable group were available between March and November 2017. Secondly, we randomly selected 5 patients from the progressive group as “progressors” and 7 from the stable group as “non-progressors” in the pilot study. In the pilot study, an untargeted metab-olomics was used to identify different metabolite biomarkers between the two groups, and we found that 6 metabolites were significantly altered. Then, we used the targeted metabo-lomics analysis to confirm the selected 6 metabolites in a validation study of 40 patients. At the beginning of the study, there were no significant differences in clinical characteristics, such as age, sex, diabetes duration, BMI, blood pressure, or cholesterol between the progressive and stable groups. The clinical characteristics of the patients involved in both studies at the
T2D patients with MA and eGFR >90 mL/min/1.73 m2 referred to outpatient clinics betweenJanuary 2010 and March 2011 (n = 102)
Urine samples available between March and November 2017(n = 58)
5–6 years of follow-up
Progressive group
Patients with renal function decline and eGFR<60 mL/min/1.73 m2 (n = 25)
Pilot study patients(n = 12)
Untargetedmetabolite analysis
Targeted metaboliteanalysis
Choose 6 metabolites ROC
Validation study patients(n = 40)
Patients with stable renal function and eGFR>60 mL/min/1.73 m2 (n = 27)
Stable group
Excluded:Hematuria (n = 2)
Urinary tract infection (n = 3)Cancer (n = 1)
Fig. 1. The workflow of patients and analysis.
250Kidney Blood Press Res 2019;44:245–263
Tang et al.: 5-Hydroxyhexanoic in Diabetic Nephropathy
www.karger.com/kbr© 2019 The Author(s). Published by S. Karger AG, BaselDOI: 10.1159/000498962
end of follow-up are displayed in Table 1. There were still no significant differences in age, sex, diabetes duration, or BMI, etc. between the two groups in the pilot or validation phases. However, the UAER of progressors was higher than of non-progressors, although not statisti-cally significant in the pilot study, while this was different between cases and controls in the validation study. The eGFR was significantly different between the two groups whether in the pilot study or the validation study.
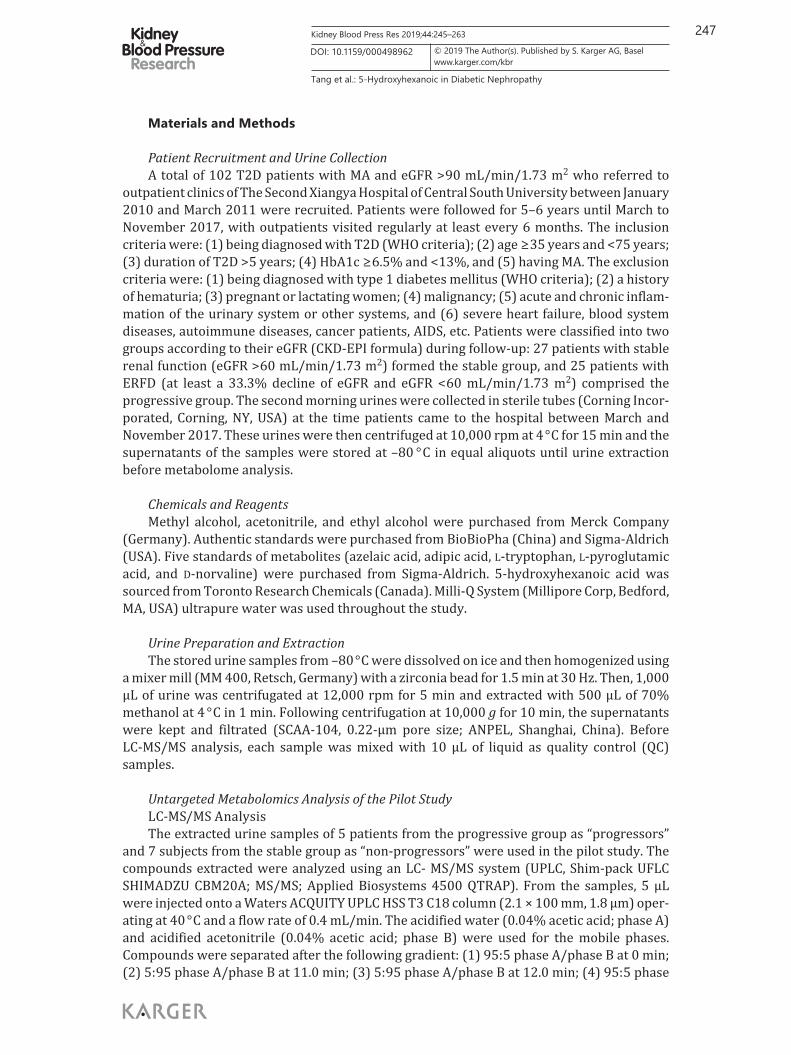
Metabolites of Untargeted Metabolomics in the Pilot StudyDetected Known MetabolitesA total 318 known metabolites were detected in positive electrospray ionization and
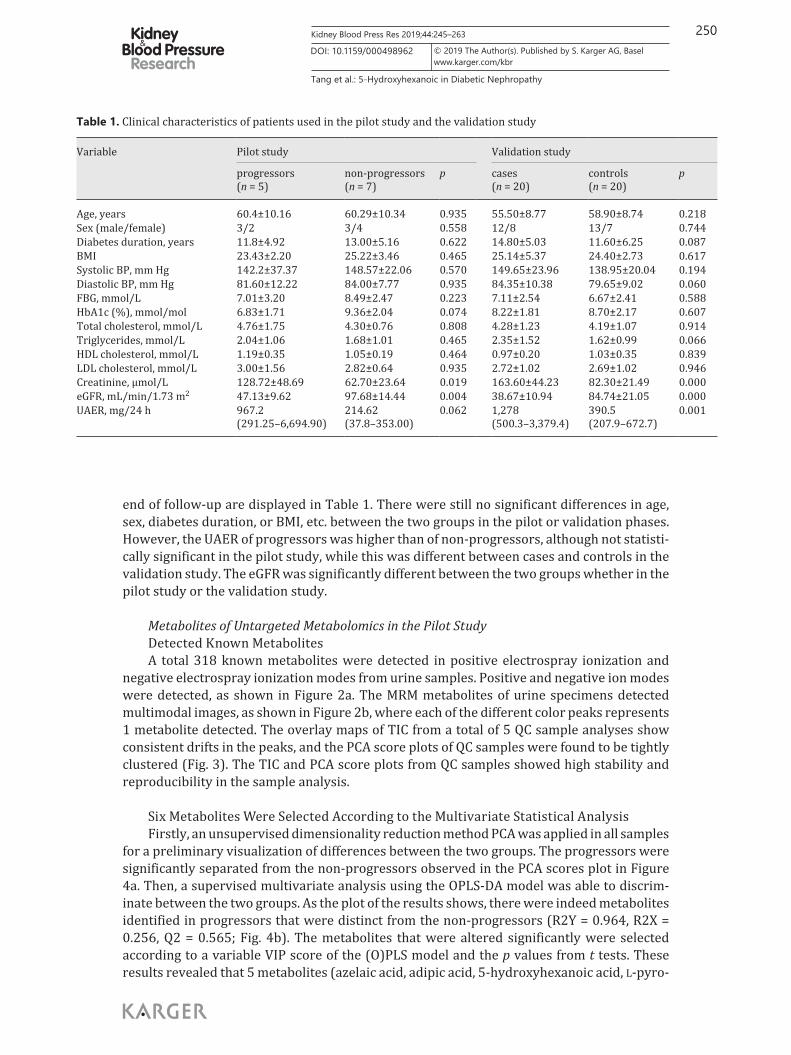
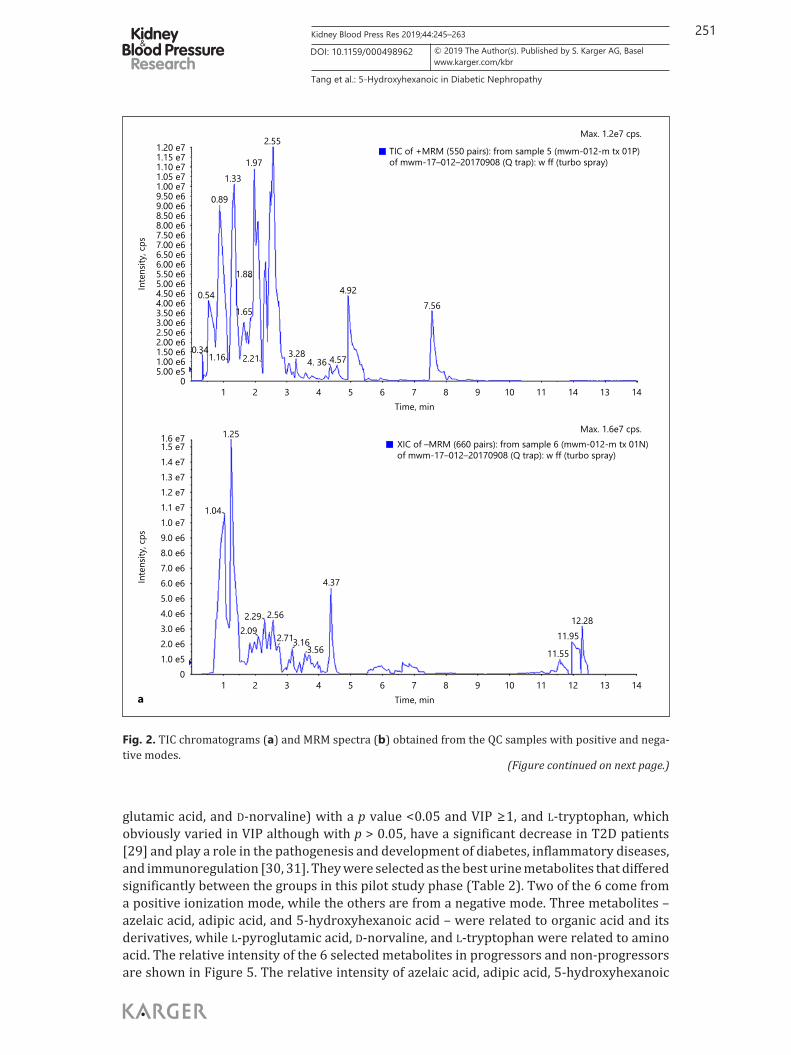
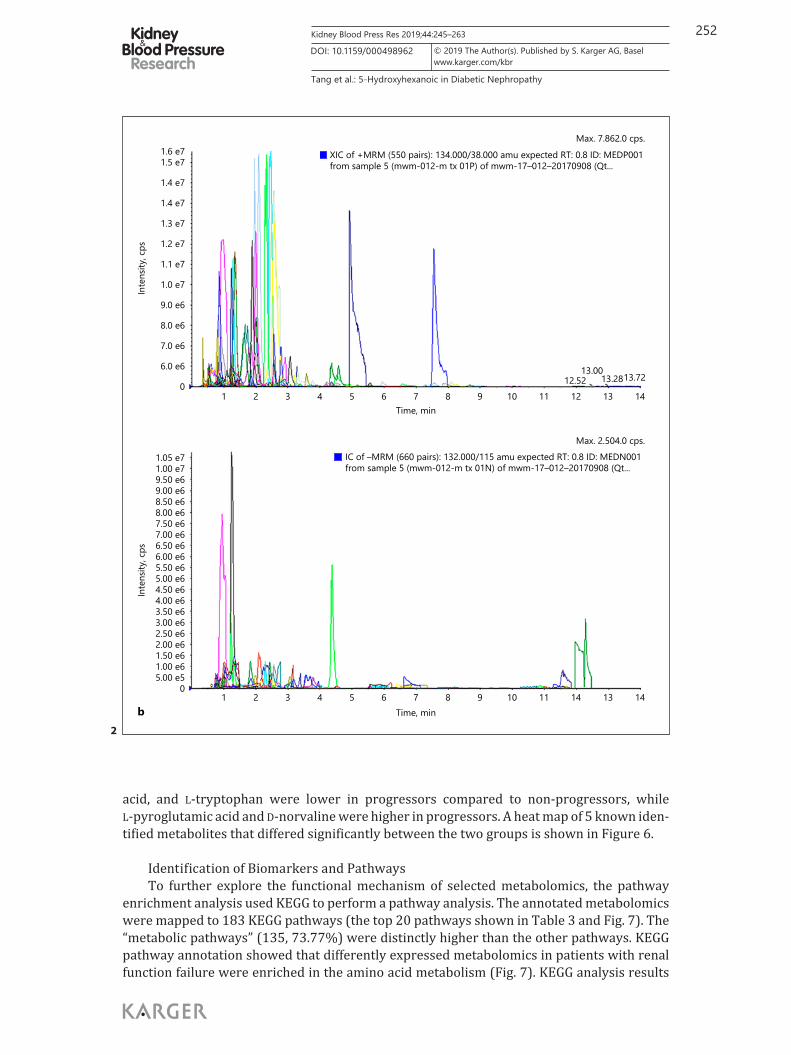
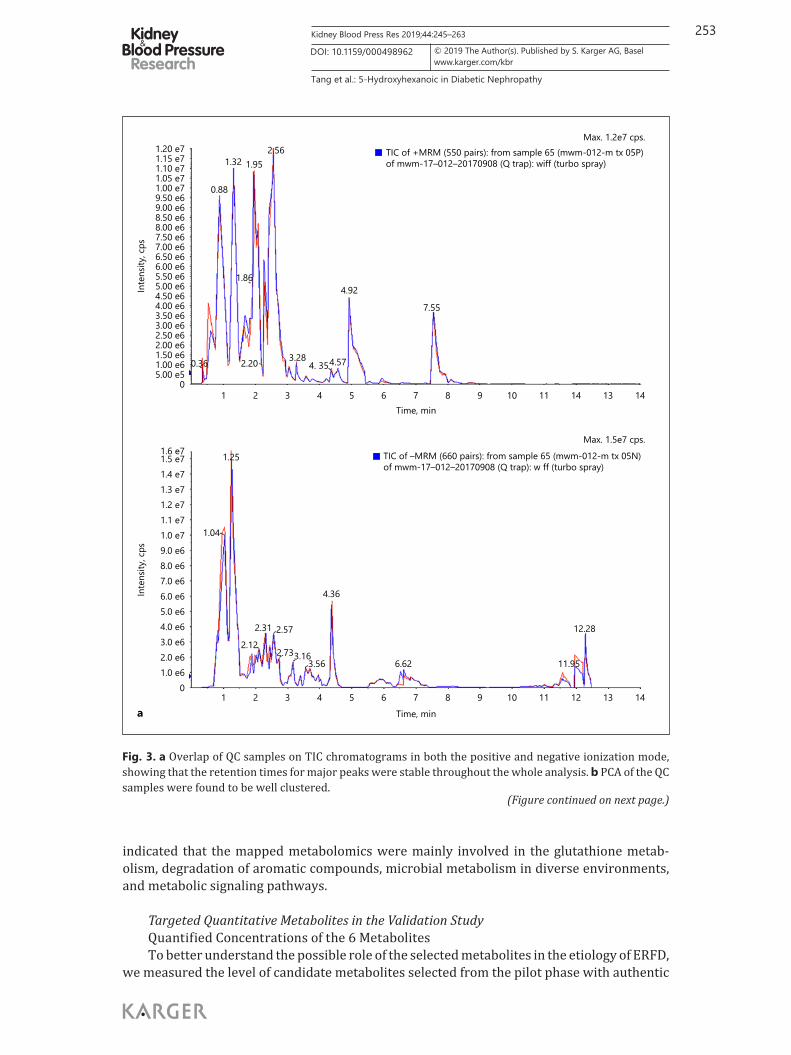
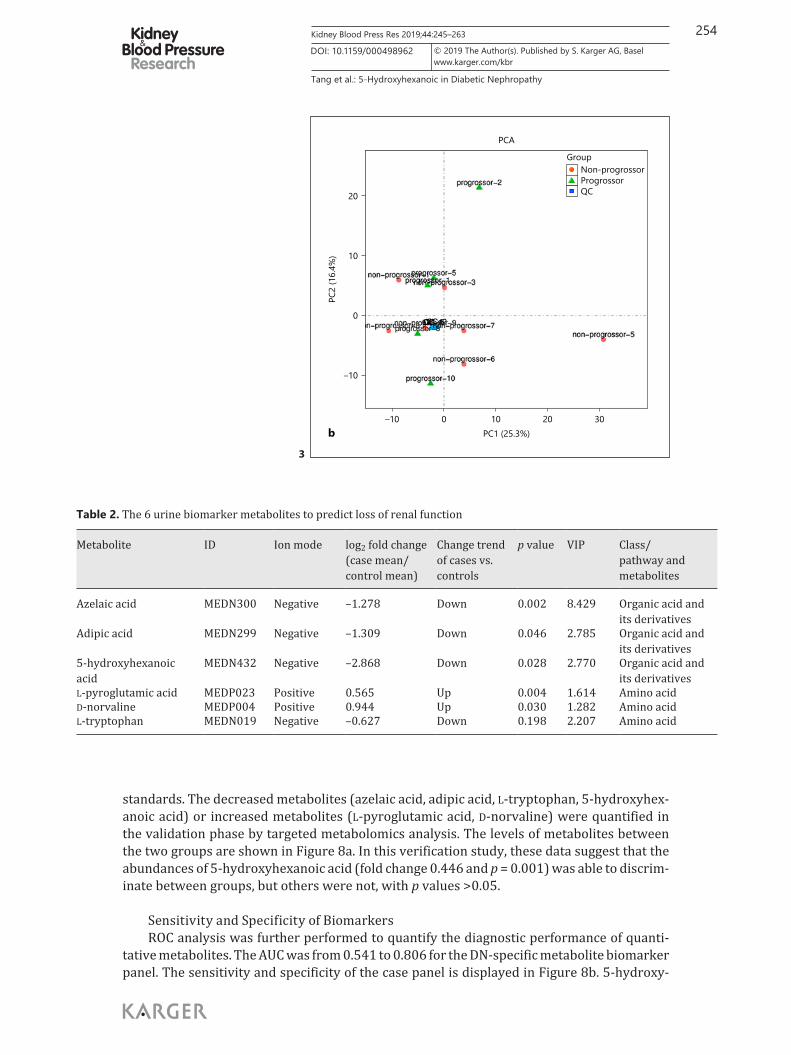
negative electrospray ionization modes from urine samples. Positive and negative ion modes were detected, as shown in Figure 2a. The MRM metabolites of urine specimens detected multimodal images, as shown in Figure 2b, where each of the different color peaks represents 1 metabolite detected. The overlay maps of TIC from a total of 5 QC sample analyses show consistent drifts in the peaks, and the PCA score plots of QC samples were found to be tightly clustered (Fig. 3). The TIC and PCA score plots from QC samples showed high stability and reproducibility in the sample analysis.
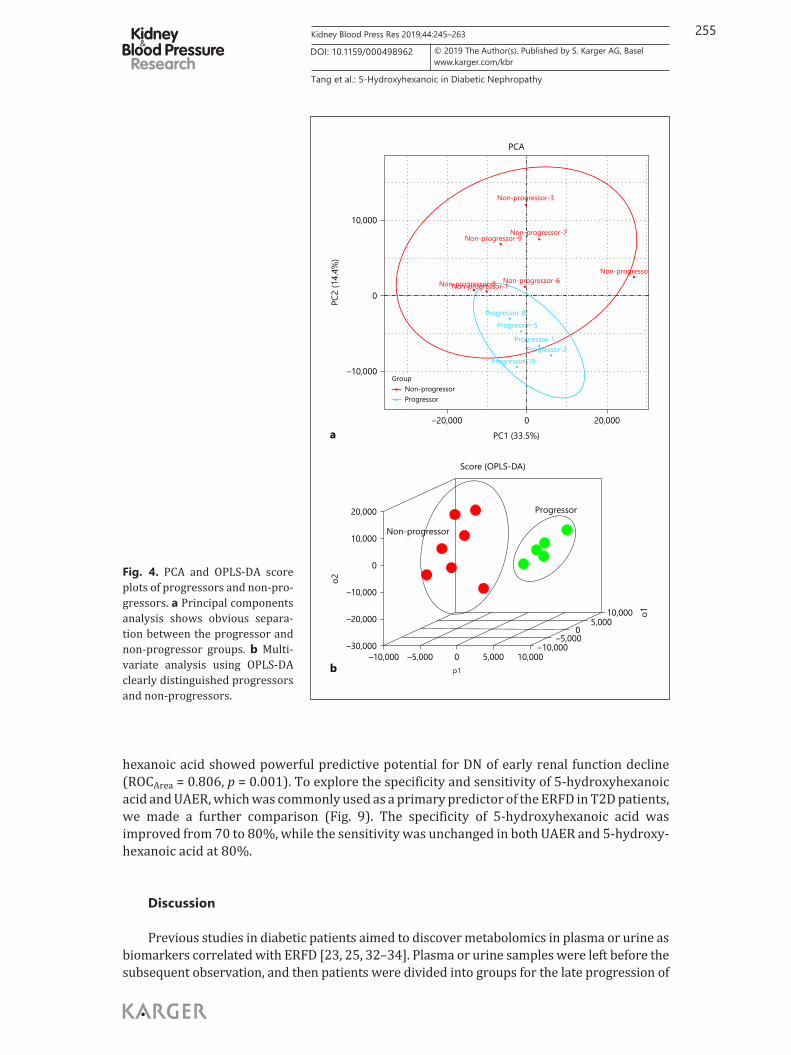
Six Metabolites Were Selected According to the Multivariate Statistical AnalysisFirstly, an unsupervised dimensionality reduction method PCA was applied in all samples
for a preliminary visualization of differences between the two groups. The progressors were significantly separated from the non-progressors observed in the PCA scores plot in Figure 4a. Then, a supervised multivariate analysis using the OPLS-DA model was able to discrim-inate between the two groups. As the plot of the results shows, there were indeed metabolites identified in progressors that were distinct from the non-progressors (R2Y = 0.964, R2X = 0.256, Q2 = 0.565; Fig. 4b). The metabolites that were altered significantly were selected according to a variable VIP score of the (O)PLS model and the p values from t tests. These results revealed that 5 metabolites (azelaic acid, adipic acid, 5-hydroxyhexanoic acid, L-pyro-
Table 1. Clinical characteristics of patients used in the pilot study and the validation study
Variable Pilot study Validation study
progressors (n = 5)
non-progressors(n = 7)
p cases (n = 20)
controls (n = 20)
p
Age, years 60.4±10.16 60.29±10.34 0.935 55.50±8.77 58.90±8.74 0.218Sex (male/female) 3/2 3/4 0.558 12/8 13/7 0.744Diabetes duration, years 11.8±4.92 13.00±5.16 0.622 14.80±5.03 11.60±6.25 0.087BMI 23.43±2.20 25.22±3.46 0.465 25.14±5.37 24.40±2.73 0.617Systolic BP, mm Hg 142.2±37.37 148.57±22.06 0.570 149.65±23.96 138.95±20.04 0.194Diastolic BP, mm Hg 81.60±12.22 84.00±7.77 0.935 84.35±10.38 79.65±9.02 0.060FBG, mmol/L 7.01±3.20 8.49±2.47 0.223 7.11±2.54 6.67±2.41 0.588HbA1c (%), mmol/mol 6.83±1.71 9.36±2.04 0.074 8.22±1.81 8.70±2.17 0.607Total cholesterol, mmol/L 4.76±1.75 4.30±0.76 0.808 4.28±1.23 4.19±1.07 0.914Triglycerides, mmol/L 2.04±1.06 1.68±1.01 0.465 2.35±1.52 1.62±0.99 0.066HDL cholesterol, mmol/L 1.19±0.35 1.05±0.19 0.464 0.97±0.20 1.03±0.35 0.839LDL cholesterol, mmol/L 3.00±1.56 2.82±0.64 0.935 2.72±1.02 2.69±1.02 0.946Creatinine, μmol/L 128.72±48.69 62.70±23.64 0.019 163.60±44.23 82.30±21.49 0.000eGFR, mL/min/1.73 m2 47.13±9.62 97.68±14.44 0.004 38.67±10.94 84.74±21.05 0.000UAER, mg/24 h 967.2
(291.25–6,694.90)214.62 (37.8–353.00)
0.062 1,278 (500.3–3,379.4)
390.5 (207.9–672.7)
0.001
251Kidney Blood Press Res 2019;44:245–263
Tang et al.: 5-Hydroxyhexanoic in Diabetic Nephropathy
www.karger.com/kbr© 2019 The Author(s). Published by S. Karger AG, BaselDOI: 10.1159/000498962
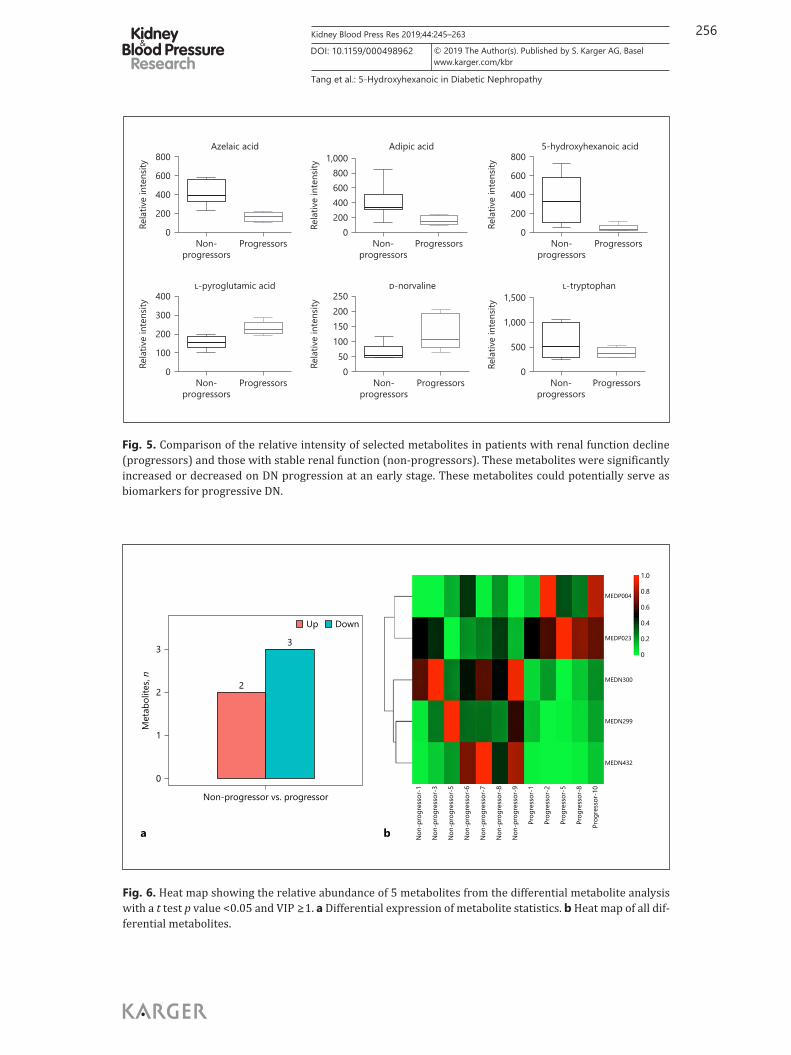
glutamic acid, and D-norvaline) with a p value < 0.05 and VIP ≥1, and L-tryptophan, which obviously varied in VIP although with p > 0.05, have a significant decrease in T2D patients [29] and play a role in the pathogenesis and development of diabetes, inflammatory diseases, and immunoregulation [30, 31]. They were selected as the best urine metabolites that differed significantly between the groups in this pilot study phase (Table 2). Two of the 6 come from a positive ionization mode, while the others are from a negative mode. Three metabolites – azelaic acid, adipic acid, and 5-hydroxyhexanoic acid – were related to organic acid and its derivatives, while L-pyroglutamic acid, D-norvaline, and L-tryptophan were related to amino acid. The relative intensity of the 6 selected metabolites in progressors and non-progressors are shown in Figure 5. The relative intensity of azelaic acid, adipic acid, 5-hydroxyhexanoic
14131211109876543210
1.0 e52.0 e63.0 e64.0 e65.0 e66.0 e67.0 e68.0 e69.0 e61.0 e71.1 e71.2 e71.3 e71.4 e71.5 e71.6 e7
Inte
nsity
, cps
1.25
1.04
2.29 2.56
2.713.163.56
4.37
11.55
11.9512.28
2.09
Max. 1.6e7 cps.XIC of –MRM (660 pairs): from sample 6 (mwm-012-m tx 01N)of mwm-17–012–20170908 (Q trap): w ff (turbo spray)
a Time, min
14131411109876543210
5.00 e51.00 e61.50 e62.00 e62.50 e63.00 e63.50 e64.00 e64.50 e65.00 e65.50 e66.00 e66.50 e67.00 e67.50 e68.00 e68.50 e69.00 e69.50 e61.00 e71.05 e71.10 e71.15 e71.20 e7
Inte
nsity
, cps
3.282.21
1.65
1.88
0.89
1.331.97
2.55
1.16
0.54
0.344. 36 4.57
4.927.56
Max. 1.2e7 cps.
TIC of +MRM (550 pairs): from sample 5 (mwm-012-m tx 01P)of mwm-17–012–20170908 (Q trap): w ff (turbo spray)
Time, min
Fig. 2. TIC chromatograms (a) and MRM spectra (b) obtained from the QC samples with positive and nega-tive modes.
(Figure continued on next page.)
252Kidney Blood Press Res 2019;44:245–263
Tang et al.: 5-Hydroxyhexanoic in Diabetic Nephropathy
www.karger.com/kbr© 2019 The Author(s). Published by S. Karger AG, BaselDOI: 10.1159/000498962
acid, and L-tryptophan were lower in progressors compared to non-progressors, while L-pyroglutamic acid and D-norvaline were higher in progressors. A heat map of 5 known iden-tified metabolites that differed significantly between the two groups is shown in Figure 6.
Identification of Biomarkers and PathwaysTo further explore the functional mechanism of selected metabolomics, the pathway
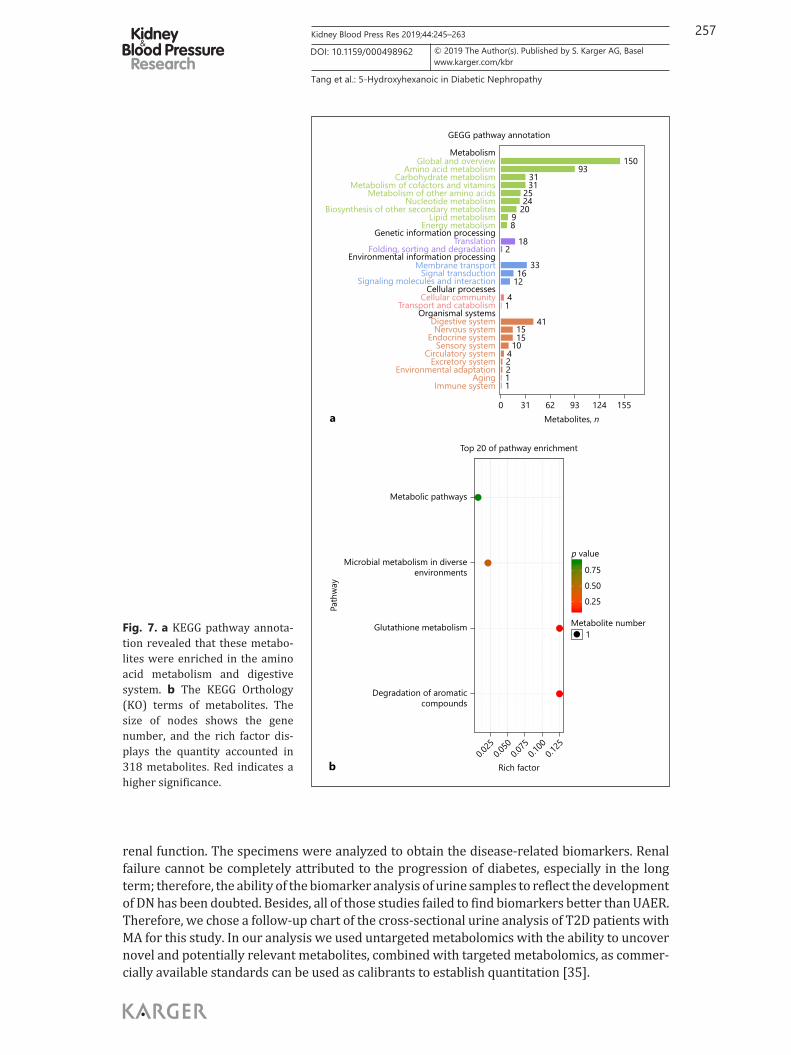
enrichment analysis used KEGG to perform a pathway analysis. The annotated metabolomics were mapped to 183 KEGG pathways (the top 20 pathways shown in Table 3 and Fig. 7). The “metabolic pathways” (135, 73.77%) were distinctly higher than the other pathways. KEGG pathway annotation showed that differently expressed metabolomics in patients with renal function failure were enriched in the amino acid metabolism (Fig. 7). KEGG analysis results
14131411109876543210
5.00 e51.00 e61.50 e62.00 e62.50 e63.00 e63.50 e64.00 e64.50 e65.00 e65.50 e66.00 e66.50 e67.00 e67.50 e68.00 e68.50 e69.00 e69.50 e61.00 e71.05 e7
Inte
nsity
, cps
Max. 2.504.0 cps.IC of –MRM (660 pairs): 132.000/115 amu expected RT: 0.8 ID: MEDN001from sample 5 (mwm-012-m tx 01N) of mwm-17–012–20170908 (Qt...
b Time, min
14131211109876543210
6.0 e6
7.0 e6
8.0 e6
9.0 e6
1.0 e7
1.1 e7
1.2 e7
1.3 e7
1.4 e7
1.4 e7
1.5 e71.6 e7
Inte
nsity
, cps
12.5213.00
13.2813.72
Max. 7.862.0 cps.
XIC of +MRM (550 pairs): 134.000/38.000 amu expected RT: 0.8 ID: MEDP001from sample 5 (mwm-012-m tx 01P) of mwm-17–012–20170908 (Qt...
Time, min
2
253Kidney Blood Press Res 2019;44:245–263
Tang et al.: 5-Hydroxyhexanoic in Diabetic Nephropathy
www.karger.com/kbr© 2019 The Author(s). Published by S. Karger AG, BaselDOI: 10.1159/000498962
indicated that the mapped metabolomics were mainly involved in the glutathione metab-olism, degradation of aromatic compounds, microbial metabolism in diverse environments, and metabolic signaling pathways.
Targeted Quantitative Metabolites in the Validation StudyQuantified Concentrations of the 6 MetabolitesTo better understand the possible role of the selected metabolites in the etiology of ERFD,
we measured the level of candidate metabolites selected from the pilot phase with authentic
14131411109876543210
5.00 e51.00 e61.50 e62.00 e62.50 e63.00 e63.50 e64.00 e64.50 e65.00 e65.50 e66.00 e66.50 e67.00 e67.50 e68.00 e68.50 e69.00 e69.50 e61.00 e71.05 e71.10 e71.15 e71.20 e7
Inte
nsity
, cps
3.282.20
1.86
0.88
1.32 1.952.56
0.36 4. 354.57
4.92
7.55
Max. 1.2e7 cps.TIC of +MRM (550 pairs): from sample 65 (mwm-012-m tx 05P)of mwm-17–012–20170908 (Q trap): wiff (turbo spray)
Time, min
14131211109876543210
1.0 e62.0 e63.0 e64.0 e65.0 e66.0 e67.0 e68.0 e69.0 e61.0 e71.1 e71.2 e71.3 e71.4 e71.5 e71.6 e7
Inte
nsity
, cps
1.25
1.04
2.31 2.57
2.733.163.56
4.36
6.62 11.95
12.282.12
Max. 1.5e7 cps.
TIC of –MRM (660 pairs): from sample 65 (mwm-012-m tx 05N)of mwm-17–012–20170908 (Q trap): w ff (turbo spray)
a Time, min
(Figure continued on next page.)
Fig. 3. a Overlap of QC samples on TIC chromatograms in both the positive and negative ionization mode, showing that the retention times for major peaks were stable throughout the whole analysis. b PCA of the QC samples were found to be well clustered.
254Kidney Blood Press Res 2019;44:245–263
Tang et al.: 5-Hydroxyhexanoic in Diabetic Nephropathy
www.karger.com/kbr© 2019 The Author(s). Published by S. Karger AG, BaselDOI: 10.1159/000498962
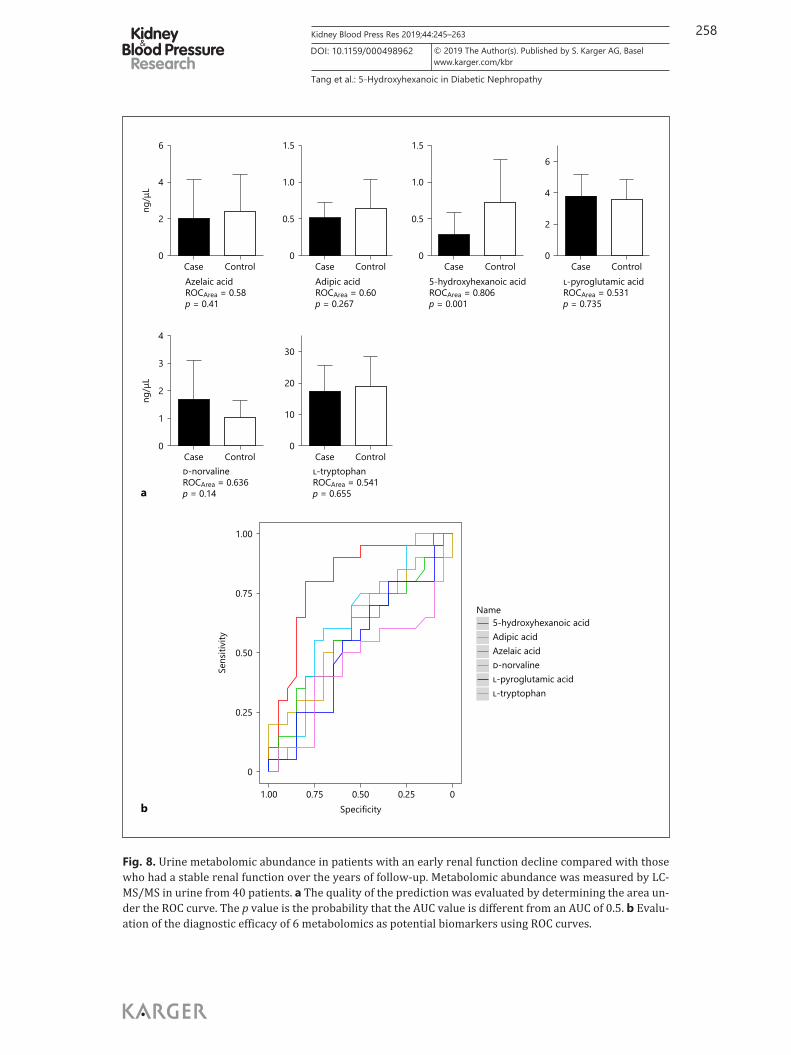
standards. The decreased metabolites (azelaic acid, adipic acid, L-tryptophan, 5-hydroxyhex-anoic acid) or increased metabolites (L-pyroglutamic acid, D-norvaline) were quantified in the validation phase by targeted metabolomics analysis. The levels of metabolites between the two groups are shown in Figure 8a. In this verification study, these data suggest that the abundances of 5-hydroxyhexanoic acid (fold change 0.446 and p = 0.001) was able to discrim-inate between groups, but others were not, with p values > 0.05.
Sensitivity and Specificity of BiomarkersROC analysis was further performed to quantify the diagnostic performance of quanti-
tative metabolites. The AUC was from 0.541 to 0.806 for the DN-specific metabolite biomarker panel. The sensitivity and specificity of the case panel is displayed in Figure 8b. 5-hydroxy-
–10
0
10
20
–10 0 10 20 30PC1 (25.3%)
PC2
(16.
4%)
PCA
GroupNon-progrossorProgrossorQC
b
Table 2. The 6 urine biomarker metabolites to predict loss of renal function
Metabolite ID Ion mode log2 fold change(case mean/control mean)
Change trend of cases vs. controls
p value VIP Class/pathway and metabolites
Azelaic acid MEDN300 Negative –1.278 Down 0.002 8.429 Organic acid and its derivatives
Adipic acid MEDN299 Negative –1.309 Down 0.046 2.785 Organic acid and its derivatives
5-hydroxyhexanoic acid
MEDN432 Negative –2.868 Down 0.028 2.770 Organic acid and its derivatives
L-pyroglutamic acid MEDP023 Positive 0.565 Up 0.004 1.614 Amino acidD-norvaline MEDP004 Positive 0.944 Up 0.030 1.282 Amino acidL-tryptophan MEDN019 Negative –0.627 Down 0.198 2.207 Amino acid
3
255Kidney Blood Press Res 2019;44:245–263
Tang et al.: 5-Hydroxyhexanoic in Diabetic Nephropathy
www.karger.com/kbr© 2019 The Author(s). Published by S. Karger AG, BaselDOI: 10.1159/000498962
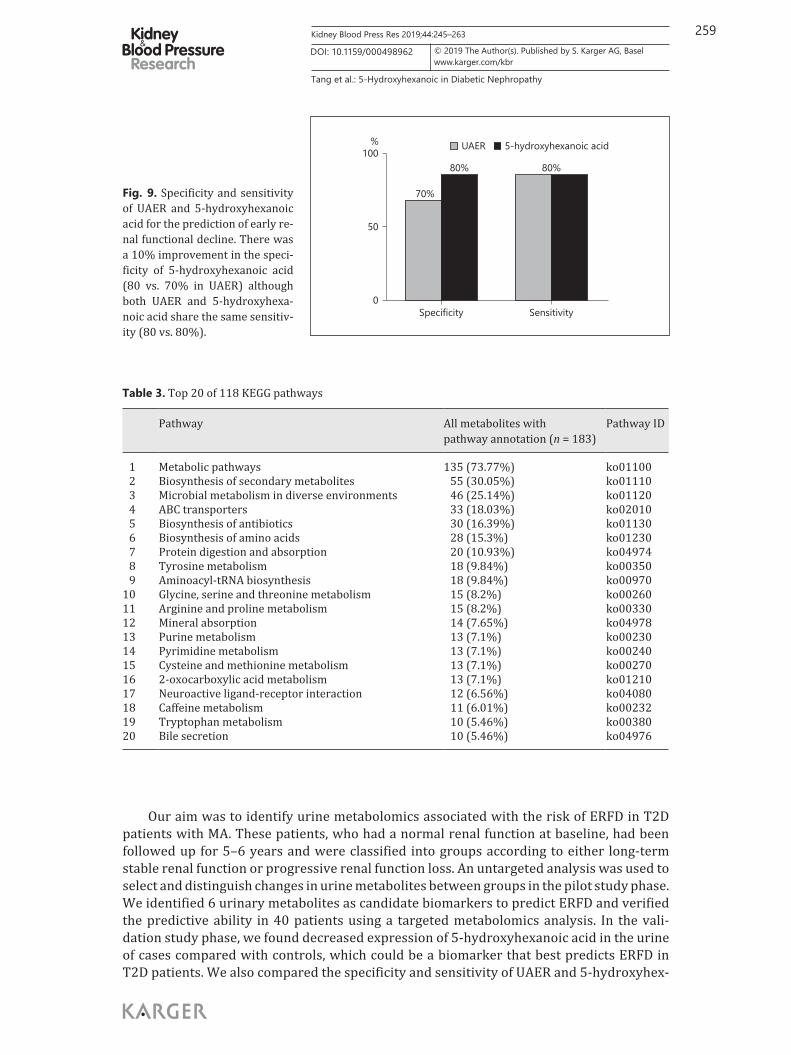
hexanoic acid showed powerful predictive potential for DN of early renal function decline (ROCArea = 0.806, p = 0.001). To explore the specificity and sensitivity of 5-hydroxyhexanoic acid and UAER, which was commonly used as a primary predictor of the ERFD in T2D patients, we made a further comparison (Fig. 9). The specificity of 5-hydroxyhexanoic acid was improved from 70 to 80%, while the sensitivity was unchanged in both UAER and 5-hydroxy-hexanoic acid at 80%.
Discussion
Previous studies in diabetic patients aimed to discover metabolomics in plasma or urine as biomarkers correlated with ERFD [23, 25, 32–34]. Plasma or urine samples were left before the subsequent observation, and then patients were divided into groups for the late progression of
10,000
0
–10,000
PC2
(14.
4%)
PCA
–20,000 0 20,000PC1 (33.5%)
Progressor-8Progressor-5
Progressor-1
Progressor-10
GroupNon-progressorProgressor
Progressor-2
Non-progressor-3
Non-progressor-7
Non-progressor-6Non-progresso
Non-progressor-8Non-progressor-1
Non-progressor-9
–30,000
–20,000
–10,000
0
10,000
20,000
Score (OPLS-DA)
Progressor
Non-progressor
–10,000 –5,000 0 5,000 10,000
o2
10,0005,000
0–5,000
–10,000o1
p1
a
b
Fig. 4. PCA and OPLS-DA score plots of progressors and non-pro-gressors. a Principal components analysis shows obvious separa-tion between the progressor and non-progressor groups. b Multi-variate analysis using OPLS-DA clearly distinguished progressors and non-progressors.
256Kidney Blood Press Res 2019;44:245–263
Tang et al.: 5-Hydroxyhexanoic in Diabetic Nephropathy
www.karger.com/kbr© 2019 The Author(s). Published by S. Karger AG, BaselDOI: 10.1159/000498962
Fig. 5. Comparison of the relative intensity of selected metabolites in patients with renal function decline (progressors) and those with stable renal function (non-progressors). These metabolites were significantly increased or decreased on DN progression at an early stage. These metabolites could potentially serve as biomarkers for progressive DN.
0
1
2
3
Met
abol
ites,
n
Non-progressor vs. progressor
2
3
Up Down
MEDP004
MEDP023
0
0.2
0.4
0.6
0.8
1.0
MEDN300
MEDN299
MEDN432
Prog
ress
or-1
0
Prog
ress
or-8
Prog
ress
or-5
Prog
ress
or-2
Prog
ress
or-1
Non
-pro
gres
sor-
9
Non
-pro
gres
sor-
8
Non
-pro
gres
sor-
7
Non
-pro
gres
sor-
6
Non
-pro
gres
sor-
5
Non
-pro
gres
sor-
3
Non
-pro
gres
sor-
1
a b
Fig. 6. Heat map showing the relative abundance of 5 metabolites from the differential metabolite analysis with a t test p value < 0.05 and VIP ≥1. a Differential expression of metabolite statistics. b Heat map of all dif-ferential metabolites.
ProgressorsNon-progressors
0
200
400
600
800Re
lativ
e in
tens
ityAzelaic acid
ProgressorsNon-progressors
0
100
200
300
400
Rela
tive
inte
nsity
L-pyroglutamic acid
ProgressorsNon-progressors
0200400600800
1,000
Rela
tive
inte
nsity
Adipic acid
ProgressorsNon-progressors
050
100150200250
Rela
tive
inte
nsity
D-norvaline
ProgressorsNon-progressors
0
200
400
600
800
Rela
tive
inte
nsity
5-hydroxyhexanoic acid
ProgressorsNon-progressors
0
500
1,000
1,500
Rela
tive
inte
nsity
L-tryptophan
257Kidney Blood Press Res 2019;44:245–263
Tang et al.: 5-Hydroxyhexanoic in Diabetic Nephropathy
www.karger.com/kbr© 2019 The Author(s). Published by S. Karger AG, BaselDOI: 10.1159/000498962
renal function. The specimens were analyzed to obtain the disease-related biomarkers. Renal failure cannot be completely attributed to the progression of diabetes, especially in the long term; therefore, the ability of the biomarker analysis of urine samples to reflect the development of DN has been doubted. Besides, all of those studies failed to find biomarkers better than UAER. Therefore, we chose a follow-up chart of the cross-sectional urine analysis of T2D patients with MA for this study. In our analysis we used untargeted metabolomics with the ability to uncover novel and potentially relevant metabolites, combined with targeted metabolomics, as commer-cially available standards can be used as calibrants to establish quantitation [35].
Degradation of aromaticcompounds
Glutathione metabolism
Microbial metabolism in diverseenvironments
Metabolic pathways
0.025
0.050
0.075
0.100
0.125
Rich factor
0.25
0.50
0.75
p value
Top 20 of pathway enrichment
Path
way
Metabolite number1
MetabolismGlobal and overview
Amino acid metabolismCarbohydrate metabolism
Metabolism of cofactors and vitaminsMetabolism of other amino acids
Nucleotide metabolismBiosynthesis of other secondary metabolites
Lipid metabolismEnergy metabolism
Genetic information processingTranslation
Folding, sorting and degradationEnvironmental information processing
Membrane transportSignal transduction
Signaling molecules and interactionCellular processes
Cellular communityTransport and catabolism
Organismal systemsDigestive systemNervous system
Endocrine systemSensory system
Circulatory systemExcretory system
Environmental adaptationAging
Immune system
0 31 62 93 124 155Metabolites, n
GEGG pathway annotation
15093
3131
2524
2098
182
3316
12
4
411515
1042211
1
a
b
Fig. 7. a KEGG pathway annota-tion revealed that these metabo-lites were enriched in the amino acid metabolism and digestive system. b The KEGG Orthology (KO) terms of metabolites. The size of nodes shows the gene number, and the rich factor dis-plays the quantity accounted in 318 metabolites. Red indicates a higher significance.
258Kidney Blood Press Res 2019;44:245–263
Tang et al.: 5-Hydroxyhexanoic in Diabetic Nephropathy
www.karger.com/kbr© 2019 The Author(s). Published by S. Karger AG, BaselDOI: 10.1159/000498962
0
2
1
3
4
ng/μ
L
Case ControlD-norvalineROCArea = 0.636p = 0.14
0
2
4
6ng
/μL
Case ControlAzelaic acidROCArea = 0.58p = 0.41
0
0.5
1.0
1.5
Case Control5-hydroxyhexanoic acidROCArea = 0.806p = 0.001
0
2
4
6
Case ControlL-pyroglutamic acidROCArea = 0.531p = 0.735
0
0.5
1.0
1.5
Case ControlAdipic acidROCArea = 0.60p = 0.267
0
10
20
30
Case ControlL-tryptophanROCArea = 0.541p = 0.655
0
0.25
0.50
0.75
1.00
Sens
itivi
ty
1.00 0.75 0.50 0.25 0Specificity
Name5-hydroxyhexanoic acidAdipic acidAzelaic acidD-norvalineL-pyroglutamic acidL-tryptophan
a
b
Fig. 8. Urine metabolomic abundance in patients with an early renal function decline compared with those who had a stable renal function over the years of follow-up. Metabolomic abundance was measured by LC-MS/MS in urine from 40 patients. a The quality of the prediction was evaluated by determining the area un-der the ROC curve. The p value is the probability that the AUC value is different from an AUC of 0.5. b Evalu-ation of the diagnostic efficacy of 6 metabolomics as potential biomarkers using ROC curves.
259Kidney Blood Press Res 2019;44:245–263
Tang et al.: 5-Hydroxyhexanoic in Diabetic Nephropathy
www.karger.com/kbr© 2019 The Author(s). Published by S. Karger AG, BaselDOI: 10.1159/000498962
Our aim was to identify urine metabolomics associated with the risk of ERFD in T2D patients with MA. These patients, who had a normal renal function at baseline, had been followed up for 5–6 years and were classified into groups according to either long-term stable renal function or progressive renal function loss. An untargeted analysis was used to select and distinguish changes in urine metabolites between groups in the pilot study phase. We identified 6 urinary metabolites as candidate biomarkers to predict ERFD and verified the predictive ability in 40 patients using a targeted metabolomics analysis. In the vali-dation study phase, we found decreased expression of 5-hydroxyhexanoic acid in the urine of cases compared with controls, which could be a biomarker that best predicts ERFD in T2D patients. We also compared the specificity and sensitivity of UAER and 5-hydroxyhex-
0
50
100%
Specificity Sensitivity
70%
80% 80%
UAER 5-hydroxyhexanoic acid
Fig. 9. Specificity and sensitivity of UAER and 5-hydroxyhexanoic acid for the prediction of early re-nal functional decline. There was a 10% improvement in the speci-ficity of 5-hydroxyhexanoic acid (80 vs. 70% in UAER) although both UAER and 5-hydroxyhexa-noic acid share the same sensitiv-ity (80 vs. 80%).
Table 3. Top 20 of 118 KEGG pathways
Pathway All metabolites with pathway annotation (n = 183)
Pathway ID
1 Metabolic pathways 135 (73.77%) ko011002 Biosynthesis of secondary metabolites 55 (30.05%) ko011103 Microbial metabolism in diverse environments 46 (25.14%) ko011204 ABC transporters 33 (18.03%) ko020105 Biosynthesis of antibiotics 30 (16.39%) ko011306 Biosynthesis of amino acids 28 (15.3%) ko012307 Protein digestion and absorption 20 (10.93%) ko049748 Tyrosine metabolism 18 (9.84%) ko003509 Aminoacyl-tRNA biosynthesis 18 (9.84%) ko00970
10 Glycine, serine and threonine metabolism 15 (8.2%) ko0026011 Arginine and proline metabolism 15 (8.2%) ko0033012 Mineral absorption 14 (7.65%) ko0497813 Purine metabolism 13 (7.1%) ko0023014 Pyrimidine metabolism 13 (7.1%) ko0024015 Cysteine and methionine metabolism 13 (7.1%) ko0027016 2-oxocarboxylic acid metabolism 13 (7.1%) ko0121017 Neuroactive ligand-receptor interaction 12 (6.56%) ko0408018 Caffeine metabolism 11 (6.01%) ko0023219 Tryptophan metabolism 10 (5.46%) ko0038020 Bile secretion 10 (5.46%) ko04976
260Kidney Blood Press Res 2019;44:245–263
Tang et al.: 5-Hydroxyhexanoic in Diabetic Nephropathy
www.karger.com/kbr© 2019 The Author(s). Published by S. Karger AG, BaselDOI: 10.1159/000498962
anoic acid for prediction of ERFD and observed that 5-hydroxyhexanoic acid was better than UAER as a predictor. This is the first discovery of a candidate marker that can predict ERFD better than UAER. The novel findings of our study may result in better clinical predic-tions of the risk of ERFD in T2D patients with MA, and the identification of who are at risk of early renal damage.
Six of the 318 known urine solutes that were detected as common and stable metabo-lites were significantly associated with the progression of ERFD in untargeted metabo-lomics analysis. The relative intensities of 4 metabolites were decreased in patients who progressed to ERFD (Fig. 5; Table 2). The association of these metabolites in DN has been reported in inflammation pathways, oxidative stress, and progression of the condition [36]. The findings revealed potential novel metabolites associated with the pathological devel-opment of renal function loss. In the targeted metabolomics analysis, the concentrations of azelaic acid, adipic acid, 5-hydroxyhexanoic acid, and L-tryptophan were still decreased, while L-pyroglutamic acid and D-norvaline were elevated in the urine of cases compared with controls. However, the differences in 5 metabolites did not reach statistical signifi-cance, with the exception of 5-hydroxyhexanoic acid (Fig. 8a). The results are promising as 5-hydroxyhexanoic acid was predictive in patients with normal renal function and before the development of early renal decline. As Figure 8b shows, 5-hydroxyhexanoic acid (ROCArea = 0.806, p = 0.001) has a powerful ability to predict ERFD in specificity and sensitivity among the selected metabolites which is even superior to UAER (Fig. 9). All these findings support that decreased levels of 5-hydroxyhexanoic acid may increase the risk of progression to ESRD in T2D patients with MA.
The changed concentrations of azelaic acid and other selected metabolites were asso-ciated with progression to DN, as has been reported in some previous studies. For example, Muthulakshmi and Saravanan [37] found that administration of azelaic acid (80 mg/kg body weight) in T2D C57BL/6J mice could positively restore levels of plasma glucose, insulin, triglycerides, and hepatic and nephritic markers to near normal. Azelaic acid also increased the levels of enzymatic and nonenzymatic antioxidants. The study demonstrated the protective effects of azelaic acid against oxidative stress induced by a high-fat diet in the liver, kidneys, and heart of the mice. Another study observed that impaired fasting glucose of diabetic subjects showed increases in L-pyroglutamic acid. [38]. In our validation study, the 5 metab-olites (azelaic acid, adipic acid, L-tryptophan, L-pyroglutamic acid, and D-norvaline) did not reach statistical significance. This may be attributed to the individual differences and a limited number of patients, and further research needs to be undertaken.
5-hydroxyhexanoic acid is a normal monohydroxy carboxylic acid degradation product of fatty acids with medium chain lengths (particularly hexanoic acid). It has been found to be involved in some diseases. In 1981, 5-hydroxyhexanoic acid was detected for the first time in the urine of diabetic patients with ketoacidosis by gas chromatography-mass spectrometry [39]. One study used a metabonomic method to distinguish the altered urinary metabolics of bipo- lar disorder (BD) subjects and healthy controls to identify and validate urinary metabolite biomarkers for BD. They found that the level of 5-hydroxyhexanoic acid was significantly increased in patients with BD [40]. Similarly, another two studies based on urinary metabolite analysis reported that 5-hydroxyhexanoic acid was identified as a “good” classifier for post-stroke depression, and levels of 5-hydroxyhexanoic acid were significantly decreased in the bladder cancer group [41, 42]. In an animal study, the concentration of 5-hydroxyhexanoic acid was significantly decreased in Ginseng polysaccharide-treated diabetic rats. The study indicated that Ginseng polysaccharide can regulate the metabolism of DNA, organic acids, and steroid hormones [43]. Those studies revealed that 5-hydroxyhexanoic acid plays an important role in the progression of disease. In our analysis, concentrations of 5-hydroxyhexanoic acid in patients with stable renal function were higher than those who had a decline in renal function. This is the
261Kidney Blood Press Res 2019;44:245–263
Tang et al.: 5-Hydroxyhexanoic in Diabetic Nephropathy
www.karger.com/kbr© 2019 The Author(s). Published by S. Karger AG, BaselDOI: 10.1159/000498962
first finding that decreased 5-hydroxyhexanoic acid is associated with the progression of ERFD in T2D patients with MA. Our data also demonstrated that 5-hydroxyhexanoic acid was served as a predictor of ERFD better than UAER in its specificity. A new insight into the metabolism of 5-hydroxyhexanoic acid participating in the pathological process of DN may provide a possible new clinical idea for the prevention of renal function decline by increasing the level of 5-hydroxy-hexanoic acid, such as through 5-hydroxyhexanoic acid supplementation. The potential ability of prediction or treatment using 5-hydroxyhexanoic acid requires further verification.
The strengths and limitations of this study should be considered. Compared to previous case-control studies in T2MD patients, our study is the first follow-up research in T2MD patients with MA who had a normal renal function at baseline and subsequently divided the subjects into two groups. We collected cross-sectional urine samples in which solutes were served as the best metabolites reflecting the progression of pathology. An untargeted analysis of the most comprehensive metabolomics platformed with the broadest spectrum of detected metabolites was used in combination with a targeted metabolomics analysis which can be used to establish accurate quantitation. The limitations of this study include its single-center design and that the groups were small. There were statistically significant levels of 6 metabo-lites between the groups in the pilot study, but 5 of the 6 metabolites had no statistically significant difference between cases and controls in the validation study. 5-hydroxyhexanoic acid was found to be the best predictor of ERFD, but it does not yet have universal pathway database annotations and the traditional pathway analysis has not been discussed. The exploratory findings in our study require further validation through multi-center studies involving larger patient populations.
Conclusion
We have identified 5-hydroxyhexanoic acid of urine metabolites as a potential biomarker correlated with the progression of ERFD in T2D patients with MA. The changed abundance of 5-hydroxyhexanoic acid in subjects who had early renal function loss may reflect a new mech-anism in which the metabolite participated in diabetic microvascular progression. In addition, we also compared the predictive ability of 5-hydroxyhexanoic acid to UAER, and found that 5-hydroxyhexanoic acid was better than UAER, but determining its true predictive ability requires larger patient studies. Ultimately, these findings may provide new therapeutic targets for the progression of DN and serve as a novel predictor of ERFD.
Acknowledgements
This study was funded by research grants (81770714, 81870500, 81470947) from the National Natural Science Foundation of China.
Statement of Ethics
This study (LL20103721) was conducted in accordance with the guidelines proposed in the Declaration of Helsinki after approval by the institutional review board of the Second Xiangya Hospital of Central South University.
262Kidney Blood Press Res 2019;44:245–263
Tang et al.: 5-Hydroxyhexanoic in Diabetic Nephropathy
www.karger.com/kbr© 2019 The Author(s). Published by S. Karger AG, BaselDOI: 10.1159/000498962
References 1 Campion CG, Sanchez-Ferras O, Batchu SN. Potential role of serum and urinary biomarkers in diagnosis and
prognosis of diabetic nephropathy. Can J Kidney Health Dis. 2017 May; 4: 2054358117705371. 2 Betz BB, Jenks SJ, Cronshaw AD, Lamont DJ, Cairns C, Manning JR, et al. Urinary peptidomics in a rodent model
of diabetic nephropathy highlights epidermal growth factor as a biomarker for renal deterioration in patients with type 2 diabetes. Kidney Int. 2016 May; 89(5): 1125–35.
3 Eggers PW. Has the incidence of end-stage renal disease in the USA and other countries stabilized? Curr Opin Nephrol Hypertens. 2011 May; 20(3): 241–5.
4 Viazzi F, Leoncini G, Conti N, Tomolillo C, Giachero G, Vercelli M, et al. Microalbuminuria is a predictor of chronic renal insufficiency in patients without diabetes and with hypertension: the MAGIC study. Clin J Am Soc Nephrol. 2010 Jun; 5(6): 1099–106.
5 Cerasola G, Cottone S, Mulè G. The progressive pathway of microalbuminuria: from early marker of renal damage to strong cardiovascular risk predictor. J Hypertens. 2010 Dec; 28(12): 2357–69.
6 Ninomiya T, Perkovic V, de Galan BE, Zoungas S, Pillai A, Jardine M, et al.; ADVANCE Collaborative Group. Albu-minuria and kidney function independently predict cardiovascular and renal outcomes in diabetes. J Am Soc Nephrol. 2009 Aug; 20(8): 1813–21.
7 Palmer BF. Proteinuria as a therapeutic target in patients with chronic kidney disease. Am J Nephrol. 2007;
27(3): 287–93. 8 Araki S, Haneda M, Koya D, Hidaka H, Sugimoto T, Isono M, et al. Reduction in microalbuminuria as an inte-
grated indicator for renal and cardiovascular risk reduction in patients with type 2 diabetes. Diabetes. 2007 Jun; 56(6): 1727–30.
9 Adler AI, Stevens RJ, Manley SE, Bilous RW, Cull CA, Holman RR; UKPDS GROUP. Development and progression of nephropathy in type 2 diabetes: the United Kingdom Prospective Diabetes Study (UKPDS 64). Kidney Int. 2003 Jan; 63(1): 225–32.
10 Chen C, Wang C, Hu C, Han Y, Zhao L, Zhu X, et al. Normoalbuminuric diabetic kidney disease. Front Med. 2017 Sep; 11(3): 310–8.
11 Perkins BA, Ficociello LH, Roshan B, Warram JH, Krolewski AS. In patients with type 1 diabetes and new-onset microalbuminuria the development of advanced chronic kidney disease may not require progression to proteinuria. Kidney Int. 2010 Jan; 77(1): 57–64.
12 Araki S, Haneda M, Sugimoto T, Isono M, Isshiki K, Kashiwagi A, et al. Factors associated with frequent remission of microalbuminuria in patients with type 2 diabetes. Diabetes. 2005 Oct; 54(10): 2983–7.
13 Perkins BA, Ficociello LH, Ostrander BE, Silva KH, Weinberg J, Warram JH, et al. Microalbuminuria and the risk for early progressive renal function decline in type 1 diabetes. J Am Soc Nephrol. 2007 Apr; 18(4): 1353–61.
14 Perkins BA, Krolewski AS. Early nephropathy in type 1 diabetes: a new perspective on who will and who will not progress. Curr Diab Rep. 2005 Dec; 5(6): 455–63.
15 Liu Z, Liu H, Xiao L, Liu G, Sun L, He L. STC-1 ameliorates renal injury in diabetic nephropathy by inhibiting the expression of BNIP3 through the AMPK/SIRT3 pathway. Lab Invest. 2019 May; 99(5): 684–97.
16 Van JA, Scholey JW, Konvalinka A. Insights into Diabetic Kidney Disease Using Urinary Proteomics and Bioin-formatics. J Am Soc Nephrol. 2017 Apr; 28(4): 1050–61.
17 Yang S, Han Y, Liu J, Song P, Xu X, Zhao L, et al. Mitochondria: A Novel Therapeutic Target in Diabetic Nephropathy. Curr Med Chem. 2017; 24(29): 3185–202.
18 Gao P, Xu B, Song P, Zhu X, Yuan S, Kanwar YS, et al. The Kidney Specific Protein myo-Inositol Oxygenase, a Potential Biomarker for Diabetic Nephropathy. Kidney Blood Press Res. 2018; 43(6): 1772–85.
19 Guo Y, Guo LN, Zhu JF, Tang CY, Feng YZ, Zhou HD. Associations of Salivary BPIFA1 Protein in Chronic Peri-odontitis Patients with Type 2 Diabetes Mellitus. Int J Endocrinol. 2017; 2017: 1087017.
Disclosure Statement
The authors have no conflicts of interest to declare.
Author Contributions
X.T., H.L., and L.H. contributed to research conception and study design. X.T., J.Y., and D.L. acquired and analyzed the data. X.T. and M.X. prepared the figures. X.T. drafted the manu-script. H.L. and L.H. supervised with and revised the manuscript. All authors read and approved final version of the manuscript.
263Kidney Blood Press Res 2019;44:245–263
Tang et al.: 5-Hydroxyhexanoic in Diabetic Nephropathy
www.karger.com/kbr© 2019 The Author(s). Published by S. Karger AG, BaselDOI: 10.1159/000498962
20 Chen W, Gong L, Guo Z, Wang W, Zhang H, Liu X, et al. A novel integrated method for large-scale detection, identification, and quantification of widely targeted metabolites: application in the study of rice metabo-lomics. Mol Plant. 2013 Nov; 6(6): 1769–80.
21 Solini A, Manca ML, Penno G, Pugliese G, Cobb JE, Ferrannini E. Prediction of Declining Renal Function and Albuminuria in Patients With Type 2 Diabetes by Metabolomics. J Clin Endocrinol Metab. 2016 Feb; 101(2):
696–704.22 Pena MJ, Lambers Heerspink HJ, Hellemons ME, Friedrich T, Dallmann G, Lajer M, et al. Urine and plasma
metabolites predict the development of diabetic nephropathy in individuals with Type 2 diabetes mellitus. Diabet Med. 2014 Sep; 31(9): 1138–47.
23 van der Kloet FM, Tempels FW, Ismail N, van der Heijden R, Kasper PT, Rojas-Cherto M, et al. Discovery of early-stage biomarkers for diabetic kidney disease using ms-based metabolomics (FinnDiane study). Metabo-lomics. 2012 Feb; 8(1): 109–19.
24 Zhang J, Yan L, Chen W, Lin L, Song X, Yan X, et al. Metabonomics research of diabetic nephropathy and type 2 diabetes mellitus based on UPLC-oaTOF-MS system. Anal Chim Acta. 2009 Sep; 650(1): 16–22.
25 Niewczas MA, Sirich TL, Mathew AV, Skupien J, Mohney RP, Warram JH, et al. Uremic solutes and risk of end-stage renal disease in type 2 diabetes: metabolomic study. Kidney Int. 2014 May; 85(5): 1214–24.
26 Wishart DS, Jewison T, Guo AC, Wilson M, Knox C, Liu Y, et al. HMDB 3.0—The Human Metabolome Database in 2013. Nucleic Acids Res. 2013 Jan; 41(Database issue):D801–7.
27 Zhu ZJ, Schultz AW, Wang J, Johnson CH, Yannone SM, Patti GJ, et al. Liquid chromatography quadrupole time-of-flight mass spectrometry characterization of metabolites guided by the METLIN database. Nat Protoc. 2013 Mar; 8(3): 451–60.
28 Kanehisa M, Araki M, Goto S, Hattori M, Hirakawa M, Itoh M, et al. KEGG for linking genomes to life and the environment. Nucleic Acids Res. 2008 Jan; 36(Database issue):D480–4.
29 Manjarrez G, Vazquez F, Delgado M, Herrera R, Hernandez J. A functional disturbance in the auditory cortex related to a low serotonergic neurotransmission in women with type 2 diabetes. Neuroendocrinology. 2007;
86(4): 289–94.30 Mondanelli G, Bianchi R, Pallotta MT, Orabona C, Albini E, Iacono A, et al. A Relay Pathway between Arginine
and Tryptophan Metabolism Confers Immunosuppressive Properties on Dendritic Cells. Immunity. 2017 Feb;
46(2): 233–44.31 Murakoshi M, Kuwabara H, Nagasaki M, Xiong YM, Reagan JD, Maeda H, et al. Discovery and pharmacological
effects of a novel GPR142 antagonist. J Recept Signal Transduct Res. 2017 Jun; 37(3): 290–6.32 Pena MJ, de Zeeuw D, Mischak H, Jankowski J, Oberbauer R, Woloszczuk W, et al. Prognostic clinical and
molecular biomarkers of renal disease in type 2 diabetes. Nephrol Dial Transplant. 2015 Aug; 30 Suppl 4:iv86–95.
33 Sharma K, Karl B, Mathew AV, Gangoiti JA, Wassel CL, Saito R, et al. Metabolomics reveals signature of mito-chondrial dysfunction in diabetic kidney disease. J Am Soc Nephrol. 2013 Nov; 24(11): 1901–12.
34 Liu J, Semiz S, van der Lee SJ, van der Spek A, Verhoeven A, van Klinken JB, et al. Metabolomics based markers predict type 2 diabetes in a 14-year follow-up study. Metabolomics. 2017; 13(9): 104.
35 Filla LA, Edwards JL. Metabolomics in diabetic complications. Mol Biosyst. 2016 Apr; 12(4): 1090–105.36 Uhlhaas S, Lange H. Striatal deficiency of L-pyroglutamic acid in Huntington’s disease is accompanied by
increased plasma levels. Brain Res. 1988 Aug; 457(1): 196–9.37 Muthulakshmi S, Saravanan R. Protective effects of azelaic acid against high-fat diet-induced oxidative stress
in liver, kidney and heart of C57BL/6J mice. Mol Cell Biochem. 2013 May; 377(1-2): 23–33.38 Kim M, Kim M, Han JY, Lee SH, Jee SH, Lee JH. The metabolites in peripheral blood mononuclear cells showed
greater differences between patients with impaired fasting glucose or type 2 diabetes and healthy controls than those in plasma. Diab Vasc Dis Res. 2017 Mar; 14(2): 130–8.
39 Niwa T, Meada K, Ohki T, Saito A, Tsuchida I. Gas chromatographic-mass spectrometric profile of organic acids in urine and serum of diabetic ketotic patients. J Chromatogr A. 1981 Sep; 225(1): 1–8.
40 Xu XJ, Zheng P, Ren GP, Liu ML, Mu J, Guo J, et al. 2,4-Dihydroxypyrimidine is a potential urinary metabolite biomarker for diagnosing bipolar disorder. Mol Biosyst. 2014 Apr; 10(4): 813–9.
41 Zhang W, Zhang XA. A Novel Urinary Metabolite Signature for Non-invasive Post-stroke Depression Diagnosis. Cell Biochem Biophys. 2015 Jul; 72(3): 661–7.
42 Zhou Y, Song R, Ma C, Zhou L, Liu X, Yin P, et al. Discovery and validation of potential urinary biomarkers for bladder cancer diagnosis using a pseudotargeted GC-MS metabolomics method. Oncotarget. 2017 Mar; 8(13):
20719–28.43 Niu J, Pi Z, Yue H, Wang Y, Yu Q, Liu S. Effect of ginseng polysaccharide on the urinary excretion of type 2
diabetic rats studied by liquid chromatography-mass spectrometry. J Chromatogr B Analyt Technol Biomed Life Sci. 2012 Oct; 907: 7–12.
Copyright © 2022 FDOKUMEN