A 200 year sub-annual record of sulfate in West Antarctica, from 16 ice cores
29
Daniel Dixon - Paper Number 39A154 – DRAFT TO ANNALS OF GLACIOLOGY 1 A 200-year sub-annual record of sulfate in West Antarctica, from 16 ice cores Daniel DIXON, 1 Paul A. MAYEWSKI, 1 Susan KASPARI, 1 Sharon SNEED, 1 Mike HANDLEY 1 1 Climate Change Institute, University of Maine, Orono, ME 04469 USA E-mail: [email protected] Abstract Sixteen high-resolution ice core records from West Antarctica and South Pole are used to examine the spatial and temporal distribution of sulfate for the last 200 years. The preservation of seasonal layers throughout the length of each record results in a dating accuracy of better than one year based on known global scale volcanic events. A dual transport source for West Antarctic sea salt (ss)SO 4 2- and excess (xs)SO 4 2- is observed: lower tropospheric for areas below 1000m elevation and mid-upper tropospheric/stratospheric for areas located above 1000m. Our xsSO 4 2- records with volcanic peaks removed do not display any evidence of an anthropogenic impact on West Antarctic SO 4 2- concentrations but do reveal that a major climate transition takes place over West Antarctica at ~1940. Global-scale volcanic eruptions appear as significant peaks in the robust spline residual xsSO 4 2- records from sites located above 1000m elevation but do not appear in the residual records from sites located below 1000m. Introduction Antarctica’s role in the global climate system is both pivotal and complex. West Antarctica in particular is the most dynamic area of the continent both atmospherically and glaciologically (Cullather and others, 1996; Bindschadler, 1998). It is impacted by several major atmospheric weather systems, the Amundsen Sea Low, and to a lesser degree the Weddell Sea Low, and the Davis Sea Low. These large
-
Upload
independent -
Category
Documents
-
view
3 -
download
0
Transcript of A 200 year sub-annual record of sulfate in West Antarctica, from 16 ice cores

Daniel Dixon - Paper Number 39A154 – DRAFT TO ANNALS OF GLACIOLOGY 1
A 200-year sub-annual record of sulfate in West Antarctica,from 16 ice cores
Daniel DIXON,1 Paul A. MAYEWSKI,1 Susan KASPARI,1
Sharon SNEED,1 Mike HANDLEY1
1Climate Change Institute, University of Maine, Orono, ME 04469 USAE-mail: [email protected]
Abstract
Sixteen high-resolution ice core records from West Antarctica and South Pole are used to examine the
spatial and temporal distribution of sulfate for the last 200 years. The preservation of seasonal layers
throughout the length of each record results in a dating accuracy of better than one year based on known
global scale volcanic events. A dual transport source for West Antarctic sea salt (ss)SO42- and excess
(xs)SO42- is observed: lower tropospheric for areas below 1000m elevation and mid-upper
tropospheric/stratospheric for areas located above 1000m. Our xsSO42- records with volcanic peaks
removed do not display any evidence of an anthropogenic impact on West Antarctic SO42- concentrations
but do reveal that a major climate transition takes place over West Antarctica at ~1940. Global-scale
volcanic eruptions appear as significant peaks in the robust spline residual xsSO42- records from sites
located above 1000m elevation but do not appear in the residual records from sites located below 1000m.
Introduction
Antarctica’s role in the global climate system is both pivotal and complex. West Antarctica in
particular is the most dynamic area of the continent both atmospherically and glaciologically (Cullather and
others, 1996; Bindschadler, 1998). It is impacted by several major atmospheric weather systems, the
Amundsen Sea Low, and to a lesser degree the Weddell Sea Low, and the Davis Sea Low. These large

Daniel Dixon - Paper Number 39A154 – DRAFT TO ANNALS OF GLACIOLOGY 2
atmospheric low-pressure systems are the primary transport mechanisms for moisture and aerosols to the
West Antarctic Ice Sheet.
Instrumental climate records are relatively sparse over the Southern Hemisphere and extend back
<100 years. Over Antarctica such records extend back only a few decades. Glaciochemical proxy data can
extend the paleoclimate record back hundreds to thousands of years and also provide a unique resource for
examining changes in the sources, pathways, and distribution of chemical species in the atmosphere
through time (Mayewski and others, 1993). This paper focuses on the sulfate (SO42-) time series available
from a series of 16 ice cores collected over West Antarctica.
Sulfate aerosols play a significant role in the heat budget of the global atmosphere, mainly through
the scattering of incoming solar radiation and through indirect effects involving clouds (Charlson and
others, 1990). In addition to anthropogenic emissions, sulfur is released into the atmosphere from a variety
of natural sources including sea salt, continental dust, volcanic eruptions, the terrestrial biosphere, and the
marine biosphere.
Major volcanic events such as the eruption of Mount Pinatubo in 1991 can inject large volumes of
sulfur gases (H2S, SO2), ash, dust, and crustal material directly into the stratosphere. Most large volcanic
eruptions (such as Krakatau 1883 and Agung 1963) significantly increase stratospheric SO42-
concentrations for at least 1-2 years after the event. Occasionally, an exceptionally large eruption, such as
Tambora, will increase atmospheric SO42- concentrations for 3-4 years (Self and others, 1981). Large
volcanic eruptions significantly affect stratospheric chemistry, inducing a higher catalytic destruction rate
of ozone resulting in enhanced levels of UV-B radiation at the Earth’s surface (Berresheim and others,
1995).
Antarctica is an ideal place to study natural atmospheric SO42- variability due to its isolated
location, the fact that Antarctic precipitation is an excellent repository for the deposition of soluble and
insoluble chemical species, and its remoteness from major anthropogenic SO42- sources that can confound
the investigation of natural variability over more populated regions (Shaw, 1982; Legrand and Mayewski,
1997). The primary types of SO42- in Antarctic aerosols are sea salt (ss) SO4
2- and excess (xs) SO42-, the
latter composed predominantly of marine biogenic emissions, volcanic emissions (Delmas, 1982; Legrand,
1997) and an as yet either non-existent or undetermined contribution from anthropogenic activity. Marine

Daniel Dixon - Paper Number 39A154 – DRAFT TO ANNALS OF GLACIOLOGY 3
biogenic emissions dominate the overall sulfur budget in the Southern Hemisphere (Bates and others, 1992;
Legrand and Mayewski, 1997).
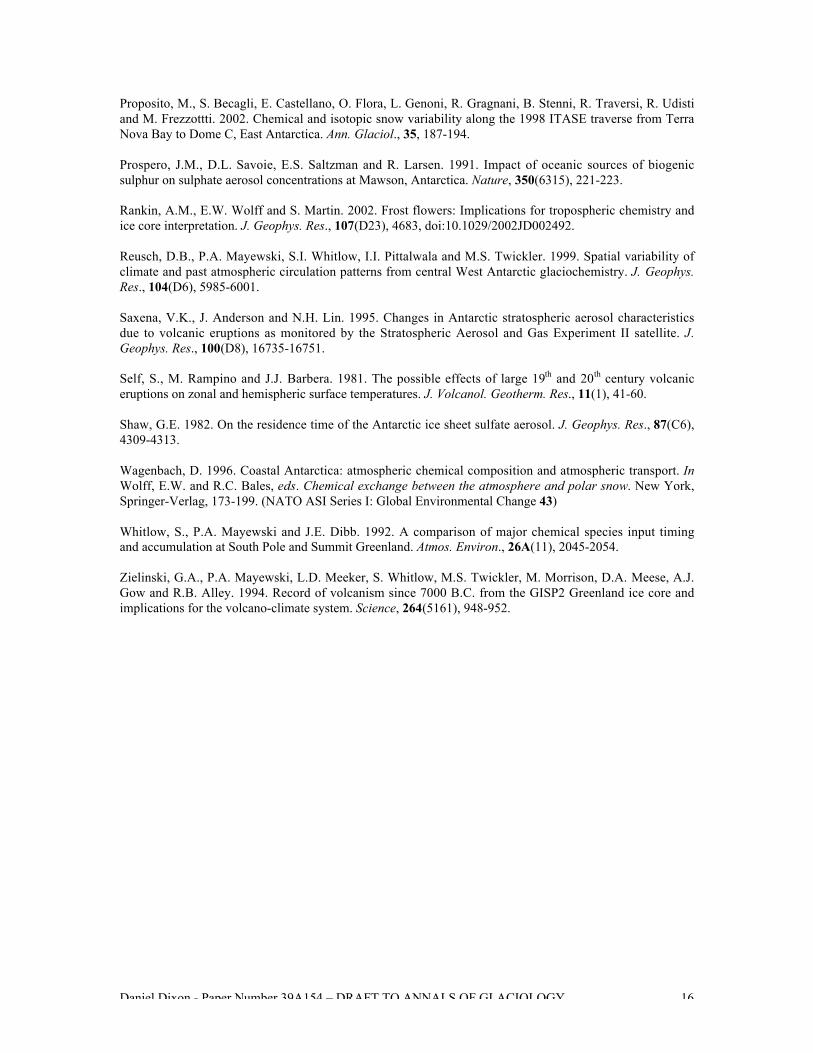
In this study sixteen sub-annually resolved, continuously sampled, multivariate ice core records
(fifteen from West Antarctica and one from South Pole – Figure 1) are used to investigate ice core SO42-
concentrations over West Antarctica. The sixteen ice cores capture the sub-annual variability in Antarctic
SO42- loading over the period 1487-2002 with a ~200-year overlap (1799-1992) for six of the cores, a 101-
year overlap (1891-1992) for eleven of the cores and a 50-year overlap (1952-1992) for all cores except 01-
6 (Table 1).
Each ice core SO42- time series is separated into its primary constituents, seasalt (ss)SO4
2- and
excess (xs)SO42-, from which the spatial and temporal variation of these fractions is investigated for the
period of the last 200 years. The methods used for separating ss from xs are discussed later. Volcanic peaks
are extracted from the xsSO42- time series by calculating the residuals from a robust spline smoothing of the
raw xsSO42- data following the technique used by Zielinski and others (1994). Several well-documented
volcanic events are detected in each xsSO42- series and these are used to reinforce the identification of
annual layer dating by providing absolute depth-age horizons.
The xsSO42- remaining after removal of the volcanic peaks is the robust spline-smoothed xsSO4
2-.
This remaining xsSO42- (rxsSO4
2-) is assumed to be a mixture of total marine biogenic SO42- and
stratospheric background SO42-. The stratospheric background SO4
2- is potentially composed of non-
explosive volcanic SO42-, an admixture of sources that reside in polar stratospheric clouds (PSC), and
continental SO42- sources such as anthropogenic emissions and dust.
The Antarctic Atmosphere and SO42- Aerosols
Throughout the year Antarctic coastal and low elevation areas are strongly influenced by lower
tropospheric air masses compared to higher elevation interior areas. The influence of mid-upper
tropospheric and stratospheric air masses on coastal sites is minor (Minikin and others, 1998; Legrand and
Wagenbach, 1999). The sea salt fraction of the total SO42- budget is large at coastal and low elevation sites,
contributing over ~25% to sites such as Siple Dome (Table 1). Several studies have shown that xsSO42-
concentrations and deposition timing are similar from site to site around the Antarctic coastline (Prospero

Daniel Dixon - Paper Number 39A154 – DRAFT TO ANNALS OF GLACIOLOGY 4
and others, 1991; Legrand and Pasteur, 1998; Minikin and others, 1998; Legrand and Wagenbach, 1999).
This similarity implies that xsSO42- concentrations at coastal Antarctic sites are controlled by large-scale
processes related to both the distribution of sulfur sources in the Southern Ocean and the atmospheric
mixing and transport patterns (Prospero and others, 1991). Coastal xsSO42- concentrations are influenced
throughout the year by long-range transport of marine biogenic emissions from mid-latitude sources located
at 50°-60°S. During the summer months these same coastal sites are inundated by xsSO42- from marine
biogenic sources located south of 60°S (Minikin and others, 1998). Concentrations of xsSO42- at coastal
sites exhibit a well-defined peak from November to January. This summer xsSO42- peak corresponds to the
breakup of the Antarctic sea ice south of 60°S and a subsequent enrichment of chlorophyll concentrations
(Minikin and others, 1998). The marine biogenic xsSO42- component accounts for roughly two thirds of the
winter and over 90% of the summer coastal xsSO42- concentrations (Minikin and others, 1998). The
remaining percentage of winter and summer coastal xsSO42- comes from sources such as long-range
transport from continental areas and sedimentation from the stratospheric reservoir.
High-elevation areas such as inland West Antarctica, South Pole, and the Polar Plateau also
receive SO42- from a variety of sources. The ssSO4
2- fraction peaks during the winter/spring transition
months when intense cyclonic activity and intrusions of lower tropospheric marine air masses are common
(Whitlow and others, 1992; Legrand and others, 1992; Hogan, 1997). The oceans surrounding Antarctica
are ice covered during the winter/spring transition. Therefore, a low/mid latitude source is proposed for the
ssSO42- (Prospero and others, 1991). By the time lower tropospheric parcels of air reach the Polar Plateau
they are severely depleted of heat, moisture, and aerosols due to the long distances traveled (Hogan and
others, 1982; Proposito, 2002). As a result, ssSO42- accounts for <5% of the total SO4
2- budget on the Polar
Plateau during the winter/spring and <1% during the summer (Harder and others, 2000; Isaksson and
others, 2001).
Mid-upper tropospheric air masses carry xsSO42- aerosols emitted primarily from low-mid latitude
marine biogenic productivity sources (Shaw, 1982; Legrand and others, 1992; Minikin and others, 1998) as
well as episodic xsSO42- input from volcanic eruptions (Legrand and Wagenbach, 1999). The SO4
2-
contained in these mid-upper tropospheric air masses dominates the summer SO42- budget of high-elevation
Antarctic areas, such as inland West Antarctica, South Pole and the interior portions of the Polar Plateau

Daniel Dixon - Paper Number 39A154 – DRAFT TO ANNALS OF GLACIOLOGY 5
(Delmas and Boutron, 1978; Delmas, 1982; Kreutz and Mayewski, 1999; Harder and others, 2000;
Isaksson and others, 2001).
High-elevation Antarctic areas are also impacted by the stratospheric SO42- layer. The
stratospheric contribution of SO42- is generally assumed to be weak (Legrand, 1997; Bergin and others,
1998) except after global scale volcanic eruptions (Legrand and Delmas, 1987; Dibb and Whitlow, 1996).
The SO42- aerosols in the stratosphere sink and mix downward into the troposphere. The slow
sedimentation of SO42- from the stratosphere is periodically enhanced by disruptions to the tropopause that
often occur during the spring breakup of the polar vortex (Saxena and others, 1995).
Methodology
Of the sixteen cores used in this study, eight have been previously reported. The Siple Dome core
(SDM94) and the three Ross Ice Drainage System cores (RIDS-A, -B, and –C) were collected by a
University of New Hampshire team in 1994 and 1995 respectively (Mayewski and others, 1995; Kreutz and
others, 1996; 1999; 2000). The South Pole core (SP95) was collected by the Polar Ice Coring Office
(PICO) in the designated clean air sector, ~1.5km upwind from South Pole Station in 1995 (Battle and
others, 1996; Meyerson and others, 2002). The Central West Antarctic cores (CWA-A and –D) were
collected during the 1994-95 field season by a University of Wisconsin team, and the results are reported
by Reusch and others, (1999). The Up-C ice core was collected during the 1995-96 field season by PICO
for Pennsylvania State University.
The eight new cores used in this study were drilled during the U.S. ITASE West Antarctic
traverses of 1999-2001 and analyzed at sub-annual, continuous resolution (Table 1). The samples were
melted using the University of Maine continuous melter system yielding, for this study, an average
resolution of ~50 samples per meter. This high sampling resolution captures the clear seasonal signal that is
present in each ion time series (Figure 2). All samples were examined for their soluble major ion content
(Na+, K+, Mg2+, Ca2+, Cl-, NO3-, SO4
2-). Each was analyzed using a Dionex® DX-500 ion chromatograph
coupled to a Gilson® autosampler. To determine anion (Cl-, SO42- and NO3
-) concentrations the
chromatograph was set up with an AS-11 column with 6 mM NaOH eluent. For cation (Na+, Ca2+, Mg2+,

Daniel Dixon - Paper Number 39A154 – DRAFT TO ANNALS OF GLACIOLOGY 6
and K+) concentrations a CS-12a column with 25 mM MSA eluent was used. All ion concentrations are
determined with an accuracy of better than 0.1 ppb.
The 1999-2001 cores are annually dated by matching seasonal peaks from each of the ion time
series (Figure 2). A ‘core-chemistry’ year is defined by a winter-spring peak in Na+, K+, Mg2+, Ca2+, and Cl-
combined with spring-summer peaks in both NO3- and xsSO4
2- in accord with the seasonal timing identified
by previous research (e.g. Whitlow and others, 1992; Wagenbach, 1996; Legrand and Mayewski, 1997;
Kreutz and Mayewski, 1999). Counting the seasonal layers down to absolute depth-age horizons (such as
the Tambora 1815 volcanic event) demonstrates that each year is preserved in the sub-annual records of
each core (Figure 3) and that lower resolution records cannot be used to accurately date volcanic events.
For this reason, only the high resolution portion of each ice core record is used in this study. Based on
several well-documented global-scale volcanic depth-age horizons, a dating accuracy of better than one
year between known volcanic events is achieved for each SO42- record. The ssSO4
2- fraction is calculated by
applying a standard seawater ratio of 30.61(Na+), 1.1(K+), 3.69(Mg2+), 1.16(Ca2+), 55.04(Cl-), and
7.68(SO42-) to the ion concentrations in each sample (Holland, 1978). The concentration values are reduced
incrementally according to this ratio until a value of zero is reached in one of the six ion concentrations.
The ion which reaches zero concentration first is considered to be the conservative ion for that sample and
the concentration values for the other five ions are recorded. These become the excess (xs) concentrations
for that sample. This technique, from O’Brien and others (1995), resulted in Na+ being the conservative ion
for >90% of the samples in each core in this study. Recent studies have noted the effect of frost flowers on
the ss fraction of ice core chemistry. Frost flowers are depleted in SO42- relative to Na+ and this produces a
ssSO42- value which is slightly higher than it should be for sites near the coast (Rankin and others, 2002).
At this time the magnitude of the fractionation effect is not constrained sufficiently for corrections to be
made to our suite of cores.
In order to examine the spatial pattern of ss and xsSO42-, mean concentrations from 1891-1991
(apart from core 01-6 which only has a 23-year record) are plotted vs. site elevation, straight line distance
from the nearest open water, and mean annual accumulation rate from 1891-1991 (Figure 4). The reason
for averaging over this time period is that any variability at lesser timescales will be averaged out. Similar
plots were constructed using ss and xsSO42- concentrations averaged from 1891-1940 and 1940-1991 to see

Daniel Dixon - Paper Number 39A154 – DRAFT TO ANNALS OF GLACIOLOGY 7
if mean values from these different time periods affected the results. The values, although slightly different,
retained their same trends with respect to elevation, straight-line distance from the nearest open water, and
mean annual accumulation rate. The temporal pattern of ssSO42- is examined by plotting the mean annual
concentrations vs. time for each core (Figure 5). A five-year running average is superimposed over this
annual data to highlight any long term trends. EOF analysis is used on the annual ssSO42- and xsSO4
2-
concentrations for the years 1891-1991 and 1939-1991 to see if any site to site associations exist in the ice
core records. These two time periods are used for the EOF calculations because the former represents the
longest period of overlap between 10 of the ice core records and the latter represents the longest period of
overlap between 13 of the records (the record from 99-1 was not used in the EOF analysis because of data
gaps).
Volcanic peaks are first identified from the xsSO42- data using a robust spline. A robust spline has
the advantage over most smoothing functions because it is not affected by large outliers (such as volcanic
peaks). The robust spline tool outputs two separate time series which, when combined make up the original
series. One of these time series is the robust spline-smoothed series and the other is the robust spline
residuals (peaks). The amount of smoothing applied to each xsSO42- series is between 80-90% as this value
provides the best approximation of the mean non-volcanic background concentrations beneath large
volcanic spikes compared to adjacent years without volcanic SO42-.
The first step of the robust spline technique is to average the raw xsSO42- data to annual resolution.
The annual average calculation incorporates the raw background xsSO42- concentrations into the annual
values. Thus, a large volcanic event that manifests as a significant rise in background xsSO42-
concentrations will be recognized by the robust spline. The robust spline function is applied to the annually
averaged xsSO42- time series and the robust spline-smoothed series and associated xsSO4
2- residuals are
extracted. The mean residual xsSO42- concentration is calculated from the positive post-1825 xsSO4
2-
residual values (this prevents the large Tambora volcanic xsSO42- signal from causing an anomalously high
mean residual xsSO42- value). The mean + 1_ and mean + 2_ residual xsSO4
2- values are used to isolate the
larger peaks from the xsSO42- residuals. Each residual xsSO4
2- peak greater than the mean + 2_ value
represents a strong volcanic signal and each residual xsSO42- peak greater than the mean + 1_ value
Daniel Dixon - Paper Number 39A154 – DRAFT TO ANNALS OF GLACIOLOGY 8
represents a probable volcanic signal (hereafter referred to as 1_ and 2_ peaks). The 1_ and 2_ peaks are
plotted on the same time axis for each core (Figure 6).
As it is not currently possible to unambiguously separate the total marine biogenic and
background stratospheric rxsSO42- components, the rxsSO4
2- time series for each core is used to examine the
long term trends in these two components over the last 200 years (Figure 7). EOF analysis is used to
determine if any associations exist between the rxsSO42- records from 1891-1991 and from 1939-1991.
Results and Discussion
Ion Concentrations and Accumulation Rate
Previous research reveals no significant correlations between snow ion concentration and
accumulation rate (e.g. Mulvaney and Wolff, 1994; Kreutz and Mayewski, 1999; Kreutz and others, 2000).
This suggests that any dilution effects which do exist are offset by additional inputs such as dry and fog
deposition (Bergin and others, 1995; Kreutz and others, 2000). Varying wet deposition scavenging ratios
can further confuse these effects. Empirical Orthogonal Function analyses (EOF) of the mean annual ion
concentrations and mean annual accumulations for each U.S. ITASE core resulted in weak correlations for
most cores. The mean annual values of accumulation were used because this was the best resolution
achievable for accumulation rate. The correlations between annual accumulation rate and SO42- are
inconsistent and highly variable from site to site. The associations range from almost zero to <50%. These
results suggest that although some portion of the SO42- is being deposited by wet deposition, another
portion is deposited without being associated with wet precipitation. Because the dry deposition velocity
and wet scavenging ratio for SO42- in West Antarctica are not well constrained and the fact that there is no
consistent association between ion concentration and accumulation rate, flux corrections for accumulation
were not applied.
Sea Salt SO42-
In Figure 4a the mean ssSO42- concentrations for sites located above 1000m elevation (Figure 1)
are seen to display a relatively consistent range of values (~4-7 ppb) apart from site 99-1 which has a mean
ssSO42- concentration of ~11 ppb. The high mean ssSO4
2- value observed at site 99-1 may be due to

Daniel Dixon - Paper Number 39A154 – DRAFT TO ANNALS OF GLACIOLOGY 9
enhanced lower tropospheric circulation near this site resulting in stronger advection of marine air masses
to the area located over and to the east of the Ross Ice Shelf (Kreutz and Mayewski, 1999). Sites located
below 1000m elevation (SDM-94, Up-C, and CWA-A) have mean ssSO42- concentrations of ~12-30 ppb
and they are located to the west of site 99-1. The South Pole site has a very low mean ssSO42- concentration
of ~3 ppb.
Comparison between concentrations of ssSO42-, annual accumulation and distance from the coast
(Figure 4b, c) does not immediately reveal any clear trends, but if the sites below 1000m elevation, site 99-
1 and the South Pole site are ignored, remaining sites display relatively similar ssSO42- concentration values
(~4-7 ppb). These results suggest that two distinct depositional regimes occur over West Antarctica. One
affects sites above 1000m elevation and the other affects sites below 1000m elevation. This supports
previous findings of Kreutz and Mayewski (1999) that lower tropospheric circulation is enhanced in the
SDM-94 vicinity because of stronger advection of marine air masses to this area. The most likely aerosol
source for the low elevation sites to the east of the Ross Ice Shelf is the Ross Sea.
Inspection of the annual ssSO42- concentrations reveals no significant long-term trends (Figure 5).
However, sites with the highest concentrations display the greatest concentration variability. An EOF
(Table 2a) performed on ten cores with annual ssSO42- values spanning the years 1891-1991 reveals a
relatively strong association (EOF 1, 20% total variance and 21%-46% variance of each core ) of SP-95
with other sites located above 1000m elevation apart from site 01-5 (Table 2a). This suggests that South
Pole receives a significant fraction of its ssSO42- aerosols from the same air masses that supply West
Antarctic sites located above 1000m elevation. Statistical associations also occur between sites 01-5 and
SDM-94, for example, in Table 2a EOF 4 (10% total variance, 32% and 44% variance of each core) these
two sites are positively correlated and in Table 2a EOF 6 (9% total variance, 40% and 23% variance of
each core) they are negatively correlated. This positive-negative association may be related to findings by
Bromwich and others (2003) who noted that the ENSO phenomena causes a pronounced dipole structure
over the Ross Ice Shelf-Marie Byrd Land area and over the Weddell Sea-Filchner/Ronne Ice Shelf. The
dipole structure is observed in surface temperatures, meridional winds, cloud fraction, and precipitation. An
EOF of annual ssSO42- concentrations from thirteen cores spanning the years 1939-1991 yielded similar
results (Table 2b) between SP-95 and other sites located above 1000m elevation (EOF 1, 19% total
Daniel Dixon - Paper Number 39A154 – DRAFT TO ANNALS OF GLACIOLOGY 10
variance and 12%-55% variance of each core). SDM-94 also displays similar positive-negative associations
with site 01-5 (EOF 2, 12% total variance, 37% and 16% variance of each core. EOF 9, 6% total variance,
18% and 30% variance of each core). The similarity between these two EOFs implies that the ssSO42-
deposition has remained relatively constant over West Antarctica for at least the last century.
Excess SO42-
The xsSO42- signals for the ice core records in this study are more complex than ssSO4
2- signals
because the former have multiple sources. The location of a particular site with respect to physical
parameters such as elevation and distance inland is critical to deciphering the xsSO42- signal. Examination
of the data in figure 4d reveals that xsSO42- concentrations decrease as elevation increases to approximately
1700m above sea level. Above this elevation the decreasing trend in xsSO42- concentration switches and as
elevation increases xsSO42- concentrations rise, although not as sharply as they decrease from sea level.
This relationship illustrates the effects of multiple xsSO42- sources, local biogenic SO4
2- near the coast, and
mid-upper tropospheric/stratospheric SO42- input to higher elevation areas.
Two xsSO42- EOFs (Table 3a, b) demonstrate the separation between sites located above and
below 1000m elevation (both EOF 1, 29% total variance and 16%-69% variance of each core located above
1000m, 0%-5% for cores located below 1000m) suggestive of two separate source regions or transport
pathways supplying xsSO42- to West Antarctica. All the core sites located above 1000m elevation exhibit a
decrease in xsSO42- concentrations as accumulation increases (Figure 4e). However, this only occurs up to a
threshold annual accumulation value of 20-24cm H2O. Sites with annual accumulation values greater than
this threshold do not display any significant trends in xsSO42- concentration. Sites located below 1000m
elevation (SDM-94, Up-C, and CWA-A) do not show any clear trends associated with annual
accumulation, although these sites do exhibit a decreasing trend in xsSO42- concentrations vs. distance from
the nearest open water (Figure 4f). Sites located above 1000m elevation display the opposite trend:
increasing xsSO42- concentrations vs. distance from the nearest open water (Figure 4f). These results
suggest that sites located above 1000m elevation receive the majority of their xsSO42- from mid-upper
tropospheric/stratospheric air masses and that sites located below 1000m elevation do not receive a
Daniel Dixon - Paper Number 39A154 – DRAFT TO ANNALS OF GLACIOLOGY 11
significant fraction of their xsSO42- from this source. Previous work suggests that the xsSO4
2- supplied to
sites located below 1000m is deposited from lower tropospheric air masses (Kreutz and Mayewski, 1999).
Remaining Excess SO42-
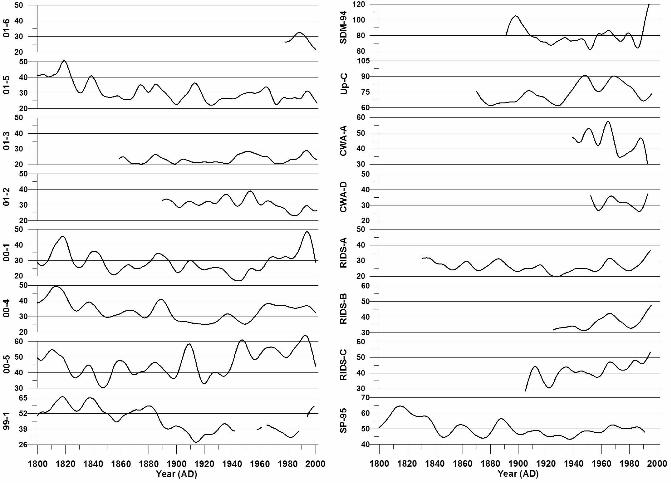
Examination of the rxsSO42- curves in Figure 7 reveals that an overall decreasing trend takes place
in all records from 1800 to ~1940. Several of the rxsSO42- records exhibit an increasing trend from ~1940
to ~1990 (00-1, 00-4, 00-5, RIDS-A, RIDS-B, RIDS-C, and to a lesser extent SP-95). Several sites exhibit
a decrease in rxsSO42- during this same time period (01-5, 01-3, and 01-2). The remaining records do not
show any significant trends or are too short to make an informed determination (site 99-1 is ignored beyond
~1940 because of missing data). The opposing rxsSO42- trends observed in our records suggests that the
source is not anthropogenic. If an anthropogenic rise in rxsSO42- were occurring, it should occur in all
rxsSO42- records simultaneously. A second argument against an anthropogenically forced rise in rxsSO4
2- is
the fact that the rise which does occur from 1939-1991 does not increase rxsSO42- levels higher than they
were during the early 1800s.
EOF results of rxsSO42- for the years 1891-1991 (Table 4a) reveal a strong association (EOF 1,
40% total variance and 13%-77% variance of each core) between cores 01-5, 01-3, 00-1, RIDS-A, 00-4,
00-5, Up-C, and SP-95. This 1891-1991 EOF captures the significant structure in the rxsSO42- curves. The
majority of this structure consists of broad rxsSO42- peaks centered around ~1910, ~1947, and 1965 (Figure
7). The large 1965 rxsSO42- peak indicates that some fraction of volcanic SO4
2- is still present in these
records after the robust spline residuals are removed. However, the ~1910 and ~1947 rxsSO42- peaks may
be a result of local volcanic eruptions or increases from non-volcanic sources such as marine biogenic SO42-
.
The EOF results of rxsSO42- for the years 1939-1991 reveal a strong negative association (EOF 1,
41% total variance and 13%-84% variance of each core) between two groups of cores (Table 4b). The first
group consists of 01-5, 01-3, and 01-2. The second group is comprised of 00-1, 00-4, RIDS-A, RIDS-B,
RIDS-C, SDM-94, and SP-95. This 1939-1991 EOF captures the overall long term trend in rxsSO42- that
takes place during this time period. The reason for the negative association is that the first group of cores
(01-5, 01-3, and 01-2) display a decreasing trend in rxsSO42- concentrations from 1939-1991 and the

Daniel Dixon - Paper Number 39A154 – DRAFT TO ANNALS OF GLACIOLOGY 12
second group (00-1, 00-4, RIDS-A, RIDS-B, RIDS-C, SDM-94, and SP-95) displays an increasing trend
(Figure 7). The trends in these rxsSO42- records suggest that a climate transition takes place over West
Antarctica during ~1940. At this time the atmospheric circulation over West Antarctica changes in such a
way as to increase the transport of rxsSO42- to central West Antarctica.
Volcanic SO42- Peaks
There are many volcanic events evident in the 16 ice core xsSO42- records used in this study
(Figure 6). The strength of the volcanic signal preserved in polar ice varies according to the location of the
core and the size, sulfur content, explosivity, and location of the eruption. Global scale volcanic eruptions,
such as Pinatubo 1991, erupt with sufficient explosive force to inject large amounts of volcanic material
directly into the stratosphere. Significant amounts of H2S and SO2 gas are emitted during a global scale
eruption. The H2S is quickly converted to SO2 and this volcanic SO2 is subsequently oxidized to H2SO4
(Junge and others, 1961; Berresheim and others, 1995). Elevated stratospheric SO42- concentrations can
take as much as 3-4 years to return to pre-volcanic levels following a global-scale eruption (Self and others,
1981). As a result, volcanic SO42- in the stratosphere can spread over the entire globe before it is removed
by mechanisms such as sedimentation.
In this study global scale eruptions (such as Tambora 1815, Krakatau, 1883, and Agung, 1963)
appear simultaneously as 2_ peaks in all of the robust spline residual xsSO42- records from sites located
above 1000m elevation but they are not obvious at sites located below 1000m elevation, such as SDM-94,
Up-C, and CWA-A (Figure 6). The lack of global scale volcanic eruption signatures in low-elevation
records supports the idea that coastal and low elevation sites in Antarctica are not strongly influenced by
mid-upper tropospheric/stratospheric air masses.
Conclusions
The 16 high-resolution sub-annual records presented in this study preserve every year of chemical
deposition in detail for the full length of each record.. The dating accuracy of these records is estimated to
be better than 1 year. Each record is calibrated using several known global-scale volcanic horizons. The
detailed preservation of annual layers in the ice cores provide a remarkable opportunity for the
Daniel Dixon - Paper Number 39A154 – DRAFT TO ANNALS OF GLACIOLOGY 13
investigation of major contributions to the Antarctic SO42- budget, notably: ssSO4
2-, volcanic event xsSO42-,
and rxsSO42-.
These data show that sites located below 1000m elevation (SDM-94, Up-C, and CWA-A) receive
higher concentrations of ssSO42- than sites located above 1000m elevation. EOF results suggest that the
sites located above 1000m elevation receive a large percentage of ssSO42- from common air masses/sources
and sites located below 1000m elevation receive ssSO42- from common air masses/sources that are separate
from the air masses/sources supplying sites located above 1000m elevation.
Concentration trends imply a dual source for West Antarctic xsSO42-: lower tropospheric near the
coast and mid-upper tropospheric/stratospheric for higher elevation areas. These results highlight the
relative importance of different xsSO42- sources and pathways for sites at different elevations. The rxsSO4
2-
records reveal an overall concentration decrease at all sites over the period 1800 to ~1940. Several of the
rxsSO42- records also exhibit an increasing trend from ~1940 to ~1990 and several exhibit a decrease during
this same time period. These rxsSO42- trends suggest that a significant shift in the spatial distribution of
SO42- took place over West Antarctica at ~1940. The atmospheric circulation changed in such a way as to
increase the transport of rxsSO42- to inland West Antarctica and decrease it to other West Antarctic sites.
This implies a major change in atmospheric circulation at this time which could not have been inferred
from a single ice core, highlighting the importance and value of having an array of accurately dated
spatially distributed records. Our records do not imply an anthropogenic source for any of the observed
trends in rxsSO42-.
In our records all global-scale volcanic eruptions appear as 2_ peaks, as determined using residuals from a
robust spline of the xsSO42- records. Global scale volcanic eruptions cannot be consistently resolved in the
xsSO42- records for sites located below 1000m elevation because the majority of volcanic SO4
2- from
global-scale eruptions is transported to Antarctica through the mid-upper troposphere/stratosphere and sites
located below 1000m elevation do not receive a significant fraction of xsSO42- from this source. High
ssSO42- and local marine biogenic SO4
2- further obscure much of the volcanic SO42- present at these lower
elevation sites. The xsSO42- signals from global-scale volcanic eruptions can be used as reliable depth/age
markers in West Antarctic cores located above 1000m elevation, but cannot be used definitively at sites
located below 1000m elevation.
Daniel Dixon - Paper Number 39A154 – DRAFT TO ANNALS OF GLACIOLOGY 14
References
Bates, T.S., B.K. Lamb, A. Guenther, J. Dignon and R.E. Stoiber. 1992. Sulfur emissions to the atmospherefrom natural sources. J. Atmos. Chem., 14(1--4), 315-337.
Battle, M., M. Bender, T. Sowers, P.P. Tans, J.H. Butler, J.W. Elkins, J.T. Ellis, T. Conway, N. Zhang, P.Lang and A.D. Clarke. 1996. Atmospheric gas concentrations over the past century measured in air fromfirn at the South Pole. Nature, 383(6597), 231-235.
Bergin, M.H., C.I. Davidson, J.E. Dibb, J.L. Jaffrezo, H.D. Kunhs and S.N. Pandis. 1995. A simple modelto estimate atmospheric concentration of aerosol species based on snow core chemistry at Summit,Greenland. Geophys. Res. Lett., 22(24), 3517-3520.
Bergin, M.H., E.A. Meyerson, J.E. Dibb and P.A. Mayewski. 1998. Relationship between continuousaerosol measurements and firn core chemistry over a 10-year period at the South Pole. Geophys. Res. Lett.,25(8), 1189-1192.
Berresheim, H., P.H. Wine and D.D. Davis. 1995. Sulfur in the atmosphere. In Singh, H.B., ed.Composition, chemistry, and climate of the atmosphere. New York, Van Nostrand Reinhold, 251-307.
Bindschadler, R.A. 1998. Future of the West Antarctic Ice Sheet. Science, 282(5388), 428-429.
Bromwich, D.H., A.J. Monaghan and Z. Guo. 2003. Modeling the ENSO modulation of Antarctic climatein the late 1990s with Polar MM5. J. Climate, in press.
Charlson, R.J., J. Langner and H. Rodhe. 1990. Sulphate aerosol and climate, Nature, 348(6296), 22.
Cullather, R.I., D.H. Bromwich, and M.L. Van Woert. 1996. Interannual variations in Antarcticprecipitation related to El Niño-Southern Oscillation. J. Geophys. Res., 101(D14), 19,109-19,118.
Delmas, R. 1982. Antarctic sulphate budget. Nature, 299(5885), 677-678.
Delmas, R. and C. Boutron. 1978. Sulfate in Antarctic snow: spatio-temporal distribution. Atmos. Environ.,12(3), 723-728.
Dibb, J.E. and S.I. Whitlow. 1996. Recent climate anomalies and their impact on snow chemistry at SouthPole, 1987-1994. Geophys. Res. Lett., 23(10), 1115-1118.
Harder, S., S.G. Warren and R.J. Charlson. 2000. Sulfate in air and snow at the South Pole: implications fortransport and deposition at sites with low snow accumulation. J. Geophys. Res., 105(D18), 22825-22832.
Hogan, A. 1997. A synthesis of warm air advection to the South Polar Plateau. J. Geophys. Res., 102(D12),14009-14020.
Hogan, A., S. Barnard, J. Samson and W. Winters. 1982. The transport of heat, water vapor and particulatematerial to the South Polar Plateau. J. Geophys. Res., 87(C6), 4287-4292.
Holland, H.D. 1978. The Chemistry of the Atmosphere and Oceans. New-York, Wiley-Interscience.
Isaksson, E., W. Karlen, P. Mayewski, M. Twickler and S. Whitlow. 2001. A high-altitude snow chemistryrecord from Amundsenisen, Dronning Maud Land, Antarctica. J. Glaciol., 47(158), 489-496.
Junge, C.E., C.W. Chagnon and J.E. Manson. 1961. Stratospheric aerosols. J. Meteorol., 18(1), 81-108.
Kreutz, K.J. and P.A. Mayewski. 1999. Spatial variability of Antarctic surface snow glaciochemistry:Implications for paleoatmospheric circulation reconstructions. Antarct. Sci., 11(1), 105-118.

Daniel Dixon - Paper Number 39A154 – DRAFT TO ANNALS OF GLACIOLOGY 15
Kreutz, K.J., P.A. Mayewski, L.D. Meeker, M.S. Twickler and S.I. Whitlow. 2000. The effect of spatialand temporal accumulation rate variability in West Antarctica on soluble ion deposition. Geophys. Res.Lett., 27(16), 2517-2520.
Kreutz, K.J., P.A. Mayewski, M.S. Twickler and S.I. Whitlow. 1996. Ice-core geochemical reconnaissancein inland West Antarctica. Antarct. J. U.S., 31(2), Review 1996, 51-52.
Kreutz, K.J., P.A. Mayewski, M.S. Twickler, S.I. Whitlow, J.W.C. White, C.A. Shuman, C.F. Raymond, H.Conway and J.R. McConnell. 1999. Seasonal variations of glaciochemical, isotopic and stratigraphicproperties in Siple Dome (Antarctica) surface snow. Ann. Glaciol., 29, 38-44.
Legrand, M. 1997. Ice-core records of atmospheric sulphur. Philos. Trans. R. Soc. Lond. Ser B., 352(1350),241-250.
Legrand, M.R. and R.J. Delmas. 1987. A 220-yr continuous record of volcanic H2SO4 in the Antarctic IceSheet. Nature, 327(6124), 671-676.
Legrand, M., C. Feniet-Saigne, E.S. Saltzman and C. Germain. 1992. Spatial and temporal variations ofmethanesulfonic acid and non sea salt sulfate in Antarctic ice. J. Atmos. Chem., 14(1--4), 245-260.
Legrand, M. and P. Mayewski. 1997. Glaciochemistry of polar ice cores: A review. Rev. Geophys., 35(3),219-143.
Legrand, L. and E.C. Pasteur. 1998. Methane sulfonic acid to non-sea-salt sulfate ratio in coastal Antarcticaerosol and surface snow. J. Geophys. Res., 103(D9), 10991-11006.
Legrand, M. and D. Wagenbach. 1999. Impact of Cerro Hudson and Pinatubo volcanic eruptions on theAntarctic air and snow chemistry. J. Geophys. Res., 104(D1), 1581-1596.
Liu, H., K.C. Jezek, B. Li and Z. Zhao. 2001. RADARSAT Antarctic Mapping Project digital elevationmodel. Version 2. Boulder, CO, National Snow and Ice Data Center.
Mayewski, P.A., M.S. Twickler and S.I. Whitlow. 1995. The Siple Dome ice core --- reconnaissanceglaciochemistry. Antarct. J. U.S., 30(5), 85-87.
Mayewski, P.A., L.D. Meeker, M.C. Morrison, M.S. Twickler, S.I. Whitlow, K.K. Ferland, D.A. Meese,M.R. Legrand and J.P. Steffensen. 1993. Greenland ice core “signal” characteristics: an expanded view ofclimate change. J. Geophys. Res., 98(D7), 12839-12847.
Meyerson, E.A., P.A. Mayewski, K.J. Kreutz, L.D. Meeker, S.I. Whitlow and M.S. Twickler. 2002. Thepolar expression of ENSO and sea-ice variability as recorded in a South Pole ice core. Ann. Glaciol., 35,430-436.
Minikin, A., M. Legrand, J. Hall, D. Wagenbach, C. Kleefeld, E. Wolff, E.C. Pasteur and F. Ducroz. 1998.Sulfur-containing species (sulfate and methanesulfonate) in coastal Antarctic aerosol and precipitation. J.Geophys. Res., 103(D9), 10975-10990.
Mulvaney, R. and E.W. Wolff. 1994. Spatial variability of the major chemistry of the Antarctic ice sheet.Ann. Glaciol., 20, 440-447.
O'Brien, S.R., P.A. Mayewski, L.D. Meeker, D.A. Meese, M.S. Twickler and S.I. Whitlow. 1995.Complexity of Holocene climate as reconstructed from a Greenland ice core. Science, 270(5244), 1962-1964.
Daniel Dixon - Paper Number 39A154 – DRAFT TO ANNALS OF GLACIOLOGY 16
Proposito, M., S. Becagli, E. Castellano, O. Flora, L. Genoni, R. Gragnani, B. Stenni, R. Traversi, R. Udistiand M. Frezzottti. 2002. Chemical and isotopic snow variability along the 1998 ITASE traverse from TerraNova Bay to Dome C, East Antarctica. Ann. Glaciol., 35, 187-194.
Prospero, J.M., D.L. Savoie, E.S. Saltzman and R. Larsen. 1991. Impact of oceanic sources of biogenicsulphur on sulphate aerosol concentrations at Mawson, Antarctica. Nature, 350(6315), 221-223.
Rankin, A.M., E.W. Wolff and S. Martin. 2002. Frost flowers: Implications for tropospheric chemistry andice core interpretation. J. Geophys. Res., 107(D23), 4683, doi:10.1029/2002JD002492.
Reusch, D.B., P.A. Mayewski, S.I. Whitlow, I.I. Pittalwala and M.S. Twickler. 1999. Spatial variability ofclimate and past atmospheric circulation patterns from central West Antarctic glaciochemistry. J. Geophys.Res., 104(D6), 5985-6001.
Saxena, V.K., J. Anderson and N.H. Lin. 1995. Changes in Antarctic stratospheric aerosol characteristicsdue to volcanic eruptions as monitored by the Stratospheric Aerosol and Gas Experiment II satellite. J.Geophys. Res., 100(D8), 16735-16751.
Self, S., M. Rampino and J.J. Barbera. 1981. The possible effects of large 19th and 20th century volcaniceruptions on zonal and hemispheric surface temperatures. J. Volcanol. Geotherm. Res., 11(1), 41-60.
Shaw, G.E. 1982. On the residence time of the Antarctic ice sheet sulfate aerosol. J. Geophys. Res., 87(C6),4309-4313.
Wagenbach, D. 1996. Coastal Antarctica: atmospheric chemical composition and atmospheric transport. InWolff, E.W. and R.C. Bales, eds. Chemical exchange between the atmosphere and polar snow. New York,Springer-Verlag, 173-199. (NATO ASI Series I: Global Environmental Change 43)
Whitlow, S., P.A. Mayewski and J.E. Dibb. 1992. A comparison of major chemical species input timingand accumulation at South Pole and Summit Greenland. Atmos. Environ., 26A(11), 2045-2054.
Zielinski, G.A., P.A. Mayewski, L.D. Meeker, S. Whitlow, M.S. Twickler, M. Morrison, D.A. Meese, A.J.Gow and R.B. Alley. 1994. Record of volcanism since 7000 B.C. from the GISP2 Greenland ice core andimplications for the volcano-climate system. Science, 264(5161), 948-952.

Daniel Dixon - Paper Number 39A154 – DRAFT TO ANNALS OF GLACIOLOGY
Figure 1.Location map of sites for all ice cores used in this study. RA, RB, and RC represent coresites RIDS-A, RIDS-B, and RIDS-C, respectively. Map created using the RAMP DigitalElevation Model (Liu and others, 2001).
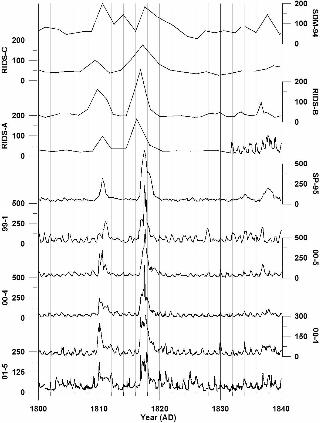
Figure 2.Raw ion data from core 01-5 plotted versus time. Ion concentrations are in parts perbillion. This data is from 94-99m depth (1820-1830) in the core. Vertical lines represent1-year increments.
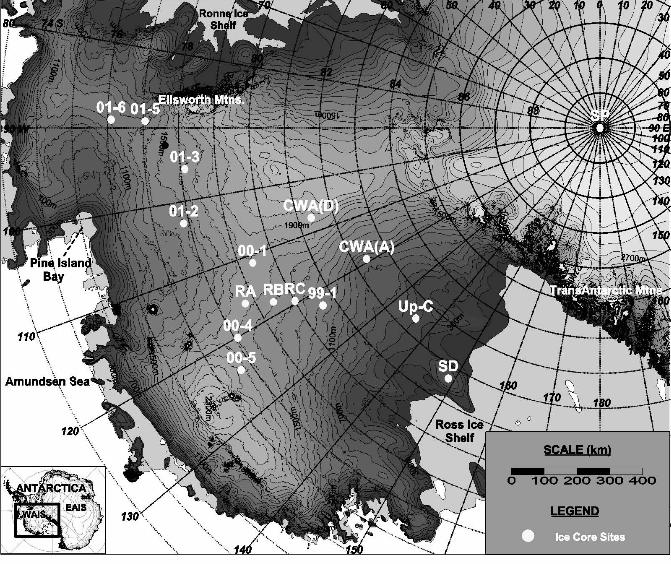
Figure 3.Sub-annual and ~bi-annual raw excess sulfate ion concentration data for the years 1800-1840 for ice cores 01-5, 00-1, 00-4, 00-5, 99-1, SP-95, RIDS-A, RIDS-B, RIDS-C, andSDM-94. All concentrations are in parts per billion. Vertical lines represent 2-yearincrements.
Figure 4.Mean annual accumulations, sea salt sulfate (ssSO4
2-) and excess sulfate (xsSO42-)
concentrations for the years 1891-1991. (a) ssSO42- vs. elevation, (b) ssSO4
2- vs. meanannual accumulation, (c) ssSO4
2- vs. straight line distance from nearest open water, (d)xsSO4
2- vs. elevation, (e) xsSO42- vs. mean annual accumulation, and (f) xsSO4
2- vs.straight line distance from nearest open water. Distances to open water are ignoring seaice. All concentrations in parts per billion.
Figure 5.Annual sea salt sulfate concentrations in parts per billion for the years 1800-2002 foreach ice core used in this study. Lighter lines represent annual concentration values andthick darker lines represent a 5-year running average. Vertical lines represent 5-yearincrements.
Figure 6.Positive residuals from robust spline smoothed annual excess sulfate concentrations foreach ice core for the years 1800-2002. Peaks that are mean + 1_ above the mean areshown in white and peaks that are mean + 2_ above the mean are shown in black. Allconcentrations are in parts per billion. Vertical lines represent 5-year increments.
Figure 7.Robust spline smoothed annual excess sulfate (rxsSO4
2-) concentrations for each ice corefor the years 1800-2002. All concentrations are in parts per billion. Vertical linesrepresent 10-year increments. Note scale change from site to site.

Daniel Dixon - Paper Number 39A154 – DRAFT TO ANNALS OF GLACIOLOGY
Table 1.Information for each ice core used in this study. Elev. = elevation, Mean Acc. = meanannual accumulation, Conc. = concentration, Sampling Res. = sampling resolution, andSamples Per Year = mean number of samples per year calculated from high entire high-resolution section of each core.
Table 2.EOF of annual sea salt sulfate concentrations (a) Results for 1891-1991, and (b) Resultsfor 1939-1991.
Table 3.EOF of annual excess sulfate concentrations (a) Results for 1891-1991, and (b) Resultsfor 1939-1991.
Table 4.EOF of robust spline smoothed annual excess sulfate concentrations (a) Results for 1891-1991, and (b) Results for 1939-1991.
FIGURE SIZES:Fig. 1) - 178mm wideFig. 2) - 85mm wideFig. 3) - 85mm wideFig. 4) - 178mm wideFig. 5) - 178mm wideFig. 6) - 178mm wideFig. 7) - 178mm wideTable 1) - 178mm wideTable 2) - 85mm wideTable 3) - 85mm wideTable 4) - 85mm wide


!['sou daltônico, não vejo cores': novas [velhas] estratégias de ...](https://static.fdokumen.com/doc/165x107/63147de0c72bc2f2dd0466bd/sou-daltonico-nao-vejo-cores-novas-velhas-estrategias-de-.jpg)