A 1-year randomized controlled trial of deferasirox versus deferoxamine for myocardial iron removal...
28
doi:10.1182/blood-2013-04-497842 Prepublished online January 2, 2014; Yiyun Zhang and Yesim Aydinok Mohsen Elalfy, Akif Yesilipek, Yurdanur Kilinç, Tomasz Lawniczek, Dany Habr, Marianne Weisskopf, Dudley J. Pennell, John B. Porter, Antonio Piga, Yongrong Lai, Amal El-Beshlawy, Khawla M. Belhoul, myocardial iron removal in beta-thalassemia major (CORDELIA) A 1-year randomized controlled trial of deferasirox versus deferoxamine for http://bloodjournal.hematologylibrary.org/site/misc/rights.xhtml#repub_requests Information about reproducing this article in parts or in its entirety may be found online at: http://bloodjournal.hematologylibrary.org/site/misc/rights.xhtml#reprints Information about ordering reprints may be found online at: http://bloodjournal.hematologylibrary.org/site/subscriptions/index.xhtml Information about subscriptions and ASH membership may be found online at: digital object identifier (DOIs) and date of initial publication. the indexed by PubMed from initial publication. Citations to Advance online articles must include final publication). Advance online articles are citable and establish publication priority; they are appeared in the paper journal (edited, typeset versions may be posted when available prior to Advance online articles have been peer reviewed and accepted for publication but have not yet Copyright 2011 by The American Society of Hematology; all rights reserved. 20036. the American Society of Hematology, 2021 L St, NW, Suite 900, Washington DC Blood (print ISSN 0006-4971, online ISSN 1528-0020), is published weekly by For personal use only. at Novartis Global on January 2, 2014. bloodjournal.hematologylibrary.org From For personal use only. at Novartis Global on January 2, 2014. bloodjournal.hematologylibrary.org From
Transcript of A 1-year randomized controlled trial of deferasirox versus deferoxamine for myocardial iron removal...

doi:10.1182/blood-2013-04-497842Prepublished online January 2, 2014;
Yiyun Zhang and Yesim AydinokMohsen Elalfy, Akif Yesilipek, Yurdanur Kilinç, Tomasz Lawniczek, Dany Habr, Marianne Weisskopf, Dudley J. Pennell, John B. Porter, Antonio Piga, Yongrong Lai, Amal El-Beshlawy, Khawla M. Belhoul, myocardial iron removal in beta-thalassemia major (CORDELIA)A 1-year randomized controlled trial of deferasirox versus deferoxamine for
http://bloodjournal.hematologylibrary.org/site/misc/rights.xhtml#repub_requestsInformation about reproducing this article in parts or in its entirety may be found online at:
http://bloodjournal.hematologylibrary.org/site/misc/rights.xhtml#reprintsInformation about ordering reprints may be found online at:
http://bloodjournal.hematologylibrary.org/site/subscriptions/index.xhtmlInformation about subscriptions and ASH membership may be found online at:
digital object identifier (DOIs) and date of initial publication. theindexed by PubMed from initial publication. Citations to Advance online articles must include
final publication). Advance online articles are citable and establish publication priority; they areappeared in the paper journal (edited, typeset versions may be posted when available prior to Advance online articles have been peer reviewed and accepted for publication but have not yet
Copyright 2011 by The American Society of Hematology; all rights reserved.20036.the American Society of Hematology, 2021 L St, NW, Suite 900, Washington DC Blood (print ISSN 0006-4971, online ISSN 1528-0020), is published weekly by
For personal use only. at Novartis Global on January 2, 2014. bloodjournal.hematologylibrary.orgFrom For personal use only. at Novartis Global on January 2, 2014. bloodjournal.hematologylibrary.orgFrom
1
A 1-Year Randomized Controlled Trial of Deferasirox versus
Deferoxamine for Myocardial Iron Removal in Beta-Thalassemia Major
(CORDELIA)
Dudley J Pennell, MD1 John B Porter, MD2 Antonio Piga, MD3 Yongrong Lai, MD4
Amal El-Beshlawy, MD5 Khawla M Belhoul, MD6 Mohsen Elalfy, MD7 Akif Yesilipek, MD8
Yurdanur Kilinç, MD9 Tomasz Lawniczek, MD10 Dany Habr, MD11 Marianne Weisskopf,
PhD10 Yiyun Zhang, PhD11 Yesim Aydinok, MD12 on behalf of CORDELIA study
investigators
1Royal Brompton Hospital, London, UK; 2University College London, London, UK; 3Universitá di Torino, Turin, Italy; 4The First Affiliated Hospital of Guangxi Medical
University, Nanning, China; 5Cairo University, Cairo, Egypt; 6Thalassemia Centre, Latifa
Hospital, Dubai, UAE; 7Ain Shams University, Cairo, Egypt; 8Akdeniz University, Antalya,
Turkey; 9Cukurova University Medical Facility, Adana, Turkey; 10Novartis Pharma AG,
Basel, Switzerland; 11Novartis Pharmaceuticals, East Hanover, NJ, USA; 12Ege University
Hospital, Izmir, Turkey
Corresponding author: Dudley J Pennell, NIHR Cardiovascular Biomedical Research Unit,
Royal Brompton Hospital, Sydney Street, London, SW3 6NP, UK
Tel: +44 20 7351 8810; Fax: +44 20 7351 8816; Email: [email protected]
Running head: Deferasirox vs DFO for cardiac iron removal
Primary scientific category: Clinical trials and observations
Secondary scientific category: Red cells, iron and erythropoiesis
Blood First Edition Paper, prepublished online January 2, 2014; DOI 10.1182/blood-2013-04-497842
Copyright © 2014 American Society of Hematology
For personal use only. at Novartis Global on January 2, 2014. bloodjournal.hematologylibrary.orgFrom

2
Key points
� In transfused beta-thalassemia major patients with severe iron burden, deferasirox
was non-inferior to DFO for myocardial iron removal
� Liver iron burden may have an impact on the rate of myocardial iron removal during
deferasirox treatment
Abstract
Transfusion-dependent patients are at risk of myocardial iron deposition. Randomized
comparison data on the efficacy and safety of deferasirox for myocardial iron removal are
lacking. CORDELIA was a prospective, randomized comparison of deferasirox (target dose
40mg/kg/day) vs subcutaneous deferoxamine (50–60mg/kg/day for 5–7 days/week) for
myocardial iron removal in 197 beta-thalassemia major patients with myocardial siderosis
(T2* 6–20ms) and no signs of cardiac dysfunction (mean age 19.8 years). The primary
objective was to demonstrate non-inferiority of deferasirox for myocardial iron removal,
assessed by changes in myocardial T2* after 1 year using a per protocol analysis. The
geometric mean (Gmean) myocardial T2* improved with deferasirox from 11.2ms at
baseline to 12.6ms at 1 year (Gmeans ratio 1.12) and with deferoxamine (11.6ms to
12.3ms; Gmeans ratio 1.07). The between-arm Gmeans ratio was 1.056 (95% confidence
intervals [CI] 0.998, 1.133). The lower 95% CI boundary was greater than the pre-specified
margin of 0.9, establishing non-inferiority of deferasirox vs deferoxamine (P=0.057 for
superiority of deferasirox). LVEF remained stable in both arms. Frequency of drug-related
adverse events was comparable between deferasirox (35.4%) and deferoxamine (30.8%).
CORDELIA met its primary endpoint of demonstrating non-inferiority of deferasirox
compared with deferoxamine for myocardial iron removal.
Clinical Trial Registration: ClinicalTrials.gov number NCT00600938
Key Words: thalassemia; iron chelation; magnetic resonance imaging; cardiac
For personal use only. at Novartis Global on January 2, 2014. bloodjournal.hematologylibrary.orgFrom

3
Introduction
Without effective iron chelation therapy, patients with transfusional iron overload are at risk
of iron deposition in vital organs such as the liver and heart. The heart is more sensitive to
iron overload than the liver, whereby lower levels of iron are sufficient to cause iron-related
heart failure and death, relative to the larger iron load that can be tolerated by the liver
before hepatic dysfunction occurs.1 Significant variation has been observed between heart
and liver iron loading,2 which is incompletely understood. Iron may load earlier in the liver
and only later in the myocardium, with differential kinetics of iron chelators between organs
playing a role.3 In beta-thalassemia major patients treated with deferoxamine evidence of
myocardial iron deposition only becomes apparent towards the end of the first decade of
life.4
Although a decrease in cardiac-related mortality has recently become apparent,5 heart
failure due to iron-induced cardiomyopathy remains a key cause of death in patients with
beta-thalassemia major.6-9 The decrease in cardiac-related mortality is due in part to the
introduction of T2* cardiovascular magnetic resonance (CMR) for the estimation of
myocardial iron, which has contributed to improved management of cardiac siderosis.10-15
T2* CMR is now widely used, is highly reproducible,16-18 and is calibrated in animal19 and
human hearts.1 Myocardial T2* >20ms is considered normal2 and iron accumulation causes
a reduction in T2*, with values <10ms being associated with increased risk of heart failure.15
Iron chelation therapy aims to prevent iron accumulation, or to remove iron deposition when
it has already occurred. The available iron chelators deferoxamine (DFO), deferiprone and
deferasirox can all remove myocardial iron with acceptable safety profiles.14,20-25 However,
there are limited data from randomized controlled trials comparing iron chelation therapies
for removal of myocardial iron,14,22,25 and none for deferasirox. Efficacy and safety of
deferasirox in myocardial iron removal has only been reported in uncontrolled single-arm
trials.20,26-28 Here, we describe the first prospective, randomized comparison of changes in
myocardial T2* with deferasirox or DFO in beta-thalassemia major patients with myocardial
siderosis. The primary objective was to demonstrate non-inferiority of deferasirox when
compared with DFO in myocardial iron removal, as assessed by changes in myocardial T2*
after 1 year.
For personal use only. at Novartis Global on January 2, 2014. bloodjournal.hematologylibrary.orgFrom

4
Methods
Patients
CORDELIA was conducted between April 10, 2008 and March 1, 2012. Patients with beta-
thalassemia major, Diamond–Blackfan anemia, Low/Int-1 myelodysplastic syndromes
(MDS) or sideroblastic anemia, aged ≥10 years with myocardial T2* 6–20ms without clinical
symptoms of cardiac dysfunction (shortness of breath at rest or exertion, orthopnea,
exercise intolerance, lower extremity edema, arrhythmias) were eligible for recruitment into
the study. Other inclusion criteria included left ventricular ejection fraction (LVEF) ≥56%;
R2-magnetic resonance imaging (MRI) liver iron concentration (LIC) ≥3mg Fe/g dw; with
lifetime history of ≥50 units of red blood cell (RBC) transfusions, and receiving
≥10 units/year of RBC transfusions.
Patients with serum creatinine above the upper limit of normal (ULN), or significant
proteinuria (urinary protein/creatinine ratio ≥1.0mg/mg in a non-first void urine sample at
baseline) were excluded. In order to avoid excluding patients with increased alanine
aminotransferase (ALT) levels due to liver iron overload, the ALT exclusion criterion was
modified to exclude patients with ALT >5 times ULN only if their LIC was <10mg Fe/g dw.
Other exclusion criteria included: considerable impaired gastrointestinal (GI) function or GI
disease, history of clinically relevant ocular and/or auditory toxicity related to iron chelation
therapy and history of HIV seropositivity or malignancy within the past 5 years.
Study design
CORDELIA was a prospective, multinational, randomized, open-label, parallel-group, Phase
II study conducted in 22 centers across 11 countries. Following a 35-day screening phase,
patients were randomized in a 1:1 ratio to receive deferasirox (Exjade®, Novartis) or DFO
(Desferal®, Novartis) for 1 year. Randomization was based on permuted blocks;
stratification by center was not conducted. The once-daily deferasirox starting dose was
20mg/kg/day for 2 weeks, followed by 30mg/kg/day for 1 week, then continued with
40mg/kg/day. An intensified dosing regimen of DFO was administered, at 50 to
60mg/kg/day via subcutaneous infusion over 8 to 12 hours, 5 to 7 days a week, in
accordance with Thalassaemia International Federation guidelines.29 Dose adjustment
recommendations were provided based on continuous assessment of efficacy and safety
For personal use only. at Novartis Global on January 2, 2014. bloodjournal.hematologylibrary.orgFrom

5
markers. Study medication was dispensed during regular study visits, and all medication
returned by the patient was counted and recorded to assess compliance. Patients were
instructed to contact the investigator if unable to take the study drug as prescribed.
The study was conducted in accordance with Good Clinical Practice guidelines and the
Declaration of Helsinki, and was approved by institutional ethics committees at all
participating sites. All patients or parents/guardians gave informed consent. An independent
data monitoring committee reviewed the safety data and advised on study continuation
and/or any changes to protocol.
Endpoints
Change in myocardial T2* was assessed as the ratio of the geometric mean (Gmean) T2* at
end of study (EOS) divided by that at baseline (GmeanEOS/ Gmeanbaseline). The primary
efficacy endpoint was the ratio of Gmean myocardial T2* after 1 year of treatment with
deferasirox divided by the ratio of Gmean for DFO.
A key secondary endpoint was to compare the two treatment groups for changes in LVEF
after 1 year of treatment, assessed by absolute change from baseline CMR. Other
endpoints included absolute change from baseline in LIC and serum ferritin after 1-year
treatment with deferasirox and DFO.
For personal use only. at Novartis Global on January 2, 2014. bloodjournal.hematologylibrary.orgFrom

6
Assessments
Efficacy was assessed using the per-protocol analysis set including all randomized patients
treated for at least 6 months and with no major protocol violations. If Month 12 myocardial
T2* value was not available, the last value obtained at ≥150 days was used. Patients
without any T2* value after ≥150 days were excluded. Myocardial T2* and LVEF were
measured with CMR at baseline, Month 6 and EOS. A standardized CMR protocol for T2*
acquisition technique2 was used and images were assessed by a central CMR core
laboratory. LIC was measured using a validated R2 MRI technique30 at baseline and then
after 6 and 12 months of study treatment. Core laboratories were blinded to treatment
allocation. Serum ferritin levels were assessed on blood samples drawn monthly from
baseline to EOS. Monthly mean iron intake in mg/kg/day was determined based on the
formula of average blood intake x 1.08/30 days.31
The safety set consisted of all randomized patients who received at least one dose of study
drug and had at least one post-baseline safety assessment. Patients were analyzed
according to treatment received (first study drug administered). Safety was evaluated
through continuous monitoring and recording of adverse events (AEs), serious AEs,
laboratory testing and clinical evaluations. Patients enrolled with a baseline myocardial T2*
<10ms underwent additional 3-monthly monitoring for cardiac function and myocardial iron.
Myocardial iron concentration was derived from myocardial T2* values based on the
formula described by Carpenter et al.1 Briefly, [Fe] = 45·(T2*)–1.22, where [Fe] is measured in
mg/g dw and T2* is measured in milliseconds. Ad hoc analysis of mean absolute change in
myocardial iron concentration was thus conducted.
Statistical methods
Study sample size was determined for the primary endpoint of testing the non-inferiority of
deferasirox compared with DFO for ratio of T2* Gmeans with two-sided 0.05 alpha-level,
85% power and a non-inferiority margin of 90%. Sample size accounted for an interim
assessment using O'Brien–Fleming boundaries and for a potential 30% patient drop out
before Month 6. The analysis plan for the primary endpoint pre-specified the per-protocol
study population for testing of non-inferiority, as per European Medicines Agency and
International Conference on Harmonisation guidelines.32,33 A sensitivity analysis of the
For personal use only. at Novartis Global on January 2, 2014. bloodjournal.hematologylibrary.orgFrom

7
intention-to-treat population was planned. In order to eliminate potential unrecognized
biases, the core clinical trial team was blinded to the treatment assignment prior to the data
base lock for the primary analysis.
For the primary efficacy variable, the two-sided repeated 95% confidence interval (CI) for
the ratio of T2* Gmeans of deferasirox over DFO was calculated. A non-inferiority margin of
0.9 (90%) was applied since a loss of 10% efficacy relative to DFO was considered not
clinically relevant. Non-inferiority was therefore pre-defined if the lower limit of the repeated
95% CI for ratio of two Gmeans was >0.9. If non-inferiority was established, a superiority
test would be performed by comparing the lower limit of the repeated CI with 1. If the lower
limit was >1, deferasirox would be declared superior to DFO; otherwise deferasirox would
not be declared superior. A two-sided adjusted P-value based on the Tsiatis, Rosner and
Mehta stage-wise ordering was calculated, testing superiority of deferasirox over DFO.
Demographic and baseline characteristics and safety variables were summarized by
frequency tables or summary statistics for continuous distributions.
For personal use only. at Novartis Global on January 2, 2014. bloodjournal.hematologylibrary.orgFrom

8
Results
Patient disposition
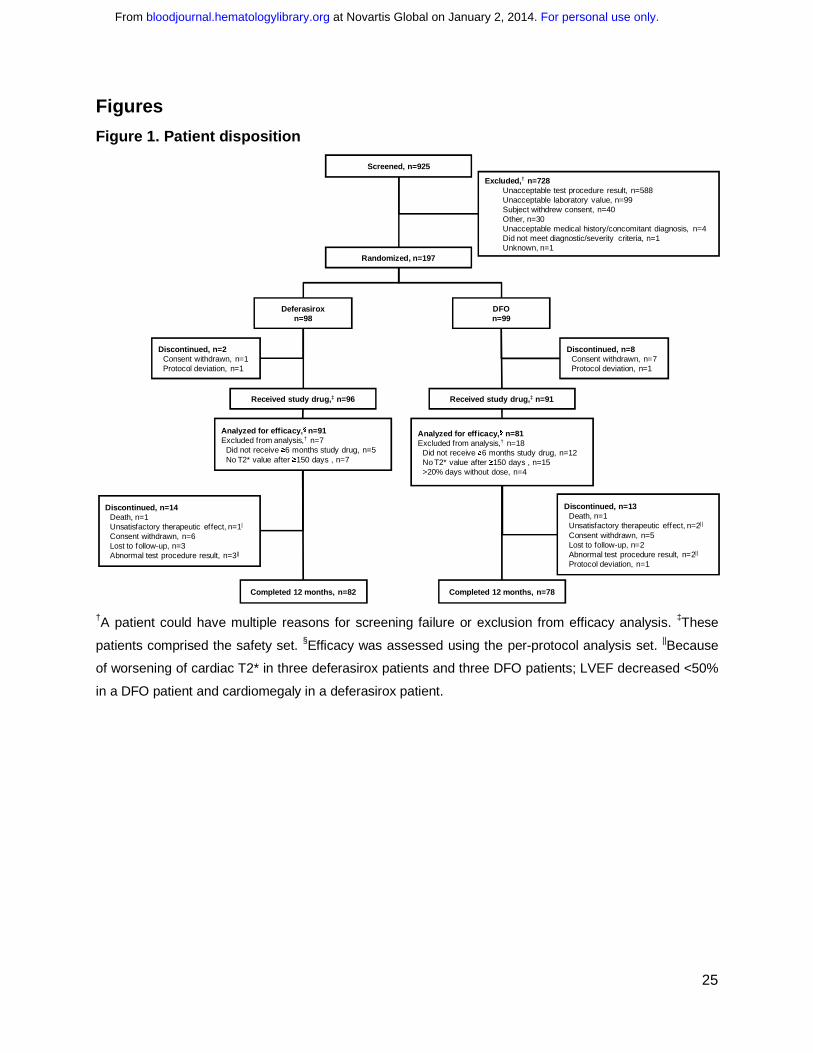
Overall, 925 patients were screened and 197 randomized (Figure 1). The majority of
patients screened were beta-thalassemia major patients (902/925; 99.1%). Other patients
who were screened and for whom underlying anemia was captured had Low/Int-risk MDS
(n=4), Diamond–Blackfan anemia, beta-thalassemia intermedia, congenital
dyserythropoietic anemia and paroxysmal nocturnal hemoglobinuria (all n=1). Only beta-
thalassemia major patients fulfilled the inclusion criteria and were enrolled in the study.
81.2% of patients (n=160) completed 1 year of treatment (Figure 1). Three patients in each
group discontinued as a result of worsening of myocardial T2*.
Baseline demographics and clinical characteristics
Baseline demographics and clinical characteristics across deferasirox and DFO groups
were similar (Table 1). Mean ±standard deviation (SD) age of patients was 19.8±6.4 years.
In patients randomized to deferasirox, Gmean (coefficient of variance [CV]) myocardial T2*
at baseline was 11.2 (32.6), and 11.6 (30.7) in DFO patients. Patients were heavily iron
overloaded, with baseline LIC of 30.0 ±17.7mg Fe/g dw and median (range) serum ferritin
levels of 4878 (613–15,331)ng/mL.
Exposure to treatment and compliance
Mean actual dose over 1-year treatment was 36.7±4.2mg/kg/day deferasirox (range:
19.7–43.3mg/kg/day). Mean actual dose of DFO was 41.5±8.7 (13.2–60.2) mg/kg/day,
when normalized to a 7-day regimen. The maximum dose used at any time during the study
was 49.9mg/kg/day deferasirox and 62.5mg/kg DFO. As a result of rounding to the nearest
whole tablet strength, eight patients received deferasirox doses >40mg/kg/day.
Patients received study drug for a median duration of 355.5 days (range 3.0–418.0) and
355.0 days (range 86.0–394.0) in the deferasirox and DFO cohort, respectively. Total
exposure was 87.8 patient-years for deferasirox patients and 81.5 patient-years for DFO
patients. Overall, deferasirox patients took 99.0±3.5% of the planned dose, and DFO
patients took 100.4±10.9%. Dose was interrupted at least once in 18.8% of deferasirox
patients and in 17.6% of DFO patients. The main reason for interruption was an AE (n=21
For personal use only. at Novartis Global on January 2, 2014. bloodjournal.hematologylibrary.orgFrom

9
[21.9%] vs n=19 [20.9%], respectively). Dose was reduced at least once in 15.6 and 19.8%
of patients, respectively; the main reason was also an AE (n=24 [25.0%] vs n=21 [23.1%]).
Average iron intake
Average iron intake throughout the study was <0.3mg/kg/day in 55.2% patients
(deferasirox, 53.8%; DFO 56.8%), 0.3 to 0.5mg/kg/day in 36.6% patients (deferasirox,
38.5%; DFO 34.6%), and >0.5mg/kg/day in 8.1% patients (deferasirox, 7.7%; DFO 8.6%)
and was similar between groups.
Efficacy of deferasirox compared with DFO
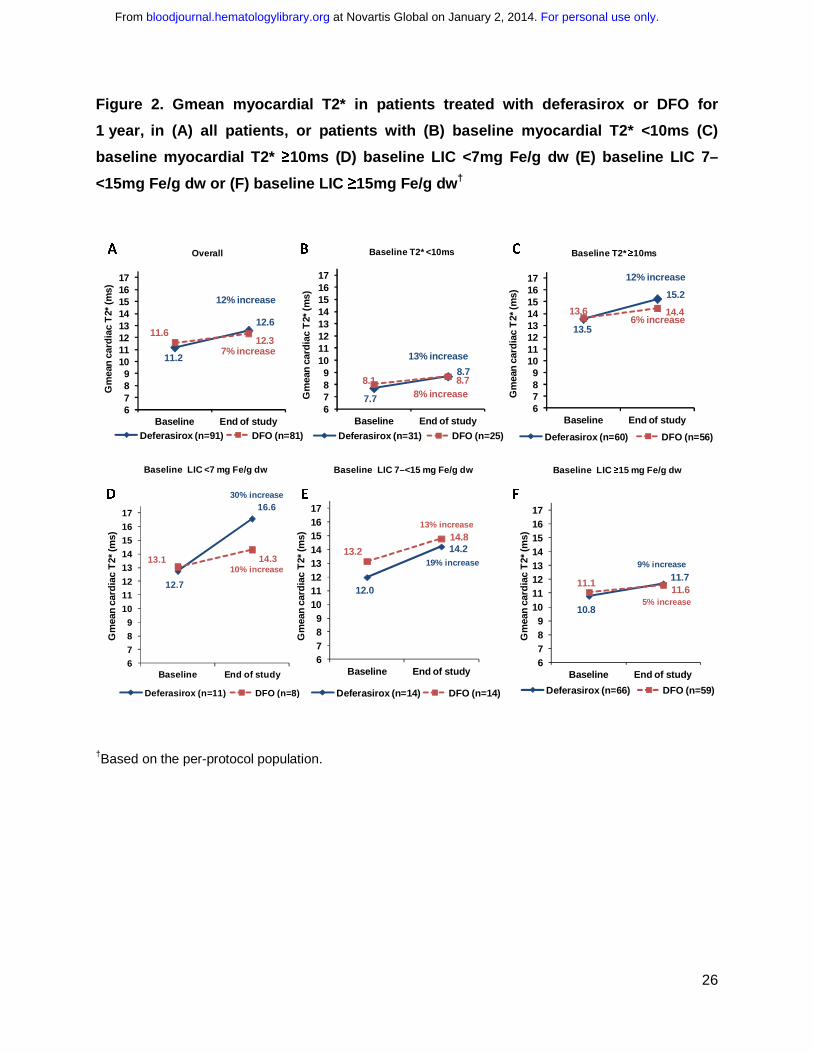
Myocardial T2* improved after 1 year of treatment (Table 2). In the per-protocol population,
Gmean (CV) myocardial T2* improved after 1 year of treatment with deferasirox by 12%
(11.2 [32.6]ms at baseline to 12.6 [42.6]ms at EOS); and by 7% for DFO (11.6 [30.7]ms to
12.3 [34.7]ms; Figure 2A). The ratio of the Gmeans of deferasirox over DFO was 1.056
(repeated 95% CI 0.998, 1.133). Since the lower bound of the 95% CI was greater than pre-
specified margin of 0.9, non-inferiority of deferasirox compared with DFO for myocardial iron
removal was demonstrated. A trend for superiority of deferasirox compared with DFO was
observed, although this did not reach statistical significance (P=0.057). An analysis of the
intention-to-treat population showed similar results to the per-protocol population (Table 2).
Myocardial T2* improved with deferasirox and DFO treatment in patients who had T2*
below or above 10ms at baseline (Figures 2B and C). In patients with baseline LIC <7mg
Fe/g dw, increase from baseline in myocardial T2* was 30% (n=11) for deferasirox and 10%
for DFO (n=8), and for patients with baseline LIC ≥15mg Fe/g dw, increase was 9% (n=66)
and 5% (n=59), respectively (Figures 2D–F).
After 1 year, 16 (17.6%) patients treated with deferasirox normalized their myocardial T2*,
and 11 (35.5%) patients improved from a baseline myocardial T2* of 6 to <10ms to 10 to
≤20ms at EOS (Figure 3A). In comparison, five (6.2%) DFO patients overall normalized
their myocardial T2*, and five (20.0%) patients treated with DFO improved from a baseline
myocardial T2* of 6 to <10ms to 10 to ≤20ms at EOS (Figure 3B). Overall, four (6.7%) and
three (5.4%) patients treated with deferasirox and DFO worsened to 6 to <10ms from a
baseline of 10 to ≤20ms. These results are based on the per-protocol analysis population
For personal use only. at Novartis Global on January 2, 2014. bloodjournal.hematologylibrary.orgFrom

10
and do not take into account patients discontinuing as a result of worsening of cardiac T2*
prior to Month 6.
Effect of deferasirox compared with DFO on cardiac function
Mean LVEF remained stable and within the normal range after 1 year of treatment with
deferasirox (66.9±5.6% at baseline to 66.3±5.8% at EOS) and DFO (66.4±5.2% to
66.4±5.8%). Change in mean LVEF after 1 year was not different between the two
treatments (P=0.54). Of patients with abnormal LVEF34 at baseline, six (54.5%) deferasirox
patients and five (50.0%) DFO patients had improved LVEF to within the normal range.
Overall, seven (8.8%) deferasirox patients and nine (12.7%) DFO patients who had LVEF in
the normal range at baseline had decreased LVEF to below lower limit of normal (LLN) by
EOS.34
Other Iron parameters
Myocardial iron concentration
After 1 year of treatment with deferasirox, myocardial iron concentration decreased from a
baseline of 2.6±1.0mg Fe/g dw to 2.3±1.2mg Fe/g dw (absolute change from baseline
–0.24±0.7mg Fe/g dw; 95% CI –0.1, –0.4). In patients treated with DFO, myocardial iron
decreased from 2.4±0.9mg Fe/g dw at baseline to 2.3±0.9mg Fe/g dw at EOS (absolute
change from baseline –0.15±0.5mg Fe/g dw; 95% CI –0.03, 0.3). Decreases in myocardial
iron were observed in all subgroups examined (Supplementary Table 1).
Liver iron concentration
After 1 year of treatment with deferasirox, LIC decreased from 29.8±17.5mg Fe/g dw at
baseline to 20.1±17.5mg Fe/g dw at EOS (absolute change from baseline,
–8.9±11.4mg Fe/g dw, 95% CI –11.5, –6.4). LIC decreased from a baseline of 30.3±17.9 to
17.7±14.4mg Fe/g dw in DFO patients (change from baseline,
–12.7±11.4mg Fe/g dw, 95% CI –15.3, –10.1).
Serum ferritin level
Treatment with deferasirox for 1 year reduced serum ferritin levels from a baseline of 5062
(613–15,331)ng/mL to 3375 (346–31,942)ng/mL at EOS (absolute change from baseline,
–1044 [–5561 to 18,838]ng/mL). In DFO patients, serum ferritin levels reduced from 4684
For personal use only. at Novartis Global on January 2, 2014. bloodjournal.hematologylibrary.orgFrom

11
(677–13,342)ng/mL at baseline to 3129 (470–9487)ng/mL after 1 year (change from
baseline, –1277 [–7577 to 2810]ng/mL).
Safety parameters
Adverse events
Investigator reported AEs, regardless of causality, were reported in 65 (67.7%) deferasirox
patients and 69 (75.8%) DFO patients (Supplementary Table 2). AEs suspected to be
related to study drug occurred in 35.4% of deferasirox patients and 30.8% of DFO patients;
the most common (≥5%) were increased blood creatinine (8.3% vs 2.2%, respectively),
proteinuria (7.3% vs 3.3%), increased ALT (6.3% vs 1.1%), increased aspartate
aminotransferase (6.3% vs 1.1%) and diarrhea (6.3% vs 1.1%) (Supplementary Table 3).
Serious AEs (SAEs), irrespective of causality, were reported in 10 (10.4%) deferasirox
patients and 10 (11.0%) DFO patients (Supplementary Table 2). Of these, two SAEs in one
patient (vomiting and upper abdominal pain) were suspected to be related to deferasirox
and two SAEs (GI infection and meningitis) were suspected to be related to DFO.
One deferasirox patient experienced an AE (arrhythmia) leading to study drug
discontinuation, which was not suspected to be related to study drug. Three DFO patients
had AEs that led to study drug discontinuation: meningitis and neurosensory deafness
suspected to be related to treatment, and myocardial T2* <6ms not suspected related to
DFO. Two deaths occurred during the study; both following AEs leading to discontinuation.
One death in the deferasirox arm was due to arrhythmia, and was not suspected to be
related to study drug. The other death in a DFO patient was due to meningitis, and was
suspected by the investigator to be related to study drug with splenectomy and progression
of diabetes considered possible contributory factors.
Laboratory parameters
Overall, three (3.1%) patients in the deferasirox cohort and one (1.1%) in the DFO cohort
had two consecutive serum creatinine increases of >33% above baseline values and above
the ULN. Increases were transient and managed with dose reduction and/or interruption.
Increased blood creatinine was also reported as an AE in all four patients. After 1-year of
For personal use only. at Novartis Global on January 2, 2014. bloodjournal.hematologylibrary.orgFrom

12
treatment, mean ±SD creatinine clearance had decreased in both deferasirox
(–37.0±42.9mL/min) and DFO patients (–23.1±36.6mL/min), although on average no
progressive decreases were observed.
Mean ±SD baseline ALT was elevated in both deferasirox (71.6±84.0U/L) and DFO
(58.7±44.5U/L) treatment arms. Among patients with abnormal baseline ALT, levels had
improved to within the normal range in 20 (31.7%) and 22 (39.3%) patients after 1 year of
treatment with deferasirox or DFO, respectively. Overall, mean ALT levels decreased during
treatment with deferasirox (Month 12: 54.2±83.9U/L; change from baseline, –3.5±80.4U/L)
and with DFO (46.3±42.2U/L; 18.9±35.5U/L). During the study, six (3.2%) patients had two
consecutive ALT increases >5x ULN and 2x baseline; including four (4.2%) deferasirox
patients and two (2.2%) DFO patients. ALT increases in deferasirox patients were transient
and resolved with dose interruption (in two patients) or without intervention (in one patient).
In the remaining deferasirox patient, this was noted at the last visit on record and no follow-
up information was available. In DFO patients, ALT levels returned to baseline after dose
interruption in one patient, and without intervention in the second patient.
For personal use only. at Novartis Global on January 2, 2014. bloodjournal.hematologylibrary.orgFrom

13
Discussion
Myocardial siderosis remains a common cause of death in patients with beta-thalassemia
major, and there is therefore a need to optimize chelation regimens specifically for
myocardial iron removal.6-9 CORDELIA was the first randomized controlled trial comparing
deferasirox with an intensified DFO regimen for myocardial iron removal in patients with
beta-thalassemia major. The study met its primary endpoint in demonstrating non-inferiority
of deferasirox compared with DFO. After 1 year of treatment, myocardial T2* improved by
12% from baseline with deferasirox, and by 7% in patients treated with DFO. There was a
trend towards superiority for deferasirox, which failed to meet conventional significance
(P=0.057). The importance of deferasirox as a non-inferior alternative treatment for cardiac
siderosis to DFO lies in its oral preparation which is preferable to injected DFO, which may
have substantial long-term compliance problems.
There are few randomized controlled trials assessing the efficacy and safety of iron
chelation therapy in beta-thalassemia major patients with myocardial iron overload.14,22,25
While CORDELIA adds to this body of data, additional well-designed randomized
comparisons would still be valuable. A comparison of deferiprone and DFO in 61 patients by
Pennell et al. showed that improvement in myocardial T2* was significantly greater for
deferiprone than DFO (27% vs 13%; P=0.023) over 1 year.14 Patients treated with
deferiprone (n=29) had baseline myocardial T2* of 13.0ms, and patients treated with DFO
(n=32) had T2* of 13.3ms. A study by Tanner et al. reports that in 65 patients, myocardial
T2* improved by 50% in patients receiving deferiprone and DFO combination therapy and
by 24% in patients receiving DFO alone.22 In all treatment arms, including DFO,
improvements in myocardial T2* in these two studies were greater than observed in
CORDELIA. However, differences observed between the CORDELIA study and prior
studies also need to be interpreted in the light of baseline patient demographics in the
respective studies and differences in treatment doses of DFO. It is notable, for example,
that baseline LIC in both the Pennell et al. and Tanner et al. studies was significantly lower
than in the CORDELIA study, which may impact cardiac T2* response. In the Pennell et al.
study, for example, patients randomized to deferiprone and DFO had LIC reported as
6.2±6.0mg Fe/g dw and 6.3±5.8mg Fe/g dw respectively.14 Even when taking into account
underestimation (around 50%)35 by superconducting quantum interference device
For personal use only. at Novartis Global on January 2, 2014. bloodjournal.hematologylibrary.orgFrom

14
measurements used in this previous study, the baseline LIC levels observed in CORDELIA
patients (30.0±17.7mg Fe/g dw) remain higher. This is also confirmed by differences in
serum ferritin levels (mean of 1791 ng/mL in deferiprone patients and 2795 ng/mL in DFO
patients,14 versus a median of 4878 ng/mL in CORDELIA patients). Serum ferritin levels
were also lower in the Tanner et al. study (1574 and 1379ng/mL for combined deferiprone
and DFO vs DFO alone, respectively)22, compared with CORDELIA. Wood et al. have
reported that baseline LIC and serum ferritin levels are clinically relevant predictors of
cardiac response to deferasirox therapy.23 This is consistent with results from CORDELIA,
in which patients with LIC <7mg Fe/g dw treated with deferasirox showed a trend towards
greater improvement in myocardial T2* compared with patients with higher baseline LIC.
Further differences between the CORDELIA study and other randomized comparisons
included patient demographics, study design and dose of DFO. Pennell et al. reported a
DFO dose equivalent to 35mg/kg/day for 7 days/week,14 Tanner et al. reported
31.0mg/kg/day for 7 days/week,22 while the dose in CORDELIA was higher at
41.5mg/kg/day for 7 days/week. Lower DFO dosing might have favored deferiprone (or
deferiprone plus DFO combination). Patient compliance can be a concern with DFO
treatment, however, patient-reported adherence to study drug regimen was very good in
CORDELIA. DFO compliance as assessed by the percentage of completed infusions in the
two studies by Pennell et al. and the Tanner et al. was also >90%.14,22
Longitudinal studies of up to 3 years of treatment with deferasirox have shown
improvements in myocardial T2* over time.20,23,26 Since heart iron clearance is slower than
that of the liver,10 normalization of myocardial T2* may take several years. To that end, a
1-year extension for CORDELIA is currently ongoing. Nevertheless, over a period of 1 year,
we observed normalization of myocardial T2* in 17.6% of deferasirox patients, compared
with 6.2% of DFO patients overall. Importantly, 35.5% of deferasirox patients and 20.0% of
DFO patients with severe myocardial siderosis improved to the mild-to-moderate category
after 1-year treatment. Three patients in each treatment group discontinued the study as a
result of worsening of myocardial T2*.
Improvements in LVEF have been shown after treatment with either deferiprone
monotherapy or in combination with DFO.14,22 In CORDELIA, LVEF remained stable during
For personal use only. at Novartis Global on January 2, 2014. bloodjournal.hematologylibrary.orgFrom
15
the study period. Other prospective clinical trials with deferasirox in patients with myocardial
siderosis have also shown no change in LVEF for treatment periods up to 3 years.20,23,26,28
In contrast, recent results from a small study of 13 patients with T2* from 10 to 20ms treated
with deferasirox for 32±7 months showed improvement in LVEF, albeit from lower baseline
values of 59.8%.36 In CORDELIA, approximately half of both the deferasirox and DFO
patients who had low LVEF at baseline improved to within the normal range34 by EOS. This
may be important since even small improvements in LVEF can reduce the risk of heart
failure, even in beta-thalassemia patients with LVEF in the normal range.37 However, 8.8%
of deferasirox patients and 12.7% of DFO patients decreased LVEF to below LLN.
Rates of dose reduction and/or interruption were similar between treatment groups, and
frequency of AEs was also similar. The safety profile of deferasirox was comparable to
previous reports; with the most common drug-related AEs being increased laboratory
parameters and diarrhea.20,23,26 Two deaths occurred during the study. The death of the
patient treated with deferasirox was due to arrhythmia and was not considered related to
study drug. The DFO patient who died as a result of meningitis was suspected by the
investigator to be related to DFO, with splenectomy and progression of diabetes identified
as possible contributory factors.
In conclusion, the randomized controlled trial CORDELIA met its primary endpoint,
demonstrating non-inferiority of once-daily oral treatment with deferasirox compared with
DFO for the removal of myocardial iron, with a trend towards superiority for deferasirox.
These data add to the body of knowledge allowing physicians to make best informed
choices for their patients.
For personal use only. at Novartis Global on January 2, 2014. bloodjournal.hematologylibrary.orgFrom

16
Acknowledgements
We thank Debbi Gorman of Mudskipper Business Ltd for medical editorial assistance.
Financial support for medical editorial assistance was provided by Novartis
Pharmaceuticals.
Funding source
The study was sponsored by Novartis Pharma AG and designed by the sponsor in close
collaboration with the Study Steering Committee. The sponsor conducted the statistical
analysis. Authors had full access to the data, and participated actively in interpreting data
and writing and critically reviewing the article with the assistance of a medical writer funded
by the sponsor. The corresponding author had final responsibility for the manuscript content
and decision to submit for publication.
Authorship contributions
JBP, YL, AE-B, KMB, ME, AY, YK and YA served as investigators on this trial, enrolling
patients. They contributed to data interpretation, reviewed and provided their comments on
this manuscript. DJP, JBP, AP and YA served as Study Steering Committee members
overseeing the conduct of the trial, from study design to analysis plan and data
interpretation. TL, DH and MW assisted in developing the trial protocol, coordinating the
execution of the trial and contributing to the analysis, interpretation and reporting of the trial
data. YZ served as the trial statistician. All authors approved the final manuscript.
Disclosures
DJP reports consultancy and receiving research grant funding and honoraria from Novartis
Pharmaceuticals and AMAG; lecture fees from Novartis Pharmaceuticals; consultancy and
honoraria from ApoPharma Inc and from Shire; and is a director and equity holder in
Cardiovascular Imaging Solutions. YA reports participation in advisory boards and
speaker’s bureau, and receiving honoraria and research grant funding from Novartis
Pharmaceuticals; and participation in advisory boards and receiving research grant funding
from Shire. JBP reports consultancy, receiving research grant funding and honoraria from
Novartis Pharmaceuticals; consultancy and receiving research grant funding from Shire;
For personal use only. at Novartis Global on January 2, 2014. bloodjournal.hematologylibrary.orgFrom

17
and consultancy for Celgene. AP reports participation in advisory boards and receiving
research grant funding from Novartis Pharmaceuticals. DH and YZ are employees of
Novartis Pharmaceuticals, and TL and MW are employees of Novartis Pharma AG. KMB,
AE-B, AY, YK, ME and YL have no relevant conflicts of interest to disclose.
For personal use only. at Novartis Global on January 2, 2014. bloodjournal.hematologylibrary.orgFrom
18
References
1. Carpenter J-P, He T, Kirk P, et al. On T2* magnetic resonance and cardiac iron.
Circulation. 2011;123(14):1519-1528.
2. Anderson LJ, Holden S, Davis B, et al. Cardiovascular T2-star (T2*) magnetic
resonance for the early diagnosis of myocardial iron overload. Eur Heart J.
2001;22(23):2171-2179.
3. Noetzli LJ, Carson SM, Nord AS, Coates TD, Wood JC. Longitudinal analysis of heart
and liver iron in thalassemia major. Blood. 2008;112(7):2973-2978.
4. Wood JC, Origa R, Agus A, et al. Onset of cardiac iron loading in pediatric patients
with thalassemia major. Haematologica. 2008;93(6):917-920.
5. Modell B, Khan M, Darlison M, et al. Improved survival of thalassaemia major in the
UK and relation to T2* cardiovascular magnetic resonance. J Cardiovasc Magn
Reson. 2008;10:42.
6. Ehlers KH, Giardina PJ, Lesser ML, ENGLE MA, Hilgartner MW. Prolonged survival in
patients with beta-thalassemia major treated with deferoxamine. J Pediatr. 1991;118(4
( Pt 1)):540-545.
7. Brittenham GM, Griffith PM, Nienhuis AW, et al. Efficacy of deferoxamine in preventing
complications of iron overload in patients with thalassemia major. N Engl J Med.
1994;331(9):567-573.
8. Olivieri NF, Nathan DG, MacMillan JH, et al. Survival in medically treated patients with
homozygous b-thalassemia. N Engl J Med. 1994;331(9):574-578.
9. Borgna-Pignatti C, Rugolotto S, De Stefano P, et al. Survival and complications in
patients with thalassemia major treated with transfusion and deferoxamine.
Haematologica. 2004;89(10):1187-1193.
10. Anderson LJ, Westwood MA, Holden S, et al. Myocardial iron clearance during
reversal of siderotic cardiomyopathy with intravenous desferrioxamine: a prospective
study using T2* cardiovascular magnetic resonance. Br J Haematol. 2004;127(3):348-
355.
11. Ghugre NR, Enriquez CM, Gonzalez I, et al. MRI detects myocardial iron in the human
heart. Magn Reson Med. 2006;56(3):681-686.
For personal use only. at Novartis Global on January 2, 2014. bloodjournal.hematologylibrary.orgFrom

19
12. Tanner MA, He T, Westwood MA, Firmin DN, Pennell DJ. Multi-center validation of the
transferability of the magnetic resonance T2* technique for the quantification of tissue
iron. Haematologica. 2006;91(10):1388-1391.
13. Pepe A, Positano V, Santarelli MF, et al. Multislice multiecho T2* cardiovascular
magnetic resonance for detection of the heterogeneous distribution of myocardial iron
overload. J Magn Reson Imaging. 2006;23(5):662-668.
14. Pennell DJ, Berdoukas V, Karagiorga M, et al. Randomized controlled trial of
deferiprone or deferoxamine in beta-thalassemia major patients with asymptomatic
myocardial siderosis. Blood. 2006;107(9):3738-3744.
15. Kirk P, Roughton M, Porter JB, et al. Cardiac T2* magnetic resonance for prediction of
cardiac complications in thalassemia major. Circulation. 2009;120(20):1961-1968.
16. Westwood MA, Anderson LJ, Firmin DN, et al. Interscanner reproducibility of
cardiovascular magnetic resonance T2* measurements of tissue iron in thalassemia. J
Magn Reson Imaging. 2003;18(5):616-620.
17. Westwood MA, Firmin DN, Gildo M, et al. Intercentre reproducibility of magnetic
resonance T2* measurements of myocardial iron in thalassaemia. Int J Cardiovasc
Imaging. 2005;21(5):531-538.
18. Kirk P, He T, Anderson LJ, et al. International reproducibility of single breathhold T2*
MR for cardiac and liver iron assessment among five thalassemia centers. J Magn
Reson Imaging. 2010;32(2):315-319.
19. Wood JC, Otto-Duessel M, Aguilar M, et al. Cardiac iron determines cardiac T2*, T2,
and T1 in the gerbil model of iron cardiomyopathy. Circulation. 2005;112(4):535-543.
20. Pennell D, Porter JB, Cappellini MD, et al. Deferasirox for up to 3 years leads to
continued improvement of myocardial T2* in patients with beta-thalassemia major.
Haematologica. 2012;97(6):842-848.
21. Pepe A, Lombardi M, Positano V, et al. Evaluation of the efficacy of oral deferiprone in
beta-thalassemia major by multislice multiecho T2*. Eur J Haematol. 2006;76(3):183-
192.
22. Tanner MA, Galanello R, Dessi C, et al. A randomized, placebo-controlled, double-
blind trial of the effect of combined therapy with deferoxamine and deferiprone on
myocardial iron in thalassemia major using cardiovascular magnetic resonance.
Circulation. 2007;115(4):1876-1884.
For personal use only. at Novartis Global on January 2, 2014. bloodjournal.hematologylibrary.orgFrom

20
23. Wood JC, Kang BP, Thompson A, et al. The effect of deferasirox on cardiac iron in
thalassemia major: impact of total body iron stores. Blood. 2010;116(4):537-543.
24. Tanner MA, Galanello R, Dessi C, et al. Combined chelation therapy in thalassemia
major for the treatment of severe myocardial siderosis with left ventricular dysfunction.
J Cardiovasc Magn Reson. 2008;10:12.
25. Maggio A, D'Amico G, Morabito A, et al. Deferiprone versus deferoxamine in patients
with thalassemia major: a randomized clinical trial. Blood Cells Mol Dis.
2002;28(2):196-208.
26. Pennell DJ, Porter JB, Cappellini MD, et al. Continued improvement in myocardial T2*
over 2 years of deferasirox therapy in b-thalassemia major patients with cardiac iron
overload. Haematologica. 2011;96(1):48-54.
27. Wood JC, Glynos T, Thompson A, et al. Follow-up report on the 2-year cardiac data
from a deferasirox monotherapy trial. Am J Hematol. 2010;85(10):818-819.
28. Pennell DJ, Porter JB, Cappellini MD, et al. Efficacy of deferasirox in reducing and
preventing cardiac iron overload in b-thalassemia. Blood. 2010;115(12):2364-2371.
29. Thalassaemia International Federation. Guidelines for the clinical management of
thalassaemia, 2nd Revised Edition. 2008. Available at:
http://www.thalassaemia.org.cy/wp-content/uploads/pdf/educational-programmes
/Publications/Guidelines%20(2008)/Thalassaemia%20Guidelines%20ENGLISH.pdf.
30. St Pierre TG, Clark PR, Chua-anusorn W, et al. Noninvasive measurement and
imaging of liver iron concentrations using proton magnetic resonance. Blood.
2005;105(2):855-861.
31. Porter JB, Shah FT. Iron overload in thalassemia and related conditions: therapeutic
goals and assessment of response to chelation therapies. Hematol Oncol Clin North
Am. 2010;24(6):1109-1130.
32. EMA Committee for proprietary medical products. Points to consider on switching
between superiority and non-inferiorty. 2000. Available at:
http://www.emea.europa.eu/docs/en_GB/document_library/Scientific_guideline/2009/0
9/WC500003658.pdf.
33. ICH harmonised tripartite guideline. Statistical principles for clinical trials. 2005.
Available at:
http://www.ich.org/fileadmin/Public_Web_Site/ICH_Products/Guidelines/Efficacy/E9/St
ep4/E9_Guideline.pdf.
For personal use only. at Novartis Global on January 2, 2014. bloodjournal.hematologylibrary.orgFrom

21
34. Westwood MA, Anderson LJ, Maceira AM, et al. Normalized left ventricular volumes
and function in thalassemia major patients with normal myocardial iron. J Magn Reson
Imaging. 2007;25(6):1147-1151.
35. Cappellini MD, Cohen A, Piga A, et al. A phase 3 study of deferasirox (ICL670), a
once-daily oral iron chelator, in patients with b-thalassemia. Blood. 2006;107(9):3455-
3462.
36. Cassinerio E, Roghi A, Pedrotti P, et al. Cardiac iron removal and functional cardiac
improvement by different iron chelation regimens in thalassemia major patients. Ann
Hematol. 2012;91(9):1443-1449.
37. Pennell DJ, Carpenter J-P, Roughton M, Cabantchik IZ. On improvement in ejection
fraction with iron chelation in thalassemia major and the risk of future heart failure.
Cardiovasc Magn Reson. 2011;13(1):45.
For personal use only. at Novartis Global on January 2, 2014. bloodjournal.hematologylibrary.orgFrom

22
Tables
Table 1. Baseline patient characteristics (mean ±SD unless otherwise stated)
Variable Deferasirox
(N=98)
DFO
(N=99)
All patients
(N=197)
Beta-thalassemia major, n (%) 98 (100) 99 (100) 197 (100)
Age, years 19.9±6.5 19.7±6.3 19.8±6.4
Age range, years 10.0–39.0 10.0–40.0 10.0–40.0
Male:female, n 58:40 57:42 115:82
Race, n (%)
Caucasian 59 (60.2) 59 (59.6) 118 (59.9)
Black 0 (0.0) 0 (0.0) 0 (0.0)
Asian 38 (38.8) 40 (40.4) 78 (39.6)
Other 1 (1.0) 0 (0.0) 1 (0.5)
Hepatitis status, n (%)
Hepatitis B 1 (1.0) 2 (2.0) 3 (1.5)
Hepatitis C 22 (22.4) 19 (19.2) 41 (20.8)
Hepatitis B and C 0 (0.0) 2 (2.0) 2 (1.0)
No hepatitis 75 (76.5) 80 (80.8) 155 (78.7)
Time since start of blood transfusions, years 19.3±6.4 18.4±6.2 18.8±6.3
Total number of blood transfusions received 315.6 294.8 305.3
Previous chelation therapy, n (%) 96 (100) 91 (100) 187 (100)
DFO 41 (42.7) 39 (42.9) 80 (42.8)
Deferiprone 9 (9.4) 5 (5.5) 14 (7.5)
DFO + deferiprone 21 (21.9) 21 (23.1) 42 (22.5)
Deferasirox 18 (18.8) 23 (25.3) 41 (21.9)
Other† 7 (7.3) 3 (3.3) 10 (5.3)
Time since start of first chelation therapy, years 14.0±7.0 14.3±7.2 14.2±7.1
Myocardial T2* categories, n (%)
6 to <10ms 33 (33.7) 32 (32.3) 65 (33.0)
10 to ≤20ms 65 (66.3) 67 (67.7) 132 (67.0)
LVEF, n (%)§
<LLN by Westwood‡ 11 (12.1) 10 (12.3) 21 (12.2)
For personal use only. at Novartis Global on January 2, 2014. bloodjournal.hematologylibrary.orgFrom

23
≥LLN by Westwood‡ 80 (87.9) 71 (87.7) 151 (87.8)
LIC, mg Fe/g dw§ 29.8±17.5 30.3±17.9 30.0±17.7
LIC categories, n (%)§
LIC <7mg Fe/g dw 11 (12.1) 8 (9.9) 19 (11.0)
LIC 7–<15mg Fe/g dw 14 (15.4) 14 (17.3) 28 (16.3)
LIC ≥15mg Fe/g dw 66 (72.5) 59 (72.8) 125 (72.7)
Median serum ferritin (range), ng/mL§ 5062
(613–15,331)
4684
(677–13,342)
4878
(613–15,331) †Unknown, or patients received irregular deferiprone and/or deferoxamine therapy. ‡Westwood criteria:
lower limit of normal (LLN) for males: <59, and for females: <63.34 §Based on the per-protocol population.
For personal use only. at Novartis Global on January 2, 2014. bloodjournal.hematologylibrary.orgFrom

24
Table 2. Comparison of myocardial T2* change from baseline in patients treated with
deferasirox or DFO for 1 year
Deferasirox
DFO
All patients
Per-protocol population (N=91) (N=81) (N=172)
Gmean T2* (CV) at baseline 11.2 (32.6) 11.6 (30.7) 11.4 (31.7)
Gmean T2* (CV) at end of study‡ 12.6 (42.6) 12.3 (34.7) 12.5 (38.9)
Gmean ratio of Month 12/Baseline
(95% CI)
1.12
(1.07, 1.18)
1.07
(1.02, 1.11)
1.10
(1.06, 1.13)
Ratio of Gmean ratios of deferasirox vs DFO – – 1.056
Repeated 95% CI of the ratio of Gmean ratios – – (0.998, 1.133)
P-value for superiority§ – – 0.057
Intention to treat population (N=92) (N=88) (N=180)
Gmean T2* (CV) at baseline 11.2 (31.9) 11.6 (32.9) 11.4 (32.4)
Gmean T2* (CV) at end of study‡ 12.5 (43.0) 12.0 (36.3) 12.2 (39.7)
Gmean ratio of Month 12/Baseline
(95% CI)
1.12
(1.07, 1.18)
1.06
(1.02, 1.11)
1.09
(1.06, 1.13)
Ratio of Gmean ratios of deferasirox vs DFO – – 1.055
Repeated 95% CI of the ratio of Gmean ratios – – (0.999, 1.129)
P-value for superiority§ – – 0.054 ‡Last available value at least 150 days after randomization; §Two-sided adjusted P-value based on the Tsiatis, Rosner and Mehta stage-wise ordering.
For personal use only. at Novartis Global on January 2, 2014. bloodjournal.hematologylibrary.orgFrom
25
Figures
Figure 1. Patient disposition
†A patient could have multiple reasons for screening failure or exclusion from efficacy analysis. ‡These
patients comprised the safety set. §Efficacy was assessed using the per-protocol analysis set. ||Because
of worsening of cardiac T2* in three deferasirox patients and three DFO patients; LVEF decreased <50%
in a DFO patient and cardiomegaly in a deferasirox patient.
Screened, n=925
Excluded,† n=728Unacceptable test procedure result, n=588Unacceptable laboratory value, n=99Subject withdrew consent, n=40Other, n=30Unacceptable medical history/concomitant diagnosis, n=4Did not meet diagnostic/severity criteria, n=1Unknown, n=1
Randomized, n=197
Deferasiroxn=98
DFOn=99
Discontinued, n=14Death, n=1Unsatisfactory therapeutic effect, n=1|
Consent withdrawn, n=6Lost to follow-up, n=3Abnormal test procedure result, n=3||
Completed 12 months, n=82 Completed 12 months, n=78
Discontinued, n=13Death, n=1Unsatisfactory therapeutic effect, n=2||
Consent withdrawn, n=5Lost to follow-up, n=2Abnormal test procedure result, n=2||
Protocol deviation, n=1
Received study drug,‡ n=96 Received study drug,‡ n=91
Discontinued, n=8Consent withdrawn, n=7Protocol deviation, n=1
Discontinued, n=2Consent withdrawn, n=1Protocol deviation, n=1
Analyzed for efficacy,§ n=91Excluded from analysis,† n=7
Did not receive ≥6 months study drug, n=5No T2* value after ≥150 days , n=7
Analyzed for efficacy,§ n=81Excluded from analysis,† n=18
Did not receive ≥6 months study drug, n=12No T2* value after ≥150 days , n=15>20% days without dose, n=4
For personal use only. at Novartis Global on January 2, 2014. bloodjournal.hematologylibrary.orgFrom
26
Figure 2. Gmean myocardial T2* in patients treated with deferasirox or DFO for
1 year, in (A) all patients, or patients with (B) baseline myocardial T2* <10ms (C)
baseline myocardial T2* ≥10ms (D) baseline LIC <7mg Fe/g dw (E) baseline LIC 7–
<15mg Fe/g dw or (F) baseline LIC ≥15mg Fe/g dw†
†Based on the per-protocol population.
11.2
12.611.6
12.3
6789
1011121314151617
Baseline End of studyDeferasirox (n=91) DFO (n=81)
Gm
ean
car
dia
c T
2* (m
s)
12% increase
7% increase
13.5
15.2
13.6 14.4
6789
1011121314151617
Baseline End of study
Deferasirox (n=60) DFO (n=56)
7.7
8.78.1 8.7
6789
1011121314151617
Baseline End of study
Deferasirox (n=31) DFO (n=25)
Gm
ean
car
dia
c T
2* (m
s)
13% increase
8% increase
12% increase
6% increase
Gm
ean
car
dia
c T
2* (m
s)
A B COverall Baseline T2* <10ms Baseline T2* ≥10ms
12.0
14.213.214.8
6789
1011121314151617
Baseline End of study
Deferasirox (n=14) DFO (n=14)
Baseline LIC <7 mg Fe/g dw
12.7
16.6
13.1 14.3
6789
101112
1314151617
Baseline End of study
Deferasirox (n=11) DFO (n=8)
Baseline LIC 7–<15 mg Fe/g dw
30% increase
10% increase
Gm
ean
card
iac
T2*
(ms)
19% increase
13% increase
10.8
11.711.111.6
6789
1011121314151617
Baseline End of study
Deferasirox (n=66) DFO (n=59)
9% increase
5% increase
Baseline LIC ≥15 mg Fe/g dw
D E F
Gm
ean
card
iac
T2*
(ms)
Gm
ean
card
iac
T2*
(ms)
For personal use only. at Novartis Global on January 2, 2014. bloodjournal.hematologylibrary.orgFrom

27
Figure 3. Shift in proportion of patients with severe, mild-to-moderate and normalized
cardiac T2* values at baseline and EOS in patients treated with (A) deferasirox or (B)
DFO for 1 year†
A
B
†Based on the per-protocol population.
3.3 9.7
34.123.1
34.154.8
6.7
65.9
56.0
35.565.9
66.7
17.6
26.7
0
10
20
30
40
50
60
70
80
90
100
Baseline EOS Baseline EOS Baseline EOS
T2* >20ms
T2* 10–≤20ms
T2* 6–<10ms
T2* <6ms
Proportion o
f
all patients (%)
All patients Baseline T2* <10ms Baseline T2* ≥10ms
30.9 28.4 30.980.0
5.4
69.165.4
20.0
69.1 85.7
6.2
8.9
0
10
20
30
40
50
60
70
80
90
100
Baseline EOS Baseline EOS Baseline EOS
T2* >20ms
T2* 10–≤20ms
T2* 6–<10ms
T2* <6ms
Proportion o
f
all patients (%)
All patients Baseline T2* <10ms Baseline T2* ≥10ms
For personal use only. at Novartis Global on January 2, 2014. bloodjournal.hematologylibrary.orgFrom