
Efficacy of Hydroxyurea (HU) in Reduction of Pack Red Cell (PRC) Transfusion Requirement Among...
23
International Research Journal of Finance and Economics ISSN 1450-2887 Issue 88 (2012) © EuroJournals Publishing, Inc. 2012 http://www.internationalresearchjournaloffinanceandeconomics.com The Relationship between Capital Structure and the Life Cycle of Firms in the Manufacturing Sector of Indonesia Siti Rahmi Utami Maastricht School of Management Endepolsdomein 150 6229 EP Maastricht The Netherlands E-mail: [email protected] Eno L. Inanga Maastricht School of Management Endepolsdomein 150 6229 EP Maastricht The Netherlands E-mail: [email protected] Tel: +31 43 387 0808 Abstract This study examines whether growth firms in the manufacturing sector of Indonesia follow the pecking order theory more closely than the mature firms in the same sector and why. To attempt to answer this question, we collected relevant data from a sample of LQ45 manufacturing companies listed in the Indonesia Stock Exchange (IDX) between 1994 and 2007. To test the hypothesis, we applied multiple regression and augmented analysis. Based on the overall results, we concluded as follow. For the LQ45 index of the growth firms in the manufacturing sector of Indonesia, the financing deficit had positive significant effects on net debt and net equity issues, whereas financing deficit had negative significant effects on new retained earnings. For Mature firms, we concluded that the financing deficit had positive significant effects on net debt issue and net equity issues, while financing deficit has negative insignificant effects on new retained earnings. Furthermore, growth and mature firms prefer external to internal financing and debt to equity if external financing is used. Therefore, both growth and mature firms tend to follow the pecking order theory. However, results showed that the pecking order theory described financing patterns of growth firms better than mature firms. Specifically, the financing deficit problem of mature firms tends to be solved more by net equity issue while that of growth firms is solved by net debt issue. Keywords: Capital Structure, Life Cycle of Firms, Pecking Order Theory JEL Classification Code: G32 1. Introduction One of the major concerns in corporate finance is to determine how firms should finance their investments and operations over the firm’s life cycle to maximize returns and ensure sustainability. These are important issues that have motivated this research. Firms in different life cycle stages have different characteristics, especially regarding the information asymmetry. Mature firms have less information asymmetry whereas growth firms have more. This is because mature and older firms are
Transcript of Efficacy of Hydroxyurea (HU) in Reduction of Pack Red Cell (PRC) Transfusion Requirement Among...

International Research Journal of Finance and Economics ISSN 1450-2887 Issue 88 (2012) © EuroJournals Publishing, Inc. 2012 http://www.internationalresearchjournaloffinanceandeconomics.com
The Relationship between Capital Structure and the Life Cycle of Firms in the Manufacturing Sector of Indonesia
Siti Rahmi Utami Maastricht School of Management Endepolsdomein 150
6229 EP Maastricht The Netherlands E-mail: [email protected]
Eno L. Inanga
Maastricht School of Management Endepolsdomein 150 6229 EP Maastricht The Netherlands
E-mail: [email protected] Tel: +31 43 387 0808
Abstract
This study examines whether growth firms in the manufacturing sector of Indonesia follow the pecking order theory more closely than the mature firms in the same sector and why. To attempt to answer this question, we collected relevant data from a sample of LQ45 manufacturing companies listed in the Indonesia Stock Exchange (IDX) between 1994 and 2007. To test the hypothesis, we applied multiple regression and augmented analysis.
Based on the overall results, we concluded as follow. For the LQ45 index of the growth firms in the manufacturing sector of Indonesia, the financing deficit had positive significant effects on net debt and net equity issues, whereas financing deficit had negative significant effects on new retained earnings. For Mature firms, we concluded that the financing deficit had positive significant effects on net debt issue and net equity issues, while financing deficit has negative insignificant effects on new retained earnings. Furthermore, growth and mature firms prefer external to internal financing and debt to equity if external financing is used. Therefore, both growth and mature firms tend to follow the pecking order theory. However, results showed that the pecking order theory described financing patterns of growth firms better than mature firms. Specifically, the financing deficit problem of mature firms tends to be solved more by net equity issue while that of growth firms is solved by net debt issue. Keywords: Capital Structure, Life Cycle of Firms, Pecking Order Theory JEL Classification Code: G32
1. Introduction One of the major concerns in corporate finance is to determine how firms should finance their investments and operations over the firm’s life cycle to maximize returns and ensure sustainability. These are important issues that have motivated this research. Firms in different life cycle stages have different characteristics, especially regarding the information asymmetry. Mature firms have less information asymmetry whereas growth firms have more. This is because mature and older firms are

International Research Journal of Finance and Economics - Issue 88 (2012) 70
more closely followed by analysts and are better known to investors and, hence, should suffer less from problems of information asymmetry.
The theory’s prediction says that firms with the greatest information asymmetry problems (specifically young-growth firms) are precisely those which should be making financing choices according to the pecking order theory. In general, the major difference between mature and young firms is not that mature firms are larger, but they are more mature. Mature firms are older, more stable, higher profit with few growth opportunities and good credit histories.
By applying pecking order arguments, growth firms place greater demand on the internally generated funds to fund their investment needs. Consequentially, firms with relatively high growth will tend to issue securities less subject to information asymmetries, such as short-term debt. In line with the trade-off theory, for companies with growth opportunities, the use of debt is limited as in the case of bankruptcy, the value of growth opportunities will be close to zero, growth opportunities are particular case of intangible assets (Myers, 1984; Williamson, 1988; and Harris and Raviv, 1990). Firms with less growth prospects should use debt because it has a disciplinary role (Jensen, 1986 and Stulz, 1990).
We focus on the pecking order theory of financing proposed by Myers (1984) and Myers and Maljuf (1984). This theory is based on asymmetric information between investors and firm managers. Due to the valuation discount that less-informed investors apply to newly issued securities, firms resort to internal funds first, then debt and equity last to satisfy their financing needs for the last. In the context of a firm’s life cycle, we expect that asymmetric information problems are more severe among young-growth firms compared to firms that have reached maturity. Hence, the theory predicted that younger, fast-growth firms should be following the pecking order more closely.
Therefore, the firm’s life cycle influenced the choice of firm’s capital structure, and it is important for the manager of a firm to apply the theory of capital structure. There have been many previous studies that examine which factors influenced the choice of firms’ capital structure. However, there has been little that analyzes the choice of firm’s capital structure over firm life cycle. For instance, Bulan and Yan (2007) found that the pecking order theory described the financing patterns of mature firms better than that of younger growth firms. Older and more mature firms are more closely followed by analysts and are better known to investors, and should therefore suffer less from problems of information asymmetry. Hence, their findings suggest that older, more stable and highly profitable firms with few growth opportunities and good credit histories are more suited to use internal funds first, and then debt before equity for their financing needs.
Bulan and Yan (2009) documented this result as a maturity effect in firm financing choice. Mature firms were able to borrow more easily and at a lower cost. Therefore, by the very nature of their life cycle stage, mature firms were pre-disposed to utilizing debt financing first before equity. Petersen Rajan (1995) presented evidence that older and more mature firms had access to a lower cost of debt, all else equal. Furthermore, mature firms generally have more internal funds due to higher profitability and lower growth opportunities. Hence, by nature of their life cycle stage, they concluded that mature firms were in a better position to following the pecking order.
Based on the conclusions of these studies, we will examine how firms in Indonesia raise capital for investments over their life cycle stages. We expect some of our conclusions to explain what is happening in Indonesia’s capital market and how manufacturing firms of LQ45 Index finance their deficit over their life cycle. The findings of this study will help to make firms informed about capital structure choices at different life cycle stages.
For this study, we will use the variables net equity issued, net debt issued, new retained earnings, and financing deficit. We classify firms into two categories according to their life cycle stage, namely, firms in their growth stage and firms in their mature stage. We define mature firms as firms that have 6-year dividend payment periods. Hence, our sample consists of 10 mature firms and 16 growth firms.

71 International Research Journal of Finance and Economics - Issue 88 (2012)
We make conclusions based on the results of analysis of hypotheses testing as follows. For growth firms, the financing deficit has significant positive effects on net debt issue and on net equity issue but it has significant negative effects on new retained earnings. For mature firms, the financing deficit has significant positive effects on net debt issue and on net equity issue but it has insignificant negative effects on new retained earnings. From these results, we concluded that our mature and growth firm prefer external to internal financing and debt to equity if external financing is used. Overall, we found that the pecking order theory described the financing patterns of growth firms better than mature firms as mature firms are more closely observed by analysts and are better known to investors, and hence, should suffer less from problems of information asymmetry. Our research findings could be as the comparison of to the findings of previous research and theories.
The rest of this paper is structured as follows. Section 2 reviews the relevant literature and the previous research. Section 3 formulates the related hypothesis by analyzing capital structure theory and some previous research. Section 4 focuses on research methodology, while section 5 analyzes the results of the hypothesis tested. Section 6 concludes the study.
2. Previous Research Some theories of the firm’s capital structure have been studied over the firm’s life cycle stages. Notable among them are the pecking order theory, trade-off theory and bankruptcy costs), and agency cost theory. We then focus on the pecking order theory of financing proposed by Myers (1984) and Myers and Maljuf (1984) as the only pecking order theory which specifically explains about the specific preference order of firm’s capital structure over firm life cycle.
The following theories are predictions of the relationship between research variables and some previous research findings. As implied by the pecking order theory of financing of Myers (1984) and Myers and Maljuf (1984), the theory was based on asymmetric information between investors and firm managers. Due to the valuation discount that less-informed investors apply to newly issued securities, firms resort to internal funds first, then debt and equity for the last to satisfy their financing needs. In the context of a firm’s life cycle, the theory predicts that younger, fast-growing firms should be following the pecking order more closely.
The trade-off theory stated that debt created a tax shield advantage through interest payments (DeAngelo and Masulis, 1980), which was balanced by the cost of bankruptcy (Baxter, 1967; Stiglitz, 1972; Kraus and Litzenberger, 1973; and Kim, 1978) to reach the optimal capital structure. According to the theory, the retained earnings of high growth firms increased and they issued more debt to maintain the target debt ratio. Thus, positive relationship between debt ratio and growth was expected based on this argument.
However, according to the agency theory of Jensen and Meckling's (1976) and Jensen's (1986), the issuance of debt by low growth firms provided a device for monitoring and controlling managers by determining the market reaction to debt issuance by firm's with different growth rates. Therefore, following Jensen and Meckling's and Jensen's arguments, low growth firms should increase debt levels in their capital structure.
Many previous studies of capital structure of the firms over its life cycle stages have been in the context of the pecking order theory. Bulan and Yan (2009) examined the central prediction of the pecking order theory of financing among firms in two distinct life cycle stages, namely growth and maturity. They found that within a life cycle stage, where levels of debt capacity and external financing needs were more homogeneous, and after sufficiently controlling for debt capacity constraints, firms with high adverse selection costs followed the pecking order more closely, consistent with the theory.
More importantly, they found that growth firms had greater financing deficits but smaller debt capacity. It implied that growth firms would reach their debt capacities more often than mature firms. They argued that within a broad sample of firms, inference regarding the empirical performance of the pecking order theory was weakened if differences in these two key attributes were unaccounted for in the empirical test.

International Research Journal of Finance and Economics - Issue 88 (2012) 72
Their results were consistent with firms following the pecking order, with the coefficient on the deficit being positive while the coefficient on the deficit-squared was negative. Both growth and mature firms were issuing debt first, while equity was the residual source of financing once they reached their debt capacities. Comparing across life cycle stages however, they found that mature firms had significantly higher debt-deficit sensitivities indicating that mature firms followed the pecking order more closely. This was contrary to conventional wisdom since they would expect growth firms to suffer more from information asymmetry problems.
Bulan and Yan (2007) studied firms’ financing behavior over life cycle stages in the context of the pecking order theory. They classified firms into two life cycle stages, namely growth and maturity, and tested the pecking order theory of financing proposed by Myers (1984) and Myers and Maljuf (1984). They used two different empirical frameworks: the Shyam-Sunder and Myers (1999) model and the Leary and Roberts (2006) model. Under both specifications, they identified two effects: a size effect and a maturity effect.
When controlling for a firm’s debt capacity, this size effect disappeared altogether, while the maturity effect remained. Overall, Bulan and Yan (2007) found that the pecking order theory described the financing patterns of mature firms better than of growth firms. This is contrary to the theory’s prediction that firms with the greatest information asymmetry problems (specifically young-growth firms) are precisely those that should be making financing choices according to the pecking order. In general, the major difference between mature and young firms is not that mature firms are larger, but because they are more “mature”. Mature firms are older, more stable, higher profitable with few growth opportunities and good credit histories. They are thus more suited to use internal funds first, and then debt before equity for their financing needs. These results are robust under alternative empirical models for testing the pecking order theory.
Bulan and Yan (2007) further saw that growth firms had larger financing deficits, as expected. The financing deficit is defined as the uses of funds minus internal sources of funds, which, by an accounting identity, is also the sum of net debt issued and net equity issued. There seems to be no difference in net debt issued between the two cohorts, while net equity issued is larger for the growth firms. From this simple comparison, the evidence seems to suggest growth firms rely more heavily on equity financing rather than debt. This finding is consistent with Agca and Mozumdar (2004) and Lemmon and Zender (2004). Overall, Bulan and Yan (2007) found that the pecking order theory described the financing patterns of mature firms better than that of younger growth firms.
Halov and Heider (2003) starting point for the analysis was the empirical puzzle that the pecking order seems to work well when it should not, i.e. for large mature firms, and seems not to work well when it should, such as for small young non-payers of dividends. They argued that the original pecking order was based on the mispricing of equity caused by not knowing the value of investments. But when outside investors also do not know the risk of investments, then debt is mis-priced too. They argued that asymmetric information about both, value and risk, transformed the adverse selection logic into a theory of debt and equity.
Their main hypothesis was that firms issued more equity and less debt in situations where risk was an important element of the adverse selection problem of outside financing. They found robust empirical support for the hypothesis and document a strong link between asset risk and the decision to issue debt and equity in a large unbalanced panel of publicly traded US firms from 1971 to 2001.
Suarez (2005) study concluded that, the pecking order’s high explanatory power could be the result of sample bias towards large and mature firms. This implies that a sample of smaller growth firms may not provide the good fit required to establish statistical power to the pecking order specification. He explained that it has been observed that even small growth firms that had the ability to issue default free debt or venture capital (close ties with local banks) were characterized by very low levels of debt (even zero) and high levels of equity financing. He added that it would be interesting to carry out similar procedures with these models using a different firm sample ( composed of small venture capital firms) to then see if the pecking order model stood the test.

73 International Research Journal of Finance and Economics - Issue 88 (2012)
Frank and Goyal (2003) examined the broad applicability of the pecking order theory. Their evidence based on a large cross-section of US publicly traded firms over long time periods, showed that external financing was heavily used by some firms. On average net equity issues track the financing deficit more closely than do net debt issues.
Diamond (1989) showed as mature firms had a good reputation so that they were able to obtain better loan rates compared to their younger firm counterparts. Helwege and Liang (1996) followed a sample of recent IPO firms and found that these firms’ decision to access the external finance markets as well as their choice of type of external finance was inconsistent with the pecking order. Hatfield, Cheng, and Davidson (1994), stated that, one might expect that a high growth firm could afford to have greater financial leverage because it could generate enough earnings to support the additional interest expense. On the other hand, it may be riskier for a low growth firm to increase its financial leverage as its earnings may not increase enough to cover the additional fixed obligations.
The empirical evidence for the agency theory also has been documented from the research findings of Voz and Forlong (1998), which concluded that, at the IPO stage, the IPO process performed a similar role to debt in reducing agency costs, and consequently, debt loses much of its agency advantage. Instead, the tax advantage of debt appears to be extremely significant in determining an IPO firm optimal debt level. Meanwhile, the mature-listed stage is associated with an increase in debt levels which appear to be in response to a new ownership structure. It appears that there is a very strong agency advantage of debt which surpasses the tax advantage. However, if a firm's growth options are high, this agency advantage appears to be outweighed by the need to maintain financial slack. Overall, they show the findings that debt has a significant but minor agency advantage (defined as reducing agency costs of equity) at the IPO stages and a significant advantage at the mature listed stage.
According to the study of Huang and Song (2002), who used the market and accounting data from more than 1000 Chinese listed companies up to the year 2000, to document the characteristics of these firms in terms of capital structure. They used sales growth rate to measure the past growth experience and Tobin’s Q to measure a firm’s growth opportunity in the future. Their finding showed that firms with high growth rate in the past tended to have higher leverage, while firms that had a good growth opportunity in the future (a higher Tobin’s Q) tended to have lower leverage. They further explained that firms with brighter growth opportunity in the future preferred to keep leverage low so they would not give up profitable investment because of the wealth transfer from shareholders to creditors, also the fast growth firms meant that these firms had good investment opportunities in the past and had used more debt to finance their investment.
Sbeiti (2010) found a negative relation between growth opportunities and leverage and it was consistent with the predictions of the agency theory that high growth firms used less debt, since they did not wish to be exposed to possible restrictions by lenders. His explanation was that growing firms had more options of choosing between risky and safe sources of funds and managers as agents to shareholders went for risky projects in order to maximize the return to their shareholders. Creditors, however, would be reluctant to provide funds to such firms as they would bear more risk for the same return. They would thus demand a higher premium from growing firms. Faced with this prospect and in order to avoid the extra cost of debt, growing firms will tend to use less debt and more equity. Hence, the relatively large magnitude of the growth coefficient may be indicative of a higher degree of information asymmetries in these markets, restricting the ability of managers to raise external debt capital. He further explains that it is also important to note that the firm-specific (such as size, liquidity, profitability and tangibility) coefficients are almost identical. However, variables such as market to book ratio reflect the capital market valuation of the firm, which in turn is affected by the conditions of the capital market.
Shah and Khan (2007) found that growth variable was significant at 10% level and was negatively related to leverage. As they expected, this negative coefficient of -0.0511 showed that growing firms did not use debt financing. They concluded that their results were in conformity with the result of Titman and Wessels (1988), Barclay, et al. (1995), and Rajan and Zingales (1995). They

International Research Journal of Finance and Economics - Issue 88 (2012) 74
explained that growing firms had more options of choosing between safe and risky firms. Managers, being agent to shareholders, would try to go for risky projects and increased return to shareholders. Creditors would be unwilling to give funds to such firms as they would bear more risk for the same return. To compensate for the additional risk in growth companies, creditors would demand risk premium. Facing extra cost of debt, growing firms would use less debt and more equity.
Shah and Khan (2007) further explained that since growing firms ran more risk of project failure as compared to businesses that were static and were run in conventional ways, managers might not want to add financial risk in addition to the high operational risk of the new projects. Thus, the managers' unwillingness to add financial risk to firm resulted in lower debt ratio for growing firms.
3. Hypothesis We tested the hypothesis to examine which firm’s life cycle followed the pecking order more closely as firm in different life cycle stage had different capital structure choices by considering the characteristics and information asymmetry. Therefore, based on pecking order theory and previous research, we hypothesize that: “In the context of firm’s life cycle, we expect that growth firms follow the pecking order theory more closely than mature firms”.
4. Research Methodology The objectives of this research are to investigate in the context of firm’s life cycle, to what extent growth firms follow the pecking order theory more closely than mature firms”. The study used quantitative approaches or strategies. 4.1. Data and Sample
We collected the data from the book of data published by Indonesia Stock Exchange (IDX). The book of data consists of financial statement of each firm. For our hypothesis, we used quantitative research strategy hence we applied quantitative data collection and quantitative data analysis.
We used research sample covering all manufacturing companies listed in LQ45 index, one of the index at Indonesian Stock Exchange. To date, the LQ45 Index covers at least 70% of market capitalization and transaction values in the regular market. The index consists of 45 stocks that have accepted the liquidity and market capitalization screenings. The firms in LQ45 index during that period were reviewed every 3 months and they still stayed in the list. Hence, within sampling period, we got 26 manufacturing firms sample. 4.2. Firm’s Life Cycle
To examine the firm capital structure over the firm life cycle, we first classified firms into two cohorts according to their life cycle stage, namely, firms in their growth stage and firms in their mature stage. Then we also classified firms into young firms and old firms.
Since we would like to examine how growth and mature firms financing their deficit, hence, it is necessary to make sub distinctions in the theoretical framework between growth-mature firms. Maturity can be regarded as a proxy for information asymmetry between firm insiders and the capital markets. Mature firms are more closely observed by analysts and should therefore be more capable of issuing more equity, and have lower debt. Growth firms are on the other hand.
In the context of a firm’s life cycle, we expected that asymmetric information problems were more severe among growth firms compared to firms that have reached maturity. Hence, the pecking order theory predicts that fast-growth firms should be following the pecking order more closely.
Bulan and Yan (2009) defined the growth stage as the first six-year period after the year of the firm’s initial public offering (IPO). The IPO itself is an important financing decision that a firm has to

75 International Research Journal of Finance and Economics - Issue 88 (2012)
make. Here, Bulan and Yan (2009) treated the IPO as the starting point of the growth stage (or the new growth stage).
DeAngelo, DeAngelo and Stulz (2006), among others, found that a firm’s propensity to pay dividends was a function of the stage where the firm is in its life cycle. In particular, Bulan, Subramanian and Tanlu (2007) found that dividend initiators were mature firms. Based on the body of work, they identified firms in their mature stage by their dividend initiation history. First, they used the entire compustat industrial annual database to find consecutive six-year periods for which a firm has positive dividends. They required that such a period should immediately follow at least one year with zero or missing dividends. They deemed these 6-year dividend payment periods as the mature stage of a firm’s life cycle. 1. Growth Firms and Mature Firms We took Grullon, Michaely and Swaminathan (2000), DeAngelo, DeAngelo and Stulz (2005), and Bulan, Subramanian and Tanlu (2007) ones who defined that initiating dividend firms were mature firms. Thus we identified firms in mature stage by their dividend history. Halov and Heider (2005), Leary and Roberts (2006), and Byoun (2007) showed that firm financing choice was complex and was driven by many factors which included pecking order theory considerations. We constructed two samples of firms based on their life cycle stage: firms in the growth stage and firms in the mature stage. a. Growth Stage Our sample was constructed from the manufacturing sector of LQ45 index over the 1994-2007 period. Some previous research defined the growth stage to be the first six-year period after the year of the firm’s IPO, however we defined the growth stage to be the firms that paid dividend less than 5 years consecutively. b. Mature Stage We took Bulan and Yan (2007) as a reference to construct the sample as follows: we included the former 6-year period in our sample. We considered these 6-year dividends payment periods as the mature stage of a firm’s life cycle. We found 10 firms had one 6-year dividend payment period; while 16 firms had less than one 6-year dividend payment periods among the 26 firms. Table 1: Firm Classifications: Growth firms
Growth firms ADMG BRPT BUDI CPIN DNKS FASW GJTL INDR INKP INAF INTP KOMI SMCB TKIM TSPC SULI
Table 2: Firm Classifications: Mature firms
Mature firms ASII AUTO GGRM HMSP INDF KAEF KLBF RMBA SMGR UNVR
2. Young Firms and Old Firms Bulan and Yan (2007) set the length of each stage to be 6 years. Evans (1987) defined six years old or younger as young firms and seven years or older as old firms. We set the length of each stage to be 6 years. By referring to Bulan and Yan (2007) to classify the growth and mature sample firms, we deem that the 6-year dividends payment periods as the mature stage of a firm’s life cycle, and we found 10 firms which had one 6-year dividend payment period; while 16 firms had less than one 6-year dividend payment periods as growth firms. From tables, we can see that all mature firms are old firms except for KAEF, all firms are old firms except for INAF and KAEF.
KAEF was categorized as old firm. It was established on January 23, 1969 and the firm was a dividend payer. Based on the fact that it listed in Indonesia Stock Exchange (IDX) on July 4th 2001, therefore, KAEF is a young mature firm that is liquid enough to pay dividend to the shareholder. INAF that was established on January 2nd, 1996 and went public on April 17th, 2001 is a growth firm.

International Research Journal of Finance and Economics - Issue 88 (2012) 76
4.3. Measuring Variables
The following sub-section is the measurement of the research variables. Our research variables of hypothesis are including net debt issue, net equity issue, and new retained earnings, as dependent variables, while financing deficit is as independent variable. The following is the description of how we measured the variables.
A. Financing Deficits Bharath, Pasquariello, and Wu (2008) measured firms’ financing deficits, dividends, investments, and cash flow separately. Frank and Goyal (2003) measured deficit as dividend plus investment and cash flow. Meanwhile, investment was measured as capital expenditure and working capital to capture a firm’s demand for funds due to its real investments. Bulan and Yan (2009) measured deficit as the financing deficit scaled by total assets, financing deficit as net equity plus net debt issues, and capital expenditures as capital expenditures divided by total assets. Frank and Goyal (2007) measured the deficit as cash dividends plus investments plus change in working capital minus internal cash flow.
Sogorb-Mira and López-Gracia (2003) measured the financing deficit as change in fixed asset plus change in working capital and change in long term debt minus cash flow. Leary and Roberts (2005) measured current investment as the sum of capital expenditures, increase in investments, acquisitions, and other use of funds, less sale of plant, property, and equipment and sale of investment. Cash flow defined as cash flow after interest and taxes net of dividends, respectively. We measured financing deficit as follows:
Financing Deficit = DIV + CAPEX + LTD payment + Δ WC – CF in which DIV is dividend payments, CAPEX is capital expenditures, ΔWC is the net change in working capital, and CF is operating cash flow (after interest and taxes), long-term debt payment. All variables are scaled by total assets, as in Frank and Goyal (2003). A positive value of financing deficit indicates a financing deficit and a negative one indicates financing surplus.
B. Net Debt Issue Leary and Roberts (2005) measured debt issuances as a change in total debt (long term plus short term) divided by total assets. Frank and Goyal (2007) measured it as net debt issued as long-term debt issuance minus long-term debt redemption. Bulan and Yan (2009) measured net debt as net debt issued scaled by total assets, or long-term debt issuance minus long-term debt reduction divided by total assets. We measured net debt issue as follows:
Net debt issue = (dTA/TA) - (Net equity issue) – (dRE/TA) Where TA is total asset, dTA is change in total asset, and dRE is change in retained earnings.
C. Net Equity Issue and New Retained Earning Leary and Roberts (2005) measured equity issuances as sale of common and preferred stock net of purchase of common and preferred stock. Frank and Goyal (2007) measured net equity issued as the issue of stock minus the repurchase of stock. Bulan and Yan (2009) measured net equity as sale of common and preferred stock minus purchase of common and preferred stock divided by total assets. Meanwhile, we measured net equity issue and newly retained earning by applying the following models :
Net equity issue = (dEq/TA) - (dRE/TA) and NRE = dRE/TA
Where TA is total asset, dEq is change in book equity, NRE is new retained earnings, and dRE is change in retained earnings.
4.4. Hypothesis Testing and Data Analysis
As our hypothesis stated that, in the context of firm’s life cycle, growth firms follow the pecking order theory more closely than mature firms, hence, we tested this hypothesis by applying multiple regression and augmented analysis.

77 International Research Journal of Finance and Economics - Issue 88 (2012)
Multiple regression analysis and augmented analysis were used to test the hypothesis. For testing hypothesis, the independent variable was financing deficit while net debt issue and net equity issue, were the dependent variables.
The objective of using regression analysis is to examine which firm is depicting the pecking order theory more, growth firms or mature firms. If firms followed the pecking order theory, the deficit is financed with internal financing, for external financing, the financing deficit is financed with debt first then equity. The firms applied the pecking order have the changes in debt with track changes in the deficit one-for-one. Hence, the expected coefficient on the deficit is 1.
The pecking order theory is able to explain why firms tend to depend on internal sources of funds and prefer debt to equity if external financing is required. Thus, a firm’s leverage is the cumulative results of the firm’s attempts to mitigate information asymmetry (Bulan and Yan, 2007).
The objective of using augmented analysis is to examine how growth and mature firms finance the deficit, with debt first or equity first. If firms followed the pecking order, changes in debt should track changes in the deficit one-for-one (Shyam-Sunder and Myers, 1999). If firms financed their deficit with debt first and issued equity only when they reached their debt capacities, then net debt issued was a concave function of the deficit (Chirinko and Singha, 2000) and the coefficient on the squared deficit term would be negative. If firms issued equity first and debt was the residual source of financing, then this relationship should be convex and the coefficient on the squared deficit term would be positive.
Firms that follow the pecking order more closely should have a debt-deficit sensitivity that is closer to one. The quadratic specification was used to account for requiring debt capacity constraints. If firms follow the pecking order, changes in debt should track changes in the deficit one-for-one (Shyam-Sunder and Myers, 1999). A. Testing the Pecking Order Theory with Regression Analysis We constructed the figure of conceptual framework to show the relationship between variables based on pecking order theory.
Figure 1: Conceptual Framework
New Retained Earning
Financing Deficit
Net Equity Issued
Net Debt Issued
Capital structure over firm’s life cycle as implied by the Pecking Order Theory
Over firms life cycle stages: growth and mature firms
In Bulan and Yan (2007), the pecking order theory of Myers and Majluf (1984) and Myers (1984) and its extensions (Lucas and McDonald, 1990) based on the idea of asymmetric information between managers and investors. Managers know more about the true value of the firm and the firm’s risk than less informed outside investors. To avoid the underinvestment problem, managers will seek to finance the new project using a security that is not undervalued in the market, such as internal funds.
In this section, we adopted a test of the pecking order theory proposed by Shyam-Sunder and Myers (1999), and based on conceptual framework we made the models as follow:
Net Debt Issue = a + b1 * Deficit + e (Model 1) Net Equity Issue = a + b1 * Deficit + e (Model 2) New Retained Earning = a + b1 * Deficit + e (Model 3) The deficit is financed with debt and/or equity. If firms followed the pecking order, changes in
debt should track changes in the deficit one-for-one. Hence, the expected coefficient on the deficit is 1.
International Research Journal of Finance and Economics - Issue 88 (2012) 78
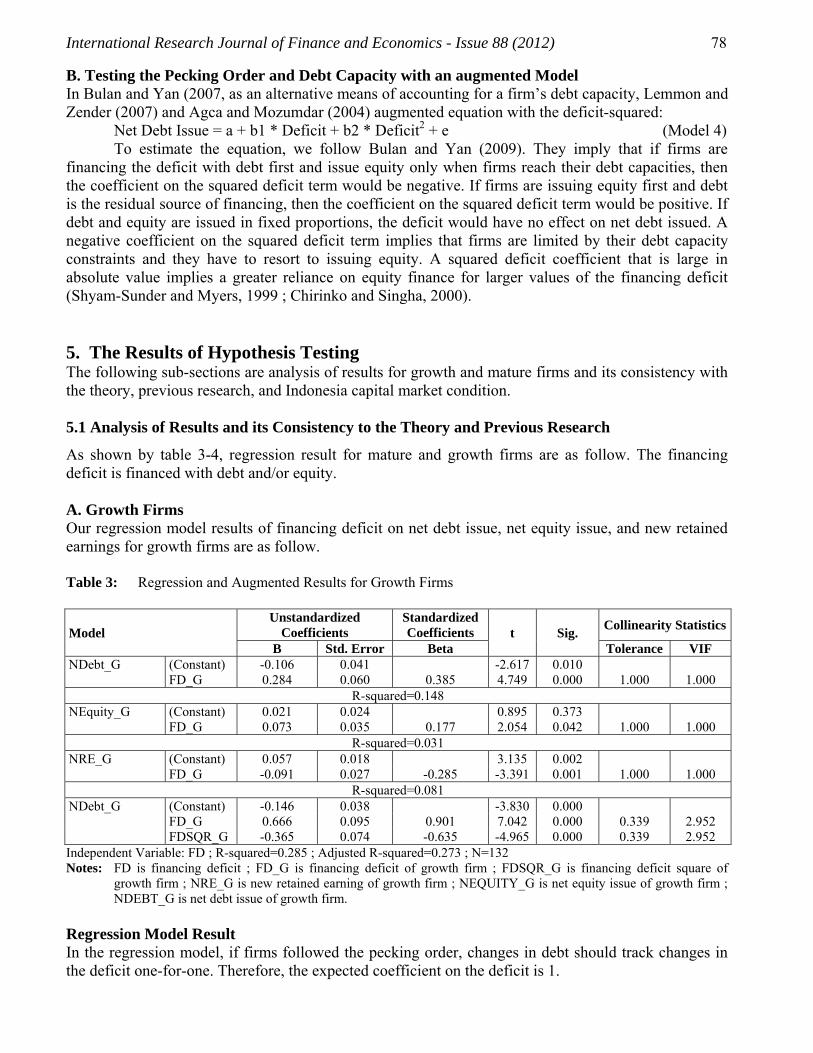
B. Testing the Pecking Order and Debt Capacity with an augmented Model In Bulan and Yan (2007, as an alternative means of accounting for a firm’s debt capacity, Lemmon and Zender (2007) and Agca and Mozumdar (2004) augmented equation with the deficit-squared:
Net Debt Issue = a + b1 * Deficit + b2 * Deficit2 + e (Model 4) To estimate the equation, we follow Bulan and Yan (2009). They imply that if firms are
financing the deficit with debt first and issue equity only when firms reach their debt capacities, then the coefficient on the squared deficit term would be negative. If firms are issuing equity first and debt is the residual source of financing, then the coefficient on the squared deficit term would be positive. If debt and equity are issued in fixed proportions, the deficit would have no effect on net debt issued. A negative coefficient on the squared deficit term implies that firms are limited by their debt capacity constraints and they have to resort to issuing equity. A squared deficit coefficient that is large in absolute value implies a greater reliance on equity finance for larger values of the financing deficit (Shyam-Sunder and Myers, 1999 ; Chirinko and Singha, 2000). 5. The Results of Hypothesis Testing The following sub-sections are analysis of results for growth and mature firms and its consistency with the theory, previous research, and Indonesia capital market condition. 5.1 Analysis of Results and its Consistency to the Theory and Previous Research
As shown by table 3-4, regression result for mature and growth firms are as follow. The financing deficit is financed with debt and/or equity. A. Growth Firms Our regression model results of financing deficit on net debt issue, net equity issue, and new retained earnings for growth firms are as follow. Table 3: Regression and Augmented Results for Growth Firms
Model Unstandardized
Coefficients Standardized Coefficients t Sig.
Collinearity Statistics
B Std. Error Beta Tolerance VIF NDebt_G (Constant) -0.106 0.041 -2.617 0.010 FD_G 0.284 0.060 0.385 4.749 0.000 1.000 1.000
R-squared=0.148 NEquity_G (Constant) 0.021 0.024 0.895 0.373 FD_G 0.073 0.035 0.177 2.054 0.042 1.000 1.000
R-squared=0.031 NRE_G (Constant) 0.057 0.018 3.135 0.002 FD_G -0.091 0.027 -0.285 -3.391 0.001 1.000 1.000
R-squared=0.081 NDebt_G (Constant) -0.146 0.038 -3.830 0.000 FD_G 0.666 0.095 0.901 7.042 0.000 0.339 2.952 FDSQR_G -0.365 0.074 -0.635 -4.965 0.000 0.339 2.952 Independent Variable: FD ; R-squared=0.285 ; Adjusted R-squared=0.273 ; N=132 Notes: FD is financing deficit ; FD_G is financing deficit of growth firm ; FDSQR_G is financing deficit square of
growth firm ; NRE_G is new retained earning of growth firm ; NEQUITY_G is net equity issue of growth firm ; NDEBT_G is net debt issue of growth firm.
Regression Model Result In the regression model, if firms followed the pecking order, changes in debt should track changes in the deficit one-for-one. Therefore, the expected coefficient on the deficit is 1.

79 International Research Journal of Finance and Economics - Issue 88 (2012)
Net Debt Issue From the tables we can conclude that the financing deficit has positive significant effects on net debt issue with t-value of 4.749 (it higher than mature firms) and significance value of 0.000. This result suggests that high deficit firms would tend to issue more net debt. However, the coefficient on the deficit is 0.284 and constant value is -0.106. Net Equity Issued The financing deficit has positive and significant effects on net equity issue with t-value of 2.054 (it lower than mature firms) and significance value of 0.042. This result suggested that high deficit firms would also tend to issue more net equity. However, the coefficient on the deficit is 0.073 and constant value is 0.021. New Retained Earning The financing deficit has negative significant effects on new retained earning with t-value of -3.391 (it more negative than mature firms) and significance value of 0.001. This result suggests that high deficit firms would not tend to use new retained earnings to finance the deficit. However, the coefficient on the deficit is -0.091 and constant value is 0.057. Augmented Model Result For augmented model, if firms are issuing equity first and debt is the residual source of financing, then this relationship should be convex and the coefficient on the squared deficit term would be positive. However, our result showed a negative coefficient (-0.365) on the squared deficit term, it implied that firms were limited by their debt capacity constraints and they have to resort to issuing equity. A squared deficit coefficient that is large in absolute value implies a greater reliance on equity finance for larger values of the financing deficit.
From these results, we can conclude that our sample of growth firm in the manufacturing sector of LQ45 Index prefers external to internal financing and debt to equity if external financing is used. This is consistent with the theory’s prediction that firms with the greater information asymmetry problems (specifically young-growth firms) are precisely those that should be making financing choices according to the pecking order. B. Mature Firms Our regression model results of financing deficit on net debt issue, net equity issue, and new retained earnings for mature firms are as follow. Table 4: Regression and Augmented Results for Mature Firms
Model Unstandardized Coefficients
Standardized Coefficients t Sig.
Collinearity Statistics
B Std. Error Beta Tolerance VIF NDebt_M (Constant) 0.026 0.021 1.201 0.233 FD_M 0.151 0.038 0.383 3.932 0.000 1.000 1.000
R-squared=0.147 ; N=92 NEquity_M (Constant) -0.005 0.013 -0.414 0.680 FD_M 0.058 0.023 0.254 2.489 0.015 1.000 1.000
R-squared=0.064 ; N=92 NRE_M (Constant) 0.074 0.014 5.368 0.000 FD_M -0.042 0.025 -0.177 -1.709 0.091 1.000 1.000
R-squared=0.031 ; N=92 NDebt_M (Constant) -0.025 0.025 -1.012 0.314 FD_M 0.404 0.082 1.025 4.895 0.000 0.193 5.174 FDSQR_M -0.129 0.038 -0.715 -3.415 0.001 0.193 5.174
Independent Variable: FD. F=14.478 (0.000) ; R-squared=0.245 ; Adjusted R-squared=0.229 ; N=92 Notes: FD is financing deficit ; FD_M is financing deficit of mature firm ; FDSQR_M is financing deficit square of
mature firm ; NRE_M is new retained earning of mature firm ; NEQUITY_M is net equity issue of mature firm ; NDEBT_M is net debt issue of mature firm.

International Research Journal of Finance and Economics - Issue 88 (2012) 80
Regression Model Result As for growth firms, the regression model of mature firms, the deficit is financed with debt and/or equity. If firms follow the pecking order, changes in debt should track changes in the deficit one-for-one. Therefore, the expected coefficient on the deficit is 1. Net Debt Issue From the tables, we can conclude that the financing deficit has positive significant effects on net debt issue with t-value of 3.932 and significance value of 0.000. This result suggested that high deficit firms would tend to issue more net debt. However, the coefficient on the deficit is 0.151 and constant value is 0.026. Net Equity Issue The financing deficit has positive significant effects on net equity issue with t-value of 2.489 and significance value of 0.015. This result suggested that high deficit firms would also tend to issue more net equity. However, the coefficient on the deficit is 0.058 and constant value is -0.005. New Retained Earning The financing deficit has negative but not significant effects on new retained earning with t-value of -1.709 and significance value of 0.091. This result suggested that high deficit firms would not tend to use new retained earnings. The coefficient on the deficit is -0.042 and constant value is 0.074. Augmented Model Result If firms are issuing equity first and debt is the residual source of financing, then this relationship should be convex and the coefficient on the squared deficit term would be positive. However, our result showed a negative coefficient (-0.129) on the squared deficit term, it implied that firms were limited by their debt capacity constraints and they have to resort to issuing equity. Prefer External or Internal Financing? The coefficient of financing deficit on new retained earnings is negative for growth and mature firms. The coefficient of financing deficit on net debt and net equity issue are positive significant for growth and mature firms. For both firms, the significance value of net debt issue is more significant than net equity issue. This evidence tends to suggest that mature and growth firms rely more heavily on external financing. Prefer Debt or Equity? Growth firms have the same significant value (0.000) with mature firms, but growth firms have higher standardized coefficients (0.385) of deficit on net debt issue than mature firms (0.383). However mature firms have higher standardized coefficients (0.254) of deficit on net equity issue than growth firms (0.177). These results imply that deficit of mature firms is solved more by net equity issue while deficit of growth firms is solved more by net debt issue.
From augmented model result, the findings are consistent with the firms following the pecking order: the coefficient on the deficit is positive and the coefficient on the deficit-squared is negative. Both growth and mature firms are issuing debt first, while equity is the residual source of financing once they have reached their debt capacities. Our evidence seems to suggest mature and growth firms rely heavily more on debt financing rather than equity financing.
For growth firms, Adjusted R Square (0.273) and R Square (0.285) are stronger than mature firms (0.229) and (0.245). R-squared of financing deficit on net debt issue of growth firms (0.148) are higher than mature firms (0.147), while R-squared of financing deficit on net equity issue of mature firms (0.064) are higher than growth firms (0.031). Therefore, overall, we found that the pecking order theory described the financing patterns of growth firms better than mature firms.

81 International Research Journal of Finance and Economics - Issue 88 (2012)
Adjusted R-squared of predictors of financing deficit and financing deficit square on net debt issue of growth firms (0.273) is higher than mature firms (0.229). It implies that financing deficit and financing deficitsquare of growth firms are rely more on net debt issue. Therefore, the pecking order theory describes the financing patterns of growth firms better than mature firms as mature firms are more closely reviewed by analysts and are better known to investors, and hence, should suffer less from problems of information asymmetry.
Meanwhile, B (the un-standardized coefficients) is the value for the regression equation for predicting the dependent variable from the independent variable. These are called un-standardized coefficients because they are measured in their natural units. The result of (constant) value and beta coefficients of financing deficit on net debt issued, net equity issued, and new retained earnings for growth and mature firms is as follows.
For growth firms, (constant) value of financing deficit on net debt issue is -0.106, B unstandardized coefficients of financing deficit is 0.284. It indicates that if there is no financing deficit, then net debt issue is -0.106, if the value of financing deficit is 1, then net debt issue is 0.178. (Constant) value of financing deficit on net equity issue is 0.021, B unstandardized coefficients of financing deficit is 0.073, it indicates that if there is no financing deficit, then net equity issue is 0.021, if the value of financing deficit is 1, then net equity issue is 0.094. (Constant) value of financing deficit on new retained earnings is 0.057, B unstandardized of financing deficit is -0.091. It indicates that if there is no financing deficit, then new retained earnings is 0.057, if the value of financing deficit is 1, then new retained earnings is -0.034 (in table 3).
For mature firms, (constant) value of financing deficit on net debt issue is 0.026, B unstandardized coefficients of financing deficit is 0.151. It indicates that if there is no financing deficit, then net debt issue is 0.026. If the value of financing deficit is 1, then net debt issue is 0.177. (Constant) value of financing deficit on net equity issue is -0.005, B unstandardized coefficients of financing deficit is 0.058. It indicates that if there is no financing deficit, then net equity issue is -0.005. If the value of financing deficit is 1, then net equity issue is 0.053. (Constant) value of financing deficit on new retained earnings is 0.074, B unstandardized coefficients of financing deficit is -0.042. It indicates that if there is no financing deficit, then new retained earnings is 0.074. If value of financing deficit is 1, then new retained earning is 0.032 (in table 4).
The standardized beta coefficients give a measure of the contribution of each variable to the model. A large value indicates that a unit change in this predictor variable has a large effect on the criterion variable. For mature firms, standardized coefficients of financing deficit on its net debt issue is 0.383, it means that the correlation coefficient between the predictor and the criterion variable is 0.383. The standardized coefficient of financing deficit on its net equity issue is 0.254. It means that the correlation coefficient between the predictor and the criterion variable is 0.254. The standardized coefficient of financing deficit on its new retained earnings is -0.177. It means that the correlation coefficient between the predictor and the criterion variable is -0.177 (in table 4).
For growth firms, the standardized coefficients of financing deficit on net debt issue is 0.385, it means that the correlation coefficient between the predictor and the criterion variable is 0.385. It is higher than mature firms. Standardized coefficient of financing deficit on net equity issue is 0.177. It means that the correlation coefficient between the predictor and the criterion variable is 0.177. It is lower than mature firms. Standardized coefficient of financing deficit of growth firms on its new retained earnings is -0.285. It means that the correlation coefficient between the predictor and the criterion variable is -0.285. It is more negative than mature firms (in table 3).
The results are consistent with firms following the pecking order: the coefficient on the deficit is positive and the coefficient on the deficit-squared is negative. Both growth and mature firms are issuing debt first, while equity is the residual source of financing once they reach their debt capacities. Comparing across life cycle stages however, we found that growth firms have significantly higher debt-deficit sensitivities indicating that growth firms follow the pecking order more closely. This is consistent to conventional wisdom since they would expect growth firms to suffer more from

International Research Journal of Finance and Economics - Issue 88 (2012) 82
information asymmetry problems. This result is not in line with the finding research of Bulan and Yan (2009).
Older and more mature firms are more closely followed by analysts and are better known to investors, and hence, should suffer less from problems of information asymmetry. For example, a good reputation, such as a long credit history, mitigates the adverse selection problem between borrowers and lenders. Thus, mature firms are able to obtain better loan rates compared to their younger firm counterparts (Diamond, 1989). Furthermore, mature firms generally have more internal funds due to higher profitability and lower growth opportunities. Older, more stable and highly profitable firms with few growth opportunities and good credit histories are more suited to use internal funds first, and then debt before equity for their financing needs.
The theory’s prediction that firms with the greatest information asymmetry problems (specifically young-growth firms) is precisely those that should be making financing choices according to the pecking order theory. In general, the major difference between mature and young firms is not only that mature firms are larger, but because they are more mature. Mature firms are older, more stable, higher profitable with few growth opportunities and good credit histories. They are thus more suited to use internal funds first, and then debt before equity for their financing needs.
According to Myers (1984), a firm is said to follow a pecking order if it prefers internal to the external financing and debt to equity if external financing is used. Therefore, overall, we found that the pecking order theory described the financing patterns of growth firms better than mature firms, as mature firms were more closely monitored by analysts and were better known to investors, and hence, should suffer less from problems of information asymmetry. Our result is consistent from the theory, and also consistent from the previous research findings of Shyam-Sunder and Myers (1999).
However, some empirical evidence for the pecking order theory over firms life cycle which inconsistent from our results are as follow. The plausible explanation is that the Indonesian economy and market conditions differ from those under which the previous research was developed.
The research by Bulan and Yan (2007) found that the pecking order theory described the financing patterns of mature firms better than of growth firms. This is contrary to the theory’s prediction that firms with the greatest information asymmetry problems (specifically young, growth firms) are precisely those that should be making financing choices according to the pecking order. These results are robust under alternative empirical models for testing the pecking order theory. Further, their evidence seems to suggest growth firms rely more heavily on equity financing rather than debt. This finding is consistent with Agca and Mozumdar (2004), Lemmon and Zender (2004).
Bulan and Yan (2009) found that within a life cycle stage, where levels of debt capacity and external financing needs were more homogeneous, and after sufficiently controlling for debt capacity constraints, firms with high adverse selection costs followed the pecking order more closely. Financing deficit of growth firms is higher than financing deficit of mature firms, as growth firms have lower cash flow than mature firms. Additionally, the findings showed that growth firms had greater financing deficits but smaller debt capacities implied that growth firms would reach their debt capacities more often than mature firms.
Halov and Heider (2003) main hypothesis was that firms issued more equity and less debt in situations where risk was an important element of the adverse selection problem of outside financing. They found robust empirical support for the hypothesis and documented a strong link between asset risk and the decision to issue debt and equity in a large unbalanced panel of publicly traded US firms from 1971 to 2001. 5.2. Analysis of Indonesia Condition
From the results, we implied that our growth and mature firms in the manufacturing sector of LQ45 Index preferred external to internal financing and debt to equity if external financing was used. Therefore, both kinds of firms were following pecking order theory. Specifically, the results implied that deficit of mature firms was solved more by net equity issue while deficit of growth firms was solved more by net debt issue.

83 International Research Journal of Finance and Economics - Issue 88 (2012)
Following the pecking order theory, growth firms should face more asymmetric information in capital markets. However, in Indonesia capital market namely Indonesia Stock Exchange (IDX), information asymmetry both for growth and mature firms is rarely happened as the Government of Indonesia has made the regulations regarding information asymmetry. The efforts of the Government are as follow: (a) Develop protection scheme of investor. Investor confidence in capital markets is absolute terms that must be constantly guarded by the regulator. Investors will utilize the capital markets industry as a means of investment and risk management if they feel confident that their interests are protected. (b) Improving the quality of financial information transparency in capital market industry. In Indonesian capital markets industry, the transparency of financial information is one form of implementation of the disclosure of information. Investment decision made by investors will be strongly influenced by the information obtained from financial statements. 5.3. Capital Structure over Firm Life Cycle
The following figures 2 and 3 are to describe which firms life cycle, namely mature/growth firms, in the manufacturing sector raise relatively more (or less) capital externally (or internally) than other firms life cycle in the manufacturing sector.
Figure 2: Capital Structure of Mature Firms Figure 3: Capital Structure of Growth Firms
FD is financing deficit ; NRE is new retained earnings ; NEQUITY is net equity issue ; NDEBT is net debt issue.
Figure 2 showed that mature firms in the manufacturing sector raise relatively more net debt than net equity, and use more new retained earnings than net equity. Figure 3 also implied that growth firms in the manufacturing sector raise relatively more net debt than net equity, and use more new retained earning than net equity. This result is consistent with our hypothesis testing results which have given more specific results. 5.4. Descriptive Statistics
Frequency table 5 consists of deviation, variance, maximum, and minimum values. These values describe the tendency of variables. The meaning of each value is as follow. The mean (or average) of a set of data values is the sum of all of the data values divided by the number of data values. Standard deviation is a widely used measurement of variability or diversity used in statistics. The variance is used as a measure of how far a set of numbers are spread out from each other. Minimum is the minimum value. Maximum is the maximum value.

International Research Journal of Finance and Economics - Issue 88 (2012) 84
Table 5: Descriptive Statistics of Variables of Mature and Growth Firms
FD_M NRE_M NEQUITY_M NDEBT_M FD_G NRE_G NEQUITY_G NDEBT_GMean 0.3629 0.0630 0.0126 0.0868 0.5297 0.0125 0.0561 0.0496 Std. Deviation 0.4580 0.1050 0.0989 0.1717 0.3955 0.1255 0.1589 0.2841 Variance 0.2100 0.0110 0.0100 0.0290 0.1560 0.016 0.0250 0.0810 Minimum -0.1740 -0.1640 -0.5690 -0.1788 -0.7599 -1.0191 -0.6053 -1.5006 Maximum 2.6410 0.5810 0.3888 0.6583 1.8433 0.3134 1.1677 0.6997
Table 5 implies that mean of net debt issue of growth firms (0.0496) is lower than net debt of
mature firms (0.0868), while net equity issue of growth firms (0.0561) is higher than net equity issue of mature firms (0.0126) as growth firm has lower cash flow. The average value of financing deficit for the growth firms is 0.5297 while that of the mature firms is 0.3629 as mature firms has higher cash flow than growth firm.
Even though growth firms have more mean value of equity than mature firms, and mature firms have more mean value of debt than growth firms, but when mature firms face financing deficit, they rely more heavily on equity while growth firms rely more heavily on debt. It indicated by R-squared, Anova, coefficients of regression and augmented. Mature firm has higher cash flow than growth firm to secure the debt.
Standard deviation, variance, minimum, and, maximum of mature firms is higher than growth firms. For net debt issue variable of mature and growth firms, minimum, of mature firms is higher than growth firms. For net debt issue variable of mature and growth firms, standard deviation, variance, maximum, of mature firms is lower than growth firms. For net equity issue variable of mature and growth firms, minimum of mature firms is higher than growth firms. For net equity issue variable of mature and growth firms, standard deviation, variance, and maximum of mature firms is lower than growth firms. For new retained earning variable of mature and growth firms, standard deviation and variance of mature firms is lower than growth firms. For new retained earning variable of mature and growth firms, minimum, and maximum of mature firms is higher than growth firms. Table 6: Mean of Aggregate Variables
Aggregate Variables Mean Aggregate Variables Mean LTL_G 0.3136 LTL_M 0.2029 FIXAS_G 0.4664 FIXAS_M 0.2815 DIV_G 0.0026 DIV_M 0.0554 dWC_G 0.0637 dWC_M 0.1016 CF_G 0.0277 CF_M 0.0997
Notes: LTL_M is long-term leverage of mature firm ; LTL_G is long-term leverage of growth firm ; FIXAS_M is fixed asset for mature firms ; FIXAS_G is fixed asset for growth firms ; DIV_M is dividend payments of mature firm ; DIV_G is dividend payments of growth firm ; dWC_M is change in working capital of mature firm ; dWC_G is change in working capital of growth firm ; CF_M is cash flow of mature firm ; CF_G is cash flow of growth firm.
Financing deficit of growth firms is higher than financing deficit of mature firms (table 5), as
growth firms have lower cash flow than mature firms (table 6). Dividend (0.0026) of growth firms is lower than dividend (0.0554) of mature firms. Mature firms pay more dividend to shareholders as it has more cash flow to distribute to shareholders. Long-term leverage (0.3136) of growth firms is higher than long-term leverage (0.2029) of mature firms. Fixed asset (0.4664) of growth firms is higher than fixed asset (0.2815) of mature firms. Change in working capital of growth firms (0.0637) is lower than change in working capital of mature firms (0.1016). Cash flow of growth firms (0.0277) is lower than cash flow of mature firms (0.0997). 5.5. Regression Assumptions
Several assumptions of the population of the research represent an idealization of reality, and as such, they are never likely to be entirely satisfied for the population in any real study (Van Horne, 1998). A

85 International Research Journal of Finance and Economics - Issue 88 (2012)
good regression model should not have the following assumptions, multicollinearity, autocorrelation, and heteroscedasticity. Tabel 7: R-Squared, Adjusted R-Squared, Durbin-Watson, Tolerance, and VIF
Model R-Squared Adjusted R Squared Durbin-Watson Tolerance VIF NDEBT_M 0.147 0.137 1.602 1.000 1.000 NEQUITY_M 0.064 0.054 2.284 1.000 1.000 NDEBT_G 0.148 0.141 1.670 1.000 1.000 NEQUITY_G 0.031 0.024 2.108 1.000 1.000
The goal of the multicollinearity test is to analyze whether there is correlation between
variables. In our research, we test multicollinearity in the regression model by testing the correlation matrix (Ghozali, 2002), the tolerance values and VIF (variance inflation factor) (Hair et al. 1998). The correlations values here are acceptable. For mature and growth firms, correlation between net debt and net equity issue and financing deficit are positive significant. It indicates that the higher financing deficit the bigger the net debt and net equity issue. For mature and growth firms, the tolerance values for net equity issued, net debt issued, and financing deficit was above the cut-off point 0.10 and the VIF values were below 10 (in table 7). Hence, from tolerance and VIF values of hypothesis testing results indicate that multicollinearity were not the problem.
R-Squared is the square of the measure of correlation and indicates the proportion of the variance in the criterion variable which is accounted for by our model. The adjusted R-squared attempts to estimate the R-squared for the population. R-squared consists of the value for growth and mature firms. For mature firms, R-squared shows a predictor financing deficit of 0.147 and 0.064 with net debt issue and net equity issue as dependent variable. This means that 14.7% and 6.4% of the net debt issue and net equity issue could be explained by the existence of financing deficit. For growth firms, R-squared shows a predictor financing deficit of 0.148 (it is higher than mature firm) and 0.031 (it is lower than mature firm) with net debt issue and net equity issue as dependent variable. This means that 14.8% and 3.1% of the net debt issue and net equity issue could be explained by the existence of financing deficit. Therefore there is no multicollinearity in the regression model.
From descriptive statistics and correlation matrix, we concluded that growth firms have lower new retained earnings and lower profitability. It indicated by profitability and new retained earning which have positive significant correlation (0.654; 0.000). Growth firms issue more net debt to solve financing deficit than equity as they have higher asset tangibility to secure net debt issue. It was shown by tangibility and financing deficit have positive significant correlation (0.551; 0.000) which implies that firm that has higher financing deficit has larger asset tangibility to secure debt issue. Tangibility and new retained earnings are negative significant correlated (-0.227; 0.001), it implies that the lower the firm’s new retained earning the larger the firm’s tangibility.
However, growth firms have higher profitability than mature firms. It shown by profitability and asset tangibility which have negative significant correlation and size and asset tangibility have positive significant correlation, profitability and risk have negative significant correlation. Hence, growth firms have low risk (earning volatility). For growth firms, long-term leverage and capital expenditure have higher composition in forming financing deficit, while for mature firms dividend and working capital have higher composition in forming financing deficit as mature firms have higher new retained earnings. Mature firms have higher dividend, working capital, cash-flow, new retained earnings, net debt issued, while growth firms have higher long-term leverage, fixed asset, financing deficit, financing deficitsquare, net equity issued (descriptive statistics). Growth firms have lower profitability, higher tangibility, higher risk, while mature firms have higher profitability, lower tangibility, lower risk (correlation matrix). It can be shown that there exists positive significant correlation (0.654; 0,000) between profitability and new retained earnings. The larger the firm’s profitability, the higher the firm’s new retained earnings.

International Research Journal of Finance and Economics - Issue 88 (2012) 86
The test of autocorrelation aims to examine whether in a linear regression model has correlation between errors in the period t with an error in the periodt-1 (before). One of the methods that we used to detect autocorrelation is the Durbin Watson (DW). For mature firms, the DW value of net debt, net equity issue, and financing deficit are 1.602 and 2.284. For growth firms, DW value between net debt and net equity issue and financing deficit are 1.670 and 2.108 (in table 7).
The test of heteroscedasticity of hypothesis aims to interpret whether the regression model has the differences residual variance from one observation to another observation (Ghozali, 2002). The graphic of scatter plot (in appendix) shows that the dots have not established a specific pattern. Some of the dots located adjacent but some other dots spread above and below the numbers of 0 at the axis Y.
From the result of testing hypothesis, to test the normal distribution that we can see from the graphs of histogram and normal P-P plot (in appendix), we concluded that the histogram gave the normal pattern of distribution. Meanwhile, the graph of normal P-P plot shows that the dots spread around the diagonal line, and the spreading follows the diagonal line. Both of graphics show that the data meets reasonable assumption of normality. Therefore, based on the results of assumptions of population described above, the regression model does not have the assumptions of heteroscedasticity, multicollinearity, autocorrelation, and the data is normally distributed. Thus, our regression model is appropriate to be used for testing the hypothesis.
6. Conclusions Based on the results of analysis of hypotheses testing, our conclusions are as follow. For growth firms, we conclude that the financing deficit has positive significant effects on net debt issue and on net equity issue, and financing deficit has negative significant effects on new retained earnings. For Mature firms, we conclude that the financing deficit has positive significant effects on net debt issue and on net equity issue, while financing deficit has negative insignificant effects on new retained earnings.
From these results, we can conclude that our mature and growth firms in the manufacturing sector of LQ45 Index prefer external to internal financing and debt to equity if external financing is used. Overall, we found that the pecking order theory described the financing patterns of growth firms better than mature firms as mature firms were more closely observed by analysts and were better known to investors, and hence, should suffer less from problems of information asymmetry. It is consistent with what our hypothesis stated. Specifically, the results implied that deficit of mature firms was solved more by net equity issue while deficit of growth firms is solved more by net debt issue.
Following pecking order theory, growth firms should face more asymmetric information in capital markets. However, in Indonesia capital market namely Indonesia Stock Exchange (IDX), information asymmetry both for growth and mature firms is rarely happened as the Government of Indonesia has stipulated the regulations regarding information asymmetry. The efforts of the Government are doing rationalization for information disclosure as the obligations of issuer, develop protection scheme of investor, and improving the quality of financial transparency information of capital market industry.
References [1] Agca, Senay and Mozumdar Abon, (2004), “Firm Size, Debt Capacity, and Corporate
Financing Choices”, working paper. [2] Barclay, M. J., and Smith, C. W., and Watts, R. L., (1995), “The Determinants of Corporate
Leverage and Dividend Policies”, Journal of Applied Corporate Finance, 7(4), pp.4-19. [3] Baxter, N., (1967), "Leverage, Risk of Ruin and the Cost of Capital," Journal of Finance 22,
pp. 3956-403. [4] Bharath, S., Pasquariello, P., and Wu, G., (2008), “Does Asymmetric Information Drive Capital
Structure Decisions?” The Review of Financial Studies, pp. 1-33.

87 International Research Journal of Finance and Economics - Issue 88 (2012)
[5] Bulan, Laarni, Subramanian, Narayanan and Tanlu, Lloyd, (2007), “On the Timing of Dividend Initiations”, Financial Management, forthcoming.
[6] Bulan and Yan, (2007), “The Pecking Order of Financing and the Firm’s Life Cycle”. [7] Bulan and Yan, (2009), “The Pecking Order of Financing and the Firm’s Life Cycle”. Banking
and Finance Letters, pp.1-16. [8] Byoun, Soku, (2007), “How and When Do Firms Adjust Their Capital Structures Towards
Targets?”, Journal of Finance, forthcoming. [9] Chirinko, Robert S. and Anuja R. Singha, (2000), “Testing Static Tradeoff Against Pecking
Order Models of Capital Structure: A Critical Comment,” Journal of Financial Economics 58: 417-425.
[10] DeAngelo, H. and R. Masulis, (1980), “Optimal capital structure under corporate and personal taxation”, Journal of Financial Economics 8, pp.3-29.
[11] De Angelo, Harry, Linda De Angelo and Rene Stulz, (2005), “Dividend Policy and the Earned/Contributed Capital Mix: A Test of the Lifecycle Theory”, Journal of Financial Economics, forthcoming.
[12] Diamond, Douglas W., (1989), “Reputation Acquisition in Debt Market”, Journal of Political Economy, 97(4), pp.828-862.
[13] Evans, David S., (1987), “The Relationship between Firm Growth, Size, and Age: Estimates for 100 Manufacturing Industries”, the Journal of Industrial Economics, Vol. 35, No. 4, The Empirical Renaissance in Industrial Economics, pp.567-581.
[14] Frank M.Z., K.V. Goyal, (2007) “Trade-Off and Pecking Order Theories of Debt”, Handbook of Corporate Finance: Empirical Corporate Finance, Vol. 2, pp. 1-82.
[15] Frank, Murray, Z. and Goyal, Vidhan, K. (2003), “Capital structure decisions”, Journal of Financial Economics, 67, pp.217-248.
[16] Frank, Murray Z. and Vidhan K.Goyal, (2003), “Testing the Pecking Order Theory of Capital Structure”, Journal of Financial Economics 67, pp.217-224
[17] Ghozali, Imam, (2002), “Aplikasi Analisis Multivariate dengan Program SPSS”. Publishers of University of Diponegoro.
[18] Grullon, Gustavo, Roni Michaely and Bhaskaran Swaminathan, (2000), “Are dividend changes a sign of firm maturity?” Journal of Business 75, No.3, pp.387-424
[19] Hair, J. F. et al. (1998), ‘’Multivariate Data Analysis’’. New Jersey: Prentice-Hall. [20] Halov N., F. Heider, (2005) “Capital Structure, asymmetric information and risk”, EFA 2004
Maastricht, pp. 1-56. [21] Harris, Milton, and Artur, Raviv, (1990), “Capital structure and the information role of debt”,
Journal of Finance 45, pp.321-349. [22] Halov, Nikolay and Florian Heider, (2003), “Capital Structure, Risk and Asymmetric
Information”, Working Paper. [23] Hatfield, Cheng, and Davidson, (1994), The Determination of Optimal Capital Structure: The
Effect Of Firm and Industry Debt Ratio on Market Value, Journal Of Financial And Strategic Decisions, Volume 7 Number 3, pp.1-14.
[24] Helwege, Jean and Nellie Liang, (1996), “Is There a Pecking Order? Evidence from a Panel of IPO Firms”, Journal of Financial Economics 40, pp.429-458.
[25] Huang, Samuel G. H. and Song, Frank M., (2002), “The Determinants of Capital Structure: Evidence from China”, HIEBS (Hong Kong Institute of Economics and Business Strategy) Working Paper, pp. 1-35.
[26] Jensen, Michael C., and William H. Meckling, (1976), “Theory of the firm: Managerial Behavior, agency costs and ownership structure”, Journal of Financial Economics 3, pp.305-360.
[27] Jensen, M. C., (1986), “Agency costs of free cash flow, corporate finance, and takeovers”, The American Economic Review, 76 (2), May, pp.323-339.

International Research Journal of Finance and Economics - Issue 88 (2012) 88
[28] Kim, E.H., (1978), "A Mean-Variance Theory of Optimal Capital Structure and Corporate Debt Capacity", Journal of Finance 33, March, pp. 45-63.
[29] Kraus, A. and R.H. Litzenberger, (1973), "A State Preference Model of Optimal Financial Leverage", Journal of Finance, September, pp. 911-922.
[30] Leary, Mark T. and Michael R.Roberts, (2005), “The Pecking Order, Debt Capacity, and Information Asymmetry”, working paper.
[31] Lemmon, Michael L. and Jaime F.Zender, (2004), “Debt Capacity and Tests of Capital Structure Theories”, working paper.
[32] Lemmon, Michael L, Michael R.Roberts, and Jaime F. Zender. (2007). “Back to the Beginning: Persistence and the Cross-Section of Corporate Capital Structure”, The Journal of Finance, Vol. LXIII, NO. 4, pp.1-34.
[33] Lucas, D., and R. L. McDonald, R. L., (1990),” Equity Issues and Stock Price Dynamics” Journal of Finance 45, pp. 1019-1043.
[34] Myers, S.C., (1984), “The Capital Structure Puzzle”, The Journal of Finance, 39 (3), pp. 575-592.
[35] Myers, Stewart C. and Nicholas S. Majluf, (1984), “Corporate financing and investment decisions when firms have information that investors do not have”, Journal of Financial Economics 13, pp.187-221.
[36] Petersen, Mitchell A. and Raghuram G. Rajan, (1995), “The Effect of Credit Market Competition on Lending Relationships,” The Quarterly Journal of Economics 110(2), pp.407-443
[37] Rajan R.G., L. Zingales, (1995), “What do we know about capital structure? Some evidence from international data”, The Journal of Finance, No. 50, pp. 1-58.
[38] Shyam-Sunder, Lakshmi and Myers S.C., (1999), “Testing Static Trade-off against Pecking Order Models of Capital Structure”, Journal of Financial Economics, 51, pp. 219-244.
[39] Sogorb, Mira F, López-Gracia J., (2003), “Pecking order versus trade-off: An empirical approach to the small and medium enterprise capital structure”, Instituto Valenciano de Investigaciones Económicas (IVIE) working paper, 09, pp.1-36.
[40] Stiglitz, J.E., (1972), "A Re-Examination of the Modigliani-Miller Theorem", American Economic Review 59, December, pp. 784-793.
[41] Stulz, R. M., (1990), “Managerial discretion and optimal financing policies”, Journal of Financial Economics, 26, pp.3-27.
[42] Sbeiti, Wafaa, (2010), “The Determinants of Capital Structure: Evidence from the GCC Countries”, International Research Journal of Finance and Economics, Issue 47, pp.1-27.
[43] Shah and Khan, (2007), “Determinants of Capital Structure: Evidence from Pakistani Panel Data”, International Review of Business Research Papers Vol. 3 No.4, pp.265-282.
[44] Suarez, Mark, (2005), “Testing Static Tradeoff against Pecking Order models of Capital Structure”, pp. 1-7.
[45] Titman, S. and Wessels, R., (1988), “The determinants of capital structure choice”, The Journal of Finance, 43 (1), March, pp.1-19.
[46] Van Horne, James C., (1998), “Financial Management and Policy” (11th Edition). Prentice Hall. [47] Vos, Ed; Forlong, Carolyn. (1998), "The Agency Advantage of Debt Over the Lifecycle of the
Firm”, Journal of Entrepreneurial and Small Business Finance, Vol. 5, No. 3, pp. 193-211. [48] Williamson, Oliver E., (1988), “Corporate Finance and Corporate Governance”, Journal of
Finance, Vol.43, No.3, pp.567-591.

89 International Research Journal of Finance and Economics - Issue 88 (2012)
Appendix Table 1: Correlations between Net Debt Issue, Net Equity Issue, and Financing Deficit
Pearson Correlation NDEBT_M FD_M NDEBT_M 1.000 0.383 (0.000) NEQUITY_M FD_M NEQUITY_M 1.000 0.254 (0.007) NDEBT_G FD_G NDEBT_G 1.000 0.385 (0.000) NEQUITY_G FD_G NEQUITY_G 1.000 0.177 (0.021)
Table 2: Correlations between All Variables
Sig. (2-tailed)
PRFT TANG SIZE RISK GROWTH
NRE NEQU
ITY NDEB
T FD
PRFT Pearson Correlation
1 -0.4110.000
-0.1760.005
-0.4210.000
-0.0900.154
0.654 0.000
-.123 0.100
-0.1100.102
-0.4610.000
TANG Pearson Correlation
-0.411 0.000
1 0.432*
0.000 -0.0120.867
-0.0440.486
-0.2270.001
0.126 0.092
-0.0460.498
0.551 0.000
SIZE Pearson Correlation
-0.176 0.005
0.432*
0.000 1
-0.0680.344
0.072 0.259
-0.0880.189
-0.186 0.012
-0.0970.146
0.150 0.022
RISK Pearson Correlation
-0.421 0.000
-0.0120.867
-0.0680.344
1 0.222 0.002
-0.4440.000
0.085 0.321
0.134 0.081
0.111 0.140
GROWTH Pearson Correlation
-0.090 0.154
-0.0440.486
0.072 0.259
0.222**
0.002 1
-0.0720.280
-0.106 0.157
-0.0530.433
-0.0580.379
NRE Pearson Correlation
0.654 0.000
-0.2270.001
-0.0880.189
-0.4440.000
-0.0720.280
1 -0.095 0.203
-0.3700.000
-0.277*
0.000
NEQUITY Pearson Correlation
-0.123 0.100
0.126 0.092
-0.186*
0.012 0.085 0.321
-0.1060.157
-0.0950.203
1 -0.267**
0.000 0.225 0.002
NDEBT Pearson Correlation
-0.110 0.102
-0.0460.498
-0.0970.146
0.134 0.081
-0.0530.433
-0.370**
0.000 -0.267*
00.000 1
0.347 0.000
FD Pearson Correlation
-0.461 0.000
0.551 0.000
0.150 0.022
0.111 0.140
-0.0580.379
-0.2770.000
0.225 0.002
0.347 0.000
1
Table 3: Name of Firms Sample
Firms Acronyms Established Listed in IDX From listed to 2007 (in years) ASII Astra International 20/02/1957 04/04/1990 17 AUTO Astra Otoparts 04/04/1979 01/10/1993 14 ADMG Polychem Indonesia 25/04/1986 20/10/1993 14 BRPT Barito Pacific 04/04/1979 01/10/1993 14 BUDI Budi Acid Jaya 15/01/1979 08/05/1995 12 CPIN Charoen Pokphand Indonesia 07/01/1972 18/03/1991 16 DNKS Dankos Laboratories 25/03/1974 13/11/1989 18 FASW Fajar Surya Wisesa 13/06/1987 19/12/1994 13 GGRM Gudang Garam 26/06/1958 27/08/1990 17 GJTL Gajah Tunggal 24/08/1951 08/05/1990 17 HMSP Hanjaya Mandala Sampoerna 27/03/1905 15/08/1990 17 INDF Indofood 14/08/1990 14/07/1994 13 INDR Indorama Synthetics 03/04/1974 03/08/1990 17 INKP Indah Kiat Pulp and Paper 07/12/1976 16/07/1990 17 INAF Indofarma 02/01/1996 17/04/2001 6 INTP Indocement Tunggal Prakasa 16/01/1985 05/12/1989 18 KLBF Kalbe Farma 10/09/1966 30/07/1991 16 KOMI Komatsu Indonesia 13/12/1982 31/10/1995 12 KAEF Kimia Farma 23/01/1969 04/07/2001 6 RMBA Bentoel International Investama 19/01/1979 05/03/1990 17

International Research Journal of Finance and Economics - Issue 88 (2012) 90
Table 3: Name of Firms Sample - continued
SMCB Holcim Indonesia 15/06/1971 10/08/1977 30 SMGR Semen Gresik (Persero) 25/03/1953 08/07/1991 16 TKIM Pabrik Kertas Tjiwi Kimia 02/10/1972 03/04/1990 17 TSPC Tempo Scan Pacific 20/05/1970 17/06/1994 13 UNVR Unilever Indonesia 05/12/1933 11/01/1982 25 SULI Sumalindo Lestari Jaya 14/04/1980 21/03/1994 13
Figure 1: Histogram, Normal P-P Plot, and Scatterplot

91 International Research Journal of Finance and Economics - Issue 88 (2012)
Figure 1: Histogram, Normal P-P Plot, and Scatterplot - continued