
Situation Analysis 2020 of the HU-HR Border Region
81
SITUATION ANALYSIS OF THE HUNGARIAN-CROATIAN BORDER REGION Detailed analysis of the programme area, based on statistical data, presentation of static and dynamic situation of the programme area in comparison to national and EU averages and tendencies. CBJointStrategy Elaborating strategic programming and project documents for Interreg Programme between Hungary and Croatia for the period 2021-2027 Approved by the Programming Committee on 22 September 2020
-
Upload
khangminh22 -
Category
Documents
-
view
1 -
download
0
Transcript of Situation Analysis 2020 of the HU-HR Border Region

SITUATION ANALYSIS OF THE HUNGARIAN-CROATIAN
BORDER REGION Detailed analysis of the programme area, based on statistical data, presentation of static and
dynamic situation of the programme area in comparison to national and EU averages and tendencies.
CBJointStrategy
Elaborating strategic programming and project documents for Interreg Programme between Hungary and Croatia for the period 2021-2027
Approved by the Programming Committee on 22 September 2020

1
Table of Contents
List of Figures ............................................................................................................................. 3
List of Tables .............................................................................................................................. 4
1. Introduction .................................................................................................................... 5
2. Demography .................................................................................................................... 6
3. Spatial structure .............................................................................................................. 9
4. Economy and Innovation .............................................................................................. 12
4.1. General economic outlook ........................................................................................ 12
4.2. R&D and innovation .................................................................................................. 14
4.3. SMEs .......................................................................................................................... 19
4.4. Agriculture/food production ..................................................................................... 21
4.5. Industry and services ................................................................................................ 25
4.6. Tourism ..................................................................................................................... 27
4.7. Summary ................................................................................................................... 31
5. Environment, low-carbon & green perspective ............................................................ 32
5.1. Natural Resources ..................................................................................................... 33
5.2. Public utilities and waste management .................................................................... 35
5.3. Energy potential ........................................................................................................ 40
5.4. Summary ................................................................................................................... 44
6. Connectivity .................................................................................................................. 45
6.1. Digital connectivity .................................................................................................... 45
6.2. Railway infrastructure ............................................................................................... 46
6.3. Road infrastructure ................................................................................................... 47
6.4. Cycling ....................................................................................................................... 51
6.5. Aviation ..................................................................................................................... 52
6.6. Inland navigation ....................................................................................................... 53
6.7. Conclusions ............................................................................................................... 54
7. Social inclusion .............................................................................................................. 56
7.1. Labour market ........................................................................................................... 56
7.2. Education and training .............................................................................................. 58
7.3. Socioeconomic integration of marginalised groups ................................................. 61
7.4. Health care ................................................................................................................ 63
7.5. Summary ................................................................................................................... 67

2
8. Closer to citizens ........................................................................................................... 68
8.1. Cultural heritage in the border area ......................................................................... 68
8.2. Further elements of the tourism supply ................................................................... 69
8.3. People-to-people cooperation .................................................................................. 69
8.4. Territorial governance............................................................................................... 70
8.5. Application of integrated tools of territorial development ...................................... 71
8.6. Cross-border governance .......................................................................................... 73
8.7. Summary ................................................................................................................... 76
9. Conclusions ................................................................................................................... 77

3
List of Figures
Figure 1: Population density of the counties within the programme area, 2019 ..................... 6 Figure 2: Population change in NUTS 3 county level from last census to 2019.01.01 .............. 7 Figure 3: Spatial structure of the Programme area: Cities, Functional Urban Areas (FUA) and
towns ...................................................................................................................................................... 9 Figure 4: Density of settlement in the counties of the Programme area ................................ 10 Figure 5: Economic performance of the counties within the programming area, 2017 ......... 13 Figure 6: Economic trends of the past decade in the counties of the programming area ...... 14 Figure 7: Business enterprise research and development expenditure (BERD), % GDP ......... 15 Figure 8: Intramural Research and development expenditure (GERD) and intensity, % GDP 16 Figure 9: Tourism arrivals and nights in 2018 (only data of commercial accommodation in
Hungarian side) ..................................................................................................................................... 29 Figure 10: Tourist overnight stay in the counties (CRO) and districts (HU) of the programming
area (only data of commercial accommodation in Hungarian side) ..................................................... 30 Figure 11: The longest expeceted ranless periods in the Hungary-Croatia border area, in
days, 10 years forecast. ........................................................................................................................ 33 Figure 12: Woodland as a percentage of land ......................................................................... 34 Figure 13: Protected areas of the Mur-Drava-Danube Biosphere Reserve. ............................ 35 Figure 14: Collected solid waste per 1000 inhabitant in the Programme area (tonnes), 2018
.............................................................................................................................................................. 37 Figure 15: Breakdown of total energy consumption in Hungary and Croatia (aggregated
values), 2017 ......................................................................................................................................... 40 Figure 16: Breakdown of total energy supply in Hungary and Croatia (aggregated values),
2017 ...................................................................................................................................................... 41 Figure 17: Photovoltaic energy potential 2019. ...................................................................... 42 Figure 18: Temperature conditions of the Upper Pannonian thermal water layer. ................ 42 Figure 19: Geothermal potential map of the basement reservoirs, comparison of the
temperature values estimated. ............................................................................................................ 43 Figure 20: Running of the Mediterranean TEN-T corridor in Croatia and Hungary. ................ 47 Figure 21: Mobility zones in the Croatia-Hungary border area. .............................................. 49 Figure 22: Location of border crossing point along the Croatia-Hungary border. .................. 50 Figure 23: Total passenger traffic (entry and exit) of permanent road border crossing points
between Croatia and Hungary. ............................................................................................................. 50 Figure 24: EuroVelo routes (EuroVelo 6 and 13) in the border area. ...................................... 52 Figure 25: Inland navigation routes and port in Croatia. ......................................................... 53 Figure 26: Composition of cross-border traffic of vessels, 2009-2018. ................................... 54 Figure 27: Early leavers from education as % of population btw 18-24 .................................. 60 Figure 28: Consumption based poverty maps for Croatia (NUTS 3) ........................................ 62 Figure 29: Number of inhabitants per family doctor in the Programme area, 2019 ............... 66 Figure 30: Urban agglomeration of Osijek set up for implementation of the ITI mechanism. 72 Figure 31: LEADER LAGs along the Hungary-Croatia border. .................................................. 73 Figure 32: Territorial coverage of Pannon EGTC. ..................................................................... 74 Figure 33: Territorial coverage of Mura EGTC and Pannon EGTC in the border area of Zala
county. .................................................................................................................................................. 75 Figure 34: Partnership of the CETC EGTC. ................................................................................ 76

4
List of Tables
Table 1: Number of settlements, 2019 .................................................................................... 11 Table 2: Expenditure in Research and Development as % of GDP .......................................... 15 Table 3: GERD per inhabitant ................................................................................................... 16 Table 4: Actual number of active business entities ................................................................. 20 Table 5: Share of agriculture, forestry and fishing in gross value added (GVA), NUTS 3. ....... 22 Table 6: Share of agriculture, forestry and fishing in employment, by NUTS 3 regions. ......... 22 Table 7: Share of number of businesses with legal personality in agriculture-related
economic activities. .............................................................................................................................. 23 Table 8: Utilised agricultural area and nubmer of holdings on NUTS 3 level (2016). .............. 24 Table 9: Land use categories (percentage, 2015). ................................................................... 24 Table 10: Distribution of gross value added by main groups of economy .............................. 26 Table 11: Distribution of gross value added by main groups of economy in Croatia, 2016 .... 27 Table 12: Tourism accommodation capacities (number of beds) in the border area (2018). . 28 Table 13: Trend of tourism nights per 1000 inhabitant by county in 2007-2018 .................... 31 Table 14: Value added of circular economy related activities as % of GDP, EU percentage is
strictly around 1. ................................................................................................................................... 36 Table 15: Collected solid waste and their use in Hungarian counties concerned ................... 38 Table 16: Collected solid communal waste and their use in Croatian counties concerned .... 39 Table 17: Digital Economic and Society Index 2019 ................................................................ 45 Table 18: Unemployment rate in 2007 and 2018, % ............................................................... 57 Table 19: Number of full time students in bachelor and master courses of institutions of
higher education ................................................................................................................................... 58 Table 20: Number of enrolled students in Institutions of Higher Education in Croatia 2013-
2018 ...................................................................................................................................................... 59 Table 21: Adult population’s education participation rate. ..................................................... 60 Table 22: People at risk of poverty as a percentage of total population ................................ 63 Table 23: Healthy years after the age of 65 ............................................................................. 64 Table 24: Number of doctors per 10,000 inhabitants in Hungarian counties concerned ....... 65 Table 25: Number of inhabitants per family doctor in Hungarian counties concerned .......... 65 Table 26: Hospital beds per 10,000 inhabitants in Hungarian counties concerned ................ 65 Table 27: Key statements by policy objectives from the situation analysis. ........................... 78

5
1. Introduction
The analysed area of the Hungarian-Croatian border region covers 31,085 km2 and hosts about 2 million inhabitants. It includes three Hungarian counties, Zala, Somogy and Baranya, as well as eight Croatian counties, Bjelovarsko-bilogorska, Koprivničko-križevačka, Međimurska, Osječko-baranjska, Požeško-slavonska, Varaždinska, Virovitičko-podravska and Vukovarsko-srijemska. The area consists of predominantly rural regions that include a number of small and medium sized towns along with one larger urban centre on each side of the border which are concentrated at and in the agglomeration of Pécs and Osijek.
In geographical terms, the two sides of the border area are similar, they belong to the Pannonian Basin. In terms of natural resources, the area bears agro-ecological and hydrological potentials as well as great forest stock. The current situation analysis of the programme area includes elaboration, statistics and findings regarding demography, spatial structure, innovation and economy, environment, connectivity, social inclusion and cultural relations, which can be found in the next chapters.
The territorial analysis carried out within this document is ought to serve as a basis to highlight issues and potentials in order to facilitate long-term increase in the level of economic and social integration of the border area and thus contribute to smart, sustainable and inclusive growth. Therefore, trends of the previous programming period are outlined along with statistical evidences highlighting the most prominent areas of interest. Since the two sides of the border use different institutional structures as well as reporting systems, in order to have a coherent picture of the region, in many cases only NUTS 2 or national data is available that can potentially give a slightly distorted picture of the current situation.

6
2. Demography
Population density is in the medium range on both sides of the border. On the Hungarian side of the cross-border cooperation area, Somogy county has the largest territory and Baranya county has the highest population. On the Croatian side Osječko-baranjska county is the largest and also is the most populated. In the programme area, which is 31 085 km2 large, the number of population exceeds 1.99 million heads (on 01.01.2019), 47% of that lives in Hungary and 53% in Croatia. The population density is 64 capita/km2, amounting to 56% of the figure of the European Union (EU 27) and lagging behind the national averages of the two countries as well (62% of the Hungarian and 87% of the Croatian average). It is especially the centre of the programme area which is scarcely populated, in the western part the population density could be regarded as high, but despite of that strong urban centre could not be found there.
Figure 1: Population density of the counties within the programme area, 2019 Source: Central Statistical Office (KSH), Croatian Bureau of Statistics (CBS), own compilation
On the Hungarian side the programme area comprises three counties, whereas Somogy has the biggest size and Baranya is the most populated. Baranya county stands out somewhat, because of its county seat is Pécs, the largest city in the programme area. Its neighbouring county, Somogy is the less populated county of Hungary, where the population density is even lower than half of the national average. In Croatia, Međimurska and Varaždinska counties are particularly densely populated, above national average, in contrast to the middle part of the territory (Bjelovarsko-

7
bilogorska, Koprivničko-križevačka, Požeško-slavonska, Virovitičko-podravska), while the eastern counties are close to Croatian average (72 inhabitant/km2).
The NUTS 3 regions in the area, the population density figures compared to the EU average vary between counties. The population density is higher than the EU average (115 persons/km2) in only two of the eleven counties: Međimurska and Varaždinska.
Figure 2: Population change in NUTS 3 county level from last census to 2019.01.01 Source: KSH, CBS, own compilation
In the entire programme area, according to the last decade, population in general decreased by 4-15%, whilst the population of the European Union increased by 4%. The population decline in the program area was 167 thousand people (113 thousand in Croatian side, 54 thousand in Hungarian side), which is over to the population of Pécs, the largest city of the area. The tendency of population decline is accelerating. The most dramatic fall of the population was registered in Vukovarsko-srijemska county (-15.1% in comparison to 2011), but Požeško-slavonska county also has quite a significant drop in the population figures (-14.1%) in contrast with the Croatian average of -4.9%. In the three Hungarian counties the decrease in the number of populations was similarly exceeding 5-7%, being three and four times as high as the national tendencies.
By the year 2019 the whole area was characterised by a population decline. In 2011 there were 1,172,526 inhabitants in the Croatian part of the programming territory, and by 2019 that number decreased to 1,059,556. The process was strengthened by the general negative migration balance of the programme area.

8
The brain drain effect is shown, a significant number of young graduates leave the program area yearly and emigrate to the capital, north-western part of Transdanubia or areas within as well as outside the EU where better labour conditions are present. The result of the above impacts in the area is that the proportion of the elderly increases and that of the young decreases within the region further deteriorating the quality and number of available workforce.
These have severe negative social and economic consequences that already can be felt and are expected to influence the future outlook of the region as well. The dependency ratio of the elderly population is the most favourable in Baranya among the three Hungarian counties: it is 30.9% (2019), being higher than the national average (29.3%). By contrast, the ratio of Zala county – 33.1% – even exceeds the ratio of the European Union (31.4%). The dependency ratio in Croatia averages at 31.6%, but it varies between the counties in the border areas.
On the Hungarian side of the border the share of people aged 19 and younger is 2-3% lower than the EU average. In Zala and Somogy counties, the share of people aged between 20 and 34 is also lower than the EU average by 2% and 1% respectively. In the Hungarian NUTS 3 regions the share of population aged 50 to 64 is 1-2% higher, while the share of those persons above 65 is similar to EU average shares.
In the eight Croatian counties, the share of young and old people is similar to the EU average. In some regions the share of those aged 35 to 49 is 2-3% lower than the EU average, while the share of those 50 to 64 is 2-3% higher.
Colourful cultural supply is available in the region as there is a wide range of different nationalities present, who contribute to the collective cultural heritage. In Baranya county 6.6% of the population is German, 4.5% Roma and 1.8% is Croatian. In Somogy 5.3% Roma and in Zala 2.6% Roma individuals are registered. Increase of the Roma population causes constantly emerging problems as their social integration is very problematic which is hindered by the fact that highest proportion of Roma minorities can be found in the micro regions in the most disadvantageous social and economic position, from which many lives on the peripheries of the region.
Croatia has 9.58% national minorities, of which Serbs are the largest (4.36%), followed by Bosnians (0.73%), Italians (0.42%) and Albanians (0.41%) and Hungarians (0.33%). Out of the eight counties included in the programme area, Vukovarsko-srijemska has the largest proportion of minorities (about 20.3%), of which 15.5% Serbs. A significant Roma population lives in Međimurska county (4.49%), Bjelovarsko-bilogorska has, in addition to 6.31% Serbian population and a significant Czech minority (5.25%) is present as well.

9
3. Spatial structure
The Hungarian-Croatian border territory is partially surrounded by water systems. On the north by the Lake Balaton, on the east by the Danube, on the south-east by the Sava river. The state border of Hungary and Croatia predominantly follows the Mura and Drava rivers until Belišće. The programme area is mostly made up of hills and fertile plains along the rivers. On the middle of the Croatian part the Slavonian Mountains (Papuk 953 m, Psunj 983 m high) are located with extensive forests. The highest mountain is Ivanščica (1059 m) on the westernmost part of the programme area. The hill of Mecsek (682 m) is situated in Baranya county, in the north of the city of Pécs and it is the highest mountain range of South Transdanubia. Further to be mentioned is the mountain the Kalnik on the western part of the Croatian side (642 m). The programme area is mostly rural, there are only four cities over 50,000 inhabitants: one in Croatia (Osijek) and three in Hungary (Pécs, Kaposvár and Zalaegerszeg).
The definition of urban areas uses population density to identify urban cores and travel-to-work flows to identify the hinterlands whose labour market is highly integrated with the cores. The Functional Urban Areas (FUA) being composed of a city and its commuting zone, FUAs encompass the economic and functional extent of cities based on daily movements of people. There are four FUAs in the area, the largest is Pécs with population of 250,000, FUA of Osijek has population of 170,000, Kaposvár and Zalaegerszeg both have population of 110,000 each.
Figure 3: Spatial structure of the Programme area: Cities, Functional Urban Areas (FUA) and towns Source: Eurostat, KSH, CBS, own compilation

10
On the Hungarian side there are three counties with three cities which at the same time are the county seats. There are nine towns with population over 10,000 and 28 towns with population under 10,000. The area on the Croatian side consists of eight counties, whereas Osječko-baranjska county has the biggest size and is the most populated. There is one city with population over 50,000, ten towns with a population over 10,000 and 26 towns under 10,000.
Local governments are functioning in settlements (város, község) in Hungary and in towns and municipalities (grad, općina) in Croatia. In Hungary there is a subcounty administrative unit – district (járás) – ten in Baranya, eight in Somogy and six in Zala.
The area is characterised by a disperse small settlement system. On the Hungarian side Baranya and Zala have the most disperse settlement structure with more than twice higher number of municipalities than on the Hungarian average. On the Croatian side there is a huge difference in the density of settlements: western counties contain an extremely high number of settlements even comparing to Croatian national average, while Eastern counties of Osječko-baranjska and Vukovarsko-srijemska are characterised by much lower density of settlements.
Figure 4: Density of settlement in the counties of the Programme area Source: KSH, CBS, own compilation
It is also relevant that the Hungarian towns along the border (Lenti, Letenye, Csurgó, Barcs, Sellye, Siklós) are all relatively small urban centres with very limited services. On the Croatian side Varaždin is an important gateway to northwest Croatia. Bjelovar, Đakovo, Koprivnica, Križevci,

11
Požega, Vinkovci, Virovitica and Vukovar all have over 10,000 inhabitants and act as middle-sized regional centres, but have limited capacity to provide regional level services and facilities. There are a number of small towns and municipalities (Beli Manastir, Belišće, Donji Miholjac, Đurđevac, Pitomača, Slatina, Valpovo) in the border area, but as on the Hungarian side, they are too small to act as drivers of regional development. Characteristics of the area are defined by some tourism-based small towns alongside Lake Balaton (Balatonboglár, Balatonföldvár, Balatonlelle, Fonyód, Zamárdi) and with considerable thermal spa (Daruvar, Harkány, Hévíz, Igal, Lenti, Siklós, Varaždinske Toplice, Zalakaros, Zalaszentgrót).
Table 1: Number of settlements, 2019 Source: KSH, CBS.

12
4. Economy and Innovation
4.1. General economic outlook
As indicated in the Border1 Orientation Paper of Hungary and Croatia, the counties of the programme area perform economically rather weak, behind EU average. Since the 2008 economic downturn, the region’s performance was characterized by either stagnation or decrease in general. In the view of respective country as well as EU averages, the border region is lagging behind. The economy has slow growth rates along with major disparities in the border region. The north-western part of the programme area performs slightly better in economic terms and Hungarian counties somewhat overperform the Croatian ones, but differences in general are not significant. During the examined period of 2007-2017, territorial inequalities have continuously been increasing and there also have been category changes that contributed to changes in GDP.
As it can be seen from Figure 5, the better performing counties compared to themselves are Varaždinska in Croatia and Zala in Hungary, furthermore, only three counties have reached at least the half of the EU average in recent years, namely Zala, Varaždinska, and Međimurska counties. The north-western part consisted of Zala, Međimurska, Varaždinska and Koprivničko-križevačka counties are the most developed ones, the exception is being Osječko-baranjska with higher rate on the southeast side. Generally, it can be said that the territory shows an East-West division in terms of economic activity and output.
1 Ref. Ares(2019)3244678 - 17/05/2019

13
Figure 5: Economic performance of the counties within the programming area, 2017 Source: Eurostat, own compilation.
Considering the economic trends visible throughout 2007-2017, the whole area has been characterised by the process of economic downturn, all counties concerned registered lower rates of development than their respective national averages (EU28=100), while some are showing positive results that might also be due to declining population numbers. These trends can be seen in Figure 6 below.
Hungary was able to increase its economic performance measured in GDP and compared to the EU average by 8 %-point, whilst Croatia only managed to reach in 2016 the level of cohesion in 2007 after suffering several crises from 2009 onwards. With regards to the counties of the programme area, Somogy county is to be considered as the most successful with its 6 %-point increase, while Međimurska county of Croatia have registered a 5% increase in the 2007-2017 period. The best performing year regarding Hungary was 2016.
Real GDP growth has been robust in the past few years attributable to increased EU funding, higher EU demand for Hungarian exports as well as a rebound in domestic household consumption. Regarding Croatia 2016 seems to be the first year too showing trends of economic recovery after the 2009 crises.
What can be said about the region is that it shows a defined East-West division regarding economic performance in view of GDP. Western counties generally perform much better than their eastern counterparts, which show significant decline or stagnation in output.

14
Figure 6: Economic trends of the past decade in the counties of the programming area Source: Eurostat, own compilation
Due to its geographical position, the cross-border area benefits from cross-border cooperation, such as the Interreg programme, as well as local nature protection and development incentives. Both Member States participate in the “EU Strategy for the Danube region” (EUSDR) and the Danube Transnational Programme. The macro-regional strategies are supported at the highest political level by the EU the Member States and the regions concerned have become an integral part of EU regional policy. During the upcoming sections of this chapter, the features of programming area regarding R&D and innovation, SMEs, Agriculture, Industry and Tourism will be explained.
4.2. R&D and innovation
R&D is one of the major drivers of innovation, therefore expenditure in this field serves as a key indicator to assess resources devoted to technology and science. In the EU, R&D expenditure has slightly increased to 2.07% of total GDP in 2017 whereas it started off at 1.77% in 2007. The border region of Hungary and Croatia is very similar to the situation to the country as a whole, since there was no significant increase recorded in the intensity of R&D activity throughout the last 10 years.

15
2007 2008 2009 2010 2011 2012 2013 2014 2015 2016 2017 European Union 1.77 1.83 1.93 1.92 1.96 2 2.01 2.02 2.03 2.04 2.07 Croatia 0.79 0.89 0.84 0.74 0.75 0.75 0.81 0.78 0.84 0.86 0.86 Continental Croatia 1.17 1.11 0.98 0.95 0.96 0.99 0.98 1.08 1.11 1.07 Hungary 0.96 0.98 1.13 1.14 1.19 1.26 1.39 1.35 1.35 1.19 1.33 Western Transdanubia 0.6 0.55 0.57 0.58 0.64 0.6 0.74 0.63 0.58 0.55 0.63 South Transdanubia 0.37 0.33 0.42 0.46 0.6 0.92 0.76 0.59 0.42 0.36 0.7
Table 2: Expenditure in Research and Development as % of GDP Source: Eurostat
Taking into consideration the results of the Regional Innovation Scoreboard of 2019, it can be said for both countries that their innovation performance is below the EU average. Considering the period from 2011 to 2019 innovation performance has decreased by 5% in Western Transdanubia, increased by 2.8% in South Transdanubia in Hungary and shows a slight increase of 1.7% in the continental part of Croatia. R&D expenditure was around 1.07% of GDP in Continental Croatia and between 0.5-1% in the two Hungarian NUTS2 regions.
The indicators for innovation potential in the Commission’s Regional Innovation Index (RII) have positively changed in by 2.8% in South Transdanubia and by 1.7% in Croatia compared to 2011 figures, while decreased by -5% in Western Transdanubia. Although an average positive change can be seen, all regions score around 50% of EU average, 52.6% in Western Transdanubia, 50.9% in South Transdanubia and 58.5% in Continental Croatia relative to EU average.
Figure 7: Business enterprise research and development expenditure (BERD), % GDP Source: EUROSTAT
The Business enterprise R&D expenditure (BERD) has been rising in both countries in
Hungary and Croatia as well, although Croatia performs way below the EU average on this aspect. In Hungary, the figure has been continuously growing with a few disruptions. There has been a sharp rise from 2017 to 2018, meaning that BERD in 2018 as a percentage of GDP stands at 1.16%.
HU
HR
EU

16
Contrary, in Croatia, BERD shows stagnating values that had slightly risen up to 0.57% in 2018. The EU average of BERD/GDP is 1.41% among EU member states.
Figure 8: Intramural Research and development expenditure (GERD) and intensity, % GDP Source: Eurostat
Regarding the total intramural R&D expenditure (GERD), both countries perform below EU average, but at the same time also go through a slight increase. In Hungary GERD as a percentage of GDP amounts to 1.53% and to 0.97% in Croatia according to the latest data of 2018. The EU average regarding GERD as a fraction of GDP is 2.11% sowing that both countries are lagging behind EU mainstream. Furthermore, the most visible differences in the level of GERD in the countries is shown best by analysing the average per capita expenditures of the EU and that of the Hungary and Croatia. It is clearly visible from Table 3 that the per capita expenditures do not even reach 1/3 of the EU levels.
GEO/TIME 2009 2010 2011 2012 2013 2014 2015 2016 2017 2018 European
Union 473 490.9 516.7 535.6 542.4 562.1 594.1 598 624.2 656.5
Croatia 88.3 77.9 78.4 77.2 83.2 80 88.7 96 101.9 122.2 Hungary 106.4 112.4 120.6 126.6 142.8 144.7 153.3 139.5 170.8 209.8
Table 3: GERD per inhabitant Source: Eurostat 2018
The population ratio employed in High Technology Manufacturing and Knowledge Intensive Sectors (HT KIS) both in the continental part of Croatia (5%) and in South and Western Transdanubia (2.6% and 3.9%, respectively) on NUTS 2 level is lower than the EU average that is 6.1% according to Eurostat data from 2018.
EU
HU
HR

17
Hungary performs below the EU average on both the Digital Technology Integration Index and in terms of the Digital Transformation Enablers’ Index. Compared to other EU Member States, Hungary performs below the average in 6 dimensions, integration of digital technology, changes in ICT start-ups, e-leadership, supply and demand of digital skills, access to finance as well as digital infrastructure. The digital infrastructure is the biggest challenge to overcome with 38% disparity compared to the EU average. Croatia performs close to the EU average on the Digital Technology Integration Index, but is significantly below the EU average in terms of the Digital Transformation Enablers’ Index. Compared to other EU Member States, Croatia scores above the EU average in two out of seven dimensions. With a lead of 15% compared to the EU average, the field where Croatia performs best is Entrepreneurial Culture. While the investment climate for enterprises performs more than 30% below EU average, digital infrastructure and the supply and demand of digital skills score approximately 20% below EU average.
In terms of the ‘e-commerce’ index (taking into account enterprises selling online, receiving/serving orders via computer mediated networks, electronic sales both domestically and to other EU countries) Hungary has the 8th lowest score among EU countries. Croatia is slightly below the EU average with respect to the e-commerce index. In terms of web sales, Croatia is slightly below the EU average and Hungary is a bit behind Croatia. There is a very large difference between web sales to own country and web sales to other EU countries in both Hungary and Croatia as inland web sales are predominant in both.
The above described tendencies of performing poorly compared to EU levels are reflected in the current innovation performance alike, as low levels of patent and trade mark applications are recorded on both sides of the border. The whole border area is categorised as less competitive. On the Global Innovation Index, Hungary scores 33rd while Croatia scores 44th in 2019.
On the Hungarian side, the R&D activities are concentrated in Pécs and to a lesser extent are present in Zalaegerszeg, Keszthely and Kaposvár. This is due to the university basis as the University of Pécs is one of the biggest universities of the country outside of Budapest, in terms of number of faculties, lecturers and students as well. University of Pécs is a main actor not only in higher education but in research alike. University research groups are working on different scientific domains, in 2012 the Szentágothai Research Centre started its operation. University of Pécs also has wide range of research-focused international relations.
On the Croatian side, the strongest university centre with a research potential is Josip Juraj Strossmayer University with various faculties (agriculture, engineering, medicine, biology, chemistry, mathematics, physics, law, social sciences). The other significant Croatian university in the border area is North University in in Varaždin and Koprivnica, especially with engineering focus.
Despite the presence of higher educational institutions, according to the available QS rankings of topuniversities.com, the programme area lacks universities and research centres that would have any international relevance or would be rated by the site.
Croatia scores at median values for employment of those with a tertiary qualification compared with school leavers. Croatia’s overall rank improves to 35 when allowance is made for income differences across countries, but its overall score is less than expected at its level of income.2
2 https://universitas21.com/what-we-do/u21-rankings/u21-ranking-national-higher-education-systems-2019/comparison-table

18
Hungary is ranked equal 35th overall, which combines ranks of 47 for Resources, 46 for Environment, 18 for Connectivity and 33 for Output. Government expenditure on higher education as a share of GDP ranks 47th and total expenditure ranks 48th. Research expenditure has declined by 36 per cent over the period 2009–16 and as a share of GDP is now ranked 39th. Total expenditure per student ranks 36th. The Connectivity ranking includes third in joint publications with industry but business ranks knowledge transfer lower at 30th. Joint publications with international authors rank 18th. Within the Output category, Hungary is ranked third for tertiary qualifications of the workforce compared with those who left after completing final year of schooling. It is ranked 32nd on publications per head and 27th for their impact. When account is taken of relative levels of GDP per capita, Hungary’s ranking is 33rd and its score is below that expected at its income level.
R&D expenditure is 2.07% of the total GDP in the EU, while only 0.86% in Croatia and 1.35% in Hungary based on 2019 Eurostat data. The R&D spending is at the highest level in Baranya, where in 2010 it amounted to 0.8% of the GDP which is even below the 1.16% national figure and less than half of the 2% rate of the EU27. In Zala the figure is one-fourth of Baranya (0.2%) and in Somogy half of that (0.4%). In Baranya during the past decade negative tendencies prevailed as regards the R&D spending and the number or researchers. As a result, Baranya lost its importance compared to other R&D centres in the country.
University of Pécs has a rather low level of productive and R&D based industrial relations, which even more weakens R&D performance of Baranya. The Centre of the Regional Committee of Hungarian Academy of Sciences is also located in Pécs. Number academicians in Baranya it is ten times more than in Somogy and Zala counties. By contrast, the industry is the less developed in Baranya, this phenomenon is justified by the fact that more than 70% of the R&D spending is coming from the central governmental budget and only 20% of the R&D expenditure is provided by the enterprises or investors. This unfavourable situation hinders the improvement of innovation processes.
The economic development and regional operational programmes in the 2007-13 programming period supported the development of cluster organizations in Hungary. According to the findings of the European Cluster Collaboration, in 2013, 34 clusters had the Accredited Cluster label. Altogether, they had 1261 members, of which there were 1140 business organizations. The 34 clusters employed around 117,000 people and their aggregate income was over 9,500 billion HUF, one quarter of which came from export activities. Currently, there are 25 Accredited Clusters in Hungary, and this number is expected to decrease due to the merger process that has been taking place.
Varaždin hosts two technology parks and a few higher education institutions, which have a significant potential to act as drivers for the development (particularly of ICT industry, since a Faculty of Organisation and Informatics as part of the University of Zagreb is established), not only in Varaždinska, but also in Međimurska county (IT cluster) and in the broader Croatian territory. Međimurska county hosts the Technology and Innovation Centre Međimurje, which is focused primarily on ICT and cooperates closely with the faculty in Varaždin (in addition to cooperation with Međimurje Polytechnics).
Belišće, Bjelovar, Donji Miholjac, Đurđevac, Koprivnica, Osijek, Vinkovci, Virovitica and Vukovar all have technology and business incubators. Recently two more technology parks have been developed: Technology Innovation Centre in Koprivnica and a technology park in Križevci. Most of the county development strategies of the Croatian counties concerned recognise insufficient

19
orientation of the regional businesses towards R&D as their developmental weakness and plan measures that should lead to the improvement of such situation.
In Croatia, a set of Competitiveness Clusters was established for the key industrial sectors, based on the “triple helix” principle namely, bringing together industries, research institutions and local and regional governments with a set of others in different phases of establishment. Examples of these clusters are the Euvita Cluster that is located in Northwest Croatia with the purpose of achieving programme aims of rural development and to connect small and medium enterprises in programmes of development of production and processing of agricultural products and rural tourism in accordance with the notion of sustainable development. Another example is the Cluster of Cultural Routes that was founded as a new destination marketing and management organisation, with the aim of realizing goals and objectives in creation and development of cultural routes. These have a potential to be drivers of not only nationally, but also regionally and locally based development of R&D. The Smart Specialisation Strategies for 2014-2020 for NUTS 2 level regions are in preparation and will presumably be aligned with the strategies of the key competitiveness clusters.
This border area presents a relatively low contribution from technology and science to the regional economy, which, in itself, requires an improvement of conditions in order to raise levels closer to EU standards at national and regional levels as well. Barriers in this field are arising due to the lack of business and entrepreneurship skills, low R&D activity, lack of experts and community, poor availability of technology, or limited access to finance. Investors at this region retain from commitment as they do not take the longer-term view into account and see no development of favourable conditions regarding digitisation, education, infrastructure, bureaucracy or human capacities to name a few.
4.3. SMEs
Enterprise density is higher on the Hungarian territories. Operating enterprises are present in lower numbers in rural areas. Density of the operating enterprises in none of the Hungarian counties reaches the national average. Among the three Hungarian counties the highest number of operating enterprises could be found in Baranya. The lowest density of the enterprises is in Somogy county.
The Croatian part of programme area shows a rather weak picture in terms of density of business units compared to Hungarian and also to Croatian national average. In terms of density of active enterprises Međimurska and Varaždinska counties clearly stand out, business activity exceeds programme area average in Bjelovarsko-bilogorska and Osječko-baranjska. On the other hand, the number of active business entities had been increasing within the period of 2011 and 2016, while just as Hungary in general, the three Hungarian counties of the border area show a decreasing trend in terms of active businesses.

20
County Number of active business
entities (2011)
Number of active business entities
(2016)
Number of active business entities
(2018-HU, 2019-HR)
HU Hungary 696 680 654 995 717,357
HU Zala 19 631 17 509 19,571
HU Baranya 26 155 22 389 24,837
HU Somogy 19 191 16 521 18,914
HR Republic of Croatia 128 930 163 109 160 630
HR Međimurska 3 090 3 718 4 079
HR Varaždinska 3 632 5 278 5 080
HR Bjelovarsko-bilogorska 2 171 2 531 3 032
HR Osječko-baranjska 5 492 7 024 7 853
HR Koprivničko-križevačka 1 997 2 510 2 800
HR Virovitičko-podravska 1 274 1 736 1 660
HR Vukorvarsko-srijemska 2 345 3 162 3 332
HR Požeško-slavonska 920 1 501 1 453
Table 4: Actual number of active business entities Source: CBS, KSH
Hungary is lacking large enterprises in the region, the number of active corporations and unincorporated enterprises with 250 or more persons employed is only 54: 20 in Zala, 18 in Somogy and 16 in Baranya. The total number of registered enterprises in 2018 is 168,866 of which 133,557 are referring to self-employment and 65,324 enterprises have 1-9 persons employed; therefore, entrepreneurs and SMEs have important role in employment as well. In recent years the supporting institutions of SMEs were strengthened on the Hungarian programming area. Chambers of commerce and centres for development of enterprises operate at county level, regional innovation agency operates at regional level, plenty of incubators were built and several industrial parks operate in the region.
In Croatia, the North-Western part of the country, including Međimurska (2017: 3872 active companies) and Varaždinska (2017: 4777 active companies) counties overall have the largest number of SMEs, the greatest share of total employment in SMEs and the greatest value-added generation by SMEs. The Central and Eastern part of Croatia except Osječko-baranjska county (2017: 7302 active companies) is overall the poorest performing part of the whole county in terms of SME activity and presence, as this largest part of the programme area possess the smallest number of enterprises (e.g. Požeško-slavonska 2017: 1359 active companies), the least employment in SMEs and the lowest generation of GDP. Similarly, to Hungary, there is an established SME support system. Traditionally, Croatian Chamber of Commerce and Chamber of Crafts are present regionally. In addition to that, recently SME support institutions have started to operate: 7 incubators, 14 support centres, 5 technology parks, 8 regional and a number of local development agencies.
In terms of transnational cooperation between chambers, Osječko-baranjska, Pécs-Baranya and Varaždinska county chambers are members of the Danube Chambers of Commerce Association, the latter being also a member of the Danube Chamber of Commerce Federation as well.
Among the eight Croatian counties, the highest spatial density of enterprises can be found in the most densely populated Međimurska region (5.6 operating enterprises per km2, which is 197% of the national average – compared to the value of the eastern part of the area spreading between 29-67% of national average), but this is also notable in relation to the number of inhabitants (2.9%,

21
which is only 90% of national average, but much higher than in the eastern part of the area, where this value spreads between 40-62%). Considering the population density of the region, the examined area of Croatia is lagging behind country averages in most indexes regarding SME matters.
The largest number of entrepreneurs in the country is naturally based in the City of Zagreb, and in 2017 it is 40 210 entrepreneurs (33.5% share), with 331 978 employees. On average, this is 50 entrepreneurs per 1000 inhabitants or 75.5 entrepreneurs per 1000 working age population, which is the highest in the Republic of Croatia. For comparison, the smallest number of entrepreneurs per 1,000 population in Vukovarsko-srijemska county is only 11.9, and compared to 1000 working-age residents this average is 18.1. In the same zone with Vukovarsko-srijemska county are Požeško-slavonska and Virovitičko-podravska counties, with an average of 12.1 to 13.8 entrepreneurs per 1000 population, or an average of 18.6 to 20.8 entrepreneurs per 1000 working-age residents.
In the Global Competitiveness Index (GCI) ranking in 2019, Croatia ranked 63rd showing a five-level progress compared to the previous year, whereas Hungary ranked 47th that is stagnating compared to 2018. Although there has not been a negative change in the ranking of Hungary and Croatia, they still stay in the bottom of the index compared to other EU countries. Defining competitiveness as the set of institutions, policies and factors that determine the level of productivity of a country and SMEs, GCI scores are calculated by drawing together country-level data covering 12 categories – the pillars of competitiveness – that together make up a comprehensive picture of a country’s competitiveness. The 12 pillars are: institutions, infrastructure, macroeconomic environment, health and primary education, higher education and training, goods market efficiency, labour market efficiency, financial market development, technological readiness, market size, business sophistication and innovation.
Both countries are lagging behind of competitiveness compared with EU member states and this has upmost importance regarding the SMEs of the area. The experiences of cohesion policy 2007-13 in Hungary show that the funds of centralized operational programme for SMEs and economic development (GOP – Economy Development Operational Programme) are reached less successfully in programme area.
4.4. Agriculture/food production
Agriculture plays a more important role in the area than it does in the national economy of the two countries. In terms of gross value added, except for Međimurska, all counties are above the respective national averages. Tendency on the Croatian side is generally decreasing, in comparison with 2007, while on the Hungarian side the role of agriculture, forestry and fishing has been even risen since 2007 (Table 5). The main agricultural areas are the excellent quality lands and soils which could be found alongside the Danube and Drava rivers. Similar tendency is seen in terms of employment (Table 6). Employment in the primary sector is more apparent on the Croatian side (16.59%, 7.54% in Hungary), however with a strong negative tendency since 2007, dropping to nearly 60% of the 2007 level. Decrease in primary employment is particularly strong in the Slavonian counties, where agriculture has been traditionally the key sector. On the Hungarian side in Zala agricultural employment has been slightly increased, though.

22
Total - all NACE activities (million EUR)
NACE A - Agriculture, forestry and fishing
(million EUR) NACE A - Share
GEO/TIME 2007 2017 2007 2017 2007 2017
Croatia 37 148,49 40 550,83 1 639,41 1 441,31 4,41% 3,55%
Varaždinska 1 227,74 1 410,52 71,43 46,85 5,82% 3,32%
Koprivničko-križevačka 885,54 814,74 110,3 111,01 12,46% 13,63%
Međimurska 754,3 912,96 77,17 65,04 10,23% 7,12%
Bjelovarsko-bilogorska 680,15 719,74 119,81 140,58 17,62% 19,53%
Virovitičko-podravska 498,79 410,69 93,47 64,71 18,74% 15,76%
Požeško-slavonska 429,93 383,29 63,57 42,82 14,79% 11,17%
Osječko-baranjska 2 198,86 2 123,65 274,1 238,75 12,47% 11,24%
Vukovarsko-srijemska 938,25 920,97 155,6 123,08 16,58% 13,36%
Croatia programme area total 7 613,56 7 696,56 965,45 832,84 12,68% 10,82%
Hungary 87 841,68 106 292,06 3 570,74 4 770,56 4,06% 4,49%
Zala 2 069,41 2 289,5 115,39 149,63 5,58% 6,54%
Baranya 2 421,58 2 608,6 171,16 258,82 7,07% 9,92%
Somogy 1 772,77 2 149,65 183,25 245,11 10,34% 11,40%
Hungary programme area total 6 263,76 7 047,75 469,80 653,56 7,50% 9,27% Table 5: Share of agriculture, forestry and fishing in gross value added (GVA), NUTS 3.
Source: Eurostat, own edition.
Total - all NACE activities (thousand)
NACE A - Agriculture, forestry and fishing (thousand)
NACE A - Agriculture, forestry and fishing (share)
GEO/TIME 2007 2017 2007 2017 2007 2017
Croatia 1 742,68 1 634,41 229,21 113,38 13,15% 6,94%
Varaždinska 77,9 69,36 11,06 5,2 14,20% 7,50%
Koprivničko-križevačka 52,37 40,68 20,11 9,81 38,40% 24,12%
Međimurska 48,79 42,26 8,13 4 16,66% 9,47%
Bjelovarsko-bilogorska 49,14 38,91 18,94 9,33 38,54% 23,98%
Virovitičko-podravska 34,32 26,14 15,41 7,6 44,90% 29,07%
Požeško-slavonska 25,59 21,65 7,22 3,57 28,21% 16,49%
Osječko-baranjska 117,28 101,67 28,31 14,1 24,14% 13,87%
Vukovarsko-srijemska 63,36 51,36 23,07 11,43 36,41% 22,25% Croatia programme area total 468,75 392,03 132,25 65,04 28,21% 16,59%
Hungary 4 125,06 4 559,03 194,61 194,14 4,72% 4,26%
Zala 109,99 110,49 6,58 6,73 5,98% 6,09%
Baranya 139,21 131,74 10,59 9,91 7,61% 7,52%
Somogy 104,29 103,87 10,61 9,47 10,17% 9,12% Hungary programme area total 353,49 346,10 27,78 26,11 7,86% 7,54%
Table 6: Share of agriculture, forestry and fishing in employment, by NUTS 3 regions. Source: Eurostat, own edition.
Role of agribusiness in number of businesses may be estimated by the data of active economic actors with legal personality, broken down by NACE categories. On both sides of the border the primary sector is represented above-average among active companies, the largest share

23
being in Somogy, that is followed by Virovitičko-podravska on the Croatian side. Only Varaždinska and Međimurska are below the national averages. The share of wider agribusiness is measurable only on the Hungarian side, with similar proportions as the share of NACE A companies (Table 7).
Geographical area
Registered legal persons total
NACE A= Agriculture, forestry and fishing
Share NACE A
10= Manufacture of food products, 11= Manufacture of beverages, 12= Manufacture of tobacco products
462= Wholesale of agricultural raw materials and live animals
463= Wholesale of food, beverages and tobacco
472= Retail sale of food, beverages and tobacco in specialised stores
Agribusiness total
Share of agribusiness
Hungary total 487 323 12 472 2,56% 5 961 2 290 5 733 6 776 33 232 6,82% Zala 9 538 544 5,70% 113 58 91 115 921 9,66% Baranya 14 819 683 4,61% 274 137 120 198 1 412 9,53% Somogy 9 406 814 8,65% 159 65 106 126 1 270 13,50% Hungary programme area total 33 763 2 041 6,05% 546 260 317 439 3 603 10,67% Croatia total 150 401 2 753 1,83%
Međimurska 3 873 66 1,70%
Varaždinska 4 777 79 1,65%
Bjelovarsko-bilogorska 2 768 130 4,70%
Osječko-baranjska 7 302 275 3,77%
Koprivničko-križevačka 2 663 106 3,98%
Virovitičko-podravska 1 554 120 7,72%
Vukorvar-Sirmium 3 082 144 4,67%
Požeško-slavonska 1 359 40 2,94% Croatia programme area total 27 378 960 3,51%
Table 7: Share of number of businesses with legal personality in agriculture-related economic activities. Source: KSH, CBS, own edition
Although the average parcel size is traditionally bigger in Hungary, the size of agricultural land used and by holdings is rather similar on the two sides. The counties of Somogy, Osječko-baranjska and Baranya have the largest agricultural area, while in terms of average size of land by agricultural holdings shows rather a west-east divide: smaller concentration is detected on the western part of the border area, while in the eastern part Vukovarsko-srijemska and Osječko-baranjska have the highest level of concentration, followed by Baranya and Vukovarsko-srijemska (Table 8). (

24
Geographical area
Utilised agricultural area by agricultural holdings (ha)
Number of agricultural
holdings
Average agricultural area by holding (ha)
Zala 132 754 18 646 7,12 Baranya 200 539 15 443 12,99 Somogy 251 493 24 767 10,15 Hungary programme area total 584 786 58 856 9,94 Međimurska 30 269 5 398 5,61 Varaždinska 30 319 8 571 3,54 Bjelovarsko-bilogorska 90 737 11 878 7,64 Osječko-baranjska 211 548 12 887 16,42 Koprivničko-križevačka 72 585 10 743 6,76 Virovitičko-podravska 83 667 6 962 12,02 Vukorvarsko-srijemska 129 634 7 533 17,21 Požeško-slavonska 43 248 5 195 8,32 Croatia programme area total 692 007 69 167 10,00
Table 8: Utilised agricultural area and nubmer of holdings on NUTS 3 level (2016). Source: KSH, Ministry of Agriculture, own edition.
On both sides of the border production of arable crops is typical, like maize, wheat and other cereals, sunflower and rape. The number of livestock decreased in the past decades, there are typically poultry and pigs for slaughter, cattle for milk and bee families for honey. Share of cropland in land use is generally higher on the Hungarian side, however percentage of woodland is higher in Croatia (Table 9). Zala and Somogy are the two most afforested counties of Hungary, but in Baranya and on the Croatian areas there are extended forests as well that could serve as a basis for touristic and wood industry purposes. The agricultural sector is suffering from a number of structural difficulties: especially the small size of agricultural holdings, but also a large share of agricultural land that is not farmed.
GEO/TIME Total land
cover Artificial
land Cropland Woodland Shrubland Grassland Bare land Water Wetland
European Union 100,0 4,4 21,5 37,8 7,4 20,5 3,5 3,2 1,7
Croatia 100,0 3,7 16,7 45,7 12,3 19,1 1,2 1,1 0,3
Kontinentalna Hrvatska 100,0 3,7 26,8 42 5,1 19,8 0,8 1,6 0,1
Hungary 100,0 4,1 43,7 24 2 19,9 2,9 2,1 1,4
Nyugat-Dunántúl 100,0 3,5 43,1 30,4 2,1 15,2 2,1 1,4 2,1
Dél-Dunántúl 100,0 3,7 44,6 29,7 2,1 13,4 2,9 3,2 0,4 Table 9: Land use categories (percentage, 2015).
Source: Eurostat.
Large part of the Croatian programme area is still contaminated with mines since 1990/1991 that presents a security issue for population – primarily in usage of land suitable for agriculture. Four out of eight counties still have mine-suspected territories covering in total 179 km2: 102,5 km2 in Osječko-baranjska county, 37,8 km2 in Požeško-slavonska county, 29 km2 in Vukovarsko-srijemska, and 9,8 km2 in Virovitičko-podravska. The target area is relatively abundant with agricultural land, however there is lack of rational land management caused by numerous factors that include

25
unresolved ownership status, problems of small private land, permanent loss of agricultural land due to urbanization, undefined management of state land, a considerable proportion of uncultivated and abandoned land.
The common asset of the area is the high level of wine-growing and production which is frequently linked to tourism and catering industry and by doing so generated significant incomes in some areas in the recent years. On the Hungarian side two wine regions with their four sub-regions are located (as part of the Pannon Wine Region they are the Pécs and Villány sub-regions, and in the Balaton wine region the Balatonboglár and the Zala sub-regions). On the Croatian part five wine-growing areas (Podunavlje, Slavonia, Prigorje–Bilogora, Moslavina, Zagorje–Međimurska, Podravina) produce high quality wines and has a number of wine routes.
4.5. Industry and services
In terms of the sectoral focus and structure of the economies in the border regions the Structural Business Statistics (SBS) data shows that Continental Croatia has a relatively stronger focus on Manufacturing, Wholesale trade, Retail trade and Accommodation and food service activities. Western Transdanubia and South Transdanubia have a stronger relative focus on Construction and Professional, scientific and technical activities. In terms of the share of people employed, Continental Croatia has a relatively stronger focus on Wholesale trade, Retail trade, ICT and Professional, scientific and technical activities.
Based on report of the Croatian Chamber of Economy for Croatian counties and the index of economic strengths, the highest ranked county is Varaždinska, followed by Međimurska and Koprivničko-križevačka county. While Bjelovarsko-bilogorska, Požeško-slavonska and Virovitičko-podravska county are listed on the other end of the rank.
Basis of economy in Varaždinska county is the manufacturing industry, which accounts for 54% of the county's total revenue and has great export growth potential. The same accounts for Koprivničko-križevačka county, where 52 percent of all employees work for the manufacturing industry, especially in the sectors of food and beverage and pharmaceutical production, followed by wholesale and retail trade, construction and agriculture.
Međimurska economy is predominantly based on manufacturing industry, which generates the highest income and employs the most people, and the agricultural, trade, transport and construction industries are also developed. It is export oriented, with a significant share of labour-intensive, low-cumulative and traditional industries, with the development of high-tech industries. Within manufacturing, the most represented industries are metal processing, textile and clothing, wood processing and food industry.
In the county of Bjelovarsko-bilogorska strengths are in agriculture and food processing industry (meat, milk, eggs, freshwater fish) presented regularly on Bjelovar Fair, within which timber industry (sawn timber and boards, the production of plywood, veneer, particle board and solid and tiled furniture and parquet) is one of the strategic branches. The main industries in Virovitičko-podravska county are agriculture (sugar beet, tobacco and medicinal plants; beekeeping, fish farming), final wood processing (office, school and other furniture, parquet floors, clogs), food and non-metal industries (ceramic tiles).
The economic environment of Požeško-slavonska county is based on agriculture (with 5,000 family farms and businesses) and processing industry. Within the manufacturing industry, the most

26
represented are metal processing, wood processing and food industries, with a smaller share of the textile industry and the production and processing of non-metallic mineral products and electrical equipment.
Osječko-baranjska county has, beside manufacturing and the food industry, timber, chemical and metal industry, machinery, building materials, and also a growing IT industry. Vukovarsko-srijemska’s economy in characterized by industry and agriculture, primarily timber, but has also significant tourism activities (cultural, cruising, rural, cycling, wine tourism).
Regarding production Zala is the leader among the counties of the cross-border region on the Hungarian side. The value of industrial production per capita of the county is 102%, in Somogy it is 70% and in Baranya it is 32% of the national average. Baranya records the lowest figure despite the fact that the biggest urban agglomeration of the area is located there. In agricultural terms, the Hungarian counties perform well, and above national average. The share of services is the highest in Baranya county, above the national average, however Somogy has also a performance near the national average. The sectors of trade, transport, hotels and restaurants are strong in Somogy, while the sectors of public administration, education, human health and social work activities are overrepresented in the Hungarian counties compared to business services. Info communication and financial services are rather weak in all of the three counties, showing a structural underdevelopment of the economic system.
NACE Code Group of industry Share of value added by main groups of economy Baranya Somogy Zala Hungary
A Agriculture, forestry and fishing 10,0 11.5
6.6 4.4
B,C,D,E Industry 19.1 20.5
27.7 26.0
F Construction 4.6 4.7
5.6 4.3
G-U Services 66.3 63.3
60.1 65.3
A–U Total 100.0 100.0
100.0 100.0
Table 10: Distribution of gross value added by main groups of economy Source: KSH, 2017
Just as in Hungary, the neighbouring regions of Croatia have significant agricultural activity, which greatly contributes to the gross value added. Međimurska, Koprivničko-križevačka and Varaždinska score higher than national average and greater than other parts of the Croatian programme area in terms of industry, while Vukovarsko-srijemska is significantly below the national average. The share of services fails to reach national average in either of the Croatian counties concerned.
Within the programme area, Osječko-baranjska county has the strongest services sector that translates into 60.2% gross-value added, while Međimurska has the smallest 45%. Public administration, education, human health and social work activities are overrepresented in Požeško-slavonska and Vukovarsko-srijemska, while real economy related service sectors are weak in these counties that reflects the status of these areas.

27
NACE Code Group of industry
Share of value added by main groups of economy
Varaždinska
Koprivničko-križevačka
Međimurska Bjelovarsko-bilogorska
Virovitičko-podravska
Požeško-slavonska
Osječko-baranjska
Vukovarsko-
srijemska Croatia
A Agriculture, forestry and
fishing 3.5 13,3 7,4 19,8 16,3 11,4 11,4 13,9 3,8
B,C,D,E Manufacturing, mining
and quarrying and other industries
41.6 35,7 43,6 22,4 23,0 24,3 22,1 18,1 21,4
C of which Manufacturing 36.8 26,3 39,3 18,6 18,1 18,9 17,1 13,1 15,3
F Construction 4.5 5,1 4,2 4,6 6,8 5,4 6,4 8,6 5,3
G-U Services 50.4 45,9 45 53,2 54,0 58,9 60,2 59,4 69,5
G,H,I
Wholesale and retail trade, transportation,
storage, accommo-dation and food service
activities
14.5 14,2 13,5 11,8 12,4 14,3 15,9 15,3 22
J Information and communication
2.2 0,7 2,1 1,6 1,1 2,2 3,5 1,3 4,5
K Financial and insurance
activities 4.0 4,4 3 5,5 4,3 2,0 3,4 1,8 6,3
L Real estate activities 8 8,4 9,4 10,9 12,6 14,2 9,8 13,5 10
M,N
Professional, scientific, technical, administrative
and support service activities
4.4 4,0 4,8 4,1 3,2 2,5 6 3,1 8,3
O,P,Q
Public administration and defence, education, human health and social
work activities
15.1 12,2 10,8 17,5 18,4 21,7 18,8 22,1 15,1
R,S,T,U Other service activities 2.2 2,0 1.4 1,8 2,0 2,0 2,8 2,3 3,3
A-U Total 100.0 100.0 100.0 100.0 100.0 100.0 100.0 100.0 100.0
Table 11: Distribution of gross value added by main groups of economy in Croatia, 2016 Source: CBS.
The Hungarian-Croatian cross border region shows no signs of real sector specialisation. Most segments of the processing industry operate here, among them it is worth mentioning the food industry, the machinery and there are significant capacities of electronic assembly plants as well. Due to the lack of large enterprises indicated in the previous section of the situation analysis, non-sectoral SME support as well as boost of the already established agricultural sector is justifiable and could potentially strengthen capacities and market share of the local establishments.
4.6. Tourism
In terms of tourism accommodation capacities, the Croatian side significantly lags behind the Hungarian counties. More than 92% of the accommodation capacities (beds including permanent and extra) is located on the Hungarian side, thereof near 70% in the four districts adjacent to the Balaton lake (Fonyód, Keszthely, Marcali, Siófok). Outside these districts the most significant capacities are in the districts of Nagykanizsa, Pécs and Siklós. On the Croatian side the biggest accommodation capacities are located in Osječko-baranjska and Varaždinska counties, which are followed by Vukovarsko-srijemska and Međimurska (Table 12).

28
County / district Number of beds Share within country
Share in border region
Zala 44 676 24,51% 22,65% Keszthely 27 113 14,88% 13,74% Lenti 2 413 1,32% 1,22% Letenye 643 0,35% 0,33% Nagykanizsa 10 067 5,52% 5,10% Zalaegerszeg 2 645 1,45% 1,34% Zalaszentgrót 1 795 0,98% 0,91% Baranya 19 962 10,95% 10,12% Bóly 329 0,18% 0,17% Hegyhát 76 0,04% 0,04% Komló 1 372 0,75% 0,70% Mohács 589 0,32% 0,30% Pécs 8 952 4,91% 4,54% Pécsvárad 762 0,42% 0,39% Sellye 114 0,06% 0,06% Siklós 6 802 3,73% 3,45% Szentlőrinc 133 0,07% 0,07% Szigetvár 709 0,39% 0,36% Somogy 117 618 64,53% 59,62% Barcs 1 112 0,61% 0,56% Csurgó 542 0,30% 0,27% Fonyód 35 518 19,49% 18,00% Kaposvár 4 089 2,24% 2,07% Marcali 11 407 6,26% 5,78% Nagyatád 1 095 0,60% 0,56% Siófok 63 581 34,89% 32,23% Tab 274 0,15% 0,14%
Hungary total 182 256 100,00% 92,39%
Koprivničko-križevačka 762 5,07% 0,39% Bjelovarsko-bilogorska 1 338 8,91% 0,68% Vukovarsko-srijemska 2 208 14,71% 1,12% Virovitičko-podravska 807 5,37% 0,41% Varaždinska 3 566 23,75% 1,81% Požeško-slavonska 1 024 6,82% 0,52% Osječko-baranjska 3 628 24,16% 1,84% Međimurska 1 682 11,20% 0,85%
Croatia total 15 015 100,00% 7,61%
Programme area total 197 271 100,00% Table 12: Tourism accommodation capacities (number of beds) in the border area (2018).
Source. KSH, CBS, own edition.
In Hungary, the role of tourism in Zala and Somogy is outstanding as regards the number of guests. In these counties the number of tourists on annual basis is around twice as many as the number of inhabitants. In Zala the number of guest nights per thousand people as of 2018 were 2 times, in Somogy 1.7 times higher than the national average. This is mostly due to the availability of waters: lake Balaton and the spas and thermal waters play decisive role in the dynamism of touristic turnover. Lake Balaton’s impact is especially strong on the tourism industry of Somogy, whereas in Zala the existence of popular spa-resorts (as Hévíz or Zalakaros) provides strong contribution to

29
these high figures. In the area the number of domestic guests exceeds that of the foreign ones. Spas of international importance are at Hévíz, Zalakaros and Harkány, but several other thermal baths are operating (for example Szigetvár, Zalaegerszeg, Kaposvár, Siklós, Zalaszentgrót, Kehidakustány, Barcs, Nagyatád, Marcali etc.).
Other important touristic destinations are in the centre of Baranya county: the Pécs – Mecsek Mountain – Siklós – Harkány area, where culture and gastronomy contribute to the touristic turnover. Pécs, with its valuable ecclesiastic (cathedrals, churches, monasteries, mosque) and secular (castles and fortresses) buildings are attracting many visitors. In Somogy and Zala hunting tourism also plays a role in engaging tourists from inland and abroad as well.
The share of foreign guest nights is the highest in Zala county (40%) though it is still lower than the Hungarian national average (49%). The tourism activity does not concentrate in the border area, the exceptions are Lenti and Siklós districts, where the Lenti and Harkány spas generates significant tourism overnights. All other Hungarian border districts have inconsiderable touristic performance.
Year 2018
Arrivals Nights
numbers per 1000
inhab. numbers
per 1000 inhab.
rate of foreigners
(%)
HU Hungary 12 548 170 1 284 31 011 261 3 173 49 HU Zala 790 724 2 943 2 743 060 10 211 40 HU Somogy 643 698 2 135 1 829 651 6 070 25
HU Baranya 326 217 904 762 732 2 115 19 HR Croatia 18 666 580 4 579 89 651 789 21 994 93
HR Međimurska 76 415 698 186 736 1 705 57
HR Vukovarsko-srijemska 80 536 528 132 042 866 21
HR Varaždinska 71 150 427 167 776 1 007 46
HR Osječko-baranjska 99 025 360 194 904 709 24
HR Požeško-slavonska 16 252 242 36 134 539 33
HR Virovitičko-podravska 18 023 242 46 299 621 28
HR Bjelovarsko-bilogorska 24 830 232 79 824 745 29
HR Koprivničko-križevačka 19 591 183 40 124 375 45 Figure 9: Tourism arrivals and nights in 2018 (only data of commercial accommodation in Hungarian side)
Source: KSH, CBS
In terms of tourism overnights the Croatian side is lagging behind the figures of the Hungarian counties, however, the better performance of the Hungarian side is, again, due to some outstandingly performing districts, along the Balaton and remote from the border. Although the eight Croatian counties along and next to the border with Hungary jointly bring only about 1% overnight stays in Croatia – due to the vast share of the coast in the country –, Međimurska is an emerging continental tourism destination, with high per capita overnight figures, which is followed by Varaždinska. In absolute numbers the most visited county is Osječko-baranjska, where in particularly Baranja region is recognised for its rural tourism and gastronomy, while Bjelovarsko-bilogorska for spa tourism in Daruvar (Figure 10).

30
Figure 10: Tourist overnight stay in the counties (CRO) and districts (HU) of the programming area (only data of commercial accommodation in Hungarian side)
Source: KSH, CBS, own compilation
Tourism nights showed slight but continuous increase in most of the counties until 2008, then – due to financial crisis – year 2009 brought a drop almost in all counties. Recovering process started in 2011 but generally the 2007 level has been reached, or slightly outperformed with the exception of Somogy, where only 74% of the 2007 results is reached. Considerable rising tendency is experienced in Međimurska, Vukorvarsko-srijemska, Varaždinska, Požeško-slavonska and Bjelovarsko-bilogorska counties (Table 13).

31
County 2007 2018 Change
2018/2007 (%)
Zala 8 200 10 211 125 Somogy 8 206 6 070 74 Baranya 2 117 2 115 100 Međimurska 559 1 705 305 Varaždinska 779 1 007 129 Vukorvar-Sirmium 404 866 214 Bjelovarsko-bilogorska 250 745 298 Osječko-baranjska 535 709 133 Virovitičko-podravska 367 621 169 Požeško-slavonska 183 539 295 Koprivničko-križevačka 284 375 132
Table 13: Trend of tourism nights per 1000 inhabitant by county in 2007-2018 Source: KSH, CBS
4.7. Summary
Main statements related to PO1 – a smarter Europe:
- Defined East-West division in terms of economic activity and output in the area. - The region performs below country averages and its GDP at PPS per inhabitant fluctuates
between 55-32% as compared to EU average. - The economic trends in between 2007 and 2017 are characterised by economic downturn
with lower rates of registered development than the respective national averages. - Enterprise density is higher on the Hungarian side than in the Croatian counties. - Within the period of 2011-2016 the number of active business entities increased in the
better performing Croatian counties and decreased in the three Hungarian counties. - SMEs are prominent in the region. There is a developed and functioning SME support
system. - The agriculture is represented above-average both in gross value added and employment on
both sides of the border area. - Gross Domestic Expenditure on R&D (GERD) is below EU average in both countries, not
reaching 1/3 of the European average. - Tourism is an emerging element of the economy, majority of guest nights is concentrated in
some outstandingly performing districts.

32
5. Environment, low-carbon & green perspective
Hungary as well as Croatia are part of the Central European biogeographical region, while Croatia also belongs to the mountainous geographical region. The global climate change is increasingly being felt in Europe and in the programme area as well. In order to avoid serious and irreversible impacts of climate change global warming must be limited to below 2 °C compared to pre-industrial level. Therefore, the EU has adopted a Strategy on adaptation to climate change3 (2013), which is followed by national and regional adaptation strategies. Hungary has adopted its national strategy for the period of 2018-2030 with an outlook to 2050. In case of Croatia the Strategy on adaptation to climate change until 2040 with a view on 2070 has been adopted in April 2020 by the Parliament. In addition, the draft of the Croatian Strategy on low carbon development by 2030 with a view on 2050 passed public consultation in June 2020. County strategies have been developed for the Hungarian counties as well.
Climate change may lead to projected temperature change, in Europe more than the global mean temperature change, change in precipitation patterns, particularly in the Mediterranean countries, the risk of summer draught is likely to increase everywhere, resulting forest fires, while precipitation in other periods of the year may lead to flash flooding and river floods. Parallel, climate change negatively affects biodiversity and lead to an increased presence of invasive species. All these phenomena may have severe impact on the built environment and the densely populated areas and on agricultural production, which is of key importance for the border region.
On transnational level in framework of the EUSDR a Disaster Management Working Group is operating, with Hungarian coordination, which includes Croatian members as well, providing a platform for cooperation. The Dridanube financed by the Danube Transnational Programme has prepared the Danube Drought Strategy, which projects various indicators, including the increase of rainless periods that will particularly threat the eastern part of the Croatian side of the border area and the central zone of the Hungarian part (Figure 11).
As it is true for the world in general, it has upmost importance in the cross-border area as well to focus efforts on developments that have positive effects on the environment. The European Green Deal aims at boosting the efficient use of resources by moving to a clear, circular economy; restore biodiversity and cut pollution.
3 Communication from the Commission to the European Parliament, the Council, the European Economic and Social Committee and the Committee of the Regions. An EU Strategy on adaptation to climate change. European Commission, Brussels, 16.4.2013, COM(2013) final.

33
Figure 11: The longest expeceted ranless periods in the Hungary-Croatia border area, in days, 10 years forecast.
Source: https://droughtwatch.eu/ (16.07.2020).
5.1. Natural Resources
The cross-border region of Hungary and Croatia has somewhat favourable environmental conditions. The heavy polluting socialist industry has been more or less renewed or replaced by modern counterparts on the Hungarian side dominantly through privatisation processes, while in Croatia a light polluting industry is prominent.
The quality of air is generally considered satisfactory in the area, although the area of Pécs in Baranya is still above the national average regarding air pollution as well as in comparison to other programme areas. The poor air quality is dominantly attributable to the heavy traffic, mixed residential heating habits, the unfavourable use of the natural environment and land provided by the Mecsek hill. In Croatia air quality is mainly satisfactory, the larger towns of the border area, such as Osijek, do not suffer by pollution to a large extent.
The border region is mainly characterized by three water systems that are concentrated at the Danube on the East side, Drava and Mura following the border line and lake Balaton at the northern area of Somogy and Zala counties. Most of these systems have been manipulated, however great efforts have recently been made in order to restore and preserve the natural river basins, as well as to rehabilitate the character and natural environment of the Ancient Drava. All three water

34
systems suffer from a great volatility of water flow, the summer heat evaporates the water mass of Balaton, which affects wildlife to a large degree.
The Drava forms the border between Hungary and Croatia for about 145 km before entering Croatia and finally joining the Danube. The lower Mura and Drava constitute a 380 km free-flowing and relatively natural watercourse. The confluence area of the Drava and Danube forms the internationally important Kopački Rit Nature Park. Flooding is also a threat, especially that of the Drava and Mura region, where natural water ponds are not available. Due to high precipitation rates in the upper basin of Drava, the river exhibits high flood risk in the upper reach. Since the construction of dams, reservoirs and lateral levees prevent most of the area from flooding. Within the downstream section, the Kopački Rit Nature Park area in particular, experiences long-lasting floods that stay for about or more than 100 days.
The hydroelectric power stations can somewhat positively influence the flow of the river, especially if there is unexpected high water flow coming. However, the fluctuation in the level of water can go up to 80 cm within a day, which negatively impacts the river (e.g. sedimentation) and its wildlife, as well as restricts waterborne traffic.
Forests of the region serve as an asset not only for tourism but for wood industry, and biomass-based energy production as well. Counties located within the border-region are heavily afforested, especially Zala, Somogy, Virovitičko-podravska and Koprivničko-križevačka.
Woodland % 2009 2012 2015
European Union : : 39.2
Croatia : : 45.7
Continental Croatia : : 42
Hungary 21.8 23.1 24
Western Transdanubia 28.3 29.8 30.4
South Transdanubia 26.1 27.8 29.7 Figure 12: Woodland as a percentage of land
Source: Eurostat 2018
The transboundary biosphere of the rivers Mur-Drava-Danube stretches along the lane of these rivers (Figure 13), which are separated by flood prevention dykes into an inundation area and a flood-controlled side. According to UNESCOs reports, most of the population lives in the transition zone of the biosphere reserve. The core zone is located in Croatia. The buffer zone has a total population of 27,239 and the transition zone has a population of approximately 470,000 inhabitants. In this part of the biosphere reserve the main cities are Varaždin, Čakovec, Koprivnica, Virovitica, Osijek, Vukovar and Ilok.

35
Figure 13: Protected areas of the Mur-Drava-Danube Biosphere Reserve. Source: Revital Integrative Raumplaning GmbH, 2019
On the Hungarian side, about 180,000 inhabitants live in small town or rural village environment, most typically in the transition zone. Baranya, Somogy and Zala counties are characterised with a network of small villages with sometimes as few inhabitants as only a couple of hundred people. One of the major functions of the biosphere reserve is to provide a training ground for the revival and modernization of floodplain management, which will ensure an extra source of livelihood for local people, and help preserve the natural values of the floodplain region. Several Interreg Danube Transnational Programme 2014-2020 projects were supported with a focus on the proper management of the planned five-country Biosphere Reserve eco-corridor (e.g. Coop MDD, D2C – Dare to Connect, REFOCUS, Amazon of Europe Bike Trail). Their results should be also capitalized in cross-border cooperation.
5.2. Public utilities and waste management
Circular economy is a concept of recycling and reusing resources as well as minimising waste output in order to keep the economy in a closed loop in order to be sustainable limit the deterioration of the environment. Although the EU is in the forefront of the world with respect to the transition and implementation to a circular economy, Hungary and Croatia are lagging behind on this aspect.
As the Circular Economy Update Report of 2019 states, barriers in Hungary include “a lack of widespread resource-efficient strategic thinking and outdated research infrastructure”. Rather than planning for a comprehensive national strategy, the government is planning to integrate circular economy principles into the current economic development strategy. The general awareness of the concept and importance of a circular economy is almost non-existent. Furthermore, regulations, laws and distortions in the current Hungarian economic system discourage circular business models while companies are not incentivised for the limiting, repurposing, reusing, or recycling of waste or by-products.

36
On average in the European Union, 1% of GDP is coming from circular economy related activities. Therefore, it can be seen that the countries are not lagging behind significantly based on statistics, however the peripheric areas of the countries such as the region of the border fall behind national levels regarding the integration of circular economy practices.
2011 2012 2013 2014 2015 2016 2017
Croatia 1.1
8 1.1
4 1.1
9 1.2
1 1.2
4 1.2
2 1.27
Hungary 0.8
4 0.7
8 0.7
5 0.8
3 0.7
6 0.9
0 0.98
Table 14: Value added of circular economy related activities as % of GDP, EU percentage is strictly around 1. Source: Eurostat 2018
In Croatia, although there are several examples of good practice at the company level regarding the introduction of circular economy principles in production processes, the country is facing barriers regarding waste management. It has upmost importance in both countries to develop regulatory framework in full compliance with EU regulations, introducing economic instruments, providing professional training, improving product design and encouraging innovations require portfolio of carefully chosen policy measures to initiate circular economy transition processes in both countries.
The Hungarian side of the border area is feature with a high, almost 100% level of access to public water supply utilities. Although developments have also recently made on the sewage system connection figures, in the programme area it is still below the national average: the “utility gap” has remained an unsolved problem. Activities regarding water regulation have been taken place in several areas in Hungary, mostly by means of EU assistance. The presence of waste water treated by 3rd grade sewage treatment system significantly varies on the programme area. The Middle region of Somogy county and the Northern and Southern periphery of Baranya are not using this method.
The level of the connection of the population to public water supply systems in the major part of Croatia is satisfactory. In comparison to the EU, the country is below average as for the majority of European countries data indicates average level of connection of the population at about 90%, although the ratio expectedly varies among countries. In Croatia the levels of water treated by the appropriate sewage systems are not satisfactory although the country rates well in terms of water supply standards according to the Water Utility Directives of 2010. Out of the total of 295 settlements with the built sewerage system, 131 (44%) settlements also have a wastewater treatment plant. Meaning, that only 27% of the total population is equipped with wastewater utility.
Overall, the coverage ratio, which means the share of the population able to connect to the public water supply system, on the level of the Republic of Croatia is on the average 80-82%. The connection ratio that is the share of the population connected to the public water supply system, is lower and it is estimated on the average at 74%. In general, larger urban centres have greater rates of connectedness to both the water supply and wastewater treatment than their counterparts and smaller agglomerations. Croatia has negotiated a transition period for the full implementation of the Water Utility Directives until 2023, when the water supply and waste-water management system will have to be renovated and fully aligned with the EU standards.

37
Figure 14: Collected solid waste per 1000 inhabitant in the Programme area (tonnes), 2018 Source: KSH, CBS, own compilation
In the three Hungarian counties, four waste collection cooperation have been formed. Their operations have undergone evaluation and planning for development, however progressive incentives have not been translated into measurable outputs.
In the past years a slight but not constant decrease in solid waste production is detected, however share of recycled waste is low (23% at average – lowest in Zala, and around 40-45% in Somogy and Baranya). Share of waste used for energy production while burning is minimal. Development of the waste management systems shall contribute to a higher share of recycling and energy production in the future.

38
County 2007 2008 2009 2010 2011 2012 2013 2014 2015 2016 2017 2018 %
2018/2007
Solid waste transported by public service (thousands tonnes)
Zala 101 107 91 98 95 81 76 81 80 82 84 82 81
Baranya 190 198 201 157 146 124 129 113 104 107 106 105 55
Somogy 144 166 144 120 112 103 103 106 108 107 105 109 76
Solid waste recycled (thousands tonnes)
Zala 11 16 13 19 18 15 13 17 17 17 18 19 166
Baranya 16 19 17 18 17 10 16 16 13 18 28 32 197
Somogy 13 18 9 7 16 7 20 24 24 24 23 37 287
Solid waste burned with energy production (thousand tonnes)
Zala - - 0 - - - - 0 0 1 0 0 -
Baranya - - - - - - 0 5 23 24 9 11 -
Somogy - - 0 0 0 0 - 1 3 13 27 12 -
Solid waste landfilled (thousands tonnes)
Zala 90 91 78 79 76 66 63 64 62 64 65 63 70
Baranya 174 179 184 139 128 114 113 92 68 66 69 61 35
Somogy 131 148 134 113 96 96 83 82 82 69 55 60 46
Solid waste landfilled (% of transported solid waste)
Zala 89 85 86 80 80 81 83 79 79 78 78 77
Baranya 91 90 91 89 88 92 88 81 65 61 65 59
Somogy 91 89 93 94 85 93 81 77 75 65 52 55
Table 15: Collected solid waste and their use in Hungarian counties concerned
Source: KSH, own compilation
In Croatia, the 4 north-western counties (Koprivničko-križevačka, Međimurska and Varaždinska county plus Krapinsko-zagorska, which does not belong to the programme area) have jointly established a regional waste management centre Piškornica, while other counties have not as yet established such centres.
Differences between individual counties are huge. While Međimurska county is the most advanced Croatian county in terms of waste separation (25.8% waste is collected separately), Vukovarsko-srijemska is among the least advanced (only 3.1% separately collected waste.
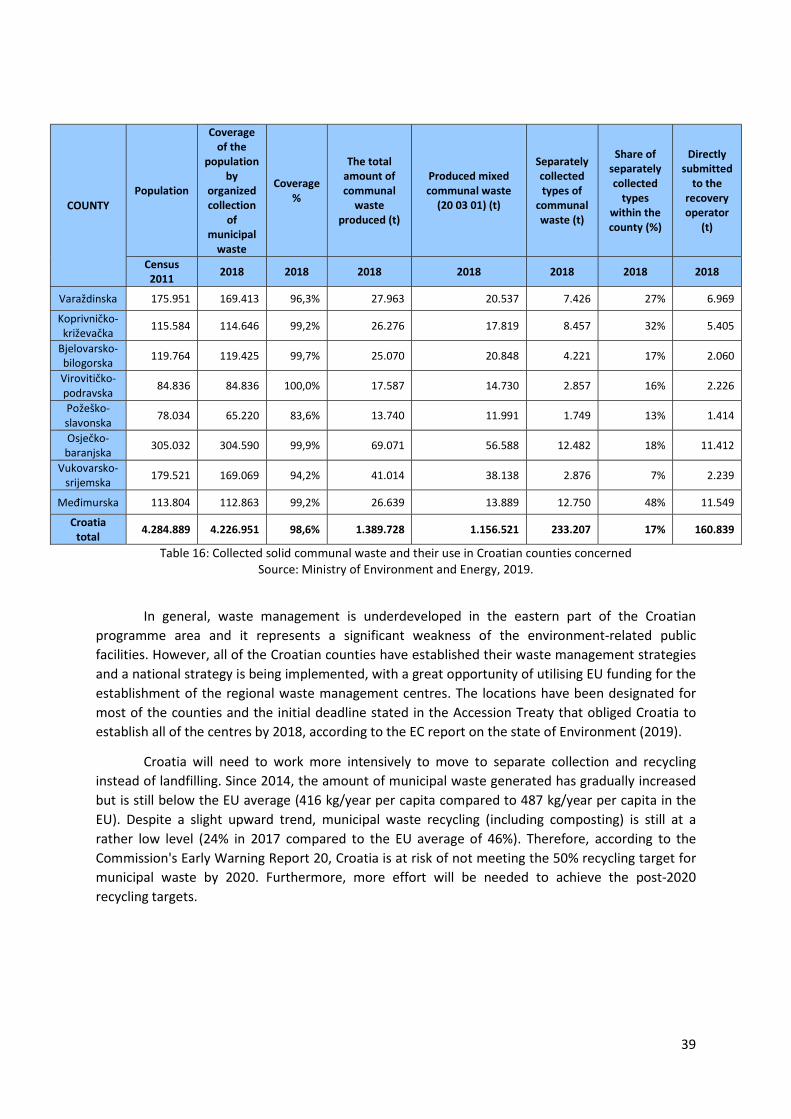
39
COUNTY Population
Coverage of the
population by
organized collection
of municipal
waste
Coverage %
The total amount of communal
waste produced (t)
Produced mixed communal waste
(20 03 01) (t)
Separately collected types of
communal waste (t)
Share of separately collected
types within the county (%)
Directly submitted
to the recovery operator
(t)
Census 2011 2018 2018 2018 2018 2018 2018 2018
Varaždinska 175.951 169.413 96,3% 27.963 20.537 7.426 27% 6.969
Koprivničko-križevačka
115.584 114.646 99,2% 26.276 17.819 8.457 32% 5.405
Bjelovarsko-bilogorska 119.764 119.425 99,7% 25.070 20.848 4.221 17% 2.060
Virovitičko-podravska
84.836 84.836 100,0% 17.587 14.730 2.857 16% 2.226
Požeško-slavonska
78.034 65.220 83,6% 13.740 11.991 1.749 13% 1.414
Osječko-baranjska
305.032 304.590 99,9% 69.071 56.588 12.482 18% 11.412
Vukovarsko-srijemska 179.521 169.069 94,2% 41.014 38.138 2.876 7% 2.239
Međimurska 113.804 112.863 99,2% 26.639 13.889 12.750 48% 11.549
Croatia total
4.284.889 4.226.951 98,6% 1.389.728 1.156.521 233.207 17% 160.839
Table 16: Collected solid communal waste and their use in Croatian counties concerned Source: Ministry of Environment and Energy, 2019.
In general, waste management is underdeveloped in the eastern part of the Croatian programme area and it represents a significant weakness of the environment-related public facilities. However, all of the Croatian counties have established their waste management strategies and a national strategy is being implemented, with a great opportunity of utilising EU funding for the establishment of the regional waste management centres. The locations have been designated for most of the counties and the initial deadline stated in the Accession Treaty that obliged Croatia to establish all of the centres by 2018, according to the EC report on the state of Environment (2019).
Croatia will need to work more intensively to move to separate collection and recycling instead of landfilling. Since 2014, the amount of municipal waste generated has gradually increased but is still below the EU average (416 kg/year per capita compared to 487 kg/year per capita in the EU). Despite a slight upward trend, municipal waste recycling (including composting) is still at a rather low level (24% in 2017 compared to the EU average of 46%). Therefore, according to the Commission's Early Warning Report 20, Croatia is at risk of not meeting the 50% recycling target for municipal waste by 2020. Furthermore, more effort will be needed to achieve the post-2020 recycling targets.

40
5.3. Energy potential
Total energy consumption in the two countries decreased until 2014, then later between 2014 and 2018 the energy consumption grew again. In 2017, Hungary’s total energy consumption was 752,58 PJ, Croatia’s value was 283,72 PJ. In the last 10 years the energy consumption of households showed a huge increase, rising from 16% to 35% of total energy consumption. Transport also produced a valuable increase (from 20% to 27%), while energy consumption of all other sectors dropped, share of agriculture dropped significantly (from 19% to 3%) – see Figure 15.
Households and their buildings account for 35% of the total energy consumption in both countries which represents the highest share in total energy consumption. Majority of the buildings do not meet the technical regulations, so energy efficiency of buildings, which means providing minimum energy consumption in order to achieve the optimum comfort of living and use of the building, is very important. Energy consumption of a building depends on its characteristics (shape and structural materials), installed energy systems (heating system, cooling system, ventilation, electrical devices and lighting used), as well as climatic conditions of the region where it is located.
Figure 15: Breakdown of total energy consumption in Hungary and Croatia (aggregated values), 2017 Source: Eurostat
The amount of imported energy sources remained the same in the last 10 years: share of import from total energy supply is 50-60% out of which a huge energy dependency can be detected in terms of fossil fuels, especially in oil and natural gas. Approx. 80% of total fossil oil is coming from import in both countries. Hungary is also heavily dependent on import of natural gas (above 80%), mainly from Russia, while share of imported natural gas is much lower in Croatia, but it has also rapidly increased in the last 10 years (from 15% to 51%).
Over 2/3 of total energy supply is based on fossil energy sources in both countries (oil and natural gas), as seen in Figure 16. The share of renewables reached 11% in Hungary and 22% in Croatia in 2017, while in Hungary nuclear energy is also present in the energy mix with a 15% share.

41
Figure 16: Breakdown of total energy supply in Hungary and Croatia (aggregated values), 2017 Source: Eurostat
Within renewables, in terms of biomass, relatively high afforestation of the border area (especially in Zala, Somogy, Virovitičko-podravska and Koprivničko-križevačka) constitutes a substantial biomass energy potential. This contributes to the fact that vast majority of renewables comes from solid biofuels (80% in Hungary, 66% in Croatia), and its share has not changed in the last 10 years. This mainly means firewood used for heating.
In Croatia hydro energy plays an important role in electricity production, amounting to 24% of total energy production. In the border region Mura and Drava rivers bear significant hydro energy potential. Three hydro power plants (HPP) operate on the Drava river in Croatia in Varaždin, Čakovec and Donja Dubrava with electric power capacity of 94 MW, 76 MW and 76 MW respectively. According to the Espoo Convention in 1999 Environmental Impact Assessment was made with the involvement of Hungary on establishment of a new HPP on the Drava at Novo Virje. However, the potential HPP has not been incorporated in the regional strategic development plans on the Croatian side. In 2016 Baranya county and in 2017 Somogy county adopted decision, which reject any proposal on building HPPs on the Croatian section of the Drava river. On the Hungarian side there are no HPPs on the rivers and there are no plans for establishment of hydro power plants in the future.
Wind potential is in the low range in the entire cross-border area. Hungarian government does not support investment in wind energy and its share is rather low. In Croatia a significant increase has taken place in the last 10 years in wind energy production and its share now reaches 5% of total renewable energy production. However, it is concentrated on the Dalmatian area, not in the Hungarian-Croatian border area.
The cross-border region is characterized by high potentials regarding the utilization of solar energy. The territory carries high potential due to the high number of sunny days throughout the year that are most prominent in Baranya and Osječko-baranjska (see Figure 17).

42
Figure 17: Photovoltaic energy potential 2019. Source: solargis.com
Throughout the cross-border territory, there is a great potential in geothermal energy due to naturally occurring resources. Parts of Somogy and Zala counties and Croatia’s northern territory lay in the Upper Pannonian basin (see Figure 18), where underground water bodies are characterized by geothermal gradient varying between 5°-7°C/100 m. This thermal water layer is situated at relatively shallow locations, so geothermal energy from these reservoirs can be utilised at favourable cost.
Figure 18: Temperature conditions of the Upper Pannonian thermal water layer. Source: Geothermal resources of the Drava Basin evaluation, DravaGeo project, 2012

43
The Interreg Danube Transnational Programme financed the DARLINGe project (as flagship project of the EUSDR PA 2), which investigated the deep geothermal energy potential of the Croatia-Hungary border area as well. Visualisation of the geothermal potentials is seen on Figure 19.
Figure 19: Geothermal potential map of the basement reservoirs, comparison of the temperature values estimated.
Source: Interreg Danube Transnational Programme – DARLINGe (Nádor, 2019; 36)
In the Geothermal Resource Assessment of the Drava Basin (2018) the studies of seismic data and tectonic mapping show that the main tectonic elements related to the formation of the basin have been the subject of neo-tectonic reactivation. Active faults exert a major control on the fluid flow and heat transfer systems of the basin. New temperature and thermal gradient maps have been constructed to check this relationship and to outline areas where hydraulically open fault systems are available. One of the many findings of the studies is that southern Transdanubia and the cross-border Croatian territories exhibit major potential for the utilization of geothermal energy.
In Hungary, geothermal energy exploitation for heating purposes has significant share among renewables, with a 40% of increase in the last 10 years and with a 5% share of total renewable energy production. Geothermal energy is utilized in several cities in the border region for district heating purposes (Barcs, Szigetvár, Szentlőrinc, Nagyatád).
On the Croatian side, share of geothermal energy from total renewable energy production is rather low (0,43% in 2017). In the border region geothermal energy is used for district heating in Bizovac. Discovering the potential of the area, MB Holding has invested in Croatia’s first geothermal power plant Velika 1 that was built in Cigleni, started to operate in the end of 2018 and today it is covering most of Bjelovar’s electricity needs. Geothermal field of Kutnjak-Lunjkovec presents the geothermal potential in Koprivničko-križevačka county.
The Hungarian Government adopted the National Energy and Climate Plan of Hungary 2030 in January 2020. The objective of the Hungarian Government is to reconcile its energy and climate

44
policies along with keeping economic development and environmental sustainability at upmost importance, to determine an acceptable level of energy demand and the future directions of energy improvements and to frame, in collaboration with energy market stakeholders, an outline for the future for Hungarian energy relations and policy.
The following main targets are set by the Plan for 2030:
- reduction of greenhouse gas emission (compared to 2005): 7% - share of renewable energy in total energy consumption: 20% - reduction of energy consumption: 8-10%
The main proposed measures:
- increase of use of renewable energy in the field of PVs (solar energy), e-mobility and district heating;
- reduction of energy consumption of buildings (end-use), promotion of industrial energy efficiency investments;
- climate-friendly modification of electricity mix.
In December 2019, the Integrated National Energy and Climate Plan for the Republic of Croatia for the Period from 2021 to 2030 was adopted by the Croatian Government. The Plan provides an overview of the current energy system and the energy and climate policy. It sets targets to be achieved by 2030, which include the reduction in greenhouse gas emissions, energy from renewable sources, energy efficiency and electricity interconnection.
The main targets for 2030:
- reduction of greenhouse gas emission (compared to 2005): 43% - share of renewable energy in total energy consumption: 36,4%
5.4. Summary
Main statements related to PO2 – a greener, low-carbon Europe:
- Climate change will threat the entire border region, in particular its eastern part.. - Mostly rural with a network of small villages or towns, and outstanding natural
environment. - The planned Mura-Drava-Danube UNESCO Biosphere Reserve does not only aim at
keeping the favourable environmental status, but contributes to sustainable tourism as well.
- Drava and Mura have significant hydroelectric potential but this is in conflict with nature conservation.
- Relatively high afforestation that is valuable for tourism, wood industry and biomass-based energy production;
- Excellent opportunity for solar energy production. - Geothermal conditions are excellent in the border region due to the high geothermal
gradient (approximately 5-7 °C / 100 m) throughout the territory. - Direct initiatives towards a more circular economy are low, however there is a general decrease in waste production throughout the region, recycling efforts are increasing, but waste management is still inefficient in both countries.

45
6. Connectivity
6.1. Digital connectivity
In terms of digital connectivity and digitization, most data and information is available on national levels only, therefore it is hard to make any accurate conclusion with regards to the border region. Regardless of the lack of local observation, both, in terms of e-commerce and digitization, the main trends indicate significant untapped potential in Hungary and Croatia alike. In both countries, according to Eurostat, internet access of households has increased from an average of 45% in 2007 to an average of 83% in 2019 while the number of individuals who have never used a computer decreased by 2-4% in both countries on the examined NUTS 2 level territories. Table 17 summarizes the countries’ scores on the 2019’s Digital Economy and Society Index (DESI) on the Digital Scoreboard of the European Commission.
Where:
- The Connectivity dimension measures the deployment of broadband infrastructure and its quality.
- The Human Capital dimension measures the skills needed to take advantage of the possibilities offered by digital.
- The Use of Internet Services dimension accounts for a variety of online activities, such as the consumption of online content (videos, music, games, etc.) video calls as well as online shopping and banking.
- The Integration of Digital Technology dimension measures the digitisation of businesses and e-commerce. By adopting digital technologies, businesses can enhance efficiency, reduce costs and better engage customers and business partners. Furthermore, the Internet as a sales outlet offers access to wider markets and potential for growth.
- The Digital Public Services dimension measures the digitisation of public services, focusing on eGovernment and eHealth. Modernisation and digitisation of public services can lead to efficiency gains for the public administration, citizens and businesses alike.
DESI composites 2019 EU average Hungary Croatia Connectivity 14.8% 15.1% 12.5% Human Capital 12% 10.5% 11.8% Use of Internet 8.01% 7.20% 7.45% Integration of Digital technology
8.21% 5.09% 7.71%
Digital Public Services 9.43% 7.46% 7.95% Table 17: Digital Economic and Society Index 2019
Source: Eurostat
As it can be seen from the DESI figures both, Hungary and Croatia perform below EU average and stand within the bottom 10 on the DESI scoreboard. Attention to these aspects should be considered in both countries if those are willing to improve in order to catch up to the leaders of digitization within the EU and in global scales as well. According to country profiles of Europe's Digital Progress Report “it remains a challenge to ensure that public services are offered online in a user-friendly way, easing the interaction of people and businesses with public administration”. The cross-border region is no different from the country as a whole, more so that most of these areas

46
are peripheries, out of the main technological or economic hubs of the countries, where digitization is still a challenge to be tackled. Barriers to develop further in these aspects include the lack of financing, awareness, and knowledge.
All in all, eGovernment is assessed as ‘non-consolidated’ in Hungary while Croatia falls into a slightly better category, that of ‘unexploited eGovernment’. Croatia scores slightly higher than the EU average on penetration, but below the EU average on digitisation. Hungary scores significantly below the EU average on both categories. Inner peripheries exist at the NUTS 3 level with respect to access to health services or education services on both sides of the border, specifically in Koprivničko-križevačka, Virovitičko-podravska, Požeško-slavonska and Somogy. Despite the existence of inner peripheries, the use of cross-border public services is low in an EU comparison. There is scope to enhance eGovernment in both countries, although eHealth services are more advanced in Croatia. The eHealth system is working more or less sufficiently in Hungary, despite its rudimental nature.
6.2. Railway infrastructure
Hungary is among the countries with the densest railway network in Europe, while Croatia is slightly below the EU average (UNECE, 2018). This difference is existing on the border regions as well, measuring network density on NUTS 2 level (Eurostat, 2017). Despite these relatively favourable macro data, population of the border region is having very limited access to cross-border rail services, with very low frequency, unfavourable journey time, however conditions are somewhat better on the Hungarian side (Poelman, Ackermans, 2017).
Railway axis of the border area is the Mediterranean corridor of the TEN-T core network, which is crossing the border area (Križevci–Koprivnica (HR)–Gyékényes (HU)–Kaposvár–Dombóvár). Although the corridor officially runs through Kaposvár, most of the traffic – due to the better quality of the recently renovated line – goes along the Balaton lake, avoiding the internal part of the border area. The Budapest–Pécs–Osijek railway line, as part of the comprehensive network (corridor V/c) has only a secondary importance from transnational point of view, yet it plays a significant role in the internal cohesion of the border area.

47
Figure 20: Running of the Mediterranean TEN-T corridor in Croatia and Hungary. Source: https://ec.europa.eu/transport/infrastructure/tentec/tentec-portal/map/maps.html (30 Jan 2020).
Between Croatia and Hungary currently there are three railway lines crossing the border, which are all used for freight transport, but two serves passenger traffic as well.
- The Zagreb–Koprivnica–Botovo (HR)–Gyékényes (HU)–Budapest line is part of the TEN-T core network (Mediterranean Corridor, V/b), on which currently one daily train operates between Budapest and Zagreb that stops in the border area (Nagykanizsa, Gyékényes, Koprivnica, Križevci) as well. In spite of being evaluated as of ‘high’ importance for the partner countries, it has been rated as ‘low’ importance for the border region (Sippel et al, 2018). As the line is completely electrified, there are potentials for development.
- The line Osijek–Beli Manastir (HR)–Magyarbóly (HU)–Villány—Pécs is part of the TEN-T comprehensive network (corridor V/c), where passenger railway transport has been completely ceased in 2015, then restored in December 2018. Currently four daily trains are operating between Pécs and Beli Manastir, with a journey time of 1 hour 19 minutes, thereof border crossing formalities take about 20 minutes. Although this connection has only ‘medium’ importance for the countries, it is rated as of ‘high’ importance for the border region (Sippel et al, 2018). The line is not electrified. Extension of the connection to Osijek would be of great added value for the border area (Government of Baranya County, 2018).
- The railway line Nagykanizsa–Murakeresztúr (HU)–Kotoriba (HR)–Čakovec is currently not used for passenger traffic and rated as of ‘low’ importance both on national level and for the border area (Sippel et al, 2018).
6.3. Road infrastructure
From road infrastructure point of view the cross-border area is situated in the triangle of three TEN-T network elements: the Mediterranean TEN-T corridor V/b (E71, A4–M7); corridor X

48
(E70, A3) and corridor V/c (E73, A5–D7–56–M6). Western part of the border area has a good connectivity to the road infrastructure network of Western Europe, but the area suffers from capacity problems, especially in high traffic periods such as the summer season. Accessibility of the eastern periphery has considerably improved by development of motorways A5 and M6, however the cross-border section between Osijek and Mohács is still missing. Construction on the Hungarian side is foreseen to start in March 20204 and be finished in 2022, with speedway parameters.5 On the Croatian side the motorway bridge at Osijek is constructed, works are ongoing between Osijek and Beli Manastir, while for the section to the border crossing technical documentation is currently being prepared (MMRI, 2017).
Besides transnational corridoes accessibility of county centres has been significantly improved. Kaposvár has got a speedway connection to M7, similar connection is currently being built to Zalaegerszeg. Extension of the M60 motorway from Pécs towards Barcs (state border) is also scheduled. On the Croatia side a new state road D10 (A4–Vrbovec–Križevci) is constructed, its extension to Koprivnica is currently being prepared. State road D12 has also been constructed between Vrbovec and Farkaševac, works towards Bjelovar are also scheduled. End point of D12 should be the border crossing Terezino Polje, providing an efficient connection between Zagreb and Pécs.
Despite newly developed sections, horizontal connections on the current internal road network is suffering from bottlenecks. In the direct border area the Podravina main road (D2) has been developed with bypasses built around major centres (Osijek, Virovitica), but horizontal connection still remains ineffective due to long transit road sections on D2. Similarly, on the Hungarian side connection between Pécs and Zala county is provided through low capacity and quality side roads. The isolated situation of the middle part of the border region significantly affects the internal cohesion of the border area as a whole.
The border of Croatia and Hungary is a particularly non-permeable one: it has the lowest border crossing density among other Hungarian borders. Average distance of border crosses is 62 km, whereas the longest distance is between Barcs–Terezino Polje and Drávaszabolcs–Donji Miholjac is 72 km. This makes the districts of Sellye and Szentlőrinc, as well as part of Szigetvár and on the Croatian side Slatina isolated from the other side of the border. This circumstance is a general obstacle to cross-border mobility and employment (Figure 21).
4 A Kormány 1082/2019. (III. 1.) Korm. határozata a 2014–2020 közötti programozási időszakban uniós forrásból megvalósítani tervezett nagyprojektekkel kapcsolatos feladatokról szóló 1374/2017. (VI. 13.) Korm. határozat módosításáról.
5 1656/2017. (IX. 13.) Korm. határozat Magyarország rövid- és középtávú közútfejlesztéséhez kapcsolódó infrastrukturális beruházások összehangolásával és azok 2022-ig történő megvalósításával összefüggő egyes kormányhatározatok módosításáról.

49
Figure 21: Mobility zones in the Croatia-Hungary border area. Source: Kavalov el al (2019; 64).
Out of the permanent border crossings the motorway crossing Goričan–Letenye has the most intensive traffic, being responsible for 55.5% of the whole traffic, with a growing tendency. The Duboševica–Udvar crossing plays a secondary role, with a share of 16%, also with a positive tendency. Detailed data is shown in Figures 22 and 23.

50
Figure 22: Location of border crossing point along the Croatia-Hungary border. Source: CBS, openstreetmap.org, own edition.
Figure 23: Total passenger traffic (entry and exit) of permanent road border crossing points between Croatia and Hungary. Source: CBS.
Besides the seven constantly operating ones there are further border crossing points for temporary opening, thereof the crossing Legrad–Őrtilos is generating a traffic of 3,000-4,000 each year, due to the border opening events organised around local festivities.
Since Mura and Drava form the state border on a long distance, opening of new border crosses would require the construction of bridges to cross the rivers. Opening of new border crossings has been investigated by a comprehensive feasibility study in 2015 (KKK, Trenecon Cowi, 2015), however only the Murakeresztúr–Kotoriba connection has been brought forward, technical documentation is expected to be prepared in 2021. Opening of new crossing points would become
0
500
1 000
1 500
2 000
2 500
3 000
3 500
4 000
4 500
5 000
2 0 1 0 2 0 1 1 2 0 1 2 2 0 1 3 2 0 1 4 2 0 1 5 2 0 1 6 2 0 1 7 2 0 1 8
THO
USA
ND
PAS
SEN
GER
S
Baranjsko Petrovo Selo-Beremend Donji Miholjac-Drávaszabolcs
Duboševica-Udvar Gola-Berzence
Goričan-Letenye (motorway) Goričan-Letenye (public road)
Terezino Polje-Barcs

51
easier after Croatia’s accession to the Schengen zone, as no new infrastructure for border control should be set up. After years of preparation the European Commission in 2019 issued a positive assessment on Croatia’s preparedness to join Schengen. Accession would be of great benefit for the border region, especially in areas where bridge construction is not needed.
In terms of scheduled coach services currently there are no cross-border connections. In pre-festive periods shopping malls in Pécs organise coach service from Osijek. International coach service operator Flixbus runs various international routes from several places in Croatia, dominantly to Austria and Germany. Budapest and Budapest Airport is accessible from Beli Manastir, Đakovo, Osijek, Vinkovci, Vukovar and Županja by bus, but these services don’t stop on the Hungarian side of the border area. In the Hungarian target area only Siófok is accessible by this operator from Zagreb6.
6.4. Cycling
Bicycle traffic and tourism in the border region is mainly present due to the EuroVelo network connected with the Hungarian and Croatian bike routes. EuroVelo is a network of 14 long distance cycle routes connecting and uniting the whole European continent. One of the network’s most popular routes, EuroVelo 6 (Atlantic – Black Sea) is going along the Danube, crossing the border at Mohács and continues towards Vukovar. This route has undergone significant development on its upstream sections, becoming a unique transnational tourism product, so its popularity is expected to rise. One of the newest routes is EuroVelo 13 (Iron Curtain Trail), which leads from the Barents Sea to the Black Sea and is more than 10,400 km long. This route runs parallel with the border and the border rivers: the main route west from Barcs on the Croatian side, then continues on the Hungarian side to Mohács (Figure 24). These routes run on various types of infrastructure (segregated bicycle paths, low-traffic public roads, water management dikes, agricultural and forestry roads), developed step-by-step by various EU and national funds, including the previous cross-border cooperation programmes. It is expected that Međimurska–Zala, the Kapela Dvor–Barcs and the Mohács–Osijek axes will become cycling tourism hotspots.
Besides transcontinental routes significant development took place in the cycling infrastructure on both sides of the border. Major towns and their catchment areas have been equipped with spreading cycling route networks, several cross-border cycling routes have also been established, including elements of EuroVelo routes and other regional routes.
6 Flixbus Route Map, https://global.flixbus.com/bus-routes.

52
Figure 24: EuroVelo routes (EuroVelo 6 and 13) in the border area. Source: Pannon ETT (2016; 18).
6.5. Aviation
In terms of air transport, the border area’s most developed airport is the Osijek Airport, which serves both scheduled and chartered flights, mostly seasonal. On each day throughout the year roundtrip flights are launched to major Croatian cities, while in the summer season scheduled flights were launched to Stuttgart, Cologne and Split as well7. Number of passengers in 2018 reached 67,212, while in 2019 dropped to 46,361 (CCAA, 2019).
On the Hungarian side the Hévíz-Balaton International Airport is the most important that serves seasonal charter flights, between May and October, from different German airports. Number of passengers in 2018 amounted to 11,466, also with decreasing tendencies8.
These two airports have the capacity to land typically used big size passenger aircrafts. Further internationally operating airport is Pécs-Pogány having a 1500 m runway that provides landing only to small jets. The airport currently does not have any regular passenger flights, used by private jets only. Number of passengers in 2018 amounted to 5,345, with a significant tendency of growth since 20159. Further non-public airports having concrete runway are located in Varaždin and Taszár (near Kaposvár) that don’t serve passenger flights.
7 Osijek Airport, http://www.osijek-airport.hr/red-letenja/. 8 Central Statistical Office, http://statinfo.ksh.hu/Statinfo/themeSelector.jsp?page=2&szst=ODMJ. 9 Central Statistical Office, http://statinfo.ksh.hu/Statinfo/themeSelector.jsp?page=2&szst=ODMJ,

53
6.6. Inland navigation
Water transport is relevant only on the eastern part of the programme area, which has access to the Danube and some part of the Drava river.
The Danube has significant relevance in inland navigation. The Danube is part of the Rhine–Danube corridor of the TEN-T core network (corridor VII). On the Hungarian side Mohács has status of public port, having several public and private docking capacities, mainly proper for bulk cargo, but aims to be upgraded for loading general cargo as well. Mohács is also the Schengen border crossing point on the Danube towards Croatia and Serbia. By Croatia’s accession to the Schengen zone this function will be maintained towards Serbia, and Vukovar shall become the new southern river border.
On the Croatia side on right side of the river Vukovar is the major navigation port, which is undergoing a significant development, with extended capacities and modernisation. In terms of tourism port besides Vukovar – which has become a favourite stopover for Danube cruise ships – smaller capacity tourism port has been set up in Batina, Aljmaš and Ilok (Figure 25). In terms of traffic Batina is the most significant, 40-50 cruise ships dock annually, with a growing tendency.
Analysing river traffic across the border, a constant decrease is detected in the overall traffic, however for tourism-related vessels (cruise ship, other passenger ship and recreational craft) traffic is growing since 2014, in 2018 by 14.6% (Figure 26).
Figure 25: Inland navigation routes and port in Croatia. Source: http://www.zeljeznice.net/forum/index.php?/topic/13541-rijeeno-brodarstvo-i-unutarnjiplovni-
putevi-u-hrvatskoj-i-svijetu/ (30 Oct 2018)

54
Figure 26: Composition of cross-border traffic of vessels, 2009-2018. Source: Mohács Border Port.
Concerning other waterflows, the Mura border river is not navigable for normal passenger ships, only for small vessels for tourism and sport. The Drava is navigable from Barcs to Osijek only for small vessels, from Osijek to Aljmaš also for large river cruisers. Osijek has the status of international port on the Drava (Figure 23), further smaller ports include Barcs, Drávaszabolcs and Belišće.
6.7. Conclusions
Main statements related to PO3 – a more connected Europe:
- The border region is situated in the triangle of three transportation corridors: V/b (A4-M7), X (A3) and V/c (A5-M6) with good accessibility on the western side.
- Road infrastructure projects on the eastern part of the border area have been under development.
- Cross-border public transport is minimal. There are three railway lines crossing the border used for freight transport, but two of them serve passenger traffic as well. Generally, the railway infrastructure offers poor availability, poor quality service.
- Cross-border public bus services are seasonal, or serve access to destinations outside the programme area.
- Low density of border-crossing opportunities that further deteriorates the permeability of the territory, however some preliminary steps have been taken towards improvement. The accession of Croatia to Schengen could facilitate the opening of new border crossing points.
- Digital infrastructure is well established; however, the cross-border area is a periphery, out of the main technological or economic hubs of the countries where digitization is still a challenge.
0
2 000
4 000
6 000
8 000
10 000
12 000
2009 2010 2011 2012 2013 2014 2015 2016 2017 2018
No.
of v
esse
ls
Total Non-tourism related total Tourism-related total

55
- There is room to enhance e-Government in both countries, while e-Health services have been developed and are available in Croatia.

56
7. Social inclusion
7.1. Labour market
Due to the negative natural rate of population change and negative net migration rate, the population changes follow a negative trend in both Hungary and Croatia. In Croatia net migration is the primary factor influencing the negative net population change rates. The age profile of the population does not deviate substantially from the average EU age profile. There is a trend of “brain-drain” effect in the region that is happening as young, educated population emigrates to other European countries or outside the EU.
Apart from high unemployment rates and low employment rates in some Croatian and Hungarian regions, additional labour market issues relate to high job vacancy rates especially in some Hungarian regions in several sectors, and the generally low level of labour productivity, which is below 50% of the EU average in the entire cross-border region (as in all of Central and Eastern Europe) according to the Border Orientation Paper of Hungary and Croatia.
The following characteristics can be said about the employment status of the region: employment rates of the age group of 20-64 are 77.9% in Western Transdanubia and 69.4% in South Transdanubia, while 66.4% in Continental Croatia and 73.2% in the EU.
The economic growth as well as the emigration of recent years has translated into reduced unemployment in Croatia, but the employment rate remains comparatively very low. Long-term unemployment for 2018 is slightly higher in Continental Croatia (3.3%) than the EU average figure (2.4%). The rates are lower in Hungary in comparison to EU levels, i.e. 0.6% on Western Transdanubia and 2.0% in South Transdanubia. The highest job vacancy rates can be observed in the ‘Manufacturing’, ‘Administrative and support service activities’ and ‘Arts, entertainment and recreation’ sectors in Western Transdanubia, and in the ‘Education’ and ‘Administrative and support service activities’ sectors in South Transdanubia. Data on employment for the county level is available as numbers of employed, where the largest share of employed compared to the total in Croatia (2018) are registered in Varaždinska and Osječko-baranjska counties. According to data on national level for Croatia, the highest job vacancy rate can be found in the ‘Accommodation and food service activities’ and ‘Public administration and defence; compulsory social security’ sectors.
In Baranya (6.9%) and Somogy county (6.3%) the unemployment is problematic as its rate is far above the national average (3.7% in 2018), but below the EU27 average (see Table 18). The most favourable situation is in Zala county, caused by the proximity of this county to the Austrian labour market and the relatively high number of commuters to Austrian workplaces. Distribution of unemployment is uneven on the Hungarian side as in the Balaton and Pécs area it is lower than in the other parts of Baranya and Somogy counties. The majority of them are low-skilled, their share in Somogy is 45% among the jobseekers. This results the presence of long-term unemployment as 22-24% of the jobseekers are registered for more than one year, similarly to the figure of the national average. The majority of the jobseekers are men, though the difference between the two sexes is not significant. The number of registered job-seeking career starters was decreased in the recent years and reached 9.2% of the registered jobseeker total (6.5% in Zala, 9.9% in Somogy, 9.7% in Baranya and 8.9% (2018) as Hungarian average).

57
In the Croatian part of the programme area higher unemployment rate has been measured than in the Hungarian part. However, the differences between the westernmost part of the area and the eastern part are huge. Like in Hungary, there is a trend of decline in unemployment primarily due to outmigration of younger population to western European countries like Germany, Austria and Ireland in particular. The cross-border commuting is not significant because of the lack of large employers and the low density of border crossing points. Language barrier also represents crucial hindering factor.
Unemployment rate
% (2007) Unemployment rate
% (2018)
Baranya 8,0 6,9 Somogy 11,5 6,3 Zala 5,5 2,6 Hungary 7,4 3,7 Continental Croatia 10,3 8,0 Croatia 9,9 8,5 EU27 7,5 7,3
Table 18: Unemployment rate in 2007 and 2018, % Source: EUROSTAT
It can be stated that labour productivity is lacking of the EU average (EU: 100,1, Croatia: 72,2, Hungary: 69,4), which is a serious problem affecting both country’s overall competitiveness in the international market.
In Croatia, there is notable disproportion between the labour market and educational system which is reflected in the fact that the majority of unemployed are those with 1-3 year vocational secondary schools, whose numbers prevail in the structure of unemployed even over those with no schooling or with primary school. Most of the unemployed have been unemployed for over 12 months (the average of long-term unemployment in the programme area is 42.8%, close to Croatian average) and majority of the unemployed and particularly of long-term unemployed are women. A significant proportion of unemployed are young (39.7% of all unemployed are below 30 in 2017), who have trouble entering the labour market, but a problem is in particular the unemployed of the population of over 50 years of age (17.2%), which tends to be hard to re-enter the job market. In spite of high unemployment rate labour shortage occurs in some professions (for example CNC turner). In general, there is a significant discrepancy between the demand and the supply of skills in the labour market in Croatia.
According to data available from CBS, the activity rate of the labour force in Croatia has increased from 48.8% in 2007 to 51.6% in 2017. The increase in the activity of the older working population has been noticed. Namely, in the period 2007–2017, the activity rate of the age group 25-49 has increased from 84.99% to 85.6%. Meanwhile, the activity rate of the age group 50-64 has increased from 52.04% to 53.2%. The increase in the activity of the older working population is mostly a consequence of the retirement plan reform, which has involved a gradual increase in the minimum retirement age. Until recently, the most usual plan to deal with unemployment was early

58
retirement. That fact is reflected in Eurostat data on duration of working life. In 2011, number of years a person age 15 is expected to be active in the labour market was only 31.1 for Croatia, while the same indicator value for EU27 was 34.7. Therefore, not only that labour market figures were below the desired level, but the unsustainable pressure was created upon pension system and public financing.
7.2. Education and training
The border region is significantly lower in terms of competitiveness attributable to educational attainment level than the EU averages. Regarding higher education and lifelong learning, the entire region on NUTS 2 level is below the EU average of 63.5. The scores of Western Transdanubia and Southern Transdanubia are 51.7 and 49.3, respectively, while that of Continental Croatia is 59.5.
In Croatia, at national level, there are large misalignments between the demand and supply of skills in the labour market. A relatively high and increasing share of employers report shortage in the supply of labour combined with a high relative dispersion of employment rates, pointing to an issue of mismatch between skills and demand.
In Hungary, similarly to Croatia, skills mismatches are coupled with weak labour market prospects for the low skilled and less employable groups. Investment is needed to improve access to employment of all jobseekers, in particular youth and long-term unemployed and inactive people, and furthermore to develop active and preventive labour market measures targeting the less employable groups of the labour force and those with disabilities.
Territorial unit 2010 2011 2012 2013 2014 2015 2016 2017 2018 Zala 1,720 1,645 1,668 1,704 1,731 1,579 1,553 1,448 1,406 Baranya 16,051 15,371 14,458 13,845 13,293 12,998 12,989 13,338 13,314 Somogy 1,978 1,881 1,748 1,829 1,704 1,599 1,714 1,598 1,580 Hungary 218,057 218,304 214,320 209,208 203,576 195,419 190,098 187,084 185,278
Table 19: Number of full time students in bachelor and master courses of institutions of higher education Source: KSH 2018
The number of students in higher education shows declining numbers in both countries. Baranya shows the highest number of participants in higher education, although this number has declined throughout the last 10 years. A similar trend is seen in Zala and Somogy counties, where the number of students declined by almost half within this period. Similar trends can be seen at the Croatian institutions within the region as the number of students has declined apart from the North University in Varaždin and Koprivnica.

59
INSTITUTION OF HIGHER EDUCATION
2013/2014 2014/2015 2015/2016 2016/2017 2017/2018
Public College 1,012 954 871 939 876 College of Management in Tourism and Informatics in Virovitica
437 389 346 403 416
College of Agriculture in Križevci 575 565 525 536 460 Private College 668 694 704 709 2 Technical College, Bjelovar 668 667 692 704 Higher Evangelical Theological College in Osijek
27 12 5 2
Public Polytechnic School 3,366 3,313 3,170 3,113 2,951 Polytechnic of Međimurje in Čakovec
896 1,060 1,051 1,044 1,010
Polytechnic "Lavoslav Ružička" in Vukovar
941 877 878 923 948
Polytechnic of Požega 1,529 1,376 1,241 1,146 993 Private Polytechnic School 2,495 0 0 0 742 Polytechnic school of Bjelovar 742 Polytechnic school of Varaždin 2,495 Public Universities 2,652 4,458 4,196 4,204 4,155 Josip Juraj Strossmayer University of Osijek
2,560 2,157 1,953 1,973 1,939
North University, Varaždin and Koprivnica
92 2,301 2,243 2,231 2,216
TOTAL NO. OF STUDENTS 10,193 9,419 8,941 8,965 8,726 Table 20: Number of enrolled students in Institutions of Higher Education in Croatia 2013-2018
Source: Agency for Higher Education, Croatia, and CBS.
Barriers due to language differences are perceived higher compared to other EU border regions. On the Hungarian side there is a general lack of language skills, whereas Croatians have a generally better knowledge of English. There is no EURES cross-border partnership-type initiative in the region. Language differences are perceived by a higher than average number of persons as an obstacle to cooperation than in other EU border regions. Overall, there is a relatively low level of labour market integration between the border regions despite the wage differences, which usually drive cross-border labour flows. Some of the barriers identified above could be addressed to enhance cross-border economic integration.
Since early leavers from education and training may face obstacles in the labour market it has great importance to assess countries regarding this matter within the EU. The strategic framework in education and training of the European cooperation adopted a benchmark to be achieved by 2020, that the share of early leavers from education and training as a percentage of population aged 18-24 should be not more than 10 % in the EU. Croatia scored well on this aspect according to 2018 data as the country only has 3.3% early leavers while Hungary is above the benchmark with 12.5%.
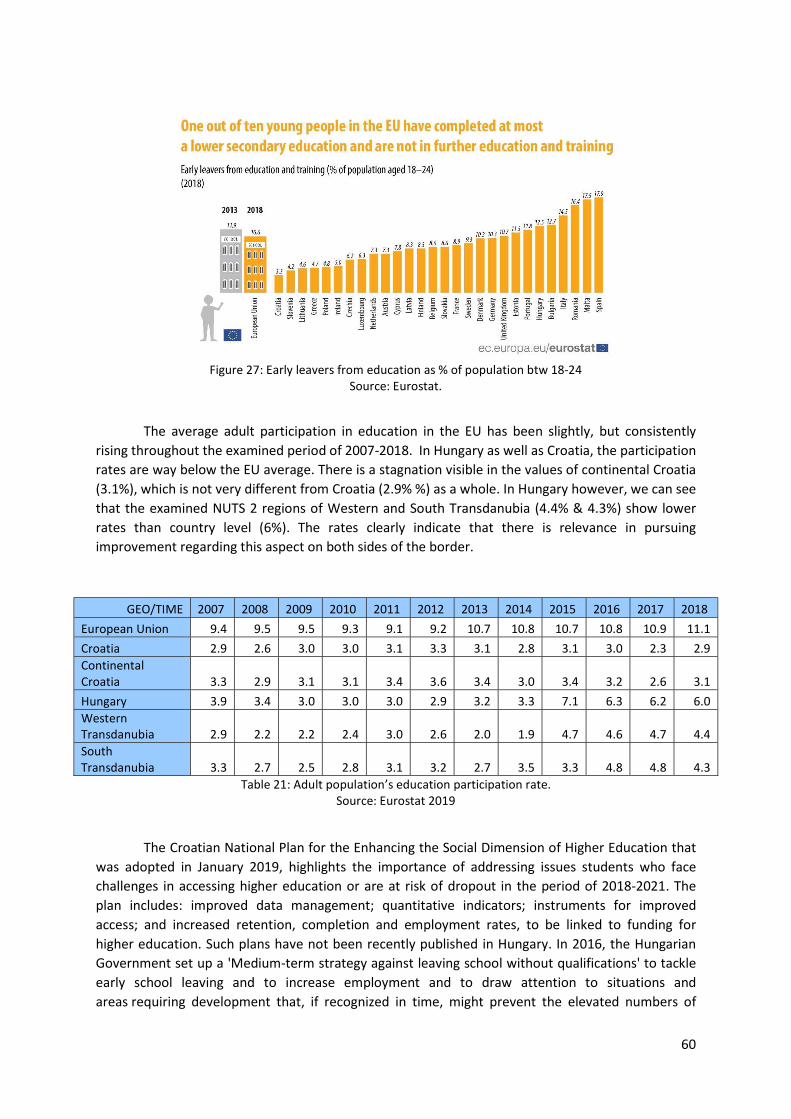
60
Figure 27: Early leavers from education as % of population btw 18-24 Source: Eurostat.
The average adult participation in education in the EU has been slightly, but consistently rising throughout the examined period of 2007-2018. In Hungary as well as Croatia, the participation rates are way below the EU average. There is a stagnation visible in the values of continental Croatia (3.1%), which is not very different from Croatia (2.9% %) as a whole. In Hungary however, we can see that the examined NUTS 2 regions of Western and South Transdanubia (4.4% & 4.3%) show lower rates than country level (6%). The rates clearly indicate that there is relevance in pursuing improvement regarding this aspect on both sides of the border.
GEO/TIME 2007 2008 2009 2010 2011 2012 2013 2014 2015 2016 2017 2018 European Union 9.4 9.5 9.5 9.3 9.1 9.2 10.7 10.8 10.7 10.8 10.9 11.1 Croatia 2.9 2.6 3.0 3.0 3.1 3.3 3.1 2.8 3.1 3.0 2.3 2.9 Continental Croatia 3.3 2.9 3.1 3.1 3.4 3.6 3.4 3.0 3.4 3.2 2.6 3.1 Hungary 3.9 3.4 3.0 3.0 3.0 2.9 3.2 3.3 7.1 6.3 6.2 6.0 Western Transdanubia 2.9 2.2 2.2 2.4 3.0 2.6 2.0 1.9 4.7 4.6 4.7 4.4 South Transdanubia 3.3 2.7 2.5 2.8 3.1 3.2 2.7 3.5 3.3 4.8 4.8 4.3
Table 21: Adult population’s education participation rate. Source: Eurostat 2019
The Croatian National Plan for the Enhancing the Social Dimension of Higher Education that was adopted in January 2019, highlights the importance of addressing issues students who face challenges in accessing higher education or are at risk of dropout in the period of 2018-2021. The plan includes: improved data management; quantitative indicators; instruments for improved access; and increased retention, completion and employment rates, to be linked to funding for higher education. Such plans have not been recently published in Hungary. In 2016, the Hungarian Government set up a 'Medium-term strategy against leaving school without qualifications' to tackle early school leaving and to increase employment and to draw attention to situations and areas requiring development that, if recognized in time, might prevent the elevated numbers of

61
school dropouts. Although measures have been taken place, the dropout rate has not declined over the years.
7.3. Socioeconomic integration of marginalised groups
The cross-border region shows some distressing features with regards to social factors. It is mostly characterised by a huge geographical handicap, which manifests in transport, education and language barriers. There are significant socio-economic disparities in access to quality health-care, education, labour market, housing market that leaves great competitiveness potential unexploited and hinders the overall growth of the countries. Concerning social factors, no NUTS 3 level data is available, however higher geographical resolutions, such as NUTS 2 regions, indicate issues that effect of the border region’s peripheries as well.
Although poverty in Hungary has decreased with the growth of the economy, according the newest country report, large regional disparities persist that contribute to the territorial concentration of poverty and significant social exclusion. The growth rate of GDP per capita was approximately 2.4% during 2010-2018, that is slightly higher than the per capita growth rate of household income. The share of income of the top 20% increased from 3.4 times to 4.3 times the income of the bottom 20% during the period of 2010-2017. This trend indicates that there has been a significant increase in inequality even though this rate is at 5.1 on average in the EU.
According to the World Bank poverty map for Croatia (2017) presented in Figure 28, the most deprived counties in the programme area are the counties of Virovitičko-podravska, Vukovarsko-srijemska, Bjelovarsko-bilogorska and Požeško-slavonska, followed by Osječko-baranjska (lowest county poverty - City of Zagreb 5.9%, highest 28.6-34.3 in most of the counties in Continental Croatia). These data are confirmed by the county rankings based on the composite development index calculated by the Ministry of Regional Development and EU Funds (2014-2016).

62
Figure 28: Consumption based poverty maps for Croatia (NUTS 3) Source: World Bank, 2017.
People who are endangered due to poverty, severely materially deprived or living in households with very low work intensity are those who belong to the group that lives at the risk of poverty. At risk-of-poverty are individuals with an equivalised disposable income below the risk-of-poverty threshold, which is at 60% of the national median equivalised disposable income. Material deprivation covers indicators relating to economic strain and durables. Severely materially deprived persons have living conditions severely constrained by a lack of resources. These deprivations items are listed here, out of which these people at least belong to 4 groups.
Deprived persons cannot afford:
- to pay rent or utility bills, - keep home adequately warm, - face unexpected expenses, - eat meat, fish or a protein equivalent every second day, - a week holiday away from home, vi) a car, vii) a washing machine, - a colour TV, or - a telephone.
As the newest Eurostat data shows, Croatia is above EU average regarding people at risk of poverty, whereas Hungary somewhat managed to optimize this rate, although South Transdanubia is still performing the worst with its 25.9% outcome.

63
2007 2008 2009 2010 2011 2012 2013 2014 2015 2016 2017 2018 European Union : : : 23.8 24.3 24.8 24.6 24.4 23.8 23.5 22.4 21.9 Croatia : : : 31.1 32.6 32.6 29.9 29.3 29.1 27.9 26.4 24.8 Hungary 29.4 28.2 29.6 29.9 31.5 33.5 34.8 31.8 28.2 26.3 25.6 19.6 Continental Croatia : : : : : : 31.7 30.5 31.1 30.3 27.3 24.9 Middle Transdanubia 27.6 25 26.1 26.8 27.4 29.3 27.6 23.4 24.3 21.3 18.4 14 Western Transdanubia 19.4 16.9 21.4 19.4 22.5 22.4 23.7 23.6 19.4 18.4 20 12.5 South Transdanubia 34.4 29.8 32.8 29.7 36.5 37.1 37.3 37.5 31.7 27.8 30.3 25.9
Table 22: People at risk of poverty as a percentage of total population Source: Eurostat
Joint communication is an issue as the language barrier between the two countries is particularly strong, the usual language of communication is either English or German, however, especially on the Hungarian side, stakeholders have limited language skills.
The country specific recommendations (CSR) that has been suggested in 2018 has no major effect so far as only limited progress has been made. CSR3 specifically addressed the issues regarding socioeconomic integration. The recommendation is as follows: “Unlock labour reserves through improving the quality of active labour market policies. Improve education outcomes and increase the participation of disadvantaged groups, in particular Roma, in quality and inclusive mainstream education. Improve the adequacy and coverage of social assistance and unemployment benefits.” As the report indicates, there is some progress, but results are far from satisfactory. There has limited progress been done in order to unlock the labour reserve, no real outcome is visible in terms of inclusive mainstream education, social assistance or unemployment benefits.
In order to mitigate factors that inhibit the inclusion of local minorities and excluded social groups. Measures should be considered to tackle labour market issues that include upskilling and reskilling targeting less employable groups such as Roma or disabled individuals. Investments in joint education and any cross-border cooperation of educational institutions could tackle the low levels of education especially in socio-economically deprived areas. Furthermore, sharing good-practices, facilitating people-to-people activities and other trust building micro-project schemes should assist long-term cooperative intentions.
7.4. Health care
Considering the performance of the health care systems of Hungary and Croatia, both are below the European average standards. Health care system in the Hungarian counties are extremely under-financed, maintains non-efficient structures, suffers from territorial disparities, lacks sufficient number of doctors and supports personnel that have low level of motivation. In general terms, the system cannot match the demand both in terms of quality and quantity.
On country level life expectancy in Hungary and Croatia is lower than European Union average. The national average in 2018 was 76.3 years for both of the countries, while the EU average was 84. Poor health conditions of the population are reflected in life expectancy figures that were

64
somewhat higher in West Transdanubia and somewhat lower in South Transdanubia than the national average. South Transdanubia is characterized by above-average level of the number of smokers and highest position in the number of heavy drinkers. Considering obesity rates, the nations’ showing detrimental pictures compared to EU where adult obesity reaches 15.9% of the total population, while this ratio is 24.4% in Croatia and 26.4% in Hungary according to 2016 data of the World Factbook.
The health status of a population is challenging to quantify as it is difficult to determine among individuals, populations, cultures, or even across time periods. As a result, the demographic measure of life expectancy has often been used to measure the state of a nation’s health, partially as it is based on a simple benchmark that is death. Indeed, life expectancy at birth remains one of the most frequently quoted indicators of health status and economic development and it has risen rapidly in the last century due to a range of factors, including: reductions in infant mortality, rising living standards, improved lifestyles, better education, as well as advances in healthcare and medicine.
Healthy Life Years at age 65 measures the number of years that a person is still expected to live at age 65 in a healthy condition. A healthy condition means the absence of limitations in functioning or disability. This aspect is a great indicator of the quality of life, more indicative than measuring by life expectancy as it measures the number of active, wholesome years, excluding those spent sick, disabled or hospitalized. As we can see from Table 23 healthy years lived after the age of 65 is significantly lower in both countries of the EU average.
Table 23: Healthy years after the age of 65 Source: Eurostat 2017
Analysing statistical data of health care institutional system, the overall picture is very different in Zala county and the other two South Transdanubian counties, especially Baranya county figures are favourable. Number of doctors have a fairly high value in Baranya, but data of Somogy is under the national average. Number of patients per doctors in Zala corresponds to the national average, while the two South Transdanubian counties have a better position. Number of non-filled practices of family doctors is the lowest in Baranya county. As regards hospital beds per capita Zala and Somogy are close to the national average, Baranya is again in the most favourable position compared to national level – to large extent as a consequence of the capacities available in Pécs (Tables 24-26).
2010 2011 2012 2013 2014 2015 2016 2017 Healthy life
years at age of 65 - Men
EU28 8.7 8.5 8.5 8.5 8.6 9.4 9.8 9.8 HR 6.6 7.4 7.7 5.5 6 4.7 5.2 5 HU 5.4 6 6.4 6.2 6 5.9 6.7 6.7 Healthy life
years at age of 65 -
Women
EU28 8.8 8.6 8.5 8.6 8.6 9.4 10.1 10.2 HR 6.5 7.3 7.9 5.9 5.8 4.5 4.9 4.8
HU 5.9 6 6.4 6.1 6.1 5.9 6.4 6.7

65
2007 2014 2015 2016 2017 2018 Zala 29 38 33 34 35 35 Baranya 45 54 49 52 54 56 Somogy 24 32 27 29 30 30 Hungary 32 40 36 38 40 41
Table 24: Number of doctors per 10,000 inhabitants in Hungarian counties concerned Source: KSH
2007 2014 2015 2016 2017 2018
Zala 1577 1549 1599 1559 1555 1562 Baranya 1372 1325 1329 1311 1323 1316 Somogy 1512 1445 1501 1565 1527 1538 Hungary 1540 1554 1566 1581 1584 1607
Table 25: Number of inhabitants per family doctor in Hungarian counties concerned Source: KSH
2007 2014 2015 2016 2017 2018 Zala 71 74 75 74 74 74 Baranya 77 83 84 80 80 81 Somogy 70 70 70 67 66 67 Hungary 72 70 70 70 70 70
Table 26: Hospital beds per 10,000 inhabitants in Hungarian counties concerned Source: KSH
In 2011 the management of hospitals has been taken over by the state. According to the Semmelweis Plan for the Rehabilitation of the Hungarian Health Care System, in the target counties the Pécs Clinical Centre has evolved to an institution of “regional progressive centre”, Kaposvár and Zalaegerszeg have the status of county hospitals. Further local hospitals are in Keszthely, Komló, Marcali, Mohács, Nagyatád, Nagykanizsa, Siófok and Szigetvár. Active beds of the Siklós hospital have been ceased in 2012. Out-patient services are available in the district centres, but they differ in scope of activities and capacity. Since the programme area is rich in thermal water and related spas, several facilities are available that along with recreational services provide medical examinations with spa treatments. In Harkány and Hévíz designated medical hospitals provide health insurance financed medical services to their patients.

66
Figure 29: Number of inhabitants per family doctor in the Programme area, 2019 Source: KSH, Croatian Health Insurance Fund (CHIF).
Croatia, like Hungary, has a relatively low level of health care financing (according to WHO statistics for 2011, both countries dedicate below 8% of their GDP to health, compared to e.g. over 11% in France, Germany, Denmark and the Netherlands) and its healthcare sector has not managed the transition from socialist economy well. While the expertise of the doctors, nurses and medical staff is still considered high, the infrastructure of the hospitals is mainly inadequate. Furthermore, there is a concentration of advanced healthcare in larger centres, especially in Zagreb, while smaller towns are often left with a basic and much less technologically advanced healthcare.
Hospitals in Croatia are established mainly by the counties (general hospitals and primary health care institutions, such as ambulances), but clinical centres, clinical hospitals and clinics are established by the state. Private persons can establish special hospitals and polyclinics. However, due to serious financial problems, majority of county hospitals have in early 2013 been centralised and are now managed by the state.
The strongest health care centre in the Croatian part of the programme area is in Osijek, which has a Clinical Hospital Centre, while other counties all have a general hospital and a number of other healthcare institutions.

67
According to the Border Needs Study, the value for the indicator ‘awareness of the cross-border health rights’ is higher than for the average EU border, as is ‘awareness of the cross-border health services ‘. In this context, a high value means more of an obstacle (i.e. not more awareness).
7.5. Summary
Main statements related to PO4 – a more social Europe:
- Registered unemployment has been constantly decreasing. - Low employment rate below the EU average, high ratio of inactive people in working
age. - Performs poorly in terms of competitiveness attributable to education, the “brain-drain
effect”, labour productivity, employment rate and in the supply and demand imbalances between the education system and the labour demand.
- Discrepancies between the demand and supply of skills in the labour market. - Educational barriers exist, from which the most substantial is the one attributable to
language differences. - There is a relatively low level of labour market integration between the border regions
despite the wage differences, which usually drive cross-border labour flows. - The number of participants in higher education declined significantly throughout the last
decade almost within the whole region. - High number of early leavers from education is an issue to be addressed in Hungary. - Adult participation rates in life-long learning are very low and are somewhat stagnating. - The region performs below national as well as EU averages regarding healthcare. There
are low levels of funding available, the infrastructure is inadequate and there is no access to technology in the peripheral areas. Life expectancy is below EU average.
- Availability of medical university education in Osijek and Pécs.

68
8. Closer to citizens
8.1. Cultural heritage in the border area
The border area is rich in cultural heritage, thereof the best-known is the UNESCO World Heritage listed Early Christian Necropolis of Pécs (Sopianae – since 2010)10. Several further elements of intangible cultural heritage have been protected in the border area11:
- Busó festivities at Mohács: masked end-of-winter carnival custom (since 2009); - Spring procession of Ljelje/Kraljice (queens) from Gorjani (2009); - Lacemaking in Croatia, including in the area of Lepoglava (since 2009); - Gingerbread from Northern Croatia (since 2010); - Bećarac singing and playing from Eastern Croatia (since 2011); - Međimurska popevka, a folksong from Međimurska (since 2018).
Cultural heritage elements on the tentative list12 since 2005:
- Frontiers of the Roman Empire – Croatian Limes; - Historical Town Planning Ensemble – Tvrđa (Fort) in Osijek; - Varaždin – Historic Nucleus and Old Town (the Castle).
Besides the internationally protected monuments the border area is known about the architectural heritage of the noble families (Adamović, Batthyány, Drašković, Eltz, Erdödy, Gutmann, Inkey, Janković, Odescalchi, Pejačević, Prandau, Savoy, Zrinski). Most of their castles and manors are used as museums or buildings with public function, however some of them has been converted to tourism accommodation. Sacral architecture is also characteristic for the area (Đakovo, Máriagyűd, Mohács, Osijek, Pécs etc.). Similar apparent are the various thematic museums like regional ethnographical collections (Göcsej Museum in Zalaegerszeg, Mohács Museum etc.) or those of particular industrial heritage (Hungarian Oil and Gas Museum in Zalaegerszeg, Mecsek Mining Museum in Pécs). Architectural remains of Turkish rule are visible on the Hungarian side (Pécs, Siklós, Szigetvár). Rural areas are also characteristic about their traditional architecture (Baranja, Ormánság, Podravina, the “Schwäbische Türkei”, Göcsej etc.). A unique element of fine art is tradition of naïve painting of Podravina (Gola, Hlebine, Molve).
Due to the mixture of various influences the area is characterised by rich gastronomy, particular micro-climate has resulted unique conditions for viticulture and wine production (Baranja triangle, Đakovo, Erdut, Ilok, Križevci, Kutjevo, Međimurska, Mohács-Bóly, Orahovica, Pécs-Szigetvár, South Balaton, Villány-Siklós, Zala).
10 Source: https://whc.unesco.org/en/list/853 (27.02.2020). 11 Source: https://ich.unesco.org/en/lists (27.02.2020). 12 Source:
https://whc.unesco.org/en/tentativelists/?action=listtentative&pattern=croatia&state=&theme=&criteria_restrication=&date_start=&date_end=&order= (27.02.2020)

69
8.2. Further elements of the tourism supply
Important tourism magnets are Lake Balaton and spa resorts in Zala (Hévíz, Kehidakustány, Lenti, Zalakaros, Zalaszentgrót), also in Baranya (Harkány, Magyarhertelend, Siklós, Sikonda, Szigetvár) and Somogy (Barcs, Csokonyavisonta, Igal, Marcali, Nagyatád). On the Croatian side Bizovac, Daruvar, Sveti Martin na Muri and Varaždinske Toplice stand out in the spa and wellness supply. These services primarily target domestic tourists, however some of them attract significant number of foreign visitors as well (Harkány, Hévíz, Lenti, Zalakaros).
Bicycle traffic and tourism in the border region is mainly present due to the EuroVelo network connected with the Hungarian and Croatian bike routes. The routes can be used by cycle tourists as well as by local people making daily journeys. One of the network’s newest routes is the Iron Curtain Trail, EuroVelo 13, which leads from the Barents Sea to the Black Sea and is more than 10,400 km long. Generally, the route between the Slovenian border and Barcs goes on the Croatian side, then from Barcs to Mohács on the Hungarian side, however – as a route following the border rivers – it is expected to be completed as a parallel route on both sides of the rivers in the future. Although most of the route is going on existing infrastructure – including several sections built from cross-border cooperation funding – and are signposted on national standards, comprehensive signposting according to EuroVelo standards is dominantly missing, just like accompanying services (biker-friendly accommodation, bookable guided tours, luggage transfer, service points etc.).
There are several Natura 2000 sites within the Hungary-Croatia cross-border area, these have been united within the Mura-Drava-Danube Biosphere Reserve, parts of which stretch into Austria, Slovenia and Serbia. Hiking areas in Hungary include the Mecsek hills, the Siklós-Villány area, the forests of Somogy (Zselic), the Zala hills. On the Croatian side Kopački rit, Papuk mountain, Krndija, Bilogora hills, Kalnik, and Međimurska are nature areas with significant tourism potential. Most significant events from tourism point of view are the various cultural festivities in Osijek and Pécs, the Renaissance Festival and Podravina Motives in Koprivnica; Busójárás/Poklade in Mohács, Špancirfest in Varaždin, Picokijada in Đurđevac, Spravišće in Križevci and high number of wine and gastronomy festivals in the wine-growing areas.
8.3. People-to-people cooperation
Partnership between towns and municipalities have undergone a big revival at the end of the 1990s and in the beginning of the 2000s. Such institutional cooperation is important foundations of cross-border cooperation on project level as well. Partnership agreements exist between Pécs – Osijek, Kaposvár – Koprivnica, Zalaegerszeg – Varaždin, Nagykanizsa – Čakovec, Komló – Valpovo, Mohács – Beli Manastir, Barcs – Virovitica, Nagyatád – Križevci, Szigetvár – Slatina, Beremend – Belišće, Őrtilos – Legrad, Letenye – Prelog, Belezna – Donja Dubrava. On county level Somogy cooperates with Bjelovarsko-bilogorska, Koprivničko-križevačka and Virovitičko-podravska. Baranya’s most important partnership is with Osječko-baranjska. Zala has also intensive relationship with Međimurska.
Along with public level institutional cooperation numerous cultural and artistic associations maintain intensive cooperation, especially minorities’ cultural associations in the neighbouring countries. Cultural life is the most intensive in Baranya county. Driving force of cultural and educational cooperation are bilingual schools. Beside those on both sides in municipalities with significant minority (Hungarian, Croatian) population education of the minority languages is accessible. Most important acts are the Tanac Dance Ensemble and the Vizin Orchestra that could

70
gain wide success on both sides of the border. Hungarian cultural life in Croatia in concentrated in Osječko-baranjska: Osijek, Kopačevo, Beli Manastir and Kneževi Vinogradi. Cultural cooperation involves mutual attendance on festivals, joint staging of theatre plays (with active involvement of the Pécs Croatian Theatre) and gastronomic events organised around characteristic regional food specialities and wine.
Cooperation of the Universities of Pécs and Osijek should also be mentioned in relation to arts, history, geography and linguistic subjects. Also, intensive contacts are maintained between museums, archives and libraries as well.
8.4. Territorial governance
European integration process has been a key facilitator of developing capacities of project generation, preparation and implementation in the border area. In Croatia EU integration process brought the development of significant governance capacities on all levels, which is laid down in the Regional Development Act13 meaning that coordinating functions have been established on ministry level (Ministry of Regional Development and EU Funds), on county (NUTS 3) level regional coordinators (regional development agencies) have been established by the counties, as public institutions. Development agencies – besides coordination of cross-border cooperation – play a key role in promotion and preparation of mainstream ERDF-funded project (Competitiveness and Cohesion, Human Resource Development Operational Programmes), and various nationally-funded schemes. In each county a partnership council is set up, as a body of governance of regional development activities. Partnership councils are composed of representatives of the county, the towns and municipalities, high education institutions and other bodies in education and training, economic and social partners and representatives of the civil society.
In Hungary the 1996: XXI. Act on Regional Development and Spatial Planning defines the basic framework of regional development, including role, responsibilities and the relevant development documents on various levels. Coordinating ministry responsible for regional development is the shared between the Ministry of Finance, which is responsible for strategic planning in regional development, while for implementation of development programmes the Ministry for Innovation and Technology Ministry is responsible. On the other hand, cross-border cooperation programmes are managed by the Ministry of Foreign Affairs and Trade, which hosts the Managing Authority of the Interreg V-A Hungary-Croatia Cross-border Cooperation Programme as well. On subnational level the law defines the county as coordinator, which is responsible for its own development concept and participation in the development of the national documents as well. For all relevant levels development concepts and programmes are created and adopted. The public administration reform since 2011 has generally changed responsibilities in public service provision, strengthening the role of the state, through its various administrative bodies and agencies (governmental offices, agencies for education and health service etc.). The Regional Development and Spatial Planning Act defines that the counties (NUTS 3) are responsible for coordination of regional and rural development activities on subnational level. In spite of the significant downsizing at county administrations, they are key players in promotion, project generation and implementation of the Territorial and Settlement Development Operational Programme and cross-border cooperation, however they are often beneficiaries of further ERDF-funded project as well.
13 Zakon o regionalnom razvoju. NN (Official Gazette) 147/14, 123/17, 118/18.

71
Besides the counties, local governments – in particular those with significant administrative capacities (district centres) – are further key players, also in cross-border cooperation.
In both counties NUTS 2 structure is currently under revision. In Croatia the current two-region system will be changed, as from 2023 a new four-region division will be applied, taking out the most developed North Croatian counties (Koprivničko-križevačka, Krapinsko-zagorska, Međimurska, Varaždinska, Zagrebačka) and the City of Zagreb (which will form a separate NUTS 2 region on its own) from the current Continental Croatia region.14 This means the western and eastern part of the border area will belong to two different NUTS 2 regions. In Hungary also the capital city Budapest has become a separate NUTS 2 region, but that does not affect the structure in the border area.
Important to point out significant differences in governance of the tourism sector. In Croatia each county should set up a tourism board, however town also have their boards, as well as some of the municipalities. Tourism boards are public bodies and legal persons, which gather public and private stakeholders for sake of infrastructure and service development, organisation of events and promotion of a destination. In Hungary similar organisations don’t exist, as the tourism sector is coordinated only on national level, through the Hungarian Tourism Agency, which does not have branch offices. Also, Hungarian side of the border area is not among the priority tourism development areas. Thus, development of a destination and promotion is coordinated by the local governments, based on their own resources.
8.5. Application of integrated tools of territorial development
In Croatia, in order to implement the Integrated Territorial Investment, altogether seven urban agglomerations have been defined, thereof one – Osijek – is located in the border area. Territorial coverage of the agglomeration has been defined on basis of daily commuting population, i.e. towns and municipalities with minimum 15% of population commuting to the agglomeration centre on daily basis. Finally – besides the city of Osijek – two towns (Belišće and Valpovo) and further 15 municipalities from Osječko-baranjska and one from Vukovarsko-srijemska county (Figure 30). A funding of 39,9 million EUR15 has been allocated to the programme, financed from the two mainstream operational programmes implemented in Croatia. The programme includes strategic projects of establishment of an IT park, development of business infrastructure for economy development, development of the central heating in Osijek, development of the Osijek fort (Tvrđa), including a new visitors’ centre, establishment of a creative incubator and development of public transport in the urban area (Osijek, 2017).
14 Gov't launches changes to country's statistical subdivision. https://vlada.gov.hr/news/gov-t-launches-changes-to-country-s-statistical-subdivision/25178 (10.02.2020).
15 Osijek.hr: https://www.osijek.hr/eu-programi-i-projekti/urbana-aglomeracija-osijek/opcenito-o-urbanoj-aglomeraciji-osijek-uaos-i-integralnim-teritorijalnim-ulaganjima-itu/o-mehanizmu-integralnih-teritorijalnih-ulaganja-itu/ (27.02.2020).

72
Figure 30: Urban agglomeration of Osijek set up for implementation of the ITI mechanism. Source: Osijek (2017; 10).
For the upcoming programming period the system of urban agglomerations will be revised
and may be extended to further towns in the border area.
As application of the tool Community-based Local Development (CLLD) in terms of governing rural development, in both countries in the rural areas along the border local action groups (LAGs) within the LEADER programme have been set up. In the 2014-2020 period from the Hungarian side six LAGs are operating, in the whole programme area altogether 18 LAGs.16 Some urban centres, such as Nagyatád, Nagykanizsa, Pécs and Siófok are not included. LAGs have set up their own development strategies and working bodies. In Hungary – with financing from Territorial and Settlement Development Operational Programme – urban CLLDs have also been set up in towns with population of 10,000 or above (Pécs, Kaposvár, Zalaegerszeg, Keszthely, Marcali, Siófok, Nagyatád, Barcs, Szigetvár, Komló, Mohács), with financing in a range of 1,5-4,7 million EUR, depending on their population. Urban CLLDs have also set up their LAGs and working bodies.
Similarly, on the Croatian side along the borderline seven LEADER LAGs have been set up, altogether 23 LAGs are operating in the whole border area.17 Towns of Bjelovar, Čakovec, Koprivnica are completely excluded, just like the core urban areas Osijek and Vukovar. In Croatia, according to governmental decision, no urban CLLDs have been set up, however it is considered to set up “small-
16 Territorial structure of LEADER LAGs: https://umvp.kormany.hu/umvp-hacs-illetekessegiteruletei (10.02.2020).
17 Croatian LAGs: http://www.hmrr.hr/hr/leader/hrvatski-lagovi/ (10.02.2020).
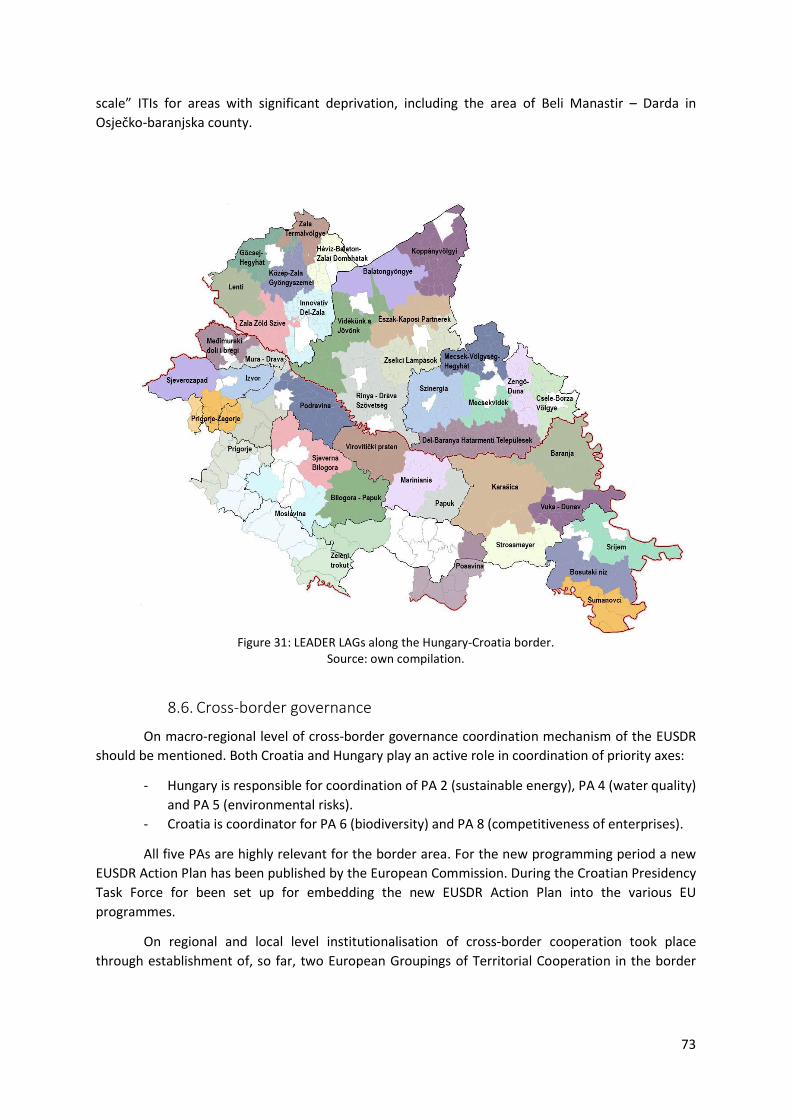
73
scale” ITIs for areas with significant deprivation, including the area of Beli Manastir – Darda in Osječko-baranjska county.
Figure 31: LEADER LAGs along the Hungary-Croatia border.
Source: own compilation.
8.6. Cross-border governance
On macro-regional level of cross-border governance coordination mechanism of the EUSDR should be mentioned. Both Croatia and Hungary play an active role in coordination of priority axes:
- Hungary is responsible for coordination of PA 2 (sustainable energy), PA 4 (water quality) and PA 5 (environmental risks).
- Croatia is coordinator for PA 6 (biodiversity) and PA 8 (competitiveness of enterprises).
All five PAs are highly relevant for the border area. For the new programming period a new EUSDR Action Plan has been published by the European Commission. During the Croatian Presidency Task Force for been set up for embedding the new EUSDR Action Plan into the various EU programmes.
On regional and local level institutionalisation of cross-border cooperation took place through establishment of, so far, two European Groupings of Territorial Cooperation in the border

74
area.18 The Pannon EGTC, initially established by Hungarian and Slovenian institutions in 2010, has been enlarged with Croatian members since 2017. Currently it counts 66 members, all border counties are included, numerous local governments and three organisations of regional significance from the Hungarian side (the Danube-Drava National Park Directorate, the Universities of Kaposvár and Pécs). Its headquarter is located in Pécs, however it has employees in Čakovec, Kaposvár and Osijek as well.
Figure 32: Territorial coverage of Pannon EGTC. Source: https://www.pannonegtc.eu/maps (10.02.2020).
The Mura EGTC is a territorially concentrated, yet very active partnership, established in 2015. It counts 13-member local governments from Zala in Hungary and eight from Međimurska, Croatia (Figure 33). Its seat is in Tótszerdahely, as the local government provides space for operation of the EGTC. The EGTC is based on the Association for Nationalities and Regional Development Alongside the River Mura, which is a cooperation platform of local governments in Zala county with significant Croatian minority. The EGTC is owner and catalysator of several projects in the border area.
18 See Regulation (EC) No 1082/2006 of the European Parliament and of the Council of 5 July 2006 on a European grouping of territorial cooperation (EGTC).

75
Figure 33: Territorial coverage of Mura EGTC and Pannon EGTC in the border area of Zala county. Source: CESCI (2016; 26).
The Central European Transport Corridor EGTC, as a multi-country EGTC, has been set up in 2014. The EGTC aims at the facilitation and promotion of cross-border, transnational and transregional cooperation for strengthening economic cohesion, through improvement of transport accessibility along the length of the North-South axis of the multimodal transport corridor from the Baltic to the Adriatic Sea. The partnership from the programme area includes the Hungarian county of Zala and Varaždinska from Croatia (Figure 34).

76
Figure 34: Partnership of the CETC EGTC. Source: http://www.cetc-egtc.eu/partners (08.07.2020).
8.7. Summary
Main statements related to PO5 – a Europe closer to citizens and the Interreg-specific objective of better cross-border governance:
- Rich in cultural heritage that includes the UNESCO World Heritage listed sites and nationally/regionally significant heritage elements and bears relevance in wine production, gastronomy and abundant history, generating potential for development of various types of tourism.
- Significant differences in territorial governance, in particular in the tourism sector: Contrary to Croatia, in Hungary tourism boards do not exist, as the tourism sector is coordinated only on national level.
- Cooperation between the two sides of the border is existing, however it is limited to partnership agreements between towns, cultural and artistic associations along with educational institutions and events.
- Integrated territorial investment (ITI) is implemented only on the Croatian side, in the urban agglomeration of Osijek.
- Community-led Local Development (CLLD): local action groups (LAGs) within the LEADER programme have been set up in the rural areas along the border in both countries, to govern rural development.
- Strong involvement of national governments in the EUSDR. - Active and spatially diverse EGTCs in the border area.

77
9. Conclusions
The detailed descriptive analysis highlights that the border region is generally – especially in GDP per capita and further economy development figures as well – lagging behind the core areas of the partner countries, however, a significant west-east divide is detected, which may define two characteristically different functional (urban) areas.
Most developed part of the border area is the western area, which is located along the Mediterranean corridor. This is particularly visible on the Croatian side, where the western part of the border region is gravitating to the agglomeration of the capital of Zagreb, moreover the two westernmost counties belong to the most developed parts of Croatia. Also, in Hungary, Zala County is the most developed part of the border region.
Although the eastern part of the border area is generally a periphery, it is dominated by the presence of two cooperating regional centres, Osijek and Pécs, which are two main urban centres of the border area. They are home of large universities, which are hubs of research and development activities.
Most peripheral part of the border region is the middle part, which lacks urban centres and economic activity, but concentrates an outstanding natural potential, which has a growing importance and significantly contributes to the image of the border area, as it is associated with good environmental quality and beautiful landscapes. This area should be dynamized by the more developed western or eastern peripheries.
Main statements by POs are summed up in Table 27.
Policy objective Negative Positive
PO1 – smart Development figures (GDP, SME density, GERD, activity) below country average.
West-east divide: relatively developed western part. R&D concentrates in the eastern part.
PO2 – green Poor implementation of circular economy.
Generally favourable conditions in the environment. Renewable energy potentials.
PO3 – connected Isolated position from transport point of view. Low permeability of the border, lack or poor cross-border transport services.
Developed digital infrastructure.
PO4 – social Low competitiveness in education, low level of labour market integration and poor performance in healthcare.
Decreasing unemployment. Availability of large universities (Pécs, Osijek, North University) and further high education institutions throughout the border area.
PO5 – closer to citizens
Low number of guest nights in the direct border area. Weak cooperation, governance asymmetries.
Abundance of cultural heritage and natural assets.
ISO Intensive cultural relations. Availability of cross-border governance
Governance differences in some sectors, in particular tourism, on regional level.

78
mechanisms (EUSDR, EGTCs). Table 27: Key statements by policy objectives from the situation analysis.
Source: own compilation.

79
References
Balkan Green Energy News (2019): Croatia’s first geothermal power plant Velika 1 officially unveiled (2019)- Balkan Green Energy News https://balkangreenenergynews.com/croatias-first-geothermal-power-plant-velika-1-officially-unveiled/ (30.01.2020).
CCAA (2019): Statistički podaci o prometu na aerodromima u RH. Croatian Civil Aviation Agency. http://www.ccaa.hr/download/documents/read/prosinac2019_4382 (30.01.2020).
CESCI (2016): A Mura Régió ETT Kohézióvizsgálata és Integrált Fejlesztési Stratégiája. https://docplayer.hu/105576210-Tartalomjegyzek-a-vizsgalati-terseg-lehatarolasa-3.html (10.02.2020).
European Commission (2019) https://ec.europa.eu/info/sites/info/files/file_import/2019-european-semester-country-report-hungary_en.pdf
Eurostat (2017): Railway lines density (km/1000 km2), by NUTS 2 regions. https://ec.europa.eu/eurostat/statistics-explained/images/b/bd/Map_2_Railway_lines_density_by_NUTS_2_regions%2C_July_2017.PNG (30.01.2020).
Government of Baranya County (2018): Mohács és térsége fenntartható turisztikai mobilitási terve. Interreg Danube, Trandsanube Pearls project.
Horváth F., Norbert P., Reményi P., Tóth T. (2018): Geothermal Resource Assessment of the Drava Basin (2018). https://secco2.eu/sites/default/files/digital_library/2018-10/LBDB-GeothermalResourceAssessmentoftheDravaBasin.pdf
KKK, Trenecon Cowi (2015): KÖZOP-hoz illeszkedő projektek határmetszési szakaszainak megvalósíthatósági tanulmány szintű feltárása, azok hálózati hatásainak vizsgálata a magyar-horvát határszakaszon (KÖZOP-3.5.0-09-11-2012-0003). V. mérföldkő: Átfogó megvalósíthatósági tanulmány. Közlekedésfejlesztési Koordinációs Központ, 2015.
MMRI (2017): Strategija prometnog razvoja Republike Hrvatske (2017.-2030.). Republika Hrvatska, Ministarstvo mora, prometa i infrastrukture. https://mmpi.gov.hr/UserDocsImages/arhiva/MMPI%20Strategija%20prometnog%20razvoja%20RH%202017.-2030.-final.pdf (5.12.2019).
Nádor A. (ed.) (2019): Cascades and Calories: Geothermal Energy in the Pannonia Basin for the 21st Century and Beyond. Interreg Danube Transnational Programme, DARLINGe. https://drive.google.com/file/d/1_yqhy0nyz9msB3gTWxx3qlUQoWlmF76q/view (08.07.2020).
Osijek (2017): Strategija razvoja urbane aglomeracije Osijek do 2020. http://www.ra-vsz.hr/UserDocsImages/dokumenti/STRATEGIJA%20RAZVOJA%20UA%20OSIJEK%20DO%202020.pdf (27.02.2020).
Pannon ETT (2016): EuroVelo nemzetközi kerékpárút hálózat turisztikai fejlesztése a Pannon ETT területén. Pannon Korlátolt Felelősségű Európai Területi Társulás.
Poelman H., Ackermans L. (2017): Passenger rail accessibility in Europe’s border areas. Working Papers WP 11/2017, European Commission.

80
https://ec.europa.eu/regional_policy/sources/docgener/work/201704_rail_passenger_accessibility.pdf (30.01.2020).
Sippel L., Nolte J., Maarfield S., Wolff D., Roux L. (2018): Comprehensive analysis of the existing cross-border rail transport connections and missing links on the internal EU borders. Final report. European Commission. https://ec.europa.eu/regional_policy/sources/docgener/studies/pdf/cb_rail_connections_en.pdf (30.01.2020).
UNECE (2018): Railway density. https://w3.unece.org/PXWeb/en/CountryRanking?IndicatorCode=47 (30.01.2020).