945181.pdf - Records Collections
407
OBG | THERE’S A WAY October 9, 2017 PAGE ϣ OF Ϧ MILWAUKEE SOLVAY COKE AND GAS PLANT SITE | EE/CA SUPPORT SAMPLING PLAN APPENDIX A – ADDENDUM TO USEPA‐APPROVED MULTI‐SITE QUALITY ASSURANCE PROJECT PLAN ADDENDUM TO USEPA‐APPROVED MULTI‐SITE QUALITY ASSURANCE PROJECT PLAN This Addendum provides site‐specific elements as identified in the USEPA‐Approved Multi‐site Quality Assurance Project Plan (QAPP). Unless specifically noted otherwise, the Multi‐site QAPP prepared for WEC Energy Group’s Wisconsin Public Service Corporation’s (WPSC) former MGP sites being addressed in an AOC for Remedial Investigations and Feasibility Studies (RI/FS), CERCLA Docket No. V‐W‐06‐C‐847, effective May 5, 2006, will be followed while implementing the Engineering Evaluation and Cost Analysis (EE/CA) Support Sampling Plan at the Milwaukee Solvay Coke and Gas Site (Site), located in Milwaukee, Wisconsin. This appendix references the Multi‐site QAPP sections which may require site‐specific elements. SECTION 1.1 – INTRODUCTION The Multi‐site QAPP addresses all the activities to be performed at the Site. Updates to reporting limits, method detection limits and laboratory standard operating procedures for the selected analytical laboratories, Pace Analytical Services, LLC and STAT Analysis Corporation, are included herein as discussed below (Section 1.4). SECTION 1.2 – PROJECT TASK ORGANIZATION The lines of authority specific to Milwaukee Solvay Coke and Gas Site are presented in Figure 1. SECTION 1.3 – PROBLEM DEFINITION/BACKGROUND INFORMATION (A5) The EE/CA Support Sampling Plan has been prepared to further determine the nature and extent of source material and address any remaining data gaps at the (Site) located in Milwaukee, Wisconsin. Specifically, this EE/CA Support Sampling Plan addresses data acquisition activities necessary to evaluate upland area removal alternatives in the EE/CA and to support a Non‐Time Critical Removal Action (NTCRA) at the Site. As discussed in the USEPA‐approved Multi‐site QAPP as typical field activities, the Milwaukee Solvay Coke and Gas Plant investigation will include test pits, surface and subsurface soil sampling (analytical and/or visual observations), and groundwater sampling. Previously collected data (as summarized in Sections 2.6, 2.7, and 2.8 of the EE/CA Support Sampling) have been used to evaluate the need for and location of additional sampling. The Problem Statement for the Site is refined to: To determine the current nature and extent of non‐aqueous phase liquid (NAPL) in soil and characterize groundwater and surface soil quality in preparation for a Non‐Time Critical Removal Action. SECTION 1.4 – PROJECT/TASK DESCRIPTION AND SCHEDULE (A6) Conditions that require further assessment to support an EE/CA with the remedial action objectives (RAOs) as presented in the AOC (Docket # V‐W‐17‐C‐010, effective August 31, 2017) are presented in Section 3.2 of the EE/CA Support Sampling Plan. Activities include, soil and groundwater sampling. The other activities presented in Section 1.4 of the Multi‐site QAPP are not anticipated at this time. Site‐specific tasks to be performed and the sampling rationale are presented in Section 3 and Table 3 of the EE/CA Support Sampling Plan. The project quantitation limits (PQLs) for the EE/CA Support Sampling Plan are provided as an attachment on Uniform Federal Policy (UFP) Worksheet #15. Pace Analytical Services is proposed for soil and water analyses. Alpha is proposed for select soil sample analysis. Both laboratories are included in the USEPA approved Multi‐ Site QAPP. Updates to the laboratory’s practical quantitation limit (PQL) and reporting limits (RL) compared to applicable Site screening levels are also provided on UFP Worksheet #15. A site‐specific sampling and analysis summary is presented on Table 4 of the EE/CA Support Sampling Plan and Table 3 and 4 detail the media to be sampled and the constituents to be analyzed.
-
Upload
khangminh22 -
Category
Documents
-
view
2 -
download
0
Transcript of 945181.pdf - Records Collections
OBG | THERE ’ S A WAY October 9, 2017
PAGE OF
MILWAUKEE SOLVAY COKE AND GAS PLANT SITE | EE/CA SUPPORT SAMPLING PLAN APPENDIX A – ADDENDUM TO USEPA‐APPROVED MULTI‐SITE QUALITY ASSURANCE PROJECT PLAN
ADDENDUM TO USEPA‐APPROVED MULTI‐SITE QUALITY ASSURANCE PROJECT PLAN
ThisAddendumprovidessite‐specificelementsasidentifiedintheUSEPA‐ApprovedMulti‐siteQualityAssuranceProjectPlan(QAPP).Unlessspecificallynotedotherwise,theMulti‐siteQAPPpreparedforWECEnergyGroup’sWisconsinPublicServiceCorporation’s(WPSC)formerMGPsitesbeingaddressedinanAOCforRemedialInvestigationsandFeasibilityStudies(RI/FS),CERCLADocketNo.V‐W‐06‐C‐847,effectiveMay5,2006,willbefollowedwhileimplementingtheEngineeringEvaluationandCostAnalysis(EE/CA)SupportSamplingPlanattheMilwaukeeSolvayCokeandGasSite(Site),locatedinMilwaukee,Wisconsin.ThisappendixreferencestheMulti‐siteQAPPsectionswhichmayrequiresite‐specificelements.
SECTION 1.1 – INTRODUCTION
TheMulti‐siteQAPPaddressesalltheactivitiestobeperformedattheSite.Updatestoreportinglimits,methoddetectionlimitsandlaboratorystandardoperatingproceduresfortheselectedanalyticallaboratories,PaceAnalyticalServices,LLCandSTATAnalysisCorporation,areincludedhereinasdiscussedbelow(Section1.4).
SECTION 1.2 – PROJECT TASK ORGANIZATION
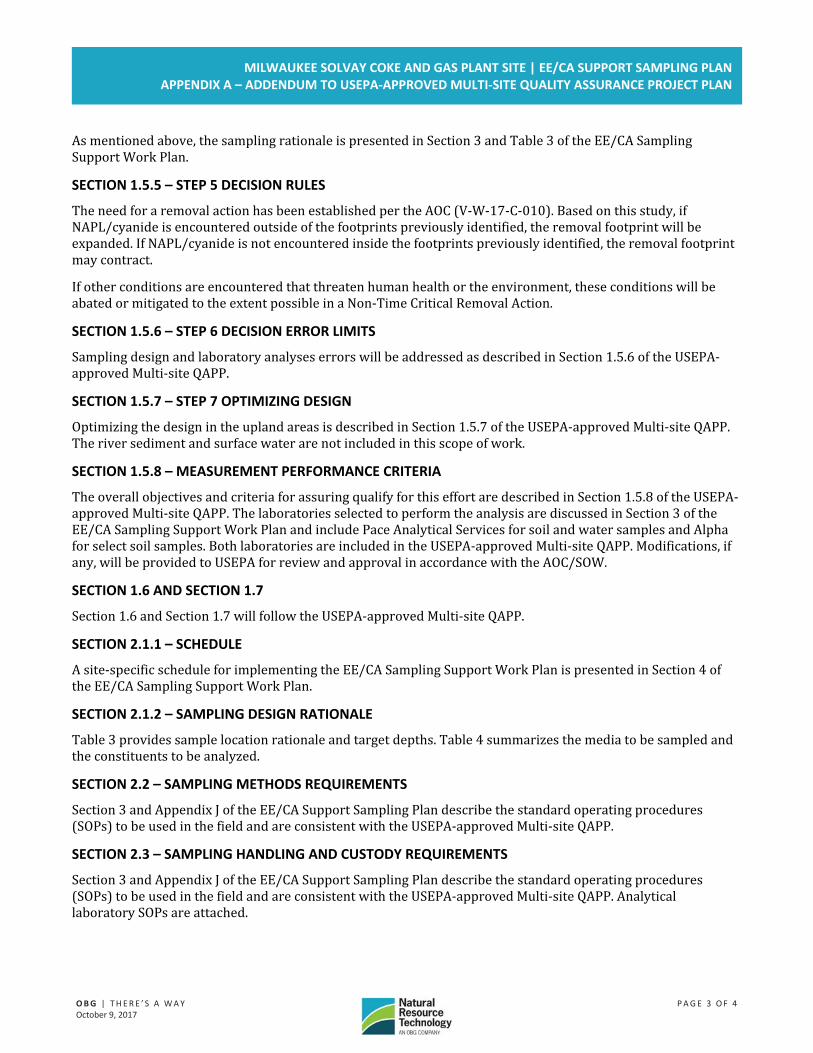
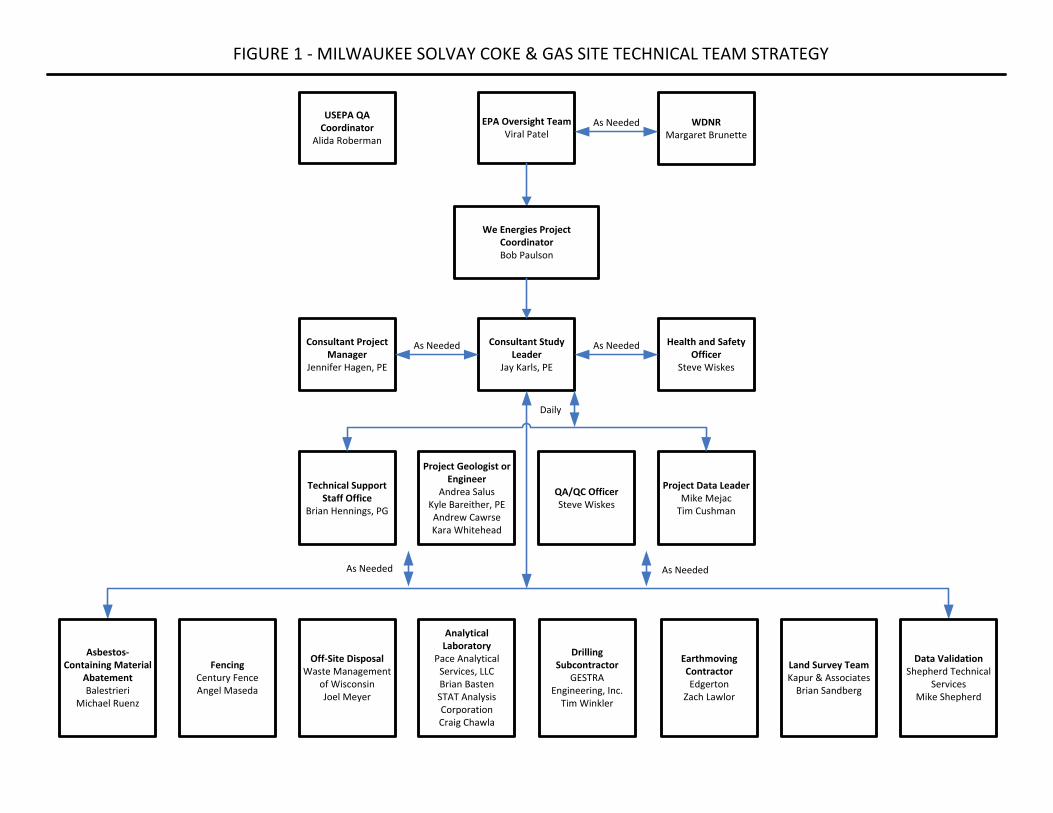
ThelinesofauthorityspecifictoMilwaukeeSolvayCokeandGasSitearepresentedinFigure1.
SECTION 1.3 – PROBLEM DEFINITION/BACKGROUND INFORMATION (A5)
TheEE/CASupportSamplingPlanhasbeenpreparedtofurtherdeterminethenatureandextentofsourcematerialandaddressanyremainingdatagapsatthe(Site)locatedinMilwaukee,Wisconsin.Specifically,thisEE/CASupportSamplingPlanaddressesdataacquisitionactivitiesnecessarytoevaluateuplandarearemovalalternativesintheEE/CAandtosupportaNon‐TimeCriticalRemovalAction(NTCRA)attheSite.
AsdiscussedintheUSEPA‐approvedMulti‐siteQAPPastypicalfieldactivities,theMilwaukeeSolvayCokeandGasPlantinvestigationwillincludetestpits,surfaceandsubsurfacesoilsampling(analyticaland/orvisualobservations),andgroundwatersampling.Previouslycollecteddata(assummarizedinSections2.6,2.7,and2.8oftheEE/CASupportSampling)havebeenusedtoevaluatetheneedforandlocationofadditionalsampling.TheProblemStatementfortheSiteisrefinedto:
Todeterminethecurrentnatureandextentofnon‐aqueousphaseliquid(NAPL)insoilandcharacterizegroundwaterandsurfacesoilqualityinpreparationforaNon‐TimeCriticalRemovalAction.
SECTION 1.4 – PROJECT/TASK DESCRIPTION AND SCHEDULE (A6)
ConditionsthatrequirefurtherassessmenttosupportanEE/CAwiththeremedialactionobjectives(RAOs)aspresentedintheAOC(Docket#V‐W‐17‐C‐010,effectiveAugust31,2017)arepresentedinSection3.2oftheEE/CASupportSamplingPlan.Activitiesinclude,soilandgroundwatersampling.
TheotheractivitiespresentedinSection1.4oftheMulti‐siteQAPParenotanticipatedatthistime.
Site‐specifictaskstobeperformedandthesamplingrationalearepresentedinSection3andTable3oftheEE/CASupportSamplingPlan.
Theprojectquantitationlimits(PQLs)fortheEE/CASupportSamplingPlanareprovidedasanattachmentonUniformFederalPolicy(UFP)Worksheet#15.PaceAnalyticalServicesisproposedforsoilandwateranalyses.Alphaisproposedforselectsoilsampleanalysis.BothlaboratoriesareincludedintheUSEPAapprovedMulti‐SiteQAPP.Updatestothelaboratory’spracticalquantitationlimit(PQL)andreportinglimits(RL)comparedtoapplicableSitescreeninglevelsarealsoprovidedonUFPWorksheet#15.Asite‐specificsamplingandanalysissummaryispresentedonTable4oftheEE/CASupportSamplingPlanandTable3and4detailthemediatobesampledandtheconstituentstobeanalyzed.
OBG | THERE ’ S A WAY October 9, 2017
PAGE OF
MILWAUKEE SOLVAY COKE AND GAS PLANT SITE | EE/CA SUPPORT SAMPLING PLAN APPENDIX A – ADDENDUM TO USEPA‐APPROVED MULTI‐SITE QUALITY ASSURANCE PROJECT PLAN
Asite‐specificscheduleforimplementingtheEE/CASupportSamplingPlanactivitiesispresentedinSection4oftheEE/CASupportSamplingPlan.
SECTION 1.5.1 – STEP 1 PROBLEM STATEMENT
TeammembersandrolesareidentifiedinFigure1andSection1.2oftheMulti‐SiteQAPP.Asdiscussedabove,theProblemStatementfortheSiteisrefinedto:
Todeterminethecurrentnatureandextentofnon‐aqueousphaseliquid(NAPL)insoilandcharacterizegroundwaterandsurfacesoilqualityinpreparationforaNon‐TimeCriticalRemovalAction.
SECTION 1.5.2 – STEP 2 DECISION IDENTIFICATION
ThestudyresultswillprovidedatatosupportaNon‐TimeCriticalRemovalAction.TheobjectivesofthestudyareprovidedinSection3.2oftheEE/CASupportSamplingPlanandsummarizedbelow:
RefinetheextentofNAPLandcyanideinsurfaceandsubsurfacesoilatthesite
Evaluatethedepthtopeatandclaylayers
Characterizepre‐removalgroundwaterquality
Characterizedirectcontactzonesoilstosupportanindustriallanduse
Sewerandwaterintakeinspectionstodocumentcurrentconditions
Thesedatawillbeusedtosupportaremovalactionapproach,anticipatedtoincludeexcavationorin‐situtreatment,asurfacebarrierandinstitutionalcontrolsasdiscussedinSection27oftheAOCandsummarizedinSection3.1oftheEE/CASupportSamplingPlan.
SECTION 1.5.3 – STEP 3 DECISION INPUTS
Asmentionedabove,Tables3and4summarizethemediatobesampled,rationale,andtheconstituentstobeanalyzed.Thelaboratory’sPQLandRLcomparedtoapplicableSitescreeninglevelsareprovidedonUFPWorksheet#15.Insomeinstances,thePQLmaybeabovethescreeninglevelbecausecommerciallyavailabletechniquescannotachievedetectionlevelsbelowthescreeninglevels.Section3andAppendixJoftheEE/CASupportSamplingPlandescribethestandardoperatingprocedures(SOPs)tobeusedinthefield.Thelaboratories’SOPsareattached.
SECTION 1.5.3.1 – SCREENING LEVEL ECOLOGICAL RISK ASSESSMENT (SLERA)
AnSLERAwaspreparedaspartoftheUSEPA‐approvedRemedialInvestigationReport,preparedforMilwaukeeSolvayCokeandGasSiteRemedialInvestigation/FeasibilityStudyGroupandanupdateisnotanticipatedtobenecessary.
SECTION 1.5.3.2 – HUMAN HEALTH RISK ASSESSMENT (HHRA)
AnHHRAwaspreparedaspartoftheUSEPA‐approvedRemedialInvestigationReport,preparedforMilwaukeeSolvayCokeandGasSiteRemedialInvestigation/FeasibilityStudyGroupandanupdateisnotanticipatedtobenecessary.
SECTION 1.5.4 – STEP 4 INVESTIGATION BOUNDARIES
Figure2oftheEE/CASamplingSupportWorkPlandepictsthesiteboundariestobeinvestigated.Figures8aand8bprovideproposedsamplinglocations.
SamplevolumesrequiredforlaboratoryandtoxicitytestingareprovidedonTable4oftheEE/CASamplingSupportWorkPlan.
OBG | THERE ’ S A WAY October 9, 2017
PAGE OF
MILWAUKEE SOLVAY COKE AND GAS PLANT SITE | EE/CA SUPPORT SAMPLING PLAN APPENDIX A – ADDENDUM TO USEPA‐APPROVED MULTI‐SITE QUALITY ASSURANCE PROJECT PLAN
Asmentionedabove,thesamplingrationaleispresentedinSection3andTable3oftheEE/CASamplingSupportWorkPlan.
SECTION 1.5.5 – STEP 5 DECISION RULES
TheneedforaremovalactionhasbeenestablishedpertheAOC(V‐W‐17‐C‐010).Basedonthisstudy,ifNAPL/cyanideisencounteredoutsideofthefootprintspreviouslyidentified,theremovalfootprintwillbeexpanded.IfNAPL/cyanideisnotencounteredinsidethefootprintspreviouslyidentified,theremovalfootprintmaycontract.
Ifotherconditionsareencounteredthatthreatenhumanhealthortheenvironment,theseconditionswillbeabatedormitigatedtotheextentpossibleinaNon‐TimeCriticalRemovalAction.
SECTION 1.5.6 – STEP 6 DECISION ERROR LIMITS
SamplingdesignandlaboratoryanalyseserrorswillbeaddressedasdescribedinSection1.5.6oftheUSEPA‐approvedMulti‐siteQAPP.
SECTION 1.5.7 – STEP 7 OPTIMIZING DESIGN
OptimizingthedesignintheuplandareasisdescribedinSection1.5.7oftheUSEPA‐approvedMulti‐siteQAPP.Theriversedimentandsurfacewaterarenotincludedinthisscopeofwork.
SECTION 1.5.8 – MEASUREMENT PERFORMANCE CRITERIA
TheoverallobjectivesandcriteriaforassuringqualifyforthiseffortaredescribedinSection1.5.8oftheUSEPA‐approvedMulti‐siteQAPP.ThelaboratoriesselectedtoperformtheanalysisarediscussedinSection3oftheEE/CASamplingSupportWorkPlanandincludePaceAnalyticalServicesforsoilandwatersamplesandAlphaforselectsoilsamples.BothlaboratoriesareincludedintheUSEPA‐approvedMulti‐siteQAPP.Modifications,ifany,willbeprovidedtoUSEPAforreviewandapprovalinaccordancewiththeAOC/SOW.
SECTION 1.6 AND SECTION 1.7
Section1.6andSection1.7willfollowtheUSEPA‐approvedMulti‐siteQAPP.
SECTION 2.1.1 – SCHEDULE
Asite‐specificscheduleforimplementingtheEE/CASamplingSupportWorkPlanispresentedinSection4oftheEE/CASamplingSupportWorkPlan.
SECTION 2.1.2 – SAMPLING DESIGN RATIONALE
Table3providessamplelocationrationaleandtargetdepths.Table4summarizesthemediatobesampledandtheconstituentstobeanalyzed.
SECTION 2.2 – SAMPLING METHODS REQUIREMENTS
Section3andAppendixJoftheEE/CASupportSamplingPlandescribethestandardoperatingprocedures(SOPs)tobeusedinthefieldandareconsistentwiththeUSEPA‐approvedMulti‐siteQAPP.
SECTION 2.3 – SAMPLING HANDLING AND CUSTODY REQUIREMENTS
Section3andAppendixJoftheEE/CASupportSamplingPlandescribethestandardoperatingprocedures(SOPs)tobeusedinthefieldandareconsistentwiththeUSEPA‐approvedMulti‐siteQAPP.AnalyticallaboratorySOPsareattached.
OBG | THERE ’ S A WAY October 9, 2017
PAGE OF
MILWAUKEE SOLVAY COKE AND GAS PLANT SITE | EE/CA SUPPORT SAMPLING PLAN APPENDIX A – ADDENDUM TO USEPA‐APPROVED MULTI‐SITE QUALITY ASSURANCE PROJECT PLAN
SECTION 2.3.1.3 – SAMPLE CONTAINER, VOLUME, PRESERVATION AND HOLDING TIME
Table4summarizesthesamplecontainers,volume,preservationandholdingtimesforthemediatobesampledandtheconstituentstobeanalyzed.
SECTION 2.4 – ANALYTICAL METHODS REQUIREMENTS (B4)
Table4summarizestheparameterstobeanalyzed.
REMAINING QAPP SECTIONS
RemainingQAPPsectionswillfollowtheintentoftheUSEPA‐approvedMulti‐siteQAPP.
ATTACHMENTS:
Figure1 LinesofCommunicationAttachment1 QAPPWorksheet#15Attachment2 AnalyticalLaboratoryStandardOperatingProcedures Attachment2‐1 PaceAnalyticalServices,LLC Attachment2‐2 STATAnalysisCorporation

O B G T H E R E ’ S A W A Y
MILWAUKEE SOLVAY COKE AND GAS PLANT SITE | EE/CA SUPPORT SAMPLING PLAN APPENDIX A – ADDENDUM TO USEPA-APPROVED MULTI-SITE QUALITY ASSURANCE PROJECT PLAN
Figure 1
Lines of Communication
EPA Oversight TeamViral Patel
WDNRMargaret Brunette
Consultant Study Leader
Jay Karls, PE
Consultant Project Manager
Jennifer Hagen, PE
Health and Safety Officer
Steve Wiskes
Technical Support Staff Office
Brian Hennings, PG
Project Geologist or Engineer
Andrea SalusKyle Bareither, PEAndrew CawrseKara Whitehead
QA/QC OfficerSteve Wiskes
Project Data LeaderMike Mejac
Tim Cushman
FencingCentury FenceAngel Maseda
Off-Site DisposalWaste Management
of WisconsinJoel Meyer
Analytical Laboratory
Pace Analytical Services, LLCBrian BastenSTAT Analysis CorporationCraig Chawla
Drilling Subcontractor
GESTRA Engineering, Inc.
Tim Winkler
Earthmoving ContractorEdgerton
Zach Lawlor
Land Survey TeamKapur & Associates
Brian Sandberg
Daily
As Needed As Needed
As Needed As Needed
As Needed
FIGURE 1 - MILWAUKEE SOLVAY COKE & GAS SITE TECHNICAL TEAM STRATEGY
We Energies Project CoordinatorBob Paulson
USEPA QA Coordinator
Alida Roberman
Asbestos-Containing Material
AbatementBalestrieri
Michael Ruenz
Data ValidationShepherd Technical
ServicesMike Shepherd
O B G T H E R E ’ S A W A Y
MILWAUKEE SOLVAY COKE AND GAS PLANT SITE | EE/CA SUPPORT SAMPLING PLAN APPENDIX A – ADDENDUM TO USEPA-APPROVED MULTI-SITE QUALITY ASSURANCE PROJECT PLAN
Attachment 1
QAPP Worksheet #15
Title: Milwaukee Solvay Coke and Gas Revision Number: 0
Revision Date: September 20, 2017 Page 1 of 52
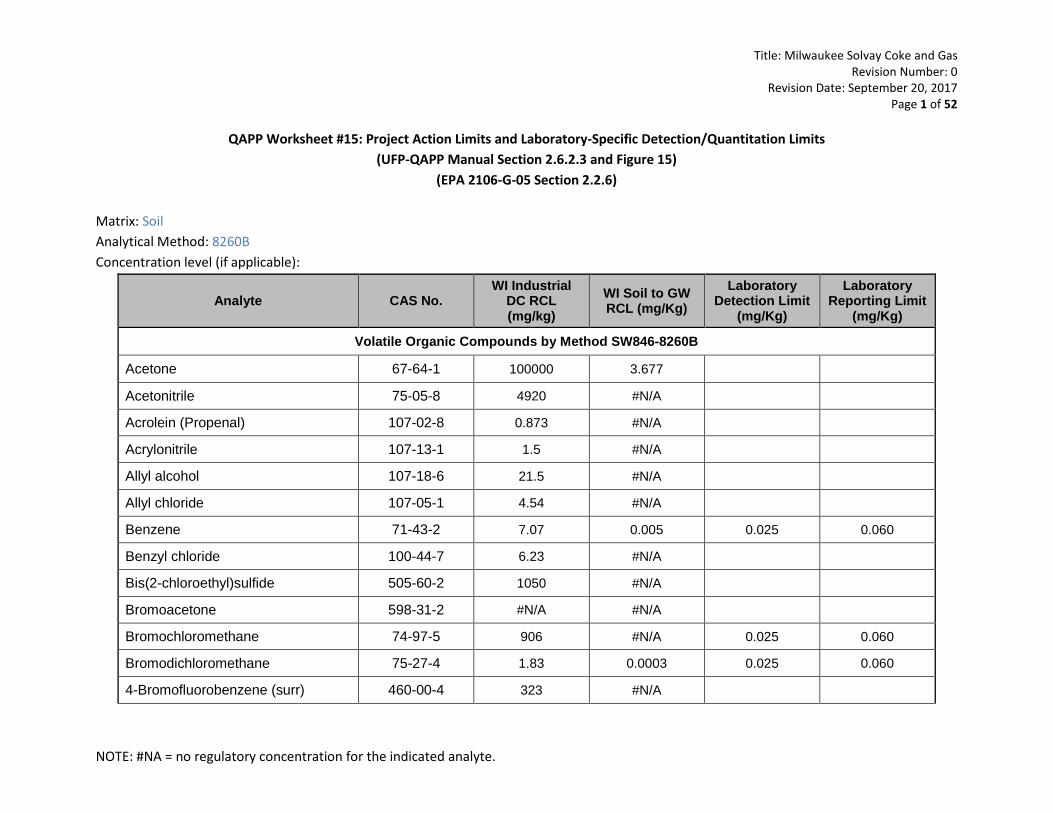
NOTE: #NA = no regulatory concentration for the indicated analyte.
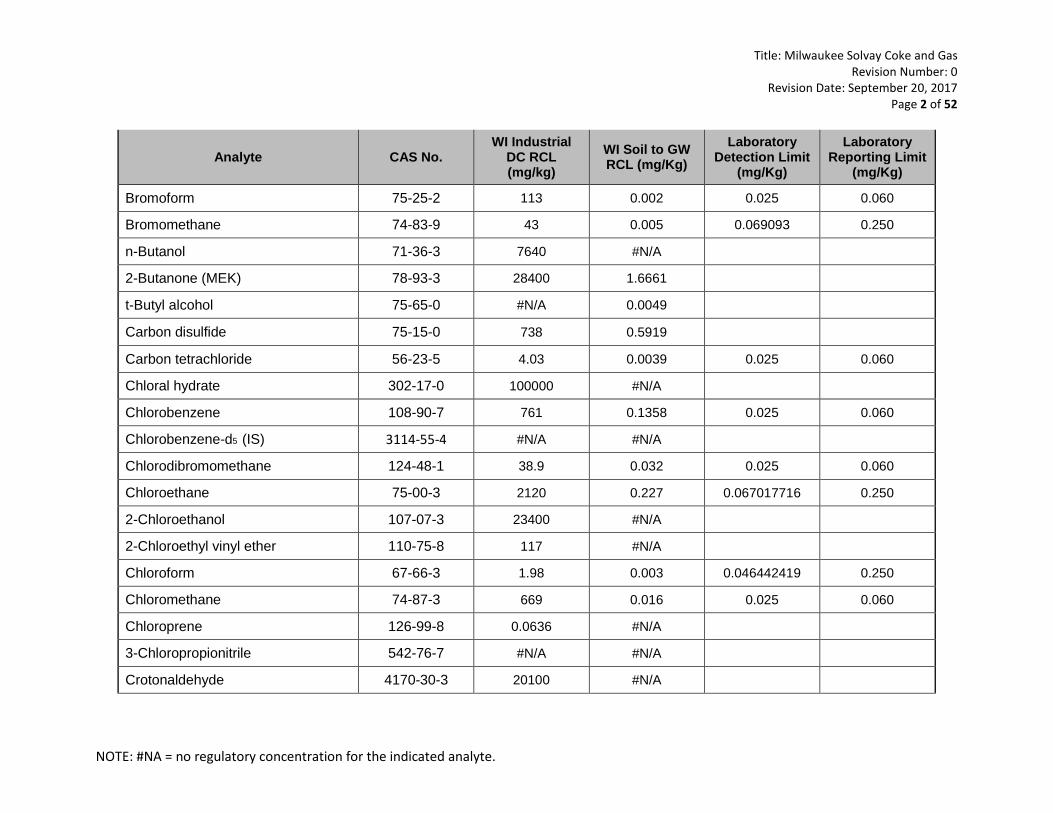
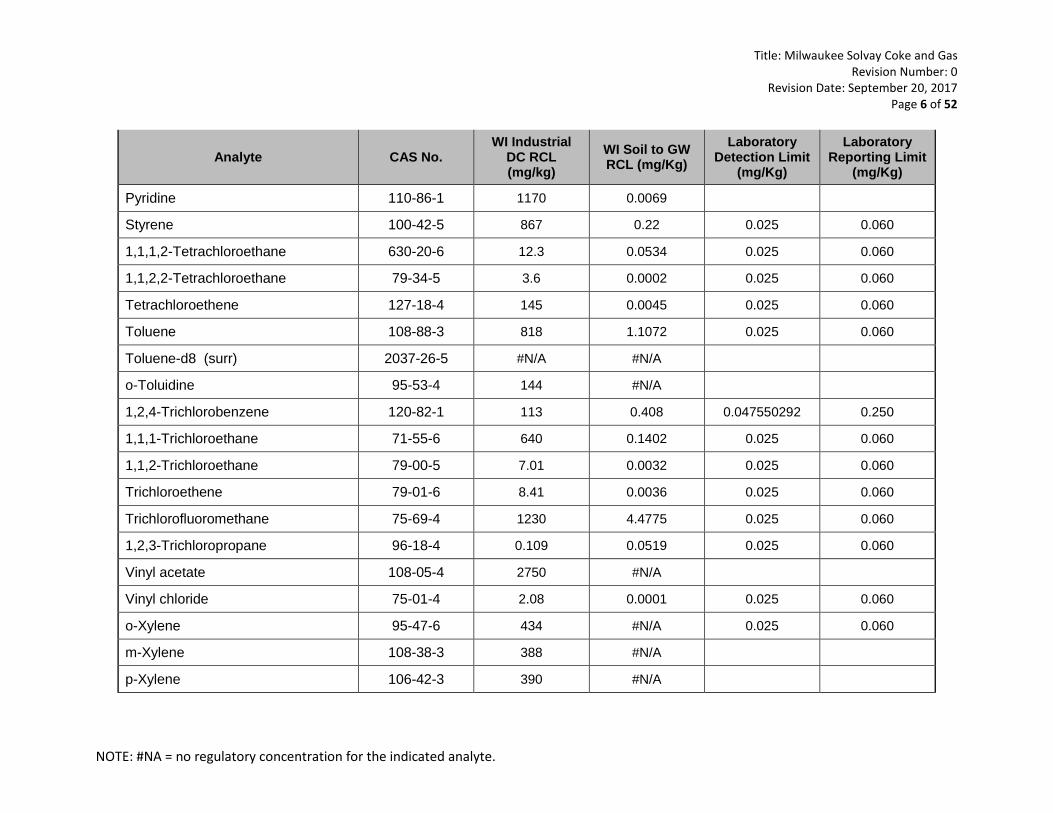
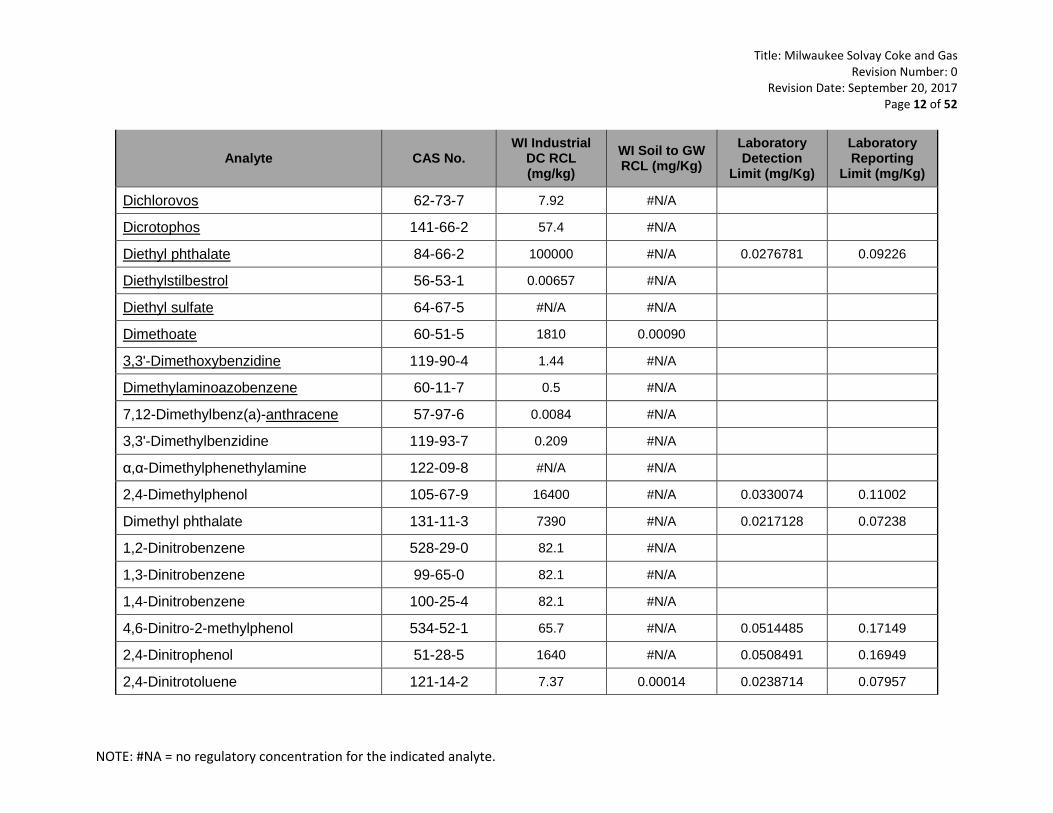
QAPP Worksheet #15: Project Action Limits and Laboratory-Specific Detection/Quantitation Limits (UFP-QAPP Manual Section 2.6.2.3 and Figure 15)
(EPA 2106-G-05 Section 2.2.6)
Matrix: Soil Analytical Method: 8260B Concentration level (if applicable):
Analyte CAS No. WI Industrial
DC RCL (mg/kg)
WI Soil to GW RCL (mg/Kg)
Laboratory Detection Limit
(mg/Kg)
Laboratory Reporting Limit
(mg/Kg)
Volatile Organic Compounds by Method SW846-8260B
Acetone 67-64-1 100000 3.677
Acetonitrile 75-05-8 4920 #N/A
Acrolein (Propenal) 107-02-8 0.873 #N/A
Acrylonitrile 107-13-1 1.5 #N/A
Allyl alcohol 107-18-6 21.5 #N/A
Allyl chloride 107-05-1 4.54 #N/A
Benzene 71-43-2 7.07 0.005 0.025 0.060
Benzyl chloride 100-44-7 6.23 #N/A
Bis(2-chloroethyl)sulfide 505-60-2 1050 #N/A
Bromoacetone 598-31-2 #N/A #N/A
Bromochloromethane 74-97-5 906 #N/A 0.025 0.060
Bromodichloromethane 75-27-4 1.83 0.0003 0.025 0.060
4-Bromofluorobenzene (surr) 460-00-4 323 #N/A
Title: Milwaukee Solvay Coke and Gas Revision Number: 0
Revision Date: September 20, 2017 Page 2 of 52
NOTE: #NA = no regulatory concentration for the indicated analyte.
Analyte CAS No. WI Industrial
DC RCL (mg/kg)
WI Soil to GW RCL (mg/Kg)
Laboratory Detection Limit
(mg/Kg)
Laboratory Reporting Limit
(mg/Kg)
Bromoform 75-25-2 113 0.002 0.025 0.060
Bromomethane 74-83-9 43 0.005 0.069093 0.250
n-Butanol 71-36-3 7640 #N/A
2-Butanone (MEK) 78-93-3 28400 1.6661
t-Butyl alcohol 75-65-0 #N/A 0.0049
Carbon disulfide 75-15-0 738 0.5919
Carbon tetrachloride 56-23-5 4.03 0.0039 0.025 0.060
Chloral hydrate 302-17-0 100000 #N/A
Chlorobenzene 108-90-7 761 0.1358 0.025 0.060
Chlorobenzene-d5 (IS) 3114-55-4 #N/A #N/A
Chlorodibromomethane 124-48-1 38.9 0.032 0.025 0.060
Chloroethane 75-00-3 2120 0.227 0.067017716 0.250
2-Chloroethanol 107-07-3 23400 #N/A
2-Chloroethyl vinyl ether 110-75-8 117 #N/A
Chloroform 67-66-3 1.98 0.003 0.046442419 0.250
Chloromethane 74-87-3 669 0.016 0.025 0.060
Chloroprene 126-99-8 0.0636 #N/A
3-Chloropropionitrile 542-76-7 #N/A #N/A
Crotonaldehyde 4170-30-3 20100 #N/A
Title: Milwaukee Solvay Coke and Gas Revision Number: 0
Revision Date: September 20, 2017 Page 3 of 52
NOTE: #NA = no regulatory concentration for the indicated analyte.
Analyte CAS No. WI Industrial
DC RCL (mg/kg)
WI Soil to GW RCL (mg/Kg)
Laboratory Detection Limit
(mg/Kg)
Laboratory Reporting Limit
(mg/Kg)
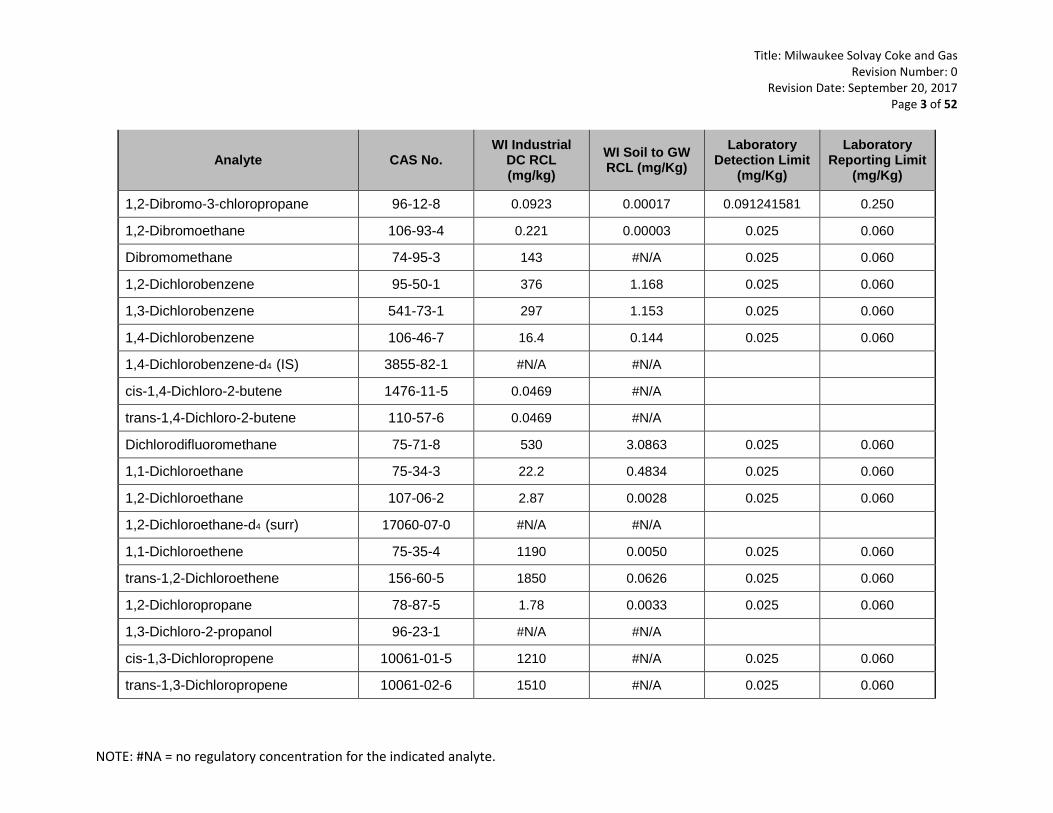
1,2-Dibromo-3-chloropropane 96-12-8 0.0923 0.00017 0.091241581 0.250
1,2-Dibromoethane 106-93-4 0.221 0.00003 0.025 0.060
Dibromomethane 74-95-3 143 #N/A 0.025 0.060
1,2-Dichlorobenzene 95-50-1 376 1.168 0.025 0.060
1,3-Dichlorobenzene 541-73-1 297 1.153 0.025 0.060
1,4-Dichlorobenzene 106-46-7 16.4 0.144 0.025 0.060
1,4-Dichlorobenzene-d4 (IS) 3855-82-1 #N/A #N/A
cis-1,4-Dichloro-2-butene 1476-11-5 0.0469 #N/A
trans-1,4-Dichloro-2-butene 110-57-6 0.0469 #N/A
Dichlorodifluoromethane 75-71-8 530 3.0863 0.025 0.060
1,1-Dichloroethane 75-34-3 22.2 0.4834 0.025 0.060
1,2-Dichloroethane 107-06-2 2.87 0.0028 0.025 0.060
1,2-Dichloroethane-d4 (surr) 17060-07-0 #N/A #N/A
1,1-Dichloroethene 75-35-4 1190 0.0050 0.025 0.060
trans-1,2-Dichloroethene 156-60-5 1850 0.0626 0.025 0.060
1,2-Dichloropropane 78-87-5 1.78 0.0033 0.025 0.060
1,3-Dichloro-2-propanol 96-23-1 #N/A #N/A
cis-1,3-Dichloropropene 10061-01-5 1210 #N/A 0.025 0.060
trans-1,3-Dichloropropene 10061-02-6 1510 #N/A 0.025 0.060
Title: Milwaukee Solvay Coke and Gas Revision Number: 0
Revision Date: September 20, 2017 Page 4 of 52
NOTE: #NA = no regulatory concentration for the indicated analyte.
Analyte CAS No. WI Industrial
DC RCL (mg/kg)
WI Soil to GW RCL (mg/Kg)
Laboratory Detection Limit
(mg/Kg)
Laboratory Reporting Limit
(mg/Kg)
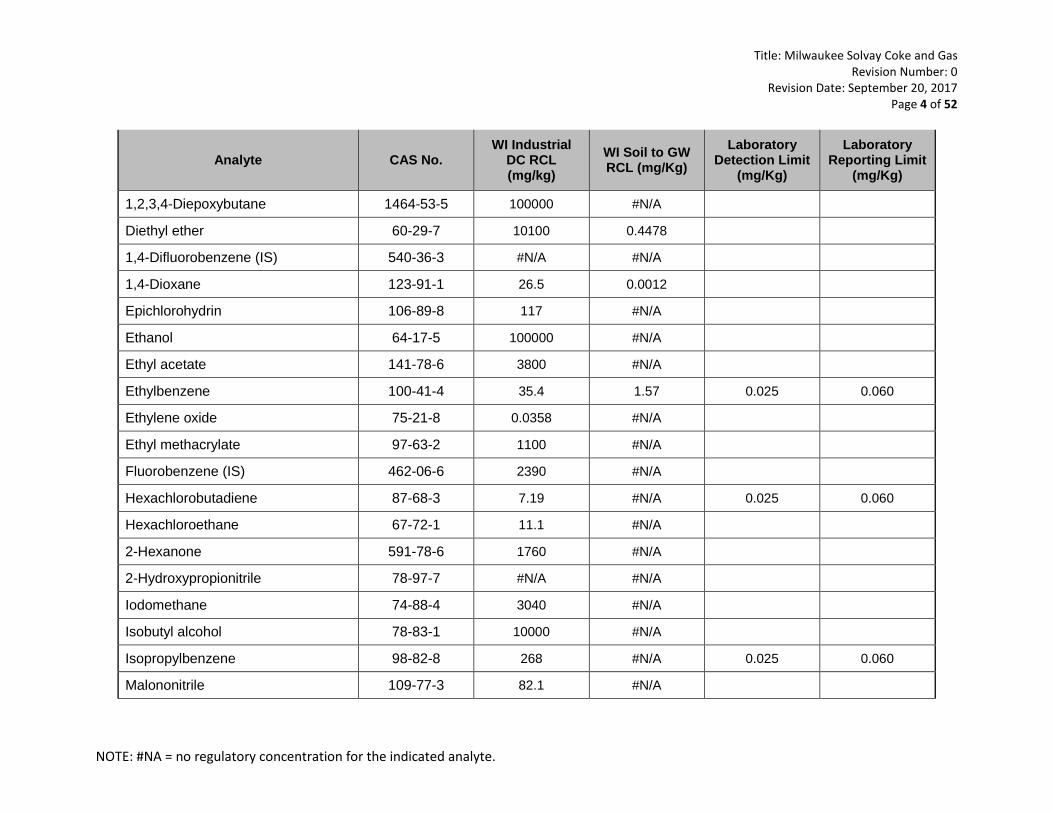
1,2,3,4-Diepoxybutane 1464-53-5 100000 #N/A
Diethyl ether 60-29-7 10100 0.4478
1,4-Difluorobenzene (IS) 540-36-3 #N/A #N/A
1,4-Dioxane 123-91-1 26.5 0.0012
Epichlorohydrin 106-89-8 117 #N/A
Ethanol 64-17-5 100000 #N/A
Ethyl acetate 141-78-6 3800 #N/A
Ethylbenzene 100-41-4 35.4 1.57 0.025 0.060
Ethylene oxide 75-21-8 0.0358 #N/A
Ethyl methacrylate 97-63-2 1100 #N/A
Fluorobenzene (IS) 462-06-6 2390 #N/A
Hexachlorobutadiene 87-68-3 7.19 #N/A 0.025 0.060
Hexachloroethane 67-72-1 11.1 #N/A
2-Hexanone 591-78-6 1760 #N/A
2-Hydroxypropionitrile 78-97-7 #N/A #N/A
Iodomethane 74-88-4 3040 #N/A
Isobutyl alcohol 78-83-1 10000 #N/A
Isopropylbenzene 98-82-8 268 #N/A 0.025 0.060
Malononitrile 109-77-3 82.1 #N/A
Title: Milwaukee Solvay Coke and Gas Revision Number: 0
Revision Date: September 20, 2017 Page 5 of 52
NOTE: #NA = no regulatory concentration for the indicated analyte.
Analyte CAS No. WI Industrial
DC RCL (mg/kg)
WI Soil to GW RCL (mg/Kg)
Laboratory Detection Limit
(mg/Kg)
Laboratory Reporting Limit
(mg/Kg)
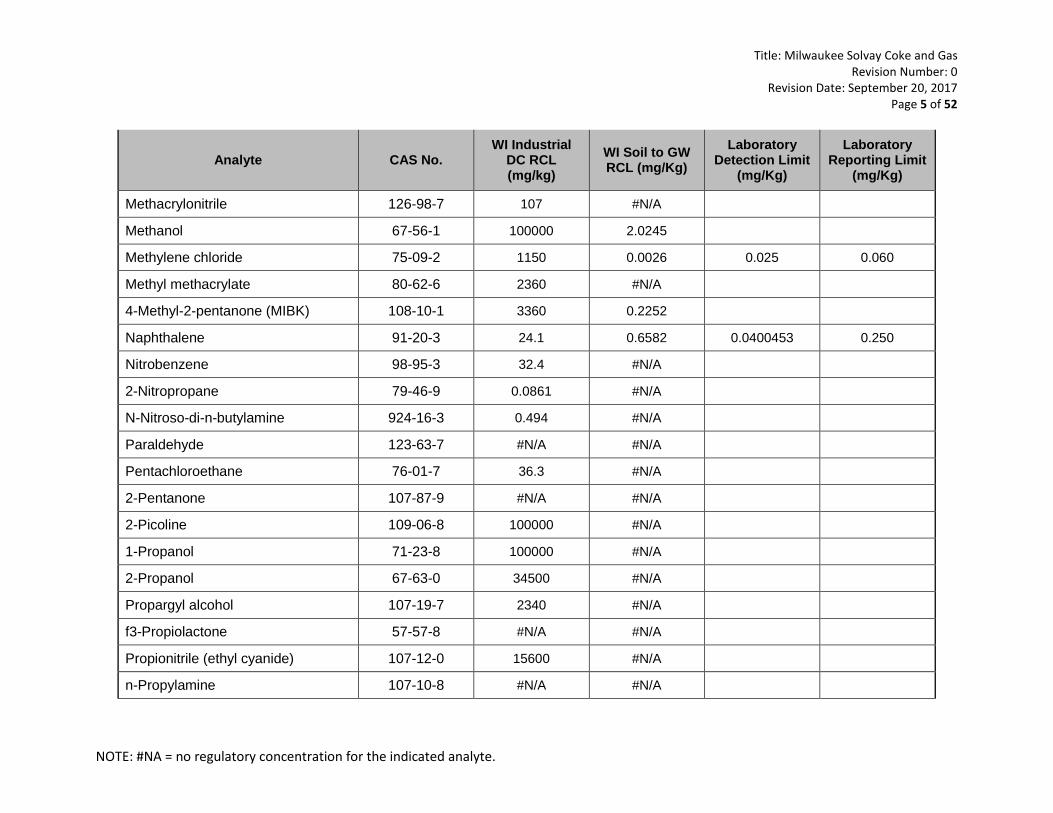
Methacrylonitrile 126-98-7 107 #N/A
Methanol 67-56-1 100000 2.0245
Methylene chloride 75-09-2 1150 0.0026 0.025 0.060
Methyl methacrylate 80-62-6 2360 #N/A
4-Methyl-2-pentanone (MIBK) 108-10-1 3360 0.2252
Naphthalene 91-20-3 24.1 0.6582 0.0400453 0.250
Nitrobenzene 98-95-3 32.4 #N/A
2-Nitropropane 79-46-9 0.0861 #N/A
N-Nitroso-di-n-butylamine 924-16-3 0.494 #N/A
Paraldehyde 123-63-7 #N/A #N/A
Pentachloroethane 76-01-7 36.3 #N/A
2-Pentanone 107-87-9 #N/A #N/A
2-Picoline 109-06-8 100000 #N/A
1-Propanol 71-23-8 100000 #N/A
2-Propanol 67-63-0 34500 #N/A
Propargyl alcohol 107-19-7 2340 #N/A
f3-Propiolactone 57-57-8 #N/A #N/A
Propionitrile (ethyl cyanide) 107-12-0 15600 #N/A
n-Propylamine 107-10-8 #N/A #N/A
Title: Milwaukee Solvay Coke and Gas Revision Number: 0
Revision Date: September 20, 2017 Page 6 of 52
NOTE: #NA = no regulatory concentration for the indicated analyte.
Analyte CAS No. WI Industrial
DC RCL (mg/kg)
WI Soil to GW RCL (mg/Kg)
Laboratory Detection Limit
(mg/Kg)
Laboratory Reporting Limit
(mg/Kg)
Pyridine 110-86-1 1170 0.0069
Styrene 100-42-5 867 0.22 0.025 0.060
1,1,1,2-Tetrachloroethane 630-20-6 12.3 0.0534 0.025 0.060
1,1,2,2-Tetrachloroethane 79-34-5 3.6 0.0002 0.025 0.060
Tetrachloroethene 127-18-4 145 0.0045 0.025 0.060
Toluene 108-88-3 818 1.1072 0.025 0.060
Toluene-d8 (surr) 2037-26-5 #N/A #N/A
o-Toluidine 95-53-4 144 #N/A
1,2,4-Trichlorobenzene 120-82-1 113 0.408 0.047550292 0.250
1,1,1-Trichloroethane 71-55-6 640 0.1402 0.025 0.060
1,1,2-Trichloroethane 79-00-5 7.01 0.0032 0.025 0.060
Trichloroethene 79-01-6 8.41 0.0036 0.025 0.060
Trichlorofluoromethane 75-69-4 1230 4.4775 0.025 0.060
1,2,3-Trichloropropane 96-18-4 0.109 0.0519 0.025 0.060
Vinyl acetate 108-05-4 2750 #N/A
Vinyl chloride 75-01-4 2.08 0.0001 0.025 0.060
o-Xylene 95-47-6 434 #N/A 0.025 0.060
m-Xylene 108-38-3 388 #N/A
p-Xylene 106-42-3 390 #N/A

Title: Milwaukee Solvay Coke and Gas Revision Number: 0
Revision Date: September 20, 2017 Page 7 of 52
NOTE: #NA = no regulatory concentration for the indicated analyte.
Analyte CAS No. WI Industrial
DC RCL (mg/kg)
WI Soil to GW RCL (mg/Kg)
Laboratory Detection Limit
(mg/Kg)
Laboratory Reporting Limit
(mg/Kg)
1,3,5-Trimethylbenzene 108-68-8 182 #N/A 0.025 0.060
1,2,4-Trimethylbenzene 95-63-6 219 #N/A 0.025 0.060
Title: Milwaukee Solvay Coke and Gas Revision Number: 0
Revision Date: September 20, 2017 Page 8 of 52
NOTE: #NA = no regulatory concentration for the indicated analyte.
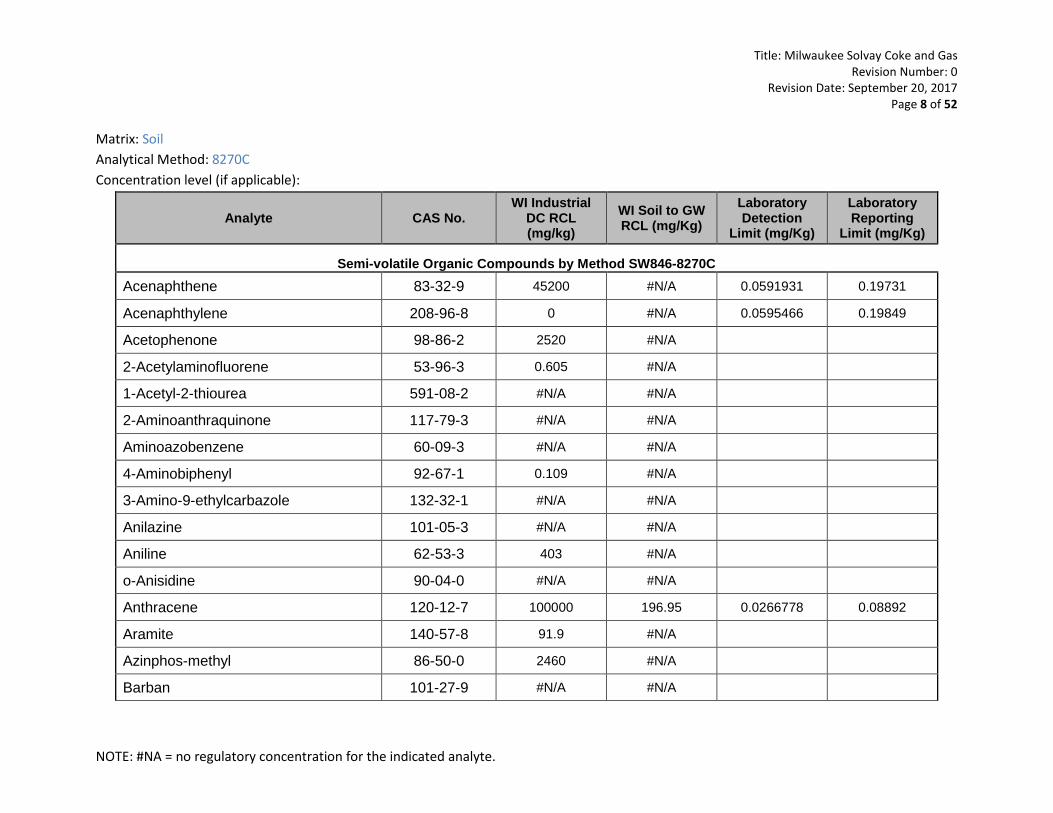
Matrix: Soil Analytical Method: 8270C Concentration level (if applicable):
Analyte CAS No. WI Industrial
DC RCL (mg/kg)
WI Soil to GW RCL (mg/Kg)
Laboratory Detection
Limit (mg/Kg)
Laboratory Reporting
Limit (mg/Kg)
Semi-volatile Organic Compounds by Method SW846-8270C Acenaphthene 83-32-9 45200 #N/A 0.0591931 0.19731
Acenaphthylene 208-96-8 0 #N/A 0.0595466 0.19849
Acetophenone 98-86-2 2520 #N/A
2-Acetylaminofluorene 53-96-3 0.605 #N/A
1-Acetyl-2-thiourea 591-08-2 #N/A #N/A
2-Aminoanthraquinone 117-79-3 #N/A #N/A
Aminoazobenzene 60-09-3 #N/A #N/A
4-Aminobiphenyl 92-67-1 0.109 #N/A
3-Amino-9-ethylcarbazole 132-32-1 #N/A #N/A
Anilazine 101-05-3 #N/A #N/A
Aniline 62-53-3 403 #N/A
o-Anisidine 90-04-0 #N/A #N/A
Anthracene 120-12-7 100000 196.95 0.0266778 0.08892
Aramite 140-57-8 91.9 #N/A
Azinphos-methyl 86-50-0 2460 #N/A
Barban 101-27-9 #N/A #N/A
Title: Milwaukee Solvay Coke and Gas Revision Number: 0
Revision Date: September 20, 2017 Page 9 of 52
NOTE: #NA = no regulatory concentration for the indicated analyte.
Analyte CAS No. WI Industrial
DC RCL (mg/kg)
WI Soil to GW RCL (mg/Kg)
Laboratory Detection
Limit (mg/Kg)
Laboratory Reporting
Limit (mg/Kg)
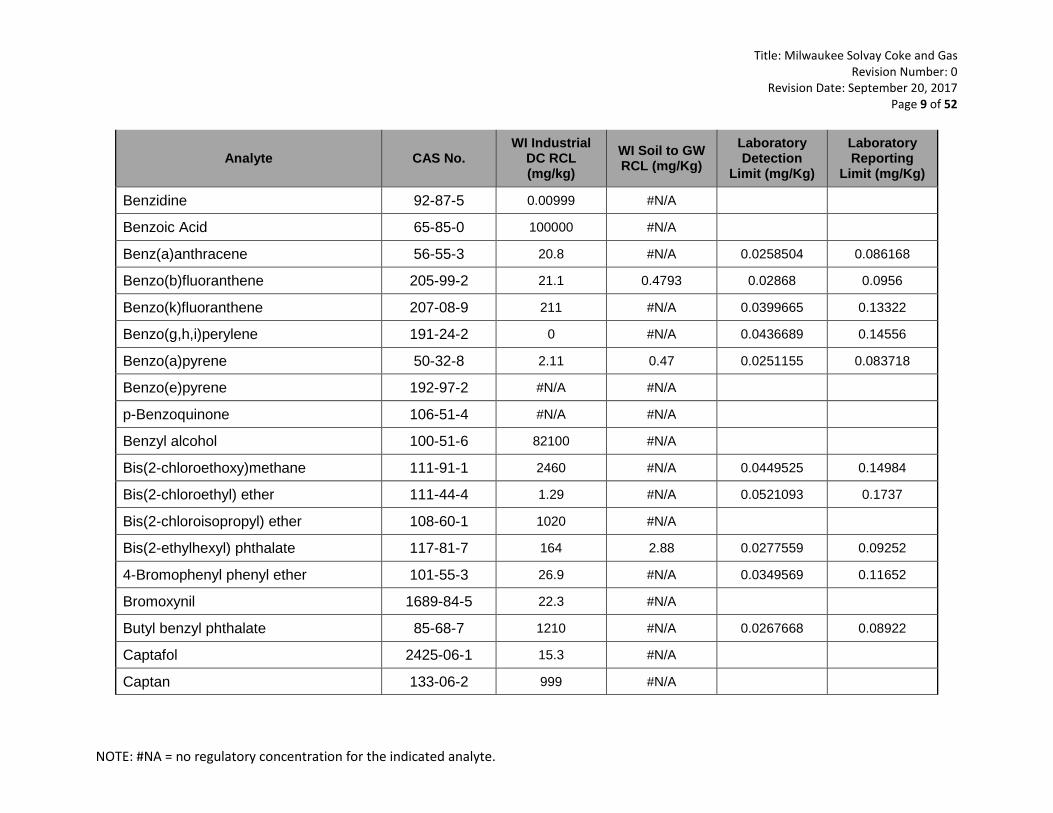
Benzidine 92-87-5 0.00999 #N/A
Benzoic Acid 65-85-0 100000 #N/A
Benz(a)anthracene 56-55-3 20.8 #N/A 0.0258504 0.086168
Benzo(b)fluoranthene 205-99-2 21.1 0.4793 0.02868 0.0956
Benzo(k)fluoranthene 207-08-9 211 #N/A 0.0399665 0.13322
Benzo(g,h,i)perylene 191-24-2 0 #N/A 0.0436689 0.14556
Benzo(a)pyrene 50-32-8 2.11 0.47 0.0251155 0.083718
Benzo(e)pyrene 192-97-2 #N/A #N/A
p-Benzoquinone 106-51-4 #N/A #N/A
Benzyl alcohol 100-51-6 82100 #N/A
Bis(2-chloroethoxy)methane 111-91-1 2460 #N/A 0.0449525 0.14984
Bis(2-chloroethyl) ether 111-44-4 1.29 #N/A 0.0521093 0.1737
Bis(2-chloroisopropyl) ether 108-60-1 1020 #N/A
Bis(2-ethylhexyl) phthalate 117-81-7 164 2.88 0.0277559 0.09252
4-Bromophenyl phenyl ether 101-55-3 26.9 #N/A 0.0349569 0.11652
Bromoxynil 1689-84-5 22.3 #N/A
Butyl benzyl phthalate 85-68-7 1210 #N/A 0.0267668 0.08922
Captafol 2425-06-1 15.3 #N/A
Captan 133-06-2 999 #N/A
Title: Milwaukee Solvay Coke and Gas Revision Number: 0
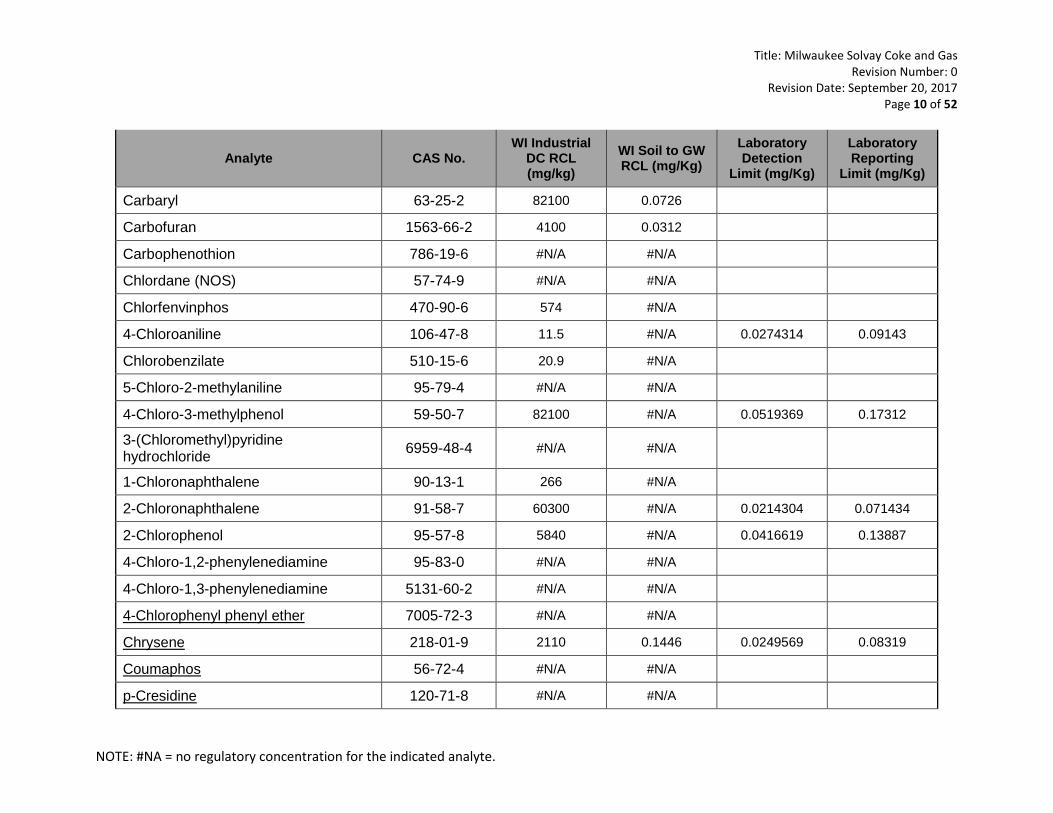
Revision Date: September 20, 2017 Page 10 of 52
NOTE: #NA = no regulatory concentration for the indicated analyte.
Analyte CAS No. WI Industrial
DC RCL (mg/kg)
WI Soil to GW RCL (mg/Kg)
Laboratory Detection
Limit (mg/Kg)
Laboratory Reporting
Limit (mg/Kg)
Carbaryl 63-25-2 82100 0.0726
Carbofuran 1563-66-2 4100 0.0312
Carbophenothion 786-19-6 #N/A #N/A
Chlordane (NOS) 57-74-9 #N/A #N/A
Chlorfenvinphos 470-90-6 574 #N/A
4-Chloroaniline 106-47-8 11.5 #N/A 0.0274314 0.09143
Chlorobenzilate 510-15-6 20.9 #N/A
5-Chloro-2-methylaniline 95-79-4 #N/A #N/A
4-Chloro-3-methylphenol 59-50-7 82100 #N/A 0.0519369 0.17312
3-(Chloromethyl)pyridine hydrochloride
6959-48-4 #N/A #N/A
1-Chloronaphthalene 90-13-1 266 #N/A
2-Chloronaphthalene 91-58-7 60300 #N/A 0.0214304 0.071434
2-Chlorophenol 95-57-8 5840 #N/A 0.0416619 0.13887
4-Chloro-1,2-phenylenediamine 95-83-0 #N/A #N/A
4-Chloro-1,3-phenylenediamine 5131-60-2 #N/A #N/A
4-Chlorophenyl phenyl ether 7005-72-3 #N/A #N/A
Chrysene 218-01-9 2110 0.1446 0.0249569 0.08319
Coumaphos 56-72-4 #N/A #N/A
p-Cresidine 120-71-8 #N/A #N/A

Title: Milwaukee Solvay Coke and Gas Revision Number: 0
Revision Date: September 20, 2017 Page 11 of 52
NOTE: #NA = no regulatory concentration for the indicated analyte.
Analyte CAS No. WI Industrial
DC RCL (mg/kg)
WI Soil to GW RCL (mg/Kg)
Laboratory Detection
Limit (mg/Kg)
Laboratory Reporting
Limit (mg/Kg)
Crotoxyphos 7700-17-6 #N/A #N/A
2-Cyclohexyl-4,6-dinitro-phenol 131-89-5 1640 #N/A
Demeton-O 298-03-3 #N/A #N/A
Demeton-S 126-75-0 #N/A #N/A
Diallate (cis or trans) 2303-16-4 37.7 #N/A
2,4-Diaminotoluene 95-80-7 #N/A #N/A
Dibenz(a,j)acridine 224-42-0 #N/A #N/A
Dibenz(a,h)anthracene 53-70-3 2.11 #N/A 0.0453374 0.15112
Dibenzofuran 132-64-9 1040 #N/A 0.0202055 0.06735
Dibenzo(a,e)pyrene 192-65-4 0.176 #N/A
1,2-Dibromo-3-chloropropane 96-12-8 0.0923 0.0002
Di-n-butyl phthalate 84-74-2 82100 5.0333 0.0249484 0.08316
Dichlone 117-80-6 #N/A #N/A
1,2-Dichlorobenzene 95-50-1 376 1.168 0.052485 0.17495
1,3-Dichlorobenzene 541-73-1 297 1.1528 0.0231143 0.077047
1,4-Dichlorobenzene 106-46-7 16.4 0.144 0.023254 0.077513
3,3'-Dichlorobenzidine 91-94-1 5.11 #N/A 0.0452872 0.15096
2,4-Dichlorophenol 120-83-2 2460 #N/A 0.0446065 0.14868
2,6-Dichlorophenol 87-65-0 #N/A #N/A
Title: Milwaukee Solvay Coke and Gas Revision Number: 0
Revision Date: September 20, 2017 Page 12 of 52
NOTE: #NA = no regulatory concentration for the indicated analyte.
Analyte CAS No. WI Industrial
DC RCL (mg/kg)
WI Soil to GW RCL (mg/Kg)
Laboratory Detection
Limit (mg/Kg)
Laboratory Reporting
Limit (mg/Kg)
Dichlorovos 62-73-7 7.92 #N/A
Dicrotophos 141-66-2 57.4 #N/A
Diethyl phthalate 84-66-2 100000 #N/A 0.0276781 0.09226
Diethylstilbestrol 56-53-1 0.00657 #N/A
Diethyl sulfate 64-67-5 #N/A #N/A
Dimethoate 60-51-5 1810 0.00090
3,3'-Dimethoxybenzidine 119-90-4 1.44 #N/A
Dimethylaminoazobenzene 60-11-7 0.5 #N/A
7,12-Dimethylbenz(a)-anthracene 57-97-6 0.0084 #N/A
3,3'-Dimethylbenzidine 119-93-7 0.209 #N/A
α,α-Dimethylphenethylamine 122-09-8 #N/A #N/A
2,4-Dimethylphenol 105-67-9 16400 #N/A 0.0330074 0.11002
Dimethyl phthalate 131-11-3 7390 #N/A 0.0217128 0.07238
1,2-Dinitrobenzene 528-29-0 82.1 #N/A
1,3-Dinitrobenzene 99-65-0 82.1 #N/A
1,4-Dinitrobenzene 100-25-4 82.1 #N/A
4,6-Dinitro-2-methylphenol 534-52-1 65.7 #N/A 0.0514485 0.17149
2,4-Dinitrophenol 51-28-5 1640 #N/A 0.0508491 0.16949
2,4-Dinitrotoluene 121-14-2 7.37 0.00014 0.0238714 0.07957
Title: Milwaukee Solvay Coke and Gas Revision Number: 0
Revision Date: September 20, 2017 Page 13 of 52
NOTE: #NA = no regulatory concentration for the indicated analyte.
Analyte CAS No. WI Industrial
DC RCL (mg/kg)
WI Soil to GW RCL (mg/Kg)
Laboratory Detection
Limit (mg/Kg)
Laboratory Reporting
Limit (mg/Kg)
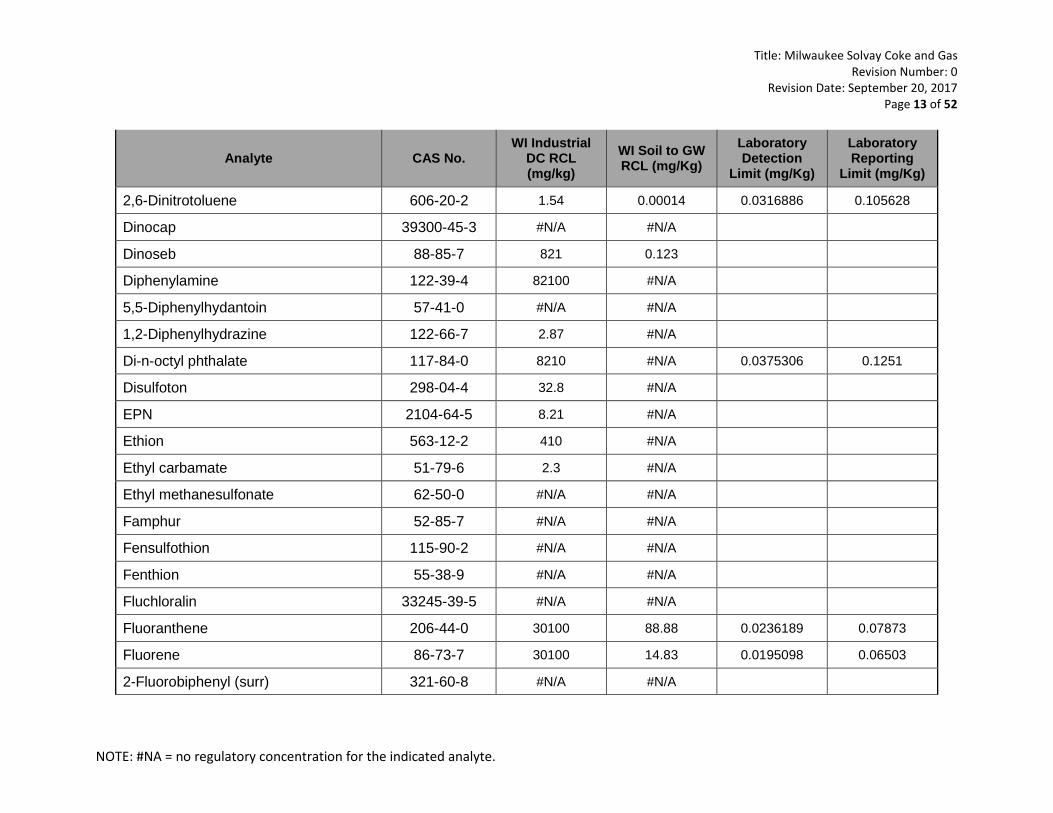
2,6-Dinitrotoluene 606-20-2 1.54 0.00014 0.0316886 0.105628
Dinocap 39300-45-3 #N/A #N/A
Dinoseb 88-85-7 821 0.123
Diphenylamine 122-39-4 82100 #N/A
5,5-Diphenylhydantoin 57-41-0 #N/A #N/A
1,2-Diphenylhydrazine 122-66-7 2.87 #N/A
Di-n-octyl phthalate 117-84-0 8210 #N/A 0.0375306 0.1251
Disulfoton 298-04-4 32.8 #N/A
EPN 2104-64-5 8.21 #N/A
Ethion 563-12-2 410 #N/A
Ethyl carbamate 51-79-6 2.3 #N/A
Ethyl methanesulfonate 62-50-0 #N/A #N/A
Famphur 52-85-7 #N/A #N/A
Fensulfothion 115-90-2 #N/A #N/A
Fenthion 55-38-9 #N/A #N/A
Fluchloralin 33245-39-5 #N/A #N/A
Fluoranthene 206-44-0 30100 88.88 0.0236189 0.07873
Fluorene 86-73-7 30100 14.83 0.0195098 0.06503
2-Fluorobiphenyl (surr) 321-60-8 #N/A #N/A

Title: Milwaukee Solvay Coke and Gas Revision Number: 0
Revision Date: September 20, 2017 Page 14 of 52
NOTE: #NA = no regulatory concentration for the indicated analyte.
Analyte CAS No. WI Industrial
DC RCL (mg/kg)
WI Soil to GW RCL (mg/Kg)
Laboratory Detection
Limit (mg/Kg)
Laboratory Reporting
Limit (mg/Kg)
2-Fluorophenol (surr) 367-12-4 27300 #N/A
Hexachlorobenzene 118-74-1 1.15 0.0252 0.0280731 0.09358
Hexachlorobutadiene 87-68-3 7.19 #N/A
Hexachlorocyclopentadiene 77-47-4 10.8 #N/A 0.0395002 0.13167
Hexachloroethane 67-72-1 11.1 #N/A 0.0267118 0.08904
Hexachlorophene 70-30-4 246 #N/A
Hexachloropropene 1888-71-7 43.8 #N/A
Hexamethylphosphoramide 680-31-9 328 #N/A
Hydroquinone 123-31-9 38.3 #N/A
Indeno(1,2,3-cd)pyrene 193-39-5 21.1 #N/A 0.0361176 0.12039
Isodrin 465-73-6 #N/A #N/A
Isophorone 78-59-1 2420 #N/A 0.0256594 0.08553
Isosafrole 120-58-1 234 #N/A
Kepone 143-50-0 0.23 #N/A
Leptophos 21609-90-5 #N/A #N/A
Malathion 121-75-5 16400 #N/A
Maleic anhydride 108-31-6 80700 #N/A
Mestranol 72-33-3 #N/A #N/A
Methapyrilene 91-80-5 #N/A #N/A

Title: Milwaukee Solvay Coke and Gas Revision Number: 0
Revision Date: September 20, 2017 Page 15 of 52
NOTE: #NA = no regulatory concentration for the indicated analyte.
Analyte CAS No. WI Industrial
DC RCL (mg/kg)
WI Soil to GW RCL (mg/Kg)
Laboratory Detection
Limit (mg/Kg)
Laboratory Reporting
Limit (mg/Kg)
3-Methylcholanthrene 56-49-5 0.104 #N/A
4,4'-Methylenebis(2-chloroaniline) 101-14-4 23 #N/A
4,4'-Methylenebis(N,N-dimethyl- aniline)
101-61-1 50 #N/A
Methyl methanesulfonate 66-27-3 23.2 #N/A
2-Methylnaphthalene 91-57-6 3010 #N/A 0.0433422 0.14447
Methyl parathion 298-00-0 205 #N/A
2-Methylphenol 95-48-7 41000 #N/A 0.0303264 0.10109
3-Methylphenol 108-39-4 41000 #N/A
4-Methylphenol 106-44-5 82100 #N/A
Mevinphos 7786-34-7 #N/A #N/A
Mexacarbate 315-18-4 #N/A #N/A
Mirex 2385-85-5 0.171 #N/A
Monocrotophos 6923-22-4 #N/A #N/A
Naled 300-76-5 2340 #N/A
Naphthalene 91-20-3 24.1 0.658 0.0583639 0.19455
1,4-Naphthoquinone 130-15-4 #N/A #N/A
1-Naphthylamine 134-32-7 #N/A #N/A
2-Naphthylamine 91-59-8 1.28 #N/A
Nicotine 54-11-5 #N/A #N/A

Title: Milwaukee Solvay Coke and Gas Revision Number: 0
Revision Date: September 20, 2017 Page 16 of 52
NOTE: #NA = no regulatory concentration for the indicated analyte.
Analyte CAS No. WI Industrial
DC RCL (mg/kg)
WI Soil to GW RCL (mg/Kg)
Laboratory Detection
Limit (mg/Kg)
Laboratory Reporting
Limit (mg/Kg)
5-Nitroacenaphthene 602-87-9 #N/A #N/A
2-Nitroaniline 88-74-4 8010 #N/A 0.047567 0.15855
3-Nitroaniline 99-09-2 #N/A #N/A 0.0283864 0.09462
4-Nitroaniline 100-01-6 115 #N/A 0.0692796 0.23093
5-Nitro-o-anisidine 99-59-2 46.9 #N/A
Nitrobenzene 98-95-3 32.4 #N/A
4-Nitrobiphenyl 92-93-3 #N/A #N/A
Nitrofen 1836-75-5 #N/A #N/A
2-Nitrophenol 88-75-5 #N/A #N/A 0.0526808 0.1756
4-Nitrophenol 100-02-7 #N/A #N/A 0.0420302 0.1401
5-Nitro-o-toluidine 99-55-8 255 #N/A
Nitroquinoline-1-oxide 56-57-5 #N/A #N/A
N-Nitrosodi-n-butylamine 924-16-3 0.494 #N/A
N-Nitrosodiethylamine 55-18-5 0.0153 #N/A
N-Nitrosodimethylamine 62-75-9 0.0397 #N/A
N-Nitrosomethylethylamine 10595-95-6 0.103 #N/A
N-Nitrosodiphenylamine 86-30-6 469 0.076 0.2264811 0.75494
N-Nitrosodi-n-propylamine 621-64-7 0.328 #N/A 0.026474 0.08824
N-Nitrosomorpholine 59-89-2 0.343 #N/A
Title: Milwaukee Solvay Coke and Gas Revision Number: 0
Revision Date: September 20, 2017 Page 17 of 52
NOTE: #NA = no regulatory concentration for the indicated analyte.
Analyte CAS No. WI Industrial
DC RCL (mg/kg)
WI Soil to GW RCL (mg/Kg)
Laboratory Detection
Limit (mg/Kg)
Laboratory Reporting
Limit (mg/Kg)
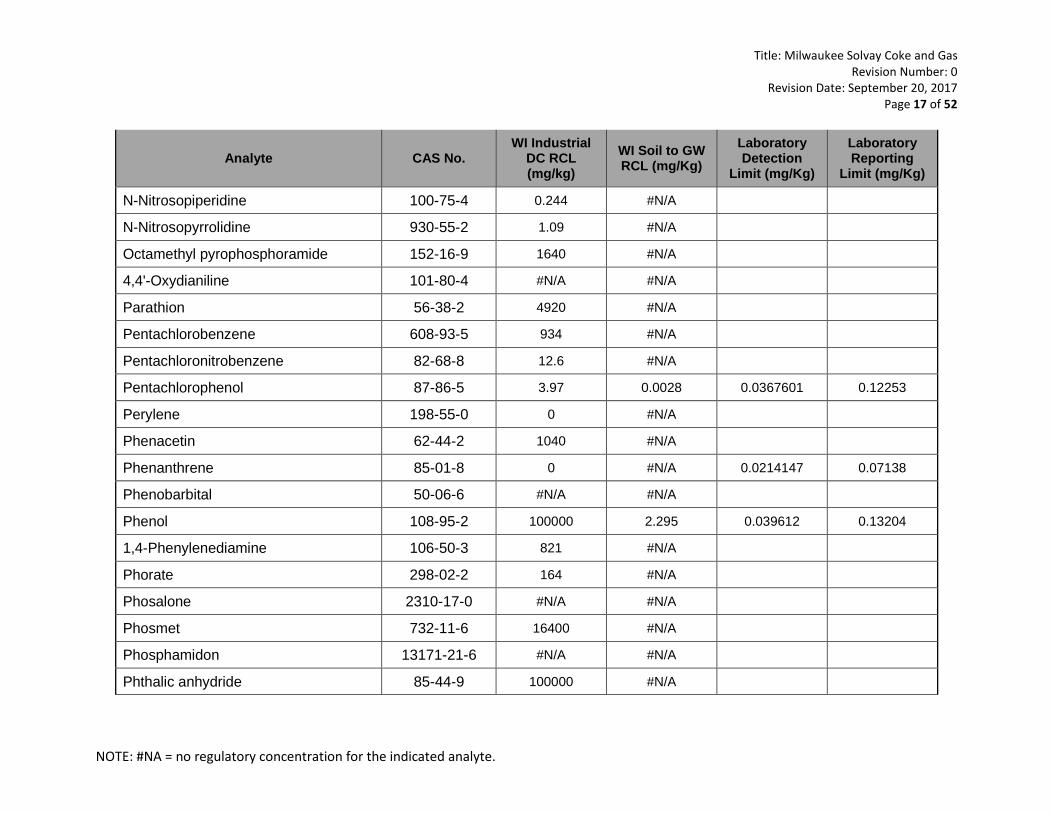
N-Nitrosopiperidine 100-75-4 0.244 #N/A
N-Nitrosopyrrolidine 930-55-2 1.09 #N/A
Octamethyl pyrophosphoramide 152-16-9 1640 #N/A
4,4'-Oxydianiline 101-80-4 #N/A #N/A
Parathion 56-38-2 4920 #N/A
Pentachlorobenzene 608-93-5 934 #N/A
Pentachloronitrobenzene 82-68-8 12.6 #N/A
Pentachlorophenol 87-86-5 3.97 0.0028 0.0367601 0.12253
Perylene 198-55-0 0 #N/A
Phenacetin 62-44-2 1040 #N/A
Phenanthrene 85-01-8 0 #N/A 0.0214147 0.07138
Phenobarbital 50-06-6 #N/A #N/A
Phenol 108-95-2 100000 2.295 0.039612 0.13204
1,4-Phenylenediamine 106-50-3 821 #N/A
Phorate 298-02-2 164 #N/A
Phosalone 2310-17-0 #N/A #N/A
Phosmet 732-11-6 16400 #N/A
Phosphamidon 13171-21-6 #N/A #N/A
Phthalic anhydride 85-44-9 100000 #N/A
Title: Milwaukee Solvay Coke and Gas Revision Number: 0
Revision Date: September 20, 2017 Page 18 of 52
NOTE: #NA = no regulatory concentration for the indicated analyte.
Analyte CAS No. WI Industrial
DC RCL (mg/kg)
WI Soil to GW RCL (mg/Kg)
Laboratory Detection
Limit (mg/Kg)
Laboratory Reporting
Limit (mg/Kg)
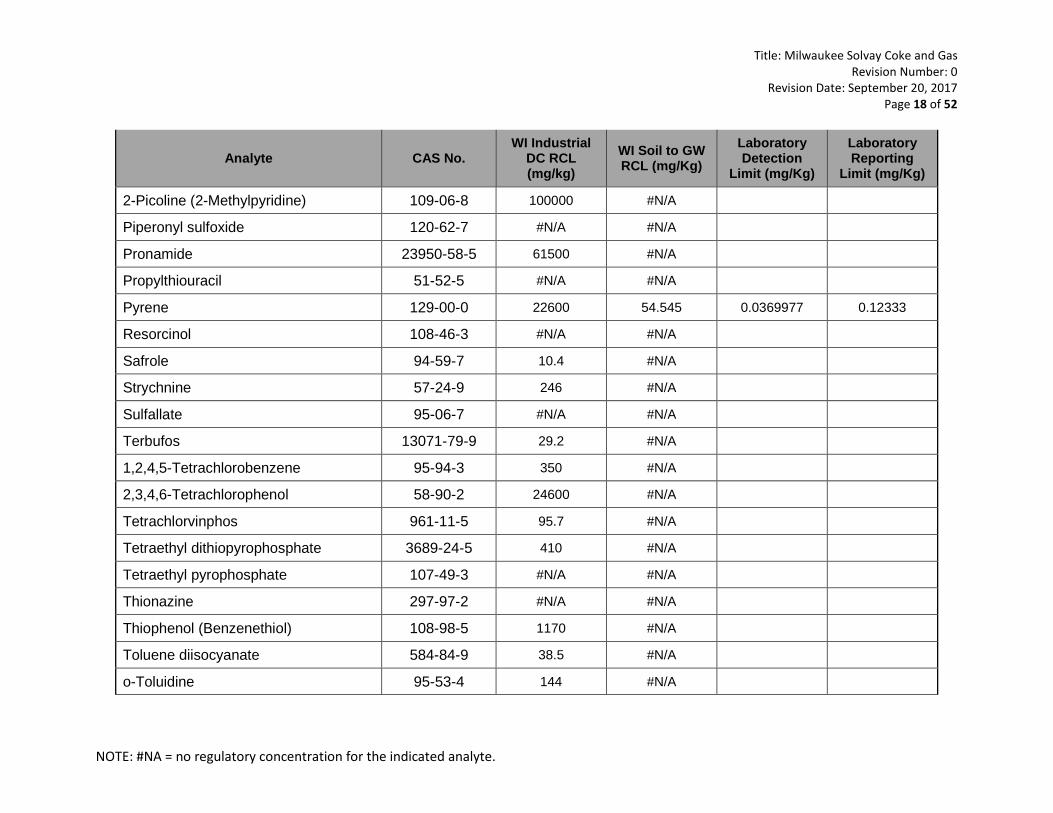
2-Picoline (2-Methylpyridine) 109-06-8 100000 #N/A
Piperonyl sulfoxide 120-62-7 #N/A #N/A
Pronamide 23950-58-5 61500 #N/A
Propylthiouracil 51-52-5 #N/A #N/A
Pyrene 129-00-0 22600 54.545 0.0369977 0.12333
Resorcinol 108-46-3 #N/A #N/A
Safrole 94-59-7 10.4 #N/A
Strychnine 57-24-9 246 #N/A
Sulfallate 95-06-7 #N/A #N/A
Terbufos 13071-79-9 29.2 #N/A
1,2,4,5-Tetrachlorobenzene 95-94-3 350 #N/A
2,3,4,6-Tetrachlorophenol 58-90-2 24600 #N/A
Tetrachlorvinphos 961-11-5 95.7 #N/A
Tetraethyl dithiopyrophosphate 3689-24-5 410 #N/A
Tetraethyl pyrophosphate 107-49-3 #N/A #N/A
Thionazine 297-97-2 #N/A #N/A
Thiophenol (Benzenethiol) 108-98-5 1170 #N/A
Toluene diisocyanate 584-84-9 38.5 #N/A
o-Toluidine 95-53-4 144 #N/A
Title: Milwaukee Solvay Coke and Gas Revision Number: 0
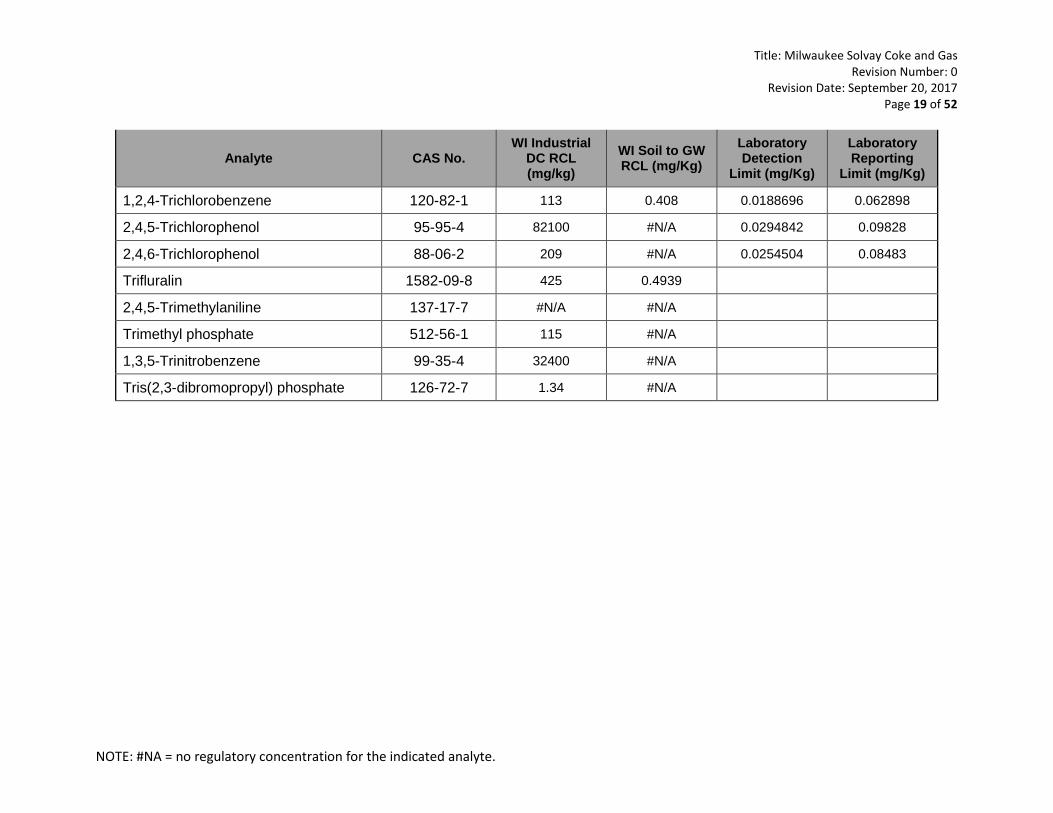
Revision Date: September 20, 2017 Page 19 of 52
NOTE: #NA = no regulatory concentration for the indicated analyte.
Analyte CAS No. WI Industrial
DC RCL (mg/kg)
WI Soil to GW RCL (mg/Kg)
Laboratory Detection
Limit (mg/Kg)
Laboratory Reporting
Limit (mg/Kg)
1,2,4-Trichlorobenzene 120-82-1 113 0.408 0.0188696 0.062898
2,4,5-Trichlorophenol 95-95-4 82100 #N/A 0.0294842 0.09828
2,4,6-Trichlorophenol 88-06-2 209 #N/A 0.0254504 0.08483
Trifluralin 1582-09-8 425 0.4939
2,4,5-Trimethylaniline 137-17-7 #N/A #N/A
Trimethyl phosphate 512-56-1 115 #N/A
1,3,5-Trinitrobenzene 99-35-4 32400 #N/A
Tris(2,3-dibromopropyl) phosphate 126-72-7 1.34 #N/A

Title: Milwaukee Solvay Coke and Gas Revision Number: 0
Revision Date: September 20, 2017 Page 20 of 52
NOTE: #NA = no regulatory concentration for the indicated analyte.
Matrix: Soil Analytical Method: 8082 Concentration level (if applicable):
Analyte CAS No. WI Industrial
DC RCL (mg/kg)
WI Soil to GW RCL (mg/Kg)
Laboratory Detection
Limit (mg/Kg)
Laboratory Reporting
Limit (mg/Kg)
Polychlorinated Biphenyls by Method SW846-8082
Aroclor 1016 12674-11-2 28 #N/A 0.025 0.050
Aroclor 1221 11104-28-2 0.883 #N/A 0.025 0.050
Aroclor 1232 11141-16-5 0.792 #N/A 0.025 0.050
Aroclor 1242 53469-21-9 0.972 #N/A 0.025 0.050
Aroclor 1248 12672-29-6 0.975 #N/A 0.025 0.050
Aroclor 1254 11097-69-1 0.988 #N/A 0.025 0.050
Aroclor 1260 11096-82-5 1 #N/A 0.025 0.050
Aroclor 1262 37324-23-5 #N/A #N/A 0.025 0.050
Aroclor 1268 11100-14-4 #N/A #N/A 0.025 0.050
Title: Milwaukee Solvay Coke and Gas Revision Number: 0
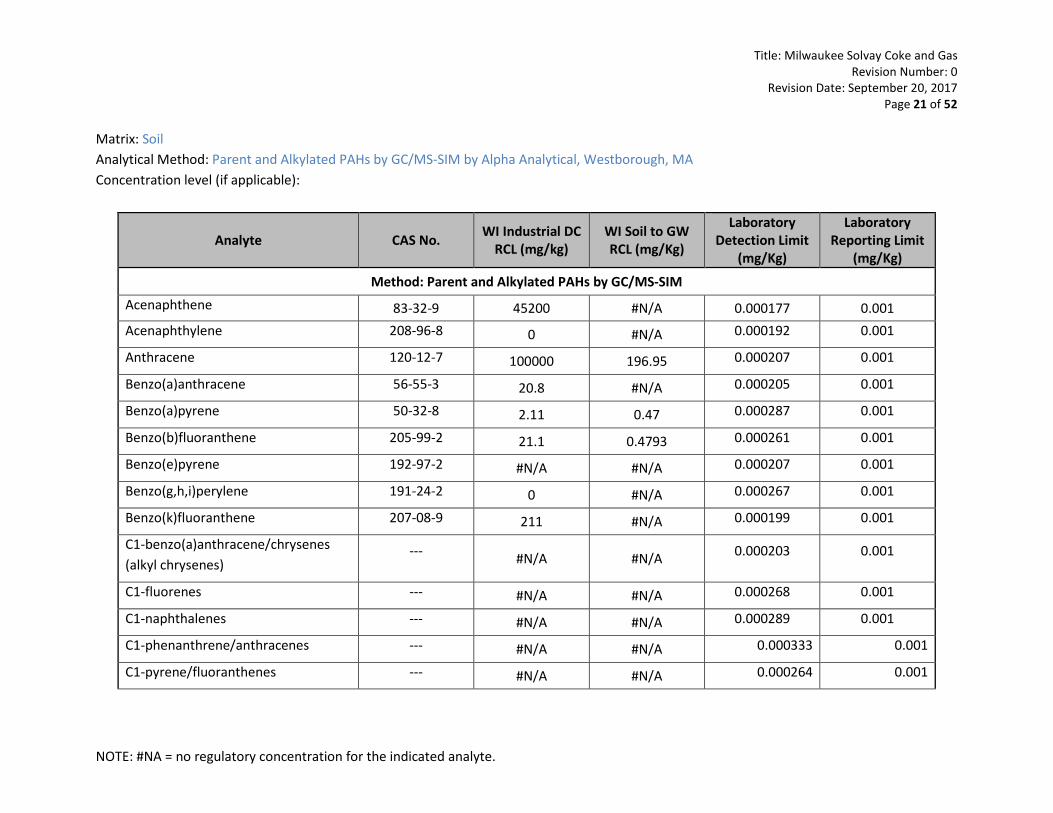
Revision Date: September 20, 2017 Page 21 of 52
NOTE: #NA = no regulatory concentration for the indicated analyte.
Matrix: Soil Analytical Method: Parent and Alkylated PAHs by GC/MS-SIM by Alpha Analytical, Westborough, MA Concentration level (if applicable):
Analyte CAS No. WI Industrial DC RCL (mg/kg)
WI Soil to GW RCL (mg/Kg)
Laboratory Detection Limit
(mg/Kg)
Laboratory Reporting Limit
(mg/Kg)
Method: Parent and Alkylated PAHs by GC/MS-SIM Acenaphthene 83-32-9 45200 #N/A 0.000177 0.001 Acenaphthylene 208-96-8 0 #N/A 0.000192 0.001
Anthracene 120-12-7 100000 196.95 0.000207 0.001
Benzo(a)anthracene 56-55-3 20.8 #N/A 0.000205 0.001
Benzo(a)pyrene 50-32-8 2.11 0.47 0.000287 0.001
Benzo(b)fluoranthene 205-99-2 21.1 0.4793 0.000261 0.001
Benzo(e)pyrene 192-97-2 #N/A #N/A 0.000207 0.001
Benzo(g,h,i)perylene 191-24-2 0 #N/A 0.000267 0.001
Benzo(k)fluoranthene 207-08-9 211 #N/A 0.000199 0.001
C1-benzo(a)anthracene/chrysenes (alkyl chrysenes)
--- #N/A #N/A 0.000203 0.001
C1-fluorenes --- #N/A #N/A 0.000268 0.001
C1-naphthalenes --- #N/A #N/A 0.000289 0.001
C1-phenanthrene/anthracenes --- #N/A #N/A 0.000333 0.001
C1-pyrene/fluoranthenes --- #N/A #N/A 0.000264 0.001
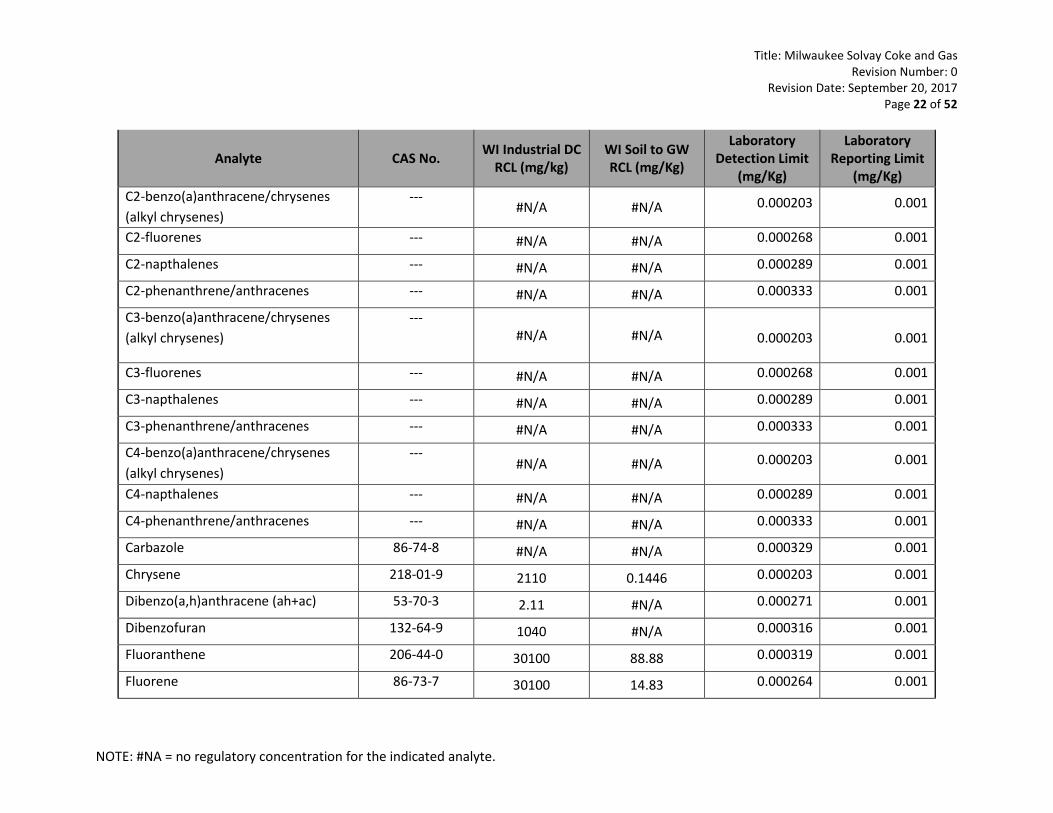
Title: Milwaukee Solvay Coke and Gas Revision Number: 0
Revision Date: September 20, 2017 Page 22 of 52
NOTE: #NA = no regulatory concentration for the indicated analyte.
Analyte CAS No. WI Industrial DC RCL (mg/kg)
WI Soil to GW RCL (mg/Kg)
Laboratory Detection Limit
(mg/Kg)
Laboratory Reporting Limit
(mg/Kg) C2-benzo(a)anthracene/chrysenes (alkyl chrysenes)
--- #N/A #N/A 0.000203 0.001
C2-fluorenes --- #N/A #N/A 0.000268 0.001
C2-napthalenes --- #N/A #N/A 0.000289 0.001
C2-phenanthrene/anthracenes --- #N/A #N/A 0.000333 0.001
C3-benzo(a)anthracene/chrysenes (alkyl chrysenes)
--- #N/A #N/A 0.000203 0.001
C3-fluorenes --- #N/A #N/A 0.000268 0.001
C3-napthalenes --- #N/A #N/A 0.000289 0.001
C3-phenanthrene/anthracenes --- #N/A #N/A 0.000333 0.001
C4-benzo(a)anthracene/chrysenes (alkyl chrysenes)
--- #N/A #N/A 0.000203 0.001
C4-napthalenes --- #N/A #N/A 0.000289 0.001
C4-phenanthrene/anthracenes --- #N/A #N/A 0.000333 0.001
Carbazole 86-74-8 #N/A #N/A 0.000329 0.001
Chrysene 218-01-9 2110 0.1446 0.000203 0.001
Dibenzo(a,h)anthracene (ah+ac) 53-70-3 2.11 #N/A 0.000271 0.001
Dibenzofuran 132-64-9 1040 #N/A 0.000316 0.001
Fluoranthene 206-44-0 30100 88.88 0.000319 0.001
Fluorene 86-73-7 30100 14.83 0.000264 0.001
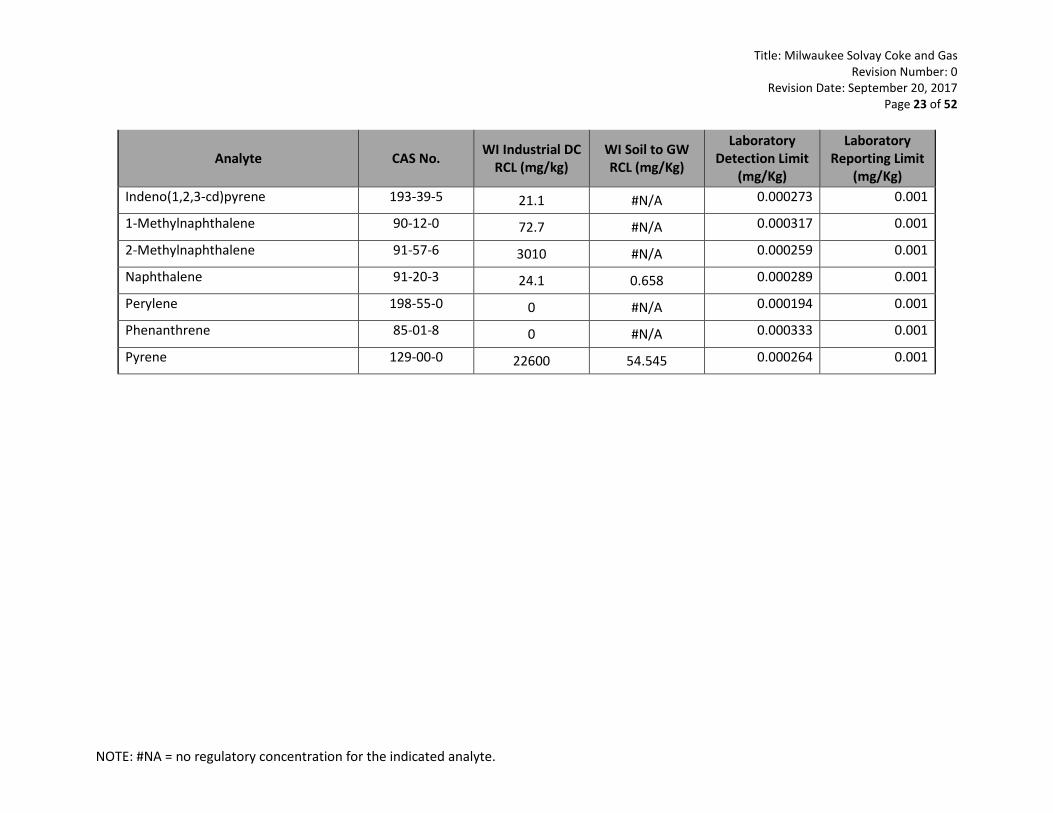
Title: Milwaukee Solvay Coke and Gas Revision Number: 0
Revision Date: September 20, 2017 Page 23 of 52
NOTE: #NA = no regulatory concentration for the indicated analyte.
Analyte CAS No. WI Industrial DC RCL (mg/kg)
WI Soil to GW RCL (mg/Kg)
Laboratory Detection Limit
(mg/Kg)
Laboratory Reporting Limit
(mg/Kg) Indeno(1,2,3-cd)pyrene 193-39-5 21.1 #N/A 0.000273 0.001
1-Methylnaphthalene 90-12-0 72.7 #N/A 0.000317 0.001
2-Methylnaphthalene 91-57-6 3010 #N/A 0.000259 0.001
Naphthalene 91-20-3 24.1 0.658 0.000289 0.001
Perylene 198-55-0 0 #N/A 0.000194 0.001
Phenanthrene 85-01-8 0 #N/A 0.000333 0.001
Pyrene 129-00-0 22600 54.545 0.000264 0.001
Title: Milwaukee Solvay Coke and Gas Revision Number: 0
Revision Date: September 20, 2017 Page 24 of 52
NOTE: #NA = no regulatory concentration for the indicated analyte.
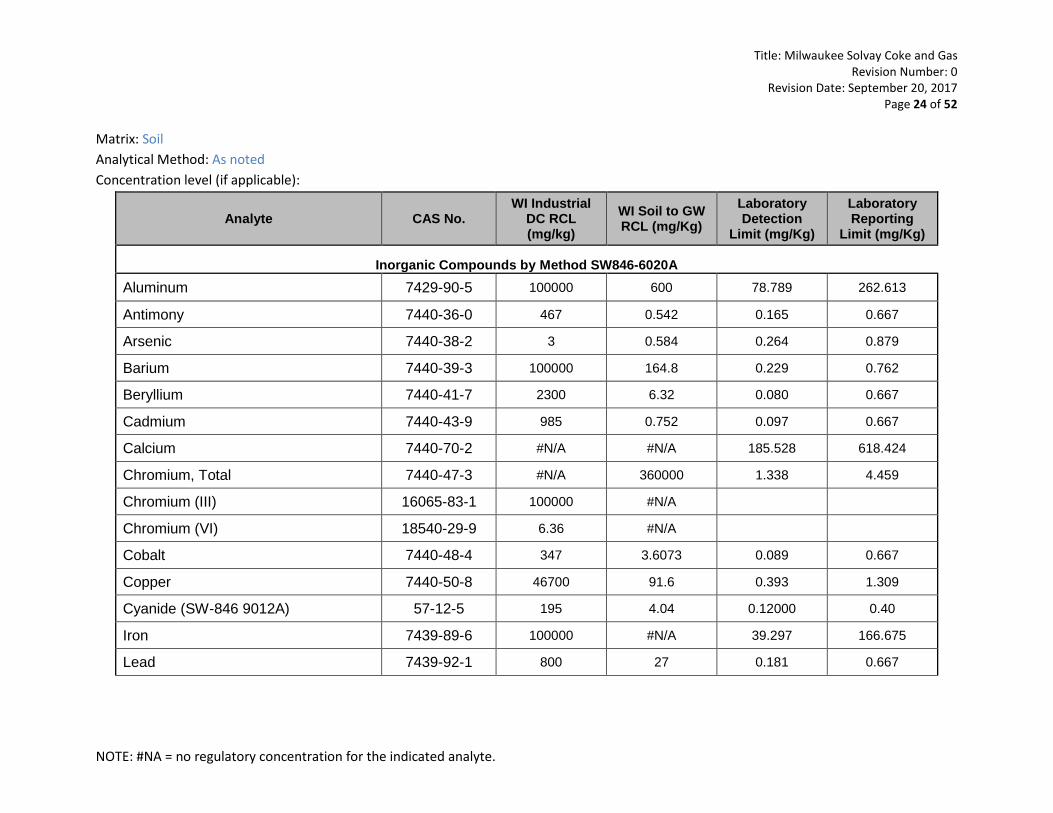
Matrix: Soil Analytical Method: As noted Concentration level (if applicable):
Analyte CAS No. WI Industrial
DC RCL (mg/kg)
WI Soil to GW RCL (mg/Kg)
Laboratory Detection
Limit (mg/Kg)
Laboratory Reporting
Limit (mg/Kg)
Inorganic Compounds by Method SW846-6020A Aluminum 7429-90-5 100000 600 78.789 262.613
Antimony 7440-36-0 467 0.542 0.165 0.667
Arsenic 7440-38-2 3 0.584 0.264 0.879
Barium 7440-39-3 100000 164.8 0.229 0.762
Beryllium 7440-41-7 2300 6.32 0.080 0.667
Cadmium 7440-43-9 985 0.752 0.097 0.667
Calcium 7440-70-2 #N/A #N/A 185.528 618.424
Chromium, Total 7440-47-3 #N/A 360000 1.338 4.459
Chromium (III) 16065-83-1 100000 #N/A
Chromium (VI) 18540-29-9 6.36 #N/A
Cobalt 7440-48-4 347 3.6073 0.089 0.667
Copper 7440-50-8 46700 91.6 0.393 1.309
Cyanide (SW-846 9012A) 57-12-5 195 4.04 0.12000 0.40
Iron 7439-89-6 100000 #N/A 39.297 166.675
Lead 7439-92-1 800 27 0.181 0.667
Title: Milwaukee Solvay Coke and Gas Revision Number: 0
Revision Date: September 20, 2017 Page 25 of 52
NOTE: #NA = no regulatory concentration for the indicated analyte.
Analyte CAS No. WI Industrial
DC RCL (mg/kg)
WI Soil to GW RCL (mg/Kg)
Laboratory Detection
Limit (mg/Kg)
Laboratory Reporting
Limit (mg/Kg)
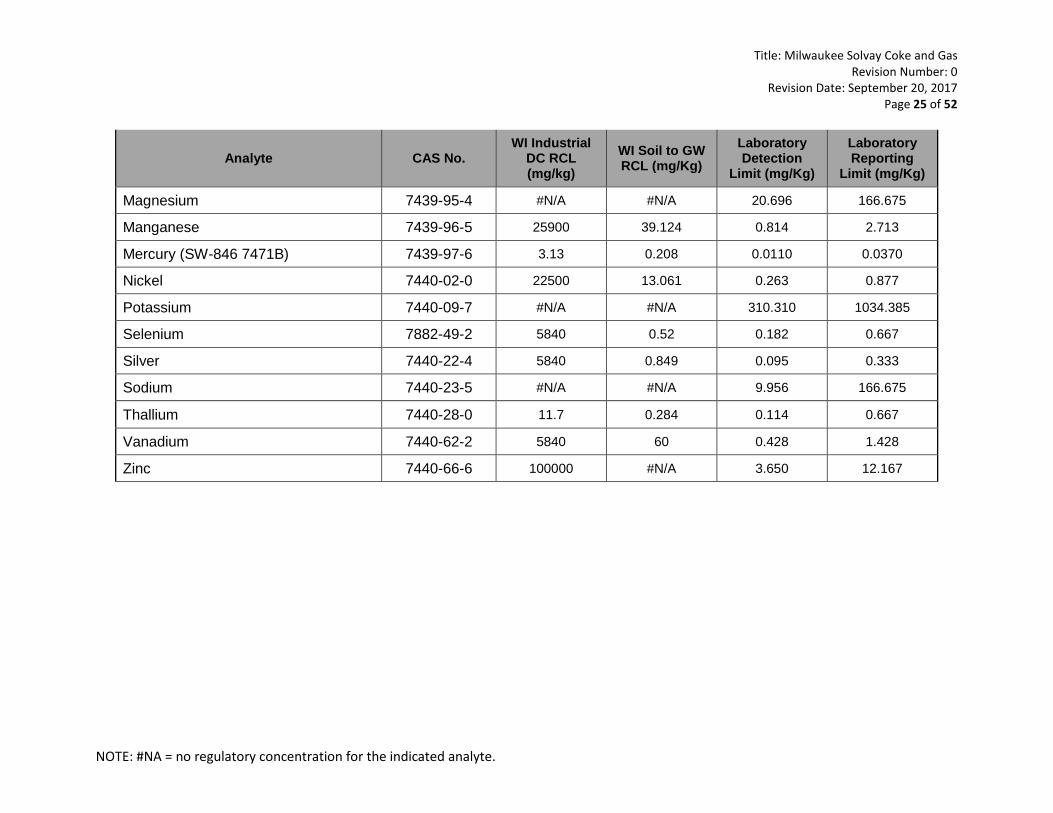
Magnesium 7439-95-4 #N/A #N/A 20.696 166.675
Manganese 7439-96-5 25900 39.124 0.814 2.713
Mercury (SW-846 7471B) 7439-97-6 3.13 0.208 0.0110 0.0370
Nickel 7440-02-0 22500 13.061 0.263 0.877
Potassium 7440-09-7 #N/A #N/A 310.310 1034.385
Selenium 7882-49-2 5840 0.52 0.182 0.667
Silver 7440-22-4 5840 0.849 0.095 0.333
Sodium 7440-23-5 #N/A #N/A 9.956 166.675
Thallium 7440-28-0 11.7 0.284 0.114 0.667
Vanadium 7440-62-2 5840 60 0.428 1.428
Zinc 7440-66-6 100000 #N/A 3.650 12.167

Title: Milwaukee Solvay Coke and Gas Revision Number: 0
Revision Date: September 20, 2017 Page 26 of 52
NOTE: #NA = no regulatory concentration for the indicated analyte.
Matrix: Soil Analytical Method: 8270C Concentration level (if applicable):
Analyte CAS No. WI Industrial
DC RCL (mg/kg)
WI Soil to GW RCL (mg/Kg)
Laboratory Detection
Limit (mg/Kg)
Laboratory Reporting
Limit (mg/Kg)
Pesticides by Method SW846-8081 Aldrin 309-00-2 0.187 #N/A 0.0005459 0.00182
α-BHC 319-84-6 0.365 #N/A 0.0004657 0.00155
β-BHC 319-85-7 1.28 #N/A 0.00054 0.0018
δ-BHC 319-86-8 #N/A #N/A 0.000508 0.00169
γ-BHC (Lindane) 58-89-9 2.54 0.0023 0.001054 0.00351
α-Chlordane 5103-71-9 #N/A #N/A 0.0005548 0.00185
γ-Chlordane 5566-34-7 #N/A #N/A 0.0006387 0.00213
4,4'-DDD 72-54-8 9.57 #N/A 0.00102 0.0034
4,4'-DDE 72-55-9 9.38 #N/A 0.001085 0.00362
4,4'-DDT 50-29-3 8.53 #N/A 0.0016 0.00533
Dieldrin 60-57-1 0.144 #N/A 0.001047 0.00349
Endosulfan I 959-98-8 #N/A #N/A 0.0005252 0.00175
Endosulfan II 33213-65-9 #N/A #N/A 0.001328 0.00443
Endosulfan sulfate 1031-07-8 #N/A #N/A 0.001284 0.00428
Endrin 72-20-8 246 0.1616 0.001177 0.00392
Endrin aldehyde 7421-93-4 #N/A #N/A 0.001173 0.00391
Title: Milwaukee Solvay Coke and Gas Revision Number: 0
Revision Date: September 20, 2017 Page 27 of 52
NOTE: #NA = no regulatory concentration for the indicated analyte.
Analyte CAS No. WI Industrial
DC RCL (mg/kg)
WI Soil to GW RCL (mg/Kg)
Laboratory Detection
Limit (mg/Kg)
Laboratory Reporting
Limit (mg/Kg)
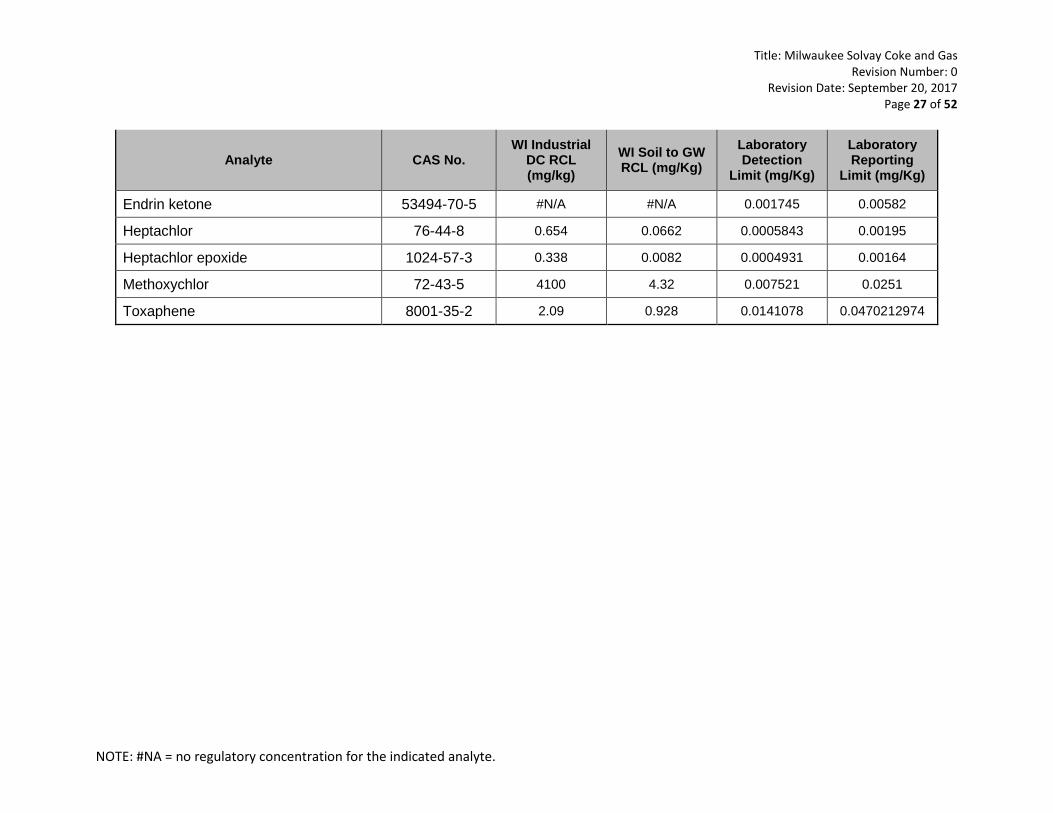
Endrin ketone 53494-70-5 #N/A #N/A 0.001745 0.00582
Heptachlor 76-44-8 0.654 0.0662 0.0005843 0.00195
Heptachlor epoxide 1024-57-3 0.338 0.0082 0.0004931 0.00164
Methoxychlor 72-43-5 4100 4.32 0.007521 0.0251
Toxaphene 8001-35-2 2.09 0.928 0.0141078 0.0470212974
Title: Milwaukee Solvay Coke and Gas Revision Number: 0
Revision Date: September 20, 2017 Page 28 of 52
NOTE: #NA = no regulatory concentration for the indicated analyte.
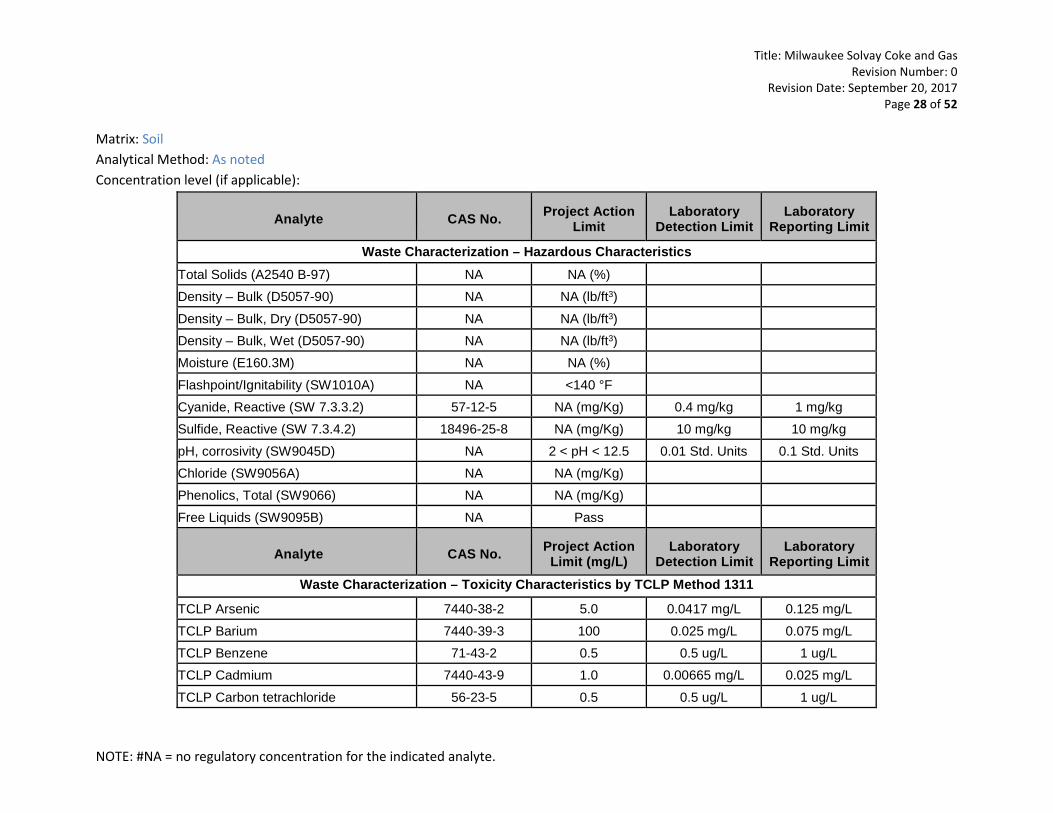
Matrix: Soil Analytical Method: As noted Concentration level (if applicable):
Analyte CAS No. Project Action Limit
Laboratory Detection Limit
Laboratory Reporting Limit
Waste Characterization – Hazardous Characteristics Total Solids (A2540 B-97) NA NA (%)
Density – Bulk (D5057-90) NA NA (lb/ft3)
Density – Bulk, Dry (D5057-90) NA NA (lb/ft3)
Density – Bulk, Wet (D5057-90) NA NA (lb/ft3)
Moisture (E160.3M) NA NA (%)
Flashpoint/Ignitability (SW1010A) NA <140 °F
Cyanide, Reactive (SW 7.3.3.2) 57-12-5 NA (mg/Kg) 0.4 mg/kg 1 mg/kg
Sulfide, Reactive (SW 7.3.4.2) 18496-25-8 NA (mg/Kg) 10 mg/kg 10 mg/kg
pH, corrosivity (SW9045D) NA 2 < pH < 12.5 0.01 Std. Units 0.1 Std. Units
Chloride (SW9056A) NA NA (mg/Kg)
Phenolics, Total (SW9066) NA NA (mg/Kg)
Free Liquids (SW9095B) NA Pass
Analyte CAS No. Project Action Limit (mg/L)
Laboratory Detection Limit
Laboratory Reporting Limit
Waste Characterization – Toxicity Characteristics by TCLP Method 1311
TCLP Arsenic 7440-38-2 5.0 0.0417 mg/L 0.125 mg/L
TCLP Barium 7440-39-3 100 0.025 mg/L 0.075 mg/L
TCLP Benzene 71-43-2 0.5 0.5 ug/L 1 ug/L
TCLP Cadmium 7440-43-9 1.0 0.00665 mg/L 0.025 mg/L
TCLP Carbon tetrachloride 56-23-5 0.5 0.5 ug/L 1 ug/L
Title: Milwaukee Solvay Coke and Gas Revision Number: 0
Revision Date: September 20, 2017 Page 29 of 52
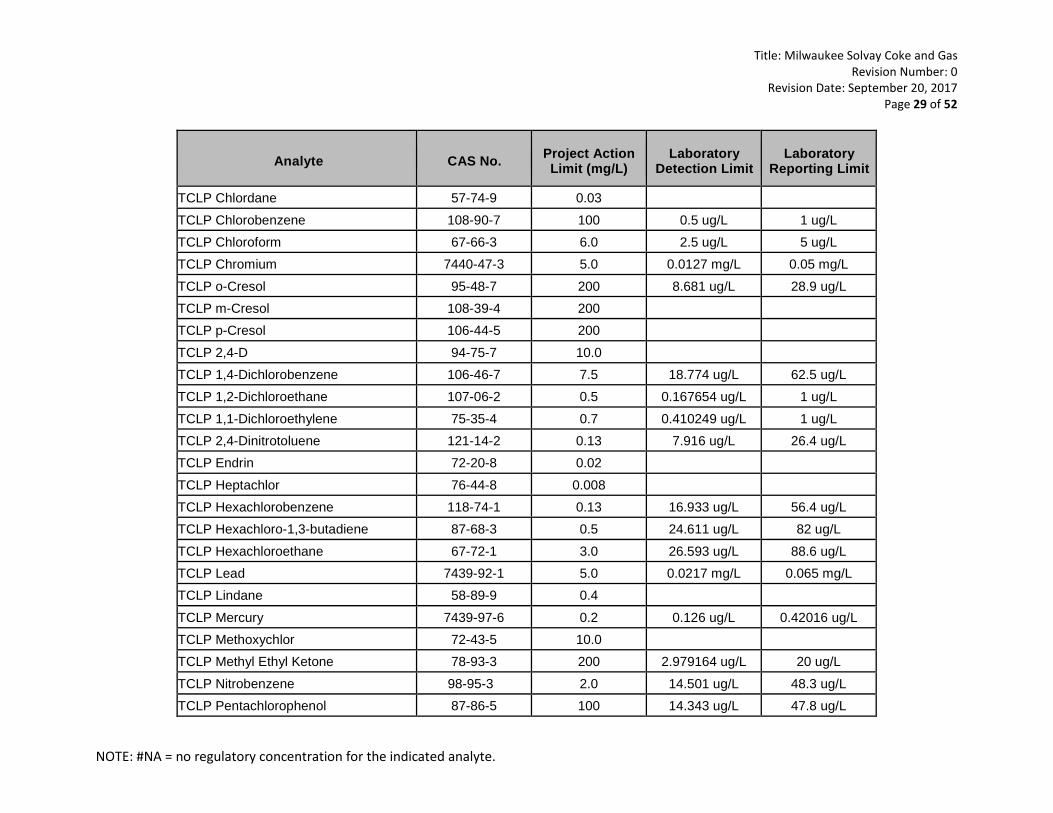
NOTE: #NA = no regulatory concentration for the indicated analyte.
Analyte CAS No. Project Action Limit (mg/L)
Laboratory Detection Limit
Laboratory Reporting Limit
TCLP Chlordane 57-74-9 0.03
TCLP Chlorobenzene 108-90-7 100 0.5 ug/L 1 ug/L
TCLP Chloroform 67-66-3 6.0 2.5 ug/L 5 ug/L
TCLP Chromium 7440-47-3 5.0 0.0127 mg/L 0.05 mg/L
TCLP o-Cresol 95-48-7 200 8.681 ug/L 28.9 ug/L
TCLP m-Cresol 108-39-4 200
TCLP p-Cresol 106-44-5 200
TCLP 2,4-D 94-75-7 10.0
TCLP 1,4-Dichlorobenzene 106-46-7 7.5 18.774 ug/L 62.5 ug/L
TCLP 1,2-Dichloroethane 107-06-2 0.5 0.167654 ug/L 1 ug/L
TCLP 1,1-Dichloroethylene 75-35-4 0.7 0.410249 ug/L 1 ug/L
TCLP 2,4-Dinitrotoluene 121-14-2 0.13 7.916 ug/L 26.4 ug/L
TCLP Endrin 72-20-8 0.02
TCLP Heptachlor 76-44-8 0.008
TCLP Hexachlorobenzene 118-74-1 0.13 16.933 ug/L 56.4 ug/L
TCLP Hexachloro-1,3-butadiene 87-68-3 0.5 24.611 ug/L 82 ug/L
TCLP Hexachloroethane 67-72-1 3.0 26.593 ug/L 88.6 ug/L
TCLP Lead 7439-92-1 5.0 0.0217 mg/L 0.065 mg/L
TCLP Lindane 58-89-9 0.4
TCLP Mercury 7439-97-6 0.2 0.126 ug/L 0.42016 ug/L
TCLP Methoxychlor 72-43-5 10.0
TCLP Methyl Ethyl Ketone 78-93-3 200 2.979164 ug/L 20 ug/L
TCLP Nitrobenzene 98-95-3 2.0 14.501 ug/L 48.3 ug/L
TCLP Pentachlorophenol 87-86-5 100 14.343 ug/L 47.8 ug/L
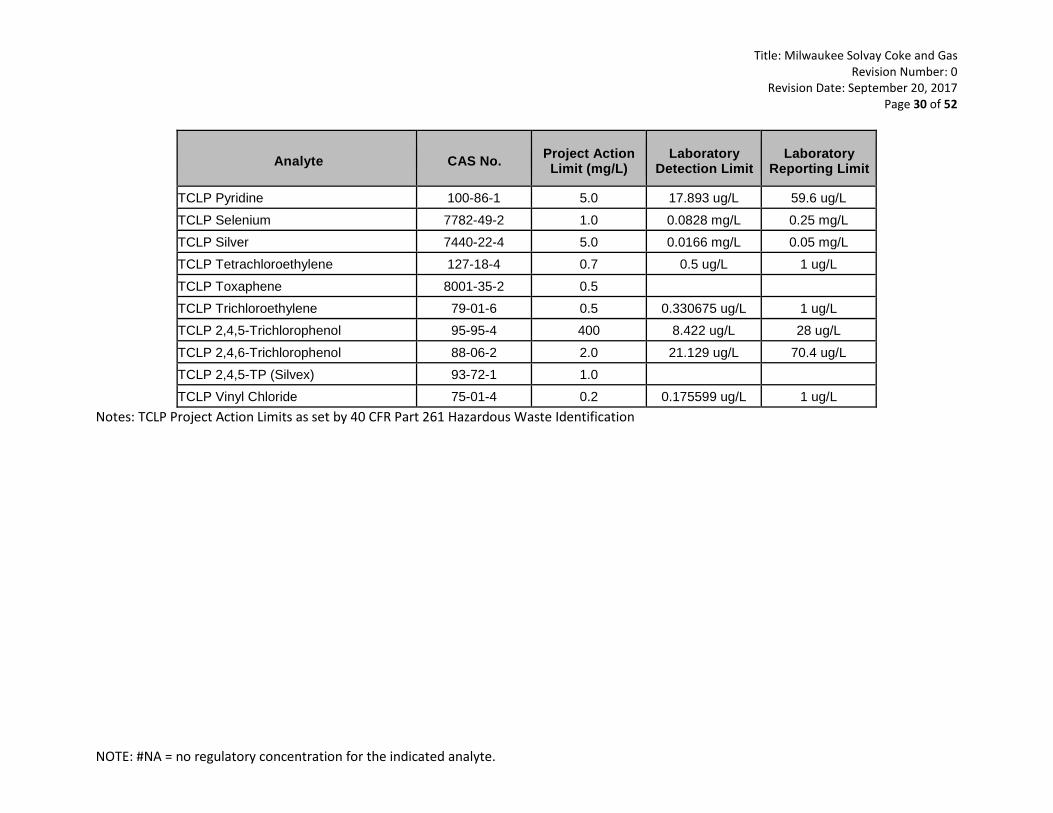
Title: Milwaukee Solvay Coke and Gas Revision Number: 0
Revision Date: September 20, 2017 Page 30 of 52
NOTE: #NA = no regulatory concentration for the indicated analyte.
Analyte CAS No. Project Action Limit (mg/L)
Laboratory Detection Limit
Laboratory Reporting Limit
TCLP Pyridine 100-86-1 5.0 17.893 ug/L 59.6 ug/L
TCLP Selenium 7782-49-2 1.0 0.0828 mg/L 0.25 mg/L
TCLP Silver 7440-22-4 5.0 0.0166 mg/L 0.05 mg/L
TCLP Tetrachloroethylene 127-18-4 0.7 0.5 ug/L 1 ug/L
TCLP Toxaphene 8001-35-2 0.5
TCLP Trichloroethylene 79-01-6 0.5 0.330675 ug/L 1 ug/L
TCLP 2,4,5-Trichlorophenol 95-95-4 400 8.422 ug/L 28 ug/L
TCLP 2,4,6-Trichlorophenol 88-06-2 2.0 21.129 ug/L 70.4 ug/L
TCLP 2,4,5-TP (Silvex) 93-72-1 1.0
TCLP Vinyl Chloride 75-01-4 0.2 0.175599 ug/L 1 ug/L
Notes: TCLP Project Action Limits as set by 40 CFR Part 261 Hazardous Waste Identification
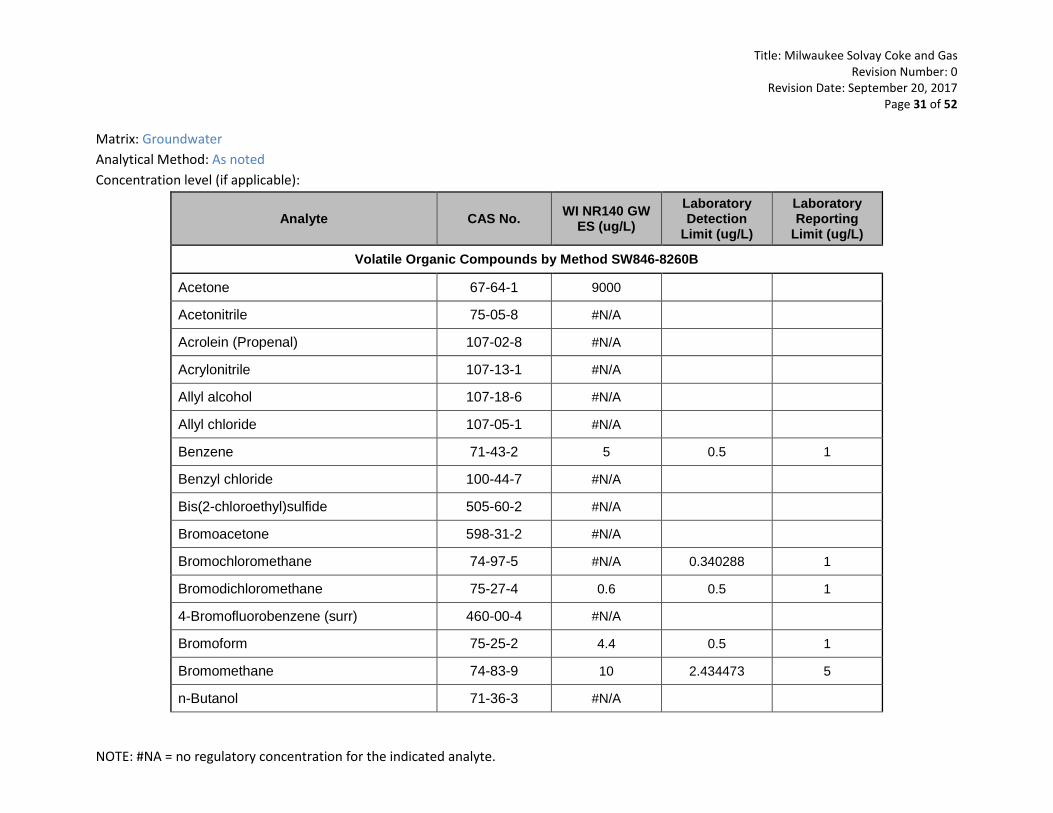
Title: Milwaukee Solvay Coke and Gas Revision Number: 0
Revision Date: September 20, 2017 Page 31 of 52
NOTE: #NA = no regulatory concentration for the indicated analyte.
Matrix: Groundwater Analytical Method: As noted Concentration level (if applicable):
Analyte CAS No. WI NR140 GW ES (ug/L)
Laboratory Detection
Limit (ug/L)
Laboratory Reporting
Limit (ug/L)
Volatile Organic Compounds by Method SW846-8260B
Acetone 67-64-1 9000
Acetonitrile 75-05-8 #N/A
Acrolein (Propenal) 107-02-8 #N/A
Acrylonitrile 107-13-1 #N/A
Allyl alcohol 107-18-6 #N/A
Allyl chloride 107-05-1 #N/A
Benzene 71-43-2 5 0.5 1
Benzyl chloride 100-44-7 #N/A
Bis(2-chloroethyl)sulfide 505-60-2 #N/A
Bromoacetone 598-31-2 #N/A
Bromochloromethane 74-97-5 #N/A 0.340288 1
Bromodichloromethane 75-27-4 0.6 0.5 1
4-Bromofluorobenzene (surr) 460-00-4 #N/A
Bromoform 75-25-2 4.4 0.5 1
Bromomethane 74-83-9 10 2.434473 5
n-Butanol 71-36-3 #N/A
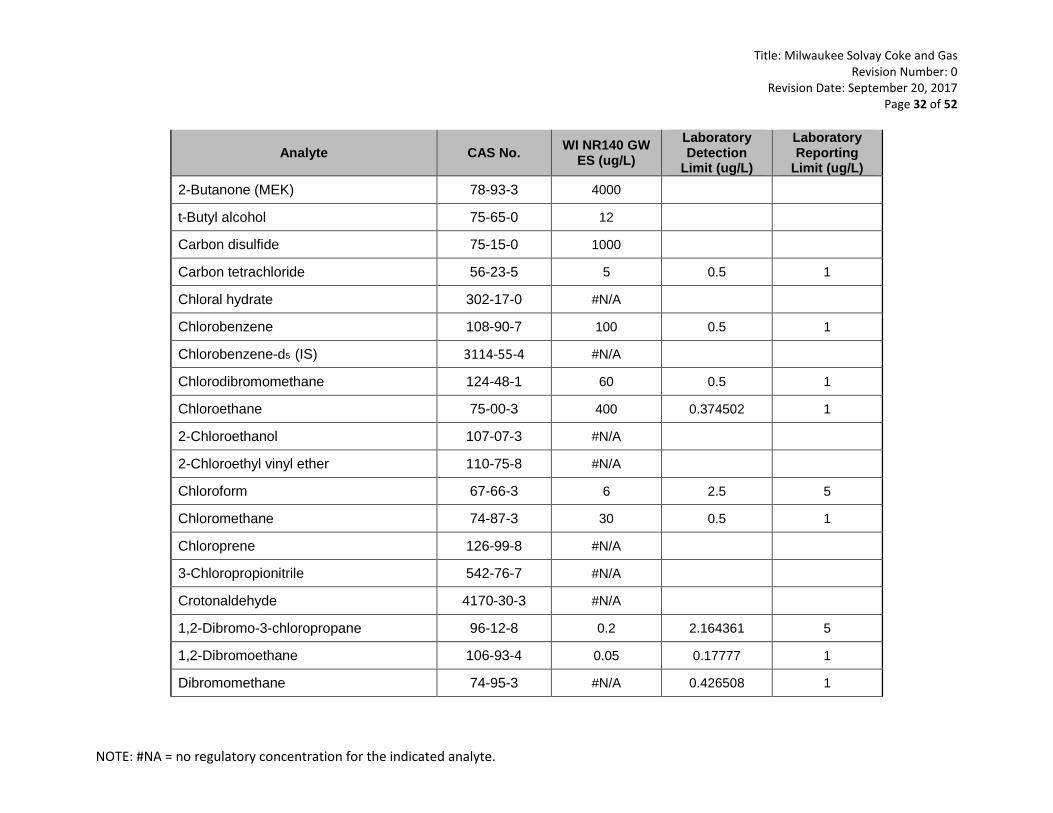
Title: Milwaukee Solvay Coke and Gas Revision Number: 0
Revision Date: September 20, 2017 Page 32 of 52
NOTE: #NA = no regulatory concentration for the indicated analyte.
Analyte CAS No. WI NR140 GW ES (ug/L)
Laboratory Detection
Limit (ug/L)
Laboratory Reporting
Limit (ug/L) 2-Butanone (MEK) 78-93-3 4000
t-Butyl alcohol 75-65-0 12
Carbon disulfide 75-15-0 1000
Carbon tetrachloride 56-23-5 5 0.5 1
Chloral hydrate 302-17-0 #N/A
Chlorobenzene 108-90-7 100 0.5 1
Chlorobenzene-d5 (IS) 3114-55-4 #N/A
Chlorodibromomethane 124-48-1 60 0.5 1
Chloroethane 75-00-3 400 0.374502 1
2-Chloroethanol 107-07-3 #N/A
2-Chloroethyl vinyl ether 110-75-8 #N/A
Chloroform 67-66-3 6 2.5 5
Chloromethane 74-87-3 30 0.5 1
Chloroprene 126-99-8 #N/A
3-Chloropropionitrile 542-76-7 #N/A
Crotonaldehyde 4170-30-3 #N/A
1,2-Dibromo-3-chloropropane 96-12-8 0.2 2.164361 5
1,2-Dibromoethane 106-93-4 0.05 0.17777 1
Dibromomethane 74-95-3 #N/A 0.426508 1
Title: Milwaukee Solvay Coke and Gas Revision Number: 0
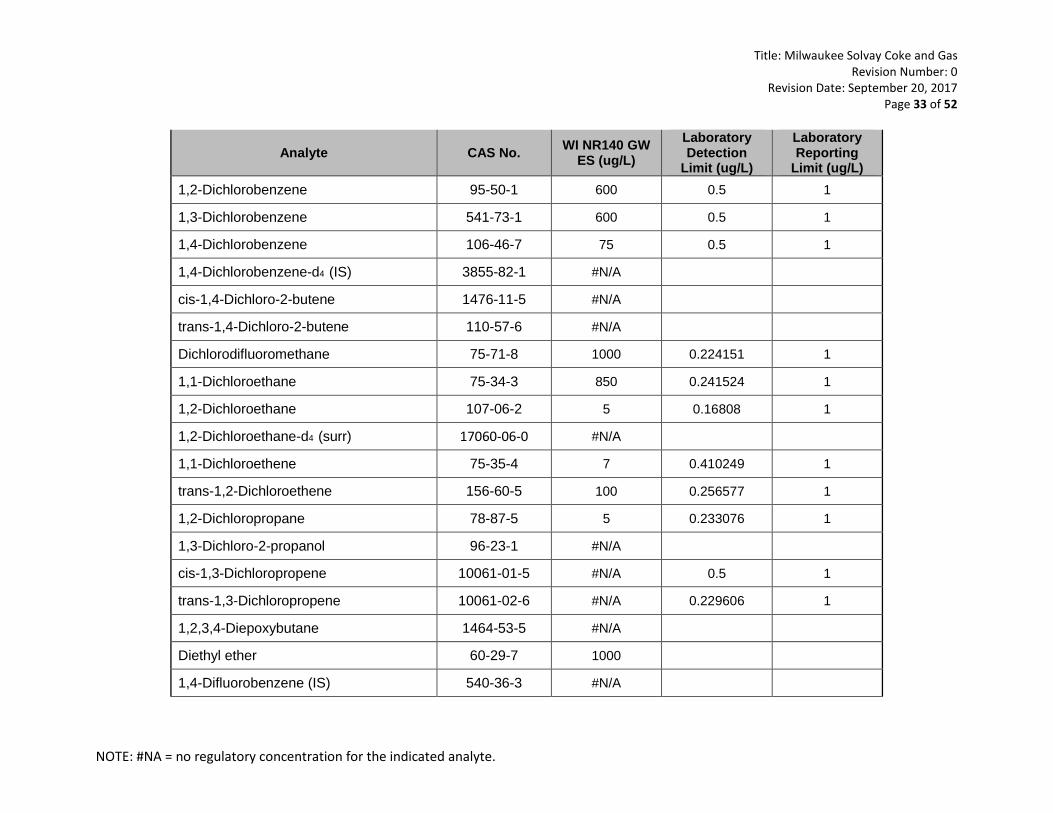
Revision Date: September 20, 2017 Page 33 of 52
NOTE: #NA = no regulatory concentration for the indicated analyte.
Analyte CAS No. WI NR140 GW ES (ug/L)
Laboratory Detection
Limit (ug/L)
Laboratory Reporting
Limit (ug/L) 1,2-Dichlorobenzene 95-50-1 600 0.5 1
1,3-Dichlorobenzene 541-73-1 600 0.5 1
1,4-Dichlorobenzene 106-46-7 75 0.5 1
1,4-Dichlorobenzene-d4 (IS) 3855-82-1 #N/A
cis-1,4-Dichloro-2-butene 1476-11-5 #N/A
trans-1,4-Dichloro-2-butene 110-57-6 #N/A
Dichlorodifluoromethane 75-71-8 1000 0.224151 1
1,1-Dichloroethane 75-34-3 850 0.241524 1
1,2-Dichloroethane 107-06-2 5 0.16808 1
1,2-Dichloroethane-d4 (surr) 17060-06-0 #N/A
1,1-Dichloroethene 75-35-4 7 0.410249 1
trans-1,2-Dichloroethene 156-60-5 100 0.256577 1
1,2-Dichloropropane 78-87-5 5 0.233076 1
1,3-Dichloro-2-propanol 96-23-1 #N/A
cis-1,3-Dichloropropene 10061-01-5 #N/A 0.5 1
trans-1,3-Dichloropropene 10061-02-6 #N/A 0.229606 1
1,2,3,4-Diepoxybutane 1464-53-5 #N/A
Diethyl ether 60-29-7 1000
1,4-Difluorobenzene (IS) 540-36-3 #N/A
Title: Milwaukee Solvay Coke and Gas Revision Number: 0
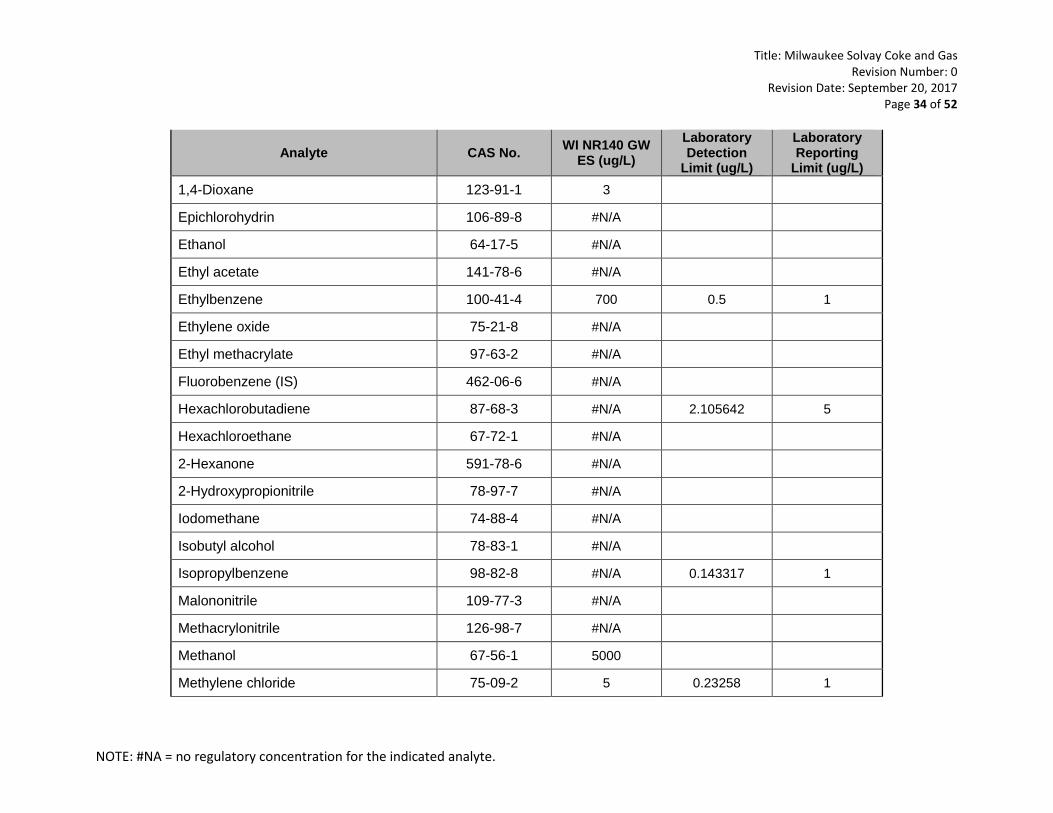
Revision Date: September 20, 2017 Page 34 of 52
NOTE: #NA = no regulatory concentration for the indicated analyte.
Analyte CAS No. WI NR140 GW ES (ug/L)
Laboratory Detection
Limit (ug/L)
Laboratory Reporting
Limit (ug/L) 1,4-Dioxane 123-91-1 3
Epichlorohydrin 106-89-8 #N/A
Ethanol 64-17-5 #N/A
Ethyl acetate 141-78-6 #N/A
Ethylbenzene 100-41-4 700 0.5 1
Ethylene oxide 75-21-8 #N/A
Ethyl methacrylate 97-63-2 #N/A
Fluorobenzene (IS) 462-06-6 #N/A
Hexachlorobutadiene 87-68-3 #N/A 2.105642 5
Hexachloroethane 67-72-1 #N/A
2-Hexanone 591-78-6 #N/A
2-Hydroxypropionitrile 78-97-7 #N/A
Iodomethane 74-88-4 #N/A
Isobutyl alcohol 78-83-1 #N/A
Isopropylbenzene 98-82-8 #N/A 0.143317 1
Malononitrile 109-77-3 #N/A
Methacrylonitrile 126-98-7 #N/A
Methanol 67-56-1 5000
Methylene chloride 75-09-2 5 0.23258 1
Title: Milwaukee Solvay Coke and Gas Revision Number: 0
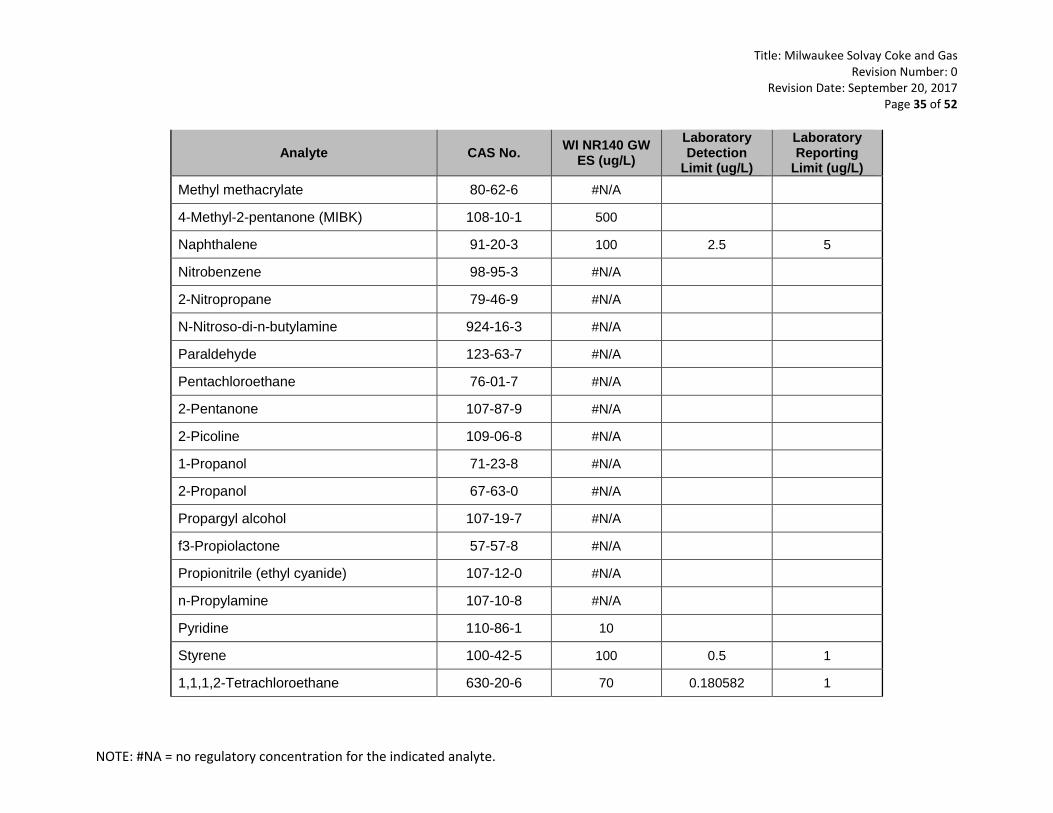
Revision Date: September 20, 2017 Page 35 of 52
NOTE: #NA = no regulatory concentration for the indicated analyte.
Analyte CAS No. WI NR140 GW ES (ug/L)
Laboratory Detection
Limit (ug/L)
Laboratory Reporting
Limit (ug/L) Methyl methacrylate 80-62-6 #N/A
4-Methyl-2-pentanone (MIBK) 108-10-1 500
Naphthalene 91-20-3 100 2.5 5
Nitrobenzene 98-95-3 #N/A
2-Nitropropane 79-46-9 #N/A
N-Nitroso-di-n-butylamine 924-16-3 #N/A
Paraldehyde 123-63-7 #N/A
Pentachloroethane 76-01-7 #N/A
2-Pentanone 107-87-9 #N/A
2-Picoline 109-06-8 #N/A
1-Propanol 71-23-8 #N/A
2-Propanol 67-63-0 #N/A
Propargyl alcohol 107-19-7 #N/A
f3-Propiolactone 57-57-8 #N/A
Propionitrile (ethyl cyanide) 107-12-0 #N/A
n-Propylamine 107-10-8 #N/A
Pyridine 110-86-1 10
Styrene 100-42-5 100 0.5 1
1,1,1,2-Tetrachloroethane 630-20-6 70 0.180582 1
Title: Milwaukee Solvay Coke and Gas Revision Number: 0
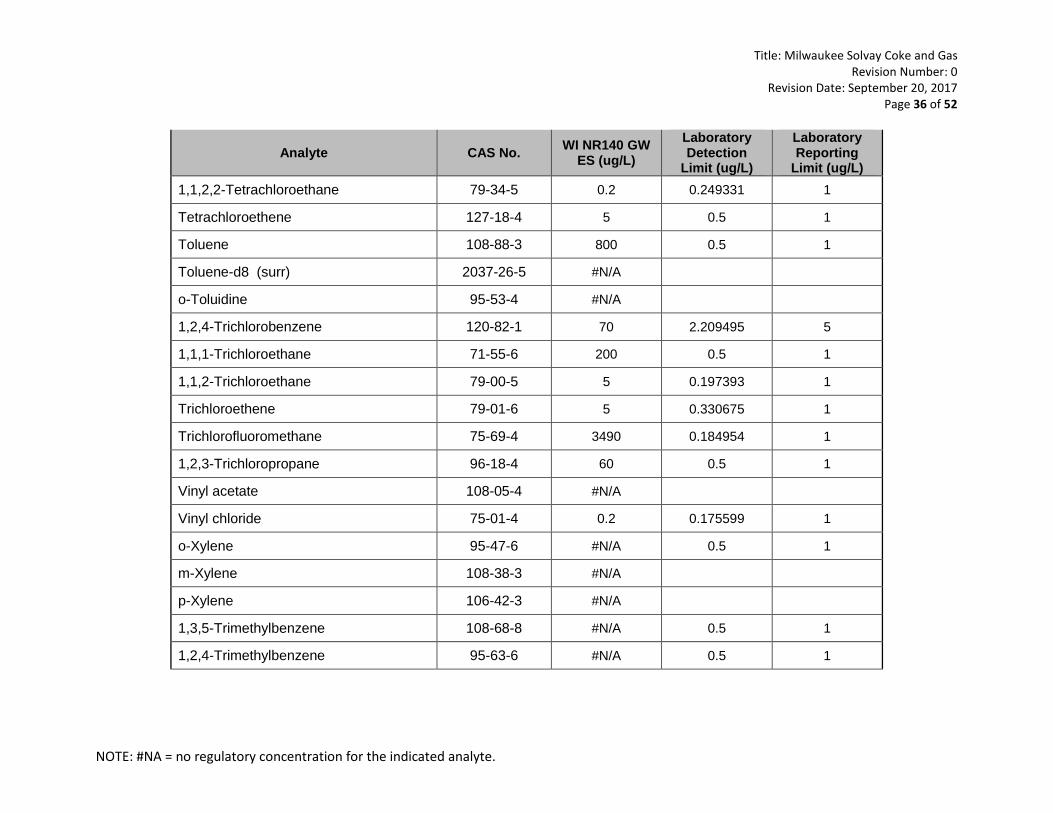
Revision Date: September 20, 2017 Page 36 of 52
NOTE: #NA = no regulatory concentration for the indicated analyte.
Analyte CAS No. WI NR140 GW ES (ug/L)
Laboratory Detection
Limit (ug/L)
Laboratory Reporting
Limit (ug/L) 1,1,2,2-Tetrachloroethane 79-34-5 0.2 0.249331 1
Tetrachloroethene 127-18-4 5 0.5 1
Toluene 108-88-3 800 0.5 1
Toluene-d8 (surr) 2037-26-5 #N/A
o-Toluidine 95-53-4 #N/A
1,2,4-Trichlorobenzene 120-82-1 70 2.209495 5
1,1,1-Trichloroethane 71-55-6 200 0.5 1
1,1,2-Trichloroethane 79-00-5 5 0.197393 1
Trichloroethene 79-01-6 5 0.330675 1
Trichlorofluoromethane 75-69-4 3490 0.184954 1
1,2,3-Trichloropropane 96-18-4 60 0.5 1
Vinyl acetate 108-05-4 #N/A
Vinyl chloride 75-01-4 0.2 0.175599 1
o-Xylene 95-47-6 #N/A 0.5 1
m-Xylene 108-38-3 #N/A
p-Xylene 106-42-3 #N/A
1,3,5-Trimethylbenzene 108-68-8 #N/A 0.5 1
1,2,4-Trimethylbenzene 95-63-6 #N/A 0.5 1
Title: Milwaukee Solvay Coke and Gas Revision Number: 0
Revision Date: September 20, 2017 Page 37 of 52
NOTE: #NA = no regulatory concentration for the indicated analyte.
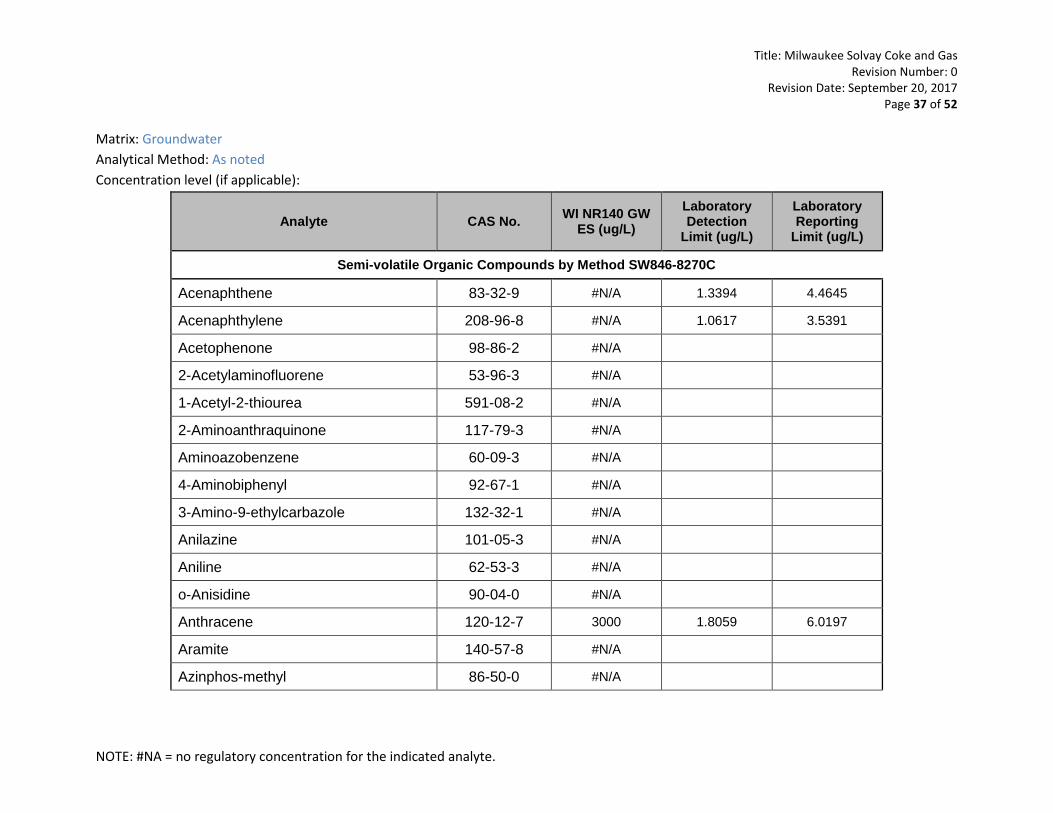
Matrix: Groundwater Analytical Method: As noted Concentration level (if applicable):
Analyte CAS No. WI NR140 GW ES (ug/L)
Laboratory Detection
Limit (ug/L)
Laboratory Reporting
Limit (ug/L)
Semi-volatile Organic Compounds by Method SW846-8270C
Acenaphthene 83-32-9 #N/A 1.3394 4.4645
Acenaphthylene 208-96-8 #N/A 1.0617 3.5391
Acetophenone 98-86-2 #N/A
2-Acetylaminofluorene 53-96-3 #N/A
1-Acetyl-2-thiourea 591-08-2 #N/A
2-Aminoanthraquinone 117-79-3 #N/A
Aminoazobenzene 60-09-3 #N/A
4-Aminobiphenyl 92-67-1 #N/A
3-Amino-9-ethylcarbazole 132-32-1 #N/A
Anilazine 101-05-3 #N/A
Aniline 62-53-3 #N/A
o-Anisidine 90-04-0 #N/A
Anthracene 120-12-7 3000 1.8059 6.0197
Aramite 140-57-8 #N/A
Azinphos-methyl 86-50-0 #N/A
Title: Milwaukee Solvay Coke and Gas Revision Number: 0
Revision Date: September 20, 2017 Page 38 of 52
NOTE: #NA = no regulatory concentration for the indicated analyte.
Analyte CAS No. WI NR140 GW ES (ug/L)
Laboratory Detection
Limit (ug/L)
Laboratory Reporting
Limit (ug/L)
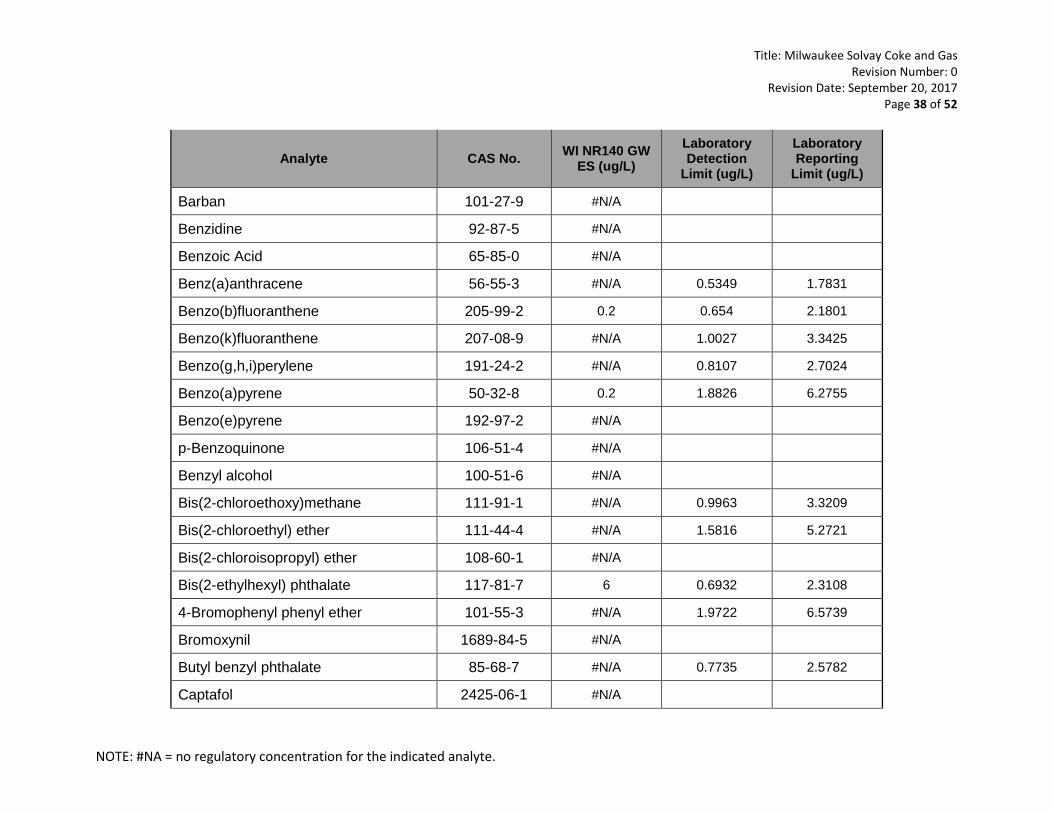
Barban 101-27-9 #N/A
Benzidine 92-87-5 #N/A
Benzoic Acid 65-85-0 #N/A
Benz(a)anthracene 56-55-3 #N/A 0.5349 1.7831
Benzo(b)fluoranthene 205-99-2 0.2 0.654 2.1801
Benzo(k)fluoranthene 207-08-9 #N/A 1.0027 3.3425
Benzo(g,h,i)perylene 191-24-2 #N/A 0.8107 2.7024
Benzo(a)pyrene 50-32-8 0.2 1.8826 6.2755
Benzo(e)pyrene 192-97-2 #N/A
p-Benzoquinone 106-51-4 #N/A
Benzyl alcohol 100-51-6 #N/A
Bis(2-chloroethoxy)methane 111-91-1 #N/A 0.9963 3.3209
Bis(2-chloroethyl) ether 111-44-4 #N/A 1.5816 5.2721
Bis(2-chloroisopropyl) ether 108-60-1 #N/A
Bis(2-ethylhexyl) phthalate 117-81-7 6 0.6932 2.3108
4-Bromophenyl phenyl ether 101-55-3 #N/A 1.9722 6.5739
Bromoxynil 1689-84-5 #N/A
Butyl benzyl phthalate 85-68-7 #N/A 0.7735 2.5782
Captafol 2425-06-1 #N/A
Title: Milwaukee Solvay Coke and Gas Revision Number: 0
Revision Date: September 20, 2017 Page 39 of 52
NOTE: #NA = no regulatory concentration for the indicated analyte.
Analyte CAS No. WI NR140 GW ES (ug/L)
Laboratory Detection
Limit (ug/L)
Laboratory Reporting
Limit (ug/L)
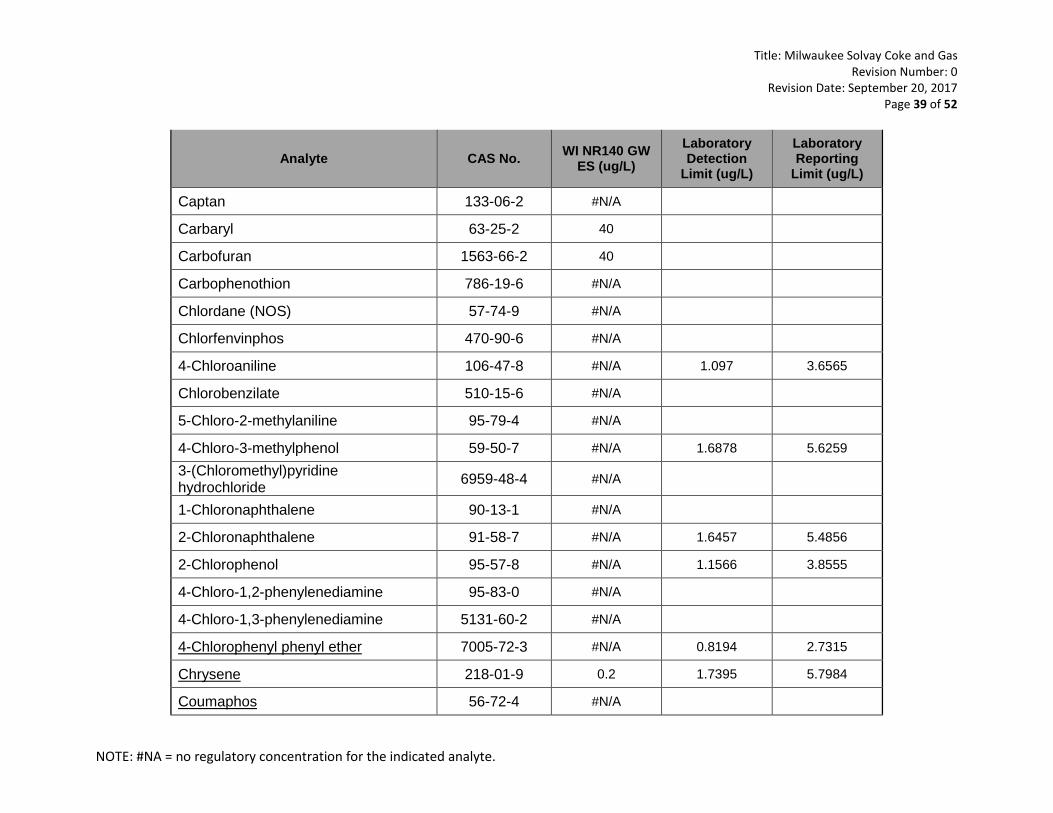
Captan 133-06-2 #N/A
Carbaryl 63-25-2 40
Carbofuran 1563-66-2 40
Carbophenothion 786-19-6 #N/A
Chlordane (NOS) 57-74-9 #N/A
Chlorfenvinphos 470-90-6 #N/A
4-Chloroaniline 106-47-8 #N/A 1.097 3.6565
Chlorobenzilate 510-15-6 #N/A
5-Chloro-2-methylaniline 95-79-4 #N/A
4-Chloro-3-methylphenol 59-50-7 #N/A 1.6878 5.6259
3-(Chloromethyl)pyridine hydrochloride
6959-48-4 #N/A
1-Chloronaphthalene 90-13-1 #N/A
2-Chloronaphthalene 91-58-7 #N/A 1.6457 5.4856
2-Chlorophenol 95-57-8 #N/A 1.1566 3.8555
4-Chloro-1,2-phenylenediamine 95-83-0 #N/A
4-Chloro-1,3-phenylenediamine 5131-60-2 #N/A
4-Chlorophenyl phenyl ether 7005-72-3 #N/A 0.8194 2.7315
Chrysene 218-01-9 0.2 1.7395 5.7984
Coumaphos 56-72-4 #N/A

Title: Milwaukee Solvay Coke and Gas Revision Number: 0
Revision Date: September 20, 2017 Page 40 of 52
NOTE: #NA = no regulatory concentration for the indicated analyte.
Analyte CAS No. WI NR140 GW ES (ug/L)
Laboratory Detection
Limit (ug/L)
Laboratory Reporting
Limit (ug/L)
p-Cresidine 120-71-8 #N/A
Crotoxyphos 7700-17-6 #N/A
2-Cyclohexyl-4,6-dinitro-phenol 131-89-5 #N/A
Demeton-O 298-03-3 #N/A
Demeton-S 126-75-0 #N/A
Diallate (cis or trans) 2303-16-4 #N/A
2,4-Diaminotoluene 95-80-7 #N/A
Dibenz(a,j)acridine 224-42-0 #N/A
Dibenz(a,h)anthracene 53-70-3 #N/A 1.3213 4.4045
Dibenzofuran 132-64-9 #N/A 0.7685 2.5618
Dibenzo(a,e)pyrene 192-65-4 #N/A
1,2-Dibromo-3-chloropropane 96-12-8 0.2
Di-n-butyl phthalate 84-74-2 1000 2.5639 8.5462
Dichlone 117-80-6 #N/A
1,2-Dichlorobenzene 95-50-1 600 1.9296 6.432
1,3-Dichlorobenzene 541-73-1 600 1.883 6.2766
1,4-Dichlorobenzene 106-46-7 75 1.8774 6.2582
3,3'-Dichlorobenzidine 91-94-1 #N/A 0.9054 3.0179
2,4-Dichlorophenol 120-83-2 #N/A 1.3667 4.5555
Title: Milwaukee Solvay Coke and Gas Revision Number: 0
Revision Date: September 20, 2017 Page 41 of 52
NOTE: #NA = no regulatory concentration for the indicated analyte.
Analyte CAS No. WI NR140 GW ES (ug/L)
Laboratory Detection
Limit (ug/L)
Laboratory Reporting
Limit (ug/L)
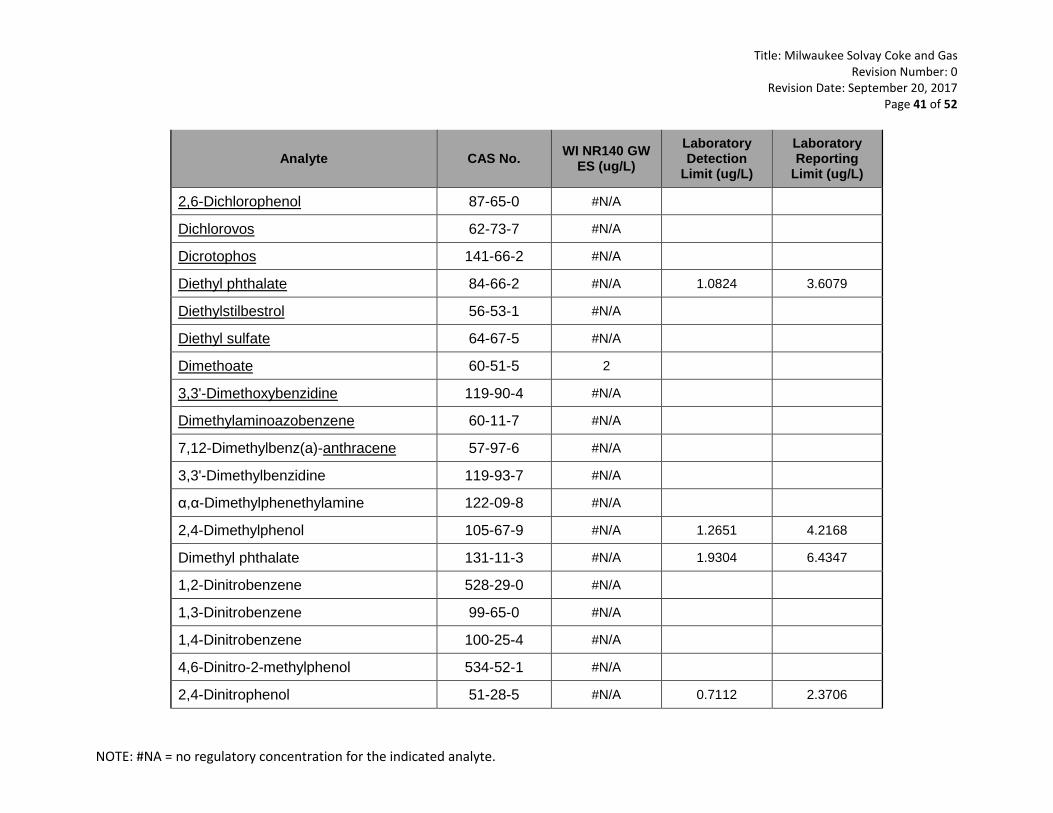
2,6-Dichlorophenol 87-65-0 #N/A
Dichlorovos 62-73-7 #N/A
Dicrotophos 141-66-2 #N/A
Diethyl phthalate 84-66-2 #N/A 1.0824 3.6079
Diethylstilbestrol 56-53-1 #N/A
Diethyl sulfate 64-67-5 #N/A
Dimethoate 60-51-5 2
3,3'-Dimethoxybenzidine 119-90-4 #N/A
Dimethylaminoazobenzene 60-11-7 #N/A
7,12-Dimethylbenz(a)-anthracene 57-97-6 #N/A
3,3'-Dimethylbenzidine 119-93-7 #N/A
α,α-Dimethylphenethylamine 122-09-8 #N/A
2,4-Dimethylphenol 105-67-9 #N/A 1.2651 4.2168
Dimethyl phthalate 131-11-3 #N/A 1.9304 6.4347
1,2-Dinitrobenzene 528-29-0 #N/A
1,3-Dinitrobenzene 99-65-0 #N/A
1,4-Dinitrobenzene 100-25-4 #N/A
4,6-Dinitro-2-methylphenol 534-52-1 #N/A
2,4-Dinitrophenol 51-28-5 #N/A 0.7112 2.3706
Title: Milwaukee Solvay Coke and Gas Revision Number: 0
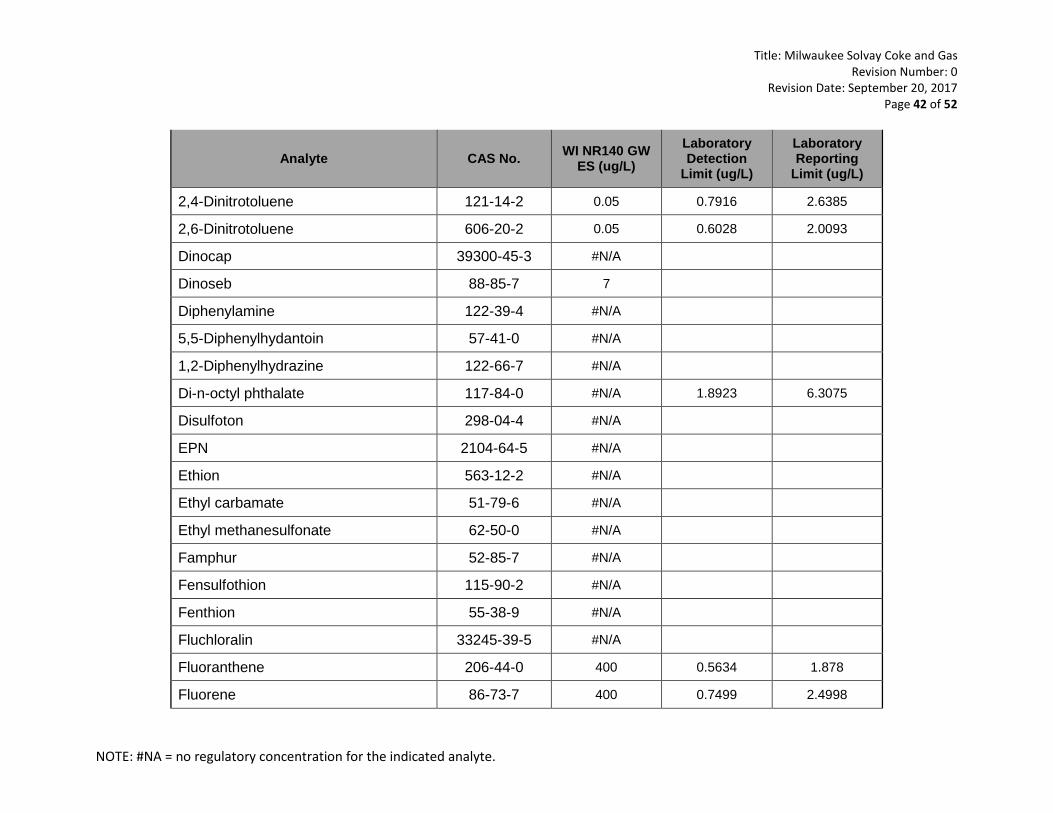
Revision Date: September 20, 2017 Page 42 of 52
NOTE: #NA = no regulatory concentration for the indicated analyte.
Analyte CAS No. WI NR140 GW ES (ug/L)
Laboratory Detection
Limit (ug/L)
Laboratory Reporting
Limit (ug/L)
2,4-Dinitrotoluene 121-14-2 0.05 0.7916 2.6385
2,6-Dinitrotoluene 606-20-2 0.05 0.6028 2.0093
Dinocap 39300-45-3 #N/A
Dinoseb 88-85-7 7
Diphenylamine 122-39-4 #N/A
5,5-Diphenylhydantoin 57-41-0 #N/A
1,2-Diphenylhydrazine 122-66-7 #N/A
Di-n-octyl phthalate 117-84-0 #N/A 1.8923 6.3075
Disulfoton 298-04-4 #N/A
EPN 2104-64-5 #N/A
Ethion 563-12-2 #N/A
Ethyl carbamate 51-79-6 #N/A
Ethyl methanesulfonate 62-50-0 #N/A
Famphur 52-85-7 #N/A
Fensulfothion 115-90-2 #N/A
Fenthion 55-38-9 #N/A
Fluchloralin 33245-39-5 #N/A
Fluoranthene 206-44-0 400 0.5634 1.878
Fluorene 86-73-7 400 0.7499 2.4998
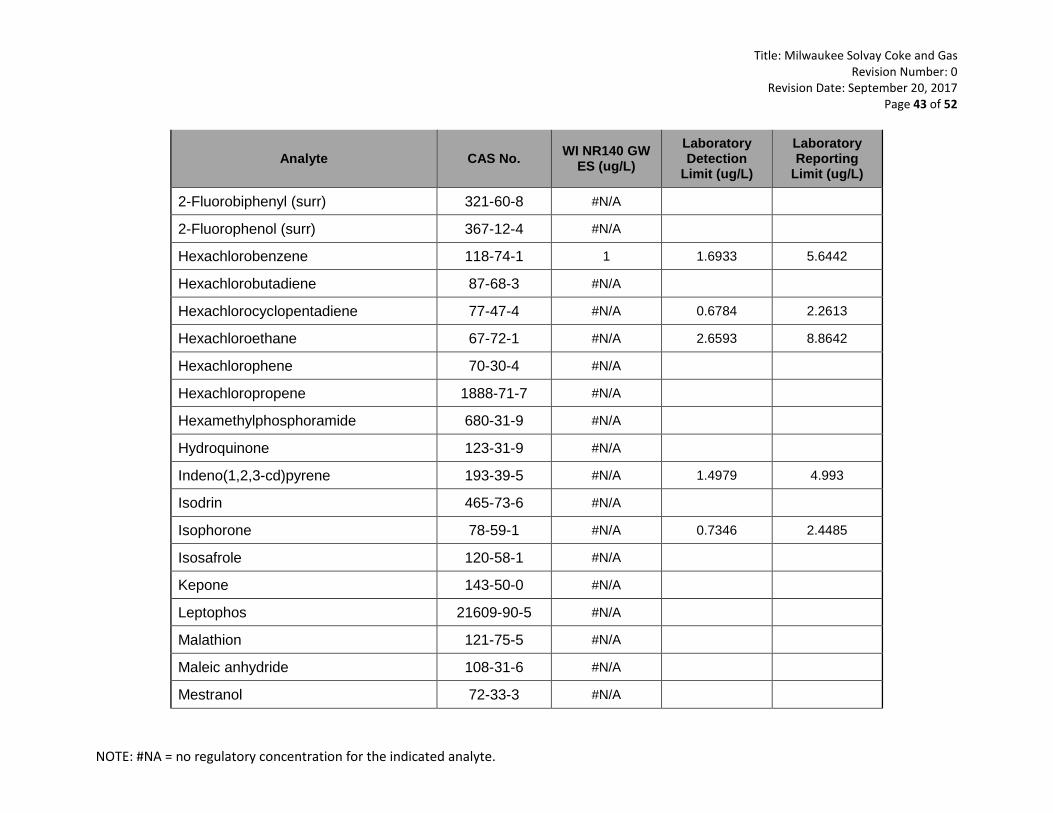
Title: Milwaukee Solvay Coke and Gas Revision Number: 0
Revision Date: September 20, 2017 Page 43 of 52
NOTE: #NA = no regulatory concentration for the indicated analyte.
Analyte CAS No. WI NR140 GW ES (ug/L)
Laboratory Detection
Limit (ug/L)
Laboratory Reporting
Limit (ug/L)
2-Fluorobiphenyl (surr) 321-60-8 #N/A
2-Fluorophenol (surr) 367-12-4 #N/A
Hexachlorobenzene 118-74-1 1 1.6933 5.6442
Hexachlorobutadiene 87-68-3 #N/A
Hexachlorocyclopentadiene 77-47-4 #N/A 0.6784 2.2613
Hexachloroethane 67-72-1 #N/A 2.6593 8.8642
Hexachlorophene 70-30-4 #N/A
Hexachloropropene 1888-71-7 #N/A
Hexamethylphosphoramide 680-31-9 #N/A
Hydroquinone 123-31-9 #N/A
Indeno(1,2,3-cd)pyrene 193-39-5 #N/A 1.4979 4.993
Isodrin 465-73-6 #N/A
Isophorone 78-59-1 #N/A 0.7346 2.4485
Isosafrole 120-58-1 #N/A
Kepone 143-50-0 #N/A
Leptophos 21609-90-5 #N/A
Malathion 121-75-5 #N/A
Maleic anhydride 108-31-6 #N/A
Mestranol 72-33-3 #N/A

Title: Milwaukee Solvay Coke and Gas Revision Number: 0
Revision Date: September 20, 2017 Page 44 of 52
NOTE: #NA = no regulatory concentration for the indicated analyte.
Analyte CAS No. WI NR140 GW ES (ug/L)
Laboratory Detection
Limit (ug/L)
Laboratory Reporting
Limit (ug/L)
Methapyrilene 91-80-5 #N/A
3-Methylcholanthrene 56-49-5 #N/A
4,4'-Methylenebis(2-chloroaniline) 101-14-4 #N/A
4,4'-Methylenebis(N,N-dimethyl- aniline)
101-61-1 #N/A
Methyl methanesulfonate 66-27-3 #N/A
2-Methylnaphthalene 91-57-6 #N/A 1.5142 5.0472
Methyl parathion 298-00-0 #N/A
2-Methylphenol 95-48-7 #N/A 0.8681 2.8938
3-Methylphenol 108-39-4 #N/A
4-Methylphenol 106-44-5 #N/A
Mevinphos 7786-34-7 #N/A
Mexacarbate 315-18-4 #N/A
Mirex 2385-85-5 #N/A
Monocrotophos 6923-22-4 #N/A
Naled 300-76-5 #N/A
Naphthalene 91-20-3 100 1.8986 6.3288
1,4-Naphthoquinone 130-15-4 #N/A
1-Naphthylamine 134-32-7 #N/A
2-Naphthylamine 91-59-8 #N/A
Title: Milwaukee Solvay Coke and Gas Revision Number: 0
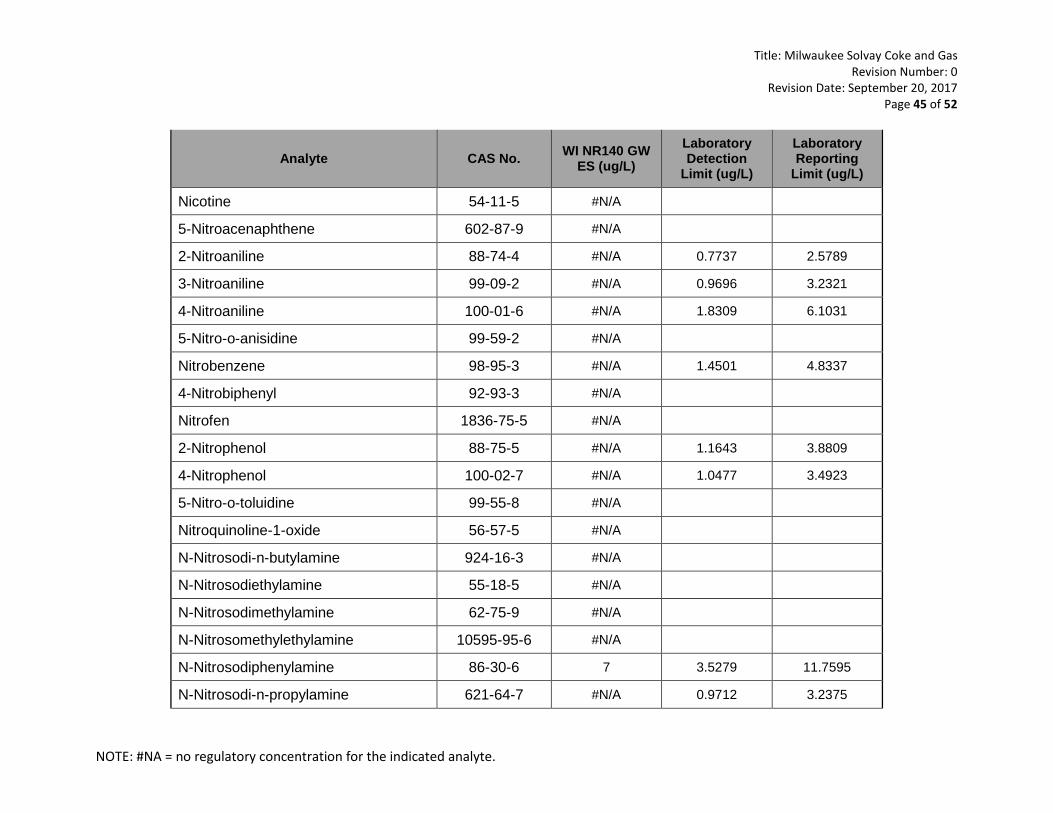
Revision Date: September 20, 2017 Page 45 of 52
NOTE: #NA = no regulatory concentration for the indicated analyte.
Analyte CAS No. WI NR140 GW ES (ug/L)
Laboratory Detection
Limit (ug/L)
Laboratory Reporting
Limit (ug/L)
Nicotine 54-11-5 #N/A
5-Nitroacenaphthene 602-87-9 #N/A
2-Nitroaniline 88-74-4 #N/A 0.7737 2.5789
3-Nitroaniline 99-09-2 #N/A 0.9696 3.2321
4-Nitroaniline 100-01-6 #N/A 1.8309 6.1031
5-Nitro-o-anisidine 99-59-2 #N/A
Nitrobenzene 98-95-3 #N/A 1.4501 4.8337
4-Nitrobiphenyl 92-93-3 #N/A
Nitrofen 1836-75-5 #N/A
2-Nitrophenol 88-75-5 #N/A 1.1643 3.8809
4-Nitrophenol 100-02-7 #N/A 1.0477 3.4923
5-Nitro-o-toluidine 99-55-8 #N/A
Nitroquinoline-1-oxide 56-57-5 #N/A
N-Nitrosodi-n-butylamine 924-16-3 #N/A
N-Nitrosodiethylamine 55-18-5 #N/A
N-Nitrosodimethylamine 62-75-9 #N/A
N-Nitrosomethylethylamine 10595-95-6 #N/A
N-Nitrosodiphenylamine 86-30-6 7 3.5279 11.7595
N-Nitrosodi-n-propylamine 621-64-7 #N/A 0.9712 3.2375
Title: Milwaukee Solvay Coke and Gas Revision Number: 0
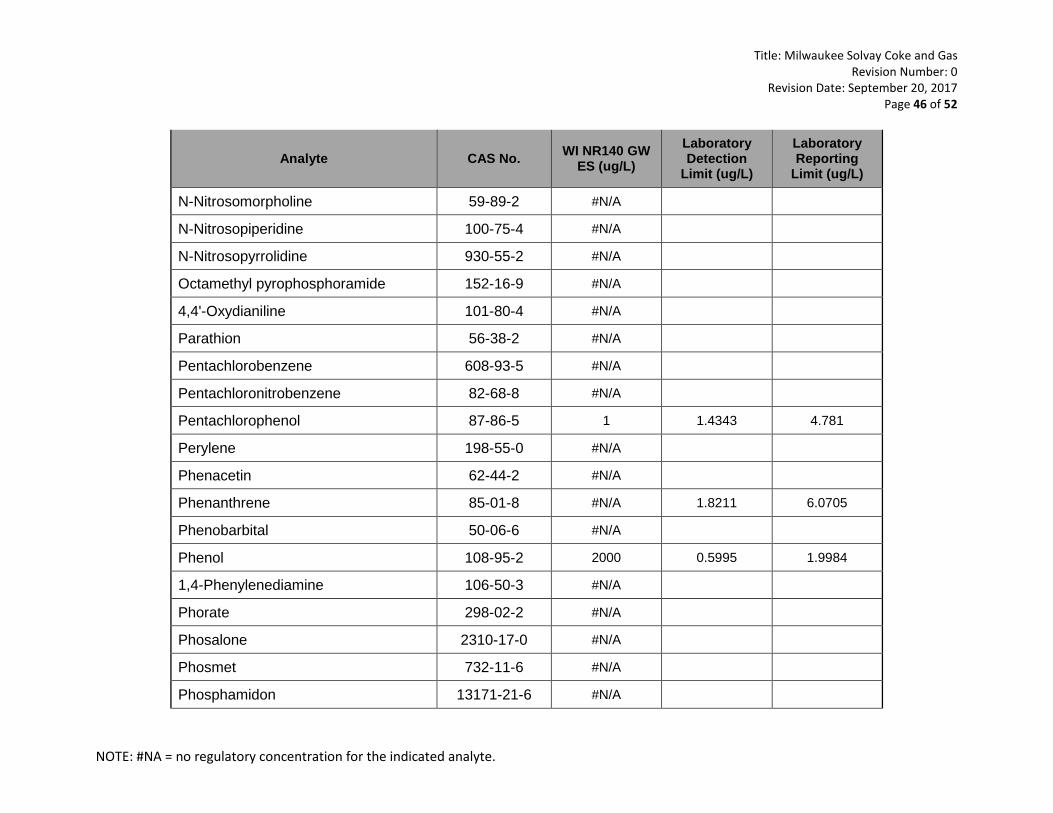
Revision Date: September 20, 2017 Page 46 of 52
NOTE: #NA = no regulatory concentration for the indicated analyte.
Analyte CAS No. WI NR140 GW ES (ug/L)
Laboratory Detection
Limit (ug/L)
Laboratory Reporting
Limit (ug/L)
N-Nitrosomorpholine 59-89-2 #N/A
N-Nitrosopiperidine 100-75-4 #N/A
N-Nitrosopyrrolidine 930-55-2 #N/A
Octamethyl pyrophosphoramide 152-16-9 #N/A
4,4'-Oxydianiline 101-80-4 #N/A
Parathion 56-38-2 #N/A
Pentachlorobenzene 608-93-5 #N/A
Pentachloronitrobenzene 82-68-8 #N/A
Pentachlorophenol 87-86-5 1 1.4343 4.781
Perylene 198-55-0 #N/A
Phenacetin 62-44-2 #N/A
Phenanthrene 85-01-8 #N/A 1.8211 6.0705
Phenobarbital 50-06-6 #N/A
Phenol 108-95-2 2000 0.5995 1.9984
1,4-Phenylenediamine 106-50-3 #N/A
Phorate 298-02-2 #N/A
Phosalone 2310-17-0 #N/A
Phosmet 732-11-6 #N/A
Phosphamidon 13171-21-6 #N/A
Title: Milwaukee Solvay Coke and Gas Revision Number: 0
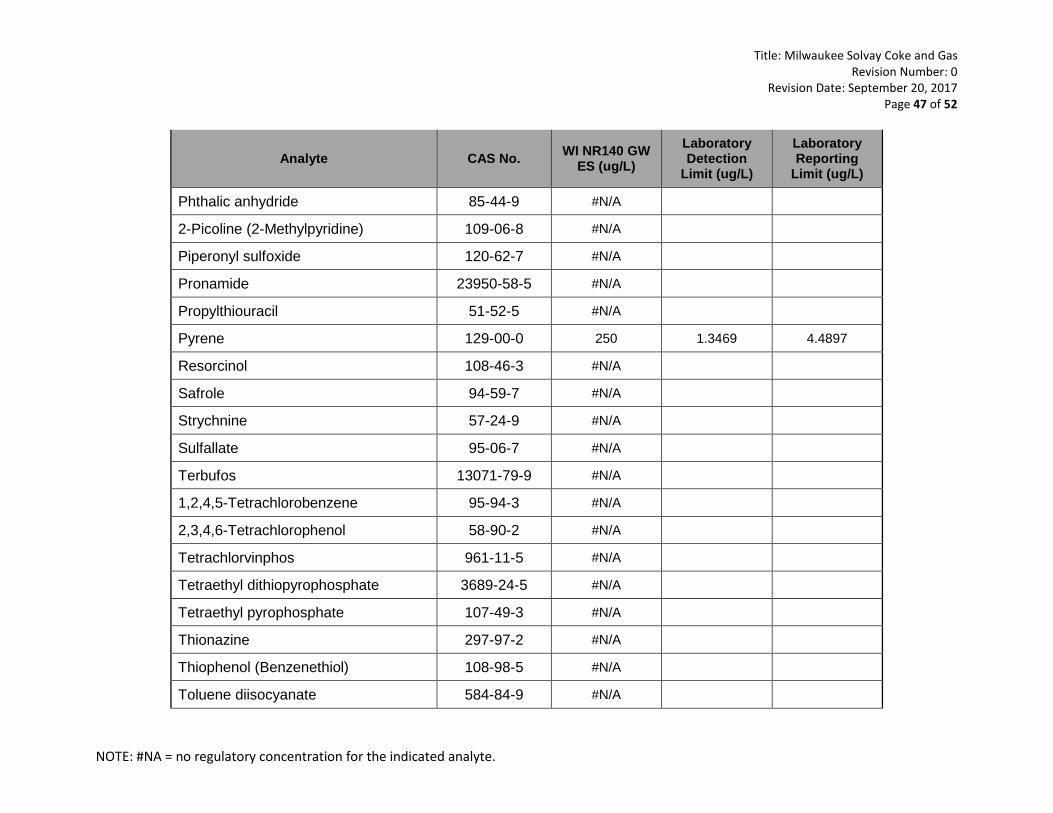
Revision Date: September 20, 2017 Page 47 of 52
NOTE: #NA = no regulatory concentration for the indicated analyte.
Analyte CAS No. WI NR140 GW ES (ug/L)
Laboratory Detection
Limit (ug/L)
Laboratory Reporting
Limit (ug/L)
Phthalic anhydride 85-44-9 #N/A
2-Picoline (2-Methylpyridine) 109-06-8 #N/A
Piperonyl sulfoxide 120-62-7 #N/A
Pronamide 23950-58-5 #N/A
Propylthiouracil 51-52-5 #N/A
Pyrene 129-00-0 250 1.3469 4.4897
Resorcinol 108-46-3 #N/A
Safrole 94-59-7 #N/A
Strychnine 57-24-9 #N/A
Sulfallate 95-06-7 #N/A
Terbufos 13071-79-9 #N/A
1,2,4,5-Tetrachlorobenzene 95-94-3 #N/A
2,3,4,6-Tetrachlorophenol 58-90-2 #N/A
Tetrachlorvinphos 961-11-5 #N/A
Tetraethyl dithiopyrophosphate 3689-24-5 #N/A
Tetraethyl pyrophosphate 107-49-3 #N/A
Thionazine 297-97-2 #N/A
Thiophenol (Benzenethiol) 108-98-5 #N/A
Toluene diisocyanate 584-84-9 #N/A
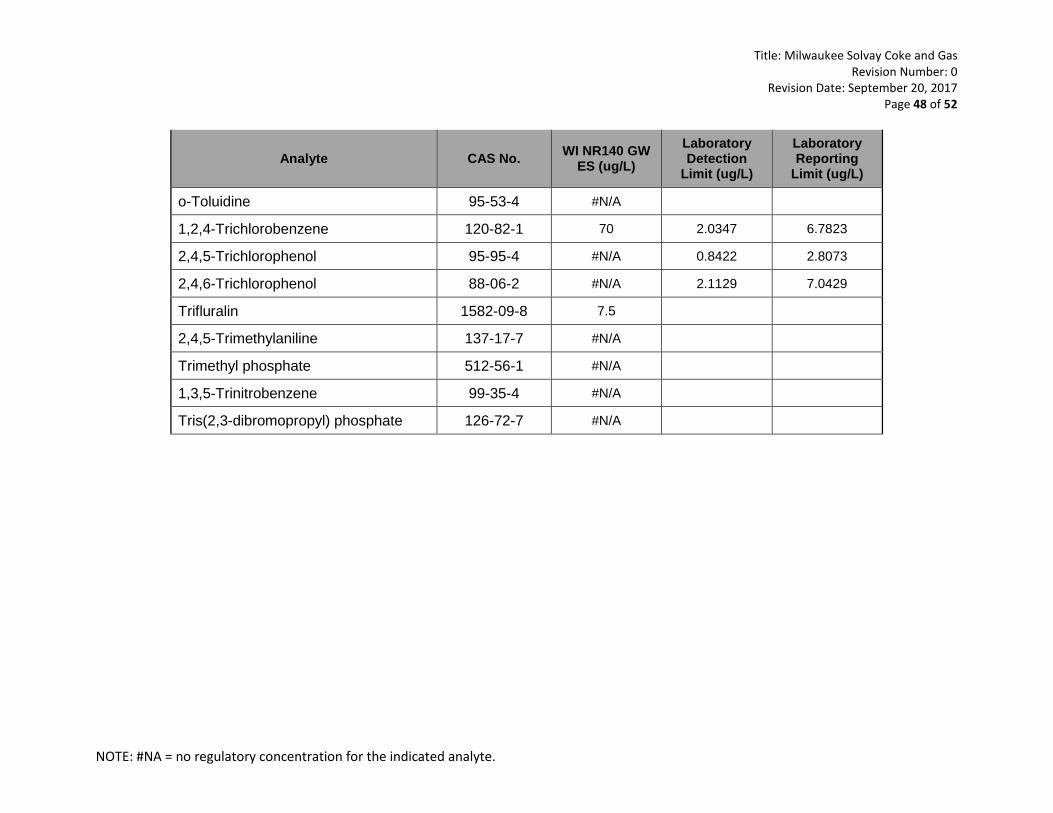
Title: Milwaukee Solvay Coke and Gas Revision Number: 0
Revision Date: September 20, 2017 Page 48 of 52
NOTE: #NA = no regulatory concentration for the indicated analyte.
Analyte CAS No. WI NR140 GW ES (ug/L)
Laboratory Detection
Limit (ug/L)
Laboratory Reporting
Limit (ug/L)
o-Toluidine 95-53-4 #N/A
1,2,4-Trichlorobenzene 120-82-1 70 2.0347 6.7823
2,4,5-Trichlorophenol 95-95-4 #N/A 0.8422 2.8073
2,4,6-Trichlorophenol 88-06-2 #N/A 2.1129 7.0429
Trifluralin 1582-09-8 7.5
2,4,5-Trimethylaniline 137-17-7 #N/A
Trimethyl phosphate 512-56-1 #N/A
1,3,5-Trinitrobenzene 99-35-4 #N/A
Tris(2,3-dibromopropyl) phosphate 126-72-7 #N/A
Title: Milwaukee Solvay Coke and Gas Revision Number: 0
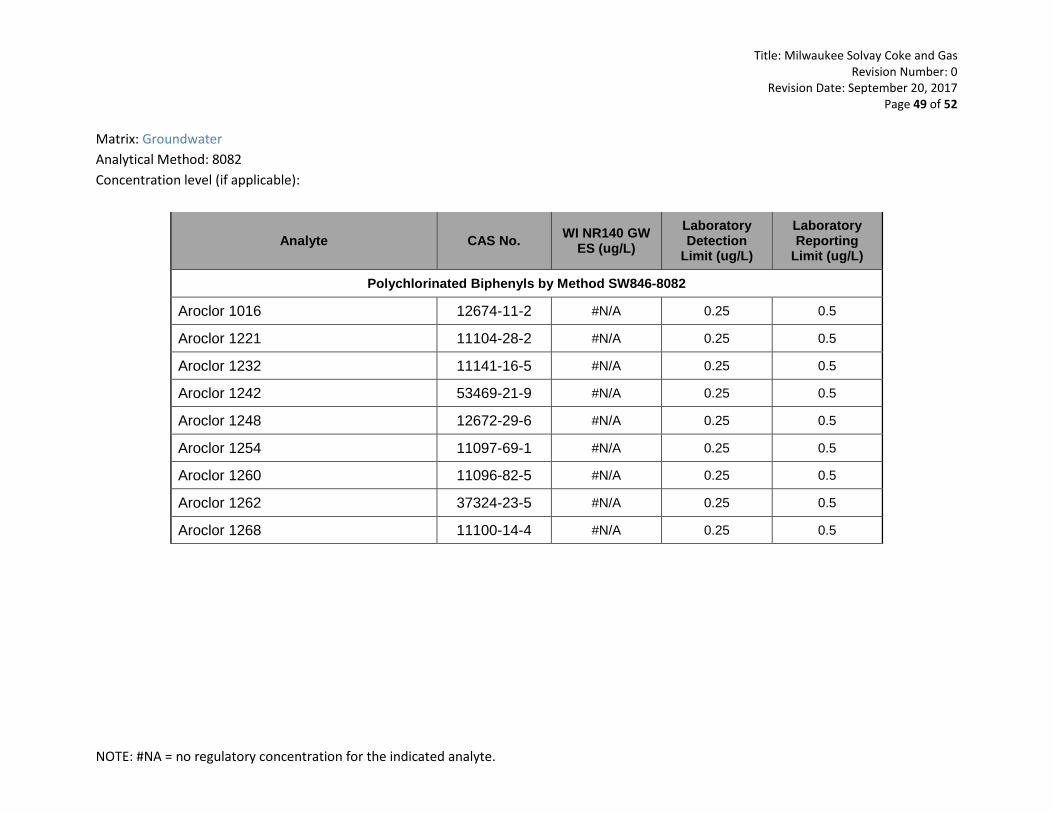
Revision Date: September 20, 2017 Page 49 of 52
NOTE: #NA = no regulatory concentration for the indicated analyte.
Matrix: Groundwater Analytical Method: 8082 Concentration level (if applicable):
Analyte CAS No. WI NR140 GW ES (ug/L)
Laboratory Detection
Limit (ug/L)
Laboratory Reporting
Limit (ug/L)
Polychlorinated Biphenyls by Method SW846-8082
Aroclor 1016 12674-11-2 #N/A 0.25 0.5
Aroclor 1221 11104-28-2 #N/A 0.25 0.5
Aroclor 1232 11141-16-5 #N/A 0.25 0.5
Aroclor 1242 53469-21-9 #N/A 0.25 0.5
Aroclor 1248 12672-29-6 #N/A 0.25 0.5
Aroclor 1254 11097-69-1 #N/A 0.25 0.5
Aroclor 1260 11096-82-5 #N/A 0.25 0.5
Aroclor 1262 37324-23-5 #N/A 0.25 0.5
Aroclor 1268 11100-14-4 #N/A 0.25 0.5
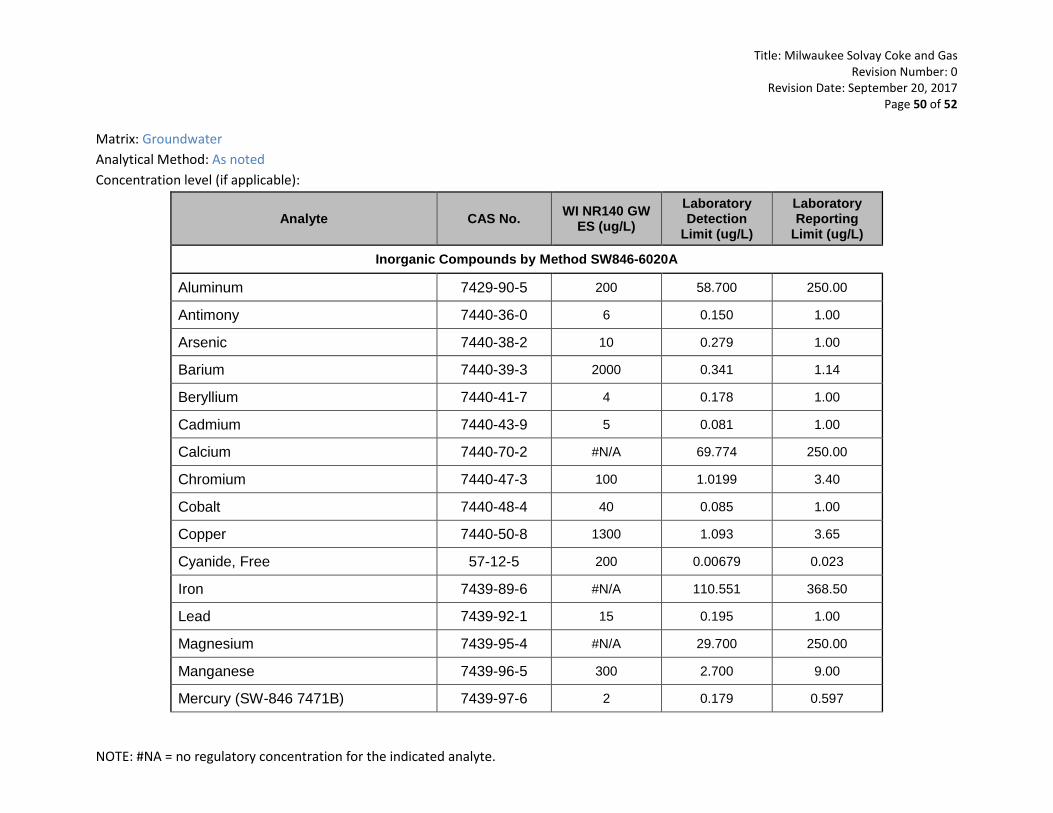
Title: Milwaukee Solvay Coke and Gas Revision Number: 0
Revision Date: September 20, 2017 Page 50 of 52
NOTE: #NA = no regulatory concentration for the indicated analyte.
Matrix: Groundwater Analytical Method: As noted Concentration level (if applicable):
Analyte CAS No. WI NR140 GW ES (ug/L)
Laboratory Detection
Limit (ug/L)
Laboratory Reporting
Limit (ug/L)
Inorganic Compounds by Method SW846-6020A
Aluminum 7429-90-5 200 58.700 250.00
Antimony 7440-36-0 6 0.150 1.00
Arsenic 7440-38-2 10 0.279 1.00
Barium 7440-39-3 2000 0.341 1.14
Beryllium 7440-41-7 4 0.178 1.00
Cadmium 7440-43-9 5 0.081 1.00
Calcium 7440-70-2 #N/A 69.774 250.00
Chromium 7440-47-3 100 1.0199 3.40
Cobalt 7440-48-4 40 0.085 1.00
Copper 7440-50-8 1300 1.093 3.65
Cyanide, Free 57-12-5 200 0.00679 0.023
Iron 7439-89-6 #N/A 110.551 368.50
Lead 7439-92-1 15 0.195 1.00
Magnesium 7439-95-4 #N/A 29.700 250.00
Manganese 7439-96-5 300 2.700 9.00
Mercury (SW-846 7471B) 7439-97-6 2 0.179 0.597
Title: Milwaukee Solvay Coke and Gas Revision Number: 0
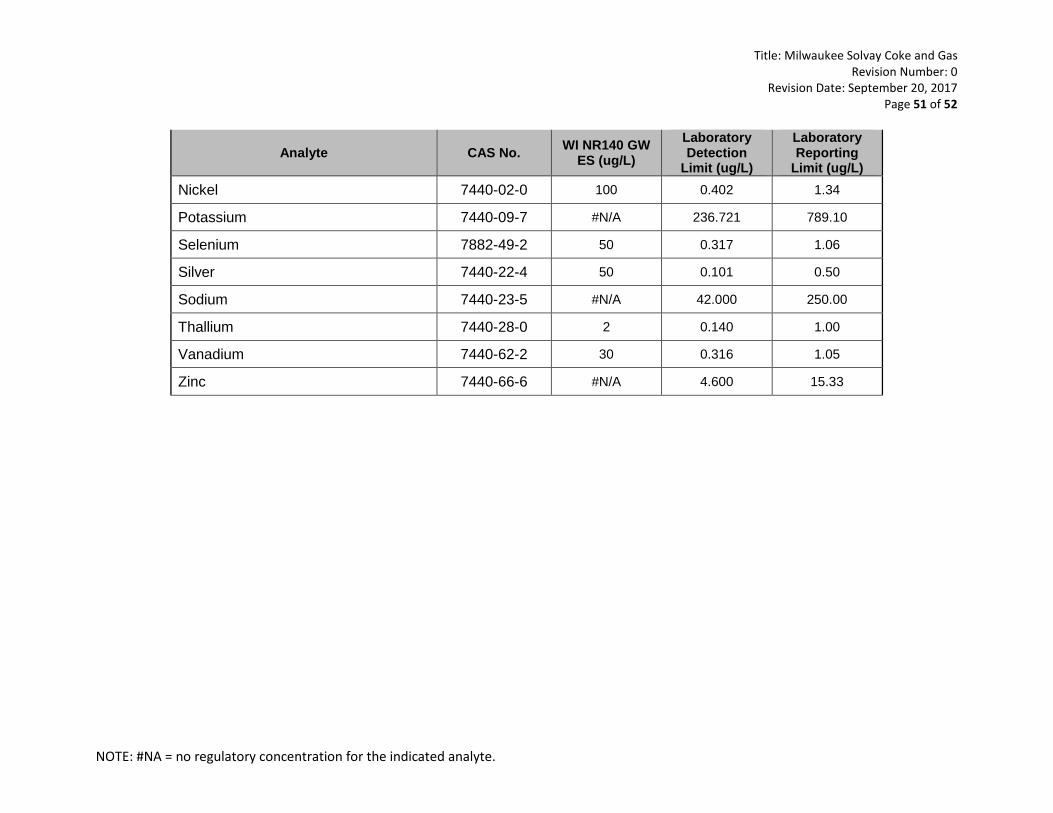
Revision Date: September 20, 2017 Page 51 of 52
NOTE: #NA = no regulatory concentration for the indicated analyte.
Analyte CAS No. WI NR140 GW ES (ug/L)
Laboratory Detection
Limit (ug/L)
Laboratory Reporting
Limit (ug/L) Nickel 7440-02-0 100 0.402 1.34
Potassium 7440-09-7 #N/A 236.721 789.10
Selenium 7882-49-2 50 0.317 1.06
Silver 7440-22-4 50 0.101 0.50
Sodium 7440-23-5 #N/A 42.000 250.00
Thallium 7440-28-0 2 0.140 1.00
Vanadium 7440-62-2 30 0.316 1.05
Zinc 7440-66-6 #N/A 4.600 15.33

Title: Milwaukee Solvay Coke and Gas Revision Number: 0
Revision Date: September 20, 2017 Page 52 of 52
NOTE: #NA = no regulatory concentration for the indicated analyte.
Matrix: Groundwater Analytical Method: As noted Concentration level (if applicable):
Analyte CAS No. WI NR140 GW ES (ug/L)
Laboratory Detection
Limit (ug/L)
Laboratory Reporting
Limit (ug/L)
Geochemical Parameters
Alkalinity, Total ((2320B) 7429-90-5 #NA 5000 10000
Nitrate-Nitrite, Total (353.2) 7440-36-0 #NA 95 250
Sulfate, Total (EPA 300.0) 14808-79-8 #NA 2000 4000

O B G T H E R E ’ S A W A Y
MILWAUKEE SOLVAY COKE AND GAS PLANT SITE | EE/CA SUPPORT SAMPLING PLAN APPENDIX A – ADDENDUM TO USEPA-APPROVED MULTI-SITE QUALITY ASSURANCE PROJECT PLAN
Attachment 2
Analytical Laboratory Standard Operating
Procedures

O B G T H E R E ’ S A W A Y
MILWAUKEE SOLVAY COKE AND GAS PLANT SITE | EE/CA SUPPORT SAMPLING PLAN APPENDIX A – ADDENDUM TO USEPA-APPROVED MULTI-SITE QUALITY ASSURANCE PROJECT PLAN
Attachment 2-1
Pace Analytical Services, LLC
STANDARD OPERATING PROCEDURE
Reactive Cyanide and Reactive Sulfide, SW-846 Chapters 7.3.3.2 (Cyanide) and 7.3.4.2 (Sulfide)
SOP NUMBER: PGH-I-017-6 REVIEW: David Harlin EFFECTIVE DATE: Date of Final Signature SUPERSEDES: PGH-I-017-5 REVIEW DATE: Upon Procedural Change
APPROVALS
____________________________________ 08/11/17 Department Manager/Supervisor Date
____________________________________ 08/14/17 Senior Quality Manager Date
PERIODIC REVIEW SIGNATURES BELOW INDICATE NO CHANGES HAVE BEEN MADE SINCE PREVIOUS APPROVAL.
Signature Title Date Signature Title Date
© 2002 - 2017 Pace Analytical Services, LLC This Standard Operating Procedure may not be reproduced, in part or in full, without written consent of Pace Analytical Services, LLC Whether distributed internally or as a “courtesy copy” to clients or regulatory agencies, this document is considered confidential and proprietary information. Any printed documents in use within a Pace Analytical Services, LLC laboratory have been reviewed and approved by the persons listed on the cover page. They can only be deemed official if proper signatures are present. This is COPY#______ distributed on ________ by _____and is ___CONTROLLED or __UNCONTROLLED.
Reactive Cyanide & Sulfide Pace Analytical Services, LLC Date: August 14, 2017 PGH-I-017-6 Page: 2 of 15
J\SOPs\Master\PACE SOPs\Wetchem\PGH-I-017-6 (Reactive Cyanide & Sulfide) SOPs distributed as Controlled Documents are given a copy number on the signed Title Page.
Copies without a number are considered uncontrolled and must be verified as the most recent version prior to each use.
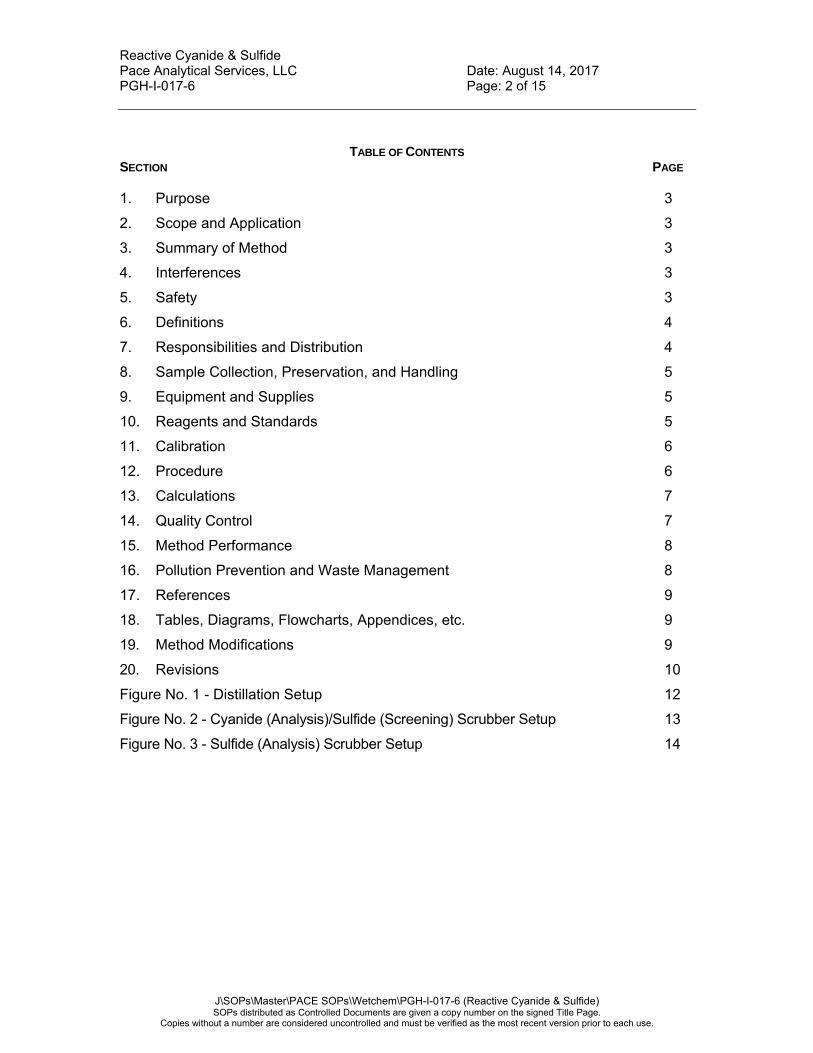
TABLE OF CONTENTS
SECTION PAGE
1. Purpose 3
2. Scope and Application 3
3. Summary of Method 3
4. Interferences 3
5. Safety 3
6. Definitions 4
7. Responsibilities and Distribution 4
8. Sample Collection, Preservation, and Handling 5
9. Equipment and Supplies 5
10. Reagents and Standards 5
11. Calibration 6
12. Procedure 6
13. Calculations 7
14. Quality Control 7
15. Method Performance 8
16. Pollution Prevention and Waste Management 8
17. References 9
18. Tables, Diagrams, Flowcharts, Appendices, etc. 9
19. Method Modifications 9
20. Revisions 10
Figure No. 1 - Distillation Setup 12
Figure No. 2 - Cyanide (Analysis)/Sulfide (Screening) Scrubber Setup 13
Figure No. 3 - Sulfide (Analysis) Scrubber Setup 14
Reactive Cyanide & Sulfide Pace Analytical Services, LLC Date: August 14, 2017 PGH-I-017-6 Page: 3 of 15
J\SOPs\Master\PACE SOPs\Wetchem\PGH-I-017-6 (Reactive Cyanide & Sulfide) SOPs distributed as Controlled Documents are given a copy number on the signed Title Page.
Copies without a number are considered uncontrolled and must be verified as the most recent version prior to each use.
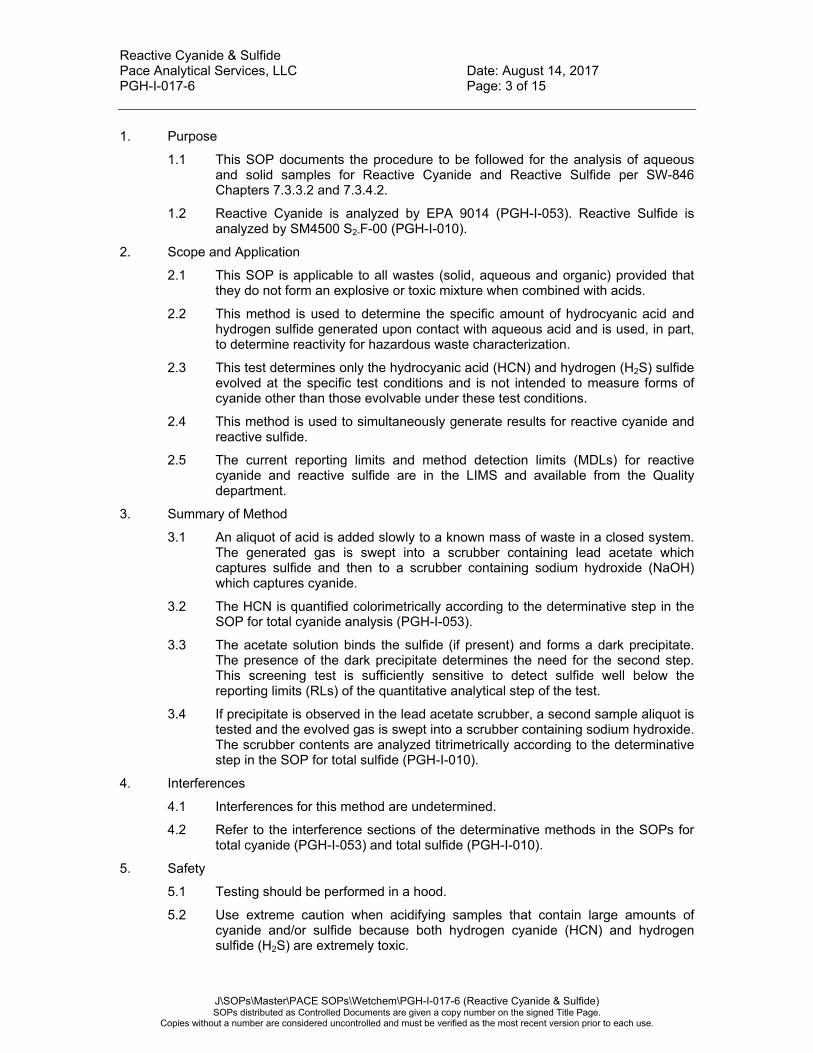
1. Purpose
1.1 This SOP documents the procedure to be followed for the analysis of aqueous and solid samples for Reactive Cyanide and Reactive Sulfide per SW-846 Chapters 7.3.3.2 and 7.3.4.2.
1.2 Reactive Cyanide is analyzed by EPA 9014 (PGH-I-053). Reactive Sulfide is analyzed by SM4500 S2-F-00 (PGH-I-010).
2. Scope and Application
2.1 This SOP is applicable to all wastes (solid, aqueous and organic) provided that they do not form an explosive or toxic mixture when combined with acids.
2.2 This method is used to determine the specific amount of hydrocyanic acid and hydrogen sulfide generated upon contact with aqueous acid and is used, in part, to determine reactivity for hazardous waste characterization.
2.3 This test determines only the hydrocyanic acid (HCN) and hydrogen (H2S) sulfide evolved at the specific test conditions and is not intended to measure forms of cyanide other than those evolvable under these test conditions.
2.4 This method is used to simultaneously generate results for reactive cyanide and reactive sulfide.
2.5 The current reporting limits and method detection limits (MDLs) for reactive cyanide and reactive sulfide are in the LIMS and available from the Quality department.
3. Summary of Method
3.1 An aliquot of acid is added slowly to a known mass of waste in a closed system. The generated gas is swept into a scrubber containing lead acetate which captures sulfide and then to a scrubber containing sodium hydroxide (NaOH) which captures cyanide.
3.2 The HCN is quantified colorimetrically according to the determinative step in the SOP for total cyanide analysis (PGH-I-053).
3.3 The acetate solution binds the sulfide (if present) and forms a dark precipitate. The presence of the dark precipitate determines the need for the second step. This screening test is sufficiently sensitive to detect sulfide well below the reporting limits (RLs) of the quantitative analytical step of the test.
3.4 If precipitate is observed in the lead acetate scrubber, a second sample aliquot is tested and the evolved gas is swept into a scrubber containing sodium hydroxide. The scrubber contents are analyzed titrimetrically according to the determinative step in the SOP for total sulfide (PGH-I-010).
4. Interferences
4.1 Interferences for this method are undetermined.
4.2 Refer to the interference sections of the determinative methods in the SOPs for total cyanide (PGH-I-053) and total sulfide (PGH-I-010).
5. Safety
5.1 Testing should be performed in a hood.
5.2 Use extreme caution when acidifying samples that contain large amounts of cyanide and/or sulfide because both hydrogen cyanide (HCN) and hydrogen sulfide (H2S) are extremely toxic.
Reactive Cyanide & Sulfide Pace Analytical Services, LLC Date: August 14, 2017 PGH-I-017-6 Page: 4 of 15
J\SOPs\Master\PACE SOPs\Wetchem\PGH-I-017-6 (Reactive Cyanide & Sulfide) SOPs distributed as Controlled Documents are given a copy number on the signed Title Page.
Copies without a number are considered uncontrolled and must be verified as the most recent version prior to each use.
5.3 Refer to the Pace Analytical Services, LLC – Pittsburgh Chemical Hygiene Plan/Safety Manual for the specific safety requirements to be followed when working in the laboratory.
5.4 The toxicity and carcinogenicity of each reagent used in this procedure has not been fully established. Each chemical should be regarded as a potential health hazard and exposure to these compounds should be minimized by good laboratory practices. At a minimum, personal protective equipment must include a lab coat, gloves, and safety glasses.
5.5 Analysts must be familiar with the Safety Data Sheets (SDS) for all chemicals and reagents used in this procedure, and the location of the SDS within the laboratory.
6. Definitions
6.1 Refer to the Glossary Section of the most recent revision of the Pace Analytical Services, LLC Quality Manual for the definitions used throughout this SOP.
6.2 Cyanide bearing waste: A waste which, when exposed to pH conditions between 2 and 12.5, can generate toxic cyanide gases, vapors, or fumes in a quantity sufficient to present a danger to human health or the environment.
6.3 Sulfide bearing waste: A waste which, when exposed to pH conditions between 2 and 12.5, can generate toxic hydrogen sulfide gases, vapors, or fumes in a quantity sufficient to present a danger to human health or the environment.
7. Responsibilities and Distribution
7.1 General Manager/Assistant General Manager (GM/AGM)
7.1.1 The GM/AGM has the overall responsibility for ensuring that SOPs are prepared and implemented for all activities appropriate to the laboratory involving the collection and reporting of analytical data.
7.1.2 The GM/AGM and Senior Quality Manager/Quality Manager have final review and approval authority for all SOPs prepared within the laboratory.
7.2 Senior Quality Manager/Quality Manager (SQM/QM)
7.2.1 The SQM/QM will maintain a master file of all SOPs applicable to the operations departments.
7.2.2 The SQM/QM will assign a unique number to each SOP prepared prior to approval and distribution.
7.2.3 The SQM/QM will distribute SOPs to applicable personnel and maintain an accurate accounting of such distribution to ensure that the SOPs, in the hands of the users, are current and complete.
7.3 Department Manager/Supervisor
7.3.1 The Department Manager/Supervisor is responsible for ensuring all staff members read, follow, and are adequately trained in the use of the SOPs
7.3.2 The Department Manager/Supervisor coordinates the preparation and revision of all SOPs within the department whenever a procedure changes.
7.3.3 The Department Manager/Supervisor provides initial approval of all SOPs within the department.
Reactive Cyanide & Sulfide Pace Analytical Services, LLC Date: August 14, 2017 PGH-I-017-6 Page: 5 of 15
J\SOPs\Master\PACE SOPs\Wetchem\PGH-I-017-6 (Reactive Cyanide & Sulfide) SOPs distributed as Controlled Documents are given a copy number on the signed Title Page.
Copies without a number are considered uncontrolled and must be verified as the most recent version prior to each use.
7.3.4 The Department Manager/Supervisor makes recommendations for SOP revision to the SQM/QM via written memo.
7.4 Individual Staff
7.4.1 Individual staff members are responsible for adherence to the specific policies and procedures contained in the applicable SOPs.
7.4.2 Individual staff members will only use a signed, controlled copy of the SOP. Each person may make recommendations to the Department Manager/Supervisor for revising SOPs as the need arises.
7.4.3 Personnel are responsible for ensuring that any deviations from this SOP are reported to the Department Manager/Supervisor.
8. Sample Collection, Preservation, and Handling
8.1 Sample collection: Samples suspected of containing sulfide or a combination of sulfide and cyanide should be collected with minimal aeration. The sample bottle should be filled completely and the analysis should commence as soon as possible.
8.2 Preservation: Samples may be preserved with a strong base to adjust the pH to 12. However, this will cause dilution of the sample, and possibly change other physical and chemical characteristics of the waste, which may affect the rate of release of hydrocyanic acid.
8.3 Shipment: Samples should be shipped in a timely manner, in a cooler.
8.4 Storage: Samples should be stored in a refrigerator at ≤6 oC and in the dark.
8.5 Holding Time: 28 days.
9. Equipment and Supplies
9.1 See Figures 1, 2, and 3 for apparatus assembly.
9.2 500mL round bottom, two-neck flasks with 24/40 ground glass joints.
9.3 Addition funnels with stop cocks and 24/40 ground glass joints.
9.4 Nitrogen supply.
9.5 Nitrogen manifold suitable for regulating the nitrogen flow to 60mL/min.
9.6 Glass adapters for connecting tubing to each flask.
9.7 Flexible plastic tubing (Nalgene lab grade 5/16” ID or equivalent).
9.8 Cork rings.
9.9 Stir plates.
9.10 100mL, 250mL, and 1L Class A graduated cylinders and volumetric flask.
9.11 Two-holed stoppers for graduated cylinders with inlet extension.
9.12 Top loading balance capable of measuring 0.01g.
9.13 Magnetic stir bars.
9.14 Timer with alarm.
9.15 Volumetric flask, 1L glass Class A.
9.16 Class A, calibrated pipette and pipette tips.
10. Reagents and Standards

Reactive Cyanide & Sulfide Pace Analytical Services, LLC Date: August 14, 2017 PGH-I-017-6 Page: 6 of 15
J\SOPs\Master\PACE SOPs\Wetchem\PGH-I-017-6 (Reactive Cyanide & Sulfide) SOPs distributed as Controlled Documents are given a copy number on the signed Title Page.
Copies without a number are considered uncontrolled and must be verified as the most recent version prior to each use.
10.1 Reagent grade deionized (DI) water.
10.2 1.0N Sulfuric acid, certified (purchased from Fisher Scientific, or equivalent).
10.3 0.01N Sulfuric acid working solution: Measure 2mL 1.0 N sulfuric acid into a 250ml Class A graduated cylinder and dilute to 200mL with DI water. Mix well.
10.4 10N Sodium hydroxide solution, certified (purchased from Fisher scientific, or equivalent).
10.5 0.25N Sodium hydroxide solution: Measure 25mL NaOH into a 1L volumetric flask and dilute to volume with DI water. Mix water. If making individually, add 1.25ml of 10N NaOH to 50ml of DI water.
10.6 Lead acetate solution: Place 30.42g lead acetate in a 1L volumetric flask. Dilute to the volume with DI water, and adjust the pH to 4.5 with glacial acetic acid. Mix well. This solution must be discarded after 6 months.
10.7 6N HCl: To a 1L volumetric add 500mL of DI water and then slowly add 500mL of concentrated HCl. Mix well.
10.8 Stock Cyanide Standard Solution (1000mg/L): This is purchased commercially. (e.g., Spex Certiprep Catalog # RSCN9-2Y, or equivalent) For commercially prepared stock, refer to manufacturer’s expiration date.
10.9 Stock Sulfide Standard Solution (1000mg/L): This is purchased commercially. (e.g. Aqua Solutions #8975, or equivalent). For commercially prepared stock, refer to manufacturer’s expiration date.
10.10 Glass beads, Fisher brand or equivalent.
11. Calibration
11.1 Not Applicable
12. Procedure
12.1 On a top loading balance, tare a cork ring and a 500mL flask. Add approximately 10g of the sample (aqueous or solid) to the flask and record this weight on the electronic bench sheet. Record the sample number on the flask. Add a rounded magnetic stir bar to the flask.
12.1.1 Method/Reagent Blank prep: add approximately 10g of glass beads to the flask. Record information and add stir bar as stated in 12.1.
12.1.2 Cyanide LCS prep: Pipette 1mL of Stock Cyanide Standard Solution into the flask and add DI up to approximately 10g. Add 10 g of glass beads to the flask as well. Record information and add stir bar as stated in 12.1.
12.1.3 Sulfide LCS prep: Pipette 2mL of Stock Sulfide Standard Solution in the flask and add DI up to approximately 10g. Add 10 g of glass beads to the flask as well. Record information and add stir bar as stated in 12.1.
12.1.4 The LCS’s must be prepared in separate flasks.
12.2 Place the cork ring and flask with sample on a stir plate in the hood. Place 200mL of 0.01N sulfuric acid into the addition funnel and position the funnel into one of the flask necks. Place one glass adapter into the other flask neck and one glass adapter into the top of the addition funnel (See Figure 1.)
12.3 Via flexible tubing, connect:
12.3.1 The nitrogen gas nozzle (from the nitrogen manifold) to the top of addition funnel;
Reactive Cyanide & Sulfide Pace Analytical Services, LLC Date: August 14, 2017 PGH-I-017-6 Page: 7 of 15
J\SOPs\Master\PACE SOPs\Wetchem\PGH-I-017-6 (Reactive Cyanide & Sulfide) SOPs distributed as Controlled Documents are given a copy number on the signed Title Page.
Copies without a number are considered uncontrolled and must be verified as the most recent version prior to each use.
12.3.2 The glass adapter on flask to scrubber #1 inlet tube (Figures 1 and 2) and,
12.3.3 The outlet from scrubber #1 to the inlet of scrubber #2 (figure 2).
12.4 In scrubber #1 (a 250mL plastic graduated cylinder), add 40mL lead acetate solution and dilute to approximately 160mL with DI water. Place the rubber stopper onto the graduated cylinder so that the inlet extension is submerged in the lead acetate solution (figure 2). The lead acetate solution binds the sulfide present in the sample. Sulfide is a known interferent to colorimetric quantitation of cyanide.
12.5 In scrubber #2 (a second 250mL graduated cylinder), add 50mL 0.25N NaOH solution. Place the rubber stopper with an elbow tube and inlet extension into the cylinder so the extension is submerged into the NaOH solution. Allow the other elbow tube to remain open to vent nitrogen gas.
12.6 Turn nitrogen gas on to a flow rate of 60mL/min.
12.7 Turn on the stir plate. NOTE: the stirring should not be so fast as to create a vortex when the acid is added.
12.8 With nitrogen flowing, slowly introduce all 200mL of the 0.01N H2SO4 from the addition funnel into the flask. At this point, set the timer for 30 minutes.
12.9 After 30 minutes, turn off the nitrogen gas and stir plate and disconnect the scrubbers. Place the solution into an appropriately labeled plastic container. Determine the amount of cyanide colorimetrically according to the determinative step in the SOP for total cyanide (PGH-I-053).
12.10 Check the contents of scrubber #1 for precipitate. If no precipitate is observed, record “No” on the bench sheet. This result is reported as “less than” the detection limit. If precipitate is observed, proceed to 12.11.
12.11 Repeat the procedure from step 12.1 through 12.9 using only one scrubber containing 5mL of 10N NaOH diluted to 200mL with DI water. (See Figure 3).
12.12 The trapping solution must be brought to a pH of 2 before proceeding. Titrate a small aliquot of the trapping solution to a pH of 2 end point with 6N HCL and calculate the amount of HCl needed to acidify the entire scrubber solution. Combine the small acidified aliquot with the remainder of the acidified scrubber solution.
12.13 Determine the amount of sulfide titrimetrically according to the determinative step in the SOP for total sulfide (PGH-I-010).
13. Calculations
13.1 See the SOPs for total cyanide (PGH-I-053) and total sulfide analysis (PGH-I-010) for the calculations pertaining to the determinative steps.
14. Quality Control
14.1 Analyze one reagent blank per analysis batch up to 20 samples. The reagent blank consists of glass beads and is analyzed in the same manner as analytical samples.
14.1.1 The Method/Reagent Blank must be free of detectable cyanide and sulfide to ensure no cross contamination (Result < Reporting Limit).
14.2 Analyze one Laboratory Control Sample (LCS) per anaylsis batch up to 20 samples for each Cyanide and Sulfide.
14.2.1 LCS for reactive sulfide must have a % Recovery between 0-52%.
Reactive Cyanide & Sulfide Pace Analytical Services, LLC Date: August 14, 2017 PGH-I-017-6 Page: 8 of 15
J\SOPs\Master\PACE SOPs\Wetchem\PGH-I-017-6 (Reactive Cyanide & Sulfide) SOPs distributed as Controlled Documents are given a copy number on the signed Title Page.
Copies without a number are considered uncontrolled and must be verified as the most recent version prior to each use.
14.2.2 LCS for reactive cyanide must have a % Recovery between 0-8%.
14.3 Analyze one duplicate (DUP) sample per analysis batch up to 20 samples.
14.3.1 Duplicate sample recoveries must agree within 20% RPD
14.4 Corrective Actions for Out-Of-Control Data
14.4.1 Method Blank (Reagent Blank) (MB/RB): Individual samples that do not meet the acceptance criteria must be reanalyzed. If there is no additional sample available for reanalysis, evaluate the usefulness of the data in the final report.
14.4.2 Laboratory Control Sample (LCS): Reanalyze the LCS once. If the problem persists, reprep and reanalyze the batch with the associated sample if LCS is outside acceptance limits.
14.4.2.1 If LCS %Recovery is outside the QC limits high and samples are non-detect, the sample data may be reported with appropriate data qualifiers.
14.4.3 Duplicate (DUP): DUP analysis that fails the replicate test must be reanalyzed to determine if analytical failure or sample heterogeneity was the cause of the problem.
14.4.4 If there is no additional sample available for reanalysis, evaluate the usefulness of the data in the final report.
14.5 Any data that are considered out-of-control (suspect) or unacceptable will be appropriately flagged as such and qualified in the final report.
15. Method Performance
15.1 If contamination is found in the reagent blank or duplicate samples are outside of acceptable limits, check the apparatus for cleanliness, leaks in the system, or contamination of the glass beads or reagents.
15.2 Each analyst to perform this analysis must read and understand this procedure with written documentation maintained in their training file.
15.3 An initial demonstration of capability (IDOC) must be performed. A record of the IDOC will be maintained on file in QA.
15.4 On an annual basis, each analyst will complete a continuing demonstration of capability (CDOC).
16. Pollution Prevention and Waste Management
16.1 Spills are promptly cleaned up using paper towels, sorbent materials or spill kits, depending on the amount of and specific substance spilled. Specific protocols for handling spills are found in Pace Analytical’s Chemical Hygiene Plan and in the SDSs.
16.2 Procedures for handling waste generated during this analysis are addressed in PGH-C-017 Waste Management and Disposal.
16.3 In order to minimize the amount of waste generated during this procedure, analyst should prepare reagents in an amount which may be used in a reasonable amount of time.
16.4 The company wide Chemical Hygiene and Safety manual contains additional information on pollution prevention.
Reactive Cyanide & Sulfide Pace Analytical Services, LLC Date: August 14, 2017 PGH-I-017-6 Page: 9 of 15
J\SOPs\Master\PACE SOPs\Wetchem\PGH-I-017-6 (Reactive Cyanide & Sulfide) SOPs distributed as Controlled Documents are given a copy number on the signed Title Page.
Copies without a number are considered uncontrolled and must be verified as the most recent version prior to each use.
16.5 If a high level of reactive cyanide or sulfide is found, the sample must be segregated and disposed of in accordance with the laboratory’s hazardous waste disposal policy.
17. References
17.1 National Environmental Laboratory Accreditation Conference (NELAC), Chapter 5, Program Policy and Structure (most recently approved revision).
17.2 TNI Standard, Requirements for Laboratories Performing Environmental Analysis, current version.
17.3 Pace Analytical Services, LLC - Pittsburgh Laboratory Quality Assurance Manual, current version.
17.4 Test Method to Determine Hydrogen Cyanide Released from Wastes, USEPA, SW-846 Chapter 7.3.3.2, Interim Guidance For Reactive Cyanide, Revision 3, 1996.
17.5 Test Method to Determine Hydrogen Sulfide Released from Wastes, USEPA, SW-846 Chapter 7.3.4.2, Interim Guidance For Reactive Sulfide, Revision 3, 1996.
17.6 U.S. Environmental Protection Agency, Methods for the determination of Inorganic Substances in Environmental Samples, EPA/600/R-93/100, EPA Method 335.4, Revision 1. August 1993.
17.7 USEPA, SW-846 III Ed., Test Methods for Evaluating Solid Wastes, Physical/Chemical Methods, Method 9014, September 1986.
17.8 Standard Method SM4500-S2-F.
17.9 SOP PGH-C-001, Sample Management, current version.
17.10 SOP PGH-Q-045, Control Charts, current version.
17.11 SOP PGH-C-032, Support Equipment, current version.
17.12 SOP PGH-Q-035, MDL/LOD/LOQ, current version.
17.13 SOP PGH-C-037, Standard and Reagent Traceability, current version.
17.14 SOP PGH-Q-038, Laboratory Equipment, current version.
17.15 SOP PGH-Q-039, Corrective Action, current version.
17.16 SOP PGH-Q-040, Internal and External Audits, current version.
17.17 SOP S-ALL-Q-020, Training, current version.
17.18 SOP S-ALL-Q-028, Lab Track, current version.
17.19 SOP PGH-C-027, DI Water, current version.
18. Tables, Diagrams, Flowcharts, Appendices, etc.
18.1 Figure 1: Distillation setup.
18.2 Figure 2: Cyanide (Analysis)/Sulfide (Screening) Scrubber setup.
18.3 Figure 3: Sulfide (Analysis) Scrubber setup.
18.4 Attachment 1 - Example Reactive Cyanide/Sulfide Prep Benchsheet.
19. Method Modifications
19.1 Two scrubbers are described in this SOP (Section 12.4). A second scrubber is not included in the reference method.
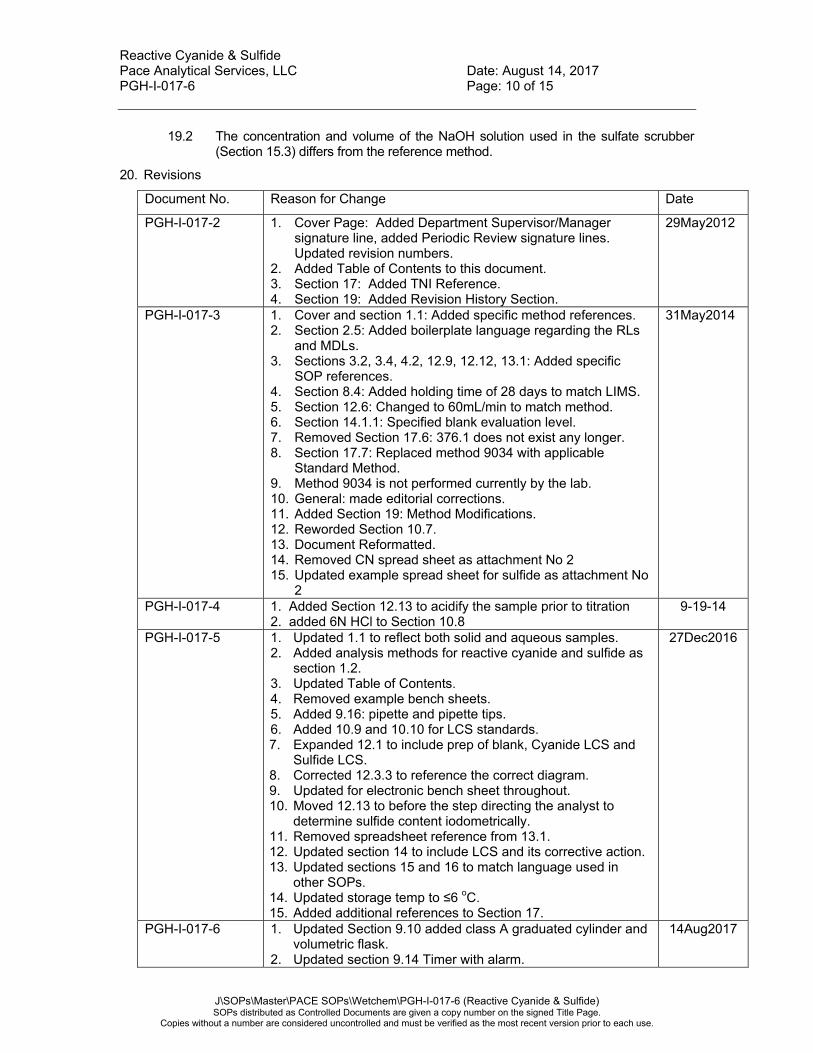
Reactive Cyanide & Sulfide Pace Analytical Services, LLC Date: August 14, 2017 PGH-I-017-6 Page: 10 of 15
J\SOPs\Master\PACE SOPs\Wetchem\PGH-I-017-6 (Reactive Cyanide & Sulfide) SOPs distributed as Controlled Documents are given a copy number on the signed Title Page.
Copies without a number are considered uncontrolled and must be verified as the most recent version prior to each use.
19.2 The concentration and volume of the NaOH solution used in the sulfate scrubber (Section 15.3) differs from the reference method.
20. Revisions
Document No. Reason for Change Date
PGH-I-017-2 1. Cover Page: Added Department Supervisor/Manager signature line, added Periodic Review signature lines. Updated revision numbers.
2. Added Table of Contents to this document. 3. Section 17: Added TNI Reference. 4. Section 19: Added Revision History Section.
29May2012
PGH-I-017-3 1. Cover and section 1.1: Added specific method references. 2. Section 2.5: Added boilerplate language regarding the RLs
and MDLs. 3. Sections 3.2, 3.4, 4.2, 12.9, 12.12, 13.1: Added specific
SOP references. 4. Section 8.4: Added holding time of 28 days to match LIMS. 5. Section 12.6: Changed to 60mL/min to match method. 6. Section 14.1.1: Specified blank evaluation level. 7. Removed Section 17.6: 376.1 does not exist any longer. 8. Section 17.7: Replaced method 9034 with applicable
Standard Method. 9. Method 9034 is not performed currently by the lab. 10. General: made editorial corrections. 11. Added Section 19: Method Modifications. 12. Reworded Section 10.7. 13. Document Reformatted. 14. Removed CN spread sheet as attachment No 2 15. Updated example spread sheet for sulfide as attachment No
2
31May2014
PGH-I-017-4 1. Added Section 12.13 to acidify the sample prior to titration 2. added 6N HCl to Section 10.8
9-19-14
PGH-I-017-5 1. Updated 1.1 to reflect both solid and aqueous samples. 2. Added analysis methods for reactive cyanide and sulfide as
section 1.2. 3. Updated Table of Contents. 4. Removed example bench sheets. 5. Added 9.16: pipette and pipette tips. 6. Added 10.9 and 10.10 for LCS standards. 7. Expanded 12.1 to include prep of blank, Cyanide LCS and
Sulfide LCS. 8. Corrected 12.3.3 to reference the correct diagram. 9. Updated for electronic bench sheet throughout. 10. Moved 12.13 to before the step directing the analyst to
determine sulfide content iodometrically. 11. Removed spreadsheet reference from 13.1. 12. Updated section 14 to include LCS and its corrective action. 13. Updated sections 15 and 16 to match language used in
other SOPs. 14. Updated storage temp to ≤6 oC. 15. Added additional references to Section 17.
27Dec2016
PGH-I-017-6 1. Updated Section 9.10 added class A graduated cylinder and volumetric flask.
2. Updated section 9.14 Timer with alarm.
14Aug2017
Reactive Cyanide & Sulfide Pace Analytical Services, LLC Date: August 14, 2017 PGH-I-017-6 Page: 11 of 15
J\SOPs\Master\PACE SOPs\Wetchem\PGH-I-017-6 (Reactive Cyanide & Sulfide) SOPs distributed as Controlled Documents are given a copy number on the signed Title Page.
Copies without a number are considered uncontrolled and must be verified as the most recent version prior to each use.
Document No. Reason for Change Date
3. Removed section 10.3. 4. Updated section 10.3 and 10.5. 5. Updated section 12.1.2, add 10g of glass beads to the flask
for cyanide. 6. Updated section 12.1.3, add 10g of glass beads to the flask
for sulfide. 7. Updated section 12.11;... 10N NaOH diluted to 200mL with
DI water. 8. Added Example Reactive Cyanide/Sulfide Prep Benchsheet.
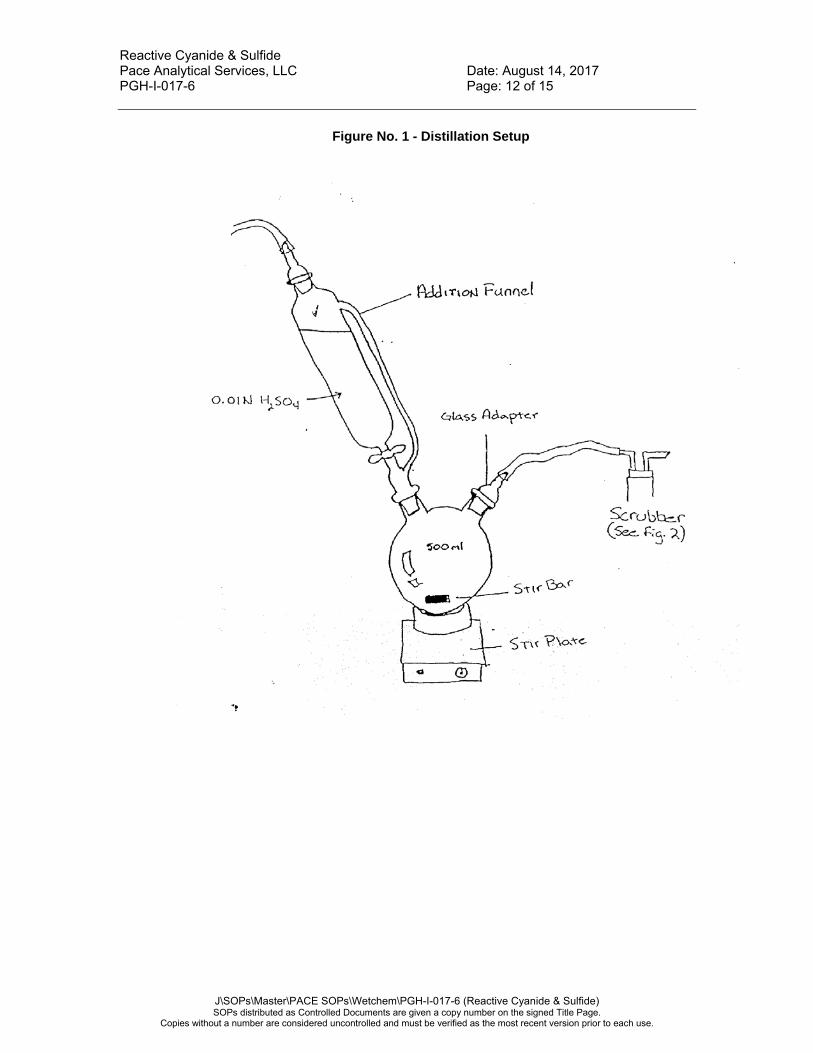
Reactive Cyanide & Sulfide Pace Analytical Services, LLC Date: August 14, 2017 PGH-I-017-6 Page: 12 of 15
J\SOPs\Master\PACE SOPs\Wetchem\PGH-I-017-6 (Reactive Cyanide & Sulfide) SOPs distributed as Controlled Documents are given a copy number on the signed Title Page.
Copies without a number are considered uncontrolled and must be verified as the most recent version prior to each use.
Figure No. 1 - Distillation Setup
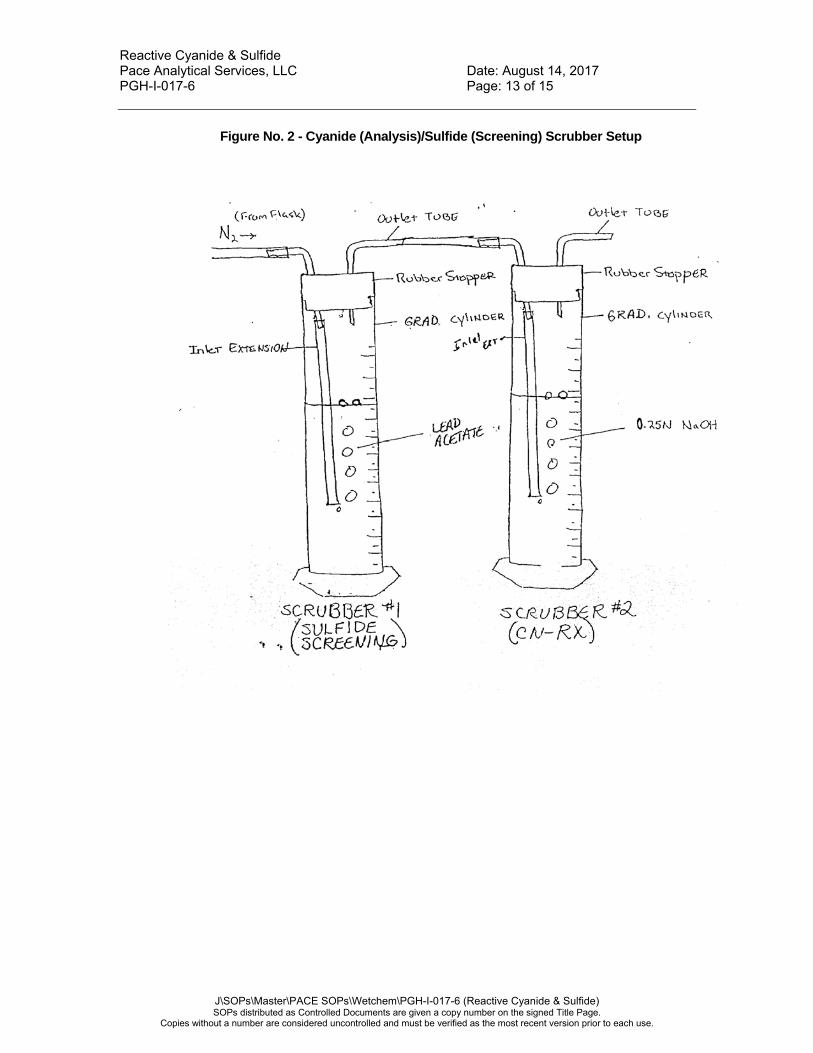
Reactive Cyanide & Sulfide Pace Analytical Services, LLC Date: August 14, 2017 PGH-I-017-6 Page: 13 of 15
J\SOPs\Master\PACE SOPs\Wetchem\PGH-I-017-6 (Reactive Cyanide & Sulfide) SOPs distributed as Controlled Documents are given a copy number on the signed Title Page.
Copies without a number are considered uncontrolled and must be verified as the most recent version prior to each use.
Figure No. 2 - Cyanide (Analysis)/Sulfide (Screening) Scrubber Setup
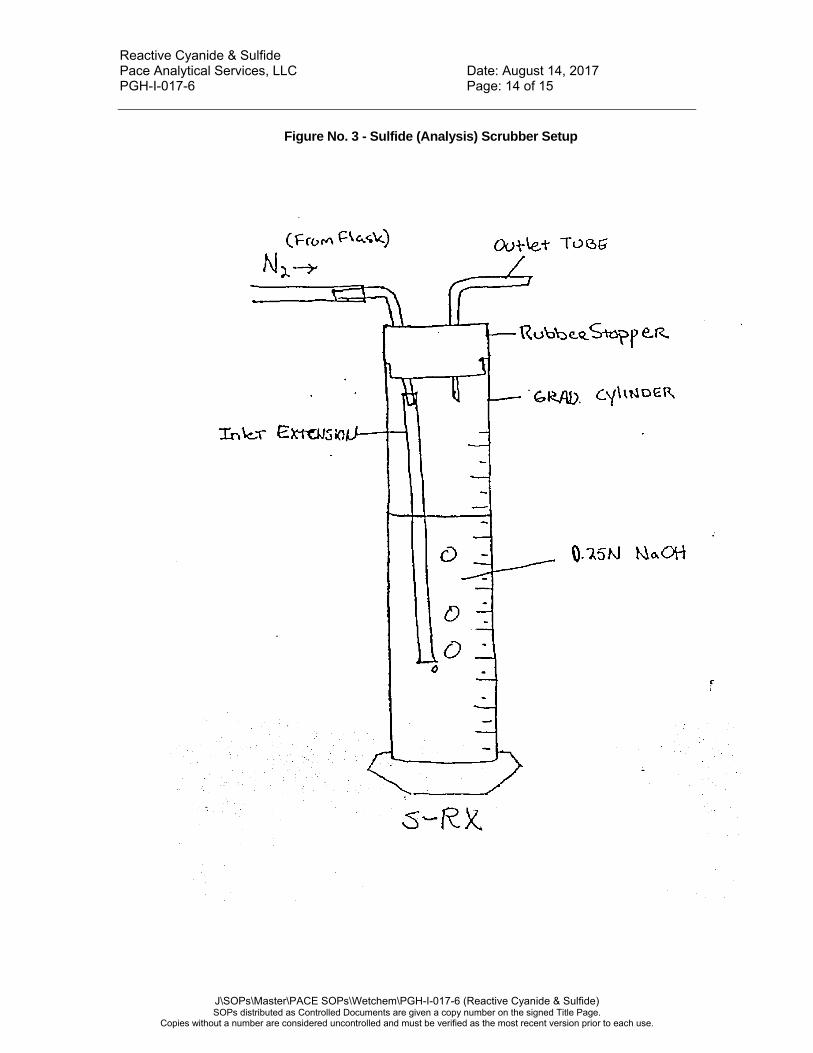
Reactive Cyanide & Sulfide Pace Analytical Services, LLC Date: August 14, 2017 PGH-I-017-6 Page: 14 of 15
J\SOPs\Master\PACE SOPs\Wetchem\PGH-I-017-6 (Reactive Cyanide & Sulfide) SOPs distributed as Controlled Documents are given a copy number on the signed Title Page.
Copies without a number are considered uncontrolled and must be verified as the most recent version prior to each use.
Figure No. 3 - Sulfide (Analysis) Scrubber Setup
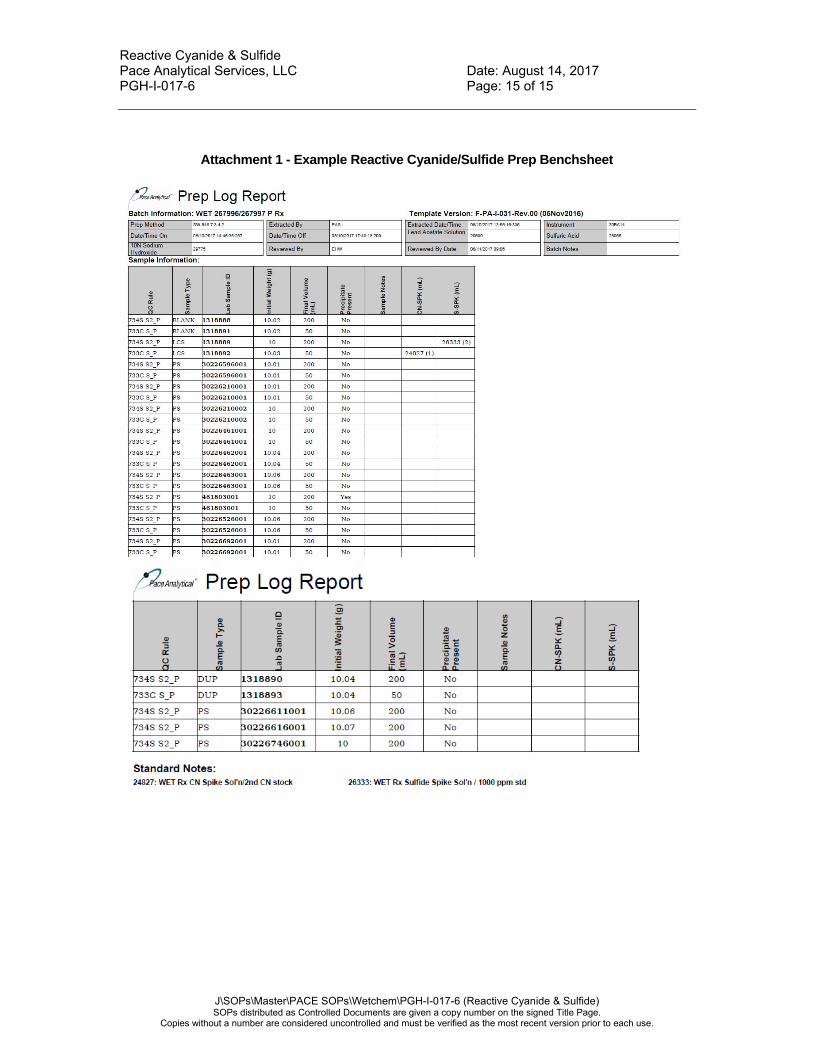
Reactive Cyanide & Sulfide Pace Analytical Services, LLC Date: August 14, 2017 PGH-I-017-6 Page: 15 of 15
J\SOPs\Master\PACE SOPs\Wetchem\PGH-I-017-6 (Reactive Cyanide & Sulfide) SOPs distributed as Controlled Documents are given a copy number on the signed Title Page.
Copies without a number are considered uncontrolled and must be verified as the most recent version prior to each use.
Attachment 1 - Example Reactive Cyanide/Sulfide Prep Benchsheet

Pace Analytical Services, LLC. – Green Bay WI 1241 Bellevue Street Suite 9
Green Bay, WI 54303 Phone: 920 469 2436
Fax: 920 469 8827
STANDARD OPERATING PROCEDURE
SAMPLE MANAGEMENT
Reference Methods: N/A
Local SOP Number: S-GB-C-010-Rev.08 Effective Date: Date of Final Signature
Supersedes: S-GB-C-010-Rev.07 SOP Template Number: SOT-ALL-C-001-rev.06
APPROVALS 04/27/17 Nils Melberg, Laboratory General Manager Date 4/3/2017 Kate Verbeten, Laboratory Quality Manager Date 4/27/17 Alee Her, Client Services Supervisor Date
PERIODIC REVIEW
SIGNATURES BELOW INDICATE NO CHANGES HAVE BEEN MADE SINCE PREVIOUS APPROVAL.
Signature Title Date
Signature Title Date
Signature Title Date
© 2002 – 2017 Pace Analytical Services, LLC. This Standard Operating Procedure may not be reproduced, in part or in full, without written consent of Pace Analytical Services, LLC. Whether distributed internally or as a “courtesy copy” to clients or regulatory agencies, this document is considered confidential and proprietary information. Copies without a distribution number below are considered uncontrolled. Any printed documents in use within a Pace Analytical Services, LLC laboratory have been reviewed and approved by the persons listed on the cover page. They can only be deemed official if proper signatures are present.
This is COPY# Distributed on by and is CONTROLLED
S-GB-C-010-Rev.08
TABLE OF CONTENTS
SECTION PAGE 1. Purpose/Identification of Method ............................................................................................ 3
2. Summary of Method ................................................................................................................. 3
3. Scope and Application .............................................................................................................. 3
4. Applicable Matrices .................................................................................................................. 3
5. Limits of Detection and Quantitation ..................................................................................... 3
6. Interferences .............................................................................................................................. 3
7. Sample Collection, Preservation, Shipment and Storage ...................................................... 4
8. Definitions .................................................................................................................................. 4
9. Equipment and Supplies (Including Computer Hardware and Software).......................... 5
10. Reagents and Standards ......................................................................................................... 6
11. Calibration and Standardization ........................................................................................... 6
12. Procedure ................................................................................................................................. 6
13. Quality Control ..................................................................................................................... 14
14. Data Analysis and Calculations ........................................................................................... 15
15. Data Assessment and Acceptance Criteria for Quality Control Measures ..................... 15
16. Corrective Actions for Out-of-Control Data ...................................................................... 15
17. Contingencies for Handling Out-of-Control or Unacceptable Data ................................ 15
18. Method Performance ............................................................................................................ 15
19. Method Modifications ........................................................................................................... 15
20. Instrument/Equipment Maintenance .................................................................................. 15
21. Troubleshooting .................................................................................................................... 15
22. Safety ...................................................................................................................................... 16
23. Waste Management .............................................................................................................. 16
24. Pollution Prevention ............................................................................................................. 16
25. References .............................................................................................................................. 16
26. Tables, Diagrams, Flowcharts, and Validation Data ......................................................... 17
27. Revisions ................................................................................................................................ 17
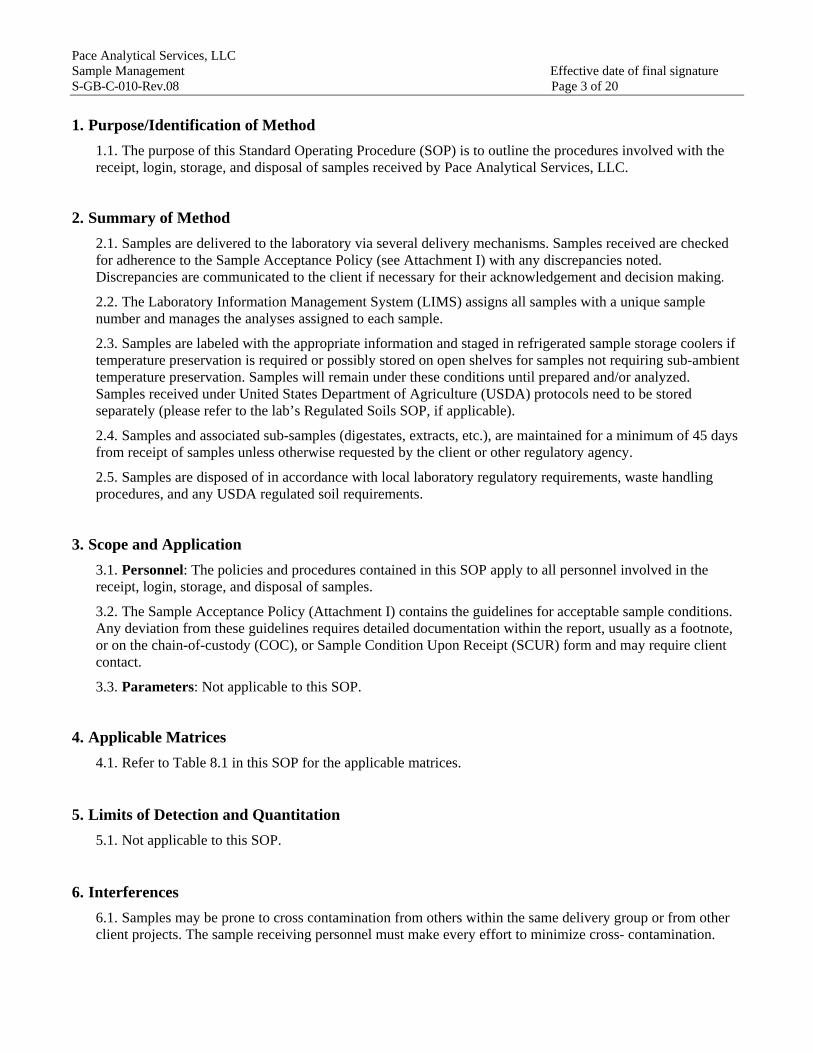
Pace Analytical Services, LLC Sample Management Effective date of final signature S-GB-C-010-Rev.08 Page 3 of 20
1. Purpose/Identification of Method
1.1. The purpose of this Standard Operating Procedure (SOP) is to outline the procedures involved with the receipt, login, storage, and disposal of samples received by Pace Analytical Services, LLC.
2. Summary of Method
2.1. Samples are delivered to the laboratory via several delivery mechanisms. Samples received are checked for adherence to the Sample Acceptance Policy (see Attachment I) with any discrepancies noted. Discrepancies are communicated to the client if necessary for their acknowledgement and decision making.
2.2. The Laboratory Information Management System (LIMS) assigns all samples with a unique sample number and manages the analyses assigned to each sample.
2.3. Samples are labeled with the appropriate information and staged in refrigerated sample storage coolers if temperature preservation is required or possibly stored on open shelves for samples not requiring sub-ambient temperature preservation. Samples will remain under these conditions until prepared and/or analyzed. Samples received under United States Department of Agriculture (USDA) protocols need to be stored separately (please refer to the lab’s Regulated Soils SOP, if applicable).
2.4. Samples and associated sub-samples (digestates, extracts, etc.), are maintained for a minimum of 45 days from receipt of samples unless otherwise requested by the client or other regulatory agency.
2.5. Samples are disposed of in accordance with local laboratory regulatory requirements, waste handling procedures, and any USDA regulated soil requirements.
3. Scope and Application
3.1. Personnel: The policies and procedures contained in this SOP apply to all personnel involved in the receipt, login, storage, and disposal of samples.
3.2. The Sample Acceptance Policy (Attachment I) contains the guidelines for acceptable sample conditions. Any deviation from these guidelines requires detailed documentation within the report, usually as a footnote, or on the chain-of-custody (COC), or Sample Condition Upon Receipt (SCUR) form and may require client contact.
3.3. Parameters: Not applicable to this SOP.
4. Applicable Matrices
4.1. Refer to Table 8.1 in this SOP for the applicable matrices.
5. Limits of Detection and Quantitation
5.1. Not applicable to this SOP.
6. Interferences
6.1. Samples may be prone to cross contamination from others within the same delivery group or from other client projects. The sample receiving personnel must make every effort to minimize cross- contamination.

Pace Analytical Services, LLC Sample Management Effective date of final signature S-GB-C-010-Rev.08 Page 4 of 20
6.2. Preservation checks are one of the most likely situations where cross-contamination may occur. Materials used in the process must be specific to each sample and may not used for multiple samples or multiple containers of the same sample.
6.3. Samples are stored under specific conditions and in specific locations, typically per the requirements of the analytical method. However, consideration must be given to samples that are uniquely different from others. Samples that are anticipated to be severely contaminated must be segregated from others in anticipation that the high levels of contaminants may cross-contaminate others in close proximity. USDA samples must also be distinctly segregated for storage.
7. Sample Collection, Preservation, Shipment and Storage
7.1. Acceptable sample preservation, containers, and hold times can be referenced in the Bottle and Preservation Table, available within the Pace Quality Assurance Manual, or as a separate document. Samples are stored separately from all standards and reagents and any known highly contaminated samples.
7.2. NOTE: To avoid contamination, no food or drink products can be located near the areas where samples are unpacked, labeled, or staged.
7.3. Sample Storage – See Section 12.3 for general storage guidelines.
8. Definitions
8.1. Definitions of terms found in this SOP are described in the Pace Analytical Services Quality Manual, Glossary Section.
8.2. Chain-of-Custody (COC): a form used to record the field identification of samples collected, analyses requested, date and time of collection, sample preservation used, and traceability of samples from time of collection until delivery to the laboratory. This is a legal document.
8.3. Laboratory Information Management System (LIMS): a computer system used to manage the flow and traceability of environmental samples and associated data within the laboratory.
8.4. Matrix: the bulk characteristics of a sample. See Table 8.1 below.
8.5. Safety Data Sheet (SDS): contains information on chemicals used in the laboratory.
8.6. Sample Custody: a sample is considered to be in someone’s custody if:
8.6.1. It is in one’s physical possession;
8.6.2. It is in someone’s view, after being in someone’s physical possession;
8.6.3. It is kept in a secured area, restricted to authorized personnel only.
8.7. Sample Condition Upon Receipt (SCUR) form: a form used to record the condition of samples received in the laboratory.
8.8. Sample Receipt Form (SRF): form generated by LIMS system after a project is logged in. Contains sample and project information.
8.9. UN Number - identification numbers preceded by the letters UN are associated with proper shipping names considered appropriate for international and domestic transportation. These shipping names along with the identification numbers are located in the Federal Register (49CFR172.101).
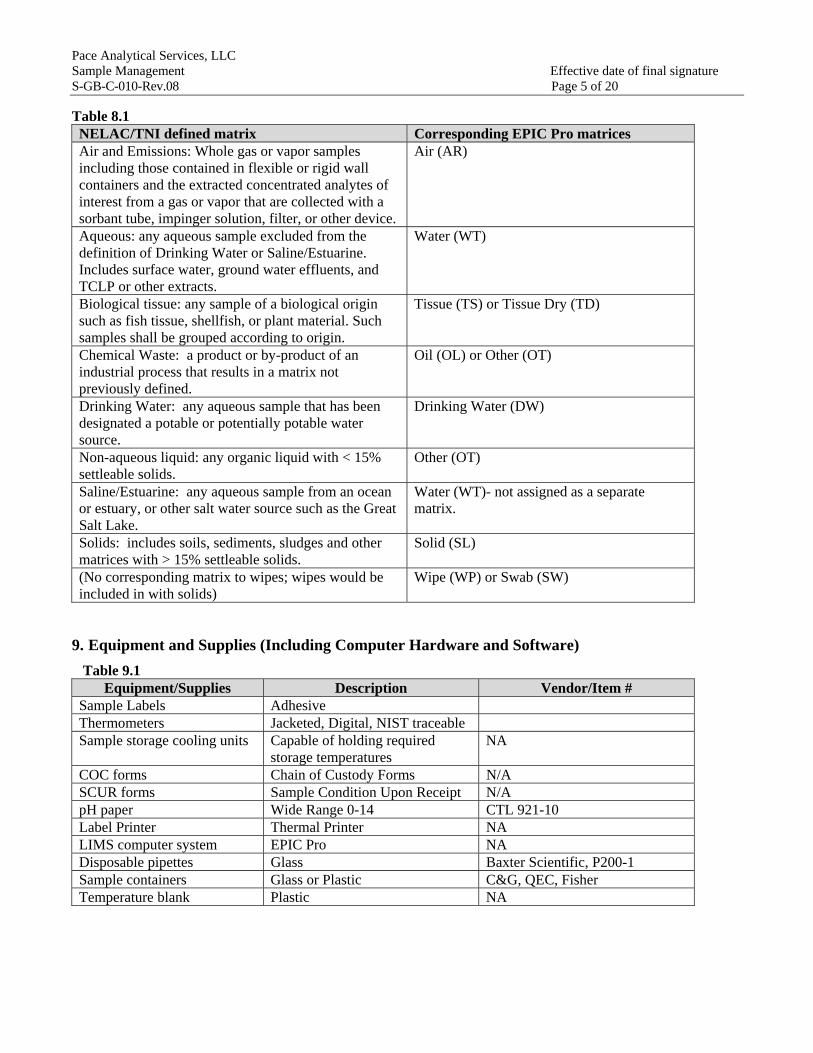
Pace Analytical Services, LLC Sample Management Effective date of final signature S-GB-C-010-Rev.08 Page 5 of 20
Table 8.1 NELAC/TNI defined matrix Corresponding EPIC Pro matrices Air and Emissions: Whole gas or vapor samples including those contained in flexible or rigid wall containers and the extracted concentrated analytes of interest from a gas or vapor that are collected with a sorbant tube, impinger solution, filter, or other device.
Air (AR)
Aqueous: any aqueous sample excluded from the definition of Drinking Water or Saline/Estuarine. Includes surface water, ground water effluents, and TCLP or other extracts.
Water (WT)
Biological tissue: any sample of a biological origin such as fish tissue, shellfish, or plant material. Such samples shall be grouped according to origin.
Tissue (TS) or Tissue Dry (TD)
Chemical Waste: a product or by-product of an industrial process that results in a matrix not previously defined.
Oil (OL) or Other (OT)
Drinking Water: any aqueous sample that has been designated a potable or potentially potable water source.
Drinking Water (DW)
Non-aqueous liquid: any organic liquid with < 15% settleable solids.
Other (OT)
Saline/Estuarine: any aqueous sample from an ocean or estuary, or other salt water source such as the Great Salt Lake.
Water (WT)- not assigned as a separate matrix.
Solids: includes soils, sediments, sludges and other matrices with > 15% settleable solids.
Solid (SL)
(No corresponding matrix to wipes; wipes would be included in with solids)
Wipe (WP) or Swab (SW)
9. Equipment and Supplies (Including Computer Hardware and Software)
Table 9.1 Equipment/Supplies Description Vendor/Item #
Sample Labels Adhesive Thermometers Jacketed, Digital, NIST traceable Sample storage cooling units Capable of holding required
storage temperatures NA
COC forms Chain of Custody Forms N/A SCUR forms Sample Condition Upon Receipt N/A pH paper Wide Range 0-14 CTL 921-10 Label Printer Thermal Printer NA LIMS computer system EPIC Pro NA Disposable pipettes Glass Baxter Scientific, P200-1 Sample containers Glass or Plastic C&G, QEC, Fisher Temperature blank Plastic NA
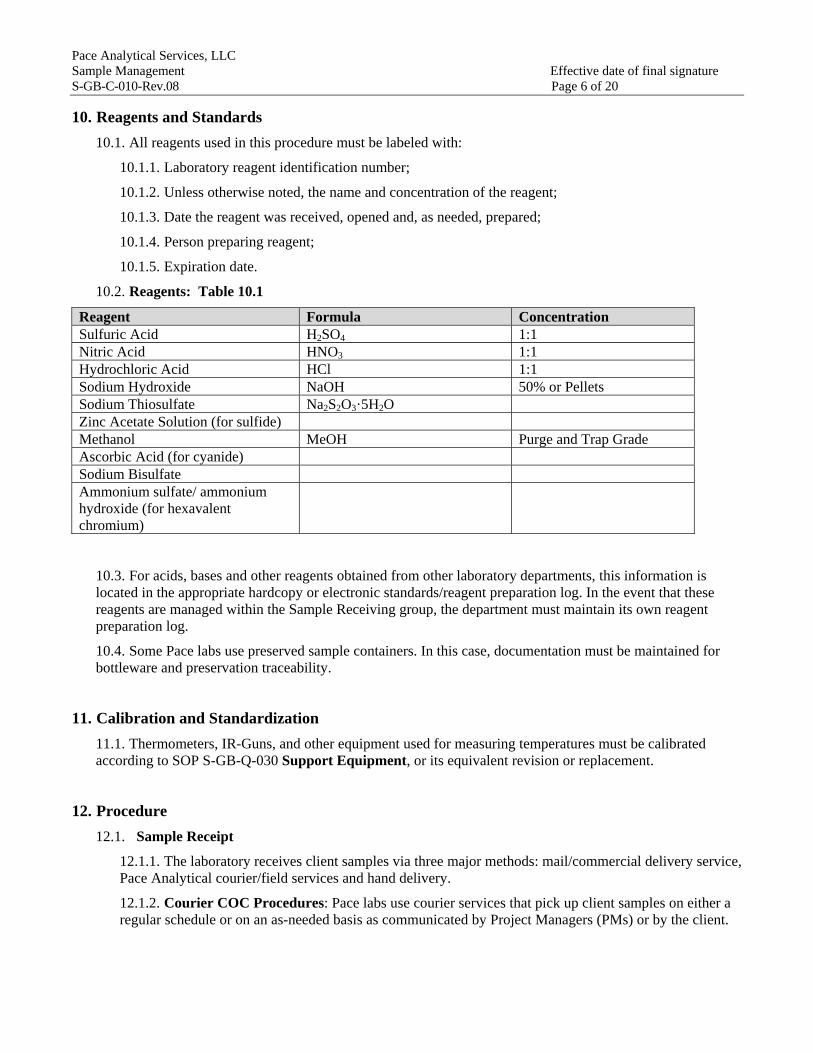
Pace Analytical Services, LLC Sample Management Effective date of final signature S-GB-C-010-Rev.08 Page 6 of 20
10. Reagents and Standards
10.1. All reagents used in this procedure must be labeled with:
10.1.1. Laboratory reagent identification number;
10.1.2. Unless otherwise noted, the name and concentration of the reagent;
10.1.3. Date the reagent was received, opened and, as needed, prepared;
10.1.4. Person preparing reagent;
10.1.5. Expiration date.
10.2. Reagents: Table 10.1
Reagent Formula Concentration Sulfuric Acid H2SO4 1:1 Nitric Acid HNO3 1:1 Hydrochloric Acid HCl 1:1 Sodium Hydroxide NaOH 50% or Pellets Sodium Thiosulfate Na2S2O3·5H2O Zinc Acetate Solution (for sulfide) Methanol MeOH Purge and Trap Grade Ascorbic Acid (for cyanide) Sodium Bisulfate Ammonium sulfate/ ammonium hydroxide (for hexavalent chromium)
10.3. For acids, bases and other reagents obtained from other laboratory departments, this information is located in the appropriate hardcopy or electronic standards/reagent preparation log. In the event that these reagents are managed within the Sample Receiving group, the department must maintain its own reagent preparation log.
10.4. Some Pace labs use preserved sample containers. In this case, documentation must be maintained for bottleware and preservation traceability.
11. Calibration and Standardization
11.1. Thermometers, IR-Guns, and other equipment used for measuring temperatures must be calibrated according to SOP S-GB-Q-030 Support Equipment, or its equivalent revision or replacement.
12. Procedure
12.1. Sample Receipt
12.1.1. The laboratory receives client samples via three major methods: mail/commercial delivery service, Pace Analytical courier/field services and hand delivery.
12.1.2. Courier COC Procedures: Pace labs use courier services that pick up client samples on either a regular schedule or on an as-needed basis as communicated by Project Managers (PMs) or by the client.
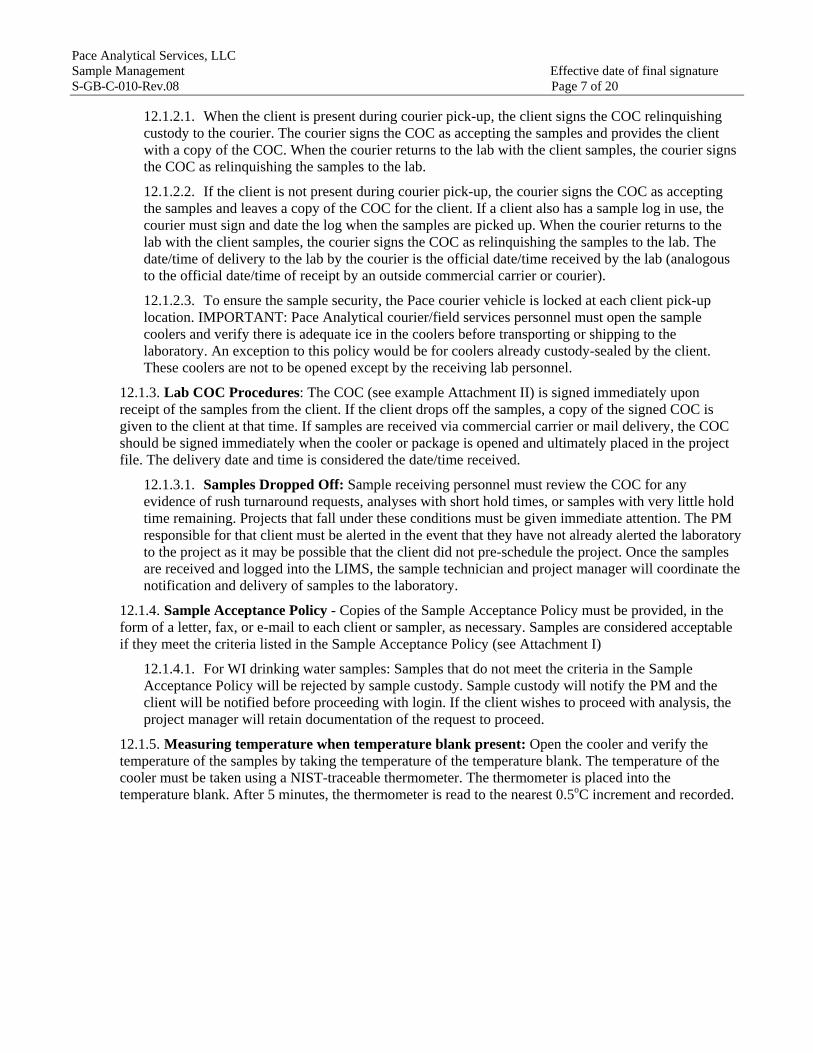
Pace Analytical Services, LLC Sample Management Effective date of final signature S-GB-C-010-Rev.08 Page 7 of 20
12.1.2.1. When the client is present during courier pick-up, the client signs the COC relinquishing custody to the courier. The courier signs the COC as accepting the samples and provides the client with a copy of the COC. When the courier returns to the lab with the client samples, the courier signs the COC as relinquishing the samples to the lab.
12.1.2.2. If the client is not present during courier pick-up, the courier signs the COC as accepting the samples and leaves a copy of the COC for the client. If a client also has a sample log in use, the courier must sign and date the log when the samples are picked up. When the courier returns to the lab with the client samples, the courier signs the COC as relinquishing the samples to the lab. The date/time of delivery to the lab by the courier is the official date/time received by the lab (analogous to the official date/time of receipt by an outside commercial carrier or courier).
12.1.2.3. To ensure the sample security, the Pace courier vehicle is locked at each client pick-up location. IMPORTANT: Pace Analytical courier/field services personnel must open the sample coolers and verify there is adequate ice in the coolers before transporting or shipping to the laboratory. An exception to this policy would be for coolers already custody-sealed by the client. These coolers are not to be opened except by the receiving lab personnel.
12.1.3. Lab COC Procedures: The COC (see example Attachment II) is signed immediately upon receipt of the samples from the client. If the client drops off the samples, a copy of the signed COC is given to the client at that time. If samples are received via commercial carrier or mail delivery, the COC should be signed immediately when the cooler or package is opened and ultimately placed in the project file. The delivery date and time is considered the date/time received.
12.1.3.1. Samples Dropped Off: Sample receiving personnel must review the COC for any evidence of rush turnaround requests, analyses with short hold times, or samples with very little hold time remaining. Projects that fall under these conditions must be given immediate attention. The PM responsible for that client must be alerted in the event that they have not already alerted the laboratory to the project as it may be possible that the client did not pre-schedule the project. Once the samples are received and logged into the LIMS, the sample technician and project manager will coordinate the notification and delivery of samples to the laboratory.
12.1.4. Sample Acceptance Policy - Copies of the Sample Acceptance Policy must be provided, in the form of a letter, fax, or e-mail to each client or sampler, as necessary. Samples are considered acceptable if they meet the criteria listed in the Sample Acceptance Policy (see Attachment I)
12.1.4.1. For WI drinking water samples: Samples that do not meet the criteria in the Sample Acceptance Policy will be rejected by sample custody. Sample custody will notify the PM and the client will be notified before proceeding with login. If the client wishes to proceed with analysis, the project manager will retain documentation of the request to proceed.
12.1.5. Measuring temperature when temperature blank present: Open the cooler and verify the temperature of the samples by taking the temperature of the temperature blank. The temperature of the cooler must be taken using a NIST-traceable thermometer. The thermometer is placed into the temperature blank. After 5 minutes, the thermometer is read to the nearest 0.5oC increment and recorded.
Pace Analytical Services, LLC Sample Management Effective date of final signature S-GB-C-010-Rev.08 Page 8 of 20
12.1.6. Measuring temperature when NO temperature blank present: If there is no temperature blank in the cooler, measure the temperature of a representative sample bottle or cooler melt water. A representative sample will reflect an “average” condition of the samples in the cooler and, depending on the manner in which they are packed, may not necessarily be in direct contact with the cooling material.
12.1.6.1. Procedure using a stick thermometer: If an IR gun is not used, the temperature of the cooler must be taken using a NIST-traceable thermometer. If there is no temperature blank, the thermometer is placed into the melt water of the cooler for approximately 5 minutes. After 5 minutes, the thermometer is read to the nearest 0.5oC increment and recorded. If no ice is present, a sample aliquot (non-volatile) is poured into a small container and the temperature of the sample is taken.
12.1.6.2. Procedure using an IR gun: If an IR gun is used, the temperature must be taken from an opaque surface such as the bottle label. Measurements taken through a transparent surface (clear or amber glass) may not be reliable and must incorporate a specific temperature correction factor for that surface reading.
12.1.7. Record the uncorrected and corrected cooler temperatures on the COC (example in Attachment II) and/or SCUR form (example in Attachment III) . In addition, record the type of “ice” used for packing the cooler (e.g., wet ice, “blue ice”, gel packs, etc.).
12.1.8. If samples within a project are spread over multiple coolers and one or more of the coolers are outside of the temperature criteria, then the contents of the cooler must be itemized and the samples and sample containers affected by the out-of-control temperature must be listed on the SCUR form for qualification in the final report. This itemization must be retained in the project file for future reference.
12.1.9. Unpack the cooler and COC. Organize the samples, grouped by client sample ID, according to the order on the COC. Review COC against samples to make sure the bottles received match the analysis requested. All anomalies must be recorded on the SCUR form.
12.1.9.1. If the lab receives coolers late or cannot unpack a cooler until the following day the following is performed:
12.1.9.1.1. The cooler is visually inspected and opened.
12.1.9.1.2. The COC is removed and signed.
12.1.9.1.3. The temperature of the cooler is taken and recorded on COC.
12.1.9.1.4. The COC is checked for short hold time samples. If short hold time samples are present, the cooler is processed immediately.
12.1.9.1.5. If short hold time samples are not present, the cooler and contents are placed into the designated Walk-in Cooler to be processed the following day.
12.1.10. For USDA samples, the cooler and all contents must be decontaminated (refer to Regulated Soil SOP for procedure). For non-USDA samples, discard any ice or water that remains in the cooler and the packing material used to secure the samples. Water or ice should be discarded down a drain that connects to the local sewer. Packing materials should be placed in the garbage. If a sample container was broken, the contents remaining in the cooler MUST be discarded in a manner consistent with the hazardous waste handling standard operating procedure.

Pace Analytical Services, LLC Sample Management Effective date of final signature S-GB-C-010-Rev.08 Page 9 of 20
12.1.11. pH Verification Instructions:
12.1.11.1. The pH of the sample must be verified on all preserved sample bottles requiring pH preservation (see exceptions below).
12.1.11.2. Open each preserved bottle (except as noted below). Use a new disposable pipette, a stirring rod or another inert utensil to withdraw a small portion of the sample. Dispense the aliquot on a sample specific pH strip and check the pH.
12.1.11.3. NOTE: Do not check the pH of samples for coliform, volatiles, Total Organic Carbon (TOC), Wisconsin Diesel Range Organics (WI-DRO), oil and grease, or hexane extractable materials (HEM). These analyses will be checked by the analyst at the bench and must not be opened by sample management personnel.
Table 12.1 – General pH Preservation Requirements by Preservative
Sample Preservatives Sample pH Requirement Hydrochloric Acid (HCl) must be less than 2 Nitric Acid (HNO3) must be less than 2 Sulfuric Acid (H2SO4) must be less than 2 Sodium Hydroxide (NaOH) must be greater than 12 Zinc Acetate and Sodium Hydroxide (NaOH) must be greater than 9
12.1.11.4. If the pH for a sample container that is supposed to be preserved is not within the required range, indicate the anomaly on the SCUR form or on the COC. If a sample does not require preservation, write N/A in the applicable section of the SCUR form.
12.1.12. pH Preservation Adjustments:
12.1.12.1. If a sample container does not meet the pH preservation required, the pH of the sample must be recorded on the COC or SCUR. Additional preservative is added so that the preservative content is < 1% of the sample container volume. For example:
12.1.12.1.1. For a 100mL container, a maximum of 1mL of preservative may be added;
12.1.12.1.2. For a 250mL container, a maximum of 2.5mL of preservative may be added;
12.1.12.1.3. For a 500mL container, a maximum of 5mL of preservative may be added;
12.1.12.1.4. For a 1L container, a maximum of 10mL of preservative may be added.
12.1.12.2. The appropriate preservative is added to the sample container, the sample is mixed and the pH is taken again. The new pH reading is also recorded on the COC or SCUR along with the amount, type and lot number of the preservative added. In addition, the sample container is marked with the preservative added, volume added, date, time and initials of the technician. For Metals analyses specifically, the lab must wait 24 hours after pH adjustment to pH < 2 before sample preparation can begin.
12.1.12.3. If unpreserved sample is received by lab and requires preservation, a clean container is used with appropriate preservation. An aliquant of unpreserved sample is poured out into preserved containers. Sample container is marked with a yellow sticker to notify lab that preservation was done in-house.
Pace Analytical Services, LLC Sample Management Effective date of final signature S-GB-C-010-Rev.08 Page 10 of 20
12.1.13. Total Residual Chlorine Verification Instructions - Total residual chlorine must be verified at the bench as required by the method or individual state regulatory agency for certain analyses (see Table 12.2). Do not check the sample bottles for those analyses listed in 12.1.11.3.
12.1.14.1. Open the appropriate sample container. Utilizing a new disposable pipette, stirring bar or other inert utensil; withdraw a small portion of the sample. Dispense the aliquot on a sample specific residual chlorine test strip.
12.1.14.2. If any chlorine is detected, regardless of amount, note the information on the COC, SCUR or analytical bench sheet.
Table 12.2 – Analyses requiring Residual Chlorine Verification
Analyses Ammonia (NH3) EPA 350.1 Nitrate (NO3) EPA 353.2 Biochemical Oxygen Demand (BOD) SM5210B Cyanides SM4500 CN and EPA 335.4 Dioxin 1613B PBDE 1614 PCBs 1668A EPA 508.1 EPA 549.2 EPA 515.3 EPA 548.1 EPA 608 EPA 610 EPA 625
12.1.14. Checking for Sulfide in Cyanide analyses: Test for sulfide by placing a drop of sample onto a piece of lead acetate paper. Darkening of the paper indicates the presence of sulfide. Follow specific method instructions for removing sulfide from samples.
12.1.15. Note any discrepancies pertaining to samples as defined by the sample acceptance policy detailed above on the COC or SCUR. Any discrepancies involving temperature, preservation, hold time, collection dates and times, sample volume, sample containers, and unclear analysis, must be reported to project management as soon as possible.

Pace Analytical Services, LLC Sample Management Effective date of final signature S-GB-C-010-Rev.08 Page 11 of 20
12.1.16. For short hold samples, the laboratory is notified and the samples are staged per section 12.2.
Table 12.3 – Analyses with Hold Times Less Than 72 Hours
Short Hold Time Analyses Details 15 minutes Field Parameters pH, Dissolved Oxygen, Residual
Chlorine 8 Hours Total/Fecal Coliform (MPN, MF),
Enterococci, Fecal Streptococci MPN Non-potable water only
8 Hours Heterotrophic Plate Count (HPC) 24 Hours Hexavalent Chromium 24 Hours Fecal Sludge MPN 24 Hours Odor 30 Hours Total Coliform (Presence / Absence) 48 Hours Color 48 Hours MBAS 48 Hours Nitrate (unpreserved) If Preserved, reported as
NO3+NO2 48 Hours Nitrite (unpreserved) If Preserved, reported as
NO3+NO2 48 Hours Ortho –phosphate 48 Hours Settable Solids 48 Hours Turbidity 48 Hours VOA - Soils by Unpreserved EPA5035 Jars, Encores, Sleeves 48 Hours Gross Alpha (NJ 48hr method)-waters EPA NJAC 7:18-6 48 Hours UV254 48 Hours Asbestos 48 Hours Chlorophyll A 48 hours to filtration 72 Hours 3030C Metals 72 Hours Volatiles – Air TO-18 Tedlar bag or equivalent
12.2. Sample Login
12.2.1. All samples received by the laboratory must be logged into the LIMS. Rush projects and/or projects with short holds should be prioritized. After these projects have been addressed, projects should be addressed on a first in, first out basis.
12.2.1.1. Samples must be logged into the LIMS so the samples can be uniquely identified (lab sample identification numbers). These lab sample ID numbers are used to track the prep and analysis activities of the samples, as well as identify the sub-samples, digestates, extracts, and other sample byproducts. This laboratory code maintains an unequivocal link with the unique client field sample ID code assigned to each sample.
12.2.1.2. Clients and Project Profiles are created in EPIC Pro as per Training Document T-ALL-IT-002 Epic Pro 02: Client Setup. Projects are logged as per Section 1 of Training Document T-ALL-IT-005 Epic Pro: Login (most current revisions or replacements).
12.2.1.3. Tests are assigned as per Training Document T-ALL-IT-002 Epic Pro 02: Client Setup, and as per Section 1 of Training Document T-ALL-IT 005 Epic Pro: Login.
Pace Analytical Services, LLC Sample Management Effective date of final signature S-GB-C-010-Rev.08 Page 12 of 20
12.2.2. Generate sample labels.
12.2.2.1. Local SRF generation is as per Section 3 of Training Document T-ALL-IT-005 Epic Pro: Login.
12.2.2.2. Local sample label generation is as per Section 2 of Training Document T-ALL-IT-005 Epic Pro: Login.
12.2.3. Attach the sample labels to the appropriate sample bottles.
12.2.3.1. Sample Management must make sure all sample ID’s match COC, Samples are staged on the counter in rows by Sample ID. All sample containers are recorded on COC.
12.2.3.2. Sample labels are printed in Sample Management. One label is printed per sample container.
12.2.3.3. The label is placed onto the side of the container
12.2.4. If any samples require analyses performed outside of the laboratory, prepare the samples for subcontracting according to the procedures listed in the SOP describing the subcontracting of analytical services, S-GB-C-009 Subcontracting Samples, or equivalent revision or replacement.
12.2.5. The Project Manager, Project Coordinator, or designated Client Services personnel must review and verify the following information by comparing the COC to SRF. Some of this information may not be provided by the client and those fields should be left blank:
12.2.7.1. Report Recipient;
12.2.7.2. Invoice Recipient;
12.2.7.3. Additional Report Recipient;
12.2.7.4. PO#;
12.2.7.5. Project Name;
12.2.7.6. Project Number;
12.2.7.7. Requested Due Date;
12.2.7.8. Sample ID;
12.2.7.9. Matrix;
12.2.7.10. Collection Date & Time;
12.2.7.11. Received Date & Time;
12.2.7.12. Analysis: Double check compound lists;
12.2.7.13. Price;
12.2.7.14. Region Codes;
12.2.7.15. Work Region % Split (for Pace internal subcontracted work).
Pace Analytical Services, LLC Sample Management Effective date of final signature S-GB-C-010-Rev.08 Page 13 of 20
12.3. Sample Storage
12.3.1. Once unpacked, samples will be logged into the LIMS in a timely manner and returned to appropriate storage conditions as soon as possible. Labs must make every effort to keep samples under the required thermal conditions during the login process. For the exceptional case where samples are not logged in the day they were received, they must be stored under appropriate temperature-controlled conditions until login takes place. In all cases, the sample temperatures must be taken as soon after receipt as possible (before samples are placed into storage) and the samples stored so as to maintain the required storage conditions while awaiting log-in.
12.3.2. Once logged into the LIMS and labeled, samples are placed in the appropriate storage areas. Specific temperature requirements are outlined in the analytical methods, but general guidelines are outlined below:
12.3.2.1. Short hold samples are placed in the short hold storage area or delivered directly to the laboratory.
12.3.2.2. Biological tissue samples are staged by receiving date or project number on shelves in a freezer for all types of analyses.
12.3.2.3. Summa canisters and Tedlar bags are stored on designated shelving at ambient temperature.
12.3.2.4. Volatiles- Aqueous samples are stored by receiving date or by project number in a segregated volatiles cooler. Associated trip blanks are stored with the samples.
12.3.2.5. Volatiles- Soil and other solid samples received preserved in methanol are stored by receiving date or by project number in a segregated volatile cooler. Associated trip blanks are stored with the samples.
12.3.2.6. Volatiles- Soil and other solid samples received preserved with a stir bar, or deionized water and a stir bar, are stored by receiving date or by project number in a segregated volatiles freezer. Associated trip blanks are stored with samples.
12.3.2.7. Volatiles- Soil and other solid samples received in 4oz containers or similar bottleware must be preserved within 48 hours. In order to preserve these samples, it is necessary to collect a 5g aliquot of the sample and transfer it to a 40mL vial. One of the following preservation options must be utilized:
12.3.2.7.1. The 5g aliquot is preserved with a stir bar, 5mL of deionized water and a stir bar, or 5mL of sodium bisulfate and a stir bar and stored in a freezer until analysis, or;
12.3.2.7.2. Within 48 hours of collection in the field, the 5g aliquot must be immediately extracted with 5mL of methanol and stored in a segregated volatiles cooler until analysis, or;
12.3.2.7.3. Within 48 hours of collection in the field, the 5g aliquot can be preserved with 10mL of deionized water and a stir bar, stored in a segregated volatile cooler and analyzed within 48 hours of collection.
12.3.2.8. Volatiles- Soil and other solid samples received in Encore samplers must be managed within 48 hours of collection by freezing the Encore or extruding it.
12.3.2.8.1. If extruding the sample into a 40mL vial containing a stir bar or a stir bar and 10mL of deionized water, then the sample is stored in the segregated volatile freezer until analysis.
12.3.2.8.2. If extruding the sample into methanol, then the sample is extracted within 48 hours of collection and the sample is stored in a segregated volatile cooler until analysis.

Pace Analytical Services, LLC Sample Management Effective date of final signature S-GB-C-010-Rev.08 Page 14 of 20
12.3.2.8.3. NOTE: if samples are not received within 48 hours of collection or are not received with enough time to process the samples correctly within 48 hours of collection, this must be noted in a way that will be visible on the final report (e.g., footnote in LIMS).
12.3.2.9. General Chemistry/Semi-volatiles- Waters and other liquid samples are staged by receiving date or by project number on the shelves in the appropriate sample storage cooler.
12.3.2.10. General Chemistry/Semi-volatiles- Soils and other solid samples are staged by receiving date or by project number on the shelves in the appropriate sample storage cooler.
12.3.2.11. Metals Solids and Liquids: These samples are staged by receiving date or by project number on designated shelving in the laboratory or appropriate designated area. These samples may be stored at ambient temperature unless Mercury or Hexavalent Chromium analysis is needed. If Mercury or Hexavalent Chromium analysis will be performed, the samples are staged by receiving date or by project number in the appropriate sample storage cooler. Samples requiring low level mercury analysis by Method 1631 are taken to the clean room for preservation and ambient storage.
12.4. Sample Retention and Disposal
12.4.1. If samples must be returned to customers, the lab must take special care to ensure that the samples are not damaged during any handling, testing, storing, or transporting processes.
12.4.2. Samples may need to be retained longer than the normal sample retention time (45 days from sample receipt). Reasons for this extended sample retention include: customer, program, or contract requirements so that samples can be retained in a secure location for the customers that is designated as a long-term storage area.
12.4.3. Disposal of unconsumed samples: Refer to the laboratory SOPs regarding waste handling and disposal: Waste Management and Handling S-GB-W-001, and Regulated Soil Handling S-GB-S-001, or current revisions or replacements.
13. Quality Control
13.1. For any sample received at the laboratory that does not meet the sample acceptance, hold time or preservation criteria, the client must be contacted by project management and advised of the situation.
13.1.1. If the client instructs the laboratory to proceed with the analysis, all appropriate personnel/departments must be informed and the client approval must be documented on the SCUR or COC. Data will be appropriately qualified.
13.1.2. The client may also instruct the laboratory to preserve the samples at the laboratory prior to proceeding with analysis. This must be documented on the COC or the SCUR, and must be noted in the final laboratory report.
13.2. All supporting documentation related to sample custody must be retained by the laboratory. This includes: memorandums, fax transmissions, the original COC, all paperwork received with the COC, the completed SCUR form and copies of email transmissions. Please contact the laboratory QM/SQM for documentation retention time frames required.
13.3. Documenting discrepancies during receipt of samples:
13.3.1. The following are examples of client discrepancies that need to be documented on the appropriate paperwork (e.g., SCUR form):
13.3.1.1. Lost samples/insufficient sample volume;
13.3.1.2. Broken or missing bottles;
Pace Analytical Services, LLC Sample Management Effective date of final signature S-GB-C-010-Rev.08 Page 15 of 20
13.3.1.3. Missing COC;
13.3.1.4. Mislabeled bottles;
13.3.1.5. Preservation error;
13.3.1.6. Missing sample related details (date, time, sample type).
13.3.2. Pace sample management discrepancies will be documented on the SCUR form, COC or within the project files. Discrepancies attributable to errors and omissions on the part of the laboratory will be addressed and resolved through the formal corrective action process.
14. Data Analysis and Calculations
14.1. Not applicable to this SOP.
15. Data Assessment and Acceptance Criteria for Quality Control Measures
15.1. Not applicable to this SOP.
16. Corrective Actions for Out-of-Control Data
16.1. Not applicable to this SOP.
17. Contingencies for Handling Out-of-Control or Unacceptable Data
17.1. Not applicable to this SOP.
18. Method Performance
18.1. All applicable personnel must read and understand this SOP with documentation of SOP review maintained in their training files.
19. Method Modifications
19.1. Not applicable to this SOP.
20. Instrument/Equipment Maintenance
20.1. Not applicable to this SOP.
21. Troubleshooting
21.1. Not applicable to this SOP.
Pace Analytical Services, LLC Sample Management Effective date of final signature S-GB-C-010-Rev.08 Page 16 of 20
22. Safety
22.1. Hazards and Precautions - Use extreme caution in handling samples and wastes as they may be hazardous. Each reagent and chemical used in this method should be treated as a potential health hazard. Reduce exposure by the use of gloves, lab coats, safety glasses, and ventilation hoods. SDS are on file and available to all personnel.
22.2. All personnel involved in sample management are responsible for complying with OSHA and DOT regulations. These regulations pertain to the safe handling and/or shipping of the chemicals specified in this procedure. Refer to the Sample Control Supervisor for any questions or concerns related to the safe handling and shipment of hazardous materials.
22.3. Other laboratory safety requirements are contained in the Chemical Hygiene Plan/Safety Manual. Immediate questions can also be addressed with the local Safety Officer.
23. Waste Management
23.1. Not applicable to this SOP.
24. Pollution Prevention
24.1. Not applicable to this SOP.
25. References
25.1. Pace Quality Assurance Manual- most current version.
25.2. National Environmental Laboratory Accreditation Conference (NELAC) Standard- most current version.
25.3. The NELAC Institute (TNI) Standard- most current version applicable to each lab.
25.4. SW-846, Test Methods for Evaluating Solid Waste Physical/Chemical Methods, USEPA, current revision.
25.5. American Public Health Association, American Water Works Association, and Water Pollution Control Federation, 1995, Standard Methods for the Examination of Water and Wastewater, A.E. Greenberg, L.W. Clesceri, A.D. Eaton and M.A.H. Franson, eds., 19th ed., American Public Health Association, Washington D.C.
25.6. U.S. Environmental Protection Agency, 1983, Methods for Chemical Analysis of Water and Wastes, EPA-600/4-79-020, Environmental Monitoring and Support Laboratory, Cincinnati, Ohio.
25.7. U.S. Environmental Protection Agency, 1988, Methods for Determination of Organic Compounds in Drinking Water, EPA/600/4-88/039, Environmental Monitoring Systems Laboratory, Cincinnati, Ohio.
25.8. Code of Federal Regulations- most recent version.
Pace Analytical Services, LLC Sample Management Effective date of final signature S-GB-C-010-Rev.08 Page 17 of 20
26. Tables, Diagrams, Flowcharts, and Validation Data
26.1. Attachment I: Sample Acceptance Policy, from form F-ALL-C-006.
26.2. Attachment II – Example Chain of Custody, F-ALL-Q-020.
26.3. Attachment III – Example Sample Condition Upon Receipt form, F-ALL-C-003.
27. Revisions
Document Number Reason for Change Date
SOT-ALL-C-001-rev.06
Cover page: revised the footer language and removed the uncontrolled document numbering line. General: made administrative edits that do not affect the policies or procedures within the document. Table 8.1: updated to match 2016 TNI Standard. Section 12.1.2.3: removed language regarding custody seals. Section 12.1.4: removed all Sample Acceptance Policy language in lieu of Attachment I. Sections 12.1.5, 12.1.6: reworded for clarity. Section 12.1.11, 12.1.13, 12.1.14: changed some text from red to black. Section 12.2.5: new section added requiring the state of origin to be documented. New Attachment I: Added Sample Acceptance Policy from form F-ALL-C-006. Old Attachment III: removed example SRF. Old Attachment IV: removed bottle/preservation table and all references to it within the SOP. 03Apr2017
S-GB-C-010-Rev.08 General: Added Pace-GB specific information which was in previous version of local SOP. 03Apr2017
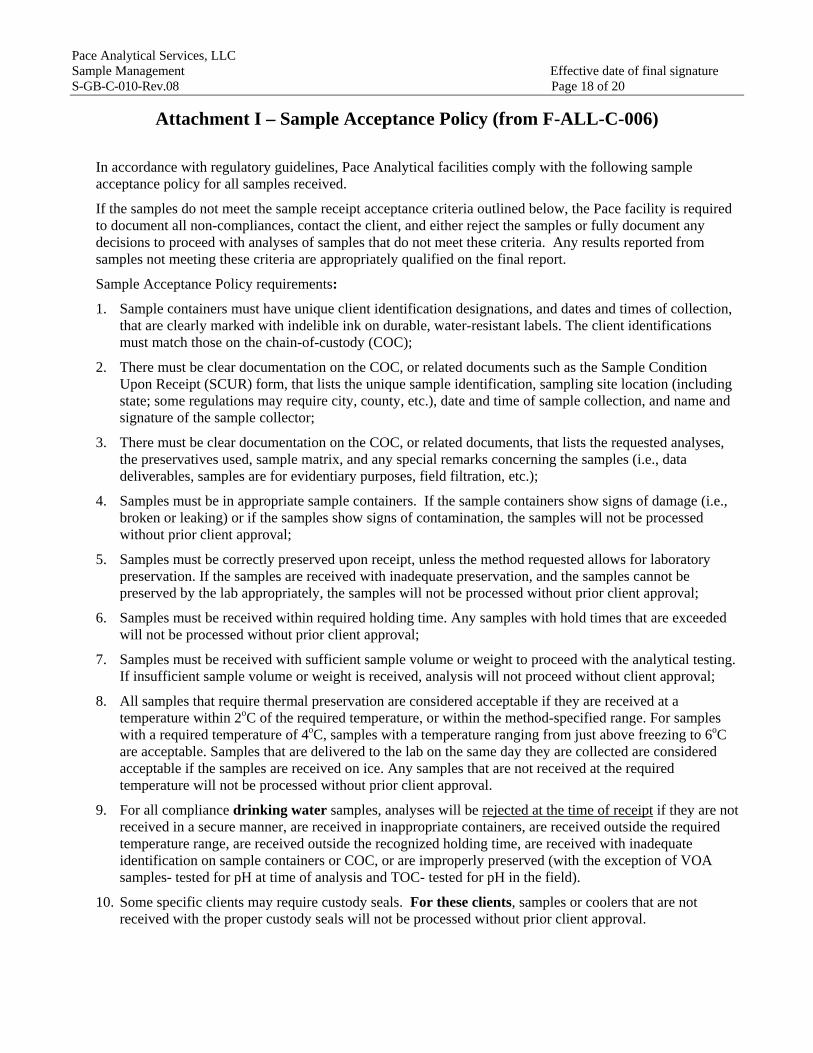
Pace Analytical Services, LLC Sample Management Effective date of final signature S-GB-C-010-Rev.08 Page 18 of 20
Attachment I – Sample Acceptance Policy (from F-ALL-C-006)
In accordance with regulatory guidelines, Pace Analytical facilities comply with the following sample acceptance policy for all samples received.
If the samples do not meet the sample receipt acceptance criteria outlined below, the Pace facility is required to document all non-compliances, contact the client, and either reject the samples or fully document any decisions to proceed with analyses of samples that do not meet these criteria. Any results reported from samples not meeting these criteria are appropriately qualified on the final report.
Sample Acceptance Policy requirements:
1. Sample containers must have unique client identification designations, and dates and times of collection, that are clearly marked with indelible ink on durable, water-resistant labels. The client identifications must match those on the chain-of-custody (COC);
2. There must be clear documentation on the COC, or related documents such as the Sample Condition Upon Receipt (SCUR) form, that lists the unique sample identification, sampling site location (including state; some regulations may require city, county, etc.), date and time of sample collection, and name and signature of the sample collector;
3. There must be clear documentation on the COC, or related documents, that lists the requested analyses, the preservatives used, sample matrix, and any special remarks concerning the samples (i.e., data deliverables, samples are for evidentiary purposes, field filtration, etc.);
4. Samples must be in appropriate sample containers. If the sample containers show signs of damage (i.e., broken or leaking) or if the samples show signs of contamination, the samples will not be processed without prior client approval;
5. Samples must be correctly preserved upon receipt, unless the method requested allows for laboratory preservation. If the samples are received with inadequate preservation, and the samples cannot be preserved by the lab appropriately, the samples will not be processed without prior client approval;
6. Samples must be received within required holding time. Any samples with hold times that are exceeded will not be processed without prior client approval;
7. Samples must be received with sufficient sample volume or weight to proceed with the analytical testing. If insufficient sample volume or weight is received, analysis will not proceed without client approval;
8. All samples that require thermal preservation are considered acceptable if they are received at a temperature within 2oC of the required temperature, or within the method-specified range. For samples with a required temperature of 4oC, samples with a temperature ranging from just above freezing to 6oC are acceptable. Samples that are delivered to the lab on the same day they are collected are considered acceptable if the samples are received on ice. Any samples that are not received at the required temperature will not be processed without prior client approval.
9. For all compliance drinking water samples, analyses will be rejected at the time of receipt if they are not received in a secure manner, are received in inappropriate containers, are received outside the required temperature range, are received outside the recognized holding time, are received with inadequate identification on sample containers or COC, or are improperly preserved (with the exception of VOA samples- tested for pH at time of analysis and TOC- tested for pH in the field).
10. Some specific clients may require custody seals. For these clients, samples or coolers that are not received with the proper custody seals will not be processed without prior client approval.
Pace Analytical Services, LLC Sample Management Effective date of final signature S-GB-C-010-Rev.08 Page 19 of 20
Attachment II – Example Chain-of-Custody Form
Pace Analytical Services, LLC Sample Management Effective date of final signature S-GB-C-010-Rev.08 Page 20 of 20
Attachment III – Example Sample Condition Upon Receipt Form

Pace Analytical Services, LLC Green Bay, WI 1241 Bellevue Street Suite 9
Green Bay, WI 54302 Phone: 920 469-2436
Fax: 920 469-8827
STANDARD OPERATING PROCEDURE
Total Cyanide using Micro-Distillation and SmartChem
Reference Method: SW846 9012B and EPA 335.4
SOP NUMBER: S-GB-I-064-REV.04
EFFECTIVE DATE: Date of Final Signature
SUPERSEDES: S-GB-I-064-Rev.03
APPROVAL __________________________________________ 06/21/17 Nils Melberg, Laboratory General Manager Date
__________________________________________ 6/21/17 Kate Verbeten, Laboratory Quality Manager Date __________________________________________ 06/21/2017 Chad Rusch, Department Manager Date
PERIODIC REVIEW SIGNATURES BELOW INDICATE NO CHANGES HAVE BEEN MADE SINCE APPROVAL.
Signature Title Date
Signature Title Date
Signature Title Date
© 2002 - 2017 Pace Analytical Services, LLC. This Standard Operating Procedure may not be reproduced, in part or in full, without written consent of Pace Analytical Services, LLC. Whether distributed internally or as a “courtesy copy” to clients or regulatory agencies, this document is considered confidential and proprietary information. Copies without a distribution number below are considered uncontrolled. Any printed documents in use within a Pace Analytical Services, LLC. laboratory have been reviewed and approved by the persons listed on the cover page. They can only be deemed official if proper signatures are present.
This is COPY# Distributed on by and is CONTROLLED
S-GB-I-064-REV.04
Table of Contents
Section Page
1. Purpose/Identification of the Method ................................................................................. 3
2. Summary of Method ............................................................................................................. 3
3. Scope and Application .......................................................................................................... 3
4. Applicable Matrices .............................................................................................................. 3
5. Limits of Detection and Quantitation ................................................................................. 3
6. Interferences .......................................................................................................................... 4
7. Sample Collection, Preservation, Shipment and Storage .................................................. 4
8. Definitions .............................................................................................................................. 5
9. Equipment and Supplies ...................................................................................................... 5
10. Reagents and Standards ....................................................................................................... 6
11. Calibration and Standardization ......................................................................................... 9
12. Procedure ............................................................................................................................... 9
13. Quality Control ................................................................................................................... 13
14. Data Analysis and Calculations ......................................................................................... 17
15. Data Assessment and Acceptance Criteria for QC Measures ........................................ 17
16. Corrective Action for Out-of-Control Data ...................................................................... 17
17. Contingencies for Handling Out-of-Control or Unacceptable Data. ............................. 17
18. Method Performance .......................................................................................................... 17
19. Method Modifications ......................................................................................................... 18
20. Instrument/Equipment Maintenance ................................................................................ 19
21. Troubleshooting .................................................................................................................. 19
22. Safety .................................................................................................................................... 19
23. Waste Management ............................................................................................................ 19
24. Pollution Prevention ........................................................................................................... 19
25. References ............................................................................................................................ 19
26 Tables, Diagrams, Flowcharts, Appendices, Addenda etc. ............................................. 20
27 Revisions .............................................................................................................................. 20
Pace Analytical Services, LLC Green Bay, WI File: S-GB-I-064-Rev.04.doc Total Cyanide using Micro-Distillation and SmartChem Date: Upon Final Signature S-GB-I-064-REV.04 Page 3 of 24
1. Purpose/Identification of the Method
This Standard Operating Procedure (SOP) describes the analyses of Total Cyanide using Micro-Distillation and Analyzed by SmartChem Discrete analyzer using methods SW846 9012B and EPA Method 335.4.
2. Summary of Method
2.1 By means of a passive miniature distillation device, MICRO DIST, cyanide in the sample is released by digesting and acidifying cyanide complexes, and converting them to hydrocyanic acid (HCN). The cyanide ion is trapped in a 1.0 M sodium hydroxide absorbing solution, which is diluted to 0.25M solution during distillation. By means of discrete analysis, the 0.25M Noah distillate is converted to cyanogens chloride by reaction with chloramines-T, pyridine and barbituric acid to give a red-colored complex. The absorbance of this complex is measured at 570 nm by measuring the peak area resulting from the sample. The peak area is proportional to the concentration of the cyanide in the sample.
2.2 All samples must be distilled before analysis.
3. Scope and Application
3.1 Personnel: The policies and procedures contained in this SOP are applicable to all personnel involved in the analytical and distillation methods.
3.2 Parameters: This SOP is applicable to the analysis of Cyanide in ground, surface, and saline waters, domestic and industrial wastes, soils, and TCLP, SPLP, ASTM extracts.
3.3 This SOP utilizes the SmartChem Discrete analyzer.
4. Applicable Matrices
4.1 Ground, surface, and saline waters
4.2 Domestic and industrial wastes
4.3 Soils and solid matrices
4.4 TCLP, SPLP, ASTM extracts
5. Limits of Detection and Quantitation
5.1 Current LOD and LOQ can be found in the Laboratory Information Management System (LIMS) - EpicPro.
5.2 Level of Detection (LOD): The LOD is determined by the 40CFR Part 136B MDL study. Once the 40CFR Part 136B MDL is determined it may be elevated if deemed unrealistic as demonstrated using method blank evaluations.
5.3 Level of Quantitation (LOQ): The LOQ is calculated as the LOD times 10/3. A realistic LOQ is typically near the lowest non-zero calibration point and higher than typical blank measurements.
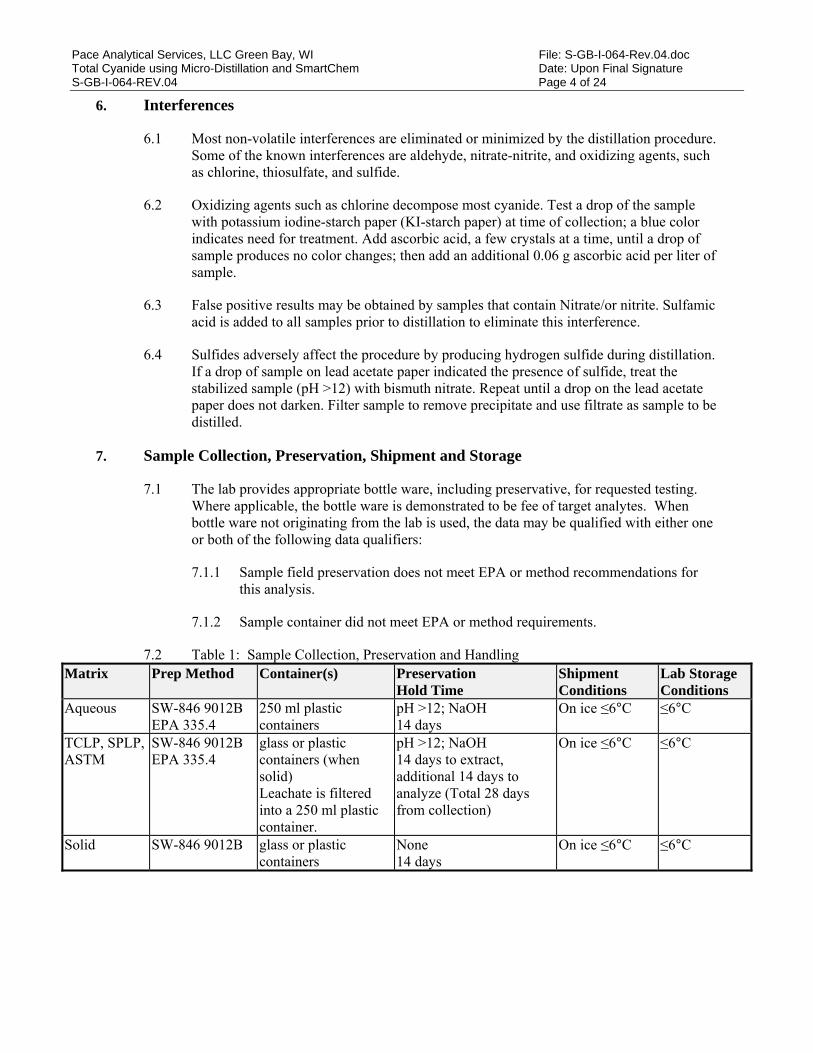
Pace Analytical Services, LLC Green Bay, WI File: S-GB-I-064-Rev.04.doc Total Cyanide using Micro-Distillation and SmartChem Date: Upon Final Signature S-GB-I-064-REV.04 Page 4 of 24
6. Interferences
6.1 Most non-volatile interferences are eliminated or minimized by the distillation procedure. Some of the known interferences are aldehyde, nitrate-nitrite, and oxidizing agents, such as chlorine, thiosulfate, and sulfide.
6.2 Oxidizing agents such as chlorine decompose most cyanide. Test a drop of the sample with potassium iodine-starch paper (KI-starch paper) at time of collection; a blue color indicates need for treatment. Add ascorbic acid, a few crystals at a time, until a drop of sample produces no color changes; then add an additional 0.06 g ascorbic acid per liter of sample.
6.3 False positive results may be obtained by samples that contain Nitrate/or nitrite. Sulfamic acid is added to all samples prior to distillation to eliminate this interference.
6.4 Sulfides adversely affect the procedure by producing hydrogen sulfide during distillation. If a drop of sample on lead acetate paper indicated the presence of sulfide, treat the stabilized sample (pH >12) with bismuth nitrate. Repeat until a drop on the lead acetate paper does not darken. Filter sample to remove precipitate and use filtrate as sample to be distilled.
7. Sample Collection, Preservation, Shipment and Storage
7.1 The lab provides appropriate bottle ware, including preservative, for requested testing. Where applicable, the bottle ware is demonstrated to be fee of target analytes. When bottle ware not originating from the lab is used, the data may be qualified with either one or both of the following data qualifiers:
7.1.1 Sample field preservation does not meet EPA or method recommendations for this analysis.
7.1.2 Sample container did not meet EPA or method requirements.
7.2 Table 1: Sample Collection, Preservation and Handling Matrix Prep Method Container(s) Preservation
Hold Time Shipment Conditions
Lab Storage Conditions
Aqueous
SW-846 9012B EPA 335.4
250 ml plastic containers
pH >12; NaOH 14 days
On ice ≤6°C ≤6°C
TCLP, SPLP, ASTM
SW-846 9012B EPA 335.4
glass or plastic containers (when solid) Leachate is filtered into a 250 ml plastic container.
pH >12; NaOH 14 days to extract, additional 14 days to analyze (Total 28 days from collection)
On ice ≤6°C ≤6°C
Solid SW-846 9012B glass or plastic containers
None 14 days
On ice ≤6°C ≤6°C

Pace Analytical Services, LLC Green Bay, WI File: S-GB-I-064-Rev.04.doc Total Cyanide using Micro-Distillation and SmartChem Date: Upon Final Signature S-GB-I-064-REV.04 Page 5 of 24
8. Definitions
8.1 Refer to Section 10.0 of the most current version of the Pace Quality Manual for the terms used at Pace Analytical. When definitions are not consistent with NELAC defined terms, an explanation will be provided in this SOP.
8.2 Reagent Base Line (RBL) – Absorbance created when the diluent and method reagents are added to the cuvette. The diluent is a matrix match of the sample matrix.
8.3 Water Base Line (WBL) – Absorbance created when reagent grade water is added to the cuvette. The WBL is used to check the quality of the cuvette, condition of the filters, and lamp. If the value is too high or too low the cuvette will be rejected and will not be used in the analysis.
9. Equipment and Supplies
Table 2: EQUIPMENT Equipment Manufacturer Model(s)/Catalog number • SmartChem Westco 200 Micro-Distillation Lachat Micro Distillation Top loading Analytical Balance
Mettler BA310P
1000 µL Pipette Eppendorf 05-402-76 (Fisher Cat#) 500 µL Pipette Eppendorf 05-402-72 (Fisher Cat#) 250 µL Pipette Eppendorf 05-402-69 (Fisher Cat#) Repipetors (0.5 - 5.0mL) Barnstead/Thermolyne 13-687-33 (Fisher Cat#) Vented Hood Hamilton Spoonula (Lab Spoon) FisherBrand or equivalent 14-375-10 (Fisher Cat#) Gloves – Heat Resistant Cyanide Manifold Lachat 10204-00-1-A Interference filter – 570 nm Lachat
Or equivalent Table 3: Supplies
Supplies Manufacturer Catalog number • Distillation tubes Environmental Express C8100C Sample Cups 4mL Unity 02-544-4 Volumetric Flasks Fisher Various
Parafilm Fisher
Teflon Chip Fisher
Or equivalent
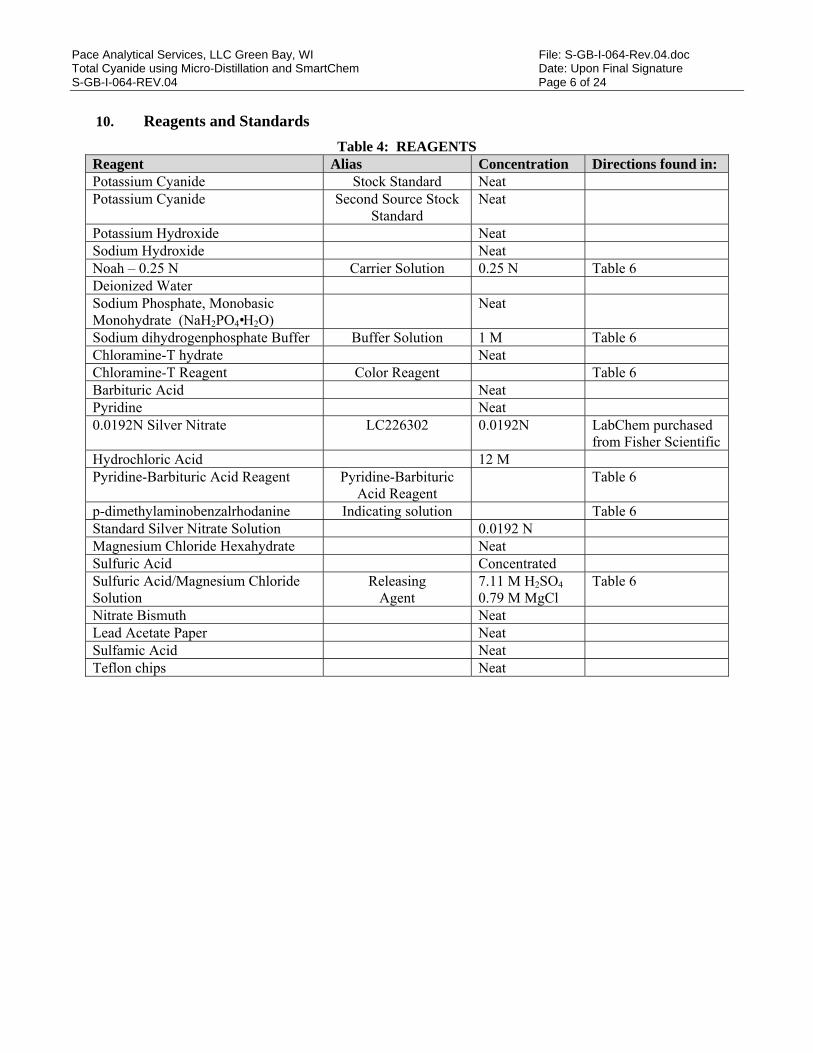
Pace Analytical Services, LLC Green Bay, WI File: S-GB-I-064-Rev.04.doc Total Cyanide using Micro-Distillation and SmartChem Date: Upon Final Signature S-GB-I-064-REV.04 Page 6 of 24
10. Reagents and Standards
Table 4: REAGENTS Reagent Alias Concentration Directions found in: Potassium Cyanide Stock Standard Neat Potassium Cyanide Second Source Stock
Standard Neat
Potassium Hydroxide Neat Sodium Hydroxide Neat Noah – 0.25 N Carrier Solution 0.25 N Table 6 Deionized Water Sodium Phosphate, Monobasic Monohydrate (NaH2PO4•H2O)
Neat
Sodium dihydrogenphosphate Buffer Buffer Solution 1 M Table 6 Chloramine-T hydrate Neat Chloramine-T Reagent Color Reagent Table 6 Barbituric Acid Neat Pyridine Neat 0.0192N Silver Nitrate LC226302 0.0192N LabChem purchased
from Fisher Scientific Hydrochloric Acid 12 M Pyridine-Barbituric Acid Reagent Pyridine-Barbituric
Acid Reagent Table 6
p-dimethylaminobenzalrhodanine Indicating solution Table 6 Standard Silver Nitrate Solution 0.0192 N Magnesium Chloride Hexahydrate Neat Sulfuric Acid Concentrated Sulfuric Acid/Magnesium Chloride Solution
Releasing Agent
7.11 M H2SO4 0.79 M MgCl
Table 6
Nitrate Bismuth Neat Lead Acetate Paper Neat Sulfamic Acid Neat Teflon chips Neat
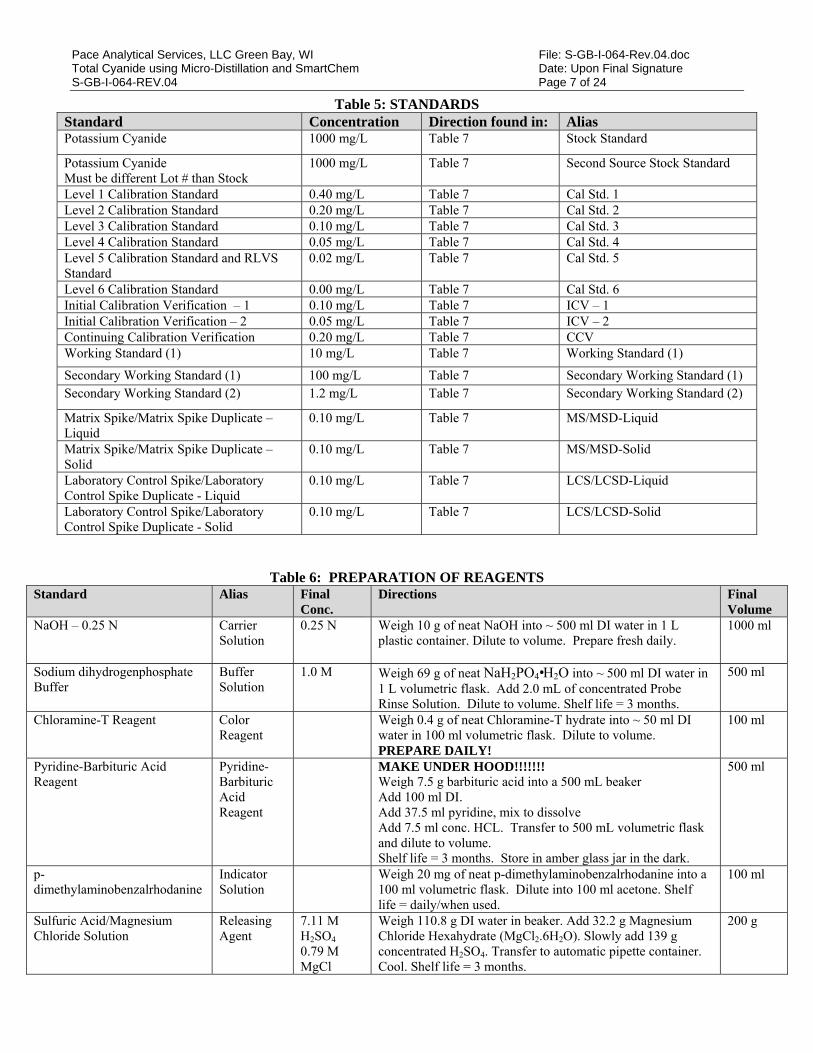
Pace Analytical Services, LLC Green Bay, WI File: S-GB-I-064-Rev.04.doc Total Cyanide using Micro-Distillation and SmartChem Date: Upon Final Signature S-GB-I-064-REV.04 Page 7 of 24
Table 5: STANDARDS Standard Concentration Direction found in: Alias Potassium Cyanide 1000 mg/L Table 7 Stock Standard
Potassium Cyanide Must be different Lot # than Stock
1000 mg/L Table 7 Second Source Stock Standard
Level 1 Calibration Standard 0.40 mg/L Table 7 Cal Std. 1 Level 2 Calibration Standard 0.20 mg/L Table 7 Cal Std. 2 Level 3 Calibration Standard 0.10 mg/L Table 7 Cal Std. 3 Level 4 Calibration Standard 0.05 mg/L Table 7 Cal Std. 4 Level 5 Calibration Standard and RLVS Standard
0.02 mg/L Table 7 Cal Std. 5
Level 6 Calibration Standard 0.00 mg/L Table 7 Cal Std. 6 Initial Calibration Verification – 1 0.10 mg/L Table 7 ICV – 1 Initial Calibration Verification – 2 0.05 mg/L Table 7 ICV – 2 Continuing Calibration Verification 0.20 mg/L Table 7 CCV Working Standard (1) 10 mg/L Table 7 Working Standard (1)
Secondary Working Standard (1) 100 mg/L Table 7 Secondary Working Standard (1) Secondary Working Standard (2) 1.2 mg/L Table 7 Secondary Working Standard (2)
Matrix Spike/Matrix Spike Duplicate – Liquid
0.10 mg/L Table 7 MS/MSD-Liquid
Matrix Spike/Matrix Spike Duplicate – Solid
0.10 mg/L Table 7 MS/MSD-Solid
Laboratory Control Spike/Laboratory Control Spike Duplicate - Liquid
0.10 mg/L Table 7 LCS/LCSD-Liquid
Laboratory Control Spike/Laboratory Control Spike Duplicate - Solid
0.10 mg/L Table 7 LCS/LCSD-Solid
Table 6: PREPARATION OF REAGENTS Standard Alias Final
Conc. Directions Final
Volume NaOH – 0.25 N Carrier
Solution
0.25 N Weigh 10 g of neat NaOH into ~ 500 ml DI water in 1 L plastic container. Dilute to volume. Prepare fresh daily.
1000 ml
Sodium dihydrogenphosphate Buffer
Buffer Solution
1.0 M Weigh 69 g of neat NaH2PO4•H2O into ~ 500 ml DI water in 1 L volumetric flask. Add 2.0 mL of concentrated Probe Rinse Solution. Dilute to volume. Shelf life = 3 months.
500 ml
Chloramine-T Reagent Color Reagent
Weigh 0.4 g of neat Chloramine-T hydrate into ~ 50 ml DI water in 100 ml volumetric flask. Dilute to volume. PREPARE DAILY!
100 ml
Pyridine-Barbituric Acid Reagent
Pyridine-Barbituric Acid Reagent
MAKE UNDER HOOD!!!!!!! Weigh 7.5 g barbituric acid into a 500 mL beaker Add 100 ml DI. Add 37.5 ml pyridine, mix to dissolve Add 7.5 ml conc. HCL. Transfer to 500 mL volumetric flask and dilute to volume. Shelf life = 3 months. Store in amber glass jar in the dark.
500 ml
p-dimethylaminobenzalrhodanine
Indicator Solution
Weigh 20 mg of neat p-dimethylaminobenzalrhodanine into a 100 ml volumetric flask. Dilute into 100 ml acetone. Shelf life = daily/when used.
100 ml
Sulfuric Acid/Magnesium Chloride Solution
Releasing Agent
7.11 M H2SO4 0.79 M MgCl
Weigh 110.8 g DI water in beaker. Add 32.2 g Magnesium Chloride Hexahydrate (MgCl2.6H2O). Slowly add 139 g concentrated H2SO4. Transfer to automatic pipette container. Cool. Shelf life = 3 months.
200 g
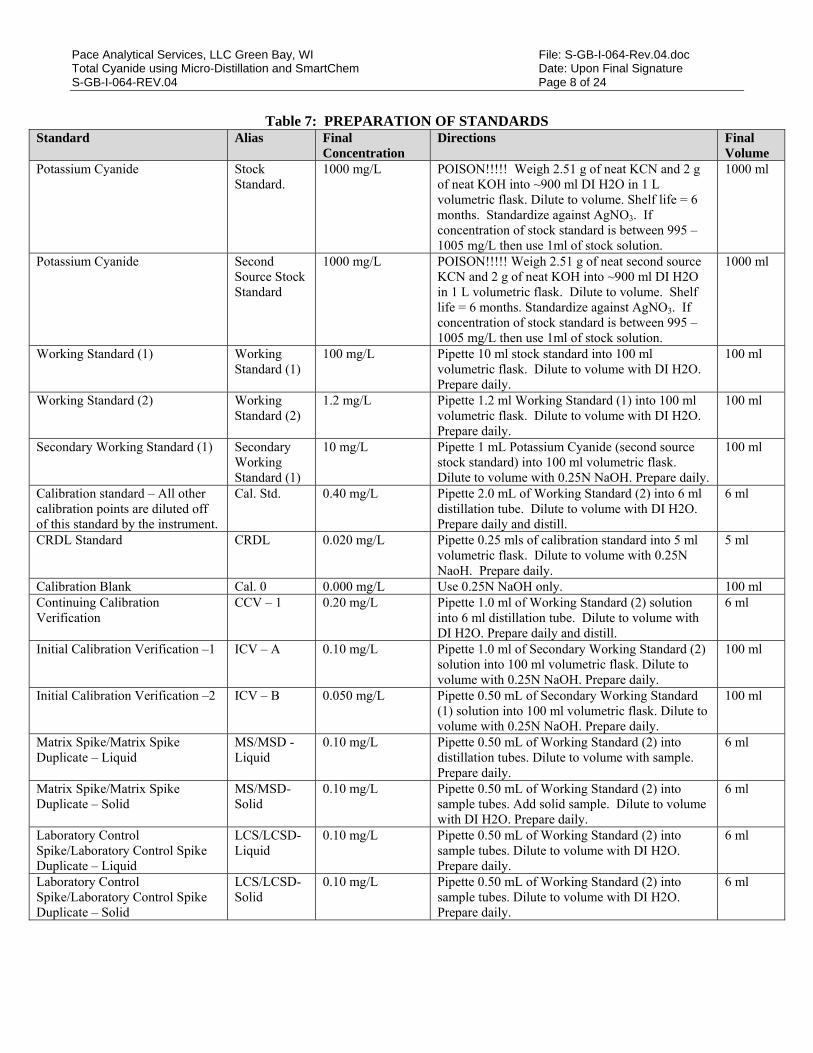
Pace Analytical Services, LLC Green Bay, WI File: S-GB-I-064-Rev.04.doc Total Cyanide using Micro-Distillation and SmartChem Date: Upon Final Signature S-GB-I-064-REV.04 Page 8 of 24
Table 7: PREPARATION OF STANDARDS
Standard Alias Final Concentration
Directions Final Volume
Potassium Cyanide
Stock Standard.
1000 mg/L POISON!!!!! Weigh 2.51 g of neat KCN and 2 g of neat KOH into ~900 ml DI H2O in 1 L volumetric flask. Dilute to volume. Shelf life = 6 months. Standardize against AgNO3. If concentration of stock standard is between 995 – 1005 mg/L then use 1ml of stock solution.
1000 ml
Potassium Cyanide Second Source Stock Standard
1000 mg/L POISON!!!!! Weigh 2.51 g of neat second source KCN and 2 g of neat KOH into ~900 ml DI H2O in 1 L volumetric flask. Dilute to volume. Shelf life = 6 months. Standardize against AgNO3. If concentration of stock standard is between 995 – 1005 mg/L then use 1ml of stock solution.
1000 ml
Working Standard (1) Working Standard (1)
100 mg/L Pipette 10 ml stock standard into 100 ml volumetric flask. Dilute to volume with DI H2O. Prepare daily.
100 ml
Working Standard (2) Working Standard (2)
1.2 mg/L Pipette 1.2 ml Working Standard (1) into 100 ml volumetric flask. Dilute to volume with DI H2O. Prepare daily.
100 ml
Secondary Working Standard (1) Secondary Working Standard (1)
10 mg/L Pipette 1 mL Potassium Cyanide (second source stock standard) into 100 ml volumetric flask. Dilute to volume with 0.25N NaOH. Prepare daily.
100 ml
Calibration standard – All other calibration points are diluted off of this standard by the instrument.
Cal. Std. 0.40 mg/L Pipette 2.0 mL of Working Standard (2) into 6 ml distillation tube. Dilute to volume with DI H2O. Prepare daily and distill.
6 ml
CRDL Standard CRDL 0.020 mg/L Pipette 0.25 mls of calibration standard into 5 ml volumetric flask. Dilute to volume with 0.25N NaoH. Prepare daily.
5 ml
Calibration Blank Cal. 0 0.000 mg/L Use 0.25N NaOH only. 100 ml Continuing Calibration Verification
CCV – 1 0.20 mg/L Pipette 1.0 ml of Working Standard (2) solution into 6 ml distillation tube. Dilute to volume with DI H2O. Prepare daily and distill.
6 ml
Initial Calibration Verification –1 ICV – A 0.10 mg/L Pipette 1.0 ml of Secondary Working Standard (2) solution into 100 ml volumetric flask. Dilute to volume with 0.25N NaOH. Prepare daily.
100 ml
Initial Calibration Verification –2 ICV – B 0.050 mg/L Pipette 0.50 mL of Secondary Working Standard (1) solution into 100 ml volumetric flask. Dilute to volume with 0.25N NaOH. Prepare daily.
100 ml
Matrix Spike/Matrix Spike Duplicate – Liquid
MS/MSD - Liquid
0.10 mg/L Pipette 0.50 mL of Working Standard (2) into distillation tubes. Dilute to volume with sample. Prepare daily.
6 ml
Matrix Spike/Matrix Spike Duplicate – Solid
MS/MSD-Solid
0.10 mg/L Pipette 0.50 mL of Working Standard (2) into sample tubes. Add solid sample. Dilute to volume with DI H2O. Prepare daily.
6 ml
Laboratory Control Spike/Laboratory Control Spike Duplicate – Liquid
LCS/LCSD-Liquid
0.10 mg/L Pipette 0.50 mL of Working Standard (2) into sample tubes. Dilute to volume with DI H2O. Prepare daily.
6 ml
Laboratory Control Spike/Laboratory Control Spike Duplicate – Solid
LCS/LCSD-Solid
0.10 mg/L Pipette 0.50 mL of Working Standard (2) into sample tubes. Dilute to volume with DI H2O. Prepare daily.
6 ml
Pace Analytical Services, LLC Green Bay, WI File: S-GB-I-064-Rev.04.doc Total Cyanide using Micro-Distillation and SmartChem Date: Upon Final Signature S-GB-I-064-REV.04 Page 9 of 24
11. Calibration and Standardization
11.1 Daily Calibration – The SmartChem must be calibrated each time it is set up and at least every 24 hours that samples are analyzed. Calibration requires analysis of a minimum of 5 standards plus a blank due to the linear regression calibration used. The working range is from the current MDL to the highest standard in the calibration curve.
11.1.1 Calibration Verification – Each calibration must be verified by analyzing an Initial Calibration Verification (ICVA/ICVB) and Initial Calibration Blank (ICB). A Continuing Calibration Verification (CCV) and Continuing Calibration Blank (CCB) must also be analyzed after each set of 10 samples.
11.1.2 Reporting Limit Verification Standard (CRDL) – A standard prepared at the concentration of the lowest calibration point. The CRDL is used to demonstrate analyte recovery at the low end of the calibration curve.
11.1.3 Acceptance Criteria – The correlation coefficient of the response for elements requiring multiple levels must be ≥ 0.995. The results of the ICV/CCV checks must agree within ± 10%. The results of the ICB/CCBs must be <LOQ.
11.1.4 Follow steps in section 12 to run calibration curve.
11.2 Dilutions -The SmartChem can automatically prepare diluted standards and samples, as required, to bring high concentration standards and samples into the working range of the method. See the SmartChem Operation Manual Chapter 3 for instructions on how to configure the SmartChem Parameter Method File.
11.3 Standardization – Cn standards made from neat sources must be standardized prior to use.
11.3.1 Add 1ml of stock/secondary source to a 100ml volumetric flask and dilute with 0.25N NaOH.
11.3.2 Pour solution in to a beaker and titrate using 0.0192N AgNO3, the starting color of the solution is yellow and will turn to a peach color indicating the end point. 1.0 mL of AgNO3 = 1.0 mg/L of Cyanide.
11.3.3 A blank NaOH is also titrated (<1 drop is needed for the color change).
12. Procedure
NOTE: Document all sample volumes, standards and reagents used in the distillation on the prep log.
12.1 Distillation Procedure - This section of the SOP details the steps in distilling the samples before analysis. Samples must be checked for sulfides before distilling. If sulfides are present and the samples treated with bismuth nitrate, the entire calibration curve must be similarly treated and distilled. Refer to section 6.4 for procedure. In the following procedure, D and M refer to the marks on the collector tube. D means “distillation” end, and M means “measuring” end.
12.1.1 Set the controller to 120°C; allow the heater to warm up. The operating temperature of the distillation block needs to be verified annually.
Pace Analytical Services, LLC Green Bay, WI File: S-GB-I-064-Rev.04.doc Total Cyanide using Micro-Distillation and SmartChem Date: Upon Final Signature S-GB-I-064-REV.04 Page 10 of 24
12.1.2 Label tubes with the M end up, place as many properly labeled collector tubes as you have samples into the collector tube rack.
12.1.3 For liquid samples, using a transfer pipette place a drop of sample on lead acetate paper. If the paper darkens this indicates the presence of sulfide. Treat the stabilized sample (pH >12) with bismuth Nitrate. Repeat until a drop on the lead acetate paper does not darken. Filter sample to remove precipitate and use filtrate as sample to be distilled. Place 6 ml of sample into each properly labeled sample tube using a calibrated automatic pipette. Add ~ 0.1 g sulfamic acid.
NOTE: If samples contain and are treated for sulfide, the entire calibration curve must also be similarly treated and distilled along with the samples.
12.1.4 For soil samples, weigh out ~0.20 g of soil or sludge to the nearest 100th on a calibrated balance and dilute to 6 ml with deionized water with a calibrated automatic pipette into each properly labeled sample tube. Add ~ 0.1 g sulfamic acid.
12.1.5 For liquid samples, prepare one method blank by adding 6 mls of DI water to properly labeled sample tube using a calibrated automatic pipette. Add ~ 0.1 g sulfamic acid.
12.1.6 For soil samples, prepare one method blank by weighing out 0.20 g of Teflon chips to the nearest 100th on a calibrated balance and dilute to 6 ml with deionized water with a calibrated automatic pipette into a properly labeled sample tube. Add ~ 0.1 g sulfamic acid.
12.1.7 For liquid samples, prepare one LCS (and one LCSD if needed/requested) by pipetting 6.0 ml of deionized water, ~ 0.1 g sulfamic acid, and 0.50 ml of 1.2 mg/L CN standard into two properly labeled sample tubes using a calibrated automatic pipette. See Table 5.
12.1.8 For soil samples, prepare one LCS (and one LCSD if needed/requested) by weighing out 0.20 g of Teflon chips to the nearest 100th on a calibrated balance. Bring to 6 ml volume with deionized water. Add ~ 0.1 g sulfamic acid and 0.50 ml of 1.2 mg/L CN standard using a calibrated automatic pipette into each properly labeled sample tube. See Table 5.
12.1.9 For liquid samples, select one parent sample and prepare one MS/MSD pair per 10 samples by adding 6.0 ml of sample, ~ 0.1 g sulfamic acid, and 0.50 ml of 1.2 mg/L CN standard into two properly labeled sample tubes using a calibrated automatic pipette. See Table 5.
12.1.10 For soil samples, select one parent sample and prepare one MS/MSD pair by weighing out 0.20 g - 0.50 g of sample to the nearest 100th on a calibrated balance. The sample weight is dependent upon the sample matrix. Bring to 6 ml volume with deionized water. Add ~ 0.1 g sulfamic acid and 0.50 mL of 1.2 mg/L CN standard using a calibrated automatic pipette into each properly labeled sample tube. See Table 5.
12.1.11 Using a calibrated pipette, add 0.75 ml of 7.11 M sulfuric acid / 0.79 M magnesium chloride solution to the sample tube using the supplied automatic pipette.

Pace Analytical Services, LLC Green Bay, WI File: S-GB-I-064-Rev.04.doc Total Cyanide using Micro-Distillation and SmartChem Date: Upon Final Signature S-GB-I-064-REV.04 Page 11 of 24
12.1.12 Immediately push the D end of a Cyanide-1 collector tube over the open end of each sample tube to start the seal.
12.1.13 Place the assembly in the press, putting the sample tube through the hole in the white base. Before pressing, the user should grip the collector tube firmly at the breakaway point to keep the tube from shifting during the pressing procedure.
12.1.14 The pressing motion should be a smooth constant pressure, which is just enough to slide the sample tube inside the collector tube. A jerky, forced motion may cause added strain to the tube and could potentially crack it. Press down on the handle until the stop ring on the sample tube hits the D end of the collector tube.
12.1.15 Put on heat-resistant gloves. Push the sample tube and D end of each tube all the way into the preheated block so that the collector tube stop ring touches the block. Placing 21 tubes should take less than one minute.
12.1.16 Set the timer for 30 minutes.
12.1.17 When 30 minutes is up, remove the first tube, use heat-resistant gloves, from the block and immediately pull its sample tube using a downward twisting motion as opposed to a sideways motion. You must remove the sample tube within 4 seconds of removing it for the block or suck-back of the sample will occur. Dispose of the sample tube and the hot solution into the 5 gallon waste container.
12.1.18 Invert each collector tube and place it into the collector tube rack, now with the D end up. It should take less than two minutes to pull and separate all 21 tubes.
12.1.19 Hold collector tube horizontally and rinse its walls with the distillate in order to homogenize it. Roll tube in order to collect all droplets from the walls of the tube. Return the tube to an upright position so the D end is up.
12.1.20 With the D end up, break the collector tube in half by pulling the D end hard toward yourself to break it, the twisting and tearing off the D end. Discard the D end.
12.1.21 In the M end of the tube dilute to the 6.0 ml mark with DI water. This results in the original sample volume, but now in 0.25 M NaOH. Pour in culture tube.
12.1.22 In the event that a distillation needs filtering prior to analysis, the batch QC must also go through the same filtration process. Document in the prep-log.
12.2 Basic System Operation (Analytical) - This portion of the SOP is designed to allow the user to set up and run a method. For a more detailed explanation of the many other options, the user should refer to the SmartChem Software Reference Manual. It is assumed that a method program has already been created for the chemistries you wish to run.
12.3 If not already on, turn on computer, printer, monitor, and the SmartChem instrument. The SmartChem on/off toggle switch is located on the left side of the instrument.
12.4 Log into the PC and Network. Click twice on SmartChem New and enter the username: SmartChem New WESTCO and password: JOE.
Pace Analytical Services, LLC Green Bay, WI File: S-GB-I-064-Rev.04.doc Total Cyanide using Micro-Distillation and SmartChem Date: Upon Final Signature S-GB-I-064-REV.04 Page 12 of 24
12.5 Build Sequence in LIMSLink of batched samples:
12.5.1 Go into LIMSLink and click on the “Running Man”.
12.5.2 Select the Prep method and click Start New followed by OK.
12.5.3 In the first two lines enter ICVA and ICVB followed ICB in the third line and CRDL in the fourth.
12.5.4 Click on Get Samples and enter the Batch, the Instrument ID (40WTA9) and click OK.
12.5.5 Repeat the last step for each batch of samples in the sequence.
12.6 SmartChem Sequence Loading and Analysis:
12.6.1 SmartChem Start-up procedure.
12.6.2 Go to Sample Entry
12.6.3 Double click on the desired Method to be run. For cyanide the method is CN-CN 335.4 Cyanide 20 to 400µg/L.
12.6.4 Click on Import from file button
12.6.5 Load Sequence file (create Run Plan) - open the SmartChem folder, scroll all the way to the right, and double click on SmartChem.
12.6.6 Save – Click on the red disk to save with the format CN073112 40WTA9 WETA/EPA335.4 CCR. 073112 is the month, day, year of the analysis. 40WTA9 is the instrument. WETA is the QUEUE and CCR is an example of analyst initials. Spaces must be used where they are. Click OK.
12.6.7 Save External File by clicking YES and Save the run plan as CN073112.
12.6.8 Go to System Monitor.
12.6.9 Select and Click on the Run Plan that was created.
12.6.10 Verify that the selected Run Plan is correct.
12.6.11 Load Samples, Standards, Controls, Diluent, and Empty Cups as displayed in the System Monitor.
12.6.12 Check the probe rinse, DI water, and Cleaning Solution bottles.
NOTE: When filling these solutions, pour slowly to minimize foaming. If filling is required while a run is in progress, do not lift siphon tube above the liquid surface. Insert a long stem funnel through the open port in the reservoir cap and fill the container slowly with the respective solution to minimize foaming.
12.6.13 Click Start in System Monitor to display user selectable options before beginning the analysis.
Pace Analytical Services, LLC Green Bay, WI File: S-GB-I-064-Rev.04.doc Total Cyanide using Micro-Distillation and SmartChem Date: Upon Final Signature S-GB-I-064-REV.04 Page 13 of 24
12.6.14 If a Wash Cuvette and/or WBL is required before the start of the analysis, then click on the appropriate button. It is recommended that a Wash Cuvette and WBL be run at the start of each day.
NOTE: It is recommended that a new WBL be run after a Wash Cuvette operation is performed and/or after the removal and/or replacement of the same or a new cuvette into the reaction tray.
12.6.15 Click the Start Button to begin analysis. A box will open. Make sure the Calibration and RBL options are selected for a run that is using a new calibration and click OK.
NOTE: Any daily or periodic maintenance must be recorded in the instrument daily logbook.
12.7 SHUTDOWN:
12.7.1 Click on EXIT icon
12.7.2 Turn off computer, printer and switch on surge suppresser.
13. Quality Control
13.1 Refer to the most current version of SOP S-GB-Q-009 Common Laboratory Calculations and Statistical Evaluation of Data for equations and calculation details.
13.2 Initial Calibration Verification (ICV)
13.2.1 The ICVA/ICVB must be analyzed before samples.
13.2.2 The ICVA/ICVB are not distilled.
13.2.3 Concentration must be within ± 10% of the true value. When measurements are outside the control limits, the analysis must be terminated, the problem corrected, and the calibration re-verified.
13.2.4 If the ICVA/ICVB is greater than the control limit and the samples are non-detects, the sample may be reported without a flag.
13.2.5 The lot number of the Potassium Cyanide Standard used to make the ICVA/ICVB must be different from that of the calibration curve standards.
13.3 Continuing Calibration Verification (CCV)
13.3.1 The CCV is analyzed after every 10 samples.
13.3.2 The CCV is distilled with the batch.
13.3.3 Concentration must be within ± 10% of the true value. When measurements are outside the control limits, the analysis must be terminated, the problem corrected, and the calibration re-verified. If the reset CCV fails, recalibrate and reanalyze all samples back to the last acceptable CCV.
13.3.4 If the CCV is greater than the control limit and the samples are non-detects, the sample may be reported without a flag.
13.3.5 The lot number of the Potassium Cyanide Standard used to make the CCV must be different from that of the ICV.
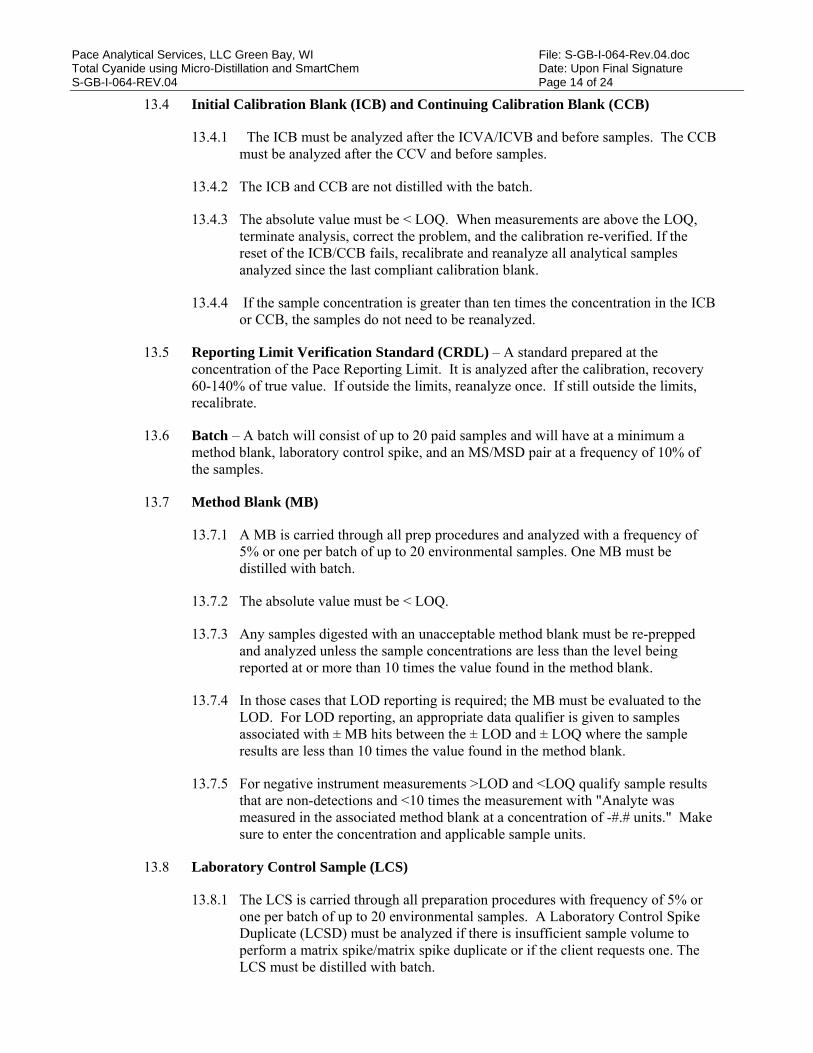
Pace Analytical Services, LLC Green Bay, WI File: S-GB-I-064-Rev.04.doc Total Cyanide using Micro-Distillation and SmartChem Date: Upon Final Signature S-GB-I-064-REV.04 Page 14 of 24
13.4 Initial Calibration Blank (ICB) and Continuing Calibration Blank (CCB)
13.4.1 The ICB must be analyzed after the ICVA/ICVB and before samples. The CCB must be analyzed after the CCV and before samples.
13.4.2 The ICB and CCB are not distilled with the batch.
13.4.3 The absolute value must be < LOQ. When measurements are above the LOQ, terminate analysis, correct the problem, and the calibration re-verified. If the reset of the ICB/CCB fails, recalibrate and reanalyze all analytical samples analyzed since the last compliant calibration blank.
13.4.4 If the sample concentration is greater than ten times the concentration in the ICB or CCB, the samples do not need to be reanalyzed.
13.5 Reporting Limit Verification Standard (CRDL) – A standard prepared at the concentration of the Pace Reporting Limit. It is analyzed after the calibration, recovery 60-140% of true value. If outside the limits, reanalyze once. If still outside the limits, recalibrate.
13.6 Batch – A batch will consist of up to 20 paid samples and will have at a minimum a method blank, laboratory control spike, and an MS/MSD pair at a frequency of 10% of the samples.
13.7 Method Blank (MB)
13.7.1 A MB is carried through all prep procedures and analyzed with a frequency of 5% or one per batch of up to 20 environmental samples. One MB must be distilled with batch.
13.7.2 The absolute value must be < LOQ.
13.7.3 Any samples digested with an unacceptable method blank must be re-prepped and analyzed unless the sample concentrations are less than the level being reported at or more than 10 times the value found in the method blank.
13.7.4 In those cases that LOD reporting is required; the MB must be evaluated to the LOD. For LOD reporting, an appropriate data qualifier is given to samples associated with ± MB hits between the ± LOD and ± LOQ where the sample results are less than 10 times the value found in the method blank.
13.7.5 For negative instrument measurements >LOD and <LOQ qualify sample results that are non-detections and <10 times the measurement with "Analyte was measured in the associated method blank at a concentration of -#.# units." Make sure to enter the concentration and applicable sample units.
13.8 Laboratory Control Sample (LCS)
13.8.1 The LCS is carried through all preparation procedures with frequency of 5% or one per batch of up to 20 environmental samples. A Laboratory Control Spike Duplicate (LCSD) must be analyzed if there is insufficient sample volume to perform a matrix spike/matrix spike duplicate or if the client requests one. The LCS must be distilled with batch.

Pace Analytical Services, LLC Green Bay, WI File: S-GB-I-064-Rev.04.doc Total Cyanide using Micro-Distillation and SmartChem Date: Upon Final Signature S-GB-I-064-REV.04 Page 15 of 24
13.8.2 Concentration must be within ± 10% of the true value for waters. For soils, the concentration must be within calculated in –house limits or default limits of ± 20%.
Accuracy Calculation: LCS % Recovery = (LCS) * 100 SA Where; LCS= LCS Result SA= Spike Added
13.8.3 When an LCSD is performed, the precision between the LCS and LCSD must be ≤ 20% RPD.
The relative percent difference (RPD) is calculated as: RPD = |S – D| * 100 (S + D)/2
Where; S = LCS value, mg/L D = LCSD value, mg/L
13.8.4 When measurements are outside the control limits, check for errors in calculations, standards preparation and spiking. If an error or problem is found and can be corrected by amending the calculations and the results falls within the limits, accept the data and report without a qualifier flag.
13.8.5 If no errors are found and sufficient sample is available, re-prepare the LCS (and/or LCSD) and all associated samples. If the recovery is within the limits in the analysis, accept the second set of data. If the recovery is still out side the limits after re-analysis, contact the PM to determine the resolution. If the client does not require additional work, report the data, applying an appropriate flag to the samples associated with the non-compliant LCS.
13.8.6 If sufficient sample volume is not available, report the sample data with an appropriate (L) qualifier flag on each of the samples associated with the non-compliant LCS (and/or LCSD). Contact the project manager regarding the occurrence.
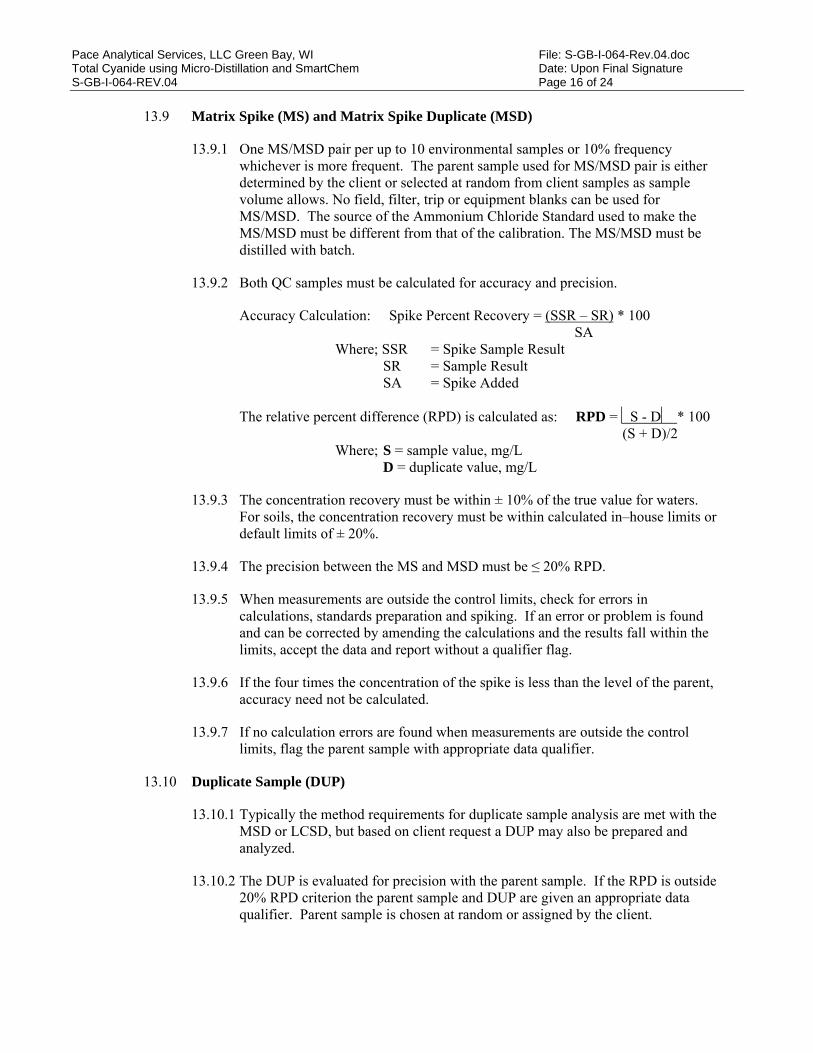
Pace Analytical Services, LLC Green Bay, WI File: S-GB-I-064-Rev.04.doc Total Cyanide using Micro-Distillation and SmartChem Date: Upon Final Signature S-GB-I-064-REV.04 Page 16 of 24
13.9 Matrix Spike (MS) and Matrix Spike Duplicate (MSD)
13.9.1 One MS/MSD pair per up to 10 environmental samples or 10% frequency whichever is more frequent. The parent sample used for MS/MSD pair is either determined by the client or selected at random from client samples as sample volume allows. No field, filter, trip or equipment blanks can be used for MS/MSD. The source of the Ammonium Chloride Standard used to make the MS/MSD must be different from that of the calibration. The MS/MSD must be distilled with batch.
13.9.2 Both QC samples must be calculated for accuracy and precision.
Accuracy Calculation: Spike Percent Recovery = (SSR – SR) * 100 SA Where; SSR = Spike Sample Result SR = Sample Result SA = Spike Added
The relative percent difference (RPD) is calculated as: RPD = S - D * 100 (S + D)/2
Where; S = sample value, mg/L D = duplicate value, mg/L
13.9.3 The concentration recovery must be within ± 10% of the true value for waters. For soils, the concentration recovery must be within calculated in–house limits or default limits of ± 20%.
13.9.4 The precision between the MS and MSD must be ≤ 20% RPD.
13.9.5 When measurements are outside the control limits, check for errors in calculations, standards preparation and spiking. If an error or problem is found and can be corrected by amending the calculations and the results fall within the limits, accept the data and report without a qualifier flag.
13.9.6 If the four times the concentration of the spike is less than the level of the parent, accuracy need not be calculated.
13.9.7 If no calculation errors are found when measurements are outside the control limits, flag the parent sample with appropriate data qualifier.
13.10 Duplicate Sample (DUP)
13.10.1 Typically the method requirements for duplicate sample analysis are met with the MSD or LCSD, but based on client request a DUP may also be prepared and analyzed.
13.10.2 The DUP is evaluated for precision with the parent sample. If the RPD is outside 20% RPD criterion the parent sample and DUP are given an appropriate data qualifier. Parent sample is chosen at random or assigned by the client.
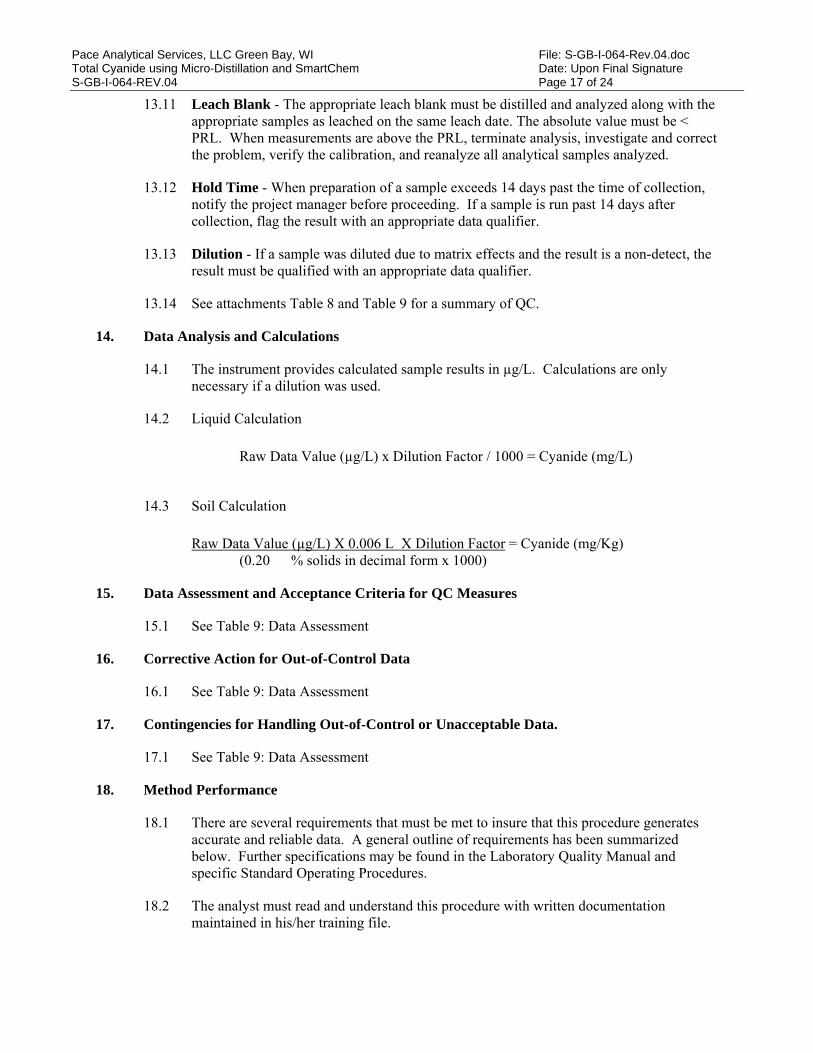
Pace Analytical Services, LLC Green Bay, WI File: S-GB-I-064-Rev.04.doc Total Cyanide using Micro-Distillation and SmartChem Date: Upon Final Signature S-GB-I-064-REV.04 Page 17 of 24
13.11 Leach Blank - The appropriate leach blank must be distilled and analyzed along with the appropriate samples as leached on the same leach date. The absolute value must be < PRL. When measurements are above the PRL, terminate analysis, investigate and correct the problem, verify the calibration, and reanalyze all analytical samples analyzed.
13.12 Hold Time - When preparation of a sample exceeds 14 days past the time of collection, notify the project manager before proceeding. If a sample is run past 14 days after collection, flag the result with an appropriate data qualifier.
13.13 Dilution - If a sample was diluted due to matrix effects and the result is a non-detect, the result must be qualified with an appropriate data qualifier.
13.14 See attachments Table 8 and Table 9 for a summary of QC.
14. Data Analysis and Calculations
14.1 The instrument provides calculated sample results in µg/L. Calculations are only necessary if a dilution was used.
14.2 Liquid Calculation
Raw Data Value (µg/L) x Dilution Factor / 1000 = Cyanide (mg/L)
14.3 Soil Calculation
Raw Data Value (µg/L) X 0.006 L X Dilution Factor = Cyanide (mg/Kg)
(0.20 % solids in decimal form x 1000)
15. Data Assessment and Acceptance Criteria for QC Measures
15.1 See Table 9: Data Assessment
16. Corrective Action for Out-of-Control Data
16.1 See Table 9: Data Assessment
17. Contingencies for Handling Out-of-Control or Unacceptable Data.
17.1 See Table 9: Data Assessment
18. Method Performance
18.1 There are several requirements that must be met to insure that this procedure generates accurate and reliable data. A general outline of requirements has been summarized below. Further specifications may be found in the Laboratory Quality Manual and specific Standard Operating Procedures.
18.2 The analyst must read and understand this procedure with written documentation maintained in his/her training file.
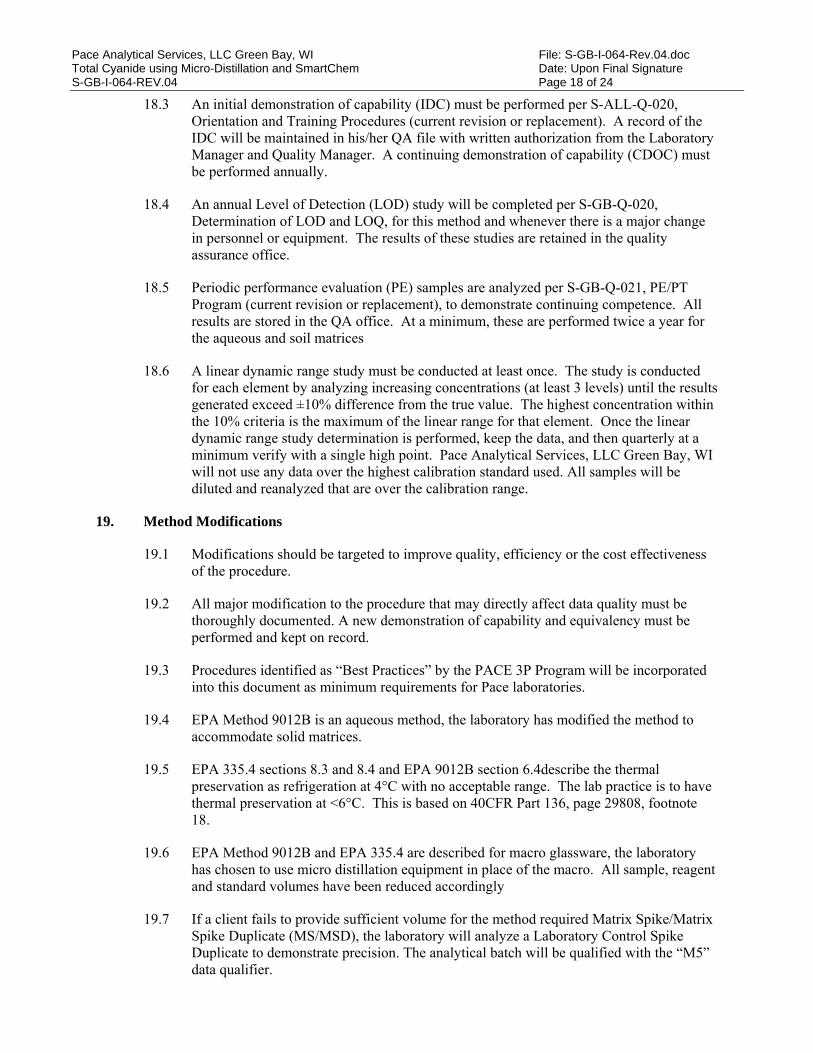
Pace Analytical Services, LLC Green Bay, WI File: S-GB-I-064-Rev.04.doc Total Cyanide using Micro-Distillation and SmartChem Date: Upon Final Signature S-GB-I-064-REV.04 Page 18 of 24
18.3 An initial demonstration of capability (IDC) must be performed per S-ALL-Q-020, Orientation and Training Procedures (current revision or replacement). A record of the IDC will be maintained in his/her QA file with written authorization from the Laboratory Manager and Quality Manager. A continuing demonstration of capability (CDOC) must be performed annually.
18.4 An annual Level of Detection (LOD) study will be completed per S-GB-Q-020, Determination of LOD and LOQ, for this method and whenever there is a major change in personnel or equipment. The results of these studies are retained in the quality assurance office.
18.5 Periodic performance evaluation (PE) samples are analyzed per S-GB-Q-021, PE/PT Program (current revision or replacement), to demonstrate continuing competence. All results are stored in the QA office. At a minimum, these are performed twice a year for the aqueous and soil matrices
18.6 A linear dynamic range study must be conducted at least once. The study is conducted for each element by analyzing increasing concentrations (at least 3 levels) until the results generated exceed ±10% difference from the true value. The highest concentration within the 10% criteria is the maximum of the linear range for that element. Once the linear dynamic range study determination is performed, keep the data, and then quarterly at a minimum verify with a single high point. Pace Analytical Services, LLC Green Bay, WI will not use any data over the highest calibration standard used. All samples will be diluted and reanalyzed that are over the calibration range.
19. Method Modifications
19.1 Modifications should be targeted to improve quality, efficiency or the cost effectiveness of the procedure.
19.2 All major modification to the procedure that may directly affect data quality must be thoroughly documented. A new demonstration of capability and equivalency must be performed and kept on record.
19.3 Procedures identified as “Best Practices” by the PACE 3P Program will be incorporated into this document as minimum requirements for Pace laboratories.
19.4 EPA Method 9012B is an aqueous method, the laboratory has modified the method to accommodate solid matrices.
19.5 EPA 335.4 sections 8.3 and 8.4 and EPA 9012B section 6.4describe the thermal preservation as refrigeration at 4°C with no acceptable range. The lab practice is to have thermal preservation at <6°C. This is based on 40CFR Part 136, page 29808, footnote 18.
19.6 EPA Method 9012B and EPA 335.4 are described for macro glassware, the laboratory has chosen to use micro distillation equipment in place of the macro. All sample, reagent and standard volumes have been reduced accordingly
19.7 If a client fails to provide sufficient volume for the method required Matrix Spike/Matrix Spike Duplicate (MS/MSD), the laboratory will analyze a Laboratory Control Spike Duplicate to demonstrate precision. The analytical batch will be qualified with the “M5” data qualifier.

Pace Analytical Services, LLC Green Bay, WI File: S-GB-I-064-Rev.04.doc Total Cyanide using Micro-Distillation and SmartChem Date: Upon Final Signature S-GB-I-064-REV.04 Page 19 of 24
20. Instrument/Equipment Maintenance
20.1 See Section 12.
21. Troubleshooting
21.1 See SmartChem Operating Manual.
22. Safety
22.1 Standards and Reagents: The toxicity and carcinogenicity of standards and reagents used in this method have not been fully defined. Each chemical compound should be treated as a potential health hazard. Reduce exposure by the use of gloves, lab coats and safety glasses. Safety Data Sheets (SDSs) are on file in the laboratory and available to all personnel. Standard solutions should be prepared in a hood whenever possible.
22.2 Samples: Take precautions when handling samples. Samples should always be treated as potentially hazardous “unknowns”. The use of personal protective equipment (gloves, lab coats and safety glasses) is required when handling samples. In the event a sample container must be opened, it is recommended to perform this in a hood whenever possible.
23. Waste Management
23.1 Excess reagents, samples and method process wastes are characterized and disposed of in an acceptable manner. For further information on waste management consult the current version of S-GB-W-001, Waste Handling and Management (most current revision or replacement).
24. Pollution Prevention
24.1 Pollution prevention encompasses any technique or procedure that reduces or eliminates the quantity or toxicity of waste at the point of generation.
24.2 The quantity of chemicals purchased is based on expected usage during its shelf life and disposal cost of unused material. Actual reagent preparation volumes reflect anticipated usage and reagent stability.
24.3 The laboratory Chemical Hygiene Plan/Health and Safety Plan contains additional information on pollution prevention.
25. References
25.1 Pace Quality Assurance manual (most current revision or replacement).
25.2 The NELAC Institute (TNI); Volume 1, Module 2, “Quality Systems” (most current revision or replacement).
25.3 SmartChem 200 Method 280-400E (Rev: April 2007)
25.4 Micro Dist Method Cyanide-1, Lachat Instruments, October 12, 2000
25.5 SW846 9012B, Revision 2.0, November 2004.
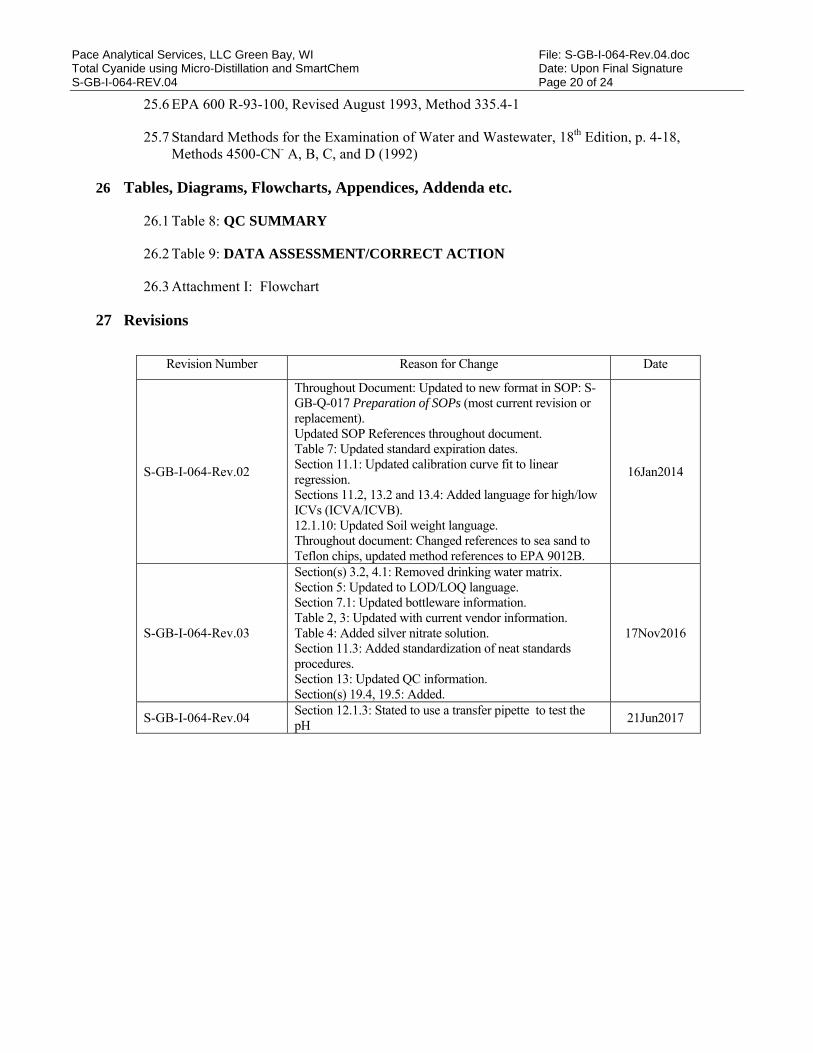
Pace Analytical Services, LLC Green Bay, WI File: S-GB-I-064-Rev.04.doc Total Cyanide using Micro-Distillation and SmartChem Date: Upon Final Signature S-GB-I-064-REV.04 Page 20 of 24
25.6 EPA 600 R-93-100, Revised August 1993, Method 335.4-1
25.7 Standard Methods for the Examination of Water and Wastewater, 18th Edition, p. 4-18, Methods 4500-CN- A, B, C, and D (1992)
26 Tables, Diagrams, Flowcharts, Appendices, Addenda etc.
26.1 Table 8: QC SUMMARY
26.2 Table 9: DATA ASSESSMENT/CORRECT ACTION
26.3 Attachment I: Flowchart
27 Revisions
Revision Number Reason for Change Date
S-GB-I-064-Rev.02
Throughout Document: Updated to new format in SOP: S-GB-Q-017 Preparation of SOPs (most current revision or replacement). Updated SOP References throughout document. Table 7: Updated standard expiration dates. Section 11.1: Updated calibration curve fit to linear regression. Sections 11.2, 13.2 and 13.4: Added language for high/low ICVs (ICVA/ICVB). 12.1.10: Updated Soil weight language. Throughout document: Changed references to sea sand to Teflon chips, updated method references to EPA 9012B.
16Jan2014
S-GB-I-064-Rev.03
Section(s) 3.2, 4.1: Removed drinking water matrix. Section 5: Updated to LOD/LOQ language. Section 7.1: Updated bottleware information. Table 2, 3: Updated with current vendor information. Table 4: Added silver nitrate solution. Section 11.3: Added standardization of neat standards procedures. Section 13: Updated QC information. Section(s) 19.4, 19.5: Added.
17Nov2016
S-GB-I-064-Rev.04 Section 12.1.3: Stated to use a transfer pipette to test the pH
21Jun2017
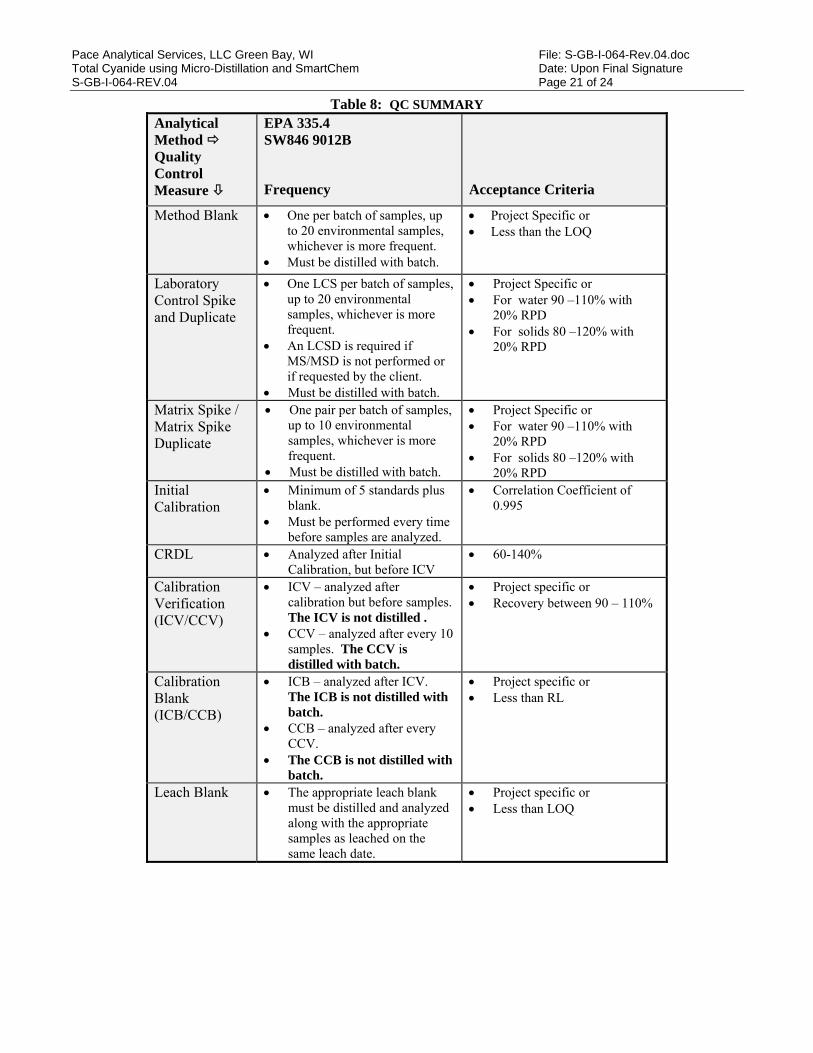
Pace Analytical Services, LLC Green Bay, WI File: S-GB-I-064-Rev.04.doc Total Cyanide using Micro-Distillation and SmartChem Date: Upon Final Signature S-GB-I-064-REV.04 Page 21 of 24
Table 8: QC SUMMARY
Analytical Method Quality Control Measure
EPA 335.4 SW846 9012B
Frequency Acceptance Criteria
Method Blank
One per batch of samples, up to 20 environmental samples, whichever is more frequent.
Must be distilled with batch.
Project Specific or Less than the LOQ
Laboratory Control Spike and Duplicate
One LCS per batch of samples, up to 20 environmental samples, whichever is more frequent.
An LCSD is required if MS/MSD is not performed or if requested by the client.
Must be distilled with batch.
Project Specific or For water 90 –110% with
20% RPD For solids 80 –120% with
20% RPD
Matrix Spike / Matrix Spike Duplicate
One pair per batch of samples, up to 10 environmental samples, whichever is more frequent.
Must be distilled with batch.
Project Specific or For water 90 –110% with
20% RPD For solids 80 –120% with
20% RPD Initial Calibration
Minimum of 5 standards plus blank.
Must be performed every time before samples are analyzed.
Correlation Coefficient of 0.995
CRDL Analyzed after Initial Calibration, but before ICV
60-140%
Calibration Verification (ICV/CCV)
ICV – analyzed after calibration but before samples. The ICV is not distilled .
CCV – analyzed after every 10 samples. The CCV is distilled with batch.
Project specific or Recovery between 90 – 110%
Calibration Blank (ICB/CCB)
ICB – analyzed after ICV. The ICB is not distilled with batch.
CCB – analyzed after every CCV.
The CCB is not distilled with batch.
Project specific or Less than RL
Leach Blank The appropriate leach blank must be distilled and analyzed along with the appropriate samples as leached on the same leach date.
Project specific or Less than LOQ
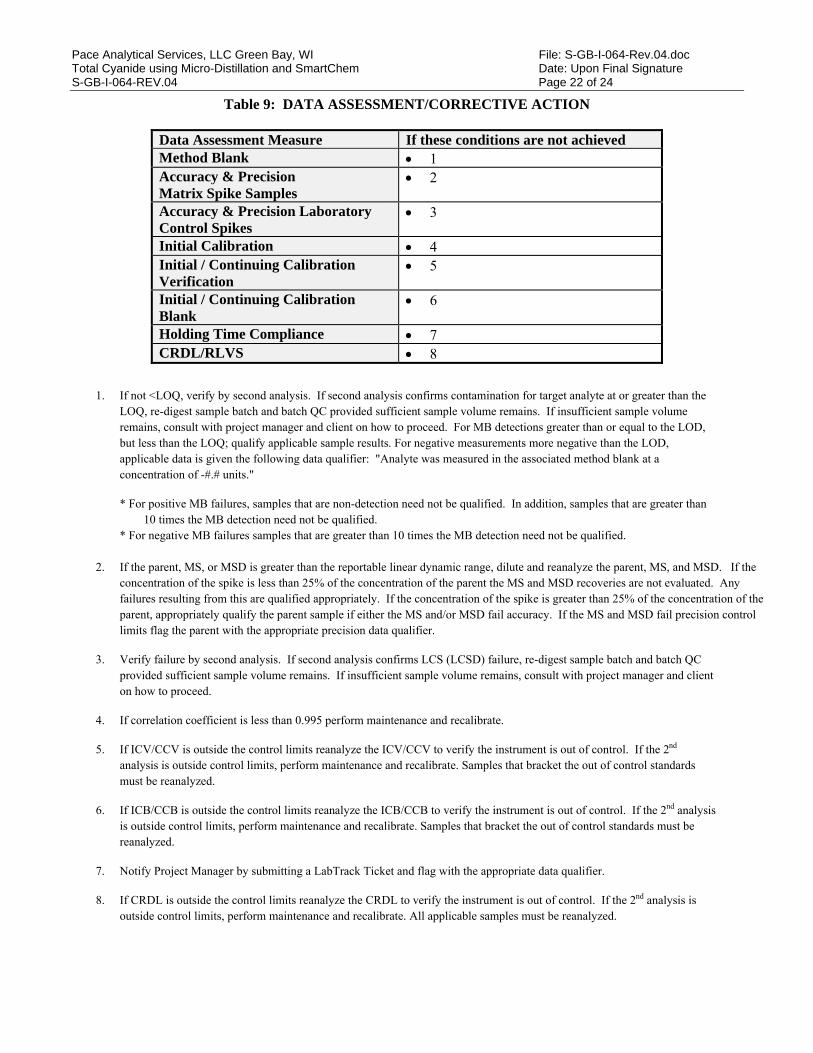
Pace Analytical Services, LLC Green Bay, WI File: S-GB-I-064-Rev.04.doc Total Cyanide using Micro-Distillation and SmartChem Date: Upon Final Signature S-GB-I-064-REV.04 Page 22 of 24
Table 9: DATA ASSESSMENT/CORRECTIVE ACTION
Data Assessment Measure If these conditions are not achieved Method Blank 1 Accuracy & Precision Matrix Spike Samples
2
Accuracy & Precision Laboratory Control Spikes
3
Initial Calibration 4 Initial / Continuing Calibration Verification
5
Initial / Continuing Calibration Blank
6
Holding Time Compliance 7 CRDL/RLVS 8
1. If not <LOQ, verify by second analysis. If second analysis confirms contamination for target analyte at or greater than the
LOQ, re-digest sample batch and batch QC provided sufficient sample volume remains. If insufficient sample volume remains, consult with project manager and client on how to proceed. For MB detections greater than or equal to the LOD, but less than the LOQ; qualify applicable sample results. For negative measurements more negative than the LOD, applicable data is given the following data qualifier: "Analyte was measured in the associated method blank at a concentration of -#.# units."
* For positive MB failures, samples that are non-detection need not be qualified. In addition, samples that are greater than 10 times the MB detection need not be qualified.
* For negative MB failures samples that are greater than 10 times the MB detection need not be qualified.
2. If the parent, MS, or MSD is greater than the reportable linear dynamic range, dilute and reanalyze the parent, MS, and MSD. If the concentration of the spike is less than 25% of the concentration of the parent the MS and MSD recoveries are not evaluated. Any failures resulting from this are qualified appropriately. If the concentration of the spike is greater than 25% of the concentration of the parent, appropriately qualify the parent sample if either the MS and/or MSD fail accuracy. If the MS and MSD fail precision control limits flag the parent with the appropriate precision data qualifier.
3. Verify failure by second analysis. If second analysis confirms LCS (LCSD) failure, re-digest sample batch and batch QC provided sufficient sample volume remains. If insufficient sample volume remains, consult with project manager and client on how to proceed.
4. If correlation coefficient is less than 0.995 perform maintenance and recalibrate.
5. If ICV/CCV is outside the control limits reanalyze the ICV/CCV to verify the instrument is out of control. If the 2nd analysis is outside control limits, perform maintenance and recalibrate. Samples that bracket the out of control standards must be reanalyzed.
6. If ICB/CCB is outside the control limits reanalyze the ICB/CCB to verify the instrument is out of control. If the 2nd analysis is outside control limits, perform maintenance and recalibrate. Samples that bracket the out of control standards must be reanalyzed.
7. Notify Project Manager by submitting a LabTrack Ticket and flag with the appropriate data qualifier.
8. If CRDL is outside the control limits reanalyze the CRDL to verify the instrument is out of control. If the 2nd analysis is outside control limits, perform maintenance and recalibrate. All applicable samples must be reanalyzed.
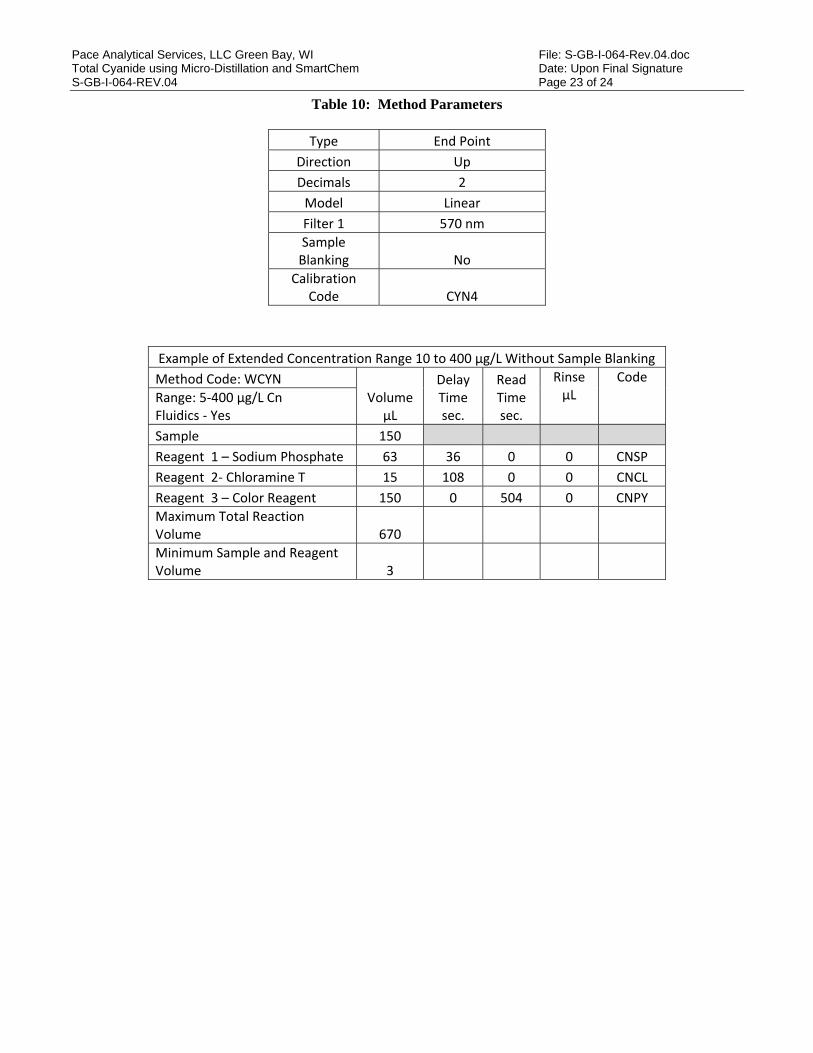
Pace Analytical Services, LLC Green Bay, WI File: S-GB-I-064-Rev.04.doc Total Cyanide using Micro-Distillation and SmartChem Date: Upon Final Signature S-GB-I-064-REV.04 Page 23 of 24
Table 10: Method Parameters
Type End Point Direction Up Decimals 2
Model Linear Filter 1 570 nm
Sample Blanking No
Calibration Code CYN4
Example of Extended Concentration Range 10 to 400 µg/L Without Sample Blanking Method Code: WCYN
Volume µL
Delay Time sec.
Read Time sec.
Rinse µL
Code Range: 5‐400 µg/L Cn Fluidics ‐ Yes Sample 150
Reagent 1 – Sodium Phosphate 63 36 0 0 CNSP Reagent 2‐ Chloramine T 15 108 0 0 CNCL Reagent 3 – Color Reagent 150 0 504 0 CNPY Maximum Total Reaction Volume 670
Minimum Sample and Reagent Volume 3
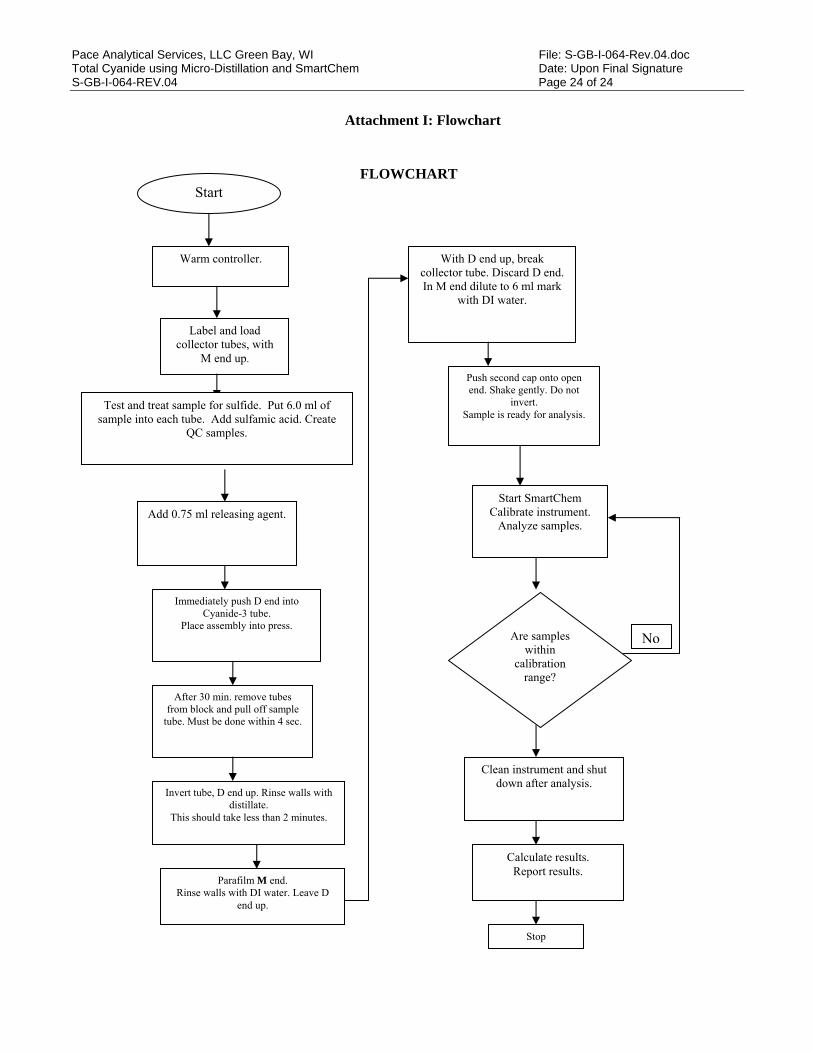
Pace Analytical Services, LLC Green Bay, WI File: S-GB-I-064-Rev.04.doc Total Cyanide using Micro-Distillation and SmartChem Date: Upon Final Signature S-GB-I-064-REV.04 Page 24 of 24
Attachment I: Flowchart
FLOWCHART Start
Warm controller.
Label and load collector tubes, with
M end up.
Test and treat sample for sulfide. Put 6.0 ml of sample into each tube. Add sulfamic acid. Create
QC samples.
Add 0.75 ml releasing agent.
Immediately push D end into Cyanide-3 tube.
Place assembly into press.
After 30 min. remove tubes from block and pull off sample
tube. Must be done within 4 sec.
Invert tube, D end up. Rinse walls with distillate.
This should take less than 2 minutes.
Parafilm M end. Rinse walls with DI water. Leave D
end up.
Push second cap onto open end. Shake gently. Do not
invert. Sample is ready for analysis.
Stop
With D end up, break collector tube. Discard D end. In M end dilute to 6 ml mark
with DI water.
Start SmartChem Calibrate instrument.
Analyze samples.
Clean instrument and shut down after analysis.
Are samples within
calibration range?
Calculate results. Report results.
No
Pace Analytical Services, Inc. 1241 Bellevue Street, Suite 9
Green Bay, WI 54302 www.pacelabs.com
Phone: 920.469.2436 Fax: 920.469.8827
STANDARD OPERATING PROCEDURE
TCLP - Toxicity Characteristic Leaching Procedure EPA SW846 1311 SPLP – Synthetic Precipitation Leaching Procedure EPA SW846 1312
ASTM - ASTM D 3987-85
Reference Methods: EPA SW846 1311, EPA SW846 1312, ASTM D 3987-85
SOP NUMBER: S-GB-I-067-REV.03
EFFECTIVE DATE: Date of Final Signature
SUPERSEDES: S-GB-I-067-Rev.02
APPROVAL _________________________________________ 06/19/15 Nils Melberg, Laboratory General Manager Date
__________________________________________ 6/19/15 Kate Grams, Laboratory Quality Manager Date __________________________________________ 6/19/15 Chad Rusch, Department Manager Date
PERIODIC REVIEW SIGNATURES BELOW INDICATE NO CHANGES HAVE BEEN MADE SINCE APPROVAL.
Signature Title Date
Signature Title Date © 2002-2015, Pace Analytical Services, Inc. This Standard Operating Procedure may not be reproduced, in part or in full, without written consent of Pace Analytical Services, Inc. Whether distributed internally or as a “courtesy copy” to clients or regulatory agencies, this document is considered confidential and proprietary information. Any printed documents in use within a Pace Analytical Services, Inc. laboratory have been reviewed and approved by the persons listed on the cover page. They can only be deemed official if proper signatures are present.
This is COPY# Distributed on by and is CONTROLLED or X UNCONTROLLED
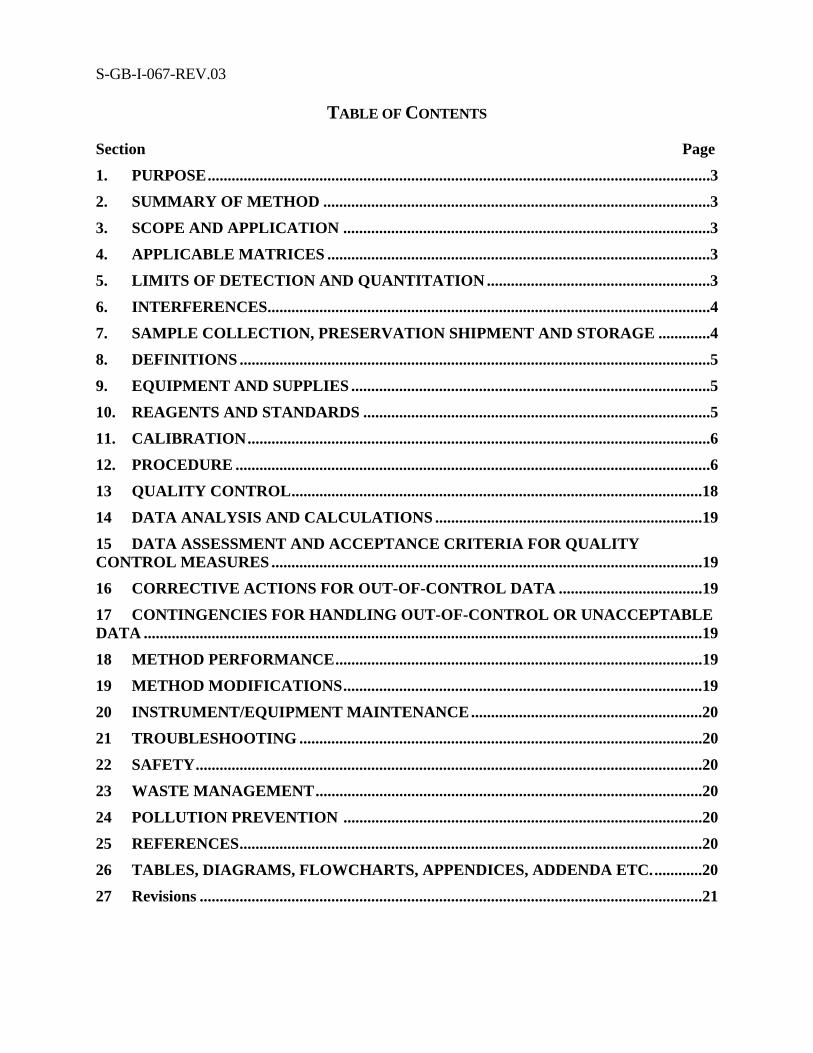
S-GB-I-067-REV.03
TABLE OF CONTENTS
Section Page
1. PURPOSE ..............................................................................................................................3
2. SUMMARY OF METHOD .................................................................................................3
3. SCOPE AND APPLICATION ............................................................................................3
4. APPLICABLE MATRICES ................................................................................................3
5. LIMITS OF DETECTION AND QUANTITATION ........................................................3
6. INTERFERENCES...............................................................................................................4
7. SAMPLE COLLECTION, PRESERVATION SHIPMENT AND STORAGE .............4
8. DEFINITIONS ......................................................................................................................5
9. EQUIPMENT AND SUPPLIES ..........................................................................................5
10. REAGENTS AND STANDARDS .......................................................................................5
11. CALIBRATION ....................................................................................................................6
12. PROCEDURE .......................................................................................................................6
13 QUALITY CONTROL .......................................................................................................18
14 DATA ANALYSIS AND CALCULATIONS ...................................................................19
15 DATA ASSESSMENT AND ACCEPTANCE CRITERIA FOR QUALITY CONTROL MEASURES ............................................................................................................19
16 CORRECTIVE ACTIONS FOR OUT-OF-CONTROL DATA ....................................19
17 CONTINGENCIES FOR HANDLING OUT-OF-CONTROL OR UNACCEPTABLE DATA ............................................................................................................................................19
18 METHOD PERFORMANCE ............................................................................................19
19 METHOD MODIFICATIONS ..........................................................................................19
20 INSTRUMENT/EQUIPMENT MAINTENANCE ..........................................................20
21 TROUBLESHOOTING .....................................................................................................20
22 SAFETY ...............................................................................................................................20
23 WASTE MANAGEMENT .................................................................................................20
24 POLLUTION PREVENTION ..........................................................................................20
25 REFERENCES ....................................................................................................................20
26 TABLES, DIAGRAMS, FLOWCHARTS, APPENDICES, ADDENDA ETC. ............20
27 Revisions ..............................................................................................................................21

Pace Analytical Services, Inc. – Green Bay Laboratory File: S-GB-I-067-Rev.03.doc TCLP, SPLP, ASTM Date: Upon Final Signature S-GB-I-067-REV.03 Page 3 of 28
1. PURPOSE
The purpose of this Standard Operating Procedure (SOP) is to provide a laboratory specific procedure for extracting organics and inorganic compounds from samples using and meeting the requirements specified in ASTM D 3987-85 and also EPA SW846 1311(TCLP) and EPA SW846 1312(SPLP). This SOP covers bottle extraction and zero headspace extraction (ZHE).
2. SUMMARY OF METHOD
2.1 An aliquot of waste sample is tumbled in a sealed container containing extraction fluid to leach out compounds of interest from the sample. The extract then becomes the sample to analyze by a determinative method (volatiles, semi-volatiles, metals, wet chemistry).
3. SCOPE AND APPLICATION
3.1 Personnel: The policies and procedures contained in this SOP are applicable to all personnel involved in the preparation and analysis of samples using the leach methods within this facility.
3.2 Parameters: This SOP applies to the methods listed in Section 1.
4. APPLICABLE MATRICES
4.1 The leach methods are designed to determine the mobility of inorganic and organic contaminants present in liquid, solid, and multi-phase wastes.
4.2 Liquid wastes (below 0.5% dry solid material), after filtration through a 0.6 to 0.8 micron glass filter, are defined as the TCLP or SPLP extract. ASTM liquid samples are tumbled at a 1:20 ratio with reagent water.
4.3 For TCLP and SPLP wastes containing greater than 0.5% solids, the liquid portion, if any, is separated from the solid phase and stored for later analysis. The solid phase is extracted (tumbled) with an amount of extraction fluid equal to 20 times the weight of the solid phase. All ASTM samples are tumbled at a 1:20 ratio with reagent water.
4.4 Bottle extractors are used for non-volatile analytes and a special ZHE extraction device is used to tumble samples for volatile analysis.
4.5 For multi-phase samples being leached by TCLP and SPLP, the initial liquid phase and the solid phase extracted water are combined and analyzed as one sample. If the wastes are not compatible, they are analyzed separately and results are mathematically combined to give a volume-weighted average concentration. ASTM samples are homogenized and tumbled without being separated.
5. LIMITS OF DETECTION AND QUANTITATION
5.1 Not applicable to this SOP.

Pace Analytical Services, Inc. – Green Bay Laboratory File: S-GB-I-067-Rev.03.doc TCLP, SPLP, ASTM Date: Upon Final Signature S-GB-I-067-REV.03 Page 4 of 28
6. INTERFERENCES
No significant interferences are listed for the preparation of the TCLP extracts. Potential interferences during analyses are discussed in the individual determinative method SOP’s.
7. SAMPLE COLLECTION, PRESERVATION SHIPMENT AND STORAGE
7.1 Samples are stored separately from all standards, reagents and highly contaminated samples. To avoid contamination, no food or drink products can be located near samples.
7.2 Liquid samples are collected in 1 Liter amber bottles with Teflon lined lids. Four to six liters may be needed for analysis. Preservations are not added to samples. After collection, samples are cooled to 4°- 6° C or lower, immediately after collection.
7.3 Solid samples are collected in 4 ounce wide-mouth bottles. At least 200g may be needed to perform the procedure. After collection, samples are cooled to 4°- 6° C or lower, immediately after collection.
7.4 Leach extracts should be prepared for analysis and analyzed as soon as possible following extraction. Extracts or portions of extracts for metallic analyte determinations must be acidified with nitric acid to a pH <2, unless precipitation occurs. Extract should be preserved for other analytes according to the guidance given in the individual analysis method. Extracts or portions of extracts for organic analyte determinations shall not be allowed to come into contact with the atmosphere to prevent losses.
7.5 TCLP, SPLP, ASTM extraction must be performed within the following times: Sample Maximum Holding Times – Days
From: Field Collection To: TCLP Extraction
From: Leach Extraction To: Preparative Extraction/digest
From: Preparative Extraction/digest To: Determinative Analysis
Total Elapsed Time
Semi-volatiles 14 7 40 61 Mercury 28 NA 28 56 Metals 180 NA 180 360 Volatiles 14 NA 14 28 Cyanide 14 NA 14 28 Total Phenol, Anions (Wet Chem) 28 NA 28 56
7.6 Preservatives shall not be added to samples before tumbling.
7.7 TCLP extracts for metallic analyte determinations must be acidified with nitric acid to a pH of < 2. This is done after an aliquot has been spiked for the MS and/or MSD.
7.8 Extracts must be preserved and stored for analytes according to the guidance given in the individual analysis methods.
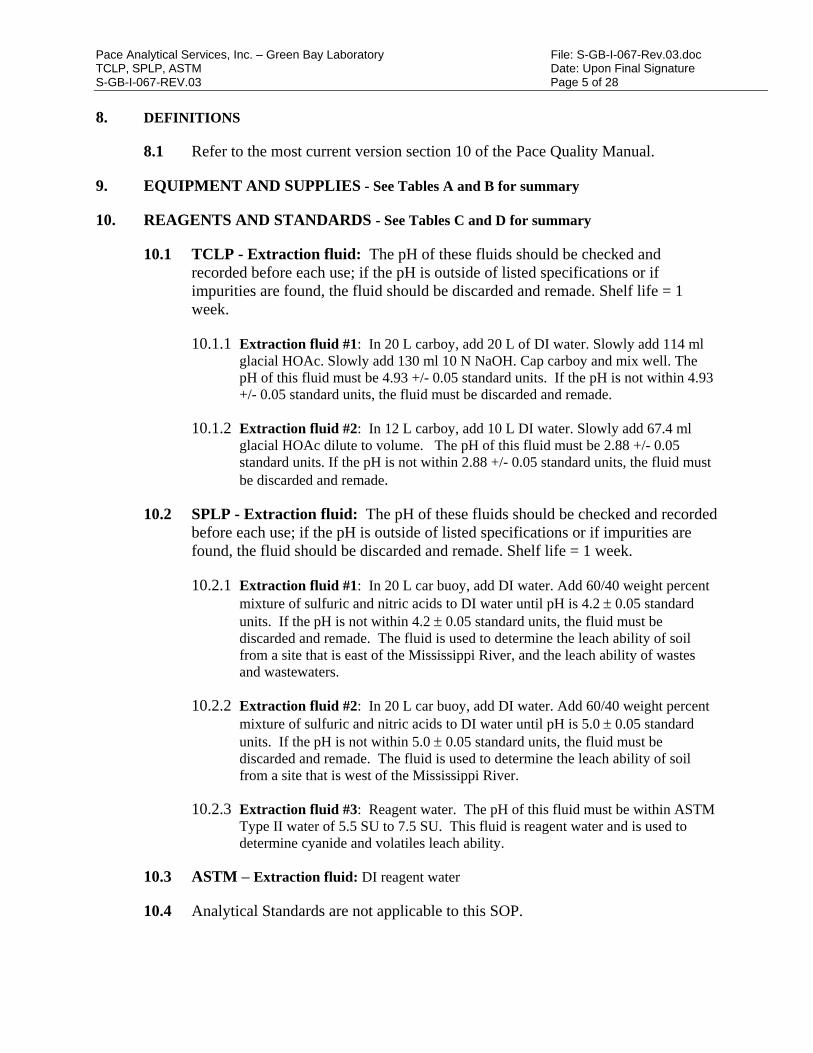
Pace Analytical Services, Inc. – Green Bay Laboratory File: S-GB-I-067-Rev.03.doc TCLP, SPLP, ASTM Date: Upon Final Signature S-GB-I-067-REV.03 Page 5 of 28
8. DEFINITIONS
8.1 Refer to the most current version section 10 of the Pace Quality Manual.
9. EQUIPMENT AND SUPPLIES - See Tables A and B for summary
10. REAGENTS AND STANDARDS - See Tables C and D for summary
10.1 TCLP - Extraction fluid: The pH of these fluids should be checked and recorded before each use; if the pH is outside of listed specifications or if impurities are found, the fluid should be discarded and remade. Shelf life = 1 week.
10.1.1 Extraction fluid #1: In 20 L carboy, add 20 L of DI water. Slowly add 114 ml glacial HOAc. Slowly add 130 ml 10 N NaOH. Cap carboy and mix well. The pH of this fluid must be 4.93 +/- 0.05 standard units. If the pH is not within 4.93 +/- 0.05 standard units, the fluid must be discarded and remade.
10.1.2 Extraction fluid #2: In 12 L carboy, add 10 L DI water. Slowly add 67.4 ml glacial HOAc dilute to volume. The pH of this fluid must be 2.88 +/- 0.05 standard units. If the pH is not within 2.88 +/- 0.05 standard units, the fluid must be discarded and remade.
10.2 SPLP - Extraction fluid: The pH of these fluids should be checked and recorded before each use; if the pH is outside of listed specifications or if impurities are found, the fluid should be discarded and remade. Shelf life = 1 week.
10.2.1 Extraction fluid #1: In 20 L car buoy, add DI water. Add 60/40 weight percent mixture of sulfuric and nitric acids to DI water until pH is 4.2 0.05 standard units. If the pH is not within 4.2 0.05 standard units, the fluid must be discarded and remade. The fluid is used to determine the leach ability of soil from a site that is east of the Mississippi River, and the leach ability of wastes and wastewaters.
10.2.2 Extraction fluid #2: In 20 L car buoy, add DI water. Add 60/40 weight percent mixture of sulfuric and nitric acids to DI water until pH is 5.0 0.05 standard units. If the pH is not within 5.0 0.05 standard units, the fluid must be discarded and remade. The fluid is used to determine the leach ability of soil from a site that is west of the Mississippi River.
10.2.3 Extraction fluid #3: Reagent water. The pH of this fluid must be within ASTM Type II water of 5.5 SU to 7.5 SU. This fluid is reagent water and is used to determine cyanide and volatiles leach ability.
10.3 ASTM – Extraction fluid: DI reagent water
10.4 Analytical Standards are not applicable to this SOP.
Pace Analytical Services, Inc. – Green Bay Laboratory File: S-GB-I-067-Rev.03.doc TCLP, SPLP, ASTM Date: Upon Final Signature S-GB-I-067-REV.03 Page 6 of 28
11. CALIBRATION
11.1 pH Meter shall be calibrated and verified as per directions in the most current version of SOP S-GB-I-071 Measurement of pH in Water, Soil, and Waste.
11.2 The balance calibration shall be verified as per the most current version of SOP S-GB-Q-030 Support Equipment.
12. PROCEDURE
12.1 ASTM Sample Preparation
12.1.1 Percent moisture is determined on each sample by Sample Management staff as per SOP S-GB-C-008, Measurement of Percent Moisture in Soils and Solids.
12.1.2 For free-flowing particulate solid wastes, obtain a sample of the appropriate size required by thoroughly mixing. A minimum sample size of 70 grams is recommended for each extraction; a sample size of 100 grams is commonly used in this method.
12.1.3 For field-cored solid wastes or castings, cut a representative section weighing approximately 100 grams for each testing. Shape the sample so the leaching solution will cover the material.
12.1.4 For fluid solid samples, mix thoroughly in a manner that does not incorporate air to assure uniformity before withdrawing a 100 gram sample for testing.
12.2 ASTM Extraction Procedure:
12.2.1 Weigh out 100 grams of sample into a 2-liter extraction bottle. Record the weight to the nearest 0.1 gram on the data sheet. If weights other than 100 grams are used, note on the data sheet.
12.2.2 Add to the container a volume of reagent water (in mL) 20 times the weight in grams of the sample. Use this dilution ratio for each sample. (Example: 100 grams sample = 2000 mL water).
12.2.3 Record the sample description, particle size, sample weight used for extraction, and amount of reagent water used in the Extraction Bench sheet Logbook.
12.2.4 Rotate at 29 +/- 2 rpm in rotating leaching apparatus continuously for 18 +/- 0.25 hours at 18 to 27ºC. Record the tumbler ID and the min/max temperatures in the TCLP logbook. If the temperature is outside of specifications during the tumbling process, the temperature needs to be brought within control, and the entire batch needs to be re-prepared. Record start and stop time in logbook
12.2.5 Open container and observe sample. Record any physical changes in the sample and leaching solution.
12.2.6 Let the sample settle for 5 minutes. Separate the bulk of the aqueous phase from the solid phase by decantation, or filtration through a course filter paper.
Pace Analytical Services, Inc. – Green Bay Laboratory File: S-GB-I-067-Rev.03.doc TCLP, SPLP, ASTM Date: Upon Final Signature S-GB-I-067-REV.03 Page 7 of 28
12.2.7 Vacuum filter the liquid through s 0.45-um filter into a 2-liter flask. Document
the lot ID of the filter used.
12.2.8 Measure the pH (record as final pH) of the extract immediately and preserve the volume of extract needed for the testing program as per Section 11.0. Record pH to the nearest 0.01 – pH units.
12.2.9 Refrigerate the extracts as soon as possible as 0º to <6ºC.
12.3 ASTM ZHE Blank Vessel Preparation if Volatile Analysis is Required.
12.3.1 When the blank vessel is completely assembled and the lot ID of the filter paper documented, the vessel needs to be pressurized to eliminate all headspace before transferring the buffer solution. The vessel is connected to nitrogen by using the quick-disconnect Swagelok fitting found at the bottom of the vessel. When the quick-disconnect Swagelok is fitted, a distinct "click" should be heard. The two-way valve on the vessel's top plate is opened, and the vent relief valve on the vessel's bottom plate is closed. Approximately 10-20 psi of pressure is applied to push the piston completely to the top of the vessel, causing the vessel to "jump" slightly. The pressure is released in the vessel by venting the relief valve on the vessel's bottom plate.
12.3.2 Fill the transfer vessel to its capacity with DI water. The vessel's top plate is put on with the two-way valve opened. All the pressure release valves should be closed at this point. The transfer line is then attached tightly to the transfer vessel, and connected to the nitrogen tank. Pressure is applied, being careful not to exceed 50 psi. (Pressure greater than 50 psi may cause the glass fiber filter to break).
12.3.3 Slowly open the two-way valve, allowing the DI water to flow through the transfer line, thus eliminating the air that is in the line. Close the valve when the solution has reached the end of the transfer line, and loosely connect it to the blank vessel. Open both valves (two-way and vent relief) on the blank vessel, and open the two-way valve on the transfer vessel. Tighten the transfer line's connection to the blank vessel once you see the solution begin to leak. This prevents the addition of headspace to the blank vessel.
12.3.4 When there is no more flow through the transfer line, close the two-way valve on the blank vessel. Release the pressure on the transfer vessel. Pressurize to 40 psi and invert the blank vessel three times. Open the two-way valve slowly to allow any headspace to escape. As soon as liquid begins to elute without bubbles, close the top valve and shut off the nitrogen.
12.4 ASTM Solid Wastes Sample Preparation if Volatile Analysis is Required.
12.4.1 The sample is weighed out to 25 ± 0.5 grams, and is added to an empty ZHE vessel. The weight of the sample, the lot ID of the filter paper, the vessel number, and the tumbler ID are recorded in the ZHE Extraction Bench sheet logbook. The top plate of the vessel is closed to an even seal, and the same procedure used for the blank in step 12.3 is followed.

Pace Analytical Services, Inc. – Green Bay Laboratory File: S-GB-I-067-Rev.03.doc TCLP, SPLP, ASTM Date: Upon Final Signature S-GB-I-067-REV.03 Page 8 of 28
12.4.2 Add the DI water to the ZHE sample vessel via the transfer vessel according to
the procedure described in the ZHE Blank Vessel section. The sample vessel is now ready to be tumbled after being pressurized to 5-10 psi.
Note: Assemble empty (dummy vessels) to fill any vacant spots in the tumbler for odd sample batches. Remove the legs from the vessels, if necessary, before tumbling. If the tumbler makes any bumping or banging noises when turned on, stop the tumbling, and re-adjust the vessels. Note: When preparing actual samples, always vent into a hood. At a pressure of 5-10 psi, all samples and the blank are placed on the tumbler and rotated for 18 hours +/- 0.25 hours at 29 ± 2 RPM and 18º to 27ºC. Record initiated and completed times, pressures, and temperatures in the ZHE logbook.
12.5 ASTM Extraction, Filtration, and Collection
12.5.1 After the samples have tumbled for 18 + 0.25 hours, stop the tumbler and enter the leaching completed time and the min/max temperatures in the ZHE extraction logbook. The legs are re-attached to the ZHE vessels if necessary.
Note: Check the pressure gauges on the ZHE extractors and record in the ZHE logbook. If the ending pressure is less than 5-10 psi, the integrity of the vessel may have been breeched and analytes may have been lost. Check for damaged gaskets or weak or worn fittings. If the ending pressure is less than 5-10 psi, re-prepare and re-tumble affected samples.
12.5.2 Attach a Luer fitted 50 mL syringe to the top of each vessel. Connect each vessel to the Swagelok fitting from the bottom to the nitrogen tank and apply 20-30 psi of pressure. Slowly open the two-way valve on the top plate of the vessel to release the extract into the barrel of the syringe. Close the two-way valve and remove the syringe. Slowly transfer the extract into a 40 mL glass vial preserved with HCl. Fill three vials per sample.
Note: Add pressure slowly when necessary. There should be no gurgling noises, indicating an influx of air, as volatiles may be lost and the sample would then be invalid. Also, if the filter in the vessel breaks open, the sample becomes invalid. If either of these occurs, the entire extraction for the sample must be repeated.
12.6 TCLP and SPLP Procedure
12.6.1 Before leaching for TCLP and SPLP, perform these evaluations on a representative waste sample of at least 100 grams. If there is not at least 100 grams, get client consent before proceeding. These test samples won't be extracted, but are used for the preliminary evaluation.
· Determination of matrix of the waste sample Determination of percent solids of the waste sample (Done in Multi-Phase
Worksheet if obviously not 100% solids) · Determination of whether the waste sample contains insignificant solids and
therefore, is its own extract after filtration, this is only done on liquid or multi-phase samples (< 0.5% (insignificant solids) or > 0.5%.) Determination of if there is a need for particle size reduction
Pace Analytical Services, Inc. – Green Bay Laboratory File: S-GB-I-067-Rev.03.doc TCLP, SPLP, ASTM Date: Upon Final Signature S-GB-I-067-REV.03 Page 9 of 28
Determination of which extraction fluid is to be used for the extraction of the waste
12.7 TCLP and SPLP Determination of the matrix of the waste
12.7.1 The matrix of the waste must be determined, recorded, and reported to the analysts receiving the TCLP extracts for matrix spiking purposes. A matrix spike shall be performed for each matrix type.
12.7.2 The matrices are defined as:
12.7.2.1 Aqueous – Matrix that contains less than 0.5% solids.
12.7.2.2 Soil – Matrix consisting of natural ground.
12.7.2.3 Sludge – Matrix consisting of bio solids from a wastewater treatment facility.
12.7.2.4 Oil/Solvent – Matrix consisting of petroleum compounds immiscible with water
12.7.2.5 Other – Matrices that are none of the above, this matrix can include plant material, waste recycling/shredder material, concrete, etc. A matrix spike must be performed on each material determined as “Other”.
12.7.3 The extraction analyst must record the matrix for each sample as defined above in the TCLP/SPLP Extraction Bench Sheet Logbook. A copy of this record must accompany the sample extract to the analysts for matrix spiking purposes.
12.8 TCLP and SPLP Percent Solids of Waste – Use Multi-Phase Worksheet if sample has free liquid
12.8.1 If the waste sample obviously will not yield free liquid during pressure filtration, it is treated as 100% solids. See Particle Size determination in section 12.9.
12.8.2 If waste is a liquid or a multi-phase sample, separate the phases by filtration as follows:
12.8.2.1 Record the weight of the glass fiber filter and the container that will receive the filtrate. Assemble the filter and filtering assembly. Record the lot ID of the filter used.
12.8.2.2 Weigh out representative sample of waste, 100-gram minimum and record weight to 0.1 grams. Quantitatively transfer entire waste sample to filter holder. Spread evenly over surface of filter. Sample should be allowed to reach room temperature, as a refrigerated sample would yield less liquid.
NOTE: If some waste material adheres to container and cannot be transferred into filter holder (>1 percent of sample weight), subtract this residue weight from the original sample weight.
Pace Analytical Services, Inc. – Green Bay Laboratory File: S-GB-I-067-Rev.03.doc TCLP, SPLP, ASTM Date: Upon Final Signature S-GB-I-067-REV.03 Page 10 of 28
12.8.2.3 Gradually apply pressure of 1-10 psi until air moves through filter. If
this point is not reached under 10 psi and if no additional liquid has passed through the filter in any 2-minute interval, slowly increase the pressure in 10-psi increments to a maximum of 50 psi. After 2 minutes at a maximum of 50 psi, the filtration is stopped.
NOTE: Instantaneous application of high pressure can degrade the glass filter and may cause plugging.
12.8.2.4 The material on the filter is defined as the solid phase of the waste and the filtrate is defined as the liquid phase.
NOTE: Some wastes, such as oily wastes or paint wastes, contain material that appears to be liquid, but may not filter. The material within the filtration device is defined as a solid. Do not replace the original filter with a fresh one during this determination.
12.8.2.5 Weigh the filled, filtrate container. Determine the weight of the liquid phase by subtracting the original weight of the filtrate container from the total weight of the filled, filtrate container.
12.8.2.6 Determine the weight of the solid phase by subtracting weight of the liquid phase from the total weight of the original sample aliquot.
12.8.2.7 Determine the percent solids using the following formula:
Percent solids = weight of solid phase X 100 total weight of sample
12.8.2.8 Evaluation of Percent Solids
12.8.2.8.1 If the percent solid is greater than or equal to 0.5% and <2%, then proceed to step 12.8.2.9 (determination of percent DRY solids).
12.8.2.8.2 If the percent solid is greater than or equal to 2%, then proceed to step 12.9 (particle size reduction determination).
12.8.2.8.3 If the percent solid is less than 0.5%, the liquid phase (filtrate) is the TCLP extract: no extraction is needed. Proceed to step 12.11 to filter the sample.
12.8.2.9 Determination of percent DRY solids.
12.8.2.9.1 Dry the filter and solid phase at 100° + 20°C until two successive weightings yield the same value within +1 percent. Record the final weight in logbook.
12.8.2.9.2 Calculate the percent dry solids as follows:
Percent DRY solids = ((Wt of dry waste + filter) - Wt of filter) X 100
Initial Wt of waste
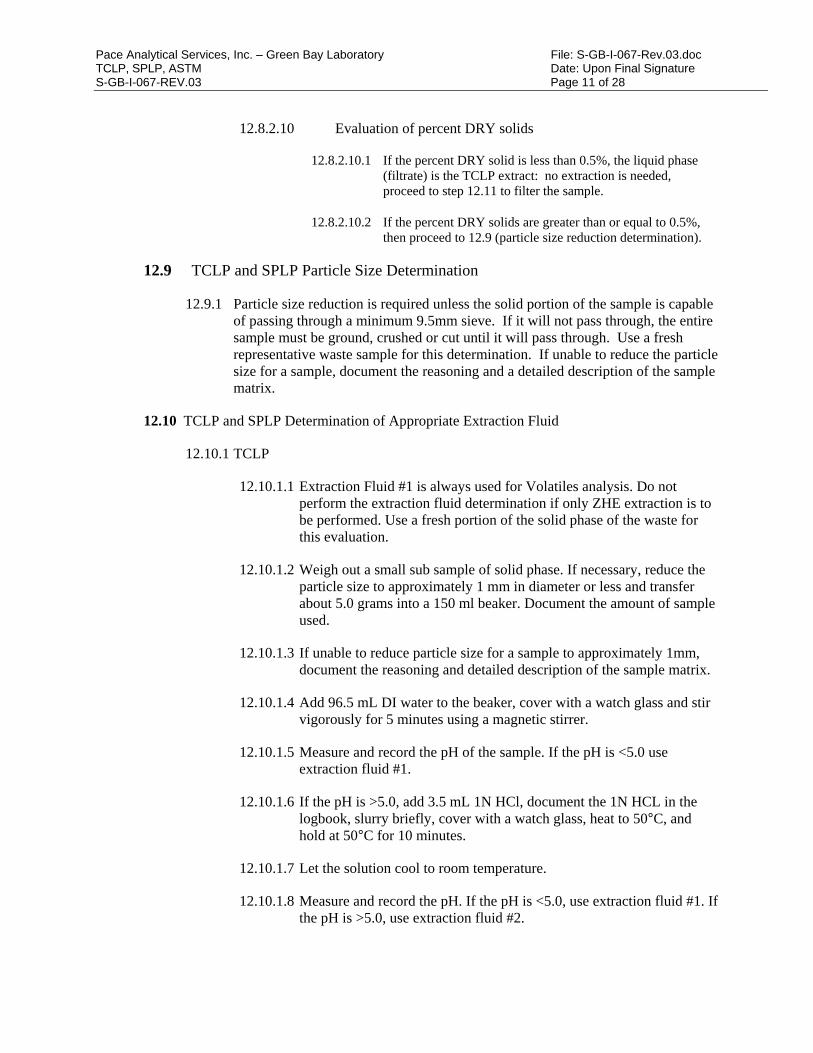
Pace Analytical Services, Inc. – Green Bay Laboratory File: S-GB-I-067-Rev.03.doc TCLP, SPLP, ASTM Date: Upon Final Signature S-GB-I-067-REV.03 Page 11 of 28
12.8.2.10 Evaluation of percent DRY solids
12.8.2.10.1 If the percent DRY solid is less than 0.5%, the liquid phase (filtrate) is the TCLP extract: no extraction is needed, proceed to step 12.11 to filter the sample.
12.8.2.10.2 If the percent DRY solids are greater than or equal to 0.5%, then proceed to 12.9 (particle size reduction determination).
12.9 TCLP and SPLP Particle Size Determination
12.9.1 Particle size reduction is required unless the solid portion of the sample is capable of passing through a minimum 9.5mm sieve. If it will not pass through, the entire sample must be ground, crushed or cut until it will pass through. Use a fresh representative waste sample for this determination. If unable to reduce the particle size for a sample, document the reasoning and a detailed description of the sample matrix.
12.10 TCLP and SPLP Determination of Appropriate Extraction Fluid
12.10.1 TCLP
12.10.1.1 Extraction Fluid #1 is always used for Volatiles analysis. Do not perform the extraction fluid determination if only ZHE extraction is to be performed. Use a fresh portion of the solid phase of the waste for this evaluation.
12.10.1.2 Weigh out a small sub sample of solid phase. If necessary, reduce the particle size to approximately 1 mm in diameter or less and transfer about 5.0 grams into a 150 ml beaker. Document the amount of sample used.
12.10.1.3 If unable to reduce particle size for a sample to approximately 1mm, document the reasoning and detailed description of the sample matrix.
12.10.1.4 Add 96.5 mL DI water to the beaker, cover with a watch glass and stir vigorously for 5 minutes using a magnetic stirrer.
12.10.1.5 Measure and record the pH of the sample. If the pH is <5.0 use extraction fluid #1.
12.10.1.6 If the pH is >5.0, add 3.5 mL 1N HCl, document the 1N HCL in the logbook, slurry briefly, cover with a watch glass, heat to 50°C, and hold at 50°C for 10 minutes.
12.10.1.7 Let the solution cool to room temperature.
12.10.1.8 Measure and record the pH. If the pH is <5.0, use extraction fluid #1. If the pH is >5.0, use extraction fluid #2.
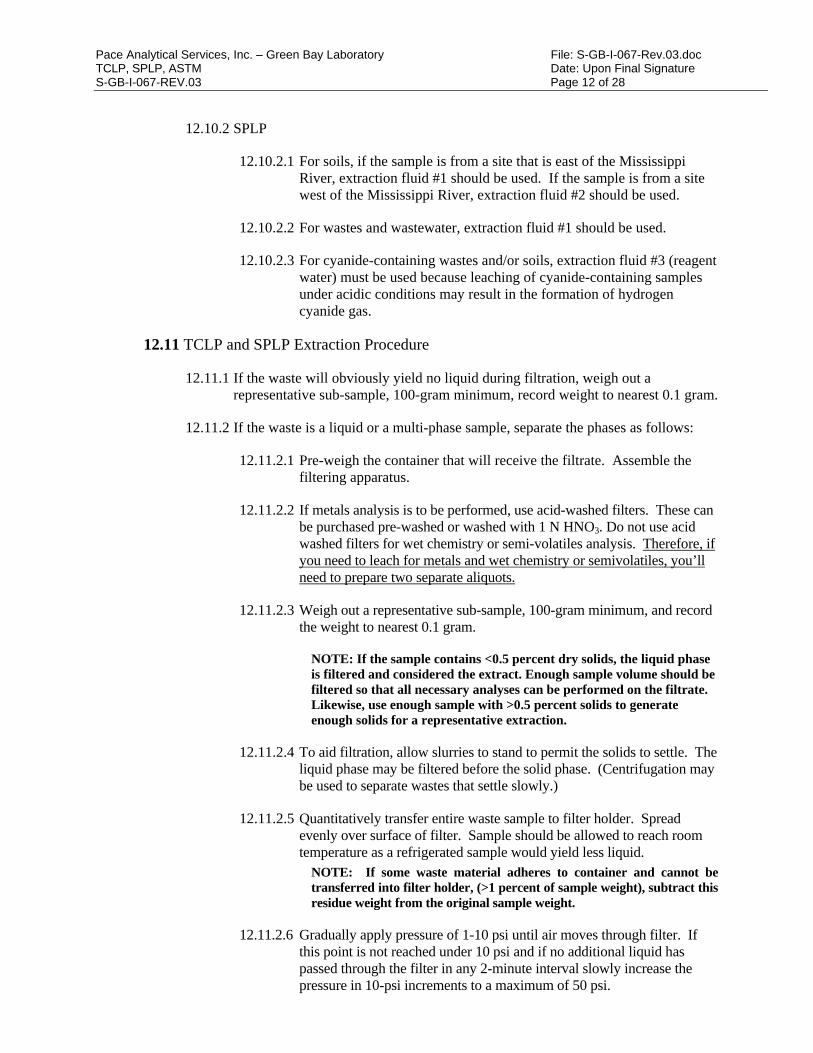
Pace Analytical Services, Inc. – Green Bay Laboratory File: S-GB-I-067-Rev.03.doc TCLP, SPLP, ASTM Date: Upon Final Signature S-GB-I-067-REV.03 Page 12 of 28
12.10.2 SPLP
12.10.2.1 For soils, if the sample is from a site that is east of the Mississippi River, extraction fluid #1 should be used. If the sample is from a site west of the Mississippi River, extraction fluid #2 should be used.
12.10.2.2 For wastes and wastewater, extraction fluid #1 should be used.
12.10.2.3 For cyanide-containing wastes and/or soils, extraction fluid #3 (reagent water) must be used because leaching of cyanide-containing samples under acidic conditions may result in the formation of hydrogen cyanide gas.
12.11 TCLP and SPLP Extraction Procedure
12.11.1 If the waste will obviously yield no liquid during filtration, weigh out a representative sub-sample, 100-gram minimum, record weight to nearest 0.1 gram.
12.11.2 If the waste is a liquid or a multi-phase sample, separate the phases as follows:
12.11.2.1 Pre-weigh the container that will receive the filtrate. Assemble the filtering apparatus.
12.11.2.2 If metals analysis is to be performed, use acid-washed filters. These can be purchased pre-washed or washed with 1 N HNO3. Do not use acid washed filters for wet chemistry or semi-volatiles analysis. Therefore, if you need to leach for metals and wet chemistry or semivolatiles, you’ll need to prepare two separate aliquots.
12.11.2.3 Weigh out a representative sub-sample, 100-gram minimum, and record the weight to nearest 0.1 gram.
NOTE: If the sample contains <0.5 percent dry solids, the liquid phase is filtered and considered the extract. Enough sample volume should be filtered so that all necessary analyses can be performed on the filtrate. Likewise, use enough sample with >0.5 percent solids to generate enough solids for a representative extraction.
12.11.2.4 To aid filtration, allow slurries to stand to permit the solids to settle. The liquid phase may be filtered before the solid phase. (Centrifugation may be used to separate wastes that settle slowly.)
12.11.2.5 Quantitatively transfer entire waste sample to filter holder. Spread evenly over surface of filter. Sample should be allowed to reach room temperature as a refrigerated sample would yield less liquid.
NOTE: If some waste material adheres to container and cannot be transferred into filter holder, (>1 percent of sample weight), subtract this residue weight from the original sample weight.
12.11.2.6 Gradually apply pressure of 1-10 psi until air moves through filter. If this point is not reached under 10 psi and if no additional liquid has passed through the filter in any 2-minute interval slowly increase the pressure in 10-psi increments to a maximum of 50 psi.

Pace Analytical Services, Inc. – Green Bay Laboratory File: S-GB-I-067-Rev.03.doc TCLP, SPLP, ASTM Date: Upon Final Signature S-GB-I-067-REV.03 Page 13 of 28
NOTE: Instantaneous application of high pressure can degrade the glass filter and may cause plugging. When air begins to move through filter or when the liquid flow ceases at 50 psi, stop the filtration.
12.11.2.7 The material in the filter holder is the solid phase of the waste, and the filtrate is the liquid phase. Make sure there is enough solid phase of the sample to perform the extraction. The liquid phase may be analyzed separately or stored at 4°C and added to the extract from the rotated sample.
12.11.2.8 Determine the weight of the solid phase by subtracting the weight of the liquid phase from the sample weight.
12.11.3 TCLP and SPLP: Determine the amount of extraction fluid by using the calculation:
Weight of extraction fluid = (20) X (% solids) X (weight of waste filtered)
100
12.11.4 Since the density of the buffer solution is very near 1 gram/ml, it is assumed that 500 grams of buffer solution is equivalent to 500 ml of buffer solution.
12.11.5 Check pH of extraction fluids. This is documented as the initial pH for the leach blank using that fluid.
12.11.6 Slowly add the amount of appropriate extraction fluid to the extraction bottle. Close the bottle tightly and secure in agitation device.
12.11.7 Record the room temperature min/max for the duration of the sample rotation. The temperature of the room where the extraction takes place shall be maintained at 23 ± 2°C. The room temperature is monitored continuously during rotation using a min/max thermometer. The room temperature is acceptable if it is within the range of 21-25°C.
12.11.8 Rotate at 30 + 2 rpm for 18 + 2 hours. Record the tumbler ID, rotational rate, the start, and stop times in logbook.
NOTE: Pressure may build up within the extraction bottle as agitation continues (e.g. calcium carbonate-containing wastes may evolve gasses such as carbon dioxide). To relieve excess pressure, the bottle may be periodically opened and vented into a hood (e.g. after 15 minutes, 30 minutes, 1 hour, etc.).
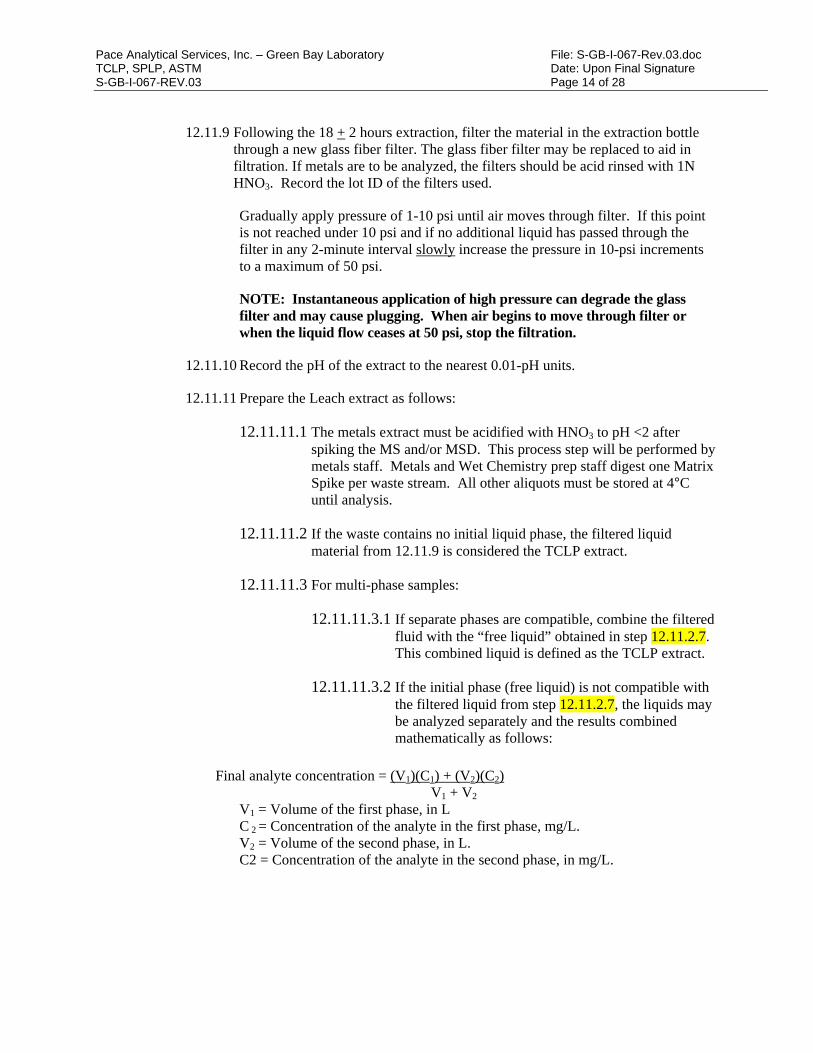
Pace Analytical Services, Inc. – Green Bay Laboratory File: S-GB-I-067-Rev.03.doc TCLP, SPLP, ASTM Date: Upon Final Signature S-GB-I-067-REV.03 Page 14 of 28
12.11.9 Following the 18 + 2 hours extraction, filter the material in the extraction bottle through a new glass fiber filter. The glass fiber filter may be replaced to aid in filtration. If metals are to be analyzed, the filters should be acid rinsed with 1N HNO3. Record the lot ID of the filters used.
Gradually apply pressure of 1-10 psi until air moves through filter. If this point is not reached under 10 psi and if no additional liquid has passed through the filter in any 2-minute interval slowly increase the pressure in 10-psi increments to a maximum of 50 psi.
NOTE: Instantaneous application of high pressure can degrade the glass filter and may cause plugging. When air begins to move through filter or when the liquid flow ceases at 50 psi, stop the filtration.
12.11.10 Record the pH of the extract to the nearest 0.01-pH units.
12.11.11 Prepare the Leach extract as follows:
12.11.11.1 The metals extract must be acidified with HNO3 to pH <2 after spiking the MS and/or MSD. This process step will be performed by metals staff. Metals and Wet Chemistry prep staff digest one Matrix Spike per waste stream. All other aliquots must be stored at 4°C until analysis.
12.11.11.2 If the waste contains no initial liquid phase, the filtered liquid material from 12.11.9 is considered the TCLP extract.
12.11.11.3 For multi-phase samples:
12.11.11.3.1 If separate phases are compatible, combine the filtered fluid with the “free liquid” obtained in step 12.11.2.7. This combined liquid is defined as the TCLP extract.
12.11.11.3.2 If the initial phase (free liquid) is not compatible with the filtered liquid from step 12.11.2.7, the liquids may be analyzed separately and the results combined mathematically as follows:
Final analyte concentration = (V1)(C1) + (V2)(C2)
V1 + V2 V1 = Volume of the first phase, in L C 2 = Concentration of the analyte in the first phase, mg/L. V2 = Volume of the second phase, in L. C2 = Concentration of the analyte in the second phase, in mg/L.
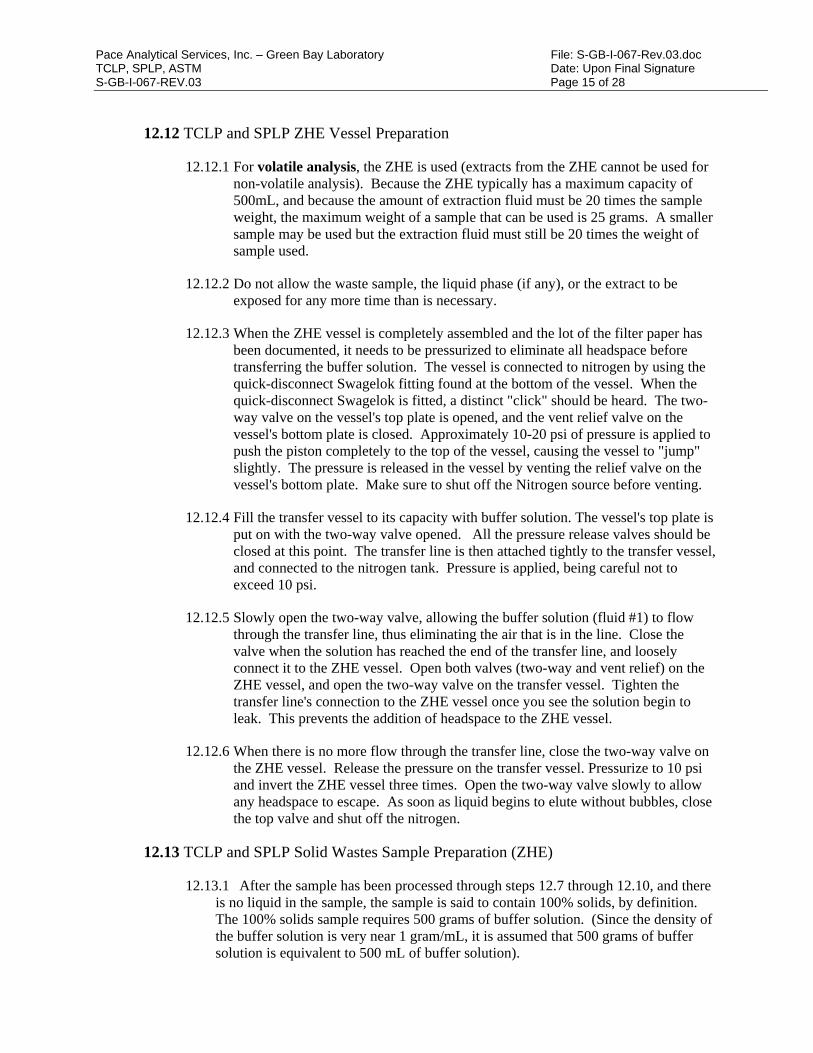
Pace Analytical Services, Inc. – Green Bay Laboratory File: S-GB-I-067-Rev.03.doc TCLP, SPLP, ASTM Date: Upon Final Signature S-GB-I-067-REV.03 Page 15 of 28
12.12 TCLP and SPLP ZHE Vessel Preparation
12.12.1 For volatile analysis, the ZHE is used (extracts from the ZHE cannot be used for non-volatile analysis). Because the ZHE typically has a maximum capacity of 500mL, and because the amount of extraction fluid must be 20 times the sample weight, the maximum weight of a sample that can be used is 25 grams. A smaller sample may be used but the extraction fluid must still be 20 times the weight of sample used.
12.12.2 Do not allow the waste sample, the liquid phase (if any), or the extract to be exposed for any more time than is necessary.
12.12.3 When the ZHE vessel is completely assembled and the lot of the filter paper has been documented, it needs to be pressurized to eliminate all headspace before transferring the buffer solution. The vessel is connected to nitrogen by using the quick-disconnect Swagelok fitting found at the bottom of the vessel. When the quick-disconnect Swagelok is fitted, a distinct "click" should be heard. The two-way valve on the vessel's top plate is opened, and the vent relief valve on the vessel's bottom plate is closed. Approximately 10-20 psi of pressure is applied to push the piston completely to the top of the vessel, causing the vessel to "jump" slightly. The pressure is released in the vessel by venting the relief valve on the vessel's bottom plate. Make sure to shut off the Nitrogen source before venting.
12.12.4 Fill the transfer vessel to its capacity with buffer solution. The vessel's top plate is put on with the two-way valve opened. All the pressure release valves should be closed at this point. The transfer line is then attached tightly to the transfer vessel, and connected to the nitrogen tank. Pressure is applied, being careful not to exceed 10 psi.
12.12.5 Slowly open the two-way valve, allowing the buffer solution (fluid #1) to flow through the transfer line, thus eliminating the air that is in the line. Close the valve when the solution has reached the end of the transfer line, and loosely connect it to the ZHE vessel. Open both valves (two-way and vent relief) on the ZHE vessel, and open the two-way valve on the transfer vessel. Tighten the transfer line's connection to the ZHE vessel once you see the solution begin to leak. This prevents the addition of headspace to the ZHE vessel.
12.12.6 When there is no more flow through the transfer line, close the two-way valve on the ZHE vessel. Release the pressure on the transfer vessel. Pressurize to 10 psi and invert the ZHE vessel three times. Open the two-way valve slowly to allow any headspace to escape. As soon as liquid begins to elute without bubbles, close the top valve and shut off the nitrogen.
12.13 TCLP and SPLP Solid Wastes Sample Preparation (ZHE)
12.13.1 After the sample has been processed through steps 12.7 through 12.10, and there is no liquid in the sample, the sample is said to contain 100% solids, by definition. The 100% solids sample requires 500 grams of buffer solution. (Since the density of the buffer solution is very near 1 gram/mL, it is assumed that 500 grams of buffer solution is equivalent to 500 mL of buffer solution).
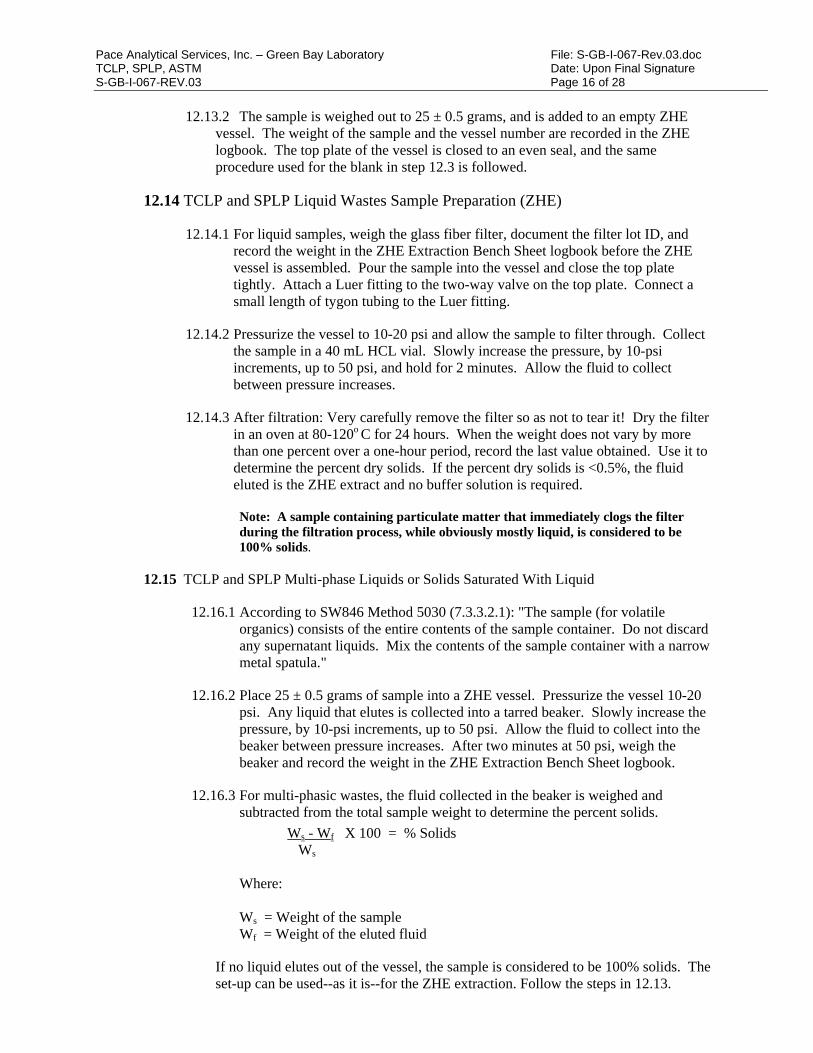
Pace Analytical Services, Inc. – Green Bay Laboratory File: S-GB-I-067-Rev.03.doc TCLP, SPLP, ASTM Date: Upon Final Signature S-GB-I-067-REV.03 Page 16 of 28
12.13.2 The sample is weighed out to 25 ± 0.5 grams, and is added to an empty ZHE
vessel. The weight of the sample and the vessel number are recorded in the ZHE logbook. The top plate of the vessel is closed to an even seal, and the same procedure used for the blank in step 12.3 is followed.
12.14 TCLP and SPLP Liquid Wastes Sample Preparation (ZHE)
12.14.1 For liquid samples, weigh the glass fiber filter, document the filter lot ID, and record the weight in the ZHE Extraction Bench Sheet logbook before the ZHE vessel is assembled. Pour the sample into the vessel and close the top plate tightly. Attach a Luer fitting to the two-way valve on the top plate. Connect a small length of tygon tubing to the Luer fitting.
12.14.2 Pressurize the vessel to 10-20 psi and allow the sample to filter through. Collect the sample in a 40 mL HCL vial. Slowly increase the pressure, by 10-psi increments, up to 50 psi, and hold for 2 minutes. Allow the fluid to collect between pressure increases.
12.14.3 After filtration: Very carefully remove the filter so as not to tear it! Dry the filter in an oven at 80-120o C for 24 hours. When the weight does not vary by more than one percent over a one-hour period, record the last value obtained. Use it to determine the percent dry solids. If the percent dry solids is <0.5%, the fluid eluted is the ZHE extract and no buffer solution is required.
Note: A sample containing particulate matter that immediately clogs the filter during the filtration process, while obviously mostly liquid, is considered to be 100% solids.
12.15 TCLP and SPLP Multi-phase Liquids or Solids Saturated With Liquid
12.16.1 According to SW846 Method 5030 (7.3.3.2.1): "The sample (for volatile organics) consists of the entire contents of the sample container. Do not discard any supernatant liquids. Mix the contents of the sample container with a narrow metal spatula."
12.16.2 Place 25 ± 0.5 grams of sample into a ZHE vessel. Pressurize the vessel 10-20 psi. Any liquid that elutes is collected into a tarred beaker. Slowly increase the pressure, by 10-psi increments, up to 50 psi. Allow the fluid to collect into the beaker between pressure increases. After two minutes at 50 psi, weigh the beaker and record the weight in the ZHE Extraction Bench Sheet logbook.
12.16.3 For multi-phasic wastes, the fluid collected in the beaker is weighed and subtracted from the total sample weight to determine the percent solids.
Ws - Wf X 100 = % Solids Ws Where: Ws = Weight of the sample
Wf = Weight of the eluted fluid
If no liquid elutes out of the vessel, the sample is considered to be 100% solids. The set-up can be used--as it is--for the ZHE extraction. Follow the steps in 12.13.
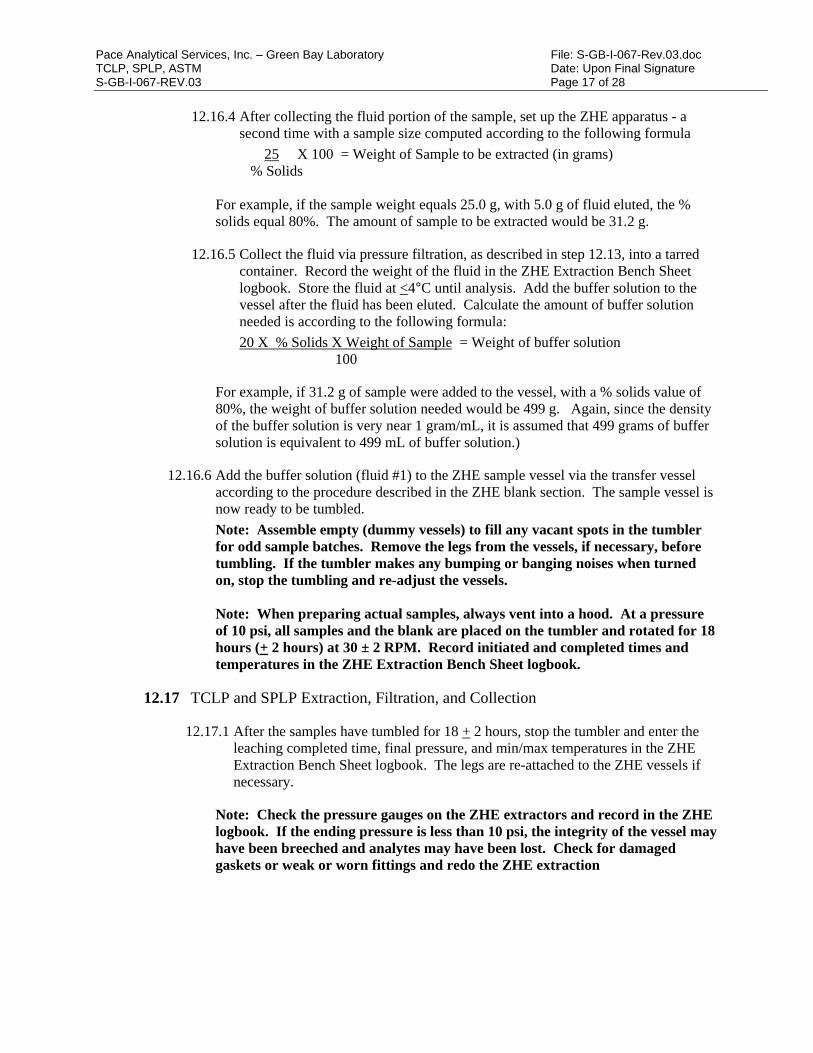
Pace Analytical Services, Inc. – Green Bay Laboratory File: S-GB-I-067-Rev.03.doc TCLP, SPLP, ASTM Date: Upon Final Signature S-GB-I-067-REV.03 Page 17 of 28
12.16.4 After collecting the fluid portion of the sample, set up the ZHE apparatus - a
second time with a sample size computed according to the following formula
25 X 100 = Weight of Sample to be extracted (in grams) % Solids For example, if the sample weight equals 25.0 g, with 5.0 g of fluid eluted, the % solids equal 80%. The amount of sample to be extracted would be 31.2 g.
12.16.5 Collect the fluid via pressure filtration, as described in step 12.13, into a tarred container. Record the weight of the fluid in the ZHE Extraction Bench Sheet logbook. Store the fluid at <4°C until analysis. Add the buffer solution to the vessel after the fluid has been eluted. Calculate the amount of buffer solution needed is according to the following formula:
20 X % Solids X Weight of Sample = Weight of buffer solution 100
For example, if 31.2 g of sample were added to the vessel, with a % solids value of 80%, the weight of buffer solution needed would be 499 g. Again, since the density of the buffer solution is very near 1 gram/mL, it is assumed that 499 grams of buffer solution is equivalent to 499 mL of buffer solution.)
12.16.6 Add the buffer solution (fluid #1) to the ZHE sample vessel via the transfer vessel according to the procedure described in the ZHE blank section. The sample vessel is now ready to be tumbled.
Note: Assemble empty (dummy vessels) to fill any vacant spots in the tumbler for odd sample batches. Remove the legs from the vessels, if necessary, before tumbling. If the tumbler makes any bumping or banging noises when turned on, stop the tumbling and re-adjust the vessels. Note: When preparing actual samples, always vent into a hood. At a pressure of 10 psi, all samples and the blank are placed on the tumbler and rotated for 18 hours (+ 2 hours) at 30 ± 2 RPM. Record initiated and completed times and temperatures in the ZHE Extraction Bench Sheet logbook.
12.17 TCLP and SPLP Extraction, Filtration, and Collection
12.17.1 After the samples have tumbled for 18 + 2 hours, stop the tumbler and enter the leaching completed time, final pressure, and min/max temperatures in the ZHE Extraction Bench Sheet logbook. The legs are re-attached to the ZHE vessels if necessary.
Note: Check the pressure gauges on the ZHE extractors and record in the ZHE logbook. If the ending pressure is less than 10 psi, the integrity of the vessel may have been breeched and analytes may have been lost. Check for damaged gaskets or weak or worn fittings and redo the ZHE extraction
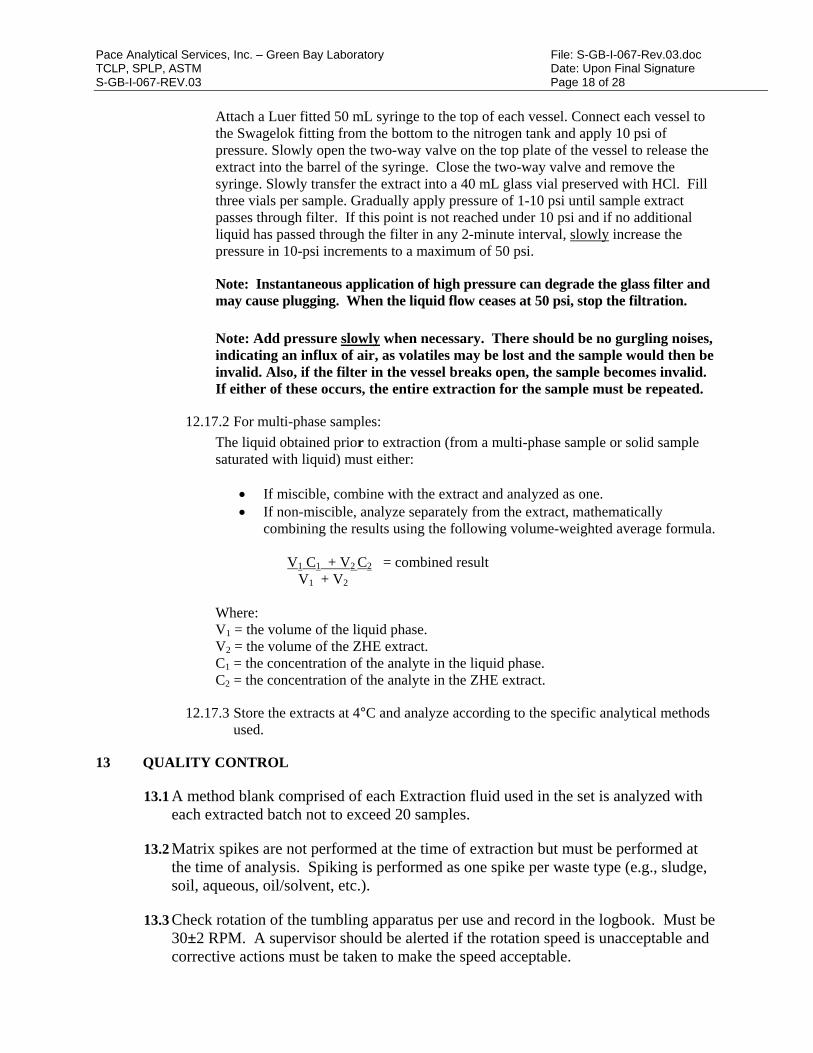
Pace Analytical Services, Inc. – Green Bay Laboratory File: S-GB-I-067-Rev.03.doc TCLP, SPLP, ASTM Date: Upon Final Signature S-GB-I-067-REV.03 Page 18 of 28
Attach a Luer fitted 50 mL syringe to the top of each vessel. Connect each vessel to the Swagelok fitting from the bottom to the nitrogen tank and apply 10 psi of pressure. Slowly open the two-way valve on the top plate of the vessel to release the extract into the barrel of the syringe. Close the two-way valve and remove the syringe. Slowly transfer the extract into a 40 mL glass vial preserved with HCl. Fill three vials per sample. Gradually apply pressure of 1-10 psi until sample extract passes through filter. If this point is not reached under 10 psi and if no additional liquid has passed through the filter in any 2-minute interval, slowly increase the pressure in 10-psi increments to a maximum of 50 psi.
Note: Instantaneous application of high pressure can degrade the glass filter and may cause plugging. When the liquid flow ceases at 50 psi, stop the filtration.
Note: Add pressure slowly when necessary. There should be no gurgling noises, indicating an influx of air, as volatiles may be lost and the sample would then be invalid. Also, if the filter in the vessel breaks open, the sample becomes invalid. If either of these occurs, the entire extraction for the sample must be repeated.
12.17.2 For multi-phase samples:
The liquid obtained prior to extraction (from a multi-phase sample or solid sample saturated with liquid) must either:
If miscible, combine with the extract and analyzed as one. If non-miscible, analyze separately from the extract, mathematically
combining the results using the following volume-weighted average formula. V1 C1 + V2 C2 = combined result V1 + V2
Where: V1 = the volume of the liquid phase. V2 = the volume of the ZHE extract. C1 = the concentration of the analyte in the liquid phase. C2 = the concentration of the analyte in the ZHE extract.
12.17.3 Store the extracts at 4°C and analyze according to the specific analytical methods used.
13 QUALITY CONTROL
13.1 A method blank comprised of each Extraction fluid used in the set is analyzed with each extracted batch not to exceed 20 samples.
13.2 Matrix spikes are not performed at the time of extraction but must be performed at the time of analysis. Spiking is performed as one spike per waste type (e.g., sludge, soil, aqueous, oil/solvent, etc.).
13.3 Check rotation of the tumbling apparatus per use and record in the logbook. Must be 30±2 RPM. A supervisor should be alerted if the rotation speed is unacceptable and corrective actions must be taken to make the speed acceptable.
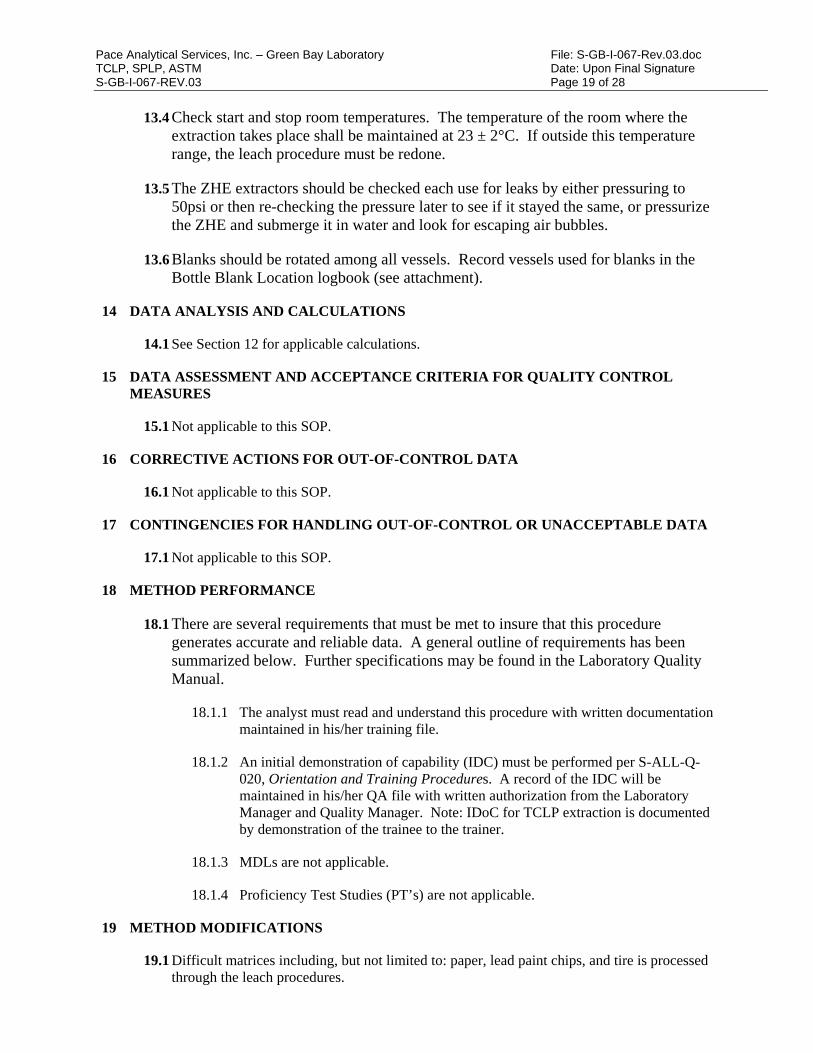
Pace Analytical Services, Inc. – Green Bay Laboratory File: S-GB-I-067-Rev.03.doc TCLP, SPLP, ASTM Date: Upon Final Signature S-GB-I-067-REV.03 Page 19 of 28
13.4 Check start and stop room temperatures. The temperature of the room where the
extraction takes place shall be maintained at 23 ± 2°C. If outside this temperature range, the leach procedure must be redone.
13.5 The ZHE extractors should be checked each use for leaks by either pressuring to 50psi or then re-checking the pressure later to see if it stayed the same, or pressurize the ZHE and submerge it in water and look for escaping air bubbles.
13.6 Blanks should be rotated among all vessels. Record vessels used for blanks in the Bottle Blank Location logbook (see attachment).
14 DATA ANALYSIS AND CALCULATIONS
14.1 See Section 12 for applicable calculations.
15 DATA ASSESSMENT AND ACCEPTANCE CRITERIA FOR QUALITY CONTROL MEASURES
15.1 Not applicable to this SOP.
16 CORRECTIVE ACTIONS FOR OUT-OF-CONTROL DATA
16.1 Not applicable to this SOP.
17 CONTINGENCIES FOR HANDLING OUT-OF-CONTROL OR UNACCEPTABLE DATA
17.1 Not applicable to this SOP.
18 METHOD PERFORMANCE
18.1 There are several requirements that must be met to insure that this procedure generates accurate and reliable data. A general outline of requirements has been summarized below. Further specifications may be found in the Laboratory Quality Manual.
18.1.1 The analyst must read and understand this procedure with written documentation maintained in his/her training file.
18.1.2 An initial demonstration of capability (IDC) must be performed per S-ALL-Q-020, Orientation and Training Procedures. A record of the IDC will be maintained in his/her QA file with written authorization from the Laboratory Manager and Quality Manager. Note: IDoC for TCLP extraction is documented by demonstration of the trainee to the trainer.
18.1.3 MDLs are not applicable.
18.1.4 Proficiency Test Studies (PT’s) are not applicable.
19 METHOD MODIFICATIONS
19.1 Difficult matrices including, but not limited to: paper, lead paint chips, and tire is processed through the leach procedures.
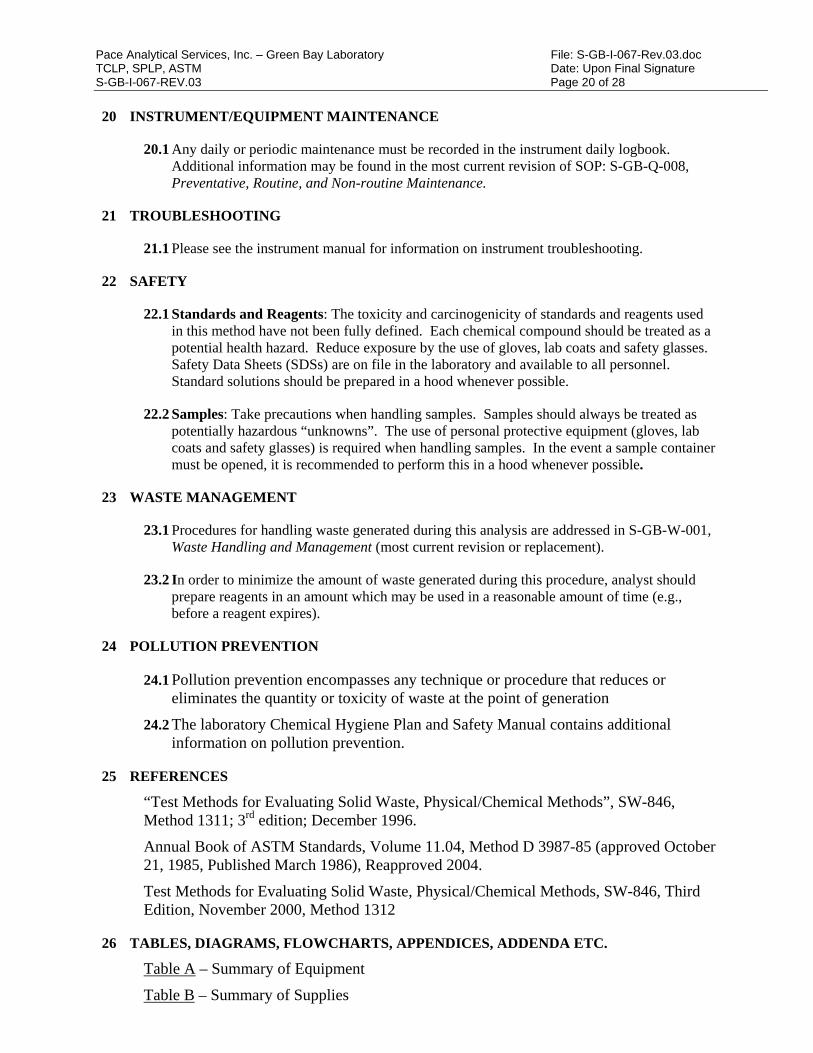
Pace Analytical Services, Inc. – Green Bay Laboratory File: S-GB-I-067-Rev.03.doc TCLP, SPLP, ASTM Date: Upon Final Signature S-GB-I-067-REV.03 Page 20 of 28
20 INSTRUMENT/EQUIPMENT MAINTENANCE
20.1 Any daily or periodic maintenance must be recorded in the instrument daily logbook. Additional information may be found in the most current revision of SOP: S-GB-Q-008, Preventative, Routine, and Non-routine Maintenance.
21 TROUBLESHOOTING
21.1 Please see the instrument manual for information on instrument troubleshooting.
22 SAFETY
22.1 Standards and Reagents: The toxicity and carcinogenicity of standards and reagents used in this method have not been fully defined. Each chemical compound should be treated as a potential health hazard. Reduce exposure by the use of gloves, lab coats and safety glasses. Safety Data Sheets (SDSs) are on file in the laboratory and available to all personnel. Standard solutions should be prepared in a hood whenever possible.
22.2 Samples: Take precautions when handling samples. Samples should always be treated as potentially hazardous “unknowns”. The use of personal protective equipment (gloves, lab coats and safety glasses) is required when handling samples. In the event a sample container must be opened, it is recommended to perform this in a hood whenever possible.
23 WASTE MANAGEMENT
23.1 Procedures for handling waste generated during this analysis are addressed in S-GB-W-001, Waste Handling and Management (most current revision or replacement).
23.2 In order to minimize the amount of waste generated during this procedure, analyst should prepare reagents in an amount which may be used in a reasonable amount of time (e.g., before a reagent expires).
24 POLLUTION PREVENTION
24.1 Pollution prevention encompasses any technique or procedure that reduces or eliminates the quantity or toxicity of waste at the point of generation
24.2 The laboratory Chemical Hygiene Plan and Safety Manual contains additional information on pollution prevention.
25 REFERENCES
“Test Methods for Evaluating Solid Waste, Physical/Chemical Methods”, SW-846, Method 1311; 3rd edition; December 1996.
Annual Book of ASTM Standards, Volume 11.04, Method D 3987-85 (approved October 21, 1985, Published March 1986), Reapproved 2004.
Test Methods for Evaluating Solid Waste, Physical/Chemical Methods, SW-846, Third Edition, November 2000, Method 1312
26 TABLES, DIAGRAMS, FLOWCHARTS, APPENDICES, ADDENDA ETC.
Table A – Summary of Equipment
Table B – Summary of Supplies
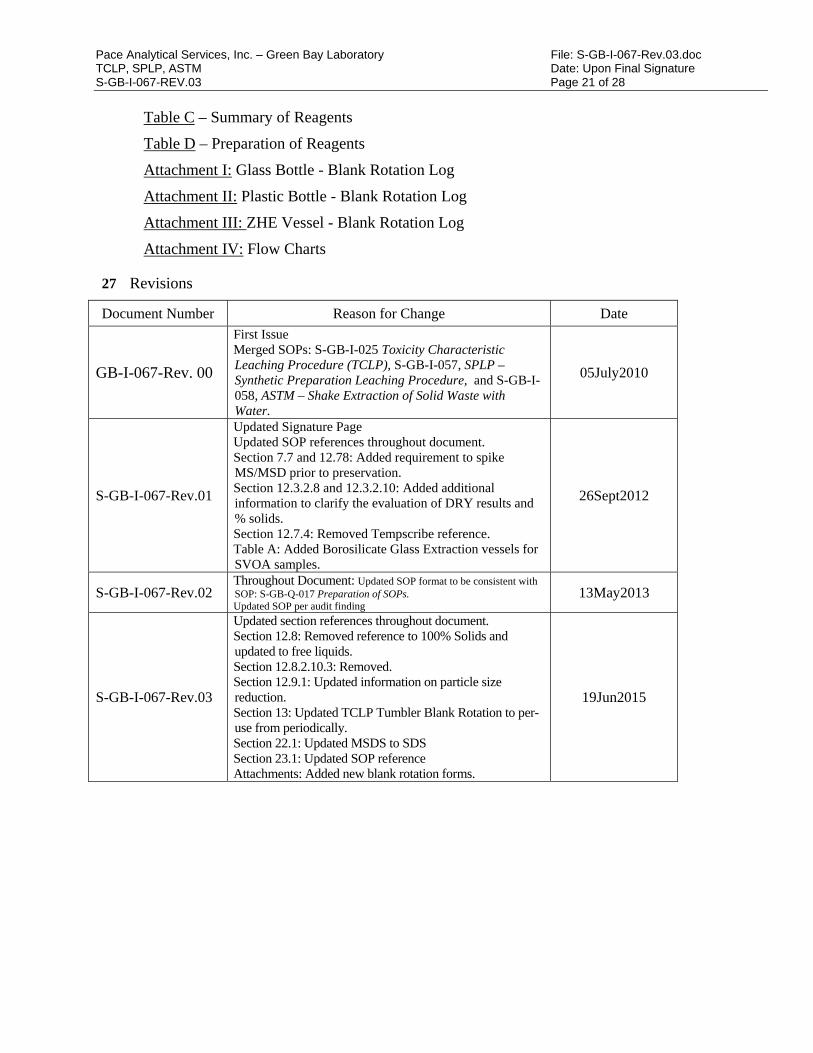
Pace Analytical Services, Inc. – Green Bay Laboratory File: S-GB-I-067-Rev.03.doc TCLP, SPLP, ASTM Date: Upon Final Signature S-GB-I-067-REV.03 Page 21 of 28
Table C – Summary of Reagents
Table D – Preparation of Reagents
Attachment I: Glass Bottle - Blank Rotation Log
Attachment II: Plastic Bottle - Blank Rotation Log
Attachment III: ZHE Vessel - Blank Rotation Log
Attachment IV: Flow Charts
27 Revisions
Document Number Reason for Change Date
GB-I-067-Rev. 00
First Issue Merged SOPs: S-GB-I-025 Toxicity Characteristic Leaching Procedure (TCLP), S-GB-I-057, SPLP – Synthetic Preparation Leaching Procedure, and S-GB-I-058, ASTM – Shake Extraction of Solid Waste with Water.
05July2010
S-GB-I-067-Rev.01
Updated Signature Page Updated SOP references throughout document. Section 7.7 and 12.78: Added requirement to spike MS/MSD prior to preservation. Section 12.3.2.8 and 12.3.2.10: Added additional information to clarify the evaluation of DRY results and % solids. Section 12.7.4: Removed Tempscribe reference. Table A: Added Borosilicate Glass Extraction vessels for SVOA samples.
26Sept2012
S-GB-I-067-Rev.02 Throughout Document: Updated SOP format to be consistent with SOP: S-GB-Q-017 Preparation of SOPs. Updated SOP per audit finding
13May2013
S-GB-I-067-Rev.03
Updated section references throughout document. Section 12.8: Removed reference to 100% Solids and updated to free liquids. Section 12.8.2.10.3: Removed. Section 12.9.1: Updated information on particle size reduction. Section 13: Updated TCLP Tumbler Blank Rotation to per-use from periodically. Section 22.1: Updated MSDS to SDS Section 23.1: Updated SOP reference Attachments: Added new blank rotation forms.
19Jun2015
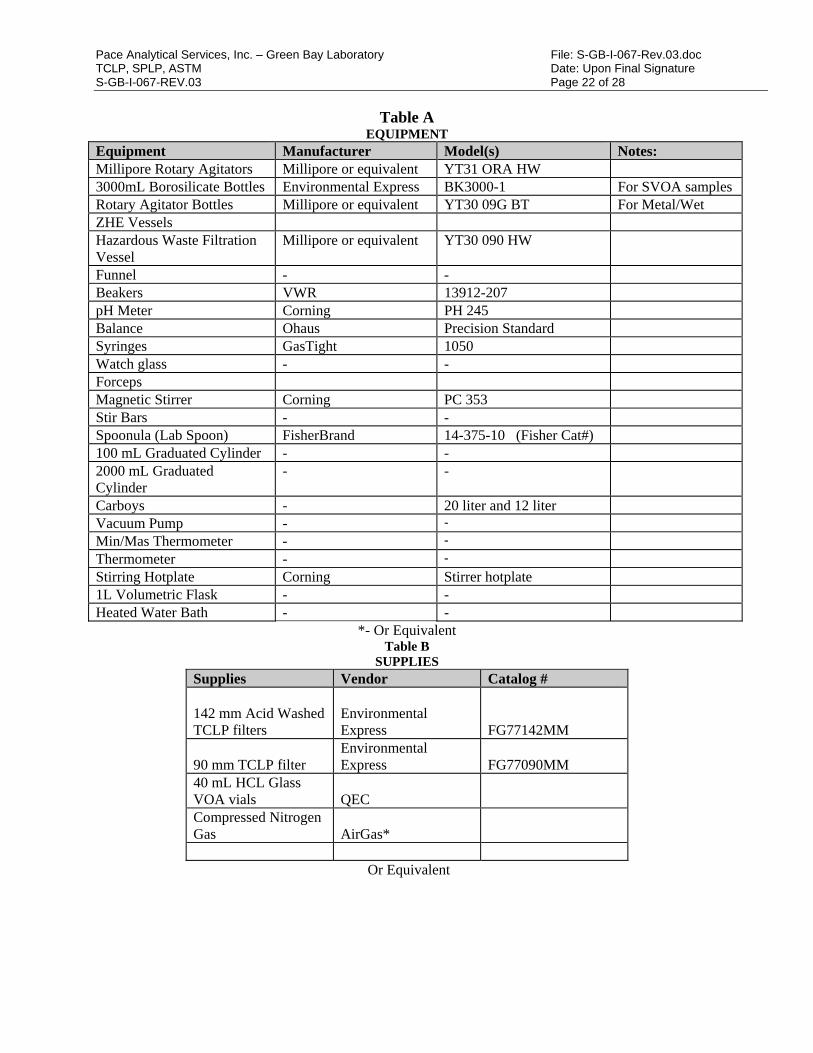
Pace Analytical Services, Inc. – Green Bay Laboratory File: S-GB-I-067-Rev.03.doc TCLP, SPLP, ASTM Date: Upon Final Signature S-GB-I-067-REV.03 Page 22 of 28
Table A
EQUIPMENT Equipment Manufacturer Model(s) Notes: Millipore Rotary Agitators Millipore or equivalent YT31 ORA HW 3000mL Borosilicate Bottles Environmental Express BK3000-1 For SVOA samples Rotary Agitator Bottles Millipore or equivalent YT30 09G BT For Metal/Wet ZHE Vessels Hazardous Waste Filtration Vessel
Millipore or equivalent YT30 090 HW
Funnel - - Beakers VWR 13912-207 pH Meter Corning PH 245 Balance Ohaus Precision Standard Syringes GasTight 1050 Watch glass - - Forceps Magnetic Stirrer Corning PC 353 Stir Bars - - Spoonula (Lab Spoon) FisherBrand 14-375-10 (Fisher Cat#) 100 mL Graduated Cylinder - - 2000 mL Graduated Cylinder
- -
Carboys - 20 liter and 12 liter Vacuum Pump - -
Min/Mas Thermometer - -
Thermometer - -
Stirring Hotplate Corning Stirrer hotplate 1L Volumetric Flask - - Heated Water Bath - -
*- Or Equivalent Table B
SUPPLIES Supplies Vendor Catalog # 142 mm Acid Washed TCLP filters
Environmental Express FG77142MM
90 mm TCLP filter Environmental Express FG77090MM
40 mL HCL Glass VOA vials QEC Compressed Nitrogen Gas AirGas*
Or Equivalent
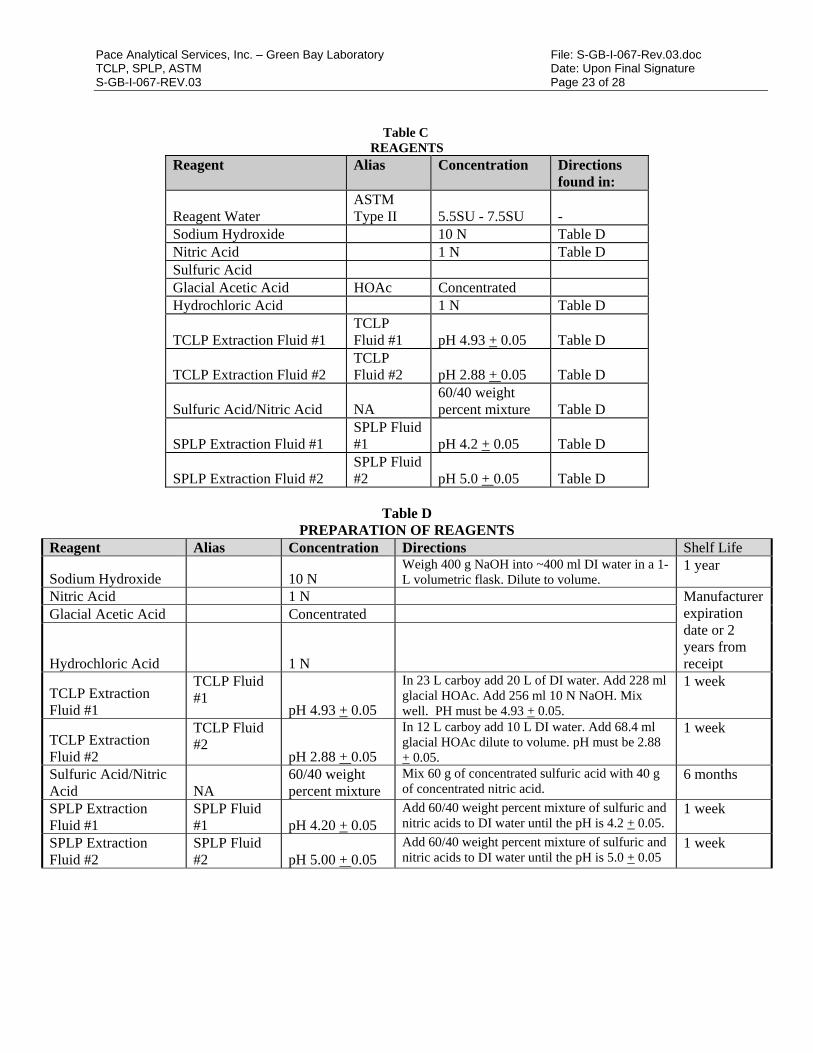
Pace Analytical Services, Inc. – Green Bay Laboratory File: S-GB-I-067-Rev.03.doc TCLP, SPLP, ASTM Date: Upon Final Signature S-GB-I-067-REV.03 Page 23 of 28
Table C REAGENTS
Reagent Alias Concentration Directions found in:
Reagent Water ASTM Type II 5.5SU - 7.5SU -
Sodium Hydroxide 10 N Table D Nitric Acid 1 N Table D Sulfuric Acid Glacial Acetic Acid HOAc Concentrated Hydrochloric Acid 1 N Table D
TCLP Extraction Fluid #1 TCLP Fluid #1 pH 4.93 + 0.05 Table D
TCLP Extraction Fluid #2 TCLP Fluid #2 pH 2.88 + 0.05 Table D
Sulfuric Acid/Nitric Acid NA 60/40 weight percent mixture Table D
SPLP Extraction Fluid #1 SPLP Fluid #1 pH 4.2 + 0.05 Table D
SPLP Extraction Fluid #2 SPLP Fluid #2 pH 5.0 + 0.05 Table D
Table D
PREPARATION OF REAGENTS Reagent Alias Concentration Directions Shelf Life
Sodium Hydroxide
10 N Weigh 400 g NaOH into ~400 ml DI water in a 1-L volumetric flask. Dilute to volume.
1 year
Nitric Acid 1 N Manufacturer expiration date or 2 years from receipt
Glacial Acetic Acid Concentrated
Hydrochloric Acid
1 N
TCLP Extraction Fluid #1
TCLP Fluid #1
pH 4.93 + 0.05
In 23 L carboy add 20 L of DI water. Add 228 ml glacial HOAc. Add 256 ml 10 N NaOH. Mix well. PH must be 4.93 + 0.05.
1 week
TCLP Extraction Fluid #2
TCLP Fluid #2
pH 2.88 + 0.05
In 12 L carboy add 10 L DI water. Add 68.4 ml glacial HOAc dilute to volume. pH must be 2.88 + 0.05.
1 week
Sulfuric Acid/Nitric Acid NA
60/40 weight percent mixture
Mix 60 g of concentrated sulfuric acid with 40 g of concentrated nitric acid.
6 months
SPLP Extraction Fluid #1
SPLP Fluid #1 pH 4.20 + 0.05
Add 60/40 weight percent mixture of sulfuric and nitric acids to DI water until the pH is 4.2 + 0.05.
1 week
SPLP Extraction Fluid #2
SPLP Fluid #2 pH 5.00 + 0.05
Add 60/40 weight percent mixture of sulfuric and nitric acids to DI water until the pH is 5.0 + 0.05
1 week
Pace Analytical Services, Inc. – Green Bay Laboratory File: S-GB-I-067-Rev.03.doc TCLP, SPLP, ASTM Date: Upon Final Signature S-GB-I-067-REV.03 Page 24 of 28
Attachment I: Glass Bottle - Blank Rotation Log

Pace Analytical Services, Inc. – Green Bay Laboratory File: S-GB-I-067-Rev.03.doc TCLP, SPLP, ASTM Date: Upon Final Signature S-GB-I-067-REV.03 Page 25 of 28
Attachment II: Plastic Bottle - Blank Rotation Log
Pace Analytical Services, Inc. – Green Bay Laboratory File: S-GB-I-067-Rev.03.doc TCLP, SPLP, ASTM Date: Upon Final Signature S-GB-I-067-REV.03 Page 26 of 28
Attachment III: ZHE Vessel - Blank Rotation Log

Pace Analytical Services, Inc. – Green Bay Laboratory File: S-GB-I-067-Rev.03.doc TCLP, SPLP, ASTM Date: Upon Final Signature S-GB-I-067-REV.03 Page 27 of 28
Attachment IX: Flow Charts FLOWCHARTS
Start
Use a sub-sample of the
sample
Percent Solids ?
< 0.5 % > 0.5 %
100 %
Separate solids from liquids with a 0.6-0.8 um glass fiber filter.
Separate solids from liquids with a 0.6-0.8 um glass fiber filter.
A A
Examine Solids
Liquid
Discard Solids
Milling Required
?
Yes
No
Extract with appropriate
fluid.
B
Reduce particles to less than 9.5 mm
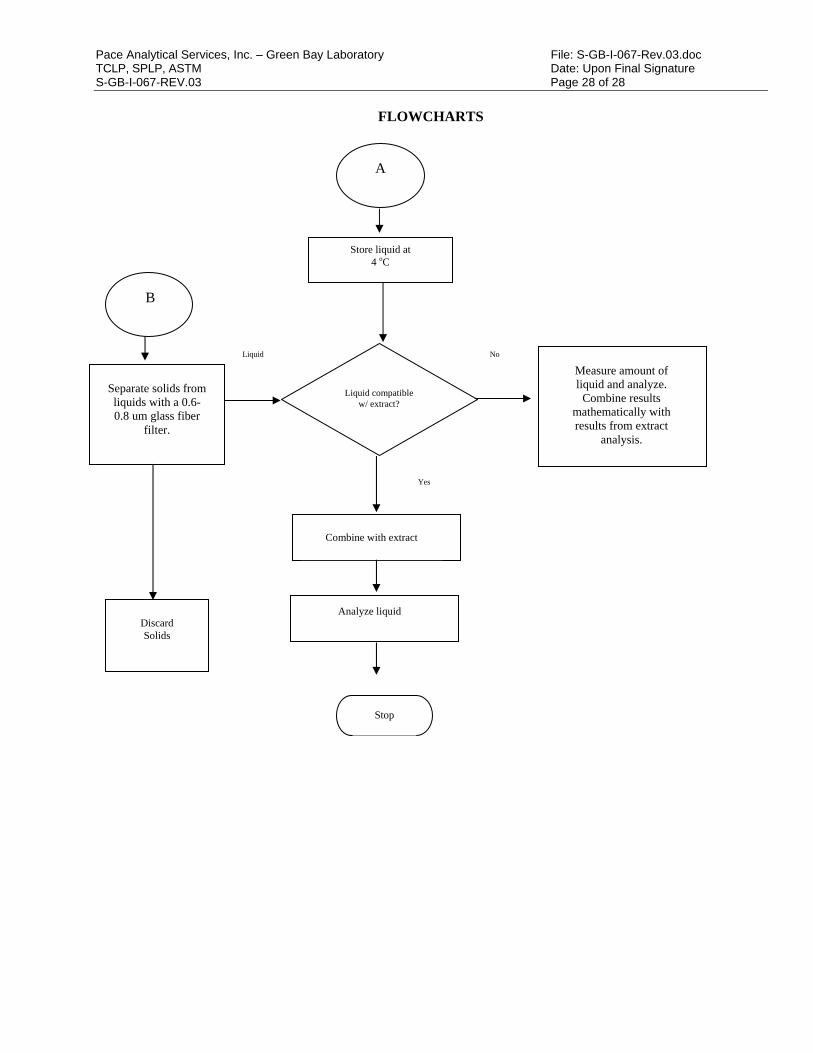
Pace Analytical Services, Inc. – Green Bay Laboratory File: S-GB-I-067-Rev.03.doc TCLP, SPLP, ASTM Date: Upon Final Signature S-GB-I-067-REV.03 Page 28 of 28
FLOWCHARTS
A
Store liquid at 4 oC
Liquid compatible w/ extract?
Yes
No
Measure amount of liquid and analyze.
Combine results mathematically with results from extract
analysis.
Combine with extract
Analyze liquid
B
Liquid
Separate solids from liquids with a 0.6-0.8 um glass fiber
filter.
Discard Solids
Stop

Pace Analytical Services, Inc. 1241 Bellevue Street, Suite 9
Green Bay, WI 54302 www.pacelabs.com Phone: 920.469.2436 Fax: 920.469.8827
SOPs distributed as Controlled Documents are given a copy number on the signed Title Page. Copies without a number are considered uncontrolled and must be verified as the most recent version prior to each use.
STANDARD OPERATING PROCEDURE
Determination of Trace Metals in Waters and Wastes By Inductively Coupled Plasma Mass Spectroscopy
Reference Methods: SW-846 6020, SW-846 6020A and EPA 200.8
SOP NUMBER: S-GB-M-006-REV.07
EFFECTIVE DATE: Date of Final Signature
SUPERSEDES: S-GB-M-006-REV.06 __________________________________________________________________________________
APPROVAL
__________________________________________ 09/14/16 Nils Melberg, Laboratory General Manager Date
________________________________________ 8/19/16 Kate Verbeten, Laboratory Quality Manager Date __________________________________________ 08/19/2016 Chad Rusch, Department Manager Date
PERIODIC REVIEW
SIGNATURES BELOW INDICATE NO CHANGES HAVE BEEN MADE SINCE APPROVAL.
Signature Title Date
Signature Title Date
Signature Title Date
© 2002 - 2016 Pace Analytical Services, Inc. This Standard Operating Procedure may not be reproduced, in part or in full, without written consent of Pace Analytical Services, Inc. Whether distributed internally or as a “courtesy copy” to clients or regulatory agencies, this document is considered confidential and proprietary information. Any printed documents in use within a Pace Analytical Services, Inc. laboratory have been reviewed and approved by the persons listed on the cover page. They can only be deemed official if proper signatures are present.
This is COPY# Distributed on by and is CONTROLLED or X UNCONTROLLED
SOPs distributed as Controlled Documents are given a copy number on the signed Title Page. Copies without a number are considered uncontrolled and must be verified as the most recent version prior to each use.
S-GB-M-006-REV.07
Table of Contents
Section Page
1. Purpose/Identification of Method ........................................................................................3
2. Summary of Method .............................................................................................................3
3. Scope and Application ..........................................................................................................3
4. Applicable Matrices ..............................................................................................................3
5. Limits of Detection and Quantitation .................................................................................4
6. Interferences ..........................................................................................................................4
7. Sample Collection, Preservation, Shipment and Storage ..................................................5
8. Definitions ..............................................................................................................................6
9. Equipment and Supplies (Including Computer Hardware and Software) .....................6
10. Reagents and Standards .......................................................................................................6
11. Calibration and Standardization .........................................................................................8
12. Procedure ...............................................................................................................................9
13. Quality Control. ..................................................................................................................13
14. Data Analysis and Calculations .........................................................................................18
15. Data Assessment and Acceptance Criteria for Quality Control Measures ...................20
16. Corrective Actions for Out-of-Control Data ....................................................................21
17. Contingencies for Handling Out-of-Control or Unacceptable Data ..............................22
18. Method Performance ..........................................................................................................22
19. Method Modifications .........................................................................................................23
20. Instrument/Equipment Maintenance ................................................................................23
21. Troubleshooting ..................................................................................................................23
22. Safety ....................................................................................................................................23
23. Waste Management ............................................................................................................24
24. Pollution Prevention ...........................................................................................................24
25. References ............................................................................................................................24
26. Tables, Diagrams, Flowcharts and Validation Data ........................................................24
27. Revisions ..............................................................................................................................25

Pace Analytical Services, Inc. – Green Bay Laboratory File: S-GB-M-006-Rev.07.doc Determination of Trace Metals in Waters and Wastes by Inductively Coupled Plasma Mass Spectroscopy Date: Upon final signature S-GB-M-006-REV.07 Page 3 of 41
SOPs distributed as Controlled Documents are given a copy number on the signed Title Page. Copies without a number are considered uncontrolled and must be verified as the most recent version prior to each use.
1. Purpose/Identification of Method
1.1 The purpose of this Standard Operating Procedure (SOP) is to provide a consistent format for analyzing samples using an ICPMS. It applies to the Thermo X Series II ICPMS.
2. Summary of Method
2.1 Prior to analysis, samples which require total (“acid-leachable”) values must be digested using appropriate sample preparation methods. A number of methods are recommended in SW846, EPA 200.7, and 200.8 for the sample preparation/digestion of various matrices for trace metals analysis by ICPMS. Applicable analytes are listed in Table A.
2.2 Methods 6020/6020A/200.8 describe the multi-elemental determination of analytes by ICPMS. The method measures ions produced by a radio frequency inductively coupled argon plasma. Analyte species originating in a liquid are nebulized and the resulting aerosol transported by argon gas into the plasma torch. The ions produced are entrained in the plasma gas and introduced, by means of an interface, into a mass spectrometer. The ions produced in the plasma are sorted according to their mass-to-charge ratios and quantified with a channel electron multiplier. Interferences must be assessed and valid corrections applied or the data flagged to indicate problems. Interference correction must include compensation for background ions contributed by the plasma gas, reagents, and constituents of the sample matrix as well as isobaric elemental corrections.
3. Scope and Application
3.1 Inductively coupled plasma-mass spectrometry (ICPMS) is applicable to the determination of sub-ppb (µg/L) concentrations of a large number of elements in biota, aqueous, and solid extracts or digests. When dissolved constituents are required, samples must be filtered and acid-preserved prior to analysis. Dissolved samples are typically acid digested prior to analysis. Acid digestion prior to centrifuging and analysis is required for aqueous and solid samples for which total (acid-leachable) elements are required.
3.2 This SOP is applicable to the determination of the analytes listed in Table A, at a minimum. Please see the QA manager for the most current LODs and LOQs for each element and method.
3.3 If Methods 6020/6020A/200.8 are used to determine any analytes not listed in Table A, it is the responsibility of the analyst to demonstrate the accuracy and precision of the method in the matrix to be analyzed. The analyst is always required to monitor potential sources of interferences and take appropriate action to ensure data of known quality.
3.4 Use of this method is restricted to analysts who are knowledgeable in the recognition and in the correction of spectral, chemical, and physical interferences in ICP-MS.
4. Applicable Matrices
4.1 This SOP is applicable to aqueous (dissolved, total, waste) samples.
4.2 This SOP is applicable to ASTM, SPLP, and TCLP samples.
4.3 This SOP is applicable to solid/soil samples.

Pace Analytical Services, Inc. – Green Bay Laboratory File: S-GB-M-006-Rev.07.doc Determination of Trace Metals in Waters and Wastes by Inductively Coupled Plasma Mass Spectroscopy Date: Upon final signature S-GB-M-006-REV.07 Page 4 of 41
SOPs distributed as Controlled Documents are given a copy number on the signed Title Page. Copies without a number are considered uncontrolled and must be verified as the most recent version prior to each use.
4.4 This SOP is applicable to Biota (biological) samples.
5. Limits of Detection and Quantitation
5.1 All current LODs and LOQs are listed in the LIMS and are available by request from the Quality Manager.
6. Interferences
6.1 Isobaric Elemental Interferences – Isobaric elemental interferences result when isotopes of different elements have the same nominal mass-to-charge ratio and cannot be resolved with the instruments spectrometer. One way to solve this problem is to measure a different isotope for which there is no interference. Alternatively, one can monitor another isotope of the element and subtract an appropriate amount from the element being analyzed, using known isotope ratio information. Corrections for most of the common elemental interferences are programmed into the software.
6.2 Isobaric Polyatomic Interferences – Isobaric polyatomic interferences result when ions containing more than one atom have the same nominal mass-to-charge ratio as an analyte of interest and cannot be resolved by the instrument’s spectrometer. An example includes ClO+ (mass 51), which interferes with V, and must be corrected by measuring ClO+ at mass 53. When possible an interference free isotope should be chosen for measurement.
6.3 Physical interferences are associated with the sample nebulization and transport processes as well as with ion-transmission efficiencies. Nebulization and transport processes can be affected if a matrix component causes a change in surface tension or viscosity. Changes in matrix composition can cause significant signal suppression or enhancement. Dissolved solids can deposit on the nebulizer tip of a pneumatic nebulizer and on the interface skimmers (reducing the orifice size and the instrument performance). Total solid levels below 0.2% (2,000 mg/L) have been currently recommended to minimize solid deposition. An internal standard can be used to correct for physical interferences, if it is carefully matched to the analyte so that the two elements are similarly affected by matrix changes.
6.4 Memory interferences can occur when there are large concentration differences between samples or standards, which are analyzed sequentially. Sample deposition on the sampler and skimmer cones, spray chamber design, and the type of nebulizer affects the extent of the memory interferences, which are observed. The rinse period between samples must be long enough to eliminate significant memory interference.
6.5 It is important to note that matrix matching acid concentrations and compositions between standards, blanks and samples is required and cannot be ignored.
6.6 Chromic acid should never be used to clean any container used in ICP-MS analysis.
6.7 Borosilicate glass in sample containers can lead to interference of Boron concentrations in samples. This is also true of volumetric flasks, thus when dilution in the flask is complete the standards must be removed as soon as possible from the dilution container and placed into a clean plastic container.
Pace Analytical Services, Inc. – Green Bay Laboratory File: S-GB-M-006-Rev.07.doc Determination of Trace Metals in Waters and Wastes by Inductively Coupled Plasma Mass Spectroscopy Date: Upon final signature S-GB-M-006-REV.07 Page 5 of 41
SOPs distributed as Controlled Documents are given a copy number on the signed Title Page. Copies without a number are considered uncontrolled and must be verified as the most recent version prior to each use.
7. Sample Collection, Preservation, Shipment and Storage
7.1 All sample containers must be HDPE, glass, or Teflon. The containers are purchased pre-cleaned and documented to be contaminant free.
7.2 Aqueous Samples
7.2.1 Dissolved samples must be filtered through a 0.45-µm pore diameter membrane filter at the time of collection or as soon after as practically possible. The laboratory can perform the filtration if the step was not performed in the field. The filtrate is then preserved to a pH<2 with nitric acid, acid not to exceed 2% of the container capacity.
7.2.2 Total samples are preserved to a pH<2 with nitric acid, acid not to exceed 2% of the container capacity.
Note: Aqueous samples that react violently to the addition of acid maybe collected without chemical preservation with proper variances approved by the regulatory authority. The responsibility of requesting this variance lies with the sample collector.
Note: Samples may be preserved in the lab. The samples may not be processed until 24 hours after preservation with a pH test of <2, unless otherwise noted on the data. Samples that do not attain a pH<2 or samples that are filtered in the lab must be flagged with P4.
7.3 Solid samples require no chemical preservation.
7.4 Tissue (biota) samples are to be shipped at 6°C or less, preferably on dry ice.
7.5 Shipments of soil and water samples to the laboratory require thermal preservation in the form of cubed or block ice. At the time of laboratory receipt, proper thermal preservation is checked by measuring the temperature of melt water or when provided the temperature blank. The Pace Analytical acceptable temperature range is 0 to 6°C. All QAPjP and regulatory authority requirements become priority over this requirement.
7.6 There are no thermal storage requirements for preserved aqueous samples. Solids samples require storage at 0 to 6°C. Tissue (biota) samples are stored at -10°C or less. . All QAPjP and regulatory authority requirements become priority over this requirement.
7.7 Sample Hold Times:
7.7.1 The hold time for solid and preserved aqueous (total and dissolved) samples, excluding Hg, is 6 months.
7.7.2 The hold time for solid and preserved aqueous (total and dissolved) samples for Hg is 28 days.
7.7.3 The hold time for biota samples, excluding Hg, is 6 months after removal from the freezer.
7.7.4 The hold time for biota samples for Hg is 28 days after removal from the freezer.
Pace Analytical Services, Inc. – Green Bay Laboratory File: S-GB-M-006-Rev.07.doc Determination of Trace Metals in Waters and Wastes by Inductively Coupled Plasma Mass Spectroscopy Date: Upon final signature S-GB-M-006-REV.07 Page 6 of 41
SOPs distributed as Controlled Documents are given a copy number on the signed Title Page. Copies without a number are considered uncontrolled and must be verified as the most recent version prior to each use.
7.8 Samples that are not received according to the SOP are given an appropriate data qualifier.
7.8.1 P4 - Sample field preservation does not meet EPA or method recommendations for this analysis.
7.8.2 C4 - Sample container did not meet EPA or method requirements.
8. Definitions
8.1 Refer to the most current version section 10 of the Pace Quality Manual.
9. Equipment and Supplies (Including Computer Hardware and Software)
9.1 All reusable labware (glass, quartz, polyethylene, PTEFE, FEP, etc.) should be sufficiently clean for the task objectives.
9.2 See Table B for a summary of Equipment.
9.3 See Table C for a summary of supplies.
10. Reagents and Standards
10.1 Standards are used in the tuning of the instrument through the calibration, calibration verification, sample analysis, and continuing calibration verification. Standard solutions include: instrument tuning solutions, calibration and calibration check standards, ICSA/AB, internal standards, low level check standards (LLC, CRI, or CRDL), and spike standards. Please see Table D for a list of working standards. Table F lists the directions to making intermediate standards from the stock standards listed in Table E.
10.1.1 Mass Spectrometer Tuning Solution: A solution containing elements representing all of the mass regions of interest (for example, 10 µg/L of 23, 24,
25Mg and 206, 207, 208Pb) must be prepared to verify that the mass resolution and mass calibration of the instrument are within the required specifications. This solution is also used to verify that the instrument has reached thermal stability.
10.1.2 Cross Calibration Solution (X Cal): contains 50 ppb of all method analyte elements. This solution is used to calculate the concentration when the detector changes from pulse mode to analog mode. This enables a large linear range while protecting the detector.
10.1.3 Calibration Standards: These are an increasing gradient of concentration for the analytes of interest. These can be made in the laboratory or purchased from commercial suppliers.
10.1.4 Initial Calibration Verification (ICV): The quality control standard is the initial calibration verification solution (ICV), which must be prepared in the same acid matrix as the calibration standards. This solution must be an independent standard at approximately half (or less than) of the concentration of the high standard used for instrument calibration. An independent standard is defined as a standard composed of the analytes from a source different from those used in the standards for instrument calibration.

Pace Analytical Services, Inc. – Green Bay Laboratory File: S-GB-M-006-Rev.07.doc Determination of Trace Metals in Waters and Wastes by Inductively Coupled Plasma Mass Spectroscopy Date: Upon final signature S-GB-M-006-REV.07 Page 7 of 41
SOPs distributed as Controlled Documents are given a copy number on the signed Title Page. Copies without a number are considered uncontrolled and must be verified as the most recent version prior to each use.
10.1.5 Reporting Limit Verification Standard (RLVS / CRDL): With every Initial Calibration, a standard corresponding to the Pace reporting limit (PRL), or lower, must also be analyzed and meet established acceptance criteria. The RLVS is analyzed prior to any samples being analyzed. It is also analyzed at the end of the analytical sequence when following 6020A or by client request. Additional RLVSs may be analyzed throughout the analytical sequence at the analyst’s discretion. These standards are the first calibration point for the analytes of interest. The analysis of this standard demonstrates the instruments ability to report down to the reporting limit with known accuracy.
10.1.6 Interference Check Solutions (ICSA and ICSAB): The ICSA and ICSAB are prepared to contain known concentrations of interfering elements that will demonstrate the magnitude of interferences and provide an adequate test of any corrections. The ICSA and ICSAB are analyzed prior to any samples. They are also analyzed at the end of the analytical sequence when following 6020A or by client request. Chloride in the ICS provides a means to evaluate software corrections for chloride-related interferences such as 35CI 16O on 51V. Iron is used to demonstrate adequate resolution of the spectrometer for the determination of manganese. Molybdenum serves to indicate oxide effects on cadmium isotopes. The other components are present to evaluate the ability of the measurement system to correct for various polyatomic isobaric interferences. The ICS is used to verify that the interference levels are corrected by the data system to within quality control limits. Table D provides a summary of the ICS-A and ICS-AB solution concentrations used.
10.1.7 Continuing Calibration Verification (CCV): This standard is near (or less than) the midpoint of the curve and used to verify that the instrument is still in calibration. This standard is from the same source as the calibration standards.
10.2 Reagents: Please see Table G for a list of reagents.
10.3 All standards, reagents, and spiking solutions are kept at room temperature. Stock standards and reagents can be used until they expire. Refer to the most current version of S-ALL-Q-025 Standard and Reagent Management and Traceability for stock standard and reagent expiration rules. Intermediate and working standards are given a six month expiration date. However the expiration date may not extend past the earliest expiration date of any stock standard used to create the solution. The use of any standard or reagent will be terminated if any contamination or problems arise prior to the expiration date.
10.4 Log-in of Standards, reagents, and spike solutions are logged as follows:
10.4.1 Stock standards have a copy of their certificate of analysis logged into the LIMS (Epic Pro). Please see the SOP T-ALL-IT-010 (most current revision or equivalent).
10.4.2 Reagents are logged in the same manner.
Pace Analytical Services, Inc. – Green Bay Laboratory File: S-GB-M-006-Rev.07.doc Determination of Trace Metals in Waters and Wastes by Inductively Coupled Plasma Mass Spectroscopy Date: Upon final signature S-GB-M-006-REV.07 Page 8 of 41
SOPs distributed as Controlled Documents are given a copy number on the signed Title Page. Copies without a number are considered uncontrolled and must be verified as the most recent version prior to each use.
11. Calibration and Standardization
11.1 The instrument is calibrated daily at a minimum when analyzing samples. High solids and complex matrices can and do result in more frequent calibration.
11.2 Calibration Curve: Demonstration and documentation of acceptable initial calibration is required before any samples are analyzed and is required periodically throughout sample analysis as dictated by the results of the continuing calibration verification standards. Calibration consists of a calibration blank and four or five non-zero standards (analyte dependent) analyzed after a calibration blank. The ICPMS software creates a curve based on this data which is linear regression using Absolute Standard Deviation weighting and uses the following equation: Y=a(x)+b. In calculating x(concentration) from y(response) the b(intercept) is subtracted. The b represents the intercept of the regression line. The correlation coefficient must be ≥0.998. If the correlation coefficient is not within criteria, the issue must be resolved and the instrument recalibrated with passing criteria prior to analyzing samples.
11.3 Calibration Levels: Please see Table D for directions on making the calibration standards and Table H to see the calibration levels used in the calculations.
11.4 Internal Standards:
11.4.1 Internal standardization must be used in all analyses to correct for instrument drift and physical interferences. For full mass range scans, a minimum of six internal standards must be used. Procedures described in this SOP for general applications detail the use of six internal standards; 45Sc-CCT, 45Sc-KED, 72Ge, 89Y, 115In, 159Tb, and 209Bi. The interpolation between 2 internal standards is done when a reported element mass is bracketed by two internal standards. Table I provides a list of acceptable internal standards and their suggested associated elements.
11.4.2 Internal standards must be present in all samples, standards and blanks at identical levels. This is achieved by directly adding the internal standard stock solution (100ppb in 3% HNO3) to all samples, standards and blanks by on-line addition prior to nebulization using a second channel of the peristaltic pump and a mixing T-connector. The concentration of the internal standard should be sufficiently high that good precision is obtained in the measurement of the isotope used for data correction and to minimize the possibility of correction errors if the internal standard is naturally present in the sample. A final concentration at the nebulizer of approximately 50 ppb will result from the addition of a 100 ppb solution.
11.4.3 Due to matrix interferences one or more of the internal standards may not be suitable. It is up to the analyst to recognize and correct the problem by diluting the sample(s) for reanalysis. This procedure may result in some analytes being diluted below the PRL and must be appropriately flagged.
11.4.4 During the determination, the software uses the ratio of analyte and internal standard intensities to adjust the final concentration values. Ratios are based on the intensities in the sample vs. the calibration blank intensities.
Pace Analytical Services, Inc. – Green Bay Laboratory File: S-GB-M-006-Rev.07.doc Determination of Trace Metals in Waters and Wastes by Inductively Coupled Plasma Mass Spectroscopy Date: Upon final signature S-GB-M-006-REV.07 Page 9 of 41
SOPs distributed as Controlled Documents are given a copy number on the signed Title Page. Copies without a number are considered uncontrolled and must be verified as the most recent version prior to each use.
11.4.5 An internal standard without Li must be used if Li is an analyte of interest. If Li is to be used as an internal standard, and Li is an analyte of interest, an isotopically enriched Li standard must be used such that the analyte can be differentiated from the internal standard. (i.e. 6Li enriched internal standard to report 7Li in samples.)
11.5 Interference Calculations: Interference equations are used to correct for isobaric elemental and polyatomic interferences. All equations can be adjusted if necessary, or added if the analyst determines that any particular correction is insufficient or if an equation is over correcting the data. Table J shows the recommended Elemental Interference Equations.
11.6 Acquisition Mode:
Points per Mass : 1 Number Replicates: 3 Dwell Time: 10 ms for all elements except Na, As, Se, Kr; 5 ms for
Na, and 50 ms for As, Se, Kr.
11.7 Example Peristaltic Pump Program:
Uptake time: 20 sec 1
Neb Settle Time: 20 sec Stabilization Time (KED Changeover): 40 sec Acquisition masses and Dwell times can be found in Table K.
12. Procedure
12.1 Solubilization and digestion procedures are in the Metals Digestion SOPs (e.g. Methods 200.8, 3010A and 3050B for both Solids and Biota).
12.2 Instrument Startup:
12.2.1 Verify argon supply and pressure.
12.2.2 Turn on water chiller and exhaust fan.
12.2.3 Ensure that the internal standard solution bottle is adequately full.
12.2.4 Verify contents of auto-sampler rinse port reservoir.
12.2.5 Empty the waste reservoir.
12.2.6 Ignite the plasma and allow at least 25 minutes of warm-up while scanning the mass analyzer. The tuning procedures may then be carried out.
12.2.7 Ensure that all peristaltic pump tubes are in good condition and correctly clamped into the peristaltic pumps. Verify that the flow of sample and internal standard solutions through the uptake lines and into the nebulizer are free from extreme pulsations by introducing a bubble into each line and observing its progress.
Pace Analytical Services, Inc. – Green Bay Laboratory File: S-GB-M-006-Rev.07.doc Determination of Trace Metals in Waters and Wastes by Inductively Coupled Plasma Mass Spectroscopy Date: Upon final signature S-GB-M-006-REV.07 Page 10 of 41
SOPs distributed as Controlled Documents are given a copy number on the signed Title Page. Copies without a number are considered uncontrolled and must be verified as the most recent version prior to each use.
12.3 Mass Tuning: Allow 25 minutes of scanning for the Instrument to achieve thermal stability. Aspirate the 10ppb Tuning Solution by inserting both the sample and internal standard delivery lines into the tune solution, so as not to dilute the tune solution. Run each of the following performance reports, print the passing report, and save the mode by month, day, year (no commas) into the configurations list by type (e.g. Standard Mode09052008, CCT Mode09052008, and CCTKED Mode09052008).
12.3.1 EPA Performance Report (Xt Standard Mode)
12.3.1.1 Mass Resolution (10 Sweeps, 5 Reps) Acquisition Parameters: Peak width measured at 5% peak maximum. Dwell Time (mSec): 10 Point Spacing: 0.05amu Mass Limits: 0.65 – 0.85 amu (Max error 0.10 amu) Defined Masses: 24Mg, 25Mg, 26Mg, 206Pb, 207Pb, 208Pb
12.3.1.2 Sensitivity and Stability (35 Sweeps, 5 Reps) Mass: Dwell (mSec): %RSD: Counts (NA=Not Applicable) 5Bkg 500.0: NA: <1 7Li 10.0: 2.0 : >60,000 24Mg 10.0 : 2.0 : >10,000 25Mg 10.0 : 2.0 : >10,000 26Mg 10.0 : 2.0 : >10,000 59Co 10.0 : 2.0 : >150,000 137Ba++ 10.0 : NA : NA 115In 10.0 : 2.0 : >400,000 137Ba 10.0 : NA : NA 138Ba 10.0 : NA : NA 140Ce 10.0 : NA : NA 156CeO 100.0 : NA : NA 206Pb 10.0 : 2.0 : >10,000 207Pb 10.0 : 2.0 : >10,000 208Pb 10.0 : 2.0 : >10,000 220Bkg 500.0 : NA : <1 238U 10.0 : 2.0 : >800,000
12.3.1.3 Oxides and Doubly Charged (Ratio Results) 137Ba++/137Ba: <0.0300 156CeO/140Ce: <0.0200
12.3.2 CCT Performance Report (Xt CCT)
Sensitivity and Stability (35 Sweeps, 5 Reps) Acquisition Parameters: Mass : Dwell (mSec) : %RSD : Counts 7Li 10.0: 2.0: >10,000 9Be 10.0: 2.0: >2,000 11B 10.0: 2.0: >2,000

Pace Analytical Services, Inc. – Green Bay Laboratory File: S-GB-M-006-Rev.07.doc Determination of Trace Metals in Waters and Wastes by Inductively Coupled Plasma Mass Spectroscopy Date: Upon final signature S-GB-M-006-REV.07 Page 11 of 41
SOPs distributed as Controlled Documents are given a copy number on the signed Title Page. Copies without a number are considered uncontrolled and must be verified as the most recent version prior to each use.
12.3.3 KED Performance Report (Xt CCT-KED)
12.3.3.1 Sensitivity and Stability (35 Sweeps, 5 Reps) Acquisition Parameters: Mass: Dwell (mSec): %RSD: Counts 78Se 100.0: NA: <20 115In 10.0: 2.0: >100,000 140Ce 10.0: NA: NA 156CeO 50.0: NA: NA
12.3.3.2 Ratio Results 156CeO/140Ce <0.0200
12.3.4 Introduce the internal standard and aspirate a new rinse blank for 5-10 minutes to eliminate any carry-over into the calibration blank.
12.3.5 The Xcal solution does not need to be run unless a deviation between the pulse counting and analog counting methods is observed in the spectra. The analog counting will appear to sit above the pulse baseline in an observed spectra and indicates that the cross calibration needs to be performed. Also, an indication of when the Xcal needs to be reset is when the calibration loses its linearity (this will likely occur first with High Resolution Mineral elements like Na and K). Aspirate the Xcal solution in Standard Mode, with both the sample delivery and internal standard lines (so as to not dilute the Xcal solution).
12.3.5.1 Cross Calibration Only. This is done when the deviation between the pulse and analog counting methods is observed (from spectra or from linearity observations) and the minimum counts per second listed in the tuning section are achievable. Run the Instrument Calibration wizard in PlasmaLab when deviation of the analog spectra is observed. The detector cross calibration is selected by default in the wizard. This will reset the detector-gating plateau such that the analog spectra (dashed line in the spectra) will sit directly on top of the pulse baseline (solid line in the spectra).
12.3.5.2 Detector Setup and Cross Calibration. This is done when the minimum counts per second listed in the tune section are not achievable. Thus, the detector dynode value will be adjusted and a new cross calibration will be performed with the new detector voltage setting. Launch the Instrument Calibration wizard in PlasmaLab and select detector set up. The detector cross calibration will be checked by default, also select the detector set up portion in the wizard. The voltage applied to the detector will be set first to achieve acceptable sensitivity followed by a detector cross calibration with the new detector setting.
Pace Analytical Services, Inc. – Green Bay Laboratory File: S-GB-M-006-Rev.07.doc Determination of Trace Metals in Waters and Wastes by Inductively Coupled Plasma Mass Spectroscopy Date: Upon final signature S-GB-M-006-REV.07 Page 12 of 41
SOPs distributed as Controlled Documents are given a copy number on the signed Title Page. Copies without a number are considered uncontrolled and must be verified as the most recent version prior to each use.
12.3.5.3 Dead Time Experiment. This experiment must be and is only performed after a detector is replaced. The dead time experiment will identify the delay or “dead time” associated with a particular detector. The dead time is the delay between the pulse measurement and analog measurement when the detector gate is dropped. In the experiment a 1ppb and 10ppb solution of Uranium is run, and the ratios between 235U and 238U are calculated for both concentrations. The values for the ratios are adjusted such that the ratio values are as close to identical as possible and that value (dead time in nanoseconds) is entered into PlasmaLab software via the Advanced Page.
12.3.6 Tune Procedure Summary (Use this order of events, some adjustments may be required after an auto tune)
12.3.6.1 Torch Box Alignment
12.3.6.2 Xt Standard Mode Autotune or X Series II Factory auto tune; Mass Calibration.
12.3.6.3 EPA Performance Report
12.3.6.4 Detector X Calibration (Note: Return to 11.3.6.2 if the Cross Calibration trips a detector set up sequence, excluding the Mass Calibration)
12.3.6.5 XT CCT Mode Auto tune
12.3.6.6 XT CCT Mode Performance Report
12.3.6.7 XT CCT/KED Auto tune
12.3.6.8 XT CCT/KED Performance Report
12.3.6.9 The tunes for passing performance reports are valid for 36 hours.
12.4 Automated Calibration, Quality Control and Sample Analysis:
12.4.1 Prepare calibration standards, blanks, spikes, samples, and QC samples. Directions to make up the standards can be found in Tables D and F.
12.4.2 Build a sequence in the sequence table and apply the repeat run rules to insert the CCV and CCB for every 10 unknowns. A typical sequence will consist of a calibration blank and calibration points 1 through 6, followed by an ICV, ICB, CRDL, ICSA, ICSAB, CCV, CCB and then batch samples and QC. The repeat rules set above will insert a CCV, CCB combo every 10 analyses and at the end of the sequence.
12.4.3 Ensure the RLVS / CRDL standards, ICSA, and ICS-AB bracket the sample list for analysis by 6020A.
Pace Analytical Services, Inc. – Green Bay Laboratory File: S-GB-M-006-Rev.07.doc Determination of Trace Metals in Waters and Wastes by Inductively Coupled Plasma Mass Spectroscopy Date: Upon final signature S-GB-M-006-REV.07 Page 13 of 41
SOPs distributed as Controlled Documents are given a copy number on the signed Title Page. Copies without a number are considered uncontrolled and must be verified as the most recent version prior to each use.
12.4.4 When the sample list and QC checks have been verified for accuracy, queue the experiment to the Technician Queue. Each experiment will require a unique code (e.g. 0905208A, 0905208B, etc.).
12.4.5 Expected values and limits for ICV, CCV, ICS-A, and ICS-AB can be found in Table L.
13. Quality Control: are three levels of quality control utilized in this SOP. They consist of Method QC, Instrument QC, and Prep/Batch QC.
13.1 Method QC consists of the instrument detection limits, linear ranges, method detection limits, the lower limit quantitation check, and demonstrations of capability. This QC must be completed prior to analyzing any samples.
13.1.1 Instrument Detection limits (IDLs): IDLs in µg/L are estimated by calculating the average of the standard deviations of the three runs on three non-consecutive days from the analysis of a reagent blank solution with ten consecutive measurements per day. Each measurement must be performed as though it were a separate analytical sample (i.e., each measurement must be followed by a rinse and/or any other procedure normally performed between the analysis of separate samples). IDLs must be determined quarterly.
13.1.2 Linear Dynamic Ranges (LDR): The LDR for each element is determined by analyzing a standard series ending at a concentration expected to be near the high end of the instruments range. The result must be within ± 10% of the expected concentration, or a lesser concentration tested until acceptable results are obtained. The element may be reported to 90% of the highest passing LDR standard tested. After the initial determination the high point is verified every 6 months (semi-annually) using the same ± 10% of the true value.
13.1.3 Method Detection Limits (MDLs): Method detection limits, at a minimum, are obtained by multiplying 3.143 by the standard deviation of seven spikes. The spikes went through the digestion procedures and were spiked at a concentration suspected to be within a factor of ten greater than the MDL. The most current version of the MDL SOP, S-ALL-Q-004, must be followed when determining MDLs. Note: The MDL determined by the MDL study is the theoretical MDL. The MDL used for reporting purposes may be higher than the theoretical MDL.
13.1.4 Lower Limit Quantitation Check (LLQC): The LLQC is a standard at the reporting limit concentration that has gone through all the preparation procedures. It has control limits of ± 30% of the true value. It is analyzed to establish the lower limit of quantitation, verified annually, and whenever new limits are established. If an element repeatedly does not meet criteria at a certain level, it should be re-evaluated to determine if that level is realistic.
13.1.5 Initial Demonstration of Capability (IDC): An initial demonstration of capability (IDC) must be performed per S-ALL-Q-020, Orientation and Training Procedures. A record of the IDC will be maintained in his/her QA file with written authorization from the Laboratory Manager and Quality Manager.

Pace Analytical Services, Inc. – Green Bay Laboratory File: S-GB-M-006-Rev.07.doc Determination of Trace Metals in Waters and Wastes by Inductively Coupled Plasma Mass Spectroscopy Date: Upon final signature S-GB-M-006-REV.07 Page 14 of 41
SOPs distributed as Controlled Documents are given a copy number on the signed Title Page. Copies without a number are considered uncontrolled and must be verified as the most recent version prior to each use.
13.2 Instrument QC: Prior to the analysis of samples, and in some cases during the analysis run, the following quality control must be generated and within limits: Performance Report for each mode of operation generated daily (Up to 36 hours since previous), Internal Standards, Interference Correction Solutions A and B (ICSA and ICSAB), Initial Calibration Verification (ICV), Continuing Calibration Verification (CCV), RLVS / CRDL standards, and Initial and Continuing Calibration Blanks (ICB and CCB).
13.2.1 The intensities of all internal standards must be monitored for every analysis. When the intensity of any required internal standard fails to fall between 70 and 125 percent of the intensity of that internal standard in the blank of the calibration, one of the following procedures is followed. The sample is diluted appropriately and reanalyzed with the addition of appropriate amounts of internal standards. This procedure must be repeated until the required internal standard intensities fall within the prescribed window. If significant deviation cannot be overcome by dilution of the sample in the same analytical run then recalibration is required. Sudden increases in internal standard recoveries of 10 or more percent may also indicate that dilutions are necessary. The presence of high levels of dissolved solids in samples can result in instrument drift. A sequence with high solids samples will have recoveries drift down. Should the internal standards drift outside of the acceptance range; these samples will need to be re-analyzed at a dilution. If a subsequent batch is clean (samples with low dissolved solids present) the instrument may see an increase in signal and internal standard recovery. Unless the internal standards are actually present in the samples, these can be re-analyzed at the same dilution after a passing recalibration.
13.2.2 The ICSA and ICSAB solution are used to verify the magnitude of elemental and molecular-ion isobaric interferences and the adequacy of any corrections. They are analyzed after the CRDL, prior to the analysis of any samples. For 6020 and 200.8, additional ICSA and ICSABs are not analyzed, as sequences do not reach 12 or more hours in duration. For 6020A and by client request, the ICSA and ICSAB will also be analyzed at the end of the analytical sequence. The analyst should be aware that precipitation from solution AB may occur with some elements, specifically silver. The control limits for the elements in the ICSA and ICSAB solutions is 80 to 120% of the expected recovery for elements with concentrations within the linear range. Elements that are not spiked must have a measurement lower than the LOQ. If an element of interest does not meet these limits, then the problem must be corrected, the instrument recalibrated, and the run reanalyzed.
13.2.3 The ICV is analyzed to check the accuracy of the curve. It must be evaluated after each calibration and before any samples are analyzed. The ICV should be at or near (or lower than) the midpoint of the calibration curve, derived from a source independent of the calibration standards, and must quantitate within ± 10% of the expected value. If these limits are not met for an element of interest, the problem must be corrected, the instrument recalibrated, and the run reanalyzed. If the ICV fails high and the samples are non-detects, then they may be reported.
Pace Analytical Services, Inc. – Green Bay Laboratory File: S-GB-M-006-Rev.07.doc Determination of Trace Metals in Waters and Wastes by Inductively Coupled Plasma Mass Spectroscopy Date: Upon final signature S-GB-M-006-REV.07 Page 15 of 41
SOPs distributed as Controlled Documents are given a copy number on the signed Title Page. Copies without a number are considered uncontrolled and must be verified as the most recent version prior to each use.
13.2.4 Reporting Limit Verification Standard (RLVS / CRDL): With every Initial Calibration, a standard corresponding to the Pace reporting limit (PRL) or lower must also be analyzed and meet established acceptance criteria. The RLVS is analyzed prior to any samples being analyzed. For 6020A and by client request it will also be analyzed at the end of the analytical sequence. Additional RLVSs may be analyzed throughout the analytical sequence at the analyst’s discretion. The limits for the RLVS are ± 30% of the true concentration. These standards are the first calibration standard for the analytes of interest. The analysis of this standard demonstrates the instruments ability to quantify down to the reporting limit with known accuracy. If an element fails the CRDL, but the CCV passes and the samples are greater than the CCV concentration, then the sample data may be reported. All others must be re-analyzed under passing criteria.
13.2.5 The CCV is analyzed to check for calibration drift. The CCV is run prior to any samples, after every 10 samples and again at the end of samples. It must quantitate within 10% of the expected value. Any sample analyzed under out-of-control calibration must be reanalyzed, following the successful re-calibration of the instrument. If the CCV fails high and the samples are non-detects, then they may be reported. All others must be re-analyzed under passing criteria.
13.2.6 The ICB is analyzed to check the accuracy of the curve. The CCBs are analyzed to check for calibration drift. In the absence of project specific reporting limits, the results of the calibration blanks must be less than the Reporting Limit. The ICB is run after the ICV and the CCBs are run after the CCVs. If the ICB or CCB fails high for an analyte and the samples are non-detects or are greater than 10x the blank value, then they may be reported. All others must be re-analyzed under passing criteria.
13.3 A batch will consist of 20 or fewer samples. Batch Quality Control will include a Method Blank (MB), Chicken Blank (CB) (Biota only), Laboratory Control Spike (LCS), Matrix Spike (MS), Matrix Spike Duplicate (MSD), Post Digestion Spike (PDS), and a Serial Dilution (SD). It may also include a Laboratory Control Spike Duplicate (LCSD) and/or Standard Reference Material (SRM)
13.3.1 The Method Blank is used to verify that interferences caused by contaminants in the solvents, reagents, glassware, etc. are known and minimized. The method blank is processed through all clean-ups, etc., which were performed on the samples in the batch. For a method blank to be acceptable, in the absence of project specific criteria, the concentration shall not be higher than the highest of the following: The reporting limit, or ten percent of the regulatory limit of concern for that analyte, or ten percent of the measured concentration in a particular sample of interest. Each sample in the batch is assessed against the above criteria to determine if the sample results are acceptable. Any sample associated with an unacceptable blank is either flagged, re-prepped for analysis, or if re-prepping is not an alternative, the results are reported with the appropriate data qualifying codes.
Pace Analytical Services, Inc. – Green Bay Laboratory File: S-GB-M-006-Rev.07.doc Determination of Trace Metals in Waters and Wastes by Inductively Coupled Plasma Mass Spectroscopy Date: Upon final signature S-GB-M-006-REV.07 Page 16 of 41
SOPs distributed as Controlled Documents are given a copy number on the signed Title Page. Copies without a number are considered uncontrolled and must be verified as the most recent version prior to each use.
13.3.2 The Chicken Blank (CB) must be prepared with every biota batch, and is processed through all clean-ups, etc., which were performed on the samples. It consists of a control matrix (ground chicken) to verify the interferences in the biological tissue is known and minimized. The CB will contain detectable amounts of elements such as K, Ca, Na, Mg, and P etc., and is used to ensure acceptable performance of the laboratory control spike. Any detections in the CB greater than the 40CFR Part 136 statistically derived MDL is subtracted from the LCS/LCSD before recovery limits are evaluated.
13.3.3 A laboratory control sample (LCS) consists of a control matrix, which has been spiked, with the analytes(s) of interest or compounds representative of those analytes. Laboratory Control Samples are analyzed at a minimum of 1 per batch of 20 or fewer samples or preparation method. Results of the LCS are expressed in terms of percent recovery, and are used to determine batch acceptance. Acceptance limits for 6020 and 6020A are 80 to 120%. Acceptance limits for 200.8 are 85 to 115% of the expected recovery. If these limits are not met with the instrument in control, then the entire batch will be re-digested and re-analyzed.
An LCS Duplicate may be analyzed to evaluate laboratory precision. The LCSD must also meet the criteria for the LCS. The Relative Percent Difference (RPD) will be calculated between the LCS and LCSD. The RPD is calculated as outlined below:
RPD = | D1 ‐ D2 |__ x 100 D1, + D2,) /2
Where: RPD = relative percent difference. D1 = first sample value. D2 = second sample value (duplicate)
The control limit for RPD is exceed 20%, or is based on laboratory generated data and not to exceed 20%. If outside this limit, all associated results are given a R1 data qualifier. Data generated with LCS samples that fall outside the established acceptance criteria are judged to be out-of-control. These data are considered suspect and the corresponding samples are reanalyzed or reported with qualifiers. For the biota matrix, any detections greater than the MDL must be subtracted from the LCS/LCSD on-instrument value before calculating the recovery limits.
NOTE: In the event where adequate sample is not supplied by the client to perform a Matrix Spike/ Matrix Spike Duplicate, the LCS and duplicate can lend insight on the precision of the analysis.
Pace Analytical Services, Inc. – Green Bay Laboratory File: S-GB-M-006-Rev.07.doc Determination of Trace Metals in Waters and Wastes by Inductively Coupled Plasma Mass Spectroscopy Date: Upon final signature S-GB-M-006-REV.07 Page 17 of 41
SOPs distributed as Controlled Documents are given a copy number on the signed Title Page. Copies without a number are considered uncontrolled and must be verified as the most recent version prior to each use.
13.3.4 Matrix spikes (MS and MSD) are performed to evaluate the effect of the sample matrix upon analytical methodology. A separate aliquot of sample is spiked with the analyte of interest and analyzed with the sample. For 6020 and 6020A an MS and MSD are performed at a minimum frequency of 5% per batch. One pair in 20 samples, per matrix type, per sample preparation method and are performed more frequently where regulations require. For 200.8, an MS/MSD pair, are performed at a 10% frequency per batch. Matrix spike recoveries are evaluated against in-house control limits. The recovery must not exceed 75 to 125% of the expected recovery. If outside this recovery, the parent is flagged with an appropriate data qualifier. If the recovery of an analyte is outside this range but the spike level in not at least 25% the background concentration in the parent sample, the data is flagged with an appropriate data qualifier. The RPD between the MS and MSD must be less than 20 %. If outside this limit, the parent is given an appropriate data qualifier. The parent sample for the MS/MSD is chosen at random unless specified by a client. Poor performance in a matrix spike generally indicates a problem with the sample composition, and not the laboratory analysis, and results are used to assist in data assessment. A matrix effect is indicated if the LCS data are within acceptance criteria but the matrix spike data exceed the acceptance criteria. Prior to calculating recovery, the parent sample concentration (results <Reporting MDL = 0) is subtracted from the spike aliquot concentrations.
13.3.5 The Post Digestion Spike (PDS) is run to verify matrix interferences. A spike is added to a portion of a prepared sample, or its dilution and must be recovered to within 80 to 120 percent of the known value. If the spike is not recovered within the specified limits with the instrument in control, then the sample has a confirmed matrix effect. Dilute the parent and re-spike the diluted sample until the PDS recovers within acceptance criteria.
13.3.6 The Serial Dilution (SD) is run to check for matrix interferences. If the analyte concentration is within the linear dynamic range (LDR) of the instrument and sufficiently high (minimally, a factor of at least 10 times greater than the lower limit of quantitation for the diluted sample, 50 times the RLVS standard for the parent sample, or by project/client specific criteria) an analysis of a fivefold (1+4) dilution must agree within ± 10% of the original determination. If these limits are not met then an interference effect must be suspected and the data qualified with an SD data qualifier. If the analytes of interest are greater than the LDR in the parent sample, the sample can be diluted and an SDL done off of the dilution.
13.3.7 The type of SRM is typically prepped and analyzed upon client request. It is a sample of known concentration chosen to resemble the matrix being analyzed.

Pace Analytical Services, Inc. – Green Bay Laboratory File: S-GB-M-006-Rev.07.doc Determination of Trace Metals in Waters and Wastes by Inductively Coupled Plasma Mass Spectroscopy Date: Upon final signature S-GB-M-006-REV.07 Page 18 of 41
SOPs distributed as Controlled Documents are given a copy number on the signed Title Page. Copies without a number are considered uncontrolled and must be verified as the most recent version prior to each use.
14. Data Analysis and Calculations
14.1 The Plasma Lab software performs all calculations necessary to convert raw counts per second data into quantitative concentration results.
14.2 Consideration should be given to the interference equations that are in the method. As a result of changing tune parameters over time, the equations may require adjustment periodically to ensure they are not over compensating or under compensating for the polyatomic or isobaric interferences. This is especially true of 52Cr and 51V as the CCT-KED tune can vary slightly from day to day operation. This variation (primarily in the add gas for the collision cell) will change the counts per second acquired for Cl and ClO ions. This can make the counts per second in the calibration blank for these isotopes artificially high or low (See Table J). In the case of Lead, quantitation is based on the sum of isotopes 206, 207, and 208 to compensate for any variation in naturally occurring isotope ratios. This is accomplished through the use of the interference correction equation for lead.
14.3 See the QA Manager for Isotopes and the respective laboratory specific method detection limits and reporting limits.
14.4 Aqueous Sample Calculation:
Raw Data result (µg/L) * DF * VF = Final Result (µg/L) VI
Where: DF = Dilution Factor VF = Final Volume (L) VI = Initial Sample Volume (L)
14.5 Soil Sample Calculation:
Raw Data result (µg/L) * DF * VF = Final Result (mg/kg dry weight) WS X %S Where: DF = Dilution Factor VF = Final Volume (L) VI = Initial Sample Volume (L) WS = Sample weight (grams)
%S = Percent solids/ 100 Example: For a sample that is 97.6% solid use 0.976
Pace Analytical Services, Inc. – Green Bay Laboratory File: S-GB-M-006-Rev.07.doc Determination of Trace Metals in Waters and Wastes by Inductively Coupled Plasma Mass Spectroscopy Date: Upon final signature S-GB-M-006-REV.07 Page 19 of 41
SOPs distributed as Controlled Documents are given a copy number on the signed Title Page. Copies without a number are considered uncontrolled and must be verified as the most recent version prior to each use.
14.6 Biota Sample Calculation:
Raw Data result (µg/L) * DF * VF = Final Result (mg/kg) WS
Where: DF = Dilution Factor VF = Final Volume (L) VI = Initial Sample Volume (L) WS = Sample weight (grams)
NOTE: Results for biological samples are routinely reported on an “as is” or wet weight basis. Dry weight correction is available on request when sufficient sample has been provided.
14.7 Hardness as CaCO3 in mg/L = 2.497 * [Ca in mg/L ] + 4.118 * [Mg in mg/L]
14.8 Silica (SiO2) (µg/L) = Silicon (Si) (µg/L) * DF * 60.09 amu (SiO2 molecular weight) / 28.09 amu (Si atomic weight)
Where: DF is the sample Dilution Factor

Pace Analytical Services, Inc. – Green Bay Laboratory File: S-GB-M-006-Rev.07.doc Determination of Trace Metals in Waters and Wastes by Inductively Coupled Plasma Mass Spectroscopy Date: Upon final signature S-GB-M-006-REV.07 Page 20 of 41
SOPs distributed as Controlled Documents are given a copy number on the signed Title Page. Copies without a number are considered uncontrolled and must be verified as the most recent version prior to each use.
15. Data Assessment and Acceptance Criteria for Quality Control Measures
Analytical Method
Criteria
Data Assessment Measure
Frequency Acceptance Criteria
MB One per batch, not to exceed 20samples.
< LOD < LOQ
LCS/LCSD One LCS per batch, not to exceed 20samples. LCSD performed by client request or if insufficient sample volume for MS/MSD.
6020: ±20% recovery of the true value. 200.8: ±15% recovery of the true value. ≤20% RPD
MS/MSD 200.8 - one pair at 10% sample frequency. 6020/6020A - one pair at 5% sample frequency.
±25% recovery of the true value. ≤20% RPD
PDS Once per batch of 20 or fewer samples.
±20% recovery of the true value.
SD Once per batch of 20 or fewer samples.
±10% RPD referenced to the parent
DUP By client request. ≤20% RPD
SRM One per batch of 20 or fewer biota samples. Additional SRMs can be performed by client request.
Reference only. Client specific acceptance criteria.
Initial Calibration Once per day at minimum. ≥0.998 correlation coefficient
ICV Once right after calibration. ±10% recovery of the true value.
ICB Once right after ICV. <RL
ICSA Prior to any samples, typically after the CRDL.
±20% recovery of the true value. <LOQ for non-spiked elements
ICSAB After the ICSA. ±20% recovery of the true value.
CRDL Prior to samples being analyzed, typically after the ICB.
±30% recovery of the true value.
CCV Prior to any samples. Bracket every 10 or fewer samples. At the end of the sequence.
±10% recovery of the true value.
CCB Right after CCVs. < RL
Pace Analytical Services, Inc. – Green Bay Laboratory File: S-GB-M-006-Rev.07.doc Determination of Trace Metals in Waters and Wastes by Inductively Coupled Plasma Mass Spectroscopy Date: Upon final signature S-GB-M-006-REV.07 Page 21 of 41
SOPs distributed as Controlled Documents are given a copy number on the signed Title Page. Copies without a number are considered uncontrolled and must be verified as the most recent version prior to each use.
16. Corrective Actions for Out-of-Control Data
Analytical Method Criteria Data Assessment Measure
If acceptance criteria are not
achieved
MB 1 LCS/LCSD 2 MS/MSD 3 PS 4 SDL 5 DUP 6 SRM 7 Initial Calibration 8 ICV 9 ICB 10 ICSA 11 ICSAB 12 CRDL 13 CCV 14 CCB 15
1. If not <LOQ, verify by second analysis. If second analysis confirms contamination for target analyte at or greater than the LOQ, re-digest sample batch and batch QC provided sufficient sample volume remains. If insufficient sample volume remains, consult with project manager and client on how to proceed. For MB detections greater than or equal to the LOD, but less than the LOQ; qualify applicable sample results. For negative measurements more negative than the LOD, applicable data is given the following data qualifier: "Analyte was measured in the associated method blank at a concentration of -#.# units."
* For positive MB failures, samples that are non-detection need not be qualified. In addition, samples that are greater than 10 times the MB detection need not be qualified.
* For negative MB failures samples that are greater than 10 times the MB detection need not be qualified. 2. Verify failure by second analysis. If second analysis confirms LCS (LCSD) failure, re-digest sample batch and batch QC
provided sufficient sample volume remains. If insufficient sample volume remains, consult with project manager and client on how to proceed.
3. If the parent, MS, or MSD is greater than the reportable linear dynamic range, dilute and reanalyze the parent, MS, and MSD. If
the concentration of the spike is less than 25% of the concentration of the parent the MS and MSD recoveries are not evaluated. Any failures resulting from this are qualified appropriately. If the concentration of the spike is greater than 25% of the concentration of the parent, appropriately qualify the parent sample if either the MS and/or MSD fail accuracy. If the MS and MSD fail precision control limits flag the parent with the appropriate precision data qualifier.
4. If the spike is not recovered within the specified limits with the instrument in control, dilute the parent and re-spike the diluted sample until the PS recovers within acceptance criteria.
5. If these limits are not met then an interference effect must be suspected and the data qualified with an appropriate data qualifier. If the analytes of interest are greater than the LDR in the parent sample, the sample can be diluted and an SDL done off of the dilution.
6. If the DUP fails precision control limits flag the parent with the appropriate precision data qualifier. 7. For Biota analysis only. Outside of client specific criteria, the SRM is digested and analyzed only to demonstrate analyte
recovery in a standard reference material. Client specific action may also exist.
Pace Analytical Services, Inc. – Green Bay Laboratory File: S-GB-M-006-Rev.07.doc Determination of Trace Metals in Waters and Wastes by Inductively Coupled Plasma Mass Spectroscopy Date: Upon final signature S-GB-M-006-REV.07 Page 22 of 41
SOPs distributed as Controlled Documents are given a copy number on the signed Title Page. Copies without a number are considered uncontrolled and must be verified as the most recent version prior to each use.
8. Correct the issue and recalibrate. 9. Verify failure by second analysis. If second analysis confirms ICV failure, correct the issue and recalibrate the instrument. No
data may be reported unless there is a passing ICV for that target element. If verification passes criteria, then proceed with the analytical sequence.
10. Verify failure by second analysis. If second analysis confirms ICB failure, correct the issue and recalibrate the
instrument. No data may be reported unless there is a passing ICB for that target element. Exceptions; if the failure is biased high and the sample is a non-detection, or the sample concentration is greater than 10 times the detection in the ICB for that target element.
11. Verify failure by second analysis. If second analysis confirms ICSA failure, the system is out of control. Correct the
issue and recalibrate the instrument. No data may be reported unless there is a passing ICSA for that target element. 12. Verify failure by second analysis. If second analysis confirms ICSAB failure, the system is out of control. Correct the
issue and recalibrate the instrument. No data may be reported unless there is a passing ICSAB for that target element. 13. Verify failure by second analysis. If second analysis confirms CRDL failure, the system is out of control. Correct the
issue and recalibrate the instrument. No data may be reported unless there is a passing CRDL for that target element. 14. Verify failure by second analysis. If second analysis confirms CCV failure, correct the issue and recalibrate the
instrument. On unattended sequence, CCVs may fail and then pass later in the sequence, but no data may be reported unless bracketed by passing CCVs for that target element. Exceptions; if the sample element concentration is greater than the CCV concentration and the bracketing CCVs are within control, that sample data may be reported.
15. Verify failure by second analysis. If second analysis confirms CCB failure, correct the issue and recalibrate the
instrument. On unattended sequence, CCBs may fail and then pass later in the sequence, but no data may be reported unless bracketed by passing CCBs. Exceptions; if the failure is biased high and the sample is a non-detection, or the sample concentration is greater than 10 times the detection in the CCB for that target element.
17. Contingencies for Handling Out-of-Control or Unacceptable Data
See section 16 Corrective Actions for Out-of-Control Data
18. Method Performance
18.1 There are several requirements that must be met to insure that this procedure generates accurate and reliable data. A general outline of requirements has been summarized below. Further specifications may be found in the Laboratory Quality Manual.
18.2 The analyst must read and understand this procedure with written documentation maintained in his/her training file.
18.3 An initial demonstration of capability (IDC) must be performed per the most recent version of S-ALL-Q-020, Orientation and Training Procedures (most current revision or replacement). A record of the IDC will be maintained in his/her QA file with written authorization from the Laboratory Manager and Quality Manager. A continuing demonstration of capability (CDOC) must be performed annually.
18.4 At a minimum, the 40CFR part 136 appendix b study must be performed every year per the most recent version of S-GB-Q-020, Determination of the LOD and LOQ (most current revision or replacement). This is to be done for this method and whenever there is a major change in personnel or equipment. The results of these studies are retained in the quality assurance office.
18.5 Periodic performance evaluation (PE) samples are analyzed per the most recent version of S-GB-Q-021 PE/PT Program (most current revision or replacement), to demonstrate continuing competence. All results are stored in the QA office. These are performed twice a year per matrix.
Pace Analytical Services, Inc. – Green Bay Laboratory File: S-GB-M-006-Rev.07.doc Determination of Trace Metals in Waters and Wastes by Inductively Coupled Plasma Mass Spectroscopy Date: Upon final signature S-GB-M-006-REV.07 Page 23 of 41
SOPs distributed as Controlled Documents are given a copy number on the signed Title Page. Copies without a number are considered uncontrolled and must be verified as the most recent version prior to each use.
19. Method Modifications
19.1 The digestion procedures are based on, but differ somewhat from 200.8, 3010A, and 3050B. Pace Wisconsin has conducted temperature, time, and side by side studies to validate the digestions utilized. Pace Wisconsin digestions are typically more aggressive with higher acid concentrations than the methods listed.
19.2 All major modifications to the procedure that may directly affect data quality must be thoroughly documented. A new demonstration of capability and equivalency must be performed and kept on record.
19.3 Procedures identified as “Best Practices” by the PACE 3P Program will be incorporated into this document as minimum requirements for Pace laboratories.
19.4 When there is insufficient volume provided by the client for the method specified matrix spike/matrix spike duplicate (MS/MSD), a laboratory control spike duplicate will be analyzed to demonstrate precision criteria. Laboratory batches will be qualified with the appropriate “M5” data qualifier. When performing this analysis on paint chip samples, a MS/MSD will not be completed on the samples due to high levels of elements present in the native sample.
19.5 Blank limits generated from the IDL, as specified in 6020, are unrealistically low. The more recent 6020A limit (LOQ) is used.
20. Instrument/Equipment Maintenance
20.1 See Thermo X Series II operator’s manual for information.
21. Troubleshooting
21.1 See Thermo X Series II operator’s manual for information.
22. Safety
22.1 The toxicity or carcinogenicity of each reagent used in this method has not been fully established. Each chemical should be regarded as a potential health hazard and exposure should be as low as reasonably achievable. Cautions are included for known extremely hazardous materials.
22.2 A reference file of Material Safety Data Sheets (MSDS) is made available to all personnel involved in the chemical analysis, and is located at the front desk. A formal safety plan has been prepared and is distributed to all personnel with documented training
22.3 Analysts should take necessary safety precautions when handling chemicals and samples. Proper personal protective equipment may include safety gloves, lab coats, and safety glasses or goggles. Analysts should be familiar with the MSDS sheets for all chemicals and reagents they use for this procedure and the location of the MSDS sheets within the laboratory. Any questions or concerns should be taken to the laboratory Chemical Hygiene/Safety Officer.

Pace Analytical Services, Inc. – Green Bay Laboratory File: S-GB-M-006-Rev.07.doc Determination of Trace Metals in Waters and Wastes by Inductively Coupled Plasma Mass Spectroscopy Date: Upon final signature S-GB-M-006-REV.07 Page 24 of 41
SOPs distributed as Controlled Documents are given a copy number on the signed Title Page. Copies without a number are considered uncontrolled and must be verified as the most recent version prior to each use.
23. Waste Management
23.1 Excess reagents samples and method process wastes are characterized and disposed of in an acceptable manner. For further information on waste management consult the current version of S-GB-W-001, Waste Handling and Management (most current revision or replacement).
24. Pollution Prevention
24.1 The quantity of chemicals purchased is based on expected usage during its shelf life and disposal cost of unused material. Actual reagent preparation volumes reflect anticipated usage and reagent stability.
25. References
25.1 PASI Quality Manual, most current revision or replacement.
25.2 The NELAC Institute (TNI); Volume 1, Module 2, “Quality Systems”- most current version
25.3 USEPA, SW-846, Method 6020A “Inductively Coupled Plasma – Mass Spectrometry”, February 2007.
25.4 USEPA, SW-846, Method 3010A, “Acid Digestion of Aqueous Samples and Extracts for Total Metals for Analysis by FLAA or ICP Spectrometry”, December 1996.
25.5 USEPA, SW-846, Method 3050B, “Acid Digestion of Sediments, Sludges, and Soils”, December 1996.
25.6 USEPA, 200.8 Revision 5.4, “Determination of Trace Elements in Water and Wastes by Inductively Coupled Plasma-Mass Spectrometry”, 1994.
26. Tables, Diagrams, Flowcharts and Validation Data
Flow Chart A ‐ ICPMS DETERMINATIVE METHOD Flow Chart B ‐ APPLICABLE ANALYTESMDL or LOD FLAGGING and REPORTING Flow Chart C ‐ EQUIPMENTEQL or PSRL FLAGGING and REPORTING Table A ‐ APPLICABLE ANALYTES Table B ‐ EQUIPMENT Table C ‐ SUPPLIES Table D ‐ STANDARDS Table E ‐ STOCK STANDARDS Table F ‐ INTERMEDIATE STANDARDS Table G ‐ REAGENTS Table H ‐ CALIBRATION LEVELS Table I ‐ INTERNAL STANDARDS Table J ‐ INTERFERENCE EQUATIONS Table K ‐ ACQUISITION/DWELL TIMES Table L ‐ INSTRUMENT QC LIMITS Table M ‐ AQUEOUS BATCH QC ON INSTRUMENT CONCENTRATIONS AND LIMITS Table N ‐ SOIL BATCH QC ON INSTRUMENT CONCENTRATIONS AND LIMITS Table O ‐ BIOTA BATCH QC ON INSTRUMENT CONCENTRATIONS AND LIMITS
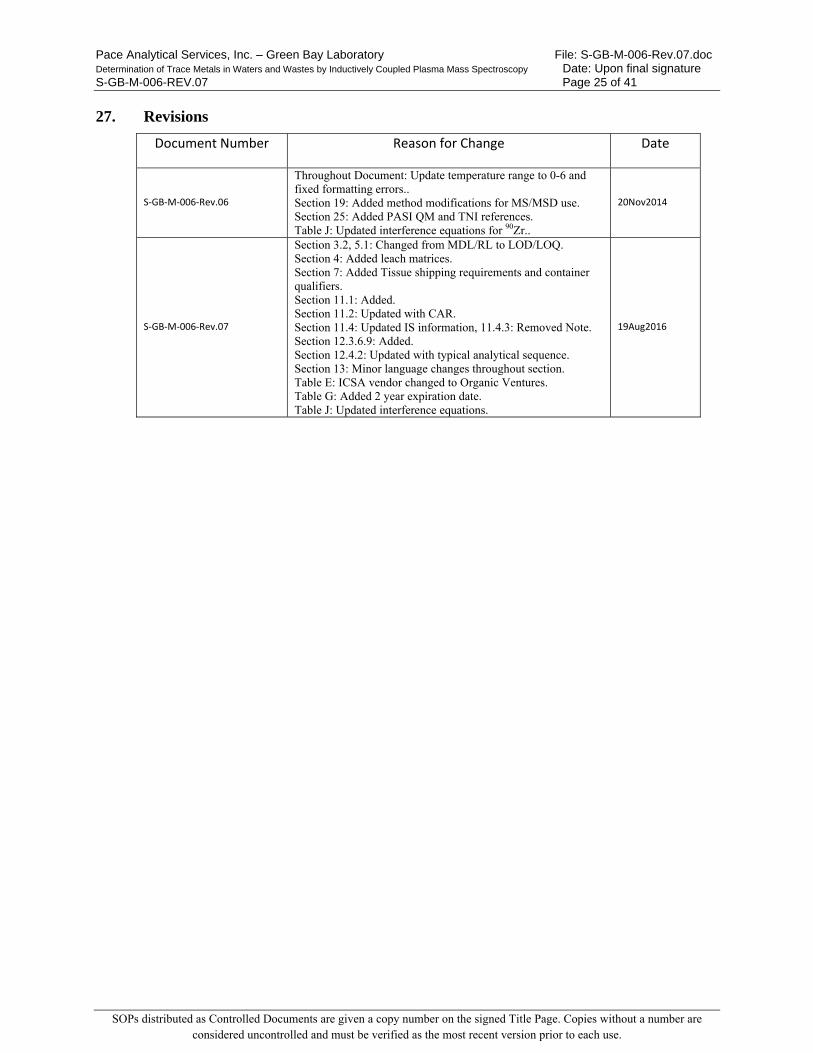
Pace Analytical Services, Inc. – Green Bay Laboratory File: S-GB-M-006-Rev.07.doc Determination of Trace Metals in Waters and Wastes by Inductively Coupled Plasma Mass Spectroscopy Date: Upon final signature S-GB-M-006-REV.07 Page 25 of 41
SOPs distributed as Controlled Documents are given a copy number on the signed Title Page. Copies without a number are considered uncontrolled and must be verified as the most recent version prior to each use.
27. Revisions
Document Number Reason for Change Date
S‐GB‐M‐006‐Rev.06
Throughout Document: Update temperature range to 0-6 and fixed formatting errors.. Section 19: Added method modifications for MS/MSD use. Section 25: Added PASI QM and TNI references. Table J: Updated interference equations for 90Zr..
20Nov2014
S‐GB‐M‐006‐Rev.07
Section 3.2, 5.1: Changed from MDL/RL to LOD/LOQ. Section 4: Added leach matrices. Section 7: Added Tissue shipping requirements and container qualifiers. Section 11.1: Added. Section 11.2: Updated with CAR. Section 11.4: Updated IS information, 11.4.3: Removed Note. Section 12.3.6.9: Added. Section 12.4.2: Updated with typical analytical sequence. Section 13: Minor language changes throughout section. Table E: ICSA vendor changed to Organic Ventures. Table G: Added 2 year expiration date. Table J: Updated interference equations.
19Aug2016
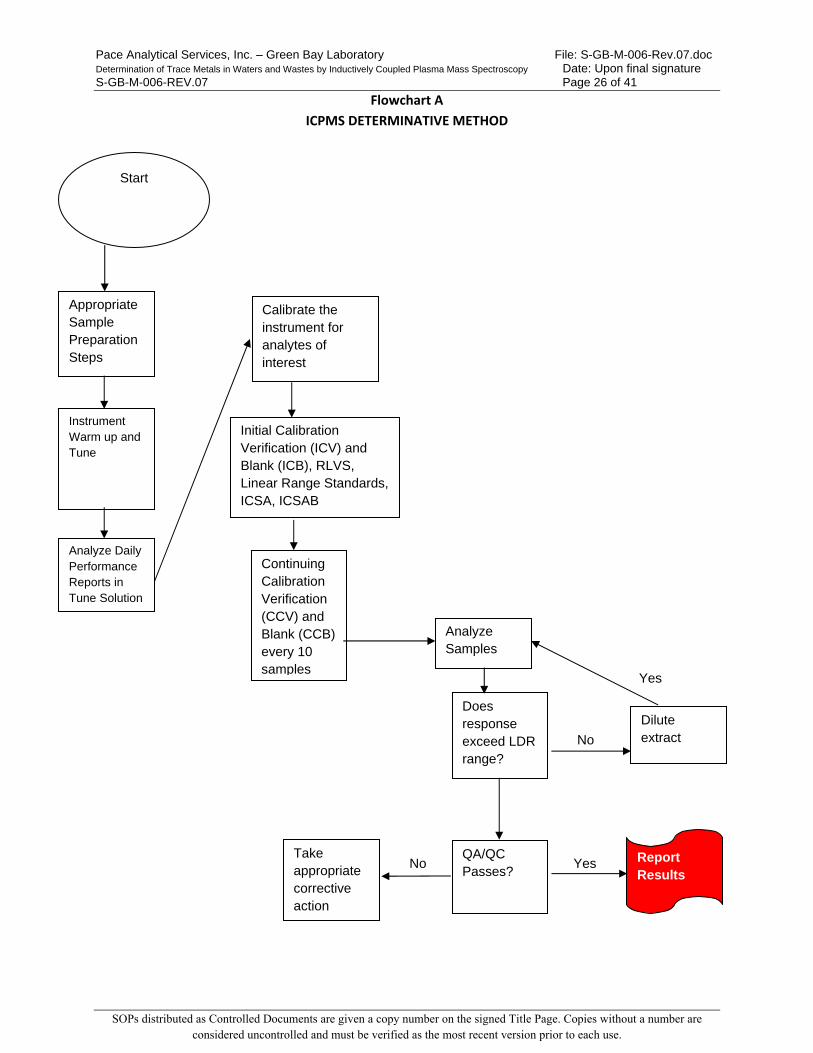
Pace Analytical Services, Inc. – Green Bay Laboratory File: S-GB-M-006-Rev.07.doc Determination of Trace Metals in Waters and Wastes by Inductively Coupled Plasma Mass Spectroscopy Date: Upon final signature S-GB-M-006-REV.07 Page 26 of 41
SOPs distributed as Controlled Documents are given a copy number on the signed Title Page. Copies without a number are considered uncontrolled and must be verified as the most recent version prior to each use.
Flowchart A ICPMS DETERMINATIVE METHOD
Yes
No
No
Yes
Appropriate Sample Preparation Steps
Instrument Warm up and Tune
Analyze Daily Performance Reports in Tune Solution
Calibrate the instrument for analytes of interest
Start
Take appropriate corrective action
Report Results
Dilute extract
Continuing Calibration Verification (CCV) and Blank (CCB) every 10 samples
Analyze Samples
Does response exceed LDR range?
Initial Calibration Verification (ICV) and Blank (ICB), RLVS, Linear Range Standards, ICSA, ICSAB
QA/QC Passes?
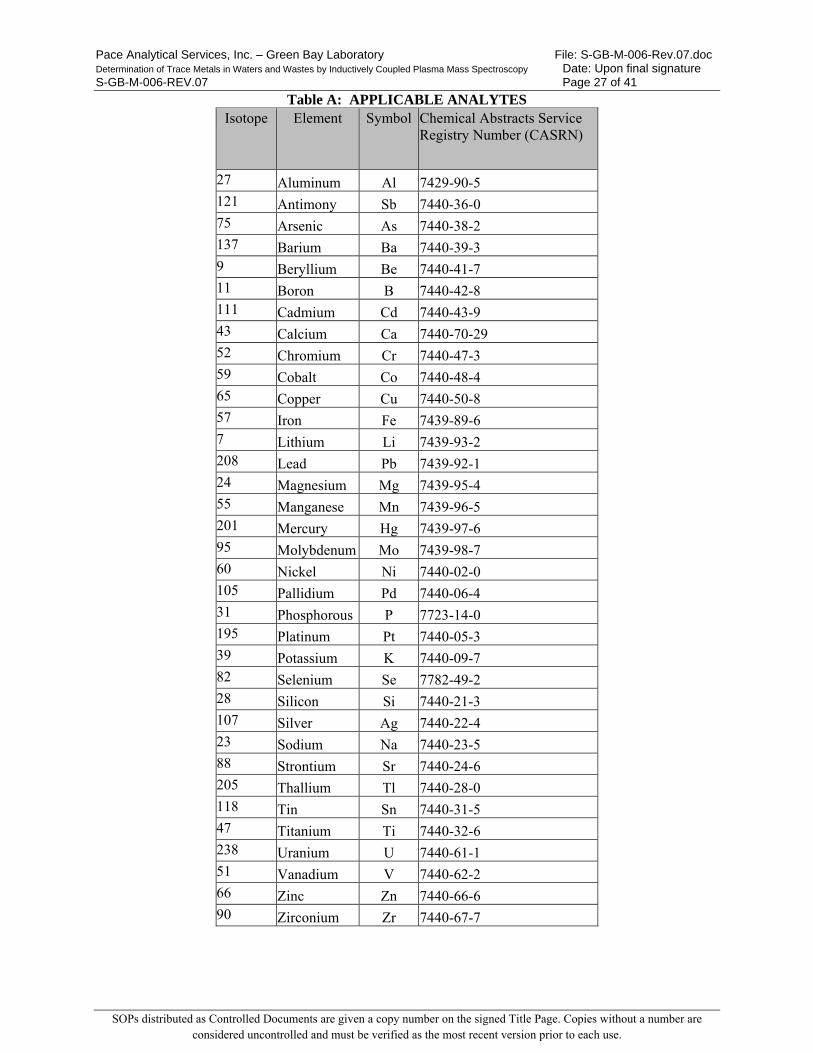
Pace Analytical Services, Inc. – Green Bay Laboratory File: S-GB-M-006-Rev.07.doc Determination of Trace Metals in Waters and Wastes by Inductively Coupled Plasma Mass Spectroscopy Date: Upon final signature S-GB-M-006-REV.07 Page 27 of 41
SOPs distributed as Controlled Documents are given a copy number on the signed Title Page. Copies without a number are considered uncontrolled and must be verified as the most recent version prior to each use.
Table A: APPLICABLE ANALYTES Isotope Element Symbol Chemical Abstracts Service
Registry Number (CASRN)
27 Aluminum Al 7429-90-5 121 Antimony Sb 7440-36-0 75 Arsenic As 7440-38-2 137 Barium Ba 7440-39-3 9 Beryllium Be 7440-41-7 11 Boron B 7440-42-8 111 Cadmium Cd 7440-43-9 43 Calcium Ca 7440-70-29 52 Chromium Cr 7440-47-3 59 Cobalt Co 7440-48-4 65 Copper Cu 7440-50-8 57 Iron Fe 7439-89-6 7 Lithium Li 7439-93-2 208 Lead Pb 7439-92-1 24 Magnesium Mg 7439-95-4 55 Manganese Mn 7439-96-5 201 Mercury Hg 7439-97-6 95 Molybdenum Mo 7439-98-7 60 Nickel Ni 7440-02-0 105 Pallidium Pd 7440-06-4 31 Phosphorous P 7723-14-0 195 Platinum Pt 7440-05-3 39 Potassium K 7440-09-7 82 Selenium Se 7782-49-2 28 Silicon Si 7440-21-3 107 Silver Ag 7440-22-4 23 Sodium Na 7440-23-5 88 Strontium Sr 7440-24-6 205 Thallium Tl 7440-28-0 118 Tin Sn 7440-31-5 47 Titanium Ti 7440-32-6 238 Uranium U 7440-61-1 51 Vanadium V 7440-62-2 66 Zinc Zn 7440-66-6 90 Zirconium Zr 7440-67-7
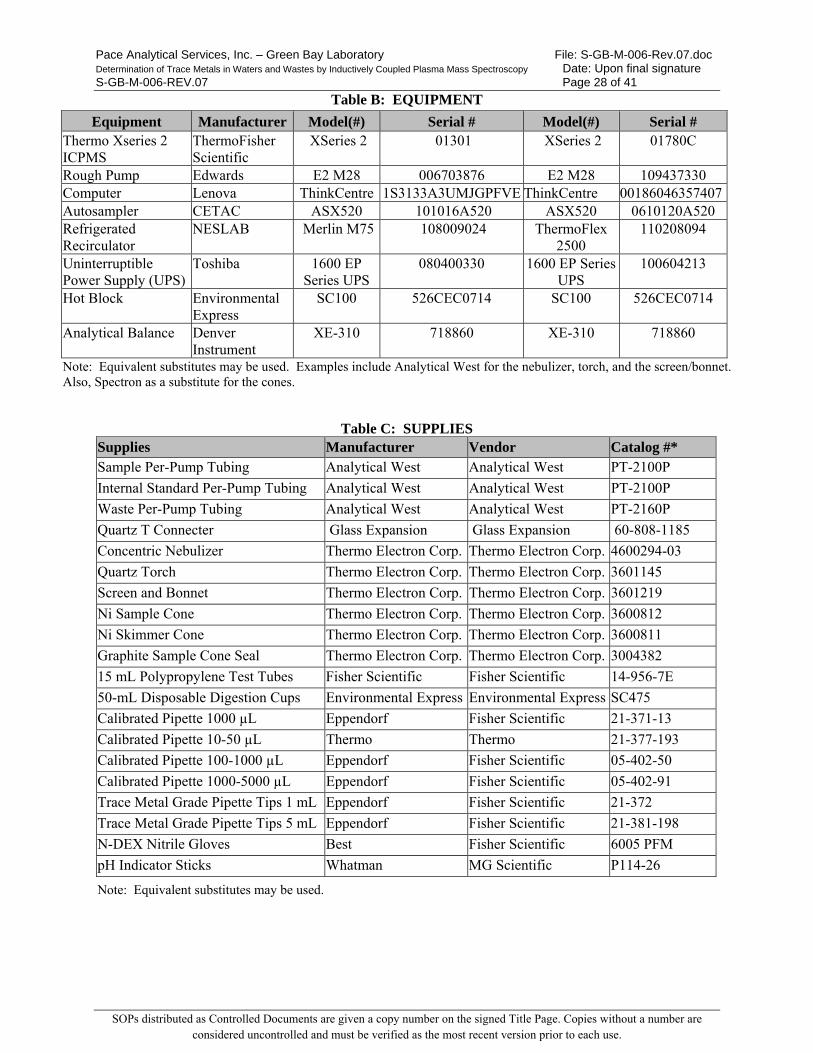
Pace Analytical Services, Inc. – Green Bay Laboratory File: S-GB-M-006-Rev.07.doc Determination of Trace Metals in Waters and Wastes by Inductively Coupled Plasma Mass Spectroscopy Date: Upon final signature S-GB-M-006-REV.07 Page 28 of 41
SOPs distributed as Controlled Documents are given a copy number on the signed Title Page. Copies without a number are considered uncontrolled and must be verified as the most recent version prior to each use.
Table B: EQUIPMENT
Equipment Manufacturer Model(#) Serial # Model(#) Serial # Thermo Xseries 2 ICPMS
ThermoFisher Scientific
XSeries 2 01301 XSeries 2 01780C
Rough Pump Edwards E2 M28 006703876 E2 M28 109437330 Computer Lenova ThinkCentre 1S3133A3UMJGPFVE ThinkCentre 00186046357407Autosampler CETAC ASX520 101016A520 ASX520 0610120A520 Refrigerated Recirculator
NESLAB Merlin M75 108009024 ThermoFlex 2500
110208094
Uninterruptible Power Supply (UPS)
Toshiba 1600 EP Series UPS
080400330 1600 EP Series UPS
100604213
Hot Block Environmental Express
SC100 526CEC0714 SC100 526CEC0714
Analytical Balance Denver Instrument
XE-310 718860 XE-310 718860
Note: Equivalent substitutes may be used. Examples include Analytical West for the nebulizer, torch, and the screen/bonnet. Also, Spectron as a substitute for the cones.
Table C: SUPPLIES Supplies Manufacturer Vendor Catalog #* Sample Per-Pump Tubing Analytical West Analytical West PT-2100P
Internal Standard Per-Pump Tubing Analytical West Analytical West PT-2100P
Waste Per-Pump Tubing Analytical West Analytical West PT-2160P
Quartz T Connecter Glass Expansion Glass Expansion 60-808-1185
Concentric Nebulizer Thermo Electron Corp. Thermo Electron Corp. 4600294-03
Quartz Torch Thermo Electron Corp. Thermo Electron Corp. 3601145
Screen and Bonnet Thermo Electron Corp. Thermo Electron Corp. 3601219
Ni Sample Cone Thermo Electron Corp. Thermo Electron Corp. 3600812
Ni Skimmer Cone Thermo Electron Corp. Thermo Electron Corp. 3600811
Graphite Sample Cone Seal Thermo Electron Corp. Thermo Electron Corp. 3004382
15 mL Polypropylene Test Tubes Fisher Scientific Fisher Scientific 14-956-7E
50-mL Disposable Digestion Cups Environmental Express Environmental Express SC475
Calibrated Pipette 1000 µL Eppendorf Fisher Scientific 21-371-13
Calibrated Pipette 10-50 µL Thermo Thermo 21-377-193
Calibrated Pipette 100-1000 µL Eppendorf Fisher Scientific 05-402-50
Calibrated Pipette 1000-5000 µL Eppendorf Fisher Scientific 05-402-91
Trace Metal Grade Pipette Tips 1 mL Eppendorf Fisher Scientific 21-372
Trace Metal Grade Pipette Tips 5 mL Eppendorf Fisher Scientific 21-381-198
N-DEX Nitrile Gloves Best Fisher Scientific 6005 PFM
pH Indicator Sticks Whatman MG Scientific P114-26
Note: Equivalent substitutes may be used.
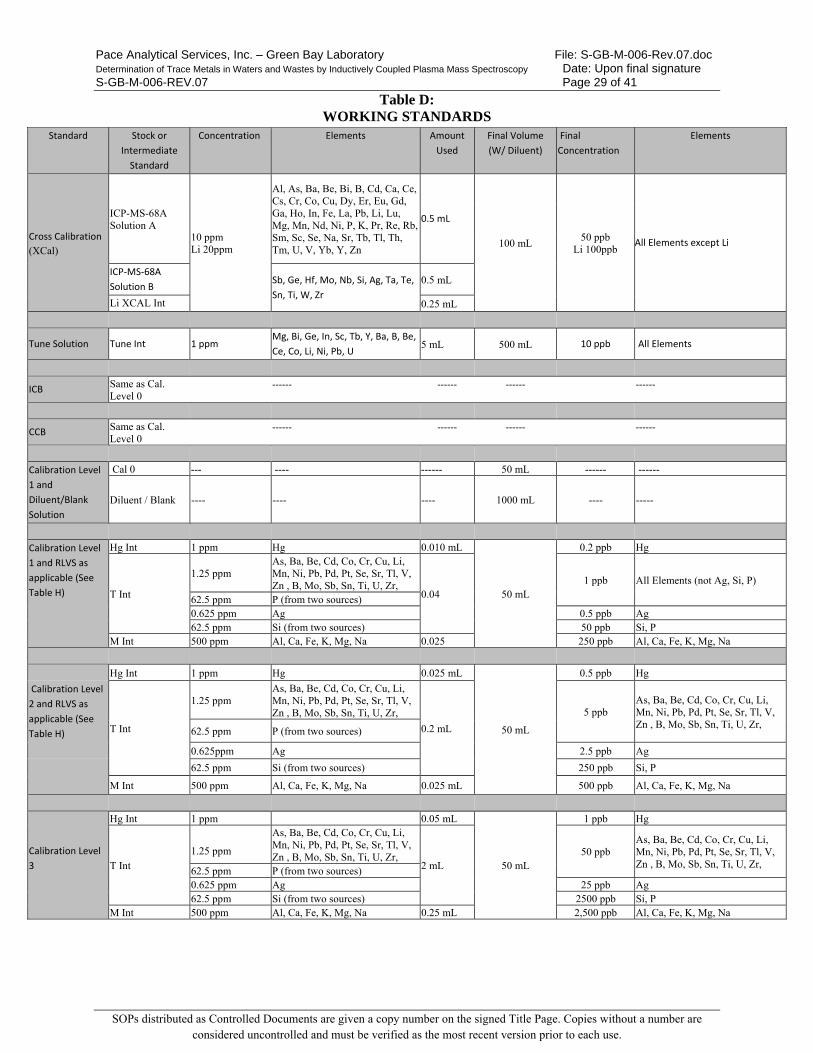
Pace Analytical Services, Inc. – Green Bay Laboratory File: S-GB-M-006-Rev.07.doc Determination of Trace Metals in Waters and Wastes by Inductively Coupled Plasma Mass Spectroscopy Date: Upon final signature S-GB-M-006-REV.07 Page 29 of 41
SOPs distributed as Controlled Documents are given a copy number on the signed Title Page. Copies without a number are considered uncontrolled and must be verified as the most recent version prior to each use.
Table D: WORKING STANDARDS
Standard Stock or Intermediate
Standard
Concentration Elements Amount Used
Final Volume (W/ Diluent)
Final Concentration
Elements
Cross Calibration (XCal)
ICP-MS-68A Solution A
10 ppm Li 20ppm
Al, As, Ba, Be, Bi, B, Cd, Ca, Ce, Cs, Cr, Co, Cu, Dy, Er, Eu, Gd, Ga, Ho, In, Fe, La, Pb, Li, Lu, Mg, Mn, Nd, Ni, P, K, Pr, Re, Rb, Sm, Sc, Se, Na, Sr, Tb, Tl, Th, Tm, U, V, Yb, Y, Zn
0.5 mL
100 mL 50 ppb
Li 100ppb All Elements except Li
ICP‐MS‐68A Solution B
Sb, Ge, Hf, Mo, Nb, Si, Ag, Ta, Te, Sn, Ti, W, Zr
0.5 mL
Li XCAL Int 0.25 mL
Tune Solution Tune Int 1 ppm Mg, Bi, Ge, In, Sc, Tb, Y, Ba, B, Be, Ce, Co, Li, Ni, Pb, U 5 mL 500 mL 10 ppb All Elements
ICB Same as Cal. Level 0
‐‐‐‐‐‐ ‐‐‐‐‐‐ ‐‐‐‐‐‐ ‐‐‐‐‐‐
CCB Same as Cal. Level 0
‐‐‐‐‐‐ ‐‐‐‐‐‐ ‐‐‐‐‐‐ ‐‐‐‐‐‐
Calibration Level 1 and Diluent/Blank Solution
Cal 0 --- ---- ------ 50 mL ------ ------
Diluent / Blank ---- ---- ---- 1000 mL ---- -----
Calibration Level 1 and RLVS as applicable (See Table H)
Hg Int 1 ppm Hg 0.010 mL
50 mL
0.2 ppb Hg
T Int
1.25 ppm As, Ba, Be, Cd, Co, Cr, Cu, Li, Mn, Ni, Pb, Pd, Pt, Se, Sr, Tl, V, Zn , B, Mo, Sb, Sn, Ti, U, Zr,
0.04 1 ppb All Elements (not Ag, Si, P)
62.5 ppm P (from two sources) 0.625 ppm Ag 0.5 ppb Ag 62.5 ppm Si (from two sources) 50 ppb Si, P
M Int 500 ppm Al, Ca, Fe, K, Mg, Na 0.025 250 ppb Al, Ca, Fe, K, Mg, Na
Hg Int 1 ppm Hg 0.025 mL
50 mL
0.5 ppb Hg
Calibration Level 2 and RLVS as applicable (See Table H) T Int
1.25 ppm As, Ba, Be, Cd, Co, Cr, Cu, Li, Mn, Ni, Pb, Pd, Pt, Se, Sr, Tl, V, Zn , B, Mo, Sb, Sn, Ti, U, Zr,
0.2 mL
5 ppb As, Ba, Be, Cd, Co, Cr, Cu, Li, Mn, Ni, Pb, Pd, Pt, Se, Sr, Tl, V, Zn , B, Mo, Sb, Sn, Ti, U, Zr,
62.5 ppm P (from two sources)
0.625ppm Ag 2.5 ppb Ag
62.5 ppm Si (from two sources) 250 ppb Si, P
M Int 500 ppm Al, Ca, Fe, K, Mg, Na 0.025 mL 500 ppb Al, Ca, Fe, K, Mg, Na
Calibration Level 3
Hg Int 1 ppm 0.05 mL
50 mL
1 ppb Hg
T Int
1.25 ppm
As, Ba, Be, Cd, Co, Cr, Cu, Li, Mn, Ni, Pb, Pd, Pt, Se, Sr, Tl, V, Zn , B, Mo, Sb, Sn, Ti, U, Zr,
2 mL 50 ppb
As, Ba, Be, Cd, Co, Cr, Cu, Li, Mn, Ni, Pb, Pd, Pt, Se, Sr, Tl, V, Zn , B, Mo, Sb, Sn, Ti, U, Zr,
62.5 ppm P (from two sources) 0.625 ppm Ag 25 ppb Ag 62.5 ppm Si (from two sources) 2500 ppb Si, P
M Int 500 ppm Al, Ca, Fe, K, Mg, Na 0.25 mL 2,500 ppb Al, Ca, Fe, K, Mg, Na
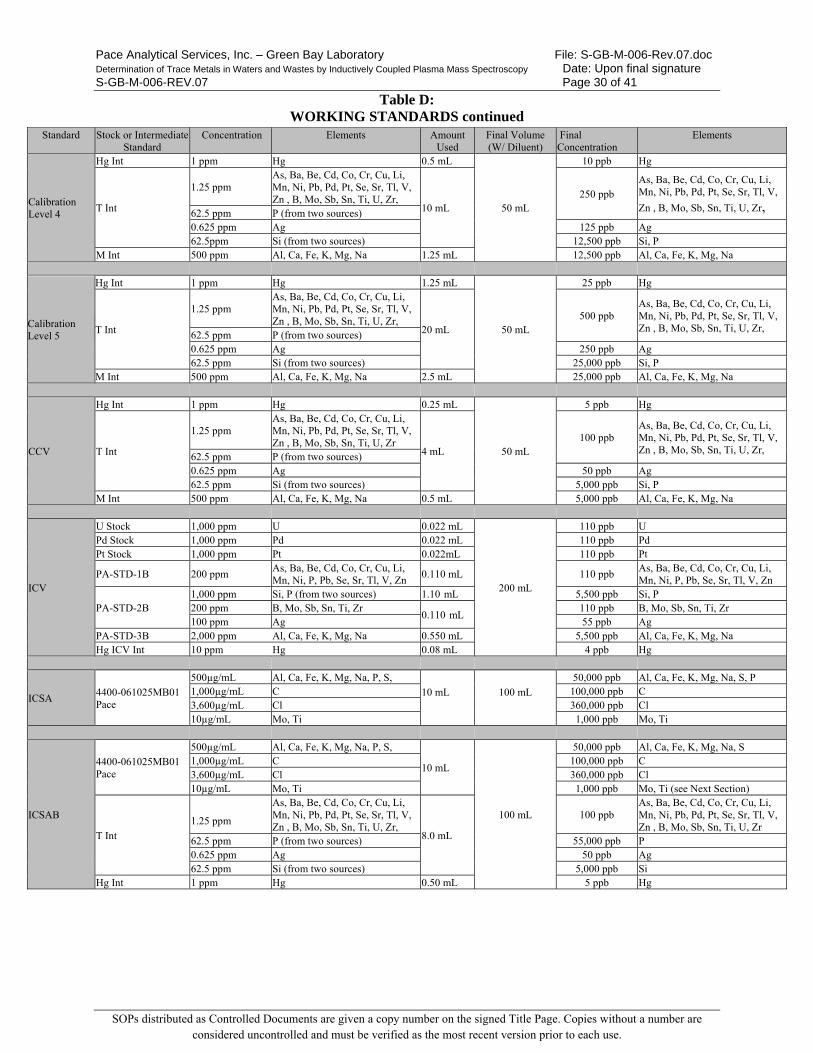
Pace Analytical Services, Inc. – Green Bay Laboratory File: S-GB-M-006-Rev.07.doc Determination of Trace Metals in Waters and Wastes by Inductively Coupled Plasma Mass Spectroscopy Date: Upon final signature S-GB-M-006-REV.07 Page 30 of 41
SOPs distributed as Controlled Documents are given a copy number on the signed Title Page. Copies without a number are considered uncontrolled and must be verified as the most recent version prior to each use.
Table D: WORKING STANDARDS continued
Standard Stock or Intermediate Standard
Concentration Elements Amount Used
Final Volume (W/ Diluent)
Final Concentration
Elements
Calibration Level 4
Hg Int 1 ppm Hg 0.5 mL
50 mL
10 ppb Hg
T Int
1.25 ppm As, Ba, Be, Cd, Co, Cr, Cu, Li, Mn, Ni, Pb, Pd, Pt, Se, Sr, Tl, V, Zn , B, Mo, Sb, Sn, Ti, U, Zr,
10 mL 250 ppb
As, Ba, Be, Cd, Co, Cr, Cu, Li, Mn, Ni, Pb, Pd, Pt, Se, Sr, Tl, V,
Zn , B, Mo, Sb, Sn, Ti, U, Zr, 62.5 ppm P (from two sources) 0.625 ppm Ag 125 ppb Ag 62.5ppm Si (from two sources) 12,500 ppb Si, P
M Int 500 ppm Al, Ca, Fe, K, Mg, Na 1.25 mL 12,500 ppb Al, Ca, Fe, K, Mg, Na
Calibration Level 5
Hg Int 1 ppm Hg 1.25 mL
50 mL
25 ppb Hg
T Int
1.25 ppm As, Ba, Be, Cd, Co, Cr, Cu, Li, Mn, Ni, Pb, Pd, Pt, Se, Sr, Tl, V, Zn , B, Mo, Sb, Sn, Ti, U, Zr,
20 mL 500 ppb
As, Ba, Be, Cd, Co, Cr, Cu, Li, Mn, Ni, Pb, Pd, Pt, Se, Sr, Tl, V, Zn , B, Mo, Sb, Sn, Ti, U, Zr,
62.5 ppm P (from two sources) 0.625 ppm Ag 250 ppb Ag 62.5 ppm Si (from two sources) 25,000 ppb Si, P
M Int 500 ppm Al, Ca, Fe, K, Mg, Na 2.5 mL 25,000 ppb Al, Ca, Fe, K, Mg, Na
CCV
Hg Int 1 ppm Hg 0.25 mL
50 mL
5 ppb Hg
T Int
1.25 ppm As, Ba, Be, Cd, Co, Cr, Cu, Li, Mn, Ni, Pb, Pd, Pt, Se, Sr, Tl, V, Zn , B, Mo, Sb, Sn, Ti, U, Zr
4 mL 100 ppb
As, Ba, Be, Cd, Co, Cr, Cu, Li, Mn, Ni, Pb, Pd, Pt, Se, Sr, Tl, V, Zn , B, Mo, Sb, Sn, Ti, U, Zr,
62.5 ppm P (from two sources) 0.625 ppm Ag 50 ppb Ag 62.5 ppm Si (from two sources) 5,000 ppb Si, P
M Int 500 ppm Al, Ca, Fe, K, Mg, Na 0.5 mL 5,000 ppb Al, Ca, Fe, K, Mg, Na
ICV
U Stock 1,000 ppm U 0.022 mL
200 mL
110 ppb U Pd Stock 1,000 ppm Pd 0.022 mL 110 ppb Pd Pt Stock 1,000 ppm Pt 0.022mL 110 ppb Pt
PA-STD-1B 200 ppm As, Ba, Be, Cd, Co, Cr, Cu, Li, Mn, Ni, P, Pb, Se, Sr, Tl, V, Zn
0.110 mL 110 ppb As, Ba, Be, Cd, Co, Cr, Cu, Li, Mn, Ni, P, Pb, Se, Sr, Tl, V, Zn
PA-STD-2B 1,000 ppm Si, P (from two sources) 1.10 mL 5,500 ppb Si, P 200 ppm B, Mo, Sb, Sn, Ti, Zr
0.110 mL 110 ppb B, Mo, Sb, Sn, Ti, Zr
100 ppm Ag 55 ppb Ag PA-STD-3B 2,000 ppm Al, Ca, Fe, K, Mg, Na 0.550 mL 5,500 ppb Al, Ca, Fe, K, Mg, Na Hg ICV Int 10 ppm Hg 0.08 mL 4 ppb Hg
ICSA 4400-061025MB01 Pace
500µg/mL Al, Ca, Fe, K, Mg, Na, P, S,
10 mL
100 mL
50,000 ppb Al, Ca, Fe, K, Mg, Na, S, P 1,000µg/mL C 100,000 ppb C 3,600µg/mL Cl 360,000 ppb Cl 10µg/mL Mo, Ti 1,000 ppb Mo, Ti
ICSAB
4400-061025MB01 Pace
500µg/mL Al, Ca, Fe, K, Mg, Na, P, S,
10 mL
100 mL
50,000 ppb Al, Ca, Fe, K, Mg, Na, S 1,000µg/mL C 100,000 ppb C 3,600µg/mL Cl 360,000 ppb Cl 10µg/mL Mo, Ti 1,000 ppb Mo, Ti (see Next Section)
T Int
1.25 ppm
As, Ba, Be, Cd, Co, Cr, Cu, Li, Mn, Ni, Pb, Pd, Pt, Se, Sr, Tl, V, Zn , B, Mo, Sb, Sn, Ti, U, Zr,
8.0 mL
100 ppb As, Ba, Be, Cd, Co, Cr, Cu, Li, Mn, Ni, Pb, Pd, Pt, Se, Sr, Tl, V, Zn , B, Mo, Sb, Sn, Ti, U, Zr
62.5 ppm P (from two sources) 55,000 ppb P 0.625 ppm Ag 50 ppb Ag 62.5 ppm Si (from two sources) 5,000 ppb Si
Hg Int 1 ppm Hg 0.50 mL 5 ppb Hg
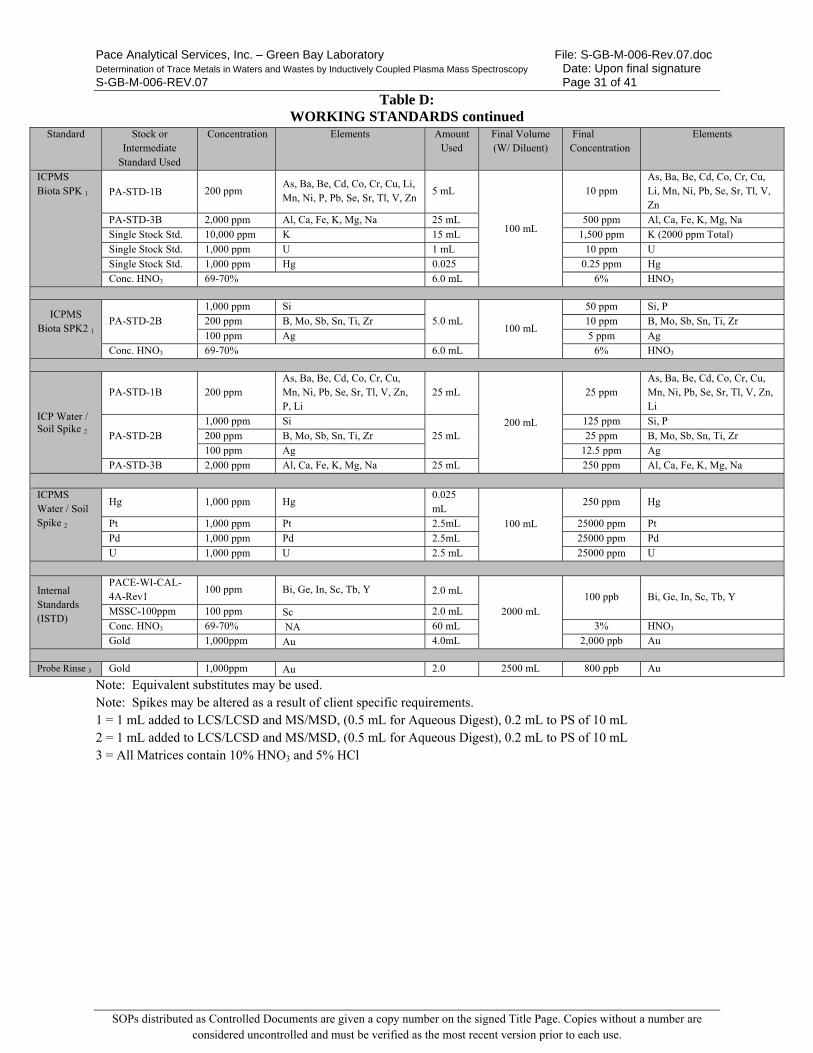
Pace Analytical Services, Inc. – Green Bay Laboratory File: S-GB-M-006-Rev.07.doc Determination of Trace Metals in Waters and Wastes by Inductively Coupled Plasma Mass Spectroscopy Date: Upon final signature S-GB-M-006-REV.07 Page 31 of 41
SOPs distributed as Controlled Documents are given a copy number on the signed Title Page. Copies without a number are considered uncontrolled and must be verified as the most recent version prior to each use.
Table D: WORKING STANDARDS continued
Standard Stock or Intermediate
Standard Used
Concentration Elements Amount Used
Final Volume (W/ Diluent)
Final Concentration
Elements
ICPMS Biota SPK 1
PA-STD-1B 200 ppm
As, Ba, Be, Cd, Co, Cr, Cu, Li, Mn, Ni, P, Pb, Se, Sr, Tl, V, Zn
5 mL
100 mL
10 ppm As, Ba, Be, Cd, Co, Cr, Cu, Li, Mn, Ni, Pb, Se, Sr, Tl, V, Zn
PA-STD-3B 2,000 ppm Al, Ca, Fe, K, Mg, Na 25 mL 500 ppm Al, Ca, Fe, K, Mg, Na Single Stock Std. 10,000 ppm K 15 mL 1,500 ppm K (2000 ppm Total)
Single Stock Std. 1,000 ppm U 1 mL 10 ppm U
Single Stock Std. 1,000 ppm Hg 0.025 0.25 ppm Hg Conc. HNO3 69-70% 6.0 mL 6% HNO3
ICPMS Biota SPK2 1
PA-STD-2B 1,000 ppm Si
5.0 mL 100 mL
50 ppm Si, P 200 ppm B, Mo, Sb, Sn, Ti, Zr 10 ppm B, Mo, Sb, Sn, Ti, Zr
100 ppm Ag 5 ppm Ag Conc. HNO3 69-70% 6.0 mL 6% HNO3
ICP Water / Soil Spike 2
PA-STD-1B 200 ppm As, Ba, Be, Cd, Co, Cr, Cu, Mn, Ni, Pb, Se, Sr, Tl, V, Zn, P, Li
25 mL
200 mL
25 ppm As, Ba, Be, Cd, Co, Cr, Cu, Mn, Ni, Pb, Se, Sr, Tl, V, Zn, Li
PA-STD-2B
1,000 ppm Si
25 mL
125 ppm Si, P
200 ppm B, Mo, Sb, Sn, Ti, Zr 25 ppm B, Mo, Sb, Sn, Ti, Zr 100 ppm Ag 12.5 ppm Ag
PA-STD-3B 2,000 ppm Al, Ca, Fe, K, Mg, Na 25 mL 250 ppm Al, Ca, Fe, K, Mg, Na
ICPMS Water / Soil Spike 2
Hg 1,000 ppm Hg 0.025 mL
100 mL
250 ppm Hg
Pt 1,000 ppm Pt 2.5mL 25000 ppm Pt
Pd 1,000 ppm Pd 2.5mL 25000 ppm Pd
U 1,000 ppm U 2.5 mL 25000 ppm U
Internal Standards (ISTD)
PACE-WI-CAL-4A-Rev1
100 ppm Bi, Ge, In, Sc, Tb, Y 2.0 mL
2000 mL
100 ppb Bi, Ge, In, Sc, Tb, Y MSSC-100ppm 100 ppm Sc 2.0 mL
Conc. HNO3 69-70% NA 60 mL 3% HNO3 Gold 1,000ppm Au 4.0mL 2,000 ppb Au
Probe Rinse 3 Gold 1,000ppm Au 2.0 2500 mL 800 ppb Au
Note: Equivalent substitutes may be used. Note: Spikes may be altered as a result of client specific requirements. 1 = 1 mL added to LCS/LCSD and MS/MSD, (0.5 mL for Aqueous Digest), 0.2 mL to PS of 10 mL 2 = 1 mL added to LCS/LCSD and MS/MSD, (0.5 mL for Aqueous Digest), 0.2 mL to PS of 10 mL 3 = All Matrices contain 10% HNO3 and 5% HCl
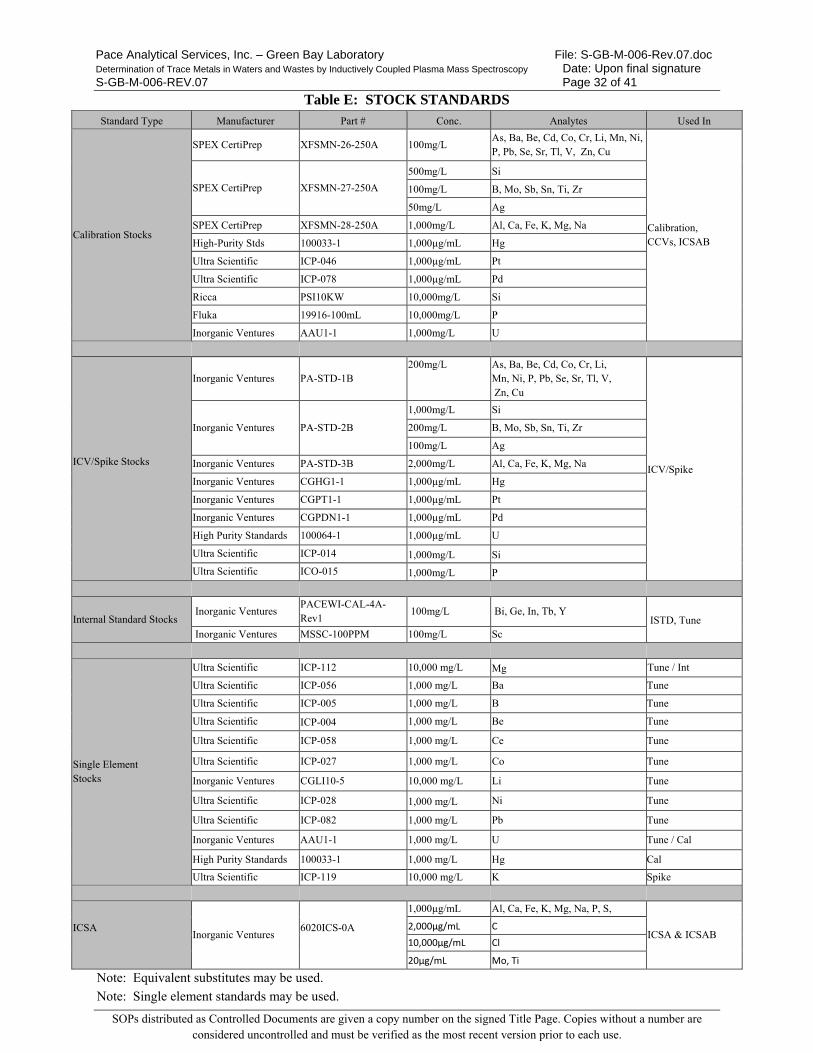
Pace Analytical Services, Inc. – Green Bay Laboratory File: S-GB-M-006-Rev.07.doc Determination of Trace Metals in Waters and Wastes by Inductively Coupled Plasma Mass Spectroscopy Date: Upon final signature S-GB-M-006-REV.07 Page 32 of 41
SOPs distributed as Controlled Documents are given a copy number on the signed Title Page. Copies without a number are considered uncontrolled and must be verified as the most recent version prior to each use.
Table E: STOCK STANDARDS Standard Type Manufacturer Part # Conc. Analytes Used In
Calibration Stocks
SPEX CertiPrep XFSMN-26-250A 100mg/L As, Ba, Be, Cd, Co, Cr, Li, Mn, Ni, P, Pb, Se, Sr, Tl, V, Zn, Cu
Calibration, CCVs, ICSAB
SPEX CertiPrep XFSMN-27-250A
500mg/L Si
100mg/L B, Mo, Sb, Sn, Ti, Zr
50mg/L Ag
SPEX CertiPrep XFSMN-28-250A 1,000mg/L Al, Ca, Fe, K, Mg, Na
High-Purity Stds 100033-1 1,000µg/mL Hg
Ultra Scientific ICP-046 1,000µg/mL Pt
Ultra Scientific ICP-078 1,000µg/mL Pd
Ricca PSI10KW 10,000mg/L Si
Fluka 19916-100mL 10,000mg/L P
Inorganic Ventures AAU1-1 1,000mg/L U
ICV/Spike Stocks
Inorganic Ventures PA-STD-1B 200mg/L
As, Ba, Be, Cd, Co, Cr, Li, Mn, Ni, P, Pb, Se, Sr, Tl, V, Zn, Cu
ICV/Spike
Inorganic Ventures PA-STD-2B
1,000mg/L Si
200mg/L B, Mo, Sb, Sn, Ti, Zr
100mg/L Ag
Inorganic Ventures PA-STD-3B 2,000mg/L Al, Ca, Fe, K, Mg, Na
Inorganic Ventures CGHG1-1 1,000µg/mL Hg
Inorganic Ventures CGPT1-1 1,000µg/mL Pt
Inorganic Ventures CGPDN1-1 1,000µg/mL Pd
High Purity Standards 100064-1 1,000µg/mL U
Ultra Scientific ICP-014 1,000mg/L Si
Ultra Scientific ICO-015 1,000mg/L P
Internal Standard Stocks Inorganic Ventures
PACEWI-CAL-4A-Rev1
100mg/L Bi, Ge, In, Tb, Y ISTD, Tune
Inorganic Ventures MSSC-100PPM 100mg/L Sc
Single Element Stocks
Ultra Scientific ICP-112 10,000 mg/L Mg Tune / Int
Ultra Scientific ICP-056 1,000 mg/L Ba Tune
Ultra Scientific ICP-005 1,000 mg/L B Tune
Ultra Scientific ICP-004 1,000 mg/L Be Tune
Ultra Scientific ICP-058 1,000 mg/L Ce Tune
Ultra Scientific ICP-027 1,000 mg/L Co Tune
Inorganic Ventures CGLI10-5 10,000 mg/L Li Tune
Ultra Scientific ICP-028 1,000 mg/L Ni Tune
Ultra Scientific ICP-082 1,000 mg/L Pb Tune
Inorganic Ventures AAU1-1 1,000 mg/L U Tune / Cal
High Purity Standards 100033-1 1,000 mg/L Hg Cal
Ultra Scientific ICP-119 10,000 mg/L K Spike
ICSA
Inorganic Ventures 6020ICS-0A
1,000µg/mL Al, Ca, Fe, K, Mg, Na, P, S,
ICSA & ICSAB 2,000µg/mL C 10,000µg/mL Cl
20µg/mL Mo, Ti
Note: Equivalent substitutes may be used.
Note: Single element standards may be used.
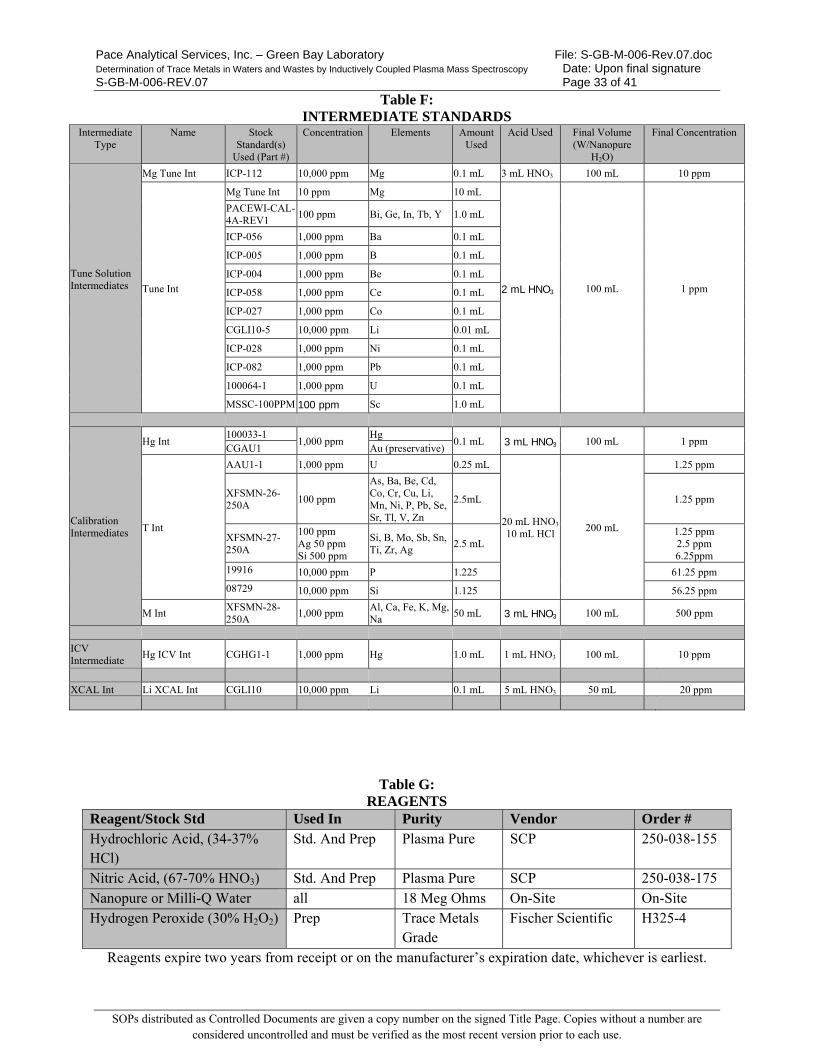
Pace Analytical Services, Inc. – Green Bay Laboratory File: S-GB-M-006-Rev.07.doc Determination of Trace Metals in Waters and Wastes by Inductively Coupled Plasma Mass Spectroscopy Date: Upon final signature S-GB-M-006-REV.07 Page 33 of 41
SOPs distributed as Controlled Documents are given a copy number on the signed Title Page. Copies without a number are considered uncontrolled and must be verified as the most recent version prior to each use.
Table F: INTERMEDIATE STANDARDS
Intermediate Type
Name Stock Standard(s)
Used (Part #)
Concentration Elements Amount Used
Acid Used Final Volume (W/Nanopure
H2O)
Final Concentration
Tune Solution Intermediates
Mg Tune Int ICP-112 10,000 ppm Mg 0.1 mL 3 mL HNO3 100 mL 10 ppm
Tune Int
Mg Tune Int 10 ppm Mg 10 mL
2 mL HNO3 100 mL 1 ppm
PACEWI-CAL-4A-REV1
100 ppm Bi, Ge, In, Tb, Y 1.0 mL
ICP-056 1,000 ppm Ba 0.1 mL
ICP-005 1,000 ppm B 0.1 mL
ICP-004 1,000 ppm Be 0.1 mL
ICP-058 1,000 ppm Ce 0.1 mL
ICP-027 1,000 ppm Co 0.1 mL
CGLI10-5 10,000 ppm Li 0.01 mL
ICP-028 1,000 ppm Ni 0.1 mL
ICP-082 1,000 ppm Pb 0.1 mL
100064-1 1,000 ppm U 0.1 mL
MSSC-100PPM 100 ppm Sc 1.0 mL
Calibration Intermediates
Hg Int 100033-1
1,000 ppm Hg
0.1 mL 3 mL HNO3 100 mL 1 ppm CGAU1 Au (preservative)
T Int
AAU1-1 1,000 ppm U 0.25 mL
20 mL HNO3
10 mL HCl 200 mL
1.25 ppm
XFSMN-26-250A
100 ppm
As, Ba, Be, Cd, Co, Cr, Cu, Li, Mn, Ni, P, Pb, Se, Sr, Tl, V, Zn
2.5mL 1.25 ppm
XFSMN-27-250A
100 ppm Ag 50 ppm Si 500 ppm
Si, B, Mo, Sb, Sn, Ti, Zr, Ag
2.5 mL 1.25 ppm 2.5 ppm 6.25ppm
19916 10,000 ppm P 1.225 61.25 ppm
08729 10,000 ppm Si 1.125 56.25 ppm
M Int XFSMN-28-250A
1,000 ppm Al, Ca, Fe, K, Mg, Na
50 mL 3 mL HNO3 100 mL 500 ppm
ICV Intermediate
Hg ICV Int CGHG1-1 1,000 ppm Hg 1.0 mL 1 mL HNO3 100 mL 10 ppm
XCAL Int Li XCAL Int CGLI10 10,000 ppm Li 0.1 mL 5 mL HNO3 50 mL 20 ppm
Table G: REAGENTS
Reagent/Stock Std Used In Purity Vendor Order # Hydrochloric Acid, (34-37% HCl)
Std. And Prep Plasma Pure SCP 250-038-155
Nitric Acid, (67-70% HNO3) Std. And Prep Plasma Pure SCP 250-038-175 Nanopure or Milli-Q Water all 18 Meg Ohms On-Site On-Site Hydrogen Peroxide (30% H2O2) Prep Trace Metals
Grade Fischer Scientific H325-4
Reagents expire two years from receipt or on the manufacturer’s expiration date, whichever is earliest.
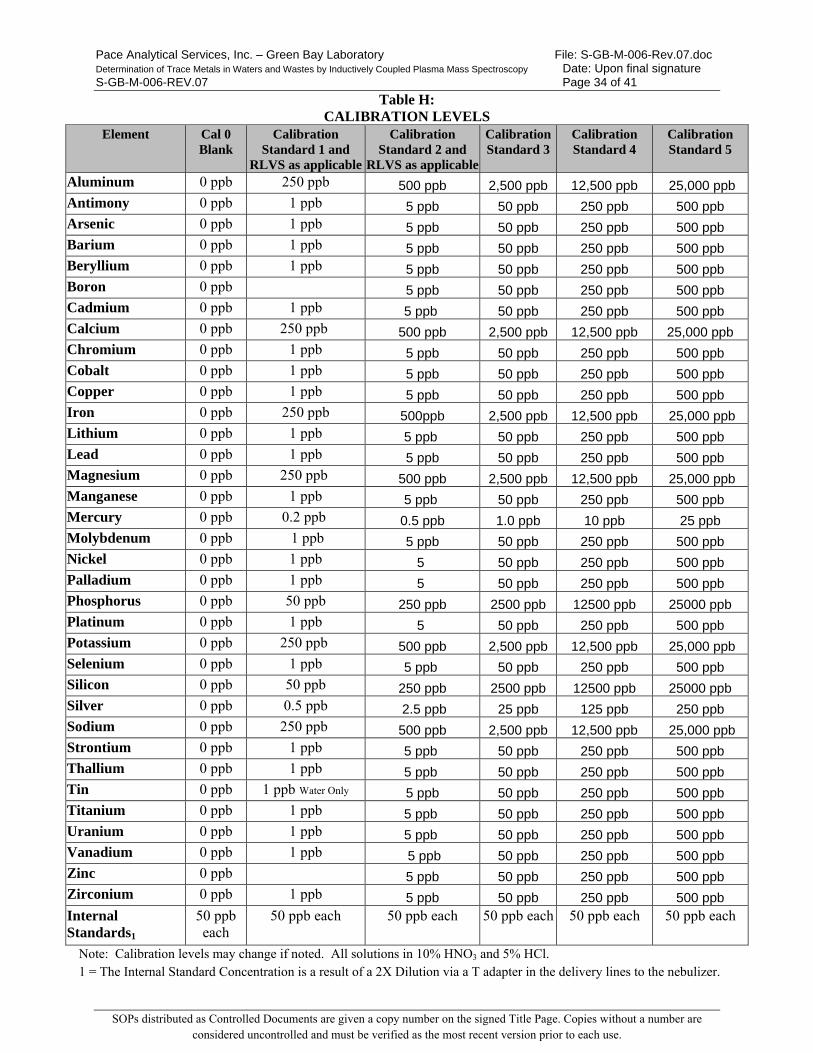
Pace Analytical Services, Inc. – Green Bay Laboratory File: S-GB-M-006-Rev.07.doc Determination of Trace Metals in Waters and Wastes by Inductively Coupled Plasma Mass Spectroscopy Date: Upon final signature S-GB-M-006-REV.07 Page 34 of 41
SOPs distributed as Controlled Documents are given a copy number on the signed Title Page. Copies without a number are considered uncontrolled and must be verified as the most recent version prior to each use.
Table H: CALIBRATION LEVELS
Element Cal 0 Blank
Calibration Standard 1 and
RLVS as applicable
Calibration Standard 2 and
RLVS as applicable
Calibration Standard 3
Calibration Standard 4
Calibration Standard 5
Aluminum 0 ppb 250 ppb 500 ppb 2,500 ppb 12,500 ppb 25,000 ppb Antimony 0 ppb 1 ppb 5 ppb 50 ppb 250 ppb 500 ppb Arsenic 0 ppb 1 ppb 5 ppb 50 ppb 250 ppb 500 ppb Barium 0 ppb 1 ppb 5 ppb 50 ppb 250 ppb 500 ppb Beryllium 0 ppb 1 ppb 5 ppb 50 ppb 250 ppb 500 ppb Boron 0 ppb 5 ppb 50 ppb 250 ppb 500 ppb Cadmium 0 ppb 1 ppb 5 ppb 50 ppb 250 ppb 500 ppb Calcium 0 ppb 250 ppb 500 ppb 2,500 ppb 12,500 ppb 25,000 ppb Chromium 0 ppb 1 ppb 5 ppb 50 ppb 250 ppb 500 ppb Cobalt 0 ppb 1 ppb 5 ppb 50 ppb 250 ppb 500 ppb Copper 0 ppb 1 ppb 5 ppb 50 ppb 250 ppb 500 ppb Iron 0 ppb 250 ppb 500ppb 2,500 ppb 12,500 ppb 25,000 ppb Lithium 0 ppb 1 ppb 5 ppb 50 ppb 250 ppb 500 ppb Lead 0 ppb 1 ppb 5 ppb 50 ppb 250 ppb 500 ppb Magnesium 0 ppb 250 ppb 500 ppb 2,500 ppb 12,500 ppb 25,000 ppb Manganese 0 ppb 1 ppb 5 ppb 50 ppb 250 ppb 500 ppb Mercury 0 ppb 0.2 ppb 0.5 ppb 1.0 ppb 10 ppb 25 ppb Molybdenum 0 ppb 1 ppb 5 ppb 50 ppb 250 ppb 500 ppb Nickel 0 ppb 1 ppb 5 50 ppb 250 ppb 500 ppb Palladium 0 ppb 1 ppb 5 50 ppb 250 ppb 500 ppb Phosphorus 0 ppb 50 ppb 250 ppb 2500 ppb 12500 ppb 25000 ppb Platinum 0 ppb 1 ppb 5 50 ppb 250 ppb 500 ppb Potassium 0 ppb 250 ppb 500 ppb 2,500 ppb 12,500 ppb 25,000 ppb Selenium 0 ppb 1 ppb 5 ppb 50 ppb 250 ppb 500 ppb Silicon 0 ppb 50 ppb 250 ppb 2500 ppb 12500 ppb 25000 ppb Silver 0 ppb 0.5 ppb 2.5 ppb 25 ppb 125 ppb 250 ppb Sodium 0 ppb 250 ppb 500 ppb 2,500 ppb 12,500 ppb 25,000 ppb Strontium 0 ppb 1 ppb 5 ppb 50 ppb 250 ppb 500 ppb Thallium 0 ppb 1 ppb 5 ppb 50 ppb 250 ppb 500 ppb Tin 0 ppb 1 ppb Water Only 5 ppb 50 ppb 250 ppb 500 ppb Titanium 0 ppb 1 ppb 5 ppb 50 ppb 250 ppb 500 ppb Uranium 0 ppb 1 ppb 5 ppb 50 ppb 250 ppb 500 ppb Vanadium 0 ppb 1 ppb 5 ppb 50 ppb 250 ppb 500 ppb Zinc 0 ppb 5 ppb 50 ppb 250 ppb 500 ppb Zirconium 0 ppb 1 ppb 5 ppb 50 ppb 250 ppb 500 ppb Internal Standards1
50 ppb each
50 ppb each 50 ppb each 50 ppb each 50 ppb each 50 ppb each
Note: Calibration levels may change if noted. All solutions in 10% HNO3 and 5% HCl. 1 = The Internal Standard Concentration is a result of a 2X Dilution via a T adapter in the delivery lines to the nebulizer.
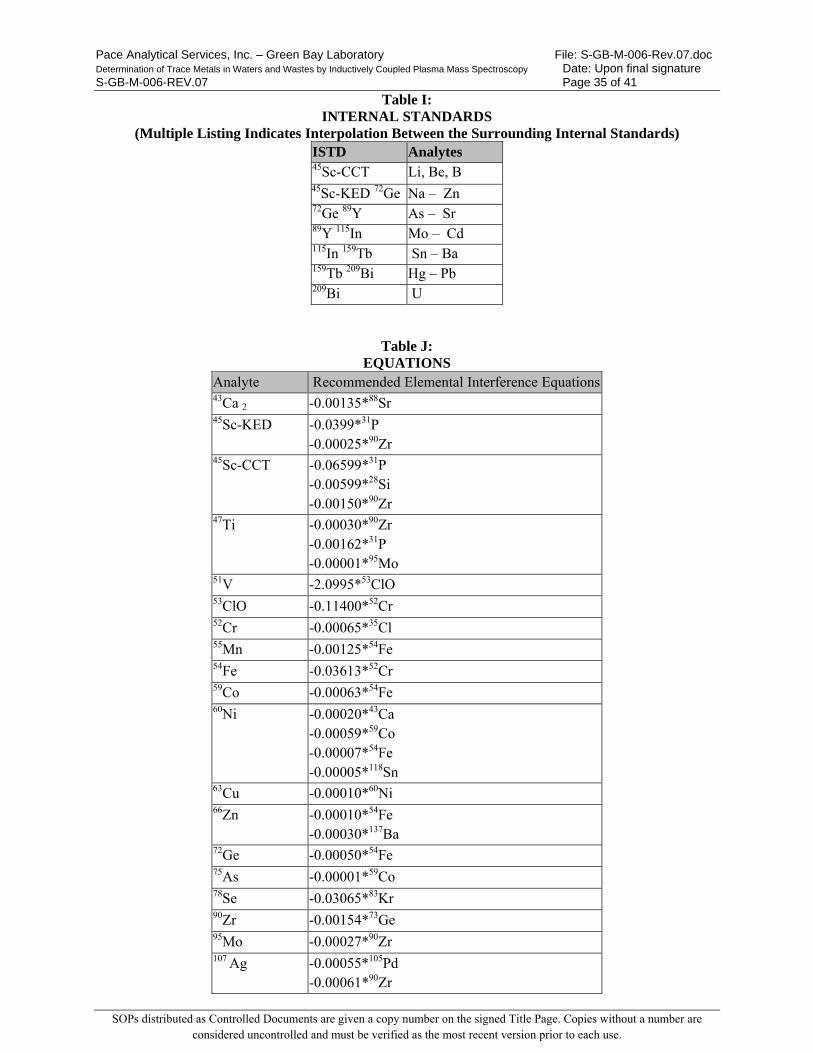
Pace Analytical Services, Inc. – Green Bay Laboratory File: S-GB-M-006-Rev.07.doc Determination of Trace Metals in Waters and Wastes by Inductively Coupled Plasma Mass Spectroscopy Date: Upon final signature S-GB-M-006-REV.07 Page 35 of 41
SOPs distributed as Controlled Documents are given a copy number on the signed Title Page. Copies without a number are considered uncontrolled and must be verified as the most recent version prior to each use.
Table I: INTERNAL STANDARDS
(Multiple Listing Indicates Interpolation Between the Surrounding Internal Standards) ISTD Analytes 45Sc-CCT Li, Be, B 45Sc-KED 72Ge Na – Zn 72Ge 89Y As – Sr 89Y 115In Mo – Cd 115In 159Tb Sn – Ba 159Tb 209Bi Hg – Pb 209Bi U
Table J: EQUATIONS
Analyte Recommended Elemental Interference Equations 43Ca 2 -0.00135*88Sr 45Sc-KED -0.0399*31P
-0.00025*90Zr 45Sc-CCT -0.06599*31P
-0.00599*28Si -0.00150*90Zr
47Ti -0.00030*90Zr -0.00162*31P -0.00001*95Mo
51V -2.0995*53ClO 53ClO -0.11400*52Cr 52Cr -0.00065*35Cl 55Mn -0.00125*54Fe 54Fe -0.03613*52Cr 59Co -0.00063*54Fe 60Ni -0.00020*43Ca
-0.00059*59Co -0.00007*54Fe -0.00005*118Sn
63Cu -0.00010*60Ni 66Zn -0.00010*54Fe
-0.00030*137Ba 72Ge -0.00050*54Fe 75As -0.00001*59Co 78Se -0.03065*83Kr 90Zr -0.00154*73Ge 95Mo -0.00027*90Zr 107 Ag -0.00055*105Pd
-0.00061*90Zr
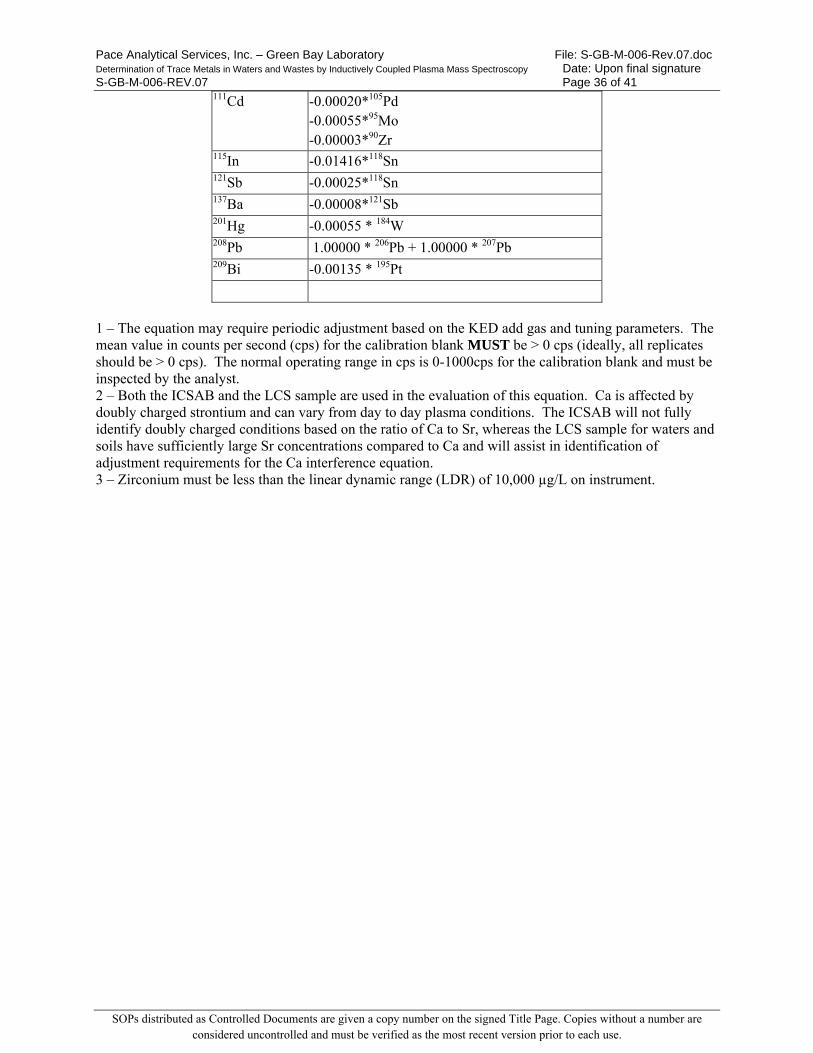
Pace Analytical Services, Inc. – Green Bay Laboratory File: S-GB-M-006-Rev.07.doc Determination of Trace Metals in Waters and Wastes by Inductively Coupled Plasma Mass Spectroscopy Date: Upon final signature S-GB-M-006-REV.07 Page 36 of 41
SOPs distributed as Controlled Documents are given a copy number on the signed Title Page. Copies without a number are considered uncontrolled and must be verified as the most recent version prior to each use.
111Cd -0.00020*105Pd -0.00055*95Mo -0.00003*90Zr
115In -0.01416*118Sn 121Sb -0.00025*118Sn 137Ba -0.00008*121Sb 201Hg -0.00055 * 184W 208Pb 1.00000 * 206Pb + 1.00000 * 207Pb 209Bi -0.00135 * 195Pt
1 – The equation may require periodic adjustment based on the KED add gas and tuning parameters. The mean value in counts per second (cps) for the calibration blank MUST be > 0 cps (ideally, all replicates should be > 0 cps). The normal operating range in cps is 0-1000cps for the calibration blank and must be inspected by the analyst. 2 – Both the ICSAB and the LCS sample are used in the evaluation of this equation. Ca is affected by doubly charged strontium and can vary from day to day plasma conditions. The ICSAB will not fully identify doubly charged conditions based on the ratio of Ca to Sr, whereas the LCS sample for waters and soils have sufficiently large Sr concentrations compared to Ca and will assist in identification of adjustment requirements for the Ca interference equation. 3 – Zirconium must be less than the linear dynamic range (LDR) of 10,000 µg/L on instrument.
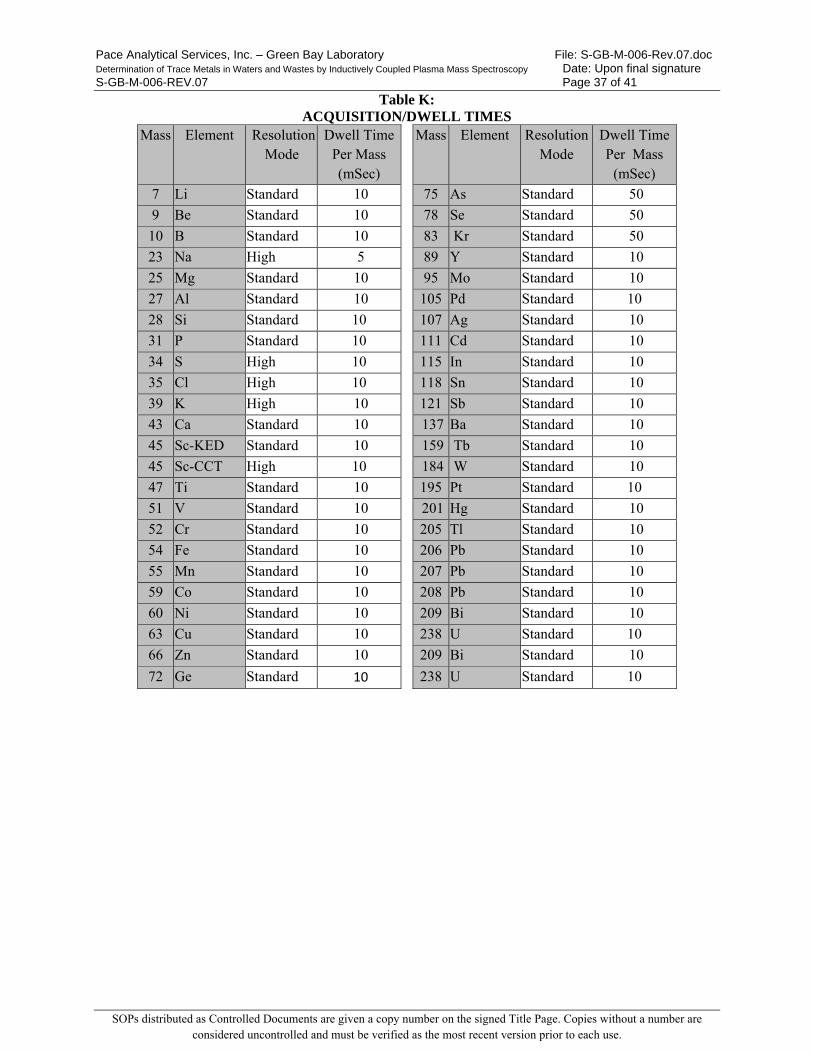
Pace Analytical Services, Inc. – Green Bay Laboratory File: S-GB-M-006-Rev.07.doc Determination of Trace Metals in Waters and Wastes by Inductively Coupled Plasma Mass Spectroscopy Date: Upon final signature S-GB-M-006-REV.07 Page 37 of 41
SOPs distributed as Controlled Documents are given a copy number on the signed Title Page. Copies without a number are considered uncontrolled and must be verified as the most recent version prior to each use.
Table K: ACQUISITION/DWELL TIMES
Mass Element Resolution Mode
Dwell Time Per Mass (mSec)
Mass Element Resolution Mode
Dwell Time Per Mass
(mSec)
7 Li Standard 10 75 As Standard 50
9 Be Standard 10 78 Se Standard 50
10 B Standard 10 83 Kr Standard 50
23 Na High 5 89 Y Standard 10
25 Mg Standard 10 95 Mo Standard 10
27 Al Standard 10 105 Pd Standard 10
28 Si Standard 10 107 Ag Standard 10
31 P Standard 10 111 Cd Standard 10
34 S High 10 115 In Standard 10
35 Cl High 10 118 Sn Standard 10
39 K High 10 121 Sb Standard 10
43 Ca Standard 10 137 Ba Standard 10
45 Sc-KED Standard 10 159 Tb Standard 10
45 Sc-CCT High 10 184 W Standard 10
47 Ti Standard 10 195 Pt Standard 10
51 V Standard 10 201 Hg Standard 10
52 Cr Standard 10 205 Tl Standard 10
54 Fe Standard 10 206 Pb Standard 10
55 Mn Standard 10 207 Pb Standard 10
59 Co Standard 10 208 Pb Standard 10
60 Ni Standard 10 209 Bi Standard 10
63 Cu Standard 10 238 U Standard 10
66 Zn Standard 10 209 Bi Standard 10
72 Ge Standard 10 238 U Standard 10
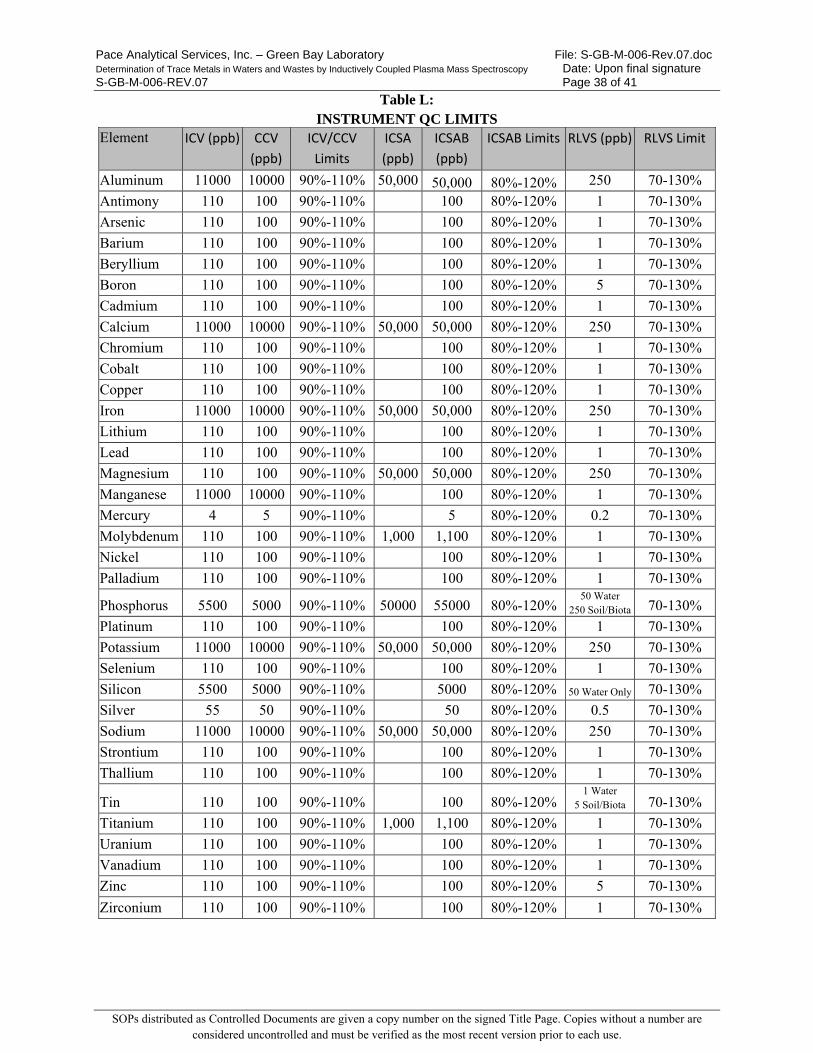
Pace Analytical Services, Inc. – Green Bay Laboratory File: S-GB-M-006-Rev.07.doc Determination of Trace Metals in Waters and Wastes by Inductively Coupled Plasma Mass Spectroscopy Date: Upon final signature S-GB-M-006-REV.07 Page 38 of 41
SOPs distributed as Controlled Documents are given a copy number on the signed Title Page. Copies without a number are considered uncontrolled and must be verified as the most recent version prior to each use.
Table L: INSTRUMENT QC LIMITS
Element ICV (ppb) CCV (ppb)
ICV/CCV Limits
ICSA (ppb)
ICSAB (ppb)
ICSAB Limits RLVS (ppb) RLVS Limit
Aluminum 11000 10000 90%-110% 50,000 50,000 80%-120% 250 70-130%
Antimony 110 100 90%-110% 100 80%-120% 1 70-130%
Arsenic 110 100 90%-110% 100 80%-120% 1 70-130%
Barium 110 100 90%-110% 100 80%-120% 1 70-130%
Beryllium 110 100 90%-110% 100 80%-120% 1 70-130%
Boron 110 100 90%-110% 100 80%-120% 5 70-130%
Cadmium 110 100 90%-110% 100 80%-120% 1 70-130%
Calcium 11000 10000 90%-110% 50,000 50,000 80%-120% 250 70-130%
Chromium 110 100 90%-110% 100 80%-120% 1 70-130%
Cobalt 110 100 90%-110% 100 80%-120% 1 70-130%
Copper 110 100 90%-110% 100 80%-120% 1 70-130%
Iron 11000 10000 90%-110% 50,000 50,000 80%-120% 250 70-130%
Lithium 110 100 90%-110% 100 80%-120% 1 70-130%
Lead 110 100 90%-110% 100 80%-120% 1 70-130%
Magnesium 110 100 90%-110% 50,000 50,000 80%-120% 250 70-130%
Manganese 11000 10000 90%-110% 100 80%-120% 1 70-130%
Mercury 4 5 90%-110% 5 80%-120% 0.2 70-130%
Molybdenum 110 100 90%-110% 1,000 1,100 80%-120% 1 70-130%
Nickel 110 100 90%-110% 100 80%-120% 1 70-130%
Palladium 110 100 90%-110% 100 80%-120% 1 70-130%
Phosphorus 5500 5000 90%-110% 50000 55000 80%-120% 50 Water
250 Soil/Biota 70-130%
Platinum 110 100 90%-110% 100 80%-120% 1 70-130%
Potassium 11000 10000 90%-110% 50,000 50,000 80%-120% 250 70-130%
Selenium 110 100 90%-110% 100 80%-120% 1 70-130%
Silicon 5500 5000 90%-110% 5000 80%-120% 50 Water Only 70-130%
Silver 55 50 90%-110% 50 80%-120% 0.5 70-130%
Sodium 11000 10000 90%-110% 50,000 50,000 80%-120% 250 70-130%
Strontium 110 100 90%-110% 100 80%-120% 1 70-130%
Thallium 110 100 90%-110% 100 80%-120% 1 70-130%
Tin 110 100 90%-110% 100 80%-120% 1 Water
5 Soil/Biota 70-130%
Titanium 110 100 90%-110% 1,000 1,100 80%-120% 1 70-130%
Uranium 110 100 90%-110% 100 80%-120% 1 70-130%
Vanadium 110 100 90%-110% 100 80%-120% 1 70-130%
Zinc 110 100 90%-110% 100 80%-120% 5 70-130%
Zirconium 110 100 90%-110% 100 80%-120% 1 70-130%
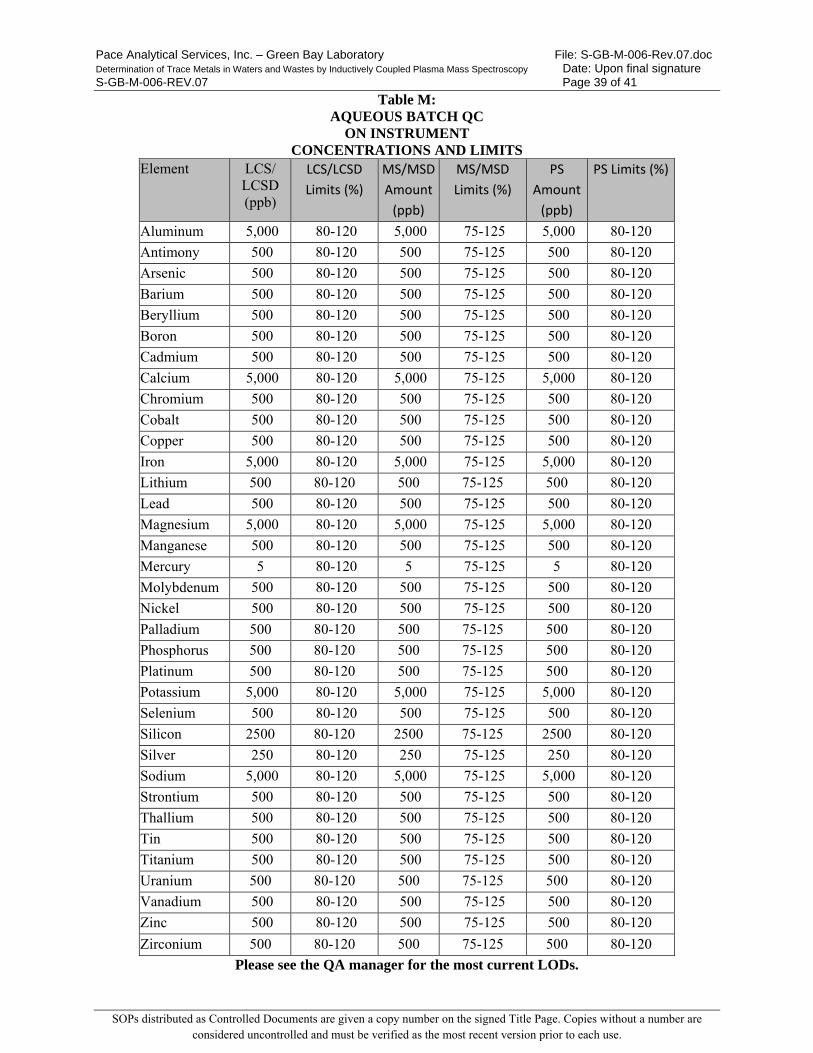
Pace Analytical Services, Inc. – Green Bay Laboratory File: S-GB-M-006-Rev.07.doc Determination of Trace Metals in Waters and Wastes by Inductively Coupled Plasma Mass Spectroscopy Date: Upon final signature S-GB-M-006-REV.07 Page 39 of 41
SOPs distributed as Controlled Documents are given a copy number on the signed Title Page. Copies without a number are considered uncontrolled and must be verified as the most recent version prior to each use.
Table M: AQUEOUS BATCH QC
ON INSTRUMENT CONCENTRATIONS AND LIMITS
Element LCS/ LCSD (ppb)
LCS/LCSD Limits (%)
MS/MSD Amount
(ppb)
MS/MSD Limits (%)
PS Amount
(ppb)
PS Limits (%)
Aluminum 5,000 80-120 5,000 75-125 5,000 80-120
Antimony 500 80-120 500 75-125 500 80-120
Arsenic 500 80-120 500 75-125 500 80-120
Barium 500 80-120 500 75-125 500 80-120
Beryllium 500 80-120 500 75-125 500 80-120
Boron 500 80-120 500 75-125 500 80-120
Cadmium 500 80-120 500 75-125 500 80-120
Calcium 5,000 80-120 5,000 75-125 5,000 80-120
Chromium 500 80-120 500 75-125 500 80-120
Cobalt 500 80-120 500 75-125 500 80-120
Copper 500 80-120 500 75-125 500 80-120
Iron 5,000 80-120 5,000 75-125 5,000 80-120
Lithium 500 80-120 500 75-125 500 80-120
Lead 500 80-120 500 75-125 500 80-120
Magnesium 5,000 80-120 5,000 75-125 5,000 80-120
Manganese 500 80-120 500 75-125 500 80-120
Mercury 5 80-120 5 75-125 5 80-120
Molybdenum 500 80-120 500 75-125 500 80-120
Nickel 500 80-120 500 75-125 500 80-120
Palladium 500 80-120 500 75-125 500 80-120
Phosphorus 500 80-120 500 75-125 500 80-120
Platinum 500 80-120 500 75-125 500 80-120
Potassium 5,000 80-120 5,000 75-125 5,000 80-120
Selenium 500 80-120 500 75-125 500 80-120
Silicon 2500 80-120 2500 75-125 2500 80-120
Silver 250 80-120 250 75-125 250 80-120
Sodium 5,000 80-120 5,000 75-125 5,000 80-120
Strontium 500 80-120 500 75-125 500 80-120
Thallium 500 80-120 500 75-125 500 80-120
Tin 500 80-120 500 75-125 500 80-120
Titanium 500 80-120 500 75-125 500 80-120
Uranium 500 80-120 500 75-125 500 80-120
Vanadium 500 80-120 500 75-125 500 80-120
Zinc 500 80-120 500 75-125 500 80-120
Zirconium 500 80-120 500 75-125 500 80-120
Please see the QA manager for the most current LODs.
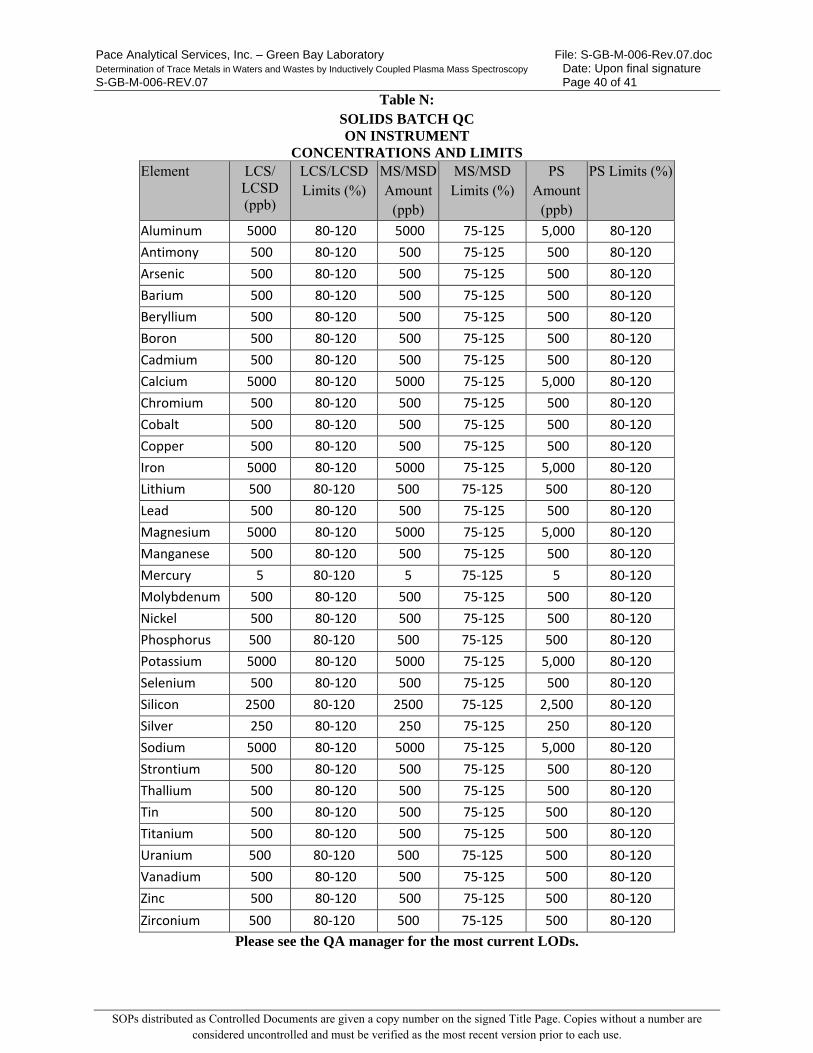
Pace Analytical Services, Inc. – Green Bay Laboratory File: S-GB-M-006-Rev.07.doc Determination of Trace Metals in Waters and Wastes by Inductively Coupled Plasma Mass Spectroscopy Date: Upon final signature S-GB-M-006-REV.07 Page 40 of 41
SOPs distributed as Controlled Documents are given a copy number on the signed Title Page. Copies without a number are considered uncontrolled and must be verified as the most recent version prior to each use.
Table N: SOLIDS BATCH QC ON INSTRUMENT
CONCENTRATIONS AND LIMITS Element LCS/
LCSD (ppb)
LCS/LCSD Limits (%)
MS/MSD Amount
(ppb)
MS/MSD Limits (%)
PS Amount
(ppb)
PS Limits (%)
Aluminum 5000 80‐120 5000 75‐125 5,000 80‐120 Antimony 500 80‐120 500 75‐125 500 80‐120 Arsenic 500 80‐120 500 75‐125 500 80‐120 Barium 500 80‐120 500 75‐125 500 80‐120 Beryllium 500 80‐120 500 75‐125 500 80‐120 Boron 500 80‐120 500 75‐125 500 80‐120 Cadmium 500 80‐120 500 75‐125 500 80‐120 Calcium 5000 80‐120 5000 75‐125 5,000 80‐120 Chromium 500 80‐120 500 75‐125 500 80‐120 Cobalt 500 80‐120 500 75‐125 500 80‐120 Copper 500 80‐120 500 75‐125 500 80‐120 Iron 5000 80‐120 5000 75‐125 5,000 80‐120 Lithium 500 80‐120 500 75‐125 500 80‐120 Lead 500 80‐120 500 75‐125 500 80‐120 Magnesium 5000 80‐120 5000 75‐125 5,000 80‐120 Manganese 500 80‐120 500 75‐125 500 80‐120 Mercury 5 80‐120 5 75‐125 5 80‐120 Molybdenum 500 80‐120 500 75‐125 500 80‐120 Nickel 500 80‐120 500 75‐125 500 80‐120 Phosphorus 500 80‐120 500 75‐125 500 80‐120 Potassium 5000 80‐120 5000 75‐125 5,000 80‐120 Selenium 500 80‐120 500 75‐125 500 80‐120 Silicon 2500 80‐120 2500 75‐125 2,500 80‐120 Silver 250 80‐120 250 75‐125 250 80‐120 Sodium 5000 80‐120 5000 75‐125 5,000 80‐120 Strontium 500 80‐120 500 75‐125 500 80‐120 Thallium 500 80‐120 500 75‐125 500 80‐120 Tin 500 80‐120 500 75‐125 500 80‐120 Titanium 500 80‐120 500 75‐125 500 80‐120 Uranium 500 80‐120 500 75‐125 500 80‐120 Vanadium 500 80‐120 500 75‐125 500 80‐120 Zinc 500 80‐120 500 75‐125 500 80‐120 Zirconium 500 80‐120 500 75‐125 500 80‐120
Please see the QA manager for the most current LODs.

Pace Analytical Services, Inc. – Green Bay Laboratory File: S-GB-M-006-Rev.07.doc Determination of Trace Metals in Waters and Wastes by Inductively Coupled Plasma Mass Spectroscopy Date: Upon final signature S-GB-M-006-REV.07 Page 41 of 41
SOPs distributed as Controlled Documents are given a copy number on the signed Title Page. Copies without a number are considered uncontrolled and must be verified as the most recent version prior to each use.
Table O: BIOTA BATCH QC ON INSTRUMENT
CONCENTRATIONS AND LIMITS Element LCS/
LCSD (ppb)
LCS/LCSD Limits (%)
MS/MSD Amount
(ppb)
MS/MSD Limits (%)
PS Amount
(ppb)
PS Limits (%)
Aluminum 10,000 80-120 10,000 75-125 10,000 80-120
Antimony 200 80-120 200 75-125 200 80-120
Arsenic 200 80-120 200 75-125 200 80-120
Barium 200 80-120 200 75-125 200 80-120
Beryllium 200 80-120 200 75-125 200 80-120
Boron 200 80-120 200 75-125 200 80-120
Cadmium 200 80-120 200 75-125 200 80-120
Calcium 10,000 80-120 10,000 75-125 10,000 80-120
Chromium 200 80-120 200 75-125 200 80-120
Cobalt 200 80-120 200 75-125 200 80-120
Copper 200 80-120 200 75-125 200 80-120
Iron 10,000 80-120 10,000 75-125 10,000 80-120
Lithium 500 80-120 500 75-125 500 80-120
Lead 200 80-120 200 75-125 200 80-120
Magnesium 10,000 80-120 10,000 75-125 10,000 80-120
Manganese 200 80-120 200 75-125 200 80-120
Mercury 5 80-120 5 75-125 5 80-120
Molybdenum 200 80-120 200 75-125 200 80-120
Nickel 200 80-120 200 75-125 200 80-120
Phosphorus 200 80-120 200 75-125 20,000 80-120
Potassium 40,000 80-120 40,000 75-125 40,000 80-120
Selenium 200 80-120 200 75-125 200 80-120
Silicon 1000 80-120 1000 75-125 1,000 80-120
Silver 100 80-120 100 75-125 100 80-120
Sodium 10,000 80-120 10,000 75-125 10,000 80-120
Strontium 200 80-120 200 75-125 200 80-120
Thallium 200 80-120 200 75-125 200 80-120
Tin 200 80-120 200 75-125 200 80-120
Titanium 200 80-120 200 75-125 200 80-120
Uranium 200 80-120 200 75-125 200 80-120
Vanadium 200 80-120 200 75-125 200 80-120
Zinc 200 80-120 200 75-125 200 80-120
Zirconium 200 80-120 200 75-125 200 80-120
Note: Biota spikes are fortified for K as a result of its natural presence in the Chicken blank.
Please see the QA manager for the most current LODs.
Pace Analytical Services, Inc. 1241 Bellevue Street Suite 9
Green Bay, WI 54302 Phone: 920 469‐2436
Fax: 920 469-8827
SOPs distributed as Controlled Documents are given a copy number on the signed Title Page. Copies without a number are considered uncontrolled and must be verified as the most recent version prior to each use.
STANDARD OPERATING PROCEDURE
The Determination of Mercury by Cold Vapor Atomic Absorption Spectroscopy – CETAC M-7500
Reference Methods: EPA SW-846 Methods 7470A and 7471B, EPA 245.1
SOP NUMBER: S-GB-M-017-REV.04
EFFECTIVE DATE: Date of Final Signature
SUPERSEDES: S-GB-M-017-Rev.03
APPROVAL
__________________________________________ 06/13/16 Nils Melberg, Laboratory General Manager Date
__________________________________________ 6/13/2016 Kate Verbeten, Laboratory Quality Manager Date
__________________________________________ 06/13/2016 Chad Rusch, Department Manager Date
PERIODIC REVIEW
SIGNATURES BELOW INDICATE NO CHANGES HAVE BEEN MADE SINCE APPROVAL.
Signature Title Date
Signature Title Date
Signature Title Date © 2002 - 2016 Pace Analytical Services, Inc. This Standard Operating Procedure may not be reproduced, in part or in full, without written consent of Pace Analytical Services, Inc. Whether distributed internally or as a “courtesy copy” to clients or regulatory agencies, this document is considered confidential and proprietary information. Any printed documents in use within a Pace Analytical Services, Inc. laboratory have been reviewed and approved by the persons listed on the cover page. They can only be deemed official if proper signatures are present.
This is COPY# Distributed on by and is CONTROLLED or X UNCONTROLLED
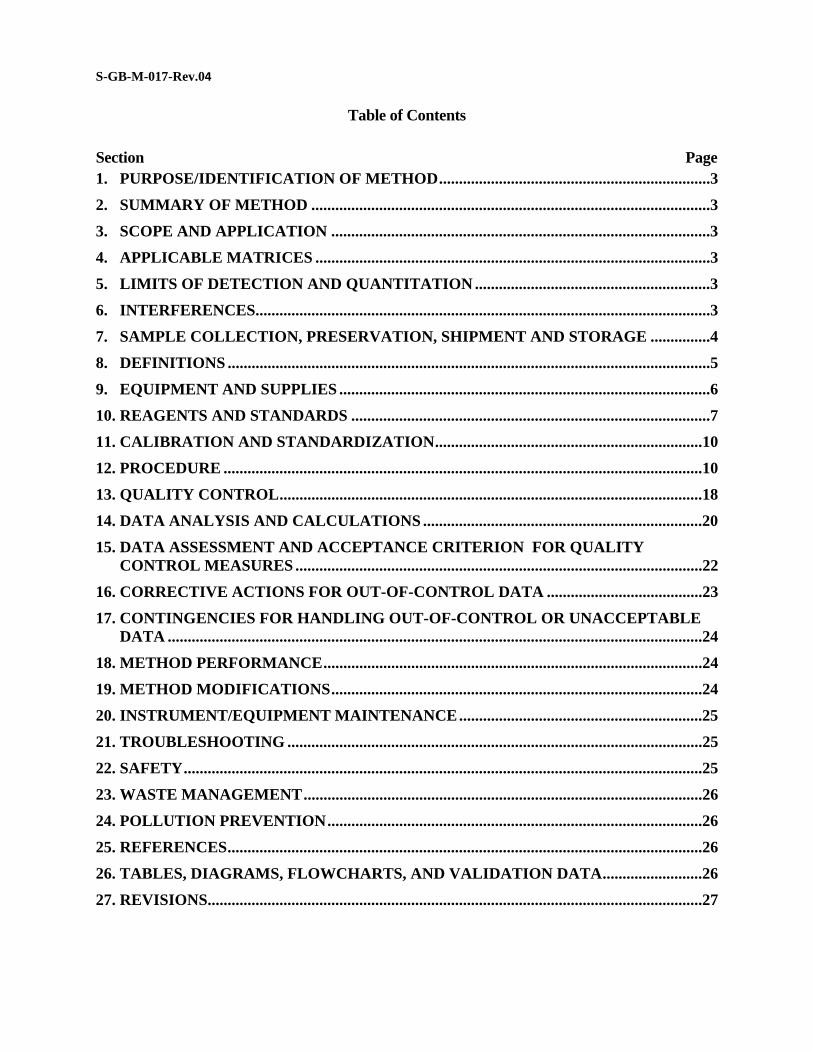
S-GB-M-017-Rev.04
Table of Contents
Section Page 1. PURPOSE/IDENTIFICATION OF METHOD ....................................................................3
2. SUMMARY OF METHOD ....................................................................................................3
3. SCOPE AND APPLICATION ...............................................................................................3
4. APPLICABLE MATRICES ...................................................................................................3
5. LIMITS OF DETECTION AND QUANTITATION ...........................................................3
6. INTERFERENCES..................................................................................................................3
7. SAMPLE COLLECTION, PRESERVATION, SHIPMENT AND STORAGE ...............4
8. DEFINITIONS .........................................................................................................................5
9. EQUIPMENT AND SUPPLIES .............................................................................................6
10. REAGENTS AND STANDARDS ..........................................................................................7
11. CALIBRATION AND STANDARDIZATION ...................................................................10
12. PROCEDURE ........................................................................................................................10
13. QUALITY CONTROL ..........................................................................................................18
14. DATA ANALYSIS AND CALCULATIONS ......................................................................20
15. DATA ASSESSMENT AND ACCEPTANCE CRITERION FOR QUALITY CONTROL MEASURES ......................................................................................................22
16. CORRECTIVE ACTIONS FOR OUT-OF-CONTROL DATA .......................................23
17. CONTINGENCIES FOR HANDLING OUT-OF-CONTROL OR UNACCEPTABLE DATA ......................................................................................................................................24
18. METHOD PERFORMANCE ...............................................................................................24
19. METHOD MODIFICATIONS .............................................................................................24
20. INSTRUMENT/EQUIPMENT MAINTENANCE .............................................................25
21. TROUBLESHOOTING ........................................................................................................25
22. SAFETY ..................................................................................................................................25
23. WASTE MANAGEMENT ....................................................................................................26
24. POLLUTION PREVENTION ..............................................................................................26
25. REFERENCES .......................................................................................................................26
26. TABLES, DIAGRAMS, FLOWCHARTS, AND VALIDATION DATA .........................26
27. REVISIONS............................................................................................................................27
Pace Analytical Services, Inc. – Green Bay Laboratory File: S-GB-M-017-Rev.04.doc Mercury by CVAAS – CETAC M-7500 Date: Upon Final Signature S-GB-M-017-REV.04 Page 3 of 28
SOPs distributed as Controlled Documents are given a copy number on the signed Title Page. Copies without a number are considered uncontrolled and must be verified as the most recent version prior to each use.
1. Purpose/Identification of Method
1.1 The purpose of this Standard Operating Procedure (SOP) is to describe the determination of mercury in water, soil/solid samples, and biological tissue analyzed by the Cetac M-7500 instrument by EPA Methods SW846 7470A, SW846 7471B and EPA 245.1.
2. Summary of Method
2.1 Cold vapor atomic absorption utilizes the volatile property of elemental mercury at the 253.7 nm wavelength. To release mercury from organic complexes, the sample is digested with oxidizing reagents and acids in a hot block. After digestion, the oxidizing reagents are neutralized. Stannous chloride is added to reduce ionic mercury to the ground state. The Flow Injection Analysis System sweeps the volatile elemental mercury out of the sample and into the cell of an atomic absorption spectrophotometer. The absorbance signal is proportional to the amount of mercury in the sample.
3. Scope and Application
3.1 This method is applicable to water samples (including surface water and domestic and industrial wastewaters), solid samples (including soils, sediments, sludge, and solid wastes), wipes, TCLP, SPLP and ASTM leachates, and biological tissue samples.
3.2 This procedure is restricted to use by, or under the supervision of, analysts experienced in the digestion of samples for metals analysis and analysis of digestates by atomic absorption spectrometry. Each analyst must demonstrate the capability to generate acceptable results with this method to be considered qualified to report sample results.
4. Applicable Matrices
4.1 7470A and EPA 245.1 apply to aqueous samples including surface water, dissolved water, domestic and industrial wastewaters, TCLP, SPLP, and ASTM leachates.
4.2 7471B applies to soil and solid samples.
4.3 7471M is a modified 7471B method that applies to biological tissue samples
5. Limits of Detection and Quantitation
5.1 All current LODs and LOQs are listed in the LIMS and are available by request from the Quality Manager.
6. Interferences
6.1 Samples can contain diverse matrix types, each of which may present analytical challenges. Spiked samples and Laboratory Control Samples are important for determining digestion efficiency.
6.2 Potassium permanganate is added to eliminate possible interference from sulfide. Concentrations as high as 20 mg/L of sulfide, as NaS, do not interfere with recovery of added inorganic Mercury from D.I. water.
Pace Analytical Services, Inc. – Green Bay Laboratory File: S-GB-M-017-Rev.04.doc Mercury by CVAAS – CETAC M-7500 Date: Upon Final Signature S-GB-M-017-REV.04 Page 4 of 28
SOPs distributed as Controlled Documents are given a copy number on the signed Title Page. Copies without a number are considered uncontrolled and must be verified as the most recent version prior to each use.
6.3 Copper has also been reported to interfere; however, copper concentrations as high as 10mg/L had no effect on recovery of Mercury from spiked samples.
6.4 Samples high in chlorides require up to 7.5 mL of additional potassium permanganate. During the oxidation step, chlorides are converted to free chlorine, which also absorbs radiation at 253.7 nm. Care must therefore be taken to ensure that free chlorine is absent before the Mercury is reduced and swept into the cell. This may be accomplished by using an excess of hydroxylamine hydrochloride reagent. Samples may be diluted to decrease the chlorides. Alternatively, the sample may be allowed to stand for at least an hour under a hood (without active purging) to remove the chlorine.
6.5 Certain volatile organic materials that absorb at this wavelength may also interfere. A preliminary run without reagents would determine if this type of interference is present.
7. Sample Collection, Preservation, Shipment and Storage
7.1 Biota Samples
7.1.1 Biota samples can be collected in clean plastic or glass containers or plastic zip-top bags.
7.1.2 Biota samples are kept frozen at ≤-10C until time of preparation to preserve integrity. Hold time is 28 days from removal from freezer.
7.2 Soil Samples
7.2.1 Soil and waste samples should be collected in clean wide-mouth glass containers to facilitate obtaining representative aliquots for measurement.
7.2.2 Samples should be stored at ≤6C and analyzed as soon as possible to minimize microbiological decomposition of organic solids. Samples must be analyzed within 28 days of collection.
7.3 Wipe Samples
7.3.1 Wipe should be collected in clean wide-mouth glass containers or a digestion vessel.
7.3.2 Samples should be stored at ≤6C and analyzed as soon as possible to minimize microbiological decomposition of organic solids. Samples must be analyzed within 28 days of collection.
7.4 Aqueous Samples
7.4.1 Water samples may be collected in plastic or glass containers and must be preserved with HNO3 to pH <2 and stored at room temperature, acid not to exceed 2% of the estimated sample volume.
Pace Analytical Services, Inc. – Green Bay Laboratory File: S-GB-M-017-Rev.04.doc Mercury by CVAAS – CETAC M-7500 Date: Upon Final Signature S-GB-M-017-REV.04 Page 5 of 28
SOPs distributed as Controlled Documents are given a copy number on the signed Title Page. Copies without a number are considered uncontrolled and must be verified as the most recent version prior to each use.
NOTE: Aqueous samples that react violently to the addition of acid may be collected without chemical preservation with proper variances approved by the regulatory authority. The responsibility of requesting this variance lies with the sample collector.
7.4.2 NOTE: Samples may be preserved in the lab. The samples may not be processed until 24 hours after preservation with a pH test of <2. Appropriate qualifier added if pH>2 after preservation Dissolved samples should be field filtered through a 0.45 micron filter prior to preservation. Samples can be filtered in the lab, but must be received unpreserved and will be qualified as not being preserved properly. A filter blank must be created when lab filtering and analyzed using method blank acceptance criterion to demonstrate the process is not affecting the data quality.
7.4.3 Samples must be analyzed within 28 days of collection.
7.5 TCLP, SPLP, and ASTM Samples
7.5.1 Leach extracts should be collected in plastic or glass containers and must be refrigerated at ≤6°C. Samples are preserved at time of digestion because leach volumes vary. The MS and MSD are not to be preserved until after they are spiked.
7.5.2 NOTE: TCLP Samples are not required to sit for 24 hours prior to digestion after the addition of nitric acid. Samples must be extracted within 28 days from field collection to leach extraction. Samples must be digested and analyzed within 28 days of the leach extraction. Total elapsed hold time is 56 days.
8. Definitions
8.1 Definitions of terms found in this SOP can also be found in the Pace Quality Manual. When definitions are not consistent with NELAC defined terms, an explanation will be provided in this SOP or the Pace Analytical Services’ Quality Manual Glossary, Section 10.0.
8.2 Biota Control Blank (Matrix Blank) – A sample of a matrix that is used for the control spike. The biota control blank will either be catfish, tilapia, chicken, or other tissue whichever is available at the time of analysis. The biota control blank should be “farm-raised” to minimize background mercury levels. The concentration in the biota control blank will be subtracted from the concentration of the laboratory control spike when the biota control blank concentration is greater than/equal to the MDL. This is done because the biota control blank is known to have some contamination. This SOP will reference biota control blank for ease. Note: For plant material analysis, alfalfa can be used as the biota control blank matrix.
8.3 Reagent Grade – Analytical reagent (AR) grade, ACS reagent grade, and reagent grade are synonymous terms for reagents, which conform to the current specifications of the Committee on Analytical Reagents of the American Chemical Society.
Pace Analytical Services, Inc. – Green Bay Laboratory File: S-GB-M-017-Rev.04.doc Mercury by CVAAS – CETAC M-7500 Date: Upon Final Signature S-GB-M-017-REV.04 Page 6 of 28
SOPs distributed as Controlled Documents are given a copy number on the signed Title Page. Copies without a number are considered uncontrolled and must be verified as the most recent version prior to each use.
8.4 Standardized Reference Material (SRM) – A certified reference material produced by the U.S. National Institute of Standards and Technology or other equivalent organization and characterized for absolute content, independent of analytical method. A SRM is analyzed with each analytical batch of biota samples.
8.5 Pace Reporting Limit (PRL) – The level at which method, permit, regulatory and client specific objectives are met. The reporting limit may never be lower than the Limit of Detection (i.e. statistically determined MDL). Reporting limits are corrected for sample amounts, including the dry weight of solids, unless otherwise specified.
9. Equipment and Supplies
9.1 Hot Block – Operated at 95 ± 3C. Heating block should be Environmental Express “Hot Block”, or equivalent.
9.2 Digestion Vials – Clean 15- mL screw cap vials, Environmental Express (SC415), or equivalent.
9.3 Digestion Vials- Clean 68-mL screw cap vials, Environmental Express (SC475), or equivalent.
9.4 Volumetric Flasks – Assorted, Class A
9.5 Graduated Cylinder – 50-mL
9.6 Mechanical Pipettes – Assorted adjustable air-displacement pipettes with disposable tips (Eppendorf or equivalent).
9.7 pH Strips
9.8 CETAC M-7500 with auto-sampler
9.9 Inert Sparging and Carrier Gas – Argon
9.10 Autosampler vials
9.11 Autosampler Pump Tubing
9.12 Specimen Cups
9.13 DORM-4 or equivalent
9.14 1570a (Trace Elements in Spinach) or equivalent
9.15 Analytical Balance – Capable of weighing to 0.001g
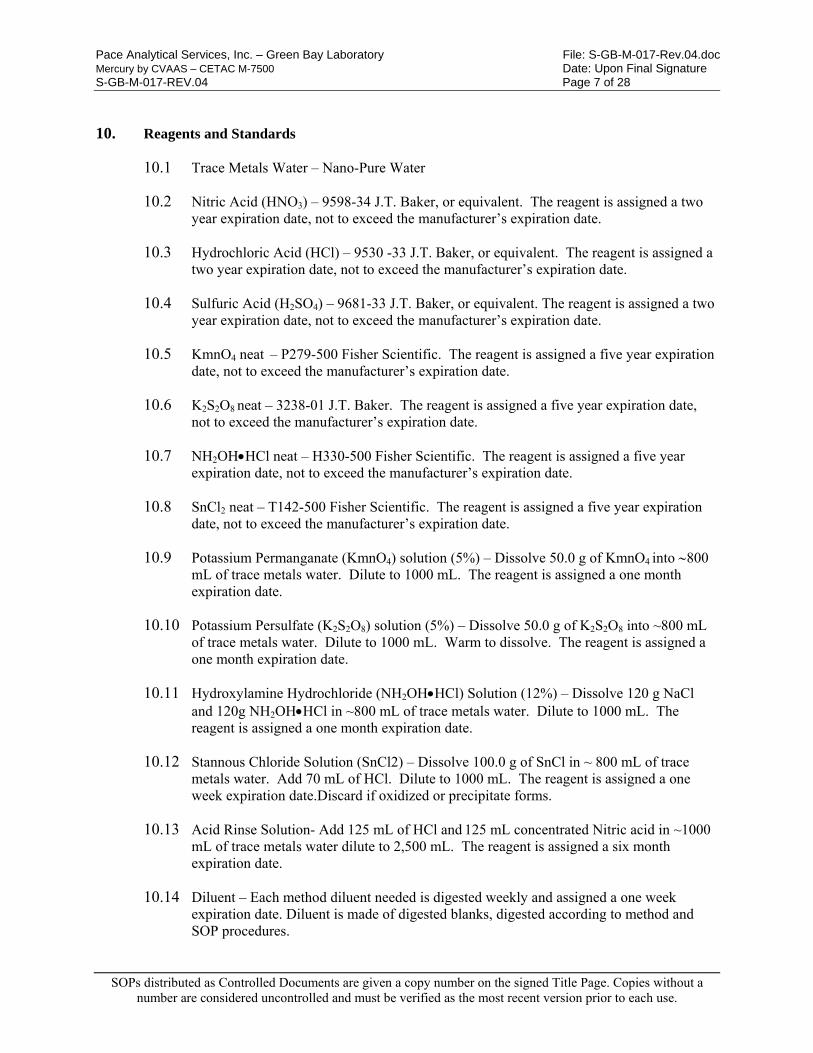
Pace Analytical Services, Inc. – Green Bay Laboratory File: S-GB-M-017-Rev.04.doc Mercury by CVAAS – CETAC M-7500 Date: Upon Final Signature S-GB-M-017-REV.04 Page 7 of 28
SOPs distributed as Controlled Documents are given a copy number on the signed Title Page. Copies without a number are considered uncontrolled and must be verified as the most recent version prior to each use.
10. Reagents and Standards
10.1 Trace Metals Water – Nano-Pure Water
10.2 Nitric Acid (HNO3) – 9598-34 J.T. Baker, or equivalent. The reagent is assigned a two year expiration date, not to exceed the manufacturer’s expiration date.
10.3 Hydrochloric Acid (HCl) – 9530 -33 J.T. Baker, or equivalent. The reagent is assigned a two year expiration date, not to exceed the manufacturer’s expiration date.
10.4 Sulfuric Acid (H2SO4) – 9681-33 J.T. Baker, or equivalent. The reagent is assigned a two year expiration date, not to exceed the manufacturer’s expiration date.
10.5 KmnO4 neat – P279-500 Fisher Scientific. The reagent is assigned a five year expiration date, not to exceed the manufacturer’s expiration date.
10.6 K2S2O8 neat – 3238-01 J.T. Baker. The reagent is assigned a five year expiration date, not to exceed the manufacturer’s expiration date.
10.7 NH2OHHCl neat – H330-500 Fisher Scientific. The reagent is assigned a five year expiration date, not to exceed the manufacturer’s expiration date.
10.8 SnCl2 neat – T142-500 Fisher Scientific. The reagent is assigned a five year expiration date, not to exceed the manufacturer’s expiration date.
10.9 Potassium Permanganate (KmnO4) solution (5%) – Dissolve 50.0 g of KmnO4 into 800 mL of trace metals water. Dilute to 1000 mL. The reagent is assigned a one month expiration date.
10.10 Potassium Persulfate (K2S2O8) solution (5%) – Dissolve 50.0 g of K2S2O8 into ~800 mL of trace metals water. Dilute to 1000 mL. Warm to dissolve. The reagent is assigned a one month expiration date.
10.11 Hydroxylamine Hydrochloride (NH2OHHCl) Solution (12%) – Dissolve 120 g NaCl and 120g NH2OHHCl in ~800 mL of trace metals water. Dilute to 1000 mL. The reagent is assigned a one month expiration date.
10.12 Stannous Chloride Solution (SnCl2) – Dissolve 100.0 g of SnCl in ~ 800 mL of trace metals water. Add 70 mL of HCl. Dilute to 1000 mL. The reagent is assigned a one week expiration date.Discard if oxidized or precipitate forms.
10.13 Acid Rinse Solution- Add 125 mL of HCl and 125 mL concentrated Nitric acid in ~1000 mL of trace metals water dilute to 2,500 mL. The reagent is assigned a six month expiration date.
10.14 Diluent – Each method diluent needed is digested weekly and assigned a one week expiration date. Diluent is made of digested blanks, digested according to method and SOP procedures.
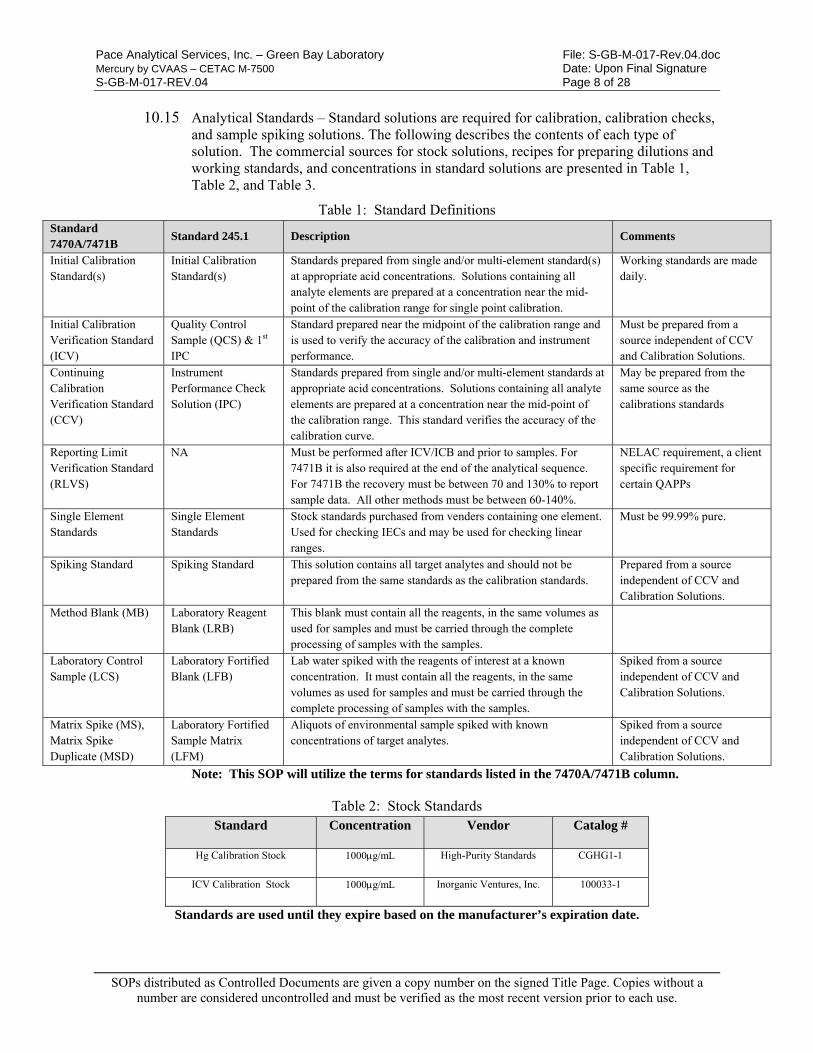
Pace Analytical Services, Inc. – Green Bay Laboratory File: S-GB-M-017-Rev.04.doc Mercury by CVAAS – CETAC M-7500 Date: Upon Final Signature S-GB-M-017-REV.04 Page 8 of 28
SOPs distributed as Controlled Documents are given a copy number on the signed Title Page. Copies without a number are considered uncontrolled and must be verified as the most recent version prior to each use.
10.15 Analytical Standards – Standard solutions are required for calibration, calibration checks, and sample spiking solutions. The following describes the contents of each type of solution. The commercial sources for stock solutions, recipes for preparing dilutions and working standards, and concentrations in standard solutions are presented in Table 1, Table 2, and Table 3.
Table 1: Standard Definitions Standard 7470A/7471B
Standard 245.1 Description Comments
Initial Calibration Standard(s)
Initial Calibration Standard(s)
Standards prepared from single and/or multi-element standard(s) at appropriate acid concentrations. Solutions containing all analyte elements are prepared at a concentration near the mid-point of the calibration range for single point calibration.
Working standards are made daily.
Initial Calibration Verification Standard (ICV)
Quality Control Sample (QCS) & 1st IPC
Standard prepared near the midpoint of the calibration range and is used to verify the accuracy of the calibration and instrument performance.
Must be prepared from a source independent of CCV and Calibration Solutions.
Continuing Calibration Verification Standard (CCV)
Instrument Performance Check Solution (IPC)
Standards prepared from single and/or multi-element standards at appropriate acid concentrations. Solutions containing all analyte elements are prepared at a concentration near the mid-point of the calibration range. This standard verifies the accuracy of the calibration curve.
May be prepared from the same source as the calibrations standards
Reporting Limit Verification Standard (RLVS)
NA Must be performed after ICV/ICB and prior to samples. For 7471B it is also required at the end of the analytical sequence. For 7471B the recovery must be between 70 and 130% to report sample data. All other methods must be between 60-140%.
NELAC requirement, a client specific requirement for certain QAPPs
Single Element Standards
Single Element Standards
Stock standards purchased from venders containing one element. Used for checking IECs and may be used for checking linear ranges.
Must be 99.99% pure.
Spiking Standard Spiking Standard This solution contains all target analytes and should not be prepared from the same standards as the calibration standards.
Prepared from a source independent of CCV and Calibration Solutions.
Method Blank (MB) Laboratory Reagent Blank (LRB)
This blank must contain all the reagents, in the same volumes as used for samples and must be carried through the complete processing of samples with the samples.
Laboratory Control Sample (LCS)
Laboratory Fortified Blank (LFB)
Lab water spiked with the reagents of interest at a known concentration. It must contain all the reagents, in the same volumes as used for samples and must be carried through the complete processing of samples with the samples.
Spiked from a source independent of CCV and Calibration Solutions.
Matrix Spike (MS), Matrix Spike Duplicate (MSD)
Laboratory Fortified Sample Matrix (LFM)
Aliquots of environmental sample spiked with known concentrations of target analytes.
Spiked from a source independent of CCV and Calibration Solutions.
Note: This SOP will utilize the terms for standards listed in the 7470A/7471B column.
Table 2: Stock Standards Standard Concentration Vendor Catalog #
Hg Calibration Stock 1000g/mL High-Purity Standards CGHG1-1
ICV Calibration Stock 1000g/mL Inorganic Ventures, Inc. 100033-1
Standards are used until they expire based on the manufacturer’s expiration date.
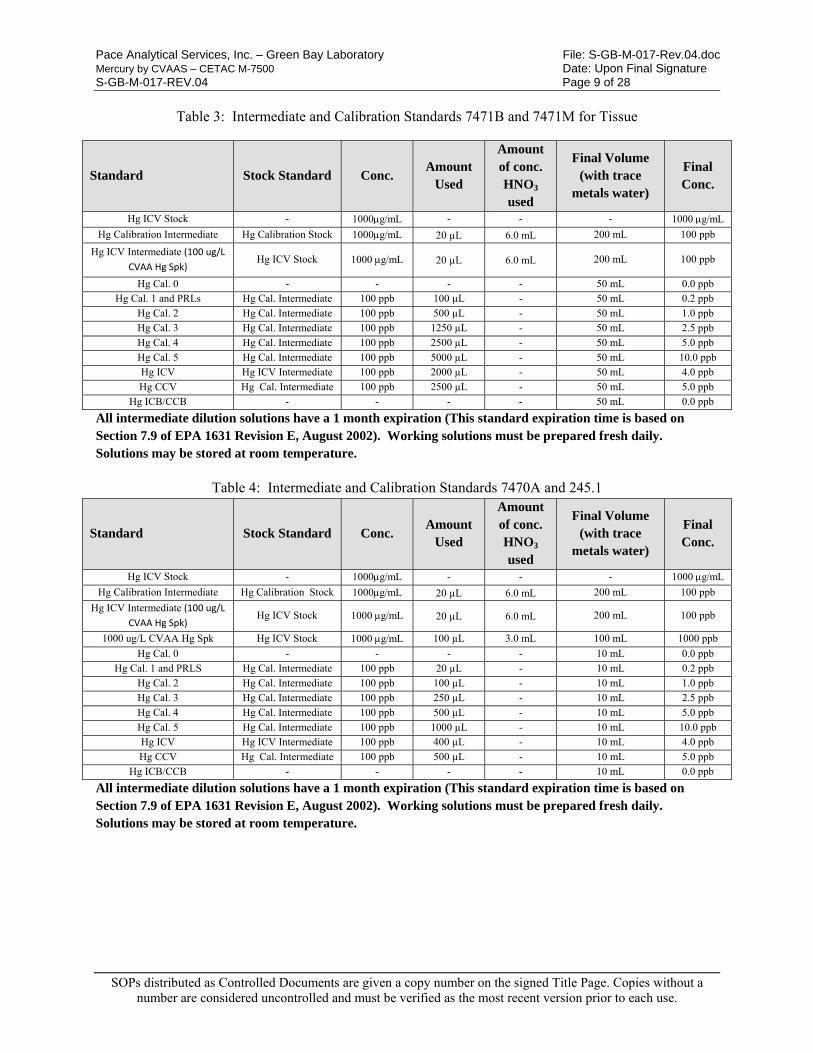
Pace Analytical Services, Inc. – Green Bay Laboratory File: S-GB-M-017-Rev.04.doc Mercury by CVAAS – CETAC M-7500 Date: Upon Final Signature S-GB-M-017-REV.04 Page 9 of 28
SOPs distributed as Controlled Documents are given a copy number on the signed Title Page. Copies without a number are considered uncontrolled and must be verified as the most recent version prior to each use.
Table 3: Intermediate and Calibration Standards 7471B and 7471M for Tissue
Standard Stock Standard Conc. Amount
Used
Amount of conc. HNO3 used
Final Volume (with trace
metals water)
Final Conc.
Hg ICV Stock - 1000g/mL - - - 1000 g/mL
Hg Calibration Intermediate Hg Calibration Stock 1000g/mL 20 µL 6.0 mL 200 mL 100 ppb
Hg ICV Intermediate (100 ug/L CVAA Hg Spk)
Hg ICV Stock 1000 g/mL 20 µL 6.0 mL 200 mL 100 ppb
Hg Cal. 0 - - - - 50 mL 0.0 ppb Hg Cal. 1 and PRLs Hg Cal. Intermediate 100 ppb 100 µL - 50 mL 0.2 ppb
Hg Cal. 2 Hg Cal. Intermediate 100 ppb 500 µL - 50 mL 1.0 ppb Hg Cal. 3 Hg Cal. Intermediate 100 ppb 1250 µL - 50 mL 2.5 ppb
Hg Cal. 4 Hg Cal. Intermediate 100 ppb 2500 µL - 50 mL 5.0 ppb
Hg Cal. 5 Hg Cal. Intermediate 100 ppb 5000 µL - 50 mL 10.0 ppb Hg ICV Hg ICV Intermediate 100 ppb 2000 µL - 50 mL 4.0 ppb
Hg CCV Hg Cal. Intermediate 100 ppb 2500 µL - 50 mL 5.0 ppb
Hg ICB/CCB - - - - 50 mL 0.0 ppb
All intermediate dilution solutions have a 1 month expiration (This standard expiration time is based on Section 7.9 of EPA 1631 Revision E, August 2002). Working solutions must be prepared fresh daily. Solutions may be stored at room temperature.
Table 4: Intermediate and Calibration Standards 7470A and 245.1
Standard Stock Standard Conc. Amount
Used
Amount of conc. HNO3 used
Final Volume (with trace
metals water)
Final Conc.
Hg ICV Stock - 1000g/mL - - - 1000 g/mL
Hg Calibration Intermediate Hg Calibration Stock 1000g/mL 20 µL 6.0 mL 200 mL 100 ppb
Hg ICV Intermediate (100 ug/L CVAA Hg Spk)
Hg ICV Stock 1000 g/mL 20 µL 6.0 mL 200 mL 100 ppb
1000 ug/L CVAA Hg Spk Hg ICV Stock 1000 g/mL 100 µL 3.0 mL 100 mL 1000 ppb
Hg Cal. 0 - - - - 10 mL 0.0 ppb
Hg Cal. 1 and PRLS Hg Cal. Intermediate 100 ppb 20 µL - 10 mL 0.2 ppb
Hg Cal. 2 Hg Cal. Intermediate 100 ppb 100 µL - 10 mL 1.0 ppb Hg Cal. 3 Hg Cal. Intermediate 100 ppb 250 µL - 10 mL 2.5 ppb
Hg Cal. 4 Hg Cal. Intermediate 100 ppb 500 µL - 10 mL 5.0 ppb
Hg Cal. 5 Hg Cal. Intermediate 100 ppb 1000 µL - 10 mL 10.0 ppb Hg ICV Hg ICV Intermediate 100 ppb 400 µL - 10 mL 4.0 ppb
Hg CCV Hg Cal. Intermediate 100 ppb 500 µL - 10 mL 5.0 ppb
Hg ICB/CCB - - - - 10 mL 0.0 ppb
All intermediate dilution solutions have a 1 month expiration (This standard expiration time is based on Section 7.9 of EPA 1631 Revision E, August 2002). Working solutions must be prepared fresh daily. Solutions may be stored at room temperature.
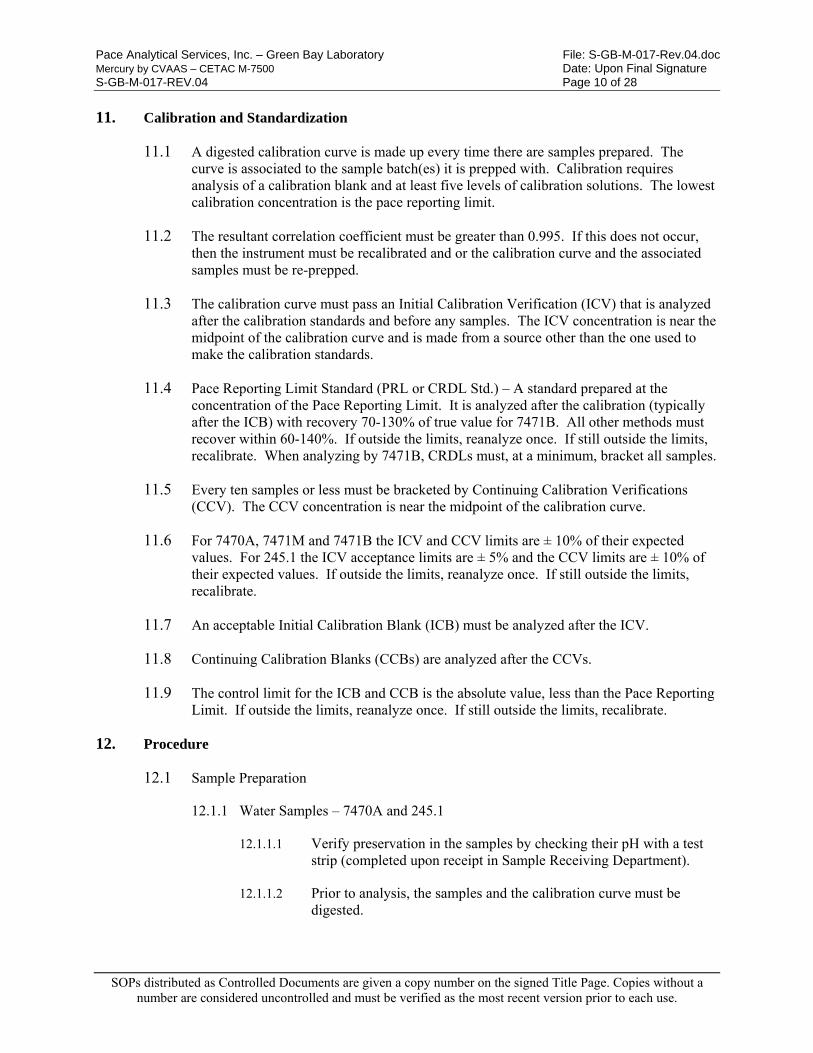
Pace Analytical Services, Inc. – Green Bay Laboratory File: S-GB-M-017-Rev.04.doc Mercury by CVAAS – CETAC M-7500 Date: Upon Final Signature S-GB-M-017-REV.04 Page 10 of 28
SOPs distributed as Controlled Documents are given a copy number on the signed Title Page. Copies without a number are considered uncontrolled and must be verified as the most recent version prior to each use.
11. Calibration and Standardization
11.1 A digested calibration curve is made up every time there are samples prepared. The curve is associated to the sample batch(es) it is prepped with. Calibration requires analysis of a calibration blank and at least five levels of calibration solutions. The lowest calibration concentration is the pace reporting limit.
11.2 The resultant correlation coefficient must be greater than 0.995. If this does not occur, then the instrument must be recalibrated and or the calibration curve and the associated samples must be re-prepped.
11.3 The calibration curve must pass an Initial Calibration Verification (ICV) that is analyzed after the calibration standards and before any samples. The ICV concentration is near the midpoint of the calibration curve and is made from a source other than the one used to make the calibration standards.
11.4 Pace Reporting Limit Standard (PRL or CRDL Std.) – A standard prepared at the concentration of the Pace Reporting Limit. It is analyzed after the calibration (typically after the ICB) with recovery 70-130% of true value for 7471B. All other methods must recover within 60-140%. If outside the limits, reanalyze once. If still outside the limits, recalibrate. When analyzing by 7471B, CRDLs must, at a minimum, bracket all samples.
11.5 Every ten samples or less must be bracketed by Continuing Calibration Verifications (CCV). The CCV concentration is near the midpoint of the calibration curve.
11.6 For 7470A, 7471M and 7471B the ICV and CCV limits are ± 10% of their expected values. For 245.1 the ICV acceptance limits are ± 5% and the CCV limits are ± 10% of their expected values. If outside the limits, reanalyze once. If still outside the limits, recalibrate.
11.7 An acceptable Initial Calibration Blank (ICB) must be analyzed after the ICV.
11.8 Continuing Calibration Blanks (CCBs) are analyzed after the CCVs.
11.9 The control limit for the ICB and CCB is the absolute value, less than the Pace Reporting Limit. If outside the limits, reanalyze once. If still outside the limits, recalibrate.
12. Procedure
12.1 Sample Preparation
12.1.1 Water Samples – 7470A and 245.1
12.1.1.1 Verify preservation in the samples by checking their pH with a test strip (completed upon receipt in Sample Receiving Department).
12.1.1.2 Prior to analysis, the samples and the calibration curve must be digested.
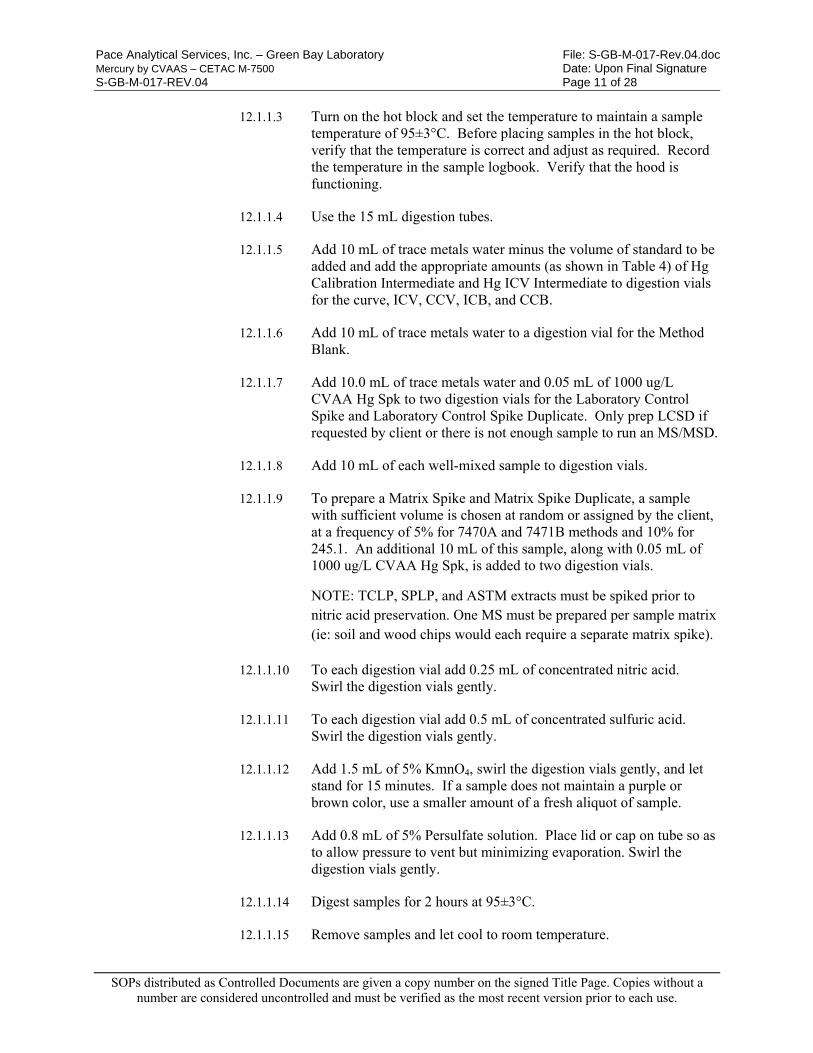
Pace Analytical Services, Inc. – Green Bay Laboratory File: S-GB-M-017-Rev.04.doc Mercury by CVAAS – CETAC M-7500 Date: Upon Final Signature S-GB-M-017-REV.04 Page 11 of 28
SOPs distributed as Controlled Documents are given a copy number on the signed Title Page. Copies without a number are considered uncontrolled and must be verified as the most recent version prior to each use.
12.1.1.3 Turn on the hot block and set the temperature to maintain a sample temperature of 95±3°C. Before placing samples in the hot block, verify that the temperature is correct and adjust as required. Record the temperature in the sample logbook. Verify that the hood is functioning.
12.1.1.4 Use the 15 mL digestion tubes.
12.1.1.5 Add 10 mL of trace metals water minus the volume of standard to be added and add the appropriate amounts (as shown in Table 4) of Hg Calibration Intermediate and Hg ICV Intermediate to digestion vials for the curve, ICV, CCV, ICB, and CCB.
12.1.1.6 Add 10 mL of trace metals water to a digestion vial for the Method Blank.
12.1.1.7 Add 10.0 mL of trace metals water and 0.05 mL of 1000 ug/L CVAA Hg Spk to two digestion vials for the Laboratory Control Spike and Laboratory Control Spike Duplicate. Only prep LCSD if requested by client or there is not enough sample to run an MS/MSD.
12.1.1.8 Add 10 mL of each well-mixed sample to digestion vials.
12.1.1.9 To prepare a Matrix Spike and Matrix Spike Duplicate, a sample with sufficient volume is chosen at random or assigned by the client, at a frequency of 5% for 7470A and 7471B methods and 10% for 245.1. An additional 10 mL of this sample, along with 0.05 mL of 1000 ug/L CVAA Hg Spk, is added to two digestion vials.
NOTE: TCLP, SPLP, and ASTM extracts must be spiked prior to nitric acid preservation. One MS must be prepared per sample matrix (ie: soil and wood chips would each require a separate matrix spike).
12.1.1.10 To each digestion vial add 0.25 mL of concentrated nitric acid. Swirl the digestion vials gently.
12.1.1.11 To each digestion vial add 0.5 mL of concentrated sulfuric acid. Swirl the digestion vials gently.
12.1.1.12 Add 1.5 mL of 5% KmnO4, swirl the digestion vials gently, and let stand for 15 minutes. If a sample does not maintain a purple or brown color, use a smaller amount of a fresh aliquot of sample.
12.1.1.13 Add 0.8 mL of 5% Persulfate solution. Place lid or cap on tube so as to allow pressure to vent but minimizing evaporation. Swirl the digestion vials gently.
12.1.1.14 Digest samples for 2 hours at 95±3°C.
12.1.1.15 Remove samples and let cool to room temperature.
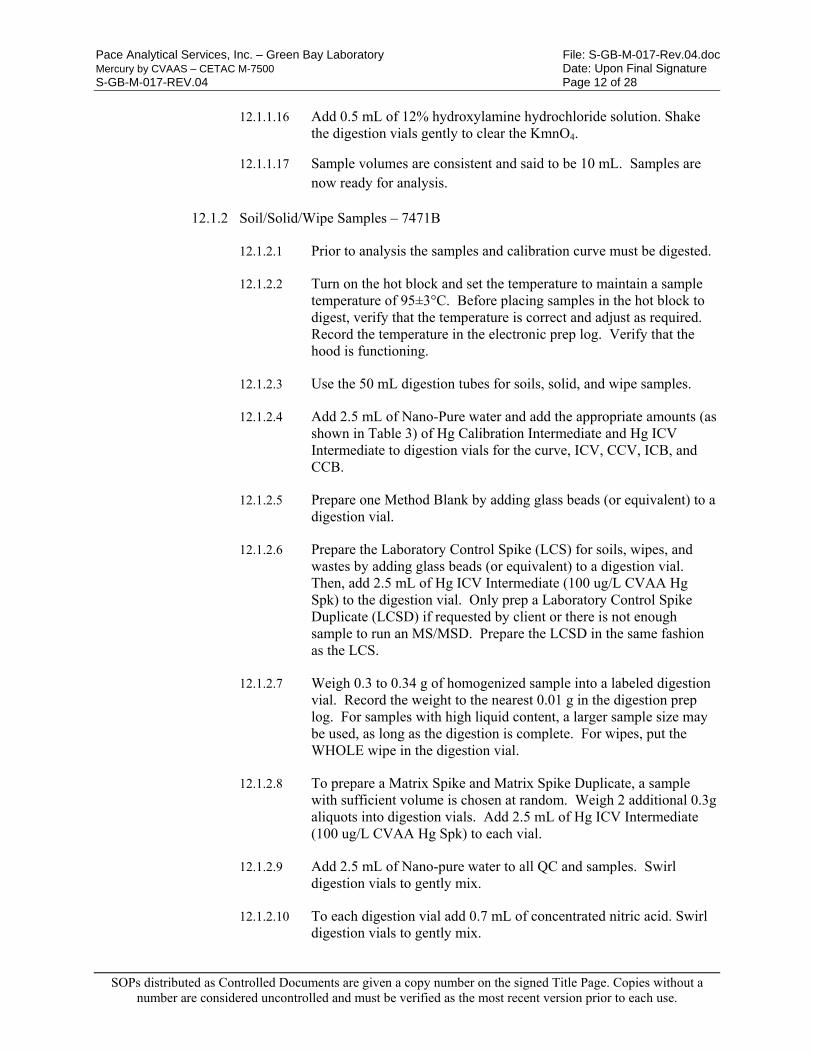
Pace Analytical Services, Inc. – Green Bay Laboratory File: S-GB-M-017-Rev.04.doc Mercury by CVAAS – CETAC M-7500 Date: Upon Final Signature S-GB-M-017-REV.04 Page 12 of 28
SOPs distributed as Controlled Documents are given a copy number on the signed Title Page. Copies without a number are considered uncontrolled and must be verified as the most recent version prior to each use.
12.1.1.16 Add 0.5 mL of 12% hydroxylamine hydrochloride solution. Shake the digestion vials gently to clear the KmnO4.
12.1.1.17 Sample volumes are consistent and said to be 10 mL. Samples are now ready for analysis.
12.1.2 Soil/Solid/Wipe Samples – 7471B
12.1.2.1 Prior to analysis the samples and calibration curve must be digested.
12.1.2.2 Turn on the hot block and set the temperature to maintain a sample temperature of 95±3°C. Before placing samples in the hot block to digest, verify that the temperature is correct and adjust as required. Record the temperature in the electronic prep log. Verify that the hood is functioning.
12.1.2.3 Use the 50 mL digestion tubes for soils, solid, and wipe samples.
12.1.2.4 Add 2.5 mL of Nano-Pure water and add the appropriate amounts (as shown in Table 3) of Hg Calibration Intermediate and Hg ICV Intermediate to digestion vials for the curve, ICV, CCV, ICB, and CCB.
12.1.2.5 Prepare one Method Blank by adding glass beads (or equivalent) to a digestion vial.
12.1.2.6 Prepare the Laboratory Control Spike (LCS) for soils, wipes, and wastes by adding glass beads (or equivalent) to a digestion vial. Then, add 2.5 mL of Hg ICV Intermediate (100 ug/L CVAA Hg Spk) to the digestion vial. Only prep a Laboratory Control Spike Duplicate (LCSD) if requested by client or there is not enough sample to run an MS/MSD. Prepare the LCSD in the same fashion as the LCS.
12.1.2.7 Weigh 0.3 to 0.34 g of homogenized sample into a labeled digestion vial. Record the weight to the nearest 0.01 g in the digestion prep log. For samples with high liquid content, a larger sample size may be used, as long as the digestion is complete. For wipes, put the WHOLE wipe in the digestion vial.
12.1.2.8 To prepare a Matrix Spike and Matrix Spike Duplicate, a sample with sufficient volume is chosen at random. Weigh 2 additional 0.3g aliquots into digestion vials. Add 2.5 mL of Hg ICV Intermediate (100 ug/L CVAA Hg Spk) to each vial.
12.1.2.9 Add 2.5 mL of Nano-pure water to all QC and samples. Swirl digestion vials to gently mix.
12.1.2.10 To each digestion vial add 0.7 mL of concentrated nitric acid. Swirl digestion vials to gently mix.

Pace Analytical Services, Inc. – Green Bay Laboratory File: S-GB-M-017-Rev.04.doc Mercury by CVAAS – CETAC M-7500 Date: Upon Final Signature S-GB-M-017-REV.04 Page 13 of 28
SOPs distributed as Controlled Documents are given a copy number on the signed Title Page. Copies without a number are considered uncontrolled and must be verified as the most recent version prior to each use.
12.1.2.11 To each digestion vial add 2.1 mL of concentrated hydrochloric acid. Swirl digestion vials to gently mix.
12.1.2.12 Heat for 2 minutes on a block set to reach 95±3°C and then allow the samples to cool.
12.1.2.13 Add about 25 mL of Nano-pure water to all QC and samples. Swirl digestion vials to gently mix.
12.1.2.14 Slowly add 7.5 mL of 5% KmnO4 to all samples and batch QC. Samples may react violently if added too quickly.
12.1.2.15 Place cap on tube so as to allow pressure to vent but minimizing evaporation, swirl the digestion vials gently, and let stand for 15 minutes. If a sample does not maintain a purple or brown color, use a smaller amount of a fresh aliquot of sample.
12.1.2.16 Digest samples for 30 minutes at 95±3°C.
12.1.2.17 Remove samples and let cool to room temperature.
12.1.2.18 Bring to a final volume of 50mL with nanopure.
12.1.2.19 Add 3.0 mL of 12% hydroxylamine hydrochloride solution. Cap the digestion vials and gently shake to clear KmnO4.Samples are consistent and said to have a final volume of 50 mL. Samples are now ready for analysis.
12.1.3 Biota Samples – 7471M
12.1.3.1 50 mL digestion vials are used for Biota samples.
12.1.3.2 Prior to analysis the samples and calibration curve must be digested.
12.1.3.3 Turn on the hot block and set the temperature to maintain a sample temperature of 95±3°C. Before placing samples in the hot block to digest, verify that the water temperature is correct and adjust as required. Record the temperature in the electronic prep log. Verify that the hood is functioning.
12.1.3.4 Add 2.5 mL of Nano-Pure water and add the appropriate amounts (as shown in Table 3) of Hg Calibration Intermediate and Hg ICV Intermediate to digestion vials for the curve, ICV, CCV, ICB, and CCB.
12.1.3.5 Prepare one Method Blank. For biota analysis, leave the Method Blank empty. A Biota Control Blank is also prepared by weighing 0.6 g of homogenized biota control blank tissue into a digestion vial.
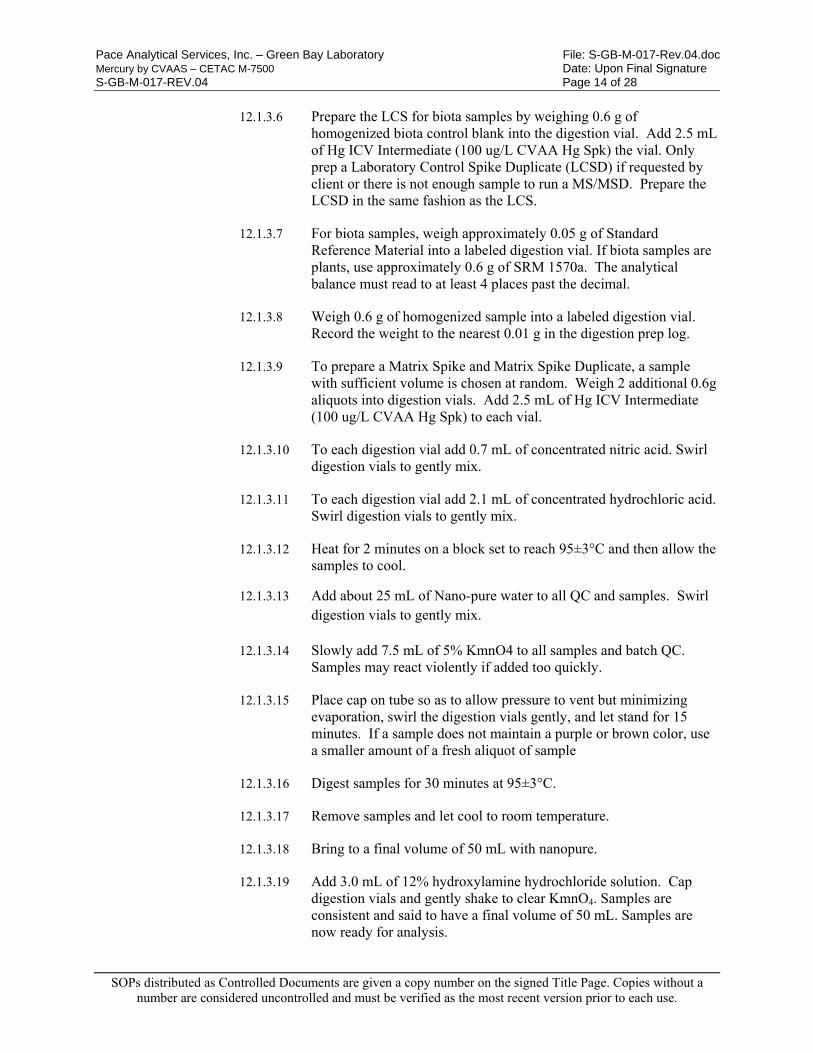
Pace Analytical Services, Inc. – Green Bay Laboratory File: S-GB-M-017-Rev.04.doc Mercury by CVAAS – CETAC M-7500 Date: Upon Final Signature S-GB-M-017-REV.04 Page 14 of 28
SOPs distributed as Controlled Documents are given a copy number on the signed Title Page. Copies without a number are considered uncontrolled and must be verified as the most recent version prior to each use.
12.1.3.6 Prepare the LCS for biota samples by weighing 0.6 g of homogenized biota control blank into the digestion vial. Add 2.5 mL of Hg ICV Intermediate (100 ug/L CVAA Hg Spk) the vial. Only prep a Laboratory Control Spike Duplicate (LCSD) if requested by client or there is not enough sample to run a MS/MSD. Prepare the LCSD in the same fashion as the LCS.
12.1.3.7 For biota samples, weigh approximately 0.05 g of Standard Reference Material into a labeled digestion vial. If biota samples are plants, use approximately 0.6 g of SRM 1570a. The analytical balance must read to at least 4 places past the decimal.
12.1.3.8 Weigh 0.6 g of homogenized sample into a labeled digestion vial. Record the weight to the nearest 0.01 g in the digestion prep log.
12.1.3.9 To prepare a Matrix Spike and Matrix Spike Duplicate, a sample with sufficient volume is chosen at random. Weigh 2 additional 0.6g aliquots into digestion vials. Add 2.5 mL of Hg ICV Intermediate (100 ug/L CVAA Hg Spk) to each vial.
12.1.3.10 To each digestion vial add 0.7 mL of concentrated nitric acid. Swirl digestion vials to gently mix.
12.1.3.11 To each digestion vial add 2.1 mL of concentrated hydrochloric acid. Swirl digestion vials to gently mix.
12.1.3.12 Heat for 2 minutes on a block set to reach 95±3°C and then allow the samples to cool.
12.1.3.13 Add about 25 mL of Nano-pure water to all QC and samples. Swirl digestion vials to gently mix.
12.1.3.14 Slowly add 7.5 mL of 5% KmnO4 to all samples and batch QC. Samples may react violently if added too quickly.
12.1.3.15 Place cap on tube so as to allow pressure to vent but minimizing evaporation, swirl the digestion vials gently, and let stand for 15 minutes. If a sample does not maintain a purple or brown color, use a smaller amount of a fresh aliquot of sample
12.1.3.16 Digest samples for 30 minutes at 95±3°C.
12.1.3.17 Remove samples and let cool to room temperature.
12.1.3.18 Bring to a final volume of 50 mL with nanopure.
12.1.3.19 Add 3.0 mL of 12% hydroxylamine hydrochloride solution. Cap digestion vials and gently shake to clear KmnO4. Samples are consistent and said to have a final volume of 50 mL. Samples are now ready for analysis.
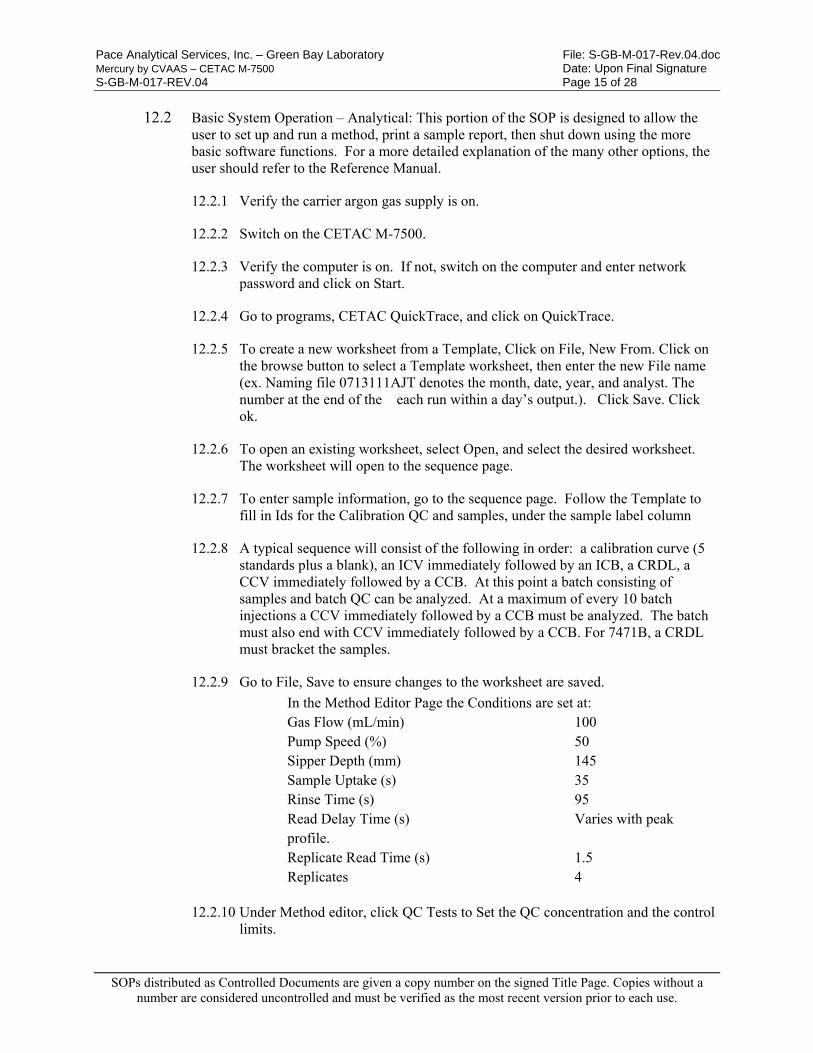
Pace Analytical Services, Inc. – Green Bay Laboratory File: S-GB-M-017-Rev.04.doc Mercury by CVAAS – CETAC M-7500 Date: Upon Final Signature S-GB-M-017-REV.04 Page 15 of 28
SOPs distributed as Controlled Documents are given a copy number on the signed Title Page. Copies without a number are considered uncontrolled and must be verified as the most recent version prior to each use.
12.2 Basic System Operation – Analytical: This portion of the SOP is designed to allow the user to set up and run a method, print a sample report, then shut down using the more basic software functions. For a more detailed explanation of the many other options, the user should refer to the Reference Manual.
12.2.1 Verify the carrier argon gas supply is on.
12.2.2 Switch on the CETAC M-7500.
12.2.3 Verify the computer is on. If not, switch on the computer and enter network password and click on Start.
12.2.4 Go to programs, CETAC QuickTrace, and click on QuickTrace.
12.2.5 To create a new worksheet from a Template, Click on File, New From. Click on the browse button to select a Template worksheet, then enter the new File name (ex. Naming file 0713111AJT denotes the month, date, year, and analyst. The number at the end of the each run within a day’s output.). Click Save. Click ok.
12.2.6 To open an existing worksheet, select Open, and select the desired worksheet. The worksheet will open to the sequence page.
12.2.7 To enter sample information, go to the sequence page. Follow the Template to fill in Ids for the Calibration QC and samples, under the sample label column
12.2.8 A typical sequence will consist of the following in order: a calibration curve (5 standards plus a blank), an ICV immediately followed by an ICB, a CRDL, a CCV immediately followed by a CCB. At this point a batch consisting of samples and batch QC can be analyzed. At a maximum of every 10 batch injections a CCV immediately followed by a CCB must be analyzed. The batch must also end with CCV immediately followed by a CCB. For 7471B, a CRDL must bracket the samples.
12.2.9 Go to File, Save to ensure changes to the worksheet are saved.
In the Method Editor Page the Conditions are set at: Gas Flow (mL/min) 100 Pump Speed (%) 50 Sipper Depth (mm) 145 Sample Uptake (s) 35 Rinse Time (s) 95 Read Delay Time (s) Varies with peak profile. Replicate Read Time (s) 1.5 Replicates 4
12.2.10 Under Method editor, click QC Tests to Set the QC concentration and the control limits.
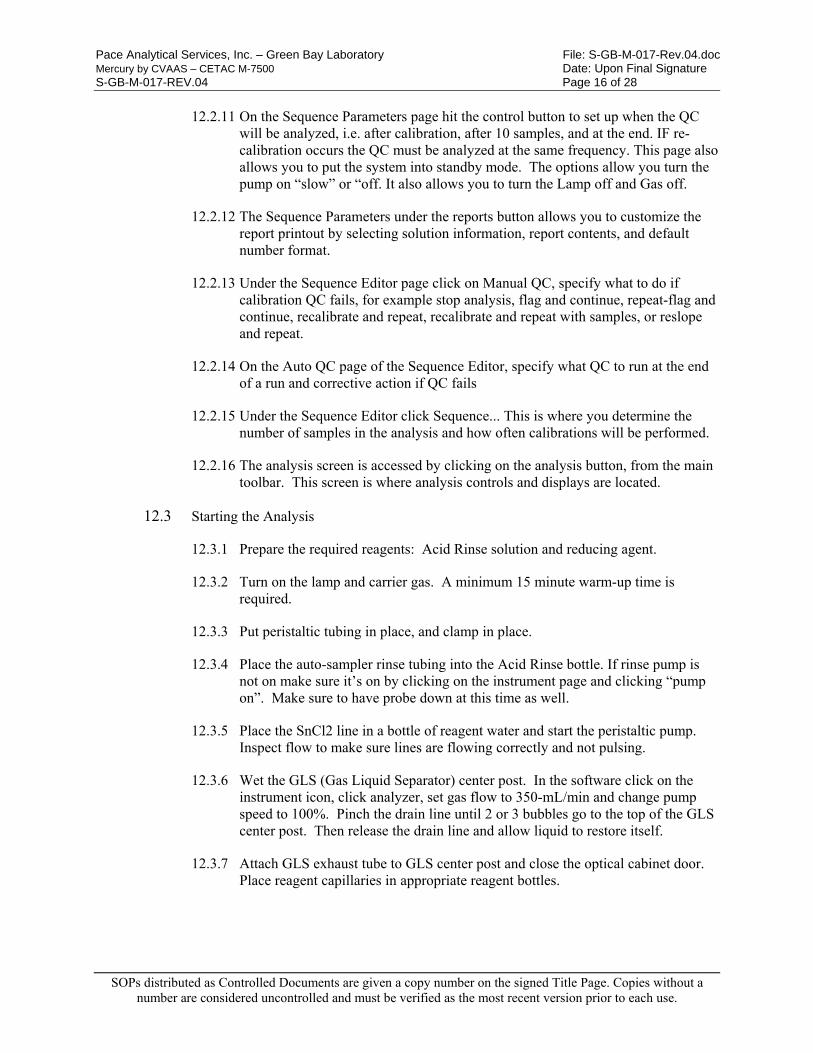
Pace Analytical Services, Inc. – Green Bay Laboratory File: S-GB-M-017-Rev.04.doc Mercury by CVAAS – CETAC M-7500 Date: Upon Final Signature S-GB-M-017-REV.04 Page 16 of 28
SOPs distributed as Controlled Documents are given a copy number on the signed Title Page. Copies without a number are considered uncontrolled and must be verified as the most recent version prior to each use.
12.2.11 On the Sequence Parameters page hit the control button to set up when the QC will be analyzed, i.e. after calibration, after 10 samples, and at the end. IF re-calibration occurs the QC must be analyzed at the same frequency. This page also allows you to put the system into standby mode. The options allow you turn the pump on “slow” or “off. It also allows you to turn the Lamp off and Gas off.
12.2.12 The Sequence Parameters under the reports button allows you to customize the report printout by selecting solution information, report contents, and default number format.
12.2.13 Under the Sequence Editor page click on Manual QC, specify what to do if calibration QC fails, for example stop analysis, flag and continue, repeat-flag and continue, recalibrate and repeat, recalibrate and repeat with samples, or reslope and repeat.
12.2.14 On the Auto QC page of the Sequence Editor, specify what QC to run at the end of a run and corrective action if QC fails
12.2.15 Under the Sequence Editor click Sequence... This is where you determine the number of samples in the analysis and how often calibrations will be performed.
12.2.16 The analysis screen is accessed by clicking on the analysis button, from the main toolbar. This screen is where analysis controls and displays are located.
12.3 Starting the Analysis
12.3.1 Prepare the required reagents: Acid Rinse solution and reducing agent.
12.3.2 Turn on the lamp and carrier gas. A minimum 15 minute warm-up time is required.
12.3.3 Put peristaltic tubing in place, and clamp in place.
12.3.4 Place the auto-sampler rinse tubing into the Acid Rinse bottle. If rinse pump is not on make sure it’s on by clicking on the instrument page and clicking “pump on”. Make sure to have probe down at this time as well.
12.3.5 Place the SnCl2 line in a bottle of reagent water and start the peristaltic pump. Inspect flow to make sure lines are flowing correctly and not pulsing.
12.3.6 Wet the GLS (Gas Liquid Separator) center post. In the software click on the instrument icon, click analyzer, set gas flow to 350-mL/min and change pump speed to 100%. Pinch the drain line until 2 or 3 bubbles go to the top of the GLS center post. Then release the drain line and allow liquid to restore itself.
12.3.7 Attach GLS exhaust tube to GLS center post and close the optical cabinet door. Place reagent capillaries in appropriate reagent bottles.

Pace Analytical Services, Inc. – Green Bay Laboratory File: S-GB-M-017-Rev.04.doc Mercury by CVAAS – CETAC M-7500 Date: Upon Final Signature S-GB-M-017-REV.04 Page 17 of 28
SOPs distributed as Controlled Documents are given a copy number on the signed Title Page. Copies without a number are considered uncontrolled and must be verified as the most recent version prior to each use.
12.3.8 Open the appropriate worksheet and verify that the gas flow and pump speed in the worksheet matches what is listed in instrument/analyzer, if the flow and the speed is not the same make the necessary change or click the auto set icon on the menu bar. This will stabilize the instrument before auto-zeroing and running a peak profile.
12.3.9 Record the Lamps mA’s in a daily instrument logbook by clicking on the instrument icon, clicking on analyzer, “status of lamp”.
12.3.10 Peak profile the high standard of the calibration. To do this click on Method Editor, read a sample icon, and then choose the location of high standard. Record the concentration of the peak profile standard in a daily instrument logbook. The read delay time is adjusted here as well.
12.3.11 Hit the GO icon to start the calibration. Once the calibration is complete a dialog window will generate stating, “Continue with Analysis” Click YES if satisfied with Calibration or click NO to re-analyze Calibration.
12.3.12 Hit the STOP icon to immediately end an analysis that is currently running. The auto-sampler probe will immediately return to the rinse station. Stopping an analysis in progress will prevent data from being saved for that sample.
12.3.13 To stop the analysis after the current sample select the Stop/After solution item from the analyze menu.
Note: If you stop during sample uptake, or before the rinse has been completed, make sure you allow sufficient time in the rinse station before re-starting the analysis.
12.3.14 If you stopped the analysis, you can simply restart by clicking the GO button. The analysis will begin at the next un-analyzed solution within the sequence.
12.3.15 To restart the analysis from the beginning you will need to generate the sequence again. Open the Sequence Editor, make any desired changes, click on Generate Sequence. Then click GO to start analysis over.
12.3.16 To read a single sample, click on the icon, analyze single sample. A dialog window will be brought up where you will enter the tube position, sample label, sample type, and other information if desired.
Note: Using the read sample feature may invalidate your QC setup. If you have stopped during a batch analysis to read a single sample, it will be inserted into the sequence after the last analyzed sample.
12.3.17 When the run is complete the instrument will automatically go into standby mode. Depending what options you have selected from sequence parameters, this may turn off or slow the pump, turn off the lamp, and/or the carrier gas flow.
12.3.18 To export the data, go to File then Export. Go to K:\Metals\CVAA\40HG2\, enter file name, and click Save. .
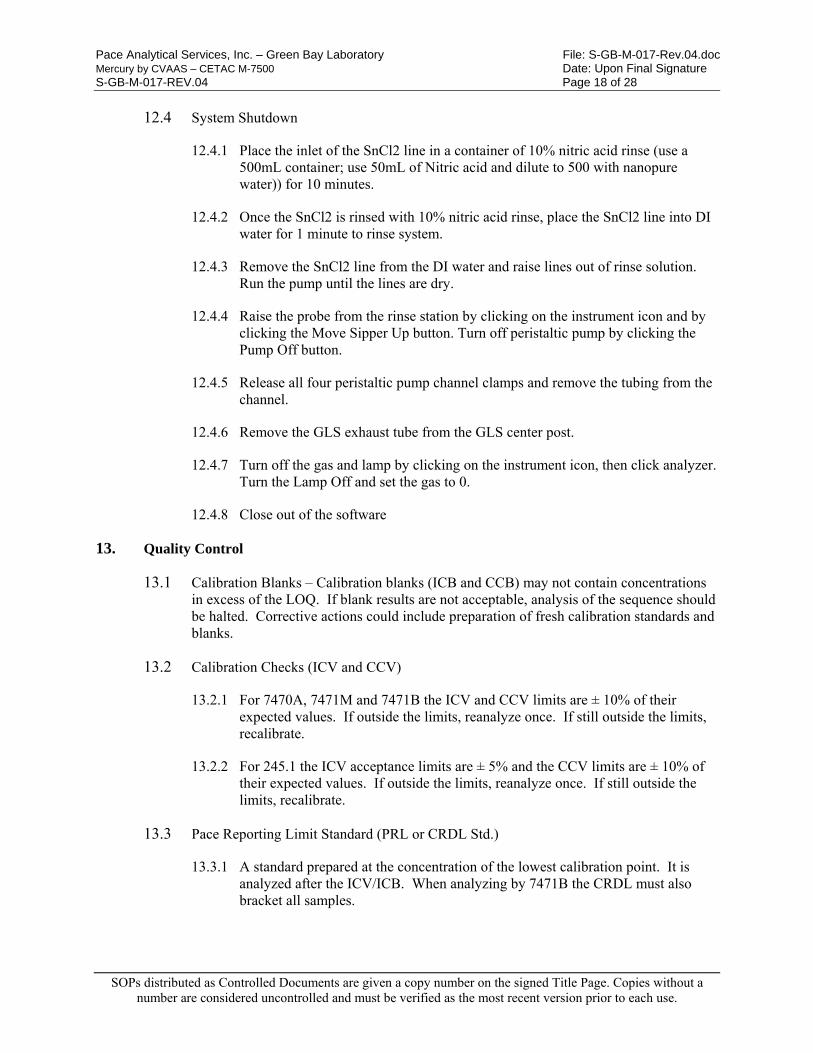
Pace Analytical Services, Inc. – Green Bay Laboratory File: S-GB-M-017-Rev.04.doc Mercury by CVAAS – CETAC M-7500 Date: Upon Final Signature S-GB-M-017-REV.04 Page 18 of 28
SOPs distributed as Controlled Documents are given a copy number on the signed Title Page. Copies without a number are considered uncontrolled and must be verified as the most recent version prior to each use.
12.4 System Shutdown
12.4.1 Place the inlet of the SnCl2 line in a container of 10% nitric acid rinse (use a 500mL container; use 50mL of Nitric acid and dilute to 500 with nanopure water)) for 10 minutes.
12.4.2 Once the SnCl2 is rinsed with 10% nitric acid rinse, place the SnCl2 line into DI water for 1 minute to rinse system.
12.4.3 Remove the SnCl2 line from the DI water and raise lines out of rinse solution. Run the pump until the lines are dry.
12.4.4 Raise the probe from the rinse station by clicking on the instrument icon and by clicking the Move Sipper Up button. Turn off peristaltic pump by clicking the Pump Off button.
12.4.5 Release all four peristaltic pump channel clamps and remove the tubing from the channel.
12.4.6 Remove the GLS exhaust tube from the GLS center post.
12.4.7 Turn off the gas and lamp by clicking on the instrument icon, then click analyzer. Turn the Lamp Off and set the gas to 0.
12.4.8 Close out of the software
13. Quality Control
13.1 Calibration Blanks – Calibration blanks (ICB and CCB) may not contain concentrations in excess of the LOQ. If blank results are not acceptable, analysis of the sequence should be halted. Corrective actions could include preparation of fresh calibration standards and blanks.
13.2 Calibration Checks (ICV and CCV)
13.2.1 For 7470A, 7471M and 7471B the ICV and CCV limits are ± 10% of their expected values. If outside the limits, reanalyze once. If still outside the limits, recalibrate.
13.2.2 For 245.1 the ICV acceptance limits are ± 5% and the CCV limits are ± 10% of their expected values. If outside the limits, reanalyze once. If still outside the limits, recalibrate.
13.3 Pace Reporting Limit Standard (PRL or CRDL Std.)
13.3.1 A standard prepared at the concentration of the lowest calibration point. It is analyzed after the ICV/ICB. When analyzing by 7471B the CRDL must also bracket all samples.
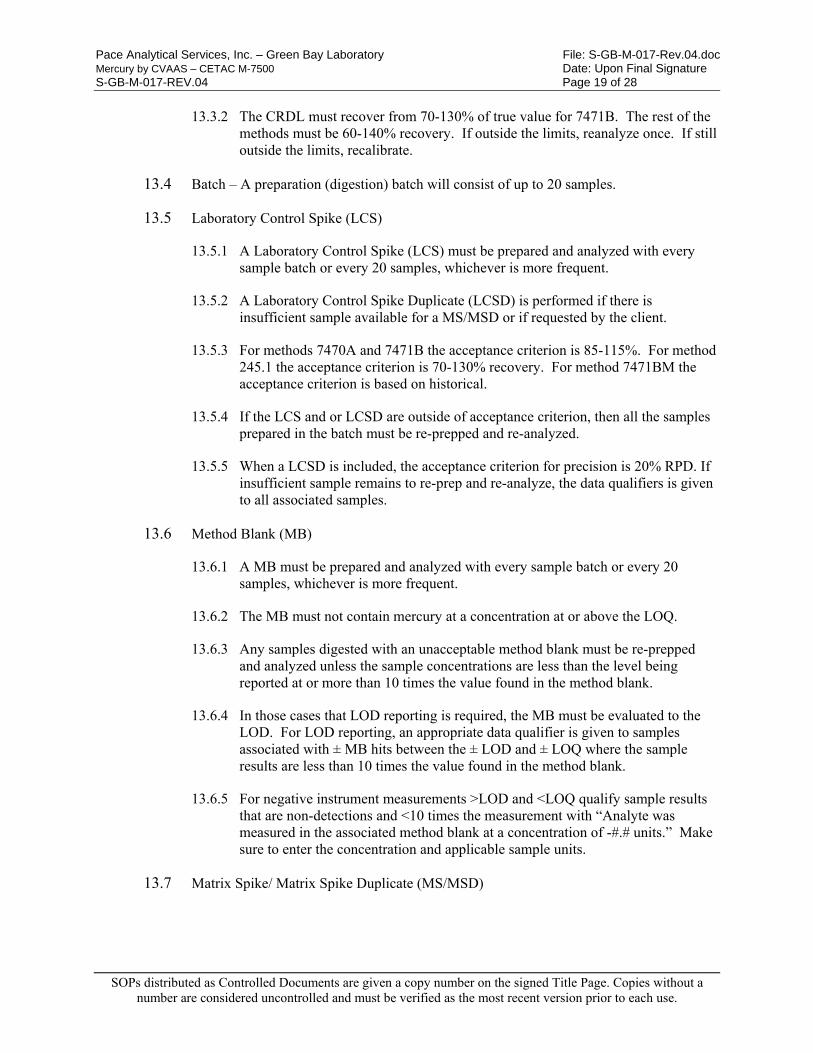
Pace Analytical Services, Inc. – Green Bay Laboratory File: S-GB-M-017-Rev.04.doc Mercury by CVAAS – CETAC M-7500 Date: Upon Final Signature S-GB-M-017-REV.04 Page 19 of 28
SOPs distributed as Controlled Documents are given a copy number on the signed Title Page. Copies without a number are considered uncontrolled and must be verified as the most recent version prior to each use.
13.3.2 The CRDL must recover from 70-130% of true value for 7471B. The rest of the methods must be 60-140% recovery. If outside the limits, reanalyze once. If still outside the limits, recalibrate.
13.4 Batch – A preparation (digestion) batch will consist of up to 20 samples.
13.5 Laboratory Control Spike (LCS)
13.5.1 A Laboratory Control Spike (LCS) must be prepared and analyzed with every sample batch or every 20 samples, whichever is more frequent.
13.5.2 A Laboratory Control Spike Duplicate (LCSD) is performed if there is insufficient sample available for a MS/MSD or if requested by the client.
13.5.3 For methods 7470A and 7471B the acceptance criterion is 85-115%. For method 245.1 the acceptance criterion is 70-130% recovery. For method 7471BM the acceptance criterion is based on historical.
13.5.4 If the LCS and or LCSD are outside of acceptance criterion, then all the samples prepared in the batch must be re-prepped and re-analyzed.
13.5.5 When a LCSD is included, the acceptance criterion for precision is 20% RPD. If insufficient sample remains to re-prep and re-analyze, the data qualifiers is given to all associated samples.
13.6 Method Blank (MB)
13.6.1 A MB must be prepared and analyzed with every sample batch or every 20 samples, whichever is more frequent.
13.6.2 The MB must not contain mercury at a concentration at or above the LOQ.
13.6.3 Any samples digested with an unacceptable method blank must be re-prepped and analyzed unless the sample concentrations are less than the level being reported at or more than 10 times the value found in the method blank.
13.6.4 In those cases that LOD reporting is required, the MB must be evaluated to the LOD. For LOD reporting, an appropriate data qualifier is given to samples associated with ± MB hits between the ± LOD and ± LOQ where the sample results are less than 10 times the value found in the method blank.
13.6.5 For negative instrument measurements >LOD and <LOQ qualify sample results that are non-detections and <10 times the measurement with “Analyte was measured in the associated method blank at a concentration of -#.# units.” Make sure to enter the concentration and applicable sample units.
13.7 Matrix Spike/ Matrix Spike Duplicate (MS/MSD)
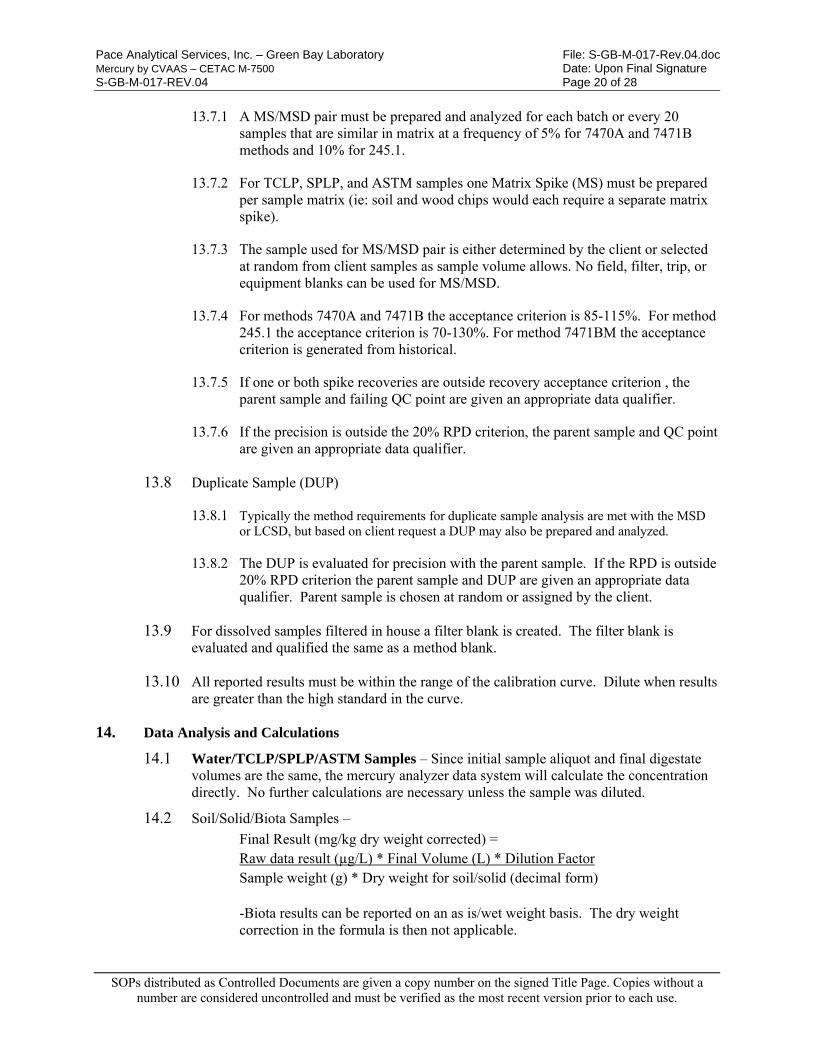
Pace Analytical Services, Inc. – Green Bay Laboratory File: S-GB-M-017-Rev.04.doc Mercury by CVAAS – CETAC M-7500 Date: Upon Final Signature S-GB-M-017-REV.04 Page 20 of 28
SOPs distributed as Controlled Documents are given a copy number on the signed Title Page. Copies without a number are considered uncontrolled and must be verified as the most recent version prior to each use.
13.7.1 A MS/MSD pair must be prepared and analyzed for each batch or every 20 samples that are similar in matrix at a frequency of 5% for 7470A and 7471B methods and 10% for 245.1.
13.7.2 For TCLP, SPLP, and ASTM samples one Matrix Spike (MS) must be prepared per sample matrix (ie: soil and wood chips would each require a separate matrix spike).
13.7.3 The sample used for MS/MSD pair is either determined by the client or selected at random from client samples as sample volume allows. No field, filter, trip, or equipment blanks can be used for MS/MSD.
13.7.4 For methods 7470A and 7471B the acceptance criterion is 85-115%. For method 245.1 the acceptance criterion is 70-130%. For method 7471BM the acceptance criterion is generated from historical.
13.7.5 If one or both spike recoveries are outside recovery acceptance criterion , the parent sample and failing QC point are given an appropriate data qualifier.
13.7.6 If the precision is outside the 20% RPD criterion, the parent sample and QC point are given an appropriate data qualifier.
13.8 Duplicate Sample (DUP)
13.8.1 Typically the method requirements for duplicate sample analysis are met with the MSD or LCSD, but based on client request a DUP may also be prepared and analyzed.
13.8.2 The DUP is evaluated for precision with the parent sample. If the RPD is outside 20% RPD criterion the parent sample and DUP are given an appropriate data qualifier. Parent sample is chosen at random or assigned by the client.
13.9 For dissolved samples filtered in house a filter blank is created. The filter blank is evaluated and qualified the same as a method blank.
13.10 All reported results must be within the range of the calibration curve. Dilute when results are greater than the high standard in the curve.
14. Data Analysis and Calculations
14.1 Water/TCLP/SPLP/ASTM Samples – Since initial sample aliquot and final digestate volumes are the same, the mercury analyzer data system will calculate the concentration directly. No further calculations are necessary unless the sample was diluted.
14.2 Soil/Solid/Biota Samples –
Final Result (mg/kg dry weight corrected) = Raw data result (µg/L) * Final Volume (L) * Dilution Factor Sample weight (g) * Dry weight for soil/solid (decimal form)
-Biota results can be reported on an as is/wet weight basis. The dry weight correction in the formula is then not applicable.
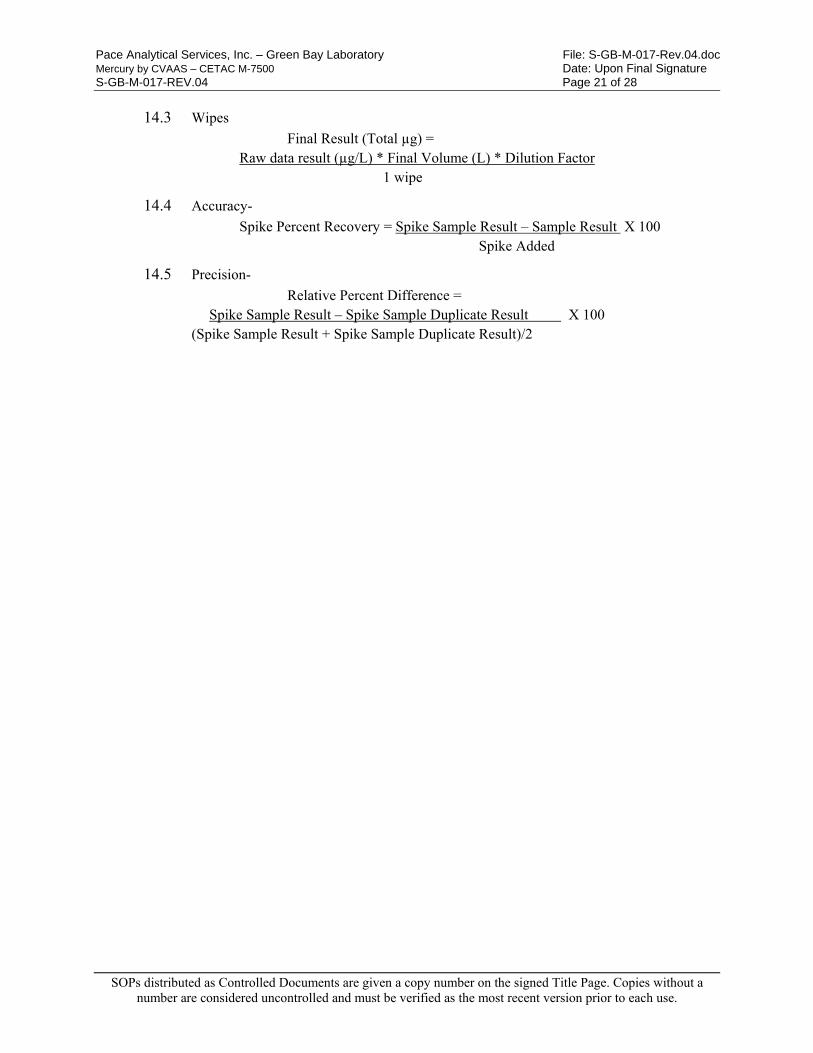
Pace Analytical Services, Inc. – Green Bay Laboratory File: S-GB-M-017-Rev.04.doc Mercury by CVAAS – CETAC M-7500 Date: Upon Final Signature S-GB-M-017-REV.04 Page 21 of 28
SOPs distributed as Controlled Documents are given a copy number on the signed Title Page. Copies without a number are considered uncontrolled and must be verified as the most recent version prior to each use.
14.3 Wipes
Final Result (Total µg) = Raw data result (µg/L) * Final Volume (L) * Dilution Factor
1 wipe
14.4 Accuracy-
Spike Percent Recovery = Spike Sample Result – Sample Result X 100 Spike Added
14.5 Precision-
Relative Percent Difference = Spike Sample Result – Spike Sample Duplicate Result X 100
(Spike Sample Result + Spike Sample Duplicate Result)/2
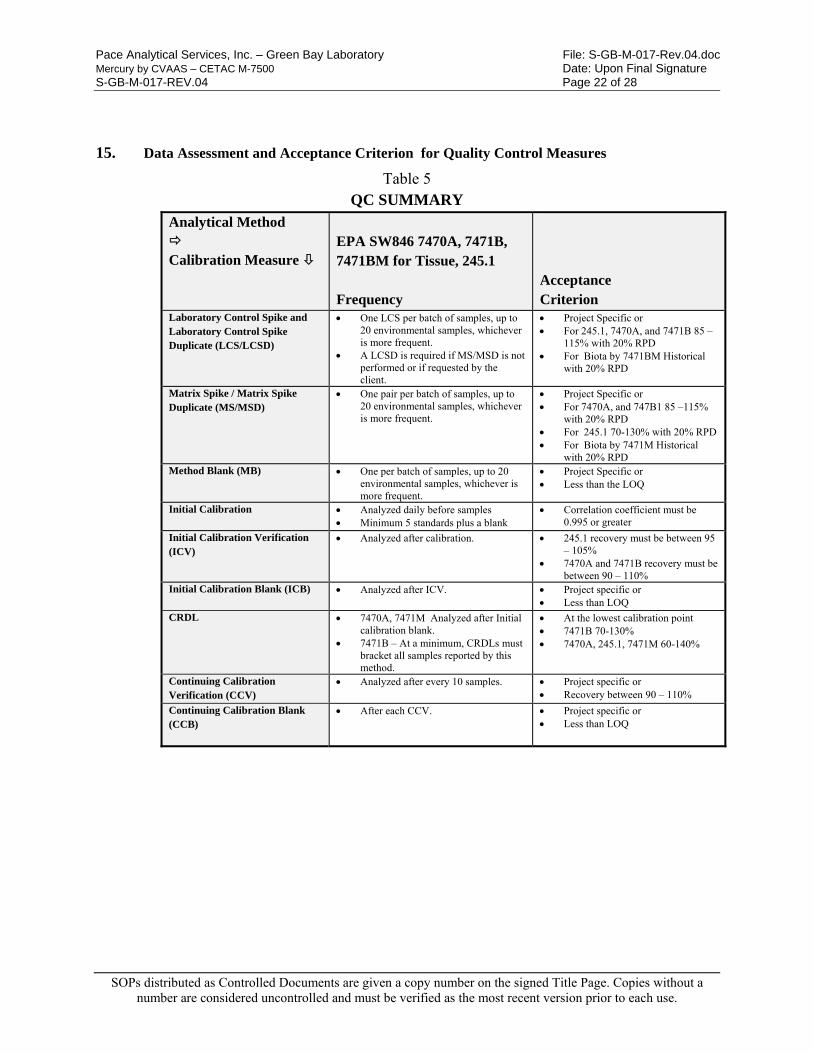
Pace Analytical Services, Inc. – Green Bay Laboratory File: S-GB-M-017-Rev.04.doc Mercury by CVAAS – CETAC M-7500 Date: Upon Final Signature S-GB-M-017-REV.04 Page 22 of 28
SOPs distributed as Controlled Documents are given a copy number on the signed Title Page. Copies without a number are considered uncontrolled and must be verified as the most recent version prior to each use.
15. Data Assessment and Acceptance Criterion for Quality Control Measures
Table 5 QC SUMMARY
Analytical Method Calibration Measure
EPA SW846 7470A, 7471B, 7471BM for Tissue, 245.1 Frequency
Acceptance Criterion
Laboratory Control Spike and Laboratory Control Spike Duplicate (LCS/LCSD)
One LCS per batch of samples, up to 20 environmental samples, whichever is more frequent.
A LCSD is required if MS/MSD is not performed or if requested by the client.
Project Specific or For 245.1, 7470A, and 7471B 85 –
115% with 20% RPD For Biota by 7471BM Historical
with 20% RPD
Matrix Spike / Matrix Spike Duplicate (MS/MSD)
One pair per batch of samples, up to 20 environmental samples, whichever is more frequent.
Project Specific or For 7470A, and 747B1 85 –115%
with 20% RPD For 245.1 70-130% with 20% RPD For Biota by 7471M Historical
with 20% RPD Method Blank (MB) One per batch of samples, up to 20
environmental samples, whichever is more frequent.
Project Specific or Less than the LOQ
Initial Calibration Analyzed daily before samples Minimum 5 standards plus a blank
Correlation coefficient must be 0.995 or greater
Initial Calibration Verification (ICV)
Analyzed after calibration. 245.1 recovery must be between 95 – 105%
7470A and 7471B recovery must be between 90 – 110%
Initial Calibration Blank (ICB) Analyzed after ICV. Project specific or Less than LOQ
CRDL 7470A, 7471M Analyzed after Initial calibration blank.
7471B – At a minimum, CRDLs must bracket all samples reported by this method.
At the lowest calibration point 7471B 70-130% 7470A, 245.1, 7471M 60-140%
Continuing Calibration Verification (CCV)
Analyzed after every 10 samples. Project specific or Recovery between 90 – 110%
Continuing Calibration Blank (CCB)
After each CCV. Project specific or Less than LOQ
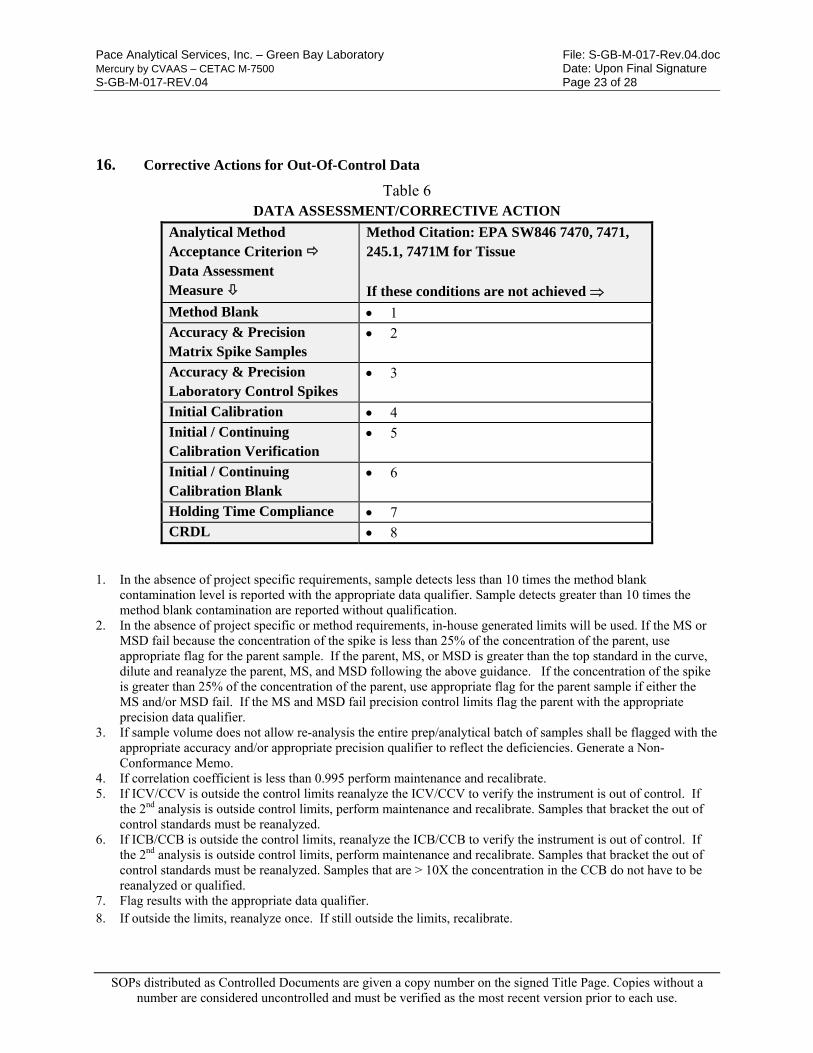
Pace Analytical Services, Inc. – Green Bay Laboratory File: S-GB-M-017-Rev.04.doc Mercury by CVAAS – CETAC M-7500 Date: Upon Final Signature S-GB-M-017-REV.04 Page 23 of 28
SOPs distributed as Controlled Documents are given a copy number on the signed Title Page. Copies without a number are considered uncontrolled and must be verified as the most recent version prior to each use.
16. Corrective Actions for Out-Of-Control Data
Table 6 DATA ASSESSMENT/CORRECTIVE ACTION
Analytical Method Acceptance Criterion Data Assessment Measure
Method Citation: EPA SW846 7470, 7471, 245.1, 7471M for Tissue
If these conditions are not achieved
Method Blank 1 Accuracy & Precision Matrix Spike Samples
2
Accuracy & Precision Laboratory Control Spikes
3
Initial Calibration 4 Initial / Continuing Calibration Verification
5
Initial / Continuing Calibration Blank
6
Holding Time Compliance 7 CRDL 8
1. In the absence of project specific requirements, sample detects less than 10 times the method blank contamination level is reported with the appropriate data qualifier. Sample detects greater than 10 times the method blank contamination are reported without qualification.
2. In the absence of project specific or method requirements, in-house generated limits will be used. If the MS or MSD fail because the concentration of the spike is less than 25% of the concentration of the parent, use appropriate flag for the parent sample. If the parent, MS, or MSD is greater than the top standard in the curve, dilute and reanalyze the parent, MS, and MSD following the above guidance. If the concentration of the spike is greater than 25% of the concentration of the parent, use appropriate flag for the parent sample if either the MS and/or MSD fail. If the MS and MSD fail precision control limits flag the parent with the appropriate precision data qualifier.
3. If sample volume does not allow re-analysis the entire prep/analytical batch of samples shall be flagged with the appropriate accuracy and/or appropriate precision qualifier to reflect the deficiencies. Generate a Non-Conformance Memo.
4. If correlation coefficient is less than 0.995 perform maintenance and recalibrate. 5. If ICV/CCV is outside the control limits reanalyze the ICV/CCV to verify the instrument is out of control. If
the 2nd analysis is outside control limits, perform maintenance and recalibrate. Samples that bracket the out of control standards must be reanalyzed.
6. If ICB/CCB is outside the control limits, reanalyze the ICB/CCB to verify the instrument is out of control. If the 2nd analysis is outside control limits, perform maintenance and recalibrate. Samples that bracket the out of control standards must be reanalyzed. Samples that are > 10X the concentration in the CCB do not have to be reanalyzed or qualified.
7. Flag results with the appropriate data qualifier. 8. If outside the limits, reanalyze once. If still outside the limits, recalibrate.
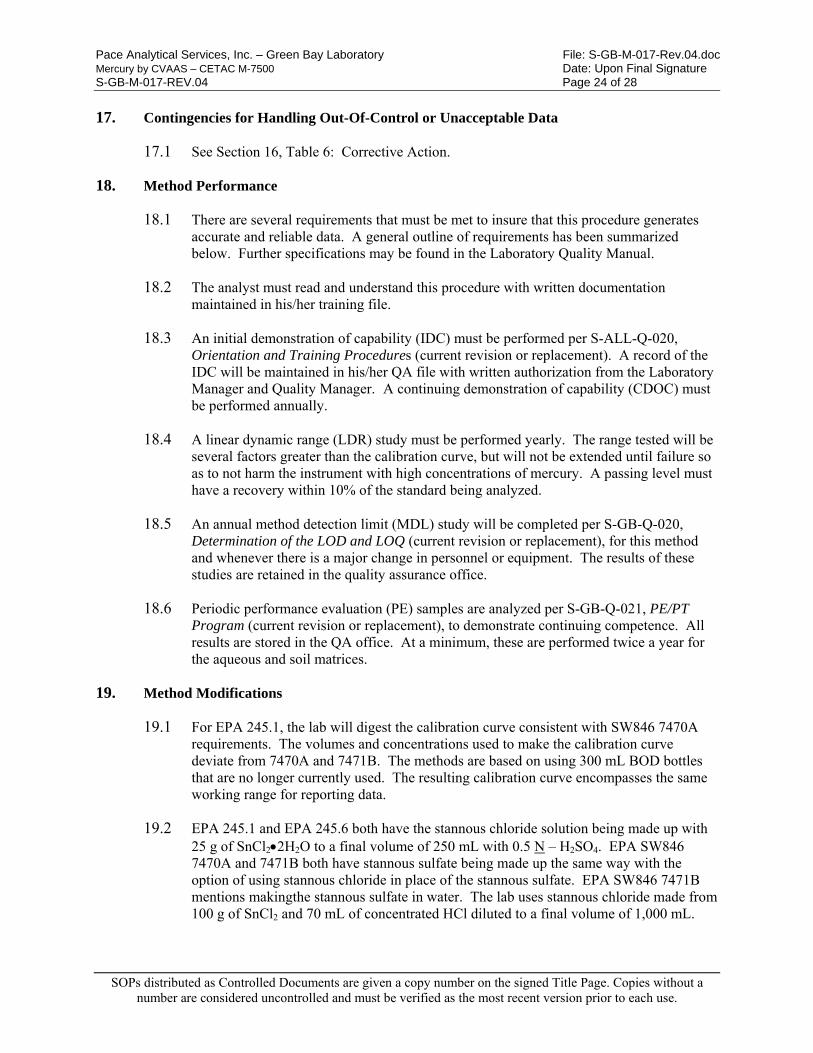
Pace Analytical Services, Inc. – Green Bay Laboratory File: S-GB-M-017-Rev.04.doc Mercury by CVAAS – CETAC M-7500 Date: Upon Final Signature S-GB-M-017-REV.04 Page 24 of 28
SOPs distributed as Controlled Documents are given a copy number on the signed Title Page. Copies without a number are considered uncontrolled and must be verified as the most recent version prior to each use.
17. Contingencies for Handling Out-Of-Control or Unacceptable Data
17.1 See Section 16, Table 6: Corrective Action.
18. Method Performance
18.1 There are several requirements that must be met to insure that this procedure generates accurate and reliable data. A general outline of requirements has been summarized below. Further specifications may be found in the Laboratory Quality Manual.
18.2 The analyst must read and understand this procedure with written documentation maintained in his/her training file.
18.3 An initial demonstration of capability (IDC) must be performed per S-ALL-Q-020, Orientation and Training Procedures (current revision or replacement). A record of the IDC will be maintained in his/her QA file with written authorization from the Laboratory Manager and Quality Manager. A continuing demonstration of capability (CDOC) must be performed annually.
18.4 A linear dynamic range (LDR) study must be performed yearly. The range tested will be several factors greater than the calibration curve, but will not be extended until failure so as to not harm the instrument with high concentrations of mercury. A passing level must have a recovery within 10% of the standard being analyzed.
18.5 An annual method detection limit (MDL) study will be completed per S-GB-Q-020, Determination of the LOD and LOQ (current revision or replacement), for this method and whenever there is a major change in personnel or equipment. The results of these studies are retained in the quality assurance office.
18.6 Periodic performance evaluation (PE) samples are analyzed per S-GB-Q-021, PE/PT Program (current revision or replacement), to demonstrate continuing competence. All results are stored in the QA office. At a minimum, these are performed twice a year for the aqueous and soil matrices.
19. Method Modifications
19.1 For EPA 245.1, the lab will digest the calibration curve consistent with SW846 7470A requirements. The volumes and concentrations used to make the calibration curve deviate from 7470A and 7471B. The methods are based on using 300 mL BOD bottles that are no longer currently used. The resulting calibration curve encompasses the same working range for reporting data.
19.2 EPA 245.1 and EPA 245.6 both have the stannous chloride solution being made up with 25 g of SnCl22H2O to a final volume of 250 mL with 0.5 N – H2SO4. EPA SW846 7470A and 7471B both have stannous sulfate being made up the same way with the option of using stannous chloride in place of the stannous sulfate. EPA SW846 7471B mentions makingthe stannous sulfate in water. The lab uses stannous chloride made from 100 g of SnCl2 and 70 mL of concentrated HCl diluted to a final volume of 1,000 mL.
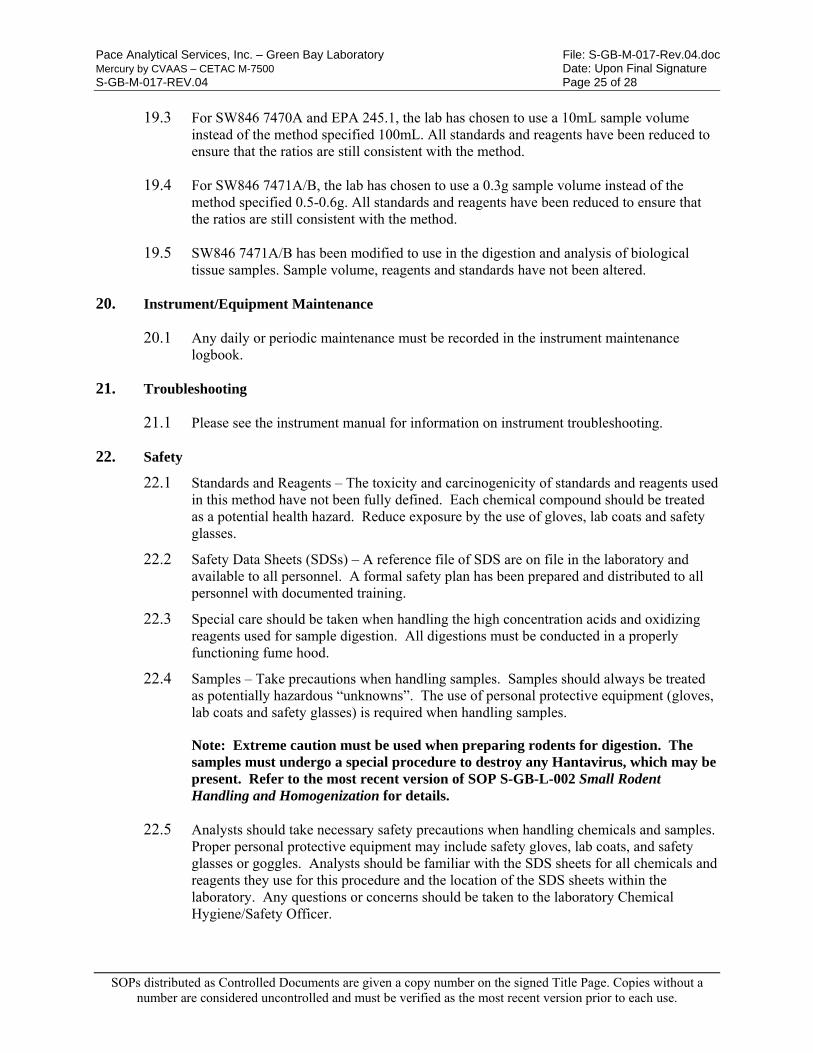
Pace Analytical Services, Inc. – Green Bay Laboratory File: S-GB-M-017-Rev.04.doc Mercury by CVAAS – CETAC M-7500 Date: Upon Final Signature S-GB-M-017-REV.04 Page 25 of 28
SOPs distributed as Controlled Documents are given a copy number on the signed Title Page. Copies without a number are considered uncontrolled and must be verified as the most recent version prior to each use.
19.3 For SW846 7470A and EPA 245.1, the lab has chosen to use a 10mL sample volume instead of the method specified 100mL. All standards and reagents have been reduced to ensure that the ratios are still consistent with the method.
19.4 For SW846 7471A/B, the lab has chosen to use a 0.3g sample volume instead of the method specified 0.5-0.6g. All standards and reagents have been reduced to ensure that the ratios are still consistent with the method.
19.5 SW846 7471A/B has been modified to use in the digestion and analysis of biological tissue samples. Sample volume, reagents and standards have not been altered.
20. Instrument/Equipment Maintenance
20.1 Any daily or periodic maintenance must be recorded in the instrument maintenance logbook.
21. Troubleshooting
21.1 Please see the instrument manual for information on instrument troubleshooting.
22. Safety
22.1 Standards and Reagents – The toxicity and carcinogenicity of standards and reagents used in this method have not been fully defined. Each chemical compound should be treated as a potential health hazard. Reduce exposure by the use of gloves, lab coats and safety glasses.
22.2 Safety Data Sheets (SDSs) – A reference file of SDS are on file in the laboratory and available to all personnel. A formal safety plan has been prepared and distributed to all personnel with documented training.
22.3 Special care should be taken when handling the high concentration acids and oxidizing reagents used for sample digestion. All digestions must be conducted in a properly functioning fume hood.
22.4 Samples – Take precautions when handling samples. Samples should always be treated as potentially hazardous “unknowns”. The use of personal protective equipment (gloves, lab coats and safety glasses) is required when handling samples.
Note: Extreme caution must be used when preparing rodents for digestion. The samples must undergo a special procedure to destroy any Hantavirus, which may be present. Refer to the most recent version of SOP S-GB-L-002 Small Rodent Handling and Homogenization for details.
22.5 Analysts should take necessary safety precautions when handling chemicals and samples. Proper personal protective equipment may include safety gloves, lab coats, and safety glasses or goggles. Analysts should be familiar with the SDS sheets for all chemicals and reagents they use for this procedure and the location of the SDS sheets within the laboratory. Any questions or concerns should be taken to the laboratory Chemical Hygiene/Safety Officer.
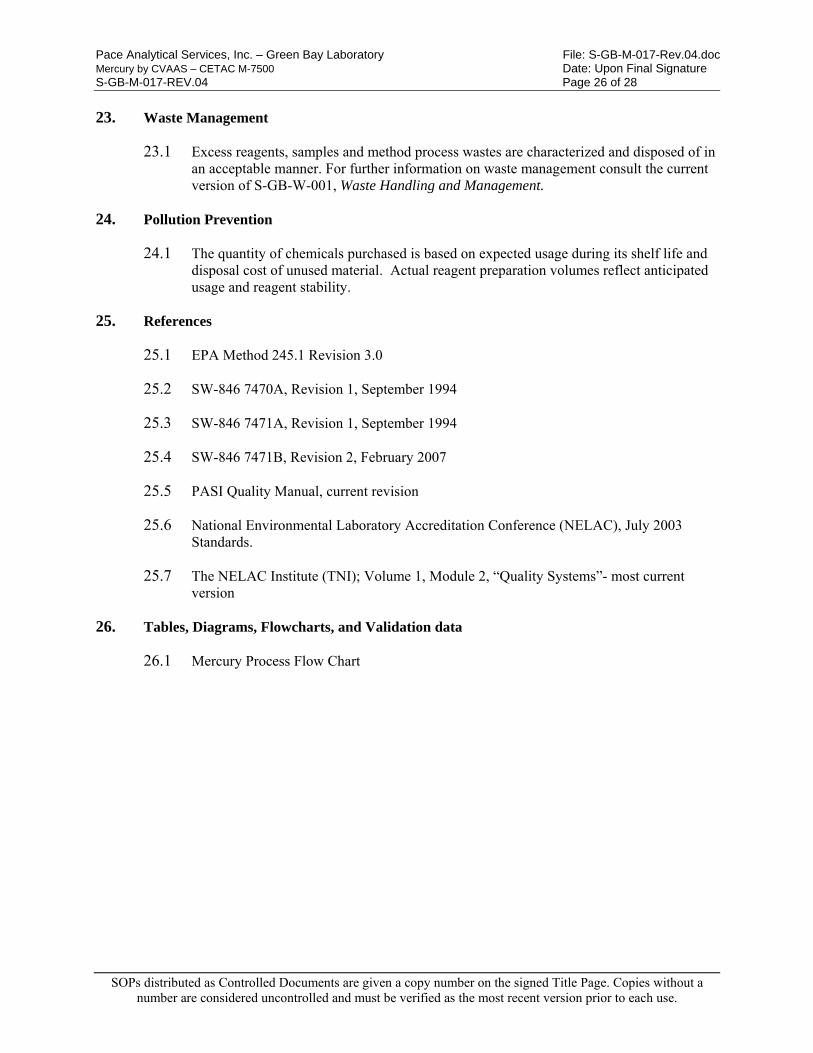
Pace Analytical Services, Inc. – Green Bay Laboratory File: S-GB-M-017-Rev.04.doc Mercury by CVAAS – CETAC M-7500 Date: Upon Final Signature S-GB-M-017-REV.04 Page 26 of 28
SOPs distributed as Controlled Documents are given a copy number on the signed Title Page. Copies without a number are considered uncontrolled and must be verified as the most recent version prior to each use.
23. Waste Management
23.1 Excess reagents, samples and method process wastes are characterized and disposed of in an acceptable manner. For further information on waste management consult the current version of S-GB-W-001, Waste Handling and Management.
24. Pollution Prevention
24.1 The quantity of chemicals purchased is based on expected usage during its shelf life and disposal cost of unused material. Actual reagent preparation volumes reflect anticipated usage and reagent stability.
25. References
25.1 EPA Method 245.1 Revision 3.0
25.2 SW-846 7470A, Revision 1, September 1994
25.3 SW-846 7471A, Revision 1, September 1994
25.4 SW-846 7471B, Revision 2, February 2007
25.5 PASI Quality Manual, current revision
25.6 National Environmental Laboratory Accreditation Conference (NELAC), July 2003 Standards.
25.7 The NELAC Institute (TNI); Volume 1, Module 2, “Quality Systems”- most current version
26. Tables, Diagrams, Flowcharts, and Validation data
26.1 Mercury Process Flow Chart

Pace Analytical Services, Inc. – Green Bay Laboratory File: S-GB-M-017-Rev.04.doc Mercury by CVAAS – CETAC M-7500 Date: Upon Final Signature S-GB-M-017-REV.04 Page 27 of 28
SOPs distributed as Controlled Documents are given a copy number on the signed Title Page. Copies without a number are considered uncontrolled and must be verified as the most recent version prior to each use.
27. Revisions
Document Number Reason for Change Date
S-GB-M-017-Rev.03
Section 12.2: Solid digestion has been updated to include the heating step and increase the acid ratios. Throughout document: Included uncontrolled document disclaimer..
26Jun2015
S-GB-M-017-Rev.04
Cover page: Updated QM name. Section 7.4.2: Added field filter information. Section 7.5: Updated leach sample information. Section 9.4: Deleted balance since also listed in Section 9.15. Section 10: Updated to include expiration dates. Section 10.14: Diluent added. Table 3: Changed to Table for 7471B Solids and Tissue. Table 4: Changed to Table for 7470 and 245.1 standards. Table 5: Deleted. Section 11.1.1.7: Changed spike to 1000ug/L at 0.05mL. Section 12: Changed spike solution volumes as needed.. Section 12.1.3.12, 12.1.3.13 and 12.1.3.15: Added. Section 12.2: Entire Section re-wrote to match current practice. Section 13 and Table 5: Added QC requirements and updated table. Section 18.4: Added LDR requirement. Section 19: Updated method modifications. Throughout Document: Changed digestion temperature range from 95±5°C to 95±3°C.
13Jun2016

Pace Analytical Services, Inc. – Green Bay Laboratory File: S-GB-M-017-Rev.04.doc Mercury by CVAAS – CETAC M-7500 Date: Upon Final Signature S-GB-M-017-REV.04 Page 28 of 28
SOPs distributed as Controlled Documents are given a copy number on the signed Title Page. Copies without a number are considered uncontrolled and must be verified as the most recent version prior to each use.
Mercury Process Flow Chart
Start
Digest Samples & QC Samples
Calibrate Instrument with Digested Curve
Standards
Analyze Samples & QC Samples
Results within Curve
?
Calculate Sample Results
Yes
No
Stop

Pace Analytical Services, Inc. 1241 Bellevue Street Suite 9
Green Bay, WI 54302 www.pacelabs.com
Phone: 920 469-2436 Fax: 920 469-8827
SOPs distributed as Controlled Documents are given a copy number on the signed Title Page. Copies without a number are considered uncontrolled and must be verified as the most recent version prior to each use.
STANDARD OPERATING PROCEDURE
Analysis of Organochlorine Pesticides by Gas Chromatography
Reference Methods: SW-846 8081A/B/ EPA 608
SOP NUMBER S-GB-O-027-Rev.08 EFFECTIVE DATE Date of Final Signature
SUPERSEDES S-GB-O-027-Rev.07
APPROVAL
__________________________________________ 07/02/15 Nils Melberg, Laboratory General Manager Date
__________________________________________ 7/2/15 Kate Grams, Laboratory Quality Manager Date
__________________________________________ 7/2/15 Chris Haase, Department Manager Date
PERIODIC REVIEW
SIGNATURES BELOW INDICATE NO CHANGES HAVE BEEN MADE SINCE APPROVAL.
Signature Title Date
Signature Title Date
Signature Title Date © 2002 - 2015 Pace Analytical Services, Inc. This Standard Operating Procedure may not be reproduced, in part or in full, without written consent of Pace Analytical Services, Inc. Whether distributed internally or as a “courtesy copy” to clients or regulatory agencies, this document is considered confidential and proprietary information.
This is COPY# Distributed on by and is CONTROLLED or X UNCONTROLLED

Analysis of Organochlorine Pesticides by Gas Chromatography File Name: S-GB-O-027-Rev.08.DOC Pace Analytical Services, Inc. – Green Bay Laboratory Date: Upon final signature S-GB-O-027-Rev. 08 Page: Page 4 of 23
SOPs distributed as Controlled Documents are given a copy number on the signed Title Page. Copies without a number are considered uncontrolled and must be verified as the most recent version prior to each use.
S-GB-O-027-REV.08
TABLE OF CONTENTS
Section Page
1. PURPOSE/IDENTIFICATION OF METHOD .......................................................................... 3
2. SUMMARY OF METHOD ........................................................................................................... 3
3. SCOPE AND APPLICATION ...................................................................................................... 3
4. APPLICABLE MATRICIES ........................................................................................................ 3
5. LIMITS OF DETECTION AND QUANTITATION ................................................................. 4
6. INTERFERENCES ........................................................................................................................ 5
7. SAMPLE COLLECTION, PRESERVATION, SHIPMENT AND STORAGE ...................... 5
8. DEFINITIONS ............................................................................................................................... 5
9. EQUIPMENT AND SUPPLIES (INCLUDING COMPUTER HARDWARE AND SOFTWARE) .............................................................................................................................................. 6
10. REAGENTS AND STANDARDS ................................................................................................. 7
11. CALIBRATION AND STANDARDIZATION ......................................................................... 10
12. PROCEDURE .............................................................................................................................. 13
13. QUALITY CONTROL ................................................................................................................ 15
14. DATAANALYSIS AND CALCULATIONS ............................................................................. 17
15. DATA ASSESSMENT AND ACCEPTANCE CRITERIA FOR QUALITY CONTROL MEASURES .............................................................................................................................................. 18
16. CORRECTIVE ACTIONS FOR OUT-OF-CONTROL DATA .............................................. 18
17. CONTINGENCIES FOR HANDLING OUT-OF-CONTROL OR UNACCEPTABLE DATA ....................................................................................................................................................... 18
18. METHOD PERFORMANCE ..................................................................................................... 19
19. METHOD MODIFICATIONS ................................................................................................... 19
20. INSTRUMENT/EQUIPMENT MAINTENANCE ................................................................... 20
21. TROUBLESHOOTING .............................................................................................................. 20
22. SAFETY ........................................................................................................................................ 20
23. WASTE MANAGEMENT .......................................................................................................... 20
24. POLLUTION PREVENTION .................................................................................................... 20
25. REFERENCES ............................................................................................................................. 21
26. TABLES, DIAGRAMS, FLOWCHARTS, APPENDICES, ADDENDA, ETC. .................... 21
27. REVISIONS.................................................................................................................................. 22

Analysis of Organochlorine Pesticides by Gas Chromatography File Name: S-GB-O-027-Rev.08.DOC Pace Analytical Services, Inc. – Green Bay Laboratory Date: Upon final signature S-GB-O-027-Rev. 08 Page: Page 3 of 23
SOPs distributed as Controlled Documents are given a copy number on the signed Title Page. Copies without a number are considered uncontrolled and must be verified as the most recent version prior to each use.
1. PURPOSE/IDENTIFICATION OF METHOD
1.1 The purpose of this Standard Operating Procedure (SOP) is to describe the analysis of various organochlorine pesticides in water, soils, sediments, biological tissue, and solid waste compliant with SW-846 Method 8081A/B and EPA 608. Samples for analysis are prepared by SW846 Method 3510C, 3540C, 3541, and 3550B. See Section 25 for list of reference SOPs.
2. SUMMARY OF METHOD
2.1 A volume of sample extract in hexane is injected into a gas chromatograph (GC) and the compounds in the GC effluent are detected by an electron capture detector (ECD) and then analyzed.
3. SCOPE AND APPLICATION
3.1 Personnel: This procedure is restricted to use by, or under the supervision of, analysts experienced in the use of gas chromatograph/electron capture detection (GC/ECD) systems and interpretation of complex chromatograms. Each analyst must demonstrate the capability to generate acceptable results with this method to be considered qualified to report sample results.
3.2 Parameters: This method is used to determine the concentration of the various organochlorine pesticides listed in Section 5, Table 1: Analyte List and Reporting Limits, utilizing a gas chromatograph equipped with dual electron capture detectors. Reporting limits are subject to change based on current analytical system performance and actual sample matrices.
4. APPLICABLE MATRICES
4.1 This SOP is applicable to the analysis of organochlorine pesticides in aqueous, soils, solids, domestic and industrial wastes and biological samples.
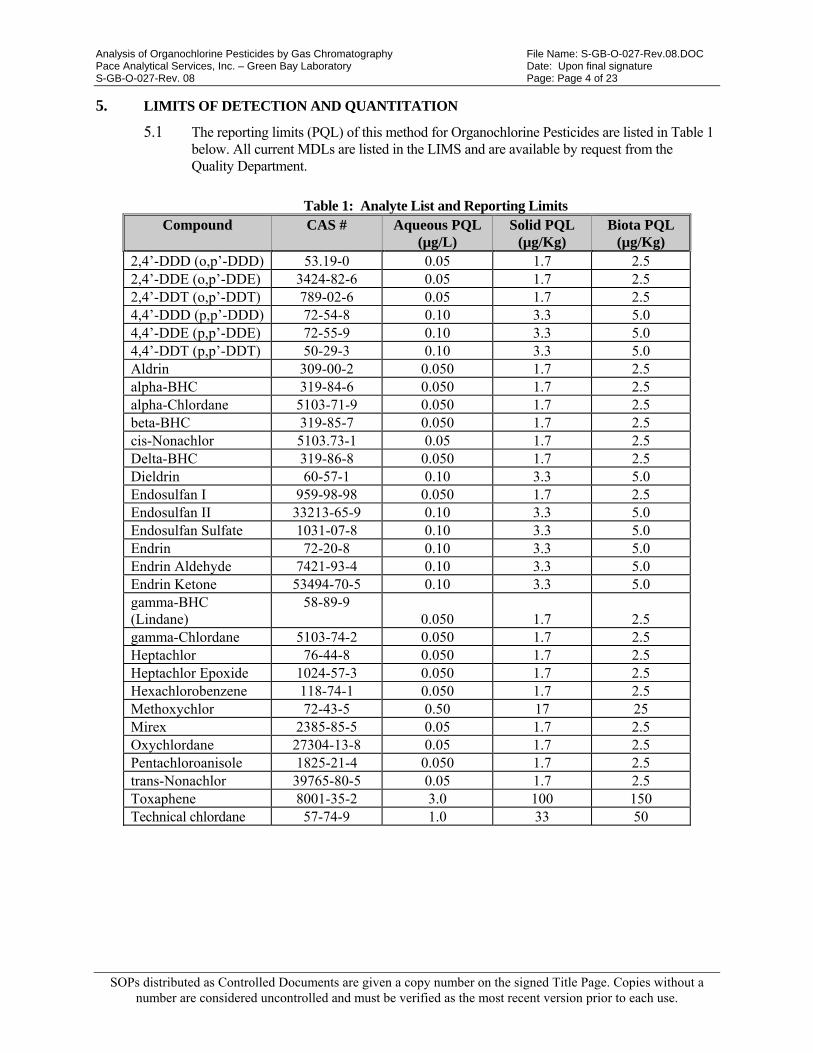
Analysis of Organochlorine Pesticides by Gas Chromatography File Name: S-GB-O-027-Rev.08.DOC Pace Analytical Services, Inc. – Green Bay Laboratory Date: Upon final signature S-GB-O-027-Rev. 08 Page: Page 4 of 23
SOPs distributed as Controlled Documents are given a copy number on the signed Title Page. Copies without a number are considered uncontrolled and must be verified as the most recent version prior to each use.
5. LIMITS OF DETECTION AND QUANTITATION
5.1 The reporting limits (PQL) of this method for Organochlorine Pesticides are listed in Table 1 below. All current MDLs are listed in the LIMS and are available by request from the Quality Department.
Table 1: Analyte List and Reporting Limits
Compound CAS # Aqueous PQL (µg/L)
Solid PQL (µg/Kg)
Biota PQL (µg/Kg)
2,4’-DDD (o,p’-DDD) 53.19-0 0.05 1.7 2.5 2,4’-DDE (o,p’-DDE) 3424-82-6 0.05 1.7 2.5 2,4’-DDT (o,p’-DDT) 789-02-6 0.05 1.7 2.5 4,4’-DDD (p,p’-DDD) 72-54-8 0.10 3.3 5.0 4,4’-DDE (p,p’-DDE) 72-55-9 0.10 3.3 5.0 4,4’-DDT (p,p’-DDT) 50-29-3 0.10 3.3 5.0 Aldrin 309-00-2 0.050 1.7 2.5 alpha-BHC 319-84-6 0.050 1.7 2.5 alpha-Chlordane 5103-71-9 0.050 1.7 2.5 beta-BHC 319-85-7 0.050 1.7 2.5 cis-Nonachlor 5103.73-1 0.05 1.7 2.5 Delta-BHC 319-86-8 0.050 1.7 2.5 Dieldrin 60-57-1 0.10 3.3 5.0 Endosulfan I 959-98-98 0.050 1.7 2.5 Endosulfan II 33213-65-9 0.10 3.3 5.0 Endosulfan Sulfate 1031-07-8 0.10 3.3 5.0 Endrin 72-20-8 0.10 3.3 5.0 Endrin Aldehyde 7421-93-4 0.10 3.3 5.0 Endrin Ketone 53494-70-5 0.10 3.3 5.0 gamma-BHC (Lindane)
58-89-9 0.050 1.7 2.5
gamma-Chlordane 5103-74-2 0.050 1.7 2.5 Heptachlor 76-44-8 0.050 1.7 2.5 Heptachlor Epoxide 1024-57-3 0.050 1.7 2.5 Hexachlorobenzene 118-74-1 0.050 1.7 2.5 Methoxychlor 72-43-5 0.50 17 25 Mirex 2385-85-5 0.05 1.7 2.5 Oxychlordane 27304-13-8 0.05 1.7 2.5 Pentachloroanisole 1825-21-4 0.050 1.7 2.5 trans-Nonachlor 39765-80-5 0.05 1.7 2.5 Toxaphene 8001-35-2 3.0 100 150 Technical chlordane 57-74-9 1.0 33 50

Analysis of Organochlorine Pesticides by Gas Chromatography File Name: S-GB-O-027-Rev.08.DOC Pace Analytical Services, Inc. – Green Bay Laboratory Date: Upon final signature S-GB-O-027-Rev. 08 Page: Page 5 of 23
SOPs distributed as Controlled Documents are given a copy number on the signed Title Page. Copies without a number are considered uncontrolled and must be verified as the most recent version prior to each use.
6. INTERFERENCES
6.1 Method interferences may be caused by contaminants in solvents, reagents, glassware and other sample processing hardware. These interferences lead to discrete artifacts or elevated baselines in gas chromatograms. Routinely, all of these materials must be demonstrated to be free from interferences by running reagent blanks and method blanks. Interferences caused by phthalate esters can pose a major problem in pesticide analysis. Common flexible plastics contain varying amounts of phthalates, which are easily extracted during laboratory operations. Avoiding the use of such plastics in the laboratory can best minimize interferences from phthalates.
6.2 Matrix interferences may be caused by contaminants that are co-extracted from the sample. The extent of matrix interferences will vary considerably from source to source, depending upon the nature of the site being sampled. Cleanup procedures such as Gel Permeation Chromatography (GPC), Florisil cartridge cleanup, Silica Gel Separation, and sulfur removal are available for the most common interference’s encountered. These cleanup procedures are described separately in the most current revision or replacement of the laboratory SOPs: S-GB-O-032 Gel Permeation Chromatography Clean-up by SW846 3640A, S-GB-O-037, Florisil Cartridge Clean-up for Organochlorine Pesticide Samples, S-GB-O-038, Silica Gel Clean-up for Organic Analysis and S-GB-O-039 Copper Clean-up for the Removal of Sulfur from PCB and Toxaphene Samples.
7. SAMPLE COLLECTION, PRESERVATION, SHIPMENT AND STORAGE
Table 2: Sample Collection, Preservation, Storage and Hold Time Sample type Collection per sample Preservation Storage Hold time
Aqueous One 1L amber glass None ≤6°C 7 days
Soil/Solid (non-aqueous)
One 8oz wide glass amber jar
None ≤6°C 14 days
Biological Tissue
-- None ≤ -10°C 365 days or longer per client request prior to extraction, typical extraction hold time do not apply.
TCLP/SPLP One 1L amber glass None ≤6°C 14 days to leach, 7 days to for solvent extraction after the tumbling process has occurred.
Extracts ONE 5 or 10mL glass amber vial.
None ≤6°C 40 days
8. DEFINITIONS
8.1 Refer to Section 10.0 of the most current version of the Pace Quality Manual for the terms used at Pace Analytical. When definitions are not consistent with NELAC defined terms, an explanation will be provided in this SOP.
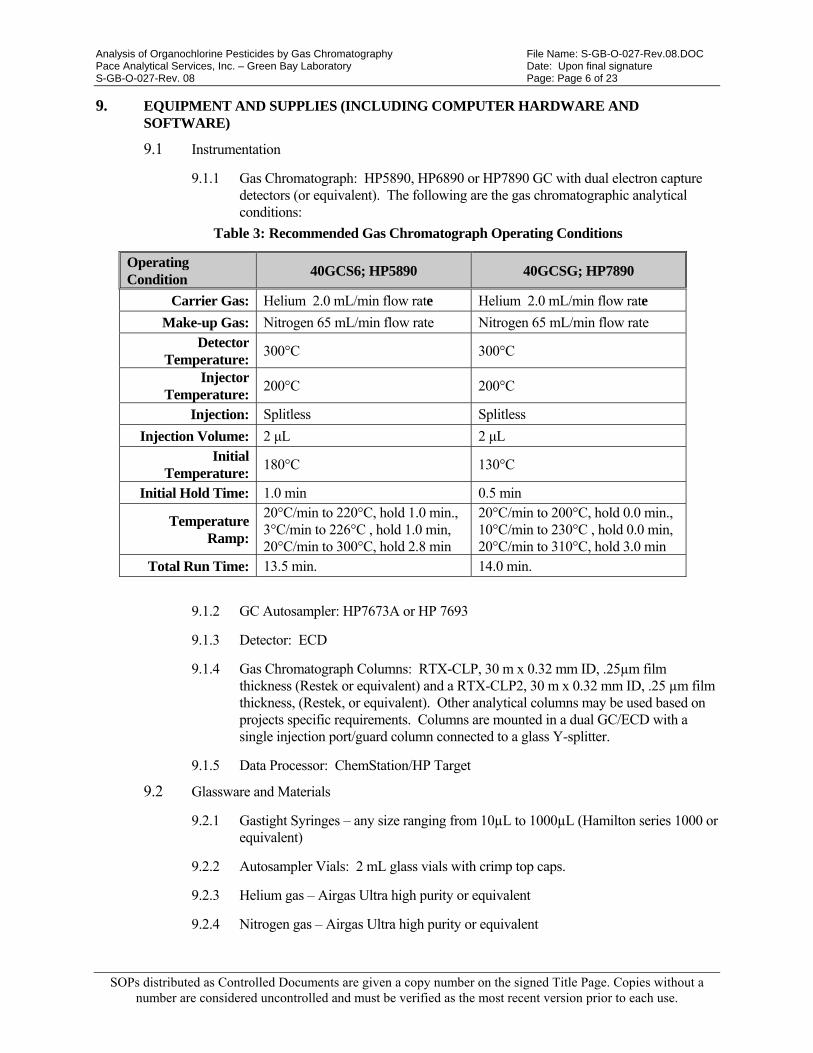
Analysis of Organochlorine Pesticides by Gas Chromatography File Name: S-GB-O-027-Rev.08.DOC Pace Analytical Services, Inc. – Green Bay Laboratory Date: Upon final signature S-GB-O-027-Rev. 08 Page: Page 6 of 23
SOPs distributed as Controlled Documents are given a copy number on the signed Title Page. Copies without a number are considered uncontrolled and must be verified as the most recent version prior to each use.
9. EQUIPMENT AND SUPPLIES (INCLUDING COMPUTER HARDWARE AND SOFTWARE)
9.1 Instrumentation
9.1.1 Gas Chromatograph: HP5890, HP6890 or HP7890 GC with dual electron capture detectors (or equivalent). The following are the gas chromatographic analytical conditions:
Table 3: Recommended Gas Chromatograph Operating Conditions
9.1.2 GC Autosampler: HP7673A or HP 7693
9.1.3 Detector: ECD
9.1.4 Gas Chromatograph Columns: RTX-CLP, 30 m x 0.32 mm ID, .25µm film thickness (Restek or equivalent) and a RTX-CLP2, 30 m x 0.32 mm ID, .25 µm film thickness, (Restek, or equivalent). Other analytical columns may be used based on projects specific requirements. Columns are mounted in a dual GC/ECD with a single injection port/guard column connected to a glass Y-splitter.
9.1.5 Data Processor: ChemStation/HP Target
9.2 Glassware and Materials
9.2.1 Gastight Syringes – any size ranging from 10µL to 1000µL (Hamilton series 1000 or equivalent)
9.2.2 Autosampler Vials: 2 mL glass vials with crimp top caps.
9.2.3 Helium gas – Airgas Ultra high purity or equivalent
9.2.4 Nitrogen gas – Airgas Ultra high purity or equivalent
Operating Condition
40GCS6; HP5890 40GCSG; HP7890
Carrier Gas: Helium 2.0 mL/min flow rate Helium 2.0 mL/min flow rate
Make-up Gas: Nitrogen 65 mL/min flow rate Nitrogen 65 mL/min flow rate Detector
Temperature: 300°C 300°C
Injector Temperature:
200°C 200°C
Injection: Splitless Splitless
Injection Volume: 2 μL 2 μL Initial
Temperature: 180°C 130°C
Initial Hold Time: 1.0 min 0.5 min
Temperature Ramp:
20°C/min to 220°C, hold 1.0 min., 3°C/min to 226°C , hold 1.0 min, 20°C/min to 300°C, hold 2.8 min
20°C/min to 200°C, hold 0.0 min., 10°C/min to 230°C , hold 0.0 min, 20°C/min to 310°C, hold 3.0 min
Total Run Time: 13.5 min. 14.0 min.

Analysis of Organochlorine Pesticides by Gas Chromatography File Name: S-GB-O-027-Rev.08.DOC Pace Analytical Services, Inc. – Green Bay Laboratory Date: Upon final signature S-GB-O-027-Rev. 08 Page: Page 7 of 23
SOPs distributed as Controlled Documents are given a copy number on the signed Title Page. Copies without a number are considered uncontrolled and must be verified as the most recent version prior to each use.
10. REAGENTS AND STANDARDS
10.1 Solvents – Hexane and acetone, pesticide grade.
Table 4: Solvents Reagent Purity Manufacturer Vendor Catalog # Expiration Date Hexane NS Grade Burdick & Jackson MG Scientific B&J-217-4 Manufacturer Exp date or 2 year from receipt Acetone Pesticide Grade Burdick & Jackson MG Scientific B&J-010-4 Manufacturer Exp date or 2 year from receipt
10.2 Stock Standard Solutions: Commercially prepared stock standards can be used at any concentration if they are certified by the manufacturer or an independent source. Shelf life of standard solutions is 1 year from the date of preparation or the expiration date on the vendor label; whichever is earliest (see Table 5 for stock standards).
10.3 Calibration Standards: Single component standards are prepared from stock standard solutions at 5 concentration levels. One of the concentration levels should be at a concentration near, but above the method detection limit. Separate calibration standards are required for each multi-component target analyte (e.g. Toxaphene and Technical Chlordane). Shelf life of the calibration standards is 6 months from the date of preparation or the expiration date of the stock standard solution; whichever is earliest (see Table 6 for standard preparation.).
10.4 Surrogate Standards: Surrogate standards are used to monitor the performance of the method. They are added to all calibration standards. Shelf life of the surrogate standards is 6 months from the date of preparation or the expiration date of the stock standard solution; whichever is earliest (see Tables 5 and 6).
10.5 Performance Evaluation Mixture (PEM): A standard comprised of DDT and Endrin, which is analyzed at the beginning of every 12 hours to determine compound breakdown (see Tables 5 and 6).
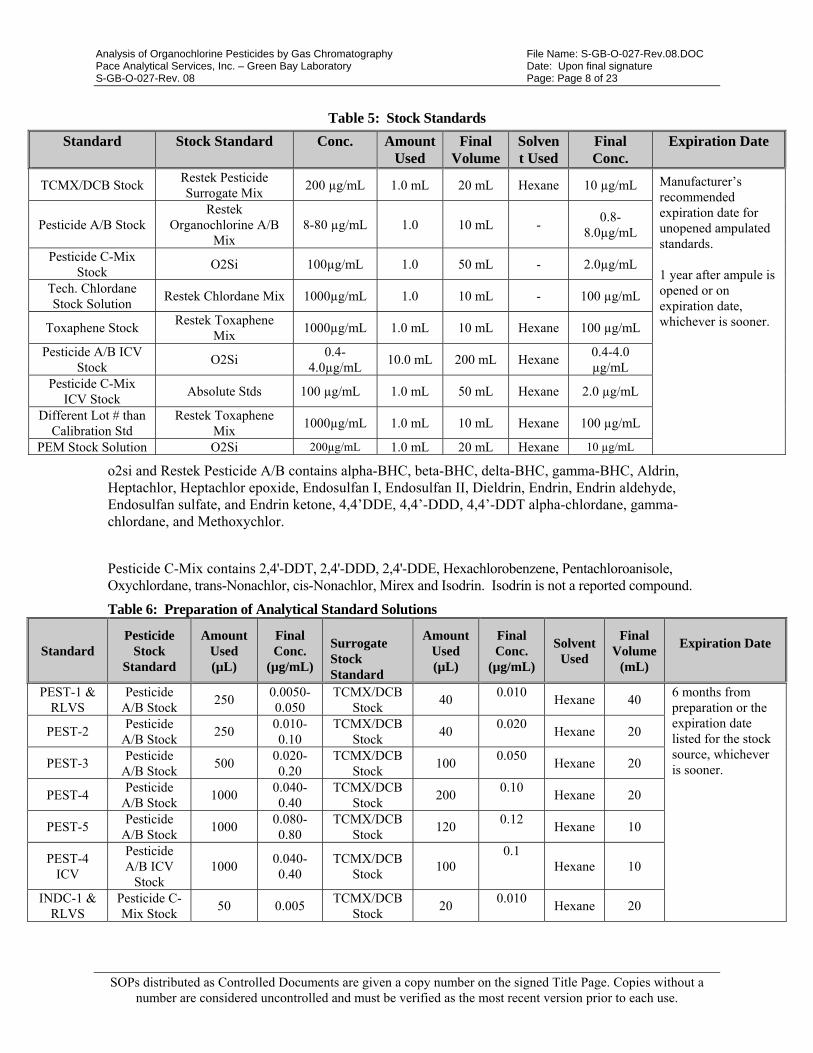
Analysis of Organochlorine Pesticides by Gas Chromatography File Name: S-GB-O-027-Rev.08.DOC Pace Analytical Services, Inc. – Green Bay Laboratory Date: Upon final signature S-GB-O-027-Rev. 08 Page: Page 8 of 23
SOPs distributed as Controlled Documents are given a copy number on the signed Title Page. Copies without a number are considered uncontrolled and must be verified as the most recent version prior to each use.
Table 5: Stock Standards
Standard Stock Standard Conc. Amount Used
Final Volume
Solvent Used
Final Conc.
Expiration Date
TCMX/DCB Stock Restek Pesticide Surrogate Mix
200 µg/mL 1.0 mL 20 mL Hexane 10 µg/mL Manufacturer’s recommended expiration date for unopened ampulated standards. 1 year after ampule is opened or on expiration date, whichever is sooner.
Pesticide A/B Stock Restek
Organochlorine A/B Mix
8-80 µg/mL 1.0 10 mL - 0.8-
8.0µg/mL
Pesticide C-Mix Stock
O2Si 100µg/mL 1.0 50 mL - 2.0µg/mL
Tech. Chlordane Stock Solution
Restek Chlordane Mix 1000µg/mL 1.0 10 mL - 100 µg/mL
Toxaphene Stock Restek Toxaphene
Mix 1000µg/mL 1.0 mL 10 mL Hexane 100 µg/mL
Pesticide A/B ICV Stock
O2Si 0.4-
4.0µg/mL 10.0 mL 200 mL Hexane
0.4-4.0 µg/mL
Pesticide C-Mix ICV Stock
Absolute Stds 100 µg/mL 1.0 mL 50 mL Hexane 2.0 µg/mL
Different Lot # than Calibration Std
Restek Toxaphene Mix
1000µg/mL 1.0 mL 10 mL Hexane 100 µg/mL
PEM Stock Solution O2Si 200µg/mL 1.0 mL 20 mL Hexane 10 µg/mL
o2si and Restek Pesticide A/B contains alpha-BHC, beta-BHC, delta-BHC, gamma-BHC, Aldrin, Heptachlor, Heptachlor epoxide, Endosulfan I, Endosulfan II, Dieldrin, Endrin, Endrin aldehyde, Endosulfan sulfate, and Endrin ketone, 4,4’DDE, 4,4’-DDD, 4,4’-DDT alpha-chlordane, gamma-chlordane, and Methoxychlor.
Pesticide C-Mix contains 2,4'-DDT, 2,4'-DDD, 2,4'-DDE, Hexachlorobenzene, Pentachloroanisole, Oxychlordane, trans-Nonachlor, cis-Nonachlor, Mirex and Isodrin. Isodrin is not a reported compound.
Table 6: Preparation of Analytical Standard Solutions
Standard Pesticide
Stock Standard
Amount Used (µL)
Final Conc.
(µg/mL)
Surrogate Stock Standard
Amount Used (µL)
Final Conc.
(µg/mL)
Solvent Used
Final Volume
(mL)
Expiration Date
PEST-1 & RLVS
Pesticide A/B Stock
250 0.0050-0.050
TCMX/DCB Stock
40 0.010
Hexane 40 6 months from preparation or the expiration date listed for the stock source, whichever is sooner.
PEST-2 Pesticide
A/B Stock 250
0.010-0.10
TCMX/DCB Stock
40 0.020
Hexane 20
PEST-3 Pesticide
A/B Stock 500
0.020-0.20
TCMX/DCB Stock
100 0.050
Hexane 20
PEST-4 Pesticide
A/B Stock 1000
0.040-0.40
TCMX/DCB Stock
200 0.10
Hexane 20
PEST-5 Pesticide
A/B Stock 1000
0.080-0.80
TCMX/DCB Stock
120 0.12
Hexane 10
PEST-4 ICV
Pesticide A/B ICV
Stock 1000
0.040-0.40
TCMX/DCB Stock
100 0.1
Hexane 10
INDC-1 & RLVS
Pesticide C-Mix Stock
50 0.005 TCMX/DCB
Stock 20
0.010 Hexane 20
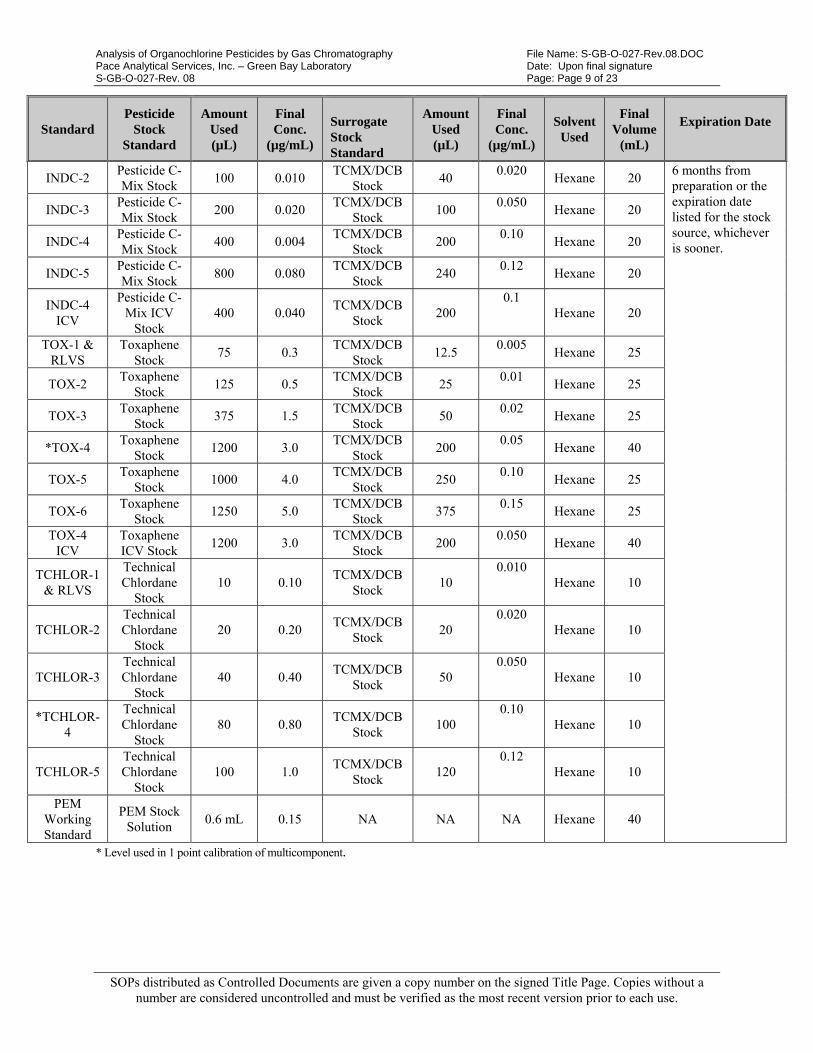
Analysis of Organochlorine Pesticides by Gas Chromatography File Name: S-GB-O-027-Rev.08.DOC Pace Analytical Services, Inc. – Green Bay Laboratory Date: Upon final signature S-GB-O-027-Rev. 08 Page: Page 9 of 23
SOPs distributed as Controlled Documents are given a copy number on the signed Title Page. Copies without a number are considered uncontrolled and must be verified as the most recent version prior to each use.
Standard Pesticide
Stock Standard
Amount Used (µL)
Final Conc.
(µg/mL)
Surrogate Stock Standard
Amount Used (µL)
Final Conc.
(µg/mL)
Solvent Used
Final Volume
(mL)
Expiration Date
INDC-2 Pesticide C-Mix Stock
100 0.010 TCMX/DCB
Stock 40
0.020 Hexane 20
6 months from preparation or the expiration date listed for the stock source, whichever is sooner.
INDC-3 Pesticide C-Mix Stock
200 0.020 TCMX/DCB
Stock 100
0.050 Hexane 20
INDC-4 Pesticide C-Mix Stock
400 0.004 TCMX/DCB
Stock 200
0.10 Hexane 20
INDC-5 Pesticide C-Mix Stock
800 0.080 TCMX/DCB
Stock 240
0.12 Hexane 20
INDC-4 ICV
Pesticide C-Mix ICV
Stock 400 0.040
TCMX/DCB Stock
200 0.1
Hexane 20
TOX-1 & RLVS
Toxaphene Stock
75 0.3 TCMX/DCB
Stock 12.5
0.005 Hexane 25
TOX-2 Toxaphene
Stock 125 0.5
TCMX/DCB Stock
25 0.01
Hexane 25
TOX-3 Toxaphene
Stock 375 1.5
TCMX/DCB Stock
50 0.02
Hexane 25
*TOX-4 Toxaphene
Stock 1200 3.0
TCMX/DCB Stock
200 0.05
Hexane 40
TOX-5 Toxaphene
Stock 1000 4.0
TCMX/DCB Stock
250 0.10
Hexane 25
TOX-6 Toxaphene
Stock 1250 5.0
TCMX/DCB Stock
375 0.15
Hexane 25
TOX-4 ICV
Toxaphene ICV Stock
1200 3.0 TCMX/DCB
Stock 200
0.050 Hexane 40
TCHLOR-1 & RLVS
Technical Chlordane
Stock 10 0.10
TCMX/DCB Stock
10 0.010
Hexane 10
TCHLOR-2 Technical Chlordane
Stock 20 0.20
TCMX/DCB Stock
20 0.020
Hexane 10
TCHLOR-3 Technical Chlordane
Stock 40 0.40
TCMX/DCB Stock
50 0.050
Hexane 10
*TCHLOR-4
Technical Chlordane
Stock 80 0.80
TCMX/DCB Stock
100 0.10
Hexane 10
TCHLOR-5 Technical Chlordane
Stock 100 1.0
TCMX/DCB Stock
120 0.12
Hexane 10
PEM Working Standard
PEM Stock Solution
0.6 mL 0.15 NA NA NA Hexane 40
* Level used in 1 point calibration of multicomponent.
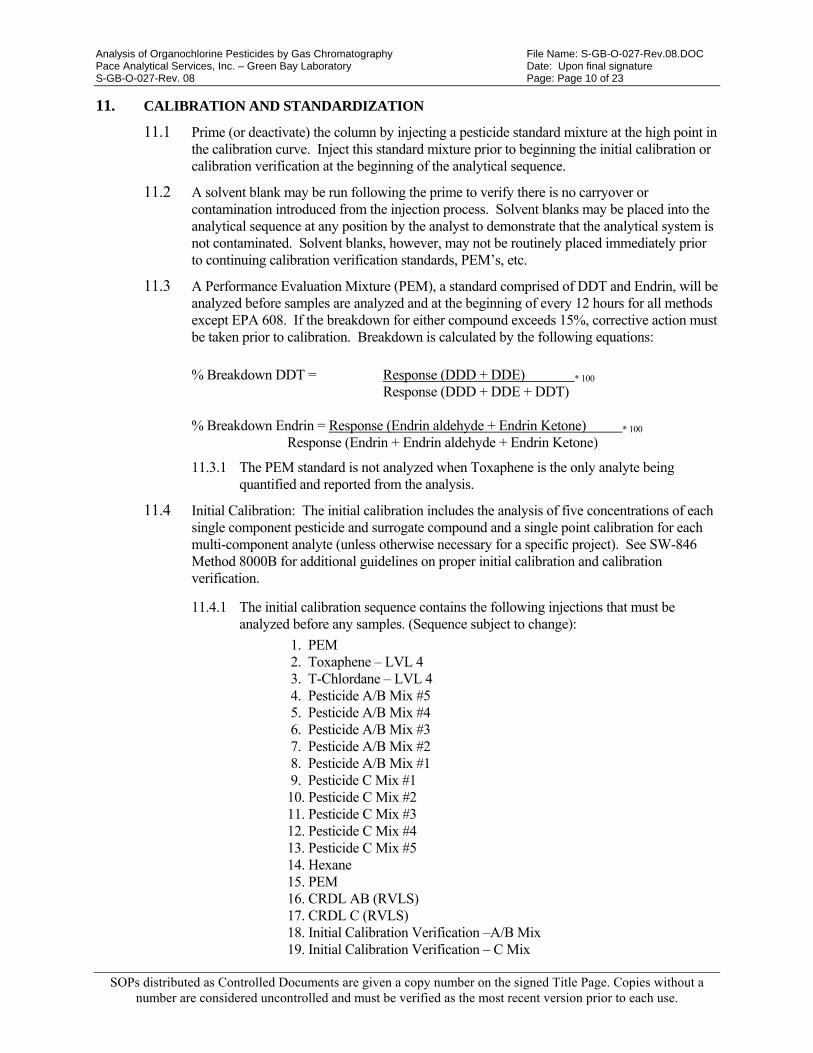
Analysis of Organochlorine Pesticides by Gas Chromatography File Name: S-GB-O-027-Rev.08.DOC Pace Analytical Services, Inc. – Green Bay Laboratory Date: Upon final signature S-GB-O-027-Rev. 08 Page: Page 10 of 23
SOPs distributed as Controlled Documents are given a copy number on the signed Title Page. Copies without a number are considered uncontrolled and must be verified as the most recent version prior to each use.
11. CALIBRATION AND STANDARDIZATION
11.1 Prime (or deactivate) the column by injecting a pesticide standard mixture at the high point in the calibration curve. Inject this standard mixture prior to beginning the initial calibration or calibration verification at the beginning of the analytical sequence.
11.2 A solvent blank may be run following the prime to verify there is no carryover or contamination introduced from the injection process. Solvent blanks may be placed into the analytical sequence at any position by the analyst to demonstrate that the analytical system is not contaminated. Solvent blanks, however, may not be routinely placed immediately prior to continuing calibration verification standards, PEM’s, etc.
11.3 A Performance Evaluation Mixture (PEM), a standard comprised of DDT and Endrin, will be analyzed before samples are analyzed and at the beginning of every 12 hours for all methods except EPA 608. If the breakdown for either compound exceeds 15%, corrective action must be taken prior to calibration. Breakdown is calculated by the following equations:
% Breakdown DDT = Response (DDD + DDE) * 100
Response (DDD + DDE + DDT)
% Breakdown Endrin = Response (Endrin aldehyde + Endrin Ketone) * 100 Response (Endrin + Endrin aldehyde + Endrin Ketone)
11.3.1 The PEM standard is not analyzed when Toxaphene is the only analyte being quantified and reported from the analysis.
11.4 Initial Calibration: The initial calibration includes the analysis of five concentrations of each single component pesticide and surrogate compound and a single point calibration for each multi-component analyte (unless otherwise necessary for a specific project). See SW-846 Method 8000B for additional guidelines on proper initial calibration and calibration verification.
11.4.1 The initial calibration sequence contains the following injections that must be analyzed before any samples. (Sequence subject to change):
1. PEM 2. Toxaphene – LVL 4 3. T-Chlordane – LVL 4 4. Pesticide A/B Mix #5 5. Pesticide A/B Mix #4 6. Pesticide A/B Mix #3 7. Pesticide A/B Mix #2 8. Pesticide A/B Mix #1 9. Pesticide C Mix #1 10. Pesticide C Mix #2 11. Pesticide C Mix #3 12. Pesticide C Mix #4 13. Pesticide C Mix #5 14. Hexane 15. PEM 16. CRDL AB (RVLS) 17. CRDL C (RVLS) 18. Initial Calibration Verification –A/B Mix 19. Initial Calibration Verification – C Mix
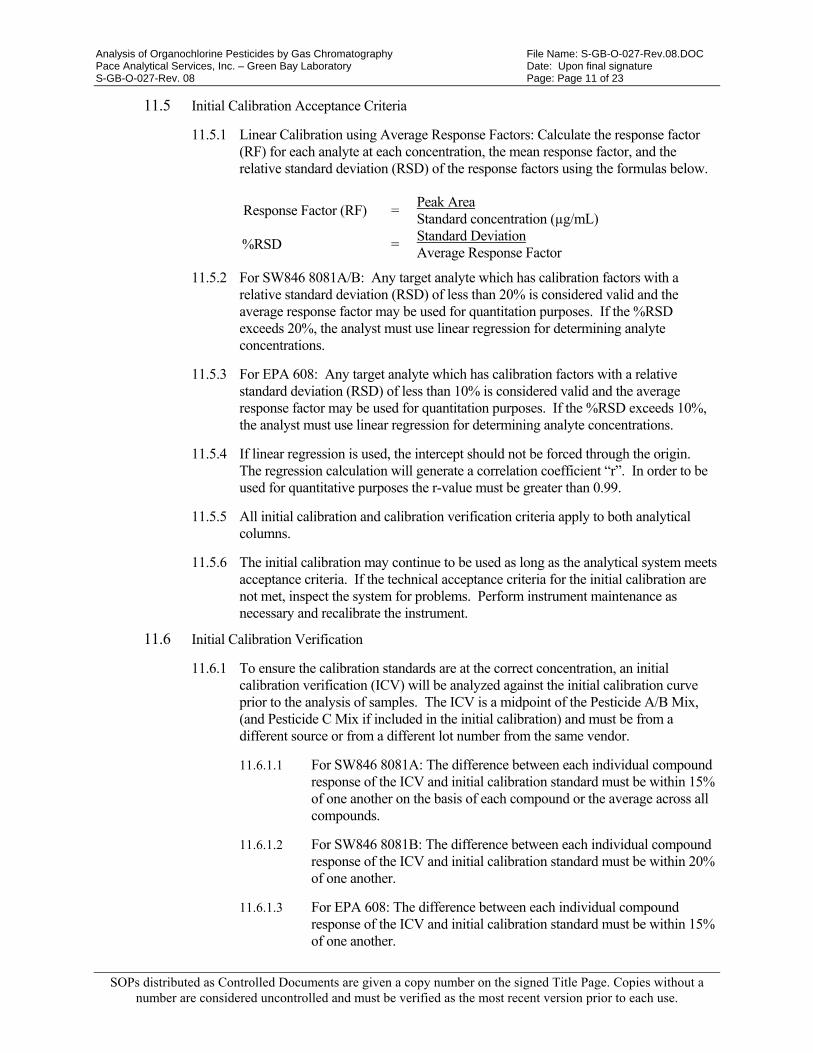
Analysis of Organochlorine Pesticides by Gas Chromatography File Name: S-GB-O-027-Rev.08.DOC Pace Analytical Services, Inc. – Green Bay Laboratory Date: Upon final signature S-GB-O-027-Rev. 08 Page: Page 11 of 23
SOPs distributed as Controlled Documents are given a copy number on the signed Title Page. Copies without a number are considered uncontrolled and must be verified as the most recent version prior to each use.
11.5 Initial Calibration Acceptance Criteria
11.5.1 Linear Calibration using Average Response Factors: Calculate the response factor (RF) for each analyte at each concentration, the mean response factor, and the relative standard deviation (RSD) of the response factors using the formulas below.
Response Factor (RF) = Peak Area Standard concentration (µg/mL)
%RSD = Standard Deviation Average Response Factor
11.5.2 For SW846 8081A/B: Any target analyte which has calibration factors with a relative standard deviation (RSD) of less than 20% is considered valid and the average response factor may be used for quantitation purposes. If the %RSD exceeds 20%, the analyst must use linear regression for determining analyte concentrations.
11.5.3 For EPA 608: Any target analyte which has calibration factors with a relative standard deviation (RSD) of less than 10% is considered valid and the average response factor may be used for quantitation purposes. If the %RSD exceeds 10%, the analyst must use linear regression for determining analyte concentrations.
11.5.4 If linear regression is used, the intercept should not be forced through the origin. The regression calculation will generate a correlation coefficient “r”. In order to be used for quantitative purposes the r-value must be greater than 0.99.
11.5.5 All initial calibration and calibration verification criteria apply to both analytical columns.
11.5.6 The initial calibration may continue to be used as long as the analytical system meets acceptance criteria. If the technical acceptance criteria for the initial calibration are not met, inspect the system for problems. Perform instrument maintenance as necessary and recalibrate the instrument.
11.6 Initial Calibration Verification
11.6.1 To ensure the calibration standards are at the correct concentration, an initial calibration verification (ICV) will be analyzed against the initial calibration curve prior to the analysis of samples. The ICV is a midpoint of the Pesticide A/B Mix, (and Pesticide C Mix if included in the initial calibration) and must be from a different source or from a different lot number from the same vendor.
11.6.1.1 For SW846 8081A: The difference between each individual compound response of the ICV and initial calibration standard must be within 15% of one another on the basis of each compound or the average across all compounds.
11.6.1.2 For SW846 8081B: The difference between each individual compound response of the ICV and initial calibration standard must be within 20% of one another.
11.6.1.3 For EPA 608: The difference between each individual compound response of the ICV and initial calibration standard must be within 15% of one another.
Analysis of Organochlorine Pesticides by Gas Chromatography File Name: S-GB-O-027-Rev.08.DOC Pace Analytical Services, Inc. – Green Bay Laboratory Date: Upon final signature S-GB-O-027-Rev. 08 Page: Page 12 of 23
SOPs distributed as Controlled Documents are given a copy number on the signed Title Page. Copies without a number are considered uncontrolled and must be verified as the most recent version prior to each use.
11.6.2 The injection of the first ICV begins the 12-hour clock in which samples may be analyzed.
11.7 Continuing Calibration Verification
11.7.1 Continuing Calibration Verification (CCV) will include the injection of the PEM standard, midpoint calibration checks of the Pesticide A/B Mix, and Pesticide C Mix if included in the sample analyte list.
11.7.2 A PEM and CCV must be analyzed every 12 hours or 20 samples, whichever is more frequent. It is recommended that calibration verification be performed after every 10 samples to minimize reruns due to calibration verification failure.
11.7.2.1 For SW846 8081A: The difference between each individual compound response of the CCV and initial calibration standard must be within 15% of one another on the basis of each compound or the average across all compounds.
11.7.2.2 For SW846 8081B: The difference between each individual compound response of the CCV and initial calibration standard must be within 20% of one another.
11.7.2.3 For EPA 608: The difference between each individual compound response of the CCV and initial calibration standard must be within 15% of one another.
11.7.3 Sample data is not acceptable unless bracketed by acceptable analyses of a CCV. Any samples not bracketed by an acceptable CCV must be reanalyzed. The ending PEM of a sequence may fail breakdown and samples can be reported.
11.8 Initial Calibration Verification and Continuing Calibration Verification Acceptance Criteria
11.8.1 The percent difference (%D) is determined for all analytes in the ICV/CCV. The individual compound %D must be within the above listed method criteria of the calibration curve for each analyte.
%D = R2 – R1 * 100
R2
Where: R1 = Theoretical Value
R2 = Calculated Amount
The analyst should verify that the software is using appropriate values for calculations.
11.8.2 If the acceptance criteria for the ICV is not met, inspect the gas chromatographic system for problems. Re-inject the standard; if acceptance criteria is not met, then a new initial calibration must be performed.
11.8.3 Results may be reported for CCV failures, biased high, if failed compounds are not detected in samples.
11.8.4 Any analyte, for any reason, not meeting the CCV acceptance criteria must be qualified, if reported to the client.
Analysis of Organochlorine Pesticides by Gas Chromatography File Name: S-GB-O-027-Rev.08.DOC Pace Analytical Services, Inc. – Green Bay Laboratory Date: Upon final signature S-GB-O-027-Rev. 08 Page: Page 13 of 23
SOPs distributed as Controlled Documents are given a copy number on the signed Title Page. Copies without a number are considered uncontrolled and must be verified as the most recent version prior to each use.
11.9 Retention Time Windows
11.9.1 Retention time windows are determined for all single and multi-components analytes.
11.9.1.1 Make at least four injections of all analytes of interest over a 72-hour period.
11.9.1.2 Record the retention time (RT) for each analyte, and selected peaks for multi-component analytes, to three decimal places. Calculate the mean and standard deviation for each peak.
11.9.1.3 The width of the retention time window is defined as + 3 standard deviations of the mean established. The minimum retention window will be + 0.030 minutes.
11.9.1.4 Establish the center of the RT window for each analyte and surrogate using the absolute RT from the calibration verification standard at the beginning of the analytical shift. Optionally, the initial calibration retention time windows may continue to be used as long as the method criteria are met. For samples run during the same shift as an initial calibration, use the RT of the mid-point standard in the initial calibration.
11.9.1.5 RT windows must be calculated on each column and instrument when a new GC column is installed. Additional guidance is provided in SW846 8000B.
11.9.2 The retention time of each analyte must fall within its respective retention time window for all standards. If not, the gas chromatographic system must be evaluated. Re-inject the standard; if not acceptable then a new calibration must be performed.
11.10 Reporting Limit Verification Standard (RVLS) – A standard prepared at the concentration of the Pace Reporting Limit. It is analyzed after the calibration and monthly thereafter. Recovery must be 60-140% of true value to be accepted. If outside the limits, reanalyze once. If still outside the limits, recalibrate.
12. PROCEDURE
12.1 Sample Analysis
12.1.1 For SW846 8081A/B a matrix spike/matrix spike duplicate must be prepared and analyzed at least once for each matrix type per every twenty samples. For EPA 608 a matrix spike/matrix spike duplicate must be prepared and analyzed at least once for each matrix type per every ten samples. The sample use for the MS/MSD pair is either determined by the client or selected at random from client samples as sample volume allows. If insufficient sample volume is available to perform a MS/MSD, a laboratory control spike and laboratory control spike duplicate will be used instead.
12.1.2 Analysis of a sample on both GC columns is required for all samples, blanks, matrix spikes, matrix spike duplicates and laboratory control samples.
12.1.3 The laboratory will identify and quantify peaks based on RT and the average calibration factor established during the initial calibration sequence.
Analysis of Organochlorine Pesticides by Gas Chromatography File Name: S-GB-O-027-Rev.08.DOC Pace Analytical Services, Inc. – Green Bay Laboratory Date: Upon final signature S-GB-O-027-Rev. 08 Page: Page 14 of 23
SOPs distributed as Controlled Documents are given a copy number on the signed Title Page. Copies without a number are considered uncontrolled and must be verified as the most recent version prior to each use.
12.1.4 The PEM and Continuing calibration verification are analyzed every 20 samples (not to exceed 12 hours) or less during an analytical sequence in order to monitor retention times, calibration factors, and column performance. (It is recommended that calibration verification be performed after every 10 samples to minimize reruns due to calibration verification failure.) Sample data can be collected only as long as the results for this standard fall within the defined limits. If two consecutive unacceptable standards are run, all extracts run since the previous acceptable standards must be reanalyzed. The ending PEM of the sequence is allowed to fail.
12.1.5 Failure to meet any of the criteria established in this method must be thoroughly documented, and technical justification for the validity of the data must be presented to the section supervisor.
12.2 Quantitation of Analytes
12.2.1 Analytes must be quantified with a laboratory data system. Peak area is the basis for quantitation.
12.2.2 Quantitation of single response pesticides and surrogate standards is performed using the column designated as the primary column. This column will generally be the RTX-CLP, however, the analyst may specify either column as the primary column. The primary column must be used unless there is a documented reason (i.e. interference) for using the confirmation column for quantitation.
12.2.2.1 The identification and quantification of peaks is based on RT and the average calibration factor established during the initial calibration sequence.
12.2.2.2 A tentative identification of an analyte occurs when a peak from a sample extract falls within the retention time window. Each tentative identification must be confirmed by a second GC column of dissimilar stationary phase.
12.2.2.3 Quantitation of multi-response analytes can be done this way. The analyst may choose 4 to 6 of the largest peaks for quantitation. The peaks chosen for quantitation should have minimal co-elution with other peaks in the chromatogram. Use each peak chosen in the standard to calculate a calibration factor for that peak. These calibration factors are then used to calculate the concentration of each corresponding peak in the sample chromatogram and the 4 to 6 resulting concentrations are averaged to provide the final result for the multi-response analyte in the sample.
Analysis of Organochlorine Pesticides by Gas Chromatography File Name: S-GB-O-027-Rev.08.DOC Pace Analytical Services, Inc. – Green Bay Laboratory Date: Upon final signature S-GB-O-027-Rev. 08 Page: Page 15 of 23
SOPs distributed as Controlled Documents are given a copy number on the signed Title Page. Copies without a number are considered uncontrolled and must be verified as the most recent version prior to each use.
13. QUALITY CONTROL
13.1 Method Blanks
13.1.1 Method blanks are an analyte-free matrix spiked with surrogate solution, extracted, and analyzed by the same procedure that is used with the associated samples.
13.1.1.1 In order to be acceptable, a method blank analysis cannot contain any of the analytes listed in this method above the reporting limit. All samples associated with a contaminated method blank must be re-extracted and reanalyzed unless the analyte concentration in the sample is greater than 20 times the amount found in the method blank, the analyte is not detected in the associated sample, or other approval is given directly by the supervisor.
13.1.2 The surrogate retention times must be within the retention time windows for both tetrachloro-m-xylene and decachlorbiphenyl. The surrogate recovery limits are established annually and distributed in the analytical laboratory. When surrogate recoveries in the method blank do not meet the recovery limits, the method blank is reanalyzed and/or the samples re-extracted.
13.2 Matrix Spike/Matrix Spike Duplicate
13.2.1 The analyte and surrogate retention times must be within the windows specified during the initial calibration or current continuing calibration.
13.2.2 The percent recovery and the relative percent difference between the recoveries of each of the compounds in the matrix spike samples will be calculated and reported by using the following equations:
Matrix Spike Recovery = SSR - SR x 100
SA Where: SSR = Spike sample result SR = Sample result SA = Spike added
RPD = |MSR - MSDR | x 100
1/2 (MSR + MSDR)
Where: RPD = Relative percent difference MSR = Matrix spike recovery MSDR = Matrix spike duplicate recovery
13.2.3 The limits for matrix spike/matrix spike duplicate compound recoveries and RPD limits are established and distributed in the analytical area. Failure to meet these limits requires corrective action by the laboratory in accordance with S-GB-Q-027 Corrective Action / Preventative Action Process, most current revision or replacement.
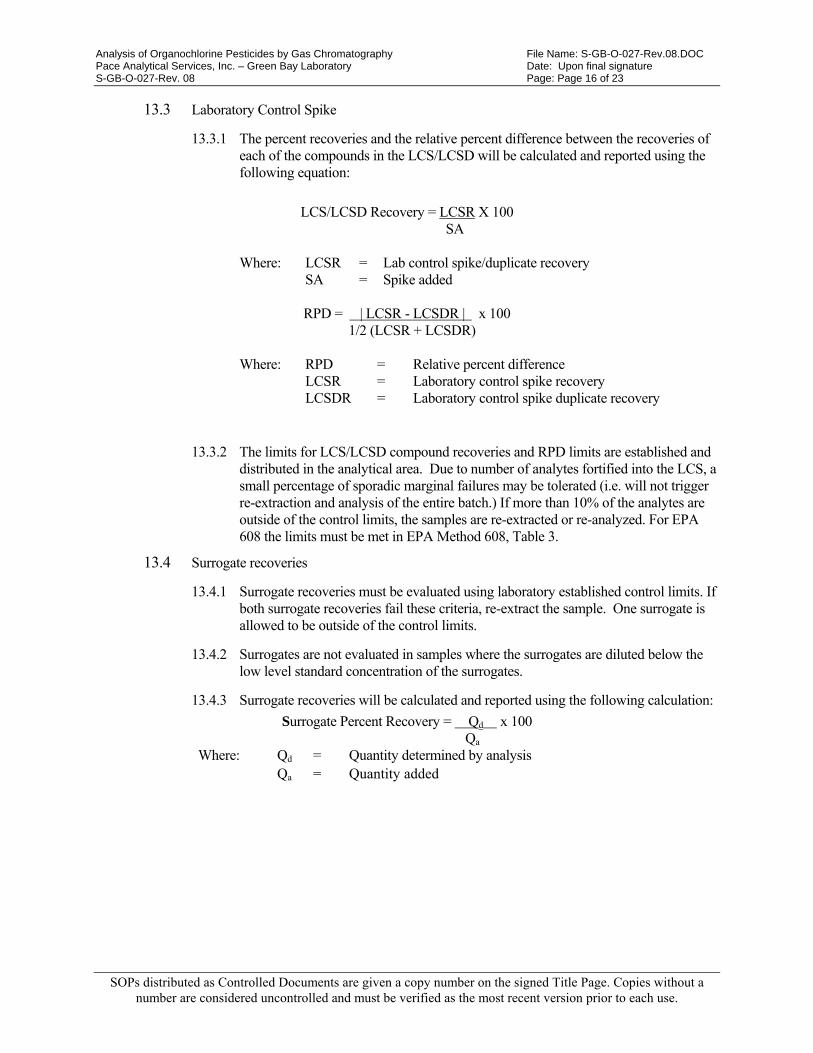
Analysis of Organochlorine Pesticides by Gas Chromatography File Name: S-GB-O-027-Rev.08.DOC Pace Analytical Services, Inc. – Green Bay Laboratory Date: Upon final signature S-GB-O-027-Rev. 08 Page: Page 16 of 23
SOPs distributed as Controlled Documents are given a copy number on the signed Title Page. Copies without a number are considered uncontrolled and must be verified as the most recent version prior to each use.
13.3 Laboratory Control Spike
13.3.1 The percent recoveries and the relative percent difference between the recoveries of each of the compounds in the LCS/LCSD will be calculated and reported using the following equation:
LCS/LCSD Recovery = LCSR X 100
SA
Where: LCSR = Lab control spike/duplicate recovery SA = Spike added
RPD = | LCSR - LCSDR | x 100
1/2 (LCSR + LCSDR)
Where: RPD = Relative percent difference LCSR = Laboratory control spike recovery LCSDR = Laboratory control spike duplicate recovery
13.3.2 The limits for LCS/LCSD compound recoveries and RPD limits are established and distributed in the analytical area. Due to number of analytes fortified into the LCS, a small percentage of sporadic marginal failures may be tolerated (i.e. will not trigger re-extraction and analysis of the entire batch.) If more than 10% of the analytes are outside of the control limits, the samples are re-extracted or re-analyzed. For EPA 608 the limits must be met in EPA Method 608, Table 3.
13.4 Surrogate recoveries
13.4.1 Surrogate recoveries must be evaluated using laboratory established control limits. If both surrogate recoveries fail these criteria, re-extract the sample. One surrogate is allowed to be outside of the control limits.
13.4.2 Surrogates are not evaluated in samples where the surrogates are diluted below the low level standard concentration of the surrogates.
13.4.3 Surrogate recoveries will be calculated and reported using the following calculation:
Surrogate Percent Recovery = Qd x 100 Qa
Where: Qd = Quantity determined by analysis Qa = Quantity added
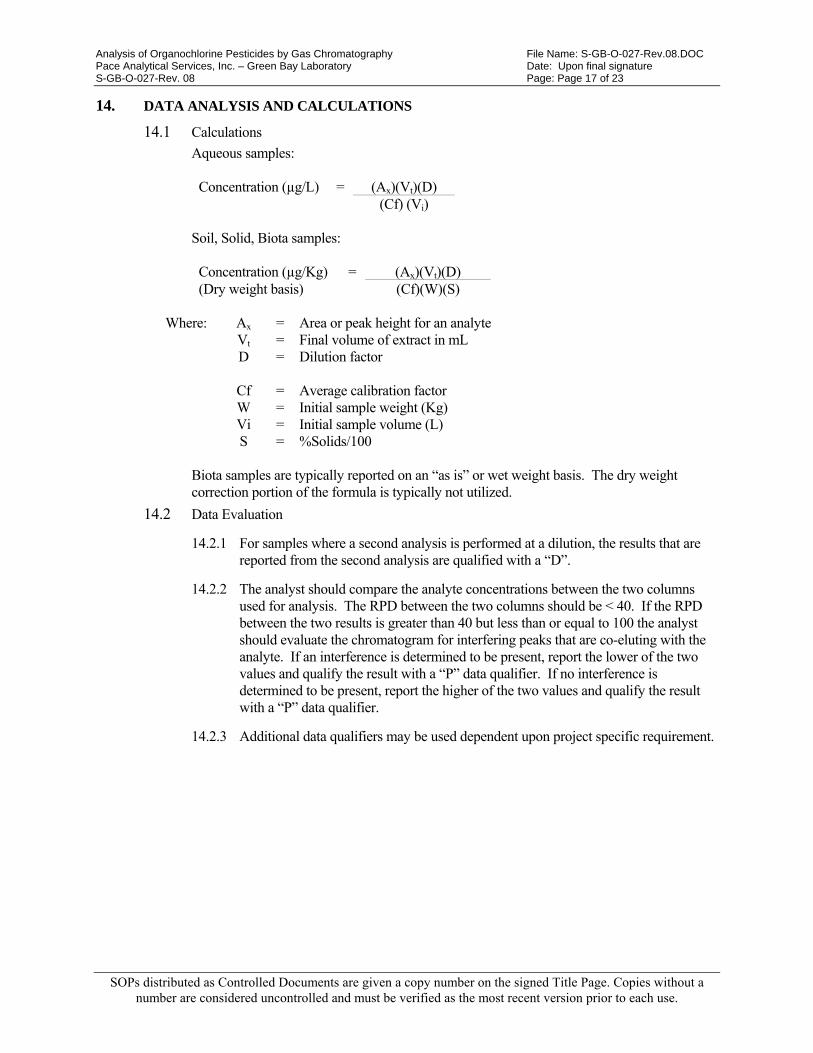
Analysis of Organochlorine Pesticides by Gas Chromatography File Name: S-GB-O-027-Rev.08.DOC Pace Analytical Services, Inc. – Green Bay Laboratory Date: Upon final signature S-GB-O-027-Rev. 08 Page: Page 17 of 23
SOPs distributed as Controlled Documents are given a copy number on the signed Title Page. Copies without a number are considered uncontrolled and must be verified as the most recent version prior to each use.
14. DATA ANALYSIS AND CALCULATIONS
14.1 Calculations
Aqueous samples:
Concentration (µg/L) = (Ax)(Vt)(D) (Cf) (Vi)
Soil, Solid, Biota samples:
Concentration (µg/Kg) = (Ax)(Vt)(D) (Dry weight basis) (Cf)(W)(S)
Where: Ax = Area or peak height for an analyte
Vt = Final volume of extract in mL D = Dilution factor
Cf = Average calibration factor W = Initial sample weight (Kg) Vi = Initial sample volume (L) S = %Solids/100
Biota samples are typically reported on an “as is” or wet weight basis. The dry weight correction portion of the formula is typically not utilized.
14.2 Data Evaluation
14.2.1 For samples where a second analysis is performed at a dilution, the results that are reported from the second analysis are qualified with a “D”.
14.2.2 The analyst should compare the analyte concentrations between the two columns used for analysis. The RPD between the two columns should be < 40. If the RPD between the two results is greater than 40 but less than or equal to 100 the analyst should evaluate the chromatogram for interfering peaks that are co-eluting with the analyte. If an interference is determined to be present, report the lower of the two values and qualify the result with a “P” data qualifier. If no interference is determined to be present, report the higher of the two values and qualify the result with a “P” data qualifier.
14.2.3 Additional data qualifiers may be used dependent upon project specific requirement.
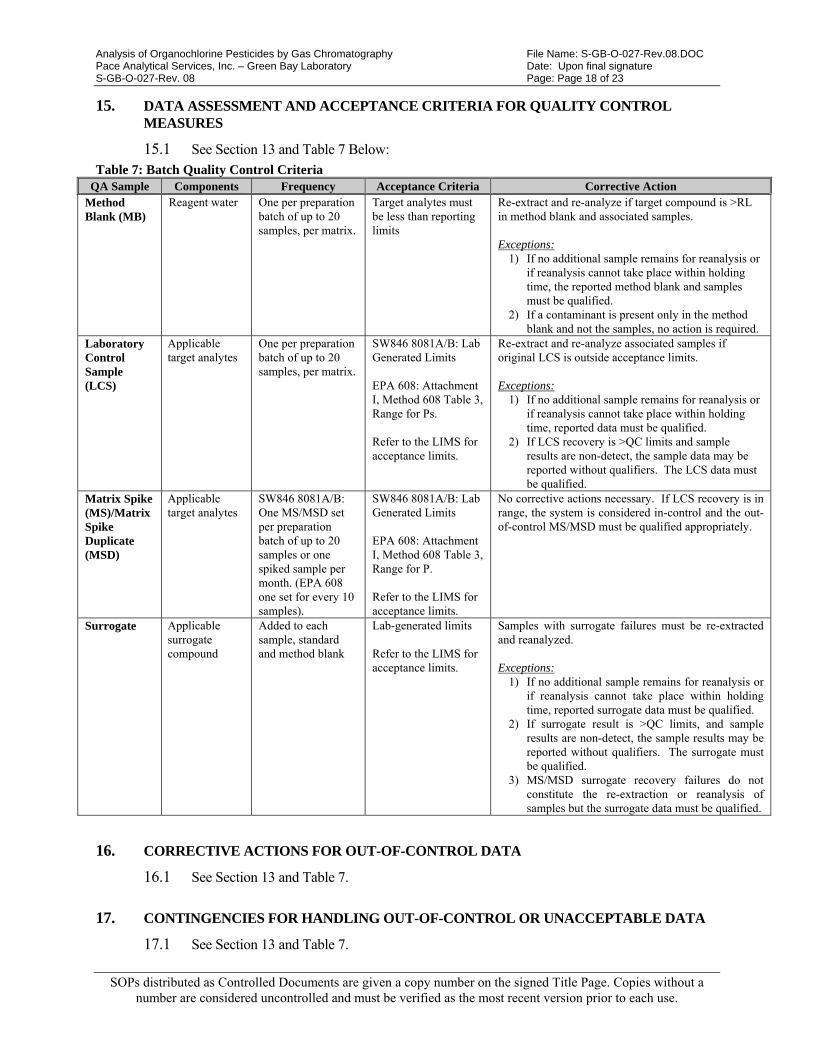
Analysis of Organochlorine Pesticides by Gas Chromatography File Name: S-GB-O-027-Rev.08.DOC Pace Analytical Services, Inc. – Green Bay Laboratory Date: Upon final signature S-GB-O-027-Rev. 08 Page: Page 18 of 23
SOPs distributed as Controlled Documents are given a copy number on the signed Title Page. Copies without a number are considered uncontrolled and must be verified as the most recent version prior to each use.
15. DATA ASSESSMENT AND ACCEPTANCE CRITERIA FOR QUALITY CONTROL MEASURES
15.1 See Section 13 and Table 7 Below: Table 7: Batch Quality Control Criteria
QA Sample Components Frequency Acceptance Criteria Corrective Action Method Blank (MB)
Reagent water One per preparation batch of up to 20 samples, per matrix.
Target analytes must be less than reporting limits
Re-extract and re-analyze if target compound is >RL in method blank and associated samples. Exceptions:
1) If no additional sample remains for reanalysis or if reanalysis cannot take place within holding time, the reported method blank and samples must be qualified.
2) If a contaminant is present only in the method blank and not the samples, no action is required.
Laboratory Control Sample (LCS)
Applicable target analytes
One per preparation batch of up to 20 samples, per matrix.
SW846 8081A/B: Lab Generated Limits EPA 608: Attachment I, Method 608 Table 3, Range for Ps. Refer to the LIMS for acceptance limits.
Re-extract and re-analyze associated samples if original LCS is outside acceptance limits. Exceptions:
1) If no additional sample remains for reanalysis or if reanalysis cannot take place within holding time, reported data must be qualified.
2) If LCS recovery is >QC limits and sample results are non-detect, the sample data may be reported without qualifiers. The LCS data must be qualified.
Matrix Spike (MS)/Matrix Spike Duplicate (MSD)
Applicable target analytes
SW846 8081A/B: One MS/MSD set per preparation batch of up to 20 samples or one spiked sample per month. (EPA 608 one set for every 10 samples).
SW846 8081A/B: Lab Generated Limits EPA 608: Attachment I, Method 608 Table 3, Range for P. Refer to the LIMS for acceptance limits.
No corrective actions necessary. If LCS recovery is in range, the system is considered in-control and the out-of-control MS/MSD must be qualified appropriately.
Surrogate Applicable surrogate compound
Added to each sample, standard and method blank
Lab-generated limits Refer to the LIMS for acceptance limits.
Samples with surrogate failures must be re-extracted and reanalyzed. Exceptions:
1) If no additional sample remains for reanalysis or if reanalysis cannot take place within holding time, reported surrogate data must be qualified.
2) If surrogate result is >QC limits, and sample results are non-detect, the sample results may be reported without qualifiers. The surrogate must be qualified.
3) MS/MSD surrogate recovery failures do not constitute the re-extraction or reanalysis of samples but the surrogate data must be qualified.
16. CORRECTIVE ACTIONS FOR OUT-OF-CONTROL DATA
16.1 See Section 13 and Table 7.
17. CONTINGENCIES FOR HANDLING OUT-OF-CONTROL OR UNACCEPTABLE DATA
17.1 See Section 13 and Table 7.
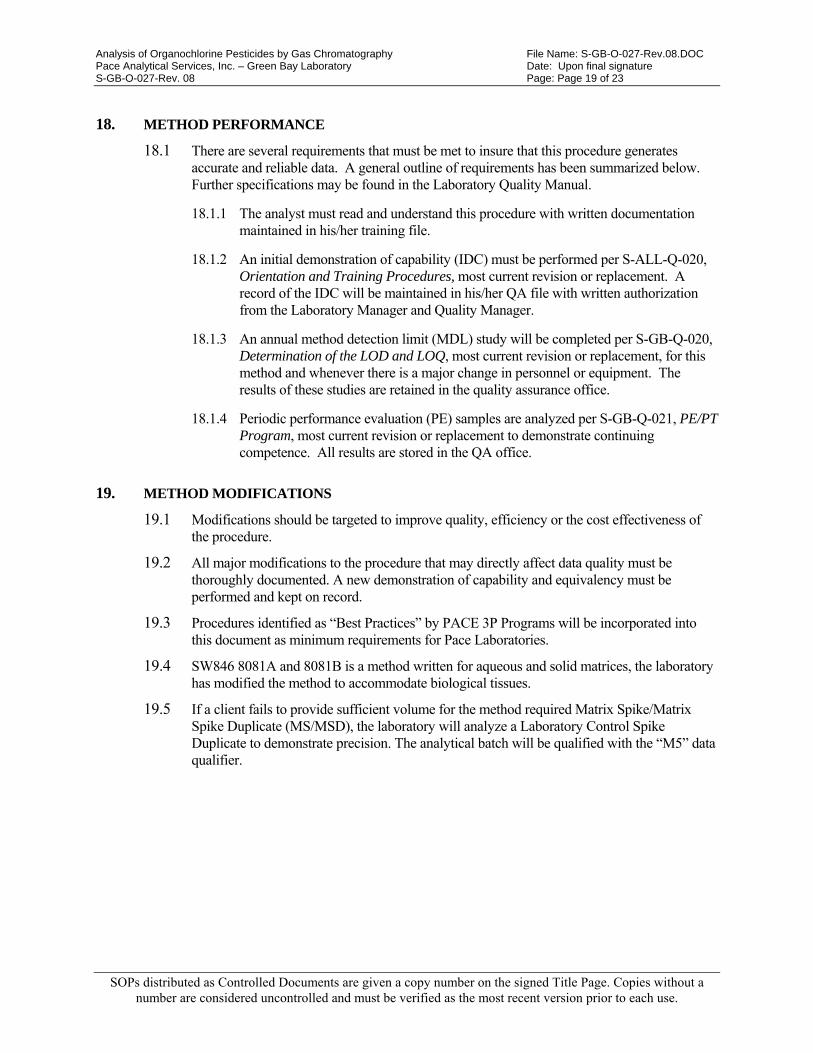
Analysis of Organochlorine Pesticides by Gas Chromatography File Name: S-GB-O-027-Rev.08.DOC Pace Analytical Services, Inc. – Green Bay Laboratory Date: Upon final signature S-GB-O-027-Rev. 08 Page: Page 19 of 23
SOPs distributed as Controlled Documents are given a copy number on the signed Title Page. Copies without a number are considered uncontrolled and must be verified as the most recent version prior to each use.
18. METHOD PERFORMANCE
18.1 There are several requirements that must be met to insure that this procedure generates accurate and reliable data. A general outline of requirements has been summarized below. Further specifications may be found in the Laboratory Quality Manual.
18.1.1 The analyst must read and understand this procedure with written documentation maintained in his/her training file.
18.1.2 An initial demonstration of capability (IDC) must be performed per S-ALL-Q-020, Orientation and Training Procedures, most current revision or replacement. A record of the IDC will be maintained in his/her QA file with written authorization from the Laboratory Manager and Quality Manager.
18.1.3 An annual method detection limit (MDL) study will be completed per S-GB-Q-020, Determination of the LOD and LOQ, most current revision or replacement, for this method and whenever there is a major change in personnel or equipment. The results of these studies are retained in the quality assurance office.
18.1.4 Periodic performance evaluation (PE) samples are analyzed per S-GB-Q-021, PE/PT Program, most current revision or replacement to demonstrate continuing competence. All results are stored in the QA office.
19. METHOD MODIFICATIONS
19.1 Modifications should be targeted to improve quality, efficiency or the cost effectiveness of the procedure.
19.2 All major modifications to the procedure that may directly affect data quality must be thoroughly documented. A new demonstration of capability and equivalency must be performed and kept on record.
19.3 Procedures identified as “Best Practices” by PACE 3P Programs will be incorporated into this document as minimum requirements for Pace Laboratories.
19.4 SW846 8081A and 8081B is a method written for aqueous and solid matrices, the laboratory has modified the method to accommodate biological tissues.
19.5 If a client fails to provide sufficient volume for the method required Matrix Spike/Matrix Spike Duplicate (MS/MSD), the laboratory will analyze a Laboratory Control Spike Duplicate to demonstrate precision. The analytical batch will be qualified with the “M5” data qualifier.
Analysis of Organochlorine Pesticides by Gas Chromatography File Name: S-GB-O-027-Rev.08.DOC Pace Analytical Services, Inc. – Green Bay Laboratory Date: Upon final signature S-GB-O-027-Rev. 08 Page: Page 20 of 23
SOPs distributed as Controlled Documents are given a copy number on the signed Title Page. Copies without a number are considered uncontrolled and must be verified as the most recent version prior to each use.
20. INSTRUMENT/EQUIPMENT MAINTENANCE
20.1 Any daily or periodic maintenance must be recorded in the instrument daily logbook. Additional information may be found in the most current revision of SOP: S-GB-Q-008, Preventative, Routine, and Non-routine Maintenance.
21. TROUBLESHOOTING
21.1 Please see the instrument operating manual for information on instrument troubleshooting.
22. SAFETY
22.1 Standards and Reagents - The toxicity and carcinogenicity of standards and reagents used in this method have not been fully defined. Each chemical compound should be treated as a potential health hazard. Reduce exposure by the use of gloves, lab coats and safety glasses. Standard solutions should be prepared in a hood.
22.2 Samples - Take precautions when handling samples. Samples should always be treated as potentially hazardous “unknowns”. The use of personal protective equipment (gloves, lab coats and safety glasses) is required when handling samples.
22.3 A reference file of Safety Data Sheets (SDS) is made available to all personnel involved in the chemical analysis, and is located at the front desk. A formal safety plan has been prepared and is distributed to all personnel with documented training.
23. WASTE MANAGEMENT
23.1 Excess reagents, samples and method process wastes are characterized and disposed of in an acceptable manner. For further information on waste management consult the current version of S-GB-W-001, Waste Management and Handling, most current revision or replacement.
24. POLLUTION PREVENTION
24.1 The quantity of chemicals purchased is based on expected usage during its shelf life and disposal cost of unused material. Actual reagent preparation volumes reflect anticipated usage and reagent stability.
24.2 The laboratory Chemical Hygiene Plan/Health and Safety Plan contains additional information on pollution prevention.
Analysis of Organochlorine Pesticides by Gas Chromatography File Name: S-GB-O-027-Rev.08.DOC Pace Analytical Services, Inc. – Green Bay Laboratory Date: Upon final signature S-GB-O-027-Rev. 08 Page: Page 21 of 23
SOPs distributed as Controlled Documents are given a copy number on the signed Title Page. Copies without a number are considered uncontrolled and must be verified as the most recent version prior to each use.
25. REFERENCES
25.1 Pace Quality Assurance Manual- most current version.
25.2 The NELAC Institute (TNI); Volume 1, Module 2, “Quality Systems”- most current version.
25.3 USEPA, SW-846, Method 8000C, Revision 3, March 2003.
25.4 USEPA, SW-846, Method 8081A, Revision 1, December 1996.
25.5 USEPA, SW-846, Method 8081B, Revision 2, February 2007
25.6 40CFR, Part 136, Appendix A, EPA Method 608.
25.7 S-GB-O-053 (most current revision or replacement), Separatory Funnel Extraction by SW846 3510C.
25.8 S-GB-O-054 (most current revision or replacement), Ultrasonic Extraction by SW846 3550B.
25.9 S-GB-O-031 (most current revision or replacement), Extraction of Biological Samples for Organochlorine Pesticides/PCBs.
25.10 S-GB-O-043 (most current revision or replacement), Extraction of Toxaphene Using Automated Soxhlet.
26. TABLES, DIAGRAMS, FLOWCHARTS, APPENDICES, ADDENDA, ETC.
26.1 Attachment I: EPA Method 608, Table 3.
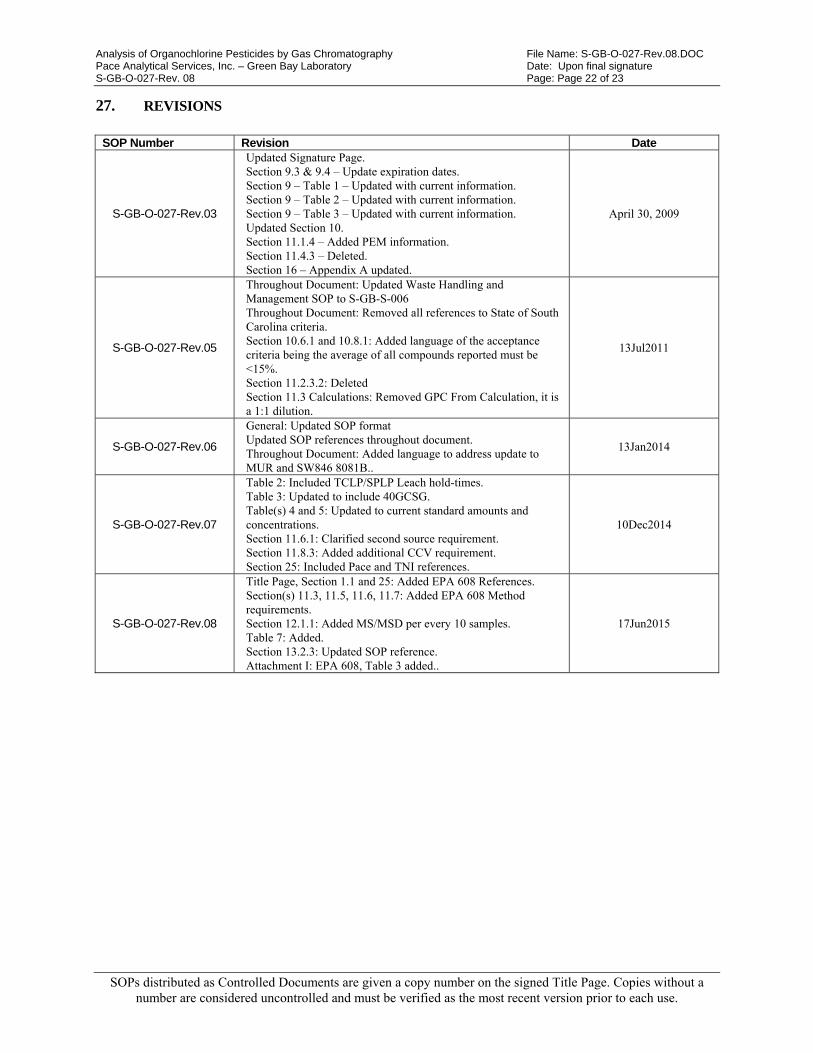
Analysis of Organochlorine Pesticides by Gas Chromatography File Name: S-GB-O-027-Rev.08.DOC Pace Analytical Services, Inc. – Green Bay Laboratory Date: Upon final signature S-GB-O-027-Rev. 08 Page: Page 22 of 23
SOPs distributed as Controlled Documents are given a copy number on the signed Title Page. Copies without a number are considered uncontrolled and must be verified as the most recent version prior to each use.
27. REVISIONS
SOP Number Revision Date
S-GB-O-027-Rev.03
Updated Signature Page. Section 9.3 & 9.4 – Update expiration dates. Section 9 – Table 1 – Updated with current information. Section 9 – Table 2 – Updated with current information. Section 9 – Table 3 – Updated with current information. Updated Section 10. Section 11.1.4 – Added PEM information. Section 11.4.3 – Deleted. Section 16 – Appendix A updated.
April 30, 2009
S-GB-O-027-Rev.05
Throughout Document: Updated Waste Handling and Management SOP to S-GB-S-006 Throughout Document: Removed all references to State of South Carolina criteria. Section 10.6.1 and 10.8.1: Added language of the acceptance criteria being the average of all compounds reported must be <15%. Section 11.2.3.2: Deleted Section 11.3 Calculations: Removed GPC From Calculation, it is a 1:1 dilution.
13Jul2011
S-GB-O-027-Rev.06
General: Updated SOP format Updated SOP references throughout document. Throughout Document: Added language to address update to MUR and SW846 8081B..
13Jan2014
S-GB-O-027-Rev.07
Table 2: Included TCLP/SPLP Leach hold-times. Table 3: Updated to include 40GCSG. Table(s) 4 and 5: Updated to current standard amounts and concentrations. Section 11.6.1: Clarified second source requirement. Section 11.8.3: Added additional CCV requirement. Section 25: Included Pace and TNI references.
10Dec2014
S-GB-O-027-Rev.08
Title Page, Section 1.1 and 25: Added EPA 608 References. Section(s) 11.3, 11.5, 11.6, 11.7: Added EPA 608 Method requirements. Section 12.1.1: Added MS/MSD per every 10 samples. Table 7: Added. Section 13.2.3: Updated SOP reference. Attachment I: EPA 608, Table 3 added..
17Jun2015
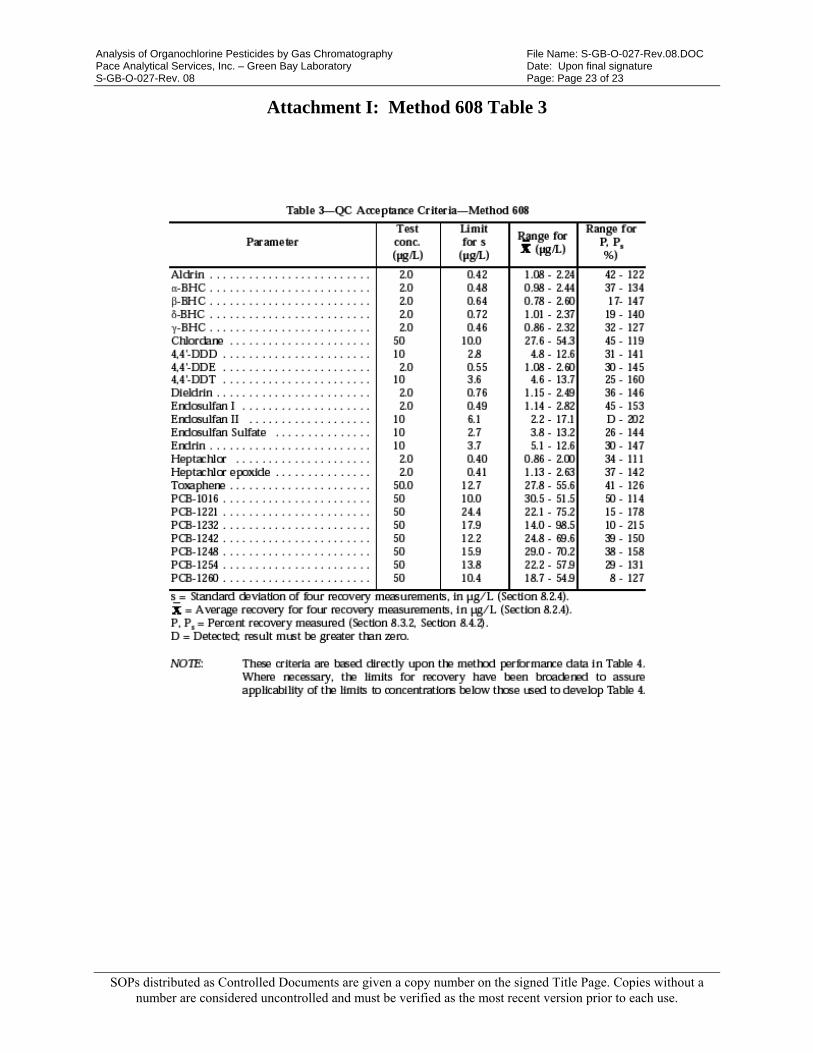
Analysis of Organochlorine Pesticides by Gas Chromatography File Name: S-GB-O-027-Rev.08.DOC Pace Analytical Services, Inc. – Green Bay Laboratory Date: Upon final signature S-GB-O-027-Rev. 08 Page: Page 23 of 23
SOPs distributed as Controlled Documents are given a copy number on the signed Title Page. Copies without a number are considered uncontrolled and must be verified as the most recent version prior to each use.
Attachment I: Method 608 Table 3
Pace Analytical Services, Inc. 1241Bellevue Street
Green Bay, WI 54302 www.pacelabs.com
Phone: 920 469 2436 Fax: 920 469 8827
SOPs distributed as Controlled Documents are given a copy number on the signed Title Page. Copies without a number are considered uncontrolled and must be verified as the most recent version prior to each use.
STANDARD OPERATING PROCEDURE
Analysis of Polychlorinated Biphenyls (PCBs) by Gas Chromatography by SW846-8082A and EPA Method 608
Reference Methods: SW-846 Method 8082A / EPA 608
SOP NUMBER: S-GB-O-047-REV.05
EFFECTIVE DATE: Date of Final Signature
SUPERSEDES: S-GB-O-047-REV.04
APPROVAL
__________________________________________ 07/02/15 Nils Melberg, Laboratory General Manager Date
__________________________________________ 6/18/15 Kate Grams, Laboratory Quality Manager Date
__________________________________________ 6/18/15 Chris Haase, Department Manager Date
PERIODIC REVIEW
SIGNATURES BELOW INDICATE NO CHANGES HAVE BEEN MADE SINCE APPROVAL.
Signature Title Date
Signature Title Date
Signature Title Date © 2002 – 2015 Pace Analytical Services, Inc. This Standard Operating Procedure may not be reproduced, in part or in full, without written consent of Pace Analytical Services, Inc. Whether distributed internally or as a “courtesy copy” to clients or regulatory agencies, this document is considered confidential and proprietary information. Any printed documents in use within a Pace Analytical Services, Inc. laboratory have been reviewed and approved by the persons listed on the cover page. They can only be deemed official if proper signatures are present
This is COPY# Distributed on by and is CONTROLLED or X UNCONTROLLED
SOPs distributed as Controlled Documents are given a copy number on the signed Title Page. Copies without a number are considered uncontrolled and must be verified as the most recent version prior to each use.
S-GB-O-047-REV.05
Table of Contents
Section Page 1. PURPOSE ........................................................................................................................................... 3
2. SUMMARY OF METHOD ............................................................................................................... 3
3. SCOPE AND APPLICATION .......................................................................................................... 3
4. APPLICABLE MATRICIES ............................................................................................................ 3
5. LIMITS OF DETECTION AND QUANTITATION ...................................................................... 4
6. INTERFERENCES ............................................................................................................................ 4
7. SAMPLE COLLECTION, PRESERVATION, SHIPMENT AND STORAGE .......................... 5
8. DEFINITIONS ................................................................................................................................... 5
9. EQUIPMENT AND SUPPLIES ....................................................................................................... 5
10. REAGENTS AND STANDARDS ................................................................................................ 6
11. CALIBRATION AND STANDARDIZATION ......................................................................... 10
12. PROCEDURE .............................................................................................................................. 13
13. QUALITY CONTROL ................................................................................................................ 15
14. DATA ANALYSIS AND CALCULATIONS ............................................................................ 17
15. DATA ASSESSMENT AND ACCEPTANCE CRITERIA FOR QUALITY CONTROL MEASURES ........... 19
16. CORRECTIVE ACTIONS FOR OUT-OF-CONTROL DATA .............................................. 20
17. CONTINGENCIES FOR HANDLING OUT-OF-CONTROL OR UNACCEPTABLE DATA ........ 20
18. METHOD PERFORMANCE ..................................................................................................... 20
19. METHOD MODIFICATIONS ................................................................................................... 21
20. INSTRUMENT/EQUIPMENT MAINTENANCE ................................................................... 21
21. TROUBLESHOOTING .............................................................................................................. 21
22. SAFETY ........................................................................................................................................ 21
23. WASTE MANAGEMENT .......................................................................................................... 22
24. POLLUTION PREVENTION .................................................................................................... 22
25. REFERENCES ............................................................................................................................. 22
26. TABLES, DIAGRAMS, FLOWCHARTS, APPENDICES, ADDENDA ETC. ..................... 23
27. REVISIONS ................................................................................................................................. 24
Pace Analytical Services, Inc. – Green Bay Laboratory File: S-GB-O-047-REV.05.doc Analysis of PCBs by GC by SW846-8082A Date: Upon final signature S-GB-O-047-REV.05 Page 3 of 25
SOPs distributed as Controlled Documents are given a copy number on the signed Title Page. Copies without a number are considered uncontrolled and must be verified as the most recent version prior to each use.
1. PURPOSE
The purpose of this Standard Operating Procedure (SOP) is to determine the concentration of PCBs in water, soil, sediment, waste, and biological samples in accordance with SW846 Method 8082A / EPA 608. Samples for analysis are prepared by SW846 Method 3510C, 3540C, 3541, and 3580A. See Section 25 for list of reference SOPs.
2. SUMMARY OF METHOD
2.1 Sample extracts are prepared for analysis by the appropriate sample preparation method. The procedures for extract preparation are described in separate SOPs. A volume of sample extract is injected into a GC and compounds in the effluent are detected by an ECD based on an operating program set up to achieve optimum separation and quantitation of target analytes.
2.2 Retention time windows, in combination with characteristic elution patterns from a dual-column analysis, are used in the identification of PCBs as Aroclors.
2.3 PCBs are quantified as Aroclor mixtures by comparison of their ECD response on a single column with a calibration curve(s) constructed from the response(s) of authentic standards.
2.4 Results are reported in parts per billion (µg/kg or µg/L). Soil and sediment sample results are corrected for moisture and reported on a dry weight basis. Biological results are reported based on wet weight, or “as is” basis
3. SCOPE AND APPLICATION
3.1 Personnel: This procedure is restricted to use by, or under the supervision of, analysts experienced in the use of gas chromatograph/electron capture detection (GC/ECD) systems and interpretation of complex chromatograms. Each analyst must demonstrate the capability to generate acceptable results with this method to be considered qualified to report sample results.
3.2 Parameters: A list of the Aroclors routinely analyzed, their CAS numbers and Pace Reporting Levels (PRLs) are shown in Section 5, Table 1. PRLs are subject to change based on current analytical system performance and actual sample matrices.
4. APPLICABLE MATRICIES
4.1 This method is used to determine the concentration of PCBs in extracts prepared from water, soil, sediment, waste, and biological samples.
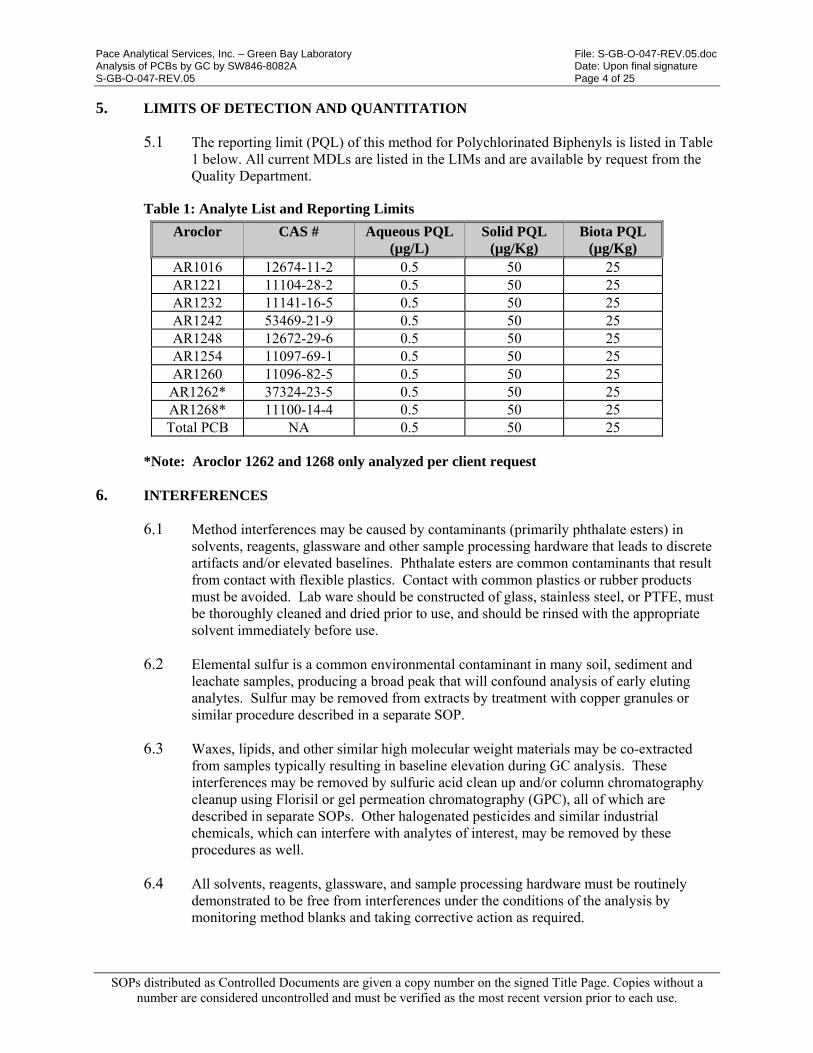
Pace Analytical Services, Inc. – Green Bay Laboratory File: S-GB-O-047-REV.05.doc Analysis of PCBs by GC by SW846-8082A Date: Upon final signature S-GB-O-047-REV.05 Page 4 of 25
SOPs distributed as Controlled Documents are given a copy number on the signed Title Page. Copies without a number are considered uncontrolled and must be verified as the most recent version prior to each use.
5. LIMITS OF DETECTION AND QUANTITATION
5.1 The reporting limit (PQL) of this method for Polychlorinated Biphenyls is listed in Table 1 below. All current MDLs are listed in the LIMs and are available by request from the Quality Department.
Table 1: Analyte List and Reporting Limits
Aroclor CAS # Aqueous PQL (µg/L)
Solid PQL (µg/Kg)
Biota PQL (µg/Kg)
AR1016 12674-11-2 0.5 50 25 AR1221 11104-28-2 0.5 50 25 AR1232 11141-16-5 0.5 50 25 AR1242 53469-21-9 0.5 50 25 AR1248 12672-29-6 0.5 50 25 AR1254 11097-69-1 0.5 50 25 AR1260 11096-82-5 0.5 50 25
AR1262* 37324-23-5 0.5 50 25 AR1268* 11100-14-4 0.5 50 25 Total PCB NA 0.5 50 25
*Note: Aroclor 1262 and 1268 only analyzed per client request
6. INTERFERENCES
6.1 Method interferences may be caused by contaminants (primarily phthalate esters) in solvents, reagents, glassware and other sample processing hardware that leads to discrete artifacts and/or elevated baselines. Phthalate esters are common contaminants that result from contact with flexible plastics. Contact with common plastics or rubber products must be avoided. Lab ware should be constructed of glass, stainless steel, or PTFE, must be thoroughly cleaned and dried prior to use, and should be rinsed with the appropriate solvent immediately before use.
6.2 Elemental sulfur is a common environmental contaminant in many soil, sediment and leachate samples, producing a broad peak that will confound analysis of early eluting analytes. Sulfur may be removed from extracts by treatment with copper granules or similar procedure described in a separate SOP.
6.3 Waxes, lipids, and other similar high molecular weight materials may be co-extracted from samples typically resulting in baseline elevation during GC analysis. These interferences may be removed by sulfuric acid clean up and/or column chromatography cleanup using Florisil or gel permeation chromatography (GPC), all of which are described in separate SOPs. Other halogenated pesticides and similar industrial chemicals, which can interfere with analytes of interest, may be removed by these procedures as well.
6.4 All solvents, reagents, glassware, and sample processing hardware must be routinely demonstrated to be free from interferences under the conditions of the analysis by monitoring method blanks and taking corrective action as required.
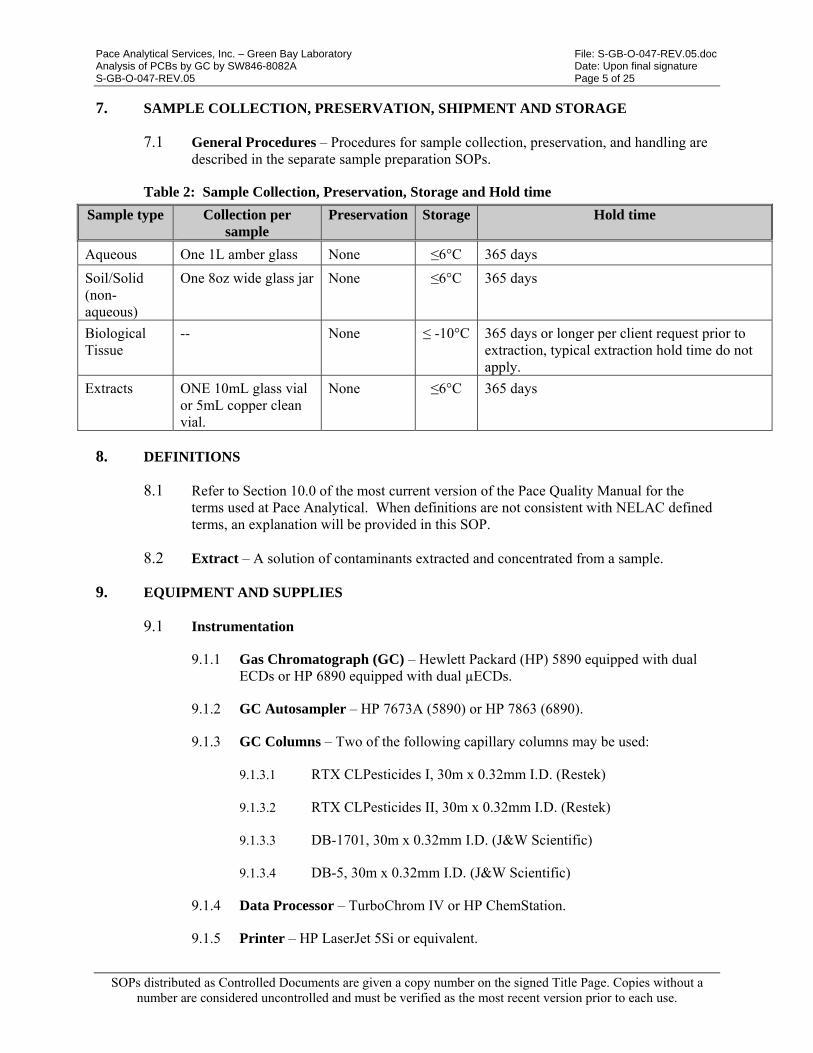
Pace Analytical Services, Inc. – Green Bay Laboratory File: S-GB-O-047-REV.05.doc Analysis of PCBs by GC by SW846-8082A Date: Upon final signature S-GB-O-047-REV.05 Page 5 of 25
SOPs distributed as Controlled Documents are given a copy number on the signed Title Page. Copies without a number are considered uncontrolled and must be verified as the most recent version prior to each use.
7. SAMPLE COLLECTION, PRESERVATION, SHIPMENT AND STORAGE
7.1 General Procedures – Procedures for sample collection, preservation, and handling are described in the separate sample preparation SOPs.
Table 2: Sample Collection, Preservation, Storage and Hold time
Sample type Collection per sample
Preservation Storage Hold time
Aqueous One 1L amber glass None ≤6°C 365 days
Soil/Solid (non-aqueous)
One 8oz wide glass jar None ≤6°C 365 days
Biological Tissue
-- None ≤ -10°C 365 days or longer per client request prior to extraction, typical extraction hold time do not apply.
Extracts ONE 10mL glass vial or 5mL copper clean vial.
None ≤6°C 365 days
8. DEFINITIONS
8.1 Refer to Section 10.0 of the most current version of the Pace Quality Manual for the terms used at Pace Analytical. When definitions are not consistent with NELAC defined terms, an explanation will be provided in this SOP.
8.2 Extract – A solution of contaminants extracted and concentrated from a sample.
9. EQUIPMENT AND SUPPLIES
9.1 Instrumentation
9.1.1 Gas Chromatograph (GC) – Hewlett Packard (HP) 5890 equipped with dual ECDs or HP 6890 equipped with dual µECDs.
9.1.2 GC Autosampler – HP 7673A (5890) or HP 7863 (6890).
9.1.3 GC Columns – Two of the following capillary columns may be used:
9.1.3.1 RTX CLPesticides I, 30m x 0.32mm I.D. (Restek)
9.1.3.2 RTX CLPesticides II, 30m x 0.32mm I.D. (Restek)
9.1.3.3 DB-1701, 30m x 0.32mm I.D. (J&W Scientific)
9.1.3.4 DB-5, 30m x 0.32mm I.D. (J&W Scientific)
9.1.4 Data Processor – TurboChrom IV or HP ChemStation.
9.1.5 Printer – HP LaserJet 5Si or equivalent.
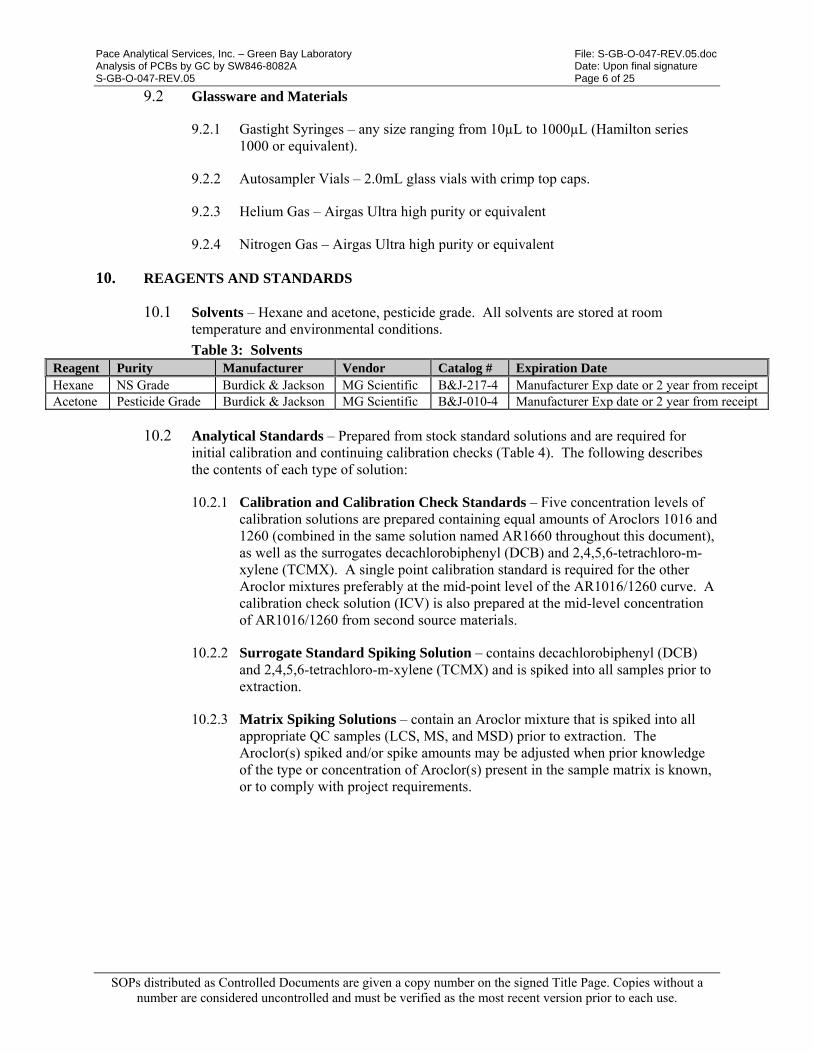
Pace Analytical Services, Inc. – Green Bay Laboratory File: S-GB-O-047-REV.05.doc Analysis of PCBs by GC by SW846-8082A Date: Upon final signature S-GB-O-047-REV.05 Page 6 of 25
SOPs distributed as Controlled Documents are given a copy number on the signed Title Page. Copies without a number are considered uncontrolled and must be verified as the most recent version prior to each use.
9.2 Glassware and Materials
9.2.1 Gastight Syringes – any size ranging from 10µL to 1000µL (Hamilton series 1000 or equivalent).
9.2.2 Autosampler Vials – 2.0mL glass vials with crimp top caps.
9.2.3 Helium Gas – Airgas Ultra high purity or equivalent
9.2.4 Nitrogen Gas – Airgas Ultra high purity or equivalent
10. REAGENTS AND STANDARDS
10.1 Solvents – Hexane and acetone, pesticide grade. All solvents are stored at room temperature and environmental conditions.
Table 3: Solvents Reagent Purity Manufacturer Vendor Catalog # Expiration Date Hexane NS Grade Burdick & Jackson MG Scientific B&J-217-4 Manufacturer Exp date or 2 year from receipt Acetone Pesticide Grade Burdick & Jackson MG Scientific B&J-010-4 Manufacturer Exp date or 2 year from receipt
10.2 Analytical Standards – Prepared from stock standard solutions and are required for initial calibration and continuing calibration checks (Table 4). The following describes the contents of each type of solution:
10.2.1 Calibration and Calibration Check Standards – Five concentration levels of calibration solutions are prepared containing equal amounts of Aroclors 1016 and 1260 (combined in the same solution named AR1660 throughout this document), as well as the surrogates decachlorobiphenyl (DCB) and 2,4,5,6-tetrachloro-m-xylene (TCMX). A single point calibration standard is required for the other Aroclor mixtures preferably at the mid-point level of the AR1016/1260 curve. A calibration check solution (ICV) is also prepared at the mid-level concentration of AR1016/1260 from second source materials.
10.2.2 Surrogate Standard Spiking Solution – contains decachlorobiphenyl (DCB) and 2,4,5,6-tetrachloro-m-xylene (TCMX) and is spiked into all samples prior to extraction.
10.2.3 Matrix Spiking Solutions – contain an Aroclor mixture that is spiked into all appropriate QC samples (LCS, MS, and MSD) prior to extraction. The Aroclor(s) spiked and/or spike amounts may be adjusted when prior knowledge of the type or concentration of Aroclor(s) present in the sample matrix is known, or to comply with project requirements.
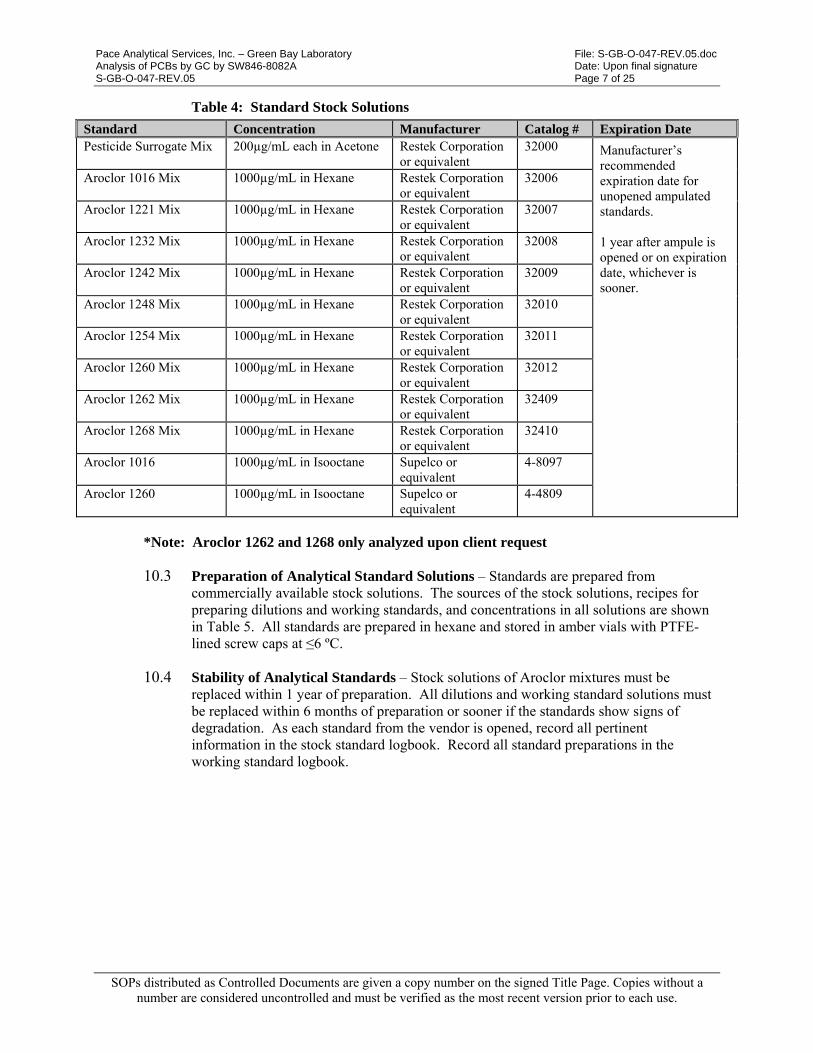
Pace Analytical Services, Inc. – Green Bay Laboratory File: S-GB-O-047-REV.05.doc Analysis of PCBs by GC by SW846-8082A Date: Upon final signature S-GB-O-047-REV.05 Page 7 of 25
SOPs distributed as Controlled Documents are given a copy number on the signed Title Page. Copies without a number are considered uncontrolled and must be verified as the most recent version prior to each use.
Table 4: Standard Stock Solutions
Standard Concentration Manufacturer Catalog # Expiration Date Pesticide Surrogate Mix 200µg/mL each in Acetone Restek Corporation
or equivalent 32000 Manufacturer’s
recommended expiration date for unopened ampulated standards. 1 year after ampule is opened or on expiration date, whichever is sooner.
Aroclor 1016 Mix 1000µg/mL in Hexane Restek Corporation or equivalent
32006
Aroclor 1221 Mix 1000µg/mL in Hexane Restek Corporation or equivalent
32007
Aroclor 1232 Mix 1000µg/mL in Hexane Restek Corporation or equivalent
32008
Aroclor 1242 Mix 1000µg/mL in Hexane Restek Corporation or equivalent
32009
Aroclor 1248 Mix 1000µg/mL in Hexane Restek Corporation or equivalent
32010
Aroclor 1254 Mix 1000µg/mL in Hexane Restek Corporation or equivalent
32011
Aroclor 1260 Mix 1000µg/mL in Hexane Restek Corporation or equivalent
32012
Aroclor 1262 Mix 1000µg/mL in Hexane Restek Corporation or equivalent
32409
Aroclor 1268 Mix 1000µg/mL in Hexane Restek Corporation or equivalent
32410
Aroclor 1016 1000µg/mL in Isooctane Supelco or equivalent
4-8097
Aroclor 1260 1000µg/mL in Isooctane Supelco or equivalent
4-4809
*Note: Aroclor 1262 and 1268 only analyzed upon client request
10.3 Preparation of Analytical Standard Solutions – Standards are prepared from commercially available stock solutions. The sources of the stock solutions, recipes for preparing dilutions and working standards, and concentrations in all solutions are shown in Table 5. All standards are prepared in hexane and stored in amber vials with PTFE-lined screw caps at ≤6 ºC.
10.4 Stability of Analytical Standards – Stock solutions of Aroclor mixtures must be replaced within 1 year of preparation. All dilutions and working standard solutions must be replaced within 6 months of preparation or sooner if the standards show signs of degradation. As each standard from the vendor is opened, record all pertinent information in the stock standard logbook. Record all standard preparations in the working standard logbook.
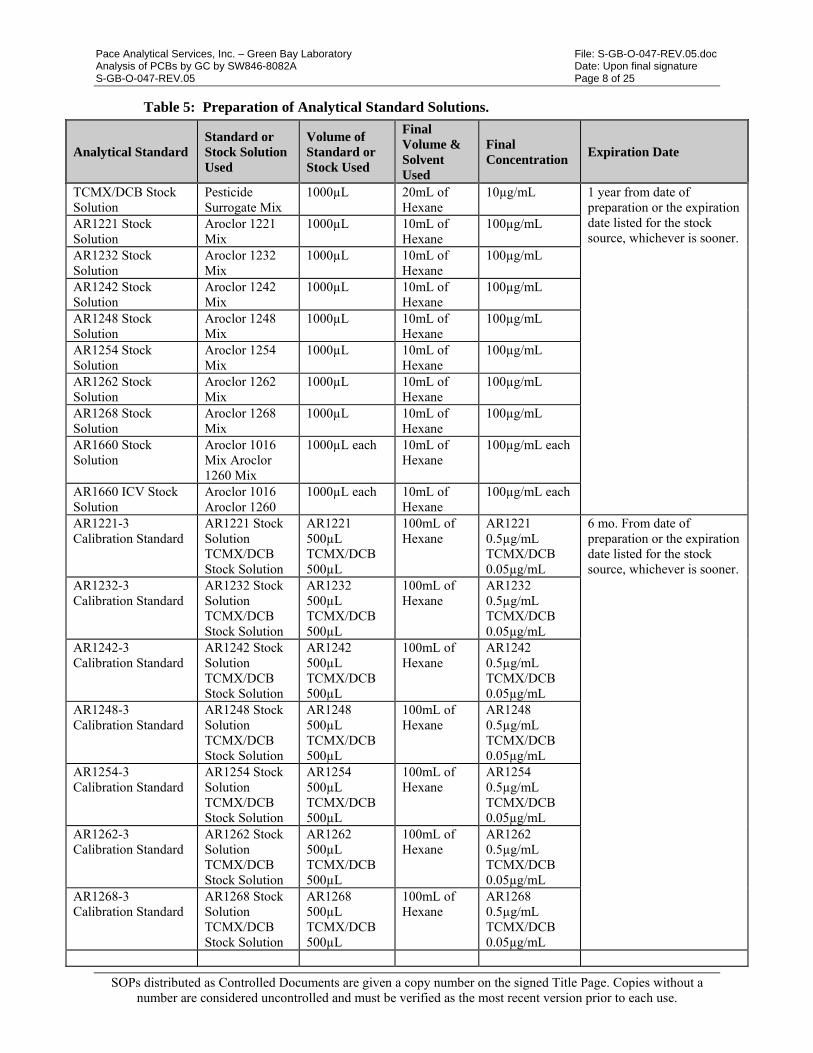
Pace Analytical Services, Inc. – Green Bay Laboratory File: S-GB-O-047-REV.05.doc Analysis of PCBs by GC by SW846-8082A Date: Upon final signature S-GB-O-047-REV.05 Page 8 of 25
SOPs distributed as Controlled Documents are given a copy number on the signed Title Page. Copies without a number are considered uncontrolled and must be verified as the most recent version prior to each use.
Table 5: Preparation of Analytical Standard Solutions.
Analytical Standard Standard or Stock Solution Used
Volume of Standard or Stock Used
Final Volume & Solvent Used
Final Concentration
Expiration Date
TCMX/DCB Stock Solution
Pesticide Surrogate Mix
1000µL 20mL of Hexane
10µg/mL 1 year from date of preparation or the expiration date listed for the stock source, whichever is sooner.
AR1221 Stock Solution
Aroclor 1221 Mix
1000µL 10mL of Hexane
100µg/mL
AR1232 Stock Solution
Aroclor 1232 Mix
1000µL 10mL of Hexane
100µg/mL
AR1242 Stock Solution
Aroclor 1242 Mix
1000µL 10mL of Hexane
100µg/mL
AR1248 Stock Solution
Aroclor 1248 Mix
1000µL 10mL of Hexane
100µg/mL
AR1254 Stock Solution
Aroclor 1254 Mix
1000µL 10mL of Hexane
100µg/mL
AR1262 Stock Solution
Aroclor 1262 Mix
1000µL 10mL of Hexane
100µg/mL
AR1268 Stock Solution
Aroclor 1268 Mix
1000µL 10mL of Hexane
100µg/mL
AR1660 Stock Solution
Aroclor 1016 Mix Aroclor 1260 Mix
1000µL each 10mL of Hexane
100µg/mL each
AR1660 ICV Stock Solution
Aroclor 1016 Aroclor 1260
1000µL each 10mL of Hexane
100µg/mL each
AR1221-3 Calibration Standard
AR1221 Stock Solution TCMX/DCB Stock Solution
AR1221 500µL TCMX/DCB 500µL
100mL of Hexane
AR1221 0.5µg/mL TCMX/DCB 0.05µg/mL
6 mo. From date of preparation or the expiration date listed for the stock source, whichever is sooner.
AR1232-3 Calibration Standard
AR1232 Stock Solution TCMX/DCB Stock Solution
AR1232 500µL TCMX/DCB 500µL
100mL of Hexane
AR1232 0.5µg/mL TCMX/DCB 0.05µg/mL
AR1242-3 Calibration Standard
AR1242 Stock Solution TCMX/DCB Stock Solution
AR1242 500µL TCMX/DCB 500µL
100mL of Hexane
AR1242 0.5µg/mL TCMX/DCB 0.05µg/mL
AR1248-3 Calibration Standard
AR1248 Stock Solution TCMX/DCB Stock Solution
AR1248 500µL TCMX/DCB 500µL
100mL of Hexane
AR1248 0.5µg/mL TCMX/DCB 0.05µg/mL
AR1254-3 Calibration Standard
AR1254 Stock Solution TCMX/DCB Stock Solution
AR1254 500µL TCMX/DCB 500µL
100mL of Hexane
AR1254 0.5µg/mL TCMX/DCB 0.05µg/mL
AR1262-3 Calibration Standard
AR1262 Stock Solution TCMX/DCB Stock Solution
AR1262 500µL TCMX/DCB 500µL
100mL of Hexane
AR1262 0.5µg/mL TCMX/DCB 0.05µg/mL
AR1268-3 Calibration Standard
AR1268 Stock Solution TCMX/DCB Stock Solution
AR1268 500µL TCMX/DCB 500µL
100mL of Hexane
AR1268 0.5µg/mL TCMX/DCB 0.05µg/mL
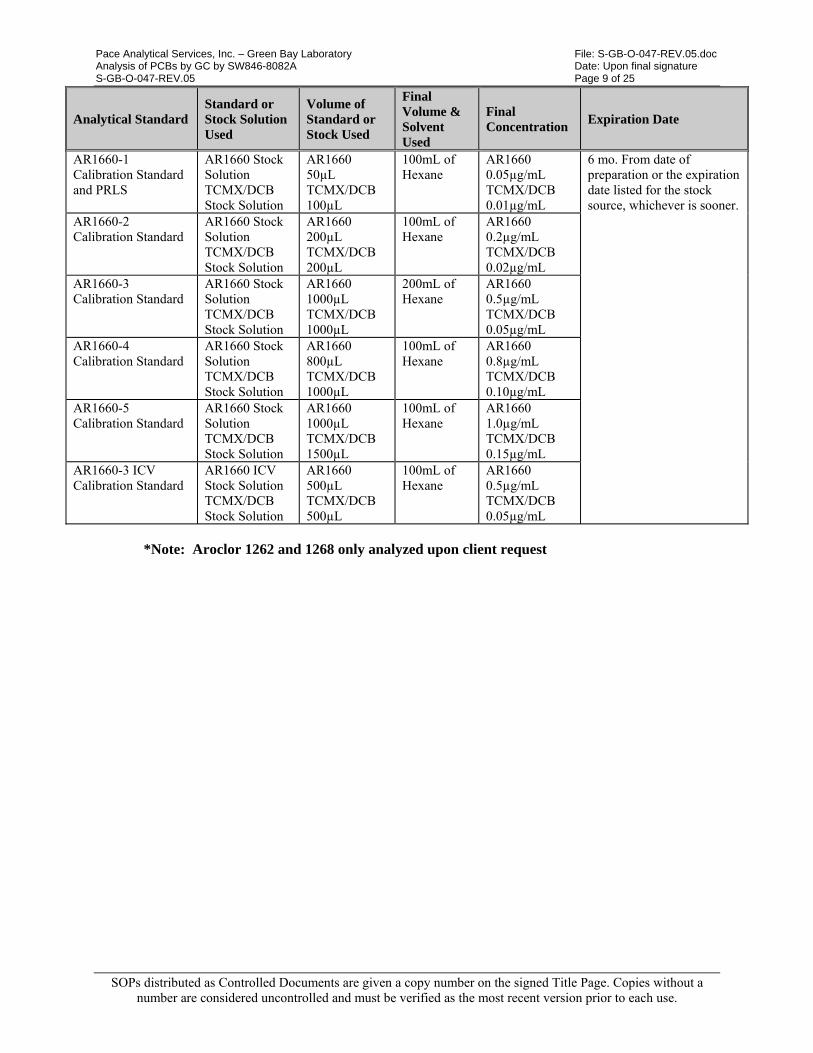
Pace Analytical Services, Inc. – Green Bay Laboratory File: S-GB-O-047-REV.05.doc Analysis of PCBs by GC by SW846-8082A Date: Upon final signature S-GB-O-047-REV.05 Page 9 of 25
SOPs distributed as Controlled Documents are given a copy number on the signed Title Page. Copies without a number are considered uncontrolled and must be verified as the most recent version prior to each use.
Analytical Standard Standard or Stock Solution Used
Volume of Standard or Stock Used
Final Volume & Solvent Used
Final Concentration
Expiration Date
AR1660-1 Calibration Standard and PRLS
AR1660 Stock Solution TCMX/DCB Stock Solution
AR1660 50µL TCMX/DCB 100µL
100mL of Hexane
AR1660 0.05µg/mL TCMX/DCB 0.01µg/mL
6 mo. From date of preparation or the expiration date listed for the stock source, whichever is sooner.
AR1660-2 Calibration Standard
AR1660 Stock Solution TCMX/DCB Stock Solution
AR1660 200µL TCMX/DCB 200µL
100mL of Hexane
AR1660 0.2µg/mL TCMX/DCB 0.02µg/mL
AR1660-3 Calibration Standard
AR1660 Stock Solution TCMX/DCB Stock Solution
AR1660 1000µL TCMX/DCB 1000µL
200mL of Hexane
AR1660 0.5µg/mL TCMX/DCB 0.05µg/mL
AR1660-4 Calibration Standard
AR1660 Stock Solution TCMX/DCB Stock Solution
AR1660 800µL TCMX/DCB 1000µL
100mL of Hexane
AR1660 0.8µg/mL TCMX/DCB 0.10µg/mL
AR1660-5 Calibration Standard
AR1660 Stock Solution TCMX/DCB Stock Solution
AR1660 1000µL TCMX/DCB 1500µL
100mL of Hexane
AR1660 1.0µg/mL TCMX/DCB 0.15µg/mL
AR1660-3 ICV Calibration Standard
AR1660 ICV Stock Solution TCMX/DCB Stock Solution
AR1660 500µL TCMX/DCB 500µL
100mL of Hexane
AR1660 0.5µg/mL TCMX/DCB 0.05µg/mL
*Note: Aroclor 1262 and 1268 only analyzed upon client request
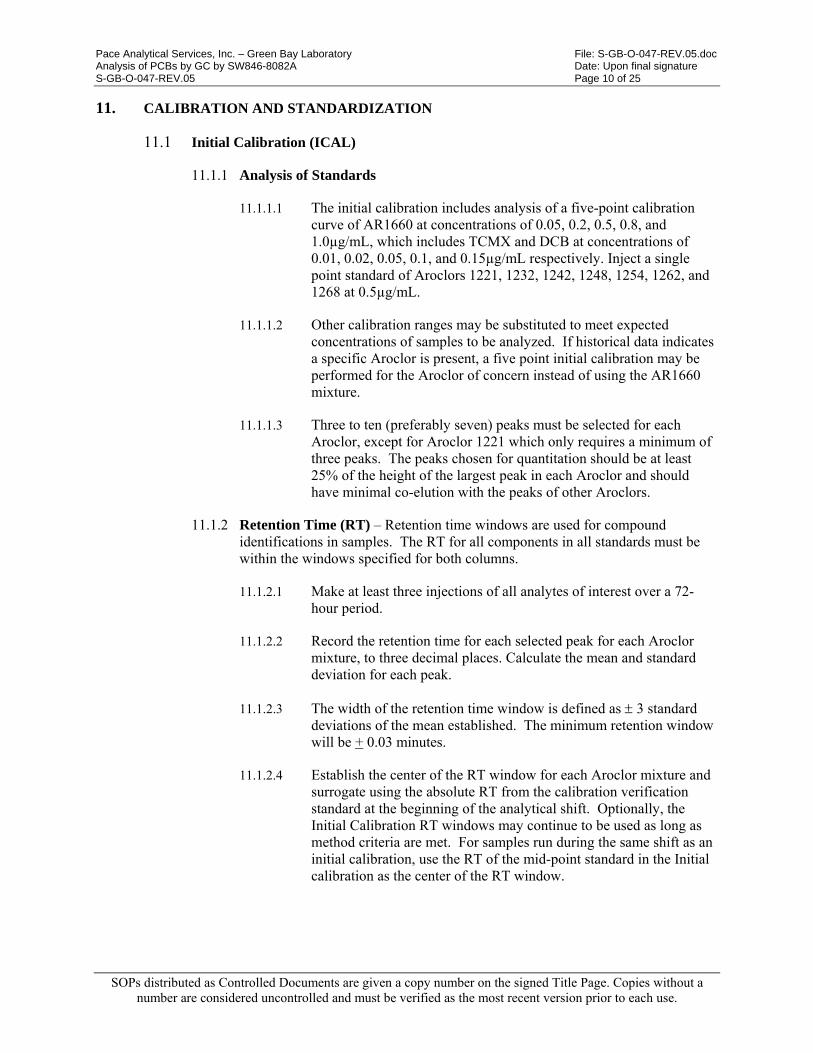
Pace Analytical Services, Inc. – Green Bay Laboratory File: S-GB-O-047-REV.05.doc Analysis of PCBs by GC by SW846-8082A Date: Upon final signature S-GB-O-047-REV.05 Page 10 of 25
SOPs distributed as Controlled Documents are given a copy number on the signed Title Page. Copies without a number are considered uncontrolled and must be verified as the most recent version prior to each use.
11. CALIBRATION AND STANDARDIZATION
11.1 Initial Calibration (ICAL)
11.1.1 Analysis of Standards
11.1.1.1 The initial calibration includes analysis of a five-point calibration curve of AR1660 at concentrations of 0.05, 0.2, 0.5, 0.8, and 1.0µg/mL, which includes TCMX and DCB at concentrations of 0.01, 0.02, 0.05, 0.1, and 0.15µg/mL respectively. Inject a single point standard of Aroclors 1221, 1232, 1242, 1248, 1254, 1262, and 1268 at 0.5µg/mL.
11.1.1.2 Other calibration ranges may be substituted to meet expected concentrations of samples to be analyzed. If historical data indicates a specific Aroclor is present, a five point initial calibration may be performed for the Aroclor of concern instead of using the AR1660 mixture.
11.1.1.3 Three to ten (preferably seven) peaks must be selected for each Aroclor, except for Aroclor 1221 which only requires a minimum of three peaks. The peaks chosen for quantitation should be at least 25% of the height of the largest peak in each Aroclor and should have minimal co-elution with the peaks of other Aroclors.
11.1.2 Retention Time (RT) – Retention time windows are used for compound identifications in samples. The RT for all components in all standards must be within the windows specified for both columns.
11.1.2.1 Make at least three injections of all analytes of interest over a 72-hour period.
11.1.2.2 Record the retention time for each selected peak for each Aroclor mixture, to three decimal places. Calculate the mean and standard deviation for each peak.
11.1.2.3 The width of the retention time window is defined as 3 standard deviations of the mean established. The minimum retention window will be + 0.03 minutes.
11.1.2.4 Establish the center of the RT window for each Aroclor mixture and surrogate using the absolute RT from the calibration verification standard at the beginning of the analytical shift. Optionally, the Initial Calibration RT windows may continue to be used as long as method criteria are met. For samples run during the same shift as an initial calibration, use the RT of the mid-point standard in the Initial calibration as the center of the RT window.
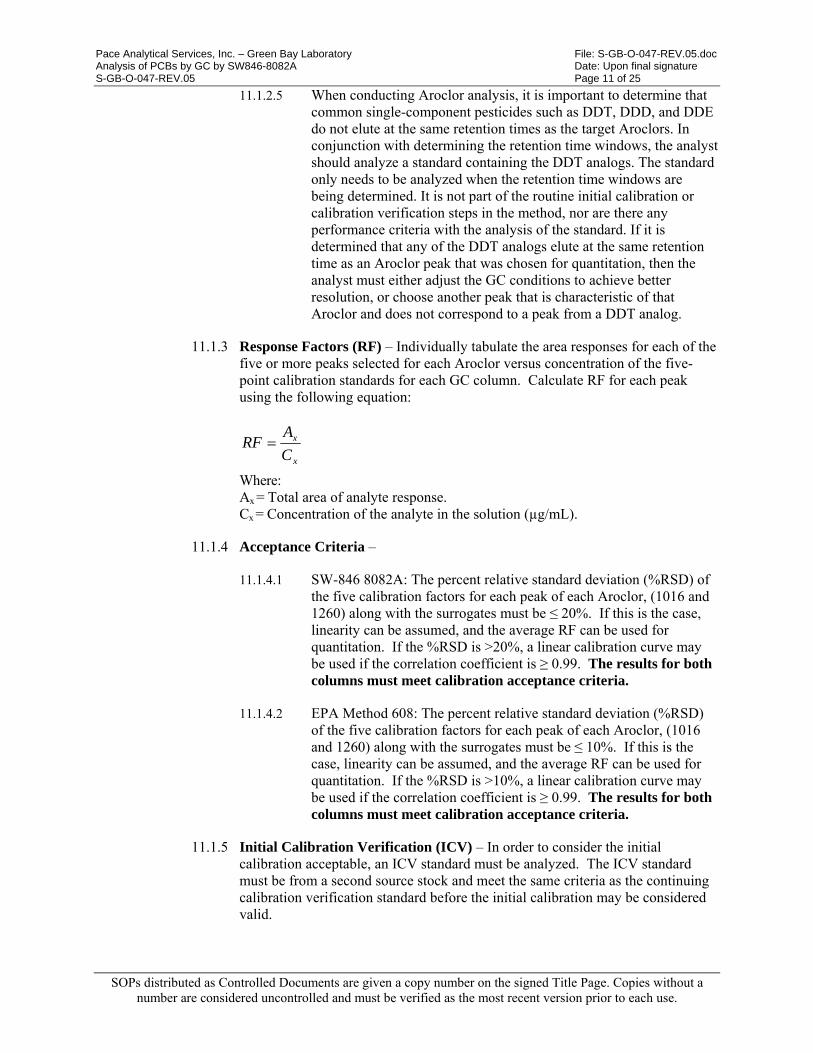
Pace Analytical Services, Inc. – Green Bay Laboratory File: S-GB-O-047-REV.05.doc Analysis of PCBs by GC by SW846-8082A Date: Upon final signature S-GB-O-047-REV.05 Page 11 of 25
SOPs distributed as Controlled Documents are given a copy number on the signed Title Page. Copies without a number are considered uncontrolled and must be verified as the most recent version prior to each use.
11.1.2.5 When conducting Aroclor analysis, it is important to determine that common single-component pesticides such as DDT, DDD, and DDE do not elute at the same retention times as the target Aroclors. In conjunction with determining the retention time windows, the analyst should analyze a standard containing the DDT analogs. The standard only needs to be analyzed when the retention time windows are being determined. It is not part of the routine initial calibration or calibration verification steps in the method, nor are there any performance criteria with the analysis of the standard. If it is determined that any of the DDT analogs elute at the same retention time as an Aroclor peak that was chosen for quantitation, then the analyst must either adjust the GC conditions to achieve better resolution, or choose another peak that is characteristic of that Aroclor and does not correspond to a peak from a DDT analog.
11.1.3 Response Factors (RF) – Individually tabulate the area responses for each of the five or more peaks selected for each Aroclor versus concentration of the five-point calibration standards for each GC column. Calculate RF for each peak using the following equation:
x
x
C
ARF
Where: Ax = Total area of analyte response. Cx = Concentration of the analyte in the solution (µg/mL).
11.1.4 Acceptance Criteria –
11.1.4.1 SW-846 8082A: The percent relative standard deviation (%RSD) of the five calibration factors for each peak of each Aroclor, (1016 and 1260) along with the surrogates must be ≤ 20%. If this is the case, linearity can be assumed, and the average RF can be used for quantitation. If the %RSD is >20%, a linear calibration curve may be used if the correlation coefficient is ≥ 0.99. The results for both columns must meet calibration acceptance criteria.
11.1.4.2 EPA Method 608: The percent relative standard deviation (%RSD) of the five calibration factors for each peak of each Aroclor, (1016 and 1260) along with the surrogates must be ≤ 10%. If this is the case, linearity can be assumed, and the average RF can be used for quantitation. If the %RSD is >10%, a linear calibration curve may be used if the correlation coefficient is ≥ 0.99. The results for both columns must meet calibration acceptance criteria.
11.1.5 Initial Calibration Verification (ICV) – In order to consider the initial calibration acceptable, an ICV standard must be analyzed. The ICV standard must be from a second source stock and meet the same criteria as the continuing calibration verification standard before the initial calibration may be considered valid.
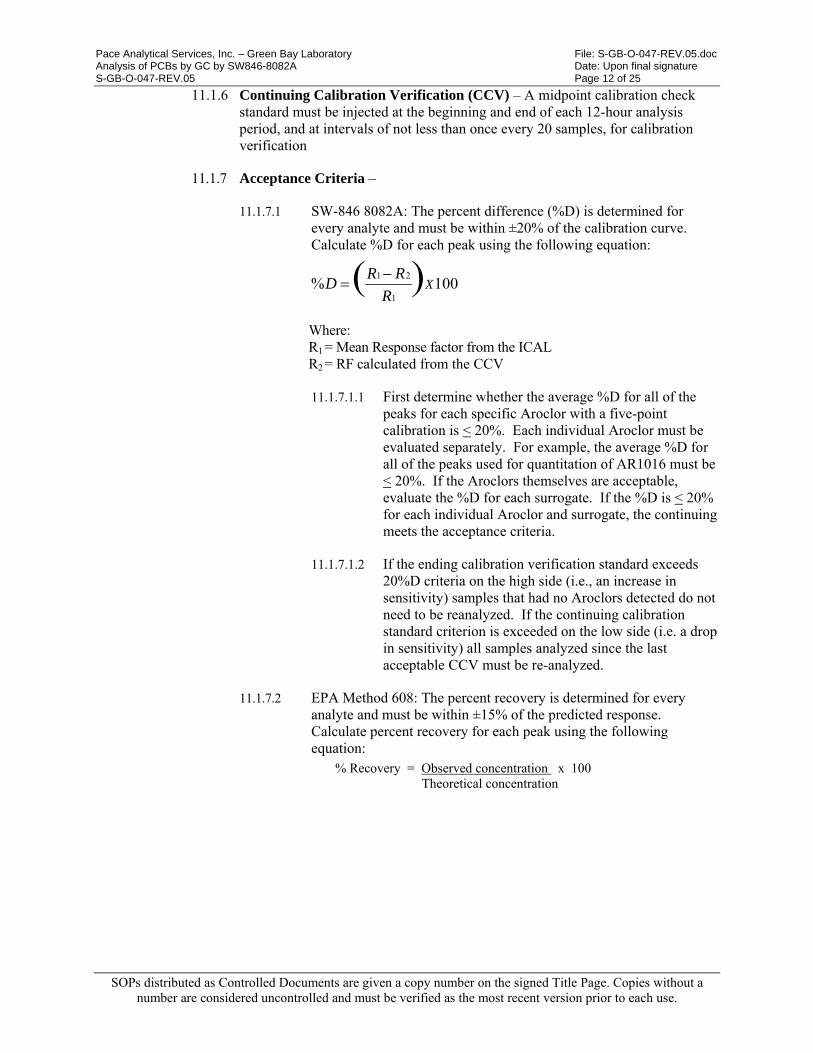
Pace Analytical Services, Inc. – Green Bay Laboratory File: S-GB-O-047-REV.05.doc Analysis of PCBs by GC by SW846-8082A Date: Upon final signature S-GB-O-047-REV.05 Page 12 of 25
SOPs distributed as Controlled Documents are given a copy number on the signed Title Page. Copies without a number are considered uncontrolled and must be verified as the most recent version prior to each use.
11.1.6 Continuing Calibration Verification (CCV) – A midpoint calibration check standard must be injected at the beginning and end of each 12-hour analysis period, and at intervals of not less than once every 20 samples, for calibration verification
11.1.7 Acceptance Criteria –
11.1.7.1 SW-846 8082A: The percent difference (%D) is determined for every analyte and must be within ±20% of the calibration curve. Calculate %D for each peak using the following equation:
100% )(1
21X
R
RRD
Where: R1 = Mean Response factor from the ICAL R2 = RF calculated from the CCV
11.1.7.1.1 First determine whether the average %D for all of the peaks for each specific Aroclor with a five-point calibration is < 20%. Each individual Aroclor must be evaluated separately. For example, the average %D for all of the peaks used for quantitation of AR1016 must be < 20%. If the Aroclors themselves are acceptable, evaluate the %D for each surrogate. If the %D is < 20% for each individual Aroclor and surrogate, the continuing meets the acceptance criteria.
11.1.7.1.2 If the ending calibration verification standard exceeds 20%D criteria on the high side (i.e., an increase in sensitivity) samples that had no Aroclors detected do not need to be reanalyzed. If the continuing calibration standard criterion is exceeded on the low side (i.e. a drop in sensitivity) all samples analyzed since the last acceptable CCV must be re-analyzed.
11.1.7.2 EPA Method 608: The percent recovery is determined for every analyte and must be within ±15% of the predicted response. Calculate percent recovery for each peak using the following equation:
% Recovery = Observed concentration x 100 Theoretical concentration
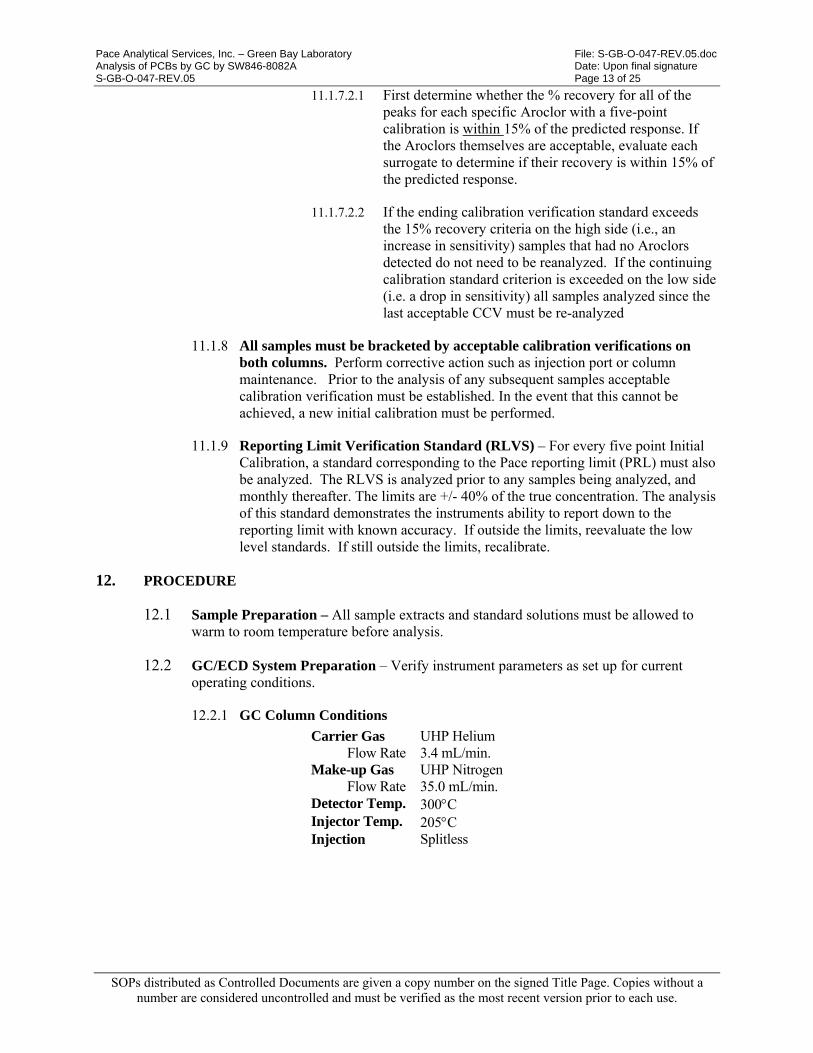
Pace Analytical Services, Inc. – Green Bay Laboratory File: S-GB-O-047-REV.05.doc Analysis of PCBs by GC by SW846-8082A Date: Upon final signature S-GB-O-047-REV.05 Page 13 of 25
SOPs distributed as Controlled Documents are given a copy number on the signed Title Page. Copies without a number are considered uncontrolled and must be verified as the most recent version prior to each use.
11.1.7.2.1 First determine whether the % recovery for all of the peaks for each specific Aroclor with a five-point calibration is within 15% of the predicted response. If the Aroclors themselves are acceptable, evaluate each surrogate to determine if their recovery is within 15% of the predicted response.
11.1.7.2.2 If the ending calibration verification standard exceeds the 15% recovery criteria on the high side (i.e., an increase in sensitivity) samples that had no Aroclors detected do not need to be reanalyzed. If the continuing calibration standard criterion is exceeded on the low side (i.e. a drop in sensitivity) all samples analyzed since the last acceptable CCV must be re-analyzed
11.1.8 All samples must be bracketed by acceptable calibration verifications on both columns. Perform corrective action such as injection port or column maintenance. Prior to the analysis of any subsequent samples acceptable calibration verification must be established. In the event that this cannot be achieved, a new initial calibration must be performed.
11.1.9 Reporting Limit Verification Standard (RLVS) – For every five point Initial Calibration, a standard corresponding to the Pace reporting limit (PRL) must also be analyzed. The RLVS is analyzed prior to any samples being analyzed, and monthly thereafter. The limits are +/- 40% of the true concentration. The analysis of this standard demonstrates the instruments ability to report down to the reporting limit with known accuracy. If outside the limits, reevaluate the low level standards. If still outside the limits, recalibrate.
12. PROCEDURE
12.1 Sample Preparation – All sample extracts and standard solutions must be allowed to warm to room temperature before analysis.
12.2 GC/ECD System Preparation – Verify instrument parameters as set up for current operating conditions.
12.2.1 GC Column Conditions
Carrier Gas UHP Helium Flow Rate 3.4 mL/min.
Make-up Gas UHP NitrogenFlow Rate 35.0 mL/min.
Detector Temp. 300C Injector Temp. 205C Injection Splitless

Pace Analytical Services, Inc. – Green Bay Laboratory File: S-GB-O-047-REV.05.doc Analysis of PCBs by GC by SW846-8082A Date: Upon final signature S-GB-O-047-REV.05 Page 14 of 25
SOPs distributed as Controlled Documents are given a copy number on the signed Title Page. Copies without a number are considered uncontrolled and must be verified as the most recent version prior to each use.
12.2.2 GC Temperature Program
Initial Temp. 110C Initial Time 1.5 min.
Rate 1 20.00C/min.Final Temp. 1 140C
Final Time 1 0.00 min. Rate 2 11.00C/min.
Final Temp. 2 280C Final Time 2 5.00 min.
Rate 3 20.00C/min.Final Temp. 3 300C
Final Time 3 3.00 min.
12.3 Batch Sequence – Generate a sequence to run a batch of samples and the associated quality control samples.
12.3.1 Initial Calibration – For example, the batch for initial calibration should include the following:
Series of 2-3 Primes Solvent Blank (Hexane) AR1660-1 (0.05µg/mL) AR1660-2 (0.2µg/mL) AR1660-3 (0.5µg/mL) AR1660-4 (0.8µg/mL) AR1660-5 (1.0µg/mL) Solvent Blank (Hexane)
AR1660-3 ICV AR1660-1 (0.1µg/mL) (PRLS)
12.3.2 Sample Analysis – For example, the typical batch for analysis of PCBs should include the following:
AR1660-301 CCV (0.5µg/mL) (20 samples or 12-hour period)
Method Blank Laboratory Control Spike
Samples Matrix Spike/Matrix Spike Duplicate
Duplicate Sample(s) AR1660-302 CCV (0.5µg/mL)
12.4 Load Autosampler – Load the autosampler with the appropriate primes, solvent blanks, standards and samples for the batch as it was created.
12.5 Analyze Samples – Analyze all standards, quality control samples, and environmental samples.
12.5.1 The method blank and LCS extracted along with the samples should be analyzed on the same instrument as the samples.
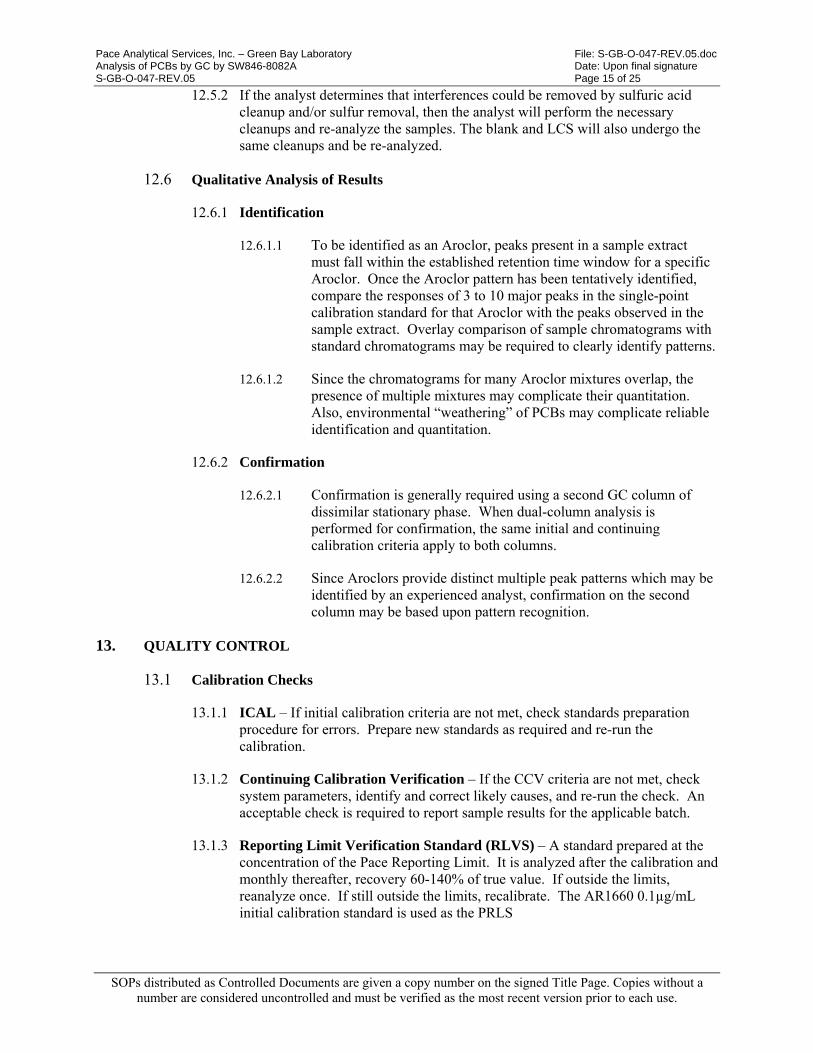
Pace Analytical Services, Inc. – Green Bay Laboratory File: S-GB-O-047-REV.05.doc Analysis of PCBs by GC by SW846-8082A Date: Upon final signature S-GB-O-047-REV.05 Page 15 of 25
SOPs distributed as Controlled Documents are given a copy number on the signed Title Page. Copies without a number are considered uncontrolled and must be verified as the most recent version prior to each use.
12.5.2 If the analyst determines that interferences could be removed by sulfuric acid cleanup and/or sulfur removal, then the analyst will perform the necessary cleanups and re-analyze the samples. The blank and LCS will also undergo the same cleanups and be re-analyzed.
12.6 Qualitative Analysis of Results
12.6.1 Identification
12.6.1.1 To be identified as an Aroclor, peaks present in a sample extract must fall within the established retention time window for a specific Aroclor. Once the Aroclor pattern has been tentatively identified, compare the responses of 3 to 10 major peaks in the single-point calibration standard for that Aroclor with the peaks observed in the sample extract. Overlay comparison of sample chromatograms with standard chromatograms may be required to clearly identify patterns.
12.6.1.2 Since the chromatograms for many Aroclor mixtures overlap, the presence of multiple mixtures may complicate their quantitation. Also, environmental “weathering” of PCBs may complicate reliable identification and quantitation.
12.6.2 Confirmation
12.6.2.1 Confirmation is generally required using a second GC column of dissimilar stationary phase. When dual-column analysis is performed for confirmation, the same initial and continuing calibration criteria apply to both columns.
12.6.2.2 Since Aroclors provide distinct multiple peak patterns which may be identified by an experienced analyst, confirmation on the second column may be based upon pattern recognition.
13. QUALITY CONTROL
13.1 Calibration Checks
13.1.1 ICAL – If initial calibration criteria are not met, check standards preparation procedure for errors. Prepare new standards as required and re-run the calibration.
13.1.2 Continuing Calibration Verification – If the CCV criteria are not met, check system parameters, identify and correct likely causes, and re-run the check. An acceptable check is required to report sample results for the applicable batch.
13.1.3 Reporting Limit Verification Standard (RLVS) – A standard prepared at the concentration of the Pace Reporting Limit. It is analyzed after the calibration and monthly thereafter, recovery 60-140% of true value. If outside the limits, reanalyze once. If still outside the limits, recalibrate. The AR1660 0.1µg/mL initial calibration standard is used as the PRLS

Pace Analytical Services, Inc. – Green Bay Laboratory File: S-GB-O-047-REV.05.doc Analysis of PCBs by GC by SW846-8082A Date: Upon final signature S-GB-O-047-REV.05 Page 16 of 25
SOPs distributed as Controlled Documents are given a copy number on the signed Title Page. Copies without a number are considered uncontrolled and must be verified as the most recent version prior to each use.
13.2 Surrogate Recoveries – Surrogate compound(s) must be added to all samples, spikes, control samples and method blanks, prior to analysis as indicators of method accuracy. Laboratory-based accuracy limits should be used for acceptance criteria. For Biota samples, if laboratory limits chart to narrow, limits will be set to 60-130%. If these criteria are not met, check system parameters, identify and correct likely causes, and re-run the samples.
13.2.1 If both surrogate recoveries fail this criterion, re-extraction of the sample may be necessary. If surrogate recoveries are higher than the acceptance criteria and target compounds are less than the reporting limit, the results may be reported with an appropriate footnote. If recoveries appear out of control due to sample matrix, report the results with an appropriate footnote.
13.2.2 One surrogate is allowed to be outside of the control limits. For instance, if an interfering peak obscures one surrogate, then that one surrogate may be excluded. The surrogate is considered diluted out and not evaluated when the dilution performed brings the theoretical on-column concentration below the concentration of the low standard in the initial calibration curve.
13.2.3 For samples run from the state of South Carolina, both surrogates must recover between 70-130%.
13.3 Method Blank –The method blank must not contain analyte responses at or above the reporting limit. If the results are not acceptable, re-analyze the method blank. If the problem persists, conduct maintenance to clean the analytical system. An acceptable method blank is required to report sample results for the applicable batch.
13.3.1 One surrogate is allowed to be outside of the control limits. For instance, if an interfering peak obscures one surrogate, then that one surrogate may be excluded. The surrogate is considered diluted out and not evaluated when the dilution performed brings the theoretical on-column concentration below the concentration of the low standard in the initial calibration curve.
13.3.2 If the blank contains any analyte of interest above the reporting limit, all of the associated samples, matrix spikes, and laboratory control spikes must be re-extracted unless the sample concentration is greater than 20X the amount found in the blank or the analyte is not detected in an associated sample. For Wisconsin projects this criteria will be “Above the LOD”.
13.4 LCS Recoveries – One LCS must be analyzed with each batch of 20 samples. Laboratory-based accuracy limits should be used to for acceptance criteria. For EPA Method 608 see Table 9 for acceptance criteria. For Biota samples, if laboratory limits chart to narrow, limits will be set to 60-130%. An acceptable LCS is required to report sample results for the applicable batch.
13.4.1 If the laboratory control spike does not meet the recovery criteria, the results of all QC performed with the batch will be evaluated by the analyst. Corrective actions include re-extraction of the samples or reanalysis of the extracts.
13.4.2 For samples run from the state of South Carolina, Ar1016 and 1260 must recover between 70-130%.
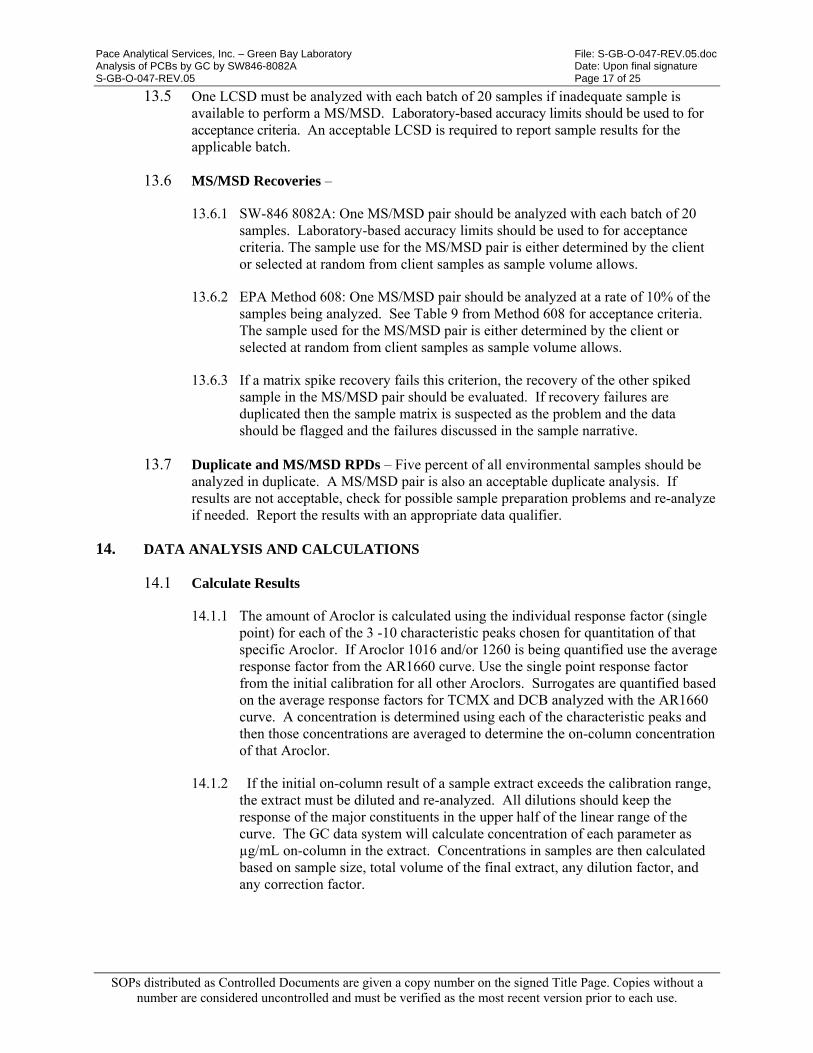
Pace Analytical Services, Inc. – Green Bay Laboratory File: S-GB-O-047-REV.05.doc Analysis of PCBs by GC by SW846-8082A Date: Upon final signature S-GB-O-047-REV.05 Page 17 of 25
SOPs distributed as Controlled Documents are given a copy number on the signed Title Page. Copies without a number are considered uncontrolled and must be verified as the most recent version prior to each use.
13.5 One LCSD must be analyzed with each batch of 20 samples if inadequate sample is available to perform a MS/MSD. Laboratory-based accuracy limits should be used to for acceptance criteria. An acceptable LCSD is required to report sample results for the applicable batch.
13.6 MS/MSD Recoveries –
13.6.1 SW-846 8082A: One MS/MSD pair should be analyzed with each batch of 20 samples. Laboratory-based accuracy limits should be used to for acceptance criteria. The sample use for the MS/MSD pair is either determined by the client or selected at random from client samples as sample volume allows.
13.6.2 EPA Method 608: One MS/MSD pair should be analyzed at a rate of 10% of the samples being analyzed. See Table 9 from Method 608 for acceptance criteria. The sample used for the MS/MSD pair is either determined by the client or selected at random from client samples as sample volume allows.
13.6.3 If a matrix spike recovery fails this criterion, the recovery of the other spiked sample in the MS/MSD pair should be evaluated. If recovery failures are duplicated then the sample matrix is suspected as the problem and the data should be flagged and the failures discussed in the sample narrative.
13.7 Duplicate and MS/MSD RPDs – Five percent of all environmental samples should be analyzed in duplicate. A MS/MSD pair is also an acceptable duplicate analysis. If results are not acceptable, check for possible sample preparation problems and re-analyze if needed. Report the results with an appropriate data qualifier.
14. DATA ANALYSIS AND CALCULATIONS
14.1 Calculate Results
14.1.1 The amount of Aroclor is calculated using the individual response factor (single point) for each of the 3 -10 characteristic peaks chosen for quantitation of that specific Aroclor. If Aroclor 1016 and/or 1260 is being quantified use the average response factor from the AR1660 curve. Use the single point response factor from the initial calibration for all other Aroclors. Surrogates are quantified based on the average response factors for TCMX and DCB analyzed with the AR1660 curve. A concentration is determined using each of the characteristic peaks and then those concentrations are averaged to determine the on-column concentration of that Aroclor.
14.1.2 If the initial on-column result of a sample extract exceeds the calibration range, the extract must be diluted and re-analyzed. All dilutions should keep the response of the major constituents in the upper half of the linear range of the curve. The GC data system will calculate concentration of each parameter as µg/mL on-column in the extract. Concentrations in samples are then calculated based on sample size, total volume of the final extract, any dilution factor, and any correction factor.
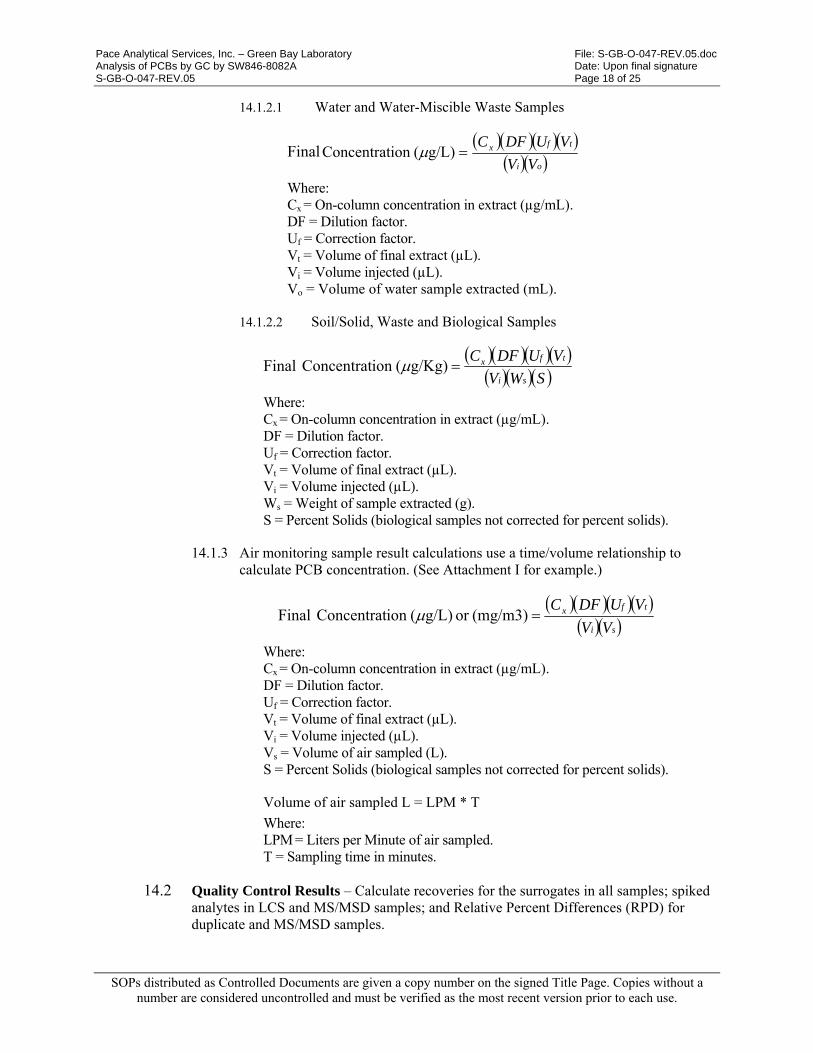
Pace Analytical Services, Inc. – Green Bay Laboratory File: S-GB-O-047-REV.05.doc Analysis of PCBs by GC by SW846-8082A Date: Upon final signature S-GB-O-047-REV.05 Page 18 of 25
SOPs distributed as Controlled Documents are given a copy number on the signed Title Page. Copies without a number are considered uncontrolled and must be verified as the most recent version prior to each use.
14.1.2.1 Water and Water-Miscible Waste Samples
Final
oi
tfx
VV
VUDFCg/L)(ion Concentrat
Where: Cx = On-column concentration in extract (µg/mL). DF = Dilution factor. Uf = Correction factor. Vt = Volume of final extract (µL). Vi = Volume injected (µL). Vo = Volume of water sample extracted (mL).
14.1.2.2 Soil/Solid, Waste and Biological Samples
Final
SWV
VUDFC
si
tfxg/Kg)(ion Concentrat
Where: Cx = On-column concentration in extract (µg/mL). DF = Dilution factor. Uf = Correction factor. Vt = Volume of final extract (µL). Vi = Volume injected (µL). Ws = Weight of sample extracted (g). S = Percent Solids (biological samples not corrected for percent solids).
14.1.3 Air monitoring sample result calculations use a time/volume relationship to calculate PCB concentration. (See Attachment I for example.)
Final
si
tfx
VV
VUDFC(mg/m3)or g/L)(ion Concentrat
Where: Cx = On-column concentration in extract (µg/mL). DF = Dilution factor. Uf = Correction factor. Vt = Volume of final extract (µL). Vi = Volume injected (µL). Vs = Volume of air sampled (L). S = Percent Solids (biological samples not corrected for percent solids).
Volume of air sampled L = LPM * T
Where: LPM = Liters per Minute of air sampled. T = Sampling time in minutes.
14.2 Quality Control Results – Calculate recoveries for the surrogates in all samples; spiked analytes in LCS and MS/MSD samples; and Relative Percent Differences (RPD) for duplicate and MS/MSD samples.
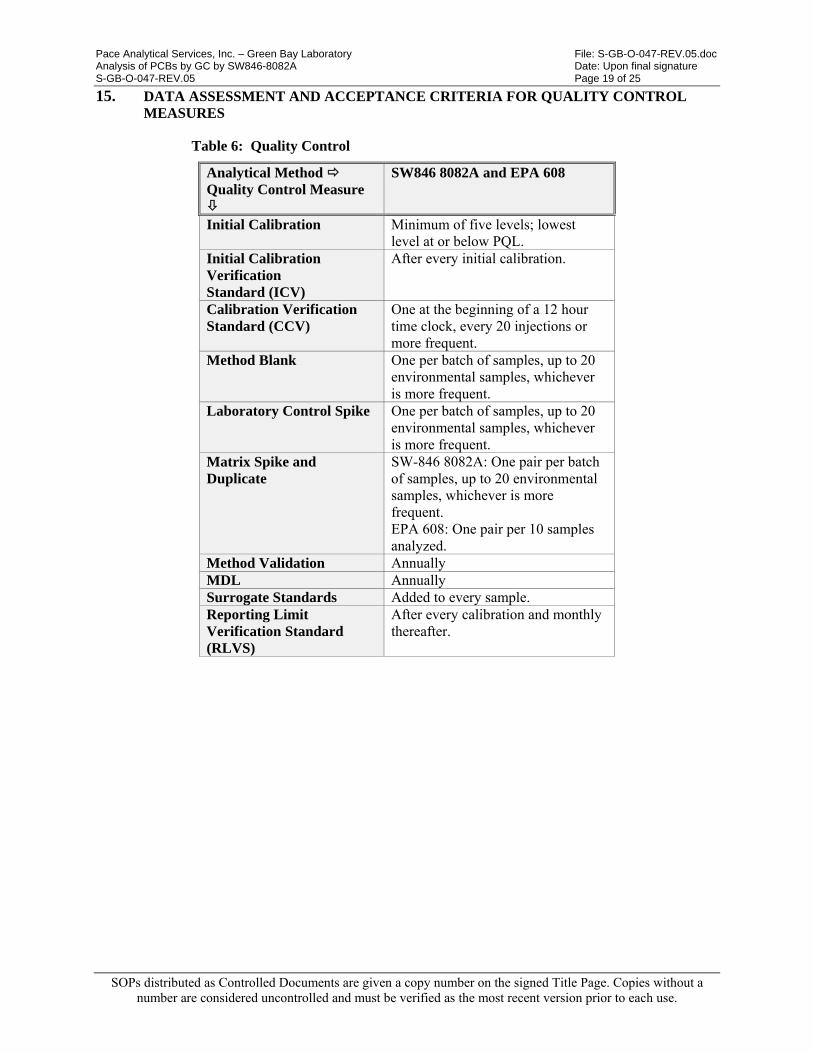
Pace Analytical Services, Inc. – Green Bay Laboratory File: S-GB-O-047-REV.05.doc Analysis of PCBs by GC by SW846-8082A Date: Upon final signature S-GB-O-047-REV.05 Page 19 of 25
SOPs distributed as Controlled Documents are given a copy number on the signed Title Page. Copies without a number are considered uncontrolled and must be verified as the most recent version prior to each use.
15. DATA ASSESSMENT AND ACCEPTANCE CRITERIA FOR QUALITY CONTROL MEASURES
Table 6: Quality Control
Analytical Method Quality Control Measure
SW846 8082A and EPA 608
Initial Calibration Minimum of five levels; lowest level at or below PQL.
Initial Calibration Verification Standard (ICV)
After every initial calibration.
Calibration Verification Standard (CCV)
One at the beginning of a 12 hour time clock, every 20 injections or more frequent.
Method Blank
One per batch of samples, up to 20 environmental samples, whichever is more frequent.
Laboratory Control Spike
One per batch of samples, up to 20 environmental samples, whichever is more frequent.
Matrix Spike and Duplicate
SW-846 8082A: One pair per batch of samples, up to 20 environmental samples, whichever is more frequent. EPA 608: One pair per 10 samples analyzed.
Method Validation Annually MDL Annually Surrogate Standards Added to every sample. Reporting Limit Verification Standard (RLVS)
After every calibration and monthly thereafter.

Pace Analytical Services, Inc. – Green Bay Laboratory File: S-GB-O-047-REV.05.doc Analysis of PCBs by GC by SW846-8082A Date: Upon final signature S-GB-O-047-REV.05 Page 20 of 25
SOPs distributed as Controlled Documents are given a copy number on the signed Title Page. Copies without a number are considered uncontrolled and must be verified as the most recent version prior to each use.
16. CORRECTIVE ACTIONS FOR OUT-OF-CONTROL DATA
Table 7: Corrective Actions
Analytical Method Acceptance Criteria Calibration Measure
SW846 8082A / EPA 608 Frequency
Acceptance Criteria
Initial Calibration
Installation of new column Creation of new analytical method CCV fails criteria
Use Average Calibration and relative standard deviation (%RSD) is ≤ 20%.
Initial Calibration Verification (ICV)
Immediately after the ICAL. Percent Difference (%D) is ≤ 20%
Continuing Calibration Verification (CCV)
At the beginning of every 12 hour shift, every 20 injections, or more frequent
Percent Difference (%D) is ≤ 20%
Laboratory Control Spike and Duplicate
One pair per batch of samples, up to 20 environmental samples, whichever is more frequent.
In house limits determined.
Matrix Spike and Duplicate
One pair per batch of samples, up to 20 environmental samples, whichever is more frequent.
In house limits determined.
MDL’s Annually 1-10 times the MDL should be equal to the spike concentration that was used to determine the MDL’s
Method Validation Annually In house limits determined. Surrogate Standards Added to every sample. In house limits determined. Reporting Limit Verification Standard (RLVS)
After every initial calibration and monthly thereafter
60-140%
17. CONTINGENCIES FOR HANDLING OUT-OF-CONTROL OR UNACCEPTABLE DATA
17.1 See Section 13, 15 and 16
18. METHOD PERFORMANCE
18.1 There are several requirements that must be met to insure that this procedure generates accurate and reliable data. A general outline of requirements has been summarized below. Further specifications may be found in the Laboratory Quality Manual.
18.1.1 The analyst must read and understand this procedure with written documentation maintained in his/her training file.
18.1.2 An initial demonstration of capability (IDC) must be performed per S-ALL-Q-020, Orientation and Training Procedures, most current revision or replacement. A record of the IDC will be maintained in his/her QA file with written authorization from the Laboratory Manager and Quality Manager.
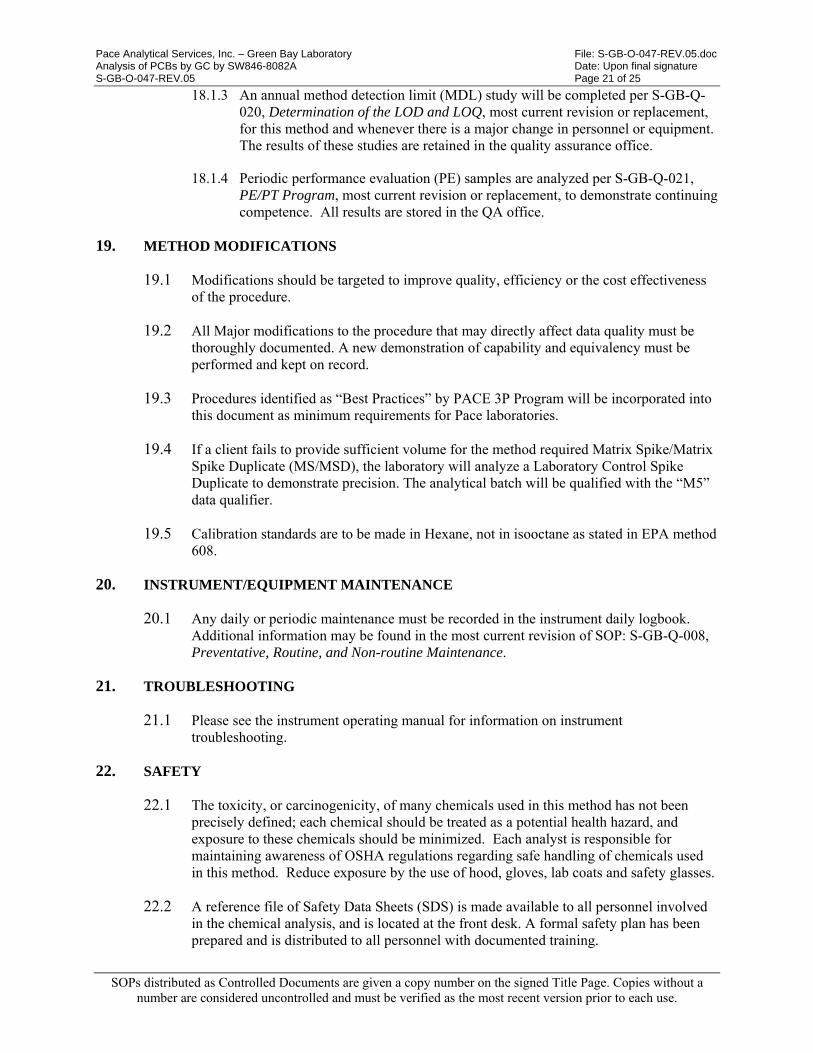
Pace Analytical Services, Inc. – Green Bay Laboratory File: S-GB-O-047-REV.05.doc Analysis of PCBs by GC by SW846-8082A Date: Upon final signature S-GB-O-047-REV.05 Page 21 of 25
SOPs distributed as Controlled Documents are given a copy number on the signed Title Page. Copies without a number are considered uncontrolled and must be verified as the most recent version prior to each use.
18.1.3 An annual method detection limit (MDL) study will be completed per S-GB-Q-020, Determination of the LOD and LOQ, most current revision or replacement, for this method and whenever there is a major change in personnel or equipment. The results of these studies are retained in the quality assurance office.
18.1.4 Periodic performance evaluation (PE) samples are analyzed per S-GB-Q-021, PE/PT Program, most current revision or replacement, to demonstrate continuing competence. All results are stored in the QA office.
19. METHOD MODIFICATIONS
19.1 Modifications should be targeted to improve quality, efficiency or the cost effectiveness of the procedure.
19.2 All Major modifications to the procedure that may directly affect data quality must be thoroughly documented. A new demonstration of capability and equivalency must be performed and kept on record.
19.3 Procedures identified as “Best Practices” by PACE 3P Program will be incorporated into this document as minimum requirements for Pace laboratories.
19.4 If a client fails to provide sufficient volume for the method required Matrix Spike/Matrix Spike Duplicate (MS/MSD), the laboratory will analyze a Laboratory Control Spike Duplicate to demonstrate precision. The analytical batch will be qualified with the “M5” data qualifier.
19.5 Calibration standards are to be made in Hexane, not in isooctane as stated in EPA method 608.
20. INSTRUMENT/EQUIPMENT MAINTENANCE
20.1 Any daily or periodic maintenance must be recorded in the instrument daily logbook. Additional information may be found in the most current revision of SOP: S-GB-Q-008, Preventative, Routine, and Non-routine Maintenance.
21. TROUBLESHOOTING
21.1 Please see the instrument operating manual for information on instrument troubleshooting.
22. SAFETY
22.1 The toxicity, or carcinogenicity, of many chemicals used in this method has not been precisely defined; each chemical should be treated as a potential health hazard, and exposure to these chemicals should be minimized. Each analyst is responsible for maintaining awareness of OSHA regulations regarding safe handling of chemicals used in this method. Reduce exposure by the use of hood, gloves, lab coats and safety glasses.
22.2 A reference file of Safety Data Sheets (SDS) is made available to all personnel involved in the chemical analysis, and is located at the front desk. A formal safety plan has been prepared and is distributed to all personnel with documented training.

Pace Analytical Services, Inc. – Green Bay Laboratory File: S-GB-O-047-REV.05.doc Analysis of PCBs by GC by SW846-8082A Date: Upon final signature S-GB-O-047-REV.05 Page 22 of 25
SOPs distributed as Controlled Documents are given a copy number on the signed Title Page. Copies without a number are considered uncontrolled and must be verified as the most recent version prior to each use.
23. WASTE MANAGEMENT
23.1 Excess reagents, samples and method process wastes are characterized and disposed of in an acceptable manner. For further information on waste management consult the current version of S-GB-W-001, Waste Handling and Management.
24. POLLUTION PREVENTION
24.1 The quantity of chemicals purchased is based on expected usage during its shelf life and disposal cost of unused material. Actual reagent preparation volumes reflect anticipated usage and reagent stability.
24.2 The laboratory Chemical Hygiene Plan/Health and Safety Plan contains additional information on pollution prevention.
25. REFERENCES
25.1 Pace Quality Assurance Manual- most current version.
25.2 The NELAC Institute (TNI); Volume 1, Module 2, “Quality Systems”- most current version.
25.3 USEPA, SW-846, Method 8082A, “Polychlorinated Biphenyls (PCBs) by Gas Chromatography”, February 2007.
25.4 USEPA, SW-846, Method 8000B, “Determinative Chromatographic Separations”, December 1996.
25.5 Appendix A to part 136, Methods for organic chemical analysis of municipal and industrial wastewater, “Method 608 – Organichlorine pesticides and PCBs”
25.6 Pace Analytical Services, Inc – Green Bay, SOP S-GB-O-053, “Separatory Funnel Extraction, most current revision or replacement.
25.7 Pace Analytical Services, Inc – Green Bay, SOP S-GB-O-031, “Extraction of Biological Samples for Organochlorine Pesticides/PCBs”, most current revision or replacement.
25.8 Pace Analytical Services, Inc – Green Bay, SOP S-GB-O-040, “Extraction of Wipes and Oil for PCB Analysis”, most current revision or replacement.
25.9 Pace Analytical Services, Inc – Green Bay, SOP S-GB-O-041, “Extraction of PCBs Using the Automated Soxhlet”, most current revision or replacement.
25.10 Pace Analytical Services, Inc – Green Bay, SOP S-GB-O-032, “Gel Permeation Chromatography”, most current revision or replacement.
25.11 Pace Analytical Services, Inc – Green Bay, SOP S-GB-O-034 Sulfuric Acid Cleanup”, most current revision or replacement.
25.12 Pace Analytical Services, Inc – Green Bay, SOP S-GB-O-036, “Florisil Cleanup for PCBs”, most current revision or replacement.
25.13 Pace Analytical Services, Inc – Green Bay, SOP S-GB-O-038, “Silica Gel Cleanup of Organochlorine Pesticides and PCBs”, most current revision or replacement.
25.14 Pace Analytical Services, Inc – Green Bay, SOP S-GB-O-039, “Copper Cleanup for the Removal of Sulfur from PCB Samples”, most current revision or replacement.

Pace Analytical Services, Inc. – Green Bay Laboratory File: S-GB-O-047-REV.05.doc Analysis of PCBs by GC by SW846-8082A Date: Upon final signature S-GB-O-047-REV.05 Page 23 of 25
SOPs distributed as Controlled Documents are given a copy number on the signed Title Page. Copies without a number are considered uncontrolled and must be verified as the most recent version prior to each use.
26. TABLES, DIAGRAMS, FLOWCHARTS, APPENDICES, ADDENDA ETC.
Attachment I: Air monitoring calculation sheet. Example
Client :Date CollectedProject number
Project name NIOSH method 5503 (modified)Pace Project # PCBs in air
Volume of Air sampled 66.44 liters
4034812-007 (Front) 4034812-013 (Back)
Client Sample ID Test Parameter Result in ugresults in ug/L
or mg/m3 Result in ugresults in ug/L
or mg/m3
<10% breakthrough front to back
sections
PCB-1016 (Aroclor 1016) <0.044 <0.00066 <0.044 <0.00066 OKPCB-1221 (Aroclor 1221) <0.044 <0.00066 <0.044 <0.00066 OKPCB-1232 (Aroclor 1232) <0.044 <0.00066 <0.044 <0.00066 OKPCB-1242 (Aroclor 1242) <0.044 <0.00066 <0.044 <0.00066 OKPCB-1248 (Aroclor 1248) <0.044 <0.00066 <0.044 <0.00066 OKPCB-1254 (Aroclor 1254) <0.044 <0.00066 <0.044 <0.00066 OKPCB-1260 (Aroclor 1260) <0.044 <0.00066 <0.044 <0.00066 OKPCB-1268 (Aroclor 1268) <0.044 <0.00066 <0.044 <0.00066 OKPCB, Total <0.044 <0.00066 <0.044 <0.00066 OKTetrachloro-m-xylene (S) 101% 34-130%* 99% 34-130%*Decachlorobiphenyl (S) 96% 34-130%* 95% 34-130%*
Samples Extracted: * acceptable range for surrogate recovery
Volume of Air sampled (L) 66.44 0.1256 LPMmg/m3 result 0.00066 529 Time
Date analyzed: 08/05/10 20:30 Date analyzed: 08/05/10 21:56
Wipe MDL = 0.02212 µg/mL.
Volume of air sample = 0.1423LPM * 481M = 68.45L
Final volume of extract = 2mL
Result in µg = On column or MDL * final volume of extract (0.02212 * 2) = 0.04424 µg
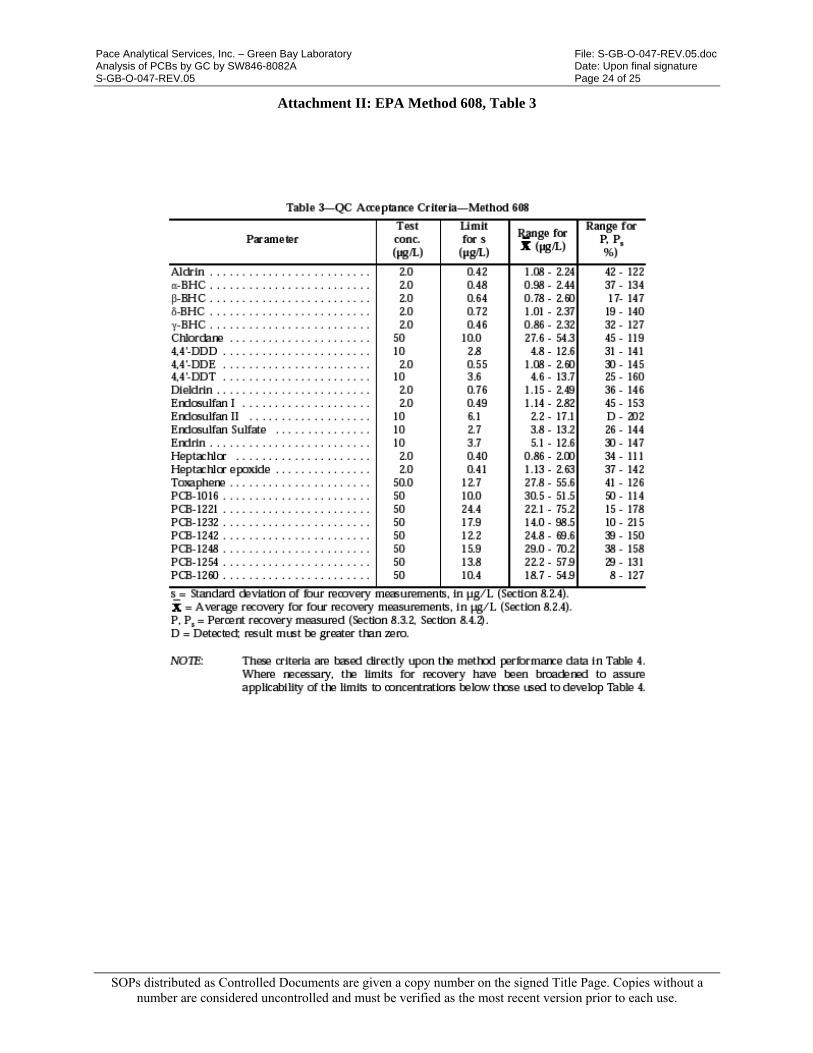
Pace Analytical Services, Inc. – Green Bay Laboratory File: S-GB-O-047-REV.05.doc Analysis of PCBs by GC by SW846-8082A Date: Upon final signature S-GB-O-047-REV.05 Page 24 of 25
SOPs distributed as Controlled Documents are given a copy number on the signed Title Page. Copies without a number are considered uncontrolled and must be verified as the most recent version prior to each use.
Attachment II: EPA Method 608, Table 3

Pace Analytical Services, Inc. – Green Bay Laboratory File: S-GB-O-047-REV.05.doc Analysis of PCBs by GC by SW846-8082A Date: Upon final signature S-GB-O-047-REV.05 Page 25 of 25
SOPs distributed as Controlled Documents are given a copy number on the signed Title Page. Copies without a number are considered uncontrolled and must be verified as the most recent version prior to each use.
27. REVISIONS
Revision Number Reason for Change Date
S-GB-O-047-REV.00 First Issue. 11Sept2008
S-GB-O-047-REV.01
Updated signature page Changed all references to TMX to TCMX Added a note to tables including Aloclor 1262 and 1268 stating they will only be analyzed upon request Section 10.1.1.1: Deleted Aloclor 1262 Section 10.2.3.1: Changed %RSD to %D for surrogate recoveries Section 10.2.5: Added that a low level standard is to be evaluated for each 5 point calibration that is analyzed
09Apr2010
S-GB-O-047-Rev.02
Section 10.1.2.5: Added requirement to verify DDT analogs to not co-elute with Aroclors of interest. Section 12.2 and 12.4: Included language that biota recovery limits should be broadened to 60-130% if laboratory charted limits are narrower than that.
13Sept2010
S-GB-O-047-Rev.03
Section 7.2: Updated analytical and extraction hold times to 365 Days. Section 11.7.3 and Table E: Added Air Wipe Calculations Section 15: Removed SOP reference to Ultrasonic Extraction
14Sept2012
S-GB-O-047-Rev.04
Throughout Document: Updated SOP format to be consistent with SOP: S-GB-Q-017 Preparation of SOPs. Updated SOP references throughout document. Throughout Document: Renumbered Tables to match order in document. Added: Tables 6 and 7. Renamed Table E to Attachment I. Sections 11.1.1.1, 12.3.1 and Table 5: Updated AR1660-1 to 0.05 and AR1660-2 to 0.20. Section 11.1.1.3: Updated AR1221 to require a minimum of 3 peaks in lieu of 5.
25Jun2014
S-GB-O-047-Rev.05
Section(s) 11.1.4, 11.1.7.2, 13.4, 13.6.2, 14.1, 25 and Table(s) 6 and Attachment II: Added EPA 608 Method Criteria. Section(s) 11.1.1.3 and 14.1.1: Allow use of 3 peaks for quantitation. Section 12.6.2.1: Removed confirmation by GC/MS. Section 19.5: Added Method Modification for solvent as hexane. Section 26: Added EPA Method 608 Table 3. Throughout Document: Added Uncontrolled Footer Statement.
18Jun2015
Pace Analytical Services, LLC – Green Bay WI. 1241 Bellevue Street Suite 9
Green Bay, WI 54302 Phone: 920 469-2436
Fax: 920 469-8827
STANDARD OPERATING PROCEDURE
DETERMINATION OF SEMI-VOLATILE ORGANICS BY GC/MS
Reference Methods: EPA SW-846 Method 8270C / EPA 625
Local SOP Number: S-GB-O-049-Rev.07 Effective Date: Date of Final Signature
Supersedes: S-GB-O-049-Rev.06 SOP Template Number: SOT-ALL-O-001-rev.01
APPROVALS 06/21/17 Nils Melberg, Laboratory General Manager Date 6/21/17 Kate Verbeten, Laboratory Quality Manager Date 6/21/17 Chris Haase, Laboratory Department Manager Date
PERIODIC REVIEW
SIGNATURES BELOW INDICATE NO CHANGES HAVE BEEN MADE SINCE PREVIOUS APPROVAL. Signature Title Date Signature Title Date Signature Title Date
© 2002 - 2017 Pace Analytical Services, LLC. This Standard Operating Procedure may not be reproduced, in part or in full, without written consent of Pace Analytical Services, LLC. Whether distributed internally or as a “courtesy copy” to clients or regulatory agencies, this document is considered confidential and proprietary information. Copies without a distribution number below are considered uncontrolled. Any printed documents in use within a Pace Analytical Services, LLC. laboratory have been reviewed and approved by the persons listed on the cover page. They can only be deemed official if proper signatures are present.
This is COPY# Distributed on by and is CONTROLLED
S-GB-O-049-Rev.07
TABLE OF CONTENTS
SECTION PAGE 1. Purpose/Identification of Method ............................................................................................... 3
2. Summary of Method ................................................................................................................... 3
3. Scope and Application ................................................................................................................ 3
4. Applicable Matrices .................................................................................................................... 4
5. Limits of Detection and Quantitation ......................................................................................... 4
6. Interferences ................................................................................................................................ 4
7. Sample Collection, Preservation, Shipment and Storage ............................................................ 4
8. Definitions................................................................................................................................... 5
9. Equipment and Supplies (Including Computer Hardware and Software) .................................. 5
10. Reagents and Standards ............................................................................................................ 6
11. Calibration and Standardization .............................................................................................. 10
12. Procedure ................................................................................................................................ 17
13. Quality Control ....................................................................................................................... 28
14. Data Analysis and Calculations .............................................................................................. 29
15. Data Assessment and Acceptance Criteria for Quality Control Measures ............................. 30
16. Corrective Actions for Out-of-Control Data ........................................................................... 30
17. Contingencies for Handling Out-of-Control or Unacceptable Data ....................................... 30
18. Method Performance ............................................................................................................... 30
19. Method Modifications ............................................................................................................. 30
20. Instrument/Equipment Maintenance ....................................................................................... 31
21. Troubleshooting ...................................................................................................................... 31
22. Safety ...................................................................................................................................... 31
23. Waste Management ................................................................................................................. 31
24. Pollution Prevention ................................................................................................................ 31
25. References ............................................................................................................................... 32
26. Tables, Diagrams, Flowcharts, and Validation Data .............................................................. 32
27. Revisions ................................................................................................................................. 32

Pace Analytical Services, LLC – Green Bay WI File: S-GB-O-049-Rev.07.doc Semi-Volatile Organics by GCMS Date: Upon Final Signature S-GB-O-049-Rev.07 Page 3 of 34
1. Purpose/Identification of Method
This Standard Operating Procedure (SOP) documents the procedures used by PASI – Green Bay to determine the concentration of Semi-volatile Organic Compounds (SVOCs) in environmental samples. The laboratory utilizes GC/MS and bases these documented procedures on those listed in EPA SW-846 Method 8270C/ EPA 625. The Green Bay laboratory currently processes water samples by automated separatory funnel using Method SW846 3510C, soil samples by Microwave Extraction using Method SW846 3546 and biota samples by soxhlet extractor using Method SW846 3540C. The latest revision of Pace’s SOPs S-GB-O-053 Separatory Funnel Extraction of Water Samples for Semivolatile Analysis (most current revision or replacement), S-GB-O-045 Microwave Extraction for the Determination of Polynuclear Aromatic hydrocarbon, Base/Neutral/Acids, and Total Petroleum Hydrocarbons on Solid Matrices (most current revision or replacement), and S-GB-O-033 Extraction of Biological Samples for Base Neutral/Acid and PAH-SIM Analysis (most current revision or replacement) for these extraction techniques are available from the quality office.
2. Summary of Method
2.1. Sample extracts are prepared for analysis by an appropriate sample preparation method. The semivolatile organic compounds are introduced into the gas chromatograph (GC) by injecting an aliquot of the sample extract. The GC conditions are programmed to separate the analytes. The GC effluent is directly introduced to a mass spectrometer (MS) for both identification and quantification of analytes. Analytes are identified by comparison of their mass spectra with spectra of authentic standards. Analytes are quantified by comparing the response of a selected major (quantitation) ion relative to an internal standard using a multi-point calibration curve.
3. Scope and Application
3.1. This procedure may be used to determine concentrations of neutral, acidic, and basic semivolatile organic compounds in extracts prepared from many types of water samples, soil samples and wastes. Analytes must be soluble in dichloromethane and amenable to capillary gas chromatography. Specific compound classes include polynuclear aromatic hydrocarbons, chlorinated hydrocarbons and pesticides, phthalate esters, organophosphate esters, nitrosamines, haloethers, aldehydes, ethers, ketones, anilines, pyridines, quinolines, aromatic nitro compounds, and phenols. A list of applicable compounds is shown in Table 11.1 Calibration Standard Compound Concentrations. Pace Reporting Levels (PRLs) are also shown for water and soil samples. PRLs are subject to change based on current analytical system performance and actual sample matrices.
3.2. This method is applicable to most water and solid samples, regardless of moisture content. Common matrices are ground and surface water, wastewater, aqueous sludge, sediment, soils, and other solid samples. Procedures may need to be adapted to address limits in the method or equipment that might hinder or interference with sample analysis. All adaptations made to address matrix related modifications must be documented within the analytical data.
3.3. This procedure is restricted to use by, or under the supervision of, analysts experienced in the use of semi-volatile configured GC/MS systems and interpretation of GC/MS data. Each analyst must demonstrate the capability to generate acceptable results with this method to be considered qualified to report sample results.
3.4. This method cannot be substituted for other similar published methods where permit or regulatory compliance is required.
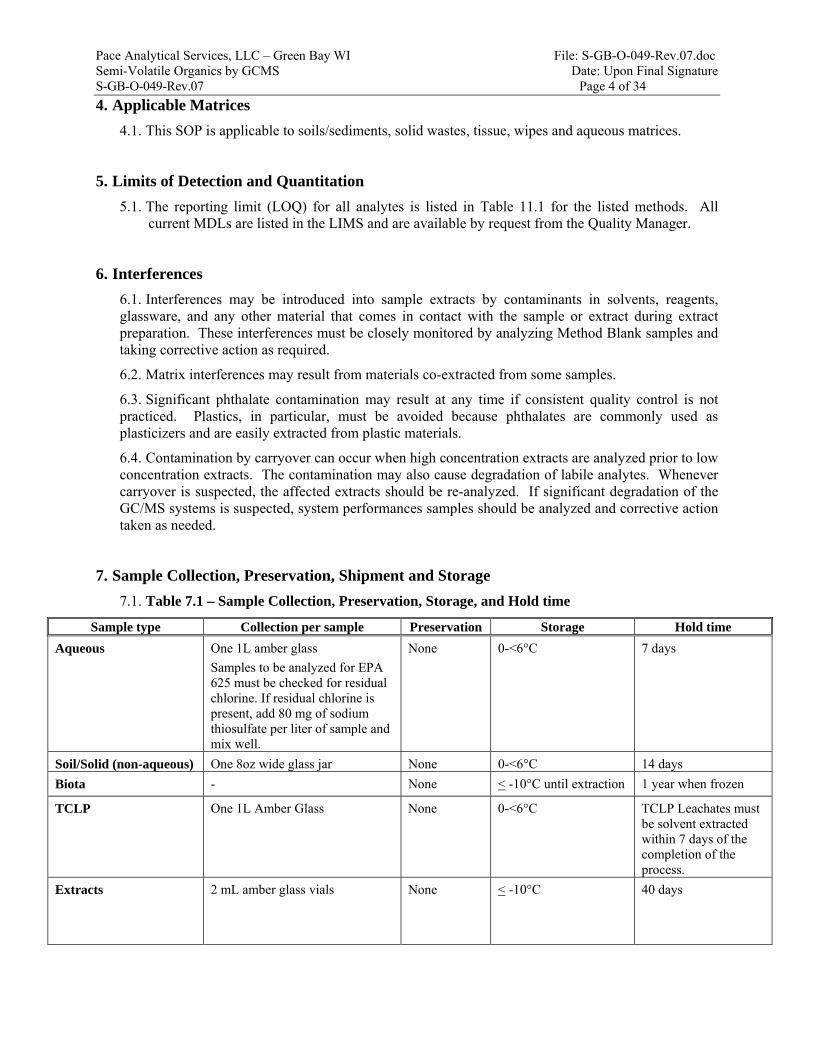
Pace Analytical Services, LLC – Green Bay WI File: S-GB-O-049-Rev.07.doc Semi-Volatile Organics by GCMS Date: Upon Final Signature S-GB-O-049-Rev.07 Page 4 of 34
4. Applicable Matrices
4.1. This SOP is applicable to soils/sediments, solid wastes, tissue, wipes and aqueous matrices.
5. Limits of Detection and Quantitation
5.1. The reporting limit (LOQ) for all analytes is listed in Table 11.1 for the listed methods. All current MDLs are listed in the LIMS and are available by request from the Quality Manager.
6. Interferences
6.1. Interferences may be introduced into sample extracts by contaminants in solvents, reagents, glassware, and any other material that comes in contact with the sample or extract during extract preparation. These interferences must be closely monitored by analyzing Method Blank samples and taking corrective action as required.
6.2. Matrix interferences may result from materials co-extracted from some samples.
6.3. Significant phthalate contamination may result at any time if consistent quality control is not practiced. Plastics, in particular, must be avoided because phthalates are commonly used as plasticizers and are easily extracted from plastic materials.
6.4. Contamination by carryover can occur when high concentration extracts are analyzed prior to low concentration extracts. The contamination may also cause degradation of labile analytes. Whenever carryover is suspected, the affected extracts should be re-analyzed. If significant degradation of the GC/MS systems is suspected, system performances samples should be analyzed and corrective action taken as needed.
7. Sample Collection, Preservation, Shipment and Storage
7.1. Table 7.1 – Sample Collection, Preservation, Storage, and Hold time
Sample type Collection per sample Preservation Storage Hold time
Aqueous One 1L amber glass
Samples to be analyzed for EPA 625 must be checked for residual chlorine. If residual chlorine is present, add 80 mg of sodium thiosulfate per liter of sample and mix well.
None 0-<6°C 7 days
Soil/Solid (non-aqueous) One 8oz wide glass jar None 0-<6°C 14 days
Biota - None < -10°C until extraction 1 year when frozen
TCLP One 1L Amber Glass None 0-<6°C TCLP Leachates must be solvent extracted within 7 days of the completion of the process.
Extracts 2 mL amber glass vials None < -10°C 40 days

Pace Analytical Services, LLC – Green Bay WI File: S-GB-O-049-Rev.07.doc Semi-Volatile Organics by GCMS Date: Upon Final Signature S-GB-O-049-Rev.07 Page 5 of 34
8. Definitions
Definitions of terms found in this SOP are described in the Pace Analytical Services Quality Manual, Glossary.
8.1. Toxicity Characteristic Leaching Procedure (TCLP) – An extraction procedure used to determine if a sample is acceptable for upland disposal. The extraction procedure is meant to simulate the leaching of contaminants under the environmental conditions typically found in a landfill.
8.2. Run Sequence Log – A logbook that lists all injections and analyses performed on a particular piece of equipment regardless of the use of the data collected from each analysis.
8.3. Tune Period – The period after the DFTPP instrument tune check within which analyses may be performed.
9. Equipment and Supplies (Including Computer Hardware and Software)
9.1. Table 9.1 - Instrumentation
Analytical Instrument/Peripherals EPIC Pro Name Serial Number
HP 5890 Series II GC 40MSS1 3336A57925
HP 5972 Mass Selective Detector 40MSS1 3501A02320
HP 7673 AutoSampler Tray 40MSS1 3526A39072
HP 7673 Injector 40MSS1 3009A20936
HP Controller 40MSS1 3526A02233
Alcatel 2005 Rough Pump 40MSS1 265402
HP 5890E GC 40MSS6 3310A49571
HP 5972A Mass Selective Detector 40MSS6 3524A03107
HP 18596A AutoSampler Tray 40MSS6 2920A10670
HP 6890 Injector 40MSS6 US0000692
HP 7673 Controller 40MSS6 3113A25880
Edwards E2M2 Rough Pump 40MSS6 53747
Agilent 7890A GC 40MSS8 CN10705029
Agilent 5975C Mass Selective Detector 40MSS8 US71226404
HP Autosampler tray G2614A 40MSS8 US93806114
HP injector G2613A 40MSS8 US93909562
Edwards E2MS Rough Pump 40MSS8 69070
Agilent 7890B 40MSSA CN15483197
Agilent 5977A Mass Selective Detector 40MSSA US1422L235
Agilent Autosampler tray G4514A 40MSSA CN13330090
Agilent injector G4513A 40MSSA CN14510236
Edwards E2M2 Rough Pump 40MSSA DUO25
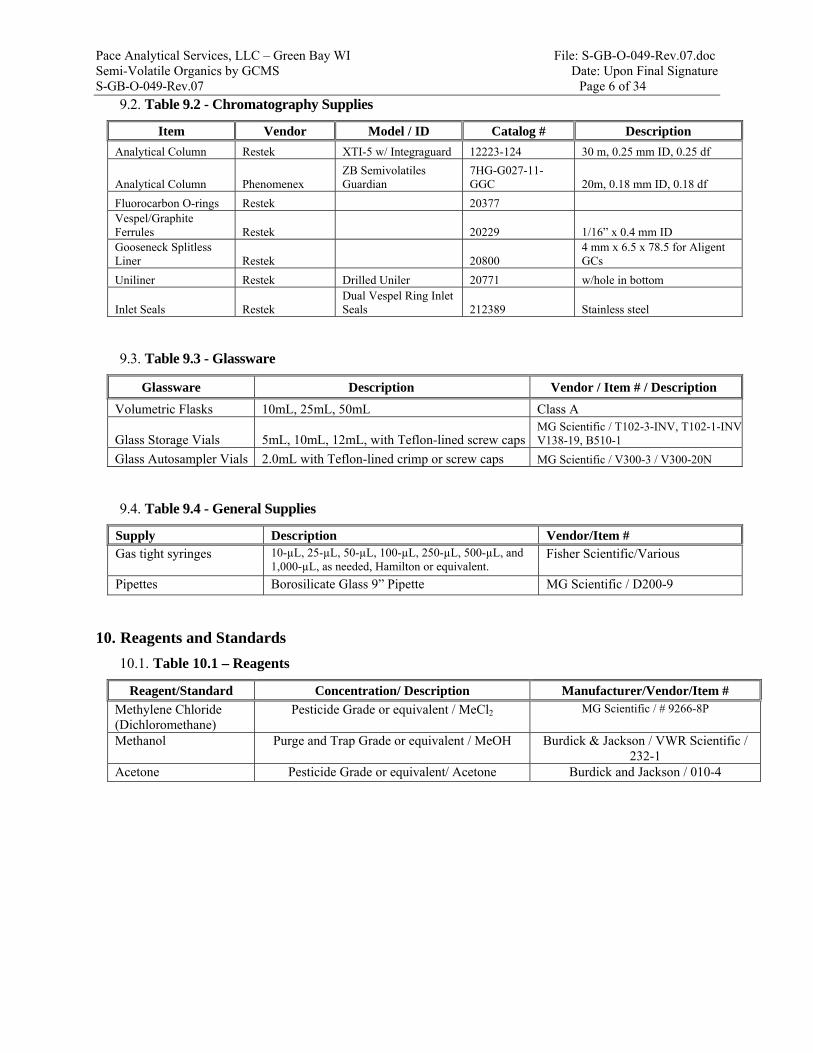
Pace Analytical Services, LLC – Green Bay WI File: S-GB-O-049-Rev.07.doc Semi-Volatile Organics by GCMS Date: Upon Final Signature S-GB-O-049-Rev.07 Page 6 of 34
9.2. Table 9.2 - Chromatography Supplies
Item Vendor Model / ID Catalog # Description
Analytical Column Restek XTI-5 w/ Integraguard 12223-124 30 m, 0.25 mm ID, 0.25 df
Analytical Column Phenomenex ZB Semivolatiles Guardian
7HG-G027-11-GGC 20m, 0.18 mm ID, 0.18 df
Fluorocarbon O-rings Restek 20377 Vespel/Graphite Ferrules Restek 20229 1/16” x 0.4 mm ID Gooseneck Splitless Liner Restek 20800
4 mm x 6.5 x 78.5 for Aligent GCs
Uniliner Restek Drilled Uniler 20771 w/hole in bottom
Inlet Seals Restek Dual Vespel Ring Inlet Seals 212389 Stainless steel
9.3. Table 9.3 - Glassware
Glassware Description Vendor / Item # / Description
Volumetric Flasks 10mL, 25mL, 50mL Class A
Glass Storage Vials 5mL, 10mL, 12mL, with Teflon-lined screw capsMG Scientific / T102-3-INV, T102-1-INVV138-19, B510-1
Glass Autosampler Vials 2.0mL with Teflon-lined crimp or screw caps MG Scientific / V300-3 / V300-20N
9.4. Table 9.4 - General Supplies
Supply Description Vendor/Item # Gas tight syringes 10-µL, 25-µL, 50-µL, 100-µL, 250-µL, 500-µL, and
1,000-µL, as needed, Hamilton or equivalent. Fisher Scientific/Various
Pipettes Borosilicate Glass 9” Pipette MG Scientific / D200-9
10. Reagents and Standards
10.1. Table 10.1 – Reagents
Reagent/Standard Concentration/ Description Manufacturer/Vendor/Item #
Methylene Chloride (Dichloromethane)
Pesticide Grade or equivalent / MeCl2 MG Scientific / # 9266-8P
Methanol Purge and Trap Grade or equivalent / MeOH Burdick & Jackson / VWR Scientific / 232-1
Acetone Pesticide Grade or equivalent/ Acetone Burdick and Jackson / 010-4

Pace Analytical Services, LLC – Green Bay WI File: S-GB-O-049-Rev.07.doc Semi-Volatile Organics by GCMS Date: Upon Final Signature S-GB-O-049-Rev.07 Page 7 of 34
10.2. Table 10.2 - Standard Definitions
Standard Description Comments
Tune Standard Decafluorotriphenylphosphine (DFTPP), 4,4’-DDT, pentachlorophenol, and benzidine solution in
dichloromethane used to verify ion response ratios and system inertness prior to analysis
Must inject no more than 50ng on column
Initial Calibration Standards
Standards prepared at varying levels to determine response and retention characteristics of instrument
Method requires a minimum of 5 levels
Continuing Calibration Verification Standard
A calibration standard prepared at mid-level concentration for all target compounds. This standard is used to verify that the instrument response has not changed significantly since the initial calibration was
performed.
Second Source Verification Standard
A standard prepared from a source other than that used for the initial calibration. This mid-level standard
verifies the accuracy of the calibration curve.
Internal Standard A solution added to all standards, samples, spikes, control samples, and method blanks prior to analysis.
This standard is used to adjust response ratios to account for instrument drift.
1,4 Dichlorobenzene-d4 Naphthalene-d8
Acenaphthene-d10
Phenanthrene-d10
Chrysene-d12
Perylene-d12 Surrogate Standard A solution added to all samples, spikes, control
samples, and method blanks prior to analysis. Nitrobenzene-d5
2-Fluorobiphenyl Terphenyl-d14
Phenol-d6
2-Fluorophenol 2,4,6-Tribromophenol
Spiking Standard This solution contains 70 target analytes and should not be prepared from the same standards as the
calibration standards.
10.3. Table 10.3 - Standard Storage Conditions
Standard Type Description Expiration Storage
Stock Solutions Concentrated reference solution purchased directly from approved vendor
Manufacturer’s recommended expiration date for unopened ampulated standards.
Stock standards must be replaced 1 year after ampule is opened or on expiration date, whichever is sooner.
Manufacturer’s recommended storage conditions
When standard is opened, record all information in the standard logbook.
Intermediate and Working Standard Solutions
Reference solutions prepared by dilutions of the stock solution
1 year from preparation or the expiration date listed for the stock source, whichever is sooner.
Working solutions must be checked frequently and replaced if degradation or evaporation is suspected.
Store in amber vials with Teflon lined screw caps
<-10 like sample extracts
If stock source conditions conflict, store according to method requirements.
10.4. Standard Sources: Standards are prepared from commercially available multi-compound stock solutions and neat materials by multiple dilutions. The sources of the stock solutions and neat
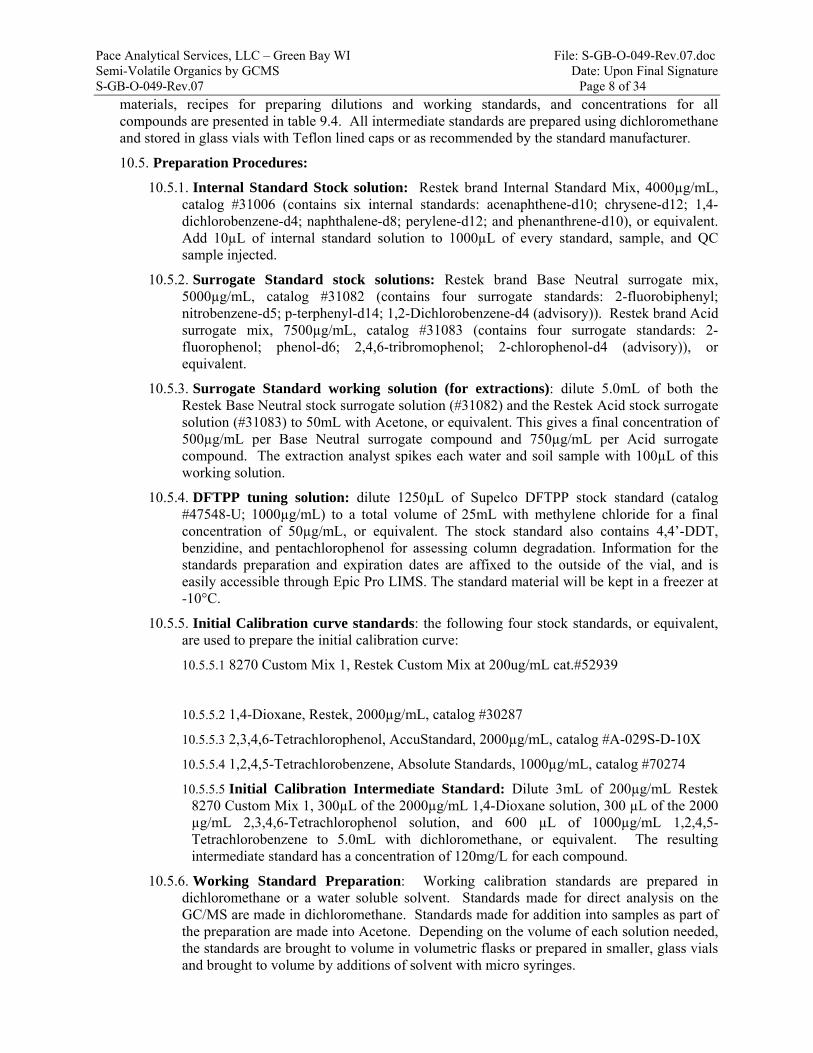
Pace Analytical Services, LLC – Green Bay WI File: S-GB-O-049-Rev.07.doc Semi-Volatile Organics by GCMS Date: Upon Final Signature S-GB-O-049-Rev.07 Page 8 of 34
materials, recipes for preparing dilutions and working standards, and concentrations for all compounds are presented in table 9.4. All intermediate standards are prepared using dichloromethane and stored in glass vials with Teflon lined caps or as recommended by the standard manufacturer.
10.5. Preparation Procedures:
10.5.1. Internal Standard Stock solution: Restek brand Internal Standard Mix, 4000µg/mL, catalog #31006 (contains six internal standards: acenaphthene-d10; chrysene-d12; 1,4-dichlorobenzene-d4; naphthalene-d8; perylene-d12; and phenanthrene-d10), or equivalent. Add 10µL of internal standard solution to 1000µL of every standard, sample, and QC sample injected.
10.5.2. Surrogate Standard stock solutions: Restek brand Base Neutral surrogate mix, 5000µg/mL, catalog #31082 (contains four surrogate standards: 2-fluorobiphenyl; nitrobenzene-d5; p-terphenyl-d14; 1,2-Dichlorobenzene-d4 (advisory)). Restek brand Acid surrogate mix, 7500µg/mL, catalog #31083 (contains four surrogate standards: 2-fluorophenol; phenol-d6; 2,4,6-tribromophenol; 2-chlorophenol-d4 (advisory)), or equivalent.
10.5.3. Surrogate Standard working solution (for extractions): dilute 5.0mL of both the Restek Base Neutral stock surrogate solution (#31082) and the Restek Acid stock surrogate solution (#31083) to 50mL with Acetone, or equivalent. This gives a final concentration of 500µg/mL per Base Neutral surrogate compound and 750µg/mL per Acid surrogate compound. The extraction analyst spikes each water and soil sample with 100µL of this working solution.
10.5.4. DFTPP tuning solution: dilute 1250µL of Supelco DFTPP stock standard (catalog #47548-U; 1000µg/mL) to a total volume of 25mL with methylene chloride for a final concentration of 50µg/mL, or equivalent. The stock standard also contains 4,4’-DDT, benzidine, and pentachlorophenol for assessing column degradation. Information for the standards preparation and expiration dates are affixed to the outside of the vial, and is easily accessible through Epic Pro LIMS. The standard material will be kept in a freezer at -10°C.
10.5.5. Initial Calibration curve standards: the following four stock standards, or equivalent, are used to prepare the initial calibration curve:
10.5.5.1 8270 Custom Mix 1, Restek Custom Mix at 200ug/mL cat.#52939
10.5.5.2 1,4-Dioxane, Restek, 2000µg/mL, catalog #30287
10.5.5.3 2,3,4,6-Tetrachlorophenol, AccuStandard, 2000µg/mL, catalog #A-029S-D-10X
10.5.5.4 1,2,4,5-Tetrachlorobenzene, Absolute Standards, 1000µg/mL, catalog #70274
10.5.5.5 Initial Calibration Intermediate Standard: Dilute 3mL of 200µg/mL Restek 8270 Custom Mix 1, 300µL of the 2000µg/mL 1,4-Dioxane solution, 300 µL of the 2000 µg/mL 2,3,4,6-Tetrachlorophenol solution, and 600 µL of 1000µg/mL 1,2,4,5-Tetrachlorobenzene to 5.0mL with dichloromethane, or equivalent. The resulting intermediate standard has a concentration of 120mg/L for each compound.
10.5.6. Working Standard Preparation: Working calibration standards are prepared in dichloromethane or a water soluble solvent. Standards made for direct analysis on the GC/MS are made in dichloromethane. Standards made for addition into samples as part of the preparation are made into Acetone. Depending on the volume of each solution needed, the standards are brought to volume in volumetric flasks or prepared in smaller, glass vials and brought to volume by additions of solvent with micro syringes.
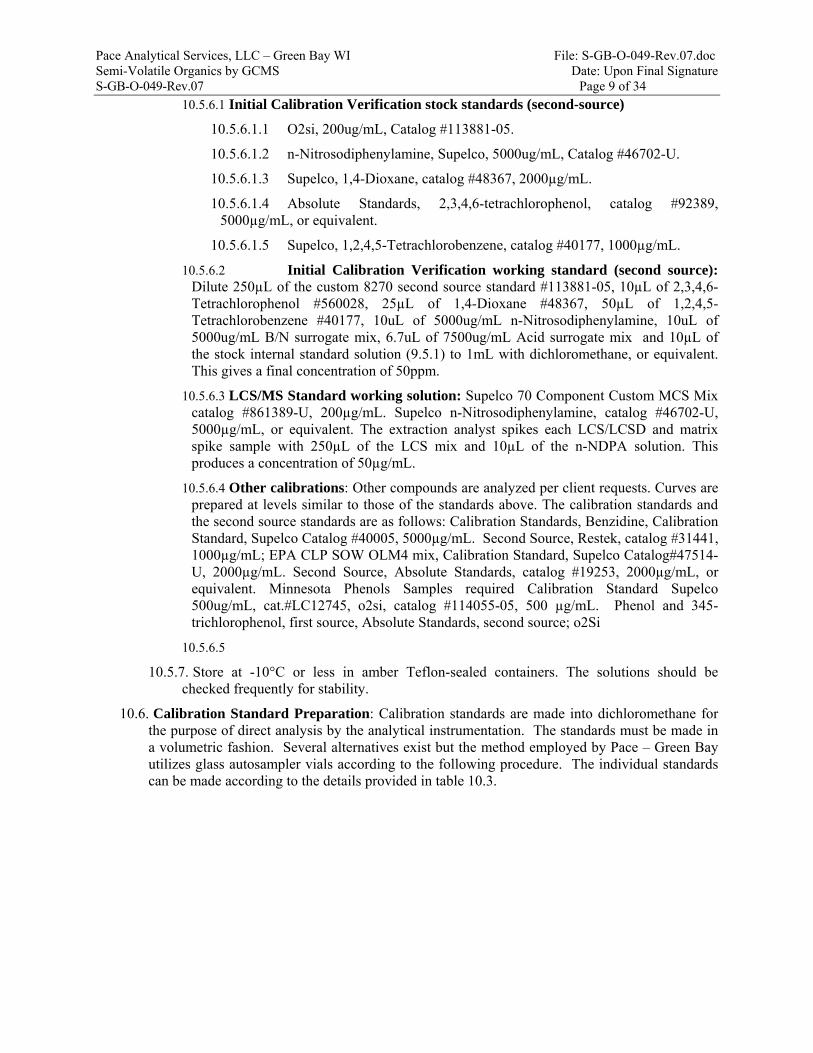
Pace Analytical Services, LLC – Green Bay WI File: S-GB-O-049-Rev.07.doc Semi-Volatile Organics by GCMS Date: Upon Final Signature S-GB-O-049-Rev.07 Page 9 of 34
10.5.6.1 Initial Calibration Verification stock standards (second-source)
10.5.6.1.1 O2si, 200ug/mL, Catalog #113881-05.
10.5.6.1.2 n-Nitrosodiphenylamine, Supelco, 5000ug/mL, Catalog #46702-U.
10.5.6.1.3 Supelco, 1,4-Dioxane, catalog #48367, 2000µg/mL.
10.5.6.1.4 Absolute Standards, 2,3,4,6-tetrachlorophenol, catalog #92389, 5000µg/mL, or equivalent.
10.5.6.1.5 Supelco, 1,2,4,5-Tetrachlorobenzene, catalog #40177, 1000µg/mL.
10.5.6.2 Initial Calibration Verification working standard (second source): Dilute 250µL of the custom 8270 second source standard #113881-05, 10µL of 2,3,4,6-Tetrachlorophenol #560028, 25µL of 1,4-Dioxane #48367, 50µL of 1,2,4,5-Tetrachlorobenzene #40177, 10uL of 5000ug/mL n-Nitrosodiphenylamine, 10uL of 5000ug/mL B/N surrogate mix, 6.7uL of 7500ug/mL Acid surrogate mix and 10µL of the stock internal standard solution (9.5.1) to 1mL with dichloromethane, or equivalent. This gives a final concentration of 50ppm.
10.5.6.3 LCS/MS Standard working solution: Supelco 70 Component Custom MCS Mix catalog #861389-U, 200µg/mL. Supelco n-Nitrosodiphenylamine, catalog #46702-U, 5000µg/mL, or equivalent. The extraction analyst spikes each LCS/LCSD and matrix spike sample with 250µL of the LCS mix and 10µL of the n-NDPA solution. This produces a concentration of 50µg/mL.
10.5.6.4 Other calibrations: Other compounds are analyzed per client requests. Curves are prepared at levels similar to those of the standards above. The calibration standards and the second source standards are as follows: Calibration Standards, Benzidine, Calibration Standard, Supelco Catalog #40005, 5000µg/mL. Second Source, Restek, catalog #31441, 1000µg/mL; EPA CLP SOW OLM4 mix, Calibration Standard, Supelco Catalog#47514-U, 2000µg/mL. Second Source, Absolute Standards, catalog #19253, 2000µg/mL, or equivalent. Minnesota Phenols Samples required Calibration Standard Supelco 500ug/mL, cat.#LC12745, o2si, catalog #114055-05, 500 µg/mL. Phenol and 345-trichlorophenol, first source, Absolute Standards, second source; o2Si
10.5.6.5
10.5.7. Store at -10°C or less in amber Teflon-sealed containers. The solutions should be checked frequently for stability.
10.6. Calibration Standard Preparation: Calibration standards are made into dichloromethane for the purpose of direct analysis by the analytical instrumentation. The standards must be made in a volumetric fashion. Several alternatives exist but the method employed by Pace – Green Bay utilizes glass autosampler vials according to the following procedure. The individual standards can be made according to the details provided in table 10.3.
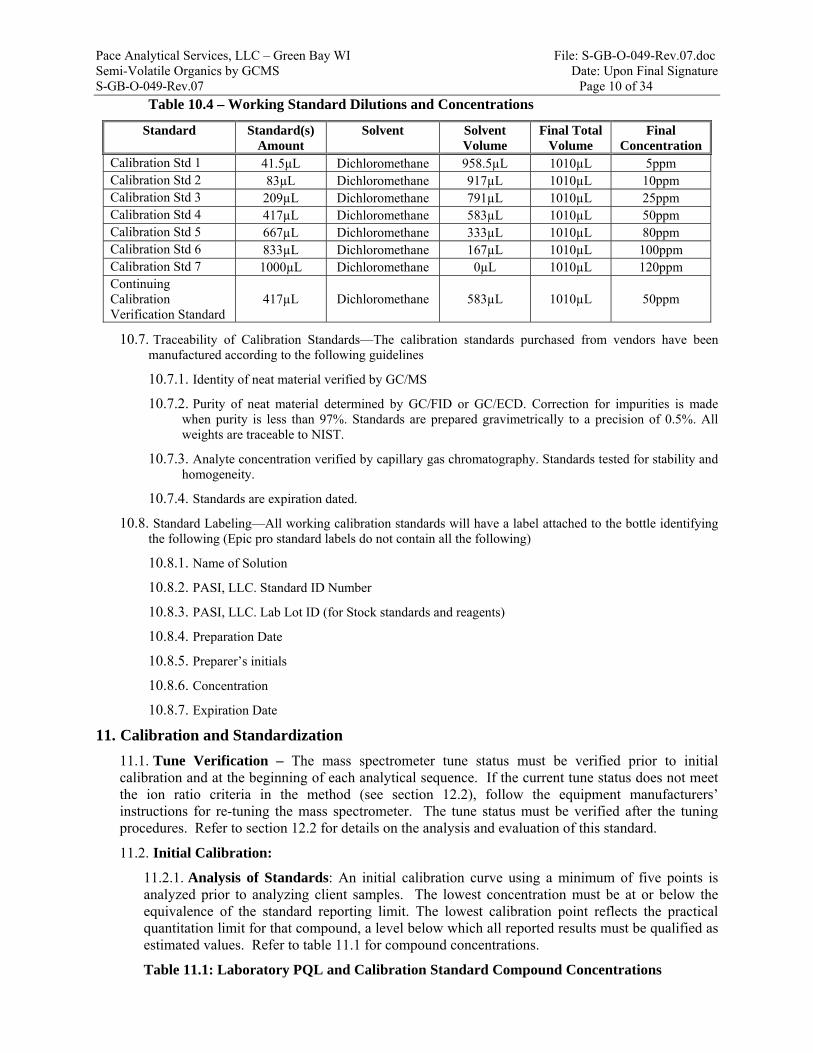
Pace Analytical Services, LLC – Green Bay WI File: S-GB-O-049-Rev.07.doc Semi-Volatile Organics by GCMS Date: Upon Final Signature S-GB-O-049-Rev.07 Page 10 of 34
Table 10.4 – Working Standard Dilutions and Concentrations
Standard Standard(s) Amount
Solvent Solvent Volume
Final Total Volume
Final Concentration
Calibration Std 1 41.5µL Dichloromethane 958.5µL 1010µL 5ppm Calibration Std 2 83µL Dichloromethane 917µL 1010µL 10ppm Calibration Std 3 209µL Dichloromethane 791µL 1010µL 25ppm Calibration Std 4 417µL Dichloromethane 583µL 1010µL 50ppm Calibration Std 5 667µL Dichloromethane 333µL 1010µL 80ppm Calibration Std 6 833µL Dichloromethane 167µL 1010µL 100ppm Calibration Std 7 1000µL Dichloromethane 0µL 1010µL 120ppm Continuing Calibration Verification Standard
417µL Dichloromethane 583µL 1010µL 50ppm
10.7. Traceability of Calibration Standards—The calibration standards purchased from vendors have been manufactured according to the following guidelines
10.7.1. Identity of neat material verified by GC/MS
10.7.2. Purity of neat material determined by GC/FID or GC/ECD. Correction for impurities is made when purity is less than 97%. Standards are prepared gravimetrically to a precision of 0.5%. All weights are traceable to NIST.
10.7.3. Analyte concentration verified by capillary gas chromatography. Standards tested for stability and homogeneity.
10.7.4. Standards are expiration dated.
10.8. Standard Labeling—All working calibration standards will have a label attached to the bottle identifying the following (Epic pro standard labels do not contain all the following)
10.8.1. Name of Solution
10.8.2. PASI, LLC. Standard ID Number
10.8.3. PASI, LLC. Lab Lot ID (for Stock standards and reagents)
10.8.4. Preparation Date
10.8.5. Preparer’s initials
10.8.6. Concentration
10.8.7. Expiration Date
11. Calibration and Standardization
11.1. Tune Verification – The mass spectrometer tune status must be verified prior to initial calibration and at the beginning of each analytical sequence. If the current tune status does not meet the ion ratio criteria in the method (see section 12.2), follow the equipment manufacturers’ instructions for re-tuning the mass spectrometer. The tune status must be verified after the tuning procedures. Refer to section 12.2 for details on the analysis and evaluation of this standard.
11.2. Initial Calibration:
11.2.1. Analysis of Standards: An initial calibration curve using a minimum of five points is analyzed prior to analyzing client samples. The lowest concentration must be at or below the equivalence of the standard reporting limit. The lowest calibration point reflects the practical quantitation limit for that compound, a level below which all reported results must be qualified as estimated values. Refer to table 11.1 for compound concentrations.
Table 11.1: Laboratory PQL and Calibration Standard Compound Concentrations
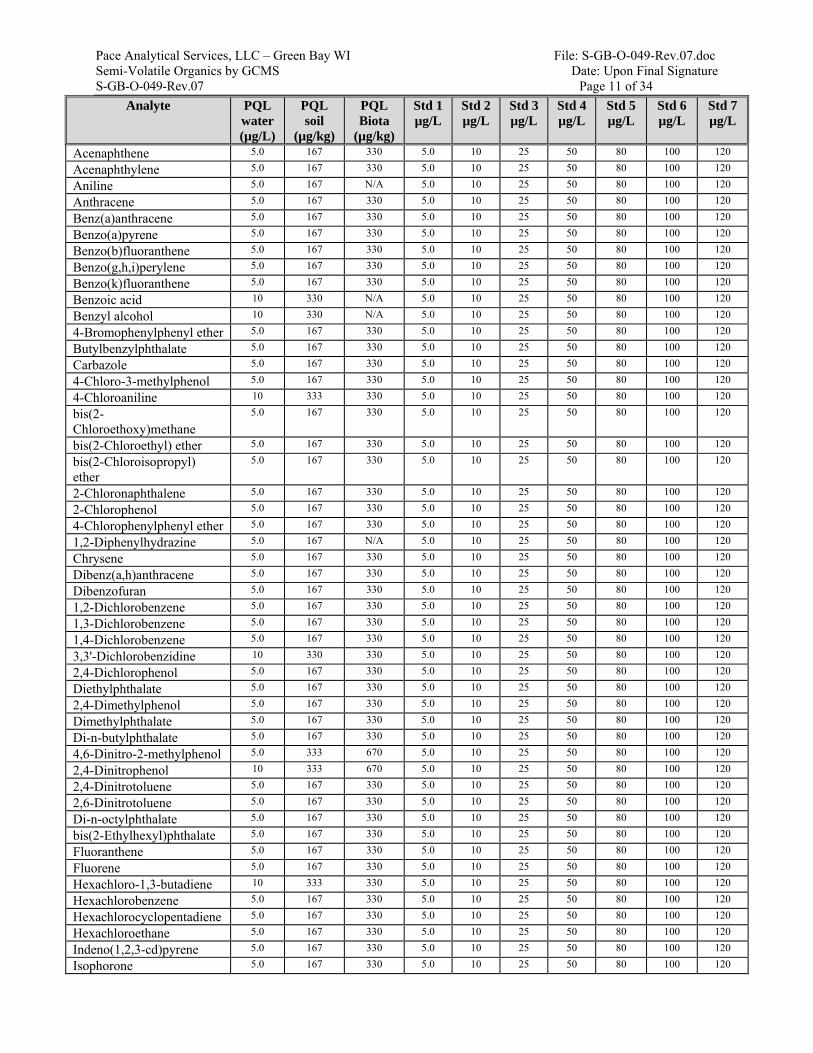
Pace Analytical Services, LLC – Green Bay WI File: S-GB-O-049-Rev.07.doc Semi-Volatile Organics by GCMS Date: Upon Final Signature S-GB-O-049-Rev.07 Page 11 of 34
Analyte PQL water (µg/L)
PQL soil
(µg/kg)
PQL Biota
(µg/kg)
Std 1 µg/L
Std 2 µg/L
Std 3 µg/L
Std 4 µg/L
Std 5 µg/L
Std 6 µg/L
Std 7 µg/L
Acenaphthene 5.0 167 330 5.0 10 25 50 80 100 120
Acenaphthylene 5.0 167 330 5.0 10 25 50 80 100 120
Aniline 5.0 167 N/A 5.0 10 25 50 80 100 120
Anthracene 5.0 167 330 5.0 10 25 50 80 100 120
Benz(a)anthracene 5.0 167 330 5.0 10 25 50 80 100 120
Benzo(a)pyrene 5.0 167 330 5.0 10 25 50 80 100 120
Benzo(b)fluoranthene 5.0 167 330 5.0 10 25 50 80 100 120
Benzo(g,h,i)perylene 5.0 167 330 5.0 10 25 50 80 100 120
Benzo(k)fluoranthene 5.0 167 330 5.0 10 25 50 80 100 120
Benzoic acid 10 330 N/A 5.0 10 25 50 80 100 120
Benzyl alcohol 10 330 N/A 5.0 10 25 50 80 100 120
4-Bromophenylphenyl ether 5.0 167 330 5.0 10 25 50 80 100 120
Butylbenzylphthalate 5.0 167 330 5.0 10 25 50 80 100 120
Carbazole 5.0 167 330 5.0 10 25 50 80 100 120
4-Chloro-3-methylphenol 5.0 167 330 5.0 10 25 50 80 100 120
4-Chloroaniline 10 333 330 5.0 10 25 50 80 100 120
bis(2-Chloroethoxy)methane
5.0 167 330 5.0 10 25 50 80 100 120
bis(2-Chloroethyl) ether 5.0 167 330 5.0 10 25 50 80 100 120
bis(2-Chloroisopropyl) ether
5.0 167 330 5.0 10 25 50 80 100 120
2-Chloronaphthalene 5.0 167 330 5.0 10 25 50 80 100 120
2-Chlorophenol 5.0 167 330 5.0 10 25 50 80 100 120
4-Chlorophenylphenyl ether 5.0 167 330 5.0 10 25 50 80 100 120
1,2-Diphenylhydrazine 5.0 167 N/A 5.0 10 25 50 80 100 120
Chrysene 5.0 167 330 5.0 10 25 50 80 100 120
Dibenz(a,h)anthracene 5.0 167 330 5.0 10 25 50 80 100 120
Dibenzofuran 5.0 167 330 5.0 10 25 50 80 100 120
1,2-Dichlorobenzene 5.0 167 330 5.0 10 25 50 80 100 120
1,3-Dichlorobenzene 5.0 167 330 5.0 10 25 50 80 100 120
1,4-Dichlorobenzene 5.0 167 330 5.0 10 25 50 80 100 120
3,3'-Dichlorobenzidine 10 330 330 5.0 10 25 50 80 100 120
2,4-Dichlorophenol 5.0 167 330 5.0 10 25 50 80 100 120
Diethylphthalate 5.0 167 330 5.0 10 25 50 80 100 120
2,4-Dimethylphenol 5.0 167 330 5.0 10 25 50 80 100 120
Dimethylphthalate 5.0 167 330 5.0 10 25 50 80 100 120
Di-n-butylphthalate 5.0 167 330 5.0 10 25 50 80 100 120
4,6-Dinitro-2-methylphenol 5.0 333 670 5.0 10 25 50 80 100 120
2,4-Dinitrophenol 10 333 670 5.0 10 25 50 80 100 120
2,4-Dinitrotoluene 5.0 167 330 5.0 10 25 50 80 100 120
2,6-Dinitrotoluene 5.0 167 330 5.0 10 25 50 80 100 120
Di-n-octylphthalate 5.0 167 330 5.0 10 25 50 80 100 120
bis(2-Ethylhexyl)phthalate 5.0 167 330 5.0 10 25 50 80 100 120
Fluoranthene 5.0 167 330 5.0 10 25 50 80 100 120
Fluorene 5.0 167 330 5.0 10 25 50 80 100 120
Hexachloro-1,3-butadiene 10 333 330 5.0 10 25 50 80 100 120
Hexachlorobenzene 5.0 167 330 5.0 10 25 50 80 100 120
Hexachlorocyclopentadiene 5.0 167 330 5.0 10 25 50 80 100 120
Hexachloroethane 5.0 167 330 5.0 10 25 50 80 100 120
Indeno(1,2,3-cd)pyrene 5.0 167 330 5.0 10 25 50 80 100 120
Isophorone 5.0 167 330 5.0 10 25 50 80 100 120
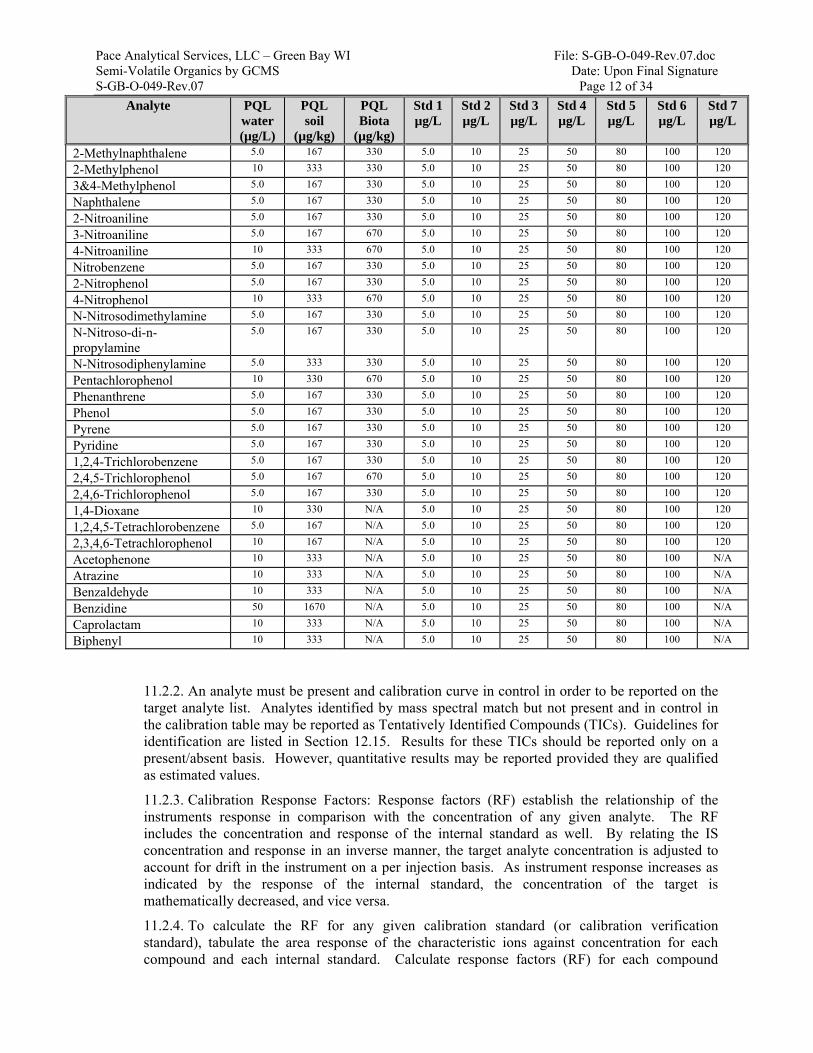
Pace Analytical Services, LLC – Green Bay WI File: S-GB-O-049-Rev.07.doc Semi-Volatile Organics by GCMS Date: Upon Final Signature S-GB-O-049-Rev.07 Page 12 of 34
Analyte PQL water (µg/L)
PQL soil
(µg/kg)
PQL Biota
(µg/kg)
Std 1 µg/L
Std 2 µg/L
Std 3 µg/L
Std 4 µg/L
Std 5 µg/L
Std 6 µg/L
Std 7 µg/L
2-Methylnaphthalene 5.0 167 330 5.0 10 25 50 80 100 120
2-Methylphenol 10 333 330 5.0 10 25 50 80 100 120
3&4-Methylphenol 5.0 167 330 5.0 10 25 50 80 100 120
Naphthalene 5.0 167 330 5.0 10 25 50 80 100 120
2-Nitroaniline 5.0 167 330 5.0 10 25 50 80 100 120
3-Nitroaniline 5.0 167 670 5.0 10 25 50 80 100 120
4-Nitroaniline 10 333 670 5.0 10 25 50 80 100 120
Nitrobenzene 5.0 167 330 5.0 10 25 50 80 100 120
2-Nitrophenol 5.0 167 330 5.0 10 25 50 80 100 120
4-Nitrophenol 10 333 670 5.0 10 25 50 80 100 120
N-Nitrosodimethylamine 5.0 167 330 5.0 10 25 50 80 100 120
N-Nitroso-di-n-propylamine
5.0 167 330 5.0 10 25 50 80 100 120
N-Nitrosodiphenylamine 5.0 333 330 5.0 10 25 50 80 100 120
Pentachlorophenol 10 330 670 5.0 10 25 50 80 100 120
Phenanthrene 5.0 167 330 5.0 10 25 50 80 100 120
Phenol 5.0 167 330 5.0 10 25 50 80 100 120
Pyrene 5.0 167 330 5.0 10 25 50 80 100 120
Pyridine 5.0 167 330 5.0 10 25 50 80 100 120
1,2,4-Trichlorobenzene 5.0 167 330 5.0 10 25 50 80 100 120
2,4,5-Trichlorophenol 5.0 167 670 5.0 10 25 50 80 100 120
2,4,6-Trichlorophenol 5.0 167 330 5.0 10 25 50 80 100 120
1,4-Dioxane 10 330 N/A 5.0 10 25 50 80 100 120
1,2,4,5-Tetrachlorobenzene 5.0 167 N/A 5.0 10 25 50 80 100 120
2,3,4,6-Tetrachlorophenol 10 167 N/A 5.0 10 25 50 80 100 120
Acetophenone 10 333 N/A 5.0 10 25 50 80 100 N/A
Atrazine 10 333 N/A 5.0 10 25 50 80 100 N/A
Benzaldehyde 10 333 N/A 5.0 10 25 50 80 100 N/A
Benzidine 50 1670 N/A 5.0 10 25 50 80 100 N/A
Caprolactam 10 333 N/A 5.0 10 25 50 80 100 N/A
Biphenyl 10 333 N/A 5.0 10 25 50 80 100 N/A
11.2.2. An analyte must be present and calibration curve in control in order to be reported on the target analyte list. Analytes identified by mass spectral match but not present and in control in the calibration table may be reported as Tentatively Identified Compounds (TICs). Guidelines for identification are listed in Section 12.15. Results for these TICs should be reported only on a present/absent basis. However, quantitative results may be reported provided they are qualified as estimated values.
11.2.3. Calibration Response Factors: Response factors (RF) establish the relationship of the instruments response in comparison with the concentration of any given analyte. The RF includes the concentration and response of the internal standard as well. By relating the IS concentration and response in an inverse manner, the target analyte concentration is adjusted to account for drift in the instrument on a per injection basis. As instrument response increases as indicated by the response of the internal standard, the concentration of the target is mathematically decreased, and vice versa.
11.2.4. To calculate the RF for any given calibration standard (or calibration verification standard), tabulate the area response of the characteristic ions against concentration for each compound and each internal standard. Calculate response factors (RF) for each compound
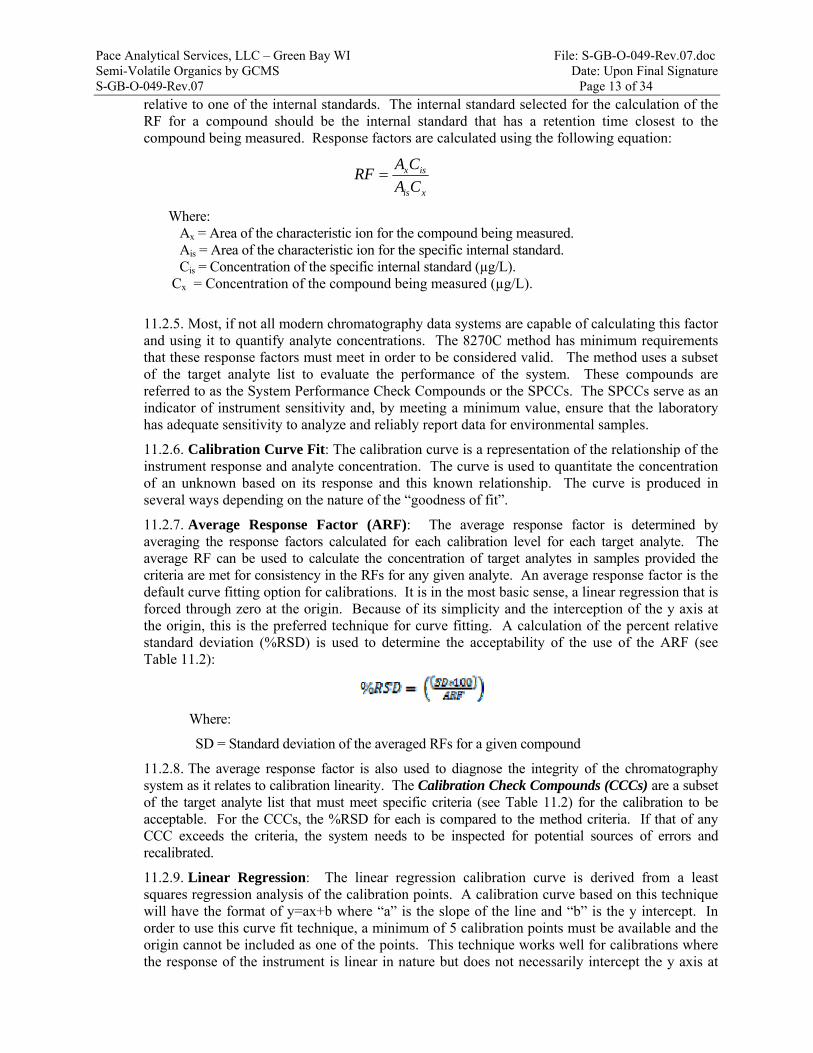
Pace Analytical Services, LLC – Green Bay WI File: S-GB-O-049-Rev.07.doc Semi-Volatile Organics by GCMS Date: Upon Final Signature S-GB-O-049-Rev.07 Page 13 of 34
relative to one of the internal standards. The internal standard selected for the calculation of the RF for a compound should be the internal standard that has a retention time closest to the compound being measured. Response factors are calculated using the following equation:
xis
isx
CA
CARF
Where: Ax = Area of the characteristic ion for the compound being measured. Ais = Area of the characteristic ion for the specific internal standard. Cis = Concentration of the specific internal standard (µg/L). Cx = Concentration of the compound being measured (µg/L).
11.2.5. Most, if not all modern chromatography data systems are capable of calculating this factor and using it to quantify analyte concentrations. The 8270C method has minimum requirements that these response factors must meet in order to be considered valid. The method uses a subset of the target analyte list to evaluate the performance of the system. These compounds are referred to as the System Performance Check Compounds or the SPCCs. The SPCCs serve as an indicator of instrument sensitivity and, by meeting a minimum value, ensure that the laboratory has adequate sensitivity to analyze and reliably report data for environmental samples.
11.2.6. Calibration Curve Fit: The calibration curve is a representation of the relationship of the instrument response and analyte concentration. The curve is used to quantitate the concentration of an unknown based on its response and this known relationship. The curve is produced in several ways depending on the nature of the “goodness of fit”.
11.2.7. Average Response Factor (ARF): The average response factor is determined by averaging the response factors calculated for each calibration level for each target analyte. The average RF can be used to calculate the concentration of target analytes in samples provided the criteria are met for consistency in the RFs for any given analyte. An average response factor is the default curve fitting option for calibrations. It is in the most basic sense, a linear regression that is forced through zero at the origin. Because of its simplicity and the interception of the y axis at the origin, this is the preferred technique for curve fitting. A calculation of the percent relative standard deviation (%RSD) is used to determine the acceptability of the use of the ARF (see Table 11.2):
Where:
SD = Standard deviation of the averaged RFs for a given compound
11.2.8. The average response factor is also used to diagnose the integrity of the chromatography system as it relates to calibration linearity. The Calibration Check Compounds (CCCs) are a subset of the target analyte list that must meet specific criteria (see Table 11.2) for the calibration to be acceptable. For the CCCs, the %RSD for each is compared to the method criteria. If that of any CCC exceeds the criteria, the system needs to be inspected for potential sources of errors and recalibrated.
11.2.9. Linear Regression: The linear regression calibration curve is derived from a least squares regression analysis of the calibration points. A calibration curve based on this technique will have the format of y=ax+b where “a” is the slope of the line and “b” is the y intercept. In order to use this curve fit technique, a minimum of 5 calibration points must be available and the origin cannot be included as one of the points. This technique works well for calibrations where the response of the instrument is linear in nature but does not necessarily intercept the y axis at
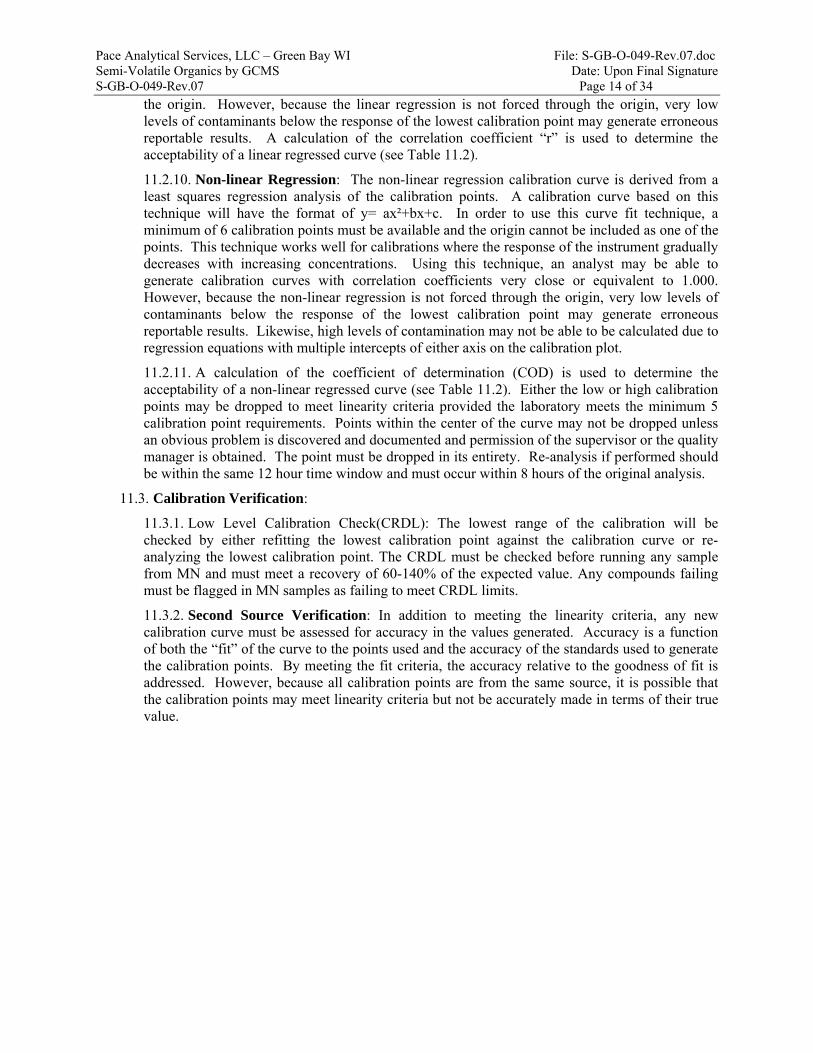
Pace Analytical Services, LLC – Green Bay WI File: S-GB-O-049-Rev.07.doc Semi-Volatile Organics by GCMS Date: Upon Final Signature S-GB-O-049-Rev.07 Page 14 of 34
the origin. However, because the linear regression is not forced through the origin, very low levels of contaminants below the response of the lowest calibration point may generate erroneous reportable results. A calculation of the correlation coefficient “r” is used to determine the acceptability of a linear regressed curve (see Table 11.2).
11.2.10. Non-linear Regression: The non-linear regression calibration curve is derived from a least squares regression analysis of the calibration points. A calibration curve based on this technique will have the format of y= ax²+bx+c. In order to use this curve fit technique, a minimum of 6 calibration points must be available and the origin cannot be included as one of the points. This technique works well for calibrations where the response of the instrument gradually decreases with increasing concentrations. Using this technique, an analyst may be able to generate calibration curves with correlation coefficients very close or equivalent to 1.000. However, because the non-linear regression is not forced through the origin, very low levels of contaminants below the response of the lowest calibration point may generate erroneous reportable results. Likewise, high levels of contamination may not be able to be calculated due to regression equations with multiple intercepts of either axis on the calibration plot.
11.2.11. A calculation of the coefficient of determination (COD) is used to determine the acceptability of a non-linear regressed curve (see Table 11.2). Either the low or high calibration points may be dropped to meet linearity criteria provided the laboratory meets the minimum 5 calibration point requirements. Points within the center of the curve may not be dropped unless an obvious problem is discovered and documented and permission of the supervisor or the quality manager is obtained. The point must be dropped in its entirety. Re-analysis if performed should be within the same 12 hour time window and must occur within 8 hours of the original analysis.
11.3. Calibration Verification:
11.3.1. Low Level Calibration Check(CRDL): The lowest range of the calibration will be checked by either refitting the lowest calibration point against the calibration curve or re-analyzing the lowest calibration point. The CRDL must be checked before running any sample from MN and must meet a recovery of 60-140% of the expected value. Any compounds failing must be flagged in MN samples as failing to meet CRDL limits.
11.3.2. Second Source Verification: In addition to meeting the linearity criteria, any new calibration curve must be assessed for accuracy in the values generated. Accuracy is a function of both the “fit” of the curve to the points used and the accuracy of the standards used to generate the calibration points. By meeting the fit criteria, the accuracy relative to the goodness of fit is addressed. However, because all calibration points are from the same source, it is possible that the calibration points may meet linearity criteria but not be accurately made in terms of their true value.
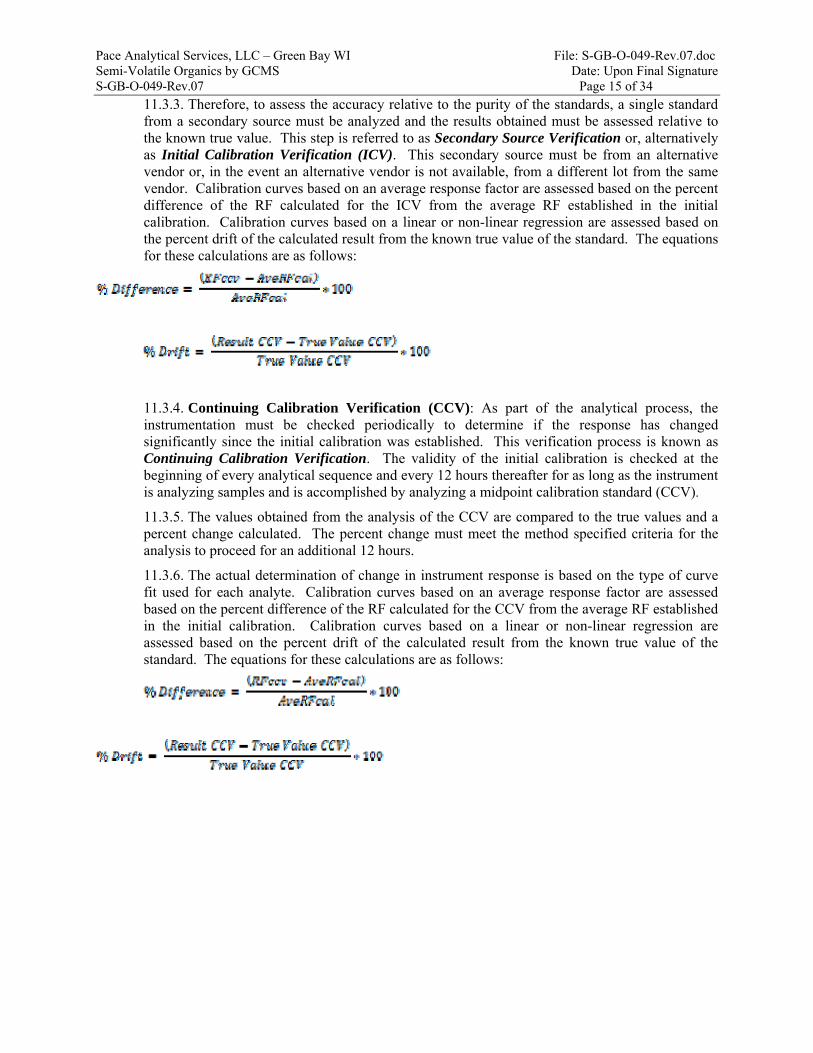
Pace Analytical Services, LLC – Green Bay WI File: S-GB-O-049-Rev.07.doc Semi-Volatile Organics by GCMS Date: Upon Final Signature S-GB-O-049-Rev.07 Page 15 of 34
11.3.3. Therefore, to assess the accuracy relative to the purity of the standards, a single standard from a secondary source must be analyzed and the results obtained must be assessed relative to the known true value. This step is referred to as Secondary Source Verification or, alternatively as Initial Calibration Verification (ICV). This secondary source must be from an alternative vendor or, in the event an alternative vendor is not available, from a different lot from the same vendor. Calibration curves based on an average response factor are assessed based on the percent difference of the RF calculated for the ICV from the average RF established in the initial calibration. Calibration curves based on a linear or non-linear regression are assessed based on the percent drift of the calculated result from the known true value of the standard. The equations for these calculations are as follows:
11.3.4. Continuing Calibration Verification (CCV): As part of the analytical process, the instrumentation must be checked periodically to determine if the response has changed significantly since the initial calibration was established. This verification process is known as Continuing Calibration Verification. The validity of the initial calibration is checked at the beginning of every analytical sequence and every 12 hours thereafter for as long as the instrument is analyzing samples and is accomplished by analyzing a midpoint calibration standard (CCV).
11.3.5. The values obtained from the analysis of the CCV are compared to the true values and a percent change calculated. The percent change must meet the method specified criteria for the analysis to proceed for an additional 12 hours.
11.3.6. The actual determination of change in instrument response is based on the type of curve fit used for each analyte. Calibration curves based on an average response factor are assessed based on the percent difference of the RF calculated for the CCV from the average RF established in the initial calibration. Calibration curves based on a linear or non-linear regression are assessed based on the percent drift of the calculated result from the known true value of the standard. The equations for these calculations are as follows:
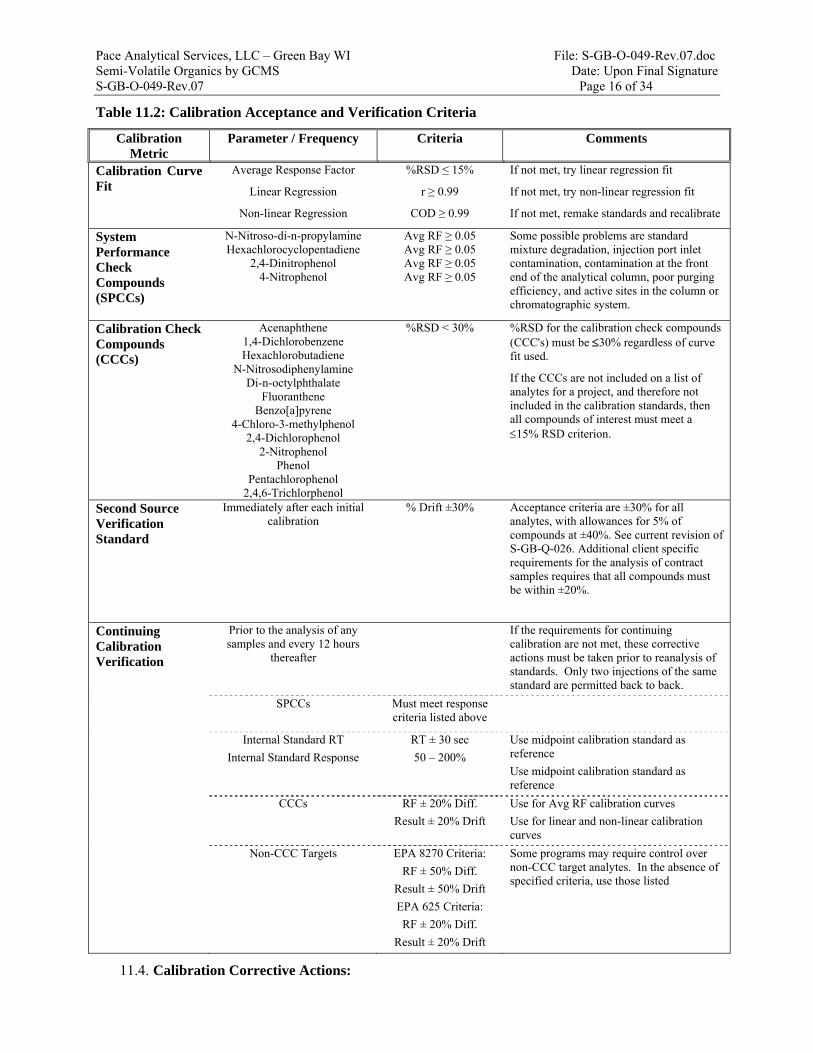
Pace Analytical Services, LLC – Green Bay WI File: S-GB-O-049-Rev.07.doc Semi-Volatile Organics by GCMS Date: Upon Final Signature S-GB-O-049-Rev.07 Page 16 of 34
Table 11.2: Calibration Acceptance and Verification Criteria
Calibration Metric
Parameter / Frequency Criteria Comments
Calibration Curve Fit
Average Response Factor
Linear Regression
Non-linear Regression
%RSD ≤ 15%
r ≥ 0.99
COD ≥ 0.99
If not met, try linear regression fit
If not met, try non-linear regression fit
If not met, remake standards and recalibrate
System Performance Check Compounds (SPCCs)
N-Nitroso-di-n-propylamine Hexachlorocyclopentadiene
2,4-Dinitrophenol 4-Nitrophenol
Avg RF ≥ 0.05 Avg RF ≥ 0.05 Avg RF ≥ 0.05 Avg RF ≥ 0.05
Some possible problems are standard mixture degradation, injection port inlet contamination, contamination at the front end of the analytical column, poor purging efficiency, and active sites in the column or chromatographic system.
Calibration Check Compounds (CCCs)
Acenaphthene 1,4-Dichlorobenzene Hexachlorobutadiene
N-Nitrosodiphenylamine Di-n-octylphthalate
Fluoranthene Benzo[a]pyrene
4-Chloro-3-methylphenol 2,4-Dichlorophenol
2-Nitrophenol Phenol
Pentachlorophenol 2,4,6-Trichlorphenol
%RSD < 30% %RSD for the calibration check compounds (CCC's) must be 30% regardless of curve fit used.
If the CCCs are not included on a list of analytes for a project, and therefore not included in the calibration standards, then all compounds of interest must meet a 15% RSD criterion.
Second Source Verification Standard
Immediately after each initial calibration
% Drift ±30% Acceptance criteria are ±30% for all analytes, with allowances for 5% of compounds at ±40%. See current revision of S-GB-Q-026. Additional client specific requirements for the analysis of contract samples requires that all compounds must be within ±20%.
Continuing Calibration Verification
Prior to the analysis of any samples and every 12 hours
thereafter
If the requirements for continuing calibration are not met, these corrective actions must be taken prior to reanalysis of standards. Only two injections of the same standard are permitted back to back.
SPCCs
Must meet response criteria listed above
Internal Standard RT
Internal Standard Response
RT ± 30 sec
50 – 200%
Use midpoint calibration standard as reference
Use midpoint calibration standard as reference
CCCs RF ± 20% Diff.
Result ± 20% Drift
Use for Avg RF calibration curves
Use for linear and non-linear calibration curves
Non-CCC Targets EPA 8270 Criteria:
RF ± 50% Diff.
Result ± 50% Drift
EPA 625 Criteria:
RF ± 20% Diff.
Result ± 20% Drift
Some programs may require control over non-CCC target analytes. In the absence of specified criteria, use those listed
11.4. Calibration Corrective Actions:
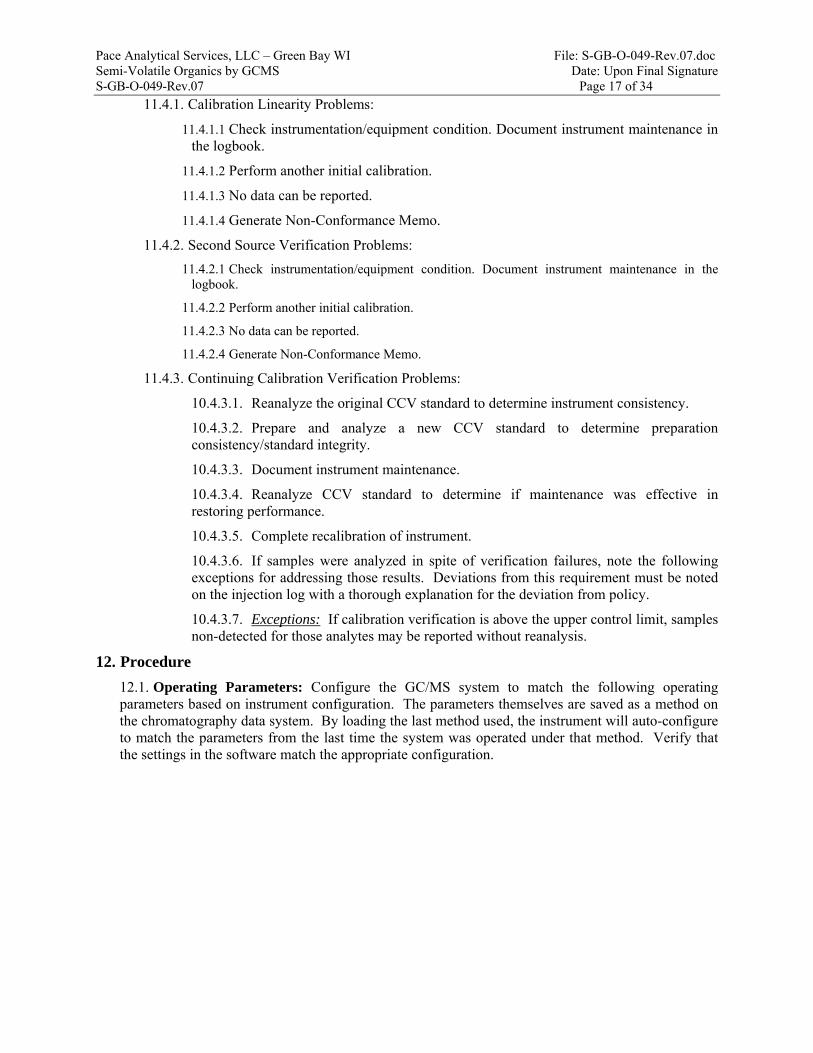
Pace Analytical Services, LLC – Green Bay WI File: S-GB-O-049-Rev.07.doc Semi-Volatile Organics by GCMS Date: Upon Final Signature S-GB-O-049-Rev.07 Page 17 of 34
11.4.1. Calibration Linearity Problems:
11.4.1.1 Check instrumentation/equipment condition. Document instrument maintenance in the logbook.
11.4.1.2 Perform another initial calibration.
11.4.1.3 No data can be reported.
11.4.1.4 Generate Non-Conformance Memo.
11.4.2. Second Source Verification Problems:
11.4.2.1 Check instrumentation/equipment condition. Document instrument maintenance in the logbook.
11.4.2.2 Perform another initial calibration.
11.4.2.3 No data can be reported.
11.4.2.4 Generate Non-Conformance Memo.
11.4.3. Continuing Calibration Verification Problems:
10.4.3.1. Reanalyze the original CCV standard to determine instrument consistency.
10.4.3.2. Prepare and analyze a new CCV standard to determine preparation consistency/standard integrity.
10.4.3.3. Document instrument maintenance.
10.4.3.4. Reanalyze CCV standard to determine if maintenance was effective in restoring performance.
10.4.3.5. Complete recalibration of instrument.
10.4.3.6. If samples were analyzed in spite of verification failures, note the following exceptions for addressing those results. Deviations from this requirement must be noted on the injection log with a thorough explanation for the deviation from policy.
10.4.3.7. Exceptions: If calibration verification is above the upper control limit, samples non-detected for those analytes may be reported without reanalysis.
12. Procedure
12.1. Operating Parameters: Configure the GC/MS system to match the following operating parameters based on instrument configuration. The parameters themselves are saved as a method on the chromatography data system. By loading the last method used, the instrument will auto-configure to match the parameters from the last time the system was operated under that method. Verify that the settings in the software match the appropriate configuration.
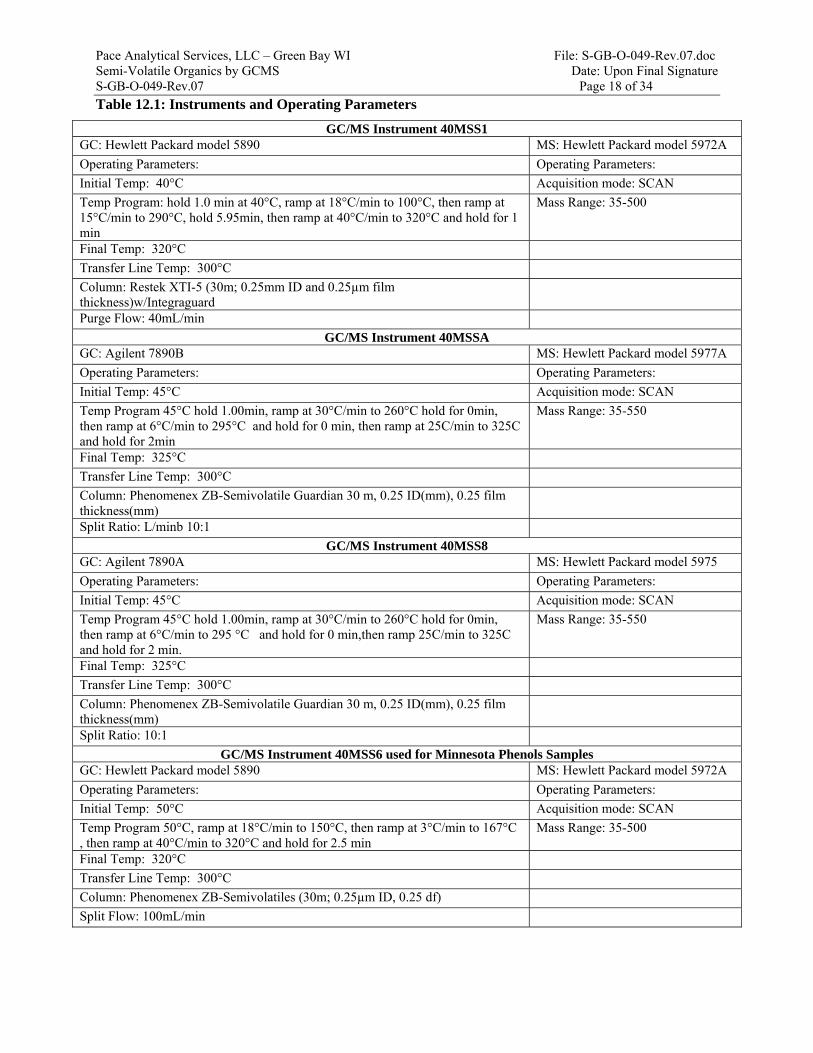
Pace Analytical Services, LLC – Green Bay WI File: S-GB-O-049-Rev.07.doc Semi-Volatile Organics by GCMS Date: Upon Final Signature S-GB-O-049-Rev.07 Page 18 of 34
Table 12.1: Instruments and Operating Parameters
GC/MS Instrument 40MSS1 GC: Hewlett Packard model 5890 MS: Hewlett Packard model 5972A
Operating Parameters: Operating Parameters:
Initial Temp: 40°C Acquisition mode: SCAN
Temp Program: hold 1.0 min at 40°C, ramp at 18°C/min to 100°C, then ramp at 15°C/min to 290°C, hold 5.95min, then ramp at 40°C/min to 320°C and hold for 1 min
Mass Range: 35-500
Final Temp: 320°C
Transfer Line Temp: 300°C
Column: Restek XTI-5 (30m; 0.25mm ID and 0.25µm film thickness)w/Integraguard
Purge Flow: 40mL/min
GC/MS Instrument 40MSSA GC: Agilent 7890B MS: Hewlett Packard model 5977A
Operating Parameters: Operating Parameters:
Initial Temp: 45°C Acquisition mode: SCAN
Temp Program 45°C hold 1.00min, ramp at 30°C/min to 260°C hold for 0min, then ramp at 6°C/min to 295°C and hold for 0 min, then ramp at 25C/min to 325C and hold for 2min
Mass Range: 35-550
Final Temp: 325°C
Transfer Line Temp: 300°C
Column: Phenomenex ZB-Semivolatile Guardian 30 m, 0.25 ID(mm), 0.25 film thickness(mm)
Split Ratio: L/minb 10:1
GC/MS Instrument 40MSS8 GC: Agilent 7890A MS: Hewlett Packard model 5975
Operating Parameters: Operating Parameters:
Initial Temp: 45°C Acquisition mode: SCAN
Temp Program 45°C hold 1.00min, ramp at 30°C/min to 260°C hold for 0min, then ramp at 6°C/min to 295 °C and hold for 0 min,then ramp 25C/min to 325C and hold for 2 min.
Mass Range: 35-550
Final Temp: 325°C
Transfer Line Temp: 300°C
Column: Phenomenex ZB-Semivolatile Guardian 30 m, 0.25 ID(mm), 0.25 film thickness(mm)
Split Ratio: 10:1
GC/MS Instrument 40MSS6 used for Minnesota Phenols Samples GC: Hewlett Packard model 5890 MS: Hewlett Packard model 5972A
Operating Parameters: Operating Parameters:
Initial Temp: 50°C Acquisition mode: SCAN
Temp Program 50°C, ramp at 18°C/min to 150°C, then ramp at 3°C/min to 167°C , then ramp at 40°C/min to 320°C and hold for 2.5 min
Mass Range: 35-500
Final Temp: 320°C
Transfer Line Temp: 300°C
Column: Phenomenex ZB-Semivolatiles (30m; 0.25µm ID, 0.25 df)
Split Flow: 100mL/min
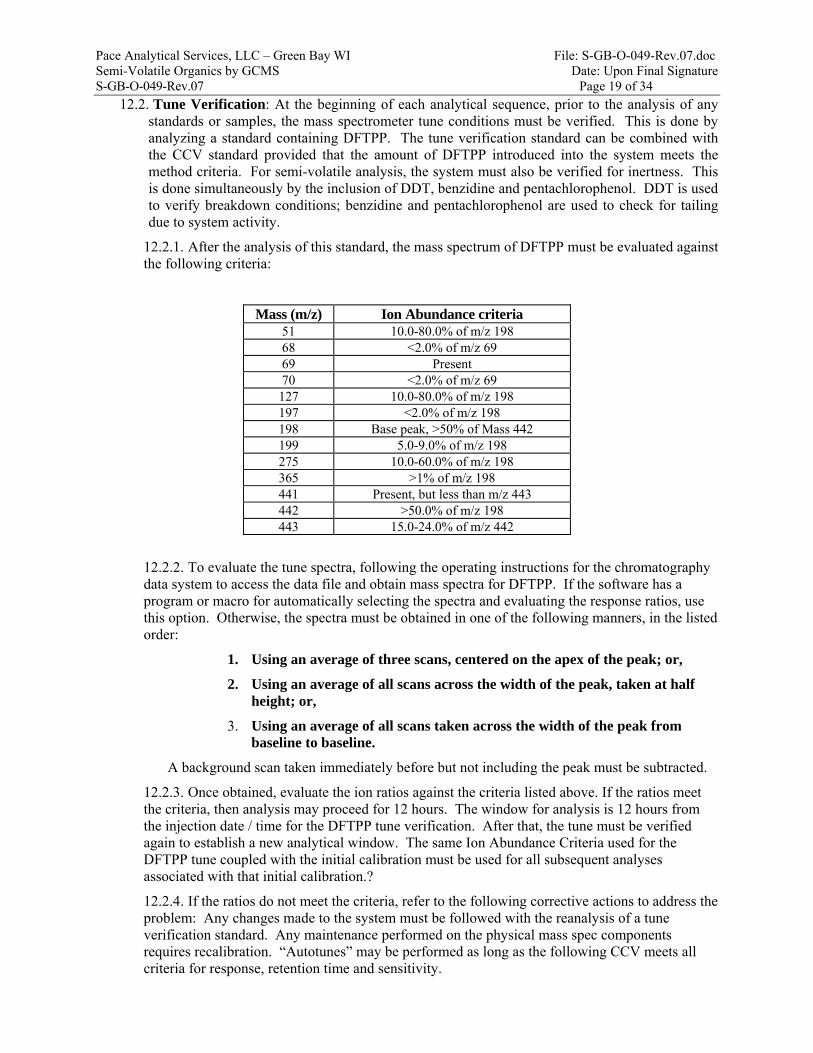
Pace Analytical Services, LLC – Green Bay WI File: S-GB-O-049-Rev.07.doc Semi-Volatile Organics by GCMS Date: Upon Final Signature S-GB-O-049-Rev.07 Page 19 of 34
12.2. Tune Verification: At the beginning of each analytical sequence, prior to the analysis of any standards or samples, the mass spectrometer tune conditions must be verified. This is done by analyzing a standard containing DFTPP. The tune verification standard can be combined with the CCV standard provided that the amount of DFTPP introduced into the system meets the method criteria. For semi-volatile analysis, the system must also be verified for inertness. This is done simultaneously by the inclusion of DDT, benzidine and pentachlorophenol. DDT is used to verify breakdown conditions; benzidine and pentachlorophenol are used to check for tailing due to system activity.
12.2.1. After the analysis of this standard, the mass spectrum of DFTPP must be evaluated against the following criteria:
Mass (m/z) Ion Abundance criteria 51 10.0-80.0% of m/z 198 68 <2.0% of m/z 69 69 Present 70 <2.0% of m/z 69 127 10.0-80.0% of m/z 198 197 <2.0% of m/z 198 198 Base peak, >50% of Mass 442 199 5.0-9.0% of m/z 198 275 10.0-60.0% of m/z 198 365 >1% of m/z 198 441 Present, but less than m/z 443 442 >50.0% of m/z 198 443 15.0-24.0% of m/z 442
12.2.2. To evaluate the tune spectra, following the operating instructions for the chromatography data system to access the data file and obtain mass spectra for DFTPP. If the software has a program or macro for automatically selecting the spectra and evaluating the response ratios, use this option. Otherwise, the spectra must be obtained in one of the following manners, in the listed order:
1. Using an average of three scans, centered on the apex of the peak; or,
2. Using an average of all scans across the width of the peak, taken at half height; or,
3. Using an average of all scans taken across the width of the peak from baseline to baseline.
A background scan taken immediately before but not including the peak must be subtracted.
12.2.3. Once obtained, evaluate the ion ratios against the criteria listed above. If the ratios meet the criteria, then analysis may proceed for 12 hours. The window for analysis is 12 hours from the injection date / time for the DFTPP tune verification. After that, the tune must be verified again to establish a new analytical window. The same Ion Abundance Criteria used for the DFTPP tune coupled with the initial calibration must be used for all subsequent analyses associated with that initial calibration.?
12.2.4. If the ratios do not meet the criteria, refer to the following corrective actions to address the problem: Any changes made to the system must be followed with the reanalysis of a tune verification standard. Any maintenance performed on the physical mass spec components requires recalibration. “Autotunes” may be performed as long as the following CCV meets all criteria for response, retention time and sensitivity.

Pace Analytical Services, LLC – Green Bay WI File: S-GB-O-049-Rev.07.doc Semi-Volatile Organics by GCMS Date: Upon Final Signature S-GB-O-049-Rev.07 Page 20 of 34
12.3. Tailing Factor Verification- Benzidine and Pentachlorophenol should be present at their normal responses, and peak tailing should not be to an excess.
12.3.1. Column performance test for base / neutrals – At the beginning of each day that the base / neutral fraction is to be analyzed for benzidine, the benzidine tailing factor must be calculated. The benzidine tailing factor must be less than 3.0.
12.3.2. Column performance test for acids – At the beginning of each day that the acid fraction is to be determined, the pentachlorophenol tailing factor must be calculated. The pentachlorophenol tailing factor must be less than 5.0.
12.3.3. Tailing factor calculation – Refer to Attachment II: Tailing Factor Calculation.
12.3.4. The tailing factor of 3.0 for Benzidine and 5.0 for Pentachlorophenol must not be exceeded. If the tailing factor for either exceeds this amount, corrective action must be taken prior to the analysis of samples(unless all compounds required by samples analyzed after this tune and check meet Calibration Check Compound(CCC) limits). The tailing factor must be verified by the analysis of another tailing factor standard after corrective action is taken. Follow the following steps to return the system to an acceptable operating condition.
12.3.4.1 Perform front-end maintenance on the GCMS System.
12.3.4.2 Begin the run again by re-analyzing the DFTPP tune solution.
12.4. Breakdown Verification- The GC/MS system must be sufficiently inert such that DDT will not breakdown excessively while in the injection port. The inertness is assessed by calculating the percent breakdown of DDT into the products DDD and DDE. The calculation is performed as follows:
12.4.1. The % breakdown must not exceed 20%. If the breakdown of DDT exceeds this amount, corrective action must be taken prior to analysis of samples(unless all compounds required by samples analyzed after this tune and check meet Calibration Check Compound(CCC) limits. The breakdown must be verified by the analysis of another breakdown standard after corrective action is taken. Follow the following steps to return the system to an acceptable operating condition.
12.4.1.1 Perform front-end maintenance on the GCMS System
12.4.1.2 Begin the run again by re-analyzing the DFTPP tune solution.
12.5. Calibration Verification: After the instrument tune conditions are verified and the system meets tune criteria, the instrument must undergo calibration verification. If it has already been determined that the instrument needs to be recalibrated, follow the procedures listed in section 11.2 (Analysis of Standards). Otherwise, analyze a Continuing Calibration Verification Standard to determine the current calibration status.
12.6. If the CCV meets control criteria, the system is deemed to be in control and analysis of samples may commence. If the CCV does not meet control criteria, follow the corrective action procedures listed section 11.4.3 (Continuing Verification Problems). If the tune verification has been combined with the CCV, the 12 hour analysis window begins from the analysis date / time of the CCV.
12.7. Note: In situations where the instrument will run unattended (i.e., overnight), the analyst may load sequential CCVs in anticipation of that the first in the series may fail due to carry over from a previous sample. If so, the CCV must be evaluated according to the protocol set forth in the Quality Assurance Manual within the Equipment and Measurement Traceability section.
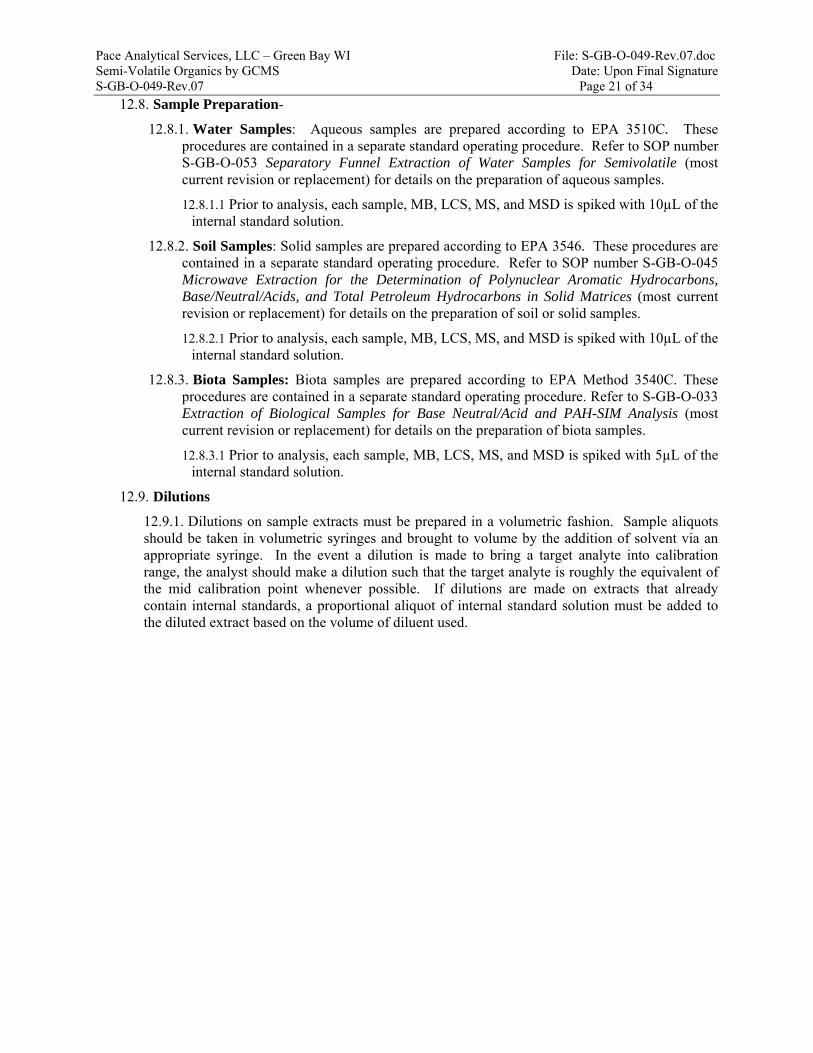
Pace Analytical Services, LLC – Green Bay WI File: S-GB-O-049-Rev.07.doc Semi-Volatile Organics by GCMS Date: Upon Final Signature S-GB-O-049-Rev.07 Page 21 of 34
12.8. Sample Preparation-
12.8.1. Water Samples: Aqueous samples are prepared according to EPA 3510C. These procedures are contained in a separate standard operating procedure. Refer to SOP number S-GB-O-053 Separatory Funnel Extraction of Water Samples for Semivolatile (most current revision or replacement) for details on the preparation of aqueous samples.
12.8.1.1 Prior to analysis, each sample, MB, LCS, MS, and MSD is spiked with 10µL of the internal standard solution.
12.8.2. Soil Samples: Solid samples are prepared according to EPA 3546. These procedures are contained in a separate standard operating procedure. Refer to SOP number S-GB-O-045 Microwave Extraction for the Determination of Polynuclear Aromatic Hydrocarbons, Base/Neutral/Acids, and Total Petroleum Hydrocarbons in Solid Matrices (most current revision or replacement) for details on the preparation of soil or solid samples.
12.8.2.1 Prior to analysis, each sample, MB, LCS, MS, and MSD is spiked with 10µL of the internal standard solution.
12.8.3. Biota Samples: Biota samples are prepared according to EPA Method 3540C. These procedures are contained in a separate standard operating procedure. Refer to S-GB-O-033 Extraction of Biological Samples for Base Neutral/Acid and PAH-SIM Analysis (most current revision or replacement) for details on the preparation of biota samples.
12.8.3.1 Prior to analysis, each sample, MB, LCS, MS, and MSD is spiked with 5µL of the internal standard solution.
12.9. Dilutions
12.9.1. Dilutions on sample extracts must be prepared in a volumetric fashion. Sample aliquots should be taken in volumetric syringes and brought to volume by the addition of solvent via an appropriate syringe. In the event a dilution is made to bring a target analyte into calibration range, the analyst should make a dilution such that the target analyte is roughly the equivalent of the mid calibration point whenever possible. If dilutions are made on extracts that already contain internal standards, a proportional aliquot of internal standard solution must be added to the diluted extract based on the volume of diluent used.
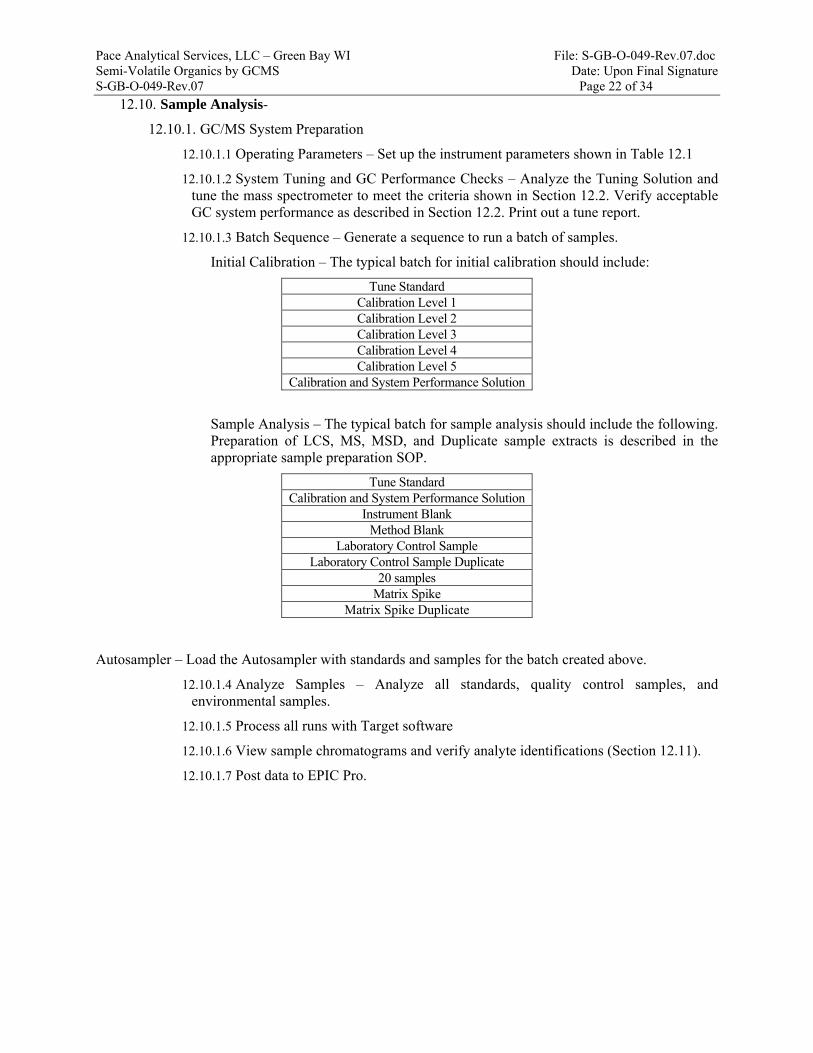
Pace Analytical Services, LLC – Green Bay WI File: S-GB-O-049-Rev.07.doc Semi-Volatile Organics by GCMS Date: Upon Final Signature S-GB-O-049-Rev.07 Page 22 of 34
12.10. Sample Analysis-
12.10.1. GC/MS System Preparation
12.10.1.1 Operating Parameters – Set up the instrument parameters shown in Table 12.1
12.10.1.2 System Tuning and GC Performance Checks – Analyze the Tuning Solution and tune the mass spectrometer to meet the criteria shown in Section 12.2. Verify acceptable GC system performance as described in Section 12.2. Print out a tune report.
12.10.1.3 Batch Sequence – Generate a sequence to run a batch of samples.
Initial Calibration – The typical batch for initial calibration should include:
Tune Standard Calibration Level 1 Calibration Level 2 Calibration Level 3 Calibration Level 4 Calibration Level 5
Calibration and System Performance Solution
Sample Analysis – The typical batch for sample analysis should include the following. Preparation of LCS, MS, MSD, and Duplicate sample extracts is described in the appropriate sample preparation SOP.
Tune Standard Calibration and System Performance Solution
Instrument Blank Method Blank
Laboratory Control Sample Laboratory Control Sample Duplicate
20 samples Matrix Spike
Matrix Spike Duplicate
Autosampler – Load the Autosampler with standards and samples for the batch created above.
12.10.1.4 Analyze Samples – Analyze all standards, quality control samples, and environmental samples.
12.10.1.5 Process all runs with Target software
12.10.1.6 View sample chromatograms and verify analyte identifications (Section 12.11).
12.10.1.7 Post data to EPIC Pro.
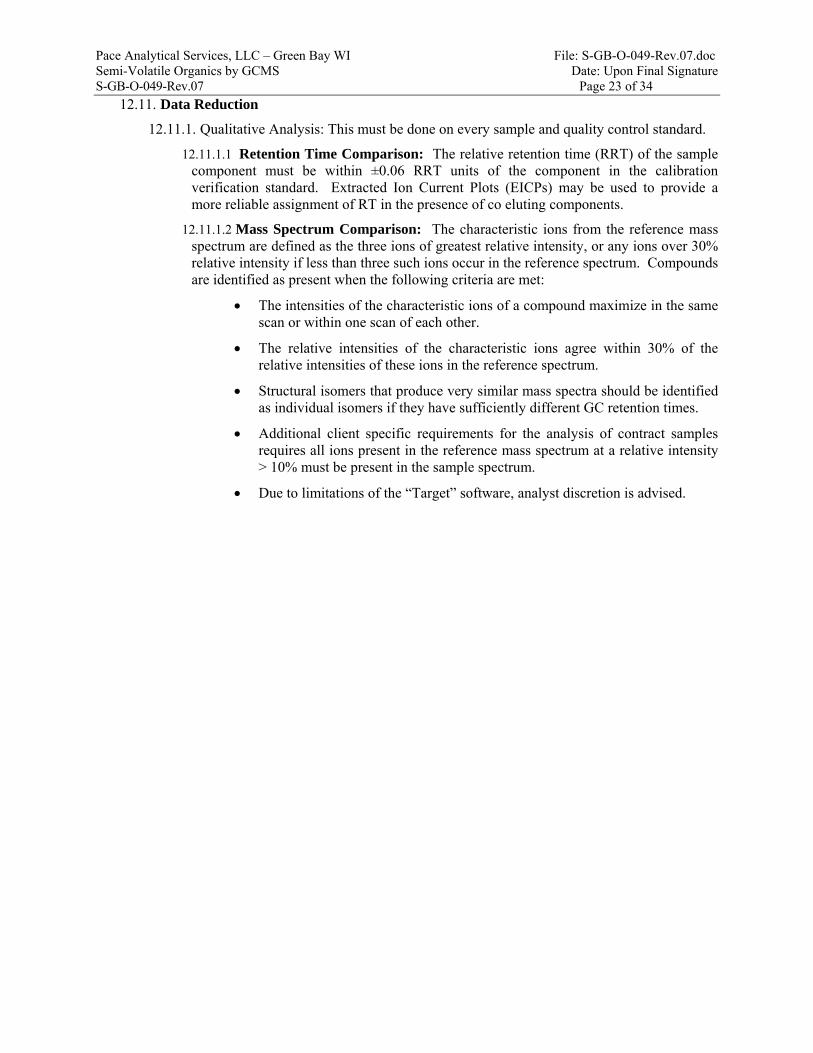
Pace Analytical Services, LLC – Green Bay WI File: S-GB-O-049-Rev.07.doc Semi-Volatile Organics by GCMS Date: Upon Final Signature S-GB-O-049-Rev.07 Page 23 of 34
12.11. Data Reduction
12.11.1. Qualitative Analysis: This must be done on every sample and quality control standard.
12.11.1.1 Retention Time Comparison: The relative retention time (RRT) of the sample component must be within ±0.06 RRT units of the component in the calibration verification standard. Extracted Ion Current Plots (EICPs) may be used to provide a more reliable assignment of RT in the presence of co eluting components.
12.11.1.2 Mass Spectrum Comparison: The characteristic ions from the reference mass spectrum are defined as the three ions of greatest relative intensity, or any ions over 30% relative intensity if less than three such ions occur in the reference spectrum. Compounds are identified as present when the following criteria are met:
The intensities of the characteristic ions of a compound maximize in the same scan or within one scan of each other.
The relative intensities of the characteristic ions agree within 30% of the relative intensities of these ions in the reference spectrum.
Structural isomers that produce very similar mass spectra should be identified as individual isomers if they have sufficiently different GC retention times.
Additional client specific requirements for the analysis of contract samples requires all ions present in the reference mass spectrum at a relative intensity > 10% must be present in the sample spectrum.
Due to limitations of the “Target” software, analyst discretion is advised.
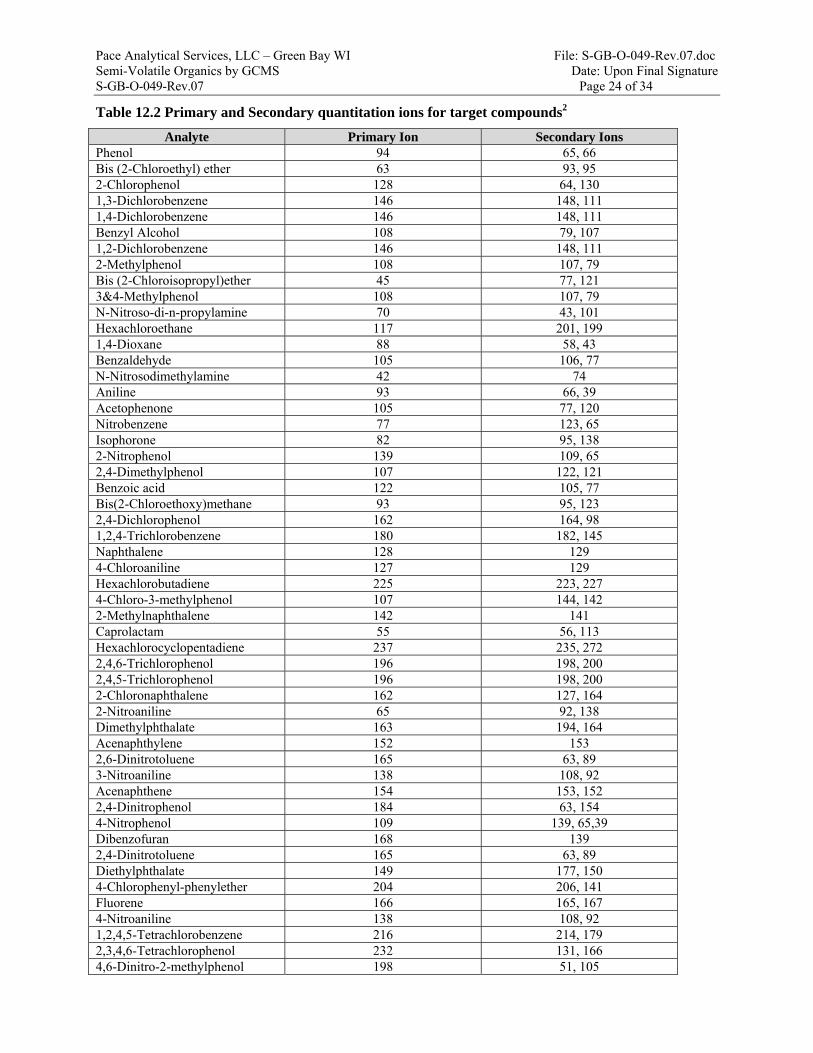
Pace Analytical Services, LLC – Green Bay WI File: S-GB-O-049-Rev.07.doc Semi-Volatile Organics by GCMS Date: Upon Final Signature S-GB-O-049-Rev.07 Page 24 of 34
Table 12.2 Primary and Secondary quantitation ions for target compounds2
Analyte Primary Ion Secondary Ions Phenol 94 65, 66 Bis (2-Chloroethyl) ether 63 93, 95 2-Chlorophenol 128 64, 130 1,3-Dichlorobenzene 146 148, 111 1,4-Dichlorobenzene 146 148, 111 Benzyl Alcohol 108 79, 107 1,2-Dichlorobenzene 146 148, 111 2-Methylphenol 108 107, 79 Bis (2-Chloroisopropyl)ether 45 77, 121 3&4-Methylphenol 108 107, 79 N-Nitroso-di-n-propylamine 70 43, 101 Hexachloroethane 117 201, 199 1,4-Dioxane 88 58, 43 Benzaldehyde 105 106, 77 N-Nitrosodimethylamine 42 74 Aniline 93 66, 39 Acetophenone 105 77, 120 Nitrobenzene 77 123, 65 Isophorone 82 95, 138 2-Nitrophenol 139 109, 65 2,4-Dimethylphenol 107 122, 121 Benzoic acid 122 105, 77 Bis(2-Chloroethoxy)methane 93 95, 123 2,4-Dichlorophenol 162 164, 98 1,2,4-Trichlorobenzene 180 182, 145 Naphthalene 128 129 4-Chloroaniline 127 129 Hexachlorobutadiene 225 223, 227 4-Chloro-3-methylphenol 107 144, 142 2-Methylnaphthalene 142 141 Caprolactam 55 56, 113 Hexachlorocyclopentadiene 237 235, 272 2,4,6-Trichlorophenol 196 198, 200 2,4,5-Trichlorophenol 196 198, 200 2-Chloronaphthalene 162 127, 164 2-Nitroaniline 65 92, 138 Dimethylphthalate 163 194, 164 Acenaphthylene 152 153 2,6-Dinitrotoluene 165 63, 89 3-Nitroaniline 138 108, 92 Acenaphthene 154 153, 152 2,4-Dinitrophenol 184 63, 154 4-Nitrophenol 109 139, 65,39 Dibenzofuran 168 139 2,4-Dinitrotoluene 165 63, 89 Diethylphthalate 149 177, 150 4-Chlorophenyl-phenylether 204 206, 141 Fluorene 166 165, 167 4-Nitroaniline 138 108, 92 1,2,4,5-Tetrachlorobenzene 216 214, 179 2,3,4,6-Tetrachlorophenol 232 131, 166 4,6-Dinitro-2-methylphenol 198 51, 105
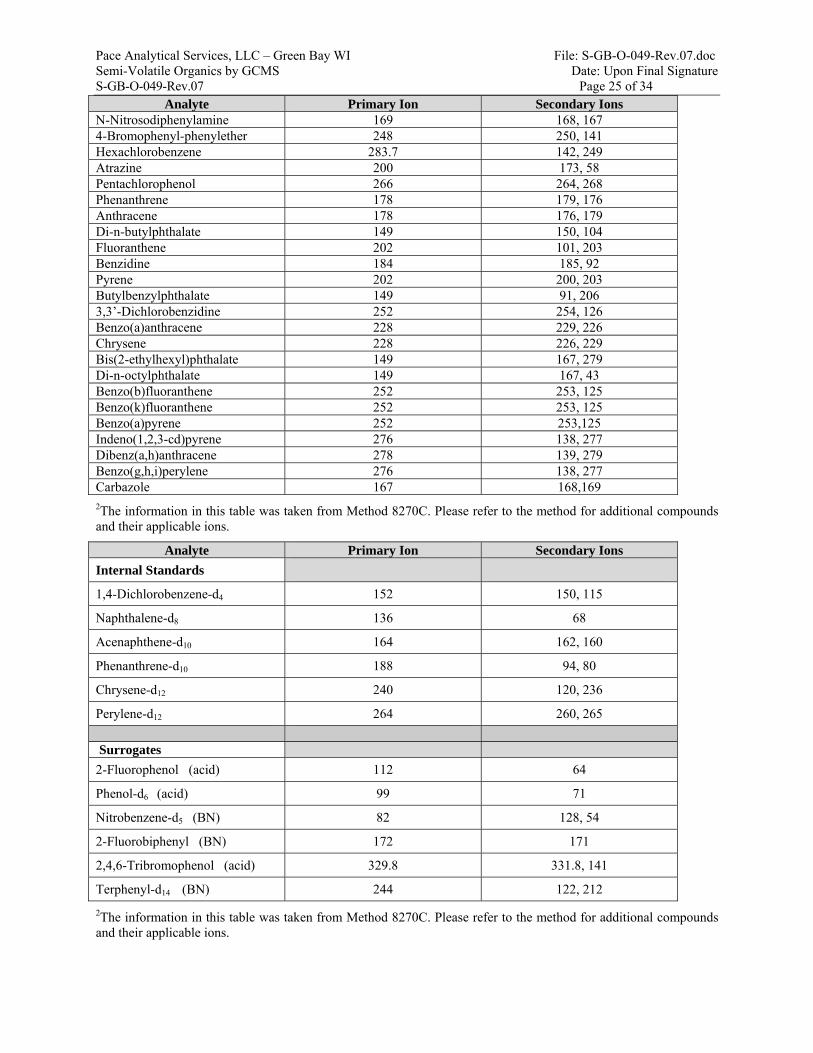
Pace Analytical Services, LLC – Green Bay WI File: S-GB-O-049-Rev.07.doc Semi-Volatile Organics by GCMS Date: Upon Final Signature S-GB-O-049-Rev.07 Page 25 of 34
Analyte Primary Ion Secondary Ions N-Nitrosodiphenylamine 169 168, 167 4-Bromophenyl-phenylether 248 250, 141 Hexachlorobenzene 283.7 142, 249 Atrazine 200 173, 58 Pentachlorophenol 266 264, 268 Phenanthrene 178 179, 176 Anthracene 178 176, 179 Di-n-butylphthalate 149 150, 104 Fluoranthene 202 101, 203 Benzidine 184 185, 92 Pyrene 202 200, 203 Butylbenzylphthalate 149 91, 206 3,3’-Dichlorobenzidine 252 254, 126 Benzo(a)anthracene 228 229, 226 Chrysene 228 226, 229 Bis(2-ethylhexyl)phthalate 149 167, 279 Di-n-octylphthalate 149 167, 43 Benzo(b)fluoranthene 252 253, 125 Benzo(k)fluoranthene 252 253, 125 Benzo(a)pyrene 252 253,125 Indeno(1,2,3-cd)pyrene 276 138, 277 Dibenz(a,h)anthracene 278 139, 279 Benzo(g,h,i)perylene 276 138, 277 Carbazole 167 168,169 2The information in this table was taken from Method 8270C. Please refer to the method for additional compounds and their applicable ions.
Analyte Primary Ion Secondary Ions
Internal Standards
1,4-Dichlorobenzene-d4 152 150, 115
Naphthalene-d8 136 68
Acenaphthene-d10 164 162, 160
Phenanthrene-d10 188 94, 80
Chrysene-d12 240 120, 236
Perylene-d12 264 260, 265
Surrogates
2-Fluorophenol (acid) 112 64
Phenol-d6 (acid) 99 71
Nitrobenzene-d5 (BN) 82 128, 54
2-Fluorobiphenyl (BN) 172 171
2,4,6-Tribromophenol (acid) 329.8 331.8, 141
Terphenyl-d14 (BN) 244 122, 212
2The information in this table was taken from Method 8270C. Please refer to the method for additional compounds and their applicable ions.
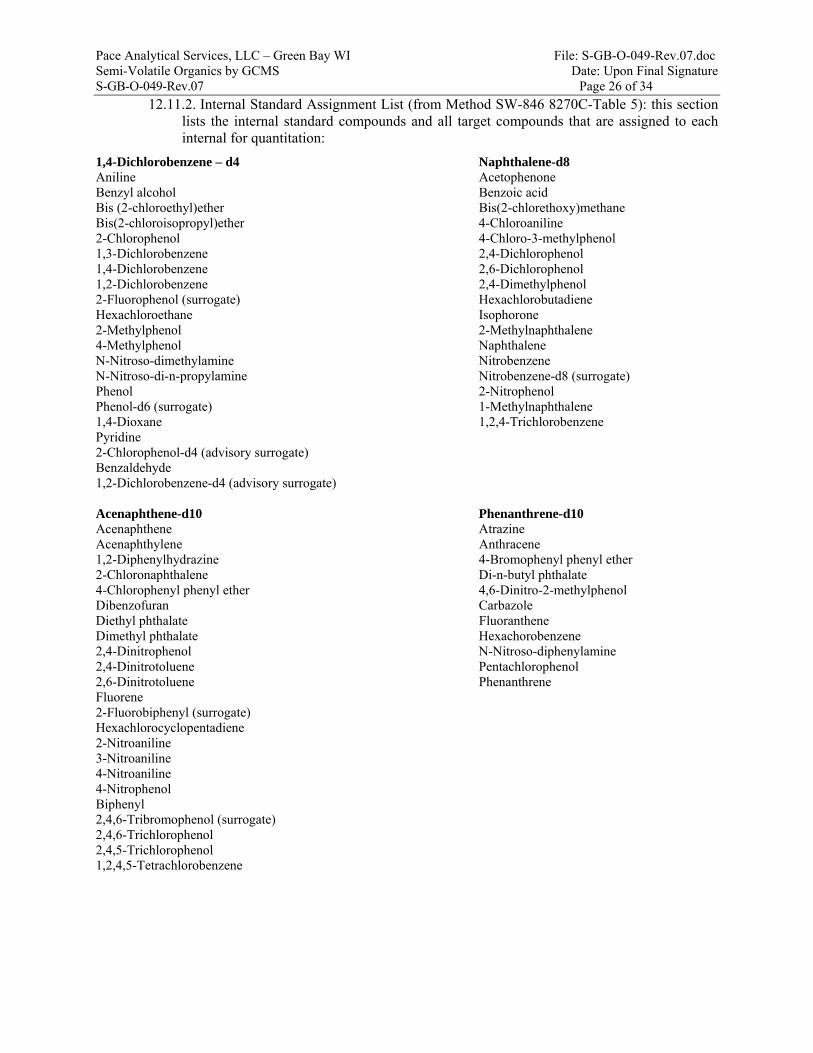
Pace Analytical Services, LLC – Green Bay WI File: S-GB-O-049-Rev.07.doc Semi-Volatile Organics by GCMS Date: Upon Final Signature S-GB-O-049-Rev.07 Page 26 of 34
12.11.2. Internal Standard Assignment List (from Method SW-846 8270C-Table 5): this section lists the internal standard compounds and all target compounds that are assigned to each internal for quantitation:
1,4-Dichlorobenzene – d4 Naphthalene-d8 Aniline Acetophenone Benzyl alcohol Benzoic acid Bis (2-chloroethyl)ether Bis(2-chlorethoxy)methane Bis(2-chloroisopropyl)ether 4-Chloroaniline 2-Chlorophenol 4-Chloro-3-methylphenol 1,3-Dichlorobenzene 2,4-Dichlorophenol 1,4-Dichlorobenzene 2,6-Dichlorophenol 1,2-Dichlorobenzene 2,4-Dimethylphenol 2-Fluorophenol (surrogate) Hexachlorobutadiene Hexachloroethane Isophorone 2-Methylphenol 2-Methylnaphthalene 4-Methylphenol Naphthalene N-Nitroso-dimethylamine Nitrobenzene N-Nitroso-di-n-propylamine Nitrobenzene-d8 (surrogate) Phenol 2-Nitrophenol Phenol-d6 (surrogate) 1-Methylnaphthalene 1,4-Dioxane 1,2,4-Trichlorobenzene Pyridine 2-Chlorophenol-d4 (advisory surrogate) Benzaldehyde 1,2-Dichlorobenzene-d4 (advisory surrogate) Acenaphthene-d10 Phenanthrene-d10 Acenaphthene Atrazine Acenaphthylene Anthracene 1,2-Diphenylhydrazine 4-Bromophenyl phenyl ether 2-Chloronaphthalene Di-n-butyl phthalate 4-Chlorophenyl phenyl ether 4,6-Dinitro-2-methylphenol Dibenzofuran Carbazole Diethyl phthalate Fluoranthene Dimethyl phthalate Hexachorobenzene 2,4-Dinitrophenol N-Nitroso-diphenylamine 2,4-Dinitrotoluene Pentachlorophenol 2,6-Dinitrotoluene Phenanthrene Fluorene 2-Fluorobiphenyl (surrogate) Hexachlorocyclopentadiene 2-Nitroaniline 3-Nitroaniline 4-Nitroaniline 4-Nitrophenol Biphenyl 2,4,6-Tribromophenol (surrogate) 2,4,6-Trichlorophenol 2,4,5-Trichlorophenol 1,2,4,5-Tetrachlorobenzene
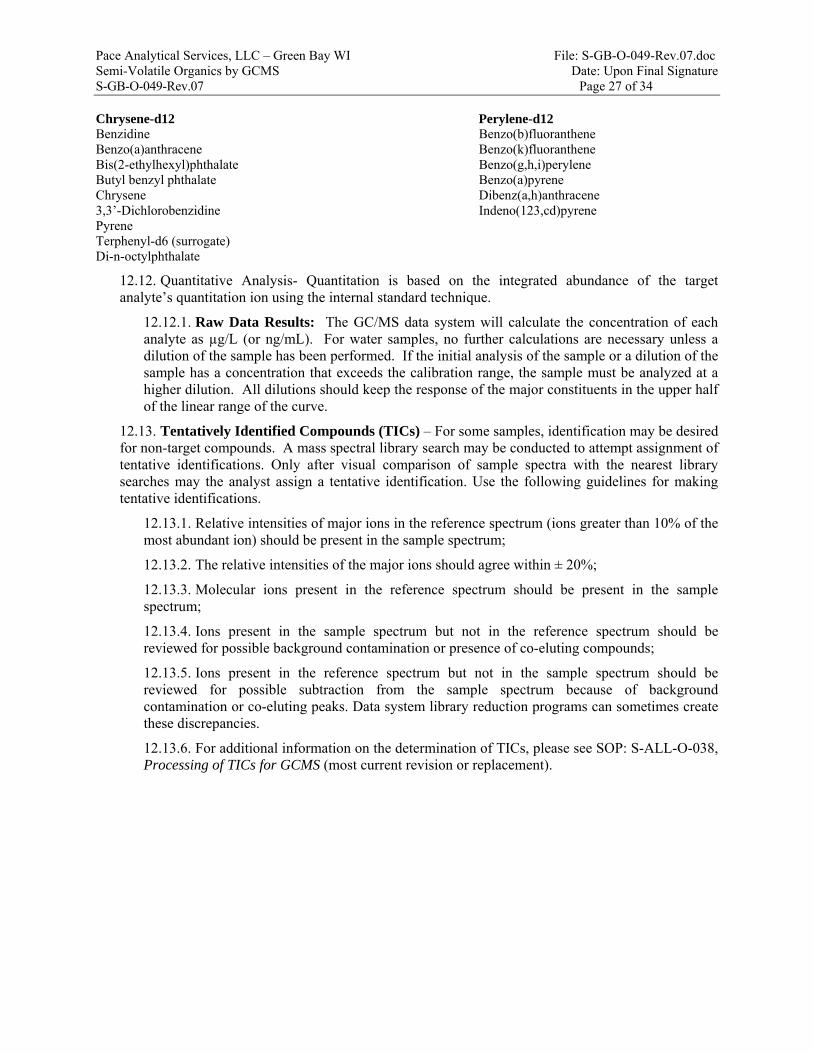
Pace Analytical Services, LLC – Green Bay WI File: S-GB-O-049-Rev.07.doc Semi-Volatile Organics by GCMS Date: Upon Final Signature S-GB-O-049-Rev.07 Page 27 of 34
Chrysene-d12 Perylene-d12 Benzidine Benzo(b)fluoranthene Benzo(a)anthracene Benzo(k)fluoranthene Bis(2-ethylhexyl)phthalate Benzo(g,h,i)perylene Butyl benzyl phthalate Benzo(a)pyrene Chrysene Dibenz(a,h)anthracene 3,3’-Dichlorobenzidine Indeno(123,cd)pyrene Pyrene Terphenyl-d6 (surrogate) Di-n-octylphthalate
12.12. Quantitative Analysis- Quantitation is based on the integrated abundance of the target analyte’s quantitation ion using the internal standard technique.
12.12.1. Raw Data Results: The GC/MS data system will calculate the concentration of each analyte as µg/L (or ng/mL). For water samples, no further calculations are necessary unless a dilution of the sample has been performed. If the initial analysis of the sample or a dilution of the sample has a concentration that exceeds the calibration range, the sample must be analyzed at a higher dilution. All dilutions should keep the response of the major constituents in the upper half of the linear range of the curve.
12.13. Tentatively Identified Compounds (TICs) – For some samples, identification may be desired for non-target compounds. A mass spectral library search may be conducted to attempt assignment of tentative identifications. Only after visual comparison of sample spectra with the nearest library searches may the analyst assign a tentative identification. Use the following guidelines for making tentative identifications.
12.13.1. Relative intensities of major ions in the reference spectrum (ions greater than 10% of the most abundant ion) should be present in the sample spectrum;
12.13.2. The relative intensities of the major ions should agree within ± 20%;
12.13.3. Molecular ions present in the reference spectrum should be present in the sample spectrum;
12.13.4. Ions present in the sample spectrum but not in the reference spectrum should be reviewed for possible background contamination or presence of co-eluting compounds;
12.13.5. Ions present in the reference spectrum but not in the sample spectrum should be reviewed for possible subtraction from the sample spectrum because of background contamination or co-eluting peaks. Data system library reduction programs can sometimes create these discrepancies.
12.13.6. For additional information on the determination of TICs, please see SOP: S-ALL-O-038, Processing of TICs for GCMS (most current revision or replacement).
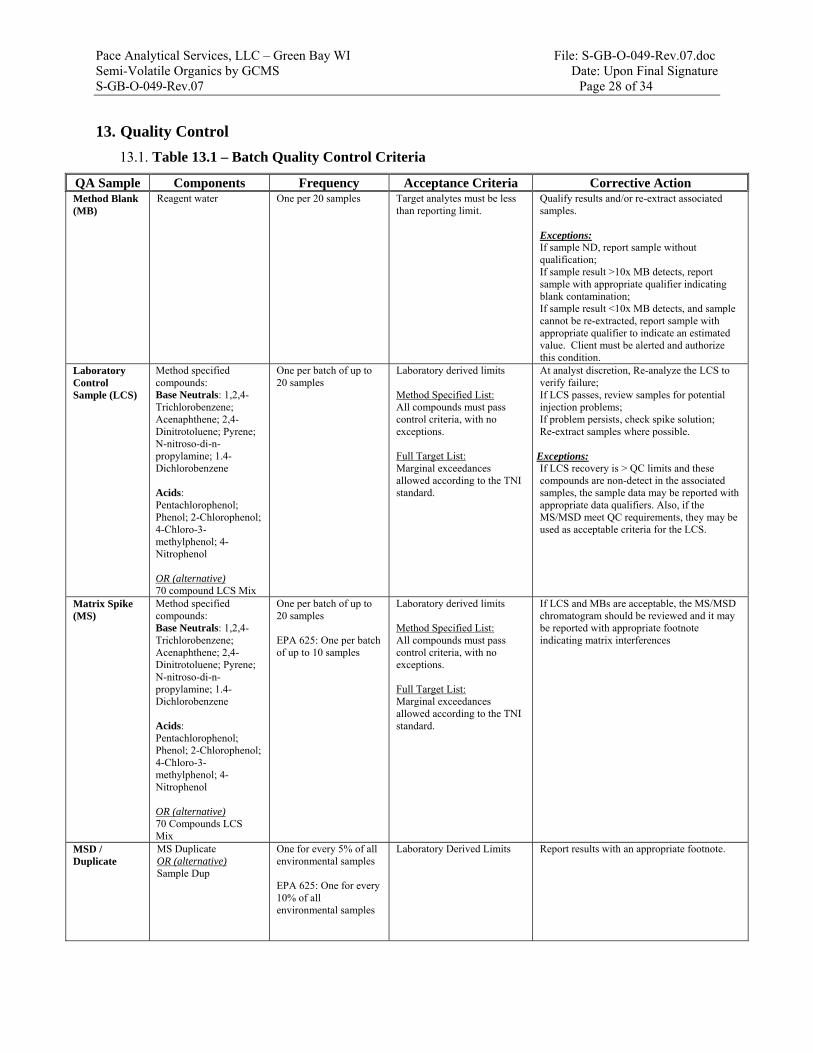
Pace Analytical Services, LLC – Green Bay WI File: S-GB-O-049-Rev.07.doc Semi-Volatile Organics by GCMS Date: Upon Final Signature S-GB-O-049-Rev.07 Page 28 of 34
13. Quality Control
13.1. Table 13.1 – Batch Quality Control Criteria
QA Sample Components Frequency Acceptance Criteria Corrective Action Method Blank (MB)
Reagent water One per 20 samples Target analytes must be less than reporting limit.
Qualify results and/or re-extract associated samples. Exceptions: If sample ND, report sample without qualification; If sample result >10x MB detects, report sample with appropriate qualifier indicating blank contamination; If sample result <10x MB detects, and sample cannot be re-extracted, report sample with appropriate qualifier to indicate an estimated value. Client must be alerted and authorize this condition.
Laboratory Control Sample (LCS)
Method specified compounds: Base Neutrals: 1,2,4-Trichlorobenzene; Acenaphthene; 2,4-Dinitrotoluene; Pyrene; N-nitroso-di-n-propylamine; 1.4-Dichlorobenzene Acids: Pentachlorophenol; Phenol; 2-Chlorophenol; 4-Chloro-3-methylphenol; 4-Nitrophenol OR (alternative) 70 compound LCS Mix
One per batch of up to 20 samples
Laboratory derived limits Method Specified List: All compounds must pass control criteria, with no exceptions. Full Target List: Marginal exceedances allowed according to the TNI standard.
At analyst discretion, Re-analyze the LCS to verify failure; If LCS passes, review samples for potential injection problems; If problem persists, check spike solution; Re-extract samples where possible.
Exceptions: If LCS recovery is > QC limits and these compounds are non-detect in the associated samples, the sample data may be reported with appropriate data qualifiers. Also, if the MS/MSD meet QC requirements, they may be used as acceptable criteria for the LCS.
Matrix Spike (MS)
Method specified compounds: Base Neutrals: 1,2,4-Trichlorobenzene; Acenaphthene; 2,4-Dinitrotoluene; Pyrene; N-nitroso-di-n-propylamine; 1.4-Dichlorobenzene Acids: Pentachlorophenol; Phenol; 2-Chlorophenol; 4-Chloro-3-methylphenol; 4-Nitrophenol OR (alternative) 70 Compounds LCS Mix
One per batch of up to 20 samples EPA 625: One per batch of up to 10 samples
Laboratory derived limits Method Specified List: All compounds must pass control criteria, with no exceptions. Full Target List: Marginal exceedances allowed according to the TNI standard.
If LCS and MBs are acceptable, the MS/MSD chromatogram should be reviewed and it may be reported with appropriate footnote indicating matrix interferences
MSD / Duplicate
MS Duplicate OR (alternative) Sample Dup
One for every 5% of all environmental samples EPA 625: One for every 10% of all environmental samples
Laboratory Derived Limits Report results with an appropriate footnote.

Pace Analytical Services, LLC – Green Bay WI File: S-GB-O-049-Rev.07.doc Semi-Volatile Organics by GCMS Date: Upon Final Signature S-GB-O-049-Rev.07 Page 29 of 34
13.2. Table 13.2 – Sample Quality Control Criteria
QA Sample Components Frequency Acceptance Criteria Corrective Action Internal Standard
1,4-Dichlorobenzene-d4 Naphthalene-d8 Acenaphthene-d10 Phenanthrene-d10 Chrysene-d12 Perylene-d12
Added to all standards, samples, spikes, control samples, and method blanks prior to analysis
Retention Time: RT must be ± 30 seconds from last calibration check on all samples
Retention Time Failure: If matrix interference is NOT probable, the analytical system must be checked for source of retention time shifting; Affected samples should be reanalyzed in the absence of an obvious instrument or matrix related interference.
Surrogate Standards
Nitrobenzene-d5 2-Fluorobiphenyl Terphenyl-d14 Phenol-d6 2-Fluorophenol 2,4,6-Tribromophenol
Added to all samples, spikes, control samples and method blanks prior to analysis
Laboratory derived limits
1 Base neutral and 1 Acid surrogate are allowed to be outside of recovery limits before action is taken. Assess impact of sample matrix. In the absence of obvious matrix interference (high background, extremely dark extract), re-extract sample. Exceptions: Surrogate recovery above criteria and target compounds < RL, result may be reported with appropriate footnote. Surrogate recovery out of control due to obvious sample matrix interference (i.e. co-elution), report results with appropriate footnote.
14. Data Analysis and Calculations
14.1. Results Calculation- Aqueous Samples:
sxx
V
DFVCg/L)(ion Concentrat
Where:
Cx = Concentration in extract (µg/mL). Vv = Volume of final extract (mL). DF = Dilution factor.
Vs = Volume of water sample extracted (mL).
14.2. Results Calculation- Soil/Solid Samples:
sxx
W
DFVC )1000(g/kg)(ion Concentrat
Where: Cx = Concentration in extract (µg/mL). Vv = Volume of final extract (mL). DF = Dilution factor. Ws = Weight of soil sample extracted (g).
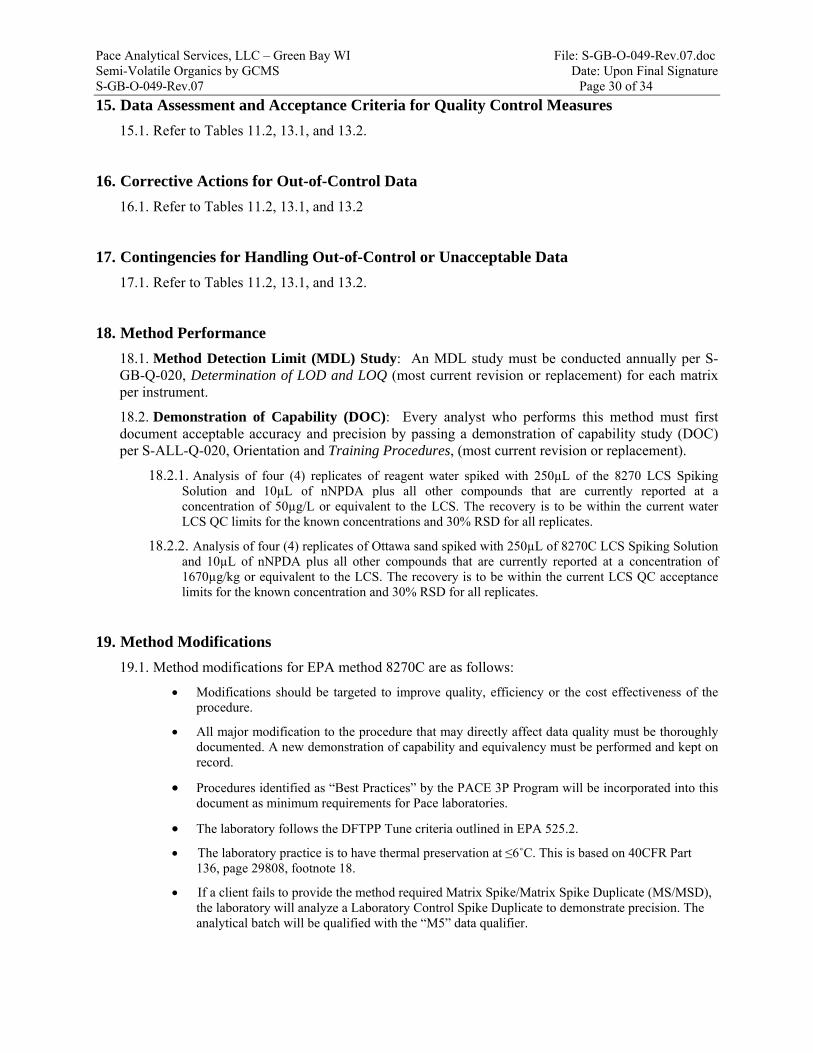
Pace Analytical Services, LLC – Green Bay WI File: S-GB-O-049-Rev.07.doc Semi-Volatile Organics by GCMS Date: Upon Final Signature S-GB-O-049-Rev.07 Page 30 of 34
15. Data Assessment and Acceptance Criteria for Quality Control Measures
15.1. Refer to Tables 11.2, 13.1, and 13.2.
16. Corrective Actions for Out-of-Control Data
16.1. Refer to Tables 11.2, 13.1, and 13.2
17. Contingencies for Handling Out-of-Control or Unacceptable Data
17.1. Refer to Tables 11.2, 13.1, and 13.2.
18. Method Performance
18.1. Method Detection Limit (MDL) Study: An MDL study must be conducted annually per S-GB-Q-020, Determination of LOD and LOQ (most current revision or replacement) for each matrix per instrument.
18.2. Demonstration of Capability (DOC): Every analyst who performs this method must first document acceptable accuracy and precision by passing a demonstration of capability study (DOC) per S-ALL-Q-020, Orientation and Training Procedures, (most current revision or replacement).
18.2.1. Analysis of four (4) replicates of reagent water spiked with 250µL of the 8270 LCS Spiking Solution and 10µL of nNPDA plus all other compounds that are currently reported at a concentration of 50µg/L or equivalent to the LCS. The recovery is to be within the current water LCS QC limits for the known concentrations and 30% RSD for all replicates.
18.2.2. Analysis of four (4) replicates of Ottawa sand spiked with 250µL of 8270C LCS Spiking Solution and 10µL of nNPDA plus all other compounds that are currently reported at a concentration of 1670µg/kg or equivalent to the LCS. The recovery is to be within the current LCS QC acceptance limits for the known concentration and 30% RSD for all replicates.
19. Method Modifications
19.1. Method modifications for EPA method 8270C are as follows:
Modifications should be targeted to improve quality, efficiency or the cost effectiveness of the procedure.
All major modification to the procedure that may directly affect data quality must be thoroughly documented. A new demonstration of capability and equivalency must be performed and kept on record.
Procedures identified as “Best Practices” by the PACE 3P Program will be incorporated into this document as minimum requirements for Pace laboratories.
The laboratory follows the DFTPP Tune criteria outlined in EPA 525.2.
The laboratory practice is to have thermal preservation at ≤6˚C. This is based on 40CFR Part 136, page 29808, footnote 18.
If a client fails to provide the method required Matrix Spike/Matrix Spike Duplicate (MS/MSD), the laboratory will analyze a Laboratory Control Spike Duplicate to demonstrate precision. The analytical batch will be qualified with the “M5” data qualifier.

Pace Analytical Services, LLC – Green Bay WI File: S-GB-O-049-Rev.07.doc Semi-Volatile Organics by GCMS Date: Upon Final Signature S-GB-O-049-Rev.07 Page 31 of 34
20. Instrument/Equipment Maintenance
20.1. Please refer to the instrument operations manual or the SOP S-GB-Q-008, Preventative, Routine, and Non-routine Maintenance (current revision or replacement).
21. Troubleshooting
21.1. Please refer to the instrument manufacturer operations manual.
22. Safety
22.1. Standards and Reagents: The toxicity and carcinogenicity of standards and reagents used in this method have not been fully defined. Each chemical compound should be treated as a potential health hazard. Reduce exposure by the use of gloves, lab coats and safety glasses. Safety Data Sheets (SDSs) are on file in the laboratory and available to all personnel. Standard solutions should be prepared in a hood whenever possible.
22.2. Samples: Take precautions when handling samples. Samples should always be treated as potentially hazardous “unknowns”. The use of personal protective equipment (gloves, lab coats and safety glasses) is required when handling samples. In the event a sample container must be opened, it is recommended to perform this in a hood whenever possible.
22.3. Equipment: Portions of the analytical instrumentation operate at high temperatures and under positive pressure. Care must be taken to minimize accidents and injuries when working on or with this equipment. Instruments should be turned off or the heated zone temperatures lowered to reduce the risk of thermal burns. Allow adequate time for the equipment to cool prior to working on these specific zones. The GC pneumatic system uses gas under high pressure. This high pressure introduces the risk of injury due to flying glass and other objects should a vessel or line rupture. Safety glasses are highly recommended at all times when working in, on or around these pieces of equipment. Even instrumentation that is not operating may contain portions of the system under pressure.
23. Waste Management
23.1. Procedures for handling waste generated during this analysis are addressed in S-GB-W-001, Waste Handling and Management (most current revision or replacement).
23.2. In order to minimize the amount of waste generated during this procedure, analyst should prepare reagents in an amount which may be used in a reasonable amount of time (i.e. before a reagent expires).
24. Pollution Prevention
24.1. The company wide Chemical Hygiene and Safety Manual contains additional information on pollution prevention.
Pace Analytical Services, LLC – Green Bay WI File: S-GB-O-049-Rev.07.doc Semi-Volatile Organics by GCMS Date: Upon Final Signature S-GB-O-049-Rev.07 Page 32 of 34
25. References
25.1. USEPA, SW-846, Method 8270C, “Semivolatile Organic Compounds by Gas Chromatography/Mass Spectrometry (GC/MS), December 1996.
25.2. USEPA, SW-846, Method 8000B, “Determinative Chromatographic Separations”, December 1996.
25.3. USEPA, Method 625, Appendix A to Part 136, (1984), “Base/Neutrals and Acids”.
25.4. USEPA, Method 525.2, Revision 2.0 (1995), “Determination of Organic Compounds in Drinking Water by Liquid-Solid Extraction and Capillary Column Gas Chromatography/Mass Spectrometry”.
25.5. Pace Quality Assurance Manual- most current version.
25.6. National Environmental Laboratory Accreditation Conference (NELAC), Chapter 5, “Quality Systems”- most current version.
25.7. The NELAC Institute (TNI); Volume 1, Module 2, “Quality Systems”- most current version.
26. Tables, Diagrams, Flowcharts, and Validation Data
26.1. Attachment I: Client Specific Requirements.
26.2. Attachment II: Tailing Factor Calculation
27. Revisions
Document Number Reason for Change Date
S-GB-O-049-Rev.05
Throughout Document: Updated SOP format to be consistent with SOP: S-GB-Q-017 Preparation of SOPs Throughout Document: Renamed Tables to be consistent with current Section. Section 11.3: Changed ICV calculation criteria to match CCV calculation criteria. Table 11.Section 12.2.1: Updated DFTPP Tune Criteria to be consistent with EPA 525.2. Section 12.3: Added tailing factor criteria. Section 19: Added Modification in relation to tune criteria. Attachment II: Tailing Factor Calculation added. 30May2013
S-GB-O-049-Rev.06
Throughout Document: Updated laboratory name to Pace Analytical Services LLC – Green Bay WI Table 7.1: Updated temperature to ≤6˚C from 4±2˚C. Table 9.1 and 12.1: Updated information for 40MSS6/40MSS8, added 40MSSA. Table 9.2: Updated with current vendor information. Section 10.1: Added Acetone. Table 10.4: Changed standard and solvent amounts in calibration curve. Table 11.1: Added pyridine. Table 11.2: Updated SOP reference to most current revision. Table 11.3.1: Added CRDL language. Table 12.2: Updated 1˚ and 2˚ ions. Table 13: Updated MB criteria from 20X to 10X rule for qualification requirements. Section 22.1: Updated MSDS to SDS Section 23.1: Updated SOP reference 24Oct2016
S-GB-O-049-Rev.07 Section 12.11.1: Added to section that data reduction must be done on every sample and quality control standard.: 21Jun2017

Pace Analytical Services, LLC – Green Bay WI File: S-GB-O-049-Rev.07.doc Semi-Volatile Organics by GCMS Date: Upon Final Signature S-GB-O-049-Rev.07 Page 33 of 34
Attachment I: Throughout document, reference to Client Specific requirements refers to samples analyzed following: BP Technical Requirements LaMP Revision 10.1, Canadian National Railway Services and Technical Specifications Manual, GE Minimum Standards Revision 2.

Pace Analytical Services, LLC – Green Bay WI File: S-GB-O-049-Rev.07.doc Semi-Volatile Organics by GCMS Date: Upon Final Signature S-GB-O-049-Rev.07 Page 34 of 34
Attachment II: DFTPP Tailing Factor Calculation
Pace Analytical Services, LLC Green Bay, WI 1241 Bellevue Street Suite 9
Green Bay, WI 54302 Phone: 920 469-2436
Fax: 920 469-8827
STANDARD OPERATING PROCEDURE
Determination of Volatile Organics by GC/MS
Reference Methods: EPA Method SW-846 8260B with 5030B and 5035; and
EPA Method 624
LOCAL SOP NUMBER: S-GB-O-056-Rev.11 EFFECTIVE DATE: Date of Final Signature
SUPERSEDES: S-GB-O-056-Rev.10 SOP TEMPLATE NUMBER: TMP-ALL-O-002-Rev.01
LOCAL APPROVAL
__________________________________________ 06/21/17 Nils Melberg, Laboratory General Manager Date __________________________________________ 6/21/17 Kate Verbeten, Laboratory Quality Manager Date __________________________________________ 6/21/2017 Scott Turner, Department Manager Date
PERIODIC REVIEW SIGNATURES BELOW INDICATE NO CHANGES HAVE BEEN MADE SINCE APPROVAL.
Signature Title Date
Signature Title Date
Signature Title Date © 2002 – 20176 Pace Analytical Services, LLC. This Standard Operating Procedure may not be reproduced, in part or in full, without written consent of Pace Analytical Services, LLC. Whether distributed internally or as a “courtesy copy” to clients or regulatory agencies, this document is considered confidential and proprietary information. Copies without a distribution number below are considered uncontrolled. Any printed documents in use within a Pace Analytical Services, LLC. laboratory have been reviewed and approved by the persons listed on the cover page. They can only be deemed official if proper signatures are present.
This is COPY# Distributed on by and is CONTROLLED
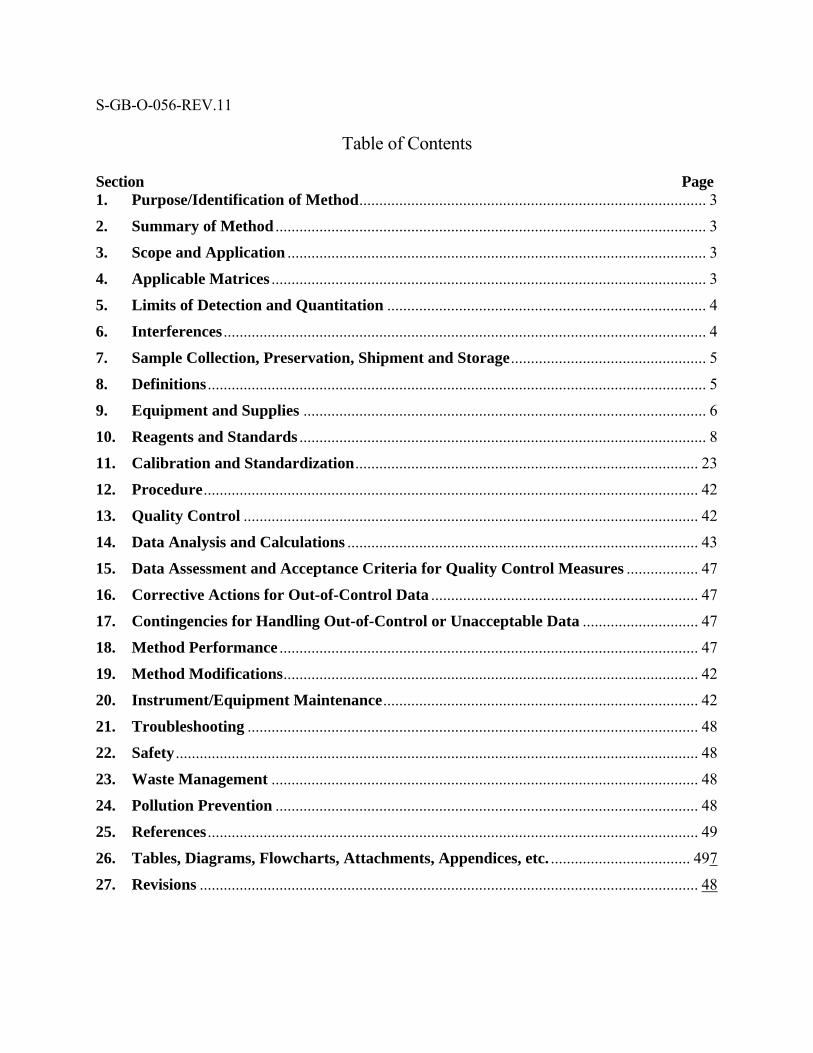
S-GB-O-056-REV.11
Table of Contents
Section Page 1. Purpose/Identification of Method ....................................................................................... 3
2. Summary of Method ............................................................................................................ 3
3. Scope and Application ......................................................................................................... 3
4. Applicable Matrices ............................................................................................................. 3
5. Limits of Detection and Quantitation ................................................................................ 4
6. Interferences ......................................................................................................................... 4
7. Sample Collection, Preservation, Shipment and Storage ................................................. 5
8. Definitions ............................................................................................................................. 5
9. Equipment and Supplies ..................................................................................................... 6
10. Reagents and Standards ...................................................................................................... 8
11. Calibration and Standardization ...................................................................................... 23
12. Procedure ............................................................................................................................ 42
13. Quality Control .................................................................................................................. 42
14. Data Analysis and Calculations ........................................................................................ 43
15. Data Assessment and Acceptance Criteria for Quality Control Measures .................. 47
16. Corrective Actions for Out-of-Control Data ................................................................... 47
17. Contingencies for Handling Out-of-Control or Unacceptable Data ............................. 47
18. Method Performance ......................................................................................................... 47
19. Method Modifications ........................................................................................................ 42
20. Instrument/Equipment Maintenance ............................................................................... 42
21. Troubleshooting ................................................................................................................. 48
22. Safety ................................................................................................................................... 48
23. Waste Management ........................................................................................................... 48
24. Pollution Prevention .......................................................................................................... 48
25. References ........................................................................................................................... 49
26. Tables, Diagrams, Flowcharts, Attachments, Appendices, etc. ................................... 497
27. Revisions ............................................................................................................................. 48

Pace Analytical Services, LLC Green Bay, WI File: S-GB-O-056-Rev.11.doc Determination of Volatile Organics by GC/MS Date: Effective upon signature S-GB-O-056-Rev.11 Page 3 of 78
1. Purpose/Identification of Method
This Standard Operating Procedure (SOP) documents the procedures used by PASI – Green Bay to determine the concentration of Volatile Organic Compounds (VOCs) in environmental samples. The laboratory utilizes purge-and-trap GC/MS and bases these documented procedures on those listed SW-846 Methods 5030B, 5035 and 8260B; and EPA 624.
2. Summary of Method
Volatile organic compounds are introduced into the gas chromatograph by a purge-and trap method. The analytes are purged from a sample aliquot or extract by purging with helium or nitrogen. The purged analytes are collected in a trap. At the completion of the purge time, the trap is rapidly heated and back flushed with helium to drive out the trapped analytes. The analytes are transferred into the inlet of a capillary gas chromatography column. The carrier gas flow through the column is controlled and the temperature is increased according to a set program to achieve optimum separation of purged analytes. The mass spectrometer is operated in a repetitive scan mode. Analytes are identified by the GC/MS retention times and by a comparison of their mass spectra with spectra of authentic standards. Analytes are quantified by comparing the response of a selected primary ion relative to an internal standard against a calibration curve.
3. Scope and Application
3.1. Personnel: This procedure is restricted to use by, or under the supervision of, analysts experienced in the use of purge-and-trap GC/MS systems and interpretation of GC/MS data. Each analyst must demonstrate the capability to generate acceptable results with this method to be considered qualified to report sample results.
3.2. Parameters: This SOP applies to compounds listed in Section 11, Table 11.1 Calibration standard compound concentrations, analyzed by SW-846 Methods 5030B, 5035 and 8260B and EPA 624.This method is applicable to most organic compounds that have boiling points below 200ºC and are insoluble or slightly soluble in water. Volatile water-soluble compounds may also be determined although quantitation limits are typically higher due to their hydrophilic properties (e.g. ketones, oxygenates). This method cannot be substituted for other similar published methods where permit or regulatory compliance is required.
4. Applicable Matrices
4.1. This SOP is applicable to most water and solid samples, regardless of moisture content. Common matrices are ground and surface water, wastewater, aqueous sludge, sediment, soils, and other solid samples. Procedures may need to be adapted to address limits in the method or equipment that might hinder or interference with sample analysis. All adaptations made to address matrix related modifications must be documented within the analytical data.
Pace Analytical Services, LLC Green Bay, WI File: S-GB-O-056-Rev.11.doc Determination of Volatile Organics by GC/MS Date: Effective upon signature S-GB-O-056-Rev.11 Page 4 of 78
5. Limits of Detection and Quantitation
5.1. The reporting limit (PQL) for all analytes can be found Section 11, Table 11.1. All current MDLs are listed in the LIMs and are available by request from the Quality Manager.
6. Interferences
6.1. Major contaminant sources are volatile materials in the laboratory and impurities in the inert purging gas and in the absorbent trap. The use of polytetrafluoroethylene (PTFE, Teflon) as thread sealants, tubing, or in flow controllers is highly recommended since other materials can be sources of contamination which may concentrate in the trap during the purging.
6.2. A common source of interfering contamination is carryover. This may occur when a sample containing low concentrations of volatile organic compounds is analyzed immediately after a sample containing high concentrations of volatile organic compounds. The preventive action to this condition is rinsing the purging apparatus and sample syringes with two or more portions of organic free water between samples. Analyze one or more blanks to check for cross contamination prior to sample analysis.
6.3. Since methylene chloride and acetone are common laboratory solvents, special precautions must be taken. The volatiles analysis and sample storage area should be located as far as possible from areas where these solvents are used or stored. Where possible, the volatiles analysis and sample storage area should be served by a separate HVAC system and maintained under positive pressure to prevent intrusion of contaminants. Laboratory clothing previously exposed to methylene chloride fumes during extraction procedures can contribute to sample contamination.
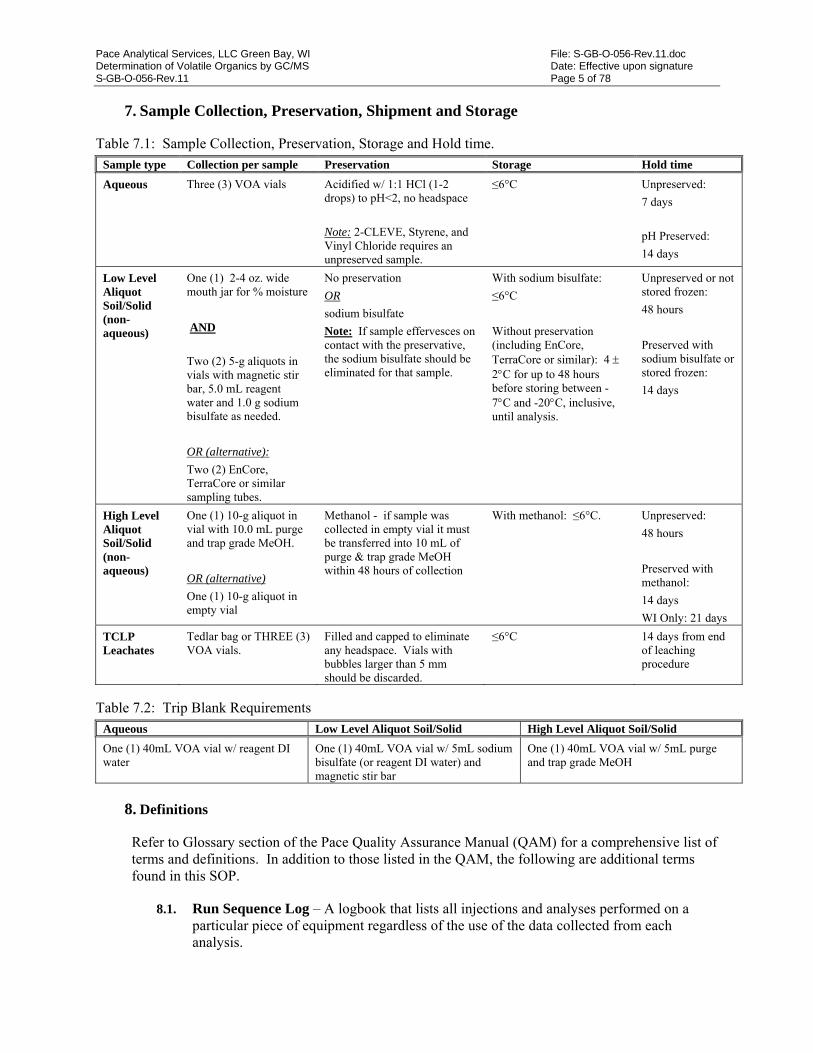
Pace Analytical Services, LLC Green Bay, WI File: S-GB-O-056-Rev.11.doc Determination of Volatile Organics by GC/MS Date: Effective upon signature S-GB-O-056-Rev.11 Page 5 of 78
7. Sample Collection, Preservation, Shipment and Storage Table 7.1: Sample Collection, Preservation, Storage and Hold time.
Sample type Collection per sample Preservation Storage Hold time
Aqueous Three (3) VOA vials Acidified w/ 1:1 HCl (1-2 drops) to pH<2, no headspace
Note: 2-CLEVE, Styrene, and Vinyl Chloride requires an unpreserved sample.
≤6°C Unpreserved:
7 days
pH Preserved:
14 days
Low Level Aliquot Soil/Solid (non-aqueous)
One (1) 2-4 oz. wide mouth jar for % moisture
AND
Two (2) 5-g aliquots in vials with magnetic stir bar, 5.0 mL reagent water and 1.0 g sodium bisulfate as needed.
OR (alternative):
Two (2) EnCore, TerraCore or similar sampling tubes.
No preservation
OR
sodium bisulfate
Note: If sample effervesces on contact with the preservative, the sodium bisulfate should be eliminated for that sample.
With sodium bisulfate:
≤6°C
Without preservation (including EnCore, TerraCore or similar): 4 2C for up to 48 hours before storing between -7C and -20C, inclusive, until analysis.
Unpreserved or not stored frozen:
48 hours
Preserved with sodium bisulfate or stored frozen:
14 days
High Level Aliquot Soil/Solid (non-aqueous)
One (1) 10-g aliquot in vial with 10.0 mL purge and trap grade MeOH.
OR (alternative)
One (1) 10-g aliquot in empty vial
Methanol - if sample was collected in empty vial it must be transferred into 10 mL of purge & trap grade MeOH within 48 hours of collection
With methanol: ≤6°C. Unpreserved:
48 hours
Preserved with methanol:
14 days
WI Only: 21 days
TCLP Leachates
Tedlar bag or THREE (3) VOA vials.
Filled and capped to eliminate any headspace. Vials with bubbles larger than 5 mm should be discarded.
≤6°C 14 days from end of leaching procedure
Table 7.2: Trip Blank Requirements
Aqueous Low Level Aliquot Soil/Solid High Level Aliquot Soil/Solid
One (1) 40mL VOA vial w/ reagent DI water
One (1) 40mL VOA vial w/ 5mL sodium bisulfate (or reagent DI water) and magnetic stir bar
One (1) 40mL VOA vial w/ 5mL purge and trap grade MeOH
8. Definitions
Refer to Glossary section of the Pace Quality Assurance Manual (QAM) for a comprehensive list of terms and definitions. In addition to those listed in the QAM, the following are additional terms found in this SOP.
8.1. Run Sequence Log – A logbook that lists all injections and analyses performed on a particular piece of equipment regardless of the use of the data collected from each analysis.
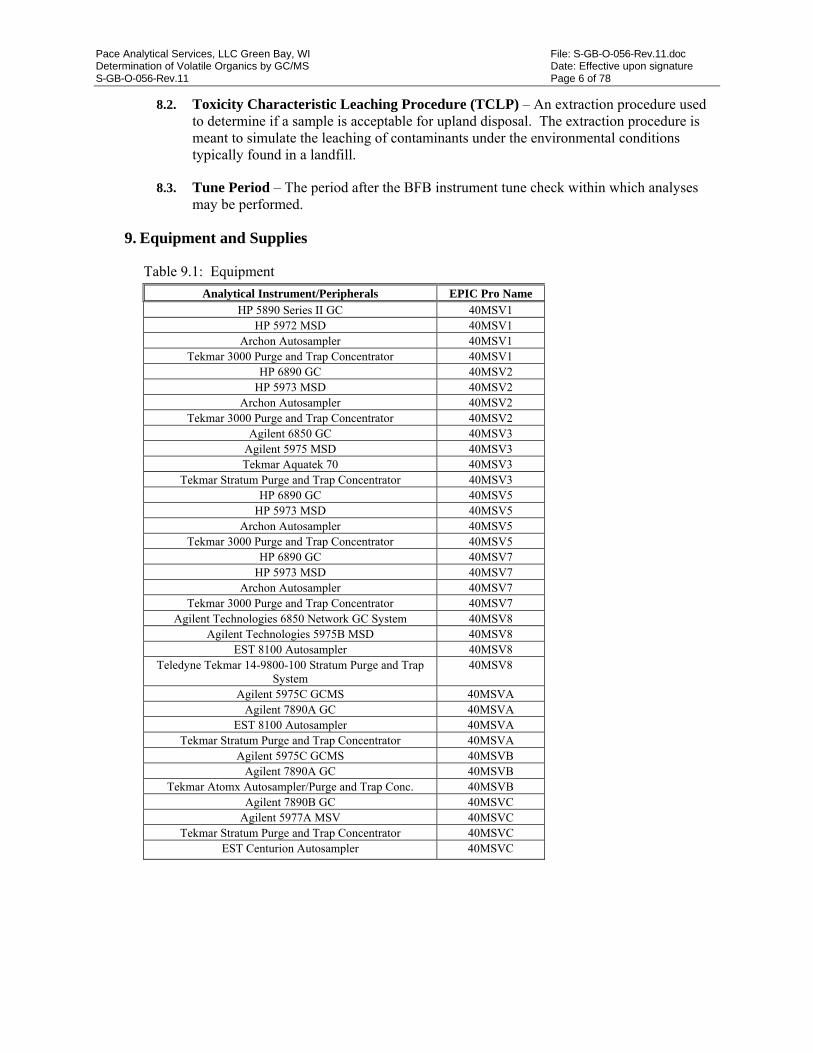
Pace Analytical Services, LLC Green Bay, WI File: S-GB-O-056-Rev.11.doc Determination of Volatile Organics by GC/MS Date: Effective upon signature S-GB-O-056-Rev.11 Page 6 of 78
8.2. Toxicity Characteristic Leaching Procedure (TCLP) – An extraction procedure used to determine if a sample is acceptable for upland disposal. The extraction procedure is meant to simulate the leaching of contaminants under the environmental conditions typically found in a landfill.
8.3. Tune Period – The period after the BFB instrument tune check within which analyses may be performed.
9. Equipment and Supplies
Table 9.1: Equipment
Analytical Instrument/Peripherals EPIC Pro Name HP 5890 Series II GC 40MSV1
HP 5972 MSD 40MSV1 Archon Autosampler 40MSV1
Tekmar 3000 Purge and Trap Concentrator 40MSV1 HP 6890 GC 40MSV2
HP 5973 MSD 40MSV2 Archon Autosampler 40MSV2
Tekmar 3000 Purge and Trap Concentrator 40MSV2 Agilent 6850 GC 40MSV3
Agilent 5975 MSD 40MSV3 Tekmar Aquatek 70 40MSV3
Tekmar Stratum Purge and Trap Concentrator 40MSV3 HP 6890 GC 40MSV5
HP 5973 MSD 40MSV5 Archon Autosampler 40MSV5
Tekmar 3000 Purge and Trap Concentrator 40MSV5 HP 6890 GC 40MSV7
HP 5973 MSD 40MSV7 Archon Autosampler 40MSV7
Tekmar 3000 Purge and Trap Concentrator 40MSV7 Agilent Technologies 6850 Network GC System 40MSV8
Agilent Technologies 5975B MSD 40MSV8 EST 8100 Autosampler 40MSV8
Teledyne Tekmar 14-9800-100 Stratum Purge and Trap System
40MSV8
Agilent 5975C GCMS 40MSVA Agilent 7890A GC 40MSVA
EST 8100 Autosampler 40MSVA Tekmar Stratum Purge and Trap Concentrator 40MSVA
Agilent 5975C GCMS 40MSVB Agilent 7890A GC 40MSVB
Tekmar Atomx Autosampler/Purge and Trap Conc. 40MSVB Agilent 7890B GC 40MSVC
Agilent 5977A MSV 40MSVC Tekmar Stratum Purge and Trap Concentrator 40MSVC
EST Centurion Autosampler 40MSVC
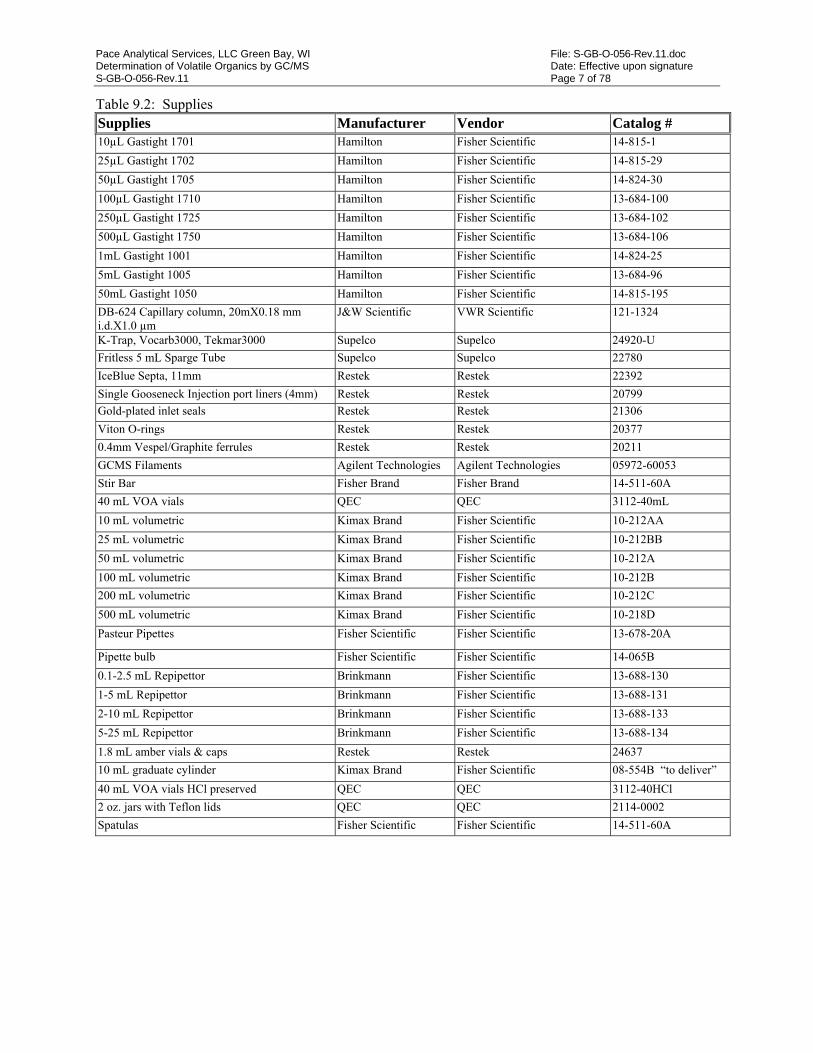
Pace Analytical Services, LLC Green Bay, WI File: S-GB-O-056-Rev.11.doc Determination of Volatile Organics by GC/MS Date: Effective upon signature S-GB-O-056-Rev.11 Page 7 of 78
Table 9.2: Supplies Supplies Manufacturer Vendor Catalog # 10µL Gastight 1701 Hamilton Fisher Scientific 14-815-1
25µL Gastight 1702 Hamilton Fisher Scientific 14-815-29
50µL Gastight 1705 Hamilton Fisher Scientific 14-824-30
100µL Gastight 1710 Hamilton Fisher Scientific 13-684-100
250µL Gastight 1725 Hamilton Fisher Scientific 13-684-102
500µL Gastight 1750 Hamilton Fisher Scientific 13-684-106
1mL Gastight 1001 Hamilton Fisher Scientific 14-824-25
5mL Gastight 1005 Hamilton Fisher Scientific 13-684-96
50mL Gastight 1050 Hamilton Fisher Scientific 14-815-195
DB-624 Capillary column, 20mX0.18 mm i.d.X1.0 µm
J&W Scientific VWR Scientific 121-1324
K-Trap, Vocarb3000, Tekmar3000 Supelco Supelco 24920-U
Fritless 5 mL Sparge Tube Supelco Supelco 22780
IceBlue Septa, 11mm Restek Restek 22392
Single Gooseneck Injection port liners (4mm) Restek Restek 20799
Gold-plated inlet seals Restek Restek 21306
Viton O-rings Restek Restek 20377
0.4mm Vespel/Graphite ferrules Restek Restek 20211
GCMS Filaments Agilent Technologies Agilent Technologies 05972-60053
Stir Bar Fisher Brand Fisher Brand 14-511-60A
40 mL VOA vials QEC QEC 3112-40mL
10 mL volumetric Kimax Brand Fisher Scientific 10-212AA
25 mL volumetric Kimax Brand Fisher Scientific 10-212BB
50 mL volumetric Kimax Brand Fisher Scientific 10-212A
100 mL volumetric Kimax Brand Fisher Scientific 10-212B
200 mL volumetric Kimax Brand Fisher Scientific 10-212C
500 mL volumetric Kimax Brand Fisher Scientific 10-218D
Pasteur Pipettes Fisher Scientific Fisher Scientific 13-678-20A
Pipette bulb Fisher Scientific Fisher Scientific 14-065B
0.1-2.5 mL Repipettor Brinkmann Fisher Scientific 13-688-130
1-5 mL Repipettor Brinkmann Fisher Scientific 13-688-131
2-10 mL Repipettor Brinkmann Fisher Scientific 13-688-133
5-25 mL Repipettor Brinkmann Fisher Scientific 13-688-134
1.8 mL amber vials & caps Restek Restek 24637
10 mL graduate cylinder Kimax Brand Fisher Scientific 08-554B “to deliver”
40 mL VOA vials HCl preserved QEC QEC 3112-40HCl
2 oz. jars with Teflon lids QEC QEC 2114-0002
Spatulas Fisher Scientific Fisher Scientific 14-511-60A
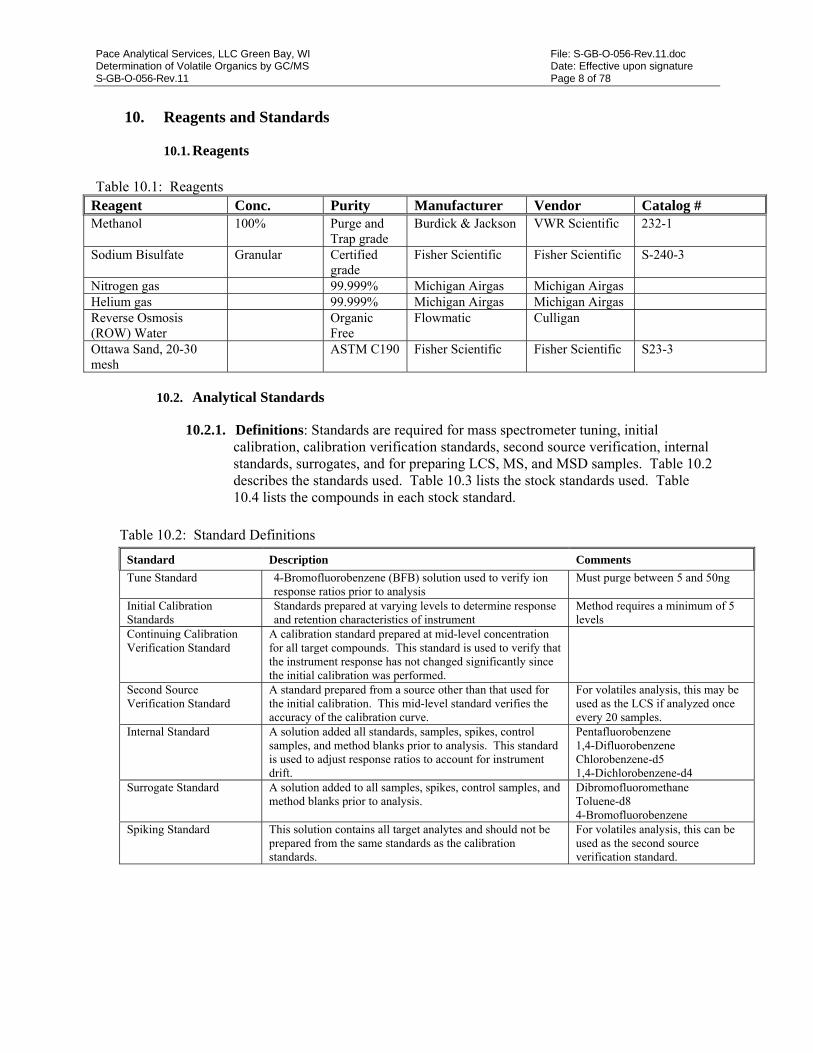
Pace Analytical Services, LLC Green Bay, WI File: S-GB-O-056-Rev.11.doc Determination of Volatile Organics by GC/MS Date: Effective upon signature S-GB-O-056-Rev.11 Page 8 of 78
10. Reagents and Standards
10.1. Reagents Table 10.1: Reagents
Reagent Conc. Purity Manufacturer Vendor Catalog # Methanol 100% Purge and
Trap grade Burdick & Jackson VWR Scientific 232-1
Sodium Bisulfate Granular Certified grade
Fisher Scientific Fisher Scientific S-240-3
Nitrogen gas 99.999% Michigan Airgas Michigan Airgas Helium gas 99.999% Michigan Airgas Michigan Airgas Reverse Osmosis (ROW) Water
Organic Free
Flowmatic Culligan
Ottawa Sand, 20-30 mesh
ASTM C190 Fisher Scientific Fisher Scientific S23-3
10.2. Analytical Standards
10.2.1. Definitions: Standards are required for mass spectrometer tuning, initial calibration, calibration verification standards, second source verification, internal standards, surrogates, and for preparing LCS, MS, and MSD samples. Table 10.2 describes the standards used. Table 10.3 lists the stock standards used. Table 10.4 lists the compounds in each stock standard.
Table 10.2: Standard Definitions
Standard Description Comments
Tune Standard 4-Bromofluorobenzene (BFB) solution used to verify ion response ratios prior to analysis
Must purge between 5 and 50ng
Initial Calibration Standards
Standards prepared at varying levels to determine response and retention characteristics of instrument
Method requires a minimum of 5 levels
Continuing Calibration Verification Standard
A calibration standard prepared at mid-level concentration for all target compounds. This standard is used to verify that the instrument response has not changed significantly since the initial calibration was performed.
Second Source Verification Standard
A standard prepared from a source other than that used for the initial calibration. This mid-level standard verifies the accuracy of the calibration curve.
For volatiles analysis, this may be used as the LCS if analyzed once every 20 samples.
Internal Standard A solution added all standards, samples, spikes, control samples, and method blanks prior to analysis. This standard is used to adjust response ratios to account for instrument drift.
Pentafluorobenzene 1,4-Difluorobenzene Chlorobenzene-d5 1,4-Dichlorobenzene-d4
Surrogate Standard A solution added to all samples, spikes, control samples, and method blanks prior to analysis.
Dibromofluoromethane Toluene-d8 4-Bromofluorobenzene
Spiking Standard This solution contains all target analytes and should not be prepared from the same standards as the calibration standards.
For volatiles analysis, this can be used as the second source verification standard.

Pace Analytical Services, LLC Green Bay, WI File: S-GB-O-056-Rev.11.doc Determination of Volatile Organics by GC/MS Date: Effective upon signature S-GB-O-056-Rev.11 Page 9 of 78
10.2.2. Stock Standards
Table 10.3: Stock Standards Standard Conc. Purity Manufacturer Vendor Catalog # 4-BFB Tuning Standard 5000 µg/mL 99% Restek Restek 30003-520 502.2 Cal Gases Mix 2000 µg/mL 99% Restek Restek 30042 502.2 ICV Gases Mix 2000 µg/mL 99% Accustandard Accustandard M-502B-10X 502.2 Cal 2000 Megamix 2000 µg/mL 99% Restek Restek 30431 Megamix – ICV 2000 µg/mL 99% o2si o2si 122708-05 Vinyl Acetate Neat 99+% Chem Service Chem Service F718 Calibration Ketone Mix 5000 µg/mL 99% Restek Restek 30006 Ketones – ICV 2000 µg/mL 99% o2si o2si 121020-10 Pace GB Custom Mix #3 various
µg/mL 99+% o2si o2si 120407-11-SS
Custom – ICV 100,000 – 200,000 µg/µL
99% o2si o2si 122707-05
Acrolein – CAL Neat 99+% Chem Service Chem Service N-11030-1G 2-Chloroethylvinyl Ether 2000 µg/mL 99+% Restek Restek 30265 Reactive Mix – ICV 100-1000
µg/mL 99% o2si o2si 120407-13
8260 Internal Standard 2500 µg/mL 99% Restek Restek 30173 8260 Surrogate Standard 2500 µg/mL 99% Restek Restek 30174 CLP 4.1Mega Mix 2000 µg/mL 99% Restek Restek 30456 502.2 Gases Mix #1 2000 µg/mL 99% Restek Restek 30006
10.2.3. Standard Mixes Table 10.4: Standard Mixes
Vendor Standard Name Catalog# Compound list Concentration
(µg/mL)
Restek 4-BFB Tuning Standard 30003-520 4-bromofluorobenzene 2500
Restek 502.2 Cal Gases Mix 30042 Bromomethane 2000 Chloroethane 2000 Chloromethane 2000 Dichlorodifluoromethane 2000 Trichlorofluoromethane 2000 Vinyl Chloride 2000 Accustandard 502.2 ICV Gases Mix = M-502B-10X Bromomethane 2000 Chloroethane 2000 Chloromethane 2000 Dichlorodifluoromethane 2000 Trichlorofluoromethane 2000 Vinyl Chloride 2000
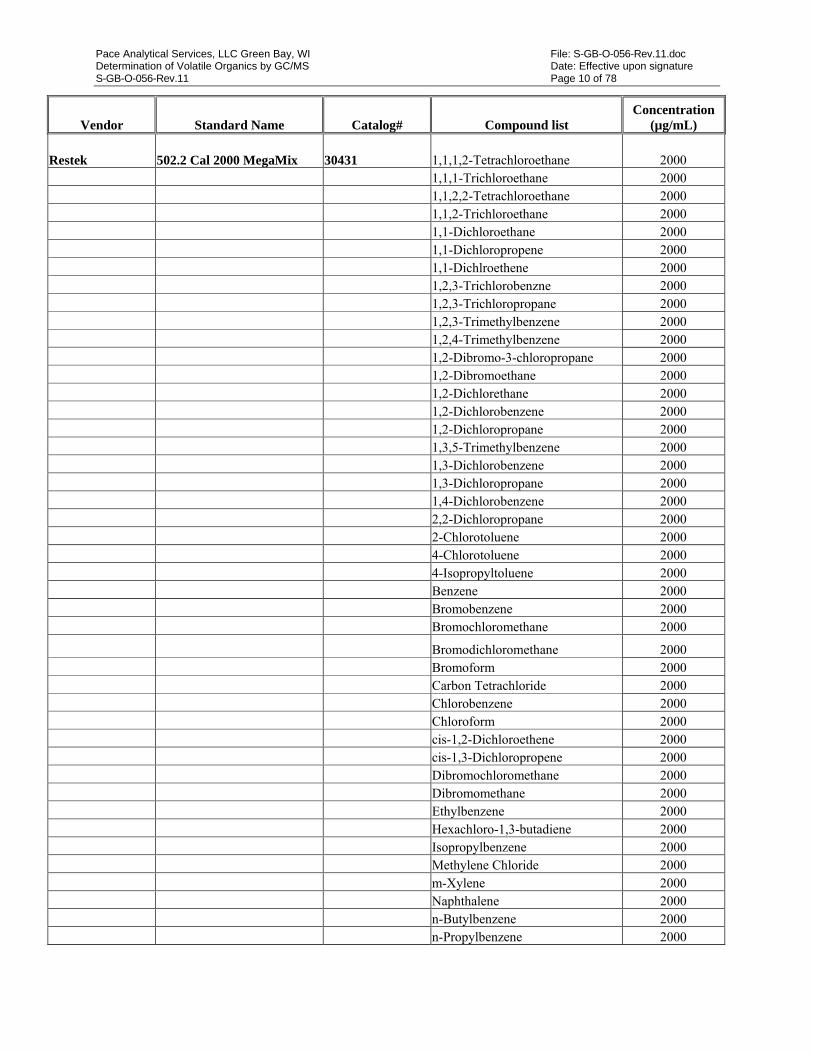
Pace Analytical Services, LLC Green Bay, WI File: S-GB-O-056-Rev.11.doc Determination of Volatile Organics by GC/MS Date: Effective upon signature S-GB-O-056-Rev.11 Page 10 of 78
Vendor Standard Name Catalog# Compound list Concentration
(µg/mL)
Restek 502.2 Cal 2000 MegaMix 30431 1,1,1,2-Tetrachloroethane 2000 1,1,1-Trichloroethane 2000 1,1,2,2-Tetrachloroethane 2000 1,1,2-Trichloroethane 2000 1,1-Dichloroethane 2000 1,1-Dichloropropene 2000 1,1-Dichlroethene 2000 1,2,3-Trichlorobenzne 2000 1,2,3-Trichloropropane 2000 1,2,3-Trimethylbenzene 2000 1,2,4-Trimethylbenzene 2000 1,2-Dibromo-3-chloropropane 2000 1,2-Dibromoethane 2000 1,2-Dichlorethane 2000 1,2-Dichlorobenzene 2000 1,2-Dichloropropane 2000 1,3,5-Trimethylbenzene 2000 1,3-Dichlorobenzene 2000 1,3-Dichloropropane 2000 1,4-Dichlorobenzene 2000 2,2-Dichloropropane 2000 2-Chlorotoluene 2000 4-Chlorotoluene 2000 4-Isopropyltoluene 2000 Benzene 2000 Bromobenzene 2000 Bromochloromethane 2000
Bromodichloromethane 2000 Bromoform 2000 Carbon Tetrachloride 2000 Chlorobenzene 2000 Chloroform 2000 cis-1,2-Dichloroethene 2000 cis-1,3-Dichloropropene 2000 Dibromochloromethane 2000 Dibromomethane 2000 Ethylbenzene 2000 Hexachloro-1,3-butadiene 2000 Isopropylbenzene 2000 Methylene Chloride 2000 m-Xylene 2000 Naphthalene 2000 n-Butylbenzene 2000 n-Propylbenzene 2000
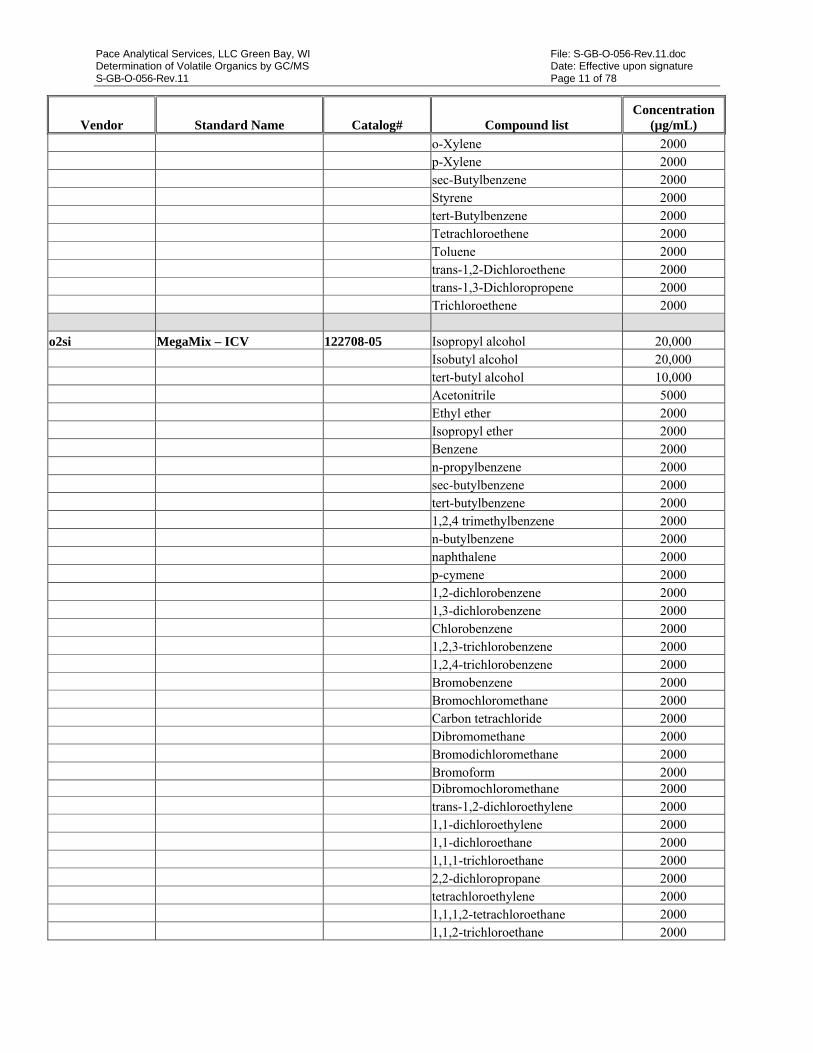
Pace Analytical Services, LLC Green Bay, WI File: S-GB-O-056-Rev.11.doc Determination of Volatile Organics by GC/MS Date: Effective upon signature S-GB-O-056-Rev.11 Page 11 of 78
Vendor Standard Name Catalog# Compound list Concentration
(µg/mL)
o-Xylene 2000 p-Xylene 2000 sec-Butylbenzene 2000 Styrene 2000 tert-Butylbenzene 2000 Tetrachloroethene 2000 Toluene 2000 trans-1,2-Dichloroethene 2000 trans-1,3-Dichloropropene 2000 Trichloroethene 2000 o2si MegaMix – ICV 122708-05 Isopropyl alcohol 20,000 Isobutyl alcohol 20,000 tert-butyl alcohol 10,000 Acetonitrile 5000 Ethyl ether 2000 Isopropyl ether 2000 Benzene 2000 n-propylbenzene 2000 sec-butylbenzene 2000 tert-butylbenzene 2000 1,2,4 trimethylbenzene 2000 n-butylbenzene 2000 naphthalene 2000 p-cymene 2000 1,2-dichlorobenzene 2000 1,3-dichlorobenzene 2000 Chlorobenzene 2000 1,2,3-trichlorobenzene 2000 1,2,4-trichlorobenzene 2000 Bromobenzene 2000 Bromochloromethane 2000 Carbon tetrachloride 2000 Dibromomethane 2000 Bromodichloromethane 2000 Bromoform 2000 Dibromochloromethane 2000 trans-1,2-dichloroethylene 2000 1,1-dichloroethylene 2000 1,1-dichloroethane 2000 1,1,1-trichloroethane 2000 2,2-dichloropropane 2000 tetrachloroethylene 2000 1,1,1,2-tetrachloroethane 2000 1,1,2-trichloroethane 2000
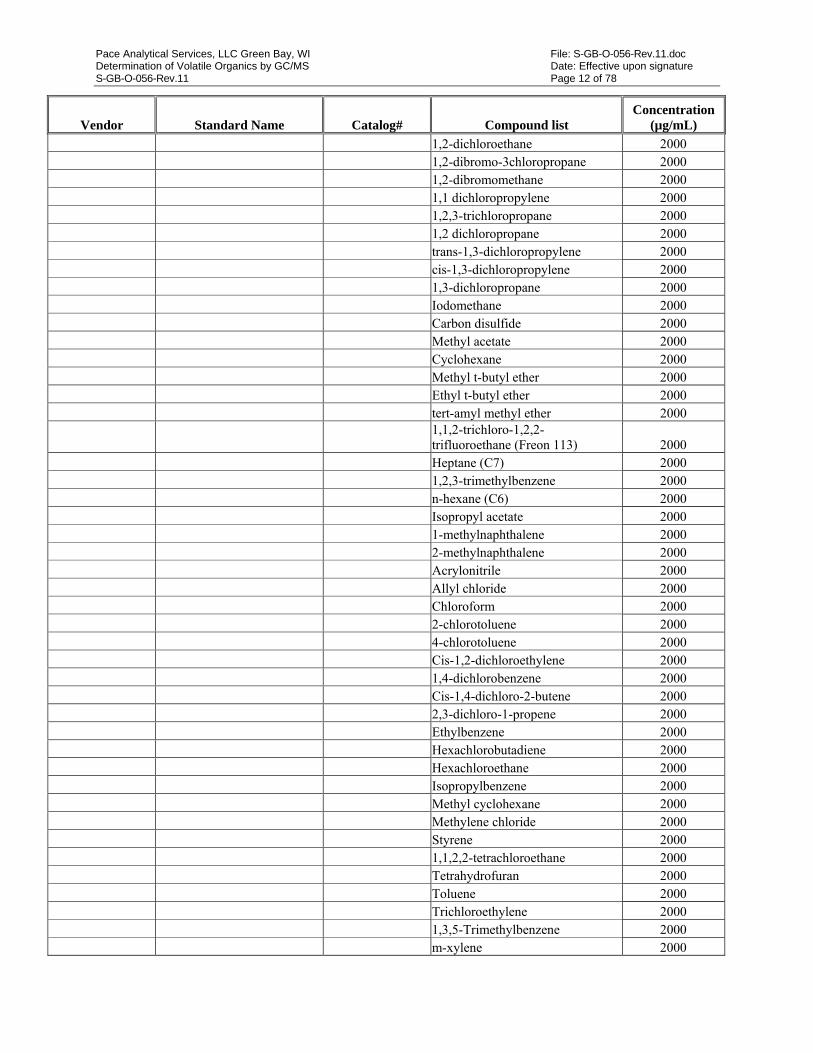
Pace Analytical Services, LLC Green Bay, WI File: S-GB-O-056-Rev.11.doc Determination of Volatile Organics by GC/MS Date: Effective upon signature S-GB-O-056-Rev.11 Page 12 of 78
Vendor Standard Name Catalog# Compound list Concentration
(µg/mL)
1,2-dichloroethane 2000 1,2-dibromo-3chloropropane 2000 1,2-dibromomethane 2000 1,1 dichloropropylene 2000 1,2,3-trichloropropane 2000 1,2 dichloropropane 2000 trans-1,3-dichloropropylene 2000 cis-1,3-dichloropropylene 2000 1,3-dichloropropane 2000 Iodomethane 2000 Carbon disulfide 2000 Methyl acetate 2000 Cyclohexane 2000 Methyl t-butyl ether 2000 Ethyl t-butyl ether 2000 tert-amyl methyl ether 2000
1,1,2-trichloro-1,2,2-trifluoroethane (Freon 113) 2000
Heptane (C7) 2000 1,2,3-trimethylbenzene 2000 n-hexane (C6) 2000 Isopropyl acetate 2000 1-methylnaphthalene 2000 2-methylnaphthalene 2000 Acrylonitrile 2000 Allyl chloride 2000 Chloroform 2000 2-chlorotoluene 2000 4-chlorotoluene 2000 Cis-1,2-dichloroethylene 2000 1,4-dichlorobenzene 2000 Cis-1,4-dichloro-2-butene 2000 2,3-dichloro-1-propene 2000 Ethylbenzene 2000 Hexachlorobutadiene 2000 Hexachloroethane 2000 Isopropylbenzene 2000 Methyl cyclohexane 2000 Methylene chloride 2000 Styrene 2000 1,1,2,2-tetrachloroethane 2000 Tetrahydrofuran 2000 Toluene 2000 Trichloroethylene 2000 1,3,5-Trimethylbenzene 2000 m-xylene 2000
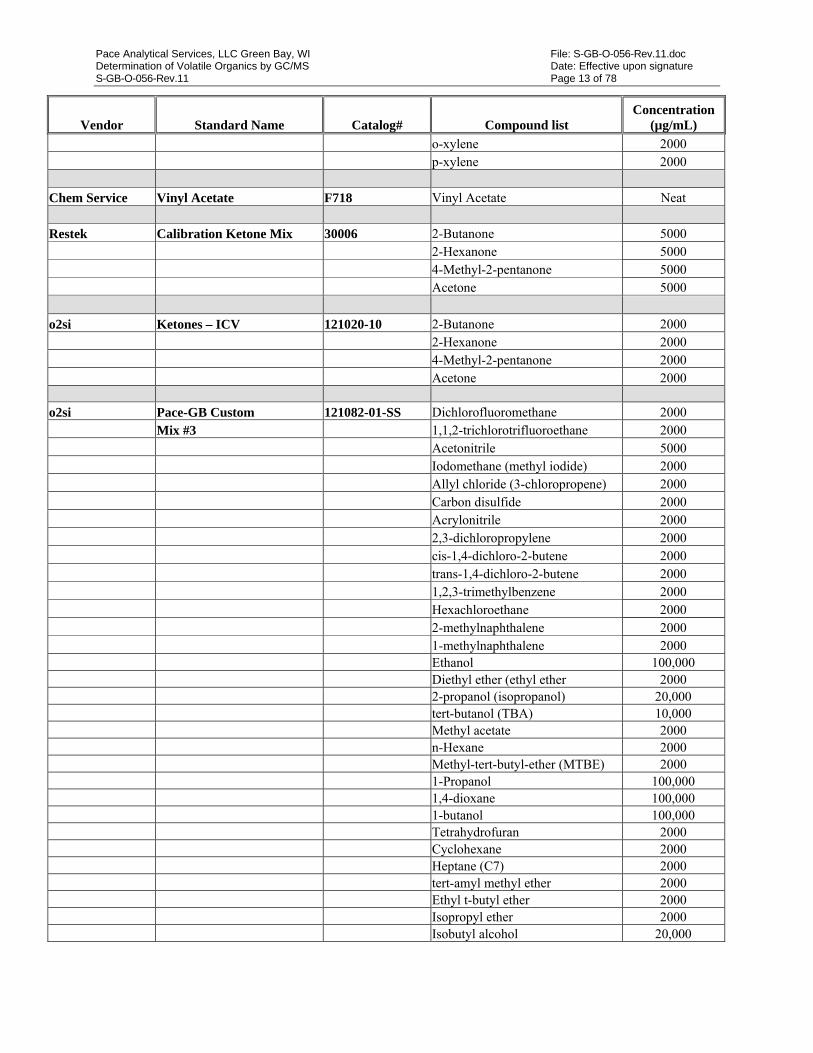
Pace Analytical Services, LLC Green Bay, WI File: S-GB-O-056-Rev.11.doc Determination of Volatile Organics by GC/MS Date: Effective upon signature S-GB-O-056-Rev.11 Page 13 of 78
Vendor Standard Name Catalog# Compound list Concentration
(µg/mL)
o-xylene 2000 p-xylene 2000 Chem Service Vinyl Acetate F718 Vinyl Acetate Neat Restek Calibration Ketone Mix 30006 2-Butanone 5000 2-Hexanone 5000 4-Methyl-2-pentanone 5000 Acetone 5000
o2si Ketones – ICV 121020-10 2-Butanone 2000 2-Hexanone 2000 4-Methyl-2-pentanone 2000 Acetone 2000 o2si Pace-GB Custom 121082-01-SS Dichlorofluoromethane 2000 Mix #3 1,1,2-trichlorotrifluoroethane 2000 Acetonitrile 5000 Iodomethane (methyl iodide) 2000 Allyl chloride (3-chloropropene) 2000 Carbon disulfide 2000 Acrylonitrile 2000 2,3-dichloropropylene 2000 cis-1,4-dichloro-2-butene 2000 trans-1,4-dichloro-2-butene 2000 1,2,3-trimethylbenzene 2000 Hexachloroethane 2000 2-methylnaphthalene 2000 1-methylnaphthalene 2000 Ethanol 100,000 Diethyl ether (ethyl ether 2000 2-propanol (isopropanol) 20,000 tert-butanol (TBA) 10,000 Methyl acetate 2000 n-Hexane 2000 Methyl-tert-butyl-ether (MTBE) 2000 1-Propanol 100,000 1,4-dioxane 100,000 1-butanol 100,000 Tetrahydrofuran 2000 Cyclohexane 2000 Heptane (C7) 2000 tert-amyl methyl ether 2000 Ethyl t-butyl ether 2000 Isopropyl ether 2000 Isobutyl alcohol 20,000
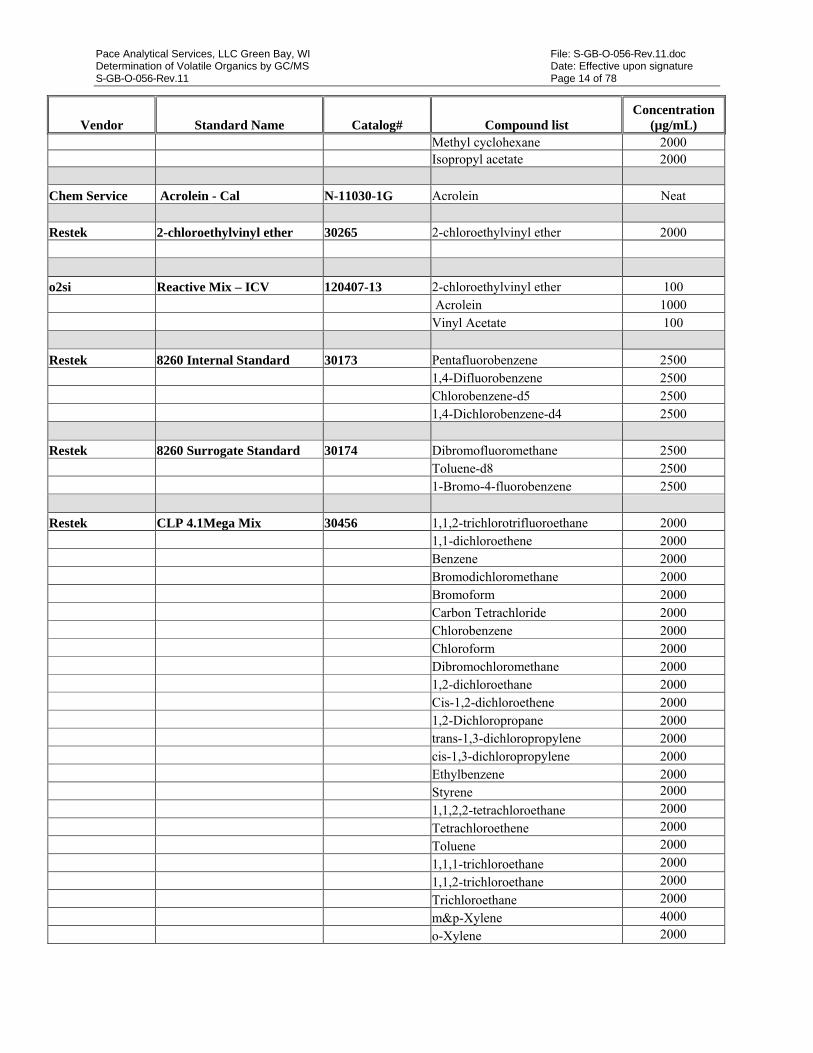
Pace Analytical Services, LLC Green Bay, WI File: S-GB-O-056-Rev.11.doc Determination of Volatile Organics by GC/MS Date: Effective upon signature S-GB-O-056-Rev.11 Page 14 of 78
Vendor Standard Name Catalog# Compound list Concentration
(µg/mL) Methyl cyclohexane 2000 Isopropyl acetate 2000
Chem Service Acrolein - Cal N-11030-1G Acrolein Neat
Restek 2-chloroethylvinyl ether 30265 2-chloroethylvinyl ether 2000
o2si Reactive Mix – ICV 120407-13 2-chloroethylvinyl ether 100 Acrolein 1000 Vinyl Acetate 100
Restek 8260 Internal Standard 30173 Pentafluorobenzene 2500 1,4-Difluorobenzene 2500 Chlorobenzene-d5 2500 1,4-Dichlorobenzene-d4 2500
Restek 8260 Surrogate Standard 30174 Dibromofluoromethane 2500 Toluene-d8 2500 1-Bromo-4-fluorobenzene 2500
Restek CLP 4.1Mega Mix 30456 1,1,2-trichlorotrifluoroethane 2000 1,1-dichloroethene 2000 Benzene 2000 Bromodichloromethane 2000 Bromoform 2000 Carbon Tetrachloride 2000 Chlorobenzene 2000 Chloroform 2000 Dibromochloromethane 2000 1,2-dichloroethane 2000 Cis-1,2-dichloroethene 2000 1,2-Dichloropropane 2000 trans-1,3-dichloropropylene 2000 cis-1,3-dichloropropylene 2000 Ethylbenzene 2000 Styrene 2000
1,1,2,2-tetrachloroethane 2000
Tetrachloroethene 2000
Toluene 2000
1,1,1-trichloroethane 2000
1,1,2-trichloroethane 2000
Trichloroethane 2000
m&p-Xylene 4000
o-Xylene 2000
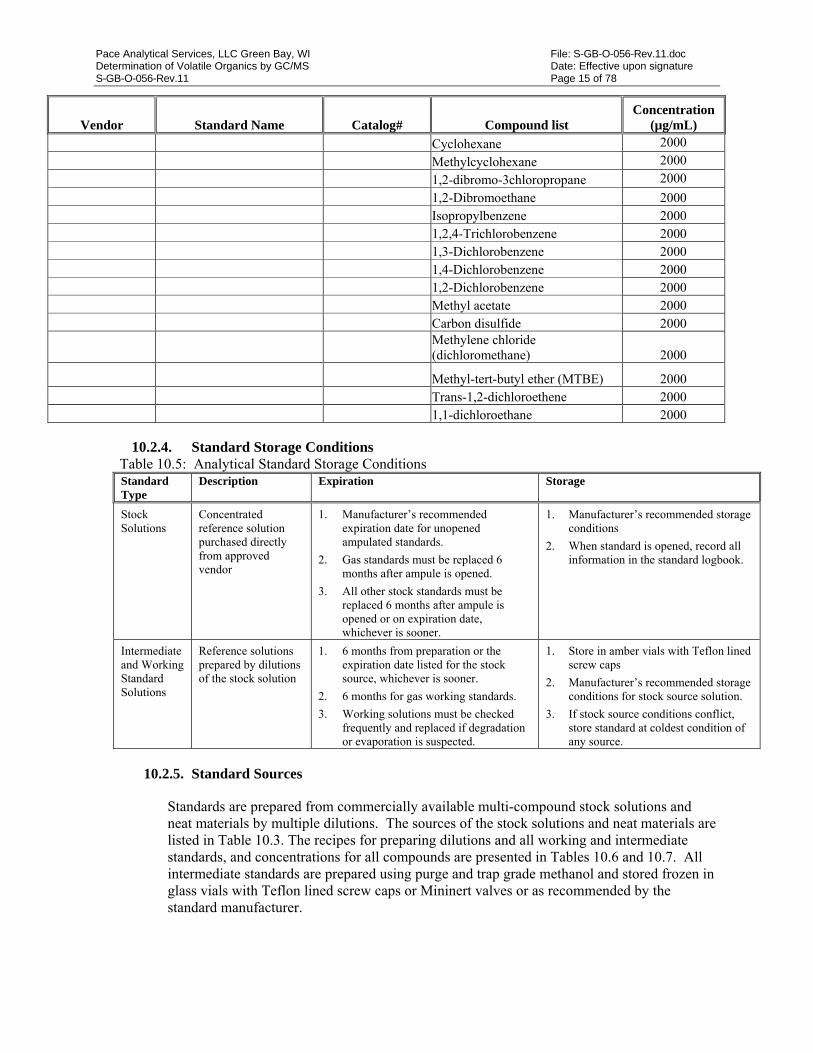
Pace Analytical Services, LLC Green Bay, WI File: S-GB-O-056-Rev.11.doc Determination of Volatile Organics by GC/MS Date: Effective upon signature S-GB-O-056-Rev.11 Page 15 of 78
Vendor Standard Name Catalog# Compound list Concentration
(µg/mL)
Cyclohexane 2000
Methylcyclohexane 2000
1,2-dibromo-3chloropropane 2000
1,2-Dibromoethane 2000 Isopropylbenzene 2000 1,2,4-Trichlorobenzene 2000 1,3-Dichlorobenzene 2000 1,4-Dichlorobenzene 2000 1,2-Dichlorobenzene 2000 Methyl acetate 2000 Carbon disulfide 2000
Methylene chloride (dichloromethane) 2000
Methyl-tert-butyl ether (MTBE) 2000 Trans-1,2-dichloroethene 2000 1,1-dichloroethane 2000
10.2.4. Standard Storage Conditions
Table 10.5: Analytical Standard Storage Conditions Standard Type
Description Expiration Storage
Stock Solutions
Concentrated reference solution purchased directly from approved vendor
1. Manufacturer’s recommended expiration date for unopened ampulated standards.
2. Gas standards must be replaced 6 months after ampule is opened.
3. All other stock standards must be replaced 6 months after ampule is opened or on expiration date, whichever is sooner.
1. Manufacturer’s recommended storage conditions
2. When standard is opened, record all information in the standard logbook.
Intermediate and Working Standard Solutions
Reference solutions prepared by dilutions of the stock solution
1. 6 months from preparation or the expiration date listed for the stock source, whichever is sooner.
2. 6 months for gas working standards.
3. Working solutions must be checked frequently and replaced if degradation or evaporation is suspected.
1. Store in amber vials with Teflon lined screw caps
2. Manufacturer’s recommended storage conditions for stock source solution.
3. If stock source conditions conflict, store standard at coldest condition of any source.
10.2.5. Standard Sources
Standards are prepared from commercially available multi-compound stock solutions and neat materials by multiple dilutions. The sources of the stock solutions and neat materials are listed in Table 10.3. The recipes for preparing dilutions and all working and intermediate standards, and concentrations for all compounds are presented in Tables 10.6 and 10.7. All intermediate standards are prepared using purge and trap grade methanol and stored frozen in glass vials with Teflon lined screw caps or Mininert valves or as recommended by the standard manufacturer.
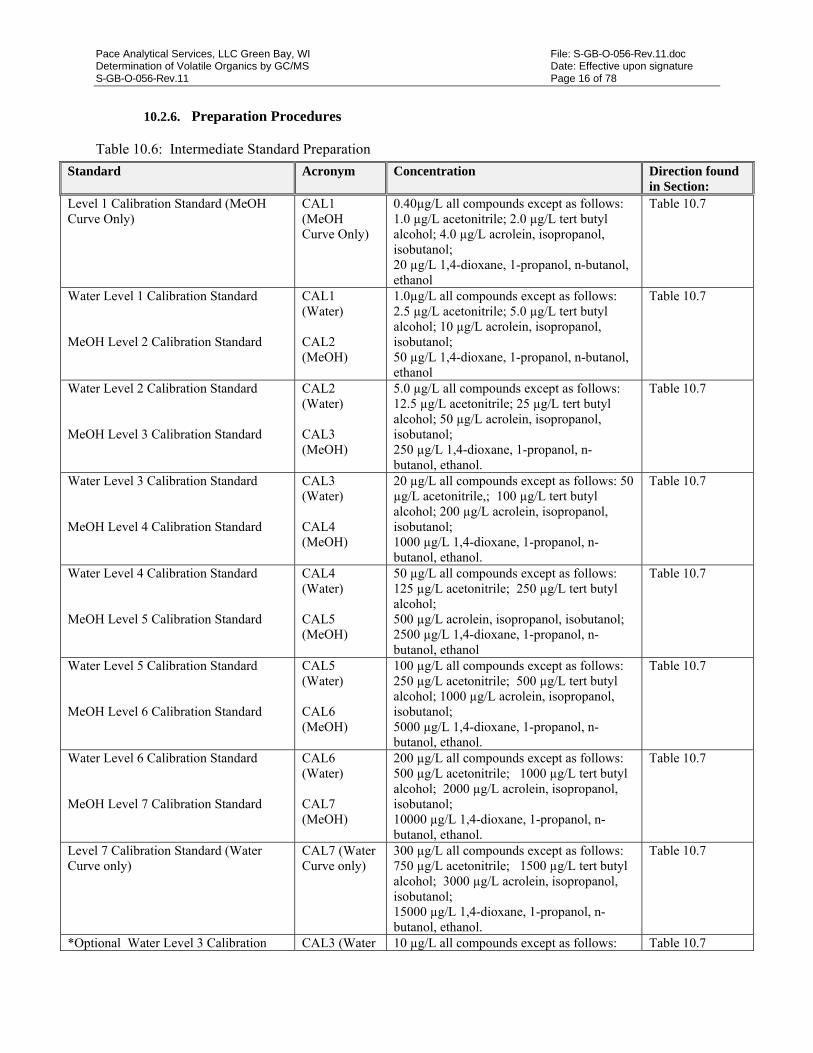
Pace Analytical Services, LLC Green Bay, WI File: S-GB-O-056-Rev.11.doc Determination of Volatile Organics by GC/MS Date: Effective upon signature S-GB-O-056-Rev.11 Page 16 of 78
10.2.6. Preparation Procedures
Table 10.6: Intermediate Standard Preparation
Standard Acronym Concentration Direction found in Section:
Level 1 Calibration Standard (MeOH Curve Only)
CAL1 (MeOH Curve Only)
0.40µg/L all compounds except as follows: 1.0 µg/L acetonitrile; 2.0 µg/L tert butyl alcohol; 4.0 µg/L acrolein, isopropanol, isobutanol; 20 µg/L 1,4-dioxane, 1-propanol, n-butanol, ethanol
Table 10.7
Water Level 1 Calibration Standard MeOH Level 2 Calibration Standard
CAL1 (Water) CAL2 (MeOH)
1.0µg/L all compounds except as follows: 2.5 µg/L acetonitrile; 5.0 µg/L tert butyl alcohol; 10 µg/L acrolein, isopropanol, isobutanol; 50 µg/L 1,4-dioxane, 1-propanol, n-butanol, ethanol
Table 10.7
Water Level 2 Calibration Standard MeOH Level 3 Calibration Standard
CAL2 (Water) CAL3 (MeOH)
5.0 µg/L all compounds except as follows: 12.5 µg/L acetonitrile; 25 µg/L tert butyl alcohol; 50 µg/L acrolein, isopropanol, isobutanol; 250 µg/L 1,4-dioxane, 1-propanol, n-butanol, ethanol.
Table 10.7
Water Level 3 Calibration Standard MeOH Level 4 Calibration Standard
CAL3 (Water) CAL4 (MeOH)
20 µg/L all compounds except as follows: 50 µg/L acetonitrile,; 100 µg/L tert butyl alcohol; 200 µg/L acrolein, isopropanol, isobutanol; 1000 µg/L 1,4-dioxane, 1-propanol, n-butanol, ethanol.
Table 10.7
Water Level 4 Calibration Standard MeOH Level 5 Calibration Standard
CAL4 (Water) CAL5 (MeOH)
50 µg/L all compounds except as follows: 125 µg/L acetonitrile; 250 µg/L tert butyl alcohol; 500 µg/L acrolein, isopropanol, isobutanol; 2500 µg/L 1,4-dioxane, 1-propanol, n-butanol, ethanol
Table 10.7
Water Level 5 Calibration Standard MeOH Level 6 Calibration Standard
CAL5 (Water) CAL6 (MeOH)
100 µg/L all compounds except as follows: 250 µg/L acetonitrile; 500 µg/L tert butyl alcohol; 1000 µg/L acrolein, isopropanol, isobutanol; 5000 µg/L 1,4-dioxane, 1-propanol, n-butanol, ethanol.
Table 10.7
Water Level 6 Calibration Standard MeOH Level 7 Calibration Standard
CAL6 (Water) CAL7 (MeOH)
200 µg/L all compounds except as follows: 500 µg/L acetonitrile; 1000 µg/L tert butyl alcohol; 2000 µg/L acrolein, isopropanol, isobutanol; 10000 µg/L 1,4-dioxane, 1-propanol, n-butanol, ethanol.
Table 10.7
Level 7 Calibration Standard (Water Curve only)
CAL7 (Water Curve only)
300 µg/L all compounds except as follows: 750 µg/L acetonitrile; 1500 µg/L tert butyl alcohol; 3000 µg/L acrolein, isopropanol, isobutanol; 15000 µg/L 1,4-dioxane, 1-propanol, n-butanol, ethanol.
Table 10.7
*Optional Water Level 3 Calibration CAL3 (Water 10 µg/L all compounds except as follows: Table 10.7
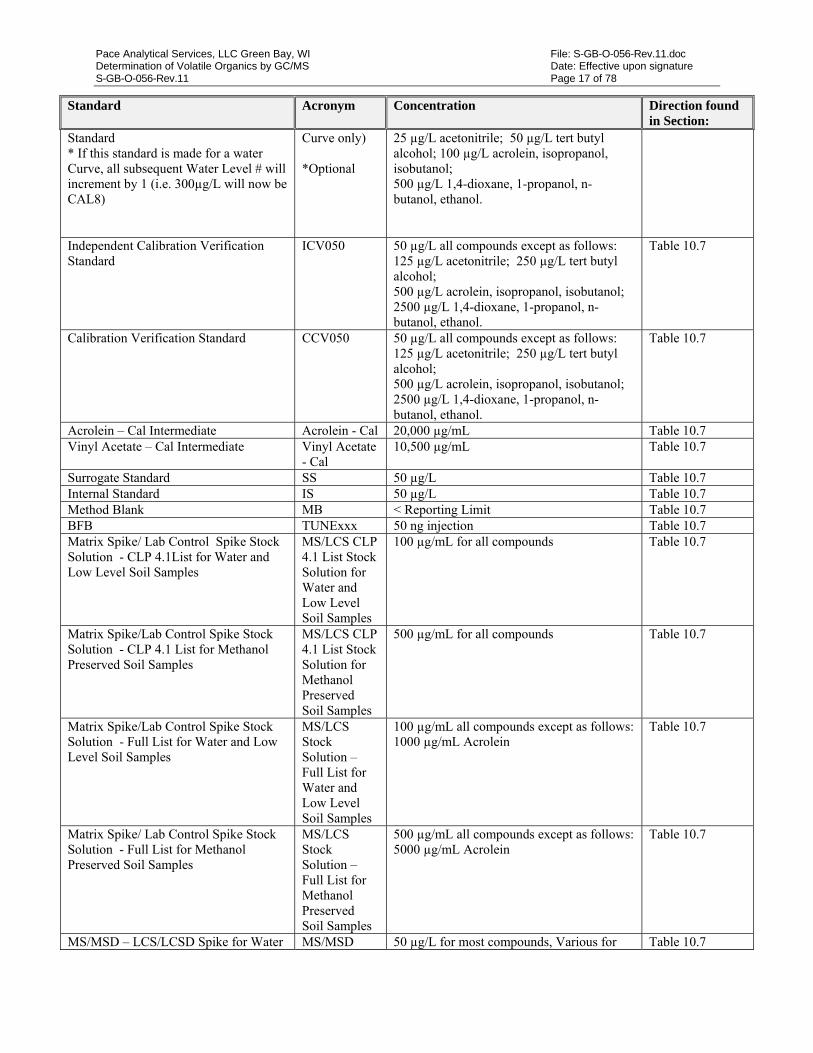
Pace Analytical Services, LLC Green Bay, WI File: S-GB-O-056-Rev.11.doc Determination of Volatile Organics by GC/MS Date: Effective upon signature S-GB-O-056-Rev.11 Page 17 of 78
Standard Acronym Concentration Direction found in Section:
Standard * If this standard is made for a water Curve, all subsequent Water Level # will increment by 1 (i.e. 300µg/L will now be CAL8)
Curve only) *Optional
25 µg/L acetonitrile; 50 µg/L tert butyl alcohol; 100 µg/L acrolein, isopropanol, isobutanol; 500 µg/L 1,4-dioxane, 1-propanol, n-butanol, ethanol.
Independent Calibration Verification Standard
ICV050 50 µg/L all compounds except as follows: 125 µg/L acetonitrile; 250 µg/L tert butyl alcohol; 500 µg/L acrolein, isopropanol, isobutanol; 2500 µg/L 1,4-dioxane, 1-propanol, n-butanol, ethanol.
Table 10.7
Calibration Verification Standard CCV050 50 µg/L all compounds except as follows: 125 µg/L acetonitrile; 250 µg/L tert butyl alcohol; 500 µg/L acrolein, isopropanol, isobutanol; 2500 µg/L 1,4-dioxane, 1-propanol, n-butanol, ethanol.
Table 10.7
Acrolein – Cal Intermediate Acrolein - Cal 20,000 µg/mL Table 10.7 Vinyl Acetate – Cal Intermediate Vinyl Acetate
- Cal 10,500 µg/mL Table 10.7
Surrogate Standard SS 50 µg/L Table 10.7 Internal Standard IS 50 µg/L Table 10.7 Method Blank MB < Reporting Limit Table 10.7 BFB TUNExxx 50 ng injection Table 10.7 Matrix Spike/ Lab Control Spike Stock Solution - CLP 4.1List for Water and Low Level Soil Samples
MS/LCS CLP 4.1 List Stock Solution for Water and Low Level Soil Samples
100 µg/mL for all compounds Table 10.7
Matrix Spike/Lab Control Spike Stock Solution - CLP 4.1 List for Methanol Preserved Soil Samples
MS/LCS CLP 4.1 List Stock Solution for Methanol Preserved Soil Samples
500 µg/mL for all compounds Table 10.7
Matrix Spike/Lab Control Spike Stock Solution - Full List for Water and Low Level Soil Samples
MS/LCS Stock Solution – Full List for Water and Low Level Soil Samples
100 µg/mL all compounds except as follows: 1000 µg/mL Acrolein
Table 10.7
Matrix Spike/ Lab Control Spike Stock Solution - Full List for Methanol Preserved Soil Samples
MS/LCS Stock Solution – Full List for Methanol Preserved Soil Samples
500 µg/mL all compounds except as follows: 5000 µg/mL Acrolein
Table 10.7
MS/MSD – LCS/LCSD Spike for Water MS/MSD 50 µg/L for most compounds, Various for Table 10.7
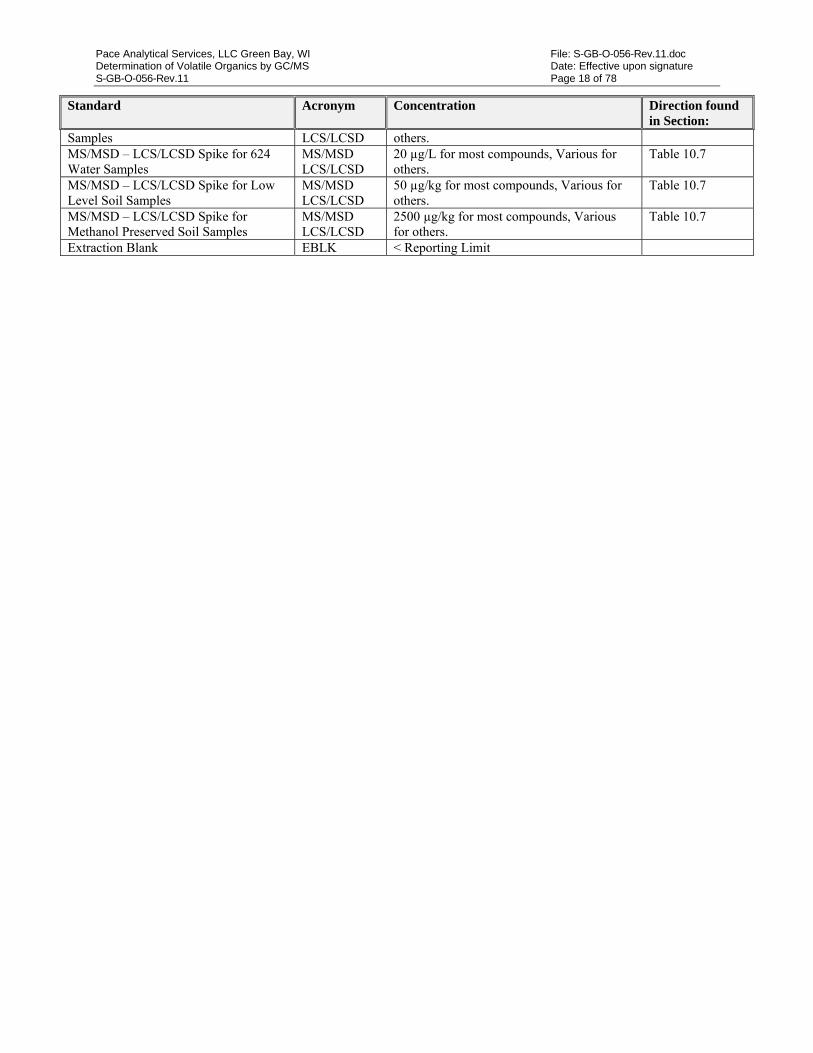
Pace Analytical Services, LLC Green Bay, WI File: S-GB-O-056-Rev.11.doc Determination of Volatile Organics by GC/MS Date: Effective upon signature S-GB-O-056-Rev.11 Page 18 of 78
Standard Acronym Concentration Direction found in Section:
Samples LCS/LCSD others. MS/MSD – LCS/LCSD Spike for 624 Water Samples
MS/MSD LCS/LCSD
20 µg/L for most compounds, Various for others.
Table 10.7
MS/MSD – LCS/LCSD Spike for Low Level Soil Samples
MS/MSD LCS/LCSD
50 µg/kg for most compounds, Various for others.
Table 10.7
MS/MSD – LCS/LCSD Spike for Methanol Preserved Soil Samples
MS/MSD LCS/LCSD
2500 µg/kg for most compounds, Various for others.
Table 10.7
Extraction Blank EBLK < Reporting Limit
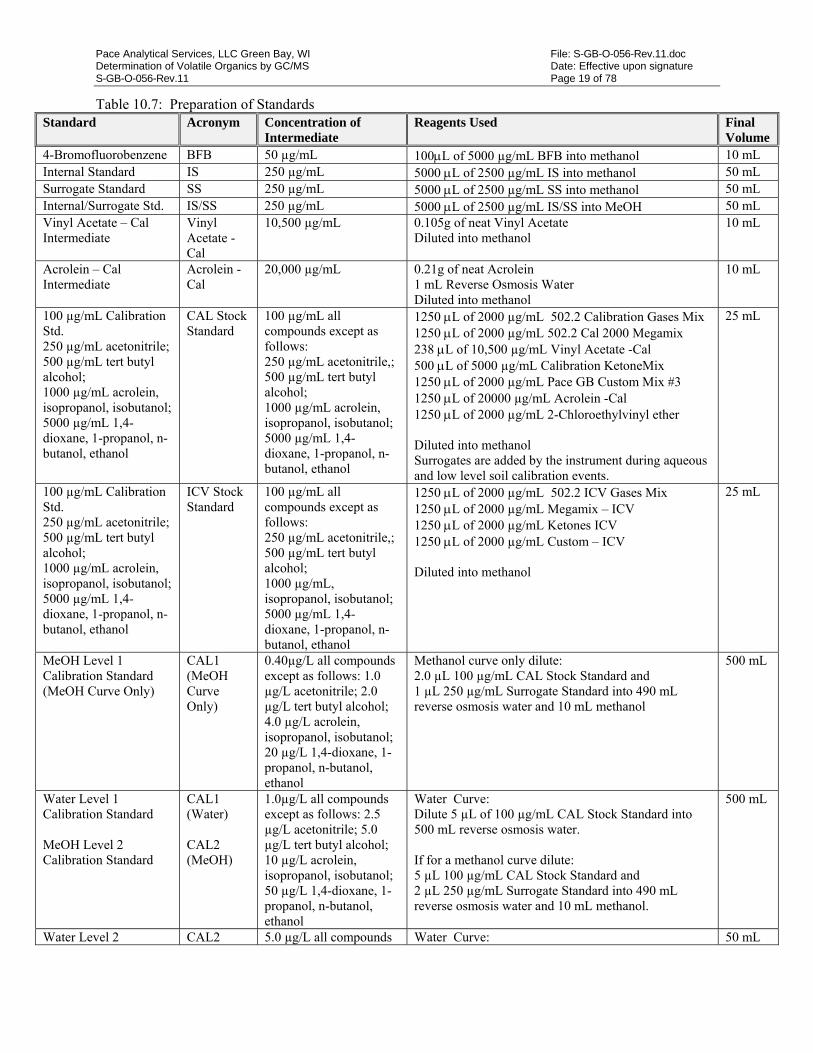
Pace Analytical Services, LLC Green Bay, WI File: S-GB-O-056-Rev.11.doc Determination of Volatile Organics by GC/MS Date: Effective upon signature S-GB-O-056-Rev.11 Page 19 of 78
Table 10.7: Preparation of Standards Standard Acronym Concentration of
Intermediate Reagents Used Final
Volume 4-Bromofluorobenzene BFB 50 µg/mL 100L of 5000 µg/mL BFB into methanol 10 mL Internal Standard IS 250 µg/mL 5000 L of 2500 µg/mL IS into methanol 50 mL Surrogate Standard SS 250 µg/mL 5000 L of 2500 µg/mL SS into methanol 50 mL Internal/Surrogate Std. IS/SS 250 µg/mL 5000 L of 2500 µg/mL IS/SS into MeOH 50 mL Vinyl Acetate – Cal Intermediate
Vinyl Acetate - Cal
10,500 µg/mL 0.105g of neat Vinyl Acetate Diluted into methanol
10 mL
Acrolein – Cal Intermediate
Acrolein - Cal
20,000 µg/mL 0.21g of neat Acrolein 1 mL Reverse Osmosis Water Diluted into methanol
10 mL
100 µg/mL Calibration Std. 250 µg/mL acetonitrile; 500 µg/mL tert butyl alcohol; 1000 µg/mL acrolein, isopropanol, isobutanol; 5000 µg/mL 1,4-dioxane, 1-propanol, n-butanol, ethanol
CAL Stock Standard
100 µg/mL all compounds except as follows: 250 µg/mL acetonitrile,; 500 µg/mL tert butyl alcohol; 1000 µg/mL acrolein, isopropanol, isobutanol; 5000 µg/mL 1,4-dioxane, 1-propanol, n-butanol, ethanol
1250 L of 2000 µg/mL 502.2 Calibration Gases Mix 1250 L of 2000 µg/mL 502.2 Cal 2000 Megamix 238 L of 10,500 µg/mL Vinyl Acetate -Cal 500 L of 5000 µg/mL Calibration KetoneMix 1250 L of 2000 µg/mL Pace GB Custom Mix #3 1250 L of 20000 µg/mL Acrolein -Cal 1250 L of 2000 µg/mL 2-Chloroethylvinyl ether Diluted into methanol Surrogates are added by the instrument during aqueous and low level soil calibration events.
25 mL
100 µg/mL Calibration Std. 250 µg/mL acetonitrile; 500 µg/mL tert butyl alcohol; 1000 µg/mL acrolein, isopropanol, isobutanol; 5000 µg/mL 1,4-dioxane, 1-propanol, n-butanol, ethanol
ICV Stock Standard
100 µg/mL all compounds except as follows: 250 µg/mL acetonitrile,; 500 µg/mL tert butyl alcohol; 1000 µg/mL, isopropanol, isobutanol; 5000 µg/mL 1,4-dioxane, 1-propanol, n-butanol, ethanol
1250 L of 2000 µg/mL 502.2 ICV Gases Mix 1250 L of 2000 µg/mL Megamix – ICV 1250 L of 2000 µg/mL Ketones ICV 1250 L of 2000 µg/mL Custom – ICV Diluted into methanol
25 mL
MeOH Level 1 Calibration Standard (MeOH Curve Only)
CAL1 (MeOH Curve Only)
0.40µg/L all compounds except as follows: 1.0 µg/L acetonitrile; 2.0 µg/L tert butyl alcohol; 4.0 µg/L acrolein, isopropanol, isobutanol; 20 µg/L 1,4-dioxane, 1-propanol, n-butanol, ethanol
Methanol curve only dilute: 2.0 µL 100 µg/mL CAL Stock Standard and 1 µL 250 µg/mL Surrogate Standard into 490 mL reverse osmosis water and 10 mL methanol
500 mL
Water Level 1 Calibration Standard MeOH Level 2 Calibration Standard
CAL1 (Water) CAL2 (MeOH)
1.0µg/L all compounds except as follows: 2.5 µg/L acetonitrile; 5.0 µg/L tert butyl alcohol; 10 µg/L acrolein, isopropanol, isobutanol; 50 µg/L 1,4-dioxane, 1-propanol, n-butanol, ethanol
Water Curve: Dilute 5 µL of 100 µg/mL CAL Stock Standard into 500 mL reverse osmosis water.
If for a methanol curve dilute: 5 µL 100 µg/mL CAL Stock Standard and 2 µL 250 µg/mL Surrogate Standard into 490 mL reverse osmosis water and 10 mL methanol.
500 mL
Water Level 2 CAL2 5.0 µg/L all compounds Water Curve: 50 mL
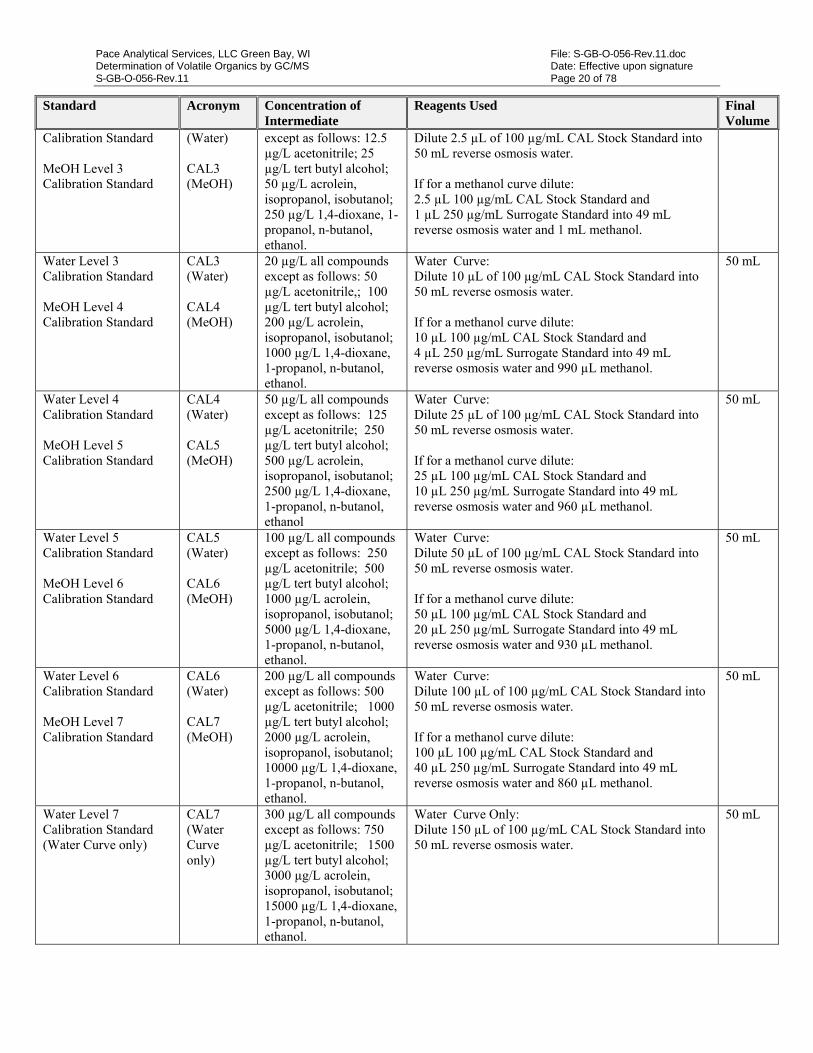
Pace Analytical Services, LLC Green Bay, WI File: S-GB-O-056-Rev.11.doc Determination of Volatile Organics by GC/MS Date: Effective upon signature S-GB-O-056-Rev.11 Page 20 of 78
Standard Acronym Concentration of Intermediate
Reagents Used Final Volume
Calibration Standard MeOH Level 3 Calibration Standard
(Water) CAL3 (MeOH)
except as follows: 12.5 µg/L acetonitrile; 25 µg/L tert butyl alcohol; 50 µg/L acrolein, isopropanol, isobutanol; 250 µg/L 1,4-dioxane, 1-propanol, n-butanol, ethanol.
Dilute 2.5 µL of 100 µg/mL CAL Stock Standard into 50 mL reverse osmosis water.
If for a methanol curve dilute: 2.5 µL 100 µg/mL CAL Stock Standard and 1 µL 250 µg/mL Surrogate Standard into 49 mL reverse osmosis water and 1 mL methanol.
Water Level 3 Calibration Standard MeOH Level 4 Calibration Standard
CAL3 (Water) CAL4 (MeOH)
20 µg/L all compounds except as follows: 50 µg/L acetonitrile,; 100 µg/L tert butyl alcohol; 200 µg/L acrolein, isopropanol, isobutanol; 1000 µg/L 1,4-dioxane, 1-propanol, n-butanol, ethanol.
Water Curve: Dilute 10 µL of 100 µg/mL CAL Stock Standard into 50 mL reverse osmosis water.
If for a methanol curve dilute: 10 µL 100 µg/mL CAL Stock Standard and 4 µL 250 µg/mL Surrogate Standard into 49 mL reverse osmosis water and 990 µL methanol.
50 mL
Water Level 4 Calibration Standard MeOH Level 5 Calibration Standard
CAL4 (Water) CAL5 (MeOH)
50 µg/L all compounds except as follows: 125 µg/L acetonitrile; 250 µg/L tert butyl alcohol; 500 µg/L acrolein, isopropanol, isobutanol; 2500 µg/L 1,4-dioxane, 1-propanol, n-butanol, ethanol
Water Curve: Dilute 25 µL of 100 µg/mL CAL Stock Standard into 50 mL reverse osmosis water.
If for a methanol curve dilute: 25 µL 100 µg/mL CAL Stock Standard and 10 µL 250 µg/mL Surrogate Standard into 49 mL reverse osmosis water and 960 µL methanol.
50 mL
Water Level 5 Calibration Standard MeOH Level 6 Calibration Standard
CAL5 (Water) CAL6 (MeOH)
100 µg/L all compounds except as follows: 250 µg/L acetonitrile; 500 µg/L tert butyl alcohol; 1000 µg/L acrolein, isopropanol, isobutanol; 5000 µg/L 1,4-dioxane, 1-propanol, n-butanol, ethanol.
Water Curve: Dilute 50 µL of 100 µg/mL CAL Stock Standard into 50 mL reverse osmosis water.
If for a methanol curve dilute: 50 µL 100 µg/mL CAL Stock Standard and 20 µL 250 µg/mL Surrogate Standard into 49 mL reverse osmosis water and 930 µL methanol.
50 mL
Water Level 6 Calibration Standard MeOH Level 7 Calibration Standard
CAL6 (Water) CAL7 (MeOH)
200 µg/L all compounds except as follows: 500 µg/L acetonitrile; 1000 µg/L tert butyl alcohol; 2000 µg/L acrolein, isopropanol, isobutanol; 10000 µg/L 1,4-dioxane, 1-propanol, n-butanol, ethanol.
Water Curve: Dilute 100 µL of 100 µg/mL CAL Stock Standard into 50 mL reverse osmosis water.
If for a methanol curve dilute: 100 µL 100 µg/mL CAL Stock Standard and 40 µL 250 µg/mL Surrogate Standard into 49 mL reverse osmosis water and 860 µL methanol.
50 mL
Water Level 7 Calibration Standard (Water Curve only)
CAL7 (Water Curve only)
300 µg/L all compounds except as follows: 750 µg/L acetonitrile; 1500 µg/L tert butyl alcohol; 3000 µg/L acrolein, isopropanol, isobutanol; 15000 µg/L 1,4-dioxane, 1-propanol, n-butanol, ethanol.
Water Curve Only: Dilute 150 µL of 100 µg/mL CAL Stock Standard into 50 mL reverse osmosis water.
50 mL

Pace Analytical Services, LLC Green Bay, WI File: S-GB-O-056-Rev.11.doc Determination of Volatile Organics by GC/MS Date: Effective upon signature S-GB-O-056-Rev.11 Page 21 of 78
Standard Acronym Concentration of Intermediate
Reagents Used Final Volume
*Optional Water Level3 Calibration Standard * If this standard is made for a water Curve, all subsequent Water Level # will increment by 1 (i.e. 300µg/L will now be CAL8)
CAL3 (Water Curve only) *Optional
10 µg/L all compounds except as follows: 25 µg/L acetonitrile; 50 µg/L tert butyl alcohol; 100 µg/L acrolein, isopropanol, isobutanol; 500 µg/L 1,4-dioxane, 1-propanol, n-butanol, ethanol.
Water Curve: Dilute 5 µL of 100 µg/mL CAL Stock Standard into 50 mL reverse osmosis water.
50 mL
Independent Calibration Verification Standard
ICV050 50 µg/L all compounds except as follows: 125 µg/L acetonitrile; 250 µg/L tert butyl alcohol; 500 µg/L acrolein, isopropanol, isobutanol; 2500 µg/L 1,4-dioxane, 1-propanol, n-butanol, ethanol
Water Curve: Dilute 25 µL of 100 µg/mL ICV Stock Standard and 25 µL Reactive Mix – ICV into 50 mL reverse osmosis water. If for a methanol curve dilute: 25 µL 100 µg/mL ICV Stock Standard, 25 µL Reactive Mix – ICV and 10 µL 250 µg/mL Surrogate Standard into 49 mL reverse osmosis water and 940 µL methanol.
50 mL
Calibration Verification Standard
CCV050 50 µg/L all compounds except as follows: 125 µg/L acetonitrile; 250 µg/L tert butyl alcohol; 500 µg/L acrolein, isopropanol, isobutanol; 2500 µg/L 1,4-dioxane, 1-propanol, n-butanol, ethanol
Water Curve: Dilute 25 µL of 100 µg/mL CAL Stock Standard into 50 mL reverse osmosis water. If for a methanol curve dilute: 25 µL 100 µg/mL CAL Stock Standard and 10 µL 250 µg/mL Surrogate Standard into 49 mL reverse osmosis water and 960 µL methanol.
50 mL
Matrix Spike/Lab Control Spike Stock Solution - TCL 4.1 List for Water and Low Level Soil Samples
MS/LCS TCL 4.1 List Stock Solution for Water and Low Level Soil Samples
100 µg/mL for all compounds
1250 L of 2000 µg/mL CLP 4.1Mega Mix 1250 L of 2000 µg/mL 502.2 Gases Mix #1 Dilute into methanol.
25 mL
Matrix Spike/Lab Control Spike Stock Solution - TCL 4.1 List for Methanol Preserved Soil Samples
MS/LCS TCL 4.1 List Stock Solution for Methanol Preserved Soil Samples
500 µg/mL for all compounds
2500 L of 2000 µg/mL CLP 4.1Mega Mix 2500 L of 2000 µg/mL 502.2 Gases Mix #1 Dilute into methanol.
10 mL
Matrix Spike/Lab Control Spike Stock Solution - Full List *
MS/LCS Stock Solution – Full List
100 µg/mL all compounds except as follows: 250 µg/mL acetonitrile; 500 µg/mL tert butyl alcohol; 1000 µg/mL
1250 L of 2000 µg/mL 502.2 ICV Gases Mix 1250 L of 2000 µg/mL Megamix – ICV 1250 L of 2000 µg/mL Ketones ICV 1250 L of 2000 µg/mL Custom – ICV Diluted into methanol
25 mL
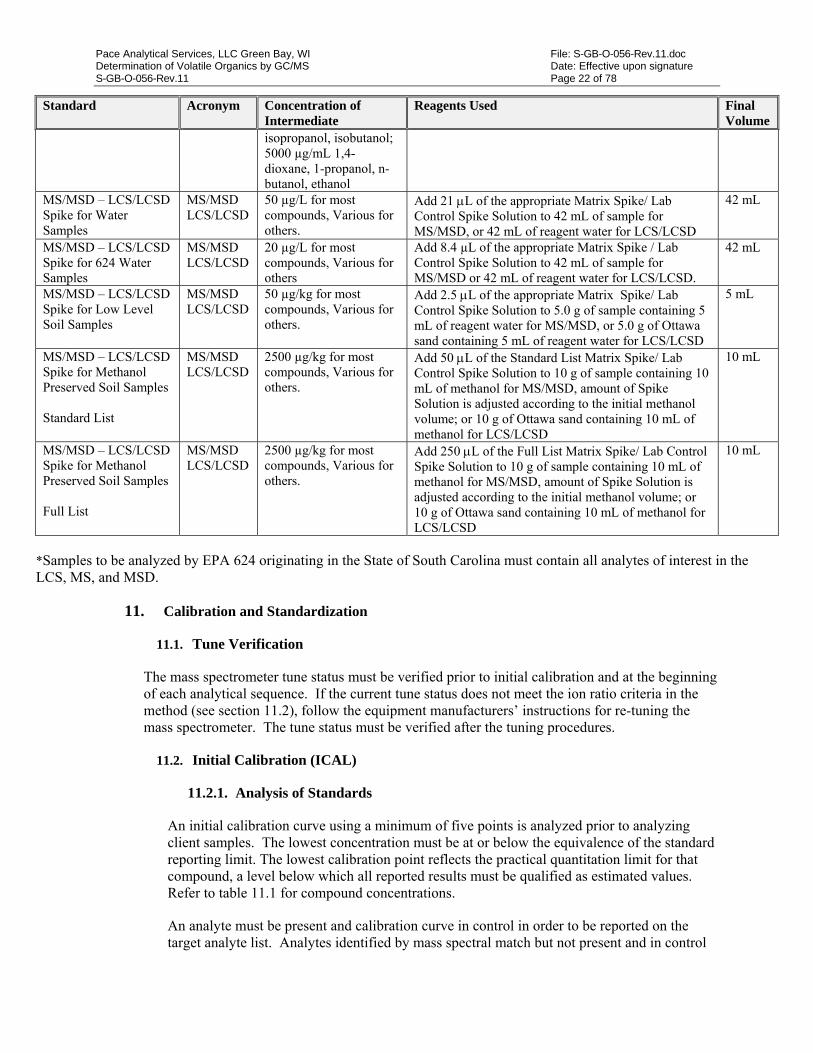
Pace Analytical Services, LLC Green Bay, WI File: S-GB-O-056-Rev.11.doc Determination of Volatile Organics by GC/MS Date: Effective upon signature S-GB-O-056-Rev.11 Page 22 of 78
Standard Acronym Concentration of Intermediate
Reagents Used Final Volume
isopropanol, isobutanol; 5000 µg/mL 1,4-dioxane, 1-propanol, n-butanol, ethanol
MS/MSD – LCS/LCSD Spike for Water Samples
MS/MSD LCS/LCSD
50 µg/L for most compounds, Various for others.
Add 21 L of the appropriate Matrix Spike/ Lab Control Spike Solution to 42 mL of sample for MS/MSD, or 42 mL of reagent water for LCS/LCSD
42 mL
MS/MSD – LCS/LCSD Spike for 624 Water Samples
MS/MSD LCS/LCSD
20 µg/L for most compounds, Various for others
Add 8.4 µL of the appropriate Matrix Spike / Lab Control Spike Solution to 42 mL of sample for MS/MSD or 42 mL of reagent water for LCS/LCSD.
42 mL
MS/MSD – LCS/LCSD Spike for Low Level Soil Samples
MS/MSD LCS/LCSD
50 µg/kg for most compounds, Various for others.
Add 2.5 L of the appropriate Matrix Spike/ Lab Control Spike Solution to 5.0 g of sample containing 5 mL of reagent water for MS/MSD, or 5.0 g of Ottawa sand containing 5 mL of reagent water for LCS/LCSD
5 mL
MS/MSD – LCS/LCSD Spike for Methanol Preserved Soil Samples Standard List
MS/MSD LCS/LCSD
2500 µg/kg for most compounds, Various for others.
Add 50 L of the Standard List Matrix Spike/ Lab Control Spike Solution to 10 g of sample containing 10 mL of methanol for MS/MSD, amount of Spike Solution is adjusted according to the initial methanol volume; or 10 g of Ottawa sand containing 10 mL of methanol for LCS/LCSD
10 mL
MS/MSD – LCS/LCSD Spike for Methanol Preserved Soil Samples Full List
MS/MSD LCS/LCSD
2500 µg/kg for most compounds, Various for others.
Add 250 L of the Full List Matrix Spike/ Lab Control Spike Solution to 10 g of sample containing 10 mL of methanol for MS/MSD, amount of Spike Solution is adjusted according to the initial methanol volume; or 10 g of Ottawa sand containing 10 mL of methanol for LCS/LCSD
10 mL
*Samples to be analyzed by EPA 624 originating in the State of South Carolina must contain all analytes of interest in the LCS, MS, and MSD.
11. Calibration and Standardization
11.1. Tune Verification
The mass spectrometer tune status must be verified prior to initial calibration and at the beginning of each analytical sequence. If the current tune status does not meet the ion ratio criteria in the method (see section 11.2), follow the equipment manufacturers’ instructions for re-tuning the mass spectrometer. The tune status must be verified after the tuning procedures.
11.2. Initial Calibration (ICAL)
11.2.1. Analysis of Standards
An initial calibration curve using a minimum of five points is analyzed prior to analyzing client samples. The lowest concentration must be at or below the equivalence of the standard reporting limit. The lowest calibration point reflects the practical quantitation limit for that compound, a level below which all reported results must be qualified as estimated values. Refer to table 11.1 for compound concentrations.
An analyte must be present and calibration curve in control in order to be reported on the target analyte list. Analytes identified by mass spectral match but not present and in control
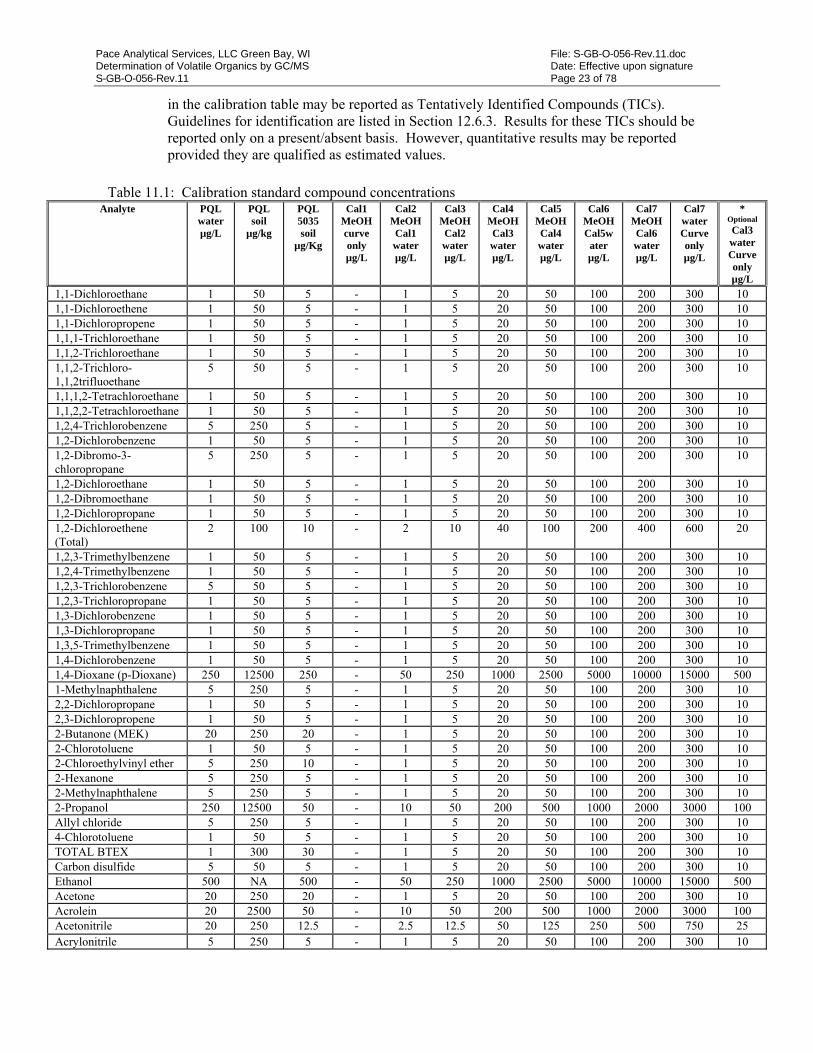
Pace Analytical Services, LLC Green Bay, WI File: S-GB-O-056-Rev.11.doc Determination of Volatile Organics by GC/MS Date: Effective upon signature S-GB-O-056-Rev.11 Page 23 of 78
in the calibration table may be reported as Tentatively Identified Compounds (TICs). Guidelines for identification are listed in Section 12.6.3. Results for these TICs should be reported only on a present/absent basis. However, quantitative results may be reported provided they are qualified as estimated values.
Table 11.1: Calibration standard compound concentrations
Analyte PQL water µg/L
PQL soil
µg/kg
PQL 5035 soil
µg/Kg
Cal1 MeOH curve only µg/L
Cal2 MeOH Cal1 water µg/L
Cal3 MeOH Cal2 water µg/L
Cal4 MeOH Cal3 water µg/L
Cal5 MeOH Cal4 water µg/L
Cal6 MeOH Cal5w
ater µg/L
Cal7 MeOH Cal6 water µg/L
Cal7 water Curve only µg/L
* Optional
Cal3 water Curve only µg/L
1,1-Dichloroethane 1 50 5 - 1 5 20 50 100 200 300 10 1,1-Dichloroethene 1 50 5 - 1 5 20 50 100 200 300 10 1,1-Dichloropropene 1 50 5 - 1 5 20 50 100 200 300 10 1,1,1-Trichloroethane 1 50 5 - 1 5 20 50 100 200 300 10 1,1,2-Trichloroethane 1 50 5 - 1 5 20 50 100 200 300 10 1,1,2-Trichloro-1,1,2trifluoethane
5 50 5 - 1 5 20 50 100 200 300 10
1,1,1,2-Tetrachloroethane 1 50 5 - 1 5 20 50 100 200 300 10 1,1,2,2-Tetrachloroethane 1 50 5 - 1 5 20 50 100 200 300 10 1,2,4-Trichlorobenzene 5 250 5 - 1 5 20 50 100 200 300 10 1,2-Dichlorobenzene 1 50 5 - 1 5 20 50 100 200 300 10 1,2-Dibromo-3-chloropropane
5 250 5 - 1 5 20 50 100 200 300 10
1,2-Dichloroethane 1 50 5 - 1 5 20 50 100 200 300 10 1,2-Dibromoethane 1 50 5 - 1 5 20 50 100 200 300 10 1,2-Dichloropropane 1 50 5 - 1 5 20 50 100 200 300 10 1,2-Dichloroethene (Total)
2 100 10 - 2 10 40 100 200 400 600 20
1,2,3-Trimethylbenzene 1 50 5 - 1 5 20 50 100 200 300 10 1,2,4-Trimethylbenzene 1 50 5 - 1 5 20 50 100 200 300 10 1,2,3-Trichlorobenzene 5 50 5 - 1 5 20 50 100 200 300 10 1,2,3-Trichloropropane 1 50 5 - 1 5 20 50 100 200 300 10 1,3-Dichlorobenzene 1 50 5 - 1 5 20 50 100 200 300 10 1,3-Dichloropropane 1 50 5 - 1 5 20 50 100 200 300 10 1,3,5-Trimethylbenzene 1 50 5 - 1 5 20 50 100 200 300 10 1,4-Dichlorobenzene 1 50 5 - 1 5 20 50 100 200 300 10 1,4-Dioxane (p-Dioxane) 250 12500 250 - 50 250 1000 2500 5000 10000 15000 500 1-Methylnaphthalene 5 250 5 - 1 5 20 50 100 200 300 10 2,2-Dichloropropane 1 50 5 - 1 5 20 50 100 200 300 10 2,3-Dichloropropene 1 50 5 - 1 5 20 50 100 200 300 10 2-Butanone (MEK) 20 250 20 - 1 5 20 50 100 200 300 10 2-Chlorotoluene 1 50 5 - 1 5 20 50 100 200 300 10 2-Chloroethylvinyl ether 5 250 10 - 1 5 20 50 100 200 300 10 2-Hexanone 5 250 5 - 1 5 20 50 100 200 300 10 2-Methylnaphthalene 5 250 5 - 1 5 20 50 100 200 300 10 2-Propanol 250 12500 50 - 10 50 200 500 1000 2000 3000 100 Allyl chloride 5 250 5 - 1 5 20 50 100 200 300 10 4-Chlorotoluene 1 50 5 - 1 5 20 50 100 200 300 10 TOTAL BTEX 1 300 30 - 1 5 20 50 100 200 300 10 Carbon disulfide 5 50 5 - 1 5 20 50 100 200 300 10 Ethanol 500 NA 500 - 50 250 1000 2500 5000 10000 15000 500 Acetone 20 250 20 - 1 5 20 50 100 200 300 10 Acrolein 20 2500 50 - 10 50 200 500 1000 2000 3000 100 Acetonitrile 20 250 12.5 - 2.5 12.5 50 125 250 500 750 25 Acrylonitrile 5 250 5 - 1 5 20 50 100 200 300 10
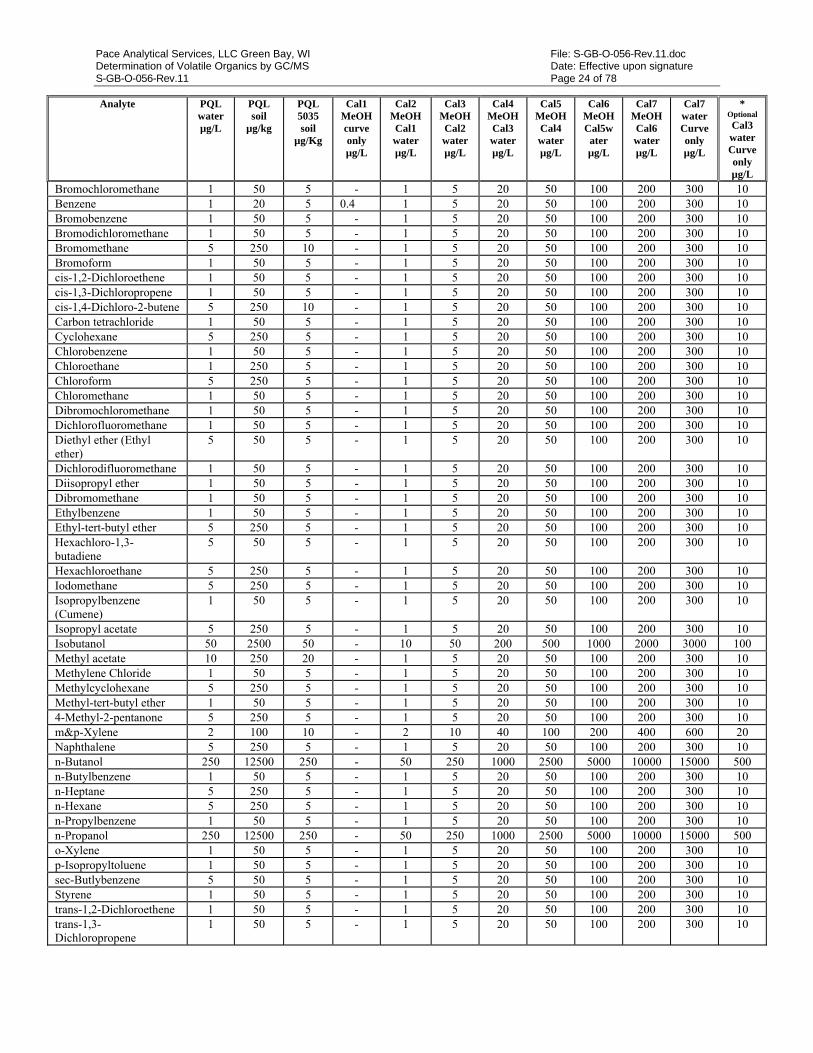
Pace Analytical Services, LLC Green Bay, WI File: S-GB-O-056-Rev.11.doc Determination of Volatile Organics by GC/MS Date: Effective upon signature S-GB-O-056-Rev.11 Page 24 of 78
Analyte PQL water µg/L
PQL soil
µg/kg
PQL 5035 soil
µg/Kg
Cal1 MeOH curve only µg/L
Cal2 MeOH Cal1 water µg/L
Cal3 MeOH Cal2 water µg/L
Cal4 MeOH Cal3 water µg/L
Cal5 MeOH Cal4 water µg/L
Cal6 MeOH Cal5w
ater µg/L
Cal7 MeOH Cal6 water µg/L
Cal7 water Curve only µg/L
* Optional
Cal3 water Curve only µg/L
Bromochloromethane 1 50 5 - 1 5 20 50 100 200 300 10 Benzene 1 20 5 0.4 1 5 20 50 100 200 300 10 Bromobenzene 1 50 5 - 1 5 20 50 100 200 300 10 Bromodichloromethane 1 50 5 - 1 5 20 50 100 200 300 10 Bromomethane 5 250 10 - 1 5 20 50 100 200 300 10 Bromoform 1 50 5 - 1 5 20 50 100 200 300 10 cis-1,2-Dichloroethene 1 50 5 - 1 5 20 50 100 200 300 10 cis-1,3-Dichloropropene 1 50 5 - 1 5 20 50 100 200 300 10 cis-1,4-Dichloro-2-butene 5 250 10 - 1 5 20 50 100 200 300 10 Carbon tetrachloride 1 50 5 - 1 5 20 50 100 200 300 10 Cyclohexane 5 250 5 - 1 5 20 50 100 200 300 10 Chlorobenzene 1 50 5 - 1 5 20 50 100 200 300 10 Chloroethane 1 250 5 - 1 5 20 50 100 200 300 10 Chloroform 5 250 5 - 1 5 20 50 100 200 300 10 Chloromethane 1 50 5 - 1 5 20 50 100 200 300 10 Dibromochloromethane 1 50 5 - 1 5 20 50 100 200 300 10 Dichlorofluoromethane 1 50 5 - 1 5 20 50 100 200 300 10 Diethyl ether (Ethyl ether)
5 50 5 - 1 5 20 50 100 200 300 10
Dichlorodifluoromethane 1 50 5 - 1 5 20 50 100 200 300 10 Diisopropyl ether 1 50 5 - 1 5 20 50 100 200 300 10 Dibromomethane 1 50 5 - 1 5 20 50 100 200 300 10 Ethylbenzene 1 50 5 - 1 5 20 50 100 200 300 10 Ethyl-tert-butyl ether 5 250 5 - 1 5 20 50 100 200 300 10 Hexachloro-1,3-butadiene
5 50 5 - 1 5 20 50 100 200 300 10
Hexachloroethane 5 250 5 - 1 5 20 50 100 200 300 10 Iodomethane 5 250 5 - 1 5 20 50 100 200 300 10 Isopropylbenzene (Cumene)
1 50 5 - 1 5 20 50 100 200 300 10
Isopropyl acetate 5 250 5 - 1 5 20 50 100 200 300 10 Isobutanol 50 2500 50 - 10 50 200 500 1000 2000 3000 100 Methyl acetate 10 250 20 - 1 5 20 50 100 200 300 10 Methylene Chloride 1 50 5 - 1 5 20 50 100 200 300 10 Methylcyclohexane 5 250 5 - 1 5 20 50 100 200 300 10 Methyl-tert-butyl ether 1 50 5 - 1 5 20 50 100 200 300 10 4-Methyl-2-pentanone 5 250 5 - 1 5 20 50 100 200 300 10 m&p-Xylene 2 100 10 - 2 10 40 100 200 400 600 20 Naphthalene 5 250 5 - 1 5 20 50 100 200 300 10 n-Butanol 250 12500 250 - 50 250 1000 2500 5000 10000 15000 500 n-Butylbenzene 1 50 5 - 1 5 20 50 100 200 300 10 n-Heptane 5 250 5 - 1 5 20 50 100 200 300 10 n-Hexane 5 250 5 - 1 5 20 50 100 200 300 10 n-Propylbenzene 1 50 5 - 1 5 20 50 100 200 300 10 n-Propanol 250 12500 250 - 50 250 1000 2500 5000 10000 15000 500 o-Xylene 1 50 5 - 1 5 20 50 100 200 300 10 p-Isopropyltoluene 1 50 5 - 1 5 20 50 100 200 300 10 sec-Butlybenzene 5 50 5 - 1 5 20 50 100 200 300 10 Styrene 1 50 5 - 1 5 20 50 100 200 300 10 trans-1,2-Dichloroethene 1 50 5 - 1 5 20 50 100 200 300 10 trans-1,3-Dichloropropene
1 50 5 - 1 5 20 50 100 200 300 10

Pace Analytical Services, LLC Green Bay, WI File: S-GB-O-056-Rev.11.doc Determination of Volatile Organics by GC/MS Date: Effective upon signature S-GB-O-056-Rev.11 Page 25 of 78
Analyte PQL water µg/L
PQL soil
µg/kg
PQL 5035 soil
µg/Kg
Cal1 MeOH curve only µg/L
Cal2 MeOH Cal1 water µg/L
Cal3 MeOH Cal2 water µg/L
Cal4 MeOH Cal3 water µg/L
Cal5 MeOH Cal4 water µg/L
Cal6 MeOH Cal5w
ater µg/L
Cal7 MeOH Cal6 water µg/L
Cal7 water Curve only µg/L
* Optional
Cal3 water Curve only µg/L
trans-1,4-Dichloro-2-butene
5 250 5 - 1 5 20 50 100 200 300 10
tert-Amyl-methyl ether 1 250 5 - 1 5 20 50 100 200 300 10 tert-Butyl Alcohol 25 1250 50 - 5 25 100 250 500 1000 1500 50 Tetrachloroethene 1 50 5 - 1 5 20 50 100 200 300 10 Tetrahydrofuran 5 250 10 - 1 5 20 50 100 200 300 10 Toluene 1 50 5 - 1 5 20 50 100 200 300 10 Trichloroethene 1 50 5 - 1 5 20 50 100 200 300 10 Trichlorofluoromethane 1 50 5 - 1 5 20 50 100 200 300 10 tert-Butylbenzene 1 50 5 - 1 5 20 50 100 200 300 10 Xylene (Total) 3 150 15 - 3 15 60 150 300 600 900 30 Vinyl acetate 5 250 5 - 1 5 20 50 100 200 300 10 Vinyl chloride 1 50 5 - 1 5 20 50 100 200 300 10
* If the Optional Cal 3 point is made for the Water Curve all subsequent Cal levels will increase by 1 (i.e. 300µg/L is now CAL8)
11.2.2. Calibration Response Factors
Response factors (RF) establish the relationship of the instruments response in comparison with the concentration of any given analyte. The RF includes the concentration and response of the internal standard as well. By relating the IS concentration and response in an inverse manner, the target analyte concentration is adjusted to account for drift in the instrument on a per injection basis. As instrument response increases as indicated by the response of the internal standard, the concentration of the target is mathematically decreased, and vice versa. To calculate the RF for any given calibration standard (or calibration verification standard), tabulate the area response of the characteristic ions against concentration for each compound and each internal standard. Calculate response factors (RF) for each compound relative to one of the internal standards. The internal standard selected for the calculation of the RF for a compound should be the internal standard that has a retention time closest to the compound being measured. Response factors are calculated using the following equation.
xis
isx
CA
CARF
Where: Ax = Area of the characteristic ion for the compound being measured. Ais = Area of the characteristic ion for the specific internal standard. Cis = Concentration of the specific internal standard (µg/L). Cx = Concentration of the compound being measured (µg/L).
Most, if not all modern chromatography data systems are capable of calculating this factor and using it to quantify analyte concentrations. The 8260B method has minimum requirements that these response factors must meet in order to be considered valid. The method uses a subset of the target analyte list to evaluate the performance of the system.
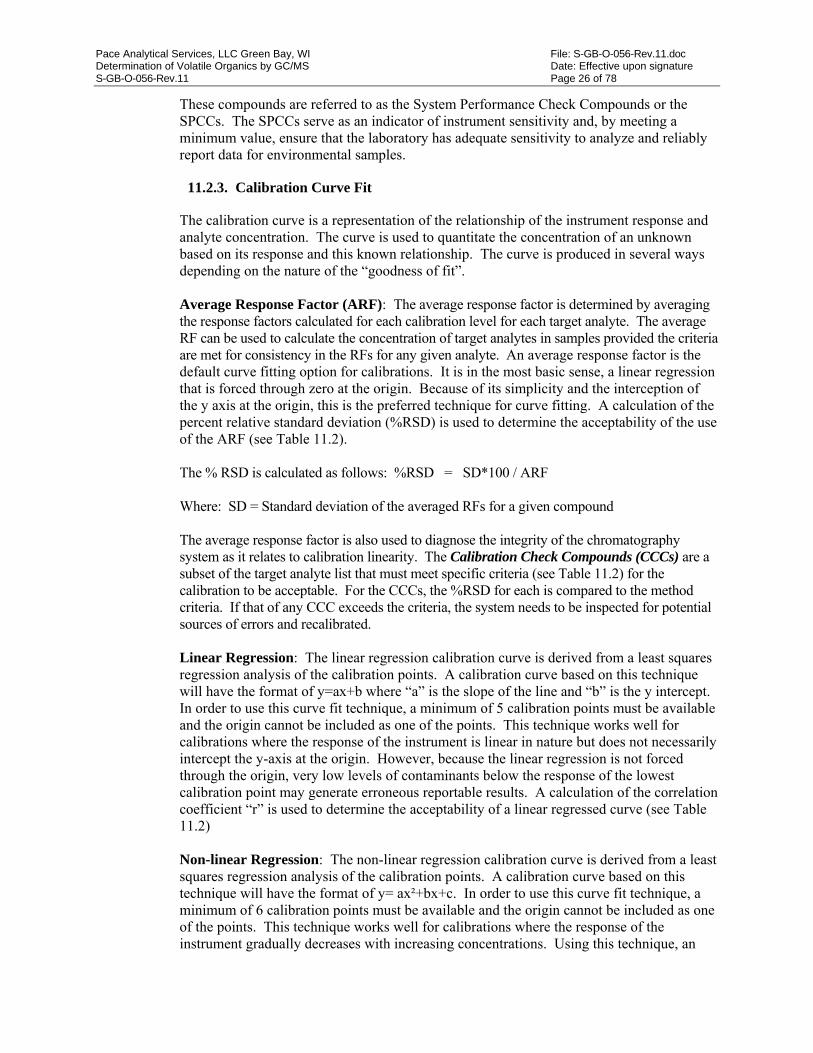
Pace Analytical Services, LLC Green Bay, WI File: S-GB-O-056-Rev.11.doc Determination of Volatile Organics by GC/MS Date: Effective upon signature S-GB-O-056-Rev.11 Page 26 of 78
These compounds are referred to as the System Performance Check Compounds or the SPCCs. The SPCCs serve as an indicator of instrument sensitivity and, by meeting a minimum value, ensure that the laboratory has adequate sensitivity to analyze and reliably report data for environmental samples.
11.2.3. Calibration Curve Fit
The calibration curve is a representation of the relationship of the instrument response and analyte concentration. The curve is used to quantitate the concentration of an unknown based on its response and this known relationship. The curve is produced in several ways depending on the nature of the “goodness of fit”.
Average Response Factor (ARF): The average response factor is determined by averaging the response factors calculated for each calibration level for each target analyte. The average RF can be used to calculate the concentration of target analytes in samples provided the criteria are met for consistency in the RFs for any given analyte. An average response factor is the default curve fitting option for calibrations. It is in the most basic sense, a linear regression that is forced through zero at the origin. Because of its simplicity and the interception of the y axis at the origin, this is the preferred technique for curve fitting. A calculation of the percent relative standard deviation (%RSD) is used to determine the acceptability of the use of the ARF (see Table 11.2).
The % RSD is calculated as follows: %RSD = SD*100 / ARF
Where: SD = Standard deviation of the averaged RFs for a given compound
The average response factor is also used to diagnose the integrity of the chromatography system as it relates to calibration linearity. The Calibration Check Compounds (CCCs) are a subset of the target analyte list that must meet specific criteria (see Table 11.2) for the calibration to be acceptable. For the CCCs, the %RSD for each is compared to the method criteria. If that of any CCC exceeds the criteria, the system needs to be inspected for potential sources of errors and recalibrated.
Linear Regression: The linear regression calibration curve is derived from a least squares regression analysis of the calibration points. A calibration curve based on this technique will have the format of y=ax+b where “a” is the slope of the line and “b” is the y intercept. In order to use this curve fit technique, a minimum of 5 calibration points must be available and the origin cannot be included as one of the points. This technique works well for calibrations where the response of the instrument is linear in nature but does not necessarily intercept the y-axis at the origin. However, because the linear regression is not forced through the origin, very low levels of contaminants below the response of the lowest calibration point may generate erroneous reportable results. A calculation of the correlation coefficient “r” is used to determine the acceptability of a linear regressed curve (see Table 11.2)
Non-linear Regression: The non-linear regression calibration curve is derived from a least squares regression analysis of the calibration points. A calibration curve based on this technique will have the format of y= ax²+bx+c. In order to use this curve fit technique, a minimum of 6 calibration points must be available and the origin cannot be included as one of the points. This technique works well for calibrations where the response of the instrument gradually decreases with increasing concentrations. Using this technique, an
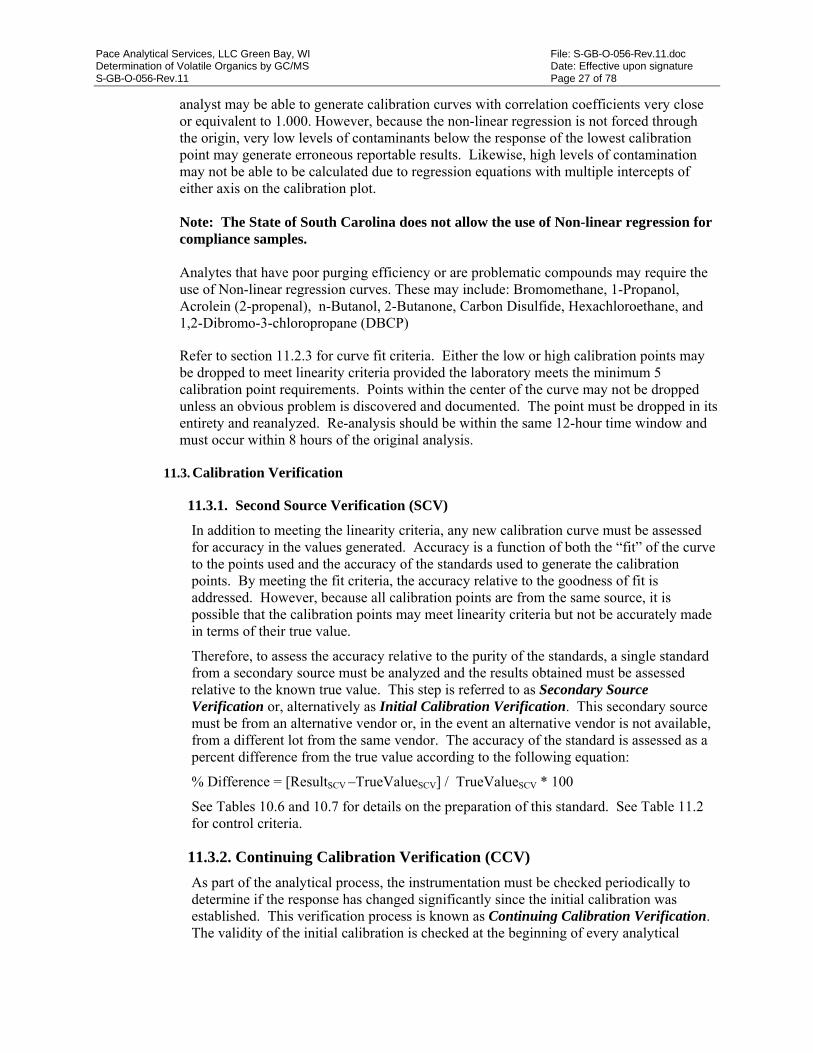
Pace Analytical Services, LLC Green Bay, WI File: S-GB-O-056-Rev.11.doc Determination of Volatile Organics by GC/MS Date: Effective upon signature S-GB-O-056-Rev.11 Page 27 of 78
analyst may be able to generate calibration curves with correlation coefficients very close or equivalent to 1.000. However, because the non-linear regression is not forced through the origin, very low levels of contaminants below the response of the lowest calibration point may generate erroneous reportable results. Likewise, high levels of contamination may not be able to be calculated due to regression equations with multiple intercepts of either axis on the calibration plot. Note: The State of South Carolina does not allow the use of Non-linear regression for compliance samples. Analytes that have poor purging efficiency or are problematic compounds may require the use of Non-linear regression curves. These may include: Bromomethane, 1-Propanol, Acrolein (2-propenal), n-Butanol, 2-Butanone, Carbon Disulfide, Hexachloroethane, and 1,2-Dibromo-3-chloropropane (DBCP)
Refer to section 11.2.3 for curve fit criteria. Either the low or high calibration points may be dropped to meet linearity criteria provided the laboratory meets the minimum 5 calibration point requirements. Points within the center of the curve may not be dropped unless an obvious problem is discovered and documented. The point must be dropped in its entirety and reanalyzed. Re-analysis should be within the same 12-hour time window and must occur within 8 hours of the original analysis.
11.3. Calibration Verification
11.3.1. Second Source Verification (SCV)
In addition to meeting the linearity criteria, any new calibration curve must be assessed for accuracy in the values generated. Accuracy is a function of both the “fit” of the curve to the points used and the accuracy of the standards used to generate the calibration points. By meeting the fit criteria, the accuracy relative to the goodness of fit is addressed. However, because all calibration points are from the same source, it is possible that the calibration points may meet linearity criteria but not be accurately made in terms of their true value.
Therefore, to assess the accuracy relative to the purity of the standards, a single standard from a secondary source must be analyzed and the results obtained must be assessed relative to the known true value. This step is referred to as Secondary Source Verification or, alternatively as Initial Calibration Verification. This secondary source must be from an alternative vendor or, in the event an alternative vendor is not available, from a different lot from the same vendor. The accuracy of the standard is assessed as a percent difference from the true value according to the following equation:
% Difference = [ResultSCV –TrueValueSCV] / TrueValueSCV * 100
See Tables 10.6 and 10.7 for details on the preparation of this standard. See Table 11.2 for control criteria.
11.3.2. Continuing Calibration Verification (CCV)
As part of the analytical process, the instrumentation must be checked periodically to determine if the response has changed significantly since the initial calibration was established. This verification process is known as Continuing Calibration Verification. The validity of the initial calibration is checked at the beginning of every analytical
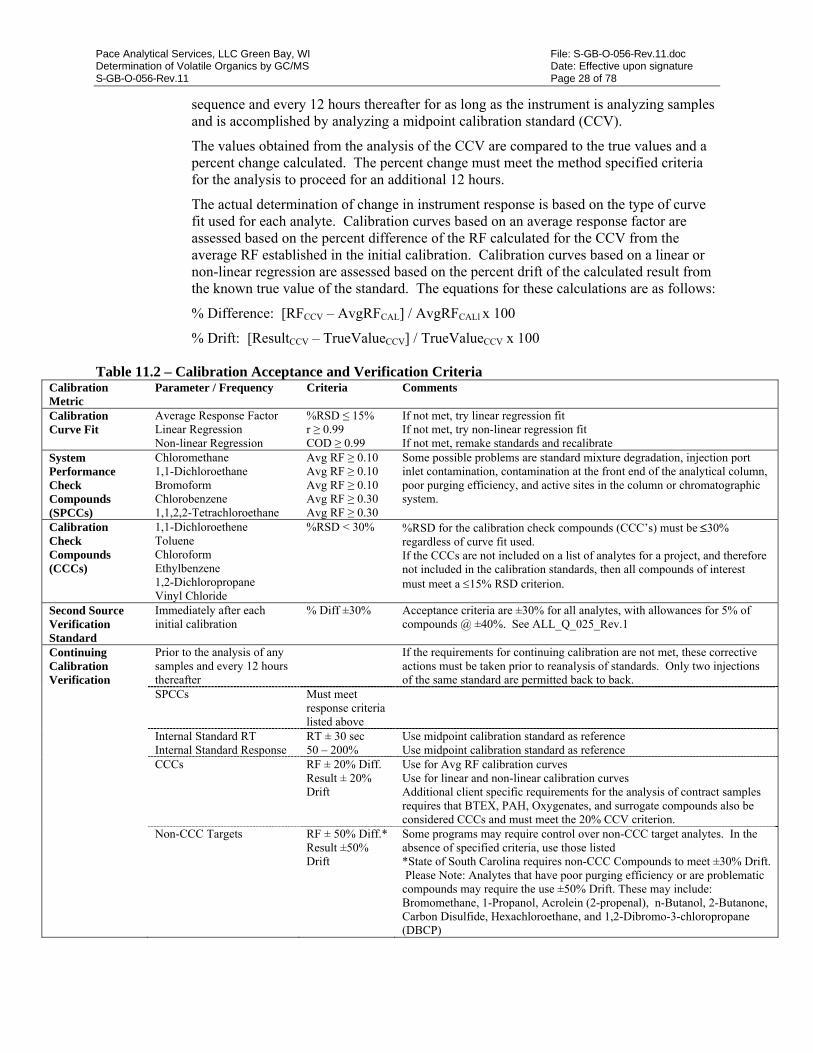
Pace Analytical Services, LLC Green Bay, WI File: S-GB-O-056-Rev.11.doc Determination of Volatile Organics by GC/MS Date: Effective upon signature S-GB-O-056-Rev.11 Page 28 of 78
sequence and every 12 hours thereafter for as long as the instrument is analyzing samples and is accomplished by analyzing a midpoint calibration standard (CCV).
The values obtained from the analysis of the CCV are compared to the true values and a percent change calculated. The percent change must meet the method specified criteria for the analysis to proceed for an additional 12 hours.
The actual determination of change in instrument response is based on the type of curve fit used for each analyte. Calibration curves based on an average response factor are assessed based on the percent difference of the RF calculated for the CCV from the average RF established in the initial calibration. Calibration curves based on a linear or non-linear regression are assessed based on the percent drift of the calculated result from the known true value of the standard. The equations for these calculations are as follows:
% Difference: [RFCCV – AvgRFCAL] / AvgRFCALl x 100
% Drift: [ResultCCV – TrueValueCCV] / TrueValueCCV x 100 Table 11.2 – Calibration Acceptance and Verification Criteria
Calibration Metric
Parameter / Frequency Criteria Comments
Calibration Curve Fit
Average Response Factor Linear Regression Non-linear Regression
%RSD ≤ 15% r ≥ 0.99 COD ≥ 0.99
If not met, try linear regression fit If not met, try non-linear regression fit If not met, remake standards and recalibrate
System Performance Check Compounds (SPCCs)
Chloromethane 1,1-Dichloroethane Bromoform Chlorobenzene 1,1,2,2-Tetrachloroethane
Avg RF ≥ 0.10 Avg RF ≥ 0.10 Avg RF ≥ 0.10 Avg RF ≥ 0.30 Avg RF ≥ 0.30
Some possible problems are standard mixture degradation, injection port inlet contamination, contamination at the front end of the analytical column, poor purging efficiency, and active sites in the column or chromatographic system.
Calibration Check Compounds (CCCs)
1,1-Dichloroethene Toluene Chloroform Ethylbenzene 1,2-Dichloropropane Vinyl Chloride
%RSD < 30% %RSD for the calibration check compounds (CCC’s) must be 30% regardless of curve fit used. If the CCCs are not included on a list of analytes for a project, and therefore not included in the calibration standards, then all compounds of interest must meet a 15% RSD criterion.
Second Source Verification Standard
Immediately after each initial calibration
% Diff ±30% Acceptance criteria are ±30% for all analytes, with allowances for 5% of compounds @ ±40%. See ALL_Q_025_Rev.1
Continuing Calibration Verification
Prior to the analysis of any samples and every 12 hours thereafter
If the requirements for continuing calibration are not met, these corrective actions must be taken prior to reanalysis of standards. Only two injections of the same standard are permitted back to back.
SPCCs
Must meet response criteria listed above
Internal Standard RT Internal Standard Response
RT ± 30 sec 50 – 200%
Use midpoint calibration standard as reference Use midpoint calibration standard as reference
CCCs RF ± 20% Diff. Result ± 20% Drift
Use for Avg RF calibration curves Use for linear and non-linear calibration curves Additional client specific requirements for the analysis of contract samples requires that BTEX, PAH, Oxygenates, and surrogate compounds also be considered CCCs and must meet the 20% CCV criterion.
Non-CCC Targets RF ± 50% Diff.* Result ±50% Drift
Some programs may require control over non-CCC target analytes. In the absence of specified criteria, use those listed *State of South Carolina requires non-CCC Compounds to meet ±30% Drift. Please Note: Analytes that have poor purging efficiency or are problematic compounds may require the use ±50% Drift. These may include: Bromomethane, 1-Propanol, Acrolein (2-propenal), n-Butanol, 2-Butanone, Carbon Disulfide, Hexachloroethane, and 1,2-Dibromo-3-chloropropane (DBCP)

Pace Analytical Services, LLC Green Bay, WI File: S-GB-O-056-Rev.11.doc Determination of Volatile Organics by GC/MS Date: Effective upon signature S-GB-O-056-Rev.11 Page 29 of 78
11.4. Calibration Corrective Actions
11.4.1. Calibration Linearity Problems
11.4.1.1. Check instrumentation/equipment condition.
11.4.1.2. Enter maintenance in instrument maintenance logbook.
11.4.1.3. Perform another initial calibration.
11.4.1.4. No data can be reported.
11.4.1.5. Generate on Non-Conformance Memo.
11.4.2. Secondary Verification Problems
11.4.2.1. Check instrumentation/equipment condition.
11.4.2.2. Enter maintenance in instrument maintenance logbook.
11.4.2.3. Perform another initial calibration.
11.4.2.4. No data can be reported.
11.4.2.5. Generate on Non-Conformance Memo
11.4.3. Continuing Verification Problems
11.4.3.1. Reanalyze the original CCV standard to determine instrument consistency.
11.4.3.2. Prepare and analyze a new CCV standard to determine preparation consistency / standard integrity.
11.4.3.3. Document instrument maintenance
11.4.3.4. Reanalyze CCV standard to determine if maintenance was effective in restoring performance.
11.4.3.5. Complete recalibration of instrument.
11.4.3.6. If samples were analyzed in spite of verification failures, note the following exceptions for addressing those results. Deviations from this requirement must be noted on the injection log with a thorough explanation for the deviation from policy.
Exceptions: If calibration verification is above the upper control limit, samples non-detected for those analytes may be reported without reanalysis.
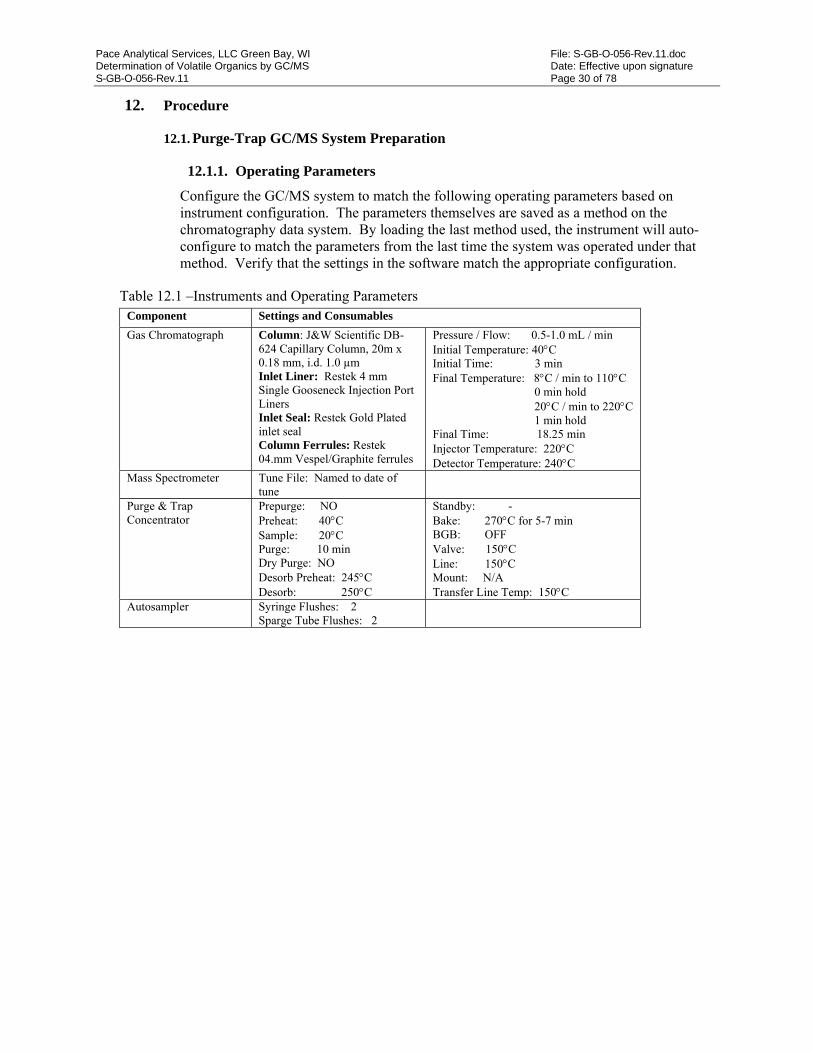
Pace Analytical Services, LLC Green Bay, WI File: S-GB-O-056-Rev.11.doc Determination of Volatile Organics by GC/MS Date: Effective upon signature S-GB-O-056-Rev.11 Page 30 of 78
12. Procedure
12.1. Purge-Trap GC/MS System Preparation
12.1.1. Operating Parameters
Configure the GC/MS system to match the following operating parameters based on instrument configuration. The parameters themselves are saved as a method on the chromatography data system. By loading the last method used, the instrument will auto-configure to match the parameters from the last time the system was operated under that method. Verify that the settings in the software match the appropriate configuration.
Table 12.1 –Instruments and Operating Parameters Component Settings and Consumables
Gas Chromatograph Column: J&W Scientific DB-624 Capillary Column, 20m x 0.18 mm, i.d. 1.0 µm Inlet Liner: Restek 4 mm Single Gooseneck Injection Port Liners Inlet Seal: Restek Gold Plated inlet seal Column Ferrules: Restek 04.mm Vespel/Graphite ferrules
Pressure / Flow: 0.5-1.0 mL / min Initial Temperature: 40C Initial Time: 3 min Final Temperature: 8C / min to 110C 0 min hold 20C / min to 220C 1 min hold Final Time: 18.25 min Injector Temperature: 220C Detector Temperature: 240C
Mass Spectrometer Tune File: Named to date of tune
Purge & Trap Concentrator
Prepurge: NO Preheat: 40C Sample: 20C Purge: 10 min Dry Purge: NO Desorb Preheat: 245C Desorb: 250C
Standby: - Bake: 270C for 5-7 min BGB: OFF Valve: 150C Line: 150C Mount: N/A Transfer Line Temp: 150C
Autosampler Syringe Flushes: 2 Sparge Tube Flushes: 2
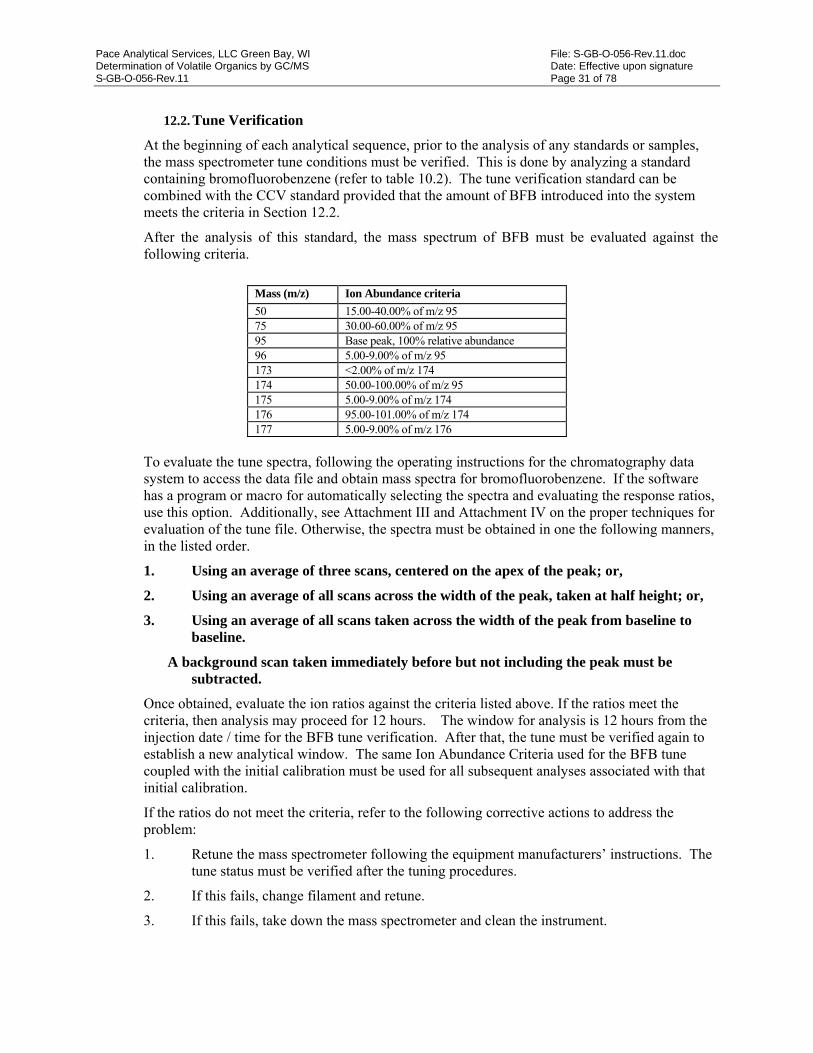
Pace Analytical Services, LLC Green Bay, WI File: S-GB-O-056-Rev.11.doc Determination of Volatile Organics by GC/MS Date: Effective upon signature S-GB-O-056-Rev.11 Page 31 of 78
12.2. Tune Verification
At the beginning of each analytical sequence, prior to the analysis of any standards or samples, the mass spectrometer tune conditions must be verified. This is done by analyzing a standard containing bromofluorobenzene (refer to table 10.2). The tune verification standard can be combined with the CCV standard provided that the amount of BFB introduced into the system meets the criteria in Section 12.2.
After the analysis of this standard, the mass spectrum of BFB must be evaluated against the following criteria.
Mass (m/z) Ion Abundance criteria
50 15.00-40.00% of m/z 95 75 30.00-60.00% of m/z 95 95 Base peak, 100% relative abundance 96 5.00-9.00% of m/z 95 173 <2.00% of m/z 174 174 50.00-100.00% of m/z 95 175 5.00-9.00% of m/z 174 176 95.00-101.00% of m/z 174 177 5.00-9.00% of m/z 176
To evaluate the tune spectra, following the operating instructions for the chromatography data system to access the data file and obtain mass spectra for bromofluorobenzene. If the software has a program or macro for automatically selecting the spectra and evaluating the response ratios, use this option. Additionally, see Attachment III and Attachment IV on the proper techniques for evaluation of the tune file. Otherwise, the spectra must be obtained in one the following manners, in the listed order.
1. Using an average of three scans, centered on the apex of the peak; or,
2. Using an average of all scans across the width of the peak, taken at half height; or,
3. Using an average of all scans taken across the width of the peak from baseline to baseline.
A background scan taken immediately before but not including the peak must be subtracted.
Once obtained, evaluate the ion ratios against the criteria listed above. If the ratios meet the criteria, then analysis may proceed for 12 hours. The window for analysis is 12 hours from the injection date / time for the BFB tune verification. After that, the tune must be verified again to establish a new analytical window. The same Ion Abundance Criteria used for the BFB tune coupled with the initial calibration must be used for all subsequent analyses associated with that initial calibration.
If the ratios do not meet the criteria, refer to the following corrective actions to address the problem:
1. Retune the mass spectrometer following the equipment manufacturers’ instructions. The tune status must be verified after the tuning procedures.
2. If this fails, change filament and retune.
3. If this fails, take down the mass spectrometer and clean the instrument.
Pace Analytical Services, LLC Green Bay, WI File: S-GB-O-056-Rev.11.doc Determination of Volatile Organics by GC/MS Date: Effective upon signature S-GB-O-056-Rev.11 Page 32 of 78
12.3. Calibration Verification
After the instrument tune conditions are verified and the system meets tune criteria, the instrument must undergo calibration verification. If it has already been determined that the instrument needs to be recalibrated, follow the procedures listed in section 11.2 (Analysis of Standards). Otherwise, analyze a Continuing Calibration Verification Standard to determine the current calibration status.
If the CCV meets control criteria, the system is deemed to be in control and analysis of samples may commence. If the CCV does not meet control criteria, follow the corrective action procedures listed section 11.4.3 (Continuing Verification Problems). If the tune verification has been combined with the CCV, the 12 hour analysis window begins from the analysis date / time of the CCV.
Note: In situations where the instrument will run unattended (i.e. overnight), the analyst may load sequential CCVs in anticipation of that the first in the series may fail due to carry over from a previous sample. If so, the CCV must be evaluated according to the protocol set forth in the Quality Assurance Manual within Section 6 – Equipment and Measurement Traceability.
12.4. Operation of the Software Systems
12.4.1. Epic Pro
12.4.1.1. Make Q-Batch 12.4.1.1.1. Batching -> New Batch -> Queue = MSV 12.4.1.1.2. Click Empty Batch icon on taskbar 12.4.1.1.3. Highlight QC Rule -> F9 -> type MSV 12.4.1.1.4. Select appropriate QC Rule (i.e. MSV water) – Select OK – F10 to
save 12.4.1.1.5. Record Q Batch #
12.4.1.2. Create Standards 12.4.1.2.1. System -> Utility -> Clone Standard by Event 12.4.1.2.2. Select Event (111 = MeOH soil curve, 115 = Water/LLsoil curve)
Select OK 12.4.1.2.3. Double Click on standard event 12.4.1.2.4. Review Standard composed of – Find/Replace if necessary 12.4.1.2.5. Update expiration date to 7 days from creation – F10 to Save 12.4.1.2.6. Operations -> Standard Log -> Enter – Record Standard #’s
12.4.2. Chemstation
12.4.2.1. Create Chemstation methods 12.4.2.1.1. Tune MS, Save Tune file as date (i.e. 072513.u) 12.4.2.1.2. Update both DBFB and Curve method to use new tune file
12.4.2.1.3. Save Curve method as date (i.e. W072513.m) 12.4.2.2. Set up Sequence
12.4.2.2.1. Load pre-existing curve sequence if available 12.4.2.2.2. Change old method to the new method & copy through all files
Pace Analytical Services, LLC Green Bay, WI File: S-GB-O-056-Rev.11.doc Determination of Volatile Organics by GC/MS Date: Effective upon signature S-GB-O-056-Rev.11 Page 33 of 78
(DBFB remains the same) 12.4.2.2.3. Change Q-Batch # in BFB, Curve and ICV files
12.4.2.3. Start Analysis 12.4.2.3.1. Run minimum of 2 BFB injections to ensure the tune is optimized 12.4.2.3.2. Retune or adjust as needed, repeat 2 more BFB 12.4.2.3.3. Analyze a 2 blanks to verify the system is clean and IS areas within
range 12.4.2.3.4. First IS, pentafluorobenzene should be between 300,000 – 550,000
area counts 12.4.2.3.5. Raise or lower EM as necessary – You Must reanalyze BFB if
voltage was adjusted
12.4.2.3.6. Reanalyze blanks to ensure correct voltage and proceed w/ analysis of curve
12.4.3. Target 12.4.3.1. Create Method
12.4.3.1.1. Rename existing method to new name matching Chemstation method (i.e. W072513.m)
Note: if other data in Directory was processed w/ old method a copy of that method must remain in directory as well.
12.4.3.1.2. To avoid excessive file size, Audit trail in method should be reset at a minimum of annually The ONLY time an audit trail may be rest is prior to calibrating the instrument. Note: The Audit trail will remain intact in previous day’s folder. Double click into method folder, highlight the .audit file and delete
12.4.3.2. Edit Method 12.4.3.2.1. Security -> Method unlocked 12.4.3.2.2. Global -> Calibration – Click “update Curve Parameters” to averaged 12.4.3.2.3. File -> Zero Calibration 12.4.3.2.4. Compound -> Edit Compound -> Calibration
12.4.3.2.4.1. Review all analytes to ensure all necessary points are enabled 12.4.3.2.4.2. Are any 300 points dropped? If so, mark them enabled and make
note of these to change the “Max Compound Amount Limit” after the curve has been run.
12.4.3.2.5. Reports -> Tabular -> “Print Custom Report” – click “Select Format” 12.4.3.2.5.1. On toolbar a “Select” icon will appear 12.4.3.2.5.2. Click on ManIntprepostRev.mac – click “Open”
Note: It is necessary to do this Every time a calibration is zeroed, even if the macro shows up in this field as the link to the macro that was lost when the calibration was zeroed.
12.4.3.2.6. Sample -> Default Sample 12.4.3.2.6.1. Change “Lab Prep Batch” field to the new Q-Batch # 12.4.3.2.6.2. Change “Client SDG” to be the instrument and date (i.e.
40MSV2-07252013) 12.4.3.2.7. Sample -> Surrogate/ISTD Parameter
12.4.3.2.7.1. Confirm that the correct IS/SS standard # is entered in the “Surrogate Lot#” field
Pace Analytical Services, LLC Green Bay, WI File: S-GB-O-056-Rev.11.doc Determination of Volatile Organics by GC/MS Date: Effective upon signature S-GB-O-056-Rev.11 Page 34 of 78
12.4.3.2.7.2. Example - 51970:1.163 The 51970 is the IS/SS number followed by a colon followed by the volume added (this is a fixed amount unless change to the standard delivery has occurred.)
12.4.3.2.8. File -> Save Method 12.4.3.2.9. File -> Exit
12.4.3.3. Process and Review Curve Data 12.4.3.3.1. If significant Column maintenance was performed, it may be
beneficial to process the 20 or 50 point first to update RT’s as the larger concentrations will have better spectra to confirm correct identification
12.4.3.3.2. Select Method to calibrate and process files 12.4.3.3.2.1. Compound Sublist should be “all.sub” 12.4.3.3.2.2. Sample Type change to Calib Sample 12.4.3.3.2.3. Cal Level change to appropriate level 1-7 12.4.3.3.2.4. Double check that the Q-Batch # in MiscInfo and Lab Prep
Batch are correct and match 12.4.3.3.2.5. Double check that the Client SDG reflects the instrument and
date 12.4.3.3.3. Review Target Data
12.4.3.3.3.1. Review each analyte of all points for correct spectrum, RT and appropriate integration
12.4.3.3.3.2. All Manual Integration of all curve points and ICV need to have Review Codes added
12.4.3.3.3.3. After reviewing all points, review each analyte point 1 -> 7 to ensure consistent RT, spectra and Integration (i.e. shoulders cropped or included, etc.)
12.4.3.4. Review Curve in Target Method 12.4.3.4.1. Edit Method 12.4.3.4.2. Edit Compound -> Calibration 12.4.3.4.3. Review each analyte to ensure Initial Calibration % RSD are less than
15.0% 12.4.3.4.3.1. Note analytes > 15% and re-examine target data for proper
integration 12.4.3.4.4. Check that all CCC compounds are less than 30% RSD
12.4.3.4.4.1. CCC’s are 11DCE, chloroform, 12DiChloropropane, toluene, ethylbenzene and vinyl chloride
12.4.3.4.4.2. Instrument maintenance must be performed to correct problem if any >30%
12.4.3.4.4.3. If RSD >15% and <30% note %RSD to record later 12.4.3.4.5. Check that all minimum relative response factors (RRF) were met for
the SPCC – Chloromethane, 11DCE, bromoform are 0.1 and 1122PCA, chlorobenzene are 0.3 – if any %RSD >15 not RRF to record later
12.4.3.4.6. If %RSD >15% - Drop Upper or lower point to achieve %RSD <15 12.4.3.4.6.1. If the Report Limit (RL) for analyte is not the 1 point, can the 1
point be disabled 12.4.3.4.6.2. Can the 7 point be dropped (or 6&7 points) - ** Will require
lowering Max Amount Note: ONLY upper or lower points can be dropped, Never an intermediate point!!
12.4.3.4.6.3. Must have minimum of 5 points for Averaged RF curve 12.4.3.4.6.4. After disabling appropriate points – Click “Update Calibration”
button
Pace Analytical Services, LLC Green Bay, WI File: S-GB-O-056-Rev.11.doc Determination of Volatile Organics by GC/MS Date: Effective upon signature S-GB-O-056-Rev.11 Page 35 of 78
12.4.3.4.7. Is %RSD still >15 – Switch Curve fit to Linear Regression 12.4.3.4.7.1. Change curve fit to Linear 12.4.3.4.7.2. **CCC Compounds (11DCE, chloroform, 12dichloropropane,
toluene, ethylbenzene, vinyl chloride) MUST still be <30% RSD. 12.4.3.4.7.3. Initial Calibration R^2 must be 0.990 or greater 12.4.3.4.7.4. Must have minimum of 5 points for Linear regression curve 12.4.3.4.7.5. b intercept should be as close to zero as possible
12.4.3.4.7.5.1. i.e. by dropping the 300 point does the intercept go from 0.1980442 -> 0.0681234
12.4.3.4.7.5.2. This will give less false positive hits but require linear range to be lowered to 2000 µg/L
12.4.3.4.8. If R^2 is not >0.990 12.4.3.4.8.1. Change curve fit to Quadratic 12.4.3.4.8.2. *Must have minimum of 6 points 12.4.3.4.8.3. R^2 must be 0.990 or greater 12.4.3.4.8.4. Like Linear regression the 300 point can be dropped (or 1 point
added if RL is 5 µg/L) to achieve the intercept closest to zero, as long as 6 points remain and linear range is adjusted.
12.4.3.4.9. If calibration for compound will not pass 12.4.3.4.9.1. The instrument cannot be run for lists including these analytes 12.4.3.4.9.2. Document analytes as failing in Run logbook 12.4.3.4.9.3. Place Post-It-Note on Instrument Terminal to alert other analysts
of failures 12.4.3.5. Update Linear Range
12.4.3.5.1. After all analyte curve fits have been checked 12.4.3.5.1.1. Compound ->Edit Compound -> Report Parms 12.4.3.5.1.2. Adjust “Max Compound Amt Limits” to reflect highest point
used (300->200 if 7th point was dropped) 12.4.3.5.2. Sublists -> Update Sublists
12.4.3.5.2.1. Check the “Update Sublists QC Limits” box 12.4.3.5.2.2. Highlight first sublist and hit Enter button 12.4.3.5.2.3. Arrow down to the next sublist and hit Enter 12.4.3.5.2.4. Repeat for all Sublists 12.4.3.5.2.5. **If you fail to update all the sublists, detects above linear range
will not be “a” flagged in target. 12.4.3.5.2.5.1. EpicPro used the “a” flag to switch Condition Code from
“OK” to “OR” 12.4.3.6. Lock Method
12.4.3.6.1. Security -> Initial Calibration Locked 12.4.3.6.2. Note: Do not select “Method Locked” – This would not allow the
method to be used to process data 12.4.3.7. Verify Initial Calibration
12.4.3.7.1. View -> Initial Calibration 12.4.3.7.2. This generates a report with calibration data that will appear on the
lower tool bar 12.4.3.7.3. Print report and review
12.4.3.7.3.1. The Calibration File Names in the header match the correct files used in the curve
12.4.3.7.3.2. All Average Response Factors < 15% and at least 5 points were included
12.4.3.7.3.3. All Linear Regression >0.990 and at least 5 points were included
Pace Analytical Services, LLC Green Bay, WI File: S-GB-O-056-Rev.11.doc Determination of Volatile Organics by GC/MS Date: Effective upon signature S-GB-O-056-Rev.11 Page 36 of 78
12.4.3.7.3.4. All Quadratic > 0.990 and at least 6 points were included 12.4.3.7.3.5. Are all low points dropped below Report Limit for that analyte 12.4.3.7.3.6. Any high points dropped verify that the Max on Column was
lowered and Record max amount on the report 12.4.3.7.3.7. No midpoints of curve are missing 12.4.3.7.3.8. All CCC compounds averaged – If not is the %RSD < 30% -
Record actual RSD on report 12.4.3.7.3.9. All SPCC minimum RF factors met – If not averaged, switch to
Averaged in method record the RF on the report and switch curve back to appropriate curve fit
12.4.3.7.4. Manually check individual Response Factors (RF) for at least one analyte
12.4.3.7.4.1. Calculation the RF for each point in the curve of an Averaged curve fit using the following formula
12.4.3.7.4.1.1. RF = (Area of analyte*concentration of IS) / (Area of IS * concentration of analyte)
12.4.3.7.5. Save method and Exit 12.4.3.8. Re-quantify and Uploading Curve and ICV
12.4.3.8.1. Select Method 12.4.3.8.2. Highlight Curve and re-quantitate 12.4.3.8.3. Process ICV – Must use all.sub (or Full.sub) 12.4.3.8.4. Review ICV and check CLP.rp
12.4.3.8.4.1. All SPCC Minimum RF must be met (if analyte is linear, must hand calculate)
12.4.3.8.4.2. All CCC Analytes must be <20% 12.4.3.8.4.3. All other analytes must be <30%
Note: Up to 5% (5 Analytes for a full list spike) may be between 30-40%)
12.4.3.8.4.4. All Analytes >40% will be flagged as failing 12.4.3.8.4.4.1. Document analytes as failing in Run logbook 12.4.3.8.4.4.2. Place Post-It-Note on Instrument Terminal to alert other
analysts of failures 12.4.3.8.5. Generate all files to paperless (BFB, Curve and ICV) 12.4.3.8.6. Upload all files to EpicPro (double check Q-Batch is correct prior to
upload) 12.4.3.8.7. Check Q-Batch in Epic to ensure Curve, BFB, and ICV imported
correctly (may take several minutes) 12.4.3.9. MN Low Standard Verification
12.4.3.9.1. Copy 1ppb, 5ppb, & 20ppb files into another folder (i.e. the unprocessed blank following 300ppb)
12.4.3.9.2. Paste all 3 files than Rename (example 07251305.D -> MN01-07251305.D)
12.4.3.9.2.1. This will allow original files to be un-manipulated 12.4.3.9.3. Cut files and paste back in original folder 12.4.3.9.4. Re-Quant new MN files as LCS
12.4.3.9.4.1. Sample Type = QC Control Sample 12.4.3.9.4.2. Click QC Sample Type
12.4.3.9.4.2.1. Sample Type = LCS 12.4.3.9.4.2.2. Spike List = MNLOW1.spk, MNLOW5.spk,
MNLOW20.spk 12.4.3.9.5. Highlight all 3 files and Do Quick Forms – Form 3 of LCS
Pace Analytical Services, LLC Green Bay, WI File: S-GB-O-056-Rev.11.doc Determination of Volatile Organics by GC/MS Date: Effective upon signature S-GB-O-056-Rev.11 Page 37 of 78
12.4.3.9.6. Print Form 3.s and pass on to Supervisor to update MN report limits in EpicPro
12.4.3.10. Before proceeding with analysis of samples 12.4.3.10.1. Check Chemstation sequence that correct Q-Batch is in BFB and
CCC 12.4.3.10.2. Check that correct Method is referenced in the sequence
12.5. Sample Preparation
12.5.1. Samples
12.5.1.1. Sample Pre-screening
12.5.1.1.1. Samples are pre-screened using a rapid GC headspace technique. See SOP S-GB-O-001 Sample Screening Volatile Organics Prior to Preparation (most current revision or replacement) for the specifics on the pre-screening of samples.
12.5.1.2. Water Samples
After pre-screening, water samples typically do not require any sample preparation unless they require a dilution to bring high-level contaminants within calibration range or to minimize matrix interference. Dilutions are made following Section 12.5.1.5.1.
After analysis check the residue in the vial following analysis using pH paper. The pH should be <2. Document results in the run sequence log as <2 or >2. Footnote any sample not meeting the pH requirement. If dilutions are required, pH preservation can be verified at the time the dilution is made using the sample remaining in the original sample container.
12.5.1.3. Soil Samples
12.5.1.3.1. Low concentration soils
Samples received for low level analysis should be contained in pre-weighed VOA vials either with or without Reverse Osmosis Water (ROW) and/or sodium bisulfate preservative. NOTE: some samples may be received in coring devices (e.g. Encore, etc.). These samples must be extruded into a VOA vial either with or without ROW and/or sodium bisulfate and a magnetic stir bar within 48 hours of sample collection. If samples are received that are greater than 10g the PM must be notified and samples will be rejected for analysis.
12.5.1.3.1.1. Weight determination: Prior to preparation or analysis of any soil received in a pre-weighed VOA vial, the sample weight must be determined and recorded. Accurately weigh the VOA vial to 0.01 g in the laboratory; record this amount in the sample preparation logbook. Subtract the tare weight recorded on the vial and 0.18g for each Pace Sample label that was affixed to the pre-tared vial; this will be the weight of sample in the vial.
12.5.1.3.1.2. Samples received pre-weighed in the field must be in 40 mL VOA vials and contain a magnetic stir bar, acid preservative and a
Pace Analytical Services, LLC Green Bay, WI File: S-GB-O-056-Rev.11.doc Determination of Volatile Organics by GC/MS Date: Effective upon signature S-GB-O-056-Rev.11 Page 38 of 78
field tare weight. The analyst will compare the field tare weight to the weight of the sample before analysis. The weight of the sample should be recorded.
12.5.1.3.1.3. All samples must be extruded from the coring devices within 48 hrs. of collection. If the samples are to also be analyzed within the 48 hr criteria, no acid preservation is required. If analysis is to occur after 48 hrs. but within 14 days, the samples must be preserved with Sodium Bisulfate or if preserved with ROW, stored frozen. The ratio of Sodium Bisulfate to sample weight is 0.2g of preservative to 1g of sample.
12.5.1.3.2. High concentration soils
12.5.1.3.2.1. Methanol-Preserved Samples: Samples received in pre-weighed vials preserved with methanol must be accurately weighed in the laboratory to 0.01 g and the sample weight determined. See Section 12.5.1.4.2.1.2. Subtract the tare weight written on the VOA vial and 0.18g for each Pace Sample label that was affixed to the pre-tared vial from the weight determined in the laboratory. This will be the weight of sample in the VOA vial. The volume of methanol in the sample container should be at a 1 to 1 ratio of soil to methanol.
12.5.1.3.2.1.1. Calculation of 1:1 ratio soil (g) to MeOH (mL).
To calculate the amount of soil weight (g) in the sample can be calculated as follows:
Where:
WS = WT-WJ - ( N *Wl )
Ws = Weight of soil in the sample (g) Wt = Total weight of the sample including vial, cap, soil, and MeOH (g) WJ = Weight of the jar including the vial, cap, and MeOH (g) N = Number of Pace Sample labels Wl = Weight of Pace Sample label affixed to the pre-tared 40mL VOA vial; which has been determined to be 0.18g To calculate volume of MeOH to achieve the 1:1 ratio of soil weight (g) to MeOH (mL) may be calculated as follows: Where:
VM = WS – 10mL
VM = Volume of MeOH required to achieve 1:1 ratio of soil (g):MeOH (mL) WS = Weight of soil in the sample (g) 10 = Volume of MeOH initially added (mL)
Pace Analytical Services, LLC Green Bay, WI File: S-GB-O-056-Rev.11.doc Determination of Volatile Organics by GC/MS Date: Effective upon signature S-GB-O-056-Rev.11 Page 39 of 78
12.5.1.3.2.2. Unpreserved Samples: Samples received in unpreserved pre-weighed vials must be accurately weighed in the laboratory to 0.01 g. NOTE: some samples may be collected and transported to the laboratory in bulk containers. An accurately weighed ≥5 gram sub-sample must be taken and added to a 40mL VOA vial. The non-compliant sample collection technique must be recorded in the preparation logbook and a qualifier added to the sample result. The samples are then preserved with 10 mL methanol within 48 hours of sample collection. To determine the sample weight: subtract the weight written on the VOA vial from the weight determined in the laboratory prior to the addition of the 10 mL methanol preservative. This will be the weight of sample in the VOA vial.
12.5.1.3.2.3. The balance is to be leveled before calibration. Calibration verification of the analytical balance is done with S-class weights. These values are to be noted in the Balance calibration logbook. The frequency of balance calibration verification is once per day before the balance is used or when the balance is moved.
12.5.1.4. Dilutions
12.5.1.4.1. Water
Dilutions on aqueous samples must be prepared in a volumetric fashion. Sample aliquots may be measured in either a volumetric pipette or syringe and brought to volume in a volumetric flask.
12.5.1.4.1.1. All steps must be performed without delays until the diluted sample is in a 40 mL VOA Vial.
12.5.1.4.1.2. Dilutions are made in gastight 50mL syringes.
12.5.1.4.1.3. Calculate the approximate volume of organic-free reverse osmosis water (ROW) added to the syringe and add slightly less than this quantity of ROW to the syringe barrel.
12.5.1.4.1.4. Inject the proper aliquot of sample using the appropriate 10µL to 5mL syringes to create the desired dilution in the 50 mL syringe. Dilute the sample to the mark with ROW. Invert, and rock back and forth three times. Repeat the above procedure for additional dilutions.
12.5.1.4.1.5. Fill a 40mL VOA vial with the diluted sample from the 50 mL syringe prepared in Section 12.5.1.5.1.4.
12.5.1.4.1.6. Place the VOA vial on the autosampler. All dilutions should keep the response of a major constituent (previously saturated peaks) in the upper half of the linear range of the curve.
12.5.1.4.1.7. The autosampler will add the internal standard and surrogate to the sample and transfer 5 mL over to the 5 mL sparge tube on the concentrator.
12.5.1.4.2. Soil
12.5.1.4.2.1. Low Level Soils
12.5.1.4.2.1.1. It will be necessary to adjust the sample weight for
Pace Analytical Services, LLC Green Bay, WI File: S-GB-O-056-Rev.11.doc Determination of Volatile Organics by GC/MS Date: Effective upon signature S-GB-O-056-Rev.11 Page 40 of 78
quantitation purposes. Any analyte hits outside of the calibration range, 200 µg/kg, will be extracted into Methanol and analyzed under High Concentration Sample criteria.
12.5.1.4.2.2. High Concentration Soils
12.5.1.4.2.2.1. Dilute all samples according to the results of the screening data. A standard analytical dilution is 1:50. Add 1.0 mL of the sample extract measured with a microsyringe of appropriate volume to 49 mL of reverse osmosis water in a 50 mL syringe.
12.5.1.4.2.2.2. To make dilutions other than a standard 1:50 dilution, fill a 50 mL syringe to a volume of 49 mL with reverse osmosis water. Using a 1.0 mL syringe, inject methanol into the 50 mL syringe to bring the total volume of sample and methanol to equal 1.0 mL. Using an appropriate volume syringe, inject the sufficient amount of sample to reach desired dilution. Invert, and rock back and forth three times.
12.5.1.4.2.2.3. The 50 mL syringe contents are place into a 40 mL VOC vial by slowly deploying the plunger and injecting on the side of the vial to eliminate cavitation and loss of analytes to volatilization or sparging. Enough of the contents are injected to created a meniscus at the top of the vial that when capped will produce a no headspace sample.
12.5.1.4.2.2.4. The vial is capped and checked for headspace. If vial is free of headspace, it is ready for analysis as per Section 14.
12.5.2. Batch QC
Refer to Table 13.1 for details on Batch QC requirements.
12.5.2.1. Method Blank
12.5.2.1.1. Water
12.5.2.1.1.1. Fill a 40mL VOA vial with reverse osmosis water (ROW) and place in autosampler rack. The autosampler will add the internal standard and surrogate to the sample and transfer 5mL over to the 5mL sparge tube on the concentrator.
12.5.2.1.1.2. When leach samples are present, one leach blank must be analyzed with the analytical batch in addition to the method blank.
12.5.2.1.2. Low Level Soil
12.5.2.1.2.1. A method blank is prepared with 5 mL of ROW into a 40 mL VOA vial containing a disposable magnetic stir bar. The vial is placed onto the autosampler and the autosampler will add the internal standard and surrogate to the sample. The blank is preheated to 40C and purged. The method blank must be analyzed under the same criteria as the samples.
12.5.2.1.3. High Concentration Soil
12.5.2.1.3.1. The method blank (extraction blank) is made by adding 10 L of
Pace Analytical Services, LLC Green Bay, WI File: S-GB-O-056-Rev.11.doc Determination of Volatile Organics by GC/MS Date: Effective upon signature S-GB-O-056-Rev.11 Page 41 of 78
the 2500 ppm surrogate standard in 10 mL methanol placed in a 40 mL VOA vial containing 10g of Ottawa sand. A 1.0 mL portion of this is diluted with 49 mL of ROW for a final concentration on the instrument of 50 µg/L.
12.5.2.2. Laboratory Control Sample/Laboratory Control Sample Duplicate
12.5.2.2.1. See Table 10.7 for spiking procedures and Table 13.1 for Batch Quality Control Criteria.
12.5.2.2.2. A Laboratory Control Sample Duplicate is required when sample volume for the Matrix Spike/Matrix Spike Duplicate is not received.
12.5.2.2.3. When EPA 624 samples are present with SW846 8260B samples, one LCS/D at 20 µg/L and one LCS/D at 50 µg/L must be analyzed to meet each method requirement. If the 20µg/L LCS/D is valid, the additional 50 µg/L LCS/D pair is not required.
12.5.2.3. MS/MSD Samples
12.5.2.3.1. See Table 10.7 for spiking procedures and Table 13.1 for Batch Quality Control Criteria..
12.5.2.3.2. When one to 20 EPA 624 samples are present one MS/MSD pair should be analyzed for every 20 samples (or one spiked sample per month) at a concentration of 20µg/L.
12.5.2.3.3. When Leach samples are analyzed, one MS must be analyzed per each sample matrix submitted for leaching.
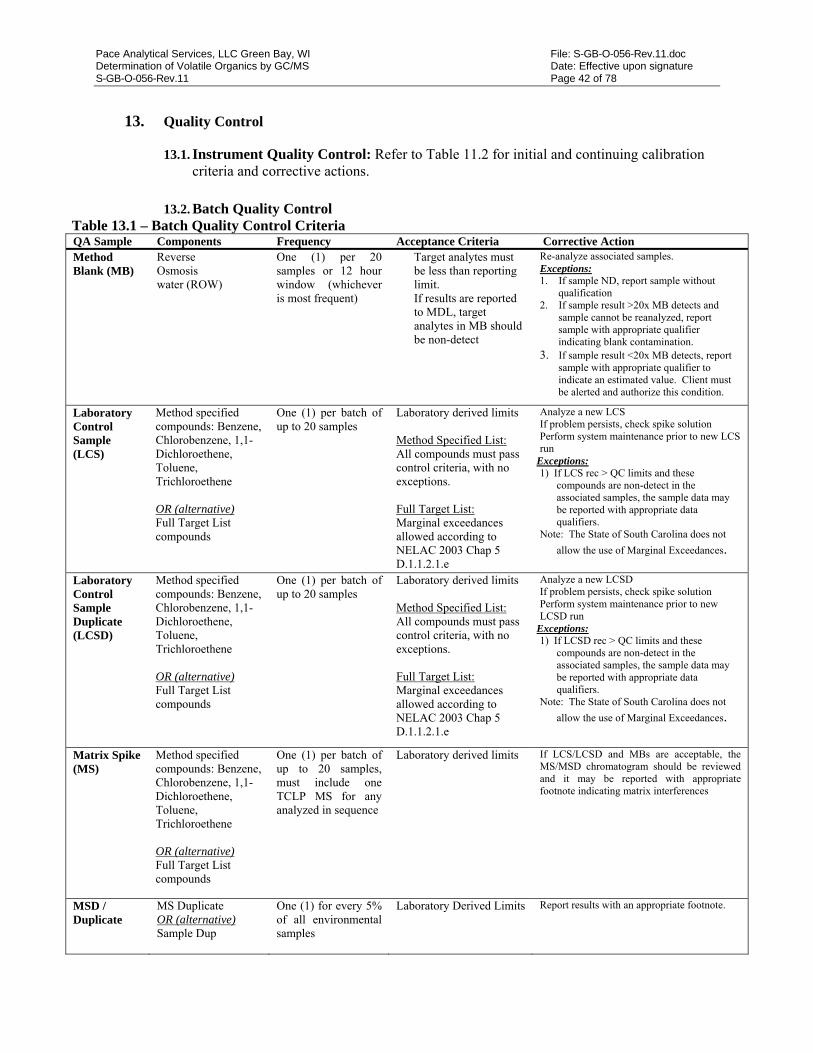
Pace Analytical Services, LLC Green Bay, WI File: S-GB-O-056-Rev.11.doc Determination of Volatile Organics by GC/MS Date: Effective upon signature S-GB-O-056-Rev.11 Page 42 of 78
13. Quality Control
13.1. Instrument Quality Control: Refer to Table 11.2 for initial and continuing calibration criteria and corrective actions.
13.2. Batch Quality Control
Table 13.1 – Batch Quality Control Criteria QA Sample Components Frequency Acceptance Criteria Corrective Action Method Blank (MB)
Reverse Osmosis water (ROW)
One (1) per 20 samples or 12 hour window (whichever is most frequent)
Target analytes must be less than reporting limit. If results are reported to MDL, target analytes in MB should be non-detect
Re-analyze associated samples. Exceptions: 1. If sample ND, report sample without
qualification 2. If sample result >20x MB detects and
sample cannot be reanalyzed, report sample with appropriate qualifier indicating blank contamination.
3. If sample result <20x MB detects, report sample with appropriate qualifier to indicate an estimated value. Client must be alerted and authorize this condition.
Laboratory Control Sample (LCS)
Method specified compounds: Benzene, Chlorobenzene, 1,1-Dichloroethene, Toluene, Trichloroethene OR (alternative) Full Target List compounds
One (1) per batch of up to 20 samples
Laboratory derived limits Method Specified List: All compounds must pass control criteria, with no exceptions. Full Target List: Marginal exceedances allowed according to NELAC 2003 Chap 5 D.1.1.2.1.e
Analyze a new LCS If problem persists, check spike solution Perform system maintenance prior to new LCS run
Exceptions: 1) If LCS rec > QC limits and these
compounds are non-detect in the associated samples, the sample data may be reported with appropriate data qualifiers.
Note: The State of South Carolina does not
allow the use of Marginal Exceedances.
Laboratory Control Sample Duplicate (LCSD)
Method specified compounds: Benzene, Chlorobenzene, 1,1-Dichloroethene, Toluene, Trichloroethene OR (alternative) Full Target List compounds
One (1) per batch of up to 20 samples
Laboratory derived limits Method Specified List: All compounds must pass control criteria, with no exceptions. Full Target List: Marginal exceedances allowed according to NELAC 2003 Chap 5 D.1.1.2.1.e
Analyze a new LCSD If problem persists, check spike solution Perform system maintenance prior to new LCSD run
Exceptions: 1) If LCSD rec > QC limits and these
compounds are non-detect in the associated samples, the sample data may be reported with appropriate data qualifiers.
Note: The State of South Carolina does not
allow the use of Marginal Exceedances.
Matrix Spike (MS)
Method specified compounds: Benzene, Chlorobenzene, 1,1-Dichloroethene, Toluene, Trichloroethene OR (alternative) Full Target List compounds
One (1) per batch of up to 20 samples, must include one TCLP MS for any analyzed in sequence
Laboratory derived limits If LCS/LCSD and MBs are acceptable, the MS/MSD chromatogram should be reviewed and it may be reported with appropriate footnote indicating matrix interferences
MSD / Duplicate
MS Duplicate OR (alternative) Sample Dup
One (1) for every 5% of all environmental samples
Laboratory Derived Limits Report results with an appropriate footnote.
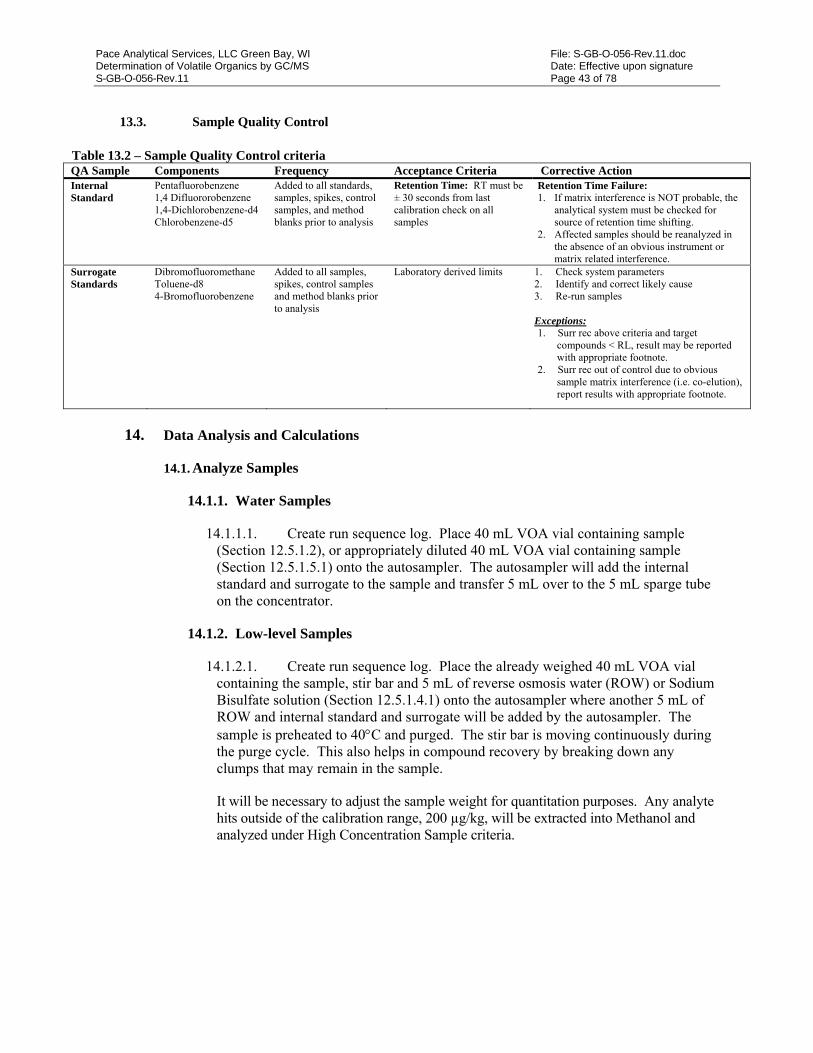
Pace Analytical Services, LLC Green Bay, WI File: S-GB-O-056-Rev.11.doc Determination of Volatile Organics by GC/MS Date: Effective upon signature S-GB-O-056-Rev.11 Page 43 of 78
13.3. Sample Quality Control
Table 13.2 – Sample Quality Control criteria QA Sample Components Frequency Acceptance Criteria Corrective Action Internal Standard
Pentafluorobenzene 1,4 Difluororobenzene 1,4-Dichlorobenzene-d4 Chlorobenzene-d5
Added to all standards, samples, spikes, control samples, and method blanks prior to analysis
Retention Time: RT must be ± 30 seconds from last calibration check on all samples
Retention Time Failure: 1. If matrix interference is NOT probable, the
analytical system must be checked for source of retention time shifting.
2. Affected samples should be reanalyzed in the absence of an obvious instrument or matrix related interference.
Surrogate Standards
Dibromofluoromethane Toluene-d8 4-Bromofluorobenzene
Added to all samples, spikes, control samples and method blanks prior to analysis
Laboratory derived limits
1. Check system parameters 2. Identify and correct likely cause 3. Re-run samples Exceptions: 1. Surr rec above criteria and target
compounds < RL, result may be reported with appropriate footnote.
2. Surr rec out of control due to obvious sample matrix interference (i.e. co-elution), report results with appropriate footnote.
14. Data Analysis and Calculations
14.1. Analyze Samples
14.1.1. Water Samples
14.1.1.1. Create run sequence log. Place 40 mL VOA vial containing sample (Section 12.5.1.2), or appropriately diluted 40 mL VOA vial containing sample (Section 12.5.1.5.1) onto the autosampler. The autosampler will add the internal standard and surrogate to the sample and transfer 5 mL over to the 5 mL sparge tube on the concentrator.
14.1.2. Low-level Samples
14.1.2.1. Create run sequence log. Place the already weighed 40 mL VOA vial containing the sample, stir bar and 5 mL of reverse osmosis water (ROW) or Sodium Bisulfate solution (Section 12.5.1.4.1) onto the autosampler where another 5 mL of ROW and internal standard and surrogate will be added by the autosampler. The sample is preheated to 40C and purged. The stir bar is moving continuously during the purge cycle. This also helps in compound recovery by breaking down any clumps that may remain in the sample.
It will be necessary to adjust the sample weight for quantitation purposes. Any analyte hits outside of the calibration range, 200 µg/kg, will be extracted into Methanol and analyzed under High Concentration Sample criteria.
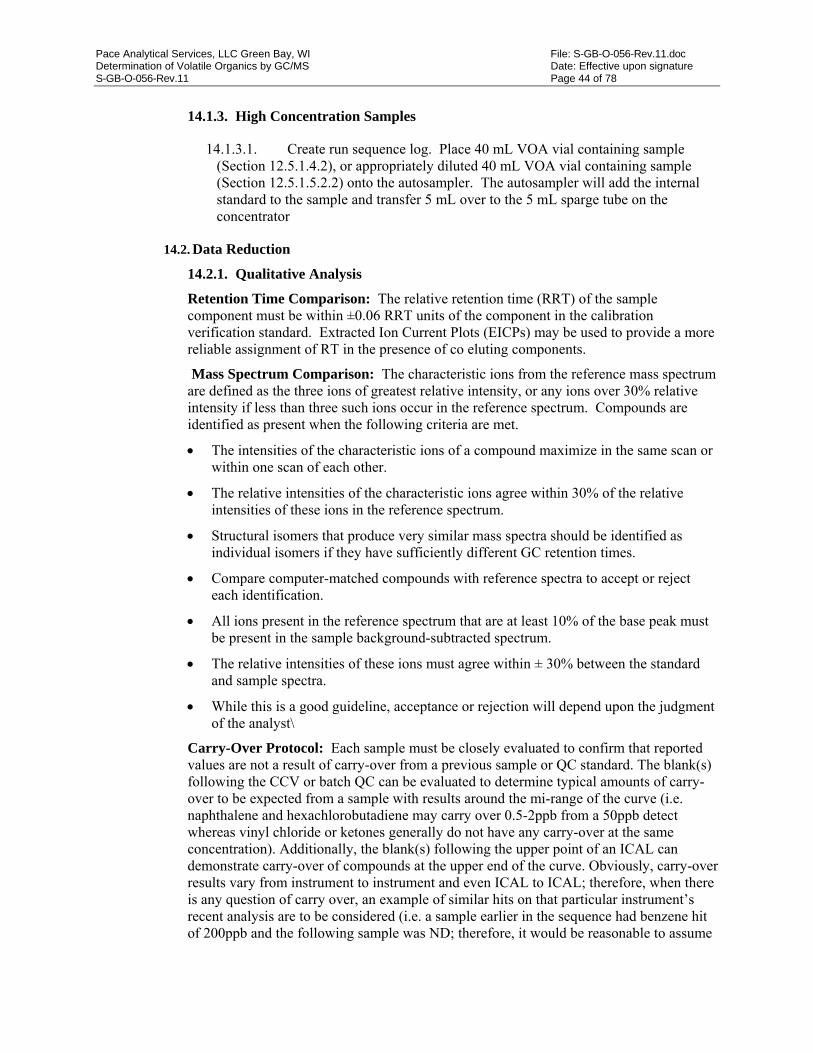
Pace Analytical Services, LLC Green Bay, WI File: S-GB-O-056-Rev.11.doc Determination of Volatile Organics by GC/MS Date: Effective upon signature S-GB-O-056-Rev.11 Page 44 of 78
14.1.3. High Concentration Samples
14.1.3.1. Create run sequence log. Place 40 mL VOA vial containing sample (Section 12.5.1.4.2), or appropriately diluted 40 mL VOA vial containing sample (Section 12.5.1.5.2.2) onto the autosampler. The autosampler will add the internal standard to the sample and transfer 5 mL over to the 5 mL sparge tube on the concentrator
14.2. Data Reduction
14.2.1. Qualitative Analysis
Retention Time Comparison: The relative retention time (RRT) of the sample component must be within ±0.06 RRT units of the component in the calibration verification standard. Extracted Ion Current Plots (EICPs) may be used to provide a more reliable assignment of RT in the presence of co eluting components.
Mass Spectrum Comparison: The characteristic ions from the reference mass spectrum are defined as the three ions of greatest relative intensity, or any ions over 30% relative intensity if less than three such ions occur in the reference spectrum. Compounds are identified as present when the following criteria are met.
The intensities of the characteristic ions of a compound maximize in the same scan or within one scan of each other.
The relative intensities of the characteristic ions agree within 30% of the relative intensities of these ions in the reference spectrum.
Structural isomers that produce very similar mass spectra should be identified as individual isomers if they have sufficiently different GC retention times.
Compare computer-matched compounds with reference spectra to accept or reject each identification.
All ions present in the reference spectrum that are at least 10% of the base peak must be present in the sample background-subtracted spectrum.
The relative intensities of these ions must agree within ± 30% between the standard and sample spectra.
While this is a good guideline, acceptance or rejection will depend upon the judgment of the analyst\
Carry-Over Protocol: Each sample must be closely evaluated to confirm that reported values are not a result of carry-over from a previous sample or QC standard. The blank(s) following the CCV or batch QC can be evaluated to determine typical amounts of carry-over to be expected from a sample with results around the mi-range of the curve (i.e. naphthalene and hexachlorobutadiene may carry over 0.5-2ppb from a 50ppb detect whereas vinyl chloride or ketones generally do not have any carry-over at the same concentration). Additionally, the blank(s) following the upper point of an ICAL can demonstrate carry-over of compounds at the upper end of the curve. Obviously, carry-over results vary from instrument to instrument and even ICAL to ICAL; therefore, when there is any question of carry over, an example of similar hits on that particular instrument’s recent analysis are to be considered (i.e. a sample earlier in the sequence had benzene hit of 200ppb and the following sample was ND; therefore, it would be reasonable to assume
Pace Analytical Services, LLC Green Bay, WI File: S-GB-O-056-Rev.11.doc Determination of Volatile Organics by GC/MS Date: Effective upon signature S-GB-O-056-Rev.11 Page 45 of 78
that a benzene detect of 1.5ppb following a sample containing 100ppb of benzene was not a result of carry-over). Every possible attempt to avoid carry-over contamination in clients’ samples will be taken. This may include running instrument clean up blanks following standards that are known to carry-over or following samples that are known to have high concentrations of contaminants, or attempting to run groups of similarly concentrated samples together instead of intermittently through a sequence. When highly contaminated samples are grouped together it is to be expected that a percentage of a reported value may result from carry-over, in this case the significance of carry-over compared to reported value must be considered (i.e. a hit of PCE typically may carry-over 0.5ppb from a sample with an on-column concentration of 100ppb; therefore, a sample with concentration of 70ppb following a sample with a concentration 100ppb may contain roughly 0.5ppb of PCE resulting from carry-over which should be deemed insignificant). Similar to rules concerning Method Blank contamination, if the reported result is greater than 20 times the expected carry-over concentration, the resulting carry-over should be considered insignificant and value acceptable to report.
14.3. Quantitative Analysis – Quantitation is based on the integrated abundance of the target analyte’s quantitation ion using the internal standard technique.
Raw Data Results: The GC/MS data system will calculate the concentration of each analyte as µg/L (or ng/mL). For water samples, no further calculations are necessary unless a dilution of the sample has been performed. If the initial analysis of the sample or a dilution of the sample has a concentration that exceeds the calibration range, the sample must be analyzed at a higher dilution. All dilutions should keep the response of the major constituents in the upper half of the linear range of the curve.

Pace Analytical Services, LLC Green Bay, WI File: S-GB-O-056-Rev.11.doc Determination of Volatile Organics by GC/MS Date: Effective upon signature S-GB-O-056-Rev.11 Page 46 of 78
14.4. Calculation – Aqueous Sample:
ois
sx
VRFA
IA(µg/L)ion Concentrat
Where: Ax= Area of characteristic ion for compound being measured. Is = Amount of internal standard injected (ng). Ais = Area of characteristic ion for the internal standard. RF = Average Relative Response factor for compound being measured. Vo = Volume of water purged (mL), taking into consideration any dilutions made.
14.5. Soil/ Solid calculations:
siis
tsx
WVRFA
VIAHigh =(ug/kg) Conc.
sis
sx
WRFA
IALow =(ug/kg) Conc.
Where: Ax, Is, Ais, RF = Same as in water and water-miscible waste above. Vt = Volume of total extract (mL). Vi = Volume of extract added (mL) for purging. Sv = Volume of diluted extract. Ws= Weight of sample extracted or purged (g). The wet weight or dry weight may be used, depending upon the specific applications of the data.
14.6. Tentatively Identified Compounds (TICs) – For some samples, identification may be desired for non-target compounds. A mass spectral library search may be conducted to attempt assignment of tentative identifications. Only after visual comparison of sample spectra with the nearest library searches may the analyst assign a tentative identification. Use the following guidelines for making tentative identifications.
Relative intensities of major ions in the reference spectrum (ions greater than 10% of the most abundant ion) should be present in the sample spectrum.
The relative intensities of the major ions should agree within ± 20%.
Molecular ions present in the reference spectrum should be present in the sample spectrum.
Ions present in the sample spectrum but not in the reference spectrum should be reviewed for possible background contamination or presence of co-eluting compounds.
Ions present in the reference spectrum but not in the sample spectrum should be reviewed for possible subtraction from the sample spectrum because of background contamination or co-eluting peaks. Data system library reduction programs can sometimes create these discrepancies.
Pace Analytical Services, LLC Green Bay, WI File: S-GB-O-056-Rev.11.doc Determination of Volatile Organics by GC/MS Date: Effective upon signature S-GB-O-056-Rev.11 Page 47 of 78
15. Data Assessment and Acceptance Criteria for Quality Control Measures
15.1. See table in Section 13.
16. Corrective Actions for Out-of-Control Data
16.1. See table in Section 13.
17. Contingencies for Handling Out-of-Control or Unacceptable Data
17.1. If not specifically listed in the table in Section 13, the contingencies are as follows. If there is no additional volume to perform analyses, all data will be reported as final with applicable qualifiers.
18. Method Performance
18.1. Method Detection Limit (MDL) Study: An MDL study must be conducted annually per S-GB-Q-020, Determination of the LOD and LOQ (most current revision or replacement) for each matrix per instrument.
18.2. Demonstration of Capability (DOC): Every analyst who performs this method must first document acceptable accuracy and precision by passing a demonstration of capability study (DOC) per S-ALL-Q-020, Orientation and Training Procedures (most current revision or replacement).
18.2.1. Analysis of four (4) LCS for each matrix the analyst will be performing. The concentration for low level soil and methanol soils should be at the current LCS spike concentration and the recovery is to be within the current LCS QC limits. The concentration for aqueous DOC should be at 20 µg/L and the recovery is to be within the current LCS QC limits.
19. Method Modifications
Method modifications for EPA method 8260B and EPA 624 are as follows:
Modifications should be targeted to improve quality, efficiency or the cost effectiveness of the procedure.
All major modifications to the procedure that may directly affect data quality must be thoroughly documented. A new demonstration of capability and equivalency must be performed and kept on record.
Procedures identified as “Best Practices” by the PACE 3P Program will be incorporated into this document as minimum requirements for Pace laboratories.
If a client fails to provide the method required Matrix Spike/Matrix Spike Duplicate (MS/MSD), the laboratory will analyze a Laboratory Control Spike Duplicate to demonstrate precision. The analytical batch will be qualified with the “M5” data qualifier.
Method modifications for EPA method 5035 is as follows:
The laboratory uses a modification of SW-846 Method 5035 for medium-level volatiles in soil. The laboratory uses 10 grams of soil and 10 mL of methanol whereas the method indicates 5 grams of soil and 5 mL of methanol.
Pace Analytical Services, LLC Green Bay, WI File: S-GB-O-056-Rev.11.doc Determination of Volatile Organics by GC/MS Date: Effective upon signature S-GB-O-056-Rev.11 Page 48 of 78
Note: Samples reported to the State of South Carolina requires the use of 5 grams of soil and 5 mL of methanol.
20. Instrument/Equipment Maintenance 20.1. See current version of SOP: S-GB-Q-008 Preventative, Routine, and Non-routine
Maintenance.
21. Troubleshooting
21.1. See most current version of the Instrument Operations Manual.
22. Safety
22.1. Standards and Reagents: The toxicity and carcinogenicity of standards and reagents used in this method have not been fully defined. Each chemical compound should be treated as a potential health hazard. Reduce exposure by the use of gloves, lab coats and safety glasses. Safety Data Sheets (SDSs) are on file in the laboratory and available to all personnel. Standard solutions should be prepared in a hood whenever possible.
22.2. Samples: Take precautions when handling samples. Samples should always be treated as potentially hazardous “unknowns”. The use of personal protective equipment (gloves, lab coats and safety glasses) is required when handling samples. In the event a sample container must be opened, it is recommended to perform this in a hood whenever possible.
22.3. Equipment: Portions of the analytical instrumentation operate at high temperatures and under positive pressure. Care must be taken to minimize accidents and injuries when working on or with this equipment. Instruments should be turned off or the heated zone temperatures lowered to reduce the risk of thermal burns. Allow adequate time for the equipment to cool prior to working on these specific zones.
The purge and trap concentrator and autosampler use gas under pressure to purge samples and, in some cases, drive the robotic assemblies. These high pressures introduce the risk of injury due to flying glass and other objects should a vessel or line rupture. Safety glasses are highly recommended at all times when working in, on or around these pieces of equipment. Even instrumentation that is not operating may contain portions of the system under pressure.
23. Waste Management
23.1. Procedures for handling waste generated during this analysis are addressed in S-GB-W-001, Waste Handling and Management (most current revision or replacement).
23.2. In order to minimize the amount of waste generated during this procedure, analyst should prepare reagents in an amount which may be used in a reasonable amount of time (i.e. before a reagent expires)
24. Pollution Prevention
24.1. The company wide Chemical Hygiene and Safety Manual contains additional information on pollution prevention.
Pace Analytical Services, LLC Green Bay, WI File: S-GB-O-056-Rev.11.doc Determination of Volatile Organics by GC/MS Date: Effective upon signature S-GB-O-056-Rev.11 Page 49 of 78
25. References
25.1. Pace Quality Assurance Manual- most current version.
25.2. The NELAC Institute (TNI); Volume 1, Module 2, “Quality Systems”- most current version.
25.3. USEPA, SW-846, Method 8260B, “Volatile Organic Compounds by Gas Chromatography/Mass Spectrometry (GC/MS), December 1996.
25.4. USEPA, SW-846, Method 5030B, “Purge and Trap for Aqueous Samples,” December 1996.
25.5. USEPA, SW-846, Method 5035A, “Closed-System Purge-and-Trap and Extraction for Volatile Organics in Soil and Waste Samples,” Draft Revision 1 July 2002.
25.6. USEPA, SW-846, Method 8000B, “Determinative Chromatographic Separations”, December 1996.
26. Tables, Diagrams, Flowcharts, Attachments, Appendices, etc.
26.1. Attachment I: Flow Chart
26.2. Attachment II: Client Specific Requirement Statement
26.3. Attachment III: Master Guide to Passing BFB for Agilent MSD Modes 5970-5973
26.4. Attachment IV: Agilent Document: BFB Tuning for Environmental Analysis: Three Ways to Succeed.
26.5. Attachment V: VOA Calibration Process
26.6. Attachment VI: VOA Calibration Checklist
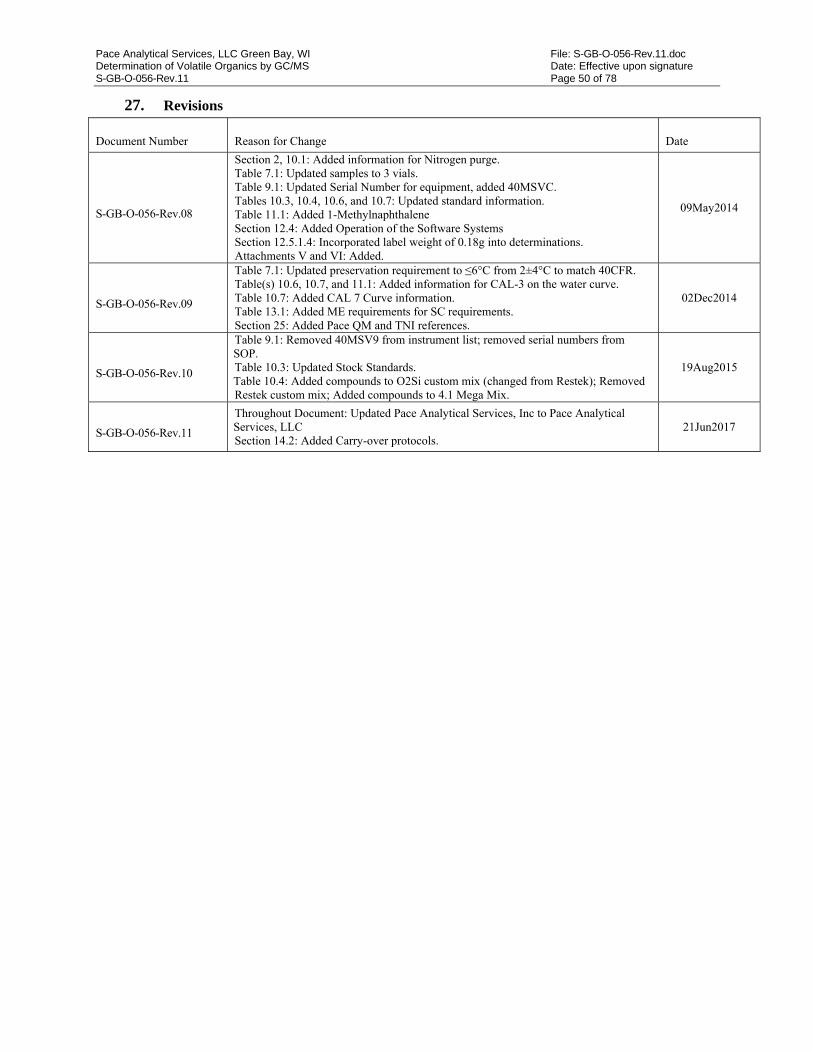
Pace Analytical Services, LLC Green Bay, WI File: S-GB-O-056-Rev.11.doc Determination of Volatile Organics by GC/MS Date: Effective upon signature S-GB-O-056-Rev.11 Page 50 of 78
27. Revisions
Document Number Reason for Change Date
S-GB-O-056-Rev.08
Section 2, 10.1: Added information for Nitrogen purge. Table 7.1: Updated samples to 3 vials. Table 9.1: Updated Serial Number for equipment, added 40MSVC. Tables 10.3, 10.4, 10.6, and 10.7: Updated standard information. Table 11.1: Added 1-Methylnaphthalene Section 12.4: Added Operation of the Software Systems Section 12.5.1.4: Incorporated label weight of 0.18g into determinations. Attachments V and VI: Added.
09May2014
S-GB-O-056-Rev.09
Table 7.1: Updated preservation requirement to ≤6°C from 2±4°C to match 40CFR. Table(s) 10.6, 10.7, and 11.1: Added information for CAL-3 on the water curve. Table 10.7: Added CAL 7 Curve information. Table 13.1: Added ME requirements for SC requirements. Section 25: Added Pace QM and TNI references.
02Dec2014
S-GB-O-056-Rev.10
Table 9.1: Removed 40MSV9 from instrument list; removed serial numbers from SOP. Table 10.3: Updated Stock Standards. Table 10.4: Added compounds to O2Si custom mix (changed from Restek); Removed Restek custom mix; Added compounds to 4.1 Mega Mix.
19Aug2015
S-GB-O-056-Rev.11
Throughout Document: Updated Pace Analytical Services, Inc to Pace Analytical Services, LLC Section 14.2: Added Carry-over protocols.
21Jun2017
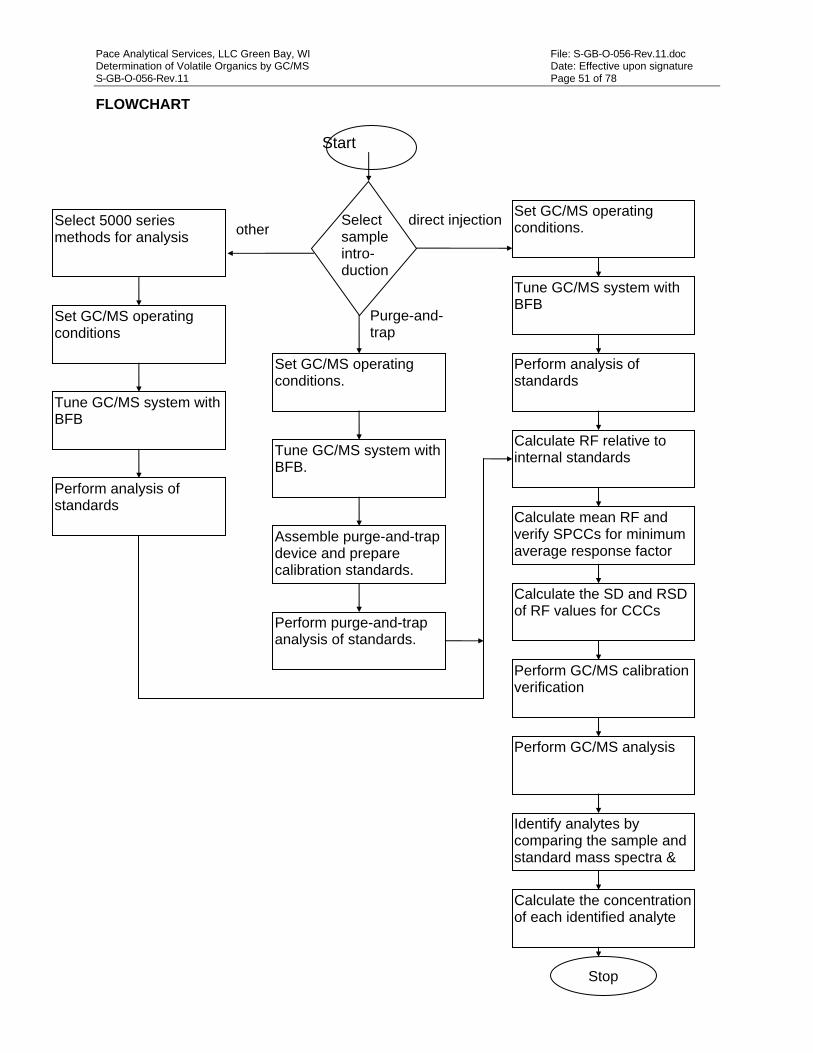
Pace Analytical Services, LLC Green Bay, WI File: S-GB-O-056-Rev.11.doc Determination of Volatile Organics by GC/MS Date: Effective upon signature S-GB-O-056-Rev.11 Page 51 of 78
FLOWCHART
Select 5000 series methods for analysis
Stop
Set GC/MS operating conditions
Tune GC/MS system with BFB
Perform analysis of standards
Select sample intro-duction
Purge-and-trap
Set GC/MS operating conditions.
Tune GC/MS system with BFB.
Assemble purge-and-trap device and prepare calibration standards.
Perform purge-and-trap analysis of standards.
Set GC/MS operating conditions. other
direct injection
Tune GC/MS system with BFB
Perform analysis of standards
Calculate RF relative to internal standards
Calculate mean RF and verify SPCCs for minimum average response factor
it i
Calculate the SD and RSD of RF values for CCCs
Perform GC/MS calibration verification
Perform GC/MS analysis
Identify analytes by comparing the sample and standard mass spectra &
t
Calculate the concentration of each identified analyte
Start
Pace Analytical Services, LLC Green Bay, WI File: S-GB-O-056-Rev.11.doc Determination of Volatile Organics by GC/MS Date: Effective upon signature S-GB-O-056-Rev.11 Page 52 of 78
Attachment II: Throughout document, reference to Client Specific requirements refers to samples analyzed following the BP Technical Requirements LaMP Revision 10.1, Canadian National Railway Services and Technical Specifications Manual.
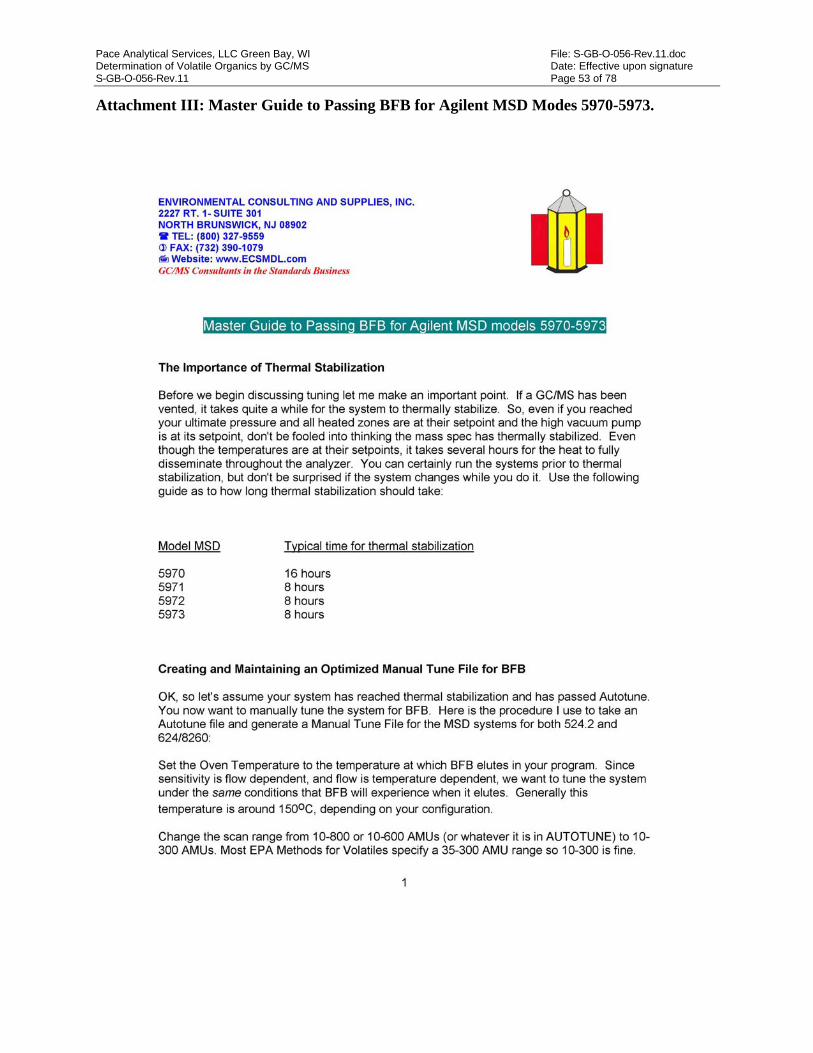
Pace Analytical Services, LLC Green Bay, WI File: S-GB-O-056-Rev.11.doc Determination of Volatile Organics by GC/MS Date: Effective upon signature S-GB-O-056-Rev.11 Page 53 of 78
Attachment III: Master Guide to Passing BFB for Agilent MSD Modes 5970-5973.
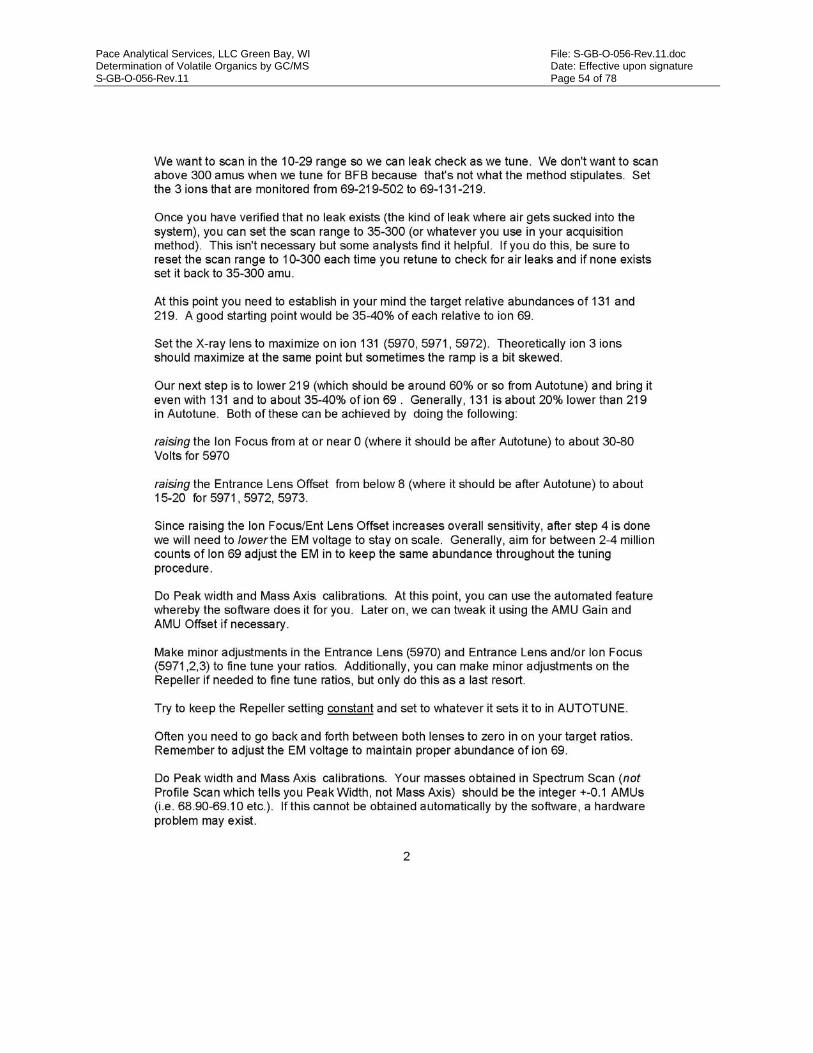
Pace Analytical Services, LLC Green Bay, WI File: S-GB-O-056-Rev.11.doc Determination of Volatile Organics by GC/MS Date: Effective upon signature S-GB-O-056-Rev.11 Page 54 of 78
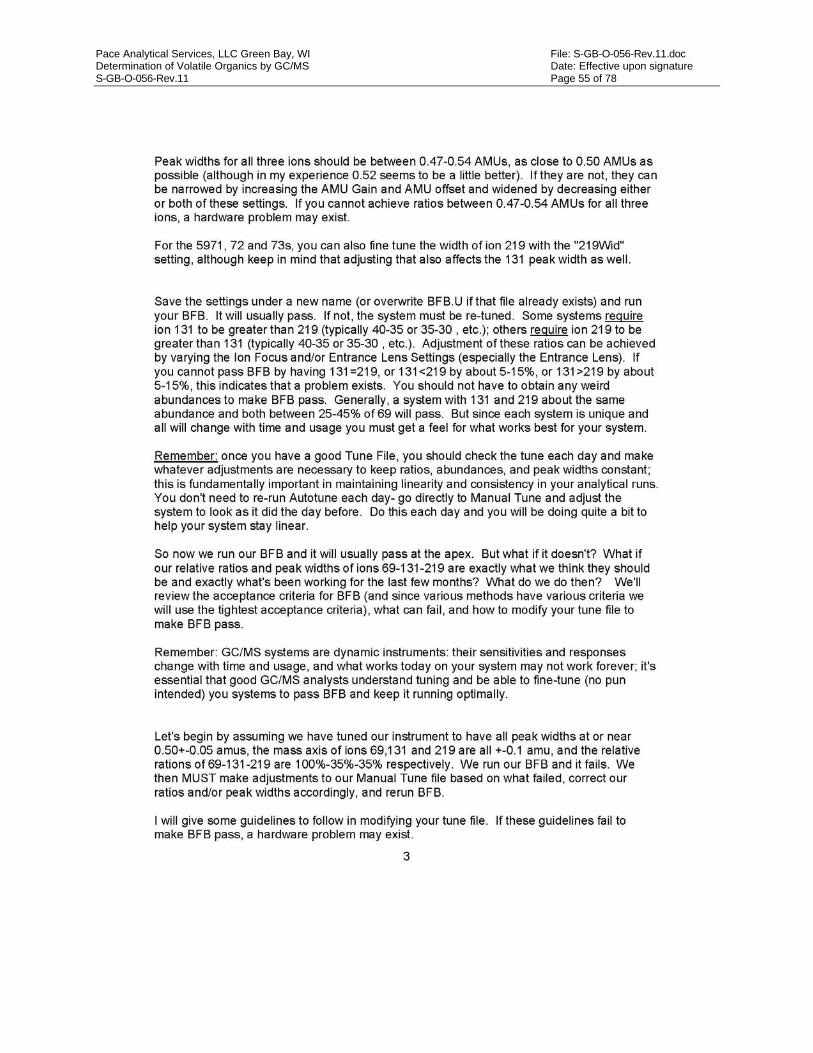
Pace Analytical Services, LLC Green Bay, WI File: S-GB-O-056-Rev.11.doc Determination of Volatile Organics by GC/MS Date: Effective upon signature S-GB-O-056-Rev.11 Page 55 of 78
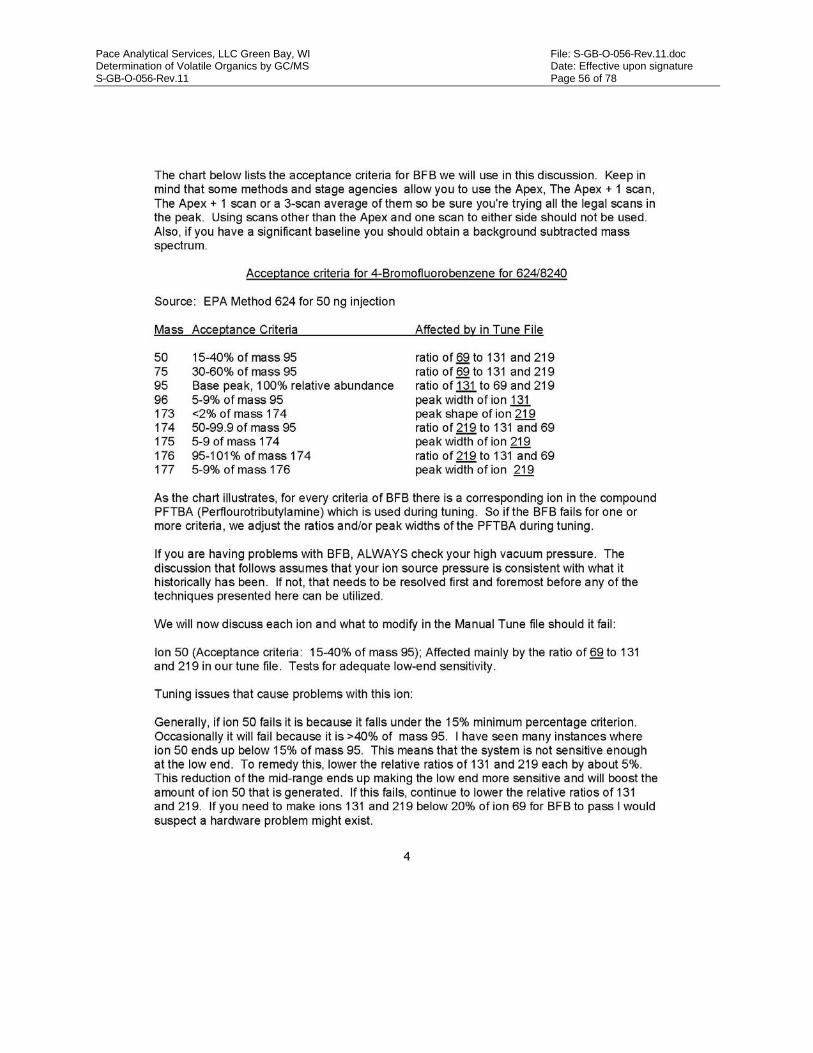
Pace Analytical Services, LLC Green Bay, WI File: S-GB-O-056-Rev.11.doc Determination of Volatile Organics by GC/MS Date: Effective upon signature S-GB-O-056-Rev.11 Page 56 of 78
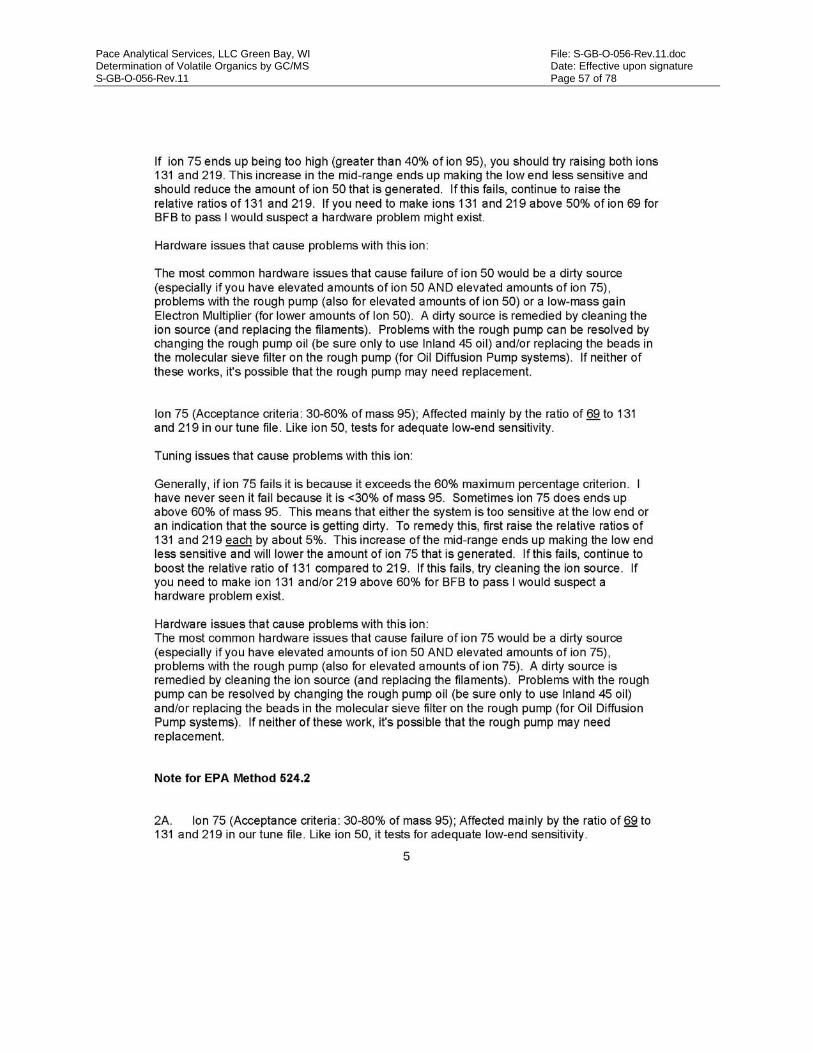
Pace Analytical Services, LLC Green Bay, WI File: S-GB-O-056-Rev.11.doc Determination of Volatile Organics by GC/MS Date: Effective upon signature S-GB-O-056-Rev.11 Page 57 of 78
Pace Analytical Services, LLC Green Bay, WI File: S-GB-O-056-Rev.11.doc Determination of Volatile Organics by GC/MS Date: Effective upon signature S-GB-O-056-Rev.11 Page 58 of 78
Pace Analytical Services, LLC Green Bay, WI File: S-GB-O-056-Rev.11.doc Determination of Volatile Organics by GC/MS Date: Effective upon signature S-GB-O-056-Rev.11 Page 59 of 78
Pace Analytical Services, LLC Green Bay, WI File: S-GB-O-056-Rev.11.doc Determination of Volatile Organics by GC/MS Date: Effective upon signature S-GB-O-056-Rev.11 Page 60 of 78
Pace Analytical Services, LLC Green Bay, WI File: S-GB-O-056-Rev.11.doc Determination of Volatile Organics by GC/MS Date: Effective upon signature S-GB-O-056-Rev.11 Page 61 of 78
Pace Analytical Services, LLC Green Bay, WI File: S-GB-O-056-Rev.11.doc Determination of Volatile Organics by GC/MS Date: Effective upon signature S-GB-O-056-Rev.11 Page 62 of 78
Pace Analytical Services, LLC Green Bay, WI File: S-GB-O-056-Rev.11.doc Determination of Volatile Organics by GC/MS Date: Effective upon signature S-GB-O-056-Rev.11 Page 63 of 78
Attachment IV: Agilent Document: BFB Tuning for Environmental Analysis: Three Ways to Succeed.
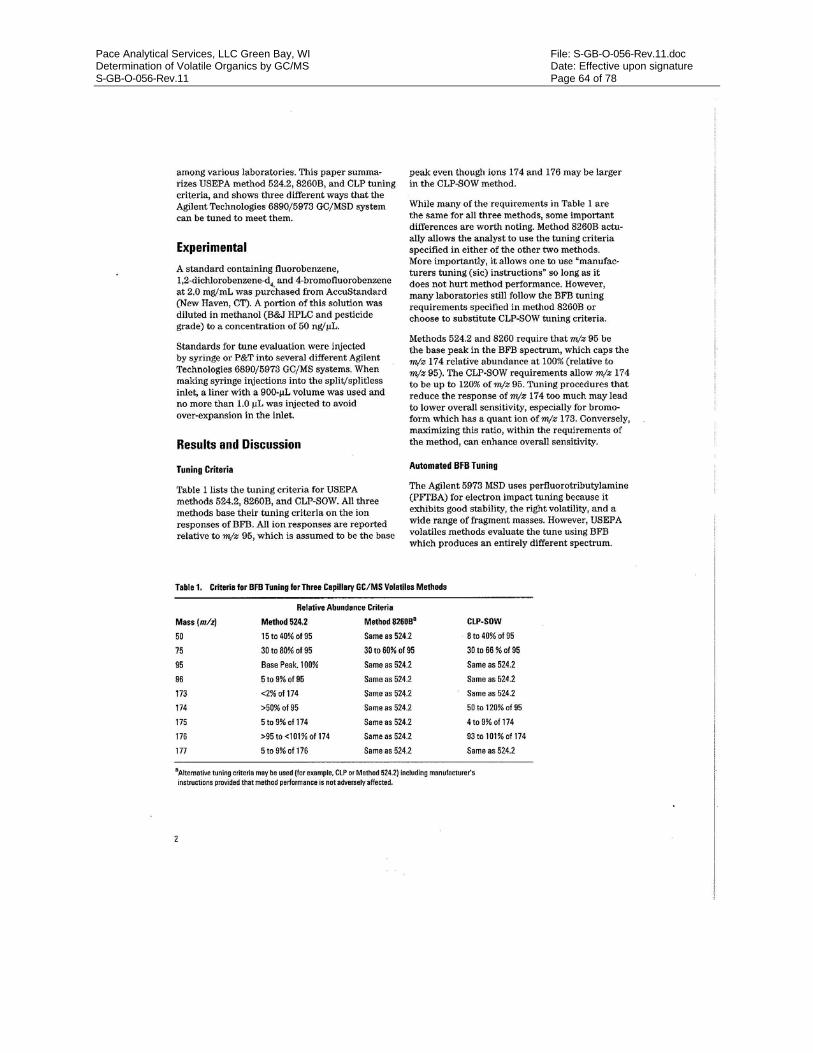
Pace Analytical Services, LLC Green Bay, WI File: S-GB-O-056-Rev.11.doc Determination of Volatile Organics by GC/MS Date: Effective upon signature S-GB-O-056-Rev.11 Page 64 of 78
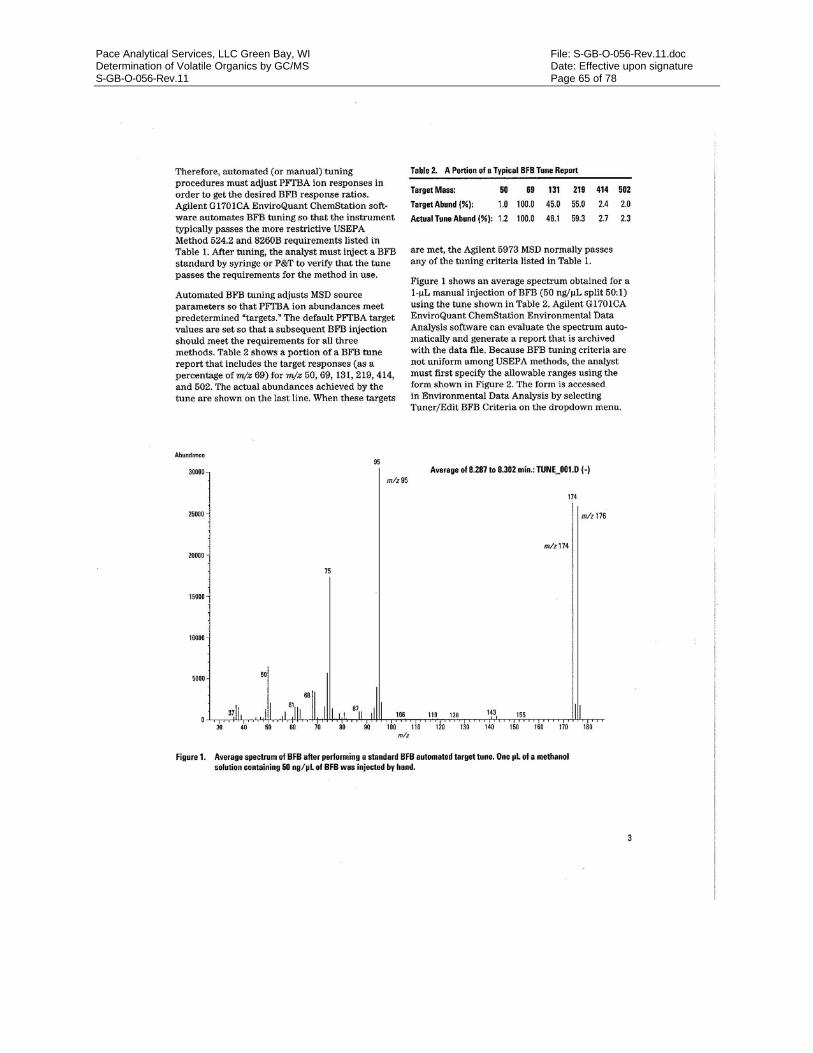
Pace Analytical Services, LLC Green Bay, WI File: S-GB-O-056-Rev.11.doc Determination of Volatile Organics by GC/MS Date: Effective upon signature S-GB-O-056-Rev.11 Page 65 of 78
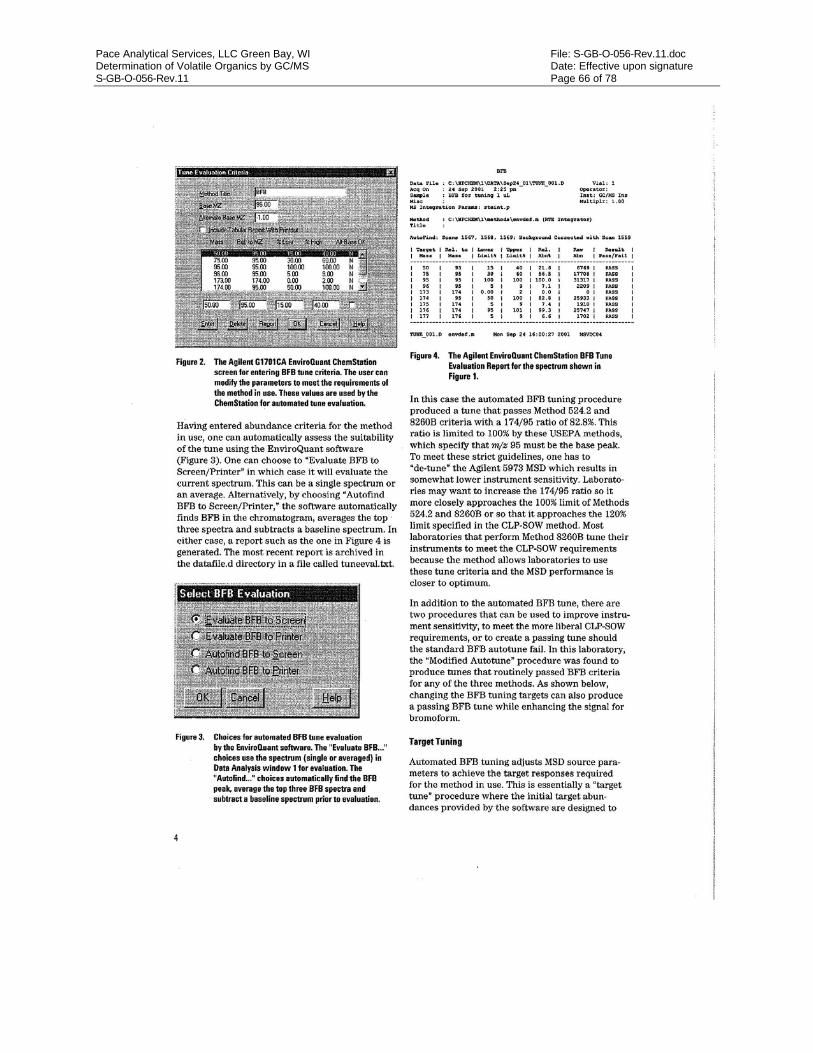
Pace Analytical Services, LLC Green Bay, WI File: S-GB-O-056-Rev.11.doc Determination of Volatile Organics by GC/MS Date: Effective upon signature S-GB-O-056-Rev.11 Page 66 of 78
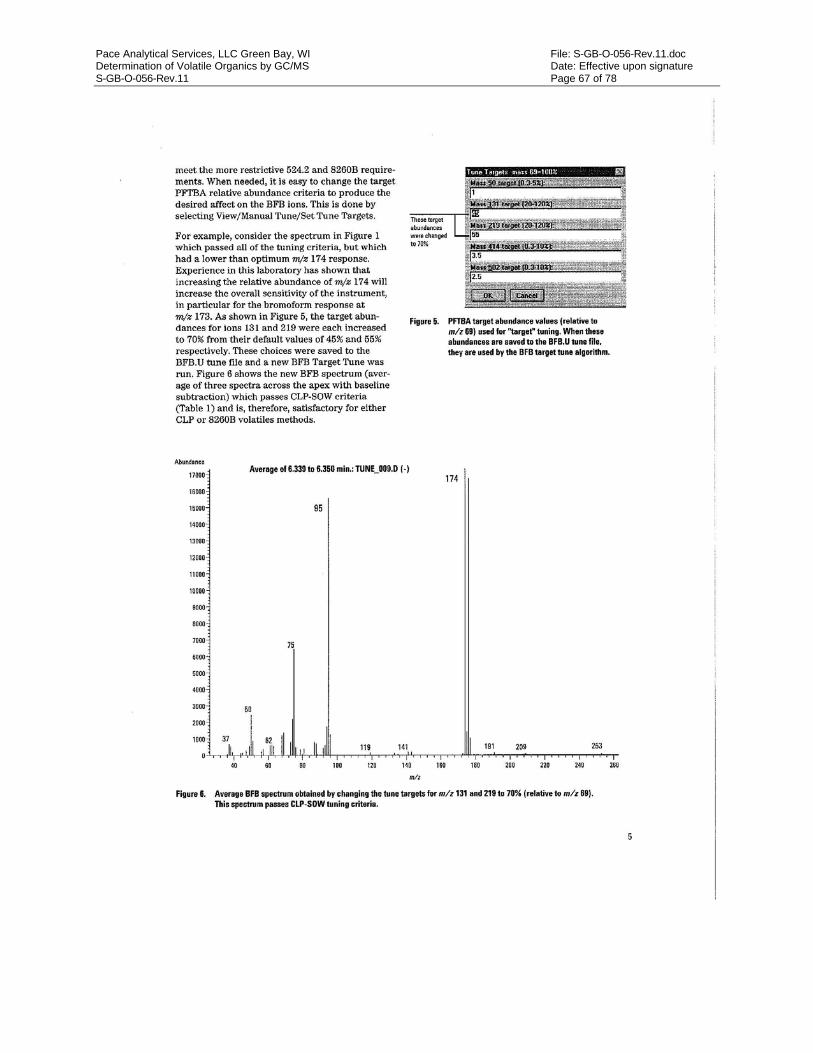
Pace Analytical Services, LLC Green Bay, WI File: S-GB-O-056-Rev.11.doc Determination of Volatile Organics by GC/MS Date: Effective upon signature S-GB-O-056-Rev.11 Page 67 of 78
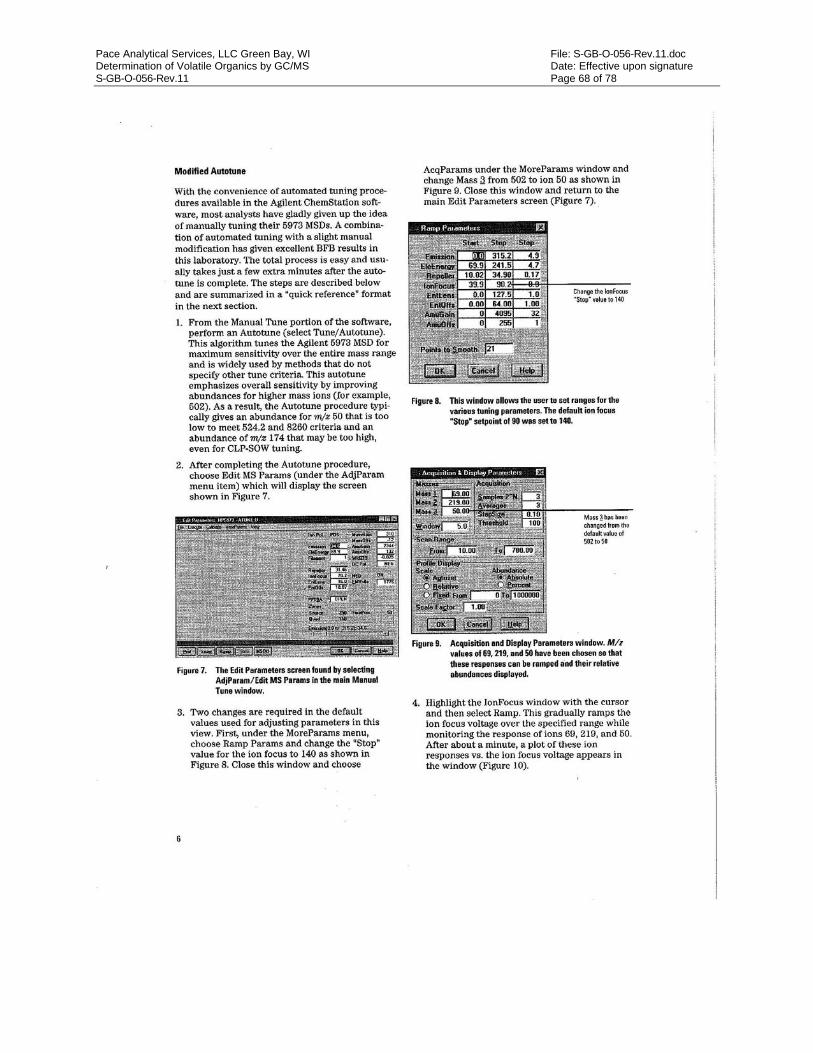
Pace Analytical Services, LLC Green Bay, WI File: S-GB-O-056-Rev.11.doc Determination of Volatile Organics by GC/MS Date: Effective upon signature S-GB-O-056-Rev.11 Page 68 of 78

Pace Analytical Services, LLC Green Bay, WI File: S-GB-O-056-Rev.11.doc Determination of Volatile Organics by GC/MS Date: Effective upon signature S-GB-O-056-Rev.11 Page 69 of 78
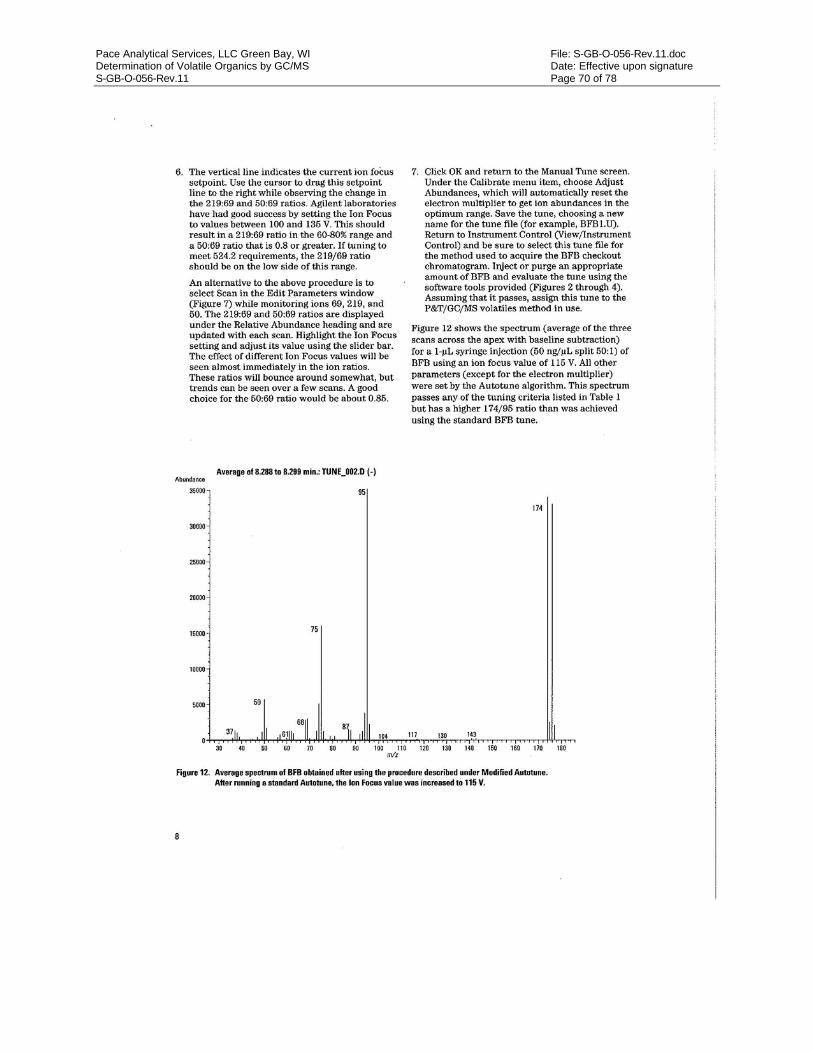
Pace Analytical Services, LLC Green Bay, WI File: S-GB-O-056-Rev.11.doc Determination of Volatile Organics by GC/MS Date: Effective upon signature S-GB-O-056-Rev.11 Page 70 of 78
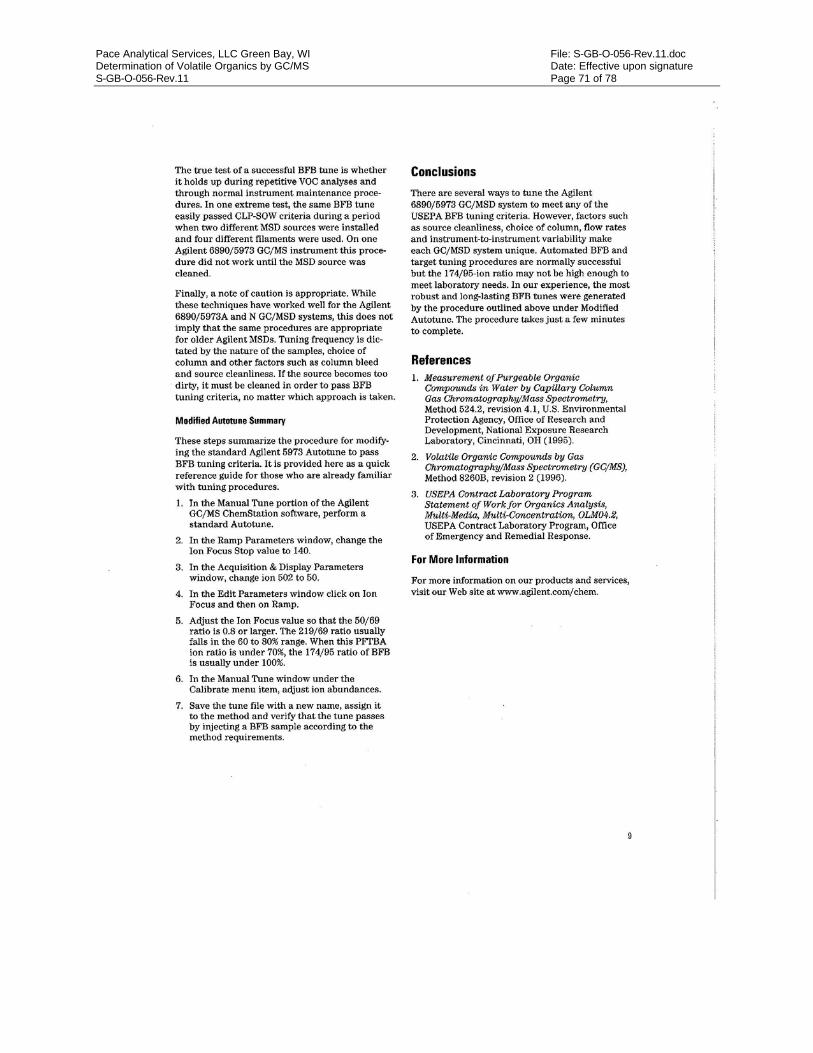
Pace Analytical Services, LLC Green Bay, WI File: S-GB-O-056-Rev.11.doc Determination of Volatile Organics by GC/MS Date: Effective upon signature S-GB-O-056-Rev.11 Page 71 of 78
Pace Analytical Services, LLC Green Bay, WI File: S-GB-O-056-Rev.11.doc Determination of Volatile Organics by GC/MS Date: Effective upon signature S-GB-O-056-Rev.11 Page 72 of 78
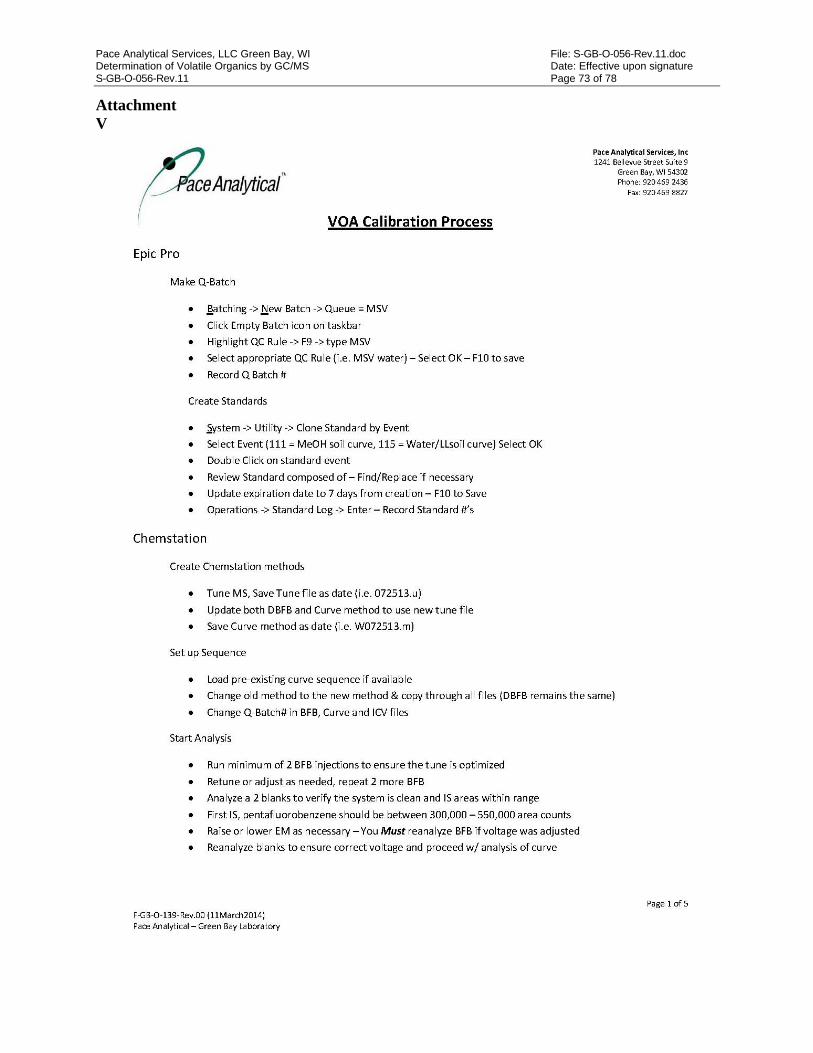
Pace Analytical Services, LLC Green Bay, WI File: S-GB-O-056-Rev.11.doc Determination of Volatile Organics by GC/MS Date: Effective upon signature S-GB-O-056-Rev.11 Page 73 of 78
Attachment V
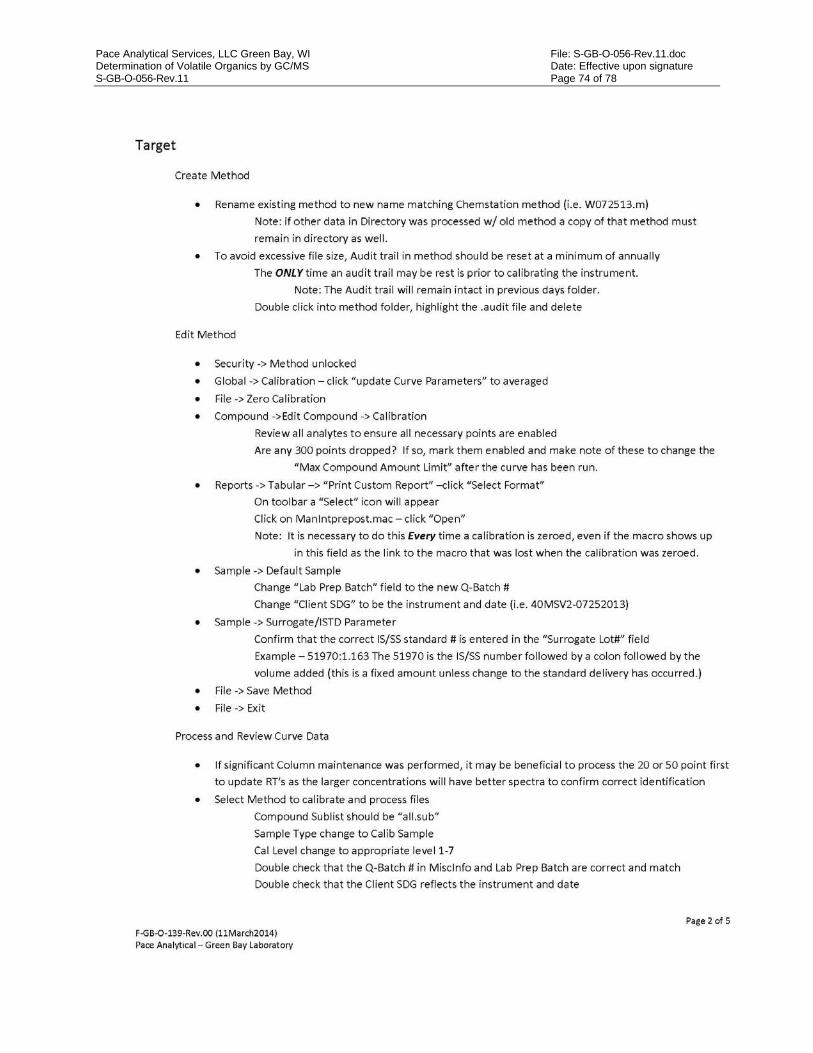
Pace Analytical Services, LLC Green Bay, WI File: S-GB-O-056-Rev.11.doc Determination of Volatile Organics by GC/MS Date: Effective upon signature S-GB-O-056-Rev.11 Page 74 of 78
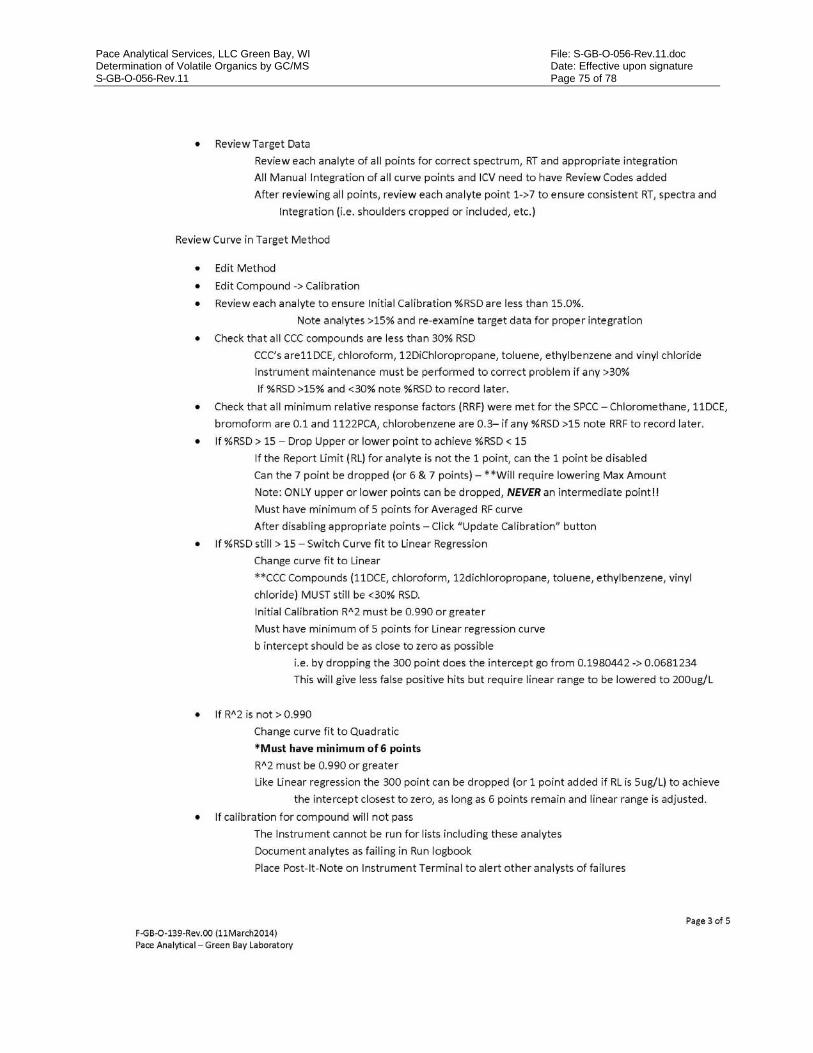
Pace Analytical Services, LLC Green Bay, WI File: S-GB-O-056-Rev.11.doc Determination of Volatile Organics by GC/MS Date: Effective upon signature S-GB-O-056-Rev.11 Page 75 of 78
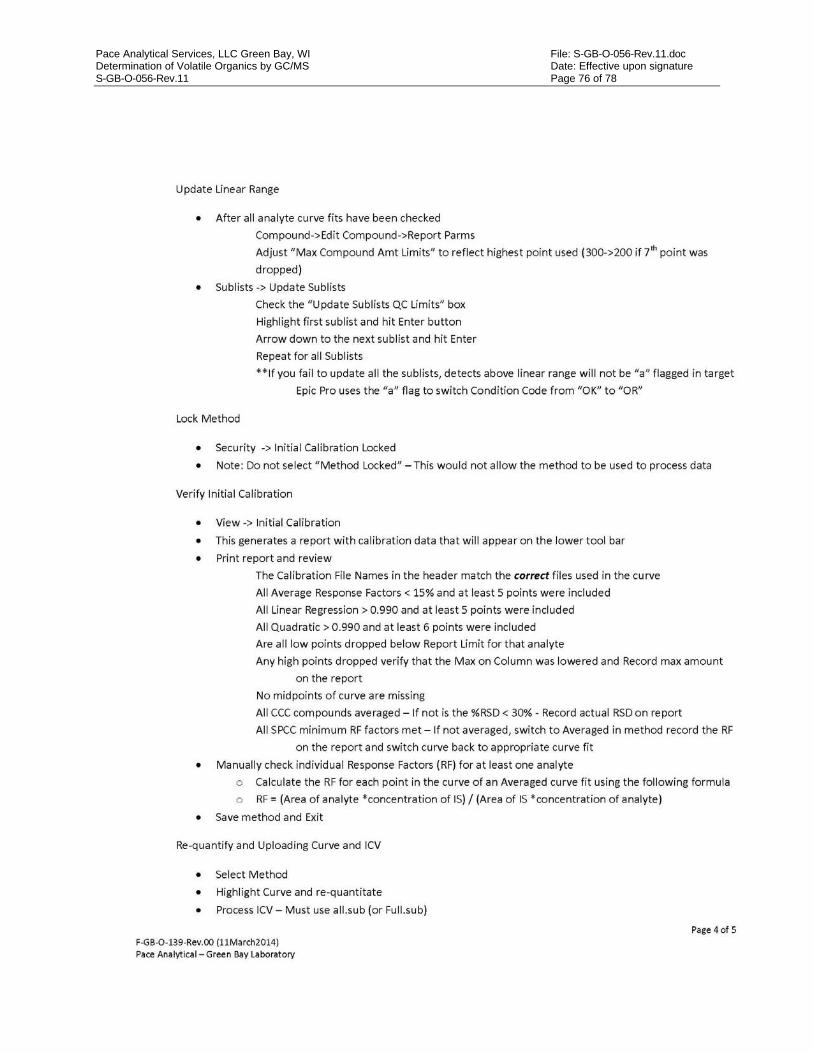
Pace Analytical Services, LLC Green Bay, WI File: S-GB-O-056-Rev.11.doc Determination of Volatile Organics by GC/MS Date: Effective upon signature S-GB-O-056-Rev.11 Page 76 of 78

Pace Analytical Services, LLC Green Bay, WI File: S-GB-O-056-Rev.11.doc Determination of Volatile Organics by GC/MS Date: Effective upon signature S-GB-O-056-Rev.11 Page 77 of 78

Pace Analytical Services, LLC Green Bay, WI File: S-GB-O-056-Rev.11.doc Determination of Volatile Organics by GC/MS Date: Effective upon signature S-GB-O-056-Rev.11 Page 78 of 78
Attachment VI
O B G T H E R E ’ S A W A Y
MILWAUKEE SOLVAY COKE AND GAS PLANT SITE | EE/CA SUPPORT SAMPLING PLAN APPENDIX A – ADDENDUM TO USEPA-APPROVED MULTI-SITE QUALITY ASSURANCE PROJECT PLAN
Attachment 2-2
STAT Analysis Corporation