EAGON & ASSOCIATES - Records Collections
139
SDMS US EPA REGION V -1 SOME IMAGES WITHIN THIS DOCUMENT MAY BE ILLEGIBLE DUE TO BAD SOURCE DOCUMENTS.
-
Upload
khangminh22 -
Category
Documents
-
view
2 -
download
0
Transcript of EAGON & ASSOCIATES - Records Collections

SDMS US EPA REGION V -1
SOME IMAGES WITHIN THISDOCUMENT MAY BE ILLEGIBLE
DUE TO BAD SOURCEDOCUMENTS.

Tremont City Landfill SiteDoc. # 139 .
FINAL REVISED
HYDROGEOLOGIC REPORT
CLARKCO LANDFILL
O H ; o .'- ~
JAN 2 71994
SOUTHWLoi u.^
GERMAN TOWNSfflP, CLARK COUNTY, OfflO
DANIS CLARKCO LANDFILL
David J. SugarHydrogeologist
Eagon &WorthingtoW
January
/.
Frank L. Majchsz;Hydrogeologist
Approved by:
Herbert B. Eagon, Jr.Hydrogeologist

TABLE OF CONTENTS
VOLUME I
EXECUTIVE SUMMARY . . . . . . . . . . . . . . . . . . . . . . . . . . . . . . . . . . . . . . . . . ES-1
1 . 0 INTRODUCTION . . . . . . . . . . . . . . . . . . . . . . . . . . . . . . . . . . . . . . . . . . . . . 1 11.1 Location . . . . . . . . . . . . . . . . . . . . . . . . . . . . . . . . . . . . . . . . . . . . . . . . . l-\1.2 Purpose and Scope . . . . . . . . . . . . . . . . . . . . . . . . . . . . . . . . . . . . . . . . . . .1-11.3 Report Structure . . . . . . . . . . . . . . . . . . . . . . . . . . . . . . . . . . . . . . . . . . . . .1-21.4 Site History . . . . . . . . . . . . . . . . . . . . . . . . . . . . . . . . . . . . . . . . . . . . . . . .1-41.5 Development Plan Overview . . . . . . . . . . . . . . . . . . . . . . . . . . . . . . . . . . . .1-6
Figure 1-1 Site Location MapFigure 1-2 Relationship of Proposed Clarkco Landfill to Existing Facilities
Table 1-1 Hydrogeologic Reports and Data Produced Clarkco Property andAdjoining Sites
2 . 0 REGIONAL HYDROGEOLOGY . . . . . . . . . . . . . . . . .2-12.1 Aquifers . . . . . . . . . . . . . . . . . . . . . . . . . . . . . . . . . . . . . . . . . . . . . . . . . 2-12.2 Water Supply Wells Within One Mile . . . . . . . . . . . . . . . . . . . . . . . . . . . . . .2-32.3 Average Yield of Water Supply Wells . . . . . . . . . . . . . . . . . . . . . . . . . . . . . 2-42.4 Public Water Supplies Within 10 Miles . . . . . . . . . . . . . . . . . . . . . . . . . . . . .2-52.5 Stratigraphy . . . . . . . . . . . . . . . . . . . . . . . . . . . . . . . . . . . . . . . . . . . . . . . 2-72.6 Structural Geology . . . . . . . . . . . . . . . . . . . . . . . . . . . . . . . . . . . . . . . . . . 2-82.7 Regional Geomorphology and Surface Water . . . . . . . . . . . . . . . . . . . . . . . . . 2-82.8 Direction of Ground-Water Flow in the Regional Aquifers . . . . . . . . . . . . . . 2-102.9 Identification of Recharge and Discharge Areas of the Regional Aquifers . . . . 2-10
Figure 2-1 Ground-Water Resources MapFigure 2-2 Sole Source Aquifer MapFigure 2-3 Public Water Supply Wells Within 10 MilesFigure 2-4 Soils MapFigure 2-5 Description of Soil Mapping Units
Table 2-1 Water Wells Within 2000 FeetTable 2-2 Community Public Water Supplies Within 10 MilesTable 2-3 Transient, Non-Community Public Water Supplies Within 10
MilesTable 2-4 Non-Transient, Non-Community Public Water Supplies Within 10
Miles
Eagon & Associates, Inc. i January 1994

TABLE OF CONTENTS (cont'd)
3.0 LOCAL HYDROGEOLOGY . . . . . . . . . . . . . . . . . . . . . . . . . . . . . . . . . . . . . .313.1 Available Information . . . . . . . . . . . . . . . . . . . . . . . . . . . . . . . . . . . . . . . . .3-13.2 Stratigraphy . . . . . . . . . . . . . . . . . . . . . . . . . . . . . . . . . . . . . . . . . . . . . . . 3-23.3 Occurrence and Movement of Ground Water . . . . . . . . . . . . . . . . . . . . . . . . . 3-63.4 Recharge and Discharge Areas . . . . . . . . . . . . . . . . . . . . . . . . . . . . . . . . . . .3-8
4.0 SITE GEOLOGY . . . . . . . . . . . . . . . . . . . . . . . . . . . . . . . . . . . . . . . . . . . . . .4-14.1 Stratigraphy . . . . . . . . . . . . . . . . . . . . . . . . . . . . . . . . . . . . . . . . . . . . . . . .4-1
4.1.1 Upper Till . . . . . . . . . . . . . . . . . . . . . . . . . . . . . . . . . . . . . . . . . . . .4-24.1.1.1 Sedimentary Composition . . . . . . . . . . . . . . . . . . . . . . . . . . . 4-24.1.1.2 Thickness and Area! Extent . . . . . . . . . . . . . . . . . . . . . . . . . 4-34.1.1.3 Physical Properties . . . . . . . . . . . . . . . . . . . . . . . . . . . . . . . .4-5
4.1.2 Inter-till Zone . . . . . . . . . . . . . . . . . . . . . . . . . . . . . . . . . . . . . . . . .4-64.1.2.1 Sedimentary Composition . . . . . . . . . . . . . . . . . . . . . . . . . . . 4-74.1.2.2 Thickness and Area! Extent . . . . . . . . . . . . . . . . . . . . . . . . . 4-74.1.2.3 Physical Properties . . . . . . . . . . . . . . . . . . . . . . . . . . . . . . . .4-8
4.1.3 Lower Till . . . . . . . . . . . . . . . . . . . . . . . . . . . . . . . . . . . . . . . . . . .4-104.1.3.1 Sedimentary Composition . . . . . . . . . . . . . . . . . . . . . . . . . . 4-104.1.3.2 Thickness and Areal Extent . . . . . . . . . . . . . . . . . . . . . . . . 4-104.1.3.3 Physical Properties . . . . . . . . . . . . . . . . . . . . . . . . . . . . . . .4-11
4.1.4 Stratified Drift . . . . . . . . . . . . . . . . . . . . . . . . . . . . . . . . . . . . . . . .4-134.1.4.1 Sedimentary Composition . . . . . . . . . . . . . . . . . . . . . . . . . . 4-134.1.4.2 Thickness and Areal Extent . . . . . . . . . . . . . . . . . . . . . . . . 4-144.1.4.3 Physical Properties . . . . . . . . . . . . . . . . . . . . . . . . . . . . . . . 4-15
4.1.5 Bedrock . . . . . . . . . . . . . . . . . . . . . . . . . . . . . . . . . . . . . . . . . . . .4-174.1.5.1 Sedimentary Composition . . . . . . . . . . . . . . . . . . . . . . . . . . 4-174.1.5.2 Thickness and Areal Extent . . . . . . . . . . . . . . . . . . . . . . . . 4-184.1.5.3 Physical Properties . . . . . . . . . . . . . . . . . . . . . . . . . . . . . . . 4-18
4.2 Geomorphology . . . . . . . . . . . . . . . . . . . . . . . . . . . . . . . . . . . . . . . . . . . .4-184.3 Structural Geology . . . . . . . . . . . . . . . . . . . . . . . . . . . . . . . . . . . . . . . . . .4-19
Figure 4-1 Generalized Stratigraphic Column for the Clarkco SiteFigure 4-2 Thickness and Areal Extent of 1092 SandFigure 4-3 Thickness and Areal Extent of 1086 SandFigure 4-4 Thickness and Areal Extent of 1077 SandFigure 4-5 Thickness and Areal Extent of 1070 SandFigure 4-6 Thickness and Areal Extent of 1060 SandFigure 4-7 Thickness and Areal Extent of 1050 SandFigure 4-8 Thickness and Areal Extent of 1035 Sand
Eagon & Associates, Inc. ii January 1994

TABLE OF CONTENTS (cont'd)
Table 4-1 Summary of Test BoringsTable 4-2 Summary of 2-Inch Wells Arranged by ClusterTable 4-3 Geotechnical Test Results for Undisturbed Samples
- Table 4-4 Geotechnical Test Results for Samples of Granular Materials
5.0 SITE HYDROGEOLOGY . . . . . . . . . . . . . . . . . . . . . . . . . . . . . . . . . . . . . . .5-15.1 Conceptual Model . . . . . . . . . . . . . . . . . . . . . . . . . . . . . . . . . . . . . . . . . . . .5-15.2 Significant Saturated Zones . . . . . . . . . . . . . . . . . . . . . . . . . . . . . . . . . . . . .5-2
5.2.1 Hydraulic Conductivity . . . . . . . . . . . . . . . . . . . . . . . . . . . . . . . . . . .5-45.2.2 Ground-Water Level Fluctuations . . . . . . . . . . . . . . . . . . . . . . . . . . . . 5-55.2.3 Recharge and Discharge . . . . . . . . . . . . . . . . . . . . . . . . . . . . . . . . . .5-75.2.4 Ground-Water Row . . . . . . . . . . . . . . . . . . . . . . . . . . . . . . . . . . . . .5-8
5.3 Uppermost Aquifer System . . . . . . . . . . . . . . . . . . . . . . . . . . . . . . . . . . . .5-145.3.1 Hydraulic Conductivity . . . . . . . . . . . . . . . . . . . . . . . . . . . . . . . . . .5-155.3.2 Ground-Water Level Fluctuations . . . . . . . . . . . . . . . . . . . . . . . . . . . 5-195.3.3 Recharge and Discharge . . . . . . . . . . . . . . . . . . . . . . . . . . . . . . . . . 5-205.3.4 Ground-Water Flow . . . . . . . . . . . . . . . . . . . . . . . . . . . . . . . . . . . .5-21
5.4 Interconnections Between Uppermost Aquifer System and Significant Zones ofSaturation . . . . . . . . . . . . . . . . . . . . . . . . . . . . . . . . . . . . . . . . . . . . . . . 5-225.4.1 72-Hour Pumping Test . . . . . . . . . . . . . . . . . . . . . . . . . . . . . . . . . . 5-22
5.4.1.1 Test Data . . . . . . . . . . . . . . . . . . . . . . . . . . . . . . . . . . . . .5-235.4.1.2 Trends and Data Correction . . . . . . . . . . . . . . . . . . . . . . . . 5-265.4.1.3 Evaluation of Vertical Interconnection . . . . . . . . . . . . . . . . . 5-305.4.1.4 Evaluation of Lateral Interconnection . . . . . . . . . . . . . . . . . . 5-305.4.1.5 Calculation of Aquifer Characteristics . . . . . . . . . . . . . . . . . 5-32
5.4.2 Lower Till In-situ Permeability Tests . . . . . . . . . . . . . . . . . . . . . . . . 5-335.4.3 Tritium Age-Dating of Ground-Water Samples . . . . . . . . . . . . . . . . . 5-35
Figure 5-1 Hydrogeologic Column for the Clarkco SiteFigure 5-2 Conceptual Model of Ground-water Movement for the Clarkco
SiteFigure 5-3 Hydrographs for Wells Screened in the 1092 SandFigure 5-4 Hydrographs for Wells Screened in the 1077 and 1070 SandsFigure 5-5 Hydrographs for Wells Screened in the 1060 SandFigure 5-6 Hydrographs for Wells Screened in the 1050 SandFigure 5-7 Hydrographs for Wells Screened in the 1035 SandFigure 5-8 Comparison of Water-Level Fluctuation to Distance to Nearest
Outcrop for Intra-Till Sand WellsFigure 5-9 Comparison of Water-Level Fluctuation to Top of Sand Pack for
Intra-Till Sand Wells
Eagon & Associates, Inc. iii January 1994

TABLE OF CONTENTS (cont'd)
Figure 5-11 Ground-Water Flow in the 1086 SandFigure 5-12 Ground-Water Flow in the 1077 SandFigure 5-13 Ground-Water Flow in the 1070 SandFigure 5-14 Ground-Water Flow in the 1060 SandFigure 5-15 Ground-Water Flow in the 1050 SandFigure 5-16 Ground-Water Flow in the 1035 SandFigure 5-17 Area where Uppermost Aquifer is ConfinedFigure 5-18 Potentiometric Surface of Uppermost Aquifer, 8/20/91Figure 5-19 Potentiometric Surface of Uppermost Aquifer, October, 1992Figure 5-20 Potentiometric Surface of Uppermost Aquifer, February, 1993Figure 5-21 Graphic Summary of Observation Wells Used for 72-hour Pumping
TestFigure 5-22 Pumping Test Hydrographs for Well PW-3Figure 5-23 Pumping Test Hydrographs for the Closest Observation Wells in the
Uppermost AquiferFigure 5-24 Pumping Test Hydrographs for the Closest Observation Wells in the
Intra-Till Sand ZonesFigure 5-25 Illustration of Method Used to Determine Barometric EfficiencyFigure 5-26 Drawdown in Uppermost Aquifer at the End of 72-hour Pumping
Test
Table 5-1 Field Hydraulic Conductivity Tests for Intra-Till Sand WellsTable 5-2 Ground-Water LevelsTable 5-3 Summary of Data Relative to Water Level Fluctuations, Intra-Till
Sand WellsTable 5-4 Summary of Hydraulic Conductivity Tests for the Uppermost
AquiferTable 5-5 Observation Wells used During 72-hour Pumping TestTable 5-6 Results of Slug Tests on Till WellsTable 5-7 Results of Tritium Analyses
6.0 SITE GROUND-WATER QUALITY . . . . . . . . . . . . . . . . . . . . . . . . . . . . . . . .6-1
Figure 6-1 Trilinear DiagramTable 6-1 Ground-Water Quality Data
7.0 LANDFILL DEVELOPMENT EVALUATION . . . . . . . . . . . . . . . . . . . . . . . . . 7-17.1 Siting Criteria . . . . . . . . . . . . . . . . . . . . . . . . . . . . . . . . . . . . . . . . . . . . . .7-17.2 Site Suitability . . . . . . . . . . . . . . . . . . . . . . . . . . . . . . . . . . . . . . . . . . . . . -7-77.3 Design and Construction Considerations . . . . . . . . . . . . . . . . . . . . . . . . . . . . 7-97.4 Ground-Water Monitoring Network . . . . . . . . . . . . . . . . . . . . . . . . . . . . . . 7-11
Eagon & Associates, Inc. IV January 1994

TABLE OF CONTENTS (cont'd)
Figure 7-1 Conceptual Design for Landfill Construction at the Clarkco SiteFigure 7-2 Proposed Ground-Water Monitoring Wells
8.0 METHODS AND PROCEDURES . . . . . . . . . . . . . . . . . . . . . . . . . . . . . . . . . .8-18.1 Drilling and Geologic Sampling . . . . . . . . . . . . . . . . . . . . . . . . . . . . . . . . . .8-1
8.1.1 The 1989 Reconnaissance Study . . . . . . . . . . . . . . . . . . . . . . . . . . . .8-18.1.2 Test Well Installations PW-1, PW-2, and PW-3 . . . . . . . . . . . . . . . . . . 8-18.1.3 Phase I and Phase n Clarkco Hydrogeologic Investigations . . . . . . . . . . 8-28.1.4 Phase ID Clarkco Hydrogeologic Investigation . . . . . . . . . . . . . . . . . . . 8-7
8.2 Well Construction . . . . . . . . . . . . . . . . . . . . . . . . . . . . . . . . . . . . . . . . . . . .8-88.2.1 Test Wells PW-1, PW-2, and PW-3 . . . . . . . . . . . . . . . . . . . . . . . . . . 8-88.2.2 Clarkco Phase I and Phase D Installations (1990 and 1991 Wells) . . . . . 8-98.2.3 Clarkco Phase IH Installations (1992 Wells) . . . . . . . . . . . . . . . . . . . 8-10
8.3 Well Development . . . . . . . . . . . . . . . . . . . . . . . . . . . . . . . . . . . . . . . . . .8-118.3.1 Test Wells PW-1, PW-2, and PW-3 . . . . . . . . . . . . . . . . . . . . . . . . . 8-118.3.2 Clarkco Phase I and Phase D Wells . . . . . . . . . . . . . . . . . . . . . . . . . 8-118.3.3 Clarkco Phase IH (1992 Wells) . . . . . . . . . . . . . . . . . . . . . . . . . . . . 8-11
8.4 Water-Level Measurements . . . . . . . . . . . . . . . . . . . . . . . . . . . . . . . . . . . . 8-118.5 Hydraulic Conductivity Testing . . . . . . . . . . . . . . . . . . . . . . . . . . . . . . . . . 8-12
8.5.1 Slug Tests . . . . . . . . . . . . . . . . . . . . . . . . . . . . . . . . . . . . . . . . . . .8-128.5.2 Pumping Tests . . . . . . . . . . . . . . . . . . . . . . . . . . . . . . . . . . . . . . . .8-14
8.5.2.1 Pumping Tests on the 2-Inch Wells . . . . . . . . . . . . . . . . . . . 8-148.5.2.2 Pumping Tests Conducted on wells PW-1, PW-2, and PW-3 hi
1990 . . . . . . . . . . . . . . . . . . . . . . . . . . . . . . . . . . . . . . . .8-148.5.2.3 72-Hour Pumping Test on PW-3 . . . . . . . . . . . . . . . . . . . . . 8-15
8.6 Geotechnical Testing of Soils . . . . . . . . . . . . . . . . . . . . . . . . . . . . . . . . . . . 8-168.7 Ground-Water Quality Determinations . . . . . . . . . . . . . . . . . . . . . . . . . . . . . 8-16
8.7.1 Detection of Immiscible Layers . . . . . . . . . . . . . . . . . . . . . . . . . . . . 8-178.7.2 Collection of Ground-Water Samples . . . . . . . . . . . . . . . . . . . . . . . . 8-178.7.3 Performance of Field Measurements . . . . . . . . . . . . . . . . . . . . . . . . . 8-188.7.4 Decontamination of Equipment . . . . . . . . . . . . . . . . . . . . . . . . . . . . 8-198.7.5 Analysis of Ground-Water Samples . . . . . . . . . . . . . . . . . . . . . . . . . 8-208.7.6 Chain of Custody Control . . . . . . . . . . . . . . . . . . . . . . . . . . . . . . . . 8-208.7.7 QA/QC . . . . . . . . . . . . . . . . . . . . . . . . . . . . . . . . . . . . . . . . . . . . .8-21
Table 8-1 Well Development Summary
9.0 REFERENCES CITED . . . . . . . . . . . . . . . . . . . . . . . . . . . . . . . . . . . . . . . . .9-1
10.0 PLATES . . . . . . . . . . . . . . . . . . . . . . . . . . . . . . . . . . . . . . . . . . . . . . . . . . .10-1
Eagon & Associates, Inc. v January 1994

TABLE OF CONTENTS (cont'd)
LIST OF PLATES
Plate 1. Water Supply Wells Within One MilePlate 2. Regional Cross-Section TracesPlate 3. Regional Hydrogeologic Cross Section W-EPlate 4. Regional Hydrogeologic Cross Section S-NPlate 5. Regional Hydrogeologic Cross Section NW-SEPlate 6. Regional Bedrock TopographyPlate 7. Potentiometric Surface of the Regional Carbonate AquiferPlate 8. Local Cross-Section TracesPlate 9. Local Cross Sections U & VPlate 10. Local Cross Sections W & XPlate 11. Local Cross Sections Y & ZPlate 12. Potentiometric Surface of the Stratified DriftPlate 13. Boring Locations and Cross Section TracesPlate 14. Cross Section A-A'Plate 15. Cross Section B-B'Plate 16. Cross Section C-C'Plate 17. Cross Section CC-C'C'Plate 18. Cross Section D-D'Plate 19. Cross Section E-E'Plate 20. Cross Section F-F'Plate 21. Cross Section G-G'Plate 22. Cross Section H-H'Plate 23. Cross Section I-I'Plate 24. Cross Section J-J'Plate 25. Cross Section K-K'Plate 26. Base of Lower TillPlate 27. Hydrographs for all Wells at Clarkco FacilityPlate 28. Potentiometric Surface of Uppermost Aquifer, 2/8/93
Eagon & Associates, Inc. vi January 1994

TABLE OF CONTENTS (cont'd)
LIST OF APPENDICES
VOLUME II
Appendix A. Water Wells Within One MileAppendix B. Public Water Supply Wells Within 10 MilesAppendix C. Boring Logs
VOLUME III
Appendix D. Well Construction DiagramsAppendix E. Boring Logs From Investigations at Adjacent FacilitiesAppendix F. Geotechnical Testing ResultsAppendix G. Slug Tests and Pumping Tests on Significant Saturated ZonesAppendix H. 1990 Pumping Tests Results - Uppermost AquiferAppendix I. 72-Hour Pumping Test on Uppermost AquiferAppendix J. Water Quality Testing Results
Eagon & Associates, Inc. vu January 1994

3.0 LOCAL HYDROGEOLOGY
3.1 Available Information
Previous investigations at the facilities on the adjoining properties to the west have
generated hydrogeologic information that is extremely beneficial to the analysis and interpretation
of the local hydrogeology surrounding the proposed Clarkco facility. Particularly useful are test
borings which were drilled to bedrock or to sufficient depths to penetrate the entire thickness of
the glacial till confining bed and at least part of the underlying stratified drift. Many of these
borings have been sampled continuously and wells have been installed in some of the deep
boreholes. Boring logs from these investigations that were utilized in the analysis of local
conditions are presented in Appendix E. The borings for well installations TBF-19D and TBF-
20D at the Barrel Fill were drilled to depths of 160.5 and 139 feet, respectively. Boring 16 at
the Barrel Fill was drilled to a depth of 100 feet.
Pertinent hydrogeologic information was generated by the ground-water assessment at the
south end of the Tremont landfill. One test boring, 89-3 (adjacent to wells A89-3S and A89-3D)
was drilled to bedrock. A new monitor well, (91- drilled during the assessment and
located west of the landfill, was drilled to bedrock. Two water wells in the assessment area, 1-
943 and 201, also were drilled to bedrock. Three borings drilled during the west seep
investigation, WS92-22B, WS92-24B, and WS92-25B, were of sufficient depth to be useful in
making correlations with the deeper borings at the proposed facility.
During the 1992 phase of the hydrologic investigation for the Clarkco site, ten deep borings
were drilled to bedrock in order to characterize the stratified drift. Two of these, 92-HDD and
92-27DD, were within or at the edge of the footprint of the proposed landfill, while five others,
C92-5DD, 92-20D, 92-2ID, 92-22DD, and 92-23D, were drilled at more distant locations on the
property hi order to characterize the local geology south and southeast of the proposed landfill.
In addition, three deep borings were drilled offsite. Two of these were drilled southeast of the
proposed landfill. Boring 92-30 was drilled and sampled to bedrock using an auger rig and was
.———._____— -—_—_- ——_ ——„———————.—————————- — . - _ . - . . . ____________________________________'————————~——~
Eagon & Associates, Inc. 3-1 January 1994

converted to a water well by deepening the hole into bedrock with a rotary rig. Boring 92-34
was drilled at the base of a sand outcrop in a borrow area behind a residence on Owner's Road.
The boring for well 92-35DD was drilled on Tremont landfill property about 390 feet west of
the existing landfill. Due to equipment limitations this boring was terminated at a depth of 152
feet before reaching bedrock.
In addition to the test borings, water-well logs in the immediate area were utilized. Some
water wells were field located more precisely with the aid of a detailed topographic map for the
area to the southeast in the vicinity of Owners Road. The base map on which these wells and
boring locations are plotted (Plate 8) is an enlargement of Plate 1 having a scale of 1 inch to 400feet. Information that was not available at the time of the January 1992 report was added toPlate 8, and some well locations were shifted as a result of additional or more accurateinformation that was included hi the April 1993 version of the Hydrogeologic Report.
Off-site borings which provide information relevant to the characterization of the
surrounding area, and that can be correlated with data that has been generated on the proposed
landfill site are included in Appendix E. Information recorded on the water well logs copied
from ODNR files (Appendix A), although much less detailed and reliable, was used to furthercharacterize the local hydrogeology. The area of interest for this characterization includes thearea bordered by Willow Dale Road on the west, Upper Valley Pike on the east, Storms Creek
on the north, and Chapman Creek on the south.
3.2 Stratigraphy
Numerous cross sections have been prepared with the data from the local area in order to
graphically portray the local geologic setting within the vicinity of the site to the extent possiblewith the available information. The purpose of these local cross sections, the traces of which areshown on Plate 8, is to show the relationship of the major hydrostratigraphic units at the site to
the surrounding area. In some cases, correlating detailed site boring logs with generalized water
well log information is somewhat difficult. In certain off-site areas where there are several
Eagon & Associates, Inc. 3-2 January 1994

water-well logs within a small area, information recorded on the logs sometimes seems
contradictory. This may be due to significant variations in lithology over short distances, or it
may be the result of varying interpretations of the drillers or differences in the level of
descriptive detail, or a combination of these. In those areas where multiple interpretations are
possible, the log or logs judged to be the most reliable or reasonable based on correlations and
other lines of evidence, are shown on the cross section.
The stratigraphy illustrated by the cross sections presented on Plates 9, 10, and 11, while
not labeled as such, is consistent with the units defined and described in detail in Sections 4.0
and 5.0 of this report. Generally, the upland areas are comprised of a thick till sequence that is
underlain by stratified drift consisting of sand and gravel layers interbedded with till and other
cohesive materials. Beneath the Clarkco site, part of the stratified drift has been defined as the
uppermost aquifer system. As shown by both the detailed and the local cross sections, the
stratified drift is quite variable with sand zones and till layers pinching out or thickening, and hi
some areas changing abruptly over short distances. In several instances, correlations of sand
zones are made on the basis of the relative water-level elevations in wells and borings, i.e. similar
water levels indicate interconnection, whereas significantly different water levels strongly suggest
no interconnection, or at the very least, a poor connection.
East-west cross sections show sand and gravel in direct contact with the carbonate bedrockwhere the latter occurs at higher elevations west of the Clarkco site. This is true on cross
sections U-U', W-W', and X-X'. In boring 89-2 on cross section W-W', the thick sands extend
to as high as elevation 1040. About 450 feet east, however, beneath the Closed Barrel Fill, these
sands are virtually nonexistent except below elevation 955, feet as shown by the log of well TBF-
19D on the same cross section. The thinning and pinching out of sand beds that are replaced by
till also is apparent on cross section X-X' in the vicinity of the Tremont Landfill and proposed
Clarkco landfill.
Cross section U-U' illustrates the poor or non-existent connection between the deep sand
zones screened in wells 90-7D and PW-2. Based on the different water level and hydrograph
Eagon & Associates, Inc. 3-3 January 1994

pattern of PW-2, as well as the log of boring 90-15 and the driller's and gamma-ray logs of PW-
2, it seems clear that PW-2 is screened in a different aquifer than are the wells which are
completed in the unconfined uppermost aquifer to the west and southwest. The top of the
bedrock surface shown on cross section U-U' is based on the bedrock contour map (Plate 6).
Inferred stratified layers at depths greater than penetrated by boring 89-1 and well 90-6D are
based on conditions observed on cross sections further south. Data are insufficient to prove or
disprove the physical continuity of any of the sand zones hi PW-2 with the gravel zone logged
at water well 65 to the east. However, well 65 was developed in the bedrock, suggesting that
the gravel is not particularly productive. There are two sand and gravel wells (22 and 23) located
near well 65 with water-level elevations of about 951 and 945, respectively as compared to about
973 at PW-2. This water level difference of more than 20 feet indicates that there is not a direct
Interconnection between PW-2 and wells 22 and 23.
Cross section V-V' illustrates the restriction or poor connection between the aquifer
screened in PW-1 and the uppermost aquifer beneath the Clarkco site. Southeast of the Clarkco
proposed landfill, the water level hi well 92-20D reflects the deep and seemingly isolated sand
zone hi which this well is screened. Additionally, the water-level elevation of about 960 feet In
92-20D is substantially higher than the water levels in wells to the east beyond the upland till
area indicating a lack of direct interconnection to these wells also.
Cross section W-W' illustrates several examples of abrupt lateral changes in lithology. For
example, thick.silty sand and gravel is encountered as high as elevation 1040 hi boring 89-2,
whereas hi boring TBF-19D no significant water-bearing sand zone was encountered in the
stratified drift above about elevation 935. Deep sands are probably in direct contact with thebedrock aquifer to the west as illustrated. Although not illustrated on a cross section, there is
an abrupt change in lithology between wells TBF-19D and TBF-20D. The 72-hour pumping test
of PW-3 that is described in Section 5.0 of the report demonstrates a lack of interconnection
between the sand zones screened in these wells. The fact that these nearby wells were each part
of a separate flow system had been Inferred on the basis of the water-level data.
Eagon & Associates, Inc. 3-4 January 1994
An abrupt change also is illustrated on section W-W between well 511 and boring 92-34.
This may be due in part to sophistication of the logging (92-34 was continuously sampled and
logged by a geologist while well 511 was logged by a residential well driller). The granular
material encountered in boring 92-34 was not considered to be particularly productive for water-
supply development in the deeper saturated zones. It is important to note that all of the domestic
water wells that have been installed on Owners Road are developed in the carbonate bedrock
aquifer. Sand and gravel zones which may connect laterally with zones at the Clarkco site are
dry or poorly permeable. If a significant sand and gravel-aquifer were present in this area it
would be reasonable to expect that a well would have been developed in it.
The conditions encountered at boring 92-30 shown on cross section X-X' probably are
typical of the experiences in developing water wells southeast of the Clarkco site. The upper
sand was dry in boring 92-30. The only zone which was seriously considered to have the
potential for a dependable domestic supply was the basal sand which was about 2 feet thick at
the top of bedrock. However, when the borehole was converted to a water well, it was
questionable whether this zone would provide a reliable supply, so the well was completed in the
underlying bedrock where an adequate supply was assured. Cross section X-X' (Plate 10)
illustrates that to the east of boring 92-30, there is a bedrock high and clay deposits that
precludes a lateral connection of the saturated sand zones in stratified drift with the buried-valley
aquifer that is further to the east.
Cross section Z-Z' (Plate 11) illustrates the uppermost aquifer pinching out to the southwest
and northeast. The interconnection between the sand zone screened in PW-3 (72-hour pumpingtest well) and the sand beds screened at the C91-5 and 92-22 well clusters is based on die
pumping-test results. Farther to the southwest, wells along Chapman Creek (south of the
Tremont Landfill) showed no response to pumping during the 72-hour pumping test. Both the
saturated and unsaturated portions of the uppermost aquifer wedge out to the northeast toward
PW-2. The sand zone that is screened in PW-2 is considered to be part of a flow system that
is separate from the uppermost aquifer underlying the Clarkco site. Because the hydrograph of
PW-2 shows that PW-2 is responsive to infiltration, the sand zone screened in this well is
Eagon & Associates, Inc. 3-5 January 1994

probably interconnected with sands associated with the floor of the Storms Creek valley farther
downstream to the northeast. Cross section Y-Y' (Plate 11) illustrates that the uppermost aquifer
at the Clarkco site is contiguous with sand and gravel deposits that crop out in Storms Creek to
the north. Field reconnaissance of Storms Creek in the vicinity of well location 407 and to a
point approximately 1600 feet east, has identified surficial materials as probable sand and gravel
deposits. Storms Creek appears to flow on top of till both to the east and west of this reach.
3.3 Occurrence and Movement of Ground Water
The local cross sections illustrate rapidly changing hydrogeologic conditions in the vicinity
of the Clarkco site. Pertinent water-level data shown on the cross sections has been used to
interpret lateral and vertical components of ground-water movement, and to identify theunsaturated zones. Plate 12 is a potentiometric map that includes various saturated zones within
the stratified drift sequence based on February 8, 1993 water-level measurements for wells at the
Clarkco and Tremont sites, and on static water levels reported on the drillers logs for the off-site
water wells at the time they were installed. Obviously, these data are not directly comparable
because the water-well information represents a wide range of time and conditions. Moreover,
it should be noted that this map represents conditions within the stratified drift as though it
comprised a single flow system. The potentiometric map of the stratified drift, however, does
not portray the potentiometric surface of a discrete saturated zone or flow system within the
stratified drift. In other words, vertical gradients and the lack of lateral connections between
zones screened in specific wells may be such that water levels are not representative of the same
system. This fact generally has been ignored in preparing this map. Therefore, conclusionsderived from the interpretation must be kept in perspective. Plate 12 illustrates the potential for
ground-water flow within the stratified drift in the immediate area around the proposed Clarkco
Landfill. The actual flow in the direction suggested by potentiometric contours, however, may
be relatively small as a result of poor lateral interconnection between individual saturated zones
or flow systems.
Eagon & Associates, Inc. 3-6 January 1994

The potentiometric contours shown on Plate 12 indicate that general direction of ground-
water migration within the stratified drift sequence is from west to east with components to the
northeast toward Storms Creek and southeast toward Chapman Creek. This configuration
generally conforms to regional ground-water flow directions in the regional bedrock aquifer as
shown on Plate 7. However, the quantity of ground-water flow in any given direction is a
function of the hydraulic conductivity of the materials through which the ground water must
move. Potentiometric contours that are closely spaced indicate flow restrictions or boundaries
between ground-water flow systems. Conversely, where contours are widely spaced, good lateral
continuity and uniformity in hydraulic conductivity are indicated. The potentiometric map of the
stratified drift sequence can be used in this manner to interpret lateral continuity, or a lack
thereof.
The closely-spaced contours immediately west of the Clarkco site suggest a restriction to
flow from west to east as described in the previous discussion of local cross sections. Although
less pronounced, a second "step down" of the potentiometric contours is evident between the
Clarkco site and the valley floor to the east. The consistency of water-level elevations in the area
of the proposed landfill footprint is quite evident and strongly indicates continuity within what
has been defined as the uppermost aquifer. The apparent limits of the "uppermost aquifer"
beneath the proposed landfill that have been delineated on Plate 12 are based on the interpretation
of water-level data, boring logs, and the 72-hour pumping test. Note that the potentiometric
surface for the uppermost aquifer flow system has a contour interval of only 0.20 foot, as
compared to a contour interval of 10 feet for the stratified drift as a whole.
The dominant flow direction in the uppermost aquifer beneath the Clarkco site is to the
east-northeast. The lack of detailed water-level information off site makes it difficult to infer
flow directions within the uppermost aquifer beyond the site boundaries. Because the aquifer
pinches out to the east, the actual flow in that direction probably is small. The potential for flow
from the area of wells 92-22D and 92-22DD to the southeast toward Chapman Creek is small
because there is no evidence of an interconnection with the thin sand beds within the stratified
drift in that direction. Similarly, between wells 90-7D and PW-2 the amount of flow is small
Eagon & Associates, Inc. 3-7 January 1994

or nonexistent due to the reduced permeability or a complete lack of interconnection. The
greatest quantity of flow from the site is thought to be to the north-northeast toward Storms
Creek, where the more permeable zones of the uppermost aquifer are thought to extend off site
(See cross section Y-Y' on Plate 11). The area in which sand and gravel has been observed to
crop out in the channel of Storms Creek is shown on Plate 12.
3.4 Recharge and Discharge Areas
The primary source of recharge to the uppermost aquifer beneath the Clarkco site appears
to be from the lower reaches of the ravine near boring 92-22D and the flats beyond, where the
uppermost aquifer system is exposed, or nearly exposed, at the surface. A component of
recharge also may come from the stratified drift west of the site where sand zones are in directcontact with the regional bedrock aquifer and where sand zones may be close to the land surface.
Comparison of the bedrock potentiometric map (Plate 7) with Plate 12, reveals that there are
areas west of the Clarkco site where there is an upward gradient between the bedrock aquifer and
the stratified drift. Available water-level elevations for bedrock wells are shown on Plate 12, but
there are few locations where both bedrock and stratified drift water-level elevations are
available. East of the Clarkco site, it appears that bedrock water levels are lower, indicating a
downward gradient and the potential for saturated zones in the stratified drift to recharge the
bedrock aquifer. Vertical gradients within the uppermost aquifer at the Clarkco site appear to
be slightly downward, except at well pair 90-14D and 92-14DD, where there is a slight upward
gradient.
The discharge areas for the stratified drift as a whole are Chapman Creek, Storms Creek,
and the valley to the east. Discharge from the uppermost aquifer beneath the Clarkco site is
thought to be to Storms Creek to the north and northeast, and potentially to deeper or laterally
contiguous zones in the stratified drift to the east. The potential for a southerly component of
flow from the area south of the proposed landfill with discharge to Chapman Creek is minimal.
The reach of Chapman Creek which receives ground-water discharge that was identified in Eagon
& Associates, 1992a is located west of well A89-1. South of the Clarkco site, the conditions are
Eagon & Associates, Inc. 3-8 January 1994

similar to those described at the southeast corner of the Tremont Landfill, where the stream is
flowing mostly on till.
To the east of the limit of the uppermost aquifer (as delineated on Plate 12) discharge from
the uppermost aquifer may occur to some of the deeper sand or laterally contiguous zones in the
stratified drift. On the local cross sections most of the sands identified east of the Clarkco site
that seem to be lateral equivalents of the uppermost aquifer are dry. Most of the ground-water
discharge from the uppermost aquifer probably occurs to the northeast to Storms Creek. The
reach of Storms Creek in which sand and gravel has been observed and which may be the
primary discharge area for the uppermost aquifer beneath the Clarkco site is shown on Plate 12
by the extension of the lines delineating the uppermost aquifer north to the stream channel.
Eagon & Associates, Inc. 3-9 January 1994

4.0 SITE GEOLOGY
Site-specific geologic data for the proposed Clarkco Landfill has been gathered from
December 1988 to the present. Table 4-1 is a chronological listing of all soil-boring and well-
installation activities from the preliminary feasibility study through detailed investigations
directed toward a PTI application. Table 4-1 documents 100 soil borings that were drilled at 55
locations for the purpose of evaluating the Clarkco site. Including PW-1, PW-2, and PW-3, the
four recently-installed till piezometers, and 92-35DD, a total of 64 wells have been installed to
date. Well construction details for each of the 2-inch PVC installations also are summarized in
Table 4-1. The same information is included in Table 4-2 in which the wells are grouped by
well cluster. The well-cluster locations are listed in chronological order in Table 4-2, and wells
within each cluster are in order of well screen depth. Plate 13 is a base map for the Clarkco site
showing the locations of all borings and wells and the traces of geologic cross sections
constructed from them.
Numerous laboratory tests have been performed on representative soil-boring samples in
order to classify and characterize the unconsolidated materials. Geotechnical test results on
undisturbed samples are presented hi Table 4-3. Geotechnical test results on jar samples from
split spoons or the continuous sampler are presented in Table 4-4. Most of the jar samples tested
are granular materials in which a well has been installed.
4.1 Stratigraphy
Hydrogeologic cross sections A-A' through K-K' (Plates 14 through 25) have been
developed to facilitate interpretation of the soil-boring data, and to aid in formulating and
illustrating the stratigraphic relationships among the unconsolidated materials which underlie the
Clarkco site. Figure 4-1 is a generalized stratigraphic column which illustrates the manner in
which stratigraphic units at the Clarkco site have been defined and subdivided based on their
lithology, physical properties and hydrogeologic significance.
Eagon & Associates, Inc. 4-1 January 1994

At the Clarkco site, a thick sequence of glacial drift overlies carbonate bedrock. Glacial
drift is a general term applied to all material (clay, silt, sand, gravel, boulders) transported by a
glacier, and deposited directly by or from the ice, or by water emanating from a glacier. It
includes both stratified and unstratified material. The upper part of the glacial drift at the
Clarkco site consists primarily of glacial till which has been mapped previously by others as thick
ground moraine (Goldthwait, 1951). On the basis of detailed study of closely-spaced on-site
borings, this till has been sub-divided in to an upper till and a lower till member. These are
separated by an inter-till zone that also is mostly till but is differentiated on the basis of a greater
incidence of sand and silt partings, seams, thin beds, and/or subtle differences in the texture or
fabric of the till that suggest reworking. In many borings, the contact between the upper or lower
till and the inter-till zone is not distinct but rather represents a gradational contact. The lower part
of the drift is stratified and the thick and highly permeable beds that are part of this unit
constitute a sand, or sand and gravel, water-table aquifer. The portion of the stratified drift that
constitutes a local aquifer beneath the Clarkco site is identified as the uppermost aquifer which
will be defined and characterized in Section 5.0. As shown in Figure 4-1, five stratigraphic units
have been recognized and defined at the Clarkco site. From youngest to oldest, the five units
are: the Upper Till, the Inter-Till zone, the Lower Till, the Stratified Drift, and Bedrock. Each
of the five stratigraphic units will be described and discussed separately.
4.1.1 Upper Till
4.1.1.1 Sedimentary Composition
Glacial till is an unsorted, unstratified mixture of rock debris, soils, and other near- surface
materials that have been picked up, mixed, modified by glacial transport, and re-deposited by
processes of glaciation. Sizes of these materials range from float blocks and large boulders to
cobbles, gravel, sand, silt, and clay. Till sheets and glacial episodes often are differentiated on
the basis of the relative amounts of particle-size groups and material types. The predominant
grain sizes usually are silt and clay with lesser amounts of sand, with traces of gravel sizes and
larger rocks.
Eagon & Associates, Inc. 4-2 January 1994

4.1.1.2 Thickness and Areal Extent
Thickness variation in the upper till is primarily a function of topography. The upper till
is thinnest in the small areas where erosion (caused by drainage flowing into ravines which
border the site) has cut into and removed most or all of the unit. The upper till extends from
grade down to the elevation of the base of this unit which ranges from about 1050 to 1057 feet.
Surface elevations within the footprint of the proposed landfill range approximately from 1112
to 1010 feet. Due to the variations in surface topography, the upper till is missing in the deep
ravines, but ranges up to about 60 feet in thickness. As seen on the cross sections, however, the
average thickness of this unit typically ranges from 40 to 60 feet hi the western part of the site
and from 20 to 40 feet in the eastern part.
Clastic units are present as minor interbeds within the upper till. These vary from sand or
silt partings less than Va-rnch thick to sand and gravel beds that, in places, are a few feet thick.
Cross sections A-A' through K-K' illustrate the absence of thick and extensive permeable beds
within the upper till.
The sand zones in the upper till are not thick blanket sands that can be consistently
encountered in all borings at specific elevations.. Attempts to correlate upper till sand zones
between the soil borings drilled in 1990 and 1991 led to an informal nomenclature based on the
approximate average elevation at which a group of beds were clustered. The addition of the 1992
borehole data prompted a review of all of the soil-boring data and a refinement of the
classification scheme. This was accomplished by posting the elevation and thickness of all sand
partings, seams, and beds on a site base map in order to identify natural groupings of beds that
may constitute ground-water pathways. The natural groupings within the upper till that wereidentified by detailed analysis of the borehole data and that are used in this report are the 1092,
1086, 1077, 1070 and 1060 sands. Although some sand zones can be correlated between borings
based on similarity of elevations, they are not necessarily continuous between borings. A fairly
common occurrence when installing multiple wells at cluster locations, was that a borehole drilled
ten feet away from an existing boring in which a certain sand was present, would encounter only
Eagon & Associates, Inc. 4-3 January 1994

till. Sometimes when the targeted sand was encountered, its thickness would be quite different.
Some of these sands have lateral continuity and constitute pathways for lateral ground-water
migration. However, many are very local in nature and occur as pods or discontinuous lenses.
A map has been prepared that shows the thickness and areal extent of each of the five
upper-till sand groupings (Figures 4-2 through 4-6). Shown on each map is an appropriate
topographic contour which, by definition, limits the possible extent of that particular sand. (If
present, the sand would outcrop at this approximate elevation.) None of these zones produce
enough water to be considered aquifers, as will be discussed in detail in Section 5.0. A short
discussion of the thickness and areal extent of each of the upper till sand zones follows.
The 1092 sand is restricted by topography to the more upland parts of the proposed Clarkco
landfill (Figure 4-2). It has been encountered only in the extreme northwest comer of the site.
It is shown to be thickest (4.0') in boring 89-3. However, this may be an exaggerated thickness
because boring 89-3 was not continuously sampled. Note that other borings nearby, 92-24Y and
92-24Z, encountered only 2.0 feet and 0.8 foot of sand, respectively. The 1092 sand is 2.6 feet
thick where it is screened in boring 90-6W. It is 0.8 foot thick where it is screened in boring
92-24Z, and 2.1 feet thick in adjacent boring 92-24Y. It was not identified in any borings south
or east of the zero sand line shown on Figure 4-2.
The 1086 sand has been identified only within a narrow band that trends northeast-
southwest through the west-center portion of the site (Figure 4-3). The maximum thickness of
the 1086 sand shown on Figure 4-3 (3.0 feet in boring 90-5) may be an exaggerated thickness
as a result of sand heave incurred while drilling. The only other significant thicknesses of 1086
sand were encountered in borings 90-1, 92-19X, and 90-12 where bed thicknesses are 1.5, 1.1,
and 1.4-foot, respectively. As shown on Figure 4-3, the 1.4-foot thickness shown for boring 90-
12 is the aggregate thickness of three separate beds.
Figure 4-4 shows the thickness and areal extent of the 1077 sand. Sand beds at this
elevation are thin or absent in the northern and southern extremes of the site and thickest near
———.—————————————————————.———————————,__________- — - ______-______________________________________.—————•—————
Eagon & Associates, Inc. 4-4 January 1994

the eastern and western boundaries of the Clarkco site. Split-spoon sampling in boring C92-9Y
strongly suggests that the sand thickness shown for boring C91-9 was greatly exaggerated as a
result of sand heave induced by the continuous sampler that was used to sample boring C91-9.
The 5.0 foot sand thickness shown for boring 90-13D may be an exaggeration, also. Only 1.2
feet of sand was recovered in the sampler, but the entire 5-foot sample run was logged as being
sand.
Figure 4-5 shows the thickness and areal extent of the 1070 sand grouping. Only six
boring locations encountered 1070 sand thicknesses of one foot or more, and all but one of these
is along the western boundary of the Clarkco site. Except for isolated occurrences in borings 92-
19X, 90-3, and 92-28X, the 1070 sand is absent over most of the rest of the Clarkco site.
As shown on Figure 4-6, the 1060 sand is the thickest and most widely distributed of the
upper till sand zones. In the north-central and northeastern parts of the site, it is present at seven
boring locations but more than one foot thick only in five borings. The 1060 sand is thickest in
the southeastern and southern parts of the site. Where the 1060 sand is thick, it may have cut
into the underlying inter-till zone.
4.1.1.3 Physical Properties
USCS Textural Classification. As seen in Table 4-3, the upper till typically is a CL material and
is quite uniform. In places, its engineering characteristics vary slightly and it is classified as CL-
ML material.
Atterberg Limits. Liquid limits in the upper till range from 18 to 23. Plastic limits range
narrowly from 11 to 13. The plasticity index varies within the narrow range of 6 to 10 which
straddles the division between CL-ML and CL materials of low plasticity.
Grain Size Distribution. The principal textural component in the upper till is silt with the major
secondary component being sand. (The opposite is true in the case of the undisturbed samples
Eagon & Associates, Inc. 4-5 January 1994

from borings C91-9 and 90-10Y.) Silt content ranges from 34.4 to 44.1%. Clay is a significant
minor component ranging from 16.4 to 20.4%. Gravel typically is a trace component ranging
from 3.4 to 15.7%.
Hydraulic Conductivity. Hydraulic conductivities determined in the laboratory on undisturbed
samples from the upper till consistently are extremely low ranging narrowly from approximately
1.2 x 10'8 to 6.3 x 108 cm/sec.
Moisture Content and Dry Unit Weight. As seen in Table 4-3, moisture contents of upper till
undisturbed samples range from 8.0 to 12.3 percent. Dry unit weight ranges from 127.65 to
136.99 pounds per cubic foot.
None of the upper till interbeds have a lithology that is distinctive. Any of the units may
range in grain size from silt to sand and gravel. All are non-plastic. The most frequently
encountered lithology is fine sand and silty sand. Grain sizes, USCS classifications, and other
characteristics, are described on the individual boring logs and laboratory determinations are
listed in Table 4-4.
4.1.2 Inter-till Zone
Whether or not the inter-till zone should be considered as a separate mapping unit is
somewhat debatable. However, for descriptive purposes, this zone is identified on the site cross
sections (Plates 14 through 25). Generally it is bracketed by elevations 1055 and 1040 feet. The
concept of a "transition zone" between two till sheets was formulated on the basis of the results
of drilling at the adjacent disposal facilities. The name inter-till zone originally was applied to
similar materials when evaluating the 1990 and 1991 boring data for the Clarkco site to reflect
the supposition that the non-till components within the inter-till zone represented an episode of
glacial retreat. This may or may not be the case. Because the term was introduced and
extensively used in the 1992 Clarkco hydrogeological report, the additional boring data recently
obtained has been used to refine the definition of this stratigraphic unit. However, an equally
Eagon & Associates, Inc. 4-6 January 1994
valid mapping approach would be to treat the inter-till zone in the same manner as the other
ground moraine units because it is predominantly till at most locations. If this approach weretaken and the concept of an inter-till zone de-emphasized, there would not be a compelling reason
to subdivide the till sequence into an upper and lower member. Sand beds within the inter-till
zone at the Clarkco site are referred to as the 1050 sand in this report, an approach which is
consistent with the description of the geology at adjacent sites.
4.1.2.1 Sedimentary Composition
The dominant material in the inter-till zone is till that is physically similar to the upper tillor lower till. In some parts of the Clarkco site, one or two sand or silt partings are the onlyobservable features that separates the inter-till zone from the upper or lower till. In other areas,several interbeds of sand and/or silt at various elevations or a thicker sequence of interlayered
sand and silt, with or without cohesive interbeds, may be present. Another constituent of theinter-till zone is a cohesive material that has essentially the same particle size distribution as thetill considered to be ground moraine, but displays subtle textures or fabrics that suggest re-working. Such material has been variously referred to as re-worked till, ablational till, glacial
backwater sediments, till-like, or "till on the boring logs. As a practical hydrogeological matter,
all such materials can be grouped because they have essentially the same physical properties.
4.1.2.2 Thickness and Areal Extent
As illustrated on cross sections A-A' through K-K' (Plates 14-25), the inter-till zone rangesin thickness from 0 to about 20 feet and probably averages 12 to 14 feet. As seen on crosssections E-E' and H-H' (Plates 19 and 22), the inter-till zone has been removed by erosion inthe deeper parts of the ravine draining the area to the south of the proposed landfill footprint.It is also absent beyond its outcrop in the other ravines and lowlands north and east of the site.
Figure 4-7 illustrates the thickness and area! extent of the 1050 sand, which is the nameapplied to sand interbeds within the inter-till zone. Figure 4-7 is different than the other sand
Eagon & Associates, Inc. 4-7 January 1994

maps because individual bed thicknesses are not posted. Shown instead is a net sand thickness
which is the sum of all interbeds that are 0.1 foot or thicker. The thickness of four, five or more
beds have been combined at some boring locations. In a few instances, the net sand thicknessshown on Figure 4-7 is an estimate of the sand portion of a finely interbedded sequence of sand
and/or silt and cohesive materials.
Figure 4-7 shows that there are only a few, relatively small areas in the central,northeastern and southern parts of the Qarkco site where the net thickness of the 1050 sandexceeds two feet. Much of the site is underlain by a combined thickness of 1050 sand that isa foot or more, but individual seams may be only 0.1 to 0.4 feet thick. If sand seams less thanone-half foot in thickness were not counted, the net thickness of the 1050 sand would bediminished almost everywhere, and in some places more than halved. Individual control points,and larger areas of no 1050 sand also would be depicted.
4.1.2.3 Physical Properties
USCS Textural Classification. The sedimentary composition of the inter-till zone is more
variable than that of the other stratigraphic units because materials other than typical till
constitute a greater percentage of its relatively small thickness. Despite this variability, it remains
a fact that the predominant material in the inter-till zone is till that is virtually indistinguishablefrom upper till or lower till samples (CL with minor CL-ML materials). The CL materials from
borings 90-11 (67.0-68.0 feet) and C91-3 (48.3-49.5 feet) are examples (see Table 4-3). Thesame USCS soil classifications (CL and CL-ML) generally apply to similar materials that havebeen described on the boring logs as till-like, glacial backwater sediments, ablational till, and re-worked till. Interbeds assigned to the 1050 sand include saturated and unsaturated silts (ML),silty sands (SM), well-graded silty sands (SW-SM), poorly-graded silty sands (SP-SM), and sandysilts (ML). Representative samples of the 1050 sand selected for laboratory characterization arelisted in Table 4-4. These include the SW-SM sand sampled from boring 90-6D (55.8-56.3) and
screened in well 90-6Z, the silty sand (SM material) screened in well 90-10X, the SP-SM sandscreened in well C91-4X, and the silty sand (SM material) sampled from boring C91-8D (42.7-
Eagon & Associates, Inc. 4-8 January 1994

44.1 feet) and screened in well C91-8X. As seen on the boring logs (Appendix C) and in Table
4-4, coarser-grained and well-sorted "clean" sands generally are absent.
Atterberg Limits. As seen in Table 4-3, undisturbed samples of cohesive materials from the
inter-till zone have engineering properties that are essentially identical to those of the surrounding
tills and that appear to resemble the upper till a little more closely. Samples from borings C91-3
and 90-11 have liquid limits of 20 and 21 and plastic limits of 12 and 13, respectively. The
plasticity index for each is 8. All of the inter-till zone samples that are not classified as CL-ML
or CL are non-plastic (Table 4-4).
Grain Size Distribution. The dominant material in the inter-till zone is glacial till. In someborings, part of the till appears to be re-worked. Like the upper and lower till stratigraphic units,the inter-till zone may contain clastic interbeds (either saturated or unsaturated). All suchinterbeds have been assigned to the 1050 sand group. Grain-size distributions of till samples
from the inter-till zone are within the ranges specified for both the upper and lower till sampleslisted in Table 4-3.
The grain-size distributions and resulting USCS classifications of three 1050 sand samplesfrom the inter-till zone (from borings 90-6D, C91-8D, and 90-10X) are listed in Table 4A.
Generally, medium and fine sand sizes predominate. A significant amount of gravel was foundonly in the sample from boring 90-6D. None of these samples are "clean" enough (have lessthan 5% by weight passing the #200 sieve) to avoid inclusion of the SM designation as part oftheir USCS classification symbol.
Hydraulic Conductivity. Permeability of the inter-till zone materials ranges approximately from7.2 x 10^ cm/sec for till (Table 4-3, boring 90-11) through about 1.1 x 10'7 cm/sec for thepredominantly silt interbeds, (estimate based on an actual determination on similar materialssampled from the lower till (Table 4-3, boring 91-9Y, WS-3) to as much as 2.3 x 1Q-2 cm/sec forthe better-sorted and "cleaner" sand units (based on the pump tests results on well 90-6Z, Table
5-1). Although thin, the sand unit screened in this well is judged to be the cleanest of the 1050
Eagon & Associates, Inc. 4-9 January 1994

sands that were encountered in any of the on-site borings that penetrated this horizon. The
second highest permeability measured in a well screened across the 1050 sand zone is 1.5 x 10"2
cm/sec based on the slug test of well C91-4Z, (Table 5-1). Permeability calculated from the
pump test of this well is about one third of the slug-test permeability (5.4 x 10"3 cm/sec). Thepump test value is considered the more accurate estimate because the pump test evaluates naturalformation beyond the developed zone surrounding the well screen.
4.1.3 Lower Till
The lower till as defined on the cross sections in Plates 14 through 22 generally occursfrom elevation 1040 down to about elevation 1015 to 1010.
4.1.3.1 Sedimentary Composition
Like the upper till unit and most of the inter-till zone, the lower till is predominantly
massive till that was deposited as ground moraine. The lower till contains a single clasticinterbed which is referred to in this report as the 1035 sand.
4.1.3.2 Thickness and Areal Extent
Figure 4-8 shows the thickness and area! extent of the 1035 sand. Generally speaking, the1035 sand is present in a north-south band that traverses the central and eastern portion of theClarkco site. Over much of the northern half of this band, the 1035 sand is less than two feetthick. To the south, it is more than one foot thick only at two locations, 92-3IX and C91-4.Combined bed thicknesses exceeding 2.0 feet are present only at five boring locations (92-19X,92-14X, 92-4X, 92-2X, and 92-15X).
Within the footprint of the proposed Clarkco landfill, the average thickness of the lowertill is about 30 feet, but its thickness may range from zero to more than 40 feet. The lower tillhas been truncated by erosion and is absent in the ravine south of boring C91-5D which is
Eagon & Associates, Inc. 4-10 January 1994

located about 1180 feet south of the proposed landfill footprint. Although surface topography
in the ravine to the south is the primary cause of rapid thickness variations, less-significant
thickness changes also result from the fact that both the upper and lower contacts of the lowertill are affected by localized stratigraphic variations in the adjacent units. This is more the case
for the contact with the underlying stratified drift in the southern and western parts of the sitethan for the contact with the overlying inter-till zone where the contact typically is subtle orgradational.
4.1.3.3 Physical Properties
USCS Textural Classification. The lower till typically is a CL material. In places, however, ithas slightly less plasticity and is classified as a CL-ML material.
Atterberg Limits. Liquid limits in the lower till range from 18 to 25 (Table 4-3). Plastic limits
range from 12 to 16. The plasticity index ranges from 6 to 11. Atterberg results for the lowertill are quite similar to those for the upper till.
Grain Size Distribution. Table 4-3 shows that the principal textural component in the lower till
is silt which ranges from 34.7 to 43.3%. The major secondary component is sand which ranges
from 27.8 to 38.7%. In the case of the undisturbed samples from boring C91-1, however, there
is slightly more sand than silt. Clay is a significant minor textural component of the lower till,ranging from 13.6 to 25.5%. Gravel contents varies from 1.5 to 16.6%.
Hydraulic Conductivity. Hydraulic conductivities determined in the laboratory on eightundisturbed samples of the lower till taken within the landfill footprint are extremely low, ranging
from approximately 1.3 x 10^ to 3.1 x 10"8 cm/sec. These values fall within a narrow range withthe average being about 1.9 x IQ* cm/sec. Four samples of the lower till from outside thefootprint also were analyzed. One sample (from boring C91-4) had a laboratory-derived value
for hydraulic conductivity of 4.5 x 10"7 cm/sec, which is uncharacteristic for the lower till (see
Table 4-3). Moreover, that analytical result is inconsistent with the physical properties of the
Eagon & Associates, Inc. 4-11 January 1994

the value derived is a statistical outlier. Such material cannot have a hydraulic conductivity of
4.45 x 10"7 cm/sec, based on experience with similar till samples at this site. In order to provide
further evidence to support this assertion, a split spoon sample (45.0 - 46.9 ft) from boring C91-4
was tested. The sample was trimmed, placed in a triaxial chamber, back saturated and tested inthe same manner as a Shelby tube or waxed sample. The value of hydraulic conductivity derived
was 3.91 x 10^ cm/sec as shown on the laboratory report which is included in Appendix F.
Results of in-situ permeability tests on four wells installed in the lower till range from 1.5x 10"7 cm/sec to 3.1 x 10"7 cm/sec. The laboratory tests are designed to measure the verticalhydraulic conductivity of the till whereas the field tests measure hydraulic conductivity in thehorizontal direction.
Moisture Content and Dry Unit Weight. The moisture content of lower till samples in Table 4-3
ranges from 9.3 to 14.1 percent. Dry weight varies from 123.71 to 134.10 pounds per cubic foot.
As seen on the boring logs in Appendix C, 1035 sand classifications range from silty sands
(SM) to fairly clean well-graded sand and gravel (SW). Poorly-graded sands (SP), and bothpoorly-graded, and well-graded sands with silt (SP-SM and SW-SM, respectively) also are
represented. Laboratory results of 1035 sand samples from borings C91-4X (SP-SM) and 90-9D
(SM) are included in Table 4-4.
Geotechnical test results on materials from three minor interbeds within the lower till areincluded in Table 4-3. These samples were selected for characterization because they are typicalof minor interbeds that are separately described on the boring logs but are included within thelarger mapping units.
The ML material from boring 91-9Y is representative of what appear to be lacustrine silts,and of silts that have gradational contacts with adjacent sand units. It is also similar to some of
the materials described as glacial backwater deposits (those that are quite uniform in textural
Eagon & Associates, Inc. 4-12 January 1994

composition and non-plastic or very low in plasticity). Its measured permeability is 1.1 x 10"7
cm/sec.
The SC-SM material from boring 91-9Y is distinguished by its slightly higher percentage
of sand and gravel-sized constituents and slightly lower percentage of clay (compared to typicaltill samples) which contribute to its lower plasticity and higher dry unit weight. Material of this
type usually would be described on the boring logs as "very hard sandy till." Despite itsengineering group classification as a silty or clayey sand, this over-consolidated till has very low
permeability (3.8 x 10"8 cm/sec).
The CL material sampled from 69.7 to 70.7 feet in boring 90-2 differs considerably fromthe lower till surrounding it. It has less sand, almost no gravel, and considerably more clay,when compared to lower till samples. Having a similar but slightly lower plastic limit, its liquidlimit and plasticity index contrast sharply with those of all of the other samples. The high clay
content largely accounts for these differences as well as for the low dry unit weight As mightbe expected, measured permeability is quite low (2.6 x 10"* cm/sec). Material of this type would
be described as sandy clayey silt. It is recognized as being more clayey than the adjacent till,possibly "sticky" in part. This material appears to be part of a lake-fill sequence that was quitevariable in composition. Overlying beds include some with black streaks and laminae that appearto be organic in origin.
4.1.4 Stratified Drift
4.1.4.1 Sedimentary Composition
Below the thick aquitard of ground moraine comprised of the upper till, the inter-till zone,and the lower till, is another thick more-complex sequence of glacial drift that is partly to mostlystratified. This stratified drift consists of silty sand, sand, sand and gravel, sandy silt, clayey silt,silty clay, till, reworked till, and other till-like cohesive materials. In places, the silty sand or
sand zones are weakly cemented. Many of the saturated sands in the deeper borings are
Eagon & Associates, Inc. 4-13 January 1994
extremely dense. Some of the sand and gravel beds also are cemented. In some borings, beds
that are described as sand and gravel were sufficiently cohesive and dense that they did not
appear to be saturated in spite of the fact that they occurred below the water table. Compact and
knitted are textural terms that have been used on the boring logs to describe materials of this
type.
In most of the site borings, a silty sand, sand, or sand and gravel is found at the base ofthe lower till at a fairly consistent elevation (1010 ±5 feet). In other places, particularly to the
south and east, non-till cohesive materials such as clayey silt or silty clay are present at the baseof the lower till. Often this contact is recognized by a color change from gray to shades of tan,brown or green. In some borings, exact placement of the base of the lower till or the contactwith the stratified drift is difficult. This is particularly the case if sand beds in the stratified driftare few and thin and nearly all of the cohesive materials are till or till-like, and similar inappearance to the lower till.
Below most of the Garkco site, the stratified drift sequence consists mostly of sand orsand and gravel (borings 92-27DD and 92-14DD). However, both till and non-till cohesivematerials are significant interbeds (cross sections A-A' through G-G', Plates 14 through 21). Tothe south and east, however, the thickness ratio of cohesive materials to sand, and sand and
gravel beds increase within the stratified drift sequence. For example, in borings 92-23 and 91-1,non-cohesive beds constitute less than 15% of the total thickness of the stratified drift sequence.
4.1.4.2 Thickness and Areal Extent
The stratified drift includes all materials from the base of the lower till to bedrock. Thethickness of this sequence ranges from about 58 feet in boring 92-23 to about 114 feet in boring92-2ID. As is the case at boring 92-23, the upper part of the stratified drift sequence has been
truncated by erosion at borings that start below the elevation of the base of the lower till.
Eagon & Associates, Inc. 4-14 January 1994

Either permeable elastics (sand or sand and gravel) or cohesive materials that may be facies
equivalents (clayey silt or silty clay) appear to be present everywhere beneath the proposedClarkco site, but the thickness of saturated permeable beds decreases significantly to the northeast
(cross sections A-A', B-B', C-CO and pinches out almost entirely to the south (cross section G-
G' and borings 91-1 and 92-23).
4.1.4.3 Physical Properties
Much of the description of the physical properties of the stratified drift sequence will focuson the thick sand and sand and gravel sequence that is regarded as the uppermost aquifer for theClarkco site.
USCS Textural Classification. As seen in Table 4-4, many of the sand or sand and gravel
samples obtained from the stratified drift sequence are classified as a silty sand (SM). This is
particularly true of its upper part. Within the main body of the thick sand and gravel sequence,there appears to be a general trend of coarsening with depth and to the west. The coarser-grained
layers within the sequence often could not be sampled effectively because the coarser gravels and
particularly, the numerous cobbles blocked the sampling devices. As a result, the coarser
classifications such as GP and GW or SP and SW are under-represented in the sieve analysesbecause they could not be retrieved. Drilling indications were used to assign USCSclassifications where sample recovery was lacking. In this way, the boring logs reflect observed
variations in the types of granular materials encountered, and in their textural classifications.
Cohesive materials also are included within the stratified drift. In areas where they are notthe dominant material type, they occur as interbeds of till or re-worked till (mostly CL withlesser amounts of CL-ML), or silt (ML) and as interbeds or laterally-equivalent cohesive
materials that generally are described on the boring logs as alluvial materials. Two examples of
the latter are listed in Table 4-3 (boring C91-3, sample WS-3 and boring C91-4, sample WS-2).The alluvial materials are finer-grained and more uniformly graded than till samples, and all are
classified CL. An example of a till or re-worked till interbed is the 112.0 - 112.5 foot sample
Eagon & Associates, Inc. 4-15 January 1994

from boring C91-9 listed in Table 4-4. This sample is classified as a CL material of low
plasticity. The 28.2 - 29.7 foot-sample from boring C91-5D is a till sample from the stratified
drift sequence. It also is a CL material (Table 4-4).
Atterberg Limits. The stratified drift sequence underlying most of the Clarkco site consistspredominantly of sand or sand and gravel deposits that generally are non-plastic. However, inmany borings, till or other cohesive units are significant interbeds. Till and/ or low-permeability
alluvial deposits are the predominant material type underlying most of the area at the southwestcorner and south of the proposed landfill. The cohesive materials in the stratified drift sequence
have plasticity characteristics that are in the range of similar materials found in the overlyingground moraine. Stratified drift materials described as till, re-worked till, or glacial backwaterdeposits are expected to have Atterberg limits within the range defined for the upper and lowertills and the inter-till zone (liquid limits 25-18; plastic Limits 16-11, and plasticity indices 11-6,Table 4-3). The 112.0 foot sample from boring C91-9 is an example of a till interbed (Table 4-4). The 28.2 - 29.7 foot sample from boring C91-5D (Table 4-3) is an example of a till sample
from the stratified drift sequence. Stratified drift materials described as alluvial or clayeylacustrine (clayey silts or silty clays) will have liquid limits of about 35-36, plastic limits ranging
from 13-18 and a plasticity index in the range of 17-23 based on lab analyses of the 83.1 - 84.2
foot sample from boring C91-3 and the 56.5 - 57.5 foot sample from boring C91-4. Stratifieddrift beds described as "bull's liver", silt, sandy silt, or silty lacustrine are non-plastic and
classified in the USCS system as an ML material. The 73.0 - 73.5 foot sample from boring C91-1 is an example (Table 4-4). This sample exhibited "bull's liver" consistency and was part of asandy silt and silty sand sequence.
Grain Size Distribution. As might be expected for heterogeneous granular materials, there isconsiderable variation in grain size. For the SM materials, which are more common in the upper
part of the stratified drift, sand percentages are seen to range from 54.4 to 86.1 (Table 4-4).Combined silt and clay percentages range from 12.1 to 30.3. Gravel percentages typically aretrace amounts (less than 10%), but are as high as 33.2 percent in one sample classified as SM.
Eagon & Associates, Inc. 4-16 January 1994
By definition, the non-cohesive materials that do not fall into the SC, SM, or SM-SC (or
GC, GM, or GM-GC) classifications have combined silt and clay percentages that total less than
12 percent. Six uppermost aquifer samples listed hi Table 4-4 fall into this category. Three arelisted as SP-SM; the others are classified as SW-SM, SP, and GP materials. Nearly all
combinations and gradations of sand and gravel sizes can be found in some part of the sand, and
sand and gravel sequence. Substantial textural variation commonly occurs within each boringand between adjacent borings. The grain-size distribution of cohesive interbeds, although highly
variable, is characteristic of the material type described. (See the preceding discussion of
Atterberg limits; the same comments and examples apply.)
Hydraulic Conductivity, Except for cohesive zones and interbeds, the sand and sand and gravelsequence within the stratified drift generally is highly permeable. The saturated part of this thickclastic sequence (below the well-defined water table at about elevation 985) is considered to be
the uppermost aquifer for the Clarkco site. The unsarurated upper part of this sand, and sand andgravel sequence is considered to be part of the same geologic deposit and has similar physical
properties. As shown on the hydrogeologic cross sections (Plates 14-25) the upper part of this
clastic deposit has been included as part of the uppermost aquifer system, even though it isunsarurated and is not an aquifer. Discussion of the hydraulic conductivity of the uppermostaquifer is in Section 5.3.1 of this report. Laboratory-determined hydraulic conductivities of
cohesive beds that are part of the stratified drift sequence range from approximately 1.4 x 10"7
to 1.8 x 10'9 cm/sec (Table 4-3).
4.1.5 Bedrock
4.1.5.1 Sedimentary Composition
Limestones and dolomites of the middle to lower Silurian system underlie the Clarkco siteand most of German Township (Norris and Fiddler, 1973). Carbonate bedrock was encountered
in all in-site borings that penetrated the entire thickness of the glacial drift.
Eagon & Associates, Inc. 4-17 January 1994

4.1.5.2 Thickness and Areal Extent
Reported thicknesses of the carbonate aquifer average about 130 feet. Twelve of the on-siteborings were drilled to the top of bedrock. Carbonate bedrock was encountered in all of these
borings at the following approximate elevations: 955 in PW-1, 925 in PW-2, 926 in PW-3, 916in 91-1, 899 in 92-20D, 904 in 92-21D, 912 in 92-22DD, 924 in 92-23, 934 in 92-27DD, 916
in 92-5DD, and 909 in 92-14DD. On the basis of these borings , the maximum relief on thebedrock surface is about 56 feet in the vicinity of the Clarkco site. The regional carbonateaquifer is present below the Clarkco site and throughout Clark County except where removed by
erosion associated with buried bedrock valleys.
4.1.5.3 Physical Properties
Carbonate bedrock encountered in the Clarkco borings generally is described as light tomedium gray, slightly bluish white or bluish gray, tan, or bluish-tannish gray microcrystalline to
granular dolomite. Hydraulic conductivities for wells completed in the carbonate aquifer
typically range from 2 x 10"3 to 5 x 10"3 cm/sec (Norris and Fidler, 1973).
42 Geomorphology
The proposed Clarkco facility is located in an upland till area that is drained to the north
by Storms Creek and to the south by Chapman Creek. Surface topography within the footprintof the proposed site is mostly gently sloping to gently rolling. Along parts of the exteriorborders of the eastern one half of the footprint, the topography is moderately sloping. Slope issteep in the area associated with the ravine in the southeast corner of the footprint. Most of theconspicuous relief results from headward erosion of surface drainage courses which flow from
the site to the north, south, and east. A small farm pond is present just north of the southernboundary of the proposed footprint (south of boring 89-6).
Eagon & Associates, Inc. 4-18 January 1994
4.3 Structural Geology
Correlation of the site boring logs indicates that the unconsolidated materials generally areflat-lying and show no indications of structural deformation. Bedrock is not exposed at the site.There are no faults mapped or known at the site.
Eagon & Associates, Inc. 4-19 January 1994
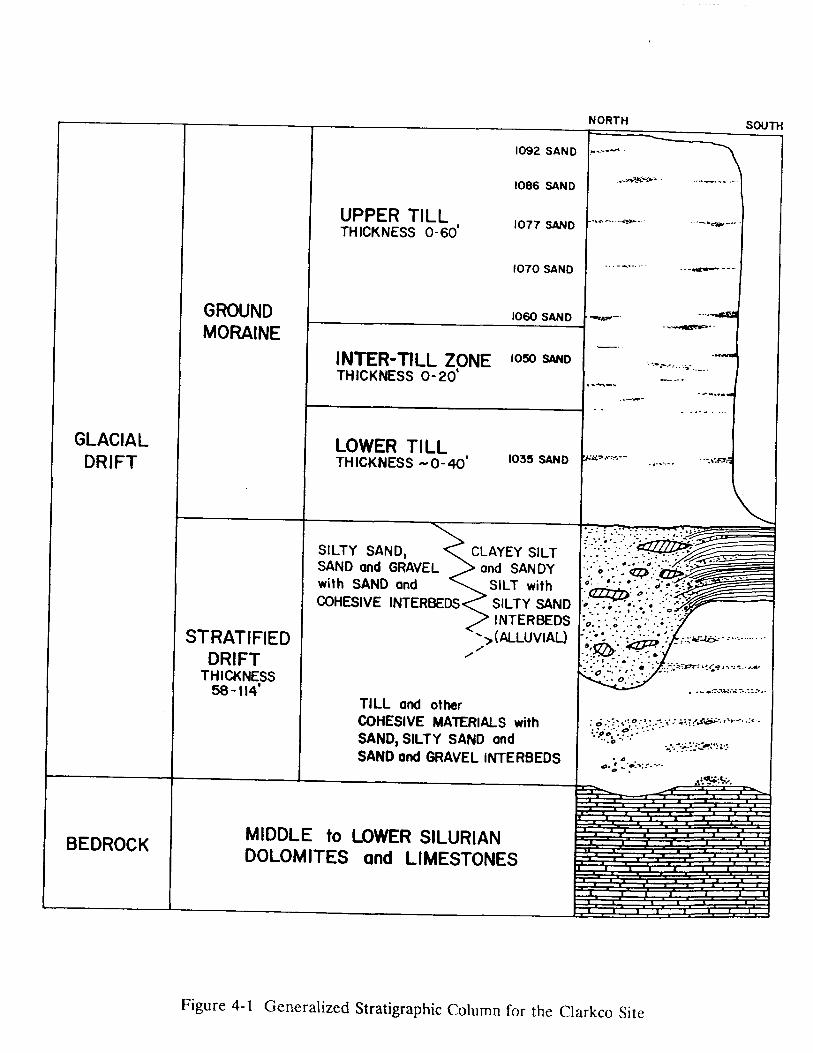
NORTH SOUTH
GLACIALDRIFT
GROUNDMORAINE
STRATIFIEDDRIFT
THICKNESS58-114'
UPPER TILLTHICKNESS 0-60'
INTER-TILL ZONE I05° SANDTHICKNESS 0-20'
LOWER TILLTHICKNESS -0-40'
SILTY SAND, <T CLAYEY SILTSAND and GRAVEL ^> and SANDYwith SAND and ^v. SILT withCOHESIVE INTERBEDS < SILTY SAND
INTERBEDS->( ALLUVIAL)
TILL and otherCOHESIVE MATERIALS withSAND, SILTY SAND andSAND and GRAVEL INTERBEDS
BEDROCK MIDDLE to LOWER SILURIANDOLOMITES and LIMESTONES
Figure 4-1 Generalized Stratigraphic Column for the Clarkco Site

92-15X
92-2X
1A/07 PRESENT "
\ ^90^^ 92-4X®V ^~- „. \
-5 \ -X192-19X— 92-18 ^X /
92-18X* \
1 090-130/\
\
/
'
)90-8X
090-80
PRESENT /989-6
l>
92-HX 92-14TP-O \
91-9Z 90-9DD '
. /91-9^90-gX I
K
' X
//'
PROPOSEDi LIMIT OFi SOLID WASTE-
) V ";\ /VJ
• C91-7
OC91-2DC92-1X*
C91-1
92-200 o]
92-25YB^92_25XB
89-7« 92-33Y
-3« LEGEND
89-8
092-28X
-+-PW-3
§ 92-290892-29X
1 92-29
Z' 92"31A AC91-4ZZi °92-31X C91~4*fe"-4X4V
f±, QC92-5DD
gl °C91-50
Q_OCt
^^*\ ^ UMfT OF SAND ZONE^^ *^^^
ft 7 THICKNESS OF SANDV (MIH.TPLE NUMBERS
INDICATE INDIVIDUALTHICKNESSES)
1
CL I
1 ' o 200 400
• 89-° 92-21DOl—— ~ ~ - __ SCALE IN FEET
ZONE N FEETIN A COLUMN
BED
_ ———— ——— • ——————— '
Figure 4-2. Thickness and Areal Extent of 1092 Sand

r
<r
1 /---
N
/. \
y M
\
1 -
V
01
CO
\X
ID
I \»
*
^
> /I1
> :/ 1 \ i >' i N ^
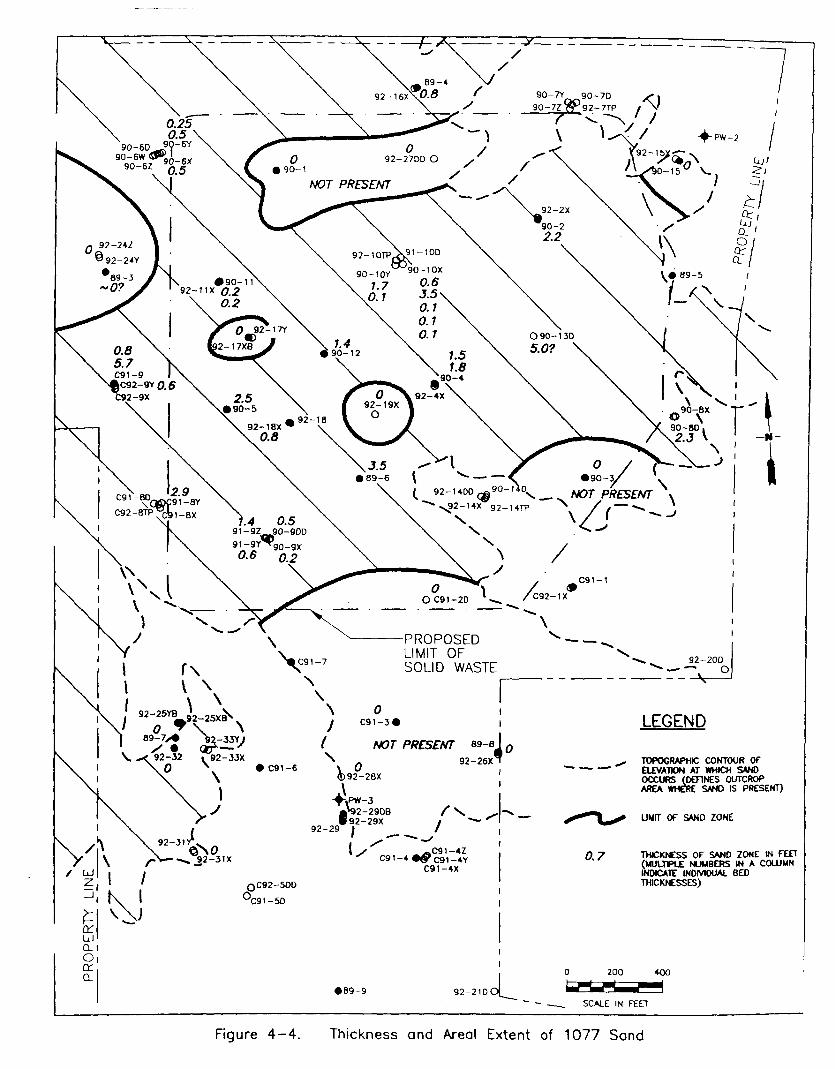
__ . NOT PRESENT
PROPOSEDLIMIT OFSOLID WASTE
NOT PRESENTTOPOGRAPHIC CONTOUR OFELEVATION AT WHICH SANDOCCURS (DEFINES OUTCROPAREA WHO?E SANO IS PRESENT)
LIMIT OF SAND ZONE
THICKNESS OF SANO ZONE IN FEET(MULTPLE NUMBERS IN A COLUMNINOCATE INDIVIDUAL BEDTHICKNESSES)
Figure 4-4. Thickness and Areal Extent of 1077 Sand


PROPOSEDLIMIT OFSOLID WASTE
92-24Z 0.3©92-24Y
NOT PRESENT
91-9Z 90-9DD
TOPOGRAPHIC CONTOUR OFQJEVATION AT WHICH SANDOCCURS (DEPNES OUTCROPAREA WHERE SAND IS PRESENT)
LIMIT OF SAND ZONE
THICKNESS OF SANO ZONE IN(MULTPLE NUMBERS IN A COLUMNINDICATE INDIVIDUAL BEDTHICKNESSES)
200 4OO
SCALE IN FZET
Figure 4-6. Thickness and Areal Extent of 1060 Sand

UD S zr o'
C/)
(0 a 3 a. a> o m X *-t- a> O m o CO a


Table 4-1SUMMARY OF TEST BORINGS
PROPOSED CLARKCO LANDFILL
Boring/WellNumber
GroundElevation
rftvCompletion
Zone
Depth toM ^pM •
Sand Pack:,:-M^Y
Depth ofScreenedInterval
(ft)
BoringDepth
(ft)
CompletionDate
RECONNAISANGE STUDY
89-189-289-389-489-589-689-789-889-9
8" PRO]
PW-1PW-2PW-3
1106.21109.61111.91077.81071.01087.91081.41082.61055.2
UMAUMAUMAUMAUMAUMAUMAUMAUMA
__— -— —__— —- —— -— —— —
__— -— —— —— —— —— -— —— —
102.0135.5125.5115.0100.0115.0100.5111.080.0
01/10/8912/14/8812/16/8812/29/8801/05/8912/20/8801/03/8912/23/8812/21/88
»0CrnON WEI1£ FOR PIMJS^
1108.71069.31075.0
UMAUMAUMA
87.098.0
115.0
97.0-122.0107.0-117.0120.0-130.0
155.0145.0149.5
03/09/9006/07/9006/08/90
PHASE I CLARKCO HYDROGEOLQOIC INVESTIGATION
90-190-290-390-490-590-6W90-6X90-6Y90-6Z90-6D90-7X90-7Y90-7Z90- 7D90-8X90-8D90-9X
1095.31087.01082.41088.31101.51102.91102.31102.11102.91102.21069.01069.21070.21069.11082.51082.91093.9
UMAUMAUMAUMAUMA
1092 Sand1070 Sand1077 Sand1050 Sand
UMAUMA1
1035 Sand1060 Sand
UMA1060 Sand
UMA1070 Sand
__— -— —— —— —8.1
30.820.552.5
111.5— —
26.86.0
82.021570.019.9
__— —— -— —— —
9.0-14.032.8-35.322.5-27.554.5-59.5
115.8-120.8__
28.8-31.37.3-9.8
87.0-92.024.0-29.072.6-77.622.4-27.4
87.588.085.088.098.515.037.529.063.0
121.059.031.515.593.030.082.028.0
10/24/9011/13/9011/15/9011/08/9011/07/9012/14/9011/29/9012/13/9012/14/9012/19/9012/05/9012/07/9012/10/9011/19/9012/11/9011/27/9012/21/90
- - Indicates borehole was pluggedUMA = Uppermost aquifer
1 Attempt to install well in perched zone above saturated portionof uppermost aquifer, Targeted zone not encountered at boring location.
bornglst.wk3 Page 1 of 4

Table 4-1 (cont'd)SUMMARY OF TEST BORINGS
PROPOSED CLARKCO LANDFILL
Boring/WellNumber
91-9Y91 -9Z90-9D90-9DD90-10X90-10Y91-10D90-1190-1290-13D90-14D90-15
GroundElevation
(m1093.81093.71094.11094.11095.71095.71095.61107.01097.41089.81061.71074.4
CompletionZone
1035 Sand1077 Sand
UMAUMA
1050 Sand1077 Sand
UMAUMAUMAUMAUMAUMA
Depth toTop of
Sand Pack(ft)
56.014.575.9
108.245.512.5
118.0— —— —
104.083.5
— —
Depth ofScreenedInterval
(ft)
58.0-63.016.8-19.385.3-90.3
110.8-115.847.5-50.014.0-19.0
122.0-127.0— -— -
105.5-110.586.4-91.4
— —
BoringDepthrm67.021.096.5
116.058.021.0
127.098.0
103.0111.093.097.0
CompletionDate
01/25/9101/26/9110/27/9012/14/9011/28/9012/12/9002/26/9111/30/9012/17/9012/11/9012/14/9012/11/90
BORING TO EVALUATE AND CHARACTERIZE UOCAL GEOEOGY
91-1 977.0 Bedrock -- -- 61.1 02/19/91
WiASE H GLARKX:0 HYDROGECtfXDGIC IhTVESTIGAI^ON
C91-1C91-2DC91-3C91-4C91-4XC91-4YC91-4ZC91-5DC91-6C91-7C91-8XC91-8YC91-8DC91-9
1057.91086.81087.21070.51069.51069.81070.41035.41040.41074.21094.61095.01094.91107.8
UMAUMAUMAUMA
1035 Sand1050 Sand1050 Sand
UMAUMAUMA
1050 Sand1070 Sand
UMAUMA
_ _100.0- —--
31.519.012.075.8- —--40.119.0
106.5—~ —
— _105.8-110.8
— ---
33.0-38.023.0-28.014.0-19.078.0-83.0
----
42.5-47.521.1-26.1
110.5-115.5— —
75.5111.0100.0102.039.029.019.584.5
101.790.548.029.0
116.0130.5
07/09/9107/02/9106/21/9106/27/9107/24/9107/24/9107/25/9107/03/9107/11/9107/17/9107/22/9107/23/9106/27/9107/15/91
rLARKf*VHVf>ROGEOLOGIC REPORT SUBMITTED JANUARY 1992
- - Indicates borehole was pluggedUMA = Uppermost aquifer
bornglst.wk3 Page 2 of 4

Table 4-1 (cont'd)SUMMARY OF TEST BORINGS
PROPOSED CLARKCO LANDFILL
Boring/WellNumber
GroundElevation
(mCompletion
Zone
f^&to;::if^jp-pr.Sand Pack••mm^1'
Depth ofScreenedInterval
(ft)
BoringDepth
(ft)
CompletionDate
PHASE III CLARKCO HYDROGBOLOOKJ INVESTIGATION (JULY 1992 WORKPLAN)BASED ON REPORT R^IEW COMMENTS
WELLS AND BORINGS USEI> 1^ 15BLINEATE AND CHARACTERIZE^A^UKA^^I) 2XM
92-2X92-4X92-11X92-14X92-15XC92-1XC92-9XC92-9Y92-16X92-17XB92-17Y92-18**92-18X**92-19X**92-24Y92-24Z92-25XB92-25YB92-26X92-28X92-2992-29X92-31X92-31Y92-3292-33X92-33Y
1087.11088.21107.81061.71073.91059.01107.71107.71077.91100.31099.81097.61097.61090.11112.01111.61055.11055.41082.31075.71071.81072.11075.81075.41080.41068.91069.9
1035 Sand1035 Sand1050 Sand1035 Sand1035 Sand1035 Sand1050 Sand1070 Sand1035 Sand1035 Sand1050 Sand1035 Sand1050 Sand1035 Sand1050 Sand1092 Sand1035 Sand1050 Sand1060 Sand1050 Sand1035 Sand1050 Sand1035 Sand1050 Sand1035 Sand1035 Sand1050 Sand
^iKlTilE TILL SEQUENCE
50.455.555.721.932.819.365.031.439.7— —
50.8— -
48.153.059.815.0— -— —
20.029.0— -15.041.520.0— —26514.0
53.5-58.558.6-63.658.0-63.024.2-29.235.0-40.022.5-27.568.0-73.034.0-39.042.7-47.7
_ _ *54.0-59.0
_ _ **
50.5-56.555.0-60.062.4-67.417.4-22.4
_ _ *
_ _ *
23.0-28.030.9-35.9
- —16.9-21.945.7-48.222.8-27.8
- —28.8-33.816.0-21.0
59.564.064.530.044.029.075.340.048.578.060.473.058.062.069.024.032.010.549.035.936.422.349.728.057.838.023.0
06/03/9206/01/9205/29/9206/29/9205/27/9205/28/9206/16/9206/23/9206/04/9208/10/9208/06/9208/13/9208/17/9208/03/9207/20/9207/21/9207/22/9207/22/9206/30/9209/16/9209/16/9209/17/9209/22/9209/23/9209/23/9209/24/9209/24/92
— — Indicates borehole was pluggedLIMA = Uppermost aquifer
* Targeted formation was not present' ' Scheduled as a boring only
bornglst.wk3 Page 3 of 4

Table 4-1 (cont'd)SUMMARY OF TEST BORINGS
PROPOSED CLARKCO LANDFILL
Boring/WellNumber
GroundElevation(m
CompletionZone
Depth toTop of
Sand Pack(ft)
Depth ofScreenedInterval
(ft)
BoringDepth
(ft)
CompletionDate
WELLS AND BORINGS USED TO CHARACTERIZE THE UPPERMOSTAQUIFER AND ESTABLISH ITS RELATIONSHIP TO THE LOCAL SETTING
C92-5DD92-14DD92-20D92-21D92-22D92-22DD92-2392-23D92-27DD92-29DB
1035.41061.31064.71056.01002.61002.4982.0982.4
1082.81073.2
UMA (B)UMA (B)UMA (B)UMA (B)
UMAUMA (B)BedrockUMA
UMA (B)UMA
111.1107.8149.7113.023.0743
21.0131.0
1123-117.31103-1153152.9-157.9115.3-120326.0-31.077.0-82.0
24.2-29.2133.0-138.0
123.0155.2167.8152.533.091.560.029.5
151.0102.5
08/05/9207/31/9207/09/9207/23/9208/25/9208/24/9207/15/9207/16/9209/17/9209/25/92
OFF SITE BORINGS
92-3092-3492-35DD
1043.0992.2
1092.7
BedrockBedrock
UMA (B)
Bedrock w— -
134.4
ell installed1
— —138.4-148.4
110.569.0
152.0
09/17/9209/29/9212/08/92
WELLS SCREENED IN GLACIAL TILL FOR IN-SITU PERMEABILITY TESTING
92-7TP92-10TP92-14TPC92-8TP
1069.51095.51061.71094.4
TillTillTillTill
32.077.247.950.0
32.9-36.978.7-83.748.7-53.751.5-56.5
38.584.054.060.0
11/11/9211/18/9211/24/9211/10/92
1 After sampling to 110.5' with an auger rig, a fluid-rotary rig was moved in to ream and deepen the boring in order to installa conventional domestic water well in the bedrock aquifer.
- — Indicates borehole was pluggedUMA = Uppermost aquifer(B) = Drilled to bedrock, but screened in uppermost aquifer.
' Targeted formation was not present* ' Scheduled as a boring only
bornglst.wk3 Page 4 of 4

Table 4-2SUMMARY OF TEST 2-INCH WELLS ARRANGED BY CLUSTER
PROPOSED CLARKCO LANDFILL
WellNumber
90-6W90-6Y90-6X90-6Z90-6D
90- 7Z90-7Y92-7TP90-7D
90-8X90-8D
91 -9Z90-9X91-9Y90-9D90-9DD
90-10Y90-10X92-10TP91-10D
90-13D
92-14X92-14TP90-14D92-14DD
C91-2D
C91-4YC91-4ZC91-4X
C91-5DC92-5DD
GroundElevation
cm1102.91102.11102.31102.91102.2
1070.21069.21069.51069.1
1082.51082.9
1093.71093.91093.81094.11094.1
1095.71095.71095.51095.6
1089.8
1061.71061.71061.71061.3
1086.8
1069.81070.41069.5
1035.41035.4
CompletionZone
1092 Sand1077 Sand1070 Sand1050 Sand
UMA
1060 Sand1035 Sand
TillUMA
1060 SandUMA
1077 Sand1070 Sand1035 Sand
UMAUMA
1077 Sand1050 Sand
TillUMA
UMA
1035 SandTill
UMAUMA (B)
UMA
1050 Sand1050 Sand1035 Sand
UMAUMA (B)
Depth toPop of
Sand Pack(K>
8.120.530.852.5
111.5
6.026.832.082.0
21570.0
14.519.956.075.9
108.2
12.545.577.2
118.0
104.0
21.947.983.5
107.8
100.0
19.012.031.5
75.8111.1
Depth ofScreenedInterval
(ft)
9.0-14.022.5-27.532.8-35.354.5-59.5
115.8-120.8
7.3-9.828.8-31.332.9-36.987.0-92.0
24.0-29.072.6-77.6
16.8-19.322.4-27.458.0-63.085.3-90.3
110.8-115.8
14.0-19.047.5-50.078.7-83.7
122.0-127.0
105.5-110.5
24.2-29.248.7-53.786.4-91.4
110.3-115.3
105.8-110.8
23.0-28.014.0-19.033.0-38.0
78.0-83.0112.3-117.3
BoringDepth
__mi___15.029.037.563.0
121.0
15.531.538.593.0
30.082.0
21.028.067.096.5
116.0
21.058.084.0
127.0
111.0
30.054.093.0
155.2
111.0
29.019.539.0
84.5123.0
CompletionDate
12/14/9012/13/9011/29/9012/14/9012/19/90
12/10/9012/07/9011/11/9211/19/90
12/11/9011/27/90
01/26/9112/21/9001/25/9110/27/9012/14/90
12/12/9011/28/9011/18/9202/26/91
12/11/90
06/29/9211/24/9212/14/9007/31/92
07/02/91
07/24/9107/25/9107/24/91
07/03/9108/05/92
UMA = Uppermost Aquifer
2inclstr.wk3 Page 1 of 3

Table4-2(cont'd)SUMMARY OF TEST 2-INCH WELLS ARRANGED BY CLUSTER
PROPOSED CLARKCO LANDFILL
WeUNumber
C91-8YC91-8XC92-8TPC91-8D
92-2X
92-4X
92-11X
92-15X
C92-1X
C92-9YC92-9X
92-16X
92-17Y
92-18X
92-19X
92-20D
92-21D
92-22D92-22DD
92-23D
92-24Z92-24Y
92-26X
92-27DD
GroundElevation
(ft)
1095.01094.61094.41094.9
1087.1
1088.2
1107.8
1073.9
1059.0
1107.71107.7
1077.9
1099.8
1097.6
1090.1
1064.7
1056.0
1002.61002.4
982.4
1111.61112.0
1082.3
1082.8
CompletionZone
1070 Sand1050 Sand
TillUMA
1035 Sand
1035 Sand
1050 Sand
1035 Sand
1035 Sand
1070 Sand1050 Sand
1035 Sand
1050 Sand
1050 Sand
1035 Sand
UMA(B)
UMA (B)
UMAUMA (B)
UMA
1092 Sand1050 Sand
1060 Sand
UMA(B)
Depth toTop of
Sand Pack(ft)
19.040.150.0
106.5
50.4
55.5
55.7
32.8
19.3
31.465.0
39.7
50.8
48.1
53.0
149.7
113.0
23.074.3
21.0
15.059.8
20.0
131.0
Depth ofScreenedInterval
(ft)
21.1-26.142.5-47.551.5-56.5
110.5-115.5
53.5-58.5
58.6-63.6
58.0-63.0
35.0-40.0
22.5-27.5
34.0-39.068.0-73.0
42.7-47.7
54.0-59.0
50.5-56.5
55.0-60.0
152.9-157.9
115.3-120.3
26.0-31.077.0-82.0
24.2-29.2
17.4-22.462.4-67.4
23.0-28.0
133.0-138.0
BoringDepth
(ft)
29.048.060.0
116.0
59.5
64.0
64.5
44.0
29.0
40.075.3
48.5
60.4
58.0
62.0
167.8
152.5
33.091.5
29.5
24.069.0
49.0
151.0
CompletionDate
07/23/9107/22/9111/10/9206/27/91
06/03/92
06/01/92
05/29/92
05/27/92
05/28/92
06/23/9206/16/92
06/04/92
08/06/92
08/17/92
08/03/92
07/09/92
07/23/92
08/25/9208/24/92
07/16/92
07/21/9207/20/92
06/30/92
09/17/92
UMA = Uppermost Aquifer
2inclstr.wk3 Page 2 of 3

Table4-2(cont'd)SUMMARY OF TEST 2-INCH WELLS ARRANGED BY CLUSTER
PROPOSED CLARKCO LANDFILL
WellNumber
92-28X
92-29X
92-31Y92-31X
92-33Y92-33X
92-35DD
GroundElevation___mi____
1075.7
1072.1
1075.41075.8
1069.91068.9
1092.7
CompletionZone
1050 Sand
1050 Sand
1050 Sand1035 Sand
1050 Sand1035 Sand
UMA (B)
Depth to•Top of
Sand Pack(ft)
29.0
15.0
20.041.5
14.0265
134.4
Depth ofScreenedInterval
(ft)
30.9-35.9
16.9-21.9
22.8-27.845.7-48.2
16.0-21.028.8-33.8
138.4-148.4
BoringDepth
__Jft)____
35.9
22.3
28.049.7
23.038.0
152.0
CompletionDate
09/16/92
09/17/92
09/23/9209/22/92
09/24/9209/24/92
12/08/92
UMA - Uppermost Aquifer
2inclstr.wk3 Page 3 of 3

Table 4-3GEOTECHNICAL TEST RESULTS FOR UNDISTURBED SAMPLES
PROPOSED CLARKCO LANDFILL
BoringSampleType'
SampleInterval
•'-' :':.-ti>sat"^: •?•:Classification
A T T B R B E R G
LiqnWLimit
PlMtlCLimit
PlasticityIndex
NaturalM:<i>'i»tBv£;Content
Dry-UnitWeight
fpcf)
S A N D S I Z E S
Coarse• " ". •':•. '; ' -• • • • ' . • • •
Medium Fine
W ASH G R AD A T I O N
Gravel Sand Silt ClayPermeability
(cm/sec)
UPPER TILL
90-290-490-590 -6X90-6YC91-7C91-990-10X90-10Y90-1590-15
STSTSTSTSTST
WS-1WS-1
STSTST
23.0 - 25.023.0 - 25.018.5 - 20.535.5 - 37.521.0 - 23.015.5 - 17.350.5 - 51.724.0 - 25.014.0 - 15.413.0 - 14.023.0 - 24.5
CLCLCLCLCLCLCL
CL-MLCL-ML
CLCL
i
C91-390-1190-13
WS-1WS-1WS-1
48.3 - 49.567.0 - 68.039.0 - 40.0
CLCLCL
2221212121212320182120
1313121313111313121212
9898810107698
10.611.311.610.311.610.08.012.39.99.011.0
131.46130.02133.86133.60131.71134.33131.06127.65136.99133.83131.83
4.54.14.85.86.34.410.86.49.85.44.8
INTER -TILL ZONE
202121
:-V' ; : ••-;r-::v
121313
888
11.08.79.2
129.43136.52134.24
4.97.04.9
11.09.69.29.89.39.89.710.610.910.111.5
18.617.118.417.015.218.416.618.620.418.622.2
5.05.17.315.713.310.17.56.25.96.93.4
34.130.832.432.630.832.637.135.641.134.138.5
40.944.140.034.437.339.435.340.936.638.739.4
20.020.020.317.318.617.920.117.316.420.418.7
3.034x10"'2.169x10-'2.269x10-'2.258x10-*3.062X10'8
2.382 x 10'8
1.194x10-*6.329x10-*6.326x10-'2.765x10''1.810x10-"
8.611.411.5
18.919.218.9
5.84.95.6
32.437.635.3
40.539.840.1
21.317.719.0
1.337x10-'7.169x 10-'1.539xlO-8
ST = Shclby TubeWS = Waxed Continuous Sampler Sample
undistb.wkS Page 1 of 2
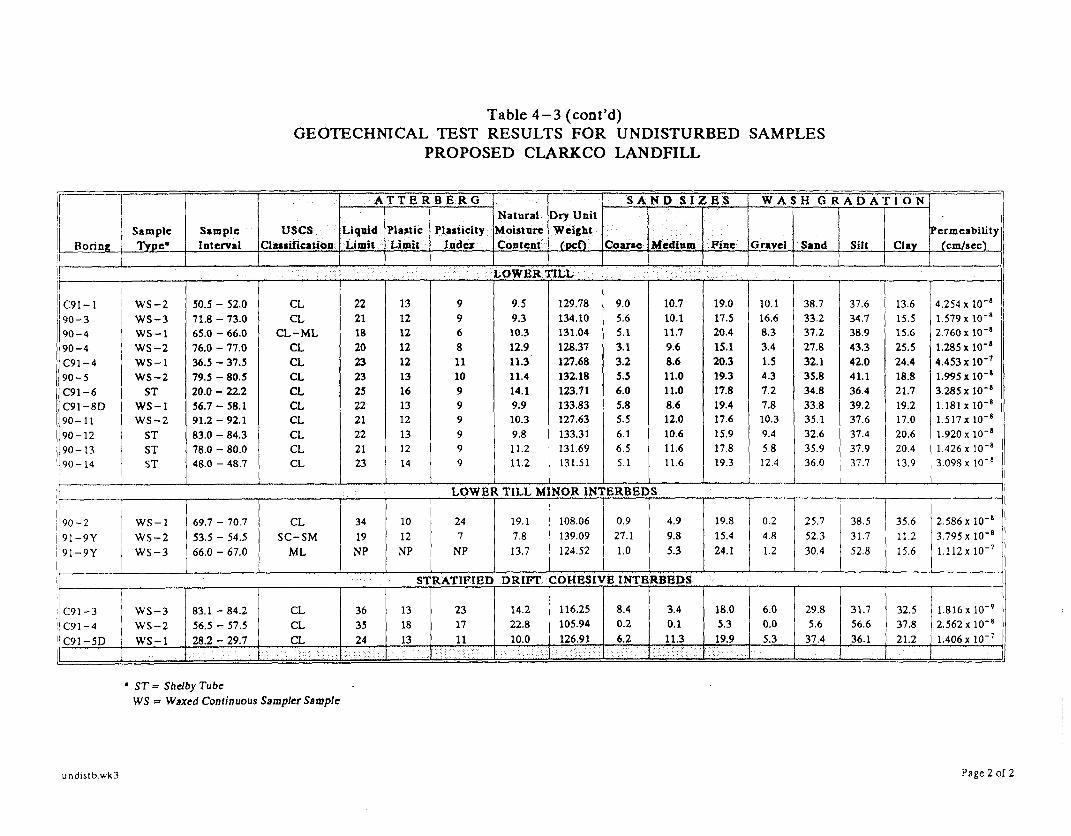
Table4-3(cont'd)GEOTECHNICAL TEST RESULTS FOR UNDISTURBED SAMPLES
PROPOSED CLARKCO LANDFILL
... .. , . . . , . . . .Ii
BoringSampleType'
SimpleInterval
usesClassification
A T T E R B E R G
LiquidLimit
PlasticLimit
PlasticityIndex
NaturalMoistureContent
Dry UnitWeight
fpcO
S A N D S I Z E S
Coarse Medium Fine
W A SH G R AD ATI O N
Gravel Sand Silt ClayPermeability
(cm/sec)
.. '-.• : - . • : - -.:::•:: : : • • • . ' ••••.•': :: . : : : ; ." ' -•:- • ' LOWER TILL • V . . ' : : . -: :':^'-< - ' : ' '^ •
C91-190-390-490-4C91-490-5C91-6C91-8D90-1190-1290-1390-14
WS-2WS-3WS-1WS-2WS-1WS-2
STWS-1WS-2
STSTST
50.5 - 52.071.8 - 73.065.0 - 66.076.0 - 77.036.5 - 37.579.5 - 80.520.0 - 22.256.7 - 58.191.2 - 92.183.0 - 84.378.0 - 80.048.0 - 48.7
CLCL
CL-MLCLCLCLCLCLCLCLCLCL
222118202323252221222123
131212121213161312131214
99681110999999
9.59.310.312.911.311.414.19.910.39.811.211.2
129.78134.10131.04128.37127.68132.18123.71133.83127.63133.31131.69131.51
9.05.65.13.13.25.56.05.85.56.16.55.1
10.710.111.79.68.611.011.08.612.010.611.611.6
19.017.520.415.120.319.317.819.417.615.917.819.3
10.116.68.33.41.54.37.27.810.39.45.812.4
38.733.237.227.832.135.834.833.835.132.635.936.0
37.634.738.943.342.041.136.439.237.637.437.937.7
13.615.515.625.524.418.821.719.217.020.620.413.9
4.254x 10"8
1.579x 10"8
2.760 x 10'8
1.285x10-"4.453 JclO'7
1.995x10-'3.285x10-'1.181x10-'1.517x 10"'1.920x10-"1.426x ID'8
3.098 x 10"'
LOWER TILL MINOR INTERBEDS
90-291-9Y91-9Y
WS-1WS-2WS-3
69.7 - 70.753.5 - 54.566.0 - 67.0
CLSC-SM
ML
3419
NP
1012NP
247
NP
19.17.813.7
108.06139.09124.52
0.927.11.0
4.99.85.3
19.815.424.1
0.24.81.2
25.752.330.4
38.531.752.8
35.611.215.6
2.586 x 10"8
3.795x 10-'1.112x10-'
STRATIFIED DRIFT COHESIVE INTBRBEDS
JC91-3C91-4C91-5D
WS-3WS-2WS-1
83.1 - 84.256.5 - 57.528.2 - 29.7
CLCLCL
363524
131813
231711
14.222.810.0
116.25105.94126.91
8.40.26.2
3.40.111.3
18.05.319.9
6.00.05.3
29.85.6
37.4
31.756.636.1
32.537.821.2
1.816x10-'2.562 x 10'8
1.406x 10"7
ST = Shelby TubeWS = Waxed Continuous Sampler Sample
undis ib .wk3 Page 2 of 2

GEOTECHNICALTable 4-4
TEST RESULTS FOR SAMPLES OF GRANULAR MATERIALSPROPOSED CLARKCO LANDFILL
Bo rineSampleType'
SampleInterval
usesClassifi-
cation
NaturalMoistureContent
SAND S I Z E S
Coarse Medium Fine
WAS H G R A D A T I O N
Gravel SandSilt
and ClayPlasticity
Index
SATURATED ZONES ABOVE THE UPPERMOST AQUIFER
C91-1
C91-4X
C91-4Z
90-6W
90 -6X
90-6D
90 -7Z
90-8D
C91-8Y
C91-8D
90-9D
90-10X
cssssssscscssscssscscscs
36-36.5
33.7-34.4
17.0-17.8
11.0-12.0
34.0-34.5
55.8-56.3
8.0-9.6
27.0-27.5
23.0-24.6
42.7-44.1
62.0-63.0
48.4-49.05
SM
SP-SM
SP-SM
SM
SP
SW-SM
SW-SM
SP
SM
SM
SM
SM
13.2
10.9
11.5
12.0
14.6
11.5
11.6
15.0
8.6
8.0
15.1
10.9
2.7
27.7
21.7
16.8
21.0
11.3
22.4
13.5
14.7
19.1
6.6
14.7
37.2
37.6
41.3
25.2
65.6
36.4
38.7
45.5
24.6
31.5
28.4
21.5
44.5
10.8
11.9
22.9
10.8
14.5
10.8
24.9
18.9
21.0
33.3
23.9
0.6
14.1
14.3
20.4
1.6
29.5
19.9
12.5
25.3
15.9
5.1
15.5
84.4
76.1
74.9
64.9
97.4
62.2
71.9
83.9
58.2
71.6
68.3
60.1
15.0
9.7
10.8
14.7
1.0
8.3
8.2
3.6
16.4
12.5
26.6
24.4
NP
NP
NP
NP
NP
NP
NP
NP
NP
NP
NP
NP
* SS = Split SpoonCS = Jar Sample from Continuous Sampler
granmatr.wk3 Page 1 of 2

Table 4-4 (cont'd)GEOTECHNICAL TEST RESULTS FOR SAMPLES OF GRANULAR MATERIALS
PROPOSED CLARKCO LANDFILL
BoringSampleType*
SampleInteival
usesClassifi-
cation
NaturalMoistureeontent
SAND S I Z E S
Goainse Medium Fine
W A S H G R A D A T I O N
Gravel SandSilt
and Clay
————————Plasticity
Index
UPPERMOST AQUIFER
C91-1
C91-2D
C91-5D
90-6D
C91-7
90-7D
90-8D
C91-8D
C91-9
C91-9
90-9D
91-10D
91-10D
CS
CS
SS
CS
CS
csVCS \\-cs VCS
CS
CS
CS
CS
73.0-73.5
109.5-110.0
79.0-80.5
93.9-94.5
^S&fr=&*r90D-90.5
CO$$£-79.8
n'JO -riLt33Qflll4.0rVri -$ 'Z- c\rjdjB-rii2.5 'Iji&ty o\o^o
\T^ £-• "O
119.0\- 120.0\ _--—
ML
SP-SM
SP-SM
SP_
gP-SM \
20.9
19.8
13.4
9.1
17.1
@s^c/A i?2^ ,̂̂ ^\ 7.6
•\ sv^swjj^™E^*. \^afcfc
* C^J >23 SM7 ,̂ weCP c'i v
CT5 ?«SM -^ y?•G P %O\ if - •*"2jJ>* '̂
°\ 9'6
f\ 9.2
if^,\ nci -^\ 9-5^.T-H*J \7.0
\.8
""" 13.2
0.1
0.2
7.7
13.4
0.2
0.8
15.9
29.9
5.9
23.8
2.0
9.4
9.2
0.4
47.4
31.3
36.4
51.1
63.0
23.4
34.5
8.6
22.9
44.2
13.3
23.3
31.6
41.2
48.4
13.0
38.0
22.3
15.5
10.8
12.7
7.7
27.0
7.7
28.9
0.1
0.0
1.4
35.1
0.0
1.8
25.9
19.5
6.8
33.2
3.3
66.5
8.3
32.1
88.8
87.4
62.8
89.3
86.1
54.8
75.2
27.2
54.4
73.2
30.4
61.4
67.8
11.2
11.1
2.1
10.7
12.1
19.3
5.3
45.8 & 20.1
12.4
23.5
3.1
30.3
NP
NP
NP
NP
NP
NP
NP
NP
8
NP
NP
NP
NP
————————
* SS = Split SpoonCS = Jar Sample from Continuous Sampler
granmatr.wk3 Page 2 of 2

5.0 SITE HYDROGEOLQGY
5.1 Conceptual Model
Figure 5-1 is a hydrogeologic column for the Clarkco site based on the generalized
stratigraphic column (Figure 4-1) presented in Section 4.0. The lithology and physical properties
of each stratigraphic unit defined at the site are summarized on Figure 5-1 and their
hydrogeologic significance is described. The Upper Till, Inter-Till Zone and Lower Till are all
aquitards which comprise a single confining bed in which minor sand seams are present. The
minor sand seams constitute significant zones of saturation because they are potentially local
migration pathways, but are not sufficiently productive to be considered aquifers. The permeable
sand and gravel zones within the underlying stratified drift constitute the uppermost aquifersystem at the Clarkco site, the upper part of which is unsaturated beneath most of the site. This
uppermost aquifer is a local aquifer that pinches out in several directions. The underlying
bedrock system is a regionally-extensive aquifer. Because of the hydrogeologic similarity of the
tills which collectively make up the confining bed, there are only three hydrostratigraphic units
which constitute the hydrogeologic framework and ground-water flow regime at the Clarkco site.
The conceptual model presented here is an overview of the site characterization that is
presented in this section of the report. Figures 5-2 is a conceptual model illustrating the three
hydrostratigraphic units and the manner in which they control ground-water flow patterns at thesite. Significant zones of saturation within the till confining bed are local pathways for horizontal
migration which discharge at outcrop areas in the ravines or on the hillsides to the north, east,
and south. Recharge to the significant zones of saturation from precipitation occurs through theweathered tills where sand zones are within 20 to 25 feet of the surface. There is a strong
downward hydraulic gradient, but the dominant flow direction is horizontal because the horizontal
permeability of the sand seams is several orders of magnitude greater than the vertical
permeability of the till.
Eagon & Associates, Inc. 5-1 January 1994

The uppermost aquifer system is unsaturated at the top due to the lack of local recharge
from precipitation through the confining bed. The dominant direction of ground-water flow
within the uppermost aquifer beneath the footprint of the proposed landfill is to the east and
northeast. The potential for ground-water flow in other directions beyond the limits of the
proposed landfill footprint is small by comparison due the lateral gradation to beds of lower
permeability within the stratified drift. The direction of flow within the regional bedrock aquifer
is generally west to east.
5.2 Significant Saturated Zones
The physical properties including hydraulic conductivity of the Upper Till, Inter-Till Zone,
and Lower Till are described in detail in this section. These units constitute a major aquitard as
demonstrated by the summary of physical properties on Figure 5-1, which also shows the
similarity of these units. As a practical matter, these units constitute a single confining bed and
the following detailed description of hydrogeologic characteristics is focused on the sand zones
which occur within it.
In order to fully characterize the hydrogeologic properties of saturated zones within the till
sequence, cluster wells were installed at several locations. Slug tests were performed on most
of these wells to determine the hydraulic conductivity of the sand zones.
Pump tests also were conducted on most of the wells that could not be bailed dry to verify
the slug test results and to determine the potential yield of these water-bearing zones, hi order
to determine whether or not they should be considered to be aquifers. Table 5-1 is a summary
of the results of all of the slug tests and pump tests that have been performed at the Clarkco site.
Results of the pumping tests indicate that none of the sand zones within the confining bed
produce enough water to be classified as an aquifer at this location. Most zones produce
significantly less than one gpm (see Table 5-1). Only wells 92-26X and 90-6Z would produce
more than one gallon per minute and the sustained yield of these wells for 24 hours was
computed to be 1.6 and 1.1 gpm, respectively. Well 90-6Z is located at the extreme northwest
Eagon & Associates, Inc. 5-2 January 1994

comer of the proposed landfill and well 92-26X is located beyond the landfill footprint about 600
feet to the south.
The information on which the determination of sustained yield is based is summarized in
the "Pumping Test Data" columns on Table 5-1. Graphs and computations for the pumping tests
are presented in Appendix G. Wells which have no available drawdown were not tested, because
a reliable supply could not be developed where water levels are at or below the top of the water
producing zone before pumping. The available drawdown was computed for each well as the
difference between the elevation of the top of the sand zone and the lowest water level observed
to date (Tables 5-2 and 5-3). The sustained yields of wells that were bailed or pumped dry in
a short period of time at rates of less than one gpm, are considered to be much less than the rateat which they were bailed or pumped. Most of the wells fall into these two categories.
A few of the wells could be pumped at rates of 0.9 or 1.0 gpm for more than an hour or
two. Time-drawdown graphs of the test data were analyzed to project the pumping levels out
to 24 hours or until the available drawdown was exceeded. At wells 92-24Z, 92-18X and 92-24Y
the available drawdown was exceeded long before 24 hours. At well 90-9X, the projected
drawdown at the end of 24 hours would have been essentially equal to the available drawdown.
This well might sustain a pumping rate of 1.0 gpm for 24 hours, but no more than that. The
sustained yield for wells 92-26X and 90-6Z was calculated from the test data by multiplying the
test rate by the ratio of the projected 24-hour drawdown to the available drawdown times the test
rate. These are the only wells which potentially are capable of producing more than one gpm.
Only 2 of 38 wells have a calculated sustained yield of 1.0 gpm or more for 24 hours based
on this simple and straight-forward method of analysis. The best well which is outside the
footprint could produce only 1.6 gpm. Considering these meager well capacities and the fact that
all of these thin sand zones have water levels that would be at or near the top of the well screen
and pump intake of a developed supply well, it seems inconceivable that a reputable water-well
contractor would attempt to develop a water supply from them. This is particularly true in view
of the fact that deeper stratified sands potentially yield 10 to 15 gpm. If such a zone is not
Eagon & Associates, Inc. 5-3 January 1994

encountered, an even greater yield is available from the regional bedrock aquifer. Moreover, the
areal extent of these intra-till sand zones is limited to the Clarkco property, or they crop out just
beyond the property boundaries. Clearly, these intra-till sand zones do not constitute the
uppermost aquifer at the Clarkco site and should be defined only as significant zones of
saturation.
5.2.1 Hydraulic Conductivity
Test results reported in Table 5-1 are grouped by sand zone. The data graphs and
computations are presented in Appendix G in the same sequence as they appear in Table 5-1.
Pump test results on the 1092 sand wells yielded hydraulic conductivities of 1.9 x 10~2 cm/sec
in well 92-24Z and 5.6 x 10~3 cm/sec in well 90-6W. Slug test hydraulic conductivities on the
1077 sand wells ranged from 4.1 x 10'3 cm/sec in well 90-10Y to 8.4 x 105 cm/sec hi well 91-
9Z. Both slug tests and pump tests were performed on two of the 1070 sand wells. Hydraulic
conductivities range from 4.6 x 10"3 cm/sec for the slug test in well 90-9X to 1.3 x 10"* cm/sec
for both the slug test and the pump test hi well 90-6X. Slug and/or pump tests also were
performed on die three 1060 sand wells. Results ranged from 2.8 x 102 cm/sec for the pump test
in well 90-7Z to 9.1 x 10^ cm/sec for the slug test in well 90-8X.
The largest number of in-situ hydraulic conductivity tests were performed on the 1050 sandwells. Hydraulic conductivities for the 1050 sand range from 2.3 x 10'2 cm/sec for the pump test
hi well 90-6Z to 1.7 x 105 cm/sec for the slug test in well 90-10X. The median value for
hydraulic conductivity is 1.1 x 10"3 and the average is 4.5 x 10"3 cm/sec.
Several hydraulic conductivity tests also were run on the 1035 sand wells. Field-
determined hydraulic conductivities ranged from 1.3 x 103 cm/sec for the slug test in well 90-7Y
to 3.6 x 10s cm/sec for the slug test in well 91-9Y. The hydraulic conductivity in the deeper
1035 sand zone is more consistent than in the 1050 sand, with a median value of 2.4 x 10"*
cm/sec. The average of die field-determined hydraulic conductivity values is 4.4 x 10^ cm/sec.
Eagon & Associates, Inc. 5-4 January 1994

In general, there is good correlation between the results obtained by both testing methods.
In no case is there an order of magnitude difference between the slug-test and pump-test results
for the same well. In fact, few of the results differ by an amount that exceeds half an order of
magnitude. Pump test results are considered the more useful because approximate well yields
were determined from the test rate and time-drawdown data. In many cases, however, wells did
not produce sufficient water to sustain a pump test, even at pumping rates as low as 0.2 gpm.
For this reason, the lowest measured permeabilities for each sand zone necessarily were based
on the slug-test method.
Field hydraulic conductivity tests were not performed on all of the wells listed in Table 5-1.
Several of these wells (92-28X, 29X, 3IX, 31Y, 33X, and 33Y) were installed specifically asmonitoring wells for the 72-hour pumping test of PW-3. Once it was determined that aparticular well could be bailed dry, or broke suction at a pumping rate of one-half gallon per
minute or less, no further attempts to quantify the permeability of the screened zone by collecting
pumping-test data were made. From the additional data listed in Table 5-1, the reason that
additional testing was considered unwarranted is apparent in most cases, particularly when
compared to the results obtained from wells screened hi saturated zones with similar sand
thicknesses and available drawdown.
5.2.2 Ground-Water Level Fluctuations
Ground-water levels have been measured on a monthly basis in all of the wells installedas part of the hydrogeologic investigation of the Clarkco site (Table 5-2). The more-recently
installed wells were added to the circuit as they were completed, hi Table 5-2, PW-1, PW-2, and
PW-3 (the initial installations) are listed first, followed by the 1990 and 1991 well installations.
The 1991 C-prefix wells are listed next. All wells (including 1992 installations) that are part of
a well cluster are grouped in Table 5-2. All of the 1992 wells that were not installed next to an
existing well, are in numerical order at the end of the table.
Eagon & Associates, Inc. 5-5 January 1994

Hydrographs have been prepared for each well in order to illustrate seasonal water-level
fluctuations. Hydrographs of wells completed in the same sand zone have been grouped in order
to facilitate analysis and discussion of similarities and differences in the patterns of variation.
Figures 5-3 through 5-7 are hydrographs for the 1092 through 1035 sand groups, respectively.
Plate 27 is a composite of hydrographs from wells at both the Clarkco and Tremont properties
which illustrates the range in water-level elevations in the various zones. The downward vertical
gradient is readily apparent from the water-level data presented on Plate 27.
Figure 5-3 illustrates that water levels in both wells developed in the 1092 sand fluctuate
similarly. Figure 5-4 illustrates that the shallower sand zones have a greater range of water-level
fluctuation. The similarity of the hydrographs for wells 91-9Z and 90-9X is because these wells
are located in the same cluster and the zones screened in these wells are separated by only 4.5
feet (see Plate 18). The hydrographs for wells 90-6Y and 90-6X coincide for the same reason.
The vertical separation between the sand zones here is 6.5 feet.
Figure 5-5 illustrates a fairly large range of fluctuation of water levels in wells 90-7Z and
90-8X. Although these wells are developed in the next lower sand zone (the 1060 sand), the
depth of overburden above the top of the sand pack is only 6 feet and 21.5 feet, respectively.
The thin overburden is a function of topography and the relationship is seen again on Figure 5-6
in the next lower 1050 sand, where the depth to the top of the sand pack in wells C91-4Z and
C91-4Y is only 12 feet and 19 feet, respectively. The hydrograph for well C91-4X (see Figure
5-7) developed in the 1035 sand is almost identical to that of well C91-4Y, the next shallower
well in the cluster (see Figure 5-6). The sand packs in these two wells are separated vertically
by about 4 feet and the sand zones are separated vertically by about 8 feet with a sand bed
between them. The similarity of the hydrographs for these wells may indicate an ineffective well
seal in C91-4X or a connection between the 1035 and 1050 sands at this location. However, this
cluster location is more than 1000 feet south of the proposed landfill footprint.
Eagon & Associates, Inc. 5-6 January 1994
5.2.3 Recharge and Discharge
The fact that water levels in the deeper sand zones fluctuate seasonally, in itself does not
indicate a direct vertical interconnection between sand zones. Water levels in the deeper sands
are confined, for the most part, and respond hydraulically to changes in water levels
downgradient in the same zone. Discharge from all of the saturated zones within the till
sequence is to the ravines or side-slopes that surround the upland area to the north, south, and
east. Near the discharge areas, overburden is much thinner, allowing for local recharge and a
greater range of water-level fluctuation as just described. This causes a corresponding water-level
change upgradient in that zone, whether or not the sand zone receives any direct rechargevertically at that location.
Downward percolation is the primary source of recharge for the saturated zones within the
till sequence. Most of the recharge to each sand zone probably occurs in areas where the sand
zone is less than 20 feet below the ground surface. This conclusion was reached as a result of
studying the hydrographs for each well and for various well groupings and attempting to
categorize the observed patterns of seasonal variation. It was observed that certain wells in each
sand grouping had larger ranges of water-level fluctuations than others and appeared to be
considerably more responsive to seasonal recharge patterns. Table 5-3 summarizes the range of
water-level fluctuations observed, as well as the distance to the outcrop elevations and the depth
to the top of the sand pack for the wells at the Clarkco site. Figure 5-8 is a graph of the
maximum observed water-level fluctuation in a particular well as a function of the distance to
the nearest potential discharge point; and Figure 5-9 is a graph of the maximum observed water-
level fluctuation as a function of the depth to the sand pack of the well screen. Both graphs
show a correlation, and either or both factors may be important in the case of specific wells.
Figure 5-9 suggests that wells that are less than 20 feet deep are likely to be more responsive to
recharge than are deeper wells, hi general, the depth of weathering in the glacial till has been
observed to be about 14-16 feet at the Clarkco site.
Eagon & Associates, Inc. 5-7 • January 1994

5.2.4 Ground-Water Flow
In a general sense, flow in the significant saturated zones within the till sequence is
outward from the upland areas to dissected lowlands that essentially surround the outline of the
proposed landfill. Flow paths and the positions of subsurface drainage divides are dependent
upon the proximity to, and rate of discharge to local surface drainage features. Flow restrictions
and/or a lack of saturated zone continuity may cause flow paths to vary somewhat from
expectations based on topography and geomorphology.
Figure 5-10 is a map illustrating ground-water flow in the 1092 sand. Water-levelelevations in wells 90-6W and 92-24Z for October 5, 1992, indicate a northerly component of
flow. The flow relationship between these two wells is consistent for the period of record
(Figure 5-3). There is no potential for flow to the east or south because the 1092 sand is absent
in borings in these directions. The flow system for the 1092 sand is a simple one. Precipitation
infiltrates the soil zone and selectively infiltrates through the weathered till and into the fairly
permeable 1092 sand. Flow is to one or several discharge points along the ravine to the north
and northwest.
The rate of flow in the 1092 sand can be approximated by a simple velocity calculation
using Darcy's Law in the following form:
v=7.480
where: V = linear velocity, in feet per dayK = hydraulic conductivity, in gpd/ftI = hydraulic gradient, in ft/ft0 = porosity, percent
The apparent gradient, based on the difference in water-level elevation between wells 90-6W and 92-24Z is about 0.004 ft/ft. The average value for hydraulic conductivity determined
Eagon & Associates, Inc. 5-8 January 1994

from pumping tests on these two wells is about 1.1 x 10~3 cm/sec or 21.2 gpd/ft2. Freeze and
Cherry, 1979, give a range of porosity values for silt between 35 and 50 percent and a range of
porosity values for sand between 25 and 50 percent. Considering that the intra-till sands at the
site are mostly silty sands, an assumed value for porosity of 35 percent seems like a conservative
number for purposes of estimating flow rates. Therefore, the rate of horizontal migration of
ground water in the 1092 sand is estimated as follows:
V = (21-2) x (.004) = Q32 ft/da^ Qr(7.48) x (.35) ' y
Figure 5-11 shows the inferred flow directions for the 1086 sand. Water-level elevations
are not shown because no wells were installed in this sand zone. The 1086 sand occurs in a
fairly narrow band traversing the west central part of the site. In most places, the 1086 sand isless than 10 feet below ground level. In only a few places, it is more than 15 feet below ground
level. Because the 1086 sand is so close to the surface, and of limited areal extent, flow in the
sand is expected to respond rapidly to, and be dominated by infiltration and discharge of
precipitation. Based on the relationship of topography to the area of sand occurrence, three
localized flow systems are envisioned; each of which discharges along the slopes of the ravine
that truncates the sand zone (Figure 5-11). Data are not available for determining flow rates in
the 1086 sand. However, this is of little importance because the 1086 sand will be removed
during excavation for the landfill.
Figure 5-12 is a ground-water flow map for the 1077 sand. Three wells: 90-6Y, 90-10Y,
and 91-9Z are completed in this sand zone. Water-level elevations in these wells on October 5,
1992 are shown on the flow map. The flow in the 1077 sand moves toward the topographically
lower areas and discharges to the ravines to the north, east and south.
Areas of thicker 1077 sand are in the east-southeastern and southwestern parts of the
landfill footprint. Flow in these areas is likely to be quantitatively more significant than in areas
to the north and northwest where little 1077 sand has been encountered. Localized flow systems
that essentially are small scale watersheds that convey runoff and infiltration to numerous
Eagon & Associates, Inc. 5-9 January 1994

discharge points, collectively constitute the ground-water flow system for the 1077 sand. The
flow system interpretation illustrated in Figure 5-12 takes into account sand thicknesses,
topography, proximity to discharge, and the water-level data.
The hydraulic gradient can be estimated by assuming that the water-level elevation at the
outcrop is the same as the outcrop elevation. Using difference in elevation between water levels
measured in wells screened in the 1077 sand, and the outcrop elevation divided by the distance
from the well to the outcrop, gives gradients ranging from about 0.01 to 0.02 ft/ft. The average
of hydraulic conductivity values determined from slug tests in wells screened in the 1077 sand
is about 1.56 x 10"3 cm/sec or 33.1 gpd/ft2. Again assuming porosity to be 35 percent, the flow
rates are estimated to range as follows:
V = C33-1) * (-01) = -13 ft/day or 46 ft/yr(7.48) x (.35) J y J *
to
V = C33-1) x (-02) = 25 ft/day or 92.3 ft/yr(7.48) x (.35) J 7
Figure 5-13 illustrates the flow system for the 1070 sand. Wells 90-6X, 90-9X, C91-8Y,
and C92-9Y are screened in the 1070 sand and water levels in these wells on October 5, 1992
are shown on the flow map. Of these four wells, only water levels in 90-9X respond in a manner
similar to water levels in the 1077 sand (Figure 5-5). However, as already discussed the sand
pack interval overlaps with that of a shallower well in the cluster. The 1070 sand is found only
in the western and northwestern parts of the proposed landfill footprint. In these areas, the 1070
sand generally is more than 20 feet below ground level and, therefore, is expected to be less
responsive to infiltration.
The gradient from well 90-6X to the outcrop area to the east is about 0.007 ft/ft, based on
the difference in elevations between the October 5, 1992, water level and the outcrop. The
gradient to the south between wells C92-9X and C91-8Y for the same period is about 0.011 (see
Eagon & Associates, Inc. 5-10 January 1994

Figure 5-13). The average hydraulic conductivity from slug tests and pumping tests in 1070 sand
wells is about 1.6 x 10"3 cm/sec or 33.9 gpd/ft2. Assuming a porosity of 35 percent, the flow
rates are estimated to be as follows:
V - <33-9> * (-007) = .09 ft/day or 32.9 ft/yr(7.48) x (.35) J y
to
V = (33-9) * (-011) = .14 ft/day or 51i9(7.48) x (.35) J
Figure 5-14 illustrates the flow system for the 1060 sand. Wells 90-7Z, 90-8X and 92-26X
are screened in the 1060 sand. The large area of no sand over much of the central part of thesite serves to sub-divide the flow system as does the fact that ravines to the southeast and south
truncate the sand body. Flow patterns that take these factors into account are shown on Figure
5-14. The hydrograph of well 90-8X (which is flashy) and to a lesser extent that of well 90-7Z
(Figure 5-5) illustrate the importance of infiltration of precipitation where the thickness of the
weathered confining layer is about 20 feet thick or less.
Gradients in the 1060 sand between wells in which water-level elevations were measured
on October 5, 1992, and the outcrop areas, calculated as previously described range from 0.004
to 0.016 ft/ft. The average hydraulic conductivity determined from field tests in 1060 sand wells
is 1.5 x 10'2 cm/sec or 318 gpd/ft2. Assuming a porosity of 35 percent, the flow rates are
estimated to be as follows:
V - <318) * (-004) - .49 ft/day or 111 ftlyr(7.48) x (.35) ' ' ' y
to
= (318) x (.016) = 1 94 or 7Q9
(7.48) x (.35)
Eagon & Associates, Inc. 5-11 January 1994

Figure 5-15 illustrates the flow system for the 1050 sand. Fourteen wells have been
screened across this sand zone. Their hydrographs are grouped in Figure 5-6. Wells C91-4Z and
C91-4Y are cluster wells screened in sand beds that are separated by cohesive beds. Water
levels, however, show that these wells are hydraulically connected and respond in a flashy
manner to infiltration. Only a few months of water-level data is available for wells 92-29X and
92-28X but their pattern of fluctuation suggests that mese wells also are hydraulically connectedand rapidly responsive.
Water levels in C92-9X, 92-17Y, and 92-18X are lower than those in most of thesurrounding wells. Although they may or may not be hydraulically connected with one another,they do not appear to be connected with the other nearby wells because they do not fit anylogical pattern of flow. Water levels in these wells correlate with relative well screen elevations,
suggesting a simple vertical gradient in an isolated saturated zone.
The other six wells in the northern part of the footprint indicate that flow generally is to
the northeast. More-variable localized patterns of flow become dominant wherever the 1050 sandis less than about twenty feet below ground level, particularly in the vicinity of potential
discharge zones. The six wells located to the south of the proposed landfill footprint, show a
pattern of flow generally toward the steep ravine that trends north-south through this group ofwells.
Hydraulic gradients were calculated between wells, and between wells and outcrops, atnumerous places for the 1050 sand based on the data contained on Figure 5-15. The range ofgradient values was found to be between 0.001 and 0.01 ft/ft. Using the median value forhydraulic conductivity determined from field tests in the 1050 sand wells and a porosity of 35percent, the flow rates are estimated to be in the following range:
Eagon & Associates, Inc. 5-12 January 1994

V = (23-3) * (.001) = Q09 ft/da Qr 3 3 ft(7.48) x (.35) y 3 y
to
K = (23.3) * (.01) = 09 ̂ . 32
(7.48) A: (.35) ' 7
Figure 5-16 illustrates the flow system for the 1035 sand. Hydrographs for the 11 wells
that are screened in the 1035 sand are shown on Figure 5-7. The relatively flat hydrograph of
well 90-7 Y (Figure 5-16) suggests the likelihood that the saturated zone screened in the well isisolated from the flow system. Another possible explanation is that the low water level resultsfrom the proximity of this well to a discharge zone. The hydrograph of well 92-15X is similar.In either case, the low and stable water-level pattern for wells 90-7Y and 92-15X sets them apartfrom the other wells in the 1035 sand group. The water level in C91-4X is anomalously highbecause the 1035 sand in this well is hydraulically connected with the 1050 sand screened in wellC91-4Y at this well cluster location. This may be the result of an ineffective well seal in wellC91-4X rather than a naturally-occurring phenomenon. Comparison of the patterns of water-level
fluctuations in these two wells (Figures 5-6 and 5-7) indicates that the wells are hydraulically
connected and provides an explanation for the flashy response in a well (C91-4X) that would nototherwise by expected to be rapidly responsive to infiltration. However, this well cluster islocated more than 1000 feet south of the proposed landfill.
Three wells (92-4X, 92-14X, and 92-19X) that encountered fairly thick 1035 sand zones(3.2, 3.0, and 3.6 feet, respectively) have maintained similar consistently-high water levels(Figure 5-7). Analysis of the water-level data from the northern part of the site suggests ageneral pattern of flow to the northeast. Water levels in wells 91-9Y and particularly, 92-2X donot fit this flow pattern. It appears that these wells are not hydraulically connected with the other
nearby 1035 sand wells or, at least, are not an integral part of the flow system. The low water
level in well 92-IX is caused by the proximity to a potential discharge point in the ravine to the
southeast of this location.
Eagon & Associates, Inc. 5-13 January 1994

The 1035 sand screened in the three wells to the south (C91-4X, 92-3 IX and 92-33X)
probably discharges to the large ravine that drains to the south from the southwestern corner of
the proposed landfill, as suggested in Figure 5-16. Well 92-33X, for instance, which is screened
across a thin sand bed that appeared to be wet during drilling, has been dry from the tune that
it was installed.
Gradients in the 1035 sand estimated between wells, and between wells and outcrops, basedon the data contained on Figure 5-16 range from 0.002 to 0.012 ft/ft. Using the median valuefor hydraulic conductivity determined from field tests in the 1035 sand wells, and a porosity of35 percent, the flow rates are estimated to be in the following range:
V = (5) x (.002) = OQ4 ftld^(7.48) x (.35) J y
to
v = (5) x (.012) =(7.48) x (.35)
5.3 Uppermost Aquifer System
Clearly, the sand and gravel sequence within the stratified drift that underlies the Clarkco
site is capable of yielding more than 10 gpm. Therefore, the first zone of saturation encounteredbelow the base of the Lower Till at the site is considered to be the uppermost aquifer.Throughout most of the area of the proposed landfill footprint, a fairly thick unsaturated zoneexists below the base of the Lower Till. The first two wells competed (90-9D and 90-8D) werescreened in the upper part of the uppermost aquifer system, and these resulted in dry holes. Eachwell was screened in what appeared to be the top of the saturated zone. Deeper drilling inseveral borings confirmed the interpretation that the initial dry completions were in localizedzones of saturation that were perched on minor confining beds or resulted from stratification that
was breached in the process of installing the wells. Fortunately, the initial plan of placing the
Eagon & Associates, Inc. 5-14 January 1994

well screen across the first zone of saturation encountered in the uppermost aquifer sequence wasrecognized as an incorrect and unworkable approach during the initial phases of the field
program.
The first well installation (90-9D) was subsequently pulled, the borehole cleaned out anddeepened, and a well reinstalled with the designation 90-9DD. Well-screen elevations for
subsequent wells were based on the water-level elevation measured in well 90-9DD without
regard to perched saturation conditions that might be encountered in individual boreholes. This
approach proved quite satisfactory. Well 90-8D, which is dry, was left in place as evidence ofthe unsaturated nature of the upper part of the uppermost aquifer.
The unsaturated part of the stratified drift at the Clarkco site is considered to be part of theuppermost aquifer system, because the dry sands beneath the Lower Till are potential pathways
for vertical migration. Plate 26 shows the base of the Lower Till, which actually defines the topof the "uppermost aquifer system", for most of the area of the proposed landfill footprint. In the
area just south of the proposed footprint, the lower till is immediately underlain by lowpermeability alluvial beds of silt and clay which, from a hydrogeologic standpoint, act as part of
the confining bed. The area in which the uppermost aquifer is considered to be confined is
delineated on Figure 5-17 and includes the area to the west of the Clarkco site which
encompasses both the Tremont Landfill and Closed Barrel Fill.
5.3.1 Hydraulic Conductivity
Slug tests attempted on most of the wells screened in the uppermost aquifer ran too fastto provide usable data. This was the case even for wells screened in aquifer materials classifiedSM. Analysis of the slug-test data indicates hydraulic conductivities exceeding 1.5 x 10~l cm/secfor the "cleaner" finer-grained materials. Hydraulic conductivities for the cleanest, coarsest-grained zones of the aquifer are estimated to range between 9.0 x 10~2 and 1.4 x 10"1 cm/sec.
Eagon & Associates, Inc. 5-15 January 1994
Usable slug-test data was obtained from three of the wells installed in the uppermost
aquifer, giving hydraulic conductivities in cm/sec of 7.6 x 10"2 for well C91-8D, 1.4 x 10"* for
well C91-5D, and 2.0 x KT* for well C91-2D.
Three pumping tests were conducted in 1990 to characterize the hydraulic properties of the
uppermost aquifer at the Clarkco property and to determine whether or not it was capable of
producing well yields of 100 gpm. Three 8-inch test wells were constructed, each in the most
productive sand and gravel zone encountered. The widely-spaced locations of PW-1, PW-2, andPW-3 are shown on Plates 8 and 13. Details of the mernodology used in drilling, wellconstruction, development and testing are described in Section 8.0 of this report. Generally-accepted practices for the construction and development of water wells were employed by theSprowls Drilling Company, an experienced water well contractor, under the supervision of ahydrogeologist on site. The open boreholes were gamma-ray logged prior to the installation of
the well screens primarily to confirm the screen-interval selections. The driller's logs, gamma-raylogs, and tabulated pumping-test data are presented in Appendix H.
Also presented in Appendix H is a representation of the pertinent well construction features
as they relate to the water-bearing zones encountered. PW-1 encountered a significant water-bearing zone of coarse sand and gravel from 94.5 to 118 feet below land surface. This entirezone was screened and developed. The static water level in this well was about 79 feet belowland surface resulting in approximately 15 feet of available drawdown. The static water level
in the water-bearing zone encountered in PW-1 is substantially higher in elevation than thoseencountered in the other two 8- inch wells. The fact that the zone that was developed, was theonly significant water-producing strata at this location is verified by both the gamma-ray log andthe observations of the on-site geologist. PW-1 is located over 1000 feet to the west of theproposed landfill footprint.
At well PW-2, only 5 feet of saturated sand and gravel were logged by the driller, and itwas encountered at a much lower elevation than that in PW-1. This zone had the greatestpotential for producing water of any zone encountered in the PW-2 borehole. The lack of
Eagon & Associates, Inc. 5-16 January 1994

significant water-bearing materials above the screened zone was confirmed by the nearest test
hole (boring 90-15) which was drilled and sampled continuously. The static water level in PW-2
was 95 feet below land surface, or about 12 feet above the top of the well screen. Available
drawdown was similar to that for PW-1 although both the water-bearing zone and the static level
were encountered at substantially lower elevations. Every effort was made to develop a high-yield producing well at this location as evidenced by the fact that the well screen and gravel pack
were extended above and below the primary water-bearing zone.
The elevation of the water-producing zone developed in PW-3 was comparable to that ofthe developed zone in PW-2. However, the formation encountered in PW-3 is substantiallycleaner and greater in thickness. In addition, the available drawdown was substantially greaterdue to the higher static water level.
Pumping tests of 24-hour duration at a rate of 100 gpm were performed on both PW-1 andPW-3. PW-2 could not produce 100 gpm as the pump broke suction at a rate of 50 gpm duringthe step test. Therefore, a 24-hour pump test was not performed on PW-2. A summary of the
pumping-test results is included in Table 5-4. Interpretation of the pump-test data indicates that
the permeability of the uppermost aquifer in PW-1 and PW-3 is about 2,750 gpd/ft2 and 1,520
gpd/ft2, respectively. The permeability of the zone screened in PW-2 is substantially less, i.e.,
about 184 gpd/ft2. Lower hydraulic conductivity, coupled with the fact that the formation is thinat this location, results in the lower well yield. Although drilled and constructed specificallyto determine hydraulic conductivity and potential well yield, water levels also have beenmeasured routinely in the three pump-test wells and the data are included in Table 5-2.
Analysis of the pumping-test data provides for some additional insights and conclusionsrelative to the hydrogeologic framework of the Clarkco site. A short discussion of the data andits interpretation at each test site follows.
Well PW-1. The time-drawdown data plotted on the semi-log graph (Appendix H) suggest thatrecharge was occurring during the 24-hour pumping test, as shown by the extremely flat slope
Eagon & Associates, Inc. 5-17 January 1994

of all but the early-time test data, i.e. less than 20 minutes. Analysis of the slope of the early-
time data yields a transmissivity which is consistent with permeability values determined by
various means at the site. If the later-time data were used to determine transmissivity,
unrealistically high values for hydraulic conductivity would result. Therefore, it is concluded thatthe flattened slope of the tune-drawdown data is the result of delayed yield from storage or some
form of leakage between stratified zones at this location.
A likely source of leakage or delayed yield is from materials overlying the producing
formation. This is consistent with the geologic interpretation of this part of the site based on test
borings. In soil boring 89-2, located about 600 feet south of PW-1 (Plate 8), a thick, partly-saturated sand and gravel zone immediately overlies the water-bearing zone developed in PW-1.The elevation at which this zone became saturated in boring 89-2 closely matches the water levelin PW-1. The upper sand and gravel zone identified in boring 89-2 is interpreted to be alenticular deposit (having a north-south orientation) that passes immediately to the west of PW-1.Pumping test data are not sufficient to quantify leakage or slow drainage from materials in thearea.
Well PW-2. The hydraulic conductivity of 184 gpd/ft2 determined for this well is based onthe relationship between transmissivity and specific capacity. The specific capacity of PW-2 wascalculated from data obtained during the step-test for this well. A longer, more extensivepumping test was not performed on PW-2 because it was not possible to stress the aquifer at a
pumping rate of 100 gpm. The PW-2 aquifer characteristics reported in Table 5-4 are consistentwith the geologic interpretation based on borehole data. As seen on cross sections A-A' and B-B', the uppermost aquifer is much thinner and probably pinches out to the northeast.
Well PW-3. The time-drawdown data from the 24-hour pumping test on PW-3 indicates thepresence of a negative boundary condition somewhere in that part of the site. The semi-log plot
(Appendix H) exhibits a steepening of the slope of the time-drawdown data beyond about 220minutes. The transmissivity derived from the early-time data is believed to accurately representthe hydraulic characteristics of the aquifer. The resulting value for hydraulic conductivity seems
Eagon & Associates, Inc. 5-18 January 1994

realistic based on the aquifer materials encountered and compared to the results of the other tests.
The presence of a negative boundary is consistent with the geologic interpretation of the site
based on test-boring data. Cross sections E-E' and G-G' show that the sand and gravel aquifer
becomes much thinner and appears to pinch out to the south.
The results of the pumping tests demonstrate that the hydrogeologic characteristics of theuppermost aquifer beneath the study area vary considerably from place to place with respect tothickness, permeability, and potential yield. Beneath parts of the property, the sand and gravelaquifer is capable of yielding 100 gpm to individual wells; whereas in other areas of the site,yields of this magnitude are not possible. In the northwestern part of the Clarkco property, inthe vicinity of PW-1, more than 1000 feet from the proposed limit of waste, the aquifer is mostprolific. It is also quite productive in the area of PW-3. The uppermost aquifer thins andbecomes finer-grained to the east, resulting in much lower productivity in the vicinity of PW-2.
The uppermost aquifer also thins and becomes finer-grained to the south as seen by the log of
boring 92-23. Wells which penetrated the full thickness of the uppermost aquifer were drilled
south and southeast of the proposed landfill footprint at 92-20D and 92-2ID. Although laterally-
equivalent sand zones were encountered in these borings, neither of these locations is thought to
have the potential for development of a 100 gpm well based on comparison of the aquifer
materials encountered with those at the other locations.
5.3.2 Ground-Water Level Fluctuations
Hydrographs for wells developed in the uppermost aquifer are included on Plate 27. Mostof the hydrographs are grouped closely together with respect to water-level elevation, showsimilar trends, and fluctuate within a range of about two feet for the period of record. Only threewells at or near the proposed landfill do not fit this pattern. Wells 92-20D and 92-23D havesubstantially lower water levels probably because they are screened in a zone which is physicallyseparated from the uppermost aquifer. The available water-level data indicates a low range offluctuation that suggests a poor connection with surficial materials as is the case with all of thewells in the stratified drift except PW-2.
Eagon & Associates, Inc. 5-19 January 1994

The hydrograph of PW-2 is unique (see Plate 27). Based on the boring log and water-level
data, this well clearly is developed in a zone that is physically separated from the uppermost
aquifer. However, the range of water-level fluctuation in PW-2 is such that it responds in the
same manner as a well that is only overlain by 20 feet or less of overburden. This is not the
case, because the top of the sand pack in PW-2 is 98 feet below the land surface. The
explanation offered for the magnitude of water-level response in this well to seasonal fluctuations
is that PW-2 is developed in a sand zone isolated from the flow system of the uppermost aquifer,but locally connected to a sand zone that extends off site to the northeast. In this direction, thetopography falls off rapidly, so that the zone occurs near the surface beneath the alluvium in thevalley floor, where response to recharge due to precipitation events is fairly rapid.
On the Tremont site, to the west of the proposed landfill, well TBF-20D responds similarlyto most wells in the uppermost aquifer (see Plate 27). The seemingly erratic scatter of datapoints on the hydrograph most likely is due to the effects of intermittent pumping of the supply
well located nearby, as will be explained in more detail in the discussion of the 72-hour pumpingtest. The hydrographs for PW-1 and TBF-19D fluctuate in a higher elevation range because they
are poorly connected to, and upgradient of, the uppermost aquifer for the Clarkco site.
5.3.3 Recharge and Discharge
Recharge to the uppermost aquifer appears to be primarily from the west and from the
topographically low area south of the proposed landfill as suggested by the flow direction. Inthe vicinity of boring 89-2 (west of the proposed footprint), a shallower aquifer appears tocoalesce with the more extensive sand and gravel aquifer and may be a source of recharge. Also,the uppermost aquifer itself appears to thicken to the west. In wells west of the proposedfootprint (PW-1, BF-19D, and BF-20D), and in the area south of the proposed landfill footprint(PW-3 and C91-5D) the uppermost aquifer is confined. The saturated zone screened in PW-2also is confined. In all of the other wells within or on the periphery of the proposed footprint,the uppermost aquifer is unconfined and flow in this area is under water-table conditions. (Figure5-17).
Eagon & Associates, Inc. 5-20 January 1994

As evidenced by the observed flow direction and gradient, the uppermost aquifer discharges
to Storms Creek to the northeast and contributes to the base flow of that perennial stream.
5.3.4 Ground-Water Flow
As seen on Plate 27, water-level elevations in PW-1 are consistently higher than the wellslocated within or near the proposed landfill footprint. Water levels in PW-2 are consistently the
lowest with those in 90-7D consistently second lowest. Exceptions to this relationship are wells
92-20D which is screened in a deep isolated sand zone, and 92-23D which is located 3750 feetsouth of the proposed landfill and also is screened in an isolated sand zone. Water-levelelevations measured on February 8, 1993 are contoured on Plate 28 and Figure 5-20 to illustratepotential flow directions. An eastward component of flow is present in the western part of theproposed landfill footprint and a northeastward flow component is indicated for the remainderof the area. The water level hi PW-2 is not contoured because it does not fit the consistentpattern of variation observed in the other wells and represents a different system. Although theaquifer screened in PW-2 is technically the uppermost aquifer at this location and could becorrelated with the zones screened in the other deep wells (cross section A-A'), it also appears
to be isolated from the flow system as illustrated by Figures 5-18 to 20. Plate 27 serves toillustrate that the up- and down-gradient relationships among piezometers within the proposedlandfill footprint are generally consistent over time as water levels fluctuate seasonally. Figures5-19 and 5-20 show the potentiometric surface based on water-level data collected on October5, 1992, and February 8, 1993, respectively. The configuration of water level contours anddirection of flow remain essentially the same as shown by Figure 5-18. The only difference ofnote is the slightly steeper gradient where the aquifer in confined south of the proposed footprint.
During the three periods for which potentiometric maps of the uppermost aquifer wereprepared (Figures 5-18, 5-19 and 5-20) the gradients range from as low as 0.0002 in thenortheastern portion of the proposed landfill to as much as 0.0015 just south of the proposedfootprint. Freeze and Cherry (1979) show that porosity values for sand range from 25 to 50
percent and porosity values for gravel range from 25 to 40 percent. Considering the materials
Eagon & Associates, Inc. 5-21 January 1994

observed from the uppermost aquifer at the Clarkco site, an assumed value of 30 percent for
porosity seems conservative. The average value for hydraulic conductivity for the uppermost
aquifer as determined from the analysis of the 72-hour pumping test is 1556 gpd/ft2 (see Table
5-4). Therefore, the calculated values for the range of ground-water flow rates to be expected
within the uppermost aquifer are as follows:
v __ (1556) x (.0002) _(7.48) x (.30) J y J *
to
5.4 Interconnections Between Uppermost Aquifer System and Significant Zones ofSaturation
The possibility for interconnection between the intra-till sand zones and the underlying
uppermost aquifer was carefully evaluated using various techniques of investigation. Li addition
to the evaluation of physical features of the geologic materials and the definition of the site
framework, additional hydraulic testing was performed. A 72-hour pumping test was performed
on PW-3 in the area where the uppermost aquifer is under confined conditions, and in-situ
permeability tests were performed on the Lower Till in the area where the upper part of theaquifer system is unsaturated. In addition, tritium testing was performed to determine the relativeage of ground water in various intra-till sand zones and the uppermost aquifer.
5.4.1 72-Hour Pumping Test
A pumping test of 72 hours duration was performed on well PW-3 from 10:30 am onOctober 6 to 10:30 am on October 9, 1992. The purpose of the test was to determine the
hydraulic interconnection, or lack thereof, between the uppermost aquifer and the saturated zones
Eagon & Associates, Inc. 5-22 January 1994
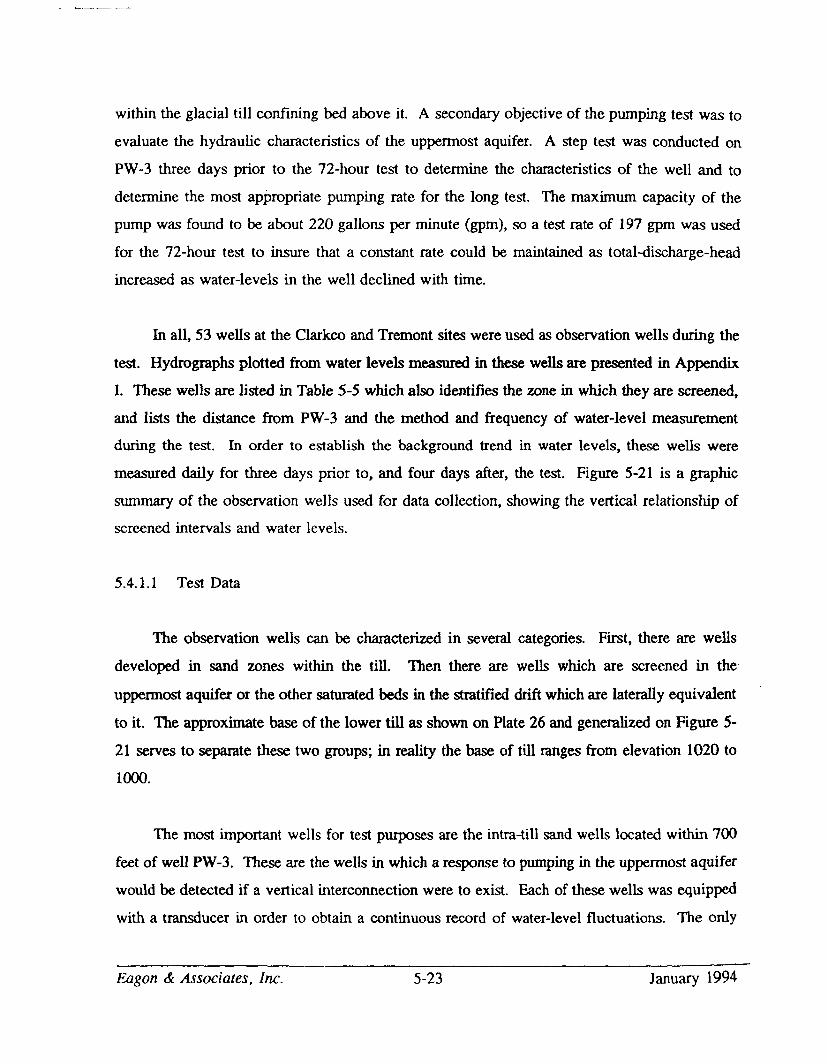
within the glacial till confining bed above it. A secondary objective of the pumping test was to
evaluate the hydraulic characteristics of the uppermost aquifer. A step test was conducted on
PW-3 three days prior to the 72-hour test to determine the characteristics of the well and to
determine the most appropriate pumping rate for the long test. The maximum capacity of the
pump was found to be about 220 gallons per minute (gpm), so a test rate of 197 gpm was used
for the 72-hour test to insure that a constant rate could be maintained as total-discharge-head
increased as water-levels in the well declined with time.
In all, 53 wells at the Clarkco and Tremont sites were used as observation wells during thetest. Hydrographs plotted from water levels measured in these wells are presented in AppendixI. These wells are listed in Table 5-5 which also identifies the zone in which they are screened,and lists the distance from PW-3 and the method and frequency of water-level measurementduring the test. In order to establish the background trend in water levels, these wells were
measured daily for three days prior to, and four days after, the test. Figure 5-21 is a graphicsummary of the observation wells used for data collection, showing the vertical relationship of
screened intervals and water levels.
5.4.1.1 Test Data
The observation wells can be characterized in several categories. First, there are wellsdeveloped in sand zones within the till. Then there are wells which are screened in the
uppermost aquifer or the other saturated beds in the stratified drift which are laterally equivalentto it. The approximate base of the lower till as shown on Plate 26 and generalized on Figure 5-21 serves to separate these two groups; in reality the base of till ranges from elevation 1020 to1000.
The most important wells for test purposes are the intra-till sand wells located within 700
feet of well PW-3. These are the wells in which a response to pumping in the uppermost aquifer
would be detected if a vertical interconnection were to exist. Each of these wells was equipped
with a transducer in order to obtain a continuous record of water-level fluctuations. The only
Eagon & Associates, Inc. 5-23 January 1994

exceptions were the two shallower wells at a 3-well cluster (C91-4X, C91-4Y and C91-4Z). Here
a continuous record was obtained in the deepest well and periodic measurements were maderoutinely in the others.
The next important category of observation wells includes those developed within the
uppermost aquifer and located within 2500 feet of PW-3. This includes TBF-19D and 20D at
the Closed Barrel Fill, and the "supply well" at the Tremont Landfill. The purpose of data
collection in these wells was to determine the shape of the cone of depression within theuppermost aquifer in order to identify directional differences in transmissivity, boundaryconditions, and areas more distant from the pumping well where the magnitude of drawdown inthe aquifer might be more likely to cause evidence of a vertical connection due to greater headdifferential. Uppermost aquifer wells within about 1000 feet of PW-3 also were used to collectearly drawdown data for computation of aquifer characteristics. Transducers were installed inwells 92-22D and 22DD and manual water-level measurements were taken frequently in wellsC91-5D, C92-5DD.C91-2D, and 92-21D for the first four hours of the test. Some earlymeasurements also were taken at TBF-19D, TBF-20D and 92-23D. These wells subsequently
were measured on a 4-hour schedule for the remainder of the test. The data collection scheduleis listed on Table 5-5.
The rest of the wells screened in the 1035 and 1050 sands that are located within a radiusof 2000 feet from PW-3 were measured on a 4-hour schedule during the test. The purpose of
including these wells in the network was to insure that all available wells developed in intra-till
sands, where even a remote possibility of a vertical interconnection existed, were observed duringthis test. Four wells developed in the 1070 and 1077 sands also were included because they werelocated at clusters where deeper wells were being measured routinely. It was a fairly simplematter to include them in the schedule.
Wells at the south end of the Tremont Landfill were selected for measurement to determine
whether or not any lateral hydraulic interconnection exists between the uppermost aquifer at the
Clarkco site and the stratified drift at the landfill where ground-water assessment studies have
Eagon & Associates, Inc. 5-24 January 1994

been performed. Transducers were installed in wells A89-3D and A91-7D, which are typical ofthe two hydrogeologic environments present at the southern end of the Tremont Landfill (Eagon
1992a). Water-level measurements were also taken on a 4-hour schedule in M-3 and A91-9S,
and daily at well M-4.
Finally, several wells at the north end of the Clarkco property were measured for
background purposes. Daily measurements were taken in wells PW-1, 90-6D and 92-27DDwhich are screened in the uppermost aquifer. A strip chart recorder was installed and operatedto obtain a continuous record of water levels in PW-2 and a transducer was installed in well 92-15X.
A continuous record of barometric fluctuations was obtained using a recording barometer
with a strip chart recorder, so that water level fluctuations could be corrected for barometricaffects. The stage of Chapman Creek also was measured routinely during and after the pumpingtest in order to relate river stage to ground-water level changes.
Hydrographs for all of the observation wells monitored during the pumping test are groupedby category, as described above, in Appendix I. Each group of hydrographs is preceded by aheader sheet which explains the logic of the grouping, lists the wells included, and summarizesunique characteristics of the data. Figure 5-22 is the hydrograph for the pumping well (PW-3)
for the data collection period before, during, and after the test. All hydrographs are plotted tothe same scale for both time and water-level elevation to facilitate comparison. Figure 5-23shows the hydrographs for the two closest well pairs screened in the uppermost aquifer, namelyC91-5D and 5DD, and 92-22D and 22DD. Figure 5-24 shows the hydrographs for the twoclosest intra-well sand wells which are 92-28X and 92-29X, located at distances from PW-3 of100 and 75 feet, respectively.
Eagon & Associates, Inc. 5-25 January 1994

5.4.1.2 Trends and Data Correction
Figure 5-24 includes a plot of the barometric pressure for the data collection period,
converted to feet of water and plotted on an inverted vertical axis so that rising pressure matches
declining ground-water levels. The plots of barometric and water-level fluctuations of wells 92-
28X and 92-29X are almost identical. Based on Figure 5-24, it appears that the only water-level
changes in these two wells during the pumping test were the result of barometric affects.
Conversely, hydrographs of wells in the uppermost aquifer (Figure 5-23) clearly show drawdown
as a result of pumping in PW-3. Some barometric affect is also apparent, causing minor
variations in water levels that vary in amount depending on the barometric efficiency of each
well.
A review of the hydrographs for intra-till sand wells within 700 feet of PW-3 indicate that
there was no drawdown produced in these wells during the 72-hour test period, hi order to
validate this conclusion the hydrographs were corrected for barometric-induced fluctuations by
calculating the barometric efficiency unique to each well and adding or subtracting the
appropriate change values using the beginning of the test as the time reference point. Figure 5-25
is an example of the manner in which the barometric efficiency was determined.
Corrected hydrographs are included in Appendix I for wells 92-28X, 92-29X, C91-4X, C91-
4Z and 91-26X. All of these plots show a straight line, with absolutely no indication of response
to pumping (drawdown) during the test. Most wells show some declining trend during the data
collection period, in varying amounts. Well 92-28X declined about 0.4 foot whereas well 92-29X
was essentially flat. Water levels in wells C91-4Z and 92-26X declined at about the same rate,
about 0.7 foot over the 10 day period. This slight decline is to be expected considering the
season and the lack of substantial precipitation during that period of time. Clearly the declining
trend is natural. It was not necessary to correct the hydrographs for wells 92-31Y and 92-33Y
because there was no barometric affect, probably because the water levels in these wells were
Eagon & Associates, Inc. 5-26 January 1994

within the sand pack zone (see Figure 5-21). The hydrograph of well 92-3IX also was
essentially featureless and required no correction. Clearly, there was no drawdown in any of
these wells.
A declining trend for the data collection period also is apparent in wells developed in the
uppermost aquifer, the hydrographs of which are grouped together in Appendix I. As seen from
the hydrographs of PW-3 and the C91-5 and 92-22 well pairs, the decline is about 0.6 to 0.7 foot
for the 10-day period. The decline is slightly less in well 92-23D which has a low barometric
efficiency. This well hydrograph requires no correction to conclude that drawdown was not
produced.
Wells C91-2D, C91-8D, 90-9DD, 90-14D, 92-14DD and 92-21D all have hydrographswhich are quite similar. Even though these wells (with the exception of 92-2ID) are developed
in what has been considered to be the unconfined portion of the uppermost aquifer, the water
level fluctuations were not affected by the pumping of PW-3, but appear to be affected by
barometric changes to varying degrees. This is probably due to stratification in the aquifer and
the fact that some have water levels above the top of the sand pack (see Figure 5-21). The
hydrographs for wells C91-2D and 90-9DD were corrected for barometric affects and show a
slight declining trend with no evidence of drawdown.
Well TBF-20D and the supply well both clearly show drawdown as a result of pumping
PW-3. However, it was not possible to keep the supply well shut down during the test and its
on-off cycling is obvious in the hydrographs for both wells. Clearly, TBF-20D is affected by
pumping of the supply well, and both wells are affected by PW-3. The data is too erratic to
determine trends, but it is possible to compute an approximation of the drawdown as a result of
pumping. Drawdown at the supply well and TBF-20D as a result of pumping PW-3 at the end
of the test is estimated to be about 0.70 and 0.65 foot, respectively. Drawdown at TBF-20D as
a result of short-term pumping at the supply well is about 1.1 feet. The supply well itself draws
down about 3 feet when the pump cycles.
Eagon & Associates, Inc. 5-27 January 1994

The hydrograph for well TBF-19D exhibits the same characteristics as other hydrographs
of wells in the uppermost aquifer which are unaffected by pumping, however, it appears to be
even more responsive to barometric changes. This is consistent with the log of this well which
clearly indicates confined conditions at this location. Hydrographs of PW-1, 90-6D, 90-10D, 90-
13D and 92-27DD are all quite similar and show the same general trends as those which were
corrected. In view of their distance from PW-3, and the fact that corrected hydrographs for
closer wells showed no drawdown, it is concluded that these wells were beyond the radius of
influence of pumping at PW-3.
Wells PW-2 and 92-20D show very minor affects of barometric fluctuations and both
hydrographs exhibit a slight declining trend. PW-2 was considered to be a background well as
it is farthest away (over 3000 feet from PW-3). Clearly there is no drawdown indicated by these
hydrographs.
The next series of hydrographs grouped together in Appendix I are those for intra-till sand
wells located more than 1000 feet from PW-3. All of these wells are located to the north of PW-
3 and all are in the area where the lower till is underlain by a fairly thick unsaturated zone. The
only exceptions are the shallow aquifer wells monitored at the Closed Barrel Fill, namely TBF-
17, 19S and 20S where the uppermost aquifer is confined. A hydraulic response to pumping was
not expected in any of these wells due to their distance from the pumping well and theunderlying unsaturated zone. Nevertheless, they were monitored to insure that the data collection
and test analysis was as comprehensive as possible.
Hydrographs of wells C92-1X, 92-4X, 92-14X, and 92-19X developed in the 1035 sand all
have the same characteristic plots as the barometric record, with slight variations in magnitude
of change due to varying barometric efficiency. As with intra-till wells closer to PW-3, no
change due to pumping was detected. Well 91-9Y is the deepest of the group and appears to be
the most responsive to barometric changes.
Eagon & Associates, Inc. 5-28 January 1994

Hie hydrographs of 1050 sand wells show similar patterns of barometric fluctuation,although more subdued. The abrupt change in water level on October 8 shown on the
hydrograph of well C91-8X looks like a data collection anomaly because the observed trend
before and after the change matches the other hydrographs. However, the change was real asconfirmed by careful verification by on-site personnel at the time. The change is thought to berelated to the physical conditions in the borehole and sand pack. Perhaps a small airpocket in
a void was released. In any event, the change cannot be attributed to pumping at PW-3. Thiswell is 1440 feet away, and more distant vertically and horizontally than many wells showing no
response. Even if some hydraulic connection were possible, any response would be gradual andnot an abrupt event. This curious change is absolutely unrelated to the pumping test.
The background well in the 1050 sand (92-15X), in which a transducer was installed, has
a low barometric efficiency and the hydrograph shows a fairly level trend. The water level isat or just below the top of the sand pack (see Figure 5-21). This hydrograph is similar to the
other intra-till wells with low barometric efficiency, i.e. like the wells developed in the 1070 and1077 sands. All three intra-till sand wells at the Closed Barrel (TBF-17, 19S, and 20S) havehydrographs that show low barometric efficiency and the characteristic background trend. As
with the closer intra-till sand wells, there is no indication of response to pumping in any of theintra-till sand wells located beyond 1000 feet from PW-3.
The five wells located at the south end of the Tremont Landfill that were monitored duringthe 72-hour pumping test (A89-3D, A91-7D, A91-9S, M-3, and M-4) showed absolutely noresponse to the pumping. The hydrographs are essentially featureless, showing little or no changeresulting from barometric fluctuation and no deviation during the pumping period. Thehydrographs for Chapman Creek shows essentially the same level trend as these wells which are
located in close proximity to it.
Eagon & Associates, Inc. 5-29 January 1994

5.4.1.3 Evaluation of Vertical Interconnection
As described in the preceding detailed discussion of hydrographs and background trends
in ground-water levels, there was absolutely no evidence of drawdown in any of the intra-till
sand wells during the pumping test. Figure 5-17 shows a general trace of the limit of the area
where confined conditions exist in the uppermost aquifer. In the unconfined area north of this
line there is no physical mechanism for a hydraulic response to be transmitted vertically.
Moreover, there was no drawdown in the uppermost aquifer in that area, as will be discussed in
the next section. Within the confined area, very careful analysis of the water-level data collected
during the test revealed no vertical interconnection between the uppermost aquifer and intra-till
sands within the confining bed above the aquifer.
5.4.1.4 Evaluation of Lateral Interconnection
Figure 5-26 shows the drawdown observed in wells which are developed in the uppermost
aquifer. Essentially all of the wells in the unconfined portion of the aquifer showed no
drawdown. It appears that the cone of depression spread asymmetrically to the northwest,
because drawdown was observed at the supply well and at TBF-20D. However, TBF-19D was
not affected. This was not unexpected, considering that the boring log suggests that well TBF-
19D is developed in a different sand zone that is isolated. The much-higher water-level elevationin TBF-19D also is strong evidence that the well is screened in a zone that is hydraulically
separate from the uppermost aquifer as defined for the Clarkco site. The same rationale applies
at well PW-1. The pumping test confirms this conclusion.
None of the observation wells located at the Tremont Landfill to the southwest of PW-3
were affected by pumping, which in the case of the confined saturated zones, indicates that there
is no lateral interconnection. Wells A91-9S and M-3, for instance, are developed in what are
considered to be local sand lenses within material which is mostly till. Therefore, it was
considered unlikely that a lateral interconnection with these wells existed and the test results
confirm this conclusion. Wells A91-7D, A89-3D, and M-4, however, are developed in effectively
Eagon & Associates, Inc. 5-30 January 1994

unconfined saturated zones which may be horizontally equivalent to the uppermost aquifer at the
Clarkco site or, more likely, to a discrete aquifer located further to the west. In either case, a
response to pumping at PW-3 would not be expected, and none was observed. This is consistent
with data presented in the Tremont Landfill assessment report (Eagon, 1992a), which describes
a flow system that discharges locally to Chapman Creek.
Well 92-23D, located south of PW-3 along Snyder Domer Road, showed no evidence of
drawdown during the test, which confirms the conclusion that the uppermost aquifer at the
Clarkco site pinches out to the south. There also was no drawdown observed at well 92-2 ID
located only 1025 feet to the southeast of PW-3. The water-level elevation in this well is*
consistent with other wells developed in the uppermost aquifer and it is screened at about the
same elevation as the screen and gravel-pack interval of PW-3. However, there is no evidenceof a lateral interconnection in the pumping test results, which leads to the conclusion that 92-2 ID
is screened in a saturated zone which is hydraulically isolated from the uppermost aquifer. This
serves to illustrate the variable nature of the stratified drift, particularly to the south and southeast
of the proposed landfill footprint.
Well 92-20D is screened in a deeper zone than the other observation wells in the uppermost
aquifer, as shown by the significantly lower water level (see Figure 5-21). The lack of observed
drawdown during the pumping test confirms this conclusion. Whether or not there was any
hydraulic response in the shallower saturated zones at well 92-20D that are closer in elevation
to the aquifer at PW-3 cannot be determined, because only the deep zone is screened at 92-20D.
However, considering that no drawdown was observed at wells C91-2D, 92-14D, and 92-14DD
also located to the northeast of PW-3, it seems doubtful that the hydraulic response would have
been transmitted through the unsaturated portion of the uppermost aquifer to this location, which
is even farther away.
The cone of depression delineated in Figure 5-26 shows the extent of the area in the
uppermost aquifer affected by the pumping of PW-3. Time-drawdown graphs presented in
Appendix I indicate that the wells in which drawdown was observed responded in a manner that
Eagon & Associates, Inc. 5-31 January 1994

can be characterized as nonieaky artesian conditions. In other words, all of the water pumped
came from storage in the aquifer, rather than some source of recharge such as confining-bed
leakage or streambed infiltration. There does appear to be delayed yield from storage as seen
from log-log plot of the time-drawdown data from well C92-5DD. This is believed to be due
to an imperfect interconnection between zones within the aquifer due to stratification. Evidence
supporting the poor connection is the smaller drawdowns observed in the shallower wells at these
locations, i.e. C91-5D and 92-22D. The delayed response shown by the semi-log graph of the
drawdown in well 92-22D is further evidence of this (see Appendix I).
Negative boundary conditions are indicated by the semi-log plots of drawdown in PW-3
and the affected observation wells. This is consistent with the shape of the cone of influence
delineated on Figure 5-26, and the apparent lack of a lateral interconnection in certain directions
from PW-3.
5.4.1.5 Calculation of Aquifer Characteristics
Aquifer characteristics that were calculated from the pumping-test data from various wells
are summarized in Table 5-4. Well TBF-20D and the supply well could not be used for time-
drawdown computations due to the erratic nature of the data caused by intermittent pumping at
the supply well. Calculated values for transmissivity (T) which are considered to be valid arein die range of 41,800 to 51,100 gpd/ft. Assuming diat the average thickness of the aquifer
within the cone of depression observed is about 30 feet, the average hydraulic conductivity for
the uppermost aquifer based on the pumping test results is 1556 gpd/ft2 or 7.3 x 10~2 cm/sec.
This compares favorably with values determined from slug tests on wells developed in the upper
portion of the uppermost aquifer shown on Table 5-4.
The storativity (S) values determined from the pumping-test data are in the typical artesian
range of 1 x 10"*. This is consistent with confined conditions in the aquifer which exist at PW-3.
However, the distance-drawdown graph plotted from test data (see Appendix I) indicates that
a storativity value of this order of magnitude would cause a very extensive cone of depression.
______._________„__________________________ — _ _ _ - —_______________________.________________„_____.————•———
Eagon & Associates, Inc. 5-32 January 1994

The transmissivity value determined from the slope of the distance-drawdown graph seems
consistent with drawdowns observed, and T values derived, from time-drawdown methods.
However, the extent of the cone defined by the distance-drawdown plot is much greater than was
actually observed. A value of 1.4 x 10"3 derived from distance-drawdown computations is high
for confined conditions and it seems obvious that the actual S must be higher yet to reconcile the
observed results with the aquifer characteristics derived. The conclusion to be derived from this
analysis is that the cone of depression developed within the confined or partially-confined part
of the aquifer to the south, and spread to the unconfined part to the north. Much of the water
pumped from storage apparently came from the unconfined part of the aquifer where the
storativity may be as high as 0.2. This is the most likely explanation for the limited size of the
cone of depression observed, and the apparent lack of drawdown experienced in the deep wells
to the north of PW-3 where water-table conditions prevail. Again, these results demonstrate thevariable nature of the uppermost aquifer and other units of which the stratified drift is comprised.
The true or average value for S cannot be determined from the test data, but it seems obvious
that it varies with local conditions and becomes larger to the north where there is a transition
from confined to unconfined conditions.
5.4.2 Lower Till In-situ Permeability Tests
Four wells screened in the Lower Till were installed to measure the in-situ permeability of
this material and demonstrate its integrity as a confining layer. Selection of the sites for these
installations was based on several factors. Good spacial distribution over the proposed site was
a primary consideration as was the desirability of installing the till wells at existing cluster well
locations. The lower till was specifically targeted because this natural barrier would be depended
upon to isolate the zone of waste placement from the uppermost aquifer beneath the entirelandfill footprint. Only well-cluster borings in which sand seams and partings were absent over
a lower till thickness of at least ten feet were considered. The ten feet of massive till screening
criterion was necessary to allow for a five-foot well screen and a well point, two feet of sandpack above the well screen, and two and one half feet of effective annular seal above the sand
pack. If sand seams or partings were present in the well screen or sand pack intervals, the slug
Eagon & Associates, Inc. 5-33 January 1994

test would measure the permeabilities of these horizontal pathways instead of the permeability
of the till.
Based on the above considerations, four installation locations and two back-up locations
were selected. Suitable materials were encountered at the original four installation sites and till
wells were installed in each and given the designations 92-7TP, 92-10TP, 92-14TP, and C91-8TP.
The till wells were installed at the 90-7, 90-10, 90-14, and C91-8 cluster well locations (Plate
13).
A four-foot well screen was installed in 92-7TP because only 6.5 feet of massive till was
encountered in this boring. Well construction tolerances in this boring were such that there was
concern that the results of the slug test on this well might be influenced by an adjacent saturated
zone. They were not.
Slug tests were performed during the period December 21-23, 1992 in each of four till
wells that were installed in November 1992. Time-drawdown plots of the till-well slug tests are
included in Appendix G.
As shown in Table 5-6, in-situ permeabilities ranged narrowly from 1.5 x 10'7 cm/sec to
3.1 x 107 cm/sec. These field determinations of hydraulic conductivity are an order of magnitudegreater than the laboratory-determined permeabilities on the undisturbed samples (Table 4-3).
The difference between the two results is less than the two orders of magnitude that might be
expected due to the fact that the laboratory tests measure permeability in the vertical direction
(perpendicular to clay structure and bedding features, if any) whereas the field tests measure the
path of least resistance (generally horizontal) that may result from sand or silt partings adjacent
to the borehole. Bouwer (1978, p.l 17) states that results yielded by the slug test primarily reflect
permeability in the horizontal direction. Even if no sedimentary features or clay-mineral
orientation resulted from depositional processes; compaction, consolidation, and isostasy resulting
from ice loading and unloading, could be expected to produce a least-principal-stress direction
in the horizontal plane that would be a path of least resistance for fluid migration.
Eagon & Associates, Inc. 5-34 January 1994
For the reasons discussed, the in-situ tests on the till wells do not duplicate the laboratory
results, but they are well within the range of variation that has been cited in the literature for
differences between horizontal and vertical permeabilities. Because vertical migration through
the till sequence is the primary concern, it is more valid to use laboratory-determined tillpermeabilities in calculations that predict or evaluate vertical rates of migration through the till,
than it is to use in-situ permeability determinations that primarily reflect hydraulic conductivity
in the horizontal direction.
5.4.3 Tritium Age-Dating of Ground-Water Samples
In order to gain additional insight into rates of recharge and movement of ground water at
the Clarkco site, as well as data that might be used to evaluate whether or not there is a directhydraulic connection between various saturated zones hi the glacial drift sequence, ground water
samples from five wells were dated radiometrically using the tritium method. The wells were
selected for testing on the basis of stratigraphy and hydrogeologic environment. Well
installations to which large amounts of water were added during drilling or construction generally
are unsuitable for testing because they are likely to yield ambiguous or inaccurate results. This
is particularly the case for saturated zones with very slow rates of ground-water movement.
Table 5-7 lists the wells that were tested, the saturated zones that the wells are screened
in, the results of the tritium tests, and the interpretation of the test results in terms of rate of
recharge to the zone tested. A copy of the test results from the tritium laboratory is included in
Appendix J.
Tritium is a naturally-occurring hydrogen isotope with a half-life of 12.26 years. Its
concentration is expressed in tritium units (TUs), which is the number of tritium atoms per 1018
atoms of hydrogen. Prior to atmospheric testing of thermonuclear devices in 1954, natural tritium
concentrations in rainfall were about 3 to 20 TUs. Thermonuclear explosions in the atmosphere
caused greatly varying TU values in precipitation worldwide and the permanent entry of man-
made tritium into the hydrologic cycle. TU values in precipitation peaked in 1963-1964 with a
Eagon & Associates, Inc. 5-35 January 1994

value of 4000 TUs recorded in Chicago. TU values subsequently declined to stable levels of
around 30 to 40 since about 1970.
The apparent age of ground water can be determined by comparing tritium levels in ground
water and rainfall. Tritium concentrations that are very low (about 0.3 TUs) indicate ground
water that is older than 50 years. Low levels of tritium (about 1.0 TUs) indicate ground water
that is younger dian 50 years but prethermonuclear. Higher TU values indicate ground water that
is post-thermonuclear in age.
The tritium results from well 91-9Z, developed in the 1077 sand, indicate that infiltration
of precipitation is rapid in the zone of weathering in the till (to a depth of about 20 feet). The
same conclusion was reached by studying the hydrographs of the various sand zones (Figures 5-3
through 5-7) and Figure 5-9. The 1077 sand screened in well 91-9Z is 17.4 feet below ground
level and the screen pack in this well is only 14.5 feet below ground-level. The high tritium
levels in well 91-9Z suggest that most or all of the water sample originated as precipitation that
percolated downward to the 1077 sand zone within the last few years. The rate of recharge to
the 1077 sand at this location is considered to be rapid because the tritium results indicate that
the ground water is young.
Results of age-dating the ground-water samples as a group, however, (Table 5-7) clearlyindicate dial there is not rapid vertical movement of groundwater through the entire till sequence.
Very low tritium levels were found in the water sampled from well 90-1 OX, which is screened
across the 1050 sand. At this location, the 1050 sand is 48.4 feet below ground level and the
depth to the screen pack in this well is 45.5 feet. The tritium concentration in well 90-10X of
0.35 TUs indicates that ground water in this sand zone is at least 50 years old and that recharge
is very slow.
Very low tritium levels also were found in the ground water sampled from well 92-4X
which is screened in the 1035 sand. The 1035 sand in well 92-4X is 56.0 feet below ground
level and the depth to the screen pack is 55.5 feet. The slightly lower tritium concentration (0.33
Eagon & Associates, Inc. 5-36 January 1994

TUs) in well 92-4X once again indicates ground water that is at least 50 years old, and that
recharge is very low.
Well 90-9DD is screened just below the water table in the uppermost aquifer. Depth to
the screen pack is 108.2 feet but depth to unsaturated sands that are part of the uppermost aquifer
system is only 75.5 feet. The water sample from well 90-9DD has a low tritium concentration
(1.26 TUs) that indicates slow recharge. (Rainfall with pre-1954 tritium concentrations of less
than 15 TUs would decay to levels of about 1.0 TU in about 30 years.)
Well 92-27DD is screened near the bottom of a thick sand and sand and gravel sequence
that constitutes the uppermost aquifer system. The upper part of the sequence is unsaturated.
Depth to the top of the sequence is 75.0 feet. Depth to the water table is about 99.0 feet. Well92-27DD is screened from 133.0 to 138.0 feet (about 38 feet below the water table) and the depth
to the top of the installed screen pack is 131.0 feet. The water sampled from this well also has
a low tritium concentration (1.00 TUs) indicating that it is pre-1954 in age and somewhat older
than the ground water from well 90-9DD. The tritium data (Table 5-7) suggests that the recharge
to the uppermost aquifer probably takes place laterally (rather than vertically through the till
sequence) because the uppermost aquifer ground water is younger than the ground water in the
1050 and 1035 sand zones that overly it.
Eagon & Associates, Inc. 5-37 January 1994
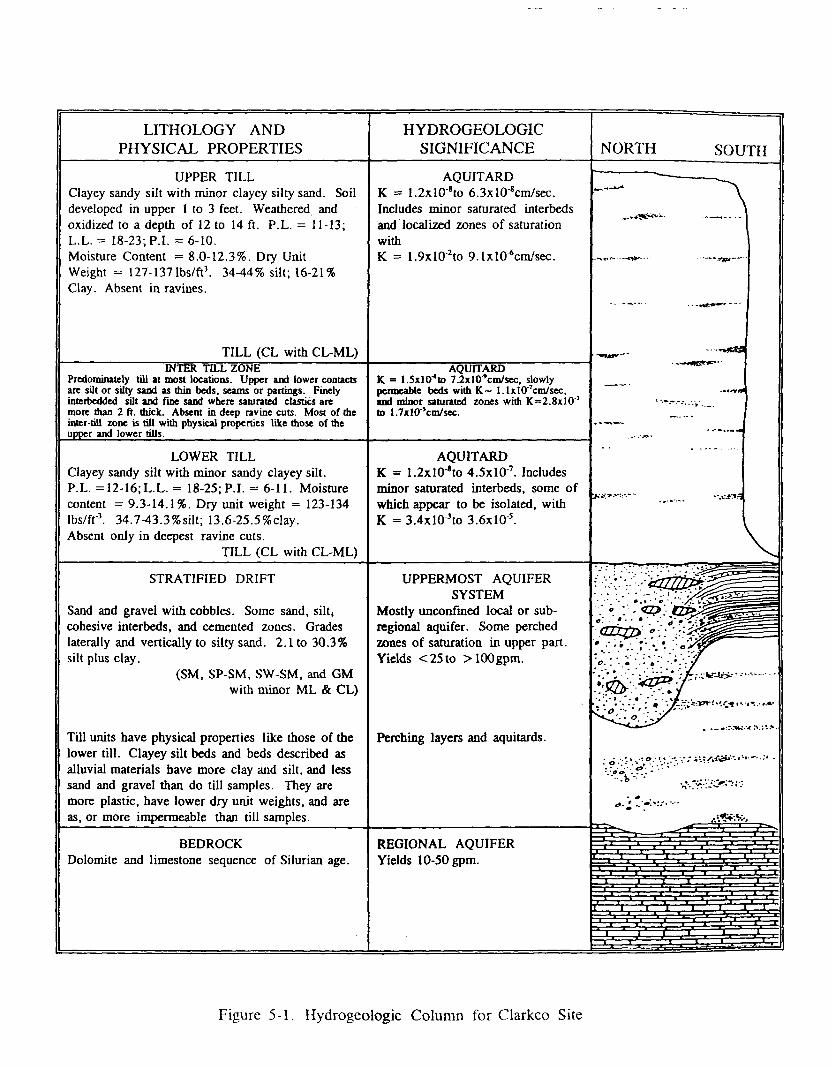
LITHOLOGY ANDPHYSICAL PROPERTIES
HYDROGEOLOGICSIGNIFICANCE NORTH SOUTH
UPPER TILLClayey sandy silt with minor clayey silty sand. Soildeveloped in upper 1 to 3 feet. Weathered andoxidized to a depth of 12 to 14 ft. P.L. = 11-13;L.L. = 18-23; P.I. =6-10.Moisture Content =8.0-12.3%. Dry UnitWeight = 127-137lbs/ft3. 34-44% silt; 16-21%Clay. Absent in ravines.
TILL (CL with CL-ML)
AQUITARDK = 1.2xl08to 6.3x10"cm/sec.Includes minor saturated interbedsand localized zones of saturationwithK = 1.9xl02to P.lxlO-'cm/sec.
INTER TILL ZONEPredominately till at most locations. Upper and lower contactsare silt or silly sand as thin beds, seams or partings. Finelyinterbedded silt and fine sand where saturated elastics aremore man 2 ft. thick. Absent in deep ravine cuts. Most of theinter-till zone is till with physical properties like those of theupper and lower tills.________________________
AQUITARDK = l.SxKT'to 7.2x10-*cm/sec, slowlypermeable beds with K~ 1.1x10'cm/sec.and minor saturated zones with K=2.8xlOz
to 1.7xlO'5cm/sec.
LOWER TILLClayey sandy silt with minor sandy clayey silt.P.L. =12-16;L.L. = 18-25; P.I. = 6-11. Moisturecontent = 9.3-14.1%. Dry unit weight = 123-134Ibs/ft'3. 34.7-43.3%silt; 13.6-25.5%clay.Absent only in deepest ravine cuts.
TILL (CL with CL-ML)
AQUITARDK = 1.2xlO-*to 4.5x10⁷. Includesminor saturated interbeds, some ofwhich appear to be isolated, withK = 3.4xl03to 3.6xl05.
STRATIFIED DRIFT
Sand and gravel with cobbles. Some sand, silt,cohesive interbeds, and cemented zones. Gradeslaterally and vertically to silty sand. 2.1 to 30.3%silt plus clay.
(SM, SP-SM, SW-SM, and GMwith minor ML & CL)
Till units have physical properties like those of thelower till. Clayey silt beds and beds described asalluvial materials have more clay and silt, and lesssand and gravel than do till samples. They aremore plastic, have lower dry unit weights, and areas, or more impermeable than till samples.
UPPERMOST AQUIFERSYSTEM
Mostly unconfmed local or sub-regional aquifer. Some perchedzones of saturation in upper part.Yields <25to >100gpm.
Perching layers and aquitards.
. ' _••.»:.'
BEDROCKDolomite and limestone sequence of Silurian age.
REGIONAL AQUIFERYields 10-50 gpm.
Figure 5-1. Hydrogeologic Column for Clarkco Site

t" V-.F:-'./-':.-s* •'•^'•v •-•••-••'̂•{-.v-frv.-r.yrix
.-.TV.-"' V V• • • V-?" *!^-:"••••-•^.-U
::.'l:<l\.r-^:^
c/oU4)E<L>
Ort
-acDo6(-*-<oTDOaa,<uocoU<Ntnaao
CO
NFIN
ING
BED
UPPER
MO
STAQ
UIFERSYSTEM
REGIO
NALAQ
UIFER

pLJJ111U^
zoIUJ
LU_JLJJ
111
UJ
1108
1106
1104
1102
1100
1098
10961-
1094
1092
1090
1088
1086
EAGON & ASSOCIATES INC.
1084
108
T
PROPOSED CLARKCO LANDFILLHYDROGRAPHS FOR WELLS COMPLETED
IN THE 1092 SAND
WELL 9MW
WELL 92-24Z
i i i I i i i i i I i i i I i i i I i i i I i i
171/91 4/1/91 7/1/91 10/1/91 1/1/92 4/1/92 7/1/92 10/1/92
Figure 5-3. Hydrographs for Wells Screened in the 1092 Sand
1/1/93
1108
1106
1104
1102
1100
1098
1096
1094
1092
1090
1088
1086
1084
1082

LLILLJ
oILLJ_lLLJ—1LU
LLJ_lio:LU
1094
1092
1090
1088
1086
1084
1082
1080
1078 -
1076
1074
1072
1070
1068
i — i
PROPOSED CLARKCO LANDFILLHYDROGRAPHS FOR WELLS COMPLETED
IN THE 1070 AND 1077 SAND
1070 SAND
- WELL 90-6X
- WELL 90-9X
- WELL C91-8Y
- WELL C92-9Y
1077 SAND
- WELL 90-6Y
- WELL 91-9Z
- WELL 90-1OY
i——i i——i i791 4/1/91 7/1/91 10/1/91 1/1/92 4/1/92 7/1/92 10/1/92
Figure 5-4. Hydrographs for Wells Screened in the 1077 and 1070 Sand
EAGON & ASSOCIATES INC-i—i—i—i—i—i—i—i——11094
1092
1090
1088
1086
1084
1082
1080
1078
1076
1074
1072
1070
10681/1/93

PLULLJ
iuu_lLLI_lLLJ
LJJ_lccLLJ
1080
1078
1076
1074
1072
1070
1068
1066
1064
1062
1060
1058
1056
1054
EAGON & ASSOCIATES INC.T
PROPOSED CLARKCO LANDFILLHYDROGRAPH FOR WELLS COMPLETED
IN THE 1060 SAND
WELL 90-7Z
WELL 90-8X
WELL C92-26X
i——i——I——i——i——t- J———I———L J———I———I———I———I———I———L.
"1/1/91 4/1/91 7/1/91 10/1/91 1/1/92 4/1/92 7/1/92 10/1/92
Figure 5-5. Hydrographs for Wells Screened in the 1060 Sand
I I I1/1/93
1080
1078
1076
1074
1072
1070
1068
1066
1064
1062
1060
1058
1056
1054
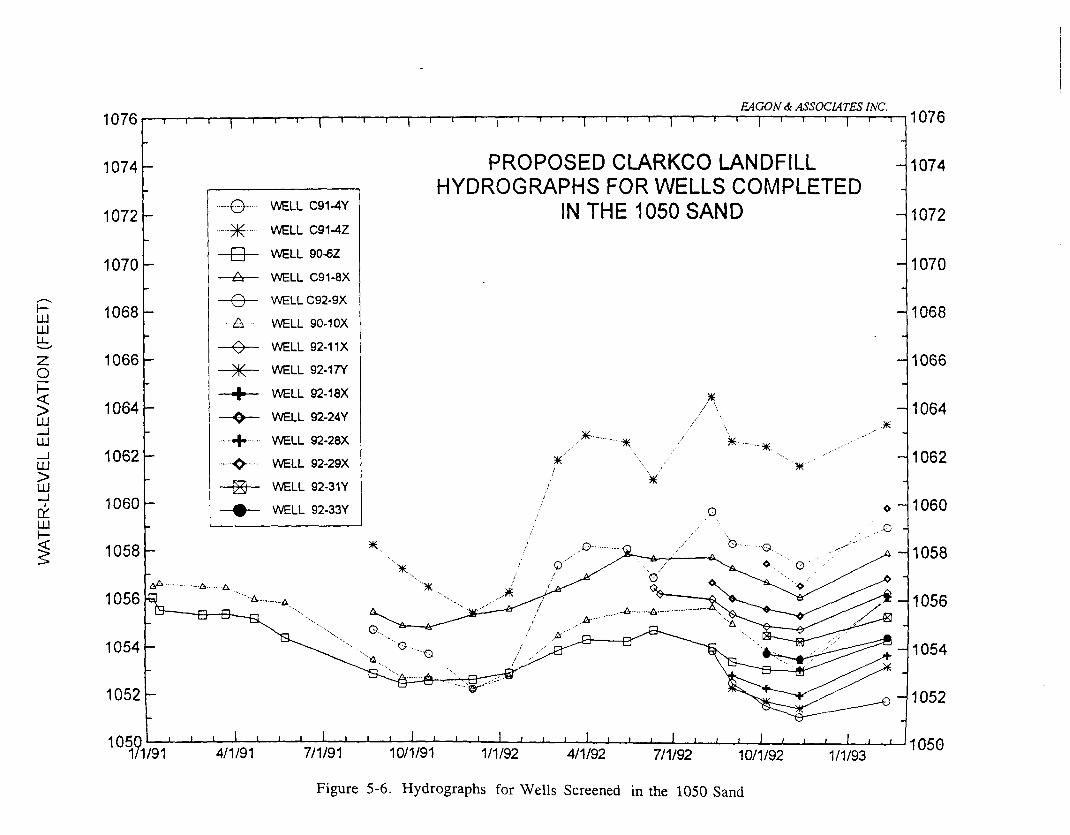
1076
LLJLULJL
o1LL1_JUJ_JUJ
LU_JQLLU
1074h
1072
1070
1068
1066
1064
1062
1060
1058
1056
1054
1052
105501/'
-i——i——r n——i——r i——i——r i——r n——i——r i——rEAGON & ASSOCIATES INC.——i——i——i——i——i——i——r
WELL C91-4Y
WELL C91-4Z
WELL 90-6Z
WELL C91-8X
WELL C92-9X
WELL 90-1 OX
WELL 92-11X
WELL 92-17Y
WELL 92-18X
WELL 92-24Y
WELL 92-28X
WELL 92-29X
WELL 92-31Y
WELL 92-33Y
PROPOSED CLARKCO LANDFILLHYDROGRAPHS FOR WELLS COMPLETED
IN THE 1050 SAND
.*•••-........
J———L I i -I——\———L. ' '
1/91 4/1/91 7/1/91 10/1/91 1/1/92 4/1/92 7/1/92 10/1/92
Figure 5-6. Hydrographs for Wells Screened in the 1050 Sand
1/1/93
1076
1074
1072
1070
1068
1066
1064
1062
1060
1058
1056
1054
1052
1050

UJLU
g
ILU_lLU_JLU
LU
UJ
Sc
1059
1057
1055
1053
1051
1049
1047
1045
1043
1041
1039
1037
1035
103
i——r T———T I———T "T———I———T
PROPOSED CLARKCO LANDFILLHYDROGRAPHS FOR WELLS
COMPLETED IN THE 1035 SAND
—©— WELLC92-1X
X WELL92-2X
0 WELLC91-4X
+ WELL 92-4X
—•— WELL 90-7Y
D WELL 91-9Y
A WELL92-14X
—-B WELL 92-15X
.....A.... WELL 92-16X
-0 WELL 92-19X
.....£>...... WELL92-31X
I . I ' I ' l l I I ' i I———L -I———I
1/91 4/1/91 7/1/91 10/1/91 1/1/92 4/1/92 7/1/92
EAGON & ASSOCIATES INC.————,1059
1057
1055
1053
1051
1049
1047
1045
1043
1041
1039
1037
1035
103310/1/92 1/1/93
Figure 5-7. Hydrographs for Wells Screened in the 1035 Sand

15.0 --.
14.0 4—
13.0 4j"
12.0 -Ij
£11.0 -jUJ -4
^10.0 -IC/5 Ez ~Q 9.0 -j< 4p? 8.0 4O J
3 7 .0^
g 6.0 1UJ J_J :o: 5.0 4UJ E\- ~| 4.0 4
—I
3.0 4—
2.0 -1—-
1.0 2
n n
, , , , , , , , | , , , . I , | , | | , , , | ,, i i | i i | ! 1 1 1 1 1 1 1 I 1 1 1 1 1 1 1 1 1 1 1 1 1 1 1 1 1 1 1 1 1 l_l 1 1 1 1 1 1 1 1 1 1 1 1 1 1 1 1 1 1 1 1 1 1 1 1 1 1 1 1 1 1 1 1-1 1-1 1 1 LI 1,1 1 1 1 1 1 1 1 1 1 1 1 1 1 1 1 1 1 1 1 1 1 1 1 1
PROPOSED CLARKCO LANDFILLCOMPARISON OF WATER - LEVEL FLUCTUATION VS. DISTANCE TO NEAREST
DISCHARGE POINT FOR WELLS ABOVE THE UPPERMOST AQUIFER90-8X
0
90-6Wo
... Q7 90-9X91 -9Z o
90-1 OYo
C91-4Zo
C91-4Yo
C91-4Xo
90-7ZO
92-24ZO
90-6Y0
90-6X 90-1 OXo o
92-29X C92-1X _Q. ov ° 91-9YQ o oy i ~v/^92-28X 92-14X C92Q-9X
0 92-16X
92-31X°°C91"6Y ° 92-2X ^X 92.24Y ° ° 92£™C92-9Y ° ° 92-1 1X
92-31 Y0 o 92-1 5X92-33Y o
EAGON & ASSOCIATES, INC.— • • • • . . T - » i - > T . i i - T t i T - t " T"T't~t T~r n i i i ^T n ITTTI t i i* t rT- i'~r T T t 'T 'T1 i~v T~I — i r1 i i T i T i i i i i i — r r r-i • t i i T i i i > T r-t T 't I~T T T'T1 > i i i i T i i t < f r-^ i i t i T-I -T-T i i < t-v T-> i i . I"T T i i i i i T-V. i •
- 15.0
- 14.0
A f} rt- 13.0
- 12.0
- 11.0
-- 10.0
§- 9.0E-| 8.01—
E- 7.0'-\ 6.0~r
\ 5.0L
E- 4.0E--
j- 3.0~r
\ 2.0^~-
j- 1.0I
- n n
100 200 300 400 500 600 700 800 900 1000 1100 1200 1300DISTANCE TO NEAREST DISCHARGE POINT (FEET)
to Mparpct Onfrror, for Tntr'i-Till <snnr|

13. U -2
-E
14.0 -i-E
13.0 -jJI
12.0 -j-:
t 11-0 ^LLJ -LJL i•—10.0 -.CO~y — •
Q 9.0 -E< -EH 8.0 -I0 jID --u± 7.0 -E_ | -rIII> 6.0 -ELU '-_J I
£T 5.0 -ELU Et- -
| 4.0 -E—.-
3.0 -EI
~
2.0 4—
1.0 4-
n n J
PROPOSED CLARKCO LANDFILLCOMPARISON OF WATER - LEVEL FLUCTUATION VS. DEPTH TO
TOP OF SAND PACK FOR WELLS ABOVE THE UPPERMOST AQUIFER90-8X
o
90-6Wo
a. „ 90-9X91 -9Z oo
90-1 OY0
C91-4ZO
C91-4Yo
C91-4X0
90-7Zo
92-24Zo
90-6Y0
90-6X 90-1 OX90-6Z 91;9Y
92-29X C92-1X „, _.„ °o o 92-28X C91-8X
en tAy C92-9X"" .
^ „ ° 92-1 6XC91Q-8Y 90-7Y o 92-19^2^x
92-26X ° C92-9Y 92-31 X 92-18#2-j7Y ° Q2% 1Xo o o »w o yz*^*+ T„-... 92-2X °9233Y 92-31 Y
92 o Y ° , 92-1 5XO
EAGON & ASSOCIA TES. INC.. -...-,-- , —— . ——— . ——— , ——— . ——— i ——— , ——— , —— i — — T —— r- — T" r-T- —— r —— r——— i ——— I ——— T ——— I —— I —— T ——— T —— -I P i ——— . —, —— 1 ——— . ——— r —— , ——— . ——— . —— • —— ~r~'T"'T' —— I ——— T — ' !"~ T —— ' r™ 1 ——— I —— T —— r t ——— IT- —— F —— T —— ̂ ——— P —— I ——— I ——— T ——— P" — F —— I ——— 1 ——— I —— T —— T ——— I ——— f —— T ——
- ID.U
'-
j- 14.0E-E- 13.0~I
E- 12.0I_
E- 11.0I_
~
E- 10.0I^_~
j- 9.0E-
E- 8.0;
E- 7.0—-
E- 6.0I~
r 5.0:
E- 4.0I_~
E- 3.0:-~
E- 2.0E-z- 1.0;
: n n
10 6020 30 40 50DEPTH TO TOP OF SAND PACK (FEET)
Figure 5-9. Comparison of Water-Level Fluctuation to Top of Sand Pack for Intra-Till Sand Wells
70

c9i-aocwc91_8YIC92^8TP^1_8X \
I "^ | 91-9Z 90-90D )
\ ' .91-9Y~90-9X I
\^.^ \
PROPOSED
i LIMIT OF' SOLID WASTE
-\
//
O C91-20
/C92-1X
C91-1
92-200 O
92-25X8
89-79 92-33Y• Q)
92-32 92-33X• C91-6
C91-3I
O92-28X
I
89-8
92-26XilI
92-29•
92-290992-29X
LEGEND
TOPOGRAPHIC CONTOUR OFELEVATION AT WHICH SANDOCCURS (OCFINES OUTCROPAREA WHERE SAND IS PRESENT)
UMIT OF SAND ZONE
92-31Y
92-31X_C9t-4Z
^C91-4YC91-4X
UJCLO(TD_
QC92-5DD
°C91-50
(,0/3/92)
DIRECTION OFGROUND-WATER FLOW
#69-9 92-210
20O 4OO
SCALE IN FEET
Figure 5-10. Ground-Water Flow in the 1092 Sand

en O 3 c 3 Q. I O c*
(T) 3) o 5' *-»• zr O 00 CD O 3 a.

PRO
PER
TY
LIN
E \
10 c en I o 3 3 CL I O 31 o 0> O O D o.
cs 10 I
——
— ~
< /
Nl
-V
/
?^1
in
A
I

o I 3 Q. I f o •-j o c/> o D Q.
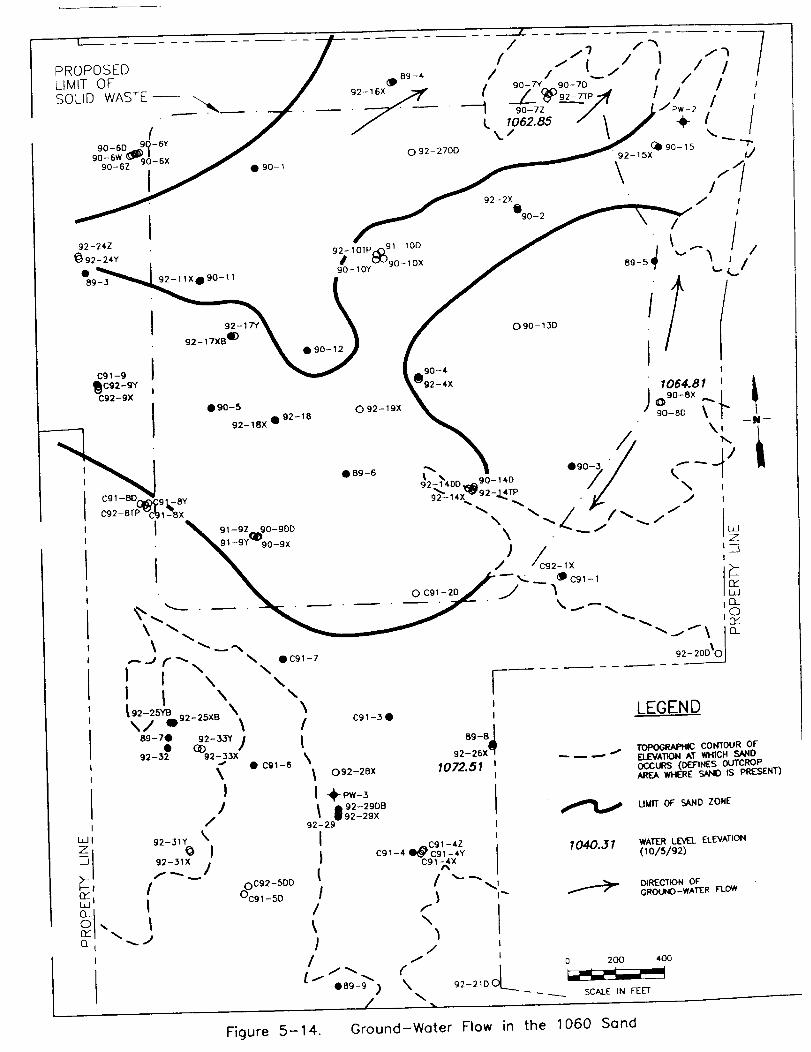
PROPOSEDLIMIT OFSOLID WASTE
'" i7TP^f / /
/ i/p*-2 ,7 \ / +
TOPOGRAPHIC CONTOUR OFELEVATHDN AT WHICH SANDOCCURS (DEFINES OUTCROPAREA WHERE SANO IS PRESENT)
DIRECTION OFGROUND-WATER FU>«
• 89-9 ) \
Figure 5-14. Ground-Water Flow in the 1060 Sand

PROPOSEDLIMIT OFSOLID WASTE ————— \
f /^ " ~^ '''^^89-4 / / //
92-16X //9°~7^090-7D / /•^ 7^92-TTP / '
92-25YB 92-25X8 \ \* 705J.66 \ ,
89-7* 92_33y ' |
92-3? * ' I92 32 92-33X / 'XMl-a\I 11054.53
92-31Y
92-31XI
CLoa:Q_
I
QC92-5DD°C91-50
C91-3«
1053.81O92-28X
-4-PW-3
•92-29DB92-29X
LEGEND89-8
92-26X
1057.37
TOPOGRAPHIC CONTOUR OFO£VATK>N AT WHICH SANDOCCURS (DEFINES OUTCROPAREA (WHERE SANO IS PRESENT)
UMIT OF SAND ZONE
WATER LEVEL ELEVATION(10/5/92)
DIRECTION OFGROUND-WATER FLOW
Figure 5-15. Ground-Water Flow in the 1050 Sand

92 1(T 092-19X92L1B tnAi^t
92-1400^0-140
PROPOSED, ,. II-T r\ri LIMIT OF
92-25YEI 92-25X8
TOPOGRAPHIC COKTOUR OFELEVATION AT WHICH SANDOCCURS (DEFINES OUTCROPAREA WHERE SAND IS PRESENT]
LIMIT OF SAND ZONE
DIRECTION OfGROUND-WATER FLOW
Figure 5-16. Ground-Water Flow in the 1035 Sand

31 lO c (0 en I --J (V <s c O a v> O O ct Q.

986.08,90-7Y__90-70
^ 92-7JP90-7Z (971.41)
-4-PW-2
986.51O90-13D
C91-9j|C92-9Y
92-9X
986.6892-1400
92-14X 92-14TP957. OJ
C91-80 :9)-8YC92-8TP"C91_8X
986.77OC91-2D
i PROPOSEDi LIMIT OF
SOLID WASTE
0—— POTENTIOMETRIC CONTOUR
1040.31 WATER LEVEL ELEVATION
WATER LEVEL IN BRACKETSNOT CONTOURED
Figure 5-18. Potentiometric Surface of Uppermost Aquifer, August 1991

985.0390-7Y 90-70
985.97 (90-60
-6W90-62 90~6X
90-10Y 90-1 OX "^ 89-5
985.31O90-130
955.4J92-1400 90-14D
C91-8CU^C91-8Y.66
1-8X 985.5991-9Z 90-900QD
90-9X
985.46OC91-2D
PROPOSEDLIMIT OFSOLID WASTE
92-25YB 92-25X8
Figure 5-19. Potentiometric Surface of Uppermost Aquifer, October 1992
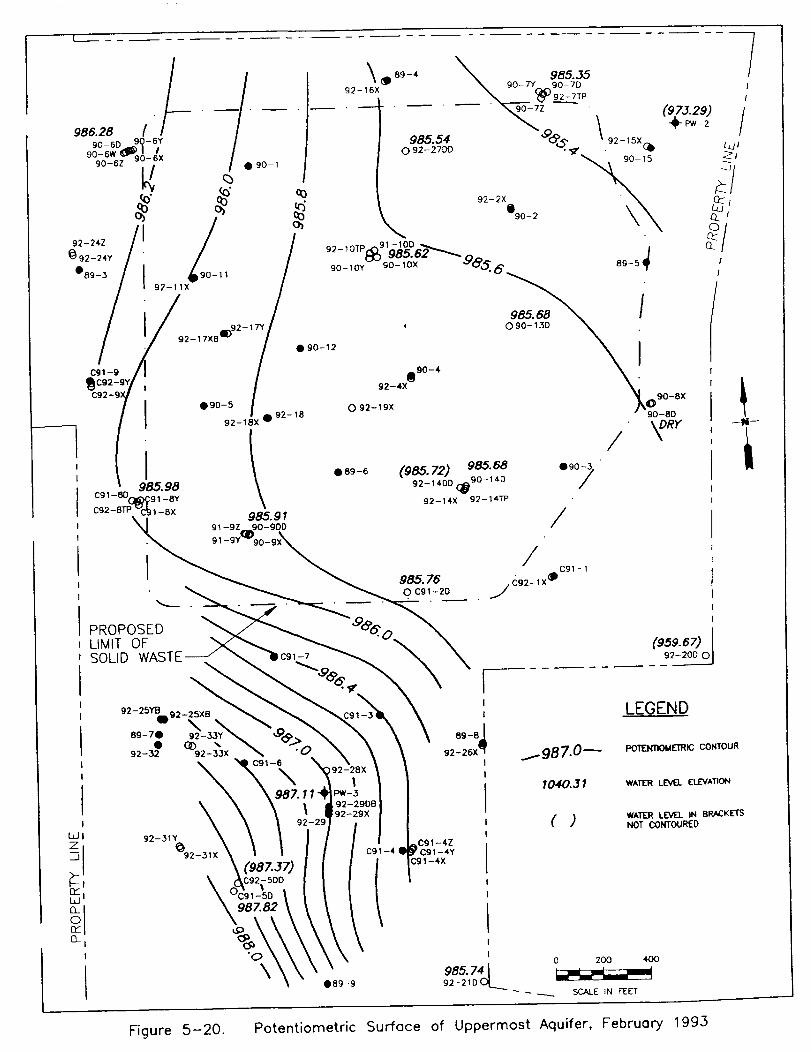
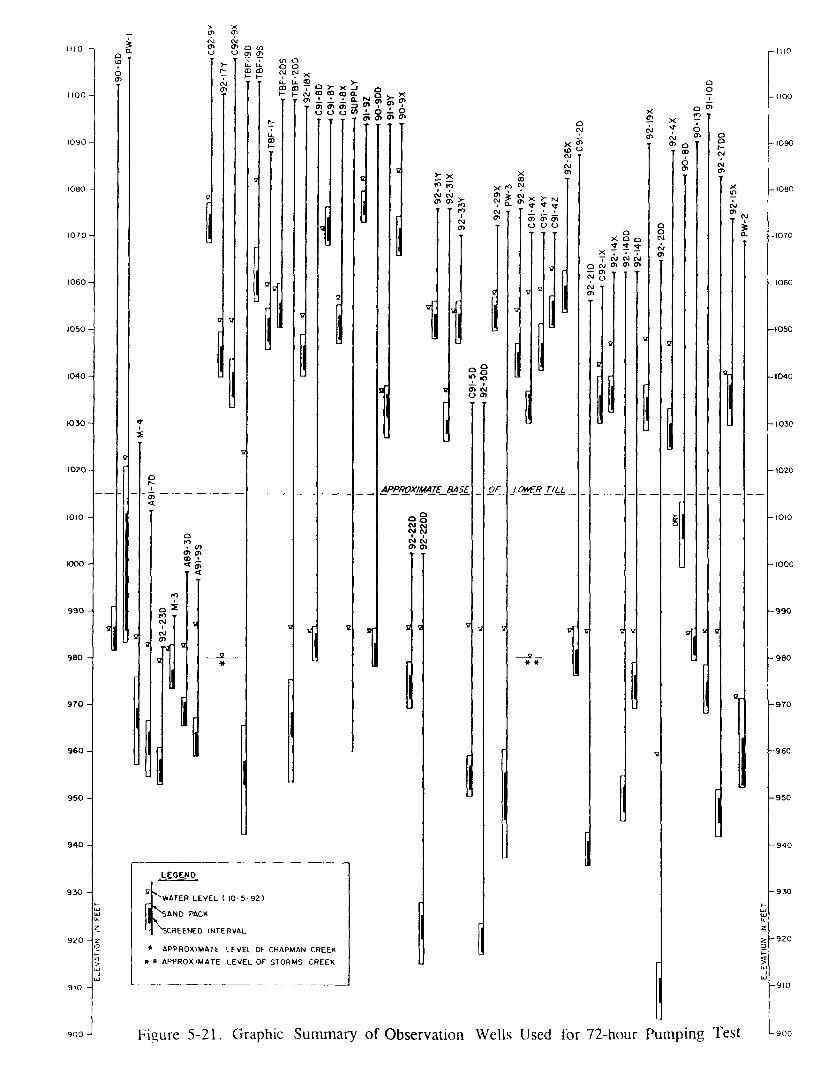
r - t l l O
r- 03 tcoO
1100 -
1090 -
1060-
1050 -
IO40-
1030-
IO20-
KXX> -
990 -
980 -
970 -
960 -
950 -
940 -
930 -
920 - 2
910 -
:>rT>*
Cn<a<
CO
!jfi
i
3•> </5 °0
OJ
B y
•>•>
<5><r•
a
[1
*
Li_ U_ CD >.C D c D T g > - X _ I 01 - l - C M C O C D o O O . H- X
ff-
^-T
Q
„,Mi1
s
r en ^ .T SSI
=
1
|l|
1*-
S enJ 0
0i
2
« ? 6en en
c
?'O^ i
a
1
i
IO
evj
> x*** ro >OJ C\J i
fO
o
1
r*i c' C
"
C
1 [0
lO (Q
<n w'APPROXIMATE BASE
I
SWATER LEVEL ( 10-5 921P^AND PACK
|\CREENED INTERVAL
1 APPROXIMATE LEVEL OF CHAPMAN CREEK
» APPROXIMATE LEVEL OF STORMS CREEK
ogCM (M
CC
a
1
1 CMn en
s -
1III
a>
XCD
< ?
^ Q-VJn
OF
3 2
»
i
\iM >
0C.
o
I
< >-r <
I
S ?> c.
y
iowfv?
I
— S
~
<ri(7)O
O r
Till
\J3>
ff
>
Q O— 0CVJ (.
CSJ '
y
1
s
I
ao
>c0G
X Q Q*T *t TT
C ~ • ~~ OJ OJ OJJ <J> ff> ff*1J
B
*
I
9
2 x Tj T o^ CM ^
O0CM
CMen
i
»
0
s
1
i
2<T>
^
1™
OO
CSJ
CVJ
fi S
Xin
WOf>.
.
1
s,.
t\J
L
hLLL
Cf-
L
L
-IO70
-IO5O
Figure 5-21. Graphic Summary of Observation Wells Used for 72-hour Pumping Test L900
-1030
-IO20
-1010
-1000
-990
-980

ior987.0 -
986.5 -
986.0 -
985.5 -
985.0 -
984.5 -
—, 984.0 -LU£ 983.5 -
g 983.0 -
< 982.5 -_LULTJ 982'° 1LU 981.5 -_LU :
-J 981.0 -
H 980.5 -< ;
^ 980.0 -_
979.5 ^
979.0 -
978.5 -^
978.0 -i
977.5 ^
977.0 -
ior
3/92 10/4/92 10/5/92 10/6/92 10/7/92 10/8/92 10/9/92 10/10/92 10/11/92 10/12/92 10/13/92 10/1
I , , I , I , I , I , I , I ,
~~~— -— __
/- — "X
IN———- ——— s.^ — -^^
f
PROPOSED CLARKCO LANDFILL72-HOUR PUMPING TEST OF PW-3
OBSERVATIONS IN PW-3(PUMP TEST STARTED 1 030 OCT. 6,
ENDED 1030 OCT. 9)—— i | —— i i i i i i i —— | —— i —— | —— i —— | —— i —— | —— i —— | —— , —— , —— , ——5/92 10/4/92 10/5/92 10/6/92 10/7/92 10/8/92 10/9/92 10/10/92 10/11/92 10/12/92 10/13/92 10/1
4/92
r 987.0
r 986.5
r 986.0
r 985.5
r 985.0
r 984.5
r 984.0
r 983.5
'- 983.0
'- 982.5
r 982.0
r 981.5
r 981.0
r 980.5
- 980.0
r 979.5
r 979.0
r 978.5
r 978.0
- 977.5
- 977.0
4/92
Figure 5-22. Pumping Test Hydrograph for Well PW-3

10/3/92 10/4/92 10/5/92 10/6/82 10/7/92 10/8/92 10/9/92 10/10/92 10/11/92 10/12/92 10/13/92 10/14/92
990.0 990.0
< 985.5 -_UJsi 985-° -3
C91-5D
C91-5DD
92-22D
92-22DD
983.0 ^
982.5 -_
982.0 -
981.5 -_
981.0 -j
980.5 -
980.0
PROPOSED CLARKCO LANDFILL72-HOUR PUMPING TEST OF PW-3WELLS IN UPPERMOST AQUIFER
(PUMP TEST STARTED 1030 OCT. 6,ENDED 1030 OCT. 9)
10/3/92 10/4/92 10/5/92 10/6/92 10/7/92 10/8/92 10/9/92 10/10/92
—I—10/11/92
980.0
10/12/92 10/13/92 10/14/92
Figure 5-23. Pumping Test Hydrographs for the Closest Observation Wells in the Uppermost Aquifer

10/3
1063.0 -
1062.5 -_
1062.0 i
1061.5 -_
1061.0 -
1060.5 -_
_-. 1060.0 -tu :UJ 1059.5 -_t- ;
g 1059.0 -m
< 1058.5 -^HI :2J 1058.0 -
UJ 1057.5 -:
-J 1057.0 -^
H 1056.5 ^
> 1056.0 -:
1055.5 -
1055.0 -E
1054.5 -
1054.0 -
1053.5 -
1053.0 -10/
/92 10/4/92 10/5/92
PROPOSED CL72-HOUR PUMPI
(PUMP TEST STAENDED 1
^ »_
^^^^^^
3/92 10/4/92 10/5«2
10/6/92 10/7/92 10/8/92 10/9/92
<\RKCO LANDFILLNG TEST OF PW-3.RTED10300CT.6,030 OCT. 9)
^-+~+~*^*~*~*^
s^~~ ——_^_._±_ts^~*~~*~t^*^
10/6/92 10/7/92 10/8/92 10/9/92
10/10/92 10/11/92 10/12/92 10/13/92 10/1i .i i i i i i i
A 92-28X
—4— 92-29X
—0— BAROMETRIC PRESSURE
^———— ̂ ^^
-%x» -̂(
—^ir~*—
~ £^*~~*—
10/10/92 10/11/92 10/12/92 10/13/92 10/1
4/92
- 31.0
- 31.5
- 32.0
- 32.5
- 33.0
- 33.5
- 34.0 >
- 34.5 §: m- 35.0 ̂ j
- 35.5 -o
"- 36.0 co
- 36.5 §: m- 37.0 "TI: m- 37.5 5: Ir 38.0 8
r 38.5
r 39.0
r 39.5
r 40.0
r 40.5
- 41.04/92
Figure 5-24. Pumping Test Hydrographs for the Closest Observation Wells in the Intra-Till Sand Zones

10/6/9
988.0 -
2-987.5 -CO
u] 987.0 -LU
§986.5 -
I 986.0 -'LU H
Lu 985.5 -
£ 985.0 -LU :
1 984.5 -
32.0 -
^ 32.5 -_
| 33.0 1
£33.5 :Z>COft 34-° -:
BA
RO
ME
TRIC
PR
f.0
CO
CO
CO
3) C
TI
Ol
4.̂
D C
O <
D
01
i i i i
1
i i
t t
1 | i
i
; 1
i i |
208.00 10/6/9220:00 10/7/9208:00 10/7/9220:00 10/8/9208:00 10/8/9220:00 10/9/9208:00
HYDROGRAPH OF 90-9DD
^^~--^-
0.1V
79%
0.14-
0.13'
76%
o.ir
.— — -~
^—~~
~~- ______
80%
—— ,
0.25'
BAROMETRIC RECORD
AVERAGE BAROMETRIC EFFICIENCY = 78 %
PROPOSED CLARKCO LANDFILLILLUSTRATION OF METHOD USED TO DETERMINE BAROMETRIC EFFICIENCY
988.0
'- 987.5
'- 987.0
i- 986.5
1 986.0
985.5
- 985.0
- 984.5
- 32.0
32.5
r 33.0
'- 33.5
'- 34.0
'- 34.5
7 35.0
1 35.5
36.010/6/9208:00 10/6/9220:00 10/7/9208:00 10/7/9220:00 10/8/9208:00 10/8/9220:00 10/9/9208:00
Figure 5-25. Illustration of Method Used to Determine Barometric Efficiency
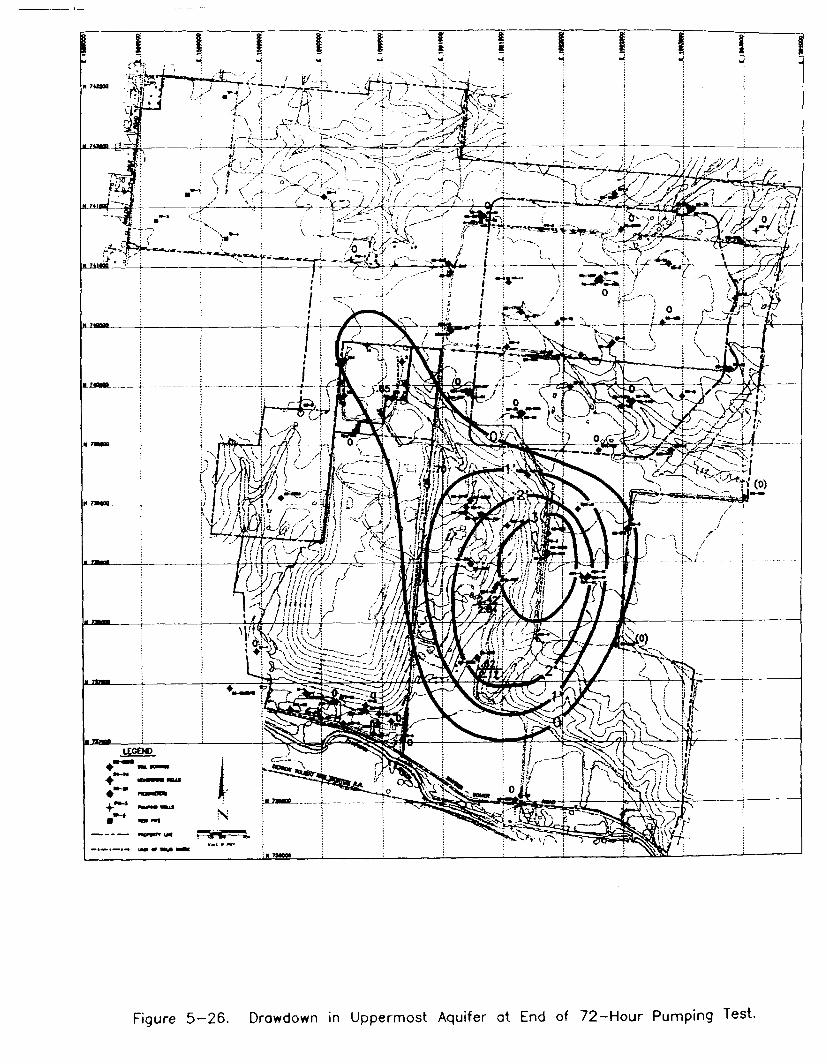
<£> cn I O) o Q Q.
O * C X)
TD 0> -i 3 o (t) —t Q m Q. o O C C. 3 0)

Table 5-1.FIELD HYDRAULIC CONDUCTIVITY TESTS, FOR INTRA-TILL SAND WELLS
PROPOSED CLARKCO LANDFILL
Well
90-6W92-24Z
90-10Y90-6Y91 -9Z
90-6X90-9XC91-8YC92-9Y
90-7Z90 -8X92-26X
90-6Z90-10XC91-4YC91-4ZC91-8X92-11X92-17Y
SandZone
1092 Sand1092 Sand
1077 Sand1077 Sand1077 Sand
1070 Sand1070 Sand1070 Sand1070 Sand
1060 Sand1060 Sand1060 Sand
1050 Sand1050 Sand1050 Sand1050 Sand1050 Sand1050 Sand1050 Sand
SandThidcnessScreened
2.60.8
1.7+0.1 = 1.8.25 +.50=0.75
1.4
2.24.2
2.9+1.0+1.6=5.50.6+1.0=1.6
1.71.7
1.7+6.5=8.2
0.60.7
0.6+0.1+0.8+0.5=2.03.1
0.3+0.1=0.41.6
0.6+0.9+0.7+0.6=2.8
ElevationTop of
1092.91092.8
1080.91078.51076.3
1069.5107031073.21074.2
1062.41059.51062.3
1047.11047.31046.11055.71056.71047.01048.1
Slug Test
5.2 xlO"3
4.1xlO~3
5.1 x 10"4
8.4xlO~5
1.3xlO~4
4.6xlO~3
13 x 10~3
1.8xlO~2
9.1 xlO"6
6.5xlO~3
1.7xlO~5
l . lxKT3
1.5xlO~2
8.4xlO~5
--
Pump Test
5.6xlO~3
1.9 xlO"2
1.3 x 10~4
2.0xlO~3
2.8xlO~2
2.5 xlO"3
2.3 x 10"2
9.1 x 10~4
5.4 xlO"3
3.9 xKT5
PUMPING TEST DATAPumping
fSOmV
1.0
.._ „ _
__
0.7
0.31.0
— —03
——— m-i
0.41.0
0.90.20.40.50.20.30.6
TjestDuration
fniih)
180_ ̂
— —
5.0
9.01440 P
__11.5
__8.0
1440 P
1440 P15.018.0120348.07.0
TestDrawdown
(ft)
7.20
___ _BD
11.02 - BS7.09 - P
— —BD
__BD
6.08 - P
5.18 - P5.75 - BS
12.85 - BS2.73 - BS8.82 - BS
BDBD
AvailableDrawdown
(ft)*
-3.281.56
0.46-0.53
1.28
8.087.03
-2.583.52
-1.631.659.61
5.355.40
12.230.55
-1.887.793.38
SustainedYield(gpm)
<10<1.0
<1.0«1.0«0.7
«0.25
<1.0«0.3
«1.0«0.44
1.6 C
1.1C«0.2«0.4«0.5«1.0«0.3«0.6
Calculated by subtracting the elevation of the top of the sand zone from the lowest water-level observed.Water levels below top of sand are reflected as a negative number
BD = Bailed DryBS = Broke Suction
P = Projected from test data.C = Calculated from test data.
intrhydr.wk3 Page I o f 2

TableS-l.(cont'd)FIELD HYDRAULIC CONDUCTIVITY TESTS, FOR INTRA-TILL SAND WELLS
PROPOSED CLARKCO LANDFILL
Well
92-18X
92-24Y
92-28X92-29X92-31Y92-33YC92-9X
90-7Y91-9YC91-4X92-14X92-15X92-16X92-19X92-2X92-31X92-33X92 -4XC92-1X
SandZone
1050 Sand
1050 Sand
1050 Sand1050 Sand1050 Sand1050 Sand1050 Sand
1035 Sand1035 Sand1035 Sand1035 Sand1035 Sand1035 Sand1035 Sand1035 Sand1035 Sand1035 Sand1035 Sand1035 Sand
Sandv/.x— ,':v-ThicknessScreened
0.5+0.2+0.9+0.1 = 1.7
0.5+0.8+0.2=1.5
0.9+1.9+1.1=3.90.9+0.1+0.1=1.1
6.0+1.0=7.00.2+0.3+0.5=1.0
0.5
1.11.00.7
0.8+3.0=3.83.2+0.4=3.6
1.32.3+0.9+0.4=3.6
0.5+1.5=2.01.40.4
1.2+1.3+2.9=5.40.3+0.4+0.3+0.7=1.7
ElevationTtipof
Sand
1046.5
1052.0
1046.21054.81058.41054.31039.3
1039.71034.11036.01038.91038.31033.91034.61031.11029.91037.81032.21036.8
Slug TestK
5.1xlO~3
3.5 x ID'31.5xlO-3
9.6 xKT4
4.6 xlO"5
1.3xlO-3
3.6 xKT5
8.5 x 10~4
_ —2.4 xKT4
3.2xlO~4
--
- —— —
Pump TestK ' - • • . " .
(Bar In)(Bar Out)(Bar In)(Bar Out)
8.8 xlCT4
9.3 x 1(T5
6.1 x 10~5
1.6 xlO'4
--
8.9 xlO'58.0 x 1CT4
PUMPING TEST DATAPumping
.: Rate :';..';'•';-:;.fH>mV
1.0
0.9
0.60.3__0.50.3
0.5— _0.50.30.40.30.30.70.4--0.30.5
'^Tfestr'Duration
i^tiicySji};^--
151
7.0
34.012.0--
20.012.0
5.0— —
20.095.05.0
15.012.03.0
15.0--
95.026.0
TestDrawdown
(ft)
6.39
8.01
11.15 - BSBD--BDBD
BD— _
17.44 - BS13.76 - BS
BDBDBDBDBD--
15.44 - BS6.35 - BS
AvailableDrawdown
(fO*
5.52
3.35
8.891.77
-4.04-0.7511.81
1.08-2.9815.647.192.024.77
12.443.326.68Dry
13.865.89
SustainedYield(EPm)
<1.0
<0.9
«0.2«0.3«1.0«0.5«0.3
«0.5«1.0
<0.5<0.3
«0.4«0.3«0.3«0.7«0.4None<0.3<0.5
Calculated by subtracting the elevation of the top of the sand zone from the lowest water-level observed.Water levels below top of sand are reflected as a negative number
BD = Bailed DryBS = Broke Suction
P = Projected from test data.C = Calculated from test data.
intrhydr.wk3 Page 2 of 2

Table 5-2.GROUND-WATER LEVELS
PROPOSED CLARKCO LANDFILL
REFERENCEELEVATION
DATE1/8/911/15/912/25/913/22/914/11/915/22/917/15/918/20/919/20/9110/17/9112/2/911/8/921/10/922/28/923/30/925/12/926/09/926/16/928/10/928/31/9210/5/9211/9/922/8/93
1109.34
PW-11026.401026.501026.491026.691026.381026.81
1025.411024.701023.621022.641022.11
1022.221022.021022.031021.84
1022.591022.441022.311022.121022.87
1071.29r.-:$sS
976.58976.72976.80976.56976.83976.37
971.41970.30969.76969.12
968.86969.23969.80971.67971.57
973.64972.65971.31970.34973.29
107735
:̂1$S988.94988.98988.91988.60988.66988.60
987.46987.01987.02986.92
986.46987.11986.88986.81986.42
987.01986.53986.02986.01987.11
1105.36:::'::":9qi6W;|
1100.681101.141100.801101.261100.411098.27
1092.521091.611090.741089.62
1090.711096.191098.611097.971100.17
1098.271095.081093.511092.971098.76
1104.76Mi&ji:
1081.381081.501081.431081.541081.251080.18
1078.281077.851077.741077.58
1078.001079.121079.651079.991080.67
1079.761078.991078.471078.391079.96
1104.39'•;^9b1-6Y
1082.571082.631082.591082.661082.191081.02
1078.821078.321078.221077.97
1078.351079.801080.411080.811081.53
1080.671079.661079.031078.911080.89
110531^!%i$ea®
1056.041055.521055.341055.361055.191054.37
1052.871052.451052.571052.63
1052.911053.871054.331054.271054.75
1054.021053.421053.091053.021054.36
1104,6*
.̂ iSiS987.48987.40987.63987.72987.42987.89
98730986.89986.97986.82
986.57986.69986.43986.40986.09
986.37986.19985.97985.84986.28
1071.599Q~7Y1042.911041.801041.831041.621041.601041.40
1040.911040.821040.811040.78
1040.871041.511041.571041.571041.55
1041.361041.171041.041041.041041.37
1072.7490- 7Z1066.901067.021066.601066.911066.641063.61
1061.731061.331061.061060.77
1060.901061.961065.541065.461064.46
1065.081063.601062.851062.501065.54
1071.4590-7D986.33986.38986.45986.54986.19986.69
986.08985.64985.74985.63
985.47985.66985.41985.42985.09
985.59985.25985.03984.86985.35
1085.1590-8X1072.171073.071073.271073.471072.751069.14
1063.201062.361061.841061.25
1061.151062.451063.281069.161070.61
1069.181066.341064.811064.191071.19
The reference elevation is the top of the PVC well casing (with well cap removed).
g—\vlevl.wk3 Page 1 of 5

Table 5-2. (cont'd)GROUND-WATER LEVELS
PROPOSED CLARKCO LANDFILL
REFERENCEELEVATION
DATE1/8/911/15/912/25/913/22/914/11/915/22/917/15/918/20/919/20/9110/17/9112/2/911/8/921/10/922/28/923/30/925/12/926/09/926/16/928/10/928/31/9210/5/9211/9/922/8/93
1
1085.1990-8D
DRYDRYDRYDRYDRYDRY
DRYDRYDRYDRY
DRYDRYDRYDRYDRY
DRYDRYDRYDRYDRY
1Q9&5890-9X1086.521087.031086.741086.711086.101085.07
1080.611079.261078.531077.33
1077.941083.371085.191085.261085.72
1085.641084.261083.721082.841085.86
:-€ifiiS':^9iim
1039.621039.521033.621036.47
1035.941035.921036.251036.34
1036.251037.391038.011039.061039.47
1036.561037.201036.981037.071038.73
109748;,:;;:9i~9£:
1087.111087.031086.261085.38
1080.931079.561078.791077.58
1078.111083.671085.431085.591086.01
1085.921084.531083.971083.061086.12
10962590^9DD
987.09987.13987.21987.30987.00987.54
986.94986.53986.59986.44
986.17986.36986.00986.01985.67
986.00985.80985.59985.44985.91
1098.3490|lOX1056.501056.621056.471056.421055.961055.80
1053.441052.701052.711052.22
1052.761054.501055.131055.501055.47
1055.651055.001053.911053.461056.05
1098.7490~l6Y1090.121090.301090.361090.451089.311088.01
1083.511082.941082.451081.36
1081.361084.801086.731087.871089.62
1088.461085.751084.061083.511088.73
1QS&989i.«lOii
986.88986.61987.12
986.53986.12986.20986.05
985.84985.98985.73985.71985.40
985.75985.55985.35985.18985.62
'•:• . " . ' '•' '.-.•'•. ' . ".
1091.7390-13D
986.67986.68986.88986.91986.65987.11
986.51986.13986.17986.03
985.81985.97985.67985.67985.35
985.69985.51985.31985.14985.68
1064.8992-14X
1048.171047.451046.621046.091048.76
1065.1790-14D
986.76986.72987.05987.29986.86987.31
986.68986.30986.33986.19
985.94986.09985.78985.77985.47
985.79985.63985.43985.24985.68
1063.9892 -HDD
985.76985.64985.44985.26985.72
* The reference elevation is the top of the PVC well casing (with well cap removed).
g—wlevl.wk3 Page 2 of 5

Table 5-2. (cont'd)GROUND-WATER LEVELS
PROPOSED CLARKCO LANDFILL
REFERENCEELEVATION
DATE1/8/911/15/912/25/913/22/914/11/915/22/917/15/918/20/919/20/9110/17/9112/2/911/8/921/10/922/28/923/30/925/12/926/09/926/16/928/10/928/31/9210/5/9211/9/922/8/93
|_ 1061.70C92-1X
1044.021043.831044.121043.161042.271041.691044.98
1089.60C91-2I>
986.94986.77986.39986.42986.13
985.62985.%985.84985.82985.51
985.88985.66985.46985.28985.76
1071 J5y^iiM:
1053.771052.881052.511051.64
1052.201056.291057.111057.001056.14
1058.541057.201057.371056.441057.76
1072.55C91-4Y
1054.721054.041053.691052.23
1052.921057.381058.171058.061056.89
1059.671058.311058.171057.431059.03
1072.91C91-4Z
1058.231057.211056.461055.40
1056.251061.801062.861062.541061.00
1064.441062.601062.391061.591063.34
1037.54C91-5D
988.08987.93987.45987.46987.42
987.24987.40987.17987.34987.31
987.64987.13986.35986.48987.82
1039.26C92-5DD
987.27986.74985.97986.16987.37
ijfee••V:C9p8X:
1055.421054.881054.821055.34
1055.561056.371056.881057.861057.66
1057.731057.271056.721056.101057.93
1098.42C91-8Y
1071.401071.101070.891070.63
1070.621071.301071.771072.431072.78
1072.591072.041071.301071.301072.68
1097.63C91-8D
987.11987.03986.63986.68986.52
986.26986.48986.09986.09985.75
986.07985.86985.66985.59985.98
110939C92-9X
1053.871052.531051.571051.111051.82
1111.36C92-9Y
1079.401078.141077.821077.721078.94
* The reference elevation is the top of the PVC well casing (with well cap removed).
g-wlevl.wk3 Page 3 of 5

Table 5-2. (cont'd)GROUND-WATER LEVELS
PROPOSED CLARKCO LANDFILL
REFERENCEELEVATION
DATE1/8/911/15/912/25/913/22/914/11/915/22/917/15/918/20/919/20/9110/17/9112/2/911/8/921/10/922/28/923/30/925/12/926/09/926/16/928/10/928/31/9210/5/9211/9/92
1 2/8/93
1091.0892-2X
1034.851035.901035.551035.441034.801034.421036.04
1092.11:;-.V':'.92|43C:
1047.841047.731047.531046.941046.501046.061048.09
;-;-'::ii<&9*:
SSJiJ
1056.471056.211056.011055.401054.921054.791056.31
1076.37:;::::\92il5X:
1040.631040.671040.891040.801040.521040.321041.03
1080;16isiiiic
1039.421039.291040.111039.691039.141038.671041.02
1103.24:!::92§l?t
1052.321051.771051.481053.25
1099.59•:-92|:18X;
1052.841052.321052.021053.73
W9232;:;j;92ii9x
1049.171047.501047.041048.91
1067.171 92-2QD
959.57959.63959.07958.51959.67
1059.1692-21D
985.75985.58985.35985.15985.74
1005.7292-22D
987.48986.61986.49988.82
1005.4392-22DD
984.99986.03986.15987.52
* The reference elevation is the top of the PVC well casing (with well cap removed).
>-wlevl.wk3 Page 4 of 5

Table 5-2. (cont'd)GROUND-WATER LEVELS
PROPOSED CLARKCO LANDFILLREFERENCEELEVATION
DATE1/8/911/15/912/25/913/22/914/11/915/22/917/15/918/20/919/20/9110/17/9112/2/911/8/921/10/922/28/923/30/925/12/926/09/926/16A>2
1 8/10/928/31/9210/5/9211/9/922/8/93
985.2492-23D
980.02979.44979.10978.96980.32
1114.5092-24Y
1056.691056.041055.621055.351056.90
11143192-24Z
1099.091096.761095.411094.361099.55
1086.1592-26X
1074.041072.701072.511071.911073.74
1084.9392-27DD
985.23985.06985.54
1080.1292-28X
1053.811053.091056.16
1075.7692-29X
1057.491056.571059.84
1079.8692-31X
1036.931036.581038.28
1078.3092-31Y
1054.531054.281055.32
1070.0492-33X
DRYDRYDRY
1073.3992-33Y
1053.761053.551054.47
1094.3392-35DD
1024.10
* The reference elevation is the top of the PVC well casing (with well cap removed).
g-wlevl.wk3 Page 5 of 5

Well
90-6W92-24Z
90-10Y90-6Y91-9Z
90-6X90-9XC91-8YC92-9Y
90 -7Z90-8X92-26X
90-6Z90-10XC91-4YC91-4ZC91-8X92-11X92-17Y
92-18X
92-24Y
SandZone
1092 Sand1092 Sand
1077 Sand1077 Sand1077 Sand
1070 Sand1070 Sand1070 Sand1070 Sand
1060 Sand1060 Sand1060 Sand
1050 Sand1050 Sand1050 Sand1050 Sand1050 Sand1050 Sand1050 Sand
1050 Sand
1050 Sand
. :---!$uSJL^r '••'•-TimelessScreened
2.60.8
1.74-0.1=1.8.25 +.50=0.75
1.4
2.24.2
2.94-1.0+1.6=5.50.6+1.0=1.6
1.71.7
1.7+6.5=8.2
0.60.7
0.6+0.1+0.8+0.5=2.03.1
0.3+0.1=0.41.6
0.6+0.9+0.7+0.6=2.8
0.5+0.2+0.9+0.1=1.7
0.5+0.8+0.2=1.5
ElevationTop ofSand
1092.91092.8
1080.91078.51076.3
1069.51070.31073.21074.2
1062.41059.51062.3
1047.11047.31046.11055.71056.71047.01048.1
1046.5
1052.0
HighestWater*Level
Elevation
1101.261099.55
1090.451082.661087.11
1081.541087.031072.781079.40
1067.021073.471074.04
1056.041056.621059.671064.441057.931056.471053.25
1053.73
1056.90
lowest';'":'Water*;:s;';:;,̂
-• . Level :o • • : ' " ;Elevation
1089.621094.36
1081.361077.971077.58
1077.581077.331070.621077.72
1060.771061.151071.91
1052.451052.701052.231056.251054.821054.791051.48
1052.02
1055.35
Flange of^ater LevelIfliictuation
(ft)
11.645.19
9.094.699.53
3.969.702.161.68
6.2512.322.13
3.593.927.448.193.111.681.77
1.71
1.55
Depth toTop of
Sand Pack(ftV
8.115.0
12.520.514.5
30.819.919.031.4
6.021.520.0
52.545.519.012.040.155.750.8
48.1
59.8
Distanceto
Outcrop(ft)
185490
270475245
540320300255
60165465
720840480500650
13001310
960
1110
Based on record to dale as presented in Table 5-2.
Page 1 of 2
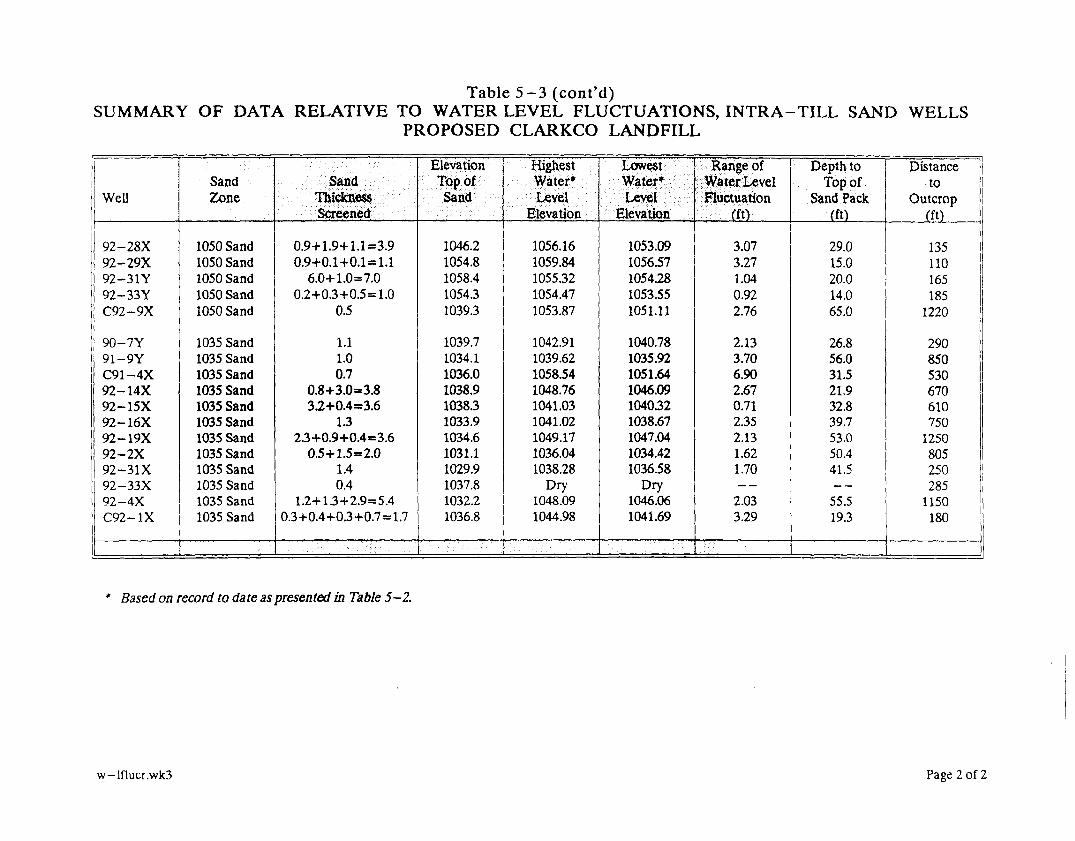
Table 5-3 (cont'd)SUMMARY OF DATA RELATIVE TO WATER LEVEL FLUCTUATIONS, INTRA-TILL SAND WELLS
PROPOSED CLARKCO LANDFILL
Well
92-28X92-29X92-31Y92-33YC92-9X
90-7Y91-9YC91-4X92-14X92-15X92-16X92-19X92 -2X92-31X92-33X92 -4XC92-1X
SandZone
1050 Sand1050 Sand1050 Sand1050 Sand1050 Sand
1035 Sand1035 Sand1035 Sand1035 Sand1035 Sand1035 Sand1035 Sand1035 Sand1035 Sand1035 Sand1035 Sand1035 Sand
'• '. -r:::.v Sand. :•:.::•; : ,.T^^e :̂.;-;': ' •: :Screened{:::: ' •'•
0.9+1.9+1.1=3.90.9+0.1+0.1 = 1.1
6.0+1.0=7.00.2+0.3+0.5=1.0
0.5
1.11.00.7
0.8+3.0=3.83.2+0.4=3.6
1.32.3+0.9+0.4=3.6
0.5+1.5=2.01.40.4
1.2+1.3+2.9=5.40.3+0.4+0.3+0.7=1.7
ElevationTop of
•.'•.•$Nt&-':-
1046.21054.81058.41054.31039.3
1039.71034.11036.01038.91038.31033.91034.61031.11029.91037.81032.21036.8
Highest. Water*'• •\::;^<Byel::- - . ' : '
Elevation
1056.161059.841055.321054.471053.87
1042.911039.621058.541048.761041.031041.021049.171036.041038.28
Dry1048.091044.98
Lowest,;v-Water* :;•:•:'.'.;.''•'}'l^^ •.'!:•• f'':^
Elevation
1053.091056.571054.281053.551051.11
1040.781035.921051.641046.091040.321038.671047.041034.421036.58
Dry1046.061041.69
Range ofi:\VaterLevelfluctuation
<ttV
3.073.271.040.922.76
2.133.706.902.670.712.352.131.621.70--
2.033.29
Depth toTop of
Sand Pack(ft)
29.015.020.014.065.0
26.856.031.521.932.839.753.050.441.5__
55.519.3
Distanceto
Outcrop(ft)
135110165185
1220
290850530670610750
1250805250285
1150180
* Based on record to date as presented in Table 5-2.
w-Iflucr.wk3 Page 2 of 2

Table 5-4SUMMARY OF HYDRAULIC CONDUCTIVITY TESTS FOR THE UPPERMOST AQUIFER
PROPOSED CLARKCO LANDFILL
WellNumber
AvailableDrawdown
• • ' • • • • (ftY
Specific^:;C^p;a t̂y ;̂:::;:.;:^^(l&rrifttHx^
Analytical; • ̂ Tftthod : ; Traiisrnislsiyity
(||)d/ftyStoradvity
AquiferThickness
^•-affite1.-':;;
HydraulicConductivity
.:; (gpd/ft2)
HydraulicConductivity
(cm/sec")Well Yield
1990 PUMPING TEST RESULTS
PW-1PW-2PW-3
241232
51.02.3
20.9
TTT
66,0004,600
43300
_ _- —— —
2425
28.5
2750184
1519
LSxlO"1
8.7xlO~3
7.2xlO~2
100gpm+~25gpm100 gpm+
• : : : . • : • : , '• /-^i^^^ '^^xtm^®^^ :• .;V '.. ' ' ' ; . ' • :.-/r- ' .
91-2D91-5D91-8D
_ _
— —__— —
BBB
____
— —
__- —™ ' —
__- —_ —
4.23.0
1611
2.0xlO~4
1.4xlO"4
7.6xlO~2
__--— —
1992 72-HOUR PUMPING TEST ON PW-3;;
PW-3C92-5DDC91-5DC92-5DDC92-5DDC91-5DC92-22DD
32— _— ______ ___— —
24.3— —— —— —— —— —__— —
TTT
DY(e)DY(1)
NLTD
?5Si:.:V:v' :": ; • ; • " : -;.;?:
77,60049^0044,80041,80045,20049,10045,20051,100
;'*;:;;Si::: ; :•' ••-..':• ';•.'••"••
__
2.8xlO~4
9.5xlO~4
S.lxlO"5
5.4xlO~4
6.0xlO~4
3.5xlO~4
3.2xlO"4
*
3030303030303030
25871650149313931507163715061703
1.2X10'17.8xlO~2
7.0xlO~2
6.6xlO~2
7.1xlO~2
7.7xlO"2
7.1xlO~2
8.0xlO~2
_ —--
— —__— —— —
T = Time-drawdown, semi-log (Cooper & Jacob, 1946)B = (Bower, 1989)
DY(e) = Delayed yield, log-log, early data (Pricket, 1965)DY(1) = Delayed yield, log-log, late data (Pricket, 1965)
NL = Nonleaky artesian, log-log (Theis, 1935)D = Distance-drawdown, semi-log (Cooper & Jacob, 1946)
* Average thickness of aquifer within thearea encompassed by cone of depressionduring test.
hv(hmner.wk3

Table 5-5OBSERVATION WELLS USED DURING 72-HOUR PUMPING TEST
PROPOSED CLARKCO LANDFILL
Well No.
92-28X92-29XC91-4XC91-4YC91-4Z92-5DDC91-5D92-33Y91-31X92-31Y92-26XC91-2D92-21D92-22D92-22DD90-9X91-9Y90-9DD91 -9ZSupply WellC92-1X92-14X92- HDD90-14DC91-8XC91-8YC91-8D92-18X92-19X92-20DTBF-20DTBF-20S92-4X
DistancefromPW-3
(feet)
10075
440440440510550595640645690900
102511051120112511251135113511401310140014001410144014501450158016201710177017801780
Zone^iliScreened
1050 Sand1050 Sand1035 Sand1050 Sand1050 Sand
UMAUMA
1050 Sand1035 Sand1050 Sand1060 Sand
UMAUMAUMAUMA
1070 Sand1035 Sand
UMA1077 Sand
1035 Sand1035 Sand
UMAUMA
1050 Sand1077 Sand
UMA1050 Sand1035 Sand
SDUMA
1050 Sand1035 Sand
||y|p^~«velMeasurementiliiitiiir'::
HHTEEEETHHTE
TTEEEEEEEEEEEEEEEEEE
MeasurementFrequency
CccBBAACCCCAACC4BA4ABBBBB4ABBABBB
Remarks
Pumped intermittently during test.
Affected by supply well
UMA = Uppermost AquiferSD = Stra tified Drift
H = Hermit Transducer with Data LoggerT = Telog TransducerE = Hand Measurement with Electric TapeS = Stevens Strip Chart Recorder
A = Intermittent measurements during 1st 2 hours,then following schedule B.
B = Measurements every 2 hours for24 hours,then at least every 4 hours for remainder of test.
C = Continuous monitoring with pressure transducer.
4 - Measurements every 4 hours.
72hrobsv.wk3 Page I o f 2

Table 5-5 (cont'd)OBSERVATION WELLS USED DURING 72-HOUR PUMPING TEST
PROPOSED CLARKCO LANDFILL
Well Nd.
TBF-17TBF-19STBF-19DC92-9X92-17YC92-9YA91-9SA89-3DM-392-23DA91-7D90-8D90-13D90-10DM-4PW-192-27DD90-6D92-15XPW-2Chapman Creek
DistancefromPW-ffeety
17901850185019701980200019802030203021502180212521002280255028902710282030253170
ZoneScreened
1050 Sand1050 Sand
UMA1050 Sand1050 Sand1077 Sand
SDSDSDSD
UMAUMAUMAUMAUMAUMAUMAUMA
1050 SandSD
Water keVelMeasurement
Method
EEEEEEETEETEEEEEEETSE
MeasurementFrequency
BBBBB4B44AC4
DailyDailyDailyDailyDailyDaily
CC4
Remarks
Background wellBackground wellBackground wellBackground well
UMA = Uppermost AquiferSD = Stratified Drift
H = Hermit Transducer with Data LoggerT = Telog TransducerE = Hand Measurement with Electric TapeS = Stevens Strip Chart Recorder
A = Intermittent measurements during 1st 2 hours,then following schedule B.
B = Measurements every 2 hours for 24 hours,then at least every 4 hours for remainder of test.
C = Continuous monitoring with pressure transducer.
4 = Measurements every 4 hours.
72hrobsv.wk3 Page 2 of 2

Table 5-6RESULTS OF SLUG TESTS ON TILL WELLS
PROPOSED CLARKCO LANDFILL
Boring/WellNumber
92-7TP92-10TP92-14TPC92-8TP
GroundElevation
at)
1069.51095.51061.71094.4
Top ofSand Pack
32.077.247.950.0
WellScreen
32.9-36.978.7-83.748.7-53.751.5-56.5
BoringDepth
(ft)
38.584.054.060.0
ZqneScreened
Lower TillLower TillLower TillLower Till
Slug TestK
(cm/sec)
2.6 xlO~7
3.1 xKT7
2.1 xlO'71.5xlO~7
————————— |
Water-LevelElevation2/8/93
1039.941018.391016.801055.96
.'-. • : , . . • , • • • . : . .':'.:.: :/: '•'•'•'.'•'•'•.':'.'•'•'•:']•'.•:'• •:>:v;-'-:-X i>x •'.'•:•:•.':•'• ' •'•: 1:'>>.':V;-:j:-:-.'>:-;'::;' :;>;•: :-:;;;;:'i;.-'-.:.-.:X;:;Xv^:";'X':-'-.'X';-:;:;X'X';^i ,'x;.;:;:;/:;:'. ::; :'>;;'^\;.::::':-:':;:;:V;il':;;;::.';:-';t;Y:^:;:;^^^'^-!; !;'•>;•':>:•! ":;^':^; ;;!;.•;•;;';: ;;-'x ; :• ' : : ;.:.-. - • . . " :". • ' • • : • • : . •. - • • • • • , . " . . " . . - • . . . • •
slugtil.wkS

Table 5-7RESULTS OF TRITIUM ANALYSES
PROPOSED CLARKCO LANDFILL
Well No.
91 -9Z
90-10X
92-4X
90-9DD
92-27DD
• :;: '• ::V:i ; '" ; ; |SMMi"--.. -' ; :••:•:•: '. :? .vV/'Zone. '• " • ' •.
1077 Sand
1050 Sand
1035 Sand
TopUMA
Base UMA
TritiumUnits(TV)
26.5
0.35
0.33
1.26
1.00
Rate of Recharge
Rapid. Probably <1 Year
Very Slow. > 50 Years
Very Slow. > 50 Years
Slow. > 30 Years; < 50 Years
Slow. > 30 Years; < 50 Years
UMA = Uppermost Aquifer
tritrslt.wkS

PfiOTOSEO CUARKCO LANOHULBBTK——
EASON a ASSOCIATES, INC.

B ASSOCIATES, INC.men STJXZT
WORTHIHfflQN, OHIO 4SOf3


w W
WEST
X
i-w M-OO t4-oo r«-oe M.'OC
LlGiiSD
90-70—— -
.̂1 /
•4-00 W-M W-00 *fr*Q 00*0
SECTION W-WKALI. r>4M>Hr*4O* v EAST
X'
«-00 l-OO B-OO 10-00 t*-O •-00 t»-00 Tt-00 04-00 KM-00
SECTION X - X 1
KALd r-400' N
EAGON a ASSOCIATES, INC
CLiBHCO UWOFlLL CO»W»*T •«..
LOCAL HYDROGEOLOGiCROSS SECTIONS W B>
___^EftMA« Tw^ . a_*H« CO 0^0