669419-1 EFFICIENCY OF AIRLINES IN INDIA ABSTRACT ...
15
Natarajan and Jain Efficiency of Airlines in India 669419-1 EFFICIENCY OF AIRLINES IN INDIA Ramachandran Natarajan, College of Business, Tennessee Technological University, Cookeville TN, 38505, U.S.A. E-Mail: [email protected], Tel: 931-372-3001 and Ravi Kumar Jain, Icfai Business School, IFHE University, Hyderabad-501203 (AP) India. E-Mail: [email protected], Mobile: 91+94405-71846 ABSTRACT This paper measures the technical efficiency of various airlines operating in India over a ten-year period, 2001-2010. For this, the Input Efficiency Profiling model of DEA along with the standard Data Envelopment Analysis (DEA) is used to gain additional insights. The study period is divided into two sub-periods, 2001-2005 and 2006-2010, to assess if there is any impact on the efficiency of airlines due to the significant entry of private operators. The study includes all airlines, private and publicly owned, both budget and full service, operating in the country offering scheduled services on domestic and international routes. While several studies on efficiency of airlines have been conducted globally, a research gap exists as to similar studies concerning airlines in India. This paper addresses that gap and thus contributes to the literature. Key Words: Airlines in India, DEA analysis, Input efficiency profiling, Productivity analysis, Technical efficiency. Introduction The civil aviation industry in India has come a long way since the Air Corporation Act was repealed in the year 1994 allowing private players to operate in scheduled services category. Several private players showed interest and were granted the status of scheduled carriers in the year 1995. However, many of those private airlines soon shut down. Only Jet Airways and Sahara Airlines survived and continued to offer scheduled services, (Table 1). Till the year 2001- 2003, the Indian civil aviation sector was characterized by the domination of government owned national carriers like Indian Airlines (domestic) and Air India (international), excessive regulations (e.g., control of aviation fuel) and taxation. All this resulted in high cost of operating airline services which acted not only as an entry barrier for the private players but also made air travel an expensive affair giving it an image of elitist mode of travel. However, the scenario has changed rapidly over the last decade and the sector has witnessed a significant growth not only in terms of the entry of new private players but also in terms of increase in passenger traffic (16% CAGR between 2001-2011 with a more rapid growth at an average of 19% in the latter half of the decade from 2006-2010, Chart 1). All this can be attributed to the introduction of structural reforms, entry of new private airlines especially with different cost structures e.g., low cost - no frills, airport modernizations, and improvement in
-
Upload
khangminh22 -
Category
Documents
-
view
1 -
download
0
Transcript of 669419-1 EFFICIENCY OF AIRLINES IN INDIA ABSTRACT ...

Natarajan and Jain Efficiency of Airlines in India
669419-1
EFFICIENCY OF AIRLINES IN INDIA
Ramachandran Natarajan, College of Business, Tennessee Technological University,
Cookeville TN, 38505, U.S.A. E-Mail: [email protected], Tel: 931-372-3001
and
Ravi Kumar Jain, Icfai Business School, IFHE University, Hyderabad-501203 (AP) India. E-Mail: [email protected], Mobile: 91+94405-71846
ABSTRACT
This paper measures the technical efficiency of various airlines operating in India over a ten-year period, 2001-2010. For this, the Input Efficiency Profiling model of DEA along with the standard Data Envelopment Analysis (DEA) is used to gain additional insights. The study period is divided into two sub-periods, 2001-2005 and 2006-2010, to assess if there is any impact on the efficiency of airlines due to the significant entry of private operators. The study includes all airlines, private and publicly owned, both budget and full service, operating in the country offering scheduled services on domestic and international routes. While several studies on efficiency of airlines have been conducted globally, a research gap exists as to similar studies concerning airlines in India. This paper addresses that gap and thus contributes to the literature.
Key Words: Airlines in India, DEA analysis, Input efficiency profiling, Productivity analysis, Technical efficiency.
Introduction
The civil aviation industry in India has come a long way since the Air Corporation Act was repealed in the year 1994 allowing private players to operate in scheduled services category. Several private players showed interest and were granted the status of scheduled carriers in the year 1995. However, many of those private airlines soon shut down. Only Jet Airways and Sahara Airlines survived and continued to offer scheduled services, (Table 1). Till the year 2001-2003, the Indian civil aviation sector was characterized by the domination of government owned national carriers like Indian Airlines (domestic) and Air India (international), excessive regulations (e.g., control of aviation fuel) and taxation. All this resulted in high cost of operating airline services which acted not only as an entry barrier for the private players but also made air travel an expensive affair giving it an image of elitist mode of travel.
However, the scenario has changed rapidly over the last decade and the sector has witnessed a significant growth not only in terms of the entry of new private players but also in terms of increase in passenger traffic (16% CAGR between 2001-2011 with a more rapid growth at an average of 19% in the latter half of the decade from 2006-2010, Chart 1). All this can be attributed to the introduction of structural reforms, entry of new private airlines especially with different cost structures e.g., low cost - no frills, airport modernizations, and improvement in

Natarajan and Jain Efficiency of Airlines in India
669419-2
service standards (ICRA Research Report; March 2012). Also, as the Indian economy began to grow faster, international passenger traffic into and out of India also began to grow, (Chart 1).
In the year 2003, India’s first low-cost carrier (LCC), Air Deccan, entered the market. This was a landmark event for this industry, which triggered an entry of several other private players. The year 2005 was also a watershed year for the Indian civil aviation sector as several private low cost and full services carriers (such as Kingfisher, Indigo, SpiceJet, GoAir, and Paramount) commenced their operations (Table 1). This led to the rapid increase in capacity as measured by Available Seat Kilometers (ASK). Some of the new entrants - Air Deccan, Spice Jet, GoAir and IndiGo - were pursuing a different strategy and competed as low cost carriers (LCC).
TABLE 1: Industry Evolution
Year Major Milestones 1953 Nine Airlines existed including Indian Airlines & Air India
1953 Nationalization of all private airlines through Air Corporations Act;
1986 Private players permitted to operate as air taxi operators
1994 Air Corporation Act repealed; Private players allowed to operate scheduled services
1995 Jet, Sahara, Modiluft, Damania, East West granted scheduled carrier status
1997 4 out of 6 operators shut down; Jet & Sahara continue
2001 Aviation Turbine Fuel (ATF) prices decontrolled
2003 Air Deccan starts operations as India’s first LCC
2005 Kingfisher, SpiceJet, IndiGo, GoAir, Paramount start operations
2007 Industry consolidates; Jet acquired Sahara; Kingfisher acquired Air Deccan; Air India and Indian airlines combined to form NACIL
2010 SpiceJet starts international operations
2011 IndiGo starts international operations, Kingfisher exits LCC segment
2012 Government allows direct ATF imports, FDI proposal for allowing foreign carriers to pick up to 49% stake under consideration
Source: ICRA Research
CHART 1: Passenger Traffic Growth
Source: CAPA 2010, Preparing for Long Term Growth of Indian Aviation, New Delhi, India
The entry of the LCCs has significantly expanded the civil aviation market by making air travel both affordable and accessible to the middle class. Low fares offered by LCCs have made air travel very attractive, prompting travelers to switch to air travel from road and rail travel. In the

Natarajan and Jain Efficiency of Airlines in India
669419-3
early days of Air Deccan 40% of its passengers were first-time flyers. SpiceJet, for instance, targeted passengers who were traveling by air-conditioned classes in Indian Railways. LCCs ushered in a new era of competition among airlines. For instance, LCCs competitive pricing set off a price war with the incumbent Full Service Carriers (FSCs) such as Indian Airlines, Jet Airways, and Air Sahara. This compelled the FSCs to discount their fares by as much as 60%-70% in some routes to match the prices of LCCs. While the aggressive pricing strategy of LCCs has created both depth and width of demand which has percolated to non-metro towns and Tier-II cities, this has hurt not only the profitability of LCCs but also the revenues, margins, and market shares of FSCs. For instance, Jet Airways, which controlled about 50% of the domestic market in 2003, saw its share (including that of its acquisition Jet Lite) drop to about one-third by 2007.
According to Kapil Kaul of Centre for Asia Pacific Aviation, “….but the aggressive expansion of the LCC segment comes at a cost to the whole sector. India’s airlines are expected to post a combined loss of approximately USD$500 million in the current financial year ending 31-Mar-07,” (Kaul, 2007).
Aggressive expansion of capacity and inability to control costs were other factors which contributed to the mounting losses. These conditions can lead only to two types of outcomes for the airlines—either some of them go bust in a market shake-out or they merge/get acquired by other airlines or business groups. Whereas in the 1990s, many private carriers went bust, this time around the industry has witnessed a wave of consolidation. Year 2007 became a landmark year in the industry when major consolidation took place, (Table 1).
In 2008, there was a steep fall in the domestic air travel due to the slowdown in the Indian economy, the H1N1 flu scare, and the terrorist attack in Mumbai in November 2008 (Chart 1). There was excess capacity all around and the airlines responded by developing plans to layoff employees and by offering deeply discounted fares to stimulate demand. Rival airlines Jet Airways and Kingfisher formed a strategic alliance for code sharing and cutting costs. The trend was to shift more capacity to LCC operations. The Indian economy slowed in 2008-09 but there was no recession and as the economy picked up in the second half of 2009, the demand for air travel made a comeback (Chart 1). Interestingly, the “pure” LCCs like SpiceJet and IndiGo made profits while carriers like Kingfisher, Jet Airways and NACIL, which had merged in 2007 and operated both FSC and LCC services, experienced huge losses. The anticipated cost reduction due to synergies from the mergers could not be realized. In 2012, the slowing economy affected demand and the domestic market was down by 4.9% compared to 2011. The airlines were also adjusting their capacities downwards to more realistic levels, (IATA, 2013).
Despite these setbacks and massive losses, the long term prospects for the industry appear to be quite good. The reason why foreign airlines such as Air Asia (Asia’s largest low cost airline wants to take 49% stake in a joint venture with the Tata Group) and Abu Dhabi-based Etihad (which took a stake in Jet Airways) still find the Indian market attractive is the huge potential for growth in air travel (Kazmin, 2013). India accounts for only about 2% of global air traffic. Only about 4% of India’s population of over 1.1 billion people had ever been on a flight. Low cost and budget airlines are better positioned to dominate this market which is highly price sensitive.
Natarajan and Jain Efficiency of Airlines in India
669419-4
The above backdrop raises the research question whether the developments described have brought about any significant change in productive efficiency of the airlines. Addressing this objective, this study investigates the productivity (technical efficiency) of various airlines operating in India over a period of ten year period starting from 2001 till 2010. Further, the study period is divided into two sub-periods, from 2001-2005 and 2006-2010, to assess if there is any impact on the productivity of airlines due to the significant entry of private operators. The study includes all airlines, both budget and full-service, operating in the country offering scheduled services on domestic and international routes. While there are several airline studies conducted globally, none to our knowledge have attempted to study the Indian airlines industry. The present study, by addressing this gap, contributes to the existing body of literature.
The paper is organized as follows. In section I, the existing literature is reviewed. The research methodology is discussed in Section II. Section III presents the sample and the data set. Results are presented and discussed in section IV. Conclusions follow in section V.
Literature Review
The existing literature in this area has covered major airlines in Asia, Europe and the USA across different cost structures (full service carriers, budget airlines and low cost carriers); size (large and small), and service type (domestic and international). Some of the important studies are cited below.
Schefczyk (1993), used the DEA technique, apparently for the first time, to analyze and compare operational performance of 15 international airline using non financial data such as Available Ton kilometer, revenue passenger kilometer etc. The study demonstrated that DEA can be a very useful tool to assess the technical efficiency of international airlines which otherwise was difficult to do using financial data because: (1) most airlines lease a substantial fraction of their fleet; and (2) different accounting and taxation rules in various countries result in different impacts of leased assets on profit and balance-sheet information of airlines.
Good, Roller, and Sickles (1995) examined the performance of the eight largest European and the eight largest American airlines for a ten year period between 1976-1986 using two methods – one a parametric using statistical estimation and another non-parametric (DEA) using linear programming. The authors observed discrepancy in the productive efficiency of European airlines even under the conditions of deregulations and liberalization of the airline industry. The study suggested that if European airlines were as productively efficient as their American counterparts then they could save approximately $4 billion per year (in 1986 dollars).
Fethi, Jackson and Jones (2001) studied efficiency across a panel of 17 European airlines in the 1990s during the early phase of liberalization using stochastic DEA constructs (which develops production frontiers that incorporate both inefficiency and stochastic error). They use the Land, Lovell and Thore (1993) model incorporating information on the covariance structure of inputs and outputs. Stochastic DEA was chosen to achieve a closer envelopment of the mean performance of the companies in the sample and reduce, if not eliminate, the effect of extreme outliers. This model computes the relative efficiencies after allowing for stochastic error. They concluded that the airlines that were efficient in 1995 resembled those that were efficient in 1993
Natarajan and Jain Efficiency of Airlines in India
669419-5
but not those in 1991. Interestingly, they also found that larger size airline companies were efficient thus implying that size of an airline does contribute to their degree of efficiency.
Scheraga (2004), investigated the structural drivers of operational efficiency as well as the financial position of airlines in a industry ridden by financial crises post-September 11, 2001. The study analyzed 38 airlines from North America, Europe, Asia and the Middle East and across different cost structures (low cost and budget airlines included for the first time in such a study) to investigate whether relative operational efficiency implied superior financial performance. The author used DEA technique to derive efficiency scores for individual airlines followed by Tobit analysis to investigate the underlying structural drivers of efficiency. The study concluded that the traditional framework developed in the literature still provided reasonable explanatory power for realized relative operational efficiency. The author also observed that relative operational efficiency did not inherently imply superior financial performance and airlines that had chosen relatively efficient operational strategies found themselves vulnerable in terms of financial performance and thus suffered the consequences in the post-September 11 environment.
Zhu (2011), measured performance efficiency of 21 airlines in the US during 2007-2008 using the centralized efficiency model, a two-stage process used to optimize performance simultaneously, instead of a standard DEA technique thus generating efficiency decomposition for the two individual stages. For instance, in stage one, resources (fuel, salaries, and other factors) are used to maintain the fleet size and load factor, and in stage two, the revenue generating capacity is assessed given the fleet size and load factors. The study considers airlines with different cost structures unlike most of the earlier studies that analyzed only major full service airlines.
Lee and Worthington (2010) is one of the very few studies in that included airlines across different cost structures (full services, low cost and budget airlines) and service types (international and domestic services). The study investigates whether the inclusion of low-cost airlines in the data set of international and domestic airlines has any impact on the efficiency scores of those otherwise ‘efficient’ full service airlines. The authors analyzed 53 airlines in the year 2006 using the non-parametric technique of DEA to investigate their technical efficiency. The study reveals that the majority of budget airlines are efficient relative to the more prestigious full service airlines. Moreover, most airlines identified as inefficient are so largely because of the overutilization of non-flight assets.
Michaelides et.al. (2009), have employed both Stochastic Frontier Analysis (SFA) and DEA using a panel data set of 24 world’s largest network airlines to estimate technical efficiency in International Air Transport for the period 1991-2000. The authors observed that the airlines achieved constant returns to scale with technical efficiencies ranging from 51% to 97%. They also observed that ownership (private or public) does not affect the technical efficiency of the airlines. Further, it is interesting to note that results from both SFA and DEA did not vary significantly.
Tofallis (1997), used a modified version of DEA called input efficiency profiling method to assess the technical efficiency of 14 major full service airlines across all five continents using the same data set used by Schefczyk (1993). The study demonstrated that input efficiency profiling

Natarajan and Jain Efficiency of Airlines in India
669419-6
gives better results when compared to standard DEA in measuring technical efficiency of the airlines.
Among the above cited studies and several others (not cited in detail here) such as: Banker and Johnston, (1994); Charnes, Galleous and Li, (1996); Gillen and Lall, (1997); Alam, Semenick and Sickles (1998); Adler and Golany, (2001); and Coli, Nissi and A. Rapposelli, (2011), none have included airlines operating in an important market like India. While such omission is perhaps justifiable for academic studies till 2003 as the Indian aviation sector was very limited with only a few players operating and primarily dominated by government owned airlines, the more recent studies also seem to have ignored the Indian aviation sector. The present study adds value to the body of literature in this area by analyzing all the airlines operating in domestic and international services in full services, budget and low cost segments.
Research Methodology
While there are many ways to define and measure the productive efficiency of an organizational/industrial unit, also called Decision Making Unit (DMU), there are two widely employed techniques namely Data Envelopment Analysis (DEA) and Stochastic Frontier Analysis (SFA), (Farrell, 1957). These methods provide a measure of the technical efficiency of a DMU in terms of radial distance from the best unit on the production frontier represented by the production function of the efficient units. Lesser the distance greater is the efficiency.
DEA is a non-parametric method as it does not impose an explicit functional form for the production frontier unlike an econometric method like SFA. DEA method assumes that all deviations from the efficient frontier are due to inefficiencies, whereas the SFA technique assumes that deviations from the efficient frontier can be a random error or due to realization of inefficiency or a random shock. In short, DEA measures efficiency relative to a deterministic frontier using linear programming techniques to envelop observed input/output vectors as tightly as possible rather than explicitly stating the form of the frontier based on the defined relationship between inputs and outputs.
As seen in the literature on measurement of airline efficiency, DEA method is widely employed for assessing the productive efficiencies of airlines across the world. This study uses the standard model of DEA i.e., Charnes, Cooper, Rhodes (CCR) formulation, (Charnes et al., 1978), which considers all the inputs together, and the input efficiency profiling model of DEA (Tofallis,1997), where the effect of each input is considered separately. Both the standard model and the input efficiency profiling model assume constant returns to scale. The standard DEA model of CCR with constant returns to scale (CRS) has linear weighted combination of all the inputs in the denominator of the objective function. This implies that all the inputs are perfectly substitutable with the weights as the marginal rates of substitution.
The study uses the following two inputs and two outputs, consistent with the ones used in the earlier academic studies, (Schefczyk, 1993; Scheraga, 2004; Lee and Worthington, 2010) but exclude the third input, ‘non-flight assets’ (NFA), in airlines operations. Lee and Worthington (2010) in their recent study has observed that excluding NFA from input set does not seem to have any significant affect on the overall efficiency of the airlines.
Natarajan and Jain Efficiency of Airlines in India
669419-7
Input 1: X1 = Total Available Ton Kilometer (ATKM) (reflects airline fleet capacity in tonnage) Input 2: X2 = Operating Cost (OC) (all operating cost excluding aircraft rentals, depreciation and amortization and other capital expenditure) Output 1: Y1 = Revenue Passenger Kilometer Performed (RPKM) (Kilometers performed of revenue paying passenger traffic) Output 2: Y2 = Non-Passenger Revenue (NPR) (revenue from non-passenger traffic such as carrying cargo)
The rationale for using the input efficiency profiling model is as follows. The input profiling model is more discriminating than the conventional DEA model when the inputs are not substitutes. This applies in the case of airlines where the two inputs i.e., available ton kilometers (a capacity measure) and operating costs (which include fuel and labor costs) are not substitutes. Before Toffalis (1997), Kopp (1981) and Kumbhakar (1988), in their productivity studies -which do not use DEA - have considered effects of each input separately. As Kumbhakar (1988) puts it “knowing the magnitude of (overall) technical efficiency is not enough. It is important to know which inputs are causing the inefficiency and to what extent”. Input profiling helps in isolating the inefficiencies with respect to each input. This information is useful for managers to set priorities and input-specific targets for improvements.
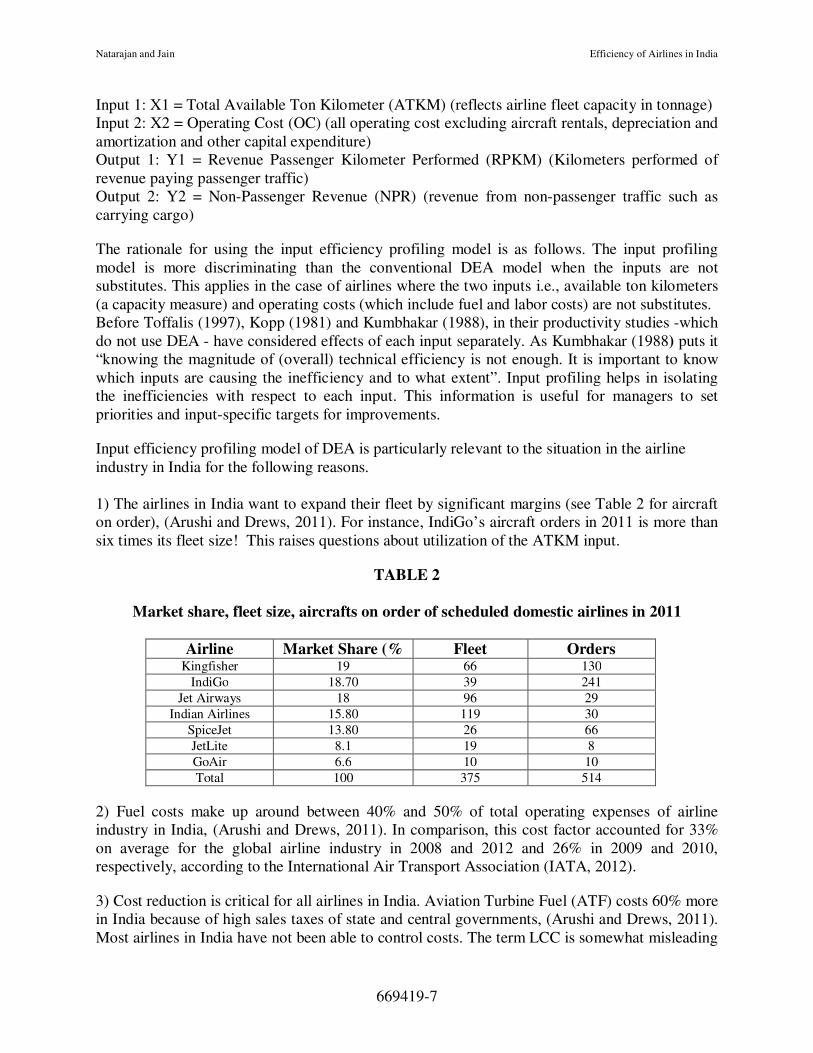
Input efficiency profiling model of DEA is particularly relevant to the situation in the airline industry in India for the following reasons. 1) The airlines in India want to expand their fleet by significant margins (see Table 2 for aircraft on order), (Arushi and Drews, 2011). For instance, IndiGo’s aircraft orders in 2011 is more than six times its fleet size! This raises questions about utilization of the ATKM input.
TABLE 2
Market share, fleet size, aircrafts on order of scheduled domestic airlines in 2011
Airline Market Share (% Fleet Orders Kingfisher 19 66 130
IndiGo 18.70 39 241
Jet Airways 18 96 29
Indian Airlines 15.80 119 30
SpiceJet 13.80 26 66
JetLite 8.1 19 8
GoAir 6.6 10 10
Total 100 375 514
2) Fuel costs make up around between 40% and 50% of total operating expenses of airline industry in India, (Arushi and Drews, 2011). In comparison, this cost factor accounted for 33% on average for the global airline industry in 2008 and 2012 and 26% in 2009 and 2010, respectively, according to the International Air Transport Association (IATA, 2012).
3) Cost reduction is critical for all airlines in India. Aviation Turbine Fuel (ATF) costs 60% more in India because of high sales taxes of state and central governments, (Arushi and Drews, 2011). Most airlines in India have not been able to control costs. The term LCC is somewhat misleading
Natarajan and Jain Efficiency of Airlines in India
669419-8
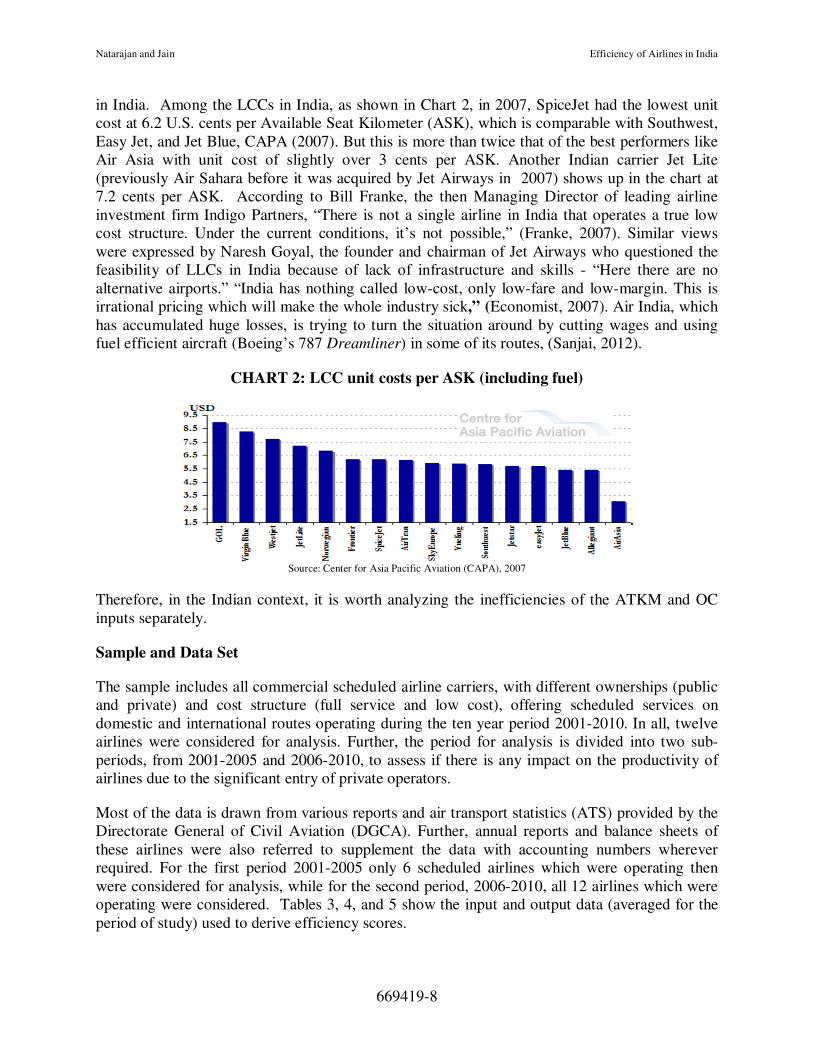
in India. Among the LCCs in India, as shown in Chart 2, in 2007, SpiceJet had the lowest unit cost at 6.2 U.S. cents per Available Seat Kilometer (ASK), which is comparable with Southwest, Easy Jet, and Jet Blue, CAPA (2007). But this is more than twice that of the best performers like Air Asia with unit cost of slightly over 3 cents per ASK. Another Indian carrier Jet Lite (previously Air Sahara before it was acquired by Jet Airways in 2007) shows up in the chart at 7.2 cents per ASK. According to Bill Franke, the then Managing Director of leading airline investment firm Indigo Partners, “There is not a single airline in India that operates a true low cost structure. Under the current conditions, it’s not possible,” (Franke, 2007). Similar views were expressed by Naresh Goyal, the founder and chairman of Jet Airways who questioned the feasibility of LLCs in India because of lack of infrastructure and skills - “Here there are no alternative airports.” “India has nothing called low-cost, only low-fare and low-margin. This is irrational pricing which will make the whole industry sick,” (Economist, 2007). Air India, which has accumulated huge losses, is trying to turn the situation around by cutting wages and using fuel efficient aircraft (Boeing’s 787 Dreamliner) in some of its routes, (Sanjai, 2012).
CHART 2: LCC unit costs per ASK (including fuel)
Source: Center for Asia Pacific Aviation (CAPA), 2007
Therefore, in the Indian context, it is worth analyzing the inefficiencies of the ATKM and OC inputs separately.
Sample and Data Set
The sample includes all commercial scheduled airline carriers, with different ownerships (public and private) and cost structure (full service and low cost), offering scheduled services on domestic and international routes operating during the ten year period 2001-2010. In all, twelve airlines were considered for analysis. Further, the period for analysis is divided into two sub-periods, from 2001-2005 and 2006-2010, to assess if there is any impact on the productivity of airlines due to the significant entry of private operators.
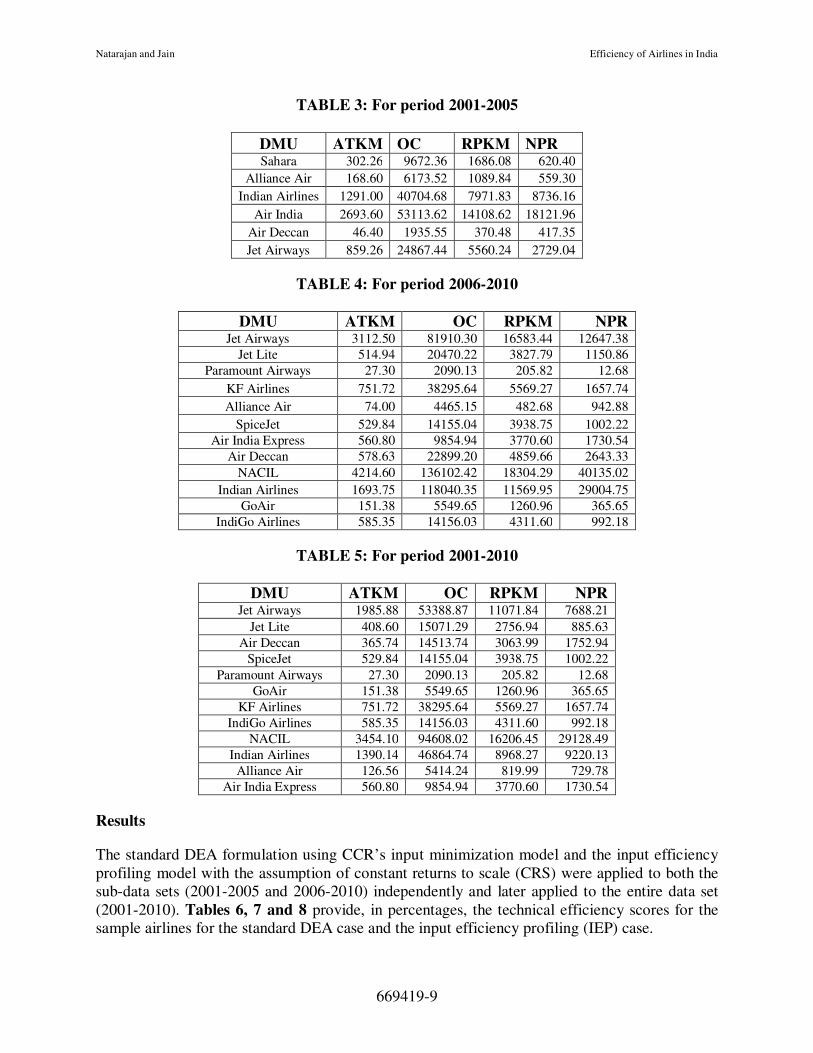
Most of the data is drawn from various reports and air transport statistics (ATS) provided by the Directorate General of Civil Aviation (DGCA). Further, annual reports and balance sheets of these airlines were also referred to supplement the data with accounting numbers wherever required. For the first period 2001-2005 only 6 scheduled airlines which were operating then were considered for analysis, while for the second period, 2006-2010, all 12 airlines which were operating were considered. Tables 3, 4, and 5 show the input and output data (averaged for the period of study) used to derive efficiency scores.
Natarajan and Jain Efficiency of Airlines in India
669419-9
TABLE 3: For period 2001-2005
DMU ATKM OC RPKM NPR Sahara 302.26 9672.36 1686.08 620.40
Alliance Air 168.60 6173.52 1089.84 559.30
Indian Airlines 1291.00 40704.68 7971.83 8736.16
Air India 2693.60 53113.62 14108.62 18121.96
Air Deccan 46.40 1935.55 370.48 417.35
Jet Airways 859.26 24867.44 5560.24 2729.04
TABLE 4: For period 2006-2010
DMU ATKM OC RPKM NPR Jet Airways 3112.50 81910.30 16583.44 12647.38
Jet Lite 514.94 20470.22 3827.79 1150.86
Paramount Airways 27.30 2090.13 205.82 12.68
KF Airlines 751.72 38295.64 5569.27 1657.74
Alliance Air 74.00 4465.15 482.68 942.88
SpiceJet 529.84 14155.04 3938.75 1002.22
Air India Express 560.80 9854.94 3770.60 1730.54
Air Deccan 578.63 22899.20 4859.66 2643.33
NACIL 4214.60 136102.42 18304.29 40135.02
Indian Airlines 1693.75 118040.35 11569.95 29004.75
GoAir 151.38 5549.65 1260.96 365.65
IndiGo Airlines 585.35 14156.03 4311.60 992.18
TABLE 5: For period 2001-2010
DMU ATKM OC RPKM NPR Jet Airways 1985.88 53388.87 11071.84 7688.21
Jet Lite 408.60 15071.29 2756.94 885.63
Air Deccan 365.74 14513.74 3063.99 1752.94
SpiceJet 529.84 14155.04 3938.75 1002.22
Paramount Airways 27.30 2090.13 205.82 12.68
GoAir 151.38 5549.65 1260.96 365.65
KF Airlines 751.72 38295.64 5569.27 1657.74
IndiGo Airlines 585.35 14156.03 4311.60 992.18
NACIL 3454.10 94608.02 16206.45 29128.49
Indian Airlines 1390.14 46864.74 8968.27 9220.13
Alliance Air 126.56 5414.24 819.99 729.78
Air India Express 560.80 9854.94 3770.60 1730.54
Results
The standard DEA formulation using CCR’s input minimization model and the input efficiency profiling model with the assumption of constant returns to scale (CRS) were applied to both the sub-data sets (2001-2005 and 2006-2010) independently and later applied to the entire data set (2001-2010). Tables 6, 7 and 8 provide, in percentages, the technical efficiency scores for the sample airlines for the standard DEA case and the input efficiency profiling (IEP) case.

Natarajan and Jain Efficiency of Airlines in India
669419-10
TABLE 6: Technical Efficiency (TE) Scores for the period 2001-2005
Airlines DEA IEP (ATKM) IEP (OC)
Air Deccan 100.00 100.00 72.06
Air India 100.00 74.80 100.00
Alliance Air 87.58 80.96 66.46 Indian Airlines 91.85 77.34 73.73
Jet Airways 100.00 81.04 84.18 Sahara 81.63 69.86 65.62 MEAN 93.51 80.67 77.01
TABLE 7: Technical Efficiency (TE) Scores for the period 2006-2010
Airlines DEA IEP (ATKM) IEP (OC) Jet Airways 78.04 65.06 70.02
Jet Lite* 88.55 89.21 48.87 Paramount Airways 89.77 89.77 25.74
KF Airlines 91.64 88.92 38.01 Alliance Air 92.01 90.46 73.19
Spice jet 98.39 88.51 72.73 Air India Express 100.00 80.28 100.00
Air Deccan 100.00 100.00 60.48 NACIL 100.00 61.68 100.00
Indian Airlines 100.00 100.00 83.33 Go Air 100.00 99.18 59.39
Indigo airlines 1.0000 87.70 79.61 MEAN 94.87 86.73 67.61
*Jet Lite was called Sahara before the latter was taken over by Jet Airways in the year 2007.
TABLE 8: Technical Efficiency (TE) Scores for the period 2001-2010
Airlines DEA IEP(ATKM) IEP (OC) Jet Lite 81.03 80.95 47.81
Jet Airways 81.42 71.77 65.96 Paramount Airways 89.99 89.99 25.74
KF Airlines 91.74 88.93 38.01 Alliance Air 93.10 93.10 55.31
Spice jet 98.39 88.74 72.73 Indian Airlines 99.82 99.52 76.25
Air India Express 100.00 80.44 100.00 NACIL 100.00 100.00 100.00
Indigo Airlines 100.00 87.92 79.61 Go Air 100.00 99.43 59.39
Air Deccan 100.00 100.00 60.93 MEAN 94.63 90.07 65.14
From Table 6, it is evident from the standard DEA scores that three (two private and one government owned airline) out of six airlines were found efficient with 100% efficiency scores during the period 2001-2005. It is also important to note that a relatively new and low-cost airline, Air Deccan, is efficient while other two major airlines like Sahara and Indian airlines are inefficient. All three airlines that are shown inefficient are established and older airlines in both

Natarajan and Jain Efficiency of Airlines in India
669419-11
private and public sector. Sahara airlines appeared to be the least efficient followed by Alliance Airlines and Indian Airlines among the airlines operating during the period 2001-2005.
Similarly, it is also evident that seven out of twelve airlines operating during the period 2001-2010 are shown as inefficient, (Table 8). Interestingly, two of the government owned airlines were efficient with 100% score while the third Indian Airlines had a score of 99.82. Of the private airlines Jet Airways and Jet Lite emerged as the least efficient with a score of 81% each.
In the latter half of the study period, 2006-2010, it is found that budget airlines such as Air Deccan, GoAir, IndiGo, and Air India Express are efficient with 100% scores (Table 7). Further, it is also interesting to note that the low cost airline, Jet Lite, of Jet Group has shown much better efficiency scores relatively to its own full service airline, Jet Airways, with efficiency scores of 88.55% and 78.04% respectively. This is consistent with the observations made by Lee and Worthington (2010), one of the very few studies that included airlines across different cost structures (full services, low cost and budget airlines) and service types (international and domestic services), that the majority of budget airlines are efficient relative to the more prestigious full service airlines. This indicates that the cost structure of an airline influences its degree of productive efficiency.
Further, both private full service airlines, Kingfisher and Jet Airways, are found be inefficient with scores of 91.64% and 78.04% respectively, while both their public sector (government owned) counterparts Indian airlines (before merger with Air India in 2007-2008) and NACIL (post merger of Indian Airlines and Air India in 2007-2008) are found to be efficient with 100% efficiency scores. When the results of the input efficiency profiling model are considered, the public sector airlines Air India Express, Air India/NACIL and Indian Airlines have performed better than the private sector airlines with respect to both the inputs (Tables 6, 7 and 8). In fact there is only one airline – NACIL - that is on the efficient frontier with respect to both the inputs (Table 8). There is greater variation in the scores of the private airlines for the Operating Cost (OC) input ranging from 25.74 (Paramount) to 79.61 (IndiGo). In general, the low cost carriers (IndiGo, Spice Jet, GoAir and Air Deccan) have been more efficient with respect to the OC input compared to full service carriers (Kingfisher, Jet Airways. Paramount and Jet Lite), (Table 8).
Similarly, 100% efficiency scores of relatively larger full service airlines like Air India, NACIL and Indian Airlines when compared to the scores 78.04% and 91.64% respectively of their smaller private sector counterparts Jet Airways and Kingfisher (Table 7) is consistent with the observation of Fethi, Jackson and Weyman-Jones (2001) that size of an airline does contribute to their degree of efficiency. Similar results are obtained for the input profiling model with large public sector airlines mentioned above outperforming the smaller private sector counterparts, (Tables 6, 7, and 8).
A comparison of the efficiency scores (for the standard DEA model) between two periods 2001-2005 (Table 6) and 2006-2010 (Table 7) does not provide any definitive evidence to believe that liberalization of airline space has brought about improvement in the efficiency scores of airline operators as the results show mixed developments. For instance, while Jet Airways efficiency score declined substantially to 78.04% in the second half from 100% in the first half of the study period; Air India and Air Deccan continued to have 100% efficiency score; and Sahara (called
Natarajan and Jain Efficiency of Airlines in India
669419-12
Jet Lite post-merger with Jet Airways), Alliance Air and Indian Airlines have shown some improvements in their efficiency scores between the two periods.
The results for the input efficiency profiling (IEP) model lead to the following observations. In Table 6, for each airline, the IEP scores for both inputs are less than the corresponding score for the standard DEA model. This is true for the other two time periods as well (Tables 7 and 8). This is always going to be the case because the feasible solutions for the linear program of input profiling is only a subset of the feasible solutions of the linear program for the standard DEA model. The standard DEA model will result in a larger proportion of DMUs on the efficient frontier As Tables 6, 7, and 8 reveal, many of the DMUs that are on the efficient frontier in the DEA model are no longer efficient in the IEP model. In fact there is only one airline, NACIL, that is on the efficient frontier with respect to both the inputs (Table 8).
Except for NACIL and Air India Express there is greater inefficiency with respect to the second input (Operating Cost), when the efficiencies of the two inputs are compared. The inefficiency for this input was as low as 25.74 percent (Paramount). The IEP scores can help identify areas for improvements in a way that the results of the standard DEA model cannot. For example, in Table 8 for Jet Airways, the standard model DEA efficiency is 81.42. This is a radial measure of efficiency which implies that Jet Airways can still produce the current level of output when both inputs are reduced equi-proportionally to 81.42 percent of their current levels. For Jet Airways, the IEP model score for input 1 in Table 8 is 71.77 percent which implies that ATKM can be reduced to 71.77 percent level of the current level of that input while keeping the current level of the output the same. However, according to Table 8, there is greater inefficiency in the use of input 2, i.e., Operating Cost (OC), for Jet Airways can reduce that input to 65.96 percent of its current level and still maintain the current level of output. The IEP scores Tables 6, 7 and 8, suggest that the airlines have to focus on improving efficiency of the Operating Cost input.
The entry of new private airlines has had an interesting impact on the input efficiencies. The average efficiency with respect to ATKM input has increased from 80.67 to 86.73 while the average efficiency with respect to the OC input has decreased from 77.01 to 67.61 (Tables 6 and 7). The average efficiency for ATKM input for the 2001-2010 was 90.07 while the average efficiency for OC input for the same time period was 65.14. One possible interpretation is that price war that was triggered by LCCs such as Air Deccan, increased the demand for air travel and therefore capacity utilization for most of the airlines whereas the increase in fuel cost (which accounts for almost half of operating expenses for airline in India) is generally beyond the control of the airlines.
Conclusions
The following broad conclusions can be drawn from the study.
1. Budget airlines and low-cost airlines are found to be more efficient when compared to the full service airlines. This supports the conclusion that cost structure of airlines matters in their ability to achieve better productive efficiencies.
2. While the new, private, low-cost airlines have been more efficient when the results of the standard DEA model are considered, the public sector airlines have been efficient in the standard DEA model and also been better performers in the results of the more realistic
Natarajan and Jain Efficiency of Airlines in India
669419-13
input efficiency profiling models. The evidence seems to suggest that publicly owned airlines are technically more efficient than the private sector counterparts. This is interesting because financially all the public sector airlines have only made losses during the period of the study, (2001-2010).
3. It is also found that size and scale of the airline influences their efficiency scores. Larger airlines (which are publicly owned) have been more efficient when compared to the smaller ones in both the standard DEA and input efficiency profiling models. In light of conclusion 2 above, it is not clear if it is the type of ownership and/or the scale of operations that is affecting the efficiency. The scale and ownership effects are conflated. This suggests that future research should take into account the effects of scale by considering the variable returns to scale (VRS) model of DEA.
4. The results of the study do not support the view that liberalization of the airline sector and the consequent entry of new airlines in India has contributed to the improvement of productive efficiencies of the airlines.
References
Arushi and Stefan Drews “Aviation and Environment,” A Working Paper of Center for Science
and Environment, New Delhi, India, June 2011
Indian Aviation Industry: “Through turbulent times, FDI relaxation alone not a game changer,” ICRA Research Report; March 2012.
Adler, N., Golany, B., (2001), “Evaluation of deregulated airline networks using data envelopment analysis combined with principal component analysis with an application to Western Europe”, European Journal of Operational Research, vol.132, Issue 2, pp. 260–273.
Alam, I., Semenick, M., Sickles, R.C., (1998), “The relationship between stock market returns and technical efficiency innovations: evidence from the US Airline Industry”, The Journal of
Productivity Analysis 9 (1), 35–51.
Banker, R., Johnston, H., (1994), “Evaluating the impacts of operating strategies on efficiency in the US Airline Industry” in: Data Envelopment Analysis: Theory, Methodology, and Application. Kluwer Academic Publishers, Boston. CAPA (2007). Accessed on March 27, 2013 from http://indiaaviation.aero/news/airline/7591/59/Unit-costs-falling---airlines-in-drive-for-efficiency-
Charnes, A., W.W. Cooper and E. Rhodes, (1978). “Measuring the efficiency of decision making units”, European Journal of Operations Research, Vol. 2, issue 6, pp 429-444.
Charnes, A., Galleous, A., Li, H., (1996), “Robustly efficient parameter frontiers: an approximation via the multiplicative DEA model for domestic and international operations of the Latin American airline industry” European Journal of Operational Research, 88, pp. 525-536.

Natarajan and Jain Efficiency of Airlines in India
669419-14
Coli, M., Nissi, E., and Rapposelli, A. (2011), “Efficiency Evaluation in an Airline Company: Some Empirical Results” Journal of Applied Sciences, vol. 11, pp 737-742
Farrell, M.J., (1957), “The measurement of productive efficiency” Journal of Royal Statistical
Society, Series A (General), vol. 120 pp. 253-290.
Franke, Bill (2007), “No true LCCs in India - Indigo Partners,” Keynote address at the 4th
annual
India and Middle East Low Cost Airline Symposium. Accessed on March 27, 2013
http://centreforaviation.com/members/download/avan/20070614.htm
Economist (2007) “Taking Flight,“ Face Value, The Economist, September 6th, 2007.
Fethi, M.D., P.M. Jackson and T.G. Weyman-Jones (2001), “European Airlines: A Stochastic DEA Study of Efficiency with Market Liberalization”, Paper presented at the Seventh European Workshop on Efficiency and Productivity Analysis (7EWEPA), University of Oviedo, Oviedo, Spain, September 25-29.
Gillen, D., Lall, A., (1997). “Developing measures of air transport productivity and performance: an application of data envelopment analysis”, Transportation Research 33, pp. 261–273.
Good, D.H., Roller, L-H., Sickles, R.C. (1995). “Airline efficiency differences between Europe and the US: Implications for the pace of EC integration and domestic regulation,” European
Journal of Operations Research, Vol. 80, pp. 510-518.
IATA (2013), Accessed on March 27, 2013 from http://www.iata.org/whatwedo/Documents/economics/Passenger-Analysis-Jan-2013.pdf
IATA (2012), Accessed on March 27, 2013 from http://www.iata.org/pressroom/facts_figures/fact_sheets/Pages/fuel.aspx
Kaul, Kapil (2007), “Aviation Consolidation Looming in India” March 7, 2007, Centre for Asia
Pacific Aviation (CAPA). Accessed on March 27, 2013 from http://www.centreforaviation.com/news/press-releases/2007/03/07/aviation-consolidation-looming-in-india-outlook-2007-report-released/page1
Kazmin, Amy (2013), “Foreign Airlines see beyond clouds in India,” Financial Times, February 21, 2013. Accessed from www.ft.com on March 27, 2013
Kopp, R.J., (1981). The measurement of productive efficiency: a reconsideration. Quarterly
Journal of Economics 96 (3), 477-504.
Kumbhakar, S.C. (1988). Estimation of input-specific technical and allocative inefficiency in stochastic frontier models. Oxford Economic Papers 40, 535-549.
Lee, B L., & Worthington, A.C. (2010). “The Relative Efficiency of International, Domestic, and Budget Airlines: Nonparametric Evidence”, Working Paper No. 2010-02, Griffith University.
Natarajan and Jain Efficiency of Airlines in India
669419-15
Michaelides, P.G., Belegri-Roboli, A., Karlaftis, M., and Marinos, T. (2009), “International Air Transportation Carriers: Evidence from SFA and DEA Technical Efficiency Results (1991-2000)” European Journal of Transportation and Infrastructure Research (EJTIR), Vol. 4, Issue 9, pp.347-362.
Sanjai, P.R. (2012), “Air India to cut wages to bring down costs” live mint, December 24, 2012 Accessed on March 27, 2013 from http://www.livemint.com/Companies/xraOS5yWgAnS9P5Y2n0yUJ/Air-India-to-cut-wages-to-bring-down-costs.html
Schefczyk, M, (1993) “Operational performance of airlines: An extension of traditional measurement paradigms”, Strategic Management Journal, Vol. 14, Issue 4, pp 301–317.
Scheraga, C.A., (2004) “Operational efficiency versus financial mobility in the global airline industry: a data envelopment and Tobit analysis”, Transportation Research, Part A 38, pp. 383–404.
Tofallis,C (1997), “Input efficiency profiling: an application to airlines” Computers and
Operations Research , vol. 24 , no.3, pp. 253-258.
Zhu, Joe (2011), “Airlines performance via two-stage network DEA approach”, Journal of
CENTRUM Cathedra, Vol. 4, Issue 2; pp. 260-269.