64th annual report of the Bank for International Settlements
227
B A N K F O R I N T E R N A T I O N A L S E T T L E M E N T S 6 4 t h A N N U A L R E P O R T 1st APRIL 1993-31st MARCH 1994 BASLE,13th JUNE 1994
-
Upload
khangminh22 -
Category
Documents
-
view
3 -
download
0
Transcript of 64th annual report of the Bank for International Settlements

B A N K F O R I N T E R N A T I O N A L
S E T T L E M E N T S
6 4 t h A N N U A L R E P O R T
1st APRIL 1993-31st M A R C H 1994 BASLE,13th J U N E 1994

B a n k f o r I n t e r n a t i o n a l S e t t l e m e n t s
6 4 t h A n n u a l R e p o r t
1st April 1993-31st March 1994 Basle, 13th June 1994

Table of Contents
Page
Introduction 1
I. Wide divergences in the world economy 3
II. Developments in the industrial countries 9
Highlights 9Main features of recent developments 10
Desynchronised business cycle 10Relative cyclical positions and exchange rate effects 12Further progress in reducing inflation 14
The problem of high and persistent unemployment 16Different levels and adjustment patterns of unemployment across countries 17Possible causes of high and persistent unemployment 19Concluding observations 27
Government debt and the constraints on fiscal policy 29Recent developments in government debt 29Rising social security transfers and ageing populations 31Fiscal policy in the current cycle 33
III. The developing countries and eastern Europe 38
Highlights 38Recent developments and policies in the developing countries 39Growth policies in South-East Asia 40
Growth "fundamentals" and policy influences 41Dynamic aspects of the growth process 42
Macroeconomic stabilisation and structural reforms in Latin America 43The nature of the reform measures and immediate post-reform developments 45The choice of nominal anchor 49Post-stabilisation issues and the need for further reforms 49
Asian economies in transition 51Economic developments and reforms in China 51Economic developments and reforms in other Asian countries 56
Eastern Europe and the Commonwealth of Independent States 57Developments and policies in eastern Europe 58Developments and policies in the Commonwealth of Independent States 62Constraints on growth in eastern Europe 65
IV. International trade 70
Highlights 70World trade 71
Developments 71Shifts in world manufacturing trade and output 73Trade policies 74

Page
Current account developments: overview 76Industrial countries 79
United States 79Japan 79Western Europe 81Other industrial countries 83
Former centrally planned economies 85Eastern Europe 85Commonwealth of Independent States 87
China 88The Asian NIEs 90Other developing countries 91Foreign direct investment 93
V. International financial markets 95
Highlights 95The international banking market 96
Activity by reporting centre and nationality of reporting banks 97Developments by currency 99Business with non-banks inside the reporting area 100Bus/ness with countries outside the reporting area 101
The securities market 103The short and medium-term note market 103The international bond market 105Type and residence of international securities issuers 110
The market for derivative instruments 112Exchange-traded instruments 112Over-the-counter markets 114Other market developments and policy issues 115
Gold 118
VI. Monetary policy 120
Highlights 120Monetary policy and economic activity 120
Indicators of domestic monetary conditions 121Monetary policy and monetary conditions in the largest economies 122Monetary policy and monetary conditions in other industrial countries 124
Monetary policy and inflation 127Alternative frameworks for monetary policy 127Targets for monetary aggregates 128Norms for exchange rates 129Discretionary demand management and a real interest rate approach 130Published inflation objectives and indicators of inflation expectations 130
Monetary policy and asset prices 134Transmission of monetary policy 136
The cash-flow channel 137The structure of indebtedness 138Monetary policy and interest payments 140Interest rates and economic activity 142
VII. Capital flows and exchange rates 145
Highlights 145Capital flows: an overview 146

Page
Developing countries 150Increased capital inflows 150Exchange rates and macroeconomic effects 153Implications for monetary policy 158
Industrial countries: exchange markets in 1993 and early 1994 160The dollar, the yen and the Deutsche Mark 160The 1993 crisis in the European exchange rate mechanism (ERM) 165Sterling, the lira and the floating Nordic currencies 170The Canadian dollar 171
VIII. Payment and settlement systems: trends and risk management 172
Highlights 172The transformation of payment and settlement arrangements 172The nature and management of payment system risks 177
Systemic risk 177Large-value interbank funds transfer systems 179The settlement of securities transactions 182The settlement of foreign exchange transactions 184The settlement of derivatives transactions 187Overall assessment 189
Prudential regulation and supervision 190
IX. Activities of the Bank 193
Cooperation between central banks and international organisations 193Functions as Agent and Trustee 195
Agent for the European Monetary Co-operation Fund (EMCF) - Agent for theEuropean Monetary Institute (EMI) 196Agent for the private ECU clearing and settlement system 197Trustee for international government loans 197Collateral Agent for Brazilian bonds 198
Multilateral financial assistance to central banks 198Operations of the Banking Department 198
Liabilities (composition of resources) 199Assets (employment of resources) 202
Net profits and their distribution 204Shareholding central banks 205Changes in the Board of Directors and in the Management 206
Conclusion 208
Balance Sheet and Profit and Loss Account at 31 st March 1994 215
Board of Directors 220
Management 221
The chapters of this Report went to press successively between 16th and 26th May 1994

List of Graphs (*) and Tables
Page
Wide divergences in the world economy
World output growth 4
Developments in the industrial countries
Real GDP in the three major industrial countries* 10Personal saving in selected countries* 11Industrial countries: real GDP, domestic demand and net exports 13Consumer price inflation 14Changes in consumer prices by contributing factor: selected periods and countries* . . 15Changes in consumer prices and wholesale prices by contributing factor:
selected periods and countries* 16Unemployment rates in selected countries and country groups* 18Changes in the labour supply and the population of working age 19Changes in real output and employment 20Employment rates in selected countries and country groups* 20Output and employment in selected countries and country groups* 21Disinflation and changes in unemployment 23Wage shares in selected countries and country groups* 24Long-term unemployment: selected years and countries 26Sources of general government debt accumulation 29Net debt, the interest burden and the cyclically adjusted primary balance* 30General government expenditure in the seven major countries 32Composition of the growth in the social security benefits/GDP ratio 34
The developing countries and eastern Europe
South-East Asia: indicators of economic development 40South-East Asia: structural indicators 42Latin America: real output and inflation 44Latin America: budget balances and gross investment 45Latin America: current account balances and real effective exchange rates 46Latin America: real interest rates 47Latin America: indicators of monetary policy 48Economies in transition: indicators of economic development 51Economies in transition: structural and basic indicators 52China: industrial developments and ownership 54China: development of taxes and extrabudgetary revenue 56Developments in real GDP 59Industrial production in the Baltic states* 60Unemployment rates and real wages* 61Consumer price inflation 62Currency regimes in the former Soviet Union 64Exchange rate developments* 65Gross fixed capital formation and net foreign direct investment* 66

Page
General government budget balances 67Real bank credit to non-financial enterprises 68Internal and external balances in Poland and Hungary* 69
International trade
Indicators of world trade* 71The composition of world exports 72Global shifts in manufacturing output and trade* 73Change in the real trade balance and the cycle* 77Competitiveness and export market shares* 78Japan: the trade surplus and exports 80The impact of the yen's appreciation on manufacturing trade* 80Consumer prices in selected European countries in a common currency 82Real effective exchange rates in selected European countries* 83Current account balances of the industrial countries and the Asian NIEs 84Eastern European trade 86China's exchange rates* 89Current account balances of developing countries 91Global pattern of direct investment 93
International financial markets
Estimated net financing in international markets 96Main features of international banking activity 97Cross-border banking activity in individual reporting centres 98International assets by nationality of reporting banks 99Currency composition of banks' cross-border claims 100Banks' business with non-bank entities in the Group of Ten countries 101Banks' business with countries outside the reporting area 102Issuing activity in the domestic and international short and medium-term note markets 104The international bond market* 106Type and currency structure of international bond issues 107Issuing activity in the domestic and international bond markets 108International long and short-term interest rates* 109Issuing activity in the domestic and international securities markets 111Markets for selected derivative instruments 112Derivative financial instruments traded on organised exchanges 113Markets for selected derivative instruments traded over the counter 115Estimated market sources of gold 119
Monetary policy
Indicators of monetary conditions* 122Short and long-term interest rates in European countries* 125Real interest rates and real exchange rates 126Published objectives for monetary aggregates 128Published inflation objectives 131Inflation outcomes, forecasts and targets* 132Implied one-year forward rates* 133Nominal and inflation-adjusted real estate prices 134Nominal and inflation-adjusted stock prices 136The structure of indebtedness of the non-financial private sector, end-1992 139Interest rates and gross interest payments relative to nominal GDP* 141Responses of gross sectoral interest payments to interest rate changes* 142Responses of gross interest payments and GDP to interest rate changes* 143

Page
Capital flows and exchange rates
Institutional investors' holdings of foreign securities 148Global net capital flows 149Global savings* 150US dollar returns on domestic bank deposits* 151Portfolio capital flows 152Developments in nominal and real effective exchange rates: selected countries in
Latin America and Asia 155Absorption of net capital inflows, real exchange rates and developments in money
and credit aggregates* 156Gross domestic investment and foreign direct investment in selected developing
countries* 157The US dollar against selected currencies and its nominal effective exchange rate* . . . . 160Official foreign exchange reserves 161The external accounts of the United States and Japan 162Bilateral exchange rates against the Deutsche Mark and its nominal effective
exchange rate* 163The German external accounts 164Real effective exchange rates* 166Positions of member currencies in the ERM* 167Bilateral exchange rates of selected currencies against the Deutsche Mark* 170
Payment and settlement systems: trends and risk management
Indicators of trends in the value of payments* 173Indicators of trends in turnover on securities markets* 174International portfolio capital flows and underlying transactions 175Salient features of selected large-value interbank funds transfer systems 176Reduction of settlement flows through netting in selected interbank funds
transfer systems 179CHIPS multilateral net debit positions and Fedwire overdrafts* 180Risk control measures in selected interbank net settlement systems 181Forward replacement cost risk for alternative settlement lags* 183Operating hours of selected large-value interbank transfer systems* 185Salient features of selected cross-border netting arrangements 187
Activities of the Bank
Outstanding Community loans as at 31st March 1994 197Development of the balance-sheet total over the past five financial years 199Development of resources over the past five financial years 199Borrowed funds, by origin 200Borrowed funds, by nature and term to maturity 201Development of investments and other assets, by nature 203Time deposits and advances and government and other securities at term,
by term to maturity 204

6 4 t h A n n u a l R e p o r t
submitted to the Annual General Meeting
of the Bank for International Settlements
held in Basle on 13th June 1994
Ladies and Gentlemen,
I have the honour to submit herewith the sixty-fourth Annual Report
of the Bank for International Settlements for the financial year which began on
1st April 1993 and ended on 31st March 1994.
The net profit for the year amounted to 138,085,797 gold francs, after
transfer of 3,274,041 gold francs to the Provision for Exceptional Costs of
Administration and 3,867,963 gold francs to the Provision for Modernisation of
Premises and Renewal of Equipment. This compares with a net profit for the
preceding year of 139,895,417 gold francs.
The Board of Directors recommends that, in application of Article 51 of
the Bank's Statutes, the present General Meeting should apply the sum of
41,085,797 gold francs in payment of a dividend of 240 Swiss francs per share.
The Board further recommends that 29,100,000 gold francs be trans-
ferred to the General Reserve Fund, 3,000,000 gold francs to the Special
Dividend Reserve Fund and the remainder of 64,900,000 gold francs to the
Free Reserve Fund.
If these proposals are approved, the Bank's dividend for the financial year
1993/94 will be payable to shareholders on 1st July 1994.

I. W i d e d i v e r g e n c e s in t h e w o r l d e c o n o m y
1993 was a year of contrasting developments among countries and regions.
In the industrial world, expansion gathered pace in the United States and
got under way in Canada, the United Kingdom and Australia, while Japan
and much of continental Europe remained stuck in recession. Among devel-
oping countries and the countries in transition the differences were, if
anything, even more pronounced, with the vigorous growth again recorded
in East and South-East Asia standing in marked contrast to the deepening
economic crisis in the former Soviet Union.
Financial developments, too, exhibited important divergences. Wi th the
exception of Japan, the health of financial institutions and of the corporate
sector has improved. This trend was most evident in the United States,
where banks again generated substantial profits and the position of non-
financial firms strengthened considerably. The behaviour of financial markets,
on the other hand, has been unpredictable. Renewed turbulence in the
ERM led to a dramatic widening of fluctuation bands, though subsequently
foreign exchange markets became strikingly calm. Later, bond markets in a
number of countries suffered a sharp reversal, after a sustained period of
rising prices, leaving many observers puzzled about the sequence of what
seemed to be minor causes and major effects. While systemic risks did not
actually surface in the process, these events added to concern that serious
losses can arise from risks that may not be adequately evaluated by financial
market participants.
Despite the strengthening of activity in the United States, growth in
the industrial countries as a whole remained weak, with total employment
stagnating or declining for the third successive year. Unemployment has
become the dominant social problem, particularly in Europe, where in a
number of countries joblessness rose to levels not seen since the 1930s.
However, the disappointing overall picture in 1993 once again concealed a
marked divergence in the cyclical position of the main groups of countries.
Growth accelerated in the United States, while recovery also became estab-
lished in the United Kingdom, Canada, Australia and New Zealand (see the
table overleaf). Activity in all these countries has been stimulated by low
interest rates and real exchange rates which appear quite competitive when
compared with long-term averages. Most continental European countries,
on the other hand, suffered output declines and there were few signs that
the cyclical turning-point might have been reached until late in the year.
For Sweden and Finland it was the third year of declining output, Finland
being the hardest hit among the industrial countries.

W o r l d output growth1
Country groups and regions
Countries cyclically ahead2
Other industrial countries3
Developing countriesAfricaMiddle EastAsiaLatin America
Eastern EuropeWorld
Memorandum item:World, exd. eastern Europe1 Average growth rates for industrial
1984-86GDP
as%oftotal
39.534.419.72.53.97.55.86.4
100.0
93.6
countries
1983-88average
4.03.44.12.8
-0.67.72.92.63.6
3.7
1989 1990 1991 1992
percentage changes in real GDP
2.54.03.93.64.85.71.11.63.4
3.5
ire calculated using
1.04.03.62.35.15.60.7
-4.92.4
2.9
- 1.02.83.31.50.95.33.0
-14.00.6
Î.6
2.01.34.61.05.67.02.3
-15.51.2
2.2
1993
2.8-0.3
4.30.63.07.23.0
-9.11.1
1.7
1991 GDP weights and exchangerates and, for eastern Europe, using 1990-91 GDP and exchange rates, including eastern Germany upto 1991. Other averages are based on 1984-86countries with 1985 GDP of at least US$ 100Australia and New Zealand. 3 Including Israel,
GDP weights andmillion. ;
Turkey ancUnited
i Malta.
exchange rates and comprise allStates, Canada, United Kingdom,
Sources: IMF World Economic Outlook, OECD National Accounts, UNWorld Tables, national data and BIS <;stimates.
Yearbook, World Bank
The economic performance of developing countries has for some yearspast depended more on the success of internal reform efforts than oncyclical conditions in the world economy. 1993 was no exception. Therewas once again vigorous growth in the increasing number of newly indus-trialising economies, apparently relatively untouched by developments inEurope and Japan. Apart from the familiar examples in East and South-EastAsia, the strong performance of China, Vietnam, India, Argentina, Chile andsome other Latin American countries may be noted. A few of these countrieswere even confronted with problems of overheating. On a regional basis,Asia once again turned in the strongest performance. The pace of expansionslowed in the Middle East and Africa, but appears to have picked up slightlyin Latin America. In eastern Europe and the former Soviet Union, therewas a marked contrast between the economic performance of thosecountries which are beginning to reap the fruits of reform, such as Poland,the Czech Republic, Hungary and Slovenia, and much of the former SovietUnion, where reforms to tackle structural and macroeconomic imbalanceshave barely begun and output continues to decline.
The difficulties experienced by the industrial countries during therecession have naturally given rise to intensive macroeconomic policy debateat both national and international level. There have been the usual differ-ences between policy-makers who advocate activist macroeconomic policiesand those who have serious reservations in that respect. On this occasion,however, there is a shared recognition of the constraints within whichmacroeconomic policies must be designed. Where budget deficits are high

and the debt/GDP ratio is rising, governments have little option but to
undertake measures aimed at credible consolidation in the fiscal balance,
whatever the short-term cyclical position. To do otherwise would undermine
confidence in the longer term and quite possibly bring about a counter-
productive rise in bond yields.
In the realm of monetary policy, too, there are major constraints. In
the first place, central banks directly control only the level of very short-
term money market interest rates. These are not necessarily closely related
with movements in the longer-term rates that, in many countries, are more
important for investment decisions. Indeed, inappropriate reductions in short
rates could be associated with increases in long rates if market participants
see them as a sign that longer-term anti-inflation discipline is weakening.
Nonetheless, despite a shared recognition of the constraints facing
policy-makers, and a common commitment to the ultimate goal of price
stability, there remain differences in emphasis among central banks about
how monetary policy should be implemented in a period of weak economic
activity. These differences are reflected in the willingness of the Japanese
and US authorities to bring rates down to quite low levels (and in the
case of the United States, to keep them there even when recovery got
under way), while European countries have remained reluctant to accel-
erate the pace of monetary easing so long as inflation remained above
levels that were acceptable in the longer term, or exchange rates remained
vulnerable.
The difference between these two approaches to the implementation
of monetary policy probably has its roots less in differences of emphasis
with respect to the objectives of monetary policy than in different views
about the nature of the transmission mechanism. Those who favour the
relatively rapid easing of monetary policy when demand is weak generally
believe that low interest rates can and should be used to stimulate economic
activity while any attendant inflationary risks will be kept in check by excess
capacity in factor and product markets. Those who favour more cautious
easing believe that the lags with which monetary policy operates are such
that the short-term effect on output is problematic while the longer-term
risks for the credibility of monetary policy are substantial.
The differences should not, of course, be exaggerated. Few would
dispute that, circumstances permitting, short-term interest rates should be
fairly low when the economy is weak. It is therefore worth looking a little
more closely at the circumstances which, apart from any inflation concerns,
may have caused central banks to keep short-term interest rates higher
than the weakness of their economies might have suggested.
Within the European exchange rate mechanism, as in any fixed but
adjustable exchange rate system, narrow margins left most central banks
with little leeway for independent action on short-term money market
rates. The decision on 2nd August 1993 to widen substantially the fluctu-
ation margins in the ERM (except between the Deutsche Mark and the
Dutch guilder) has changed this situation only in principle, since participating
central banks have clearly not abandoned their objective of keeping their

currencies close to their central parities. Chapter VII discusses the reasoning
behind this policy and the advantages which were nevertheless gained by
widening the band.
For floating currencies, too, exchange rate considerations may be
important in the setting of short-term interest rates. Even minor shifts in
currency preferences can have sizable cumulative exchange rate effects, with
initial changes feeding into expectations and thus triggering further changes.
These exchange rate effects are in turn a major channel for the genera-
tion and propagation of inflationary impulses. Interest rate changes have
potentially important effects on exchange rates not just through their direct
impact on yield differentials on short-term assets but also because they
affect market participants' expectations about the future course of monetary
policy.
Money supply developments and deviations from targets, which for
some central banks have in the past provided a powerful argument against
an anticyclical short-term interest rate policy, do not seem to have been
a major factor in guiding policy developments recently. Even a massive over-
shooting of the intermediate target variable M3 in Germany was not allowed
to exert a dominant influence on policy, attributable as it was to a whole
range of special factors. Concerns as to whether very low short-term
interest rates might trigger another asset price cycle have also not played
a major role in short-term interest rate management. In the United States
and the United Kingdom, the recovery of financial asset prices was seen
as a welcome contribution to the strengthening of balance sheets, while in
Japan most asset prices remain at relatively depressed levels.
Decisions with respect to money market interest rates should, in
principle, be influenced by the manner in which short-term interest rates
are linked to other financial asset prices and hence to decisions affecting
the real economy. These linkages - the "transmission mechanism" of monetary
policy - may well differ over time and between countries. Such differences
- the globalisation of financial markets notwithstanding - seem to be firmly
embedded in national financial structures and relate to the relative impor-
tance of short and long-term interest rates, and fixed and variable rates,
in financial contracts. However, the major easing of monetary policy in
Europe over the last year or so is likely to have a substantial impact on
activity irrespective of such differences in financial structure, as the reduction
in short-term interest rates has by and large gone hand in hand with a
similar decline in long-term rates. Chapter VI discusses these questions in
some detail.
The issue facing the United States, as the country most advanced in
the recovery process, is whether timely rises in short-term interest rates,
by dampening inflation expectations, can limit upward pressures on long-
term interest rates. The action by the Federal Reserve in the early months
of 1994, which may in part have counted on effects of this kind, did little
to confirm such assumptions - at least in the context of an unexpectedly
strong economy. It did, however, bring into play another factor of great
importance for long-term interest rates, namely the sometimes almost

mechanical international linkage between bond markets. Just as long-term
rates in different currencies had for some time declined together, largely
irrespective of national levels and movements of short-term money market
rates, in the early months of 1994 they tended to follow the lead of the
United States in the opposite direction. These linkages seem to be partic-
ularly close during periods of market disturbance. When markets are calmer,
however, differences in cyclical positions and associated developments in
monetary policies seem to be compatible with greater divergences in bond
market trends.
Important though appropriate macroeconomic policies are, many of
the most pressing economic problems facing the industrial countries require,
in addition, determined efforts to deal with structural rigidities and to
improve the flexibility of markets. In the process of adapting to increased
competitive pressures, industrial firms have reacted, as might be expected
in a market economy, by making every effort to cut costs and shed labour.
The challenge facing the industrial countries is to improve the capacity of
their economies to absorb redundant labour into new activities. This requires
action both on the demand side of the labour market, to increase firms'
incentive to take on additional workers, and on the supply side, to ensure
that labour has the requisite characteristics and is willing to accept employ-
ment at a market-clearing wage. Chapter II examines why some economies
are more afflicted by high and persistent unemployment than others. There
are indications that attitudes in most of these countries have started to
change. But some of the structural weaknesses revealed by the recession
will take a long time to remedy.
Structural policies are also clearly of key importance in the developing
countries. The task is not simply to provide increased employment oppor-
tunities, but to strengthen incentives to save and invest and to improve
the allocation of resources. A gratifying feature of developments in the past
several years has been the increasing number of countries that have taken
decisive steps towards opening their economies and subjecting the alloca-
tion of resources to market disciplines. There is an accumulating body of
evidence that such policies are effective in strengthening growth perfor-
mance. The most spectacular examples of success are to be found in the
newly industrialising economies of East and South-East Asia. Their ranks are
now being joined by countries as geographically diverse as China, India,
Pakistan, Mexico, Argentina and Poland, to cite only the larger economies
in their respective regions. All of these countries have confounded the old
accepted wisdom that developing countries could not achieve sustained
growth while the industrial world was in recession. Their potential for
success will be all the greater when the pace of activity in the industrial
countries picks up.
The recent experience of developing countries also points to the
benefits of macroeconomic stability. Although some countries (Brazil, for
example) have from time to time combined high growth with inflation, the
overwhelming evidence is that persistent high rates of price increase
undermine the sustainability of output growth. The current situation of the

former Soviet Union, where extreme macroeconomic instability has been
combined with continued structural distortion, illustrates the difficulty of
reviving growth under such conditions.
While this Report goes into many of the issues just raised, it covers
much wider ground. Among the topics discussed are the development of
world trade, including structural shifts in the pattern of trade over the last
two decades and the completion of the Uruguay Round (Chapter IV); recent
trends in international banking, securities and derivatives business (Chapter V);
the changing pattern of international capital flows and the growing attrac-
tiveness of "emerging markets" (Chapter VII); and the major developments
that have taken place over the last decade or so in payment and settle-
ment systems, with particular reference to safeguarding against systemic
risk (Chapter VIII).
8

I I . D e v e l o p m e n t s in t h e i n d u s t r i a l c o u n t r i e s
Highlights
The business cycle in the industrial countries continued to be desynchro-
nised last year. Led by the United States, a recovery gained momentum in
the course of the year in the United Kingdom, Canada, Australia and New
Zealand. However, output gaps increased further in Germany and other
continental European countries while in Japan there were still few signs
that the downturn had bottomed out, even after a series of stimulatory
fiscal measures and reductions in interest rates.
Despite the divergence in real growth, and relatively large changes in
nominal and real effective exchange rates, inflation rates continued to
converge. At the end of last year the rise in consumer prices averaged
3% in the industrial countries, the lowest rate in thirty years apart from
1986, which was influenced by falling oil prices.
At the same time, and notwithstanding a marked decline in the United
States, unemployment continued to rise last year and now affects over
33 million people in the industrial world. The problem is especially severe
in the EU countries, where over 11% of the labour force is unemployed
and about one-half of the jobless have been out of work for at least a
year. Many workers have dropped out of the labour force, discouraged by
the poor employment prospects, and a large proportion of those in work
are only working part-time, some of them by choice but most because
full-time jobs are not available.
Another aspect of the European unemployment problem is the high
persistence of unemployment. Wi th every business cycle trough since 1970
the number of unemployed has progressively ratcheted up, pointing to
worsening structural problems in the European labour markets. These include
regulatory or institutional arrangements which prevent real and relative
wages from adjusting to changes in supply and demand, disincentives to
work caused by social transfers and taxes, a lack of incentives and oppor-
tunities to improve skills and difficulties in adjusting to and benefiting from
technological progress and increased trade with the developing countries.
While most of the rise in unemployment since the onset of the recession
is cyclical, solutions to the structural problems which do not jeopardise
recent gains in the fight against inflation call, above all, for measures to
increase flexibility and improve work incentives.
Cyclical as well as structural factors also contributed to the dete-
rioration in fiscal balances and the acceleration of government debt
accumulation. The rise in unemployment compensation and other forms of
assistance was almost universal and was not confined to countries still in

recession, highlighting the unsustainability of certain transfer and pension
systems in the medium term due to the ageing of the population. Fearing
a further deterioration in medium-term sustainability, most high-debt countries
last year made efforts to offset the automatic stabilisers by implementing
austerity measures. Other countries were able to attenuate the downturn
and yet maintain credibility by combining a deterioration in the primary
balance with new medium-term consolidation programmes.
Main features o f recent developments
Desynchronised business cycle
The growth of output in the industrial countries in 1993, at just over 1%,
was well below that of productive potential for the third consecutive year.
Moreover, the business cycle continued to be highly desynchronised (see
the graph below). Almost half of the countries recorded negative growth
and, underlining the weakness of the recovery, only a few countries managed
to reduce the gap between actual and potential output. As a result, the
number of unemployed rose to over 33 million, with Europe accounting
for more than half of this figure.
The US economy, which had been among the first to enter recession,
has continued to lead the recovery, aided by low interest rates, a strength-
ening of balance sheets in the private sector and improved competitive-
ness in several key industries following restructuring and cost-cutting. The
strengthening of US domestic demand contributed VA-2% to aggregate
GDP growth in the industrial countries and was by far the most significant
factor in overall growth last year. In Japan, on the other hand, domestic
demand remained subdued and the output gap widened further. Substan-
Growth belowpotential ...
... despite USrecovery
Widening outputgaps in Japan ...
Real G D P in the th ree major industr ial countr ies
Percentage changes over four quarters
United StatesJapanWestern Germany
1990
Source: National data.
1991 1992 1993
10

Personal saving in selected countries'1
Annual averages, as a percentage of disposable income
United StatesWestern GermanyUnited KingdomCanadaAustralia
89
25
20
15
10
93 85 89 93* For France, Italy and the United Kingdom, gross saving; for other countries, net saving. Figures for1993 are partly estimated.Sources: OECD Economic Outlook and national data.
... and Germany
Improvedhousehold andbusinessconfidence ...
tial increases in public spending and transfers over a period of eighteen
months (see page 36) and lower interest rates were unable to offset fully
a growing underlying weakness in private sector spending, in part because,
unlike in the United States, the process of balance-sheet correction still
has a long way to go. Moreover, the dampening effects of an appreciating
currency on the export sector appear to have worked through very quickly
while large terms-of-trade gains have not led to a corresponding increase
in consumer spending. The output gap also rose in western Germany
although it remained smaller than in previous recessions. In eastern Germany,
on the other hand, output growth accelerated in the course of the year,
spurred by construction and capital goods spending and activity in the
services sector. Signs of internal or autonomous sources of growth can
also be observed, though transfers from western Germany have remained
very high.
Apart from the United States, recovery was evident in several other
countries that had entered the recession relatively early. In Canada net
export growth provided a significant contribution owing to the strength of
the US economy. More generally, however, the recovery can be related to
an improvement in household and business confidence, especially pronounced
towards the end of the year, reflecting the combined effect of low interest
rates and stronger financial balances of both households and enterprises.
11
A typical feature seen in all countries in the early phase of recovery was
a decline in household saving rates, in marked contrast to those countries
that are still in recession (see the graph on page 11), where household
consumption remained depressed by fears of job losses and generally low
confidence. In Germany, however, a fall in the saving rate prevented a
further deepening of the recession.
The improved confidence in the United States was reflected in invest-
ment and household spending on durable goods. In fact, fixed capital
formation was easily the most buoyant component of aggregate demand. The
strength of spending on consumer durables underlines the stronger balance-
sheet position of the household sector as a whole. However, an element
of some concern is the relatively high debt service/income ratio of middle-
income households, which have been most adversely affected by the stag-
nation of real wages (see page 25). In the United Kingdom the recovery
was led by private consumption, whereas private fixed investment remained
well below its 1989 peak, despite a sharp reduction in debt interest payments
and rising profits.
The weakness of investment in continental Europe and Japan was less
surprising given the continuing recession. The contraction in spending on
business equipment in Japan, Germany and Italy reduced overall output by
114-2%. The decline in Japan was particularly steep as the effects of previous
overinvestment and distorted balance sheets were reinforced by falling
profits in many export industries due to the appreciation of the yen. Expen-
diture on consumer durables, notably automobiles, was also weak in Japan
and most of Europe. Residential investment, on the other hand, was rela-
tively well maintained in Japan and Germany owing to, respectively, the
availability of housing loans at low interest rates and excess demand as a
result of immigration.
A slightly different cycle can be observed in the commercial real estate
market. Business has started to revive in the United States and the United
Kingdom, but not yet in Canada and Australia. Last year, for the first time
since 1987, total financial returns on US commercial real estate were positive.
In Japan, by contrast, commercial property prices have continued to fall,
in Tokyo by almost 40% since their peak. Because real estate loans in Japan
account for about one-quarter of banks' total loan stock, the continuing
slump has contributed to a marked rise in non-performing loans and has
heightened banks' reluctance to lend.
... stimulatingspending ondurable goodsin somecountries ...
... but not inothers
Incipientrecovery incommercial realestate markets
Relative cyclical positions and exchange rate effects
Cyclical forces also influenced movements in net exports (see the table
opposite). Generally, countries in a relatively weak cyclical position benefited
from positive growth of net exports, especially those that had also expe-
rienced a marked real exchange rate depreciation. In several of these
countries net export growth was the only source of stimulus. For example,
in Italy and Finland net export growth contributed 41/2% to GDP, and in
Sweden and Spain 3%. By contrast, in Turkey the stimulus from domestic
Forces affectingnet exportgrowth
12

Industr ial count r ies : real GDP,
Countries andcountry groups
United StatesJapanGermanyFranceItalyUnited KingdomCanada
Group of Seven
AustraliaAustriaBelgiumDenmarkFinlandGreeceIrelandIsraelNetherlandsNew ZealandNorwayPortugalSpainSwedenSwitzerlandTurkey5
Other industrial
All industrial
domest ic demand and
Real GDP1981-91
2.44.22.73
2.32.32.62.4
2.8
2.82.52.22.32.31.73.63.62.21.2"2.62.83.21.81.95.0
2.6
2.81 Demand components generally2 Percentage point contribution toSource: National data.
1992
2.61.22.11.20.7
-0.60.7
1.7
2.11.51.41.2
-3.80.94.66.61.4
-0.33.41.10.8
-1.9-0.1
6.4
1.0
1.6
exclude the
1993
net expor ts 1
Domestic demand1981-91
annual |
3.00.1
-1.2-0.9-0.7
1.92.4
1.2
3.4-0.3-1.3
1.2-2.6
0.02.53.50.24.92.3
-0.5-1.0-2.1-0.6
7.2
0.2
1.1
2.54.22.43
2.52.63.02.5
2.9
2.12.52.21.72.72.01.23.92.21.2"1.22.94.01.92.44.5
2.6.
2.9
statistical discrepancy
1992jercentage
2.90.42.70.20.80.40.0
1.6
2.81.72.5
-0.6-5.9
0.8-1.5
5.91.43.11.93.71.1
-2.2-3.0
8.2
0.8
1.5
figures fo
1993changes
3.90.3
-1.4-1.9-5.0
2.01.8
1.1
2.50.6
-2.20.4
-7.30.81.55.7
-0.46.42.3
-0.9-3.6-4.9-1.416.0
-0.7
0.8
• 1993 are
Net exports1981-91
-0.10.10.53
-0.3-0.4-0.4-0.2
-0.1
0.5-0.1
0.00.7
-0.5-1.1
2.8-1.1
0.3-0.2"
1.4-0.7-1.0
0.0-0.5
0.2
-0.2
-0.1
1992
-0.31.0
-0.61.0
-0.1-0.9
0.8
0.1
-0.3-0.1-1.1
1.82.10.06.2
-0.40.1
-3.61.8
-3.2-0.4
0.33.2
-1.9
0.3
0.1
partly preliminary orGDP growth. 3 Western Germany only. 4 Fiscal years beginning 1st
2
1993
-0.9-0.3
0.21.04.6
-0.20.5
0.1
0.5-0.9
1.00.84.5
-0.91.0
-3.20.5
-2.0-0.4
0.52.82.80.8
-9.2
0.9
0.2
ästimated.April. 5 GNP.
demand was entirely "lost" through a real appreciation of the currency and
lower net exports.
In other cases exchange rate movements and relative cyclical positions
influenced net exports in opposite directions. Despite a comparatively
weak cyclical position, Japan recorded negative net export growth owing
to a substantial real appreciation of the yen. On the other hand, notwith-
standing the early onset of recovery, Canada showed positive net export
growth, due to a favourable real exchange rate and a relatively weak
domestic demand position compared with its major trading partner.
Among the smaller economies, Australia benefited from its closeness to
the booming Asian market and Ireland, like Canada, from a relatively weak
cyclical position vis-à-vis its major trading partner. By contrast, in Austria
even moderate domestic demand growth exceeded that of neighbouring
countries.
13

Further progress in reducing inflation
Average consumer price inflation in the industrial countries fell to only 3%
last year, the lowest rate since the sharp oil price decline in 1986 (see the
table below). There has been a significant convergence of inflation rates in
the Group of Ten countries, which was further consolidated in 1993 and
the early part of this year. Despite the recession and a marked reduction
in the growth of nominal wages and unit labour costs, Germany's inflation
rate remained above the average for the industrial countries, owing mainly
to developments in the services sector and public tariffs. However, following
recent settlements in wage-leading sectors, implying negative real wage
growth and, through more flexible working hours, a widening of enterprises'
scope for reducing costs, price inflation is generally expected to continue
to decline this year, even allowing for the effect of higher indirect taxes.
Another notable feature of the inflation picture is that convergence
has taken place despite large divergences in nominal effective exchange
rates. In particular, consumer price inflation has continued to fall in countries
that over the last two to three years have experienced a substantial
Low andconverginginflation rates
Consumer price inf lat ion
Countries
United StatesJapanGermanyFranceItalyUnited KingdomCanada
AustraliaAustriaBelgiumDenmarkFinlandGreeceIrelandIsraelNetherlandsNew ZealandNorwayPortugalSpainSwedenSwitzerlandTurkey
Average4
1982-90 1991 1992 1993March June Sept. Dec.
1994March
annual percentage changes, based on end-of-period figures1
4.01.71.72
4.47.25.84.4
7.32.83.44.45.5
18.44.7
78.81.59.06.1
15.87.76.82.8
50.5
4.3
3.12.76.13.16.04.53.8
1.53.12.82.34.2
18.03.6
18.03.71.02.99.25.58.15.2
71.1
4.2
2.91.23.61.94.62.62.1
0.24.22.41.52.3
14.42.39.42.31.32.28.45.32.03.4
66.0
3.1
3.11.24.72.23
4.31.91.9
1.23.92.91.12.73
16.41.9
10.82.51.02.57.34.04.93.6
58.0
3.2
3.00.94.71.94.21.21.6
1.93.62.40.92.0
15.80.9
11.22.31.32.35.64.94.83.1
67.2
3.1
2.71.54.52.34.21.81.9
2.23.42.81.21.7
12.81.4
10.42.81.52.26.04.34.23.4
68.2
3.1
2.71.04.32.14.01.91.7
2.03.52.71.51.6
12.11.5
11.32.61.41.86.44.94.12.5
71.1
3.0
2.51.33.21.54.22.30.2
1.43.12.31.70.4
10.21.79.62.91.31.06.05.01.81.3
73.6
2.81 Quarterly figures for Australia, Ireland and New Zealand. 2 Western Germany only. 3 New index.4 Weighted average, based on 1991 exchangerates ancconsumption weights.
14

Changes in consumer prices by contributing
factor: selected periods and countries
Consumer prices1
Contribution of unit labour costs2
Contribution of the nominal effective exchange rate2
United Kingdom
L t L
Canada 20
16
12
n
72-76 79-82 90-93 71-76 82-86 90-93 76-79 83-86 91-93
Australia Finland Sweden
D
Spain 16
12
- 473-78 84-86 91-93 70-73 77-78 90-93 76-79 80-83 91-93 79-83 90-931 Percentage changes, annual rates. 2 Calculated as the percentage change in unit labour costs(the nominal effective exchange rate) multiplied by the compensation (import) share in GDP.Sources: OECD National Accounts and national data.
... despite largevariations inexchange rates
depreciation of their currency, raising the question of whether the "pass-through" of exchange rate changes into retail prices is different from thatin earlier periods. The graph above tentatively examines this issue for sevencountries. In most cases consumer price inflation is significantly below therates observed in earlier periods of currency depreciation. However, thelower rates of inflation can be attributed mainly to the simultaneous andmarked reduction in unit labour cost increases whereas in several countries(Italy, Canada, Finland and Sweden) the estimated contributions of exchangerate changes in the 1990s are similar to those seen in periods when inflationwas much higher. Indeed, in three of the countries unit labour costs havefallen during the period of depreciating exchange rates as a result of lowernominal wage increases, cuts in employers' social security contributions andsignificant one-time productivity gains.
15

Changes in consumer prices and wholesale prices by
cont r ibu t ing factor : selected per iods and countr ies
Consumer prices1
Wholesale prices1
Contribution of unit labour costs2
Contribution of the nominal effective exchange rate2
United States Japan Western Germany
u u-2
-41980-84 1990-93 1984-88 1990-93 1984-87 1991 -93
1 Percentage changes, annual rates. 2 Calculated as the percentage change in unit labour costs(the nominal effective exchange rate) multiplied by the compensation (import) share in GDP.Sources: OECD National Accounts and national data.
The contributions of unit labour costs and exchange rates to consumer
price inflation have been entirely different in the three largest economies,
all of which, in effective terms, have experienced an appreciation of their
currency during the 1990s (see the graph above). Wi th stagnating output,
Japan's tradition of lifetime employment has resulted in significant increases
in unit labour costs; even allowing for the exchange rate effect in indus-
tries mainly serving the domestic market, profit margins have fallen. In
Germany the reasons for the marked rise in consumer prices compared
with the earlier period of appreciation are mainly to be found in the
services sector and public tariffs, while in the tradables sector profit margins
have been squeezed. Developments in the United States are more similar
to those in the countries with depreciating currencies, as unit labour costs
have fallen and have thus reinforced the effects of exchange rate movements.
Inflation in thethree majoreconomies
The p rob lem o f high and persistent unemp loyment
Wi th output growth generally expected to recover this year and inflation
projected to remain low, the most serious problem facing policy-makers in
the OECD countries is unemployment. Last year over 33 million workers,
or 8.2% of the labour force, were "actively seeking work" and by the end
of 1994 unemployment is expected to reach 35 million, or SVi% of the
labour force. If those who have dropped out of the labour force because
Over 33 millionjobless ...
16

... with a largeproportion oflong-termunemployed ...
... and high youthunemployment
Lowunemploymentin Japan
of the poor job prospects ("discouraged workers") and workers in invol-
untary part-time employment are also included, the overall rate of unem-
ployment last year might have been as high as MVi%, with Japan accounting
for a substantial part of the 4-point difference. The figure would be even
higher and more disturbing if those who are kept off the unemployment
register through public training schemes, subsidised employment or early
retirement were taken into account as well. In the OECD countries the
average number of persons covered by such measures amounts to at least
2-3% of the labour force, but in some countries, notably in Europe, the
number of workers benefiting from specific labour market measures in the
early 1990s was equivalent to 50-75% of those registered as unemployed.
Unemployment is progressively becoming the dominant social problem
in the industrial economies. In several continental European countries (see
the table on page 26) about one-half of all unemployed have been out of
work for twelve months or more, which suggests that they are being
"dislodged" from the labour market because they have lost the skills sought
by employers or have become demotivated and have reduced their search
activities. Moreover, in contrast to the early 1980s unemployment is increas-
ingly concentrated among prime age (25 to 44-year-old) male workers.
Female workers have generally found it easier to obtain jobs in the services
sector, though in many cases as involuntary part-time workers. While youth
unemployment rates still tend to exceed average rates except in countries
with apprenticeship systems (see page 27), they have fallen in some countries
owing to specific employment and training measures. Elsewhere, notably in
France and most of southern Europe, youth unemployment has remained
around 25%, even though a high proportion of the young have left the
labour force discouraged by the poor job prospects.
Different levels and adjustment patterns of unemployment across countries
While high unemployment is a serious problem throughout most of the
industrialised world, the level as well as the dynamic behaviour differ signif-
icantly between countries (see the graph overleaf). In the United States,
unemployment is very sensitive to changes in output, partly due to the
scope for temporary lay-offs. The rate of unemployment rose to almost
11% during the recession of the early 1980s, but fell to nearly 5% during
the subsequent recovery and has since been significantly below the average
for the European Union.
In Japan, and similarly in Europe, temporary lay-offs are virtually unknown
and temporary output fluctuations are frequently absorbed in reduced
working time, in some countries partly financed by government contribu-
tions. Thus the average unemployment rate in Japan has remained in the
2-3% range during the last ten years, even though GDP growth has been
as volatile as in the United States. Unemployment in the EFTA countries
followed a pattern very similar to that in Japan until the late 1980s but
then rose sharply in all countries except Austria. These increases were
partly due to the depth of the recession. However, in some countries they
also reflected a progressive erosion of international competitiveness during
17

Unemp loymen t rates in selected countr ies and coun t ry groups
Quarterly averages
United StatesJapanEFTA countries1
EU countries2
CanadaAustralia
87 89 91 931 Excluding Iceland and Liechtenstein. 2 Twelve member states.Source: National data.
most of the previous decade as domestic demand growth had kept actual
unemployment at an unsustainably low level.
Unemployment is a particularly severe problem in the EU countries,
Canada and Australia. First, the average levels are higher than in the United
States, Japan and most of the EFTA countries. Secondly, unemployment has
shown a much greater degree of persistence. Wi th each output trough since
the early 1970s unemployment has steadily increased because, unlike in the
United States, cyclical recoveries have been accompanied by comparatively
small employment gains (see the table on page 20). Moreover, the average
duration of unemployment is much longer in Europe than in other countries
while labour market "turnover", as measured by job losses and gains, is
relatively small. Consequently, many observers have concluded that even
though a recovery will help to reduce labour market slack, the rate of unem-
ployment at which inflation will re-emerge is rising and is now considerably
higher than in the 1970s.
Persistently highunemployment inEU countries...
18

... and lowemploymentrates
Falling laboursupply growth
The poor labour market performance of Europe, compared with the
United States and Japan, is also evident from employment rates (see the
graph overleaf), defined as the proportion of the population of working
age which is employed. While employment rates in both the United States
and Japan have increased over the last twenty-three years, they have fallen
in EU as well as EFTA countries, in the former group to a level that is
almost 20% below that of Japan. On this alternative measure, developments
in Canada have been similar to those in the United States, while the
employment rate in Australia has fallen, though by less than in the EU
countries.
Possible causes of high and persistent unemployment
The problem of high and persistent unemployment is mainly concentrated
in the EU countries. Labour force growth does not appear to have been
the primary cause of the rise in unemployment in these countries. Rather,
it can be related to the inflexibility of labour markets in the face of changes
in economic conditions. The reasons for the particularly sluggish response
and for the severity of the unemployment problem in the EU countries
are not yet well understood, though wage rigidities and various institu-
tional factors appear to play a major role.
Labour supply and job creation
The table below shows a decline in labour force growth during 1982-93
compared with the previous period except for Japan and Australia. The
increase in the latter two countries is the result of rising participation
rates, while in the United States and Canada the slowdown is mostly due
to demographic factors. In Europe the decline in labour force growth can
also be related to demographic factors, though participation rates fell in
some countries as workers withdrew from the labour force because of
poor job prospects or in response to measures encouraging early retire-
ment. Consequently, Europe's unemployment problem cannot be ascribed
to labour supply developments but has to be explained by the failure to
create jobs.
Changes in the labour supply and the populat ion o f w o r k i n g age
Countries andcountry groups
United StatesJapanEU countries*CanadaAustraliaEFTA countries
1970-82Labour supply Population of
working age
1982-93Labour supply Population of
working agepercentage changes, annual rates
2.30.90.72.91.90.9
* Excluding eastern Germany.
1.60.90.82.01.90.5
Sources: OECD Labour Force Statistics and BIS estimates.
1.31.10.51.42.00.4
0.80.80.71.01.60.6
19

Changes in real output and employment
Countries andcountry groups
United StatesJapanEFTA countriesAustraliaCanadaEU countries
Western GermanyFranceItalySpainUnited Kingdom
Periods1
1982-901984-911984-901983-901982-901983-911983-911984-911982-911986-911983-90
1 Periods chosen to include only years with
Cumulativechangein GDP
30.036.017.530.532.525.029.519.025.023.525.0
Cumulativechange in
employment
18.510.55.5
24.518.58.5
10.03.55.0
15.014.0
positive employment growtl
Ratio2
1980s
0.600.300.300.800.550.350.350.200.200.650.55
i; for Japan, initiayears based on changes in employment growth. 2 Ratio of cumulative employment changelative output change for the periods selecteeand for 1970-93.
1970-93
0.650.200.150.400.500.070.060.060.07
-0.050.02
and finalto cumu-
Note: Regressing changes in employment on output changes for the United States and the EU countriesrespectively and allowing for a structural shift between the 1970s and 1980:obtained:
1970-81Intercept Elasticity
United States -0.00 0.85EU countries -0.70 0.30
1982-93Intercept Elasticity
-0.60-1.35
Sources: OECD National Accounts and Labour Force Statistics.
0.850.85
, the following results were
A low rate of job creation has been an almost perennial European
problem (see the graph opposite): since 1970 employment in the EU countries
has grown by only 5Vi% and in the EFTA countries by less than 10%,
compared with 50% or more in the United States and Canada. Low employ-
ment growth in Europe cannot be simply explained by low output growth,
as GDP in the EU countries has expanded as rapidly as in the United
Employment rates in selected countries and country groups1
1 1970 I 1 1993 80
United Japan Canada Australia EU countries2 EFTAStates countriesJ
70
60
50
401 Total employment as a percentage of the population of working age. 2 Twelve member states.3 Excluding Iceland and Liechtenstein.Source: OECD Labour Force Statistics.
Low rate ofjob creationin Europe
20

O u t p u t and employment in selected countr ies and count ry groups
Cumulative percentage changes, 1970-93
Output
UnitedStates
Japan
ZI Employment, of which:
Canada
In industry
Australia EU countries1 EFTA 15°countries2
125
1 Twelve member states. 2 Excluding Iceland and Liechtenstein.Source: OECD Labour Force Statistics.
High and risingunemploymentin the 1980s...
States, though not as fast as in Japan, Australia and Canada. But output
growth in Europe has been much less labour-intensive than in the United
States (see the table opposite). The labour intensity of output growth is
also relatively low in Japan, while the employment/output ratios observed
for Canada and Australia are closer to the US ratio. A low rate of job
creation per unit of output growth, of course, implies high growth of labour
productivity, which is in general desirable. However, in order to reap the
benefits of large productivity gains ways must be found to use productively
the labour that is saved.
The response of nominal and real wages to exogenous changes
In any event, the current unemployment problem in Europe does not
appear to have been caused by changes in the labour intensity of output
growth, since this has not declined (indeed it has risen) in recent years
(see the note to the table opposite). The European unemployment problem,
and in particular the rise in joblessness in the early 1980s, is more likely
to be linked to real wages and to the way in which European labour
markets react to exogenous developments. The table on page 23 considers
the response of unemployment to two such developments: declines in
inflation induced by the need to strengthen medium-term stability and terms-
of-trade changes. These are rather crude measures of labour market responses,
21

in particular for the Nordic EFTA countries in the 1990s, when the principal
policy objective was to correct imbalances that had built up during the
1980s. In addition, the earlier terms-of-trade improvements were absent
and external shocks in the form of lower exports significantly affected
labour market developments.
Nonetheless, the table clearly indicates that one important element of
the unemployment problem in Europe, as well as in Canada and Australia,
is the sluggish response of labour markets. The degree of disinflation and
the associated strength of the policy measures taken in Europe were not
significantly greater than in North America. Moreover, the European countries
benefited from considerably larger terms-of-trade gains than the United
States, Canada and Australia, though not as much as Japan. The reasons
for the sluggish labour market response are not explored in the table, but
there is ample evidence to suggest that real wage targets are far more
entrenched among workers in the EU countries than in Japan and the EFTA
countries, with real wage behaviour in the United States, Canada and
Australia falling somewhere in between. Consequently, the rigidity of real
wages in circumstances when adjustments are called for is probably the
most important reason for the rise in EU unemployment in the 1980s.
Finding ways to reduce real wage rigidity is also fundamental to preventing
even higher unemployment, all the more so since a rise in the EU countries
is far more difficult to reverse than elsewhere.
The severity of the unemployment problem in the European Union
The second half of the 1980s was a period of cyclical recovery and
falling unemployment in the OECD countries. However, the extent to which
earlier and lower levels of unemployment were restored varied widely. In
the United States, Canada and Australia the restoration rate was 100% or
more and in Japan about two-thirds of the job losses were reversed. In
the European countries, by contrast, the period of output recovery was
shorter and the restoration rate was less than one-half. The lack of job
creation was particularly serious in the EU countries as it meant that the
downturn in the early 1990s started from an unemployment rate which
was 3 percentage points higher than prior to the previous downturn.
Moreover, even after the recovery more than one-half of the unemployed
had been without a job for twelve months or more, a proportion only
slightly less than at the peak unemployment level of 1986. In North America,
on the other hand, the proportion of long-term unemployed was less than
7% and in the EFTA countries less than 10%.
Capital shortages and high wage shares. The question then arises as to
whether the recovery in Europe was curtailed because of capacity constraints
and/or excessive labour costs relative to labour productivity. Business fixed
investment was weak in the early 1980s and the shift towards labour-saving
investment observed in many countries has raised fears that earlier and
lower rates of unemployment can no longer be achieved, because the
necessary output capacities are not available. Developments in capacity
utilisation rates may provide some evidence of capital shortages even though
... due to realwage rigidities ...
... and lack of jobcreation duringcyclical recovery
Risk of capacityconstraints ...
22

Disinflation and changes in
Countries andcountry groups
United StatesJapanEU countries5
AustraliaCanadaEFTA countries
Decline in therate of inflation1
(a)
7.34.68.74.88.45.1
(b)
1.91.22.07.03.83.6
1 Decline in the rate of inflation measuredColumn (a)
1981-86 (United States and Canada)1980-87 (Japan and EU countries)1982-85 (Australia)1981-87 (EFTA countries)
unemployment
Change in theterms of trade2
(c)
-1.0-3.0-1.6
0.82.0
-1.0
(d)
-0.4-1.0-0.3
1.50.8
-0.2
Change inunemployment3
(e)
0.60.64.01.93.20.7
(0
1.30.21.61.72.73.2
"Sacrifice"ratio"1
(g)
0.100.150.450.400.400.15
by the GDP deflator over the following periods:Column (b)
1989-93 (United States and Canada)1990-93 (Japan, EU and EFTA countries)1988-93 (Australia)
2 Change in the ratio of import to export deflators (scaled by the ratio of foreign trade to GDP]the periods of disinflation. 3 Cumulative annual rise in unemployment over thetion. 4 Measured as (e)/(a) and (f)/(b) respectively. s Excluding eastern GermanySource: OECD Economic Outlook.
(h)
0.700.150.750.250.700.90
overseriods of disinfla-
... notablyin services
Mostly stable orfalling labourshares of income
recent changes in relative factor prices have meant that profitable outputcapacity may be higher than previously assumed. Prior to the latest recessionthree of the major EU countries recorded utilisation rates which were veryclose to earlier peaks, whereas in Canada, Australia and the United Statesless than 95% of earlier peak rates had been reached, even following outputincreases twice as large as those seen in Europe. Indicators of businessfixed investment by sector point to a marked shift from industry to services,in line with the general decline of the share of industry in overall GDP.However, the growth of investment in the services sector has been compar-atively modest in the EU countries, indicating a low capacity to generatenew jobs in services and a possible source of the secular decline in theratio of vacancies to the number of unemployed. As was shown in thegraph on page 21, industrial employment relative to total employment hasfallen in most countries, but while the United States has been able tocreate new jobs in the services sector, this has not been the case in theEU countries to the same extent.
The labour cost issue is examined in the graph overleaf, which showsdevelopments in the labour share of income. The US labour market is char-acterised by highly stable factor income shares, whereas in Japan and theEU countries the wage share rose in the mid-1970s and again followingthe second oil shock but has since declined. In the EFTA countries therewas a sharp rise in the 1970s, which may have been due to the high-employment policies pursued combined with marked increases in non-wagelabour costs. During the current recession the wage share has fallen asreal wage growth moderated and productivity growth was boosted bylabour-shedding. In Canada and Australia, by contrast, the recession appearsto have increased the labour share of income. In Australia, though, thewage share has remained well below earlier levels and actually declined
23

Wage shares in selected countr ies and coun t ry groups
Compensation of employees as a percentage of total factor income
United StatesJapanEFTA countries1
70
66
75 80 85 90 751 Excluding Iceland and Liechtenstein. 2 Twelve member states.Sources: OECD National Accounts and Labour Force Statistics.
EU countries2
CanadaAustralia
80 90
last year as the recovery gained momentum, whereas in Canada it is the
highest for twenty-five years.
A t first glance, the graph does not point to excessive labour cost
growth as a cause of higher unemployment in the 1980s, except possibly
in Canada. On closer examination, however, the following considerations
cast a different light on the issue:
- the fall in the wage share could be due to an unemployment-induced
moderation of real wage growth. Consequently, at lower rates of unem-
ployment excessive labour shares of income might re-emerge unless the
underlying behaviour of real wages has changed. On this question, however,
the evidence is ambiguous. Econometric studies of wages and prices do
not point to any changes in wage behaviour, except, possibly, for the United
States. On the other hand, more intensive international competition together
with institutional changes might imply that wage behaviour has moderated
significantly and become more sensitive to the influence of market forces.
The 1980s saw a general move towards decentralised bargaining, partly
reflecting a lower degree of unionisation and partly as a result of the shift
from industry to service employment. Most countries have abolished wage
indexation or, as in France, replaced earlier systems based on past price
changes with wage adjustments geared to the expected rate of inflation,
thereby increasing the responsiveness of nominal wages to anti-inflation
policies. Another significant change, most notable in the United States and
the United Kingdom, is the decline in union density owing to shifts in
employment towards sectors with low unionisation rates, a reduction in
union membership in traditionally unionised sectors and policies curbing
union power;
Yet labourcosts may betoo high ...
... unless wagebehaviour haschanged or...
24

... real wagesadjust to changesin productivity...
... andinternationalcompetition
The employmenteffects ofhigh redundancy
costs...
- although it might appear that firms' demand for labour should not
be affected as long as real wages and labour costs increase in step with
labour productivity, causality may also run the other way. Rising real wage
costs in Europe could have induced firms to increase productivity through
lay-offs or more capital-intensive investment, whereas in the United States
employees seem to have scaled down their wage claims in step with the
gradual decline in productivity growth. As was shown in the graph on
page 21, there is a striking difference between the EU countries and the
United States with respect to the ability to create new jobs. This is "matched"
by an equally striking difference in the development of real wages, which
have been virtually flat for thirty years in the United States compared with
average growth of around 2% in the EU countries;
- with growing international mobility of real capital and the increasing
exposure of industrial countries to competition from lower-cost developing
countries and reforming countries in eastern Europe, there are also grounds
for including cost developments in other countries in calculating "warranted"
real wage changes. In Australia and North America exposure to competi-
tive pressures from the South-East Asian countries and Mexico respectively
may have contributed to the recent rise in unemployment, notably in indus-
tries with a large share of unskilled workers. Unit labour costs in Europe
are significantly higher than those in the newly industrialising economies
(NIEs), but trade with these countries still accounts for only a fraction of
total demand. On the other hand, since 1980 the EU countries' share in
world trade of manufactured goods outside Europe has fallen from 22 to
17Vi%. In addition, more liberal trade with eastern Europe could in the
future have implications for wage levels in sectors such as steel and textiles
even if the initial changes in trade are likely to be rather modest.
High hiring and firing costs. A factor contributing to the persistence of
unemployment and to the high proportion of long-term unemployed in the
EU countries (see the table overleaf) is no doubt high hiring and redun-
dancy costs. When redundancy payments equal several months' pay, required
warning periods are long or lay-offs are subject to lengthy and difficult
negotiations, enterprises will only reluctantly take on new employees, and
only once a recovery of output is clearly evident. As the table on page 20
showed, the ratio of employment to output changes is low in the EU
countries compared with Australia, the United States and Canada, owing
mainly to developments in Germany, France and Italy. Even lower ratios
are to be found for the EFTA countries and Japan. In the former case this
is widely ascribed to high redundancy costs in some countries, while in
Japan the main reason is the lifetime employment system prevalent in large
manufacturing enterprises. Redundancies are particularly costly and compli-
cated in Spain, which has contributed to a poor employment performance
over the longer term. During the 1980s the ratio of employment to
output growth increased significantly, but this can largely be explained by
the rise in female part-time employment and, in particular, by a regulatory
change allowing temporary work contracts; as a result, by the end of last
year more than 30% of all employed workers were on temporary contracts.
25

Long- te rm unemployment : * selected years and <
Countries
United StatesJapanCanadaAustraliaFinlandNorwayEU countries
Western GermanyFranceUnited KingdomBelgium
1983 1985 1987
:ount r ies
1989 1991
as a percentage of total unemployment
13.312.99.9
27.519.86.3
46.039.342.247.066.3
9.512.910.330.921.110.254.647.946.848.669.8
8.118.99.4
28.619.05.0
53.548.245.545.974.9
* Long-term unemployed defined as workers who have been without amore.Source: OECD Employment Outlook.
5.718.76.8
23.06.9
11.653.049.043.940.876.3
6.317.97.2
24.99.1
20.246.445.537.228.161.6
job for twelve months or
High taxes and the costs of the welfare state. In many European countries
employers' social security contributions have been increased to finance
government expenditure, notably the rising costs of the welfare state (see
page 32 below). Together with other non-wage labour costs, these payments
account for nearly 50% of total labour costs in several EU countries,
compared with around 25% in the United States and Japan. Because social
security contributions and other non-wage labour costs typically rise in
periods of high unemployment, they tend to reduce the cyclical sensitivity
of total labour costs and may thus help to explain the high "sacrifice" ratio
observed in the table on page 23 and to some extent also the greater
persistence of unemployment. Moreover, since most social security contri-
butions paid by employers are subject to ceilings, the ratio of non-wage
labour costs to wages tends to be higher for lower-paid workers, which
may have contributed to the shift in labour demand towards skilled workers
(see below). Finally, to the extent that social security contributions are
used to finance high unemployment benefits they may create disincentive
effects, boosting real wage growth as well as unemployment.
Unemployment and the flexibility of wage structures. For a number of
reasons the rather rigid wage structures observed in most continental
European countries constitute part of the unemployment problem. The fall
in union density in the United States and the United Kingdom may be
partly responsible for the lower persistence of unemployment in these
countries. In the United Kingdom unemployment had already started to
decline last year, when the recovery of output was still very weak. By
contrast, continued high union densities could be one of the reasons for
the rigid wage structure and the persistently high unemployment rates in
some of the Scandinavian countries and Germany. The large proportion of
long-term unemployed in Europe, in particular among unskilled workers,
can undoubtedly be related to inflexible relative wages in the face of
... and non-wagelabour costs
Rigid wagestructures as asource ofunemploymentpersistence ...
26

... though thereare exceptions
No single cause
technology and trade-induced declines in the relative demand for unskilled
labour. There is also evidence that large regional disparities in unemploy-
ment are not reflected in regional wage differentials. Even excluding the
former GDR, regional unemployment disparities have widened in Germany
while the corresponding wage differentials have narrowed. In Canada, where
the degree of unemployment persistence is also relatively high, a similar
development was observed during the second half of the 1980s. The problem
is, however, most acute in Italy, where for decades unemployment in the
South has been substantially higher than in the North without inducing any
adjustment of relative earnings.
Yet the hypothesis that narrow and rigid wage differentials can be seen
as a principal cause of high unemployment is subject to some important
caveats. Differences in the growth of the skilled and highly educated
workforce explain to a large extent why wage differentials related to
education have been more stable in Germany than in the United States.
Moreover, owing to the apprenticeship system German workers can better
adjust to shifts in relative demand without any change in wages than their
counterparts in the United States. In the United States many new entrants
have very low or no skills, whereas new entrants in Germany have typically
received theoretical as well as vocational and practical training, creating a
high degree of substitutability between different groups of workers when
changes in relative demand call for adjustments. Finally, while institutional
and statutory arrangements have undoubtedly contributed to the stability
of the wage structure, notably in Germany but also in other European
countries, there is little firm evidence that this has been a direct cause of
higher unemployment. For instance, the rise in unemployment among unskilled
workers in Germany has been only marginally higher than that in total
unemployment. Conversely, despite a high degree of flexibility unskilled
workers in the United States and the United Kingdom have experienced
difficulties in finding jobs and have either remained unemployed or left the
labour force.
Concluding observations
One general conclusion emerging from the preceding discussion is that
there is no single explanation of the differences in labour market behaviour
across countries nor any clear consensus as to how the unemployment
problem can be solved. Measures that have led to positive results in some
countries may not work in others. For instance, the levels as well as the
changes over time of unemployment in Australia and Canada are strikingly
similar to those seen in the EU countries. However, further analysis points
to significant differences in the underlying behaviour of labour and product
markets between those two countries and the EU countries, suggesting
that the potential solutions would also differ.
Nonetheless, a few general observations can be made. First of all, the
current unemployment rate of 11Vi% in the EU countries is partly cyclical
and should decline as the recovery proceeds. Attempts to speed up the
recovery are subject to risks as inflation is sensitive to both the level of
27

and changes in the output gap. Moreover, even on the most favourable
estimates some 7-8% of hard<ore or structural unemployment would remain
after a cyclical recovery. According to most studies this component has
gradually increased in Australia, Canada and, in particular, in the EU countries.
Secondly, a principal condition for alleviating the structural unemploy-
ment problem in Europe is that measures are adopted and implemented
which make real wages more sensitive to changing labour market conditions
and thus attenuate the effects of future shocks and stabilisation policies.
Thirdly, in attempting to reduce structural unemployment, it is also
important to identify the exact causes:
- as a result of the lower growth of the capital stock and labour-
saving investment, there is a risk that existing capacities will not be able
to support a return to full employment unless incentives to substitute
labour for capital are enhanced;
- technological progress during the 1980s has been biased against labour
and, in particular, against the unskilled. In the long run technological progress
is the main source of real income growth and not a cause of unemploy-
ment, but in order to smooth the short-run adjustment it is crucial that
aggregate real wages as well as wage structures should be flexible;
- in some countries competition from lower-cost developing countries
may have reduced the demand for labour through trade, outsourcing or
the relocation of production. So far, this effect has probably been small,
but given the increased international mobility of real capital, progress in
communications technology and rapid productivity growth in some developing
countries it may become of more significance in the future, reinforcing the
need for wage flexibility;
- the growing burden of employers' social security contributions and
other non-wage labour costs may in some cases have constituted a disin-
centive to taking on labour. The best solution may be to scale back such
contributions, especially where they are earmarked for expenditures that
create disincentive effects and/or lessen real wage flexibility;
- the inflexibility of relative wages in conditions of large shifts in the
relative demand for different groups of labour is no doubt an important
source of structural unemployment, notably in Europe. To reduce it, it is
essential that regulatory arrangements which hinder a smooth adjustment
in labour markets should be eliminated and that wages should be deter-
mined by market forces rather than institutional practices.
Finally, while the elimination of the various causes of structural unem-
ployment through supply-side or structural measures is a necessary condition
for a non-inflationary reduction of unemployment it is not sufficient. In order
to actually reduce structural unemployment such measures need to be
complemented by policies that allow aggregate demand to grow at a pace
sufficient to gradually absorb cyclical and other sources of slack. Moreover,
provided that the necessary structural measures have been implemented a
somewhat faster increase in demand should not jeopardise the improve-
ments that have already been achieved in price and inflation performance.
Reducingstructuralunemploymentcalls for:
sensitivity tochange;
enhancedincentives andflexibility; and
the removal ofdisincentives andobstacles tomarket forces
Need for gradualdemand growth
28

Rapidly risingdebt ratios ...
Government debt and the constraints on fiscal policy
Recent developments in government debt
The use of fiscal policy to stimulate aggregate demand and alleviate unem-
ployment has been severely constrained by the high levels of government
debt with which most industrialised countries entered the current downturn.
Nevertheless, the ratio of government debt to GDP continued to rise in 1993,reflecting both a cyclical and a structural deterioration in government budget
balances. Only Japan and Ireland have managed to reduce their debt/GDP ratios
over the last four years. In the seven major countries, excluding Japan, the
debt/GDP ratio has increased on average by more than 10 percentage points
since 1989. Overall, net debt in the OECD countries reached almost 40% of
GDP in 1993, from about 32% in 1989.
Sources of general
Countries
United StatesJapanGermany1
FranceItalyUnitedKingdomCanadaAustraliaAustriaBelgiumDenmarkFinlandGreeceIrelandNetherlandsNorwayPortugalSpainSwedenAverage2
government debt
1989Net borrowing, of which
Interestpayments
2.00.92.22.28.4
2.44.91.93.19.53.80.58.16.24.4
-2.57.13.10.42.6
Primary deficitCyclical
-0.7-0.2-0.1-0.2-0.5
-1.6-1.0-0.4-0.1-0.8
0.8-2.5-1.0
0.6-0.3
0.1-0.6-1.5-3.5-0.6
Other
accumulation
Growtheffect
0.2-3.2-2.2-0.7
2.0
-1.7-0.9-2.9-0.2-2.3-4.0-0.9
9.6-5.8
0.60.9
-3.51.2
-2.2-0.9
_----
--------
as a
2.11.11.41.77.9
3.02.51.63.69.71.20.19.9
-11.7- 3.0
1.3-11.9---
Note: The change in the net debt ratio comprises the net
3.40.12.4
Netdebt
1
1993
Met borrowing, of whichInterest
payments
percentage
30.414.922.724.896.1
30.140.212.256.9
119.726.1
- 1.774.1
105.454.9
-20.371.730.8
- 4.831.9
Primary deficitCyclical
of GDP
2.00.32.93.1
10.9
2.65.31.03.59.93.13.1
13.55.84.8
-0.67.64.71.82.9
interest payments ratio, a cof the primary deficit and the growth effect. The sum of the firstment. The cyclically adjustec component of the primaryGDP minus revenue as a percentage of GDP. The growthend of the previous period, where g isratio.1 1989 data referto westernGermany
deficit
0.21.50.32.81.8
2.32.61.71.20.52.87.80.2
-1.00.01.51.01.02.91.2
Other
1.4-0.8
0.70.0
-3.0
3.2-0.9
3.0-1.8-3.5-1.5-1.8
1.1-1.6-0.7
2.2-0.5
1.510.00.5
Growtheffect
1.9- 0.0- 0.6- 0.4- 3.8
- 1.4- 1.9- 0.6- 1.7- 2.1- 0.5- 0.1-11.1- 4.9- 1.0
0.6- 3.2- 1.2
0.00.0
Netdebt
39.16.0
27.535.6
112.6
41.960.122.857.1
129.033.33.1
94.892.159.8
-13.467.642.017.738.0
yclical and a cyclically adjusted componentthree equals the net borrowing/GDP ratio of generais calculated
effect is calculatedthe current growth rate
only. 2 WeightedSources: OECD Economic Outlook and BIS estimates.
as primary expenditure as aas -g/( + g) time
of nominal GDP. A positive sign
percentage1 govern-of trend
the net debt/GDP ratio at theimplies an
average based on 1991 GDP and exchange rates.
increase inthe debt
29

N e t debt, the interest burden and the cyclically adjusted
primary balance
As a percentage of GDP
Left-hand scale:i i Net debt
Denmark
Right-hand scale:Interest burden*
—— Cyclically adjusted primary balance*
Japan
i i i i i i i i i i i i i i i i ,~ 10
70 75 80 85 70 75 80 85 90
* For an explanation, see the table on page 29. The interest burden is the sum of net interestpayments as a percentage of GDP and the growth effect. A primary surplus exceeding the interestburden indicates a sustainable fiscal situation with falling debt ratios.Sources: OECD Economic Outlook and BIS estimates.
30

... as progress inthe 1980s due toconsolidationprogrammes ...
... and buoyanteconomicgrowth ...
... is reversed inthe early 1990s
Rising socialsecurity transfersreflectingcyclical...
During the middle and late 1980s sustained economic expansion, com-
bined with medium-term fiscal stabilisation programmes, helped to slow
down the spiral of rising government debt and interest payments. As cycli-
cally adjusted primary surpluses caught up with rising interest burdens (see
the graph opposite), government debt accumulation decelerated and was
even reversed in some cases. Several countries (such as the United Kingdom,
Germany, France, Denmark and Belgium) opted for a relatively quick and
substantial turnround in the first half of the 1980s. In one of the most
successful stabilisation programmes, the Danish Government managed to
improve its cyclically adjusted primary balance by more than 10% of GDP
in the four years following the adoption of stabilisation policies in 1982.
Other countries took a more gradual approach (for example Japan and
Austria) or had to wait for the economic boom of the late 1980s to consol-
idate their primary balances (for example Ireland, Sweden and Canada).
Some (such as Italy) made little progress during the 1980s as interest
payments continued to run ahead of primary balances.
As can be seen from the table, buoyant economic growth in the late
1980s contributed substantially to the reduction in debt/GDP ratios both
by increasing the denominator and through its effect on the cyclical component
of government budgets. In some countries these favourable cyclical devel-
opments concealed the fact that the improvement in the cyclically adjusted
primary balance had come to a halt or had even been reversed, although
further structural consolidation was necessary. The economic downturn since
1990 and the consequent cyclical deterioration in primary balances by an
average 2% of GDP has exposed these weaknesses. Over the same period
countries with net debt/GDP ratios of under 40% have experienced an
average deterioration in their cyclically adjusted primary balances of 2% of
GDP, in contrast to an average improvement of Vi% of GDP in the high-
debt countries. Consequently, debt/GDP ratios have again been rising very
rapidly since 1989, with the most dramatic increases, of around 20 percentage
points over the last four years, being recorded by Sweden, Greece and
Canada.
Rising social security transfers and ageing populations
One feature of the current deterioration in budget balances is the almost
universal rise in the share of social security and other government transfers
in GDP. Since 1989 these transfers have increased on average by more than
2% of GDP in the OECD countries, and in Sweden and Finland by about
7% and 10% of GDP respectively. To a considerable extent this is a cyclical
phenomenon resulting from higher unemployment compensation and other
income assistance programmes, but it is also indicative of a more struc-
tural shift in the composition of government spending. The table overleaf
shows that, after rapid increases in the 1970s following the first oil crisis,
the share of total government expenditure in GDP stabilised in many
countries. However, there were quite diverse developments in the
components of government expenditure. While the share of government
consumption has on average decreased, the share of both debt interest
31

General gove rnmen t expend i tu re in
Items and years
Total expenditure 197019801990
Social security benefits 1970and other transfers 1980
1990Government consumption 1970
19801990
Debt interest payments 197019801990
Memorandum items:Public pensions* 1990Public health 1990
UnitedStates
the seven major countr ies
Japan WesternGermany
France Italy UnitedKingdom
Canada
as a percentage of GDP
30.831.833.3
26.936.936.868.358.956.73.93.76.3
75.215.7
19.032.031.7
38.347.945.1
38.546.149.8
as a percentage of total
25.832.937.939.230.728.83.29.9
12.5
16.915.0
* For the United States and Canada, 1990; for other countries, 1988Sources: OECD Economic Outlook, Pension LiabilitiesPolicy 1994.
37.039.643.241.242.240.62.54.05.8
15.313.2
42.745.046.839.040.036.52.83.25.9
78.073.3
in the Seven Major Countries 1992
33.041.953.2
36.743.039.9
expenditure
39.035.536.040.235.733.25.0
13.018.1
27.77 7.8
23.727.430.447.549.250.110.610.98.6
7 7.373.0
and New Orientations
33.538.845.8
24.226.028.755.049.244.010.913.920.6
8.514.9
for Social
payments and social security transfers has risen. The reason for the increase
in debt service costs is obvious from the discussion above, but the rise in
transfers has several causes. The table on page 34 examines the contribu-
tion of demographic and labour market developments. In most countries
changes in employment and dependency ratios were factors making for a
reduction in the ratio of social security benefits to GDP after 1983. However,
in many cases these factors were more than offset by further increases in
the per capita benefit level as a proportion of the average wage. This
suggests that although in the 1980s some governments adjusted transfer
conditions by abolishing indexation, lowering the ratio of benefits to wages
and tightening eligibility criteria, there continued to be a substantial growth
in real transfers per beneficiary, a broader take-up of entitlements and a
widening of programme coverage.
Demographic projections show that old age dependency ratios will rise
substantially, and in some cases even double, as the "baby boom" genera-
tion reaches retirement age. This will place additional pressure on public
health and pension expenditures, which, as the table above shows, are already
among the largest government spending categories. Japan in particular is
facing a rapid ageing of its population, which explains the Government's
reluctance to rely too heavily on debt financing to help stimulate the
economy. On the assumption of constant benefit levels per beneficiary,
labour force participation and eligibility rates, the projected ratio of pension
expenditure to GDP would double by 2040 from about 6% in 1990. In
Italy the increase, from 11% in 1990 to 22% in 2040, would be even more
... and structuralfactors
Future pressureon health andpensionexpenditures
32

worrying. According to OECD estimates the net discounted liabilities to
which these largely unfunded pension entitlements give rise are equivalent
to more than twice nominal GDP in Japan, France, Italy and Canada and
more than one and a half times GDP in Germany and the United Kingdom.
As the increases in contribution rates required to finance this rise in public
pension expenditure would be crippling, many governments are turning to
a combination of reduced pensions, higher retirement ages and the intro-
duction of private pension funds to address the problem. In Italy measures
have recently been taken to gradually raise the pensionable age to 65 for
men and 60 for women, to lengthen the reference period for calculating
pension entitlements from five to ten years and to increase the required
number of years of contribution. In addition, contribution rates have
been raised by 0.3% of gross earnings and the creation of private pension
funds is being promoted. Similar measures have been taken or are being
considered in most other industrialised countries.
Fiscal policy in the current cycle
Constraints The rapid rise in government debt combined with the substantial future
on fiscal policy pressure on government expenditure due to ageing populations has dominated
the debate about the appropriate fiscal policy stance in the current cycle. The
effectiveness of fiscal policy as an instrument to stabilise the economy has
been in serious doubt since attempts at fiscal stimulus in the 1970s and
early 1980s helped fuel inflation and resulted in rising debt/GDP ratios. High
government debt has been associated with a fall in worldwide saving,
increases in real interest rates, the crowding-out of interest-sensitive private
investment projects and a slowing of growth. The medium-term goal of
reducing government debt does not necessarily rule out a stabilisation role
for fiscal policy in the short run. The current debate, however, is focused
less on the use of fiscal policy as an active stabilisation instrument than
on the extent to which the automatic stabilisers should be allowed to work
and on when, how far and how fast an expansionary fiscal policy should
be reversed. The answers to these questions depend on the sustainability,
vulnerability and credibility of current fiscal policies.
The role of Sustainability relates to the ability to maintain current expenditure and
sustainability... revenue paths without permanently increasing government debt in relation
to GDP and is a precondition for any flexible use of fiscal policy. Italy,
which entered the worldwide downturn in 1990 with a primary deficit and
a high debt/GDP ratio, has very little scope to allow the automatic stabilisers
to operate. Despite a difficult economic and political environment succes-
sive Italian governments have managed to turn the primary deficit into a
surplus. The revised convergence plan drawn up in July 1993 projects a
gradual increase in the primary surplus to 3.6% of GDP in 1996. In contrast
to previous budgets, the proposed deficit reduction for 1994 relies predom-
inantly on savings in primary spending, resulting inter alia from reduced
state pension payments and tighter control over health spending.
Normal cyclical variations in output should not endanger a sustainable
fiscal policy, as only modest improvements in the structural primary surplus
33

Composition of the growth in i
Countries
United StatesJapanWestern GermanyFranceItalyUnited KingdomCanadaAustraliaAustriaBelgiumDenmarkFinlandGreeceIrelandNetherlandsNorwayPortugalSpainSweden
the social security benefits/GDP
1978-83ASS
2.041.800.143.042.482.491.831.430.862.522.540.373.974.641.650.491.723.231.11
ADR
-0.11-0.05-1.00-0.64-0.48-0.31-0.20-0.14-0.71-0.49-0.45-0.08-0.21-0.20-0.71-0.25-0.23-0.27-0.17
AER ABWas
0.30-0.62
0.821.060.491.290.070.390.851.590.03
-0.49-0.12
0.602.22
-0.17-0.69
2.20-0.16
1.882.200.382.202.832.142.171.411.402.103.071.013.403.951.343.512.891.882.73
AWS
ratio
1986-91*ASS ADR
a percentage of GDP
-0.050.28
-0.040.41
-0.38-0.62-0.29-0.20-0.64-0.67-0.11-0.70
0.850.39
-1.16-2.45-0.20-0.62-1.24
-0.12-0.26-2.19
0.381.00
-0.852.350.850.45
-2.270.87
-1.091.22
-1.23-0.89
5.032.781.332.03
0.12-0.37-0.13-0.16-0.36
0.010.09
-0.19-0.19
0.01-0.36
0.10-0.39-0.59-0.37-0.23-0.37-0.68
0.12
AER
-1.39-1.00-0.92-0.56-0.48-0.37-0.85-0.70-0.65-0.82-0.80-0.18-0.48
0.49-1.30
0.02-0.88-2.00-0.59
ABW
1.181.24
-0.332.702.58
-0.822.652.171.37
-0.062.54
-1.053.15
-0.141.934.645.045.012.19
AWS
-0.03-0.05-0.84-1.55-0.71
0.280.40
-0.46-0.06-1.42-0.53
0.00-1.01-1.03-1.12
0.67-0.92-0.83
0.32
Note: The change in the ratio of social security benefits to GDP (ASS) is made up of four component changes due to the depen-dency ratio (ADR), the employment ratio (AER), the per capita benefit as a proportion of the average wage (ABW) and theshare of wages in GDP (AWS). The dependency ratio is calculated as the ratio of the population aged under 15 or over 65 tothe population aged 15 to 65.* For Germany, 1983-90; for Finland,1983-89.Sources: OECD Economic Outlook and AnnualLabour Force Statistics.
are required to stabilise the debt/GDP ratio in the medium term. Several
countries have, however, experienced a protracted and very deep
recession. This raises questions about the persistence of the unfavourable
output developments and the corresponding deficits. Over the last four
years average GDP growth in Canada has been close to zero, while real
GDP in Sweden and Finland has been declining for three consecutive years.
On the basis of most estimates of the cyclical sensitivity of the govern-
ment budget, this can easily account for an increase in the debt/GDP ratio
of at least 10 percentage points. Both Canada and Finland have managed
to limit the cyclically adjusted deterioration in their non-interest govern-
ment budget. In Sweden, on the other hand, the cyclically adjusted component
has deteriorated by more than 10 percentage points since 1989, reflecting
factors such as government financial support for the banking system and
the lagged adjustment of transfer payments to lower inflation. Several
packages concluded in 1992, aimed at reducing the generosity of welfare
payments, did not prevent large budget overruns, forcing the Government
to announce in April 1993 a programme of further consolidation for the
period 1994-98. That sustainability is in jeopardy is evident from OECD
34

... vulnera-bility...
... and credibility
Some stimulus inFrance...
projections showing that without such measures the Swedish net debt/GDP
ratio would very rapidly rise to 80% or more by the end of the decade.
High government debt also increases the vulnerability of the fiscal
authorities to the business cycle through its effects on the interest burden.
Wi th a debt/GDP ratio of around 100%, every 1 % increase in the differ-
ential between the average interest rate on the government debt and the
nominal growth rate raises the interest burden by 1 % of GDP. Typically,
at the start of a downturn real interest rates are high, while growth rates
fall rapidly. The substantial effects of this on debt accumulation can be seen
in the cases of Belgium, Italy and Ireland. In Belgium, for example, the
interest burden effect fluctuated from 2.5% of GDP in 1985 to -0 .2% in
1989 and back to 7.8% in 1993 (see the graph on page 30). These swings
overshadow all recent structural improvements in the primary surplus
and have obliged the Government to take further austerity measures.
The Belgian convergence plan drawn up in June 1992 and revised in April
1993 aims at reducing general government net borrowing to 3% of GDP
in 1996. To counteract the negative effects of high real interest rates and
slow growth several corrective measures have been taken, including the
approval of a Global Plan in November 1993 which aims inter alia at
restoring the financial balance of the social security system by means of
measures in the areas of health care, pensions, family allowances and unem-
ployment benefits.
The vulnerability of high-debt countries to interest rate rises can also
impair the credibility of the monetary authorities. This was most obvious
during the European currency turmoil in 1992 and 1993. In Italy around
65% of the government debt is either short-term or has been issued at
floating interest rates, which makes the average interest cost highly sensitive
to changes in short-term interest rates. In Belgium the average maturity
of the government debt is longer, but more than a quarter has a maturity
of less than one year. The interaction of monetary policy with government
debt is also evident in Canada, where a deliberate disinflation policy, combined
with a sustained risk premium over long-term rates in the United States,
has led to unprecedented rises in the interest burden.
The credibility of the fiscal authorities and their budget plans plays a
role in determining the effect of changes in fiscal policy. As medium-term
budget plans affect future levels of government debt, spending and taxes,
they also have an impact on expectations of future interest rates and
output, which might lead to changes in current long-term interest rates.
Such expectation effects can offset the direct demand effects of current
changes in taxes and government expenditure. The French Government, for
example, has placed recent stimulative fiscal measures within a framework
of medium-term fiscal consolidation in order not to upset the financial and
exchange markets and to avoid negative crowding-out effects. The proposed
1994 budget projects a deficit of Fr.fr. 300 billion (4.2% of GDP), but
government expenditure is to grow by only 1.1% relative to the revised
1993 budget, which includes measures to support employment and to boost
construction.
35

In the United Kingdom and the United States, on the other hand, the
main concern has been to tighten fiscal policy without endangering an
initially hesitant recovery. The announcement of a credible deficit reduction
plan in which most of the adjustments are for delayed implementation has
been a partial solution to this problem. The aim is to lessen the direct
demand effects at the outset of the programme, while the expectation
of future debt reductions can lead to an immediate fall in long-term
interest rates and stimulate interest-sensitive demand components. In the
United States the announcement and approval of the 1993 Omnibus Budget
Reconciliation Act were followed by a decline in long-term bond yields.
This package, which was recently reinforced by the 1994 budget proposal
and an almost total freeze on discretionary spending for the next five years,
is expected ultimately to reduce the federal deficit by 1 % % of GDP.
Although in the United Kingdom the 1993 spring budget had little effect
on the financial markets, the first unified autumn budget led to a signifi-
cant rally in the bond markets. The combined direct effect of the two
budgets is to increase tax revenues in 1994 by 1.3% of GDP and cut expen-
diture by 0.5%. Finally, in Germany, the approval in May 1993 of the Federal
Consolidation Programme, which includes a 7.5% income tax surcharge
from 1995 to finance the structural reform process in eastern Germany,
triggered a further decline in long-term interest rates. This programme was
supported in the 1994 budget by public spending cuts over the next three
years, including a 3% reduction in unemployment benefits and social assis-
tance payments.
An important element in the success of the strategies in these countries
is the realisation that a tighter fiscal policy will make it easier for the
monetary authorities to bring down interest rates and stimulate interest-
sensitive spending without jeopardising progress against inflation. In Japan,
on the other hand, three successive fiscal packages in August 1992 and
April and September 1993, expanding government investment by an
estimated 5.2% of GDP, have not yet resulted in a revival of economic
growth. In February 1994 an additional fiscal package was therefore proposed,
including a one-time reduction in income taxes and further increases in
public investment.
The desire to enhance credibility was one reason for the adoption of
the Maastricht fiscal criteria by the EU countries. Convergence programmes
were established, multilateral surveillance was strengthened, and definitions
of fiscal concepts and objectives were harmonised. As a result of reduced
growth prospects, the goal of reaching the 3% deficit target by 1996 became
much more difficult. Almost all the initial convergence plans had to be
revised. In Germany, for example, excluding additional borrowing of about
2% of GDP by the Treuhand Agency, the Federal Railways and the Federal
Post Office, the initially projected deficit/GDP ratio was overshot by about
1 percentage point in 1993. Substantial overruns in 1993 also prompted
the Spanish Government to propose a restrictive 1994 budget which aims
at limiting the deficit to 5.7% of projected GDP and to announce a new
three-year plan to cut the public deficit further last February. Under the
... fiscaltightening in theUnited States,the UnitedKingdom andGermany...
... andstrong expansionin Japan
Large overruns inthe convergenceprogrammes ofEU countries
36
new Portuguese medium-term convergence programme, the Government
plans to lower the general government deficit to just over 3% of GDP,
stabilising the ratio of debt to GDP at 67% over the next four years.
Credibility will also benefit from concrete measures that address the
structural problems in the government budget. In many continental European
countries government revenues have reached more than 45% of GDP, and
even more than 50% in the Nordic countries, leaving little scope for further
tax increases. In these countries consolidation efforts must focus on containing
and reducing government expenditure. The expected future decrease in the
tax burden and in its distortive effects on output could bolster private
sector confidence and offset direct negative demand effects. The most
important factor in establishing credibility is, however, actual performance
in government debt consolidation. Although many countries were able to
stabilise their debt/GDP ratios at the end of the 1980s in conditions of
above-average growth, only a few succeeded in substantially reducing them.
In the light of the future pressure on government expenditure due to ageing
populations, this has impaired the credibility of the fiscal authorities in the
current downturn, leaving most governments with no choice but to tighten
fiscal policy in order to prevent undesired effects on the financial markets.
37

I. T h e d e v e l o p i n g c o u n t r i e s a n d e a s t e r n E u r o p e
Highlights
Led by Asia, real growth in the developing world, at about 4Vi% last year,
was significantly higher than in the industrial countries. Moreover, if Brazil
is excluded, the rate of inflation declined. At the same time, owing to
weak export demand and worsening terms of trade, the current account
deficit of the developing countries (excluding the newly industrialising
economies (NIEs)) increased to US$ 91 billion. Even though this was easily
financed by abundant capital inflows (see also Chapter VII), the increases
in foreign debt recently recorded by some countries, notably in Latin
America, need to be carefully monitored if they are not to pose problems
in the future.
The favourable output and inflation performance and the differences
observed between various groups of developing countries owe much to
the policies pursued. The NIEs have for many years achieved rapid growth
through policies promoting exports of manufactured goods. Similar policies
are now stimulating growth in other South-East Asian countries, such as
Indonesia, Malaysia and Thailand. Structural reforms and resolute stabilisa-
tion policies in a number of Latin American countries have succeeded in
reducing inflation and reviving real growth. In South Asia, India and Pakistan
have also adopted pro-market reforms, and similar trends may be observed
in parts of the Middle East and in some countries in Africa.
Yet the effects of growth-oriented policies have been most dramatic
among those Asian countries that are in transition towards market economies.
Over the last two years China has recorded average GDP growth of more
than 13%. Relatively high growth has also been seen in Vietnam, Laos and
Cambodia. At the same time, because China's reform policies have placed
a greater burden on macroeconomic control instruments and the effec-
tiveness of these instruments has progressively weakened, there is a growing
risk of excess demand pressures and rising inflation.
The striking contrast in economic performance last year between
eastern Europe and the members of the Commonwealth of Independent
States (CIS) provided a further illustration of the importance of appropri-
ately designed economic policies. Consistent reform efforts and determined
stabilisation policies in many eastern European countries have laid the foun-
dation for a resumption of growth. They were rewarded with a bottoming-
out of output last year, and in some cases with the first signs of recovery.
In stark contrast, the failure of the CIS economies to solve the basic issues
of economic cooperation in the region and to redress macroeconomic
38

imbalances resulted in another year of falling output and high inflation. The
opportunity to pursue individual stabilisation policies provided by the collapse
of the rouble zone was not utilised.
While the stabilisation of output in eastern Europe raised hopes that
recovery may be within reach, achieving sustainable growth remains a
challenge. Much has to be done to raise investment from its present level
and to strengthen current balance-of-payments positions. The continuing
weakness of investment underscores the urgent need to increase domestic
saving if a sustainable balance of payments and higher growth are to be
attained.
Continuing highgrowth withlower inflation
Policy-induceddifferences inperformance
Recent developments and policies in the developing countr ies
Real output growth in the developing countries last year, at about 4Vi%,
was largely unchanged from 1992 and for the third consecutive year signif-
icantly higher than that in the industrial countries, this time by an even
wider margin (see the table on page 4). Growth in Asia continued to be
rapid while stronger growth in Latin America offset weaker trends in the
Middle East and Africa. 1993 also saw a further decline in the rate of
inflation to just over 15% (excluding Brazil). Most of the decline can be
ascribed to developments in Latin America, as inflation did not change
significantly in other regions.
There were again, however, large differences in the performance of
individual countries, highlighting, in particular, the effects of the different
policies pursued. The NIEs (Hong Kong, Singapore, South Korea and Taiwan)
further developed their growth strategy based on export promotion and
stable macroeconomic policies, and this strategy was successfully applied
by several other South-East Asian countries. The growth performance of
Asia also reflected the reform policies implemented in China and more
recently in other Asian countries in transition which have adopted the
"Chinese reform model". Pro-market policies, including deregulation, trade
liberalisation and privatisation, have also been introduced in Pakistan, Sri
Lanka and, most notably, India in recent years with favourable effects on
these countries' output performance. In Latin America the determined
pursuit of stabilisation policies and structural reforms has reversed earlier
trends of declining output and accelerating inflation. Africa, however,
confronted with worsening terms of trade, unfavourable weather condi-
tions and, in some countries, civil strife, recorded a further fall in per
capita income. A major policy event in early 1994 was the currency deval-
uation in the countries belonging to the CFA franc zone, a change that is
likely to have a profound impact on future economic trends. The Middle
East and North Africa presented a picture of marked contrasts last year.
Growth was low or negative in the oil-exporting countries owing to weak
demand for oil and falling prices and was sluggish in countries such as
Algeria and Egypt, of which the former was adversely affected by social
unrest. On the other hand, Jordan and Syria, benefiting from reform policies,
recorded growth rates of 5-6%.
39

G r o w t h policies in South-East Asia
Over the last twenty-five years, output growth in South-East Asia (the
seven countries included in the table below) has averaged 73A% and aggregate
GDP has more than sextupled. A marked rise in intra-regional trade has
increasingly shielded these countries from the world business cycle.
The policies pursued by the seven countries have a number of common
features, including the promotion of saving, investment in education, stable
fiscal, monetary and exchange rate policies, low inflation and export-led
growth based on the manufacturing sector. However, the differences in
economic structures and growth strategies are equally marked. In Taiwan
the manufacturing sector consists of a large number of small to medium-
sized enterprises, while in South Korea large conglomerates have played
the dominant role. Malaysia and Indonesia, and to a lesser extent Thailand,
have a rich natural resource base and a principal component of their growth
strategies has been the development of industry in order to reduce their
dependence on exports of raw materials and consequent exposure to
volatile terms of trade. Hong Kong and Singapore are city states and, in
addition to exports of manufactured goods, their high growth can be
attributed to the development of internationally competitive services sectors,
in particular in the financial area.
The policy measures applied have also differed. Singapore and Hong
Kong have followed a liberal and non-interventionist strategy, while Taiwan
and South Korea have relied on more interventionist approaches. The other
three South-East Asian economies (Indonesia, Malaysia and Thailand) are
progressively implementing policies of deregulation and liberalisation. Overall,
the achievements of the seven countries have not only depended on the
initial conditions and targets but have also been the outcome of a dynamic
process in which policies are continuously adjusted to external as well as
internal changes and impulses. Thus, in response to the maturing of their
High and self-contained growth
Commonfeatures withindifferenteconomicstructures...
... andcontinuousadaptation ofgrowth strategies
South-East Asia: indicators of economic
Countries
Hong KongSingaporeSouth KoreaTaiwanAverage2
IndonesiaMalaysiaThailandAverage2
Real GDP1970-80 1981-90
9.49.08.29.78.9
8.08.06.87.6
6.77.09.38.08.3
5.56.07.86.3
1991-93
5.07.46.46.36.2
6.68.47.77.2
deve lopment
Consumer prices1970-80
Dercentage
8.67.1
16.310.472.7
17.05.99.8
13.21 Hourly earnings in manufacturing industry deflated by consumer prices
1981-90 1991-93changes, annual rate
8.12.36.33.15.3
8.63.24.46.5
9.82.76.83.76.7
8.84.24.56.8
. 2 Weighted average
Real earnings1
1970-80
6.33.09.97.88.7
5.02.01.03.3
, based onSources: World Bank World Tables, IMF International Financial Statistics, Asian Development BankOutlook and national data.
1981-90
4.25.06.27.56.7
5.93.26.45.6
1991-93
3.42.16.46.15.5
n.a.6.45.0n.a.
1990 PPP weights.Asian Development
40

High rates ofsaving andinvestment
Flexible labourmarkets withlarge employmentand productivitygains
Interventionistpolicies used todifferent degreesand...
economies and a deteriorating competitive position vis-à-vis other Asian
countries, the NIEs are currently undergoing a process of industrial restruc-
turing. Recently they have experienced growth rates below those of the
other three South-East Asian countries. This pattern was especially marked
last year, when, despite an unexpectedly sharp expansion of almost 10% in
Singapore, GDP growth in the NIEs averaged "only" 6%, compared with
7Vi% in the rest of the region.
Growth "fundamentals" and policy influences
Broadly speaking, economic growth is determined by three fundamental
factors: the volume of real capital formation, the efficiency with which
capital and other resources are used and technological progress. In all three
respects the policies pursued in South-East Asia have played a decisive role.
All seven countries have enjoyed high and for the most part rising
national saving and domestic investment rates (see the table overleaf). To
a large extent these have been "self-generated" as rapid growth stimulated
household and enterprise saving and prevented an accumulation of public
sector deficits. Policies have contributed through generally low inflation and
a conservative fiscal stance with high government saving. In some countries
public pension or insurance funds have underpinned capital formation
(Singapore) or served as an instrument for financing government deficits
(Malaysia).
Most of the South-East Asian countries have benefited from aggregate
productivity gains as rural workers, made redundant by strong output
increases induced by agricultural reforms, have been absorbed in industry
or services. These sectoral shifts have taken place with only transitory
increases in unemployment and, on average, real wage growth has not
exceeded productivity growth. A typical feature of South-East Asian labour
markets is that wages are highly sensitive to unemployment. On the whole,
this has facilitated adjustment, though in periods of excess demand for
labour real wage gains have tended to erode profit margins and weaken
international competitiveness. In some cases interventionist policies, such
as the incomes policies adopted in Singapore or "wage guidance" in other
countries, have been applied. Overall, however, the unusually high growth
of employment without excessive wage pressures owes much to invest-
ment in primary and secondary education, which has ensured an ample
supply of skilled workers and helped to prevent large changes in relative
incomes. Indeed, in contrast to most other developing countries, income
distribution in South-East Asian economies has become more equal and
the proportion of the population living in poverty has fallen dramatically.
To varying degrees the South-East Asian countries have attempted to
encourage capital formation through interest subsidies or tax incentives and
have influenced the allocation of capital through directed loans. "Infant
industries" have been protected while exports have been promoted through
subsidies. Close cooperation between governments and private business or
the creation of public enterprises in sectors with high start-up costs and/or
externalities have been additional components of the industrial growth
41

South-East
Countries
Hong KongSingaporeSouth KoreaTaiwan
IndonesiaMalaysiaThailand
* 1992.Sources: World
Asia: s t ructura l indicators
1991 percapitaGNP
inUS$
13,20012,8906,3409,070
6102,4901,580
Budget balance1971-80
6.20.4
- 2.20.0
- 2.4-13.3- 4.9
Bank World Tables,Outlook and national data.
1981-90
-0.65.8
-1.0-0.1
-3.0-6.1-0.1
1991-93Gross
1971-80national1981-90
saving1991-93
Merchandise exports1970
as a percentage of GDP, annual averages
2.711.8-0.5-1.7
-4.4-1.6
3.6
IMF International
28.529.022.031.8
24.527.022.2
Financial
31.042.031.033.5
28.529.022.7
Statistics
31.147.536.029.0
35.029.034.0
69.776.310.126.0
12.841.39.7
1980
71.8155.327.547.3
30.152.620.0
1992
123.8133.825.339.1
25.768.830.4
Unemployment1980
as%labour
3.93.55.21.2
1.75.60.9
1993
of the• force
2.02.7*2.81.4
2.2*3.03.6
, Asian Development Bank Asian Development
strategy. Interventionist policies of this kind have been pursued most inten-
sively in South Korea and Taiwan, while Singapore and especially Hong
Kong have rarely resorted to such measures. Indonesia, Malaysia and Thailand
have also relied less on interventionist policies, owing to international
pressures against protectionism and, in particular, the difficulties of using
credit and interest rate controls at a time when financial markets are
becoming increasingly integrated. Overall, the main features and net effects
of these policies can be summarised in three points:
- rigorous screening and monitoring criteria, usually based on export
performance, have been applied in deciding whether certain sectors or
enterprises should continue to receive support;
- interventionist policies have never been allowed to interfere with
the macroeconomic targets of low inflation and small budget deficits;
- as a result, the return on investment and capital has generally been
higher than in most other developing countries and also higher than in the
industrial countries.
By welcoming foreign direct investment or seeking licensing arrange-
ments the South-East Asian countries have complemented their own already
rapid technological progress. This catching-up process and the adaptation
of foreign technologies to domestic production have been significantly aided
by the existence of a highly educated labour force. Their infrastructure is
also more advanced than that in most other developing countries, but
because of their rapid growth all seven countries have recently been forced
to devote a rising share of public expenditure to strengthening infrastruc-
tural development.
Dynamic aspects of the growth process
As the four NIEs have gradually caught up with the technologies of the
industrial countries and their economies have matured, excess demand and
inflationary pressures in labour markets combined with currency apprecia-
... subject tostrictperformancecriteria
Sources oftechnologicalprogress
Industrialadjustment in theNIEs...
42

... benefitingother countriesin the region
Changingsensitivities tomovements ofthe yen
tion have caused them to lose competitiveness, in particular against emerging
rivals in the region. They have countered the problem in two ways: by
upgrading their manufacturing sectors, shifting from labour-intensive products
to "high-tech" consumer and investment goods, and by relocating or
outsourcing production to other South-East Asian countries with lower
labour costs. This adjustment process is especially evident in Hong Kong
and Singapore. The former has shifted most of its manufacturing produc-
tion to the southern provinces of China while the redundant labour force
has been absorbed by the services sector. Singapore has also invested in
neighbouring countries while at the same time upgrading its domestic
industry. As a result, its manufactured exports now come largely from the
computer-related electronics industry, which last year accounted for most
of the unexpectedly rapid expansion of overall GDP.
The other South-East Asian countries have greatly benefited from this
process. Until they were recently overtaken by China, they had been the
main recipients of foreign direct investment from the NIEs. Direct invest-
ment inflows to these countries have provided a stimulus to growth and
served as a major source of finance, accounting in some periods for nearly
25% of total investment in the case of Malaysia. Thus a "virtuous" circle
has gradually evolved whereby direct investment, taking advantage of shifting
cost structures and the upgrading of technology, has reinforced the expansion
in intra-regional trade (see Chapter IV) and helped to internalise growth
in the region. Combined with surging exports to China this process has
helped to shelter South-East Asia from the business cycle in the industrial
world.
This development has also changed the relative vulnerability to real
exchange rate movements. The real appreciation of the yen following the
Plaza Agreement brought benefits to the four NIEs in the form of improved
competitiveness and direct investment inflows from Japan, while most other
South-East Asian countries suffered terms-of-trade losses and rising external
debt. By contrast, the appreciation of the yen during the second half of
1993 appears to have mainly benefited the three emerging economies in
terms of increased competitiveness and foreign direct investment inflows. The
NIEs, notably South Korea and Taiwan, have profited less than previously
as the range of products in which they compete with Japan is largely
confined to capital and technology-intensive products and direct investment
inflows have been much smaller.
Dismalperformance inthe 1980s...
Macroeconomic stabil isation and s t ructura l re forms in Latin Amer i ca
During the 1980s real per capita income in Latin America declined by an
estimated 9% and annual inflation was in many countries often in triple
digits or even higher. There were several reasons for this dismal picture
of a "lost decade": the debt crisis that erupted in 1982, real income losses
due to large net interest payments abroad and substantial terms-of-trade
deteriorations, and natural disasters in several countries. Most importantly,
however, the poor performance was due to slowness in correcting the
43

macroeconomic imbalances that had built up earlier and triggered the debt
crisis and to difficulties in counteracting previous inappropriate policies.
Notwithstanding continuing terms-of-trade losses and a slowdown in
growth outside Brazil last year (see the table below), output growth averaged
nearly 3% during 1990-93, restoring more than one-third of the earlier
decline in per capita income. This reversal, which was accompanied by a
remarkable fall in the average rate of inflation (excluding Brazil) to 18%
last year, can be ascribed to a growing recognition of the need for reforms
and to a determined effort to implement policies aimed at macroeconomic
stabilisation and structural adjustment. As a result, the region has seen a
revival of business fixed investment and a resumption of capital inflows,
providing rather strong evidence that confidence is being re-established
among domestic as well as foreign investors.
The timing of the policy shift has varied. Chile embarked on a new
course already in the 1970s, Mexico in 1987 and Argentina and Peru only
in 1991-92, while Brazil, until 1993, had still not found the consensus
necessary for credible reform. These differences, which are also evident in
the nature and scope of the measures taken, have had a profound impact
on recent performance. Some countries, such as Chile, Mexico, Bolivia and
Argentina, have consolidated earlier gains but, except for Chile, have not
yet reaped all the benefits of the transition from stabilisation to sustain-
able growth with low inflation; others, including Ecuador, Peru, Uruguay
and Venezuela, are in a state of volatile real growth and mostly high rates
of inflation; and Brazil still suffers from chronically high inflation, fuelled by
large nominal budget deficits (see note 4 to the table opposite) and, in
particular, widespread indexation. Nonetheless, after two years with no
growth, Brazil was among the fastest-growing countries in the region in
1993, though the recovery started to falter in the second half of the year.
The Government has recently proposed another stabilisation plan including
a more restrictive fiscal policy and, as a novel feature, the introduction of
... followed by amarked reversalof policies
Varied timing ofthe policy shift
Recent measuresin Brazil
Latin Amer ica : rea
Countries
ChileBoliviaMexicoArgentinaBrazilAverage3
Excl. Brazil
o u t p u t and inf lat ion
Real GDP1980-85 1986-90 1991-92 1993
Memo item:1993 percapita
income'
Consumer prices1980-85 1986-90 1991-92 1993
Memo item:Peak rate2
percentage changes, annual rates
-0.4-1.9
1.9-2.1
1.10.50.1
1 Index, 1980 = 100. 2 Sinceusing 1990 PPP weights.
6.51.71.40.32.01.97.8
8.23.73.18.80.02.53.9
1970; year of peat
Sources: IMF International Financial Statistics,national data.
6.03.20.46.05.03.02.0
130.282.094.3
100.894.395.496.4
21.3611.060.8
322.5149.0118.599.0
19.346.569.6
584.0657.5519.0277.5
. rate in brackets. 3 Weighted average for
18.616.719.184.2
656.0281.042.0
12.78.59.8
10.51,933737.018.0
Latin America and
:CLAC Overview of the economy of Latin America and the
505(1974)11,750(1985)
132(1987)3,080(1989)3,118(1990)1,578(1990)
652(1990)
the Caribbean,
Caribbean and
44
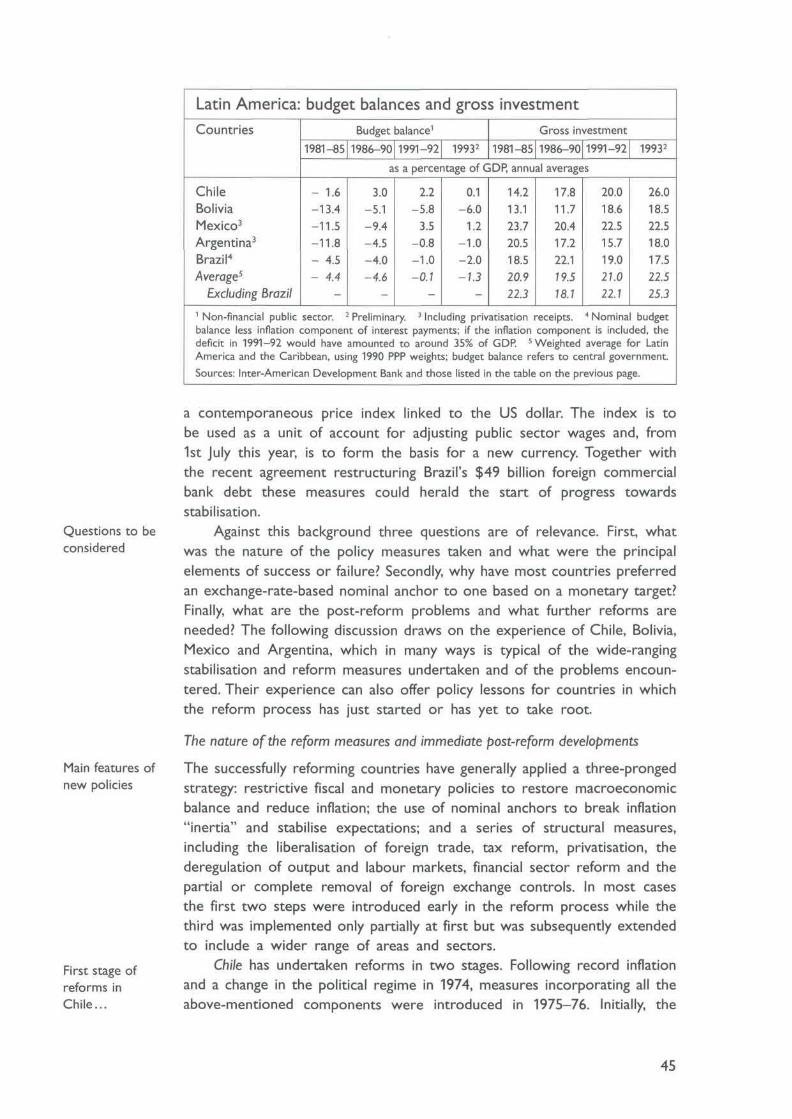
Questions to beconsidered
Main features ofnew policies
Latin Amer ica :
Countries
ChileBoliviaMexico3
Argentina3
Brazil4
Average5
Excluding Brazil1 Non-financial publicbalance less inflation
budget balances and gross investment
Budget balance1
1981-85 1986-90 1991-92 19932Gross investment
1981-85 1986-90 1991-92 19932
as a percentage of GDP, annual averages
- 1.6-13.4-11.5-11.8- 4.5- 4.4
-
3.0-5.1-9.4-4.5-4.0-4.6
-
2.2-5.8
3.5-0.8-1.0-0.7
-
0.1-6.0
1.2-1.0-2.0-1.3
-
14.213.123.720.518.520.922.3
17.811.720.417.222.119.518.1
20.018.622.515.719.021.022.1
sector. 2 Preliminary. 3 Including privatisation receipts. 4 Nominacomponent of interest payments; if the
deficit in 1991-92 would have amounted to around 35% ofAmerica and the Caribbean, using 1990 PPP weights; budgetSources: Inter-American Development Bank and those listed ir
26.018.522.518.017.522.525.3
budgetinflation component is included, theGDP. 5 Weighted average for Latinbalance refers to central government.i the table on the previous page.
First stage ofreforms inChile...
a contemporaneous price index linked to the US dollar. The index is to
be used as a unit of account for adjusting public sector wages and, from
1st July this year, is to form the basis for a new currency. Together with
the recent agreement restructuring Brazil's $49 billion foreign commercial
bank debt these measures could herald the start of progress towards
stabilisation.
Against this background three questions are of relevance. First, what
was the nature of the policy measures taken and what were the principal
elements of success or failure? Secondly, why have most countries preferred
an exchange-rate-based nominal anchor to one based on a monetary target?
Finally, what are the post-reform problems and what further reforms are
needed? The following discussion draws on the experience of Chile, Bolivia,
Mexico and Argentina, which in many ways is typical of the wide-ranging
stabilisation and reform measures undertaken and of the problems encoun-
tered. Their experience can also offer policy lessons for countries in which
the reform process has just started or has yet to take root.
The nature of the reform measures and immediate post-reform developments
The successfully reforming countries have generally applied a three-pronged
strategy: restrictive fiscal and monetary policies to restore macroeconomic
balance and reduce inflation; the use of nominal anchors to break inflation
"inertia" and stabilise expectations; and a series of structural measures,
including the liberalisation of foreign trade, tax reform, privatisation, the
deregulation of output and labour markets, financial sector reform and the
partial or complete removal of foreign exchange controls. In most cases
the first two steps were introduced early in the reform process while the
third was implemented only partially at first but was subsequently extended
to include a wider range of areas and sectors.
Chile has undertaken reforms in two stages. Following record inflation
and a change in the political regime in 1974, measures incorporating all the
above-mentioned components were introduced in 1975—76. Initially, the
45

programme relied on a very tight monetary policy as the key element in
the efforts to reduce inflation and this was combined with an exchange
rate policy based on a crawling peg against the US dollar. However, from
1979 onwards a completely fixed rate was adopted while monetary policy
became somewhat less restrictive. Despite a relatively quick resumption of
real growth and continued fiscal discipline, the policy package eventually
failed, mainly because wage indexation based on past price changes sustained
a high degree of inflation inertia, resulting in an accelerating real appreci-
ation of the exchange rate and a widening external imbalance.
The difficulties encountered in its earlier programme may seem irrel-
evant in view of Chile's recent performance, which has included average
growth of 7V2% during 1990-93, a fall in the rate of inflation to less than
13% and a marked rise in the investment/GDP ratio (see the tables on
pages 44 and 45). However, it provided two crucial lessons both for Chile's
subsequent reforms and for the exchange-rate-based programmes adopted
in other countries: first, the combination of a fixed nominal exchange rate
with ex post wage indexation is likely to be unsustainable; and secondly,
fiscal discipline is a necessary but not sufficient condition for reducing inflation.
The second stage of reforms started with a large devaluation after the
debt crisis. This was followed by the introduction of restrictive fiscal and
monetary policies in 1984-85 and subsequently by further structural measures,
including the creation of an independent central bank and, last year, a major
capital market reform. In contrast to the first stage, the authorities abandoned
the exchange-rate-based nominal anchor and attempted to reduce the
external imbalance by means of a series of nominal devaluations. Because
wage indexation had been abolished and unemployment was high at the
start of the programme, these devaluations had only a moderate effect on
nominal wages. Consequently, the rate of price inflation, real wages and
the real effective exchange rate declined during the second half of the
1980s (see the table below), while export growth accelerated. At the same
time, improved profit shares led to a marked increase in private capital
formation despite high real lending rates (see the table opposite).
... with crucialpolicy lessons
Second stageof reforms
Latin Amer ica :
current account balances and real effective
Countries
ChileBoliviaMexicoArgentinaBrazil
Current account balance1981-85 1986-90 1991-92 19932
as a percentage of GDP,annual averages
-10.0- 3.9- 0.9- 2.2- 2.8
-3.5-6.2-0.9-1.6-0.4
-0.5-8.5-5.9-2.6
0.6
- 5.0-10.0- 5.7- 3.0
0.11 Nominal effective rates deflated by relative consumeration (depreciation). 2 Preliminary.Sources: See the tables on pages 44 and 45.
exchange rates
Real effective exchange rate1979-81
14373
122145126
1982-84indices
133939296
116
1986,1985 =
8173729394
1990100
71519288
154
19932
7641
118137133
prices; increase (decrease) indicates appreci-
46

Featuresof Bolivianreform...
... and a furtherpolicy lesson
Features ofMexican reformand its results
Latin Amer ica :
Countries
ChileBoliviaMexicoArgentinaBrazil
real in terest rates
Deposit rates1
1980 1983 1986 1990 19933
Lending rates2
1980 1983 1986 1990 19933
in percentages per annum
2.4-29.0- 5.8-20.0
32.1
0.6-10.64
-47.0-63.0
12.5
- 0.5- 8.5"- 1.5
5.0-36.2
14.36.74.5
-17.54
41.5"1 Deposit rates less changes in consumer prices.in wholesale prices. 3
5.513.75.80.5
25.04
7.5-21.3- 3.8
10.9-13.0
- 2.7-13.5"-50.7
13.94
25.62 Lending rates (for Brazi
Preliminary. 4 Monthly rate.Sources: See the tables on pages 44 and 45.
6.57.0"
- 7.571.0
-51.0
27.021.813.8n.a.
-27.04
15.851.09.54.4
35.04
, Bank rate) less changes
Bolivia's reform programme was introduced in 1985 against the back-
ground of one of the highest inflation rates ever recorded in the region.
It contained all the components mentioned above, including the unification
of the informal and official exchange rates, which entailed a devaluation of
the latter to only a fraction of its previous value. Although the initial
objective of introducing a currency board and using the US dollar as a
nominal anchor was not achieved (indeed the currency depreciated by a
further 25% over the next two years) the target of bringing down inflation
was met within a short period and by 1987 the rate of price increase had
fallen below 15%. Real output recovered more slowly. As a result of the
restrictive policies and a series of large terms-of-trade losses real output
did not return to its 1980 level until 1991, and per capita GDP in 1993
was still below its 1980 level. One reason for the slow recovery of output
was the weakness of investment, which by the end of the 1980s had declined
to less than 10% of GDP. Hence, one lesson to be drawn from Bolivia's
experience is that in the absence of complementary policy measures and
a change in expectations, stabilisation policies cannot restore economic
growth. Slow growth also complicates the maintenance of fiscal balance
because of the associated loss of tax revenue. Thus, after the initial consol-
idation, Bolivia's budget balance soon moved back into deficit, and last year
the shortfall reached 6% of GDP.
A three-pronged policy programme was adopted in Mexico in 1987
following record levels of inflation. During the next six years the programme
underwent continuous adjustments and extensions, including the abolition
of interest rate and credit controls in 1989 and legislative changes to create
an independent central bank with effect from early this year. A key element
of the Mexican reform and stabilisation policies has been a nominal anchor
based on a pre-announced annual devaluation (or fluctuation band) against
the US dollar, combined with a comprehensive incomes policy programme
to stabilise expectations and break the inflation inertia entrenched in the
earlier system of wage indexation. Owing to the gradualist nature of the
programme, inflation has come down only slowly, though last year a single-
digit rate was recorded for the first time since 1972. Real GDP has expanded
at a moderate pace, but growth fell below 1 % last year as tight policies
47

Latin Amer ica : indicators o f monetary
Countries
ChileBoliviaMexicoArgentinaBrazil
* Estimated.
Credit to1980 1985
43.411.615.625.422.4
70.110.110.917.418.1
Sources: See the table on page '
the private sector1990
50.218.920.615.77.2
iS.
1992as a
51.230.332.715.210.7
1993*
pol icy
1980 1985percentage of GDP
44.531.535.515.510.9
25.918.829.121.411.9
41.110.025.215.918.8
1990
40.621.624.010.415.9
1992
39.030.429.413.730.8
1993*
37.035.028.516.025.3
were maintained in order to hold inflation down and defend the exchange
rate. Despite sluggish growth Mexico has managed to keep urban unem-
ployment low. However, even following some strengthening since 1988
average real wages are still below their 1980 level. Moreover, poverty and
underemployment are widespread in rural areas and recently this has caused
some political and social unrest. The external deficit has widened to nearly
6% of GDP as a result of surging imports following extensive trade liber-
alisation and a real appreciation of the peso. However, the current account
deficit has been more than financed by capital inflows attracted by a
favourable interest rate differential as strong growth of private credit demand
(see the table above) against the background of a tight monetary policy
has kept real lending rates high.
Argentina's reform programme was introduced in 1991 and followed
several unsuccessful stabilisation measures during the 1980s, the most well-
known of which was the Austral Plan of 1985. This plan, like the contem-
poraneous Cruzado Plan in Brazil, had attempted to break the inflation
spiral by means of an exchange-rate-based nominal anchor, but it eventu-
ally broke down mainly because fiscal discipline was not maintained. Partly
as a result of the failure of past stabilisation efforts, confidence in the
political authorities was eroded and during the 1980s Argentina's real output
fell by an average 1 % a year while inflation was in triple digits.
A principal element in the stabilisation plan of March 1991 was the
"Convertibility Act", which established a monetary system with two essential
features: a nominal anchor based on a fixed nominal exchange rate against
the US dollar and a rule which limited the monetary base to the level of
international reserves, thereby abolishing the discretionary power of the
central bank to expand domestic credit. The immediate consequence of the
plan was a dramatic change in expectations, leading to a sharp drop in
inflation and a resumption of real output growth. During 1991-93 the fall
in per capita income over the previous decade was completely reversed
and by April this year the twelve-month rate of inflation had slowed to
only 414%. Moreover, under the influence of the Convertibility Act, backed
up by an extensive tax reform and privatisation receipts amounting to 2-3%
of GDP, the budget of the non-financial public sector was close to balance
Earlierstabilisationprogrammes inArgentina...
... and a newreform plan in1991
48

Reasons foradoptingexchange-rate-based nominalanchors
Real currencyappreciation anddeterioratingtrade balances
High realinterest rates
in 1992-93. However, as in Mexico, the use of the exchange rate as a
nominal anchor caused a marked real appreciation of the currency. Together
with wide-ranging trade liberalisation measures this led to a deterioration
in the trade and current account balances.
The choice of nominal anchor
A feature common to virtually all stabilisation programmes in Latin America
has been the reliance on a fixed nominal exchange rate rather than a
monetary target as the nominal anchor. There appear to have been three
principal reasons for this choice:
- in order to strengthen credibility governments have found it helpful
to link their currencies to that of a country with a better inflation perfor-
mance, usually the United States. To further strengthen credibility, in partic-
ular during the initial phase of reform, they have generally preferred pegging
to a single currency rather than to a trade-weighted currency basket,
although the latter might perhaps have had a less distortive effect on trade
flows;
- a fixed nominal exchange rate provides a clear signal to the general
public as well as to employers and trade unions owing to the large weight
of tradable goods in consumer prices;
- the relationship between the monetary aggregates and nominal income
tends to become unstable in periods of disinflation because the demand
for real money balances increases, thus making aggregate targets unreliable
as a guide for monetary policy.
Post-stabilisation issues and the need for further reforms
Despite the immediate success of the policies implemented and the consol-
idation of inflation gains, most countries undertaking stabilisation and struc-
tural reforms face a number of problems which need to be tackled if
further progress is to be made:
- countries relying on a fixed nominal exchange rate as the principal
nominal anchor have experienced a marked real appreciation of their curren-
cies and a worsening of the external current account balance. Thanks to
large capital inflows (see Chapter VII) financing the current account deficits
has generally not been a problem; in fact, inflows in excess of the deficit
have in several instances made it more difficult to maintain monetary stability.
Several countries also devalued their currencies prior to fixing the exchange
rate, suggesting that profit margins may still be relatively comfortable.
Moreover, private investment has increased in most countries, more or
less offsetting the fall in public investment. Nonetheless, given the loss of
market shares, in particular in domestic markets, there is a need for further
restructuring of domestic industries in order to create the conditions
required for maintaining the nominal anchor and, at the same time, improving
the external balance;
- most countries have experienced a marked rise in real interest rates
as a result of restrictive monetary policies. Real lending rates have been
particularly high, due in part to a widening of interest margins and in part
49
to a more rapid deceleration in wholesale prices than in consumer prices.
While the emergence of positive real deposit rates should eventually boost
domestic saving, the very high real lending rates could weaken business
fixed investment and hence the prospects of achieving more rapid and
sustainable real growth. Last year, however, the average investment/GDP
ratio for Latin America, excluding Brazil, rose to nearly 25%;
- in Bolivia, hyperinflation was eliminated in less than one year with
relatively low output losses because the monetary system and economic insti-
tutions had effectively ceased to function. In other countries, too, initial
reductions in inflation were achieved without large declines in output growth.
It has been more difficult to reduce inflation once it had fallen to the 10-15%
range, possibly indicating that forces of inertia were still present and/or
that inflation expectations had not declined in line with the actual rate;
- Chile has managed the transition from stabilisation to sustainable
growth, while most other countries have succeeded in creating the condi-
tions required for higher growth but have not yet experienced a period
of strong and sustained expansion. Output in Bolivia has recovered only
very slowly and last year Mexico recorded the lowest growth rate for
seven years.
A number of reforms are still pending. First, while most countries have
reformed their tax systems, the expenditure side has not yet been restruc-
tured and reductions were made mainly with a view to eliminating the
fiscal deficit. Capital spending has been cut by more than current spending
and expenditure on education, health and welfare has also been reduced.
Consequently, many countries face an urgent need to upgrade their infra-
structure and improve their education and health care systems. Some
countries may also have to raise taxes to meet pension payments or, as
has recently been done in Chile, establish private pension schemes.
Secondly, because the faster rate of growth has so far mainly benefited
those in the upper income brackets, poverty has become a serious problem
in the region. On average the poorest 20% of the population receives well
under 5% of total income and in several cases, including Argentina and
Mexico, heightened social tensions have started to affect confidence and
economic activity. Moreover, despite the revival of output growth unem-
ployment has increased, as previously "discouraged" workers have rejoined
the labour force. Against this background, Chile and Mexico introduced
social reforms during 1992-93 and other countries may have to take similar
measures.
Thirdly, most countries need to strengthen and reform their financial
sectors. The wide margin between deposit and lending rates may be a sign
of high risk premia but could also indicate that competition is limited.
Because money and capital markets remain underdeveloped several countries
have experienced difficulties in offsetting the domestic liquidity effects of
large capital inflows. Particularly those that have liberalised capital transac-
tions before deregulating their domestic financial markets may face a risk
of financial instability if capital inflows are suddenly reversed (see also
Chapter VII).
The transitionfrom highinflation ...
... to sustainedgrowth
The need toreform publicexpenditure ...
... relievepoverty...
... andstrengthenfinancial sectors
50

China'sperformancecompared withother economiesin transition
Nonetheless, considering that several failed stabilisation attempts had
severely impaired the authorities' credibility and that, with the exception
of the fall in US interest rates, external developments (worsening terms
of trade and weak export demand) have been unfavourable, the results
achieved so far are impressive and should not be underestimated because
of the problems and the need for further reforms. Most Latin American
countries have successfully broken the earlier inflation cycle and are starting
to create the conditions necessary for sustained growth.
Asian economies in t rans i t ion
Economic developments and reforms in China
Real output in China has grown by 13% in each of the last two years,
raising total GDP to almost four times its 1978 level (see the table below).
This stands in sharp contrast to both eastern Europe and the CIS economies,
which recorded positive, albeit rather low, growth until 1989 but have since
suffered large declines in output. It is also markedly different from the
situation in Mongolia, whose economic system prior to reform was very
similar to those of the European countries and where developments have
followed a similar pattern. This contrast between the economic perfor-
mance of China and that of other former centrally planned economies
raises questions about the reform and transition policies adopted. Some
argue that China's unique performance is the result of more appropriate
policies, while others see the main reason in the initial conditions, in partic-
ular the fact that China was still a rural, underdeveloped economy when
the reform process started. Both factors have been important; in fact, it
is difficult to separate the two because the reform policies adopted in
China were a natural outcome of the country's economic and organisational
structure, notably a high degree of decentralisation along regional lines.
Initial and structural conditions
While eastern Europe and the former Soviet Union ended the last
decade with large macroeconomic imbalances that required rigorous
Economies in t rans i t ion: indicators o f economic deve lopment
Countries andcountry groups
ChinaVietnamMongoliaIndiaEastern EuropeFormer Soviet Union1 Preliminary. 21986-89. 3
Sources: Asian Development
Real GDP1978-89 1990-93
Consumer prices1978-89 1990-93
percentage changes, annual rates
9.24.16.14.82.93.1
9.56.8
- 5.03.8
-10.0-10.3
7.5217.52
4.68.3
36.91.3
1989.
5.439.020.510.5
144.7316.5
M2/GDP1978
in
25.0n.a.
35.835.558.5n.a.
1985 19921
percentages
57.028.447.143.057.648.5
101.533.552.248.056.265.23
Bank Asian Development Outlook and Key Economic Indicators, IMFOccasional Papers and national data.
51

stabilisation policies as a first step, China did not suffer from such imbal-
ances when the process of policy changes started in 1978. Pressures for
reform stemmed more from a desire to improve the effectiveness of
resource allocation and relieve poverty, especially in rural areas. The first
set of reform policies focused on liberalising the agricultural sector, which
immediately triggered a favourable output response, in sharp contrast to
the decline in real income in eastern Europe.
The share of agriculture in output and employment in China was rela-
tively high prior to the reforms (see the table below). A substantial share
of production also originated in industry, with state-owned enterprises
(SOEs) accounting for over 75% of industrial output. While the existence
of "surplus labour" at low wages in agriculture was an advantage not
enjoyed by eastern Europe and the CIS economies, China's performance
owes much to the supply response released in non-state industry.
Unlike the highly centralised and concentrated economic structure in
eastern Europe and the CIS economies, with very large production units
and a high degree of regional interdependence, the structure in China was
decentralised and based on relatively small production units. Moreover, the
provinces had historically enjoyed considerable autonomy. This organisational
and regional structure fostered the development of markets and competi-
tion between regions and has provided a suitable environment for the
economic experiments that have played an important role in China's reform
policies. On the other hand, it also created duplication and, owing to the
lack of macroeconomic instruments of control, regional competition has
periodically generated excess demand pressures.
Another aspect of the country's economic structure was that each
region was largely self-contained and self-sufficient and that at the start of
the reform period China was a relatively closed economy. The dependence
on trade with the former CMEA countries was therefore limited, which
shielded China from the terms-of-trade shocks suffered by the eastern
European countries and Mongolia when the CMEA was dissolved. Moreover,
Absence ofmacroeconomicimbalances and astrong supplyresponse
Decentralisedstructure withautonomousregions
The influence offoreign trade...
Economies in t rans i t ion :
Countries andcountry groups
ChinaVietnamMongoliaIndiaEastern EuropeFormer Soviet Union
1985per
capitaf-r\D
inUS$
225115665285
3,0503,350
11980. 21985. 3 Calculated on therespectively.Sources: See the previous table.
s t ructura l and basic
GDP, by
Agricul-ture
25.642.717.439.614.714.9
sector1
Indus-try
indicators
Employment,by sector1
Agricul-ture
51.726.333.324.454.951.5
68.970.039.775.04
24.920.3
Indus-try
in
15.810.616.025.04
34.929.4
basis of Rb. 2.4 = US$ 1. 4 Proportion
Invest-ment/GDP2
Ex-ports/GDP2
Destination of exports2
OECD
percentages
35.010.940.223.930.020.8
9.411.922.45.7
29.04.4
41.418.53.2
48.028.225.6
Asia
38.834.00.39.23.77.4
CMEA
8.336.03
92.021.067.855.4
af total population living in rural and urban areas
52

... and of theoverseascommunities
Some features ofthe Chinesereform process
The agriculturalreform...
... and the rapidgrowth of thenon-stateindustrial sector
Measurespromotingforeign trade
with the gradual opening of its economy (see below), China's geographical
location has enabled it to benefit from trade with the dynamic South-East
Asian economies.
The large overseas Chinese communities have no doubt also influ-
enced China's performance, especially since the economy was opened up
to foreign trade and direct investment. The close financial and commercial
relations with Hong Kong have been particularly important, not least for
the southern provinces, which over the last three years have recorded
average annual growth of 20%.
Main features of the reforms
China's reform process was not based on a comprehensive plan but
has been gradual, experimental and partial in nature. It has involved a
number of areas and sectors and developed certain features not observed
in eastern Europe. In particular, from the very beginning the reforms were
helped by strong output growth which enhanced the sustainability of the
process and prevented the "reform fatigue" seen in other countries. Moreover,
even though the reforms were accompanied by large changes in the regional
and sectoral distribution of income, the supply response meant that the
distributional distortions associated with large contractions in output were
avoided.
The principal agricultural reform measures adopted in 1978 contained
increases in procurement prices and a return to household farming, including
the right for farmers to sell part of their output on the free market. The
improved incentives elicited a strong supply response and an unexpectedly
large rise in household saving which, together with the release of labour
made redundant by productivity gains, provided inputs and incentives for
the development of industries in rural areas.
As from 1984 local authorities were given greater autonomy, in partic-
ular permission to create township and village enterprises (TVEs) and to
retain a large part of their profits. Spurred by high saving and the avail-
ability of excess labour from agriculture, the TVEs expanded rapidly and,
together with other rural enterprises, they accounted for about one-quarter
of total industrial output by 1990 (see the table overleaf). Similar rights
were later granted to larger cities, with the result that by the same year
the share of the SOEs in industrial output had fallen to 55%. The rapid
expansion of the non-state sector is the single most important factor in
China's growth performance. One major reason for this is probably that,
unlike the SOEs, the non-state enterprises have been subject to a "hard
budget constraint" as they have received no subsidies and have had to
finance investment out of retained profits or through bank credits, which
were frequently difficult to obtain because of the extent of lending to loss-
making SOEs.
Whereas in 1978 exports accounted for less than 10% of China's GDP,
various steps to liberalise exports combined with rapid growth in neigh-
bouring countries, a large real currency depreciation and export subsidies
have helped to raise the share of foreign trade in GDP to about one-third.
53

China: industr ial developments and
Ownership
State-ownedNon-state-ownedof which: Rural
Share of value added1979 1990
ownersh ip
Share of employment1979 1990
in percentages
78.521.59.0
54.645.425.3
72.028.022.5
53.746.338.6
Output1981-90
% change,annual rate
7.521.528.0
Sources: Qian, Y. and Xu, C, Discussion Paper No. 154, Centre for Economic Performance, LondonSchool of Economics and national data.
Imports of capital goods were encouraged and measures were taken to
promote foreign direct investment. As a result, China last year recorded
net direct investment inflows of about $15 billion, the largest in the
developing world. Over the last ten years the technology and know-how
acquired through direct investment have made a substantial contribution to
growth.
A principal feature of China's reform process has been the reliance
on a "two-track" price system, whereby a predetermined share of output
was subject to price control or "guidance" while output above the quota
could be sold at market prices. This system distorted relative prices but
had the advantage that supply shortages were relatively rare. Moreover,
decisions "at the margin" were made at market-determined relative prices.
However, the system also provided incentives for corruption and partly
discriminated against non-state enterprises.
The need for further reforms
While the macroeconomic effects of China's reform policies have no
doubt been substantial, certain shortcomings are evident and there is a
clear need for further reforms. As is discussed below, China has yet to
establish a fully effective framework for macroeconomic policies. This problem
is in part related to the high degree of regional autonomy and the partial
and experimental nature of the reforms which, together with differences
in resource endowment, have meant that rapid growth has been accom-
panied by widening regional divergences. Because inter-regional labour
mobility is subject to administrative and economic obstacles and the declining
revenue share of the central government constrains the possibilities for
equalisation payments via the budget, there is a risk of income disparities
widening still further. It is officially estimated that more than one-third of
the labour force in agriculture may be redundant and the growing income
gap vis-à-vis urban areas has already given rise to tensions. At first sight
this appears paradoxical in view of the early success of rural reforms.
However, the rapid productivity gains mainly reflected a once-for-all "catching-
up" process and since the mid-1980s productivity growth in agriculture has
stagnated due to soil erosion, a decline in the availability of fertile arable
land and the small size of family units with their limited scope for economies
of scale.
The "two-track"price system
Regionalautonomy andgrowing incomedisparities
54

Potential sourcesof higher inflation
Loss-making stateenterprises
The absence ofmacroeconomicinstruments
Some recentpolicymeasures...
The two-track price system is a potential source of inflation as controlled
prices are significantly lower than market prices. Subsidies, now accounting
for about one-third of central government expenditure, have also been
increased in order to moderate price rises. The unusually rapid growth of
the M2/GDP ratio (see the table on page 51) might be a source of future
inflation or financial disturbances. Because of the impressive rise in household
saving, partly a response to the authorities' attempts to keep real deposit
rates positive, and the absence of supply shortages, China does not suffer
from the "monetary overhang" problem previously seen in some of the
eastern European countries. On the other hand, if consumer sentiment
were to change adversely, large amounts of liquidity could quickly be released
from savings accounts, generating pressure on goods markets and elimi-
nating a non-inflationary source of finance for the fiscal deficit.
Despite several attempts to improve the management and operation
of the SOEs, they are not yet subject to hard budget constraints. Mounting
losses have raised the fiscal imbalance or have been financed by bank
credits, boosting money supply growth and burdening banks with a growing
stock of non-performing loans.
Since 1978 China has gone through several cycles, as each set of
reforms triggered a strong demand expansion which soon developed into
a state of overheating and was then halted by administrative controls. This
high cyclical volatility can be attributed to two interrelated factors which
have left the central government without adequate means of fiscal and
monetary control: the policy of decentralisation, and the absence, until
recently, of comprehensive fiscal and financial reform. Since 1978 both the
ratio of taxes to GDP and the share of the central government in total
revenue have fallen (see the table overleaf) owing to a regressive tax system
and a revenue distribution scheme which has raised the share of taxes
retained by the regional and local authorities. The financial sector has
remained largely underdeveloped despite the creation of a two-tier banking
system in 1984, the opening of two equity markets and some initial steps
towards establishing a capital market. Directed credits have been common
and indirect instruments for controlling monetary and credit developments
are ineffective.
Late last year steps were taken towards giving the central bank greater
independence, creating commercial banks and transferring policy loans to
the budget. The official and swap market exchange rates were unified early
this year, entailing a devaluation of the former by about one-third against
the US dollar. Decisions have also been taken to reform the fiscal system
starting this year, including the introduction of a uniform 33% corporate
tax, a value added tax and a capital gains tax as well as a restructuring
of the tax-sharing system in order to increase the share of the central
government. Finally, a set of measures is aimed at reviving the ailing state
enterprise sector and making management more independent and account-
able. One hundred of the largest enterprises will be transformed into joint
stock companies and a state-financed social safety net is planned to take
over the social services currently provided by the SOEs.
55

China: deve lopment of taxes and ext rabudgetary
Items
Taxesof which: Central governmentExtrabudgetary revenueof which: Central governmentTotalof which: Central government
Source: IMF Occasional Paper No.107.
1979
26.7n.a.
11.3n.a.
38.0n.a.
1982as a percentage
20.010.315.55.2
35.515.5
revenue
1987ofGNP
19.59.4
18.07.3
37.516.7
1990
16.67.5
15.36.1
31.913.6
It is still too early to say whether the planned reforms can be effectively
implemented during the current cycle. Although capital spending contributed
significantly to the high real growth recorded last year it was excessive in
some areas, indicating a need to tighten credit policies. The rapid growth
was accompanied by a marked acceleration of inflation even though excess
demand pressures were in part absorbed by a steep rise in imports.
However, the authorities face the dilemma that unemployment and under-
employment are also rising. This will make it harder to impose stricter
accountability on the SOEs and the budget for this year in fact foresees
further tax relief. The most difficult task, however, is likely to be that of
counterbalancing one of the effects of earlier policies of decentralisation
and increasing the revenue share of the central government.
Economic developments and reforms in other Asian countries
During the last ten years economic reforms have also been adopted in
other Asian countries making the transition towards a market economy,
including Vietnam, Cambodia, Laos and Mongolia. Results have differed, with
countries whose initial and structural conditions were similar to those in
China standing in marked contrast to Mongolia, whose system was closer
to that of the eastern European countries. In Vietnam growth has averaged
over 6% annually since the start of the reforms, while Mongolia has suffered
severe output losses following the removal of price controls and the aban-
donment of the previous central planning system.
The experience of Vietnam and Mongolia also differs in other respects.
Unlike China in 1978, both countries faced macroeconomic imbalances when
reforms were launched in 1986 and 1989 respectively. Mongolia tightened
policies to counter the effects of price liberalisation and saw a sharp contrac-
tion in output as the impact of restrictive policies was compounded by
deteriorating terms of trade and the loss of export markets following the
dissolution of the CMEA trading system. Vietnam, by contrast, postponed
stabilisation and inflation accelerated to a monthly rate of over 30%. This
posed a serious threat to financial stability and further growth but after a
price and currency reform and a severe tightening of fiscal and monetary
policy in 1989 inflation was brought under control. Moreover, helped
by structural conditions very similar to those in China, a positive supply
... and theireffects on thecurrent cycle
Reform policiesin Vietnam andMongolia
56

Market-orientedreformsin India...
... with positiveeffects...
... but also aneed for furtherattention
response in the agricultural sector, rising demand for oil and a relatively
small trade share with the CMEA countries, Vietnam avoided any decline
in output. On the other hand, attempts to open up foreign trade and
attract foreign direct investment have so far yielded limited benefits on
account of the US embargo in effect until early this year and the country's
unsettled arrears with multilateral lending institutions. Another handicap has
been the underdeveloped infrastructure and an investment/GDP ratio of
barely 10%.
India, with large agricultural and state-owned enterprise sectors and a
per capita income similar to that of China, has also initiated significant
market-oriented reforms. Following a foreign exchange crisis in 1991 action
was taken to open the economy to foreign competition by liberalising
foreign trade, eliminating the dual exchange rate system and deregulating
the private sector. The initial reforms also included measures to reduce the
budget deficit and the first steps towards privatising state-owned enter-
prises.
During the last two years output growth in India has averaged 4%
and the external current account has improved substantially following a
real currency depreciation of 25-30% and a marked rise in export earnings.
Foreign exchange reserves have also been strengthened as a result of rela-
tively large capital inflows reflecting net portfolio investment as well as
recourse by Indian enterprises to international bond financing. Nevertheless,
recent developments in the budget will need to be addressed if problems
are to be avoided in the future. Following an initial consolidation the budget
deficit widened last year to over 7% of GDP, compared with a target of
less than 5%. Most of the deficit was financed by the banking system, which
responded to stricter capital adequacy requirements by increasing govern-
ment bond holdings while reducing credit to the private sector. Another
area to which attention will have to be directed is the industrial sector
where, in contrast to agriculture, output has stagnated, hampered by an
inflexible labour market and inefficient state-owned enterprises.
Output stabilisesin easternEurope...
Eastern Europe and the C o m m o n w e a l t h of Independent States
There was a striking contrast in economic performance last year between
eastern European countries and the members of the Commonwealth of
Independent States (CIS), which provided a clear illustration that consis-
tent reform efforts and resolute stabilisation policies are a prerequisite for
the resumption of growth. In eastern Europe, the rapid output decline of
previous years slowed down markedly and in several countries the first
signs of growth appeared in the second half of the year - even in Estonia,
which had started reforms under extremely difficult conditions. Other
countries in the region seem to have followed the lead of those more
advanced in the reform process. After expansionary policies had led to
rapidly accelerating inflation, Romania embarked on a stabilisation programme
in early 1994. Measures to stabilise the economy have also been taken by
Croatia and the FYR of Macedonia.
57
In stark contrast, the CIS states again did not address basic economic
problems. They continued to issue roubles in order to buy goods from
each other, leading to rising trade deficits with Russia and rapid inflation.
Matters came to a head in July, when the currency reform in Russia replaced
the Soviet rouble with a Russian one, effectively putting an end to the
rouble zone and forcing the other states to introduce their own curren-
cies. While this might have provided them with an opportunity to pursue
individual stabilisation policies, they proved unable to bring their budget
deficits and credit expansion under control. Inflation in the region remained
in the range of 20% a month and hyperinflation took hold in Ukraine. The
output slump continued unabated.
Amid welcome signs of a resumption of growth in eastern Europe,
two problems came to the fore to which attention must be given if the
growth process is to be placed on a sustainable basis. First, investment
remained low in most countries. Secondly, current account balances dete-
riorated as consumption rose and exports to western countries declined. This
underscores the relevance of the eastern European requests for "trade,
not aid" in the form of better access to western markets, in particular
in so-called "sensitive" areas where restrictions remain pervasive. Without
scope to expand exports, growth will remain circumscribed by external
financing constraints. But the current account deterioration also highlights
the need to increase domestic saving through reduced budget deficits and
improved incentives to save.
Developments and policies in eastern Europe
After several years of declining output, production in eastern Europe
stabilised in 1993. Positive growth rates for the year as a whole were
recorded by Albania, Croatia, Estonia, Poland, Romania and Slovenia (see
the table opposite). Signs of recovery also emerged in the Czech Republic,
Hungary and Latvia in the second half of the year. All these countries, with
the exception of Romania, have pursued determined reform and stabilisa-
tion policies. Three common elements can be discerned. First, the growth
in credit to state enterprises has been brought under control. Secondly,
incomes policies have been applied to ensure that rises in earnings are
consistent with the objectives of the stabilisation programme. Thirdly, fiscal
deficits have been contained and, in the stabilisation programmes in the
Baltic states and Croatia, have been reduced substantially or even elimi-
nated. Experience in Hungary and Poland, however, points to the difficulty
of containing budget deficits over a longer period.
Reforms began under very difficult external circumstances in the Baltic
states. Exports to the other former Soviet republics accounted for about
two-thirds of output, making these countries particularly vulnerable to the
collapse of trade in the region. Heavy economic dependence on Russia
took its toll when huge energy price rises led to a terms-of-trade loss well
in excess of 10% of income in 1992. This was an important factor in the
fall in GDP of one-third and an even sharper decline in industrial produc-
tion (see the graph on page 60). By the autumn of 1992 the Baltic states
... but continuedcontraction inthe CIS
Determinedreform effortsyield results...
... even underdifficultcircumstances
58

Developments
Countries
AlbaniaBulgariaCzech RepublicHungaryPolandRomaniaSlovak Republic
CroatiaFYR MacedoniaSloveniaYugoslavia3
Average4
in real GDP 1
Former Soviet Union4
EstoniaLatviaLithuaniaRussiaUkraine
Overall average4
1989
9.8-1.9
4.50.70.2
-5.81.2
-4.41.9
-1.81.9
-0.2
2.53.36.81.52.04.11.6
1 For the FYR of Macedonia, gross materiaYugoslavia, GMP prior(NMP) prior to 1991
1990 1991percentage changes
-10.0- 9.1- 1.2- 3.5-11.6- 7.4- 2.5
- 9.3- 9.5- 4.7- 8.4
- 7.6
- 2.3- 4.0
2.9- 5.0- 2.0- 3.4- 4.1
-un-11.7-14.2-11.9- 7.6-15.1-11.2
-28.7-10.7- 9.3-11.0
-12.5
-13.0-11.3- 8.3-13.1-15.0-11.9-12.8
1992
- 9.7- 5.4- 6.6- 4.5
2.6-13.6- 6.1
-23.6-13.4- 6.0-27.0
- 8.6
-19.1-19.3-40.0-35.2-19.0-11.0-15.5
product (GMP); for Croatia, GMP priorto 1992; for most states of the former
(for Russia, NMPMontenegro. 4 Weighted average, based onSources: National data,IMF and EBRD.
prior to 1990).1990-91 GDP and
Soviet Union,
19932
11.0- 4.2- 0.3- 1.0
4.01.0
- 4.1
1.4-15.2
1.0-30.0
- 3.0
-12.23.0
- 3.5-16.2-12.0-14.0- 9.1
to 1993; fornet material product
2 Partly estimated.exchange rates.
ì Serbia and
had introduced their own currencies, preparing the ground for the pursuit
of independent macroeconomic policies. They managed to broadly balance
their budgets in both 1992 and 1993, despite the large drop in output. A
tight monetary policy stance brought inflation down to annual rates in the
35—45% range in Estonia and Latvia. Monetary control in Estonia was
achieved through a currency board arrangement, tying the expansion of the
money supply to the inflow of foreign exchange. Latvia pursued a tight
monetary policy and kept its nominal exchange rate broadly unchanged.
Although Lithuania, too, managed to balance its budget, monetary policy
was less tight and inflation remained higher. Industrial production stabilised
last year and Estonia actually recorded positive output growth.
A number of other countries in the region seem to have concluded
that without macroeconomic stabilisation sustained growth is unlikely to
be achieved. These countries include Romania, Croatia and the FYR of
Macedonia. Romania had pursued an expansionary monetary policy during
the first three quarters of 1993 which was reflected in large negative real
interest rates, leading to a further acceleration of inflation. The authorities
recognised that this policy stance was unsustainable, tightened monetary
policy and agreed with the IMF on a stabilisation programme in May 1994.
The adjustment programme adopted in Croatia has demonstrated that
high inflation can be reduced quickly through rigorous stabilisation policies
59

Industrial p roduc t ion in the Baltic states
Three-month uncentred moving averages, end-1990 - 100
1991
* Manufacturing.Source: National data.
1992 1993
without affecting output. Monthly price rises there had accelerated to 39%
by October last year, when the Government embarked on a stabilisation
programme which relied on tight fiscal and monetary policies as well as
restrictions on wage increases. Inflation declined almost immediately and
prices actually fell in the first quarter of 1994.
The pattern of growth in 1993 came as a surprise to many. The first
signs of a bottoming-out of the decline in output had been observed in
the second half of 1992 as a result of a rapid increase in exports to OECD
countries. But expectations of export-led growth were disappointed when
the expansion of exports faltered in the first half of 1993. Instead, the
resumption of growth was driven by rising domestic demand, in particular
private consumption. In the Czech Republic, Hungary and Slovenia rising
real wages, due to a combination of rapid private sector growth, low unem-
ployment (Czech Republic) and weak corporate governance (Slovenia) were
the main cause. Elsewhere higher consumption does not appear to have
been attributable to an increase in recorded earnings, suggesting substan-
tial unreported income.
The stabilisation of output and rapid private sector growth were
reflected in a moderation of the increase in unemployment, as shown
in the graph opposite. The low unemployment rate of only VA% in the
Czech Republic, compared with rates of 10-15% in other countries, can
be largely explained by three factors. First, the participation rate in the
Czech Republic had been exceptionally high at the start of the reform
process, but by 1992 it had declined substantially. Secondly, booming tourism
and rapid growth of the services sector absorbed a large number of
workers. Thirdly, many workers have been employed across the border in
Germany. Since 1990 industrial employment has declined by one-third and
Growth is led byconsumption...
... while theincrease inunemploymentmoderates ...
60

... and inflationdeclines
agricultural employment by two-fifths, adjustments comparable to or even
exceeding those in other countries in the region. Moreover, the average
duration of unemployment is short and turnover of the unemployed high,
indicating rapid adjustment.
Inflation declined in most countries. The annual inflation rates shown
in the table overleaf do not, however, adequately reflect underlying inflation
on account of one-time price jumps related to the introduction or raising
of value added taxes. In several countries inflation seems to have stabilised
in the 20—40% range, although lower rates of price increase were recorded
in the Czech and Slovak republics and Hungary and much higher ones in
Bulgaria, Romania and Lithuania.
Even though recent experience has demonstrated that effective stabi-
lisation can bring inflation under control and lay the foundations for a
resumption of output growth, this is clearly only the first step. Corporate
governance must be strengthened through privatisation, commercial banking
skills have to be developed and the legal system has to be improved, to
mention just a few of the tasks lying ahead. Inevitably, this process will
Unemp loymen t rates and real wages
Unemployment rates1
Czech RepublicSlovak RepublicHungaryBulgaria
PolandRomaniaSlovenia
MINIIMI
I I I I I I I I I I I I M I I I I I I I M I I I I I I I I I I I I I I1991 1992 1993 1994
i i I i i I i i I i i I i i I i i I i i I i i I i i I i i I i i I i i I i
1991 1992 1993 19941 In percentages. 2 Three-month uncentred moving averages of nominal earnings deflated by consumerprices, end-1990 = 100.Source: National data.
61

Consumer pr ice inf lat ion
Countries
AlbaniaBulgariaCzech RepublicHungaryPolandRomaniaSlovak Republic
CroatiaFYR MacedoniaSloveniaYugoslavia2
EstoniaLatviaLithuaniaRussiaUkraine
1989 1990 1991 1992year-on-year percentage changes, based or
0.05.61.4
17.02510.81.2
1,2002.7631
1,3061,265
4.74.72.12.44.7
0.023.89.7
28.95865.1
10.4
610608550580
17.210.58.45.6
10.5
35.533956.735.070.316661.2
123115118122
211124225160172
22691.311.123.043.021010.0
6661,691
2018,926
1,069951
1,0201,534
9261 December to December. 2 Serbia and Montenegro. 3 Billion per cent.Sources: National data, IMF and EBRD.
1993 1994 Qli period averages
85.272.820.822.535.325623.2
1,51833532.3
116.5403
89.8110410912
3,850
22.959.810.016.830.826515.5
629
19.9
44.136.2148737
4,751
take time. Meanwhile, demands on governments to grant subsidies and to
protect enterprises from import competition are increasing, and wages in
the state sector are tending to rise regardless of productivity. These and
other pressures are mounting but will have to be resisted if the short-
term stabilisation gains are to be consolidated and economic transforma-
tion is to succeed.
Developments and policies in the Commonwealth of Independent States
1993 saw the collapse of the rouble zone as Russia introduced its own
currency, finally ending the multiple and uncoordinated issuance of roubles.
Over a period stretching back at least to 1991, the former Soviet republics
had had an incentive to expand credit. The faster a republic expanded credit
compared with the others the higher were its gains in the form of imports
from other republics - but only at the cost of exporting excess demand
and stoking inflation in the rest of the rouble zone. In order to control
trade credits to the other republics, the Russian Government had therefore,
in July 1992, obliged them to channel trade payments through clearing
accounts at the Russian central bank. This first step did not, however,
eliminate the inflationary bias since the Russian central bank continued to
supply rouble notes and to grant interest-free "technical credits" to republics
with trade deficits.
The situation changed dramatically last year, when the Soviet roubles
circulating in Russia were replaced with Russian roubles and technical credits
were replaced by interest-bearing government loans. These moves presented
the other republics with a stark choice between introducing their own
But pressuresare mounting
The rouble zonedisintegrates...
62

... and inflationremains high
Tighter policiesin Russia ...
currencies and negotiating a new agreement with Russia in order to remain
in the new rouble zone.
Initially, most of the republics chose the latter option, but they subse-
quently realised that the price was high. Russia demanded full control over
credit growth in the other CIS states, a say in their public finances and
the surrender of half of their foreign exchange and gold reserves to the
Russian central bank as a guarantee that the agreements would be
honoured. The ensuing discussions focused on the control of fiscal deficits
and monetary expansion and the perceived need for some convergence of
economic policies.
In the end, the other republics took the view that yielding economic
sovereignty to a foreign state over whose decision-making they would have
little influence was undesirable and all but Belarus and Tajikistan decided
not to join the new rouble zone. This decision was reinforced by the fact
that Russia raised the prices of its energy exports towards world market
levels in the second half of 1993, thereby eliminating the attraction of
continuing to benefit from hidden subsidies in the future. Even the two
states which had initially opted to join the new rouble zone may not
become permanent members. Russia started to print special roubles for
Tajikistan in 1994, while in Belarus opposition to the implementation of the
monetary agreement with Russia has been growing. The dates of intro-
duction and the status of the currencies of the former Soviet republics are
summarised in the table overleaf.
Even though the introduction of new currencies removed a disincen-
tive to the implementation of stabilisation policies, none of the republics
successfully addressed the problem of macroeconomic imbalance. Budget
deficits remained large and credit to state enterprises at negative real
interest rates continued. Monthly inflation of the order of 20% or more
was recorded throughout the region.
In Russia, macroeconomic stability again proved elusive. Directed credits
at low interest rates and subsidies to loss-making firms continued on a
large scale, weakening the incentive to adjust and fuelling inflation. An
attempt at financial stabilisation was made in the second half of the year,
supported by an IMF loan. The central bank raised its refinancing rate to
almost 600% per annum by the end of the year, leading to high positive
real interest rates. Moreover, sequestration of expenditure by the Ministry
of Finance succeeded in limiting the fiscal deficit to 8% of GDP. The initial
success of these measures was reflected in a decline in inflation to a
monthly rate of about 13% by December and in a relatively stable rouble
exchange rate. Following elections, concerns emerged that the new Govern-
ment might attach less importance to stabilisation. These concerns were
reflected in a sharp depreciation of the rouble from Rb. 1,231 to the US
dollar in November to Rb. 1,830 in April this year, and a decline of
secondary market prices for Russia's external debt by almost half. Contrary
to widely held expectations, monetary and fiscal policies remained relatively
tight during the first quarter of this year. After protracted negotiations, a
stabilisation programme was agreed with the IMF in April which requires
63

the maintenance of tight monetary policies, a reduction of the budget deficit
to 61/i% of GDP and a decline in inflation to 7% per month by the end
of the year. However, additional efforts will be required if the policy targets
under the programme are to be met.
Arresting the output slump has been the major policy goal of the
Ukrainian authorities since November 1992, when Ukraine left the rouble
zone. The main policy instruments used to this end have been the placing
of state orders (as previously under central planning), price and exchange
controls and the liberal injection of credit into state-owned agricultural and
industrial enterprises. The results of these policies and the ensuing huge
budget deficits have been disastrous. Hyperinflation gripped the country
while output declined by 14% in 1992 and by a similar amount in 1993. The
degree of financial instability is most clearly illustrated by the development
of the karbovanets/rouble exchange rate implicit in the graph opposite.
From par at its introduction in November 1992, the Ukrainian currency
depreciated to about 6 to the rouble a year later, when the currency
exchange in Kiev was closed by the authorities. In parallel markets the
price of the rouble was up to four times higher.
The failure of the CIS states to address the fundamental problems of
internal macroeconomic stability and international trade and payments, and
the ensuing collapse of trade, undoubtedly contributed to the decline in
output, in the same way as the earlier breakdown of the CMEA trading
system had reduced output in eastern Europe. The reduction of Russian
subsidies and large terms-of-trade losses due to the increase in prices for
... andhyperinflationin Ukraine
Currency regimes in the former Soviet Union
Countries
EstoniaLatvia
Lithuania
BelarusUkraineKirgizstanGeorgiaRussiaAzerbaijanTurkmenistanKazakhstanUzbekistan
Armenia
MoldovaTajikistan
Sources: IMF and
Currency
KroonLat
Litas
Belarussian roubleKarbovanetsSomCouponRussian roubleManatManatTengeSum coupon
Dram
LeuRussian rouble
national data.
Introductiondate
June 1992June 1993
July 1993
Nov. 1992Nov. 1992May 1993April 1993July 1993Aug. 1993Nov. 1993Nov. 1993Nov. 1993
Nov. 1993
Nov. 1993Jan. 1994
Present currencyregime
Pegged to the DMFloating
Pegged to the US dollar
FloatingMultiple exchange ratesFloatingFloatingFloatingFloatingFloatingFloatingFloating
Floating
FloatingFloating
Remarks
Currency boardTemporary currency (Latvian rouble),July 1992Temporary currency (talonas),Oct. 1992; currency board, April 1994Monetary agreement with Russia
Permanent currency under discussion
Manat sole legal tender since Jan. 1994Rate set in the interbank marketRate set at weekly auctionsNational currency planned for thesecond half of 1994Dram sole legal tender sinceMarch 1994Leu sole legal tenderMonetary agreement with Russia;Tajik rouble to be introduced
64

Exchange rate developments
End-month rates against the US dollar, currency introduction date1 = 100
Rouble (Russia)Kroon (Estonia)Lat (Latvia)Litas (Lithuania)Karbovanets2 (Ukraine)
(semi-logarithmic scale)
1992 19931 See the table on page 64; for the Russian rouble, end-June 1992. 2 Official rate.Sources: OECD and Financial Times.
1994
Putting growthon a durablebasis remains achallenge
supplies of Russian oil and gas will further depress income. The combined
impact has been estimated at 15% of GDP. To cite only one example, the
payment of world market prices for energy imports could swallow up the
entire foreign currency earnings of Ukraine. Income losses are inevitable,
but what can be avoided is the deleterious influence of the lack of effective
stabilisation and the uncertainty created by inconsistency in the imple-
mentation of reforms. The sharp contrast with the experience of the Baltic
states indicates that consistent reform efforts can yield positive results even
in very difficult circumstances.
Constraints on growth in eastern Europe
Despite the stabilisation of output in eastern Europe and signs of recovery
in some countries, achieving sustainable growth remains a challenge. Two
factors in particular require attention if growth is to be placed on a durable
basis. First, fixed investment has to rise substantially, both in quality and
in quantity. Secondly, widening current account deficits in some countries
are seen as jeopardising creditworthiness and incompatible with available
external financing.
The adequacy of present investment levels is increasingly being ques-
tioned. Given the poor condition of a large part of the existing capital
stock and the recognised need to improve the infrastructure, present invest-
ment rates - except in the Czech and Slovak republics - appear insuffi-
cient to support sustained growth (see the graph overleaf), although the
65

Gross f ixed capital f o rma t ion and net foreign d i rec t investment
As a percentage of GDP
Romania Slovenia Bulgaria Poland SlovakRepublic
HungaryNote: The narrow bars represent net foreign direct investment.* Partly estimated.Sources: IMF, Vienna Institute for Comparative Economic Studies and national data.
CzechRepublic
investment needs could be partly met through better maintenance and reha-
bilitation.
Why has investment remained weak? In addition to the general climate
of economic and political uncertainty, four factors seem to have played a
role in most countries. First, capital income is taxed heavily in eastern
Europe. Secondly, government financing needs have absorbed much of
household saving. Thirdly, bank lending to industry has declined sharply.
Finally, foreign investment and financing remain of limited importance.
Effective marginal tax rates on capital income may be of the order of
80% or even above. These high rates stem from the interaction between
high inflation and a tax system designed for an economy with more or
less stable prices as nominal interest earnings and capital gains are taxed
at the same rate as real earnings and gains. To the extent that the tax
authorities have been able to limit the erosion of the real value of tax
revenues due to inflation by requiring monthly payments, normal statutory
rates of around 40% are transformed into high effective rates on real
income, depressing retained earnings and expected returns, both key deter-
minants of investment. High tax rates are to some degree inevitable in
eastern Europe, owing to the elevated level of social protection in relation
to GDP. Nonetheless, the negative consequences can be alleviated by reducing
marginal rates and broadening the tax base, a process that is under way
in most countries in the region.
Rising government financing needs have absorbed a sizable proportion
of household saving. Large fiscal deficits have emerged everywhere
except in the Baltic states, the Czech Republic and Slovenia, as can be
seen from the table opposite. At the same time, the composition of state
Investment mustbe supportedthrough reducedtaxation of capitalincome, ...
... lower budgetdeficits...
66

General gove rnmen t budget balances
Countries
AlbaniaBulgaria
Including foreign debt interest arrearsCzech Republic*HungaryPolandRomaniaSlovak Republic*Slovenia
* Central government.Sources: National data, IMF and EBRD.
1989 1990 1991 1992 1993as a percentage of GDP
-5.5-3.7-1.4
-1.3-7.4
8.4-0.6
0.3
- 3.7- 8.5-12.7- 0.2
0.43.51.0
- 0.2- 0.3
-43.7- 4.1-14.7- 2.1- 4.6- 6.2
0.6- 3.8
2.6
-21.8- 6.2-14.0- 0.2- 7.5- 6.8- 5.5- 3.1
0.3
-15.5- 9.1-13.5
0.1- 5.8- 4.1- 4.6- 6.9
0.5
expenditure has also changed. Transfer payments have increased at the
expense of capital spending, contributing directly to the sluggishness of
investment demand.
Bank lending to industry has declined dramatically in the last three
years. Initially banks had lent to enterprises in distress because they were
locked into a mutual dependency through non-performing loans. Thus, much
household saving was channelled into loss-making enterprises. More recently,
however, measures have been taken to break the inefficient link between
banks and enterprises in the Czech Republic, Hungary, Poland, the Slovak
...and bank Republic, Slovenia and also Bulgaria. Banks in these countries have been
recapitalisation recapitalised, albeit to varying degrees, corporate governance has been
strengthened through the establishment of supervisory boards and through
privatisation, and bank regulation and supervision have been improved.
Stricter accounting standards have brought the problem of non-performing
loans into sharper focus and provisioning has been made mandatory, while
new rules require banks gradually to conform to the Basle guidelines on
capital adequacy. As a result of these measures, bank lending to enterprises
has actually contracted in real terms (see the table overleaf).
In times of severe economic shocks and widespread uncertainty banks
are likely to increase credit rationing. In the case of many eastern European
banks, rationing behaviour may have been aggravated by the shortage of
appraisal and monitoring skills, in particular as far as longer-term loans are
concerned. Although economic growth will reduce uncertainty, bank lending
is unlikely to pick up soon. The development of commercial banking skills
will take time, as will the building-up of information on prospective borrowers.
Lending to small and newly founded enterprises will be subject to even
tighter limits. The high fixed costs of making such loans cannot be recovered
through higher interest rates because this would increase the probability
of default.
In Bulgaria and Romania continuing high inflation has eroded the real
value of savings deposits and, together with households' reduced willingness
67

Real bank cred i t
Countries
Bulgaria3
Czech RepublicHungaryPolandRomania3
Slovak RepublicSlovenia1 Bank credit deflated bySource: National data.
t o non-financial enterpr ises1
1991 1992 19932
percentage changes, end of period
-51.6-19.7-11.0- 2.9-24.4
n.a.n.a.
consumer prices. 2 Partly estimated.
-30.22.9
-18.2-11.2-55.2
4.9-35.0
3 Non-government sector.
-10.10.3
-14.3- 3.9-28.1-10.3
8.9
to hold financial assets with the domestic banking system, has led to a contrac-
tion of the real broad money supply. As a result, real credit to enterprises has
declined further.
The potential contribution of foreign financing, and foreign direct invest-
ment in particular, to domestic investment was perhaps overestimated
initially. In the last few years, foreign direct investment has played an
important role only in Hungary, which recorded inflows of 7% of GDP in
1993, and in the Czech Republic. Both countries have also attracted increasing
amounts of portfolio investment. Flows to the other countries in the region
have been small, as can be seen from the graph on page 66. Arrears on
external commercial bank debt have been an additional obstacle in Bulgaria
and Poland, depressing the inflow of new private capital until the end of
last year. Following years of negotiations, Bulgaria signed an agreement in
principle with creditor banks in November last year, although the precise
conditions have yet to be worked out. After an IMF agreement had paved
the way for a 50% reduction in its official debt, Poland was granted a
broadly similar reduction in March 1994 in its commercial bank debt of
$13 billion, thereby greatly moderating the country's external debt problems
and eliminating a major impediment to increased capital inflows.
The general deterioration in current account balances in eastern Europe
has been a further source of concern. In Hungary, in particular, the current
account deficit, at 10% of GDP, has reached such proportions that a further
widening could undermine investor confidence and could be difficult to
finance. A more moderate deficit of 3% emerged in Poland. Both external
and domestic factors contributed to these developments. On the external
side, sluggish growth among major trading partners dampened foreign
demand, but exports were also constrained by non-tariff barriers, which
affect about half of eastern European exports.
On the domestic side, the reduction in government deficits was not
enough to offset the effects of declining household saving and rising
investment including inventories (see the graph opposite). Growing private
demand, fuelled in part by a buoyant private sector, drew in imports and
led to greater domestic consumption of exportable goods. Real currency
Deterioratingcurrentaccounts...
68

Internal and external balances in Poland and Hungary
As a percentage of GDP
Poland
Household savingGovernment balanceCurrent account
Hungary
I I
-3
- 6
- 9
1990 1991 1992 1993* 1990 1991 1992 1993*
* Partly estimated.Source: National data.
... highlight theneed to boostsaving
appreciation and the consequent loss of competitiveness also contributed
to the worsening of the trade balance, as described in more detail in
Chapter IV.
The need to simultaneously raise the investment ratio and contain
current account deficits suggests that a return to sustainable growth must
be underpinned by policies to boost domestic saving. Avoiding confiscatory
taxation of enterprise profits is one way to encourage private saving, and
ensuring adequate returns on financial instruments is another. But the most
effective policy contribution may consist in reducing budget deficits. The
two countries which seem to be avoiding balance-of-payments constraints
despite an incipient recovery and have seen credit to enterprises expand
in real terms, namely the Czech Republic and Slovenia, have both main-
tained broadly balanced budgets.
69

IV. I n t e r n a t i o n a l t r a d e
Highlights
The increasing globalisation of international trade was again much in evidence
last year. Nowhere was this clearer than in Asia, where many countries
that had played only a marginal role in world trade little more than a
decade ago (often relying on agricultural or raw material exports) have
become major and diversified traders. In particular, the integration of China
into the world economy has proceeded at almost breakneck speed. India,
whose involvement in international trade has lagged in the past, has imple-
mented radical measures of liberalisation. Indeed the adoption of liberal
trading policies in so much of the non-OECD world is little short of a
revolution. In the course of the Uruguay Round negotiations more than
sixty developing and transition economies notified the GATT of unilateral
liberalisation measures. The Uruguay Round agreement that finally emerged
this year is perhaps the most comprehensive accord ever and, provided
it is implemented effectively, has the potential for substantially reducing
government interference in trade.
International trade developments last year were dominated by the
widening divergence in output growth not only among the major industrial
countries but also between the industrial and the developing world. The
increasing strength of the US recovery and the deepening recession in Japan
led to a renewed rise in current account imbalances. By early 1993, the
real effective value of the yen had reached new heights, and it continued
to appreciate for much of the year. This is beginning to have a major
impact on Japan's underlying surplus that is for the moment obscured by
the deep recession and by "J-curve" effects.
While recovery got under way in the United Kingdom, continued
weakness in continental Europe depressed trade last year. Export perfor-
mance differed widely across Europe as exports of those countries whose
currencies had depreciated significantly against the Deutsche Mark rose
strongly while other countries' exports stagnated. Japanese exports have
fallen, while exports of the rest of Asia — helped by depreciation against
the yen — have continued to boom. Intra-Asian foreign direct investment
has been a major vehicle for sustaining growth as enterprises in higher-
income countries have invested heavily in countries where wages are much
lower. Foreign direct investment and a competitive exchange rate have also
stimulated Chinese exports, in the process integrating China more closely
with the dynamic South-East Asian economy.
Heavy foreign investment in Latin America has sustained real ex-
change rates at a high level, contributing to large current account deficits.
70

A marked widening in the current account deficits of most eastern European
countries has led to increased emphasis on maintaining competitiveness by
adjusting the nominal exchange rate to compensate for relatively high
inflation. A number of African countries sought to improve competitive-
ness through depreciation: the large devaluation of the CFA franc was the
most notable case.
Wi th the rouble zone breaking up, the widespread adoption of separate
currencies has given Russia and the other countries responsibility for their
own monetary policy and raises the possibility that a start can be madeon putting trade within the Commonwealth of Independent States on a
sound economic basis.
Weakness incontinentalEurope contrastswith buoyancyelsewhere
W o r l d trade
Developments
The rate of expansion in the volume of world trade last year was held
back by a pronounced (if statistically overstated - see page 81) decline in
continental European imports (see the graph below). Elsewhere in the indus-
trial world, imports expanded strongly, boosted in North America and the
United Kingdom by economic recovery and in Japan by the appreciation
of the yen. The trade of developing countries also continued to grow
strongly; as dependence on industrial country markets has lessened, trade
has been increasingly driven by buoyant demand in other developing country
markets, trade liberalisation and increased intra-regional investment. Trade
Indicators of world trade
World trade and outputvolume growth1
Import volumes(1987 = 100; semi-logarithmic scale)
Trade3 Output
Western Europe2
North America, Latin America
Dynamic Asianeconomies3
Japan
88 89 90 91 92 93 87 88 90 91 92 931 Excluding eastern Europe and the former Soviet Union. Output growth as measured by percentagechanges in real GDP. 2 Belgium, France, western Germany, Italy, the Netherlands, Spain, Sweden,Switzerland and the United Kingdom. 3 Hong Kong, Indonesia, Malaysia, Singapore, South Korea,Taiwan and Thailand.
71

in the Asian developing region has been particularly dynamic, with the
Chinese economic boom providing a major stimulus. Despite weaker activity,
Latin American import volumes still rose by about 8% last year (compared
with 17-18% in the previous two years).
There was no growth in the dollar value of world merchandise trade
last year. Slow economic growth in the industrial countries and a small rise
in the effective rate of the dollar contributed to a 4% drop in the dollar
prices of manufactured exports, the first significant decline since the
mid-1980s. Sluggish demand conditions in industrial countries also explained
in part the continued softening of non-oil commodity prices: for the fifth
year in a row these prices fell - by almost 4%, taking the cumulative
decline since 1988 to over 15%. The sharpest declines were recorded for
metals and minerals. Oil prices fell from an average of over $18 per barrel
in 1992 to about $13 per barrel by the end of 1993, the lowest level for
five years. Weak demand, rising production in OPEC countries (where
agreed output ceilings were exceeded for most of the year) and an expansion
of North Sea supplies were the main influences. OPEC's decision in March
1994 to maintain, and not reduce, production ceilings until the end of 1994kept oil prices weak in the early months of the year. These developments,
if sustained, will have a major effect on trade balances: a one dollar decline
in the oil price per barrel reduces industrial countries' imported energy
bill by over $10 billion.
Relative to the prices of manufactured exports, commodity prices have
weakened steadily, falling to less than half their mid-1970s peak. The persis-
tence of this trend over two decades - covering periods of both growth
and recession - has undermined commodity agreements aimed at stabil-
ising prices, and most of them have foundered in recent years. The secular
slowdown of growth in industrial countries after 1973, combined with the
lower intensity of raw material use in industrial output, has curbed the
demand for commodities. At the same time, commodity output capacity
has expanded strongly - partly as a result of the use of improved produc-
tion technology but partly too as a reflection of the pressure on many
countries to raise export earnings. A very recent example of increased
Trade prices fall
Commodityprices
The composition of world <
MerchandiseInvisibles
Investment incomeCommercial services
TransportTravelOther
Other services
1980as a
75.424.69.9
13.34.73.94.81.4
2xports
1985percentage
70.229.813.315.15.74.25.81.4
1990 1991 1992 1993*of total exports of goods and services
66.133.916.316.54.75.06.81.1
65.634.416.616.74.64.97.21.1
65.734.315.717.64.65.27.81.0
65.734.315.118.2
5.5
1.0
* Partly estimated.
72

Increasingimportance ofservices
Asia'sindustrialisa-tion ...
supply in world markets has been the growth of metals exports from theCIS, supplies which were previously absorbed at home by inefficient heavyindustries. In agriculture a further factor depressing world trade prices hasbeen industrial countries' agricultural policies, which have stimulated domesticoutput and created excess supplies that sought outlets on world markets.
An important medium-term trend in international trade has been thegrowing share of non-merchandise transactions. Current account develop-ments have increasingly reflected movements in net investment income andother service transactions. Such transactions now constitute over one-thirdof total trade in goods and services, compared with less than one-quarterin 1980. In particular, investment income has grown rapidly over the lastdecade as the globalisation of financial markets, deregulation and innova-tion have spurred cross-border financial transactions; however, declininginterest rates in recent years have masked the underlying trend. The shareof commercial services has risen to over 18% of total trade; the true figuremay be even higher as many service items tend to be under-reported.Industrial countries, in particular, have increased exports of services fasterthan merchandise exports, accentuating their dominance of services trade.
Shifts in world manufacturing trade and output
In recent years there has been a steady shift of world manufacturing
output from Europe and North America to Asia. Although international
comparisons of the real value of output are anything but straightforward,
calculations based on 1980 purchasing power parities suggest that manu-
facturing activity in Asia caught up with output levels in Europe and the
NAFTA countries by the mid-1980s (see the graph below). Using actual
1980 exchange rates would put the catch-up in the early 1990s.
Global shifts in manufacturing output and trade
Manufacturing output1
Western EuropeNAFTA area3
Asia4
Latin America5
1,500
,200
900
Export market share2
80 85 901 In billions of US dollars expressed at constant 1980 prices and converted at 1980 manufacturing PPPs(US PPP = 1). 2 Percentage of total extra-regional manufactured exports. 3 Canada, Mexico andthe United States. 4Japan, the Asian NIEs, China, India, Indonesia, Malaysia, the Philippines andThailand. 5 Argentina, Brazil, Chile, Colombia, Peru and Venezuela.
73

The growth of output in Asia has been driven by exports, and not
by import substitution. The share of output exported has risen sharply -
to an average of over 50% for the NIEs and 35% for the other ASEAN
countries (see the table on page 42). There has been a corresponding
increase in the ratio of imports to GDP. Hong Kong and Singapore have
pursued free trade policies for many years, and the other countries in the
region have significantly reduced barriers to imports in recent years. By
exposing the economy to the greater competition in international markets,
openness to trade has been an important ingredient of rapid economic
growth. Asia's share of world trade has thereby increased much more
rapidly than its share of world output.
Asia's effective presence in world trade of manufactured goods is best
highlighted by its share of extra-regional trade. (World trade statistics are
still heavily influenced by large intra-European trade flows.) The Asian region
now supplies over 40% of the extra-regional demand for imported manu-
factured goods, compared with about 25% for both western Europe and
the NAFTA countries - a reversal of the relative position in the early
1970s. Japan led the Asian export drive up to the early 1970s, followed
by the NIEs up to the mid-1980s, and then, most recently, by China,
Indonesia, Malaysia and Thailand.
The major developing countries in Latin America have not been able
to match the Asian economies. Their share of the world market has remained
fairly stable at around 5%, and their share of global manufacturing output
has changed little.
Intra-Asian trade, exceptionally buoyant notwithstanding the virtual
absence of explicit preferential trading arrangements, now accounts for
nearly half of Asia's trade (compared with one-third in the early 1970s). Very
strong economic growth in most of the region combined with the close
production links created and fostered by extensive intra-regional direct
investment has provided the momentum for greater intra-Asian integration.
Intra-European trade in manufactured goods has also risen strongly and
now amounts to 24% of the area's GDP. The progressive dismantling of
barriers to trade and the establishment of a single market have been key
factors. By contrast, Europe's extra-regional trade has expanded more slowly
and is now equivalent to only 7% of area GDP, the lowest proportion of
the four regions shown in the graph on page 73.
Trade policies
Seven years of trade negotiations in the Uruguay Round drew to a close
in December 1993, overrunning the original deadline by three years. No
previous round had addressed such a wide spectrum of issues. A compre-
hensive attempt was made to tackle many areas that in the past had been
put to one side as too politically sensitive or too intractable. The Final Act
of the Uruguay Round included an agreement to establish the Wor ld Trade
Organisation as the successor of the GATT. Its main functions will be to
monitor the implementation of the Round's agreements, to serve as the
permanent forum for further trade negotiations and to provide mechanisms
... led byexports ..
... and supportedby tradeliberalisation
Intra-regionaltrade in Asia .
... and Europe
Uruguay Roundconcluded
74

Progress inliberalisingmerchandisetrade ...
... incorporatingnew areas ofinternationalcommerce ...
... and subjectingtrade policiesto clearer rules
for the multilateral settlement of trade disputes. The finalised legal texts
were signed in April 1994; after ratification by the individual member states,
the agreement is expected to come into force around the middle of 1995.
Much was achieved by the Uruguay Round. Within the traditional area
of merchandise trade, agreement was reached not only to cut tariffs on
industrial goods by over one-third, but also to extend the coverage of
GATT rules to trade in agriculture, clothing and textiles. Greater market
conformity for agricultural trade is to be achieved by limiting production
subsidies, by significantly reducing subsidised exports and by converting
non-tariff barriers into tariffs that in turn are to be progressively reduced.
Even so, some quantitative restrictions can be maintained until the end of
the century: one notable case in point is Japan's import of rice. Trade in
textiles and clothing, largely managed on a discriminatory basis throughout
most of the post-war period, will also become subject to multilateral rules,
with bilateral quotas to be phased out over a ten-year period.
More important, perhaps, the negotiations covered entirely new areas
of international commerce. A broad framework agreement was worked out
to cover trade in services - financial services, telecommunications, transport,
audiovisual products, tourism, professional services and the movement of
workers. Basic obligations such as the most-favoured-nation (MFN) principle
(the extension to all member countries of concessions granted to one
country) and transparency were accepted - backed up in some cases by
specific national commitments to grant national treatment and enhance
market access for foreign services. Significant progress was also made in
agreeing on a multilateral framework of principles to govern intellectual
property rights and trade-related investment measures.
Trade-related policies and measures were also extensively reviewed. The
fuller definition of what constitutes actionable trade-distorting subsidies
should help reduce resort to countervailing duties. Rules on the legal deter-
mination of dumping and on the implementation of anti-dumping measures
were also clarified and tightened. In particular, the maximum duration of
such measures - some have existed for over twenty years - was set at
five years. In addition, greater restraint was sought on the use of measures
to safeguard a domestic industry that claims serious injury from increased
imports. The imposition of new "grey area" measures, such as voluntary
export restraints and orderly market arrangements, was prohibited; existing
measures are to be phased out. Finally, the GATT settlement system was
strengthened significantly, to limit the scope for the unilateral resolution of
trade disputes.
The multilateral reduction of trade barriers envisaged in the Uruguay
Round agreement should help to counteract the trade diversion effects
inherent in any regional trade arrangement. Not only can such arrange-
ments direct demand away from more efficient suppliers outside the region,
but the lack of a common external tariff in most free trade areas often
increases resort to non-transparent rules of origin that sometimes serve
as barriers to trade with the wider world.
But against these undoubted achievements must be set the fact that
75

much was left undone. The rules on certain subsidies (for instance in some
"high-tech" industries) and on anti-dumping procedures were less tightly
drawn than had been hoped, leaving room for future dispute. In many
service sectors, the agreements mostly covered only the basic principles,
with actual liberalisation commitments being left for future negotiations:
commitments to liberalise trade in telecommunications, air and maritime
transport and the audiovisual sector fall into this category.
Financial services proved to be a particularly thorny issue and reso-
lution was postponed until after the entry into force of the Uruguay Round
agreement. Disappointed by how little a number of Asian and Latin American
countries were willing to commit themselves to open their financial markets
to foreign firms, the United States proposed in October 1993 a two-tier
approach - in line with the terms of the proposed Fair Trade in Financial
Services Act under consideration in the US Congress - which would give
trading partners differential access to US financial markets depending on
the extent to which they agreed to open their markets to US firms. As
current US law requires regulators to apply an "unconditional" national
treatment standard to foreign financial services firms, the proposal to insti-
tutionalise reciprocity encountered strong foreign opposition. The United
States therefore agreed to continue the negotiations for another six
months following the entry into force of the Uruguay Round agreement,
but reserved the right, at the end of this period, to exclude financial services
from the MFN principle if, in its view, other countries had not offered
sufficient openness in domestic financial markets. Correspondingly, the
countries thus affected would be under no obligation to implement
whatever liberalisation measures they had proposed during the original
negotiations.
It is to be hoped that the Uruguay Round agreement can create the
necessary momentum to reverse the trend towards managed trade. By the
early 1990s almost one-fifth of total merchandise imports of industrial
countries was covered by non-tariff measures; and developing countries
have increasingly resorted to such measures (imposing anti-dumping duties
in particular). In early March 1994, the United States revived its "Super 301"
trade policy instrument that permits it to impose sanctions on countries
with barriers to US exports that it judges unacceptable. The use of this
instrument - or even the threat - has often resulted in market-sharing
arrangements or numerical import targets that limit competition, thereby
forcing consumers or industrial users to pay higher prices and weakening
the pressures on producers to be efficient and innovative. The European
Union also continues to rely on bilateral arrangements (in late March, for
instance, it agreed with Japan on the maximum number of Japanese cars
that could be imported in 1994).
Unfinishedbusiness ...
... particularly intrade in financialservices
Drift towardsmanaged trade
C u r r e n t account developments: ove rv iew
As in 1992, external developments last year were dominated by marked
cyclical differences in economic activity. The graph opposite summarises the
76

Current accountdevelopmentsreflect cyclicalfactors ...
... and changes incompetitiveness
impact of relative demand on the real trade balances of the more importanteconomies (in the developing as well as in the developed world) over thelast two years. During this period, continental Europe experienced apronounced weakening of domestic demand: recorded imports fell bya cumulative 3%. By contrast, the volume of North American importsrose by 10% in each of the last two years. Latin American domesticdemand has also grown faster than output growth in recent years, andthe real trade balance deteriorated sharply. A strong rise in import-intensiveinvestment demand in some Asian developing countries, such as China,Thailand and Taiwan, resulted in a significant deterioration of their realtrade balances.
A marked improvement in competitiveness has affected the relativeposition of a number of countries - shown above the red line in the graphwhich relates changes in the real trade balance to cyclical factors. Italy isone notable case. Japan stands out on the other side, as an appreciationof the yen has reduced real net exports. As for Latin America, Brazil andChile - both with relatively strong competitive positions - are well abovethe line while a major real appreciation has sharply reduced the net exportsof Argentina (beyond the scale of the graph) and Mexico. In the face ofvery strong growth in domestic demand, China's real depreciation has
Change in the real trade balance and the cycle
Change in the real trade balance2
Notes: AU = Australia; BE = Belgium; CA = Canada; CH = Switzerland; DE = Germany; ES = Spain;FR = France; GB = United Kingdom; IT = Italy; JP = Japan; NL = Netherlands; SE = Sweden;US = United States; CN = China; KR = South Korea; MY = Malaysia; SG = Singapore; TH = Thailand;TW = Taiwan; BR = Brazil; CL = Chile; MX = Mexico. The red line shows the regression of changesin the real trade balance on the strength of domestic demand.1 Change in real domestic demand between 1991 and 1993 relative to trend GDP growth less thecorresponding change in partner countries. 2 Change in the trade balance between 1991 and 1993,measured at constant 1991 prices and expressed as a percentage of average 1991 merchandiseexports and imports.
77

Compet i t i veness and e x p o r t marke t shares
Quarterly averages, 1985 = 100
Competitiveness in terms of: _
Export market share1
United States Japan
Unit labour costs1
Consumer prices
Western Germany
Other western Europe2 Dynamic Asia3
88 91 94 85 91 941 In manufacturing. 2 Belgium, France, Italy, the Netherlands, Spain, Sweden, Switzerland and theUnited Kingdom. 3 Hong Kong, Indonesia, Malaysia, Singapore, South Korea, Taiwan and Thailand.4 Argentina, Brazil, Chile and Mexico.
limited the deterioration in the real trade balance. A number of other
Asian countries lie below the line not so much because of worsening
competitiveness but more because of a very strong expansion in imports
of capital goods as investment has boomed.
The impact of cost competitiveness on export performance in a more
medium-term perspective is illustrated in the graph above. The improved
competitiveness of US manufacturing since the mid-1980s has enabled US
producers to slowly regain export market shares. The counterpart is that
substantial increases in relative costs in Germany and Japan have hurt export
performance. The recent improvement in the competitiveness of European
countries other than Germany appears to have halted market share losses.
Finally, real exchange rate appreciation in Latin America has prevented
export market gains as large as might have been expected from extensive
economic reforms. The reverse is true for Asia.
Costcompetitivenessand exportperformance
78

Industrial countr ies
Larger currentaccount deficitdue to ...
... rapidly risingimports ...
... slowingexports ...
... and decliningnet investmentincome
Widening tradesurplus
Differencesfrom 1980s
Reorientationof trade towardsAsia
United States
As the non-oil trade deficit widened again last year, the US current account
deficit exceeded $100 billion for the first time in the 1990s; the trade
deficit increased further in the early months of 1994. Wi th the terms of
trade barely changed, the widening reflected a cyclical buoyancy of imports
and a deceleration of export growth as stagnation in continental Europe and
in Japan continued.
Imports of capital goods (other than automotive products and civilian
aircraft) rose by nearly 25%; computer equipment imports were up by
some 40%. This rate of increase exceeded the 16% rise in real domestic
fixed investment in durable equipment. Despite a slowdown from earlier
years, non-agricultural export growth remained significant last year. Capital
goods exports increased at above-average rates as did exports of auto-
motive products: these two groups now account for over half of US exports.
The other components of the US current account changed little last
year. Adverse cyclical factors brought a five-year period of rapidly rising
surpluses on services to an end. Wi th external financial liabilities exceeding
financial assets by a wide margin, falling international interest rates served
to moderate the decline of US net investment income. Overall, the balance
on investment income fell to virtually zero last year - for the first time
since before the First Wor ld War.
Japan
Japan's current account surplus rose in dollar terms last year but by signif-
icantly less than in the previous two years. The trade surplus widened by
$9 billion and net investment income on overseas investments rose by a
little over $5 billion.
The factors behind the reappearance of a large Japanese trade surplus
were quite different from those of the 1980s. One important difference is
that export growth has been much lower than in the early 1980s, when
exports had been strongly stimulated by a temporarily undervalued yen:
the much stronger yen since then, protectionist pressures abroad and
increased foreign direct investment have contained export growth (see the
table overleaf). A second difference is that the main bilateral counterpart
to Japan's increased surplus is to be found in Asia, not in the United States.
A third difference is the greater severity of the domestic recession.
A considerable part of the expansion of trade with Asia has reflected
Japanese companies' diversion of some of their manufacturing production
to countries with lower labour costs. An early wave of such investment,
in the 1970s, was directed at the NIEs; later, as wages rose in these
economies, direct investment shifted to Indonesia, Malaysia and Thailand,
where wages were lower; last year saw a major redirection to China. As
Japanese enterprises or joint ventures in Asia tend to be highly trade-oriented,
exporting heavily both to Japan and to the wider world, this shift has had
a major influence on trade patterns.
79

Japan: the trade surplus and exports
Total
of which vis-à-vis:United StatesWestern EuropeSouth-East Asia and China
Change in trade surplus(in billions of US dollars)From 1982
to 1986
75.8
39.37.9
16.5
From 1990to 1993
68.1
12.27.4
31.3
Percentage growth inexports (dollar values)
From 1982to 1986
50.7
121.573.246.0
From 1990to 1993
25.8
16.72.5
51.6
While strong terms-of-trade gains boosted the trade surplus in dollarterms, the surplus at constant prices declined by almost $14 billion, thelargest fall since 1988. When allowance is made for Japan's much weakercyclical position relative to conditions in its major markets (notably theUnited States and Asia), the underlying external adjustment in the country'smanufacturing trade balance is even more sizable. The decline in Japan'sreal export market share accelerated appreciably in 1992 and 1993, extendinga trend established by the earlier appreciation of the yen (see the graphbelow). More recent, and perhaps more remarkable, is the steep rise inimports of manufactured goods - a category that has hitherto been unusuallylow in Japan. In 1990 imports amounted to only 6% of gross domesticoutput of manufactured goods; the continuation of strong import growthand virtually flat industrial production took this percentage to 8% by theend of last year.
Declining exports and rising imports have had a major depressive effecton the Japanese economy. In principle, however, terms-of-trade gains from
Sizable correctionin real terms ...
... as share ofexport marketsdeclines ...
... and importpenetration rises
The impact of the yen's appreciation on manufacturing trade
Nominal effectiveexchange rate
1990 911985 86
Exports1
I I
17
15
13
11
1990 911985 86
9287
9388
9489
Imports2
1990 911985 86
Note: The nominal effective exchange rate is rebased to 1985 and 1990 = 100 respectively. Exportand import shares are based on value shares in 1985 and 1990 respectively with quarterly changescomputed at constant prices.1 As a percentage of world exports. 2 As a percentage of gross domestic production.
80

Terms-of-tradegains nottransmitted todomestic prices
Recession-induced tradesurplus partlyreflectsunder-reportingof imports
Gains incompetitiveness
Marked shifts inintra-Europeancompetitivepositions
the appreciation of the yen should provide an important offset. Indeed, the
cumulative terms-of-trade gain since 1990 has been substantial: even allowing
for the modest decline in export prices, the net gain has amounted to
almost 30%, or about 2% of GNR But lower import prices have not been
reflected in consumer prices to any great extent, and this has limited the
potential stimulus to consumer spending. The case of oil products is perhaps
the most striking example of the limited pass-through of import price
declines into consumer prices. Despite a 20% decline in world oil prices
last year, tax-exclusive prices of petrol and domestic heating oil in Japan
rose by about 5-10% in dollar terms in the year to the fourth quarter of
1993 - taking price levels to about two to three times the levels prevailing
in major European countries (where dollar prices fell by about 15% over
the same period).
Western Europe
The recession in continental Europe depressed imports last year. However,
the scale of the import decline is uncertain: the new reporting system for
trade within the European Union, introduced on 1st January 1993, has
distorted intra-EU trade statistics. A preliminary aggregation of bilateral
trade data for 1993 suggests that the sum of reported intra-EU exports
exceeds the sum of reported intra-EU imports by between $20 and
25 billion - a statistical discrepancy that in the past has usually been small.
This suggests a greater under-reporting of imports than of exports, where
tax-refund considerations encourage prompter and more complete reporting;
by implication, the western European trade surplus for 1993 shown in the
table on page 84 is overstated.
Calculations that exclude intra-regional trade weights suggest that
western Europe's competitiveness has improved: by late 1993, relative unit
labour costs had fallen by about 15% from their peak in mid-1992. Also,
external demand has been boosted by the cyclical recovery in North
America and the continuing strong growth in South-East Asia. As a result,
western Europe's trade deficit with the world outside Europe was reduced
by over $45 billion last year.
Competitive positions within western Europe also changed significantly
as the earlier marked divergence in real exchange rates was reversed.
The path of consumer prices expressed in a common currency provides
one simple indicator of this. Up to mid-1992, just before the European
currency crisis broke, accumulated inflation differentials combined with stable
nominal exchange rates had led to losses of competitiveness in Italy, Spain,
Sweden and the United Kingdom relative to countries where inflation was
lower (Belgium, France, the Netherlands and Switzerland). By mid-1992,
consumer prices expressed in Deutsche Mark had risen in the first group
of countries by an average of 34% over 1987 levels; the rise in the second
group was around 13%, a little below the increase seen in Germany (see
the table overleaf). This major divergence had a significant impact on external
positions: current account deficits in the first group of countries were
between V/i and V/i% of GDP, while countries in the second group had
81

large external surpluses or, in the case of France, had eliminated earlier
deficits.
The exchange rate changes in Europe since mid-1992 have brought the
DM-adjusted changes in consumer prices in surplus and deficit countries
much closer together. Thanks to large lira and krona depreciations, the
cumulative DM-adjusted changes in Italian and Swedish consumer prices
since 1987 have fallen below the cumulative changes recorded in the surplus
countries over the corresponding period.
The large depreciation of the lira stimulated Italian exports, which rose
by about 9% in volume terms last year, more than twice as fast as in 1992
and well above the expansion in export markets. As import volumes are
reported to have declined even faster than domestic demand, a $28 billion
current account deficit in 1992 was transformed into a $11 billion surplus
last year. Improved competitiveness also contributed to a 16% increase in
Spanish export volumes and in turn a much lower trade deficit last year.
Swedish exports also rose strongly and the trade surplus widened. In all
three cases, the response of export volumes to exchange rate deprecia-
tion has been surprisingly rapid - a result, perhaps, of the pronounced
weakness in domestic demand. In contrast, the volume of UK exports rose
by only 4%. Moreover, as the UK economic recovery took firmer hold,
the widening cyclical divergence with continental Europe left the United
Kingdom with a sizable current account deficit.
While the volume of exports of the four main depreciating countries
rose by an average of 8% last year, flat or falling exports were recorded by
those that did not devalue against the Deutsche Mark. However, import
demand in Belgium, France, the Netherlands and Switzerland was even
weaker, with declines in import volumes in 1993 ranging from 1 % (the
Netherlands and Switzerland) to 31/2% (France), although some pick-up in
demand could be detected as the year went on, particularly in France and
Switzerland. The current account surpluses of all four countries widened
significantly.
Strong exportperformance inmost depreciatingcountries ...
... contrastingwith stagnatingexports in theothers
Consumer prices in selected European count r ies in a c o m m o n cur rency
Periods Surplus countries1
Belgium France Nether-lands
Switzer-land
Average
WesternGermany
Deficit countries1
Italy Spain Sweden UnitedKingdom'
Average
in Deutsche Mark, 1987 = 100
19901991199219931994 Q I
Memo item:May-August1992
108.4112.4115.1116.6119.7
115.2
109.1111.5114.6115.8
117.8
115.2
104.4107.8111.3114.5
116.6
111.1
107.0112.5112.4117.0
125.1
112.0
107.2111.1113.3115.9
119.8
113.4
106.9110.6115.0119.7
122.4
7 75.7
115.4121.9121.9105.3
105.0
126.9
130.1138.8140.6125.4
121.6
145.0
119.8131.6131.8109.3
111.9
735.2
114.7125.7123.8115.0
120.3
730.0
120.0129.5129.5113.8
114.7
134.31 According to average current account position in 1991-93. 2 Excluding housing.
82

Real effective exchange rates in selected European countr ies*
Monthly averages, 1987 = 100
BelgiumFranceNetherlandsSwitzerland
120
110
I I1990 1991 1992 1993 1994 1990
* Based on relative unit labour costs in manufacturing.
ItalySpainSwedenUnited Kingdom
I I I I I
80
I I I ,701991 1992 1993 1994
Germany
Turkey
Buoyant exportgrowth inCanada ...
Given a marked loss of competitiveness, German exports remained
weak throughout most of 1993 although they appeared to pick up in the
final quarter of the year. But with domestic demand in Germany shrinking,
imports declined even more so that Germany's trade surplus increased to
$40 billion. Much of this widening was offset by the rapid deterioration in
the invisibles account. For the first time since 1982, net investment income
turned negative in the final quarter of the year, although part of this
deterioration may be illusory, reflecting the statistical difficulties in capturing
the "foreign" interest earnings on German residents' savings channelled via
Luxembourg into domestic financial assets. The current account deficit
remained above $20 billion.
Turkey's current account deficit widened to almost 6% of GDP last
year. A large public sector deficit fuelled domestic demand growth, leading
to higher inflation and a significant real exchange rate appreciation; the
volume of imports rose by one-third. These imbalances, a sharp rise in
external indebtedness and uncertainty about policy provoked a severe run
on the currency in early 1994. In early April, the authorities announced a
series of measures to reduce demand and curb inflation.
Other industrial countries
Canadian exports rose strongly for the second year in succession after
three years of below-average growth. The recovery of US domestic demand
and a sharp drop in the real exchange rate were the major factors. Following
heavy losses up to late 1991, competitiveness has improved sharply as wage
costs were contained and as the nominal effective exchange rate depreci-
ated by 15% between late 1991 and early 1994: relative unit labour costs
have now fallen back to the low levels seen in the mid-1980s. However,
strong export growth was matched by vigorous import growth. Moreover,
the servicing of the country's large external debt required heavy net
83
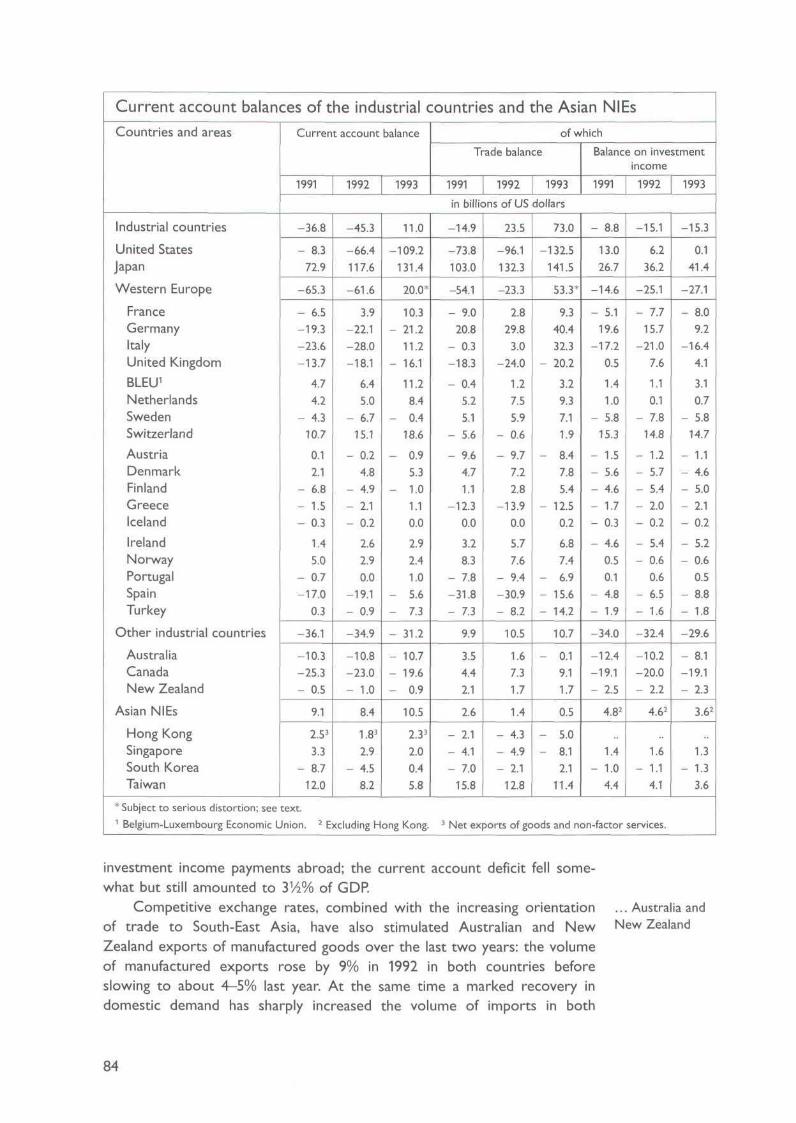
Current account balances of the industrial countries and 1
Countries and areas
Industrial countries
United StatesJapan
Western Europe
FranceGermanyItalyUnited Kingdom
BLEU1
NetherlandsSwedenSwitzerland
AustriaDenmarkFinlandGreeceIceland
IrelandNorwayPortugalSpainTurkey
Other industrial countries
AustraliaCanadaNew Zealand
Asian NIEs
Hong KongSingaporeSouth KoreaTaiwan
Current account
1991 1992
-36.8
- 8.372.9
-65.3
- 6.5-19.3-23.6-13.7
4.74.2
- 4.310.7
0.12.1
- 6.8- 1.5- 0.3
1.45.0
- 0.7-17.0
0.3
-36.1
-10.3-25.3- 0.5
9.1
2.53
3.3- 8.7
12.0
-45.3
-66.4117.6
-61.6
3.9-22.1-28.0-18.1
6.45.0
- 6.715.1
- 0.24.8
- 4.9- 2.1- 0.2
2.62.90.0
-19.1- 0.9
-34.9
-10.8-23.0- 1.0
8.4
1.83
2.9- 4.5
8.2
* Subject to serious distortion; see text.
balance
1993
11.0
-109.2131.4
20.0*
10.3- 21.2
11.2- 16.1
11.28.4
- 0.418.6
- 0.95.3
- 1.01.10.0
2.92.41.0
- 5.6- 7.3
- 31.2
- 10.7- 19.6- 0.9
10.5
2.33
2.00.45.8
1 Belgium-Luxembourg Economic Union. 2 Excluding Hong Kong.
the Asian NIEs
of whichTrade balance
1991 1992in billions of US
-14.9
-73.8103.0
-54.1
- 9.020.8
- 0.3-18.3
- 0.45.25.1
- 5.6
- 9.64.71.1
-12.30.0
3.28.3
- 7.8-31.8- 7.3
9.9
3.54.42.1
2.6
- 2.1- 4.1- 7.0
15.8
23.5
-96.1132.3
-23.3
2.829.83.0
-24.0
1.27.55.9
- 0.6
- 9.77.22.8
-13.90.0
5.77.6
- 9.4-30.9- 8.2
10.5
1.67.31.7
1.4
- 4.3- 4.9- 2.1
12.8
1993dollars
73.0
-132.5141.5
53.3*
9.340.432.3
- 20.2
3.29.37.11.9
- 8.47.85.4
- 12.50.2
6.87.4
- 6.9- 15.6- 14.2
10.7
- 0.19.11.7
0.5
- 5.0- 8.1
2.111.4
Balance on investment
1991
- 8.8
13.026.7
-14.6
- 5.119.6
-17.20.5
1.41.0
- 5.815.3
- 1.5- 5.6- 4.6- 1.7- 0.3
- 4.60.50.1
- 4.8- 1.9
-34.0
-12.4-19.1- 2.5
4.82
1.4- 1.0
4.4
3 Net exports of goods and non-factor
income1992
-15.1
6.236.2
-25.1
- 7.715.7
-21.07.6
1.10.1
- 7.814.8
- 1.2- 5.7- 5.4- 2.0- 0.2
- 5.4- 0.6
0.6- 6.5- 1.6
-32.4
-10.2-20.0- 2.2
4.62
1.6- 1.1
4.1
services.
1993
-15.3
0.141.4
-27.1
- 8.09.2
-16.44.1
3.10.7
- 5.814.7
- 1.1- 4.6- 5.0- 2.1- 0.2
- 5.2- 0.6
0.5- 8.8- 1.8
-29.6
- 8.1-19.1- 2.3
3.62
1.3- 1.3
3.6
investment income payments abroad; the current account deficit fell some-
what but still amounted to VA% of GDP.
Competitive exchange rates, combined with the increasing orientation
of trade to South-East Asia, have also stimulated Australian and New
Zealand exports of manufactured goods over the last two years: the volume
of manufactured exports rose by 9% in 1992 in both countries before
slowing to about 4-5% last year. At the same time a marked recovery in
domestic demand has sharply increased the volume of imports in both
... Australia andNew Zealand
84

countries. The trade surplus remained unchanged in New Zealand and turned
into a small deficit in Australia. Given its large external debt and thus
sizable investment income payments, Australia's current account deficit
amounted to almost 4% of GDP in 1993.
Stagnatingexport volumes
Shift inorientation ofexchange ratepolicies
Czech and Slovakrepublics
Hungary
Poland
Slovenia
Former central ly planned economies
Eastern Europe
The volume of eastern Europe's exports stagnated last year after two years
of strong growth. One depressive factor was probably the sharp appreci-
ation in real exchange rates over the last couple of years. It is also possible
that the transition from state trading had artificially inflated exports in 1991
and 1992 as the excessive inventories typically held in command economies
were sold and as the absence of hard budget constraints permitted the
export of goods at below-cost prices. Wi th imports rising strongly, the
area's trade deficit widened by about $4 billion.
These developments have led to a shift of emphasis in exchange rate
policies from providing a "nominal anchor" to maintaining international
competitiveness in the face of continuing high inflation. Only two countries
have maintained fixed nominal exchange rates for any length of time: the
Czech Republic (since December 1990) and Estonia (since June 1992).
Because the Czech koruna has remained competitive and because tight
fiscal and other policies have been maintained (see Chapter III), the trade
deficit was cut substantially last year as exports expanded steadily. Moreover,
portfolio capital inflows rose, permitting an increase in reserves of about
$3 billion and supporting the fixed exchange rate. The external deficit of
the Slovak Republic, much more dependent on trade with Russia, widened. The
Slovak koruna was devalued in July 1993 and a 10% surcharge was imposed
on imported consumer goods in March 1994.
Hungary's trade deficit widened sharply, mainly because of increased
domestic spending although some special factors (notably the embargo on
trade with parts of former Yugoslavia and a drought) also depressed exports.
Wi th the balance on invisibles swinging from surplus to deficit, the current
account deficit reached about 10% of GNP. This deficit was mostly financed
by direct investment inflows, in particular in connection with the privati-
sation of the telecommunications system. In a major shift, exchange rate
policy sought to limit further real exchange rate appreciation: the forint
was devalued against its currency basket on five occasions during 1993,
with a cumulative depreciation of 15%.
The Polish deficit widened as imports rose strongly. The crawling peg
exchange rate regime in operation since 1991, which implies an annual rate
of depreciation of about 20-25%, proved insufficient to maintain compet-
itiveness and had to be supplemented by further devaluations, the latest -
of 8% - in August 1993.
Slovenian exports stagnated last year while imports rose sharply, leading
to a deterioration of almost $1 billion in the trade balance. Trade liberal-
isation and a modest expansion in GDP - after three years of severe
85

Eastern European t rade
Countries and areas
Eastern EuropeBulgaria2
Czech RepublicHungary2
Poland2
Romania2
Slovak RepublicSlovenia
Memorandum item:Commonwealth of IndependentStates2
Exports1991
28.31.24.46.49.52.31.43.0
28.7
1992
33.81.65.77.0
10.72.32.04.4
26.7
19931
33.91.67.16.2
10.42.61.84.2
30.7
Imports1991 1992in billions of US
31.91.74.16.6
72.62.31.43.2
27.31 Partly estimated. 2 Based on OECD countries' trade data. Import data on4°/o f.o.b./c.i.f. margin. Trade between
39.41.96.97.8
13.73.22.03.9
24.7
19931
dollars
43.42.17.58.5
15.03.52.34.6
26.1
a c.i.f. basis adjustecthe former Soviet Union and Finland is excluded.
Trade balance1991
-3.6-0.5
0.3-0.2-3.1
0.00.1
-0.2
1.5
to f.o.b. t
1992 19931
-5.7-0.3-1.3-0.8-3.0-0.8
0.00.5
2.0
-9.5-0.5-0.4-2.3-4.5-0.9-0.5-0.3
4.6
>y subtraction of a
contraction - were the main factors. Unlike a number of other countries
in the region, the real exchange rate (measured in terms of prices) has
been held down (although real wages have grown rapidly). Bulgaria and
Romania, heavily dependent on imports of oil and raw materials, faced
increasing balance-of-payments difficulties.
The Baltic states have weaned themselves from extreme export depen-
dence on the Russian market and have coped with a massive terms-of-
trade shock as the prices of imported energy rose to world levels. Although
there have been important differences, Estonia and Latvia have pursued
tight monetary policies which have insulated them from the hyperinflation
that engulfed Russia, and which have led to huge appreciation in the -
initially very low - exchange rate vis-à-vis western trading partners. As
described in more detail in last year's Annual Report, Estonia led the way
by tying its newly introduced kroon to the Deutsche Mark - keeping
domestic interest rates very high to attract the capital inflows needed to
sustain this commitment. Output fell sharply; and within a year inflation
had been brought down. Last year output and exports rose strongly, and
trade was redirected towards the West; in early 1994, however, inflation
rebounded. Latvia also used tight monetary policy to bring about disinfla-
tion but did so while allowing its new currency to float against the convert-
ible currencies. Lithuania has taken rather longer to tighten policies. Rouble-
denominated coupons were replaced by a new currency only in July 1993;after several months of floating culminated in a period of heavy downward
pressure, the authorities tied the currency to the dollar in April 1994.
Access to markets in the industrial countries is essential for the full
success of the economic reforms in eastern Europe. The Association
Agreements with the European Union and other similar agreements did
much to enlarge access to western markets; last year, the European Union
decided to accelerate the tariff reductions envisaged in these Agreements.
Bulgaria andRomania
Estonia
Latvia
Lithuania
Need for greateraccess towestern markets
86

Trade surplus
Real exchangerate appreciation
Capital flight
Difficulty inputting intra-CIStrade on acommercial basis
Nevertheless, eastern European producers have run into protectionist
barriers as their traditional export goods - agricultural products, iron and
steel, textiles and clothing - are among the products most protected in
the West. Quite apart from the cost of such protectionism for consumers,
these restrictions almost certainly rebound on western exporting enter-
prises as any curtailment in eastern European exports is very likely to be
accompanied by an approximately equal reduction in their imports.
Commonwealth of Independent States
The dollar value of exports from the CIS to the industrial world rose last
year, as exports of metals and other heavy industry products increased.
Oil exports were broadly unchanged with a sharp fall in production being
offset by deep cuts in domestic consumption for the second year in succes-
sion. The scale of the difficulties confronting the CIS is underlined by the
fact that the production of oil - the main export commodity - is now
running at about 40% below output rates prevailing at the end of the
1980s. According to partner country trade data, the trade surplus with the
industrial countries rose last year.
Wi th continued rapid inflation, the rouble fell sharply during the first
half of 1993, going from Rb. 414 to the dollar in December 1992 to Rb. 1,081
by June 1993, although in real terms the currency appreciated. But the
slide was halted for much of the remainder of the year: intervention,
changes in foreign trade regulations and a compression of import demand
as subsidies were reduced were the main factors. Also, towards the end
of the year rouble interest rates became positive in real terms, thus elim-
inating the hugely negative real rates that had characterised Russian monetary
policy since prices were liberalised. The consequence of this interlude of
nominal exchange rate stability at a time of rampant inflation was that the
real effective exchange rate more than doubled. From late 1993, however,
uncertainty about the direction of policy led to renewed downward pressure
on the rouble, with its dollar value falling by April 1994 to about Rb. 1,800.
The rapid fall in the value of the rouble must have created strong
incentives to hide export earnings - particularly during the period when
rouble interest rates were so negative in real terms. Capital flight has
doubtless occurred but its size is uncertain. BIS international banking statis-
tics put deposits from the former Soviet Union held with reporting banks
at $16 billion at the end of 1993. After adjustment for exchange rate
changes, deposits rose by $314 billion in the first half of the year when
the rouble plummeted but fell by $1 billion in the second half when it was
more stable. However, covert capital exports are not fully captured by
these statistics.
Putting trade between Russia and the other states onto a normal
commercial basis has proved very difficult because, under central planning,
Russia had supplied the other states with energy at a fraction of world
prices and imported from them manufactured goods that were not compet-
itive on world markets. Despite massive increases in the rouble price of
energy exports and substantial cuts in supply, prices remained well below
87
world market levels during 1992: one Russian government estimate puts
the implicit trade subsidy during that year at 13% of Russian GDP. In
addition Russia continued to make substantial financial transfers to the other
republics.
The sheer size of this support was a major reason for the reluctance
of most of the former republics to leave the rouble area. Although by no
means the only factor, the failure to come to terms with this issue postponed
stabilisation policies in both Russia and the other republics. In 1993, however,
Russia took major steps to reduce these subsidies. Oil prices in dollar
terms were increased and the Russian authorities tightened the conditions
for the extension of new credits; interstate financing through the accounts
of the Russian central bank virtually dried up. Even though no framework
for effective interstate monetary coordination could be agreed, most countries
still clung to the rouble: by mid-1993, only the Baltic states, Ukraine and
Kirgizstan had left the rouble area. The crunch came in July 1993 with the
demonetisation of pre-1993 rouble banknotes - 1993 banknotes had been
issued only in Russia, not the other republics. Renewed attempts to preserve
the rouble area as a monetary union came to nothing and, by the end of
1993, all the other republics (with the exception of Tajikistan) had intro-
duced their own legal tender. The Russian central bank then began to
quote exchange rates between the rouble and all new national currencies,
incorporating prevailing market discounts on currencies in the region. The
combined effects of the marked cutback in the implicit trade subsidy and
the end of most official transfers from Russia now weigh heavily on the
other states of the CIS: an IMF estimate puts the loss at 15% of GDP for
these countries as a whole. However, the close links between Russia and
a number of the other states have prompted a search for new mechanisms
of cooperation on economic and other matters.
Heavy Russiansubsidies
China
A change with far-reaching consequences for China's economic relations
was the abandonment, in January 1994, of the multiple exchange rate
mechanism. The official exchange rate under this system coexisted with the
more market-responsive rates in the various Foreign Exchange Adjustment
Centres throughout China. Arbitrage between these so-called "swap centres"
was imperfect; because dealings in these centres remained subject to admin-
istrative controls - for example limiting access only to certain participants
- black markets also existed, their actual importance at any one time
depending on the extent of official interference.
This scheme served to encourage exports as most foreign exchange
earnings could be sold at the more favourable swap rates: only 20% of
enterprises' foreign earnings had to be exchanged at the official rate. Never-
theless, the state reserved the right to buy a further 30% at a specified
swap rate - in effect allowing it to pre-empt 50% of export earnings for
the purchase of official or "plan" imports (e.g. of certain agricultural goods
or by state-owned enterprises) or for official reserve accumulation. "Non-plan"
Unification ofexchange rateregime
Earliercoexistence ofofficial and swaprates ...
88

China's exchange rates
Monthly averages
Spot exchange rates(yuan/US dollar)
Real effective exchange rate1
(1990 = 100)
Official rateSwap rate2
Weighted averagerate for exporters
100
90
601993 19941990 1991 1992 1993 1994 1990 1991 1992
1 Based on the weighted average rate for exporters and relative consumer prices. 2 Shanghai swapcentre rate.
... led todistortions
Inflation andwidening externaldeficits ...
... put thesystem undersevere strain
imports had to be paid for at the more expensive swap rates. This mechanism
in effect magnified the potential impact of a rise in non-plan imports on
swap rates: if the state took its full 50% of export earnings, an equal rise
in exports and non-plan imports would lead to downward pressure on
swap rates. A t the same time, official reserves could be rising. The system
may also have encouraged some under-reporting of exports: officially reported
exports are below industrial countries' reported imports from China.
By late 1991, substantial devaluation of the official rate, much lower
inflation and a large current account surplus had reduced the gap between
the official rate and the swap rates to less than 10%. But hopes that the
authorities would be able to unify exchange rates were subsequently dashed
by a resurgence of inflation. Moreover, significant reductions in import tariffs
during 1993 (still very high by international standards, notably on consumer
goods) fuelled the import boom and, according to official Chinese figures,
contributed to a $14 billion deterioration in the trade account last year.
These developments put the exchange rate mechanism under severe
strain. Attempts by the authorities at various stages during the year to put
a floor under the falling swap rates - by intervention but also by admin-
istrative means - diverted transactions to black markets and ultimately
proved unsustainable. The swap rate dropped sharply before rebounding
and stabilising at around Yuan 8.7 to the dollar during the final months of
the year (see the graph). A t the end of the year the government scrapped
the official rate, leaving a single managed and administered floating rate.
During the early months of 1994, the currency settled at the rate that had
prevailed in the swap markets before the change and about one-third below
the old official rate. Although the official intention is to replace the swap
89

centres with a single interbank foreign currency market, foreign companies
have had to continue their foreign exchange operations at the swap centres.
These changes will have a major impact on Chinese trade. The sharp
rise in the local currency cost of official imports will squeeze state-owned
enterprises that are already running heavy losses. On the other hand, the
unification of exchange rates will benefit those foreign investors who were
required to bring in funds at the official rate but were permitted to
repatriate profits only at a swap rate. If consumer price indices can be
taken to be accurate and relevant measures of inflation, the exchange rate
facing exporters depreciated in real effective terms by over 20% between
1990 and the end of 1993 (see the graph on page 89). Such a large
depreciation is not unusual for a country undertaking major trade liberalisation.
Nonetheless, the considerable stimulus to exports makes the need for
effective measures to contain domestic demand growth all the greater.
It is therefore to be welcomed that recent steps to restrict credit have
reinforced the effect of depreciation in constraining import demand and
thus have contributed to a renewed rise in foreign exchange reserves.
Impact ofexchange rateunification
The Asian NIEs
China's extremely rapid growth has provided a strong stimulus to other
Asian economies. Additional factors behind continued Asian buoyancy include
the underlying strength of domestic demand and the highly elastic supply
of labour.
The recent vigour of domestic demand in the area has its roots in
the earlier period of rapid and often export-led growth, which had given
rise to marked internal economic strains. In particular, severe labour
shortages in South Korea and Taiwan led to sharp rises in real wages and
consumption. The period of hectic growth also provoked serious bottle-
necks in the transport and communications infrastructure, creating a demand
for major public investment programmes.
Higher real wages in the countries which had industrialised first led
enterprises to invest heavily in low-wage neighbouring countries - thereby
assuring themselves of an elastic supply of labour no longer available at
home. In this way, intra-Asian foreign direct investment flows hastened the
integration of the low-wage countries into the international economy and
stimulated their import demand - not only for investment goods but also
for the advanced components used in local processing.
As enterprises in the NIEs moved their labour-intensive manufacturing
to other Asian countries, their share of world markets declined and the
share of more sophisticated products in their exports increased. The recent
appreciation of the yen has furthered this transformation, greatly strength-
ening the position of South Korean and Taiwanese exporters relative to
their Japanese competitors. South Korean exports of labour-intensive
products, for instance, have fallen, squeezed by the rapid expansion of
capacity in other Asian countries with much lower wages; but exports of
cars, computers and so on - where the main competitor is Japan - have
Strength ofdomestic demand
Foreign directinvestment withinAsia
Transformationof trade of NIEs
South Korea
90

Taiwan
risen sharply. The recovery of exports was the main factor behind the
country's first current account surplus since 1989. This rise in exports led
to a steep increase in imports from Japan, on which South Korea is heavily
dependent for capital equipment and electronic components; hence the
bilateral deficit vis-à-vis Japan did not change. Taiwan's exports, stimulated
by the recent depreciation of the Taiwan dollar, have followed a similar
pattern. However, the trade surplus fell as imports expanded rapidly. Also
a boom in Singapore's exports of computers and related products - not only
to the United States - limited the deterioration in the current account.
External deficitsin Latin Americaand Asiareflecting ...
... the strengthof domesticdemand ...
O t h e r developing count r ies
The current account deficit of the developing countries (other than the
Asian NIEs) widened to $91 billion last year, equivalent to some 12% of
their total exports of goods and services, up sharply from the 1992 figure
of less than 10%. The deterioration was most pronounced in Latin America,
where the deficit exceeded 23% of exports, the highest level since the
outbreak of the debt crisis in 1982. In Asia, China's $16 billion swing from
surplus to deficit was the principal factor. The current account deficit of
the rest of Asia narrowed last year.
Two common roots of the external deficits in both continents were
a rapid expansion in domestic demand and sizable increases in private capital
inflows. Over the last three years, domestic demand in both regions has
been stronger than elsewhere. The graph on page 77 illustrates the role
C u r r e n t account balances o f developing countr ies
Countries and areas
Developing countries2
Africa
China
Other Asia2
of which: India3
IndonesiaMalaysiaThailand
Middle East
Latin Americaof which: Argentina
BrazilChileMexico
Current account
1991
-92.0
- 4.9
13.3
-21.5- 2.1- 4.1- 4.2- 7.4
-60.4
-16.6- 2.8- 1.4
0.1-13.8
1 Partly estimated. 2 Excluding the Asian
1992
-72.8
- 7.4
6.4
-20.2- 4.9- 3.7- 1.6- 6.1
-17.6
-31.2- 8.4
6.3- 0.6-22.8
Dalance
19931
of whichTrade balance
1991 1992
in billions of US
-90.9
- 7.9
- 9.6
-15.4- 0.5- 1.9- 2.1- 6.5
-18.6
-36.8- 7.6- 0.6- 2.1-20.5
19.0
8.7
8.7
-12.2- 2.1
4.80.5
- 6.0
7.9
13.04.4
10.61.6
-11.3
NIEs. 3 Financial year starting
- 2.9
3.3
5.2
- 9.9- 4.1
6.03.4
- 4.2
10.7
- 3.9- 1.5
15.50.7
-20.7
n April.
19931
dollars
-11.4
2.4
- 9.1
- 4.0- 0.5
8.83.4
- 4.3
14.6
- 8.6- 2.5
13.1- 1.0-18.8
Balance on investmentincome
1991 1992
-47.4
-17.6
0.8
-13.0- 3.7- 5.5- 2.4- 2.0
14.4
-29.2- 5.6- 9.7- 1.8- 7.1
-49.3
-17.1
0.2
-12.616
- 6.0- 2.9- 2.3
10.8
-28.0- 4.6- 8.1- 1.9- 7.5
19931
-55.0
-16.9
- 0.3
-14.53.4
- 6.1- 3.1- 2.7
8.3
-28.9- 3.9- 9.0- 1.5- 8.5
91

of cyclical conditions in changes in the real trade balance of a number of
developing countries. Secondly, heavy capital inflows (see Chapter VII) eased
the financial constraints that had limited import growth in Latin America
in the 1980s and contributed to rapid industrialisation in Asia. In addition,
trade liberalisation pursued in many countries has released latent import
demand.
An important difference, however, is that Latin American exports have
expanded by much less than Asian exports. The volume of Latin American
exports in 1993 was about 20% higher than in 1990, while the volume of
imports rose by 50%. In Asia, by contrast, the expansion in imports and
exports has been more balanced, at around 40%.
The trade performance of many Latin American countries has been
hurt by marked real exchange rate appreciation since 1990, especially in
Argentina, Colombia, Mexico and Peru where trade balances have deteri-
orated sharply in recent years. In Chile, on the other hand, the mainte-
nance of competitiveness has sustained real export growth; the trade deficit
that emerged reflected to a large extent deteriorating terms of trade. Brazil
has been a case apart in recent years: with a rather depreciated real
exchange rate, the trade surplus remained large last year, although the
current account surplus was eliminated.
In Asia real effective exchange rates have been rather stable in recent
years. In Indonesia, Malaysia and Thailand the preservation of the compet-
itiveness gains from the dollar depreciation in the mid-1980s has facilitated
the continued growth of exports. But very strong investment-led increases
in imports have led to sizable current account deficits in all three countries.
India has become more fully integrated with the world trading
system. Three years ago, the authorities - faced with a current account
deficit of over 3% of GDP, capital flight, growing external indebtedness and
depleted reserves - took steps to tighten fiscal and monetary policies, to
reduce state intervention (including the easier approval of foreign invest-
ment) and to make the exchange rate more competitive, devaluing by about
19% against the US dollar. During 1992 and 1993 a second round of reforms
focused on financial market reform and trade liberalisation, which included
a relaxation of restrictions on imports. In addition, the dual exchange rate
system was unified in early 1993 (implying an effective depreciation) and
the rupee was made convertible for trade purposes. These reforms produced
a large improvement in India's external accounts: the trade deficit, which
had been close to $7 billion at the height of the crisis in the financial year
1990/91, was virtually eliminated by 1993/94. The dollar value of exports
rose by 20% last year. Capital inflows gathered strength, leading to upward
pressure on the exchange rate and complicating monetary management.
The 50% devaluation of the CFA franc in January 1994 from a parity
against the French franc that had applied since 1948 (together with a 33%
devaluation for the Comorian franc) has provided these countries with the
chance to restore competitiveness and to bring better balance to their
economies. The sharp fall in dollar commodity prices in the mid-1980s
followed by the rise in the French franc against the dollar in the late 1980s
... and increasedcapital inflows
Competitivenessand tradeperformance inLatin America
Investment-ledimport growthin Asia
India's reforms
Large devaluationof CFA franc
92

had made their export sectors extremely uncompetitive, and permitted a
level of imports that export earnings could not sustain. Substantial external
assistance is planned to help cushion the shock of adjusting to a more
realistic exchange rate.
Cyclical patternof outflowsfrom industrialcountries
Falling Japaneseinvestment
Foreign d i rec t investment
The pattern of direct investment outflows reflected differences in the cyclical
position of investor countries. A strong expansion in flows from the United
States and the United Kingdom was combined with significant declines in
flows from the rest of the industrial world. The sum of US and UK outflows
rose by over $22 billion and accounted for half of total industrial country
outflows. There was a decline of almost equal magnitude in outflows from
continental European countries; Belgium and France saw the sharpest falls.
Japanese investment abroad fell once again. The apparently very poor
rate of return earned on earlier investments may have discouraged further
investment: according to balance-of-payments statistics, total investment
earnings in recent years have averaged only $8 billion annually, on a cumu-
lative FDI stock put at $250 billion. The US recovery did not prevent
Japanese-owned affiliates in the United States from suffering further losses
in 1993. According to estimates by MITI, returns on Japanese investment
in Asian countries have consistently been much higher; the strengthening
Global pat tern o f d i rec t
Total outflows
Industrial countriesof which: United States
JapanUnited KingdomOther Europe
Developing countriesof which: Asia
Latin America
Total inflows
Industrial countriesof which: United States
JapanUnited KingdomOther Europe
Developing countriesof which: Asia
Eastern EuropeLatin America
nvestment
1976-80
39.5
38.776.92.37.89.8
0.80.10.2
31.8
25.39.00.15.68.7
6.52.10.03.7
1981-85in
43.0
41.38.45.19.2
14.6
1.77.70.2
52.6
34.919.10.34.39.9
17.74.90.04.7
1986-90 1990 1991 1992billions of US dollars, annual averages
162.8
154.025.132.128.159.4
8.97.80.6
147.6
124.15170.3
21.738.8
23.573.70.25.8
217.4
203.527.748.019.4
102.8
14.072.51.0
193.9
161.048.0
1.832.563.6
32.820.20.66.8
184.5
173.329.730.776.090.7
11.29.31.2
152.5
111.024.0
1.416.257.5
41.623.32.5
11.3
173.5
158.934.817.218.585.1
14.572.90.3
140.3
85.92.42.7
16.854.1
54.432.73.4
13.8
1993*
173.4
152.550.213.725.454.2
20.819.00.5
175.7
101.537.50.7
74.550.7
74.247.55.0
17.5
* Partly estimated.
93

of the yen has further stimulated investment in low-wage Asian countries,
notably China.
Cyclical factors also led to a sharp rise in investment in the United
States, but inflows remained well below the heavy rates seen in the
late 1980s. As European inflows declined, gross inflows into the industrial
world came to about $100 billion. The most significant development in 1993
was the boom in foreign direct investment in the developing world.
Preliminary estimates suggest total inflows of about $75 billion, making FDI
the largest single source of external finance for developing countries.
Several factors account for this. The much increased role of Asian
countries in international trade - including intra-regional trade - is one
important factor. Over $45 billion flowed into Asian developing countries
last year. Balance-of-payments statistics suggest a $14 billion rise in FDI in
China to about $25 billion. Although the figure was inflated by the "round-
tripping" of Chinese capital through Hong Kong (to take advantage of fiscal
and other benefits given to foreign investors), there can be little doubt
that the boom in China has greatly stimulated foreign investment. FDI in
Malaysia and Indonesia slackened after years of heavy inflows: investment
approvals last year dropped steeply as these countries faced competition
from China. South Korea, Taiwan and almost certainly Hong Kong have in
recent years become major net providers of FDI capital - notably to other
Asian countries. China, too, has become a significant investor, with cumulative
investments in Hong Kong put at $13 billion at the end of last year.
A second factor is that regional trade agreements have increased the
attractiveness of a number of countries as a base for export-oriented
manufacturing operations. NAFTA - which reduced restrictions on foreign
direct investment - has probably had such an effect on Mexico. The EU
Association Agreements with eastern European countries may have similar
effects. A number of other countries have also dismantled restrictions on
foreign investment. Investment in Chile, for instance, has been boosted by
allowing foreign investors to exploit the country's natural resources.
A final factor has been privatisation. This has been particularly important
in eastern Europe: one estimate suggests that more than half of the revenue
from privatisation has come from abroad. Privatisation was also important
in Latin America last year, particularly in Argentina, the destination of more
than one-third of total direct investment in the region. However, privati-
sation has played little part in Asian flows. As is discussed in Chapter VII,
investment related to privatisation represents a change of ownership of
existing assets, and not of itself new fixed capital formation.
FDI boom in thedeveloping worldreflecting ...
... Asia's growingtrade share ...
... regional tradeagreements ...
... andprivatisation
94
V. I n t e r n a t i o n a l f i n a n c i a l m a r k e t s
Highlights
Wi th banks' traditional on-balance-sheet business dampened by credit
concerns and a number of other cyclical and long-term factors, a large
proportion of total international financing last year continued to be conducted
through the securities markets. Both gross and net securities issuance
reached new highs, buoyed by declining interest rates and the growing
popularity of Euro-medium-term notes (EMTNs), global issues and customised
securities linked to derivatives. The growth of international bank assets
remained well below the 1987-90 average and included a large volume of
securities purchases by banks for their own account, leading to a record
overlap between the two market segments. At the same time, the contin-
uing volatility of interest rates and exchange rates further encouraged the
use of derivatives, on and off organised exchanges, by a widening range of
participants. The unsettled conditions in financial markets may also have
been one reason for some revival of interest in gold.
The interdependence of markets worldwide increased last year, further
blurring the distinctions between bank credit and securities issues, domestic
and international paper, cash instruments and derivatives, and between
different categories of derivative products. This growing integration stimu-
lated cross-border investment flows. Thus, new position-taking in foreign
exchange, securities and derivatives markets resulted in major banking flows
between European centres. In addition, banks boosted their trading and
ancillary services, drawing from them a rising share of their revenues. In
the securities markets, the increasing use of global bonds, issued simulta-
neously on domestic and foreign markets, added liquidity, while EMTN
programmes with multi-currency options offered flexibility on a scale not
available at the purely domestic level. The proliferation of tailor-made
products, such as "structured" securities, whose initial risk/return profile
is modified by the embedding of derivative features, generated new business
and further accentuated the integration of various market segments. Finally,
the growing linkages between derivative instruments - futures, options and
swaps - helped to raise trading volumes and liquidity, though the net contri-
bution of this to underlying cash markets is hard to ascertain.
Measures were taken in a number of countries to remove competi-
tive distortions and to facilitate the international financing of public sector
deficits. Governments offered large liquid issues, encouraged the use of
national currencies for Euro-bonds and EMTN programmes and supported
the expansion of derivative contracts on government paper. By attracting
capital in search of secondary market liquidity, these measures contributed
95

Estimated net financing in international markets
Components of net international financing
Total cross-border claims of reporting banks3
Local claims in foreign currencyminus: Interbank redepositingA = Net international bank credit4
B = Net Euro-note placementsTotal completed international bond issuesminus: Redemptions and repurchasesC = Net international bond financing
D = A + B + C = Total international financingminus: Double<ounting5
E = Total net international financing
Changes1
1988 1989 1990 1991 1992 19932
Stocksat end-19932
in billions of US dollars
436.174.8
250.9260.019.9
221.682.5
139.1
419.069.0
350.0
684.9122.2397.1410.0
8.0264.789.6
175.0
593.178.1
515.0
608.3106.0249.3465.033.0
239.8107.7132.1
630.180.1
550.0
- 54.7- 48.7-183.3
80.034.9
319.7149.3170.5
285.440.4
245.0
189.9-25.7-30.8195.040.4
342.2222.9119.3
354.774.7
280.0
274.7-13.4
96.3165.072.7
466.4282.6183.8
421.5121.5300.0
6,464.91,127.33,812.33,780.0
255.8
1,849.8
5,885.7705.7
5,180.0
Note: The inclusion for the first time at end-September 1990 of the positions of banks in the five eastern German Lander addedabout $20 billion to the recorded expansion in the cross-border claims of reporting banks. At the same time, positions vis-à-vis the former German Democratic Republic have been reallocated to Germany.1 Banking and, from 1990, Euro-note placement data relate to changes in amounts outstanding at constant end-of-quarterexchange rates; bond financing data relate to flow figures converted at exchange rates prevailing on announcement dates.2 Preliminary. 3 Banks in the Group of Ten countries plus Luxembourg, Austria, Denmark, Finland, Ireland, Norway, Spain, theBahamas, Bahrain, the Cayman Islands, Hong Kong, the Netherlands Antilles and Singapore, and the branches of US banks inPanama. 4 Excluding, on an estimated basis, redepositing between reporting banks. 5 International bonds taken up by thereporting banks, to the extent that they are included in the banking statistics as claims on non-residents.
to market expansion. Ample liquidity, sizable cross-border investments and
reflows of principal and interest payments made it possible to accommodate
a large volume of public sector issues, a recovery of corporate borrowing
demand from some countries and new issues from the developing world.
Interest rate and exchange rate developments were felt in various
ways. In the banking sector, the shift by borrowers away from traditional
sources of credit in favour of securities issues was more than offset by
new business related to foreign exchange transactions and lending against
securities. Wi th respect to securities business, the turbulence in the foreign
exchange market does not seem to have had a significant impact on the
currency composition of issuance except perhaps in the case of the ECU.
In the field of derivatives, finally, the expansion in interest rate-related
instruments recorded both on and off exchanges was supported by expec-
tations of a general decline in interest rates. On the other hand, the ERM
crisis did not lead to a significant overall increase in exchange-traded
currency-related derivatives, as participants continued to rely on traditional
cash and forward markets for hedging and position-taking.
The international banking market
The growth of the gross and net international bank credit aggregates, at Moderate$261 billion (4%) and $165 billion (5%) respectively, remained moderate growth of bankcompared with the second half of the 1980s. On the liabilities side, reporting lending ...
96

... but noshortage ofloanable funds
Persistence oflender selectivity
Contrasts in theactivity ofindividualcentres ...
banks relied heavily on the liquidity available in domestic markets to compen-
sate for the smaller volume of cross-border deposits received from non-
banks in the industrialised world and a rundown of deposits from other
regions. While the downgrading of a number of internationally active banks
may have impaired their ability to attract deposits, there was no evidence
of a shortage of loanable funds. In fact, conditions in the market for syndi-
cated loans, where a high proportion of announced facilities ($221 billion)
represented refinancing or the establishment of precautionary lines, suggest
the opposite. Competition to attract prime names intensified, resulting in
a lowering of spreads and fees for such borrowers, and the market opened
up to new customers. Nonetheless, ample liquidity did not weaken selec-
tivity, as exemplified by greater cost differentiation between the various
categories of borrower.
Activity by reporting centre and nationality of reporting banks
As in 1992, there was a sharp contrast between the expansion of business
in Europe and a contraction in the United States and Japan. The declines
in claims in the latter two countries were due to the further scaling-back
of Japanese banks' international positions. Whereas in 1991-92 the retrench-
ment of these banks had reflected in large measure a genuine retreat from
the international interbank market, last year it stemmed from the trimming
of cross-border positions between affiliated offices. Most affected by the
Main features o f internat ional banking act ivi ty
Uses and sources of international bank credit
A = Claims on outside-area countriesof which: On non-banks
B = Claims on entities within the reporting area(?) Claims on non-banks(2) Banks' own use for domestic lending(3) Interbank redepositing
C = Unallocated
D = A + B + C = Total gross international bank assets
E = D - B (3) = Estimated net international bank credit
A = Liabilities to outside-area countriesof which: To non-banks
B = Liabilities to entities within the reporting area(1) Liabilities to non-banks(2) Banks' own supply of domestic funds(3) Interbank redepositing
C = Unallocated
D = A + B + C = Total gross international bank liabilities
Changes, excluding exchange
1990
-11.9- 9.6
680.8284.4147.1249.3
45.4
714.3
465.0
92.037.6
626.47 75.7165.3285.4
32.0
750.4
rate effects1991 1992in billions of US
8.1- 0.7
-103.9700.8
- 21.3-183.3
- 7.6
-103.3
80.0
- 12.3- 12.2
-201.776.520.3
-238.5
55.5
-158.5
66.218.2
95.690.535.9
-30.8
2.4
164.2
195.0
13.7- 9.0
100.8101.854.7
-55.6
24.9
139.4
1993*dollars
17.25.3
227.17 78.672.796.3
17.0
261.3
165.0
-15.4-20.8
81.257.897.9
-68.4
30.8
96.6
Stocksat end-1993*
829.3417.5
6,629.61,982.2
835.23,812.3
133.4
7,592.3
3,780.0
706.7297.9
6,131.47,294.91,331.23,505.3
447.2
7,285.3
* Preliminary.
97

Cross -bo rde r banking activity
Country ofresidence ofreporting banks
All countries
United KingdomJapanUnited StatesFranceGermanySwitzerlandNetherlandsSpainItalyCaribbean centresAsian centresOther countries
in individua repor t ing centres
AssetsChanges, excluding exchange
1990rate effects
1991 1992 1993*
Stocksat end-1993*
LiabilitiesChanges, excluding exchange
1990rate effects
1991 1992 1993*
Stocksat end-1993*
in billions of US dollars
608.3
86.172.6
-28.264.672.545.821.89.42.4
65.8117.577.9
-54.7
-51.9-35.9
6.8-14.5
10.2- 6.5
7.38.34.54.0
- 5.318.4
189.9
87.7-57.9-24.7
75.06.16.06.1
25.44.2
-18.421.758.6
274.7
50.8- 6.6-17.1
64.995.1
-12.34.1
55.613.68.7
- 0.518.5
6,464.9
1,052.7918.6542.7514.6446.0358.6172.8116.9113.5599.5868.2760.8
646.8
104.647.0-2.588.146.842.820.117.96.7
78.9101.295.2
-130.7
- 43.7-127.9
1.218.712.30.13.29.9
25.01.8
- 20.3- 11.0
110.2
65.5-128.8
38.223.650.43.8
17.914.831.4
- 11.517.6
- 12.5
32.7
36.5-38.8
27.111.443.1
- 9.73.79.1
-19.8- 1.6- 2.8-25.4
6,266.1
1,134.1688.4715.4492.0301.4287.2155.387.7
214.1589.5840.4760.5
* Preliminary.
process were the Japan Offshore Market in Tokyo and the International
Banking Facilities in New York. In fact, more than the whole of the decline
in cross-border claims of banks in the United States was accounted for by
Japanese banks' affiliates in that country.
When the international assets of individual nationality groups of banks
are aggregated across reporting countries, the slight increase in current
dollar terms reported for Japanese banks translates into a fall of roughly
$50 billion after exchange rate effects are eliminated, following a cumula-
tive $400 billion (or 20%) contraction in the preceding two years. On the
other hand, US banks' international business was supported by their improved
credit standing, as reflected in a number of upgradings by rating agencies,
and strong positioning in underwriting and trading. There was, in particular,
an expansion in the books of their London affiliates and in their direct
credit to non-bank customers.
The international activity of European banks varied widely from country
to country. While most EU banks expanded their international assets signif-
icantly, banks in some other countries sharply reduced their market presence.
Nordic banks continued to be burdened by problem loans and, like Italian
banks, experienced repayments of foreign currency credits by residents in
the wake of the 1992 currency upheaval. In the case of Swiss banks the
downturn was more than entirely due to a decline in traditional trustee
intermediation, whereas direct lending to the non-bank sector was
buoyant. Even for those banks that expanded their cross-border business,
there was a tendency to pare down inter-office accounts, the share of
which in total reported international claims fell by a further percentage
point, to 27%.
... and ofdifferentnationality groupsof banks
98
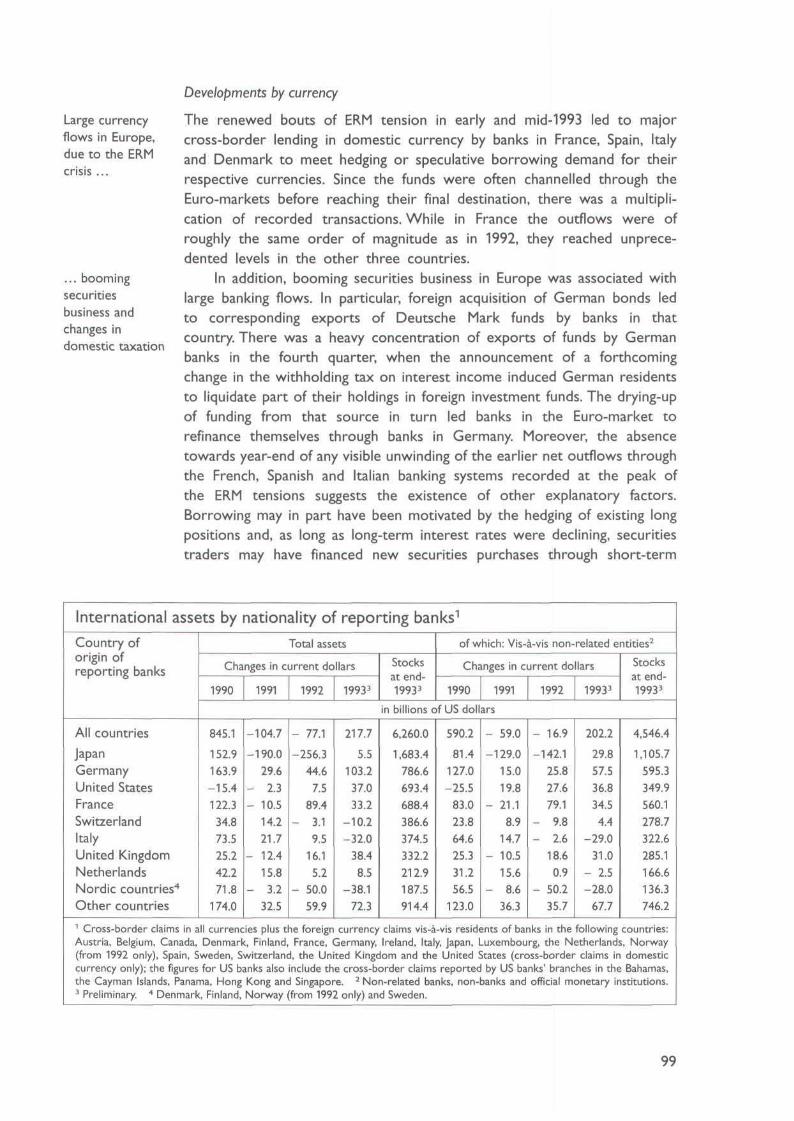
Large currencyflows in Europe,due to the ERM
crisis
... boomingsecuritiesbusiness andchanges indomestic taxation
Developments by currency
The renewed bouts of ERM tension in early and mid-1993 led to majorcross-border lending in domestic currency by banks in France, Spain, Italyand Denmark to meet hedging or speculative borrowing demand for theirrespective currencies. Since the funds were often channelled through theEuro-markets before reaching their final destination, there was a multipli-cation of recorded transactions. While in France the outflows were ofroughly the same order of magnitude as in 1992, they reached unprece-dented levels in the other three countries.
In addition, booming securities business in Europe was associated withlarge banking flows. In particular, foreign acquisition of German bonds ledto corresponding exports of Deutsche Mark funds by banks in thatcountry. There was a heavy concentration of exports of funds by Germanbanks in the fourth quarter, when the announcement of a forthcomingchange in the withholding tax on interest income induced German residentsto liquidate part of their holdings in foreign investment funds. The drying-upof funding from that source in turn led banks in the Euro-market torefinance themselves through banks in Germany. Moreover, the absencetowards year-end of any visible unwinding of the earlier net outflows throughthe French, Spanish and Italian banking systems recorded at the peak ofthe ERM tensions suggests the existence of other explanatory factors.Borrowing may in part have been motivated by the hedging of existing longpositions and, as long as long-term interest rates were declining, securitiestraders may have financed new securities purchases through short-term
International assets by nationality of reporting banks1
Country oforigin ofreporting banks
All countries
JapanGermanyUnited StatesFranceSwitzerlandItalyUnited KingdomNetherlandsNordic countries4
Other countries
Total assets
Changes in current dollars
1990 1991 1992 19933
Stocks
at end-19933
of which: Vis-à-vis non-related entities2
Changes in current dollars
1990 1991 1992 19933
Stocks
at end-19933
in billions of US dollars
845.1
152.9163.9-15.4122.334.873.525.242.271.8
174.0
-104.7
-190.029.6
- 2.3- 10.5
14.221.7
- 12.415.8
- 3.232.5
- 77.1
-256.344.67.5
89.4- 3.1
9.516.15.2
- 50.059.9
1 Cross-border claims in all currencies plus the foreignAustria, Belgium, Canada,Denmarl„ Finland,(from 1992 only), Spain, Sweden, Switzerlanccurrency only); the figuresfor US banks alsothe Cayman Islands, Panama, Hong3 Preliminary. 4 Denmark, Finland,
Kong ancNorway
France,
217.7
5.5103.237.033.2
-10.2-32.0
38.48.5
-38.172.3
currencyGermany,
6,260.0
1,683.4786.6693.4688.4386.6374.5332.2212.9187.5914.4
590.2
81.4127.0-25.5
83.023.864.625.331.256.5
123.0
- 59.0
-129.015.019.8
- 21.18.9
14.7- 10.5
15.6- 8.6
36.3
- 16.9
-142.125.827.679.1
- 9.8- 2.6
18.60.9
- 50.235.7
202.2
29.857.536.834.54.4
-29.031.0
- 2.5-28.0
67.7
claims vis-à-vis residents of banks in the followingIreland, Italy, Japan, Luxembourg, the Netherland.
I, the United Kingdom and thenclude the cross-border claims
United States (cross-border claims inreported by US banks' branches in the
4,546.4
1,105.7595.3349.9560.1278.7322.6285.1166.6136.3746.2
countries:, NorwaydomesticBahamas,
Singapore. 2 Non-related banks, non-banks and official monetary institutions.from 1992 only) and Sweden.
99

Cur rency compos i t ion
Currencies
All currencies
US dollarDeutsche MarkECUJapanese yenFrench francSwiss francPound sterlingItalian liraSpanish pesetaOther
of banks' c ross-border claims1
Domestic currencyChanges, excluding exchange
1990rate effects
1991 1992 19932
Stocksat end-19932
Foreign currencyChanges, excluding exchange
1990rate effects
1991 1992 19932
Stocksat end-19932
in billions of US dollars
48.7
-23.429.6
19.98.9
10.49.0
- 7.40.21.5
20.8
1.6- 6.4
20.85.5
- 8.2-10.0
3.31.7
12.61 Banks in industrial reporting countries only.
7.3
-18.4-16.0
-28.549.5
- 8.524.02.8
10.6- 8.1
186.0
-13.075.5
- 4.041.3
- 0.415.017.736.217.8
2 Preliminary.
1,728.1
482.5265.3
486.5145.086.299.325.945.292.3
376.3
162.936.921.322.828.99.0
25.127.0
42.5
-74.2
-78.0-10.5
15.8-43.6
14.01.1
-18.720.1
25.7
179.3
78.575.612.3
-43.86.94.2
12.98.5
24.2
80.5
3.936.25.7
-18.820.2
-18.0- 8.3
30.0
29.7
3,269.2
1,723.4497.6162.0143.7117.8113.898.294.1
318.6
bank borrowing. No direct statistical evidence is available at present, but
there are also strong indications that bank lending against securities is fast
becoming an important instrument of liquidity management in Europe.
Business with non-banks inside the reporting area
On the liabilities side of banks' cross-border business with non-bank entities
located inside the reporting area, the main feature of the period under
review was the $12.5 billion of new deposits placed by German residents.
Avoidance of the German withholding tax introduced in January 1993 was
probably the prime factor, although, in the absence of data from Luxem-
bourg, it is not possible to assess the full scale of this movement. At the
same time, banks in Germany received $9.6 billion of deposits from non-
bank entities located in the Netherlands, presumably representing the
onlending of funds raised in the form of securities issues by financing affil-
iates in that country. The only other major group of non-bank depositors
comprised entities located in the United Kingdom and Belgium-Luxembourg,
reflecting those countries' role in Euro-currency banking and securities
business. In other Group of Ten countries, stagnation in cross-border non-
bank depositing reflected either weak conditions in the home market (e.g. in
Japan and France) or a shift from Euro-dollar deposits to other types of
asset (in the United States, as a result of the steepness of the yield curve).
On the lending side, there were sizable increases in cross-border claims
on non-banks located in the United States, the United Kingdom and Germany.
Wi th the exception of transactions with entities located in the United
Kingdom, which are inflated by the Euro-currency market role of London,
new credits tended to be denominated overwhelmingly in the currency of
the borrowers and represented a significant proportion of the growth of
the corresponding domestic credit aggregates. Increases in bank assets
Large exports ofdomestic fundsby Germannon-bankresidents
100

External assetsboosted bybanks' ownpurchases ofsecurities
Subduedoutside-arealending ...
reflected to a large extent banks' own purchases of securities and, espe-
cially in the case of the United States, a recovery in syndicated credits
other than for refinancing purposes. Circular movements of short-term
funds through the Euro-market to circumvent domestic regulations or
taxation also contributed to the expansion.
Business with countries outside the reporting area
Banks' continuing reluctance to lend to a number of countries, together
with borrowers' improved access to bond and equity markets, dampened
overall bank credit to countries outside the reporting area. The shift to
other forms of financing was most pronounced in Latin America, but was
seen also in Asia, whereas banks' caution was chiefly responsible for the
decline in exposures to eastern Europe and the Middle East. In the latter
Banks' business w i t h non-bank
Country ofresidence ofnon-bank customers
Total assets
JapanUnited StatesGermanyFranceUnited KingdomItalySwitzerlandCanadaNetherlandsBelgiumSweden
Total liabilities
JapanUnited StatesGermanyFranceUnited KingdomItalySwitzerlandCanadaNetherlandsBelgiumSweden
: enti t ies in the G r o u p o f Ten countr ies
Changes, excluding «Cross-border positions1
1990
193.0
63.750.12.55.6
10.823.34.58.3
15.83.44.9
108.5
-2.022.128.812.314.37.3
10.66.21.67.5
-0.1
1991
84.2
44.15.69.52.25.68.0
- 1.33.44.70.91.5
4.0
- 5.7-12.1
11.7- 0.1
3.93.21.3
- 3.64.70.00.6
1992 19933
112.2
12.329.735.06.61.79.21.83.1
-1.9-0.415.2
45.3
-0.2-9.230.86.9
-2.15.41.6
-1.78.95.8
-0.8
141.8
13.438.134.712.036.27.1
-0.43.51.41.0
-5.2
28.4
-2.8-3.612.5-1.6
8.00.4
-2.2-1.512.65.41.4
exchange rate effectsMemorandum item:Domestic bank credit
1990n billions
8216
351.5-12.5141.7153.962.651.022.521.817.414.0
- 0.4
659.0
241.458.867.878.389.958.38.1
23.214.87.0
11.5
and money2
1991 1992 1993of US dollars
593.0
133.713.0
174.985.041.864.217.130.813.38.2
10.9
412.8
90.956.479.423.247.867.08.0
14.511.99.14.6
702.5
147.0111.1191.584.737.770.111.323.612.418.1-5.1
273.1
-4.46.3
104.650.030.925.46.7
19.315.018.70.5
632.5
42.8194.6199.065.935.411.117.347.79.5
13.74
- 4.6
433.3
102.946.1
145.7-14.7
44.837.517.88.8
17.823.43.2
Stocks at end-1993Cross-borderposi-
tions1-3
1,183.0
283.3344.1150.246.494.584.623.743.056.328.628.3
766.6
18.3252.5165.543.069.736.953.611.071.040.74.4
1 Positions vis-à-vis Belgium include those vis-à-vis Luxembourg. 2 For Japan, M2+CDs; for the United Kingdom, M4countries, M3.
3 Preliminary. 4 First nine months of 1993. 5 At end-September 1993.
Memoitem:
Domesticbank
credit andmoney2
17,173.5
5,803.14,652.02,213.21,615.1
946.6496.9411.4340.0314.5296.6s
83.9
13,448.1
4,708.54,244.31,098.9
892.6811.5574.8283.4310.3241.4196.985.5
; for other
101
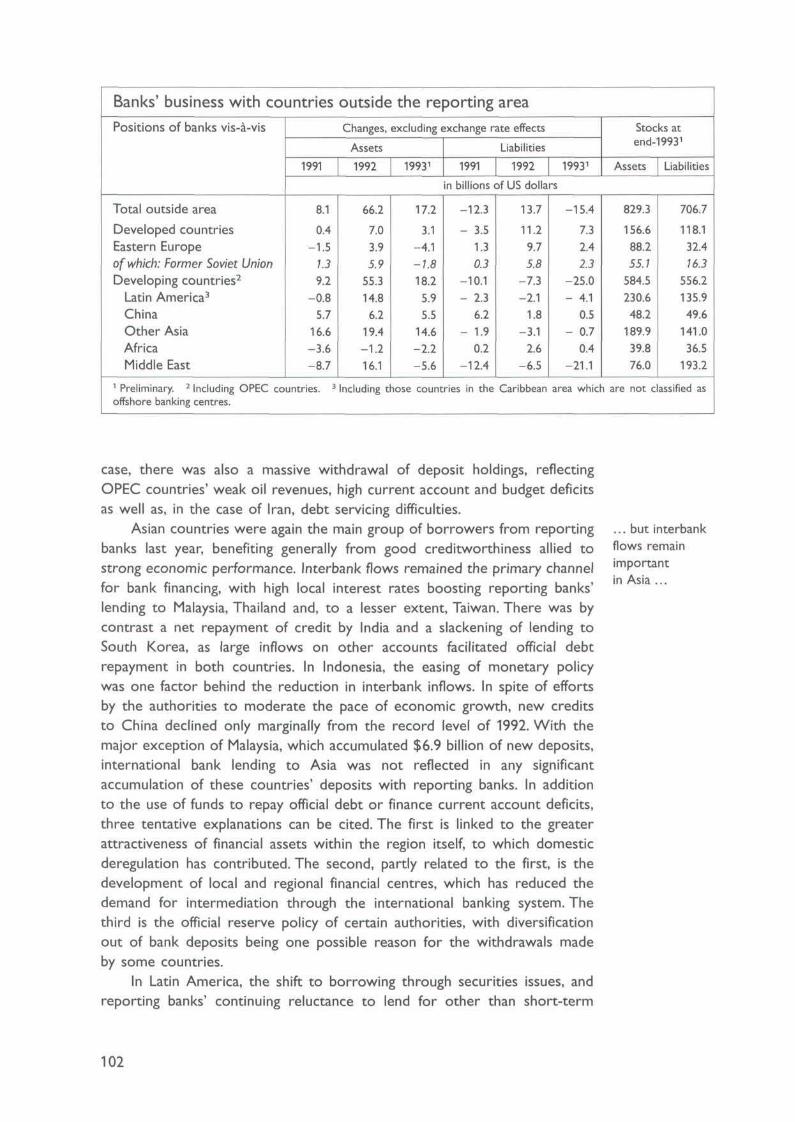
Banks' business w i t h countr ies
Positions of banks vis-à-vis
Total outside area
Developed countriesEastern Europeof which: Former Soviet UnionDeveloping countries2
Latin America3
ChinaOther AsiaAfricaMiddle East
outside
Changes,
the repor t ing area
excluding exchange rate effects
Assets1991
8.1
0.4-1.5
1.39.2
-0.85.7
16.6-3.6-8.7
1 Preliminary. 2 Including OPEC countries. 3
offshore banking centres.
1992
66.2
7.03.95.9
55.314.86.2
19.4-1.216.1
19931
17.2
3.1-4.1-1.818.25.95.5
14.6-2.2-5.6
Liabilities1991
in billions <
-12.3
- 3.51.30.3
-10.1- 2.3
6.2- 1.9
0.2-12.4
Including those countries in the
1992 19931
3f US dollars
13.7
11.29.75.8
-7.3-2.1
1.8-3.1
2.6-6.5
Caribbean
-15.4
7.32.42.3
-25.0- 4.1
0.5- 0.7
0.4-21.1
Stocks atend-19931
Assets
829.3
156.688.255.1
584.5230.648.2
189.939.876.0
Liabilities
706.7
118.132.416.3
556.2135.949.6
141.036.5
193.2
area which are not classified as
case, there was also a massive withdrawal of deposit holdings, reflecting
OPEC countries' weak oil revenues, high current account and budget deficits
as well as, in the case of Iran, debt servicing difficulties.
Asian countries were again the main group of borrowers from reporting
banks last year, benefiting generally from good creditworthiness allied to
strong economic performance. Interbank flows remained the primary channel
for bank financing, with high local interest rates boosting reporting banks'
lending to Malaysia, Thailand and, to a lesser extent, Taiwan. There was by
contrast a net repayment of credit by India and a slackening of lending to
South Korea, as large inflows on other accounts facilitated official debt
repayment in both countries. In Indonesia, the easing of monetary policy
was one factor behind the reduction in interbank inflows. In spite of efforts
by the authorities to moderate the pace of economic growth, new credits
to China declined only marginally from the record level of 1992. Wi th the
major exception of Malaysia, which accumulated $6.9 billion of new deposits,
international bank lending to Asia was not reflected in any significant
accumulation of these countries' deposits with reporting banks. In addition
to the use of funds to repay official debt or finance current account deficits,
three tentative explanations can be cited. The first is linked to the greater
attractiveness of financial assets within the region itself, to which domestic
deregulation has contributed. The second, partly related to the first, is the
development of local and regional financial centres, which has reduced the
demand for intermediation through the international banking system. The
third is the official reserve policy of certain authorities, with diversification
out of bank deposits being one possible reason for the withdrawals made
by some countries.
In Latin America, the shift to borrowing through securities issues, and
reporting banks' continuing reluctance to lend for other than short-term
... but interbankflows remainimportantin Asia ...
102
... as do short-term credits toLatin America
Record lendingto Turkey
trade financing purposes, held back banking flows to the region and resulted
in a further rise in the share of maturities up to one year (to more than
50% on average at end-June 1993, the latest date for which such a breakdown
is available). At the same time, private residents in these countries continued
to repatriate funds held with reporting banks, and these movements generally
exceeded the placement of foreign exchange accruals with banks (except
in the cases of Chile and Mexico). There were sizable increases in claims
on Mexico ($3.8 billion) and Brazil ($2.4 billion), which were more than
accounted for by short-term interbank lines and, in the case of Brazil
(whose debt restructuring agreement with creditor banks was signed in
April 1994), new interest arrears. On the other hand, banks' outstanding
exposure to Argentina fell by $1.4 billion as a result of the debt reduction
agreement signed in December 1992.
In eastern Europe, substantial direct and portfolio investment made it
possible for Hungary and the Czech Republic to repay part of their debt
to international banks. Write-offs reduced banks' exposure to other countries,
although the accumulation of interest arrears by Poland and the former
Soviet Union and new officially guaranteed credits to Russia partially offset
the decline. Some repatriation of foreign deposits by Polish non-bank
residents contributed to the financing of the current account deficit, whereas
entities in the former Soviet Union built up foreign assets.
Finally, with respect to other countries outside the reporting area,
repayments of bank credit by Australian and South African entities in 1993
contrasted with the $5 billion rise in reporting banks' claims on Turkish
entities. Although Turkey was a major Euro-bond issuer last year, the gap
between local interest rates and the rate of currency depreciation encour-
aged short-term banking inflows, until the rate of depreciation accelerated
in March this year. The increase in reported claims on Portugal was equiv-
alent to only one-half of the $5 billion of new deposits placed with reporting
banks. After the lifting of the remaining capital controls at the beginning
of 1993, interbank outflows were the main channel through which renewed
pressures on the escudo manifested themselves during the year.
Large volume offunds availableunder Euro-noteprogrammes
EMTNsoutstandingexceed ECP
The securit ies marke t
The short and medium-term note market
With $117 billion of new announcements during the year, the cumulative
total of Euro-note programmes launched so far exceeded $780 billion at
the end of 1993. At the same time, total drawings under existing facilities
amounted to a record $73 billion, which was nearly twice as much as in
1992, bringing the actual stock of notes to $256 billion by the end of the
year. Net new issues were more than accounted for by Euro-medium-term
notes (EMTNs), 60% of which were denominated in currencies other than
the US dollar. By contrast, the market for short-term notes, including Euro-
commercial paper (ECP), saw net repayments for the first time. The strong
growth of EMTNs meant that, at the end of 1993, the outstanding stock
of such instruments exceeded the volume of ECP by over 80%.
103

Issuing act iv i ty in
markets
Sectors andcurrencies
Short-term notes4
US dollarJapanese yenFrench francSpanish pesetaCanadian dollarPound sterlingDeutsche MarkOther5
Medium-term notesUS dollarFrench francPound sterlingOther5
the domest ic and in ternat ional
Net issues1
Domestic2
1990
96.135.920.112.016.7-0.2
0.60.0
11.1
24.724.00.00.70.0
1 Changes in amounts outstanding atlocal market; OECD countries only,4 Data on domestic issuesrelate to
1991
-43.1-29.7-26.9
5.32.20.0
- 0.25.40.7
43.642.40.01.20.0
1992
18.817.0-1.6-3.5
5.4-2.4
0.25.1
-1.4
93.734.455.93.40.0
constant exchangesxcluding
1993
-11.48.6
-10.3- 7.6- 4.7
1.22.3
- 2.71.7
62.933.622.37.00.0
rates. 2
Iceland and Turkey.:ommercial paper only; data
other short-term Euro-notes. 5 Including theSources: Euroclear, nationa
ECU.authorities and BIS.
sho r t and med ium- te rm no te
International3
1990in billions
18.910.60.50.00.00.01.40.06.4
14.26.40.00.47.4
Issues by3 Issues
1991 1992of US dollars
16.510.2-0.3
0.00.10.10.31.25.0
18.47.00.21.49.9
residents
12.114.6-0.2
0.20.20.10.02.5
-5.4
28.311.20.52.8
13.8
1993
-5.4-7.3-0.4-0.3-0.3
0.42.5
-0.70.6
78.131.12.46.2
38.4
and non-residents
Amountsoutstanding at
end-1993Domes-
tic2
782.6553.898.838.518.917.38.06.8
40.6
296.7210.474.511.80.0
Inter-national3
109.286.80.20.00.00.54.22.8
14.7
146.663.93.0
10.269.6
n local currency in theby residents and non-residents in foreigr
on international issues relateto Euro-commercialcurrency.
paper and
In the short-term Euro-note market, there was a reduction in the
amount of paper outstanding but some increase in the volume of new
facilities, which may be explained by precautionary arrangements and the
enlargement of existing programmes by a number of top-rated borrowers.
The decline in the stock of paper was due in large measure to a shift by
international banks away from issuance of certificates of deposit in favour
of longer-term funding, in particular floating rate notes (FRNs).
Activity in the EMTN market was boosted by investor preference for
longer-term paper, the introduction of new currencies and maturities in
drawing options and the development of special features. There was in
particular a shift away from "best efforts" placement towards the under-
writing of issues, which facilitates the raising of large amounts of funds at
short notice. A number of transactions - more than half in recent quarters
according to certain market sources — were linked to derivative instru-
ments ("structured"), allowing issuers and investors to modify original
risk/return profiles according to their own expectations and preferences.
The relaxation of issuing constraints in several OECD countries also
contributed to market expansion. Since July 1993 Japanese companies have
been allowed to tap the EMTN market directly, and applications and
notification rules have been simplified. In other countries a number of
Growingpopularity ofunderwrittenissues ...
... "structured"notes ...
104

... and multi-currency options
However,flexibility mayhave been at thecost of liquidity
Record grossand net issuanceof internationalbonds
Growingdichotomybetween largeliquid issues andtailor-madeproducts
deregulatory measures were introduced (in France, Italy and Switzerland)
or proposed (in the United Kingdom) to facilitate the use of the national
currency in EMTN programmes.
Multi-currency options have become the norm in EMTN programmes,
enhancing the competitiveness of the technique vis-à-vis other forms of
funding. Last year, EMTNs accounted for 30% of the total growth of inter-
national bonds and notes outstanding and amounted to more than twice
the volume of new dollar-denominated MTNs in the United States. Since
their inception in 1986 EMTNs have evolved from being a borrowing device
bridging the maturity gap between short-term Euro-notes and Euro-bonds
to become a more general fund-raising instrument providing a high degree
of flexibility (in terms of currency, maturity, size and structure of offerings)
on very competitive terms (since funds are raised under the same initial
legal and documentation arrangements). However, concerns have been voiced
with respect to the liquidity of structured securities issued under such
facilities. Against this background, a decisive step was taken recently by the
Wor ld Bank with the introduction of a global multi-currency note programme
incorporating a continuous buyback commitment.
The international bond market
Gross announcements of new issues in the international bond market surged
to a record $481 billion, an increase of 40% over 1992. Borrowing demand
was buoyed by a combination of declining bond yields, large and rising fiscal
deficits in many OECD countries and the need in several countries to
bolster foreign exchange reserves. Financial institutions' demand for wholesale
funds and capital and substantial borrowing by developing countries also
contributed to the boom in gross issuance. After allowing for redemptions
and repurchases, net issues were, at $184 billion, slightly higher than the
previous record set in 1989. This expansion occurred despite increasing
competition from other markets (such as domestic securities and EMTNs).
The market was characterised by a growing dichotomy between large
liquid issues and tailor-made products. On the one hand, global bonds,
which are registered issues launched in both domestic and international
markets, continued to gain in importance, with total issues of $29 billion
during the year and $59 billion outstanding at year-end. Global bonds now
encompass a wide range of currencies (including for the first time last year
Deutsche Mark paper), maturities (up to forty years), issue sizes and cate-
gories of borrower. On the other hand, there was a proliferation of
somewhat less liquid tailor-made or "niche" products. One example is the
development of the "dragon" bond market for issues in Asia aimed at
tapping the financial resources of the rapidly growing Asian economies.
Another can be seen in the rising number of structured instruments such
as FRNs with caps (which fix maximum coupons) and collars (which set
minimum and maximum coupons). These features, together with expecta-
tions of interest rate tightening in the dollar sector after the summer and
strong demand for funds by financial institutions, combined to boost FRN
issues last year. There was also an increase in Euro-convertible issues by
105

The internat ional bond marke tUS$bn
500
400
300
200
100
Left-hand scale:Announced issuesNet issues
Right-hand scale:Public sector* borrowing as a percentageof total announcements
30
26
22
18
14
101987 1988 1989 1990 1991 1992 1993
* Excluding international institutions.Sources: Bank of England, ISMA and BIS.
non-Japanese Asian names in response to the strong performance of local
equity markets.
The further deregulation of domestic and Euro-bond issuance also
affected activity in the international bond market. In Japan the Ministry of
Finance announced a series of measures which included permission for
Japanese banks' overseas subsidiaries to underwrite Euro-yen bonds, an
easing of rating requirements for issuance on the domestic market and of
other restrictions on Japanese domestic issues, a shortening of the notifi-
cation requirements for Euro-yen issues by Japanese companies, and, as
from 1st January 1994, the abolition of the ninety-day waiting period for
the purchase by domestic investors of Euro-yen bonds issued by foreign
governments and international organisations. The Swiss authorities also
relaxed regulations for foreign Swiss franc issues by requiring (as from
1st April 1993) that only the lead manager be located in Switzerland or
Liechtenstein, and by abolishing the stamp duty. In June the Italian author-
ities authorised foreign banks to become lead managers and to trade in
Euro-lira securities on the same footing as Italian banks. This measure was
followed by the relaxing of restrictions on Euro-lira issues. As from 1st January
1994 the abolition of VAT on issuance fees in the French franc bond market
became effective, following a number of other deregulatory measures.
As regards market structure, growing government borrowing require-
ments have accentuated the need for more efficient primary and secondary
domestic debt markets. Much of this reorientation has involved the use
of techniques initially developed in the United States. In the domestic
government debt markets, for instance, there has been a shift away from
quantitative allocations towards auctions and underwriting by primary dealers.
In the secondary markets, higher liquidity has been achieved by moving
towards standardised public issues, by rationalising and streamlining official
Activitysupported byderegulation ..
... and bygovernmentborrowingrequirements
106

Increasingworldwideintegration ofsecuritiesmarkets
Limited impact ofthe ERM crisis onprimary marketactivity
debt management procedures, by issuing larger volumes within certain
maturity bands and new tranches fungible with outstanding paper, and by
establishing primary dealers committed to making two-way markets in certain
government securities. Authorities have also attempted to improve market
efficiency by clarifying or simplifying issuing procedures, eliminating tax
impediments (especially those related to withholding taxes) and harmon-
ising settlement procedures.
This greater homogeneity of national debt markets has contributed to the
further integration of securities markets worldwide. As a result, borrowing,
investment and trading have increasingly been taking place across markets.
This has been reflected in large volumes of domestic government paper being
taken up by foreign investors, and in a rising number of domestic issuers
shifting to the international market, either to tap foreign resources directly
or to arbitrage between domestic and international issuing conditions. The
strong growth recorded last year in the Deutsche Mark, French franc, Italian
lira and peseta sectors of the Euro-market should be seen in this context.
A t the same time, domestic paper, including in particular government debt,
has increasingly been traded through international clearing houses, which
accounted for most of the 65% expansion in secondary market trading
reported by Euroclear and Cedei last year.
The latest ERM crisis appears to have had a limited impact on primary
market activity. Admittedly, strong investment inflows into the German
market created favourable borrowing conditions in the recently liberalised
Euro-DM segment. In addition, mounting pressures on the French franc in
the early summer were associated with a 30% decrease in the volume of
new issues in that currency between the second and third quarters, although
Type and cur rency s t ruc tu re o f in ternat ional bond issues
Sectors and currencies Announced issues* Net issues*
1990 1991 1992 1993 1990 1991 1992 1993
in billions of US dollars
Stocksat end-1993
Total issues
Straight fixed rate issuesof which: US dollar
Japanese yenDeutsche Mark
Floating rate notesof which: US dollar
Pound sterlingDeutsche Mark
Equity-related issuesof which: US dollar
Swiss francDeutsche Mark
241.7166.252.230.2
7.3
42.515.010.88.2
33.119.58.21.9
317.6
256.275.039.712.2
19.04.47.62.8
42.424.9
7.04.7
343.8
276.790.939.629.2
42.925.15.43.5
24.212.95.32.1
481.1
373.1113.149.250.2
68.543.08.63.9
39.619.59.82.3
132.1
80.816.024.8
1.3
28.27.66.97.3
23.115.94.10.7
170.5
142.027.920.74.8
3.5-5.1
4.62.7
25.015.12.33.7
119.3
115.341.23.6
17.1
23.714.83.01.9
-19.8-20.0- 2.8
1.5
183.8
193.763.814.327.0
44.731.73.52.7
-54.6-54.8- 3.6- 2.0
1,849.81,389.9
455.1233.6142.0
263.3157.144.325.2
196.7110.043.816.9
* Flow data at current exchange rates.Sources: Bank of England, ISMA and BIS.
107

the success of a large domestic government bond issue in July may also
have diverted investors away from the Euro-market. The widening of the
ERM bands in August was followed by a narrowing of the yield differen-
tial between French franc and Deutsche Mark government bonds and a
resumption of French franc issues. Apart from episodes of currency tension,
the broadly based decline in long-term interest rates supported issuance
of fixed rate instruments across the board, with prospects for capital gains
seemingly overriding currency considerations in investors' decisions.
The most visible sign in bond markets of tensions within the ERM was
seen in activity in the ECU market, where repayments have exceeded new
issues almost continuously since the third quarter of 1992 and trading on
secondary and futures markets has dropped significantly. At the end of
1993, total ECU Euro-bonds and Euro-notes outstanding amounted to
$98 billion, representing a 27% contraction from the September 1992
peak. Nonetheless, the decline in investor interest does not appear to
have caused market disruption, nor to have prevented the absorption of
a continuing, albeit subdued, flow of new issues by European supranational
and sovereign entities. The spread between the actual ECU yield and that
of the underlying basket of currencies taken individually had become positive
in the summer of 1992 but turned negative again in the early part of 1993,
and was only temporarily reversed thereafter. Wi th the easing of currency
tensions, two developments contributed more recently to improving condi-
tions in the ECU market. On 1st September the Bank of England launched
Predominance ofinterest rateconsiderations
In the ECUmarket the stockof papercontinues todecline
Issuing act ivi ty in the domest ic and
Currencies
All currencies
US dollarJapanese yenDeutsche MarkItalian liraFrench francPound sterlingCanadian dollarSwiss francDutch guilderSpanish pesetaECUOther
nternat ional
Net issues1
Domestic2
1990 1991 1992
985.7
462.8120.5167.068.338.5
-19.722.818.711.74.1
14.776.4
1,185.9
S57.1141.5126.1119.431.624.027.516.313.926.06.9
95.6
1,202.2
573.6141.6188.469.935.837.424.910.314.612.44.1
89.2
1993ir
1,370.9
529.6175.3217.9108.256.077.026.6-0.316.151.53.6
109.41 For domestic bonds, changes in amounts outstanding at constantexchange rates. 2 Issues by residents in local currenc)Turkey. 3 Issues by residents in foreign markets and inSources: Bank of Englanc
bond ina rke ts
International3
1990l billions
132.1
39.526.89.26.07.8
16.11.67.4
-0.31.6
11.25.1
exchange
1991 1992of US dollars
170.5
37.920.611.29.3
15.920.614.15.40.93.0
26.25.4
119.3
36.05.9
20.56.2
21.811.27.4
-6.74.71.6
10.30.4
1993
183.8
40.720.527.69.6
34.127.220.4-2.8
6.03.9
-4.20.7
Amountsoutstanding at
end-1993Domes-
tic2
15,561.7
7,301.83,397.01,353.3
738.2546.1328.0327.2179.6173.9143.352.5
1,020.8
Inter-national3
1,849.8
722.2252.0184.129.592.4
146.380.5
149.932.910.690.059.5
; rates; for international bonds, flow data at currenti in the local market only; OECD countries only,foreign currency in
, ISMA, national authorities and BIS.the localmarket.
excluding Iceland and
108

Internat ional long and sho r t - t e rm interest rates
Monthly averages, in percentages and percentage points
Long-term1 Short-term2
Long-term differentials
1992 1993 1994 1992 1993 19941 Yields in annual terms on five-year interest rate swaps. 2 Three-month Euro-market interest rates.3 Long-term rates minus short-term rates. 4 Vis-à-vis German long-term rates.
Abrupt reversalof marketsentiment at thebeginning of1994...
a new ECU clearing facility, offering same-day settlement for ECU-denominated
paper, in order to enhance market liquidity and promote an ECU repo
market, and towards the end of the year several governments announced
their intention to increase issuance in ECUs in 1994.
Coincident with the decision by the US Federal Reserve on 4th February
1994 to raise the federal funds rate there was an abrupt change in market
sentiment worldwide. This sharply reversed the buoyant conditions which
had prevailed in the primary market for international bond issues. Whereas
total announcements in January exceeded the 1993 monthly average by
74%, they fell to 17% below that average in February-March. Within the
market, there was a partial shift away from fixed rate to FRN issuance.
At the same time, the offloading of paper on the secondary market
pushed trading through international clearing houses to new highs. Trans-
actions in interest rate futures and options also reached record levels, as
a result of the liquidation or adjustment of large outstanding positions in
109

the new interest rate environment. Capital losses were particularly signif-
icant for some structured FRNs (notably those including floors on interest
payments, which lost their value when actual rates increased) and for Latin
American issues, thus raising questions about market liquidity and price
formation.
Type and residence of international securities issuers
As in 1992, governments and state agencies were the major issuers in the
international securities markets. Altogether, they accounted for 37% of the
expansion in the total stock outstanding. The most active borrowers were
from Canada, Sweden, Italy, Denmark and Finland. Together with the placing
of domestic issues with non-residents and measures to enhance marketability,
the increasing recourse of governments to international markets is part of
an overall policy to enlarge the absorptive base for their debt, reduce
borrowing costs and increase debt management flexibility. Most noteworthy
in this regard has been the development of large individual global and Euro-
bond issues, of EMTN programmes with multi-currency drawing options,
and of the trading of domestic government paper through international
clearing houses.
In the case of the private sector, market expansion was driven by
drawings under Euro-note facilities, as record gross bond issues by non-
financial corporate borrowers were nearly matched by repayments of past
issues. In particular, the upsurge in new international bond issues by Japanese
companies, to $54 billion, should be seen in relation to the $93 billion of
maturing (mostly equity-related) Euro-bonds from such entities. On the other
hand, a marked increase in both gross and net borrowing was recorded
by French, German, Dutch, US, Swedish and Canadian entities, reflecting,
in the United States and Canada, a recovery of demand from the corporate
sector and, elsewhere, high funding requirements of banks and other financial
institutions. In the case of French private entities, net new borrowing was
overwhelmingly denominated in the national currency, as remaining domestic
restrictions continued to favour Euro-French franc issuance.
Faced with subdued borrowing demand from the corporate sector in
most major countries, large repayment flows and substantially smaller returns
from prime names, investors sought higher margins by lending to lower-
quality borrowers. Thus, developing country borrowers more than doubled
their net issuance of international debt securities last year, from $12.5 billion
to $29.2 billion. Within the group, Latin American names were again predom-
inant, with Mexico raising $9.6 billion, Argentina $6.7 billion and Brazil
$5.4 billion. While public sector entities were generally able to achieve
better terms, a number of private names made their debut in the market,
although with considerable differentiation in issuing conditions and, towards
the end of the year, some general resistance by investors to reduced
margins relative to benchmark issues. At the same time, Asian borrowers
(from South Korea, China, Thailand and the Philippines in particular) stepped
up their borrowing, and this movement tended to gather pace in the course
of the year. Until recently, Asian borrowers had relied heavily on bank
... with majorcapital losses
Increasingrecourseof public sectorentities to themarket
Issues of bondsby non-financialcorporateborrowersalmost fully offsetby repayments
Broadening of therange of issuersto include manynew LDCborrowers
110
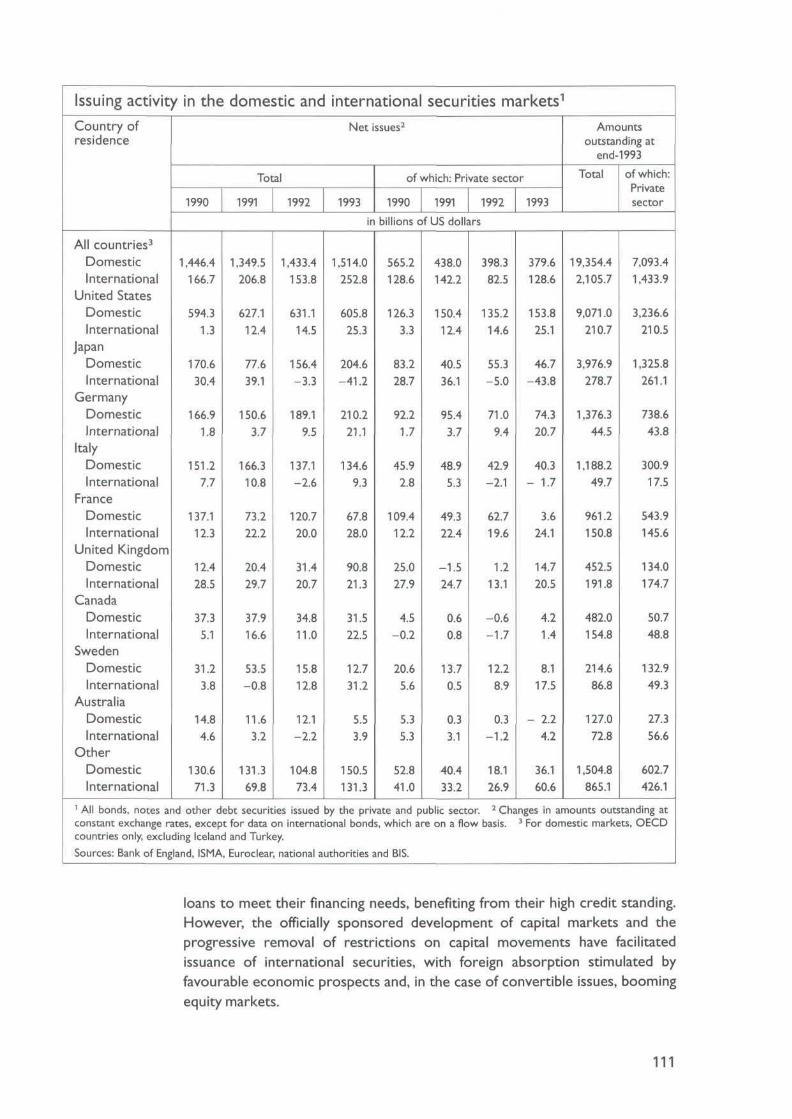
Issuing activity
Country ofresidence
All countries3
DomesticInternational
United StatesDomesticInternational
JapanDomesticInternational
GermanyDomesticInternational
ItalyDomesticInternational
FranceDomesticInternational
United KingdomDomesticInternational
CanadaDomesticInternational
SwedenDomesticInternational
AustraliaDomesticInternational
OtherDomesticInternational
1
1 All bonds, notes and
in the
1990
,446.4166.7
594.31.3
170.630.4
166.91.8
151.27.7
137.112.3
12.428.5
37.35.1
31.23.8
14.84.6
130.671.3
domestic and international securities markets1
Total
1991
1,349.5206.8
627.112.4
77.639.1
150.63.7
166.310.8
73.222.2
20.429.7
37.916.6
53.5-0.8
11.63.2
131.369.8
1
other debt securitiesconstant exchange rates, except for data oncountries only, excluding Iceland and Turkey.Sources: Bank of England, ISMA
1992
,433.4153.8
631.114.5
156.4-3.3
189.19.5
137.1-2.6
120.720.0
31.420.7
34.811.0
15.812.8
12.1-2.2
104.873.4
1
issued by
Net!
1993in
,514.0252.8
605.825.3
204.6-41.2
210.221.1
134.69.3
67.828.0
90.821.3
31.522.5
12.731.2
5.53.9
150.5131.3
ssues2
of which: Private sector
1990billions
565.2128.6
126.33.3
83.228.7
92.21.7
45.92.8
109.412.2
25.027.9
4.5-0.2
20.65.6
5.35.3
52.841.0
the private andinternational bonds, which
, Euroclear, national authorities :ind BIS.
1991of US dollars
438.0142.2
150.412.4
40.536.1
95.43.7
48.95.3
49.322.4
-1.524.7
0.60.8
13.70.5
0.33.1
40.433.2
public sector.are on a flow
1992
398.382.5
135.214.6
55.3-5.0
71.09.4
42.9-2.1
62.719.6
1.213.1
-0.6-1.7
12.28.9
0.3-1.2
18.126.9
1993
379.6128.6
153.825.1
46.7-43.8
74.320.7
40.3- 1.7
3.624.1
14.720.5
4.21.4
8.117.5
- 2.24.2
36.160.6
Amountsoutstanding at
end-1993Total
19,354.42,105.7
9,071.0210.7
3,976.9278.7
1,376.344.5
1,188.249.7
961.2150.8
452.5191.8
482.0154.8
214.686.8
127.072.8
1,504.8865.1
of which:
Privatesector
7,093.41,433.9
3,236.6210.5
1,325.8261.1
738.643.8
300.917.5
543.9145.6
134.0174.7
50.748.8
132.949.3
27.356.6
602.7426.1
2 Changes in amounts outstanding atbasis. 3 For domestic markets, OECD
loans to meet their financing needs, benefiting from their high credit standing.
However, the officially sponsored development of capital markets and the
progressive removal of restrictions on capital movements have facilitated
issuance of international securities, with foreign absorption stimulated by
favourable economic prospects and, in the case of convertible issues, booming
equity markets.
111

The marke t f o r derivat ive inst ruments
Organised and over-the-counter (OTC) derivatives markets both grew rapidly
in 1993. Activity continued to be supported by a number of secular factors
such as the globalisation of investment, the proliferation of new exchanges
and products, a deepening of the user base and expansion of securitisation
and structured transactions. Contributory cyclical and other short-term
factors included bull markets in stocks and fixed income securities and high
currency volatility. An abrupt change in sentiment in bond and equity markets
in February and March this year led to record turnover on many exchanges.
Derivatives exchanges continued to list new contracts and extended the
maturity of existing ones. Competition between exchanges in Europe remained
keen, while in the United States organised exchanges attempted to capture
OTC business by introducing instruments replicating some of the features
of OTC contracts. Nevertheless, in the OTC markets themselves growth
continued unabated. While market participants continued to work on new
structures and procedures aimed at reducing counterparty risks, several
studies were published which addressed the issue of risks in OTC markets
(see page 117 below).
Exchange-traded instruments
Turnover of financial futures and options contracts on organised exchanges
continued to increase at a rapid pace in 1993, with the number of contracts
traded rising by 22%. As a result of a further strong expansion in activity
outside the United States (34%, compared with 12% in the United States)
non-US exchanges caught up with their US counterparts. In fact, leaving
options aside, the volume of trading outside the United States substantially
Rapid growthin both organisedand OTCmarkets ...
... withcompetition andinnovationcontinuing ata rapid rate
Non-USexchange tradingin futures andoptions catchesup with that inthe United States
Markets f o r selected der ivat ive inst ruments
Instruments
Exchange-traded instrumentsInterest rate futuresInterest rate options1
Currency futuresCurrency options1
Stock market index futuresStock market index options1
Over-the-counter instruments2
Interest rate swapsCurrency swaps3
Other swap-related derivatives4
Notional principal outstanding1988 1989
1,306.0895.4279.211.648.027.844.0
1,010.2319.6
1,768.31,200.6
387.915.650.141.872.2
1,502.6449.1
1990 1991n billions of US dollars
2,291.71,454.1
599.516.356.169.796.0
3,450.32,311.5
577.5561.3
3,523.42,157.11,072.6
17.861.277.3
137.4
4,449.43,065.1
807.2577.2
1992
4,640.52,902.21,385.4
24.580.180.7
167.6
5,345.73,850.8
860.4634.5
1993
7,839.34,960.42,362.4
29.881.1
119.2286.4
1 Calls and puts. 2 Data collected by the International Swaps and Derivatives Association (ISDA) only; the two sides ofcontracts between ISDA members are reported once only; excluding instruments such as forward rateoptions, forward foreign exchange contracts and equity and commodity-relatedcurrencies; including cross-currency interest rate swaps. 4 Caps, collars, floors
derivatives. 3 Adjustecand swaptions.
Sources: Futures Industry Association, various futures and options exchanges, ISDA and BIS calculation
agreements, currencyfor reporting of both
5.
112

Der ivat ive financial inst ruments t raded on organised exchanges
Instruments
Interest rate futures
On short-term instrumentsof which: Three-month Euro-dollar rates^
Three-month Euro-yen rates2
Three-month Euro-DM rates3
On long-term instrumentsof which: US Treasury bonds4
French government bonds5
Japanese government bonds6
German government bonds7
Interest rate options8
Currency futures
Currency options8
Stock market index futures
Stock market index options8
Totalof which: In the United States
In EuropeIn Japan
Annual turnover of contracts
1989
201.0
70.246.84.77.6
130.872.815.019.15.3
39.5
27.5
20.7
30.1
101.7
420.4286.264.445.7
1 Traded on the Chicago Mercantile Exchange - International
1990 1991 1992in millions
219.1
76.039.415.23.1
143.178.216.016.49.6
52.0
29.1
18.9
39.4
119.1
477.7310.383.060.6
230.9
84.847.776.24.8
146.169.927.772.912.4
50.8
29.2
22.9
54.6
121.4
509.8300.7Î7O.566.2
330.1
130.866.97 7.472.2
199.377.737.712.118.9
64.8
30.7
23.4
52.0
133.9
634.9339.4185.051.7
1993
427.0
166.870.226.921.3
260.280.736.815.628.1
82.9
38.0
23.8
60.7
141.8
774.2379.0255.957.8
Notionalprincipal
outstandingat end-1993in billions
of US dollars
4,960.4
4,627.02,7 78.67,080.7
427.2
333.432.612.6
136.033.3
2,362.4
29.8
81.1
119.2
286.4
7,839.34,328.91,819.91,193.6
Monetary Market (CME-IMM), Singapore Mercantile Exchange(SIMEX), London International Financial Futures Exchange (LIFFE), Tokyo International Financial Futures Exchange (TIFFE) andSydney Futures Exchange (SFE). 2 Traded on the TIFFE and SIMEX. 3 Traded on the Marché à Terme International de France(MATIF) and LIFFE. 4 Traded on the Chicago Board of TradeNew York Futures Exchange (NYFE) and Tokyo Stock Exchangeand CBOT. 7 Traded on the LIFFE and Deutsche Terminbörse
CBOT), LIFFE, Mid-America Commodity Exchange (MIDAM),(TSE). 5 Traded on the MATIF. <(DTB). 8 Calls and puts.
Sources: Futures Industry Association, various futures and options exchanges and BIS calculations.
Traded onthe TSE, LIFFE
Strongest growthin interest ratecontracts
exceeded US trading. Growth was particularly rapid in Europe and certain
non-OECD countries, especially on recently established exchanges. The
increase in trading was most pronounced in interest rate contracts and,
with turnover rising by 29%, their share in total financial derivatives activity
increased from 62 to 66%. The sharp rise in trading of interest rate
contracts in Europe reflected factors such as the growing use of such
instruments for the active management of financial risk, demand for enhanced
liquidity in domestic bond markets and the continuing process of interna-
tional portfolio diversification. In addition, trading in financial derivatives
was mutually reinforcing to the extent that position-taking in traded options,
swaps and other OTC instruments often generates a series of hedging-
related trades in the underlying futures markets.
Trading in currency futures grew at a faster pace than in 1992 (24%).
However, much of the increase reflected expansion in a narrow range of
contracts, principally those in yen and Brazilian cruzeiros. Activity in exchange-
113

traded currency options rose only marginally (2%). Wi th much of the
activity in currency-related derivatives conducted in OTC forward and
options markets, the strong pressures which persisted in European currency
markets were reflected only minimally in trading on organised exchanges.
Nevertheless, some increase in activity was recorded for certain exchange-
traded contracts on European currencies. For instance, the widening of
ERM fluctuation bands in August was followed by a tripling of trading in
French franc options on the Philadelphia Stock Exchange. Futures and options
on stock market indices increased by 17% and 6% respectively. In Japan,
however, activity continued to be weak, with a 27% decline in the combined
turnover of such instruments.
Over-the-counter markets
Interest rate and currency swaps. In the first half of 1993, the latest period
for which data on new contracts are available from the International Swaps
and Derivatives Association (ISDA), the notional value of new swaps increased
by 27% relative to the second half of 1992 to reach a new record of
$2,095 billion. Of this, interest rate swaps accounted for $1,938 billion and
currency swaps for $157 billion, representing rises of 29% and 8% respec-
tively over the previous six-month period. Growth in the volume of interest
rate swaps rebounded following a slowdown in the second half of 1992,
while currency swaps expanded again after a year of contraction.
Within the interest rate swaps sector, very buoyant growth in non-dollar
currency segments led to a further decline in the share of dollar business
(from 43 to 40%). The large volume of non-dollar business may have reflec-
ted interest rate uncertainty in Europe and the further development of
swaps in Europe and Asia. Swaps with maturities between five and eight
years staged a strong comeback, following a contraction in the second half
of 1992. The revival of activity in the currency swap market was principally
the result of increases in contracts involving the yen and the US dollar.
However, new contracts arranged in the first half of 1993 remained below
the peak reached in the second half of 1991. There was a significant increase
in the average size of currency contracts, suggesting that a relatively high
proportion was related to large international bond issues, in which such
swaps tend to involve larger amounts than in hedging transactions.
Other swap-related derivatives. Following a pause in the second half
of 1992, business in swap-related instruments, such as caps, floors, collars
and swaptions, rebounded sharply in the first half of 1993, with a partic-
ularly strong expansion taking place in swaptions. Much of the increase was
linked to the large volume of structured Euro-bond and EMTN issues. For
example, structured FRN issues including features such as caps and collars
rose from $2.8 billion in 1992 to $19.1 billion in 1993.
Another indication of the scale of activity in OTC derivatives markets
was provided by the record volume of business in warrants on stocks,
fixed income securities and commodities. According to private sector data,
the aggregate value of warrant issues increased from $9.8 billion in 1992
to $49.1 billion in 1993. Although a large proportion of this was linked to
Currency-relatedcontracts tradedprimarilyoff exchanges
Interest rateswaps expandrapidly ...
... especiallyin non-dollarcurrencies
Revival ofcurrency swaps
Sharp increasein swap-relatedderivatives
Growingpopularity ofwarrants ...
114

Markets f o r selected der ivat ive inst ruments t raded over the counter 1
Instruments
TotalInterest rate swapsCurrency swaps2
Other swap-related derivatives3
New contracts arranged1990 1991 1992
HI1992H II
1993HI
Amountsoutstandingat end-1992
notional principal in billions of US dollars
1,769.31,264.3
212.8292.3
2,332.91,621.8
328.4382.7
1,768.01,318.3
156.1293.6
1,949.01,504.3
145.8298.8
2,605.01,938.5
156.8509.7
5,345.73,850.8
860.4634.5
1 Data collected by ISDA only; the two sides of contracts between ISDA members are reported once only; excluding instru-ments such as forward rate agreements, currency options, forward foreign exchange contracts and equity and commodity-related derivatives. 2 Adjusted for reporting of both currencies; including cross-currency interest rate swaps. 3 Caps, collars,floors and swaptions.Source: ISDA.
... and ofstructuredsecurities withderivativefeatures
Competitionbetweenexchanges inEurope
European equities and bonds, there were a significant number of issues
on individual stocks or baskets of stocks of firms in developing countries.
Warrant issues are generally sold to retail investors who have no access
to organised exchanges or who are from countries where markets for
equity derivatives are not yet developed. They also allow investors to take
tailored exposures to particular equity markets to an extent which would
not be possible through organised exchanges or equivalent OTC options.
Buoyant activity and the increasing number of intermediaries have reportedly
deepened liquidity and reduced price premia over OTC options.
Last year also saw a strong expansion in the issuance of structured
securities in an attempt to preserve current income in a context of declining
yields. For instance, some securities were offered with higher initial coupons
but with principal repayment linked to financial indices such as stock market
indices. In addition, the greater flow of cross-border equity investment,
combined with the high degree of uncertainty prevailing in currency markets,
spurred the development of products which allow investor participation in
foreign equity markets while removing the attendant foreign exchange risk.
The widening of the ERM bands in August also generated greater interest
in products such as options on baskets of ERM currencies.
Other market developments and policy issues
Competition between exchanges remained intense in 1993. This was most
evident in Europe, where LIFFE continued to take advantage of London's
central position in global cash markets by expanding its listing of instru-
ments related to foreign securities. Meanwhile, a number of other European
exchanges attempted to strengthen their competitive position vis-à-vis LIFFE
by entering into mutual cooperation agreements and extending the range
of products offered. As an illustration of the first element of this strategy,
the MATIF in France and the Deutsche Terminbörse (DTB) in Germany
established a trading partnership providing for reciprocal trading of certain
interest rate contracts. One example of the second leg of this strategy
was the introduction by the DTB of a Deutsche Mark interbank contract
115
sharing some of the characteristics of LIFFE's Euro-DM contract. The DTB
also introduced a long-term contract (on 15 to 30-year Bunds and Treuhand
bonds) following the German Government's decision to resume issuance
of longer-term bonds.
In the United States exchanges concentrated on creating products and
services that would enable them to compete more effectively with OTC
markets. The Chicago Board Options Exchange (CBOE) introduced so-called
"flex" options on equity indices which offer some of the features of
customised OTC instruments, such as the possibility to select strike price,
term (up to five years) and exercise type (American or European), while
at the same time providing the benefits of reduced counterparty risk and
the price transparency offered by exchange-traded instruments. The CBOE's
innovation was taken up by other US exchanges with contracts on equity
indices and US Treasury securities. Such contracts could improve the liquidity
of options markets by facilitating the entry of new (lower-rated) counter-
parties. Meanwhile, the Chicago Mercantile Exchange (CME) and Singapore
Mercantile Exchange (SIMEX) introduced currency contracts designed to
replicate OTC foreign exchange cash transactions. The CME's "rolling spot"
contracts, for instance, allow firms to replicate spot transactions but without
automatic settlement after two days (as is the case in the cash market)
and without the exchange of gross amounts. By netting profits and losses
on intraday trading, the settlement of transactions through an exchange
should reduce the number and volume of interbank transactions and therefore
delivery risks. The posting of margins at the exchange should also substan-
tially reduce counterparty risks.
Concerns about rising counterparty exposures in OTC markets have
in recent years led market participants to respond in a number of ways. These
include: the development of master agreements incorporating netting provi-
sions; clauses providing for the termination of contracts in the event that
a counterparty is downgraded, certain exposure thresholds are reached, or
other adverse changes occur in a firm's financial condition; the imposition
of collateral requirements on outstanding OTC positions; periodic marking
to market and settlement of open positions; the reduction of credit lines
to lower-rated counterparties and the capping of exposures to better-rated
ones; and the establishment of separately capitalised derivatives subsidiaries.
While several of these measures have served to reduce counterparty
risks, concerns remain regarding the implications of collateralisation and
termination clauses, since in periods of financial market instability it may
be very difficult to evaluate collateral needs or to obtain the required
collateral. Furthermore, imposing or raising collateral requirements in the
event of a downgrading of credit ratings or financial market turbulence
could accentuate the price volatility of the pledged financial assets. Finally,
while derivatives subsidiaries have been established with complex legal and
operating frameworks to shield them from the risk of bankruptcy of the
parent company, doubts remain as to whether they would be generally
immune from the contagion problems besetting conglomerate structures in
the event of difficulties at affiliates.
US exchangesintroducecontracts tocompete withOTC markets
Measurescontinue to betaken by marketparticipants toreduce risks ...
... but concernsremain
116

Discussionsconcerning OTCclearing housesare pursued
Published studiescall for...
... improved riskmanagement andtransparency
Need forbroader analysisof policy issues
Discussions about the establishment of clearing houses for OTC deriva-
tives trading continued last year. If properly designed, such facilities could
substantially reduce counterparty risks in OTC derivatives. However, there
are technical and practical obstacles to extending the clearing house concept
to OTC markets, owing to the customised nature of transactions and a
lack of agreement concerning the valuation of many instruments (see Chapter
VIII). Moreover, highly rated counterparties may have limited incentive to
participate in such arrangements. Nevertheless, a number of financial
intermediaries and exchanges began offering clearing services for OTC
products. For example, one investment bank, acting as third-party agent,
introduced a "margining service" for OTC transactions designed to monitor
counterparties' exposure, make margin calls and periodic revaluations of
collateral and provide custodial facilities for the assets pledged. Because of
the sensitivity of financial information pertaining to margin flows, such
margining services may be of greatest use to second-tier participants (such
as pension funds and insurance companies) which do not enter into direct
competition with major commercial and investment banks. The Chicago
Board of Trade (CBOT) also announced plans to introduce a collateral
management service for OTC transactions and may eventually launch a full
clearing house arrangement for semi-standardised swaps. Several other
exchanges are working on similar schemes.
A number of studies of derivatives markets were released by central
banks, regulatory authorities, legislators and market participants in the course
of last year. A report published in July by the Group of Thirty received
particular attention. Prepared mainly by market participants, the report
provided a comprehensive survey of activity in derivatives markets, their
risks and the procedures for managing those risks. It also contained a set
of recommendations on sound practice for dealers and end-users designed
to strengthen risk management and improve market transparency. In addition,
the report called on regulators and legislators to recognise netting arrange-
ments, remove legal and regulatory uncertainties, eliminate tax distortions
affecting the use of derivatives and develop internationally consistent
accounting and reporting procedures. The report concluded that the growth
of derivatives markets had not introduced risks of a fundamentally different
nature from those already present in financial markets. It also argued that
systemic risks had not been significantly aggravated by derivatives activity
and that supervisory concerns could be addressed within existing regula-
tory structures. Although the report was widely welcomed in regulatory
circles for setting out principles of sound risk management, it was generally
felt that a more extensive analysis of the public policy issues raised by
derivatives would be useful. These extend beyond the sound management
of individual firms to include market transparency, customer protection and,
more generally, systemic issues.
Heavy trading losses incurred during the year by some corporate users
of derivative products added to concerns about the way in which these
instruments had been used. It appears that the losses were largely the
result of either inappropriate hedging strategies, inadequate internal control
117

mechanisms (which had allowed fraudulent or unauthorised trading to take
place), outright speculation aimed at boosting income in a context of
declining returns on financial assets, or miscalculation of the tax implica-
tions of derivatives.
These losses and the ongoing debate about the potential risks posed
by derivatives markets have accentuated the need to develop more appro-
priate measures for the exposures which derivatives actually entail and for
the size of markets in comparison with cash markets. The report on Recent
Developments in International Interbank Relations, the "Promisel Report",
published in 1992 by a working group established by the Group of Ten
central banks, had already called for improvements in the quality and
coverage of market statistics on OTC derivatives. At present, data on
derivatives markets are collected by exchanges, various industry groups,
such as the Futures Industry Association and the International Swaps and
Derivatives Association (ISDA), and national regulators (as part of their
supervisory duties). Some information is also available in the published
accounts of market-makers and end-users. Recently, much attention has
centred on the notional amount of swaps outstanding as reported by
ISDA. While the survey conducted by ISDA is currently the most compre-
hensive for swaps and swap-related transactions, the data collected represent
only a partial indicator of OTC market activity. OTC business is much
broader, incorporating forward and option-type instruments on currencies,
fixed income securities and equity assets as well as a vast array of cross-
product swaps and structured securities. In May this year, the Chairman
of the Committee of central bank Governors of the Group of Ten countries
announced that the Committee had approved plans to launch a global
survey of activity in the derivatives markets, to be conducted in conjunc-
tion with the triennial Central Bank Survey of Foreign Exchange Market
Activity, the next of which will take place in April 1995.
Gold
After several years of weak interest, investors in North America and Europe
again found gold to be an attractive investment medium last year. Falling
interest rates, which reduced the opportunity cost of holding the metal,
and volatility in currency and financial markets combined to boost market
demand. Although the recession in Europe weakened demand for jewellery
and other gold products, there was a modest increase in gold consumption
in North America as economic growth gathered pace. In the aggregate, how-
ever, consumption demand fell back from the peak level reached in 1992.On the supply side, mine output increased slightly. The most note-
worthy feature was the unusually large amount of gold disposed of by
official holders. In fact, net sales were larger than in any year since 1979.This was principally because of the settlement of a 400 tonne forward
transaction undertaken by the Netherlands in late 1992 and record sales
by Canada within the context of its long-standing programme of reducing
its official holdings.
Revival ofinvestor interestin gold ...
... met by largesupply fromofficial holders ...
118

Estimated market sources of gold
Items
World production1
South AfricaUnited StatesAustraliaFormer Soviet UnionCanadaChinaBrazilPapua New GuineaOthers
Net supply from official stocks2
Net supply from financial operations13
Total (= estimated non-monetary absorption)
Memorandum items:
Market price of goldin current US dollarsin constant US dollars4
1989 1990 1991 1992 1993in tonnes
2,07060826620428516086
10134
326180140
2,390
2,135605294244270167958434
342
30
235
2,400
2,1606012962362521771107961
348
70
65
2,295
2,2356143292442371601187771
385
305
185
2,725
2,2806203362472441511277662
417565135
2,980
annual averages, in US dollars per ounce
381119
384114
362103
34495
36097
1 As published by the Gold Fields Mineral Services Ltd. (London). 2As reported to the IMF.3 Including gold loans, forward sales and option hedging. 4 Deflated by the US consumer price index(1970 = 100).
... and leadingto some firmingof the gold price
Owing to the buoyancy of investment and speculative demand, prices
firmed (in real terms) for the first time in six years. Quotations rose to
over $390 at the end of the year, 17% above the level at the end of 1992.In the first four months of 1994, gold traded in the $370-395 range. Deriv-
atives markets played an important role in the gold market last year.
Various gold-linked financial instruments allowed investors to take positions
in the market without bearing the costs of holding the physical commodity.
Hedge funds and the proprietary trading desks of the bullion houses were
reported to have been present in the market on a variety of occasions.
Price volatility increased substantially in the spring of 1993 and remained
high up to September. This in turn encouraged dealers who trade their
portfolios actively to pay greater heed to the gold market.
119
V I . M o n e t a r y p o l i c y
Highlights
Last year, monetary policy in the industrial countries reflected the desire
of monetary authorities to permit a gradual recovery of real economic
activity while consolidating and extending the gains that had been made
against inflation.
In the United States policy remained accommodative in 1993 but was
tightened moderately in early 1994 with a view to forestalling a revival of
inflation as the pace of expansion quickened and economic slack dimin-
ished. Elsewhere in the industrial world interest rates continued to fall.
The easing of monetary policy in those countries which had floated or
devalued their currencies in late 1992 or early 1993 continued. The pace
of the easing in Germany took account of slowly abating wage and price
pressures. In other ERM countries the relaxation of policy mainly took
place following the widening of the exchange rate fluctuation bands when
their currencies, after first weakening, recovered against the Deutsche Mark.
Wi th short-term interest rates lower, developments in asset prices
were somewhat more positive in 1993 than in the previous year. The decline
in real estate prices came to an end in some countries and slowed in
others, although the weakness of property prices is still hampering economic
recovery in Japan and many European countries. Bond prices were on a
rising trend for most of the year, and equity prices were also generally
buoyant, with the notable exception of Japan. In early 1994, however,
financial asset prices suffered a setback.
The slow response of economic activity to the lowering of short-term
interest rates and the differences between countries in the maturity and
interest rate basis of financial contracts highlighted by exchange market
turbulence have drawn increased attention to the monetary policy trans-
mission process and illustrated the need for flexibility in the implementa-
tion of policy.
Monetary authorities have nevertheless continued to stress the impor-
tance of price stability as the ultimate goal of monetary policy. However,
their approaches to achieving this objective now differ considerably, particularly
with respect to the use of intermediate objectives and the publication of
quantified inflation objectives.
Monetary policy and economic activity
Last year central banks in the industrial countries faced difficult choices as
to how much they could do to accommodate the recovery of economic
120

Short-terminterest rates
The termstructure ofinterest rates
Developments inmonetary andcredit aggregates
activity without endangering what had been achieved with regard to price
stability. The continued existence of slack in the United States and the
weakening of economic activity in Japan were the major considerations
determining the stance of monetary policy in these countries. In most
European countries, however, policy was in varying degrees constrained by
concern that rapid monetary easing might revive inflationary pressures either
through its direct effect on expectations or indirectly via its effect on the
exchange rate. Differing judgements about the consequences of lowering
short-term interest rates contributed to differences between the stance of
policy in ER.M countries and elsewhere.
Indicators of domestic monetary conditions
Assessing the impact of monetary policy on the economy requires the use
of a range of indicators. Short-term interest rates are the instrument that
is most directly under the control of policy-makers, but they are not neces-
sarily the most important variable affecting economic decisions. The influence
of monetary policy on economic activity also depends on long-term interest
rates, exchange rates and domestic asset prices, as well as the (unob-
servable) effects of policy changes on inflation expectations.
The spread between nominal short rates and bond yields has been
interpreted in various ways. An upward-sloping yield curve indicates that
short-term rates are low relative to their expected average value in the
future and thus that monetary policy is relatively easy. But there is no
mechanical link between policy-induced changes in short rates and the
behaviour of long rates. When reductions in short rates are seen as part
of a credible strategy aimed at achieving price stability, they may be accom-
panied by falls in bond yields. If, on the other hand, they are seen as
reflecting a wish to give greater priority to growth over containing inflation,
they may have the opposite effect. In most countries the impact of changes
in policy-influenced rates on output depends significantly on the behaviour
of long rates, which highlights the importance of credibility in influencing
the response of bond markets to changes in monetary policy. During 1993,
falling short-term rates in Europe elicited a parallel response in long-term
yields, but in early 1994 long and short yields moved in opposite direc-
tions, re-establishing in most countries a positively shaped yield curve.
While the instrument of monetary policy is the control of short-term
interest rates, monetary growth rates have been widely used for judging
the stance of monetary policy. An increasing number of countries, however,
have found the demand for money to be insufficiently stable for monetary
growth rates to be the primary guide for the implementation of policy in
the short run. Changing patterns of intermediation in the financial system
induced both by innovation and by changes in the interest rate environ-
ment have tended to weaken the relationship between the development
of monetary aggregates and the level of final demand. Nevertheless, in many
countries the behaviour of money and credit is assigned a role, sometimes
an important one, as an information variable.
121

Monetary policy and monetary conditions in the largest economies
In lowering short-term interest rates in the United States in the last few
years the Federal Reserve had expressly taken into account unusual financial
constraints on economic activity associated with corporate and household
debt burdens. Although short rates did not fall further in 1993, the declines
in bond yields in the first three quarters of the year facilitated balance-
sheet restructuring by enterprises and households and contributed to a
quickening of interest-sensitive investment spending, which helped to absorb
spare productive capacity. Deposit institutions began to ease tight credit
terms, although their interest rate margins remained wide. Bank lending
Monetary policyin theUnited States ...
Indicators of monetary condi t ions
Real GDP1
Consumer prices12
Broad money13
Bank credit to private sector1
Overnight money market rateReal three-month rate4
Government bond yieldTerm structure5
United States
87 89 91 93 87 89 91 93
122

Indicators of monetary conditions (continued)
87 89 91 93 89 91 931 Changes over four quarters. 2 For the United Kingdom and Canada, RPIX and CPU respectively(see the graph on page 132). 3 For the United States and Italy, M2; for Canada, M2+; for Japan,Mî+CDs; for Germany and France, M3; for the United Kingdom, M4. 4 Three-month money marketrate minus consumer price inflation. 5 Ten-year government bond yield minus three-month rate.
.Japan ...
expanded slowly but non-bank financing in the bond and equity marketswas unusually large. Weak growth of the broad monetary aggregates, partlyreflecting the large placements in bond and share mutual funds, resulted ina further rise in the income velocity of M2. In early 1994, a first upwardadjustment of the federal funds rate left short-term rates still close tothe core inflation rate, but produced a much sharper reaction in bondmarkets.
Overnight money market rates in Japan were brought down furtherin the autumn of 1993, when a weakening of business confidence and invest-ment further undermined growth prospects. Continuing slow expansion ofM2+CDs and a decline in bank credit to the private sector reflected aretrenchment of real investment and balance-sheet adjustments by non-financial corporations, as well as the response of banks to loan losses.Short-term interest rates reached unprecedentedly low levels in nominal
123

terms. However, as consumer prices barely increased and producer prices
actually fell last year, real short rates were probably somewhat higher than
in the United States.
Short-term interest rates in the four largest European economies were
at high levels in late 1992 and early 1993 in relation both to current rates
of increase in consumer prices and to bond yields. In real terms, short
rates fell in both the United Kingdom and Italy after the floating of their
respective currencies. In the British case, the decline took place over about
six months following the floating of sterling, whereas in the Italian case
reductions in rates were more gradual and continued throughout the year.
Short-term interest rates in Germany were lowered in stages as inflationary
pressures eased, and following the widening of the ERM bands real short
rates in France also fell substantially. Bond yields in Germany, France and
Italy were on a generally declining course after mid-1993 and remained
below short rates until early 1994.
The growth of M3 in Germany stayed high in 1993 and the demand
for long-term credit was strong, though demand for short-term credit
weakened substantially. The upsurge in monetary growth in late 1993 and
early 1994 partly reflected special influences linked to tax changes. A quick-
ening of the expansion of M4 in the United Kingdom was associated with
a recovery of bank lending to the personal sector, though companies'
demand for broad money and credit remained weak. In France M3 and
bank credit recorded falls, in response to the weakness of economic activity
but also as a result of shifts in lending and deposits to the financial markets
following changes in the tax treatment of money market funds. Fast growth
of M2 in Italy in 1993 seems to have been largely attributable to declines
in interest rates.
In Canada monetary policy had the twin aims of easing monetary condi-
tions in the face of a large output gap and resisting downward pressure
on the exchange rate that might threaten the stated inflation objective.
Short-term interest rates generally declined during 1993. In the spring of
1994, however, short-term interest rates again rose well above rates in the
United States, despite long-standing inflation differentials in favour of Canada,
as the authorities attempted to limit the weakening of the Canadian dollar.
Bond yields remained higher in Canada than in the United States, appar-
ently because of risk premia associated with political uncertainties and large
budget deficits, especially in certain provinces. Though influenced by pref-
erences of business borrowers and lenders for capital market instruments,
rates of expansion of bank credit and M2+ reflected the slow pace of
recovery.
Monetary policy and monetary conditions in other industrial countries
In many countries interest rate policy has continued to be strongly influ-
enced by developments in exchange markets. In some ERM countries efforts
to defend exchange rates resulted in substantial rises in short-term interest
rates in early and mid-1993. Policies remained cautious after the widening
of the ERM bands, reductions in rates being generally geared to restoring
... Germany,France, theUnited Kingdom,Italy...
and Canada
Monetary policyin ERM countries
124

Shor t and long- te rm interest rates in European count r ies
Monthly averages
GermanyFranceItalyBelgium
_____ Denmark
Three-month interbank rates1
United KingdomSpainNetherlandsPortugalIreland
SwedenNorwayFinlandAustria
I I M I I I I II I II IIGovernment bond yields2
111 [ 1111111111111 n 11111111992 1993 1994 1992 1993 1994 1992 1993
1 For Portugal and Sweden, Treasury bills. 2 Representative (mainly ten-year) bonds.
16
12
Jl
1994
Finland, Norwayand Sweden
interest rate differentials vis-à-vis Germany to pre-crisis levels. By early
1994 currency spreads within the ERM band were comparable to those
that had existed before the widening of bands.
Nominal short-term rates fell below German rates in only a few European
countries in 1993 and early 1994. Apart from the United Kingdom, these
included Finland, whose currency had depreciated but rose in real effective
terms last year, Norway, which held the krone stable against the ECU after
a small depreciation in late 1992, and the Netherlands, whose currency
remained closely linked to the Deutsche Mark. Short-term interest rates in
Sweden declined substantially but remained well above those in Germany.
An assessment of the evolution of monetary policy and monetary condi-
tions has to take account of developments in exchange markets. A decline
in the exchange rate, with unchanged interest rates, represents an effective
easing in monetary conditions. It can add to inflationary pressures, other
125

things being equal, both through its effect on the demand for net exports
and because of the direct pass-through effect of higher import costs.
Over the past two years movements in the real exchange rates of
European countries have diverged substantially. In Sweden and Finland, as
in the United Kingdom and Italy, monetary conditions were eased by depre-
ciation of the currency in 1992-93. In Spain and Ireland, economic activity
was stimulated by ER.M realignments which implied substantial falls in real
effective exchange rates. The real effective exchange rate changed little on
balance over the period in Belgium but appreciated in the Netherlands and
Denmark.
Divergent movements in real exchange rates were a more prominent
feature of developments in the smaller European economies in 1993 than
divergences in real interest rate changes. Since early 1992 real interest rates
in all European countries have fallen on balance. Between early 1992 and
the spring of 1994 short-term interest rates in Belgium, the Netherlands,
Denmark and Spain declined by about 2-3 percentage points in real terms,
broadly in line with the decline in Germany. Real short-term interest rates
in Sweden, Norway and Finland appear to have fallen somewhat more
overall, but in both groups of countries real short-term rates remained
above those in Germany.
While declines in short-term interest rates have helped to pave the
way for economic recovery, long-term interest rates play a large role in
Real in terest rates and real exchange rates
Countries
GermanyFranceBelgiumNetherlandsDenmarkIrelandSpainItalyUnited KingdomSwedenNorwayFinlandJapanCanadaAustraliaSwitzerland
Real short-term interest rate1
level2
March1992
4.97.26.95.77.56.95.76.94.99.37.89.43.15.15.92.7
1993
3.79.15.45.1
13.49.1
10.67.12.54.86.36.22.13.44.11.5
1994
2.64.83.92.34.44.43.24.22.75.44.34.41.14.23.62.6
change3
Real exchangerate change24
twelve months ending in March1993
-1.11.9
-1.5-0.6
5.92.14.90.2
-2.4-4.5-1.6-3.2-1.0-1.7-1.7-1.2
1994
-1.1-4.3-1.6-2.8-8.9-4.7-7.5-2.9
0.20.6
-2.0-1.6-1.0
0.8-0.6
1.1
1993
9.47.72.46.07.6
- 3.7- 9.6-21.5-14.6-25.0- 0.4-25.9
21.0- 5.0- 7.3- 0.1
1994
0.70.4
- 2.70.3
- 3.7- 4.2-16.2- 4.1
1.4- 9.5- 3.3
1.516.8
-10.1- 2.7
4.8
1 Three-month rate deflated by the change in consumer prices over the previous twelve months (forthe United Kingdom, retail prices excluding mortgage interest payments; for Canada, consumerprices excluding food and energy). 2 In percentages. 3 In percentage points. 4 Effective ratescalculated on the basis of unit labour costs.Sources: National data and BIS.
Effect ofexchange ratechanges onmonetaryconditions
Changes in realshort-terminterest rates
Long-terminterest rates
126

Monetary policyin Australia andSwitzerland
The use ofintermediateobjectives inmonetary policy
Policyframeworks nowmore diversified
the financing of households and non-bank enterprises in many continental
European countries, as is discussed below. Interestingly, long-term rates in
most European countries whose currencies had depreciated fell by more
than yields in Germany last year. Indeed the differentials narrowed even in
comparison with their early 1992 pre-crisis levels. This no doubt partly
reflected a reduction in near-term currency risk once depreciation had
taken place, together with growing signs of a relatively modest pass-through
of devaluation to prices. However, robust efforts to resist exchange market
pressures, even when ultimately unsuccessful, and the caution subsequently
displayed in lowering short-term interest rates may have enhanced the
credibility of policy. Moreover, in a number of countries whose currencies
depreciated steps taken to strengthen the institutional framework for
monetary policy, for example by increasing central bank autonomy,
contributed to public confidence in stability-oriented policies.
In Australia a weakening of the real exchange rate until September
1993 and its subsequent strengthening helped mitigate the effects on the
economy of developments in the prices of commodity exports. Overnight
rates were kept unchanged. The effect on monetary conditions in Switzer-
land of a firming of the Swiss franc in real effective terms in late 1993 was
partly counteracted by a lowering of short-term interest rates. Real short-
term interest rates in both countries, whose currencies have long been
floating, remained higher than in the United States.
Moneta ry pol icy and inflat ion
Alternative frameworks for monetary policy
For many years the conduct of monetary policy in most industrial countries
was based on the premise that both price stability and a satisfactory overall
performance of the economy could best be achieved by gearing policy to
an intermediate target which served as a nominal anchor. Stabilisation of
the growth of an appropriately chosen monetary aggregate, given reason-
able stability in the demand for money, or a suitable exchange rate objective,
given a satisfactory economic performance in an anchor country, was seen
as the best way of achieving price stability in the medium and longer run.
Long-run price stability, in turn, was seen as the most conducive environ-
ment for the growth of output, investment and employment. The drawback
that the monetary authorities' ability to employ discretion in responding
to disturbances was thereby limited was thought to be outweighed by the
risk that discretionary responses could be misjudged, or unduly influenced
by political considerations. The use of intermediate objectives to provide
consistency in policy was designed to limit systematic inflationary bias and
to permit a build-up of credibility.
More recently the framework of policy in different countries, and in
particular the use made of intermediate targets and indicators, has become
more diversified. There is widespread agreement that, although monetary
policy can have output effects in the short run, in the longer run it influ-
ences mainly the rate of inflation. Inflation, in turn, has adverse effects on
127

the efficiency of resource utilisation. There is less consensus on how bestto ensure that the goal of price stability is properly taken into account inthe application of policy instruments. The framework within which somecentral banks seek to address this question has changed. Quantified inflationobjectives have been established in the United Kingdom, Canada, Sweden,Finland and New Zealand. Narrow band exchange rate commitments continueto be employed as intermediate objectives in the Netherlands and Austria.ERM central rates remain the focus for policy even in those countries thathave adopted wider margins. Other countries rely on a range of indicators,with less weight having been given to monetary aggregates in the UnitedStates and Japan in the last two years.
Targets for monetary aggregates
Monetary aggregate targets potentially provide a clear policy focus and helpto highlight the responsibility of the monetary authorities with regard toinflation. However, they become less useful when developments in thechosen aggregates are not sufficiently closely related to the ultimate policygoals or cannot be controlled closely by the policy instruments availableto central banks. In the last two or three years, the difficulties faced bycentral banks in using monetary aggregates as targets and indicators haveincreased further as a result of a contraction of deposit institutions' sharein financial intermediation in the United States and Japan, and the impactof exchange market disturbances on monetary developments in someEuropean countries.
Targets or projections for the growth of monetary aggregates havebeen given less emphasis in the United States, Japan and the United Kingdom.Targets for monetary aggregates are still used in Germany, Switzerland,
Published objectives for monetary aggregatesFourth quarter to fourth quarter changes, in percentages1
1993 Objective2
Outcome1994 Objective2
1993 Objective2
Outcome1994 Objective2
United StatesM2
1-51.31-5
M3
0-40.50-4
United KingdomMO
0-45.6
0-4
M4
3-95.93-9
TDNS
4-84.94-8
Italy
M2
5-77.8
5-7
JapanM2+CDs
21.61-23
SpainALP
8.63-7
Germany
M3
4V2-6V27.4
4-6
SwitzerlandCBM
32.8
1
France
M3
4-6V2-1.5
5
Greece
M3
9-1215.2
9-11
Note: TDNS = total domestic credit market debt of non-financial sectors; MO = wide monetary base;ALP = liquid assets held by the public; CBM = central bank money stock.1 For Spain and Greece, December to December; for the outcome in the United Kingdom, twelve-month periods ending in March of the following year. 2 For the United Kingdom and the UnitedStates (TDNS), monitoring ranges; for Japan and, for 1993, Switzerland, projection only. The figuresshown for 1994 for France and Switzerland are medium-term norms. That for France is also areference for the growth of domestic debt. 3 Second quarter to second quarter.
128

Developmentsin monetaryaggregatesinterpretedflexibly
Continued use ofexchange rates aspolicy anchors inERM countries
France, Italy, Spain and Greece. In Switzerland the growth norms for the
monetary base relate only to periods of several years, cyclical or other
deviations being accepted in individual years. The norms to apply as from
1994 for money and domestic credit in France also relate only to the
medium term. In Germany a monetary target has remained central to the
design of monetary policy, though the Bundesbank has long interpreted
short-term monetary developments flexibly in the light of other indicators.
Norms for monetary expansion were assigned an enhanced role as monetary
policy guides, along with other indicators, in Italy and Spain following the
easing of exchange rate constraints on monetary policy; yet overshooting
of the objectives was accepted last year in view of the weakness of the
economy. Clearly the use now made of monetary aggregates in inflation
control strategies entails a large element of flexibility in interpreting monetary
developments.
Norms for exchange rates
Since mid-1992, when exchange rate anchors still formed the basis of
monetary policy in most European industrial countries, five countries have
floated their currencies and adopted other inflation control strategies.
However, the widening of ERM bands last year did not result in member
countries using the additional margin of flexibility to permit an indepen-
dent easing of monetary conditions. As subsequent developments in their
policies and exchange rates indicate, ERM central parities continue to serve
as medium-term policy anchors.
It has long been recognised that fixed exchange rate based policies
call for satisfactory inflation performance in the anchor country and can
give rise to dilemmas when countries' cyclical positions diverge. However,
this did not become a practical consideration in Europe until after German
unification, because exchange rate targets played a positive role in restraining
inflation and cyclical conditions were reasonably consistent. Cyclical diver-
gences became more apparent following German unification and were part
of the reason for the action of countries which floated their currencies in
1992. But the widening of ERM bands in 1993 was more a response to
the difficulties of targeting narrow exchange rate bands in the presence of
large private cross-border capital flows facilitated by the removal of exchange
controls and the growing institutionalisation of private saving.
In most ERM countries the monetary authorities still see advantages
in exchange rate anchors because of the visibility of the objective and the
ease with which public support for it can be mobilised. The systematic use
of exchange rate adjustments to offset cyclical disturbances is inconsistent
with their use as a discipline for monetary policy and an instrument of
economic integration. Wide swings in floating exchange rates have at times
had adverse effects on economic activity, as in Japan last year. Yet as recent
experience has demonstrated, there are also dangers in adopting as an
anchor an exchange rate constraint that cannot be maintained when pressures
emerge.
129

Discretionary demand management and a real interest rate approach
In the absence of reliable intermediate objectives monetary authorities have
to pursue a more discretionary approach, relying on a range of indicators
to assess whether instruments need to be adjusted to keep the expansion
of output in line with non-inflationary rates of resource utilisation. In doing
so they make judgemental allowance for the nature of the disturbances
affecting aggregate spending and economic activity, such as credit supply
constraints and weakness of asset prices, as was the case in the United
States and Japan in recent years. A judgemental approach, however, is
confronted with the twin challenges of taking proper account of the lags
that are at work, and explaining persuasively why policy measures are being
taken ahead of evidence of changes in the inflation situation.
In assessing whether an adjustment of nominal rates can be justified,
it can sometimes be useful to compare the implied level of real interest
rates with what might be considered "normal" as a cycle average. Such an
approach was suggested by the Chairman of the Federal Reserve Board in
testimony to Congress in July 1993.
The underlying idea is that while real interest rates may be held low
or high for a certain period, to combat financial fragility or overheating,
prolonged departures from cycle average levels of real rates will eventu-
ally lead to an overcorrection, thus amplifying the business cycle.
It is, of course, difficult to say what a "neutral" level of real interest
rates might be. In most industrial countries real rates seem to have been
higher throughout the 1980s than in the 1970s, but the extent of the change
and the reasons for it remain controversial. Assessments of equilibrium real
long-term rates for regular use as a monetary policy information variable
would have to allow for cyclical and structural changes due to non-monetary
influences such as expected developments in the government budget and
in the profitability of investment. Fixing real rates at an inappropriate level
could lead to a cumulative inflationary or deflationary process.
The real federal funds rate in the United States seems to have been
negative only for brief periods. The major exception occurred in the mid-
1970s, when, it is now widely agreed, monetary policy was excessively easy
and contributed to the subsequent acceleration of inflation. Last year the
overnight rate was probably negative in real terms in the United States
although it was positive in all other countries. Given the strength of the
economic recovery in the United States, and in the absence of reliable
monetary aggregates to lend support to a timely tightening of policy, it
could plausibly be argued that keeping real policy-influenced interest rates
negative for too long risked contributing to a build-up of inflation.
Judgementalapproaches
Criteria for realinterest rates
Published inflation objectives and indicators of inflation expectations
In recent years explicit medium-term targets for inflation have been published
by the central banks of Canada and New Zealand, and, following the floating
of their currencies, the United Kingdom, Sweden and Finland. In some
cases the targets have been set by or in agreement with the government.
Publication ofmedium-termtargets forinflation
130

Published inflat ion object ives1
1993 Objective2
OutcomeLong-term objective2
UnitedKingdom
Canada Sweden NewZealand
Finland France
December to December, in percentages
1 t2.7<2
IV2-3V21.71-3
4.11-3
0-21.4
0-21.6
22.1<2
1 Target variables: for the United Kingdom, retail prices excluding mortgage interest payments; forother countries, consumer prices. 2The objective shown for 1993 for the United Kingdom appliesfor the remainder of the present Parliament. The long-term objective for Canada applies until 1998.Those for Sweden and Finland apply as from 1995.
Technicalquestions raisedby inflationtargeting
In principle, such an approach could give policy-makers more leeway to
adapt policy to unexpected developments in aggregate demand in individual
countries than exchange rate objectives. The target can be used to express
a conviction that there is no long-run trade-off between output and inflation.
At the same time, the horizon set for the achievement of the inflation
goals can allow for the fact that an excessively rapid reduction in inflation
may have undesirable implications for the level of activity. In the absence
of intermediate objectives to serve as a policy anchor, the intention has
been to gear settings of policy instruments to ensuring that the inflation
target is met.
The publication of inflation targets may help to establish a clearer focus
on controlling inflation as the primary objective of monetary policy, even
when an intermediate target is also announced. A quantification of the final
objective of price stability was published in France in January 1994, together
with medium-term objectives for domestic monetary and credit aggregates.
An inflation objective appears implicit in the 2% allowance made for a
tolerable year-on-year inflation rate in setting the annual targets for M3
growth in Germany.
The quantitative definition of the inflation goal may suggest a firmer
commitment for monetary policy and, if it reduces pressures on the central
bank to engage in fine-tuning, may contribute to a strengthening of cred-
ibility. The credibility of the goal may be reinforced by institutional changes
granting independence to the central bank or otherwise shielding monetary
policy from political pressure.
The technical questions raised by inflation targeting include the precise
measure of inflation to be used and the choice of a target level or range.
Most monetary authorities have in practice chosen the consumer price
index, largely because of public familiarity and its influence on wage-
bargaining. In Canada, New Zealand and Sweden allowance is made for tax
changes or other specified shocks. In the United Kingdom the mortgage
interest component of housing costs, which is largely a reflection of policy-
influenced interest rates, is excluded from the targeted price index. A range,
though less precise than a point target, may for that reason sometimes be
more credible. Figures greater than zero for the inflation objective reflect
a recognition of measurement error and bias in price indices, as well as
131

the practical problems that would arise from generalised falling prices. In
general, where countries have published targets, the mid-point or maximum
of the range has been 2%.
Given the long lags between changes in the settings of policy instru-
ments and inflation, means must be available to the central bank for ensuring
timely and appropriate adjustment of instruments. In the absence of
intermediate objectives the approach may rest partly on forecasts of the
relationship between instrument settings, aggregate demand pressures and
inflation, or may rely heavily on a single indicator such as the exchange
rate, as is the case in New Zealand.
In Canada and New Zealand recorded inflation rates fell to the lower
end of the target ranges in 1992, partly as a result of protracted recession
in major export markets and, in the case of Canada, the impact of struc-
tural changes which weakened economic activity more than expected. In
the United Kingdom, Sweden and Finland a key objective has been to help
ensure that the response of the economy to currency depreciation does
not drive the inflation rate above the target range. The United Kingdom,
which was the first of these three countries to adopt an inflation target,
seems to have been relatively successful so far, and inflation fell to the
middle of the target range by early 1994. In general, however, it is too
early to judge how effective inflation targeting strategies will prove in
containing an acceleration of inflation as economic activity strengthens.
In the United Kingdom and Sweden emphasis is placed on improving
the transparency of the policy process and on helping market participants
distinguish between transitory and lasting influences on inflation. A central
role is played by inflation reports published by the central bank. These
Inflationoutcomes andtargets
Inflation ou tcomes , forecasts and targets
Year-on-year percentage changes
United Kingdom
RPIX1
Projection
_L
Canada
1990 1992 1994 1996
Consumer price index (CPI)- CPlex2
• Target range mid-point
1990 1992 1994 1996
Note: For the United Kingdom the shaded area represents the central projections plus or minus theabsolute average error on consumer price inflation projections since 1985.1 Retail price index excluding mortgage interest payments. 2 CPI excluding food and energy.
132

Implied one-year forward rates*
In percentage points
United Kingdom Germany
I I I I I I I I 1*1 I I I I MItaly Japan
March 1992March 1993Sept. 1993Dec. 1993March 1994
i I I I I I I10 4 7
Years
10
12
10
10
France
United States
I I
10
12
10
I I I I I I I10
* Calculated from yield curves for government bonds in the months shown. For example, the one-year forward interest rate five years ahead is the yield on a one-year bond issued in five years thatequalises the return between investing today in a six-year bond and investing today in a five-year bondand, upon maturity, investing in a one-year bond. Methods of calculating underlying yield curves differfrom country to country.Sources: National data and BIS estimates.
Forward interestrates and inflationexpectations
include central bank forecasts of inflation in the light of current policies,based on assessments of developments in wage costs, the exchange rateand asset prices and prospective changes in demand pressures. The forecastfor inflation one or two years ahead can indicate whether meeting theobjectives seems to call for policy changes.
Private forecasts are also used to give timely warnings of any build-up of inflation expectations. Close attention is paid to opinion surveys anddevelopments in forward interest rates embedded in the term structure ofinterest rates. Such forward rates are potentially useful but are not alwayseasy to interpret. Declines in near-term forward rates such as those recordedbetween early 1992 and late 1993 in many European countries probablyreflect expectations about official responses to cyclical developments. How-ever, the substantial falls in distant forward interest rates such as occurredin the United Kingdom over the same period suggest a fall in long-terminflation expectations. This interpretation is supported by a decrease from
133

about 6% to around VA% in the inflation expectations component
calculated from a comparison with distant forward rates for price-indexed
government securities. Small declines in distant forward nominal rates were
recorded last year in Italy, as well as in Japan, Germany and France, where
inflation prospects seem to have been regarded as relatively favourable for
some time. The renewed increase in forward rates in all countries in early
1994 is difficult to interpret but it may suggest that the earlier falls should
not be attributed entirely to declines in inflation expectations.
Monetary policy and asset prices
In recent years the impact on economic activity of large falls in real estate
prices, following a boom in the late 1980s, has been a significant consid-
eration in the framing of monetary policy in the United States, Japan and
many of the European countries whose currencies were floated. Large
declines in real estate prices in both nominal and real terms over a number
Real estateprices andmonetary policy
Nominal and inflation-adjusted real estate prices
Countries andcities
United StatesJapanUnited KingdomCanadaAustraliaGermanyFrance1
SwedenNorwayFinland
United States2
TokyoLondonToronto3
SydneyFrankfurtParisMilanMadridStockholmOsloHelsinki
Nominal prices
1988 1989 1992 1993
Inflation-adjusted prices
1988 1989 1992 1993indices, 1986 = 100
Residential property prices
114.5134.9146.5138.3138.8100.5117.6133.9117.7152.2
119.9157.8177.1155.9165.898.5
129.4157.4109.1185.8
132.9150.6165.9158.5182.5150.5149.9171.389.2
121.8
135.6143.5161.7161.0185.8149.5147.2153.191.3
112.9
106.1133.8134.1127.4119.399.0
110.9121.5101.5139.1
106.0153.1150.4136.8132.594.4
117.9134.189.9
159.3
103.8134.9117.2123.8130.4130.5125.0118.266.791.7
102.9127.0112.5123.5130.4124.6120.2100.966.883.2
Commercial property prices: major cities
107.1165.9164.6124.2177.8140.9117.6132.7203.9162.2110.8160.8
1 New housing. 2 North-East.Sources: National daté and BIS e
107.9173.9160.0136.3187.3193.4144.2167.3292.9183.893.5
189.2
71.9136.569.2
104.282.1
199.3119.9201.0177.094.665.5
121.6
68.1111.573.391.073.6
182.5104.9170.2112.175.767.1
118.2
99.2164.6150.7114.4152.9138.8110.9120.6184.8147.195.5
147.0
95.4168.7135.8119.6149.7185.4131.3143.1248.6156.677.1
162.23 Price index for offices in Ontario.stimates;
various private real estate associations.
56.2122.348.981.458.7
172.899.9
144.4125.465.249.091.6
51.798.751.069.851.7
152.185.6
117.175.949.949.187.1
For commercial property prices, Jones Lang Wootton and
134

Buoyancy ofshare prices in1993
Declines in bondand share pricesin early 1994
of years in several countries worsened debt burdens, created situations of
negative household equity and induced balance-sheet adjustments in the
private sector. They also resulted in a tightening of credit supply conditions
by banks and other financial institutions. By last year there were signs that
the long residential property cycle was turning, with renewed rises in house
prices becoming evident in the United States, the United Kingdom, Canada
and Australia. In Sweden a period of falling house prices came to an end.
However, in Japan and some continental European countries, where the
peak in house prices was reached more recently, prices appear to have
continued to fall last year.
The legacy of overbuilding of commercial property stemming from
the earlier upswing in property prices has been particularly severe in the
United Kingdom and some Nordic countries and continues to depress non-
residential property prices in a wider range of countries. Indications of a
resumption of commercial building activity appeared last year in some of
the countries which had entered the property cycle first, including Canada
and the United States. In the United Kingdom the urban commercial property
price index rose in both nominal and real terms but further declines were
recorded in Germany, France and, more particularly, Spain and Italy. In
Japan, where falls in asset prices have contributed to burdening banks'
balance sheets, the authorities stepped up their efforts to encourage a
restructuring. Budgetary measures taken to assist the construction sector
were designed to help moderate the fall in property prices.
In the United States, the buoyancy of share prices evident for several
years proved remarkably resilient in 1993. It could be viewed as a channel
through which monetary ease supported a recovery of economic activity.
In Europe the widespread recovery in share prices from their September
1992 troughs continued in 1993, the rise being generally most pronounced
in some countries where monetary conditions were eased through currency
depreciation as well as by declines in interest rates. In Sweden, Norway,
Finland, Spain and Italy the increase was far greater than in Germany or
France. Share prices in Japan remained fragile last year, the upturn which
began in early 1993 being largely reversed in the autumn in response to
disappointment about the outlook for the economy and the appreciation
of the yen.
Following their strong showing in 1993 share prices in many industrial
countries weakened in early 1994 amid fears that the protracted decline
in long-term interest rates was coming to an end. The turnaround in share
prices was accompanied by a marked increase in volatility.
In the United States, where bond prices had begun to decline in
September 1993, the sharp fall recorded between February and April 1994
following the first tightening of monetary policy in the present economic
recovery reflected concerns about the risk of a build-up of inflationary
pressures in a context of greater than expected real growth.
The rapid responses of other financial markets to rises in bond yields
in the United States are more difficult to explain, given the absence in
Japan and many European countries of clear signs of an economic recovery.
135

Nomina l and inf lat ion-adjusted s tock prices
Countries
United StatesJapanUnited KingdomCanadaGermanyFranceItalySpainSwedenNorwayFinland
Nominal pricesJune1990
129.0136.2124.1100.4132.0132.6108.5120.9185.5211.1128.6
Sept.1992
March1993indices
149.878.5
122.693.4
100.8117.452.587.498.6
109.052.7
161.277.9
150.0102.1111.6130.172.499.8
140.8150.891.0
March1994
Inflation-adjusted pricesJune1990
, first quarter 1987
166.192.6
171.6122.7135.9142.694.8
140.2203.2227.0170.4
110.9127.698.286.4
123.4119.990.4
100.9148.0177.9106.8
Sept.1992
= 100
118.469.588.274.787.099.938.663.469.286.340.6
March1993
125.368.9
108.080.693.7
108.852.071.295.4
117.469.0
March1994
125.980.8
120.896.7
110.5117.665.495.2
135.4174.9128.7
Somewhat reminiscent of the worldwide break in share prices in October
1987, the simultaneous falls in bond prices in many markets in early 1994
have been widely ascribed to a correction of earlier large rises associated
with major increases in cross-border position-taking.
Transmission of moneta ry pol icy
The monetary policy transmission mechanism has recently attracted increased
attention. Three factors have helped to prompt the renewed interest. First,
real economic growth in the present recovery has appeared to respond
more slowly than on earlier occasions to the relaxation of monetary
policy. This has led to some concern that the ability of lower interest rates
to stimulate aggregate demand has been reduced. Secondly, the turbulence
in the European foreign exchange markets between mid-1992 and mid-1993
has raised the question of how far short-term interest rates can be used
to defend exchange rate parities without adverse effects on real economic
activity. Thirdly, different countries appear to respond differently to monetary
stimuli. This raises the question of whether there are dissimilarities in the
transmission mechanism across countries and, if so, what the implications
are for monetary policy coordination. While differences in the transmission
mechanism do not in themselves prevent the coordination of monetary
policy, such coordination needs to reflect the diversity in economic struc-
tures that exists.
Monetary policy affects macroeconomic developments in several ways.
By influencing real interest rates, it has a direct impact on the saving/invest-
ment choices of households and firms. Monetary policy also operates through
a cash-flow channel by affecting the disposable income of the private sector.
As a result of the financial deregulation and the marked increase in the
gross indebtedness of firms and households in a number of countries during
the 1980s, the cash-flow implications of monetary policy have become
increasingly important in recent years.
The cash-floweffects ofmonetarypolicy havebecome moreimportant
136

The cash-flowchannel dependson:
the structureof indebtedness;
theresponsivenessof interest ratesto policy;
The extent of the impact of monetary easing on the cash flow of the
private sector is illustrated by the experience of the United Kingdom and
the United States. The process of easing of monetary policy in the United
Kingdom that started at the end of 1990 led to a reduction of over 40%
in the ratio of gross interest payments to nominal GDP in the private non-
financial sector between the third quarter of 1990 and the third quarter
of 1993. In the United States the relaxation of monetary policy between
1989 and 1993 significantly reduced gross interest payments by the private
sector. Interest payments by the non-financial corporate sector relative to
nominal GDP fell by 30% over the same period, while interest payments
by households relative to nominal GDP fell by 18%.
The cash-flow channel
The cash-flow channel of monetary policy transmission derives from the
effect of changes in nominal interest rates on interest payments made and
received by firms and households. An increase in the interest rate will raise
nominal interest payments and, even if it simply matches an increase in the
inflation rate, will generally worsen borrowers' cash-flow positions. If
borrowers are unable to finance the higher debt service costs, either from
current income or by additional borrowing, firms and households will reduce
their expenditure on goods and services.
The importance of the cash-flow effect depends critically on three
factors: the net indebtedness of individual firms and households; the respon-
siveness of the interest rates that apply to the private sector's assets and
liabilities to changes in the short-term interest rates through which central
banks implement monetary policy; and the ability of firms and households
to increase their borrowing.
The structure of indebtedness in the economy plays an important role
in determining the size of the cash-flow effect. However, even if the
household sector is a net holder of interest-bearing assets, an increase in
interest rates does not necessarily have an expansionary effect on consumer
expenditure. In the first place, adjustments in interest rates paid and received
may not take place at the same time following a change in monetary policy.
Secondly, within the household sector, creditor and debtor households may
exhibit asymmetric behaviour: net debtors are more likely to be credit
constrained, while net creditors may have a lower marginal propensity to
consume out of changes in disposable income. The likelihood that the
responses of firms and households to changes in the debt service burden
will be larger in the case of net debtors than in that of net lenders suggests
that data on net interest payments by the household or corporate sector
(which make no distinction between interest paid by net borrowers and
interest received by net lenders) may not fully capture the importance of
the cash-flow channel.
The second major factor determining the cash-flow effects of monetary
policy is the responsiveness of the interest rates set by banks and in capital
markets to changes in the rates controlled by the central bank. Since the
importance of the cash-flow channel probably hinges disproportionately on
137

the behaviour of net borrowers, the degree to which the interest rates
that apply to the stock of borrowing by the non-financial sector are affected
by monetary policy is particularly relevant. The importance of the cash-flow
channel therefore depends critically on the maturity structure of borrowing,
and the extent to which contractual lending rates are adjustable. Further-
more, since the responses of interest rates charged by banks to monetary
policy may differ from those of interest rates determined in the capital
markets, the share of bank borrowing in total borrowing is also of relevance
in assessing the cash-flow implications of monetary policy.
The third factor that influences the importance of the cash-flow channel and borrowing
is the extent to which firms and households are able to adjust their constraints
borrowing in response to increases in interest rates. Since the ability to
borrow is constrained by the capacity to service interest payments, the
cash-flow effect is likely to be particularly strong in the case of households
and firms which are already heavily indebted and/or have low net worth.
Increases in interest rates that are accompanied by declines in asset prices
which erode borrowers' ability to post collateral will have particularly large
macroeconomic effects, as recent experience in Japan, the United States
and the Nordic countries suggests. Furthermore, changes in asset prices
that affect the value of banks' loan portfolios, and thus influence banks'
willingness to undertake further lending, also play an important role in
determining the cash-flow effects of monetary policy.
The structure of indebtedness
Because of the limited availability of data on the relative importance of
fixed and variable rate financing, it is difficult to assess how far the structure
of private indebtedness in this regard differs across countries. Moreover,
the distinction between fixed and variable rate lending is itself unclear since
interest rates on some lending classified as fixed rate may be adjusted occa-
sionally, while in the case of variable rate loans the interest rate may be
reset only infrequently, or may be linked to a longer-term capital market
rate which is not very sensitive to the short-term rates determined by
central banks. In addition, since the distinction between short and long-
term lending differs between countries, the data are not easily comparable
internationally. Furthermore, capital market innovations have increased the
scope for borrowers and lenders to use derivative instruments to transform
the character of the stream of payments or receipts under the primary
borrowing or lending contracts.
These caveats should be borne in mind when interpreting the table
opposite, which presents some estimates of the structure of borrowing in
a number of countries. It suggests that there are significant differences ...but appear
between countries. In Germany and France a substantial proportion of significant
lending is at predominantly fixed interest rates. In contrast, variable rate
lending is predominant in the United Kingdom, and is also common in
Japan, the United States and Canada. Differences in the maturity structure
of borrowing appear less pronounced. Wi th the exception of Canada and
the United States, the relative importance of banks as a source of financing
Differences in thestructure ofindebtedness aredifficult toassess ...
138

The structure of indebtedness of the non-financial private
sector, end-1992
Countries
Canada
France
Germany
Italy
Japan
United Kingdom
United States
Shares offixed rate indebtedness*
40% of total loans toprivate corporations.
87% of bank credit tohouseholds; 31% ofbank credit to firms.
53% of bank credit atrelatively rigid rates.
19% of bank loans.
15% of bank lendingto small firms.
47% of all bank credit.
longer-term indebtedness*
42% of total loans toprivate corporations.
68% of companies'indebtedness; 87% ofhousehold indebtedness.
69% of enterprises'indebtedness; 85% ofhousing indebtedness.
37% of companies'indebtedness; 71% ofhousehold indebtedness.
43% of bank loans.
67% of large companies'indebtedness.
60% of corporations'indebtedness; 69% ofhousehold indebtedness.
bank credit
27% of total loans toprivate corporations.
82% of companies'indebtedness.
89% of enterprises'indebtedness.
68% of companies'indebtedness.
74% of corporations'indebtedness.
63% of companies'indebtedness.
30% of corporations'indebtedness.
Note: Stocks of indebtedness, excluding trade credit and equities. Based on national data; definitionsdiffer between countries; figures should be regarded as estimates.* For the United States, mortgages and bonds.Sources: Central banks and BIS estimates.
A highproportion oflong-term fixedrate lendingslows down thetransmissionprocess and ...
is also broadly similar in the countries included in the table. To the extentthat interest rates set by banks for loans to businesses respond morequickly to changes in monetary policy than those set in capital markets,the fact that firms in Canada and the United States use the capital marketsfor a large part of their financing may tend to dampen the impact ofmonetary policy.
The existence in some countries of a large proportion of long-termloans with fixed interest rates suggests that the average interest rate onprivate debt outstanding evolves sluggishly over time. Even substantial changesin the interest rates that apply to new lending will therefore have only amodest impact on the cash-flow positions of borrowers. Widespread useof long-term fixed rate lending, and the resulting stickiness of the averageinterest rate on the stock of loans, therefore has important implicationsfor the conduct of monetary policy. With interest rates on the outstandingstock of loans largely determined by past lending agreements, the effectsof any given change in short-term interest rates are delayed or, to theextent the policy change is temporary, reduced. On the other hand, increasesin interest rates that are of sufficient duration to become embedded inthe average interest rate on the outstanding stock of loans can exert a
139

contractionary influence on aggregate demand for considerable periods of
time.
The differences between countries reviewed above also raise important
and difficult questions regarding the relationship between financial structure
and long-term economic performance. One such question concerns the
costs and benefits of fixed as against variable rate long-term lending, or,
more precisely, whether interest rate risk is efficiently allocated between
debtors and creditors, and also among individual creditors.
The ability and willingness to assume such risk is likely to vary among
both borrowers and lenders, which suggests that a well-functioning financial
system should allow creditors and debtors to assume the level of interest
rate risk they desire. This can be done by financially sophisticated borrowers
by using interest rate swaps, futures and options. For smaller borrowers,
who typically do not participate in derivatives markets, it is important that
the financial system should offer a sufficiently broad menu of borrowing
contracts to enable them to adjust their exposure to interest rate risk to
the desired level.
It is difficult to know whether borrowers and lenders are exposed to
too much (or too little) interest rate risk, and whether the financial structure
is sufficiently rich to allocate the interest rate risk appropriately. While the
absence of long-term fixed rate lending in many countries suggests that
borrowers assume too much interest rate risk, as illustrated by the recent
experience of mortgage borrowers in the United Kingdom, a prevalence
of long-term fixed rate lending can cause problems for lenders, as indicated
by the difficulties of thrift institutions in the United States. However, the
development of derivative instruments is having the effect that borrowers
and lenders are no longer constrained to accept the amount of interest
rate risk embodied in primary lending instruments.
Monetary policy and interest payments
Further indications of the differences between countries in the importance
of the cash-flow channel can be obtained by studying the responses of
interest payments by firms and households to changes in monetary policy. The
graph opposite shows gross interest payments by households and the non-
financial corporate sector in relation to nominal GDP in four countries for
which relevant quarterly data are available. An interest rate which serves
as an indicator of the stance of monetary policy is included in the graph
to highlight the role of monetary policy. The graph clearly reveals differences
between countries in the responses of interest payments to a tightening
of monetary policy. In Canada, the United Kingdom and the United States,
in which a large proportion of loans tends to be at variable rates, interest
payments appear to respond relatively quickly and strongly to a tightening
of monetary policy. In France, on the other hand, the responses appear
limited and delayed. To the extent that the results for France are repre-
sentative of other countries with substantial long-term fixed rate financing,
the behaviour of interest payments illustrates how financial structure plays
an important role in the monetary policy transmission process.
... affects theallocation ofinterest rate risk
Derivativeinstruments andinterest rate risk
Financialstructure and theresponse ofinterest paymentsto monetarypolicy
140

Interest rates and gross interest payments relative t o nominal G D P
Quarterly averages, in percentage points and percentages
Interest rate1 _ ^ _ Payments by householdsPayments by non-financial enterprises2
United Kingdom France
82 87 92 77 82 87 921 For the United Kingdom, Bank of England Band 1 (bill purchase) rate; for France, Bank of Francetender rate; for Canada, Bank rate; for the United States, federal funds rate. 2 For the UnitedKingdom and the United States, payments by non-financial corporations.Source: Central banks.
Responses ofsectoral interestpayments
A more formal analysis of the data in the graph underlines these
conclusions. The graph overleaf uses the historical information contained
in the graph above to simulate responses of interest payments to a permanent
increase of 100 basis points in the interest rate indicating the stance of
monetary policy. To permit comparability between sectors and countries,
the interest payments are expressed in index form. The graph illustrates
that the pass-through of changes in official interest rates to the cash flows
of both firms and households in the United Kingdom is both rapid and
large. By comparison, in France the pass-through is smaller and more
delayed. Indeed, the interest payments of firms and households in France
appear fairly insensitive in the short run to changes in official interest rates.
It should be noted that the above effects of interest rate changes for France
were obtained from estimates over the period 1976-92. The elimination of
the system of bank credit ceilings in 1987 and the increased liberalisation
of the French financial system suggest that these simulations would tend
to understate the current cash-flow effects of interest rate changes.
The responses of interest payments in Canada and the United States
are, particularly for the corporate sector, larger and quicker than those in
141

Responses of gross sectoral interest payments tointerest rate changes*
Interest payment/GDP ratio prior to policy change = 100
Household sector Non-financial corporate sector
United Kingdom France
8 12 0Quarters after policy change
8 12
Note: Calculated from estimated error-correction models comprising interest payments and interestrates, using the data in the graph on page 141. The estimation periods start in 1976 (for the UnitedKingdom, 1982-84) and end in 1993 (for France, 1992).* Responses to a 100 basis point permanent increase in interest rates.
France, but slower than those in the United Kingdom. The limited pass-through of changes in the federal funds rate to mortgage interest paymentsis notable in the United States, where long-term fixed rate financing ofhousing is still common, despite the increased share of adjustable ratemortgages.
Interest rates and economic activity
The evidence reviewed above suggests that differences in financial structureaffect the extent to which interest payments respond to changes in monetarypolicy. Monetary policy is therefore likely to have a quicker effect on thedemand for goods and services, and hence real economic activity, in countriesin which borrowing is largely at variable interest rates or at short term.Some indications that this may be the case are given in the graph opposite.
The graph shows estimates of how interest payments and real GDPrespond to a 100 basis point increase in a short-term interest rate. Allestimates of economic relationships are sensitive to the choice of data,sample period and methodology. The results should therefore be viewedas illustrative of possible differences between countries in the importance
Responsesof real GDP
142
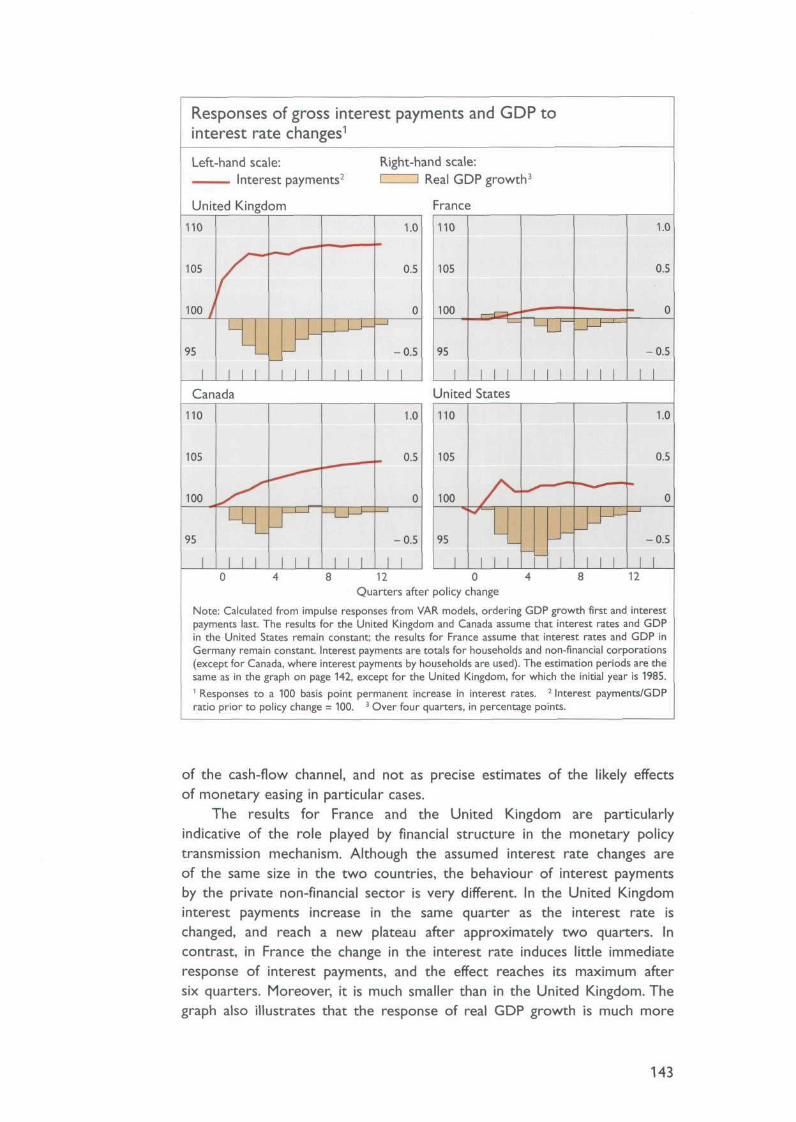
Responses of gross interest payments and G D P to
interest rate changes1
Left-hand scale:Interest payments2
United Kingdom
Right-hand scale:I I Real GDP growth3
France
12 0Quarters after policy change
12
Note: Calculated from impulse responses from VAR models, ordering GDP growth first and interestpayments last. The results for the United Kingdom and Canada assume that interest rates and GDPin the United States remain constant; the results for France assume that interest rates and GDP inGermany remain constant. Interest payments are totals for households and non-financial corporations(except for Canada, where interest payments by households are used). The estimation periods are thesame as in the graph on page 142, except for the United Kingdom, for which the initial year is 1985.1 Responses to a 100 basis point permanent increase in interest rates. 2 Interest payments/GDPratio prior to policy change = 100. 3 Over four quarters, in percentage points.
of the cash-flow channel, and not as precise estimates of the likely effectsof monetary easing in particular cases.
The results for France and the United Kingdom are particularlyindicative of the role played by financial structure in the monetary policytransmission mechanism. Although the assumed interest rate changes areof the same size in the two countries, the behaviour of interest paymentsby the private non-financial sector is very different. In the United Kingdominterest payments increase in the same quarter as the interest rate ischanged, and reach a new plateau after approximately two quarters. Incontrast, in France the change in the interest rate induces little immediateresponse of interest payments, and the effect reaches its maximum aftersix quarters. Moreover, it is much smaller than in the United Kingdom. Thegraph also illustrates that the response of real GDP growth is much more
143

limited in France than in the United Kingdom. While the estimates suggest
that the increase in the interest rate depresses real GDP growth in the
United Kingdom by 0.5% after four quarters, in France the response is
again smaller and more delayed.
The differences in the estimated effects of interest rate changes on
interest payments and economic activity in France and the United Kingdom
highlight the constraints imposed by a preponderance of variable rate
financing on the use of interest rate policy in periods of exchange rate
turmoil. Furthermore, together with the results for Canada and the United
States, the estimates illustrate how the effect of monetary policy on economic
activity depends on the extent to which changes in interest rates affect
interest payments by firms and households, which in turn depends on the
relative importance of long-term fixed interest rate financing.
144
V I I . C a p i t a l f l o w s a n d e x c h a n g e r a t e s
Highlights
Following extensive deregulation and liberalisation over the past decade or
so, international capital movements have increased enormously and now
dwarf transactions on current account. In one respect - namely the freedom
of private sector agents to transact international financial business - the
situation is not entirely unprecedented, though it has never been experi-
enced to the present degree, even before the First Wor ld War. Indeed, in
some respects it is entirely novel, in that the whole pace and complexity of
international capital transactions have been transformed by data-processing
and communications technology, and by the financial innovation which that
has facilitated. The ramifications of these developments are potentially profound
and, in this chapter, are considered in two broad areas.
The first concerns the recent revival of capital flows to developing
countries. This major redirection of capital flows is welcome in that funds
are flowing to areas where the potential real return should be very high.
Major economic reforms and improved performance in the recipient countries
have played a big part in attracting foreign capital. However, three consid-
erations suggest a need for caution. First, if foreign inflows are accompanied
by increases in consumption (public or private) - rather than investment -
they may not be sustainable for very long. Secondly, inflows have in some
cases put upward pressure on real exchange rates and this has contributed
to large current account deficits. There has been substantial exchange
market intervention to counter this pressure. Foreign exchange reserves in
the developing world rose by $240 billion over the period 1990-93 and the
associated increases in domestic liquidity have created difficulties in a number
of countries. Finally, the risk that capital inflows may reverse themselves has
increased vulnerability to macroeconomic shocks in some countries.
The second broad area concerns exchange rate regimes, especially in
the industrial world. The new situation was again graphically illustrated in
the period under review, firstly by the 1993 ERM crisis in Europe, which
resulted in a sharp widening of the mechanism's permitted fluctuation bands,
and secondly, though less spectacularly, by the steep rise in the international
value of the yen. One important difference from the turmoil in European
exchange markets in 1992 and early 1993 was that the latest crisis resulted,
in the end, in remarkably little change in actual exchange rates. Instead,
European policy-makers demonstrated that careful implementation of policy
can help achieve exchange rate stability, even in the absence of binding fixed
rate commitments, at least where the underlying fundamentals are sound.
There may be broader lessons here for the international monetary system
145

in general, and in particular for the merits of different types of exchange
rate arrangements.
One important conclusion, for developing and developed countries alike,
is that a sound and internationally consistent macroeconomic policy framework
has been made even more necessary by the integration of the world's capital
markets. Exchange rates are now much less likely to be kept stable by official
exchange market intervention alone. In the developing world, sound policies
are necessary not just to attract capital inflows per se, but also to help
avoid their undesirable side-effects, and to ensure that the resources provided
are put to the most productive use.
Capital f lows: an ove rv iew
In recent years world capital markets have become more integrated than at
any time since the pre-1914 gold standard period. Indeed a comparison with
that period serves to bring certain aspects of recent experience into sharper
focus. One evident similarity concerns currency convertibility. The scope
of convertibility has been considerably widened during the past decade or
so - both in terms of the number of countries and in terms of the range
of transactions covered. The adoption of effective currency convertibility and
trade liberalisation - important pillars of recent reforms in the transition
economies and in the developing world - have increased the pressure on
countries to set realistic exchange rates. Capital transactions have also been
progressively liberalised. Even as recently as the mid-1970s, currency
convertibility in most industrial countries applied only to current external
transactions; by the early 1990s, however, residents in all major industrial
countries enjoyed almost complete freedom to acquire and dispose of foreign
assets - as they had before 1914. Capital markets in the industrial world are
open to non-residents, and those in the developing world have become
increasingly so. The easing of restrictions on the acquisition of assets by
foreign residents, improved settlement and clearing procedures and reduced
taxes and transactions costs have been the main measures facilitating foreign
investment in developing countries. This has been particularly true in Latin
America; a number of Asian countries continue to restrict foreign investment
in their capital markets.
However, three aspects of the recent period of increased international
capital mobility set it apart from the pre-1914 period of free capital movements:
the monetary and exchange rate regime, the range of financial assets and
the role of institutional investors.
The first, and perhaps biggest, difference is that exchange rates are more
flexible than they were then. In current circumstances, the liberalisation of
capital flows has proved hard to reconcile with fixed exchange rates, as
experience since the breakdown of the Bretton Woods system has shown.
Why did the heavy capital flows in the earlier period not upset fixed exchange
rates? One reason was the much greater credibility of the gold standard
commitment. This meant that only small interest rate differentials were
required to finance current account imbalances: highly interest rate elastic
Increased capitalmarketintegration ...
... convert-ibility ...
... and greaterfreedom ofcapitalmovements
Flexible exchangerates ...
146

... wide range offinancial assets ...
... andimportance ofinstitutionalinvestors
capital flows thus supported the fixed exchange rate. In such a situation
capital mobility helps to stabilise a fixed rate regime as capital flows smoothly
finance ex ante balance-of-payments imbalances. An additional reason why
heavy capital flows were consistent with exchange rate stability in the earlier
period was their orientation towards real investment, often with a high
import content. Hence the transfer of capital could be effected without
putting pressure on the fixed exchange rate. Moreover, it yielded real returns
that could be used to service the debt incurred. These elements are relevant
also for analysing developments in the recent period: where foreign invest-
ment is associated with rising imports, capital inflows will not necessarily
put upward pressure on the exchange rate. For example, a large propor-
tion of Asian capital inflows has been closely linked to increased domestic
investment and imports of investment goods. This has contributed to real
exchange rate stability in the region and has also helped to prevent excessive
increases in domestic liquidity. In Latin America, by contrast, the influx of
foreign capital - dominated by portfolio and short-term financial flows - was
less directly associated with increased imports of investment goods and there
was a greater degree of upward pressure on real exchange rates.
The second difference from the pre-1914 period is the much wider
range of financial assets that can be readily traded nowadays - in domestic
as well as in international markets. Moreover, such assets (notably in different
currencies) have yielded much more divergent real returns than during
the gold standard period. Then, there was less of a need for the financial
diversification and risk-hedging which lies behind the high turnover in modern
securities markets. Total international securities transactions in the six Group
of Seven countries that compile such data amounted to $6 trillion per quarter
in the second half of 1993 - about five to six times the value of interna-
tional trade. As a result, portfolio-related transactions in the foreign exchange
market now dominate trade-related transactions. In the United States, Japan
and the United Kingdom this change had already occurred about a decade
ago; in continental Europe, it has been more recent (see also the table on
page 175). This increased volume of portfolio capital movements has made
foreign exchange markets much more sensitive to changes in sentiment in
financial markets, an important factor behind recent developments in European
exchange rates.
A third difference is the much greater weight of institutional investors.
It was the diversification of institutional investors' portfolios that was a major
driving force of capital flows in the 1980s (see the table overleaf). The
progressive relaxation of restrictions on foreign investment by Japanese
insurance companies during this period set in train a major diversification
into foreign securities. The consequence of this was that for several years
the heavy demand of Japanese investors for foreign financial assets
exceeded Japan's large current account surplus, thus putting downward
pressure on the yen. By 1990 this process of diversification had apparently
run its course. In the 1990s, Japanese institutional investors have sought, if
anything, to reduce their foreign exposure. Institutional investors in a number
of European countries also increased the share of foreign securities in their
147
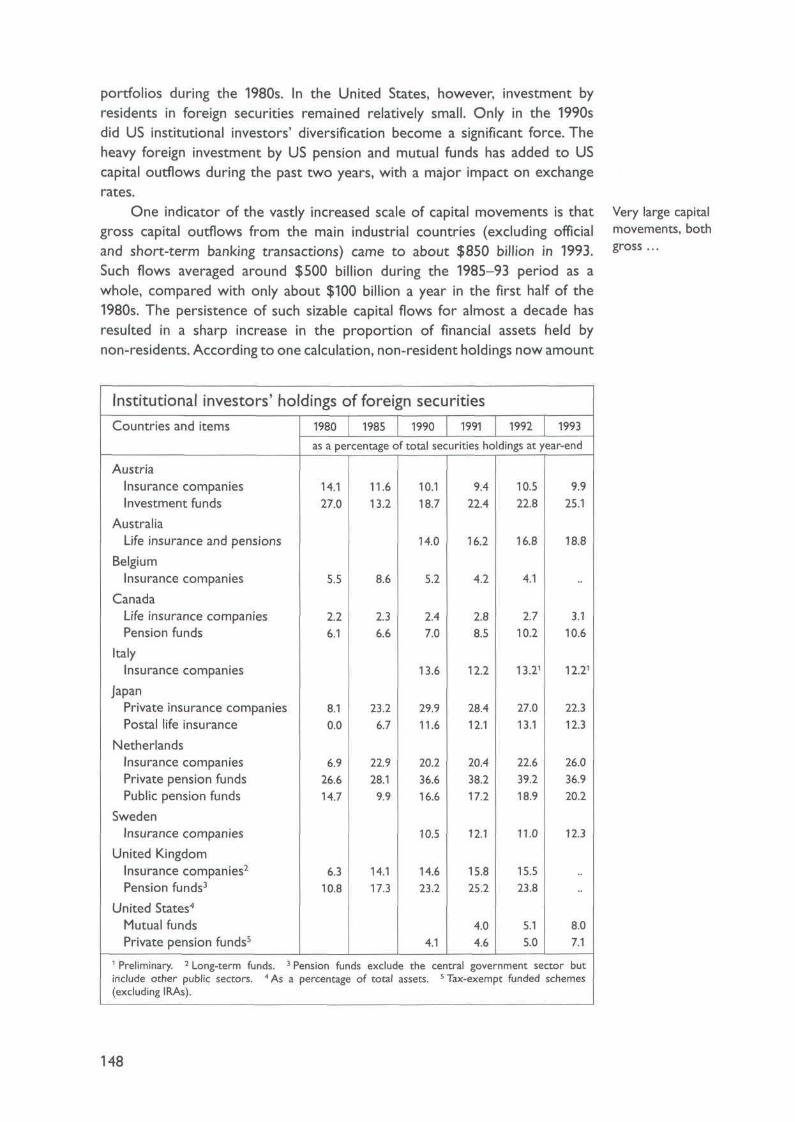
portfolios during the 1980s. In the United States, however, investment by
residents in foreign securities remained relatively small. Only in the 1990sdid US institutional investors' diversification become a significant force. The
heavy foreign investment by US pension and mutual funds has added to US
capital outflows during the past two years, with a major impact on exchange
rates.
One indicator of the vastly increased scale of capital movements is that
gross capital outflows from the main industrial countries (excluding official
and short-term banking transactions) came to about $850 billion in 1993.Such flows averaged around $500 billion during the 1985-93 period as a
whole, compared with only about $100 billion a year in the first half of the
1980s. The persistence of such sizable capital flows for almost a decade has
resulted in a sharp increase in the proportion of financial assets held by
non-residents. According to one calculation, non-resident holdings now amount
Very large capitalmovements, bothgross ...
Institutional investors ' holdings of foreign securities
Countries and items
AustriaInsurance companiesInvestment funds
AustraliaLife insurance and pensions
BelgiumInsurance companies
CanadaLife insurance companiesPension funds
ItalyInsurance companies
JapanPrivate insurance companiesPostal life insurance
NetherlandsInsurance companiesPrivate pension fundsPublic pension funds
SwedenInsurance companies
United KingdomInsurance companies2
Pension funds3
United States4
Mutual fundsPrivate pension funds5
1980 1985 1990 1991 1992 1993as a percentage of total securities holdings at year-end
14.127.0
5.5
2.26.1
8.10.0
6.926.614.7
6.310.8
11.613.2
8.6
2.36.6
23.26.7
22.928.19.9
14.117.3
10.118.7
14.0
5.2
2.47.0
13.6
29.911.6
20.236.616.6
10.5
14.623.2
4.1
9.422.4
16.2
4.2
2.88.5
12.2
28.412.1
20.438.217.2
12.1
15.825.2
4.04.6
10.522.8
16.8
4.1
2.710.2
13.21
27.013.1
22.639.218.9
11.0
15.523.8
5.15.0
9.925.1
18.8
3.110.6
12.21
22.312.3
26.036.920.2
12.3
8.07.1
1 Preliminary. 2 Long-term funds. 3 Pension funds exclude the central government sector butinclude other public sectors. 4As a(excluding IRAs).
jercentage: of total assets. 5 Tax-exempt funded schemes
148

Global net capital
Countries
United States
Japan
Western Europe
Developing countriesof which: Asian NIEs2
Other AsiaLatin America
Note: Changes in net officia
f lows
1976-80 1981-85 1986-90 1991in billions of US dollars, annual
-9.3
-0.3
27.1
15.84.16.4
22.6
55.9
-23.0
2.6
40.93.5
15.212.5
99.7
-63.9
15.3
37.4- 6.022.38.8
-13.5
-90.0
75.0
126.43.5
36.034.2
1992 19931
averages
24.4
-118.9
55.7
143.05.0
48.157.5
41.3
-108.0
- 20.6
159.57.2
50.067.4
monetary position are excluded. A minus sign indicates a capital outflow.1 Partly estimated. 2 Excluding Hong Kong.
... and net
Resumption offlows todevelopingcountries ...
... supplementedby high domesticsavings
to around 20-25% of total outstanding government bonds in the Group of
Ten countries other than Japan. Such holdings are very sensitive to shifts
of sentiment in international financial markets. Economic policies - in
particular attempts to maintain unrealistic exchange rates or inadequate
macroeconomic policies - are now more subject to the sanction of capital
markets.
Net capital flows have also become large (see the table above). In the
1980s, the net movement of funds was mostly between the industrial countries,
with Japan being the main capital exporter and the United States the principal
capital importer. Relatively little capital flowed to the developing world, partly
because the international debt crisis had made foreign investors more reluctant
to invest there. In addition, poor economic policies in a number of developing
countries kept actual returns on investment well below their full potential.
But this pattern was reversed in the early 1990s, with net flows into
the developing world rising to about $160 billion in 1993. Capital was
directed in particular to Latin America (where flows amounted to almost
5% of GDP last year) and to lower-wage Asian developing countries (about
4%). As is discussed in Chapter III, the pursuit in much of the developing
world of policies conducive to sustainable growth served to restore the
classical direction of capital flows. Relative cyclical positions have also played
a role as output has continued to expand in the developing world while
economic activity has been subdued in the industrial world and US short-term
interest rates have remained very low. Unlike the 1970s, the private sector,
not the public sector, has been the main user of funds.
Nonetheless, despite the resumption of capital inflows domestic savings
have played a far more important role in the financing of investment. Aggre-
gate saving/GDP ratios have on the whole been significantly higher than in
industrial countries, largely reflecting very high saving propensities in Asia
(see the graph overleaf). Almost 25% of world savings now comes from
the developing countries, compared with 15% in the early 1970s. The coin-
cidence of strong inflows of foreign capital with much increased domestic
savings in the developing countries means that the recent restoration of the
developing world as a major capital importer is more likely to be sustainable.
149

Global savings"
United StatesOther industrial countriesDeveloping countries
In billions of US dollars As a percentage of GDP
5,000
4,000
3,000
2,000
1,000
28
25
22
19
16
131975 1980 1985 1990 1991 1992-79 -84 -89
1975 1980 1985 1990 1991 1992-79 -84 -89
: At 1992 prices and exchange rates. For 1975-89, annual averages.
Developing countries
Increased capital inflows
Most remarkable in the recent resurgence of investor interest in the devel-
oping world was the scale on which foreign capital returned to Latin America,
where net flows have caught up with those into the Asian developing countries
(see the table on page 149). While inflows into Latin America are dominated
by portfolio and privatisation-related flows, those into Asia have mainly taken
the form of direct investment capital.
As in previous years, around one-half of net inflows into Latin America
went to Mexico, where they were the equivalent of 8% of GDP last year.
Argentina was the second most important recipient, with inflows rising to
7% of GDP. Although there were also sizable inflows into the higher-income
Asian countries - notably Singapore and, more recently, South Korea - the
bulk of flows went to those lower-income countries where industrialisation
is proceeding very fast. Since 1990, Malaysia and Thailand have imported
capital at an average rate of more than 10% of GDP. A new development
last year was a marked rise in investment in India, where foreign capital was
attracted by the liberalisation of enterprise borrowing abroad, progress
towards currency convertibility and other reforms.
The resurgence of inflows in a number of developing countries was
in part due to improved monetary discipline. In particular, higher real
interest rates in Latin America encouraged the repatriation of flight capital,
Inflows intoLatin Americaexceed thoseinto Asia
Short-term flowsattracted by highinterest rates
150
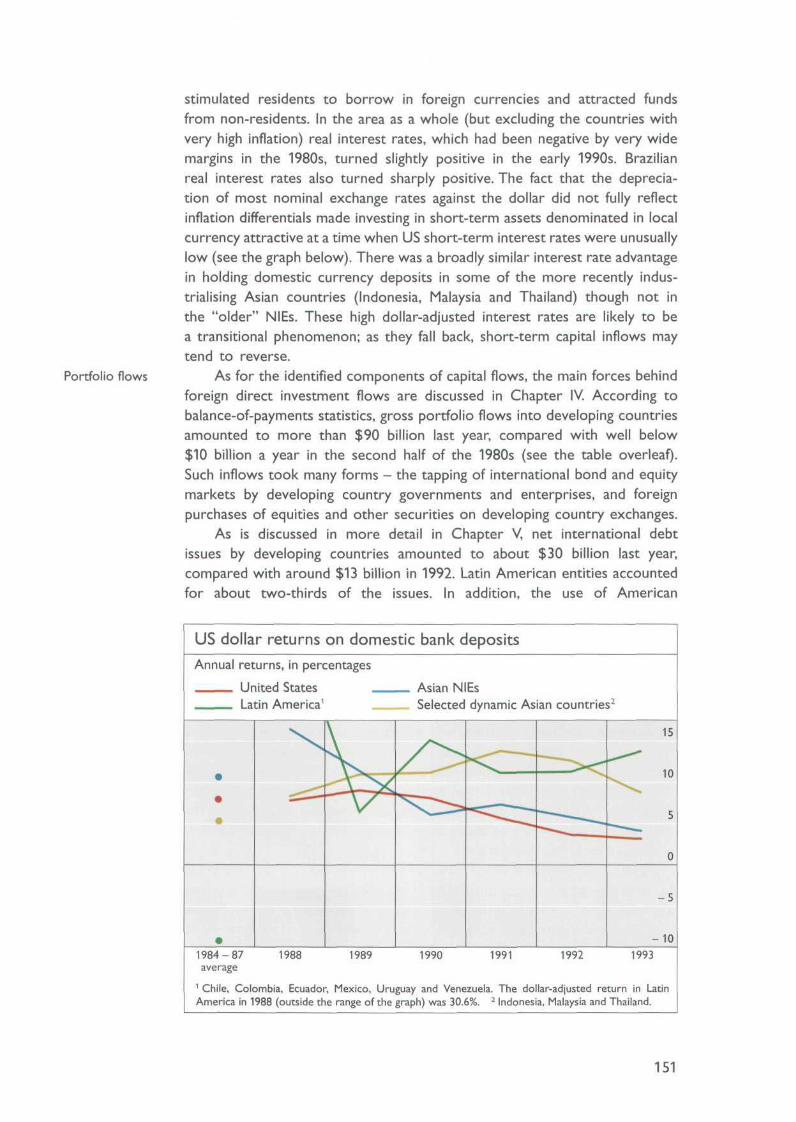
Portfolio flows
stimulated residents to borrow in foreign currencies and attracted funds
from non-residents. In the area as a whole (but excluding the countries with
very high inflation) real interest rates, which had been negative by very wide
margins in the 1980s, turned slightly positive in the early 1990s. Brazilian
real interest rates also turned sharply positive. The fact that the deprecia-
tion of most nominal exchange rates against the dollar did not fully reflect
inflation differentials made investing in short-term assets denominated in local
currency attractive at a time when US short-term interest rates were unusually
low (see the graph below). There was a broadly similar interest rate advantage
in holding domestic currency deposits in some of the more recently indus-
trialising Asian countries (Indonesia, Malaysia and Thailand) though not in
the "older" NIEs. These high dollar-adjusted interest rates are likely to be
a transitional phenomenon; as they fall back, short-term capital inflows may
tend to reverse.
As for the identified components of capital flows, the main forces behind
foreign direct investment flows are discussed in Chapter IV. According to
balance-of-payments statistics, gross portfolio flows into developing countries
amounted to more than $90 billion last year, compared with well below
$10 billion a year in the second half of the 1980s (see the table overleaf).
Such inflows took many forms - the tapping of international bond and equity
markets by developing country governments and enterprises, and foreign
purchases of equities and other securities on developing country exchanges.
As is discussed in more detail in Chapter V, net international debt
issues by developing countries amounted to about $30 billion last year,
compared with around $13 billion in 1992. Latin American entities accounted
for about two-thirds of the issues. In addition, the use of American
US dol lar re turns on domest ic
Annual returns, in percentages
United StatesLatin America1
•
•
•
/
1984-87 1988 1989average
bank deposits
Asian NIEsSelected dynamic
/ \
^ >
1990 1991
Asian countries2
•»«.« «
1992 1993
15
IU
5
0
-5
10
1 Chile, Colombia, Ecuador, Mexico, Uruguay and Venezuela. The dollar-adjusted return in LatinAmerica in 1988 (outside the range of the graph) was 30.6%. 2 Indonesia, Malaysia and Thailand.
151

Por t fo l io capital f lows
Countries
United States
Japan
Western Europeof which: United Kingdom
Developing countries2
of which: Asian NIEs2
Other AsiaLatin America
United States
Japan
Western Europeof which: United Kingdom
Developing countries2
of which: Asian NIEs2
Other AsiaLatin America
1976-80 1981-85 1986-90 1991in billions of US dollars, annual
1992averages
19931
Outflows
5.3
3.4
6.22.3
8.70.70.00.2
6.5
25.0
27.713.5
3.60.20.00.1
13.6
85.9
82.126.6
3.51.20.22.3
44.7
74.3
148.157.6
10.72.30.37.7
48.0
34.4
168.455.4
10.52.30.56.4
125.4
51.7
260.6142.4
20.53.72.0
14.8
Inflows
5.2
5.1
16.72.3
1.90.10.21.3
29.4
12.6
25.93.5
4.10.51.71.2
44.7
26.9
99.124.7
8.20.31.35.4
54.0
115.3
185.534.4
27.94.20.9
22.0
67.2
8.2
221.835.7
50.77.30.4
39.7
103.9
-11.1
396.567.5
91.913.89.7
67.91 Partly estimated. 2 Excluding Hong Kong.
Depository Receipts has made it easier for developing country entities to
raise equity capital in the US market.
But the most important element was increased investment in the emerging
equity markets. These markets have enjoyed a considerable boom in the
last four years, with Latin America recording a particularly vigorous rise.
The picture for Asia was more differentiated, with the more open markets
as well as the newer stock exchanges showing the largest rises. Hong Kong
has played an increasingly important role because it has given foreign investors
the chance to buy into companies with assets in China but at the same time
hold shares that can be readily sold for convertible currency. Share price
increases were relatively moderate in South Korea and Taiwan, where signif-
icant restrictions still inhibit foreign participation. One consequence of some
importance was that this boom took market capitalisation/GDP ratios to
levels at least comparable to those prevailing in the developed world - and
in some cases a good deal higher.
The sharp decline in share prices in early 1994 was a timely reminder
that the emerging markets can be more volatile than markets in industrial
countries. Also, pricing in these markets does not appear to be as efficient
as in industrial country markets in that price movements tend to show more
marked "bandwagon" effects, and may be more subject to speculative bubbles.
Yet the improvement in the economic prospects of much of the developing
world has been such that the incentives for portfolio managers in industrial
countries to diversify into developing country equities remain powerful.
Emerging equitymarkets ...
... arouseenduring interest
152
Capital inflowsmay lead to areal appreciation
Other policiesto counteractexchange ratepressures
Divergent realexchange ratesin Asia andLatin America,owing to ...
In addition, the fact that fluctuations in their prices are not closely corre-
lated with fluctuations in equity prices in industrial countries has made them
appear ideal vehicles for diversification. Moreover, the development of country
funds portfolios managed by professional managers has made it much easier
to invest in many, quite different, markets without detailed knowledge of
the performance of individual companies.
Exchange rates and macroeconomic effects
The revival of capital inflows has enabled highly indebted countries to expand
imports and overall output growth. Capital inflows have also provided a
complementary source of financing for investment, notably in countries with
low income and limited scope for raising domestic saving.
However, not all the effects of net capital inflows are necessarily
favourable. Real effective exchange rates may appreciate, causing a deterio-
ration in the competitive position of the tradables sectors and increasing
vulnerability to external shocks, in particular higher international interest
rates. Exchange rate policies play a key role in transmitting the effects of
capital inflows. Countries which rely on an exchange-rate-based nominal
anchor as the principal anti-inflation instrument and manage to maintain a
stable nominal rate may experience a real appreciation if capital inflows
induce an excessive rise in domestic credit, leading to higher rates of infla-
tion. Countries with more flexible exchange rate policies have some scope
for a temporary absorption of inflationary pressures through a nominal
appreciation of the currency but will, in the face of sustained inflows, also
experience a loss of competitiveness.
Governments may address such problems by using other policies to
counteract upward pressures on the exchange rate. Restrictive fiscal policies,
for instance, reduce the risk of higher inflation. They can also lower nominal
interest rates and so limit inflows that were mainly attracted by a favourable
interest rate differential. Moreover, tight fiscal policies combined with trade
liberalisation and other structural reforms may help to shift demand towards
import-intensive investment, inducing a rise in the current account deficit
and thus attenuating upward pressure on the real exchange rate. The monetary
authorities, through exchange market intervention and sterilisation, can
attempt to insulate domestic credit and money supply growth from capital
inflows and so reduce the risk of inflationary pressures. However, this will
require an increase in government bond issuance and keep domestic interest
rates high, stimulating continued inflows and holding up the fiscal cost of
debt service.
Capital inflows and exchange rate developments. Although capital flows
have recently been of a similar order of magnitude in Asia and Latin America,
in general real effective exchange rates have not risen in Asia during the
1990s as they have in Latin America. This is partly because several Latin
American currencies were undervalued when stabilisation programmes were
implemented, but the difference is mainly accounted for by four other factors.
The first is the very different inflation history of the two regions (see
also Chapter III). Relatively low inflation in countries such as Malaysia,
153

Singapore, Taiwan and Thailand meant that policy-makers could keep nominal
exchange rates fairly stable without having to accept a real appreciation. They
were further helped by the appreciation of the yen, which, given the scale
of their trade with Japan, resulted in a nominal as well as a real effective
depreciation of their currencies. In Latin America, by contrast, high inherited
rates of inflation meant that anti-inflation policies using exchange-rate-based
nominal anchors (as in Argentina and Mexico) led to sizable real apprecia-
tion even though the rate of inflation declined during the period of large
capital inflows. Secondly, nominal exchange rate policies tend to be more
flexible in Asia than in Latin America, and a number of Asian countries have
kept tighter controls on both inward foreign investment and domestic financial
markets. Thirdly, foreign direct investment inflows in Asia have been asso-
ciated with high, and in some countries increasing, real investment, gener-
ating imports of capital goods and, therefore, some offsetting current account
deterioration. Finally, Asian countries have succeeded in sterilising a larger
proportion of foreign reserve increases than have Latin American countries.
Their sterilisation policies, together with remaining (or additional) financial
market and exchange controls, also appear to have left a relatively wide
scope for independent monetary policies.
Exchange rate policies. The exchange rate policies pursued by Asian and
Latin American countries receiving the bulk of capital inflows can be classified
into three groups (see the table opposite): those that have adopted quasi-
currency board arrangements to sustain a fixed rate against the US dollar
(Argentina and Hong Kong); those that have pegged their exchange rates
or maintained a high degree of stability against the US dollar (Mexico, Thailand,
Malaysia and Taiwan); and those that have had more flexible arrangements,
mainly aimed at achieving a stable or depreciating real effective exchange
rate (Chile, Indonesia and South Korea). Singapore is in a category of its
own, having sought a nominal appreciation of its currency to dampen the
effect of import price increases on the domestic rate of inflation. As a result
of this policy the nominal exchange rate has appreciated by some 15% over
the last four years, while the real appreciation has been less than 10%.
Hong Kong is a rather special case in that it has maintained its fixed
exchange rate since 1983. This long period of stability and the sheer size of
the Exchange Fund available to defend the currency (almost $45 billion at
the end of 1993) have given this commitment almost unparalleled credibility.
Argentina has had a currency board arrangement since March 1991. Mexico,
like Argentina, has experienced a marked real appreciation of its currency
because the exchange rate adjustments only partially compensated for the
inflation differential against the United States. Indonesia and South Korea,
by contrast, relying on more flexible exchange rate policies, were able to
offset the effects of their relatively high rates of inflation through nominal
depreciation. Singapore's experience, compared with that of Argentina and
Mexico, provides perhaps the sharpest illustration of the importance of the
lingering effects of past price performance. Wi th a historically very low rate
of inflation Singapore was able to use nominal appreciation to help reduce
consumer price inflation even further.
... differentinflationhistory ...
... and policy-related factors
Features ofexchange ratepolicies indifferentcountries ...
... and theirimplications forreal exchangerates
154

Developments in nominal and real <
selected countries in Latin America
Countries
Argentina
Hong Kong
Thailand
Mexico
Chile
Indonesia
Malaysia
Singapore
South Korea
Taiwan
Brazil
* 812,667 (Argentina) i
NRNRNRNRNRNRNRNRNRNRNR
ind
1985
*
11310011794
1201,095
941851401661801371471021261111009196*65
1,101,613
1989indices,
1,15278
10099
10098
11497
1141051041041021049397
108104104105
2,44090
(Brazil).Note: N = nominal effective exchange rate ordepreciation). R = realas deflator.
effective exchange rate
19911990 =
5113310010610010093
11187
10195999797
104103959999981785
2ffective exchange rates:
and
1992100
491411001101019791
12084
1069195
1021031071058693
1031031.578
exchange rate[decline
Asia
1993
491551001181019490
12875
10688
100101103107106849398980.187
Memorandum item:Exchange rate regime
Pegged to US$ since 1991
Pegged to US$ since 1983
Pegged to basket since 1984
Linked to US$within band since 1987Adjustment based on setof indicators within bandManaged float
Managed float
Managed float
Managed float
Managed float
Independently floating
against the US dollar (decline indicatesindicates depreciation), using consumer prices
Sources: Asian Development Bank, UN Commission forInternational Monetar)r Fund and BIS estimates
Latin /\merica and the Caribbean,
Interdependenceof capital inflowsand exchangerates
Real exchangerates and currentaccount changes
The precise impact of capital inflows on nominal and real effective
exchange rates is difficult to assess as the causal sequence can run both
ways. On the one hand, the exchange-rate-based nominal anchors typical of
Latin American countries, combined with tight monetary policies and the
consequent favourable interest rate differentials, have provided an important
incentive for capital inflows. On the other hand, in certain periods capital
inflows can be an autonomous factor, putting upward pressure on nominal
and real effective exchange rates and forcing the authorities to introduce
special measures, as is discussed further below. Under such conditions some
countries also modified their exchange rate targets, seeking to maintain the
idea of a fixed rate by widening the bands within which the exchange rate
was allowed to fluctuate, or by revaluing the reference rate in the hope that
greater exchange rate uncertainty would deter short-term speculative inflows.
Saving, investment and the composition of capital inflows. Differences in
external current account imbalances provide another reason for the diverse
movements of real effective exchange rates in Asia and Latin America.
155

A b s o r p t i o n of net capital inflows, real exchange rates
and developments in money and cred i t aggregates1
Left-hand scale (in US$ bn):[ ~Z] Current account balancet-~ -«~J Change in reserves
Right-hand scale (1990 = 100):Real effective exchange rate2
Selected Latin American countries3
As a percentage of GDP:
I I Domestic creditr i Net foreign assets
Selected Asian countries
90 921 Unweighted averages. 2 In terms of relative consumer prices. 3 Argentina, Chile and Mexico.4 Singapore and South Korea. 5 Indonesia, Malaysia and Thailand.
As can be seen from the graph above, Latin American countries have expe-
rienced a marked rise in their current account deficits, which seems to
reflect both the real appreciation of their currencies and also other factors
156

Gross domest ic investment and foreign d i rec t investment
in selected developing count r ies
Gross investment (as a percentage of GDP)Foreign direct investment (as a percentage of gross investment)
Argentina Chile Mexico
20
10
Indonesia
h I h
Malaysia Thailand40
30
20
10
86-89 90 91 92 93 86-89 90 91 92 93 86-89 90 91 92 93avg. avg. avg.
Sources: IMF International Financial Statistics and national data.
The influenceof realinvestment...
such as the liberalisation of foreign trade. The principal factor behind the
widening imbalances has been much increased imports rather than falling
exports; there is little evidence of excessive domestic demand growth. Some
Asian countries have also recorded high current account deficits recently
but these coincided with growing capital inflows and took place against a
background of stable exchange rates.
A second striking fact is that investment, which tends to be more
import-intensive than other demand components, has accounted for a much
larger share of GDP in Asia than in Latin America. Investment ratios in Latin
America have shown some increase as capital inflows have been accompa-
nied by stronger private investment, while public investment was cut as part
of fiscal consolidation efforts; the productiveness of aggregate investment
may, therefore, have improved. Nevertheless, in Asia the boom in imports
was more clearly related to strong investment growth, notably in export-
creating manufacturing sectors. The deterioration in the current account
attenuated upward pressure on exchange rates, while investment growth
created the basis for a subsequent narrowing of current account imbalances.
157

The composition of capital inflows has probably also played a role in
determining their macroeconomic consequences. The share of foreign direct
investment in both gross capital formation and capital inflows has been higher
in Asia than in Latin America (see the graph on page 157). But what has
been most important is the nature of foreign direct investment. In Latin
America it has mainly taken the form of debt/equity swaps and privatisa-
tions, which do not necessarily generate additional capital formation. In Asia,
by contrast, foreign direct investment has mostly been in the form of
acquisitions or the setting-up of new enterprises.
One additional source, though mainly of an indirect nature, of divergent
current account and exchange rate movements may be changes in fiscal
policies. Most Asian countries, having had a long tradition of small budget
deficits, had little need for further consolidation in the 1990s. In Latin America,
by contrast, earlier lax fiscal policies were reversed only towards the end
of the 1980s. This fiscal improvement undoubtedly enhanced confidence
among foreign investors and encouraged reflows from residents' accounts
held abroad, thus reinforcing upward pressures on real exchange rates.
Implications for monetary policy
Recent exchange market developments in Latin American and Asian countries
raise two questions. First, by what means have countries been able to
reconcile exchange rate stability objectives with domestic aims of monetary
policy? Secondly, to what extent have the countries which succeeded in
maintaining a relatively fixed nominal exchange rate been forced to surrender
some monetary policy autonomy?
Even in those countries that have removed most foreign exchange and
domestic financial market controls, and which pursue a fixed nominal exchange
rate policy, domestic and foreign financial assets are probably not perfect
substitutes. This provides the authorities with some scope for varying domestic
interest rates relative to those of other countries. In addition, there are
large differences in the extent to which countries have actually removed
capital controls and liberalised financial markets. Hong Kong did so at a very
early stage, and with a completely fixed nominal exchange rate the monetary
authorities probably sacrificed some degree of policy autonomy. This
became evident during the early 1990s when real interest rates turned
negative owing to a combination of low US rates and a relatively high
domestic rate of inflation. As a result, property prices rose sharply, prompting
the authorities recently to consider measures to curb excess demand for
real estate. Singapore also liberalised its financial system early, but opted
for a flexible exchange rate as a means of achieving lower inflation. At the
other end of the spectrum, South Korea and Taiwan have kept a number
of internal and external restrictions and, in addition, have more flexible
exchange rate policies.
Elsewhere effective intervention and sterilisation policies have been
implemented by combining some, albeit limited, exchange rate flexibility with
controls on either capital flows or domestic financial markets. Several countries
apply an exchange rate band rather than a completely fixed rate and can
... thecomposition ofcapital inflows ..
... and fiscalpolicies
Assetsubstitution andinterest ratepolicies
The case ofHong Kong
Sterilisationpolicies andmonetaryautonomy
158

Special measuresin periods oflarge inflows
Conflicts withdomestictargets ...
... but alsocoincidence oftargets
thus pursue an autonomous monetary policy as long as the actual rate is
within the band. In periods of large inflows some of these countries have
widened the band and thus their room for manoeuvre. The composition of
capital inflows and government debt/asset operations may also help. In
Thailand a large proportion of inflows has been in the form of long-term
direct and equity portfolio investment and foreign bank loans. In combina-
tion with remaining financial controls, this has enabled the authorities to
keep the nominal exchange rate within a relatively narrow range against the
US dollar while expanding credit in step with the needs of a rapidly growing
economy. In several Latin American countries capital inflows in the form of
debt/equity swaps and purchases of equities related to privatisation have
essentially been sterilised without any involvement on the part of the central
banks and without any measurable effect on interest rates. Malaysia and
Singapore have absorbed excess liquidity by shifting deposits of the govern-
ment or compulsory saving schemes from private banks to the central bank.
Nonetheless, during periods of exceptionally large capital inflows the
target of maintaining financial stability and international competitiveness has
called for additional, though mostly temporary, measures. In such periods a
number of countries have introduced higher reserve requirements for banks
or negative interest rates on non-residents' deposits (Chile, Malaysia and
South Korea) and have imposed limits on banks' liabilities in foreign curren-
cies (Mexico) or on portfolio investment by non-residents (South Korea and
Malaysia). In some countries, non-residents have been excluded from certain
markets and operations (Malaysia) or policies encouraging capital outflows
have been adopted (Chile, South Korea, Taiwan and Thailand). In cases where
government bond markets were not sufficiently developed the authorities
have relied on sales of central bank bonds and advance repayments of
foreign debt (as for instance in South Korea during 1985-89) have also been
used to insulate domestic credit and liquidity developments from increases
in reserves.
These measures have been quite effective as temporary expedients but
run the risk of distorting financial developments, notably to the disadvan-
tage of banks. There have also been several instances in which capital inflows
and associated downward pressures on domestic interest rates came into
conflict with attempts to reduce inflation and prevent excessive demand
growth. This largely explains Chile's introduction of measures restricting
inflows and encouraging outflows in 1992 when the economy was growing
at 10% and approaching full capacity. Similarly, during 1990-92 Indonesia was
pursuing a tight monetary policy under which relatively high interest rates
attracted foreign inflows. On the other hand, in the course of 1993 some
central banks were helped by a coincidence of internal and external needs.
For example, Indonesia, South Korea and Thailand adopted more expan-
sionary policies and the reduction of interest rates and interest rate differ-
entials helped to stem a rise in capital inflows which might have threatened
price stability. In Singapore higher interest rates directed against overheating
were consistent with the aim of strengthening the nominal exchange rate
and thus dampening the influence of import prices on consumer price inflation.
159

Industr ial count r ies : exchange markets in 1993 and early 1994
The dollar, the yen and the Deutsche Mark
Despite the exchange rate instability experienced from time to time as inter-
national financial integration advanced, the international value of the dollar
was relatively stable during the period from early 1993 to early 1994, its
nominal effective rate fluctuating within a fairly narrow range until a weakening
began during April this year and pressures intensified - at least temporarily
- at the beginning of May. This was in some contrast to the experience
of the previous few years during which the uncertain ebb and flow of
confidence in the US recovery had been positively correlated with more
noticeable short-term cycles in the dollar's value.
More significant than the dollar's overall stability for most of the period
were its contrasting sharp fall against the Japanese yen and rise against the
Deutsche Mark and other European currencies, as well as against the Canadian
dollar. On several occasions the US authorities joined those in Japan to
intervene in the exchange markets against the yen's rise. Thus, taking the
period as a whole, earlier market expectations that a continuing recovery
of the US economy and a decline in interest differentials would strengthen
the dollar proved unfounded. In February-April 1994 the dollar weakened
despite indications of continuing firmness in the economy early in the new
year, and despite steps towards a less accommodative US monetary policy
stance. The latter were accompanied, however, by a sharp fall in dollar bond
prices, greater than for example in Germany, and fears of further falls may
Relative stabilityof the dollaroverall ...
... but sharp fallagainst the yen,offset by a riseagainst someother currencies
The US dol lar against selected currencies
and its nominal effective exchange rate
Weekly averages, third week of February 1987 = 100
1992 1993 1994
160

Official fore ign exchange reserves1
Items
Totalof which:
Industrial countriesAsian NIEsOther developing countries
Total
Dollar reservesof which held:
In the United StatesWith banks outside the US3
Non-dollar reservesof which held with banks3
Memorandum item:Identified reserves in:
Deutsche MarkJapanese yenPound sterlingPrivate ECUFrench franc
1989 1990 1991
in billions
1992 1993
of US dollarsChanges, at current exchange rates
54.4
31.58.1
11.4
125.0
81.111.637.1
43.0
-14.319.554.6
24.4
-25.915.531.9
104.7
28.520.947.9
Changes, at constant exchange rates2
57.2
6.8
-4.11.7
50.47.2
14.010.82.87.32.6
90.9
39.7
19.93.4
51.216.9
10.016.04.1
13.77.4
1 Excluding official ECU holdings. 2 Partly estimated.with banks reporting to the BIS.
42.0
30.8
11.35.8
11.2-29.2
- 8.14.23.92.34.6
46.5
47.5
31.89.1
- 1.0- 6.9
- 7.1- 4.4
4.9-11.0- 1.0
109.3
60.0
78.31.4
49.34.2
38.73.34.13.71.1
Amountsoutstandingat end-1993
962.9
459.8195.0285.7
962.9
577.1
418.095.0
385.895.7
159.592.031.424.818.8
3 Deposits by official monetary institutions
Reversal of therelationshipbetween thedollar and thestrength of theUS economyeventually leadsto coordinatedintervention
Large increase inofficial dollarholdings in theUnited Statespartly offsetsdeficits on UScurrent andlong-term capitalaccounts
have contributed to some shift away from the dollar. In other words, once
the upturn had become sufficiently well established that markets were
persuaded that the trough in the American interest rate cycle had clearly
been passed, the positive relationship between the exchange rate and the
indicators of real recovery was - at least for a time - reversed. The situation
intensified in early May to such an extent that the US authorities led inter-
nationally concerted intervention in support of the dollar, and the Treasury
Secretary announced that the US authorities had no interest in an under-
valued dollar.
During 1993, as the table overleaf shows, the rising US current account
deficit had as its main counterpart net official monetary movements. This was
not the consequence of a decline in reserves, which in fact grew by $2 billion
despite occasional US exchange market intervention. It stemmed rather
from an increase of $78 billion in other countries' official holdings of US dollars
in the United States, in large part reflecting strong reserve growth in
developing countries. It may also have been a result of portfolio shifts into
US Treasury bills, as the already low interest advantage of Euro-dollar deposits
declined further for a time. Private financing (excluding the statistical
discrepancy), by contrast, fell to just $6.7 billion, entirely on account of
161

another large drop (of $47 billion) in banks' net foreign claims as, in particular,
the retrenchment of Japanese banks' international activity continued. Record
capital flows in the form of securities transactions were registered last year,
but resulted in a net outflow of only $21.4 billion - international portfolio
diversification not being confined to US investors. Finally, with growth picking
up in the United States, foreign direct investment inflows rose markedly: in
1992 these had dropped to their lowest level in twenty years, but they
recovered to over $30 billion last year, and the net outflow declined.
A major feature of the period under review was the sharp rise in the
international value of the yen. Between mid-January and mid-August last year
the Japanese currency rose by around 24% against the dollar and by 33%against the Deutsche Mark. It then fell back somewhat during the last four
and a half months of 1993 before strengthening again in the new year to
around its earlier levels, particularly after the breakdown of the US-Japanese
trade talks in mid-February, and again in late April and early May as political
uncertainty intensified in Japan and the dollar weakened more generally. In
real effective terms, this means that the yen has recently been some 70%above its temporary low point in early 1990, or about 30% above its level
in early 1987 following the correction of the dollar's massive overvaluation
in the early 1980s.
Already in March and April of last year, starting to fear too sharp a
rise of the yen, the Bank of Japan reportedly intervened to contain its
Sharpappreciation ofthe yen
The external accounts
United StatesCurrent accountCapital account1
of which:Direct investmentSecurities2
Banks, other than aboveStatistical discrepancy
Net official monetarymovements3
JapanCurrent accountCapital account1
of which:Direct investmentSecuritiesBanks, other than aboveStatistical discrepancy
Net official monetarymovements3
1 Defined as: -(current account +
of the
1989
-101.6118.6
30.946.35.2
- 17.4
- 17.0
57.2- 81.9
- 45.2- 28.0
8.6- 22.0
24.7
net officia
United States and Japan
1990
-91.962.0
20.9-29.732.430.8
29.9
35.8-56.6
-46.3- 5.0-13.6-20.9
20.9
monetar)
1991
- 8.3-13.5
- 5.19.2
- 5.1-15.1
21.8
72.9-90.0
-29.441.0
-93.5- 7.8
17.1
1992 1993in billions of US
- 66.424.4
- 32.419.243.6
- 12.2
42.0
117.6-118.9
- 14.5- 26.2- 73.0- 10.5
1.4
-109.241.3
- 18.7- 21.4
46.826.7
68.0
131.4-108.0
- 13.6- 62.7- 15.0- 0.3
- 23.5
1993 1dollars
-14.74.3
- 1.5- 3.9
9.23.1
10.3
35.9-31.4
- 3.0- 4.4-25.1
4.2
- 4.5
1993 II
-25.77.6
-2.1- 9.7
3.913.5
18.1
31.4-26.5
-3.9-20.9- 4.2
5.3
-4.9
1993 III
-35.017.4
-6.1-25.133.4
7.2
17.6
32.0-18.0
-2.2-2.5
0.3-9.0
-14.0
1993 IV
-33.912.0
- 9.017.20.23.0
21.9
32.1-32.1
- 4.5-35.0
14.0- 0.7
- 0.1
! movements); a minus sign indicates a capital outflow. 2 Including USTreasury securities. 3 Changes in gold and foreign exchange reserves less changes in liabilities to foreign monetary authorities.A minus sign indicates an increasein official assets.
162

Joint interventionundertaken
Bilateral exchange rates against the Deutsche Mark
and its nominal effective exchange rate
Weekly averages, third week of February 1987 = 100
DM per ¥DM per Sw.fr.DM per A$DM per Sch.Nominal effectiverate of the DM
appreciation, after having previously lowered the official discount rate to
2Vi% in February. The US authorities themselves also intervened in modest
amounts. In addition, they issued a statement declaring that "exchange rates
should reflect fundamentals and attempts to artificially influence or manipu-
late exchange rates are inappropriate". Nevertheless, joint intervention was
reportedly undertaken on several occasions up to 8th June, and again in
mid-August following the ERM crisis.
After that the dollar strengthened somewhat, and the yen lost ground
until around the end of the year, partly because of signs of a quickening of
the US recovery, and partly in anticipation of a successful outcome of the
US-Japanese trade negotiations.
Early in the new year however, the yen again turned upwards as US
dissatisfaction with the progress of the trade talks became apparent and it
was assumed, rightly or wrongly, that this would lead to action to strengthen
the yen. This situation became acute in mid-February when the talks actually
broke down, and again the Bank of Japan reportedly intervened to sell yen.
Even so, the yen remained relatively strong and began to rise once more
until in early May concerted intervention was undertaken in support of the
dollar designed to prevent it from falling through the psychologically important
barrier of ¥100.
The $27 billion increase in Japan's non-gold reserves in 1993 reflected
repeated recourse to official intervention. By the end of 1993 Japan's official
holdings stood at $99 billion, the largest in the world.
163

Despite record inflows of portfolio capital into Germany, only part ofwhich was related to the ERM crisis, the overall value of the Deutsche Mark,like that of the dollar, changed remarkably little during the period underreview. As other European currencies had succumbed to overwhelmingspeculative pressures, the Deutsche Mark's nominal effective value hadappreciated by 31/2% during 1992. Last year, however, the Deutsche Markfell slightly on average even though it did rise for a time during the crisisin the European exchange rate mechanism. The crisis, however, did not leadto major or sustained devaluations of other currencies as in 1992 and early1993, although the lira, the Swedish krona and the peseta, inter alia, generallydrifted further downwards.
Even so, for the second year in succession, gross inflows of portfoliocapital into Germany nearly doubled, reaching DM 242 billion. These inflowswere motivated by continuing relatively high levels of interest rates in Germanyand by expectations of future reductions, as well as by the strong specula-tive pressures in the ERM. Gross portfolio capital outflows almost halved tojust DM 40 billion last year. As in 1992, some two-thirds of the portfolioinflows went into public sector bonds. Purchases of domestic bonds byGerman residents channelled through Luxembourg investment funds alsoplayed an important role in inflating both inflows and outflows.
Like the dollar,the DeutscheMark displaysoverall stability
Large grossportfolio capitalflows in Germany
The German external accounts
Periods
1992January-June
JulyAugustSeptember
OctoberNovemberDecember
1993January-June
JulyAugustSeptember
OctoberNovemberDecember
Currentaccount
Capital accountTotal
(includingerrorsand
omissions)
of whichNet direct
invest-ment
Foreigninvest-ment inGermansecurities
Germaninvest-ment inforeign
securities
Commer-cial banks'short-term
trans-actions
Netofficial
HUM H S^^ ¥*\£monetarymovG"merits*
in billions of Deutsche Mark
-18.5
- 7.4- 1.2- 2.0
- 2.1- 0.2- 3.1
-12.9
- 7.8- 5.7- 3.1
- 3.71.1
- 3.1
28.8
8.94.5
84.5
-35.9- 0.9
13.2
-38.1
21.049.9
-29.7
- 8.30.83.9
-8.8
-1.5-1.3-3.5
-0.2-0.6-8.1
-6.6
-1.7-0.8-2.4
-1.0-0.7-6.6
9.7
12.410.432.8
20.68.0
29.6
135.2
30.21.3
19.0
20.213.522.3
-34.4
- 5.7- 2.7
3.2
-11.1- 9.7-10.1
-58.3
- 4.1- 5.3
3.1
- 2.04.8
21.5
56.8
- 8.63.0
33.0
-24.9- 2.2
6.7
-40.0
10.930.8
-29.7
2.0-25.0-51.6
-10.3
-1.5- 3.3-82.5
38.01.1
-10.2
51.0
-13.2-44.1
32.8
12.0- 1.9- 0.8
* Changes in gold and foreign exchange reserves less changes in liabilities to foreign monetary authorities. A minus sign indicatesan increase in official assets
164

The outcomeof the 1992 ERMcrisis as abackdropto the latest one
The introduction of a withholding tax on interest income had much
inflated capital outflows (mainly purchases of Luxembourg investment certifi-
cates mentioned above) from Germany in 1992, but the process seemed to
have run its course by the middle of 1993. Additional changes in the tax
legislation (seeking to capture interest income received from abroad) became
known in September and further reduced the attractiveness of investing in
Luxembourg funds, and even induced brisk net sales of such investment
certificates in the final months of the year.
The large surplus on long-term capital account was to some extent
offset by non-bank short-term capital outflows. Partly reflecting their desire
to avoid the withholding tax on interest earnings, non-bank residents greatly
increased their short-term bank deposits abroad, particularly during the first
quarter of 1993. Nevertheless, banks' short-term cross-border claims also
rose sharply, although major swings took place in the course of the year,
given heavy speculative pressures in the ERM during the summer.
In contrast to Japan's experience, Germany's official non-gold reserves
fell during 1993, by $13 billion. Reserves had been swollen by the turbulence
in the exchange market in the autumn of 1992 and their decline by the end
of 1993 represented a return to more normal levels, despite a temporary
rebound during the 1993 ERM crisis.
The 1993 crisis in the European exchange rate mechanism (ERM)
Last year's Annual Report (Chapter VIII) described in detail the protracted
period of exchange market turmoil in Europe which continued intermittently
through the period then under review up to mid-May 1993, when the
Portuguese escudo and the Spanish peseta were again devalued in the ERM.
By that time, a total of ten European fixed or pegged rate currencies (including
the three non-ERM Nordic ones) had come under unprecedented and repeated
downward attack in the exchange markets (others had of course experi-
enced counterpart upward pressures). And despite record levels of official
intervention, only three - the French and Belgian francs and the Danish
krone - had avoided either devaluation or enforced floating. In all these
cases the authorities considered the so-called "fundamentals" to be sound
as inflation appeared to be well under control and current accounts were
in surplus. Although the international competitiveness of all three countries
had been adversely affected by the aftermath of the 1992 exchange market
turmoil, it had not got out of line with the levels prevailing after the previous
major change in parities in early 1987 (see the graph overleaf); Denmark
was perhaps an exception, but to a relatively minor extent. Therefore by
1993 not only did there seem to be no reason for these currencies to be
devalued, there was also good reason not to depreciate, in that price stability
and the credibility of policy might well have been compromised.
At the same time, however, another outcome of the earlier crises
(in addition to their competitiveness implications) had been to harm the
credibility of rigid exchange rate commitments. In other words, some major
implications of the integration and development of international capital markets
had again been very clearly demonstrated. In this regard the summer 1993
165

Real effective exchange rates *
Monthly averages, February 1987 = 100
FranceBelgiumDenmark
11111 M M ii ii ii ii 11111 IMI I HI1993 1994
In terms of relative unit labour costs.
ERM crisis was not a novel phenomenon; but its outcome has so far been
quite different from those in 1992 and early 1993.
Following the devaluation of the Irish pound at the beginning of February
1993, tensions persisted intermittently in the ERM, with the French franc in
particular near its floor in the narrow band until well into April, as the
Bundesbank cut interest rates fairly steadily but cautiously. The decisive
result of the French elections in late March helped to lift pressure off the
French franc, and a little later the Bundesbank reduced interest rates again.
Indeed, so much did sentiment about the French franc change that the
authorities were able to lower interest rates by 3% in two months and
even, for a time during late June and early July, to permit French short-term
interest rates to fall below German ones. In addition, the positive outcome
of the second Danish referendum on the Maastricht Treaty had added to
confidence more generally. The Danish authorities reportedly made some
purchases of foreign exchange, and both they and the French and Belgian
authorities were able to lower short-term interest rates further. In the case
of the lira - now outside the ERM - a similar opportunity also presented
itself at times during May and into June, in part because of some weakening
of the Deutsche Mark.
Towards the end of June, however, a further rise in French unem-
ployment was announced. This seemed to serve as a reminder to the
markets of the limits to which domestic interest rates could be raised to
defend fixed parities in depressed economies, no matter how sound the
"traditional" fundamentals. Thus, although the Bundesbank gradually reduced
interest rates further, and France, Denmark and Belgium among others all
followed suit, the size of the resulting interest rate changes was necessarily
such that they could not by themselves have been expected to increase
significantly the margin of manoeuvre for combating exchange rate strains.
Indeed it may well be that the episode merely served to underline the fact
Cautious cuts inGerman interestrates areaccompanied, fora time, by largercuts in someother countries
A new crisisthreatens ...
166

Positions of member currencies in the ERM
Weekly averages of deviations from the centre of the bands, in percentages
- 4
1993 1994
Note: On 2nd August 1993 the ERM began operating with 15% margins of fluctuation from unchangedbilateral central rates, with the exception of the Dutch guilder/DM fluctuation band; the shaded areashows the spread between the strongest and weakest currencies since 2nd August and the horizon-tal lines the limits of the narrow band of the ERM in use prior to that date.
... and comesto a head on30th July
that the road to appreciably lower real interest rates in Europe was goingto be a long one, and pressures reappeared.
In the final week of July the French franc started to come under massiveselling pressure and the Bank of France raised interest rates. The sellingpressure also spread to the Danish krone again, as well as to the peseta,the escudo and the Belgian franc. In spite of very heavy official intervention,the tensions continued as the markets waited to see what action the Bundes-bank would take. When expectations as to the scale of German interestrate cuts were disappointed, turmoil broke out in the markets. On Friday,
167

30th July both the French franc and the Danish krone fell to the floor of
the narrow band, from which it seemed that no feasible amount of inter-
vention could lift them, even after the Bundesbank had let it be known that
it would not resist some fall in market interest rates below the discount
rate.
The situation paralleled that in September 1992 in the following sense.
In the face of massive capital flows - rational or not in terms of conven-
tional fundamentals - the defence of narrow exchange rate margins, via
increases in short-term interest rates and intervention, had become simul-
taneously an engine of deflation in already depressed economies, and one
of potentially even higher inflation in Germany. For it was the Bundesbank
alone which could provide the necessary volume of resources for interven-
tion, but only by risking an unacceptable rise in the German money supply
and imposing onerous repayment obligations on countries borrowing under
the very short-term financing facility (VSTF) of the EMS and bilateral credit
facilities. The markets took the view that neither further deflation outside
Germany nor higher inflation in Germany were at all credible policies in the
degree which would have been necessary to counter the potential volume
of currency sales.
After the overwhelming exchange market pressure on 30th July it was
decided over the following weekend to widen temporarily both existing ERM
bands to a pre-emptive ±15%. The Deutsche Mark/Dutch guilder fluctuation
margin remained unchanged at 214%. At the same time, the official commu-
niqué stressed that the existing grid of central rates was still thought to be
"fully justified", and expressed confidence that market rates would soon
approach these parities again.
To back this up, no immediate or significant advantage was taken of the
apparently increased room for manoeuvre in interest rate policy. For example,
the French authorities only gradually lowered the 24-hour rate from 10 to
7%%. Apart from a commitment to the former parities per se, and a desire
to avoid the inflationary consequences of any devaluation, another important
motivation for this policy caution was the need in several countries to attract
capital inflows, in part to meet obligations incurred under the short-term
financial support operations. A further major concern was to keep long-
term interest rates on a downward path. For a time in August and part of
September, this policy orientation was made even more difficult to maintain
as the Deutsche Mark strengthened against the dollar. Nevertheless, the
stance was maintained.
Apart from the fact that the situation was deliberately not exploited to
try to bring about a faster reduction in interest rates, this cautious policy
approach proved remarkably successful. The spread of the former narrow
band currencies around their unchanged central rates increased for a time
to over 8% in August and to almost 9% in September, mainly as a result of
the relatively slow recovery of the Danish krone, due partly perhaps to the
announcement of a relatively expansionary budget in Denmark. The French
and Belgian francs, by contrast, never fell very far and, albeit with some fluc-
tuation, have occasionally risen above the mid-point of the band. This has
Massiveintervention isunable toprevent...
... a large pre-emptive wideningof the ERM'sfluctuationmargins
Thereafter,policies are easedonly cautiously...
168

...and ERMexchange ratesremain relativelystable vis-à-visunchangedcentral rates
A furtherdemonstrationof the power ofcapital flows ...
... to pose anuncomfortablepolicy dilemma
Importanceof sound policiesunderlined ...
been particularly true more recently in the case of the Belgian franc -
although at one point in September interest rates had to be raised again
before, in November, a major austerity package was agreed. The Belgian
franc began to rise quite sharply, and interest rates were then reduced again
in several small steps.
Short-term interest rates have in fact been reduced significantly over
time, in Germany as well as in other ERM member countries, albeit at a
rather slow pace. Finally, reserves have been significantly reconstituted: the
Bundesbank reported that EMS partner central banks had been able to repay
almost all of their intervention-related obligations under the VSTF and bilateral
credit facilities by the end of the year. Support operations by the Bundes-
bank had resulted in purchases of EMS partner currencies equivalent to
almost DM 60 billion ($35 billion) in July, which, while less than during the
September 1992 crisis, had of course been much more concentrated, partic-
ularly on the French franc. The Bank of France later announced that the
whole of the Fr.fr. 107 billion borrowed through the European Monetary
Co-operation Fund had been repaid on 14th January 1994, one month ahead
of schedule.
One of the general lessons to be drawn from the latest European
exchange rate crisis was not new. The crisis simply reconfirmed the fact
that, in today's international capital markets, potential capital flows are of
such a magnitude that they cannot always be credibly countered by official
intervention to maintain a fixed exchange rate commitment. Even where the
"fundamentals" are deemed to be sound, as in the latest episode in Europe,
the underlying monetary policy changes implicitly required to hold a fixed
exchange rate can, apparently, quickly come to be seen as "non-credible" —
especially where unemployment is very high. And for strong-currency coun-
tries, even the mere possibility of an exchange rate change can require policy
changes that risk impairing, not improving, the credibility of the stance of
their monetary policies.
A second lesson was also not new, having already been demonstrated
both at the time of the breakdown of the Bretton Woods system in 1971-73
and again in the ERM in 1992. This is the importance - in fixed rate systems -
of the anchor currency's being sound, not only in terms of low inflation but
also in terms of a background of a well-balanced macroeconomic policy mix.
For the European Community itself the crisis seemed at the time to
imply more far-reaching consequences, political as much as economic, than
the earlier one. The "core" EC exchange rate relationship had apparently
been overwhelmed, and much pessimism was voiced as to the prospects, in
particular for the existing EMU timetable.
Yet in one respect at least, hindsight should now be tempering this
pessimism. While ERM exchange rates have certainly fluctuated since early
August 1993 over a wider range than that of the previous bands, the fluc-
tuations have been quite restrained. In the event - and in contrast to the
outcome of the earlier crisis - the latest one did not in the end result in
a major realignment of real effective exchange rates. Indeed, there might
here be a third lesson to be drawn from the crisis. It is true that one reason
169

Bilateral exchange rates of selected currencies
against the Deutsche Mark
Weekly averages, third week of February 1987 = 100
1992 1993 1994
for the unexpected stability of ERM exchange rates after August 1993 is
likely to have been the restoration of two-way risk in the market. But
another may well have been the careful setting of individual countries'
monetary policies: the fact that, in the circumstances, they could achieve so
much relative exchange rate stability might be taken as an encouraging sign.
Indeed, it raises the question of whether, in today's world, the maximum
possible degree of exchange rate stability might not be achieved by a combi-
nation of sound and internationally coordinated macroeconomic policies in
a context of relatively less constraining, formal, exchange rate arrangements.
The preservation of unchanged central rates may have made this stability all
the more achievable in that it maintained a credible focus for exchange rate
expectations despite the de facto absence of fixed margins. A final lesson
may be that the structural policies needed to bring about a lasting reduc-
tion in unemployment in Europe (see Chapter II and the Conclusion) are
also made urgent by exchange rate considerations. The reason is the role
apparently played by unemployment in influencing market participants' views
about the ability of central banks to keep exchange rates at their desired
levels.
Sterling, the lira and the floating Nordic currencies
During the 1992 exchange market turmoil a total of five European curren-
cies had been forced from a fixed or pegged rate regime to one of floating.
Wi th the exception of the Norwegian krone, all these currencies fell sharply
further during the early months of 1993 before recovering rather fitfully.
Nevertheless, over the period from the start of 1993 to mid-April 1994 as
... anddemonstrated bythe relativelybenign outcomeof the 1993 crisis
Some currenciesforced to float in1992 lose furtherground for a time
170

The Canadiandollar comesunder pressureas policycredibility isquestioned
a whole, the lira and the Swedish krona in particular tended to fall somewhat
further in nominal effective terms. Sterling, too, weakened again during the
first quarter of 1994 as interest rates were reduced further and as renewed
political uncertainties appeared.
In the background, all five countries faced the need to tread a careful
path between, on the one hand, making further cuts in interest rates (see
Chapter VI, page 125) and, on the other, trying to restore their net external
reserve positions without resort to additional depreciation of their curren-
cies, given the inflationary risks involved. But in contrast to the countries
most affected by the 1993 crisis, neither did they make any attempt to push
exchange rates back to their former levels, in part because the cost of doing
so might have been high but also because some correction of their compet-
itive positions had been justified.
The Canadian dollar
The final noteworthy feature of exchange rate developments in 1993 and
early 1994 concerned the Canadian dollar, which continued to decline until,
in March-April 1994, a sharp sell-off suddenly occurred. There were several
factors in the background. For example, earlier Canadian cost and price
performance had been such that, by late 1991, the Canadian dollar's real
effective exchange rate had appreciated by some 25% compared with its
level at the time of the Louvre Accord. By late March 1994, the whole of
this rise had been reversed.
A combination of budgetary (federal and provincial) and political and
constitutional uncertainties (see Chapter II) weighed on the exchange rate.
Then in February 1994 the US authorities began to move to a less accom-
modative policy stance, and the Bank of Canada brought about a very sharp
2% rise in Canadian short-term interest rates in late March and early April.
Perhaps two lessons emerge from this experience. First, the markets
again displayed their potential for imposing pressures for policy discipline.
Secondly, and less reassuringly, the episode demonstrated that, even under
virtually free-floating conditions, the markets can sense, and may possibly
try to exploit, the authorities' room for interest rate manoeuvre in defence
of an exchange rate in an underemployed economy.
171

V i l i . P a y m e n t a n d s e t t l e m e n t s y s t e m s :
t r e n d s a n d r i s k m a n a g e m e n t
Highlights
Payment and settlement systems are to economic activity what roads are
to traffic: necessary but typically taken for granted unless they cause an
accident or bottlenecks develop. Economic transactions give rise to settlement
obligations to be discharged through the transfer of money between the
contracting parties. The organisation and mechanics of this process attracted
no particular attention on the part of policy-makers or market participants
until about a decade ago. Since then, the unprecedented surge in financial
activity, both within and across national borders, and the emergence of
episodes of financial distress have generated considerable interest in payment
and settlement systems.
The spectacular growth in the value of transactions has put pressure
on existing systems; against a background of heightened competition in the
financial industry, it has also radically altered the scale of the liquidity and
credit risks involved. A number of episodes of financial strain, such as the
stock market crash of 1987, have highlighted their potential for propagating
and amplifying financial shocks. The management of payment system risks, at
both firm and system-wide level, is now high on the agenda of public author-
ities and private agents. In recent years a broad range of initiatives have
been taken with a view to ensuring the efficiency and soundness of the
arrangements. As the institutions generally responsible for safeguarding the
integrity of the payment system, central banks have played a key role.
It now seems appropriate to take stock of these developments from a
longer-term perspective. This chapter first outlines the main changes that
have taken place in the structure and workings of payment and settlement
systems over the last decade or so. It then turns to the nature of payment
system risks and reviews the steps taken to contain them. The main focus
is on systemic risk, that is, the risk which arises from the linkages between
institutions or markets. Finally, the chapter considers the common ground
between the oversight of payment and settlement systems, on the one hand,
and the prudential regulation and supervision of banks and securities firms,
on the other.
The t rans fo rmat ion o f payment and set t lement arrangements
The profound changes that have occurred in the structure and workings of
payment and settlement arrangements since the early 1980s have mirrored
the transformation of the financial industry more generally. Some of these
developments are readily visible to retail customers. Examples include a wider
172

Surge in theoverall value ofpayments ...
spectrum of instruments available for executing payments; the application ofinformation technology, for instance in the form of automated teller machines;a greater ability to economise on cash balances, such as through credit cards;a better remuneration of transactions deposits; and the introduction ofexplicit charges on hitherto free services. However, highly visible thoughthey are, these developments have been less significant than those in the"wholesale" segment, which involves large-value transactions between banks,other financial institutions and non-financial companies.
Reflecting a surge in the number and average size of economic trans-actions, the period under consideration has witnessed an unprecedentedincrease in the value of payments. Since commercial transactions grow inline with economic activity, it is the expansion in financial activity that hasbeen responsible for this trend. While figures on the overall value of paymentsare difficult to obtain, the trend is captured by the sharp rise in the ratioof interbank funds transfers to GNP in the Group of Ten countries (seethe graph below). The rise has been especially pronounced in Japan, wherethe ratio jumped from around 20 in 1980 to 120 in 1990, before falling
Indicators of trends in the value of payments1
Ratio of the annual value of funds transfers to GNP
i i Retail transfers Wholesale transfers:2
United States Japan
50
• H i l l n
50
25
DomesticInternational
Germany
United Kingdom
100
75
50
25
70 75 80 85 90 92 70 75 80 85 90 92 70 75 80 85 90 921 Payments through the main interbank funds transfer systems. 2 The breakdown into domestic andinternational is based solely on the specialisation of the systems; for the United Kingdom, such abreakdown is not feasible.
173

somewhat subsequently. Moreover, historical statistics for Japan confirm theunprecedented nature of the increase: estimates suggest that the ratio inthe mid-1970s was still of the same order of magnitude as it had been inthe early part of the century.
The overall value of payments is now very large in all countries. Thefigures indicate, for instance, that it takes only about two and a half businessdays for the interbank funds transfer systems in Japan to generate a turnoverequivalent to the country's annual GNR In the case of the United States andGermany, it takes a little over three and four days respectively. Moreover,albeit to an extent that differs across countries, these numbers underesti-mate the value of payment flows: they exclude payments that take placebetween accounts held at the same bank and the rapidly growing fundstransfers in respect of securities and derivatives transactions carried out inseparate sub-systems.
A large part of the increase in interbank funds transfers relates todomestic money market transactions, reflecting the introduction of newshort-term instruments and the greater breadth and depth of existing mar-kets. However, a typically larger share is associated with foreign exchangetransactions, which have mushroomed as a result of the dismantling offoreign exchange controls and the internationalisation of finance. Independentevidence is provided by the Group of Ten central banks' survey of foreignexchange market activity, according to which daily net turnover was closeto US$ 900 billion in April 1992, almost three times its value in 1986, and
... reflectingthe rise in moneymarket...
... foreignexchange ...
Indicators of trends in turnover on securities markets1
As a percentage of GNP
United StatesJapanUnitedKingdomItaly
GermanyFranceInternationalmarkets2
81 85 89 931 Estimates of the annual value of secondary market transactions in equities and bonds, including insome cases those carried out over the counter. A purchase and corresponding sale are counted asa single transaction. 2 Total transactions settled through Euroclear and Cedei as a percentage oftotal GNP (in US dollars) in the Group of Ten countries.
174

Internat ional po r t fo l i o capital
Countries
United States CFT
Japan CFT
Germany CFT
France CFT
Italy CFT
United Kingdom CFT
Canada CFT
f lows
1975
0.94.20.61.80.45.10.73.30.10.90.2n.a.0.23.3
Note: CF = capital flows; T = underlying transactions.1 Capital flows are defined as the absolute value of theunderlying transactions include all purchasesseries has since been discontinued.Source: National balance-of-payments data.
and sales
and under ly ing i
1980 1985
transactions1
1990as a percentage of GDP
0.79.31.67.70.67.50.76.70.21.12.0n.a.0.79.6
2.136.45.7
62.53.8
33.92.2
29.10.44.07.4
366.01.1
26.7
sum of gross portfolio
0.992.12.5
121.01.6
54.94.3
58.73.5
26.64.4
689.00.5
64.2
nflows andby residents and non-residents. 2
1993
3.8134.9
1.578.78.9
169.65.2
196.07.1
274.621.7
1.015.82
3.1152.7
outflows;1991;the
... and securitiestransactions
Greaterspecialisationof payment andsettlementsystems
around twelve times the combined GDP of OECD countries on an annualised
basis. In some countries the settlement of foreign exchange transactions
makes up the lion's share of activity in the interbank funds transfer systems.
An extreme case is that of Switzerland: the value of the traffic handled falls
to as little as 10% of its normal level on US bank holidays.
An additional factor behind the rise in the overall value of payments
has been the rapid growth of turnover in securities markets, especially
government securities (see the graph opposite). In line with the evidence
on foreign exchange transactions, a significant part of this growth has taken
place in international markets and has represented cross-border investments.
Indeed, the increase in international capital flows, which has attracted so
much attention in recent years, pales in comparison with that in the value
of the underlying transactions, that is, all sales and purchases by residents
and non-residents (see the table above).
Payment and settlement systems have been extensively modified in order
to accommodate the sharp rise in the number and average size of funds
transfers and the growing complexity of financial activity. In particular, in all
countries there has been a tendency towards greater specialisation of settle-
ment systems and a shortening of settlement lags.
Greater specialisation has taken a variety of forms. Special arrangements
have been developed to handle different types of financial transaction, including
the clearing and settlement of trading in securities and derivatives. Automated
clearing houses now generally process bulk small-value payments related to
commercial and retail transactions. In each Group of Ten country there is
currently at least one wholesale (large-value) electronic interbank funds
175

Salient features o f selected large-value in terbank
systems1
Countries and
BelgiumCanada
France
Germany
Italy
Japan
Netherlands
SwedenSwitzerland
systems
(ELLIPS)UPS(LVTS)SAGITTAIRE(TBF)EIL-ZVEAF (EAF2)BISS (BISS2)MESIPSBOJ-NETFEYCSFA (FA2)BCH-8007RIXSIC (SIC2)
United Kingdom CHAPS
United States
EU countriesPrivate ECU
1 Planned systems
(CHAPS)CHIPSFedwire
clearing
Type
RTGSNetNetNet
RTGSRTGSNet
RTGSNetNet
Net + RTGSNet
RTGSNet
RTGSRTGSNet
RTGSNet
RTGS
Net
Launchdate
planned1976
planned1984
(1994)1987
1990/planned1989 (1995)
1989198919881989
1985 (1995)19821986
1987 (1994)1984
(1995)19701982
1986
in
funds t ransfer
Turnover (1992)billions of
US dollars
in brackets. 2 GDP of the European Union.
-8,359
-10,981
-8,728
53,23780
8,4809,733
283,46249,0297,8608,0557,660
23,77436,969
-238,255199,175
15,235
as a ratio ofGDP
-14.7
-8.5
-4.9
29.70.16.98.0
11113.413.914.331.098.635.2
-39.533.0
2.22
transfer system. While some of these systems may also handle the payment
leg of small transactions, their architecture has been conceived to deal with
large, time-critical and hence mainly financial operations, which account for
most of the traffic. An increasing number of these systems have been
designed specifically to support the domestic counterpart of foreign exchange
and Euro-market dealings. Settlement takes place on the books of the central
bank.
Large-value funds transfer systems were established or substantially
modified with the introduction of information technology during the 1980s
(see the table above). Virtually all of them now provide at least same-day
settlement. Most of the systems settle on a multilateral net basis at the end
of the day: transfer orders are accumulated in the course of the settlement
cycle and only the net balance of each participant vis-à-vis all other participants
is finally transferred. A growing number of them now also offer intraday
settlement: in so-called real-time gross settlement systems (RTGSs) funds
transfers are settled individually as soon as the corresponding orders are
sent. As will be discussed below, the introduction of RTGSs has to a large
extent reflected concerns about the risk management characteristics of
systems which settle on a multilateral basis only at fixed intervals.
176

Change in thenature and scaleof risks
The potential ofthe arrangementsfor propagatingfinancialstrains ...
The structural trends described above have gone hand in hand with far-
reaching changes in the nature of the risks involved in the settlement process.
First, the surge in financial transactions has substantially increased the scale
of the credit and liquidity risks faced by participants. The failure by a counter-
party to fulfil its delivery or payment obligations can result in sizable
losses to the agent on the other side of the trade. Secondly, heightened
competition in the financial industry, coupled with the use of more sophis-
ticated cash management techniques by customers, has tended to lead to a
higher concentration of credit and liquidity risks among payment inter-
mediaries, mainly banks. For instance, banks have increasingly offered over-
drafts as part of their payment services and large customers have routinely
come to expect funds to be available within the course of the day regard-
less of whether interbank settlement has taken place. Thirdly, the rapid
growth in cross-border and foreign exchange transactions has meant that a
greater proportion of the exposures are across national boundaries. This has
highlighted the problems arising from the coexistence of separate domestic
settlement systems, each governed by its own rules and legal framework.
The nature and management o f payment system risks
Systemic risk
The fundamental policy concern in the context of payment and settlement
systems is not so much the risks run by individual institutions or confined
to particular market segments. Rather, it is systemic risk, namely the risk
that the failure of a participant to meet its contractual obligations may in
turn cause other participants to default, with the chain reaction leading to
broader financial difficulties.
Payment and settlement systems are potentially a key institutional channel
for the propagation of systemic crises. The failure of one or more institu-
tions to settle or the fear that they might be unable to do so can trigger
and spread a financial disturbance. And disruptions to the payment system
can have repercussions throughout the economy: all economic activity is
predicated on the ability to settle transactions and confidence that coun-
terparties will do likewise.
Several characteristics of the risks incurred through payment and settle-
ment systems suggest that their potential for exacerbating any particular
disturbance is especially high. Since the value of transactions to be settled
is so large at any given point in time and there is generally imperfect synchro-
nisation between payments and receipts or between the cash and delivery
leg of trades, credit and liquidity exposures, albeit short-lived, can be very
large in relation to the capital of participants. This is especially true in the
case of those providers of payment services, such as banks, whose task is
precisely that of absorbing liquidity risks which would otherwise have fallen
on their customers. In addition, owing to the pace of financial activity, notably
trading, it is extremely difficult for agents to form a view of the indirect
exposures they face through the settlement position of their counterparties
vis-à-vis others.
177

Large and unpredictable exposures, together with limited information
about their true size and distribution, make up the mixture which could
spread and intensify financial shocks. The concern is that, unable to distinguish
short-run liquidity problems from underlying solvency difficulties, participants
would naturally tend to curtail the availability of funds and withdraw from
transactions. This could in turn force distress sales of assets, leading to
general price declines and undermining the solvency of institutions. In a
worst-case scenario, a vicious circle of induced defaults on settlement
obligations, falling prices and insolvencies could ensue. Temporary failures to
settle can thus lead to insolvencies as agents act on the limited information
available.
That these risks should be taken seriously has been confirmed by the
unfolding of events during several episodes of financial distress. As is described
below, signs of self-reinforcing spiralling pressures were evident following the
failure of Bankhaus Herstatt in 1974: even though typical exposures were
much smaller then than they are today, the bankruptcy of this medium-sized
bank, quite active in foreign exchange trading, caused serious disruptions to
CHIPS, the main settlement system for the dollar leg of the trades in the
United States. At the time of the stock market crash of 1987, the tendency
for money centre banks to limit the provision of credit to securities
firms threatened to force some of them into default and to exacerbate
the crisis. Even in the case of the failure of Drexel Burnham Lambert, a
medium-sized non-bank financial firm, it was only through major efforts by the
authorities and market participants that systemic problems were contained.
Counterparties refused to deal with subsidiaries of the firm despite public
assurances regarding their solvency and there was an incipient generalised
decline in confidence in counterparties. This pattern of behaviour threat-
ened to produce a wider liquidity squeeze and settlement "gridlocks" in a
range of markets, including those for government securities, derivatives and
foreign exchange.
The foregoing analysis points to several dimensions in which action may
be taken to reduce the risks inherent in the settlement process, quite apart
from safeguarding the operational integrity of the arrangements in place.
One is improvements in the ability of participants to monitor and control
their direct exposures to counterparties, possibly complemented by more
centralised monitoring facilities. A second is a shortening of settlement
lags commensurate with technical possibilities. A third is the reduction of
"involuntary" credits arising from asynchronous payments and receipts or
from lags between the execution of the delivery and payment legs of trades.
A fourth, crucial one is the implementation of arrangements to limit the
impact of a failure to settle by one participant on the ability of others to
do likewise, commonly achieved through some form of risk-sharing. A fifth
is ensuring that participants have the necessary incentives to control the
risks they incur; limiting the reliance on central bank support to resolve a
settlement failure is especially important in this context. A final dimension
is the reduction of legal uncertainties which may impinge on the settlement
process, such as those surrounding netting schemes and bankruptcy laws;
... as highlightedby severalepisodes ...
... has prompteda policyresponse ...
178
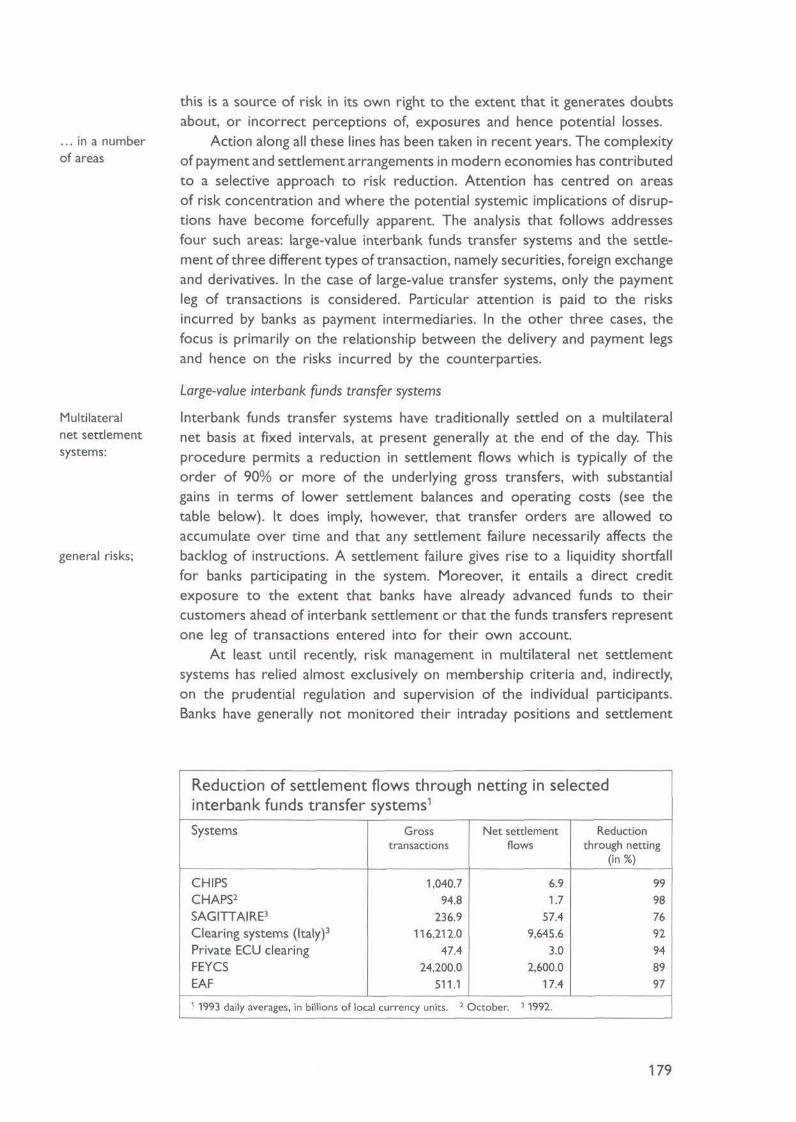
... in a numberof areas
Multilateralnet settlementsystems:
general risks;
this is a source of risk in its own right to the extent that it generates doubts
about, or incorrect perceptions of, exposures and hence potential losses.
Action along all these lines has been taken in recent years. The complexity
of payment and settlement arrangements in modern economies has contributed
to a selective approach to risk reduction. Attention has centred on areas
of risk concentration and where the potential systemic implications of disrup-
tions have become forcefully apparent. The analysis that follows addresses
four such areas: large-value interbank funds transfer systems and the settle-
ment of three different types of transaction, namely securities, foreign exchange
and derivatives. In the case of large-value transfer systems, only the payment
leg of transactions is considered. Particular attention is paid to the risks
incurred by banks as payment intermediaries. In the other three cases, the
focus is primarily on the relationship between the delivery and payment legs
and hence on the risks incurred by the counterparties.
Large-value interbank funds transfer systems
Interbank funds transfer systems have traditionally settled on a multilateral
net basis at fixed intervals, at present generally at the end of the day. This
procedure permits a reduction in settlement flows which is typically of the
order of 90% or more of the underlying gross transfers, with substantial
gains in terms of lower settlement balances and operating costs (see the
table below). It does imply, however, that transfer orders are allowed to
accumulate over time and that any settlement failure necessarily affects the
backlog of instructions. A settlement failure gives rise to a liquidity shortfall
for banks participating in the system. Moreover, it entails a direct credit
exposure to the extent that banks have already advanced funds to their
customers ahead of interbank settlement or that the funds transfers represent
one leg of transactions entered into for their own account.
A t least until recently, risk management in multilateral net settlement
systems has relied almost exclusively on membership criteria and, indirectly,
on the prudential regulation and supervision of the individual participants.
Banks have generally not monitored their intraday positions and settlement
Reduction of se t t lement
in terbank funds t ransfer
Systems
CHIPSCHAPS2
SAGITTAIRE3
Clearing systems (Italy)3
Private ECU clearingFEYCSEAF
f lows through
systems1
Grosstransactions
1,040.794.8
236.9116,212.0
47.424,200.0
511.11 1993 daily averages, in billions of local currency units. 2 <
i netting in selected
Net settlementflows
6.91.7
57.49,645.6
3.02,600.0
17.4
Reductionthrough netting
(in %)
99987692948997
October. 3 1992.
179

has been open-ended: there has been no inbuilt mechanism designed to
ensure that the original set of funds transfers could be settled in the event
of the inability to settle by one or more of the participants. Most of the
systems have allowed transfer orders to be made conditional on successful
settlement. Such "unwinding" clauses were originally intended to give indi-
vidual participants protection. However, they fail to address the basic problem,
namely the system-wide liquidity shortfall implied by the settlement failure.
Comparatively informal arrangements of this kind were acceptable in a
financial system generating limited interbank settlement traffic among a few
institutions which could disregard the risk of unexpected defaults. They are
less well-suited to the landscape that has been taking shape in recent years.
This is best illustrated by CHIPS, in which the value of intraday multilateral
net balances has been rising rapidly since the early 1970s (see the graph
below). Simulations carried out in the mid-1980s revealed that the unexpected
settlement failure of a major participant could result in close to half of all
participants being unable to settle, with as much as one-third of the total
value of transfers remaining unsettled. Moreover, it was not possible to
predict which institutions would be affected and, because of the knock-on
effects, even participants without direct dealings or in a net debit position
vis-à-vis the failing institution might be unable to meet their obligations.
Admittedly, owing to the large volumes handled in relation to the participants'
size, CHIPS is probably an extreme case. Nevertheless, the example makes
clear that as intraday exposures rise, so does the reliance of participants on
emergency liquidity support from the central bank. In other words, the
central bank faces something akin to a contingent liability, difficult to control
and of uncertain magnitude.
There are several ways in which risk management can be improved in
multilateral net settlement systems. These include a shortening of the settle-
ment lag, the introduction of real-time monitoring facilities and the setting
inadequacyof unwindingclauses;
and riskmanagement
CHIPS mult i lateral net debi t posi t ions and Fedwire overdraf ts*
In billions of US dollars
Fedwire securitiesFedwire fundsCHIPSTotal
n n
250
200
150
100
50
0
As % of total central bank assets
1970 1975 1980 1985 1990 1993 1970 1975 1980 1985 1990 1993
* Sum of daily peak amounts for individual institutions; annual averages. Prior to 1985, estimates.
180

Risk con t ro l measures in selected interbank net se t t lement
systems
Measures
Same-day settlementReal-time monitoringBilateral debit caps3
Multilateral debit capsLoss-sharing ruleCollateral requirement
Note: - = not envisaged.
USCHIPS
UKCHAPS
JapanFEYCS
GermanyEAF/EAF2
year of implementatior
198119701
1984198619901990
19841
198419921993
_4-
19891
19891
19891
-19891
-
1990U
plannedplanned
--
planned
1 Year in which the system was launched. 2 The planned EAF2 proceduresettlement at the end of twenty-minute cycles and multilateral net settlementthe end of the day. 3 Sometimes called net sender or credit limits. 4 Sinceexplicitly related to bilateral exposures.
CanadaLVTS
plannedplannedplannedplannedplannedplanned
ECUclearing
1988planned
-19931993
-
envisages bilateral netof residual balances at1992 losseshave been
Real-timegross settlementsystems ...
... cansignificantlyimprove riskmanagement
of caps on the bilateral and multilateral net debit positions of participants.
The most important safeguard, however, consists in liquidity-pooling and loss-
sharing arrangements among participants aimed at ensuring settlement despite
the failure of individual institutions. Such mechanisms attempt to decouple
illiquidity from insolvency problems, that is, to eliminate the cash-flow shortfall
and to allow the losses on the underlying contracts to be dealt with sepa-
rately through the courts. The risk management measures adopted or in
prospect cover the whole range just outlined. The pace of the initiatives,
while uneven across countries, has quickened in recent years (see the table
above).
An alternative way of mitigating the problems entailed by delayed settle-
ment is to introduce systems that settle on a real-time gross basis. In this
case, funds transfer orders are settled as soon as they have been sent
provided that the sending bank has sufficient cover in its account with the
central bank. The individual transfers are thus unconditional and irrevocable
("final"); intraday finality is then possible and the uncertainty surrounding
unwinding provisions is eliminated. Exposures become more transparent:
participants should technically be in a position continuously to monitor their
settlement accounts and credit limits, if any. The obvious gains in terms of
risk management come at the cost of higher intraday liquid balances and
operating outlays for participants.
The residual risks associated with RTGSs depend crucially on the mech-
anisms in place to deal with the tighter liquidity constraint implied by the
arrangements in comparison with multilateral net settlement systems. At one
end of the spectrum, if the central bank provides unlimited uncollateralised
intraday credit at zero cost, settlement risk is entirely eliminated; the central
bank, however, absorbs all the credit risk. This situation, which applied to
Fedwire in the United States until 1986, is hardly conducive to prudent risk
management on the part of participants. At the other end, if settlement
balances are inadequate and intraday borrowing facilities and procedures to
181

manage the traffic of funds transfers not well-developed, there is a risk that
orders may not be executed. Knock-on effects can lead to a generalised
gridlock with potential systemic consequences. Incipient gridlocks were not
infrequent in the early days of SIC, the Swiss system, in which the central
bank does not provide an intraday overdraft facility: at times banks did not
have enough funds to complete their transfer orders and the system risked
grinding to a halt. Partly encouraged by an appropriate fee structure, partici-
pants have adjusted by spreading transfers more evenly during the day and
breaking up large orders.
The fundamental issue underlying the operation of RTGSs is the need
to strike a balance between the availability of central bank lending to supply
liquidity to the system and the preservation of participants' incentives to
prudently manage risks. Among the Group of Ten countries, intraday central
bank overdrafts in support of RTGSs are available everywhere except in
Switzerland, where a few banks account for the bulk of the interbank transfers,
and Japan, where only a very small fraction of transfers are channelled through
the gross system and an intraday interbank credit market has emerged.
Elsewhere, overdrafts are generally granted at a zero interest rate but are
limited by ceilings and/or by eligible collateral. Concern about the compar-
atively lax terms on which the rapidly increasing volume of daylight credit
was granted through Fedwire (see the graph on page 180) has prompted a
series of risk reduction measures. The programme, launched in 1986, has
introduced self-imposed caps and, since April 1994, the pricing of overdrafts.
There is a growing consensus on the benefits that RTGSs can yield in
terms of risk management provided that the systems are properly designed.
Several RTGSs have been introduced recently and more are planned to begin
operating in the near future or are in the process of being upgraded, notably
through the introduction of more sophisticated queuing facilities for the
regulation of order traffic (see the table on page 176). Moreover, RTGSs
have been endorsed in a report by the Ad Hoc Working Group on EC
Payment Systems to the Committee of EC central bank Governors, published
in 1992. The report addresses the main issues raised in the field of payments
by the single market and economic and monetary union. It calls, inter
alia, for "minimum common features" for domestic payment systems. A
follow-up document published in late 1993 recommends more specifically
that "as soon as possible, every member state should have a real-time gross
settlement system into which as many large-value payments as possible should
be channelled".
The settlement of securities transactions
The two main sources of risk for counterparties in securities transactions
are the time-lags between trading and settlement ("settlement lags") and the
non-simultaneous execution of the delivery and payment legs of the trades.
The settlement lag not only makes the assessment of indirect exposures
more difficult, it also exposes counterparties to the risk that the trade
may fail to be settled. In that event, one of the two parties would suffer a
loss if the price of the security had moved against it ("forward replacement
Need for properdesign
The risks insecuritiestransactions
182

Forward replacement cost risk1 f o r al ternat ive set t lement lags
In percentages
United States2
25
20
15
10
JZL 1 1 1 °
Japan3
October 19871993 average
• • 1993 peak
15
United Kingdom4
I I 0 . EL JZL15 10 1 15 10 1
25
20
15
10
015 10 5 3 1
Days1 Absolute percentage change in the equity price indices calculated over different rolling horizons. Theactual settlement lags for equities in the United States, Japan and the United Kingdom are currentlyfive, three and between six and fifteen days respectively. 2 S & P 500. 3 TOPIX. 4 FT-SE 100.
... can be bettermanaged ...
... throughshortersettlement lags ..
cost risk"). This risk can be especially large at times of turbulence in the
markets, when price volatility is high. A shortening of the settlement lag can
considerably reduce this form of risk (see the graph above). In addition,
unless the settlement of the two legs of the transaction is simultaneous
("delivery versus payment", or DVP), the party performing its obligation first
runs the risk that the counterparty may fail to perform its own obligation.
This is by far the more serious concern because the potential loss is equal
to the full value of the transaction ("principal risk").
Market participants and public authorities had been aware of the risks
involved in the settlement of securities transactions for some while, but the
severe settlement problems experienced at the time of the global stock
market crash prompted a series of policy initiatives. Several reports have
been published since then by domestic and international bodies with a view
to improving risk management procedures, including the Group of Thirty
(1989), the Fédération Internationale des Bourses de Valeurs (1989), the
International Organisation of Securities Commissions (1992) and the
Committee on Payment and Settlement Systems of the central banks of the
Group of Ten (1992). In all of these reports, the shortening of the settlement
lag and the introduction of DVP mechanisms are given high priority.
Settlement lags have traditionally been rather long in securities markets,
primarily reflecting the need to process, confirm and match trades as well
as to transfer the securities and legal title to them. In recent years considerable
progress has been made towards reducing such lags. A vital step facilitating
this process has been the progressive introduction of central securities
depositories (CSDs). This has made it possible to immobilise physical securities
183

or to transform them into pure book entries, thereby avoiding the need for
physical transfers. However, the three-day target recommended in the Group
of Thirty report, to be achieved by the end of 1992, has proved too ambitious
in many cases, especially for equities.
The development of CSDs has also paved the way for the achievement
of DVP. As late as the mid-1980s very few systems included DVP mechanisms;
the Fedwire book-entry securities system in the United States was one of
the exceptions. By now, however, a majority of Group of Ten countries have
at least one system which meets this standard. There are a number of ways
in which DVP may be attained. One is to settle irrevocably and simultaneously
both legs of the transaction on a gross basis, as in the Fedwire securities
system or Cedei and Euroclear, the two international CSDs. A more common
procedure is to net all the payments of each participant and, possibly, some
of its trades. The payment leg is then generally settled via a large-value funds
transfer system. An alternative arrangement achieves quasi-DVP through the
issuance of a third-party (bank) guarantee for the payment leg of the trans-
action ("assured payment", as in the Central Gilts Office system (CGO) in
the United Kingdom).
As the last example makes clear, the introduction of DVP is not just a
matter of technical possibilities; more fundamentally, it may require substan-
tial extensions of credit, typically collateralised by the underlying securities,
as well as the active use of securities lending facilities. The need for this
form of liquidity is especially acute in the case of cross-border transactions,
because of time gaps between the processing cycles of both delivery and
payment legs in national systems. Its main suppliers are central banks,
participating banks and CSDs. The risks involved in its provision need to be
adequately managed if the benefits of DVP are not to be undermined.
Certain risks also arise from the methods of aggregation of transactions
and the arrangements for the resolution of settlement failures. Just as in
large-value interbank funds transfer systems, a common way of resolving a
settlement failure is through partial unwinds of trades. Moreover, the unwind
may in principle result from settlement difficulties in the large-value funds
transfer systems which channel the payment leg of the transactions, not from
defaults on the securities trades as such. An increasingly favoured way of
limiting these risks is to settle the payment leg through an RTGS, which
guarantees irrevocability and finality. A complementary approach is to put in
place system guarantees through loss-sharing arrangements, possibly backed
by collateral. Very few systems at present have such facilities.
The settlement of foreign exchange transactions
Most foreign exchange transactions are settled two days after the trade date.
Since the exchange rates between the major currencies can easily move by
a significant amount in that interval, the potential forward replacement cost
is not inconsiderable. However, by far the most important risk again stems
from the non-simultaneous settlement of the two legs of the transaction
("cross-currency settlement risk" or "Herstatt risk"). This risk has been
a source of greater concern than that associated with the settlement of
...and DVPmechanisms
Herstatt risk:
184

illustration;
Opera t ing hours of selected large-value interbank transfer systems
For same value day
I Net settlement system (final settlement indicated)Gross settlement system (intraday settlement)
21 24 03 06 09 12 15 18 21 24 03 06 09
BOJ-NET
GMT+1 12 15 18 21 24 03 06 09 12 15 18 21 24
France
SAGITTAIRE
Germany
EAF
EIL-ZV
Switzerland
SIC
ECU clearing system
GMT 12 15 18 21 24 03 06 09 12 15 18 21 24
United Kingdom
CHAPS
GMT-5 (Easternstandard time) 06 09 12 15 18 21 24 03 06 09 12 15 18
Uni ted States
Fedwire*
CHIPS *«n
*The lighter shading indicates the approved extension, to become operational in early 1997.
secu r i t i es f o r severa l reasons : t h e a m o u n t s i n v o l v e d a r e m u c h la rger ; t h e
r i s k necessar i ly has an i n t e r n a t i o n a l d i m e n s i o n ; i t is m o r e d i f f i cu l t t o manage;
and t h e t r a d e s g iv ing r ise t o i t a re ma in l y b e t w e e n banks. A c c o r d i n g t o t h e
la tes t s u r v e y o f f o r e i g n exchange m a r k e t ac t i v i t y by t h e G r o u p o f T e n c e n t r a l
banks , a r o u n d 8 0 % o f t o t a l n e t f o r e i g n exchange m a r k e t t u r n o v e r can be
e s t i m a t e d t o be i n t e r b a n k .
A key c o n s t r a i n t a t t h e o r i g i n o f H e r s t a t t r i sk is t h a t t h e r e is n o e f fec t i ve
o v e r l a p b e t w e e n t h e o p e r a t i n g h o u r s o f t h e la rge-va lue i n t e r b a n k funds
t r a n s f e r sys tems o f t h e c o u n t r i e s o f t h e t h r e e m o s t ac t i ve l y t r a d e d c u r r e n -
c ies, n a m e l y t h e US do l la r , t h e D e u t s c h e M a r k and t h e y e n (see t h e g r a p h
a b o v e ) . Since s e t t l e m e n t t yp i ca l l y t akes p lace in t h e c o u n t r y o f issue o f each
c u r r e n c y , o n e o f t h e pa r t i es t o t h e t r a d e is e x p o s e d t o c r e d i t r isk . In t h e
case o f a y e n / d o l l a r t r a n s a c t i o n , f o r ins tance , t h e p a r t y d e l i v e r i n g t h e yen
w o u l d have t o w a i t b e t w e e n f ive a n d a hal f and s e v e n t e e n h o u r s b e f o r e
rece i v i ng t h e c o r r e s p o n d i n g d o l l a r a m o u n t .
H e r s t a t t r i sk d e r i v e s i ts n a m e f r o m t h e r i s k v i v id l y i l l u s t r a t ed by t h e
fa i l u re o f Bankhaus H e r s t a t t in 1974. T h e c l o s u r e t o o k p lace a f t e r t h e
i r r e v o c a b l e s e t t l e m e n t o f t h e D e u t s c h e M a r k leg o f f o r e i g n exchange
t r a n s a c t i o n s b u t b e f o r e s e t t l e m e n t o f t h e d o l l a r leg. T h i s le f t H e r s t a t t
185
counterparties expecting the dollars facing non-payment and caused major
disruption to the operations of CHIPS. General confidence in counterparties
was badly shaken. Banks in New York refused to make payments on their
own account or for their customers, triggering a chain reaction across the
system. It was only with great difficulty that normal operations could be
resumed. Estimates indicate that the value of daily gross funds transfers
declined from the usual $60 billion to around $36 billion during the three
days following the failure.
There are several ways in which the management of Herstatt risk can
be improved. First, the safety of the settlement mechanisms of each of the
two legs can be enhanced. The Herstatt episode, for instance, was a powerful
motivation for the risk control measures subsequently adopted in CHIPS
(see the table on page 181). Secondly, the settlement flows between
counterparties associated with the original trades can be reduced. Although
partly aimed also at limiting traditional credit exposures, several private
schemes for the netting of foreign exchange contracts, either recently intro-
duced or planned, also imply a significant reduction in the amounts to be
settled (see the table opposite). Thirdly, payment arrangements outside the
country of issue of a currency can be used to limit interbank settlement
flows across borders. One such scheme is based on correspondent bank
relationships and clears the dollar leg of yen/dollar transactions in the books
of a private bank in Tokyo; any related overdrafts granted by the bank are
subsequently repaid and settled in New York during the US business day.
Finally, full DVP mechanisms can be introduced. This would generally call for
the upgrading of central bank services as a complement to private initiatives.
Although cross-border netting and settlement schemes can make a signif-
icant contribution to the management of risks, their potential benefits will
remain beyond reach if they are poorly designed. In 1990 a report on
interbank netting schemes by the central banks of the Group of Ten countries
(the "Lamfalussy Report") addressed these issues. The report recommends
a set of minimum standards for the operation of cross-border multi-currency
netting schemes and sets out the principles for cooperative central bank
oversight. It stresses the importance of a well-founded legal basis and well-
structured mechanisms for the management of credit and liquidity risk. In
particular, the arrangements "should, at a minimum, be capable of ensuring
the timely completion of daily settlements in the event of an inability to
settle by the participant with the largest single net debit position". The
standards have served as the blueprint against which all recent schemes have
been assessed; given their compass, they have also been applied to a variety
of purely domestic settlement systems.
The central banks of the Group of Ten countries are also studying ways
of upgrading their services to support DVP mechanisms. The range of possi-
bilities was described in a report published in September 1993. An important,
though limited, step is the introduction of procedures permitting intraday
final settlement in the domestic interbank funds transfer systems, most notably
through RTGSs. A second step could be the extension of their operating
hours so as to narrow or eliminate time zone gaps. In February 1994, for
and riskmanagement
The role ofcentral banks
186

Salient features o f selected cross-border netting arrangements
Features
NettingContractsParticipants
Type
NumberLocation
Area of operation
Year of introduction
FXNET
bilateralforex
banks
±40-
global
1987
ISDA masteragreement
bilateralswaps
all marketparticipants
±200-
global
1987
ICSI
bilateralforex
banks
15Chicago
North America/London1992
Multinet
multilateralforex
banks
15Chicago/
New YorkOECD
planned
Note: ISDA: International Swaps and Derivatives Association; ICSI: International Clearing Systems Inc.; ECHO:House Organisation.
ECHO
multilateralforex and other
banks
15London
OECD
planned
Exchange Clearing
Derivativeinstruments limitsettlementflows ...
instance, the Federal Reserve announced that it would bring forward the
daily opening of Fedwire by six hours as from early 1997 (see the graph on
page 185). Taken together, such measures would facilitate the achievement
of DVP by private agents. They would not, however, guarantee that
participants would make the necessary investments to take advantage of
the new opportunities. Securing DVP on central bank accounts requires
operational linkages between them. The central banks could conceivably
provide such multi-currency settlement services directly, either individually
or through a specialised international institution which would settle irre-
vocably and simultaneously both legs of the cross-currency trades on its
books (a "common agent"). These services, however, would represent a
major departure from existing arrangements, call for much closer coopera-
tion and raise a host of difficult issues, ranging from the monetary policy
implications to the need for agreement on the appropriate balance between
public involvement and market discipline.
The settlement of derivatives transactions
The settlement lag in spot transactions arises from technological and oper-
ational frictions; by contrast, the relationship between the buyer and the
seller of a derivative instrument is by definition longer-lived. Derivative
contracts involve commitments to transfer cash or perform exchanges at
future dates. Just as in the case of the extension of a loan, credit risk between
the two counterparties is inherent in the nature of the transaction. It is the
result of frictions only to the extent that the mandated future spot exchanges
of cash for financial or real assets are themselves subject to settlement lags
or are not on a DVP basis.
The expansion of derivatives markets in recent years has been truly
remarkable in terms of both turnover and notional amounts outstanding (see
the tables on pages 112 and 113 in Chapter V); nevertheless, the impact on
settlement flows has been much smaller than those figures might suggest.
187

By design, the settlement techniques for many types of derivatives limit settle-
ment flows. Some transactions, for instance currency futures and interest
rate swaps, involve no exchange of principal. In addition, netting mechanisms
are extensively used and positions may be closed simply by reversing trades,
as in the case of exchange-traded derivatives. For example, the average daily
payments made by members to the Chicago-based Options Clearing Corpo-
ration in 1993 amounted to $71 million, or only some 0.4% of estimated
turnover.
This does not mean, however, that settlement risk is unimportant; rather,
its management is more difficult to disentangle from procedures aimed at
limiting the forward replacement cost risk implied by the contracts. Indeed,
the related settlement flows may be highly variable and unpredictable: not
only are the exposures longer-lived than those in spot transactions, the
market values of some types of derivatives, such as options, are more volatile
than those of the underlying instruments. The management of the forward
replacement cost risk and the associated settlement risk differs substantially
depending on whether the derivatives are traded on exchanges or over the
counter.
Risk management for exchange-traded instruments is centralised. A
clearing house acts as counterparty to all the trades between its members,
which enter into transactions for their own account and on behalf of their
customers. The underlying credit exposures are thereby effectively netted
on a multilateral basis. In order to protect itself from the risk of default,
the clearing house requires the posting of collateral ("margin") and, as in
the case of futures, daily settlement of the amounts due ("variation margin").
When price volatility is especially high, intraday margin calls are also possible.
The actual settlement of these obligations generally takes place the following
day. In many respects, the additional risk management mechanisms resemble
those found in some large-value funds transfer systems: limits on members'
positions (multilateral caps), the power to assess members (loss-sharing
agreements) and backup credit lines (interbank and central bank standing
credit facilities).
By contrast, the credit risk in over-the-counter (OTC) markets is managed
on a bilateral basis. Participants typically rely on credit limits on their mutual
exposures and netting, as in the case of the ISDA master agreement for
swaps. They have also made increasing, though still limited, use of collateral
requirements, adjustable in relation to the size of the exposures or the
creditworthiness of the counterparty. Daily settlement is rare.
A major current policy issue is the desirability and feasibility of extending
clearing house arrangements to OTC products. By their very nature, such
arrangements tend to concentrate risk on the clearing house, whose soundness
underpins the whole market. They also imply greater short-run liquidity
pressures because of the daily margining of contracts. Both factors were
evident during the 1987 stock market crash in the United States: a liquidity
squeeze developed as margin calls and settlements jumped from less than
$1 billion to around $4 billion in certain key derivatives markets and the
severe financial difficulties of a large clearing member of the Options Clearing
... but settlementrisk remainssignificant
Risk managementfor exchange-traded and OTCinstruments
Extendingclearing housearrangements toOTC products ...
188

... can yieldconsiderablebenefits
Much still needsto be done
Obstacles havehinderedprogress ...
Corporation threatened to force the closure of the market. In the wake of
that episode a number of large institutions have begun to treat clearing
houses like other counterparties, setting exposure limits and diversifying their
trades across exchanges. Similarly, several steps have been taken to avoid
unnecessary pressures on liquidity, notably through greater reliance on the
netting of margins across contracts ("cross-margining"). Nevertheless, as the
Lamfalussy Report concludes, provided clearing house arrangements are
properly designed they can yield considerable benefits in terms of risk
management.
A t the same time, a number of practical obstacles stand in the way of
their extension to OTC markets. A large proportion of OTC products are
highly customised; prices are not observable and there are considerable diffi-
culties in agreeing on valuations. The instruments are often traded across
borders, which raises serious legal and regulatory problems. In addition, the
introduction of multilateral netting may not be in the individual interest of
all participants. The most creditworthy players, which now dominate the
market, may find their comparative advantage being undermined. The scheme
would only be attractive to them to the extent that it resulted in a compen-
sating increase in activity in a broader, more efficient and liquid market.
Overall assessment
The foregoing analysis indicates that much has been set in motion in recent
years to improve risk management in payment and settlement systems. The
risks involved are now better understood and concrete steps have been
taken or are planned to contain them. A t the same time, progress has been
neither easy nor uniform; the agenda for the future is still a full one.
Several purely economic factors have contributed to slowing down
progress. The necessary changes are costly. They typically call for heavy
investment in new technology, which may in turn undermine the profitability
of past investment decisions. They may also involve the posting of consid-
erable amounts of collateral. While the costs are easily quantifiable, the
benefits are not. The costs are generally private, the benefits a common
good. The distribution of the costs is clear, that of the benefits less so. For
example, while the merits of RTGSs have been acknowledged by banks, there
has sometimes been resistance to their introduction or active use. Similarly,
cost considerations largely explain the limited progress made in the
implementation of mechanisms aimed at avoiding unwinds in systems for the
settlement of securities and in setting up multilateral netting schemes for
cross-border transactions.
A second factor hindering progress is the difficulty of adapting the legal
framework to the new market realities. The framework has failed to keep
pace with the rapid changes that have taken place in payment and settle-
ment arrangements. As a result, considerable legal uncertainty surrounds the
rights and obligations of participants. For example, present laws regarding
the ownership, transfer and pledging of securities often date back to the
period when securities were held only in physical form. Similarly, in some
countries "zero-hour" rules may render void all transactions entered into
189

by the failing institution on the day of bankruptcy, hindering the achieve-
ment of intraday final settlement.
It is perhaps not surprising that progress has been slowest in the area
of international transactions. It is there that competitive forces are strongest
and voluntary cooperation indispensable. It is there, too, that the tension
between the borderless nature of finance and essentially national, not neces-
sarily consistent legal frameworks is most apparent. The complex choice-of-
law and conflict-of-law questions that beset cross-border netting and settlement
schemes are a vivid illustration of these difficulties.
... especiallywith respectto internationaltransactions
Prudential regulat ion and supervision
The oversight of payment and settlement systems and the prudential regu-
lation and supervision of banks and securities firms have much in common.
In particular, they share a fundamental concern for the solvency of financial
institutions and, ultimately, for the stability of the financial system. As already
discussed, it is the insolvency of participants, or the threat thereof, that
typically lies at the origin of disruptions to payment and settlement arrange-
ments. Conversely, the propagation of distress through these arrangements
can lead to multiple insolvencies. Pure liquidity problems, provided they are
correctly and unambiguously identified as such, represent less of a concern. For
example, owing to a technical failure affecting its transfers of securities, in
November 1985 a New York bank accumulated a daylight overdraft of almost
$30 billion with the central bank and borrowed over $20 billion through
the discount window at the end of the day, almost double its balance sheet
and over twenty times its capital. The episode highlighted the speed and
ease with which credit exposures vis-à-vis the central bank could be incurred
under existing arrangements and the potential knock-on effects that would
otherwise be involved. It also made clear, however, that when the solvency
of an institution is secure problems are manageable.
While the concerns overlap considerably, there are major differences
in approach between the two areas of oversight. Prudential regulation and
supervision focuses on individual institutions; to an extent that depends on
the institutions' business, it tends to give higher priority to the risks outstanding
after settlement; it pays limited regard to intraday risks. By contrast, the
focus of risk management in payment and settlement systems is the inter-
relationship between institutions; particular attention is paid to settlement
risks; intraday risks play a dominant role.
That being said, the profound changes in the nature of financial activity
over the last decade or so have tended to erode some of these distinc-
tions. Although prudential regulation and supervision has maintained its
emphasis on the financial strength of individual institutions, it has come to
attach greater weight to some of the risks arising in the process of settling
transactions and to the mechanisms partly aimed at reducing them. Mention
need only be made here of two examples, both in the context of capital
standards: the treatment of unsettled trades and the recognition of contract
netting.
Commonconcerns
The majordifferences inapproach ...
... are beingeroded
190

Historically, the capital standards for banks have largely ignored the
credit risk associated with unsettled trades, just as they have made no
allowance for market risk; by contrast, similar requirements for securities
firms have given high priority to both forms of risk. As banks have become
increasingly active in trading, pressures for a greater harmonisation of capital
standards have grown. In the EC Capital Adequacy Directive of March 1993,
which applies to both credit institutions and securities firms, certain unsettled
obligations are explicitly taken into account. The Directive is due to be
implemented by January 1996 at the latest.
The issue of the recognition of contract netting in formulating the
standards has gained greatly in importance with the spread of the use of
netting procedures. In April 1993 the Basle Committee on Banking Super-
vision issued proposals for amendments to its 1988 Capital Accord, partly
in the light of the publication of the Lamfalussy Report. The amendments
put forward extend the recognition of bilateral netting schemes to all those
deemed to be effective under the relevant laws and in compliance with the
minimum standards set forth in that Report. The document also provides
an analysis of the considerations that might guide the Committee's future
assessment of multilateral schemes.
Key role of the Given the similarity in the concerns of the oversight of payment and
central bank settlement systems, on the one hand, and prudential regulation and super-
vision, on the other, it is not surprising that in many cases both functions
are at least in part performed by the same institution, namely the central
bank. Although to different degrees, central banks in all Group of Ten
countries play an active role de jure or de facto in the oversight of the
payment system. In a majority of them they are also involved in the super-
vision of individual banks. Historically, both functions have their origin in the
role of the central bank as ultimate supplier of a risk-free settlement medium
to the financial system: the provision of liquidity is the last line of defence
in the containment of systemic crises.
Regardless of whether the central bank has specific responsibility for
prudential regulation and supervision, access to information about the financial
soundness of participants in the payment system is crucial for the perfor-
mance of its oversight function and crisis management. Distinguishing solvency
from mere liquidity problems is a difficult task; it becomes practically impos-
sible without the necessary advance knowledge of the financial condition of
participants. Lack of information narrows considerably the range of options
open to the central bank. These problems have become more acute as a
result of the profound changes that have taken place in the nature of financial
activity: the rapidly changing size and often greater opaqueness of market
and settlement exposures; the greater range of markets and market participants,
some of which are further removed than the central bank's "privileged inter-
locutors" (the banks); and the increased speed with which disturbances can
be transmitted across market segments, institutions and national borders.
The information needs of the central bank are an important dimension
of the problem of the organisation of the lines of defence to deal with
systemic risk. This issue is in the forefront of current policy discussions in
191

the United States, where there are plans to reallocate the responsibility for
banking supervision, at present divided among several bodies, including the
central bank. It is also topical in Europe. The creation of the single market
for financial services in the European Union implies a shift from host to
home-country supervision and the possibility of cross-border ("remote")
direct participation in domestic large-value funds transfer systems; the
existence of appropriate channels for the exchange of information between
national authorities becomes all the more essential. Looking ahead, the precise
contours of central bank involvement in the oversight of payment systems
and prudential regulation and supervision in the future European monetary
union are still to be decided.
As the nature of financial activity continues to evolve, the years ahead Prospects
are likely to see an intensification of the cooperative efforts between the
authorities in charge of prudential supervision and those responsible for the
oversight of payment and settlement systems. The progressive expansion in
the sphere of markets and hence in trading can be expected to further
heighten the risks involved in the execution of financial transactions, whether
these are incurred by the counterparties to the trades or by the interme-
diaries facilitating their completion. The challenge is to put in place a series
of lines of defence capable of containing systemic risk without impairing,
and indeed if possible improving, the efficiency of the arrangements. In the
present financial landscape meeting that challenge will inevitably call for close
international cooperation.
192

I X . A c t i v i t i e s o f t h e B a n k
1. Coope ra t i on between central banks and
internat ional organisations
During the past year the Bank has played its traditional role in fostering
international monetary cooperation.
The Bank participated as an observer at meetings of both the Interim
Committee of the Board of Governors of the International Monetary Fund
and the Finance Ministers and central bank Governors of the Group of Ten
countries. It also contributed to the work of the Deputies of the Group of
Ten Ministers and Governors.
The Bank organised periodic meetings of central bank officials on a wide
variety of subjects. As in the past, it also provided the secretariats for various
committees and groups of experts.
The Basle Committee on Banking Supervision devoted most of its
attention during the period to the supervisory treatment of risks in financial
markets. In recent months it has been reviewing banks' comments on
three consultative papers issued in April 1993, addressing netting, market
risk and interest rate risk. The Committee is working on a guidance paper
for bank supervisors on banks' management and control of the risks arising
from derivatives activities and is also seeking to extend its knowledge of
banks' in-house models for measuring these risks. Another aspect of the
Committee's work has been to act as the focal point for intensifying regional
cooperation between bank supervisors in non-Group of Ten countries,
especially those with responsibility for banks in emerging markets. To this
end, a survey on national supervisory practices has been conducted and the
results are in the process of being distributed to those supervisors who
would find them useful. In September 1993 Dr. T. Padoa-Schioppa, Deputy
Director General of the Bank of Italy, was appointed Chairman of the
Committee following the resignation of Mr. E. Gerald Corrigan in June 1993.
The Euro-currency Standing Committee continued to monitor develop-
ments in international banking and capital markets and to discuss
issues bearing on their functioning and stability. In particular, the Committee
continued its assessment of the implications of the growth of markets for
derivative financial instruments. In addition, the Committee discussed issues
relating to changes in the scale and direction of international capital flows
and recent changes in investment management and trading practices. The
Bank also continued to compile, analyse and publish statistical data on
developments in international banking and other financial markets.
The Committee on Payment and Settlement Systems continued to review
developments in domestic and cross-border payment, netting and settlement
193

arrangements in the Group of Ten countries. In September 1993 the BIS
published a report prepared by the Committee entitled Central Bank Payment
and Settlement Services with respect to Cross-Border and Multi-Currency
Transactions. This report is a follow-up to the Report of the Committee on
Interbank Netting Schemes, which was published by the BIS in 1990. It reflects
the analysis carried out by a special working group, chaired by Mr. T. Noël
of the Bank of Canada, of a range of options that central banks might
consider in an effort to help reduce risk and increase efficiency in the settle-
ment of cross-border and multi-currency interbank transactions. Another
working group, chaired by Mr. P. Parkinson of the Board of Governors of
the Federal Reserve System, is conducting a study of settlement arrange-
ments relating to cross-border securities transactions. In December 1993
the BIS published a new edition of the reference work on payment systems
in the Group of Ten countries (known as the "Red Book"). This extensively
revised edition includes comprehensive statistical information on payment
systems, a special chapter on cross-border payment system arrangements
and a glossary of terms. In February 1994 the Group of Ten central bank
Governors appointed Mr. W. McDonough, President of the Federal Reserve
Bank of New York, to succeed Mr. W. Angeli as Chairman of the Committee.
The Service for Eastern European Countries and International
Organisations extended its work of coordinating the technical assistance
and training provided by a substantial number of central banks to their
counterparts in eastern European countries and the states of the former
Soviet Union, some of which now themselves also provide assistance. In
particular, the Service maintains a database on the technical assistance and
training received by these countries; these records, which are for the most
part updated on a monthly basis, are an important means of helping avoid
duplication of effort. The information is forwarded to the Organisation for
Economic Co-operation and Development for inclusion in its Register. The
Service continued to organise meetings and seminars for representatives
from most of the central banks in its area. The BIS also participated actively
in the work of the Joint Vienna Institute (whose courses, since its inception
in September 1992, have been attended by approximately 2,000 participants),
for example by contributing to the first Comprehensive Course. This five-
month course is designed to help junior officials give policy advice in a wide
variety of areas. In addition, the Service continued to organise specialised
seminars on central banking topics, with the help of lecturers from the BIS
and various central banks, including some in eastern Europe.
The discussions held by the Group of Computer Experts at its twice-
yearly meetings focused on the changes required of central banks, and their
information technology (IT) departments in particular, in adapting to the
developments that have taken place in recent years. The two main topics
to which the Group devoted attention were, first, the distribution of IT
resources and the related questions of cost control, staff adaptation and the
division of responsibilities between user and IT departments and, secondly,
open systems, one of the potential advantages of which is to offer greater
independence from IT suppliers. The Working Party on Security Issues
194
examined these subjects from its own perspective. It also completed a survey
of systems for non-payments-related data exchanges between central banks
and the outside world by drawing up a list of measures to safeguard against
the risks posed by this type of exchange.
The Group of Experts on Monetary and Economic Data Bank Questions
addressed ways of strengthening the Data Bank Services of the BIS, partic-
ularly in the context of issues concerning data supply and access by the
central banks of the Group of Ten countries. Attention was centred on
continuing efforts to improve the timeliness of reporting, data quality control,
access techniques and information security. Progress was made on broad-
ening the coverage of the database, especially through bilateral arrangements
with central banks of countries outside the Group of Ten. Questions involving
international standards in the field of data transmission were also examined.
Until their dissolution at the end of December 1993, the Committee
of Governors of the Central Banks of the Member States of the European
Economic Community and the Board of Governors of the European Monetary
Co-operation Fund (EMCF) as well as their sub-committees and working
groups continued to hold most of their meetings at the BIS, where the
Committee of Governors' permanent Secretariat was also located. A detailed
account of the activities of the Committee of Governors, which was the
principal forum for monetary cooperation in the European Community for
nearly thirty years, can be found in the Committee's annual reports to the
European Parliament, the Council of the European Communities and the
European Council.1
On 1st January 1994, the date set for the commencement of stage two
of economic and monetary union (EMU) under Article 109e of the Treaty
on European Union (the "Maastricht Treaty"), both the Committee of
Governors and the EMCF were replaced by the European Monetary Institute
(EMI). The main tasks of the new body, established with its own legal person-
ality under Article 109f of the Treaty, are to strengthen the coordination of
EU member states' monetary policies and to prepare for the transition to
stage three of EMU in the monetary field. The EMI took up its duties on
1st January 1994 and for a short transitional period will continue to use the
infrastructure which supported the Committee of Governors and the EMCF
in the past. It is expected to become fully operational at its seat in Frankfurt
as from the autumn of 1994, once the necessary practical and organisational
arrangements have been made.
2. Functions as Agen t and Trustee
During the past financial year the Bank continued to perform various Agency
functions in connection with international financial settlements.
1 The most recent annual report was published in April 1993 and essentially covered develop-ments in 1992. Developments in 1993 will be covered in the first annual report of the EuropeanMonetary Institute, which is expected to be published in April 1995. Copies of the annual reportsof the Committee of Governors can be obtained by EU residents from their national centralbanks and by non-EU residents from the EMI at its provisional postal address in Basle.
195

(a) Agent for the European Monetary Co-operation Fund (EMCF) -
Agent for the European Monetary Institute (EMI)
Up to 31st December 1993 the Bank continued to perform the functions of
Agent for the EMCF2 which it had been executing since 1st June 1973. Wi th
effect from 1st January 1994, pursuant to Article 109f(2) of the Treaty on
European Union, the tasks performed by the EMCF were taken over by the
European Monetary Institute (EMI) and the EMCF was thereby dissolved. In
accordance with Article 1.3 of the Statute of the EMI, all assets and liabil-
ities of the EMCF automatically passed to the EMI. The EMI and the BIS
agreed that the latter would continue to perform, as Agent for the EMI, on
a transitional basis and on the same terms, the functions it had previously
carried out as Agent for the EMCF.
These functions, on the one hand, are connected with the operation
of the EMS and, on the other, relate to the execution of financial opera-
tions in connection with Community borrowing and lending for the purpose
of balance-of-payments support for EC member countries.
The volume of ECUs issued by the EMCF/EMI through three-month swap
operations with each of the EC central banks that are signatories to the
Agreement of 13th March 1979 and with the Luxembourg Monetary Institute
rose from approximately ECU 51 billion at 1st April 1993 to ECU 58 billion
at 31st March 1994. This expansion of ECU 7 billion over the year was
primarily due to a sharp rise in the price of gold in terms of ECUs and in
the US dollar/ECU exchange rate, partially offset by a slight reduction in the
US dollar and gold reserve contributions received from EC central banks.
As regards the Community borrowing and lending operations referred
to in Council Regulation (EEC) No. 1969/88 adjusting the Community loan
mechanism designed to support the balance of payments of member states,3
particulars of which were given in the fifty-sixth, fifty-seventh, sixty-first and
sixty-third Annual Reports on pages 171, 183, 205-206 and 205 respectively,
during the period under review the Agent continued to receive from
the borrowers, namely Greece and Italy, and to distribute to the creditors
vis-à-vis the Community the sums due in respect of interest, commission
and expenses on loans outstanding.
By virtue of the Decision of the Council of the European Communities
of 18th January 1993 and under the terms of the aforementioned
Regulation (EEC) No. 1969/88, the Community granted to the Italian Republic
a loan in four tranches for a total amount of ECU 8 billion, or its
equivalent in other currencies. The first tranche of ECU 2 billion had been
made available in March 1993 and had involved two financial operations (see
the sixty-third Annual Report, page 205); the second tranche was made
available in November 1993 and involved the following three loans: an
2 For a description of the structure and functions of the EMCF, see the fifty-fourth Annual Report,pages 162-164.3 With effect from 24th June 1988 this Regulation replaced Regulation (EEC) No. 682/81 of16th March 1981, which had previously been the legal basis for the EMCF's activity in connectionwith Community borrowing and lending operations.
196

ECU 1 billion loan 1993-2000 at 6% per annum, a DM 1 billion loan 1993-98
at 5%% per annum and an ECU 475 million floating rate loan 1993-98
(corresponding to the issue of bonds in the same amount at 5Vi% per
annum). The financial transactions connected with these three operations
were carried out value 3rd, 10th and 26th November 1993 respectively.
In addition, at the final maturity date of 25th February 1994, the Agent
carried out, value the same date, the financial transaction relating to the
repayment by Greece of the ECU 200 million loan 1987-94 at 75/e%
per annum (second tranche of the ECU 350 million loan in two tranches),
corresponding to the second tranche of the issue of notes in the same
amount and at the same rate.
The following table shows, as at 31st March 1994, the total of outstanding
Community lending operations.
Outs tand ing C o m m u n i t y loans as at 31st March 1994
Borrowing countries
GreeceItaly
Total
Deutsche Mark ECUsin millions
5363,900
4,436
7401,975
2,715
(b) Agent for the private ECU clearing and settlement system
Since October 1986 the Bank has performed the functions of Agent for
the private ECU clearing and settlement system in accordance with the
provisions of successive agreements concluded between the ECU Banking
Association (EBA), Paris, and the BIS, the most recent of which was signed
and entered into force on 15th September 1993.4 Member banks of the EBA
may be granted the status of clearing bank on the basis of criteria drawn
up by that body. One new bank joined the system on 21st March 1994,
bringing the number of participating clearing banks to forty-five.
(c) Trustee for international government loans
The Bank has assumed certain Trustee functions with regard to the funding
bonds 1990-2010 of the Dawes and Young Loans, issued by the Govern-
ment of the Federal Republic of Germany pursuant to the London Agreement
on German External Debts of 27th February 1953. Details of these bond
issues and the Bank's functions may be found in the Bank's sixty-third Annual
Report, pages 205-207.
The Deutsche Bundesbank, as Paying Agent for all uncertificated bonds
of all issues of the Dawes and Young Loans, notified the Bank that it had
paid out approximately DM 7.5 million to bondholders in respect of the
interest maturity dates of 3rd April and 3rd October 1993, as well as interest
4 For a description of the structure and operation of the clearing system, see the fifty-sixthAnnual Report, page 172.
197

arrears. The newly calculated redemption values and conversion factors in
respect of the aforementioned interest maturity dates were published by the
German Federal Debt Administration (Bundesschuldenverwaltung) in the
Federal Journal.
Concerning the application of the exchange guarantee clause for the
Young Loan by the German Federal Debt Administration, the Bank has
repeated its earlier reservations (see the Bank's fiftieth Annual Report,
pages 168-169, and its announcement published in various financial news-
papers on 3Oth/31st May 1980) and has stressed that they also extend to
the funding bonds 1990-2010. The Paying Agents have been advised to take
the appropriate precautionary measures in order to safeguard the rights of
the bondholders. Further details may be found in announcements published
by the Deutsche Bundesbank, inter alia in the Federal Journal No. 192 of
12th October 1993 (page 9459).
(d) Collateral Agent for Brazilian bonds
On 15th April 1994 the BIS assumed new functions in connection with the
restructuring of Brazilian external debt which had been agreed by Brazil in
November 1993. In accordance with two Collateral Pledge Agreements, the
BIS acts in the capacity of Collateral Agent to hold and invest collateral for
the benefit of the holders of certain US dollar denominated bonds, maturing
in either fifteen or thirty years, which have been issued by Brazil under the
restructuring arrangements.
3. Mul t i lateral financial assistance t o central banks
During the financial year 1993/94 only one very short-term facility was set
up, in favour of the central bank of the FYR of Macedonia. This operation,
for an amount of US$ 30 million, took the form of a bridging loan and was
linked to transactions concluded by the Wor ld Bank; it was backed by a
group of central banks.
4. Opera t ions o f the Banking Depa r tmen t
The Balance Sheet of the Bank and the Profit and Loss Account, expressed
in gold francs,5 have been certified by the auditors; they are reproduced at
the end of this Report.
A t the close of the financial year 1993/94, on 31st March 1994, the
balance-sheet total stood at GF 64,975,713,443
On 31st March 1993 it had amounted to GF 59,966,449,459
There was thus an increase of GF 5,009,263,984
or 8%, compared with 12 billion gold francs, or 25%, during the preceding
financial year.
5 The gold franc (abbreviated to GF) is the equivalent of GF 0.290 322 58... grammes fine gold -Article 4 of the Statutes. Assets and liabilities in US dollars are converted at US$ 208 per ounceof fine gold (equivalent to 1 gold franc = US$ 1.941 49...); all other items in currencies areconverted on the basis of market rates against the US dollar.
198

This rise was due to the growth of resources in currencies, while
liabilities in gold declined. The impact of exchange rate movements, in gold
franc terms, was minor; it affected the balance-sheet items denominated in
currencies other than the US dollar. Over the financial year the Deutsche
Mark depreciated by 2.9%, the pound sterling by 0.5% and the ECU by 3.4%;
on the other hand, the Swiss franc and the Japanese yen appreciated by
5.6% and 13.2% respectively. Had it not been for the exchange rate effect,
the increase in the balance sheet would have been approximately 150 million
gold francs greater.
BIS: Deve lopment of the balance-sheet to ta l
ove r the past f ive financial years
Financial years ended31st March
19901991199219931994
Balance-sheet total Movement over the yearin millions of gold francs
41,29145,71947,96159,96664,976
943+ 4,428+ 2,242+ 12,005+ 5,010
in percentages
- 2+ 11+ 5+ 25+ 8
The following are not included in the Balance Sheet:
- bills and other securities held in custody for the account of central banks
and other depositors;
- accounting entries arising from the Bank's functions as Agent for the
European Monetary Institute as described in Section 2 above;
- gold held under earmark, which stood at 960 million gold francs on
31st March 1994, compared with 1,059 million on 31st March 1993.
Liabilities (compos i t ion o f resources)
BIS: Deve lopmen t o f resources over the past five financial years(after allocation of the net profit for the yearas proposed to the Annual General Meeting)
Financial yearsended31st March
19901991199219931994
Paid-up capitaland reserves
Borrowedfunds
Otherliabilities
Balance-sheettotal
in millions of gold francs
1,4761,5571,6441,7451,842
38,67342,85644,86656,51561,226
1,1421,3061,4511,7061,908
41,29145,71947,96159,96664,976
A. Capital and reserves
(a) Paid-up capital GF 295,703,125
The Bank's authorised capital remained unchanged at 1,500 million gold francs;
there was likewise no change in the issued capital, which is made up of
473,125 shares paid up to the extent of 25%.
199

(b) Reserves
(1) Legal Reserve Fund GF 30,070,313
In 1971 the total of this Fund was raised to 10% of the then paid-up
capital. It has since remained unchanged. This is the proportion laid down
in Article 51 (1 ) of the Statutes.
(2) General Reserve Fund GF 732,216,157
On 31st March 1993 this Fund had stood at 703.1 million gold francs;
it is proposed that a sum of 29.1 million be transferred to it from the net
profit, in conformity with the provisions of Article 51 (3) of the Statutes.
(3) Special Dividend Reserve Fund GF 50,530,055
It is recommended that this Fund be raised from 47.5 million gold francs
to 50.5 million by allocation of 3 million from the net profit.
GF 733,666,872(4) Free Reserve Fund
This compares with 668.8 million gold francs at the end of the previous
financial year, representing an increase of 64.9 million.
On 31st March 1994 the total of the Bank's reserves will thus stand at
GF 1,546,483,397
compared with 1,449.5 million on 31st March 1993, showing a rise of 97 million,
transferred from the net profit for the financial year 1993/94. The reserves
had been raised by 101 million gold francs at the end of the preceding
financial year.
ß. Borrowed funds
The following tables show the origin, nature and term of the Bank's borrowed
resources.
BIS: B o r r o w e d funds, by o r ig in
Origin
Deposits of central banksDeposits of other depositors
Total
Financial years ended 31st March1993 1994
Movement
in millions of gold francs
54,6861,829
56,515
59,2112,015
61,226
+ 4,525+ 186
+ 4,711
The total of borrowed funds - gold and currencies taken together -
increased by 8%, compared with 26% in the preceding financial year. The
rise was due mainly to an expansion in the holdings of central banks (+ 8%),
but also to an increase in deposits received from other depositors (+10%).
The share of "Deposits of central banks" in total borrowed funds
remained stable, amounting to 96.7%, compared with 96.8% on 31st March
200

BIS: B o r r o w e d funds, by na tu re and t e r m t o m a t u r i t y
Term
SightNot exceeding3 monthsOver 3 months
Total
Deposits in goldFinancial years
ended 31st March1993 1994
Move-ment
Deposits in currenciesFinancial years
ended 31st March1993 1994
Move-ment
TotalFinancial years
ended 31st March1993 1994
Move-ment
in millions of gold francs
4,334
303
4,367
3,927
4490
4,061
- 407
+ 14+ 87
- 306
1,845
49,437866
52,148
1,233
53,9511,981
57,165
- 612
+ 4,514+ 1,115
+ 5,017
6,179
49,467869
56,515
5,160
53,9952,071
61,226
- 1,019
+ 4,528+ 1,202
+ 4,711
1993; that of funds placed by other depositors (mostly international institutions)
thus rose slightly from 3.2% to 3.3%.
The increase in liabilities in currencies was mainly in US dollars; resources
in Deutsche Mark and pounds sterling decreased. During the financial year
the total of each currency fluctuated appreciably.
Deposits in US dollars represent 69% of resources in currencies, those
in Deutsche Mark 18% and those in ECUs 4%. The share of each of the
other currencies is smaller.
The total of deposits in gold declined by 7%, whereas those in curren-
cies increased by 9.6%. As a result, the share of gold in total borrowed
funds stands at 6.6%, compared with 7.7% on 31st March 1993, and that of
currencies at 93.4%, compared with 92.3% previously.
Sight deposits declined by 33.2%, while funds with a maturity not exceeding
three months rose by 9.1% and those with longer maturities more than
doubled.
On the basis of maturity, sight deposits constitute 8.4% of the total,
those with a maximum maturity of three months 88.2% and those at over
three months 3.4%, compared with 10.9%, 87.5% and 1.6% respectively on
31st March 1993.
GF 4,061,111,651(a) Deposits in gold
This compares with 4,367 million gold francs on 31st March 1993. This item
registered a further decrease, even more marked than in the preceding
financial year.
The decline in these resources, of 306 million gold francs, was attributable
to a reduction in sight deposits, partially offset by an increase in time deposits
in gold.
(b) Deposits in currencies GF 57,164,913,520
The total of these resources had stood at 52,148 million gold francs on
31st March 1993. The rise thus amounted to 5,017 million; it chiefly reflected
the increase in deposits with a maximum maturity of three months.
201

C. Other liabilities
The total of other liabilities amounted to GF 1,907,510,750
compared with 1,706 million gold francs at the end of the preceding financial
year. This amount includes the items "Staff pension scheme", "Miscellaneous"
and "Dividend payable on 1st July 1994".
(a) The item "Staff pension scheme" stood at GF 200,202,916
compared with 172 million gold francs on 31st March 1993. This item, which
is regularly increased during the financial year, represents the Bank's liability
in respect of staff pensions; it is denominated in Swiss francs.
(b) The item "Miscellaneous" stood at GF 1,666,213,037
It had amounted to 1,495 million gold francs on 31st March 1993.
(c) The item "Dividend payable on 1st July 1994" stood at GF 41,085,797
The dividend payable per share, which was raised from 200 to 240 Swiss
francs at the end of the previous financial year, remains unchanged at 240 Swiss
francs. The equivalent in gold francs is to be set aside out of the net profit
for the financial year 1993/94. An amount of 38.9 million gold francs had
been set aside out of the net profit for the previous financial year; the differ-
ence reflects exchange rate movements.
The net profit for the financial year under review, as shown in the Profit
and Loss Account, amounted to 138.1 million gold francs, before deduction
of the above-mentioned dividend.
It is proposed that the balance of 97 million gold francs be allocated in
accordance with Article 51 of the Statutes. Details of this allocation are
given in Section 5 below.
The net profit for the financial year compares with that of 139.9 million
gold francs for the financial year 1992/93.
Assets (emp loyment o f resources)
The following table gives a breakdown of the balance-sheet asset items
according to their nature.
An examination of the table shows a contraction in assets in gold and
an increase in those in currencies. This development reflects the movements
recorded in both gold and currency resources.
(a) Sight assets in gold GF 4,338,320,401
This compares with 4,727 million gold francs on 31st March 1993. The decline
of 389 million in this item was due in large part to the decrease in liabil-
ities in gold but also to the investments made on the market (see item (d)).
(b) Cash on hand and sight assets in currencies G F 12,021,055
On 31st March 1993 this item had stood at 8 million gold francs.
202

BIS: Deve lopmen t o f investments and o t h e r assets, by nature
Nature
Sight assetsGoldCurrencies
Treasury billsTime deposits andadvances
GoldCurrencies
Government andother securities at termMiscellaneous
TotalGoldCurrencies
Financial years ended 31st March1993 1994
Movement
in millions of gold francs
4,7278 4,735
2,175
41341,184 41,597
11,42831
5,14054,826 59,966
4,33812 4,350
3,511
58041,370 41,950
15,08877
4,91860,058 64,976
- 389+ 4 - 3 8 5
+ 1,336
+ 167+ 186 + 353
+ 3,660+ 46
- 222+ 5,232 + 5,010
(c) Treasury bills GF 3,510,671,575
This compares with 2,175 million gold francs at the end of the previous
financial year. Both the volume and the composition of this portfolio can
fluctuate considerably. Purchases of Treasury bills are made on various markets.
(d) Time deposits and advances GF 41,950,211,324
On 31st March 1993 the total of this item, which comprises gold and currency
transactions, had stood at 41,597 million gold francs, giving an increase of
only 353 million.
- Investments in gold GF 579,775,726
This compares with 413 million gold francs on 31st March 1993.
- Investments in currencies GF 41,370,435,598
This compares with 41,184 million gold francs on 31st March 1993.
The increase in this item, like that in Treasury bills (see item (c) above)
and in government and other securities at term (see item (e) below), was
linked to the expansion in resources in currencies.
(e) Government and other securities at term GF 15,087,920,103
The value of this portfolio, which had stood at 11,428 million gold francs on
31st March 1993, varied appreciably during the financial year. It is made
up of securities - Treasury securities and commercial paper in particular —
purchased on various markets.
The main movement affecting the currency composition of the Bank's
assets was a further increase in the item in US dollars, which constitute the
largest element.
203

Assets and liabilities in gold decreased by 222 million and 306 million
gold francs respectively. The difference of 84 million corresponds to the rise
in forward gold operations, referred to below.
The following table gives a breakdown according to residual term to
maturity of investments in time deposits and advances (in gold and curren-
cies) and in government and other securities at term.
BIS: T i m e deposits and advances and gove rnmen t
and o t h e r securit ies at t e r m , by t e r m t o matur i t y
Term
Not exceeding 3 monthsOver 3 months
Total
Financial years ended 31st March1993 1994
Movement
in millions of gold francs
43,6499,376
53,025
43,70413,334
57,038
+ 55+ 3,958
+ 4,013
Investments with maturities not exceeding three months remained stable,
increasing by only 55 million gold francs; on the other hand, those at longer
term rose by 3,958 million, or 42%.
Wi th regard to relative shares, deposits with a maximum maturity of
three months account for 76.6% of total investments, compared with 82.3%
on 31st March 1993, and those at over three months 23.4%, compared with
17.7% previously.
(f) Miscellaneous G F 76,568,985
This item had stood at 31.5 million gold francs on 31st March 1993.
Forward gold operations
These operations are mentioned in Note 2 to the Balance Sheet and show
a negative balance of GF 195,074,876
There was a marked increase in these transactions. A t the end of the
previous financial year they had shown a negative balance of 111 million gold
francs.
5. N e t prof i ts and the i r d is t r ibu t ion
The accounts for the sixty-fourth financial year ended 31st March 1994 show
a net operating surplus of 145,227,801 gold francs, compared with 162,427,719
gold francs for the preceding financial year. The reduction in the net operating
surplus mainly reflects the lower level of interest rates for the major curren-
cies compared with those prevailing in the preceding financial year; this
resulted in decreased interest income on the Bank's own funds held in
currencies and also led to tighter trading margins on its borrowed funds
operations.
This year's result is shown after deduction of 50,450,402 gold francs in
respect of costs of administration, representing a 2.4% increase over the
204

previous year's figure of 49,255,621 gold francs. A larger increase would have
been recorded but for the effect of valuation changes, in particular the lower
value of the Swiss franc during much of the year against the gold franc. In
terms of Swiss francs, in which currency most of the Bank's expenditure is
incurred, the increase in costs amounted to about 6%.
The Board of Directors has decided to transfer 3,274,041 gold francs
to the Provision for Exceptional Costs of Administration and to supplement
- by means of a further transfer of 3,867,963 gold francs - the Provision
for Modernisation of Premises and Renewal of Equipment, which exists to
meet the cost of maintaining the Bank's premises and to finance the contin-
uing series of technical projects involving investment expenditure. As a result
of these transfers the net profit amounts to 138,085,797 gold francs, against
139,895,417 gold francs for the previous financial year. The allocation of this
amount is governed by Article 51 of the Statutes.
On the basis of this Article, the Board of Directors recommends that
the net profit of 138,085,797 gold francs be applied by the General Meeting
in the following manner:
(i) an amount of 41,085,797 gold francs in payment of a dividend of 240 Swiss
francs per share;
(ii) an amount of 29,100,000 gold francs to be transferred to the General
Reserve Fund;
(iii) an amount of 3,000,000 gold francs to be transferred to the Special
Dividend Reserve Fund; and
(iv) an amount of 64,900,000 gold francs, representing the remainder of the
available net profit, to be transferred to the Free Reserve Fund. This
Fund can be used by the Board of Directors for any purpose that is in
conformity with the Statutes.
If the above proposals are accepted, the dividend will be paid on 1st July
1994 to the shareholders whose names are contained in the Bank's share
register on 20th June 1994.
The Balance Sheet, the Profit and Loss Account and a summary statement
showing the movements in the Bank's reserves during the financial year will
be found at the end of this Report. The Bank's accounts have been audited
by Price Waterhouse, who have confirmed that the Balance Sheet and the
Profit and Loss Account give, on the basis described in Note 1, a true and
fair view of the state of the Bank's affairs at 31st March 1994 and of its
profit for the year ended on that date. Price Waterhouse's report is appended
at the foot of the Balance Sheet.
6. Shareholding central banks
Following the dissolution of the Czech and Slovak Federal Republic and the
establishment of an independent Czech Republic and an independent Slovak
Republic with effect from 1st January 1993, the two successor central banks
to the former State Bank of Czechoslovakia approached the BIS with a view
to achieving an agreed division of the Czechoslovak issue of the Bank's
205

capital. As a consequence, at the Extraordinary General Meeting of the Bank
held on 14th June 1993, which took place immediately prior to the 1993
Annual General Meeting of the Bank, the Czechoslovak issue was cancelled
and an equivalent number of new shares, comprising the Czech issue and
the Slovak issue, respectively, of the Bank's capital, was simultaneously issued
to the Czech National Bank and to the National Bank of Slovakia.
7. Changes in the Board of D i rec to rs and in the Management
Mr. Bengt Dennis relinquished the offices of Chairman of the Board of
Directors and President of the Bank on 31st December 1993, on comple-
tion of the three-year period for which he had been elected. The Board
elected Dr. W.F. Duisenberg, President of the Netherlands Bank, as successor
to Mr. Dennis in these two positions for a period of three years commencing
on 1st January 1994.
Lord Richardson of Duntisbourne relinquished his directorship and
therefore his position as Vice-Chairman of the Board at the end of June
1993. On 1st July 1993 Mr. Edward A.J. George succeeded Mr. Robert
Leigh-Pemberton as Governor of the Bank of England and became an ex
officio member of the Board in his place. Mr. George appointed
Mr. Leigh-Pemberton (now Lord Kingsdown) as a member of the Board to
succeed Lord Richardson of Duntisbourne as from 1st July 1993.
At its meeting on 14th September 1993 the Board elected Dr. Lamberto
Dini as Vice-Chairman of the Board of Directors for a period of three years
as from that date.
M. Jacques de Larosière ceased to be a member of the Board on
15th September 1993, when he relinquished the office of Governor of the
Bank of France. His successor in that post, M. Jean-Claude Trichet, became
an ex officio Director as from 16th September 1993. Prof. Helmut Schlesinger
relinquished the office of President of the Deutsche Bundesbank at the end
of September 1993. His successor in that post, Dr. Hans Tietmeyer, became
an ex officio Director as from 1st October 1993. Prof. Leonhard Gleske
retired from the Board on 30th September 1993. To succeed him Dr. Tietmeyer
appointed Prof. Schlesinger as from 1st October 1993. Mr. Urban Bäckström
was elected as a member of the Board to succeed Mr. Dennis as
from 1st January 1994. Dr. Dini and M. Philippe Wilmès were reappointed
to the Board in September 1993 and February 1994 respectively and
Dr. Duisenberg was re-elected to the Board in March 1994.
In October 1993 Dr. Tietmeyer, President of the Deutsche Bundesbank,
appointed Herr Helmut Schieber as his Alternate and in November 1993
Dr. Antonio Fazio, Governor of the Bank of Italy, appointed Dr. Stefano
Lo Faso as his Alternate in the absence of Dr. Carlo Santini. Finally, in
March 1994 Mr. George, Governor of the Bank of England, appointed
Mr. W.A. Allen as his Alternate in the absence of Mr. T. A. Clark.
As regards the Management of the Bank, M. Alexandre Lamfalussy
relinquished his position as General Manager at the end of December 1993.
He was succeeded by Mr. Andrew D. Crockett on 1st January 1994. Dr. Gunter
206

D. Baer and M. Guy Noppen were appointed Managers in the General
Secretariat as from March 1994 and Dr. W.R. White was appointed Manager
in the Monetary and Economic Department as from June 1994. Dr. Kurt
Spinnler, Deputy Manager, and Herr Robert von Werra, Assistant Manager,
retired at the end of December 1993.
207
C o n c l u s i o n
As recovery from the protracted recession spreads through the industrial
world, economic policies face both a short-term and a longer-term challenge.
In the short term, the task is to accommodate a revival of demand, while
maintaining the credibility of the basic counter-inflationary thrust of policy.
In a longer-term context, the challenge is to improve the structural func-
tioning of the industrial economies, so that the scourge of unemployment
can be more effectively tackled, and the cycle of overheating followed by
recession can be moderated. In the developing world, a growing number of
countries have demonstrated that the right policies can produce good results
despite an inhospitable international environment. It will be important to
learn the lessons of their experience, so that improvements in investment,
employment and growth can be more widely shared.
The brightest aspect of the recent economic performance in the indus-
trial countries has been low inflation. While favourable terms of trade and
the weakness of economic activity have been important factors, the deter-
mination displayed in the implementation of monetary policy has been crucial.
This has helped to weed out the cost-push elements which tend to keep
inflation high even after immediate excess demand pressures have abated.
Yet questions are still raised about the fruits of this achievement. What will
the good price performance - provided it can be preserved - do to improve
the prospects for growth and employment in a longer-term perspective?
The drive towards greater price stability was based on experience of
the heavy costs of inflation. Inflation can lead to the expropriation of savers
and tends to undermine both the willingness to save and the ability to invest.
It distorts the relative prices that govern the allocation of resources, with
too many resources flowing into inflation hedges which do not necessarily
enhance overall productivity. The inherent tendency of price increases to
accelerate contributes to uncertainty and results in distortions in long-term
interest rates and exchange rates. These adverse consequences of inflation
sooner or later force the authorities to resort to restrictive policies which
in the short run have a dampening effect on real activity and employment.
Evidence from the 1970s - and more evidence has since become available
in the developing world - seems to confirm that countries with a better
price performance are generally more successful at achieving sustainable
growth.
That is not to say that public support for policies aimed at preserving
price stability can be taken for granted. As experience of the costs of inflation
recedes, the notion that output and employment can be increased by accepting
208

a little more inflation inevitably gains currency again. The undoubted existence
of a short-term trade-off between inflation and output growth can come to
obscure the fact that no such trade-off exists in the longer term. This places
a particular onus on central banks to explain, on a continuing basis, the
rationale for the policy of price stability and the consequences of departing
from it. Reducing inflation is always a long-drawn-out, painful process; this
puts a high premium on maintaining stability, once it has been achieved.
As a safeguard against pressures arising from changes in public sentiment,
central banks in many countries have been given greater responsibility for
the maintenance of price stability, in an attempt to insulate them from the
short-term exigencies of the political process.
The maintenance of a monetary policy with clearly defined priorities -
within the bounds of what monetary policy is capable of achieving - has
become all the more important with the deepening and internationalisation
of financial markets. Markets for the longer-term instruments that are of
particular relevance for investment decisions respond to monetary policy
actions in ways that are not always easy to predict. Market participants try
to read longer-term implications into individual monetary policy decisions.
Depending on the markets' view of the sustainability of a particular change
in short-term interest rates, longer yields may move sympathetically, or
in the opposite direction. This underlines the importance of a clear
medium-term orientation for monetary policy. But it does not make it any
easier for central banks to select the appropriate setting for monetary
policy instruments in circumstances where the reliance that can be placed
on traditional indicators has diminished.
The darkest aspect of the recent economic performance of the indus-
trial countries is the high and, in some cases, still rising level of unemploy-
ment. The question is increasingly put: what is wrong with economic policies
which are unable to prevent unemployment of this order of magnitude from
developing in the first instance and from being remedied once it has arisen?
It is perhaps not surprising that cyclical weakness of demand is blamed by
many for the current rate of joblessness. Those who hold this view see the
remedy as lying mainly in stimulating aggregate demand, even if this results
in some increase in underlying inflation.
Unemployment no doubt has an important cyclical element. Yet evidence
from the range of studies considered in this Report suggests that the
longer-term trend of unemployment is not primarily the result of the
macroeconomic policies that keep inflation down but of structural rigidities
that prevent the labour market from functioning efficiently. To put it in
positive terms: labour markets should be such that all are able to secure
employment who are able and willing to work at the current price for their
skills. In practice, however, legal or other arrangements, originally designed
to protect workers in employment, have turned against those without
jobs. Moreover, what was supposed to soften the effects of temporary
unemployment too often tends to prolong it. The international correlation
between the degree of labour market rigidities of various kinds and the level
of unemployment is becoming increasingly clear.
209

This constitutes a major challenge for regulatory and structural policies.
Unfortunately for the prospects of achieving reform, existing arrangements
are often backed by a strong social consensus. They represent a large part
of what are still seen as important social achievements. They are rarely
viewed by the general public as an impediment to the effective operation of
labour markets that bears much responsibility for a major fiscal burden and
unnecessary social hardship.
The difficulties in bringing about a change in attitudes towards labour
market regulation are evident. There seems to be little alternative to a
patient explanation of economic cause and effect as a means of preparing
public attitudes for the changes in present arrangements that are essential
if lasting progress is to be made in tackling the evil of unemployment.
The issue of jobs is closely bound up in the public mind - though not
necessarily correctly - with that of international competitiveness. The debate
about the causes and consequences of changing international competitive-
ness has been stimulated greatly by the spectacular export-led growth
achieved by so many countries in East and South-East Asia. It is quite obvious
that recent shifts in the centres of growth and of industrial activity are
related not to endowments of natural resources but to the economic policies
being pursued: regulatory and structural as well as macroeconomic.
The success of East Asian economies, and the fact that in many product
lines they have greatly increased their share of markets in mature industrial
countries, has contributed to a rise in protectionist sentiment. On occasion,
this sentiment has been influenced by the claim that, since wages in devel-
oping countries are lower than those in Europe and North America, the
competition is somehow "unfair". Such views present a further challenge to
political leadership. Only on a most superficial view does the spread of indus-
trialisation create unemployment in the "o ld" industrial countries, because
the newly industrialising countries overall import as much as they export.
The expansion of world industrial capacity is, therefore, of potential benefit
to all, the more so the more scope is given to international competition.
The Uruguay Round accord is of great importance in this regard, although
determined efforts are still required to clarify certain aspects of it and to
avoid backsliding once the agreement has been finalised. Of course, trans-
lating the opportunities offered into actual benefits depends on flexibility -
the more adaptable the economy the greater the advantage to be gained.
Foreign investors' willingness to commit funds to particular countries
depends foremost on the existence of a congenial economic environment.
Major policy reforms have transformed the attractiveness of large parts
of the developing world as a location for investment. Indeed the flood of
foreign capital into both Asia and Latin America has been one of the striking
features of the early 1990s. There have, however, been important differences
in the two areas' experience with capital inflows. In Asia, they have been
associated with a high rate of investment. In Latin America, the rate of
investment has picked up only recently and still remains relatively low.
Because the danger of a reversal of capital flows puts pressure on the author-
ities to maintain macroeconomic stability and to persist with microeconomic
210

reforms, the incentives for governments to maintain reform-minded policies
have increased with the heavier reliance on foreign capital.
Yet much remains to be done in a number of developing and transi-
tion economies. China, for all its impressive economic performance in recent
years, has still to come to grips with the essential elements of macro-
economic control, although the unification of its exchange rate has been an
important step in this regard. Brazil's authorities have proposed an ambitious
stabilisation programme - but it will require determined and persistent imple-
mentation to achieve success. India has made a decisive break with past
policies and embraced an outward-looking policy strategy. Here too, however,
efforts need to be maintained over a run of years if the new strategy is to
become self-sustaining.
In eastern Europe, certain countries appear to have turned the corner,
and income has begun to rise again. In no case, however, has output regained
former levels, although its quality may have improved. Other countries in
the region are still struggling to restore macroeconomic stability, while in
most of the CIS states the lack of stabilisation policies continues to hold
back reform efforts, and output and employment levels remain on a downward
path. Many developing countries in Africa continue to register declining per
capita incomes. Some recent changes, however, augur well for a better
performance in the years ahead. The more realistic exchange rate for the
CFA franc should help to improve the export prospects of the countries
concerned. A number of North African countries have taken similar steps
towards adopting more appropriate exchange rates. South Africa's first
election based on universal suffrage led to the formation of a new govern-
ment that has declared its commitment to free markets as well as to political
reform. If policy can be held to this direction, then foreign capital is likely
to flow into the country again after many years of economic sanctions.
The last subject to be addressed in this Conclusion concerns the stability
of financial markets in the face of ever greater freedom of capital movements,
both across borders and involving a wider range of instruments and insti-
tutions. The question refers not only to private institutions and markets,
but also to exchange rate arrangements both in Europe and elsewhere. In
a wider sense it is also related to the problems of monetary management
referred to above.
The advantages of free capital movements are not in question: financial
resources can be allocated to where they are most productive and the
discipline that is thereby imposed on governments is by and large healthy.
But in a global perspective the question has to be asked what conditions
are required for unrestricted freedom of capital movements to be benefi-
cial, and whether these conditions are indeed fulfilled. What has become
abundantly clear from recent experience is the need for stable and consis-
tent underlying policies if capital flows are not to lead to exchange rate
instability and/or threaten domestic liquidity management. Developments in
the European exchange rate mechanism (ERM) over the past two years or
so suggest that credible policies with a well understood focus can be more
effective in generating the desired degree of exchange rate stability than
211

tightly defined intervention obligations if the latter do not command the
confidence of market participants. In the developing world, the importance
of stable policies is just as apparent, given the evident vulnerability of capital
flows to changes in sentiment on the part of foreign investors.
Capital market developments have had implications beyond those for
cross-border financial flows and exchange rates. There have been a number
of episodes in which financial market disruptions threatened to cause diffi-
culties in the domestic economies of industrial countries. Financial markets
are often subject to swings of sentiment that are hard to account for in
terms of changes in underlying economic conditions. The stock market crash
of 1987 was the first big event to draw greater attention to a new quality
of financial markets deriving from international linkages, new technology and
the development of new financial instruments. The pace has quickened with
the European exchange market turbulence in September 1992, which did not
die down until fluctuation bands were substantially widened in the summer
of 1993. The recent dramatic decline in bond prices illustrates that the whole
range of financial contracts is subject to sudden changes in sentiment.
These developments give rise to a number of questions that are increas-
ingly debated, and not only in financial circles. Have financial innovation and
liberalisation contributed to greater instability of asset prices? Is there a
threat to the soundness of the financial system? Does innovation change the
response of the economy to macroeconomic policy instruments? And what,
if anything, should be done to regulate the use of new instruments?
These are not easy questions to answer. It will presumably be several
years, at least, before a settled consensus emerges. Certain observations can
nevertheless be made. First, there are doubtless some conditions in which
the new instruments made possible by financial innovation and liberalisation
can contribute to asset price volatility. Yet there is no inherent reason why
the greater freedom to transact in capital markets should, in general, make
prices more volatile. If anything, more depth and liquidity in markets, and a
greater ability to disaggregate exposures and hedge unwelcome risks, should
reinforce the stabilising properties of markets. Still, innovations mean that
changes in the markets' perceptions of underlying policies can be more
quickly translated into price movements than before. This reinforces the
need for monetary policy to be seen to be holding to a stable course.
A second observation relates to the implications of financial market
innovation for the soundness of the banking system. In principle, the greater
attention to the management and pricing of risk that new instruments
engender, together with the improved ability to hedge risks, should be factors
that increase the resilience of financial institutions. Experience has never-
theless shown that the new instruments can be misused. The growing size
of derivatives markets, together with the complexity of risk management
strategies employed, underlines the importance of ensuring that all partici-
pants in the market manage their portfolios prudently, and that the market
itself is robust to sudden disturbances.
A third observation concerns the effects of financial market innovation
on economic responses to the standard macroeconomic instruments
212

employed by central banks. On the one hand, there has been no diminu-
tion in central banks' ability to control short-term money market interest
rates, and no reason to doubt that the response of the economy to interest
rate changes still goes in the traditional direction. On the other hand, the
availability of new or cheaper ways of hedging against financial market risks
presumably changes the behaviour of economic agents, at least at the margin.
Otherwise it would be difficult to explain the growth of derivatives markets.
The extent to which such changes in behavioural response call for adapta-
tions in how central banks implement policy is unclear, but it is a question
that deserves, and is the subject of, further investigation as these markets
continue to grow.
Lastly, how should central banks respond to accelerating financial
innovation? This is perhaps the most difficult issue to address. Precipitate
reactions have obvious drawbacks. Liberalisation and innovation in capital
markets offer enormous benefits to the users of markets through the more
efficient allocation of financial resources and enhanced opportunities to
manage risk. It is very important to preserve these gains. Any official action
should therefore be directed at improving the ability of market participants
to exploit the advantages of new instruments without jeopardising their
own financial soundness or the stability of the financial system more
widely. Doubtless there is work still to be done to strengthen the control
procedures of institutions using the market, as well as to adapt capital
adequacy standards for market-makers. More is also required to improve
market transparency (through disclosure) and to make market infrastructure
more resilient (for example, by strengthening settlement systems). On the
macroeconomic side, it would be a mistake to assume that policy-making
would be made easier if financial instruments could be limited or capital
movements controlled. Global markets are now so highly integrated that
suppressing the symptoms of investor preferences in one market would
simply lead to their manifestation elsewhere.
What capital market innovations demonstrate is the need for stable
monetary policies, implemented in a medium-term framework. If market
participants have confidence in the medium-term environment for invest-
ment decisions, then these decisions are more likely to contribute to stability
and less likely to have disruptive consequences. And with credible policies,
the scope for a measure of short-run flexibility in the face of cyclical
fluctuations is enhanced.
Basle, 26th May 1994 ANDREW CROCKETT
General Manager
213

B a l a n c e S h e e t a n d P r o f i t a n d L o s s A c c o u n t
at 31st March 1994
215

B a l a n c e S h e e t a t 3 1 s t M a r c h 1 9 9 4(in gold francs - see Note 1 )
Assets
Gold
Cash on hand and on sight account with banks
Treasury bills
Time deposits and advances
GoldNot exceeding 3 months 135 148 834Over 3 months 444 626 892
CurrenciesNot exceeding 3 months 34 767 434 706Over 3 months 6 603 000 892
Government and other securities at termNot exceeding 3 months 8 801 168 720Over 3 months 6 286 751 383
Miscellaneous
Land, buildings and equipment
4 338 320 401
12 021 055
3 510 671 575
41 950 211 324
15 087 920 103
76 568 984
164 975 713 443
Note 1 :The gold franc is the equivalent of 0.290 322 58... grammes fine gold - Article 4 of the Statutes.Assets and liabilities in US dollars are converted at US$ 208 per fine ounce of gold (equivalent to1 gold franc = US$ 1.941 49...), and all other items in currencies on the basis of market ratesagainst the US dollar.
Note 2:At 31st March 1994, gold payable against currencies on forward contracts amounted to195 074 876 gold francs.
216

Before Afterallocation of theyear's Net Profit
Liabilities
CapitalAuthorised: 600 000 shares, each of 2 500 gold francs . 1 500 000 000Issued: 473 125 shares 1 182 812 500
of which 25% paid up
ReservesLegal Reserve Fund 30 070 313General Reserve Fund 703 116 157Special Dividend Reserve Fund 47 530 055Free Reserve Fund 668 766 872
Deposits (gold)Central banks
Sight 3 927 133 252Not exceeding 3 months 44 169 042Over 3 months 89 808 958
Other depositorsSight 39?
Deposits (currencies)Central banks
Sight 1 184 731 837Not exceeding 3 months 51 984 873 492Over 3 months 1 980 595 968
Other depositorsSight 48 571 239Not exceeding 3 months 1 966 140 984
Staff Pension Scheme
Miscellaneous
Profit and Loss Account
Dividend payable on 1st July 1994
295 703 125
1 449 483 397
4 061 111 651
57 164 913 520
200 202 9161 666 213 037138 085 797
64 975 713 443
295 703 125
30 070 313732 216 15750 530 055733 666 872
1 546 483 397
4 061 111 651
57 164 913 520
200 202 9161 666 213 037
41 085 79764 975 713 443
Report of the Auditors to the Board of Directors and to the General Meetingof the Bank for International Settlements, BasleIn our opinion the Balance Sheet and the Profit and Loss Account, including the notes thereon, give, on the basis described inNote 1, a true and fair view of the state of the Bank's affairs at 31st March 1994 and of its profit for the year ended on that date.We have obtained all the information and explanations which we have required. The Bank has kept proper books, and theBalance Sheet and the Profit and Loss Account are in agreement with them and with the information and explanations given us.
Basle, 29th April 1994 PRICE WATERHOUSE
217

P r o f i t a n d L o s s A c c o u n tfor the financial year ended 31st March 1994(in gold francs)
Net interest and other operating income 195 678 203
Less: Costs of administrationBoard of Directors 843 122Management and Staff 34 123 436Office and other expenses 15 483 844 50 450 402
Net operating surplus 145 227 801
Less: Amounts transferred toProvision for Exceptional Costs of Administration 3 274 041Provision for Modernisation of Premises andRenewal of Equipment 3 867 963 7 142 004
Net Profit for the financial year ended 31st March 1994 138 085 797
The Board of Directors recommends to the Annual General Meeting thatthe Net Profit should be allocated in accordance with Article 51 of theStatutes as follows:
Dividend: 240 Swiss francs per share on 473 125 shares 41 085 79797 000 000
Transfer to General Reserve Fund 29 100 00067 900 000
Transfer to Special Dividend Reserve Fund 3 000 00064 900 000
Transfer to Free Reserve Fund 64 900 000
218

M o v e m e n t s in t h e B a n k ' s r e s e r v e sduring the financial year ended 31st March 1994(in gold francs)
I. Development of the Reserve Funds resulting from allocations for the financial year 1993/94
Balances at 1st April 1993, after allocation ofNet Profit for the financial year 1992/93 . . .
Add: Allocations for the financial year 1993/94
Balances at 31st March 1994 as perBalance Sheet 30 070 313
LegalReserve
30 070
30 070
Fund
313
313
GeneralReserve
703 116
29 100
732 216
Fund
157
000
157
SpecialDividendReserve Fund
47 530 055
3 000 000
50 530 055
FreeReserve Fund
668 766 872
64 900 000
733 666 872
II. Paid-up Capital and Reserve Funds at 31st March 1994 (after allocation) were represented by:
Paid-upCapital
Reserves Total
Net assets inGold 295 703 125 366 206 475 661 909 600Currencies — 1 180 276 922 1 180 276 922
295 703 125 1 546 483 397 1 842 186 522
219
Board o f D i rec to rs
Dr. W. F. Duisenberg, Amsterdam
Chairman of the Board of Directors,
President of the Bank
Dr. Lamberto Dini, Rome
Vice-Chairman
Urban Bäckström, Stockholm
Bernard Clappier, Paris
Dr. Antonio Fazio, Rome
Edward A. J. George, London
The Rt. Hon. Lord Kingsdown, London
Dr. Markus Lusser, Zurich
Prof. Dr. Helmut Schlesinger, Frankfurt a/M.
Dr. Hans Tietmeyer, Frankfurt a/M.
Jean-Claude Trichet, Paris
Alfons Verplaetse, Brussels
Philippe Wilmès, Brussels
Alternates
T. A. Clark, London, or
W. A. Allen, London
Hervé Hannoun, Paris, or
André Robert, Paris
Jean-Jacques Rey, Brussels
Dr. Carlo Santini, Rome, or
Dr. Stefano Lo Faso, Rome
Helmut Schieber, Frankfurt a/M., or
Dr. Wolfgang Rieke, Frankfurt a/M.
220

Management
Andrew Crockett
Rémi Gros
Dr. Giampietro Morelli
Dr. Horst Bockelmann
G.M.Gil l
Marten de Boer
Dr. Renato Filosa
Prof. Dr. Mario Giovanoli
Dr. Gunter D. Baer
Guy Noppen
Dr. W. R. White
Jean Vallet
André Bascoul
Dr. Joseph R. Bisignano
Jean-Claude Dagassan
P. C. Bridge
Jean-Marc Andreoli
Yukio lura
Alexander Radzyner
Claude Sivy
Günter Pleines
F.C. Musch
J. A. Bispham
Daniel Lefort
General Manager
Assistant General Manager,
Head of the Banking Department
Secretary General,
Head of Department
Economic Adviser,
Head of the Monetary and Economic
Department
Deputy Head of the Banking Department,
Manager
Manager, Operational Security,
Accounting and Budgeting
Manager, Monetary and Economic
Department
Legal Adviser, Manager
Manager, General Secretariat
Manager, General Secretariat
Manager, Monetary and Economic
Department (as from 1st June 1994)
Deputy Secretary General
Deputy Manager, General Secretariat
Deputy Manager, Monetary and
Economic Department
Assistant Manager, ECU Clearing Agent
Assistant Manager, Banking Department
Assistant Manager, General Secretariat
Assistant Manager, Banking Department
Assistant Manager, General Secretariat
Assistant Manager, Control Operational
Security
Assistant Manager, Banking Department
Secretary General of the Basle Committee on
Banking Supervision, Monetary and Economic
Department
Assistant Manager, Monetary and Economic
Department
Assistant Manager, Legal Service
221