Agenda for the 37th meeting of the Board of Approval to be ...
Upload
khangminh22Category
view
6download
0
B A N K F O R
I N T E R N A T I O N A L S E T T L E M E N T S
T H I R T Y - S E V E N T H A N N U A L R E P O R T
1st APRIL 1966 — 31st MARCH 1967
BASLE
12th June 1967

TABLE OF CONTENTS
Page
Introduction
Part I - Current Economic Trends and Policies 1966-67
United States (p. 3); Germany (p. g); United Kingdom (p. 12); France(p. 17); Netherlands (p. 19); Belgium (p. 21); Switzerland (p. 22); Sweden(p- 23)> Canada (p. 24); Italy (p. 25); Japan (p. 27); eastern Europe (p. 28);the development of global reserves (p. 30)
P a r t i i - Monetary and Economic Survey 38
I. C r e d i t D e v e l o p m e n t s a n d P o l i c i e s 38
Bank credit and liquid-asset formation (p. 38); comparative interest ratemovements (p. 41) ; capital markets : domestic and international (p. 45) ;credit developments in individual countries : United States (p. 4g), Canada(p. 52), United Kingdom (p. 55), Germany (p. 58), Netherlands (p. 62),Belgium (p. 64), France (p. 63), Italy (p. 68), Switzerland (p. 69), Austria(p. 71), Denmark (p. 72), Norway (p. 73), Sweden (p. 74), Finland (p. 75),Spain (p. 76), Japan (p. 77)
I I . W o r l d T r a d e a n d P a y m e n t s 79
The development of services (p. 82): transportation (p. 83), investmentincome (p. 83), tourism (p. 8$), remittances (p. 86), government transactions(p. 86); balances of payments: United States (p. 87), Canada (p. go), westernEuropean countries (p. gì), United Kingdom (p. g3), Germany (p. g$), Italy(p. g7), France (p. gg), Belgium-Luxemburg Economic Union (p. 101), Nether-lands (p. 101), Austria (p. 102), Switzerland (p. 103), Denmark (p. 104),Finland (p. 104), Norway (p. 10$), Sweden (p. 105), Spain (p. 105), Japan(p. 107); commercial policy (p. 108)
I I I . G o l d , R e s e r v e s a n d F o r e i g n E x c h a n g e n o
Gold production, markets and reserves (p. no); International MonetaryFund (p. 116); official reserves and other monetary movements: UnitedStates (p. 119), United Kingdom (p. 121), continental western Europe (p. 123),Germany (p. 125), France (p. 126), Italy (p. 127), Netherlands (p. 128),Belgium (p.12g), Austria (p. 12g), Switzerland (p. 12g), Sweden (p. 130),Finland (p. 130), Spain (p. 130), Canada (p. 130), Japan (p. 131); foreignexchange markets (p. X31): sterling (p. 132), Swiss franc (p. 134), DeutscheMark (p. 134), French franc (p. 135), Italian lira (p. 136); other exchangedevelopments (p. 136)

Page
IV. T h e E u r o - C u r r e n c y M a r k e t 138
Geographical distribution of European banks' external dollar positions (p. 139),size of the Euro-dollar market (p. 141), changes in the external foreign currencypositions of banks (p. 143), interest rate developments (p. 144)
V. T h e E u r o p e a n M o n e t a r y A g r e e m e n t 153
Modification of the Agreement (p. 153); operations under the Agreement:European Fund (p. 154), Multilateral System of Settlements (p. 156); manage-ment of the European Monetary Agreement (p. 156)
Part III - Activities of the Bank 158
Operations of the Banking Department (p. 158): composition of resources(p. 159), employment of resources (p. 162); the Bank as Trustee and FiscalAgent for international government loans (p. 166); the Bank as Depositaryunder the terms of the Act of Pledge concluded with the High Authority ofthe European Coal and Steel Community (p. 168); the Bank as Agent forthe OECD (European Monetary Agreement) (p. i6g); development ofco-operation between central banks and international organisations (p. 170);net profits and their distribution (p. 171); changes in the Board of Directors(p. 172)
Conclusion 174
Balance sheet as at 31st March 1967 and Profit and Loss Account for the financialyear ended 31st March 1967.

LIST OF TABLES A N D G R A P H S
(Graphs are indicated by an asterisk)
Page
Part I - Current Economic Trends and Policies 1966-67
United States:Changes in demand factors 4Excess reserves and borrowings of FR member banks * 7
Industrial production * 8Gross national product and its components 11Interest rates* 15United Kingdom: The budget 16Eastern European economies: National income, industrial and
agricultural production , 29Changes in global reserves 32Sources of increases in global reserves 35
Part II - Monetary and Economic Survey
I . C r e d i t D e v e l o p m e n t s a n d P o l i c i e s
The banking system: Monetary survey . 39Comparative interest rate movements 42Interest rates * 43Official discount rates 44Domestic capital markets : Net issues 46Foreign and international bond issues 48United States : Funds supplied to the credit markets 50Gross national saving and investment 53United Kingdom: Saving and fixed investment 56Germany: Monetary indicators * 59
I I . W o r l d T r a d e a n d P a y m e n t s
International trade 79Foreign trade * 81Western Europe, North America and Japan:
Balance of invisible transactions 82Aggregate invisible transactions 83Investment income . 84
Balances of payments :United States 88Canada 91Western European countries 92

Page
Balances of payments (continued) :United Kingdom 94Germany 96Italy 98France 100Netherlands 102Spain 106Japan 107
I I I . G o l d , R e s e r v e s a n d F o r e i g n E x c h a n g e
World gold production n oSources and uses of gold i nSupply and uses of gold * . ' 112Gold market prices * 113World supply and uses of silver 114World gold reserves 115International Monetary Fund: Drawings and repurchases 117United States : External monetary movements , 119United Kingdom: External monetary movements 122Continental European countries, Canada and Japan :
External monetary positions 124Germany: External monetary movements 126Italy: External monetary movements 127Sterling/dollar exchange rates * 133European quotations for the US dollar * 135
IV. T h e E u r o - C u r r e n c y M a r k e t
Changes in the banks' external foreign currency positions 138Dollar positions of European banks vis-à-vis non-residents 140Estimated net size of the Euro-dollar market 142External positions in foreign currencies of European banks . . . . . . . . 143Rates of interest in London and New York and arbitrage
margins in London * 145Commercial banks' short-term liabilities and assets in certain foreign
currencies vis-à-vis non-residents 147Commercial banks' short-term liabilities and assets in certain foreign
currencies vis-à-vis non-residents, excluding positions vis-à-visthe country of issue of the currency in question 150
V. T h e E u r o p e a n M o n e t a r y A g r e e m e n t
European Fund:Credits granted 154Utilisation of credits granted 155Statement of account 157
Page
Part III - Activities of the Bank
Annual balance-sheet totals 158Memorandum accounts 159Liabilities* 159Composition of resources 160Resources, by origin 160Resources, by nature and term 161Cash holdings and investments 162Gold position 162Assets * 164Time deposits and advances and other bills and securities , . . 165German External Loan 1924 (Dawes Loan) 167German Government International Loan 1930 (Young Loan) 167Austrian Government International Loan 1930 168Secured loans of the High Authority of the European Coal and Steel
Community 169

T H I R T Y - S E V E N T H A N N U A L R E P O R T
submitted to the
ANNUAL GENERAL MEETING
of the
BANK FOR INTERNATIONAL SETTLEMENTS
held in
Basle on 12th June 1967.
Gentlemen,
I have the honour to submit herewith the Annual Report of the Bankfor International Settlements for the thirty-seventh financial year, which beganon ist April 1966 and ended on 31st March 1967.
After deduction of the transfers to provisions, the net profit amountedto 32,074,487 gold francs, compared with 22,578,751 gold francs for thepreceding year. With the addition to the net profit of the balance of9,842,787 gold francs brought forward from the previous financial year, thereis a sum of 41,917,274 gold francs available.
The Board of Directors recommends that the present General Meetingshould declare, as last year, a dividend of 112.50 gold francs per share, i.e. atotal distribution of 22,500,000 gold francs. The dividend will consist of37.50 gold francs in respect of the annual cumulative dividend of 6 per cent.,54.47 gold francs in respect of the remainder of the undeclared cumulativedividend and 20.53 gold francs representing an additional, non-cumulativedividend of 3.28 per cent. If the other recommendations of the Board ofDirectors are accepted, the sum of 9,409,310 gold francs will be transferredto the General Reserve Fund and the sum of 10,007,964 gold francs to aSpecial Dividend Reserve Fund.
Part I of this Report deals with economic developments and policies inEurope and the United States in 1966 and the early months of 1967, andexamines the development of global reserves in the course of the last twelveyears.

In Part II a survey is given of developments in the fields of credit,external payments and reserves and in the foreign exchange and Euro-currency markets; an outline is also given of the working of the EuropeanMonetary Agreement.
Part III deals with the activities of the Bank and gives details of theresults of the year's business operations, together with an analysis of thebalance sheet as at 31st March 1967. It also deals with the functions of theBank on behalf of the High Authority of the European Coal and SteelCommunity and as Trustee and Fiscal Agent for international loans. Finally,it touches on the Bank's rôle in promoting co-operation between central banksas well as on its relations with other international institutions.

— 3
PART I
CURRENT ECONOMIC TRENDS AND POLICIES1966-67.
In the past year a marked change has come over the economic situationin many of the principal industrial countries. In the early months of 1966excess demand was exerting strong inflationary pressures on prices and thelabour market. While official policies were directed to curbing the boom, theyhad not yet gathered the strength, or had the time, to show results. In thecourse of the year, however, the effect of policy restraint became more andmore evident and by the first quarter of 1967 had produced a situation thatranged from marked slow-down or easing to mild recession.
The countries that dominated in giving this general cast to the inter-national economic picture were the United States, Germany and the UnitedKingdom, not only because of their own size but because the change intheir overall demand soon came to be felt beyond their borders. In greater orlesser degree, the development of the situation in the other countries ofwestern Europe has been similar.
Italy and Japan have stood out as exceptions to the more general turnin the demand picture. As they had been obliged to impose stabilisationprogrammes in 1963-64, their economies were in a balanced phase of expan-sion by the beginning of last year, and this has continued to run on smoothlyup to the present time.
There have also in the past year been substantial changes in balance-of-payments situations, particularly of the bigger countries. The large surplusposition of France has turned to deficit and Italy's has been sharply curtailed.The United Kingdom's, deficit has shifted into mild surplus and that ofGermany into substantial surplus. For the United States, although tightmoney in the past year produced an exceptional shift in capital flows, theunderlying payments position deteriorated. While swings in external positionsare no doubt better than prolonged surpluses and deficits, the goal of equi-librium appears as elusive as ever and it is only in a few countries that anear-balanced position seems in prospect.
United States.
To tax or not to tax; that was the question. And the indecisive way itwas answered gives the key to what happened to the US economy over thelast eighteen months. On the one hand, it allowed the forces of excess

4
demand to gather momentum and, on the other, it left the task of restraintto monetary policy.
The question posed itself in the wake of the announcement by thePresident on 28th July 1965 that the military forces in Vietnam and the draftcall were to be substantially increased. This clearly implied a sharp rise indefence expenditure, with a multiplied effect on economic activity through itsrepercussions on major categories of private spending. And this jolt to totaldemand, coming in a situation of already strongly expanding demand andabout full employment, was bound to lead to inflationary pressures on pricesand the labour market. Within a matter of weeks these implications of thestepping-up of the Vietnam conflict became evident in the market-place andby the fourth quarter of 1965 a boom situation manifested itself.
The fever chart of the economy, given in the table below, shows grossnational expenditure increasing at an average rate of $12.9 milliard in the
United States; Changes in demand factors, 1965-67.
Demand factors
Personal consumptionexpenditure
Durable goodsOther
Government purchases ofgoods and services . . . .
OtherGross private fixed investment
Residential construction .Producers' plant and
equipmentChange in business inventoriesNet exports of goods and
services
Gross national expenditure . .
2nd and 3rdquarters 1965
Average qua4th quarter 1965
and1st quarter 1966
rterly changes
2nd to 4thquarter 1966 1st quarter 1967
in milliards of dollars, seasonally adjusted
+ 8.1+ 0.8+ 7.3
+ 3.0+ 1.2+ 1.8
+ 1.8
+ 1.8— 0.4
+ 0.4
+ 12.9
+ 10.3+ 1.8+ 8.5
+ 3.7+ 2.0+ 1.7
+ 3.8+ 0.4
+ 3.4+ 0.1
- 0.5
+ 17.4
+ 6.2-0.2+ 6.4
+ 5.3+ 3.6+ 1.7
- 0.7— 2.2
+ 1.5+ 2.5
— 0.6
+ 12.7
+ 5.8— 1.2+ 7.1
+ 8.0+ 4.2+ 3.8
+ 0.2+ 0.2
-10.8
+ 1.3
+ 4.4
second and third quarters of 1965. At this rate the economy was continuingthe balanced expansion of the previous few years, with reasonably stableprices and moderate wage increases. Then the rate of rise jumped to $17.4 milliardin the next two quarters. Defence spending rapidly increased and, what is more,orders were being placed that would make for a larger rise later on. Besidesthis direct stimulus, the spectre of war added a psychological factor whichhelped boost the quarterly increase in business plant and equipment outlaysfrom $1.8 to 3.4 milliard and in consumer expenditure from $8.1 to 10.3 mil-liard in this short space of time.
The resulting strain on resources is indicated by the flatness of inven-tories; as raw materials and goods in process in the defence industries musthave been rising, consumer and capital purchasing was running ahead ofoutput. In the six months after September 1965 production in the group of

equipment and defence goods industries rose at an annual rate of 23 per cent.There was pressure not only on capacity but also on the labour market, asunemployment declined to 4 per cent, by January and was further reducedthereafter. And prices started an accelerated rise that was to carry on throughoutthe year. From balanced growth, the atmosphere had become one ofinflationary boom.
With much public discussion of the pros and cons of the matter, thegovernment hesitated all through 1966 over the advisability of curbing privatedemand by a strong tax increase. It did, however, introduce several fiscalmeasures in March which cancelled reductions in excise taxes that had comeinto force in January and increased the withholding tax on individual income.In April an appeal was made to business to reduce capital spending plansand in September the 7 per cent, tax credit on investment in machinery andequipment and the provision for accelerated depreciation on new buildingswere suspended.
In the Federal Reserve System the policy requirements of the situationwere more clearly evaluated as the demand for credit became excessive andother signs of booming demand appeared, and monetary policy was soondirected to the task of restraint. In December 1965 the discount rate wasraised from 4 to 4% per cent, and the ceilings under Regulation Q from4-4Vz to 5% per cent, on deposits of thirty days or more. As this measurearoused some controversy in Washington circles, it was not followed upimmediately by other restraining actions. But gradually the grip of tightmoney became apparent in financial markets, reaching real stringency by thelate summer, and interest rates went up to levels that had not been seen fordecades.
While the monetary measures were being intensified, business demandfor bank loans remained high, partly anticipating future needs. But, none theless, monetary policy attained its objective of dampening total demand as theyear wore on. The sharply lowered rate of demand increase in the secondquarter must be attributed to a natural settling-down of the buying wavethat had occurred during the previous six months. However, the continuationof more moderate demand after that and the real easing towards the end ofthe year and in the first quarter of 1967 were due to monetary restraint. Asmortgage funds became more expensive and harder to get, residential construc-tion dropped sharply; automobile sales declined, and the rise in businessinvestment outlays was greatly reduced. These developments are indicative ofthe ways in which room was made in the economy for growing defenceexpenditure with a lessening of inflationary pressures. In fact, by late 1966the easing of demand led to substantial involuntary inventory accumulation.
Excess demand inevitably led to rising prices. Consumer prices went upby 3.7 per cent, over the twelve months to October 1966 and wholesaleprices by 3 per cent.; while the gross national product in real terms in-creased by 5.4 per cent, in 196,6, the rise in nominal terms was 8.6 per cent.Furthermore, the wage guide-lines that had been closely adhered to for several

years did not hold after the middle of the year, and the wage round at higherrates has continued in 1967 despite the change in the labour-market situation.
The forces operating in the domestic economy also led to a significantdeterioration in the US external payments position. Directly linked to the warin Vietnam, military expenditure abroad increased by about $1 milliard at anannual rate from mid-1965 to the last quarter of 1966. In addition, the spurtin demand spilled over into imports, which increased by 19 per cent, in1966, the major upsurge taking place in the first three quarters. The risewas concentrated on manufactured goods, both consumer and capital, asdomestic capacity was strained and delivery schedules lengthened. In fact,capital goods imports advanced by 65 per cent. Even though exports weredoing well, the trade surplus, exclusive of government-financed exports,declined to $730 million — down $1.3 milliard from the year before. Asdemand slackened towards the end of the year, the growth of imports beganto subside and was quite small in the early months of 1967. Exports continuedto show strength, however, so that the adverse movement of the trade balancewas partially reversed.
The worsening trade position and larger overseas military costs werepartly offset by a significant improvement in the balance on long-term capitalaccount in 1966. The main factors contributing to this were the high interestrates prevailing in the United States and the voluntary restraint of capitalexports. Thus, there was a $2 milliard inflow of foreign longer-term funds in1966, compared with practical balance in 1965. This included a large shiftinto longer-term certificates of deposit and government agency securities,a good part of which was placed by international institutions and foreignmonetary authorities. In addition, the outflow of US private long-term capitalwas reduced by $0.9 milliard from the figure of some $4.4 milliard in 1965.US firms financed a larger proportion of their foreign investments throughnew security issues in Europe and the resultant long-term inflow partly offsetthe $3.4 milliard direct investment outflow. Owing to the strong domesticdemand for credit there was also a moderate reduction in long-term US bankloans to foreigners, and net purchases of foreign securities by US residentsdeclined slightly.
As a result of these varying influences the balance-of-payments deficitincreased on the liquidity basis from $1.3 milliard in 1965 to $1.4 milliardlast year. However, the deterioration would have been sharper had it notbeen for the shift from liquid to non-liquid investments by foreign officialinstitutions. In addition, net military prepayments by Germany contributed tothe inflow of official funds, and $0.4 milliard of debt prepayments wasreceived from France, Italy and Germany.
In the domestic economy inflationary demand pressures had clearlyabated towards the end of 1966. While the Federal Reserve had acted torelieve the stringency in financial markets in the autumn, it definitely shiftedto a policy of monetary ease in December through large open-market opera-tions. Non-borrowed reserves resumed their growth in November and December,

United States: Excess reserves and borrowingsof Federal Reserve member banks.Last week of month, in millions of dollars.
Excess reserves
Borrowings at Federal Reserve banks
-8001965 1966 1967
800
600
400
200
0
-200
-400
-600
-800
and jus t before the year -end t h e Federa l Reserve rescinded t h e reques t
addressed to banks in Sep tember to restrict business loans. T h e policy towards
easier m o n e y was cont inued in early 1967. I n M a r c h m e m b e r - b a n k reserve
requ i remen t s o n savings deposi ts and , i n par t , o n t ime deposi ts were r educed
from 4 to 3 pe r cent. , and early in Apr i l t h e d iscount rate was lowered from
4% to 4 per cent. W i t h U S interest rates declining, the p r o g r a m m e to c u r b
capital outflows in the coming year was s t reng thened in D e c e m b e r . W i t h effect
from January 1967, the interest equalisat ion tax was raised f rom an equivalent
of 1 to iy 2 pe r cent, and ex tended for another two years.
W h e n the Federa l budge t was presented in January , the gove rnmen t had
to make a difficult assessment of the emphas is to b e given to fiscal policy.
O n the one hand , d e m a n d for t h e t ime be ing had s topped expanding and
the re was no immedia te need for it to b e res t ra ined further . O n t h e other , a
very large budge t deficit was in prospec t . Besides th is , easier m o n e y was likely to
br ing some revival to sectors like housing, wages were rising and a fur ther
increase in defence expend i tu re seemed probab le . O n balance, it was con-
sidered that a revival of d e m a n d was likely b y the second half of 1967, so
tha t a tax increase was called for. T h e proposals were for a 6 pe r cent,
surcharge on individual and corpora te income taxes wi th effect f rom i s t Ju ly
and a rise in social securi ty taxes as from i s t J anua ry 1968. A s total d e m a n d
cont inued to flag in the spr ing m o n t h s , however , t h e 7 pe r cent, tax credit
o n inves tment i n e q u i p m e n t a n d t h e provis ion for accelerated deprecia t ion o n
industr ia l and commercia l bui ld ings were res tored. T h e r e was also a release of
some previously frozen Federa l budge ta ry funds for h ighways and o ther
projects . I t was not yet evident wha t ac t ion Congress wou ld take o n t h e
proposed tax increases.
T o s u m up , the si tuat ion in t h e U n i t e d States echoes a familiar refrain: t h e
b o o m has ended , b u t t h e wage -push l ingers on . So does the external deficit!

Industrial production.Adjusted monthly indexes: 1964 = 100.
130
120
110
100
130
120
110
100
130
120
110
mn
130
120
110
inn
AUSTRIA
,1967
. / V T f , Ì
GERMANY
SWEDEN
1967
/ " " *« . - - '
-:->' 1 i i 1
•"1*965- 1964
X-1966
,•'_•••...•
1 1
1965
...1964
, ,
4' J
1 1
UNITED STATES
1967 1966—•
1965
1964
BELGIUM
-1967^ / \
, i 1 , , 1
ITALY
1967
/-•""--
, , 1 , , 1
SWITZERLAND
•—"""Ï965"""""."
• " " • • " " I " , i 1
CANADA
1167
, "'**
••••;", 'Ï , , i ,
1966 1965 I
1964,
1966
1964y
- •—-•" ' '1
1964**
1966 „
1965 ' '
1964
, 1 , ,
FRANCE
1967
v -
i i 1 i
1966 _„_
1965 '*'
•' . 1964, -••i 1 i i 1 i i
NETHERLANDS
1967
..<•", 1 ,
1966 ^ , -
'""' 1965
' I V Ä I
UNITED KINGDOM
•",' i i ,
^ t 6 6 1965"v~•* ,.ri^— ..—••••
19641 1 1 1 | 1 1
, JAPAN
1967
.^y
1966 ^/
1965
'»•' ' / •••.•••
••" , 1964 pii 1 i i 1 i .
130
120
110
100
130
120
110
100
130
120
110
100
130
120
110
100

— 9 —
Germany.
The situation in Germany has been somewhat similar to that of theUnited States in that severe monetary tightness was the main instrumentused to combat an inflationary boom. Of course, the process extended over alonger time span in Germany, but in both countries excess demand wasbrought under control. In Germany, however, there was not rising defenceexpenditure to put a floor under the reaction, and policy has had to beshifted more deliberately to promote recovery.
As far back as 1964 the expansion in Germany led to over-full employ-ment and inflationary strains in the economy. With the fiscal position stronglyexpansionary, it was the Bundesbank that applied the brakes. A first movewas made in the summer of 1964 by increasing minimum reserve require-ments. Subsequently, monetary policy was tightened step by step by allpossible means. As a result, bank liquidity came under considerable pressure,bank credit and capital-market funds became scarce and interest rates wentup to almost prohibitive levels. However, as government spending remainedexpansionary until well into 1966, it took some time for the central bank'srestraint measures to bite. Nevertheless, by the spring of 1966 their effect wasmaking itself felt, the upswing came to a halt and soon a decline set in.
This reversal was clearly reflected in the fall in new domestic orders,which, after reaching a peak in March and April, had contracted roughly10 per cent, by the end of the year. Even more pronounced was the declineof i7V2 per cent, in the value of building projects over the same period.Industrial output decreased, too, although as there was a considerable backlogof orders in the spring of 1966 the fall between then and the end of theyear was only 4% per cent. Once the backlog had been worked off, thedecline accelerated.
The cyclical change was also evident in labour-market developments,though unemployment did not begin to rise until the autumn. By February1967, however, the total of persons out of work had risen to 674,000, againstonly 236,000 in February 1966. In addition, short-time working, almostunknown for some years, had increased considerably and the number offoreign workers fell between September 1966 and January 1967 by almost20 per cent. This was partly seasonal, but it is expected that a substantialproportion of those at present in their home countries will not obtain freshcontracts. The turn in the cycle is shown also in the unusually sharp decreasein vacancies from 622,000 in March 1966 to 275,000 in February 1967.
On the demand side, the main factor in the cyclical downturn was theweakening of investment activity in both the private and the public sectors,and it was, in fact, the capital goods industries, together with the buildingsector, that suffered the strongest setback. The national accounts show thatgross fixed investment in money terms was actually 1.1 per cent, lower inthe second half of 1966 than in the corresponding period of 1965. Thiscontrasts sharply with the 7.4 per cent, increase for the January-June period.The divergence was more marked in purchases of equipment: in the first

— io —
half of 1966 they showed a 4.6 per cent, rise on the level a year earlier, butin the second half of the year they recorded a 5 per cent. fall. Householddemand, too, tapered off in the summer and growth rates for private con-sumption fell — in line with income developments — from 9 per cent, inthe first half of the year to 4 per cent, in the fourth quarter, both comparedwith the same period of 1965.
The advance of prices began to slow down in the middle of the year.Industrial goods prices, which had climbed steadily throughout 1965 and hadrisen even more sharply in the early months of 1966, have remained more orless unchanged since last summer. The cost of living, on the other hand,continued to go up until recently — mainly owing to the persistent rise inrents and a fresh upswing in food prices — but the increase was moremoderate than before. The rise of wages, which had previously averagedabout 9 per cent., did not ease up until late in 1966.
The recessionary trend at home was counteracted, though only to asmall extent, by foreign trade developments. As delivery schedules shortenedin Germany, exporters intensified their sales efforts abroad, where demandwas still active. Consequently exports rose sharply in 1966, with a 12.5 percent, gain for the year. At the same time — also owing to cyclical factors —imports levelled off and eventually decreased. With these divergent develop-ments, the external current account shifted back from a substantial deficit inthe period January-June to an even higher surplus in the latter half of 1966.For the year as a whole a surplus of D M 0.4 milliard was recorded, against adeficit of D M 6.1 milliard in 1965. However, the effect on the liquidity of theeconomy of this large shift was to some extent weakened by a decrease inthe net inflow of capital (excluding special government transactions) and achange in leads and lags of D M 2.8 milliard.
As the easing tendencies in the economy strengthened, the Bundesbankhad to take account of the fact that wages were continuing to mount andfiscal developments — the most expansionary factor in the previous upswing— were still obscure. Initially, therefore, the policy of monetary restraint wasmaintained, although the effects of the increasing external surplus on bankliquidity were accepted.
Around the turn of the year the situation was clearly different: wagesand prices had almost ceased to rise, a solution to the fiscal problems seemedin sight, and, above all, unemployment was rising. In view of these develop-ments,' the Bundesbank adjusted its policy drastically. From Decemberonwards minimum reserve regulations were amended and requirements cut inthree stages, the discount rate was brought down gradually and selling pricesfor money-market paper were lowered accordingly. While the effect of easiermoney on domestic interest rates was somewhat limited by an outflow offunds, rates have receded. This has been more pronounced in the short-termarea than in bond-market yields —• which are still around 7 per cent.Credit demand, on the other hand, has not reacted accordingly, and so far onlythe public sector has taken advantage of the banks' increased credit facilities.

— II —
Changes in the gross national product and its components,at constant prices.
Countries
Denmark1....
Germany . . . .
Italy . . . .
Netherlands. . .
Norway1 . . . .
Sweden1 . . . .
Switzerland . . .
Total for abovecountries . .
United Kingdom.
United States . .
Years
196419651966
196419651966
196419651966
196419651966
196419651966
196419651966
196419651966
196419651966
196419651966
196419651966
196419651966
196419651966
196419651966196419651966
Sources of demand
Consumption
Private Public
Gross fixed domesticinvestment
TotalPlant andequip-ment
Dwell-ings
Exportsof goods
andservices
Resources
Importsof goods
andservices
Grossnationalproduct
in percentages
3.95.15.1
4.13.53.0
6.64.64.1
5.94.74.0
4.73.94.7
5.46.13.2
2.52.25.7
6.17.83.9
4.03.24.6
5.34.41.5
4.83.52.2
4.74.54.0
3.81.71.6
5.86.04.9
6.3— 1.1
4.5
4.25.24.0
8.03.74.3
6:73.64.0
4.83.93.3
— 1.26.60.3
3.43.63.6
2.80.92.6
4.68.83.8
5.16.54.4
4.10.85.8
2.74.73.0
1.93.53.2
1.12.18.4
9.04.77.3
12.91.24.0
19.26.94.6
3.38.52.0
10.15.27.4
12.06.90.5
— 6.5— 8.4
3.7
16.95.17.6
1.58.74.8
7.04.03.5
8.9— 1.4— 0.7
8.44.13.3
17.03.50.8
6.32
8.02
5.12
9.44.8
5.31.66.0
17.47.04.8
7.68.12.5
7.81.8
10.4
13.08.70.0
— 1 1.9— 9.6
6.1
14.73.67.5
1.09.65.6
5.84.16.0
8.4— 1.3— 0.4
7.34.34.1
14.73.81.8
8.911.39.7
7.24.0
46.20.1
- 2.5
28.36.33.8
— 9.310.01.0
16.914.90.0
8.4— 0.6
2.6
6.0— 6.0— 0.9
28.812.18.1
4.53.6
— 0.6
11.13.7
— 4.0
10.6— 2.1— 1.8
12.83.41:1
26.82.4
— 2.9
— 0.8— 2.0— 10.2
7.76.56.3
12.78.87.0
8.88.02.7
5.74.65.0
7.71 1.37.1
10.47.1
10.3
11.620.812.5
12.19.15.5
10.77.37.6
10.64.05.1
6.812.05.8
10.010.08.1
3.95.33.0
13.42.5
10.2
7.79.2
10.4
11.27.79.5
19.97.15.7
19.16.53.0
12.43.6
11.1
10.914.82.1
— 5.11.9
13.4
14.37.38.0
8.19.67.9
10.01 1.02.9
8.73.14.1
9.98.46.9
8.62.02.6
5.310.717.4
6.82.44.3
6.63.33.5
8.04.62.4
6.75.52.0
5.94.24.8
6.64.82.6
2.83.55.5
9.35.44.3
4.95.74.3
7.63.52.6
5.14.22.3
6.04.33.8
5.82.21.4
5.35.95.4
1 In the case of Denmark, Norway and Sweden the official data for domestic investment include main-tenance and repairs; these are excluded from the above figures. * Private investment and new civil publicconstruction.

— 12 —
In government policy, too, account had finally to be taken of the changein economic conditions. In the autumn, when the first fiscal estimates for1967 were made, attention was focused on budget-balancing. Earlier investmentprogrammes and appropriations for current expenditure pointed to an automaticincrease in 1967 budgetary outlays which it seemed impossible to cover inthe light of revenue forecasts and the tight situation on the financial markets.The authorities therefore tried to cut down expenditure and raise revenue.
The original budget, presented in September, foresaw an increase inFederal expenditure of over 7 per cent., so that changes in fiscal legislationwere proposed to reduce the deficit by D M 3.5 to 0.5 milliard. But, as theeconomic downswing made itself felt and had repercussions on tax receipts,the expected deficit tended to grow at the same time as the recessionarytrends limited the scope for deflationary action. The budget, as modifiedup to the end of January, proposed to augment revenue mainly by increasingtaxes on consumption, abolishing tax concessions and speeding up tax collec-tion. On the expenditure side, cuts were envisaged in subsidies and socialexpenditure, but there was also to be a shifting of burdens onto otherbodies or into the future.
While the budget deficit was not very large as presented, the estimatesdid not take into account further cyclical declines in receipts already consideredlikely. In departing from the previous aim of running a roughly balanced budget,the government has turned for the first time in many years to an anti-cyclicalapproach to fiscal policy, which in the circumstances called for deficit-spending.
Besides the regular budget, this policy was implemented by a "contin-gency budget" announced in January, which provided for credit-financedinvestment expenditure of up to D M 2.5 milliard. D M 850 million of this sumwas already appropriated by March, mainly for additional capital outlays bythe Federal Railways and the Postal Administration and for road construction.In addition, in order to stimulate private investment, special depreciation allow-ances were granted to industry for a period of nine months.
As of the late spring the fiscal stimulus had had little time to makeitself felt and monetary ease had not yet brought down the level of long-terminterest rates to a point that was encouraging a general upturn in investment.On the other hand, exports were still a sustaining factor and the recessionwas not deepening. It was reasonable, therefore, to expect economic activityto begin a revival without too much delay. In any case, the authoritiesannounced their intention to take further stimulating steps later in the yearif they should be needed.
United Kingdom.
The experiment conducted in the United Kingdom to test the noveltheory that forced-draught expansion of the economy would itself eventuallyright the balance-of-payments deficit was abandoned last July, after morethan two years of negative results.

— 13 —
The various measures of monetary and fiscal restraint imposed in late1964 and in 1965 had slowed down the real rate of expansion but had failed toeliminate the excessive demand, which was still intense in the first quarter of1966. By that time, too, the balance of payments was no longer showingimprovement, as it had in 1965. To meet the situation, the budget of May1966 introduced new taxes, calculated to yield £386 million in 1966-67, andmade a further direct attack on the external problem by means of voluntaryrestraint on investment in the more developed sterling-area countries and stepsto cut back government expenditure overseas.
Of the new revenue that would result from the budget, over 80 percent, was to come from a new selective tax on employment. As time wasrequired to bring this tax into operation, it was not to become effectivebefore September and had, therefore, no immediate impact upon domesticdemand. Productive capacity consequently remained overstretched in thesecond quarter. Consumer expenditure showed some reaction from pre-budgetbuying, but was held up partly because the existing prices and incomespolicy proved to be more successful in limiting price increases than in restrain-ing the rise in wages. Private investment, financed by heavy capital issuesduring the first half-year, also remained at a relatively high level and therewas steady growth of public current and capital spending. On balance, totalfinal expenditure was a little lower in real terms, but the labour marketremained as tight as ever, with unemployment at 1.2 per cent, of total em-ployees — less than a year earlier — and vacancies increasing. Moreover,although the external position was blurred by the seamen's strike in May andJune, the trade deficit was seen to be expanding.
Besides these adverse domestic forces, the rise of interest rates in theUnited States attracted a substantial volume of short-term funds away fromLondon during the first half of the year, which intensified the pressure in thesterling exchange market. This combination of factors caused a weakening ofconfidence in the pound and in July a major crisis developed. Immediatesupport of the currency could be met only through heavy borrowing againstfacilities provided by overseas monetary institutions.
In the face of this crisis, decisive action to ensure a balance-of-paymentsadjustment became the absolute priority for policy and, more than ever, thisimplied a substantial cut in internal demand. O n 20th July measures wereannounced which aimed to reduce expected domestic expenditure by over£500 million and, in addition, to cut spending overseas directly by some£150 million. Private demand at home was to be reduced by £350 million byfurther restrictions on consumer credit, increases in indirect taxes and insurtax, higher post-office charges and the further direct limitation of lessessential building. Tighter exchange restrictions were to make a direct contri-bution of £50 million to the balance of payments. Public expenditure, too,was to be curtailed by cuts of £150 million in domestic investment, mainlyby public enterprises, and of at least £100 million in spending overseas, thoughthese were not to be effective until 1967-68.

— 14 —
In addition, a rigid standstill was imposed on incomes and prices untilthe end of the year, to be followed by a further six months of severerestraint. These direct controls and fiscal measures were supplemented byfurther monetary action. Some days earlier Bank rate had been raised to 7per cent, and additional special deposits requested from the banks. At aboutthe same time it was announced that no easing of the ceiling on bank creditwould be permitted to offset the squeeze on company liquidity expected laterin the year. With the impact of the selective employment tax still to come,the scope and stringency of this programme demonstrated the resolution ofthe UK authorities.
The measures rapidly affected private spending. Consumption in thesecond half of the year was 2V2 per cent, lower than in the first, despite adecline in the savings ratio. The impact was especially heavy on salesof durable goods, with new car sales dropping by about one-third. Privateinvestment, too, declined progressively towards the end of the year. Therewas, however, some offset from rising public-sector expenditure and higherexports. Although industrial production fell rather sharply after August, totaloutput did not contract significantly but stagnated.
As demand receded, there was a marked decline in business confidence,which had remained so buoyant in the face of earlier restrictive measures.This showed in a prompt falling-off in the demand for finance as investmentprogrammes were curtailed. Many prospective capital issues which had threat-ened to overburden the market were withdrawn or postponed and long-terminterest rates began to decline. Demand for bank advances also fell away andthe banks, which had expected difficulty in keeping within their creditceilings, found themselves with room to spare for priority borrowers.
There was also a rapid adjustment of work forces to the lower level ofproduction — in contrast to the earlier labour hoarding. By the end of theyear the number of unemployed had risen to nearly 450,000, 1.9 per cent, oftotal employees, and reported vacancies showed a comparable fall. Thischange in the labour-market situation gave support to the incomes freeze,which many had initially suspected of being unrealistic. Hourly wage rates inindustry rose at an annual rate of 8 per cent, between January and Junebut were virtually unchanged after July and the tendency to shorter normalworking hours was halted. Retail prices rose by 2.6 per cent, in the first sixmonths of 1966 but by only 1.0 per cent, in the latter half of the year, andeven this increase was largely attributable to the tax changes and to seasonalfactors.
With quite a short time-lag, the easing in the domestic economy broughtan improvement in the balance of payments. Over the year as a whole thecurrent-account deficit was nearly halved, to £61 million, but this improvementwas entirely due to a substantial surplus of £135 million (seasonally adjusted)in the fourth quarter. This result was affected by an unusual number ofspecial factors, but the strength of exports at the end of the year and adecline in imports not affected by the removal of the import surcharge in

Interest rates.
United KingdomEuro-dollar in LoGermanyUnited StatesNetherlands
ndon-
i I
GermanyUnited Kingdom9 international $ issues in LondonNetherlandsUnited States, I i i I i i I i i I i
9%
1965 1966 1967 1965 1966 19671 United Kingdom: three-month deposits with local authorities; Germany: three-month money-market loans;United States: three-month certificates of deposit (secondary market); Netherlands: three-month Treasury bills.2 Germany: industrial bonds; United Kingdom: 20-year debenture and loan stocks; Netherlands: three privatebonds (4'/2—4% per cent.); United States: industrial bonds.
November clearly reflected the dampening of domestic demand. The long-termcapital account also showed an improvement of £m million, spread moreevenly through the year and almost entirely on private account. The basicbalance registered a deficit of £189 million for the year, against one of£348 million in 1965, and a surplus of £121 million in the fourth quarter,despite the resumption of service on the North American post-war loans.
Pressure in the exchange market continued for a time and furtherdrawing on foreign short-term assistance was required in August. The changebegan later in September, however, and in October a start was made inrepaying central-bank assistance. Wi th the substantial easing of monetaryconditions in the United States in December, which was coupled with arenewal of confidence in sterling, short-term funds returned to London on alarge scale. Furthermore, the balance of payments was in more than seasonalsurplus in the first quarter of 1967. These factors together put a large volumeof foreign exchange into official hands, enabling the bulk of short-termassistance to be liquidated by the end of March.
The broad picture from 1964 to that time can be summed up asfollows. The demands on sterling had come from balance-of-payments deficitsin the years 1964-66 and from confidence movements of funds out of London.These had been financed by medium-term borrowing from the I M F andSwitzerland of £900 million, by the transfer of £316 million from theTreasury's portfolio to the reserves and by heavy drawings on monetary

— i6 —
assistance from abroad. By the end of March sterling balances had been forthe most part reconstituted and short-term assistance largely paid off, whilethe medium-term debt outstanding plus the transfer from the portfolio to thereserves about equalled the previous external deficits — moderately offset byrecent surpluses.
On 25th May the United Kingdom repaid to the I M F $405 million ofthe $1 milliard that it had drawn in December 1964. The sum repaidcorresponded to the total of GAB credits granted to the I M F in connectionwith the 1964 UK drawing. At the same time the $80 million credit grantedby Switzerland to the United Kingdom in December 1964 was also repaid.
By the end of 1966 the U K economy had absorbed the initial shockof the July measures. After November industrial production stabilised;similarly, both the rise in unemployment and the drop in the number ofvacancies moderated around the turn of the year. The decline in consumerspending appeared to level off and some rise in wage rates was to be ex-pected. Although private investment continued to fall, it had been given amild stimulus by an increase in grants on investment expenditure incurredover the next two years, and by the accelerated payment of such grants.Interest rates were well below their peak and, with short-term rates abroaddeclining, Bank rate was reduced to 6 per cent, by mid-March. Moreover,although the July programme had foreshadowed a reduction in public-sector expenditure for the coming fiscal year, the official estimates showedthat public investment in particular would continue to be an expansionaryfactor. And, although sterling had recovered in the first quarter, it wasessential not to jeopardise the improvement on external account.
The budget of April 1967 was based on the expectation that outputduring the calendar year 1967 would rise by 3 per cent., or at about the
United Kingdom: The budget.
Items
RevenueTax revenue
Total revenue
ExpenditureSupply servicesConsolidated Fund standing services . . .
Total expenditure
SurplusConsolidated Fund loans (net)
Overall deficit (— )
1965-66
Results
Financial years1966-67
Estimates1 Results
1967-68
Estimates1
in millions of £ sterling
8,324821
9,145
7,1401,316
8,456
689— 1,265
- 576
9,626893
10,519
8,0231,449
9,472
1,047— 1,334
— 287
9,371908
10,279
8,1081,433
9,541
738— 1,478
— 740
10,6791,025
11,704
9,5071,560
1 1,067
637— 1,580
— 943
1 After budget changes. 2 Preliminary.

— 17 —
underlying rate of growth of productive capacity. As this outlook was con-sistent with the current objectives of policy, the budget made only minortax changes.
As presented, the budget anticipated an increase in revenues of£1,425 million as against a rise in expenditure of £1,526 million. ConsolidatedFund lending, especially to the nationalised industries, was expected to in-crease by £102 million, so that the overall deficit would rise from £740 to943 million. This fiscal stimulus, in conjunction with the large size of thedeficit, was not without risk and required restraint of possible renewedinflationary forces from the private sector.
Borrowing on this scale could clearly generate excessive monetaryliquidity. T o meet this danger, the budget amended the terms of issue ofcertain forms of non-marketable government debt in order to promote saving,and, although the credit ceiling was abolished for the clearing and Scottishbanks, these banks are to continue to be controlled through the more flexibleuse of special deposits. For other banks and finance houses direct restrictionis retained for the time being.
Continued restraint will also be applied to prices and incomes, althoughsome relaxation of the criteria against which proposed increases will bemeasured is in view. The government is to retain statutory powers to delayincreases but expects that the lower pressure of demand will reduce thenecessity for official intervention.
A feature of the past two years has been the resistance of the UKeconomy to restraint and the severity of the measures eventually necessary tocreate the conditions required for external recovery. Besides the excessive riseof wages, a fundamental factor in this has been the expansionary rôle ofpublic-sector expenditure, which, however desirable in itself, has not beenaccommodated to short-term demand management. A major share of theadjustment has consequently fallen on private investment. Since longer-termeasing of the balance-of-payments constraint is directly linked with such in-vestment, it is important that when business spending recovers the demandson the economy from the public sector be tailored to make room for it.
France.
With economic policy directed to expansion, the recovery in Francewhich began in the spring of 1965 continued at a rapid pace until the endof the summer of 1966. Since then the increase in activity has slowed downas a result mainly of some slackening in consumer demand and of a weaken-ing in exports, primarily in those to Germany and the United Kingdom. Bythe spring of this year activity was in a sideways movement, not too differentfrom that in other countries of the Continent. For 1966 as a whole, however,the increase in the gross national product reached 4.8 per cent., comparedwith 4.2 per cent, the year before, and industrial output was more than6 per cent, higher than in 1965.

— i8 —
The main forces behind this increase were the continued rapid advanceof public investment outlays and a satisfactory revival of private productive in-vestment; the latter was stimulated by a 10 per cent, tax credit introduced inFebruary 1966 and applicable up to the end of the year. In contrast to 1965,private demand for housing weakened and led to a decline in building-sectoractivity.
With important elements of the 1963 stabilisation programme :— namelybudgetary strictness and a prohibition on price increases — remaining inforce, economic growth has not been accompanied by significant inflationarypressure. Indeed, the price rise of 2.8 per cent, at the retail level and near-stability at the wholesale level was equal to or lower than that recorded in1965, while wage increases tended to slow down somewhat. Apart from pricecontrols and public-sector incomes policy, other factors, such as more intensecompetition from abroad, which was encouraged to some extent by theremoval of some import restrictions, and a progressive easing of the labourmarket, also played a rôle.
As regards the balance of payments, while 1966 as a whole showed asurplus, a reversal occurred in the course of the year. The previous largesurplus was maintained in the first half of the year but has given way sincethe autumn to a deficit. Most of the deterioration was in the basic balance,both long-term capital and current transactions. Imports continued to risewith domestic activity, whereas exports tapered off as the boom in neigh-bouring countries faded. Net invisible receipts were smaller, and the previousinflow of long-term capital was much reduced by tight money and highinterest rates abroad.
In the monetary sphere, while quasi-money and liquid savings keptgrowing rapidly, the increase in the money supply was moderate and, inContrast to preceding years, not higher than that in the gross national productin current terms. Following the balance-of-payments developments, the flow ofdomestic liquidity arising from the external factor steadily declined in thecourse of the year and has shifted to liquidity absorption since the autumn.For 1966 as a whole the flow of savings to the Treasury was more thanenough to cover the budget deficit of some Fr.fr. 2 milliard and permittedthe draining-off of some liquidity. Consequently, bank credits to the economy,which in 1966 rose by 15 per cent., have become the only source of liquidity.In view of this development and of the flagging condition of the economy,the Bank of France completely removed credit restraints in February 1967.
Wi th the economy in a reasonably balanced position, the authoritieshave taken the opportunity to make further progress in financial reforms.Freedom in financial relations between France and foreign countries wasre-established as from 31st January 1967. This involved the abolition ofall exchange control regulations and the introduction of full convertibility ofthe franc and complete freedom for transfers into or out of France of allmeans of payment, securities and gold. In addition, a flexible system ofreserve requirements for the banks was introduced to replace the former

— 19 —
"coefficient de trésorerie" and the scope of activity of both banks andsavings institutions was enlarged. Although certain transactions — especiallythose concerning direct foreign investment and foreign securities issued inFrance — are kept subject to control, these liberalisation measures representa basic change, which should have a lasting effect on the French economy.
While the new freedom in financial relations will give wider scope forinitiative to the private sector, which is indeed its purpose, it implies lesslatitude in the conduct of official policy. The monetary authorities havealready had to take account of the increased influence of interest rate levelsabroad. Open-market operations have had to be broadened and the authoritieshave intervened for the first time as a seller on the market to maintaininternal rates at levels necessary to avoid large outflows of funds. And, in thefuture, the need to maintain sound budgetary policies and to avoid significantacceleration in prices and wages will be reinforced.
Netherlands.
In the Netherlands the wage explosion of late 1963 had propelled theeconomy into a roaring boom which led the central bank to adopt a tightmonetary policy to bring the situation under control. Although real expansionand overall monetary demand were much smaller in 1965 than the yearbefore, this was due more to physical limitations than to a firm grip ofpolicy on market forces. Hence, at the beginning of 1966 the Netherlandseconomy was entering another year with over-full employment and stronginflationary pressures.
Given this situation, the restrictive monetary policy was maintained. Itwas directed also that long-term lending be kept in line with the accrual oflong-term funds. In addition, the government's policy, which had previouslybeen an expansionary influence, was modified somewhat. Tax increases andother fiscal measures were planned to reduce the budget deficit in 1966 tosubstantially less than in 1965. Against this background, fairly balancedgrowth was anticipated for 1966 and an external surplus seemed in prospect.
Actual developments early in the year, however, pointed to a newstrengthening of inflationary pressures. Bank credit in the first four monthswas growing at an annual rate about twice as high as had been laid down inthe restrictive measures. In addition, it became apparent by the spring thatcentral-government expenditure — mainly on transfers and salaries — wasincreasing more than estimated and that a budget deficit in excess of that for1965 was to be expected. At the same time the price rise was acceleratingand the trade deficit widened considerably.
In view of the situation, new corrective measures were initiated. Thecentral bank raised the discount rate on 2nd May and lowered the permissibleannual rate of expansion of short-term bank credit. The government introduceda new programme under which wage rises were to be limited to 7 per cent.

— 20 —
in 1966 and prices were generally to be kept at their end-May level. Inaddition, government investment projects were postponed and the recruitmentof new civil servants was prohibited. Finally, financing through the Bank forNetherlands Municipalities, introduced in 1965 to protect the capital market,was restricted to really urgent requirements.
These measures were fairly successful, although the government's deficitremained quite large. Between April and December the banks absorbed theexcess over the norm in short-term lending. The directive on long-termlending was also respected. A side-effect, however, was that banks shiftedaway from portfolio investment and thus curtailed the supply of funds to thebond market. On the capital market, existing tensions increased and, withdemand still high, interest rates went up to 7 per cent, for new governmentloans and to almost 8 per cent, for mortgage loans. The very tight marketinduced the public sector to cover its financial needs to a greater extent byshort-term borrowing. After the middle of the year, however, capital-marketrates became stable and towards the end of the year they even turned downsomewhat.
These financial strains, together with slackening foreign demand andsome curtailment of public investment, exercised a retarding influence oneconomic activity. Industrial production rose more slowly after August, neworders in the metal industries remained virtually stationary and, above all,labour-market strains diminished. The number of vacancies on an adjustedbasis dropped from about 85,000 in the late spring of 1966 to 47,000 inMarch 1967; the rate of unemployment increased over the same period fromslightly more than 1 per cent, to 2.5 per cent.
In 1966 as a whole the real gross national product increased by 4.3 percent., against 5.4 per cent, in 1965, though, with the balance of paymentsshifting from surplus to deficit, the percentage rises in real national expendi-ture were the other way round. The main forces behind the increase weresharp rises in private productive and public investment and in governmentconsumption. In contrast, the growth rates for household consumption,residential building and exports decreased. It was, none the less, a year ofgreater price inflation; consumer prices were up by 6 per cent, (partly becauseof excise taxes), compared with 5 per cent, in 1965, and investment goodsprices were 5.5 per cent, higher, as against 4 per cent, in the previous year.
As already indicated, however, the pressure of inflation was at fullstrength only in the first half of the year and waned in the second half. Bythe early months of 1967 prices were reasonably stable and overall economicactivity was making little headway. Imports had lost momentum more than sixmonths before and the balance of payments was close to equilibrium. Permis-sible wage increases had been fixed at 4 per cent, for the first half of theyear and 1.5 per cent, for the second.
At the start of 1967 the prospects for the year were judged to bereasonably good. But more recent developments have indicated a further

— 21 —
slackening of business activity. Unemployment, in particular, continued toincrease, and in certain structurally weak regions it rose to high levels. Thisinduced the government as early as January and February to provide specialassistance by granting investment incentives and releasing funds to createemployment in the areas in question. Monetary policy, too, has been adjusted;in March the discount rate was reduced and it was announced that banksexceeding the lending ceiling would not have to make penal deposits with theNederlandsche Bank.
Belgium.
The change in trend which occurred last year in most industrial countrieswas quite marked in Belgium. Recovery strengthened considerably in theearly months of 1966 and, while capacity was not hard pressed, the expansionwas accompanied by accentuation of inflationary strains. Hence, in April andMay the authorities again took stabilisation measures; steps were initiated toslow down the increase in public expenditure and to impose a three-monthfreeze on the prices of goods and services. In addition, bank credit wasrestrained by a rise in the discount rate in June.
Although these mild measures may have had some effect, they probablyplayed only a small part in the shift to a declining rate of expansion thatemerged during the summer and still prevailed in the spring of this year.Other factors, such as the weakening of exports and the flagging of domesticprivate demand, were the main forces at work.
As in neighbouring countries, the export decline was mainly in shipmentsto Germany; it explains the current-account deficit as well as the bulk of theoverall deficit in the balance of payments, which came to B.fr. 5.9 milliard, incontrast to a surplus of B.fr. 8.5 milliard in 1965.
As a result of the various dampening influences, industrial productionlast year was weak after its early upswing, and in December 1966 it wasback at the same level as twelve months earlier. There were fair margins ofidle capacity and the number of unemployed rose. The gross national productincreased over the year by about 3.5 per cent, in volume terms, or onlyslightly more than in 1965, the improvement being due to the upswing duringthe first quarter.
Although price pressures were strong early in the year, the abatement ofdemand after the first quarter served to dampen them and in December theretail price index was at about the same level as in June. The total increasefor the year was 3.2 per cent., compared with 4.1 per cent, in 1965. SinceJanuary 1967 prices have been freed altogether, except for the obligation togive advance notice of increases. While price pressures weakened in 1966,wages, despite the easing in the labour market, continued their rapid rise,gross hourly earnings going up by 10 per cent, over the year, compared with7.6 per cent, in 1965.

— 22 —
In view of continued inflationary pressures, now of the cost-push variety,the authorities have eased the monetary situation only moderately. While theofficial discount rate was reduced in February, in March and again in May1967, partly in line with developments abroad, the limitations on the expan-sion of credit introduced in April 1966 were extended for the first six monthsof this year. However, on the basis of a new law granting the governmentspecial powers to revive the economy and ensure budget equilibrium, severalmeasures were taken in April 1967. They aimed to promote investmentthrough a Fund for Economic Expansion and Regional Reorganisation ofB.fr. 5 milliard and by granting fiscal advantages for new investment. Theyprovided also for increased taxes to yield B.fr. 1.5 milliard in 1967.
Switzerland.
During the past year the Swiss authorities succeeded in combining fullemployment with balance-of-payments equilibrium, but the problem of arather high rate of price increase has remained. While the growth of the grossnational product in real terms declined from 4.2 to 2.3 per cent., the slow-down in current prices was only from 7.8 to 7.2 per cent. At the end of 1966the consumer-price index stood 4.6 per cent, above its level a year earlier.
The anti-inflationary measures which had been taken in 1964 were quiteeffective in slowing down the growth of private domestic demand. Total in-vestment, which in constant prices advanced at a rate of 8.9 per cent, in1964, declined by 3.5 per cent, in 1965 and by another 0.9 per cent, in 1966.The situation of chronic excess demand in the building sector has beenremedied and private consumption has continued to expand at a lower ratethan gross national expenditure.
The stabilising effects of the various anti-inflationary measures were,however, largely offset by the continued buoyancy of current public expendi-ture and exports. In 1966 public consumption advanced at a rate of 11.5 percent, in current prices and exports went up by 9.8 per cent.
A second reason for the failure of economic policy to show majorresults in the field of prices was that inflation has been taking on much moreof a cost-push character. The government's restrictive policy with respect toforeign labour has tended to increase the tensions in the labour market. Theupward adjustment of the Swiss interest rate level, which had been renderedinevitable by the rise in interest rates abroad, has, in view of the highmortgage indebtedness of the Swiss economy, contributed to the upwardmovement of rents. A third autonomous factor behind the upward trend ofprices has been the principle of granting agriculture a certain income paritywith earnings in industry. As long as wage increases completely absorbindustrial productivity gains, and thus rule out any offsetting downturn ofindustrial prices, this policy inevitably leads to some wage/price spiral, whichdoes not readily lend itself to the conventional treatment of restricting aggre-gate demand.
— 23 —
Apart from its price record, the Swiss economy's performance in thepast year was an impressive one. The slower growth of the gross nationalproduct was partly due to government policy, which prescribed another 5 percent, reduction in the foreign labour force between March 1966 and January1967. In fact, at 3.3 per cent., the rate of increase in gross national productper person employed was about as high as during the preceding boom years.Industrial production, despite a 1.3 per cent, decline in the industrial labourforce, stood in the fourth quarter of 1966 4.4 per cent, above its level a yearearlier. Even after its recent slow-down, investment still accounts for overa fourth of the gross national product, which is one of the highest proportionsrecorded in the industrial countries. In addition, after five years of deficits,the Swiss economy in 1966 achieved a substantial current-account surplus inits balance of payments.
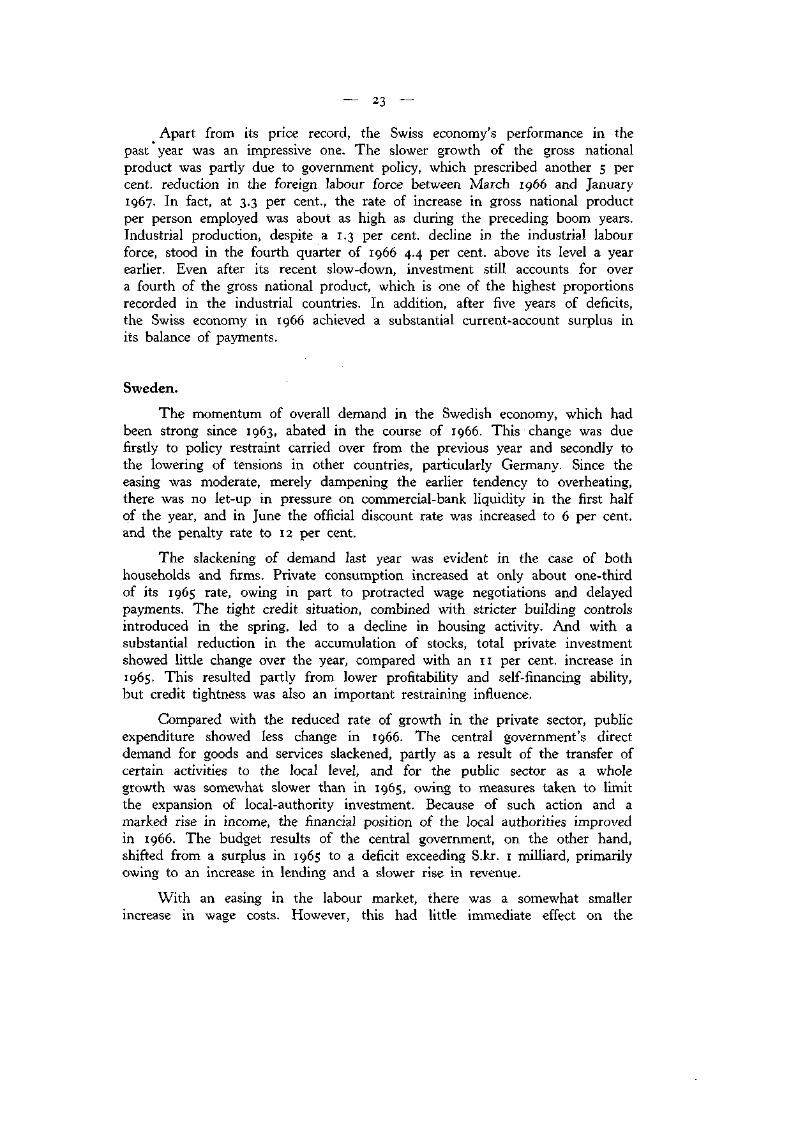
Sweden.
The momentum of overall demand in the Swedish economy, which hadbeen strong since 1963, abated in the course of 1966. This change was duefirstly to policy restraint carried over from the previous year and secondly tothe lowering of tensions in other countries, particularly Germany. Since theeasing was moderate, merely dampening the earlier tendency to overheating,there was no let-up in pressure on commercial-bank liquidity in the first halfof the year, and in June the official discount rate was increased to 6 per cent,and the penalty rate to 12 per cent.
The slackening of demand last year was evident in the case of bothhouseholds and firms. Private consumption increased at only about one-thirdof its 1965 rate, owing in part to protracted wage negotiations and delayedpayments. The tight credit situation, combined with stricter building controlsintroduced in the spring, led to a decline in housing activity. And with asubstantial reduction in the accumulation of stocks, total private investmentshowed little change over the year, compared with an 11 per cent, increase in1965. This resulted partly from lower profitability and self-financing ability,but credit tightness was also an important restraining influence.
Compared with the reduced rate of growth in the private sector, publicexpenditure showed less change in 1966. The central government's directdemand for goods and services slackened, partly as a result of the transfer ofcertain activities to the local level, and for the public sector as a wholegrowth was somewhat slower than in 1965, owing to measures taken to limitthe expansion of local-authority investment. Because of such action and amarked rise in income, the financial position of the local authorities improvedin 1966. The budget results of the central government, on the other hand,shifted from a surplus in 1965 to a deficit exceeding S.kr. 1 milliard, primarilyowing to an increase in lending and a slower rise in revenue.
With an easing in the labour market, there was a somewhat smallerincrease in wage costs. However, this had little immediate effect on the

— 24 —
behaviour of prices; consumer prices, excluding the effects of indirect taxesand subsidies, went up by about 5 per cent., or a little more than in 1965,and, while the gross national product rose by 8.8 per cent, in current prices,the real gain amounted to only about 3 per cent.
As after mid-year the slow-down in activity became apparent, central-bank policy was relaxed somewhat. The adjustment of credit policy to markettrends was continued early in 1967 and the discount rate was lowered toSVz per cent, in February and to 5 per cent, in March. While the easiermonetary policy was designed to stimulate productive investment, a fee wasintroduced to discourage certain types of non-priority construction and theturnover tax was increased from 10 to 11 per cent, in March to dampenprivate consumption.
This combination of measures shows that there is little concern about asignificant contraction and, in fact, demand is expected to pick up later in theyear. Renewed overheating of the economy this year is not anticipated,however, and reducing the current-account external deficit, which was stillconsiderable in 1966, and slowing down price increases continue to beimportant objectives of economic policy.
Canada .
After several years of rapid expansion, the slack in the Canadianeconomy had been progressively taken up. By the end of 1965 gross outputwas one-third greater than in 1961 and unemployment had been reduced to3% per cent., its lowest level since 1956. By that time, however, definite signsof inflationary pressures had appeared; expenditure by the public sector wascontinuing to rise rapidly and business fixed investment was expanding atboom proportions. To limit the excess overall demand, with its accompanyingcost and price pressures, and to maintain the country's external financialposition, monetary policy began to be tightened.
A clear shift to restraint was made in the March 1966 budget; govern-ment construction expenditure was cut, some depreciation allowances werereduced sharply, and a 5 per cent, refundable tax was levied on after-taxcorporation profits. As an incentive to defer investment expenditure, the salestax on production machinery was to be lowered in April 1967 and abolisheda year later. To reduce spending for consumption, personal income tax,except for the lower brackets, was raised as from June 1966, thus reversingthe 1965 tax cut. Later in the year these budget restraints were reinforced bysome additional measures, including withdrawal of the winter house-buildingincentive programme, and in a supplementary budget in December theFederal sales tax and the old-age social security tax were raised.
As a result of the various monetary and fiscal measures the investmentboom began to taper off in the second half of the year and, although the16 per cent, annual increase in capital outlays was still large, it was substan-tially smaller than the 23 per cent, rise indicated by the mid-year review of

— 25 —
investment intentions. On the other hand, expenditure on goods and servicesby the Federal Government rose by 19 per cent., against 11 per cent, in1965, and, despite the March measures, its net position on a national accountsbasis weakened by Can.$ 444 million. Expenditure by provincial and munici-pal governments rose as usual more rapidly than their revenues.
As in the United States, the extreme tightness of credit had a veryuneven effect on different sectors of the Canadian economy, the impact onmortgage borrowers being particularly severe. The lack of mortgage funds hadalready caused a slow-down in house-building in late 1965 and this trend wasintensified last year. Tighter credit conditions and higher taxes also acted as adampening influence on domestic sales of motor-cars and other durableconsumer goods, the steep decline in the stock market serving as a furtherdiscouraging factor.
As demand pressures moderated in the summer and early autumn, theBank of Canada switched to a policy of greater ease. Economic activity wasagain stronger in the final quarter of the year but there seemed little prospectof renewed overheating. In fact, the survey of investment intentions for 1967showed total planned outlays on plant and equipment to be about the sameas in 1966. The Bank of Canada moved towards easier money, a step whichwas facilitated by similar action in the United States. Late in 1966 and earlyin 1967 the government also announced a number of measures designed tostimulate house-building activity and in April there was a lifting of some ofthe earlier tax restraints on business investment. The estimated increase ingovernment spending should also provide considerable stimulus this year.
Although demand pressures abated after mid-1966, prices and wages rosesharply and about two-fifths of the 11 per cent, increase in the gross nationalproduct last year was accounted for by higher prices. Tight labour-marketconditions coincided with a large number of contract negotiations and the6.9 per cent, increase in wages and salaries in the non-farm sector considerablyexceeded the productivity improvement. An important objective of economicpolicy in 1967 will be to arrest the price and wage rise while maintaining asatisfactory rate of growth to employ the rapidly increasing labour force.
Despite the strong expansion last year, the external trade balance im-proved. On capital account, direct investment inflows increased sharply andnew issues floated in the United States rose, but large net purchases weremade of US common stocks and there was a substantial outflow of fundsthrough the banking system.
Italy.
Having weathered a serious setback in 1964, the Italian economy lastyear was an exception to the general recessionary tendency in western Europe;a 5.5 per cent, increase in the real gross national product was successfullycombined with a continuing current-account surplus and a high degree ofprice stability.

— 26 —
The economic recovery, which had begun hesitantly in the spring of1965, was at first led by an increase in public expenditure and a strongexport performance, while the easing of monetary conditions and fiscal incen-tives to investment were not very successful in reviving private investmentdemand. In the course of 1966, however, the recovery became more broadlybased. Exports remained a dynamic element but, with the gradual reconstitu-tion of profit margins and higher rates of capacity utilisation, private investmentalso showed signs of improvement. This is reflected in the rise of 6.1 percent, in total investment, after declines of 8.2 and 7.5 per cent, in 1964 and1965. Investment in industry went up by nearly 10 per cent, and public-sector investment by 5.4 per cent. Private consumption expenditure, afterlagging behind in 1965, expanded at a slightly higher rate than the total grossnational product, whereas the increase in current public expenditure (incurrent prices) slowed down from 12.8 to 6.9 per cent. The growth rateof imports jumped from 2.7 to 16 per cent.
Reflecting the continuing strength of exports, the recovery was mostpronounced in the industrial sector (excluding building), which accounted forabout two-thirds of the increase in the gross national product. Industrialproduction advanced by about 11 per cent, between the fourth quarters of1965 and 1966 and exceeded its pre-recession peak by 18 per cent. Never-theless, certain branches, such as the textile and building-materials industries,have not yet regained their previous highs. The building sector has remainedthe chief weak spot in an otherwise fairly bright picture, but here, too, thereare indications of an improvement. Thus dwellings completed during 1966were 25 per cent, down on 1965, but new building permits issued werenearly 10 per cent. up.
The recovery of economic activity was mainly reflected in a return frompart to full-time employment. Overall employment actually declined slightly,owing primarily to the weakness of the building sector and a renewed shift oflabour from agriculture. The data thus far in 1967, however, point to animprovement in the employment situation.
The continued ease of the labour market has contributed towards modera-ting the upward trend of wages. Contractual minimum wage rates at theend of December exceeded their level a year earlier by only 4.7 per cent. Thedecline in the rate of wage increases was in itself one of the major factorsbehind the slow-down of the upward movement of the automatic wage scalefrom 10 points in 1964 to 6 points in 1965 and only 3 points in 1966. Thecost-of-living index at the end of 1966 stood only 1.8 per cent, above itslevel a year earlier, while the wholesale-price index showed virtually no in-crease over the year.
Monetary policy throughout 1966 was directed towards keeping liquidityin ample supply, the main object being to encourage the upswing in invest-ment. This policy also succeeded in insulating the Italian credit marketfrom the interest rate advance abroad and led to a substantial increase in netcapital exports, which offset about two-thirds of the total current-account

— 27 —
surplus. At the same time net issues of fixed-interest securities on the capitalmarket showed a spectacular rise from about Lit. 2,000 to 2,800 milliard.
The budget was less expansionary than in 1965. The central administra-tion's overall national-income deficit declined from Lit. 819 to 689 milliard.At the same time, however, the Treasury's net financing requirement rose byLit. 324 milliard to Lit. 1,867 milliard owing to increased government lendingfor investment purposes. Favourable capital-market conditions enabled theTreasury to finance a larger proportion of its needs by long-term borrowing.
The need for relief, reconstruction and river-control expenditure follow-ing the flood disasters led to large tax increases in November. Income taxwas raised by 10 per cent, for one year and taxes on petrol, alcoholicbeverages and tobacco were increased for two years.
Despite these charges, the outlook for the Italian economy remainsfavourable. As a result of cyclical developments abroad the growth of exportshas slackened but, with the absorption of excess capacity, aggregate demand islikely to receive increasing stimulus from domestic investment.
Japan.
Under the stimulus of an easy monetary policy and expansionary fiscalmeasures the Japanese economy began early in 1966 to recover from theprevious year's recession and the upward movement gathered momentum asthe year progressed. A crucial factor in the recovery and its speed was thefavourable international environment for Japanese exports, particularly thosegoing to the United States and to neighbouring countries in the Far East.But consumer spending picked up after a period of stagnation, inventoriesstarted to be rebuilt, and private equipment investment also soon began torise, showing a gain for the full year of about 8 per cent.
Under these influences the gross national product, which had registereda gain of 10 per cent, in 1965, went up by another 15 per cent, last year. In1965, however, about 6 per cent, of the increase had reflected higher prices,compared with 5 per cent, in 1966.
The monetary ease initiated in the previous year was continued through-out 1966 and early 1967. However, credit demand took some time to recoverand in the first half of the year bank loans grew at a slower pace than inthe same period of 1965. This changed in the second half as the revival ofprivate-sector activity gained momentum, and bank loans then went up morequickly. As to fiscal policy, the new practice of floating government bondswas stepped up in 1966 and there was considerable stimulus from risinggovernment expenditure.
As a result of the situation of monetary ease prevailing in Japan in1966, domestic interest rates, which had previously been high in comparisonwith overseas rates, declined relative to the latter. This development ledJapanese traders to switch borrowing from overseas to domestic banks. Later

— 28 —
in the year and in early 1967 the relationship between overseas interest ratesand Japanese rates became more normal, as the former declined from theirautumn peaks and the latter tended to rise slightly.
Despite higher economic activity, the trade balance showed a surplus of$2.3 milliard in 1966, compared with one of $1.9 milliard in the previousyear, as exports rose by 15.7 per cent., while imports grew by 14.4 per cent.This more than covered the substantial deficit on services and transfers,amounting to $1 milliard, and a deficit on capital account of over $900 mil-lion, leaving an overall balance-of-payments surplus of $320 million.
In late 1966 and early 1967 there was an acceleration in economicactivity and a marked tightening of the labour market. Thus the policyproblem began to shift from that of counteracting recessionary tendencies toone of keeping the new expansion under control in order to avoid a cost/pricespiral and deterioration in the country's external position. The business re-covery being stronger than expected, the government early this year reducedits planned increase in expenditure, at the same time curtailing the scheduledamount of government bond flotations. Central-bank policy has remained oneof general ease.
Eastern Europe.
In their plans for last year the eastern European countries anticipatedan improved agricultural performance but slower industrial expansion. In theevent, output targets in both these key sectors were surpassed almost every-where, so that the rate of growth of the net material product was generallyfaster than expected and compared very favourably with the average for the fivepreceding years. In quantitative terms, therefore, 1966 was clearly successful.
More emphasis has recently been placed on improving efficiency andon adapting output, in terms both of quality and of product mix, moreclosely to the pattern of demand. It is too early as yet to judge the resultsin this regard; however, the new approach has produced changes in agri-cultural policy. Over recent years purchase prices for agricultural productshave been selectively raised and consequently also the sector's share indistributed income. This has brought both a relative improvement in ruralconsumption standards and a rise in agricultural investment, which has alsobeen encouraged by state capital grants and credits. Moreover, industry hasbeen better orientated to supplying the farms with essential inputs, particu-larly of chemical fertilisers and farm machinery. These policies, together withfavourable weather conditions, contributed to the better results in 1966.In the countries where agriculture is proportionately most important globalproduction rose very strongly, by some 15 per cent, in Albania and Bulgariaand by over 11 per cent, in Rumania. After a fall in 1965, output went upby 10 per cent, in Czechoslovakia, and a similar result was achieved in theUSSR, where growth has averaged over 8 per cent, a year since the shortfallof 1962-63. In Poland, where farming remains largely in private hands,

— 29 —
production increased by 5V2 per cent, after a growth of 7 /2 per cent, in 1965.Only in Hungary, where the losses of the previous year were scarcely madegood, were results disappointing.
In the region as a whole the longer-term trend towards slower industrialexpansion was expected to continue last year, with a growth target of lessthan 7 per cent, compared with the 8.6 per cent, achieved in 1965. Butplans were exceeded, and production in fact expanded by just under 8% percent. These figures are heavily influenced by the performance of the USSR,where overfulfilment of the target by the capital goods sector in particularresulted in an 8.6 per cent, rise in total output — well above the planned6.7 per cent, and only slightly less than in the previous year.
Eastern European economies:National income, industrial and agricultural production.
Countries
Albania . . . .Bulgaria . . . .Czechoslovakia .Eastern GermanyHungary . . . .PolandRumania . . . .USSR
Yugoslavia . . .
Net material product
1961-65 1966 1966-70Plan
Global industrial output
1961-65 1966 1966-70Plan
Global agricultural output
1961-65 1966 1966-70Plan
annual increases, in percentages
5.76.51.83.54.76.09.16.8
7.52
11.07.04.56.06.07.97.5
9.02
7.4-8.28.5
4.1-4.4
3.5-3.96.07.0
6.6-7.1
7.5-8.S2
6.811.75.35.81
7.98.5
13.88.6
10.8
12.012.27.46.51
6.67.4
1 1.78.6
4.3
8.711.2
5.1-5.4
5.7-6.37.6
10.6-1 1.68.0-8.5
9.0-10.0
5.23.2
— 0.4
1.32.82.52.3
1.6
15.015.010.0
5.0-6.05.5
1 1.210.0
16.0
6.2-7.05.42.8
2.5-2.82.4
4.7-5.74.5
4.6
1 "Commodity production" after 1964 (i.e. excluding work in progress). 2 Gross material product.
In other countries the difference between output plans and performancewas less striking. Faster expansion in mining, in engineering and in theprocessing industries dependent upon agricultural requirements led to excep-tional growth in Albania, Bulgaria and Rumania, where industrial output roseby 12 per cent. Expansion also continued in Czechoslovakia, where therecovery since 1963 is now being consolidated, and in Poland, although herethe growth rate declined. Even so, in both these countries production increasedby nearly 7% per cent. Although slower than elsewhere, the industrialgrowth rate of bV2 per cent, recorded in Hungary and eastern Germany was,in both cases, faster than in 1965. The improvement was particularly markedin Hungary, where activity had been restrained in the previous year as partof à programme to correct the country's adverse balance of payments.
A change to more intensive development is an important aim of thecurrent reforms, which made limited progress last year. In the USSR andBulgaria new decentralised control techniques were extended to broader sectorsof industry, but elsewhere implementation was slow. The need to establish anup-to-date system of wholesale prices, based on full costs, accounts for thedelay. These prices will be introduced in Czechoslovakia, eastern Germany,

the USSR and Bulgaria during the current year, and are a necessary con-dition of the wider use of profits as the criterion of enterprise efficiency,to which material incentives will be geared. In several countries this is viewedas a first step towards a situation in which the pattern of demand will exerta direct influence on production decisions through its effect on profits, andin which central planning will operate more through fiscal, credit and interestrate policies and less through statutory directives.
In the longer term these changes may also result in a more flexiblemanagement of foreign trade. At present, through the foreign purchasingmonopolies, imports are kept within the bounds set by earnings from exportsand the availability of foreign credit. Reserves are drawn upon essentially toease bottlenecks. This policy gave the region as a whole a surplus in externaltrade over the years 1961-65, although the cumulative surplus during the periodwas less than $1 milliard on a trade turnover averaging over $34 milliard a year.
The decentralisation process in eastern Europe is similar to that whichhas been taking place over a much longer period in Yugoslavia. The lateststage in this process came in 1965 with sweeping structural reforms designedto establish market forces as the basis for resource allocation. These changescame at a time when the Yugoslav economy was subject to excess demand,and were therefore accompanied by a policy of credit restraint. Added to thereorientation of output, this policy halved the rate of growth of industrialproduction in 1965 and again last year, when output rose by only 4.3 percent. At the same time, record agricultural production, with an expansion of16 per cent, in 1966, made for a sharp upturn in the gross material product,which went up by 9 per cent, against only 3 per cent, the year before.Despite this improvement, a strong recovery of investment spending in thesecond half of the year, added to the renewed growth of consumption, causeda return of demand pressure and further restraint was imposed towardsthe end of 1966.
Under the impact of the reform, which included a 40 per cent, devalua-tion of the dinar, and of domestic restraint, the balance of payments improvedin 1965, when the current account was in equilibrium. Last year saw afurther 12 per cent, rise in exports, but the trade balance neverthelessworsened as the result of a 22 per cent, increase in imports. The deteriorationon current account, to a $30 million deficit, was less marked, however,thanks to increased earnings from tourism and other services.
T h e development of global reserves.
The discussions on the reform of the international monetary system inthe past few years have been dealing with three basic problems: (1) themeans of assuring an adequate growth of global reserves, (2) the improvementof the adjustment process, and (3) the implications for reserve compositionof the shortage of new monetary gold. As the various countries put dif-ferent emphasis on these problems, a coherent conception of the futuresystem has not been arrived at.
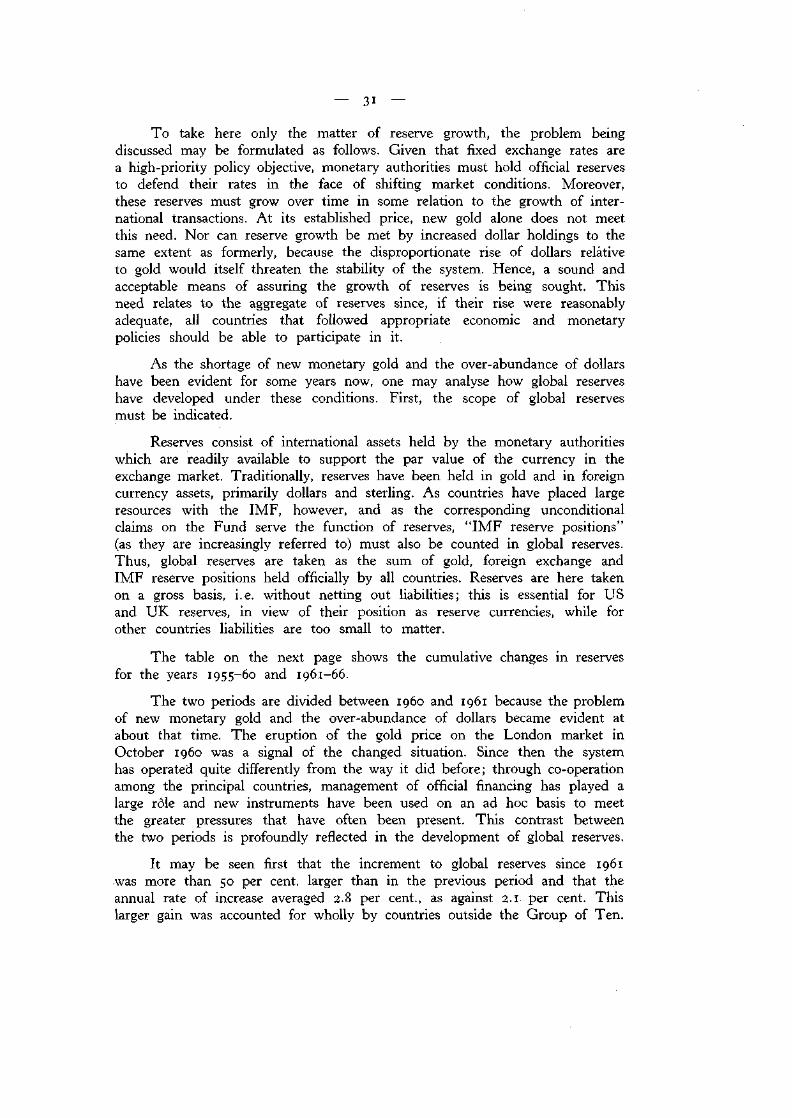
— 31 —
To take here only the matter of reserve growth, the problem beingdiscussed may be formulated as follows. Given that fixed exchange rates area high-priority policy objective, monetary authorities must hold official reservesto defend their rates in the face of shifting market conditions. Moreover,these reserves must grow over time in some relation to the growth of inter-national transactions. At its established price, new gold alone does not meetthis need. Nor can reserve growth be met by increased dollar holdings to thesame extent as formerly, because the disproportionate rise of dollars relativeto gold would itself threaten the stability of the system. Hence, a sound andacceptable means of assuring the growth of reserves is being sought. Thisneed relates to the aggregate of reserves since, if their rise were reasonablyadequate, all countries that followed appropriate economic and monetarypolicies should be able to participate in it.
As the shortage of new monetary gold and the over-abundance of dollarshave been evident for some years now, one may analyse how global reserveshave developed under these conditions. First, the scope of global reservesmust be indicated.
Reserves consist of international assets held by the monetary authoritieswhich are readily available to support the par value of the currency in theexchange market. Traditionally, reserves have been held in gold and in foreigncurrency assets, primarily dollars and sterling. As countries have placed largeresources with the IMF, however, and as the corresponding unconditionalclaims on the Fund serve the function of reserves, " I M F reserve positions"(as they are increasingly referred to) must also be counted in global reserves.Thus, global reserves are taken as the sum of gold, foreign exchange andIMF reserve positions held officially by all countries. Reserves are here takenon a gross basis, i.e. without netting out liabilities; this is essential for USand UK reserves, in view of their position as reserve currencies, while forother countries liabilities are too small to matter.
The table on the next page shows the cumulative changes in reservesfor the years 1955-60 and 1961-66.
The two periods are divided between i960 and 1961 because the problemof new monetary gold and the over-abundance of dollars became evident atabout that time. The eruption of the gold price on the London market inOctober i960 was a signal of the changed situation. Since then the systemhas operated quite differently from the way it did before; through co-operationamong the principal countries, management of official financing has played alarge rôle and new instruments have been used on an ad hoc basis to meetthe greater pressures that have often been present. This contrast betweenthe two periods is profoundly reflected in the development of global reserves.
It may be seen first that the increment to global reserves since 1961was more than 50 per cent, larger than in the previous period and that theannual rate of increase averaged 2.8 per cent., as against 2.1 per cent. Thislarger gain was accounted for wholly by countries outside the Group of Ten.

Changes in global reserves, 1955-66(in milliards of US dollars and average annual percentage increases).
Areas and years
All countries1955-601961 66
Group of Ten1955-601961-66
Other developedcountries
1955-601961 66
Less-developedcountries
1955-601961-66
Group of Ten excludingUS and UK
1955-601961-66
United States1955-601961-66
United Kingdom1955-601961-66
Gold
Amount
+ 3.1+ 2.9
+ 3.1+ 1.3
+ 0.4+ 1.6
-0.4-0.1
+ 6.8+ 6.7
-4.0— 4.6
+ 0.3— 0.9
%
1.41.2
7.70.6
4.611.2
13.27.2
7.7
IMFreserveposition
Amount
+ 1.7+ 2.8
+ 1.4+ 2.0
+ 0.2+ 0.5
+ 0.2+ 0.3
+ 0.8+ 3.7
+ 0.4— 1.2
+ 0.3— 0.5
Foreign exchange
Amount
+ 2.1+ 5.2
+ 2.8+ 2.2
+ 0.0+ 1.3
— 0.7+ 1.7
+ 2.6+ 0.1
+ 1.3
+ 0.2+ 0.7
%
2.04.2
6.33.6
6.2
4.0
6.30.2
8.278.0
Total
Amount
+ 6.9+ 10.8
+ 7.3+ 5.5
+ 0.6+ 3.4
— 1.0+ 1.9
+ 10.2+ 10.5
— 3.6— 4.5
+ 0.7— 0.6
0//o
2.72.8
2.91.9
2.18.9
3.2
10.56.6
3.5
Source: International Financial Statistics. The "less-developed countries" group is the same as in the IMFreserve statistics. "Other developed countries" is the same, with the addition of Austria, Denmark and Norway.Figures may not add up to totals because of rounding.
The record of the less-developed countries was particularly improved, astheir reserves increased by $1.9 milliard, in contrast to a loss of $1 milliardin the earlier period — a turn-round of almost $3 milliard. In the 1950sthese countries were adversely affected by the aftermath of the Korean war;they have evidently benefited also from the strong expansion of the USeconomy since 1961. However, the increase in their reserves over the lastsix years can hardly be considered excessive.
The developed countries outside the Group of Ten also had a muchimproved position, with a gain of almost $3 milliard more in the secondperiod than in the first. The rate of increase, at almost 9 per cent., was veryhigh, and even over the whole twelve years the average rate was 5.4 per cent.
The Group of Ten countries gained $1.8 milliard less reserves in thesecond period and their rate of increase was sharply lower. More important,however, was the contrast between the two reserve centres and the other coun-tries of the Group. The non-reserve countries gained more than $10 milliardin both periods, and their rate of increase averaged 8.5 per cent, over thewhole twelve years. The United States and the United Kingdom together lostreserves in both periods; the loss of $3 milliard in the first was more thanaccounted for by the United States, while the United Kingdom accounted for$600 million of the $5 milliard combined loss in the second period.
— 33 —
So far as participation in global reserve growth is concerned, therefore,the countries outside the Group of Ten have fared much better since 1961,while the non-reserve countries of the Group had more than adequateincreases in both periods. The reserve centres did not share in the rise inglobal reserves; in fact, UK reserves at the end of the twelve years wereabout the same as at the beginning, while the US reserves were lower by$8.1 milliard.
This picture reflects, of course, the greater disequilibrium in internationalpayments in the period since 1961. But it is the asset composition of theincrease in reserves which shows the change in the operation of the system.Broadly speaking, new gold contributed less to reserve creation, while I M Freserve positions and foreign exchange assets became much more importantsources.
The decrease in additions to countries' gold reserves occurred in spiteof substantially larger new supplies. Gold production and Russian salesincreased from $7.5 milliard in 1955-60 to $10.2 milliard in 1961-66, butthe sharper rise in private demand left less gold for monetary purposes. Inthe recent period, in fact, there were net transfers of $195 million of goldfrom international institutions ( IMF and BIS) to countries' reserves, whereasin the earlier years these institutions had added $505 million to their goldholdings. Thus, the gold stocks of countries plus the international institutionsrose by $2.7 milliard during 1961-66, as against $3.6 milliard in the earlierperiod.
For the Group of Ten, excluding the United States and the UnitedKingdom, the proportion of gold in their total reserve increase was muchthe same in the two periods, at about two-thirds; as there was less newmonetary gold in the second period, however, and as the additions to goldstocks of non-Group of Ten countries went up from roughly zero to $1.5milliard, this meant drawing a larger volume of gold from the two reservecentres.
With regard to the larger increase in I M F reserve positions since 1961,the difference being $1.1 milliard, this reflects credit-tranche drawings on theFund — in particular the drawing by the United Kingdom. Global reservesare not changed in their total by countries' payments of gold subscriptionsto the Fund, as these only shift the form of assets. Similarly, drawings onFund reserve positions merely shift these assets from one country to another.However, credit-tranche drawings do add to global reserves, since they setup Fund reserve positions to the account of the countries whose currenciesare drawn. It will be seen that it was the non-reserve members of the Groupof Ten that financed the bulk of the Fund's requirements in the years1961-66.
To turn now to foreign exchange assets, the increase in the growth ofthese holdings in the second period was accounted for entirely by countriesoutside the Group of Ten; the Group of Ten countries actually accumulateda somewhat smaller volume than previously. Again, however, there was a

— 34 —
significant change within the Group of Ten. The two reserve centres, whichtraditionally held only gold in their reserves, acquired $2 milliard of foreignexchange assets in the second period; the other countries of the Group,which increased their exchange holdings by $2.6 milliard in the first period,showed virtually no increase after 1961. While this outcome reflects areluctance to accumulate dollars, it occurred also because, in addition tomaintaining a high level of gold acquisition, the non-reserve countries of theGroup put $3 milliard more of resources into the IMF. The increased foreignexchange holdings of the two reserve centres, on the other hand, are explainedlargely by special transactions which have become important in the operationof the system in the last six years. •
During the years 1955-60 the growth of reserves took place through theaccumulation of new gold stocks and the acquisition of ordinary foreignexchange assets, mostly in dollars, such as Treasury bills, deposits with banks,etc. The amount stemming from credit operations of the I M F was small andthere were very few special operations which affected reserves. One such wasthe liquidation of the European Payments Union, which, because currentpositions were consolidated into longer-term debt, reduced the foreign exchangereserves of the countries concerned by some $550 million. Another was thepurchase by the United States of $800 million's worth of gold from the I M Fagainst special Treasury securities, which increased its reserves by thatamount. As these operations were largely offsetting in their effect on globalreserves, it may be said that the growth of reserves came about quasi-automatically in this earlier period.
In the years 1961-66, however, there were special transactions involvingad hoc liquidity creation which played a major rôle in the growth of globalreserves. These transactions were confined almost entirely to the Group ofTen countries. They may be explained partly by: (1) the efforts of theUnited States to limit the drain of gold reserves arising mainly from its owndeficit but at times also from the shifts of dollar reserves among othercountries; and (2) the United Kingdom's need for resources to protect theexchange rate in the face of an external deficit and confidence movementsagainst sterling. Partly also, they may be seen as providing acceptable assetsto European countries in surplus that did not want to add unduly to theirordinary dollar exchange holdings or to exert greater pressure on the USgold stock.
Special transactions that accounted for increased reserves include theissue of US Treasury foreign currency securities (Roosa bonds), the use ofcentral-bank facilities, primarily swaps, and the transfer to the UK reservesof assets out of its Treasury dollar portfolio. In general, the statistical effectof these transactions on reserves is equal to the amount of the assets that areput into reserves. With regard to central-bank swaps, this is the case alsowhen the creditor country advances resources out of its reserves. A swap ofdollars against sterling drawn by the Bank of England on the Bundesbank,for example, adds to the reserves of the United Kingdom and leaves the

— 35 —
German reserves unchanged — sterling having replaced the dollars put up.But, when neither party puts up resources from its reserves, as is the case,for example, in a swap of dollars against sterling drawn by the Bank of Eng-land on the Federal Reserve, the reserves of both countries increase, so thatdouble the amount of the swap is added to global reserves.
Figures for the reserves accounted for by special transactions as at theend of 1966 are shown in the following table. Together, these special trans-actions account for more than a third of the increase in global reserves from1961 to 1966 and three-quarters of the increase in foreign exchange reserves.Inside the Group of Ten they account for 69 per cent, of the increase intotal reserves and for more than the whole of the increase in foreign exchangereserves, $3.8 milliard as against $2.2 milliard. Excluding special transactions,non-reserve members of the Group of Ten had a decline of $0.7 milliard intheir foreign exchange reserves during this period.
Sources of increases in global reserves.
Gold
IMF reserve positionsarising out of
Gold subscriptionsMembers' credit-tranche drawings
US Government non-marketable bondsCentral-bank facilitiesUK dollar security portfolio
Total '
1955-60 1961-66
in millions of US dollars
3,1152,075
1,515210
6,915
2,8601,385
1,4101,350
4302,470
885
10,790
While the special transactions just described had the effect of increasingreserves, the Group of Ten countries also used special transactions in waysthat had a reverse effect; that is, they limited the rise in reserves. Firstly,there was the prepayment of official debt, largely to the United States. Overthe 1961-66 period this amounted to some $2.1 milliard, excluding paymentswhich would have fallen due during this period anyway. Secondly, monetaryauthorities acquired foreign assets which have not been counted as reserves.While this partly depended on the particular country's definition of reserves,most of these assets, which in all amounted to some $1.3 milliard at the endof 1966, are less liquid than those included in reserves; they often representlonger-term investment of balances not needed as reserves.
Without these special transactions, taken together, the statistical rise ofglobal reserves would be $3.4 milliard larger during 1961-66 than it wasin fact.
The calculated effects of special transactions on reserves are, of course,statistical; had they not been undertaken, both the international paymentssituation and the movement of global reserves would have been very different.

— 36 — •
The growth of global reserves has been reviewed here in some detailbecause its significance lies to a large degree in the kinds of assets accumulatedand their distribution among countries. Even so, the conclusions that can bedrawn from the record and their implications for the future are subject toconsiderable latitude.
With the importance of special transactions, global reserves are a lesshomogeneous and meaningful aggregate than they used to be; as the assetsthat arise from official credit arrangements are to some extent not readilymarketable, they do not provide the same degree of "liquidity" as traditionalreserves. This may not be important so long as the volume of such assets isrelatively small, but a problem could arise if they were relied upon for thecontinuous growth of global reserves.
It will be evident, also, that the record of the past six years cannot betaken as evidence of the "need" for global reserves, particularly in view ofthe volume of special transactions undertaken to limit reserve accumulation.The actual growth of reserves was much influenced by the balance-of-paymentsdeficits of the two reserve-currency countries and, as these deficits could havebeen considerably smaller, the growth of global reserves could have beensmaller also and still been in conformity with the "need".
None the less, gold supplies and ordinary foreign exchange assetsprovided only a quite small increment to global reserves in this period; thegrowth rate from these two sources alone was I . I per cent., so that theactual growth of 2.8 per cent, depended on I M F facilities and special reserve-creating transactions. It is difficult to envisage the system operating smoothlyfor any length of time with reserves growing only at the smaller figure, andit therefore seems not unreasonable to say that official credit transactions tosome extent reflected global reserve needs.
While the existence of a sufficient global stock of reserves is obviouslyone aspect of reserve "needs", history indicates that the system has a needalso of a fairly continuous increase in that aggregate. This may happen notso much because countries direct their policies to increasing their reserves,but simply to avoiding deficits and losing reserves. On balance, therefore,total reserves tend to go up. The dilemma of the system is that, with newmonetary gold so limited, this supply of reserves has depended on apersistent deficit in the external accounts of the United States. Althoughthe redistribution of reserves that occurred in the 1950s had its favourableside in strengthening the world payments system, no way has been found tocorrect the disequilibrium in the 1960s when further redistribution has beenundesirable.
It is significant also that the problems of the system, and the measuresthey have called forth, have centred on the Group of Ten. Other countries,taken together, have obtained a satisfactory increase in reserves withoutengaging in special transactions. If global reserves stopped rising, however, itis likely that many of these countries would be adversely affected.

— 37 —
In assessing the future, it seems clear that, as the supply of new goldfor monetary purposes is declining and as the willingness to hold ordinaryforeign exchange is linked to the availability of gold, the growth of globalreserves from these sources is likely to be less than in the past. It is apparenttoo that the drain of gold from the United States cannot for long continueon its former scale. To what extent it will be reduced by a smaller imbalancein payments, however, and to what extent by use of special transactions re-mains to be seen.
As regards the effect on reserves of official credit operations, the futureis also not so clear. Official credits all have repayment obligations and whenthere is net liquidation global reserves are reduced. This has happened on alarge scale in the first quarter of 1967 with the repayment of central-bankassistance by the United Kingdom. The associated decline in global reservesis obviously of little importance as such and the situation has certainly beenstrengthened by these debts being paid off. The ups and downs of officialcredits are illustrated by the operation of the Federal Reserve swap network;total drawings on the network by various countries have been $7.7 milliard,but none were outstanding at the end of March 1967. Yet, over time, thesystem has operated to make the growth of reserves a persistent force and,despite the ups and downs and shifts among countries from one type ofcredit to another, total borrowed reserves outstanding have tended to rise.There is some prospect of this in the rest of 1967.
Finally, it seems rather misleading to contrast the present state ofaffairs with a possible future one in which additions to reserves from tradi-tional sources might not be enough. Supplementing these sources has beengoing on for six years already and the outlook is that this process willcontinue.

P A R T II
M O N E T A R Y A N D E C O N O M I C S U R V E Y .
I. C R E D I T D E V E L O P M E N T S A N D P O L I C I E S .
The dramatic tightening of monetary conditions, on both internationaland key domestic markets, carried interest rates to historically high levels bythe late summer of 1966. Although in some ways interrelated, these move-ments derived primarily from a coincidence of largely autonomous developmentsin the United States, the United Kingdom and Germany. Each of thesecountries had experienced domestic inflationary strains side by side withexternal deficits, and each of them placed heavy reliance on monetary policyto bring the situation under control. In various neighbouring countries, in-cluding Canada, the Netherlands, Sweden and Switzerland, developmentsmoved along fairly similar lines.
Domestic money-market rates, and with them Euro-currency rates, movedupwards in close parallel from late 1965 up to the summer of 1966. Discountrate adjustments in the United States and Canada at the turn of the yearwere followed by a round of increases on the Continent in the spring and bya rise to 7 per cent, in the United Kingdom in July. Moreover, long-termyields in the United States, which had begun to rise sharply after the middleof 1965, reached by August 1966 their highest levels for decades. In manywestern European countries, however, the increase in long-term rates hadstarted earlier and went even further.
The easing of credit markets since last autumn has been almost asstriking as their previous tightening. Short and long-term interest levels havecome down substantially in the countries where they had previously recordedthe largest increases. In the Euro-currency market the tone has been set bythe large reflux of funds borrowed last year by the United States. Long-terminterest levels within western Europe have generally moved closer together,but the differentials vis-à-vis the United States remain wide.
Bank credit and liquid-asset formation.
In 1965 and a large part of 1966 the rate of credit expansion, relativeto the growth of the gross national product, was clearly running to excess inNorth America and much of western Europe. The following table gives

— 39 —
The banking system: Monetary survey.
Countries
Belgium
Denmark
Finland3 . .
Franco
Gsrmanv
Italy
Netherlands . . .
Spain
Sweden . .
Switzerland . . .
United Kingdom3.
United States . .
Canada
japan .
Years
196419651966196419651966196419651966196419651966196419651966196419651966196419651966196419651966196419651966196419651966196419651966196419651966196419651966196419651966196419651966196419651966
Netforeignassets
Annual changes iassets
Creditto publicsector
Creditto privatesector
i mainliabilities
Money Ouasi-money
Grossnationalproduct,at marketprices
in milliards of national currency units
2.51- 1.66- 2.3O2
8.806.80
— 5.600.820.120.22126
- 282— 457
3.803.331.832.00
— 0.203.104839924180.110.08
— 0.270.271.130.07
21.00— 3.60— 14.60
1.060.120.560.85"0.56"0.414
— 5785
— 3045
- 10s
— 0.10s
— 1.206
— 0.606
0.350.160.34
— 274154133
2.382.152.462
9.0016.1018.30
— 0.980.880.14
— 4869
215— 0.32
1.281.038.408.806.005489228210.170.891.170.200.340.48
28.1032.8049.00
— 0.36- 0.67
1.570.610.860.79
— 20055099
6.408.904.10
— 0.260.040.65727745912
11.3815.0315.412
10.7013.9022.503.422.364.47
1,1301,1671,37810.6612.0414.4021.7025.3019.401,1041,4702,646
1.081.471.091.391.231.98
90.00125.50112.50
4.823.925.193.924.464.50967570308
17.8026.4016.801.021.670.75
3,7912,7744,656
3.084.192.42
19.7021.1021.001.401.702.23
5645
12612.2115.2713.645.405.101.30908
1,8712,080
1.151.701.180.570.770.84
60.3062.3050.90
1.271.081.441.721.091.125859095546.807.30
— 1.300.711.200.80
1,0121,6111,459
10.4210.721 1.206.10
1 1.6012.901.531.192.04949
1,0221,2182.612.775.05
13.9017.3019.90
8701,4901,6902.422.502.431.231.761.45
78.0082.4079.903.831.644.814.304.734.16—
13.2019.4011.100.500.780.53
2,5032,9083,697
222.77241.70260.50773.82836.96902.0061.9169.4776.67
23,43325,81927,591431.90461.40497.50413.80449.60477.9033,07735,57538,39761.8368.6575.8845.1850.1054.17
1,062.901,287.401,474.20
92.97102.15110.8055.5459.8864.17
33,06635,42637,424631.70681.20739.6047.4052.1157.78
27,64530,44135,190
Moneyand
quasi-money,1as per-
centagesof GNP
50.652.854.445.746.046.148.247.448.239.740.542.039.540.641.638.640.342.361.965.369.958.859.458.453.252.052.367.466.466.967.365.464.7
124.8125.8125.834.334.334.542.843.142.535.435.934.890.495.196.3
1 Annual averages (based on quarterly data). 2 Twelve months to October. 3 In millions of national currencyunits. " National Bank only. 5 Includes the Exchange Equalisation Account's assets (other than transfer fromUS dollar portfolio), net IMF position and deposit banks' net assets. ' Official assets plus net IMF position.Source: IMF, International Financial Statistics.

— 4° • —
a comparative survey of liquid-asset formation via the banking system and thecorresponding changes in claims on the public, private and foreign sectors. Itthus reflects in part the composition of domestic credit demand and the extentto which economic policy —• not only monetary policy but also budgetaryand incomes policy — was successful in influencing bank credit and liquidityformation. As in many countries credit demand eased late in the year, theannual data shown in the table present a somewhat mixed picture.
In a number of countries the granting of bank credit to the publicsector, which had become an increasingly important source of monetaryexpansion in 1965, fell away somewhat in 1966. In certain of them, includingDenmark, Germany and Italy, the public sector's reduced recourse to bankcredit in 1966 was attributable partly to the achievement of better budgetaryresults. On the other hand, in Belgium the budget also improved but, inorder to ease capital-market strains, the government borrowed more from thebanking system than in 1965 and began again to take up funds from abroad.
In some countries the slower growth in bank credit to the governmentwas due partly to a shift in the pattern of borrowing. In Switzerland andItaly the public authorities raised a larger proportion of funds through netcapital issues and in Germany at short term outside the banking system. InFrance the central government's budget shifted from overall balance to asmall deficit last year. However, Treasury borrowing, mainly for purposes ofre-lending to the economy, was more than covered outside the bankingsystem, thus permitting some repayment to the banks. But in the Netherlandsnot only did the central government's budget position deteriorate further butits financing via the banking system, including the central bank, also increased.
In the United States and the United Kingdom the expansion in bankcredit to the public sector was smaller last year, although the US budget deficitincreased and that in the United Kingdom remained large. In the UnitedStates the banks curtailed their acquisition of public-sector securities, whilethe amount held by the non-bank public increased. In the United Kingdomthe Treasury's financing needs were met mostly by an increase in overseaspurchases of Treasury bills and by the sterling that became available throughthe Exchange Equalisation Account.
In Canada, on the other hand, the central government's budget position,excluding the operations of the new national pension fund, deteriorated in1966, as also did that of the provinces and municipalities. Part of the publicsector's larger cash requirements were met via the banks and the central bank.In Sweden developments followed similar lines. In Japan, as part of a de-liberate effort to stimulate activity, the budget deficit was increased and financedmainly via the sale of bonds to the banking system.
Bank credit to the private sector rose more slowly in a number ofcountries last year, at first because of tighter money, later because of aneasing of demand. The deceleration was quite marked in the United States,Canada, the United Kingdom, Germany and the Netherlands, while inSwitzerland and Austria the increase in absolute terms was not much more

— 41 —
than in 1965. In some of these countries — the United Kingdom, theNetherlands and Switzerland — credit to the private sector was restricted bya quantitative ceiling.
In contrast, lending to the private sector accelerated in countries whereactivity had been cyclically depressed — Belgium, France, Italy and Japan —as well as in the Scandinavian countries and Finland.
Bank credit expansion and liquid-asset formation constitute an inter-related process. At the margin it is limited by central-bank policy to influencebank liquidity, taking account of the effects of the balance of payments,Treasury operations and other factors. Normally, monetary restraint expressesitself in a slowing-down in the growth of liquid assets relative to the grossnational product and in a rise in long-term interest rates, and for mone-tary ease the reverse is true. The inverse relationship between liquiditytrends and long-term interest rates is generally borne out in the results formost of the countries last year. But in Germany, for example, liquiditypreference in 1966 was such that a sharp rise in long-term interest yieldswent hand in hand with an increase in money and quasi-money relative tothe gross national product. In Denmark, too, a larger proportion of funds wasplaced with the banks despite the high level of interest rates.
Comparative interest rate movements .
In the United States the rise in short-term interest rates in 1966 markedthe continuation, under changed circumstances, of an upward adjustment inprogress since 1962. Over this period the official discount rate was raised inthree steps, the last in December 1965, from 3 to 4V2 per cent. The maxi-mum rates payable on time deposits under Regulation Q were increased muchmore, those on 3-6 month deposits being brought up from 2V2 to 5% percent. The need favourably to influence short-term capital movements playeda prominent rôle in these adjustments, although by December 1965 domesticconsiderations had become of decisive importance.
The movement of US long-term interest rates, on the other hand,followed a somewhat different course. The yields on long-term governmentbonds, after rising moderately between the end of 1962 and the spring of1964, then remained very stable. However, from the summer of 1965 on-wards, as demand pressures became excessive, they began to rise steeply andcontinued to move upwards until August 1966.
The gap between short and long-term interest rates in the UnitedStates gradually closed between 1962 and 1966. In the latter part of theperiod, in fact, short-term yields went appreciably above those at long term.
In the United Kingdom the rise in interest rates, both short and long-term, began in late 1963 as a domestic upswing got under way. Thereafter,until the late summer of 1966, the trend remained upward, though it wasmarked by a particularly steep rise during the crisis of late 1964 and early1965 and a subsequent easing of rates later in 1965.

Comparative interest rate movements, 1962-67.1
Country
Money-market rates2
End-1962
Mid-1965
August1966
March1967
in percentages
Changefrom1962
to March1967
in percent-age points
Yields on long-term government bonds
End-1962
Mid-1965
August1966
March1967
in percentages
Changefrom1962
to March1967
in percent-age points
Netherlands. . .Denmark . . . .Switzerland . . .Germany . . . .BelgiumSwedenUnited Kingdom.FranceItalyUnited States .Canada
2.884.372.73
3.643.51
2.863.87
4.18
3.734.873.57
5.594.41
3.813.95
5
473
6
.03
.21
.00
.95
.704.77
45
.93
.07
4.505.123.45
5.695.00
4.294.26
+ 2.74
+ 1.62+ 0.75+ 0.72
+ 2.05+ 1.49
+ 1.43+ 0.39
4.196.453.126.104.964.355.615.314.883.875.07
5.24• 7.613.927.105.595.006.655.475.464.145.16
6.538.054.248.605.816.107.175.985.554.805.91
5.838.054.727.205.885.236.396.085.564.455.45
+ 1.64+ 1.60+ 1.60+ 1.10+ 0.92+ 0.88+ 0.78+ 0.77+ 0.68+ 0.58+ 0.38
1 The international comparability of interest rates is very limited, lying more in relative movements over time thanin absolute differences. 2 Belgium, France: call-money rates; Netherlands, United Kingdom, United States,Canada: three-month Treasury bills; Germany, Switzerland: three-month deposit rates.
O n t h e C o n t i n e n t s h o r t - t e r m m a r k e t r a t e s g e n e r a l l y m o v e d u p w a r d s f r o m
1 9 6 2 t o 1 9 6 6 a n d k e p t m o r e o r l ess i n l i n e w i t h t h o s e i n t h e U n i t e d S t a t e s
a n d i n t h e E u r o - c u r r e n c y m a r k e t . O n e r e a s o n fo r t h e f a i r ly c l o s e c o r r e s p o n d -
e n c e b e t w e e n s h o r t - t e r m i n t e r e s t r a t e m o v e m e n t s l ies i n t h e l i n k a g e s , b o t h
d i r e c t a n d t h r o u g h t h e E u r o - c u r r e n c y m a r k e t , t h a t h a v e c o m e t o e x i s t a m o n g
t h e n a t i o n a l m o n e y m a r k e t s . A n o t h e r is t h a t , a s r e s e r v e - c u r r e n c y c o u n t r i e s , t h e
U n i t e d S t a t e s a n d t h e U n i t e d K i n g d o m h a v e o n b a l a n c e - o f - p a y m e n t s g r o u n d s
h a d t o k e e p t h e i r s h o r t - t e r m r a t e s c l o s e l y a t t u n e d t o e c o n o m i c c o n d i t i o n s
e l s e w h e r e .
O n t h e o t h e r h a n d , l o n g - t e r m i n t e r e s t d i f f e r e n t i a l s b e t w e e n t h e U n i t e d
S t a t e s a n d v i r t u a l l y al l w e s t e r n E u r o p e a n c o u n t r i e s h a v e w i d e n e d o v e r r e c e n t
y e a r s . I n t h e p e r i o d f r o m 1 9 6 2 u p t o t h e m i d d l e o f 1 9 6 5 , i n w h i c h y i e l d s
o n l o n g - t e r m g o v e r n m e n t b o n d s i n t h e U n i t e d S t a t e s s h o w e d l i t t l e r i s e , l a r g e
i n c r e a s e s o c c u r r e d i n D e n m a r k , G e r m a n y , t h e N e t h e r l a n d s a n d t h e U n i t e d
K i n g d o m . S m a l l e r r i s e s , b u t s t i l l g r e a t e r t h a n i n t h e U n i t e d S t a t e s , t o o k p l a c e
i n B e l g i u m , I t a l y a n d S w e d e n . T h e l o n g - t e r m y i e l d i n S w i t z e r l a n d , t h o u g h
s t a r t i n g a t a m u c h l o w e r l eve l t h a n i n t h e U n i t e d S t a t e s , r o s e b y n e a r l y t h e
s a m e a m o u n t a s i n G e r m a n y a n d t h e N e t h e r l a n d s . O n l y i n F r a n c e w a s t h e
i n c r e a s e n o g r e a t e r t h a n i n t h e U n i t e d S t a t e s .
B e t w e e n t h e m i d d l e of 1965 a n d A u g u s t 1966 t h e y i e l d i n t h e U n i t e d
S t a t e s o n l o n g - t e r m g o v e r n m e n t b o n d s m o v e d u p s h a r p l y f r o m 4 . 1 4 t o
4 . 8 0 p e r c e n t . Y e t , e v e n d u r i n g t h i s p e r i o d , t h e y i e l d s i n s o m e o f t h e
c o n t i n e n t a l c o u n t r i e s — G e r m a n y , t h e N e t h e r l a n d s a n d S w e d e n — s h o w e d a n
e v e n g r e a t e r i n c r e a s e , w h i l e i n F r a n c e , t h e U n i t e d K i n g d o m a n d D e n m a r k t h e
r i s e w a s m o r e o r l ess c o m p a r a b l e . B u t i n o t h e r c o u n t r i e s — B e l g i u m , I t a l y
a n d S w i t z e r l a n d — t h e y i e l d s a d v a n c e d a p p r e c i a b l y l e s s t h a n i n t h e U n i t e d

— 43 —
Interest rates.
AUSTRIA BELGIUM FRANCE
Government bonds
Official discount rate
2 11 i i i i i i i
\l A/ Day-to-day/_\/ * ' \/ money |1—1/ V>'— 1» (private bills)
! V Day-to-day money)'l I I I I I I I I I M I M I I • I M l ,
Official discount rateAs from February 1965,ki f
rGERMANY
Industrial bonds
Official discount rate
ITALY
•—— —— Industrial bonds
Government bonds
NETHERLANDS
Officialdiscount rate
3-month Treasury bills
I I I i i I i i I
Telegraph andTelephone bonds
1965 1966 1967 1965 1966. 1967 1965 1966 1967/VP/567
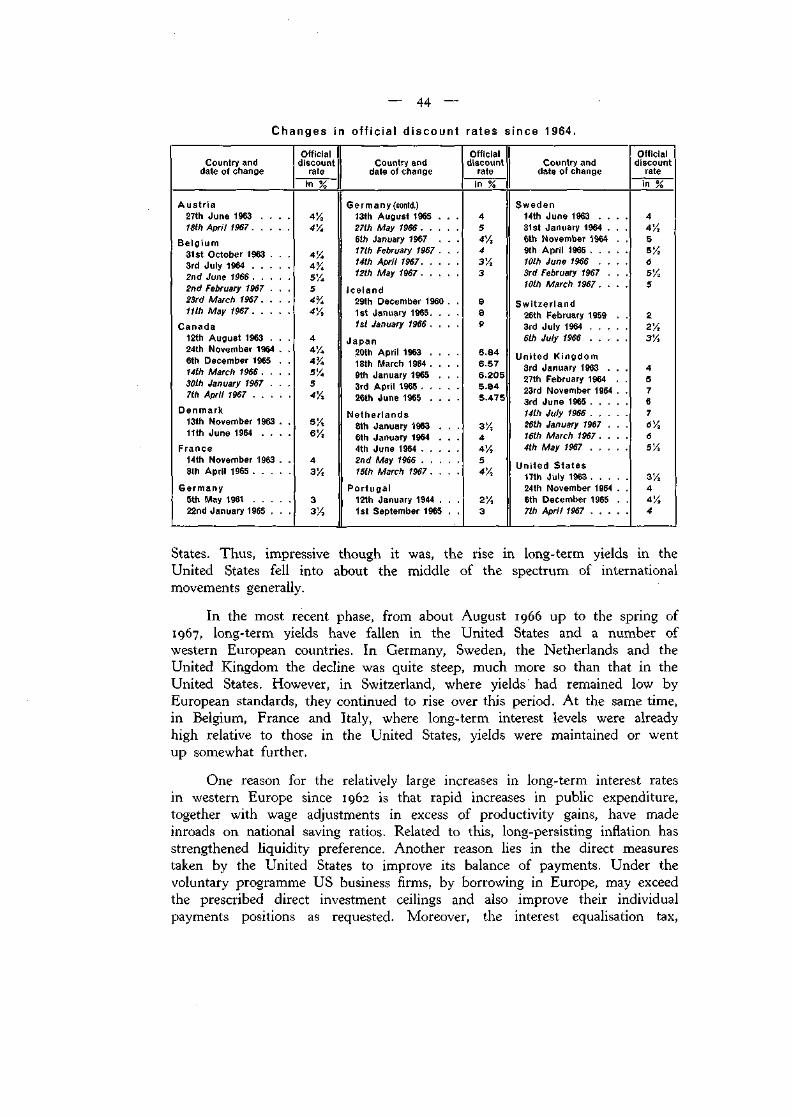
Changes in official discount
Country anddate of change
Austria27th June 1963 . . . .18th April 1967
31st October 1963 . . .3rd July 19642nd June 19662nd February 1967 . . .23rd March 1967....11th May 1967
Canada12th August 1963 . . .24th November 1964 . .6th December 1965 . .14th March 1966 . . . .30th January 1967 . . .7th April 1967
Denmark13th November 1963 . .11th June 1964 . . . .
France14th November 1963 . .8th April 1965
Germany5th May 196122nd January 1965 . . .
Officialdiscount
ratein %
41/,4%
4'A4%5/454'A4%
441/,4%5/454%
5%6/2
43/2
33%
Country anddate of change
Germany (contd.)13th August 1965 . . .27th May 19666th January 1967 . . .17th February 1967 . . .14th April 196712th May 1967
Iceland29th December 1960 . .1st January 1965. . . .1st January 1966 . . . .
Japan20th April 1963 . . . .18th March 1964 . . . .9th January 1965 . . .3rd April 196526th June 1965 . . . .
Netherlands8th January 1963 . . .6th January 1964 . . .4th June 19642nd May 196615th March 1967 . . . .
Portugal12th January 1944 . . .1st September 1965 . .
rates since 1964.
Officialdiscount
ratein %
454V,43%3
989
5.846.576.2055.845.475
3%441/,54%
27*3
Country anddate of change
Sweden14th June 1963 . . . .31st January 1964 . . .6th November 1964 . .9th April 196510th June 1966 . . . .3rd February 1967 . . .10th March 1967 . . . .
Switzerland26th February 1959 . .3rd July 19646th July 1966
United Kingdom3rd January 1963 . . .27th February 1964 . .23rd November 1964 . .3rd June 196514th July 196626th January 1967 . . .16th March 1967 . . . .4th May 1967
United States17th July 196324th November 1964 . .6th December 1965 . .7th April 1967
Officialdiscount
ratein %
44/,5s'A65%5
22'/23%
457676 V,65%
3'/s44%4
States. Thus, impressive though it was, the rise in long-term yields in theUnited States fell into about the middle of the spectrum of internationalmovements generally.
In the most recent phase, from about August 1966 up to the spring of1967, long-term yields have fallen in the United States and a number ofwestern European countries. In Germany, Sweden, the Netherlands and theUnited Kingdom the decline was quite steep, much more so than that in theUnited States. However, in Switzerland, where yields had remained low byEuropean standards, they continued to rise over this period. At the same time,in Belgium, France and Italy, where long-term interest levels were alreadyhigh relative to those in the United States, yields were maintained or wentup somewhat further.
One reason for the relatively large increases in long-term interest ratesin western Europe since 1962 is that rapid increases in public expenditure,together with wage adjustments in excess of productivity gains, have madeinroads on national saving ratios. Related to this, long-persisting inflation hasstrengthened liquidity preference. Another reason lies in the direct measurestaken by the United States to improve its balance of payments. Under thevoluntary programme US business firms, by borrowing in Europe, may exceedthe prescribed direct investment ceilings and also improve their individualpayments positions as requested. Moreover, the interest equalisation tax,

— 45 —
which with effect from January 1967 was raised in terms of its interestequivalent from 1 to 1% per cent., encourages US residents to invest at homeand potential foreign borrowers to turn to European international and domesticmarkets.
It is noteworthy, on the other hand, that long-term interest differentialswithin western Europe are now narrower than at any time in recent years.This reflects, on the one hand, the substantial upward adjustments in theNetherlands, Sweden and Switzerland, where by international standards yieldshad been low, and, on the other hand, the relatively easy cyclical situation inBelgium, France, Germany and Italy. In France budget restraint has alsohelped to limit the rise in yields, and since last summer there has also beenan improvement in the underlying budget position in Belgium, Germanyand Italy.
Capital markets : domestic and international.
Under conditions of monetary restraint, the proportion of total creditthat is channelled via the banking system normally tends to decline. Potentialborrowers find it necessary to turn more to the capital market, and the banksthemselves, in trying to sustain their ordinary lending, tend to cut back theirnet security acquisitions. At the same time, as security prices fall and yieldsrise, non-bank investors, particularly institutional investors, move in in-creasingly to take advantage of buying opportunities in the long-term market.The slower rate of deposit formation limits the banks' scope for multiplecredit creation and thus helps to curb credit expansion by the financialsystem as a whole.
Developments along these lines were clearly reflected last year in therise of new issues in countries such as the United States, the United Kingdomand Canada. In the first two countries the increase was ascribable largely toprivate borrowing, while in Canada the public sector, particularly the pro-vinces and municipalities, became more prominent.
Where monetary restraint was applied on the Continent, shifts in theflow of funds often tended to be more towards time and savings deposits thantowards new capital issues. This was particularly true in Germany, owing tostrong liquidity preference and limited institutional support for the market.In Switzerland capital issues were kept down by a system of quotas and inDenmark by agreement among the mortgage institutions. In the Netherlands, onthe other hand, relatively more funds passed through the capital market lastyear, but the bulk of these were in the form of private loans rather thannew issues. In Sweden the larger volume of issues was facilitated by institu-tional buying, particularly by the public insurance institutions.
In Italy and Japan, where monetary ease prevailed, a marked increase inpublic issues was facilitated by further large bank purchases of securities. InFrance new-issue activity was about the same as in 1965, but a relatively

Domestic capital markets: Net issues.
Countries
Belgium . . . .
Denmark . . . .
France . .
Germany . . . .
Italy
Netherlands. . .
Sweden . . . .
Switzerland5 . .
United Kingdom
United States7 .
Canada
japan
Years
196419651966196419651966196419651966196419651966196419651966196419651966196419651966196419651966196419651966196419651966196419651966196419651966196419651966
Public
State
Localauthor-
itiesand
publicbodies
Private1
Shares BondsForeignissues Total
in milliards of national currency units
7.8917.2112.96
-0.18— 0.14— 0.16
0.550.000.001.512
1.152
0.362
70161
1,50.20
— 0.03-0.0215.0027.5124.440.1 1
— 0.29— 0.14— 0.16— 0.22
0.00— 0.1 1*
0.22'0.23'0.80s
-4.70»— 1.20°
0.56— 0.06
0.42— 17— 10
797
12.8212.2713.94
E
0.470.680.841.761.960.061594
501*51"
0.290.590.668.339.109.000.370.200.150.660.750.900.090.210.195.106.105.500.880.671.32
69151217
11.9811.4111.960.240.300.235.015.023.662.243.962.695554064700.210.110.06
20.1234.7640.080.490.930.721.541.541.210.230.070.193.303.104.400.330.450.53860277433
5.6615.2515.473.494.824.205.146.347.66
10.249.365.10
1,2211,2951,1970.140.710.80
19.9325.9326.193.152.814.832.121.811.590.290.370.506.608.10
11.300.560.920.51904'0
1.39110
1,575f0
0.170.26
E
0.150.120.200.893
1.363
0.62*
1472
— 0.050.04
— 0.07
E
-
0.280.260.420.060.02
— 0.021.20'1.50'1.30'
E
38.5256.4054.333.554.994.27
1 1.3212.1612.3616.6417.798.83
2,0052,3773,2900.781.411.43
63.3897.3099.714.113.665.554.444.144.120.560.891.09
17.0014.1021.302.321.992.77
1,8161,8093,022
Privateand
foreignissues
Totalnew
issues
as percentagesof GNP
2.33.23.06.07.45.82.52.52.33.23.31.85.44.84.50.51.21.03.85.45.23.93.75.07.76.05.0.a.3.8.8
1.92.31.92.61.86.45.55.7
5.06.76.05.77.25.62.62.62.54.04.01.96.16.78.61.32.11.96.08.77.84.43.65.08.06.96.41.72.52.92.72.12.94.93.84.86.65.98.6
1 Includes issues of semi-public credit institutions and nationalised industries. 2 Change in market holdingsof bonded loans and medium-term notes. 3 Includes issues sold to foreigners; however, see footnote 2 to tableon page 48. The 1966 figure above excludes US company issues in exchange for shares of German companies." Includes indirect Treasury borrowing. 5 Includes privately-placed issues. ' Change in marketable debt(excluding Treasury bills) in public hands. 7 Based on Federal Reserve flow-of-funds data, excluding mort-gage loans. " Change in public holdings of marketable debt having a maturity of one year or more. ' Gross.10 Includes public corporation bonds.
bigger volume of funds was placed outside the banking system in other forms,including housing savings. In Belgium the decline in new issues was theresult largely of a reduction in central-government flotations, which was offsetto only a small extent by greater private and other borrowing.
— 47 —
With the exception of rises in Italy and Japan early in the year, shareprices declined steeply in 1966 in most countries. The common cause wasmonetary tightness and the rise in long-term interest rates. But whereas inthe United States, the United Kingdom and Canada the decline was asso-ciated in part with a larger volume of share issues, new share notationsdropped off considerably in most continental countries. From the viewpoint ofthe borrowers, one reason for this was no doubt the depth that share priceshad reached after several years of decline. From the viewpoint of lenders, onespecial factor on the Continent was the large volume of international bondissues, which drew long-term funds from domestic markets. Late in 1966, asmonetary conditions eased and interest rates declined, share prices staged arecovery, especially in the United States, Canada and the United Kingdom.
The volume of foreign issues on domestic capital markets is shown forindividual countries in the table on page 46 on a net basis and in thebroader context of international issues as a whole in the table on page 48.The only markets, apart from that of the United States, where issues of thisconventional type have at times reached significant proportions are Switzerland,the Netherlands and Germany. Throughout western Europe, apart fromGermany, such issues generally require official approval, while in theUnited States they are subject, with certain exceptions, to the interest equali-sation tax. In recent years the authorities in both Switzerland and theNetherlands have restricted foreign issues in order to ease strains on theirdomestic capital markets. In Germany the volume of issues has been limitedmore by the high prevailing rates of interest. Foreign issues on continentalmarkets and in the United Kingdom rose to $531 million in 1966. Apartfrom a large issue by a US international company in Germany, there was asmall increase in Switzerland, while in Italy and France approval was givenfor certain issues by international institutions.
Foreign issues in the United States in 1966 totalled $1,317 million, i.e.about $100 million less than in 1963, when the interest equalisation tax wasintroduced. Issues in the United States by continental Europe and theUnited Kingdom, which in 1963 had amounted to $347 million, were only$9 million last year. On the other hand, Canadian issues, which are condi-tionally exempt from the tax, accounted for 82 per cent, of the total in 1966,as against 54 per cent, in 1963. U p to a certain borrowing limit Japan isalso exempt from the interest equalisation tax; however, in view of itsexternal surplus last year, it borrowed neither in the United States norelsewhere.
International issues, after rising steeply from $120 million in 1963 to$1,192 million in 1965, fell away somewhat to $1,155 million last year. Incontrast to "foreign" issues on individual markets, these are organised byinternational underwriting syndicates for sale in a number of countries.They require no special consent in the main issuing centres, are denominatedin various key currencies or currency combinations, and depend for their saleprimarily on the freedom of various countries' residents to buy foreignsecurities. Within the 1966 total, issues by industrial and commercial companies

increased considerably, and those by governments and international institutionsdeclined, having shifted partly to domestic markets. Issues denominated inUS dollars accounted for about two-thirds of the total, while the others wereexpressed in various currencies, particularly Deutsche Mark. As the effectiveyield on new issues continued to rise until the early autumn, companiesincreasingly shortened the term of borrowing in order to avoid long-termcommitments at high rates. By September new private issues of five years'maturity gave an effective yield of over 7 per cent., while those at longerterm offered 6% per cent, or more. In the spring of 1967 new five-year bondissues carried yields of 6-6y4 per cent., while those at long term weretypically 6 4—6 4 per cent.
Foreign and international bond issues.'
Borrowers
Continental Europe . . . .
United States
International institutions . .
Total issues placed . .
Years
196319641965196619631964196519661963196419651966196319641965196619631964196519661963196419651966
1963196419651966
1963196419651966
Foreign issues on domestic markets
Conti-nental
Europe2UnitedKing-dom
Canada UnitedStates Total
Inter-nationalissues2
Totalissuesabroad
in millions of US dollars
14974667516152312
__——
_10
1923
2536
——
6
——
817079
196
277195178475
44
14
_-
——19
_-129555942
_8
_-
148686356
—_-
—-
_—
_—-
__—
_—2318
—2318
19245259
1555
80-762767959
1,081
136
63—163219205143
515520085
1,4131,1911,5321,317
3411239598
17120
10312
762767959
1,081
101S21803663
—298274264185
86233302299
1,8381,4541,7961,866
93406441413
_2540
__—-
_29647422
16235
-
51 10126
5266286101
120838
1,1921,155
43452953551217120
12852
762767959
1,081
_30666620219898
—298279374311
91499588400
1,9582,2922,9883,021
1 Including private placements. Company borrowing through foreign subsidiaries is normally treated as borrow-ing by the country of the parent company. 2 Non-resident loans issued in Germany after the announcementof the 25 per cent, coupon tax in March 1964 are generally treated as international issues. Since such issues areexempt from the tax, they were issued at interest rates below those prevailing on the domestic market for salemainly to foreigners. 3 Consists of US company issues in exchange for shares of German companies (prin-cipally by Texaco for shares of Deutsche Erdöl).

— 49 —
US companies and their foreign affiliates substantially increased theirissues abroad last year. In view of their extensive direct investment plans,and given the U S balance-of-payments guide-lines, these companies' internationalissues rose to $474 million from $296 million in 1965. Thus, borrowing byUS companies and their affiliates accounted for over two-fifths of totalinternational issues in 1966, as against about one-quarter in 1965. Issues byScandinavian countries, which in 1964 had reached a high level, declined in1965 and again last year. On the other hand, issues by borrowers from theEEC countries, after rising substantially in 1965, dropped off slightly.
Together, foreign and international issues amounted to over $3,020 mil-lion in 1966. This figure, though only marginally above that for 1965, wasover half as much again as the $1,960 million recorded in 1963. Almost allthe growth over this three-year period was in international issues, which rosefrom about 6 per cent, of the total in 1963 to 38 per cent, in 1966. More-over, of the overall increase of about $1,065 million, the United States andCanada accounted for well over 90 per cent. Continental borrowers, restrictedby both the interest equalisation tax and tighter conditions in the principalcontinental centres, shifted over from 1964 onwards largely to internationalissues. In 1966 borrowing by the United Kingdom was negligible, whileJapan was out of the market altogether. The rest of the world has shared tosome extent in the recent growth of the market by larger recourse to inter-national issues and indirectly through the activities of international institutions.
In the first four months of 1967 issues of the international type totalled$623 million, compared with $529 million in the corresponding period of1966. Within these totals, issues by US companies and affiliates declined to$130 million from $261 million, while those by western European borrowersrose to $338 million from $188 million.
Credit developments in individual countries.
United States. The Federal Government's growing budget deficit, com-bined with a further strengthening of private credit demand, set the stagelate in 1965 for a decisive turn towards monetary restraint. In the secondhalf of the year, according to flow-of-funds data, the private sector's holdingsof currency and demand deposits rose at an annual adjusted rate of $12.8 mil-liard, as against one of only $2.9 milliard in the first six months. Most ofthis change was due to the emerging budget deficit, which the Treasuryfinanced from cash balances and by short-term borrowing. Moreover, bankloans to business began to advance sharply in the fourth quarter.
In December 1965, after market interest rates had risen appreciably inthe autumn, the Federal Reserve authorities raised the discount rate from 4to 4V2 per cent. At the same time the maximum rates payable on timedeposits under Regulation Q were increased by 1-1V2 per cent, to a new highof 5V2 per cent. Over the first eight months of 1966 the Federal Reserveauthorities gradually intensified the restraint, mainly by limiting their acquisi-tion of government securities. The tightening was reflected in a rise in

United States: Total net funds supplied to the credit markets.
By sectors and financialinstruments
Increases In assetsPrivate sector1
Currency and demand depositsTime and savings accounts
at commercial banksat savings institutions
Securities and other credit-market claims . .Private insurance and pension fundsOther2
Total
Credit supplied to borrowers viaCommercial banks and Federal Reserve SystemOther financial institutionsDirect financial investment
Total . . . . .
Increases in borrowers' liabilitiesPrivate sector1
MortgagesCorporate securitiesState and local obligations
US Government
Other securitiesCash balances (increase —)
Total
19641965
1sthalf
2ndhalf
19661sthalf
2ndhalf
in milliards of US dollars, at annual adjusted rates
6.5
13.015.88.4
11.112.0
66.8
24.928.913.0
66.8
10.78.0
25.75.45.9
4.03.0
— 0.24.4
66.8
2.9
19.212.810.211.515.5
72.1
28.527.616.0
72.1
17.99.8
24.95.77.4
4.60.7
— 2.23.3
72.1
12.8
19.813.49.3
11.96.9
74.1
37.926.79.5
74.1
18.69.1
26.05.17.4
2.4- 0.6
4.21.9
74.1
3.2
17.07.3
20.712.119.3
79.6
27.721.030.9
79.6
20.08.1
21.713.66.3
- 6.615.5
- 1.92.4
79.6
2.5
7.67.3
21.513.59.1
61.5
16.722.422.4
61.5
15.35.7
17.69.35.5
} . . .2.91.2
61.51 Excluding financial institutions. 2 Including government, foreign and miscellaneous claims.
member banks' net borrowed reserves from only $2 million in December1965 to $390 million in August 1966.
Concurrently, despite the increase in Regulation Q ceilings, the commer-cial banks began to experience competition for funds as a result of risingmarket interest rates, especially long-term ones. The corporate sector morethan doubled its recourse to new capital issues while continuing to increaseits bank loans at about the same rate. Moreover, the Federal Government,partly to improve its budget, arranged that Federal agencies should rely lesson budgetary funds and more on the sale of new issues and participationcertificates. As a result of these developments, the proportion of financialfunds invested directly in the credit markets as an alternative to placementwith financial institutions rose from 13 per cent, in the second half of 1965to 39 per cent, in the first half of 1966.
None the less, the commercial banks succeeded in continuing to expandtheir loans rapidly during this period. Competing more aggressively for funds,the banks quickly raised the rates payable on certificates of deposit to their

— s i —
ceilings and began to offer such certificates in small denominations. Moreover,the banks with overseas branches borrowed large amounts of foreign-owneddollar balances. To help meet loan demand, the banks cut back their holdingsof government securities and slowed down their purchases of State and local-government issues, thus contributing to market pressures making for higherinterest rates. They also stiffened their own lending terms, increasing theprime loan rate four times — from 4% to 6 per cent. — between December1965 and mid-August 1966. As late as July, however, business loans werestill advancing at an annual rate of about 20 per cent.
Higher market interest rates, together with the competition of commercialbanks for deposits, fell particularly hard on the savings institutions and themortgage market. In the United States, unlike some countries, these institu-tions do not have the possibility of periodically adjusting debtor interest rateson outstanding mortgage contracts to changes in market conditions. Hence theyhad little scope for putting up effective resistance to the competition forfunds from other quarters by raising their deposit rates. The rate of forma-tion of time and savings deposits at savings institutions declined from$15.8 milliard in 1964 to $13.1 milliard in 1965 and then plummeted to anannual rate of $7.3 milliard in 1966.
During the summer the Federal Reserve took various steps to redressthe balance between the commercial banks and the savings institutions. In Julythe Regulation Q ceiling on new multiple-maturity time deposits was reducedto s per cent, for deposits at 90 days or more, and to 4 per cent, for thoseat shorter term. Between July and September reserve requirements on timedeposits in excess of $5 million (consisting mainly of certificates of depositheld by business firms) were raised in two steps from 4 to 6 per cent. Bankissues of promissory notes maturing in less than two years were also broughtunder reserve-requirement and interest-ceiling regulations.
Credit-market strains approached crisis proportions in the late summer.Fiscal action remained uncertain, while business firms' continued anticipatoryborrowing, together with sales of Federal agency securities, weighed heavilyon the market. In addition, the banks were faced with a possible run-off ofcertificates of deposit owing to September tax payments. At about this time,too, the commercial banks' loan/deposit ratio touched a post-war high ofalmost 67 per cent., while that for the New York banks went to almost80 per cent. Against this background, the Federal Reserve authorities onist September requested the member banks to slow down the expansion oftheir loans, particularly to business firms. It was indicated, moreover, thatadherence to this objective would be kept in mind by the Federal Reserveauthorities when member banks came to the discount window.
Other measures quickly followed. Early in September the Administrationannounced the suspension of tax benefits on new investment outlays on plantand equipment, as well as a curtailment of agency issues until the end ofthe year. In late September Congress enacted temporary legislation permittinggreater differentiation in the establishment of interest ceilings on time and

— 52 —
savings deposits. The Federal Reserve promptly reduced from 5% to 5 percent, the maximum rate payable on time deposits of less than $ 100,000, thusputting the commercial banks in a less favourable competitive position vis-à-vis savings institutions.
As much of the growth of demand for funds had been based oninflationary expectations, the September measures produced a sharp reaction inthe credit markets. From the beginning of September 1966 to the end ofMarch 1967 business loans by the Federal Reserve's weekly-reporting memberbanks increased by only $3.7 milliard, as against a rise of $5.9 milliarda year earlier. Over the same period, aided by a progressive easing of mone-tary policy, the banks acquired $5.2 milliard of securities, whereas in thecorresponding months of 1965-66 they had reduced their portfolio by $1.8 milliard.
Just before the end of 1966 the Federal Reserve authorities announcedthat their September statement on business loans and discount administrationwas no longer applicable. In March 1967 reserve requirements were reducedfrom 4 to 3 per cent, for savings deposits and for time deposits of up to$5 million. Over the whole six-month period, moreover, open-market opera-tions were geared to ease the banks' liquidity position, which shifted from netborrowed reserves of about $400 million in the August-October period to netfree reserves of about $300 million in early April 1967. In addition, thebanks repaid to their overseas branches a substantial volume of foreign-owned dollars borrowed in earlier months.
From about November 1966 onwards short-term market interest ratesdeclined sharply. Towards the end of January 1967 the banks began toadjust their prime loan rate, in most cases from 6 to 5% per cent., and inlate March a rate of s1^ per cent, was generally adopted. On 7th April 1967the official discount rate was lowered from 4% to 4 per cent. By May theyield on long-term government securities, which after rising to 4.80 per cent,in August 1966 had by mid-March dropped to below 4.45 per cent., hadrisen again to around 4% per cent. The recent increase was occasioned by aheavy volume of security issues, reflecting both corporate demand and aresumption of Federal agency issues. In general, however, long-term funds havebeen relatively plentiful, particularly in the mortgage market, and residentialhousing has shown signs of upturn. The tax benefits on new business investmentwere restored as from early March, and investment plans may now be upgradedas a result of the temporary postponement of the 6 per cent, tax surcharge.
Canada. A further intensification of monetary restraint in early 1966,combined with an impressive package of fiscal and budget measures in March,helped to slow down the growth of credit in the first half of the year. Inthis period the increase in the chartered banks' domestic assets dropped to anannual rate of 3 per cent, from 12 per cent, in 1965. In December 1965,concurrently with the US discount rate increase, Bank rate was raised from4% to 4% per cent. But, unlike in the United States, it was increased againto 5% per cent, in early March prior to the new budget. During thesemonths, moreover, bank liquidity was kept under pressure by debt-management

— 53 —
Gross national saving and investment.
Countries
Belgium . . . .
Denmark . . . .
Finland
France
Germany . . . .
Italy
Netherlands. . .
Norway
Sweden
Switzerland . . .
United Kingdom.
United States . .
Canada
japan
Years
1964196519661964196519661964196519661964196519661964196519661964196519661964196519661964196519661964196519661964196519661964196519661964196519661964196519661964196519664
Gross
House-holds
! national saving
Enter-prises
Publicities
Totalsavingand
invest-ment
Gross national investmentGross domestic
fixed capitalformation
HousingPlant andequip-ment
Changein
stocksNet
C* LCI 1 Id!balance
as percentages of gross national product at market prices
8.29.29.2
11.411.310.7
16.016.0
7.68.27.09.39.69.58.32
9.22
8.72
1 1.911.41 1.48.18.28.3
11.81 1.31 1.2
19.822.622
9.89.89.7
.512.711.912.0
20 72221
8.47.06.88.99.79.05.85.75.17.47.27.04.35.66.0
1 1.912.68.3
.4
.96.66.1
1Î13.113.2
1i10.710.49.28.78.88.7
14.914.013.416.415.516.7
2.21.31.15.75.5
7.47.47.24.04.04.17.76.26.33.80.90.74.04.24.26.46.16.49.1
10.4.9
5.55.1
.92.53.44.42.83
3.63
3.63
3.84.75.17.77.68.4
21.81
21.81
21.021.721.521.626.927.025.621.421.821.927.826.726.223.623.523.226.525.925.927.128.528.324.123.522.727.528.027.918.41
18.6*18.1'18.71
19.41
19.21
23.0*24.3'25.01
36.21
34.41
33.3'
5.85.75.74.24.34.45.35.65.55.86.66.36.36.06.07.76.86.24.54.95.04.14.03.95.75.85.37.67.16.73.73.73.54.5°4.23
3.63
4.34.13.85.66.06.4
15.415.015.217.717.617.319.319.819.714.915.015.420.120.519.614.112.112.220.419.620.023.824.624.617.317.317.621.920.620.014.014.114.112.63
13.33
13.83
1 8.820.622.027.225.326.6
0.40.10.52.11.61.24.63.92.41.90.41.01.11.50.20.60.71.22.71.32.00.41.41.51.21.90.91.40.80.71.91.10.70.71.31.60.81.81.74.02.0
-0.8
0.10.9
— 0.4-2.3— 2.0— 1.3— 2.4— 2.3— 2.0— 1.1— 0.1— 0.7
0.3— 1.3
0.41.23.93.6
— 1.10.1
— 1.1— 1.2— 1.5— 1.7— 0.1— 1.5— 1.1- 3.4— 0.5
0.5— 1.2-0.3— 0.2
0.90.60.2
— 0.9— 2.2— 1.9— 0.6
1.11.1
< Including a residual error. 2 Includes depreciation charged on residential buildings. 3 Including, asan element of both saving and investment, new civil public construction. * January-September.
and open-market operations, and there was an increase in the volume oflonger-term government bonds in the hands of non-bank residents, excludinggovernment accounts. The chartered banks' liquid assets ratio, which hadbeen declining since late 1963, continued to fall until June 1966.

— 54 —
Towards the middle of the year aggregate demand showed signs ofmoderating. Over the summer months, however, international financial develop-ments were such that monetary conditions in Canada continued to tighten.The Bank of Canada sought to mitigate these tendencies, though on externalgrounds it could not counteract them altogether, by giving strong support tothe bond market in July and August. The average yield on long-term govern-ment bonds rose to a peak of nearly 6 per cent, in late August, which wasa full percentage point above the level of January 1965, when the uptrend began.
At all events, the monetary authorities' actions served to ease bankliquidity and credit availability from the middle of 1966 onwards. Creditexpansion was resumed, even in the face of higher interest charges, and thechartered banks' total loans expanded at an annual rate of 9 per cent, in thesecond half of the year. Bank liquidity also improved, partly as a result of anincrease in the central government's financing requirement, which was met tosome extent by central-bank purchases of government securities in this period.Bank lending to both the private sector and local authorities picked up speedand industrial production showed a new advance from the late summeronwards. This development was strengthened by the September reversal inmarket conditions in the United States and Canada, though the long-terminterest differential in favour of Canada tended to widen up to the end ofthe year.
Both the chartered banks and other financial institutions experiencedsomewhat slower deposit growth in 1966, reflecting their difficulty in com-peting for funds as capital-market interest rates rose. As in the United States,credit restraint bore with particular severity on the housing sector, andmortgage approvals in the second half of the year were almost one-thirdlower than in 1965. Over the year as a whole the non-financial corporatesector substantially reduced its net recourse to bank and other loans — andto a lesser extent to new capital issues — but this reduced flow of fundswas compensated partly by a marked rise in direct investment by foreigners.The decline in new corporate issues was more than offset by a large increasein flotations by the central and local governments, so that net capital issuesrose by almost $750 million to over $2.7 milliard in 1966. Another featurelast year was the coming into force of the national pensions scheme. Theamount contributed totalled almost $530 million and was largely lent on tothe provinces to finance their rapidly expanding outlays.
Towards the close of the year and early in 1967 credit conditions easedfurther as interest rates declined in international markets. Wi th private invest-ment showing weakness, both in plant and equipment and in housing, theBank of Canada acted so as to increase bank liquidity. At the end of January1967 Bank rate was reduced from 5% to 5 per cent, and in April, coincidentwith the US reduction, it was lowered to 4% per cent. T o stimulate invest-ment activity some of the restrictions introduced in the March 1966 budgetwere lifted later in the spring. In May the new Bank Act came into force,the effect of which is likely to be an increase in competition between finan-cial institutions and greater bank participation in mortgage lending.

— 55 —
United Kingdom. As broadly conceived in the spring of 1966, governmentpolicy implied a continued need, at least until the autumn, for heavy relianceon monetary restraint. The May budget, though designed to yield a substan-tially larger revenue surplus, was not to have its main impact until later inthe year, when the selective employment tax was to take effect. Moreover, in-comes policy, still based on voluntary restraint under conditions of highdemand, was not producing the necessary results.
In February 1966 quantitative restrictions on sterling lending to theprivate sector were further tightened. Whereas in the year to March 1966 theclearing banks had been asked to limit the growth in their advances to 5 percent., they were now requested to regard the level set for March as aceiling, seasonal movements apart, until further review. As on earlier occa-sions, and in more general terms, other banking and financial institutionswere also asked to exercise restraint. Furthermore, priority to credit forexports and productive investment was again recommended. About the sametime hire-purchase terms were stiffened, the maximum payment period beingput for cars at twenty-seven months and for most other goods at twenty-fourmonths and the minimum down-payment requirements generally at 25 per cent.
As a result of these measures, consumer borrowing showed a furthermodest decline over the first half of 1966. Any effect this might have had onconsumption, however, was swamped by the continuing rapid growth inpersonal disposable income. Moreover, private-sector investment, although itappeared to taper off somewhat, remained at a high level. This was facilitatedin part by the utilisation of the remaining margin of expansion for bankcredit. Between November 1965 and May 1966 advances to manufacturingindustry, building and contracting, and retail trade rose on an adjusted basisby nearly 5 per cent. In addition, business firms turned increasingly to thecapital market, where net issues by public companies grew to nearly £400 mil-lion in the first six months of 1966 from under £300 million in the precedingsix months. In view of the buoyancy of public-sector expenditure — much ofit for productive investment by public enterprises, on which credit policycould exert no real influence — business confidence remained high.
Thus, while monetary policy helped to contain the expansion of private-sector demand, it could do little actually to reduce it — and even less tocurb overall demand.
The monetary measures taken as part of the July emergency programmeaimed at both reinforcing domestic credit restraint and counteracting theprevious rise in interest rates abroad. First the authorities announced that theexisting ceiling on bank credit would remain unchanged up to March 1967 anduntil further notice thereafter. It was added that no special credit arrange-ments would be made to facilitate payment of the selective employment taxbeginning in September. Shortly after, on 14th July, Bank rate was raised from6 to 7 per cent, and the special deposits required from London clearing banksand Scottish banks were doubled. Moreover, hire-purchase terms were againtightened, mainly by a sharp increase in minimum down-payment requirements.

- 56 -
More significant, in terms of longer-run objectives, were the measures offiscal, budgetary and incomes policy (see page 13). These measures, togetherwith the selective employment tax, were designed to halt cost inflation, in-crease productivity and, by curbing consumption, raise the rate of nationalsaving. Hence they offered the prospect that any resulting decline in privateinvestment would be temporary and less pronounced than if reliance wereplaced on credit restraint alone.
The impact on the structure of savings and investment implicit in thesepolicies may be seen in the wider context of developments during the pastthree years. From 1963 to 1966 public-sector fixed investment rose in moneyterms by over 45 per cent, to reach £3,115 million, while that in the privatesector went up by 25 per cent, to £3,485 million. Within the private sectorthe increase by companies was about 30 per cent, and by the personal sectorsome 10 per cent. It may be observed that public-sector saving has showneven more rapid growth, rising from the equivalent of 48 per cent, of public-sector fixed investment in 1963 to 73 per cent, in 1966. The growth inpublic saving took place more at the expense of private consumption than ofprivate saving, with public and private saving combined rising from 18.8 to21.4 per cent, of the gross domestic product between 1963 and 1966. Despitethe large expansion in public investment, fixed outlays by private companiesincreased over the same period from 7.2 to 7.9 per cent, of the gross domesticproduct.
These developments do not gainsay the fact that for most of the period1963-66 gross domestic investment (including inventory investment) was per-mitted to rise too rapidly relative to the improvement in national saving. The
United
Items
Fixed investment .
Savino
Fixed investment .
Kingdom: Saving and fixed investment,
Years
19631964196519661963196419651966
19631964196519661963196419651966
Private sector
Personal
1,5901,8151,8801,890
860900
1,010955
6.06.36.15.93.23.13.33.0
Com-panies Total
in millions2,4102,6403,1902,6751,9152,3652,4752,530
4,0004,4555,0704,5652,7753,2653,4853,485
as percentages of9.09.2
70.58.47.28.38.77.9
75.075.516.614.310.411.411.410.9
Publiccorpo-rations
Public
Centralgovern-ment
by sectors.
sector
Localauthor-ities
of £ sterling, at market prices530590660640
1,0251,1901,2951,450
225485890
1,190225280305340
265330310455880
1,1 151,2051,325
Total
1,0201,4051,8602,2852,1302,5852,8053,115
gross domestic product at factor cost2.02.72.22.03.84.14.24.5
0.81.72.93.70.97.0T.O1.1
7 .01.11.01.43.33.94.04.1
3,84.96.17.18.09.09.29.7
total
5,0205,8606,9306,8504,9055,8506,2906,600
18.820.422.721.418.420.420.620.6

— 57 —
result was domestic inflation and a deterioration in net foreign investment.Thus, when the present downtrend in private investment is reversed, it willbe important for public investment to be adjusted so as to avoid renewedstrain on productive capacity.
In the more restrained domestic atmosphere which prevailed after July,credit policy remained generally unchanged. However, with the burden ofrestraint now shifted more to other instruments and with private demandreceding, the programme of direct credit control ceased to be restrictive forpriority borrowers. Its continued selective application, however, helped toensure that the productive capacity released was not promptly reabsorbed inless essential activity. In addition, as the gilt-edged market gathered strength,the authorities made heavy sales of securities while allowing interest yields todecline gradually.
In 1966 as a whole the banking sector's advances (in all currencies) toUK residents rose by only £22 million, against an increase of £425 million,or 6y2 per cent., in 1965. The direction of lending was broadly consistentwith the official recommendation. The expansion of resident deposits was only 3per cent., against 7% per cent, in 1965, but it was still large compared withthe rise in advances. The difference expressed itself mainly in a reduction ofsome £260 million in the banking sector's net liabilities to non-residents,reflecting the attraction of short-term dollar interest rates for much of theyear and the lack of confidence in sterling.
The Exchequer returns for the calendar year 1966 show a substantialimprovement on revenue account, largely offset by a further rise in Consoli-dated Fund lending, notably for investment by public enterprises and localauthorities. The total financing requirement declined by £66 million to£531 million. However, the Exchequer's external transactions, predominantlyofficial sales of foreign exchange and short-term assistance from overseasmonetary authorities, covered £462 million of this deficit, compared with£118 million in 1965. Domestic borrowing was, therefore, very sharplyreduced to only £69 million, against £479 million the year before. Domesticholdings of all forms of government debt outside the banking sector actuallydeclined by £52 million, after a rise of £171 million in 1965. Net with-drawals of national savings, despite more generous terms, were particularlyheavy. Recourse to the banking sector was reduced from £308 million in 1965to £121 million in 1966. Moreover, this borrowing was very largely in non-liquid form: the further call for special deposits raised £100 million and thebanking sector took up £119 million of government stocks and £85 million oftax reserve certificates. The banks' Treasury bill portfolio declined by £209million. These changes helped to offset the sharp increase in bank liquidityresulting from the contraction of advances after July.
The course of Exchequer financing was influenced to a marked extent bydevelopments in the capital market. Net issues by non-financial companies in1966 rose by 40 per cent, to £566 million, including an increase of over60 per cent, in issues by manufacturing industry, notably in the chemicals

- 58 -
sector. Financial institutions raised £120 million, after only £38 million in1965, and local-authority issues, at £189 million, although 10 per cent, lessthan in the previous year, were still very large. Within the total of netissues of £859 million, nearly 40 per cent, was concentrated in the first threemonths, which tended to depress the government bond market. By the end ofthe year, however, with less pressure from other borrowers, gilt-edged securi-ties had recovered strongly and net sales to the public reached £410 millionin the final quarter, bringing total Exchequer borrowing in this form for theyear to £229 million.
The relaxation of US monetary policy at the end of 1966 and therelated trend towards lower short-term interest rates in Europe made possiblea reduction of 1 x/% per cent, in the U K Bank rate in the course of the firstfive months of the current year. This action added to the buoyancy of thegilt-edged market, which, if it is sustained, will go some way towards easingthe sizable financing problem posed by the recent budget for the fiscal year1967. Wi th no net increase in revenue from new taxes, the expected declineof £100 million in the surplus of revenue over expenditure, and a comparablerise in central-government lending, would give an Exchequer borrowingrequirement of £943 million, against £740 million in 1966-67. Moreover, theanticipated surplus on the UK balance of payments, together with thescheduled repayment of the I M F and Swiss loans, suggests that the Ex-chequer will need substantially to increase its borrowing from domesticsources. Efforts may be necessary, therefore, to avoid excessive governmentrecourse to the banking system. At all events, the impact of Exchequerborrowing on monetary expansion will be mitigated by the continuation ofcredit control through official guidance on the direction of lending and theuse of the special-deposits mechanism in the case of the clearing and Scottishbanks, which as from 12th April were released from the obligation to observea ceiling on advances. Other banks and the finance houses will continue tobe subject to the ceiling (while other arrangements are being worked out)and to lending guidance.
Germany. The gradual intensification of monetary restraint from thesummer of 1964 onwards did not create the same policy conflict as on earlieroccasions. Inasmuch as domestic inflationary pressures were accompanied by anexternal payments deficit, there was not the same danger that capital inflowswould be disequilibrating. Yet, dilemma there was. Public-sector budgets,instead of compensating for excess private demand, were themselves contri-buting to demand pressures and, indirectly, cost inflation. Inevitably, moreover,the effects of credit restraint were to some extent circumvented throughrecourse by domestic borrowers to loans from abroad. In these circumstancesthe containment of inflation by monetary policy led to increasingly highinterest rates, carrying with it the usual risk of an abrupt shift in expecta-tions concerning the profitability of investment.
In the early months of 1966 the demand for funds continued strongand the credit markets tightened further. On several occasions the Bundesbank

— 59 —
Germany: Selected monetary indicators.
26
22
18
BANKS'
/ N-
1 1 1
DOMESTIC LENDING 1
/ " - \ Public/ \ /
*» ' Private
sector
\
•"- »sector
, I ,
\
i i
V\
BANK LIQUIDITY z
10
BANKS
iffl1 1
DOMESTIC
1 1
LIABILITIES 1
J I I I I I I I I1963 1964 1965 1966 1967
/I i i **/ i i i I i i i I I i i I I
Banks' domesticsecurity purchases5
1963 1964 1965 1966 19671 Percentage changes over corresponding quarter of preceding year. 2 End of quarter, in milliards of DM.3 Domestic money-market paper and foreign liquid assets. " Quarterly, in milliards of DM. 5 Excluding issuesand purchases of bank bonds.
raised the rate on its transactions in money-market paper. In May, after bothforeign and domestic interest yields had risen considerably, it increased theofficial discount rate from 4 to s per cent, and the rate on secured advancesfrom 5 to 6% per cent. Also in May, the second phase of a reduction inrediscount quotas, absorbing about D M 1.3 milliard of unused facilities,became effective.
Deposit formation and bank credit expansion slowed down noticeably inthe first six months of 1966. In this period the credit institutions' totaldeposit liabilities rose by only D M 9.4 milliard, as against D M 12.6 milliarda year earlier, reflecting mainly a curtailment in the expansion of sightdeposits. Moreover, owing to very unfavourable capital-market conditions, thecredit institutions cut back their bond issues to about D M 3.0 milliard fromD M 6.1 milliard in the same period of 1965. To some extent the slowergrowth of resources was associated with a more moderate expansion in theirlending, which declined to D M 14.7 milliard from D M 16.5 milliard in thefirst six months of 1965. Within this total, however, lending to the private

— 6o —
sector continued strong and the increase, at D M 12.5 milliard, was much thesame as in 1965. On the other hand, credit-granting to the public sectordeclined in the first half of 1966, falling to D M 1.8 milliard from D M 2.6 milliardin the corresponding period of 1965, owing mainly to an improvement in thecash budget position of the central government and the Länder. While thismay have been partly due to deliberate budget restraint, it also appears thatthe limited accessibility and high cost of credit served to keep down publicexpenditure. Finally, in view of growing liquidity strains, the credit institu-tions cut back their acquisitions of securities to less than D M 300 million,whereas in the first half of 1965 they had bought D M 1,580 million.
As a result of autonomous forces, together with the growth of minimumreserve requirements, the absorption of bank liquidity in the first half of1966 was almost D M 3.1 milliard, after having already amounted to overD M 6.1 milliard in the preceding eighteen months. The most importantliquidity drain came from the external deficit, which was still large in thefirst quarter, and from an increase in the public authorities' deposits with thecentral bank. The credit institutions met their liquidity needs mainly fromdomestic sources, by borrowing from the central bank some D M 2.6 milliardand by selling to it money-market paper in the amount of almost D M 0.5 milliard.
The new-issues market, after weakening substantially in 1965, showedsigns of a developing crisis in the first half of 1966. The yield on public-authority bonds, after rising from an average of 6.2 per cent, in 1964 to7.7 per cent, by the end of 1965, moved steadily upwards to reach 8.4 percent, by June 1966. New domestic bond issues in the January-June periodtotalled only D M 3.2 milliard, as against D M 7.8 milliard in the correspond-ing period of 1965. The banks' smaller acquisitions go some way towardsexplaining this smaller volume, as does also their reluctance to go to themarket with their own issues. T o some extent, too, the figures do not give thefull picture, because medium and long-term direct lending by insurancecompanies and other non-bank institutions increased markedly, taking theplace of previous bond purchases in the market. Moreover, the publicauthorities, through a self-imposed scheme of rationing, limited their ownrecourse to security flotations. Last but not least, the general public stoodaside from the market, partly because of lower household savings and partlybecause interest rates were expected to go higher.
In terms of final demand, the decisive change appears to have come inthe early summer of 1966, by which time tight credit conditions had initiateda decline in private fixed investment. In subsequent months the marked shiftto an external surplus, together with an easing in the demand for bankcredit, produced a complete reversal in the trend of bank liquidity. Since,however, the banks used their liquidity accruals largely to repay indebtednessto the central bank, conditions in the credit and capital markets were some-what slow to change.
The private sector's demand for bank credit sagged in the second halfof 1966 to D M 6.6 milliard, scarcely more than one-half the D M 12.4 milliard

— 6i —
borrowed in the same period of 1965. The public authorities, on theother hand, increased their borrowing to D M 4.7 milliard from D M 4.3 mil-liard in the earlier period. However, the 1966 figure reflects in part theD M 1.0 milliard raised around the turn of the year in order to financeforeign exchange payments to the United States as an offset to militaryexpenditure in Germany. Deposits with the credit institutions rose in thesecond half-year by D M 19.1 milliard, or slightly more than a year earlier.The banks' security portfolio increased by D M 220 million, whereas it haddeclined by D M 580 million in the last half of 1965. On balance, bankliquidity increased through autonomous market forces by D M 2,850 millionin the second half of 1966. Some D M 1,850 million was used to repayindebtedness to the central bank, while most of the rest was employedabroad.
New bond issues in the July-December period came to only D M 2.3 mil-liard, or one-half as much as in the same period of 1965. The demand forfunds was held in check by procedures governing the timing of issues and bymutual agreement among the public authorities. On the supply side, bondacquisitions by the banks remained small, while the general public, given theprevailing uncertainties, continued to show a high degree of liquidity pre-ference. The yield on public-authority bonds rose further to 8.6 per cent, inJuly/August, but thereafter edged slowly downwards until November and thendropped by half a percentage point to 7.7 per cent, in December.
Towards the turn of the year demand had eased considerably, theunderlying budget position was better and the external surplus was large andthreatening to become larger. In these circumstances the Bundesbank movedtowards a policy of active monetary ease. At the beginning of December, atfirst as a temporary end-year move, minimum reserve requirements for sightand time deposits were reduced by 9 per cent. At about the same time, inorder to attract more funds to the domestic market, the Bundesbank sus-pended with effect from ist January the regulation exempting from minimumreserve requirements the banks' deposit liabilities to foreigners in so far asthey are offset by short-term foreign assets. To compensate for this, thereduction in reserve requirements was made permanent. On 6th January 1967the official discount rate was lowered from 5 to 4x/2 per cent, and the rate onsecured advances from 6% to 5% per cent. Wi th effect from ist February thespecial reserve ratios for liabilities vis-à-vis non-residents were reduced fromthe legal maximum to the ratios in force for liabilities towards residents. On17th February the official discount rate was again lowered by a/2 per cent, to4 per cent, and minimum reserve ratios were cut by 10 per cent, across theboard. Following the April reduction in the US discount rate, the Bundesbanklowered its rate once again to 3% per cent. Wi th effect from May theminimum reserve requirements were cut by a further 5 per cent. Finally, thediscount rate was reduced on 12th May to 3 per cent.
The return to monetary ease, and particularly the lowering of interestrates, has been carried out in harmony with developments abroad. Sinceinterest levels elsewhere act as a constraint on the Bundesbank's actions, it

— 62 —
proceeded cautiously in bringing rates down. As a structural measure, theBundesbank agreed in March to abolish completely the fixing of maximuminterest rates for bank credits and deposits. On the bond market yields declinedfurther in the first few months of 1967, and in April the authorities shiftedover from a nominal rate of 7 per cent, to one of 6x/2 per cent. To someextent a revival of demand will be stimulated by the anti-cyclical measuresdescribed on page 12, including increases in government expenditure financedby short-term credit. More generally, given the background of credit ease, itis expected that there will also be some autonomous recovery of demandlater in the year.
Netherlands. In the years 1963-66 the Netherlands experienced a markedupward adjustment of costs and prices, accompanied by a fairly moderatedeterioration in the balance of payments but also last year by difficulties instructurally weak industrial sectors. Sharp advances in wages, central andlocal-government expenditure, and investment in housing and industry providedthe fuel for this inflationary movement. The strength of the emerging demandfor funds, against the background of the central bank's efforts to restrictcredit availability, may be seen in the course of interest rates. The yield onindustrial bonds, which between 1959 and 1963 had fluctuated narrowlywithin a range of 3%-4% per cent., thereafter climbed steeply to reach7% per cent, by the summer of 1966. This movement, of course, reflects alsothe influence of rising rates abroad.
The central government's net financial requirement, after expanding fromFl. 310 million in 1963 to Fl. 1,040 million in 1965, went up further toFl. 1,620 million in 1966. Within the year, however, the government was ableto improve its position, largely as a result of the curbs on expenditure,particularly public investment, introduced in May. In the second half of 1966,for the first time since 1963, the growth of revenue outstripped that ofexpenditure. Over 1966 as a whole the government increased its recourse tolong-term borrowing, but the proportion of its net financial requirement metin this way dropped from 74 to 66 per cent. To avoid subjecting the capitalmarket to further strain, it borrowed relatively more at short term. Afterrising by Fl. 570 million in 1965, bank credit taken up by the centralgovernment went up in 1966 by Fl. 800 million, of which an appreciablepart was reflected in an increase in floating debt vis-à-vis the NederlandscheBank.
After a sharp ascent to a peak of Fl. 2,220 million in 1964, the localauthorities' net financial requirement declined for two years in succession,falling in 1966 to Fl. 1,760 million. This decline is attributable largely tothe placing of quantitative limits on borrowing by public bodies. Last year,moreover, the local authorities were permitted to have access to the capitalmarket only via central public-borrowing institutions, mainly the Bank forNetherlands Municipalities. The proportion of the sector's net financial re-quirement that was met by long-term borrowing dropped much more than inthe case of the central government, viz. from over 95 per cent, in 1965 to
- 63 -
6i per cent, in 1966. However, recourse to bank credit and other short-termborrowing was confined mostly to the first half of the year. By the secondhalf the sector's financial needs had been reduced further and were almostfully covered by long-term resources.
In the early part of 1966 the private sector's demand for bank creditwas strong. Although the Nederlandsche Bank had fixed the ceiling forshort-term credit-granting to this sector for the months January-April at 5 percent., equivalent to three-quarters of the actual growth in the correspondingperiod of 1965, loans in fact increased by about 10 per cent. This led to afurther tightening of monetary policy in May, when the discount rate wasraised from 4^4 to 5 per cent, and the lending ceiling was brought down,partly on seasonal grounds, to 4 per cent, for the period January-August as awhole. Shortly after, an easing of domestic demand set in. By late summerthe demand for short-term bank credit had fallen off, and it did not show itsusual seasonal recovery later in the year. On the other hand, longer-termbank lending, which at the request of the central bank was to be kept inline with the availability of longer-term resources, picked up in the latter halfof the year.
In 1966, even more than in 1965, deposit formation lagged behind theexpansion of bank credit, partly because of the balance-of-payments deficitand partly because of high yields in the capital market. The commercialbanks' total loans rose by Fl. 1,520 million, or I2V2 per cent., while theirtotal deposits went up by only Fl. 690 million, or 6 per cent. In thesecircumstances the banks cut back their holdings of securities somewhat,particularly in the early months of the year, and borrowed rather more thanusual from the central bank. What is more important, they further reducedtheir net foreign position by about Fl. 380 million. One may also note thatincreased recourse by Dutch firms to trade credit from abroad not onlyhelped them to circumvent domestic credit restrictions but also mitigatedliquidity pressures on the banks.
At Fl. 7,130 million, the net funds raised by domestic borrowers on thecapital market in 1966, mostly in the form of private and mortgage loans,recorded an increase of 2 per cent., compared with one of 10 per cent, in1965. However, because of the restraint shown by the public authorities,whose borrowing dropped by 21 per cent, to Fl. 2,140 million, the privatesector was able to take up long-term funds to a total of Fl. 4,990 million,or 17 per cent, more than in 1965. The supply of funds from the banks andsavings institutions contracted by 28 per cent, to Fl. 1,660 million, but thiswas more than offset by the growth of funds from institutional investors anda somewhat larger net inflow of foreign portfolio capital. The availability ofnew funds from business and households, at Fl. 1,200 million, was slightlyless than in 1965 but still one-third greater than in 1964.
The combination of budget and monetary restraint applied in 1966appears to have produced an easing of inflationary pressures without seriouslyimpeding the continued expansion of industrial production. Long-term bond

— 6 4 -
yields remained high until November, but they have since declined appreciably.On 15th March the Nederlandsche Bank reduced its discount rate from 5 to4% per cent, and for the time being exempted the banks from the obligationto make non-interest-bearing deposits with the central bank in the event oflending in excess of the prescribed ceiling. The ceiling itself was fixed forJanuary-April 1967 at 4 per cent, of the amount outstanding in the lastquarter of 1965. The central government expects a financing deficit in 1967of about the same size as in 1966; it will in fact be more appropriate thanlast year's because of the present easier demand situation. The local authori-ties have been asked to limit until further notice their short-term borrowingto 105 per cent, of the amount outstanding in July 1966, and they willcontinue in 1967 to be obliged to centralise their borrowing on the capitalmarket.
Belgium. In late 1965 and early 1966 a renewed economic upswingappeared to be taking firm hold. As a precautionary measure, designed tokeep credit expansion within non-inflationary bounds, the National Bank inApril requested the banks to limit the growth of their lending in 1966 to12 per cent, of the end-1965 level. Within this limit the banks were alsoasked to give priority to loans for productive investment and to observemoderation in lending for building, consumption and speculative stock accu-mulation. In addition, it was recommended that the banks should financemedium and long-term lending only with resources of suitable maturity. Thesavings banks, life assurance companies and public credit institutions continuedto be associated with the programme of credit restraint.
In the event the expansion proved short-lived. Under the influence of aweakening in exports, caused mainly by disinflationary measures taken inneighbouring countries, economic activity began to slow down in the spring.Cost inflation, however, continued to go ahead, leading in May to theimposition of a temporary price freeze. In order further to counteract risingcosts, but also to help keep domestic interest rates in line with those abroad,the National Bank raised its discount rate from 4% to 5% per cent, on2nd June.
The shift into external basic deficit in 1966 had a restrictive effect onthe formation of liquid assets via the banking system. However, domesticbank credit expansion worked in the opposite direction. The Treasury hadgreater recourse to monetary financing, partly through borrowing abroad, andbank credit to the private sector accelerated. Thus, at B.fr. 34 milliard, theincrease in money and quasi-money came to 8y2 per cent., almost equallingthe 9 per cent, rise in 1965.
The Treasury's net financial requirement fell from B.fr. 22.1 milliard in1965 to B.fr. 17.1 milliard last year, thanks partly to an increase in indirecttaxation as from the beginning of 1966 and partly to the restraint exercisedover expenditure. In 1965 the Treasury had borrowed B.fr. 26.9 milliard onthe domestic market, of which about two-thirds was at medium and long term,and had used B.fr. 4.8 milliard of the proceeds to reduce its foreign

- 6s - '
indebtedness. But last year, in view of the strains on the domestic creditmarkets, the Treasury turned once again to borrowing abroad, while con-tinuing to have recourse to monetary financing for a considerable part of itsreduced domestic borrowing.
Bank credit to the private sector, in so far as it was subject to theceiling, went up by 4,4 per cent, in the first half of 1966 and by 15.4 percent, for the year as a whole, as against 17 per cent, in 1965. Although theceiling introduced in April remained in effect, the National Bank indicated atthe end of June that it would agree to an overstepping of the limit in caseswhere this was due to investment credits enjoying a government guarantee orsubsidy. The banking system's total credits to the private sector increased in1966 by B.fr. 22.4 milliard, or 20 per cent., compared with 14% per cent, in1965. The strength of credit demand was largely a result of the squeeze onprofits caused by the weakening of final demand and by the continuedupward push of wages.
At the end of 1966 the National Bank prolonged the credit ceiling untilmid-1967, at which time bank lending should not exceed 118 per cent, of theend-1965 level. Now explicitly excluded from the ceiling, however, are in-vestment credits guaranteed or subsidised by the government and also exportcredits in the form of bank acceptances. As a move towards greater ease andin order to align rates with those prevailing internationally, the officialdiscount rate was reduced in three steps between February and early Mayfrom 5% to 4% per cent.
France. In 1966 the aim of policy was to encourage the renewedupswing of economic activity without jeopardising the degree of price andcost stability achieved in recent years under the stabilisation programme. Thisresult was obtained by moderately expansionary budget and credit policiestempered by continued restraint on public-sector incomes as well as onliquid-asset formation. During the year controls over industrial prices weresomewhat relaxed and the prices of certain agricultural goods and publicservices were adjusted upwards.
The central government's budget, after having been brought from a largedeficit into balance over the years 1964-65, moved back into moderatedeficit last year. At Fr.fr. 2 milliard, however, the deficit was more or lessconsistent with the need to promote economic expansion. In considerable partit was the result of larger outlays in favour of the nationalised industries andthe social security system. It also reflected a 10 per cent, tax credit grantedon investment goods purchased or ordered during the year and increasedlending to the Fund for Economic and Social Development.
Although it helped to augment final demand, the budget was financed soas to limit the growth of money and quasi-money. This result was achievedpartly through the issue of another National Equipment Loan — forFr.fr. 1.5 milliard, as against Fr.fr. 1.0 milliard in 1965 — the proceeds ofwhich were mainly used for re-lending to industry. But more important were
— 66 —
the funds which accrued to the Treasury from postal and correspondents'accounts. In 1966 Treasury operations exercised a restrictive effect on liquid-asset creation of the order of Fr.fr. 1.7 milliard, whereas in 1965 theycontributed to monetary expansion to the extent of Fr.fr. 0.5 milliard.
The deteriorating external payments position also tended to limit thegrowth of liquid assets. The banking system's net foreign position, afterimproving by Fr.fr. 5.58 milliard in 1965, recorded a gain (including debtrepayment) of Fr.fr. 2.13 milliard for 1966 as a whole, although from the latesummer onwards the position was one of deficit. On the other hand, creditsto the private sector by the banking system (including the central bank)expanded by Fr.fr. 15.3 milliard, or 12.6 per cent., compared with 11 percent, in 1965. This was attributable primarily to the further upswing ineconomic activity. Thus, as restrained by debt-management operations and theexternal position, the growth of money and quasi-money via the bankingsystem came to Fr.fr. 19.1 milliard, or 9.7 per cent., which was slightlybelow the 10 per cent, rise recorded in the previous year.
Owing partly to a slowing-down in the expansion of the currencycirculation, total bank deposits, including those at longer term, increased byFr.fr. 13.8 milliard, thus showing a rise of 12.9 per cent., compared with11.8 per cent, in 1965. Within this total, quasi-monetary assets with thebanks went up by 26.5 per cent. This was the result of measures put intoeffect in early 1966 to give the banks greater opportunity to attract savings,both on booklet accounts and under a new housing-savings scheme, incompetition with savings banks. On the other hand, the Treasury, by borrow-ing more from other sources, reduced its net indebtedness with the banksby some Fr.fr. 3.9 milliard. This, together with the high rate of depositformation, helped the banks to increase their credits granted to the economyby Fr.fr. 16.9 milliard. This expansion amounted to 15.5 per cent., asagainst 13.4 per cent, in 1965. Medium-term credits for construction and, ina lesser degree, for equipment recorded substantial gains. The banks hadrecourse to rediscounting with the central bank and other institutions, butthe total came to only Fr.fr. 1.8 milliard, or about Fr.fr. 1 milliard lessthan in 1965.
Total credit-granting by other financial institutions, including specialcredit institutions and the Treasury, went up in 1966 by Fr.fr. 18.4 milliard,or 15.2 per cent., compared with 13.8 per cent, in 1965. This was madepossible by a larger supply of public funds from the Treasury, a fastergrowth of deposits with the savings banks and greater recourse to the capitalmarket by the special credit institutions.
Net capital issues increased slightly, to Fr.fr. 12.4 milliard fromFr.fr. 12.2 milliard in 1965. Within this total, share issues dropped offappreciably, reflecting a further deterioration in conditions on the sharemarket. However, the financing needs of industry were met to a larger extentthrough the intermediary of the specialised credit institutions and the Treasury.Combined, their gross bond issues went up from Fr.fr. 4.7 milliard in 1965

- 6 7 -
to Fr.fr. 6.s milliard in 1966, the lending counterpart of which is reflected inthe figures given in the preceding paragraph. About the middle of the year,in order to encourage a greater flow of capital, the authorities raised thenominal interest rate on new bond issues by y2 per cent.
Money-market interest rates, which were more under the influence ofexternal developments, went up considerably, day-to-day rates rising by morethan 1 per cent, to an average of 5.7 per cent, in December 1966. Through-out the year the discount rate was kept unchanged at 3x/2 per cent., and theauthorities acted at times to ease market pressures, mainly through severalreductions in the "coefficient de trésorerie". However, in the second half ofthe year, by which time an external deficit had emerged, the central bankprovided funds to the market only at rising rates, thus helping to limit theoutflow of capital. By early 1967 the rate on day-to-day money had fallenback to about 5 per cent.
Against the background of continued monetary stability, the authoritiesintroduced further measures to broaden the activity of financial institutionsand to spur competition between them. For instance, institutions specialisingin financing investment, such as the Crédit National, and private housing,such as the Crédit Foncier, were granted permission to issue marketablemedium-term bonds suitable for placement with banks. In addition, thebanks were permitted to introduce long-term savings contracts carrying fiscalprivileges. With a view to reducing the cost of housing loans and extendingtheir term, efforts were also initiated to promote a mortgage market, princi-pally through the agency of the Crédit Foncier.
With regard to monetary policy instruments, an important change camein January 1967 with the introduction of a system of compulsory reserves forall banks and statutory deposit institutions. Under this system the banks mustplace interest-free deposits with the Bank of France proportionate to the mainitems of their short-term French franc liabilities at up to three years.Introduced gradually, the system is to be fully operative by 2ist October1967, by which time the reserve ratios will be 4V2 per cent, for sight depositsand 2 per cent, for other accounts. The limit to which these ratios may beraised by decision of the central bank is 10 per cent., as established for thetime being by the National Credit Council. At the same time the "coeffi-cient de trésorerie" was abolished but, as an interim measure, a minimumratio in respect of securities representing medium-term credits was laid down.In addition, the banks' minimum Treasury bill ratio, which was part of theoverall "coefficient", is to be progressively lowered from 5 per cent, to nilbetween January and ist September 1967. In view of the introduction ofvirtually full capital-account convertibility early this year, the system ofvariable reserve requirements, combined with the greater use of open-marketoperations, provides the authorities with an additional element of flexibility inmonetary management. For the immediate future, the deterioration in thebalance of payments, the adherence to budgetary orthodoxy revealed in theestimates for 1967, and the more hesitant advance of economic activityshould minimise the danger of any excessive growth of domestic liquidity.

— 68 —
Italy. The primary objective of economic policy in 1966 and early 1967was to encourage the upswing in economic activity, especially in investment.Budgetary, debt-management and monetary policies contributed in unison to-wards this goal, against a background of relatively stable prices and wagesand a declining external surplus.
So far as the government's rôle is concerned, the central administration'scurrent-account surplus, expressed in national-income terms, increased fromLit. 186 milliard in 1965 to Lit. 433 milliard in 1966. Thus, after the centraladministration's own investment expenditure and capital transfers, its overallnational-income deficit declined from Lit. 819 to 689 milliard. On the otherhand, as a result mainly of government lending for investment purposes, thenet requirement of the Treasury (including the Postal Savings Fund) rose fromLit. 1,543 milliard in 1965 to Lit. 1,867 milliard last year.
The Treasury's new borrowing from the credit institutions amounted in1966 to about Lit. 800 milliard, compared with Lit. 600 milliard in 1965.But, whereas in 1965 about one-third of this borrowing was through sales ofTreasury bills, in 1966 it derived almost exclusively from the banks' purchasesof long-term government securities. Furthermore, the Treasury's net securitysales to the general public rose from about Lit. 195 milliard in 1965 toLit. 668 milliard in 1966. In these ways, together with postal savings andother borrowings, the Treasury was able through longer-term borrowing tomeet about three-quarters of its net cash requirement, as against about two-fifths in 1965. Its position vis-à-vis the central bank, after having deterioratedby Lit. 293 milliard in 1965, showed a net improvement of Lit. 78 milliardin 1966.
The credit institutions' lending to the domestic economy went up by14.6 per cent., against 7.2 per cent, in 1965, the rate of increase in privateand public-sector credit being about the same. The rise in deposit liabilities,at 15.3 per cent., was even greater, though less than the 17.7 per cent,increase in the preceding year. The banks' loan/deposit ratio, which had beenas high as 78.6 per cent, at the end of 1963, thus dropped in 1966 from 67.7to 67.3 per cent. Besides accelerating their lending, the credit institutionsagain made heavy purchases of securities. Excluding their holdings of Treasurybills, which dropped off last year, the addition to their security holdingsamounted to Lit. 1,340 milliard, representing an increase of 32 per cent.,following one of 38 per cent, in 1965. The bulk of these acquisitions weregovernment or government-guaranteed issues, and some Lit. 300 milliard, ofwhich Lit. 200 milliard consisted of mortgage bonds, was used under existingregulations to meet compulsory reserve requirements. Another part, someLit. 500 milliard, was used as collateral with the central bank. Hence thecredit institutions' free portfolio of securities rose by less than Lit. 525 mil-liard, or just over 20 per cent.
Among the factors adding to bank liquidity, the Treasury's deficitoperations in 1966 provided Lit. 1,867 milliard, while liquidity creation viathe external surplus declined to Lit. 418 milliard from Lit. 994 milliard in

- 6 9 -
1965. On the other hand, bank liquidity was absorbed to the extent ofLit. 1,392 milliard through the growth of the currency circulation andminimum reserve requirements. Thus, the net increase in liquidity resultingfrom these autonomous factors came in 1966 to Lit. 809 milliard, as againstLit. 1,066 milliard in 1965. As to the effects of policy, the authorities' netsales of securities as the result of debt-management and open-market opera-tions absorbed liquidity in the amount of Lit. 1,370 milliard, though thisabsorption was mitigated by the already-mentioned use of Lit. 300 milliard ofsecurities to meet reserve requirements. Moreover, in accordance with existinginstructions, the banks used part of their liquid resources to bring their netforeign position into equilibrium. On balance, these policy factors drainedaway more liquidity than was created by autonomous forces, thus constrainingthe banks to increase their borrowing at the Bank of Italy by almost Lit.535 milliard, as against only Lit. 35 milliard in 1965.
The loans of the special credit institutions increased by 14 per cent, toreach almost Lit. 9,310 milliard at the end of 1966. At this level theseinstitutions' loans, which are mainly at longer term for investment in industry,construction and agriculture, are about three-fifths as large as those of theother credit institutions. Last year the special credit institutions, for their ownaccount, issued new bonds totalling Lit. 945 milliard, representing an increaseof 12 per cent. In addition, they issued Lit. 887 milliard for the account ofthe Treasury (including railway bonds).
The capital market was very receptive in 1966, net issues advancing fromLit. 2,377 t o 3.290 milliard. Although the absolute amount taken by thebanking sector increased, its share in the total declined appreciably, reflectinga strong interest on the part of the general public and institutional investorsfor fixed-interest securities. The relative stability of consumer prices andinterest rates over a sustained period helps to explain this, but a reluctance toinvest in housing and shares also played a significant part. The share marketremained under the shadow of fiscal deliberations, which culminated inFebruary 1967 in the withdrawal of the option to pay tax at a flat rate of30 per cent, on dividends instead of declaring the dividend receipts forincome-tax assessment.
In early 1967 the economy continued to advance buoyantly. In Marchthe yield on industrial bonds, at 6.7 per cent., was at about the same levelas a year earlier.
Switzerland. Despite a constantly high savings ratio, a further decline inreal investment and a slow-down in the growth of the real national product,credit markets remained tight throughout 1966. To some extent this was theresult of cost inflation, which pushed up the economy's credit needs. Moreimportant, however, Swiss credit-market developments in 1966 were influencedto a large extent by the tightening of capital and credit markets abroad.Despite a further upward adjustment of domestic interest rates — industrialbond by 3A per cent, and mortgage by XA per cent. — identified net long-termcapital exports increased from Sw.fr. 260 to almost 750 million in 1966.

— 70 —
Owing to the attraction of higher interest rates abroad, any efforts bythe monetary authorities to prevent a rise in domestic rates through liquiditycreation would have run counter to the primary goal of containing domesticinflation. So far as interest rates are concerned, therefore, the National Bank'spolicy was essentially limited to smoothing out and keeping in check theupward movement. Thus the increase in the official discount rate from 2.5 to3.5 per cent, in July 1966 represented primarily an adjustment to the highercall-money rates, which had risen from a monthly average of 2.75 per cent,in January to 3.75 per cent, in June.
Capital exports last year were largely covered by the current-accountsurplus and, apart from temporary fluctuations, the balance of payments didnot have a restrictive impact on the domestic money supply. In fact theNational Bank's gold and foreign exchange holdings went up by Sw.fr. 340 millionon a December-to-December basis. The note circulation rose by Sw.fr. 610 mil-lion, or 6.1 per cent., while the increase in the total money supply amountedto only 3.8 per cent, and was thus considerably smaller than the 7.2 per cent,rise in the nominal gross national product.
The tightness of monetary conditions abroad was also reflected in theslower growth of the banks' resources, which expanded by only Sw.fr. 5,025million, or 7.3 per cent., compared with Sw.fr. 5,480 million, or 8.7 per cent.,in 1965. Demand deposits showed virtually no increase, whereas time depositswent up by 12% per cent. This development was partly the result of the higherinterest rates which the banks, in view of the lending possibilities on theEuro-currency markets, were able to offer on fixed-term deposits. To someextent it also reflected the reserved attitude of Swiss investors, who owingto the upward trend of interest rates were reluctant to buy medium-termcash certificates and other longer-term bank paper. In fact, the rate of in-crease of cash certificates outstanding dropped from 13.6 to 4.0 per cent. Thegrowth of savings deposits, at just over 8 per cent., was much the same asin 1965.
In contrast to the banks' reduced intake of funds, their rate of creditexpansion accelerated from 8.8 per cent, in 1965 to 9.3 per cent., leading toa reduction in their liquidity position. The increase in foreign credits wasparticularly pronounced, but lending to residents, which in the case of somebanks ran up against the official credit ceilings, also advanced at a rate ofabout 8 per cent. The system of statutory ceilings on credit expansion, whichwas due to expire in March 1967, was replaced as from January 1967 bya central-bank guide-line which (with certain exceptions) puts the maximumrate at which banks may expand their credits to residents in 1967 at 7 per cent,of the end-1966 totals, and which thus tries to bring the rate of credit creationrather more into line with the actual growth possibilities of the economy.This limit must also be seen against the background of an anticipated con-siderable growth in the public sector's financial requirements in 1967.
The capital markets in 1966 were characterised by a situation of excessdemand. The Swiss Banking Commission continued to ration new issues

— 71 —
rather stringently but, with a % per cent, rise in bond yields, total netplacements, at Sw.fr. 2,810 million, were about Sw.fr. 250 million higher thanin 1965. Within this total, a larger proportion was accorded to foreign issues,which increased from Sw.fr. 260 to 425 million. In addition, in March 1966the Swiss banks were authorised to participate with a share of up to 10-15per cent, in issuing consortia for certain international loans. Moreover, theSwiss authorities gradually rescinded in the course of 1966 the restrictionswhich had been imposed in the spring of 1964 on the investment of foreigncapital in Swiss bonds, shares and other types of securities. The prohibitionof the payment of interest on foreigners' Swiss franc deposits and the banks'obligation to offset any net increase in such deposits by investing abroad orby making a non-interest-bearing deposit with the National Bank expired inMarch 1967.
Austria. Economic activity remained stable at a high level in 1966. Partlyowing to the slowing-down of growth in other countries, exports showedweakness. Industrial earnings advanced by 12 per cent, but the cost of livingwent up by only 2 per cent. The expansion of consumption contributed to amarked rise in imports and a widening of the external payments deficit.Industrial investment, on the other hand, was only marginally higher thanin 1965.
The demand for credit remained keen, particularly in the first half ofthe year, and the credit institutions came under liquidity pressure, partly onaccount of the balance-of-payments deficit. In view of the wage and pricetrend, and of the external imbalance, monetary policy steered a cautious course.To discourage borrowing from the central bank, the rate for secured advanceswas raised around mid-year by y2 per cent, to $y2 per cent. On the otherhand, the banks' credit ceiling was raised from 68 to 70 per cent, of theirliabilities, thus permitting increased lending by banks in a liquid position. InAugust, moreover, the central bank redeemed Sch. 1 milliard of money-marketTreasury certificates issued in July 1965 to absorb liquidity. On the averagethe credit institutions' indebtedness to the central bank amounted in 1966 toSch. 2.4 milliard, as against Sch. 535 million in 1965, though in December itwas back near the level of a year earlier. More important, the credit institu-tions had substantial recourse to short-term borrowing abroad, their overallforeign position shifting from net assets of Sch. 240 million at the end of1965 to net liabilities of Sch. 1.6 milliard at the end of 1966. In consequence,despite the external deficit, the official reserves increased by over Sch. 500million.
The credit institutions' loans rose in 1966 by Sch. 14.7 milliard, or 16per cent., compared with a growth of about 18 per cent, in 1965. At Sch. 2.1 mil-liard, their net purchases of domestic securities were almost the same as inthe preceding year. The expansion of their deposits, on the other hand, wasonly Sch. 11.2 milliard, representing an increase of 10.8 per cent., comparedwith 13.3 per cent, in 1965. Thus, besides reducing their holdings of Treasurycertificates and having recourse to central-bank credit and foreign borrowing,

— 72 —
the credit institutions also increased their own bond issues, which went up bySch. 2.4 milliard, as against Sch. 1.5 milliard the year before.
In early 1967, with industrial activity below its level of a year earlier,industrial investment was expected to show a decline of about 7 per cent, forthe year as a whole. Public expenditure, on the other hand, is to increasemarkedly, and the government, in order to leave the capital market free forthe private sector, plans to meet part of its financing requirements byborrowing abroad. Early in 1967 monetary policy shifted towards greater ease,and on 18th April the National Bank reduced its discount rate from 4% to4% per cent.
Denmark. Demand pressures, which had been strong throughout most of1965, were more moderate in the early months of 1966, reflecting mainly aslowing-down in the growth of industrial investment and exports. Thiseasing was partly the result of monetary and fiscal measures taken in 1965 butit was also attributable to stabilisation efforts by other countries and thecontinuing rise of Danish costs. Led by residential construction, economicactivity gathered force again from the spring onwards. Industrial investmentand exports remained weak,, however, and consumer prices, though risingless than in 1965, went up by about s per cent, over the year as a whole.
The government's budget helped significantly to restrain consumptionand enlarge saving. In 1966 the cash budget surplus rose to D.kr. 1,215 mil-lion from D.kr. 685 million in 1965. For the most part, except for scheduleddebt redemption, the surplus went to improve the government's accounts withthe central bank. In turn, the Nationalbank put a roughly equivalent amountof funds into the capital market through the purchase of long-term govern-ment bonds.
In 1966 the central bank's government security purchases plus govern-ment debt redemption came to D.kr. 1.0 milliard, whereas in 1965 this totalhad reached D.kr. 1.5 milliard. In 1965, however, the central bank's inter-vention in the market had been designed to ease even greater strains on thecapital market, as mortgage bond and other issues had risen by 37% per cent,to D.kr. 5.1 milliard. But in 1966, largely in consequence of the ceilingsimposed on mortgage lending as from the middle of 1965, such issues droppedback by 14 per cent, to a level of D.kr. 4.4 milliard. The interest rate onfirst mortgage bonds, after rising from about 6% per cent, in early 1964 toabove 9 per cent, in the spring of 1965, remained relatively stable until latein 1966, when it moved to above gVi per cent.
The commercial banks' activity expanded sharply in 1966, their loanshaving increased by 15% per cent., as against 9% per cent, in 1965. Reflectingpartly the public's liquidity preference, demand and time deposits rose inabout the same proportion, providing scope for the banks to increase theirinvestments. Their purchases of bonds and shares, amounting to D.kr. 535 millionin 1966 compared with D.kr. 180 million in 1965, gave added support to thecapital market.

— 73 —
The credit measures in force in 1966 remained basically the same asthose introduced in 1965. In February 1965 the commercial banks, in avoluntary arrangement with the Nationalbank, had agreed to place 20 per cent,of any increase in their deposits in a special account with the Nationalbankor, alternatively, to utilise it to improve their net foreign position. In Marcha similar agreement was reached with the savings banks. Subsequently, inJanuary 1967, it was laid down that banks may cover special deposit commit-ments arising from December 1966 onwards by depositing bonds of under tenyears' maturity with the Nationalbank.
These measures were effective in limiting the banks' access to liquidfunds from abroad. In fact, the commercial banks reduced their net foreignliabilities from D.kr. 305 million in December 1965 to D.kr. 180 million inDecember 1966. The measures were also effective in sterilising aboutD.kr. 100 million in special deposits over the year. They did not, however,prevent the banks from turning to central-bank credit in the form of discountsand advances, which rose from D.kr. 895 million in December 1965 toD.kr. 1,615 million in December 1966. The official discount rate remainedunchanged at 6% per cent., the level to which it had been raised in June 1964.
Norway. With activity already at a high level, a strong new advance indemand, led by exports and investment, brought productive capacity understrain in 1966. Wages and consumer prices increased substantially, and thecontribution of the external overall surplus to domestic liquidity contractedsharply.
According .to the official recommendation at the outset of 1966, bankloan expansion was to be kept down to 6-6V2 per cent. Early in the year,operating under the new Monetary and Credit Act, the authorities directedthe commercial banks to maintain liquid reserves corresponding to 5 per cent,of their total assets. ' In June, after an acceleration of bank lending, thisreserve requirement was raised to 8 per cent. However, special domesticfactors and difficulties met in raising funds abroad kept credit demand high.By August outstanding credits at commercial banks were about N.kr. 1.1 mil-liard higher than a year earlier and were running about N.kr. 500 million abovethe recommended ceilings. Consequently, at the end of September those bankswhich in the preceding twelve months had increased their lending by morethan 10 per cent, were instructed to hold an extra reserve corresponding to50 per cent, of the excess amount. Under new official recommendations, themaximum permissible increase over a twelve-month period was fixed at 9 percent, at the end of October and 8 per cent, at the end of November untilMarch 1967, when the extra reserve requirements were discontinued. Con-struction loans for residential housing were not included. By the end of 1966the commercial banks' domestic loans, other than those for house-building,were about 9 per cent, higher than a year before.
Early in 1967 resources continued to be under strain, with considerableincreases expected in both private and public spending. The planned growthin public expenditure, at 9.7 per cent., was much above the increase in 1966

— 74 —
and the expected growth of the real national product. With the aim of furthertightening credit, the authorities recommended that the increase in commercial-bank loans in 1967 be kept to no more than N.kr. 700 million (about 7 percent.) and those of the savings banks to N.kr. 550 million (about 6Y2 percent.). In the spring, moreover, additional measures were taken to curb con-sumption and investment, including a tightening of hire-purchase terms, aspacing-out of lending by the state banks and a selective curtailment of newbuilding.
Sweden. In view of the continuing strong demand for credit, monetarypolicy was tightened further in early 1966. In the first five months of the yearcommercial-bank loans increased by S.kr. 2.2 milliard, against S.kr. 1.8 milliardin the same period of 1965. In order to meet this demand the commercial bankscurtailed their holdings of government securities and borrowed more from thecentral bank. Thus in May their net indebtedness to the Riksbank reachedS.kr. 800 million, compared with S.kr. 590 million a year earlier. On 10thJune, so as to increase the flow of longer-term funds, the central bank raisedits discount rate from 5% to 6 per cent., the highest level for thirty-fiveyears. Accordingly, the banks put up their deposit and lending rates, and thenominal interest rate moved up by y2 per cent, to 6% per cent, for housingbonds and 7 per cent, for industrial bonds.
Final demand eased perceptibly towards the middle of the year. Inven-tory accumulation, which in 1965 and early 1966 had largely caused theexternal deficit, returned to normal, and companies' fixed investment grewmore slowly. Concurrently, the expansion of bank credit to t,he private sectorslowed down and, partly in conjunction with an improvement in the externalaccounts, deposit formation and bank liquidity began to rise. Another factor ofmajor importance was the emergence of a substantial central-governmentbudget deficit, stemming largely from a loss of buoyancy in revenue combinedwith an increase in housing loans and in income transfers to the localauthorities. By financing this deficit partly via the Riksbank, the authoritiesgave an additional fillip to monetary expansion and bank liquidity. For 1966as a whole the banks' liquid assets rose by almost S.kr. 2.0 milliard, afterdeclining by S.kr. 350 million in 1965. With effect from July, banks adheringstrictly to the liquidity ratios laid down by the Riksbank were released frompaying the penalty rate for borrowing over certain limits.
The net increase in lending for the credit system as a whole came in1966 to S.kr. 12.6 milliard, compared with S.kr. 10.6 milliard in 1965 andS.kr. 9.4 milliard in 1964. At S.kr. 4.7 milliard, the funds raised by theprivate sector, excluding housing, were no greater than in 1965, although anappreciably larger proportion was raised on the capital market. On the otherhand, the central government, which in 1965 had repaid S.kr. 250 million tothe credit institutions and the general public, had a net financing requirementin 1966 of almost S.kr. 1.3 milliard. Of this total, S.kr. 880 million wasfinanced at the Riksbank, while the commercial and other banks reduced theirclaims on the government by nearly S.kr. 200 million. The difference —
— 75 —
S.kr. 570 million — was taken up by capital-market institutions and thegeneral public. The local authorities' net financing requirement remained aboutthe same as in the previous year, partly because of greater revenue butpartly also because building controls limited their investment activity. Lendingto the housing sector expanded more rapidly in 1966, particularly sincefinancing became easier in the second half of the year. Thanks mainly to themortgage institutions, which, with higher interest rates, were able to attractmore funds, total credit to this sector expanded by S.kr. 5.5 milliard in 1966,compared with a little under S.kr. 5.0 milliard in 1965.
Reflecting the budget deficit and its financing partly via the Riksbank,a somewhat bigger proportion of total credit was channelled through thebanking system last year. However, capital-market activity also increased quitesubstantially; the number of mortgage issues, in particular, was greater afterthe rise in interest rates in June. As in previous years, the public creditinstitutions, mainly the National Pensions Fund, were chiefly responsible forthe increased flow of long-term funds.
The signs of weakness that had appeared in some sectors in the courseof 1966 continued in early 1967. The monetary authorities, though remainingcautious on both domestic and external grounds, lowered the discount rate to5% per cent, in February and to 5 per cent, in March.
Finland. Under the influence of a restrictive monetary policy the slow-down that began towards the end of 1965 continued last year, the decline inprivate capital formation being particularly marked. However, government
^expenditure continued to rise rapidly and, although some taxes and chargeswere raised in the middle of the year, the Treasury's cash difficulties reachedmajor proportions, culminating in a F.mk. 300 million credit facility from thecentral bank in December. In the absence of any major fiscal measures, andwith a continued rapid rise in incomes, private consumption also showed aconsiderable increase, contributing to a continuation of the trade deficit andthe drain on official reserves.
Despite the slow-down in economic activity, credit demand remainedstrong in 1966, partly reflecting the pressure of costs and the squeeze onprofits. Credit granted by all credit institutions increased by 1134 per cent, toF.mk. 12.1 milliard, while commercial-bank lending, which depended largelyon central-bank credit, went up by 14 per cent, to F.mk. 4.9 milliard. Tohelp curb this growth the Bank of Finland laid down quantitative restrictionson bank advances until the end of October, when such credits were toamount to no more than 115 per cent, of their end-1964 level. The centralbank also set new rediscounting quotas from the beginning of May, whichcould be exceeded by a maximum of 25 per cent, but only at steeply pro-gressive penalty rates. Because of the weakening foreign exchange position, stilltighter directives were issued at the end of October, giving banks certainlevels to which they had to reduce their rediscounts by January and June1967. The weekly average of rediscounts amounted to F.mk. 725 million in1966, i.e. F.mk. 150 million more than in 1965. Towards the end of the year,

in connection with the loan to the Treasury, a special cash reserve agreementwas concluded with the banks. Under this the banks make special depositswith the Bank of Finland depending on the growth of their deposits in 1967,the combined maximum being F.mk. 300 million.
Although the tight monetary policy helped reduce overall demand pres-sures in 1966, it was less effective against cost/price inflation. Consumerprices rose by nearly 5 per cent., wages went up about 9 per cent., and thebalance of payments recorded a deficit of about F.mk. 500 million. Conse-quently, monetary policy was reinforced by various fiscal measures in the1967 budget. Among other things, the purchase tax was raised from 10 to11 per cent, from the beginning of the year and the personal income andproperty taxes and the company tax were increased. These measures are, onthe one hand, designed to achieve equilibrium in the government financesand ; on the other, to restrict the growth of consumption and import demand.The relaxation in the international capital market may also make it easier toraise funds abroad. In the meantime Finland has been granted a F.mk. 300 mil-lion I M F stand-by credit to support the country's official reserve position.
Spain. Economic activity rose sharply once again in 1966, led by an18 per cent, expansion in industrial investment and a 21 per cent, advance inpublic-sector outlays. On the supply side, thanks to a better-than-averageagricultural year and a big increase in industrial production, the real nationalproduct went up by over 8 per cent. However, price and wage pressures werestrong, contributing to a further steep rise in imports.
Various new stabilisation measures were introduced in 1966. Early in theyear credit ceilings were imposed for the first time, setting the permissiblelimit for bank credit expansion to the private sector at 17 per cent, of theend-1965 level. In March the interest rates on secured advances from thecentral bank were increased by 1 per cent, to a range of 5-6 per cent. In thesecond half of 1966 the proportion of deposits that the banks must investin government securities was twice raised, each time by one percentage point,bringing it to 17 per cent. In October new legislation was passed restrictingpublic expenditure in 1966 and provisionally limiting public investment in1967 to the previous year's level. In addition, hire-purchase terms weretightened and measures taken to encourage savings and exports.
The credit institutions' lending to the private sector, including theirholdings of securities, increased by Pesetas 112 milliard, corresponding to theceiling of 17 per cent., whereas in 1965 the rise had been 24 per cent. Theexpansion of credit to the public sector, on the other hand, at Pesetas 47 mil-liard, came to 20 per cent., compared with 19 per cent, in 1965. The centraladministration, it may be observed, reduced its cash deficit from Pesetas 33.3 mil-liard in 1965 to Pesetas 30.6 milliard last year, but this improvement had itscounterpart mainly in a curtailment of new issues. Moreover, the measures tocontain public expenditure were taken too late in the year to affect materiallythe 1966 outcome. Under the influence of the external deficit, deposit forma-tion with the credit institutions increased by only Pesetas 106 milliard, or

— 77 —
13-6 per cent., as against 19.3 per cent, in 1965. Again in 1966, therefore,the banks' lending activity necessitated borrowing from the central bank, whichrose by nearly. Pesetas 23 milliard.
The restraint programme had a dampening influence on demand in thecourse of the year and this, combined with rising labour costs and fallingprofitability, led to a slower growth of investment. There was also a. decelera-tion in the price rise, and the increase in the cost of living, at 5.3 per cent.,was considerably less than the 9.4 per cent, recorded in 1965. None the less,the external situation and wage/price trends still give cause for concern,necessitating a continuation of the restraint policy. In March 1967 thepercentage of deposits which the banks must invest in government securitieswas increased to 18 per cent.
Japan. In overcoming the economy's first acute post-war recession, theauthorities brought to bear a strong combination of fiscal and monetarymeasures. In its special action of July 1965, and again in its budget for thefiscal year 1966-67, the government adopted a broad reflationary budgetprogramme, concentrating on public investment. The emerging deficit wasfinanced through bond issues, which were placed mainly with the banks andother financial institutions. In the monetary sphere, the Bank of Japanlowered its discount rate in three stages in the first half of 1965 from 6.57 to5.48 per cent., where it subsequently remained. In addition, with the wideningof the government bond market, the central bank also used open-marketoperations to create greater monetary ease.
In the first half of 1966 production turned buoyantly upwards under theinfluence of rising public expenditure and a faster growth in exports. Inthese circumstances the private sector's demand for credit did not gather forceuntil the second half of the year, by which time investment outlays hadaccelerated. Throughout most of the year, moreover, as credit abroad becamerelatively dearer, Japanese traders turned increasingly to domestic sources offunds, while granting more credit to their customers abroad. Towards the endof the year, as overseas rates declined and Japanese rates remained stable, thissituation began to reverse itself. A final factor associated with higher creditdemand was the slower growth of exports and continued rise in imports inlate 1966 and early 1967.
In 1966 total deposits with the commercial, postal savings and co-operative banks went up by Yen 4,830 milliard, or almost 17 per cent.,compared with 10 per cent, in 1965. At over Yen 4,650 milliard, theincrease in lending to the private sector came to 15 per cent., as against10 per cent, in 1965. Net lending to the public sector was Yen 910 milliard,compared with Yen 745 milliard in 1965. With monetary policy easy anddomestic money-market rates low, the banks also improved their net foreignposition by about Yen 150 milliard, through both an increase in foreign assetsand a reduction in foreign liabilities. Altogether, the liquidity supplied by theBank of Japan by means of advances and purchases of bills and securitiesamounted in 1966 to almost Yen 560 milliard, as against less than Yen 55 milliard

- 78 —
in 1965. For the most part, however, this went to offset the liquidity drainassociated with the growth of the currency circulation and an improvement inthe Treasury's account with the central bank.
Employed for the first time as a flexible policy instrument, the budgetfor the fiscal year 1966-67 made an important contribution to the economicupswing. General-account expenditure rose by over 20 per cent, to reachYen 4,477 milliard, while government bond flotations increased from Yen197 milliard in the year 1965-66, when this practice started, to Yen 730 mil-liard in 1966-67. Of this amount 11 per cent, was taken up by individualsand 89 per cent, by the banking system and other financial institutions.
In early 1967, as demand pressures became stronger, the policy problemchanged from counteracting recession to keeping the new expansion undercontrol. To moderate the business recovery, which was better than expected,the government curtailed its planned general-account expenditure for the fiscalyear 1967-68, which is now budgeted to rise by 15.9 per cent. The increasein the Treasury's investment and loan programmes is 17.8 per cent., thelowest for five years. Government bond issues are expected not to exceedYen 800 milliard.

79 —
II. W O R L D T R A D E A N D P A Y M E N T S .
The expansion of world trade, which had slowed down somewhat in 1965,accelerated slightly last year. World exports measured in current values rose by9.5 per cent., against 8.5 per cent, in the previous year. This fairly even rateof progress conceals two divergent movements — a rapid acceleration ofexports from Canada and western Europe to the United States, and a furtherdeceleration of intra-European trade growth, reflecting chiefly the effect of thelevelling-off of economic activity in Germany.
International trade.
Areas
Developed areasWestern Europe
EEC . . . .EFTAOther countries
Total for western Europe . . . .
United States . .
Other areas2
Total for developed areas . . .
Developing areas
Other areas
Total for developing areas . . .
Grand total4 . .
Exports
1964
42.624.54.6
71.7
26.68.16.75.5
118.6
9.924.1
34.0
152.6
1965 1966
in milliards
47.926.65.1
79.6
27.58.58.55.5
129.6
10.425.6
36.0
165.6
52.728.55.7
86.9
30.510.09.85.8
143.0
11.13
27.03
38.13
181.1
Imports
1964 1965
Df US dollars
45.130.77.5
83.3
20.37.67.96.6
125.7
8.626.6
35.2
160.9
49.132.28.9
90.2
23.28.78.27.5
137.8
8.828.4
37.2
175.0
1966
53.733.910.0
97.6
27.710.09.57.3
152.1
9.33
30.53
39.83
191.9
Changes involume of
exports19
imports66
in percentages
+ 8.0+ 5.3+ 9.1
+ 7.2
+ 14.1'+ 12.3+ 16.2+ 4.3
+ 8.1
+ 6.03
+ 5.03
+ 5.33
+ 7.8
+ 8.7+ 6.0+ 11.4
+ 7.7
+ 72.5+ 77.9— 6.3
+ 9.7
+ 5.3*+ 4.23
+ 4.53
+ 8.a
1 First half of 1965 to first half of 1966. 2 Australia, New Zealand and South Africa. 3 Preliminary.4 Represents roughly 90 per cent, of world trade, as the trade of centrally-planned economies is included onlyto the extent that it is reflected in the imports and exports of their partners in the West.
In the first quarter of 1966 world exports were 13 per cent, higher thanin the comparable period of 1965, when they were affected by a prolongedstrike in US ports. The rate of increase slackened in the second quarter anddropped to 7 per cent, in the fourth quarter.
As in 1965, the increase in the value of international trade was almostentirely due to an expansion in volume, unit values having risen by only1 per cent. In developed countries the volume of imports expanded morethan that of exports, viz. by nearly 10 as against 8 per cent. The reverse was

— 8o —
the case in developing countries, where exports rose by 5.5 per cent, andimports by 4.5 per cent. On an average, the terms of trade of the developedcountries remained unchanged last year and those of developing countriesdeteriorated marginally.
Export prices of primary commodities, which on a year-to-year com-parison had fallen in 1965, increased by 1 per cent, last year. Those ofcommodities from developing countries, which had been worst affected theprevious year, remained stable, while those of products from developedcountries went up by 2 per cent., largely because of higher quotations forcereals and wool. Export prices of non-ferrous base metals rose by 15 percent., owing entirely to the advance of copper prices. In the past three yearsprices of non-ferrous metals have gone up by 60 per cent., a trend which hasbenefited, inter alia, some developing countries, such as Chile, Malaysia andZambia.
As regards the more recent trend of world commodity prices, a risefrom mid-1965 to the first quarter of 1966 was followed by a substantialdecline in the next two quarters, which affected almost all commodities exceptcocoa and wheat. Prices levelled out towards the end of the year and re-mained steady in the first quarter of 1967, when they were some 5 per cent,down on the corresponding quarter of 1966.
In terms of value, the rates of expansion of trade among developedcountries were much higher last year in North America and Japan than inwestern Europe. US imports rose by nearly 20 per cent., partly as a resultof the war in Vietnam, and since exports increased only half as much thetrade surplus was reduced from $4.3 to 2.8 milliard. The counterpart of thegrowth in US imports was a substantial increase in western European,Canadian and Japanese exports, which went up by 25, 24 and 20 per cent,respectively in regard to the United States and by 9, 18 and 15.5 per cent.altogether. The EEC countries' imports and exports both increased byabout 9 per cent., whereas in the E F T A group exports went up by 7 percent, and imports by 5 per cent, (the latter figure mainly reflects the verymoderate rise in UK imports). Exports of the group comprising Australia,New Zealand and South Africa expanded by 8 per cent., while importsactually declined by 3 per cent., chiefly owing to a substantial fall in SouthAfrican imports. In the case of developing countries as a whole, imports seemto have expanded in line with exports.
Trade developments in the EEC countries reflected primarily changes inGerman trade. In 1965, when the German economy was buoyant, importsfrom its EEC partners shot up by 31 per cent., while exports to them roseby only 7 per cent., owing to shortage of productive capacity in Germanyand also to low demand in France and Italy. The opposite situation prevailedin 1966, when, owing to a slackening of domestic demand, German importsfrom the other EEC countries rose by only 4 per cent., whereas exports tothem expanded by 16 per cent., mainly in response to the recovery in Italyand France.

8i
Foreign trade.Uncentred moving averages of adjusted monthly figures, in milliards of US dollars.
0.24
0.21
0.18
0.15
AUSTRIA
ImportsImports
Exports
BELGIUM-0.80
-0.70
-0.50
I I I I I I I I I I I I I I II I I I I I I I I I I I I I I IQQ I I I I I I I I I I I I I I I I I I I I I I I I I I I I I I I Oi
FRANCEImports
1.20
1.05
0.90
0.75
1.75
1.50
GERMANYExports
'.72
ITALY-0.96
-0.84
-0.60
NETHERL/s
II I 1 l l , ,1 M
NDS
Imports
Exports
,. 1 . . !.. 1 i i
r~
i,
0.42
0.36
0.30
SWEDEN
Imports
SWITZERLAND
Imports-
0 24 I i i I i i 1 ' ' I i i I ' i I i i i i i I i i I i i I i i I I i i I i i I i i I i i I i i I i i I i i I M I i IQ2Q I i i I i i I ' i I i i I ' i I i i 1 ' i I i i I ' i I i
-0.25
UNITED KINGDOM
Exports
3.20
2.40
UNITED STATES
2.00 \\~I
CANADA-0.96
-Exports—1/'\. 84
-0.72
-0.60
J0.48
JAPAN
M i M ii , i ,
Exports /Sft?
</Imports
i i! i i
0.80
0.70
0.60
0.50
0.401.60
1.40
1.20
1.00
0.96
0.84
0.72
0.60
J 1965 1966 1967 1965 1966 1967 1965 1966 1967

— 82 —
The development of services.
One of the outstanding developments of the period since the end of thesecond world war has been the increasing economic interdependence of thevarious countries and areas of the world. This has found its expression notonly in the field of trade but also in that of invisible transactions, i.e.services and unilateral transfers.
Between 1955 and 1965 the aggregate invisible receipts of western Europe,North America and Japan went up from $22.4 to 49.0 milliard, or by119 per cent. Over the same period their aggregate invisible expenditures rosefrom $22.2 to 47.8 milliard, or by 116 per cent. As their exports andimports increased by 120 and 116 per cent, respectively, the share of invi-sibles in their current-account total declined a little.
Western Europe, North America and Japan:Balance of invisible transactions.
Areas
WesternEurope . . .
United States
Canada . . .
Japan . . . .
Years
195519601965195519601965195519601965195519601965
Transpor-tation'
Invest-ment
incomeTourism Remit-
tances2Govern-menttrans-
actions3
Other Total
in millions of US dollars
+ 450+ 850+ 1,300+ 200— 165- 275— 15— 95— 75— 160— 285— 550
+ 620+ 825+ 1,1 10+ 1,955+ 2,350+ 4,255- 330— 495— 705— 40— 35— 190
+ 570+ 1,275+ 1,925- 500— 855— 1,190— 120— 215- 30+ 5
—— 20
+ 210+ 410+ 510- 455— 485— 630— 70— 155
_4_5
55
+ 1,230— 390— 1,325— 4,835— 4,770— 4,465+ 40— 100
5+ 500+ 325+ 215
+ 805+ 870+ 550+ 395+ 850+ 1,680— 155— 235— 430— 30- 130- 425
+ 3,885+ 3,840+ 4,070— 3,240— 3,075— 625— 650— 1,295— 1,240+ 275— 125— 970
1 Including merchandise insurance. 2 Earnings of workers temporarily employed abroad and emigrants'remittances. 3 Services and transfers, both civilian and military. 4 Migrants' funds only; personal andinstitutional remittances included under "Other". 5 Not available separately; included under "Other".Note: Discrepancies between figures in the above table and those in western Europe's consolidated balanceand in the country tables are explained by differences in method. The above data are based for nearly all countrieson their transactions balance and they exclude processing and merchanting, which are considered to belongto trade, whereas in the other tables the cash balance had to be used in some cases and processing and merchant-ing transactions were counted as invisibles. As regards the United States the difference is due to the inclusionof government grants in the above table and their exclusion from services on page 88.
The break-down of invisible transactions by area shows a net surplusfor western Europe and net deficits for North America and Japan. In theperiod 1955-65 Europe's invisible surplus, to which all the main categories ofinvisible transactions except government expenditure contributed, was fairlystable at around $4 milliard a year. As regards North America, the UnitedStates' invisible deficit shrank from $3.2 to 0.6 milliard thanks to the dynamicgrowth of investment income, its only major invisible item to yield a surplus,whereas concurrently Canada's deficit rose from $0.7 to 1.2 milliard. Japan'sinvisible account has also deteriorated considerably in recent years, from asurplus of $0.3 milliard in 1955 to a deficit of just under $1 milliard tenyears later.

- 83 -
Among the five major categories of invisible transactions, transportationis still the most important one for the countries concerned, having accountedin 1965 for one-quarter of their combined receipts and expenditure. WesternEurope's net surplus on transport nearly trebled between 1955 and 1965, to$1.3 milliard. Amongst the traditionally sea-faring countries, Greece and thenorthern countries did best during this period. Their shipping tonnage morethan doubled and their net transportation receipts went up from $0.6 to1.4 milliard. In the case of the United Kingdom, the share of whose merchantfleet in the overall total declined from 20 to 14 per cent., the improvement— from a net deficit of $0.1 milliard in 1955 to a net surplus of the samesize in 1965 — was much less marked. The Netherlands' surplus on trans-portation increased over these ten years from $145 to 350 million, the volumeof goods loaded and unloaded at Dutch ports having doubled.
Western Europe, North America and Japan:Aggregate invisible transactions.
Items
Transportation1 . .Investment incomeTourismRemittances2 . . .Government3 . . .Other
Total . . . .
Foreign trade . . .
Services andtransfers as a per-centage of trade. .
Receipts
1955 1960 1965
Expenditure
1955 1960 1965
Balance
1955 1960 1965
in millions of US dollars6,5804,9252,780
5153,5504,075
22,425
53,725
42
8,8406,9405,0101,0753,2256,275
31,365
77,620
40
12,9001 1,5709,0752,0953,6009,765
49,005
118,1 10
41
6,1052,7202,825
8306,6153,060
22,155
53,700
41
8,5354,2954,8051,3058,1604,920
32,020
74,745
43
12,5007,1008,3902,2159,1758,390
47,770
1 15,885
41
+ 475+ 2,205— 45— 315—3,065+ 1,015
+ 270
+ 25
-
+ 305+ 2,645+ 205— 230—4,935+ 1,355
- 655
+ 2,875
-
+ 400+ 4,470+ 685— 120—5,575+ 1,375
+ 1,235
+ 2,225
-1 Including merchandise insurance. 2 Earnings of workers temporarily employed abroad and emigrants'remittances. 3 Services and transfers, both civilian and military.
In the case of the United States, the share of whose merchant fleet inthe world total has shrunk since the war from about 50 per cent, to only12 per cent., the transportation account has steadily deteriorated. The post-war surpluses came to an end in 1957, and in 1965 a deficit of $275 millionwas recorded. Japan's transportation account has been consistently unfavourabledespite a considerable increase in the size of the merchant fleet, with thenet deficit increasing from $160 million in 1955 to $550 million ten yearslater.
Total net investment income of western Europe, North America andJapan rose from $2.2 to 4.5 milliard between 1955 and 1965, most of theincrease occurring in the 1960s.
US net receipts went up from $2.0 to 4.3 milliard and those of westernEurope from Co.6 to 1.1 milliard, reflecting chiefly the rise in U K net income

_ 8 4 —
from $0.5 to 1.3 milliard. Other countries in Europe with a surplus ofreceipts over out-payments in 1965 were, in decreasing order, Switzerland, theNetherlands, France, Ireland, Sweden and the BLEU. Germany was the onlylarge European deficit country, with net out-payments totalling nearly$500 million in 1965. Outside Europe, Canada and Japan registered mountingnet out-payments.
The United States' gross income from its investments abroad went upbetween 1955 and 1965 from $2.4 to 5.9 milliard and its total assets from$45 to 106 milliard, whilst foreigners' income from investments in theUnited States grew from $0.5 to 1.6 milliard, their assets having risen from$30 to 59 milliard. About half of all foreign assets in the United States arein the form of short-term claims, compared with some 10-15 per cent, in thecase of US foreign assets abroad. U p to 1957 income from direct investmentaccounted for roughly 80 per cent, of total US investment income fromabroad. This proportion has since declined to about two-thirds, owing chieflyto the expansion of foreign borrowing in the United States in the form ofsecurity issues.
Western Europe, North America and Japan :Investment income.
Countries
Western EuropeAustriaBLEUDenmark . . . .FinlandFrance,Germany . . . .GreeceIcelandIrelandItalyNetherlands. . .NorwayPortugal . . . .SpainSwedenSwitzerland . . .TurkeyUnited Kingdom .
Total forwesternEurope . . .
CanadaUnited States . . .Japan
Receipts
1955 1960 1965
Expenditure
1955 1960 1965
Balance
1955 1960 1965
in millions of US dollars
5130105
15050
7025
1951010
30170
1,445
2,305
1602,445
15
201802510
19020010
8585
32020101045
215
1,905
3,330
1803,350
80
402454010
36533010
12020056040203085
320
2,770
5,185
2855,900
200
590201580
1955
4545
110255
10155010
960
1,685
49049055
251302015
110395
55
501 15215605
25205530
1,225
2,505
6751,000
115
652405055
280795205
652853601103065406045
1,505
4,075
9901,645
390
+ 40— 10— 10+ 70— 145— 5
+ 25— 20+ 85- 15+ 5— 10+ 15+ 120— 10+ 485
+ 620
— 330+ 1,955- 40
— 5+ 50+ 5— 5+ 80- 195+ 5— 5+ 35— 30+ 105— 40+ 5— 15+ 25+ 160— 30+ 680
+ 825
— 495+ 2,350— 35
— 25+ 5— 10— 45+ 85— 465— 10— 5+ 55— 85+ 200— 70- 10— 35+ 45+ 260— 45+ 1,265
+ 1,110
— 705+ 4,255— 190

- 85 -
Canada's investment-income deficit, which increased from $330 to 700 mil-lion over the period, is largely vis-à-vis the United States, which accountsfor about three-quarters of total foreign investment in the country.
The United Kingdom's foreign assets, which declined from $14 to8 milliard between 1938 and 1948, have since been reconstituted, despitecontrols on investment outside the sterling area. At the end of 1964 theUnited Kingdom had long-term foreign investments amounting to $28.7 mil-liard, against long-term foreign liabilities of $16.7 milliard. UK receipts frominterest and dividends doubled between 1955 and 1965 to $2.8 milliard. Onthe other hand, the corresponding out-payments went up from $1.0 to1.5 milliard. Net investment income is by far the biggest surplus item oninvisible account and during the period under review it has been about equalto the net deficit on government services and transfers.
In Switzerland net investment income, which ranks second after tourism,increased steadily during the period under review from $120 to 260 million.At the end of 1965 Switzerland's total foreign assets were estimated at$18.5 milliard and its total liabilities at $8.5 milliard. Its long-term assets andliabilities totalled. $10.7 and 4.5 milliard respectively, whilst the banks' foreignassets and liabilities stood at $4.3 and 3.9 milliard respectively.
In the Netherlands receipts and payments in respect of investmentincome roughly trebled between 1955 and 1965. Receipts went up from$195 to 560 million and payments from $110 to 360 million. In most yearsthere was a net capital outflow, security transactions being the most importantitem in the capital-account balance. Except in 1961, foreign purchases ofDutch securities exceeded purchases of foreign securities by Netherlandsresidents throughout the 1955-65 period.
Germany is the only country in western Europe with a large deficit inrespect of investment income, despite the fact that in nearly all the yearsunder review the net outflow of official capital exceeded the net inflow ofprivate capital. U p to 1961 the former consisted for the most part of contrac-tual repayments under the London Debt Agreement; later on, it representedloans and credits to developing countries, which amounted in the 1960s toabout $280 million a year. As yields on foreign investment in Germany weremuch higher than those on German official lending, net out-payments on thisitem increased from $145 million in 1955 to $465 million in 1965.
In recent years tourism has become one of western Europe's majorexport industries. Gross receipts from this service item rose during the periodunder review from $1.8 milliard to about $7 milliard. France, Italy and Spainaccounted for more than half of this rise, with increased receipts of $0.7, 1.1and 1.0 milliard respectively. In addition, gross tourist receipts of Austria andSwitzerland went up by about $0.5 milliard each during this period. GrossEuropean expenditure on foreign travel also rose sharply during the periodunder review, from $1.2 to 4.9 milliard. Two-thirds of the increase wasaccounted for by France, Germany and the United Kingdom, with increasesof $0.8, 1.2 and 0.5 milliard respectively.

— 86 —
Western Europe's net surplus on tourist account therefore rose from$0.6 milliard to nearly $2 milliard between 1955 and 1965. Italy and Spainboth had net surpluses of $1 milliard in 1965, and they were followed byAustria and Switzerland with $0.4 milliard each. Germany's tourist deficit inthat year amounted to $660 million, and those of Sweden and the UnitedKingdom to $115 and 270 million respectively.
US expenditure on and receipts from foreign travel both approximatelydoubled between 1955 and 1965, to stand at $2.4 and 1.2 milliard respectivelyin the latter year. The net deficit thus increased from $0.5 to 1.2 milliard.The Canadian deficit, on the other hand, owing mainly to increased receiptsfrom US visitors, narrowed from $120 to 30 million.
Remittances, covering earnings of workers temporarily employed abroadand emigrants' remittances, have grown with the increase of labour migrationboth within and to Europe. The peak number of foreign workers employed inEuropean countries is estimated to have risen from 2.5 to 5.4 million between1962 and 1965. The principal European employers of foreign labour in thelatter year were Germany with 1.1 million, France with 1 million, Switzerlandwith 800,000 and the United Kingdom with 700,000 workers. The mainsupplying countries were Italy with 1.5 million, Spain with 675,000 andIreland with 600,000 workers.
Western European countries' aggregate gross receipts from workers'remittances went up from $400 million in 1955 to $1,900 million in 1965 andtheir net receipts from $200 to 500 million. The aggregate gross receipts ofMediterranean European countries expanded during this period from $225 to1,430 million, those of Italy alone increasing from $125 to 800 million. In1965 the Mediterranean countries' net receipts from this source came to$1,350 million and were the next largest invisible-income item after tourism.
As Europe's economic recovery proceeded in the 1950s, its net receiptsfrom government transactions, representing chiefly US aid, diminished. How-ever, in 1955, owing to large-scale US payments to France to help finance thewar in Indo-China, overall net receipts amounted to $1.2 milliard. Thereafterthe balance on government transactions reflected chiefly the net UK deficit,which grew from less than $400 million in 1955 to about $1,250 millionin 1965. Germany's government transactions showed only a small surplus inmost years, large receipts from foreign military agencies having been nearlyoffset by German payments on reparations and indemnities. In 1965 receiptsand expenditure were practically balanced, at nearly $1,100 million in eachcase.
Outside Europe, the net outflow of US Government funds remainedvery large at between $4 and 5 milliard a year, about half of which repre-sented military expenditure, while in Japan the net inflow of official funds —mostly US military aid — declined from $500 million in 1955 to $200 millionin 1965.
- 8 7 -
Balances of payments.
United States. US balance-of-payments developments in 1966 weredominated by two factors: the escalation of the war in Vietnam and thedomestic investment boom. The former produced a $0.7 milliard rise in netoverseas military expenditure, whilst the latter was mixed in its effects. Onthe one hand, increasing strains on domestic resources led to a $1.1 milliarddecline in the trade surplus; on the other hand, the related tightening ofdomestic credit conditions contributed towards a $1.9 milliard reduction in thenet outflow of private capital. The improvement in the capital account, whichalso owed something to the voluntary restraint programme, as well as tospecial conversions of certain foreign official dollar holdings from liquid tonon-liquid form, practically offset the deterioration on current account, so thatthe deficit, measured on the liquidity basis, only edged up from $1.3 to1.4 milliard. On the official-settlements basis, however, there was a shift froma deficit of $1.3 milliard to a surplus of $0.2 milliard, owing mainly to the$2.7 milliard increase in liquid liabilities to foreign commercial banks.
The narrowing of the trade surplus from $4.8 to 3.7 milliard was theresult not of a slow-down in exports but of the exceptional strength ofimports. After a 15 per cent, increase in 1965, they went up by a further19 per cent, last year to a level more than 75 per cent, above their 1961cyclical low. The pressure of domestic demand was most clearly reflected inthe increase in imports of manufactured goods. Imports of consumer goodsother than food and beverages, after a $0.7 milliard rise in 1965, went up by$1.3 milliard, or 30 per cent., in 1966. The predominant item here wasmotor-cars, imports of which — mainly from Canada and Germany —practically doubled, from $670 to 1,245 million. Imports of capital equipment,which had gone up by $450 million in 1965, rose further by $1 milliard, or60 per cent. And purchases of industrial materials, which expanded at aboutthe same pace as industrial production, showed a rise of $1.1 milliard.
The growth of commercial exports, despite increasing capacity strains,accelerated from 3 to 11 per cent, (on a Bureau of Census basis). Part of thehigher growth rate may be explained by the 1965 dock strike. There was a re-covery of agricultural exports following their decline in 1965, but the rate ofgrowth of non-agricultural exports also quickened, from 5 to 10 per cent.Exports of machine tools, however, for which domestic demand was particularlystrong, declined.
With regard to the geographical distribution of exports, the greatestincreases were in those to Canada ( + 2 0 per cent.) and Japan ( + 1 4 per cent.);together, these two countries accounted for about half of the $2.7 milliardexpansion of US exports. Sales to western European countries, on the otherhand, went up by 8 per cent.
The recent slackening of the pace of US economic activity has alreadybegun to show through in the trade accounts. The increase in imports beganto slow down in the fourth quarter of last year and continued to in the first
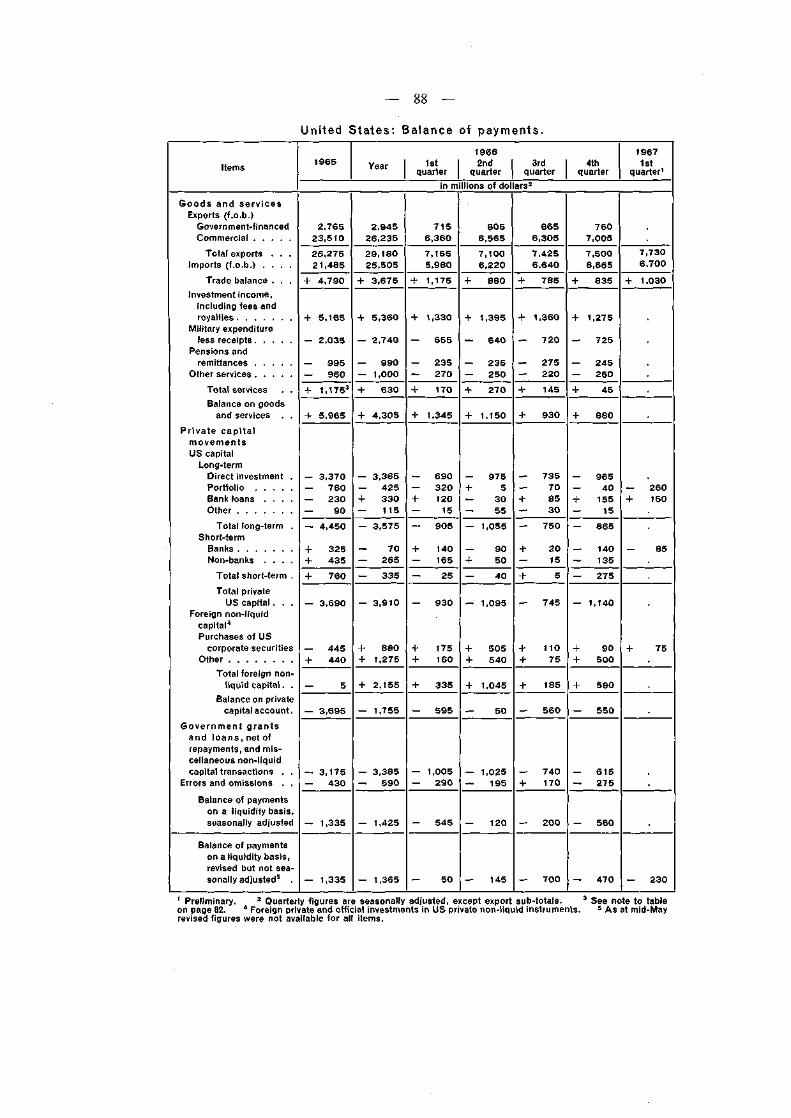
Goods and servicesExports (f.o.b.)
Government-financedCommercial
Total exports . . .Imports (f.o.b.) . . . .
Trade balance . . .Investment income,
including fees and
Military expenditure
Pensions and
Other servicesTotal services . .Balance on goods
and services . .Private capital
movementsUS capital
Long-termDirect investment .PortfolioBank loans . . . .Other
Total long-term .Short-term
Non-banks . . . .Total short-term .Total private
US capital. . .Foreign non-liquid
capital4Purchases of US
corporate securitiesOther
Total foreign non-liquid capital. .
Balance on privatecapital account.
Government grantsand loans, net ofrepayments, and mis-cellaneous non-liquidcapital transactions . .
Errors and omissions . .Balance of payments
on a liquidity basis,seasonally adjusted
Balance of paymentson a liquidity basis,revised but not sea-sonally adjusted5 .
United States: Balance
1965 Year 1stquarter
of payments.19662nd
quarter3rd
quarter4th
quarter
19671st
quarter1in millions of dollars2
2,76523,51026,27521,485
+ 4,790
+ 5,165
2,035
— 995— 960+ 1.1753
+ 5,965
— 3,370- 760— 230— 90— 4,450
+ 325+ 435+ 760
— 3,690
— 445+ 440
— 5
— 3,695
- 3,175— 430
— 1,335
— 1,335
2,94526,23529,18025,505
+ 3,675
+ 5,360
— 2,740
— 990- 1,000+ 630
+ 4,305
— 3,365— 425+ 330- 115- 3,575
— 70— 265— 335
- 3,910
+ 880+ 1,275
+ 2,155
— 1,755
— 3,385— 590
— 1,425
— 1,365
7156,3607,1555,980
+ 1,175
+ 1,330
— 655
— 235— 270+ 170
+ 1,345
— 690— 320+ 120— 15— 905
+ 140— 165— 25
- 930
+ 175+ 160
+ 335
— 595
— 1,005— 290
— 545
— 50
8056,5657,1006,220
+ 880
+ 1,395
— 640
— 235— 250+ 270
+ 1,150
— 975+ 5— 30— 55— 1,055
— 90+ 50— 40
— 1,095
+ 505+ 540
+ 1,045
— 50
- 1,025— 195
— 120
— 145
6656,3057,4256,640
+ 785
+ 1,360
— 720
— 275— 220+ 145
+ 930
— 735- 70+ 85— 30— 750
+ 20- 15+ 5
.— 745
+ 1 10+ 75
+ 185
— 560
— 740+ 170
— 200
— 700
7607,0057,5006,665
+ 835
+ 1,275
— 725
— 245— 260+ 45
+ 880
— 965- 40+ 155— 15— 865
— 140— 135— 275
— 1,140
+ 90+ 500
+ 590
— 550
— 615— 275
— 560
— 470
7,7306,700
+ 1,030
— 260+ 150
— 85
+ 75
— 2301 Preliminary. 2 Quarterly figures are seasonally adjusted, except export sub-totals. 3 See note to tableon page 82. " Foreign private and official investments in US private non-liquid instruments. 5 As at mid-Mayrevised figures were not available for all items.

— 89 —
quarter of 1967, when, owing also to a marked rise in exports, the tradesurplus went up to over $1 milliard.
The other principal deterioration in the balance of payments was theincrease from $2.0 to 2.7 milliard in net military expenditure. This wasentirely due to the war in Vietnam. As far as the other main items of thecurrent-account balance are concerned, net receipts from interest and dividends(including fees and royalties) continued to expand, although considerably lessfast than in preceding years. Between i960 and 1965 the yearly increase hadaveraged $480 million, while in 1966 it amounted to only $195 million.Income from direct investment, which had gone up by $290 million in 1965,showed hardly any increase. The balance on other service items (includingprivate remittances) showed virtually no change, both receipts and expendituresrising by about $0.5 milliard. The current-account surplus therefore declinedby $1.7 to 4.3 milliard.
The deficit on private capital account, which had already receded fromits peak level of $6.3 milliard in 1964 to $3.7 milliard in 1965, narrowedfurther to $1.75 milliard. The pattern of development, however, was quitedifferent in 1966 from the previous year. In 1965 the balance on short-termcapital movements improved by $2.9 milliard, while the long-term capitaloutflow increased by $0.3 milliard; in 1966, in contrast, the short-term capitalaccount deteriorated from a $0.9 milliard surplus to a $0.1 milliard deficit,while the long-term capital outflow was reduced from $4.6 to 1.7 milliard.Moreover, whereas in 1965, owing to the voluntary restraint programme, thesmaller capital-account deficit had been the result of a decline in the netoutflow of US capital, in 1966 it was almost wholly due to an increase in thenet inflow of foreign capital.
Net exports of private US capital, which had declined from $6.5 to3.7 milliard in 1965, edged up to $3.9 milliard. Direct investment, afterincreasing to $3.4 milliard in 1965, remained at this high level last year.Investment in continental western Europe and in Canada rose by $210 and175 million respectively, but investment in Asian and African countries(excluding Japan and South Africa) was reduced by $300 to 250 million.
Net new foreign issues on the US capital market fell from $1.0 to0.7 milliard last year, mostly owing to larger redemptions. In addition, USresidents continued, under the influence of the interest equalisation tax, todraw down their foreign security portfolios, net sales amounting to $275 mil-lion — $50 million more than in 1965. In the banking sector, US longer-term claims fell by $330 million while short-term loans expanded by $70 mil-lion, so that total bank loans to foreigners were reduced by $260 million andat the end of the year stood $865 million below the ceiling set under thevoluntary restraint programme. On the other hand, the foreign short-termclaims of non-bank US residents, after a $435 million decline in 1965, wentup by $265 million. Deposits in the Euro-dollar market of funds raised byUS corporations in the European capital market seem to have been the maincause of this increase.

— go —
The net flow of foreign non-liquid capital to the United States expandedfrom zero in 1965 to about $2.2 milliard. Over half of this increase wasaccounted for by foreign holdings of US securities (other than those issued bythe Treasury), which, following a decline of $445 million in 1965 when theU K Treasury was liquidating its dollar security portfolio, rose by $880 million.A major part of the increase in 1966 came from foreign purchases of securitiesissued by US corporations in the European capital markets. In addition, therewere substantial foreign official purchases of US Government agency securities.
Foreign long-term claims on US banks, which had already gone up by$205 million in 1965, advanced by a further $930 million. Virtually the wholeof this increase took the form of long-term time deposits and purchases oflong-term certificates of deposit by Asian and Latin American countries andinternational institutions.
Despite an increase from $220 to 430 million in advance debt payments,net government grants and loans (including miscellaneous non-liquid capitaltransactions) rose a little from $3.2 to 3.4 milliard. Grants increased by justover $100 million and there was a rise of almost $250 million in officialholdings of foreign currencies not included in the reserves.
Canada. Despite an increase in the level of domestic economic activity,Canada's export surplus, including non-monetary gold, increased in 1966 from$235 to 465 million. Furthermore, net capital inflows were $315 million higherthan in 1965, so that the overall balance of payments shifted from a deficitof $260 million to a surplus of $145 million.
Exports, on a balance-of-payments basis, rose by $1,400 million, or17 per cent. Sales to the United States, which account for three-fifths of thetotal, went up by 24 per cent. Half of this increase was accounted for by arise from $340 to 900 million in deliveries of motor-cars, trucks and spareparts, which, under the 1965 US-Canadian automotive agreement, are duty-freein either direction. There was a small decline in exports to the UnitedKingdom, but sales to all other countries increased by $300 million, or 13 percent. More than two-thirds of this was accounted for by larger shipments ofwheat and flour, in particular to the USSR and India.
For the third year in succession Canadian imports rose by 14.5 per cent.Purchases of goods subject to the US-Canadian automotive agreement wentup by 41 per cent, and other imports by 10.5 per cent. — about the samerise as in 1965.
Owing mainly to larger interest and dividend payments, the deficit onservices account increased by $140 million. This item was also affected by anincrease in Canadian Government aid, predominantly for the financing of thewheat shipments to India.
The net inflow of long-term capital, at $880 million, was the largestsince 1959 and $220 million above the level of the previous year. Net directinvestment in fact went up by $360 million. Foreign direct investment in

Canada: Balance of payments.
Items
Merchandise trade (f.o.b.)Exports
Trade balance
ServicesInvestment incomeOther
Total
Current balance
Long-term capitalNet new Canadian issues abroad .Transactions in outstanding
Canadian securitiesTransactions in foreign securities .Direct investmentOther
Total
Balance on current andlong-term capital account. .
Total balance (= changesin monetary items)
1965
8,2157,980
+ 235
— 705— 530
— 1,235
— 1,000
+ 765
— 185— 80+ 260— 100
+ 660
— 340+ 80
— 260
Year
9,6159,150
+ 465
— 815— 560
— 1,375
— 910
+ 875
— 215— 330+ 620— 70
+ 880
— 30+ 175
+ 145
1stquarter
in millions
2,3402,205
+ 135
- 185— 140
— 325
— 190
+ 435
— 20— 65+ 95- 30
+ 415
+ 225— 215
+ 10
19662nd
quarter3rd
quarterDf US dollars1
2,3352,240
+ 95
— 190— 120
— 310
— 215
+ 190
— 60— 85+ 140+ 15
+ 200
— 15— 105
— 120
2,4502,310
+ 140
— 210— 165
— 375
— 235
+ 185
— 80— 105+ 220— 40
+ 180
— 55+ 250
+ 195
4thquarter
2,4902,395
+ 95
— 230— 135— 365
— 270
+ 65
— 55— 75+ 165— 15
+ 85
— 185+ 245
+ 60
1 Quarterly data in the current balance are seasonally adjusted. 2 Including the balancing item.
Canada rose very sharply, from $375 to 610 million, mostly coming from theUnited States. In addition, for the first time since 1950 there was on balanceno direct Canadian investment abroad, owing to the sale by a Canadianpetroleum company of its foreign subsidiary.
Net new issues of Canadian securities abroad also increased, from $765to 875 million. Half of the inflow from this item occurred in the first quarterof the year on account of the transfer, which had been deferred from theprevious quarter, of the proceeds of large Canadian issues placed in theNew York market in late 1965. On the other hand, net Canadian purchasesof foreign, mostly US, securities rose from $80 to 330 million, while netshort-term inflows of capital, excluding Canadian bank funds, went up from$80 to 175 million and thus also contributed to the turn-round in the balanceof payments.
Western European countries. The combined current-account deficit ofwestern European countries was reduced from $1.3 milliard in 1965 to$0.7 milliard last year. The surplus of the EEC countries increased from$0.8 to 1.3 milliard, while the deficit of the E F T A countries was reducedfrom $1.1 to 0.8 milliard.

W e s t e r n E u r o p e a n c o u n t r i e s : B a l a n c e s o f p a y m e n t s .
Countries YearsTradebalance(f.o.b.) Services' Current
balanceNet capital movements
(inflow +)2
Long-term I Short-term
Overallbalance3
in millions of US dollars
Belgium-Luxemburg. . .
France / . .
Germany
Italy
Netherlands
Total EEC . . . .
Austria
Denmark
Norway
Portugal
Sweden
Switzerland
United Kingdom . . . .
Total EFTA . . .
Finland
Greece
Iceland
Ireland
Spain
Turkey
Total "Other" . .
Grand total. . . .
19651966
19651966
19651966
19651966
19651966
19651966
19651966
19651966
19651966
19651966
19651966
19651966
19651966
19651966
19651966
19651966
19651966
19651966
19651966
19651966
19651966
19651966
— 90— 350+ 390— 45
+ 1,275+ 2,915
— 475'— 995'
— 670— 605
430920
— 525"— 6706
— 285— 265
— 780*— 850*
— 295— 325
— 4056
— 3006
— 710'— 6506
— 755— 385
— 3,755— 3,445
— 225*— 230'— 700'— 725'
+ 5— 10
— 415'— 365*
— 1,670— 2,000
— 115°— 235*
— 3,120— 3,565
• 6,445• 6,090
2402S0
13080
— 2,795— 2,810+ 2,110+ 2,380
650515
335415
490480
175205
670685
170300
+ 105+ 65
+ 640+ 730
+ 450+ 215
+ 2,700+ 2,680
3525
435490
00
+ 300+ 320+ 1,280+ 1,420
+ 40+ 65
+ 2,090+ 2,320
+ 5,125'+ 5,415
+ 150— 100
52035
— 1,520+ 105
+ 1,635+ 1,385
— 20— 90
+ 765+ 1,335
— 35— 190— 1 10— 60
— 110— 165
— 125— 25
— 300— 235
— 70+ 80
— 305— 170
— 1,055— 765
— 190— 205— 265— 235
+ 5— 10
— 1 15— 45
— 390— 580
— 75— 170
— 1,030— 1,245
— 1,320- 675
50 — 65— 10
3305.2955
11010
+ 205— 250*
— 45— 8051*
— 45+ 55
+ 1,035+ 595
— 15— 20
+ 65— 5
275 + 1,350— 135
— 55- 30
35155
13090
200135651 10
70351457
307
+ 325+ 330+ 130- 95
— 670— 360
28030
+ 655+ 430
3550
205220
+ 10
+ 65+ 120
195360
7010
3040
9015
+ 100+ 135
790960
+ 3,070+ 1,255
+ 135- 110
960340
— 280+ 450+ 1,575+ 560
— 40
+ 2,390+ 1,200
— 55- 65
2030
1605
851 15
2595
+ 608
— 15"
— 695— 500
— 400- 335
— 85— 145— 30+ 25
— 50+ 75— 1058
— 205"
+ 258
— 35"
— 240- 285
+ 1,750+ 580
1 Including unilateral transfers. 2 Calculated as the difference between the current balance and the overallbalance. Long-term capital movements are shown separately where possible. Total figures or figures for short-term capital movements include errors and omissions. 3 Equal to changes in net official assets and the netforeign position of commercial banks. " Including official debt prepayments. 5 Including the balance ofFrench overseas territories vis-à-vis the non-franc area. ' Imports c.i.f. 7 Including the balance of Portugueseoverseas territories vis-à-vis the non-escudo area. 8 Net official assets only. ' See note to table on page 82.
— 93 —
The outstanding change in 1966 was a turn-round in the Germanbalance from a deficit of $1.5 milliard to a surplus of $0.1 milliard, entirelyowing to a rise in the export surplus. The current balances of other EECcountries deteriorated, as there was a decline in the French and Italiansurpluses, a shift from surplus to deficit in the case of Belgium and a rise inthe Netherlands' deficit. With the exception of Austria and Norway, thecurrent-account balances of all E F T A countries improved.
The combined deficit of the six countries outside the EEC and E F T Agroups increased by over $200 million, chiefly owing to larger deficits in Spainand Turkey.
United Kingdom. Owing largely to the measures taken in July 1966, thebalance-of-payments deficit on current and long-term capital account wasagain substantially reduced, from $975 to 530 million. If account is taken ofthe effect of the resumption of service on the post-war North Americanloans, the real improvement in the basic position was of the order of $625 mil-lion. Both the merchandise and long-term capital accounts contributedsubstantially to the improvement, the trade deficit declining by $370 millionand the net capital outflow by $310 million. On the other hand, net receiptsfrom services fell by $235 million. As the surplus on the balancing item wasalso sharply reduced, the overall deficit declined only from $695 to 500 mil-lion. Despite some deterioration of the trade balance, the overall balanceprobably continued in surplus in the first quarter of 1967.
Exports, on a trade-account basis, went up by 6.5 per cent., comparedwith 7 per cent, in 1965. Much of the 1966 rise was attributable to a 25 percent, increase in sales to the United States, which followed almost as large again in the previous year. Exports to E F T A countries rose by 11 per cent,and those to EEC countries by 5.5 per cent., assisted by an impressive revivalin sales to Italy and France. Exports to eastern Europe and the USSRcontinued their rapid growth, whereas those to the sterling area (excludingRhodesia), which had risen by 7 per cent, in 1965, fell by 1.5 per cent.
Imports increased by 3.5 per cent., compared with only 1 per cent, in1965 ; 1 per cent, of the rise represented higher prices and 2.5 per cent, agrowth in volume. Despite the continuation of the import surcharge untilalmost the end of the year, imports in categories largely subject to it, i.e. allexcept food, fuels and basic materials, went up by 9.5 per cent, in 1966,whilst food imports remained at their 1965 level and those of basic materialsfell by 4 per cent. Imports of capital goods were up by 13 per cent, (machineryimports by 17 per cent.), whereas those of consumer goods increased by11 per cent. Imports of semi-manufactured goods rose by 8 per cent. — toa large extent reflecting the higher copper price, although in volume copperimports declined.
The trade balance improved considerably during the course of theyear, from a deficit of $505 million in the first half to a surplus of $120 mil-lion in the second half. To some extent this reflected two special factors: the
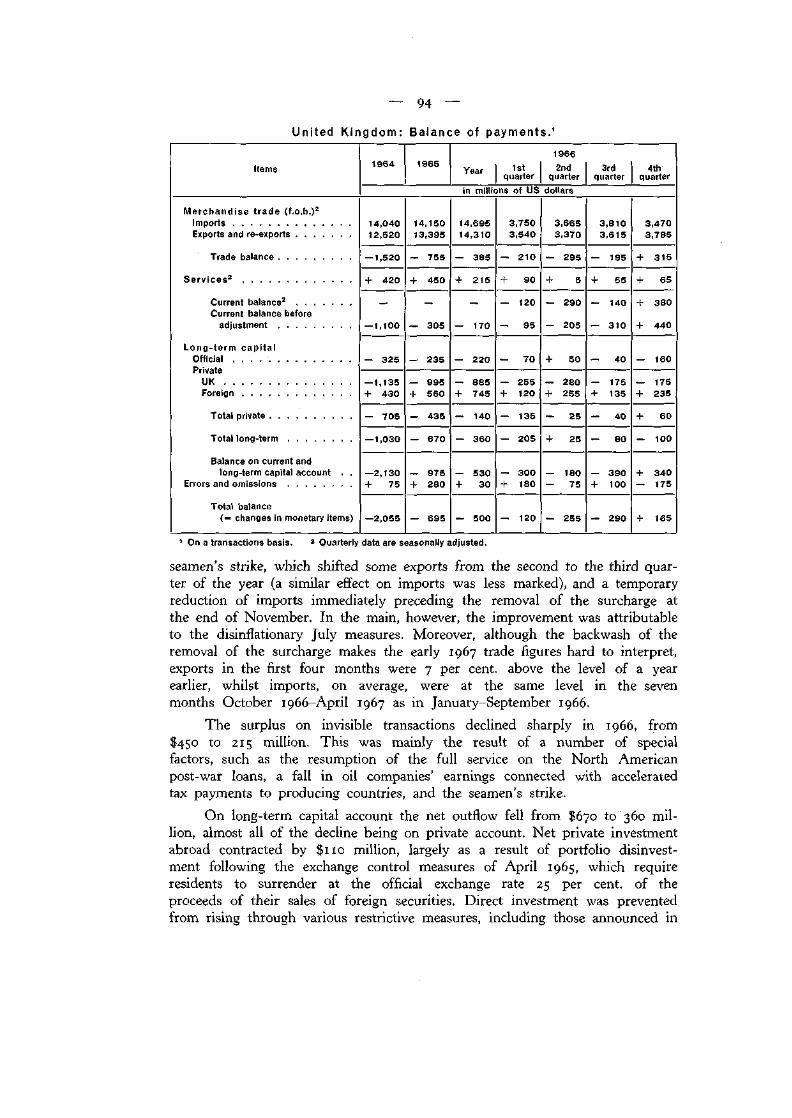
94 —
United Kingdom:
Items
Merchandise trade (f.o.b.)2ImportsExports and re-exports
Trade balance
Services2
Current balance2
Current balance beforeadjustment
Long-term capitalOfficial . . .Private
UKForeign
Total private
Balance on current andlong-term capital account . .
Errors and omissions
Total balance(= changes in monetary items)
1964
14,04012,520
— 1,520
+ 420
-1,100
- 325
— 1,135+ 430
- 705
— 1,030
—2,130+ 75
—2,055
Balance of payments.1
1965
14,15013,395
— 755
+ 450
— 305
- 235
— 995+ 560
- 435
— 670
— 975+ 280
— 695
Year 1stquarter
in millions of US
14,69514,310
- 385
+ 215
— 170
— 220
— 885+ 745- 140
— 360
- 530+ 30
— 500
3,7503,540
— 210
+ 90
— 120
— 95
— 70
— 255+ 120
— 135
- 205
— 300+ 180
- 120
19662nd
quarterdollars
3,6653,370
- 295
+ 5
- 290
— 205
+ 50
— 280+ 255
- 25
+ 25
— 180— 75
- 255
3rdquarter
3,8103,615
— 195
+ 55
— 140
— 310
— 40
— 175+ 135- 40
— 80
— 390+ 100
- 290
4thquarter
3,4703,785
+ 315
+ 65
+ 380
+ 440
— 160
— 175+ 235
+ 60
— 100
+ 340— 175
+ 165
1 On a transactions basis. 2 Quarterly data are seasonally adjusted.
seamen's strike, which shifted some exports from the second to the third quar-ter of the year (a similar effect on imports was less marked), and a temporaryreduction of imports immediately preceding the removal of the surcharge atthe end of November. In the main, however, the improvement was attributableto the disinflationary July measures. Moreover, although the backwash of theremoval of the surcharge makes the early 1967 trade figures hard to interpret,exports in the first four months were 7 per cent, above the level of a yearearlier, whilst imports, on average, were at the same level in the sevenmonths October 1966-April 1967 as in January-September 1966.
The surplus on invisible transactions declined sharply in 1966, from$450 to 215 million. This was mainly the result of a number of specialfactors, such as the resumption of the full service on the North Americanpost-war loans, a fall in oil companies' earnings connected with acceleratedtax payments to producing countries, and the seamen's strike.
On long-term capital account the net outflow fell from $670 to 360 mil-lion, almost all of the decline being on private account. Net private investmentabroad contracted by $110 million, largely as a result of portfolio disinvest-ment following the exchange control measures of April 1965, which requireresidents to surrender at the official exchange rate 25 per cent, of theproceeds of their sales of foreign securities. Direct investment was preventedfrom rising through various restrictive measures, including those announced in

— 95 —
May 1966 concerning outflows to the developed countries of the sterling area.There was also a fall in overseas investment by oil companies,
The net inflow of foreign private capital into the United Kingdom, onthe other hand, rose by $185 million to a total of $745 million. Directinvestment increased by nearly $100 million, reflecting several large transac-tions involving the acquisition of a majority interest in UK companies by USconcerns. There was also an increase in investments by foreign oil companies,including outlays by companies prospecting for natural gas in the North Sea.Overseas holdings of U K securities again contracted, with net disinvestment,at $145 million, $10 million higher than in the previous year.
At $220 million, the net outflow of official capital was somewhat smallerthan in 1965. Loans granted by the United Kingdom, at $265 million, were$55 million up, more than offsetting the decline in government economicgrants to developing countries entered on current account. Some $145 millionwas drawn during the year from the Export-Import Bank to pay for USmilitary aircraft and missiles, and these drawings brought the official capitalaccount into net surplus in the second quarter; in the fourth quarter, on theother hand, payment of the first full instalments since 1963 on the NorthAmerican loans contributed to a net outflow of $160 million.
The balancing item, representing partly time-lags between the recordingof transactions in the balance of payments and the settling of accounts, whichhad been positive to the extent of $280 million in 1965 and had averaged$175 million in the period 1958-65, fell to $30 million last year. The declinewas accounted for entirely by an exceptionally large negative figure in thefourth quarter, when the removal of the import surcharge meant that for atime arrivals of goods from abroad lagged behind payments for imports.
Germany. The main feature of Germany's balance of payments in 1966was the continued improvement in the trade balance, which had begun in thelast quarter of 1965 and which brought the trade surplus for the year up tojust on $2 milliard, compared with a figure of $300 million in 1965. Therewas a partly offsetting movement of I450 million in the long-term capitalaccount, nearly half of which was due to a debt prepayment to the UnitedStates of $195 million. The basic balance of payments therefore improvedfrom a deficit of $1,315 million in 1965 to one of only $145 million in 1966,or to a surplus of $50 million if the debt prepayment is excluded. The tradesurplus continued to expand in the first quarter of 1967, in which it amountedto $1,080 million, the highest quarterly figure ever attained. As other itemsof the balance of payments showed a net deficit of $160 million, there wasan overall surplus of $920 million.
Most of the improvement in the trade balance resulted from the factthat imports rose by only $0.5 milliard, or 3 per cent., compared with anincrease of nearly $3 milliard in 1965. In the first half of 1966 imports were8 per cent, higher than in the corresponding period of 1965, while in thesecond half they fell slightly below the corresponding 1965 level. Three

Items
Merchandise tradeExports (f.o.b.)Imports (c.i.f.)
Trade balance . . .ServicesUnilateral transfers .
Current balance . .
Long-term capitalNet German investment
abroadNet foreign investment
in Germany
Total private . . . .Official
Total
Balance on currentand long-term . . . .capital account....
Short-term capitalPrivateOfficial
TotalErrors and omissions . .
Total balance (= changesin monetary items) . .
Germany: Balance of
1965 Year 1stquarter
payments.'
19662nd
quarter3rd
quarter4th
quarter
19671st
quarterin millions of US dollars
17,91017,610
+ 300— 355- 1,465
— 1,520
— 480
+ 1,005
+ 525- 320
+ 205
— 1,315
+ 205+ 350
+ 555+ 480
- 280
20,15518,165
+ 1,990— 410-1,475
+ 105
— 610
+ 980
+ 370- 6202
— 250
— 145
+ 425— 35
+ 390+ 205
+ 450
4,7404,530
+ 210— 75— 385
— 250
— 160
+ 295
+ 135— 85
+ 50
— 200
+ 125— 40
+ • 85+ 175
+ 60
4,9054,560
+ 345— 120— 350
- 125
- 230
+ 350
+ 120- 150
- 30
- 155
+ 100+ 1 15
+ 215+ 100
+ 160
4,9704,405
+ 565— 190— 335
+ 40
— 100
+ 190
+ 90- 85
+ 5
+ 45
+ 200
+ 200+ 55
+ 300
5,5404,670
+ 870— 25— 405
+ 440
— 120
+ 145
+ 25— 3002
— 275
+ 165
— 1 10
— 1 10— 125
— 70
5,1904,110
+ 1,080— 40- 320
+ 720
— 190
+ 115
— 75— 50
— 125
+ 595
+ 155— 25
+ 130+ 195
+ 920
1 On a transactions basis. 2 Including a debt prepayment of $195 million to the United States.
main factors contributed to this development. First and foremost was theslackening of domestic demand, which mainly affected imports of manufacturedgoods for civilian use. These had expanded by 29 per cent, in 1965, and by24 per cent, in the first quarter of 1966. Thereafter the rate of increaseslowed down to 13 and 5 per cent, respectively in the second and thirdquarters of the year, whilst in the fourth quarter there was a decline of 2 percent, compared with the corresponding period of 1965. Secondly, gooddomestic crops reduced the increase in food imports from 20 to 3.5 per cent.;and thirdly, imports of defence equipment fell by about one-third.
Exports rose during 1966 to $20.2 milliard, or by 12.5 per cent.,compared with a 10.5 per cent, rise in the previous year. This was mainly inresponse to strong demand in France, Italy and the United States. Sales tothese countries, which account for about one-quarter of total exports, went upby i8, 26 and 25 per cent, respectively. The expansion of exports quickenedin the second half of the year, with a strong upward trend in sales ofmachinery and motor-cars.

— 97 —
As regards the area pattern of the trade balance, the net positionvis-à-vis other EEC countries turned from a deficit of $360 million to asurplus of $380 million, whilst the deficit with regard to North America wasreduced from $900 to 500 million and the surplus vis-à-vis all other countriesrose from $1.6 to 2.1 milliard.
The deficit on services account (excluding freight and insurance onimports, which are included in the trade balance) rose from $355 to 410 mil-lion. Net expenditure on foreign travel showed a further increase of $160 mil-lion and expenditure on "miscellaneous services" went up by $185 million,over 25 per cent, of which represented higher spending for the promotion ofexports. On the other hand, net receipts from foreign troops stationed inGermany were $200 million higher than in 1965.
On long-term capital account there were marked changes in 1966 bothin the private and the official sector. In the private sector, net Germaninvestment abroad rose from $480 to 610 million, chiefly through an increasein portfolio investment. In particular, what has come to be known as theTexaco transaction, i.e. the conversion of $180 million's worth of shares in aGerman oil company into convertible bonds of a US subsidiary company, showedup in this item of the balance of payments as an increase in German portfolioinvestment abroad. This transaction did not, however, have any net effect on theoverall long-term capital account, since the sale of the shares in the German oilcompany was recorded as direct foreign investment in Germany. Despite this, netnew foreign investment in the Federal Republic was lower in 1966, so that thetotal inflow of private long-term capital was reduced from $525 to 370 million.
At the same time the net outflow of official long-term capital rose consid-erably in 1966, from $320 to 620 million. Most of this is accounted for by the$195 million debt prepayment to the US Government in December 1966. Takingthe private and official sectors together, the long-term capital account showedan outflow of $250 million, or $55 million excluding the debt prepayment.
In the short-term capital account, official transactions recorded an outflowof $35 million, compared with an inflow of $350 million the year before. Thischange was mainly the result of the fact that in 1966 advance payments fordefence equipment exceeded actual deliveries. In the private sector, on theother hand, increased short-term borrowing by German enterprises (which,however, ceased in the fourth quarter) raised the inflow from $205 to425 million. Finally, the slackening of imports, coupled with the faster rise ofexports, reduced the positive balancing item from $480 to 205 million. Theoverall balance of payments therefore showed a surplus of $450 million,compared with a deficit of $280 million the year before.
Italy. A rising trade deficit, together with a record outflow of capital,reduced the Italian external surplus from $1.6 milliard in 1965 to $0.6 milliard.The deficits on trade and capital account increased by $0.5 and 0.8 milliardrespectively, but at the same time there was a further growth of $0.3 milliardin net service receipts.
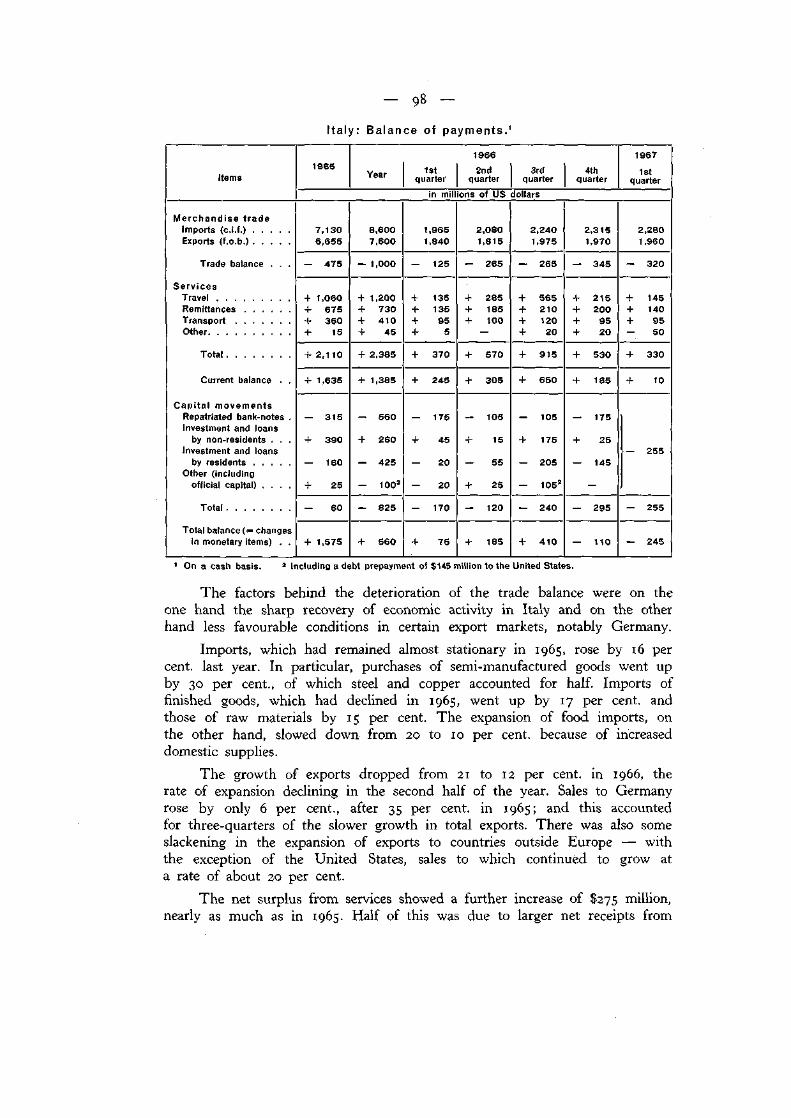
Italy: Balance of payments.1
Items
Merchandise trade
Exports (f.o.b.)
Trade balance . . .
ServicesTravelRemittancesTransportOther
Total
Current balance . .
Capital movementsRepatriated bank-notes .Investment and loans
by non-residents . . .Investment and loans
by residentsOther (including
official capital) . . . .
Total
Total balance (= changesin monetary items) . .
1965Year 1st
quarter
19662nd
quarter3rd
quarter4th
quarter
19671st
quarterin millions of US dollars
7,1306,655
— 475
+ 1,060+ 675+ 360+ 15
+ 2,110
+ 1,635
— 315
+ 390
— 160
+ 25
- 60
+ 1,575
8,6007,600
— 1,000
+ 1,200+ 730+ 410+ 45
+ 2,385
+ 1,385
— 560
+ 260
— 425
- 1002
— 825
+ 560
1,9651,840
— 125
+ 135+ 135+ 95+ 5
+ 370
+ 245
— 176
+ 45
- 20
— 20
- 170
+ 75
2,0801,815
— 265
+ 285+ 185+ 100
+ 570
+ 305
— 105
+ 15
— 55
+ 25
— 120
+ 185
2,2401,975
— 265
+ 565+ 210+ 120+ 20
+ 915
+ 650
— 105
+ 175
— 205
- 1052
— 240
+ 410
2,3151,970
— 345
+ 215+ 200+ 95+ 20
+ 530
+ 185
— 175
+ 25
— 145
— 295
— 110
2,2801,960
— 320
+ 145+ 140+ 95— 50
+ 330
+ 10
— 255
- 255
— 245
1 On a cash basis. 2 Including a debt prepayment of $145 million to the United States.
T h e factors behind the deterioration of the trade balance were on theone hand the sharp recovery of economic activity in Italy and on the otherhand less favourable conditions in certain export markets, notably Germany.
Imports, which had remained almost stationary in 1965, rose by 16 percent, last year. In particular, purchases of semi-manufactured goods went upby 30 per cent., of which steel and copper accounted for half. Imports offinished goods, which had declined in 1965, went up by 17 per cent, andthose of raw materials by 15 per cent. The expansion of food imports, onthe other hand, slowed down from 20 to 10 per cent, because of increaseddomestic supplies.
The growth of exports dropped from 21 to 12 per cent, in 1966, therate of expansion declining in the second half of the year. Sales to Germanyrose by only 6 per cent., after 35 per cent, in 1965; and this accountedfor three-quarters of the slower growth in total exports. There was also someslackening in the expansion of exports to countries outside Europe — withthe exception of the United States, sales to which continued to grow ata rate of about 20 per cent.
The net surplus from services showed a further increase of $275 million,nearly as much as in 1965. Half of this was due to larger net receipts from
— 99 —
tourism and a fifth each to net receipts from transportation and higherworkers' remittances. The number of emigrants to EEC and other Europeancountries, in particular Switzerland, was some 7 per cent, less than in theprevious year. As, however, emigration to overseas countries rose steeply, thetotal number of persons going abroad increased by 3 per cent.
The other dominant factor in 1966 was the net capital outflow. Itamounted to $825 million for the whole year — over 35 per cent, ofwhich was in the fourth quarter — compared with only $60 million in 1965.Italian savings were attracted abroad by higher interest rates, which alsocaused Italian debtors to make anticipatory repayments of loans. Direct Italianinvestment abroad rose by $75 million, and net foreign loans taken up onthe Italian market increased by $190 million. Foreign investment in Italy,on the other hand, declined by $130 million. The capital outflow in theform of bank-notes expanded by $245 million, reflecting uncertaintiesconcerning the coupon tax, which were brought to an end by a decree ofFebruary 1967 subjecting all dividends payable to Italian residents to a 5per cent, withholding tax. "Other" capital movements include the debtprepayment of $145 million to the United States in September 1966.
In the first quarter of 1967 the current account was in equilibrium,whereas the net capital outflow continued at a high level, exceeding $250 million.
France. The overall surplus on France's balance of payments, which hadfluctuated between $600 and 1,200 million in the previous five years, droppedto $340 million in 1966, its lowest level since 1958. The trade surplusof $390 million in 1965 shifted to a deficit of $45 million and there was adecline of $205 million in net private foreign investment in France. Thebasic balance was still in surplus in the first half of the year, but movedinto deficit in the second half.
Stimulated by the recovery of economic activity, imports from outsidethe franc area (as measured by customs statistics) went up from $8.8 to10.3 milliard, or by 17 per cent., compared with only 4.5 per cent, in 1965.Semi-manufactured goods showed the fastest advance; consumer and equipmentgoods increased by 24 and 18 per cent, respectively. Purchases of rawmaterials — excluding fuel imports, which rose very moderately —- went upby 13 per cent., largely owing to the need to replenish stocks.
Exports to countries outside the franc area rose to $9.4 milliard, or by11 per cent., compared with approximately 14 per cent, in the two precedingyears. The slower overall rate of expansion was largely due to a slackeningin the growth rate of exports of semi-manufactured products. The tradedeficit vis-à-vis the non-franc area thus grew by $580 million. The balancevis-à-vis EEC countries shifted from a surplus of $100 million to a deficitof $245 million, nearly two-thirds of the deterioration" representing a fall inexports to Germany. The surplus in relation to E F T A countries was reducedfrom $420 to 280 million, chiefly because of a larger deficit vis-à-vis Swedenand a smaller surplus in trade with Switzerland. As for trade with the French

ioo —
France: Balance of payments
Items
Merchandise trade (f.o.b.)ExportsImports
Trade balance
ServicesTransportationTravelWorkers' remittancesOther
Total
Current balance
Long-term capitalOfficialPrivate
Total
Balance on current and long-termcapital account
Short-term capital andadjustments
Rest of French franc area . . .
Total balance (= changesin monetary items) . . . .
1965 Year2 1stquarter
19662nd
quarterin millions of US dollars
8,6008,210
+ 390
+ 40- 30— 275+ 395
+ 130
+ 520
— 2503
+ 360
+ 1 10
+ 630
+ 60+ 270
+ 960
9,4859,530
— 45
+ 55+ 30- 330+ 325
+ 80
+ 35
- 145"+ 155
+ 10
+ 45
+ 45+ 250
+ 340
2,3102,280
+ 30
- 10+ 30— 70+ 95
+ 45
+ 75
— 15+ 65
+ 50
+ 125
— 15+ 95
+ 205
2,4202,385
+ 35
+ 10+ 80— 75+ 75
+ 90
+ 125
+ 80
+ 80
+ 205
+ 85+ 55
+ 345
3rdquarter
2,3302,300
+ 30
+ 40— 120— 85+ 20
— 145
— 1 15
— 1054
— 50
- 155
— 270
+ 105+ 50
— 1 15
4thquarter
2,3302,530
— 200
+ 15+ 35— 95+ 105
+ 60
— 140
— 25+ 50
+ 25
— 115
— 20+ 45
— 901 On a cash basis. 2 The sum of the quarters does not tally with the annual figure, as revisions are includedin the yearly total but not in the quarterly figures. 3 Including a debt prepayment of $179 million to theUS Export-Import Bank. 4 Including a debt prepayment of $71 million to the United States.
franc area, the 1965 surplus was converted into a deficit in 1966, mainly asa result of a sharp drop in exports to Algeria.
Net receipts from services and transfers showed a further contractionlast year, declining from $130 to 80 million. Remittances abroad by foreignworkers increased by $55 million and income from royalties and other servicesfell off. On the other hand, there was an improvement of $60 million ontravel account.
Policy measures both in France and elsewhere (e.g. US Governmentpressure on enterprises to limit direct investment abroad) and the relativelylow level of French interest rates combined to reduce the net inflow ofprivate long-term capital from $360 to 155 million. Owing to the depressedstate of the French stock exchange, foreign interest in French securities felloff, while at the same time French residents became net purchasers offoreign securities; thus, whereas in 1965 there had been a net inflow of$175 million in respect of security transactions, in 1966 this was reduced to$25 million. The net outflow of official long-term capital declined from $250 to145 million, entirely owing to smaller prepayments of debt to the United States.

— roi —
At $250 million, net receipts from overseas countries of the franc areawere slightly below their 1965 level; they declined substantially towards theend of the year.
Belgium-Luxemburg Economic Union. In 1966 the overall balance of theBLEU swung round from a surplus of $135 million to a deficit of $110 mil-lion owing to a rise in the import surplus from $90 to 350 million.
The principal change in the trade accounts was the slowing-down of theexpansion of exports from 14 per cent, in 1965 to 7 per cent. To a consider-able extent this reflected the less favourable conditions prevailing in theGerman market, which takes about one-fifth of all Belgian exports. Whilesales of non-ferrous metals went up by 26 per cent., reflecting the rise inthe price of copper, and those of textile products by 10 per cent., iron andsteel exports declined by 4 per cent., and those of coal by one-third.Imports increased by 10.5 per cent., compared with 9 per cent, in 1965;those of equipment goods went up by some 10 per cent., twice as fast asthose of consumer goods.
Last year the public sector reduced its net foreign indebtedness by$50 million, compared with $110 million the year before, but this reductionin the outflow was more than offset by the increase in purchases of foreignsecurities by BLEU residents.
Netherlands. On a cash basis, the Netherlands' deficit on current account;which had contracted in 1965, widened again last year as a result of adeterioration on services account.
The growth of imports on a customs statistics basis had fallen from 18to 6 per cent, in 1965. Last year imports increased by 7 per cent., reflectingthe pressure of demand which prevailed in the greater part of the year.As far as consumer goods are concerned, there was a rise of 17 per cent.,nearly as much as in the previous year. Exports rose by 6 per cent., com-pared with 10 per cent, in 1965. There were certain exceptional factors thatadversely affected the trade balance in the first quarter of 1966. An abnormalincrease in imports for stock-building coincided with a decline in agri-cultural exports due to the ban by foreign countries on meat and cattlefrom the Netherlands in view of an outbreak of foot-and-mouth disease.This decline may have represented a loss of about $50 million in exportearnings. Exports to EEC countries went up by 5 per cent, over the year(those to France and Germany by 12 and 2 per cent, respectively) andthose to E F T A countries by 1 per cent., owing to the stagnation of sales tothe United Kingdom, while those to North and Latin America expanded by19 and 25 per cent, respectively.
For the year as a whole the import surplus amounted to $605 million,compared with $670 million in 1965. This reduction in the trade deficit wasmore than offset by the fall in net receipts on services account from $650 to515 million. Income from, investment was $50 million less than in 1965,mainly because of lower dividends paid by foreign subsidiaries of Dutch

— 102 —
Netherlands: Balance of payments.*
Items
Merchandise trade (f.o.b.)ImportsExports
Trade balance . . .
ServicesInvestment income . . .Other
Total
Current balance . .
Capital movementsLong-term
PrivateDutchForeign
BanksOfficial
Total long-term .
Balance on capitalaccount . . . .
Total balance (= changesin monetary items) . . .
1965Year 1st
quarter
19662nd
quarter3rd
quarter4th
quarter
19671st
quarterin millions of US dollars
6,6555,985
— 670
+ 200+ 450
+ 650
- 20
— 290+ 305— 25- 35
— 45
+ 65
+ 20
-
7,0456,440
— 605
+ 150+ 365
+ 515
- 90
- 275+ 355
— 25
+ 55
— 5
+ 50
— 40
1,7201,500
— 220
+ 10+ 75
+ 85
- 135
— 130+ 95— 20— 5
— 60
+ 30
— 30
— 165
1,7551,585
— 170
— 5+ 100+ 95
— 75
— 10+ 55+ 15— 10
+ 50
+ 10
+ 60
— 15
1,7551,625
— 130
+ 80+ 95
+ 175
+ 45
- 85+ 90— 5
-
+ 5
+ 5
+ 50
1,8151,730
— 85
+ 65+ 95
+ 160
+ 75
— 50+ 115+ 5— 5
+ 65
— 50
+ 15
+ 90
1,7551,635
— 120
+ 45+ 50
+ 95
— 25
} - »— 5— 5— 25
— 10
— 35
— 60
* On a cash basis.
companies; expenditure by Dutch tourists abroad increased by $6o million;and unilateral transfers, which had yielded a net inflow of $30 million in1965, when the last instalment was paid under the Netherlands-GermanFinancial Treaty, resulted in a net outflow of $20 million.
In 1966 long-term capital movements shifted from a net outflow of$45 million to a net inflow of $55 million, nearly three-quarters of thechange being due to securities transactions. In particular, net new loan issuesabroad yielded $75 million, compared with only $5 million in 1965. Noforeign issues were authorised on the Dutch market last year.
Austria. Because of a rise from $525 to 670 million in the trade deficit,the basic balance of payments deteriorated in 1966 from a deficit of $90million to one of $220 million. This deterioration was largely offset, however,by a rise in short-term capital inflows (including errors and omissions) from$35 to 155 million, so that the overall deficit of $65 million was little greaterthan in 1965.
Imports rose by n per cent. ; the biggest increase was in semi-manufactured and manufactured goods, impelled by the strong demand for

— 103 —
machinery and motor-cars. After rising sharply in 1965, imports of foodstuffsremained practically stable last year. Exports went up by only 5 per cent.,against 11 per cent, in 1965. Those of raw materials and foodstuffs actuallydeclined, while exports of manufactured and semi-manufactured goods increasedby 7.5 per cent., although the sub-group of machinery and vehicles showeda rise of only 4 per cent. While the slower rate of expansion was mainlythe result of a weakening of demand in Germany, the growing discriminationon EEC markets and the fact that Austrian exporters cannot grant as favourablecredit terms as many of their competitors also played a rôle.
The uninterrupted growth of net tourist receipts, which account foralmost the entire surplus on services, practically came to a halt last year. At$425 million, they were barely $5 million higher than in 1965. Growingcompetition from other countries, rising Austrian travel expenditure abroadand bad weather contributed to this result. As net receipts from otherservices and unilateral transfers fell off somewhat, total net invisible receiptsdeclined from $490 to 480 million.
The net outflow of long-term capital was reduced from $55 to 30 millionlast year, mainly as a result of increased borrowing by Austrian enterprises.Net long-term credits taken up abroad rose from $10 to 70 million. At thesame time Austrian long-term credits granted expanded from $70 to 95 mil-lion, export credits accounting for $45 and 65 million respectively in thetwo years. The net inflow of short-term capital went up from $10 to 65 mil-lion and the positive errors and omissions item from $25 to 90 million.
Switzerland. The continued slowing-down in domestic economic expansion,together with interest rate developments abroad, resulted in the pattern ofSwitzerland's balance of payments being rather different in 1966 from what it hadbeen in other recent years. The current account moved from deficit into surplusand the capital account from surplus into deficit. The overall balance, measuredby the changes in net official assets, showed a small deficit of $15 million.
The trade deficit was reduced from $710 to 650 million. Imports, whichhad started to expand towards the end of 1965, increased by 7 per cent, in1966, compared with 2.5 per cent, in the previous year. There was strongdemand for investment and consumer goods, whereas the cooling-down in thebuilding sector led to a decline in imports of iron and semi-finished ironproducts. Exports rose by 10.5 per cent., slightly less than in 1965, and inthe course of 1966 their growth slackened because of cyclical developments insome other European countries. Exports to overseas countries, above all theUnited States, Brazil and Japan, expanded by as much as 15 per cent., whilethose to E F T A and EEC countries rose by 9 and 5.5 per cent, respectively.
Net receipts from invisible items are estimated to have increased from$640 to 730 million, reflecting a rise in investment income and touristreceipts and a decrease in workers' remittances due to the reduction inforeign labour. The current-account balance, therefore, shifted from a deficitof $70 million to a surplus of $80 million — the first since i960.

— 104 —
Owing mainly to rising interest rates abroad, the total capital account,including errors and omissions, showed an outflow of $95 million in 1966, thefirst for some years. The outflow from identified transactions rose from$85 to 185 million. Net new foreign issues in Switzerland went up from$50 to 75 million and authorised bank credits to foreigners from $35 ton o million. At the same time the inflow from unidentified capital trans-actions, including the change in the banks' net foreign position as well aserrors and omissions, came down from $215 to 90 million.
Denmark. The improvement both in the trade and invisible accountsreduced the current deficit from $110 to 60 million. At the same time thenet inflow of capital declined from $130 to 90 million and the overall balanceagain showed a small surplus.
Both imports and exports rose by about 6 per cent., reducing the tradedeficit from $285 to 265 million. There was, however, some increase in thedeficit between the first and second halves of the year, as imports began togo up faster with the pick-up in domestic economic activity while the rate ofgrowth of exports slackened. The rise in exports during 1966 included a 5per cent, increase in export prices, mainly of agricultural products. Exportsof manufactured products, excluding ships, rose by 8.5 per cent., after increasesof 17.5 per cent, in 1964 and 12.5 per cent, in 1965. The slackening oftheir growth reflects a certain loss of competitiveness due to rapidly risingcosts, as well as weakening demand last year in Germany, Sweden andthe United Kingdom.
Since i960 Denmark has been a large importer of capital, on bothofficial and private account. Last year the net inflow was reduced from$130 to 90 million, since repayments exceeded new borrowing in the publicsector and net receipts from commercial credits declined. Borrowing by privateenterprises, which was not permitted in 1965, was resumed last year on alimited scale.
Finland. The growth rate of the Finnish economy accelerated in thesecond half of 1966 and, at the same time, imports were stepped up. Overthe year as a whole, however, imports rose by only 5 per cent., against 9 percent, in the previous year. There was a similar drop in the growth rate ofexports, viz. from 10.5 to 5.5 per cent., so that the import surplus, at$230 million, was about the same as in 1965. The trade deficit vis-à-viswestern countries was reduced by $45 million, but that vis-à-vis bilateral-agreement countries expanded by a like amount. The terms of trade deterio-rated by 3 per cent., as import prices increased over the year while those ofexports, taken as a whole, remained stable. Although the deficit in respect oftourism narrowed in 1966, the surplus on invisible items contracted somewhat,owing chiefly to heavier interest payments on the growing external debt.
In 1966 the net capital inflow was reduced from $105 to 60 million.The net inflow of long-term capital was kept down by long-term debtrepayments, whereas the net inflow of short-term capital fell off. Towards the
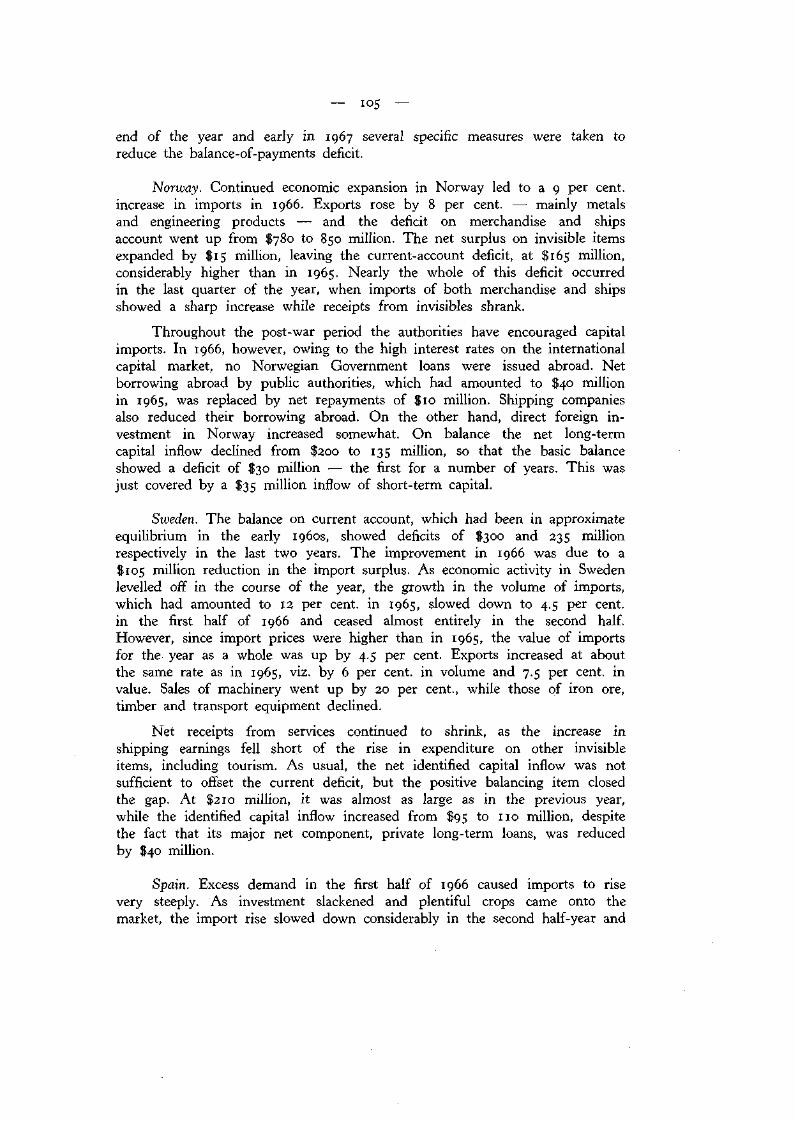
— los —
end of the year and early in 1967 several specific measures were taken toreduce the balance-of-payments deficit.
Norway. Continued economic expansion in Norway led to a 9 per cent,increase in imports in 1966. Exports rose by 8 per cent. — mainly metalsand engineering products — and the deficit on merchandise and shipsaccount went up from $780 to 850 million. The net surplus on invisible itemsexpanded by $15 million, leaving the current-account deficit, at $165 million,considerably higher than in 1965. Nearly the whole of this deficit occurredin the last quarter of the year, when imports of both merchandise and shipsshowed a sharp increase while receipts from invisibles shrank.
Throughout the post-war period the authorities have encouraged capitalimports. In 1966, however, owing to the high interest rates on the internationalcapital market, no Norwegian Government loans were issued abroad. Netborrowing abroad by public authorities, which had amounted to $40 millionin 1965, was replaced by net repayments of $10 million. Shipping companiesalso reduced their borrowing abroad. On the other hand, direct foreign in-vestment in Norway increased somewhat. On balance the net long-termcapital inflow declined from $200 to 135 million, so that the basic balanceshowed a deficit of $30 million — the first for a number of years. This wasjust covered by a $35 million inflow of short-term capital.
Sweden. The balance on current account, which had been in approximateequilibrium in the early 1960s, showed deficits of $300 and 235 millionrespectively in the last two years. The improvement in 1966 was due to a$105 million reduction in the import surplus. As economic activity in Swedenlevelled off in the course of the year, the growth in the volume of imports,which had amounted to 12 per cent, in 1965, slowed down to 4.5 per cent,in the first half of 1966 and ceased almost entirely in the second half.However, since import prices were higher than in 1965, the value of importsfor the year as a whole was up by 4.5 per cent. Exports increased at aboutthe same rate as in 1965, viz. by 6 per cent, in volume and 7.5 per cent, invalue. Sales of machinery went up by 20 per cent., while those of iron ore,timber and transport equipment declined.
Net receipts from services continued to shrink, as the increase inshipping earnings fell short of the rise in expenditure on other invisibleitems, including tourism. As usual, the net identified capital inflow was notsufficient to offset the current deficit, but the positive balancing item closedthe gap. At $210 million, it was almost as large as in the previous year,while the identified capital inflow increased from $95 to n o million, despitethe fact that its major net component, private long-term loans, was reducedby $40 million.
Spain. Excess demand in the first half of 1966 caused imports to risevery steeply. As investment slackened and plentiful crops came onto themarket, the import rise slowed down considerably in the second half-year and

— io6 —
the trade deficit contracted from $1,035 to 965 million. Owing to the seasonallarge surplus from tourism and to a substantial capital inflow, the balance oncurrent and long-term capital account, which had shown a deficit of $285 mil-lion in the first half, moved into surplus in the latter part of the year.
Imports, as measured by customs statistics, which had shot up by 34 percent, in 1965, continued to expand at the same rate in the first half of 1966but the increase slowed down to 6 per cent, in the second half. While importsof foodstuffs and semi-manufactured products, which had risen by 36 and28 per cent, respectively in the first half-year, actually declined by 9 and5 per cent, in the second, in the case of investment goods the increase merelyslowed down, from 36 to 8 per cent. On the other hand, imports of con-sumer goods went up by another 26 per cent, in the second half of 1966,compared with 44 per cent, in the first half, and those of raw materials roseby 20 per cent., compared with 50 per cent, in the first half.
Exports, which had stagnated in 1965 because of a decline in sales ofagricultural products, not only recorded a 30 per cent, gain last year butshowed a more favourable composition, as it was the more sophisticatedproducts which registered the highest rates of increase. Thus, over the yearas a whole exports of investment goods more than doubled, those of consumergoods went up by a third and those of foodstuffs by a fifth.
Receipts from unilateral transfers, chiefly workers' remittances, went upfrom $300 to 480 million in 1966 but those from tourism, which had in-creased by leaps and bounds since 1959, rose by only 8 per cent. Thenumber of tourists went up by a fifth to 17.3 million, but the averagereceipts per visitor declined from $81 to 72.
Spain: Balance of payments
Items
Merchandise trade (f.o.b.)ImportsExports
Trade balance
ServicesUnilateral transfers2
Current balance
Long-term capital
Balance on current andlong-term capital account .
Short-term capital
Overall balance(= changes inofficial reserves)
Year
19651sthalf
2ndhalf
1
Year19661sthalf
2ndhalf
in millions of US dollars
2,7151,045
— 1,670
+ 980+ 300
— 390
+ 195
- 195
+ 90
— 105
1,235560
— 675
+ 325+ 155
— 195
+ 90
— 105
+ 45
— 60
1,480485
— 995
+ 655+ 145
— 195
+ 105
— 90
+ 45
— 45
3,2601,260
—2,000
+ 940+ 480
— 580
+ 360
— 220
+ 15
— 205
1,725690
— 1,035
+ 375+ 220
— 440
+ 155
— 285
+ 70
— 215
1,535570
— 965
+ 565+ 260
— 140
+ 205
+ 65
— 55
+ 10
1 On a cash basis. 2 Chiefly workers' remittances.

— 107 —
Although the net long and short-term capital inflow increased from$285 to 375 million, it was not sufficient to offset the large current deficit,and for the second year in succession the official reserves fell.
Japan. Despite the sharp recovery of domestic economic activity, thelarge trade surplus which had emerged as a result of the 1965 recessionincreased in 1966. Imports, after remaining fairly stagnant in 1965, advancedby 14-5 per cent., while exports went up by 15.5 per cent. Their continuedbuoyancy was partly a reflection of the war in Vietnam and boom conditionsin the United States. Thus, on a customs statistics basis, exports to a group ofcountries in the Far East went up by 46 per cent, and those to the UnitedStates by 20 per cent.
The deficit on invisible items increased from $970 million in 1965 to$1,030 million in 1966 but even so the current-account surplus widened from$930 to 1,250 million. In the first quarter of 1967, however, the currentbalance turned to a deficit of $170 million, as owing to a very strong growthof imports the trade surplus was reduced to $150 million.
The combination of domestic credit ease and mounting capital-markettensions abroad resulted in a further sharp rise in long-term capital exports,which doubled to $820 million. These represented mainly yen credits to Indiaand other Asian countries, private debt repayments and commercial creditsconnected with the rise in exports of the chemical and iron and steel industries.
Japan: Balance of payments.
Items
Merchandise trade (f.o.b.)Exports
Trade balance
ServicesTransportationInvestment income
Other
Total
Current balanceLong-term capital account . .
Balance on current andlong-term capital account .
Short-term capital account . .Errors and omissions
Total balance (= changesin monetary items) . . . .
Year
19651sthalf
2ndhalf
1
Year
19661sthalf
2ndhalf
in millions of US dollars
8,3306,430
+ 1,900
— 525— 190+ 310— 565
— 970
+ 930— 415
+ 515— 60— 45
+ 410
3,8753,290
+ 585
- 230— 100+ 125— 275
— 480
+ 105- 125
— 20+ 30+ 20
+ 30
4,4553,140
+ 1,315
— 295- 90+ 185— 290
— 490
+ 825— 290
+ 535— 90— 65
+ 380
9,6407,360
+ 2,280
— 610— 185+ 440- 675
— 1,030
+ 1,250— 820
+ 430- 55— 55
+ 320
4,3803,560
+ 820
— 320- 95+ 195— 325
— 545
+ 275— 285
— 10
+ 45
+ 35
5,2603,800
+ 1,460
— 290— 90+ 245- 350
— 485
+ 975— 535
+ 440— 55— 100
+ 285
1 On a transactions basis. 2 Mainly military transactions.

— io8 —
Commercial policy.
Today, ten years after its inception, the European Economic Communityis about half-way towards the goals laid down in the Rome Treaty. Realisationof the common market is in sight but the integration of the six nationaleconomies into a single economy is still a long way off. The merger of theexecutive bodies of the EEC, the ECSC and Euratom, which was agreed uponby the member countries under a treaty dated 8th April 1965, is to take placeon ist July 1967.
On 26th July 1966 the Council of Ministers decided that a 5 per cent,reduction in the Community's internal tariffs for industrial goods would bemade on ist July 1967 and that the remaining 15 per cent, would beabolished a year later, at which date the common external tariff would alsocome into force. With regard to agricultural policy, the Council decided on26th July to set up marketing organisations for fruit and vegetables, sugar andfats, and fixed the prices for milk, beef, sugar, rice, oilseeds and olive oil. Infact, olive oil was the first agricultural product to reach the stage of a commonmarket, on 10th November 1966, without a transitional period. Importantsteps towards the unification of economic policies were taken in February1967. On 8th February the Council accepted the medium-term economicpolicy programme for the period 1966-70 and on the following day it approvedthe guide-lines for the harmonisation of turnover taxes, which involves theintroduction of an added-value tax to come into operation on ist January1970 at the latest.
Negotiations with Austria for a possible link with the EEC continuedthroughout 1966 and the first half of 1967, but have not yet been completed.On n t h May 1967 the UK Government, with strong parliamentary support,made a formal application for membership of the three Communities. Almostsimultaneously, Ireland and Denmark submitted their applications, while otherE F T A countries expressed their readiness to negotiate.
On ist January 1967 — three years ahead of schedule — the E F T Acountries abolished the remaining 20 per cent, customs duties on industrialproducts. Finland lowered its duties to 10 per cent, and the remainder willbe eliminated by the end of 1967. Some exceptions — of limited duration —have been granted to Austria, Finland, Norway and Switzerland, while everycountry except Denmark, which has no such duties, is maintaining revenueduties on certain goods. In the near future emphasis will be placed on theremoval of barriers other than tariffs and on the enforcement of rules of faircompetition.
After four years of arduous negotiations the Kennedy Round wascompleted on 15th May 1967. Some fifty countries, representing about 80 percent, of world trade, took part in the negotiations. The most difficult problemsto be solved affected the EEC, the United Kingdom and the United States.Much detailed work remains to be done before the full implications of theagreement are clear. Although the main target of a 50 per cent, linearreduction in the tariffs for industrial products has not been entirely achieved,

— 109 —
tariff cuts of between 30 and 40 per cent, were made. It is estimated thatthese reductions apply to some $40 milliard's worth of goods, or roughly athird of world trade in manufactured products. As regards agriculturalproducts, the minimum price for wheat was fixed at $1,725 per bushel andit was agreed to grant 4.5 million metric tons of cereals annually as aid todeveloping countries. Certain developed countries reduced their tariffs ontropical products, in some cases with immediate effect. Although the tariffreductions would normally be implemented over a five-year period, it wasdecided to examine, before signature of the agreement on 30th June 1967, thepossibility of making cuts in advance for the benefit of developing countries.

— n o —
I I I . G O L D , R E S E R V E S A N D F O R E I G N E X C H A N G E .
Gold production, markets and reserves.
In 1966 world gold production (excluding the USSR, other easternEuropean countries, mainland China and North Korea) is estimated to haveamounted to 41.1 million ounces, the same as in the preceding year. As usual,the combined output of all producing countries other than South Africacontinued to decline. Canadian output in particular, which is the next largestafter that of South Africa, registered a marked drop of over 300,000 ounces,or nearly 9 per cent. On the other hand, production expanded a little in theUnited States, Australia, Japan and the Philippines. The outstanding featureof the year, however, was the slow-down in the rate of growth of SouthAfrican output, from 1.4 to only 0.3 million ounces. During the precedingtwelve years South African output had grown from 11.9 to 30.5 millionounces, outpacing by far the gradual downward trend of production elsewhereand enabling total production to rise, in round figures, from 24 to 41 millionounces. This phase of expansion in the gold-mining industry would appearnow to have ended.
World gold production.
Countries
South Africa
United States . . .
Mexico
Total listedOther countries1
Estimated world total'
Value ofestimated world totalat $35 per fine ounce . .
1929
10,4121,9282,059
427208335163137655
16,3242,276
18,600
6502
1940
14,0465,3334,8701,644
886867
1,121632883
30,2826,718
37,000
1,295
1946
weight11,9272,8491,575
82458640
1437420
18,6593,041
21,700
in
760
1953 1963 1964
in thousands of fine ounces11,9414,0561,9581,075
731258481437483
21,4202,680
24,100
27,4324,0031,4541,024
921433376325238
36,2062,494
38,700
29,1373,7991,456
964865460426365210
37,6822,418
40,100
millions of US dollars
845 1,355 1,405
1965
30,5403,5871,705
878755519436319216
38,9552,145
41,100
1,440
1966
30,8693,2741,790
905684555445280212
39,0142,086
41,100
1,4401 Excluding the USSR, eastern Europe, mainland China and North Korea. 2 At the official price of $20.67 per fineounce then in effect, $385 million.
The huge expansion of South African gold output was due to thedevelopment of new mines. Production in these new gold-fields between 1953and 1966 went up from 2.5 to 25.1 million ounces, whereas the production ofthe older mining areas declined from 9.4 to 5.8 million ounces. The opening-up of the new gold-fields reached its climax in 1961-62; since then the

— I l l —
growth of South African gold production has tended to slow down andin the course of 1966 seems to have come to a halt. Although strikes aroundthe year-end may have contributed somewhat to the poor out-turn for 1966,the basic factors behind this trend in South African gold production are thelack of new gold discoveries and the effect on profits of rising wages andmaterial costs. In the older mines that belong to the Transvaal and OrangeFree State Chamber of Mines, where output declined by 0.5 to 5.3 millionounces in 1966, the cost per ton of ore milled has gone up by 22 per cent,since 1958 and, notwithstanding a shift to higher-yielding ores, average profitsper ounce have been reduced by 44 per cent.
Valued at the official parity of $35 an ounce, total 1966 gold output wasworth $1,440 million. And, as there were no offerings of gold by the USSR,this was also the total of fresh gold supplies that became available duringthe year. Total demand for gold other than from western official sources,although considerably below the 1965 peak of $1,750 million, did not shrinkas much as supplies did, with the result that total official western goldstocks had to be drawn on during the year to the extent of $95 millionin order to maintain the balance between demand and supply.
Estimated sources and uses of gold.
Gold production1
Sales by the USSR
Total
1962 1963 1964 1965 1966
in millions of US dollars1,295
200
1,495
3301,165
1,355550
1,905
8401,065
1,405450
1,855
7501,105
1,440550
1,990
2401,750
1,440
1,440
— 951,535
1 Excluding the USSR, eastern Europe, mainland China and North Korea. 2 Residual figures. Includes estimatedpurchases by China of about $150 million in 1965 and $75 million in 1966.
Chinese purchases of gold, which had been estimated at about $150million for the year 1965, may be put at some $75 million for 1966. Non-monetary demand for gold, therefore, was of the order of $1,450 million,roughly $150 million less than it had been in 1965, but substantially abovethe 1962-64 average of about $1,100 million. This is to a large extentaccounted for by the upward trend in industrial and traditional hoardingdemand for gold, though in addition there was certainly some speculativebuying in 1966.
1966 was the first year since the war in which official gold stocks failedto register any increase. Altogether, in the twenty-one years since the end ofthe second world war, out of total fresh gold supplies of $25.2 milliard acumulative amount of $9.9 milliard was added to western official stocks. Thegraphs on the following page show the year-by-year relationship over thisperiod between monetary and non-monetary demand for gold, as well as thecumulative development of supplies and official reserves.

112
Supply and uses of gold, 1946-66.
NEW GOLD SUPPLY, IN MILLIONS OF US DOLLARS,AND SHARE ACCRUING TO WESTERN OFFICIAL RESERVES.
1950-850 1951-825 1952-850
1953-920 1954 = 970 1955 = 1015 1956 = 1125 1957-1275 1958-1270 1959-1425
-7
1960=1375 1961 = 1515 1962-1495 1963-1905 1964-1855 1965-19% 1966-1440
Western official reserves (in percentages)Other usesNote: "Other uses" include, for 1965 and 1966, estimated Chinese purchasesof $150 and 75 million respectively.
Supply
1946= 0.71947- 1.51948- 2.31949= 3.11950- 4.01951- 4.81952- 5.6
1954- 7.51955- 8.61956= 971957-11.01958-12.21959-13.61960-15.01961=16.51962-18.01963-19.91964-21.81965-23.81966-25.2
-2b
20
10
n
SUPPLY OF GOLD /AND INCREASE IN WESTERN OFFICIAL GOLD RESERVES. /
Cumulative, in milliards of US dollars. //
//
//
//
/
Supply of gold /
/
jS ^S Official gold reserves
. i i i 1 i i i i i i i i 1 i i i i m
2b-
20
10
n
Increasein reserves1946- 0.31947- 0.81948= 1.21949- 1.71950- 2.01951 = 2.31952- 2.5
1954- 3.61.955 = 4.31956- 4.81957= 5.51958- 6.11959- 6.91960-7.21961 - 7.81962 - 8.21963 - 9.01964= 9.81965-10.01966- 9.9
1945 1950 1955 1960 1965

— 113
Turning to developments on the London gold market, there were twoimportant factors that held down market supplies during the period underreview and that contributed to the net drain which, for the first full yearsince it came into existence, the central-bank gold pool experienced in 1966.One was the absence, already mentioned, of Russian sales; and the otherwas the low level of South African sales until late in 1966, owing to thatcountry's balance-of-payments surplus. The easing of private demand in theearlier part of 1966 brought the London fixing price down from over $35.17at the end of January to below $35.11, its lowest level for the year, inearly May. The emergence of another acute phase of the sterling crisis,however, led to a strengthening of demand in June and thereafter buyingpressure remained heavy until after the annual meeting of the I M F earlyin October. Accordingly, the fixing price gradually increased to a peak of$35.18 in mid-July and then fluctuated rather sharply around this level untilearly October, when it fell to $35.15. Towards the end of the year con-jecture about the possibility of South Africa becoming involved in theRhodesian crisis and about an increase in the gold price contributed to arenewed emergence of tensions. In the second half of December the fixingprice came close to $35.19%. Quotations eased early in the new year, butthen strengthened again to $35.i9y2 in late January. Despite the fact thatduring the first quarter of 1967 South African gold sales were considerably inexcess of current production, the fixing price was mostly above $35.15 and inmid-May it stood at around $35.18. Following the suspension of silver salesby the US Treasury (see next page), and also partly in connection with events inthe Middle East, demand for gold increased sharply later in the month and on25th May the fixing price reached $35.19%, its highest level since October 1962.
Gold market prices.In US dollars per fine ounce.
35.15
35.10
35.05
35.00 1 I 1 1 I1965
«Napoleon» price in ParisWednesday price in US dollarsperline ounce and premium in percentage"
1 In h1965 1966
1966
1967! , I
1967
30+20 "+10Parity
35.20
35.15
35.10
35.05
35.00

— 114 —
The market price of gold coins increased appreciably during 1966, forthe second year in succession. Expressed in terms of dollars per fine ounce,the Paris market quotation for the "napoleon", after easing during the earliermonths of 1966, rose from $48.25 at the end of May to a fourteen-year peakof $53.75 around the turn of the year. Early in 1967 it receded to about$52.50 but in late May it went up to $54 for the same reasons that causedthe rise in the price of gold bullion. Within their general programme ofexchange liberalisation the French authorities lifted as from 31st January1967 the ban on private gold imports and exports. While this move hasrendered the Paris market an integral part of the international gold market,there is so far no evidence that it has increased the turnover on the Parisgold market.
Acting under powers conferred on it by the Coinage Act of 1965, on18th May 1967 the US Treasury suspended all sales of silver except those to"legitimate domestic concerns which use silver in their business". In addition,it introduced a ban on the melting-down, treatment and export of silvercoins. This development came after more than eight years in which worlddemand for silver consistently exceeded fresh supplies. During this period theUS Treasury acted as a residual seller of the metal to the market at a fixedprice (which since September 1963 had been $1,293 P e r n n e ounce) with theresult that between the end of 1958 and the suspension of sales the Treasury'ssilver stock was reduced from 2,100 to some 500 million ounces — the latterfigure being just about the amount of Treasury silver certificates outstanding.The immediate result of the suspension of the Treasury's sales was theemergence of a market price higher than the official US selling price. At theend of May 1967 this market price stood at $1.55 per fine ounce.
Year
1959 . . . .1960 . . . .1961 . . . .1962 . . . .1963 . . . .1964 . . . .1965 . . . .1966 . . . .
Newproduction1
World
Supply
Other*
supply
Total
and uses of silver.
Uses1
Coinage Industrial Total
Excess ofdemand
oversupply
Change inUS
Treasury'ssilver stock
in millions of fine ounces
189208203209215217223231
3553559975—9837
22426125a308290217321268
86104137128166267376107
213225240259261304347357
299329377387427571723464
— 75— 68— 1 19— 79— 137— 354— 402— 196
— 47— 68- 130— 96— 184-369— 418— 202
1 Excluding the USSR, eastern Europe, mainland China and North Korea. 2 Scrap, demonetised coins, changesin inventories and sales by China and the USSR.
As already mentioned, world gold reserves (excluding those of the USSR,other eastern European countries, mainland China and North Korea) declinedby $95 million in 1966 to a total of $43,205 million at the end of the year.Apart from this, the main feature of official gold movements during the year

World gold reserves.
Countries or areasChanges in
1965 1966
Amountsoutstandingend-1966
in millions of US dollarsUnited StatesCanadaWestern Europe
of whichAustriaBelgium-LuxemburgFranceGermanyItaly ,NetherlandsPortugalSpainSwitzerlandUnited KingdomOther
Latin American republics . . . .of which
BrazilColombia . . .MexicoOther
AsiaAtrica
of whichSouth AfricaOther
Other countriesTotal for all countriesInternational institutions
of whichBISEuropean FundIMF
, Other
Grand total
— 1,665
+ 125
+ 2,435
+ 7 00+ 705+ 975+ 760+ 300+ 70+ 55+ 7 95+ 3/5+ 7 30+ 30
— 80
— 30— 25— 10— 75
+ 75
— 1 15
— 7 50
+ 35— 5
+ 770
— 530
— 510+ 20— 40
+ 240
570
105
125
— 35+ 530— 120+ 10— 25+ 70— 25— 200— 325— 5
— 70
— 75— 70— 50+ 5
— 30
+ 165
+ 270— 45
- 730
+ 635
+ 7 35— 75+ 575
95
13,235
1,045
22,835
7007,5255,2404,2902,4551,730645785
2,8407,940725
4525770805
640240
935
1,690
880
250
40,920
2,285
— 42550
2,65010
43,205
w a s t h e t r a n s f e r o f m e t a l f r o m c o u n t r i e s ' r e s e r v e s t o t h e i n t e r n a t i o n a l m o n e t a r y
i n s t i t u t i o n s o w i n g m a i n l y t o t h e p a y m e n t o f g o l d s u b s c r i p t i o n s i n c o n n e c t i o n
w i t h t h e g e n e r a l i n c r e a s e i n I M F q u o t a s .
T h e g o l d s t o c k s o f t h e i n t e r n a t i o n a l m o n e t a r y i n s t i t u t i o n s r o s e b y $ 6 3 5
m i l l i o n d u r i n g 1 9 6 6 . M o s t o f t h i s w e n t t o t h e I M F , w h o s e h o l d i n g s g r e w
b y $ 5 1 5 m i l l i o n . G o l d s u b s c r i p t i o n s p a i d t o t h e F u n d i n 1 9 6 6 t o t a l l e d $ 8 5 3
m i l l i o n ; t h e e f f e c t o f t h e s e p a y m e n t s o n c o u n t r i e s ' g o l d r e s e r v e s w a s , h o w e v e r ,
p a r t l y m i t i g a t e d t h r o u g h g o l d d e p o s i t s o f $ 2 5 4 m i l l i o n w h i c h t h e F u n d m a d e
w i t h t h e U n i t e d S t a t e s a n d t h e U n i t e d K i n g d o m a s w e l l a s b y i t s g o l d
s a l e s o f $ 1 4 8 m i l l i o n t o m e m b e r c o u n t r i e s . T h e r e w a s a l s o a n i m p r o v e m e n t
d u r i n g 1 9 6 6 i n t h e s p o t g o l d p o s i t i o n o f t h e B I S . M a i n l y b e c a u s e t h e e n d -
1 9 6 6 g o l d s w a p s b e t w e e n t h e B I S a n d t h e S w i s s N a t i o n a l B a n k w e r e $ 2 2 0 m i l -
l i o n l o w e r t h a n t h o s e o f e n d - 1 9 6 5 , t h e n e g a t i v e s p o t g o l d p o s i t i o n o f
t h e B I S w a s $ 1 3 5 m i l l i o n l e s s a t t h e e n d o f 1 9 6 6 t h a n i t h a d b e e n a y e a r
e a r l i e r .

— n ò —
Turning to countries' gold reserves, the biggest losses in 1966 wererecorded by the two reserve centres. The United States' gold loss amountedto $570 million, which was very much below the 1965 figure of $1,665 mil-lion. The principal reason for the much smaller loss was, of course, areduction in other countries' conversions of dollars into gold. Total netUS sales to other countries in 1966 came to $610 million, as against $1,320 mil-lion the year before. Sales to western Europe were $660 million, Francetaking $600 million and Italy $60 million. These were virtually the onlyEuropean gold purchases of any note in 1966, whereas during 1965 mostEuropean countries had made substantial conversions at the US Treasury.The 1966 gold loss was also held down by the fact that $177 million ofsales to other countries was "mitigated" by the IMF, while the 1965 loss hadbeen increased by the payment of the $259 million US gold subscription tothe Fund.
The gold reserves of the United Kingdom declined by $325 million in1966. Other western European countries taken together added $200 million totheir official gold stocks. France, with $530 million, and Portugal, with$70 million, were the only European countries to record substantial gains,whilst, apart from the United Kingdom, Switzerland, with $200 million, andGermany, with $120 million, were the only substantial losers. And, as hasbeen explained above, the Swiss "loss" was fictitious, since it was largely theresult of a change in end-year window-dressing arrangements. Except in thecase of the United Kingdom and Switzerland, European gold losses in 1966were mostly due to gold payments to the IMF.
In the rest of the world there were only two changes of any note ingold reserves. Canada's reserve declined by $105 million, accruals fromdomestic production being more than offset by sales of $200 million to theUnited States. And South Africa's gold reserve rose by $210 million. In fact,it went up by $250 million during the first seven months of the year, butwas subsequently reduced somewhat when government stockpiling programmesturned the balance of payments into deficit.
International Monetary Fund.
1966 saw a considerable expansion in the total resources of the IMF.The 25 per cent, general increase in quotas decided on in 1964 came intoeffect in February and together with special increases in the quotas of sixteenmember countries it raised the total of all Fund quotas from $16 to about2i milliard. The operations of the Fund were again on a large scale in 1966,though drawings were considerably less than in 1965. Member countries' grossdrawings totalled $1,448 million, compared with $2,433 million the year before.Repurchases, at $721 million, were slightly greater than in 1965, and total netdrawings declined from $1,732 to 727 million.
Gross drawings by the United States amounted to $680 million, comparedwith $435 million in 1965. Other members drew a total of $159 million in

_ n 7 _._
International Monetary Fund: Drawings and repurchases in 1966.
Countries or areas
United StatesUnited KingdomOther Europe
of whichYugoslavia
Latin Americaof which
ArgentinaBrazilChileColombia
Othersof which
CeylonGhanaIndia
Total
Drawings Repurchases Net drawings
in millions of US dollars68012283
38174
48
3038
389
3052
225
1,448
159*82*63
40220
76394534
197
112
125
721
5214020
— 2— 46
— 28— 39— 15
4192
1950
100
727
* Repurchases by other members' drawings.
US dollars during the year, so that net US drawings were $521 million.Technical drawings by the United States, the object of which is to provideother Fund members with currencies that they can use for repurchases,amounted to $430 million, of which $400 million was in Canadian dollars andthe rest in Deutsche Mark. In addition, the United States drew $250 millionof lire in August 1966 and used the proceeds to absorb dollars held by theItalian monetary authorities. By the end of 1966 cumulative gross drawings bythe United States since February 1964 amounted to $1,640 million, of which$1,090 million were technical drawings. As other countries' US dollar drawingsduring this period amounted to $719 million, total net US drawings were$921 million. This represents just over 70 per cent, of the US gold trancheof $1,290 million.
The United Kingdom made a further drawing, of $122 million, in 1966.However, as other countries drew $82 million of sterling during the year, thenet U K position declined by only $40 million. The British drawing wasequal to the increase in the gold tranche of the U K quota and was made inorder to mitigate the burden on the British reserves of the gold subscriptionpayment. The drawing was in Deutsche Mark, which were used to purchasegold from the Deutsche Bundesbank. The Fund then sold a correspondingamount of gold to the Bundesbank, thus replenishing its own Deutsche Markbalances and at the same time compensating the Bundesbank for its gold saleto the Bank of England.
Other European countries' net drawings totalled only $20 million in 1966.The largest single drawing was one of $38 million by Yugoslavia, which was,however, more than offset by repurchases of $40 million. Other transactionsof European countries included net drawings of $21 million by Ireland andgross drawings and repurchases of $21 million by Turkey.

Latin American countries on balance reduced their Fund indebtednessby $46 million. Elsewhere in the world Fund members drew a net amount of$192 million, of which India accounted for $100 million and Ghana for$50 million.
Fourteen different currencies were drawn on the Fund during the year.Heading the list for the first time was the Canadian dollar, with $460 million.$400 million of these drawings, however, was used by other members forrepurchases and the net use of Canadian dollars was only $48 million. On anet basis the most used currency was the lira, with $304 million, followed bythe Deutsche Mark, with $225 million.
Out of total gross drawings of $1,448 million, $1,050 million wasfinanced out of member countries' currency subscriptions, $148 million fromFund gold sales and $250 million from a five-year loan in lire which theFund obtained from Italy in August 1966. The latter transaction was thefirst in which a member country had made a loan to the Fund outside theframework of the General Arrangements to Borrow. The terms of the Italianloan are similar to those applied under the GAB,
During 1966 and the first quarter of 1967 the Fund deposited $272 mil-lion in gold with the two reserve centres to mitigate the effect on their goldreserves of other countries' purchases of gold from them for gold subscriptionpayments to the Fund. Altogether, between September 1965 and March 1967the Fund made gold "mitigation" deposits totalling $315 million, of which$228 million with the United States and $87 million with the United Kingdom.Out of a total of $1,177 million paid into the Fund in gold since February1965 in connection with the increase in quotas, $463 million had, by the endof March 1967, been returned to members by the Fund through sales anddeposits of gold.
A feature of the year was the revision and extension of the Fund'sspecial facilities, introduced in 1963, for the compensatory financing ofprimary-producing member countries' payments deficits arising out of exportshortfalls. Under the new facilities the ceiling on members' outstanding com-pensatory drawings has been raised from 25 to 50 per cent, of the quota.This means that if eligible Fund members use this facility, as well as theirordinary Fund drawing rights, to the full the Fund's holdings of theircurrencies could rise to 250 per cent, of the quotas, as against 225 per cent,previously.
Total net drawings on the Fund in the first quarter of 1967 were$100 million, the principal transaction being a drawing of $166 million bySpain. Another feature of the quarter was that the currency principally usedfor drawings was the pound sterling, with $72 million. These drawings ofsterling by other Fund members of course produced a corresponding im-provement in the net UK position. Then on 25th May the United Kingdomrepaid to the Fund $405 million out of the $1 milliard that it had drawnin December 1964. The Fund used this amount to repay the sums madeavailable to it on that occasion under the General Arrangements to Borrow.

Official reserves and other monetary movements .
United States. Measured according to the liquidity concept, the USbalance-of-payments deficit was about the same in 1966 as it had been the yearbefore — $1,370 million as against $1,335 million. The pattern of its financing,however, was quite different. In 1965 it had been covered as to 90 per cent,by official financing, while in 1966 there was a surplus of $245 million onthe official-settlements basis, and, within this, an improvement of $1,020million in the net balance of liquid liabilities and assets in the official sector.
United States: External monetary movements.
Items
Reservesof which
GoldForeign exchange . . .IMF gold tranche
positionLiabilities to official
foreignersof which
LiquidNon-liquid
Balance on official-settlements basis....less
Non-liquid liabilitiesto official foreigners
Total change In officialliquid positionplus
Liabilities to non-official foreigners. .
Balance on liquidity basis .
1965 Year 1st quarter1966
2ndquarterl 3rd quarter4th quarter1967
1st quarterin millions of US dollars
(+ = increase in assets, decrease in liabilities)
— 1,220
—1,665+ 350
+ 95
- 85
+ 75— 100
— 1,305
+ 100
— 1,205
— 130
— 1,335
— 570
— 570+ 540
— 540
+ 815
+ 1,590— 775
+ 245
+ 775
+ 1,020
—2,390
— 1,370
— 425
— 70— 220
— 135
+ 825
+ 850— 25
+ 400
+ 25
+ 425
— 475
— 50
- 70
— 210+ 165— 25
- 315
— 55— 260
- 385
+ 260
— 125
- 25
— 150
— 80
- »70+ 425
- 335
+ 490
+ 600— 110
+ 410
+ 110
+ 520
— 1,220
— 700
+ 5
— 120
+ no
— 45— 185
+ 195— 380
— 180
+ 380
+ 200
— 670
— 470
-1,025
— 50-1,005
+ 30
- 255
+ 85- 340
— 1,280
+ 340
— 940
+ 710
- 230
The outstanding feature of US monetary movements in 1966 was theincrease of $2,390 million in liabilities to non-official foreigners. This develop-ment, which was most marked in the second half of the year, came aboutas a result of the tightening of monetary conditions in the United States. Inparticular, banks in the United States were attracting deposits through theoperations of their foreign branches in the Euro-dollar market. Some ofthese deposits may have come from official sources, although they are recordedin the statistics as being owed to non-official institutions. This is because,when foreign monetary authorities shift the employment of their dollars fromthe United States to the Euro-dollar market, or when they decide to employnewly-received dollars in that market, the US statistics show an increase inliabilities to foreign commercial banks, not to official holders. It is probable,therefore, that the US statistics exaggerate the real increase that took place innon-official holdings of dollars, as well as the real decline in official holdings.

— 120 —
Although the inflow of short-term funds through the banking systemmore than covered the liquidity deficit, this did not mean that the USauthorities had no external financing problems in 1966. On the contrary, thegold stock fell by a further $570 million, net sales of gold to foreign countriesamounting to $610 million. In addition, the I M F gold tranche positiondeteriorated by $540 million. The effect of these reserve losses on the netofficial position was, however, more than offset by the changes that occurredin official holdings of foreign exchange and in liabilities to official foreigners.
US official holdings of convertible foreign exchange, which had alreadyrisen by $350 million during 1965, went up by a further $540 million in 1966and at the end of the year stood at the record figure of $1,320 million. Nearlyhalf of the 1966 increase came from the sterling counterpart of assistancegiven to the Bank of England, while most of the rest represented the proceedsof a $200 million Deutsche Mark/dollar swap between the Federal ReserveSystem and the BIS in December 1966, the purpose of which was to enablethe BIS to moderate the end-of-year rise in Euro-dollar interest rates. Theincrease in US official exchange holdings then had as a counterpart anincrease in foreign holdings of dollars.
As regards liabilities to official foreigners, these declined by $815 millionduring 1966. Liquid liabilities were reduced by $1,590 million, whilst therewas an increase of $775 million in certain non-liquid liabilities to foreignofficial agencies, which, while they do not affect the overall balance on theliquidity basis, are included in the official-settlements balance. Part of thedecline in liquid liabilities was simply the counterpart of the rise in non-liquid liabilities; and another part will have been reflected in the recordedincrease of liabilities to non-official foreigners, although, as was pointed outabove, some of this shift may not have represented a real transfer of dollarsfrom official to private hands. In addition, the liquid liabilities to officialforeigners were affected by the debt prepayments which foreign governmentsmade during the course of the year. These totalled $410 million, of whichGermany accounted for $195 million, Italy for $145 million and France for$70 million. In 1965 the only debt prepayment had been one of $180 millionby France. If these prepayments were considered as financing items andadded to the liquidity deficit, then the overall deficit for 1966 would go upto $1,780 million, compared with $1,515 million in 1965.
Liabilities to official foreigners also include foreign holdings of US Govern-ment non-marketable bonds, mostly denominated in the holder's currency andusually known as Roosa bonds. The total of Roosa bonds outstanding declinedby $450 million in 1966. Germany's holdings went down by $250 million,Canada's by $125 million, Austria's by $50 million and Switzerland's by$45 million. On the other hand, Italy's Roosa bond holdings rose by $25 mil-lion. In addition, a further $515 million was converted from non-liquid toliquid form, $300 million in Germany, $190 million in Switzerland and$25 million in Austria. These conversions involved corresponding shiftsbetween non-liquid and liquid liabilities to official foreigners.

— 121 —
The liquidity deficit for the first quarter of 1967, before seasonaladjustment, was $230 million. On the official-settlements basis, however, thedeficit was $1,280 million. The difference between these two figures isaccounted for by two factors. The first, and most important, was an outflowof $710 million through the banking system in the form of a reductionin liabilities to non-official foreigners, caused by the repayment of fundswhich banks in the United States had borrowed in the Euro-dollar marketduring 1966. The second was a further increase of $340 million in non-liquid liabilities to official foreigners. Apart from this latter increase, theofficial-settlements deficit was essentially financed through a reduction of$1,005 million in official holdings of convertible foreign exchange, mostlysterling.
United Kingdom. The principal feature of UK monetary movements in1966 was that despite a marked improvement in the overall balance ofpayments there was an outflow of funds from London on a scale such thatthe total of official financing was considerably greater than it had been in1965. More precisely, there was a substantial outflow during the summermonths of both years, but in 1966 the autumn reflux was much smaller thanit had been in 1965, owing to a decline in the sterling holdings of overseassterling-area countries, and to the adverse covered differential on the com-parison with dollar interest rates.
Thanks to the measures which the British authorities took in July 1966,the payments deficit declined from $695 to 500 million. And the real im-provement was greater than this, since the 1966 deficit included some$200 million for the servicing of the post-war loans obtained from the UnitedStates and Canada; corresponding payments in 1964 and 1965 had beenmostly deferred. The exact composition of monetary movements in 1966cannot be precisely measured, owing to lack of information about the amountof central-bank assistance taken by the Bank of England. A rough idea ofwhat happened can, however, be obtained if it is assumed that movements inofficial holdings of sterling outside the sterling area were by and large due tothe taking or reimbursement of central-bank assistance.
Using this assumption, it can be deduced that total official financingrequirements for 1966 may have exceeded the payments deficit by somethingof the order of $1 milliard. This figure therefore measures very roughly theextent of the adverse monetary movements that occurred during the year.There were two main factors behind these movements: the renewed crisis ofconfidence in sterling during the summer of 1966 and the attraction of highdollar interest rates. The effects of these two factors for the year 1966 as awhole show up mainly in the reduction of $420 million in the item "Othersterling liabilities (net)" (which measures the change in all sterling liabilitiesexcept those to official holders outside the sterling area and which includes adecline of $475 million in liabilities to non-official holders outside the sterlingarea) and in the decrease of $455 million in net foreign currency liabilities ofUK banks.
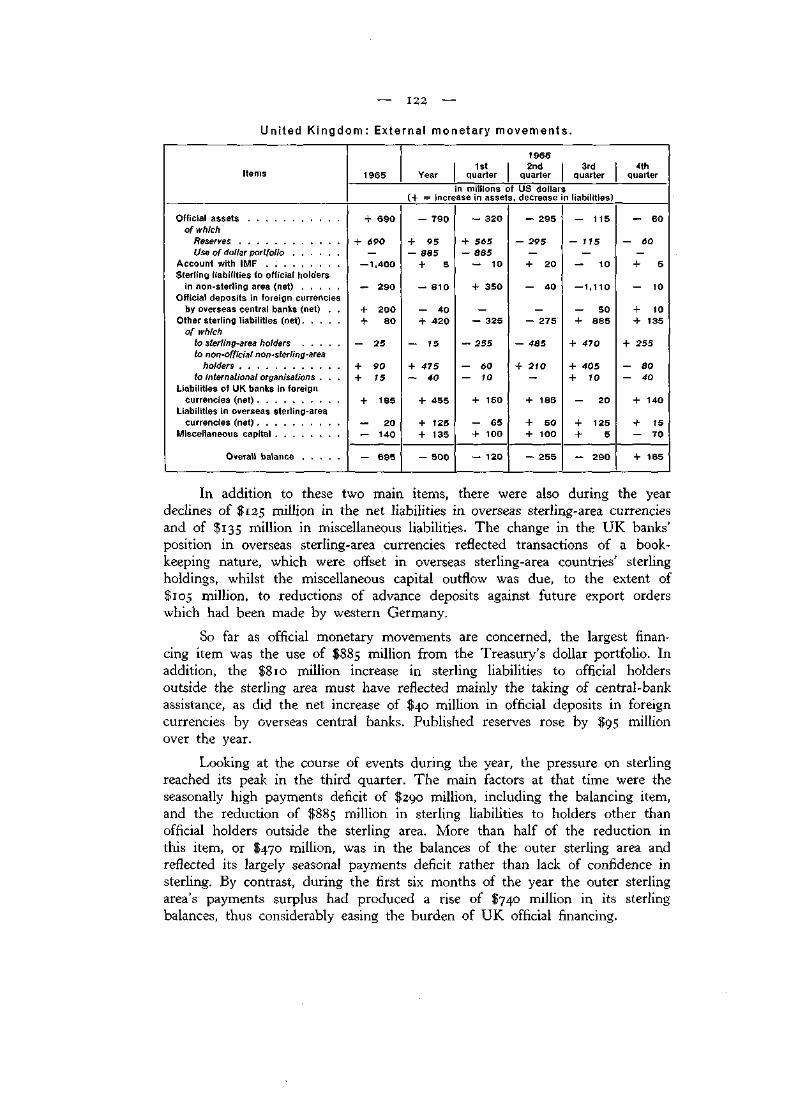
— 122 —
United Kingdom: External monetary movements.
Items 1965 Year1st
quarter
19662nd
quarter3rd
quarter4th
quarterin millions of US dollars
(+ = increase in assets, decrease in liabilities)
Official assetsof which
ReservesUse of dollar portfolio
Account with IMF .Sterling liabilities to official holders
in non-sterling area (net)Official deposits in foreign currencies
by overseas central banks (net) . .Other sterling liabilities (net)
of whichto sterling-area holdersto non-official non-sterling-area
holdersto international organisations . . .
Liabilities of UK banks In foreigncurrencies (net)
Liabilities in overseas sterling-areacurrencies (net)
Miscellaneous capital
Overall balance
+ 690
+ 690
— 1,400
— 290
+ 200+ 80
— 25
+ 90
+ 15
+ 185
— 20— 140- 695
— 790
+ 95— 885+ 5
— 810
— 40+ 420
— 75
+ 475— 40
+ 455
+ 125+ 135
— 500
— 320
+ 5<S5— 885— 10
+ 350
— 325
— 255
— 60
— 10
+ 150
— 65+ 100— 120
— 295
- 295
+ 20
— 40
— 275
- 485
+ 270
+ 185
+ 50+ 100
— 255
— 1 15
- T75
— 10
— 1,1 10
— 50+ 885
+ 470
+ 405+ 70
— 20
+ 125
— 290
- 60
— 60
+ 5
- 10
+ 10+ 135
+ 255
— 80
— 40
+ 140
+ 15- 70+ 165
I n a d d i t i o n t o t h e s e t w o m a i n i t e m s , t h e r e w e r e a l s o d u r i n g t h e y e a r
d e c l i n e s o f $ 1 2 5 m i l l i o n i n t h e n e t l i ab i l i t i e s i n o v e r s e a s s t e r l i n g - a r e a c u r r e n c i e s
a n d o f $ 1 3 5 m i l l i o n i n m i s c e l l a n e o u s l i ab i l i t i e s . T h e c h a n g e i n t h e U K b a n k s '
p o s i t i o n i n o v e r s e a s s t e r l i n g - a r e a c u r r e n c i e s r e f l e c t e d t r a n s a c t i o n s o f a b o o k -
k e e p i n g n a t u r e , w h i c h w e r e offse t i n o v e r s e a s s t e r l i n g - a r e a c o u n t r i e s ' s t e r l i n g
h o l d i n g s , w h i l s t t h e m i s c e l l a n e o u s c a p i t a l o u t f l o w w a s d u e , t o t h e e x t e n t of
$ 1 0 5 m i l l i o n , t o r e d u c t i o n s o f a d v a n c e d e p o s i t s a g a i n s t f u t u r e e x p o r t o r d e r s
w h i c h h a d b e e n m a d e b y w e s t e r n G e r m a n y .
So far as official m o n e t a r y m o v e m e n t s a r e c o n c e r n e d , t h e l a r g e s t finan-
c i n g i t e m w a s t h e u s e o f $ 8 8 5 m i l l i o n f r o m t h e T r e a s u r y ' s d o l l a r p o r t f o l i o . I n
a d d i t i o n , t h e $ 8 1 0 m i l l i o n i n c r e a s e i n s t e r l i n g l i ab i l i t i e s t o official h o l d e r s
o u t s i d e t h e s t e r l i n g a r e a m u s t h a v e r e f l e c t e d m a i n l y t h e t a k i n g o f c e n t r a l - b a n k
a s s i s t a n c e , a s d i d t h e n e t i n c r e a s e o f $ 4 0 m i l l i o n i n official d e p o s i t s i n f o r e i g n
c u r r e n c i e s b y o v e r s e a s c e n t r a l b a n k s . P u b l i s h e d r e s e r v e s r o s e b y $ 9 5 m i l l i o n
o v e r t h e y e a r .
L o o k i n g a t t h e c o u r s e of e v e n t s d u r i n g t h e y e a r , t h e p r e s s u r e o n s t e r l i n g
r e a c h e d i t s p e a k i n t h e t h i r d q u a r t e r . T h e m a i n f a c t o r s a t t h a t t i m e w e r e t h e
s e a s o n a l l y h i g h p a y m e n t s def ic i t o f $ 2 9 0 m i l l i o n , i n c l u d i n g t h e b a l a n c i n g i t e m ,
a n d t h e r e d u c t i o n o f $ 8 8 5 m i l l i o n i n s t e r l i n g l i ab i l i t i e s t o h o l d e r s o t h e r t h a n
official h o l d e r s o u t s i d e t h e s t e r l i n g a r e a . M o r e t h a n h a l f o f t h e r e d u c t i o n i n
t h i s i t e m , o r $ 4 7 0 m i l l i o n , w a s i n t h e b a l a n c e s o f t h e o u t e r s t e r l i n g a r e a a n d
r e f l e c t e d i t s l a r g e l y s e a s o n a l p a y m e n t s de f i c i t r a t h e r t h a n l a c k of c o n f i d e n c e i n
s t e r l i n g . B y c o n t r a s t , d u r i n g t h e first s ix m o n t h s of t h e y e a r t h e o u t e r s t e r l i n g
a r e a ' s p a y m e n t s s u r p l u s h a d p r o d u c e d a r i s e o f $ 7 4 0 m i l l i o n i n i t s s t e r l i n g
b a l a n c e s , t h u s c o n s i d e r a b l y e a s i n g t h e b u r d e n of U K official financing.

— 123 —
In the last quarter of 1966 the balance of payments turned into surplus.The reserves went down by $60 million but some repayments of assistancewere made. At the same time, the sterling balances of the non-sterling areabegan to be rebuilt. Officially-held balances, excluding assistance, must haveshown a significant rise, since even including repayments of assistance theywent up by $10 million during the quarter. And privately-held non-sterling-areabalances also increased, by $80 million. The potential effect on the reservesof these inflows, as well as of miscellaneous capital receipts of $70 million,was, however, nullified by a renewed outflow of $140 million arising fromchanges in the banks' net foreign currency position and by a further reductionof $255 million in the outer sterling area's sterling balances.
During the first quarter of 1967 there was a substantial inflow of fundsto London, particularly at the beginning of the year. This took the formpartly of a further rebuilding of sterling balances by the non-sterling areaand partly of a reflux of funds from the United States following the easingof dollar interest rates. Details of first-quarter developments are not yetavailable, but it is known that the reserves went up by $160 million and thatmost of the outstanding central-bank assistance was repaid.
Continental western Europe. The main features of the external monetarymovements of continental western European countries for 1966 show a con-siderable contrast with those for 1965. Firstly, the total external monetarysurplus, at $1,080 million, was less than half what it had been the yearbefore. To a considerable extent this reflected the decline of the Frenchand Italian surpluses. In addition, it may be mentioned that debt prepaymentsfrom this group of countries to the United States rose from $180 to 410million. Secondly, the improvement in the net foreign positions of thosecontinental banking systems for which data are available amounted to only10 per cent, of the overall surplus, as against 40 per cent, in 1965. Here, too,the difference is accounted for chiefly by France and Italy. Thirdly, thegrowth of official assets slowed down from $1,495 to 975 million. Fourthly,whereas the $335 million increase in official gold and exchange holdingsrecorded in 1965 was the net result of a reduction of $1,980 million inexchange holdings and a rise of $2,315 million in gold reserves, in 1966neither of these items showed much movement, gold reserves going up by$200 million and exchange holdings declining by $85 million.
So far as the gold reserves of continental Europe are concerned, morethan half of the difference between the 1965 and 1966 increases can beaccounted for by transactions between these countries and the internationalmonetary institutions. Thus in 1965 continental European countries received$350 million of gold from the I M F in connection with the $1.4 milliard UKdrawing; in 1966, on the other hand, they made gold subscriptions of$365 million to the Fund. Furthermore, the Swiss National Bank's end-yeargold swaps with the BIS increased by $330 million in 1965, but decreased by$220 million in 1966. Nevertheless the fact remains that in 1965, evenexcluding these transactions with the international institutions, the increase in

124 —
Continental European countries,Canada and Japan: External monetary positions.
CountriesEndof
year
Gold andforeign
exchangeNet IMFand GABposition
Totalofficialassets
Com-mercialbanks(net)
Totalforeignassets
Changes(+ = increase inassets, decrease
in liabilities)Totalofficialassets
Com-mercialbanks
in millions of US dollars
Austria
Belgium-Luxemburg . . . .
Denmark
Finland
France
Germany
Greece
Iceland
Ireland
Italy
Netherlands
Norway
Portugal
Spain
Sweden
Switzerland
Turkey
Total
Canada . .
Japan
19651966
19651966
19651966
19651966
19651966
19651966
19651966
19651966
19651966
19651966
19651966
19651966
19651966
19651966
19651966
19651966
19651966
19651966
19651966
19651966
1,2351,225
2,1452,120
510510
275140
5,3705,655
7,0707,240
235250
4550
395490
4,4004,235
2,0452,030
445480
9901,100
1,2701,040
815845
3,7003,685
6025
31,00531,120
2,6052,230
1,8651,735
70100
310370
6070
1530
885985
1,0751,255
1525
55
10
550685
360415
2545
1520
140165
140165
2020
3,6554,515
355450
255320
1,3051,325
2,4552,490
570580
290170
6,2556,640
8,1458,495
250275
5055
405490
4,9505,120
2,4052,445
470525
1,0051,120
1,4101,205
9551,010
3,7003,685
405
34,66035,635
2,9602,680
2,1202,055
60145
560705
4525
6590
110155
680580
510
250240
195195
3545
1040
110110
95135
-1,215*-1.1102
70355
900515
1,2451,180
1,8951,785
525555
22580
6,1456,485
7,4657,915
255280
4545
655730
4,7555,315
2,4402,400
480485
1,1151,230
1,4101,205
1,0501,145
29,705*30,835*
2,8903,035
1,2201,540
— 10+ 20
16035
— 60+ 10
- 70- 120
+ 705+ 385
- 325+ 350
— 3025
- 40+ 85
+ 955+ 170
+ 55+ 115
- 105— 205
+ 55
+ 60— 15
+ 25— 35
+ 1,495+ 975
+ 140— 280
+ 130- 65
— 45- 85
- 25- 145
8020
- 15- 25
+ 255- 45
+ 45'+ 100
— 5
— 10— 10
+ 620+ 390
7540
9055
- 75— 80
+ 70- 50
+ 30
2040
+ 9502
+ 1052
— 400+ 425
+ 280+ 385
' After elimination of statistical changes. 2 Fifteen countries only.Note : For Group of Ten countries, plus Switzerland, the figures for official assets are those used for multi-lateral surveillance. They do not in most cases correspond to published reserve figures.

— 125 —
continental European gold reserves was somewhat larger than the total ofofficial financing, whereas in 1966 it was somewhat smaller.
As regards the difference between 1965 and 1966 in the movement ofcontinental official exchange holdings, much of the explanation of the largedrop that occurred in 1965 is to be found in the extent to which thesecountries lent their currencies through the I M F and the large increase in theircommercial banks' net foreign positions. In addition, there were in 1965 someexceptional conversions into gold of exchange reserves that had accrued inearlier years.
With regard to the geographical distribution of continental Europeanreserve increases in 1966, the largest rises were recorded in France ($385 million)and Germany ($350 million). Italy's official assets went up by $170 million,their rise having been limited by transfers of dollars to the banking systemthrough special swap arrangements. In relation to their economic rôle,rather large reserve gains were shown by Portugal ($115 million), Ireland($85 million) and Norway ($55 million).
Three countries accounted for virtually the whole advance in continentalgold reserves, viz. France ($530 million), Portugal ($70 million) and Greece($40 million). France also showed the largest decline in exchange reserves($250 million), but Spain's holdings fell substantially, by $205 million, andItaly's by $175 million. Germany's foreign exchange assets, on the otherhand, went up by $285 million. The $860 million increase in continental netIMF positions was fairly broadly distributed, though Italy, with $335 million,had much the largest individual rise. This included the $250 million specialloan to the Fund in August 1966.
During the first quarter of 1967 the net official assets of continentalcountries declined by $545 million, their gold and exchange holdings goingdown by $435 million and their net I M F and GAB positions by $110 million.On the other hand, the net foreign liabilities of the commercial banks inthose countries for which data are available fell by $740 million, the Germanbanks alone having increased their foreign position by $820 million.
Germany. For Germany the main influence on monetary movementsduring 1966 was the pronounced improvement in the balance of paymentsfrom a deficit of $280 million to a surplus of $450 million. If the debtprepayment of $195 million made to the United States in December 1966 iscounted as an official financing item, the 1966 surplus becomes $645 million.As there was not much change in the banks' net positions, the improvementin the balance of payments showed up mainly in a turn-round of the netofficial position from a loss of $325 million to a gain of $350 million, or$545 million if the debt prepayment is included.
It was not until May 1966 that the external position moved decisivelyinto surplus. During the first four months of the year, in fact, there was aslight deficit of $5 million. The commercial banks recorded a seasonal improvement
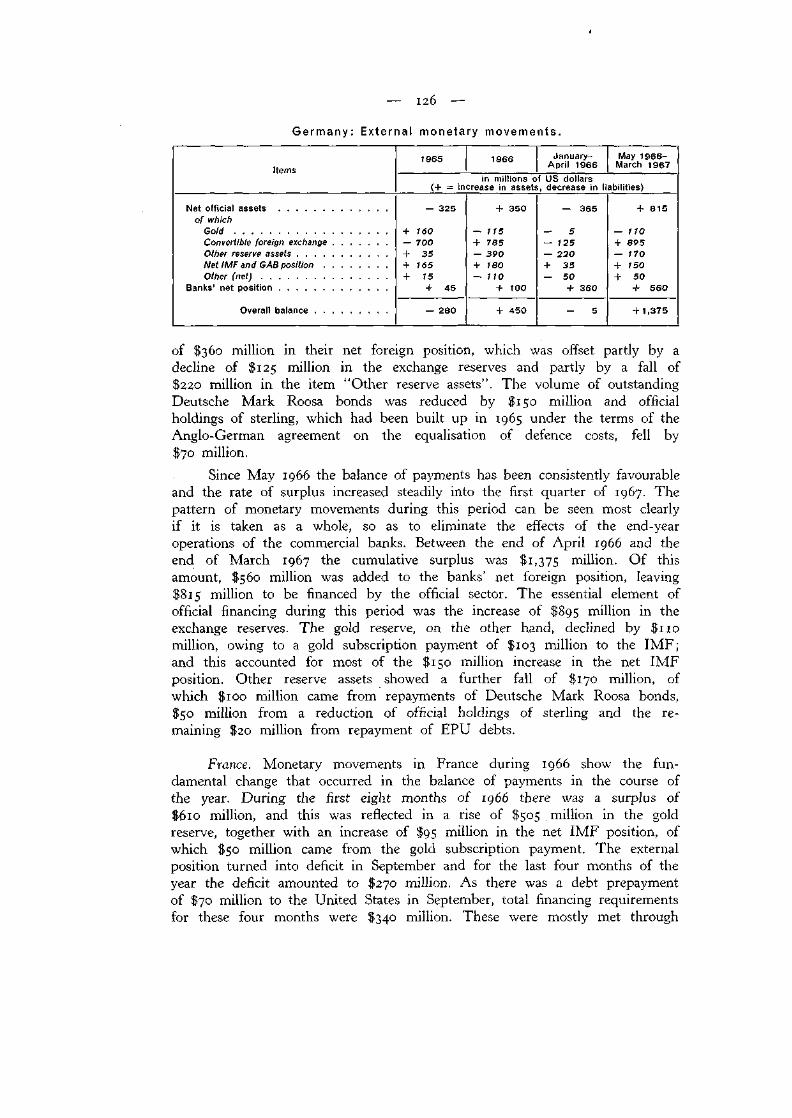
I2Ó —
Germany: External monetary movements.
Items1965 1966
January-April 1966
May 1966-March 1967
in millions of US dollars(+ = increase in assets, decrease in liabilities)
Net official assetsof which
GoldConvertible foreign exchangeOther reserve assets . . . .Net IMF and GAB position .Other (net)
Banks' net position
Overall balance . .
— 325
+ 160— 700+ 35+ 765+ 15
45
— 280
+ 350
— 115+ 785— 390+ 180— 110
100
+ 450
— 365
— 5— 125— 220+ 35— 50
360
- 5
+ 815
— 110+ 89S— 170+ 150+ 50
+ 560
+ 1,375
o f $ 3 6 0 m i l l i o n i n t h e i r n e t f o r e i g n p o s i t i o n , w h i c h w a s o f f s e t p a r t l y b y a
d e c l i n e o f $ 1 2 5 m i l l i o n i n t h e e x c h a n g e r e s e r v e s a n d p a r t l y b y a f a l l o f
$ 2 2 0 m i l l i o n i n t h e i t e m " O t h e r r e s e r v e a s s e t s " . T h e v o l u m e o f o u t s t a n d i n g
D e u t s c h e M a r k R o o s a b o n d s w a s r e d u c e d b y $ 1 5 0 m i l l i o n a n d o f f i c i a l
h o l d i n g s o f s t e r l i n g , w h i c h h a d b e e n b u i l t u p i n 1 9 6 5 u n d e r t h e t e r m s o f t h e
A n g l o - G e r m a n a g r e e m e n t o n t h e e q u a l i s a t i o n o f d e f e n c e c o s t s , f e l l b y
$ 7 0 m i l l i o n .
S i n c e M a y 1 9 6 6 t h e b a l a n c e o f p a y m e n t s h a s b e e n c o n s i s t e n t l y f a v o u r a b l e
a n d t h e r a t e o f s u r p l u s i n c r e a s e d s t e a d i l y i n t o t h e f i r s t q u a r t e r o f 1 9 6 7 . T h e
p a t t e r n o f m o n e t a r y m o v e m e n t s d u r i n g t h i s p e r i o d c a n b e s e e n m o s t c l e a r l y
i f i t i s t a k e n a s a w h o l e , s o a s t o e l i m i n a t e t h e e f f e c t s o f t h e e n d - y e a r
o p e r a t i o n s o f t h e c o m m e r c i a l b a n k s . B e t w e e n t h e e n d o f A p r i l 1 9 6 6 a n d t h e
e n d o f M a r c h 1 9 6 7 t h e c u m u l a t i v e s u r p l u s w a s $ 1 , 3 7 5 m i l l i o n . O f t h i s
a m o u n t , $ 5 6 0 m i l l i o n w a s a d d e d t o t h e b a n k s ' n e t f o r e i g n p o s i t i o n , l e a v i n g
$ 8 1 5 m i l l i o n t o b e financed b y t h e o f f i c i a l s e c t o r . T h e e s s e n t i a l e l e m e n t o f
o f f i c i a l financing d u r i n g t h i s p e r i o d w a s t h e i n c r e a s e o f $ 8 9 5 m i l l i o n i n t h e
e x c h a n g e r e s e r v e s . T h e g o l d r e s e r v e , o n t h e o t h e r h a n d , d e c l i n e d b y $ 1 1 0
m i l l i o n , o w i n g t o a g o l d s u b s c r i p t i o n p a y m e n t o f $ 1 0 3 m i l l i o n t o t h e I M F ;
a n d t h i s a c c o u n t e d f o r m o s t o f t h e $ 1 5 0 m i l l i o n i n c r e a s e i n t h e n e t I M F
p o s i t i o n . O t h e r r e s e r v e a s s e t s s h o w e d a f u r t h e r f a l l o f $ 1 7 0 m i l l i o n , o f
w h i c h $ 1 0 0 m i l l i o n c a m e f r o m r e p a y m e n t s o f D e u t s c h e M a r k R o o s a b o n d s ,
$ 5 0 m i l l i o n f r o m a r e d u c t i o n o f o f f i c i a l h o l d i n g s o f s t e r l i n g a n d t h e r e -
m a i n i n g $ 2 0 m i l l i o n f r o m r e p a y m e n t o f E P U d e b t s .
France. M o n e t a r y m o v e m e n t s i n F r a n c e d u r i n g 1 9 6 6 s h o w t h e f u n -
d a m e n t a l c h a n g e t h a t o c c u r r e d i n t h e b a l a n c e o f p a y m e n t s i n t h e c o u r s e o f
t h e y e a r . D u r i n g t h e first e i g h t m o n t h s o f 1 9 6 6 t h e r e w a s a s u r p l u s o f
$ 6 1 0 m i l l i o n , a n d t h i s w a s r e f l e c t e d i n a r i s e o f $ 5 0 5 m i l l i o n i n t h e g o l d
r e s e r v e , t o g e t h e r w i t h a n i n c r e a s e o f $ 9 5 m i l l i o n i n t h e n e t I M F p o s i t i o n , o f
w h i c h $ 5 0 m i l l i o n c a m e f r o m t h e g o l d s u b s c r i p t i o n p a y m e n t . T h e e x t e r n a l
p o s i t i o n t u r n e d i n t o d e f i c i t i n S e p t e m b e r a n d f o r t h e l a s t f o u r m o n t h s o f t h e
y e a r t h e d e f i c i t a m o u n t e d to $ 2 7 0 m i l l i o n . A s t h e r e w a s a d e b t p r e p a y m e n t
o f $ 7 0 m i l l i o n t o t h e U n i t e d S t a t e s i n S e p t e m b e r , t o t a l financing r e q u i r e m e n t s
f o r t h e s e f o u r m o n t h s w e r e $ 3 4 0 m i l l i o n . T h e s e w e r e m o s t l y m e t t h r o u g h

— 127 —
drawing $245 million on the exchange reserves, and there was a decline of$45 million in the banks' net foreign position. During the first quarter of1967 there was a further moderate deficit of $50 million. As this wasaccompanied by an inflow of $60 million through the banks, net officialassets rose slightly.
Italy. As in France, the balance of payments became markedly lessfavourable in 1966. The long period of surplus, which had begun in thesecond quarter of 1964, came to an end in the third quarter of 1966 and gaveway to a deficit of $110 million in the last quarter of the year. As a result,the annual surplus was reduced from $1,575 million in 1965 to $560 millionin 1966. These figures, however, overstate the deterioration that occurredbetween the two years, since there was a debt prepayment of $145 million tothe US Government in September 1966 which may be considered as a sortof financing item.
During the first three quarters of 1966 the Italian commercial bankscontinued to absorb part of the balance-of-payments surplus and thus helpedto moderate the need for official financing. Within this general framework,however, the pattern of monetary movements varied considerably from quarterto quarter.
In the first quarter there were no problems of official financing, sincethe overall surplus of $75 million was more than covered by an increase,partly seasonal, of $220 million in the banks' net foreign position. Netreserves fell by $275 million, which was considerably more than the banks'external surplus for the quarter. There were two reasons for this. One wasthe gold subscription payment of just over $30 million to the I M F and theother was the increase of $90 million in the item "Other official assets",representing a shift from first-line reserves into longer-term assets.
Items
of whichGoldForeign exchange . . .Other reserve assets .Short-term liabilities .
Net IMF and GABposition and otherloans to IMF
Other official assets . . .
Net official position . . .
Banks' net position . . .
Overall balance. .
Italy: External monetary
1965
+ 400
+ 295— 110+ 225— 10
+ 405+ 150
+ 955
+ 620
+ 1,575
Year
(+ =
— 220
+ 10— 175— 85+ 30
+ 335+ 55+ 170
+ 390
+ 560
1stquarter
movements.
19662nd
quarter3rd
quarter4th
quarterin millions of US dollars
increase in assets, decrease in liabilities)
— 275
— 35— 190- 50
+ 40+ 90
— 145
+ 220
+ 75
+ 175
+ 165— 10
+ 30— 30
+ 175
+ 10
+ 185
— 35
— 10- 7 05+ 60+ 20
+ 255+ 5
+ 225
+ 185
+ 410
- 85
+ 55— 65— 85+ 10
+ 10— 10
— 85
— 25
— 1 10
19671st
quarter
- 170
— )50— 15— 5
+ 25+ 5— 140
- 105
— 245

— 128 —
During the second quarter the surplus rose to $185 million, the monetarycounterpart of which was an increase of $175 million in net reserves. In thethird quarter, when the surplus reached its seasonal peak, the banks' netforeign position showed a substantial rise of $185 million, leaving $225 millionto be financed by the official sector. In July the Federal Reserve activated itslira swap facility to the extent of $225 million in order to absorb the influxof dollars into Italy's reserves. But in the following month this swap wasliquidated by means of a $250 million lira drawing by the United States onthe IMF. This drawing was financed by a special lira loan to the Fund, whichessentially accounts for the third-quarter increase in Italy's net I M F position.
The last-quarter deficit was mostly reflected in a decline of $85 millionin the net official position. More precisely, it was financed by a reduction ofthat amount in dollars held under swaps with the Federal Reserve, which areincluded in the item "Other reserve assets". The exchange reserves declinedby $65 million, almost entirely as a result of gold purchases from the USTreasury.
Owing partly to fiscally-motivated outflows of capital, the overall deficitincreased to $245 million in the first quarter of 1967. The exchange reservesfell by $150 million and the banks' net foreign position declined by $105 mil-lion. The deficit was concentrated in January and February, after which Marchshowed a surplus of $40 million.
Italian policy as regards the financing of the payments surplus can beclearly seen by adding together the monetary items for 1965 and 1966. Outof a total surplus of $2,135 million, $1,010 million was financed through thebanks and a further $740 million through the IMF. The first-line reserves ofgold and foreign exchange showed a rise of only $20 million.
Netherlands. In 1966 the balance of payments showed a deficit of$40 million. The banking system, however, reduced its net foreign position bytwice that amount, so that net official monetary assets were able to rise by$40 million. In fact there was an increase of $55 million in the net I M Fposition, accompanied by a decline of $15 million in the gold and exchangereserves. The increase in the Netherlands' net Fund position was due as to$25 million to the payment of its gold subscription to the Fund and for therest to other members' drawings of florins on the Fund. These transactionsproduced a corresponding reduction in the gold and exchange reservesrespectively, but, so far as the exchange reserves are concerned, they weremore than offset by the effects of the reduction in the banks' net foreignposition, so that the exchange reserves actually rose during the year by$10 million.
There was a considerable contrast between the two halves of 1966 asregards both the pattern and direction of external monetary movements.During the first six months of the year there was a balance-of-paymentsdeficit of $180 million, which was reflected in a $105 million reduction in thebanks' net foreign assets and a decline of $75 million in net official assets.

— 129 —
In the second half of the year, however, when the balance of paymentsmoved into surplus on a cash basis, the banks' foreign position increased byonly $25 million, whilst net official assets rose by $115 million.
The cash balance of payments showed a further deficit of $60 millionduring the first quarter of 1967, the counterpart to which was a decline in thenet external position of both the official and banking sectors. The exchangereserves fell by $50 million, partly through a rise of some $20 million inother official assets; and the banks' net foreign liabilities went up by $35 million.
Belgium. In Belgium the pattern of monetary movements for 1966 as awhole was somewhat similar to that in the Netherlands. The balance ofpayments showed a deficit of $110 million, but owing to a reduction of$145 million in the banks' net foreign position there was a rise of $35 mil-lion in net official assets. As in the Netherlands, the net I M F positionincreased more than the total of official assets, namely by $60 million, whilstthe gold and exchange reserves declined by $25 million. In the first quarterof 1967 there was a payments surplus of $35 million. Net official monetaryassets, however, fell by $10 million, since the banks' net foreign liabilities,which had risen by $185 million during the three preceding quarters, werereduced by $45 million.
Austria. In Austria, too, a payments deficit was accompanied in 1966 byan increase in net official assets. The overall external deficit was $65 million,but this was more than covered by a reduction of $85 million in the banks'foreign position, nearly all of which occurred during the last quarter of theyear, when the deficit reached $90 million. The increase of $20 million intotal net official assets was, as in the Netherlands and Belgium, more thanaccounted for by a rise of $30 million in the net I M F position, of which$25 million resulted from the payment of Austria's gold subscription to theFund. There was no change in the gold reserve during the year, whilst theexchange reserves decreased by $10 million.
Switzerland. Switzerland's net official monetary assets fell by $15 millionin 1966. The gold and exchange reserves went up by $75 million, whilstother official assets declined by $90 million. During the first four monthsof the year the reserves were reduced by $450 million, partly for seasonalreasons and partly because of the attraction of rising interest rates abroad.In May the Swiss money and capital markets began to tighten and this,combined with mid-year window-dressing, led to an increase of $200 mil-lion in reserves by the end of June. The effects of the reversal of thewindow-dressing operations in July were to a considerable extent offset by therepercussions of the sterling crisis, but the reserves declined gradually be-tween end-June and end-October by a total of $110 million before risingagain by $435 million by the end of the year. The gold reserve was $200 mil-lion lower at the end of 1966 than it had been a year earlier, essentiallybecause of smaller end-year swaps with the BIS. The exchange reserves, onthe other hand, went up during the year by $275 million. As regards the

— 130 —
decline of $90 million in other official assets, $45 million came about througha reduction in the Swiss Confederation's holdings of non-marketable USGovernment securities denominated in Swiss francs.
During the early months of 1967 there were considerable further fluctua-tions in the reserves. Following a seasonal decline of $415 million in January,there were, for the first time, window-dressing operations by the banks at theend of the first quarter, which produced a rise of $210 million in the reservesduring March. The reversal of these operations contributed largely to thedecline of $280 million in the reserves during April.
Of the northern countries, Denmark and Norway were about in balancefor 1966, whilst Sweden recorded a surplus and Finland a deficit.
Sweden. The overall balance of payments showed a surplus of $95 mil-lion. Net official assets went up by $55 million, of which the exchangereserves accounted for $30 million and the net I M F position for $25 million.The banks' net foreign assets rose by $40 million, a decline of $40 million inthe first half of the year being followed by an increase of $80 million in thefollowing six months.
Finland. The balance-of-payments deficit increased between 1965 and1966 from $85 to 145 million, over half of the rise being recorded in thefinal quarter of the year. Most of the 1966 deficit was financed by a reductionof $120 million in net official assets. The gold reserve declined by $40 million,of which $15 million was paid to the I M F and was reflected in an increasein Finland's net Fund position, and the exchange reserves fell by $80 million.
Spain. The balance-of-payments deficit increased to $205 million in 1966.During the first six months net official assets declined by $215 million, thegold and exchange reserves falling by $240 million whilst the net I M Fposition, owing to the payment of the Fund gold subscription, went up by$25 million. Then, during the third quarter, the reserves rose seasonally by$85 million and, although they declined again during the last quarter, at theend of the year they stood $15 million above the mid-year figure. During thefirst quarter of 1967 there was a further deficit of $170 million, virtually allof which was financed by drawing $165 million, the whole of Spain's goldtranche position, from the IMF.
Canada. The balance of payments, measured as the sum of changes innet official monetary assets and in the net foreign position of the banks,improved between 1965 and 1966 from a deficit of $260 million to a surplusof $145 million. At the same time there was a complete reversal not only ofthe direction but also of the pattern of monetary movements. In 1965 the defi-cit had been more than covered by a $400 million net reduction in the banks'short-term foreign position, so that net official monetary assets rose by $140 mil-lion. In 1966, on the other hand, the banks' net foreign position increasedby $425 million, whilst net official assets were reduced by $280 million.

— 131 —
The 1966 increase in the banks' foreign position resulted essentially fromthe pull of higher interest rates in the United States. More than half of therise took place in the third quarter of the year, when monetary conditions inthe United States were particularly tight. So far as the change in net officialassets is concerned, the main item was a fall of $430 million in the gold andexchange reserves. The gold reserve went down by $105 million, includinggold sales of $200 million to the US Treasury; and the exchange reserveswere reduced by $325 million during the year, $145 million of which resultedfrom repurchases by the Canadian Government of its own US dollar obliga-tions held in the United States. The exchange reserves were also affected bycertain transactions which led to increases in non-reserve monetary assets.On the one hand, Canada's net I M F position went up by $95 millionduring the year and, on the other hand, the Canadian Government purchased$25 million of IBRD securities from US residents. By the end of 1966Canada's gold and US dollar reserves plus its net creditor position in theI M F had fallen to about $2,500 million, somewhat below the figure whichhad been agreed on with the US authorities in return for Canadian exemptionfrom the US interest equalisation tax.
In the first quarter of 1967 there was a balance-of-payments deficit of$315 million, nearly all of which was financed by a $280 million decline in the
_hanks!-jiet foreign position. The reserves fell-by-%j-million, official-^xehange-balances decreasing by $70 million, whilst the gold reserve rose by $35 million.
Japan. The overall balance showed a surplus of $320 million in 1966,compared with one of $410 million the year before. The surplus was morethan financed, as in the case of Canada, by an increase of $385 millionin the banks' net foreign position. Since interest rates abroad, particularly inthe United States, were higher than those in Japan, the banks' yen liabilitiesfell by $215 million and their net foreign exchange liabilities by $170 million.Japan's net official monetary assets declined over the year by $65 million,the principal changes being a fall of $100 million in the exchange reservesand an increase of $65 million in the net I M F position.
During the first quarter of 1967 there was a deficit of $285 million,which was more than covered by a decline of $300 million in the banks'net foreign position.
Foreign exchange markets.
Two important sets of factors affected exchange-market developmentsduring the period under review. On the one hand, there was the in-fluence of US monetary policy and, on the other, the evolution of the basicbalance of payments in certain important European countries. So far as theformer is concerned, the period under review falls into two distinct phases.During the first of these, which lasted for most of 1966, tight monetaryconditions were attracting funds to the United States. This, despite thecontinuing US balance-of-payments deficit, created a strong underlying demand

— 132 —
for dollars and contributed, except in large surplus countries, to some weakeningof European currencies against the dollar. During the second phase, whichbegan in December 1966 and was still continuing in the early months of1967, US monetary policy was being progressively relaxed. Partly as a resultof this, and although policies in some European countries were eased, to someextent in sympathy with US developments, most European currencies wereat or above par on the US dollar by early May 1967.
So far- as the exchange-market effects of European balance-of-paymentsdevelopments are concerned, these are most clearly seen in the weakness ofsterling in the spring and summer of 1966, followed by its recovery fromlate September onwards, in the weakening of the French franc and the Italianlira during the last quarter of 1966, and in the progressive strengthening ofthe Deutsche Mark from May 1966 onwards.
Sterling. At the beginning of 1966 the outlook for the pound appearedencouraging. A steady inflow of funds since September 1965 had, despite largeofficial purchases of dollars, most of which were used for the repayment ofassistance and for the reduction of the authorities' outstanding forward exchangecommitments, brought the spot rate by mid-January up to $2.8ox/2- Over thesame period the three-month forward discount on the dollar had narrowedfrom 2Y2 to 1 per cent, per annum.
From mid-February onwards, however, the situation began to deteriorateagain. Doubts about the underlying trend of the balance of payments began toreappear and this, followed by the announcement of the general election date,brought the spot rate down to par by the end of the month. At the sametime the upward movement of interest rates in other countries, particularlythe United States, began to put pressure on sterling. By the end of Marchthe spot rate was not much above $2.79%, at or around which level it thenremained until mid-May.
Pressure on sterling increased further when the seamen's strike began on16th May. By the end of that month the spot rate had fallen to $2.79V8 andthe devaluation of the Indian rupee in early June was an added source ofgeneral unease. The announcement on 13th June of new central-bank supportarrangements for sterling brought momentary relief but this was soon followedby a further tightening of monetary conditions abroad as mid-year approached,and despite official support the spot rate went below $2.79. During the secondquarter, however, there was little change in the authorities' forward exchangecommitments, and the three-month forward discount on the dollar in factdeclined from 1 to 0.6 per cent, per annum, largely as a result of theswapping of sterling into dollars.
In July continuing tight monetary conditions abroad, coupled with thepublication of unfavourable balance-of-payments figures for the first quarterof the year and a substantial loss of reserves for June, caused the situationto deteriorate rather drastically. During the first half of the month there washeavy selling of sterling, both spot and forward. At considerable cost to the

— 133
Sterling/dollar exchange raies.*Friday figures.
2.82
2.80
2.78
-I
/ ~^N * '"\».v«,'\,.<'Security sterling \ . - • -w- '
-1
Three-month forward sterling
i i I i i i i
+ 1+0.75
•0.75
-2
1967
* The spot dollar rate for sterling is shown both in dollars and, as is also the case for the security sterlingrate, as a percentage of the parity. The three-month forward rate for sterling is shown as a discount on thespot rate, on a percentage per annum basis.
reserves, which were supplemented by substantial external assistance, the spotrate was not allowed to fall below $2.78 s/8, but the three-month forwarddiscount widened to over 1 per cent, by mid-month. Indicators of the abruptdecline of confidence in sterling included a widening of the discount on securitysterling to over 3 per cent, and a rise in three-month Euro-sterling interestrates to over 8 per cent. Strong measures were then taken to correct thesituation, but sterling continued to be under some pressure until well intoSeptember, although from about the middle of August onwards this seemedto be due as much to a general shortage of dollars overseas as to confidencefactors. The spot rate, after recovering to about $2.79 at the end of July,weakened again in August and remained below that level until the secondhalf of September, whilst the forward rate weakened considerably in late Julyand early August, to a discount of 1% per cent, per annum.
The announcement on 13th September of further central-bank supportarrangements, made at a time when the dollar shortage was already becomingless acute and it was becoming apparent that sterling itself was in shortsupply, at last brought a reversal of the situation. Sterling strengthened, bothspot and forward, later in the month and the improvement was generallymaintained for the rest of the year. Though the spot rate did not go muchabove $2.79, the three-month forward discount on the dollar had come downto less than % per cent, per annum by the end of October.

— 134 —
A decline in dollar interest rates from December 1966 onwards movedinterest-arbitrage margins in favour of sterling. This, together with growingexpectations of a reduction in sterling interest rates, accentuated the normalseasonal return of funds after the end of the year. With the basic balanceof payments back in surplus, there was, therefore, a very large inflow offoreign exchange during January 1967, which allowed the authorities to makesubstantial repayments of assistance whilst also letting the spot rate rise to about$2.79%. After easing somewhat in February, quotations strengthened againduring March, and in mid-April, by which time the bulk of the assistancehad been paid off, the spot rate reached parity for the first time for over ayear. In May, however, a number of factors combined to produce an easingof the rate to about $2.79% at the end of the month.
Swiss franc. During the early months of 1966 there was a considerableoutflow of funds from Switzerland, partly for the usual seasonal reasons andpartly because of rising interest rates in the Euro-dollar market. As a resultthe spot rate for the Swiss franc against the dollar eased progressively fromSw.fr. 4.3i7/8 at the end of 1965 to Sw.fr. 4.343/8 three months later. In Aprila tightening of the Swiss money market caused the Swiss franc to becomefirmer and by early May the spot dollar rate had reached the official interven-tion point of Sw.fr. 4.3iV%. An equally sharp fall in the forward premium onthe dollar, which ran off completely during April, suggests that this tightnesswas not expected to last beyond mid-year. In the event, however, the sterlingcrisis kept the spot rate for the dollar very close to the intervention pointuntil late July.
In August, after the height of the sterling crisis was passed, fundsbegan to flow out of Switzerland again as interest rates abroad reached theirpeak, and the spot rate for the dollar eased to Sw.fr. 4.33. Following afurther weakening to almost Sw.fr. 4.34 in October, it hardened duringNovember to Sw.fr. 4.31%, as end-year liquidity preparations were put inhand, but then eased to below Sw.fr. 4.32 in December when the end-yeartightness of the market was moderated by official intervention.
Early in 1967 the spot rate for the dollar eased further, in accordancewith the usual seasonal pattern. But as domestic interest rates remained firm,in contrast with the general downward trend apparent elsewhere, demand forfrancs brought the spot rate up to the official intervention point in lateApril 1967.
Deutsche Mark. The striking improvement that occurred in Germany'sbalance of payments during the period under review was reflected in theexchange-market quotations for the Deutsche Mark. This improvement, how-ever, did not begin to make itself felt until May 1966. In fact, during thefirst four months of the year the Deutsche Mark remained well below paron the dollar, partly because of a seasonal outflow of funds through the banksin January and partly because the overall external position continued indeficit during February, March and April. Indeed, had the US authorities not

135 —
European quotations for the US dollar.Friday figures, showing the European currencies above ( + ) or below (—) par on the US dollar.
+ 1.60
M.20
+0.80
+ 0.40
Parity
-0.40
-0.80
V
\
Y
Eli?]i i 1
A
\\\\
Swiss franc
French franc
Italian lira
V\
!
\
\\
J111
Deutsche Mark
i i 1 i I 1 i i
\
/(
|
V '••...
i i
/
\ J
[ i i i1965 1966 1967
+ 1.60
+ 1.20
+ 0.80
0.40
Parity
-0.40
-0.80
been purchasing Deutsche Mark during these months in the market, the spotrate against the dollar might have fallen even further.
From the end of April onwards spot quotations improved almost con-tinuously and the Deutsche Mark reached its upper limit on the dollar byDecember. Although the swing into very large balance-of-payments surplusexplains the strength of the upward movement in the exchange rate, otherfactors influenced its rate of appreciation. The acute sterling crisis certainlycontributed to the sharpness of the rise in mid-year, whereas subsequently theupward trend of quotations was moderated by the attraction of Euro-dollarinterest rates. Despite an easing of liquidity requirements for the banks,tight domestic monetary conditions in connection with the year-end finallycarried the rate to its ceiling.
A substantial, more-than-seasonal outflow of funds in the new year causedthe Deutsche Mark to ease in January, but, although this outflow continued,under the weight of the external surplus the exchange rate soon recoveredto just below its ceiling.
French franc. The long series of external surpluses which had begunas soon as the franc was stabilised in December 1958 came to an end inthe late summer of 1966, and the spot rate for the French franc against thedollar, which had remained consistently at or very close to the upper interventionpoint, began to ease rather rapidly. It went below par at the end of September1966 and by the end of the year stood at a discount of some 0.3 per cent.Although the balance of payments continued in moderate deficit, the franc

— 136 —
became a little firmer in the new year. Quotations then eased again inFebruary and March, only to become much firmer in April, and by lateMay the spot rate for the franc was well above par.
Italian lira. The most striking feature of exchange-market quotations forthe lira during the period under review was their greater flexibility. FromMarch 1964 until early in 1966 the spot rate against the dollar had beenheld by the authorities just above the parity of Lit. 625. From there it roseto Lit. 623% in August 1966, reflecting the seasonal strengthening of thebalance of payments, and subsequently declined to just below par in January1967 as the external position turned into deficit. When the balance of pay-ments reverted to surplus in March 1967 the lira went above par on thedollar again, and at the end of April it stood at Lit.
Other exchange developments.
There were further changes during the year both in foreign exchangecontrols in the strict sense as well as in certain less formal arrangementslimiting the freedom of international monetary flows. The reserve-currencycountries both had recourse to further restraints on outward transfers, whilein France there were substantial relaxations of administrative regulations.
In the United States the balance-of-payments guide-lines for 1967followed their earlier pattern. Non-financial corporations were asked to limitdirect investment abroad during 1966-67 to an annual average 20 per cent,above that for 1962—64. The existing ceiling on commercial-bank foreignlending of 109 per cent, of the end-1964 level has been retained until the endof 1967, and the banks have been requested to phase their lending within thisceiling evenly over the period. Finally, non-bank financial institutions were askedto keep the growth in their foreign assets down to 5 per cent, betweenOctober 1966 and the end of 1967. In addition, there were a number of changesaffecting the interest equalisation tax, which was prolonged until July 1969.The rate of tax, in terms of interest equivalent, was raised to 1% per cent.,and the President of the United States was authorised to vary the taxbetween 1 and 1% per cent. In February 1967 exemption was extended tolending by foreign branches of US banks for periods of over one year.
The outward movement of long-term capital was already heavily circum-scribed in the United Kingdom, and the exchange control aspects of theJuly 1966 programme consequently concentrated rather on tightening existingrestrictions on current transfers. The basic annual holiday travel allowancewas cut to £50 per person, and the limit on cash gifts from UK residentsto residents outside the sterling area was similarly reduced. At the same time,control over outward transfers by UK emigrants was tightened. A monthlater, to reduce the scope for switching between sterling and foreign currenciesby the UK banking sector, the individual limits imposed upon authorisedforeign exchange dealers' open positions and their spot against forward

— 137 —
positions were reduced. A change of a rather different kind was announcedwith the April 1967 budget, when it was decided that all non-residenttransactions in sterling securities would be settled at the official rate ofexchange, thereby abolishing the market in security sterling.
On the Continent the most important development was the Frenchmove to virtually complete convertibility. From the end of January 1967almost all the remaining exchange control regulations were rescinded and thegeneral freedom of transfer of all means of payment, securities and gold wasrestored. This broad liberalisation had been foreshadowed, in 1966, by thegeneral permission granted to banks to open foreign currency accounts fortheir customers, and by the extension to one year of the time-limit onforward exchange operations and on French franc credits to non-residents.Permission is still required, however, for foreign direct investment in France(including portfolio investment resulting in the acquisition of a 20 per cent,interest in a French quoted company) or for direct French investment abroad.Equally, the introduction of foreign securities on the French capital market andFrench non-bank borrowing abroad in excess of Fr.fr. 2 million still requireadvance authorisation.
Outside Europe and North America, perhaps the most significantexchange developments were the currency devaluations in India, Brazil andArgentina. From 6th June 1966 the declared par value of the rupee wasreduced by some 36 per cent, from Rupees 4.76 to Rupees 7.5 = US $1.As part of a wider currency reform, the free rate for the new Braziliancruzeiro (equal to 1,000 old cruzeiros) was devalued by 18 per cent, fromCruz. 2.22 to Cruz. 2.72 = US $1 from 13th February 1967; and a monthlater, after a series of smaller devaluations, the Argentine peso was devaluedby 29 per cent, from Pesos 250 to Pesos 350 = US $1, a rate which appliesto all operations.

- 138 -
IV. T H E E U R O - C U R R E N C Y M A R K E T .
In 1966 the Euro-currency market experienced its largest annual increase,in both liabilities and assets. For the reporting European countries the dollarvolume in the market, net of redeposits between banks, may be estimatedto have risen from about $10 to 13 milliard.
The main expansionary factor was the tightening of credit in theUnited States, which, among other things, led to heavy Euro-dollar borrowingby US banks. In addition, demand was kept high by the reduced foreignaccess to bank credit in the United States and by credit-market tensions inGermany and the Netherlands. The resultant strengthening of the demand forEuro-dollars led to a sharp rise in Euro-dollar deposit rates that was apparentlyquite successful in attracting new funds to the market. In addition, the supplyof Euro-dollars received support from a further increase in the ItalianExchange Office's dollar swaps, from the depositing in the Euro-dollar marketof part of the proceeds of US issues in the Euro-capital market and from thesterling crisis in the summer of 1966, which partly took the form of switchesof foreign London-held sterling balances into Euro-dollars.
The external dollar liabilities of the banks of the eight reportingEuropean countries went up by $3.4 milliard, or about 30 per cent., in 1966and their assets by $4.5 milliard, or nearly 40 per cent. The $1.1 milliardincrease in their net dollar asset position reflected mainly larger placementsin the United States. This demand for Euro-dollars tended to shift thebanks' new lending away from their own area and to cause them to convertincreased amounts of other currencies into dollars. This latter point is con-firmed by the $480 million deterioration in the banks' net foreign positionin reported currencies other than dollars.
Changes in the banks' external foreign currency positions.
ItemsDollars
Liabilities Assets Netposition
Other reported currencies'
Liabilities Assets Netposition
in millions of US dollarsEight reporting European countries2
19651966
Amount outstanding at endof19663
Canada and Japan19651966 .
Amount outstanding at endof 19663
+ 1,710
+ 3,370
14,720
— 50
— 220
4,700
+ 2,590
+ 4,470
16,060
— 100
+ 470
5,760
+ 880
+ 1,100
+ 1,340
— 50
+ 690
+ 1,060
+ 250
+ 770
3,590
+ 20
- 80
310
520
290
3,850
110
30
460
+ 270
— 480
260
— 130
+ 50
7 50
1 Sterling, Swiss francs, Deutsche Mark, French francs, Dutch florins, Italian lire. 2 Belgium-Luxemburg, France,Germany, Italy, Netherlands, Sweden, Switzerland, United Kingdom. 3 For full series see tables on pages 147-152.

— 139 "
Liabilities and assets in these other currencies went up by $770 and290 million respectively, or at a considerably lower average rate than thepositions in dollars. As in preceding years, their relative importance thustended to decline. Whereas in comparison with September 1963, the earliestdate for which reasonably complete data are available, the banks' total grosspositions in dollars more than doubled, those in the other reported currencieswent up by only about one-third. The development differed markedly, how-ever, from currency to currency. In 1966 reported liabilities in Frenchfrancs expanded from $100 to 570 million, those in Swiss francs from $930 to1,220 million and those in Deutsche Mark from $870 to 970 million, whereasliabilities in Dutch florins declined from $170 to 70 million and those insterling from $730 to 710 million.
The external gross foreign currency positions of the Canadian andJapanese banks, which are, however, only partly related to developments inthe Euro-currency market, showed comparatively little overall change in 1966.Liabilities in dollars declined by $220 to 4,700 million, whereas assets wentup by $470 to 5,760 million; the net asset position thus widened sharply from$370 to 1,060 million. Reflecting the voluntary restraint programme and thetightening of US credit conditions, the whole of this rise was vis-à-vis theUnited States, whereas the net position vis-à-vis the rest of the worlddeclined by $150 million. The Japanese and Canadian banks' external positionsin foreign currencies other than dollars are of relatively minor importance andhave, if anything, tended to decline.
Geographical distribution of the reporting European banks' external dollar posi-tions. Only $1,270 million, or about 38 per cent., of the $3,370 million increasein the reporting European banks' dollar liabilities in 1966 was vis-à-vis countriesoutside the reporting group. Liabilities towards US residents, despite the voluntaryrestraint programme, went up by $320 million. A factor behind this movementwas the depositing in the Euro-dollar market of part of the $475 million raisedby US corporations through their security issues in the Euro-capital market.
The reporting banks' liabilities to outside countries other than theUnited States, after edging up by only $160 million in 1965, advanced by$950 million last year. The main causes of this were the highly attractiveinterest rates offered in the Euro-dollar market and the flight out of sterling.Liabilities to "Other western Europe" went up by $240 million and thoseto Latin America, the Middle East and "Other" by $540 million. ,u
The banks' liabilities vis-à-vis countries within the reporting group, aftershowing a $1.4 milliard increase in 1965, mounted by another $2.1 milliardlast year. A substantial part of this advance consisted of funds flowing to theUnited Kingdom on their way to the United States. Liabilities vis-à-visSwitzerland went up by $850 million and those vis-à-vis Belgium by $300 million;the rest of the $2.1 milliard increase was fairly broadly distributed.
The geographical break-down of the rise in assets was quite differentfrom that of liabilities, claims on countries outside the reporting groupaccounting for about two-thirds of the total $4,470 million increase. Assets

140
Dollar positions of reporting European banks vis-à-vis non-residents.
Positions vis-à-vis1964
December1965
December March1966
June September Decemberin millions of US dollars
LiabilitiesOther western Europe . . . .Eastern EuropeCanadaJapanLatin AmericaMiddle EastOther
TotalUnited States
Total outside own areaPosition inside own area . .
of which vis-à-visBelgiumFranceGermanyItalyNetherlandsSwedenSwitzerlandUnited Kingdom
Grand total
AssetsOther western Europe . . . .Eastern EuropeCanadaJapanLatin AmericaMiddle EastOther
TotalUnited States
Total outside own areaPosition inside own area . .
of which vis-à-visBelgiumFranceGermanyItalyNetherlandsSwedenSwitzerlandUnited Kingdom
Grand total
80026088040
610680740
4,0101,260
5,2704,370
2705507 40620260110
1,2401,1 BO
9,640
380460420440290110120
2,2202,820
5,0403,960
32054037088023090
3301,200
9,000
85029056050
720850850
4,1701,370
5,5405,810
340840190
1,240290130
1,7301,050
11,350
6705406705T0380170270
3,2103,010
6,2205,370
3707»0370
1,070370160460
1,860
1 1,590
77022049060710860860
3,9701,450
5,4205,060
39072025085026080
1,790720
10,480
620580480530400150310
3,0703,530
6,6004,800
400520340650400150570
1,770
1 1,400
87019051060
740960950
4,2801,680
5,9605,550
450880220880300130
1,750940
11,510
780720420610470150350
3,5003,900
7,4004,860
380550410600470180580
1,690
12,260
1,02028061050
7601,0901,060
4,8701,800
6,6706,400
520960340
1,300320110
1,880970
13,070
760690360620420170390
3,4104,720
8,1305,930
390780480890520160570
2,140
14,060
1,09036066050
8401,0001,120
5,1201,690
6,8107,910
6401,040240
1,510410150
2,5801,340
14,720
890670620670450190390
3,8805,270
9,1506,910
460900480
1,190570180670
2,460
16,060
v i s - à - v i s U S r e s i d e n t s , a f t e r e d g i n g u p b y o n l y $ 1 9 0 m i l l i o n i n 1 9 6 5 , a d v a n c e d
b y $ 2 , 2 6 0 m i l l i o n , o r a b o u t 7 5 p e r c e n t . , a n d u n d o u b t e d l y r e p r e s e n t e d t h e
m o s t d y n a m i c m a r k e t e l e m e n t i n 1 9 6 6 . T h e b u l k o f t h i s r i s e w a s i n t h e f o r m
o f i n c r e a s e d E u r o - d o l l a r b o r r o w i n g b y U S b a n k s t h r o u g h t h e i r b r a n c h e s i n
E u r o p e , m a i n l y i n L o n d o n . T h i s a c t i v i t y s e e m s t o h a v e c o n t i n u e d u p t o t h e
m i d d l e o f D e c e m b e r 1 9 6 6 , b u t w a s a p p a r e n t l y g r e a t e s t d u r i n g t h e t h i r d
q u a r t e r , w h e n c l a i m s o n t h e U n i t e d S t a t e s s h o t u p b y $ 8 2 0 m i l l i o n .

The increase in the banks' assets vis-à-vis outside countries other thanthe United States slowed down from $990 to 670 million. The explanation forthe smaller rise may largely be that, whereas in 1965 the enactment of theUS voluntary restraint programme tended to increase these countries' depen-dence on Euro-dollar borrowing, in 1966 the greater competition for Euro-dollar funds from US banks left less room for other kinds of borrowers. The$670 million gain was fairly broadly distributed; only claims on Canadadeclined. Assets vis-à-vis Japanese residents — reflecting the economicupswing and the diminished availability of US credit — went up by $160 million,or nearly one-third.
At $1,540 million, the increase in claims on countries within the reportinggroup was on about the same scale as in 1965. Claims on the United Kingdomrose by $600 million, or about one-third.
As regards the geographical break-down of the reporting banks' netposition, the $1.1 milliard addition to their net assets was in the form of a$1,940 million rise in net claims on the United States and of $280 and560 million increases in net liabilities to other outside countries and withintheir own area. The biggest change vis-à-vis countries outside the reportingarea other than the United States was the $160 million rise in net claims onJapan. The net position vis-à-vis Canada, on the other hand, which owing tothe US voluntary restraint programme had shown a $570 million improvementin 1965, declined by $150 million.
Within the reporting area the banks' net position deteriorated by$640 million vis-à-vis Switzerland, $210 million vis-à-vis Belgium and $150 millionvis-à-vis Italy. On the other hand, their net position improved by $310 millionvis-à-vis the United Kingdom and by $80 and 60 million respectively vis-à-vis the Netherlands and Germany. The increase in their net claims on theUnited Kingdom was a counterpart to the sharp rise in the U K banks' claimson the United States, whereas the larger borrowing by Dutch and Germanresidents reflected mainly the tightness of the domestic credit markets.
The net size of the Euro-dollar market. To obtain a truer picture of thenet amount of credit channelled through the Euro-dollar market, several factorshave to be taken into account in considering the data in the table on page 140.On the one hand, the figures are inflated both by a substantial amount ofredepositing between banks and by certain positions which are not related toEuro-dollar market transactions. On the other hand, they do not includepositions vis-à-vis residents and cannot show the intake or the placement ofdollars in the form of swaps. The table on the next page tries to makeallowance for these various factors, using the methods described on pages145-147 of the BIS's Thirty-Sixth Annual Report.
These estimates suggest that the net size of the Euro-dollar marketincreased in 1966 from about $10 to 13 milliard. Liabilities towards theUnited States rose by $0.3 milliard and those towards other outside countriesby $0.9 milliard, while the increase in the supply of funds from within thereporting area may be put at about $1.8 milliard.

— 142 —
Estimated net size of the Euro-dollar market.
Items
Outside areaUnited States . .Other countries .
Total . . . .
Inside areaOfficial monetary
institutions . .Non-residents
other thanbanks . . . .
Non-bank resi-dents, plusswaps from orinto the domes-tic or thirdcurrencies* . .
Total . . . .
Total net sizeof the market .
Sources
1964
0.74.0
4.7
0.8
0.8
1.7
3.3
8.0
1965
0.84.2
5.0
2.2
1.0
1.8
5.0
10.0
1966
Uses
1964
end-year figures
1.15.1
6.2
2.8
1.5
2.5
6.8
13.0
1.52.2
3.7
_
0.5
3.8
4.3
8.0
1965 1966
Net
1964
, in milliards of US dollars
1.83.2
5.0
—
0.6
4.4
5.0
10.0
4.13.9
8.0
—
0.8
4.2
5.0
13.0
+ 0.8— 1.8
— 1.0
— 0.8
— 0.3
+ 2.1
+ 1.0
—
1965
+ 1.0— 1.0
-
— 2.2
— 0.4
+ 2.6
-
—
1966
+ 3.0— 1.2
+ 1.8
— 2.8
— 0.7
+ 1.7
— 1.8
—
* Excluding swaps carried out under special arrangements with official monetary institutions but including,under "Uses", the reporting banks' own use of Euro-dollars for liquidity purposes and window-dressing operations(temporary switching out of dollars into the domestic currency).
The changes in the positions vis-à-vis outside countries are the same asresult from the data on page 140. As regards the $1.8 milliard increasein the supply from within the reporting area, funds received from officialmonetary institutions were up by about $0.6 milliard. $350 million of thischange was due to a further rise in the amount of dollars obtained bythe Italian banks through swaps with the Italian Exchange Office and about$310 million to end-of-year Euro-dollar placements by the Swiss NationalBank. Liabilities to non-residents other than banks went up by $0.5 milliard;about $0.2 milliard of this movement seems to have been due to an increasein Swiss (non-bank) residents' deposits with U K banks and reflected theattraction of the high Euro-dollar deposit rates. The increase in the supplyof Euro-dollars from non-bank residents and through swaps might beestimated at about $0.7 milliard. The $480 million deterioration in thebanks' net position in foreign currencies other than dollars shown in thetable on page 138 would seem to point to a substantial increase in theamount of switching from other foreign currencies into dollars. Moreover, theavailable evidence suggests that there was an increase both in outright dollarliabilities to domestic non-bank residents and in the banks' switching out oftheir domestic currencies into dollars.
As regards uses, the whole increase in lending seems to have beenvis-à-vis outside countries. As already indicated by the figures in the table onpage 140, claims on the United States went up by about $2.3 milliard and

143 —
those vis-à-vis the rest of the outside world by $0.7 milliard. Placementswithin the reporting area seem to have changed little. Owing mainly to a$0.2 milliard rise in the U K banks' claims on German non-banks, assetsvis-à-vis non-residents other than banks went up from $0.6 to 0.8 milliard,but this increase seems to have been roughly offset by a decline in lending toresidents. The main factor behind the estimated decline of about $0.2 milliardin this latter item was the reduction in the UK banks' lending to localauthorities. On the other hand, the Italian banks continued to swap dollarsinto other currencies in order to lend them to residents.
Changes in the external foreign currency positions of banks in individualcountries. At $2,330 and 2,760 million respectively, the expansion of the UKbanks' dollar positions accounted for about 70 per cent, of the total increasein the reporting European banks' dollar liabilities and about 60 per cent, of theincrease in their assets. As a result the UK banks' share in total outstandingpositions went up by 6 per cent, to 48 per cent. Their dominant rôle in the1966 expansion of the market reflected above all the sharp rise in the USbanks' Euro-dollar borrowing, which was mainly channelled through theirbranches in London. Thus the UK banks' claims on US residents advanced by$1.9 milliard and their liabilities towards the rest of the world by about thesame amount, $650 million of this latter increase being vis-à-vis Switzerland.Liabilities vis-à-vis the United States went up by $400 million. The $430million reduction in the U K banks' net debtor position, which reflected theincreased demand for Euro-dollars from the United States, was facilitated bythe domestic credit ceilings and the smaller market financing requirementsof UK local authorities.
The Italian banks' foreign currency assets vis-à-vis non-residents wentup by $690 to 2,730 million and those vis-à-vis residents by $160 to1,980 million. Their net external position in foreign currencies, which hadalready recorded a $590 million improvement in 1965, strengthened by another
External positions in foreign currencies of thereporting European banks.
Banks of
Liabilities
DollarsOther
reportedcurrencies*
Assets
DollarsOther
reportedcurrencies*
Net position
DollarsOther
reportedcurrencies'
changes from end-1965 to end-1966, in millions of US dollars
Belgium-LuxemburgFranceGermanyItalyNetherlands . . . .SwedenSwitzerland . . . .United Kingdom . .
110
260
40
220
260
40
190
+ 2,330
Total change + 3,370
340
100
20
150
140
70
150
140
+ 770
270
640
40
520
130
70
120
+ 2,760
4,470
60
40
50
170
1 10
40
1 10
1 10
+ 290
160
380
+ 300
- 130
+ 30
— 70
+ 430
+ 1,100
— 280
— 140
— 30
+ 20
— 30
— 30
+ 40
— 30
- 480
Sterling, Swiss francs, Deutsche Mark, French francs, Dutch florins, Italian lire.

— 144 —
$32O million. Within the space of two years the Italian banks' net positionthus shifted from $700 million of liabilities to $210 million of assets. Themain reasons for the improvement in 1966 were a further $350 millionincrease in the banks' use of the Italian Exchange Office's special swapfacilities and the domestic credit ease, which contrasted with rising interestrates abroad.
The relative ease of domestic credit conditions, together with the gradualliberalisation of French foreign exchange policy, was also one of the majorfactors behind the $380 million increase in the French banks' external netdollar assets. About one-third of this seems to have been due to switchesout of third currencies into dollars. Claims on US residents went up from$200 to 590 million.
The main features in the development of the Belgian-Luxemburg banks'foreign currency position were a $360 million rise in French franc liabilitiesand a $270 million increase in dollar assets. About two-thirds of the Frenchfrancs seems to have been re-lent to residents. The largest individual change indollar claims was a $90 million increase vis-à-vis the Netherlands. On a netbasis, the Belgian-Luxemburg banks' position improved by $160 million indollars but deteriorated by $280 million in the other reported currencies.
The Dutch banks' net foreign currency position shifted from $80 millionof assets to $80 million of liabilities. The main cause of this turn-round wasthe tightening of domestic credit. The German, Swedish and Swiss banks'foreign currency positions showed little overall change.
Towards the end of 1966 several central banks took action to ease thetensions arising from the commercial banks' end-year operations. Directsupport given to the Euro-dollar market amounted to about $800 million. TheSwiss National Bank channelled back approximately $470 million acquiredfrom its banks, of which $310 million directly and the remainder through theBIS. The BIS, for its part, placed an additional $275 million in the Euro-dollar market; of this amount, $200 million was obtained by activating theswap facility with the US Federal Reserve and the rest came from the BIS'sown resources. The Nederlandsche Bank placed dollars on a swap basis withits commercial banks, while the Deutsche Bundesbank and the Bank of Italytook measures to limit their banks' end-year repatriations.
Interest rate developments. In 1966 the tightening of some of the keynational credit markets and the ensuing strengthening of demand for Euro-dollar credits led to a sharp increase in Euro-dollar interest rates. The rateon three-month deposits in London, which had already shown a strongupward momentum in the last quarter of 1965, continued its rising trendthroughout the first nine months of 1966 and by early September it stood at6% per cent., or 2% per cent, above its level a year earlier. The usualseasonal tightening pushed the rate up further to 7 per cent, in October and

Rates of interest in London and New York and arbitrage margins in London.Weekly, in percentages per annum.
THREE-MONTH RATES
Loans to UK local authorities |N
I ! ! I ! I I I 1 I ! I ! I I 1 I !
+ 1.0
+ 0.5
0
-0.5
-1.0
UK banks' external dollar position (right-hand scale)~ In favour of sterling r J Quarterly changes, in millions of US dollars (
COVERED ARBITRAGE MARGINS.(left-hand scale) million+500
+ 250
0
-250
-500
1964 1965 1966 1967
at one point early in December it even exceeded that level by 1/8 per cent.This seasonal peak coincided, however, with the turning-point in the inter-national credit situation and was immediately followed by a sharp decline,which carried the three-month rate to below 5% per cent, early in February.After a short pause the downward movement resumed in March, and by theend of April the rate had fallen to 45/8 per cent. In May the rate strengthened,to reach 5a/8 per cent, by the end of the month.
The yield on US negotiable certificates of deposit, which are in someways a competitor of Euro-dollar deposits, also went up, but not quite as muchas that on Euro-dollars. As a result the margin between the two rateswidened from its past average of about 3/8 per cent, to reach i1/8 percent, during the fourth quarter of 1966. This rather high margin in favour ofEuro-dollar deposits was one of the reasons why US corporations depositeda major part of the proceeds of their Euro-bond issues in the Euro-dollarmarket in 1966. At the same time the much higher rates on Euro-dollardeposits did not deter the US banks from borrowing through their Europeanbranches in the Euro-dollar market. The explanation is that the ratespaid on certificates of deposit were held down by Regulation Q. and thusdid not fully reflect the actual scarcity of credit in the United States;moreover, the US banks' taking of deposits from their foreign subsidiaries isnot subject to reserve requirements and is therefore less costly than thenominal rates suggest.

— 146 —
With the decline in Euro-dollar rates, their margin over the yieldson certificates of deposit tended to narrow. By the end of April 1967 it hadfallen to % per cent., but it widened to y2 per cent, in the course of May.
The climb of the Euro-dollar rate in 1966 was also reflected in thecovered interest-arbitrage margins between Euro-dollar and U K local-authoritydeposits. Apart from January and the second half of December, this marginstood throughout most of 1966 in favour of Euro-dollars and thus tended todiscourage the UK banks from switching Euro-dollar funds into sterling. Thiswas undoubtedly the main factor behind the $430 million improvement in theU K banks' net external dollar position. In the third quarter, however, whenowing to the weakness of forward sterling the covered interest-arbitragemargins in favour of Euro-dollar deposits were at their highest, the UKbanks' net dollar liabilities expanded. The reason for this paradoxical situationwas the renewed outbreak of the sterling crisis, which led to substantialswitches of foreign London-held balances out of sterling into Euro-dollars.Although the U K banks' external dollar assets went up by $760 million, thisgrowth was not quite large enough to offset the whole of the $810 million risein their dollar liabilities. By the fourth quarter, however, the UK banks hadcaught up with the situation; their assets showed a record increase of $930million and their net position improved by $230 million.
The sharp decline in the Euro-dollar rate from the second half ofDecember onwards shifted the covered interest-arbitrage margins back infavour of UK local-authority deposits. In the first quarter of 1967 the UKbanks' net dollar liabilities went up by $520 million, thus more than off-setting their decline in 1966.
Complete figures for the changes in the banks' Euro-dollar positionsduring the first quarter of 1967 are not yet available. Nevertheless there canbe little doubt that the winding-up of end-year operations caused the totalvolume of outstanding credit to decline. Apart from this seasonal factor,the development of the Euro-dollar market was dominated by the easing ofmonetary conditions in the United States and Germany. Easier credit withinthe United States led to a reduction in the US banks' borrowing in theEuro-dollar market; as a result, the claims of UK banks on the UnitedStates, after rising by $i,88o million in the course of 1966, decreased by$230 million. Although there was also some decline in the demand fromGerman residents, the main impact of Germany's return to monetary easewas on the supply side of the Euro-dollar market. The German banks'external dollar assets shot up by $360 to 760 million, about $240 million ofthis increase being vis-à-vis the United Kingdom and another $100 millionvis-à-vis France, whereas claims on the United States declined slightly. Thechange in the relationship between the supply and demand for Euro-dollars,which had already become discernible in the course of December, wasreflected in a pronounced easing of market conditions that continued untilMay, when interest rates began to strengthen again.

— 147 —
Short-term liabilities and assets of ten countries' commercialbanks in certain foreign currencies vis-à-vis non-residents.
Countries
Belgium-Luxemburg . . .
France2
Germany
Italy . . . . . . .
End of month
1963 September1964 March
SeptemberDecember
1965 MarchJuneSeptemberDecember
1966 MarchJuneSeptemberDecember
1963 September1964 March
SeptemberDecember
1965 MarchJuneSeptemberDecember
1966 MarchJuneSeptemberDecember
1963 September1964 March
SeptemberDecember
1965 MarchJuneSeptemberDecember
1966 MarchJuneSeptemberDecember
1963 September1964 March
SeptemberDecember
1965 MarchJuneSeptemberDecember
1966 MarchJuneSeptemberDecember
US dollars
Liabil-ities Assets
360380290420400400480560560530570670650610620810730770920
1,070770810
1,1001,330
270220290440230250270370290300330330
1,5401,2401,2501,5301,3401,2801,230,710
1,2201,2301,6301,930
260310310360440440460470530520590740
670710720860890830980
1,2201,1601,2801,5701,860
510510420440510460400440440470660400
950780810870800900
1,3401,5701,2801,3301,8802,090
Other currencies1
Liabil-ities Assets
in millions of US
280370540520570680630600770790810940
630590540560550550510530750710710630
10011080806070707050506050
750580360360450460460440500460490590
230210270320280360330380490470410440
660560560660590700680640740650610600
170130150120120120120170100110100120
410300270320260320380470560480630640
Total
Liabil-ities
dollars
640750830940970
1,0801,1101,1601,3301,3201,3801,610
1,2801,2001,1601,3701,2801,3201,4301,6001,5201,5201,8101,960
370330370520290320340440340350390380
2,2901,8201,6101,8901,7901,7401,6902,1501,7201,6902,1202,520
Assets
490520580680720800790850
1,020990
1,0001,180
1,3301,2701,2801,5201,4801,5301,6601,8601,9001,9302,1802,460
680640570560630580520610540580760520
1,3601,0801,0801,1901,0601,2201,7202,0401,8401,8102,5102,730
Net
— 150— 230— 250— 260-250— 280— 320— 310— 310— 330— 380-430
5070
120150200210230260380410370500
31031020040
340260180170200230370140
— 930-740— 530— 700— 730— 520
30— 110
120120390210
1 Sterling, Swiss francs, Deutsche Mark, Dutch florins, French francs, Italian lire. 2 Positions vis-à-vis banks only.

148 —
Short-term liabilities and assets of ten countries' commercialbanks in certain foreign currencies vis-à-vis non-residents (continued).
Countries
Netherlands....
Switzerland3 . . .
United Kingdom. .
End of month
1963 September1964 March
SeptemberDecember
1965 MarchJuneSeptemberDecember
1966 MarchJuneSeptemberDecember
1963 September1964 March
SeptemberDecember
1965 MarchJuneSeptemberDecember
1966 MarchJuneSeptemberDecember
1963 September1964 March
SeptemberDecember
1965 MarchJuneSeptemberDecember
1966 MarchJuneSeptemberDecember
1963 September1964 March
SeptemberDecember
1965 MarchJuneSeptemberDecember
1966 MarchJuneSeptemberDecember
US dollars
Liabil-ities Assets
270280310360360400400530570650670790
8080
110110130150130150140150150190
1,0601,2201,3701,5901,4501,4801,5801,7001,4901,7601,7301,890
3,1603,1003,8904,3804,5604,4104,7505,2605,4406,0806,8907,590
360330280390420380360420360450440550
150180200230180220220260230220230330
1,6601,9602,1102,1802,2702,3602,3802,6602,5202,3702,3102,780
2,9702,8103,1903,6703,4103,5204,0004,5504,8805,6206,3807,310
Other currencies1
Liabil-ities Assets
in millions of US1002
802
1502
1502
1502
1802
2002
2102
290=3102
3102
3502
4050805070
10010070
100100100140
2904
3004
360330340330320360360260210210
490490490520550480510540620640640680
2802
2202
2602
2902
3002
3402
4002
4002
5002
5202
4502
5102
1001401701 101 10130130160150160170200
500"500"560560510520440550560550470440
510540640660720690740790850900930900
Total
Liabil-ities
dollars370360460510510580600740860960980
1,140
120130190160200250230220240250250330
1,350"1,520"1,7301,9201,7901,8101,9002,0601,8502,0201,9402,100
3,6503,5904,3804,9005,1 104,8905,2605,8006,0606,7207,5308,270
Assets
640550540680720720760820860970890
1,060
250320370340290350350420380380400530
2,160"2.4604
2,6702,7402,7802,8802,8203,2103,0802,9202,7803,220
3,4803,3503,8304,3304,1304,2104,7405,3405,7306,5207,3108,210
Net
27019080
17021014016080
10- 90— 80
13019018018090
100120200140130150200
810"9404
940820990
1,070920
1,1501,230
900840
1,120
— 170— 240— 550— 570— 980— 680— 520— 460— 330— 200— 220— 60
1 Sterling, Swiss francs, Deutsche Mark, Dutch florins, French francs, Italian lire. s Sterling, Swiss francsand Deutsche Mark only. 3 Including Euro-currency assets of the BIS. 4 Estimates.

— 149 —
Short-term liabilities and assets of ten countries' commercialbanks in certain foreign currencies vis-à-vis non-residents (continued).
Countries
Sub-total,eight Europeancountries . . .
Canada
Japan
Grand total .
End of month
1963 September1964 March
SeptemberDecember
1965 MarchJuneSeptemberDecember
1966 MarchJuneSeptemberDecember
1963 Serjtember1964 March
SeptemberDecember
1965 MarchJuneSeptemberDecember
1966 MarchJuneSeptemberDecember
1963 September1964 March
SeptemberDecember
1965 MarchJuneSeptemberDecember
1966 MarchJuneSeptemberDecember
1963 September1964 March
SeptemberDecember
1965 MarchJuneSeptemberDecember
1966 MarchJuneSeptemberDecember
US dollars
Liabil-ities Assets
7,3907,1308,1309,6409,2009,1409,760
11,35010,4801 1,51013,07014,7202,3502,1702,4402,5902,3702,2202,4702,3702,0401,9601,8302,1501,8202,1 102,2302,3802,5002,5402,4602,5502,5702,5902,4602,550
11,56011,41012,80014,61014,07013,90014,69016,27015,09016,06017,36019,420
7,5307,5908,0409,0008,9209,110
10,1401 1,59011,40012,26014,06016,0602,7902,3602,7803,1802,7702,4402,7402,6702,4402,3602,4902,8901,6601,7802,0202,2102,2902,4702,6002,6202,6002,6402,8402,870
11,9801 1,73012,84014,39013,98014,02015,48016,88016,44017,26019,39021,820
Other currencies'
Liabil-ities Assets
in millions of US
2.6802
2.5702
2,6002,5702,7402,8502,8002,8203,4403,3203,3303,590
20'10'40'20'30'30'30'30'30'10'10'10'
370330390350370380370360340350340300
3,0702
2.9102
3,0302,9403,1403,2603,2003,2103,8103,6803,6803,900
2.8602
2.6002
2,8803,0402,8903,1803,2203,5603,9503,8403,7703,850
130'170'230'200'190'150'120'110'120'90'803
80'230300380400400370360380340330350380
3.2202
3.0702
3,4903,6403,4803,7003,7004,0504,4104,2604,2004,310
Total
Liabil-ities
dollars
10.0702
9.7002
10,73012,2101 1,94011,99012,56014,17013,92014,83016,40018,3102,3702,1802,4802,6102,4002,2502,5002,4002,0701,9701,8402,1602,1902,4402,6202,7302,8702,9202,8302,9102,9102,9402,8002,850
14.6302
14.3202
15,83017,55017,21017,16017,89019,48018,90019,74021,04023,320
Assets
10.3902
10.1902
10,92012,0401 1,81012,29013,36015,15015,35016,10017,83019,9102,9202,5303,0103,3802,9602,5902,8602,7802,5602,4502,5702,9701,8902,0802,4002,6102,6902,8402,9603,0002,9402,9703,1903,250
15.2002
14.8002
16,33018,03017,46017,72019,18020,93020,85021,52023,59026,130
Net
3202
4902
190— 170— 130
300800980
1,4301,2701,4301,600
550350530770560340360380490480730810
— 300— 360— 220- 120— 180— 80
130903030
3904005702
480s
500480250560
1,2901,4501,9501,7802,5502,810
1 Sterling, Swiss francs, Deutsche Mark, Dutch florins, French francs, Italian lire,other currencies, but mainly sterling.
2 Estimates. 3 All

Short-term liabilities and assets of ten countries' commercial banks incertain foreign currencies vis-à-vis non-residents, excluding
positions vis-à-vis the country of issue of the currency in question.
Countries
Belgium-Luxemburg . . .
France3
Germany . . .
Italy
End of month
1963 September1964 March
SeptemberDecember
1965 MarchJuneSeptemberDecember
1966 MarchJuneSeptemberDecember
1963 SeDtember1964 March
SeptemberDecember
1965 MarchJuneSeptemberDecember
1966 MarchJuneSeptemberDecember
1963 September1964 March
SeptemberDecember
1965 MarchJuneSeptemberDecember
1966 MarchJuneSeptemberDecember
1963 Serjtember• y \j \jt \0^s | t • i • *# w i1964 MarchSeptember
December1965 March
JuneSeptemberDecember
1966 MarchJuneSeptemberDecember
US dollars
Liabil-ities
2802
2902
2202
330350330420460460410470560
600590590730660650760940660680940
1,230220190260390190200220310240260290260
1,4201,0601,0101,2501,030
990940
1,420960980
1,3801,700
Assets
1902
2202
2302
260310290280350420360430560
550540530660660620740
1,010910
1,0501,1501,270
300290190160160190190230290310470260570450460600640760
1,2001,3701,1 101,1401,6701,870
Other currencies'
Liabil-ities Assets
in millions of US
380300400400410460490560620350350310400330310340360430420450430505050402030303020202020
440330200210250260260250280260340390
60607060
100110110120110
380320330340350360360370410360380360202020102010101010101010
230140120150110160190200270280310390
Total
Liabil-ities
dollars
710650730820870920900
1,0301,180
950940900
1,130990960
1,1001,3001,1 101,1001,3901,660
270240310430210230250340260280310280
1,8601,3901,2101,4601,2801,2501,2001,6701,2401,2401,7202,090
Assets
320370360340450530470550670
930860860
1,0001,010
9801,1001,3801,3201,4101,5301,630
320310210170180200200240300320480270800590580750750920
1,3901,5701,3801,4201,9802,260
Net
— 390— 280- 370- 480- 420- 390- 430— 480— 510
— 20- 80- 40— 130
2020
—80
210310140
— 305070
— 100— 260- 30- 30— 50— 100
4040
170— 10— 1,060— 800— 630- 710— 530- 330
190— 100
140180260170
• Sterling, Swiss francs, Deutsche Mark, Dutch florins, French francs, Italian lire,vis-à-vis banks only.
2 Estimates. 3 Positions

Short-term liabilities and assets of ten countries' commercial banks incertain foreign currencies vis-à-vis non-residents, excluding positions
vis-à-vis the country of issue of the currency in question (continued).
Countries
Netherlands....
Sweden
Switzerland3 . . .
United Kingdom .
End of month
1963 September1964 March
SeptemberDecember
1965 MarchJuneSeptemberDecember
1966 MarchJuneSeptemberDecember
1963 September1964 March
SeptemberDecember
1965 MarchJuneSeptemberDecember
1966 MarchJuneSeptemberDecember
1963 September1964 March
SeptemberDecember
1965 MarchJuneSeptemberDecember
1966 MarchJuneSeptemberDecember
1963 September1964 March
SeptemberDecember
1965 MarchJuneSeptemberDecember
1966 MarchJuneSeptemberDecember
US dollars
Liabil-ities Assets
230240270320300360370470480570600720
7070808090
110110120120120130160
920,060,210,440,290,310,420,550,320,590,570
1,750
2,8002,7803,4003,8404,0603,9104,2304,7104,7705,2105,8906,640
250230190300340300270340280350350470
10090
1201401 10140120170130140170240
1,3301,5301,7101,6101,8001,8501,8402,1602,0701,8501,8302,300
1,9701,7402,0102,4601,9502,0902,3202,9502,6603,1503,2803,830
Other currencies'
Liabil-ities Assets
in millions of US
40=40=60=
100=1002
100=130s
140=190=190=190=220=
101010304050505050506060
200180150140160170160170120130
50=40=50=
100=110=120=110=90=
1402
150=160=170=
203030203040404030303050
901207080
11090
110150130140
Total
Liabil-ities
dollars
270280330420400460500610670760790940
808090
110130160160170170170190220
1,4101,6201,4401,4501,5801,7201,4801,7601,6901,880
Assets
300270240400450420380430420500510640
120120150160140180160210160170200290
1,8001,7301,8701,9301,9502,2502,1802,0001,9602,440
Net
30— 10— 90- 20
50— 40— 120— 180— 250— 260— 280— 300
404060501020
—40
- 10—1070
390110430480370530700240270560
•1 Sterling, Swiss francs, Deutsche Mark, Dutch florins, French francs, Italian lire,and Deutsche Mark only. 3 Including Euro-currency assets of the BIS.
2 Sterling, Swiss francs

— 152 —
Short-term liabilities and assets of ten countries' commercial banks incertain foreign currencies vis-à-vis non-residents, excluding positions
vis-à-vis the country of issue of the currency in question (continued).
Countries
Sub-total,eight Europeancountries . . .
Canada
Japan
Grand total .
End of month
1963 September1964 March
SeptemberDecember
1965 MarchJuneSeptemberDecember
1966 MarchJuneSeptemberDecember
1963 September1964 March
SeptemberDecember
1965 MarchJuneSeptemberDecember
1966 MarchJuneSeptemberDecember
1963 September1 ^ \j %j % v f* iv ill w v •1964 MarchSeptember
December1965 March
JuneSeptemberDecember
1966 MarchJuneSeptemberDecember
1963 September1964 March
SeptemberDecember
1965 MarchJuneSeptemberDecember
1966 MarchJuneSeptemberDecember
US dollars
Liabil-ities
6.54O2
6.2802
7.0402
8,3807,9707,8608,4709,9809,0309,820
11,27013,020
890860860910
1,0101,1 101,3801,3901,1901,1801,1201,450
300250330350380360380390430480560610
7.7302
7.3902
8.2302
9,6409,3609,330
10,2301 1,76010,6501 1,48012,95015,080
Assets
5.2602
5.0902
5,440s
6,1905,9706,2406,9608,5807,8708,3509,350
10,800760620890
1,2101,010
760810900840830800930300340510550550570690690680720780790
6.3202
6,050s
6,840a
7,9507,5307,5708,460
10,1709,3909,900
10,93012,520
Other currencies1
Liabil-ities Assets
in millions of US
10=10=10'20'30=20=20=30=30=10'_3
3
100100100120120100100807070
40=30=40=30=30'30=30'40'40'40=40'40=
240260230220220230210190210230
Total
Liabil-ities
dollars
900870870930
1,0401,1301,400,420,220,190,120
1,450
430450480480500490530560630680
Assets
800650930
1,2401,040
790840940880870840970
750810780790910920890910990
1,020
•
Net
— 100— 220
60310
— 340— 560— 480— 340— 320-280— 480
320360300310410430360350360340
1 Sterling, Swiss francs, Deutsche Mark, Dutch florins, French francs, Italian lire,currencies, but mainly sterling.
2 Estimates. All other

— 153
V. T H E E U R O P E A N M O N E T A R Y A G R E E M E N T .
The European Monetary Agreement (EMA), which came into force on27th December 1958, serves as a framework for co-operation between themonetary authorities of Contracting Parties, with the broad objective ofencouraging multilateralism in international trade and currency convertibility.Its two principal operational aspects are: the European Fund, from whichmembers may receive short or medium-term balance-of-payments assistance,and the Multilateral System of Settlements, under which each membercountry's central bank is assured of obtaining settlement in dollars of itsholdings of other members' currencies at an exchange rate known in advance.The Agreement is operated by the Council of the Organisation for EconomicCo-operation and Development (OECD) and a Board of Management. TheBank for International Settlements, acting as Agent, is entrusted with theexecution of all financial operations under the Agreement.
Modification of the Agreement.
Following a comprehensive review during 1965, the Agreement was renewedfor a period of three years until the end of 1968. A number of amendments tothe Agreement, described in last year's Annual Report, arose out of thisreview, including provision for an alternative and more rapid procedure forthe granting of credits from the European Fund through delegation to theBoard of Management of authority to grant credits of not more than$50 million* each for periods of up to one year.
Particularly in the light of this new facility, it is desirable that theEuropean Fund should have ready access to additional funds when existingliquid assets are temporarily inadequate to meet a drawing on a creditgranted by the Board. Supplementary finance would normally be obtained bya general call-up of unpaid capital contributions from Contracting Parties andby drawing upon the capital of the former European Payments Union (EPU).An additional method of financing was provided for in i960, when the articlesof the Agreement were amended to permit the European Fund to receive specialcredits from Contracting Parties. In practice it has proved unnecessary toraise additional finance by this alternative method, but it has more recentlybeen felt that, should the occasion arise, it might involve protracted negotia-tion. Accordingly, in May 1967, the Board of Management proposed to theCouncil further amendments to the Agreement which would allow theEuropean Fund to obtain short-term credits from international financialinstitutions situated within the territory of a Contracting Party. It was furtherproposed that authority to obtain such credits, to a total outstanding of up to
* For convenience, the dollar sign ($) is used throughout the text of this chapter, whether the amountreferred to is in US dollars, gold or EMA units of account.

— 154 —
$5° million and for a maximum period of one year, be delegated to the Boardof Management. The Bank for International Settlements, having beenapproached by the Secretary General of the OECD, has indicated its readinessin principle to co-operate in such financing subject to agreement beingreached in each particular case. At the end of May 1967 the proposals werestill before the Council.
Operations under the Agreement.
European Fund. The table below sets out the credits granted from theEuropean Fund which were outstanding during the year April 1966 to March1967, together with the rates of interest and service charges applied to them.No new credits were granted during this period.
EMA: Credits granted from the European Fundin the fiscal year ended March 1967.
Credits
Credits repaid since 31 st March 1966
Turkey (4th credit; balance). . .
Credits available at 31st March 1967
Turkey (6th credit)
Greece
Amountgranted
in millions ofunits of account
10.0
15.0
20.0
25.0
5.0
15.0
5.0
30.0
Period available
15th March 1963to dates below*
30th June 1963to dates below*
31st March 1965to dates below*
30th July 1965to dates below*
29th October 1965to dates below*
15th March 1966to dates below*
31st October 1966to dates below*
8th February 1966to dates below*
Intereston amounts
drawnService chargeon amountsundrawn
in percentages per annum
3.50
3.75
3.875
0.25
0.25
0.25
*The balance of the fourth credit to Turkey was repayable as follows: 15 million on 31st October 1966 and 10 millionon 15th March 1967. The sixth credit to Turkey is repayable as follows: ten instalments of 5 million each on 30th Juneand 31st December 1968,31st March, 30th June, 30th September and 31st December 1969, and 31st March, 31st May,29th July and 28th October 1970; one instalment of 15 million on 14th March 1971 ; and one instalment of 5 millionon 30th October 1971. The credit to Greece is repayable as follows: 5 million on 7th February 1969, 10 million on7th February 1970 and 15 million on 7th February 1971.
At the end of March 1966 credits totalling $120 million were outstanding.Of this amount, $90 million represented the balance of the fourth credit andthe first four tranches of the sixth credit to Turkey, and the remaining$30 million represented the credit to Greece granted in February 1966 andfully drawn since 9th March 1966.
With effect from 31st October 1966, the Board of Management releasedthe final tranche of $5 million of the sixth credit to Turkey. This amountwas promptly drawn and used to refinance a part of the $15 million third

— 155 —
instalment of the fourth credit which was due for repayment on the samedate. On 15th March 1967 Turkey repaid the final instalment of $10 millionof the fourth credit in cash. These transactions reduced Turkey's indebtednessto the European Fund in respect of credits to $70 million by the end ofMarch 1967 and the total of credits outstanding to $100 million.
In the light of an anticipated balance-of-payments deficit in 1967 and ofthe critically low level of Turkey's official reserves the Council on 23rd May1967 decided to grant a further credit to that country with effect fromist June 1967, for an amount of $25 million. The conditions governing therepayment of this new credit are closely comparable with those accorded toGreece in February 1966. A sum of $5 million is repayable at the end of thethird year, a further $5 million at the end of the fourth year, and thebalance of $15 million at the end of the fifth year. These terms representthe maximum period allowable under the Agreement.
The table on the utilisation of credits granted shows the position at thevalue date for multilateral settlements (the fifth working day of the followingmonth) for February 1959, when the first credits were granted, for the end
EMA: Utilisation of credits granted from the European Fund.
Atvalue date forsettlements
formonth
Greece
Avail-ableandun-
drawn
Draw-ingsout-
stand-ing
Iceland
Avail-ableandun-
drawn
Draw-ingsout-
stand-ing
Spain
Avail-ableandun-
drawn
Draw-ingsout-
stand-ing
Turkey
Avail-ableandun-
drawn
Draw-ingsout-
stand-ing
Totals
Avail-ableandun-
drawn
Draw-ingsout-
stand-ing
Totalcredit
grantee
in millions of units of account
1959February .December.
1960December.
1961December.
1962December.
1963December.
1964December.
1965January. .February .October .
1966February .March . .October .
1967March . .
15.0 — —
25.0
-
-
-
-
-
-
-
5.030.030.0
30.0
-
5.0
7.0
5.0
-
-
-
-
-
-
7.0
5.0
-
-
-
-
-
51.0
76.0
-
-
-
-
-
-
-
24.0
24.0
-
-
-
-
—
—
-
21.50.5
15.0
-
-
-
-
_
-
-
21.0
21.5
50.0
80.0
95.0
105.0
100.095.090.0
90.090.080.0
70.0
36.551.5
96.0
7.0
5.0
-
-
-
25.0
-
45.0
52.5
55.0
80.0
95.0
105.0
100.095.090.0
95.0120.01 10.0
100.0
— 36.5
96.5
148.5
62.0
85.0
95.0
105.0
100.0
95.0
90.0
120.0
120.0
1 10.0
100.0

- 156 -
of each year from 1959 to 1964, and for each month from end-1964 toMarch 1967 in which changes occurred.
There was no call-up of capital in the period under review, so thatthe amount of contributions paid in remained unchanged at $38 million.Together with $148 million from the former EPU capital, this leaves the
"active capital of the Fund at $186 million, while uncalled capital remains at$421 million.
Multilateral System of Settlements. No amounts of interim finance weredrawn during the year under review. Buying and selling rates notified bymember countries for their currencies remained unchanged and no balanceswere brought into the Multilateral System of Settlements.
Since the coming into force of the EMA, payments to or by theEuropean Fund in respect of the multilateral settlements have totalled$37.8 million.
Management of the European Monetary Agreement.
The Board of Management of the EMA supervises the execution of theAgreement and advises the Council of the O E C D on all related matters.The Board also follows the economic and financial situation in membercountries on the basis of reports made by the Secretariat or by the variouscommittees of the Organisation and, on occasion, by special missions. Indischarging these functions the Board meets when necessary, recently aboutsix times a year. In December 1966 the Council re-appointed M. Hay asChairman of the Board for a further year.
The Bank for International Settlements, as Agent, presents monthlyreports on the operations carried out under the Agreement and on the in-vestments of the European Fund, and also provides the Board with monthlystatistical material on the international gold and foreign exchange markets andon the evolution of the external monetary position of O E C D countries.
The operations of the Fund as described in the previous pages arereflected in the following summary of the Statement of Account.
Credits and claims outstanding, which amounted at the beginning ofoperations to $35 million, representing long-term claims on Norway andTurkey transferred from the EPU, stood at a peak of $143.1 million atend-March 1966, of which $120 million represented credits drawn and out-standing and $23.1 million the balance of the long-term claims on Norwayand Turkey. The total was unchanged until the end of October, when it fellto $133.1 million as the result of the net repayment by Turkey describedabove. In December the sixth amortisation payment of the long-term claimson Norway and Turkey reduced the total by a further $2.6 million, and withthe repayment by Turkey in March of the final $10 million outstanding from thefourth credit the sum of credits and claims outstanding declined to $120.5 million.
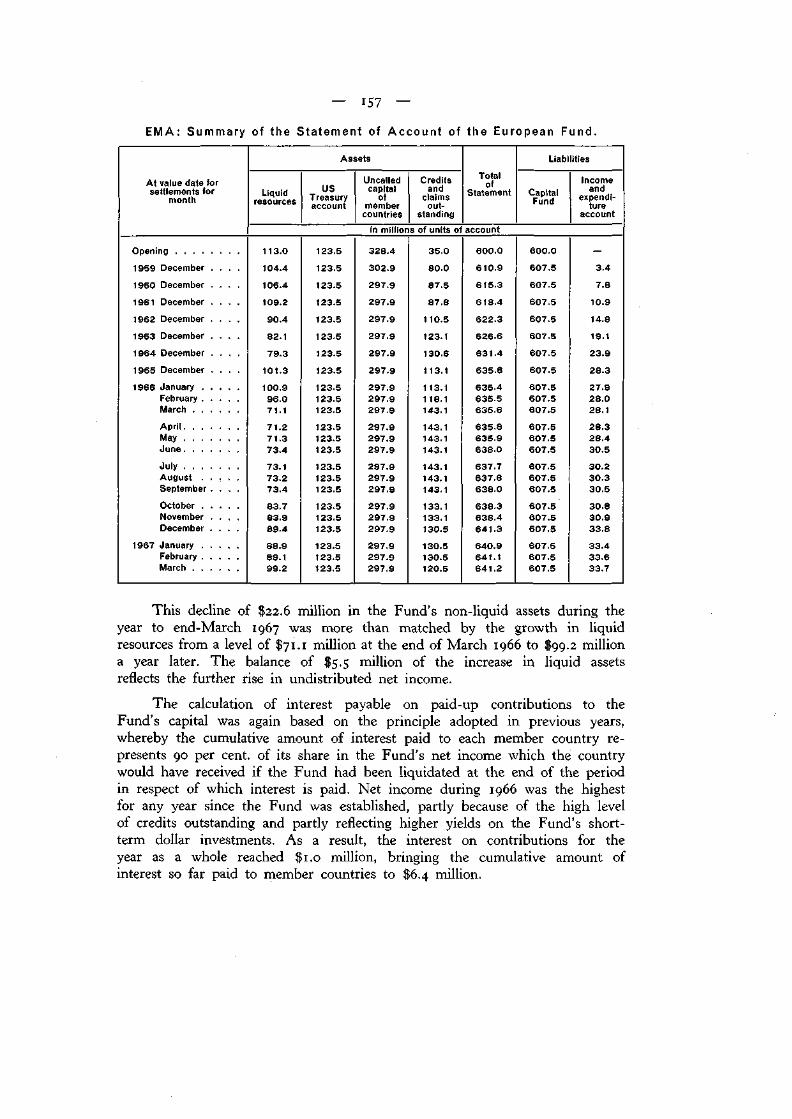
— 157 —
EMA: Summary of the Statement of Account of the European Fund.
At value date forsettlements for
month
Assets
Liquidresources
USTreasuryaccount
Uncalledcapitalof
membercountries
Creditsandclaimsout-
standing
Totalof
Statement
Liabilities
CapitalFund
in millions of units of account
Incomeand
expendi-ture
account
Opening1959 December .1960 December .1961 December .1962 December .1963 December .1964 December .1965 December .1966 January . .
February . .March . . .April. . . .May . . . .June. . . .July . . . .August . .September .October . .November .December .
1967 January . .February . .March . . .
113.0104.4106.4109.290.482.179.3
101.3100.996.071.171.271.373.473.173.273.483.783.989.488.989.199.2
123.5123.5123.5123.5123.5123.5123.5123.5123.5123.5123.5123.5123.5123.5123.5123.5123.5123.5123.5123.5123.5123.5123.5
328.4302.9297.9297.9297.9297.9297.9297.9297.9297.9297.9297.9297.9297.9297.9297.9297.9297.9297.9297.9297.9297.9297.9
35.080.087.587.8
1 10.5123.1130.61 13.11 13.11 18.1143.1143.1143.1143.1143.1143.1143.1133.1133.1130.5130.5130.5120.5
600.0610.9615.3618.4622.3626.6631.4635.8635.4635.5635.6635.8635.9638.0637.7637.8638.0638.3638.4641.3640.9641.1641.2
600.0607.5607.5607.5607.5607.5607.5607.5607.5607.5607.5607.5607.5607.5607.5607.5607.5607.5607.5607.5607.5607.5607.5
3.47.8
10.914.819.123.928.327.928.028.128.328.430.530.230.330.530.830.933.833.433.633.7
This decline of $22.6 million in the Fund's non-liquid assets during theyear to end-March 1967 was more than matched by the growth in liquidresources from a level of $71.1 million at the end of March 1966 to $99.2 milliona year later. The balance of $5.5 million of the increase in liquid assetsreflects the further rise in undistributed net income.
The calculation of interest payable on paid-up contributions to theFund's capital was again based on the principle adopted in previous years,whereby the cumulative amount of interest paid to each member country re-presents 90 per cent, of its share in the Fund's net income which the countrywould have received if the Fund had been liquidated at the end of the periodin respect of which interest is paid. Net income during 1966 was the highestfor any year since the Fund was established, partly because of the high levelof credits outstanding and partly reflecting higher yields on the Fund's short-term dollar investments. As a result, the interest on contributions for theyear as a whole reached $1.0 million, bringing the cumulative amount ofinterest so far paid to member countries to $6.4 million.

- 158 —
P A R T III
A C T I V I T I E S O F T H E B A N K .
i. Operations of the Banking Department.
The balance sheet of the Bank as at 31st March 1967, certified by theauditors, is reproduced at the end of the present Report. The following twochanges have been made in the presentation.
On the one hand, in connection with the settlement of the Bank'sinvestments in Germany two temporary items appeared in the balance sheet asat 31st March 1966: "Claim in respect of the Arrangement dated 29thNovember 1965 with the Federal Republic of Germany" on the assets sideand "Claims of Governments in respect of the Annuity Trust Account" onthe liabilities side. The settlement having been effected in April 1966, theseitems immediately lapsed and hence do not figure in the balance sheet as at31st March 1967.
On the other hand, the item "Provision for contingencies" has been splitinto, two following the creation of a "Provision for building purposes", whichwill be discussed in Section 6 below: "Net profits and their distribution".
BIS: Development of thebalance-sheet total.
The balance-sheet total as at 31st March 1967 amounted to8,231,996,517 francs,* against 7,881,659,477 on 31st March 1966, showing anincrease of 350,337,040 francs. The total of the monthly statement of accountfluctuated fairly widely during the financial year; thus, at the end of May 1966
it declined to 7,282 million and at theend of December 1966, at 9,098 mil-lion, it for the first time exceededthe 9 milliard level.
The following items are notincluded in the balance sheet: goldunder earmark, bills and other securi-ties held in custody for the account ofcentral banks and other depositors ; theassets (gold under earmark, bank bal-
' First section. ances, bills and other securities) held
* Except where otherwise indicated, the term "francs" in this Part signifies gold francs. The method ofconversion into gold francs (units of 0.290 322 58... grammes fine gold — Article 5 of the Statutes) of thevarious currencies included in the balance sheet is the same as that adopted in preceding years; the conversionis based on the exchange rates quoted for the various currencies against dollars and on the US Treasury'sselling price for gold at the end of the financial year.
Financial yearsended
31st March
19631964196519661967
Total ofbalance sheet Movement
in millions of francs
4,950*5,778'7,850'7,8828,232
+ 218+ 828+ 2,072+ • 32+ 350

159 —
by the Bank as Agent for the Organisation for Economic Co-operation and Devel-opment in connection with the European Monetary Agreement, as Depositaryunder the Act of Pledge concluded with the High Authority of the EuropeanCoal and Steel Community and as Trustee or Fiscal Agent for internationalgovernment loans. As was done in the case of the balance sheet as at 31st March1966, the amounts in question are shown at the foot of the assets column underthe heading "Memorandum accounts (b)". The figures are given in the table below.
BIS: Memorandum accounts (b) .
Items
Earmarked goldBank balancesBills and other securities
Total of items not included inthe balance sheet
Financial years e1966
nded 31st March1967
in millions of francs1,145
32715
1,892
1,23326
678
1,937
COMPOSITION OF RESOURCES (liabilities).
A. O w n f u n d s .
The "Capital authorised and issued" remained unchanged at 500 millionfrancs, of which 125 million was paid up.
BIS: Liabilities.End of quarter, in milliards of francs.*
Deposits and Notes (currencies)
•M1957/58 1958/59 1959/60 1960/61 1961/62 1962/63 1963/64 1964/65 1965/66 1966/67
Total of first part of statement of account up to and including 31st December 1965; thereafter total of statementof account.

— i6o —
The Bank's reserves, at 25.8 million, also showed no change, the LegalReserve Fund and the General Reserve Fund remaining unaltered.
The balance of the Profit and Loss Account, which comprises the netprofit for the financial year ended 31st March 1967 and the balance brought for-ward from the preceding year, amounted to 41.9 million on 31st March 1967,against 32.3 million a year earlier. The "Provision for contingencies", whichhad stood at 216.2 million on 31st March 1966, was replaced as at 31st March1967 by a "Provision" consisting of two sub-items, which together totalled231 million. The figures just given are commented on in Section 6: "Netprofits and their distribution".
The item "Miscellaneous" rose from 33.3 million on 31st March 1966 to44.1 million on 31st March 1967.
At the end of March 1967 the Bank's own funds ("Miscellaneous"included) amounted to 468 million francs, i.e. 6 per cent, of its borrowedfunds (7,764 million) and 5.7 per cent, of the balance-sheet total (8,232 million).If the non-paid-up capital (375 million) were included in the Bank's own funds,the ratios would be roughly 11 per cent, and 10 per cent, respectively.
The following table gives a break-down of the Bank's resources (notincluding the non-paid-up capital), in absolute terms and in percentages, as atthe end of each of the last five financial years.
BIS: Composition of resources.
Financial yearsended
31st March
19631964196519661967
Own funds Borrowedfunds Total
in millions of francs389403433433468
4,5615,3707,4177,4497,764
4,950*5,778*7,850*7,8828,232
Ratio of ovborrowed
funds
vn funds tobalance-sheet
totalin percentages
8.57.65.85.86.0
7.97.75.55.55.7
First section of the balance sheet.
B. B o r r o w e d f u n d s .
The following tables show the origin, nature and term of the Bank'sresources.
BIS: Resources, by origin.
Origin
Central banksOther depositors . .Notes
Total . . .
* Not including "Claims of Governments
Financial y1966*
6,104901362
7,367
in respect of the
ears ended 31st March1967
in millions of francs6,602
869293
7,764
Annuity Trust Account".
Movement
+ 498- 32— 69
+ 397

The deposits of central banks showed a moderate increase of about 8 percent.; those of other depositors decreased very slightly. The item "Notes",which represents notes issued by the Bank in currencies in favour of commer-cial banks, showed a reduction of some 20 per cent., since the monetary policyaims underlying the issue of such paper on certain markets were no longerapplicable.
BIS: Resources, by nature and term.
Term
SightNot exceeding 3 months . .Between 3 and 6 months . .Between 6 and 9 months . .Between 9 and 12 months . .Over 1 year
Total
Deposits in gold
Finayears31stN
1966
icialsndedlarch1967
Move-ment
Deposits in currencies
Finayears31st IV1966*
icialändedlarch
1967
Move-ment
Note!
Finayears31st N
1966
icialendedlarch1967
Move-ment
in millions of francs2,484
59110227290
3,539
2,593325164338141
3,561
+ 109- 266+ 62+ 66+ 51
+ 22
1842,816
380174524
3,466
2403,282
309531016
3,910
+ 56+ 466— 71+ 36— 35- 8
+ 444
34616
362
2912
293
- 55— 14
— 69
* Not including "Claims of Governments in respect of the Annuity Trust Account".
Deposits in gold remained practically unchanged over the financial year,whereas those in currencies rose by 13 per cent.
As far as gold deposits are concerned, sight accounts showed littlevariation during the year; at the end of the year they were slightly higherthan at the beginning. Time deposits, in contrast, were a little lower at theyear-end and had fluctuated sharply at various times in the course of theyear; between the end of February and the end of March 1967, for example,they fell by almost half. These fluctuations were attributable in particular tothe conclusion of swaps under which gold sold spot and purchased forward bythe Bank was left on deposit with it for the duration of the operations. Atthe same time there was a shift in the distribution of deposits according toterm, about two-thirds of the decrease in accounts at less than three monthsbeing offset by an increase in funds at longer term — between three andtwelve months. The ratio of time accounts to total gold deposits was a littlelower at the end of the financial year than at the beginning — 27 per cent,against 30 per cent.
With regard to resources in currencies, the rise in deposits was theresult of an increase in funds at not exceeding three months. The movementsduring the year in this category of deposit were largely connected with swapsunder which currency sold spot by the Bank was sometimes entrusted to itfor short periods. These operations included swaps carried out under thearrangement concluded in June 1966 in which a number of central banks andthe Bank participated. This arrangement, which was renewed in March 1967,had as its object the further strengthening of sterling, Other deposits incurrencies underwent little change, at least in absolute figures: rises occurred

— 162 —
in sight accounts and in funds at between six and nine months and declinesin deposits at between three and six months and at over nine months. Itshould be noted, however, that sight deposits fluctuated very sharply duringthe year (the minimum was 32 million and the maximum 1,268 million, thelatter figure having been reached as a result of various swaps concluded by theBank of which the countervalue was credited to sight accounts in its books).
At the beginning of the financial year the Bank's resources were almostevenly divided between gold deposits (48 per cent.) and currency deposits(47 per cent.), while the remaining 5 per cent, consisted of notes; on 31stMarch 1967 these percentages were 46, 50 and 4 respectively.
EMPLOYMENT OF RESOURCES (assets).
BIS: Distribution by nature of total cash holdings and investments.
NatureFinancial years ended 31st March1966 I 1967 Movement
in millions of francs
CashGold . . .Currencies
InvestmentsGold . . .Currencies*
TotalGold . . .Currencies*
3,025381 3,406
4233,924 4,347
3,4484,305 7,753
3,096156 3,252
4204,559 4,979
3,5164,715 8,231
+ 71— 225 — 154
— 3+ 635
68410
632
+ 478
* Not including the "Claim in respect of the Arrangement dated 29th November 1965 with the Federal Republicof Germany".
The development of the Bank's gold position is shown in the followingtable, which gives the maximum and minimum figures for the financial year.
BIS: Gold position.
End of month
1966March . . .MayJuly . . . .August . . .December. .
1967January . . .February . .March . . .
Movement:31st March1966 to31st March1967
Spot position
Goldin bars
and coinsInvest-mentsin gold
Depositsin gold
Netbalance
Forwardoperations
Netbalance
Finalnetgold
position
in millions of francs
3,0252,8242,5272,520 (min.)2,583
3,0953,0533,096 (max.)
+ 71
423424426 (max.)426422
419 (min.)420420
- 3
3,5393,360 (min.)4,1814,1334,303
4,3534,359 (max.)3,561
+ 22
— 91— 112— 1,228— 1,187— 1,298 (min.)
— 839— 886— 45 (max.)
+ 46
+ 439 (min.)+ 479+ 1,607+ 1,576+ 1,712 (max.)
+ 1,257+ 1,308+ 472
+ 33
348 (min.)367379389414
418422427 (max.)
+ 79
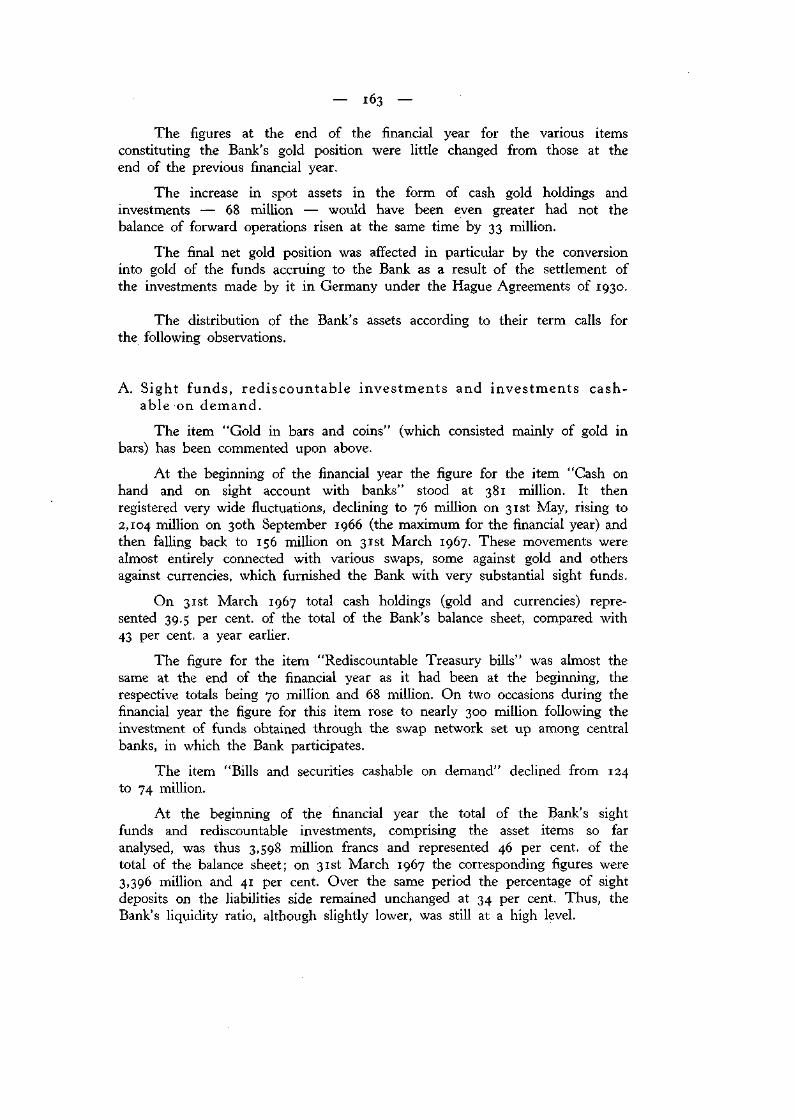
The figures at the end of the financial year for the various itemsconstituting the Bank's gold position were little changed from those at theend of the previous financial year.
The increase in spot assets in the form of cash gold holdings andinvestments — 68 million — would have been even greater had not thebalance of forward operations risen at the same time by 33 million.
The final net gold position was affected in particular by the conversioninto gold of the funds accruing to the Bank as a result of the settlement ofthe investments made by it in Germany under the Hague Agreements of 1930.
The distribution of the Bank's assets according to their term calls forthe following observations.
A. S i g h t f u n d s , r e d i s c o u n t a b l e i n v e s t m e n t s a n d i n v e s t m e n t s c a s h -a b l e on d e m a n d .
The item "Gold in bars and coins" (which consisted mainly of gold inbars) has been commented upon above.
At the beginning of the financial year the figure for the item "Cash onhand and on sight account with banks" stood at 381 million. It thenregistered very wide fluctuations, declining to 76 million on 31st May, rising to2,104 million on 30th September 1966 (the maximum for the financial year) andthen falling back to 156 million on 31st March 1967. These movements werealmost entirely connected with various swaps, some against gold and othersagainst currencies, which furnished the Bank with very substantial sight funds.
On 31st March 1967 total cash holdings (gold and currencies) repre-sented 39.5 per cent, of the total of the Bank's balance sheet, compared with43 per cent, a year earlier.
The figure for the item "Rediscountable Treasury bills" was almost thesame at the end of the financial year as it had been at the beginning, therespective totals being 70 million and 68 million. On two occasions during thefinancial year the figure for this item rose to nearly 300 million following theinvestment of funds obtained through the swap network set up among centralbanks, in which the Bank participates.
The item "Bills and securities cashable on demand" declined from 124to 74 million.
At the beginning of the financial year the total of the Bank's sightfunds and rediscountable investments, comprising the asset items so faranalysed, was thus 3,598 million francs and represented 46 per cent, of thetotal of the balance sheet; on 31st March 1967 the corresponding figures were3,396 million and 41 per cent. Over the same period the percentage of sightdeposits on the liabilities side remained unchanged at 34 per cent. Thus, theBank's liquidity ratio, although slightly lower, was still at a high level.

—• 164 —
BIS: Asseis.End of quarter, in milliards of francs.'
securities cashable on demand1957/58 1958/59 1959/60 1960/61 1961/62 1962/63 1963/64 1964/65 1965/66 1966/67
* Total of first part of statement of account up to and including 31st December 1965; thereafter total of statementof account.
B. T i m e d e p o s i t s a n d i n v e s t m e n t s .
Very wide fluctuations occurred in the figure for the item "Timedeposits and advances". From its level of 2,507 million at the beginning ofthe financial year the total gradually declined until the end of September1966, when it stood at 2,030 million, its lowest level for the year, and thenrose again, reaching its maximum of 4,108 million on 31st December 1966.By the end of January 1967 it had fallen back to 3,449 million, and it closedthe financial year at the level — still a high one — of 3,551 million, 1,044 millionabove that of a year earlier.
These wide-scale movements were due firstly to the fact that the Bankobtained large amounts of funds at certain times during the year as a resultof operations carried out within the framework of central-bank co-operation orof spot gold sales covered by corresponding forward purchases; secondly, tothe transfer of sight investments to "Time deposits and advances" as and whendeposits placed with the Bank were switched from sight accounts to timeaccounts; and thirdly, to the reduction in the total of the item "Other billsand securities".

- 16s -
Indeed, in contrast to what had often been the pattern in previousyears, the movements in the item "Other bills and securities" frequentlydiverged from and were less marked than those in "Time deposits andadvances". From 1,648 million at the beginning of the financial year, whichwas nearly its maximum, the total gradually fell to 1,187 million on 30thNovember, but then from the end of December onwards it remained fairlysteady at the level at which it closed the financial year, viz. 1,284 million.The decline over the year thus amounted to 364 million.
The following table shows the composition according to term of theBank's time investments as at the end of the last two financial years.
BIS: Time
Periods
Not exceeding 3 months . . .Between 3 and 6 months . .Between 6 and 9 months . .Between 9 and 12 months . .Over 1 year
Total
deposits and advancesand securities.
Financial years e1966
and other bills
nded 31st March1967
in3,062
576228147142
4,155
millions of francs3,805
49925424829
4,835
Movement
+ 743— 77+ 26+ 101— 1 13
+ 680
The overall increase in investments in the form of time deposits andadvances and other bills and securities was more than accounted for by therise in funds invested at less than three months. The total of the fundsinvested at more than six months remained practically unchanged; the almostcomplete liquidation of investments at over one year was roughly offset bythe increase in investments at between six and twelve months. Hence therewas a shortening of the average term of the Bank's time investments taken asa whole. Finally, it should be noted that, as in the past few years, a sub-stantial proportion of these funds was in fact mobilisable at very short notice.
Apart from the increase in time deposits in currencies entrusted to theBank by central banks, there was no fundamental change during the financialyear in the volume or composition of borrowed resources.
As in preceding years, the main feature of the Bank's activity was thegrowing volume of swaps — of gold against currencies or of currenciesagainst currencies — concluded with central banks.
These swaps, carried out within the framework of monetary co-operationbetween central banks, enabled the Bank to play an active and increasing partin the development of such co-operation, particularly in connection with thearrangement concluded in June 1966.

— 166 — .
Furthermore, the Bank obtained by some of these swaps the necessaryresources to serve as an intermediary between the monetary authorities andthe market. It was thereby able to help to a certain extent and at certaintimes (especially at the end of December) to relieve tension caused by thelarge-scale repatriation of funds by commercial banks and by so doing dampeddown the rise in interest rates on the Euro-dollar market.
The total volume of the Bank's operations reached a new record level,amounting to n o milliard in 1966-67, against 86 milliard in 1965-66 and72 milliard in 1964-65.
The net profit for the past financial year was appreciably higher thanthat for the previous financial year. While partly attributable to the rise inthe funds received in the form of deposits, the increase was due even more tothe larger volume of resources obtained by way of swaps and the widening ofprofit margins resulting from the development of interest rates on the marketsin the first nine months of the financial year.
2. The Bank as Trustee and Fiscal Agent for international governmentloans.
In conformity with the agreements in force, the Bank continued in theyear under review to perform the functions of Fiscal Agent of the Trusteesfor the new bonds of the German External Loan 1924 (Dawes Loan) and ofTrustee for the new bonds of the German Government International Loan1930 (Young Loan) which were issued by the Government of the FederalRepublic of Germany in accordance with the London Agreement on GermanExternal Debts of 27th February 1953.
The financial year 1966-67 ended for the Dawes Loan on 15th April1967 and for the Young Loan on ist June 1967. The interest in respect ofthe financial year 1966-67 amounted to the equivalent of about 11.5 millionfrancs for the Dawes Loan and of about 35.7 million francs for the YoungLoan; it was duly paid to the Bank and distributed by the latter among thePaying Agents. Redemption of the Dawes Loan was effected in respect of thefinancial year 1966-67 partly by purchases of bonds on the market and partlyby drawings; redemption of the Young Loan was effected entirely by purchasesof bonds on the market.
The question whether the exchange guarantee attached to the YoungLoan under the terms of the London Agreement is applicable in the case ofthe revaluation of the Deutsche Mark in 1961 has not yet been settled. Thematter is in the hands of the governments of the countries in which issuesof the Loan were made.
The position as regards the Dawes and Young Loans is as shown inthe following tables.

167
German External Loan 1924(Dawes Loan).
Issue
American . . .Belgian . . . .British . . . .DutchFrench . . . .Swedish . . .Swiss . . . .Swiss . . . .
American . . .Belgian . . . .British . . . .Dutch.French . . . .Swiss . . . .Swiss . . . .
Currency
$££££
S.kr.£
Sw.fr.
$£££££
Sw.fr.
Nominal value
Bonds Issued
44,107,000583,200
8,277,2001,323,0001,929,600
14,209,0001,130,5008,251,000
8,206,000157,800
2,232,000291,400498,9001 15,000415,000
Bonds por drawn fo
in respect of th1958-59 to1965-66
urchasedredemption
3 financial years1966-67
Conversion bonds13,084,000
123,6001,752,400
262,100403,500
2,782,000235,300
1,581,000
Funding1,886,000
37,700525,70061,400
118,70026,60090,000
2,045,00018,400
264,30042,20061,200
428,00036,800
244,000
bonds244,000
5,00070,7009,000
15,8003,600
11,000
Balanceafter redemption
28,978,000441,200
6,260,5001018 7001,464,900
10,999,000858,400
6,426,000
6,076,000115,100
1,635,600221,000364,40084,800
314,000
Issue
American . . .Belgian . . . .British . . . .DutchFrench . . . .German . . . .Swedish . . .Swiss . . . .
American . . .Belgian . . . .British . . . .DutchFrench . . . .German . . . .Swedish . . .Swiss . . . .
German
Currency
$B.fr.£FI.
Fr.fr.DMS.kr.Sw.fr.
$B.fr.£FI.
Fr.fr.DMS.kr.Sw.fr.
Government International(Young Loan).
Loan 1930
Nominal value*
Bonds issued
55,466,000202,769,000
17,703,00052,487,000
445,555,00014,504,00092,763,00058,383,000
9,004,00045,662,0004,223,9008,488,000
98,140,000416,000
6,014,0001,405,000
Bonds purchasedor drawn for redemption
in respect of the financial years1958-59 to1965-66 1966-67
Conversion bonds5,326,000
19,371,0001,676,3004,875,000
42,160,0001,363,0008,824,0005,566,000
Fundinç855,000
4,402,000402,500800,000
9,160,00039,000
580,000133,000
824,0002,924,000
254,700755,000
6,442,000210,000
1,341,000841,000
bonds127,000657,00059,200
124,0001,401,000
6,00086,00019,000
Balanceafter redemption
49,316,000180,474,00015,772,00046,857,000
396,953,00012,931,00082,598,00051,976,000
8,022,00040,603,0003,762,2007,564,000
87,579,000371,000
5,348,0001,253,000
• Nominal value on 1st May 1967 established in accordance with the provisions of the London Agreement onGerman External Debts of 27th February 1953 but without taking account of the revaluation of the Deutsche Markin March 1961.
i68 —
The Bank is also Trustee for the assented bonds of the AustrianGovernment International Loan 1930 and for those coupons of the loan whichthe Federal Republic of Germany has undertaken to pay to the extent of75 per cent, of the nominal value. In both cases the service was carried outin conformity with the relevant agreements.
The following table shows the position as regards the assented bonds ofthe loan and their redemption.
Austrian Government International Loan 1930.
Issue Currency
Nominal value
Bondsassented
Bonds purchasedor drawn for redemption
in respect ofthe financial years
1959 to 1965 1966
Balanceafter redemption
American . .Anglo-DutchSwiss . . .
$£
Sw.fr.
1,667,000
856,600
7,102,000
459,000
231,200
1,610,000
79,000
38,600
276,000
1,129,000586,800
5,216,000
3 . T h e B a n k a s D e p o s i t a r y u n d e r t h e t e r m s o f t h e A c t o f P l e d g e
c o n c l u d e d w i t h t h e H i g h A u t h o r i t y o f t h e E u r o p e a n C o a l a n d S t e e l
C o m m u n i t y .
T h e B a n k h a s c o n t i n u e d t o p e r f o r m t h e f u n c t i o n s o f D e p o s i t a r y i n
r e s p e c t o f t h e l o a n s o f t h e H i g h A u t h o r i t y o f t h e E u r o p e a n C o a l a n d S t e e l
C o m m u n i t y w h i c h a r e s e c u r e d i n a c c o r d a n c e w i t h t h e p r o v i s i o n s o f t h e A c t
o f P l e d g e c o n c l u d e d b e t w e e n i t a n d t h e H i g h A u t h o r i t y o n 2 8 t h N o v e m b e r
1 9 5 4 -
T h e t o t a l a m o u n t o f t h e s e s e c u r e d l o a n s w a s o r i g i n a l l y e q u i v a l e n t t o
a b o u t 8 1 7 m i l l i o n f r a n c s . R e p a y m e n t s b y t h e H i g h A u t h o r i t y u p t o i s t A p r i l
1 9 6 7 a m o u n t e d t o t h e e q u i v a l e n t o f a b o u t 2 8 9 m i l l i o n f r a n c s , s o t h a t t h e t o t a l
a m o u n t o u t s t a n d i n g w a s r e d u c e d t o t h e e q u i v a l e n t o f a b o u t 5 2 8 m i l l i o n f r a n c s .
F u r t h e r p a r t i c u l a r s o f t h e s e l o a n s a r e g i v e n i n t h e t a b l e o n t h e n e x t p a g e .
T h e H i g h A u t h o r i t y h a s u s e d t h e p r o c e e d s o f t h e s e l o a n s t o g r a n t
c r e d i t s i n t h e m e m b e r c o u n t r i e s o f t h e E u r o p e a n C o a l a n d S t e e l C o m m u n i t y .
D u r i n g t h e financial y e a r 1 9 6 6 - 6 7 t h e B a n k r e c e i v e d f r o m t h e b o r r o w e r s
a n d d i s t r i b u t e d a m o n g t h e P a y i n g A g e n t s t h e e q u i v a l e n t o f a b o u t 2 7 m i l l i o n
f r a n c s i n r e s p e c t o f i n t e r e s t a n d t h e e q u i v a l e n t o f a b o u t 3 5 m i l l i o n f r a n c s i n
r e s p e c t o f r e d e m p t i o n .
T h e H i g h A u t h o r i t y h a s a l s o r a i s e d l o a n s w h i c h a r e n o t s e c u r e d i n
a c c o r d a n c e w i t h t h e A c t o f P l e d g e , b u t t h e B a n k h a s n o f u n c t i o n i n c o n n e c -
t i o n w i t h s u c h l o a n s .

— IÓ9 —
Secured loans of the High Authorityof the European Coal and Steel Community.
Seriesof Se-curedNotesof theHigh
Author-ity
1st2nd
3rd
4th
5th
6th7th»
10th
11th2
13th2
15th
16th
Dates01
issue
19541955
1955
1955
1956
195619571957
195819601961
1961
Countriesof issue
United StatesBelgium
Germany
Luxemburg
Saar
SwitzerlandUnited StatesLuxemburg
United StatesUnited StatesLuxemburg
Netherlands
Lenders
US GovernmentCaisse Générale
d'Epargne et deRetraite, Brussels
Rheinische Giro-zentrale undProvinzlalbank,Düsseldorf
Landesbank fürWestfalen (Giro-zentrale), Münster
Caisse d'Epargne del'Etat, Luxemburg
Landesbank undGirozentraleSaar, Saarbrücken
Public issuePublic issueEtablissement
d'Assurance contrela Vieillesse etl'Invalidité,Luxemburg
Public issuePublic issueEtablissement
d'Assurance contrela Vieillesse etl'Invalidité,Luxemburg
Public issue
Originalamounts of loans
$ 100,000,000
B.fr. 200,000,000
DM 25,000,000
DM 25,000,000B.fr. 20,000,000L.fr. 5,000,000
DM 2,977,450'Sw.fr. 50,000,000$ 25,000,000
L.fr. 100,000,000$ 35,000,000$ 25,000,000
L.fr. 100,000,000FI. 50,000,000
Amountsunredeemedon1st April 1967
68,900,000
147,800,000
16,884,850
16,884,85014,780,000
—
1,932,36531,250,00015,500,000
85,057,22228,100,00023,350,000
94,412,80450,000,000
Ratesof
interest
%
3%
37,
3%
3%3%—
4%4%5%
5%55%
5%4'/2
Yearof
finalTinaimatu-rity
1979
1982
1981
19811982—
197719741975
198219781980
19861981
1 This loan, which was contracted in French francs, was converted into Deutsche Mark in 1959. The originalamount was 350,000,000 old French francs. 2 The Secured Notes of the 8th, 9th, 12th and 14th Series havebeen entirely redeemed.
4. T h e Bank as Agent for the Organisation for Economic Co-operationand Development (European Monetary Agreement) .
The Bank's activities in its continuing capacity as Agent for the execu-tion of the financial operations of the E M A under the Organisation forEconomic Co-operation and Development have been described in Chapter Vof Part II of the present Report. The Bank has received in this connection,as last year, a contribution of Sw.fr. $00,000 towards its administrativeexpenses, together with the reimbursement of its out-of-pocket expenses; theseamounts have been credited to "Costs of administration" in the Bank's Profitand Loss Account, but are not shown, as in the past, as a separate item.

— 170 —
5. Development of co-operation between central banks and internationalorganisations.
Co-operation between central banks, the promotion of which is one of theprimary functions of the Bank and which it has constantly endeavoured to furtherover the years, has become closer and been intensified during the last year.
Prominent among operations within this framework is the arrangementset up in Basle last June by a group of major central banks and the Bankwith the object of providing facilities for the Bank of England in order torelieve the pressure on the officiai reserves of the United Kingdom arisingfrom fluctuations in the sterling balances of overseas countries and thus tostrengthen the sterling system. These central-bank facilities were channelledthrough the Bank, and their usefulness has been clearly borne out. Further-more, in close co-operation with certain central banks, the Bank has contri-buted effectively to co-ordinated efforts to alleviate undesirable seasonal strainson markets, in particular the Euro-dollar market. This has been partlyachieved, in agreement with the Federal Reserve Bank of New York, by theutilisation of the swap arrangements concluded between the latter and theBank for International Settlements. The total of these swap lines amounts toUS $400 million, half of which is against Swiss francs and half against otherEuropean currencies.
The Bank's activity in the field of research and exchanges of informationhas been continued. A number of meetings of central-bank experts have beenorganised — in addition to the regular meetings of the Board of Directors —either to study economic and monetary problems of general interest or toexamine specific questions such as the development of the gold and Euro-currency markets. The Bank's services have assisted in the work of thesegroups.
The Bank has continued to perform the task entrusted to it in August1964 by the Ministers of the Group of Ten of collecting and distributing toall participants of the Group and to Working Party No. 3 of the OECDstatistical data relevant to the means used to finance surpluses and deficits onexternal account. These data provide the essential basis for multilateralsurveillance of international liquidity creation. The Governors of the centralbanks of the Group, when they meet at the Bank, also exchange informationat the earliest possible stage on arrangements entered into between membersof the Group for new or enlarged credit facilities and the evolution of suchcredits. Co-operation in this field has proved to be of great value.
The Bank has continued to be associated in the work carried out bythe Deputies of the Group of Ten and its Study Groups on the internationalliquidity problem, the creation of a new reserve instrument and the adjustmentprocess. The Bank's services have also assisted in this work.
The continued co-operation between central banks has strengthenedrelations between the Bank, on the one hand, and the O E C D and the IMF,on the other.

6. Net profits and their distribution.
The accounts for the thirty-seventh financial year ended 31st March 1967showed a surplus of 47,074,487 francs. The surplus for 1965-66 was38.578,751 francs.
The Board of Directors has decided to continue to build up theprovision for exceptional costs of administration and the provision for con-tingencies, to the extent of 200,000 francs and 3,800,000 francs respectively.In 1966 transfers to these provisions had amounted to 1 million and 15 mil-lion francs respectively.
In addition, it has become necessary to constitute a provision forbuilding purposes. In view of the large profit for the financial year 1966-67,the Board of Directors has decided to pay into this new provision an amountof 11 million francs. At present the Bank's offices are spread over six buildings;the premises date from the beginning of the century and are no longer in linewith modern requirements. Four of these buildings, including the main one, areowned by the Bank. The other two are adjoining, but the Bank is only thelessee of a number of rooms in them. Since this is not a rational situation,the Bank is studying the possibility of constructing a new building either onthe land it owns or on a site in the neighbourhood that has been offered to it.
After deduction of the transfers to the provisions, the net profit amountsto 32,074,487 francs, to which must be added the sum of 9,842,787 francscarried forward from the previous financial year. The profit available fordistribution thus amounts to 41,917,274 francs. This makes it possible notonly to pay the cumulative dividend oi 6 per cent, per annum on the paid-upcapital and the balance of the undeclared cumulative dividend but also tomake other distributions provided for under Article 53 of the Bank's Statutes.
The cumulative dividend amounts to 37.50 francs and the balance ofthe undeclared cumulative dividend to 54.47 francs per share. After appro-priation of the sums required for the distribution of these two dividends, i.e.7,500,000 and 10,894,000 francs respectively, totalling 18,394,000 francs, anamount of 23,523,274 francs remains to be distributed.
Under the provisions of sub-clause (c) of Article 53 of the Statutes, 20 percent, of this sum, viz. 4,704,655 francs, can be utilised to pay a supplemen-tary dividend or to build up a Special Dividend Reserve Fund. The Board ofDirectors recommends to the General Meeting that 4,106,000 francs be usedto pay a supplementary dividend of 20.53 francs per share. As regards theremaining 598,655 francs, the Board of Directors, exercising the powersvested in it by sub-clause (c) of Article 53 and basing itself on the policypursued by the Bank in the early years of its existence, has decided toappropriate this to a reconstituted Special Dividend Reserve Fund.
The appropriation of the balance of the available profit, namely18,818,619 francs, is regulated by sub-clauses (d) et seq. of Article 53 of theStatutes.
— 172 —
Until the General Reserve Fund reaches an amount equal to that of thepaid-up capital, half of this balance must be transferred to that Fund, whichwill go up from 13,342,650 to 22,751,960 francs. The last transfer to thisReserve was made in 1940.
Following the settlement of the assets and liabilities of the Bankappertaining to the Hague Agreements of 1930 (Young Plan), to whichreference was made in the Bank's Thirty-Sixth Annual Report, the appropria-tion of the other half is now subject to the provisions of sub-clause (f) ofArticle 53. On the basis of that clause, the Board of Directors recommendsto the General Meeting that the whole of this sum, viz. 9,409,309 francs, bepaid into the Special Dividend Reserve Fund. If this proposal is accepted,this Fund will amount to 10,007,964 francs, which approximately correspondsto the sum brought forward from the previous financial year, which can nolonger be carried forward since this would be contrary to the provisions ofArticle 53.
Under the proposals of the Board of Directors, the total distributionwill amount to 112.50 francs per share, the same sum as that paid in 1966.It will be payable on ist July 1967 in the amount of 160.75 Swiss francs pershare. In the case of dividends which cannot be paid on that date, the con-version into Swiss francs will take place on the day of their payment at thethen prevailing rate of exchange.
The Balance Sheet, the Profit and Loss Account and the AppropriationAccount will be found at the end of this Report.
The accounts of the Bank have been duly audited by Messrs. PriceWaterhouse & Co., Zurich, who have confirmed that the Balance Sheet andthe Profit and Loss Account give a true and correct view of the state of theBank's affairs as at 31st March 1967 and of its profit for the year ended onthat date. Messrs. Price Waterhouse & Co.'s certificate is appended at thefoot of the Balance Sheet.
7. Changes in the Board of Directors.
The Earl of Cromer, who, as Governor of the Bank of England, hadbeen an ex officio Director of the Bank for International Settlements since1961, resigned as Governor of the Bank of England at the end of June 1966,at the same time ceasing to be an ex officio Director of the Bank. TheChairman, at the meeting held on 13th June 1966, expressed the Board'ssincere thanks for the outstanding services which Lord Cromer had renderedto the Bank.
Sir Leslie O'Brien, who succeeded Lord Cromer as Governor of theBank of England on ist July 1966, became an ex officio Director of theBank for International Settlements on the same date. He was welcomed bythe Chairman at the first Board meeting which he attended on n t h July1966.

— 173 —
At the meeting of the Board held on n t h July 1966, the Chairmanannounced that Sir Leslie O'Brien had appointed Mr. C. J. Morse, Directorof the Bank of England, as his Alternate on the Board of Directors in placeof Sir Maurice Parsons and that Mr. R. G. Raw would continue to act asSir Leslie O'Brien's Alternate in the absence of Mr. Morse. The Bank isgrateful to Sir Maurice Parsons for his valuable services.
At the meeting of the Board held on n t h July 1966 the Chairmanannounced that Dr. W. Schwegler, who had been a member of the Boardsince 1956, had decided to resign from his office as a member of the Boardof Directors of the Bank for International Settlements on 31st August 1966,when he would retire from his post as ' President of the Direktorium of theSwiss National Bank. He thanked Dr. Schwegler in the name of the Boardfor the eminent services he had rendered to the Bank over many years.
At its meeting on n t h July 1966 the Board elected, under Articles 28(3)and 29 of the Statutes, Dr. Edwin Stopper, who had been appointed Presidentof the Direktorium of the Swiss National Bank as from ist September 1966,to be a member of the Board of Directors for the unexpired period ofDr. Schwegler's term of office ending on 31st March 1968. At the meetingon 5th September 1966 the Chairman welcomed Dr. Stopper, who wasattending his first meeting as a member of the Board of Directors.
The mandate of M. Maurice Frère as a member of the Board was dueto expire on 7th August 1966 and he was re-appointed under Article 28(2) ofthe Statutes by M. Ansiaux, Governor of the National Bank of Belgium, inJuly 1966 for a further period of three years ending on 7th August 1969.
The mandate of Dr. Donato Menichella as a member of the Board wasdue to expire on 7th November 1966 and he was re-appointed under Article28(2) of the Statutes by Dr. Carli, Governor of the Bank of Italy, in Sep-tember 1966 for a further period of three years ending on 7th November 1969.
The mandate as a member of the Board of Dr. M. W . Holtrop beingdue to expire on 31st March 1967, he was re-elected under Article 28(3) ofthe Statutes at the meeting of the Board held on 13th March 1967 for afurther period of three years ending on 31st March 1970.
At the meeting of the Board held on 8th May 1967 the Chairmanannounced that M. Brunet had appointed M. Marcel Théron, GeneralManager of the Foreign Department of the Bank of France, as his secondAlternate in place of M. Gilbert Bouchet. The Bank is grateful to M. Bouchetfor the valuable services he has rendered to the Bank since his appointmentmore than two years ago.

— 174 —
C O N C L U S I O N .
Whereas a year ago excess demand and rising prices was the prevailingsituation in most of the industrial countries, the general economic climatetoday ranges from lack of expansionary momentum to mild recession. Threecountries have been dominant in bringing about this change in the conjunc-ture — the United States, Germany and the United Kingdom — both because oftheir own size and because the easing of activity in them has had reper-cussions on the export demand over a wider area. Expansion of output iscontinuing only in Italy and Japan.
Excess demand emerged suddenly in the United States with the inten-sification of the Vietnam war, while in Germany it built up more slowly overmany months. But the situation in both countries was similar in that risingpublic-sector expenditure was the major factor in forcing boom conditions.Also, adequate fiscal restraint to curb inflationary pressures was not forth-coming and the containment of excess demand was left to central-bank policy.To counteract the stimulus from the budget deficit, very severe monetaryrestriction was required in both countries, which sent interest rates well aboveprevious post-war levels. In the end, this policy succeeded in overcominginflation, though the process was slower and involved more sectoral difficultiesthan what could have been achieved with a better policy mix.
In the United Kingdom large negotiated wage increases had added tothe strong expansionary impulse from public expenditure to produce excessdemand by early in 1964. After vain hopes that the situation would correctitself with the help of mild restraints, the authorities tried to impose a strongcurb on demand in the budget a year ago. The means used, however, werenot immediately effective or convincing. Hence, there was a substantial flightfrom sterling in the early summer of 1966 which necessitated a furtherpackage of restrictive measures in July. The freeze on wages and prices andthe new tax increases imposed at that time very soon brought a betterbalance in both the domestic and external spheres.
While there has not yet been a clear shift to renewed expansion, thepresent situation does not show any of the characteristic signs of a defla-tionary spiral. With regard to the economic outlook, also, it is important thatthe easing of demand did not reflect an autonomous business cycle — suchas might come from an overexpansion of productive capacity. Rather, it cameabout through anti-inflationary policy and, with inflation having subsided,^there is little reason to expect protracted stagnation. Monetary policy hasbeen relaxed in all countries and positive steps to stimulate activity have beentaken in Germany and several other countries. In both the United States andthe United Kingdom the rates of overall budget deficit are very large and, ifthey are financed through monetary expansion, the danger of excess domesticliquidity is just as real as that of stagnant demand — particularly in view of

— 175 —
the external payments problems of both countries. In general, official policymust guard against reactivation of excess demand; hence, expansion is likelyto be renewed at a more moderate pace than in the 1962-65 period.
Restrictive measures in the end gained their objective; but the impressionthat remains from recent experience is one of groping towards stabilisation.The situation was not obscure from an analytical standpoint and the policyremedies required were not very difficult to formulate. Thus, nothing waswrong with the "new economics", as sometimes charged; the trouble wasfailure to act promptly and effectively. In particular, fiscal policy was tooinflexible, which meant that monetary restrictions had to be pushed close tothe limit. As this process came near to producing a monetary crisis and,indeed, contributed to the intense strains in the foreign exchange market, thecase for a better policy mix in the future cannot be brushed aside.
The problem of more effective use of the whole range of policy instru-ments, to help prevent imbalance in the first place and to correct it morequickly when it comes, is not one for governments and parliaments alone.There is no doubt that public opinion relishes tax cuts more than taxincreases, and that "full employment" has greater support than this lesstangible goal of monetary stability. It is significant that several governmentsfell in the process of seeking budgetary restraint. Therefore, it is vital thatthe public become better informed on these matters. One must say, for thetime being, that in quite a few countries control of the opinion cycle is moredifficult than control of the business cycle.
The cyclical movement over the past year has produced significantchanges in the balance-of-payments situation of the main countries. In Italythe large surplus of the two previous years has been sharply curtailed;imports have increased substantially with continued domestic expansion andnet capital exports were induced by higher interest rates abroad. In France,also, where the dampening of internal demand was milder than in most othercountries, the external surplus has shifted to a small deficit due to higherimports and to a much reduced capital inflow. In the United Kingdom, on theother hand, the previous balance-of-payments deficit has been corrected byrestraint of domestic demand and further limitations on capital exports.Similarly, in Germany the deficit has disappeared but, with the recession indomestic demand causing a rise in exports and a fall in imports, it has givenway to a large surplus.
The significant exception to generally better balance in internationalpayments, however, is the United States. The upsurge of home demand ledto soaring imports, so that the trade surplus, excluding government-financedexports, fell to only a little over $700 million. To this deterioration wasadded a large rise in military expenditure abroad because of the war inVietnam. As the tight monetary conditions of last year attracted unusuallylarge capital imports, the overall external deficit did not rise very much.However, the prospect this year is that the underlying deterioration willbecome more evident, which would pose problems for monetary policy.

— 176 —
Official discussions on reform of the international monetary system in thepast year have concentrated on plans for deliberate creation of a new reserveasset to supplement gold in the growth of global reserves over the longerterm. While it has been agreed that the increment of gold and dollars islikely to be insufficient in the future, there has not been agreement on howto make good this deficiency. Many countries believe the new asset shouldhave the character of an owned reserve so that it might, at least in time,serve as an international money in its own right. Other countries believe sucha course to be too dangerous and would limit contingency planning toprovision of an additional element of credit in the system, part of whichcould be automatic. Perhaps more importantly, the two views are quitedivergent on how much supplement to gold may be needed for globalreserves and how soon. The deterioration of the US balance of payments, andthe unlikelihood of equilibrium being restored in the next year or two, hashad a strong influence on the views of the hard money school. Given thepersistence of that deficit, these countries are reluctant to separate the prob-lem of reform of the means of reserve creation in the system from the prob-lem of stricter implementation of the adjustment process.
It is too early to know what proposals for strengthening the I M F mightbe presented at the coming meeting in Rio de Janeiro. While such a stepwould be welcome, it is hardly likely that it will go very far to resolve theproblem of the future growth of reserves. Where the matter stands is thatan alternative to the present gold-exchange standard has not been found; noris there a clear view about how to operate that system with a very limitedflow of new monetary gold.
Meanwhile, it seems likely that, in the practical task of managing theflows of payments, there will be continued recourse to the expedients of adhoc credit transactions and direct controls.
GABRIEL FERRAS
General Manager

B A L A N C E S H E E T A N D P R O F I T A N D L O S S A C C O U N T
AS AT 31st MARCH 1967

ASSETS
B A L A N C E S H E E TIN GOLD FRANCS (UNITS OF 0.290 322 58...
Gold in bars and coins 3,095,923,425 37.6
Cash on hand and on sight account with banks 155,533,515
Rediscountable Treasury bills
Bills and securities cashable on demand
Time deposits and advancesNot exceeding 3 months 2,905,993,888Between 3 and 6 months 272,963,858Between 6 and 9 months 160,440,341Between 9 and 12 months 211,658,614
70,473,519
74,223,807
3,551,056,701
Other bills and securitiesGold
Not exceeding 3 months 282,673,089Between 3 and 6 months 95,114,787Between 6 and 9 months 23,346,085Between 9 and 12 months 19,012,096
CurrenciesNot exceeding 3 months 616,621,496Between 3 and 6 months 130,732,607Between 6 and 9 months 69,640,555Between 9 and 12 months 17,314,479Over 1 year 29,275,240
1,283,730,434
Miscellaneous assets 1,050,115
Buildings and equipment 1
8,231,996,517
1.9
0.9
0.9
35.33.31.92.6
3.41.20.30.2
7.51.60.80.20.4
0.0
0.0
100
MEMORANDUM ACCOUNTSa. Forward gold operations:
Net balance: gold receivable (currencies to be delivered) 47 1,594,422b, Funds, bills and other securities administered or held by the Bank for account of third parties :
Earmarked gold 1,233,031,174Bank balances 26,288,404Bills and other securities 677,697,186

A S A T 3 1 s t M A R C H 1 9 6 7GRAMMES FINE GOLD - ART. 5 OF THE STATUTES) LIABILITIES
CapitalAuthorised and issued 200,000 shares, each of 2,500 gold francs 500,000,000
of which 25% paid up 125,000,000
ReservesLegal Reserve Fund 12,500,000General Reserve Fund 13,342,650
_ . 25,842,650Deposits (gold)Central banks
Between 9 and 12 months 141,164,686Between 6 and 9 months 237,859,991Between 3 and 6 months ... ., 74,864,788Not exceeding 3 months 221,537,433Sight 2,326,306,125
Other depositorsBetween 6 and 9 months 99,949,256Between 3 and 6 months 89,601,231Not exceeding 3 months 103,436,255Sight 266,489,919
Deposits (currencies) 3,561,209,684Central banks
Over 1 year 16,220,264Between 9 and 12 months 9,581,924Between 6 and 9 months 52,408,796Between 3 and 6 months 309,190,996Not exceeding 3 months 2,991,199,828Sight 221,336,672
Other depositorsNot exceeding 3 months 290,699,118Sight 18,942,037
3,909,579,635Notes
Between 3 and 6 months 2,327,358Not exceeding 3 months 291,067,560
293,394,918Miscellaneous 44,052,356
Profit and Loss Account •• ... 41,917,274
ProvisionsProvision for contingencies - 220,000,000Provision for building purposes 11,000,000
231,000,000
8,231,996,517
7.5
0.3
7.72.90.92.7
28.3
1.21.11.33.3
0.20.10.73.8
36.32.7
3.50.2
0.03.5
0.5
0.5
2.8700
REPORT OF THE AUDITORS TO THE BOARD OF DIRECTORS AND THE SHAREHOLDERS OFTHE BANK FOR INTERNATIONAL SETTLEMENTS, BASLE.
In our opinion the foregoing Balance Sheet and the annexed Profit and Loss Account give a true and correctview of the state of the Bank's affairs as at 31st March 1967 and of its profit for the year ended on that date.We have obtained all the information and explanations which we considered necessary. In our opinion theBank has kept proper books and the said accounts are in agreement with them and with the said informationand explanations.
ZURICH, 3rd May 1967. PRICE WATERHOUSE & CO.

PROFIT AND LOSS ACCOUNTfor the financial year ended 31st March 1967
Net interest and other incomeLess: Costs of administration:
Board of Directors 141,428Executives and Staff 7,101,620Office and other expenses 1,631,479
Net operating surplusLess: Amounts appropriated to the following provisions:
Exceptional costs of administration 200,000Contingencies 3,800,000Building purposes 11,000,000
NETPROFITforthefinancialyearendedSistMarchise?Add: Balance brought forward from the preceding yearTOTAL PROFITS AVAILABLE
Gold Francs55,949,014
8,874,52747,074,487
15,000,00032,074,4879,842,787
41,917,274
APPROPRIATION ACCOUNT
TOTAL PROFITS AVAILABLE, as aboveApplied in accordance with Article 53 of the Statutes,as follows:
Sub-clause (b)Cumulative dividend of 37.50 gold francs per share ... 7,500,000Balance of undeclared cumulative dividend of
54,47 gold francs per share 10,894,000Sub-clause (c) - 20% of 23,523,274
Additional non-cumulative dividend of20.53 gold francs per share 4,106,000
Transfer to Special Dividend Reserve Fund 598,655Sub-clause (d) - 50% of 18,818,619
Transfer to General Reserve FundSub-clause (f) - 50% of 18,818,619
Transfer to Special Dividend Reserve Fund
Gold Francs41,917,274
18,394,00023,523,274
4,704,65518,818,619
9,409,3109,409,309
9,409,309

BOARD O F D IRECTORS
Dr. M. W. Holtrop, Amsterdam Qiairman of the Board of Directors,President of the Bank
Maurice Frère, Brussels Vice-Chairman
Hubert Ansiaux, Brussels
M. J. Babington Smith, London
Karl Blessing, Frankfurt a/M.
Dr. Rudolf Brinckmann, Hamburg
Jacques Brunet, Paris
Dr. Guido Carli, Rome
Henri Deroy, Paris
Dr. Donato Menichella, Rome
Sir Leslie O'Brien, London
Dr. Edwin Stopper, Zurich
Per Asbrink, Stockholm
Alternates
Dr. Paolo Baffi, Rome, or
Prof. Pietro Stoppani, Rome
Bernard Clappier, Paris, or
Marcel Théron, Paris
G. J. Morse, London, or
R. G. Raw, London
Cecil de Strycker, Brussels
M A N A G E M E N T
Gabriel Ferras General Manager
Dr. Milton Gilbert Economic Adviser,Head of the Monetary andEconomic Department
Dr. Antonio d'Aroma Secretary General,
Head of Department
Dr. Hans H. Mandel Head of the Banking Department
D. H. Macdonald Manager
Georges Janson Manager
Henri Guisan Legal Adviser
Dr. Antonio Rainoni Manager
Jan Knap Assistant Manager
Copyright © 2022 FDOKUMEN