6. technical study of 10 priority projects 6.1 review of existing ...
168
Final Report Chapter 6 Technical Study of 10 Priority Projects JICA Master Plan Study of 6-1 January 2009 Hydropower Development in Cambodia 6. TECHNICAL STUDY OF 10 PRIORITY PROJECTS 6.1 REVIEW OF EXISTING REPORTS Of the selected 10 priority projects, the study team reviewed the existing reports. The review results were reflected to hydrological analysis and project planning works. Table 6.1.1 shows the available existing reports. Table 6.1.1 Existing Reports on Selected Ten Projects No. Project name Abbreviation Name of existing report 7&8 Lower Se San 2 + Lower Sre Pok 2 LL2 12 Prek Liang 1 PL1 14 Prek Liang 2 PL2 COMPREHENSIVE DEVELOPMENT OF HYDROPOWER IN SE SAN RIVER BASIN IN CAMBODIA VOLUME 1 SUMMARY REPORT VOLUME 2 MAIN REPORT VOLUME 3 APPENDIX OCTOBER 2006 POWER ENGINEERING CONSULTING COMPANY 1 (PECC1), ELECTRICITY OF VIET NAM (EVN) 22 Stung Kep 2 KP2 FEASIBILITY STUDY REPORT OF STUNG TATAY HYDROELECTRIC PROJECT DECEMBER 2007 CHINA NATIONAL HEAVY MACHINERY CORPORATION, NORTHWEST HYDRO CONSULTING ENGINEERS 29 Bokor Plateau BP BOKOR HYDROPOWER PROJECT IN CAMBODIA PRELIMINARY STUDY REPORT NOVEMBER 2007 IDICO VIET NAM URBAN AND INDUSTRIAL ZONE DEVELOPMENTINVESTMENT CORPORATION 6.2 TOPOGRAPHY 6.2.1 Preparation of topographic map by sublet works Of the selected ten priority projects, topographic maps with 1:10,000 scales were prepared for the following six projects using the existing aerophotographs. The works were sublet to a local company from the study team.
-
Upload
khangminh22 -
Category
Documents
-
view
3 -
download
0
Transcript of 6. technical study of 10 priority projects 6.1 review of existing ...

Final Report Chapter 6 Technical Study of 10 Priority Projects
JICA Master Plan Study of 6-1 January 2009 Hydropower Development in Cambodia
6. TECHNICAL STUDY OF 10 PRIORITY PROJECTS
6.1 REVIEW OF EXISTING REPORTS
Of the selected 10 priority projects, the study team reviewed the existing reports. The review results were reflected to hydrological analysis and project planning works. Table 6.1.1 shows the available existing reports.
Table 6.1.1 Existing Reports on Selected Ten Projects
No. Project name Abbreviation Name of existing report
7&8 Lower Se San 2 + Lower Sre Pok 2
LL2
12 Prek Liang 1 PL1
14 Prek Liang 2 PL2
COMPREHENSIVE DEVELOPMENT OF HYDROPOWER IN SE SAN RIVER BASIN IN CAMBODIA
VOLUME 1 SUMMARY REPORT
VOLUME 2 MAIN REPORT
VOLUME 3 APPENDIX
OCTOBER 2006
POWER ENGINEERING CONSULTING COMPANY 1 (PECC1), ELECTRICITY OF VIET NAM (EVN)
22 Stung Kep 2 KP2 FEASIBILITY STUDY REPORT OF STUNG TATAY HYDROELECTRIC PROJECT
DECEMBER 2007
CHINA NATIONAL HEAVY MACHINERY CORPORATION, NORTHWEST HYDRO CONSULTING ENGINEERS
29 Bokor Plateau BP BOKOR HYDROPOWER PROJECT IN CAMBODIA PRELIMINARY STUDY REPORT
NOVEMBER 2007
IDICO
VIET NAM URBAN AND INDUSTRIAL ZONE DEVELOPMENTINVESTMENT CORPORATION
6.2 TOPOGRAPHY
6.2.1 Preparation of topographic map by sublet works
Of the selected ten priority projects, topographic maps with 1:10,000 scales were prepared for the following six projects using the existing aerophotographs. The works were sublet to a local company from the study team.

Final Report Chapter 6 Technical Study of 10 Priority Projects
JICA Master Plan Study of 6-2 January 2009 Hydropower Development in Cambodia
#12 Prek Liang I #13 Prek Liang IA #14 Prek Liang II #20 Stung Metoek II #22 Stung Kep II #29 Bokor Plateau
During the course of ground control point (GCP) survey, it was realized that the GCP survey was not possible for the locations of to above, because the target area was covered with dense forest and identification of control points were hardly possible. Under such situation, the local company in charge of the work proposed a map preparation works using laser profiler. The study team examined the proposal of the company and discussed with the company in detail. As a result the study team accepted that the proposed method could obtain the same results as the original method in terms of budget, schedule and quality of the output. Thus the study team approved to apply the laser profiler to the to
locations above.
For the remaining locations of to , maps were prepared by aerial mapping of aerophotographs. Table 6.2.1 shows the list of aerophotographs used for the map preparation works.
Table 6.2.1 List of Photographs used for Aerophotogrammetry
Site No. Site Name Area (km2) Used Aerial Photographs 20 Stung Metoek II 42 1/25,000, Feb. 1993
C5506813958, C5506813957 C5506913959, C5506913960, C5506913961, C5506913962 C5607014073, C5607014072 1/40,000, Jan. 2003 40A_1823, 40A_1822, 40A_1821 41A_1541, 41A_1542
22 Stung Kep II 87 1/40,000, Dec. 2001 49_0973, 49_0972, 49_0971 49_0970, 49_0969 50_0918, 50_0919, 50_0920 50_0921, 50_0922
29 Bokor Plateau 4 1/25,000, Dec. 1994 C6410915999, C6410915998 C6410915997, C6410915996
Total Area 182 27 photos
Of the prepared topographic maps, the following is a sample map of Bokor Plateau site:

Final Report Chapter 6 Technical Study of 10 Priority Projects
JICA Master Plan Study of 6-3 January 2009 Hydropower Development in Cambodia
Source: Study Team
Figure 6.2.1 A Sample Map prepared using Aerophotogrammetry – Bokor Plateau Site

Final Report Chapter 6 Technical Study of 10 Priority Projects
JICA Master Plan Study of 6-4 January 2009 Hydropower Development in Cambodia
6.3 HYDRO-METEOROLOGY
6.3.1 Hydro-Meteorological Observation System in Cambodia
Hydrological and meteorological observation in Cambodia has been managed by the Ministry of Water Resources and Meteorology (MOWRAM). In MOWRAM, the Department of Hydrology and River Works (DHRW) is in charge of hydrological observation and the Department of Meteorology (DOM) is responsible for meteorological observation. The observed data are sent from branch offices of MOWRAM to the head office and compiled in the data base (HYMOS).
In addition, the hydrological and meteorological data provided by the Mekong River Commission (MRC)1 are sourced as the observed data of MOWRAM.
6.3.2 Hydrological and Rainfall Station
In accordance with the hydro-meteorological data base (HYMOS) managed by MOWRAM, there are 73 hydrological stations2 and 221 rainfall stations3 in Cambodia. Location of the stations in the data base is shown in Figure 6.3.1.
Most of the stations are located around Phnom Penh, Tonle Sap and Mekong Mainstream. There are only limited observation stations in Koh Kong and Ratanak Kiri Province, the area for the 10 priority projects in the Study.
1 In the data list of MRC (as of December 2005), there are 72 hydrological stations (35 stations have discharge data and the
remaining stations have only water level data), 24 meteorological stations and 204 rainfall stations. 2 Of the 73 stations, 35 stations have discharge data and the remaining stations have only water level data. 3 Of the 221 stations, 21 stations have meteorological data including rainfall and 32 stations have no location data
(coordination data).

Final Report Chapter 6 Technical Study of 10 Priority Projects
JICA Master Plan Study of 6-5 January 2009 Hydropower Development in Cambodia
Source: Study Team *) Location of the observation stations is plotted based on the coordination data of HYMOS.
Figure 6.3.1 Location of Hydrological/Meteorological Stations in Cambodia and Catchment Area of Priority Projects
H
ydro
logi
cal s
tatio
ns
Met
eoro
logi
cal s
tatio
ns

Final Report Chapter 6 Technical Study of 10 Priority Projects
JICA Master Plan Study of 6-6 January 2009 Hydropower Development in Cambodia
6.3.3 Rainfall and Discharge Data at Existing Observation Station Related to 10 Priority Projects
Existing rainfall and discharge data related to the 10 priority projects are limited. Consequently, rainfall and discharge data related to the 10 priority projects are collected and compiled as much as possible referring to data from MOWRAM, related existing studies and data in Vietnam.
Figures 6.3.2 - 6.3.4 show location of the projects and rainfall/hydrological stations, and Tables 6.3.1 - 6.3.2 show representative data of the stations.
Source: Study Team
Figure 6.3.2 5 Projects in the Southwest Area and Hydrological/Meteorological Stations
Hydrological stations
Meteorological stations

Final Report Chapter 6 Technical Study of 10 Priority Projects
JICA Master Plan Study of 6-7 January 2009 Hydropower Development in Cambodia
Source: Study Team
Figure 6.3.3 Bokor Plateau Project in the Central Mountainous Area and Hydrological/Meteorological Stations
Source: Study Team
Figure 6.3.4 4 Projects in the Northeast Area and Hydrological/Meteorological Stations
Hydrological stations
Meteorological stations
Hydrological stations
Meteorological stations

Final Report Chapter 6 Technical Study of 10 Priority Projects
JICA Master Plan Study of 6-8 January 2009 Hydropower Development in Cambodia
Table 6.3.1 Rainfall Stations Related to 10 Priority Projects
Related Project Rainfall Station Province Observation
Period* (years)
Mean Annual Rainfall
(mm) Koh Kong Koh Kong 15 3,690 TEPSCO MGS Koh Kong 2 4,570 Huai Sato (Thai) 27 3,080 A. Muang Trat (Thai) 25 3,590 Khlong Yai (Thai) 24 4,780 Leach Pursat 19 1,560 Dap Bat Pursat 20 1,280 Peam Pursat 4 1,130 Talo Pursat 9 1,190 Treng Battambang 8 1,270 Chamlong Kuoy Battambang 8 1,150 Samlot Battambang 3 1,790 Cheang Meanchey Battambang 3 1,260 Maung Russey Battambang 26 1,170 Pailin Pailin 18 1,230 Rattanak Mondol Pailin 3 1,020 Kirirom Kampong Speu 8 1,650 Trapeang Chor Kampong Speu 4 1,180
5 projects in the southwest area − MSRC − MTK2 − MTK3 − KP2 − USRC
Oral Kampong Speu 8 1,200 Kampot Kampot 54 1,940 Bokor Kampot 6 4,920 Sihanouk Ville Sihanouk Ville 41 3,390 Phu Quoc (Vietnam) 42 3,000 Dorng Tong Kampot 3 1,200 Chumkiri Kampot 3 1,230 Kirirom Kampong Speu 8 1,650
BP
Sre Khlong Kampong Speu 4 1,240 Stung Treng Stung Treng 46 1,760 O Krieng Kratie 8 1,730 Sambor Kratie 18 1,650 Ban Lung Ratanak Kiri 10 2,480 Veun Sai Ratanak Kiri 22 2,330 Andoung Meas Ratanak Kiri 5 1,790 Dac Glei (Vietnam) 21 1,520 Dak To (Vietnam) 24 1,860 Kon Tum (Vietnam) 25 1,760 Pleiku (Vietnam) 25 2,260 Lumphat Ratanak Kiri 10 1,700 Buon Ho (Vietnam) 24 1,600 Krong Bong (Vietnam) 18 1,580 Duc Xuyen (Vietnam) 23 1,940 Dak Mil (Vietnam) 20 1,790
4 projects in the northeast area − LL2 − PL1 − PL1A − PL2
Sen Monorom Mondul Kiri 3 1,810 *) incl. data missing periods Source: Study Team

Final Report Chapter 6 Technical Study of 10 Priority Projects
JICA Master Plan Study of 6-9 January 2009 Hydropower Development in Cambodia
The high rainfall areas in south-western and central mountain regions with annual rainfall of more than 3,000 mm shown in boldface in Table 6.3.1 are noticeable.
Table 6.3.2 Hydrological Stations Related to 10 Priority Projects
Related Project
Hydrological Station River Basin
Catchment Area (km2)
Observation Period* (years)
Mean Annual
Discharge (m3/s)
Mean Annual Run-off (mm)
TEPSCO HGS SRC+Touch 2292** 2 98.4 1,350
Huai Sato (Thai) 190 26 10.1 1,670 Taing Leach Pursat 2,011 50 31.3 490 Bac Trakoun Pursat 4,245 9 82.5 613 Peam Pursat 243 8 16.7 2,170 Prey Klong (down) Pursat 421 10 14.4 1,080
Sre Ponleu Battambang 566 65 23.4 1,310 Treng Battambang 2,225 44 69.7 989
Mong Russey Battambang (St.Dauntri) 1,214 2 2.9 77
Peam Khley Prek Thnot 3,662 10 40.1 346
5 projects in the southwest area − MSRC − MTK2 − MTK3 − KP2 − USRC
Anlong Touk Prek Thnot 3,650 50 39.4 340 Tuk Chhuu Kamchay 745** 5 60.1 2,540 N5 (Kamchay) Kamchay 710 1 50.5 2,240
BP
Kbal Chay Prek Tuek sub river 52.5 2 4.1 2,450
Stung Treng Mekong 635,000 81 13,200 654 Ban Kamphun (daily) 7 1,600 1,020
Ban Kamphun (monthly)
Se San & Sre Pok 49,500
79 1,570 1,000
Voeun Sai Se San 16,300 11 674 1,300 Andaung Meas Se San 11,779** 6 521 1,400
Kon Tum 3,056 23 99.4 1,030 Trung Nghia 3,320 8 136 1,290 Sa Binh
Se San (Vietnam)
6,732 9 234 1,100 Lumphat (daily) 6 664 818
Lumphat (monthly)
Sre Pok 25,600 56 922 1,140
Giang Son 3,180 25 73.9 733 Ban Don 10,700 24 271 799 Duc Xuyen
Sre Pok (Vietnam)
3,080 23 109 1,110 Ban Khmoun Se Kong 29,600 65 1,380 1,470 Siempang Se Kong 23,500 50 911 1,220
4 projects in the northeast area − LL2 − PL1 − PL1A − PL2
O Romis O Romis 38 3 1.6 1,310 *) incl. data missing periods **) measured by Study Team on GIS Source: Study Team

Final Report Chapter 6 Technical Study of 10 Priority Projects
JICA Master Plan Study of 6-10 January 2009 Hydropower Development in Cambodia
In the table above, there are four hydrological stations with annual runoff over 2,000 mm. Of these, at Peam, the annual rainfall amounts to 1,130 mm. The annual rainfall increases in the upper reach, as the area comes closer to the sea, however, it is necessary to confirm the reliability of annual runoff value of 2,170 mm through actual measurement. Annual runoff values of 2,240 to 2,540 mm in Bokor Plateau area, such as Kamchay hydrological station, may be possible considering:
(1) the data of the three stations are consistent to each other, and
(2) the stations are located in the pluvious Bokor plateau with annual rainfall of over 4,000 mm.
6.3.4 Characteristics of Rainfall and Discharge Related to 10 Priority Projects
(1) Southwest Area
Characteristics of rainfall and discharge related to 5 projects (MSRC, MTK2, MTK3, USRC, KP2) in the southwest area are shown in Figures 6.3.5 - 6.3.8.
Koh Kong, TEPSCO MGS and stations in Thailand, located in the west of the Cardamon Mountains, have a lot of rainfall. With regard to annual run-off, TEPSCO HGS and Huai Sato, located in the Cardamon Mountains, and Peam in the most upstream of Pursat show high value.
3,690
4,565
3,0783,587
4,783
1,5551,275 1,128 1,186 1,265 1,145
1,787
1,255 1,165 1,230 1,020
1,6481,183 1,195
0
1,000
2,000
3,000
4,000
5,000
6,000
Koh
Kon
g
TEP
SC
O M
GS
Hua
i Sat
o (T
hai)
A. M
uang
Tra
t (Th
ai)
Khl
ong
Yai
(Tha
i)
Leac
h (P
ST)
Dap
Bat
(PS
T)
Pea
m (P
ST)
Talo
(PS
T)
Tren
g (B
B)
Cha
mlo
ng K
uoy
(BB
)
Sam
lot (
BB
)
Che
ang
Mea
nche
y (B
B)
Mau
ng R
usse
y (B
B)
Pai
lin
Rat
tana
k M
ondo
l
Kiri
rom
Trap
eang
Cho
r (P
rek
Thno
t)
Ora
l (P
rek
Thno
t)
Mea
n A
nnua
l Rai
nfal
l (m
m)
Source: Study Team
Figure 6.3.5 Mean Annual Rainfall in the Southwest Area

Final Report Chapter 6 Technical Study of 10 Priority Projects
JICA Master Plan Study of 6-11 January 2009 Hydropower Development in Cambodia
0
200
400
600
800
1,000
1,200
Jan Feb Mar Apr May Jun Jul Aug Sep Oct Nov Dec
Mea
n M
onth
ly R
ainf
all (
mm
)Koh KongTEPSCO MGSHuai Sato (Thai)A. Muang Trat (Thai)Khlong Yai (Thai)Leach (PST)Dap Bat (PST)Peam (PST)Talo(PST)Treng (BB)Chamlong Kuoy (BB)Samlot (BB)Cheang Meanchey (BB)Maung Russey (BB)PailinRattanak MondolKirirom
Source: Study Team
Figure 6.3.6 Mean Monthly Rainfall in Southwest Area
1,354
1,670
490613
2,170
1,077
1,306
989
77
346 340
0
500
1,000
1,500
2,000
2,500
TEP
SC
O H
GS
Hua
i Sat
o
Tain
g Le
ach
(PS
T)
Bac
Tra
koun
(PS
T)
Pea
m (P
ST)
Pre
y K
long
(dow
n) (P
ST)
Sre
Pon
leu
(BB
)
Tren
g (B
B)
Mon
g R
usse
y(B
B; S
t.Dau
ntri)
Pea
m K
hley
(Pre
k Th
not)
Anl
ong
Touk
(Pre
k Th
not)
Mea
n A
nnua
l R
un-o
ff (m
m)
Source: Study Team Figure 6.3.7 Mean Annual Run-off in the Southwest Area

Final Report Chapter 6 Technical Study of 10 Priority Projects
JICA Master Plan Study of 6-12 January 2009 Hydropower Development in Cambodia
0
100
200
300
400
500
600
700
800
900
Jan Feb Mar Apr May Jun Jul Aug Sep Oct Nov Dec
Mean Monthly Run-off (mm) TEPSCO HGS
Huai Sato
Taing Leach (PST)
Bac Trakoun (PST)
Peam (PST)
Prey Klong (down) (PST)
Sre Ponleu (BB)
Treng (BB)
Mong Russey (BB; St.Dauntri)
Peam Khley (Prek Thnot)
Anlong Touk (Prek Thnot)
Source: Study Team
Figure 6.3.8 Mean Monthly Run-off in the Southwest Area
(2) Central Mountainous Area
Characteristics of rainfall and discharge related to #29 Bokor Plateau (BP) Project in the central mountainous area are shown in Figures 6.3.9 - 6.3.12.
Annual rainfall at Bokor is remarkably high. The reason seems that Bokor station is located in the west of the Bokor Cliff and regional rainfall due to the southwest monsoon directly influences rainfall at the station.
1,936
4,922
3,3932,998
1,198 1,2291,648
1,239
0
1,000
2,000
3,000
4,000
5,000
6,000
Kam
pot
Bok
or
Sih
anou
k V
ille
Phu
Quo
c
Dor
ng T
ong
Chu
m K
iri
Kiri
rom
Sre
Khl
ong
Mea
n A
nnua
l Rai
nfal
l (m
m)
Source: Study Team
Figure 6.3.9 Mean Annual Rainfall in the Central Mountainous Area

Final Report Chapter 6 Technical Study of 10 Priority Projects
JICA Master Plan Study of 6-13 January 2009 Hydropower Development in Cambodia
0
200
400
600
800
1,000
1,200
Jan Feb Mar Apr May Jun Jul Aug Sep Oct Nov Dec
Mea
n M
onth
ly R
ainf
all (
mm
)
KampotBokorSihanouk VillePhu QuocDorng TongChumkiriKirirom
Source: Study Team
Figure 6.3.10 Mean Monthly Rainfall in the Central Mountainous Area
2,5432,244
2,450
0
500
1,000
1,500
2,000
2,500
3,000
Tuk
Chh
oo
N5
(Kam
chay
)
Kba
l Cha
y
Mea
n A
nnua
l Run
-off
(mm
)
Source: Study Team
Figure 6.3.11 Mean Annual Run-off in the Central Mountainous Area

Final Report Chapter 6 Technical Study of 10 Priority Projects
JICA Master Plan Study of 6-14 January 2009 Hydropower Development in Cambodia
0
200
400
600
800
1,000
1,200
Jan Feb Mar Apr May Jun Jul Aug Sep Oct Nov Dec
Mea
n M
onth
ly R
un-o
ff (m
m)
Tuk ChhooN5 (Kamchay)Kbal Chay
Source: Study Team
Figure 6.3.12 Mean Monthly Run-off in the Central Mountainous Area
(3) Northeast Area
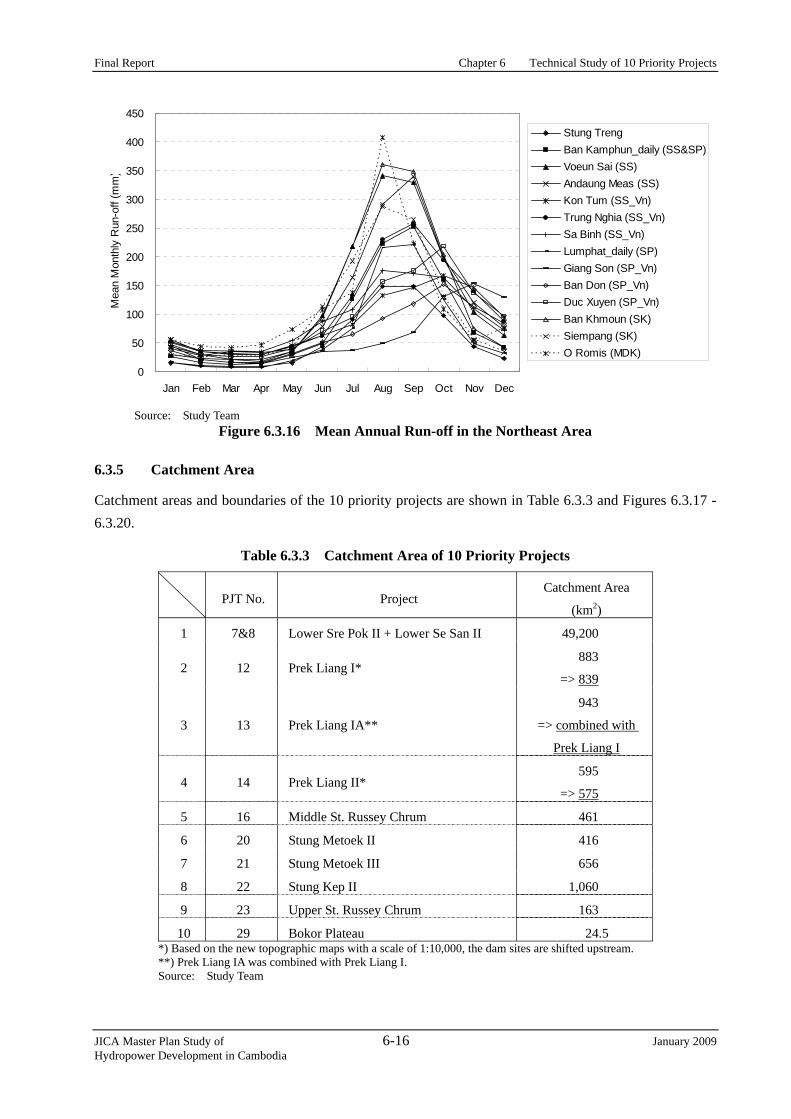
Characteristics of rainfall and discharge related to 4 projects (#7&8 LL2, #12 PL1, #13 PL1A, #14 PL2) in the northeast area are shown in Figures 6.3.13 - 6.3.16.
1,756 1,732 1,648
2,4832,331
1,786
1,518
1,8641,755
2,259
1,695 1,596 1,575
1,9421,788 1,812
0
500
1,000
1,500
2,000
2,500
3,000
Stu
ng T
reng
O K
rieng
Sam
bor
Ban
Lun
g (S
S)
Voe
un S
ai (S
S)
And
oung
Mea
s (S
S)
Dac
Gle
i (S
S_V
n)
Dak
To
(SS
_Vn)
Kon
Tum
(SS
_Vn)
Ple
iku
(SS
_Vn)
Lum
phat
(SP
)
Buo
n H
o (S
P_V
n)
Kro
ng B
ong
(SP
_Vn)
Duc
Xuy
en (S
P_V
n)
Dak
Mil
(SP
_Vn)
Sen
Mon
orom
(MD
K)
Mea
n A
nnua
l Rai
nfal
l (m
m)
Source: Study Team
Figure 6.3.13 Mean Annual Rainfall in the Northeast Area

Final Report Chapter 6 Technical Study of 10 Priority Projects
JICA Master Plan Study of 6-15 January 2009 Hydropower Development in Cambodia
0
100
200
300
400
500
600
700
Jan Feb Mar Apr May Jun Jul Aug Sep Oct Nov Dec
Mea
n M
onth
ly R
ainf
all (
mm
)Stung TrengO KriengSamborBan Lung (SS)Voeun Sai (SS)Andoung Meas (SS)Dac Glei (SS_Vn)Dak To (SS_Vn)Kon Tum (SS_Vn)Pleiku (SS_Vn)Lumphat (SP)Buon Ho (SP_Vn)Krong Bong (SP_Vn)Duc Xuyen (SP_Vn)Dak Mil (SP_Vn)Sen Monorom (MDK)
Source: Study Team
Figure 6.3.14 Mean Monthly Rainfall in the Northeast Area
654
1,022
1,3041,395
1,026
1,290
1,095
818733
799
1,113
1,467
1,2231,305
0
200
400
600
800
1,000
1,200
1,400
1,600
Stu
ng T
reng
Ban
Kam
phun
_dai
ly (S
S&
SP
)
Voe
un S
ai (S
S)
And
aung
Mea
s (S
S)
Kon
Tum
(SS
_Vn)
Trun
g N
ghia
(SS
_Vn)
Sa
Bin
h (S
S_V
n)
Lum
phat
_dai
ly (S
P)
Gia
ng S
on (S
P_V
n)
Ban
Don
(SP
_Vn)
Duc
Xuy
en (S
P_V
n)
Ban
Khm
oun
(SK
)
Sie
mpa
ng (S
K)
O R
omis
(MD
K)
Mea
n A
nnua
l Run
-off
(mm
)
Source: Study Team
Figure 6.3.15 Mean Annual Run-off in the Northeast Area
Final Report Chapter 6 Technical Study of 10 Priority Projects
JICA Master Plan Study of 6-16 January 2009 Hydropower Development in Cambodia
0
50
100
150
200
250
300
350
400
450
Jan Feb Mar Apr May Jun Jul Aug Sep Oct Nov Dec
Mea
n M
onth
ly R
un-o
ff (m
m)
Stung TrengBan Kamphun_daily (SS&SP)Voeun Sai (SS)Andaung Meas (SS)Kon Tum (SS_Vn)Trung Nghia (SS_Vn)Sa Binh (SS_Vn)Lumphat_daily (SP)Giang Son (SP_Vn)Ban Don (SP_Vn)Duc Xuyen (SP_Vn)Ban Khmoun (SK)Siempang (SK)O Romis (MDK)
Source: Study Team
Figure 6.3.16 Mean Annual Run-off in the Northeast Area
6.3.5 Catchment Area
Catchment areas and boundaries of the 10 priority projects are shown in Table 6.3.3 and Figures 6.3.17 - 6.3.20.
Table 6.3.3 Catchment Area of 10 Priority Projects
PJT No. Project Catchment Area
(km2)
1 7&8 Lower Sre Pok II + Lower Se San II 49,200
2 12 Prek Liang I* 883
=> 839
3 13 Prek Liang IA**
943
=> combined with
Prek Liang I
4 14 Prek Liang II* 595
=> 575
5 16 Middle St. Russey Chrum 461
6 20 Stung Metoek II 416
7 21 Stung Metoek III 656
8 22 Stung Kep II 1,060
9 23 Upper St. Russey Chrum 163
10 29 Bokor Plateau 24.5 *) Based on the new topographic maps with a scale of 1:10,000, the dam sites are shifted upstream. **) Prek Liang IA was combined with Prek Liang I. Source: Study Team

Final Report Chapter 6 Technical Study of 10 Priority Projects
JICA Master Plan Study of 6-17 January 2009 Hydropower Development in Cambodia
Source: Study Team Figure 6.3.17 Catchment Boundary of 3 Projects in the Northeast Area
Source: Study Team Figure 6.3.18 Catchment Boundary of Prek Liang 2 Projects in the Northeast Area

Final Report Chapter 6 Technical Study of 10 Priority Projects
JICA Master Plan Study of 6-18 January 2009 Hydropower Development in Cambodia
Source: Study Team
Figure 6.3.19 Catchment Boundary of 5 Projects in the Southwest Area
Source: Study Team
Figure 6.3.20 Catchment Boundary of BP and Kamchay Project in the Central Mountainous Area

Final Report Chapter 6 Technical Study of 10 Priority Projects
JICA Master Plan Study of 6-19 January 2009 Hydropower Development in Cambodia
6.3.6 Basin Rainfalls
Estimated basin rainfalls of the 9 priority projects are shown in Table 6.3.4.
Basin rainfalls of the projects in the northeast area were derived by the Thiessen method. Basin rainfalls of the projects in the southwest area were estimated based on an isohyet map of the area because there are few referable rainfall stations. Because of the same reason as the projects in the southwest area, #29 BP in the central mountainous area was also estimated from an isohyet map of the area.
Table 6.3.4 Basin Rainfalls of Priority Projects
PJT No. Project Name Basin Rainfall (mm/yr) Estimation Method
1 7&8 Lower Sre Pok II + Lower Se San II 1,840 Thiessen method 2 12 new Prek Liang I 1,840 Thiessen method 3 14 new Prek Liang II 1,850 Thiessen method 4 16 Middle St. Russey Chrum 2,620 Isohyetal method 5 20 Stung Metoek II 3,010 Isohyetal method 6 21 Stung Metoek III 3,100 Isohyetal method 7 22 Stung Kep II 2,690 Isohyetal method 8 23 Upper St. Russey Chrum 2,420 Isohyetal method 9 29 Bokor Plateau 4,630 Isohyetal method
Source: Study Team
Thiessen polygons and isohyets used in the estimates above are shown in Figures 6.3.21 - 6.3.23.
Source: Study Team
Figure 6.3.21 Thiessen Polygon Related to 3 Projects in the Northeast Area

Final Report Chapter 6 Technical Study of 10 Priority Projects
JICA Master Plan Study of 6-20 January 2009 Hydropower Development in Cambodia
Remarks) In order to consider the influence due to the Cardamon Mountains, an annual rainfall at USRC was assumed at
2,600mm. Source: Study Team
Figure 6.3.22 Isohyets Related to 5 Projects in the Southwest Area
Source: Study Team
Figure 6.3.23 Isohyets Related to BP Project in the Central Mountainous Area

Final Report Chapter 6 Technical Study of 10 Priority Projects
JICA Master Plan Study of 6-21 January 2009 Hydropower Development in Cambodia
6.3.7 Estimation Method of Discharge Data for Power Generation Planning
Existing rainfall and discharge data related to the priority projects are limited. In addition, volume and quality of the data differ by projects. With regard to estimation of the discharge for power generation planning (mean discharge and dry season discharge), suitable estimation methods for each project were applied considering referable data. Estimation methods of long-term mean discharge for each project are summarized in the following table:
Table 6.3.5 Estimation Method of Long Term Mean Discharge for Each Project
PJT No. Project Estimation Method of Mean Discharge
1 7&8 Lower Sre Pok II + Lower
Se San II
Estimated from run-off characteristics of whole Se San and
Sre Pok basin
2 12 Prek Liang I
3 14 Prek Liang II
Examined run-off characteristics of Se San upstream basin,
and then estimated from value of neighbouring similar basin
4 16 Middle St. Russey Chrum
5 20 Stung Metoek II
6 21 Stung Metoek III
7 22 Stung Kep II
8 23 Upper St. Russey Chrum
Examined long-term mean discharge at neighbouring
stations referring to observed discharge for 1 year and
long-term rainfall, and then estimated from the discharge at
neighbouring stations, ratio of basin rainfall and ratio of
catchment area
9 29 Bokor Plateau Estimated from neighbouring observed discharge and ratio
of catchment area Source: Study Team
Estimations of long-term mean discharge for each project are explained hereinafter.
6.3.8 Estimation of Long-Term Mean Discharge for 5 Projects in the Southwest Area
Long-term mean discharges for 5 projects in the southwest area were estimated as follows:
(1) Referable Hydrological Station
Existing hydrological stations in the west of the Cardamon Mountains and the southwest area are only the following 2:
Table 6.3.6 Existing Hydrological Station Related to 5 Projects in the Southwest Area
Annual Mean Discharge Qm Hydrologica
l Station
Catchment Area (km2)
Annual Run-off (mm/yr)
Specific Discharge
(m3/s/100km2)
Dry Season Discharge Q90
(m3/s/100km2)Remarks
TEPSCO HGS 2,292* 1,550 4.91 0.11
in Koh Kong, daily, 321 days (2005/3/27 - 2006/2/10)
Huai Sato 190 1,670 5.29 0.43 in Thai, monthly, 26 years (1971 - 1996)
*) measured by JICA Study Team on GIS Source: Study Team

Final Report Chapter 6 Technical Study of 10 Priority Projects
JICA Master Plan Study of 6-22 January 2009 Hydropower Development in Cambodia
Dimensionless flow duration curves of observed discharge at the stations above are shown in the following figure:
0%
50%
100%
150%
200%
250%
300%
350%
0% 10% 20% 30% 40% 50% 60% 70% 80% 90% 100%
Duration Time (% to year)
Flow
(% to
Qm
)
TEPSCO HGS_ObsHuai Sato
Source: Study Team Figure 6.3.24 Dimensionless Flow Duration Curve of Observed Discharge at Existing
Hydrological Station in the Southwest Area
Even though Huai Sato has long-term data, it is located slightly away from the project area and in Thailand. In addition, only monthly data are available for Huai Sato. At the beginning of examination, discharge at Huai Sato could not be judged as reliable enough because its mean dry season discharge for the initial 6 years of the 26 years appeared over-rated.
Observed discharge at TEPSCO HGS is only for 1 year, and its flow duration curve is not smooth. However, TEPSCO HGS is the nearest station and only the station in the southwest area in Cambodia. Consequently, discharge at TEPSCO HGS was examined more in detail as follows:
(2) Reliability of Observed Discharge at TEPSCO HGS
Based on the catchment area and mean discharge, annual run-off at TEPSCO HGS is calculated at 1,550 mm. Besides, basin rainfall of TEPSCO HGS is estimated at 2,920 mm/yr referring to isohyets in the southwest area (refer to Figure 6.3.22).
Basin rainfall of TEPSCO HGS for the observed period (2005.3 - 2006.2) is estimated at 3,230 mm/yr referring to rainfall at Koh Kong. That is, (Rainfall at Koh Kong for TEPSCO HGS observation period: 4,087 mm) x (Basin Rainfall of TEPSCO HGS: 2,920 mm) / (Long-term Mean Annual Rainfall at Koh Kong: 3,690 mm).
Consequently, the run-off at TEPSCO HGS for the observed period (1,550 mm) was 48% of the rainfall 3,230 mm at TEPSCO HGS for the same period (3,230 mm), that is, run-off coefficient at TEPSCO HGS is estimated at 48%.

Final Report Chapter 6 Technical Study of 10 Priority Projects
JICA Master Plan Study of 6-23 January 2009 Hydropower Development in Cambodia
This value seems to be appropriate considering related existing study results (run-off coefficient at SRC/Atay in LSRC-F/S: 51%) and data at Huai Sato (ratio of discharge and rainfall at Huai Sato: 54%).
(3) Estimation of Long-term Mean Discharge at TEPSCO HGS
Based on the equation derived from correlation between observed discharge at TEPSCO HGS and rainfall at Koh Kong (monthly data for 15 years, 180 data), long-term time series of monthly discharge at TEPSCO HGS was estimated. Long-term mean discharge/dry season discharge and dimensionless flow duration curve estimated at TEPSCO HGS are shown in Table 6.3.7 and Figure 6.3.25.
Table 6.3.7 Estimated Long-term Mean and Dry Season Discharges at TEPSCO HGS
C.A. Basin Mean
Rainfall
Annual Mean Discharge Qm
Run-off Coeff. Dry Season Discharge Q90 Discharge
Data km2 mm m3/s
mm/yr m3/s/100km2 % m3/s m3/s/100km2 % to Qm
Estimated Long-term Discharge at TEPSCO HGS
2,292 2,920* 90.8 1,250 3.96 43 0.75 0.03 0.8
Observed Short-term Discharge at TEPSCO HGS
2,292 3,230* 113 1,550 4.91 48 2.50 0.11 2.2
Observed Discharge at Huai Sato
190 3,078** 10.1 1,670 5.29 54 0.81 0.43 8.1
*) estimated from isohyet (refer to Figure 6.3.22) **) Mean annual rainfall at Huai Sato Source: Study Team
As shown in the table above, long-term annual run-off height was estimated at 1,250 mm against 1,550 mm of the observed annual run-off for 1 year. It could be inferred that the estimated annual run-off was 81% (=1,250mm / 1,550 mm) of the observed annual run-off because the observed year had higher rainfall than the other years. According to the rainfall records at Koh Kong, the rainfall at Koh Kong for the observation period (1 year) of TEPSCO HGS was 4,087 mm. This is 111% of the long-term mean annual rainfall at Koh Kong (3,690 mm), suggesting that the period was actually rich in rainfall.
The long-term rainfall is 90% of the rainfall for TEPSCO HGS observation period, and it exceeds the 81% above for long-term annual run-off by 9%. For estimation of long-term average inflow, the reduction by 19% from the estimate for the one year may suggest an underestimate of the runoff height if compared with the reduction at 10% from the observed rainfall for the same year.
Considering such general hydrological characteristics that annual run-off coefficient also lowers when annual rainfall lowers, it can be a conservative estimate to avoid over-estimate of long-term mean run-off.

Final Report Chapter 6 Technical Study of 10 Priority Projects
JICA Master Plan Study of 6-24 January 2009 Hydropower Development in Cambodia
0%
50%
100%
150%
200%
250%
300%
350%
0% 10% 20% 30% 40% 50% 60% 70% 80% 90% 100%
Duration Time (% to year)
Flow
(% to
Qm
)TEPSCO HGS_EstTEPSCO HGS_ObsHuai Sato
Source: Study Team Figure 6.3.25 Dimensionless Flow Duration Curve of Estimated Discharge at TEPSCO HGS
(4) Estimation of Long-term Mean Discharge for 5 Projects in the Southwest Area
Based on the estimated mean discharge at TEPSCO HGS, mean discharge and dry season discharge for 5 projects in the southwest area were estimated using the following equation:
Long-term Mean/Dry Season Discharge PROJECT = Estimated Long-term Mean/Dry Season Discharge TEPSCO
HGS x Basin Rainfall Ratio x Catchment Area Ratio
Where,
Basin Rainfall Ratio = Basin Average Rainfall PROJECT / Basin Average Rainfall TEPSCO HGS(=2,920 mm)
Catchment Area Ratio = Catchment Area PROJECT / Catchment Area TEPSCO HGS(=2,292 km2)
Estimated long-term mean discharge and dry season discharge for the projects are shown in Table 6.3.8.

Final Report Chapter 6 Technical Study of 10 Priority Projects
JICA Master Plan Study of 6-25 January 2009 Hydropower Development in Cambodia
Table 6.3.8 Estimated Long-term Mean Discharge and Dry Season Discharge for 5 Projects in the Southwest Area
Catchment Area
Basin Average Rainfall
Annual Mean Discharge
Qm
Run-off Coeff.
Dry Season Discharge Q90 Project
km2 mm m3/s mm/yr m3/s/100km2 % m3/s m3/s/100km2 % to
Qm
MSRC 461 2,620 16.4 1,120 3.55 43 0.14 0.03 0.8
MTK2 416 3,010 17.0 1,290 4.09 43 0.14 0.03 0.8
MTK3 656 3,100 27.7 1,330 4.22 43 0.23 0.03 0.8
KP2 1,060 2,690 38.7 1,150 3.65 43 0.32 0.03 0.8
USRC 163 2,420 5.4 1,040 3.30 43 0.04 0.03 0.8
Source: Study Team
(5) Verification of Estimated Dry Season Discharge for 5 Projects in the Southwest Area
Dry season discharges for 5 projects in the southwest area were estimated at 0.8% of Qm. It means that discharge drastically falls down in the dry season. This coincides with the fact that the discharge of rivers in the southwest area much differ between the rainy and dry seasons and the rivers often almost dry up in the dry season.
In accordance with the observed discharge by the Study Team in February 2008 (dry season), discharge at #16 MSRC, #22 KP2 and Tatay were 0.1, 0.1 and 0.5 m3/s, respectively. These observed discharges were in agreement with the estimated dry season discharges.
6.3.9 Estimation of Long-term Mean Discharge for Bokor Plateau Project
(1) Referable Hydrological Station
Existing hydrological stations around #29 Bokor Plateau (BP) Project are the following 3:

Final Report Chapter 6 Technical Study of 10 Priority Projects
JICA Master Plan Study of 6-26 January 2009 Hydropower Development in Cambodia
Table 6.3.9 Existing Hydrological Stations Related to BP
Annual Mean Discharge Qm Hydrological
Station
Catchment Area (km2)
Annual Run-off (mm/yr)
Specific Discharge
(m3/s/100km2)
Dry Season Discharge Q90 (m3/s/100km2)
Remarks
Tuk Chhoo 745* 2,560 8.11 0.10 in Kamchay River basin, daily, 5 years (2001 - 2005)**
N5 (Kamchay dam site) 710 2,260 7.16 0.04
in Kamchay River basin, daily, 1 year (1964)
Kbal Chay 52.5 2,640*** 8.38*** 0.29***
in Sihanouk Ville (Prek Tuek sub river), daily, 1.5 years (2001/2/16 - 2002/8/31)
*) measured by JICA Study Team on GIS **) converted from water level data of MOWRAM and H-Q curve in Kamchay-F/S (June 2002, EXPERCO) ***) derived from 1 year data (2001/3/1 - 2002/2/28) Source: Study Team
Dimensionless flow duration curves of observed discharge at the stations above are shown in the following figure:
0%
50%
100%
150%
200%
250%
300%
350%
0% 10% 20% 30% 40% 50% 60% 70% 80% 90% 100%
Duration Time (% to year)
Flow
(% to
Qm
)
Tuk ChhooN5 (Kamchay dam site)Kbal Chay
Source: Study Team
Figure 6.3.26 Dimensionless Flow Duration Curves of Observed Discharges at Existing Hydrological Stations Related to BP
(2) Estimation of Long-term Mean Discharge at N5 (Kamchay dam site)
Between the Tuk Chhoo and N5 stations, N5 station was examined more in detail because of the lower annual run-off recorded at N5.
N5 data was observed in 1964, and its annual run-off is 2,260 mm.

Final Report Chapter 6 Technical Study of 10 Priority Projects
JICA Master Plan Study of 6-27 January 2009 Hydropower Development in Cambodia
In accordance with rainfall data at Phu Quoc for 40 years, rainfall in 1964 was 96.5% (2,892 mm) for mean annual rainfall (3,000 mm).
Assuming that annual run-off at N5 in 1965 was 96.5% of the long-term average following the rainfall variation above at Phu Quoc, long-term annual run-off at N5 is estimated at 2,340 mm (= 2,260 / 0.965). In addition, the dry season discharge at N5 was estimated as 0.6% of Qm referring to the dry season discharge of observed discharge at N5.
Table 6.3.10 Estimated Long-term Mean Discharge and Dry Season Discharge at N5 (Kamchay dam site)
C.A.
Basin
Mean
Rainfall
Annual Mean Discharge
Qm
Run-off
Coeff. Dry Season Discharge Q90
Discharge
Data
km2 mm m3/s
mm/yr m3/s/100km2 % m3/s km2 mm
Estimated
Long Term
Discharge
at N5
710 3,800* 52.7
2,340 7.42 62 0.31 0.04 0.6
Observed
Discharge
at N5
710 3,800* 50.9
2,260 7.16 59 0.30 0.04 0.6
*) assumed at average of annual rainfall at Bokor (4,922 mm), Sihanouk Ville (3,393 mm) and Phu Quoc (2,998 mm) = 3,771 mm -> 3,800 mm; annual rainfall at Kampot (1,939 mm) was not referred considering hydrological characteristics in the area
Source: Study Team
(3) Estimation of Long-term Mean Discharge for BP
Referable hydrological data for #29 BP is limited. Besides, basin rainfall of BP seems to be higher than that of Kamchay referring to isohyets in Figure 6.3.23. Consequently, it is conservative to apply the estimated run-off height at N5 (Kamchay dam site) to BP without rainfall adjustment. In addition, observed discharge at BP site by the Study Team in February 2008, 0.0013 m3/s (2008.2.29), was assumed to be representative and applied to estimate of the dry season discharge of BP.
Estimated long-term mean discharge and dry season discharge for BP are shown in Table 6.3.11.
Table 6.3.11 Estimated Long-term Mean Discharge and Dry Season Discharge for BP
Catchment Area
Basin Average Rainfall
Annual Mean Discharge
Run-off Coeff.
Dry Season Discharge Q90
Project km2 mm m3/s
mm m3/s/100km2 % m3/s m3/s/100km2 % to Qm
BP 24.5 4,630 1.8
2,3407.42 51 0.0013 0.01 0.1
Source: Study Team

Final Report Chapter 6 Technical Study of 10 Priority Projects
JICA Master Plan Study of 6-28 January 2009 Hydropower Development in Cambodia
(4) Verification of Estimated Discharge for BP
Annual run-off at Kamchay dam site estimated in the Kamchay-FS (Jun. 2002, EXPERCO) is 2,450 mm (710 km2, 55.2 m3/s). This value is 5% higher than the value estimated by the Study Team (2,340 mm).
Dry season discharge for #29 BP was estimated at 0.1% of Qm. It shows that discharge drastically falls down in the dry season. This coincides with the fact that rivers in central mountainous area often almost dry up in the dry season like rivers in the southwest area. Observed minimum daily discharge at Tuk Chhoo, N5 and Kbal Chay are 0.17, 0.10 and 0.0002 m3/s, respectively.
6.3.10 Estimation of Long-term Mean Discharge for Lower Sre Pok II + Lower Se San II (LL2)
(1) Referable Hydrological Station
The following table shows existing hydrological stations in Se San and Sre Pok basins related to #7&8 LL2 Project.
Table 6.3.12 Existing Hydrological Station Related to LL2
Annual Mean Discharge Qm Hydrological
Station
Catchment Area (km2)
Annual Run-off (mm/yr)
Specific Discharge
(m3/s/100km2)
Dry Season Discharge Q90(m3/s/100km2)
Remarks
1,020 3.24 0.50 daily, 7 years (1961 - 63, 66 - 69) Ban
Kamphun 49,500 1,000 3.18 0.58 monthly, 65 years
(1926 - 90)
Voeun Sai 16,300 1,310 4.15 0.75 SS, daily, 1 year (1965)
Andaung Meas 11,779* 1,400 4.44 0.71 SS, daily, 2 yeas
(2002, 2005)
Kon Tum* 3,056 1,030 3.26 1.00 SS, daily, 23 years (1978 - 2000)
Trung Ngia* 3,320 1,290 4.10 1.00 SS, daily, 8 years (1990 - 1997)
Sa Binh* 6,732 1,100 3.48 1.28 SS, daily, 9 years (1982 - 1990)
Dak Mot** 1,292 1,650 5.24 - SS Konplong** 943 1,330 4.23 - SS
818 2.59 0.21 SP, daily, 6 years (69, 01 - 03, 05 - 06)
Lumphat 25,600 1,140 3.60 0.63
SP, monthly, 54 years (42 - 90, 01 - 03, 05 - 06)
Giang Son* 3,180 735 2.33 0.37 SP, daily, 24 years (1977 - 2000)
Ban Don* 10,700 802 2.54 0.52 SP, daily, 24 years (1977 - 2000)
Duc Xuyen* 3,080 1,120 3.54 0.80 SP, daily, 23 years (1978 - 2000)
*) data from Study on Nationwide Water Resources Development and Management in the Socialist Republic of Vietnam (JICA, Sep. 2003)
**) data from Comprehensive Development Study of Hydropower in Se San River Basin in Cambodia (PECC1, Oct. 2006) Source: Study Team

Final Report Chapter 6 Technical Study of 10 Priority Projects
JICA Master Plan Study of 6-29 January 2009 Hydropower Development in Cambodia
(2) Run-off Characteristics of Se San and Sre Pok Basin
The following figure shows run-off characteristics of Se San and Sre Pok basins based on the above discharge data:
Se San Sre Pok Input Data Krong Po Ko Dak Bla Calc. Data
Dak Mot KonplongC.A. (km2) 1,292 943Run-off (mm) 1,652 75% 1,334 56%Run-off (mcm) 2,135 1,258Basin Rainfall (mm) 2,204 2,398 applied Run-off Coef. @Trung Ngia, Kon Tum
Remains @Trung NRemains @Kon TumC.A. (km2) 2,028 2,113Run-off (mm) 1,065 75% 892 56%Run-off (mcm) 2,161 1,885 VietnamBasin Rainfall (mm) 1,421 1,603
Trung Nghia Kon Tum Duc Xuyen Giang SonC.A. (km2) 3,320 3,056 3,080 3,180Run-off (mm) 1,294 75% 1,029 56% 1,117 60% 735 44%Run-off (mcm) 4,295 3,143 3,440 2,337Basin Rainfall (mm) 1,726 from Thie 1,849 from Thiessen 1,870 from Thie 1,652 from Thiessen
Sa Binh Ban DonC.A. (km2) 6,732 10,700Run-off (mm) 1,098 61% 802 46%Run-off (mcm) 7,395 8,580Basin Rainfall (mm) 1,787 from Thiessen 1,754 from Thiessen
Remains @Voeun SaiC.A. (km2) 9,568Run-off (mm) 1,214 61% =Run-off @Sa Binh x Basin Rainfall Ratio (1975mm/1787mm)Run-off (mcm) 11,614Basin Rainfall (mm) 1,975 derived from Basin Rainfall of Sa Binh and Voeun Sai (1897mm)
Remains @Sa Binh - LL2 Lumphat (daily)C.A. (km2) 11,818 25,600Run-off (mm) 1,214 62% 818 46% CambodiaRun-off (mcm) 14,345 20,933Basin Rainfall (mm) 1,950 =Se San sub-total 1,774 =Sre Pok sub-total
Se San sub-total @LL2 Sre Pok sub-total @LL2 RemainsC.A. (km2) 18,550 =C.A.@LSS2A 30,620 =C.A.@LSP2 30Run-off (mm) 1,172 60% =[Sa Binh]+ 818 46% =Lumphat 818 =LumphatRun-off (mcm) 21,740 [Remains @Sa Binh - LL2] 25,038 25Basin Rainfall (mm) 1,950 from Thiessen 1,774 from Thiessen -
Ban Kamphun (dailyBan Kamphun (monthly) LL2C.A. (km2) 49,500 49,500 49,200Run-off (mm) 1,022 55% 1,002 54% 951 52%Run-off (mcm) 50,585 49,605 46,802Basin Rainfall (mm) 1,842 =LL2 1,842 =LL2 1,842 from Thiessen
Remarks) Voeun Sai and Andaung Meas were excluded in the above water balance due to short observation period and uncertainty. Source: Study Team
Figure 6.3.27 Run-off Characteristics of Se San, Sre Pok Basin
(3) Estimation of Long-term Mean Discharge for LL2 Project
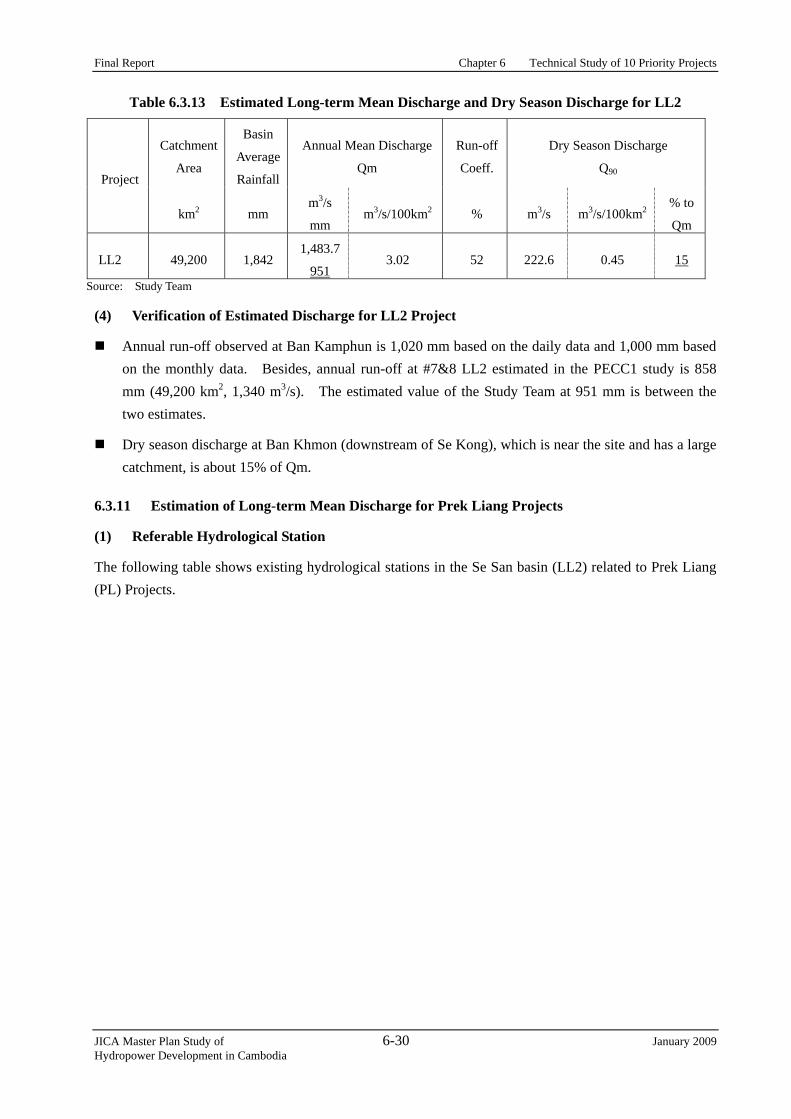
Annual run-off at #7&8 LL2 was estimated at 951 mm based on Figure 6.3.27. Dry season discharge at LL2 was estimated at 15% of Qm referring to the dry season discharge observed at Ban Kamphun. Estimated mean discharge and dry season discharge for LL2 are shown in Table 6.3.13.
Final Report Chapter 6 Technical Study of 10 Priority Projects
JICA Master Plan Study of 6-30 January 2009 Hydropower Development in Cambodia
Table 6.3.13 Estimated Long-term Mean Discharge and Dry Season Discharge for LL2
Catchment
Area
Basin
Average
Rainfall
Annual Mean Discharge
Qm
Run-off
Coeff.
Dry Season Discharge
Q90 Project
km2 mm m3/s
mm m3/s/100km2 % m3/s m3/s/100km2
% to
Qm
LL2 49,200 1,842 1,483.7
951 3.02 52 222.6 0.45 15
Source: Study Team
(4) Verification of Estimated Discharge for LL2 Project
Annual run-off observed at Ban Kamphun is 1,020 mm based on the daily data and 1,000 mm based on the monthly data. Besides, annual run-off at #7&8 LL2 estimated in the PECC1 study is 858 mm (49,200 km2, 1,340 m3/s). The estimated value of the Study Team at 951 mm is between the two estimates.
Dry season discharge at Ban Khmon (downstream of Se Kong), which is near the site and has a large catchment, is about 15% of Qm.
6.3.11 Estimation of Long-term Mean Discharge for Prek Liang Projects
(1) Referable Hydrological Station
The following table shows existing hydrological stations in the Se San basin (LL2) related to Prek Liang (PL) Projects.

Final Report Chapter 6 Technical Study of 10 Priority Projects
JICA Master Plan Study of 6-31 January 2009 Hydropower Development in Cambodia
Table 6.3.14 Existing Hydrological Stations Related to PL
Annual Mean Discharge Qm Hydrological
Station
Catchment Area (km2)
Annual Run-off (mm/yr)
Annual Run-off (mm/yr)
Dry Season Discharge Q90(m3/s/100km2)
Remarks
Voeun Sai 16,300 1,310 4.15 0.75 SS, daily, 1 year (1965)
Andaung Meas
11,779* 1,400 4.44 0.71 SS, daily, 2 yeas (2002, 2005)
Kon Tum* 3,056 1,030 3.26 1.00 SS, daily, 23 years (1978 - 2000)
Trung Ngia* 3,320 1,290 4.10 1.00 SS, daily, 8 years (1990 - 1997)
Sa Binh* 6,732 1,100 3.48 1.28 SS, daily, 9 years (1982 - 1990)
Dak Mot** 1,292 1,650 5.24 - SS
Konplong** 943 1,330 4.23 - SS *) data from Study on Nationwide Water Resources Development and Management in the Socialist Republic of Vietnam
(JICA, Sep. 2003) **) data from Comprehensive Development Study of Hydropower in Se San River Basin in Cambodia (PECC1, Oct. 2006) Source: Study Team
(2) Run-off Characteristics of Se San Upstream Basin
The following figure shows run-off characteristics of the Se San upstream basin based on discharge data above.
Se San Input Data Krong Po Ko Dak Bla Calc. Data
Dak Mot KonplongC.A. (km2) 1,292 943Run-off (mm) 1,652 75% 1,334 56%Run-off (mcm) 2,135 1,258Basin Rainfall (mm) 2,204 2,398 applied Run-off Coef.
@Trung Ngia, Kon TumRemains @Trung NRemains @Kon Tum
C.A. (km2) 2,028 2,113Run-off (mm) 1,065 75% 892 56%Run-off (mcm) 2,161 1,885Basin Rainfall (mm) 1,421 1,603
Trung Nghia Kon TumC.A. (km2) 3,320 3,056Run-off (mm) 1,294 75% 1,029 56%Run-off (mcm) 4,295 3,143Basin Rainfall (mm) 1,726 from Thie 1,849 from Thiessen
Sa BinhC.A. (km2) 6,732Run-off (mm) 1,098 61%Run-off (mcm) 7,395Basin Rainfall (mm) 1,787 from Thiessen
Source: Study Team Figure 6.3.28 Run-off Characteristics of Se San Upstream Basin

Final Report Chapter 6 Technical Study of 10 Priority Projects
JICA Master Plan Study of 6-32 January 2009 Hydropower Development in Cambodia
(3) Estimation of Long-term Mean Discharge for PL Projects
Among annual run-off data in the figure above, referable values for PL Projects are: (1) 1,070 mm at Krong Poko downstream basin; (2) 1,030 mm at Kon Tum basin (whole Dak Bla basin); and (3) 1,100 mm at Sa Binh basin (Krong Poko + Dak Bla basin) considering the basin directions and elevations against monsoons.
Of the three data above, (1) 1,070 mm at Krong Poko downstream basin was applied to estimating annual run-off of PL projects, since it is adjacent to the project area, the catchment area is similar, and topographic and geographic conditions toward two monsoons are comparable.
With regard to the dry season discharge, Trung Nha basin is 24% of Qm, Kon Tun basin is 31% of Qm, Sa Binh basin is 37% of Qm, and O Ronis basin in Mondul Kiri Province, which is expected to be similarly affected by the two monsoons, is 32% of Qm. The value of Sa Binh basin may not be referable because it is affected by existing Yali hydropower. Consequently, an average of remaining three values, 30%, was applied to the dry season discharge of PL projects.
Estimated long-term mean discharge and dry season discharge of PL projects are shown in Table 6.3.15.
Table 6.3.15 Estimated Long-term Mean Discharge and Dry Season Discharge for PL Projects
Catchment
Area
Basin
Average
Rainfall
Annual Mean Discharge
Qm
Run-off
Coeff.
Dry Season Discharge
Q90 Project
km2 mm m3/s
mm m3/s/100km2 % m3/s m3/s/100km2
% to
Qm
new
PL1 839 1,840
28.5
1,070 3.39 58 8.5 1.02 30
new
PL2 575 1,850
19.5
1,070 3.39 58 5.9 1.02 30
Source: Study Team
(4) Verification of Estimated Discharge for PL Projects
In accordance with the discharge measurement by the Study Team made once in February 2008 (dry season), the discharge downstream of the PL1 outfall site (catchment area is about 1,000 km2) was 13.4 m3/s (1.34 m3/s/100km2). The observed specific discharge shows similar level to the specific discharge of the estimated dry season discharge (1.02 m3/s/100km2).
Annual run-off height of PL1 and PL2 estimated in the PECC1 study were 1,260 mm (883 km2, 35.4 m3/s) and 1,270 mm (595 km2, 23.9 m3/s) respectively, and those are 18% higher than the estimates of the Study Team (1,070 mm). Comparing to annual run-off of the Se San upstream basin shown in Figure 6.3.25, 1,260 mm of the estimate of PECC1 seems rather high. On the other hand, 1,070 mm of the estimate of the Study Team may possibly be conservative. It is needed to confirm the discharge by actual measurements in the following stage of these projects.
The estimated dry season discharge of PL projects is 30% of Qm. This is double the value (15%) of

Final Report Chapter 6 Technical Study of 10 Priority Projects
JICA Master Plan Study of 6-33 January 2009 Hydropower Development in Cambodia
Ban Kamphun (confluence of Se San and Sre Pok). The discharge condition is preferable and it is considered because of the two monsoons.
6.3.12 An overview of runoff characteristics of basins in Cambodia
The Study Team estimated the long term annual discharge, the runoff coefficient, and the rate of decrease of dry season discharge against annual average discharge for each hydropower project site, based on 1) the existing reports, 2) analysis on hydrological records, and 3) actual discharge measurement by the Study Team itself. Table 6.3.16 shows the summary of hydrological characteristics for each hydropower potential region. Table 6.3.17 shows the estimated hydrological values for each hydropower project site.
The hydropower potentials in Cambodia are available in the three areas: the South-western Region centering at Koh Kong Province, Central Mountain over Kampot and Kampong Speu Provinces, and North-eastern Region of Ratanak Kiri and Mondul Kiri Provinces. Rain-gauges and stream gauging stations existing in these 3 regions are limited only to the North-eastern Region. Even if we view over whole Cambodia, the observatories and gauges are concentrated to the Tonle Sap Region and along the mainstream of Mekong, which are apart from the hydropower potential regions and are different in hydro-meteorological conditions. Accordingly, it would incur significant errors if we base our hydropower planning on the rainfall and runoff records of these observatories and gauges. This absolute limitation in the hydro-meteorological data available for development planning is one of the greatest issues in developing the hydropower potentials in Cambodia.
Table 6.3.16 Runoff Features by Region of Hydropower Potentials in Cambodia
No. Item Symbol Unit North-eastern Region
Central Mountain
South-western Region
1. Annual basin rainfall Ra mm around 1,800 3,800-4,600 2,500-3,100
2. Annual runoff height Qa mm 900-1,100 2,350- 1,000-1,300
3. Annual runoff coefficient Ca - 0.50-0.60 0.51-0.62 around 0.43
4.
Ration of Dry season flow against Annual mean flow
Qd/Qa % 15-30 0.1-0.6 0.8
Source: Study Team
In the present Hydropower Master Plan Study, we had a chance to review and compare the runoff features of the hydropower potentials all over the country from the macroscopic viewpoint based on the rain-gauges and stream gauging stations available in Cambodia. Then, the runoff features have been clarified as summarized in the above table. Appropriate estimate of the annual runoff height will directly result in assessment of annual energy generation, which would further control the dependability of operating revenue of power sales and financial viability of each project.

Final Report Chapter 6 Technical Study of 10 Priority Projects
JICA Master Plan Study of 6-34 January 2009 Hydropower Development in Cambodia
Table 6.3.17 Summary of Estimated Runoff Features of Existing and Priority Projects
Estimates by past studies and existing plans
1 Kamchay EXPERCO-JST 710 3,800 2,350 0.62 52.9 0.30 0.006
FS by EXPERCO2002, basin rain & Q90
2 Kirirom 3 CEPT 105 2,600 1,240 0.48 4.1 - - Fs by CEPT 2005
4 Lower Stung RusseyChrum Tepsco 1,550 2,690 1,380 0.51 67.8 - - FS by TEPSCO 2006
KFIC 567 3,026 2,280 0.75 41 - - FS by KFIC Feb. 2006
Tepsco 550 2,390 1,220 0.51 21.3 - - p. 4-29, TEPSCO 2006
4 New Tatay (same asKep II) CNHMC 1,073 2,850 2,030 0.71 69.1 - - FS by CNHMC Dec.
2007
5 Bokor Plateau IDICO 25 3,100 - - 2.4 - - FS by IDICO
6 LL2 PECC1 49,200 1,840 852 0.46 1,330 246 0.185 FS by PECC1, basinrain by JST
7 O Romis, MondolKiri JICA 38 1,810 1,370 0.76 1.7 0.52 0.306
JICA BD report,possibility of higherbasin rainfall?
Estimates by JICA Study TeamNorth-eastern Region
8 Prek Liang I JST 839 1,790 1,070 0.60 28.5 8.55 0.300
9 Prek Liang II JST 575 1,840 1,070 0.58 19.5 5.85 0.300
10 LL2 JST 48,200 1,840 951 0.52 1,450 218 0.150
Central Mountains
11 Bokor Plateau JST 23.8 4,630 2,350 0.51 1.8 0.0013 0.001Measured at 0.0013m3/s on 2008.2.29
South-western Region
12 Stung Kep II (newTatay of CNHMC) JST 1,085 2,690 1,150 0.43 39.6 0.33 0.008 Measured at 0.58 m3/s
on 2008.2.14-15
13 Upper Stung RusseyChrum JST 170 2,420 1,040 0.43 5.6 0.05 0.009
14 Middle Stung RusseyChrum JST 473 2,620 1,120 0.43 16.8 0.14 0.008 Measured at 0.1 m3/s
on 2008.2.22
15 Stung Metoek II JST 432 3,010 1,290 0.43 17.7 0.15 0.008
16 Stung Metoek III JST 673 3,100 1,330 0.43 28.4 0.24 0.008
Measured at 13.4 m3/sd/s of PL1 outfall on2008.2.5
ProjectBasin Area(km2)
Remarks
Stung Atay
SourceAnnualRunoffCoefficient
3
RunoffHeight(mm/yr)
BasinRainfall(mm/yr)
AverageDischarge
Qm (m3/s)
Q90 or Qd
(m3/s)Q90/QmNo.
Source: Study Team
The following runoff features of hydropower potentials in Cambodia may be derived from Tables 1.2.1 and 1.2.2:
(1) The highest basin rainfall of around 4,000 mm/yr is observed at Central Mountains that soars high for more than 1,000 m facing the Gulf of Thailand to the northwest of Kampot. The next high rainfalls of 2,500-3,100 mm are observed in the South-western Region around Koh Kong Province also facing the Gulf of Thailand. The North-eastern Region of Ratanak Kiri Province is situated far from the Gulf and has relatively low rainfalls of around 1,800 mm. The rainfalls in Pursat Province, which is situated on the southern shore of Tonle Sap behind the Cardamom

Final Report Chapter 6 Technical Study of 10 Priority Projects
JICA Master Plan Study of 6-35 January 2009 Hydropower Development in Cambodia
Mountains looking from the Gulf of Thailand, is the lowest at 1,100-1,600 mm being about one half of that in the coastal areas.
(2) In terms of annual runoff height, the Central Mountain has the highest rainfall outstanding at 2,350 mm in Cambodia. It is estimated to lower to about one half of it or 1,000-1,300 mm in the South-western Region, and 900-1,100 mm in the North-eastern Region. The annual runoff height is in proportion to the annual basin rainfall, and about one half of the annual rainfall would come out to and runs down the river courses.
(3) In terms of annual runoff coefficient, it is the highest at 0.62 in the Central Mountain4 while low at about 0.43 in the South-western Region. In the North-eastern Region where the basin rainfall is lowest among the three hydropower potential regions, the runoff coefficient is estimated to be relatively high at 0.50-0.605.
(4) In the Central Mountains and South-western Region the dry season runoff drops distinctly. It dropped on the Kamchay river in March to April 1964 to 0.6% of the annual mean of 1964. On the contrary, in the North-eastern Region the dry season runoff is remarkably high at 15-30% of the annual mean. As noted in the right-hand-most column of Table 6.3.17, this high dry season runoff in the North-eastern Region was supported by the discharge measurements made by the Study Team in February 2008.
(5) In the North-eastern Region, there is the second small rainy season from November to January next year being affected by the Northeast Monsoon, which results in relatively limited drops in the dry season runoff in that Region. On the contrary, because of almost no rainfalls in the Central Mountains and South-western Region from November through to April next year, the rivers mostly dry up in February onward. Thus the North-eastern Monsoon creates the distinct difference in the hydrology between the two Regions.
(6) Similarly, the reason for relatively high annual runoff coefficient in the North-eastern Region is: 1) as a result of the rainfalls continuing up to January owing to the Northeast Monsoon, and 2) the Southwest Monsoon will start from May before the basin has become fully dry. On the contrary, the runoff coefficient of the South-west Region, which is featured by the distinct dry season, is
4 The annual runoff coefficient of Bokor Plateau project may be obtained as 0.51. However, such calculation is based on the
rainfall records of only one gauge and no stream gauging records at all. Accordingly, it was assumed to be on conservative side that the annual runoff height was the same with that of Kamchay project. There remains a possibility that the coefficient might be high at around 0.6 like at Kamchay.
5 The runoff coefficients in Cambodia are 27-32% in the Pursat basins, 46-51% in the Lower Stung Russey Chrum basin, 52% at Huai Sato, Thailand, 57% at Kirirom III project site, 57% at Khlong Yai river basin, Thailand. It is in a general range of 27-57%. The coefficient of 0.62 at Kamchay is outstanding. One at O Romis is further high at 0.76. However, it would need checking of a possibility of underestimate of the basin rainfalls.
The specific runoff is very high at 5.29 m3/s/100 km2(=1,670 mm/yr) at Huai Sato, Thailand located adjacent to the South-western Region. On the contrary the specific runoff is very low at 1.28 m3/s/100 km2(=404 mm/yr) in the Pursat basins situated on the northern slopes of the Cardamon Mountains, which is about one fourth of Huai Sato. It is estimated that (1) Annual rainfall (R) is about double at Huai Sato being 3,000 mm against 1,400 mm in Pursat basins; (2) as a result of this great difference in the annual rainfalls and slopes of riverbed, annual runoff coefficient (C)is also about double at Huai Sato being at 52%+ against 27-32% in Pursat basins; (3) As a results, specific runoff may be expressed as QSW = RSW x CSW ≒ 2Rpr x 2Cpr ≒ 4 Qpr. It is estimated thus the great difference has been observed in the annual runoff height of about four times in the two adjacent basins.

Final Report Chapter 6 Technical Study of 10 Priority Projects
JICA Master Plan Study of 6-36 January 2009 Hydropower Development in Cambodia
estimated to be around 0.5 or lower. It further lowers in the Pursat and Kampong Speu Provinces which are located in the inland with less annual rainfalls.
Source: ERA15 (European Centre for Medium-Range Weather Forecasts (ECMWF), 15-year Re-Analysis) data set, Kouichi Masuda
Figure 6.3.29 Seasonal Variation of Monsoon Directions
6.3.13 Flood Discharge
Figure 6.3.30 shows design flood discharges of existing hydropower plans and Creager’s Curve.

Final Report Chapter 6 Technical Study of 10 Priority Projects
JICA Master Plan Study of 6-37 January 2009 Hydropower Development in Cambodia
km2 m3/s m3/s/km2Existing Kirirom 1 98.8 1,110.0 11.2
O Chum 1 23.1 64.0 2.8O Chum 2 44.7 210.0 4.7
Kamchay-FKamchay 710.0 9,000.0 12.7 PMFCETIC Kirirom 3 104.6 524.0 5.0 100 yr
104.6 845.0 8.1 2000 yrChugoku El LSP2 30,620.0 51,000.0 1.7 10000 yrKEPCO 29,490.0 51,000.0 1.7 10000 yrMekong Se Sambor 646,000.0 161,000.0 0.2 PMF
LSRC-F/S LSRC (upper) 1,437.0 8,500.0 5.9 10000 yr C=100(TEPSCO) LSRC (lower) 1,550.0 8,800.0 5.7 10000 yr C=100
Atay 550.0 5,300.0 9.6 10000 yr C=100
PECC1 Se San 1 11,070.0 24,163.0 2.2 10000 yrLower Se San 3 15,400.0 28,312.0 1.8 10000 yrLower Se San 2A 18,550.0 30,957.0 1.7 10000 yrLower Sre Pok 2 30,620.0 28,666.0 0.9 10000 yrLL2 49,200.0 49,443.0 1.0 10000 yrPL1 883.0 2,934.0 3.3 10000 yrPL2 595.0 2,234.0 3.8 10000 yr
Tatay-F/S Tatay (upstream, nort 529.0 4,390.0 8.3 10000 yr(CHMC) Tatay (upstream, sou 544.0 4,520.0 8.3 10000 yr
Tatay (upstream, tota 1,073.0 8,910.0 8.3 10000 yrTatay (downstream) 1,088.0 9,030.0 8.3 10000 yrTatay (plant site) 1,143.0 9,500.0 8.3 10000 yr
Kirirom 1
O Chum 1
O Chum 2
Kamchay(PMF)
Kirirom 3(2000 yr)
Sambor(PMF)
LSRC_upper(10000 yr)
Atay(10000 yr)
LL2(10000 yr)
PL1(10000 yr)
Tatay_upstream,total(10000 yr)
LSP2(10000 yr)
Se San 1(10000 yr)Lower Se San 3(10000 yr)
Lower Se San 2A(10000 yr)
Lower Sre Pok 2(10000 yr)
PL2(10000 yr)
0.1
1.0
10.0
100.0
10 100 1,000 10,000 100,000 1,000,000
Catchment Area (km2)
Spe
cific
Flo
od D
isch
arge
(m3/
s/km
2)
C=140C=120C=100 C=80 C=60
C=40
C-20
Source: Study Team Figure 6.3.30 Design Flood Discharge of Existing Hydropower Plan and Creager’s Curve
According to the figure above, most of the design flood discharges with 1/10,000 probability are ranged between C=100 to C=140.
For the cases of C=100, C=120, and C=140, flood discharge of priority projects are estimated as below:
Kirirom 1
O Chum 1
O Chum 2
Kamchay(PMF)
Kirirom 3(2000 yr)
LSP2(10000 yr)
Sambor(PMF)
LSRC_upper(10000 yr)
Atay(10000 yr)
Se San 1(10000 yr)
Lower Se San 3(10000 yr)
Lower Se San 2A(10000 yr)
Lower Sre Pok 2(10000 yr)
LL2(10000 yr)
PL1(10000 yr)
PL2(10000 yr)
Tatay_upstream,total(10000 yr)

Final Report Chapter 6 Technical Study of 10 Priority Projects
JICA Master Plan Study of 6-38 January 2009 Hydropower Development in Cambodia
Table 6.3.18 Flood Discharge of Priority Projects for Creager’s C = 100, 120, 140
Flood Discharge (m3/s) PJT No. Project
C=100 C=120 C=140
1 7&8 Lower Sre Pok II + Lower Se San II 31,500 37,800 44,140
2 12 new Prek Liang I 6,540 7,850 9,150
3 14 new Prek Liang II 5,410 6,490 7,580
4 16 Middle St. Russey Chrum 4,830 5,790 6,760
5 20 Stung Metoek II 4,570 5,490 6,400
6 21 Stung Metoek III 5,790 6,940 8,100
7 22 Stung Kep II 7,320 8,780 10,200
8 23 Upper St. Russey Chrum 2,710 3,250 3,800
9 29 Bokor Plateau 791 949 1,110 Source: Study Team
6.3.14 Sediment Transport
With regard to issues of the sediment transport, MOWRAM has conducted observation of the total suspended solid (TSS) as part of monthly observation of river water quality. Table 6.3.17 shows average TSS of each river from January 2005 to December 2006.
Table 6.3.19 Total Suspended Solid (TSS) of Each River
Catchment
Area
Mean
DischargeAverage TSS
Station ID Station Name River CA km2 Qm m3/s mg/l* m3/km2/yr**
H014501 Stung Treng Mekong 635,000 13,200 64.7 33
H020107 Backprea Battambang 514 9.0 126.3 54
H440103 Andoung Meas Se San 11,779 523 32.2 35
H450101 Lumphat Sre Pok 25,600 664 34.6 22
H430102 Siempang Se Kong 23,500 911 49.6 47 *) observed data **) derived from C.A. and Qm Source: Study Team
The table above shows that the specific Total Suspended Solid (TSS) values of Se San and Sre Pok are around one half of the values of Battambang and Se Kong.
The following table summaries the data of sediment transport estimated in the existing studies.

Final Report Chapter 6 Technical Study of 10 Priority Projects
JICA Master Plan Study of 6-39 January 2009 Hydropower Development in Cambodia
Table 6.3.20 Sediment Transports by Existing Studies
No. Project
Sediment
Production*
(m3/km2/yr)
1 Nam Theun 1 142
2 Se Kong 4 135
3 Se Kong 5 143
4 Xe Kaman 3 277
5 Nam Kong 1 170
6 Houay Lamphan Gnai 236
7 Lower Sre Pok 2 36
8 Lower Se San 2 36
9 Se San 3 260
10 Se San 4 378
11 Upper Kontum 244
12 LSRC Upper 460
13 LSRC Lower 549 *) #1 - 11: data from Se Kong - Se San and Nam Thuen River Basins
Hydropower Study (ADB/Halcrow, Jul. 1999), #12 & 13: data from Lower Stung Russey Chrum Hydropower Project (TEPSCO, Aug. 2006)
Source: Study Team
Assuming that sediment transport for the priority project is 200 m3/km2/year, sediment volumes of each project for 100 years are tentatively assumed at this MP stage as follows:
Table 6.3.21 Sediment Volume assumed for Priority Projects for 100 Year
Catchment
Area
Sediment
Volume PJT No. Project
km2 mcm/100yr
1 7&8 Lower Sre Pok II + Lower Se San II 49,200 984
2 12 new Prek Liang I 839 16.8
3 14 new Prek Liang II 575 11.5
4 16 Middle St. Russey Chrum 461 9.2
5 20 Stung Metoek II 416 8.3
6 21 Stung Metoek III 656 13.1
7 22 Stung Kep II 1,060 21.2
8 23 Upper St. Russey Chrum 163 3.3
9 29 Bokor Plateau 24.5 0.5 Source: Study Team

Final Report Chapter 6 Technical Study of 10 Priority Projects
JICA Master Plan Study of 6-40 January 2009 Hydropower Development in Cambodia
6.4 GEOLOGY
6.4.1 Regional Geology
Geological features of Cambodia vary. It consists of sedimentary, metamorphic, and igneous rocks extending from the Precambrian through Quaternary geologic age, as summarized in the geological map from an ESCAP report*6 (see Figure 6.4.1). According to said report, Cambodia territory is classified into geologic units as shown in Table 6.4.1.
Source: ESCAP report
Figure 6.4.1 Geological Map of Cambodia
Table 6.4.1 Geologic Units of Cambodia
Exposed basement of the Kontum Massif PC Precambrian – Early Palaeozoic granites and high grade metamorphics
Zones of Indosinian folding DC Anticlinorial zones CT Synclinorial zones
Undeformed or gently folded cover strata C-P Paleozoic sedimentary units A, R Volcano-sedimentary units
M Mesozoic sedimentary units B Neogene – Quaternary platform basaltic rocks Q Quaternary sedimentary rocks and unconsolidated sediments
Intrusive rock groups G Pre-Carboniferous to Cretaceous intrusives
Source: ESCAP report
As shown in Figure 6.4.1, surface geology in Cambodia can be divided into unconsolidated sediments in the Quaternary lying on the northwest, central, to southeast of the territory and the rocks lying on the northeastern and southeastern parts.
*6 UNITED NATIONS (1993): Atlas of Mineral Resources of the ESCAP Region, Vol. 10, CAMBODIA, Explanatory Brochure
12-14
7,8
29
22 16,23
20,21
7, 8: LSS2, LSP2 12-14: Prek Liang 16, 23: Middle & Upper Stung Russey Chrum 20,21: St. Metoek II & III 22: St Kep II 29: Bokor Plateau

Final Report Chapter 6 Technical Study of 10 Priority Projects
JICA Master Plan Study of 6-41 January 2009 Hydropower Development in Cambodia
The unconsolidated sediments are formed by the slight subsidence of the broad area along the northwest-southeast axes of the Quaternary. The great basin of Tonle Sap lies at the center of the subsided area. Topography of the area ranges from very gentle to flat due to the gentle subsidence and filling of depression parts with unconsolidated sediments.
The areas underlain by rocks can be divided into two geologic groups, and further subdivided into four subgroups in terms of lithfacies (geologic component) and geo-tectonic evolution as summarized below:
(1) Old and hard rocks An intense geotectonic event (the Indosinian orogeny) occurred on a wide area of Cambodia and its surrounding areas, marked by a strong folding that began in the late Permian age, and culminated in the middle Triassic age. Old rocks from Pre-Cambrian to Permian age consist of hard rocks, originating from marine deposits, which were folded and faulted by the geotectonic activities. Very roughly speaking, general features of the rocks can be summarized as follows: 1) The oldest subgroup
- Age: Pre-Cambodian - Main components: Granite and high-grade metamorphic rocks (Gneiss, Amphibolite,
etc) - Original features: Very stiff and relatively coarse grained - Deformation features: The adverse influence of tectonic activities such as crushing
and shearing is not so remarkable at an outcrop scale. 2) Old subgroup
- Age: Cambrian to middle Carboniferous - Main components: Low- to medium-grade metamorphic rocks, shale, cherty shale,
sandstones, marl, silicified shale - Original features: Relatively stiff and fine to medium grained - Deformation features: The adverse influence of tectonic activities such as crushing
and shearing is remarkable at an outcrop scale. 3) Middle subgroup
- Age: Upper Carboniferous to Permian - Main components: Limestone - Original features: Stiff and massive - Deformation features: The adverse influence of tectonic activities such as crushing
and shearing is not remarkable at an outcrop scale. (2) Young and moderately hard rocks
Younger rocks of the Triassic and later in geologic age are moderately hard rocks of continental, littoral, or lacustrine origin. Since geotectonic activity was not so intense after the Triassic age, the rocks are not so mechanically disturbed. The general features of the rocks are as follows. 4) Young subgroup
- Age: Triassic to Cretaceous - Main components: Relatively coarse grained clastic rocks such as sandstone,
conglomerate, siltstone, and volcani-clastic rocks - Original features: Moderately hard to slightly soft and relatively coarse grained - Deformation features: The adverse influence of tectonic activities is not remarkable.

Final Report Chapter 6 Technical Study of 10 Priority Projects
JICA Master Plan Study of 6-42 January 2009 Hydropower Development in Cambodia
6.4.2 Dam site geology
The selected ten sites are located in mountainous areas with accessibility problems. Geological features at remote country areas, especially the Prek Liang and Russey Churum sites, remain unknown due to the difficulty in conducting geological investigation. As shown in Table 6.4.1, existing geological maps show different geological features.
As presented in the itinerary below, reconnaissance of selected dam sites was carried out by the JICA-MIME Joint Research Team for purposes of obtaining geotechnical assessment. However, investigation of sites #14 and No.23, Prek Liang II and Upper Russey Chrum respectively, were not performed due to accessibility problems mentioned above.
The site reconnaissance focused in particular on the dam site geology, which was vital in determining the feasibility of the project, considering that the time and available data are limited for carrying out the study.
No. Date Site Reconnaissance Area 1st 27/10/2007-30/10/2007 Ratanak Kiri, Stung Treng and Kraite 2nd 02/11/2007-03/11/2007 Bokor Plateau 3rd 09/11/2007-13/11/2007 Stung Kep II, Stung Metoek III 4th 15/11/2007-17/11/2007 Stung Metoek II 5th 08/02/2008-08/02/2008 Prek Liang 6th 12/02/2008-16/02/2008 Stung Kep II 7th 21/02/2008-25/02/2008 Middle Russey Chrum 8th 27/02/2008-28/02/2008 Bokor Plateau
Based on the results of the site reconnaissance, no serious geological concerns were identified in any of the surveyed sites. The results of site reconnaissance at the selected dam sites are summarized in Table 6.4.3 to Table 6.4.9.
However, it is noted that since all the sites remain geologically unknown as mentioned earlier, detailed geological investigations are still necessary to realistically assess the feasibility of the selected sites.
Table 6.4.2 Geologic Units of Selected 10 Sites
Site Reference 1 Reference 2 7&8 Lower Sre Pok II
+ Lower Se San II (LL2)
Unknown geologic era: No classified rock
Devono-Carboniferous: silicified shale, green phtanite, blue-grey calcareous sandstone, covered by relatively thick old alluvium
12 Prek Liang I (PLI)
Unknown geologic era: Crystallized indeterminable rocks
Undifferenciated crystalline rock
13 Prek Liang IA (PLIA)
Unknown geologic era: Crystallized indeterminable rocks
Undifferenciated crystalline rock
14 Prek Liang II (PLII)
Quaternary: Volcanic deposits
Cambrian-Silurian and Precambrian indeterminated rock type
16 Middle St. Russey Chrum (M.RC)
Unknown geologic era: No classified rock
Middle Jurassic to Lower Cretaceous: Upper Sandstone, covered by relatively thick recent alluvium or indifferenciates
20 Stung Metoek II (SMII)
Middle Jurassic – Early Cretaceous: Sandstone
Middle Jurassic to Lower Cretaceous: Upper Sandstone
21 Stung Metoek III Middle Jurassic – Early Middle Jurassic to Lower Cretaceous: Upper

Final Report Chapter 6 Technical Study of 10 Priority Projects
JICA Master Plan Study of 6-43 January 2009 Hydropower Development in Cambodia
Site Reference 1 Reference 2 (SMIII) Cretaceous: Sandstone Sandstone
22 Stung Kep II (SKII)
Middle Jurassic – Early Cretaceous: Sandstone
Middle Jurassic to Lower Cretaceous: Upper Sandstone
23 Upper St. Russey Chrum (U.RC)
Middle Jurassic – Early Cretaceous: Sandstone
Middle Jurassic to Lower Cretaceous: Upper Sandstone, covered by relatively thick recent alluvium or indifferenciates
29 Bokor Plateau (BP)
Middle Jurassic – Early Cretaceous: Sandstone
Middle Jurassic to Lower Cretaceous: Upper Sandstone
Reference 1: Geological map by Department of Geology, General Department of Mining Resources Reference 2: Geological of Cambodia in the ESCAP report
Table 6.4.3 Summary of Geological Assessment for #7&8 LL2
Site No. #7&8 LL2 1. General Geology
Devono-Carboniferous: silicified shale, green phtanite, blue-grey calcareous sandstone, covered by relatively thick old alluvium
2. Dam site Schematic Geological Section along dam axis
Topography Tonle Sap River, forming relatively broad valley, meanders through gentle hills to the west.
Geology Observation area in the reconnaissance was limited to the riverside of the dam site, due to difficult access. Bedrock Although no outcrops of bedrocks were observed at the dam site, fairly stiff bedrocks composed of bedded chart and siliceous shale are exposed on the riverbed, about 2 km downstream of the dam site. The dam site is possibly underlain by similar bedded chart and siliceous shale dipping steeply to the northeast. Unconsolidated deposits The riverbed is covered mainly with relatively thick silty river deposits. Engineering Assessment During the observation of the outcrops about 2 km downstream of the dam site, an estimated unconfined compressive strength of about 50 MPa, was determined by hammering pieces of sound rocks, Accordingly, the sound rocks are probably suitable for dam foundation.
River deposits
colluvial deposits colluvial deposits
chart and siliceous shale

Final Report Chapter 6 Technical Study of 10 Priority Projects
JICA Master Plan Study of 6-44 January 2009 Hydropower Development in Cambodia
Table 6.4.4 Summary of Geological Assessment for #12 & 13 Prek Liang 1 & 1A
Site No. #12,13 Prek Liang 1 & 1A 1. General Geology
Because of difficult accessibility, detailed geological investigation has not been carried out yet. According to existing geological maps, this site is underlain by crystallized rocks (of Precambrian age based on the Geology of Cambodia in the ESCAP report) and volcanic rocks covering the upstream area of the reservoir. Site reconnaissance revealed that the area from the dam site to the powerhouse is underlain by andestic rocks with rock facies possibly originating from the Tertiary age. Many small hills in the upstream area of the reservoir, with elevation of about 500-600 m, indicate that this area is covered with gentle dipping stratum of sedimentary rocks, including volcanic rocks.
2. Dam site Schematic Geological Section along dam axis
Topography Prek Liang River forms 30-40 degrees V-shape valley with about 25 m wide riverbed. A NNE-SSW oriented lineament, which is a possible weak belt, obliquely crosses the river at about 150 m upstream of the dam site.
Geology Bedrock The dam site is covered with crystallized welded tuff and volcanic breccia. Hard andestic rocks are exposed on the left bank of the riverbed, while it intermittently crops out on the right bank. Unconsolidated Sediment River deposits are composed of gravelly sand/silt, including boulders of about 2 m in diameter. Its thickness is expected to be about 5 m based on site reconnaissance. Relatively thick colluvial deposits (about 10-15 m in thickness) cover the right bank. Structure Gently dipping upstream-ward in general, but inclination of beds increase toward the upstream to the dam site, with an immediate dipping of about 40 degrees. Alteration
No significant alteration was detected. A NNE-SSW oriented hydrothermal altered zone with about 20 m in thickness, soften and bleached, are observed at about 500 m downstream of the dam site. NNE-SSW oriented valleys at about 150 m upstream of the dam site also indicate some weak zones. Weathering Fresh and sound rocks are expected in the shallow area
85
25
5
50
5
40
40
646075
5
10
30
80
12
80
0 1 2 3 4 5 km
LegendOutcrops of bedrock
Survey route & Camp site
Suspicious landslide
Supposed altered zoneJoint/Dips 2
NPrek Kiang I Dam site
Headrace Tunnel
200m
400m
0 km 1 km 2 km 3 km
Dam site
Schematic Geology along the River Section
Flow structure
? ? Approx. 25 m
Colluvial deposits
Bedrock (andestic volcanic breccia)
River deposits

Final Report Chapter 6 Technical Study of 10 Priority Projects
JICA Master Plan Study of 6-45 January 2009 Hydropower Development in Cambodia
on the riverbed. However, upper slope portions are still unknown. The right bank seems to be relatively deep. Engineering Assessment Hard andestic rocks exposed on both banks along the river are expected to be suitable for the foundation of 70-80 m class concrete gravity dam. Estimated unconfined compressive strengths obtained by hammering sound rock pieces is about 80-100 MPa. Cohesion and internal friction angle in the shear strength of the sound rocks are expected to be 25-30 MPa and 40-45 degrees, respectively. Relatively gentle slope features on the right bank indicate that sound rock surface on the right bank would be relatively deep.
2. Reservoir Water tightness According to the existing geological map and topographic inspection conducted, the
reservoir area is underlain by crystallized rocks and Quaternary volcanic deposits with gentle to almost flat strata covering the upstream area. Accordingly, the geological boundary and pervious layers intercalated in volcanic deposits, in addition to faults and altered zones, should be considered for the leakage risk analysis of the reservoir However, in the case of FSL of 340 m, the pass seems to be long enough as required, since the smallest pass exceeds 4 km, although geological investigation including ground mapping of the reservoir area is still necessary to determine the final conclusion
Landslide On the basis of topographic interpretation using 1:100,000 scale maps, significant landslides are foreseen in the reservoir area.
3. Material Resources
Andestic rocks exposed along the river would be suitable as concrete aggregates, although quality check remains necessary, since the rocks have been subjected to regional acid alternation which may contain minerals harmful to concrete. According to results of site reconnaissance, the distribution of terrace deposits or talus deposits is limited and no good borrow area for earth materials is available within the surveyed vicinity.
4. Other Related Structure
Headrace Tunnel Portal area No significant landslide in this area. The portal area is covered with colluvial deposits, which needs to be excavated. A NNE-SSW lineament should be noted during the geological investigation of this area. Tunnel Alignment Tunnel alignment will penetrate andestic welded tuff and volcanic breccia with almost flat structure. Based on site reconnaissance the rock mass behavior of most sections of the connection tunnel is expected to be governed by stable rock mass, although some faults or local discontinuities may cause overbreak. Some NNE-SSW lineaments, which are possible weak belts, cross the tunnel alignment. Tunnel alignment is recommended to minimize the geological risk by crossing the lineament at right angles, if unavoidable. The high potential sections of water inflow include some lineaments, faults, flow units with columnar joints and geological boundary of flow units. Powerhouse Based on site reconnaissance along the main river, powerhouse site can be expected to be underlain by very stiff and wide joint spacing andestic welded tuff or volcanic breccia. It is preferable in the layout arrangement of the powerhouse cabin that lineaments indicating faults or alteration, identified from topographic interpretation and ground mapping, are avoided to reduce geological risks. Additionally, geological investigation including detailed ground mapping and core drilling is necessary to assess the feasibility of the powerhouse.

Final Report Chapter 6 Technical Study of 10 Priority Projects
JICA Master Plan Study of 6-46 January 2009 Hydropower Development in Cambodia
Table 6.4.5 Summary of Geological Assessment for #16 Middle Russey Chrum
Site No. #16 Middle Russey Chrum 1. General Geology
Middle Russey Chrum Dam site is underlain mainly by sandstone of Middle Jurassic to Lower Cretaceous age. Neogene to Quaternary platform basaltic rocks are distributed along the river.
2. Dam site Schematic Geological Section along dam axis
Topography Stung Russey Chrum sharply denudes a plateau of Middle Jurassic to Lower Cretaceous sandstone, meanderingly flows westward at the Middle Russey Chrum dam site, and flows southward after the confluence of A Kay River approximately 15 km west of the dam site. Bedded sandstone crops out on the riverbed and the right bank. The river forms asymmetric valley with a riverbed of about 40 m in width. The right bank has a relatively steep slope of about 30 degrees, while its left bank has a relatively narrow ridge with a gentle slope of 10-15 degrees.
Geology Bedrock Middle Jurassic to Lower Cretaceous consist of alternate layers of sandstone (expected unconfined compressive strength, UCS: 30-50 MPa) and siltstone (expected UCS 10-20 MPa). The components are dominated by medium to fine grained arkosic sandstone with cross-bedding. According to the existing information from the drilling survey carried out by TEPSCO in 2006 at the Lower Russey Chrum Site, geological structure is almost flat and mudstone dominates below EL. 100 m. Unconsolidated Sediment Bedded sandstone strata are exposed on most of the riverbed. River deposits consist of gravelly sand including boulders of about 3 m in diameter. Small terraces covered with 1 m - 3 m thick fine sand are distributed on the left bank. Depth of colluvial deposits is estimated to be about 10 m -15 m on the left bank and 2 m - 3 m on the right bank (probably thicker on the upper slope). Structure Gently dipping northwest ward (to the right bank). Fault No faults were observed. Joint Not significant, but N-S and E-W joint sets are dominated Alteration None, but the basaltic rock at about 700 m downstream of the dam site possibly might have weakened sandstone at the contact zone. Weathering Bedrocks on the riverbed, consisting of hard sandstone, with varying color shades of yellow to red due to weathering. The pieces of surface rock sample show relatively high water absorption and low bulk density.
Engineering Assessment Hard sandstone exposed on the riverbed has enough bearing capacity for a 40 m class dam foundation. However, sheeting joints in weathered sandstone are expected beneath the riverbed while relatively soft siltstone layers might be intercalated in the sandstone. Accordingly, its suitability as dam foundation in terms of strength and water tightness should be assessed carefully by means of core drilling survey, etc. Estimated unconfined compressive strength of about 30-50 MPa is obtained by hammering
approx. 40 m
sandstone/siltstone
colluvial deposit colluvial deposit

Final Report Chapter 6 Technical Study of 10 Priority Projects
JICA Master Plan Study of 6-47 January 2009 Hydropower Development in Cambodia
sound rock pieces. Cohesion and internal friction angle in the shear strength of the sound rocks are expected to be 15 MPa and 40-45 degrees respectively. Low permeability of the foundation are expected based on the data of Low Russey Churum investigation (TEPSCO, 2006). However, some bedrocks on the riverbed seem to be pervious due to the sheeting joints. Groundwater level of the both banks might be low. It is noted that water tightness of the relatively thin left abutment of the dam site needs to be further assessed.
2. Reservoir Water tightness The reservoir area is underlain mainly by alternative strata of sandstone and siltstone.
According to existing information from geological investigation carried out in geologically similar sites such as Lower Russey Chrum or St. Kep II, sufficient water tightness of bedrocks in the reservoir can be expected. However, water tightness should be assessed carefully especially in the following sites. - The narrow ridge of the left bank of dam site - Basaltic rocks distributed area on the riverbed
Landslide No significant landslides were observed, according to site reconnaissance. Some relatively gentle slopes beneath the cliffs are covered with colluvial deposits, which might be eroded and become unstable due to impounded water, eventually causing collapses.
3. Material Resources
For Rock material Thick bedded sandstone is available as rock materials. For Earth material Good resources of earth materials could not be found near the dam site. For Concrete Aggregates Basaltic rocks will be suitable in quality but limited in quantity. Sandstone rocks occur widely in the reservoir area, but seemed to be severely weathered and low quality in general
4. Other Related Structure
Headrace Tunnel Portal Covered with colluvial deposits of 5 m -10 m in thickness. The portal area will require some excavation works. No significant landslides were detected at the portal site. Tunnel Tunnel alignment will penetrate alternate layers of hard sandstone and relatively soft siltstone, with an almost flat structure. The rock mass behavior of most sections of the connection tunnel is expected to be governed by stable rock mass, although some minor faults or local discontinuities may cause overbreak. Necessary tunnel supports should be provided due to geological conditions. Particularly, relatively soft siltstone dominated sections or weathered portions may require tunnel supports such as rock bolts, steel rib support and concrete lining. The potential of water inflow will be low in general, except for faults or geological boundaries. Powerhouse According to the interpretation of the existing geological map, the powerhouse site is underlain by alternate layers of hard sandstone and relatively soft siltstone with an almost flat structure.

Final Report Chapter 6 Technical Study of 10 Priority Projects
JICA Master Plan Study of 6-48 January 2009 Hydropower Development in Cambodia
Table 6.4.6 Summary of Geological Assessment #20 Stung Metoek II
Site No. #20 Stung Metoek II 1. General Geology
Stung Metoek II Dam site is underlain by alternate layers of hard sandstone and relatively soft siltstone with an almost flat structure of Middle Jurassic to Lower Cretaceous age. Outcrops of sandstone is originally grey in color, but yellowish due to weathering, with some softened in the surface zone of about 5 m in thickness, and relatively massive/jointed at 15 cm -200 cm intervals. Outcrops of siltstone-mudstone, greenish, reddish grey, or dark grey in color, is also weathered and softened.
2. Dam site Topography According to topographic interpretation
using 1:100,000 scale maps, this area shows cuesta feature reflecting alternate layers of hard sandstone and weak siltstone. The dam site seems to be located in sandstone dominated hilly area as shown in the following Figure, although this could not be confirmed since the actual dam site is inaccessible as it is located in a minefield area. According to site reconnaissance, actual valley shape is steeper and different from the indications in the 1:100,000 topographic map images. Thus, it might be preferable to shift somewhat to the upstream, Evaluation of dam site using detailed map is recommendable.
Geology As mentioned above, actual condition could not be confirmed due to accessibility issue. St. Metoek II Dam site could be underlain by alternate layers of hard sandstone and relatively soft siltstone with an almost flat structure of Middle Jurassic to Lower Cretaceous age. These should have sufficient bearing capacity for the dam’s foundation. It should be noted that weathering of surface zone of the dam abutment and siltstone seems to be relatively intense and softened.
gentle slope
steep slope
gentle slope
steep
slope
Dam site
2 km

Final Report Chapter 6 Technical Study of 10 Priority Projects
JICA Master Plan Study of 6-49 January 2009 Hydropower Development in Cambodia
Table 6.4.7 Summary of Geological Assessment for #21 Stung Metoek III
Site No. #21 Stung Metoek III 1. General Geology
Stung Metoek III Dam site is underlain by alternate layers of hard sandstone and relatively soft siltstone with an almost flat structure of Middle Jurassic to Lower Cretaceous age.
2. Dam site Topography Three alternative dam sites with almost
similar dam crest lengths are topographically suitable as discussed below. 1. Upstream site Left bank: Relatively narrow ridge with isolated hill of about 80 m high above the riverbed on the map (possibly 50 m long based on site inspection). Additionally, the slope on the downstream side is deeply denuded by a small stream, which is a disadvantage in terms of water tightness. There is an existing terrace of about 100 m wide. Riverbed: 30 m- 40 m in width. The depth of the bedrock surface is probably 5 m or deeper. Right bank: Relatively gentle up to 200 m in elevation except at the riverside. A small stream runs parallel to the main river around the dam crest. 2. Middle site Left bank: Similar to Upper site. The existing terrace is relatively wider. Riverbed: Similar to Upper site. Bedrocks are exposed on some riverbed. Right bank: Relatively steep up to 200 m in elevation. It appears to be a stable slope. 3. Downstream site Left bank: Relatively gentle slope. Colluvial deposits are not thick with a probable stable slope. Detailed condition however is not yet confirmed. Riverbed: Sound sandstone is exposed. The downstream portion of this site becomes steeper.Right bank: Relatively gentle slope. Colluvial deposits might be relatively thick and slope appears stable. Detailed condition however is not yet confirmed.
Geology Bedrock Middle Jurassic to Lower Cretaceous alternate layers of sandstone (expected UCS: 30-50 MPa) and siltstone (expected UCS 10-20 MPa). Medium to fine grained arkosic sandstone with cross-bedding seems to occur around the riverbed and cliffs, with siltstone layers intercalated. Unconsolidated deposits Unconsolidated deposits are thin in general. Bedrocks are exposed on some portions. Relatively thick colluvial deposits occur beneath the cliffs. Structure Almost flat Fault N-S oriented echelon faults are suspected according to topographic interpretation of the satellite image shown in the figure. Upstream site and middle site has risks of water leakage through the faults. Engineering Assessment Downstream site seems to be suitable from geological aspects. Additionally, downstream site can shorten the tunnel length and reduce the backwater effects from the spill gate.
Upstream
Middle Downstream
Echelon fault

Final Report Chapter 6 Technical Study of 10 Priority Projects
JICA Master Plan Study of 6-50 January 2009 Hydropower Development in Cambodia
Table 6.4.8 Summary of Geological Assessment for #22 St. Kep II
Site No. #20 Stung Kep II 1. General Geology
Stung Kep II Dam site is underlain mainly by sandstone of Middle Jurassic to Lower Cretaceous age. Neogene to Quaternary platform basaltic rocks are distributed along the Tatay River.
2. 1 Dam site 1 Tatay dam site Schematic Geological Section along dam axis
Topography Stung Tatay River sharply denudes a plateau of sandstone, meanderingly flows westward. Riverbed of the dam site is about 40m wide. Slope on both banks varies from 20 degrees - 40 degrees with cliffs beneath the plateau. Small terraces of basaltic lava with 3-5 m high above the riverbed are scattered along the river.
Geology Bedrock Middle Jurassic to Lower Cretaceous alternate layers of sandstone (expected UCS: 30-50 MPa) and siltstone (expected UCS 10-20 MPa). The components are dominated by medium to fine grained arkosic sandstone with cross-bedding. Some riverbed is covered with Neogene – Quaternary platform basaltic rocks with columnar joints of about 5 m in thickness. According to the existing data from the drilling survey carried out by CHMC, geological structure is almost flat and mudstone dominates below elevation EL. 110 m. Unconsolidated Deposits River deposits are composed of gravelly sand/silt including boulders of about 1 m in diameter. Its thickness is expected to be about 2-3 m according to site reconnaissance. According to aerial photo interpretation, relatively thick colluvial deposits are detected on both banks beneath the cliffs. Structure Generally flat with gentle dipping downstream-ward and upstream towards the dam site Fault No significant faults were observed. Joint Not significant, but N-S and E-W oriented joint sets dominated Alteration
Locally, some altered and softened portions especially beneath basaltic rocks were observed along the river bed. Weathering
Bedrocks on the riverbed, consisted of hard sandstone have color shades varying from yellow to red due to weathering. Engineering Assessment Hard sandstone exposed on the riverbed are suitable for the foundation of a rockfill type dam, while relatively soft siltstone layers intercalated in sandstone might be disadvantageous for a gravity type dam. Estimated unconfined compressive strength obtained by hammering of sound rock pieces is about 30-50 MPa. The cohesion and internal friction angle in shear strength of the sound rocks is expected to be 15 MPa and 40-45 degrees, respectively. Since sheeting joints in weathered sandstone are expected beneath the riverbed, suitability for the foundation both in terms of strength and water tightness should be assessed by core drilling survey, etc. Furthermore, basaltic rocks on the right bank are probably highly pervious due to columnar joints which have leakage risks. In case of low groutability, these
approx. 40 m basalt
sandstone and siltstone
colluvial deposit colluvial deposit

Final Report Chapter 6 Technical Study of 10 Priority Projects
JICA Master Plan Study of 6-51 January 2009 Hydropower Development in Cambodia
high pervious rocks would need to be removed. Low permeability of the foundation of about 20 m-25 m below ground surface can be expected based on the geological investigations carried out by CHMC near the dam site. However, groundwater level of both banks might be low.
2.2 Dam site 2 Stung Kep dam site Schematic Geological Section along dam axis
Topography Stung Kep River sharply denudes a plateau of Middle Jurassic to Lower Cretaceous sandstone, meanderingly flows westward. Width of riverbed in the project area ranges between 40 m to 120 m. Slope on both banks are varies from about 20 degrees to 40 degrees, with cliffs beneath the plateau. The dam axis may need to be shifted based on detailed topographical maps, since bedrocks are exposed at about 200 m upstream of the planned dam axis.
Geology Bedrock Middle Jurassic to Lower Cretaceous alternate layers (about 50 cm in thickness) of sandstone (expected UCS: 30 MPa - 50 MPa) and siltstone (expected UCS 10-20 MPa). The components are dominated with medium to fine grained arkosic sandstone with cross-bedding. Unconsolidated Sediment Based on site reconnaissance river deposits are composed of gravelly sand/silt including boulders of about 1 m in diameter, and its thickness is expected to be about 2 m - 3 m. Both abutments are covered with 10 m - 15 m thick colluvial deposits. Structure Almost flat - gently dipping upstream-ward to the dam site Fault No significant faults were observed. Joint Not significant, but N-S and E-W oriented joint sets dominated Alteration Locally, some were altered and softened Weathering Bedrocks on the riverbed are stained to pale yellow or pale red due to weathering.
Engineering Assessment Geologically similar to Stung Tatay site.
2. Reservoir
Water tightness The reservoir area is underlain mainly by alternate strata of sandstone and siltstone. According to existing information obtained from geological investigation carried out in geologically similar sites such as Lower Russey Chrum or St. Kep II, sufficient water tightness of bedrocks in the reservoir can be expected. Leakage risk to another river system will be low.
Landslide No significant landslides were observed, according to site reconnaissance. Some relatively gentle slopes beneath cliffs are covered with colluvial deposits, which might be eroded and become unstable due to impounded water, eventually causing collapse.
3. Material Resources
For Rock material Thick bedded sandstone is available as rock materials. For Earth material Good resources of earth materials could not be found near the dam site. For Concrete Aggregates Basaltic rocks will be suitable in quality but limited in quantity. Sandstone rocks occur widely in the reservoir area, but they seemed to be severely weathered and generally low in quality.
Water depth: 5 m +/- ?
sandstone/siltstone
approx. 40 m
colluvial deposits

Final Report Chapter 6 Technical Study of 10 Priority Projects
JICA Master Plan Study of 6-52 January 2009 Hydropower Development in Cambodia
4. Other Related Structure
Connection Tunnel Portal Covered with colluvial deposits of 5 m-10 m in thickness. The portal area will require some excavation works. No significant landslides were identified at the portal site. The section from the portal of Stung Kep side to about 2 km might be softened due to weathering. Tunnel Tunnel alignment will penetrate alternate layers of hard sandstone and relatively soft siltstone with an almost flat structure. The rock mass behavior of most sections of the connection tunnel is expected to be governed by stable rock mass, although some minor faults or local discontinuities may cause overbreak. Necessary tunnel supports should be provided due to geological conditions. Particularly, relatively soft siltstone dominated sections or weathered portions may require tunnel supports such as rock bolts, steel rib support and concrete lining. The potential of water inflow will be low in general except for faults or geological boundaries. Headrace Tunnel Tunnel alignment will penetrate alternate layers of hard sandstone and relatively soft siltstone with an almost flat structure. Although geological information is limited, the rock mass behavior of most sections of the connection tunnel is expected to be governed by stable rock mass, although some minor faults or local discontinuities may cause overbreak. Necessary tunnel supports should be applied based on the geological condition. Particularly, relatively soft siltstone dominated sections or weathered portions may require tunnel supports such as rock bolts, steel rib support and concrete lining. The potential of water inflow will be low in general except for faults or geological boundaries. Powerhouse The powerhouse site is underlain by alternate layers of hard sandstone and relatively soft siltstone with an almost flat structure. According to topographic interpretations, the slope of the tailrace portal site seems to be covered with relatively thick colluvial deposits as shown in the figure below.
Schematic geological profile of the slope near the tailrace
Colluvial deposit
Sandstone/siltstone
Riverbed

Final Report Chapter 6 Technical Study of 10 Priority Projects
JICA Master Plan Study of 6-53 January 2009 Hydropower Development in Cambodia
Table 6.4.9 Summary of Geological Assessment for #29 Bokor Plateau
Site No. #29 Bokor Plateau 1. General Bokor Plateau Dam site is underlain mainly by sandstone of Middle Jurassic to Lower
Cretaceous age. 2. Dam site Schematic Geological Section along dam axis
Schematic Geological Section along Dam axis of Upstream Site
Schematic Geological Section along Dam axis of Downstream Site
Topography Bokor River sharply denudes a plateau of Middle Jurassic to Lower Cretaceous sandstone.
The dam site is planned at the upstream reach of the river. Two alternative dam sites are shown in the Figure. Downstream site is situated on a steep and narrow valley at about 300 m downstream of the fall. Upstream site is situated on a plateau of hard sandstone at about 700 m upstream of the fall.
Geology Bedrock Middle Jurassic to Lower Cretaceous alternate layers of sandstone (expected UCS: 30-50 MPa) and siltstone (expected UCS 10-20 MPa). The components are dominated with medium to fine grained arkosic sandstone with cross-bedding. Unconsolidated Sediment Downstream site Boulders of more than 10 m in diameter cover the riverbed. Upstream site Very thin gravely sand. Colluvial deposits are less than 1 m in thickness in general. Sandstone bedrocks are exposed on some portions in the reservoir area. Structure Almost flat. Fault No significant faults were observed.
Bedrocks are almost exposed on the riverbed and reservoir area
Big boulders
Weathered, and loosened
Downstream site
Upstream site
1 km
Waterfall Bokor

Final Report Chapter 6 Technical Study of 10 Priority Projects
JICA Master Plan Study of 6-54 January 2009 Hydropower Development in Cambodia
Joint Not significant, but sheeting joints are developed in the weathered sandstone.. Alteration No significant alteration Weathering Bedrocks on the riverbed are stained to pale yellow or pale red due to weathering. Engineering Assessment
Upstream site can reduce the required dam height and volume, although the catchment area of 2 km decreases. Additionally, upstream site is more preferable than the downstream site, in terms of workability and accessibility.
2. Reservoir Water tightness Reservoir area is situated on Bokor Plateau of 930-950 m in elevation.
Residual soil and colluvial deposits are almost negligible. Good water tightness of bedrock in the reservoir can be expected. Impact to forest environment by impending water is not significant.
Landslide No significant landslides.
6.4.3 Seismic risk
(1) Data collection of existing seismic data
Based previous on survey or available data on earthquakes, no active faults or active structures have been identified in the selected sites.
No significant earthquakes exceeding magnitude 6 were recorded in the study area, as shown in Figure 6.4.2.
Figure 6.4.2 Seismotectonic Map of Continental Asia.
Source: Hazard map –Eastern Asia, The Global Seismic Hazard Assessment Program (GSHAP), a demonstration project of the UN/International Decade of Natural Disaster Reduction,1998
Note: Thick lines indicate active faults. Solid dots indicate earthquakes with ,magnitudes of equal or greater than 6.0
CAMBODIA

Final Report Chapter 6 Technical Study of 10 Priority Projects
JICA Master Plan Study of 6-55 January 2009 Hydropower Development in Cambodia
According to “Hazard map –Eastern Asia” prepared by The Global Seismic Hazard Assessment Program (GSHAP), the peak ground acceleration at the study sites ranges between 0.2 m/s2 - 0.4 m/s2 (0.02g-0.04g), as shown in Figure 6.4.3.
Figure 6.4.3 Peak Ground Acceleration of Eastern Asia
Source: Hazard map –Eastern Asia, The Global Seismic Hazard Assessment Program (GSHAP), a demonstration project of the UN/International Decade of Natural Disaster Reduction,1998.
Note: The GSHAP Global Seismic Hazard Map has been compiled by merging the regional maps produced for different GSHAP regions and test areas. It depicts the global seismic hazard as peak ground acceleration (pga) with a 10% chance of exceedance in 50 years, corresponding to a return period of 475 years.
(2) Estimation of Design Seismicity
The probable maximum peak accelerations of both edges of Cambodia (Prek Liang site near the northeast edge and Stung Metoek site near the southwest edge) were estimated based on the existing seismic record (1973-Present) issued by US Geological Survey as shown in Figure 6.6.4.
The biggest earthquakes within the 500 km radius since 1973 were recorded at magnitude 5.3 and magnitude 5.0, which occurred at remote areas located at 453 km from Prek Liang site and 280 km from St. Metoek site respectively. No earthquakes greater than magnitude 4.0 has occurred within a 200 km radius from any of the selected sites.
The probable maximum peak accelerations for 100-year return period are:
Prek Liang site: 2.9 gal =0.003g
St. Metoek site: 5.0 gal =0.005g

Final Report Chapter 6 Technical Study of 10 Priority Projects
JICA Master Plan Study of 6-56 January 2009 Hydropower Development in Cambodia
The probable maximum peak accelerations for 200-year return period are:
Prek Liang site: 5.7 gal =0.006g
St. Metoek site: 9.9 gal =0.010g
Figure 6.4.4 Acceleration vs Return Period
(3) Design Seismicity of Dam Sites on Similar Geo-tectonic Region (Experiences from Dam sites in Middle to South Vietnam)
For the Ham Thuan – Da Mi Project, the estimated values of design seismic acceleration is 0.035g for rock-based structures and 0.07g for earth-based structures. Meanwhile, for Dai Ninh and Dong Nai projects, a value of 0.1g is taken as a conservative minimum value for design.
It can be concluded that although all selected sites are situated in low earthquake zones, design seismic acceleration values estimated as 0.1g (horizontal) and 0.05g (vertical), are considered to be on the safe side.
y = 36.127x - 5.5561
0
1
10
100
1,000
0 1 10 100
accelation (gal)
Return period
y = 20.69x - 3.902
0.1
1
10
100
1000
0 1 10 100
acceleration (gal)return period
Prek Liang site Stung Metoek site

Final Report Chapter 6 Technical Study of 10 Priority Projects
JICA Master Plan Study of 6-57 January 2009 Hydropower Development in Cambodia
6.5 HYDROPOWER DEVELOPMENT PLAN
6.5.1 Layout, Access Road and Transmission Lines for Hydropower Development
During the first screening stage, the study team examined the layout of each project using the existing maps with 1:100,000 and 1:50,000 to estimate the aggregate cost and to examine the economic viability of each project. For the selected ten projects in the first screening, the study team conducted field surveys during the second stage. Of the ten projects, topographic maps with scales of 1:10,000 were prepared for the six projects through interpretation of aerophotographs which were procured for the project. Prepared maps were used for the project planning purpose.
Outline routes for the access road were prepared based on the field surveys conducted and by referring to the existing road maps, 1:100,000 topographic maps, and aerophotographs. The access road costs were estimated for the major three categories, i.e., the sections passing flat lands, mountainous sections, and sections for rehabilitation of the existing roads.
Necessary transmission line length was estimated by assuming that the line was supposed to be connected to the EDC national grid at the grid substation (GS) located in the nearest provincial capital. In case any other power development/power transmission plans existed, the transmission line was assumed to be connected to the national grid at the nearest substation.
The layout of each hydropower development plan and outline route for the access roads are presented in the Appendix-A. The explanation on each development plan is given in sub-section “6.5.6 Points to consider for each hydropower development.”
6.5.2 Hydropower Development Plan
Based on the result of field surveys and the result of hydrological analysis, hydropower development plans were prepared with the following manners:
(1) Preparation of reservoir area and storage capacity curve
Reservoir area and storage capacity curve of each project site was prepared to determine the storage capacity of the reservoir considering the hydrological characteristics of the site, and the ratio of reservoir storage capacity against annual inflow (Capacity Inflow Ratio : CIR).
The target CIR was set at 20% for the projects located in the north-eastern part of Cambodia, which has relatively stable flow regime. While the target CIR was set at 30% for the projects located in the south-western part, as such area has drastic drawdown of the river discharge during the dry season.

Final Report Chapter 6 Technical Study of 10 Priority Projects
JICA Master Plan Study of 6-58 January 2009 Hydropower Development in Cambodia
H-A-V Curve
306
137
40
1
0
10.56
6.35
0.00
3.35
0.55
260
270
280
290
300
310
320
330
0 20 40 60 80 100 120 140 160 180 200 220 240 260 280 300 320 340 360
Reservoir Storage Volume (MCM)
Elev
atio
n (m
) --
0.02.04.06.08.010.012.0Reservoir Surface Area (km2)
Storage Volume
Surface Area
Figure 6.5.1 An Example of Reservoir Area and Storage Capacity Curve
(2) Setting of full supply level (FSL), minimum operation level (MOL), and dead water level (DWL)
Based on the assumed 100 year sediment volume, sedimentation level (dead water level: DWL) was determined. The height of inlet and the diameter of headrace tunnel were designed from the maximum plant discharge to determine the minimum operation level (MOL).
D
1 m
h > 2.0 x D
MOL
FSL
DWL
Figure 6.5.2 Determination of Minimum Operation Level (MOL)
(3) Planning of overall layout of the hydropower development plan
Based on the available topographic maps and the results of field surveys, the study team examined and planned the overall layout of each hydropower project. With due considerations to geological and topographic conditions, the location of the dam, powerhouse and outfall was selected to decide the route of the waterway. The layouts are shown in Appendix-A.

Final Report Chapter 6 Technical Study of 10 Priority Projects
JICA Master Plan Study of 6-59 January 2009 Hydropower Development in Cambodia
6.5.3 Power Generation Planning
Based on the selected layouts, the study team simulated power generation with reservoir operation model, selected the installed capacity with a target plant factor at 40%, and estimated annual power generation, etc.
(1) Inflow data
In and around the target project area, the existing gauging station was selected which had similar hydrological and meteorological characteristics with the selected project. Monthly inflow data of the target project site was prepared by multiplying the ratio of long-term annual runoff of the planned site and the selected gauging station, which were estimated separately (refer to sub-chapter 6.3). Prepared data was used for the reservoir operation simulation.
The target project site and referred data are as follows:
Target project site Referred data
#7&8 LL2 Seven year monthly discharge data of Ban Kamphun gauging station located right downstream of the project site
#12 PL1, #14 PL2 23 year monthly discharge data of Kontum gauging station located upstream basin of Se San river
#16 MSRC, #20 MTK2, #21 MTK3, #22 KP2, #23 USRC, #29 BP
After examination of Huai Sato gauging station (Thailand)’s 26 year monthly data, the first six year data seemed to have overestimated dry season discharge. Therefore, 20 year monthly discharge data of Huai Sato was applied by abandoning the suspicious data of the first six years.
(2) Evaporation from the reservoir surface
Evaporation from the reservoir surface was assumed at 700 mm/year. This value was derived by assuming the average pan evaporation in Cambodia as 1,000 mm/year, and by multiplying the conversion factor of 0.7 to get the reservoir surface evaporation.
(3) River maintenance flow to the downstream of the dam
River maintenance flow is necessary to maintain the river environment between the proposed dam site and the tailrace outlet (outfall). With reference to the Japanese standard, river maintenance flow for each project was estimated as 0.2 m3/sec/100 km2.
(4) Reservoir operation simulation
Long-term monthly inflow data was assumed for each target project to simulate reservoir operation. The firm discharge (Qf) was calculated as the highest one which enables the reservoir operation without lowering the reservoir water level below the minimum operation level (MOL). The maximum plant discharge and the installed capacity were determined aiming at plant factor of 40% with six hour daily peak operation. The followings are the result of reservoir operation simulation results:

Final Report Chapter 6 Technical Study of 10 Priority Projects
JICA Master Plan Study of 6-60 January 2009 Hydropower Development in Cambodia
Inflow and Discharge Utilizable for Power Generation
0
20
40
60
80
100
120
140
0 12 24 36 48 60 72 84 96 108 120 132 144 156 168 180 192 204 216 228 240 252 264 276
Month
Inflo
w/P
ower
Dis
char
ge (m
3/s)
0
500
1,000
1,500
2,000
2,500
3,000
3,500
4,000
Spill
out
(m3/
s)InflowQpowerSpill out
FSL 325 masl, Pi 100 MW, Qtgt = 16.9 m3/s 16.90Qtgt = m3/s
Figure 6.5.3 Result of Reservoir Operation Simulation (1)
Relationship between Inflow and Average discharge for power generation (Qpower)
Simulated Reservoir Water Levels
290
300
310
320
330
340
0 12 24 36 48 60 72 84 96 108
120
132
144
156
168
180
192
204
216
228
240
252
264
276
Month
Res
ervo
ir W
ater
Lev
el (m
asl)
FSL 325 masl, Pi 100 MW, Qtgt = 16.9 m3/sPrek Liang 1 Hydropower Project Qtgt = 16.90 m3/s
Figure 6.5.4 Result of Reservoir Operation Simulation (2)
Fluctuation of reservoir water level (FSL 325 m, MOL 290 m)
Duration Curve of Power Output
0
20
40
60
80
100
120
0 5 10 15 20 25 30 35 40 45 50 55 60 65 70 75 80 85 90 95 100
Duration Time (%)
Pow
er (M
W)
FSL 325 masl, Pi 100 MW, Qtgt = 16.9 m3/sPrek Liang 1 Hydropower Project Qtgt = 16.90 m3/s
Figure 6.5.5 Result of Reservoir Operation Simulation (3)
Duration curve for 24 hour continuous power output

Final Report Chapter 6 Technical Study of 10 Priority Projects
JICA Master Plan Study of 6-61 January 2009 Hydropower Development in Cambodia
Preliminary design and cost estimate
Quantities for construction works were estimated based on the hydropower development layout and features for each structure prepared by power generation planning. By referring to the “Guide Manual for Development Aid Programs and Studies of Hydro Electric Power Projects” prepared by New Energy Foundation (Tokyo, Japan 1996), simple empirical equations were applied to estimating the work quantity. Major features for work quantity estimate are as follows:
<Major features for quantity estimate>
1) Dam height, 2) Crest length, 3) Dam volume, 4) Spillway (from flood discharge and dam height), 5) Intake facility (from available depth, maximum plant discharge, and intake diameter), 6) Headrace tunnel (from inner diameter, lining thickness, and tunnel length), 7) Surgetank (from maximum plant discharge and length of head race tunnel) 8) Penstock, 9) Powerhouse, 10) Tailrace, 11) Access road, 12) Others.
<Unit price>
Information on construction unit price was collected for Cambodia, Laos, Viet Nam and neighbouring countries and adjusted by eliminating the extreme values, to estimate standard unit prices as of September 2007.
Major unit prices are shown in Table 6.5.1.
Table 6.5.1 Major Unit Price
No. Item Unit Pride Unit
1 Excavation (common) 3.0 $/m3
2 Excavation (rock) 10.2 $/m3
3 Excavation (tunnel) 47.5 $/m3
4 Embankment (rock material) 8.8 $/m3
5 Embankment (random material) 7.1 $/m3
6 Concrete for open structures 76.0 $/m3
7 Concrete for tunnel 142.0 $/m3
8 Mass concrete 70.0 $/m3
9 Reinforcement bar 1,124 $/ton
10 Steel gate 5,000 $/ton
11 Steel pipe 3,500 $/ton Source: Study Team
<Environmental mitigation cost and compensation cost>
Three percent of total civil construction cost was allocated as reservoir area development and environmental conservation costs for each project. Resettlement cost was estimated at $3,500 per household7, and $11,204 per hectare for farm lands8. For #7&8 LL2 project, additional compensation cost at $500 per hectare of inundated land, which PECC1 applied to their feasibility study, was adopted.
7 Power Transmission Project in Cambodia, ADB June 2007

Final Report Chapter 6 Technical Study of 10 Priority Projects
JICA Master Plan Study of 6-62 January 2009 Hydropower Development in Cambodia
Unit generation cost
Unit generation cost was calculated based on the estimated construction cost for each project with annual power generation figure. With such figure, economic analysis and financial analysis were conducted. The results are shown below: Name of Project #7&8 LL2 #12 PL1 #14 PL2 #16 MSRC #20 MTK2 #21 MTK3 #22 KP2 #23 USRC #29 BPInstalled
Capacity (MW)420 100 56 28 25 26 116 28 26
Annual PowerGeneration (GWh)
1,725 348 198 96 86 90 407 98 91
Construction Cost(mil. USD)
623 162 70 85 71 72 314 124 55
Unit Generation Cost(USCent/kWh) 4.76 6.13 4.64 11.52 10.77 10.41 9.98 16.41 9.19
EIRR (%) 18.2 18.2 21.7 10.1 10.7 11.2 10.7 6.4 13.4FIRR (%) 16.5 13.1 16.8 6.4 7.0 7.3 7.8 3.5 8.6
Source: Study Team
For the economic and financial analysis of selected projects, the following adjustment was made from the assumptions adopted during the first screening stage.
1) Calculation of the Economic Benefit of CO2 Emission Reduction
More than 90% of electricity generation in Cambodia are by fossil fuel-fired thermal power plants. Hydropower development is expected to contribute to reducing emission of CO2. On the other hand, certain amount of CO2 will be emitted also from reservoirs constructed for the hydropower projects due to the decomposition of leaves, twigs and other rapidly degradable biomass. In addition, certain area of forest, which may absorb CO2, will be submerged in the reservoir.
Taking above factors into consideration, amount of CO2 emission reduction (increase) of each project was calculated in Section 6.3 of this report. Monetary value of CO2 reduction was assumed as $27.5 per CO2 -ton, based on actual average transaction price of CER (Certified Emission Reductions) in ECX, biggest CDM credit exchange market in Europe, for the period from March to June 2008.
If CDM is applied to the certain hydropower project, amount of CER will be additional revenue of the project. However, it is not very sure whether the project can get the CER or not. Accordingly benefit of CO2 reduction was counted as economic benefit but not as financial revenue.
2) Administration and Engineering Cost
Administration and engineering costs were assumed at 7 to 10% of the total civil construction cost and electrical and mechanical equipment cost. Administration and engineering costs were assumed at 10% when the total cost of civil, electrical and mechanical, and land compensation and resettlement was less than $200 million. When the same total cost was more than $500 million, the value was set at 7%.
8 Resettlement Plan for GMS Road Improvement Project in Cambodia, Royal Government of Cambodia/Ministry of Public
Works and Transport, August 2002. The price was adjusted to 2007 level using the conversion factor of consumer price index of 1.1204.

Final Report Chapter 6 Technical Study of 10 Priority Projects
JICA Master Plan Study of 6-63 January 2009 Hydropower Development in Cambodia
Points to consider for each hydropower development
#7&8 Lower Sre Pok 2 + Lower Se San 2 (LL2) Project
Detailed study was conducted by Electricity of Viet Nam (EVN), Power Engineering Consulting Company 1 (PECC1) for the period from May 2005 to May 2006. Related reports were obtained and reviewed during the first screening stage. As there was no significant differences between the JICA study team’s review and EVN’s development plan, the installed capacity was adopted after the EVN-PECC1’s plan at 420 MW. However, the energy generation was newly estimated by the study team. The layout shown in Appendix-A is the abstract from the PECC1’s report.
#12 Prek Liang 1 (PL1) Project
During the first screening stage, there were #12 Prek Liang 1 and #13 Prek Liang 1A schemes which were separately planned. In view of economic viability and nature conservation, these two schemes were combined and reformulated as #12 Prek Liang 1 Project. As the project is located in the national park, and due to the topographical constraint, the waterway and the powerhouse were planned as underground type aiming at the mitigation of the environmental impacts. As a result of re-examination of the layout using newly prepared 1:10,000 maps, it was considered appropriate to shift the previous dam site by about two kilo meters upstream. With this shifting, dam height could be lowered and thereby the dam volume and construction cost was reduced. Reduced head by lowering dam height can be developed by extending the headrace tunnel by two kilometers more with less cost. With such re-layout, the power generation benefit remains the same. It was noticed that there were about 30 m elevation differences between the existing 1:100,000 maps and newly prepared maps at a scale of 1:10,000. Project features and relevant water levels were determined based on the elevations from newly prepared maps9. This plan generates 100 MW electricity with gross head of 200 m. As this project is located inside the national park, it is of the top priority issue to harmonize “hydropower development” and “environment conservation” when the Ministry of Environment (MOE) and the Ministry of Industry, Mines and Energy (MIME) discuss on the issues of the national park zonings, as well as to build national consensus for the national interest of Cambodia.
#14 Prek Liang 2 (PL2) Project
As a result of re-examination on the newly prepared maps, original dam site was shifted upstream to reduce the dam height and volume. It was realized that there was about 20 m height difference between the newly prepared maps and the existing 1:100,000 maps. Project features and relevant water levels were determined based on the elevations from newly prepared maps. In view of the access road preparation, implementation sequence should be #12 PL1 first followed by #14 PL2.
9 The new maps for Prek Liang sites with 1:10,000 scale were prepared using laser profile survey with helicopter. As the
laser profile survey can calibrate the tree height, it was possible that there were differences from the previous survey from aerophtographs.

Final Report Chapter 6 Technical Study of 10 Priority Projects
JICA Master Plan Study of 6-64 January 2009 Hydropower Development in Cambodia
#16 Middle Stung Russey Chrum (MSRC) Project
At the MSRC project site, there is an 18 km straight river reach between riverbed contour lines of EL. 340 m and EL. 360 m. This means that it is possible to create the necessary reservoir capacity by a relatively low dam. Such flat and long valley topography is efficient in obtaining required reservoir capacity. The dam height was set at 45 m and the full supply level (FSL) was set at 380 masl.
It is probable that the full supply level (FSL) of the Lower Stung Russey Chrum (LSRC) project, which was committed in May 2008 to develop, may affect the tail water level (TWL) of #16 MSRC project. For details, it is necessary to confirm the concession agreement between MIME and the developers, however, the study team examined and prepared the most probable two alternatives. One is the original plan examined during the first screening stage, i.e., to set the TWL at EL. 120 m, which is the FSL of LSRC Lower Scheme (TWL 120 alternative). The other one is the alternative plan to set the TWL at EL. 260 m, which is the FSL of LSRC Upper Scheme (TWL 260 alternative). The gross head of MSRC’s TWL 260 alternative is 120 m, which is the half of TWL 120 alternative, therefore, TWL 260 alternative has lower economic and financial viability. Further, as the power density goes below 4 MW/km2, simplified reservoir emission of greenhouse gas at 90 g/kWh cannot be applied. As a result of river discharge measurement during the field survey, it was realized that the drop in the river discharge during the dry season was quite significant. Taking such results into consideration, the study team reviewed the hydrological indices to reflect to the planning.
During the third field investigation, the Study Team got information that LSRC’s concession agreement was concluded in May 2008. In that agreement, LSRC included both lower and upper schemes for development. Therefore, MSRC’s TWL was determined to be 260 masl.
#20 Stung Metoek 2 (MTK2) Project
As this project is located in the south-western part of Cambodia, which has significantly small dry season discharge, the target capacity inflow ratio (CIR) was set at 30% in formulating power generation plan10. By checking on the newly prepared 1:10,000 maps, the elevations around powerhouse were about 20 m higher compared with the existing 1:100,000 maps.
Two alternatives were examined considering the topography. One is to extend the waterway down to EL. 144 m (on the 1:10,000 map) for power generation (upstream powerhouse alternative). The other one is to extend the waterway down to EL. 141 m (downstream powerhouse alternative). The downstream powerhouse alternative can gain the head three meter more than the upstream powerhouse alternative, but the waterway length will be 900 m longer.
The riverbed elevation at the tailrace outlet of the downstream powerhouse alternative at 141 masl is shown as 120 masl in the existing 1:100,000 map. Full supply level (FSL) of #21 MTK3 project located downstream of #20 MTK2 will be planned with 1:100,000 map at 120 masl, as the available maps for #21
10 During the feasibility study in the future, in case the scheme is developed as multipurpose development project including the
water supply to Koh Kong city and Thailand, the CIR value of 30% should be reexamined to determine the optimum development scale. In addition, care should be taken on too large value of CIR, as such large value of CIR will decrease the ratio of water rotation in the reservoir, which may badly affect to the deterioration of water quality. Generally speaking, more than 40% CIR will hardly contribute to the improvement of regulating capacity of the reservoir.
Final Report Chapter 6 Technical Study of 10 Priority Projects
JICA Master Plan Study of 6-65 January 2009 Hydropower Development in Cambodia
MTK3 project is only 1:100,000 maps11. In a practical sense, TWL of #20 MTK2 and FSL of #21 MTK3 will be set at the same elevation, therefore, there will be no head which remains undeveloped.
#21 Stung Metoek 3 (MTK3) Project
As described in the #20 MTK2 project, FSL was set at 120 masl in the 1:100,000 map. As described in Section 6.4 Geology, there are three alternative dam axes (upper, middle, lower). The lower dam axis is geotechnically the most advantageous. The dam was planned as 44 m high concrete gravity type with the riverbed elevation at 81 masl at the lower dam axis. The tailwater level could be identified down to EL. 60 m with the existing 1:100,000 maps. With satellite images, it could be assumed that there was further 5 m head at the minimum on the downstream 500 m river section. Thus, the powerhouse location was selected 500 m further downstream from the 60 masl contour line location to assume the tailwater level at 55 masl.
As for the implementation sequence, #20 MTK2 may preferably be implemented first followed by #21 MTK3, in view of the diversion convenience for #21 MTK3 during the construction works and flow regulation effect to #21 MTK3.
#22 New Tatay (Stung Kep 2, KP2) Project
During the first screening stage, two alternatives were examined. One is to construct a dam at the confluence of Kep and Tatay rivers (one dam alternative). The other one is to construct dams on Kep river and Tatay river and to connect both reservoirs with tunnel (two dam alternative). The two dam alternative was examined thereafter, as this alternative had the higher economic performance.
In December 2007, after completion of the first screening, the following were noticed:
A Chinese private company, CHMC who obtained the MOU of #18 Tatay Project located upstream, moved the dam site to the area adjacent to #22 Stung Kep 2 (KP2) proposed by the study team in August 2007, by about 1.5 km downstream.
CHMC referred the moved dam site as Tatay Project to continue their study.
For this “#22 New Tatay Project”, the concession agreement was concluded with the Government in May 2008 toward implementation.
Therefore, in this Master Plan Study, this “#22 New Tatay Project” is treated as the committed project for implementation from now on.
#23 Upper Stung Russey Chrum (USRC) Project
As this project is located in the south-western part of Cambodia, which has significantly small dry season discharge, the target capacity inflow ratio (CIR) was set at 30% in formulating power generation plan. By using the existing 1:100,000 maps, the dam axis was set at riverbed elevation around 680 masl, and the FSL was set at 760 masl. There continues the steep terrain from the proposed dam site toward
11 MTK3 project site is located at the border area with Thailand. A part of necessary aerophotographs for topographic mapping
was not available. Therefore, 1:10,000 maps for MTK3 was not prepared. Instead, such maps were prepared for other sites.

Final Report Chapter 6 Technical Study of 10 Priority Projects
JICA Master Plan Study of 6-66 January 2009 Hydropower Development in Cambodia
upstream. Therefore, to obtain enough storage capacity, the dam height becomes as high as 75 m. From the result of discharge measurement during the field survey for MSRC project, hydrological features were reviewed. From the review result, it was supposed that there could be the significant decrease of dry season discharge. By reflecting such results to the power generation planning, economic index went down significantly. Even with CDM benefit taken into consideration, EIRR was below 10%.
#29 Bokor Plateau (BP) Project
This project will construct a 22 m high earthfill dam on the river located at 900 – 1,000 masl highland to divert 3.5 m3/sec discharge at the maximum to the sea side. The tailwater level is 40 masl, total head is around 900 m. The catchment area is as small as 24.5 km2, and the drop in the river discharge during the dry season is significant.
A Vietnamese company IDICO has conducted a preliminary study. With IDICO’s idea, river water will be diverted to the downstream area of the planned Kamchay dam site at 75 masl with steel penstock with about 7 km for power generation. The preliminary study was prepared based on the limited available material. IDICO’s study has significant differences from the JICA study team’s plan in terms of layout and energy generation.
In addition, the catchment area of #29 BP project is located inside the basin of the Kamchay hydropower project which is under construction. #29 BP project’s catchment area is 24.5 km2, which stays at 3.5% of the Kamchay catchment area of 710 km2. By diverting 1.4 m3/sec discharge on average for #29 BP project, Kamchay project’s annual power generation will decrease by about 13 GWh/year. This decreased amount is 2.8% of the annual average power generation of Kamchay project at 460 GWh. As #29 BP project will slightly decrease the annual energy generation of Kamchay project, it will be necessary to compensate for the reduction in the energy generation. Though #29 BP project may decrease the Kamchay energy, the total power benefit will be maximized by the implementation of both projects owing to the high head of #29 BP at about 900 m.
Table 6.5.2 shows the principal features of the priority projects.

Final Report Chapter 6 Technical Study of 10 Priority Projects
JICA Master Plan Study of 6-67 January 2009 Hydropower Development in Cambodia
Table 6.5.2 Principal Features of Priority Projects 7 & 8 12 15 16 20 21b 22 23 29b
Lower Sre PokII + Lower Se
San II *Prek Liang I Prek Liang II
Middle St.Russey Chrum
*
Stung MetoekII
Stung MetoekIII Stung Kep II
Upper St.Russey Chrum
*Bokor Plateao
LL2 PL1 PL2 MSRC MTK2 MTK3 KP2 USRC BP1. Basin and Discharge Symbol Unit
Location Stung Treng Ratanak Kiri Ratanak Kiri Koh Kong Pursat Koh Kong Koh Kong Pursat KampotName of River Se San Prekliang Prekliang Stung Russey Stung Metoek Stung Metoek Stung Kep Stung RusseyCatchment Area A km2 49,200 839 575 461 416 656 1060 163 24.5Anuual Run-off Qa mcm 46,800 899 615 517 536 851 1,220 170 57Average Discharge Qm m3/sec 1480 28.5 19.5 16.4 17.0 27.0 38.7 5.4 1.8Specific Discharge qa m3/s/100km2 3.01 3.40 3.39 3.56 4.09 4.12 3.65 3.31 7.35
2. ReservoirSurface Area Ar km2 394 9.5 9.3 13.1 14.1 11.4 10.5 2 3.2Gross Capacity Sg mcm 2,772 264 157 234 227 186 268 57 22.0Sediment Volume Ssd mcm 984 16.78 11.5 9.22 8.32 13.12 21.2 3.26 0.49Effective Capacity Se mcm 331 219 110 180 188 116 239 50 18Ratio (Se/Qa) CIR % 0.71% 24.36% 17.89% 34.82% 35.07% 13.63% 19.59% 29.41% 31.58%
3. Power Plan
Power System Dam type Damwaterway
Damwaterway
DamWaterway
DamWaterway
DamWaterway
DamWaterway
DamWaterway
DamWaterway
Maximum Plant discharge Qmax m3/sec 1948 67.2 42.1 32.8 34.9 56.1 73.9 10.3 3.5m3/sec 92.0 16.9 9.6 9.2 9.7 15.6 15.6 2.87 1.0
% to Qm 6% 59% 49% 56% 57% 58% 40% 53% 56%m3/sec 898 25.3 17.1 12.4 13.1 21.1 27.8 4 1.38
% to Qm 60.7% 88.8% 87.7% 75.6% 77.1% 78.1% 71.8% 74.1% 76.7%Full supply level FSL EL.m 75.0 325.0 490.0 380.0 245.0 120.0 215.0 760.0 947.0Minimum operating level MOL EL.m 74.0 291.0 475.0 360.0 225.0 105.0 174.0 720.0 940.0Dead water level DWL EL.m 65.2 281.0 465.0 344.0 215.0 97.0 165.0 710.0 935.0Tail water level TWL EL.m 47.9 125.0 325.0 260.0 144.0 55.0 0.0 380.0 40.0Intake Diameter ID m 10.4 5.4 4.6 4.2 4.2 5.0 5.6 2.6 2.6Effective Head He m 25.9 178.8 153.9 102.4 86.1 55.7 188.6 325.7 899.8Installed Capacity Pi MW 420 100 54 28 25 26 116 28 26Dependable Peak Power Pd MW 220 100 48 28 25 26 92 28 26Annual Energy Production Ea GWh/yr 1,725 348 198 96 86 90 407 98 91Firm Energy Production Ef GWh/yr 480 217 107 64 58 58 205 66 65
4. Structures 1) Dam Type Earthfill Concrete Concrete Concrete Concrete Concrete Rockfill x 2 Rockfill Earthfill
Crest Length x Height m 7,750 x 32 325.7 x 55 189 x 47 320 x 45 172 x 46 361 x 44 847 x 97, 599 x 62.5 516 x 75 1,162 x22
Dam Volume V mcm 4.43 0.158 0.067 0.175 0.076 0.189 6.7 2.23 0.49Design Flood IDF m3/sec 49,400 2,930 2,230 2,900 2,740 3,470 5,270 1,960 569
2) WaterwayType - Tunnel Tunnel Tunnel Tunnel Tunnel Tunnel Tunnel Tunnel
Dimension x Length D x L (m)
5.4 x 5,000(HRT)
5.4 x 3,800(TRT)
4.6 x 4,600 4.2 x 9,300 4.2 x 4,000 5.0 x 2,300
5.6 x 10,800(HRT),
5.6 x 1,000(TRT)
2.6 x 8,000 2.6 x 3,200
Penstock pipe d x L (m) 9.0 x 40 3.8 x 147.5 3.0 x 134 2.6 x 215 2.7 x 406 3.4 x 203 4.0 x 147 1.5 x 1,730 1.3 x 4,000 3) Powerhouse
Generator Type Kaplan Francis Francis Francis Francis Francis Francis Pelton PeltonCapacity x Units MW x nos 84.0 x 5 50.0 x 2 27.0 x 2 14.0 x 2 12.5 x 2 13.0 x 2 58.0 x 2 14.0 x 2 13.0 x 2
4) Transmission Line
Voltage (kV) x Circuit x Length (km) kV x cct xkm
230 x 2 x 40(St.Treng)
115 x 2 x 83(Banlung)
115 x 2 x 13(Banlung)
115 x 10(Atay SW)
115 x 60(Koh Kong)
115 x 5(Koh Kong)
230 x 2 x 5(R48 JCT)
115 x 37(Atay SW)
115 x 22(Kampot)
5) Access Road L km 10 72 92 25 23 46.5 9 31 95. Construction Cost (incl. Resettlement cost) C mil.$ 623.1 162.4 70.2 85.2 71.0 71.8 314.2 124.2 55.26. Economic
Cost for kW (excl. Resettlement cost) UCC $/kW 1,348 1,605 1,284 2,992 2,463 2,721 2,659 4,366 2,432Cost for kWh UGC ¢/kWh 4.76 6.13 4.64 11.52 10.77 10.41 9.98 16.41 9.19
7. ResettlementNumber of Households hh 1,224 0 0 0 168 0 0 0 0
Average Discharge for PowerGeneration
No.
Project Name
Abbreviation
Firm discharge Qf
Qp
Source: Study Team

Final Report Chapter 6 Technical Study of 10 Priority Projects
JICA Master Plan Study of 6-68 January 2009 Hydropower Development in Cambodia
6.6 TRANSMISSION LINES FOR THE PRIORITY PROJECTS
Main purpose of the transmission line to be constructed for new development of generating power station is to transmit electric power generated by the said power plant to the power grid. Therefore the consideration and design of such line shall be made with different point of view for the transmission lines for the extension and/or reinforcement of the power grid in order to save its construction cost.
In the case of the extension and/or reinforcement of the power grid, it is the most important to supply stably and continuously electric power to the customers. Therefore, necessary countermeasures shall be considered to avoid any obstructions to continuous power supply when the transmission line is stopped by force due to faults and/or damage of the facilities. In general, however necessary countermeasures will be limited in the preset acceptable range in order to suppress construction cost and tariff increase. For example, the (N-1) contingency criterion is normally adopted for the transmission systems having not so dense, for minimizing forced-outage due to faults and suppressing their construction costs. (N-1) contingency means to establish a system keeping stable power supply under any case where any one circuit of transmission line or a transformer bank is out of service.
On the other hand, forced outage due to fault of the transmission line for transmitting generated power to the grid (hereinafter called as Power Source Line) does not mean “supply obstruction of the specific area and/or to customers” from the viewpoint of power system operation. It means “drop-out of generating plant from the system (deficiency of power supply capacity)”, because the generating plant sending out power through the Power Source Line will be obliged to stop its operation due to the fault of the line. Namely, for continuing system operation in stable manner, necessary measures for compensating the shortage of power supply capacity of the system shall be taken. For compensating the shortage of supply capacity, it will be taken as the first step to increase the output of the remaining generating plants in operation, followed by starting-up of stand-by plants such as hydropower, gas turbine, diesel generators, etc., and then to start-up thermal power plants, etc. depending on the capacity dropped-out from the power system.
In general, drop-out of generating plants from the system including above-mentioned cases have been usually considered not only in the generation expansion plan but also in the daily operation plan in the economically acceptable level as a reserve capacity. Therefore, if the capacity of drop-out of plant from the system is within the estimated range, no hindrance of power supply will be occurred. However, there are some differences of an incremental operation expense of the system between the drop-out of hydropower plant and thermal as explained hereunder.
For the thermal power plant, fuel cost shares the biggest portion of the generating cost, followed by depreciation cost of the plant, operation cost of auxiliary equipment, personnel cost of operators, maintenance cost, etc. Therefore, incremental expense due to a shift from the said thermal power plant to others will be minimized, because the difference of fuel cost of the both power plants will be additionally required.
For the hydropower plant, depreciation cost shares the biggest portion of the generating cost, followed by personnel cost of operators, maintenance cost, operation cost of auxiliary equipment, etc. No fuel cost is

Final Report Chapter 6 Technical Study of 10 Priority Projects
JICA Master Plan Study of 6-69 January 2009 Hydropower Development in Cambodia
required. It means that expense for maintaining hydropower station during standstill of its operation is similar to the expense during operation. Therefore, all generating expense including fuel cost of power plant operated for compensating power deficiency due to drop-out of the said hydropower plant from the system will be surely required as increment cost.
In addition to the above incremental cost differences, normally a big part of the transmission line for a hydropower plant will be constructed in mountain range where access to the tower sites is difficult. Therefore, the restoration work period of the damaged Power Source Line for the hydropower plant will be longer than that for the thermal power plant, because of the difficulty of not only transportation of materials for the restoration but also works for the restoration like tower erection, paying-out of conductors, stringing conductors, etc.
6.6.1 Transmission Line of Each Selected Project
From the above-mentioned points of view, main features of transmission line for the selected priority projects are determined on the following criteria which are similar to the criteria for the extension of the national grid. The results are summarized in Table 6.6.1.
(1) A steel lattice tower is used as support structure for the all transmission lines.
(2) The voltage of the nearest substation will be adopted as a transmission line voltage for establishing simple system configuration when technically applicable.
(3) Kind of conductor shall be ACSR. The minimum size of conductor is 95 mm2 (max. transmission capacity: 50 MW/cct) for 115 kV and 400 mm2 (max. transmission capacity: 250 MW/cct) for 230 kV for using single conductor per phase from the technical viewpoint of corona phenomena.
(4) Double circuit line will be considered for the maximum output of the plant more than 60 MW for 115 kV line and 160 MW for 230 kV line.
Table 6.6.1 Main Features of Transmission Lines
Project LL2 PL1 PL2 BP MSRC MTK2 MTK3Max Output (MW) 420 100 54 26 28 25 26Nearest Substation - Name St. Treng Ratanak Kiri PL1 Kampot Ou Saom Koh Kong MTK2 - Voltage 230/115 115 115 230 230 230 230Transmission Line - Length (km) 32 83 13 32 10 45 15 - Voltage (kV) 230 115 115 230 230 230 230 - Circuit 2 2 1 1 1 1 1 - Conductor 2x330 2x200 1x200 1x400 1x400 1x400 1x400
Source: Study Team

Final Report Chapter7 Economic and Financial Aspects of 10 Priority Projects
JICA Master Plan Study of 7-1 January 2009 Hydropower Development in Cambodia
7. ECONOMIC AND FINANCIAL ASPECTS OF PRIORITY PROJECTS
7.1 ECONOMIC EVALUATION FROM THE VIEWPOINT OF NATIONAL ECONOMY OF CAMBODIA
7.1.1 General Assumptions for the Economic Analysis
Economic evaluations were made for the 8 priority projects1. Economic evaluation aims at measuring the “economic” impact on the country by implementing a project from a viewpoint of national economy.
The EIRR calculation is based on the following assumptions: 1) all revenues and costs are in 2007 constant prices and are expressed in US dollar ($); (2) assessment period are assumed at 30-year after the completion of the projects*2; 3) project costs exclude tax, nonphysical contingencies, interest during construction, and other financing costs; and 4) operating costs exclude depreciation and debt servicing.
7.1.2 Economic Costs of the Priority Projects
Market values are usually distorted with transfer payments within Cambodia such as taxes and subsidies. These payments are transferred to the Government that acts on behalf of the nation. Then, these should not be treated as costs of the national economy. These have to be excluded from the market values of cost and benefits as a whole. Following the principles, tax and price contingency were excluded from the market cost, also the local portion of the every project cost estimated was converted to border price applying a conversion factor of 0.90, which is commonly adopted in economic analysis in Cambodia.
(1) Capital Cost
The financial cost of the priority projects were estimated at $52.2 million (#29 Bokor Plateau) to 623.1 million (#7&8 Lower Sre Pok II + Lower Se San II) in “5. Technical Review of 10 Priority Projects, (4) Hydropower Planning, 4) Cost estimate”, including 1) civil work cost, 2) generating equipment cost, 3) transmission and substation cost, 4) land acquisition and compensation cost, 5) administration and construction supervision cost, and 6) value added tax. Unit construction cost, excluding land acquisition and compensation cost, of the priority projects varied from $1,348 per kW (#7&8 Lower Sre Pok II + Lower Se San II) to $4,366 per kW (#23 Upper Stung Russey Chrum).
After deducting price contingency and taxes and applying standard conversion factor of 0.90 to the local cost portion, the economic cost of the priority projects was calculated at $47.7 million (#29 Bokor Plateau) to $546.1 million (#7&8 Lower Sre Pok II + Lower Se San II).
1 In Chapter 5, 10 priority hydropower projects were selected. Of which, 2 projects (Prek Liang 1 and Prek Liang 1A) were merged to form
one project (Prek Liang 1) after the site investigation survey. In addition, concession agreement of Stung Kep II (New Tatay) project was concluded between Cambodian government and Chinese contractor in May 2008. Thus, economic and financial analyses in this chapter targeted for the remaining 8 projects.
2 With referring to the concession period of the existing contract agreement between CETIC and MIME for the Kirirom III Hydropower Station, commercial operation period of the priority hydropower project was assumed 30 years.

Final Report Chapter7 Economic and Financial Aspects of 10 Priority Projects
JICA Master Plan Study of 7-2 January 2009 Hydropower Development in Cambodia
These capital costs were assumed to be disbursed during the construction period of 5 years (1st year: 5%, 2nd: 10%, 3rd: 30%, 4th: 35%, and 5th: 20%) for all the projects.
Table 7.1.1 Cost of the Priority Projects (Financial, Economic Cost and Cost per kW)
Financial Cost Economic Cost Name of the Project
Installed Capacity (MW) $1,000 $ per kW $1,000
7&8 Lower Sre Pok II + Lower Se San II 420 623,068 1,348 546,078 12 Prek Liang I 100 162,445 1,605 140,908 14 Prek Liang II 54 70,158 1,284 60,874 16 Middle Stung Russey Chrum 28 85,231 2,992 73,556 20 Stung Metoek II 25 70,985 2,463 62,101 21 Stung Metoek III 26 71,757 2,721 62,202 23 Upper Stung Russey Chrum 28 124,161 4,366 107,036 29 Bokor Plateau 26 55,169 2,432 47,738
Source: Study Team
(2) Fixed Operation and Maintenance Cost
The fixed operation and maintenance (O&M) cost is required annually during the economic life of the project. The fixed O&M cost includes daily operation and maintenance activities as well as semi-overhauling executed every 6 years of operation, and was assumed at 0.5% for civil and metal works and 1.5% for electro-mechanical equipment, and transmission related facilities. Estimated fixed O&M costs were varied from $0.33 million/year to $4.52 million/year.
(3) Variable Operation and Maintenance Cost
Variable O&M cost includes only the cost for lubricant. In Cambodia, water charge/tax is not levied on the project operating entities. Cost of lubricant was assumed at 0.0151 ¢/kWh, based on actual average expenditure for lubricant at the hydropower stations in Indonesia in 2006. Based on these assumptions, variable O&M cost was computed for all the projects.
7.1.3 Economic Benefits of the Priority Projects
(1) Selection of the Candidates of the Alternative Energy Source (First Screening)
The economic benefit can be calculated as a sum of avoided costs of Alternative Thermal Power Plant (ATPP). Avoided costs can be divided into two components, one is construction and fixed O&M cost of firm peak capacity of the hydropower project, and the other consists of fuel cost and variable O&M cost saving of energy generation. The former benefit is called a “capacity benefit” and the latter is known as “energy benefit”.
In calculating economic benefit of a hydropower project, type of alternative thermal power station to be used for calculation should be the lowest among various types of generating plants, and also should be feasible option in terms of fuel supply and technical aspects.
In order to determine alternative thermal plant, five types of generation plants, namely coal fired steam turbine, gas fired combined cycle, HFO fired medium speed and low speed diesel generator, and energy import from neighboring countries were selected.

Final Report Chapter7 Economic and Financial Aspects of 10 Priority Projects
JICA Master Plan Study of 7-3 January 2009 Hydropower Development in Cambodia
As a result of the first screening, of the five alternatives as examined below, energy import was excluded from the candidate alternative while the other four generating plants (combined cycle, coal steam, and low/medium speed diesel) are considered to be suitable option in terms of fuel supply and technical feasibility.
Gas Combined Cycle Power Plant
At present in Cambodia, there is neither gas-fired power station nor facilities for importing gas, such as pipeline and LNG terminal. While technical feasibility of the combined cycle power station using domestic natural gas was confirmed by a JICA study in 2001*3, availability of gas from domestic gas fields is still not clear.
Currently, Cambodia has six potential oil and gas fields in off-shore Sihanoukville. Only one of these has so far been explored, the so-called Block A. The Block A drillings, conducted by a foreign consortium led by Chevron including GS Caltex of South Korea and Japan's Mitsui Oil. Chevron confirmed "significant finds" from its initial exploration in 2005 and then more test drills were conducted. However, they have not published any figure about deposit yet. As such, technical and financial viability of the gas/oil fields are not confirmed yet. Given conditions, according to the Power Supply Development Plan from 2007 to 2020*4, development of the first gas combined cycle power plant was planned not in the near future but in 2020 (450 MW), and next to 2022 (450 MW). Judging from these circumstances, while combined cycle power station seems unrealistic option in short/middle term, it is still possible option in long-term. And thus, combined cycle power station was selected as the candidate of alternative thermal unit,
Coal-fired Steam Power Plant
At present there is no coal-fired power station in Cambodia. Currently, coal fired power plant in Sihanoukville with installed capacity of 200 MW (100 MW x 2 units) and related transmission facilities are being planned. MIME and EDC already selected concessionaire, joint venture of Malaysian company and Cambodian company, for this BOO (Built Own Operate) project. The negotiation will be concluded within a few months, and the power plant is expected to start commercial operation in 2010.
Construction cost was estimated at about $350 million, including jetty and tugboat for importing coal. Concessionaire intends to import coal from Indonesia.
In addition to this 200 MW power plant, the Power Supply Development Plan from 2007 to 2020 includes BOO based 400 MW coal fired power plant in Sihanoukville in 2013. Given the situation, coal-fired power station was judged reasonable candidate for alternative to hydropower.
Diesel Power Plants
Diesel power plants occupied more than 95% of the electric power generation in Cambodia in 2006. There are three types of diesel engine, namely high speed, medium speed and low speed. Since the high speed diesel engine has very small capacity, it was excluded from the candidate of alternative. Low
3 Feasibility Study on the Sihanoukville Combined Cycle Power Development Project in Cambodia, Oct 2001, JICA/ NEWJEC 4 Source: Report on Power Sector of the Kingdom of Cambodia for the year 2006, June 2007, EAC

Final Report Chapter7 Economic and Financial Aspects of 10 Priority Projects
JICA Master Plan Study of 7-4 January 2009 Hydropower Development in Cambodia
speed diesel engine has higher thermal efficiency but is more expensive in the capital cost. Middle speed diesel engine is commonly used in Cambodia.
EDC’s power purchase price from the diesel IPPs has increased rapidly particularly following the rapid rise in the international crude oil price since 2003. In December 2006, unit purchase prices from IPPs of the EDC Phnom Penh Branch were ranged between 12 and 16 ¢/kWh. Given the situation, while diesel power plants have high generation cost, there are no technical issues, and thus diesel power plants were selected as the candidate alternative for hydropower.
Energy import from neighboring countries
According to the power development plan, MIME intends to import energy from Vietnam (200 MW), Laos (20 MW), and Thailand (80 MW) by 2012. Such energy import at a total of 320 MW will cover about 49% of forecast peak demand (652 MW) of the EDC grid in 2012*5. Taking energy security of the country into consideration, further dependence on the energy import should be avoided. For this reason, energy import is excluded from alternative energy source of hydropower development.
(2) Determination of the Alternative Thermal Power Plant (Second Screening)
With reference to the various reports and interviews to concerned persons, general features of selected alternatives were assumed as follows:
Table 7.1.2 Major Assumptions for Calculating Levelized Cost of Generation of ATPPs
Gas Combined Cycle Plant
Coal-fired Steam Turbine
Medium Speed Diesel Generator
Low Speed Diesel Generator
Capital Cost ($/kW) 870*2 1,700*3 1,370*1 2,020*1 Construction Period (year) 3 3 2 2 Disbursement 30%, 50% and 20% 30%, 50% and 20% 40% and 60% 40% and 60% Type of Fuel Natural Gas Coal Heavy Fuel Oil Heavy Fuel Oil Heat Rate (kcal/kWh) 1,592*2 2,324*3 1,988*1 1,761*1 Price of Fuel ($) 8.44 /MMBtu*5 62.70 /ton*6 59.35 /barrel*4 59.35 /barrel*4
Calorific Value of Fuel (kcal) - 5,800 /ton*6 1,584,425 /barrel*5 1,584,425 /barrel*5
Project Life (years) 25*1 20*1 25*1 25*1
Annual O&M Cost 3.0% of
capital cost*1 5.0% of
capital cost*1 5.5% of
capital cost*1 5.5% of
capital cost*1 Source: *1: Generation Expansion Plan of Cambodia p 3-39 (World Bank/KOICA, December 2006),
*2: The Sihanoukville Combined Cycle Power Development Project, JICA/NEWJEC, Oct. 2001, *3: Feasibility Study on the Sihanoukville Coal-fired Power Station, MIME *4: Financial Statements for the year ended 31 December 2005, EDC Phnom Penh Operation, *5: EIA Annual Energy Outlook 2007, Coal price for electric generation (average during 2006-2007:
$37.05/ton) + transportation cost (generation expansion plan of Cambodia page 3-41, World Bank/KOICA, assumed as same as sea freight cost of oil: $25.0/ton)
*6: EIA Annual Energy Outlook 2007, Gas price for power generation (average during 2006-2007: $7.40/MMBTU) + (sea freight cost: $0.5/MMBTU, liquefaction cost: $1.0/MMBTU, re-gasification cost: $0.4 /MMBTU)
Figure 7.1.1 illustrates levelized cost of generation for each alternative thermal by plant factor (PF)*6. The figure shows that the levelized costs of generation become lower along with the increase in the PF,
5 Source: Power Development Master Plan, Final Report, December 2006, Korea Electric Power Corporation/ World Bank,
Base Case Demand Forecast 6 Plant Factor = The ratio of the electrical energy produced by a generating unit(s) for certain time period (a year for example)
to the electrical energy that could have been produced at continuous full-power operation during the same period.

Final Report Chapter7 Economic and Financial Aspects of 10 Priority Projects
JICA Master Plan Study of 7-5 January 2009 Hydropower Development in Cambodia
and the least cost alternative changes depending on PF. When PF is lower than 52.9%, gas-fired combined cycle is the least cost alternative while when PF is higher than 52.9% coal-fired steam turbine is the least cost alternative.
Figure 7.1.1 Comparison of Levelized Generation Cost of Alternative Thermal Power Plant
Gas-fired combined cycle power plant was selected as the least cost alternative thermal power plant since the 8 priority projects had been planned with target PF at 40% being lower than 52.9%.
(3) Calculation of Economic Benefits
Calculation of the kW Adjustment Factor and the kWh Adjustment Factor
Generally speaking, a hydropower is normally more mechanically reliable than a thermal. Also, a hydropower has more flexibility in terms of fast-start capability and quick response to changing loads. In order to reflect these characteristics, an adjustment is applied to reflect the higher capacity value of the hydropower project. This higher value is given because somewhat more thermal capacity would be required than hydro capacity to firmly respond to changes in the system peak load. Power benefit can be calculated by multiplying firm peak capacity of hydropower station, kW adjustment factor and kW value. Also energy benefit will be worked out by multiplying energy production of hydropower project, kWh adjustment factor and kWh value.
The following formula and assumptions were used for calculating the kW and kWh adjustment factors.
The kW adjustment factor was estimated to be 1.220 and the kWh adjustment factor at 1.026.
(1 - AxR of HPP) x (1 - AvF of HPP) x (1- T/L loss of HPP) kW Adjustment Factor = (1- AxR of ATPP) x (1 - AvF of ATPP) x (1- T/L loss of ATPP)
(1 - AxR of HPP) × (1 - T/L loss of HPP) kWh adjustment factor =
(1 - AxR of ATPP) × (1 - T/L loss of ATPP) * AxR= Auxiliary Use Rate, T/L loss= Transmission loss, HPP: Hydropower plant, ATPP: Alternative thermal power plant AvF= Availability factor: operating hours- duration planned outage- duration of forced outage)/total time of a year

Final Report Chapter7 Economic and Financial Aspects of 10 Priority Projects
JICA Master Plan Study of 7-6 January 2009 Hydropower Development in Cambodia
Table 7.1.3 Assumptions for Calculating Adjustment Factors
Alternative Thermal Power (Gas CCPP) Priority Hydroelectric Power - Station Use 2.80% - Station Use 0.30% - Forced Outage 8.00% - Forced Outage 0.50% - Planned Outage 11.00% - Planned Outage 3.15% - Transmission Loss 2.00% - Transmission Loss 2.00%
Source: Study Team
Power Benefit
The 8 priority hydropower projects are planed to have a firm peak capacity of 25 MW ~ 220 MW. Thus, installed capacity of the alternative thermal power station needs 31 MW ~ 268 MW (Firm Peak Capacity × kW adjustment factor). On the other hand, the kW value or the annualized fixed cost of alternative power station is calculated at $133.7 per kW (kW construction cost × capital recovery factor @12% of discount rate + fixed annual O&M cost). Using the following assumptions, power benefit is worked out at $3.34~29.42 million/year (installed capacity of ATTP × kW value, refer to Figure 7.1.2 and Table 7.1.4).
Table 7.1.4 Power Benefit of the Priority Projects
Variable O&M Cost*b (¢/kWh) 0.122 Fixed O&M Cost*b ($/kW/yr) 2.49
Installed Capacity of ATPP (MW) 31 ~ 268 kW-Value ($/kW/yr) 133.7
Capital Recovery Factor*a 0.1241 Power Benefit ($ mil./yr) 3.34 ~ 29.42Source: Study Team Note: *a: Capacity Recovery factor= i*(1+i)n / {(1+i)n-1}, where: n= service life, and i= discount rate of 12%
*b: Quoted form the final report of “Electricity Network Master Plan in Cambodia, Volume 1: Generation Expansion Plan, Appendix 4, page 10, October 2006, EGAT”
Energy Benefit
The priority projects are planed to generate 78 ~ 1,725 GWh of energy per annum. Taking auxiliary loss and transmission loss of hydro and alternative thermal into consideration, alternative thermal power station needs to generate 80 ~ 1,770 GWh per annum on an average (annual generation of hydropower projects × kWh adjustment factor). Using the following assumptions, the kWh value and energy benefit were calculated at6.07 ¢/kWh and energy benefit at $4.8 ~ 104.8 million/year (adjusted energy production of ATTP × kWh value, refer to Figure 7.1.2 and Table 7.1.5).
Table 7.1.5 Energy Benefit of the Priority Projects
Unit Cost of Fuel (¢/ kWh) 5.87 Variable O&M Cost*a (¢/kWh) 0.122
kWh-Value (¢/kWh) 6.07 Generation of ATPP (GWh) 80 ~ 1,770
Energy Benefit ($ mil/yr.) 4.8 ~ 104.8 Source: Study Team Note: *a=Quoted form the final report of “Electricity Network Master Plan in Cambodia, Volume 1: Generation Expansion
Plan, Appendix 4, page 10, October 2006, EGAT”

Final Report Chapter7 Economic and Financial Aspects of 10 Priority Projects
JICA Master Plan Study of 7-7 January 2009 Hydropower Development in Cambodia
Source: Study Team
Figure 7.1.2 Summary of Power Benefit and Energy Benefit of the Priority Projects
7.1.4 Results of the Economic Analysis
Figure 7.1.3 shows the relation among the calculated EIRR, unit construction cost in US$ per kW, and installed capacities of the 8 priority projects. Generally, the lower unit construction costs would have the higher EIRR of the projects.
Source: Study Team Note: Size of circles indicate relative scale of installed capacity of each project
Figure 7.1.3 Relation among the Calculated EIRR, Unit Construction Costs and Installed Capacities of the Priority Projects
Generally speaking, EIRR of the projects should exceed the Cambodia’s economic opportunity cost of capital of 12%. In addition, the Study team adopted more relaxed threshold of 10% as the minimum

Final Report Chapter7 Economic and Financial Aspects of 10 Priority Projects
JICA Master Plan Study of 7-8 January 2009 Hydropower Development in Cambodia
threshold for the master plan level study.
Of the 8 priority projects, the EIRR of the 4 projects exceed standard threshold of 12%. With regard to the EIRR of the 3 projects, the EIRR varied between the minimum threshold of 10% and standard threshold of 12%. However, EIRR of #23 Upper Stung Russey Chrum (8.0%) is lower than the minimum threshold of 10% (refer to Table 7.1.6), and thus is deemed not economically feasible from viewpoint of the national economy.
Table 7.1.6 Summary of Economic Analysis of the Priority Projects Installed Capacity
Firm Peak Capacity
Energy Production
Power Benefit
Energy Benefit EIRR
No. Name of the Project (MW) (MW) (GWh/yr.) ($ 1,000/yr.) ($ 1,000 yr.) (%)
7&8 Lower Sre Pok II + Lower Se San II 420 220 1,725 29,418 104,788 18.2%
12 Prek Liang I 100 100 348 13,372 21,140 18.2%
14 Prek Liang II 54 48 198 6,418 12,028 21.7%
16 Middle St. Russey Chrum 28 28 96 3,744 5,832 10.1%
20 Stung Metoek II 25 25 86 3,343 5,224 10.7%
21 Stung Metoek III 26 26 90 3,477 5,467 11.2%
23 Upper St. Russey Chrum 28 27 98 3,610 5,935 8.0%
29 Bokor Plateau 22.3 26 78.2 3,477 4,750 13.4%
Source: Study Team

Final Report Chapter7 Economic and Financial Aspects of 10 Priority Projects
JICA Master Plan Study of 7-9 January 2009 Hydropower Development in Cambodia
7.2 FINANCIAL EVALUATION FROM THE VIEWPOINT OF PROFITABILITY OF PROJECT OPERATING ENTITY
7.2.1 General Assumptions for the Financial Analysis
The financial analysis of a project examines the adequacy of returns to the project-operating entity, whereas economic analysis measures the effect of the project on the national economy, as a whole.
Being the same as economic evaluation, the cash flow for financial evaluation of the project was prepared in real terms using constant 2007 prices. All prices and costs are expressed in US dollar ($). With reference to the existing contract between EDC and Hydropower IPPs, assessment period of the priority hydropower stations was assumed as 30 years.
Since the large and medium scale hydropower development in Cambodia has been and will be made by IPP basis in principle, in this financial analysis, the project operating entities of priority projects were assumed to be private investors. Accordingly project cost includes the power station as well as transmission line to the nearest substation, and the benefit was revenue from sales of electricity to EDC at the substation.
7.2.2 Financial Costs of the Priority Projects
Financial costs of the priority projects include physical contingency and various taxes, but exclude nonphysical contingencies, interest during construction, other financing costs, depreciation and debt servicing. Financial costs can be divided into 1) capital cost, 2) fixed O&M costs, and variable O&M costs.
(1) Capital Cost
The financial cost of the 8 priority projects was estimated at $55.2 million (#29 Bokor Plateau) to 623.1 million (#7&8 Lower Sre Pok II + Lower Se San II), refer to Table 7.2.1. These capital costs were assumed to be disbursed during the construction period of 5 years (1st year: 5%, 2nd: 10%, 3rd: 30%, 4th: 35%, and 5th: 20%) for all the projects.
(2) Fixed Operation and Maintenance Cost
The fixed operation and maintenance (O&M) cost is required annually during the economic life of the project. The fixed O&M cost includes daily operation and maintenance activities as well as semi-overhauling executed every 6 years of operation, and was assumed at 0.5% for civil and metal works and 1.5% for electro-mechanical equipment, and transmission related facilities. Estimated fixed O&M costs varied from $0.33 million/year to $4.52 million/year.
(3) Variable Operation and Maintenance Cost
Variable O&M cost includes only the cost for lubricant. In Cambodia, water charge/tax is not levied on the project operating entities. Cost of lubricant was assumed at 0.0151 ¢/kWh, based on actual average expenditure for lubricant at the hydropower stations in Indonesia* in 2006. Based on these assumptions, variable O&M cost was computed for all the projects.

Final Report Chapter7 Economic and Financial Aspects of 10 Priority Projects
JICA Master Plan Study of 7-10 January 2009 Hydropower Development in Cambodia
7.2.3 Financial Benefits of the Priority Projects
(1) Revenue from Sale of Electricity
Financial benefit was measured as the revenue from sales of electricity received from EDC. Generated energy was assumed to be sold to EDC at the nearest substation (delivery point). Sales revenue can be measured as the products of average sales price of electricity, and sales volume of electricity at delivery point. Sales volume of energy was calculated by deducting auxiliary loss at the power station and transmission loss from annual generation volume. Auxiliary loss of 0.3% and transmission loss between the power stations to the substations of 1.0% were used in calculating sales volume of energy at the delivery point.
According to the EAC and EDC, power purchase prices from the IPP hydropower stations are as follows:
Table 7.2.1 Unit Sales Price of Electricity from the Hydro IPPs to EDC Name of
Power Station Operator Installed Capacity
Start of Operation
Price of Electricity
Kirirom I CEPTC (China Electric Power Technology Import and Export Corporation) 12 MW 2002 7.00 ¢/kWh
Kirirom III CEPTC (China Electric Power Technology Import and Export Corporation) 18 MW
2010 (Plan) 8.10 ¢/kWh
Kamchay SINOHYDRO 193 MW2010 (Plan) 8.08 ¢/kWh
Stung Atay CYC (China Yunnan Corporation) 120 MW2012 (Plan) 5.81 ¢/kWh
Note: Power purchase price data is provisional figure, except for Kirirom I Source: MIME, EAC, and EDC
Figure 7.2.1 Comparison of Sales Price to EDC between the Priority Hydro and Others
In this financial analysis, whole sale price of 8.0 ¢/kWh was assumed for all the priority projects. As shown in the figure above, the assumed whole sale prices of the priority hydropower projects at 8.0 ¢/kWh is slightly higher than the price of Kirirom I (7.0 ¢/kWh), Stung Atay (5.8 ¢/kWh) and import energy from Vietnam (6.90¢/kWh in December 2007). But it is slightly lower than Kirirom III

Final Report Chapter7 Economic and Financial Aspects of 10 Priority Projects
JICA Master Plan Study of 7-11 January 2009 Hydropower Development in Cambodia
(8.10 ¢/kWh), Kamchay (8.08 ¢/kWh), and imports from Thailand (8.49 ~ 9.37 ¢/kWh in December 2007)*7. Also, 8.00 ¢/kWh is lower than one half of the purchase price from diesel based IPPs (16.96 ~ 34.90 ¢/kWh in December 2007)*8
7.2.4 Results of the Financial Analysis
Figure 7.2.2 shows the relation among the calculated FIRR, unit construction cost in $ per kW and annual energy productions of the priority projects. Generally, the lower unit construction costs would have the higher FIRR of the projects.
Generally speaking in Cambodia, FIRR of the projects should exceed 10%. In addition, the Study Team adopted more relaxed threshold of 7% as the minimum threshold for the master plan level study.
Of the 8 priority projects, the FIRR of the 3 projects are more than 10%, FIRR of 3 projects are distributed between 7% and 10%. However, FIRR of the remaining 2 project (#16 Middle Stung Russey Chrum and #23 Upper Stung Russey Chrum) was below the minimum threshold of 7.0% (refer to Table 7.2.2). In implementing these 2 projects, selling price of electricity would need a tariff higher than 8 cent per kWh.
In the case of #23 Upper Stung Russey Chrum project, the project has a quite low financial viability (FIRR= 3.5%). In addition, the project was judged to be unfeasible from the viewpoint of national economy (refer to 7.1.4), and thus the project is discarded from the further study.
Source: Study Team Note: Size of circles indicate relative scale of installed capacity of each project Figure 7.2.2 Relation among the Calculated FIRR, Unit Construction Costs and Annual Energy
Productions of the 8 Priority Projects 7 Thai Bath 2.99 ~ 3.30 /kWh (Source: Report on Power Sector of the Kingdom of Cambodia for the year 2006, EAC, June
2007), Exchange rate used: 1 Bath= $0.0284 as of 15 December 2006 8 Source: Report on Power Sector of the Kingdom of Cambodia for the year 2006, EAC, June 2007

Final Report Chapter7 Economic and Financial Aspects of 10 Priority Projects
JICA Master Plan Study of 7-12 January 2009 Hydropower Development in Cambodia
On the other hand, #14 Prek Liang II shows the highest FIRR of 16.8%, followed by #7&8 Lower Sre Pok II + Lower Se San II (16.5%), and #12 Prek Liang I (13.1%).
Table 7.2.2 Summary of Financial Analysis of the Priority Projects
No. Name of the Project
Energy Production (GWh/year)
Plant Factor(%)
Total Project Cost
($1,000)
Unit Cost of Construction
($/kW)
Financial Cost of
Generation* (¢/kWh)
FIRR (%)
7 & 8 Lower Sre Pok II + Lower Se San II 1,725 46.9% 623,068 1,348.1 4.76 16.5%
12 Prek Liang I 348 39.7% 162,445 1,605.3 6.13 13.1%
14 Prek Liang II 198 41.9% 70,158 1,283.6 4.64 16.8%
16 Middle St. Russey Chrum 96 39.1% 85,231 2,991.8 11.52 6.4%
20 Stung Metoek II 86 39.3% 70,985 2,463.1 10.77 7.0%
21 Stung Metoek IIII 90 39.5% 71,757 2,721.3 10.41 7.34%
23 Upper St. Russey Chrum 98 40.0% 5,953 4,365.6 16.41 3.5%
29 Bokor Plateau 78.2 40.0% 55,169 2,432.3 9.19 8.6%
Source: Study Team Note: Financial cost of generation was calculated using 10% of discount rate

Final Report Chapter 8 Environmental and Social Considerations
JICA Master Plan Study of 8-1 January 2009 Hydropower Development in Cambodia
8. ENVIRONMENTAL AND SOCIAL CONSIDERATIONS OF 10 PRIORITY PROJECTS
8.1 SOCIAL CONSIDERATIONS
8.1.1 Interview Survey of People in and around the Project Site
(1) Purpose of the Study
The Study Team grasped the outline of the socio-economic conditions of 29 nominated potential sites by reviewing the existing data such as Rural Development Database. 10 priority projects sites were selected by the multi-criteria analysis based on the technical, environmental and economical indicators, as described in Chapter 5. The household survey targeting the selected sites was conducted by the Study Team in order to compare more detail of socio-economic conditions. By understanding the tendency of their awareness and mindset on modernization, electricity and so on, the assessment of priority projects were tuned up.
This socio-economic survey is not a complete census but sample survey because it is a baseline survey. The survey results show the present livelihood in the target sites.
(2) Methodology
An interview survey was conducted in and around the prioritized hydropower project sites. The target villages for the interview survey were selected based on the conditions listed below:
1) The ten project sites are located within the six basins, therefore the target villages for the interview survey were selected in these same basins.
Projects #12-14 Prek Liang I, IA and II are located in the same basin and the inhabitants only living downstream are common for all three projects (100 samples in total commonly for the three projects).
Projects #16 Middle St. Russey Chrum and #23 Upper St. Russey Chrum, are in the same basin, therefore some inhabitants may get some common impacts (100 samples in total commonly for the two projects). A 100 samples were taken from Srae Kor commune in the planed site of Project #7&8 (LL2) along the Se San River, a 100 samples from Kbal Romeas commune for the same project area along the Sre Pok River, another 100 samples from Hot Pak commune in upper stream of LL2 plus Ta Lat commune and Phluk commune on downstream reaches of LL2.
Projects #20 St. Metoek II and #21 St. Metoek III, are in the same basin (100 samples for two projects).
2) In principle, the number of samples was set at 100 for one basin.
3) Since #7&8 Lower Sre Pok II + Lower Se San II project covers a wide area ranging over two

Final Report Chapter 8 Environmental and Social Considerations
JICA Master Plan Study of 8-2 January 2009 Hydropower Development in Cambodia
rivers and its reservoir scale is wide compared to the other projects, 200 samples were added to make a total 300 samples for this project.
4) Consequently, the total number of samples was set at 800.
(2) Target Sites
A location map of the target villages is shown in Figure 8.1.1. The target village names and corresponding number of households are presented in Table 8.1.1. Most of the target respondents for the interview survey are residing outside the envisaged reservoir areas. Some target villages are more than 50 km away from the project sites because the project sites are situated deep in the remote mountains. Of the ten projects, only two include residential area and farmlands within the planned reservoir areas.
100 samples
100 samples
100 samples
100 samples
300 samples
100 samples
Source: Study Team
Figure 8.1.1 Target Sites of the Interview Survey

Final Report Chapter 8 Environmental and Social Considerations
JICA Master Plan Study of 8-3 January 2009 Hydropower Development in Cambodia
Table 8.1.1 Target Villages and Number of Households No Project Name Province District Commune Village Families Population Sample12 Prek Liang I Bangket 56 264 13 Prek Liang IA Ta Bouk 88 424 14 Prek Liang II
Ratanak Kiri
Ta Veaeng Taveaeng Leu
Ta Veaeng 123 904
100
Hot Pak 149 867 Ratanak Kiri
Veun Sai Hot Pak Veun Hay 59 335
50
Kbal Romeas 97 432 Krabei Chrum 146 696
Kbal Romeas
Srae Sranok 91 426
100
Phum Muoy 156 658 Srae Kor Phum Pir 134 602
100
Rumpoat 39 188 Ta Lat Ta Lat 59 311 Ban Bung 52 173
7&8 Lower Sre Pok II+Lower Se san II (LL2)
Stung Treng
Sesan
Phluk Phluk 173 749
50
Kandal 139 721 Preaek Ampil 232 1541
29 Bokor Plateau Kampot Kampot Kaoh Touch
Preaek Chek 100 493
100
Anlong Vak 134 590 22 Stung Kep II (New Tatay)
Koh Kong Kaoh Kong Ta Tai KraomKaoh Andaet 73 346
100
Mondol Seima Bak Khlang Kaoh Pao 88 389 Phum Ti Buon 1450 6949
16 23
Middle St. Russey Chrum Upper St. Russey Chrum
Koh Kong Smach Mean Chay
Dang Tong Phum Ti Pir 452 2134
100
Aekakpheap 50 239 Kandal 77 322
20 21
St. Metoek II St. Metoek III
Pursat Veal Veaeng Thma Da
Sangkom Thmei 41 174
100
800 Source: Study Team
Concurrently with the household interview survey using questionnaires, key informant interviews were conducted by experts of the Study Team in order to understand the background of the villagers' lives from the socio-economic and historical viewpoints. Environmental issues relative to the villagers' lives were reviewed as well.
8.1.2 Analysis of the Interview Survey
(1) Background Information of the Respondents
The characteristics of the target villages were analyzed from various viewpoints such as culture, economics and environment. First, the baseline information was compared among the target villages to grasp the people’s characteristics.
1) Head of Household
Table 8.1.2 shows the sex and age of heads of households in each target village. In Cambodia, as in the other Asian countries, elder men would generally be heads of their respective households. When husbands pass away, the widows take over the headship. In case of divorce, women look after the children in most cases.

Final Report Chapter 8 Environmental and Social Considerations
JICA Master Plan Study of 8-4 January 2009 Hydropower Development in Cambodia
Table 8.1.2 Sex and Age of Head of Household
Sex of Head of Household Age of Head of Household Male Female Total Male Female Average Prek Liang 95 5 100 44.3 46.0 44.4 LL2 others 79 21 100 45.5 48.1 46.0 Kbal Romeas 83 17 100 44.2 51.8 45.5 Srae Kor 88 12 100 43.9 44.2 43.9 Bokor Plateau 84 16 100 44.2 52.8 45.6 Stung Kep II 76 24 100 46.3 48.5 46.8 Russey Chrum 82 18 100 42.9 46.1 43.5 Metoek 89 11 100 42.1 42.1 42.1 Overall 676 124 800 44.1 48.0 44.7
Source: Study Team
2) Number of Household Members
The average size of households in Cambodia in 2004 was 5.1 persons. There was a tendency that the sizes of households were greater in rural areas than in urban areas. In the target villages of the interview survey, the same tendencies were observed. The target villages in the northeast region were much isolated compared to those in the southwest region. Accordingly, the average size of households in the northeast region was greater.
Figure 8.1.2 illustrates the frequency distribution of household sizes in the target villages.
0612182430
Prek Liang
0612182430
n =100Xbar=6.8s =3.66
LL2 others
n =100Xbar=6.0s =2.52
0612182430
Kbal Romeas
0612182430
n =100Xbar=6.5s =2.73
Srae Kor
n =100Xbar=6.1s =2.31
0612182430
Bokor Plateao
0612182430
n =100Xbar=5.4s =1.88
Stung Kep II
n =100Xbar=4.8s =2.20
0.0 2.0 4.0 6.0 8.010.012.014.016.018.020.022.00612182430
Russey Chrum
0.0 2.0 4.0 6.0 8.010.012.014.016.018.020.022.00612182430
n =100Xbar=4.7s =2.29
0.0 2.0 4.0 6.0 8.010.012.014.016.018.020.022.0
Metoek
0.0 2.0 4.0 6.0 8.010.012.014.016.018.020.022.0
n =100Xbar=5.0s =2.03
Num Family
Source: Study Team
Figure 8.1.2 Frequency Distribution of Household Sizes

Final Report Chapter 8 Environmental and Social Considerations
JICA Master Plan Study of 8-5 January 2009 Hydropower Development in Cambodia
3) Educational Level
Figure 8.1.3 illustrates the educational level of the heads of households. The educational level of target villages in the northeast region was rather low in comparison with those of the southwest region. The reasons for the low education in the northeast were not only because of the disadvantageous isolated location but also because of ethnicity. Most of the inhabitants of the Ratanak Kiri Province were Lao. There were some other tribal ethnic groups as well. They don’t speak the Cambodian language and had less opportunity to get an education.
0% 20% 40% 60% 80% 100%
Prek Liang
LL2 other
Kbal Romeas
Srae Kor
Bokor Plateao
Stung Kep II (NewTatay)
Russey Chrum
Metoek
Drop out
Primary
Middle G8
High G10
Collage G12
Univ more
Source: Study Team
Figure 8.1.3 Educational Background of Heads of Households
4) Religion
The majority of Cambodia, i.e. 95% of the population, believes in Buddhism. The second largest population is Islamic which accounts for 4% of the population. Respondents were asked about their religious beliefs for reference in order to understand their lifestyles. Table 8.1.3 shows the various religions of the target villages.
It is said that Cambodian Muslims tend to live along the river. In the household interview survey, some families living in the downstream villages of Russey Chrum River were recognized as Muslim as well. Most of the Muslim families, 18 respondents out of 30, were engaged in fishing activities as their primary occupation.
As mentioned in Table 4.6.3 “Populations of Minority Groups”, 79.5% of the population in Ratanak Kiri Province is regarded as an ethnic minority. Some ethnic groups believe in animism or shamanism, maintaining their traditions. The majority of respondents, living far downstream of the Prek Liang hydropower project site in Ratanak Kiri Province, are minority ethnic groups and believe in animism as shown in Table 8.1.3.

Final Report Chapter 8 Environmental and Social Considerations
JICA Master Plan Study of 8-6 January 2009 Hydropower Development in Cambodia
Table 8.1.3 Religious Backgrounds of the Respondents
Buddhism Christianity Islam Animism or Shamanism
No religion Total
Prek Liang 31 4 65 100 LL2 others 91 7 2 100 Kbal Romeas 91 9 100 Srae Kor 98 1 1 100 Bokor Plateau 99 1 100 Stung Kep II 100 100 Russey Chrum 70 30 100 Metoek 100 100 Total 680 5 30 82 3 800
Source: Study Team
(2) Economic Activities and Living Standards
1) Primary Occupation
Table 8.1.4 shows the respondents' answers concerning their primary occupation. Although the questionnaire asked only for one main job, some of the interviewers allowed multiple answers when interviewees wished so. As a result, the total number of the answers exceeded the total number of respondents. Some characteristics can be pointed out below by analyzing the table:
530 respondents out of 800 were owner-cultivators, and in particular, more than 90% of respondents in #12-14 Prek Liang, LL2, Kbal Romeas and Srae Kor were engaged in cultivating their own farmlands.
Fishing was the second most important economic activity as replied by 249 out of 800 respondents living along the rivers,.
In some parts of the target villages for Prek Liang and LL2 projects, some respondents are still active in hunting.
Respondents in the northeast region were engaged in various economic activities. They were not engaged in a monopolized system but kept a recycle-oriented lifestyle.
Downstream of Russey Chrum River and close to the sea was a rather urbanized area so that the majority of respondents were engaged in fishing but not in farming.
Of the respondents of Bokor Plateau and Stung Russey Chrum, about one half selected “others” referring to being company staff. The respondents of Metoek were engaged in timber logging.

Final Report Chapter 8 Environmental and Social Considerations
JICA Master Plan Study of 8-7 January 2009 Hydropower Development in Cambodia
Table 8.1.4 Main Job of Head of Household
Owner cultivator
Farm labor Breeder Fisherman Hunter Self-
employed
Company executives/ Investor
Govt. employee/
teacher
Not working/R
etired
Others (staff, log,,
etc.) Total
Prek Liang 91 0 0 37 8 6 1 25 2 10 180LL2 others 94 0 4 45 10 4 0 3 4 27 191Kbal Romeas 99 1 12 55 5 3 0 7 4 9 195Srae Kor 98 0 0 1 0 1 0 0 0 0 100Bokor Plateau 52 2 0 36 0 15 1 8 0 30 144Stung Kep II (New Tatay) 43 1 0 18 0 7 1 5 0 31 106
Russey Chrum 6 2 0 54 0 4 2 10 0 22 100Metoek 47 3 0 3 0 3 0 13 1 34 104Total 530 9 16 249 23 43 5 71 11 163 1120Note: Total number of jobs exceeded the total number of interviewees because of multiple answers. Source: Study Team
2) Income and Expenditure
The total sample being valid for both expenditure and income was 786. As shown in Table 8.1.5, the overall average of expenditure per capita per year was $270.86 and that of income was $306.43.
Table 8.1.5 Expenditure and Income of Household
per household per year ($) per capita per year ($) Expenditure Income Expenditure Income Prek Liang 593 714 110 136 LL2 others 942 1,210 168 199 Kbal Romeas 1,047 1,191 206 229 Srae Kor 1,736 1,834 326 339 Bokor Plateau 1,291 1,907 252 375 Stung Kep II (New Tatay) 1,084 1,295 270 322 Russey Chrum 1,744 1,723 433 422 Metoek 1,639 1,760 398 425 Overall average 1,260 1,457 271 306 Source: Study Team
Comparing the target villages, the following tendencies and characteristics were found out:
The income level in the northeast region was lower than that of the southwest region.
The income level of Srae Kor was highest among the four northeast villages. This may be due to a newly rehabilitated community road.
The income level of the Thma Da Commune along the Metoek River was the highest among the eight target villages although it was situated in an isolated remote area. People there mainly earned cash income by logging and selling open land in recent years. A border gate to Thailand was opened in April 2007 and brought benefits to the villagers.
Dang Tong Commune which was located downstream of Russey Chrum River had been developing in recent years with the construction of road networks from Sihanoukville to the Thai border. People tend to invest, while borrowing, for the procurement of motorcycles etc.
247 respondents out of 786 valid answers said that their income was less than their

Final Report Chapter 8 Environmental and Social Considerations
JICA Master Plan Study of 8-8 January 2009 Hydropower Development in Cambodia
expenditure. In terms of the consideration how to cope with the deficit, the 275 respondents answered including the respondents who are not deficit this target year. Table 8.1.6 indicates the answers to the question “If the income is less than expenditure, please tell the reasons, whether you have debt or remittance from families.” Deficit was mostly covered by debt or remittance from family members living abroad.
Ethnic groups in the northeast region maintained their traditional ways of life but they were no longer able to live without cash earnings. More than 20% of the respondents borrowed money from others.
Table 8.1.6 Management of Deficit
1. NA
2. Debt
3. Remittance
4. Saving
5. Others 2&3 2&4 2&5 3&4 3&5 Total
Prek Liang 58 21 13 5 1 1 1 100LL2 others 64 23 7 1 3 2 100Kbal Romeas 59 23 7 11 100Srae Kor 62 16 5 17 100Bokor Plateau 70 9 5 1 4 2 1 6 1 1 100Stung Kep II (New Tatay) 73 11 5 8 97
Russey Chrum 63 19 6 11 99Metoek 62 5 1 20 2 90Total 511 127 48 3 79 3 1 11 1 2 786Source: Study Team
1. Not applicable (Income is more than expenditure) 2. Debt 3. Remittance from families 4. Withdraw money from saving accounts 5. Other reasons (specify__________________________)
3) Assets
In order to figure out the degree of modernization and affordability of people’s livelihood, the kinds of typical assets held by respondents were surveyed. Figure 8.1.4 illustrates the number of households which have assets listed in the questionnaire. The features of each village are stated below:
The majority of respondents had radios which were one of the important tools to access information.
The household ratio with TV sets was still low. However, more than 50% of the respondents of Russey Chrum and Metoek enjoyed watching TV. In Metoek, TV programs were broadcast from Thailand.
Most of the villages were not covered by mobile phone services. Respondents who had mobile phones used them only when they traveled into the service area.
The distribution ratio of motorcycles was higher than expected, particularly in Metoek. Opening the border once a week might have encouraged the villagers to buy motorcycles as business investments for border trading.

Final Report Chapter 8 Environmental and Social Considerations
JICA Master Plan Study of 8-9 January 2009 Hydropower Development in Cambodia
Prek Liang
0102030405060708090
Radio
Television
Fan
Iron
Washing
Refrigerator
PC
Telephone
Motorycle
Car
Truck
LL2 others
010
2030
4050
6070
8090
Radio
Television
Fan
Iron
Washing
Refrigerator
PC
Telephone
Motorycle
Car
Truck
Kbal Romeas
010
2030
4050
6070
8090
Radio
Television
Fan
Iron
Washing
Refrigerator
PC
Telephone
Motorycle
Car
Truck
Srae Kor
010
2030
4050
6070
8090
Radio
Television
Fan
Iron
Washing
Refrigerator
PC
Telephone
Motorycle
Car
Truck
Bokor Plateao
010
2030
4050
6070
8090
Radio
Television
Fan
Iron
Washing
Refrigerator
PC
Telephone
Motorycle
Car
Truck
Stung Kep II (New Tatay)
010
2030
4050
6070
8090
Radio
Television
Fan
Iron
Washing
Refrigerator
PC
Telephone
Motorycle
Car
Truck
Russey Chrum
010
2030
4050
6070
8090
Radio
Television
Fan
Iron
Washing
Refrigerator
PC
Telephone
Motorycle
Car
Truck
Metoek
010
2030
4050
6070
8090
Radio
Television
Fan
Iron
Washing
Refrigerator
PC
Telephone
Motorycle
Car
Truck
Source: Study Team
Figure 8.1.4 Assets of Households
(3) Electrification
1) Lighting Cost
Most of the target villages have no connection to distribution lines of the rural electricity enterprises (REE) including EDC. People had been using kerosene lamps and candles as well as flashlights or engine generators. The unit cost of lighting in rural areas was reportedly much higher than that in urban areas where mini-grids distribute electricity. The results of the household interview survey are shown in Table 8.1.7.
The average lighting cost was calculated, including replies of zero payment, among the 132 respondents. As shown in Table 8.1.8, the standard deviation was very large. The average could be influenced by the outstanding high values. Monthly lighting costs below $5.00 were paid by 67.8% of the respondents.

Final Report Chapter 8 Environmental and Social Considerations
JICA Master Plan Study of 8-10 January 2009 Hydropower Development in Cambodia
Table 8.1.7 Lighting Cost (/month/household)
Size n
Min ($)
Max ($)
Average($) St.dv
Prek Liang 99 0 25 1.8 3.07
LLS others 99 0 58 4.5 8.08
Kbal Romeas 100 0 40 5.1 6.20
Srae Kor 100 0 79 7.0 11.27
Bokor Plateau 100 0 46 4.1 5.49
Stung Kep II (New Tatay) 100 0 82 7.5 11.11
Russey Chrum 100 0 17 2.3 3.29
Metoek 98 0 45 7.5 7.97
Overall 796 0 82 5.0 7.90Source: Study Team * $0 is included * 4 samples over $100 per month are excluded as outliers. * cumulative frequency curve and theoretical distribution curve are
shown in the figure.
01428425670
Prek Liang
01428425670
n =100Xbar=2.8s =10.41
020406080100
LL2 others
020406080100
n =100Xbar=5.9s =16.63
01428425670
Kbal Romeas
01428425670
n =100Xbar=5.1s =6.20
020406080100
Srae Kor
020406080100
n =100Xbar=7.0s =11.27
01428425670
Bokor Plateao
01428425670
n =100Xbar=4.1s =5.49
020406080100
Stung Kep II
020406080100
n =100Xbar=7.5s =11.11
0.0 4.0 8.012.0 18.022.026.030.001428425670
Russey Chrum
0.0 4.0 8.012.0 18.022.026.030.001428425670
n =100Xbar=2.3s =3.29
0.0 4.0 8.012.0 18.022.026.030.0020406080100
Metoek
0.0 4.0 8.012.0 18.022.026.030.0020406080100
n =100Xbar=11.8s =34.01
Light Cost
Source: Study Team Figure 8.1.5 Lighting Cost
2) Electricity Cost
Focusing on the monthly electricity cost per household, excluding the other lighting costs such as kerosene and candle, there were 261 respondents who were paying electricity tariff. The overall average was $21.93 per household per month. Some of the respondents were using electricity, not only for household use, but also for business by operating one engine generator. Accordingly, the average became high. In the case of using a generator, the electricity cost meant the cost of petrol. The following were found as reference information:
Table 8.1.8 Electricity Cost ($/month/household)
n Min ($)
Max ($)
Average($) St.dv
Prek Liang 4 3 53 16.9 23.88
LLS others 5 2 150 32.5 65.71
Kbal Romeas 7 1 30 5.1 10.98
Srae Kor 20 1 30 3.0 7.11
Bokor Plateau 24 1 166 21.6 39.99
Stung Kep II (New Tatay) 49 2 75 13.9 19.76
Russey Chrum 82 1 34 6.0 4.78
Metoek 70 1 113 15.3 23.07
Overall 261 1 166 11.8 21.93* Cases indicating $0 are excluded. Source: Study Team
0
7
14
21
28
35Prek Liang
0
7
14
21
28
35n =4Xbar=16.9s =23.88
0
20
40
60
80
100LL2 others
0
20
40
60
80
100n =5Xbar=32.5s =65.71
0
7
14
21
28
35Kbal Romeas
0
7
14
21
28
35n =7Xbar=5.1s =10.98
0
20
40
60
80
100Srae Kor
0
20
40
60
80
100n =20Xbar=3.0s =7.11
0
7
14
21
28
35Bokor Plateao
0
7
14
21
28
35n =24Xbar=21.6s =39.99
0
20
40
60
80
100Stung Kep II
0
20
40
60
80
100n =49Xbar=13.9s =19.76
0.06.0 15.024.033.042.051.060.00
7
14
21
28
35Russey Chrum
0.06.0 15.024.033.042.051.060.00
7
14
21
28
35n =82Xbar=6.0s =4.78
0.06.0 15.024.033.042.051.060.00
20
40
60
80
100Metoek
0.06.0 15.024.033.042.051.060.00
20
40
60
80
100n =70Xbar=15.3s =23.07
Electric_cost
Source: Study Team Figure 8.1.6 Electricity Cost

Final Report Chapter 8 Environmental and Social Considerations
JICA Master Plan Study of 8-11 January 2009 Hydropower Development in Cambodia
Villages located far downstream of the Prek Liang project site had no electricity. Only a few restaurants or offices were using electricity.
Communes downstream of Russey Chrum River enjoyed electricity which was supplied by private REE. Therefore the distribution level of electrical goods was relatively high, i.e. TV at 68%, electric fan 42% and electric iron 18%.
Villagers in the Thma Da Commune along the Metoek River used their own generators for electricity. Since the price of petrol increased, the production cost of electricity increased. They used electricity not only for lighting but also for TV (61%), fan (32%) and iron (9%).
Unit costs of electricity differed among villages. Isolated rural areas where distribution lines hardly arrive have a disadvantage in unit cost of electricity.
Exceptionally, people in Kbal Romeas Commune and Srae Kor Commune that would be affected by the Lower Se San II + Lower Sre Pok II project enjoyed free electricity services for one year from a private company which was running a business in the forest of the Economic Land Concession nearby.
Table 8.1.9 shows number of households and monthly average expenditures in the cross table indicating battery light users, generator users and electricity supply by private REEs. The monthly average expenditure for battery light users is $5.63, and that of the grid electricity users is $9.02. There are 117 households using both electricity sources of battery and grid electricity, of which the monthly average expenditure is $12.32.
Table 8.1.9 Status of Grid Electrification and Utilization of Battery Lighting
Number of grid electrified/non-electrified household ( ): Average amount of payment ($/month)*
Non-electrified Electrified Total Non-user 299 (0.00) 194 (7.04) 493 (2.77) User 190 (1.51) 117 (12.32) 307 (5.63)
Number of household of battery users Total 489 (0.59) 311 (9.02) 800 (3.87)
Source: Study Team * $0 is inclusively calculated
Table 8.1.10 presents the survey results on electrified households in the target project areas. Electrification ratio on Prek Liang site is the lowest in progress and the LL2 site is the second lowest. In Srae Kor village, a private company has started electricity supply to the community free of charge since 2007 for one year and most of the house holds in the village has been connected to generator. A part of villages in Kbal Romeas has also been electrified by private companies with relatively low tariffs. Reasons for such free/low cost electricity supply are not clear. The free services of the electricity had been finished after one year. After socio-economic survey, the Study Team visited Srae Kor again, August 2008, and realized the villagers there stopped using the donated generator and distribution lines since they didn’t reach the consensus of operating system by themselves.

Final Report Chapter 8 Environmental and Social Considerations
JICA Master Plan Study of 8-12 January 2009 Hydropower Development in Cambodia
Table 8.1.10 Household Electrification Status by Target Areas
Area/Plan Non-electrifiedhousehold
Electrified household
Total
Prek Liang 85 15 100 LL2 others 67 33 100 Kbal Romeas 48 52 100 Srae Kor 8 92 100 Bokor Plateau 29 71 100 Stung Kep II (New Tatay) 26 74 100 Russey Chrum 12 88 100 Metoek 24 76 100 Total 299 501 800
Source: Study Team
Table 8.1.11 indicates replies to the question “Do you want to use electricity even if it is a pay service?” and “If yes, how much can you pay for electricity per month?” About 84.4% of the respondents, which was 675 out of 800, answered that they wished to have electricity even if it was a pay service. An overall average of willingness to pay (WTP) was $3.73 per month. However, averages of the target villages had a wide range of difference from each other depending on the current conditions of electrification. Respondents who were enjoying free electric services, i.e. in Srae Kor, had a low WTP. On the other hand, respondents of Metoek who were spending a high electricity cost for their own generators replied that they wished to have integrated distribution lines that they expected to realize lower costs than what they spent.
Table 8.1.11 Willingness to Pay
Do you want to use electricity even if it is a pay service?
If yes, how much can you pay for electricity per month?
No need If tariff is acceptable, yes No need Acceptable cost
per month ($) Average ($)
Prek Liang 10 90 0.00 2.52 2.52 LL2 others 38 62 0.00 1.91 1.91 Kbal Romeas 28 72 0.00 1.15 1.15 Srae Kor 35 65 0.00 1.30 1.30 Bokor Plateau 3 97 0.00 4.99 4.99 Stung Kep II (New Tatay) 6 94 3.75 5.44 5.42 Russey Chrum 3 97 1.25 4.55 4.51 Metoek 2 98 5.00 6.38 6.37 Total / average 125 675 3.33 3.73 3.73 Source Study Team
(4) Water and Hygiene
1) Water Utilization
Cambodia has a tropical rainforest climate with high rainfall over 1000 mm/year to 4000 mm/year. However, water management had not been effective enough to improve the people’s livelihoods. Utilities of drinking water supply had not been well established. Therefore, people in rural areas were taking water directly from rivers or ponds, or storing rainwater from roofs to tanks. International donors supported groundwater well drilling but arsenic was reportedly detected in some of the wells.

Final Report Chapter 8 Environmental and Social Considerations
JICA Master Plan Study of 8-13 January 2009 Hydropower Development in Cambodia
In the target villages of the questionnaire survey, the respondents in the northeast region mainly use river water and well water whereas the respondents in the southeast region depend on rainwater. There were 47 households using piped water in urban areas downstream of the Russey Chrum River. Sixty seven respondents in the Thma Da commune answered that they took flowing water from the channel or tributary which the Pol Pot party built.
Table 8.1.12 Drinking Water
Piped water Private well Public well Flowing water in channel
/ tributary
No use
Sub Main No use
Sub MainNo use
Sub Main No use
Sub Main
Prek Liang 100 0 0 74 5 21 68 2 30 84 7 9 LL2 others 99 0 1 94 3 3 67 11 22 99 1 0 Kbal Romeas 98 0 2 98 0 2 47 13 40 100 0 0 Srae Kor 100 0 0 96 0 4 59 15 26 100 0 0 Bokor Plateau 88 0 12 34 3 63 77 1 22 100 0 0 Stung Kep II 100 0 0 35 4 61 89 2 9 78 2 20 Russey Chrum 52 1 47 70 2 28 91 0 9 96 1 3 Metoek 96 1 3 98 1 1 99 0 1 29 4 67 Overall 733 2 65 599 18 183 597 44 159 686 15 99 Overall (%) 91.6% 0.3% 8.1% 74.9% 2.3% 22.9% 74.6% 5.5% 19.9% 85.8% 1.9% 12.4%
Well of landlord River or pond Rainwater Bottled water
No use Sub Main No
use Sub Main No use Sub Main No
use Sub Main
Prek Liang 95 2 3 28 19 53 10 86 4 97 2 1 LL2 others 100 0 0 4 8 88 5 91 4 100 0 0 Kbal Romeas 99 0 1 2 6 92 8 91 1 100 0 0 Srae Kor 98 0 2 1 6 93 4 85 11 99 1 0 Bokor Plateau 98 0 2 98 2 0 17 80 3 100 0 0 Stung Kep II 91 1 8 79 9 12 7 6 87 87 7 6 Russey Chrum 91 1 8 95 2 3 11 6 83 75 3 22 Metoek 100 0 0 75 4 21 11 28 61 81 2 17 Overall 772 4 24 382 56 362 73 473 254 739 15 46 Overall (%) 96.5% 0.5% 3.0% 47.8% 7.0% 45.3% 9.1% 59.1% 31.8% 92.4% 1.9% 5.8%Source: Study Team
2) Cost of Water Management
Most respondents in the northeast region did not pay for drinking water while the ratio who bought drinking water was high in the southwest region. The total number of respondents who bought drinking water was 208 and their average cost of drinking water was 36,012 Riel ($9.00) per month.
Since irrigation systems are not popular in the target villages, most respondents did not pay for irrigation. The total number of respondents who paid for irrigation was 60 and their average cost was 39,845 Riel ($9.96) per month.

Final Report Chapter 8 Environmental and Social Considerations
JICA Master Plan Study of 8-14 January 2009 Hydropower Development in Cambodia
Table 8.1.13 Cost of Water Management
Drinking Water Irrigation Water Respondents who
pay Cost /month (Riel) Respondents who pay
Cost / month (Riel)
Prek Liang 6 31,417 0 - LL2 others 1 54,000 0 - Kbal Romeas 4 13,375 1 5,800 Srae Kor 1 10,000 0 - Bokor Plateau 15 50,583 11 17,582 Stung Kep II (New Tatay) 25 46,180 3 115,000 Russey Chrum 73 19,730 3 28,335 Metoek 83 46,157 42 41,940 Overall 208 36,012 60 39,845 Source: Study Team
3) Toilet
Figure 8.1.7 illustrates the types of toilet. About 68.3% of the respondents did not have a toilet at home. However, some used huts as toilets, which was built along the rivers apart from the residential areas.
Code1 Pit
latrine Flush toilet
No toilet
Total
Prek Liang 22 1 77 100
LL2 others 1 1 98 100 Kbal Romeas 5 12 83 100 Srae Kor 37 19 44 100 Bokor Plateau 6 64 30 100 Stung Kep II] (New Tatay)
10 9 81 100
Russey Chrum 3 27 70 100 Metoek 13 24 63 100
Overall 97 157 546 800 Overall(%) 12.1 19.6 68.3 100
0% 20% 40% 60% 80% 100%
Prek Liang
LL2 others
Kbal Romeas
Srae Kor
Bokor Plateao
Stung Kep II
Russey Chrum
Metoek
Overall
Pit latrine
Flush tilet
No tilet
Source: Study Team Figure 8.1.7 Type of Toilet
4) Waste Disposal
Most respondents burn their wastes beside houses. Wastes could often be used as fuel. About 64.25% of the respondents answered that they used twigs, husks and/or stems of crops as cooking fuel. Some of the respondents, especially those living downstream of the Stung Kep and Russey Chrum, threw wastes into rivers. “Others” include disposal in forests or somewhere near their houses. A few respondents answered that they made compost for agriculture. There were some respondents who answered that waste was used for feeding animals.

Final Report Chapter 8 Environmental and Social Considerations
JICA Master Plan Study of 8-15 January 2009 Hydropower Development in Cambodia
0%
20%
40%
60%
80%
100%
Bury
Burn
Throw to river
Others
Bury 14% 14% 21% 23% 13% 15% 14% 27% 18%
Burn 90% 86% 84% 84% 81% 75% 49% 92% 80%
Throw to river 5% 9% 7% 5% 8% 48% 49% 19% 19%
Others 21% 11% 6% 7% 24% 26% 19% 27% 18%
PrekLiang
LL2others
KbalRomeas
Srae KorBokorPlateao
StungKep II
RusseyChrum
Metoek Overall
Source: Study Team Figure 8.1.8 Waste Disposal
(5) Awareness and Mind-Set about Lifestyle
1) Degree of Livelihood Satisfaction and Complaint
Degrees of livelihood satisfaction were asked for each item as shown below in Figure 8.1.9. No security issues were observed among the eight target villages. On the other hand, cash income had a low satisfaction rating among the respondents Health care was a big concern of most of the respondents. However, health conditions of the target village of Bokor Plateau project were better than the others.
1 2 3 41 2 3 4
Education
Land management
Food Nutrition
Security
Cash income
Transportation
Light & Heat
Marketing
Health
Prek Liang LL2 others Kbal Romea Srae Kor Bokor Plat Metoek
Stung Kep Russey Chr
Very Satisfied Very Unsatisfied Satisfied Unsatisfied
Source: Study Team
Figure 8.1.9 Degree of Livelihood Satisfaction

Final Report Chapter 8 Environmental and Social Considerations
JICA Master Plan Study of 8-16 January 2009 Hydropower Development in Cambodia
2) Problems of Concern
Table 8.1.14 shows the ratings in terms of problems being faced by respondents. Respondents rated the degree of difficulty from no problem (1) to big problem (5).
Table 8.1.14 Problems Being Faced by Respondents (Average Score)
Prek Liang
LL2 others
Kbal Romeas
Srae Kor
Bokor Plateau
Stung Kep II (New Tatay)
Russey Chrum
Metoek Overall
Shortage of education opportunities 2.23 2.06 2.40 2.32 2.41 2.76 2.47 2.88 2.44 High cost of education 2.08 1.97 2.22 2.20 2.63 2.90 2.86 3.14 2.50 Children's low motivation in study 1.84 1.60 1.86 1.72 1.88 2.61 2.37 2.48 2.05 Having trouble with land ownership
1.41 1.32 1.91 1.88 1.63 1.98 1.76 2.28 1.77
Registration of land 1.53 1.55 2.07 2.11 1.77 1.94 1.66 2.15 1.85 Low land quality and low yield 3.00 2.53 3.00 2.28 2.40 2.86 2.38 2.48 2.62 Insufficient irrigation systems 2.05 2.00 2.28 2.21 2.09 2.79 2.18 2.65 2.28 Shortage of labor 2.40 2.16 2.22 2.11 2.15 3.09 2.74 2.95 2.48 Shortage of business opportunities 1.64 1.54 1.48 1.62 1.78 2.87 2.86 2.77 2.07 Inaccessibility of electricity 2.46 1.91 1.89 1.77 2.36 3.45 2.65 3.42 2.49 High living expenses 3.43 3.21 3.43 3.15 3.28 3.87 4.09 3.96 3.55 Inaccessibility of information 2.17 1.80 1.76 1.78 1.95 2.68 2.11 2.98 2.15 Security problems 1.25 1.65 1.52 1.79 1.39 1.79 1.74 1.95 1.64 Inaccessibility of health care services
2.89 3.11 3.18 3.03 2.38 3.08 2.51 3.28 2.93
Shortage of transportation means 2.41 2.37 2.31 2.16 1.61 2.49 2.52 3.61 2.44 Insufficient road conditions 2.77 2.55 2.55 2.48 1.57 2.35 2.83 4.15 2.66 Low selling price of products 2.77 2.32 2.52 2.41 2.71 3.10 3.26 3.11 2.78 Broken family network due to immigration
1.51 1.33 1.47 1.45 1.46 1.33 1.21 1.44 1.40
Less collaboration with neighbors 1.36 1.34 1.38 1.50 1.17 1.73 1.58 1.59 1.46 Inaccessibility of micro credit 1.31 1.23 1.21 1.34 1.29 1.65 1.73 1.83 1.45Source: Study Team
3) Conflict of Land Ownership
Figure 8.1.10 illustrates replies to the question “Have you ever heard about troubles concerning land ownership of neighbors?” About 59 respondents in the Metoek area answered “yes”. A legal land registration system had not been introduced in the Thma Da Commune. Many land investors came to buy land expecting price hikes because of the proximity of the Thma Da Commune to the Thai Border. Land speculation was booming in Cambodia and some of the potential lands for development would be targeted by outsiders. The number of respondents shown in the figure represents not that of conflicts but that of those who heard of land conflicts.

Final Report Chapter 8 Environmental and Social Considerations
JICA Master Plan Study of 8-17 January 2009 Hydropower Development in Cambodia
18
9
17 15
3033
9
59
0
10
20
30
40
50
60
70
PrekLiang
LL2others
KabalRomeas
SraeKor
BokorPlateao
StungKep II
RusseyChrum
Metoek
Source: Study Team
Figure 8.1.10 Respondents Who Heard of Land Conflicts inside Villages
4) Mind-Set Concerning Modernization and Development
It is important to understand the respondents' ways of thinking about modernization and development for assessment of maturity for development. The following alternative replies were presented to the interviewees and the most appropriate was selected by respondents. The results are illustrated in Figure 8.1.11.
1. Strongly keep traditional lifestyle (conservative) 2. Change of traditional activities is not desirable (passive resistance to modernization) 3. Anything will do. No idea. 4. Change of some traditional activities is acceptable (a bit positive for modernization) 5. Willing to modernize the villages (positive for modernization)
33
24
32
18
23
24
36
7
197
6
19
19
25
6
7
7
4
93
8
6
5
4
15
6
1
6
51
46
47
43
48
48
41
35
66
374
7
4
1
5
8
22
21
17
85
0% 20% 40% 60% 80% 100%
Prek Liang
LL2 others
Kabal Romeas
Srae Kor
Bokor Plateao
Stung Kep II
Russey Chrum
Metoek
Overall
Conservative
Passive resistance
No idea
Less positive
Positive
Source: Study Team
Figure 8.1.11 Mind-Set Concerning Modernization

Final Report Chapter 8 Environmental and Social Considerations
JICA Master Plan Study of 8-18 January 2009 Hydropower Development in Cambodia
(6) Hydropower and Dam Construction
Opinion Concerning Hydropower Development
General opinions concerning hydropower development were asked during the questionnaire survey. Conditions were not the same among the target villages whether these would be submerged in the planned reservoir or not. Table 8.1.15 summarizes the replies of the respondents to hydropower development.
Intermediate value of score is 3 which means agree and oppose is half-and-half. It was obvious that the respondents in the Kbal Romeas and Srae Kor Communes strongly opposed the hydropower dam construction because their villages would be submerged and they would have to resettle. They worried about their properties such as houses and paddy fields. In addition, the elderly people love villages that had long histories since the 1920s.
Table 8.1.15 Villagers’ Position to Hydropower Development
1 2 3 4 5
Strongly oppose Not like No idea Passively
accept Positively
accept Average of
score Prek Liang 2 6 22 28 42 4.02 LL2 others 28 38 6 13 15 2.49 Kbal Romeas 53 39 1 6 1.66 Srae Kor 49 46 1 1 3 1.63 Bokor Plateau 1 18 31 50 4.29 Stung Kep II (New Tatay) 1 4 8 32 55 4.36
Russey Chrum 3 7 39 51 4.35 Metoek 1 2 4 47 46 4.35 Overall 138 135 67 191 268 3.40
Source: Study Team
“Damage to environmental resources” was the most significant reason for opposing the projects as stated by 173 respondents. The second largest reason was “Worse for Inhabitants, Good for the Rich” as indicated by 107 respondents. Particularly, in the case of the integrated hydropower project of Lower Sre Pok II + Lower Se San II, the generated power would be exported to Vietnam and therefore the inhabitants there complained “the project would sacrifice Cambodians to benefit non-Cambodians.”
Meanwhile, those inhabitants who reside in the envisaged reservoir area of the Metoek II project were positive about dam construction. The history of their villages is short and most inhabitants moved there from different parts of the country. They lived close to the border of Thailand, a country that was already developed, and were stimulated by modern technology. Due to landmines, the farmlands were limited. Therefore, people expected a large scale of economic development which would support them in order to catch up with their neighbors. Since they were facing water shortages, the degree of expectation for sustainable water management was high.

Final Report Chapter 8 Environmental and Social Considerations
JICA Master Plan Study of 8-19 January 2009 Hydropower Development in Cambodia
Prek Liang
60 2 2 5
46
20
00
10
20
30
40
50
60
70
Damage
Natural
Resources
Damage
Ecology
System
Sacrifice
Inhabitants
Worse
Inhabitants
Good for Rich
Good for
water
management
Improved by
Electricity
Improved by
Road
Compensation
LL2 others
40
6
1725
0
21
90
0
10
20
30
40
50
60
70
Damage
Natural
Resources
Damage
Ecology
System
Sacrifice
Inhabitants
Worse
Inhabitants
Good for Rich
Good for
water
management
Improved by
Electricity
Improved by
Road
Compensation
Kabal Romeas
59
7
2837
05
1 00
10
20
30
40
50
60
70
Damage
Natural
Resources
Damage
Ecology
System
Sacrifice
Inhabitants
Worse
Inhabitants
Good for Rich
Good for
water
management
Improved by
Electricity
Improved by
Road
Compensation
Srae Kor
64
1322
42
0 3 0 00
10
20
30
40
50
60
70
Damage
Natural
Resources
Damage
Ecology
System
Sacrifice
Inhabitants
Worse
Inhabitants
Good for Rich
Good for
water
management
Improved by
Electricity
Improved by
Road
Compensation
Bokor Plateao
1 0 0 0
11
64
61
0
10
20
30
40
50
60
70
Damage
Natural
Resources
Damage
Ecology
System
Sacrifice
Inhabitants
Worse
Inhabitants
Good for Rich
Good for
water
management
Improved by
Electricity
Improved by
Road
Compensation
Stung Kep II (New Tatay)
1 2 3 0
48
68
24
38
0
10
20
30
40
50
60
70Damage
Natural
Resources
Damage
Ecology
System
Sacrifice
Inhabitants
Worse
Inhabitants
Good for Rich
Good for
water
management
Improved by
Electricity
Improved by
Road
Compensation
Stung Russey Chrum
0 0 2 0
4654
6
40
0
10
20
30
40
50
60
70
Damage
Natural
Resources
Damage
Ecology
System
Sacrifice
Inhabitants
Worse
Inhabitants
Good for Rich
Good for
water
management
Improved by
Electricity
Improved by
Road
Compensation
Stung Metoek
2 0 1 1
53
43
20
45
0
10
20
30
40
50
60
70
Damage
Natural
Resources
Damage
Ecology
System
Sacrifice
Inhabitants
Worse
Inhabitants
Good for Rich
Good for
water
management
Improved by
Electricity
Improved by
Road
Compensation
Source: Study Team
Figure 8.1.12 Opinions about Hydropower Development
Table 8.1.16 indicates the opinions concerning resettlement caused by dam construction. Inhabitants in the target villages of the interview survey other than in Kbal Romeas, Srae Kor and Metoek do not need to resettle but they were also interviewed for reference. Since the inhabitants would not be directly affected by these projects, they were quick to answer “yes”. However, those inhabitants subject to resettlement answered “no”.
A notable feature was found in the responses of the inhabitants in Metoek. They did not have a very negative image on dam construction.

Final Report Chapter 8 Environmental and Social Considerations
JICA Master Plan Study of 8-20 January 2009 Hydropower Development in Cambodia
Table 8.1.16 Opinions about Resettlement
1 2 3 4 5
Code No No, principle No idea Conditional
Yes Positively
Yes Average of
score Prek Liang 14 6 5 44 31 3.72 LL2 others 45 12 3 13 27 2.65 Kbal Romeas 37 30 2 13 18 2.45 Srae Kor 49 12 1 8 30 2.58 Bokor Plateau 1 6 8 57 28 4.05 Stung Kep II 15 10 12 38 25 3.48 Russey Chrum 12 7 21 37 23 3.52 Metoek 4 10 3 57 26 3.91 Overall 177 93 55 267 208 3.30 Source: Study Team
8.1.3 Findings
The study team subcontracted a questionnaire interview survey of households. At the same time, the village profiles were compiled through the key-informant interviews and observation trips. After analyzing the abovementioned quantitative data and integrating it with qualitative information, the findings are summarized below:
(1) Target Villages Located in Planned Reservoir
1) Integrated Project of #7&8 Lower Se San II + Lower Sre Pok II
Kbal Romeas Village, Krabei Chrum Village and Srae Srannok Village along the Sre Pok River in Kbal Romeas Commune will be submerged according to the design of the Lower Se San II + Lower Sre Pok II integrated hydropower project.
Phum Muoy village and Phum Pir village in the Sre Kor Commune are located on the opposite banks of the Se San River. Two of them will be submerged together with the Kbal Romeas Commune.
The notable features of the two communes are listed below:
Most inhabitants are Lao ethnics speaking the Lao language, They believe in Buddha, Customs, behavior and culture are very similar to Khmer, Road accesses to Krabei Chrum and Srae Sranok of Kbal Romeas is not year-round, Life is simple and abstemious with expenditures below $1 per person per day, Wealth in community prosperity, Generator and distribution lines were donated by private companies, while in some parts,
electricity was free of charge for one year. Since the cost of fuel is required, some of the communities left generators and distribution
lines, Almost satisfied with their traditional lifestyle, Long village history since 1920s makes inhabitants stick to original home land,

Final Report Chapter 8 Environmental and Social Considerations
JICA Master Plan Study of 8-21 January 2009 Hydropower Development in Cambodia
They are confused by unclear information about hydropower projects, They are upset about being sacrificed for electricity supply to Vietnam, Almost all of them opposed the project and refused to move.
2) #20&21 Metoek II and Metoek III
The Metoek II project is located upstream of the Metoek River while the Metoek III is downstream. The Thma Da Commune is located in and around the Metoek II reservoir area. Part of the commune would be submerged depending on the full supply level (FSL) of the Metoek II reservoir. Features of the commune are listed below:
The first people moved into this place in 1979, and the village was officially registered in 1998. Most inhabitants were former supporters of the Pol Pot Party who came from all over
Cambodia. Road conditions were much improved in recent years. After opening the border to Thailand, their lifestyles changed dramatically. Land prices were increasing by speculation and logging was booming for clearing of open
land. Landmine accidents were increasing because people go to clear forests in order to make a
sizable sum of money. The majority of inhabitants already used electricity to enjoy lighting and watching TV. Most commodities were purchased from Thailand. The image of hydropower for generating electricity and for managing water with electric
pumps was good,. People were willing to move their houses, if necessary. An army camp with 400 soldiers is located along the border. Private investors had a joint venture with a Malaysian company to construct roads and a
hospital.
(2) Target Villages for Interview Survey Outside Planned Reservoir Areas
1) Integrated Project of #7&8 Lower Se San II + Lower Sre Pok II (villages outside the planned reservoir area)
The Hot Pak Commune is located upstream of the Lower Se San reservoir area. Since the feasibility study was under implementation by EVN and the design features were not clear, it was unknown whether the Hot Pak Commune will be submerged or not. The Ta Lat Commune is located upstream of the Sre Pok River, and the Phluk Commune is located downstream of the power plant site.
These communes are located in very isolated and remote areas. Villagers are Lao Buddhists. Hunting in the forest is still one of the main jobs. Income is very low and it is rather a self-supplying economy. Number of debtors is increasing. Majority of households are non-electrified and willing to have electricity even if they have to
pay for the services.

Final Report Chapter 8 Environmental and Social Considerations
JICA Master Plan Study of 8-22 January 2009 Hydropower Development in Cambodia
2) #12-14 Prek Liang I, IA and II (villages are far downstream of power station site)
Taveaeng Leu Commune is the closest commune to but is about 15 km downstream of the outfall site of the Prek Liang I project.
Ethnic minority believe in traditional animism. Cash income is the lowest among the target villages of the questionnaire survey They live in a self-supply economy. Some of them depend on debt and remittance, which means that their lifestyle is no longer
cashless. Most households are non-electrified and are willing to have electricity even if they have to pay
for the services. People are positive about the hydropower project which would supply electricity provided that
they do not need resettlement. 3) #29 Bokor Plateau (villages downstream of the planned reservoir area, being to the south of
the Plateau)
The Kandal village, Preaek Ampil village and Preaek Chek village belong to the Kaoh Touch Commune. The project site is the nearest to Phnom Penh among the 10 priority project sites.
There are advantages in the access to Phnom Penh. Looking from the villages, the river flows towards the opposite side of the mountain. The river water would be diverted when hydropower is constructed. Since villages face the sea, many inhabitants are engaged in fishing. Majority have private wells and toilets. Inhabitants have accepted recent modernization that had taken place along with the
development of tourist spots in the Bokor national park. Inhabitants were not informed of dam construction. Therefore many answered as “no idea”
but their image on hydropower was positive. 4) #22 Stung Kep II (New Tatay) (villages outside the planned reservoir area)
The Anlong Vak village and the Kaoh Andaet village in Ta Tai Kraom Commune are located downstream of the Stung Kep River.
People are engaged in agriculture and fishing. Road conditions were improved in recent years. Lighting costs including electricity is very high. They are willing to have electricity at reasonable tariff. Majority have private wells for drinking water. People are positive on hydropower development for water management and electricity
generation. Few people were concerned about potential impacts on the downstream mangroves which
provide habitats for fish. Such impacts may result from potential changes in the flow regime due to flood regulation by reservoir.

Final Report Chapter 8 Environmental and Social Considerations
JICA Master Plan Study of 8-23 January 2009 Hydropower Development in Cambodia
5) #16 Middle St. Russey Chrum and #23 Upper St. Russey Chrum (villages outside the planned reservoir area)
The Kaoh Pao Village belongs to the Bak Khlang Commune in Mondol Seima District and the Phum Ti Buon village and Phum Ti Pir Village belong to Dang Tong Commune in Smach Mean Chay District.
Dang Tong Commune is regarded in the Seila village database as an urbanized area. There are residential areas of Muslim families in the Phum Ti Buon village. Many people are not engaged in agriculture. Fishing is popular since the sea is very close. Most households already have electricity. Household ratio with TV sets is very high. The electricity cost is at a reasonable level compared with the other target villages. Habit of waste disposal to the river is not appropriate. People are positive on hydropower project. People are not aware of the natural environment.
8.2 ENVIRONMENTAL CONSIDERATIONS
Environmental aspects of the potential hydropower sites were analyzed using two approaches: 1) questionnaire survey to sample households and 2) GIS-based analysis using relevant geospatial data. For the first approach, questions related to environmental aspects were also included and the results are presented in Section 8.1. Section 8.2 presents the GIS-based geospatial analysis along with some inputs from the field observation and study on existing documents and information.
8.2.1 Protected Areas
(1) Introduction
All, but one, promising hydropower sites selected during this study were concentrated in the northeast and southwest region of the country. These regions present mountainous topography with considerable amount of rainfall, both of which are essential conditions for hydropower. Again, being mountainous, most of the protected areas and wildlife sanctuaries in Cambodia are also concentrated in these regions (Figure 8.2.1). Thus, there is a natural conflict of interest between the development of hydropower resources and environmental conservation of the protected areas. In this connection an attempt was made to analyze the extent of such environmental impacts and possible mitigation options and plans.
(2) Present Situation
There are 33 different types of protected areas (Table 8.2.1) proclaimed in the country. The total area amounts to 46,560 km2, which is approximately 25.72% of the total area of Cambodia (181,035 sq. km.1). Having this large share of the protected areas, it reflects a promising situation for the protection of flora
1 http://www.cambodia.gov.kh/unisql1/egov/english/home.view.html

Final Report Chapter 8 Environmental and Social Considerations
JICA Master Plan Study of 8-24 January 2009 Hydropower Development in Cambodia
and fauna and is very beneficial for the environmental protection of the country. Furthermore, official figures show that the country has 53% of its area under forest classification1 and most of the protected areas (except a few such as Tonle Sap) are part of it. Thus, proclaiming these protected areas had much favorable impact in conserving the natural environment. However, there is a considerable degree of work to be done to enforce such proclamation. In the recent past, after achieving political stability in the country, efforts had been made through national and international collaboration in this field, specifically through the Ministry of Environment (MOE). According to the MOE, the main achievements are a formulation of the 1) zoning concept and 2) laws and regulations for the protection of proclaimed protected areas. Although certain progress had been made, implementation and enforcement of such activities were not easy.
Source: Study Team
Figure 8.2.1 Distribution of Protected Areas and Potential Hydropower Sites
A law for the protection and utilization of natural resources available in such protected areas was passed at the national assembly in December 2007. The MOE is now preparing the strategies and other necessary measures to enforce these laws. One of the most demanding work is the zoning of the protected area. The MOE had already defined such zoning along with preliminary demarcations of some areas. There are four categories of zoning defined for the protected areas as listed below:
Core zone (Strict): Core area to be maintained for the health of the protected area
Zoning under study

Final Report Chapter 8 Environmental and Social Considerations
JICA Master Plan Study of 8-25 January 2009 Hydropower Development in Cambodia
Conservation zone: Second tier sensitive area. Proper environmental assessment is required before any change in the existing landscape and land cover
Sustainable use zone (Development): Area can be used for development but with due consideration and respect to the existing surrounding environment. This zone is also termed as CPA (Community Protected Area).
Community zone (Local Community): the zone is used by the local community based on their judgment that best serves the community as well as the protected area.
According to the MOE, due to the financial constraints, there was no clear schedule to zone all the protected areas. With some support from donor agencies and some international NGOs, zoning of a few protected areas had been studied recently. Among the protected areas, the National Parks and Wildlife Conservation areas had been given more priority for the zoning. For example, two wildlife conversation areas, Phnom Samkos and Phnom Aural (marked in Figure 8.2.1) had been studied for zoning, under the “Cardamom Mountain Wildlife Sanctuary Project” jointly by the MIS-GIS office and FFI (Fauna and Flora International). It had been learned that there were 6 to 12 other protected areas where some level of zoning study had been done. However, these areas had not been officially published since the necessary law/sub-decree had not been enacted yet. The law/sub-decree is still under consideration by the authorities concerned. Zoning is crucial in taking any decision on development projects located inside or on the border of the protected areas, such as hydropower.

Final Report Chapter 8 Environmental and Social Considerations
JICA Master Plan Study of 8-26 January 2009 Hydropower Development in Cambodia
Table 8.2.1 Types and Area of Protected Areas in Cambodia
S. No. Name Status(Type)
Area(ha.) S. No. Name Status
(Type)Area(ha.)
1 Ang TrapengThmor 10 12,905.81 18 Phnom Nam Lyr 12 53,832.51
2 Angkor 13 13,518.11 19 Phnom Prich 12 221,818.393 Banteay Chhmar 13 81,897.05 20 Phnom Samkos 12 330,793.374 Beng Per 12 249,407.59 21 Preah Vihear 13 4,844.615 Botum Sakor 11 182,584.96 22 Preah Vihear_dfw 9 190,028.486 Cardamom 8 401,310.81 23 Ream 11 14,676.487 Dong Peng 14 28,968.27 24 Roniem Daun Sam I 12 16,565.758 Kbal Chay 8 6,356.07 25 Roniem Daun Sam II 12 21,268.259 Kep 11 6,663.96 26 Roniem Daun sam III 12 2,100.00
10 Kirirom 11 28,374.69 27 Samlaut 14 59,916.4811 Kulen Promtep 12 406,759.25 28 Snoul 12 74,360.8912 Lomphat 12 251,468.06 29 Snoul_dfw 9 297,915.8013 Mondul Kirri 9 429,437.24 30 SWEC 6 144,275.2114 Peam Krasop 12 24,590.55 31 Ta Moa 7 2,384.4715 Phnom Aural 12 256,737.06 32 Tonle Sap 14 322,269.6416 Phnom Bokor 11 142,316.56 33 Virachey 11 338,056.6517 Phnom Kulen 11 37,608.17 4,656,011.19Total
Protected Areas Status Description6: South West Elephant Corridor (SWEC), 7: Zoo, 8: Watersheds Protection, 9: Bio-DiversityConservation, 10: Water Birds Conservation, 11: National Park, 12: Wildlife Conservation, 13:Protected Landscape, 14: Multiple Purpose Source: Study Team
Besides the questionnaire survey, the study team (which included various experts such as a civil engineer, hydrologist, geologist, sociologist, GIS/natural environmentalist and others) had several multipurpose field visits to observe the present site conditions of the forests and protected areas in and around potential hydropower sites, along with the primary objective of formulation of a hydropower master plan. Specifically, a team composed of a sociologist and a GIS/natural environmentalist visited potential hydropower sites such as Stung Metoek II (Project Site #20) that lies inside the Wildlife Conservation “Phnom Samkos” Protected Area, and Bokor Plateau (Project Site #29) that lies inside National Park “Phnom Bokor” Protected Area. Based on these two ground observations and information from questionnaires survey, the following can be summarized with viewpoints of observation of general landscape, general socioeconomic activities related to environment, and general environmental issues, with the perspective of the development of a hydropower project:
In general, exploitation activities of agricultural land along with deforestation can be observed at several places including those around and inside defined protected areas and national parks. However, the degrees of such activities vary from mild to severe. For example, Bokor Plateau (Site #29) can be categorized as mild while that of Stung Metoek II (site #20) is severe.
Tree trimming is going on in many areas in Pursat Province, which holds several potential hydropower sites. It can be inferred that inappropriate use of natural resources and mismanagement of cleared land were widespread.

Final Report Chapter 8 Environmental and Social Considerations
JICA Master Plan Study of 8-27 January 2009 Hydropower Development in Cambodia
Slash and burn agricultural activities, specifically for growing rainfed paddies, are still being practiced in and around Stung Metoek II (site #20).
In some cases like Bokor Plateau (Site #29), there were signs of forest regeneration but most of it were natural forest without any re-plantation. Most of the deforested areas were invaded by shrubs and grasses.
There were active infrastructure developments and restoration activities going on around the country including the area with hydropower potential.
It had been observed that there was plenty of water during the rainy season, but in the dry season, many rivulets and rivers went dry. Such situation comes from the climate conditions in the southwest region where only one rainy season is created by southwest monsoon. Dry season starts from November and continues until next April, resulting decreased or dried river conditions. It had been reported that some communes (Thma Da for example) experienced flash floods during the rainy season but people had to expend considerable time to fetch water during the dry season.
It had been learned that RGC is not fully aware of integrated watershed management.
Government agencies responsible for agriculture, forestry and environment should advise and educate the people on the sustainable use of natural resources. The presence of the Ministry of Environment at some places, however, was not effective as it should be.
Hunting of wildlife, specifically wild deer, wild boars and monkeys, was observed in some areas such as Thma Da commune of #20 Stung Metoek II. Unwise fishing, for example, electric fishing, was also found.
Some of the area needs active reforestation
(3) Possible Impacts from Hydropower Development
As explained before, the ten prioritized hydropower project sites fall inside the six basins. Most of them are inside the protected areas, partially or fully (Figure 8.2.1). It was obvious that there will be some degree of adverse impacts as well as beneficial impacts on the protected areas. Some of the issues are summarized below:
According to the land use map, almost all potential hydropower sites are dominated with land cover types of forest, shrubland, and grassland. However, in reality, things are a bit different. For example, most of the envisaged reservoir areas of sites #20 (Stung Metoek II) and #29 (Bokor Plateau) had already been deforested. Furthermore, deforested lands in site #20 are in fact mostly dominated by slash and burn type of agriculture with temporary land rights (lease for 5 years).

Final Report Chapter 8 Environmental and Social Considerations
JICA Master Plan Study of 8-28 January 2009 Hydropower Development in Cambodia
It can be said that most of the proposed reservoir area is dominated by bushes and grass, thus environmental damage will be minimal.
Riverine forests along several small channels will be under water if the project pushes through.
The reservoir will have water for the survival of aquatic life as well as wild animals and birds from the surrounding reserves and national parks. However, it will alter the downstream river flow, which might have some degree of adverse impact on aquatic life.
Some forest areas will be submerged in the reservoir, displacing the flora and fauna.
Although it was not confirmed, some endangered species might be in the area and need to be checked and verified by the authorities concerned.
(4) Possible Mitigation
The nine prioritized project sites namely Prek Liang I and II, Middle St. Russey Chrum, Upper St. Russey Chrum, St. Metoek II, St. Metoek III, Lower Sre Pok II + Lower Se San II, and Bokor Plateau are located in the six basins as mentioned earlier. Prior to the examination of the mitigation plans, it was necessary to see their geophysical location and their area extent with respect to the protected areas. Table 8.2.2 shows the extent (area) of reservoir of the potential hydropower sites situated inside the protected areas. The bold characters indicate the selected seven master plan projects. It can be seen that of the ten prioritized sites, all are inside the protected area except for #7&8 Lower Sre Pok II + Lower Se San II, which is almost completely outside (only 0.6% are inside).

Final Report Chapter 8 Environmental and Social Considerations
JICA Master Plan Study of 8-29 January 2009 Hydropower Development in Cambodia
Table 8.2.2 Geophysical Location and Area Extent of Potential Hydropower Sites in Relation of Protected Areas.
IDs Name
TotalReservoir
Area(sq. km.)
Name Status(Type)
Snoul 12 142.45Snoul_dfw 9 5,579.00
3 Prek Ter III 178.79 - - - - -4 Prek Ter II 101.55 Phnom Prich 12 1,901.61 1,901.61 18.75 Sre Pok IV 52.62 Mondul Kirri 9 5,242.70 5,242.70 99.6
Phnom Nam Lyr 12 0.71Mondul Kirri 9 1,150.55
7 Lower Sre Pok II + Lower Se San 355.14 Lomphat 12 210.68 210.68 0.610 Se Kong 117.11 Virachey 11 495.57 495.57 4.211 Lower Se San III 460.68 Virachey 11 1,527.06 1,527.06 3.312 Prek Liang I 7.15 Virachey 11 715.39 715.39 100.014 Prek Liang II 14.16 Virachey 11 1,415.82 1,415.82 100.0
Lomphat 12 43,243.49Mondul Kirri 9 21,455.52
16 Middle St. Russey Chrum 22.59 Cardamom 8 2,258.87 2,258.87 100.017 Stung Chhay Areng 135.10 Cardamom 8 4,754.16 4,754.16 35.218 Stung Tatay 47.06 Cardamom 8 2,909.72 2,909.72 61.819 Stung Metoek I 4.60 Phnom Samkos 12 460.23 460.23 100.020 Stung Metoek II 20.22 Phnom Samkos 12 2,021.68 2,021.68 100.021 Stung Metoek III 11.20 Phnom Samkos 12 1,120.13 1,120.13 100.0
Stung Kep II-B 5.23 SWEC 6 347.98Stung Kep II-A 2.32 SWEC 6 42.95
23 Upper St. Russey Chrum 4.45 Cardamom 8 445.28 445.28 100.0Phnom Samkos 12 6,448.08Cardamom 8 83.76
25 Stung Pursat II 24.75 Cardamom 8 1,426.89 1,426.89 57.726 Stung Sen 939.40 Beng Per 12 2,105.11 2,105.11 2.227 Stung Battanmbang II 39.67 Phnom Samkos 12 3,967.49 3,967.49 100.028 Stung Battanmbang I 132.30 Phnom Samkos 12 96.73 96.73 0.7
Bokor Plateao 1.84 Phnom Bokor 11 184.37Bokor Plateao-B 0.09 Phnom Bokor 11 9.13
Project Site # 13 "Prek Liang IA" is runoff type, thus there in no reservoir
ReservoirArea InsideReserve (ha)
TotalReservoir
Area InsideReserve
(ha)
% ofReservoir
Area InsideReserve
6: South West Elephant Corridor (SWEC), 7: Zoo, 8: Watersheds Protection, 9: Bio-Diversity Conservation, 10: WaterBirds Conservation, 11: National Park, 12: Wildlife Conservation, 13: Protected Landscape, 14: Multiple Purpose
Protected Areas Status Description
193.50
98.4
100.0
91.2
51.8
64.3
100.0
5,721.46
1,151.26
64,699.01
6,531.84
390.9422
29
6 Prek Por I
Lower Sre Pok III15
24
Protected Areas
2 Prek Chhlong II
Potential Hydropower
58.12
11.51
709.78
Stung Pursat I 101.54
Source: Study Team
The simple illustration presented above of the area extent of hydropower projects shows a gloomy picture, but there is another side of the story. If the area extent of potential hydropower and protected area of Table 8.2.2 are swapped, Table 8.2.3 will result, showing that the extended protected areas will be under the reservoir, in the case that all 29 projects push through. The bold characters indicate the selected seven master plan projects. In such a case, only less than 5% (in aggregated form) of the protected areas will be affected except for two cases: Lomphat and Mondul Kiri. In the case of implementing only the ten prioritized projects, then these two areas will also be under less than 5%.

Final Report Chapter 8 Environmental and Social Considerations
JICA Master Plan Study of 8-30 January 2009 Hydropower Development in Cambodia
Table 8.2.3 Geophysical Location and Area Extent of Protected Areas in Relation of Potential Hydropower Sites Potential Hydropower
Name Status(Type)
TotalReserve
Area (ha)IDs Name
- - 3 Prek Ter III - -Beng Per 12 249,407.59 26 Stung Sen 2,105.11 2,105.11 0.84
16 Middle St. Russey Chrum 2,258.8717 Stung Chhay Areng 4,754.1618 Stung Tatay 2,909.7223 Upper St. Russey Chrum 445.2824 Stung Pursat I 83.7625 Stung Pursat II 1,426.89
7 Lower Sre Pok II+ Lower Se San II 210.68
15 Lower Sre Pok III 43,243.495 Sre Pok IV 5,242.706 Prek Por I 1,150.55
15 Lower Sre Pok III 21,455.52Bokor Plateao 184.37Bokor Plateao-B 9.13
Phnom Nam Lyr 12 53,832.51 6 Prek Por I 0.71 0.71 0.00Phnom Prich 12 221,818.39 4 Prek Ter II 1,901.61 1,901.61 0.86
19 Stung Metoek I 460.2320 Stung Metoek II 2,021.6821 Stung Metoek III 1,120.1324 Stung Pursat I 6,448.0827 Stung Battanmbang II 3,967.4928 Stung Battanmbang I 96.73
Snoul 12 74,360.89 2 Prek Chhlong II 142.45 142.45 0.19Snoul_dfw 9 297,915.80 2 Prek Chhlong II 5,579.00 5,579.00 1.87
Stung Kep II-B 347.98Stung Kep II-A 42.95
10 Se Kong 495.5711 Lower Se San III 1,527.0612 Prek Liang I 715.3914 Prek Liang II 1,415.82
11
12Phnom Samkos
SWEC 6
6: South West Elephant Corridor (SWEC), 7: Zoo, 8: Watersheds Protection, 9: Bio-Diversity Conservation, 10:Water Birds Conservation, 11: National Park, 12: Wildlife Conservation, 13: Protected Landscape, 14: Multiple
Project Site # 13 "Prek Liang IA" is runoff type, thus there in no reservoir
401,310.81
251,468.06
429,437.24
330,793.37
338,056.65
144,275.21
142,316.56
Cardamom
ReservoirArea InsideReserve (ha)
29
22
Protected Areas Status Description
8
12Lomphat
Mondul Kirri 9
Phnom Bokor
% ofReserve
Area InsideReservoir
4,153.85
2.96
17.28
6.48
0.14
4.27
0.27
1.23Virachey 11
Protected Areas TotalReserve Area
InsideReservoir
(ha)
11,878.67
43,454.17
27,848.77
193.50
14,114.34
390.94
Source: Study Team
This analysis shows that the adverse impact is not very severe unless a reservoir falls inside the “core zone” and “ecologically sensitive” areas. To see such impact, zoning of the protected areas is essential.
As an example, an environmental and socioeconomic damage mitigation plan was formulated for Site No. 7 & 8. At the full supply level, the total size of the reservoir will be 355.14 km2, which comprises the categories of land use/land cover as shown in Tables 8.2.4 and 8.2.5. These land uses/covers may have adverse impacts on the socio-economy (agricultural lands) and natural environment (forest).

Final Report Chapter 8 Environmental and Social Considerations
JICA Master Plan Study of 8-31 January 2009 Hydropower Development in Cambodia
Table 8.2.4 Types of Land Use/Land Cover Considered for Mitigation Plan
Deciduous forestEvergreen broad leafed forest
Mixed forest from evergreen and deciduous speciesRiparian forest
Forest1
Source: Study Team
Based on the table above on the land use/land cover definition, the total area of forest land is 284.86 km2. In order to compensate or substitute the CO2 sink capacity of the forest submerged, it would be required to make reforestation by planting trees for pulp etc. in an area corresponding to about 22%2 or 6.270 ha. After reviewing the available land use/land cover categories, the following types enumerated in Table 8.2.6 can be taken as candidates for such replacement.
Table 8.2.5 Potential Land Use/Land Cover Categories for Reforestation
Land use Categories Used for Available Land for Replacement or Substiturion1 Swidden agriculture (Slash and burn)2 Bamboo and Secondary forests3 Dry Deciduous (Open) forest4 Grassland (undifferentiated)5 Woodland and scattered trees (C < 10%)6 Barren land7 Grass Savannah8 Shrubland (undifferentiated)
Source: Study Team
In order to find the suitable land area for reforestation, a buffer zone was drawn around the reservoir. The area of buffer zone by distance from the reservoir edge is presented in Table 8.2.7. After evaluating the land use/land cover types of each buffer zone, the available land area, which is suitable for reforestation was calculated and is presented in Table 8.2.8.
2 The unit CO2 sink capacity of tropical rainforest in Cambodia is estimated at 5.19トン-CO2/ha/yr. On the other hand, the
unit production of pulp tree or fuel tree for biomass gasification is estimated at 10 dry ton/ha/yr. Its CO2-fixing capacity will then be calculated as 10 x 1.37 (adjustment for biomass belowground) x 0.47 (Carbon content) x (44/12) = 23.6 ton-CO2/ha/yr。Accordingly, the required land area for reforestation will be 5.19 / 23.6 = 1 / 4.55 = 22%. That is, if we plant pulp tress on the land corresponding to 22% of the forest land submerged, we can substitute the CO2-sink capacity of the forest.

Final Report Chapter 8 Environmental and Social Considerations
JICA Master Plan Study of 8-32 January 2009 Hydropower Development in Cambodia
Table 8.2.6 Land Area of Buffer Zone Table 8.2.7 Available Land for Reforestation BufferZone(km)
DescriptionArea
(km2.)
CumulativeArea
(sq.km.)Reservoir Land area to be
reforested 62.7
2.5 28.4 28.45 23.8 52.2
10 78.9 131.115 87.3 218.320 174.5 392.825 178.4 571.230 243.3 814.5
Available landarea for
reforestation
Source: Study Team Source: Study Team
The distribution of such land is illustrated in Figure 8.2.2.
Source: Study Team
Figure 8.2.2 Buffer Zone and Distribution of Potential Lands for Proposed Reforestation
8.2.2 Forest and Biodiversity
(1) Forest
According to the land use/land cover map prepared in 2002 (extracting and compiling land use from various data starting as early as 1992 to 2002), forest covers more than 53% of the total land area of Cambodia followed by agricultural lands with nearly 23%. Figure 8.2.3 shows the land use/land cover
S.No. Distance (km) Area (sq.km.)1 Reservoir 355.142 Reservoir Edge to 2.5 605.563 2.5 to 5 443.254 5 to 10 843.725 10 to 15 981.556 15 to 20 1,133.007 20 to 25 1,287.228 25 to 30 1,442.75

Final Report Chapter 8 Environmental and Social Considerations
JICA Master Plan Study of 8-33 January 2009 Hydropower Development in Cambodia
distribution in Cambodia. It may be observed that most of the forests are found in the northeast and southwest of the country where most of the potential hydropower sites are located.
There is a difference between the officially proclaimed forest area and actual forest area measured by the Study Team on digital maps. It is a well known fact that Cambodia has one of the worst deforestation rates, which are still going on in one form or the other. The forest cover map presented earlier does not precisely show the actual forest area but rather the official figures. The dense or primary forest is much less, probably it does not reach double digit percentage figure, and most of the areas are either open forest or shrubs and bushes. Furthermore, some of the highlands and plateaus are covered with savanna type grasses.
Cambodia has a tropical monsoon climate, which, along with local geophysical conditions, determines the type of forest in the country. The densest rainforests are found in the mountains and along the southwestern areas, while highlands and plateaus contain savanna type grasses. In qualitative forest type terms, Cambodian forests may be classified as 1) evergreen forest, 2) deciduous forest, 3) hill evergreen forest, and 4) swamp forest. The evergreen forest can be further divided into two sub-types: i) dry evergreen forest, and ii) secondary evergreen forest. Similarly, the deciduous forest can be divided into i) deciduous dipterocarp forest, and ii) a mixed deciduous forest. There are some pine trees found mixed with other types of forests in higher altitude areas.
Source: MOPWT
Figure 8.2.3 Major Land Use/Land Cover Distribution in Cambodia

Final Report Chapter 8 Environmental and Social Considerations
JICA Master Plan Study of 8-34 January 2009 Hydropower Development in Cambodia
(2) Biodiversity
Sitting in the tropical monsoon climatic zone, Cambodia has a rich biodiversity with several indigenous flora and fauna. For many species, Cambodia might reportedly be the last refuge. Of these, there are several kinds of plant and animal species. The wild animals would include large mammals such as elephants, deer, wild oxen, panthers, bears, and tigers; several types of birds that includes cormorants, cranes, parrots, pheasants, and wild ducks; reptiles such as numerous poisonous snakes, frogs, turtles; several kinds of fishes and insects.
As mentioned earlier, ten prioritized potential hydropower sites lie in two prominent regions; northeast and southwest of the country. For example, Cardamom mountain forest (southwest region) hosts prioritized project sites of Middle and Upper Stung Russey Chrum, Stung Metoek II and III, and Stung Kep II (New Tatay). In the other region, Prek Liang I, II sites lie in Virachey National Park forest (northeast region). The flora and fauna of Cambodia as a whole have more or less many similarities and are found in respective regions. However, there are some degrees of different types in the northeast and southwest regions. Thus, it would be appropriate to summarize the biodiversity on these two representative forests/natural reserves.
(3) Virachey National Park (Prek Liang I, II)
The Virachey National Park (VNP) and surrounding forests are located near the border of Lao, Viet Nam and Cambodia. The high altitude and rugged terrain make accessibility for human activities somewhat difficult, which in return, become a favorable condition for flora and fauna. It is still very common to find some of the undisturbed natural forest covers in the area. Mountainous topography and wet climate (due to the two rainy seasons in these areas) give favorable environment for many species of plants and mammals, birds, reptiles and insects. Furthermore, the relatively dense network of perennial rivers and rivulets is favorable for several kinds of fish and amphibious animals. Geophysical conditions of the area are suitable, thus provide breeding ground for several species. Given the conditions of appropriate protection and scientifically devised sustainable use of the forest resources of the area, it could become one of the valuable areas for the protection of several endangered species of flora and fauna.
Realizing the importance of the forest resources of the area, the government of Cambodia had created VNP under the Royal Decree for creation and designation of the Protected Areas, enforced on 1st November 1993. VNP is managed by the Ministry of Environment. VNP would be one of the top priority areas for conservation in Southeast Asia. The streams from the mountains of Virachey National Park contribute to the low flow of the Mekong River during the dry season, being blessed by the northwest monsoon that prevails in the northeast of Cambodia and adjacent Vietnam from November to January.
Since 2000, the World Bank finances “Biodiversity and Protected Area Management Project (BPAMP)” within the Virachey National Park. This project aims at improving the capabilities of staff in the Ministry of Environment to plan, implement and effectively monitor the protected areas. This includes

Final Report Chapter 8 Environmental and Social Considerations
JICA Master Plan Study of 8-35 January 2009 Hydropower Development in Cambodia
developing and testing proactive measures in order to minimize unsustainable exploitation and degradation of the biodiversity of national and global significance in the Virachey National Park. There are four components: 1) national policy and capacity building, 2) park protection and management, 3) community development, and 4) project management. The extension of this conservation project (2008-2012) will soon be approved by the World Bank.
1) Major Type of Fauna
There had been some studies in the past about the fauna of the VNP, which however may not be claimed as systematic. Previous surveys and studies indicate that there may be as many as 156 vertebrate species in the park area. Of these, 43 are of international significance. Some of the bovids, cats, small carnivores and primates are listed as endangered. Globally threatened primate species can be found in the Virachey National Park. These include slow loris, pygmy loris, pig-tailed macaque, long-tailed macaque, douc langur and yellow-cheeked crested gibbon. Key species of particular concern include elephant, tiger, gaur and banteng (BPAMP, 2007).
It is estimated that as many as 100 bird species of international significance are present in VNP and surrounding forest areas. This area is one of the two areas in Cambodia known to support Germain’s Peacock Pheasant, a restricted-range species. In addition, the park is refuge to a number of globally threatened and near-threatened species, including Siamese sireback, red-collared woodpecker and great hornbill (BPAMP, 2005). A number of significant records had been found (Mlicovsky, 1999), including three species recorded for the first time in Cambodia: White browed Piculet Sasia ochracea, Eurasian Woodcock Scolopax rusticola, and Japanese Paradise-flycatcher Terpsiphone atrocaudata.
The aquatic environment in the Virachey National Park is a suitable place for fresh water crocodile, otters, and freshwater tortoise. Some fish species are of conservation significance. As an example, Emmett (Emmett, 2006) surveyed some rivers in the area in 2006 and listed about 30 fish species. These include among others Osphronemus exodon, Raiamas guttatus, Xenentodon cancila, Barbodes schwanefeldi, Hypsibarbus sp. Cf. vernayi, Parambassis apogonoides, Annamia normani, Mystus albolineatus.
2) Major Type of Flora
Dense semi-evergreen lowland and montane (low mountain) forests, upland savannahs, bamboo thickets and occasional patches of mixed deciduous forests dominate the vegetation of forests in and around Virachey National Park. Hills and low mountains dominate the topography of the area, with most areas lying higher than 400 masl, and elevations reaching over 1,500 masl along the borders of Lao and Vietnam. Grassland and scrubland formations are found in isolated areas and marshes as well.
The literature describes two broad vegetation formations for Virachey National Park. Two vegetation formations are found in seven landscapes, each with its own predominant vegetation (BPAMP, 2005):
Humid medium elevation formations (above 600 masl) with montane slopes and montane peneplain

Final Report Chapter 8 Environmental and Social Considerations
JICA Master Plan Study of 8-36 January 2009 Hydropower Development in Cambodia
Humid low elevation formations with middle valley reaches, valley floors, western lowland, isolated granite outcrops and wetlands
The indigenous local community collects forest products for self-consumption and for selling as well. Among the commercial/human consumption value, more than 60 species of wild edible vegetable, 30 species of wild edible fruits, 3 kinds of dry and oil resin, rattan and bamboo can be listed (BPAMP, 2000).
(4) Cardamom Mountain Forest and Protected Areas (Middle Stung Russey Chrum, Upper Stung Russey Chrum, Stung Metoek II, Stung Metoek III, New Tatay)
Cardamom mountain is one of the important rainforest areas of the country, hosting three protected areas adjacent to each other, namely Phnom Samkos, Central Cardamom and Phnom Aural. The Cardamom protected area was gazetted in 2002 and had a formally demarcated boundary. It is managed by the Cardamoms Conservation Program, which is a partnership between Conservation International (CI) and the Forestry Administration (FA) of RGC. The area has now been designated as ‘protected forest’ and all logging concessions have been cancelled within its boundaries. The area is covered with evergreen forest, dry dipterocarp forest, pine forest, grasslands, and wetland habitats, with an elevation range of approximately 50–1,500 masl. This area contains a wide variety of lowland and mid-altitude habitats surrounding a core central plateau, of which about 60,000 hectares have an elevation over 1,000 masl (Emmett and Olson, 2005).
The area has been recognized as an internationally important region for biodiversity conservation. With limited resources and technical know-how, but with collaboration from conservation organizations, studies and biological surveys have been conducted in southwest Cambodia including the following five:
A preliminary wildlife survey in the Cardamom mountains region of southwest Cambodia – FFI, 1999
Cardamom Mountains Biodiversity Survey – FFI, 2000
Social and Ecological Surveys of Phnom Aural Wildlife Sanctuary – FFI, 2002
Mini-RAP Assessment of the Silver Road Logging Concession, Cardamom Mountain Area, Cambodia – CI, 2003
Biodiversity Assessment of the Southern Cardamoms and Botum-Sakor Peninsular – WildAid, 2003
These study reports can be used as references for the details of the biodiversity of the area. For an overview, a brief introduction on flora and fauna is presented below:
1) Major Type of Fauna
The areas surveyed by CI in 2004 were found to contain a high diversity and abundance of threatened species. With the CI survey, twelve mammal species, two birds, seven reptiles, one amphibian, and one

Final Report Chapter 8 Environmental and Social Considerations
JICA Master Plan Study of 8-37 January 2009 Hydropower Development in Cambodia
fish were classified as ‘globally threatened’, and many others were classified as ‘near threatened’ or ‘data deficient.’ Potentially undescribed species were discovered, including a rodent (Rattus sp), at least one species of shrew (Crocidura sp), a snake (Oligodon sp), several frogs (e.g., Philautus sp and Polypedates sp), a skink (Scincella sp), and a caecilian (Ichthyophis sp) (Emmett and Olson, 2005).
Mammal Species
In total, approximately 79 mammal species were recorded in the Cardamom area (Emmett and Olson, 2005). Of these, twelve were classified as ‘globally threatened.’ Species such as fishing cats and otters are identified in the area and are dependant on wetland habitats which provide fishes as their main food. However, their number is dwindling dangerously. Some of the surveys show the presence of mammals like Eurasian otter Lutra lutra, Smooth-coated otter Lutrogale perspicillata, Asian small-clawed otter Aonyx cinerea, and the Hairy-nosed otter Lutra sumatrana (Daltry & Traeholt, 2003).
Wild cattle tracks were identified on the upland plateau in the pine forest, montane evergreen forest, and grassland. The gaur is vulnerable and these identifications and records are important and positive signs for the need of conservation of this specie. Elephant dung was identified in and around a large cave in the Knorgl Strol mountain area. Two species of bear inhabit this region: the Malayan Sun bear Helarctos malayanus, and the Asiatic black bear Ursus thibethanus. Both bear species are widespread in Asia, but both are threatened due to hunting and habitat loss throughout their range (Emmett and Olson, 2005) .
Large cat scats were identified in the Russey Chrum Valley. The size and consistency of the scats indicate either a leopard or a tiger. The survival of these species in the region is dependent on high levels of direct protection and improved enforcement of wildlife laws within Cambodia’s justice system. Asian golden cat and clouded leopard (vulnerable species) were recorded in fairly low numbers in the area (Emmett and Olson, 2005) .
The CI’s 2004 survey recorded two species of tree shrew, and at least eight rodents and two insectivore species. Of these, ten species are new records for the Cardamom Mountains, and six species are new records for Cambodia. Some of the rats and shrews appear to be morphologically distinct from known species and may be new to science. Several voucher specimens from the rodent genera Maxomys and Niviventer were externally different to previously recorded species for the country and may be new records for Cambodia, or even new to science. Eleven species of bats were recorded during this survey. Two species, Myotis horsfieldi and Rhinolophus lepidus, are new records for Cambodia. Both species are found throughout the Cardamom region. Another species, Rhinolophus shameli, is listed as near threatened on the IUCN list (Emmett and Olson, 2005) .
Bird Species
A total of 93 bird species were recorded in and around the Cardamom region (Emmett and Olson, 2005). Fifteen of the species represent new records for the region. Three of these represent specifically the Cardamom Mountains. The new species for the Cardamom Mountains are the Black-browed Reed Warbler, Chinese Sparrowhawk, and Common Moorhen. Additional new species for the region are the

Final Report Chapter 8 Environmental and Social Considerations
JICA Master Plan Study of 8-38 January 2009 Hydropower Development in Cambodia
Lesser Fish Eagle, Oriental Bay Owl, Black-headed Bulbul, Changeable Hawk Eagle, Common Tailorbird, Oriental Darter, Long-tailed Broadbill, Osprey, Rackettailed Treepie, Cattle Egret, Oriental Reed Warbler, and Green Imperial Pigeon. However, it is yet to be confirmed that the potential record of the White-crowned Hornbill would represent an expansion of the known distribution of this globally ’near-threatened’ species.
Reptile and Amphibian Species
The CI’s survey in 2004 recorded at least 55 reptile and 29 amphibian species (Emmett and Olson, 2005) A large number of the reptile species identified in the region were classified as ‘globally threatened.’ The Siamese crocodile, Crocodylus siamensis, is critically endangered. The elongated tortoise, Indotestudo elongate, is endangered. The Asiatic softshell turtle, Amyda cartilaginea, Asian giant pond turtle, Heosemys grandis, black marsh turtle, Siebenrockiella crassicollis, impressed tortoise, Manouria impressa, and the Asian box turtle, Cuora alboinensis, are identified in the area and classified as ‘vulnerable.’ The Asian leaf turtle, Cyclemys atripons, is ‘near threatened.’ One of the amphibian species, the spiny-breasted giant frog, Paa fasciculispina, is classified as ‘vulnerable’, and Mortensen’s frog, Rana mortenseni, is ‘near threatened.’ (Emmett and Olson, 2005) .
Fish Species
Forty-three species of fish from the 14 families (five Orders) were identified, 33 of which were newly recorded for the Cardamom Mountains. These results bring the total number of fish species recorded from drainage basin originating in the Cardamom Mountains to 54. The family Cyprinidae (carps, minnows and barbs) dominated the collections with 20 species, more than three times as many species as the next most abundant group, Balitoridae (hill stream loaches). Three or fewer species were observed in the other 12 families, with six families being represented by only one species (Anabantidae, Cobitidae, Gobiidae, Osteoglossidae, Pristolepididae, and Sisoridae). The highest priority for freshwater fish conservation in the region, and indeed in southwest Cambodia, is the endangered Asian arowana or dragon fish, Scleropages formosus, and Blackfish, Tor sp. (Emmett and Olson, 2005).
2) Major Type of Flora
The Cardamom mountain area forest and protected areas contain some of the most important hill river systems and swathes of contiguous evergreen forest in Cambodia. Deforestation in this region is occurring at a comparatively low rate and the evergreen forests appear to be in good condition. It is under favorable conditions for the other several plant species. Some of the ‘globally threatened’ plant species such as the endangered agar wood Aquilaria crassna are identified in the area (Emmett and Olson, 2005).
The lowland wetlands on the eastern side of the Areng valley and the upland marshes to the east and north of O’Som represent a significant still-water bodies in the region, both in terms of size and biological importance. These wetlands are home to the world’s largest known wild populations of critically endangered species. The wetlands biodiversity (both flora and fauna) within the Areng Valley are

Final Report Chapter 8 Environmental and Social Considerations
JICA Master Plan Study of 8-39 January 2009 Hydropower Development in Cambodia
threatened by over-fishing and conversion to agriculture. However, the upland marshes around O’Som show fewer signs of disturbance (Emmett and Olson, 2005).
(5) Overview on Envisaged Impacts on the Ecosystem
Table 8.2.8 shows the extent of reservoir areas of the selected seven potential hydropower sites falling inside the protected areas. #7&8 Lower Sre Pok II + Lower Se San II project hardly falls inside the protected areas (only 0.6% of the reservoir area located inside the protected areas). For other six projects, the whole reservoir area (100%) of each project is located inside the protected areas.
Table 8.2.8 Area Extent of Selected 7 Potential Hydropower Sites in Relation of Protected Areas
ID NameTotal
ReservoirArea (km2)
Name Status(Type)
7 Lower Sre Pok II + Lower Se Sa 355.14 Lomphat 12 210.68 210.68 0.612 Prek Liang I 7.15 Virachey 11 715.39 715.39 100.014 Prek Liang II 14.16 Virachey 11 1,415.82 1,415.82 100.016 Middle St. Russey Chrum 22.59 Cardamom 8 2,258.87 2,258.87 100.020 Stung Metoek II 20.22 Phnom Samkos 12 2,021.68 2,021.68 100.021 Stung Metoek III 11.20 Phnom Samkos 12 1,120.13 1,120.13 100.0
Bokor Plateao 1.84 Phnom Bokor 11 184.37Bokor Plateao-B 0.09 Phnom Bokor 11 9.13
6: South West Elephant Corridor (SWEC), 7: Zoo, 8: Watersheds Protection, 9: Bio-Diversity Conservation, 10: Water BirdsConservation, 11: National Park, 12: Wildlife Conservation, 13: Protected Landscape, 14: Multiple Purpose
Protected Areas Status Description
193.50
Protected AreasPotential Hydropower
29 100.0
Reservoir AreaInside Reserve(ha)
Total (ha)
% ofReservoir
Area InsideReserve
Source: Study Team
Table 8.2.9 shows the ratio of inundated area against total area of protected areas. In all protected areas, inundated area against the total area of protected area is less than 1%. This fact suggests that in case the reservoir area does not fall inside the “core zone” or “conservation zone” in the protected areas, it is possible to accept the environmental impacts by inundation. In order to evaluate the environmental impacts in more detail, zoning of the protected area is more important.
In chapter 1, Table 1.1.3 shows the area of primary forest in the envisaged reservoirs. Table 1.2.5 shows the details of land use in the envisaged reservoirs. By assuming the inundated areas of primary forest to be indices of impacts to the ecosystem, impacts are relatively high in #7&8 LL2, #16 MSRC, #20 Stung Metoek II, which have more than 1,000 ha of primary forest inundation in the reservoir. Further, by assuming the share of primary forest in the inundated area as magnitude of impacts, i.e., if the share is nearly 100%, the reservoir is located in the primary forest, and if the share is low, it means that the reservoir is situated in between the border of primary and secondary forests. It is assumed that #12 Prek Liang 1, #16 MSRC, and #23 USRC with more than 90% share are considered to be situated in the primary forest region. On the other hand, shares for #29 Bokor Plateau, #20 Stung Metoek 2, and #21 Stung Metoek 3 stays around 50%, which means that the reservoir of these projects may be situated in the mixed forest of primary and secondary forests.
It is not possible to identify the existence and magnitude of impacts on individual ecosystem in this Master Plan Study. The necessary items and check points for EIA in the next stage may be referred to the EIA guidelines which are introduced in sub-clause 9.4.2.

Final Report Chapter 8 Environmental and Social Considerations
JICA Master Plan Study of 8-40 January 2009 Hydropower Development in Cambodia
Table 8.2.9 Inundated Areas for Ongoing and MP Projects against Total Area of Protected Areas Candidate Project Site
NameStatus(Type)
TotalReserve
Area(ha)ID Name
16 Middle St. Russey Chrum 2258.8717 Stung Chhay Areng -18 Stung Tatay -23 Upper St. Russey Chrum -24 Stung Pursat I -25 Stung Pursat II -
7 Lower Sre Pok II+ Lower Se Sa 210.68
15 Lower Sre Pok III -5 Sre Pok IV -6 Prek Por I -15 Lower Sre Pok III -
Bokor Plateao 184.37Bokor Plateao-B 9.13
Phnom Nam Lyr 12 53832.51 6 Prek Por I - 0.00 0.00Phnom Prich 12 221818.39 4 Prek Ter II - 0.00 0.00
19 Stung Metoek I -20 Stung Metoek II 2021.6821 Stung Metoek III 1120.1324 Stung Pursat I -27 Stung Battanmbang II -28 Stung Battanmbang I -
Snoul 12 74360.89 2 Prek Chhlong II - 0.00 0.00Snoul_dfw 9 297915.80 2 Prek Chhlong II - 0.00 0.00
Stung Kep II-B 347.98Stung Kep II-A 42.95
10 Se Kong -11 Lower Se San III -12 Prek Liang I 715.3914 Prek Liang II 1415.82
12Phnom Samkos
SWEC 6
6: South West Elephant Corridor (SWEC), 7: Zoo, 8: Watersheds Protection, 9: Bio-Diversity Conservation, 10: Water BirdsConservation, 11: National Park, 12: Wildlife Conservation, 13: Protected Landscape, 14: Multiple Purpose
401310.81
251468.06
429437.24
330793.37
338056.65
144275.21
142316.56
Cardamom
11
Reservoir AreaInside Reserve(ha)
29
22
Protected Areas Status Description
8
12Lomphat
Mondul Kirri 9
Phnom Bokor
% ofInundation
Area againstTotal Rserve
Area
2131.21
0.56
0.08
0.00
0.14
0.95
0.27
0.63Virachey 11
Protected Area
Total ReserveArea Inside
Reserve(ha)
2258.87
210.68
0.00
193.50
3141.81
390.94
Source: Study Team
8.2.3 River Discharge
All the seven MP projects are planned with dam and reservoir.
Of these, #7&8 LL2 project located in northeastern part is a dam type hydropower development, of which power house is located just downstream of the dam. Therefore there is no river section which would have less or no flow during the power generation. In addition, though LL2 project has a wide reservoir area, the project is of run-of-river type in view of the flow regulating function. In principle, LL2 project releases the inflow as flows in, toward downstream. Therefore there would be hardly changes on the flow regime on the downstream river reaches. Warning on the water release would be required if daily peak operation causes unacceptable water level fluctuations in the downstream. The need for the warning system depends on the speed of water level fluctuation. It is necessary to examine such needs during the feasibility study. LL2 project may block the migration routes of fish, and would require mitigation measures (see No. 6 of Table 9.4.2 and sub-clause 9.4.2 (7) 3)). However, the flow regime would hardly change.

Final Report Chapter 8 Environmental and Social Considerations
JICA Master Plan Study of 8-41 January 2009 Hydropower Development in Cambodia
As for Prek Liang 1 and 2 in the northeastern part, three projects in the southwestern part (Middle Stung Russey Chrum, Stung Metoek 2 and 3), and Bokor Plateau project in the central mountains, it is expected that social impacts in downstream areas of these projects are relatively small. For the six MP projects except LL2 project, river sections between the dam and the power house will be the depleted section. As most of these depleted sections are located in the remote mountain area, there would be no social impacts expected.
8.2.4 Sediment Transport
It is needed to consider impacts on sediment transport and downstream environment. In particular, impacts such as river bank erosion due to sediment trap and reduction of agricultural production due to decrease of nutrient supply should be considered.
In this study, from a view point of Strategic Environmental Assessment (SEA), Mekong Mainstream projects with unconfirmed technical feasibility on sand flushing from the reservoir, were excluded from the list of MP projects in the preliminary examination stage. LL2 project would trap the transported sediment in the reservoir, and would cause downstream impacts. It is necessary to take care of these impacts during the feasibility study stage.
For 3 projects in the southwest area and BP in the central mountains, volume of sediment transport may remarkably change due to dam construction. This is because those areas have relatively steep topography with a lot of rainfall and thus sediment production in the areas would be high. On the other hand, it is considered that unit sediment production in the basin of three projects in the northeast area may not be so high because the rainfall in the areas is not as high as in the southwest coastal area and the central mountains.
In conducting EIA as a next step, general countermeasures against rather large amount of trapped sediment are as follows:
Sand flushing through sand gate
Dredging/sand removal from the reservoir
Bypassing sand through tunnel/channel

Final Report Chapter 9 Master Plan of Hydropower Development in Cambodia
JICA Master Plan Study of 9-1 January 2009 Hydropower Development in Cambodia
9. MASTER PLAN OF HYDROPOWER DEVELOPMENT IN CAMBODIA
9.1 PRIORITY RANKING FOR THE SELECTED 10 PROJECTS
(1) Priority Ranking
On the 10 priority projects selected in Chapter 5, hydropower development plan was formulated through field investigations and technical assessment in Chapter 6. Economic and financial analysis was made in Chapter 7, and social and natural environmental impacts were overviewed in Chapter 8. As a result of field surveys, #12 Prek Liang 1 and #13 Prek Liang 1A, which had been separately re-formulated during the first screening stage, were combined as single Prek Liang 1 project from the economic point of view. A concession agreement on the #22 New Tatay project was concluded between the government and a Chinese developer in May 2008. Therefore, the MP Study treats #22 New Tatay project as committed one hereinafter. Accordingly, the number of priority projects decreased to eight.
Of the MP candidate projects, priority ranking was made with the same manner as the first screening as described in Chapter 5, by the following five aspects comprehensive assessment. The ranking of the selected projects are shown in Table 9.1.1 with the principal features (detailed classification by aspect with rating scale and units of elements are given in Chapter 5, Table 5.2.2.)
<Technical and Economic Aspects> 1) Technical aspect 2) Economic and financial aspects
<Environmental Aspects and Speed> 3) Socioeconomic aspect 4) Environmental aspect 5) Speed of implementation
The score and ranking of each project evaluated only with Technical and Economic Aspects are shown on the first line of Table 9.1.1. In addition, the result of Five Aspects Comprehensive Assessment (FACA) including Social and Natural Environmental Aspects are shown several lines below it. Taking into account of Environmental Aspects, #20&21 Stung Metoek II & III with rather large area of reservoir goes one rank down, #16 MSRC goes two ranks up, and #29 Bokor Plateau goes one rank up. Since these projects were once selected through the first screening by FACA, there are no significant differences observed between “Technical and Economic Assessment” and “FACA”.

Final Report Chapter 9 Master Plan of Hydropower Development in Cambodia
JICA Master Plan Study of 9-2 January 2009 Hydropower Development in Cambodia
Table 9.1.1 Priority Ranking of the Candidate Hydropower Projects Weight 7 & 8 12 14 16 20 21 22 23 29
Lower SrePok II +Lower SeSan II *
Prek Liang I Prek LiangII
Middle St.RusseyChrum *
StungMetoek II
StungMetoek III
Stung KepII
Upper St.RusseyChrum *
BokorPlateau
Abbreviation LL2 PL1 PL2 MSRC MTK2 MTK3 KP2 USRC BP
Total score of technical and economicevaluation
47.6 38.1 40.9 9.5 11.8 11.4 18.7 8.5 16.8
Rank 1 3 2 8 6 7 4 9 5
EIRR required for MP candidate projects: 10% 18.2% 18.2% 21.7% 10.1% 10.7% 11.2% 10.7% 6.4% 13.4%
EIRR value considering CDM benefit 21.6% 21.6% 25.3% 12.1% 12.8% 13.3% 13.4% 8.0% 15.7%
Five aspect comprehensive assessment (FACA) 1.000 67.9 64.3 66.8 48.2 43.8 42.0 55.6 58.5
Rank 1.000 1 3 2 6 7 8 5 4
Power Generation Features and Economic Viability Unit
Installed Capacity MW 420.0 100.0 54.0 28.0 25.0 26.0 116.0 28.0 26.0
Annual energy generation GWh 1,725 348 198 96 86 90 407 98 91
Unit generation cost Cent/kWh 4.76 6.13 4.64 11.52 10.77 10.41 9.98 16.41 9.19
FIRR % 16.5 13.1 16.8 6.4 7.0 7.3 7.8 3.5 8.6
Main Environmental ImpactsCO2 Emission Reduction(t-CO2/km2) t-CO2/km2 2,859 30,368 15,484 5,053 4,262 5,588 32,181 31,650 17,375Reservoir surface area more than 100 km2 indicated as bold km2 394 10 9 13 14 11 11 2 3
Households to be resettled more than 1,000 households indicated as bold hh 1,224 0 0 0 168 0 0 0 0
Farmlands innundated more than 1,000 ha indicated as bold ha 1,347 0 0 9 724 0 0 0 0
Source: Study Team
First of all, as a result of technical and economic evaluation, it was realized that EIRR of #23 USRC project was 6.4% at the level of MP study. Even taking account of CDM benefit, EIRR still remains at 8.0%. This value is below the opportunity cost of capital at 10% in Cambodia. The investment on this project could not be justified from the national economic point of view. Therefore, #23 USRC project is excluded from the subjects of the Master Plan Study to 2024.
(2) Updating of Scoring of FACA at Second Screening
After the first screening, the ratings of each evaluation item were updated for hydrology, geology, and environment, based on the result of the field survey.
The following geological values of evaluation were changed:
#7&8 LL2 Project: During the first screening, it was pointed out that there may be a possibility of limestone distributions in the project area. After the field survey, it appeared that the possibility of limestone distributions was low.
#29 BP Project: During the first screening, it was pointed out that there may be thick overburden distributed on a part of the potential site. After the field survey, it was considered that the possibility of thick overburden distribution was low.

Final Report Chapter 9 Master Plan of Hydropower Development in Cambodia
JICA Master Plan Study of 9-3 January 2009 Hydropower Development in Cambodia
Apart from the above, changes in project features due to minor modifications on dam site locations or layout were reflected to the evaluation values. Further, installed capacity, firm power output, and economic evaluation index are also tuned up for priority ranking.
As a result of the priority ranking, #7&8 LL2 project is top ranked at the level of technical and economic evaluation as well as at the level of FACA.
(3) Breakdown of Scores by Five Aspects
Figure 9.1.1 shows the detailed scores by five aspects. All of the top ranked three projects (#7&8 LL2, #14 PL2, #12 PL1) gain high scores in both “Technical” and “Economic and Financial” aspects. Two projects of #22 KP2 and #29 BP get evenly distributed scores for each category, and ranked at fourth and fifth. Remaining three projects (#16 MSRC, #20 MTK2, and #21 MTK3) have less scores in both “Technical” and “Economic and Financial” aspects. However, #20 MTK2, and #21 MTK3 are located in the border area with Thailand where chronic water shortage has been suffered. As both projects would jointly provide abundant water resources of 15.6 m3/s even during the dry season, it will be necessary to consider these projects as a multipurpose project jointly with water resource development.
0.0
10.0
20.0
30.0
40.0
50.0
60.0
70.0
Sco
re
7&8
LL2
12 P
L1
14 P
L2
16 M
SR
C
20 M
TK2
21 M
TK3
22 K
P2
23 U
SRC
29 B
PDetailed Scores by Five Aspects
Speed ofImplementation
Economic andFinancial Aspects
Technical Feasibility
Natural EnvironmentalImpacts
Socio-EconomicEnvironmental Impact
Figure 9.1.1 Detailed Scores by Five Aspects
(4) Existing, Committed and New Projects for Hydropower MP of Cambodia
As a result of comparisons and examinations above, seven new projects were selected as shown in Table 9.1.2 together with two existing projects and five committed projects, as the subjects for the Hydropower Master Plan toward 2024.

Final Report Chapter 9 Master Plan of Hydropower Development in Cambodia
JICA Master Plan Study of 9-4 January 2009 Hydropower Development in Cambodia
Table 9.1.2 Existing, Committed and Newly Selected Hydropower Projects of Cambodia
Basin Area AnnualRunoff
EffectiveHead
InstalledCapcity
AnnualEnergy
PlantFactor
(km2) (m3/s) (m) (MW) (GWh) -Existing hydropower stations
- Kirirom 1 Kampong Speu,Koh Kong EAC 99 373.5 12.0 48 0.46
- O Chum Ratanak Kiri EAC 23 31.0 1.0 3 0.36
122 - - 13.0 51 0.46
Committed projects for implementation (excluded from Master Plan Study)
- Kamchay Kampot MIME 710 54 122.0 193.2 498 0.30 Under construction bySinohydro, China
- Stung Atay Pursat MIME 590+567 79.2+77 181+35 120.0 572 0.55 Under construction by CYC,China
- Kirirom III Koh Kong MIME 105 4 271.0 18.0 73 0.47 CETIC, China, PPA undernegotiation
- Lower St. RusseyChrum Koh Kong MIME 1,020 57 103.0 338.0 1,019 0.35 CA with Michelle to build
until 2015 with $495.7 m.
- #22 New Tatay(former Stung Kep II) Koh Kong CHMC 1,144 69.2 185.5 246.0 858 0.40 CA with CHMC to build until
2014 with $540 m.
2,979 - - 915.2 3,020 0.38
Priority projects for Hydropower Master Plan
1 #7&8 Lower SrepokII + Lower Sesan II Stung Treng JST 48,200 1,480 25.9 420.0 1,725 0.48 Under FS by EVN, Vietnam
2 #14 Prek Liang II Ratnak Kiri JST 575 19.5 150.8 54.0 198 0.42 -
3 #12 Prek Liang I Ratnak Kiri JST 839 28.5 178.4 100.0 348 0.40 -
4 #29 Bokor Plateau Kampot JST 24.5 1.80 911.7 26.0 91 0.41
5 #16 Middle St. RusseyChrum Koh Kong JST 461 16.4 224.0 28.0 96 0.40 LOP on Pre-FS with KTC,
Korea
6 #20 Stung Metoek II Koh Kong JST 416 17.0 88.1 25.0 86 0.40 -
7 #21 Stung Metoek III Koh Kong JST 656 27.7 55.7 26.0 90 0.40 -
51,172 - - 679 2,634 0.45
54,272 - - 1,607.2 5,705 0.41Total
Sub-total 3
SourcePriorityRank Project Province Remarks
Sub-total 1
Sub-total 2
Source: Study Team
The seven projects have a total installed capacity of 679 MW and a total annual energy of 2,634 GWh.
(5) Economic Performance of MP Projects
Table 9.1.3 presents principal features of power generation and economic indicators of the seven priority projects of the Hydropower Master Plan. The total construction costs of the seven projects are estimated at $1,138 million. Weighted average of kW construction cost is $1,680 and weighted average of kWh cost is 7.26 cent.

Final Report Chapter 9 Master Plan of Hydropower Development in Cambodia
JICA Master Plan Study of 9-5 January 2009 Hydropower Development in Cambodia
Table 9.1.3 Economy of Hydropower MP Projects
InstalledCapcity
AnnualEnergy
Annualreduction of
CO2
Construc-tion Cost kW Cost kWh Cost EIRR FIRR EIRR with
CDM
(MW) (GWh) (1000 t-CO2) ($ m) ($/kW) (c/kWh) (%) (%) (%)
1 #7&8 Lower Sre Pok II+ Lower Se San II (LL2) 420.0 1,725 1,127 623 1,480 4.76 18.2 16.5 -
2 #14 Prek Liang II (PL2) 54.0 198 146 70 1,300 4.64 21.7 16.8 25.3
3 #12 Prek Liang I (PL1) 100.0 348 289 162 1,620 6.13 18.2 13.1 21.6
4 #29 Bokor Plateau (BP) 26.0 91 57 55 2,120 9.19 13.4 8.6 15.7
5 #16 Middle St. RusseyChrum (MSRC) 28.0 96 66 85 3,040 11.52 10.1 6.4 -
6 #20 Stung Metoek II(MTK2) 25.0 86 60 71 2,840 10.77 10.7 7.0 -
7 #21 Stung Metoek III(MTK3) 26.0 90 64 72 2,770 10.41 11.2 7.3 -
679 2,634 1,809 1,138 2,170 8.20 14.8 10.8 20.9
1,680 7.26
8 #23 Upper St. RusseyChrum (USRC) 28.0 98 63 124 4,430 16.41 5.9 2.7 -
Note: CDM effect was provisionally accounted only for those having Power Density > 4 MW/km2.
No. Project
Total/Arithmetic Average
Weighted Average
Source: Study Team
(6) Overview of Foreseen Environmental Impacts of MP Projects
Of the selected seven MP projects, resettlement and inundation of farmland would take place only in #7&8 Lower Sre Pok II + Lower Se San II (LL2) project and the #20 Stung Metoek II project. As for #7&8 LL2 project, an IPP is preparing resettlement plans as part of FS-EIA after exchanging MOU with MIME. According to the hearing survey to the villagers made under the Study, villagers said “There were explanations on the dam development and resettlement from the developers, but there was no explanation from the government.” It is important for RGC to provide information on the power policy of the government, needs of the project and resettlement, planned implementation by private finance, and basic policy of the government for the resettlement compensation. As for #20 Stung Metoek II, there has been no action by the private developer since July 2007.
Four results of the preliminary study are presented below in relation to the environmental impacts of the selected seven MP projects:
Impacts on the life of rare species: No specific information was obtained from villagers on the seasonal migration of wild elephants.
Existence of heritage, nature, topography inside the proposed reservoir: There was no particular report on the heritage obtained from the hearing survey made through the sub-contractor.
Impacts of seasonal flow regulation by the reservoir on the downstream reaches: Particular impacts not foreseen (#7&8 LL2 project has small regulating capacity compared with the annual inflow. Other projects do not have villages downstream of the intake. All the projects were formulated and assessed taking into consideration the flow release for environmental management.)

Final Report Chapter 9 Master Plan of Hydropower Development in Cambodia
JICA Master Plan Study of 9-6 January 2009 Hydropower Development in Cambodia
Possibility of riverbed lowering in the downstream riverbed: There may be such possibility in #7&8 LL2 project.
#7&8 LL2 project will create a wide reservoir in the gently sloped hilly topography. It is required to carefully study and prepare mitigation measures of environmental impacts including the following:
The project is located downstream-most of hydropower stations existing on the Se San River and Sre Pok River. Its reservoir capacity is small compared with its annual inflow and, therefore, the LL2 reservoir would be operated as run-of-river scheme in principle. If hourly output control is required for semi-peak load operation, the power station would be operated in accordance with the hourly scheduled load. It is desirable to limit the semi-peak load operation to an extent that the rising speed of the downstream river water level would remain within 30 cm in 30 minutes. In case the water level rising speed exceeds the said limit by all means, it will be required to install a discharge warning system to the river stretches where such water level rising speed is forecast. The system is to avoid water related casualties to the people who may be along the river shore.
If the spillway of the project is of gated overflow type, it would inevitably incur certain risk of mal-operation of gates. If it is of non-gated free overflow type, the said risk of mal-operation can be fully avoided, however, it will require a surcharge depth above the Full Supply Level (FSL) and the reservoir would expand its area during the flooding period due to the higher flood water level. Examinations are required on the optimum type of spillway, including the combination of gated overflow and non-gated free overflow types, which can avoid the rapid fluctuation of river water level on the downstream reaches and limit the expansion of reservoir area during the flood.
If power generation of #7&8 LL2 project is stopped probably during the off-peak night time, it will be required to release 96 m3/s from the dam during the shutdown period of power generation if Japanese standard rate of environmental flow release (EFR) at 0.2 m3/s/100km2 is adopted. This amount of flow release is equivalent to about 20% of the single turbine discharge. Therefore it will be difficult to release such discharge through turbine. Accordingly, it will be important to study the required and sufficient amount of EFR and study on the need to add a small turbine generator to facilitate such EFR through turbine.
9.2 EXISTING GENERATION EXPANSION PLAN
As explained in the Sub-section 4.5.1, a current generation expansion plan has been formulated in the Master Plan 2006 (MP 2006). The MP 2006 aims at effective use of the renewable energy in Cambodia and the major hydropower projects, of which potential was verified through desk study, reconnaissance survey, or pre-feasibility study, were taken into the Expansion Plan with a priority. As a result of the study for the normal demand growth scenario, 13 hydropower projects having a total output of 1,985 MW and 5 coal-fired thermal and gas-fired combined-cycle power plants having a total output of 1,500 MW are recommended to be developed up to the year 2024. The peak demand, installed (name plate) capacity and supply capacity in the dry season of the Base Case Scenario are given in Figure 9.2.1.

Final Report Chapter 9 Master Plan of Hydropower Development in Cambodia
JICA Master Plan Study of 9-7 January 2009 Hydropower Development in Cambodia
0
1,000
2,000
3,000
4,000
2005 2010 2015 2020
Installed Capacity (MW)(Name Plate Output)Supply Capacity in Dry Season (MW)
Peak Demand (MW)
LEGEND
Figure 9.2.1 Current Generation Expansion Plan (Master Plan 2006)
Furthermore, the generation expansion plan of the MP 2006 has been reviewed by the Government and the result has been introduced in the EAC Annual Report 2006. The implementation timing and planned output of the hydropower projects in the EAC Annual Report 2006 are almost the same with the MP 2006. However, the implementation of the thermal power projects has been slightly changed:
MP 2006 EAC Annual Report 2006
coal-fired plant #1 (200 MW) coal-fired plant#1 (200 MW) combined cycle gas turbine (CCGT)
#1 (200 MW) coal-fired plant#2 (400 MW)
CCGT#2 (200 MW) CCGT#1 (450 MW) CCGT#3 (450 MW) CCGT#2 (450 MW) CCGT#4 (450 MW)
As given in Figure 9.2.1, the difference between the planned installed capacity and its expected supply capacity of the system seems to be big because of the inappropriate assessment of the possible output of hydropower plants in the dry season. Most of the proposed hydropower projects are planned as reservoir type in the present Study. In these cases, higher output in the dry season than planned in the MP 2006 will be expected, depending on the type of inflow duration curve and CIR (ratio between the reservoir capacity and annual inflow). Therefore, it is recommended to review the Generation Expansion Plan from time to time, not only based on the price trend of oil resources but also based on the

Final Report Chapter 9 Master Plan of Hydropower Development in Cambodia
JICA Master Plan Study of 9-8 January 2009 Hydropower Development in Cambodia
more in-depth study of these hydropower projects, for the least cost combination of hydropower and thermal plants to achieve economic operation of the power supply system.
The following projects out of those taken up in the MP 2006 have been proposed by the private firms and already approved by the Government by August 2008:
1) Kirirom III Hydro (18 MW, 2010)
2) Kamchay Hydro (193 MW, 2010)
3) Coal-fired Thermal Plant #1 (100 MW, 2011)
4) Stung Atay Hydro (120 MW, 2012)
5) Coal-fired Thermal Plant #2 (100 MW, 2012)
6) Lower Russey Chrum Hydro (235 MW, 2013)
7) #22 New Tatay Hydro (246 MW, 2013)
Therefore, the 7 priority projects explained in Sub-section 9.1 will be best fit to the Generation Expansion Plan, fixing the committed projects above.
9.3 HYDROPOWER EXPANSION PLAN
9.3.1 Introduction
As explained in Chapter 2, the ultimate purpose of the Study is to review and update the Generation Expansion Plan prepared in the MP 2006 with the priority projects finally selected in Sub-section 9.1. The committed hydropower projects will be constructed as scheduled according to the agreement of the Government and IPP. The demand forecasts were worked out in the MP 2006 and were the base of the existing Generation Expansion Plan. The same demand forecasts were used for updating the Generation Expansion Plan under the Study because it is very important to harmonize with the existing Expansion Plan. However, only Base and High Demand Scenarios were used in the Study because the difference between Low Demand Scenario and the actual records after preparation of the MP 2006 has become significant.
Almost all the hydropower projects in the existing Generation Expansion Plan except for the above-mentioned committed ones were also reviewed and modified and/or excluded from the candidate projects for the Study through the selection study of the priority projects due to 1) the technical difficulty not yet resolved, 2) overlapping with the other project areas, 3) low economic performance, etc. Of the projects recommended for development in the MP 2006, except for the five hydropower projects committed or under construction (as described in Section 9.1), all the projects were reviewed. Finally, the seven projects have been selected as the candidates for the Master Plan formulation.

Final Report Chapter 9 Master Plan of Hydropower Development in Cambodia
JICA Master Plan Study of 9-9 January 2009 Hydropower Development in Cambodia
In addition to using the same demand forecasts for the Study, those assumptions, conditions, criteria, etc. adopted in formulating the existing Generation Expansion Plan of the MP 2006 were also used for the Study except for the items discussed hereinafter. These common bases will be more convenient for the Cambodian side to compare the results of the two Generation Expansion Plans as well as to revise and integrate into the Generation Development Plans.
9.3.2 Dependable Output of Hydropower Stations
The purpose of formulating the Generation Expansion Plan is to make clear the need of generation development in the future in order to supply stable and dependable electricity to the customers. In general, the thermal power plants are expected to be able to provide supply capacity to the power system at its rated output throughout the year as far as enough fuel is stored, except for the period of forced outage due to faults of machines, scheduled outage for overhaul of machines or repair of the faults. On the other hand, supply capacity of the hydropower stations depends on the usable amount of water which has large seasonal fluctuation in general unless flow is seasonally regulated by reservoir. Therefore, it is a normal practice to treat the supply capacity in the driest season of the year as the dependable power of hydros which can be stably supplied throughout the year. Particularly for hydropower development with significant difference in the inflow between the rainy and dry seasons like in Cambodia, it is necessary to severely estimate the dependable output during the dry season being supported by reservoir operation, to enable stable supply of electricity to users throughout the year.
In the MP 2006, however, supply capacity of hydropower plants in the dry season were simply assumed at “26.1% of the nominal capacity” as explained in the table 3-15 and in page 3-53 of the report, and were commonly applied to all the hydropower candidates. As explained above, dependable output in the dry season depends on the dry season inflow for the run-of-river scheme, and effective storage volume of reservoir against annual inflow to the reservoir (capacity inflow ratio; CIR) for the reservoir type development, i.e., it largely depends on the regulating capacity of the reservoir. By applying reservoir operation simulation using inflow data and effective storage of the reservoir, it is possible to estimate the dependable output during the dry season with some extent of accuracy.
In the Study, the primary energy (firm energy) is used for calculation of dependable output in the dry season, which is generated throughout the year by output having 95% of probability and is usually indicated in the study reports on hydropower projects. The output having 95% of supply probability throughout the year is calculated from the annual inflow duration curve for a run-of-river type and from the results of reservoir operation simulation study for a reservoir type. For the committed hydropower projects, as far as the primary energy or dependable output in the dry season is clearly mentioned in the reference report such value was adopted.
Installed capacity, annual energy, firm energy and available energy in the dry season of hydropower projects are summarized in Table 9.3.1 for formulating Generation Expansion Plan in the Study. The available energy in the dry season is used for verifying the energy balance of the power supply system in the dry season after formulation of the Generation Expansion Plan.

Final Report Chapter 9 Master Plan of Hydropower Development in Cambodia
JICA Master Plan Study of 9-10 January 2009 Hydropower Development in Cambodia
Table 9.3.1 Installed Capacity and Generated Energy of Hydropower Projects Installed Annual Firm In Dry
Hydropower Projects Capacity Energy Energy Season(MW) (GWh) (GWh) (GWh)
Committed Projects1 Kamchay 193 498 n.a n.a2 Kirirom III 18 76 n.a n.a3 Stung Atay 120 306 186 1084 Lower Russei Chrum 235 805 449 n.a5 New Tatay 246 858 333 n.a
Total 812 2,543 - -Priority Projects selected under the Study
1 Lower Se San & Sre Pok 2 420 1,725 480 2312 Prek Liang 1 100 348 217 1123 Prek Liang 2 54 198 107 544 Bokor Plateau 26 91 65 325 Stung Metoek II 25 86 58 306 Stung Metoek III 26 90 58 307 Lower Stung Russei Chrum 28 96 64 33
Total 679 2,634 1,049 522 Source: Study Team
Typical daily load curves of the Phnom Penh system are given on Figure 9.3.1 of which original hourly outputs of power plants including those of IPP have been recorded by the Load Dispatching Center of EDC. Each daily load curve is of the day when monthly maximum peak demand was recorded. As shown on the figure, it is clear that the former night peak type has been shifted to the day peak type. In future, day time demand will increase at higher speed than that of the night time demand. It is expected that the day time peak will become more sharp. The trend of daily load curve having day peak will be not affected, even though the Grid is extended along with the transmission extension and presently isolated power supply systems are integrated to the Grid, because the demand of Phnom Penh areas is much bigger than those of the isolated systems.
The priority hydropower projects selected under the Study will be commissioned and available for the power system operation only after 2015 because of the lead time for feasibility study, detailed design, tendering, and construction. The day time demand is supposed to become more sharp by that time. Therefore, the supply capacity in the dry season of each hydropower project is calculated and applied to the formulation of the Generation Expansion Plan in the Study under the assumption of 9.6 hours operation per day (40% of a day) by using available water in the dry season (firm energy in the dry season). For the committed hydropower projects, as far as a firm energy is presented in their related survey and/or study reports, the same criterion is applied. The same criteria of the MP 2006, 26.1% of the nominal output of power plant is applied when no certain information on the firm energy is available.
0.0
50.0
100.0
150.0
200.0
250.0
1 3 5 7 9 11 13 15 17 19 21 23
Time
Power Demand (MW)
Jan.23'07
Jun.14'07
Dec.20'08
Jun.02'08
Source: Study Team
Figure 9.3.1 Typical Load Curves

Final Report Chapter 9 Master Plan of Hydropower Development in Cambodia
JICA Master Plan Study of 9-11 January 2009 Hydropower Development in Cambodia
9.3.3 Thermal Power Plants
As explained in Sub-section 9.2, the thermal power plants are recommended in the MP 2006 for implementation up to 2024 for the Base Demand Scenario as shown below. Another thermal development plan is presented in the EAC Annual Report 2006. In addition to these two development plans, the development order of the thermal power plants has been revised by MIME in their revised Generation Development Plan which was handed over to the Study Team in August 2008.
MP 2006 EAC Annual Report 2006 MIME Revision 2008
coal-fired plant #1 (200 MW) coal-fired plant#1 (200 MW) coal-fired plant #1 (2x100 MW) combined cycle gas turbine (CCGT)
#1 (200 MW) coal-fired plant#2 (400 MW) coal-fired plant #2
(5x100 + 1x200 MW) CCGT#2 (200 MW) CCGT#1 (450 MW) CCGT#3 (450 MW) CCGT#2 (450 MW) CCGT#4 (450 MW)
In general, efficiency of the generating machine having bigger unit capacity is higher than that of smaller unit and the unit generating cost can also be kept at a lower level. On the other hand, bigger reserve capacity of the system should be required and considered to minimize the system disturbance due to forced outage of the unit not only in the planning of generation expansion but also in the daily operation of the power supply system. Adoption of bigger unit capacity may increase the reserve capacity of the comparatively small system. It will increase the total operation cost.
In the Study, unit capacity of the thermal plat is set at 100 – 200 – 400 MW, because a plant having 100 MW unit has been committed and it is assumed that the other bigger unit will commence its operation in the power supply system when the required reserve capacity (15% of the forecasted peak demand) of the system becomes similar to the unit capacity (200 MW, and then 400 MW). The same capacity with the unit capacity is considered as the required reserve capacity when the unit capacity is bigger than the 15% of the system peak demand.
9.3.4 Formulation of Generation Expansion Plan
The generation expansion plan is formulated based on the power balance and energy balance in the dry season when the dependable output will remarkably decrease. To enable stable power supply, it is necessary to consider the reserve capacity. To secure the reserve, it is considered in the Study to input the optimum candidate power plants into the power system one by one including thermal power plants. In inputting candidate power plants into the system, care should be taken to avoid excessive reserve capacity, i.e., to minimize the prior investment for the power system, and decide the candidates to input year by year.
The generation expansion plans for the Base and High Demand Scenarios worked out in the MP 2006 are formulated by using the candidate projects including the committed hydropower projects, the priority projects selected in the Study and above-mentioned thermal plants. The results are given in Tables 9.3.2

Final Report Chapter 9 Master Plan of Hydropower Development in Cambodia
JICA Master Plan Study of 9-12 January 2009 Hydropower Development in Cambodia
and 9.3.3, and Figures 9.3.2 and 9.3.3. It is noted that the projects selected in the Study are put into the power system with priority to minimize a surplus reserve capacity of the system, because their economic superiority has been proven in the prior stage of the Study by economic comparison study with the alternative thermal plants.
In the Mater Plan 2006, total installed capacity of hydropower plants of 1,985 MW has been recommended to be developed till 2024 for the both of Base and High Demand Scenarios, and development of thermal plants is 1,500 MW for the Base Demand Scenario, and 2,400 MW for the High Scenario. In the present Study, total capacity of hydropower projects to be developed is 1,491 MW for both Demand Scenarios and thermal plants to be developed are 1,500 MW for the Base Scenario and 2,300 MW for the High Scenario. For the both Master Plans, total capacity of hydropower plants to be developed is almost the same, but there is a difference of 494 MW of hydropower development between the two Generation Expansion Plans. This is because of 1) exclusion of the Sambor project from the candidate hydropower projects for its technical feasibility of sand flushing unsolved yet, and 2) even without having the Sambor on the expansion sequence of hydros, the Grid will not require an increase of thermal plants in the present Study to offset the reduction of total capacity of hydros by 494 MW and the required power supply capacity is secured also in the dry season because of the enhanced dry season outputs of hydros achieved through the planning of reservoir projects with target CIR at 20-30%.
According to the Generation Expansion Plan optimized in the present Study, the completion year of Stung Atay, Lower Stung Russey Chrum and New Tatay may be possible to put off by one year in comparison with the existing Development Plan, if the future power demand is similar to the Base Demand Scenario. Even for the High Demand Scenario, the completion time of New Tatay project is supposed to be put off by one year.
Energy balance in the dry season is examined against the above-mentioned Generation Expansion Plan and the results of the examination are given in Tables 9.3.4 and 9.3.5. As shown in these tables, no shortage of energy supply in the dry season occurs throughout the study horizon. Available energy of diesel and thermal power plants are calculated on the basis of spinning reserve margin, forced-outage rate, maintenance period, etc, as assumed in the MP 2006. As for the imported energy, contracted capacity and annual load factor of the Phnom Penh system in 2007 are used for calculating available energy in the dry season.

Final Report
Chapter 9 M
aster Plan of Hydropow
er Developm
ent in Cam
bodia
JICA
Master Plan Study of
9-13 January 2009
Hydropow
er Developm
ent in Cam
bodia
Table 9.3.2 Generation Expansion Plan for Base Demand Scenario 2005 2006 2007 2008 2009 2010 2011 2012 2013 2014 2015 2016 2017 2018 2019 2020 2021 2022 2023 2024
Peak Demand : Base Case (MW) of Master Plan 2006 134 156 180 215 268 467 516 652 717 866 1,008 1,122 1,219 1,325 1,440 1,610 1,752 1,894 2,048 2,216
I. Existing Diesel PlantsAvailable Total Output (MW) 150 218 198 198 198 198 198 198 195 195 195 195 195 195 195 195 195 195 195 195
Max MWII. Import Yr to Grid Contract
1 Thailand by 115kV line 2012 20/80 (20) (20) (20) (80) (80) (80) 80.0 80.0 80.0 80.0 80.0 80.0 80.0 80.0 80.0 80.0 80.0 80.0 80.02 Vietnam by 230kV line 2009 80/200 200.0 200.0 200.0 200.0 200.0 200.0 200.0 200.0 200.0 200.0 200.0 200.0 200.0 200.0 200.0 200.03 Vietnam by 115kV line 2012 20 (20) (20) (20) 20.0 20.0 20.0 20.0 20.0 20.0 20.0 20.0 20.0 20.0 20.0 20.0 20.04 Laos by 115kV line 2013 20 (20) (20) (20) (20) 20.0 20.0 20.0 20.0 20.0 20.0 20.0 20.0 20.0 20.0 20.0 20.0Total Imported Power for the National Grid in Dry Season (MW) 0 0 0 200 200 200 300 320 320 320 320 320 320 320 320 320 320 320 320
III. Hydropower Development Inst MW Unit Cap Firm En MWinDryExisting : Kirirm I 2001 12.0 6.0 14.3 4.1 4.1 4.1 4.1 4.1 4.1 4.1 4.1 4.1 4.1 4.1 4.1 4.1 4.1 4.1 4.1 4.1 4.1 4.1 4.1 4.1Committed Hydro Plants1 Kamchay 2010 193.2 64.4 n.a 50.4 50.4 50.4 50.4 50.4 50.4 50.4 50.4 50.4 50.4 50.4 50.4 50.4 50.4 50.4 50.42 Kirirom III 2010 18.0 7.5 n.a 4.7 4.7 4.7 4.7 4.7 4.7 4.7 4.7 4.7 4.7 4.7 4.7 4.7 4.7 4.7 4.73 Stung Atay 2012 120.0 50.0 186.0 53.1 53.1 53.1 53.1 53.1 53.1 53.1 53.1 53.1 53.1 53.1 53.1 53.14 Lower Russey Chrum 2013 235.0 64.0 449.0 128.1 128.1 128.1 128.1 128.1 128.1 128.1 128.1 128.1 128.1 128.1 128.15 New Tatay 2013 246.0 82.0 333.0 95.0 95.0 95.0 95.0 95.0 95.0 95.0 95.0 95.0 95.0 95.0 95.0
812.2 331.4Total of Committed Hydro Plants 55.1 55.1 55.1 108.2 331.4 331.4 331.4 331.4 331.4 331.4 331.4 331.4 331.4 331.4 331.4
Master Plan Inst CapUnit Cap Firm En.MWinDry1 LSP2 + LSS2 2016-18 420.0 70.0 480.0 137.0 137.0 137.0 137.0 137.0 137.0 137.0 137.02 Prek Liang 1 100.0 33.4 217.0 61.9 61.9 61.9 61.9 61.9 61.9 61.93 Prek Liang 2 54.0 27.0 107.0 30.5 30.5 30.5 30.5 30.5 30.5 30.54 Bokor Plateau 26.0 13.0 65.0 18.6 18.6 18.6 18.6 18.6 18.6 18.6 18.6 18.65 Stung Metoek II 25.0 12.5 58.0 16.6 16.6 16.6 16.6 16.6 16.6 16.6 16.6 16.6 16.66 Stung Metoek III 26.0 13.0 58.0 16.6 16.6 16.6 16.6 16.6 16.6 16.6 16.6 16.6 16.67 Middle St. Russei Chrum 28.0 14.0 64.0 18.3 18.3 18.3 18.3 18.3 18.3 18.3
679.0 1,049.0 299.4Total of Hydro Plants for the Master Plan 0.0 33.1 51.7 188.6 299.4 299.4 299.4 299.4 299.4 299.4
IV. Thermal Plants to be Developed1 Coal-fired plant #1 200 100 100.0 200.0 200.0 200.0 200.0 200.0 200.0 200.0 200.0 200.0 200.0 200.0 200.0 200.02 Coal-fired plant #2 700 100/200 100.0 200.0 300.0 300.0 300.0 500.0 700.0 700.0 700.0 700.03 Coal-fired plant #3 1000 200 200.0 400.0 600.04 Coal or gas-fired plant 1600 400Total of Thermal Plants to be Developed 0 100 200 200 200 300 400 500 500 500 700 900 1,100 1,300 1,500
V. Total Supply Capacity 154 222 202 202 402 457 557 757 827 1,050 1,150 1,283 1,402 1,539 1,650 1,850 2,050 2,250 2,450 2,650VI. Reserve Margin15 % of Peak Demand 20.1 23.4 27.0 32.3 40.2 70.1 77.4 97.8 107.6 129.9 151.2 168.3 182.9 198.8 216.0 241.5 262.8 284.1 307.2 332.4Maximum Unit Capacity 6.5 6.5 6.5 6.5 6.5 64.4 100.0 100.0 100.0 100.0 100.0 100.0 100.0 100.0 100.0 200.0 200.0 200.0 200.0 200.0Required Margin in MW 20.1 23.4 27.0 32.3 40.2 70.1 100.0 100.0 107.6 129.9 151.2 168.3 182.9 198.8 216.0 241.5 262.8 284.1 307.2 332.4Margin against Peak Demand in MW 20.5 66.5 22.0 -13.0 134.0 -9.9 41.1 105.1 110.2 184.3 142.3 161.4 183.0 214.0 209.7 239.7 297.7 355.7 401.7 433.7
in % 15.3% 42.6% 12.2% -6.1% 50.0% -2.1% 8.0% 16.1% 15.4% 21.3% 14.1% 14.4% 15.0% 16.1% 14.6% 14.9% 17.0% 18.8% 19.6% 19.6%2005 2006 2007 2008 2009 2010 2011 2012 2013 2014 2015 2016 2017 2018 2019 2020 2021 2022 2023 2024
Year
Year Source: Study Team

Final Report
Chapter 9 M
aster Plan of Hydropow
er Developm
ent in Cam
bodia
JICA
Master Plan Study of
9-14 January 2009
Hydropow
er Developm
ent in Cam
bodia
Table 9.3.3 Generation Expansion Plan for High Demand Scenario 2005 2006 2007 2008 2009 2010 2011 2012 2013 2014 2015 2016 2017 2018 2019 2020 2021 2022 2023 2024
Peak Demand : High Case (MW) of Master Plan 2006 134 159 186 225 271 502 561 719 800 979 1,155 1,302 1,435 1,582 1,746 1,985 2,195 2,409 2,647 2,912
I. Existing Diesel PlantsAvailable Total Output (MW) 150 218 198 198 198 198 198 198 195 195 195 195 195 195 195 195 195 195 195 195
Max MWII. Import Yr to Grid Contract
1 Thailand by 115kV line 2012 20/80 (20) (20) (20) (80) (80) (80) 80.0 80.0 80.0 80.0 80.0 80.0 80.0 80.0 80.0 80.0 80.0 80.0 80.02 Vietnam by 230kV line 2009 80/200 200.0 200.0 200.0 200.0 200.0 200.0 200.0 200.0 200.0 200.0 200.0 200.0 200.0 200.0 200.0 200.03 Vietnam by 115kV line 2012 20 (20) (20) (20) 20.0 20.0 20.0 20.0 20.0 20.0 20.0 20.0 20.0 20.0 20.0 20.0 20.04 Laos by 115kV line 2013 20 (20) (20) (20) (20) 20.0 20.0 20.0 20.0 20.0 20.0 20.0 20.0 20.0 20.0 20.0 20.0Total Imported Power for the National Grid in Dry Season (MW) 0 0 0 200 200 200 300 320 320 320 320 320 320 320 320 320 320 320 320
III. Hydropower Development Inst MW Unit MW Firm En MWinDryExisting : Kirirm I 2001 12.0 6.0 14.3 4.1 4.1 4.1 4.1 4.1 4.1 4.1 4.1 4.1 4.1 4.1 4.1 4.1 4.1 4.1 4.1 4.1 4.1 4.1 4.1 4.1
Committed Hydro Plants1 Kamchay 2010 193.2 64.4 n.a 50.4 50.4 50.4 50.4 50.4 50.4 50.4 50.4 50.4 50.4 50.4 50.4 50.4 50.4 50.4 50.42 Kirirom III 2010 18.0 7.5 n.a 4.7 4.7 4.7 4.7 4.7 4.7 4.7 4.7 4.7 4.7 4.7 4.7 4.7 4.7 4.7 4.73 Stung Atay 2012 120.0 50.0 186.0 53.1 53.1 53.1 53.1 53.1 53.1 53.1 53.1 53.1 53.1 53.1 53.1 53.1 53.14 Lower Russey Chrum 2013 235.0 64.0 449.0 128.1 128.1 128.1 128.1 128.1 128.1 128.1 128.1 128.1 128.1 128.1 128.1 128.15 New Tatay 2013 246.0 82.0 333.0 95.0 95.0 95.0 95.0 95.0 95.0 95.0 95.0 95.0 95.0 95.0 95.0
812.2 331.4Total of Committed Hydro Plants 55.1 55.1 108.2 236.3 331.4 331.4 331.4 331.4 331.4 331.4 331.4 331.4 331.4 331.4 331.4
Master Plan Inst CapUnit Cap Firm En.MWinDry1 LSP2 + LSS2 420.0 70.0 480.0 137.0 137.0 137.0 137.0 137.0 137.0 137.0 137.02 Prek Liang 1 100.0 33.4 217.0 61.9 61.9 61.9 61.9 61.9 61.9 61.9 61.9 61.93 Prek Liang 2 54.0 27.0 107.0 30.5 30.5 30.5 30.5 30.5 30.5 30.5 30.5 30.5 30.54 Bokor Plateau 26.0 13.0 65.0 18.6 18.6 18.6 18.6 18.6 18.6 18.6 18.65 Stung Metoek II 25.0 12.5 58.0 16.6 16.6 16.6 16.6 16.6 16.6 16.6 16.66 Stung Metoek III 26.0 13.0 58.0 16.6 16.6 16.6 16.6 16.6 16.6 16.6 16.6 16.6 16.67 Middle St. Russei Chrum 28.0 14.0 64.0 18.3 18.3 18.3 18.3 18.3 18.3
679.0 1,049.0 299.4Total of Hydro Plants for the Master Plan 47.1 109.0 281.1 281.1 299.4 299.4 299.4 299.4 299.4
IV. Thermal Plants to be Developed
1 Coal-fired plant #1 200 100 100 200 200 200 200 200 200 200 200 200 200 200 200 2002 Coal-fired plant #2 700 100/200 100 300 400 500 500 700 700 700 700 700 7003 Coal-fired plant #3 1000 200 200 600 800 1,000 1,0004 Coal or gas-fired plant 1600 400 400Total of Thermal Plants to be Developed 0 0 0 0 100 200 200 300 500 600 700 700 900 1,100 1,500 1,700 1,900 2,300
V. Total Supply Capacity 154 222 202 202 402 457 557 810 955 1,150 1,350 1,497 1,659 1,831 2,031 2,250 2,650 2,850 3,050 3,450VI. Reserve Margin15 % of Peak Demand 20.1 23.9 27.9 33.8 40.7 75.3 84.2 107.9 120.0 146.9 173.3 195.3 215.3 237.3 261.9 297.8 329.3 361.4 397.1 436.8Maximum Unit Capacity 6.5 6.5 6.5 6.5 6.5 64.4 100.0 100.0 100.0 100.0 100.0 100.0 100.0 100.0 200.0 200.0 200.0 200.0 200.0 400.0Required Margin in MW 20.1 23.9 27.9 33.8 40.7 75.3 100.0 107.9 120.0 146.9 173.3 195.3 215.3 237.3 261.9 297.8 329.3 361.4 397.1 436.8Margin against Available Output in MW 20.5 63.5 16.0 -23.0 131.0 -44.9 -3.9 91.2 155.3 171.3 195.3 195.4 224.4 249.4 285.4 264.7 454.7 440.7 402.7 537.7
in % 15.3% 39.9% 8.6% -10.2% 48.3% -8.9% -0.7% 12.7% 19.4% 17.5% 16.9% 15.0% 15.6% 15.8% 16.3% 13.3% 20.7% 18.3% 15.2% 18.5%2005 2006 2007 2008 2009 2010 2011 2012 2013 2014 2015 2016 2017 2018 2019 2020 2021 2022 2023 2024
Year
Year Source: Study Team

Final Report Chapter 9 Master Plan of Hydropower Development in Cambodia
JICA Master Plan Study of 9-15 January 2009 Hydropower Development in Cambodia
0
500
1,000
1,500
2,000
2,500
3,000
3,500
4,000
4,500
2005
2006
2007
2008
2009
2010
2011
2012
2013
2014
2015
2016
2017
2018
2019
2020
2021
2022
2023
2024
Year
Inst
alle
d C
apac
ity (M
W)
Hydro of the Study
Ex & Committed Hydro
Thermal Plants
Import
Diesel Plants
Supply Capacity
Peak Demand
Source: Study Team
Figure 9.3.2 Generation Expansion Plan for Base Demand Scenario
0
500
1,000
1,500
2,000
2,500
3,000
3,500
4,000
4,500
2005
2006
2007
2008
2009
2010
2011
2012
2013
2014
2015
2016
2017
2018
2019
2020
2021
2022
2023
2024
Year
Inst
alle
d C
apac
ity (M
W)
Hydro of the Study
Ex & Committed HydroThermal Plants
ImportDiesel Plants
Supply CapacityPeak Demand
Source: Study Team
Figure 9.3.3 Generation Expansion Plan for High Demand Scenario

Final Report
Chapter 9 M
aster Plan of Hydropow
er Developm
ent in Cam
bodia
JICA
Master Plan Study of
9-16 January 2009
Hydropow
er Developm
ent in Cam
bodia
Table 9.3.4 Energy Balance for Base Demand Scenario
2005 2006 2007 2008 2009 2010 2011 2012 2013 2014 2015 2016 2017 2018 2019 2020 2021 2022 2023 2024Annual Energy Demand (GWH) of Master Plan 2006 764 887 1,020 1,271 1,472 2,574 2,891 3,750 4,188 4,728 5,250 5,869 6,408 7,000 7,646 8,550 9,330 10,111 10,958 11,879
382 444 510 636 736 1,287 1,446 1,875 2,094 2,364 2,625 2,935 3,204 3,500 3,823 4,275 4,665 5,056 5,479 5,940
I. Existing Diesel PlantsAvailable Total Output (MW) 150 218 198 198 198 198 198 198 195 195 195 195 195 195 195 195 195 195 195 195Available Max. Energy in Dry Season (GWh) 524 760 689 689 689 689 689 689 679 679 679 679 679 679 679 679 679 679 679 679
Max MWII. Import To Grid Contract GWh In future
1 Thailand by 115kV line 2012 20/80 55.2 220.8 (55.2) (55.2) (55.2) (220.8) (220.8) (220.8) 220.8 220.8 220.8 220.8 220.8 220.8 220.8 220.8 220.8 220.8 220.8 220.8 220.82 Vietnam by 230kV line 2009 80/200 220.8 551.9 551.9 551.9 551.9 551.9 551.9 551.9 551.9 551.9 551.9 551.9 551.9 551.9 551.9 551.9 551.9 551.93 Vietnam by 115kV line 2013 20 55.2 55.2 (55.2) (55.2) (55.2) (55.2) 55.2 55.2 55.2 55.2 55.2 55.2 55.2 55.2 55.2 55.2 55.2 55.24 Laos by 115kV line 2013 20 55.2 55.2 (55.2) (55.2) (55.2) (55.2) 55.2 55.2 55.2 55.2 55.2 55.2 55.2 55.2 55.2 55.2 55.2 55.2Available Total Energy for National Network in Dry Season (GWh) 0 0 0 552 552 552 773 883 883 883 883 883 883 883 883 883 883 883 883
III. Hydropower Development Inst MW Y.GWh Firm EnGWhinDryExisting : Kirirm I 2001 12.0 46.9 n.a 7.2 7.2 7.2 7.2 7.2 7.2 7.2 7.2 7.2 7.2 7.2 7.2 7.2 7.2 7.2 7.2 7.2 7.2 7.2 7.2 7.2
Committed Hydro Plants1 Kamchay 2010 193.2 498.0 n.a 130.0 130.0 130.0 130.0 130.0 130.0 130.0 130.0 130.0 130.0 130.0 130.0 130.0 130.0 130.0 130.02 Kirirom III 2010 15.0 76.0 n.a 19.8 19.8 19.8 19.8 19.8 19.8 19.8 19.8 19.8 19.8 19.8 19.8 19.8 19.8 19.8 19.83 Stung Atay 2012 120.0 306.0 186.0 108.0 108.0 108.0 108.0 108.0 108.0 108.0 108.0 108.0 108.0 108.0 108.0 108.04 Lower Russey Chrum 2014 235.0 805.0 449.0 224.5 224.5 224.5 224.5 224.5 224.5 224.5 224.5 224.5 224.5 224.5 224.55 New Tatay 2015 246.0 858.0 333.0 166.5 166.5 166.5 166.5 166.5 166.5 166.5 166.5 166.5 166.5 166.5 166.5
Total 809.2 2,543.0 648.8Total of Committed Hydro Plants 150 150 150 258 482 649 649 649 649 649 649 649 649 649 649
Master Plan Inst Cap Y.GWh Firm En. in Dry1 LSP2 + LSS2 420.0 1725.0 480.0 231.0 231.0 231.0 231.0 231.0 231.0 231.0 231.02 Prek Liang 1 100.0 348.0 217.0 112.0 112.0 112.0 112.0 112.0 112.0 112.03 Prek Liang 2 54.0 198.0 107.0 54.0 54.0 54.0 54.0 54.0 54.0 54.04 Bokor Plateau 26.0 91.0 65.0 32.0 32.0 32.0 32.0 32.0 32.0 32.0 32.0 32.05 Stung Metoek II 25.0 86.0 58.0 30.0 30.0 30.0 30.0 30.0 30.0 30.0 30.0 30.0 30.06 Stung Metoek III 26.0 90.0 58.0 30.0 30.0 30.0 30.0 30.0 30.0 30.0 30.0 30.0 30.07 Middle St. Russei Chrum 28.0 96.0 64.0 33.0 33.0 33.0 33.0 33.0 33.0 33.0
Total 679.0 2,634.0 1,049.0 522.0Total of Hydro for Master Plan 60 92 323 522 522 522 522 522 522
IV. Thermal Power DevelopmentThermal Plants
Plant Unit Nos GWh/unit *11 Coal-fired plant #1 200 100 2 348.2 348.2 696.4 696.4 696.4 696.4 696.4 696.4 696.4 696.4 696.4 696.4 696.4 696.4 696.42 Coal-fired plant #2 400 100/200 6 348.2 696.4 348.2 696.4 1,044.6 1,044.6 1,044.6 1,741.1 2,437.5 2,437.5 2,437.5 2,437.53 Coal-fired plant #3 1000 200 5 696.4 696.4 1,392.8 2,089.34 Coal or gas-fired plant 1600 400 4 1,392.8Total of Thermal Plants 348 696 696 696 1,045 1,393 1,741 1,741 1,741 2,437 3,134 3,830 4,527 5,223
V. Total Available Energy in Dry Season (GWh) 531 768 696 696 1,248 1,398 1,746 2,315 2,523 2,748 3,262 3,670 4,051 4,282 4,481 5,177 5,874 6,570 7,266 7,963
VI. Surplus Energy (GWh) 149 324 186 61 512 111 301 440 429 384 637 736 847 782 658 902 1,209 1,514 1,787 2,023
% of Required Energy 39.0% 73.1% 36.5% 9.6% 69.6% 8.6% 20.8% 23.5% 20.5% 16.2% 24.3% 25.1% 26.4% 22.3% 17.2% 21.1% 25.9% 30.0% 32.6% 34.1%2005 2006 2007 2008 2009 2010 2011 2012 2013 2014 2015 2016 2017 2018 2019 2020 2021 2022 2023 2024Year
Energy in Dry
Energy Demand in Dry Seasons (for 6 months) : Base Case (GWh)
Year
Source: Study Team

Final Report
Chapter 9 M
aster Plan of Hydropow
er Developm
ent in Cam
bodia
JICA
Master Plan Study of
9-17 January 2009
Hydropow
er Developm
ent in Cam
bodia
Table 9.3.5 Energy Balance for High Demand Scenario
2005 2006 2007 2008 2009 2010 2011 2012 2013 2014 2015 2016 2017 2018 2019 2020 2021 2022 2023 2024Annual Energy Demand (GWH) of Master Plan 2006 764 901 1,051 1,328 1,560 2,766 3,147 4,133 4,677 5,351 6,022 6,809 7,553 8,369 9,278 10,548 11,691 12,863 14,160 15,599
382 451 526 664 780 1,383 1,574 2,067 2,339 2,676 3,011 3,405 3,777 4,185 4,639 5,274 5,846 6,432 7,080 7,800
I. Existing Diesel PlantsAvailable Total Output (MW) 150 218 198 198 198 198 198 198 195 195 195 195 195 195 195 195 195 195 195 195Available Max. Energy in Dry Season (GWh) 524 760 689 689 689 689 689 689 679 679 679 679 679 679 679 679 679 679 679 679
Max MWII. Import To Grid Contract GWh In future
1 Thailand by 115kV line 2012 20/80 55.2 220.8 (55.2) (55.2) (55.2) (220.8) (220.8) (220.8) 220.8 220.8 220.8 220.8 220.8 220.8 220.8 220.8 220.8 220.8 220.8 220.8 220.82 Vietnam by 230kV line 2009 80/200 220.8 551.9 551.9 551.9 551.9 551.9 551.9 551.9 551.9 551.9 551.9 551.9 551.9 551.9 551.9 551.9 551.9 551.93 Vietnam by 115kV line 2013 20 55.2 55.2 (55.2) (55.2) (55.2) (55.2) 55.2 55.2 55.2 55.2 55.2 55.2 55.2 55.2 55.2 55.2 55.2 55.24 Laos by 115kV line 2013 20 55.2 55.2 (55.2) (55.2) (55.2) (55.2) 55.2 55.2 55.2 55.2 55.2 55.2 55.2 55.2 55.2 55.2 55.2 55.2Available Total Energy for National Network in Dry Season (GWh) 0 0 0 552 552 552 773 883 883 883 883 883 883 883 883 883 883 883 883
III. Hydropower Development Inst MW Y.GWh Firm EnGWhinDryExisting : Kirirm I 2001 12.0 46.9 n.a 7.2 7.2 7.2 7.2 7.2 7.2 7.2 7.2 7.2 7.2 7.2 7.2 7.2 7.2 7.2 7.2 7.2 7.2 7.2 7.2 7.2
Committed Hydro Plants1 Kamchay 2010 193.2 498.0 n.a 130.0 130.0 130.0 130.0 130.0 130.0 130.0 130.0 130.0 130.0 130.0 130.0 130.0 130.0 130.0 130.02 Kirirom III 2010 15.0 76.0 n.a 19.8 19.8 19.8 19.8 19.8 19.8 19.8 19.8 19.8 19.8 19.8 19.8 19.8 19.8 19.8 19.83 Stung Atay 2012 120.0 306.0 186.0 108.0 108.0 108.0 108.0 108.0 108.0 108.0 108.0 108.0 108.0 108.0 108.0 108.0 108.04 Lower Russey Chrum 2014 235.0 805.0 449.0 224.5 224.5 224.5 224.5 224.5 224.5 224.5 224.5 224.5 224.5 224.5 224.5 224.55 New Tatay 2015 246.0 858.0 333.0 166.5 166.5 166.5 166.5 166.5 166.5 166.5 166.5 166.5 166.5 166.5 166.5
Total 809.2 2,543.0 648.8Total of Committed Hydro Plants 150 150 258 482 482 649 649 649 649 649 649 649 649 649 649
Master Plan Inst Cap Y.GWh Firm En. in Dry1 LSP2 + LSS2 420.0 1725.0 480.0 231.0 231.0 231.0 231.0 231.0 231.0 231.0 231.02 Prek Liang 1 100.0 348.0 217.0 112.0 112.0 112.0 112.0 112.0 112.0 112.0 112.0 112.03 Prek Liang 2 54.0 198.0 107.0 54.0 54.0 54.0 54.0 54.0 54.0 54.0 54.0 54.0 54.04 Bokor Plateau 26.0 91.0 65.0 32.0 32.0 32.0 32.0 32.0 32.0 32.0 32.05 Stung Metoek II 25.0 86.0 58.0 30.0 30.0 30.0 30.0 30.0 30.0 30.0 30.06 Stung Metoek III 26.0 90.0 58.0 30.0 30.0 30.0 30.0 30.0 30.0 30.0 30.0 30.0 30.07 Middle St. Russei Chrum 28.0 96.0 64.0 33.0 33.0 33.0 33.0 33.0 33.0
Total 679.0 2,634.0 1,049.0 522.0Total of Hydro for Master Plan 84 196 489 489 522 522 522 522 522
IV. Thermal Power DevelopmentThermal Plants
Plant Unit Nos GWh/unit1 Coal-fired plant #1 200 100 2 348.2 348.2 696.4 696.4 696.4 696.4 696.4 696.4 696.4 696.4 696.4 696.4 696.4 696.4 696.42 Coal-fired plant #2 400 100/200 6 348.2 696.4 348.2 1,044.6 1,392.8 1,741.1 1,741.1 2,437.5 2,437.5 2,437.5 2,437.5 2,437.5 2,437.53 Coal-fired plant #3 1000 200 5 696.4 696.4 2,089.3 2,785.7 3,482.1 3,482.14 Coal or gas-fired plant 1600 400 4 1,392.8 1,392.8Total of Thermal Plants 348 696 696 1,045 1,741 2,089 2,437 2,437 3,134 3,830 5,223 5,920 6,616 8,009
V. Total Available Energy in Dry Season (GWh) 531 768 696 696 1,248 1,398 1,746 2,423 2,748 3,096 3,959 4,391 4,851 5,144 5,841 6,570 7,963 8,659 9,356 10,748
VI. Surplus Energy (GWh) 149 317 171 32 468 15 173 357 409 420 948 986 1,075 960 1,202 1,296 2,117 2,228 2,276 2,949
% of Required Energy in Dry Season 39.0% 70.4% 32.5% 4.9% 60.0% 1.1% 11.0% 17.3% 17.5% 15.7% 31.5% 29.0% 28.5% 22.9% 25.9% 24.6% 36.2% 34.6% 32.1% 37.8%2005 2006 2007 2008 2009 2010 2011 2012 2013 2014 2015 2016 2017 2018 2019 2020 2021 2022 2023 2024Year
Energy in Dry
Energy Demand in Dry Seasons (for 6 months) : High Case (GWh)
Year
Source: Study Team

Final Report Chapter 9 Master Plan of Hydropower Development in Cambodia
JICA Master Plan Study of 9-18 January 2009 Hydropower Development in Cambodia
The required input years of the seven MP projects are shown in Figure 9.3.4 for high demand scenario including required timing of preceding feasibility study, detailed design, and procurement & construction.
Source: Study Team
Figure 9.3.4 Implementation Schedule of Seven MP Projects, High Demand Scenario
9.3.5 Technical Remarks on Generation Expansion Plan
Explanation of the concerns on the aforementioned generation expansion plan is given below:
(1) Supply Capacity Deficit of the Year 2008, 2010 and 2011
As indicated in Tables 9.3.2 and 9.3.3, supply capacity deficits appear in the year 2008, 2010 and 2011 for both Base and High Demand Scenarios. Especially, the maximum power demand of 239 MW was recorded on May 27, 2008 which was higher than that of the High Demand Forecast value. For such extreme demand increase, necessary countermeasures such as load shedding, additional power purchase from IPP, etc. are considered to be taken by the Government.
On the other hand, supply capacity deficits of the year 2010 and 2011 are considered to be caused by over estimate of the demand in Kampot area in the MP 2006. Namely, a cement factory having its production capacity of 1 million ton per annum had been constructed in the area at the time when the MP 2006 was formulated and its power demand from the Grid had been over-estimated. The over-estimated demand of Kampot area is scheduled to be integrated into the Grid in 2010 by the extension of 230 kV transmission line from Takeo and the peak demand of the Grid of 268 MW in 2009 is rocketed to 467 MW (in the Base Demand Scenario). According to the EAC Annual Report 2006, Kampot Power Plant Co., Ltd. (IPP, license No. 142L) aiming at power supply to the cement factory has been established and power plant was constructed in the same site and its operation has already been started. In this power plant, the total installed capacity of generating machines is 2,316 kW. The supply capacity deficits in the year 2010 and 2011 may be solved, if the demand forecast of Kampot area is reviewed based on the certain information on their power demand from the Grid to be collected from the related staff of the factory.
No. Year MW 2007 2008 2009 2010 2011 2012 2013 2014 2015 2016 2017 2018 2019 2020 2021 2022 2023 2024
1 LSP2 + LSS2 2018 420.0
2 Prek Liang 1 2017 100.0
3 Prek Liang 2 2016 54.0
4 Bokor Plateau 2018 26.0
5 Stung Metoek II 2018 25.0
6 Stung Metoek III 2016 26.0
7 Middle St. Russey Chrum 2020 28.0
679.0
Legend:
Project Name
Total
FS / DD Power Generation Procurement &constructionPreliminary study

Final Report Chapter 9 Master Plan of Hydropower Development in Cambodia
JICA Master Plan Study of 9-19 January 2009 Hydropower Development in Cambodia
(2) Cascade Development of Hydropower Projects
It is noted that annual generated energy of the priority projects given in Table 9.3.1 has been basically calculated as single project by the simulation study of single reservoir even hydropower projects are located in cascade on the same river such as Prek Liang, Stung Metoek, because all candidate projects stand on the same base and independent from each other in formulation of the Generation Expansion Plan in the Study. In general, if some hydropower plants are cascaded on the same river, available water for generation in the dry season for the plant located downstream will increase due to an increase in the dry season inflow to the reservoir. As a result of the increase in the dry season inflow, the firm energy of the downstream plant will be increased and its dependable output in the dry season also be increased.
It is recommended to review in more detail the annual firm energy and dependable output in the dry season of the project by simulation study of combined reservoir operation in the feasibility study stage which is the next step following this Study and to reflect to the review study of the Generation Expansion Plan. However, it is noted that total annual generated energy will not be changed so much and the change in the annual energy will be limited to the energy increase due to decrease of spilled water from reservoirs by appropriate operation, because of no change in the total rainfall in the catchment area.
(3) Operation of Hydropower Plants through the Year
Actual monthly generated energy of Kirirom I Hydropower Station in the past 4 years is given in Table 9.3.6. The Load Dispatching center of EDC has recorded hourly output of each power plant of the Phnom Penh power supply system including these of IPP. Monthly operation days of Kirirom I power plant were examined from the actual hourly operation records from January 2007 to July 2008 and given in the same table. It is clearly understood that operation of Kirirom I plant is concentrated on the period from July to November in the rainy season and a little less than 80% of annual energy is generated in the period on an average of the 4 years. Furthermore, there are so many days not operated in the dry season and it is considered that scheduled operation to meet the power system requirement has not been made up to the present.
Frankly speaking, it is noted that the supply capacity of Kirirom I in the dry season would not be expected not only in formulating Generation Expansion Plan but also in daily operation. It is considered that there is some difficulty for proper operation of the reservoir through the year, because of size of its catchment and effective reservoir capacity. However, it is strongly recommended that usable discharge for power generation through the year should be analyzed by using actual operation records, fluctuation records of reservoir water level, inflow to the reservoir, spilled water from the reservoir, etc., and optimum operation rule of reservoir should be established to meet the power system requirement in the dry season.

Final Report Chapter 9 Master Plan of Hydropower Development in Cambodia
JICA Master Plan Study of 9-20 January 2009 Hydropower Development in Cambodia
Table 9.3.6 Actual Monthly Operation Records of Kirirom I Year Jan Feb Mar Apr May Jun Jul Aug Sep Oct Nov Dec Total
Generated Energy in MWh2004 524 247 95 431 1,790 1,544 3,270 3,510 5,303 5,148 5,114 49 27,0242005 961 82 510 319 476 926 1,462 8,237 8,143 7,853 7,859 4,055 40,8822006 2,045 1,530 1,054 1,600 1,606 4,301 6,115 8,270 8,196 8,030 4,357 582 47,6862007 725 1,013 1,001 797 2,412 2,050 7,283 8,035 7,984 7,866 5,857 1,507 46,531
Average 1,064 718 665 787 1,571 2,205 4,533 7,013 7,406 7,224 5,797 1,548 40,531Operated Days in 2007Nos of Day 6 8 9 7 9 13 31 31 30 31 25 8 208Ratio (%) 19.4 28.6 29.0 23.3 29.0 43.3 100.0 100.0 100.0 100.0 83.3 25.8 57.0
Source: EDC
0
1,000
2,000
3,000
4,000
5,000
6,000
7,000
8,000
9,000
1 2 3 4 5 6 7 8 9 10 11 12
Month
Ener
gy g
ener
atio
n (M
Wh)
2004
2005
2006
2007
Figure 9.3.5 Actual Monthly Operation Records of Kirirom I
9.4 ISSUES OF MANAGEMENT OF PROJECT IMPLEMENTATION AND MONITORING
9.4.1 Implementing Organization/Investment and Project Operation
(1) Implementing Organization for Generation Expansion
Present Situation as of 2008
Upon promulgation of the Electricity Law of Cambodia in 2001, the power sector has been liberalized and opened to the electricity service providers of the private sector. EDC is one of the electricity service providers but owns a Complex License that enables EDC to undertake generation, transmission, and distribution. The Transmission License is to undertake planning, erection, operation, and management of the countrywide transmission network and is issued only to EDC. Generation License permits EDC to build, own and operate power plants either as EDC’s own asset or as the Government project. In order to secure the stable power supply, the Government recognizes the importance that EDC build, own and operate certain ratio of the generation capacity.
However, since 1) in Cambodia where various infrastructures are in shortage, the financing needs of the public works are competing to each other, 2) since it would take 3-5 years until the Government can use

Final Report Chapter 9 Master Plan of Hydropower Development in Cambodia
JICA Master Plan Study of 9-21 January 2009 Hydropower Development in Cambodia
soft loans from MDB/ODA, it has become common way for the government to depend on the private sector in implementing the Generation Expansion Plan which consists of profitable projects and can attract investors.
The World Bank financed the Private Power Policy Study in 2001. However, the procurement method recommended in the study report has not been approved by the Government.
The selection method of developers (IPP) practiced in the power sector of Cambodia as of 2008 is outlined below:
An IPP who is interested in implementation of certain hydropower project will first submit a proposal for pre-feasibility study or feasibility study to the Minister of MIME. The Minister will call for evaluation of the proposal and views of the Hydroelectricity Department under General Department of Energy. If the view of the Hydroelectricity Department is positive, Letter of Permission(LOP)will be issued to permit the pre-feasibility study and MOU(Memorandum of Understanding)will be exchanged to permit the feasibility study. MOU may include the following:
1) MOU will be exchanged between MIME and the developer (IPP).
2) The validity period of MOU may be two years from the date of signing and can be extended by mutual agreement. If IPP does not start the field survey within 90 days from the date of MOU, the MOU will be invalid.
3) MOU is to give the right to undertake a feasibility study on condition that IPP should bear all the costs. MIME will make necessary arrangements for IPP to get necessary data and access to relevant ministry/agency. It includes EIA and will assess environmental impacts including construction sites and people residing in and around the proposed reservoir areas and power station site. MOU also requires IPP to identify, as part of the study, the procurement method of finance and investors.
4) Upon completion of the study, IPP will submit reports and one set of data to MIME.
5) The study results will not be opened to the third party without the mutual agreement.
6) Upon completion of the Study, MIME will invite IPP or its agent and discuss on the project implementation. However, in case no mutual agreement has been achieved within six months, MIME has the right to invite a third party for negotiation and to conclude a contract on the project implementation.
MIME, EAC and EDC will jointly review the study outputs. MIME will review mainly the technical and environmental aspects, EAC cost aspect, and EDC operation and maintenance aspect. Although tendering is a normal process to select developer after the feasibility study, direct negotiation and appoint method may be taken where only one or two bidders are expected. Upon mutual agreement between the Government and IPP on the project implementation, it will be reported to the Prime Minister in writing, the Government will provide concession, and EAC will issue License for Generation. In the negotiation of Power Purchase Agreement (PPA), a committee will be organized by MEF, MIME, EAC, and EDC and

Final Report Chapter 9 Master Plan of Hydropower Development in Cambodia
JICA Master Plan Study of 9-22 January 2009 Hydropower Development in Cambodia
will be chaired by MIME. The committee will be organized for every project to appraise the implementation agreement and PPA. After finalizing the PPA and obtaining the approval of EAC, EDC who is the off-taker of the electricity generated will sign the PPA. A sample form prepared by UK consultant (Mott MacDonald) in 2001 is used for PPA. There are two sample forms, one for large project and the other for small. After starting the power generation, EAC as Regulator will monitor the management of the electricity services in accordance with the implementation agreement.
Future Issues
After launching those hydropower projects that are under negotiation, the following would be the issues of the power sector:
Aiming at energy security and long-term lowering of the unit generation costs of the entire Grid, it is desirable, although it may take certain time, for the Government to get soft loan and implement generation projects so that EDC will own certain share of generation capacities and operate these1. As to the EDC share of the Grid generation capacity, EDC should target at 15% at the minimum which is the reserve capacity and could hardly be owned by the private sector as it will not generate electricity.
In the process of selecting the priority projects, some projects were excluded for their low power density, low economic performance, etc. Of these there might be some projects that would become feasible if developed for multipurpose. For example, a hydropower project located in such region as has strong demand for water supply or irrigation, or a hydropower project that has high firming up effects of the dry season outputs of the downstream projects although the economy of itself may be low, these projects could hardly be developed by IPP of the private sector whose objective is the sales revenue of electricity. Development of this type of projects should be implemented by the Cambodian side although it may take long time. A careful operation and management of reservoirs will be needed not only for the needs of the power grid but also for the water supply and irrigation. To this end, a development model that facilitates operation and management by the Cambodia side will be needed.
As far as the projects EDC will implement, contractors will be selected through competitive bidding in principle.
(2) Priority Implementation of Master Plan Projects
The demand forecast used in the formulation of the MP 2006 had been developed for the present electrification situation such as non-existence of National Grid, scattering of regional load centers countrywide and isolated and independent to each other. Also adopted in the forecast were various and challenging assumptions. As pointed out in the present Report, it should be noted that some deviations from the forecast are becoming apparent. Accordingly, when the MP 2006 is reviewed, the countrywide
1 It would also be effective for long-term lowering of grid generation costs to expand transmission and substation network
with soft loans, although it is not generation projects.

Final Report Chapter 9 Master Plan of Hydropower Development in Cambodia
JICA Master Plan Study of 9-23 January 2009 Hydropower Development in Cambodia
perspective of the power demand growth should be studied, theoretical appropriateness of the basic demand forecast be examined, and then the MP 2006 and the succeeding program of RGC should be updated. As already described in the selection of the priority hydropower projects of the Master Plan Study, the Generation Expansion Plan to follow the ongoing implementation of the committed hydros including thermal plants was prepared, in order to maintain consistency with the MP 2006, adopting not only the demand forecasts but also the conditions and assumptions employed in formulating the MP 2006. In general, generation projects need long time from planning to commissioning of operation. Accordingly it is recommended that RGC aggressively tackle the feasibility study of the Master Plan projects selected in the Study.
(3) Establishment and Operation of Hydro-meteorological Observation System
Hydro-meteorological observatories, that is, the stream gauging stations and rain-gauges among others existing in Cambodia are concentrated on Phnom Penh, Tonle Sap, and Mekong Mainstream basins. In those hydropower potential areas of North-eastern Region (Ratanak Kiri, Stung Treng) and South-western Region (Koh Kong, Pursat), the number of gauging stations are quite limited (refer to Chapter 6 for details). In those project basins situated in the South-western Region and Prek Liang basins in the North-eastern Region, there is neither stream gauging station equipped with discharge measuring facilities nor rain-gauge except for temporary staff gauges. Hydrological data necessary for hydropower development could not be collected and accumulated if we simply depend only on the observation network of MOWRAM. In general, a 30 year hydro-meteorological data are required for hydropower planning and operation and a 10 year data are desired at the minimum. The shorter the available period of hydro-meteorological data, the greater the hydrological risks such as power sales revenue falls in short of the planned level, floods exceeding the design flood would take place to cause flood damage to the project facilities. It is recommended that as to the five committed projects and the seven MP projects, MIME conclude contracts with respective developers requiring the developers to install staff gauges and rain-gauge, build facilities for discharge measurements, provide current meters for low flow and high flow measurements, execute discharge measurements, and to submit copy of the observation and measurement data including annual report and analysis of H-Q curve and so forth. As to those projects of which developer has not been selected, it will be required that the Hydro-electricity Department of MIME undertake the observation and arrange the budget therefore.
Some examples of observation process and actual stream gauging conducted as part of the present Master Plan Study are given below:
1) Water Level Observation on Staff Gauges
Staff gauges will be installed nearby the project site to observe the river water level thereon. The developer given with the right of pre-FS or FS should employ an observer to read water levels twice a day (morning and evening). The observation should be started upon onset of the pre-FS or FS. Copy of the observed data should be submitted to MIME. The observation should be continued also after completion of the Study. If the contract negotiation for implementation is failed or when the contract period of BOT is completed, MIME should

Final Report Chapter 9 Master Plan of Hydropower Development in Cambodia
JICA Master Plan Study of 9-24 January 2009 Hydropower Development in Cambodia
succeed the observation. It is the principle of hydro-meteorological observation to continue without interruption.
2) Discharge Measurements
Discharge measurements should be executed once a month at the minimum, once a week in principle. The measurement should be made using a current meter except for high flood flow measurements in which float may be used depending on the conditions. Several 10s of discharge measurements will be required to develop H-Q curve for a wide range from low flow to high flood flow. Since the measurement of flood flows incur safety risk, special facilities such as spanning of a cable over the river for velocity measurement will be required. Copy of the measurements and its graphical distribution and updated H-Q curve should also be submitted to MIME.
The costs for these facilities and measurements should be borne by respective developers.
Under the present Master Plan Study, staff gauges were installed on the Prek Liang River in Ratanak Kiri and Stung Metoek River in Koh Kong. Gauge height reading was continued since then by local observers (see pictures below). Throughout the study period, technology transfer to the counterpart staff was conducted at the time of field reconnaissance. Of the staff of Hydro-electricity Department of MIME, four engineers have practiced and learnt the discharge measurement using a current meter. It is expected the technology acquired through the present Master Plan Study contribute to implementing the hydropower development in Cambodia.
Installation of staff gauge in Yon Village, on the right bank of the Prek Liang River
Staff gauge and local observer who receives instructions on gauge height reading and daily logging
Figure 9.4.1 Installation of Gauging Staff and Training of Gauge Reading

Final Report Chapter 9 Master Plan of Hydropower Development in Cambodia
JICA Master Plan Study of 9-25 January 2009 Hydropower Development in Cambodia
Figure 9.4.2 Sample Monthly Sheet of Daily Gauge Height Records
Evaluation Criteria of Newly Proposed Projects
When a new hydropower project is identified and or proposed, its preliminary evaluation will be required:
1) Of the social and environmental impacts of a reservoir, judgment of the project implementation be suspended if there are such cases:
It incurs some issues of which technical feasibility for mitigation measures have not been clarified like sand flushing of Sambor reservoir situated in the flat region;
Existence of an endangered species or historical remains has been identified but its countermeasure has not been prepared.
2) It is recommended that the power density of a single purpose project for hydropower generation be checked at the initial stage of project planning except when EIA has been executed to confirm the project acceptability. If the power density is lower than 0.5 MW/km2, it is a precaution and suggests the project would have significant environmental impacts and would need a careful EIA (refer to Section 9.4.2, paragraph (1), item 3)). A multi-purpose project will require a separate study.

Final Report Chapter 9 Master Plan of Hydropower Development in Cambodia
JICA Master Plan Study of 9-26 January 2009 Hydropower Development in Cambodia
3) Those hydropower projects situated inside the Mekong River Basin need notice to MRC as shown below:
Water use in the dry season Mekong Mainstream Projects Tributary Projects
Development and utilization inside the basin
Prior consultation aiming at achieving an agreement at Joint Committee of MRC
Notification
Development and utilization by inter-basin water transfer
To be agreed by Joint Committee of MRC, through specific agreement for each project
Notification
4) Economic Performances
It is recommended that the following be used as the standard level of project requirements. Since FIRR and ROE depend on the power purchase tariff, these are reference indicator for the preliminary evaluation. Whether we should implement a hydropower project or not in view of the national economic interest of Cambodia, that is whether the project is in superior to alternative thermal projects can be judged by EIRR. If EIRR is assessed to exceed 10% as a result of the feasibility study after clearing the technical feasibility and environmental and social considerations, the project should be implemented.
EIRR > 10% FIRR > 10% A standard ROE = 15%
However, EIRR assessed at master plan study or pre-FS may include significant error. Therefore, EIRR is not an absolute indicator. When there are needs other than for hydropower development such as for flood control and water resources development (irrigation, water supply), a plan should be prepared for multi-purpose development and EIRR be assessed accordingly.
5) Operation Management by IPP
Upon completion of the construction works, IPP will undertake the operation management of the electricity business. After expiry of the BOT contract period, the generation facilities and the operation will be handed over to EDC.
Notes on Operation of Hydropower Stations
One of the great differences between hydropower and thermal power from the viewpoint of grid management is while thermal plants can artificially adjust its operation throughout the year, hydropower stations will strongly receive influences of nature and, therefore, cannot adjust its operation independently from the nature. Under the situation that generation equipment has no mechanical problem and fuel stock is secured, thermal plants can respond to any supply demand

Final Report Chapter 9 Master Plan of Hydropower Development in Cambodia
JICA Master Plan Study of 9-27 January 2009 Hydropower Development in Cambodia
of the grid. On the other hand, hydropower stations, even if having a great reservoir capacity, can hardly respond to the generation demand from the grid once the reservoir becomes empty no longer to have water storage for power generation. Accordingly, in the hydropower stations it will be important to manage the water storage in the reservoir so that the station can respond to the scheduled power generation.
On the other hand, in the case of IPP project of which PPA is based on the energy output, such operation as to maximize the annual energy output is the most desirable and, therefore, the power discharge will be maximized. In other words, the spill out from the reservoir will be minimized, that is, the reservoir water level will be maintained as low as possible to avoid spilling of the reservoir inflow. The past reservoir operation described in Section 9.4.5 is a typical case. In particular, a fluctuation in the reservoir water levels will not affect much the gross head of a dam-waterway type project. As a result, the operation in Kirirom I has been practiced. However, in the case of dam type hydropower project, the fluctuation in the reservoir water levels will much affect the gross head. In this case, an optimum target level of reservoir exists. A reservoir will be operated to maintain the reservoir level high around the target level (often referred to as High Reservoir Level Operation), to maximize the energy output. A reservoir operation study should be executed carefully before commissioning of the project. It is important to manage the reservoir operation in response to the changes in the grid situation of available power.
Present Operation of Existing Hydro and Issue
As may be inferred from the background described above, there is an issue in the operation management of a hydropower station. The operator will release the reservoir inflow as much as possible during the rainy season in order to maximize the energy generation. There is no incentive to store water in the reservoir. As a result, the reservoir will become almost empty in the dry season and the adequate power generation will not be possible. New hydropower projects will be commissioned one after another in the future, maximization of the energy generation, that is, maximization of the dry season power output of the hydropower stations should be achieved by providing appropriate conditions and incentive measures in PPA and monitoring of reservoir operation to issue timely instructions to hydropower stations.
Upon putting the many large scale hydros into operation in the grid, it will be required to strengthen the Load Dispatching Center (LDC) for monitoring the available storage in each reservoir and issuing instructions on daily energy generation at each hydro station. In order to facilitate such judgment and instruction, hydro-meteorological observatory system as described in Section 9.4.1 paragraph (3) should be established by respective developers as early as possible and rainfall and hydrological data should be accumulated. These data will contribute to optimum operation of reservoir groups. Investments on the hydro-meteorological system will return in many folds finally as the maximized generation and power outputs of hydropower station group.

Final Report Chapter 9 Master Plan of Hydropower Development in Cambodia
JICA Master Plan Study of 9-28 January 2009 Hydropower Development in Cambodia
9.4.2 Environmental and Social Considerations
(1) EIA Guidelines
The Law on the Environmental Protection and Natural Resources Management and Sub-Decree on Environmental Impact Assessment Process, August 11, 1999 of RGC as well as the environmental guidelines of the World Bank, ADB, and JICA (including the former JBIC) can be downloaded from respective URLs below:
Table 9.4.1 EIA Guidelines for Reference
No. Environmental Guidelines URL 1. RGC: Sub-Decree on Environmental
Impact Assessment Process, August 11, 1999, to the Law on the Environmental Protection and Natural Resources Management, 1996. Protected Area Law was promulgated in January 2008 on the Protected Areas which were defined by the Law above. However, the Protected Area Law has not been available on the web sites.
http://www.camnet.com.kh/moe/EnvironmentLow.htm http://siteresources.worldbank.org/INTEAPREGTOPENVIRONMENT/Resources/Cambodia_EIA_Sub_Decree_1999.doc
2. The World Bank: The World Bank’s New Operational Manual, OP 4.01 January 1999
http://www.env.go.jp/earth/coop/coop/materials/10-eiae/10-eiae-7.pdf
3. ADB: Environmental Impact Assessment for Developing Countries in Asia, December 1997
http://www.adb.org/Documents/Books/Environment_Impact/#contents
4. New JICA: Guidelines for Environmental and Social Considerations are under study for integration of the two between former JICA and former JBIC.
-
5. Former JBIC: “JBIC Guidelines for Environmental and Social Considerations”, April 2002, in Japanese “Environmental Checklist of Dam/Reservoir Projects” in Japanese
http://www.jica.go.jp/environment/guideline/archives/jbic/guideline/pdf/kankyou_GL.pdf http://www.jica.go.jp/environment/guideline/archives/jbic/guideline/docs/check_12.xls
6. Former JICA: Existing Guidelines are “JICA Guidelines for Environmental and Social Considerations”, April 2004
http://www.jica.go.jp/environment/guideline/archives/jica/pdf/guideline_eng.pdf
Source: The study team
(2) Envisaged Environmental Impacts and Possible Mitigation Measures
Based on the available information and analysis, the following can be considered in order to mitigate the possible environmental damages:

Final Report Chapter 9 Master Plan of Hydropower Development in Cambodia
JICA Master Plan Study of 9-29 January 2009 Hydropower Development in Cambodia
Table 9.4.2 Envisaged Environmental Impacts and Possible Mitigation Measures
No. Envisaged
Environmental Impacts
Possible Mitigation Measures
1. Resettlement Compensation for houses (monetary compensation, compensation in kind)
Tentative monetary compensation to secure livelihood at the initial stage of resettlement
Measures for improvement of livelihood: Fish farming using the reservoir surface, small scale pumped irrigation using reservoir water, etc.
Measures for regional development/improvement: Rural electrification, improvement of farm road, water supply, community facilities
2. Inundated farmland Monetary compensation or provision of alternative farmland and alternative livelihood including job training
3. Inundated road Construction of relocation road
4. Inundation of forest etc.
Take precaution by Power Density at initial stage of project planning
Tree felling and taking out before impounding
Tree planting: Tree planting in the shrublands and grasslands around the reservoir area to mitigate loss in the CO2 fixing sink capacity of the inundated primary forest.
5. Transportation by boat
Navigation lock: Installation of navigation lock where there is the navigation demand by boat. However, if modal shift from boat to truck transportation in the future with road construction, such navigation lock may become unnecessary. Monetary compensation may also be considered depending on the demand scale.
6. Fish migration Installation of fish pass
Nursing and release of fish juvenile
Fish farming using the reservoir surface: There are successful examples in Indonesia and Nepal. WWF warns that the risk of Mekong River is triggered by overcatch of the fish resources. Further, it would be difficult to continue the way of fishing style practiced since the ancient era also in the 21st Century. It is considered necessary in the future on the Lake Tonle Sap and Mekong River to promote fish farming regardless of dam construction.
7. River section between intake and outfall (outlet of power discharge)
Environmental Flow Release: To support the water use and ecosystem in the river section, certain discharge will be released for such section, e.g. at 0.20 m3/s in 100 km2 of the catchment area.
Warning for water release: Warning system for water release should be installed if it is judged necessary for power generation and release of flood. In Japan, warning system will be installed if the water level rising speed is faster than 30 cm in 30 minutes.
8. Protected Areas To classify the Protected Area into four zones, and officially announce by Sub-decree of the Environmental Law.

Final Report Chapter 9 Master Plan of Hydropower Development in Cambodia
JICA Master Plan Study of 9-30 January 2009 Hydropower Development in Cambodia
No. Envisaged
Environmental Impacts
Possible Mitigation Measures
Access control: To install check gates on the access road, which would be constructed for construction works and operation & maintenance activities. This is to prevent uncontrolled entrance to the Protected Area for illegal activities like tree felling, opening of farmland, and hunting. Access control should be made based on the Environmental Law.
Financial and technical assistances for the management of the Protected Areas and National Parks
Environmental education: To provide chances to the people for experiencing walk and life in natural environment
Watershed management of the upstream area: afforestation, soil conservation (sand retention forest, check dams, contour-line farming)
Surveys on endangered species whether such species live in the proposed reservoir area or not. This will be as part of EIA survey to be conducted during the feasibility study stage. In case specific species are identified, appropriate countermeasures should be taken in a sustainable manner.
For the seven MP project areas existing information on the endangered species of fauna and flora are introduced in Table 4.8.2, Sub-Sections 4.8.3 and 8.2.2. These are summarized below by project:
#7&8 LL2: The upstream part of the reservoir area or its 0.6% belong to the Lomphat wildlife reserve (Table 8.2.8). There is a report that wild elephants seasonally migrate in the reserve (Table 4.8.2). The study team got no such information in the course of the hearing survey made on the natural and social environment.
#12&14 PL1-PL2: Virachey National Park is situated on the north bank of the Se San River. The reservoirs of these projects are located within the Park. There is a report that the Park provides habitats for several endangered species including tigers, elephants, douc langur (Table 4.8.2 and paragraph (3) of Sub-Section 8.2.2).
#29 Bokor Plateau: The project site is located in the Phnom Bokor National Park where tigers, elephants, sun bears reportedly inhabit (Table 4.8.2). The reservoir area is located to the north of the past summer resort on the plateau. As of 2008, the resort was under planning for rehabilitation.
#16 MSRC: The project site is located in the western part of the Cardamon Protected Area. According to the CI survey made in 2004, twelve mammal species, two birds, seven reptiles, one amphibian, and one fish were classified as ‘globally threatened’. CI views the Stung Chhay Areng basin located in the eastern part of the Cardamon is of particular significance in terms of biodiversity.
#20&21 Stung Metoek 2&3: The project sites are

Final Report Chapter 9 Master Plan of Hydropower Development in Cambodia
JICA Master Plan Study of 9-31 January 2009 Hydropower Development in Cambodia
No. Envisaged
Environmental Impacts
Possible Mitigation Measures
located inside the valley of Stung Metoek River which belongs to Phnom Samkos wildlife reserve. The reserve includes high mountains and is reported to provide habitats for birds of endangered species (Table 4.8.2).
9. Widening of gaps Establishment and operation, by the Government, of Social and Environmental Fund (SEF) through Cross Subsidy by the grid users, implementation of the Project Area Development by IPP and communities with subsidy from SEF, and implementation of the Livelihood Improvement Program with contribution from IPP.
Dissemination activities by the related authorities on education and agriculture extension services to promote: 1) environment conservation, 2) agro-forestry, and 3) ecotourism
Source: Study Team
(3) Aiming at Socioeconomic Development in harmony with Environment
The Chairman of Parliament singed the Protected Area Law (PAL) in January 2008. PAL stipulates that the Protected Area will be grouped into 4 zones. In the two upper zones (Core Zone and Conservation Zone) development of infrastructure is prohibited. Zoning of the Protected Area will be studied one after another and will be defined by the Sub-decree to PAL. It is required at the zoning, without bias neither to environmental conservation nor to resources development, to pursue development and harnessing of the hydropower, water resources, mineral resources, and so forth for the national interests while conserving the environment of the country. It would be necessary and effective for RGC repeatedly to explain to the public on the basic policy of the Government regarding the environment and development.
The Law on the Environmental Protection and Natural Resources Management, 1996 prescribes the objectives in its Chapter 1, Article 1 as follows:
To protect {and} promote environmental quality and public health through the prevention, reduction, and control of pollution
To assess the environmental impacts of all proposed projects prior to the issuance of the decision by the Royal Government
To ensure the rational and sustainable conservation, development, management, and use of the natural resources of the Kingdom of Cambodia
To encourage and enable the public to participate in environmental protection and natural resource management
To suppress any acts that cause harm to the environment
In order to promote sustainable development of hydropower resources while conserving the environment, it is recommended to execute a series of campaign for achieving national consensus. The campaign may include the following:

Final Report Chapter 9 Master Plan of Hydropower Development in Cambodia
JICA Master Plan Study of 9-32 January 2009 Hydropower Development in Cambodia
To create a catch copy like “Socio-economic Development in Harmony with Environment”;
The Government should explain to and deepen the understanding of the urban residents in particular on the fact 1) why they can enjoy the life with electricity but without power plants inside the urban areas and 2) the need of Cross Subsidy among the Grid users as the thanks to those people who have accepted resettlement and or other impacts accompanying to the implementation of hydropower and or thermal power projects. MIME/DIME should hold public meetings to disseminate the project implementation plan and information to the stakeholders concerned preceding the FS-EIA and resettlement planning by private developers so that the people concerned can get advanced proper information from the Government;
To hold inspection tours of power stations and substations;
To build and operate such facilities for the people to experience the life in natural environment.
(4) Notes for Resettlement Planning
Figure 9.4.3 presents four compensation items in relation to resettlement. Study on the following matters will be important:2
1) Preceding the explanation by foreign developer to the people on the resettlement of hydropower projects in Cambodia, it is important for RGC first to explain to the people about the national policy of energy and electricity, outlines and needs of the project, reason why involuntary resettlement is required, plan for EDC or other private developers to implement the project, and basic approach of the Government for resettlement. According to the hearing survey conducted under the Study, such opinions were taken up “We have not got explanation from the public. Why do we need to resettle for electricity export to foreign country?” The explanation from the Government to the people at the very first stage is an essential requirement in achieving understanding of the people for resettlement.
2) The resettlement plan should be studied and prepared through participatory planning. There is an example that the people once resettled in accordance with the top-down plan returned to the previous place.
3) If more than half of one community is subject for resettlement but some parts of the households do not need resettlement, it should be a principle to resettle the whole community and maintain the community also at the new host land as far as the people wish so.
4) Since alternative farmland would be relatively easy to identify and acquire in the project areas of Cambodia, it should be another principle of resettlement to provide the farmland necessary and sufficient to have agricultural products at the same level or higher than before the resettlement.
5) In selecting the host land, the following should be studied:
2 Reference materials of the World Bank: Involuntary Resettlement: Comparative Perspectives, World Bank Series on
Evaluation and Development, Vol 2), World Bank.

Final Report Chapter 9 Master Plan of Hydropower Development in Cambodia
JICA Master Plan Study of 9-33 January 2009 Hydropower Development in Cambodia
The location should be selected taking into consideration the convenience for navigation and road transport. It is desirable the host land be close to the lake shore on one hand and close to the main road to the provincial town on the other hand. In view of the electrification by extension of distribution lines from the power station of the project, it is also desirable to be not very far from the station.
The host land should be appropriate for use as farmland (fertility, flat or hilly land). It should be studied if an irrigation by a low head pump from the lake surface is appropriate for the farming after the relocation. It is also important the required area of land is available within one area (for resettlement by whole community as well as for effective maintenance of farm roads).
Land for housing and community facilities including community roads should also be acquired. The scenic value of commanding panoramic view of the lake surface would be one of the factors for site selection. Such view may be potential resources for echo-tourism.
When the host land is adjacent to existing communities, social study should be made in advance not to cause social discord among different communities.
It will be the best if creek water or groundwater is available for drinking and domestic use throughout the year. However, in Cambodia which has distinct dry season, it would be required to tap the groundwater or pump from the lake surface. Drinking water could be supplied by pumping with appropriate treatment.
6) Monetary compensation will also be planned when necessary to cover transportation costs of movables upon resettlement and compensation for livelihood for the initial period after resettlement. There is an experience that because of delay in the payment of compensation money, people borrowed money of high interest rates and struggled in repayment. Livelihood compensation over long years may be provided on installment basis.
7) In accordance with “Dengen-Sampo (Three Generation Laws)” in Japan since 1974 (refer to paragraph (8) hereof), surcharge tariff has been collected from power companies and provided, in addition to ordinary compensation accompanying to the resettlement, to those rural development projects to be prepared by Prefecture government and implemented by City-Town-Village government covering such projects as improvement of living standards, building of infrastructures, environmental conservation and so forth. Necessary projects have been implemented by obtaining the understanding and cooperation of the people living in the project area through inputs of various efforts extended over long time.

Final Report Chapter 9 Master Plan of Hydropower Development in Cambodia
JICA Master Plan Study of 9-34 January 2009 Hydropower Development in Cambodia
Figure 9.4.3 Items of Resettlement Compensation
(5) Introduction of Power Density (PD)
A concept of PD was introduced into the selection process of 10 priority projects in Stage 1 study as described in Section 5.4.3. The Study Team recommends the Power Density criteria be introduced also in the initial assessment of new projects other than the Master Plan projects.
Figure 9.4.4 shows power density and number of people for resettlement per power output of world hydropower dams. There are five precedents reported in the world that have lower PD than 0.5 MW/km2. The PD at 0.5 MW/km2 (red vertical line) is on the left side on the figure, that is, this PD level is at a significantly low level being rather close to the world lows (although it may seem distant on the logarithmic scale). This PD level was selected to meet the growing electricity demand and the need of hydropower development in Cambodia while maintaining the practical balance with the environment (refer to Table 5.4.2 for such balance of hydropower development and environmental).
Although there are 10 projects shown on the left side of PD at 0.5 MW/km2, 5 had provisional EIRR lower than 5% and 2 were ranked by FACA at or lower than 24th. The rests are #11 LSS3, #15 LSP3, and #24 PST1. At Stage 1 of the present Master Plan Study, #11 LSS3 and #15 LSP3 projects were not retained as subjects for the further selecting study for their low PD and because there were no field survey and EIA that convince the acceptability of their social and environmental impacts. These two projects are shown in the lower left corner of the figure, that is, these would have a wide submerged land and large number of people for resettlement compared to its power output. Although there are some precedents in the world, it may be inferred that these projects have significant impacts both in the area of submerged land and number of people for resettlement.
Compensation for Resettlement
Householdsfor
Resettlement
House Compensation--> Principle of resettlement as community
--> Principle of House for House
Farmland Compensation--> Principle of Land for Land
Livelihood Compensation--> Transportation of household goods
--> Compensation for initial livelihood (cash, rice)--> Irrigation of new farmland lakeside, fish culture,
etc.
Compensation of Community Infrastructures--> Village roads, school, tenple, etc.
SPC

Final Report Chapter 9 Master Plan of Hydropower Development in Cambodia
JICA Master Plan Study of 9-35 January 2009 Hydropower Development in Cambodia
The last project in Cambodia on the left side of PD line is #24 PST1 which is located on left and upper corner of the figure. It requires no resettlement. If this project is developed for multipurpose for hydropower and irrigation water supply for example, the PD criteria will not be relevant.
For reference, CDM Board accepts use of simplified constant as a unit reservoir emission of CO2 if PD is greater than 4.0 MW/km2. This special permission is to encourage development of clean and renewable hydropower resources by reducing the burden to prove the level of reservoir emission when PD is high. If PD is lower than 4.0 MW/km2 and if they still wish to get Certified Emission Reduction (CER) from CDM Board, applicants to CDM are required to prove the level of reservoir emission.
As described below, the PD of 0.5 MW/km2 may be close to the level that could be achieved by growing sugarcane in the proposed reservoir area and producing bio-ethanol.
According to the sugarcane harvesting in Brazil, bio-ethanol is produced with a unit production at 5.82 kL/ha. Heat rate of bio-ethanol is 5,589 kcal. Assuming the power generation efficiency at 40%, with one liter of bio-ethanol we can generate 2.60 kWh/L, which is equivalent to 15,100 kWh/ha or 1,510,000 kWh/ km2. Assuming plant factor at 40%, its PD will be 0.43 MW/km2.
As explained above, if we grow sugarcane in the proposed reservoir areas, there would be a possibility to achieve PD by biomass energy similar to the low PD hydros. It is considered that the PD level at 0.5 MW/km2 to take precaution against potential environmental impacts is not excessively severe from the viewpoints of land efficiency as well as development of domestic energy resources. The decision maker should well recognize those projects that have PD lower than 0.5 MW/km2 may incur significant environmental impacts on one hand and low land efficiency in energy production on the other hand. In such case, detailed field survey and EIA should be conducted in sufficient time and should be followed by feasibility study preceding final decision.3
It is to be noted that the proposed PD criteria is relevant to a single purpose project for hydropower development. When a reservoir has a flood control effect or when the discharge after power generation will be used for irrigation or municipal water supply, the PD criteria will not be relevant.
3 There may remain such possibility as to subtract the areas of grassland, shrubland, wasteland from the denominator of PD.

Final Report Chapter 9 Master Plan of Hydropower Development in Cambodia
JICA Master Plan Study of 9-36 January 2009 Hydropower Development in Cambodia
#10 Se Kong
#7&8 Lower Sre Pok 2 + Lowers Se San 2
#11 Lower Se San 3 #20 Stung Metoek 2
#15 Lower Sre Pok 3 #17 Stung Chhay Areng
Balbina
Akosombo/Volta
Kompienga
Churchill Nam Theun Hinboun
Nam Ngum
SobradinhoAswan High
Kainji
Cahora Bassa
Kedung Ombo
Pak Mun
Khao Laem
Narmada Sagar
Nam Theun 2
Yacyreta
Mangla
Ataturk
TuchuruiBakun
Ilha Solteira
Guri Complex
Pehuenche
Tehri
Three Gorges
Victoria
Itaipu
Tarbela
Ertan
Grand Coulee
Ghanzi Barotha
Arun III
#28 Stung Battambang 1
#3 Prek Ter 3
#26 Stung Sen
#2 Prek Chhlong
0.00
0.01
0.10
1.00
10.00
100.00
1,000.00
0.01 0.10 1.00 10.00 100.00 1,000.00
Installed Capacity/Reservoir Area (MW/km2)
MW
/Per
son
to b
e re
settl
edNoPersonto beresettled
#18 StungTatay#4 Prek Ter 2
#24 Stung Pursat 1
#25 Stung Pursat 2
#6 Prek Por 1
#5 Sre Pok 4
#9 Stung Treng
#21 Stung Metoek 3#29 Bokor Plateau
#12 & 13 Prek Liang 1 & 1A
#23 Upper St. Russey Chrum
#22 Stung Kep 2 (NewTatay)
#19 Stung Metoek 1
#16 Middle St.Russey Chrum
#14 PrekLiang 2
#27 Stung Battambang 2
#1 Sambor
Relationship betweenPower Density and MW per
Person Resettled
:Dams reported to IUCN
29 projects in Cambodia undergone First Screening
(7 MP projects: Underlined)
:8 projects with provisionalEIRR below 5%
:3 projects with provisional ranking lower than 20
:18 potential projects
Source: Prepared by Study Team based on the material from World Bank Web Page etc.
Figure 9.4.4 PD and Number of People Resettled per MW of Hydropower Dams
(6) Judgment Whether to Implement Mekong Mainstream Projects in relation to Reservoir Sedimentation
It will be required to clarify and confirm the technical feasibility of sand flushing of sediment deposits to be accumulated in the reservoir bed that will be created on flat region like in Cambodia. For that purpose, it will be required to make field survey and laboratory tests including SS concentration, particle size distribution, mineral components of clay materials, section and profile survey of reservoir area, hydraulic model tests, computer simulation, etc.
The Mekong River has many branch streams in its section between Stung Treng and Sambor dam site. There can be an idea to develop run-of-river scheme utilizing these branch streams4. Even if we totally close the Mekong River by a dam (dam type development), the reservoir capacity will be very small compared to the annual inflow and it is, therefore, a run-of-river type in terms of its function to regulate reservoir inflow. Although the power output of a run-of-river type scheme utilizing branch stream will drastically decrease in the rainy season, it is expected that the dry season power output be theoretically the same with that of dam type development.
4 These new hydropower projects are not included in the 29 projects and are not subjects of the present Master Plan Study. “An example of using a part of river course for power generation in the Mekong Mainstream” is shown in Appendix D-3.
To be carefully judged
Least impacts

Final Report Chapter 9 Master Plan of Hydropower Development in Cambodia
JICA Master Plan Study of 9-37 January 2009 Hydropower Development in Cambodia
(7) Facility Planning in relation to Environmental Conservation
1) Underground structures inside Protected Areas:
By adopting underground layout of headrace and tailrace waterways, power station, the scenery impacts could be mitigated. In general there may be such thinking that underground cavern is more expensive than surface type power house. However, a surface type power station often requires deep setting to found turbine on sound bedrock, which results to require a large slope cutting behind the power house. The underground cavern could shorten the headrace tunnel length, avoid cascade development resulting from technical difficulty of long headrace tunnel, construction cost of tailrace tunnel reduces because of non-pressure type, and so forth. Thus, we should note that gross construction costs could be reduced in some cases.
2) Environmental Maintenance Flow:
The standard in Japan sets the rate of environmental maintenance flow in proportion to the area of basin. The rivers in the South-western Region of Cambodia would almost dry up in the dry season. In the present MP Study the standard in Japan, that is, 0.2 m3/s/100 km2 was adopted. As a result, there would be such possibility that a reservoir scheme situated in the Southwestern Region in particular facilitate diversified usage of the water resources in the dry season. The dry season inflow of a run-of-river type hydro will be much below 0.2 m3/s/100 km2. Accordingly, this maintenance flow rate should not be applied to a run-of-river scheme in Cambodia if any. It is required to decide the environmental maintenance flow balancing the dry season inflow and the water use and ecology on the downstream river reaches.
3) Fish Pass:
As to the rivers in the North-eastern Region, there is a report that some fishes migrates between Tonle Sap and 3S Rivers (Sre Pok, Se San, and Se Kong). As to the blockage of the migration routes of the fishes, installation of fish pass is one of the options. There remains a possibility of the dam construction affecting the fisher. However, it is difficult to assess the impacts quantitatively. WWF reports that the risk factor of the Mekong River is in over-catch of fishes. It is required to study on the fresh water aquaculture using the lake water surface. It is no longer possible to continue the outdated fishing also in the 21st century like hunting and gathering on the ancient time. It is required to promote freshwater aquaculture as practiced in China at a great scale.
According to the Dam Catalogue 2008 issued by the Japan Congress on Large Dam, there are 15 dams as of 2008 that installed fish pass. Table 9.4.3 lists projects with fish pass in Japan and Figure 9.4.5 shows pictures of fish pass. In planning fish pass of #7&8 LL2 project, a careful comparative study will be required to have the most appropriate type.

Final Report Chapter 9 Master Plan of Hydropower Development in Cambodia
JICA Master Plan Study of 9-38 January 2009 Hydropower Development in Cambodia
Table 9.4.3 Dams with Fish Pass in Japan and Their Feasutes
Height(m)
CrestLength Type Height
DiffereLength
(m) Intended Species Characteristics
1 Aono 29 286 natural 18 652 Not limited Minimize the usage of concrete and placed naturalstones as much as possible.
2 Arase 25 210.8 folding back iceharbour 16 335 sweetfish, eel,
Rhinogobius brunneus
3 Ikeda 24 247 cascade 21 sweetfish, dace, freshwaterminnow, carp, catfish, eel
4 OhnoHeadworks 26 66.2 21 Pools at an interval of 10m are provided for the fish to
rest
5 Kanna 45 185Located closer to the river mouth, considerations aremade for crabs or shrimps to pass. An example of fishpass installed in relatively high dam
6 Koshido 22.8 120.3 sweetfish A rare fish pass which can observe the fish very close
7 Samani 44 140 cascade (partiallychannel) 22 288 white-spotted char, cherry
salmon, salmon Newly installed fish pass to the existing dam
8 Shoukawa-goukuchi 18.5 103.3 cascade
9 Shiromaru 30.3 61 ice harbour 27 332 seema, cherry salmon,salmon
10 Setoishi 26.5 139.4 ice harbour 430 Three quarter of the long fish pass (430 m) is tunnel orculvert.
11 Nakaiwa 26.3 107.9 22 332 sweetfish,seema, Japanesedace
12 Nishidaira 31.5 144.4 cascade13 Nibutani 32 550 cascade cherry salmon14 Pirika 40 1480 cascade, natural 2400 cherry salmon15 Meboro 40 150 cascade 14 178 Equiped with float type power shute gate.
No.Features of Fish Pass
Name of damFeature of Dam
1) Cascade type fish pass of Nishidaira dam and the powerhouse 2) Cascade type fish pass of Nibutani dam
3) Fish pass of Nakaiwa dam 4) Fish pass of Meboro dam (center) and the whole picture of the dam
Source : 1) Dam’s Room http://damsroom.web.infoseek.co.jp/Dam_nishidaira_frame.htm 2) Dam’s Room http://damsroom.web.infoseek.co.jp/Dam_nibutani2_frame.htm 3) Dam Roman http://fumu2.jp/damdam/ 4) Dam binran(handbook) http://wwwsoc.nii.ac.jp/jdf/Dambinran/binran/All/All_2651.html
Figure 9.4.5 Existing Fish Pass in Japan

Final Report Chapter 9 Master Plan of Hydropower Development in Cambodia
JICA Master Plan Study of 9-39 January 2009 Hydropower Development in Cambodia
4) Navigation Lock:
A navigation lock should be provided where navigation demand is high. However, there may be a case that although the navigation is a major transport means at present, it may be forecast that truck transportation will become the main future means in accordance with the ongoing development of the road networks. In such case, the navigation lock would soon become useless in the future. Depending on the demand forecast, monetary compensation may also be studied as an alternative.
5) Power Station and Dam Discharge Warning:
When it is judged prerequisite for daily operation of power station and or operation of spillway, discharge warning system should be installed. According to a standard in Japan, such warning system is installed when it is forecast that the river water level rises at a rate faster than 30 cm in 30 minutes.
It is required to establish the Operation Rule of power stations in order not to exceed the limit above for the rising speed of downstream water levels. Even if the actual operation is made strictly in accordance with the Operation Rule keeping the limit, there remains a risk of Grid Disturbance breaking out due to incidents of large scale. In order to avoid further extension of such Grid Disturbance even if taken place, there would be a case that a station be obliged to suddenly increase the power output. For those stations that are operated for peak load, the rising speed of downstream river water levels should be simulated and when danger is forecast, necessary countermeasures should be taken. In particular, a large scale power station like #7&8 LL2 has superior capacity for regulating further extension of Grid Disturbance and, therefore, it is essential for RGC to seek for the ultimate safety even in case of emergency discharging operation.
(8) Social and Environmental Fund and Project Area Development
1) Samples of Cross Subsidy
Cross subsidy is a special purpose tax. In order to secure the use of the cross subsidy and to manage the money, a Special Account or Fund should be established by law.
2) Similar Sample in Japan
“Dengen-Sampo (Three Generation Laws)” was enacted in 1974. In order to promote implementation of generation projects, Dengen-Sampo is to contribute and return part of the benefits created by construction of power projects, to the people in the project area. It consist of 1) Tax law for promotion of generation expansion, 2) Special Account law for Generation Expansion, and 3) Law for Regional Development around Generation Facilities. It is prerequisite for implementation of a hydro to have cooperation from the people of the

Final Report Chapter 9 Master Plan of Hydropower Development in Cambodia
JICA Master Plan Study of 9-40 January 2009 Hydropower Development in Cambodia
project area. Accordingly, in accordance with these laws, the power company collects cross subsidy from the grid users as surcharge to the power tariff. The cross subsidy collected and reserved in the Special Account of the Central Government is allocated to each City-Town-Village for construction of roads, public facilities, etc. The local government also benefits from the tax on in-movables.
Dengen-Sampo may be outlined as follows:
Tax law for promotion of generation expansion: To collect tax for promotion of generation expansion from power companies at Yen 445 per MWH sold. This corresponds to a surcharge at 0.42 cent/kWh at an exchange rate of August 2008 ($1.00 = Yen 105).
Special Account law for Generation Expansion: From the Special Account for promotion of generation expansion, subsidy is provided at Yen 190 per MWh under Account for Project Acceptance and Yen 255 under Account for Generation Diversification.
Law for Regional Development around Generation Facilities: Prefecture Government prepares Project Area Development Plan and relevant City-Town-Village government will implement it with subsidy from the Special Account.
In 2003, some parts of 2) Special Account law for Generation Expansion and 3) Law for Regional Development around Generation Facilities were amended into “Subsidy for Project Acceptance” to expand the use of the subsidy to promotion of village industry or welfare services. It is also intended to support with priority those generation projects such as nuclear power, hydropower, geothermal, etc. that has low environmental load and can supply stable power.
3) Sample of other sector in Japan -- Universal Service of Telephone
In Japan, a universal tariff system is managed by cross-subsidy, to facilitate universal service for the telecommunication also on isolated islands where special costs is incurred, emergency notices to police and ambulance. As source of the services, a number charge at Yen 6 per telephone number is collected and is allocated to providing such universal services. The number charge is reviewed every six month with reference to the increase or decrease of telephone subscribers.
4) Sample of the Philippines – Internal Subsidy System
The Department of Energy (DOE) imposes universal charge at 0.0373 Peso/kWh (1-3% of the electricity tariff) to all the customers of NPC (grid operator) including domestic, commercial, industrial, and public institutions. DOE entrusts the collection business of universal charges to NPC. DOE manages the money by establishing Special Fund. Small Power Utility Group (SPUG) of NPC, which is an organization for promotion of electrification of off-grid areas,
Final Report Chapter 9 Master Plan of Hydropower Development in Cambodia
JICA Master Plan Study of 9-41 January 2009 Hydropower Development in Cambodia
undertakes the transaction of subsidy. The subsidy is allocated to electrification projects of non-electrified villages using renewable energy. Details of the subsidy will be defined in Renewal Energy Act.
5) Sample of Bangladesh -- 2-Step Loan for rural electrification
The money flow and interest rate are as shown below:
JBIC→GOB (Ministry of Finance): Interest rate at 1%, repayment period 30 years including grace period of 10 years
GOB→REB (Rural Electrification Bureau): Interest rate at 2%, repayment period 30 years including grace period of 5 years
REB→PBSs (Electrification Cooperatives): Interest rate at 3%, repayment period 33 years including grace period of 8 years
The fund is allocated mainly to construction of distribution network. REB is responsible for procurement and construction while PBSs for operation and management after completion. Upon commencement of the operation, PBSs start repayment of the 2-step loans to REB.
6) Sample in Kenya
In Kenya, a 5% surcharge is added to a power tariff and is allocated for promotion of rural electrification projects.
7) Concept of Cross Subsidy among Grid Users and Project Area Development with SPC Contributions
Points of resettlement planning have been described in paragraph (4). It is desired to establish a system that facilitates continuous improvements of the living standard of the people who would live in the remote mountainous areas also after the resettlement. To achieve such system, the following two may be considered based on the background as presented in Figure 9.4.6:
A certain surcharge will be imposed on the power tariff as cross subsidy of the grid users in Cambodia. The surcharge will be pooled in the Special Account or Fund (Social and Environmental Fund). It will be allocated to financing those projects for Project Area Development including environmental conservation and rural electrification.
IPP as implementing agency of hydropower projects will be required to raise capitals to SPC for resettlement compensation etc. In addition to the four resettlement compensation, IPP will allocate its stock as thanks to the people for acceptance of the resettlement and will also contribute mitigation costs for environmental impacts. With these funds, IPP will execute resettlement compensation and environmental conservation in the Project area.

Final Report Chapter 9 Master Plan of Hydropower Development in Cambodia
JICA Master Plan Study of 9-42 January 2009 Hydropower Development in Cambodia
Cross subsidy by users of National Grid
Compensation/Contribution by IPP
Users ofNational Grid
Background to the Need of CrossSubsidy & Compensations by IPP
Returning part of the benefits forsocial & environmental impacts
IPP of theproject
Benefiting from power plantsthrough National Grid
Resettlement etc. for dam construction
Emission of exhasut gasses etc.to around thermal powerplants
People in the project area
Contirbution for environmentaldisturbances
Contribution for acceptance ofresettlement
Four compensations for resettlement
Increase in urban-rural divide
Figure 9.4.6 Background to the Needs of Cross Subsidy and Contribution by IPP
8) An Idea to Support Project Area Development in Cambodia
Figure 9.4.7 presents the concept of SEF for Project Area Development and SPC contributions for compensation. Cross subsidy through SEF is for the whole grid users including corporate users to contribute part of the benefits obtained by using electricity and to return it to the people in the project area. It will be used mainly for Project Area Development in order to improve the living standard there. On the other hand, the IPP contributions will compensate for social and environmental impacts. Such systems are being studied worldwide. However, there is few examples except for compensation for resettlement and submersion of farmland. The dividend to the people resettled is to treat their acceptance of the involuntary resettlement as capital raising to SPC in kind as the people’s contribution by accepting move to a new host place leaving the long lived place and the stock of SPC would be issued to the community as a whole. That is, SPC will raise such capital under the name of the community in exchange of the project acceptance. Separately from this, parts of the external non-economy costs of environment will be borne by the developers and will be raised also as capital of SPC for financing those activities of environmental conservation. SPC will undertake Project Area Development and environmental conservation with own capitals and subsidy through SEF. The community resettled will receive dividend from SPC after starting power generation. The dividend may be used as source of micro-credit for continuous improvements of living standards. The communities will participate in the joint activities with SPC and will also monitor such activities.

Final Report Chapter 9 Master Plan of Hydropower Development in Cambodia
JICA Master Plan Study of 9-43 January 2009 Hydropower Development in Cambodia
Communities in Project Area
Contribution foracceptance ofresettlement
Contribution forenvironmentaldisturbances
SPC in cooperation with community
Resettlement Compensation and Community Development with SEF
IPP
1. Acceptance ofresettlement
Fourcompensations for
resettlement(house, farmland,
livelihood, &community facilities)
Crosssubsidy
SEF from Grid users
Dividend to thecommunity
resettledafter starting power
generation
Communitydevelopment
projects(electrification,
community roads, etc.)
Environmentalconservation
activities(management of visitorsfrom entering Protected
Area, patrol, etc.)
Costs forresettlement
Figure 9.4.7 An Idea of Project Area Development with SEF and Compensation by
SPC Contributions
It is desirable that the Project Area Development with SEF subsidy and environmental conservation by SPC capital are implemented under a comprehensive development program include the following:
Community infrastructures such as village roads, electrification, water supply;
Livelihood measures such as irrigation and aquaculture;
BHN facilities like school, heath post;
Welfare facilities like community hall;
Environmental education and building and operation of pro-environment facilities like promenade and camping area to experience life in natural environment;
Environmental conservation activities like checking of illegal access to Protected Area;
Management of micro-credit.
9.4.3 Procurement Plan of Finance
The basic approach of RGC as of 2008 in relation to the financial arrangement for implementing the Master Plan projects is to Build-Operate-Transfer (BOT) with the private finance. In the case of BOT, the MP projects could be implemented without particular financial inputs by RGC. This is a natural selection of RGC who has the policy obligation to supply electricity to the people of Cambodia under such financing situation that the public financing in cooperation with MDB and ODA would take several years from application to commencement of the loan disbursement. However, if RGC totally depends on the private financing alone, there would be certain adverse effects as examined in Table 9.4.4 below:

Final Report Chapter 9 Master Plan of Hydropower Development in Cambodia
JICA Master Plan Study of 9-44 January 2009 Hydropower Development in Cambodia
Table 9.4.4 Pros and Cons of Generation Expansion with Private Financing
Pros Cons
Financial inputs of RGC are not required. The public debt will not increase.
The developer will recover the investments from the future power tariff. The power tariff may become higher.
Compared with public loan (some of these include very low interest rate at 0.01% per annum), the interest rates available for the developers would in general be higher and shorter in repayment period, which would lead to a higher tariff.
Fast in decision. Since each project is developed by individual developer, combination of these would not necessarily result in an optimum basin development.
In place of pursuing the maximum net benefit (B-C) as a development project of natural resources of Cambodia, maximum investment efficiency, that is, the highest FIRR or the maximum benefit-cost ratio (B/C) would be pursued. There may be a possibility that certain potentials of low investment efficiency remain undeveloped.
There may be a case that IPP is interested only in a specific project within a basin and is not interested in the maximization of the total benefit of the basin-wide hydropower development. As a result an optimum development plan of individual project would not necessarily form an element of the optimum basin development plan. Also there may be such a case that although one project contributes to the maximization of the entire benefit of the basin development, financial viability of that particular project may be low and no IPP would show interests in its implementation.
In such cases, the two issues above could be overcome with the following counter-measures:
MIME should prepare a basin master plan in advance for hydropower development in each basin. It should be followed by implementation of individual projects by IPP. Thus an optimum development of whole the basin potential could be achieved.
The Stung Atay and MSRC projects will significantly augment the dry season power outputs of two dam schemes of the LSRC project located downstream. This is an augmentation effect on the Dry Season Power Outputs to be

Final Report Chapter 9 Master Plan of Hydropower Development in Cambodia
JICA Master Plan Study of 9-45 January 2009 Hydropower Development in Cambodia
welcomed by the power sector of Cambodia and the people. However, the financial viability of MSRC project itself is rather low. It would be solved either by requiring the IPP of the LSRC project for integrated development of LSRC and MSRC, or by making special consideration in setting power tariff of MSRC from the viewpoint of the augmentation effect on the Dry Season Power Outputs in order to encourage the implementation of MSRC by IPP.
RGC can transfer most of the risks to IPP, such as hydrological risk (risk to face low rainfall year), flood risk, landslide risk, subsurface geological risk, risk of price inflation, risk of exchange rates, risk of delay in works completion, and so forth.
Power tariff will rise by the risks to be borne by IPP.
RGC retains risks of electricity not supplied to the Grid as planned and scheduled.
RGC needs neither pre-FS nor FS.
What RGC should undertake by the time of construction is evaluation of proposal, pre-FS, FS, concluding contract, and monitoring of implementation.
Know-how on the hydropower planning, design, construction supervision will not be accumulated in the staff of RGC.
In order to complement the expected cons above, it is recommended that RGC promotes procurement of public financing in parallel with the ongoing project implementation with Private Finance Initiative (PFI) so as to start the following in a few years:
MIME/EDC to participate in the project implementation by raising capital to SPC with back finance from MDB;
MIME/EDC to implement a model project as public works or PPP project with public finance from MDB and ODA.
9.4.4 Human Resources Development
A JICA study program was provided in Tokyo in September 2008 to the three officers participating from MIME with the following seminar programs:
1) Basics of hydropower planning
2) Sedimentation and reservoir operation
3) Cost estimate
4) Economic evaluation and financial analysis
5) Unit generation cost and power tariff
6) Environmental impact assessment
7) Development and resettlement

Final Report Chapter 9 Master Plan of Hydropower Development in Cambodia
JICA Master Plan Study of 9-46 January 2009 Hydropower Development in Cambodia
8) Hydropower development and social environment
9) Inspection tour: Example of hydropower projects in national park, example of environmental consideration in national park by power company
Since MIME has 30 staff in the Hydro-electricity Department, it is desirable to have similar study programs also in the future. Although desk study is also required, it alone will not be sufficient. According to the past experience in other countries, important technology transfer and capacity development could be well achieved through on-the-job training. At the early stage of the nation’s development, project implementation as public works with foreign financial supports could engage the staff of RGC directly in the following works to accumulate the experience:
1) Field investigation works such as topographic survey, hydrological observation, geological investigation, and so forth;
2) Hydropower planning, preliminary design, cost estimate, environmental impact assessment, economic evaluation and financial analysis;
3) Design, preparation of tender documents, tender evaluation, contract negotiation;
4) Contract management, quality control, time control, payment management, safety control;
5) Operation, maintenance and replacement of generation facilities.
9.4.5 Cooperation with Relevant Sectors
In order to implement hydropower projects, the following would be needed to have various cooperation from central and local government organizations:
1) Cooperation with MEF towards creation of cross subsidy system for setting up of the proposed Social and Environmental Fund (SEF);
2) Cooperation with MOE in zoning of the Protected Areas;
3) Cooperation with MAFF (FA) for acquisition of forest land to be submerged in reservoir, reforestation program, and fishery, fish pass, etc.
4) Cooperation with MOWRAM in hydrological observation;
5) Cooperation with MOPWT in construction of relocation roads, access roads, and navigation.