6. SITE 884 1 - Ocean Drilling Program
94
Rea, D.K., Basov, I.A., Janecek, T.R., Palmer-Julson, A., et al.. 1993 Proceedings of the Ocean Drilling Program, Initial Reports, Vol. 145 6. SITE 884 1 Shipboard Scientific Party 2 HOLE 884A Date occupied: 20 August 1992 Date departed: 20 August 1992 Time on hole: 9 hr, 15 min Position: 51°27.026'N, 168°20.228'E Bottom felt (rig floor; m, drill-pipe measurement): 3837.8 Distance between rig floor and sea level (m): 11.17 Water depth (drill-pipe measurement from sea level, m): 3826.6 Total depth (rig floor; m): 3847.5 Penetration (m): 9.7 Number of cores (including cores with no recovery): 1 Total length of cored section (m): 9.7 Total core recovered (m): 9.72 Core recovery (%): 100 Oldest sediment cored: Depth (mbsf): 9.7 Nature: silty clay Age: Quaternary Measured velocity(km/s): 1.43 Comments: Missed mud line. HOLE 884B D^te occupied: 20 August 1992 Date departed: 24 August 1992 Time on hole: 3 days, 17 hr, 15 min Position: 51 °27.026'N, 168°20.228'E Bottom toH (rig floor; m, drill-pipe measurement): 3836.0 Distance between rig floor and sea level (m): 11.17 Water depth (drill-pipe measurement from sea level, m): 3824.8 Total depth (rig floor; m): 4689.9 Penetration (m): 853.9 Number of cores (including cores with no recovery): 91 Total length of cored section (m): 853.9 Total core recovered (m): 791.76 Core recovery (%): 92.7 Oldest sediment cored: Depth (mbsf): 853.9 Nature: ashy claystone and clayey ash Age: early Eocene Measured velocity(km/s): 1.69 HOLE 884C Date occupied: 24 August 1992 Date departed: 25 August 1992 Time on hole: 1 day, 6 hr, 30 min Position: 51°27.038'N, 168°20.217'E Bottom felt (rig floor; m, drill-pipe measurement): 3836.1 Distance between rig floor and sea level (m): 11.17 Water depth (drill-pipe measurement from sea level, m): 3824.9 Total depth (rig floor; m): 4193.9 Penetration (m): 357.8 Number of cores (including cores with no recovery): 38 Total length of cored section (m): 357.8 Total core recovered (m): 294.56 Core recovery (%): 82.3 Oldest sediment cored: Depth (mbsf): 357.8 Nature: diatom clay and clayey diatom ooze Age: late Miocene Measured velocity (km/s): 1.53 HOLE 884D Date occupied: 25 August 1992 Date departed: 26 August 1992 Time on hole: 8 hr Position: 51°27.038'N, 168°20.196'E Bottom felt (rig floor; m, drill-pipe measurement): 3837.2 Distance between rig floor and sea level (m): 11.17 Water depth (drill-pipe measurement from sea level, m): 3826.0 Total depth (rig floor; m): 3852.0 Penetration (m): 14.8 Number of cores (including cores with no recovery): 2 Total length of cored section (m): 14.8 Total core recovered (m): 13.92 Core recovery (%): 94.1 Oldest sediment cored: Depth (mbsf): 14.8 Nature: clay with diatoms Age: Quaternary Comments: Cores used for high-resolution paleomagnetic studies. HOLE 884E Rea, D.K., Basov, I.A., Janecek, T.R., Palmer-Julson, A., et al., 1993. Proc. ODP, Init. Repts., 145: College Station, TX (Ocean Drilling Program). Shipboard Scientific Party is as given in list of participants preceding the contents. Date occupied: 26 August 1992 Date departed: 31 August 1992 209
-
Upload
khangminh22 -
Category
Documents
-
view
3 -
download
0
Transcript of 6. SITE 884 1 - Ocean Drilling Program

Rea, D.K., Basov, I.A., Janecek, T.R., Palmer-Julson, A., et al.. 1993Proceedings of the Ocean Drilling Program, Initial Reports, Vol. 145
6. SITE 884 1
Shipboard Scientific Party2
HOLE 884A
Date occupied: 20 August 1992
Date departed: 20 August 1992
Time on hole: 9 hr, 15 min
Position: 51 °27.026'N, 168°20.228'E
Bottom felt (rig floor; m, drill-pipe measurement): 3837.8
Distance between rig floor and sea level (m): 11.17
Water depth (drill-pipe measurement from sea level, m): 3826.6
Total depth (rig floor; m): 3847.5
Penetration (m): 9.7
Number of cores (including cores with no recovery): 1
Total length of cored section (m): 9.7
Total core recovered (m): 9.72
Core recovery (%): 100
Oldest sediment cored:Depth (mbsf): 9.7Nature: silty clayAge: QuaternaryMeasured velocity(km/s): 1.43
Comments: Missed mud line.
HOLE 884B
D^te occupied: 20 August 1992
Date departed: 24 August 1992
Time on hole: 3 days, 17 hr, 15 min
Position: 51 °27.026'N, 168°20.228'E
Bottom toH (rig floor; m, drill-pipe measurement): 3836.0
Distance between rig floor and sea level (m): 11.17
Water depth (drill-pipe measurement from sea level, m): 3824.8
Total depth (rig floor; m): 4689.9
Penetration (m): 853.9
Number of cores (including cores with no recovery): 91
Total length of cored section (m): 853.9
Total core recovered (m): 791.76
Core recovery (%): 92.7
Oldest sediment cored:Depth (mbsf): 853.9Nature: ashy claystone and clayey ashAge: early EoceneMeasured velocity(km/s): 1.69
HOLE 884C
Date occupied: 24 August 1992
Date departed: 25 August 1992
Time on hole: 1 day, 6 hr, 30 min
Position: 51°27.038'N, 168°20.217'E
Bottom felt (rig floor; m, drill-pipe measurement): 3836.1
Distance between rig floor and sea level (m): 11.17
Water depth (drill-pipe measurement from sea level, m): 3824.9
Total depth (rig floor; m): 4193.9
Penetration (m): 357.8
Number of cores (including cores with no recovery): 38
Total length of cored section (m): 357.8
Total core recovered (m): 294.56
Core recovery (%): 82.3
Oldest sediment cored:Depth (mbsf): 357.8Nature: diatom clay and clayey diatom oozeAge: late MioceneMeasured velocity (km/s): 1.53
HOLE 884D
Date occupied: 25 August 1992
Date departed: 26 August 1992
Time on hole: 8 hr
Position: 51°27.038'N, 168°20.196'E
Bottom felt (rig floor; m, drill-pipe measurement): 3837.2
Distance between rig floor and sea level (m): 11.17
Water depth (drill-pipe measurement from sea level, m): 3826.0
Total depth (rig floor; m): 3852.0
Penetration (m): 14.8
Number of cores (including cores with no recovery): 2
Total length of cored section (m): 14.8
Total core recovered (m): 13.92
Core recovery (%): 94.1
Oldest sediment cored:Depth (mbsf): 14.8Nature: clay with diatomsAge: Quaternary
Comments: Cores used for high-resolution paleomagnetic studies.
HOLE 884E
Rea, D.K., Basov, I.A., Janecek, T.R., Palmer-Julson, A., et al., 1993. Proc. ODP,Init. Repts., 145: College Station, TX (Ocean Drilling Program).
Shipboard Scientific Party is as given in list of participants preceding the contents.
Date occupied: 26 August 1992
Date departed: 31 August 1992
209

SITE 884
Time on hole: 5 days, 11 hr
Position: 51 °27.034'N, 168°20.216'E
Bottom felt (rig floor; m, drill-pipe measurement): 3836.0
Distance between rig floor and sea level (m): 11.17
Water depth (drill-pipe measurement from sea level, m): 3824.8
Total depth (rig floor; m): 4765.8
Penetration (m): 929.8
Number of cores (including cores with no recovery): 10
Total length of cored section (m): 87.0
Total core recovered (m): 66.78
Core recovery (%): 76.6
Oldest sediment cored:Depth (mbsf): 0.38Nature: claystoneAge: unknown
Hard rock:Depth (mbsf): 929.8Nature: basaltMeasured velocity(km/s): 5.54
Basement:Depth (mbsf): 929.8Nature: basaltMeasured velocity (km/s): 5.54
Comments: Washed from 0 to 842.2 mbsf.
Principal results: The survey for proposed site DSM-4 (Site 884; Figs. 1and 2) began on the morning of 20 August 1992. A beacon was dropped at0832 hr, and the ship completed the survey and took up station at Site 884at 1100 hr. The first core missed the mud line and was designated Hole 884A;the ship moved over 20 m and we began Hole 884B with a good mud-linecore retrieved at about 1900 hr on 20 August. Coring in Hole 884Bcontinued for 89 hr, raising 91 APC and XCB cores from 0 to 853.9 mbsfwith 92.7% overall recovery. Core 145-884B-91X contained basalt in thecore catcher. The core recovery from Hole 884B of 791.76 m and percentrecovery of 92.7% exceed the previous ODP records for recovery in verylong APC/XCB holes: 716.74 m in Hole 807A, and 89.7% recovery inHole 806B. Thus, Hole 884B stands with Hole 883B as one of the deepestpenetrating and most successful XCB drilling operations to date.
Beginning at 0900 hr on 24 August, we pulled up the drill pipe to theseafloor, offset 20 m, and began piston coring in Hole 884C; Core 145-884C-1H was recovered at about noon that day. Hole 884C was continuedto a depth of 357.8 mbsf with 82.3% recovery to duplicate the upper portionof the section and to fill in the coring gaps left in Hole 884B. We werelargely successful in achieving these objectives. Hole 884D, consisting oftwo APC cores extending 0 to 14.8 mbsf with 94.1% recovery, wasintended for continuous sampling to determine paleointensity variations ofEarth's magnetic field. Drilling was completed late in the evening of 25August. On 26 August, the drill pipe was pulled up and the bit and BHAchanged for rotary drilling; Hole 884E was washed down to 842.8 mbsf,and basalt drilling began at 0600 hr on 27 August. The last basalt core,145-884E-10R, was recovered at about 0300 hr on 29 August; 87 m ofbasalt had been penetrated in 45 hr with a recovery of 66.78 m (76.8%).Logging operations followed on 29 and 30 August. Logging was hinderedby a bridge at about 750 mbsf, presumably a swelling ash layer, but all fivetool systems (the geochemical tool, formation microscanner, Quad combo,magnetic susceptibility, and magnetometer tools) made reasonably tocompletely successful runs above that depth. Logging operations werecompleted about 0545 hr on 31 August. Both beacons returned to thesurface upon command, so for the first time during Leg 145 no unintendedmetal was left behind at the drill site. The JO1DES Resolution startedsoutheast toward proposed Site NW-4A just before 1300 hr later thesame day.
Drilling at Site 884 penetrated 854 m of Cenozoic sediment and 87 mof the underlying basalt. The sediment column was divided into two mainlithologic units, each with subunits. Lithologic Subunit IA (0-128 mbsf)is a Quaternary to upper Pliocene clay with diatoms. Vitric ash layers, somemore than 1 m in thickness, and a few dropstones occur in this unit. Sub-unit IB (128.2-440.2 mbsf) is an upper Pliocene to upper Miocene clayeydiatom ooze. A pure dolomite concretion occurs at 172 mbsf, and a pieceof wood approximately 6 cm across is found at 214 mbsf in sediments ofearly Pliocene age. Lithologic Subunit IC (440.2-546.1 mbsf) is an upperMiocene to middle Miocene claystone with accessory diatoms and somechalk. Bladed and twinned crystals of native copper occur within the grayclaystones of Subunit IC. Subunit ID (546.1-604.8 mbsf) is a middle Mio-cene to lower Miocene diatomite with clay. Unit II is differentiated fromthe overlying materials by the clear presence of reworked materials.Subunit IIA (604.8-694.7 mbsf) is a lower Miocene to lower Oligoceneclaystone with minor chalk. This subunit shows evidence of downslopereworking and contains native copper as discrete grains. Subunit HB(694.7-771 mbsf) is an upper Eocene claystone conglomerate. Diatomsare no longer present in this part of the section, which is dominated bydownslope reworking. Ash layers are present in the lower part of thissubunit. Subunit HC (771-854 mbsf) is a middle Eocene to upper Paleo-cene^) claystone with ash. Native copper occurs as streaks on slickensidesurfaces in the lowest few cores of Hole 884B. Lithologic Unit III (854-941 mbsf) is basalt that occurs as 13 units, 10 of which are massive flows.Much of the basalt has coarse phenocrysts; fresh olivine is found in thelower 50 m of the recovered section.
At Site 884, dropstones occur in lithologic Subunit IA in amountscomparable to those in material of similar age at Site 883, but in loweramounts than at the sites farther south, thus continuing the trend seen inLeg 145 sites of a northward decline in ice-rafted debris. No dropstonesolder than late Pliocene (the Matuyama/Gauss reversal boundary) occur.Ash layers are common to abundant in sediments younger than 2.6 Ma andoccur again in the Eocene portion of the section. Along with the recordfrom Site 883, these Eocene ashes will help to define the period of Eocenevolcanism that has been suggested by scattered data from around thePacific basin.
The Neogene and Quaternary sediments of Site 884 are characterizedby moderate fluxes of clay and silica. An increase in the flux of clay froma few tenths of a g(cm2 k.y.)"1 to about 1 g(cm2 k.y.)"1 occurs at the timeof a possible brief hiatus about 12 Ma (Subunit ID/IC boundary). The Meijisediment tongue appears to be a North Atlantic type of drift deposit thathas been accumulating since the Eocene/Oligocene boundary. It is charac-terized by both a mineral assemblage and a diatom flora that are derivedfrom the north, relatively high sedimentation rates and few sedimentarystructures. These boreal and neritic diatom assemblages occur only in theMeiji Drift site at Detroit Seamount, not in the shallower sites. The flux ofopal has remained at about 1.0 to 1.5 g(cm2 • k.y.)"1 for most of the timesince 12 Ma and was highest during the latest Miocene and early Pliocene.
A remarkable result at Site 884 is the construction of a continuousmagnetic reversal stratigraphy spanning at least the past 12 m.y. Further,a complete sequence of all North Pacific Ocean diatom zones, late Qua-ternary to late Oligocene, is present at Site 884, although two severelycondensed zones occur at 12.0-13.5 and 17.5-20.0 Ma. The reversalstratigraphy will permit direct correlation of North Pacific Ocean siliceousmicrofossil biostratigraphy with the reversal time scale for the first time insediments older than 7 Ma and will permit a more precise reconstructionof the sedimentation processes of the North Pacific Ocean drift depositthan would otherwise be possible.
BACKGROUND AND SCIENTIFIC OBJECTIVES
Site 884 (proposed Site DSM-4) is the deepest of a three-site depthtransect down the slopes of Detroit Seamount and was the last site tobe drilled. We had several primary objectives at this site. One was toobtain a high-resolution record of calcium carbonate, and eventuallycarbon and oxygen isotopic information, to be able to define the nature
210

SITE 884
60°N
Site883*Site 882^
40° -
150°E 180 150°
Figure 1. Index map of the North Pacific Ocean showing Leg 145 drill sites.
and variability of North Pacific Ocean deep waters. The carbonaterecord from Site 884 was to be compared with those from intermedi-ate-depth Site 882 and shallow Site 883 to provide a record ofcarbonate deposition between 2400 and 3800 m for the northwesternPacific Ocean. These records then can be compared with records fromdepth transects in the Atlantic, Indian, and Equatorial Pacific oceans.
A second important objective was to obtain high-resolution mid-dle to late Neogene records of siliceous sedimentation to further ourunderstanding of the timing and amount of the significant silicadeposition that began in the North Pacific Ocean in the upper portionsof the Miocene. The late Pliocene and Pleistocene history of ter-rigenous influx, especially ice-rafted debris, and tephrochronologyshould have been well displayed in the sediments of Site 884. Muchof the section should have been of a suitable lithology for the deter-mination of a magnetic reversal stratigraphy.
The unique objective of Site 884 was to define the history of theMeiji Tongue, which may be a drift deposit like those in the NorthAtlantic Ocean. The Meiji Tongue progrades 2000 km south alongthe east side of the northern Emperor Seamounts, occasionally spill-ing over to the west through the deeper passages between the sea-mounts (Scholl et al, 1977;Damuthetal., 1983;Mammerickx, 1985).The source of the Meiji deposit seems to be the southwestern BeringSea and Komandordskaya Basin (between the Shirshov Ridge andKamchatka Peninsula) via a deep passage at the western extreme ofthe Aleutian Islands between the Komandorskiye Islands and theKamchatka Peninsula. By analogy with the drift deposits of the NorthAtlantic Ocean, we anticipated that coring the Meiji Tongue wouldenable us to document the geologic history of thermohaline circula-tion in the deep northwestern Pacific Ocean. Before the Leg 145drilling, this deposit had been sampled only by piston core, so its age,composition, and to a certain degree its thickness, have remained amatter of some speculation and interest.
The lower portion of the section, situated on the lower flanks ofDetroit Seamount, may contain Paleogene and Latest Cretaceouscarbonates deposited beneath the Northern Hemisphere subtropicalgyre. Furthermore, similar settings in the central and South Pacificoceans have been the locus of significant amounts of downslopetransport from nearby highs, bringing shallow-water, even reefaldebris down to the drill site. Sediments reflecting such a process wereexpected at Site 884. The timing of the slumping episodes can be
compared with that of the presumably erosional unconformities at theshallow Site 883.
To achieve these objectives, three holes were planned. Hole 884Awas to be an APC/XCB hole, piston-coring until no longer feasibleand then continuing down with XCB-coring. Hole 884B was to be anAPC hole to match that portion of Hole 884A with appropriatevertical offsets. After the completion of piston-coring, the bit was tobe changed to an RCB assembly. Hole 884C was to be washed downto the depth of the bottom of Hole 8 84A, where rotary-coring wouldbegin. Rotary-coring was to continue until it was time to start thelogging operation. Logging would consist of the standard three-runsuite of tools plus two runs for the French magnetometer tools.
OPERATIONS
Transit to Proposed Site DSM-4
The 47-nmi transit to proposed Site DSM-4 began at 0430 hr (localtime), 20 August. Seismic gear was deployed throughout the transit.After a beacon was deployed at the proposed site location at 0830 hr,the ship continued the survey until 1030 hr, at which time the seismicgear was retrieved. The ship then returned to the site location, acquiredthe beacon at 1100 hr, and was positioned on site with thrusters andhydrophones lowered by 1130 hr, 20 August.
Hole 884A
The first piston core was taken at 1745 hr on 20 August at a waterdepth of 3826.6 mbsl (PDR reading). The core barrel was full with9.7 m of sediment and therefore could not be used to determine themud-line depth (see Table 1 for a summary of the coring operations).After Core 145-884A-1H was retrieved, the pipe was pulled abovethe mud line and the ship was offset to begin a second hole.
Hole 884B
The drill pipe was pulled up 5 m relative to Hole 884A, and thefirst core from Hole 884B was taken at 1830 hr with 6.47 m ofsedimented recovered to establish the mud-line depth at 3836.0 mbrf.Piston coring advanced successfully through Core 145-884B-9H.Core 145-884B-10H (82.596-86.3 mbsf) advanced only 3.8 m and
211
SITE 884
51°36'N
Detroit Seamount
51°00'
50°00' L L166°42'E 167°00' 168°00' 168°36'
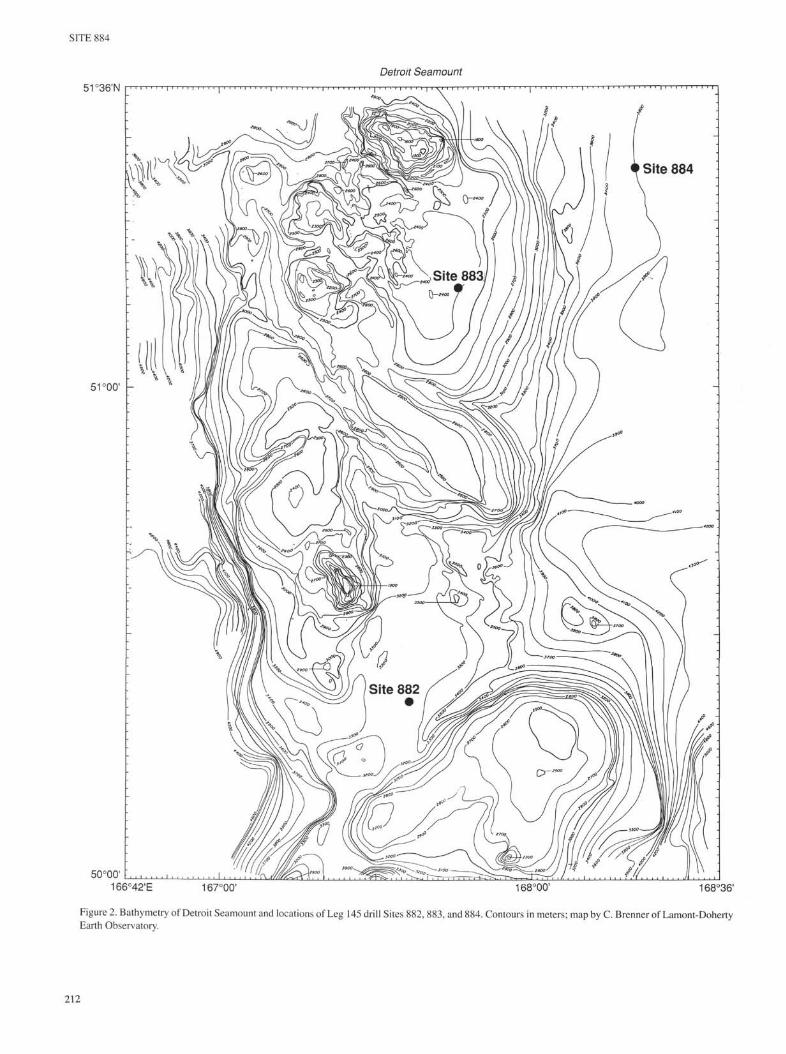
Figure 2. Bathymetry of Detroit Seamount and locations of Leg 145 drill Sites 882, 883, and 884. Contours in meters; map by C. Brenner of Lamont-DohertyEarth Observatory.
212

SITE 884
Core 145-884B-11H (86.3-87.3 mbsf), the last piston core of thishole, was only able to advance 1 m. APC coring operations endedafter Core 145-884B-11H with 87.3 m cored and 89.46 m of sedimentrecovered (102.5% recovery). Piston cores 145-884B-4H through-UH were oriented.
XCB coring was initiated with Core 145-884B-12X (87.3-93.3mbsf) Coring advanced routinely to 853.9 mbsf (Core 145-884B-91X). Core 145-884B-91X contained a 40-cm chunk of basalt, con-firming that basement had been reached. XCB-coring operationsrecovered 702.30 m over an interval of 766.6 m (91.6% recovery). Thetotal percentage of recovery from the hole was an impressive 92.7%.
After coring operations ceased, the top drive was set back and thepipe was pulled out of the hole. From 853.9 to 536 mbsf, the hole wassticky, and an overpull of 60,000 lb was required to advance the pipe;above 536 mbsf, resistance disappeared. The bit cleared the mud lineat 1100 hr, 24 August, and the vessel was offset 20 m north.
Hole 884C
This hole was spudded at 1130 hr, 24 August, and Core 145-884C-1H contained 2.4 m of sediment, thereby establishing the mud line at3836.1 mbrf. APC-coring advanced to 78.4 mbsf (Core 145-884C-9H), at which point operations were switched to the XCB-coringsystem. XCB-coring had advanced to 357.8 mbsf (Core 145-884C-38X) when time expired for this site. Cores 145-884C-4H through-9H were oriented. APC-coring penetrated 78.4 m recovering 74.88 m(95.5%), and XCB-coring recovered 219.68 m over a 279.4-m inter-val (78.6% recovery). Total recovery was 82.3%.
Hole 884D
After the bit cleared the mud line of Hole 884C at 2000 hr, 25August, the ship was offset 20 m west, and two cores were taken forhigh-resolution paleomagnetic studies. A total of 14.8 m of sedimentwas cored with 13.92 m recovered. At the end of coring operations,the APC/XCB bit and BHA were brought to the drill floor to changeto RCB-coring operations.
Hole 884E
An RCB-coring assembly was made up and run to the seafloor.The hole was spudded at 0830 hr, 26 August, and the bit washed aheadto 842.8 mbsf by 0530 hr, 27 August. Wash barrels were retrieved at300,600, and 842.8 mbsf. In addition, a wiper trip was made between842 and 794 mbsf.
RCB-coring began at 0630 hr, 27 August, and the basement-sedi-ment contact was reached with the first core (842.5-852.5 mbsf). TenRCB cores were taken that penetrated more than 80 m into basement.Coring was terminated at 0300 hr, 29 August, because of time con-straints. Overall, 87.0 m of sediment/basement was cored and 66.78 mrecovered (76.8% recovery). The rate of penetration (ROP) variedfrom a low of 1.5 m/hr (Core 145-884E-6R) to a high of 4.5 m/hr (Core145-884E-1R). The average for the entire cored interval was 2.4 m/hr.
In preparation for logging, a wiper trip was run from total depth(929.8 mbsf) to 111.0 mbsf and back to 912 mbsf, at which point 18 mof hard fill was found. The interval from 912 to 930 mbsf was washedand reamed, followed by a 50-barrel mud sweep.
At 0945 hr, 29 August, the rotary shifting tool was run in the holewith the wireline and released the bit. The top drive then was set backand the pipe was pulled to 82.0 mbsf for logging operations.
Logging in Hole 884E
Five tools were run in Hole 844E: the Schlumberger Quad combi-nation, formation microscanner (FMS), and geochemical tool strings,and the French magnetometer and susceptibility tools. The wireline
heave compensator (WHC) was not operational during all loggingruns because of electronic failure. A summary of Hole 884E loggingoperations is shown in Table 2.
Total penetration in Hole 884E was 930 mbsf; however, unstableborehole conditions made logging operations impossible in the low-ermost sediment or igneous basement. The first logging run encoun-tered an impenetrable bridge at 760 mbsf, and because of a com-bination of further bridge formation and sloughing of unconsolidatedsediments into the borehole during the course of logging operations,this depth had decreased to 645 mbsf by the final logging run.
The French CEA-LETI/TOTAL/CNRS-ENS magnetometer(NMRT) and susceptibility (SUMT) tools were run first to ensure thatboth tools would measure a borehole environment unaffected by anyelectromagnetic induction measurements. Two passes of the NMRTwere conducted at 1800 ft/hr over the intervals 760-770 mbsf and738-770 mbsf, respectively. One main up-going log of the SUMTwas recorded at 3600 ft/hr from 682-664 mbsf; a shorter repeatup-going log was recorded from 365-359 mbsf.
The Quad-combo tool (with the new Lamont temperature tool)was run next. During the down-going log run, the sonic tool (SDT)failed at a depth of 614 mbsf, and the tool was pulled out of the hole.After the SDT was replaced, the Quad combo was run back in the holeand set down on a bridge at 693 mbsf. The up-going log was runsuccessfully from 693-652 mbsf.
The fourth logging run consisted of the formation microscanner(FMS) tool string. Three passes were made at 1500 ft/hr over theintervals from 654-52, 654-414, and 428-452 mbsf.
The last logging run consisted of the geochemical tool (GST) withthe old Lamont temperature tool. The tool was run from 647 to652 mbsf at 550 ft/hr. At 310 mbsf, however, the GST calibrationfailed, and log yields became highly variable.
At 0600 hr, 31 August, the logging equipment was rigged down,and by 0630 hr the pipe was pulled out of the hole. The bit clearedthe seafloor at 0645 hr. The drilling equipment was secured by1230 hr, 31 August, for the transit to proposed Site NW-4A. Concur-rent with the pulling of the pipe, both beacons were successfullyrecalled and on deck by 0900 hr.
LITHOSTRATIGRAPHY
Introduction
Drilling at Site 884 (Figs. 1 and 2) recovered a sedimentary sectionthat is divided into two units, based on sediment lithology and on thepresence of structures indicative of reworking and mass movement.The sedimentary section overlies a third lithostratigraphic unit, whichis composed of basalt (Figs. 3 and 4). The sedimentary sequence isapproximately 850 m thick and ranges in age from Quaternary toearly Eocene(?).
Unit I (0-604.8 mbsf) consists mainly of diatoms and clay invarying proportions, which leads to its further division into foursubunits. Volcanic ash is present as a minor lithology in Subunits IAand IB (Fig. 3). Except for rare laminations, no primary sedimentarystructures are observed in Unit I.
Unit II (604.8-854 mbsf) is composed of a variety of lithologies,including chalk, conglomerate, and claystone; the latter is interpretedas altered ash. The conglomerates are redeposited units consisting ofangular clasts of altered ash or claystone dispersed in a matrix of eitherclaystone or chalk. Evidence for both small-scale reworking andsignificant mass movement is present throughout much of this unit.The boundary between Unit I and Unit II is placed at the first evi-dence of reworking and visible load structures.
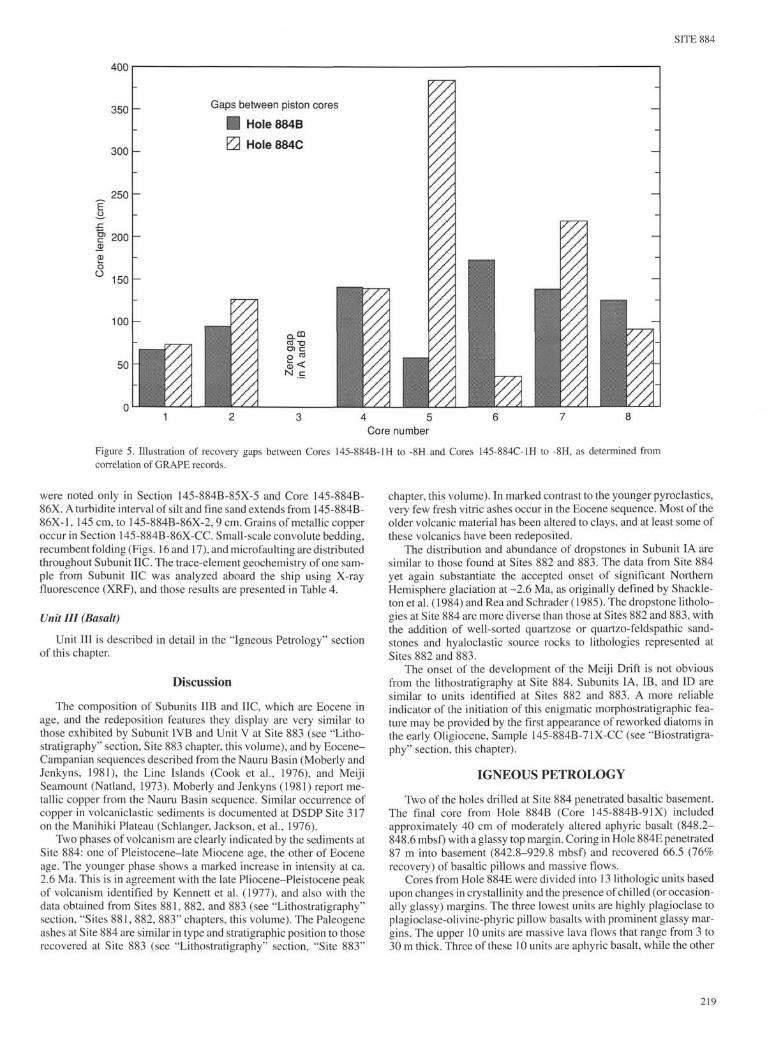
Because approximately 10% of the sedimentary section was notrecovered between successive full APC cores, an attempt has beenmade to quantify the size of these gaps by correlating the GRAPErecords between Holes 884B, 884C, and 884D. The coring gaps atthese holes average approximately 1.2 m (Table 3; Fig. 5).
213

SITE 884
Table 1. Summary of coring operations at Site 884.
Date Length LengthCore (Aug Time Depth cored recovered Recoveryno. 1992) (UTC) (mbsf) (m) (m) (%)
Hole 884A
1H- 20 0700 0.0-9.7 9.7 9.72 100.0
Coring totals 9 J 9/72 100.0
Hole 884B1H- 20 0800 0.0-6.5 6.5 6.47 99.52H- 20 0830 6.5-16.0 9.5 9.84 103.03H- 20 0915 16.0-25.5 9.5 9.60 101.04H- 20 1010 25.5-35.0 9.5 9.83 103.05H- 20 1100 35.0-44.5 9.5 9.80 103.06H- 20 1140 44.5-54.0 9.5 9.92 104.07H- 20 1235 54.0-63.5 9.5 9.75 102.08H- 20 1325 63.5-73.0 9.5 9.87 104.09H- 20 1415 73.0-82.5 9.5 9.84 103.010H- 20 1510 82.5-86.3 3.8 3.48 91.611H- 20 1555 86.3-87.3 1.0 1.06 106.012X- 20 1700 87.3-83.3 6.0 0.87 14.513X- 20 1755 93.3-103.0 9.7 5.21 53.714X- 20 1845 103.0-112.6 9.6 9.14 95.215X- 20 1940 112.6-122.2 9.6 8.90 92.716X- 20 2020 122.2-131.8 9.6 9.54 99.417X- 20 2100 131.8-141.5 9.7 9.69 99.918X- 20 2230 141.5-151.1 9.6 9.55 99.519X- 20 2350 151.1-160.8 9.7 9.65 99.520X 21 0040 160.8-170.5 9.7 0.00 0.021X 21 0130 170.5-180.1 9.6 9.68 101.022X 21 0210 180.1-189.8 9.7 9.53 98.223X 21 0250 189.8-199.4 9.6 9.60 100.024X 21 0330 199.4-209.1 9.7 9.62 99.225X 21 0415 209.1-118.7 9.6 9.69 101.026X 21 0500 218.7-228.4 9.7 9.33 96.227X 21 0550 228.4-238.0 9.6 9.64 100.028X 21 0635 238.0-247.6 9.6 1.29 13.429X 21 0715 247.6-257.3 9.7 4.81 49.630X 21 0800 257.3-267.0 9.7 9.55 98.431X 21 0840 267.0-276.7 9.7 9.81 101.032X 21 0920 276.7-286.3 9.6 9.54 99.433X 21 1000 286.3-296.0 9.7 7.31 75.334X 21 1035 296.0-305.7 9.7 4.06 41.835X 21 1130 305.7-315.3 9.6 9.74 101.036X 21 1200 315.3-325.0 9.7 9.81 101.037X 21 1235 325.0-334.3 9.3 9.63 103.038X 21 1330 334.3-343.9 9.6 9.87 103.039X 21 1410 343.9-353.6 9.7 9.87 102.040X 21 1455 353.6-363.1 9.5 9.79 103.041X 21 1550 363.1-372.7 9.6 9.63 100.042X 21 1635 372.7-382.4 9.7 9.71 100.043X 21 1720 382.4-392.0 9.6 9.60 100.044X 21 1815 392.0-401.7 9.7 9.39 96.845X 21 1910 401.7-411.3 9.6 9.85 102.046X 21 1950 411.3-420.9 9.6 9.20 95.847X 21 2030 420.9-430.6 9.7 9.82 101.048X 21 2115 430.6-440.2 9.6 8.20 85.449X 21 2200 440.2-449.8 9.6 9.85 102.050X 21 2250 449.8^59.3 9.5 9.93 104.051X 21 2350 459.3^68.9 9.6 9.92 103.052X 22 0040 468.9^178.6 9.7 9.86 101.053X 22 0130 478.6-488.2 9.6 9.57 99.754X 22 0215 488.2-497.8 9.6 9.67 101.055X 22 0300 497.8-507.4 9.6 9.80 102.056X 22 0340 507.4-517.1 9.7 9.99 103.057X 22 0415 517.1-526.7 9.6 9.34 97.358X 22 0500 526.7-536.4 9.7 9.89 102.059X 22 0550 536.4-546.1 9.7 9.23 95.160X 22 0620 546.1-555.6 9.5 9.87 104.061X 22 0700 555.6-565.3 9.7 9.51 98.062X 22 0740 565.3-574.8 9.5 8.81 92.763X 22 0823 574.8-584.4 9.6 9.03 94.064X 22 0900 584.4-594.1 9.7 9.96 102.065X 22 0945 594.1-603.8 9.7 9.97 103.066X 22 1030 603.8-613.3 9.5 8.50 89.567X 22 1140 613.3-622.8 9.5 8.54 89.968X 22 1240 622.8-632.4 9.6 10.08 105.069X 22 1350 632.4-642.0 9.6 9.95 103.070X 22 1450 642.0-651.7 9.7 9.69 99.971X 22 1545 651.7-661.3 9.6 9.70 101.072X 22 1640 661.3-671.0 9.7 9.93 102.073X 22 1735 671.0-680.6 9.6 7.02 73.174X 22 1845 680.6-690.2 9.6 9.82 102.075X 22 1945 690.2-699.8 9.6 9.91 103.076X 22 2045 699.8-709.5 9.7 9.99 103.077X 22 2145 709.5-719.1 9.6 10.09 105.178X 22 2245 719.1-728.8 9.7 8.29 85.4
214

SITE 884
Table 1 (continued).
Date Length LengthCore (Aug Time Depth cored recovered Recoveryno. 1992) (UTC) (mbsf) (m) (m) (%)
79X 22 2345 728.8-738.4 9.6 9.04 94.180X 23 0040 738.4-748.1 9.7 9.48 97.781X 23 0200 748.1-757.7 9.6 6.46 67.382X 23 0500 757.7-767.4 9.7 9.86 101.083X 23 0645 767.4-777.0 9.6 9.71 101.084X 23 0840 777.0-786.7 9.7 9.91 102.085X 23 1020 786.7-796.4 9.7 9.72 100.086X 23 1200 796.4-806.1 9.7 9.63 99.387X 23 1305 806.1-815.6 9.5 8.58 90.388X 23 1455 815.6-825.1 9.5 6.05 63.789X 23 1650 825.1-834.6 9.5 9.33 98.290X 23 1915 834.6-844.3 9.7 4.40 45.391X 23 2200 844.3-853.9 9.6 4.23 44.0
Coring totals 853.9 791.69 92J
Hole 884C1H 24 0130 0.0-2.4 2.4 2.40 100.02H 24 0205 2.4-11.9 9.5 9.69 102.03H 24 0245 11.9-21.4 9.5 8.92 93.94H 24 0330 21.4-30.9 9.5 7.98 84.05H 24 0420 30.9-40.4 9.5 9.77 103.06H 24 0520 40.4-^9.9 9.5 9.92 104.07H 24 0640 49.9-59.4 9.5 7.87 82.88H 24 0730 59.4-68.9 9.5 9.65 101.09H 24 0820 68.9-78.4 9.5 8.68 91.310X 24 0930 78.4-88.2 9.8 5.24 53.411X 24 1025 88.2-97.8 9.6 0.92 9.612X 24 1105 97.8-107.4 9.6 5.72 59.613X 24 1155 107.4-117.0 9.6 9.15 95.314X 24 1235 117.0-126.7 9.7 2.27 23.415X 24 1325 126.7-136.3 9.6 9.28 96.616X 24 1400 136.3-146.0 9.7 9.47 97.617X 24 1435 146.0-155.7 9.7 8.84 91.118X 24 1510 155.7-165.3 9.6 9.49 98.819X 24 1550 165.3-175.0 9.7 9.66 99.620X 24 1625 175.0-184.6 9.6 9.60 100.021X 24 1700 184.6-194.3 9.7 9.65 99.522X 24 1735 194.3-204.0 9.7 9.65 99.523X 24 1830 204.0-213.6 9.6 9.84 102.024X 24 1900 213.6-223.3 9.7 9.48 97.725X 24 1945 223.3-232.9 9.6 9.79 102.026X 24 2030 232.9-242.5 9.6 9.77 102.027X 24 2100 242.5-252.2 9.7 9.55 98.428X 24 2140 252.2-261.8 9.6 9.93 103.029X 24 2215 261.8-271.4 9.6 9.82 102.030X 24 2300 271.4-281.1 9.7 0.67 6.93IX 24 2345 281.1-290.7 9.6 9.57 99.732X 25 0020 290.7-300.4 9.7 9.88 102.033X 25 0100 300.4-310.1 9.7 0.00 0.034X 25 0200 310.1-319.7 9.6 2.14 22.335X 25 0300 319.7-329.2 9.5 9.76 103.036X 25 0400 329.2-338.7 9.5 9.79 103.037X 25 0440 338.7-348.2 9.5 9.73 102.038X 25 0520 348.2-357.8 9.6 1.02 10.6
Coring totals 357.8 294.56 82.3
Hole 884D1H 25 0750 0.0-5.3 5.3 5.33 100.02H 25 0830 5.3-14.8 9.5 8.59 90.4
Coring totals 14~8 13.92 94.1
Hole 884E(Washed from 0 to to 842.8 mbsf)
1R 26 2245 842.8-852.5 9.7 6.08 62.72R 27 0310 852.5-862.3 9.8 9.29 92.93R 27 0630 862.3-872.1 9.8 9.40 95.94R 27 1100 872.1-881.8 9.7 7.63 78.65R 27 1640 881.8-891.5 9.7 7.00 72.16R 27 2115 891.5-896.1 4.6 4.62 100.07R- 28 0045 896.1-901.1 5.0 5.70 114.08R 28 0710 901.1-910.7 9.6 0.87 9.19R 28 1115 910.7-920.3 9.6 8.30 86.410R 28 1535 920.3-929.8 9.5 7.89 83.0
Coring totals 871) 66.78 76.6
Washed 842.8Total 929.8
215

SITE
Table 2. Summary of logging operations in Hole 884E.
Date(Aug.1992)
2930
Time(local)
0345
0545
061009451050
121514151645
17401850
19452145
21502338
Depth(mbrf)
Surface
3930
4450Surface4529
3836Surface4490
44904264
3888Surface
504483
31 0225 4164
0500 38360700 Surface
Comment
French magnetometer (NRMT) tool made up, RIH.Make up Quad tool string with new Lamont
temperature tool, RIH.Quad out of pipe, begin down-going log at 2500
ft/hr.Sonic (SDT) tool failure, POOH.Replace SDT, Quad RIH againQuad set down on bridge, begin up-going log at
1800 ft/hr. Pipe raised to 52 mbsf.Quad at mud line, end up-going log, POOH.Make up FMS tool string, RIH.Begin first up-going log to base of pipe at 1500
ft/hr. Pipe raised to 52 mbsf.Begin second up-going log to 4250 mbrf.Adjust gains, begin third up-going log to base of
pipe.FMS at end of pipe, POOH.Make up geochemical tool string with old Lamont
temperature tool, RIH.GST fails to calibrate, continue RIH.GST successfully calibrates,,start up-going log at 550 ft/hour.GST calibration fails (RDF>15), BHT <7°C. Yield
logs become highly variable, continue up-goinglog. Raise pipe to 52 mbsf.
End up-going log, POOH.Rig down, end logging operations.
Description of Lithologic Units
Unit I
Intervals: Core 145-884A-1HCores 145-884B-lHto-66XCores 145-884C-lHto-38XCores 145-884D-lHto-2H
Depth: 0-604.8 mbsfAge: Quaternary to early Miocene
Unit I is composed of clay and claystone, clayey diatom ooze,clayey diatomite and diatomite. Volcanic ash layers and carbonate-rich horizons are present as subordinate lithologies. Dropstones arepresent in the upper 119 m of the unit.
Evidence of bioturbation is present in the form of burrow fills,burrowed gradational upper surfaces on decimeter-scale volcanic ashhorizons, and Zoophycos trace fossils below 495 mbsf.
With the exception of the bases of ash layers, boundaries betweenthe different lithologies within Unit I are gradational.
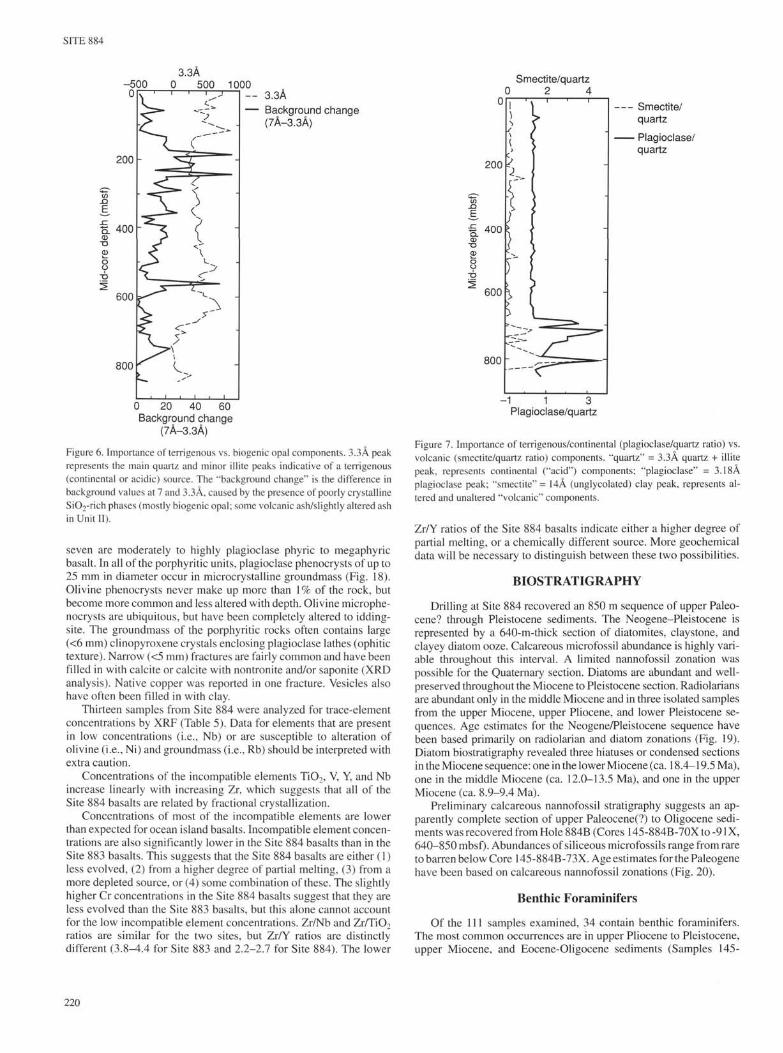
Based on the different proportions of clay to diatoms and on thedistribution of ash layers and dropstones, Unit I has been divided intofour subunits. Subunit IA (0-128 mbsf) contains predominantly clayand diatom clay; spicule-rich zones form a minor lithology. Vitric ashesare also present. Dropstones are scattered throughout this subunit.Subunit IB (128^440.2 mbsf) is composed of clayey diatom ooze.Volcanic ashes are much less common than in Subunit IA. Subunit IC(440.2-546.1 mbsf) mainly consists of diatom clay with no discreteash layers present. Subunit ID (546.1-604 mbsf) is composed ofdiatomite and contains no volcanic ashes. The boundary betweenSubunits IA and IB is gradational and corresponds to a decrease in graindensity and an increase in water content (see "Physical Properties"section, this chapter). The boundary between Subunits IB and IC is setat 440.2 m, at the base of a diatom claystone and diatomite interval.The boundary between Subunits IC and ID is placed at 546.1 mbsf, atthe base of a major claystone interval. The positions of these boundar-ies also are substantiated by XRD data (Figs. 6 and 7).
X-ray diffraction patterns reveal relatively low smectite/quartzand plagioclase/quartz ratios throughout Unit I, suggesting the im-portance of "'continental" sources through eolian and water columntransport processes (Fig. 7). A relatively high abundance of the
terrigenous component and a relatively low abundance of opal char-acterize Subunit IA (Fig. 6). Variations in both the terrigenous and thebiogenic components show the compositional heterogeneity withinthis subunit. A distinct change in the relative abundances of theterrigenous and biogenic components separates Subunit IA fromSubunit IB. Subunit IB has a relatively high opal content and arelatively low content of terrigenous material, with a large amount ofvariability in both. The seemingly gradual decrease in the opal/ter-rigenous component ratio through the subunit is difficult to assesswith the data provided. The XRD data for Subunit IC show thewell-defined boundaries of this interval and its characteristic increasein the abundance of the terrigenous component and decrease in opal(Fig. 6). Subunit ID is well defined by changes in opal and ischaracterized by a very high relative opal abundance and a relativelylow terrigenous component abundance.
Subunit IA
Intervals: Core 145-884A-1HCores 145-884B-lHto-16XCores 145-884C-lHto-15XCores 145-884D-lHto-2H
Depth: 0-128 mbsfAge: Quaternary to late Pliocene
Subunit IA contains a variety of sediment types, ranging from clayand diatom clay as major lithologies to diatom ooze with clay as aminor lithology. These lithologies contain abundant spicule-enrichedhorizons. Dropstones occur at irregular intervals throughout Sub-unit IA (Fig. 4). Dropstone varieties present in Subunit IA includefine-grained felsic volcanic material, quartzo-feldspathic sandstone,litho-feldspathic sandstone (volcaniclastic), hyaloclastite, and phyl-lite or semischist.
Fresh vitric ashes constitute a minor lithology in Subunit IA(Fig. 3). Individual ash layers are up to 2.5 m thick (e.g., Interval884C-6H-4, 8 cm, to -6H-5, 115 cm). Some volcanic ash intervalsrepresent multiple eruptions, as indicated by the presence of a sharpboundary between light- and dark-colored ash (Figs. 8 and 9). Manyash layers have sharp bases and bioturbated upper surfaces. The ashesare more abundant between 40 and 100 mbsf (Fig. 3).
Indurated green and purple layers having thicknesses rangingfrom 0.5 to 10 cm are common in the upper 80 m of Subunit IA. Thesecolor bands, although clearly defined by their colors, appear to becompositionally identical to the adjacent sediment.
Subunit IB
Intervals: Cores 145-884B-17X to -48XCores 145-884C-16Xto-38X
Depth: 128-440.2 mbsfAge: late Pliocene to late Miocene
Subunit IB is composed predominantly of clayey diatom ooze and(below 363 mbsf) clayey diatomite. Diatom ooze with clay and clayeydiatom mixed sediment are minor variants. Parallel and lenticularlaminations in Core 145-884B-43X and Core 145-884B-45X are theonly important physical sedimentary structures noted. The relativelyfew ash layers (compared with Subunit IA) rarely exceed 13 cm inthickness. No ash layers are observed below 344 mbsf. A piece ofwood was found in Interval 145-884B-25X-4, 60-64 cm (214.2mbsf). Carbonate concretions were encountered in Core 145-884B-3IX (272 mbsf; Fig. 10) and a dolomite concretion was observed at172 mbsf in Core 145-884C-19X.
Subunit IC
Intervals: Cores 145-884B-48X to -59XDepth: 440.2-546.1 mbsfAge: late Miocene to middle Miocene
216

SITE 884
Lithologicunit
Clay(%) QQ Q Ash (m/core)
100-
200-
300-
jß 400-E
500-
600-
700-
800-
900
IAClay, diatom clay, =ash, dropstones =
IBClayey
diatom ooze,clayey diatomite
ICClaystone
ID Diatomite =
HA Claystone,chalk
HB Conglomerateclaystone. chalk
NC Claystone
Basalt
Figure 3. Lithostratigraphic column, with abundances downhole of clay, opal, and ash at Site 884, as determined from smearslides of the dominant lithologies. Lithologic units shown on left.
The main lithology in Subunit IC is dark gray to gray claystone,with greenish gray and reddish black mottles appearing in Cores145-884B-49X and 145-884B-52X. A sandstone turbidite sequenceis present in Core 145-884B-50X at approximately 459.5 mbsf.Metallic copper in the form of bladed and twinned crystals wasobserved in Sections 145-884B-56X-1 and -4 and 145-884B-57X-2through -57X-4. Zoophycos trace fossils are present downcore fromInterval 145-884B-54X-5, 24 cm. No volcanic ash was observed inSubunit IC.
Subunit ID
Intervals: Cores 145-884B-59X to -66XDepth: 546.1-604.8 mbsfAge: middle Miocene to early Miocene
Subunit ID consists of diatomite with clay or with spicules as amajor lithology, and grades downhole at approximately 590 m (Sec-tion 145-884B-64X-4) to diatom chalk and diatomite. Zoophycostrace fossils are present in several cores (Fig. 11). No ash layers wereobserved.
Unit II
Intervals: Cores 145-884B-66X to -9IXDepth: 604.8-854 mbsfAge: early Miocene to early Eocene(?) late Paleocene(?)
Unit II consists of vitric claystones (some of which are alteredvitric ashes), chalks, and conglomerates. The latter are intraforma-tional, being the result of redeposition. A few vitric ashes are alsopresent. The distribution of these sediment types allows the divisionof Unit II into three subunits.
The upper boundary of Unit II is placed at 604.8 mbsf (Core145-884B-66X-1) on the basis of the first occurrences of sedimentarystructures indicative of scouring and sediment redeposition. Further-more, micropaleontological data indicate the presence of a hiatus at
about this horizon (see "Biostratigraphy" section, this chapter). Thecontact between Subunits IIA and HB occurs at 694.7 m (Core145-884B-75X), at the first appearance of claystone with indicationof altered ash.
X-ray diffraction (XRD) data presented in Figure 7 show relativelylow opal contents and a declining relative abundance of terrigenouscomponents in Subunit IIA. Both of these components are low inabundance because of the increased abundance of CaCO3 in thesediments. The relative abundance of the terrigenous component re-mains low in Subunit HB, but the change in diffractogram backgroundlevels increases because of the presence of volcanic ash and slightlyaltered ash. In Subunit HC, the change in diffractogram backgroundlevels drops, and the relative abundance of terrigenous materialsincreases slightly because of the importance of clay (including someillite). Low ratios of both smectite and Plagioclase (which can be usedas an indicator of altered and unaltered volcanic components) relativeto quartz (an indicator of silicic "cratonic" components) occur inSubunit IIA (Fig. 6), consistent with the low abun- dances of ash/alteredash observed in the cores during description. Subunits HB and HCshow increased smectite/quartz and plagioclase/quartz ratios, consis-tent with the visual description of these more ash-rich units (Fig. 3).The XRD data also may record some grain size dependency, with themaximum plagioclase/quartz ratio in the coarser-grained sediments ofSubunit HB, whereas the maximum smectite/quartz ratio is in SubunitHC, which is finer grained (clay dominated).
Subunit IIA
Intervals: Cores 145-884B-66X to -75XDepth: 604.8-694.7 mbsfAge: early Miocene to late Eocene
Subunit IIA consists predominantly of claystone, with lesser amountsof chalk and nannofossil chalk; the latter two lithologies become morefrequent below 662 mbsf. An 85-cm-thick debris flow deposit com-posed of sand-sized claystone and nannofossil detritus occurs in Sec-
217

SITE 884
100-
200-
300-
J§ 400-
ε
S• 500 π
600-
700-
800-
900
Lithologicunit
Carbonate (%) Dropstone int.0 100 0 2 4 6 8 0
Clay (%)100
Clay, diatom clay,ash, dropstones
IBClayey
diatom ooze,clayey diatomite
ICClaystone
ID Diatomite =
HA Claystone,chalk
HB Conglomerateclaystone, chalk
HC Claystone =
Basalt
Figure 4. Lithostratigraphic column, with frequency of dropstone intervals and the carbonate and clay abundances, asdetermined from smear slides of the dominant lithologies downhole at Site 884. Lithologic units shown on left.
Table 3. Recovery gaps between cores as deter-mined from correlation of GRAPE records.
Between
145-884B-
145-884C-
145-884D-
core
1H2H3H4H5H6H7H8H
IH2H3H4H5H6H7H8H
IH
and
core
2H3H4H5H6H7H8H9H
2H3H4H5H6H7H8H9H
2H
Is a gap of(cm)
67940
14158
172138125
73126
013938535
21991
162
tion 145-884B-74X-1. Sedimentary structures observed at the top ofSubunit IIA (Core 145-884B-66X) include a sandy interval withparallel lamination and micro-loaded base (interval 145-884B-66X-1,97-101 cm), microfaults (Fig. 12), healed fractures, and several sharpcolor contacts, interpreted to be surfaces of erosion or nondeposition.At least one of these surfaces may represent an appreciable hiatus(e.g., interval 145-884B-66X-2, 76 cm) (see "Biostratigraphy" sec-tion, this chapter). Evidence for reworking and resedimentation in-cludes scour surfaces and thin (<5 cm) turbidite sequences.
Bluish green mottles appear in Core 145-884B-67X and continuein Core 145-884B-68X. Scarce metallic copper grains, seen in Core145-884B-68X, are found within these bluish green haloes.
Subunit HB
Intervals: Cores 145-884B-75X toSection 145-884B-83X-3
Depth: 694.7-771 mbsfAge: late Eocene to early-middle Eocene
Subunit HB consists of variably colored light to dark chalk,claystone (including altered ash), and minor fresh ash. Diatoms arenot found below 710 mbsf. Sedimentary features indicative of soft-sediment deformation and relatively large-scale redeposition are com-mon, and include recumbent folds. At several horizons (e.g., interval145-884B-81X-1, 90 cm, to -81X-2, 55 cm), slumping has produceddiamictic conglomerates composed of plastically deformed, angular,intraformational clasts of claystone, altered ash or chalk dispersed ina matrix composed of either claystone, clayey chalk or chalk. Fewintervals within this subunit appear to have remained undisturbedafter initial deposition, as indicated by widespread microfaulting andfolding (Figs. 13, 14, and 15).
Subunit HC
Intervals: Section 145-884B-83X-3 toCore 145-884B-91X
Depth: 771-854 mbsfAge: early-middle Eocene to early Eocene(?) late Paleocene (?)
Subunit HC consists of claystone, altered clayey ash, and ash. Thelatter are usually the darker-colored lithologies. Nannofossil chalkoccurs throughout Subunit HC but is a minor lithology. A single vitricash was noted in Section 145-884B-86X-5. Throughout Subunit HC,laminated intervals are present to common in abundance, but moder-ate bioturbation is widespread. The frequent occurrence of sharpcontacts between lithologies suggests the presence of scour surfacesand, possibly, diastems. Evidence of redeposition is less widespreadin Subunit HC than it was in Subunit HB, and diamictic conglomerates
SITE 884
400
350
300
250
200
150
100
Gaps between piston cores
Hole 884B
Yλ Hole884C
4 5Core number
Figure 5. Illustration of recovery gaps between Cores 145-884B-1H to -8H and Cores 145-884C-1H to -8H, as determined from
correlation of GRAPE records.
were noted only in Section 145-884B-85X-5 and Core 145-884B-86X. Aturbidite interval of silt and fine sand extends from 145-884B-86X-1, 145 cm, to 145-884B-86X-2, 9 cm. Grains of metallic copperoccur in Section 145-884B-86X-CC. Small-scale convolute bedding,recumbent folding (Figs. 16 and 17), and microfaulting are distributedthroughout Subunit HC. The trace-element geochemistry of one sam-ple from Subunit HC was analyzed aboard the ship using X-rayfluorescence (XRF), and those results are presented in Table 4.
Unit III (Basalt)
Unit III is described in detail in the "Igneous Petrology" sectionof this chapter.
Discussion
The composition of Subunits HB and HC, which are Eocene inage, and the redeposition features they display are very similar tothose exhibited by Subunit IVB and Unit V at Site 883 (see "Litho-stratigraphy" section, Site 883 chapter, this volume), and by Eocene-Campanian sequences described from the Nauru Basin (Moberly andJenkyns, 1981), the Line Islands (Cook et al., 1976), and MeijiSeamount (Natland, 1973). Moberly and Jenkyns (1981) report me-tallic copper from the Nauru Basin sequence. Similar occurrence ofcopper in volcaniclastic sediments is documented at DSDP Site 317on the Manihiki Plateau (Schlanger, Jackson, et al., 1976).
Two phases of volcanism are clearly indicated by the sediments atSite 884: one of Pleistocene-late Miocene age, the other of Eoceneage. The younger phase shows a marked increase in intensity at ca.2.6 Ma. This is in agreement with the late Pliocene-Pleistocene peakof volcanism identified by Kennett et al. (1977), and also with thedata obtained from Sites 881, 882, and 883 (see "Lithostratigraphy"section, "Sites 881, 882, 883" chapters, this volume). The Paleogeneashes at Site 884 are similar in type and stratigraphic position to thoserecovered at Site 883 (see "Lithostratigraphy" section, "Site 883"
chapter, this volume). In marked contrast to the younger pyroclastics,very few fresh vitric ashes occur in the Eocene sequence. Most of theolder volcanic material has been altered to clays, and at least some ofthese volcanics have been redeposited.
The distribution and abundance of dropstones in Subunit IA aresimilar to those found at Sites 882 and 883. The data from Site 884yet again substantiate the accepted onset of significant NorthernHemisphere glaciation at -2.6 Ma, as originally defined by Shackle-ton et al. (1984) and Rea and Schrader (1985). The dropstone litholo-gies at Site 884 are more diverse than those at Sites 882 and 883, withthe addition of well-sorted quartzose or quartzo-feldspathic sand-stones and hyaloclastic source rocks to lithologies represented atSites 882 and 883.
The onset of the development of the Meiji Drift is not obviousfrom the lithostratigraphy at Site 884. Subunits IA, IB, and ID aresimilar to units identified at Sites 882 and 883. A more reliableindicator of the initiation of this enigmatic morphostratigraphic fea-ture may be provided by the first appearance of reworked diatoms inthe early Oligiocene, Sample 145-884B-71X-CC (see "Biostratigra-phy" section, this chapter).
IGNEOUS PETROLOGY
Two of the holes drilled at Site 884 penetrated basaltic basement.The final core from Hole 884B (Core 145-884B-91X) includedapproximately 40 cm of moderately altered aphyric basalt (848.2-848.6 mbsf) with a glassy top margin. Coring in Hole 884E penetrated87 m into basement (842.8-929.8 mbsf) and recovered 66.5 (76%recovery) of basaltic pillows and massive flows.
Cores from Hole 884E were divided into 13 lithologic units basedupon changes in crystallinity and the presence of chilled (or occasion-ally glassy) margins. The three lowest units are highly Plagioclase toplagioclase-olivine-phyric pillow basalts with prominent glassy mar-gins. The upper 10 units are massive lava flows that range from 3 to30 m thick. Three of these 10 units are aphyric basalt, while the other
219
SITE 884
3.3Å0 500 1000
— 3.3Å
200 -
Smectite/quartz0 2 4
— Background change(7Å-3.3Å)
B. 400
600 ?
800
0 20 40 60Background change
(7Å-3.3Å)
Figure 6. Importance of terrigenous vs. biogenic opal components. 3.3Å peakrepresents the main quartz and minor illite peaks indicative of a terrigenous(continental or acidic) source. The "background change" is the difference inbackground values at 7 and 3.3Å, caused by the presence of poorly crystallineSiO2-rich phases (mostly biogenic opal; some volcanic ash/slightly altered ashin Unit II).
seven are moderately to highly Plagioclase phyric to megaphyricbasalt. In all of the porphyritic units, Plagioclase phenocrysts of up to25 mm in diameter occur in microcrystalline groundmass (Fig. 18).Olivine phenocrysts never make up more than 1 % of the rock, butbecome more common and less altered with depth. Olivine microphe-nocrysts are ubiquitous, but have been completely altered to idding-site. The groundmass of the porphyritic rocks often contains large(<6 mm) clinopyroxene crystals enclosing Plagioclase lathes (ophitictexture). Narrow (<5 mm) fractures are fairly common and have beenfilled in with calcite or calcite with nontronite and/or saponite (XRDanalysis). Native copper was reported in one fracture. Vesicles alsohave often been filled in with clay.
Thirteen samples from Site 884 were analyzed for trace-elementconcentrations by XRF (Table 5). Data for elements that are presentin low concentrations (i.e., Nb) or are susceptible to alteration ofolivine (i.e., Ni) and groundmass (i.e., Rb) should be interpreted withextra caution.
Concentrations of the incompatible elements TiO2, V, Y, and Nbincrease linearly with increasing Zr, which suggests that all of theSite 884 basalts are related by fractional crystallization.
Concentrations of most of the incompatible elements are lowerthan expected for ocean island basalts. Incompatible element concen-trations are also significantly lower in the Site 884 basalts than in theSite 883 basalts. This suggests that the Site 884 basalts are either (1)less evolved, (2) from a higher degree of partial melting, (3) from amore depleted source, or (4) some combination of these. The slightlyhigher Cr concentrations in the Site 884 basalts suggest that they areless evolved than the Site 883 basalts, but this alone cannot accountfor the low incompatible element concentrations. Zr/Nb and Zr/TiO2
ratios are similar for the two sites, but Zr/Y ratios are distinctlydifferent (3.8-4.4 for Site 883 and 2.2-2.7 for Site 884). The lower
200 i
Smectite/quartz
Plagioclase/quartz
~ 400
600
800 "
-1 1 3Plagioclase/quartz
Figure 7. Importance of terrigenous/continental (plagioclase/quartz ratio) vs.volcanic (smectite/quartz ratio) components, "quartz" = 3.3Å quartz + illitepeak, represents continental ("acid") components; "plagioclase" = 3.18ÅPlagioclase peak; "smectite" = 14Å (unglycolated) clay peak, represents al-tered and unaltered "volcanic" components.
Zr/Y ratios of the Site 884 basalts indicate either a higher degree ofpartial melting, or a chemically different source. More geochemicaldata will be necessary to distinguish between these two possibilities.
BIOSTRATIGRAPHY
Drilling at Site 884 recovered an 850 m sequence of upper Paleo-cene? through Pleistocene sediments. The Neogene-Pleistocene isrepresented by a 640-m-thick section of diatomites, claystone, andclayey diatom ooze. Calcareous microfossil abundance is highly vari-able throughout this interval. A limited nannofossil zonation waspossible for the Quaternary section. Diatoms are abundant and well-preserved throughout the Miocene to Pleistocene section. Radiolariansare abundant only in the middle Miocene and in three isolated samplesfrom the upper Miocene, upper Pliocene, and lower Pleistocene se-quences. Age estimates for the Neogene/Pleistocene sequence havebeen based primarily on radiolarian and diatom zonations (Fig. 19).Diatom biostratigraphy revealed three hiatuses or condensed sectionsin the Miocene sequence: one in the lower Miocene (ca. 18.4-19.5 Ma),one in the middle Miocene (ca. 12.0-13.5 Ma), and one in the upperMiocene (ca. 8.9-9.4 Ma).
Preliminary calcareous nannofossil stratigraphy suggests an ap-parently complete section of upper Paleocene(?) to Oligocene sedi-ments was recovered from Hole 884B (Cores 145-884B-70Xto-91X,640-850 mbsf) Abundances of siliceous microfossils range from rareto barren below Core 145-884B-73X. Age estimates for the Paleogenehave been based on calcareous nannofossil zonations (Fig. 20).
Benthic Foraminifers
Of the 111 samples examined, 34 contain benthic foraminifers.The most common occurrences are in upper Pliocene to Pleistocene,upper Miocene, and Eocene-Oligocene sediments (Samples 145-
220

SITE 884
cm54 - i
5 6 -
5 8 -
6 0 -
6 2 -
6 4 -
6 6 -
cm80-
8 2 -
8 4 -
8 6 -
8 8 -
9 0 -
9 2 -
68- 1
Figure 8. Subunit IA; dark-colored ash layer directly overlying a lighter-
colored ash layer (interval 145-884C-9H-2, 54-68 cm).
884C-4H-CC to -21 X-CC; Samples 145-884B-30X-CC to -47X-CC;Samples 145-884C-28X-CC to -37X-CC; Samples 145-884B-69X to145-884B-76X-CC).
Pliocene-Pleistocene
Pliocene-Pleistocene sediments were recovered in Cores 145-884B-1H through -3IX and 145-884C-1H through -30X. Thesesamples contain rare-to-common occurrences of a low-diversity cal-careous and agglutinated fauna. Dominant species include Epis-tominella exigua, Martinottiella communis, Melonis barleeanum,Melonis pompilioides, Oridorsalis umbonatus, Pullenia bulloides,Uvigerina proboscidea, and Uvigerina senticosa. Other commonspecies include Eggerella bradyi, Nuttallides umbonifera, Planulinarugosa, Planulina wuellerstorfi, and Pyrgo murrhina.
Miocene
Foraminifers are present in upper and lower Miocene sediments(Samples 145-884B-30X-CC to -47X-CC; -64X-CC, -65X-CC, and
9 4 -
9 6 -
9 8 -
100 ~1
Figure 9. Subunit IA; dark-colored vitric ash layer directly overlying a lighter-colored vitric ash layer. Both ash layers have sharp lower contacts, and the darkone has a (slightly) bioturbated upper contact. Several lone dropstones up to1 cm in diameter are present at the bottom of the light ash layer (interval145-884B-8H-5, 80-100 cm).
221

SITE 884
cm9 0 - |
9 2 -
9 4 -
9 6 -
9 8 -
1 0 0 -
102 —
1 0 4 -
1 0 6 -
108
1 1 0 -
1 1 2 -
114-
116 -
118 —
120—'
Figure 10. Subunitclayey diatom ooze
IB; interval of diagenetic microcrystalline calcite within(interval 145-884C-31X-5, 90-120 cm).
-66X-1, 100-102 cm; Samples 145-884C-28X-CC to -37X-CC).These samples contain a sparse fauna dominated by Gyroidinoidesspp., Martinottiella communis, Oridorsalis umbonatus, Pullenia bul-loides, and Pyrgo murrhina. In addition, rare occurrences of Cibici-doides bradyi, C. mundulus, C. robertsonianus and Laticarininapauperata also are observed.
Evidence of downslope transport is found in one sample fromCore 145-884B-66X (Sample 145-884B-66X-1, 100-102 cm), takenfrom a sandy, laminated interval. This sample contains species notfound elsewhere in the Miocene section and its assemblage is domi-nated by the Paleogene middle-bathyal species Bolivina tectiformis.
Eocene-Oligocene
Three samples of Oligocene age (145-884B-69X-CC, -71X-CC,and -73X-CC) contain rare, poorly preserved specimens of Nuttal-lides umbonifera and Oridorsalis spp.
Eocene foraminifers are present in three samples (145-884B-75X-CC, -76X-CC, and -82X-CC). Preservation is moderate to poor, withevidence of recrystallization. Assemblages are dominated by Globo-cassidulina subglobosa, Nuttallides truempyi, Cibicidoides prae-mundulus, C. grimsdalei, and Oridorsalis umbonatus. Additionaltaxa include Anomalinoides semicribratus, Anomalinoides praeacuta,and Bulimina trinitatensis.
Paleoenvironment
The benthic foraminiferal faunas of Site 884 indicate a lower-bathyal to abyssal paleodepth (>IOOO mbsl), based on Tjalsma andLohmann (1983) and van Morkhoven et al. (1986). AMiocene sectiondeepening from lower bathyal to abyssal depths is supported by thegradual increase in abundance of Melonis pompilioides, Pyrgo mur-rhina, and Uvigerina senticosa.
Evidence of downslope transport is found in one sample from thelower Miocene of Site 884 (Sample 145-884B-66X-1, 100-102 cm),which contains a middle bathyal (600-1000 mbsl) fauna.
Calcareous Nannofossils
Calcareous nannofossil assemblages were examined in all core-catcher samples recovered from Site 884. Additional samples fromselected intervals also were examined for calcareous nannofossils.Abundances range from barren to abundant, with generally moderatepreservation. A limited zonation was possible for the recovered Pleis-tocene and the Eocene-Oligocene sequences, whereas the Miocene-Pliocene sequence was mostly barren of nannofossils.
Pleistocene
At Site 884, Pleistocene sediments were recovered through Sec-tion 145-884B-12X-CC and 145-884C-12X-CC (Fig. 19). Despitelow species diversity and the scattered occurrence, one zonal bound-ary could be recognized within the Pleistocene sequence. The lastoccurrence (LO) of Pseudoemiliania lacunosa (0.49 Ma) can beobserved between Samples 145-884B-6H-CC and -9H-1, 80 cm(54.0-73.8 mbsf), and between 145-884C-4H-CC and -5H-CC(30.9-40.4 mbsf), respectively, marking the top of Zone NN19. Oneadditional nannofossil event, the first occurrence (FO) of Gephyro-capsa oceanica s.l. (1.67 Ma), can be observed in Hole 884C betweenSamples 145-884C-9H-CC and -14X-CC (78.4-126.7 mbsf). Be-cause of the total absence of discoasters, the base of Zone NN19 couldnot be recognized at this site.
Miocene-Pliocene
The Miocene-Pliocene sequence recovered at Site 884 is mostlybarren of calcareous nannofossils. The assemblages observed aredominated by species of the genus Reticulofenestra. Only one Plio-

SITE 884
cm
1 1 6 -
1 1 8 -
120-1
Figure 11. Subunit ID; Horizontal Zoophycos burrows in light gray diatomchalk (interval 145-884B-64X-4, 113-120 cm).
cene calcareous nannofossil event, the LO of Reticulofenestra pseu-doumbilica (3.71 Ma), can be observed, marking the top of ZoneNN15 between Samples 145-884B-19X-CC and -21X-3, 90 cm, andbetween Samples 145-884C-18X-CC and -19X-CC, respectively, atapproximately 167 mbsf (Fig. 19). In the Miocene sequence, calcare-ous nannofossils are scarce to abundant. The assemblages are domi-nated by Reticulofenestra species with rare Coccolithus pelagicus.
Eocene-Oligocene
The Eocene-Oligocene sediments recovered at Site 884 are richin calcareous nannofossils. Using the LO of Reticulofenestra bisecta(top of Zone NP25, 23.81 Ma) as an approximation for the Oligo-cene/Miocene boundary, the boundary can be placed between Sam-ples 145-884B-69X-CC and -70X-1, 48 cm, at approximately 640mbsf (Fig. 20).
The LO of Reticulofenestra umbilica (14 mm)(31.72 Ma), whichmarks the top of Zone NP22 of the Oligocene, can be observedbetween Samples 145-884B-70X-CC and -71X-CC (651.7-661.3mbsf). The top of Zone NP21, marked by the LO ofEricsonia formosa(32.70 Ma), can be seen between Samples 145-884B-73X-CC and-74X-1,50 cm (-680 mbsf). The latter sample contains rare, probablyreworked specimens of Nannotetrina fulgens (LO in Zone NP15).The absence of sphenoliths made further subdivision of the Oligocenesequence impossible.
Stratigraphically, the Oligocene/Eocene transition falls betweenthe LO of E. formosa and the LO of Discoaster saipanensis (top ofZone NP20). In Hole 884B, the latter event can be observed betweenSamples 145-884B-74X-CC and -75X-2, 132 cm. Therefore, theOligocene/Eocene transition may be placed between 680.6 and 693.0mbsf (Fig. 20).
The Eocene calcareous nannofossil assemblages observed at Site884 show several indications of sediment mixing (see also "Lithostra-tigraphy" section, this chapter). One sample (Sample 145-884B-8IX-CC) contains white nannofossil-bearing clasts of middle Eocene agein a light brown matrix that had a late Eocene age. Another sample(Sample 145-884B-85X-CC), contains both Eocene Discoaster kuep-peri (NP12-mid NP 14) and Paleocene Discoaster mohleri (NP7-NP9). Discoaster multiradiatus (NP9-NP11) can be observed in onlyone sample (Sample 145-884B-87X-CC). These observations sug-
cm120—1
1 2 1 -
1 2 2 -
1 2 3 -
124-
125—
Figure 12. Subunit IIA. Moderately burrowed ashy claystone and chalk withclay. Note microfault in right of center at 124 cm. Several Zoophycos burrowstraverse the core (interval 145-884B-66X-2, 120-125 cm).
gest that sediment mixing took place through the Eocene, making itdifficult, at this stage, to establish a zonation for this sequence atSite 884.
In addition to the LO of D. saipanensis, the F0 of Isthmolithusrecurvus has been tentatively placed between Samples 145-884B-81X-CC and -82X-CC, marking the top of Zone NP18 of the upperEocene section (Fig. 19). The last sample holding calcareous nanno-fossils is Sample 145-884B-87X-CC, which contains specimens ofD. multiradiatus, E. formosa, Reticulofenestra reticulata, and Cycli-cargolithus floridanus, again indicating remixing of sediments. Sam-ples 145-884-88X-CC through -91X-CC are barren of calcareousnannofossils. However, the observation of a probably reworked speci-men of D. mohleri in Sample 145-884B-85X-CC suggests that upperPaleocene sediments may be present at Site 884, although they maynot be identifiable at this stage.
Radiolarians
Sediments from core-catcher samples at Site 884 that containradiolarians ranging in age from late Oligocene/early Miocene throughQuaternary. Radiolarian concentrations decrease markedly below themiddle part of the Pleistocene, similar to results from Sites 882 and883. Abundant radiolarians occur in only three isolated samples (in thelower part of the Pleistocene, upper Pliocene, upper Miocene) and a40-m-long middle Miocene interval. The presence of high concentra-tions of diatoms within the upper Miocene through the upper Pliocenesection may account for these low radiolarian abundances. Pre-Mio-cene sediments recovered at the site do not contain radiolarians, exceptfor a few samples that may be of early Oligocene age.
Preservation of radiolarians varies from good to poor throughoutthe sediments, with most middle Pleistocene and younger sedimentsmoderately well to well preserved. Preservation decreases below thislevel, with an increasing number of poorly preserved samples beingencountered with increasing age. The combination of low abun-dances and only moderately good to poor preservation of radiolariansthroughout much of the Miocene and Pliocene sequence make itdifficult to determine zonal boundaries for this site. When abundantradiolarians are encountered, a faunal assemblage is present that isusually characteristic of a specific zone. Samples having less thanabundant concentrations of radiolarians, however, contain only a few,and in some instances, none of the diagnostic zonal species.
The entire sediment interval from Holes 884A (Core 145-884 A-1H) and 884D (Cores 145-884D-1H and -2H) as well as the first twocores from Holes 884B and three cores from Hole 884C contain a

cm
6 6 -
6 8 -
7 0 -
7 2 -
7 4 -
7 6 -1 2 -
7 8 -1 4 -
1 6 -
Figure 13. Subunit HB; fractures filled in by calcite within well-biscuited (bydrilling), dark claystone (interval 145-884B-76X-5, 0-17 cm).
moderately well to well preserved faunal assemblage characteristicof the late Quaternary Botryostrobus aquilonaris Zone (Hays, 1970).Radiolarians range from abundant to rare in these samples. AlthoughLychnocanium grande is present in the uppermost core-catcher sam-ples from Holes 884A, 884B, and 884D (Samples 145-884A-1H-CC,-884B-1H-CC, -884D-1H-CC), it is not found in Sample 145-884C-1H-CC in Hole 884C, indicating that the sediments from the upper-most 2.4 m of this core are younger than 0.05 Ma. The presence ofDruppatractus acquilonius, combined with the absence of Stylatrac-tus universus in Sample 145-884C-3H-CC, narrows the age range onthis sample to between 0.35 and 0.45 Ma (Morley et al., 1982; Haysand Shackleton, 1976; Morley and Shackleton, 1978).
8 0 -
8 2 -
84 - 1
Figure 14. Nose of overturned fold in sediments of Subunit HB. Note disperseddark fragments of altered ash, suggesting redeposition before the deformation(interval 145-884B-83X-3, 65-84 cm).

SITE 884
cm58-i
5 9 -
6 0 -
6 1 -
6 2 -
6 3 -
6 4 -
6 5 -
Figure 15. Subunit HB; intraclast of ashy claystone surrounded by matrix ofdeformed laminated ashy claystone. Note widespread occurrence of dispersedclasts of dark ash throughout interval, indicative of redeposition (interval145-884B-83X-3, 58-65 cm).
The sediment interval between Samples 145-884B-3H-CC and-6H-CC in Hole 884B and Samples 145-884C-4H-CC and -7H-CCin Hole 884C has been assigned to the late Quaternary S. universusZone (Hays, 1970), based on the presence of 5. universus, L. grande,and D. acquilonius and the absence of Eucyrtidium matuyamai.Radiolarians are abundant in the two core-catcher samples from theuppermost portion of the interval in Hole 884B, but are rare in allother sediments representative of this radiolarian zone in both Holes884B and 884C. The siliceous fauna is moderately well to well pre-served in most samples.
The boundary between the S. universus and the E. matuyamai(Hays, 1970; Foreman, 1975) zones occurs between Samples 145-884B-6H-CC and -7H-CC in Hole 884B and between Samples 145-884C-7H-CC and -8H-CC in Hole 884C. Except for a single core-catcher sample containing common radiolarians from the middle ofthe E. matuyamai Zone in Hole 884C, radiolarian concentrations arerare, and preservation becomes poorer with increasing age. The baseof this zone is marked by the FO of E. matuyamai, which coincideswith the Olduvai Subchron. This datum level registers in sedimentsthat also contain the Olduvai Subchron in Hole 884B (betweenSamples 145-884B-11H-CC and -12X-CC). Because of the poorpreservation and low abundance of radiolarians, however, this leveloccurs several meters above the Olduvai in Hole 884C (betweenSamples 145-884C-9H-CC and -10X-CC).
Directly below the LO of E. matuyamai in Hole 884B, abundancesof radiolarians increase from common to abundant in two samplesbefore decreasing to rare for the entire remainder of the Pliocenesequence. The occurrence of rare Stichocorys peregrina specimensin a single sample (145-884B-23X-CC) permits tentative placementof the boundary between the Pliocene Lamprocyrtis heteroporos(Hays, 1970; Foreman, 1975) and S. langii (Foreman, 1975) zones(between Samples 145-884B-22X-CC and -23X-CC). Although Lheteroporos occurs in samples above and below this interval, thisspecies is not present in the core-catcher samples examined within itsnamed zone (Samples 145-884B-12X-CC through -22X-CC). There-fore, the tentative zonal designation for this interval is based on theabsence of both E. matuyamai and S. peregrina in all samples (with
cm
1 0 8 -
1 1 0 -
1 1 2 -
114 —
116—'
Figure 16. Subunit HC; recumbent folding within laminated claystone, chalk,and clayey ash. Note the microfault that cuts the lower limb of the fold, and theslightly inclined scour surface that truncates the top of the folded laminae.Uppermost 7 cm exhibit lenticular lamination and possible cross laminations,and have experienced minor deformation (interval 145-884B-84X-5, 107—116 cm).
the FO E. matuyamai and the LO of S. peregrina marking the top andbottom of this zone, respectively) and the presence of S. langii,Sphaeropyle robusta, D. acquilonius, and S. universus in many of thesamples. The recorded LO of Cycladophora davisiana var. davisiana(with an estimated age of -3.0 Ma), between Samples 145-884B-15X-CC and -16X-CC provides additional evidence for placement ofthis radiolarian-bearing sequence within the L. heteroporos Zone. Itis not possible to identify the boundary between the L. heteroporosand S. langii zones in Hole 884C because of our inability to locatethe LO of S. peregrina in comparably-aged sediments. However, theLO of C. davisiana var. davisiana falls in these sediments betweenSamples 145-884C-15X-CC and -16X-CC. Radiolarian concentra-tions in Hole 884C are similar to those in samples found from thisinterval in Hole 884B.
The boundary between the S. langii (Foreman, 1975) and S.peregrina (Riedel and Sanfilippo, 1970, 1978) zones apparently isrecorded in Hole 884B between Samples 145-884B-31X-CC and-32X-CC. L. heteroporos and 5. langii are present in several of thesamples directly above this level and are absent in samples below it.Besides 5. langii, most samples also include S. robusta, D. acquilo-nius, and S. universus. L. heteroporos and S. peregrina, however,occur in only a few samples from this interval. The F0 of L. hetero-poros (between Samples 145-884C-30X-CC and -31X-CC) has beenused to place tentatively the boundary between these two zones inHole 884C. Radiolarians are rare in sediments below this boundary,throughout the upper Miocene interval in both Holes 884B and 884C,and preservation is poor in many of the samples. Based on thepresence of S. peregrina in Samples 145-884C-36X-CC and -37X-CC, along with D. acquilonius, T. redondoensis, Phormostichoartusfistula, and Botryostrobus bramlettei in most of the remaining sam-
SITE 884
cm85 - i
8 7 -
8 9 -
9 1 -
9 3 -
9 5 -
97 - 1
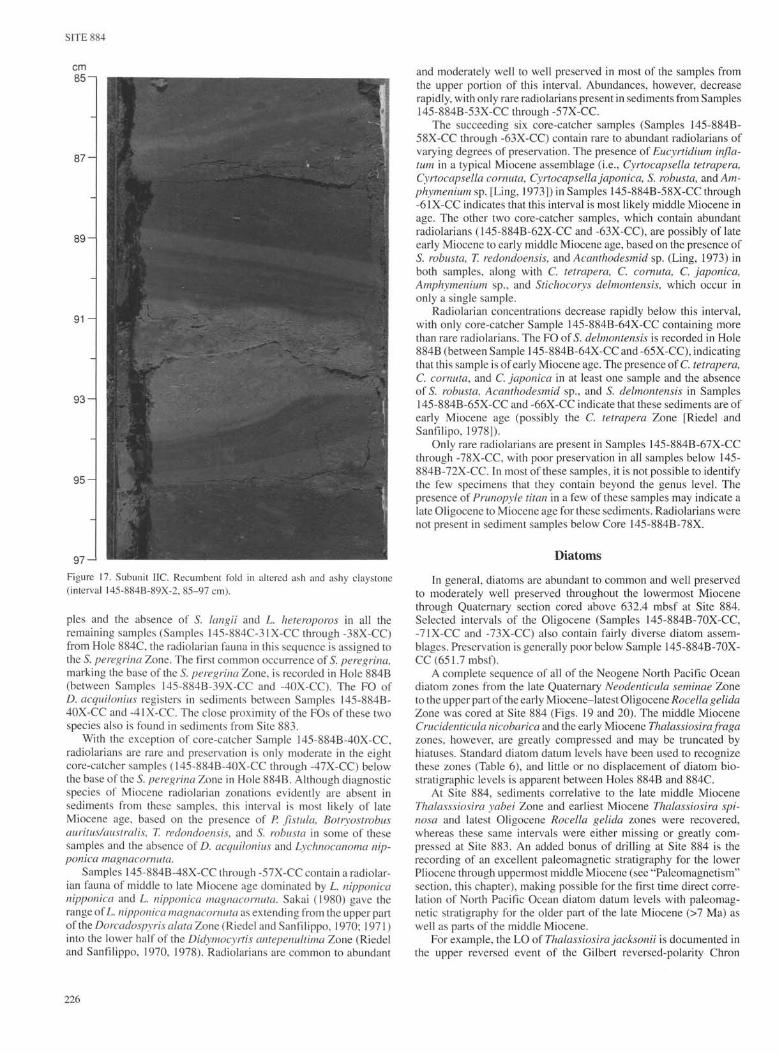
Figure 17. Subunit HC. Recumbent fold in altered ash and ashy claystone(interval 145-884B-89X-2, 85-97 cm).
pies and the absence of S. langii and L heteroporos in all theremaining samples (Samples 145-884C-31X-CC through -38X-CC)from Hole 884C, the radiolarian fauna in this sequence is assigned tothe S. peregrina Zone. The first common occurrence of 5. peregrina,marking the base of the 5. peregrina Zone, is recorded in Hole 884B(between Samples 145-884B-39X-CC and -40X-CC). The FO ofD. acquilonius registers in sediments between Samples 145-884B-40X-CC and -41X-CC. The close proximity of the FOs of these twospecies also is found in sediments from Site 883.
With the exception of core-catcher Sample 145-884B-40X-CC,radiolarians are rare and preservation is only moderate in the eightcore-catcher samples (145-884B-40X-CC through -47X-CC) belowthe base of the S. peregrina Zone in Hole 884B. Although diagnosticspecies of Miocene radiolarian zonations evidently are absent insediments from these samples, this interval is most likely of lateMiocene age, based on the presence of P. fistula, Botryostrobusauritus/australis, T. redondoensis, and 5. robusta in some of thesesamples and the absence of D. acquilonius and Lychnocanoma nip-ponica magnacornuta.
Samples 145-884B-48X-CC through -57X-CC contain a radiolar-ian fauna of middle to late Miocene age dominated by L. nipponicanipponica and L. nipponica magnacornuta. Sakai (1980) gave therange of L. nipponica magnacornuta as extending from the upper partof the Dorcadospyris alata Zone (Riedel and Sanfilippo, 1970; 1971)into the lower half of the Didymocyrtis antepenultima Zone (Riedeland Sanfilippo, 1970, 1978). Radiolarians are common to abundant
and moderately well to well preserved in most of the samples fromthe upper portion of this interval. Abundances, however, decreaserapidly, with only rare radiolarians present in sediments from Samples145-884B-53X-CC through -57X-CC.
The succeeding six core-catcher samples (Samples 145-884B-58X-CC through -63X-CC) contain rare to abundant radiolarians ofvarying degrees of preservation. The presence of Eucyrtidium infla-tum in a typical Miocene assemblage (i.e., Cyrtocapsella tetrapera,Cyrtocapsella cornuta, Cyrtocapsella japonica, S. robusta, and Am-phymeniumsp. [Ling, 1973]) in Samples 145-884B-58X-CC through-61X-CC indicates that this interval is most likely middle Miocene inage. The other two core-catcher samples, which contain abundantradiolarians (145-884B-62X-CC and -63X-CC), are possibly of lateearly Miocene to early middle Miocene age, based on the presence ofS. robusta, T. redondoensis, and Acanthodesmid sp. (Ling, 1973) inboth samples, along with C. tetrapera, C. cornuta, C. japonica,Amphymenium sp., and Stichocorys delmontensis, which occur inonly a single sample.
Radiolarian concentrations decrease rapidly below this interval,with only core-catcher Sample 145-884B-64X-CC containing morethan rare radiolarians. The F0 of S. delmontensis is recorded in Hole884B (between Sample 145-884B-64X-CC and-65X-CC), indicatingthat this sample is of early Miocene age. The presence of C. tetrapera,C. cornuta, and C. japonica in at least one sample and the absenceof S. robusta, Acanthodesmid sp., and S. delmontensis in Samples145-884B-65X-CC and -66X-CC indicate that these sediments are ofearly Miocene age (possibly the C. tetrapera Zone [Riedel andSanfilipo, 1978]).
Only rare radiolarians are present in Samples 145-884B-67X-CCthrough -78X-CC, with poor preservation in all samples below 145-884B-72X-CC. In most of these samples, it is not possible to identifythe few specimens that they contain beyond the genus level. Thepresence of Prunopyle titan in a few of these samples may indicate alate Oligocene to Miocene age for these sediments. Radiolarians werenot present in sediment samples below Core 145-884B-78X.
Diatoms
In general, diatoms are abundant to common and well preservedto moderately well preserved throughout the lowermost Miocenethrough Quaternary section cored above 632.4 mbsf at Site 884.Selected intervals of the Oligocene (Samples 145-884B-70X-CC,-71X-CC and -73X-CC) also contain fairly diverse diatom assem-blages. Preservation is generally poor below Sample 145-884B-70X-CC (651.7 mbsf).
A complete sequence of all of the Neogene North Pacific Oceandiatom zones from the late Quaternary Neodenticula seminae Zoneto the upper part of the early Miocene-latest Oligocene Rocella gelidaZone was cored at Site 884 (Figs. 19 and 20). The middle MioceneCrucidenticula nicobarica and the early Miocene Thalassiosirafragazones, however, are greatly compressed and may be truncated byhiatuses. Standard diatom datum levels have been used to recognizethese zones (Table 6), and little or no displacement of diatom bio-stratigraphic levels is apparent between Holes 884B and 884C.
At Site 884, sediments correlative to the late middle MioceneThalasssiosira yabei Zone and earliest Miocene Thalassiosira spi-nosa and latest Oligocene Rocella gelida zones were recovered,whereas these same intervals were either missing or greatly com-pressed at Site 883. An added bonus of drilling at Site 884 is therecording of an excellent paleomagnetic stratigraphy for the lowerPliocene through uppermost middle Miocene (see "Paleomagnetism"section, this chapter), making possible for the first time direct corre-lation of North Pacific Ocean diatom datum levels with paleomag-netic stratigraphy for the older part of the late Miocene (>7 Ma) aswell as parts of the middle Miocene.
For example, the LO of Thalassiosira jacksonii is documented inthe upper reversed event of the Gilbert reversed-polarity Chron

SITE 884
Table 4. Trace-element geochemistry of interval145-884B-90X-3, 25-30 cm, Subunit HC.
cmO-i
Interval: 145-884B-90X-3,25-30 cm
Element
NbZrYSrRbZnCuNiCrVTiO2
Ba
Abundance*
6.6157.8109.1502.8
67.8284.1340.6206.2
42.1254.8
1.0615,676.0
Abundances are in ppm for all elements except Tiθ2; Tiθ2abundances in weight %.
(Subchron C2An.3r) at 3.75 Ma, instead of in the middle portion ofthe Gauss (3.3 Ma), as was proposed by Koizumi (1992). This dis-crepancy may possibly be explained by dissolution of the relativelydelicate valves of T. jacksonii in sediments from Site 884. The F0 ofNeodenticula koizumii (ca. 195-199 mbsf) is found at an equivalenthorizon to the LO T. jacksonii at Site 884 (3.75 Ma), an age equivalentto that suggested by Koizumi and Tanimura (1985) in DSDP Leg 86sediments to the south, but somewhat younger than the 4.2-Ma(Subchron C3r.lr) age reported by Basilian et al. (1991) in Kam-chatka. The age of this datum level is especially important, becauseit defines the boundary between the Neodenticula koizumiilN. kam-tschatica Zone and the underlying Neodenticula kamtschatica Zoneand because it constrains sedimentation rates in the middle part ofthe Pliocene.
The F0 of Thalassiosira latimarginata (276.7-281.1 mbsf) falls atthe base of the lower normal event (Subchron C3n.4n) of the Gilbertreversed-polarity Chron. This is slightly higher than the F0 of T.oestrupü (286.3-290.7 mbsf). Koizumi (1992) also reported the F0 ofT. latimarginata as just above the FO of T. oestrupü in the Sea of Japan.
The FO of Thalassiosira praeoestrupü at Site 884 (320-325 mbsf)coincides with the base of Subchron C3An.ln (5.95 Ma), an age thatagrees with the correlations of Bodén (in press) at DSDP Site 578 inthe Northwest Pacific. The LO of Thalassiosira miocenica in thesame interval at Site 884, on the other hand, is slightly older than the5.7-Ma age estimated by Koizumi and Tanimura (1985) at Site 578.This discrepancy may result from an earlier disappearance of T.miocenica, a warm-water species, at the more northern Site 884.
The F0 of Neodenticula kamtschatica, which marks the boundarybetween the early Pliocene-latest Miocene N. kamtschatica Zone andthe late Miocene Thalassionema schraderi Zone, has been estimatedto be about 7.0 Ma (Koizumi, 1992), based on the paleomagneticcalibration of this event by Burckle and Opdyke (1977) with thelowermost part of reversed polarity Chron C3B (Koizumi, 1992). AtSite 884, the FO of N. kamtschatica in Sample 145-884B-41X-CC(372.7 mbsf) falls at the top of Chron C4n, at a slightly older age(7.25 Ma). Similarly, the last common occurrence of Thalassionemaschraderi, which Barron estimated (1992) was about 7.2 Ma, isslightly older at Site 884 (ca. 7.45 Ma), based on its coincidence withthe top of Subchron C4n.2n (Table 6, Fig. 20).
Paleomagnetic stratigraphy identifies Subchron C4Ar betweenabout 437 and 451 mbsf (Fig. 20), but this dominantly reversedsubchron seems to be reduced in length compared to normally polar-ized Subchrons C4An and C5n, and it contains only one short normalpolarity event, instead of the two that should be present in Subchron4Ar. (1992)'s Barron correlation of the LO of Denticulopsis dimorpha(Sample 145-884B-48X-CC) with the upper part of Subchron C4Ar(9.0 Ma) is in accord with this interpretation. Thus, the possibilityexists of a short hiatus in the middle part of the D. dimorpha Zone
2 -
4 -
6 -
8 -
1 0 -
1 2 -
1 4 -
Figure 18. Photograph of interval 145-884E-10R-3, 0-15 cm, showing largePlagioclase phenocrysts.
between Samples 145-884B-48X-CC (440.2 mbsf) and -49-1, 25-26 cm (440.45 mbsf). This is supported by the presence of commonDenticulopsis katayamae in the former sample and the presence ofD. crassa in the latter sample. According to Yanagisawa and Akiba(1990), these occurrences are restricted to the uppermost and lower-most parts of the D. dimorpha Zone, respectively. Lithostratigraphy(see "Lithostratigraphy" section, this chapter) identifies the boundarybetween lithologic Subunit IB (clayey diatom ooze and diatomite),and lithologic Subunit IC (claystone) at the break between Cores145-884B-48Xand-49X.
The F0 of Denticulopsis dimorpha, which defines the base of theD. dimorpha Zone, is calibrated to paleomagetic stratigraphy for the
227

SITE 884
Table 5. Results of whole-rock analyses of trace element by XRF.
Core, section, interval (cm)
Hole 884B-91X-CC, 8-12
Hole 884E-1R-1, 121-1262R-2, 36--404R-4, 27-324R-4, 118-1235R-4, 19-245R-6, 20-246R-2,4-86R-3, 25-299R-2, 134-13910R-4, 0-610R-5, 76-8010R-6, 132-136
Unit
1
112246668
101113
Depth(mbsf)
848.30
844.01854.32876.78877.69886.45888.98892.90894.54913.42924.52926.62928.38
Nb
2.2
2.02.02.01.02.03.03.04.03.03.02.02.2
Zr
80
7976665465S3SSSX59564160
Y
30
292930272933353323201823
Sr
135
127120KW11210S141129122134145161152
Rb
12
140
1330
11000155
Zn
70
745873627572697042423752
Cu
143
13912512413415713413814211310189
119
Ni
138
12088
1061157370807663785360
Cr
342
330325194175210
259216230237277
V
269
301
306276327351340357
182245
TiO2
1.31
1.301.271.261.191.291.481.581.530.990.910.801.07
Concentrations are in parts per million, except for TiCb, which is in weight percent. See "Explanatory Notes" chapter (this volume) for machine conditions and replicate standard analyses.
first time at Site 884 and falls in the upper part of Chron C5n (Fig. 20).This event has an extrapolated age of about 9.8 Ma, rather than theage of 9.5 Ma estimated by Barron (1992).
A second hiatus or greatly compressed interval in the middleMiocene occurs during the early part of the Denticulopsis praedimor-pha Zone and the greater part of the underlying Crucidenticulanicobarica Zone in Sample 145-884B-58X-CC. Based on the inter-preted absence of Subchrons C5A through C5AB (Fig. 20), theinterval between about 12.4 and 13.2 Ma may be removed at anunconformity in the lower part of Core 145-884B-58X. Equivalenthiatuses have been documented at DSDP Sites 438 and 584 off Japanby Akiba (1985) and at DSDP Site 183 in the Gulf of Alaska by Barron(1989). This hiatus also corresponds with the lower part of a majorhiatus or compressed interval present between 547.1 and 558.77 mbsfin Hole 883B.
The early Miocene Thalassiosira fraga Zone is restricted to theinterval from Samples 145-884B-66X-1,25-26 cm, to -66X-3,25-26cm (603.8-607.05 mbsf) (Table 6). This long zone (18.4-20.1 Ma) iseither greatly compressed or truncated by a hiatus within this interval.Lithologic evidence for an unconformity in this interval is a sandy,laminated interval that occurs between 97 and 101 cm of Section145-884B-66X-1 (604.8 mbsf) (see "Lithostratigraphy" section, thischapter). Samples 145-884B-66X-2, 25-26 cm, and -66X-3, 25-26cm, below this sandy interval contain common Thalassiosira spinosaand lack well-developed specimens of Thalassiosira fraga, charac-teristics that indicate the lower part of the T. fraga Zone. The under-lying T. spinosa Zone is recognized below the F0 of T. fraga inSample 145-884B-66X-3, 25-26 cm, and above the LO of Rocellagelida in Sample 145-884B-68X-CC.
Sample 145-884B-68X-CC contains Rocella gelida and Lisitziniaornata and is latest Oligocene or earliest Miocene in age. A diverseassemblage from the middle part of the Oligocene, including Cavi-tatus (Synedra) jouseana, C. rectus (n. sp., Akiba et al., in press),Kisseleviella carina, and Cestodiscus trochus, is present in Sample145-884B-70X-CC. The presence of few Pyxilla spp. and rare Cavi-tatus miocenica suggests a late early Oligocene age for Sample 145-884B-71X-CC, while poorly preserved specimens of Rouxia sp. andPyxilla spp. in Sample 145-884B-73X-CC are also probably earlyOligocene in age.
In contrast to the diatom assemblages recovered at Sites 882 and883, those examined from the uppermost Miocene through Quater-nary section of Site 884 contain consistent, but typically few, neriticplanktonic diatoms from the arcto-boreal region, as well as benthicdiatoms displaced from shelf environments. These taxa include Tha-lassiosira gravida, Porosira glacialis, Detonula conferavea,Cosmiodiscus insignis, Thalassiosira hyalina, Pyxidicula zabelinae,Delphineis spp., Odontella aurita, Actinoptychus senarius, Paraliasulcata, Pseudopyxilla americana, as well as representatives of thebenthic genera Cocconeis and Diploneis, and are taken as evidence
for sediment transport from the Bering Sea or Aleutian shelf. Notethat this distinct arcto-boreal assemblage only evolved during thelatest Miocene (Barron, 1980), so that such a Bering Sea or Aleutianinfluence on sedimention may extend farther back in time. In fact,neritic taxa (such as Actinoptychus senarius, Kisseleviella spp., andParalia sulcata) are scattered down through Sample 145-884B-71X-CC (early Oligocene?), the lowermost sample observed to haverelatively common diatoms. This transport must have been contem-poraneous, because reworked diatoms are extremely rare in Site 884sediments. Scattered occurrences of early Pliocene to late Mioceneand early Miocene diatoms are present in selected intervals of thePleistocene and upper Pliocene section.
In selected intervals of the Pliocene and Miocene section atSite 884, rare-to-few, warm-water taxa are recorded. These intervalsand their warm-water taxa include Samples 145-884B-22X-CC and-23X-CC (ca. 3.6-3.8 Ma)(Hemidiscus cuneiformis and Nitzschiareinholdii), Samples 145-884B-29X-CC through -31X-CC (4.7-5.0Ma) {Thalassiosira convexa), Samples 145-884B-36X-CC and -37X-CC (ca. 5.8—6.3 Ma) (T. convexa and T. miocenica), Sample 145-884B-61X-CC (ca. 15 Ma) (Coscinodiscus lewisianus), and Samples145-884B-64X-1, 25-26 cm, to -64X-CC (ca. 16.2-17 Ma) (Azpeitiaspp. and common Crucidenticula spp.). These intervals probablyrecord the proximity to Site 884 of warm surface waters. Quantitativestudy will be necessary to constrain these and other possible warmintervals further.
PALEOMAGNETISM
At Site 884, pass-through measurements of magnetic susceptibilityand remanence were performed on APC and XCB cores from Holes884B (Cores 145-884B-1H to -83X) and 884C (Cores 145-884-1H to-38X). Readings were taken at 10-cm spacings. Measurements ofnatural remanent magnetization (NRM) after 15 mT demagnetizationwere performed on all sections of all cores; the undemagnetized NRMof one section per core was measured also. Two or three 7-cm3 sampleswere taken from all sections of Hole 884B that contained soft sediment(Cores 145-884B-1H to -40X). A single sample per section was takenbetween Cores 145-884B-41X and -66X. Measurements were per-formed using both the Molspin and the Japanese spinner magnetome-ters. Samples were demagnetized in five steps up to 25 or 35 mT. Inaddition to the NRM demagnetization, the Japanese instrument pro-vided anhysteretic remanent magnetization (ARM) data. The multishotorientation devices were deployed in the upper parts of Holes 884Band 884C, and orientations obtained for Cores 145-884B-4H to -UHand Cores 145-884C-4H to -9H. Where both the multishot and tensortools were used, orientations from the two devices agree to within 8°.Automated susceptibility (K) was measured at 5-cm intervals for allcores from Holes 884A, 884B, 884C, and 884D, in conjunction withother measurements performed using the multisensor track.

SITE 884
40 -
80 -
120 -
160-
a.Q
N. koizumii-N. kamtschatica
200-
240-
280-
320 -
360-
400 -I
Figure 19. Stratigraphic position of cores, recovery (black), ages, placement of magnetostratigraphic chrons and subchrons, polarity log, and placement ofdiatom, radiolarian, calcareous nannofossil zones and the bathymetric range of benthic foraminifers in Holes 884B and 884C. Intervals filled by slanted linesindicate uncertainty in the placement of biostratigraphic boundaries.
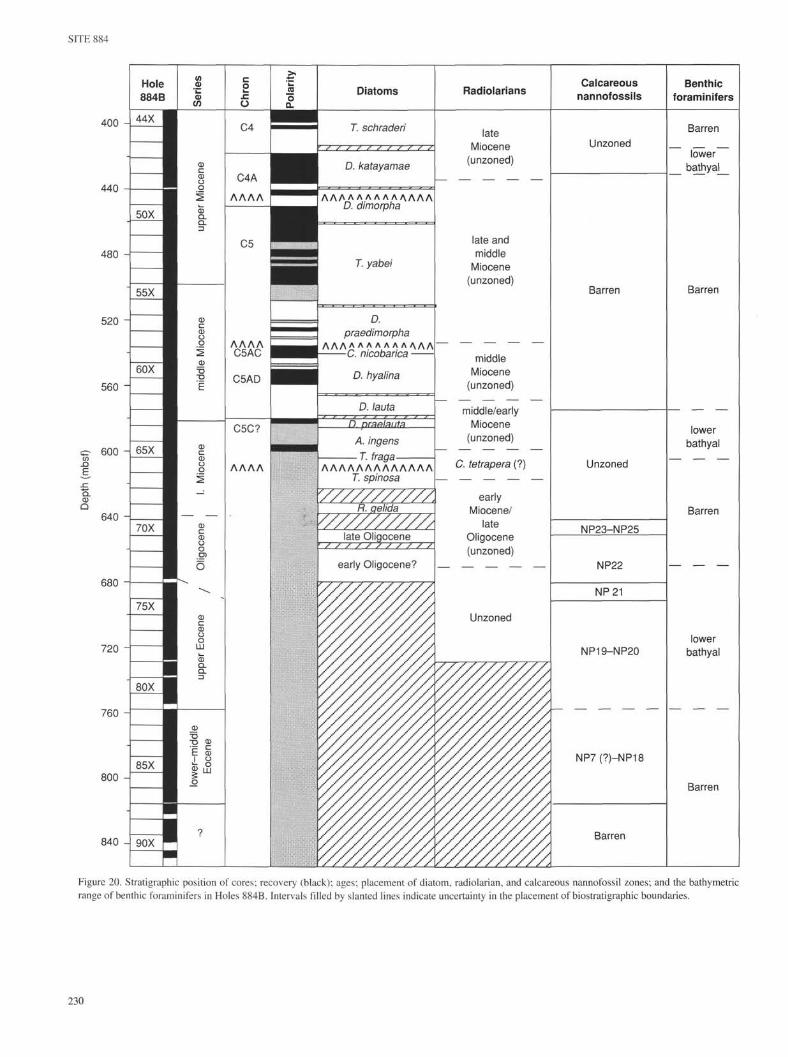
SITE 884
400 -
440
480 -
520 -
560 -
sr• 600 -
E
Q.CDQ
640 -
680 -
720 -
760 -
800 -
840 -
ΛΛΛΛΛΛΛΛΛΛΛΛΛD. dimorpha
D.
praedimorphaΛΛΛΛΛΛΛΛΛΛΛΛΛ
C. nicobanca
A. ingens
T. fraga
ΛΛΛΛΛΛΛΛΛΛΛΛΛT. spinosa
Radiolarians
lateMiocene
(unzoned)
late andmiddle
Miocene(unzoned)
middleMiocene
(unzoned)
middle/early
Miocene
(unzoned)
C. tetrapera (?)
earlyMiocene/
lateOligocene(unzoned)
Unzoned
Calcareousnannofossils
Unzoned
Barren
Unzoned
NP23-NP25
NP22
NP 21
NP19-NP20
NP7(?)-NP18
Barren
Benthicforaminifers
Barren
lower
bathyal
Barren
lower
bathyal
Barren
lower
bathyal
Barren
Figure 20. Stratigraphic position of cores; recovery (black); ages; placement of diatom, radiolarian, and calcareous nannofossil zones; and the bathymetricrange of benthic foraminifers in Holes 884B. Intervals filled by slanted lines indicate uncertainty in the placement of biostratigraphic boundaries.

SITE 884
Table 6. Age and stratigraphic position of radiolarian (R), diatom (D) and calcareous nannofossil (N) datum levels in Holes 884B and 884C.
Sample no.
RlD2R2R3N3D5R5D6N8D7R7D8D9D12D13R8R9D14D15N15D17D16RllR12D18AD18BD19D21D23D24D24BRRD25D26D30R
D32D33D32AD34D36RR
RD38D41D42D44D46RD49D50D52D53RD54D55D57RD58D60D61N54N62N63\ 6 4N66
LOLOLOLOLOLCOLOF0F0LOF0LOLOLCOF0F0LOLOLOLOF0F0LOF0LOLOF0FOLOFOF0F0FCOF0LCOLCOLO
LOF0F0F0LCOLObFO
bLOF0LOFOFCOFOFOF0F0FOFOFOFOF0F0F0LOF0LOLOLOLOLOF0
Datum
Lychnocanoma grandeSimonseniella curvirostrisDruppatractus acquiloniusStylatractus universusPseudoemiliania lacunosaActinocyclus oculatusEucyrtidium matuyamaiSimonseniella curvirostrisGephyrocapsa oceanica s.l.Coscinodiscus pustulatusEucyrtidium matuyamaiPyxidicula horridusNeodenticula koizumiiNeodenticula kamtschaticaNeodenticula seminaeCycladophora davisianaStichocorys peregrinaThalassiosira marujamicaThalassiosira jacksoniiReticulofenestra pseudoumbilicaNeodenticula koizumiiActinocyclus oculatusTheocorys redondoensisLamprocyrtis heteroporos^Thalassiosira plicata^Cosmiodiscus insignis^Thalassiosira latimarginataThalassiosira oestrupiiThalassiosira miocenicaThalassiosira praeoestrupiiThalassiosira miocenicaDruppatractus acquiloniusStichocorys peregrina^Neodenticula kamtschatica^Thalassionema schraderi^Denticulopsis hustedtiiLychnocanoma nipponica
magnacornutaDenticulopsis dimorphaDenticulopsis katayamaeThalassionema schraderi^Denticulopsis dimorphaDenticulopsis praedimorphaCyrtocapsella tetraperaLychnocanoma nipponica
magnacornutaEucyrtidium inflatumSimonseniella barboiCrucidenticula nicobaricaDenticulopsis praedimorpha^Denticulopsis hustedtiiDenticulopsis hustedtiiEucyrtidium inflatumDenticulopsis hyalinaActinocyclys ingens nodusDenticulopsis lautaDenticulopsis praelautaStichocorys delmontensisCrucidenticula sawamuraeActinocyclus ingensThalassiosira fragaCryptocapsella tetraperaRocella gelidaThalassiosira spinosaLisitzinia ornataReticulofenestra bisectaReticulofenestra umbilicaEricsonia formosaDiscoaster saipanensisIsthmolithus recurvus
CK92(Ma)
0.050.30.350.450.491.001.051.581.671.81.91.82.02.63-2.72.72.82.93.23.33.713.753.8
4.64.64.65.055.45.75.956.36.756.757.257.458.48.5
9.09.3
9.810.812.112.15
12.211.512.412.813.314.214.814.915.115.916.220.618.418.420.122.621.824.124.123.831.732.735.035.1
Interval145-884B-
/1H-CC1H-CC/2H-CC2H-CC/3H-CC2H-CC/3H-CC6H-CC/9H-1.805H-CC/6H-CC6H-CC/7H-CC11H-CC/12X-CC
13X-4, 54/14X-4,4711H-CC/12X-CC12X-CC/13X-4,5413X-4, 54/144, 4715X-CC/16X-CC15X-CC/16X-CC15X-CC/16X-CC22X-CC/23X-CC18X-CC/19X-CC22X-CC/23X-CC19X-CC/21X-3, 8222X-CC/23X-CC23X-CC/24X-CC35X-CC/36X-CC31X-CC/32X-CC29X-CC/30X-CC29X-CC/30X-CC30X-CC/31X-CC32X-CC/33X-CC35X-CC/36X-CC35X-CC/36X-CC37X-CC/38X-CC
39X-CC/40X-CC41X-CC/42X-2, 2642X-5, 25/42X-CC46X-2, 25/46X-4, 2547X-CC/48X-CC
48X-6, 25/48X-CC48X-CC/49X-1,2548X-CC/49X-CC50X-CC/51X-2,2756X-2, 25/56X-4, 2555X-CC/56X-CC57X-CC/58X-CC
57X-CC/58X-CC57X-CC/58X-2, 2558X-5, 25/58X-6, 2558X-5, 25/58X-6, 2558X-7, 25/58X-CC60X-CC/61X-CC61X-CC/62X-CC61X-CC/62X-2, 2562X-4, 25/62X-CC63X-2, 25/63X-5, 2563X-CC/64X-1,2564X-CC/65X-CC65X-CC/66X-1,2565X-CC/66X-1,2566X-3, 25/66X-5, 2566X-CC/67X-CC67X-CC/68X-CC67X-CC/68X-CC67X-CC/68X-CC69X-CC/70X-l,4870X-CC/71X-CC73X-CC/74X-l,5074X-CC/75X-CC81X-CC/82X-CC
Depth (mbsf)145-884B-
/6.56.5/16.016.0/25.516.0/25.554.0/73.844.5/54.054.0/63.587.3/93.3
98.34/108.9787.3/93.393.3/98.3498.34/108.97122.2/131.8122.2/131.8122.2/131.8189.8/199.4151.0/160.8189.8/199.4160.8/175.7189.8/199.4199.4/209.1315.3/325.0276.7/286.3252.4/267.0252.4/267.0276.7/286.3286.3/296.0315.3/325.0315.3/325.0334.3/343.940X-CC/41X-CC353.6/363.1372.7/374.46378.95/382.4413.05/416.05430.6/440.2
438.35/440.2440.2/440.45440.2/449.8459.3/461.07509.15/512.15507.4/517.1526.7/536.4
526.7/536.4526.7/528.45532.75/534.25532.75/534.25535.75/536.4555.6/565.3565.3/574.8565.3/567.05570.05/574.8576.55/581.05584.4/584.65594.1/603.8603.8/604.05603.8/604.05607.05/610.05613.3/622.8622.8/632.4622.8/632.4622.8/632.4642.0/642.48651.7/661.3680.6/681.1690.2/699.8757.7/767.4
Interval145-884C-
1H-CC/2H-CC2H-CC/3H-CC2H-CC/3H-CC3H-CC/4H-CC4H-CC/5H-CC6H-CC/7H-CC7H-CC/8H-CC10X-CC/11X-CC9H-CC/14X-CC
9H-CC/10X-CC12X-CC/13X-CC11X-CC/12X-CC15X-CC/16X-CC15X-CC/16X-CC15X-CC/16H-CC
17X-CC/18X-CC21X-CC/22X-CC18X-CC/19X-CC21X-CC/22X-CC22X-CC/23X-CC31X-CC/32X-CC30X-CC/31X-CC28X-CC/29X-CC
29X-CC/30X-CC30X-CC/31X-CC34X-CC/35X-CC34X-CC/35X-CC36X-CC/37X-CC363.1/372.7
Depth (mbsf)145-884C-
2.4/11.911.9/21.411.9/21.221.4/30.930.9/40.449.9/59.459.4/68.988.2/97.878.4/126.7
78.4/88.2107.4/117.097.8/107.4136.3/146.0136.3/146.0136.3/146.0
155.7/165.3194.3/204.0165.3/175.0194.3/204.0204.0/213.7290.7/300.4281.1/290.7261.8/271.4
271.4/281.1281.1/290.7319.7/329.2319.7/329.2338.7/348.2
New age based on paleomagnetic stratigraphy of this site.First or last occurrence truncated by hiatus.
Notes: Samples constraining each datum level are separated by a slash (/) as is the meters sub-bottom depths (mbsf) of these samples. LO = last occurrence; LCO =last common occurrence; FO = first occurrence; FCO = first common occurrence. CK92 refers to the Cande and Kent (1992) geomagnetic polarity time scale.
In addition to the above measurements on the sediments from Site884, whole-core measurements were performed on the basaltic base-ment recovered in Hole 884E. With the exception of parts of Cores145-884E-5R and -9R, recovery was continuous enough to make thisa meaningful measurement. Discrete paleomagnetic core sampleswere drilled and extracted from basaltic basement in Cores 145-884E-
1R to -1 OR. Two to four samples per core were subjected to either AFalternating field or thermal demagnetization. In addition to thesesamples, the 7-cm3 samples, cut for physical property measurements,were alternating field (AF) demagnetized and measured before thephysical property experiments were performed. This represents anadditional two to six samples per core.
231

SITE 884
Susceptibility (cgs) Intensity (mA/m)
1 0 ° 101 10 2 103 101 10° 101 10 2 10 3
Susceptibility (cgs)
101 102 103
u
100
200
300
400
500
600
700
800
Jz :
• ^ fi j?h,
Figure 21. Magnetic susceptibilities and NRM intensities, after demagnetiza-tion at 15 mT, from Hole 884B compared with whole-core susceptibility (bothon log scales).
Results
Pass-through measurements of NRM 15 mT demagnetization, andwhole-core susceptibility are shown in Figure 21 for Hole 884B.Site 884 is characterized, at all depths, by higher remanence andsusceptibility values than those at Sites 882 and 883. This differenceis particularly marked in the intermediate depth regions (e.g., Site 883,87-600 mbsf), which have weaker intensities at all sites because of thedilution by diatoms. Between 200 and 600 mbsf, the intensity is aboutan order of magnitude higher than at equivalent intermediate depths atSite 883. This result is in keeping with the generally higher claycontents found at all depths at Site 884. An additional contrast to theother sites is that no abrupt decrease in intensity with depth marks thetop of the high diatom zone, but rather a gradual decrease is seenbetween about 100 and 150 mbsf. At Site 884, the remanence intensitycurve follows the susceptibility curve. The zone of low intensity andK between 200 and 600 mbsf is followed, with depth, by a gradualincrease, between 600 and 700 mbsf, to values comparable to thosefound in the top 100 m of the sediment column. Mean intensities afterdemagnetization are about 100 mA/m from 0 to 100 mbsf (varyingbetween 20 and 300 mA/m), about 30 mA/m from 150 to 600 mbsf(varying between 1 and 100 mA/m), and about 200 mA/m from 600to 850 mbsf. These changes in K and intensity coincide with lithologicSubunits IA (initial high K and intensity), Subunits IB to ID (all at fairlylow K and intensity) and Unit II (high K and intensity), respectively.
Measurements of ARM, demagnetized at 30 mT on the Japanesespinner magnetometer, are shown in comparison to susceptibility inFigure 22. The ratio of ARM to susceptibility (seen qualitatively inthe separation between the two curves) is an indicator of magneticgrain size. This is because the ARM is mostly held in the finer grainedfraction, whereas the susceptibility (K) is controlled by the coarse
-610
ARM
-510
(kA/m)
-410
700
800
Figure 22. Comparison of results from whole-core measurements of suscepti-bility (solid line) with ARM, demagnetized to 30 mT, from discrete samples(open triangles) for Hole 884B. Both are plotted on log scales spanning anequal number of orders of magnitude to preserve the relative magnitudes ofthe ARM and K. Variation in the separation of the two curves indicates a changein the ARM/ZT ratio.
fraction. Between 150 and 370 mbsf, the two curves parallel eachother, indicating a constant ARM/ÅT ratio (Fig. 22). In this region, thevarious troughs and peaks of the two curves reflect only dilutionchanges of a magnetic faction whose basic properties are constant.However, between about 50 and 130 mbsf the ratio changes signifi-cantly. The two curves cross each other at about 75 mbsf and againnear 100 mbsf. This indicates either a significant coarsening of themagnetic grain size or a change in magnetic mineralogy. The phe-nomenon cannot be explained by dilution effects. This zone is closeto the Olduvai Chron reversal, where serious core recovery problemsoccurred in both Holes 884B and 884C. Another zone of interest liesbetween about 30 and 70 mbsf, where an apparent gradual coarseningof the magnetic grain size with depth may reflect the zone of ironoxide reduction predicted by the geochemistry. The finer grains arethe first to be affected by alteration.
As at earlier sites, a reversed drilling overprint was observed incores from Site 884. Discrete sample demagnetizations show that thisoverprint is removed by 5 to 10 mT demagnetization fields. However,in contrast to earlier sites, the discrete samples held a measurable and,apparently, stable remanence throughout most of Hole 884B. Exam-ples of sample demagnetizations are shown in Figure 23, and acomparison of the whole-core measured inclinations (after 15 mTdemagnetization), with the discrete sample results (after 25 mTdemagnetization), is shown in Figure 24. With the exception of dis-turbed parts of the cores, the sediments appear to record stable normaland reversed field directions between 0 and at least 600 mbsf inHole 884B (the axial dipole field inclination is about ±68° at a latitudeof51°33'N).
232

SITE 884
W 145-884B-29X-1, 68-70 cm W, Up
6 •
I /IP
145-884B-36X-1, 33-35 cm
N
J0=1.9e-5
E, Dn
145-884B-5H-5, 125-127 cm
N
W, Up
E, Dn
I96I?I9
éI
9
KE, Dn
145-884B-12X-1, 60-62 cm
n= 5.9e-5
1.0 'i
Figure 23. Examples of discrete sample demagnetizations from Hole 884B. For the Zijderfeld plots the open circles joined by dotted lines indicate the verticalcomponent plotted against the x (north-south) component. In the equal area projections, open/filled circles indicate an upward/downward pointing vector.
In whole-core measurement, the directional results from XCB-cor-ing contain more noise than results from APC-coring. The record fromSection 145-884C-24X-3 (Fig. 25) illustrates particularly well someof the nature of the noise introduced by XCB coring. The periodicsignal in inclination, declination, and intensity delineates zones oftwisting, separated by breaks (failure). Both inclination and declinationhave been significantly modified by this deformation process. How-ever, the polarity of the magnetization in the sediment seems to haveremained largely intact. Support for this conclusion is found in resultsfrom Hole 884C, which agree remarkably well with those from Hole884B and show little depth offset. With the exception of poor recoverynear the termination of the Olduvai Chron, the recovery in Hole 884Ccompleted zones of poor recovery in Hole 884B, so that a continuousdepth coverage was obtained down to 350 mbsf.
Core 145-884B-40X marks the transition from soft sediment tomore lithified sediment in Hole 884B. Below this level, the sedimentwas broken into drilling biscuits by XCB-coring. Despite this defor-mation, the cores again appear to have retained a coherent magne-tostratigraphy, at least as far down as Core 145-884B-65X. Thisindicates that, on average, the drilling biscuits must have retained theirvertical orientation.
Whole cores were measured from the basaltic basement recoveredin Hole 884E (Cores 145-884E-1R to -10R). The NRM was strong
enough to exceed the dynamic range of the 2G magnetometer. How-ever, a small amount of AF demagnetization was sufficient to reducethe magnetization into a measurable range. The results, after 15 mTdemagnetization, are shown in Figure 26. Individual samples, takenin pairs, were subjected to AF and thermal demagnetization. Exam-ples of the results also are shown in Figure 26. Thermal demagneti-zation gave comparable results to AF demagnetization but was muchmore noisy. The results appear to show a two-step demagnetization: alarge component was removed between 400° and 450°C, and a secondcomponent became unblocked between 550° and 600°C. Both com-ponents appear to carry roughly the same direction of magnetization.
Conclusions
The results from Holes 884B and 884C provide at least 600 m ofcoherent magnetostratigraphy. In the first 350 mbsf, the two holesprovi<~h an almost continuous record, because zones of poor recoveryand c^ung gaps in one hole are completed by results from the other.Figure 27 illustrates the complete magnetostratigraphy, how it wasconstructed from the two holes, and its correlation to the polarity timescale of Cande and Kent (1992). Aclear interpretation is possible from0 Ma to as far back as the top of Chron 5Ar-ln (12.618 Ma) at about580 mbsf. Although the magnetic results appear to provide a continu-
233

SITE 884
Inclination(degrees)
Inclination(degrees)
-90-60-30 0 30 60 90 -90-60-30 0 30 60 900i MM i H^-I 200
Intensity(mA/m)
0 10 20
Declination(degrees)
180 360
Inclination(degrees)
-60 0 60
20
40
60
80
100Q.CDD
120
140
160
180
200
220
240
260
280
300
320
340
360
380
400
Figure 24. Whole-core measurements of inclination, after 15 mT demagneti-zation, from Hole 884B compared with inclinations from discrete samplesdemagnetized at 25 mT (open diamonds).
ous record over this interval, and do provide a coherent picture ofsedimentation rate variation (Fig. 28), the biostratigraphy suggeststhat a hiatus or compressed zone occurs below the base of Chron 5n.The duration of the hiatus and its location are uncertain, and betterdefinition should be achieved with further and more-detailed bio-stratigraphic work within this zone. However, a second possibleinterpretation of the magnetostratigraphy (shown in Fig. 28, and givenin Table 7) has been made to include a compressed zone at the baseof Chron 5n.
An age vs. depth curve, based on the magnetostratigraphy, isshown in Figure 28. A significant low value in sedimentation rateoccurs at the level of the apparent and large change in rock magneticindicators of grain size (70-120 mbsf) The middle of this region isthe zone of poor recovery at the top of the Olduvai.
We attempted to obtain a mean inclination from the lava unitsrecovered in Hole 884E. Results are summarized in Table 8. Twoapproaches were followed: first, the whole-core inclinations wereaveraged within each of the lava units; then a mean of the 13 units wascalculated (the last three pillow basalts were treated as one unit);second, linear regressions were performed on the individual sampleAF demagnetizations between 10 and 45 mT. Again averages withinthe units were calculated, followed by the mean of the units. The whole-core results give a mean inclination of 54.3°, and the individual sampleresults give a mean of 51.6°. However, these results correspond to apaleolatitude of 34.8° and 32.2°, respectively. However results mustbe treated with caution, because nothing is yet known of the age rangerepresented by the lava units recovered. Also, we do not know if themagnetization of the lavas is primary, and results from 10 lava unitsare unlikely to provide an unbiased estimate of the mean paleofield.
CDQ
216.6
216.8
217
217.2
217.4
217.6
217.8
218
X I ' I
I"
: ) ~:
/ —• (-JA
/ , i i
Figure 25. Inclination, declination, and intensity from Section 145-884C-24X-3.The directional and intensity results show a periodic variation produced by drillingdeformation. The core apparently broke into 20- to 30-cm sections, which weredeformed by twisting before failure as the drill penetrated the sediment.
SEDIMENTATION RATES AND FLUXES
To calculate sedimentation rates and sediment fluxes (mass accu-mulation rates), we considered the sedimentary section at Site 884 toconsist of five time-stratigraphic intervals. The limits of these inter-vals were chosen on the basis of changes in sedimentation rate anddry-bulk density, as well as changes in sediment composition. Thus,these should represent intervals of relatively constant flux, but do notnecessarily coincide with lithologic units defined for this site. Asshown in Figure 29, three of these intervals correspond directly tolithologic units, whereas the two intervals between -120 and 530mbsf are equivalent to parts or combinations of lithologic units.
Sedimentation Rates
Linear rates of sedimentation were calculated using magnetostra-tigraphy for the upper three intervals and biostratigraphy for thedeepest two intervals. In general, rates decrease down the core, but asat other Detroit Seamount locations (Sites 882 and 883), maximumrates occurred during early Pliocene and late Miocene time, where wefind an average rate of -60 m/m.y. (Fig. 29 and Table 9). For ourlowermost interval, which is identical to lithologic Subunit IIA, thebiostratigraphy is uncertain and datum levels only approximate astraight line. The sedimentation rate for that unit (6.2 m/m.y.) isprobably a minimum estimate because of the likelihood of undetectedhiatuses. It is important to stress that our estimated rates of sedimen-tation reflect averages for intervals of time millions of years long. Itis likely that significant variability exists within these intervals, whichmight cause large changes in mass accumulation rate on shortertime scales.
Sediment Fluxes
Sediment fluxes were determined in the conventional way, takingthe product of the sedimentation rate, the dry-bulk density, and the

SITE 884
Inclination5 1 (degrees)ü 3 _ 6 0 -30 0 30 60
840
AFD THD(0-40 mT) (0-600°C)
2R-4, 100 cm
940
Figure 26. Results from lava basement recovered in Hole 884E, Cores 145-884E-1R to -10R. The solid line shows the whole-core inclination afterdemagnetization at 15 mT, and the squares illustrate the directions obtainedfrom linear regressions on single sample AF demagnetizations. Some examplesof AF and thermal demagnetizations of single samples are shown on the right.Core number and basalt unit are indicated on the left.
concentration of the sediment component. Average fluxes were cal-culated for the five time-stratigraphic intervals, results of which areshown as histograms in Figure 29 and keyed to the depth intervalswith dashed lines. Raw data for each of these intervals in Hole 884Bwere averaged and are presented in Table 9. Dry-bulk density valueswere taken from pycnometer measurements, and sedimentary com-ponent data come from smear slide estimates, with the exception ofpercentages of carbonate and total organic carbon (TOC), which weremeasured analytically. Flux results (in g[cm2 • k.y.]"') for diatoms,clay, glass, quartz, and carbonate are listed in Table 9 and are shownin the histograms (TOC fluxes are too near zero to be visible in thehistograms). These results are only semiquantitative, because of thenature of estimates of smear slide abundances as well as possibleerrors when calculating deposition rates. For example, Thiede andRea (1981) noted previously that smear slide results tended to over-
estimate coarse-grained sedimentary components that were subse-quently measured analytically in shore-based studies. Additionalerrors may stem from the assumption that abundance estimates aredirectly proportional to the weight percentage of each sedimentarycomponent. Thus, taking the 0- to 2.6-Ma, interval gram for example,we assume that an average of 30% diatoms translates directly to 0.30 gdiatoms per g of bulk sediment.
Average sediment fluxes for the five time-stratigraphic intervalsreveal distinctive changes with time (Fig. 29). As at Sites 881 through883, the base of the uppermost interval at Site 884 is time equivalentwith the onset of Northern Hemisphere glaciation, and the sedimentis dominated by clay and diatom fluxes. Quartz is a minor componentof the upper interval, whereas it is virtually absent below.
During the second interval, roughly equivalent to latest Miocenethrough the middle Pliocene time, the sediment is still dominated bydiatom and clay fluxes, but diatoms are relatively more important thanabove. At Site 884, this interval contrasts with that at the shallowerDetroit Seamount sites (882 and 883) by its significant clay flux andrelatively reduced diatom flux. The late Miocene through middlePliocene aged sections at those sites are marked by both higher ratesof sedimentation and higher diatom percentages, resulting in diatomfluxes that are higher than those at Site 884 by at least a factor of two.At the deeper Site 884, on Meiji Drift, clay fluxes in the Pliocene andlate Miocene sections are as high as is in the Pleistocene at the othersites. This attests to the significance of clay transport and focusing bybottom currents at depths greater than 3300 m (the depth of Site 882).
Between 6.2 and 11.9 Ma, clay and diatom fluxes are of equal, butreduced, importance; fluxes are reduced even further in the nextinterval (12.8-17.5 Ma; Fig. 29). By Oligocene to earliest Miocenetime (20.1-34.8 Ma), opal flux had become insignificant, and the clayflux remained relatively unchanged. Meiji Drift sedimentation ap-pears to have begun as early as 34.8 Ma, with the change in claycharacter from authigenic (>34.8 Ma) to terrigenous. Unlike at theshallower Detroit Seamount sites, carbonate flux is never significantat Site 884.
In summary, as with the long record at Site 883, the evolution offlux patterns at Site 884 reflects plate migration of this site northwardsince the Paleogene, coupled with changing Oceanographic and cli-matic conditions. Because carbonate flux at this site was never signifi-cant, whereas it was significant during the Paleogene at Site 883, weinfer that Site 884 must have been beneath the CCD at least since theearly Oligocene. As we have seen at Site 883, beginning during themiddle Miocene, silica deposition became important at Site 884. Thisprobably reflects evolving deep-ocean circulation patterns at that time(Keller and Barron, 1987), which may also account for increased clayflux. Thus, the origin of Meiji Drift can be traced by its terrigenousclay flux, beginning at -35 Ma, increasing at -12 Ma, and culminatingat -2.6 Ma in response to increased supply owing to high-latitudeclimate changes and increased transport activity by deep currents.
INORGANIC GEOCHEMISTRY
Thirty-seven interstitial water samples were collected at Site 884at depths ranging from 2.95 to 831 mbsf. Three closely spaced sam-ples were taken from Hole 884A between 3.65 and 5.15 mbsf, and 34broadly spaced samples were collected from Hole 884B at depthsranging from 2.95 mbsf to near the bottom of the hole at 831 mbsf.The trio of samples from Hole 8 84A was assigned to the depth scalefor Hole 884B by correlating the magnetic susceptibility profiles forthe two holes. Analytical results are listed in Table 10 and have beenplotted separately for the two sample sets in all graphs in this section.
The pore-water samples span all of Subunits IA (0-128 mbsf), IB(128-440.2 mbsf), and IC (440.2-546.1 mbsf), which are composedof clay and ash, calcareous diatom ooze, clayey diatomite, and clay-stone; and Subunits IIA (604.8-694.7 mbsf), HB (694.7-771 mbsf),and HC (771-854 mbsf), which are composed of diatomite, claystone,

SITE 884
Hole 884B Cande andInclination (degrees) Kent (1992)
0-90T6q-30 0 30 60 90
Hole 884CInclination (degrees)
90-60-30 Q 30 60. 90
550 "
600 "
Figure 27. Magnetic inclination records, after 15 mT demagnetization, from Holes 884B and 884C.The magnetostratigraphic inteΦretation is shown in the center where the gray zones connect normalperiods to their location on Cande and Kent's (1992) time scale. Changes in the slope of the grayzones indicate changes in sedimentation rate with respect to the linear time scale.

SITE 884
A Sedimentation rate B(m/m.y.)
10 30 50 70 900
100
200
300
L \ :|||r :> -
\\ Hole
^ 884B -. / 884C
-~ ^ Average
mbs
f)JZQ.0)Q
U
50
100
150
200
250
300
350
400
450
o%
Age (Ma)
4 5 6 7
Interpretation 1
o - Interpretation 2
400
400
500
8 9 10 11 12 13 14Age (Ma)
Figure 28. A. Plot of sedimentation rate vs. depth. B. Plot of depth vs. age for Site 884. Plots were calculated for both Holes 884B and884C. The mean of the two holes is shown as the solid black line.
nannofossil chalk, conglomerates, and altered ash (see "Lithostratig-raphy" section, this chapter).
Chloride concentrations in interstitial waters at Site 884 rangefrom the value of North Pacific Ocean Deep Water (554 mM) in theshallowest samples (2.95-6.95 mbsf; Fig. 30A) to a maximum of-565 mM between about 31 and 41 mbsf. As at Sites 881 through883, the Cl" maximum probably reflects the ongoing diffusive adjust-ment of the pore-water Cl" distribution to the increased mean salinityof seawater during the glacially dominated Pleistocene age, and thefresher seawater of the Holocene (McDuff, 1985). The depth of theCl maximum in Hole 884B is similar to that normally encounteredin pelagic sections (McDuff, 1985), but is about 10 to 15 m deeperthan was observed at Site 883 (see "Inorganic Geochemistry" section,"Site 883" chapter, this volume). This contrast probably reflects agreater degree of upward advection at Site 883, which is attributableto underconsolidation of the thick high-porosity diatomaceous oozeat that location. Below 41 mbsf in Hole 884B, the chloride contentremains relatively constant to about 715 mbsf, with concentrationsranging between 559 and 563 mM (Fig. 30B). A slight but measurabledecline in Cl" occurs between 715 and 802 mbsf, in an intervaldominated by claystone, calcareous chalk, and altered ash (SubunitHB). This depletion may represent uptake of chloride by the alterationof volcanic ash and underlying basalt that was intersected at -854mbsf. Chloride concentrations in Cores 145-884B-74X (-687 mbsf)and -89X (831 mbsf) were unusually low (524 and 527 mM, respec-tively). Both whole-round samples from these cores yielded smallamounts of interstitial water (3-6 mL, as opposed to the normal30-40 mL), and we suspect that these low Cl" concentrations areeither an artifact of squeezing at very high pressure for long periods(3 hr) in the case of Core 145-884B-89X, or a reflection of contami-nation by traces of fresh water in the squeezing apparatus.
Nitrite is present at 5.10 and 6.95 mbsf in Hole 884A; NO2
concentrations were undetectable in the sample above these locationsat 3.65 mbsf in Hole 884A and in the four uppermost samples takenfrom Hole 884B (2.95 and 12.45-31.45 mbsf; Fig. 30C; Table 10).These data suggest that nitrate reduction is occurring between about5 and 7 mbsf, which is consistent with the distributions of manganese,alkalinity, and sulfate (see below).
The concentration of dissolved manganese in the shallowest sam-ple at Site 884 (61 µM at 2.95 mbsf) is sharply higher than in theoverlying bottom water (< 100 nM in seawater; Landing and Bruland,1980). Concentrations continue to increase to a shallow subsurfacemaximum of 145 µM at -22 mbsf. The upward concavity in the profileabove this maximum is approximately coincident with the occurrenceof dissolved nitrite, implying that the zones of denitrification andMnO2 reduction overlap (Fig. 30C). The first-order decline in thedissolved manganese content between a depth of about 30 and 180mbsf suggests that precipitation of a manganese carbonate phase isoccurring in this interval, which is characterized by green gray clayeydiatom ooze. A pronounced, deep maximum in dissolved manganeseoccurs between 610 and 720 mbsf at Site 884, relatively near thebottom of the drilled section (Fig. 30D). Adisconformity representinga 1.5-m.y. hiatus can be defined by diatom biostratigraphy between604 and 610 mbsf (see "Biostratigraphy" section, this chapter) andseparates overlying diatom-rich sediments of Subunit ID from theunderlying section, which consists of the claystone and chalk ofSubunit IIA. These deposits were frequently noted as being reworkedand bioturbated and grayish-brown to dark reddish-brown (see "Lith-ostratigraphy" section, this chapter). This set of characteristics im-plies that the sediment column remained oxic during the depositionof these facies in the Eocene to early Miocene time. In contrast, theoverlying diatom ooze, diatomites, and diatom-bearing claystones are
237

SITE 884
Table 7. Depths of polarity chron boundaries in Holes 884B and 884C.
Chron
Clr.ln
Clr.2r-ln
C2n
C2r.ln
C2An.ln
C2An.2n
C2An.3n
C3n.ln
C3n.2n
C3n.3n
C3n.4n
C3An.ln
C3An.2n
C3Bn
C3Br.ln
C3Br.2n
C4n.ln
C4n.2n
C4r.ln
C4An
C4Ar.ln
C4Ar.2n
C5n.ln
C5n.2n
C5r.ln
C5r.2n
C5An.ln
C5An.2n
C5Ar.ln
C5Ar.2n
C5AAn
C5ABn
C5ACn
Age(Ma)
0.7800.9841.0491.2011.2121.7571.9832.1972.2292.6003.0543.1273.2213.3253.5534.0334.1344.2654.4324.6114.6944.8125.0465.7055.9466.0786.3766.7446.9016.9466.9817.1537.1877.2457.3767.4647.8928.0478.0798.5298.8619.0699.1499.4289.4919.5929.7359.77710.06510.33010.59510.83410.94010.98911.37811.43411.85212.00012.10812.33312.61812.64912.71812.76412.94113.09413.26313.47613.67414.059
Hole 8841
Depth (mbsf)
42.5054.00-55.1059.40
96.90107.10108.20121.30-122.50148.10152.35159.50-159.70
179.20219.65224.20
252.10(7)258.40(7)266.30-267.20276.50-276.90311.55324.80-325.20334.50348.00364.00-364.60367.60369.10370.25
374.20379.65381.50400.20
418.45436.15440.65445.20451.10(7)453.10(7)453.50(7)457.30(7)458.00^59.50(7)478.00481.00485.00498.00-507.00
523.00526.00534.50542.50550.00559.00580.00
3
Notes
cb
cb
ggcb+gcb+gcbcb
cbcb
Hole 884C
Depth (mbsf)
41.1055.0059.7066.1566.60
101.90
118.50-127.00147.00-147.80154.50-156.00158.50-159.50164.4178.0218.45224.50235.90244.25251.50-252.40256.90261.80-261.90
325.70332.40348.20
Notes
cb
cb
cb
cb
g
cb
Interpretation 2
Depth (mbsf)
458.00
520.70522.10523.00525.50528.50530.00531.00532.50535.00542.30550.00559.00
Note: The annotation "cb" indicates that a reversal occurred in a core break; "g" indicates a core gap. Below Chron 5n, a secondpossible interpretation is given for Hole 884B magnetostratigraphy.
moderately bioturbated and gray to greenish-gray or occasionallybrown, suggesting that the sediments immediately above the discon-formity were less oxidizing and perhaps mildly reducing at shallowdepths during deposition. This paleodepositional scenario is sup-ported by the present dissolved manganese profile in the pore fluids,which indicates that the formerly oxic deposits below the hiatus arenow suboxic. Progressive dissolution of manganese oxides within the
zone of a downward-migrating reduction front can account for theobserved release of manganese to solution in the interval immediatelybelow the disconformity. The dissolved sulfate profile supports thishypothesis, as discussed below. At the base of the section (-740-831mbsf), the pore-water samples show a dramatic decline in dissolvedmanganese concentrations (from 145 µM at 715 mbsf to 20 µM at773 mbsf; Fig. 30D). Black coatings on lithic clasts and black laminae
238

SITE 884
Table 8. The calculation of mean inclinations from basaltic basement recovered in Hole 884E.
Hardrockunit
1234567
910111213
Whole-coreaverage inclination
(de
-64.66-48.49-18.84
49.63-52.74-32.06-63.58-67.18-54.11-59.62-56.18-54.40-58.48
g )
64.6648.4948.8449.6352.7432.0663.5867.1854.1159.62
56.35
Whole core-average
Inclination 54.30°Paleolatitude 34.83°
s,(deg.)
-59.4-57.4^ 8 . 4
50.7^ 8 . 8-32.5-63.1-60.7-40.9-53.4-58.0
S2
(deg.)
-57.7-52.8
-35.5
^ 4 . 5-58.1
Sample results
S3 S4
(deg.) (deg.)
^ 9 . 7
-15.4 -24.5
^ 3 . 6
S,(deg.)
-25.9
Sample absoluteaverage inclination
(deg.)
58.5553.3048.4050.7048.8026.7663.1060.7043.0055.7558.00
Sample absolute average
Inclination 51.55°Paleolatitude 32.20°
in this interval, although not yet positively identified, may be ferro-manganese oxides (see "Lithostratigraphy" section, this chapter) andtheir presence, coupled with the low dissolved manganese levels,suggests that the consolidated sediments in this zone are not yet (andmay never become) suboxic or anoxic; the original oxic nature ofthese deposits may have been preserved for about 50 m.y.
Titration alkalinity increases sharply with depth in the upper sectionat Site 884, from 4.03 mM at 2.95 mbsf to -8.6 mM at 50 mbsf (Fig.31 A). A broad maximum with values up to 8.67 mM characterizes theinterval between 50 and 263 mbsf; values progressively decreasebelow this depth, reaching -0.73 mM at 802.30 mbsf (Fig. 31 A).Downward diffusion of alkalinity from the base of the broad maximumtoward the basement is implied by the concentration gradient. A lowalkalinity would have prevailed during the deposition of Eocene cal-careous facies were those deposits oxic; thus, the measured profilesupports an interpretation derived from the dissolved manganese dis-tribution. The precipitation of carbonate vein-fillings in the underlyingbasalts must also have contributed to the low alkalinity values meas-ured in the lowermost three pore-water samples.
The concentration of sulfate at 2.95 mbsf at Site 884 (-28.6 mM;Table 10) is almost identical to that in North Pacific Deep Water(Fig. 31 A), indicating that sulfate reduction is not occurring in the top3 m at this location. Progressive reduction of SO2." has produced afirst-order decline between 3 and -250 mbsf, where a minimum ofabout 20 mM is reached. Below this horizon, a gradual, approximatelylinear increase to 25.4 mM at 802 mbsf indicates that sulfate isdiffusing upward from near the base of the section. Reduction ofS θ | is unlikely to be occurring at depths greater than about 320 mbsf;which is consistent with the relatively low organic carbon concentra-tions and organic carbon accumulation rates observed in the lowerhalf of the drilled section, implying a low oxidant demand (see"Organic Geochemistry" and "Sedimentation Rates and Fluxes" sec-tions, this chapter). In addition, sulfate reduction would effectivelybe prohibited by the (presumed) presence of the manganese and ironoxyhydroxides in this interval; these phases would act as the thermo-dynamically preferred electron acceptors.
Dissolved ammonium in pore waters at Site 884 increases withdepth from 96 µM at 2.95 mbsf to about 689 µM at 176 mbsf(Fig. 3 IB). Concentrations are essentially constant between -176 and321 mbsf and decrease approximately linearly below this interval toa value of 29 µM at 831 mbsf (Fig. 3 IB). The upward convexity inthe interval between the uppermost sample and -290 mbsf indicatesthat this is the principal zone of NH3 release. This is consistent withthe sulfate distribution, which indicates that the highest rate of anero-bic decomposition occurs over roughly the same depth range. Thegenerally linear decline of the ammonium content below 321 mbsf isa reflection of downward diffusion from the zone of production in the
more organic-rich upper portion of the section toward the organic-lean sediments overlying the basement. The profile implies that a sinkfor ammonium may lie near the base of the hole. Illite, for example,is a common constituent of the clay-rich deposits below the hiatus at-600 mbsf and is known to take up ammonium through isomorphoussubstitution of NH4 for K+.
The concentration of magnesium in the uppermost sample (2.95mbsf) is slightly lower than that of North Pacific Deep Water (52.1mM, compared with 53.5 mM) and decreases gradually to a minimumof about 47 mM at 321 mbsf (Fig. 31C). Between 321 and 629 mbsf,the magnesium content rises slightly, before increasing sharply be-tween 802 and 831 mbsf. This increase should be viewed with caution,however, as the basal pore water sample at 831 mbsf consisted of only3 mL, and squeezing artifacts may have influenced the measuredconcentration. The decline in the dissolved magnesium contents in theupper -200 m may reflect dolomitization in the sulfate reduction zone.Indeed, a concretion sampled from Core 145-884C- 19X of Hole 884C(Interval 145-884C-19X, 66-68 cm, -172 mbsf) was determined byXRD to consist of essentially pure dolomite.
The concentration of calcium in the uppermost sample is about thesame as that in North Pacific Deep Water (10.5 mM) and remainsconstant to a depth of about 176 mbsf (Fig. 31C). Below this hori-zon, concentrations increase steadily, reaching a maximum value of31.3 mM at 715 mbsf. A pronounced decline to 26.5 mM occurs inthe interval between 715 and 831 mbsf. A steady increase between-300 and 700 mbsf is not matched by a commensurate depletion inmagnesium, suggesting that alteration reactions in the basalts are notcontrolling the overall distribution of calcium. Instead, alteration ofcalcic feldspars in ash, plus dissolution of calcite (pressure dissolu-tion?) in the calcareous ash-bearing chalks and claystones below-600 mbsf, can potentially account for addition of Ca2+ to porewaters. The dissolved strontium profile is generally similar to that ofcalcium (as discussed below) and offers some support for the disso-lution hypothesis. The slight progressive decline in calcium towardthe basement in the lower 100 m of the sampled section indicatesconsumption at greater depths, which is consistent with the presenceof well-crystallized calcite fracture-fillings in the underlying basaltand observed alteration of olivine to iddingsite (see "Igneous Petrol-ogy" section, this chapter). Iddingsitization releases magnesium (Deeret al., 1966), which may account for the increased (but suspect) Mg2+
content in the deepest pore-water sample. The apparent lack ofreactivity, evinced by the largely invariant magnesium profile below300 mbsf, particularly in the 600- to 700-mbsf interval, implies thatthe ubiquitous authigenic smectite in the latter zone is not magnesian.Instead, the high iron content, typified by the common reddish-browncolor of the clay and ashstones in this horizon, implies that nontronitemay be the dominant smectite phase.

SITE 884
Site 884Linear sedimentation rates
300
400
500
600
700
800
Subunit IA)
2.0
1.0
(lower Subunit IB and ~Subunit IC)
Mass accumulation rates(g[cm2 k.y.]-1)
,0.0
0-2.6 Ma
2.6-6.2 Ma
6.2-11.9 Ma
12.8-17.5 Ma
20.1-34.8 Ma
15 20 25Age (Ma)
30 35 40 Diatoms Clay Glass Quartz Carbonate
Figure 29. Sedimentation rate plot (left) for Site 884 using magnetostratigraphy from Holes 884A and 884B (solid symbols) and biostratigraphy fromHole 884B (open symbols; squares, circles, and triangles = diatoms, radiolarians, and nannofossils, respectively). For flux (mass accumulation rate)calculations, the section was divided into five intervals where rates of sedimentation, dry-bulk density, and sediment composition are relativelyconstant. These intervals are identified by dashed lines tie the stratigraphic column to the flux results (histograms at right). The flux results quantifythe origin of late Paleogene Meiji Drift sedimentation, Neogene siliceous and hemipelagic sedimentation, and late Neogene and Quaternary terrigenoussedimentation associated with glaciation.
The concentration of dissolved silicate in the uppermost pore-water sample at Site 884 (-962 µM) is sharply higher than that in theoverlying North Pacific Bottom Water (-160 µM), reflecting pro-nounced dissolution of opaline diatom frustules within the uppermostsediment column (Fig. 3ID), as observed previously at Sites 881through 883. The average concentration of silicate generally increaseswith depth to a maximum of ~ 1300 µM at -600 mbsf, then decreasingbetween this level and 715 mbsf to about 1100 µM. The dissolvedsilicate maximum between 550 and 600 mbsf is coincident with apronounced increase in diatom abundance, which occurred during themiddle Miocene cooling event (at about 15 Ma; see "Biostratigraphy"
section for a comprehensive discussion). Between 744 and 831 mbsf,the concentration of silicate decreases dramatically to about 180 µM,coincident with the total disappearance of diatoms below about 700mbsf (see "Biostratigraphy" section, this chapter). The lowest valuesoccur in the nannofossil chalk and clayey ash interval just above thebasalt basement, probably reflecting uptake during smectite authi-genesis, which is ubiquitous in this zone (see "Lithostratigraphy"section, this chapter). The extreme sharpness of the discontinuity inthe silicate profile at about 725 mbsf can be attributed to three factors:(1) immediately above the discontinuity, the pore fluids are kept in astate of saturation with respect to opal by continuing dissolution of
240
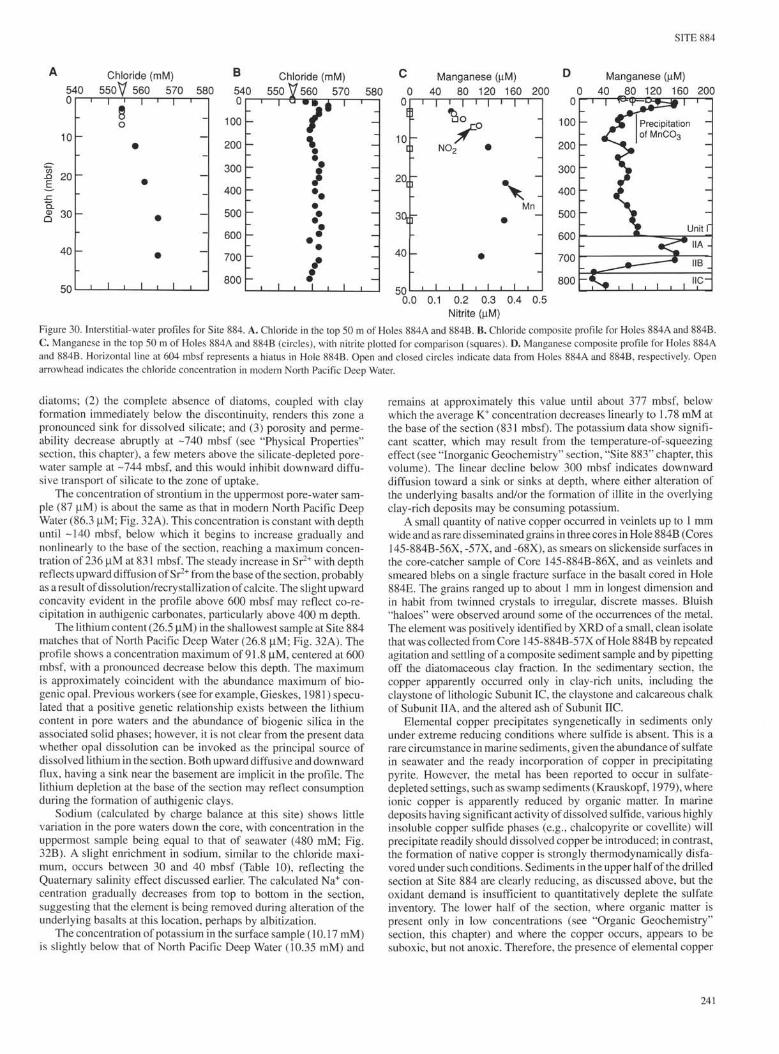
SITE 884
5400
Chloride (mM)550 V 560 570 580 540
0
Chloride (mM)550 V 560 570 580
Manganese (µM)40 80 120 160 200
Manganese (µM)40 80 120 160 200
0.0 0.1 0.2 0.3 0.4Nitrite (µM)
Figure 30. Interstitial-water profiles for Site 884. A. Chloride in the top 50 m of Holes 884A and 884B. B. Chloride composite profile for Holes 884A and 884B.C. Manganese in the top 50 m of Holes 884A and 884B (circles), with nitrite plotted for comparison (squares). D. Manganese composite profile for Holes 884Aand 884B. Horizontal line at 604 mbsf represents a hiatus in Hole 884B. Open and closed circles indicate data from Holes 884A and 884B, respectively. Openarrowhead indicates the chloride concentration in modern North Pacific Deep Water.
diatoms; (2) the complete absence of diatoms, coupled with clayformation immediately below the discontinuity, renders this zone apronounced sink for dissolved silicate; and (3) porosity and perme-ability decrease abruptly at -740 mbsf (see "Physical Properties"section, this chapter), a few meters above the silicate-depleted pore-water sample at -744 mbsf, and this would inhibit downward diffu-sive transport of silicate to the zone of uptake.
The concentration of strontium in the uppermost pore-water sam-ple (87 µM) is about the same as that in modern North Pacific DeepWater (86.3 µM; Fig. 32A). This concentration is constant with depthuntil -140 mbsf, below which it begins to increase gradually andnonlinearly to the base of the section, reaching a maximum concen-tration of 236 µM at 831 mbsf. The steady increase in Sr2+ with depthreflects upward diffusion of Sr2+ from the base of the section, probablyas a result of dis solution/recrystallization of calcite. The slight upwardconcavity evident in the profile above 600 mbsf may reflect co-re -cipitation in authigenic carbonates, particularly above 400 m depth.
The lithium content (26.5 µM) in the shallowest sample at Site 884matches that of North Pacific Deep Water (26.8 µM; Fig. 32A). Theprofile shows a concentration maximum of 91.8 µM, centered at 600mbsf, with a pronounced decrease below this depth. The maximumis approximately coincident with the abundance maximum of bio-genic opal. Previous workers (see for example, Gieskes, 1981) specu-lated that a positive genetic relationship exists between the lithiumcontent in pore waters and the abundance of biogenic silica in theassociated solid phases; however, it is not clear from the present datawhether opal dissolution can be invoked as the principal source ofdissolved lithium in the section. Both upward diffusive and downwardflux, having a sink near the basement are implicit in the profile. Thelithium depletion at the base of the section may reflect consumptionduring the formation of authigenic clays.
Sodium (calculated by charge balance at this site) shows littlevariation in the pore waters down the core, with concentration in theuppermost sample being equal to that of seawater (480 mM; Fig.32B). A slight enrichment in sodium, similar to the chloride maxi-mum, occurs between 30 and 40 mbsf (Table 10), reflecting theQuaternary salinity effect discussed earlier. The calculated Na+ con-centration gradually decreases from top to bottom in the section,suggesting that the element is being removed during alteration of theunderlying basalts at this location, perhaps by albitization.
The concentration of potassium in the surface sample (10.17 mM)is slightly below that of North Pacific Deep Water (10.35 mM) and
remains at approximately this value until about 377 mbsf, belowwhich the average K+ concentration decreases linearly to 1.78 mM atthe base of the section (831 mbsf). The potassium data show signifi-cant scatter, which may result from the temperature-of-squeezingeffect (see "Inorganic Geochemistry" section, "Site 883" chapter, thisvolume). The linear decline below 300 mbsf indicates downwarddiffusion toward a sink or sinks at depth, where either alteration ofthe underlying basalts and/or the formation of illite in the overlyingclay-rich deposits may be consuming potassium.
A small quantity of native copper occurred in veinlets up to 1 mmwide and as rare disseminated grains in three cores in Hole 884B (Cores145-884B-56X, -57X, and -68X), as smears on slickenside surfaces inthe core-catcher sample of Core 145-884B-86X, and as veinlets andsmeared blebs on a single fracture surface in the basalt cored in Hole884E. The grains ranged up to about 1 mm in longest dimension andin habit from twinned crystals to irregular, discrete masses. Bluish"haloes" were observed around some of the occurrences of the metal.The element was positively identified by XRD of a small, clean isolatethat was collected from Core 145-884B-57X of Hole 884B by repeatedagitation and settling of a composite sediment sample and by pipettingoff the diatomaceous clay fraction. In the sedimentary section, thecopper apparently occurred only in clay-rich units, including theclaystone of lithologic Subunit IC, the claystone and calcareous chalkof Subunit IIA, and the altered ash of Subunit HC.
Elemental copper precipitates syngenetically in sediments onlyunder extreme reducing conditions where sulfide is absent. This is arare circumstance in marine sediments, given the abundance of sulfatein seawater and the ready incorporation of copper in precipitatingpyrite. However, the metal has been reported to occur in sulfate-depleted settings, such as swamp sediments (Krauskopf, 1979), whereionic copper is apparently reduced by organic matter. In marinedeposits having significant activity of dissolved sulfide, various highlyinsoluble copper sulfide phases (e.g., chalcopyrite or covellite) willprecipitate readily should dissolved copper be introduced; in contrast,the formation of native copper is strongly thermodynamically disfa-vored under such conditions. Sediments in the upper half of the drilledsection at Site 884 are clearly reducing, as discussed above, but theoxidant demand is insufficient to quantitatively deplete the sulfateinventory. The lower half of the section, where organic matter ispresent only in low concentrations (see "Organic Geochemistry"section, this chapter) and where the copper occurs, appears to besuboxic, but not anoxic. Therefore, the presence of elemental copper
24.!
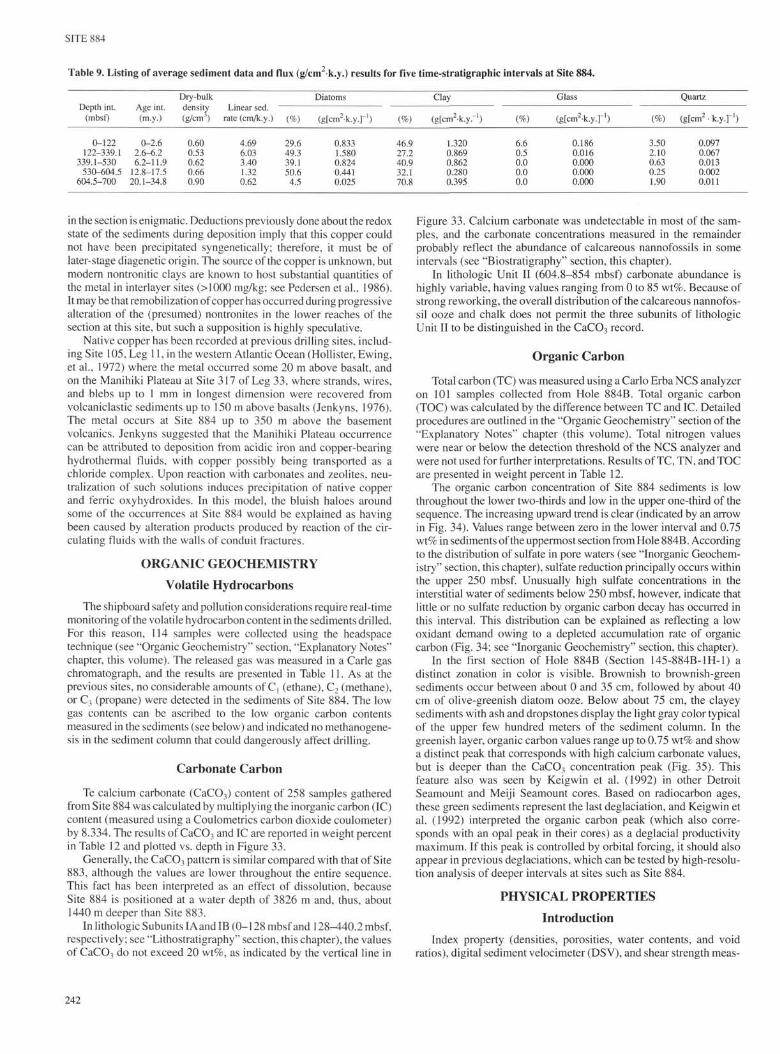
SITE 884
Table 9. Listing of average sediment data and flux (g/cm k.y.) results for five time-stratigraphic intervals at Site 884.
Depth int.(mbsf)
Age int.(m.y.)
Dry-bulkdensity(g/cm*)
DiatomsLinear sed.
rate (cm/k.y.)
Clay Glass
(%) (gtcπ/ k.y.r1) (gfcm k.y.-1) (g[cm2•k.y.r')
Quartz
(g[cm2
0-122122-339.1
339.1-530530-604.5
604.5-700
0-2.62.6-6.26.2-11.9
12.8-17.520.1-34.8
0.530.620.66
4.696.033.401.32
29.649.339.150.6
4.5
0.8331.5800.8240.4410.025
46.927.240.932.170.8
1.3200.8690.8620.2800.395
6.60.50.00.00.0
0.1860.0160.0000.0000.000
3.502.100.630.251.90
0.0970.0670.0130.0020.011
in the section is enigmatic. Deductions previously done about the redoxstate of the sediments during deposition imply that this copper couldnot have been precipitated syngenetically; therefore, it must be oflater-stage diagenetic origin. The source of the copper is unknown, butmodern nontronitic clays are known to host substantial quantities ofthe metal in interlayer sites (>IOOO mg/kg; see Pedersen et al, 1986).It may be that remobilization of copper has occurred during progressivealteration of the (presumed) nontronites in the lower reaches of thesection at this site, but such a supposition is highly speculative.
Native copper has been recorded at previous drilling sites, includ-ing Site 105, Leg 11, in the western Atlantic Ocean (Hollister, Ewing,et al., 1972) where the metal occurred some 20 m above basalt, andon the Manihiki Plateau at Site 317 of Leg 33, where strands, wires,and blebs up to 1 mm in longest dimension were recovered fromvolcaniclastic sediments up to 150 m above basalts (Jenkyns, 1976).The metal occurs at Site 884 up to 350 m above the basementvolcanics. Jenkyns suggested that the Manihiki Plateau occurrencecan be attributed to deposition from acidic iron and copper-bearinghydrothermal fluids, with copper possibly being transported as achloride complex. Upon reaction with carbonates and zeolites, neu-tralization of such solutions induces precipitation of native copperand ferric oxyhydroxides. In this model, the bluish haloes aroundsome of the occurrences at Site 884 would be explained as havingbeen caused by alteration products produced by reaction of the cir-culating fluids with the walls of conduit fractures.
ORGANIC GEOCHEMISTRY
Volatile Hydrocarbons
The shipboard safety and pollution considerations require real-timemonitoring of the volatile hydrocarbon content in the sediments drilled.For this reason, 114 samples were collected using the headspacetechnique (see "Organic Geochemistry" section, "Explanatory Notes"chapter, this volume). The released gas was measured in a Carle gaschromatograph, and the results are presented in Table 11. As at theprevious sites, no considerable amounts of C, (ethane), C-, (methane),or C3 (propane) were detected in the sediments of Site 884. The lowgas contents can be ascribed to the low organic carbon contentsmeasured in the sediments (see below) and indicated no methanogene-sis in the sediment column that could dangerously affect drilling.
Carbonate Carbon
Te calcium carbonate (CaCO3) content of 258 samples gatheredfrom Site 884 was calculated by multiplying the inorganic carbon (IC)content (measured using a Coulometrics carbon dioxide coulometer)by 8.334. The results of CaCO3 and IC are reported in weight percentin Table 12 and plotted vs. depth in Figure 33.
Generally, the CaCO3 pattern is similar compared with that of Site883, although the values are lower throughout the entire sequence.This fact has been interpreted as an effect of dissolution, becauseSite 884 is positioned at a water depth of 3826 m and, thus, about1440 m deeper than Site 883.
In lithologic Subunits IAand IB (0-128 mbsf and 128^140.2 mbsf,respectively; see "Lithostratigraphy" section, this chapter), the valuesof CaCO3 do not exceed 20 wt%, as indicated by the vertical line in
Figure 33. Calcium carbonate was undetectable in most of the sam-ples, and the carbonate concentrations measured in the remainderprobably reflect the abundance of calcareous nannofossils in someintervals (see "Biostratigraphy" section, this chapter).
In lithologic Unit II (604.8-854 mbsf) carbonate abundance ishighly variable, having values ranging from 0 to 85 wt%. Because ofstrong reworking, the overall distribution of the calcareous nannofos-sil ooze and chalk does not permit the three subunits of lithologicUnit II to be distinguished in the CaCO3 record.
Organic Carbon
Total carbon (TC) was measured using a Carlo Erba NCS analyzeron 101 samples collected from Hole 884B. Total organic carbon(TOC) was calculated by the difference between TC and IC. Detailedprocedures are outlined in the "Organic Geochemistry" section of the"Explanatory Notes" chapter (this volume). Total nitrogen valueswere near or below the detection threshold of the NCS analyzer andwere not used for further interpretations. Results of TC, TN, and TOCare presented in weight percent in Table 12.
The organic carbon concentration of Site 884 sediments is lowthroughout the lower two-thirds and low in the upper one-third of thesequence. The increasing upward trend is clear (indicated by an arrowin Fig. 34). Values range between zero in the lower interval and 0.75wt% in sediments of the uppermost section from Hole 8 84B. Accordingto the distribution of sulfate in pore waters (see "Inorganic Geochem-istry" section, this chapter), sulfate reduction principally occurs withinthe upper 250 mbsf. Unusually high sulfate concentrations in theinterstitial water of sediments below 250 mbsf, however, indicate thatlittle or no sulfate reduction by organic carbon decay has occurred inthis interval. This distribution can be explained as reflecting a lowoxidant demand owing to a depleted accumulation rate of organiccarbon (Fig. 34; see "Inorganic Geochemistry" section, this chapter).
In the first section of Hole 884B (Section 145-884B-1H-1) adistinct zonation in color is visible. Brownish to brownish-greensediments occur between about 0 and 35 cm, followed by about 40cm of olive-greenish diatom ooze. Below about 75 cm, the clayeysediments with ash and dropstones display the light gray color typicalof the upper few hundred meters of the sediment column. In thegreenish layer, organic carbon values range up to 0.75 wt% and showa distinct peak that corresponds with high calcium carbonate values,but is deeper than the CaCO3 concentration peak (Fig. 35). Thisfeature also was seen by Keigwin et al. (1992) in other DetroitSeamount and Meiji Seamount cores. Based on radiocarbon ages,these green sediments represent the last deglaciation, and Keigwin etal. (1992) interpreted the organic carbon peak (which also corre-sponds with an opal peak in their cores) as a deglacial productivitymaximum. If this peak is controlled by orbital forcing, it should alsoappear in previous deglaciations, which can be tested by high-resolu-tion analysis of deeper intervals at sites such as Site 884.
PHYSICAL PROPERTIES
Introduction
Index property (densities, porosities, water contents, and voidratios), digital sediment velocimeter (DSV), and shear strength meas-

SITE 884
Table 9 (continued).
Carbonate TOC
(g[cmz k.y.]-) (g[cm2 k .y . r )
2.72.92.45.9
10.6
0.0760.0930.0510.0510.059
0.410.240.130.170.08
0.0120.0760.0030.0010.000
urements were taken at 1.5-m intervals in cores from Holes 884A and884B. In cores from Hole 884C, index properties were measured at1.5-m intervals and shear strength and DSV measurements were takenat approximately 3-m intervals. A summary of all measurements takenis shown in Table 13. Continuous measurements of GRAPE bulkdensity, P-wave velocities, and magnetic susceptibility were taken inall five holes using the multisensor track (MST). Tables containingthe compressional wave velocity (from DSV and Hamilton Frame)and shear strength data from Holes 884B, 884C, and 884E areincluded, as are tables of index property data from Holes 8 84 A, 884B,884C, and 884E (Tables 14 through 17). GRAPE and the P-wavelogger data have been smoothed and culled in the same manner asthose from Sites 881, 882, and 883 (see "Physical Properties" section,"Site 881" chapter, this volume). Thermal conductivity measurementswere conducted on the core of Holes 884B and 884C.
Index Properties and Vane Shear Strength
Profiles of sediment wet-bulk density, dry-bulk density, dry watercontent, and porosity values for Holes 884B and 884C (see Figs. 36and 37) show good correspondence. The shear strength profilescorrelate well in the top 85 mbsf, which was cored using the APC, butthis correlation does not continue to such an extent in the XCB-coredsection (see Fig. 38). Shear strength values increase along trendsconsistent with increasing overburden pressure downhole.
In lithologic Subunit IA (see "Lithostratigraphy" section, thischapter), the wet-bulk density, dry-bulk density, dry water content,and wet porosity values in the upper 128 mbsf remain fairly constant,averaging 1.38 g/cm3, 0.60 g/cm3, 136%, and 76%, respectively.Based upon the physical properties data from Holes 884B and 884C,Subunit IB (128-440 mbsf) is characterized by a distinct decrease inboth wet-bulk density (to an average of 1.33 g/cm3), and dry-bulkdensity (to an average of 0.55 g/cm3) and a corresponding increase inwet porosity and dry water content to averages of 77% and 145%,respectively (see Figs. 37 through 39). These slope breaks at approxi-mately 128 mbsf correspond to a change in sediment type from a claywith diatoms above 128 mbsf to a clayey diatom ooze below (see"Lithostratigraphy" section, this chapter). The changes observed inindex properties are most likely the result of a relative increase inbiogenic silica in Subunit IB. A second, less marked change in thebaseline value of wet-bulk density occurs at approximately 440 mbsf,marking the top of Subunit IC. At this point, the wet-bulk and dry-bulkdensity values increase (to an average of 1.41 and 0.67 g/cm3, respec-tively), which corresponds to a slight decrease in the dry water content(averaging 114%) and wet porosity (to an average of 73%). Thisboundary is more pronounced in the grain density profiles (Fig. 39).The top of Subunit IC is coincident with a slight decrease in thepercentage diatom component that was observed from smear slideanalysis, and may explain the changes in index-property data (see"Lithostratigraphy" section, this chapter). In lithologic Subunit ID,
Table 10. Interstitial-water data for Site 884.
Core, section,interval (cm)
145-884A-IH-1, 145-1501H-2, 145-1501H-4, 145-150
145-884B-1H-2, 145-1502HA 145-1503H-4, 145-1504H-4, 145-1505H-4, 145-1506H-4, 145-1508H t, 145-15010H-1,115-12013X-3, 145-15015X-4, 145-15017X-4, 145-15021X-4, 145-15024X-4, 145-15027X-4, 145-15030X-4, 145-15033X-3, 145-15036X-4, 145-15039X-4, 145-15042X-3, 145-15045X-5, 145-15048X-5, 145-15052X-4, 145-15056X-4, 145-15059X-4, 145-15062XA 145-15065X-4, 145-15068X< 145-150Tl×A, 145-15074X-4, 145-15077X-4, 145-15080X-4, 145-15083X-4, 145-15086XA 145-15089X< 145-150
Depth(mbsf)a
3.655.106.95
2.9512.4521.9531.4540.9550.4569.45S3.6597.75
118.55137.75176.45205.35234.35263.25290.75321.25349.85377.15407.65436.55474.85513.35542.35571.25600.05628.75657.65686.55715.40744.30773.30802.30831.00
pH
7.797.777.67
7.637.737.727.777.SO7.S57.817.777.697.S57.757.917.647.637.757.577.567.587.607.677.777.467.677.167.317.577.267.35π m7.437.S98.09S.12n.m.
Alk.
(mM)
4.634.845.15
4.035.986.667.587.918.588.508.678.548.508.238.028.238.208 . 1 3
7.656.637.657.176.946.126.136.405.05MX)4.564.543.92
n.m.1.950.711.170.73
n.m.
S
(g/kg)
35.035.035.0
35.035.035.035.035.035.035.035.035.035.(134.534.534.535.035.034.535.035.035.035.035.035.035.035.035.035.035.035.0
n.m.35.035.035.035.0
am.
C(mM)
554554554
554558561565565562562561560560559559560561561563562562561561563561562561563562559562524562561560559527
Mg
(mM)
52.252.953.2
52.153.452.451.851.451.850.3
49.3
48.448.44S.548.547.347.746.947.147.148.047.848.3
48.548.848.548.948.848.748.447.247.148.453.7
Ca
(mM)
10.6
11.0
10.5
11.110.911.211.111.210.811.010.910.610.710.611.312.012.212.913.415.416.117.318.219.922.222.824.824.627.429,029.13 1.331.330.029.726.4
SO 4
(mM)
27.527.527.6
28.626.725.625.024.724.023.522.922.421.921.921.421.420.820.921.220.921.521.821.622.522.722.523.424.023.223.924.S23.025.224.225.025.423.2
NH 4
(µM)
74
no393
9620940S37257645260356754656962368967866866869566156(157451948X66241 N>
i79595472225194144162103798329
NO,
(µM)
00.170.24
0000
n.m.n.m.n.m.n.m.n.m.n.m.n.m.n.m.n.m.n.m.n.m.n.m.n.m.n.m.n.m.n.m.n.m.n.m.n.m.n.m.n.m.n.m.n.m.n.m.n.m.n.m.n.m.n.m.n.m.n.m.
H 4 S i 0 4
(µM)
859747768
962732950833828823921
8301165909
10121039058
i • • !
11151 1801086int;.-!1163n.m.121311731 19413311225120910S61108
17920619S131
K(mM)
10.5410.429.95
10.179.90
10.179.91
10.0610.7710.049.769.959.78
10.809.848.57
9.7210.6410.38
8 258.79
5.928.35
6.766.127.075.113.372,(162.821.861.78
Li
(µM)
25.5
24.3
26.523.824.023.623.824.225.0
26.626.027.928.231.833.836.6
44.952.056.261.767.675.978.8
87.991.886.473.665.439.532.431.134.632.7
Na(mM)
477476475
48047848?48648648118548 1482483481481482480482482479476474472472466464461462459452452
n.m.451451454
452n.m.
Sr
(µM)
868788
87
S789888588
8786
889939696
1001011101131211231311431511681751681741X4204215216236236
Mn
(µM)
66
105
6111814514310996766258644938
6577
64747262625672
798885
15112514714573212039
Mg/Ca
(molratio)
4.94
4.82
4.964.804.834.644.634.624.664.554.514.614.524.554.294.053.893.683.493.072.932.782.632.422.202.121.971.971.781.681.661.551.511.571.632.04
Depth of Hole 883A i i based on correlation of Holes 883A and 883B using magnetic susceptibility data. n.m. = not measured.
! :
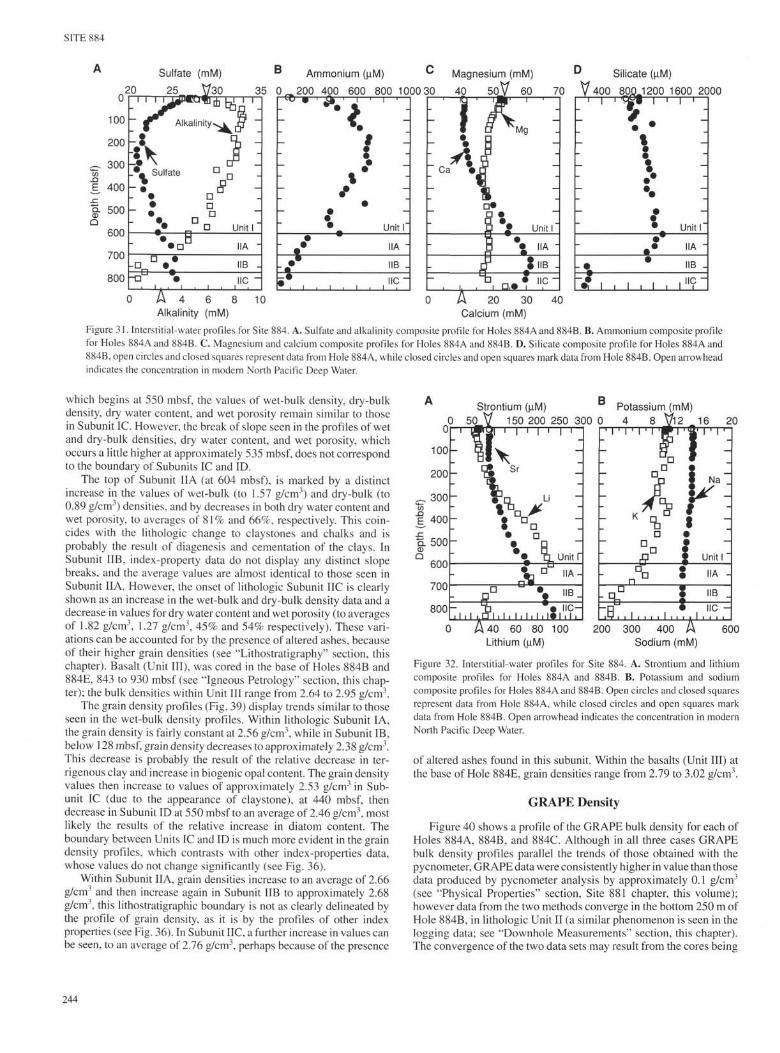
SITE 884
Sulfate (mM)
25 V30
B
35 0
Ammonium (µM) **
200 400 600 800 1000 30
Magnesium (mM)
40 5θV 60 70
i Unit T
MA "
MB _
lie
o 10 0
D Silicate (µM)
V 4 0 0 80J3J200 1600 2000
Δ 20 30Calcium (mM)
1 1
-
-
-
-
•
ygw i '
•{
/•
i i i i
i >
i i
i i
i
U n i t l "
IIA "
IIB .
. HC ~
4 6 8Alkalinity (mM)
Figure 31. Interstitial-water profiles for Site 884. A. Sulfate and alkalinity composite profile for Holes 884A and 884B. B. Ammonium composite profilefor Holes 884A and 884B. C. Magnesium and calcium composite profiles for Holes 884A and 884B. D. Silicate composite profile for Holes 884A and884B, open circles and closed squares represent data from Hole 884A, while closed circles and open squares mark data from Hole 884B. Open arrowheadindicates the concentration in modern North Pacific Deep Water.
which begins at 550 mbsf, the values of wet-bulk density, dry-bulkdensity, dry water content, and wet porosity remain similar to thosein Subunit IC. However, the break of slope seen in the profiles of wetand dry-bulk densities, dry water content, and wet porosity, whichoccurs a little higher at approximately 535 mbsf, does not correspondto the boundary of Subunits IC and ID.
The top of Subunit IIA (at 604 mbsf), is marked by a distinctincrease in the values of wet-bulk (to 1.57 g/cm3) and dry-bulk (to0.89 g/cm3) densities, and by decreases in both dry water content andwet porosity, to averages of 81% and 66%, respectively. This coin-cides with the lithologic change to claystones and chalks and isprobably the result of diagenesis and cementation of the clays. InSubunit IIB, index-property data do not display any distinct slopebreaks, and the average values are almost identical to those seen inSubunit IIA. However, the onset of lithologic Subunit HC is clearlyshown as an increase in the wet-bulk and dry-bulk density data and adecrease in values for dry water content and wet porosity (to averagesof 1.82 g/cm3, 1.27 g/cm3, 45% and 54% respectively). These vari-ations can be accounted for by the presence of altered ashes, becauseof their higher grain densities (see "Lithostratigraphy" section, thischapter). Basalt (Unit III), was cored in the base of Holes 884B and884E, 843 to 930 mbsf (see "Igneous Petrology" section, this chap-ter); the bulk densities within Unit III range from 2.64 to 2.95 g/cm3.
The grain density profiles (Fig. 39) display trends similar to thoseseen in the wet-bulk density profiles. Within lithologic Subunit IA,the grain density is fairly constant at 2.56 g/cm3, while in Subunit IB,below 128 mbsf, grain density decreases to approximately 2.38 g/cm3.This decrease is probably the result of the relative decrease in ter-rigenous clay and increase in biogenic opal content. The grain densityvalues then increase to values of approximately 2.53 g/cm3 in Sub-unit IC (due to the appearance of claystone), at 440 mbsf, thendecrease in Subunit ID at 550 mbsf to an average of 2.46 g/cm3, mostlikely the results of the relative increase in diatom content. Theboundary between Units IC and ID is much more evident in the graindensity profiles, which contrasts with other index-properties data,whose values do not change significantly (see Fig. 36).
Within Subunit IIA, grain densities increase to an average of 2.66g/cm3 and then increase again in Subunit IIB to approximately 2.68g/cm3, this lithostratigraphic boundary is not as clearly delineated bythe profile of grain density, as it is by the profiles of other indexproperties (see Fig. 36). In Subunit HC, a further increase in values canbe seen, to an average of 2.16 g/cm3, perhaps because of the presence
BStrontium (µM)
50 V 150 200 250 300 0
Potassium (mM)4 8 V12 16
40 60 80 100Lithium (µM)
• • B • • I . . • • I , . . , I • •
200 300 400 A 600Sodium (mM)
Figure 32. Interstitial-water profiles for Site 884. A. Strontium and lithiumcomposite profiles for Holes 884A and 884B. B. Potassium and sodiumcomposite profiles for Holes 884A and 884B. Open circles and closed squaresrepresent data from Hole 884A, while closed circles and open squares markdata from Hole 884B. Open arrowhead indicates the concentration in modernNorth Pacific Deep Water.
of altered ashes found in this subunit. Within the basalts (Unit III) atthe base of Hole 884E, grain densities range from 2.79 to 3.02 g/cm3.
GRAPE Density
Figure 40 shows a profile of the GRAPE bulk density for each ofHoles 884A, 884B, and 884C. Although in all three cases GRAPEbulk density profiles parallel the trends of those obtained with thepycnometer, GRAPE data were consistently higher in value than thosedata produced by pycnometer analysis by approximately 0.1 g/cm3
(see "Physical Properties" section, Site 881 chapter, this volume);however data from the two methods converge in the bottom 250 m ofHole 884B, in lithologic Unit II (a similar phenomenon is seen in thelogging data; see "Downhole Measurements" section, this chapter).The convergence of the two data sets may result from the cores being
244

SITE 884
Table 11. Results of headspace gas analyses fromHoles 884A, 884B, and 884C.
Table 11 (continued).
Core, section,interval (cm)
145-884A-1H-5, 0-3
145-884B-1H-3, 0-32H-5, 0-33H-5, 0-34H-5, 0-35H-5, 0-36H-5, 0-37H-5, 0-38H-5, 0-39H-5, 0-310H-2, 0-312X-l,0-313X-4, 0-315X-4, 0-316X-5, 0-317X-5, 0-318X-5, 0-319X-5, 0-321X-5, 0-322X-5, 0-323X-4, 0-324X-5, 0-325X-5, 0-326X-5, 0-327X-5, 0-329X-2, 0-33OX-5, 0-331X-5, 0-332X-5, 0-333X-4, 0-334X-2, 0-335X-5, 0-336X-5, 0-337X-5, 0-338X-5, 0-339X-5, 0-340X-5, 0-341X-5, 0-342X-4, 0-343X-5, 0-344X-5, 0-345X-5, 0-346X-5, 0-347X-5, 0-348X-5, 0-349X-5, 0-350X-5, 0-351X-5, 0-352X-5, 0-353X-5, 0-356X-5, 0-357X-5, 0-358X-5, 0-359X-5, 0-360X-5, 0-361X-5, 0-362X-5, 0-363X-5, 0-365X-5, 0-366X-5, 0-367X-5, 0-368X-5, 0-369X-5, 0-370X-5, 0-371X-5, 0-372X-5, 0-373X-4, 0-374X-5, 0-375X-5, 0-376X-5, 0-377X-5, 0-378X-5, 0-379X-5, 0-383X-5, 0-384X-4, 0-385X-4, 0-386X-4, 137-14087X-5, 0-388X-3, 0-389X-4, 137-14090X-2, 0-391X-2, 0-3
Depth(mbsf)
6.00
3.0012.5022.0031.5041.0050.5060.0069.5079.0083.7087.3097.80117.10128.20137.80147.50157.10176.50186.10194.30205.40215.10224.70234.40249.10263.30273.00282.70290.80297.50311.70321.30331.00340.30349.90359.60369.10377.20388.40398.00407.70417.30426.90436.60446.20455.80465.30474.90484.60513.40523.10532.70542.40552.10561.60571.30580.80600.10609.80619.30628.80638.40648.00657.70667.30675.50686.60696.20705.80715.50725.10734.80773.40781.50791.20802.27812.10818.60830.97836.10845.80
c,(ppm)
7
43328
785112914101511917105611133534247410397836111591311
1214117947
3
2565644243223233323322222
C2(ppm)
3
433269681171
146113
35465564825210102741061
1
23411
11
1
(ppm)
1
21111I111111
1111
31
;>
2122221118
61
3311
121
9
Core, section,interval (cm)
145-884C-2H-5, 0-33H-5, 0-34H-4, 0-35H-4, 0-36H-6, 0-37H-4, 0-38H-5, 0-39H-5, 0-310X-3, 0-312X-3, 0-313X-4, 0-314X-2, 0-315X-5, 0-316X-5, 0-317X-4, 0-318X-5, 0-319X-5, 0-320X-5, 0-321X-5, 0-322X-5, 0-323X-5, 0-324X-5, 0-325X-5, 0-326X-5, 0-327X-5, 0-328X-5, 0-329X-5, 0-331X-5, 0-332X-5, 0-335X-5, 0-336X-5, 0-337X-5, 0-3
Depth(mbsf)
8.4017.9025.9035.4047.9054.4065.4074.9081.40100.80111.90118.50132.70142.30150.50161.70171.30181.00190.60200.30210.00219.60229.30238.90248.50258.20267.80287.10296.70325.70335.20344.70
c,(ppm)
267
93712810661011111111111012121011756633797
c2(ppm)
222111
c3(ppm)
31898
Ci = methane, C2 = ethane, C3 = propane.Note: all samples analyzed were headspace samples.
held in their liners, under some pressure, during GRAPE testing andbecause when they are split, expansion takes place and any waterbetween the liner and the sediment may be soaked up, thus yieldinglower bulk density values. Discrete 2-min count measurements wereused when testing the selected samples of basalt from Hole 884E.
Compressional Wave Velocities
Figure 41 shows profiles of compressional wave velocity data. TheP-wave profiles include data from the P-wave logger (PWL), Hamil-ton Frame, and the DSV. Below 85 mbsf, PWL data are not availabledue to the nature of the XCB cores. Compressional wave velocitiesobtained from the PWL average 1480 m/s (1451 m/s in Hole 884B,1508 m/s in Hole 884C) throughout the section logged, but increasedown the hole (Fig. 41 A), as do the velocities measured with the DSVand Hamilton Frame. The spiky nature of the PWL data may beattributed to the presence of ash layers and coarse ice-rafted debris(IRD) (see "Lithostratigraphy" section, this chapter). The DSV andHamilton Frame measurements are less sensitive to the presence ofthe ash layers and IRD because of the bias inherent in the discontinu-ous nature of DSV and Hamilton Frame sampling. Figure 4 IB showsdata from the DSV, and the Hamilton Frame and the predicted velocitycurve for a diatomaceous silty clay (Hamilton, 1979). Data fromSite 884 have lower values, which may be attributable to high con-centrations of diatoms and clay, which have lower compressionalwave velocities, as reported by Tucholke et al. (1976; e.g., clayeydiatom ooze: 1580 m/s and diatom-rich clay: 1520 m/s), or morelikely, second a rebound effect whereby the sediments experience gasexpansion during recovery causing velocities to decrease. This effectalso can be seen when comparing physical properties data with soniclog data (see "Downhole Measurements" section, this chapter).
The compressional wave velocity, obtained from DSV and Ham-ilton Frame measurements of cores from Hole 884B, range from 1416

SITE 884
Table 12. Results of geochemical analyses from Hole 884B. Table 12 (continued).
Core, section,interval (cm)
145-884B-
1H-1, 14-151H-1,32-331H-1,41-421H-1, 46-471H-1, 53-541H-1, 60-611H-1, 68-691H-1,72-731H-1,76-772H-1,74-752H-3, 77-782H-6, 76-773H-1, 77-783H-3, 70-713H-6, 61-624H-1, 111-1124H-3, 111-1124H-5, 76-775H-1, 78-795H-3, 77-785H-6, 77-786H-1,77-786H-3, 76-776H-6, 76-777H-1, 76-777H-3, 75-767H-6, 76-778H-1.76-778H-3. 76-778H-6, 66-679H-1,76-779H-3, 76-779H-7, 31-3212X-1,35-3613X-1,76-7713X-3, 77-7814X-1,77-7814X-3, 77-7814X-6, 77-7815X1, 76-7715X-3, 76-7715X-6, 77-7816X-1, 76-7716X-3, 76-7716X-6, 76-7717X-1,77-7817X-3, 77-7817X-6, 77-7818X-1,77-7818X-3, 77-7818X-6, 77-7819X4,78-7919X-3, 78-7919X-6, 78-7921X-1, 76-7721X-3, 76-7721X-6,76-7722X-1,77-7822X-3, 77-7822X-6, 77-7823X-1,77-7823X-3, 77-7823X-6, 77-7824X-1,77-7824X-3, 76-7724X-6, 76-7725X-1,77-7825X-3, 77-7825X-6, 76-7726X-1,77-7826X-3, 76-7726X-6, 76-7727X-1,76-7727X-3, 76-7727X-6, 75-7628X-1,38-3929X-1,76-7729X-3, 76-7730X-1,77-7830X-3, 77-7830X-6, 77-783IX-1,77-7831X-3, 77-78
Depth(mbsf)
0.140.320.410.460.530.600.680.720.767.24
10.2714.7616.7719.7024.1126.6129.6132.2635.7838.7743.2745.2748.2652.7654.7657.7562.2664.2667.2671.6673.7676.7682.3187.6594.0697.07
103.77106.77111.27113.36116.36120.87122.96125.96130.46132.57135.57140.07142.27145.27149.77151.88154.88159.38171.26174.26178.76180.87183.87188.37190.57193.57198.07200.17203.16207.66209.87212.87217.36219.47222.46226.96229.16232.16236.65238.38248.36251.36258.07261.07265.57267.77270.77
TC(wt%)
1.491.442.161.851.951.350.890.810.400.350.510.490.340.480.530.450.370.3201.21000.49000.40000.47000.2900.3000.1800.13000.20000.22000.2101.531.3201.3900.4902.03000.34000.29000.27000.24000.45000.210000.280.260.191.5402.03
IC(wt%)
1.301.201.661.211.210.600.150.0800.200.05000.060.1400000.8600000000000000000000000000001.331.0001.1800.301.8500000000000000000000002.20
12.S01.84
TOC(wt%)
0.190.240.500.640.740.750.740.730.400.150.460.490.340.420.390.450.370.32
0.35
0.49
0.40
0.47
0.29
0.30
0.18
0.13
0.20
0.22
0.21
0.20.32
0.21
0.19
0.18
0.34
0.29
0.27
0.24
0.45
0.21
0.28
0.19
0.19
CaCO,(wt%)
10.810.013.810.110.15.01.20.701.70.4000.51.2000
7.2
0
0
0
0
0
0
0
0
0
0
11.18.3
9.8
2.5
15.4
0
0
0
0
0
0
0
0
15.3
TN(wt%)
00.050.080.080.100.110.100.100.060.040.080.060.060.070.060.070.060.05
0.05
0.07
0.08
0.08
0.06
0.07
0.05
0.05
0.06
0.06
0.06
0.050.07
0.05
0.05
0.07
0.06
0.06
0.06
0.06
0.07
0.07
0.05
0.05
0.05
Core, section,interval (cm)
31X-6, 77-7832X-1,77-7832X-3, 77-7832X-6, 77-7833X-1,77-7833X-2, 77-7833X-5, 77-7834X-1,77-7834X-3, 76-7735X-1,77-7835X-3, 77-7835X-6, 77-7836X-1,78-7936X-3, 77-7836X-6, 77-7837X-1,76-7737X-3, 77-7837X-6, 75-7638X-1, 76-7738X-3, 76-7738X-4, 76-7739X-1,78-7939X-3, 78-7939X-6, 76-7740X-1,76-7740X-3, 76-7740X-6, 76-7741X-1, 76-7741X-3, 66-6741X-6, 82-8342X-1,77-7842X-3, 77-7842X-6, 74-7543X-1,61-6243X-3, 61-6243X-6, 56-5744X-1,83-8444X-3, 74-7545X-1,79-8045X-3, 88-8945X-6, 78-7946X-1,55-5646X-3, 83-8446X-6, 82-8347X-1,77-7847X-3, 126-12747X-6, 88-8948X-1,84-8548X-3, 60-6148X-6, 60-6149X-1,20-2149X-3, 84-8549X-6, 98-9950X-1,79-8050X-3, 36-3750X-6, 125-1265IX-1,93-9451X-3, 54-5551X-6, 72-7352X-1, 121-12252X-3, 105-10652X-6, 80-8153X-1, 142-14353X-3, 36-3753X-6, 91-9254X-1,33-3454X-3, 44-4554X-6, 90-9155X-1,90-9155X-3, 24-2555X-6, 67-6856X-1, 23-2456X-3, 79-8056X-6, 103-10457X-1,77-7857X-3, 57-5857X-6, 57-5858X-1, 57-5858X-3, 82-8358X-6, 91-9259X-1,79-8059X-3, 86-8759X-6, 80-8160X-1,81-8260X-3, 78-79
Depth(mbsf)
275.27277.47280.47284.97287.07288.57293.07296.77299.76306.47309.47313.97316.08319.07323.57325.76328.77333.25335.06338.06339.56344.68347.68352.16354.36357.36361.86363.86366.76371.42373.47376.47380.94383.01386.01390.46392.83395.74400.29402.58405.48409.75412.13415.12419.57422.16424.78429.24431.20434.20438.30441.04444.18448.49450.16454.05458.23459.84463.02468.01469.95472.70477.82478.96482.51486.43488.64492.10496.60498.04501.47505.23508.19511.43515.67517.67520.67525.17527.52530.61534.99537.26540.20544.71546.88
TC(wt%)
000.1900.200.25000.190.280.22000.260.3500.280.450.360.710.1300.17000.15000.15000.11000.10000.0101.800.860.250.532.300.9000.11.360.522.430.1400.15002.741.150.240.31000.09000.2400.110.10000.25000.12000.12000.0801.940.2900
IC(wt%)
00001.700002.30
000
2.900.153.730.481.1000000
000II
00000
000
15.00.742.14.42.117.500
11.34.32.341.2000
022.8
9.62.00000000.1500.90000.09000000000
016.20.1500
TOC(wt%)
0.19
0.25
0.19
0.22
0.26
0.13
0.23
0.17
0.15
0.15
0.11
0.10
0.01
0.12
0.19
0.1
0.09
0.15
0.31
0.09
0.09
0.1
0.16
0.12
0.12
0.08
0.14
CaCO3
(wt%)
0
0
0
0
0
1.2
4
0
0
0
0
0
0
6.2
17.6
0
19.5
0
0
0
1.2
0
0.7
0
0
0
1.2
TN(wt%)
0.05
0.05
0.05
0.05
0.05
0.01
0.05
0.04
0.04
0.01
0.03
0.01
0.01
0.01
0.04
0.03
0.01
0.03
0.02
0.02
0.02
0.03
0.03
0.02
0.03
0.03
0.03
246

SITE 884
Table 12 (continued). Table 12 (continued).
Core, section,interval (cm)
Depth TC IC(mbsf) (wt%) (wt%)
TOC(wt%)
CaCO3 TN(wt%) (wt%)
60X-6, 64-656IX-1,93-9461X-3, 75-7661X-6, 62-6362X-1,69-7062X-3, 76-7762X-6, 78-7963X-1,65-6663X-3, 20-2163X-6, 57-5864X-1,57-5864X-3, 56-5764X-6, 68-6965X-1, 94-9565X-3, 83-8465X-6, 89-9066X-1,50-5166X-3, 76-7766X-6, 75-7667X-1,73-7467X-3, 76-7767X-5, 81-8268X-1, 81-8268X-3, 77-7868X-6, 70-7169X-1,81-8269X-3, 77-7869X-6, 77-7870X-1,77-7870X-3, 133-13470X-6, 52-5371X-1, 80-8171X-3, 92-9371X-6, 44-4572X-1, 76-7772X-3, 113-11472X-6, 106-10773X-1,78-7973X-3, 59-6074X-1,65-6674X-3, 42^t374X-6, 82-8375X-1, 63-6475X-3, 105-10675X-6, 89-9076X-1,53-5476X-3, 72-73
549.74554.53556.35559.22563.79566.06569.08573.45575.00578.37582.87584.96588.08592.14594.93597.99602.10604.56607.55612.03614.06617.11620.11623.57626.50631.11633.17636.17640.67643.33645.52650.30652.62655.14659.96662.43665.36669.58671.59674.65681.02684.42688.73691.25694.09698.23700.52
0.10.5300.07000.09000.27000.624.685.734.773.272.330.08000.08000.14000.06000.06000.141.463.440.06002.913.910.08009.901.44
04.400000000000.13
3947.74.72
27.219.40000000000000
00
12.228.70002.84
32.60009.83
12
0.1
0.07
0.09
0.27
0.49
0.04
0.08
0.08
0.14
0.06
0.06
0.14
0.06
0.07
0.08
0.07
0
0
0
0
1.1
39.3
0
0
0
0
0
0
0
23.7
0
81.9
0.02
0.02
0.03
0
0.03
0.02
0
0
0.03
0.04
0
0
0
0.01
0.01
0
Core, section,interval (cm)
Depth TC(mbsf) (wt%;
IC(wt%)
TOC CaCO3 TN(wt%) (wt%) (wt%)
76X-6, 67-6877X-1,24-2577X-3, 47^*877X-6, 99-10078X-1,75-7678X-3, 77-7878X-5, 76-7779X-1,77-7879X-3, 77-7880X-1,69-7080X-3, 78-7980X-6, 63-6481X-1,47^1881X-3, 71-7282X-1,82-8382X-3, 91-9283X-1,70-7183X-2, 76-7783X-6, 72-7384X-1,51-5284X-3, 79-8084X-6, 77-7885X-1,65-6685X-3, 86-8785X-6, 60-6186X-1,57-5886X-3, 79-8086X-6, 67-6887X-1,56-5787X-3, 68-6987X-6, 98-9988X-1,77-7888X-3, 72-7389X-1,60-6189X-3, 29-3089X-6, 88-8989X-7, 64-6590X-1, 10-1190X-3, 93-9490X-3, 84-859IX-1,25-26
703.47707.54709.97713.49717.75719.87722.86725.87729.57732.49739.18742.03746.37748.81751.92758.61761.40768.16769.62775.41777.79780.77785.15787.56790.30794.77797.19800.07804.46806.78810.08814.37816.32819.20825.39828.98833.24834.20835.53838.44844.55
2.9809.341.46000.01003.101.250.0402.35.302.17.276.636.015.122.890.390.454.267.381.544.675.25000.020.202.9200.020000.020
2.970
77.81.40000003.02
10.400
19.25.23
17.57.28
55.25.63
42.624.10.243.7
35.57.24
12.838.95.070001.702.780000000
0.01
0.06
0.01
0.08
0.04
0.07
0
0.38
0.15
0.14
0.18
0.02
0.14
0.02
0.02
24.7
11.7
0
25.2
0
43.6
60.6
46.9
2.0
60.3
42.2
0
23.2
0
0
0.01
0
0
0
0
0
0
0
0
0
0
0
0.01
0.01
0.01
TC = total carbon, IC = inorganic carbon, TOC = total organic carbon, and TN = totalnitrogen. All results are given in weight percent of bulk dry sediment.
to 2247 m/s and average 1572 m/s. In the upper part of Hole 884B(Unit I), velocities range from 1416 to 1683 m/s, increasing down thehole. These data reflect a fluid-dominated system of relatively uncon-solidated sediment; this is illustrated in Figure 42, showing compres-sional wave velocity vs. dry water content; the higher water contentsare characteristic of velocities ranging from 1400 to 1600 m/s (mostlydata from Unit I). In the lower portion of Hole 8 84B (within lithologicUnit II), velocities exhibit the greatest variation (1554-2247 m/s) andthe highest values, with an average of 1744 m/s. This is probably aresponse to the variation in the degree of lithification of the sediments,which have typically increasing compressional wave velocity withdecreasing dry water content (Fig. 42). The general trend of velocitiesincreasing down the hole can be explained by the sediments consoli-dating and forming grain-to-grain contacts while increasing bulkmodulus and rigidity. Compressional wave velocities of the basaltcored in Hole 884E were measured using the Hamilton Frame, reveal-ing values that range from 4774 to 6135 m/s and average 5763 m/s.
Thermal Conductivity
The thermal conductivity profiles of Holes 884B and 884C (Fig.43) show three distinct divisions. Within lithologic Unit I (0-604mbsf), thermal conductivity averages 0.99 W/(m °C) and then in-creases at 604 mbsf (the boundary of Units I and II) to an average of1.24 W/(m °C). At approximately 770 mbsf, the top of Subunit HC,a further increase to 1.38 W/(m °C) is seen, but the range of valuesis much greater than in Hole 884B (0.55-2.06 W/(m •°C). The thermal
conductivity data are inversely related to the porosity data (Fig. 44).Within Units I and II, little scatter can be seen, indicating that porosity(and water content, because the sediments are saturated) is controllingthermal conductivity. The theoretical thermal conductivity of a mixof fused silica and seawater also is shown in Figure 44, calculatedfrom the following equation relating the conductivities of two phasesvia porosity.
K = Kf0Ks(l-0),
where K is thermal conductivity, Kf is fluid conductivity (1.46 W/[m °C] for seawater), Ks is the solid conductivity is the solid (3.25W/[m °C] for fused silica), and (f> is porosity expressed as a fraction(from Wilkens and Handyside, 1985). The data from Hole 884B fallbelow this line, which may result from the domination of clays andopaline ilica.
DOWNHOLE MEASUREMENTS
Logging Operations and Quality of Logs
Five tools were run in Hole 884E: the Schlumberger Quad combi-nation, formation microscanner (FMS), and geochemical tool strings,and the French magnetometer and susceptibility tools. The wirelineheave compensator (WHC) was not operational during any of thelogging runs because of failed electronics. Sea-state conditions weremild throughout the logging operations (1-2 m wave amplitude), butinspection of the individual gamma-ray logs from the three separate
247
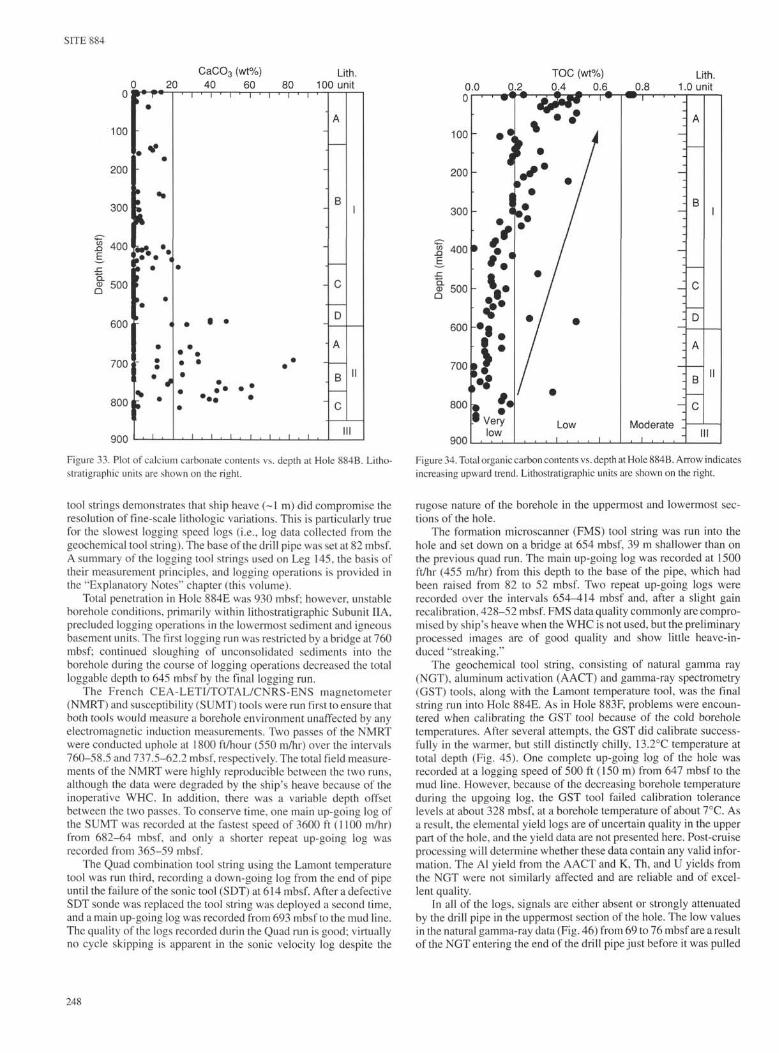
SITE 884
CaCO3 (wt%) Lith.20 40 60 80 100 unit
100
200
300
400
8" 500
600
700
800
900
> f I1
1
»1
i
•*, i ,
•••••
, i , i . i . I . I . > . I ,
A
B
C
D
<
CD
O
1
II
III
0.0 0.2TOC (wt%)0.4 0.6 0.8
Lith.1.0 unit
Q
•Ve rylow
4}ç••
/Low
. , , i , , , i .
. ..
. I .
..
. I
..
..
I .
..
. I
..
..
I .
..
. I
...
.1
Moderate '., i , . .
A
B
C
D
A
B
C
1
II
III
Figure 33. Plot of calcium carbonate contents vs. depth at Hole 884B. Litho-stratigraphic units are shown on the right.
100 -
200 -
300 -
400
500 -
600 -
700
800
900
Figure 34. Total organic carbon contents vs. depth at Hole 884B. Arrow indicatesincreasing upward trend. Lithostratigraphic units are shown on the right.
tool strings demonstrates that ship heave (~ 1 m) did compromise theresolution of fine-scale lithologic variations. This is particularly truefor the slowest logging speed logs (i.e., log data collected from thegeochemical tool string). The base of the drill pipe was set at 82 mbsf.A summary of the logging tool strings used on Leg 145, the basis oftheir measurement principles, and logging operations is provided inthe "Explanatory Notes" chapter (this volume).
Total penetration in Hole 884E was 930 mbsf; however, unstableborehole conditions, primarily within lithostratigraphic Subunit IIA,precluded logging operations in the lowermost sediment and igneousbasement units. The first logging run was restricted by a bridge at 760mbsf; continued sloughing of unconsolidated sediments into theborehole during the course of logging operations decreased the totalloggable depth to 645 mbsf by the final logging run.
The French CEA-LETI/TOTAL/CNRS-ENS magnetometer(NMRT) and susceptibility (SUMT) tools were run first to ensure thatboth tools would measure a borehole environment unaffected by anyelectromagnetic induction measurements. Two passes of the NMRTwere conducted uphole at 1800 ft/hour (550 m/hr) over the intervals760-58.5 and 737.5-62.2 mbsf, respectively. The total field measure-ments of the NMRT were highly reproducible between the two runs,although the data were degraded by the ship's heave because of theinoperative WHC. In addition, there was a variable depth offsetbetween the two passes. To conserve time, one main up-going log ofthe SUMT was recorded at the fastest speed of 3600 ft (1100 m/hr)from 682-64 mbsf, and only a shorter repeat up-going log wasrecorded from 365-59 mbsf.
The Quad combination tool string using the Lamont temperaturetool was run third, recording a down-going log from the end of pipeuntil the failure of the sonic tool (SDT) at 614 mbsf. After a defectiveSDT sonde was replaced the tool string was deployed a second time,and a main up-going log was recorded from 693 mbsf to the mud line.The quality of the logs recorded durin the Quad run is good; virtuallyno cycle skipping is apparent in the sonic velocity log despite the
rugose nature of the borehole in the uppermost and lowermost sec-tions of the hole.
The formation microscanner (FMS) tool string was run into thehole and set down on a bridge at 654 mbsf, 39 m shallower than onthe previous quad run. The main up-going log was recorded at 1500ft/hr (455 m/hr) from this depth to the base of the pipe, which hadbeen raised from 82 to 52 mbsf. Two repeat up-going logs wererecorded over the intervals 654-414 mbsf and, after a slight gainrecalibration, 428-52 mbsf. FMS data quality commonly are compro-mised by ship's heave when the WHC is not used, but the preliminaryprocessed images are of good quality and show little heave-in-duced "streaking."
The geochemical tool string, consisting of natural gamma ray(NGT), aluminum activation (AACT) and gamma-ray spectrometry(GST) tools, along with the Lamont temperature tool, was the finalstring run into Hole 884E. As in Hole 883F, problems were encoun-tered when calibrating the GST tool because of the cold boreholetemperatures. After several attempts, the GST did calibrate success-fully in the warmer, but still distinctly chilly, 13.2°C temperature attotal depth (Fig. 45). One complete up-going log of the hole wasrecorded at a logging speed of 500 ft (150 m) from 647 mbsf to themud line. However, because of the decreasing borehole temperatureduring the upgoing log, the GST tool failed calibration tolerancelevels at about 328 mbsf, at a borehole temperature of about 7°C. Asa result, the elemental yield logs are of uncertain quality in the upperpart of the hole, and the yield data are not presented here. Post-cruiseprocessing will determine whether these data contain any valid infor-mation. The Al yield from the AACT and K, Th, and U yields fromthe NGT were not similarly affected and are reliable and of excel-lent quality.
In all of the logs, signals are either absent or strongly attenuatedby the drill pipe in the uppermost section of the hole. The low valuesin the natural gamma-ray data (Fig. 46) from 69 to 76 mbsf are a resultof the NGT entering the end of the drill pipe just before it was pulled

SITE 884
TOC (%)0.2 0.4 0.6 0.8 1
CaCO3 (%)5 10 15
Table 13. Summary of physical properties measurements,Site 884.
150
Figure 35. Total organic carbon and calcium carbonate contents vs. depth ofSection 145-884B-1H-1. Sediment color is shown in the center of plot.
up 30 m, which caused an attenuation of the signal over this shortinterval. The neutron porosity log (Fig. 47) appears noisy throughoutthe entire logged interval and is not a reliable indicator of trueformation porosity. This is a result of the high formation porositiesencountered in Hole 884E, which are outside the limits for which thetool is calibrated.
Results
Borehole Temperature
Borehole temperatures measured by the Lamont temperature tool(TLT) reflect the temperature of the seawater in the borehole ratherthan the true formation temperature. The formation cools duringdrilling operations because of circulation of cold seawater, and onlyafter drilling operations have ceased can the temperatures begin torebound. The first deployment of the TLT, on the Quad tool string,about 24 hr after the end of drilling operations, yielded a bottom-holetemperature of 10.5°C (Fig. 45). The second deployment of the TLT,on the geochemical tool string, yielded a bottom-hole temperature of13.2°C; an increase of 2.7°C over the intervening 12 hr.
Lithology
Variations in the log data reflect changes in the physical andchemical properties of the formation. The geochemical and geophysi-cal log data recorded at Hole 884E are presented in Figures 46, 47,and 48. These data are shown adjacent to the major lithology vari-ations, as determined primarily from visual and smear-slide analysesof sediments from Hole 884B (see "Lithostratigraphy" section, thischapter). Good general agreement exists between the lithologic clas-sification of core and the various log responses.
Although the NGT is run on each of the Schlumberger tool strings,the data presented in Figure 46 are taken from the geochemical toolstring, which is run at a much lower logging speed and, hence,provides much better counting statistics.
The 850-m-thick sedimentary column at Site 884 is divided intotwo units based on sediment lithology and on the presence of struc-tures indicative of reworking. Unit I is further divided into foursubunits, the uppermost of which, Subunit IA, is rich in clay, IRD,and ash layers. The boundary between Subunits IA and IB at 128 mbsfis well defined in the natural gamma-ray logs (Fig. 46) by a sharpdecline in the total gamma-ray flux from the formation, indicative ofthe change from clay-rich Subunit IA to the clayey diatom ooze ofSubunit IB, which contains considerably less clay and, therefore, hasa lower K, Th, and U content. This compositional change also isreflected in the Al log (Fig. 47), which shows a sharp decrease acrossthe transition to Subunit IB. The bulk density and resistivity logs
Physical propertiesmeasurements
Index propertiesVane shear strengthDSV or Hamilton FrameGRAPEP-wave loggerThermal conductivity
Hole884A
XXXXX
Hole884B
XXXXXX
Hole884C
XXXXXX
Hole884D
XX
Hole884E
X
XX
(Fig. 48) decrease across the boundary from Subunit IA to IB; thevariability in the logs decreases as well across this boundary. Thisreflects the change from the higher density and more variable lithol-ogy of clay-rich Subunit IA into the more uniform lower density andhigher porosity of Subunit IB; this is confirmed by physical propertymeasurements on core samples (see "Physical Properties" section,this chapter). The sonic velocity increases slightly into Subunit IBdespite both the decrease in bulk density and increase in porosity. Thisincrease in sonic velocity is caused by the increased matrix rigidityof the diatomaceous material in comparison to the more clay-richSubunit IA above. Borehole diameter (Fig. 48) also decreases fromgreater than 18 in. just below the base of the drill pipe in Subunit IAto between 11 and 13 in. in most of Subunit IA. The small inflectionsin the caliper log at 10-m intervals apparent in Subunit IB were causedby overwashing at the addition of each pipe joint during drilling.
Lithologic Subunits IB, IC, and ID exhibit less variability in all ofthe logs compared with the overlying Subunit IA. The logs in thelower three subunits reflect the variation of clay and diatomaceouscontent with little IRD, and with fewer and thinner volcanic ashlayers. The natural gamma-ray and Al logs (Figs. 46 and 47) indicatethat the lowest clay contents are found from the top of Subunit IB toabout 240 mbsf and again in Subunit ID, the less clay-rich diatomite.The positive spike in the gamma-ray log at 275 mbsf, also exhibitedin the Al, resistivity, and sonic velocity logs, probably is caused by avolcanic ash layer, although this is not recorded in the cores. Carbon-ate concretions were encountered in Core 145-884B-31X (-272mbsf), but these would not produce an increase in the Al log. The bulkdensity and sonic velocity logs (Fig. 48) indicate a classical compac-tion trend throughout Subunits IA, IB, and IC, with gradual increasein values with depth. The gradual and normal compaction profile isnot evident in the resistivity log, as resistivity actually decreasesslowly downhole. The expected increase in resistivity is obscured bythe effect of a gradual downward increase in borehole temperatures,which decreases fluid resistivity (compare Figs. 45 and 48).
Within Subunit IC, a pronounced increase in resistivity is centeredat about 520 mbsf (Fig. 48). This increase in resistivity is accompaniedby a slight increase in both sonic velocity and bulk density logs, butthe change is most apparent in the resistivity log, indicating a decreasein porosity. This resistivity anomaly is unusually symmetric andsmooth, and little evidence suggests it is entirely related to a lithologychange based on core description and information from the other logs.However, native (metallic) copper particles were observed in thedepth range of this resistivity anomaly in Cores 145-884B-56X and-57X. The presence of copper implicates probable hydrothermal fluidcirculation through this zone, and, therefore, the resistivity increasemay result from a decrease of porosity caused by the deposition ofsecondary minerals from solution. Physical property measurementson discrete core samples confirm a decrease in porosity over this zone(see "Physical Properties" section, this chapter).
Lithologic Subunit IIA consists predominantly of claystone, withlesser amounts of nannofossil chalk, and is the lowermost unit thatwas logged in Hole 884E. The natural gamma-ray logs (Fig. 46) coveronly the uppermost 30 m of this subunit but show a marked increasein total gamma ray, and the Th and K logs indicate higher clay content
240
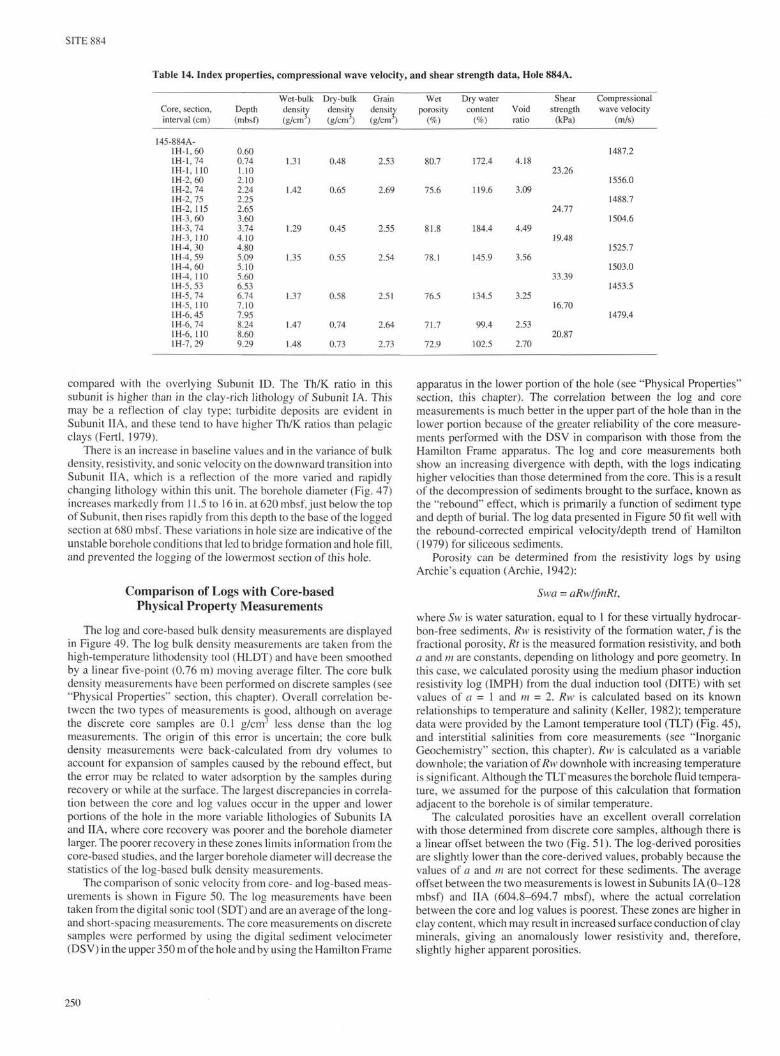
SITE 884
Table 14. Index properties, compressional wave velocity, and shear strength data, Hole 884A.
Core, section,interval (cm)
145-884 A-1H-1,6O1H-1,741H-1,11O1H-2, 601H-2, 741H-2, 751H-2, 1151H-3, 601H-3, 741H-3, 1101H-4, 301H-4, 591H-4, 601H-4, 1101H-5, 53lH-5,741H-5, 110lH-6,45lH-6,741H-6, 1101H-7, 29
Depth(mbsf)
0.600.741.102.102.242.252.653.603.744.104.805.095.105.606.536.747.107.958.248.609.29
Wet-bulkdensity(g/cm*)
1.31
1.42
1.29
1.35
1.37
1.47
1.48
Dry-bulkdensity(g/cm*)
0.48
0.65
0.45
0.55
0.58
0.74
0.73
Graindensity(g/cm1)
2.53
2.69
2.55
2.54
2.51
2.64
2.73
Wetporosity
(%)
80.7
75.6
81.8
78.1
76.5
71.7
72.9
Dry watercontent
(%)
172.4
119.6
184.4
145.9
134.5
99.4
102.5
Voidratio
4.18
3.09
4.49
3.56
3.25
2.53
2.70
Shearstrength
(kPa)
23.26
24.77
19.48
33.39
16.70
20.87
Compressionalwave velocity
(m/s)
1487.2
1556.0
1488.7
1504.6
1525.7
1503.0
1453.5
1479.4
compared with the overlying Subunit ID. The Th/K ratio in thissubunit is higher than in the clay-rich lithology of Subunit IA. Thismay be a reflection of clay type; turbidite deposits are evident inSubunit IIA, and these tend to have higher Th/K ratios than pelagicclays (Fertl, 1979).
There is an increase in baseline values and in the variance of bulkdensity, resistivity, and sonic velocity on the downward transition intoSubunit IIA, which is a reflection of the more varied and rapidlychanging lithology within this unit. The borehole diameter (Fig. 47)increases markedly from 11.5 to 16 in. at 620 mbsf, just below the topof Subunit, then rises rapidly from this depth to the base of the loggedsection at 680 mbsf. These variations in hole size are indicative of theunstable borehole conditions that led to bridge formation and hole fill,and prevented the logging of the lowermost section of this hole.
Comparison of Logs with Core-basedPhysical Property Measurements
The log and core-based bulk density measurements are displayedin Figure 49. The log bulk density measurements are taken from thehigh-temperature lithodensity tool (HLDT) and have been smoothedby a linear five-point (0.76 m) moving average filter. The core bulkdensity measurements have been performed on discrete samples (see"Physical Properties" section, this chapter). Overall correlation be-tween the two types of measurements is good, although on averagethe discrete core samples are 0.1 g/cm3 less dense than the logmeasurements. The origin of this error is uncertain; the core bulkdensity measurements were back-calculated from dry volumes toaccount for expansion of samples caused by the rebound effect, butthe error may be related to water adsorption by the samples duringrecovery or while at the surface. The largest discrepancies in correla-tion between the core and log values occur in the upper and lowerportions of the hole in the more variable lithologies of Subunits IAand IIA, where core recovery was poorer and the borehole diameterlarger. The poorer recovery in these zones limits information from thecore-based studies, and the larger borehole diameter will decrease thestatistics of the log-based bulk density measurements.
The comparison of sonic velocity from core- and log-based meas-urements is shown in Figure 50. The log measurements have beentaken from the digital sonic tool (SDT) and are an average of the long-and short-spacing measurements. The core measurements on discretesamples were performed by using the digital sediment velocimeter(DS V) in the upper 350 m of the hole and by using the Hamilton Frame
apparatus in the lower portion of the hole (see "Physical Properties"section, this chapter). The correlation between the log and coremeasurements is much better in the upper part of the hole than in thelower portion because of the greater reliability of the core measure-ments performed with the DSV in comparison with those from theHamilton Frame apparatus. The log and core measurements bothshow an increasing divergence with depth, with the logs indicatinghigher velocities than those determined from the core. This is a resultof the decompression of sediments brought to the surface, known asthe "rebound" effect, which is primarily a function of sediment typeand depth of burial. The log data presented in Figure 50 fit well withthe rebound-corrected empirical velocity/depth trend of Hamilton(1979) for siliceous sediments.
Porosity can be determined from the resistivity logs by usingArchie's equation (Archie, 1942):
Swa = aRwIfmRt,
where Sw is water saturation, equal to 1 for these virtually hydrocar-bon-free sediments, Rw is resistivity of the formation water,/is thefractional porosity, Rt is the measured formation resistivity, and botha and m are constants, depending on lithology and pore geometry. Inthis case, we calculated porosity using the medium phasor inductionresistivity log (IMPH) from the dual induction tool (DITE) with setvalues of a = 1 and m = 2. Rw is calculated based on its knownrelationships to temperature and salinity (Keller, 1982); temperaturedata were provided by the Lamont temperature tool (TLT) (Fig. 45),and interstitial salinities from core measurements (see "InorganicGeochemistry" section, this chapter). Rw is calculated as a variabledownhole; the variation of Rw downhole with increasing temperatureis significant. Although the TLT measures the borehole fluid tempera-ture, we assumed for the purpose of this calculation that formationadjacent to the borehole is of similar temperature.
The calculated porosities have an excellent overall correlationwith those determined from discrete core samples, although there isa linear offset between the two (Fig. 51). The log-derived porositiesare slightly lower than the core-derived values, probably because thevalues of a and m are not correct for these sediments. The averageoffset between the two measurements is lowest in Subunits IA(0-128mbsf) and IIA (604.8-694.7 mbsf), where the actual correlationbetween the core and log values is poorest. These zones are higher inclay content, which may result in increased surface conduction of clayminerals, giving an anomalously lower resistivity and, therefore,slightly higher apparent porosities.

SITE 884
Wet-bulk density Dry-bulk density Dry-water content Wet porosity(g/cm3) (g/cm3) (%) (%) Lith.
1.0 1.4 1.8 0.2 0.6 1.0 1.4 0 100 200 40 60 80 unit
200 -
400 -
Q.CDQ
600 -
800 -
1000
IA
IB
Figure 36. Index property data vs. depth for Hole 884B. Lithologic units are shown at right.
Magnetic Induction and Magnetic SusceptibilityLog Results
Hole 884E was logged with two passes each of the two Frenchmagnetic logging tools (total induction and susceptibility). The repeatlogs will permit analysis of the different components that affect themeasurement of the surrounding formation magnetization. For themagnetometer and the susceptibility tools, several components weremeasured together and must be separated before isolating total induc-tion or susceptibility data that accurately reflect the sedimentaryformations surrounding the borehole.
Total Induction
The magnetometer measures the total induction B = µQ[H +(Jj + Jr)] (S1 units), which is commonly and incorrectly referred to as"EarüYs magnetic field." B (EarüYs total induction) is expressed innannoteslas (nT) and is the induction resulting either from a magneticfield H (Earth's field in that case) and/or from an induced magnetiza-tion J j or remanent magnetization Jn both expressed in amperes permeter (A/m), with µ0 being the permeability of vacuum. To avoidconfusion between the mathematically defined total induction B andthe induced magnetization /,, here we refer to induction as the "ßfield," which will be expressed in nannoteslas.
In a borehole, B is the sum of several components:
B(z, t) = Br(z) + Ba(z) + Bf(z) + Bt(z, t)
with Br being the inner regular induction, Ba the induction caused bynearby highly magnetized rocks (anomaly field), Bf the inductionproduced by the geological formations surrounding the hole (what wefinally want to measure), and Bt the induction caused by transientvariations of Earth's field H. To isolate Bf, the desired component, wemust first evaluate and remove Br, Ba, and Bt.
To a first approximation (see "Explanatory Notes" chapter, thisvolume), Br can be estimated by assuming it is dipolar, axial, and
centered. Thus, we easily can remove its contribution to the field B,measured by the magnetometer using the local value (48,715 nT) andits gradient as a linear function of depth (-22 nT/km). Figure 52 showsthe remaining "local" field BL{z) for the two runs that only containlocal effects, i.e.: BLI(z) = Bf(z) + Ba(z) + Bt (z, t) and, BL2(z) = Bf(z)+ Ba(z) + Bt2(z, t).
Three different magnetic signatures can be recognized throughoutthe logged sequence (Fig. 52). In the uppermost part, the remaining"local" BL field shows large variations, with values exceeding 1000nT followed by a sharp decrease at about 68-69 mbsf. Down to about85 mbsf, BL increases downward from a value of about -1600 nT at70 mbsf to an average value of-600 nT, a result of the highly magneticdrill pipe set at 70 mbsf. A broad zone, free of any large magneticvariations apart from sharp negative peaks, occurs between 90 and720 mbsf and corresponds to the sediments of Site 884. Below about700 mbsf, the remaining BL signal becomes constant with "anoma-lies" within 0.4 nT peak to peak (Figs. 52 and 53).
The average value of the "local" fields Bu and BL2 m m e central
sedimentary section is significantly lower than zero. To get the truevalue of Bf, the signal attributable to the close surrounding rocks,which should be the same for the two runs, one must evaluate theanomaly field Ba and the transient fields Bt and Bt2.
Analysis of the Components of the Magnetic Induction
Figure 53 shows the "local" BL field for the two runs between 150and 750 mbsf. At this scale, the two runs are similar, indicating thatno major disturbance of Earth's field occurred during logging.
Figure 54 shows, in detail, the two runs between 150 and 600 mbsf.Again, agreement is good between the two runs, but with a variabledepth offset between them. This depth offset is more significant in thelower part of the hole than in the upper part. Thus, it seems that avarying depth discrepancy occurred between and/or during the twologs. The WHC was not used during logging operations at Hole 884Ebecause of an electronics failure. Although some of the depth errors
25,

SITE 884
Table 15. Index properties, compressional wave velocity, and shear strength data, Hole 884B.
Core, sectioninterval (cm)
145-884B-1H-1,441H-1,451H-1, 1091H-1,11O1H-2, 451H-2, 741H-2, 1051H-3, 531H-3, 741H-3, 105lH-4,451H-4, 791H-4, 112H-l,402H-1.712H-1, 102H-2, 402H-2.812H-2, 1102H-3, 402H-3, 742H-3, 1102H-4, 422H-4, 742H-4, 102H-5, 402H-5, 742H-5, 1102H-6, 352H-6, 742H-6, 1102H-7, 493H-1.403H-1.743H-1.1103H-2, 743H-2, 903H-2, 1103H-3, 403H-3, 703H-3, 1053H-4, 403H-4, 703H-4, 113H-5, 403H-5, 743H-5, 1103H-6, 403H-6, 593H-6, 1103H-7, 394H-1.754H-1, 104H-1, 1054H-2, 404H-2, 1044H-2, 1104H-3, 404H-3, 1094H-3, 1104H-4, 404H-4, 1094H-4, 1104H-5, 504H-5, 744H-5, 114H-6, 404H-6, 744H-6, 114H-7, 395H-1.405H-1.745H-1, 1105H-2, 405H-2, 745H-2, 115H-3, 505H-3, 745H-3, 1105H-4, 405H-4, 745H-4, 105H-5, 35
Depth(mbsf)
0.440.451.091.101.952.242.553.533.744.054.955.295.606.907.217.55K.408.819.109.90
10.2410.6011.4211.7412.0512.9013.2413.6014.3514.7415.1015.9916.4016.7417.1018.2418.4018.6019.4019.7020.0520.9021.2021.6222.4022.7423.1023.9024.0924.6025.3926.2526.5526.5927.4028.0428.1028.9029.5929.6030.4031.0931.1032.0032.2432.6033.4033.7434.1034.8935.4035.7436.1036.9037.2437.6038.5038.7439.1039.9040.2440.5541.35
Wet bulkdensity(g/cm*)
1.23
1.32
1.37
1.38
1.33
1.35
1.39
1.38
1.30
1.32
1.43
1.29
1.33
1.35
1.37
1.45
1.39
1.40
1.36
1.41
1.33
1.35
1.29
1.40
1.19
1.40
1.33
1.36
1.28
1.39
Dry bulkdensity(g/cm )
0.35
0.51
0.58
0.59
0.53
0.54
0.60
0.60
0.47
0.50
0.66
0.45
0.51
0.56
0.58
0.71
0.60
0.62
0.55
0.61
0.56
0.55
0.45
0.60
0.31
0.64
0.53
0.56
0.45
0.59
Graindensity(g/cm5)
2.56
2.52
2.55
2.68
2.42
2.57
2.68
2.56
2.50
2.51
2.67
2.54
2.57
2.49
2.64
2.62
2.62
2.63
2.69
2.74
2.32
2.59
2.53
2.70
2.31
2.54
2.51
2.57
2.47
2.72
Wet porosity(%)
86.1
79.4
76.9
77.8
77.5
78.6
77.1
76.2
80.9
79.7
74.7
82.0
79.7
77.0
77.9
72.7
76.9
76.1
79.2
77.2
75.6
78.5
81.8
77.3
86.2
74.5
78.6
77.7
81.4
78.0
Dry watercontent
(%)
253.7
159.4
135.8
135.7
148.5
148.7
130.7
129.7
177.4
163.4
115.2
188.3
160.1
139.9
138.4
105.4
131.7
125.6
148.1
128.6
138.4
146.3
185.0
131.1
285.3
119.2
152.5
140.9
184.7
136.1
Shearstrength
(kPa)
16.70
20.41
21.33
21.33
21.12
33.86
42.20
54.73
65.29
56.29
48.78
50.28
42.03
44.28
48.78
55.54
60.79
45.78
50.28
59.29
60.04
42.03
60.79
49.53
51.03
49.53
Compressionalwave vel.
(m/s)
1506.2
1490.3
1493.5
1517.5
1504.6
1462.5
1504.6
1415.7
1596.4
1504.6
1504.6
1517.5
1493.5
1504.6
1496.6
1498.2
1498.2
1499.8
1493.5
1509.4
1488.7
1501.4
1488.7
1511
1512.7
1498.2
1501.4

SITE 884
Table 15 (continued).
Core, sectioninterval (cm)
5H-5, 745H-5, 115H-6, 405H-6, 745H-6, 115H-7, 396H-1.556H-1, 746H-l,1106H-3, 406H-3, 746H-3,1106H-4, 746H-4, 756H-4, 1156H-5, 406H-5, 746H-5, 1106H-6, 406H-6, 746H-6, 1106H-7, 397H-1.407H-1,747H-1, 1107H-2, 407H-2, 647H-2, 127H-3, 407H-3, 747H-3, 107H-4, 407H-4, 747H-4, 117H-5, 407H-5, 807H-5, 1107H-6, 407H-6, 747H-6, 117H-7, 298H-1.408H-1.748H-1, 1158H-2, 408H-2, 748H-2, 1108H-3, 408H-3, 748H-3, 1108H-4, 408H-4, 748H-4, 1108H-5, 408H-5, 748H-5, 1108H-6, 408H-6, 648H-6.1108H-7, 299H-l,409H-1, 749H-1, 1109H-2, 409H-2, 749H-2, 1109H-3,409H-3, 749H-3, 1109H-4, 409H-4, 749H-4, 1109H-5, 409H-5, 749H-5, 1109H-7, 3910H-2, 4010H-2, 7410H-2, 12012X-1.3913X-1.4013X-1.7413X-1, 11013X-2, 40
Depth(mbsf)
41.7442.1542.9043.2443.6044.3945.0545.2445.6047.9048.2448.6049.7449.7550.1550.9051.2451.6052.4052.7453.1053.8954.4054.7455.1555.9056.1456.7257.4057.7458.0558.9059.2459.6060.4060.8061.1061.9062.2462.6563.2963.9064.2464.6565.4065.7466.1066.9067.2467.6068.4068.7469.1069.9070.2470.6071.4071.6472.1072.7973.4073.7474.1074.9075.2475.6076.4076.7477.1077.9078.2478.6079.4079.7480.1082.3984.1084.4484.9087.6993.7094.0494.4095.20
Wet bulkdensity(g/cm*)
1.30
1.42
1.36
1.35
1.45
1.38
1.41
1.36
1.30
1.33
1.40
1.39
1.41
1.38
1.39
1.37
1.34
1.22
1.41
1.43
1.35
1.48
1.49
1.37
1.44
1.28
1.40
1.41
1.44
1.51
1.43
1.45
Dry bulkdensity(g/cm*)
0.48
0.67
0.57
0.57
0.71
0.61
0.65
0.57
0.48
0.51
0.64
0.64
0.63
0.61
0.61
0.57
0.55
0.36
0.63
0.67
0.57
0.73
0.76
0.58
0.70
0.46
0.65
0.66
0.68
0.80
0.68
0.71
Graindensity(g/cm5)
2.40
2.55
2.49
2.46
2.63
2.54
2.51
2.55
2.43
2.60
2.54
2.43
2.63
2.54
2.52
2.57
2.49
2.28
2.72
2.62
2.49
2.71
2.61
2.56
2.55
2.32
2.47
2.5
2.69
2.59
2.62
2.63
Wet porosity(%)
79.6
73.6
76.6
76.5
72.7
75.7
73.8
77.4
80.1
80.0
74.5
73.2
75.8
75.7
75.3
77.4
77.5
83.7
76.6
74.2
76.8
72.6
70.4
77.2
72.2
80.0
73.4
73.2
74.4
68.7
73.8
72.7
Dry watercontent
(%)
170.1
113.1
136.5
137.3
104.9
127.4
116.5
140.2
172.8
160.5
119.5
117.0
123.4
127.6
125.5
138.3
144.4
235.5
125.2
114.4
138.8
101.3
94.4
137.3
105.6
179.5
115.7
113.3
111.9
87.8
111.5
105.3
Shearstrength
(kPa)
50.28
56.29
57.04
57.04
56.29
59.29
60.79
60.79
48.03
55.54
84.05
71.30
65.29
58.54
49.53
59.29
98.31
68.29
64.54
59.29
66.79
66.79
57.04
48.78
42.03
36.77
Compressionalwave vel.
(m/s)
1499.8
1506.2
1501.4
1503.0
1504.6
1511.0
1471.7
1525.7
1504.6
1520.8
1509.4
1504.6
1511.0
1535.7
1507.8
1514.3
1515.9
1507.8
1493.5
1509.4
1532.3
1501.4
1499.8
1527.4
1499.8
1509.4
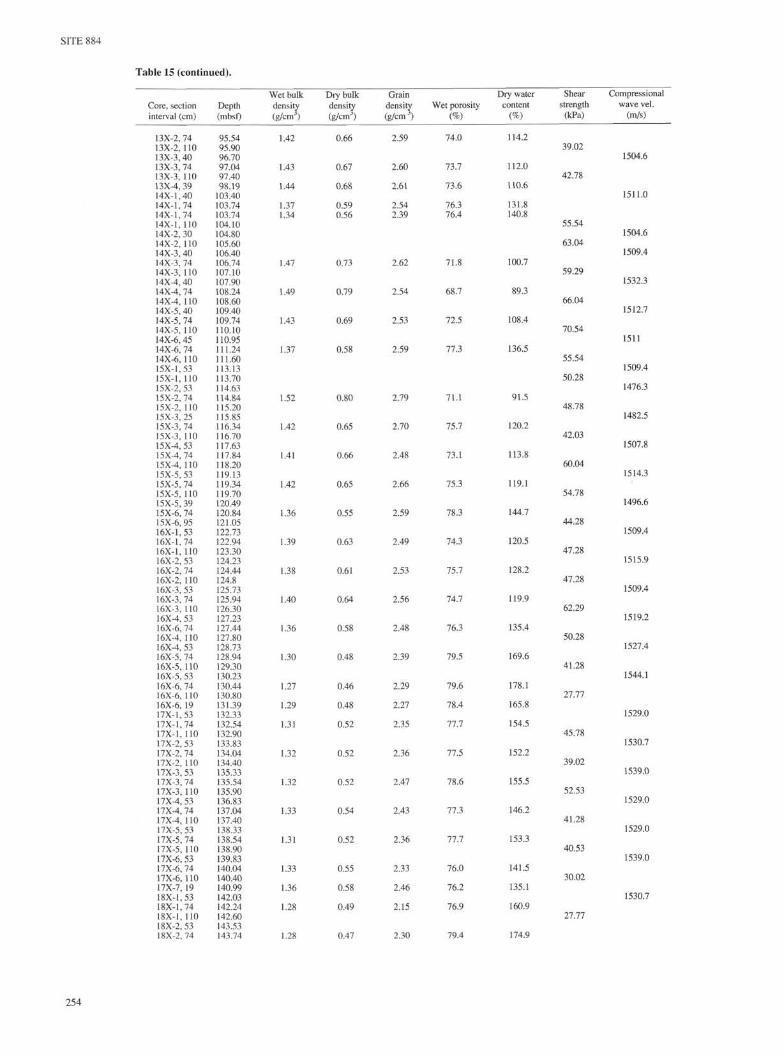
SITE 884
Table 15 (continued).
Core, sectioninterval (cm)
13X-2, 7413X-2, 11013X-3, 4013X-3, 7413X-3, 11013X-4, 3914X-l,4014X-1, 7414X-1,7414X-1,11014X-2, 3014X-2, 11014X-3,4014X-3, 7414X-3, 11014X-4, 4014X-4, 7414X-4, 11014X-5, 4014X-5, 7414X-5, 11014X-6, 4514X-6, 7414X-6, 11015X-1.5315X-1, 11015X-2, 5315X-2, 7415X-2, 11015X-3, 2515X-3, 7415X-3, 11015X-4, 5315X-4, 7415X-4.11015X-5,5315X-5, 7415X-5, 11015X-5, 3915X-6, 7415X-6, 9516X-1, 5316X-1, 7416X-1, 11016X-2, 5316X-2, 7416X-2, 11016X-3, 5316X-3.7416X-3, 11016X-4, 5316X-6, 7416X-4, 11016X-4, 5316X-5, 7416X-5, 11016X-5, 5316X-6, 7416X-6, 11016X-6, 1917X-1, 5317X-1.7417X1, 11017X-2,5317X-2, 7417X-2, 11017X-3, 5317X-3, 7417X-3, 11017X-4, 5317X-4, 7417X-4,11017X-5, 5317X-5.7417X-5, 11017X-6, 5317X-6, 7417X-6, 11017X-7, 1918X-1.5318X-1.7418X-1,11018X-2, 5318X-2, 74
Depth(mbsf)
95.5495.9096.7097.0497.4098.19
103.40103.74103.74104.10104.80105.60106.40106.74107.10107.90108.24108.60109.40109.74110.10110.95111.24111.60113.13113.70114.63114.84115.20115.85116.34116.70117.63117.84118.20119.13119.34119.70120.49120.84121.05122.73122.94123.30124.23124.44124.8125.73125.94126.30127.23127.44127.80128.73128.94129.30130.23130.44130.80131.39132.33132.54132.90133.83134.04134.40135.33135.54135.90136.83137.04137.40138.33138.54138.90139.83140.04140.40140.99142.03142.24142.60143.53143.74
Wet bulkdensity(g/cπθ
1.42
1.43
1.44
1.371.34
1.47
1.49
1.43
1.37
1.52
1.42
1.41
1.42
1.36
1.39
1.38
1.40
1.36
1.30
1.27
1.29
1.31
1.32
1.32
1.33
1.31
1.33
1.36
1.28
1.28
Dry bulkdensity(g/cm)
0.66
0.67
0.68
0.590.56
0.73
0.79
0.69
0.58
0.80
0.65
0.66
0.65
0.55
0.63
0.61
0.64
0.58
0.48
0.46
0.48
0.52
0.52
0.52
0.54
0.52
0.55
0.58
0.49
0.47
Graindensity(g/cm5)
2.59
2.60
2.61
2.542.39
2.62
2.54
2.53
2.59
2.79
2.70
2.48
2.66
2.59
2.49
2.53
2.56
2.48
2.39
2.29
2.27
2.35
2.36
2.47
2.43
2.36
2.33
2.46
2.15
2.30
Wet porosity(%)
74.0
73.7
73.6
76.376.4
71.8
68.7
72.5
77.3
71.1
75.7
73.1
75.3
78.3
74.3
75.7
74.7
76.3
79.5
79.6
78.4
77.7
77.5
78.6
77.3
77.7
76.0
76.2
76.9
79.4
Dry watercontent
(%)
114.2
112.0
110.6
131.8140.8
100.7
89.3
108.4
136.5
91.5
120.2
113.8
119.1
144.7
120.5
128.2
119.9
135.4
169.6
178.1
165.8
154.5
152.2
155.5
146.2
153.3
141.5
135.1
160.9
174.9
Shear
strength(kPa)
39.02
42.78
55.54
63.04
59.29
66.04
70.54
55.54
50.28
48.78
42.03
60.04
54.78
44.28
47.28
47.28
62.29
50.28
41.28
27.77
45.78
39.02
52.53
41.28
40.53
30.02
27.77
Compressional
wave vel.(m/s)
1504.6
1511.0
1504.6
1509.4
1532.3
1512.7
1511
1509.4
1476.3
1482.5
1507.8
1514.3
1496.6
1509.4
1515.9
1509.4
1519.2
1527.4
1544.1
1529.0
1530.7
1539.0
1529.0
1529.0
1539.0
1530.7
254

SITE 884
Table 15 (continued).
Wet bulk Dry bulk Grain Dry water Shear CompressionalCore, section Depth density density density Wet porosity content strength wave vel.interval (cm) (mbsf) (g/crr/) (g/cnT) (g/cm*) (%) (%) (kPa) (m/s)
18X-2, 110 144.10 27.0218X-3,53 145.03 1530.718X-3,74 145.24 1.30 0.51 2.26 77.1 155.018X-3, 110 145.60 28.5218X-4,53 146.53 1529.018X-4,53 146.53 1539.018X-4,74 146.74 1.28 0.46 2.34 80.0 177.918X-4, 110 147.10 30.0218X-5, 15 147.65 1582.118X-5,53 148.03 1532.318X-5,74 148.24 1.30 0.49 2.36 79.0 166.818X-5, 110 148.60 31.5218X-6.53 149.53 1530.718X-6,74 149.74 1.27 0.46 2.27 79.5 177.518X-6, 110 150.10 18.0118X-7, 19 150.69 1.33 0.53 2.42 77.7 150.019X-1,53 151.63 1547.419X-1.74 151.84 1.31 0.53 2.29 76.6 149.319X-1,110 152.20 38.2719X-2,53 153.13 1544.119X-2,74 153.34 1.30 0.49 2.35 78.6 162.919X-2, 110 153.70 26.2719X-3,53 154.63 1529.019X-3.74 154.84 1.32 0.51 2.45 78.8 158.219X-3, 110 155.20 32.2719X-4,53 156.13 1535.719X-4,74 156.34 1.29 0.48 2.32 79.0 169.219X-4, 110 156.70 30.0219X-5,53 157.63 1532.319X-5,74 157.84 1.29 0.50 2.29 78.0 161.219X-5, 110 158.20 33.7719X-6,53 159.13 1545.819X-6,74 159.34 1.29 0.47 2.35 79.6 173.019X-6, 110 159.70 42.0319X-7, 19 160.29 1.29 0.48 2.34 79.2 169.021X-1.53 171.03 1534.021X-1.74 171.24 1.30 0.49 2.42 79.5 166.821X-1, 110 171.60 51.7821X-2,53 172.53 1493.521X-2,74 172.74 1.34 0.55 2.43 77.2 144.521X-2, 110 173.10 45.7821X-3,53 174.03 1530.721X-3,74 174.24 1.32 0.53 2.35 77.2 149.921X-3, 110 174.60 68.2921X-4,53 175.53 1542.421X-4,74 175.74 1.31 0.53 2.23 75.7 145.121X-4, 110 176.10 74.321X-5,53 177.03 1509.421X-5,74 177.24 1.32 0.53 2.38 77.3 148.921X-5, 110 177.60 71.321X-6,74 178.74 1.30 0.52 2.18 75.9 150.021X-6, 110 179.10 52.5321X-7, 19 179.69 1.33 0.54 2.37 76.7 144.622X-1.53 180.63 1544.122X-1.74 180.84 1.31 0.52 2.30 76.8 150.122X4,110 181.20 35.2722X-2,53 182.13 1499.822X-2,74 182.34 1.36 0.59 2.37 74.8 130.222X-2, 110 182.70 34.5222X-3,53 183.63 1549.122X-3,74 183.84 1.27 0.46 2.22 78.9 175.222X-3, 110 184.20 36.0222X-4,53 185.13 1535.722X-4,74 185.34 1.28 0.46 2.32 79.9 178.522X-4, 110 185.70 36.0222X-5,53 186.63 1545.822X-5,74 186.84 1.29 0.49 2.31 78.5 164.722X-5, 110 187.20 45.0322X-6,53 188.13 1544.122X-6,74 188.34 1.33 0.52 2.48 78.5 153.422X-6, 110 188.70 53.2822X-7, 19 189.29 1.30 0.51 2.29 77.3 154.923X-1.35 190.15 1459.523X-1.57 190.37 11.2623X-1.74 190.54 1.23 0.39 2.22 82.3 218.823X-2,53 191.83 1552.523X-2.74 192.04 1.29 0.49 2.3 78.2 162.323X-2, 110 192.40 43.5323X-3,53 193.33 1545.823X-3,74 193.54 1.29 0.49 2.27 78.2 164.723X-3, 110 193.90 44.2823X-4,53 194.83 1545.823X-4,74 195.04 1.31 0.51 2.32 77.6 155.923X-4, 110 195.40 40.53
255

SITE 884
Table 15 (continued).
Wet bulk Dry bulk Grain Dry water Shear CompressionalCore, section Depth density density density Wet porosity content strength wave vel.interval (cm) (mbsf) (g/cπ/) (g/cm*) (g/cm3) (%) (%) (kPa) (m/s)
23X-5,53 196.33 1537.323X-5,74 196.54 1.32 0.54 2.26 75.7 143.623X-5.110 196.90 36.7723X-6,53 197.83 1554.323X-6,74 198.04 1.28 0.46 2.36 80.0 176.923X-6, 110 198.40 53.2823X-7, 19 198.99 1.28 0.46 2.35 80.3 180.624X-1,53 199.93 1539.024X-1,74 200.14 1.28 0.47 2.36 80.0 176.124X-l,110 200.50 48.0324X-2.53 201.43 1545.824X-2,74 201.64 1.24 0.40 2.26 81.9 208.824X-2, 110 202.00 50.2824X-3,53 202.93 1544.124X-3,74 203.14 1.29 0.48 2.32 78.8 167.224X-3, 110 203.50 77.324X-4,53 204.43 1545.824X-4,74 204.64 1.27 0.47 2.15 77.7 168.824X-4, 110 205.00 65.2924X-5,53 205.93 1539.024X-5.74 206.14 1.31 0.51 2.41 78.6 159.024X-5, 110 206.50 92.3124X-6,53 207.43 1547.424X-6,74 207.64 1.36 0.57 2.50 76.9 138.524X-6, 110 208.00 76.5524X-7,19 208.59 1.33 0.53 2.47 78.3 151.625X-1,53 209.63 1547.425X-1,74 209.84 1.31 0.52 2.34 77.4 152.025X-l,110 210.20 36.0225X-2,53 211.13 1535.725X-2,74 211.34 1.28 0.47 2.28 79.0 172.425X-2, 110 211.70 41.2825X-3,53 212.63 1542.425X-3,74 212.84 1.28 0.46 2.33 79.8 177.025X-3, 110 213.20 37.5225X-4,53 214.13 1540.725X-4, 74 214.34 1.32 0.50 2.54 80.0 164.125X-4, 110 214.70 30.0225X-5,53 215.63 1547.425X-5,74 215.84 1.31 0.51 2.29 77.2 153.625X-5.110 216.20 58.5425X-6,53 217.13 1545.825X-6.74 217.34 1.30 0.48 2.41 79.6 168.525X-6, 110 217.70 75.825X-0, 19 218.68 1.35 0.55 2.47 77.2 142.726X-1.53 219.23 1512.726X-1,74 219.44 1.31 0.50 2.44 79.1 162.026X-1, 110 219.80 29.2726X-2,53 220.73 1504.626X-2,74 220.94 1.27 0.45 2.31 80.3 184.026X-2, 110 221.30 53.2826X-3,53 222.23 1499.826X-3,74 222.44 1.28 0.48 2.25 78.3 166.926X-3, 110 222.80 43.5326X-4,53 223.73 1540.726X-4,74 223.94 1.29 0.48 2.32 78.9 167.426X-4, 110 224.30 75.826X-5,53 225.23 1545.826X-5,74 225.44 1.30 0.50 2.31 78.1 160.526X-5, 112 225.82 85.5526X-6,53 226.73 1520.826X-6,74 226.94 1.29 0.48 2.29 78.6 167.626X-6,90 227.10 65.2926X-7, 19 227.39 1.31 0.51 2.38 78.2 157.526X-1,53 228.93 1532.327X-1,74 229.14 1.28 0.45 2.46 81.4 186.127X-1, 110 229.50 45.7827X-2,53 230.43 1540.727X-2,74 230.64 1.30 0.48 2.47 80.1 169.827X-2, 110 231.00 45.0327X-3,53 231.93 1547.427X-3,74 232.14 1.30 0.51 2.25 77.2 156.127X-3, 110 232.50 39.7827X-4,53 233.43 1544.127X-4,74 233.64 1.28 0.46 2.37 80.2 177.927X-4, 110 234.00 57.0427X-5,53 234.93 1549.127X-5,69 235.09 1.29 0.48 2.33 79.1 169.827X-5, 110 235.50 54.0327X-6,53 236.43 1540.727X-6, 74 236.64 1.29 0.48 2.31 78.9 168.927X-6, 110 237.00 63.0427X-7, 19 237.59 1.28 0.46 2.31 79.9 179.127X-1,39 238.39 1.29 0.48 2.32 78.9 167.8
256

SITE 884
Table 15 (continued).
Core, sectioninterval (cm)
28X-28X-28X-29X-29X-
,70,105,53,74,110
29X-2, 5329X-2, 7429X-2, 11029X-3, 5329X-3, 7429X-3, 11029X-1, 4030X-1.7430X-l,11030X-2, 4030X-2, 7430X-2, 11030X-3, 4030X-3, 743OX-3, 11030X-4, 4030X-4, 7430X-4, 1103OX-5,4030X-5, 7430X-5, 11030X-6, 4030X-6, 7430X-6, 11030X-1.4030X-1.7431X-1, 11031X-2,4031X-2, 7431X-2, 11031X-3,4031X-3.7431X-3, 11031X-4.4031X-4, 7431X-4, U031X-5,4031X-5.7431X-5, 11031X-6,4031X-6, 7431X-6, 11031X-7, 3931X-1.4031X-1.7432X-1, 11032X-2, 4032X-2, 7432X-2, 11032X-3,4032X-3, 7432X-3, 11032X-4,4032X-4, 7432X-4, 11032X-5, 4032X-5, 7432X-5, 11032X-5, 4032X-6, 7432X-6, 11032X-7,1932X-1.4032X-1.7432X-1,11033X-2, 4033X-2, 7433X-2, 11033X-3, 4033X-3, 7433X-3, 11033X-4, 4033X-4, 7433X-4, 11033X-5, 4033X-5, 7433X-1.4033X-1, 7433X-1, 110
Depth(mbsf)
238.70239.05248.13248.34248.70249.63249.84250.20251.13251.34251.70257.70258.04258.40259.20259.54259.90260.70261.04261.40262.20262.54262.90263.70264.04264.40265.20265.54265.90267.40267.74268.10268.90269.24269.60270.40270.74271.10271.90272.24272.60273.40273.74274.10274.90275.24275.60276.39277.10277.44277.80278.60278.94279.30280.10280.44280.80281.60281.94282.30283.10283.44283.80284.60284.94285.30285.89286.70287.04287.40288.20288.54288.90289.70290.04290.40291.20291.54291.90292.70293.04296.40296.74297.10
Wet bulkdensity(g/cm*)
1.36
1.33
1.33
1.34
1.34
1.33
1.34
1.37
1.37
1.32
1.38
1.36
1.36
1.34
1.33
1.32
1.31
1.32
1.31
1.32
1.35
1.32
1.34
1.33
1.32
1.27
1.43
1.34
1.41
Dry bulkdensity(g/cm3)
0.60
0.54
0.55
0.56
0.53
0.53
0.55
0.59
0.59
0.51
0.64
0.58
0.57
0.55
0.54
0.53
0.52
0.53
0.53
0.53
0.56
0.54
0.56
0.56
0.54
0.44
0.73
0.55
0.66
Graindensity(g/cm1)
2.38
2.41
2.41
2.41
2.52
2.43
2.43
2.47
2.52
2.47
2.34
2.48
2.51
2.48
2.42
2.31
2.32
2.39
2.28
2.33
2.45
2.28
2.33
2.33
2.36
2.41
2.34
2.41
2.52
Wet porosity(%)
74.4
77.1
77.0
76.4
78.5
77.9
77.1
75.9
76.4
79.0
72.2
76.4
76.7
77.5
77.3
76.6
77.2
77.6
76.4
76.7
76.6
76.0
75.7
75.7
77.0
81.4
68.7
76.8
73.6
Dry watercontent
(%)
126.8
0.6
144.6
139.1
151.2
150.8
144.0
132.1
133.3
159.0
115.0
135.8
136.7
144.8
146.0
147.2
151.9
150.7
147.2
146.9
139.2
144.1
138.4
138.8
147.2
190.6
96.7
142.6
114.9
Shearstrength
(kPa)
25.52
74.30
78.05
81.80
67.54
50.28
60.79
72.80
84.05
79.55
69.04
65.29
57.04
57.04
57.04
75.80
59.29
62.29
66.04
58.54
61.54
78.80
51.03
54.03
49.53
54.78
78.05
Compressionalwave vel.
(m/s)
1545.8
1545.8
1539.0
1532.3
1549.1
1534.0
1539.0
1545.8
1539.0
1527.4
1519.2
1524.1
1527.4
1537.3
1545.8
1509.4
1529.0
1534.0
1539.0
1540.7
1537.3
1562.9
1544.1
1519.2
1532.3
1535.7
1550.8
1517.5
257

SITE 884
Table 15 (continued).
Wet bulk Dry bulk Grain Dry water Shear CompressioπalCore, section Depth density density density Wet porosity content strength wave vel.interval (cm) (mbsf) (g/cm3) (g/cm*> (g/cm5) (%) (%) (kPa) (m/s)
34X-2,74 298.24 1.37 0.60 2.42 74.8 127.434X-2, 110 298.60 72.0534X-3,74 299.74 1.37 0.60 2.40 74.6 126.934X-1.74 306.44 1.32 0.54 2.30 76.1 143.734X4,110 306.80 104.3235X-2, 74 307.94 1.35 0.58 2.38 75.4 133.635X-2, 110 308.30 80.3035X-3,40 309.10 1535.735X-3,74 309.44 1.35 0.58 2.41 75.6 133.535X-3, 110 309.80 85.5535X-4,40 310.60 1509.435X-4,74 310.94 1.37 0.58 2.50 76.4 134.135X-4, 110 311.30 81.8035X-5,74 312.44 1.40 0.64 2.51 74.1 118.635X-5, 120 312.90 87.0635X-6.74 313.94 1.39 0.62 2.47 74.4 122.135X-7, 19 314.89 1.35 0.58 2.35 74.9 131.835X-1.74 316.04 1.42 0.69 2.47 71.8 107.235X-1, 110 316.40 60.7935X-2.40 317.20 1491.936X-2,74 317.54 1.34 0.54 2.43 77.3 145.836X-2, 110 317.90 81.8036X-3,40 318.70 1550.836X-3.74 319.04 1.36 0.59 2.41 75.1 129.636X-3,110 319.40 81.8036X-4,74 320.54 1.40 0.65 2.41 72.7 114.436X-4, 110 320.90 75.8036X-5,40 321.70 1519.236X-5,74 322.04 1.33 0.56 2.28 75.0 13736X-5, 110 322.40 89.3136X-6,48 323.28 1542.436X-6,74 323.54 1.33 0.55 2.33 76.0 141.536X-6, 105 323.85 83.3036X-7.29 324.59 1.36 0.59 2.44 75.4 130.736X-l,40 325.40 1545.836X-1,74 325.74 1.32 0.54 2.32 76.5 145.536X-1, 110 326.10 74.3037X-2,40 326.90 1550.837X-2,74 327.24 1.35 0.56 2.45 76.9 141.437X-2, 110 327.60 90.8137X-3,74 328.74 1.32 0.55 2.29 75.8 141.737X-3, 110 329.10 69.0437X-4,40 329.90 1530.737X-4,74 330.24 1.38 0.61 2.53 75.6 127.837X-4, 110 330.60 78.0537X-5,40 331.40 1537.337X-5,74 331.74 1.34 0.57 2.33 75.1 134.137X-5, 110 332.10 94.5637X-6,40 332.90 1568.137X-6,74 333.24 1.36 0.59 2.46 75.7 131.937X-6, 110 333.61 14.8237X-7,39 334.39 1.35 0.58 2.30 74.3 130.537X-1.74 335.04 1.36 0.59 2.40 75.2 131.337X-1, 110 335.40 71.3037X-2, 74 336.54 1.37 0.61 2.43 74.8 126.538X-2.110 336.90 80.3038X-3,74 338.04 1.33 0.54 2.42 77.2 146.038X-4,74 339.54 1.35 0.57 2.41 76.0 136.638X-4, 110 339.90 74.3038X-5,74 341.04 1.31 0.52 2.32 77.3 152.938X-5, 110 341.40 72.0538X-6,74 342.54 1.34 0.56 2.38 76.1 139.238X-6, 110 342.90 80.3038X-7,39 343.69 1.37 0.60 2.44 75.2 129.538X-1.40 344.30 1535.738X-1.74 344.64 1.34 0.55 2.47 77.4 143.838X-1, 110 345.00 57.0439X-2,74 346.14 1.34 0.56 2.41 76.3 139.339X-2, 110 346.50 66.0439X-3,40 347.30 1568.139X-3,74 347.64 1.32 0.55 2.26 75.2 139.639X-3, 110 348.00 69.0439X-4,40 348.80 1554.339X-4,74 349.14 1.33 0.55 2.33 75.9 140.239X-4, 110 349.50 63.0439X-5,40 350.30 1573.339X-5,74 350.64 1.32 0.54 2.32 76.2 143.939X-5, 110 351.00 82.5539X-6,74 352.14 1.33 0.56 2.30 75.2 137.139X-6, 110 352.50 96.8139X-0,9 353.59 1.34 0.56 2.39 76.3 140.339X-1.50 354.10 1557.739X-1.74 354.34 1.30 0.52 2.21 76.1 149.839X-1, 110 354.70 69.04
258

SITE 884
Table 15 (continued).
Wet bulk Dry bulk Grain Dry water Shear CompressionalCore, section Depth density density density Wet porosity content strength wave vel.interval (cm) (mbsf> (g/cm*) (g/cnr) (g/ciri ) (%) (%) (kPa) (m/s)
40X-2,74 355.84 1.38 0.60 2.50 75.6 128.640X-2, 110 356.20 87.0640X-3,74 357.34 1.34 0.55 2.43 76.9 142.640X-3, 110 357.70 95.3140X-4,74 358.84 1.33 0.55 2.33 76.1 142.040X-4, 110 359.20 70.5440X-5,74 360.34 1.33 0.57 2.27 74.7 135.140X-5, 110 360.70 120.8340X-6,74 361.84 1.37 0.60 2.52 76.0 130.440X-6, 110 362.20 127.5840X-7.39 362.99 1.35 0.58 2.41 75.8 134.740X-1.74 363.84 1.35 0.55 2.48 77.3 142.840X-1, 115 364.25 120.0840X-2, 74 365.34 1.38 0.60 2.57 76.1 129.141X-3,60 366.70 1.36 0.57 2.57 77.6 140.641X-4,54 368.14 1.39 0.60 2.59 76.3 129.641X-5,74 369.84 1.36 0.59 2.44 75.5 131.741X-6.79 371.39 1.35 0.55 2.55 78.0 144.941X-7,29 372.39 1.36 0.56 2.55 77.6 141.141X-1.74 373.44 1.38 0.60 2.52 75.9 130.041X-2,59 374.79 1.38 0.60 2.58 76.4 130.341X-3,74 376.44 1.38 0.61 2.56 75.9 128.242X-3,108 376.78 1539.042X-4,45 377.65 1484.342X-4,74 377.94 1.40 0.63 2.55 74.9 122.042X-5,37 379.07 1570.842X-5.59 379.29 1.39 0.61 2.53 75.4 125.842X-6,74 380.94 1.37 0.60 2.5 75.8 129.842X-7,39 382.09 1.35 0.59 2.33 74.4 129.942X-1,59 382.99 1.33 0.55 2.38 76.6 143.442X-2,59 384.49 1.34 0.58 2.25 73.8 129.942X-3,59 385.99 1.39 0.65 2.41 72.8 115.043X-4,74 387.64 1.35 0.59 2.35 74.5 129.043X-5,74 389.14 1.36 0.58 2.45 75.8 132.843X-6,54 390.44 1.38 0.61 2.48 75.0 125.843X-7,49 391.89 1.36 0.60 2.36 74.3 127.243X-1,80 392.80 1563.243X-1,81 392.81 1.36 0.59 2.44 75.5 130.743X-2, 69 394.19 1.37 0.58 2.55 76.9 136.444X-3,72 395.72 1.36 0.58 2.47 76.1 134.244X-4,73 397.23 1.29 0.53 2.12 74.8 145.544X-5,77 398.77 1.32 0.54 2.32 76.6 146.144X-6,77 400.27 1.36 0.60 2.4 74.9 128.944X-7,3 401.03 1.37 0.58 2.53 76.7 135.044X-1,87 402.57 1.39 0.63 2.5 74.7 122.444X-2,67 403.87 1.36 0.59 2.36 74.6 129.344X-2,67 403.87 1542.845X-3,76 405.46 1.36 0.59 2.46 75.7 131.945X-4,81 407.01 1.34 0.56 2.37 76.1 139.345X-5,89 408.59 1.33 0.54 2.39 77.2 147.245X-6,53 409.73 1.34 0.55 2.38 76.4 141.245X-7,31 411.01 1.34 0.58 2.34 75.0 133.745X-1.81 412.11 1.33 0.55 2.34 76.1 141.845X-2,81 413.61 1.34 0.57 2.35 75.2 134.045X-3,82 415.12 1.39 0.64 2.44 73.4 117.246X-4,82 416.62 1.43 0.70 2.43 70.9 103.946X-4, 100 416.80 1549.346X-5,68 417.98 1558.546X-5,85 418.15 1.46 0.73 2.56 71.1 99.646X-6,75 419.55 1.37 0.59 2.46 75.6 130.946X-7,39 420.19 1.32 0.55 2.31 76.0 142.346X-1, 123 422.13 1.33 0.57 2.28 74.8 135.346X-2,79 423.19 1.30 0.53 2.17 75.5 147.246X-3,86 424.76 1.33 0.55 2.30 75.7 140.847X-4,81 426.21 1.29 0.53 2.09 74.5 145.247X-5,79 427.69 1.30 0.53 2.13 74.8 144.647X-6.82 429.22 1.37 0.62 2.35 73.4 121.547X-7, 19 430.09 1.33 0.53 2.44 77.8 149.647X-1.59 431.19 1.30 0.53 2.17 75.3 146.547X-2, 67 432.77 1.37 0.61 2.41 74.5 126.047X-2,67 432.77 1574.648X-3,55 434.15 1.40 0.66 2.45 72.9 113.548X-3,57 434.17 1545.348X-4,81 435.91 1.39 0.64 2.41 73.2 117.648X-5, 125 437.85 1.35 0.60 2.29 73.3 124.648X-5, 126 437.86 1548.848X-6, 19 438.29 1.36 0.60 2.38 74.5 127.248X-1,88 441.08 1.39 0.62 2.50 74.7 122.548X-1,89 441.09 1563.948X-2,79 442.49 1.37 0.61 2.41 74.1 123.749X-3, 100 444.20 1.38 0.63 2.35 73.0 11949X-3, 101 444.21 1557.649X-4,83 445.53 1.37 0.59 2.46 75.6 131.349X-5,8 446.28 1.39 0.64 2.46 73.7 118.5
259
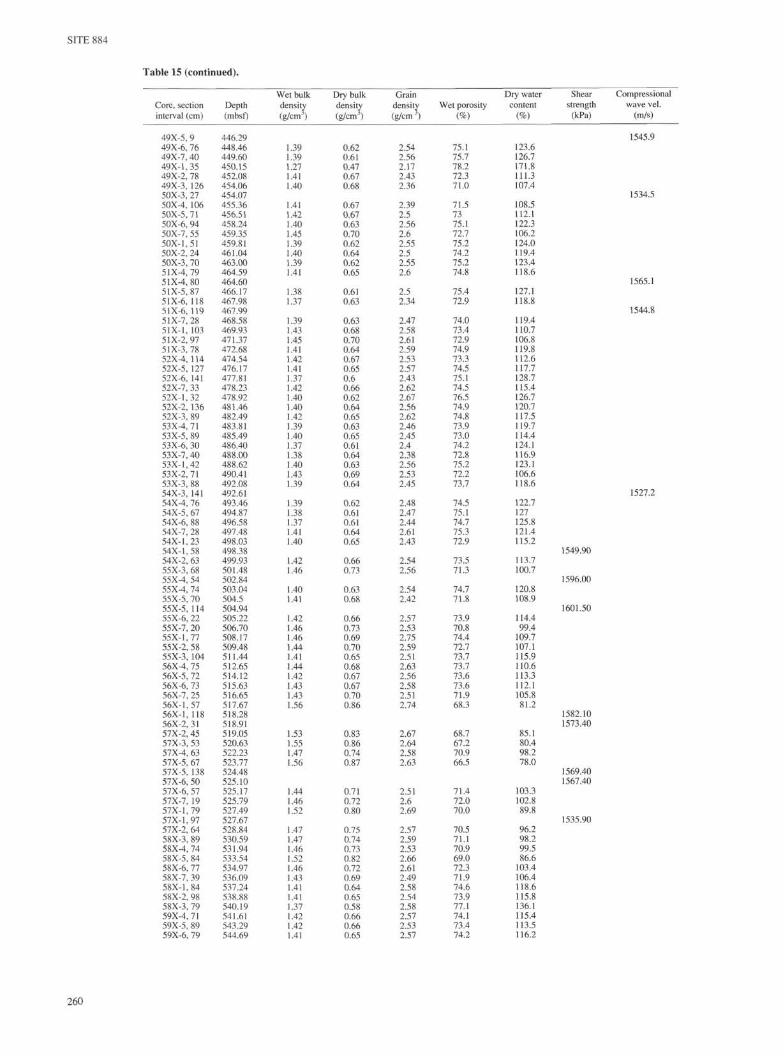
SITE 884
Table 15 (continued).
Core, sectioninterval (cm)
49X-5, 949X-6, 7649X-7,4049X-1.3549X-2, 7849X-3, 1265OX-3, 2750X-4, 10650X-5, 7150X-6, 9450X-7, 5550X-l,5150X-2, 2450X-3, 7051X-4, 7951X-4, 8051X-5, 8751X-6, 11851X-6, 11951X-7, 2851X-1, 10351X-2, 9751X-3, 7852X-4, 11452X-5, 12752X-6, 14152X-7, 3352X-1.3252X-2, 13652X-3, 8953X-4, 7153X-5, 8953X-6, 3053X-7, 4053X-1, 4253X-2,7153X-3, 8854X-3, 14154X-4, 7654X-5, 6754X-6, 8854X-7, 2854X-1,2354X-1,5854X-2, 6355X-3, 6855X-4, 5455X-4, 7455X-5, 7055X-5, 11455X-6, 2255X-7, 2055X-1.7755X-2, 5855X-3, 10456X-4, 7556X-5, 7256X-6, 7356X-7, 2556X-1,5756X-1, 11856X-2, 3157X-2, 4557X-3, 5357X-4, 6357X-5, 6757X-5, 13857X-6, 5057X-6, 5757X-7, 1957X-1.7957X-1.9757X-2, 6458X-3, 8958X-4, 7458X-5, 8458X-6, 7758X-7, 3958X-1.8458X-2, 9858X-3, 7959X-4, 7159X-5, 8959X-6, 79
Depth(mbsf)
446.29448.46449.60450.15452.08454.06454.07455.36456.51458.24459.35459.81461.04463.00464.59464.60466.17467.98467.99468.58469.93471.37472.68474.54476.17477.81478.23478.92481.46482.49483.81485.49486.40488.00488.62490.41492.08492.61493.46494.87496.58497.48498.03498.38499.93501.48502.84503.04504.5504.94505.22506.70508.17509.48511.44512.65514.12515.63516.65517.67518.28518.91519.05520.63522.23523.77524.48525.10525.17525.79527.49527.67528.84530.59531.94533.54534.97536.09537.24538.88540.19541.61543.29544.69
Wet bulkdensity(g/cm*)
1.391.391.271.41.40
1.411.421.401.451,391.401.391.41
1.381.37
1.391.431.451.411.421.411.371.421.401.401.42.39
1.401.37L.381.401.431.39
1.391.381.371.411.40
1.421.46
1.401.41
1.421.461.461.441.411.441.421.431.43.56
1.531.551.471.56
.44
.46
.52
.47
.47
.46
.52
.461.43.41.41.37.42.42.41
Dry bulkdensity(g/cm3)
0.620.610.470.670.68
0.670.670.630.700.620.640.620.65
0.610.63
0.630.680.700.640.670.650.60.660.620.640.650.630.650.610.640.630.690.64
0.620.610.610.640.65
0.660.73
0.630.68
0.660.730.690.700.650.680.670.670.700.86
0.830.860.740.87
0.710.720.80
0.750.740.730.820.720.690.640.650.580.660.660.65
Graindensity(g/cm3)
2.542.562.172.432.36
2.392.52.562.62.552.52.552.6
2.52.34
2.472.582.612.592.532.572.432.622.672.562.622.462.452.42.382.562.532.45
2.482.472.442.612.43
2.542.56
2.542.42
2.572.532.752.592.512.632.562.582.512.74
2.672.642.582.63
2.512.62.69
2.572.592.532.662.612.492.582.542.582.572.532.57
Wet porosity(%)
75.175.778.272.371.0
71.57375.172.775.274.275.274.8
75.472.9
74.073.472.974.973.374.575.174.576.574.974.873.973.074.272.875.272.273.7
74.575.174.775.372.9
73.571.3
74.771.8
73.970.874.472.773.773.773.673.671.968.3
68.767.270.966.5
71.472.070.0
70.571.170.969.072.371.974.673.977.174.173.474.2
Dry watercontent
(%)
123.6126.7171.8111.3107.4
108.5112.1122.3106.2124.0119.4123.4118.6
127.1118.8
119.4110.7106.8119.8112.6117.7128.7115.4126.7120.7117.5119.7114.4124.1116.9123.1106.6118.6
122.7127125.8121.4115.2
113.7100.7
120.8108.9
114.499.4
109.7107.1115.9110.6113.3112.1105.881.2
85.180.498.278.0
103.3102.889.8
96.298.299.586.6
103.4106.4118.6115.8136.1115.4113.5116.2
Shearstrength
(kPa)
1549.90
1596.00
1601.50
1582.101573.40
1569.401567.40
1535.90
Compressionalwave vel.
(m/s)
1545.9
1534.5
1565.1
1544.8
1527.2

SITE 884
Table 15 (continued).
Wet bulk Dry bulk Grain Dry water Shear CompressionalCore, section Depth density density density Wet porosity content strength wave vel.interval (cm) (mbsf) (g/crri) (g/cnrO (g/cm5) (%) (%) (kPa) (m/s)
59X-1,76 546.86 1.39 0.62 2.54 75.1 123.659X-2, 81 548.41 1.36 0.59 2.37 74.8 130.359X-3,59 549.69 1.37 0.61 2.42 74.4 125.060X-4,84 551.44 1.37 0.61 2.42 74.5 125.360X-5,67 552.77 1.37 0.61 2.37 73.9 124.160X-6,91 554.51 1.35 0.59 2.33 74.5 130.060X-7,44 555.54 1.38 0.62 2.42 74.0 122.460X-l,74 556.34 1.34 0.57 2.27 74.4 132.960X-2,69 557.79 1.34 0.56 2.37 76.0 138.760X-3,59 559.19 1.34 0.56 2.41 76.4 139.761X-4,69 560.79 1.37 0.61 2.39 74.2 124.561X-5,81 562.41 1.32 0.55 2.25 75.3 140.561X-6, 69 563.79 1.34 0.58 2.34 75.1 133.861X-1,74 566.04 1.35 0.58 2.33 74.8 131.861X-2,79 567.59 1.38 0.61 2.43 74.4 124.261X-3,75 569.05 1.34 0.56 2.38 76.1 139.062X-4,81 570.61 1.39 0.63 2.47 74.1 120.262X-5,77 572.07 1.38 0.62 2.45 74.3 122.962X-6,63 573.43 1.34 0.56 2.34 75.7 137.862X-1,23 575.03 1.36 0.60 2.36 74.4 127.562X-2, 104 577.34 1.36 0.59 2.42 75.3 131.262X-3,55 578.35 1.34 0.57 2.35 75.3 135.363X-4,84 580.14 1.35 0.58 2.42 75.8 134.663X-5,94 581.74 1.39 0.64 2.42 73.0 116.263X-6,55 582.85 1.37 0.60 2.52 76.0 130.863X-1,54 584.94 1.33 0.55 2.32 75.9 141.463X-1,92 585.32 1531.463X-2,65 586.55 1.39 0.62 2.57 75.5 124.964X-2, 103 586.93 1530.364X-3.66 588.06 1.38 0.60 2.58 76.6 131.664X-4,79 589.69 1.40 0.64 2.47 73.7 117.864X-5,29 590.69 1.53 0.84 2.61 67.3 81.864X-6,92 592.12 1.55 0.85 2.65 67.5 81.164X-7,79 593.49 1.52 0.83 2.54 67.0 82.664X-1,81 594.91 1.56 0.88 2.61 66.0 76.864X-2,54 596.14 1.42 0.69 2.4 70.9 105.264X-3,87 597.97 1.57 0.91 2.62 65.1 73.565X-4,73 599.33 1.46 0.73 2.56 71.2 99.965X-5.51 600.61 1.58 0.93 2.61 64.2 70.965X-6,48 602.08 1.57 0.88 2.72 67.5 78.965X-6,82 602.42 1538.465X-7, 56 603.66 1.49 0.77 2.6 70.1 93.265X-1,74 604.54 1.51 0.82 2.55 67.6 84.865X-2,6 605.36 1564.065X-2,74 606.04 1.61 0.96 2.63 63.4 67.966X-3,79 607.59 1.54 0.84 2.7 68.4 83.166X-4,74 609.04 1.60 0.94 2.67 64.6 70.766X-4, 120 609.50 1582.966X-5,59 610.39 1.53 0.83 2.69 69.0 85.566X-6, 14 611.44 1581.366X-6,74 612.04 1.52 0.81 2.69 69.4 87.566X-1.74 614.04 1.48 0.76 2.6 70.5 95.266X-1, 115 614.45 1583.166X-2,64 615.44 1.66 1.02 2.76 62.8 63.267X-3,79 617.09 1.72 1.11 2.76 59.6 55.267X-4,74 618.54 1.65 1.02 2.69 61.9 62.467X-4,84 618.64 1621.967X-5,79 620.09 1.75 1.16 2.73 57.2 50.567X-6,49 621.29 1.73 1.14 2.74 58.1 52.367X-1,79 623.59 1.71 1.14 2.55 55.0 49.467X-2, 89 625.19 1.61 0.95 2.67 64.0 68.767X-3,69 626.49 1.74 1.18 2.64 55.2 48.168X-4,74 628.04 1.65 1.00 2.73 63.2 64.868X-5, 105 629.85 1.51 0.81 2.56 68.0 85.868X-5, 146 630.26 1555.268X-6,79 631.09 1.62 0.96 2.75 64.8 69.168X-7,49 632.29 1.71 1.10 2.74 59.8 55.968X-1, 134 633.74 1.50 0.81 2.50 67.4 85.568X-1, 146 633.86 1585.768X-2, 133 635.23 1.41 0.67 2.49 72.9 11269X-3,132 636.72 1.54 0.83 2.74 69.3 85.369X-3, 139 636.79 1584.069X-4,66 637.56 1.59 0.92 2.72 65.9 73.569X-5,74 639.14 1.78 1.22 2.71 54.9 46.269X-5, 123 639.63 1641.069X-6,88 640.78 1.73 1.16 2.67 56.4 5069X-7,51 641.91 1.76 1.18 2.71 56.0 48.569X-1, 131 643.31 1.74 1.14 2.78 58.6 52.569X-2,44 643.94 1.77 1.22 2.65 53.9 45.469X-2,52 644.02 1587.570X-3, 50 645.50 1.76 1.20 2.7 55.5 47.670X-4,91 647.41 1.58 0.93 2.56 63.4 69.870X-5, 101 649.01 1.57 0.89 2.66 66.2 76.170X-5, 107 649.07 1550.1
261

SITE 884
Table 15 (continued).
Core, sectioninterval (cm)
70X-6, 6870X-6, 7770X-7, 4270X-1.8970X-1, 10170X-2, 6171X-3.3671X-3.4171X-4, 4271X-5,4271X-5, 8371X-6, 7471X-7, 2071X1, 11171X-2, 10671X-2, 11772X-3, 10672X-4, 8672X-4, 9972X-5, 3372X-5, 4772X-6, 7772X-7, 4372X-1, 5772X-1.6572X-2, 7873X-3, 5973X-3, 6573X-4, 6373X-4, 6973X-5, 3973X-1.4073X-2, 4573X-3, 8174X-4, 3574X-5, 7074X-5, 10274X-6, 6274X-7, 3174X-1.7274X-1, 10374X-2, 5575X-3, 8675X-4, 5875X-4, 11175X-5, 7075X-5, 7875X-6, 5275X-7, 2475X-1.7075X-1.8975X-2, 7476X-3, 6876X-3, 12076X-4, 5876X-5, 7576X-5, 8276X-6, 1776X-6, 2376X-6, 2376X-7,4576X-1.4576X-2, 6376X-3, 9677X-3, 10377X-4, 7777X-5, 8477X-5, 11577X-6, 7477X-7, 3777X-0, 2177X-1, 7477X-2, 4377X-2, 7478X-3, 3978X-3, 7478X-4, 7478X-5, 1578X-5, 7478X-1.7478X-2, 1678X-2, 7979X-3, 6779X-4, 84
Depth(mbsf)
650.18650.27651.42652.59652.71653.81655.06655.11656.62658.12658.53659.94660.9662.41663.86663.97665.36666.66666.79667.63667.77669.57670.73671.57671.65673.28674.59674.65676.13676.19677.39681.00682.55684.41685.45687.30687.62688.72689.91690.92691.23692.25694.06695.28695.81696.90696.98698.22698.94700.50700.69702.04703.48704.00704.88706.55706.62707.47707.53707.53709.25709.95711.63713.46713.53714.77716.34716.65717.74718.87719.32719.84721.03721.34722.49722.84724.34725.25725.84729.54730.46731.09732.47734.14
Wet bulkdensity(g/cm3)
1.531.491.45
1.52
.54
.46
.51
.58
.53
.55
.52
1.50
1.48
1.491.581.461.47
1.55
1.511.71
1.671.561.441.341.36
1.351.471.53
1.361.411.69
1.471.52
1.731.751.61
1.571.59
1.451.73
1.501.501.571.811.451.52
1.471.78
1.681.731.661.71
1.39
1.571.67
1.381.61
1.561.57.63
Dry bulkdensity(g/cm*)
0.830.780.71
0.81
0.840.720.79
0.890.870.870.82
0.78
0.78
0.780.900.730.74
0.85
0.811.08
1.060.880.720.550.57
0.520.730.83
0.540.651.06
0.720.79
1.171.180.93
0.870.95
0.721.16
0.780.780.881.240.710.83
0.711.27
1.051.131.061.11
0.62
0.881.05
0.570.96
0.880.870.98
Graindensity(g/cm5)
2.612.552.54
2.69
2.732.612.67
2.742.482.662.63
2.66
2.48
2.612.692.622.67
2.71
2.572.82
2.632.672.442.472.59
2.752.702.63
2.792.602.75
2.712.79
2.622.722.77
2.752.58
2.532.66
2.662.662.772.772.612.57
2.782.55
2.732.752.582.71
2.52
2.702.70
2.722.62
2.632.722.71
Wet porosity(%)
67.868.971.6
69.6
69.172.170.0
67.464.667.268.6
70.3
68.2
70.066.271.972.2
68.4
68.161.5
59.666.870.077.277.8
80.672.768.2
80.474.761.2
73.171.3
55.256.566.0
68.063.0
71.456.3
70.270.268.054.872.567.3
74.150.2
61.158.458.658.6
75.1
67.261.0
78.762.9
66.267.663.6
Dry watercontent
(%)
83.390.0
102.9
88.0
84.6102.890.5
78.076.079.485.8
92.2
89.5
92.475.1
101.4100.6
82.8
85.758.5
57.878.099.0
143.0140.5
158102.484.2
153.2117.859.1
104.392.4
48.549.272.4
79.968.0
101.949.9
91.791.779.445.1
104.482.9
106.640.6
59.552.756.453.9
124.4
78.359.6
141.666.9
77.079.366.6
Shear Compressionalstrength wave vel.
(kPa) (m/s)
1576.1
1582.7
1571.2
1569.6
1584.8
1606.0
1582.1
1577.0
1575.1
1631.2
1589.9
1612.2
1604.8
1683.0
1592.8
1610.7
1880.21664.3
1666.4
1653.7
1598.9
1587.3
1722.0
1618.5

SITE 884
Table 15 (continued).
Core, sectioninterval (cm)
79X-4, 14379X-5, 4979X-6, 3479X-6, 7479X-1, 7479X-1, 8879X-2, 7480X-2, 14180X-3, 1480X-3, 5980X-4, 5980X-4, 10480X-4, 1098OX-5, 13480X-6, 2280X-6, 4480X-0, 2080X-l,6880X-2, 6980X-2, 10381X-3, 2181X-3, 2581X-3, 7981X-4, 3081X-1.8981X-1, 10881X-2, 8482X-3, 5982X-3, 7882X-4, 6382X-4, 11682X-5, 7482X-5, 8382X-6, 7482X-1, 7982X-2, 5482X-2, 9283X-3, 5883X-3, 7483X-4, 7483X-4, 12983X-5, 7383X-5, 7983X-6, 7983X-7, 6983X-7, 8083X-1.7483X-2, 7983X-2, 8584X-3, 7584X-4, 8884X-4, 9784X-5, 6484X-6, 5684X-6, 6284X-7, 3284X-1.8384X-1.9484X-2, 6385X-2, 6585X-3, 5985X-4, 7785X-5, 6585X-5,7185X-6, 5685X-7, 785X-7, 1785X-1.7885X-1.8385X-2, 786X-3, 6586X-3, 10686X-4, 2386X-5, 10486X-5, 10886X-6,4586X-6, 5486X-7, 2086X-1.6886X-2, 6286X-2, 6887X-3, 9987X-4, 2387X-4, 29
Depth(mbsf)
734.73735.29736.64737.04739.14739.28740.64741.31741.54741.99743.49743.94743.99745.74746.12746.34747.71748.78750.29750.63751.31751.35751.89752.90758.59758.78760.04761.29761.48762.83763.36764.44764.53765.94768.19769.44769.82770.98771.14772.64773.19774.13774.19775.69776.44776.55111.14779.29779.35780.75782.38782.47783.64785.06785.12786.32787.53787.64788.83788.85790.29791.97793.35793.41794.76795.77795.87797.18797.23797.97800.05800.46801.13803.44803.48804.35804.44805.10806.78808.22808.28810.09810.83810.89
Wet bulkdensity(g/cm*)
1.60
1.471.46
1.46
1.471.65
1.761.40
1.371.661.701.95
1.841.901.631.83
2.011.87
1.82
1.83
1.961.991.93
1.941.92
1.731.912.01
1.811.92
1.711.79
1.84
1.581.711.79
1.75
1.941.861.66
1.77
1.891.82
1.921.92
2.01
1.83
1.591.731.881.82
1.781.91
Dry bulkdensity(g/cm*)
0.93
0.770.73
0.69
0.731.00
1.170.66
0.561.001.061.46
1.301.410.981.29
1.581.35
1.27
1.28
1.491.541.45
1.471.39
1.121.421.55
1.251.40
1.091.21
1.27
0.901.061.22
1.16
1.461.341.04
1.20
1.361.28
1.461.44
1.57
1.27
0.941.171.381.27
1.211.40
Graindensity(g/cm3)
2.76
2.442.59
2.74
2.622.75
2.792.44
2.682.872.862.81
2.772.712.712.74
2.732.76
2.75
2.82
2.762.752.72
2.752.88
2.742.752.8
2.812.88
2.82.82
2.86
2.722.882.75
2.74
2.772.772.66
2.72
2.822.74
2.662.75
2.76
2.81
2.62.612.732.77
2.732.77
Wet porosity(%)
66.0
68.171.6
74.4
71.763.2
57.772.6
78.864.962.748.0
52.847.963.752.5
41.951.0
53.6
54.4
45.843.846.3
46.451.5
58.748.444.3
55.551.4
60.656.8
55.5
66.762.955.4
57.4
47.251.560.7
55.7
51.753.1
44.947.4
42.8
54.6
63.754.949.354.1
55.449.0
Dry watcontem
(%)
72.9
90.3100.9
109.8
100.064.6
50.4112.5
144.366.660.633.8
41.534.966.941.5
27.238.8
43.3
43.6
31.529.232.7
32.538.0
53.635.029.2
45.637.7
56.748.1
44.8
76.060.746.6
50.8
33.139.559.8
47.6
39.042.6
3 1.533.8
28.0
44.2
69.648.036.843.8
46.935.8
Shearstrength
(kPa)
Compressionalwave vel.
(m/s)
1953.4
1780.4
1584.3
2246.72154.3
1603.8
1554.5
1714.91706.0
1664.4
1775.7
1657.7
1651.5
1980.01848.7
1697.41772.5
1838.4
1633.1
1673.2
1625.3
1664.4
2163.0
1994.3
1742.0
1684.5
1879.6
1716.2
2138.6
1688.8
1762.3
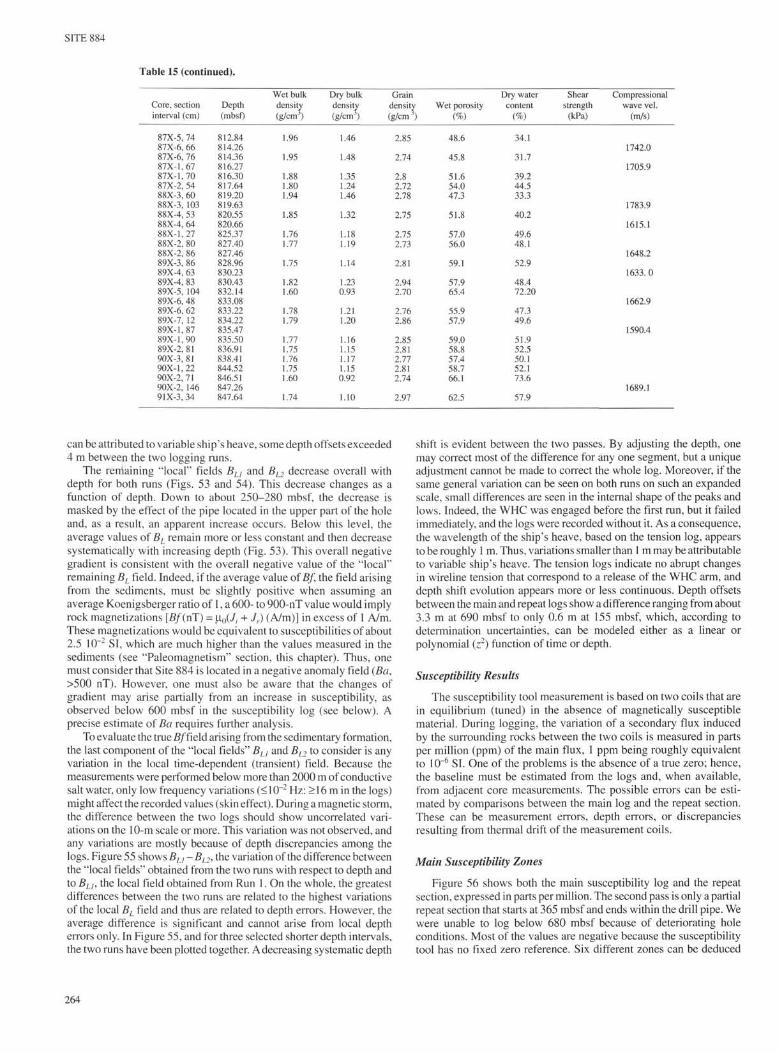
SITE 884
Table 15 (continued).
Core, sectioninterval (cm)
87X-5, 7487X-6, 6687X-6, 7687X-1.6787X-1.7087X-2, 5488X-3, 6088X-3, 10388X-4, 5388X-4, 6488X-1, 2788X-2, 8088X-2, 8689X-3, 8689X-4, 6389X-4, 8389X-5, 10489X-6, 4889X-6, 6289X-7, 1289X-1,8789X-1.9089X-2, 8190X-3, 8190X-1.2290X-2,7190X-2, 14691X-3,34
Depth(mbsf)
812.84814.26814.36816.27816.30817.64819.20819.63820.55820.66825.37827.40827.46828.96830.23830.43832.14833.08833.22834.22835.47835.50836.91838.41844.52846.51847.26847.64
Wet bulkdensity(g/cm3)
1.96
1.95
1.881.801.94
1.85
1.761.77
1.75
1.821.60
1.781.79
1.771.751.761.751.60
1.74
Dry bulkdensity(g/cm*)
1.46
1.48
1.351.241.46
1.32
1.181.19
1.14
1.230.93
1.211.20
1.161.151.171.150.92
1.10
Graindensity(g/cm-1)
2.85
2.74
2.82.722.78
2.75
2.752.73
2.81
2.942.70
2.762.86
2.852.812.772.812.74
2.97
Wet porosity(%)
48.6
45.8
51.654.047.3
51.8
57.056.0
59.1
57.965.4
55.957.9
59.058.857.458.766.1
62.5
Dry watercontent
(%)
34.1
31.7
39.244.533.3
40.2
49.648.1
52.9
48.472.20
47.349.6
51.952.550.152.173.6
57.9
Shearstrength
(kPa)
Compressionalwave vel.
(m/s)
1742.0
1705.9
1783.9
1615.1
1648.2
1633. 0
1662.9
1590.4
1689.1
can be attributed to variable ship's heave, some depth offsets exceeded4 m between the two logging runs.
The remaining "local" fields Bu and BL2 decrease overall withdepth for both runs (Figs. 53 and 54). This decrease changes as afunction of depth. Down to about 250-280 mbsf, the decrease ismasked by the effect of the pipe located in the upper part of the holeand, as a result, an apparent increase occurs. Below this level, theaverage values of BL remain more or less constant and then decreasesystematically with increasing depth (Fig. 53). This overall negativegradient is consistent with the overall negative value of the "local"remaining BL field. Indeed, if the average value of Bf, the field arisingfrom the sediments, must be slightly positive when assuming anaverage Koenigsberger ratio of 1, a 600- to 900-nT value would implyrock magnetizations [5/(nT) = µ0(i, + J,.) (A/m)] in excess of 1 A/m.These magnetizations would be equivalent to susceptibilities of about2.5 I0"2 S1, which are much higher than the values measured in thesediments (see "Paleomagnetism" section, this chapter). Thus, onemust consider that Site 884 is located in a negative anomaly field (Ba,>500 nT). However, one must also be aware that the changes ofgradient may arise partially from an increase in susceptibility, asobserved below 600 mbsf in the susceptibility log (see below). Aprecise estimate of Ba requires further analysis.
To evaluate the true 5/field arising from the sedimentary formation,the last component of the "local fields" BL] and BL2
t 0 consider is anyvariation in the local time-dependent (transient) field. Because themeasurements were performed below more than 2000 m of conductivesalt water, only low frequency variations (<10~2 Hz: >16 m in the logs)might affect the recorded values (skin effect). During a magnetic storm,the difference between the two logs should show uncorrelated vari-ations on the 10-m scale or more. This variation was not observed, andany variations are mostly because of depth discrepancies among thelogs. Figure 55 shows BLj - BL2, the variation of the difference betweenthe "local fields" obtained from the two runs with respect to depth andto BLh the local field obtained from Run 1. On the whole, the greatestdifferences between the two runs are related to the highest variationsof the local BL field and thus are related to depth errors. However, theaverage difference is significant and cannot arise from local deptherrors only. In Figure 55, and for three selected shorter depth intervals,the two runs have been plotted together. A decreasing systematic depth
shift is evident between the two passes. By adjusting the depth, onemay correct most of the difference for any one segment, but a uniqueadjustment cannot be made to correct the whole log. Moreover, if thesame general variation can be seen on both runs on such an expandedscale, small differences are seen in the internal shape of the peaks andlows. Indeed, the WHC was engaged before the first run, but it failedimmediately, and the logs were recorded without it. As a consequence,the wavelength of the ship's heave, based on the tension log, appearsto be roughly 1 m. Thus, variations smaller than 1 m may be attributableto variable ship's heave. The tension logs indicate no abrupt changesin wireline tension that correspond to a release of the WHC arm, anddepth shift evolution appears more or less continuous. Depth offsetsbetween the main and repeat logs show a difference ranging from about3.3 m at 690 mbsf to only 0.6 m at 155 mbsf, which, according todetermination uncertainties, can be modeled either as a linear orpolynomial (z2) function of time or depth.
Susceptibility Results
The susceptibility tool measurement is based on two coils that arein equilibrium (tuned) in the absence of magnetically susceptiblematerial. During logging, the variation of a secondary flux inducedby the surrounding rocks between the two coils is measured in partsper million (ppm) of the main flux, 1 ppm being roughly equivalentto I0"6 S1. One of the problems is the absence of a true zero; hence,the baseline must be estimated from the logs and, when available,from adjacent core measurements. The possible errors can be esti-mated by comparisons between the main log and the repeat section.These can be measurement errors, depth errors, or discrepanciesresulting from thermal drift of the measurement coils.
Main Susceptibility Zones
Figure 56 shows both the main susceptibility log and the repeatsection, expressed in parts per million. The second pass is only a partialrepeat section that starts at 365 mbsf and ends within the drill pipe. Wewere unable to log below 680 mbsf because of deteriorating holeconditions. Most of the values are negative because the susceptibilitytool has no fixed zero reference. Six different zones can be deduced
264

SITE 884
Wet-bulk density Dry-bulk density Dry-water content Wet porosity(g/cm3) (g/cm3) (%) (%) Lith.
1.0 1.4 1.8 0.2 0.6 1.0 1.4 0 100 200 40 60 80 unit
200 -
^ 400 -
CDQ
600 -
800 -
1000
IA
IB
Figure 37. Index property data vs. depth for Hole 884C. Lithologic units are shown at right.
from these logs. From 60 to about 120 mbsf, average susceptibilityvalues are high and have numerous narrow peaks. Between 120 andabout 245 mbsf, the average susceptibility is low and contains a fewlocal anomalies. Note that the apparent minimum values, which seemto correspond to a flat line, are not the result of a zero susceptibilitybut are the result of the lower cutoff from the channel used for thatrepresentation. Because of the limited discrete possible values fordigitization, two channels are available for susceptibility. One of them,represented here, has a high resolution of 1 ppm/step but a limiteddynamic range, whereas the other one has a 5 ppm/step resolution buta broader range. When checking the lower resolution channel, valueslower than the apparent limit of Figure 56 were obtained for that zone.From 245 to about 360 mbsf, the average susceptibility gently increasesuntil it reaches a constant level. The data show that susceptibilitychanges occur within narrow zones. Below 360 and down to about 460mbsf, the average susceptibility remains the same, but the signal showsbroader anomalies than in the overlying zone. Between 460 and 630mbsf, the average susceptibility is slightly higher and has broad andsmooth variations. Below 630 mbsf to the bottom of the log, suscepti-bility increases markedly with depth.
Analysis of the Susceptibility Records
Figure 57 shows a close-up of the susceptibility records, correctedfor a -2750 offset of the zero value, for the 60 to 360 mbsf intervalof the repeat section. The correlation between the main log (Run 1)and the repeat section is good in terms of their general shape andvariability. No broad discrepancies exist between the two runs, indi-cating few large measurement errors or thermal drift. However,fine-scale differences do occur.
In Figure 58, a plot is presented for the first run between 60 and360 mbsf as well as the difference in susceptibility between the tworuns (k2 - k ). In some zones, the difference is small and more or lessconstant at about 20 ppm. Thermal drift is a function of two tempera-tures: the external temperature measured at the receiving coil and the
difference in temperature between the excited coil and the receivingcoil. The temperature of the tool decreased during logging operations,but temperature differences between the two runs remained within2°C, and the observed discrepancy, in the zone where few suscepti-bility discrepancies exist between the two logs, is consistent with theknown thermal drift of the tool. Most of the highest peaks on thedifference plot are related to zones of high susceptibility variationsand thus to depth discrepancy. When compared with the log from Hole883F, the differences are much larger and are not related to local depthdiscrepancies only. Figure 58 also presents a detailed plot of the tworuns at the same scale for three zones. As for the total induction (Bfield) logs, a systematic depth shift was observed between the twosusceptibility runs, which indicates an overall decrease with decreas-ing depth (Fig. 58). However, the evolution of that depth shift is notregular; it begins at about a 2.2-m offset at 350 mbsf and declines toabout 0.4 m at 60 mbsf, with an intermediate minimum of 0.9 m at290 mbsf and a local maximum of 1.6 at 225 mbsf. As for the tensionlogs, the ship's heave during the susceptibility runs was more signifi-cant and more variable than during the total field logging, whichinduced small-scale errors. This can explain why the detailed com-parisons are more difficult on the expanded scale susceptibility plots.
The analysis of the total induction (B field) and susceptibility logsreveals that two common problems compromise data quality. The firstproblem is that the WHC was not operational. Indeed, if repeatabilityis good above the 2-m scale, it becomes poorer for smaller intervals.One must use caution when interpreting small-scale variations inthese magnetic logs. Had sea-state conditions been calmer duringlogging, we may have been able to isolate the cause of the secondproblem: the larger-valued depth errors. As the hole was collapsing,the bottom of the hole was unexpectedly reached twice: before Run2 of the magnetometer and before Run 1 of the susceptibility tool.Both cases seem to have been related to the problem of depth shift.Indeed, the data show that the apparent depth of anomalies that canbe correlated between the two runs is higher when the bottom of thehole is reached just before the beginning of a log.
265
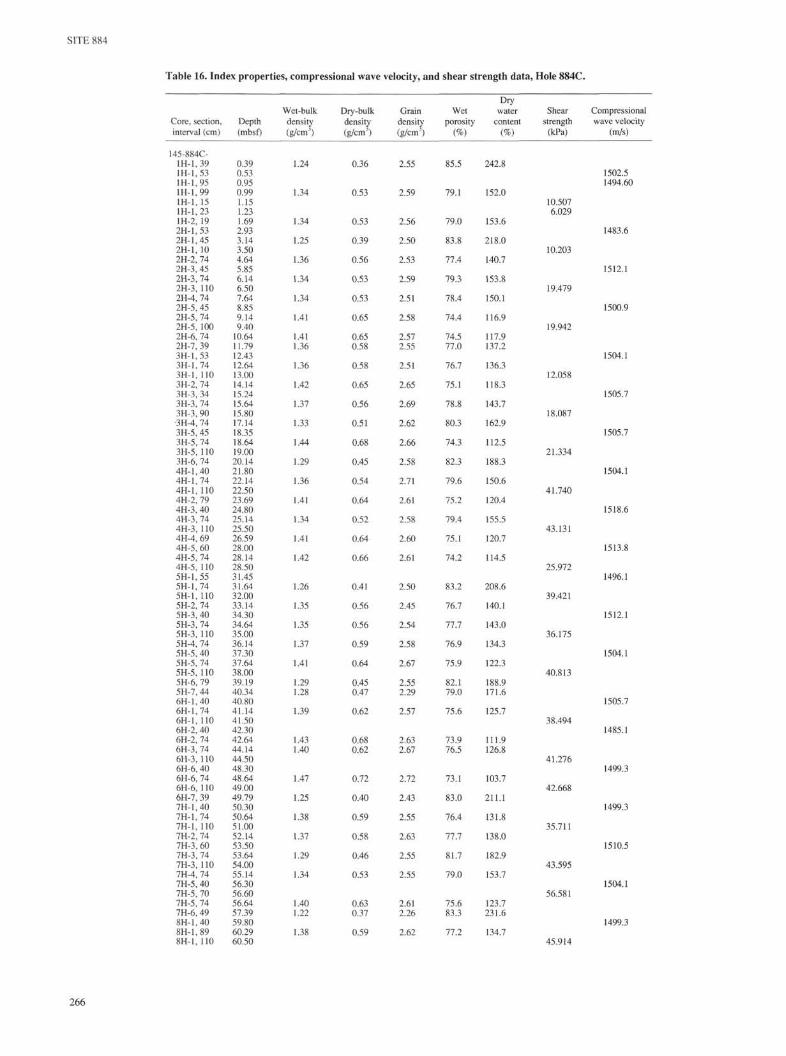
SITE 884
Table 16. Index properties, compressional wave velocity, and shear strength data, Hole 884C.
Core, section,interval (cm)
Depth(mbsf)
Wet-bulkdensity(g/cm*)
Dry-bulkdensity(g/cm*)
Graindensity(g/cm*)
Wetporosity
(%)
Drywater
content(%)
Shearstrength
(kPa)
Compressionalwave velocity
(m/s)
145-884C-1H-1.391H-1,531H-1,951H-1,991H-1,151H-1,231H-2, 192H-1.532H-1,452H-1, 102H-2, 742H-3, 452H-3, 742H-3, 1102H-4, 742H-5, 452H-5, 742H-5, 1002H-6, 742H-7, 393H-1,533H-1,743H-1, 1103H-2, 743H-3, 343H-3, 743H-3, 903H-4, 743H-5, 453H-5, 743H-5, 1103H-6, 744H-l,404H-1,744H-1, 1104H-2, 794H-3,404H-3, 744H-3, 1104H-4, 694H-5, 604H-5, 744H-5, 1105H-1,555H-1, 745H-1, 1105H-2, 745H-3, 405H-3, 745H-3, 1105H-4, 745H-5,405H-5, 745H-5, 1105H-6, 795H-7, 446H-l,406H-1,746H-1.1106H-2, 406H-2, 746H-3, 746H-3, 1106H-6, 406H-6, 746H-6, 1106H-7, 397H-l,407H-1,747H-l,1107H-2, 747H-3, 607H-3, 747H-3, 1107H-4, 747H-5, 407H-5, 707H-5, 747H-6, 498H-l,408H-1,898H-1, 110
0.390.530.950.991.151.231.692.933.143.504.645.856.146.507.648.859.149.40
10.6411.7912.4312.6413.0014.1415.2415.6415.8017.1418.3518.6419.0020.1421.8022.1422.5023.6924.8025.1425.5026.5928.0028.1428.5031.4531.6432.0033.1434.3034.6435.0036.1437.3037.6438.0039.1940.3440.8041.1441.5042.3042.6444.1444.5048.3048.6449.0049.7950.3050.6451.0052.1453.5053.6454.0055.1456.3056.6056.6457.3959.8060.2960.50
1.24
1.34
1.34
1.25
1.36
1.34
1.34
1.41
1.411.36
1.36
1.42
1.37
1.33
1.44
1.29
1.36
1.41
1.34
1.41
1.42
1.26
1.35
1.35
1.37
1.41
1.291.28
1.39
1.431.40
1.47
1.25
1.38
1.37
1.29
1.34
1.401.22
1.38
0.36
0.53
0.53
0.39
0.56
0.53
0.53
0.65
0.650.58
0.58
0.65
0.56
0.51
0.68
0.45
0.54
0.64
0.52
0.64
0.66
0.41
0.56
0.56
0.59
0.64
0.450.47
0.62
2.55
2.59
2.56
2.50
2.53
2.59
2.51
2.58
2.572.55
2.51
2.65
2.69
2.62
2.66
2.58
2.71
2.61
2.58
2.60
2.61
2.50
2.45
2.54
2.58
2.67
2.552.29
2.57
85.5
79.1
79.0
83.8
77.4
79.3
78.4
74.4
74.577.0
76.7
75.1
78.8
80.3
74.3
82.3
79.6
75.2
79.4
75.1
74.2
83.2
76.7
77.7
76.9
75.9
82.179.0
75.6
242.8
152.0
153.6
218.0
140.7
153.8
150.1
116.9
117.9137.2
136.3
118.3
143.7
162.9
112.5
188.3
150.6
120.4
155.5
120.7
114.5
208.6
140.1
143.0
134.3
122.3
188.9171.6
125.7
10.5076.029
10.203
19.479
19.942
12.058
18.087
21.334
41.740
43.131
25.972
39.421
36.175
40.813
0.680.62
0.72
0.40
0.59
0.58
0.46
0.53
0.630.37
2.632.67
2.72
2.43
2.55
2.63
2.55
2.55
2.612.26
73.976.5
73.1
83.0
76.4
77.7
81.7
79.0
75.683.3
111.9126.8
103.7
211.1
131.8
138.0
182.9
153.7
123.7231.6
0.59 2.62 77.2 134.7
35.711
43.595
56.581
45.914
1502.51494.60
1483.6
1512.1
1500.9
1504.1
1505.7
1505.7
1504.1
1518.6
1513.8
1496.1
1512.1
1504.1
38.494
41.276
42.668
1505.7
1485.1
1499.3
1499.3
1510.5
1504.1
1499.3

SITE 884
Table 16 continued.
Core, section,interval (cm)
8H-2, 748H-3,408H-3, 748H-3,1108H-4, 748H-5,408H-5, 748H-5,1108H-6, 748H-7, 299H-1.409H-1.749H-1, 1109H-2, 749H-3, 409H-3, 749H-4, 749H-4, 1109H-5, 509H-5, 749H-5, 1109H-6,4910X-1 4010X-1, 7410X-1, U010X-2, 7410X-3, 4010X-3, 7410X-3, 11011X-1,2912X-1.4012X-1, 7412X-1,11012X-2, 7412X-3, 4012X-3, 7412X-3, 11012X-4, 7413X-1.4013X-1,7413X-1.11013X-2, 7413X-3, 4013X-3, 7413X-3, 11013X-4, 7413X-5, 4013X-5, 7413X-5.11O13X-6, 7414X-1, 7414X-1, 11014X-2, 1915X-1.4015X-1.7415X-1, 11015X-2, 7415X-3, 4015X-3, 7415X-3, 11015X-4, 7415X-5, 4015X-5, 7415X-5, 11015X-6, 7415X-7, 3916X-1.4016X-1, 7416X4,11016X-2, 7416X-3, 4016X-3, 7416X-3, 11016X-4, 7416X-5, 4016X-5, 7416X-5, 11016X-6, 7416X-7, 1917X-1, 4017X-1, 7417X-1, 11017X-2, 7417X-3.40
Depth(mbsf)
61.6462.8063.1463.5064.6465.8066.1466.5067.6468.6969.3069.6470.0071.1472.3072.6474.1474.5075.4075.6476.0076.8978.8079.1479.5080.6481.8082.1482.5088.4998.2098.5498.90
100.04101.20101.54101.90103.04107.80108.14108.50109.64110.80111.14111.50112.64113.80114.14114.50115.64117.74118.10118.69127.10127.44127.80128.94130.10130.44130.80131.94133.10133.44133.80134.94135.59136.70137.04137.40138.54139.70140.04140.40141.54142.70143.04143.40144.54145.49146.40146.74147.10148.24149.40
Wet-bulkdensity(g/cm5)
1.41
1.35
1.30
1.36
1.421.29
1.46
1.40
1.431.36
1.38
1.39
1.26
1.35
1.40
1.40
1.40
1.40
1.44
1.38
1.47
1.44
1.44
1.33
1.42
1.411.42
1.40
1.30
1.30
1.32
1.30
1.34
1.361.34
1.33
1.29
1.29
1.26
1.40
1.331.31
1.30
1.30
Dry-bulkdensity(g/cm*)
0.64
0.54
0.48
0.56
0.650.47
0.7
0.63
0.670.58
0.61
0.61
0.43
0.56
0.61
0.62
0.62
0.65
0.7
0.61
0.74
0.67
0.69
0.53
0.66
0.650.65
0.64
0.49
0.49
0.52
0.52
0.55
0.580.56
0.54
0.49
0.5
0.44
0.63
0.530.52
0.49
0.51
Graindensity(g/cm3)
2.58
2.59
2.38
2.61
2.602.44
2.74
2.63
2.612.51
2.50
2.60
2.29
2.49
2.72
2.61
2.67
2.50
2.57
2.52
2.60
2.71
2.57
2.46
2.57
2.562.65
2.54
2.33
2.33
2.36
2.27
2.44
2.432.41
2.37
2.33
2.17
2.20
2.52
2.502.30
2.44
2.29
Wetporosity
(%)
74.8
78.8
79.2
78.2
74.580.2
74.2
75.8
74.176.7
75.2
76.4
81.0
77.2
77.2
75.8
76.6
73.6
72.3
75.4
71.0
75.1
72.7
78.0
74.1
74.375.0
74.6
78.6
78.6
77.4
77.0
77.1
75.876.5
76.9
78.8
76.4
79.5
74.4
78.676.9
79.8
77.4
Drywater
content(%)
119.1
149.7
167.5
142.7
116.9173.6
109.1
123.9
114.1136.5
125.8
128.9
193.9
142.0
129.6
124.4
127.0
116.0
105.3
126.2
97.6
115.6
107.2
150.5
115.4
117.5117.7
119.6
164.0
163.9
151.2
152.9
143.5
134.2140.6
146.6
166.4
155.2
183.0
120.1
153.2150.2
168.4
155.3
Shearstrength
(kPa)
44.987
52.871
65.292
63.791
84.053
44.278
50.282
58.537
63.791
56.286
68.293
65.292
59.288
38.274
54.034
71.295
44.278
43.528
51.032
39.025
Compressionalwave velocity
(m/s)
1507.3
1499.3
1512.1
1507.3
1518.6
1508.9
1513.8
1504.1
1507.3
1512.1
1517.0
1543.5
1543.5
1541.8
1548.6
1528.5
1538.5
1531.8
1528.5
1515.4
267

SITE 884
Table 16 continued.
DryWet-bulk Dry-bulk Grain Wet water Shear Compressional
Core, section, Depth density density density porosity content strength wave velocityinterval (cm) (mbsf) (g/cm) (g/cm*) (g/cm*) (%) (%) (kPa) (m/s)
17X-3,74 149.74 1.26 0.45 2.20 79.0 178.017X-3, 110 150.10 45.77917X-4,74 151.24 1.29 0.48 2.32 78.9 167.917X-5,40 152.40 1533.517X-5,74 152.74 1.35 0.58 2.38 75.4 133.717X-5, 110 153.10 57.03617X-6,74 154.24 1.32 0.54 2.31 76.4 0.518X-1.40 156.10 1530.218X-1.74 156.44 1.31 0.49 2.44 79.4 165.018X-1, 110 156.80 51.78318X-2,74 157.94 1.30 0.50 2.30 77.8 158.918X-3.40 159.10 1548.618X-3,74 159.44 1.29 0.48 2.33 79.1 169.218X-3, 110 159.80 43.52818X-4,74 160.94 1.30 0.50 2.33 78.1 159.118X-5,40 162.10 1555.418X-5,74 162.44 1.31 0.51 2.31 77.4 154.218X-5, 110 162.80 46.53018X-6,74 163.94 1.33 0.56 2.28 75.3 138.519X-1.40 165.70 1505.719X-1.74 166.04 1.37 0.59 2.47 75.7 130.919X-1, 110 166.40 53.28419X-2,74 167.54 1.29 0.50 2.25 77.6 160.119X-3,40 168.70 1531.819X-3,74 169.04 1.40 0.65 2.41 72.6 113.819X-3, 110 169.40 45.77919X-4,74 170.54 1.30 0.50 2.36 78.6 162.119X-5,30 171.60 1500.919X-5,74 172.04 1.30 0.49 2.37 78.9 164.819X-5, 110 172.40 50.28219X-6,74 173.54 1.32 0.51 2.41 78.4 156.319X-7,39 174.69 1.33 0.53 2.43 78.0 151.520X-1.50 175.50 1525.220X-1.74 175.74 1.29 0.48 2.27 78.4 166.920X-1.110 176.10 31.52020X-2,74 177.24 1.30 0.50 2.29 77.7 158.620X-3,53 178.53 1538.520X-3,74 178.74 1.31 0.49 2.47 79.7 166.320X-3, 110 179.10 48.78120X-4,74 180.24 1.27 0.46 2.26 79.3 176.820X-5,53 181.53 1536.820X-5,74 181.74 1.30 0.50 2.32 78.3 162.020X-5, 110 182.10 35.27220X-6,74 183.24 1.28 0.47 2.30 79.1 171.320X-7, 19 184.19 1.27 0.45 2.32 80.2 181.721X-1.53 185.13 1545.221X-1.74 185.34 1.28 0.46 2.29 79.5 176.021X-1.110 185.70 27.76821X-2,74 186.84 1.29 0.46 2.39 80.2 176.921X-3,53 188.13 1548.621X-3,74 188.34 1.27 0.46 2.24 78.9 174.121X-3, 110 188.70 36.77321X-4,74 189.84 1.28 0.47 2.29 79.3 174.121X-5,53 191.13 1540.221X-5,74 191.34 1.34 0.57 2.39 75.9 137.121X-5, 110 191.70 35.27221X-6,74 192.84 1.27 0.46 2.28 79.4 176.421X-7, 19 193.79 1.34 0.57 2.36 75.6 136.222X-1,53 194.83 1525.222X-1.74 195.04 1.29 0.46 2.40 80.4 178.322X-1, 110 195.40 30.77022X-2.74 196.54 1.27 0.46 2.27 79.3 176.722X-3,53 197.83 1540.222X-3.74 198.04 1.27 0.46 2.18 78.4 173.822X-3, 110 198.40 32.27122X-4,74 199.54 1.30 0.48 2.38 79.4 168.422X-5,53 200.83 1538.522X-5,74 201.04 1.26 0.44 2.22 79.8 185.622X-5, 110 201.40 31.52022X-6, 74 202.54 1.26 0.43 2.30 80.9 19222X-7,29 203.59 1.26 0.43 2.30 80.8 190.523X-1.53 204.53 1540.223X-1.74 204.74 1.27 0.45 2.37 80.8 185.723X-1, 110 205.10 31.52023X-2,74 206.24 1.35 0.57 2.43 76.4 138.223X-3,53 207.53 1528.523X-3.74 207.74 1.27 0.45 2.27 79.7 179.723X-3, 110 208.10 27.76823X-4,74 209.24 1.28 0.47 2.35 79.8 175.423X-5.53 210.53 1531.823X-5.74 210.74 1.30 0.51 2.31 77.7 157.623X-5, 110 211.10 46.53023X-6,74 212.24 1.28 0.46 2.29 79.4 176.023X-7,29 213.29 1.28 0.47 2.26 79.0 173.4
268

SITE 884
Table 16 continued.
DryWet-bulk Dry-bulk Grain Wet water Shear Compressional
Core, section, Depth density density density porosity content strength wave velocityinterval (cm) (mbsf) (g/cm*) (g/cπr) (g/cnθ (%) (%) (kPa) (m/s)
24X-1.53 214.13 1540.224X-1,74 214.34 1.31 0.52 2.32 77.1 150.724X-l,110 214.70 52.53324X-2,74 215.84 1.31 0.50 2.39 78.7 160.324X-3,53 217.13 1531.824X-3,74 217.34 1.29 0.50 2.23 77.2 158.324X-3, 110 217.70 59.28824X-4,74 218.84 1.32 0.53 2.37 77.1 147.824X-5,53 220.13 1538.524X-5,74 220.34 1.31 0.51 2.34 78.0 158.024X-5, 110 220.70 66.79224X-6,74 221.84 1.30 0.49 2.39 79.3 167.124X-7,39 222.49 1.31 0.51 2.30 77.3 153.825X-1,53 223.83 1531.825X-1.74 224.04 1.27 0.45 2.31 80.0 180.625X-1, 110 224.40 33.02125X-2,74 225.54 1.27 0.43 2.35 81.2 191.325X-3,53 226.83 1538.525X-3,74 227.04 1.28 0.47 2.33 79.6 174.025X-3, 110 227.40 43.52825X-5,53 229.83 1546.925X-5,74 230.04 1.28 0.46 2.33 80.0 179.825X-5, 110 230.40 40.52625X-6,74 231.54 1.29 0.48 2.39 79.7 171.925X-7,29 232.59 1.30 0.49 2.35 78.6 163.626X-1,53 233.43 1541.826X-1,74 233.64 1.29 0.50 2.26 77.6 159.526X-1, 110 234.00 47.28026X-2,74 235.14 1.29 0.47 2.35 79.6 173.526X-3,53 236.43 1538.526X-3,74 236.64 1.29 0.47 2.38 79.9 174.526X-3, 110 237.00 38.27426X-4,74 238.14 1.28 0.46 2.32 79.8 177.526X-5,53 239.43 1543.526X-5,74 239.64 1.31 0.51 2.40 78.3 156.426X-5, 110 240.00 60.78926X-6,74 241.14 1.29 0.49 2.29 78.3 163.826X-7,29 242.09 1.32 0.54 2.33 76.6 146.227X-1,53 243.03 1468.227X-1,74 243.24 1.31 0.50 2.44 79.1 16227X-l,110 243.60 46.53027X-2,84 244.84 1.32 0.55 2.24 75.2 140.427X-3,53 246.03 1533.527X-3,69 246.19 1.32 0.54 2.32 76.4 144.927X-3, 110 246.60 75.79827X-4,74 247.74 1.34 0.55 2.41 76.9 143.727X-5.53 249.03 1510.527X-5,74 249.24 1.34 0.55 2.42 76.9 143.127X-5, 110 249.60 72.04627X-6,79 250.79 1.32 0.54 2.34 76.6 0.627X-7, 14 251.64 1.33 0.54 2.39 77.1 146.728X-1,53 252.73 1536.828X-1,74 252.94 1.33 0.53 2.45 77.9 149.728X-l,110 253.30 64.541 \28X-2,74 254.44 1.39 0.60 2.67 77.3 132.628X-3.43 255.63 1538.528X-3,74 255.94 1.34 0.56 2.41 76.4 140.228X-3, 110 256.30 76.54928X-4,74 257.44 1.32 0.50 2.49 79.5 162.628X-5,53 258.73 1525.228X-5,74 258.94 1.33 0.54 2.37 77.0 147.028X-5, 110 259.30 78.80028X-6,69 260.39 1.38 0.61 2.51 75.2 125.228X-7,54 261.74 1.33 0.54 2.42 77.3 146.229X-1,63 262.43 1536.829X-1,74 262.54 1.32 0.52 2.38 77.6 151.529X-1, 119 262.99 66.04229X-2,74 264.04 1.36 0.57 2.53 77.3 140.029X-3,53 265.33 1533.529X-3.74 265.54 1.35 0.56 2.48 77.3 142.529X-3, 110 265.90 56.28629X-4,74 267.04 1.38 0.60 2.59 76.6 131.329X-5,53 268.33 1510.529X-5,74 268.54 1.31 0.48 2.49 80.2 169.729X-5, 110 268.90 51.03229X-6,79 270.09 1.32 0.52 2.37 77.7 153.229X-7,29 271.09 1.39 0.63 2.47 74.1 120.030X-1.24 271.64 1.33 0.57 2.24 74.4 134.831X-1.53 281.63 1540.231X-1,74 281.84 1.34 0.57 2.34 75.3 135.431X-1, 100 282.10 21.76431X-2,74 283.34 1.35 0.56 2.46 76.7 139.231X-3,53 284.63 1546.931X-3,74 284.84 1.31 0.51 2.39 78.2 156.9
269

SITE 884
Table 16 continued.
Core, section,interval (cm)
Depth(mbsf)
Wet-bulkdensity(g/cm*)
Dry-bulkdensity(g/cm3)
Graindensity(g/cmJ)
Wetporosity
(%)
Drywater
content
(%)
Shearstrength
(kPa)
Compressionalwave velocity
(m/s)
31X-3, 11031X-4, 7431X-5, 6531X-5, 7431X-5, 12531X-6, 6931X-7, 1932X-1.5332X-1.7432X-1, 11032X-2, 7432X-3, 5332X-3, 7432X-3, 11032X-4, 7432X-5, 5332X-5, 7432X-5,11032X-6, 6932X-7, 5434X-1, 5034X-1.7434X-1,12034X-2, 2435X-1.5335X-1.7435X-l,11035X-2, 7435X-3, 5335X-3, 7435X-3, 11035X-4, 7435X-5, 5335X-5, 7435X-5,11035X-6, 7435X-7, 2936X-1.5336X-1, 7436X-1. 11036X-2, 7436X-3, 5336X-3, 7436X-3, 11036X-4, 7436X-5, 5336X-5, 7436X-5, 11036X-6, 7436X-7, 2937X-1,5337X-1.7437X-1, 11037X-2, 7437X-3, 5337X-3, 7437X-3, 11037X-4, 7437X-5, 5337X-5, 7437X-5, 11037X-6, 7437X-7, 2938X-1.49
285.20286.34287.75287.84288.35289.29290.29291.23291.44291.80292.94294.23294.44294.80295.94297.23297.44297.80298.89300.24310.60310.84311.30311.84320.23320.44320.80321.94323.23323.44323.89324.94326.23326.44326.80327.94328.99329.73329.94330.30331.44332.73332.94333.30334.44335.73335.94336.30337.44338.49339.23339.44339.80340.94342.23342.44342.80343.94345.23345.44345.80346.94347.99348.69
1.38
1.31
1.381.32
1.33
1.36
1.36
1.36
1.40
1.411.37
1.33
1.34
1.35
1.37
1.34
1.32
1.34
1.381.32
1.30
1.31
1.31
1.35
1.35
1.351.32
1.32
1.3
1.33
1.34
1.35
1.361.351.31
0.62
0.52
0.620.53
0.53
0.58
0.60
0.59
0.64
0.640.61
0.55
0.56
0.58
0.61
0.58
0.54
0.57
0.620.53
0.49
0.53
0.54
0.57
0.58
0.580.54
0.53
0.51
0.55
0.55
0.57
0.600.590.53
2.44
2.32
2.462.33
2.45
2.41
2.39
2.43
2.54
2.622.40
2.35
2.44
2.42
2.36
2.33
2.31
2.30
2.472.34
2.41
2.28
2.25
2.41
2.34
2.362.29
2.31
2.26
2.36
2.41
2.48
2.352.382.27
74.4
77.5
74.576.7
78.2
75.4
74.7
75.5
74.5
75.174.3
76.2
76.8
75.9
73.9
74.9
76.3
74.7
74.776.9
79.2
76.4
75.8
75.9
74.9
75.076.2
76.5
77.2
76.4
76.8
76.8
74.175.176.4
123.3
154.0
122.9147.0
152.2
132.0
127.9
131.5
119.5
119.5125.4
141.5
141.5
135.0
124.5
132.9
144.3
133.5
124.3148.0
165.0
147.2
135.5
132.3
131.6145.3
146.5
155.7
142.4
143.2
138.6
126.9131.4148.4
67.543
66.042
60.038
89.307
71.295
33.021
60.789
54.785
42.027
87.806
54.034
87.806
51.032
84.804
58.537
1541.8
1535.1
1550.3
1555.4
1460.6
1530.2
1546.9
1546.9
1553.7
1557.1
1555.4
1543.5
1528.5
1517
Conclusions About Total Inductionand Susceptibility Data
Analysis of the downhole magnetic measurements performed inHole 884E shows that, on the whole, the data are reliable when takinginto account the depth shifts that occurred between repeated sectionsand the small discrepancies arising from ship's heave. These data willpermit comparisons with main lithology and laboratory susceptibilitymeasurements.
Comparison of Magnetic Logs with Core Data
Figure 59 shows the comparison of the "local" B field obtainedfrom the first run of the magnetometer (BL!, nT) with the corrected
susceptibility (ku ppm), and the whole-core susceptibility valuesmeasured in cores from Hole 884B and transformed into I0"6 S1values. Generally, from 70 to 680 mbsf the anomalies from both logsare negatively correlated. This finding was expected for high lati-tudes. A nearby layer bearing a magnetization direction of x , y , zwill, in a borehole, produce an induction (or B field) with an xx,y ,-2z, direction (Barthes, 1990). Thus, the projection of the B fieldarising from the susceptibility of the surrounding rocks onto thedirection of the ambient Earth's field will produce a negative corre-lation. However, this negative correlation is a geometrical effect andis true only for anomalies arising from the sediments surrounding theborehole, not for regional anomalies. For these simple geometrical
270

SITE 884
Table 17. Index properties and compressional wave velocity data, Hole 884E.
Core, section,interval (cm)
145-884E-lR-1,721R-4,71lR-5,592R-1.763R-3.574R-2.714R-4,214R-5,795R-1/755R-4J45R-5,1346R-3,617R-2,857R-3,1369R-2,989R-4,789R-7,2210R-5,62
Depth(mbsf)
843.52847.94848.99853.26865.51874.22876.72878.54882.55886.4888.66894.9898.42900.33913.06915.47919.33926.48
Wet-bulkdensity(g/cm3)
2.692.81
2.952.912.912.762.812.842.862.712.852.872.642.872.682.832.68
GRAPEbulk
density(g/cm*)
2.692.802.812.982.422.792.832.732.332.942.832.902.912.842.942.812.922.78
Dry-bulkdensity(g/cm*)
2.572.742.842.912.892.892.712.762.802.832.652.802.832.552.842.612.782.62
Graindensity(g/cm*)
2.902.932.963.022.962.962.862.902.912.932.812.932.952.82.912.812.922.79
Dryporosity
(%)
11.36.64.13.92.52.25.24.64.03.15.84.24.09.02.57.24.76.0
Dry watercontent
(%)
4.52.51.51.40.90.82.01.71.51.12.21.61.43.60.92.81.72.3
Void ratio
0.130.070.040.040.030.020.050.050.040.030.060.040.040.100.030.080.050.06
Compressionalwave velocity
(m/s)
4773.75312.15707.65851.56023.06135.26028.95807.25977.06084.55796.65898.05923.25517.26063.95818.45468.55539.8
reasons, and depending on the magnetic latitude (as well as the toolresponse and hole diameter), a given susceptibility will have a varyingeffect on the magnetometer sensor: the transfer coefficient betweenthe two tools will depend on the field inclination. In Figure 59, therelative scales for both tools have been selected for practical repre-sentation purposes. Thus, the overall variations in relative amplitudein both logs do not mean that surrounding rocks are more susceptibleor remanent. The two logs do not always correlate strongly. In theinterval from 60 to 100 mbsf, the total induction log has been dom-inated by the effect of the pipe located in the upper part of the hole.Furthermore, the relative variation of susceptibility and of the B fieldis not always the same, indicating changes in the relative value of theinduced and remanent magnetization, as well as changes in the direc-tion of the remanent magnetization.
Comparison with Core Susceptibility Measurements
Several observations can be made by comparing the downhole andlaboratory susceptibility data. More sharp and narrow peaks can beseen in the record obtained from whole-core measurements conductedin the laboratory. These peaks are often correlated to lower amplitudeand broader ones in the logs. One reason for this difference is the realresolution of the log and core measurements. Laboratory data arerecorded each 5 cm and correspond to the measurement of a smallvolume of material. In contrast, downhole data represent a much largervolume of material, thus the tool's response tends to broaden theanomalies. And wider and smoother anomalies, which sometimescorrespond to very thin ash layers, will be seen in the susceptibility logrecord. Some peaks that may be seen on the logs do not appear in thelaboratory core measurements. This may reflect lateral variation be-tween Holes 884B and 884E, incomplete core recovery, and/or discon-tinuous sources such as discontinuous ash layers. However, in mostcases, the two data sets can be correlated, sometimes peak to peak forintervals of several meters or tens of meters (e.g., within the intervalat 450-510 mbsf of Hole 884E). Finally, the correlations between thelaboratory and downhole data imply that only a small depth offsetbetween Holes 884B and 884E (Fig. 59), which are 24 m apart.
Comparison with Lithology
In general, overall sediment magnetization should decrease as thebiogenic silica content of the sediment increases. An increase in clayand ash content should correspond to an increase of the magnetiza-tion. Strictly speaking, the clays themselves are paramagnetic, butoften are associated with magnetite. Contents of carbonates and
nannofossils either can correspond to an increase of magnetization,if magnetite is associated, or not correspond, if the rocks are purecalcium carbonate.
A first-order comparison between the logs and the average lithol-ogy for Site 884 reveals some interesting correlations. Subunit IA ischaracterized by a high susceptibility, in agreement with its high clayand ash content (Figs. 56 and 59A). The transition between SubunitsIB and IC, which corresponds to an increase in downhole clay contentthat matches well with an increase of average susceptibility below440 to 460 mbsf (Figs. 56, 59B, and 59C). From a more detailedstandpoint, the susceptibility record illustrates that this increase oc-curs in two steps: first, a lesser increase centered at 450 mbsf and alarger increase below 460 mbsf. This observation agrees well with thelithological data (Fig. 3; see "Lithostratigraphy" section, this chapter).The transition between Unit I and Unit II roughly corresponds to thebeginning of an increase in susceptibility at a 610-mbsf compositedepth (Figs. 56 and 59E). Subunit IB has a complicated susceptibilitystructure, but can be matched with the evolution of the clay contentin Hole 884B. A relatively high clay content occurs at the top ofSubunit IB down to about 190 mbsf, followed by relative low claycontents down to 250 mbsf, then by another higher content with minorvariations down to about 390 mbsf (Fig. 3; see "Lithostratigraphy"section, this chapter). In the susceptibility record, this sequence showsa low average value that correlates to the central low clay-contentzone (Fig. 56).
Ash levels occur within the upper 300 m of Hole 884B. High andvariable susceptibility values can be observed in Subunit IA that canbe correlated with ash occurrence. At about 170,225,270, and 320 mbsf,several discrete susceptibility peaks are correlated with the presenceof ash layers. By using the barrel sheets, better correlations probablywill be possible between ash occurrence and the magnetic records.
In conclusion, magnetic downhole data show close relationshipswith lithology and may help to refine the lithostratigraphy duringfuture higher-resolution work. Because susceptibility also was re-corded in cores, the downhole susceptibility log may allow us to makea composite depth for the whole 884 Site.
SEISMIC-LITHOLOGIC CORRELATION
All the Leg 145 drilling locations were surveyed in order to dropa beacon at the correct pre-selected location. In every case, surveyswere run in the figure of the number 4 with the long leg duplicatingthe site-survey trackline used to select the site and the cross-leg beingas nearly orthogonal as practical. The shipboard air-gun seismic
271

SITE 884
Shear strength(kPa)
0 40 80 120Lith.unit
200
400
600
800
1000
* Hole884B- Hole884C
IA
IB
III
Figure 38. Shear strength data vs. depth for Holes 884B and 884C. Lithologicunits are shown at right.
reflection profiling system was used for all the surveys except Site883 when it was inoperable; the 3.5-kHz profiling system was usedto locate that drill site. Details of the survey and seismic processingtechniques are given in the Site 881 chapter (see "Seismic-LithologicCorrelation" section, "Site 881" chapter, this volume).
Site 884, located on the Meiji Drift, was selected on the basis of sitesurveys conducted in 1987 by the Farnella. Figure 60 is a seismicprofile from the site-survey cruise that has been processed by D. Scholland S. Dadisman at the U.S. Geological Survey to show depths ratherthan two-way traveltimes. Basaltic basement is indicated by the changein reflection character at the 4.7-km total depth. Drilling encounteredbasement at this site within a depth of 10 m of where the USGS-processed record predicted. The carbonates and downslope reworkedmaterials that characterize most of lithologic Unit II make up thestrongly reflective acoustic unit overlying basement. Lithologic Sub-units ID, IC, and IB are more nearly pure diatom oozes and appear inthe profile as a more transparent acoustic unit in the middle portion ofthe section. The upper, more highly reflective portion of the sectioncorresponds to Subunit IA, which is characterized by significantamounts of clay, ash, and ice-rafted material in the siliceous ooze.
The entire sedimentary accumulation at Site 884 from Subunit IIAup to the seafloor represents the Meiji Drift (Fig. 60). Within this unit,the reflectors show horizontal continuity across the whole deposit.Small channels are evident in the profile. An active one can be seenat the left edge of the figure and buried channels are common. All thispresent and past small-scale channeling is a strong indication of a longhistory of bottom-current activity at Site 884, currents associated withthe formation of the Meiji Drift deposit.
SUMMARY AND CONCLUSIONS
Geologic Record
Drilling at Site 884 penetrated 854 m of Cenozoic sediments onthe lower flank of Detroit Seamount, including the Meiji Drift, and
87 m into the underlying basalt. The sedimentary section can bedivided into two major units, each having subunits. Unit I is charac-terized by clay and diatom ooze in changing relative abundances andUnit II is dominated by chalk and claystone and displays evidence ofminor to total downslope redeposition. Lithologic Subunit IA (0-128mbsf) is a Quaternary to upper Pliocene diatom clay and clay. Drop-stones and spicule-enriched horizons occur as minor lithologies, andfresh ash layers up to 2.5 m thick are common. Some of the thickerash layers record multiple eruptions. Subunit IB (128-440.2 mbsf) isan upper Pliocene to upper Miocene clayey diatom ooze that gradesdown to a clayey diatomite. This subunit has a few ash layers and rareparallel and lenticular laminae. A dolomite concretion occurs at about172 mbsf, and a piece of wood was found in lower Pliocene sedimentsat 214 mbsf. Lithologic Subunit IC (440.2-545.6 mbsf) is an upperto middle Miocene gray clay. Zoophycos trace fossils occur in thelower portion of the unit. Native copper in the form of small bladedand twinned crystals and small veinlets was noted at depths of 507 to526 mbsf. Subunit ID (545.6-604.8 mbsf) is a middle to lowerMiocene diatomite with clay or occasionally with spicules. Diatomchalks occur in the lower portion of the unit and Zoophycos tracefossils are present.
Lithologic Subunit IIA (604.8-694.7 mbsf) is a lower Miocene touppermost Eocene claystone with some chalk in the lower portion ofthe unit. This subunit displays modest evidence for reworking in theform of sharp contacts, parallel laminae, and thin turbidites. Smallbluish-green mottles at 623 to 632 mbsf on rare occasions have grainsof native copper at their centers. Subunit HB (694.7-771 mbsf) is anupper to lower-middle Eocene chalk and claystone. Ash is a minorcomponent of this unit; the clay stones have been interpreted as alteredashes on the basis of their relatively high smectite content. Little ofthis unit appears undisturbed. Soft-sediment deformation, includingrecumbent folding, is common, and large-scale slump features suchas conglomerates having angular clasts occur. Subunit HC (771-854mbsf) is a middle-lower to lower Eocene (Paleocene nannofossilsoccur in the reworked materials of Subunit HB) claystone with clayeyash and ash. These claystones have been interpreted to representaltered ashes on the basis of smectite content. Minor amounts of chalkoccur in this subunit. Evidence for redeposition is less widespreadthan in the overlying subunit, but turbidites and sharp contacts arecommon. Streaks of native copper were observed at 806 mbsf.
XRD analyses of the minerals in the sediments of Site 884 showa remarkably constant composition of the terrigenous componentfrom the sediment surface down to about 685 mbsf, the time of theEocene/Oligocene boundary, and near the lower boundary of SubunitIIA. This component is characterized by a relatively low smectite toquartz-plus-illite ratio and a modest Plagioclase to quartz-plus-illiteratio. The mineral fraction chlorite-plus-kaolinite, dominated by chlo-rite in the North Pacific, is of lesser relative abundance in thesesediments, but increases gradually in importance up the core, begin-ning at about 700 mbsf. Below approximately 685 mbsf, both smectiteand Plagioclase are of much greater relative importance in the claysof Subunits HB and HC. These clays, therefore, have been interpretedas altered ashes.
Lithologic Unit III (854-941 mbsf) is basalt that occurs in 13 units.Ten units are flows and three are pillow lavas. These flows arethick—one is 30 m thick—and usually have chilled or baked margins;however, no glassy margins were recovered. Weakly zoned, large (to25 mm) Plagioclase crystals occur in several of the flows, and fresholivine is common in the lower 50 m; thus, the basalt has been onlyslightly altered.
A complete sequence of all North Pacific Ocean diatom zones thatranges in age from late Quaternary to late Oligocene occurs at Site884. The intervals between 12.0 and 13.5 Ma and approximately 17.5to 20 Ma are characterized by condensed sections or diastems. Nanno-fossil biostratigraphy permits definition of the Miocene/Oligoceneboundary at 640 mbsf and the Oligocene/Eocene boundary between680 and 693 mbsf, within and at the base of lithologic Subunit IIA.
272

SITE 884
2.0
Grain density(g/cm3)
2.5 3.0
B
2.0
Grain density(g/cm3)
2.5 3.0
C
2.0
Grain density(g/cm3)
2.5 3.0Lith.unit
200
cr• 400W
E
GLCDQ
600
800
1000
**Sr
Λ
IA
IB
Figure 39. Grain density data vs. depth. A. Hole 884B. B. Hole 884C. C. Hole 884E.Lithologic units are shown at right.
The diatom assemblage at Site 884 includes one component, anarctic-boreal group that has characterized portions of the Bering Seasince it evolved during late Miocene time. In addition, a benthic formthat lives only in the shallow waters of the Aleutian-Bering regionoccurs consistently, although in low abundance, throughout lithologicUnit I and Subunit IIA. These unusual diatom occurrences indicaterelatively long-distance, generally southerly transport of the contain-ing sediments.
The rapidly accumulating, clay-rich sediments of Site 884 permit-ted the development of a magnetic-reversal stratigraphy that is coher-ent back into the middle Miocene at about 13.5 Ma. This stratigraphyis a singular achievement and, for instance, permits the direct corre-lation for the first time of the North Pacific Ocean diatom zonationsto the magnetic reversal time scale in sediments older than latestMiocene. Further, the depositional history of much of the Meiji Driftcan now be constrained with the temporal control provided by themagnetostratigraphy. Initial paleomagnetic results from the basalts ofthe lower flank of Detroit Seamount indicate that those rocks arereversely magnetized and were erupted at a paleolatitude of approxi-mately 33°N.
Rates of deposition at Site 884 were high during the late Plioceneand Pleistocene, since 2.6 Ma. The linear sedimentation rate (LSR) forthat interval is about 47 m/m.y. The clay-plus-quartz flux is 1.4g(cm2 k.y.)"1 and diatoms accumulated at 0.8 g(cm2 • k.y.)"1 duringthe past 2.6 Ma. In the remainder of the Pliocene and uppermost Mio-cene sequence (2.6-6.2 Ma), the LSR averages 60 m/m.y., while themass accumulation rate (MAR) of clay-plus-quartz is 0.9 g(cπr • k.y.)"1
and that of diatoms is 1.6 g(cm2 k.y.)"1. In the remainder of the upperMiocene and in the upper part of the middle Miocene (between 6.2 and11.9 Ma), the LSR is 34 m/m.y. and the MAR of clay-plus-quartz issimilar to that of the overlying unit, 0.9 g(cm2 k.y.)"1; however, thediatom flux is somewhat lower, about 0.8 g(cm2 • k.y.)"1. Between 13.5and 17.5 Ma, LSR values were much reduced, averaging only 13m/m.y. The MAR of the diatomaceous component is 0.4 g(cm2 k.y.)"1
and that of the terrigenous component, clay-plus-quartz, is 0.3g(cm2 k.y.)"1. In the Oligocene and lower Miocene portion of thesection (between 20.1 and 34.8 Ma), LSR values are low, only 6m/m.y. Diatoms are not a volumetrically important component of thesediment in this unit and clay-plus-quartz fluxes are moderate, about0.4 g(cm2 k.y.)"1. Throughout the entire Oligocene to Quaternaryinterval, the MAR of CaCO3 is low, ranging from about 50 to 90mg(cm2 k.y.)"1. Site 884 has not been above the CCD since the endof Eocene time. Meaningful pelagic sedimentation rates could not becalculated for lithologic Subunits HB and HC; their total of 159 m ofsediment accumulated over a span of about 20 m.y., for a bulk LSRof 8 m/m.y.
Paleoceanography and Paleoclimatology
The basalts of Detroit Seamount were erupted during latest Cre-taceous time, based on evidence from Site 883, at the Hawaiian hotspot in the subtropical North Pacific Ocean. Should the estimate forthe age of basement be correct, then as much as 20 m.y. passed beforeany significant accumulation of sediment occurred at Site 884. Noneof the downslope-transported material of lithologic Unit II, whichshould be a reliable integrator of upslope lithologies, shows anyindication of shallow-water or reefal material. Displaced foraminifersnow found in Subunit IIA indicate an original paleodepth of less than500 m below sea level. This value can be taken as the deeper constrainton seamount depth; the shallower constraint is the 100 to 150 m waterdepth beyond which no reef growth is possible. We conclude thatDetroit Seamount never built up to sea level.
Ash and CaCO3 were deposited on the slopes of Detroit Seamountduring early Tertiary time. During the Eocene, and culminating in themiddle Eocene, important amounts of sediment reworking and down-slope redeposition occurred, resulting in soft sediment deformation,intraformational conglomerates, turbidites, parallel laminae, scourmarks, etc. Downslope reworking of this same age has been docu-
273

SITE 884
GRAPE-bulk density B GRAPE-bulk density(g/cm3) (g/cm3) Lith.
1.0 1.4 1.8 2.2 1.0 1.4 1.8 2.2 unit
200 -
s=> 400 -
CLΦQ
600 -
800 -
. 1 , 1 . 1 ,
IA
IB
IC
ID
HA
MB
lie
III
1000
Figure 40. GRAPE bulk density data vs. depth. A. Hole 884B. B. Hole 884C.Lithologic units are shown at right.
mented elsewhere in the central and northern Pacific Ocean (Schlangerand Premoli Silva, 1981; Rea and Thiede, 1981; Valuer et al., 1983)and the information from Detroit Seamount significantly broadens theknown region of that activity. By the end of Eocene time, the earlyTertiary ash influx had ended, reworking had essentially ceased, car-bonate deposition was reduced to a minor portion of the whole, andthe deposition of continentally derived hemipelagic clays and quartzbecame important.
The flux of the hemipelagic continental component of the DetroitSeamount sediments has increased ever since first becoming importantat the time of the Eocene/Oligocene boundary. Oligocene and lowerand middle Miocene rates are a few tenths of a g(cm2 k.y.)"1. Ratesincrease to 0.9 g(cm2 • k.y.)"1 during the middle Miocene at about 12Ma, and again to about 1.4 g(cπr k.y.)"1 at the time of the onset ofNorthern Hemisphere glaciation at 2.6 Ma. Diatoms become an impor-tant contributor to the sediments above the condensed interval in thelower Miocene with flux rates of 0.4 g(cm2 • k.y.)"1 during the period17.5 to 13 Ma. During the late middle Miocene the diatom flux doublesto 0.8 g(cm2 • k.y.)"1, and then doubles again to 1.6 g(cm2 k.y.)"1 inthe latest Miocene at 6.2 Ma. This period of maximum diatom flux inthe latest Miocene and early and middle portions of the Pliocene hasbeen seen in all the Leg 145 drill sites and corresponds to a relativelywarm period in the Northwest Pacific Ocean. During the late Plioceneand Quaternary age, diatom fluxes returned to their previously mod-erate level of 0.8 g(cm2 k.y.)"1.
At Site 884, dropstones occur in Subunit IA in similar amounts tothose in nearby Site 883, in slightly lower abundances than thoseencountered at Site 882, 110 km to the south, and in much lowerabundances than those at Site 881, about 475 km to the south, againemphasizing the northward decline in IRD. Taken together, the Leg145 and Leg 86 drill sites (Krissek et al., 1985; Heath, Burckle, et al,1985) neatly define the source of the Northwest Pacific Ocean drop-stones as the Sea of Okhotsk, or possibly the southern Kamchatka
Peninsula, a fact first suspected by Conolly and Ewing (1970).Dropstones appear in the section at the time of the Matuyama/Gaussreversal boundary at 2.6 Ma and thus herald the onset of majorglaciation in the Northern Hemisphere (Rea and Schrader, 1985). Incontrast to more southerly locations, no dropstones older than latePliocene were found in Site 883 or Site 884 sediments.
Ash layers are common to abundant in sediments younger than2.6 Ma and occur again in the Eocene portion of the section. At 2.6Ma, the deposition of volcanogenic material increases by more thanan order of magnitude. This increase in ash deposition, beginningduring the latest Pliocene in the North Pacific Ocean has been knownfor many years (Kennett and Thunell, 1975; Kennett et al., 1977),however, the Leg 145 sites provide much better dated sequences fordetermining timing of onset of the northwestern Pacific portion of thisoceanwide volcanic episode than has been available previously. Ex-amination of the individual ash layers should reveal geochemicaltrends in Kuril-Kamchatka volcanism. The lower occurrence of ashlayers provides, along with Site 883, one of the first good definitionsof a period of Eocene volcanism that has been suggested by variousdata from scattered locations such as Hess Rise (Vallier et al., 1983)and the Central Pacific Ocean basins (Rea and Thiede, 1981).
The presence of native copper as crystals and veinlets or streaks inthe sediments of Site 884 is an unusual aspect of authigenic activity inthis location. Copper in deep-sea sediments is very rare, but has beenreported from the Pacific Ocean (Manihiki Plateau, Jenkyns, 1976),Atlantic Ocean (western Atlantic, Hollister, Ewing, et al., 1972; AngolaBasin, Siesser, 1978) and the Caribbean Sea (Donelley and Nalli,1973). Most occurrences have been related, without significant labo-ratory investigation, to percolation of hydrothermal fluids through asedimentary section characterized by the proper geochemical hostconditions (see Jenkyns, 1976). Enough copper exists in the sedimentsof Site 884 to provide a fruitful basis for a sophisticated geochemicalstudy of this phenomenon.
The Meiji Drift
Deep thermohaline currents, confined to the Coriolis-correct sideof a basin or deep-sea ridge, can be responsible for the long-term,long-distance transport of sediment. The resulting deposits are greatlyelongated parallel to the flow-constraining bathymetry and may ex-ceed 1 km in thickness. The sediments in these deposits are often somecombination of biogenic-pelagic material and land-derived, fine-grained hemipelagic sediment. Drift sediments are almost alwayshomogeneous and bioturbated and rarely display the sedimentarystructures commonly associated with deep currents such as parallellaminae, sharp contacts, and scour marks or cross-bedding. Rates ofdeposition, often several tens of meters per million years, depend onsupply and are noticeably higher in the drift deposit than in nearbydeposits that have been accumulating under purely pelagic conditions(Kidd and Hill, 1987; Pickering et al., 1989).
During DSDP Legs 93 (van Hinte, Wise, et al, 1986) and 94(Ruddiman, Kidd, et al., 1987), three of the major drift deposits in theNorth Atlantic Ocean were drilled. The Hatteras Outer Rise, drilledat Site 603, is a uniform silt and clay "muddy contourite," composedof silica and nannofossil-bearing clay. About 950 m of this deposithas accumulated at Site 603 since the middle Miocene, giving sedi-mentation rates of more than 90 m/m.y. for this time span (Wise andvan Hinte, 1986). The Feni Drift, a deposit 600 km long, 100 km wide,and up to 1600 m thick, was drilled at Site 610 in the North Atlantic.This deposit is glacial-aged mud with ooze above 135 mbsf andnannofossil ooze and chalk with low clay content below that horizon.The deposit is early Miocene in age at a depth of 723 mbsf, giving asedimentation rate of more than 40 m/m.y. (Ruddiman, Kidd, et al.,1987; Kidd and Hill, 1987). Drilling at Site 611 encountered theGardar Drift, a deposit 1000 km long, 130 km wide, and 1450 m thick.The Gardar Drift is an alternating mud and carbonate ooze of latePliocene and Quaternary age in the upper 105 mbsf and a structure -
274

SITE 884
Compressional wave velocity (m/s) [_rth.1400 1800 2200 1400 1800 2200 unit
0
200
400
Q.CD
Q 600
800
1000
^ Hole 884C Hole 884B IA
IB
B Compressional wave velocity (m/s)
1400 1800 2200 1000 3000 50000
Lith.unit
200
400
- Q
Q_CD
Q600
800
1000
— Hamilton,(1979)
Hole 884BHole 884C
Hole 884E
Hole 884E
IA
IB
Figure 41. Compressional wave velocity data vs. depth. A. P-wave logger data from Holes 884B and 884C. Lithologic units are shown, asdiscussed in the text. B. Hamilton Frame and DSV data from Holes 884B, 884C, and 884E (the predicted velocity profile for diatomaceoussilty clay is shown, after Hamilton [1979]). Lithologic units are shown as discussed in the text.
less, homogeneous, pure carbonate ooze and chalk below. The upper571 m of this deposit was deposited at uniform rates of 60 m/m.y. inthe Miocene and Pliocene to 100 m/m.y. in the Quaternary (Ruddi-man, Kidd, et al., 1987; Kidd and Hill, 1987). The resulting overviewof drift deposition provided by these and prior drilling legs shows thatthe deposits are fundamentally pelagic in bulk composition, consistof nannofossils and foraminifers, are without sedimentary structuresindicative of current-controlled deposition, and have high and rela-tively uniform sedimentation rates. Tracing the reflector surfacesunderlying the drift deposits to drill holes where they could be datedmade it possible to determine that deposition of drift deposits in theNorth Atlantic began at the time of the Eocene/Oligocene boundary(Kidd and Hill, 1987).
The thick sediment deposit on the northeast side of the ObruchevSwell was first noted by Ewing et al. (1968) in their general reviewof Pacific Ocean sediment thicknesses. During DSDPLeg 19, one site(Site 192) was drilled on the upper portion of the swell, on MeijiSeamount, where thick pelagic and hemipelagic deposits were en-countered (Creager, Scholl, et al., 1973). Scholl et al. (1977) providedthe first detailed description of the Meiji Drift deposit, based uponseismic-reflection profiles and the Leg 19 findings at Meiji Seamount.The Meiji Drift in the Northwest Pacific Ocean is a sedimentarydeposit on the northeastern side of the northernmost Emperor Sea-mount chain that is more than 800 km long and about 350 km wide,between 300-m isopachs. The deposit is up to 1800 m thick at itsnorthwestern end at the Kamchatka Strait and thins to the southeast.Scholl et al. (1977) noted a clear link of the mineral component in theMiocene and younger deposits of Meiji Seamount to the same mate-rial at Site 191 in the Komandorski Basin and to Siberian sourceregions. They concluded that the Kamchatka Current that flows souththrough the deep Kamchatka Strait transports Siberian terrigenousmaterials to the northwestern Pacific Ocean, forming deposits both
northeast of the northern Emperor Seamounts, the Meiji Drift, andalong the base of the Kamchatka-Kuril continental margin.
Mammerickx (1985) presented information to suggest that theMeiji Drift deposit may be traceable as far south along the easternflank of the Emperor Seamounts as 35°N, a distance of more than2000 km from the Kamchatka Strait. She emphasized the strongsimilarity of the Meiji Drift to the North Atlantic Ocean drifts andpresumed the same depositional process. In support of this hypothe-sis, she noted several reports of indications of sources of cold, deepwater in the far Northwest Pacific (Mammerickx, 1985).
Site 884 was positioned on the Meiji Drift at a location where thedeposit was expected to be thin enough (less than 800 m thick) so thatit could be penetrated completely. The seismic reflection profile takenby the Farnella and processed at the U.S. Geological Survey by Scholland Dadisman (pers. comm., 1992), along which Site 884 was chosen,shows clear evidence of ongoing sediment transport processes in theform of modern and buried channels (Fig. 60), demonstrating that thislocation has been one of active deep-water flow throughout the historyof the deposit. Site 884 is on the southwestern side of the mainsedimentary axis of the deposit; the site-survey profiles collected bythe JOIDES Resolution show that the sedimentary horizons thicken tothe northeast.
The information gathered as a result of drilling at Site 884 includesseveral important results. First, during Leg 145 we were able to definea sediment body that contains pelagic-biogenic materials, largelysiliceous, and hemipelagic land-derived clays and quartz. Second,deposition of this feature has continued since the time of the Eo-cene/Oligocene boundary, with the possible exception of one or twobrief lacunae in the Miocene. Third, the mineralogy of the terrigenouscomponent has remained invariant throughout the time of deposition,with the exception of a modest increase in the relative abundance ofthe 7Å clay component, which is dominated by chlorite in the North
275

140050 100 150 200 250
Dry-water content (%)300
Figure 42. Compressional wave velocity vs. dry water content data forHole 884B.
Pacific Ocean. Finally, northern-source diatoms occur throughout thedeposit. All these indications suggest a constant depositional processsupplied by sediment from the same northern or northwesterly sourceregion. The MARs of the sediment components vary as plate motioncarries the site toward the continental source, the importance of whichvaries with climatic regime, and as production of the biogenic com-ponent waxes and wanes.
Backtracking the site along the Hawaiian trend for the past 35 m.y.places it in the relative location of about 40°N and 165°W, in themiddle of the Oligocene North Pacific Ocean (Rea and Duncan,1986). Mineral fluxes in the Oligocene portion of the section are about400 g(cm2 k.y.>~1, 20 to 40 times greater than mid-Cenozoic eolianfluxes to the ocean (Janecek and Rea, 1983; Janecek, 1985), and soare clearly hemipelagic. The problem is to discover how such longdistance hemipelagic transport might be accomplished. One possibil-ity is that the northwestward continuation of the Hawaii-EmperorRidge acted as a flow guide for the North Pacific Ocean thermohalinecirculation, diverting bottom-water flow coming south from the Ber-ing Sea to the southeast along this proposed Meiji extension. If so,the history of the Hawaii-Emperor-Meiji extension ridge, hence thelife of the Hawaiian hot spot, is extended by about 40 m.y.
The assembled data suggest that the deposition of the Meiji Driftwas occurring by early Oligocene time. Northern-source minerals anddiatoms have accumulated at moderate to high rates, generally in-creasing throughout the middle and late Cenozoic, in an elongatedeposit on the northeast flank of the northwestern extension of theEmperor Ridge. The supply of terrigenous material increases mark-edly at times of known climate change during the middle Mioceneand late Pliocene, and thus may be related to the enhanced physicalerosion of the continents surrounding the North Pacific Ocean causedby deterioration of climate in those regions. The (presumably) earlyOligocene onset and continuing deposition of the Meiji Drift entailsimportant consequences to the physical oceanography of the NorthPacific Ocean. Southerly flow of bottom waters from the Bering Seainto the North Pacific Basin has been occurring for as much as 35 m.y.Presumably, this flow has been controlled geographically by the
location of one or two deep passages through the Aleutian Ridge. Atpresent, and perhaps ever since the last important change in directionand rate of plate convergence in the region at about 43 Ma (Rea andDuncan, 1986), the deep passage is at the western end of the Aleutianchain, the Kamkchatka Strait. The basins of the Bering Sea haveserved as catchments for the voluminous elastics, mostly turbidites,that derive from Siberia and Alaska, allowing for bypassing of thefiner, hemipelagic component to the North Pacific Ocean. Withoutsuch a large catchment basin, the elastics entering the NortheastPacific directly from North America have formed the vast turbiditeabyssal plains of the Gulf of Alaska.
In a broader sense, the onset of drift deposition in the North Pacificat generally the same time as in the North Atlantic suggests a similarOceanographic and probably climatic setting. The paleolatitude andpaleodepth of the Bering Sea and the basins between the Iceland-Faeroes Ridge and the Charley-Gibbs Fracture Zone are similar.Pelagic sediments in the North Atlantic are more calcareous, but themid-Tertiary supply of elastics appears to have been greater in theNorth Pacific. The response of the northern oceans to the onset ofSouthern Hemisphere glaciation during the earliest Oligocene timeseems to have involved a fundamental change in deep circulation. Itremains a fruitful area of research.
REFERENCES*
Akiba, F., 1985. Middle Miocene to Quaternary diatom biostratigraphy in theNankai Trough and Japan Trench, and modified lower Miocene throughQuaternary diatom zones for the middle- to high-latitudes of the NorthPacific. In Kagami, H., Karig, D.E., Coulbourn, W.T., et al., Init. Repts.DSDP, 87:393—481.
Akiba, F., Hiramatsu, C, and Yanagisawa,Y., in press. A Cenozoic diatomgenus Cavitatus Williams; an emended description and two new biostrati-graphically useful species, C. lanceolatus and C. rectus from Japan. Bull.Nat. Sci. Mus. (Tokyo).
Archie, G.E., 1942. The electrical resistivity log as an aid in determining somereservoir characteristics. Trans. Am. Inst. Min. Metall. Pet. Eng., 146:54—62.
Barron, J.A., 1980. Lower Miocene to Quaternary diatom biostratigraphy ofLeg 57, off Northeastern Japan, Deep Sea Drilling Project. In von Huene,R., Nasu, N., et al., Init. Repts. DSDP, 56, 57 (Pt. 2): Washington (U.S.Govt. Printing Office), 641-686.
, 1989. The late Cenozoic stratigraphic record and hiatuses of thenortheast Pacific: results from the Deep Sea Drilling Project. In Winterer,E.L., Hussong, D.M., and Decker, R.W. (Eds.), The Geology of NorthAmerica (Vol. N): The Eastern Pacific Ocean and Hawaii. Geol. Soc. Am.,Geol. of North America Sen, 311-322.
-, 1992. Neogene diatom datum levels in the equatorial and NorthPacific. In Saito, T., and Ishizaki, K. (Eds.), The Centenary of JapaneseMicropaleontology: Tokyo (Tokyo Univ. Press), 413-425.
Barthes, V, 1990. Modelisation magnetique en forage. Rap. CEA/LETI/DSYS/SETIA, 90-59.
Basilian, A.E., Barinov, K.B., Oreshkina, TV., and Trubikhin, V.N., 1991.Bering Sea transgressions in Pliocene. Proc. 13th INQUA Congr. PlioceneAnthropogene Paleogeography and Biostratigraphy. Moscow, 5-24. (inRussian)
Bodén, P., in press. Taxonomy and stratigraphic occurrence of Thalassiosiratetraoestrupii sp. nov. and related species in upper Miocene and lowerPliocene sediments from the Norwegian Sea, North Atlantic and northwestPacific. Terra Nova.
Burckle, L.H., and Opdyke, N.D., 1977. Late Neogene diatom correlations inthe circum-Pacific. In Saito, T, and Ujiié (Eds.), Proc. 1st Int. Congr.Pacific Neogene Stratigr., Tokyo, 1976. Tokyo (Kaiyo Shupan), 255-284.
Cande, S.C., and Kent, D.V., 1992. Anew geomagnetic polarity timescale forthe Late Cretaceous and Cenozoic. J. Geophys. Res., 97:13917-13951.
Conolly, J.R., and Ewing, M., 1970. Ice-rafted detritus in Northwest Pacificdeep-sea sediments. In Hays, J.D. (Ed.), Geological Investigations of theNorth Pacific. Mem.—Geol. Soc. Am., 12:219-231.
Abbreviations for names of organizations and publication titles in ODP reference listsfollow the style given in Chemical Abstracts Service Source Index (published byAmerican Chemical Society).
276
SITE 884
Cook, H.E., Jenkyns, H.C., and Kelts, K.R., 1976. Redeposited sedimentsalong the Line Islands, equatorial Pacific. In Schlanger, S.O., Jackson,E.D., et al., Init. Repts. DSDP, 33: Washington (U.S. Govt. Printing Office),837-847.
Creager, J.S., Scholl, D.W., et al., 1973. Init. Repts. DSDP, 19: Washington(U.S. Govt. Printing Office).
Damuth, J.E., Jacobi, R.D., and Hayes, D.E., 1983. Sedimentation processesin the northwest Pacific Basin revealed by the echo-character mappingstudies. Geol. Soc. Am. Bull., 94:381-395.
Deer, W.A., Howie, R.A., and Zussman, J., 1966. An Introduction to theRock-Forming Minerals: London (Longman Group).
Donelley, T.W., and Nalli, G., 1973. Mineralogy and chemistry of Caribbeansediments. In Edgar, N.T., Saunders, J.B., et al., Init. Repts. DSDP, 15:Washington (U.S. Govt. Printing Office), 929-961.
Ewing, J., Ewing, M., Aitken, T., and Ludwig, W.J., 1968. North Pacificsediment layers measured by seismic profiling. In Knopoff, L., Drake,C.L., and Hart, PJ. (Eds.), The Crust and Upper Mantle of the PacificArea. Am. Geophys. Union Monogr., 12:147-173.
Fertl, W.H., 1979. Gamma ray spectral data assists in complex formationevaluation. Log Analyst, 20:421-423.
Foreman, H.P., 1975. Radiolaria from the North Pacific, Deep Sea DrillingProject, Leg 32. In Larson, R.L., Moberly, R., et al., Init. Repts. DSDP, 32:Washington (U.S. Govt. Printing Office), 579-676.
Gieskes, J.M., 1981. Deep-sea drilling interstitial water studies: implicationsfor chemical alteration of the oceanic crust, layers I and IL In Warme, J.E.,Douglas, R.G., and Winterer, E.L. (Eds.), The Deep Sea Drilling Project:A Decade of Progress. Spec. Publ.—Soc. Econ. Paleontol. Mineral.,32:149-167.
Hamilton, E.L., 1979. Sound velocity gradients in marine sediments. J. Acoust.Soc. Am., 65:909-922.
Hays, J.D., 1970. Stratigraphy and evolutionary trends of radiolaria in NorthPacific deep sea sediments. In Hays, J.D. (Ed.), Geological Investigationsof the North Pacific. Mem.—Geol. Soc. Am., 126:185-218.
Hays, J.D., and Shackleton, NJ., 1976. Globally synchronous extinction ofradiolarian Stylatractus universus. Geology, 4:649-652.
Heath, G.R., Burckle, L.H., et al., 1985. Init. Repts. DSDP, 86: Washington(U.S. Govt. Printing Office).
Hollister, CD., Ewing, J.I., et al., 1972. Init. Repts. DSDP, 11: Washington(U.S. Govt. Printing Office).
Janecek, T.R., 1985. Eolian sedimentation in the Northwest Pacific Ocean: apreliminary examination of the data from Deep Sea Drilling Project Sites576 and 578. In Heath, G.R., Burckle, L.H., et al., Init. Repts. DSDP, 86:Washington (U.S. Govt. Printing Office), 589-603.
Janecek, T.R., and Rea, D.K., 1983. Eolian deposition in the northeast PacificOcean: Cenozoic history of atmospheric circulation. Geol. Soc. Am. Bull.,94:730-738.
Jenkyns, H.C., 1976. Sediments and sedimentary history, Manihiki Plateau,South Pacific Ocean. In Schlanger, S.O., Jackson, E.D., et al., Init. Repts.DSDP, 33: Washington (U.S. Govt. Printing Office), 873-890.
Keigwin, L.D., Jones, G.A., and Froelich, N.P., 1992. A 15,000-year paleoen-vironmental record from Meiji seamount, far northwestern Pacific. EarthPlanet Sci. Lett., 111:425-440.
Keller, G., and Barron, J.A., 1987. Paleodepth distribution of Neogene deep-sea hiatuses. Paleoceanography, 2:697-713.
Keller, G.V., 1982. Electrical properties of rocks. In Carmichael, R.S. (Ed.),Handbook of Physical Properties of Rocks (Vol. 1): Boca Raton, FL (CRCPress), 217-293.
Kennett, J.P., McBirney, A.R., and Thunell, R.C., 1977. Episodes of Cenozoicvolcanism in the circum-Pacific region. J. Volcanol. Geotherm. Res.,2:145-163.
Kennett, J.P., and Thunell, R.C., 1975. Global increase in Quaternary explosivevolcanism. Science, 187:497-503.
Kidd, R.B., and Hill, PR., 1987. Sedimentation on Feni and Gardar sedimentdrifts. In Ruddiman, W.F., Kidd, R.B., et al., Init. Repts. DSDP, 94 (Pt. 2):Washington (U.S. Govt. Printing Office), 1217-1244.
Koizumi, I., 1992. Diatom biostratigraphy of the Japan Sea: Leg 127. InPisciotto, K. A., Ingle, J.C., Jr., von Breymann, M.T., Barron, J., et al., Proc.ODP, Sci. Results, 127/128 (Pt. 1): College Station, TX (Ocean DrillingProgram), 249-289.
Koizumi, I., and Tanimura, Y., 1985. Neogene diatom biostratigraphy of themiddle latitude western North Pacific, Deep Sea Drilling Project Leg 86.In Heath, G.R., Burckle, L.H., et al., Init. Repts. DSDP, 86: Washington(U.S. Govt. Printing Office), 269-300.
Krauskopf, K.B., 1979. Introduction to Geochemistry (2nd ed.): New York(McGraw-Hill).
Krissek, L.A., Morley, J J., and Lofland, D.K., 1985. The occurrence, abun-dance, and composition of ice-rafted debris in sediments from Deep SeaDrilling Project Sites 579 and 580, northwest Pacific. In Heath, G.R.,Burckle, L.H., et al., Init. Repts. DSDP, 86: Washington (U.S. Govt.Printing Office), 647-655.
Landing, W.M., and Bruland, K.W., 1980. Manganese in the North Pacific.Earth Planet. Sci. Lett, 49:45^6.
Ling, H.Y., 1973. Radiolaria: Leg 19 of the Deep Sea Drilling Project. InCreager, J.S., Scholl, D.W., et al., Init. Repts. DSDP, 19: Washington (U.S.Govt. Printing Office), 777-797.
Mammerickx, J., 1985. A deep-sea thermohaline flow path in the northwestPacific. Mar. Geol., 65:1-19.
McDuff, R.E., 1985. The chemistry of interstitial waters, Deep Sea DrillingProject, Leg 86. In Heath, G.R., Burckle, L.H., et al., Init. Repts. DSDP,86: Washington (U.S. Govt. Printing Office), 675-687.
Moberly, R., and Jenkyns, H.C., 1981. Cretaceous volcanogenic sediments ofthe Nauru Basin, Deep Sea Drilling Project Leg 61. In Larson, R.L.,Schlanger, S.O., et al., Init. Repts. DSDP, 61: Washington (U.S. Govt.Printing Office), 533-548.
Morley, J J., Hays, J.D., and Robertson, J.H., 1982. Stratigraphic frameworkfor the late Pleistocene in the northwest Pacific ocean. Deep-Sea Res. PartA, 29:1485-1499.
Morley, J.J., and Shackleton, NJ., 1978. Extension of the radiolarian Styla-tractus universus as a biostratigraphic datum to the Atlantic Ocean. Geol-ogy, 6:309-311.
Natland, J.H., 1973. Basal ferromanganoan sediments at DSDP Site 183,Aleutian Plain and Site 192, Meiji Guyot, Northwest Pacific, Leg 19. InCreager, J.S., Scholl, D.W., et al., Init. Repts. DSDP, 19: Washington (U.S.Govt. Printing Office), 629-641.
Pedersen, T.F., Vogel, J.S., and Southon, J.N., 1986. Copper and manganesein hemipelagic sediments at 21°N: diagenetic contrasts. Geochim. Cosmo-chim.Acta, 50:2019-2031.
Pickering, K.T., Hiscott, R.N., and Hein, FJ., 1989. Deep Marine Environ-ments: Clastic Sedimentation and Tectonics: London (Unwin Hyman).
Rea, D.K., and Duncan, R.A., 1986. North Pacific Plate convergence: aquantitative record of the past 140 m.y. Geology, 14:373-376.
Rea, D.K., and Schrader, H., 1985. Late Pliocene onset of glaciation: ice raftingand diatom stratigraphy of North Pacific DSDP cores. Palaeogeogr.,Palaeoclimatol, Palaeoecol., 49:313-325.
Rea, D.K., and Thiede, J., 1981. Mesozoic and Cenozoic mass accumulationrates of the major sediment components in the Nauru Basin, WesternEquatorial Pacific. In Larson, R.L., Schlanger, S.O., et al., Init. Repts.DSDP, 61: Washington (U.S. Govt. Printing Office), 549-555.
Riedel, W.R., and Sanfilippo, A., 1970. Radiolaria, Leg 4, Deep Sea DrillingProject. In Bader, R.G., Gerard, R.D., et al., Init. Repts. DSDP, 4: Wash-ington (U.S. Govt. Printing Office), 503-575.
, 1971. Cenozoic radiolaria from the western tropical Pacific, Leg 7.In Winterer, E.L., Riedel, W.R., et al., Init. Repts. DSDP, 1 (Pt. 2):Washington (U.S. Govt. Printing Office), 1529-1672.
-, 1978. Stratigraphy and evolution of tropical Cenozoic radiolarians.Micropaleontology, 24:61-96.
Ruddiman, W.F., Kidd, R.B., Thomas, E., et al., 1987. Init. Repts. DSDP, 94(Pt. 1): Washington (U.S. Govt. Printing Office).
Sakai, T, 1980. Radiolarians from Sites 434, 435, and 436, Northwest Pacific,Leg 56, Deep Sea Drilling Project. In von Huene, R., Nasu, N., et al., Init.Repts. DSDP, 56, 57 (Pt. 2): Washington (U.S. Govt. Printing Office),695-733.
Schlanger, S.O., Jackson, E.D., et al, 1976. Init. Repts. DSDP, 33: Washington(U.S. Govt. Printing Office).
Schlanger, S.O., and Premoli Silva, I., 1981. Tectonic, volcanic, and paleo-geographic implications of redeposited reef faunas of Late Cretaceous andTertiary age from the Nauru Basin and the Line Islands. In Larson, R.L.,Schlanger, S.O., et al., Init. Repts. DSDP, 61: Washington (U.S. Govt.Printing Office), 817-827.
Scholl, D.V., Hein, J.R., Marlow, M., Buffington, E.C., 1977. Meiji sedimenttongue: North Pacific evidence for limited movement between the Pacificand North American plates. Geol. Soc. Am. Bull., 88:1567-1576.
Shackleton, NJ., Backman, J., Zimmerman, H., Kent, D.V., Hall, M.A.,Roberts, D.G., Schnitker, D., Baldauf, J.G., Desprairies, A., Homrighausen,R., Huddlestun, P., Keene, J.B., Kaltenback, A J., Krumsiek, K.A.O., Mor-ton, A.C., Murray, J.W., and Westberg-Smith, J., 1984. Oxygen isotope
277

SITE 884
calibration of the onset of ice-rafting and history of glaciation in the NorthAtlantic region. Nature, 307:620-623.
Siesser, W.G., 1978. Native copper in DSDP Leg 40 sediments. In Bolli, H.M.,Ryan, W.B.F., et al., Init. Repts. DSDP, 40 (SuppL, Pt. 4): Washington (U.S.Govt. Printing Office), 761-765.
Thiede, J., and Rea, D.K., 1981. Mass accumulation rates of Barremian toRecent biogenic sediments from the Mid-Pacific Mountains (Deep SeaDrilling Project Site 463) and Hess Rise (Sites 464,465,466) central NorthPacific Ocean. In Thiede, J., Valuer, T.L., et al., Init. Repts. DSDP, 62:Washington (U.S. Govt. Printing Office), 637-651.
Tjalsma, R.C., and Lohmann, G.P., 1983. Paleocene-Eocene bathyal andabyssal benthic foraminifera from the Atlantic Ocean. Micropaleontol.Spec. Publ., 4.
Tucholke, B.E., Edgar, N.T., and Boyce, R.E., 1976. Physical properties andcorrelations with acoustic stratigraphy: Leg 35, Deep Sea Drilling Project.In Hollister, CD., Craddock, C , et al., Init. Repts. DSDP, 35: Washington(U.S. Govt. Printing Office), 229-250.
Valuer, T.L., Dean, W.E., Rea, D.K., and Thiede, J., 1983. Geologic evolutionof Hess Rise, central North Pacific Ocean. Geol. Soc. Am. Bull 94-1289-1307.
van Hinte, J.E., Wise, S.W., Jr., et al., 1987. Init. Repts. DSDP, 93: Washington(U.S. Govt. Printing Office).
van Morkhoven, F.P.C.M., Berggren, W.A., and Edwards, A.S., 1986. Ceno-zoic cosmopolitan deep-water benthic foraminifera. Bull. Cent. Rech.Explor.-Prod. Elf-Aquitaine, Mem. 11.
Wilkens, R.H., and Handyside, T., 1985. Physical properties of equatorialPacific sediments. In Mayer, L., Theyer, F., Thomas, E., et al., Init. Repts.DSDP, 85: Washington (U.S. Govt. Printing Office), 839-847.
Wise, S.W., Jr., and van Hinte, J.E., 1987. Mesozoic-Cenozoic depositionalenvironments revealed by Deep-Sea Drilling Project Leg 93 drilling on thecontinental rise off the Eastern United States: cruise summary. In van Hinte,J.E., Wise, S.W., Jr., et al., Init. Repts. DSDP, 93: Washington (U.S. Govt.Printing Office), 1367-1423.
Yanagisawa, Y., and Akiba, F., 1990. Taxonomy and phylogeny of threemarine diatom genera, Crucidenticula, Denticulopsis, and Neodenticula.Bull. Geol. Surv. Jpn. [Chishitsu Chosasho Geppo], 41:197-301.
Ms 145IR-108
NOTE: For all sites drilled, core-description forms ("barrel sheets") and core photographs canbe found in Section 3, beginning on page 395. Forms containing smear-slide data can be foundin Section 4, beginning on page 985. Thin-section data are given in Section 5, beginning on page1013. Conventional log, FMS, dipmeter, and geochemical log (element and oxide weight %) datacan be found in CD-ROM form (back pocket).
Thermal conductivity(W/[m °C]) Lith.
0.5 1.0 1.5 2.0 unit
200 -
_ 400
J
a.Q
600
800
1000
f
1"3•-*
Hole 884B
Hole884C
•
•
1A
IB
IC
ID
IIA
HB
HC
III
Figure 43. Thermal conductivity data vs. depth for Holes 884B and 884C.Lithologic units are shown at right, as discussed in the text.
40 50 60 70 80 90Wet porosity (%)
Figure 44. Thermal conductivity vs. wet porosity data for Hole 884B. Thetheoretical thermal conductivity of a mix of fused silica and seawater is shownin bold (after Wilkens and Handyside, 1985).
0 5 10
Temperature (°C)
Figure 45. Temperature data recorded by the Lamont temperature logging toolon the quad combination and geochemical tool strings.

SITE 884
cCO 3
3 CO oO
>,
>oSer
X2• •
(―Q.Φ
Q
700
Spectral gammaray (API)
Computer gamma 60ray (API) Potassium Thorium Uranium
Clay Diatomite Ash Chalk
Figure 46. Data from the natural gamma-ray spectrometry tool (NGT) recorded on the geochemical tool string. The displayed data havebeen smoothed by a linear nine-point (1.37 m) moving average filter.
279
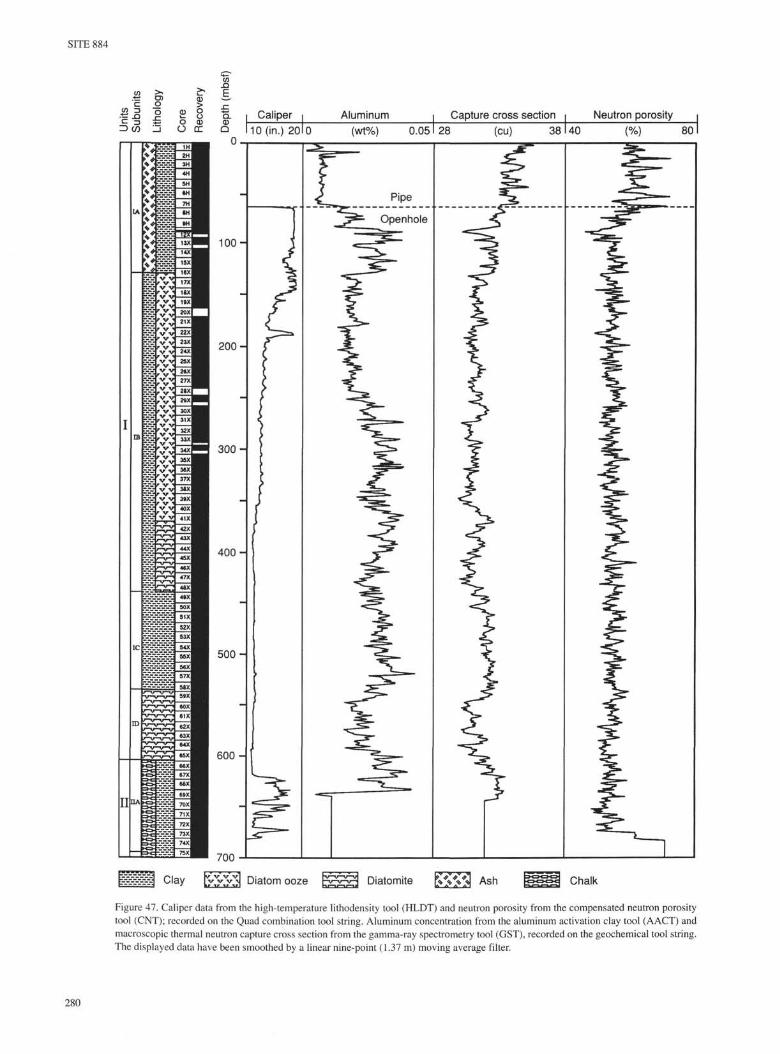
SITE 884
c
113 CD
CD
δo
Qi
.αE
ΦQ
100-
2 0 0 -
3 0 0 -
400-^
5 0 0 -
600 -
700
Caliper Aluminum
10 (in.) 20I0 (wt%) 0.05
Pipe
Openhole
Capture cross section i Neutron porosity
28 (cu) 38140 (%) 80
Diatomite Ash Chalk
Figure 47. Caliper data from the high-temperature lithodensity tool (HLDT) and neutron porosity from the compensated neutron porositytool (CNT); recorded on the Quad combination tool string. Aluminum concentration from the aluminum activation clay tool (AACT) andmacroscopic thermal neutron capture cross section from the gamma-ray spectrometry tool (GST), recorded on the geochemical tool string.The displayed data have been smoothed by a linear nine-point (1.37 m) moving average filter.
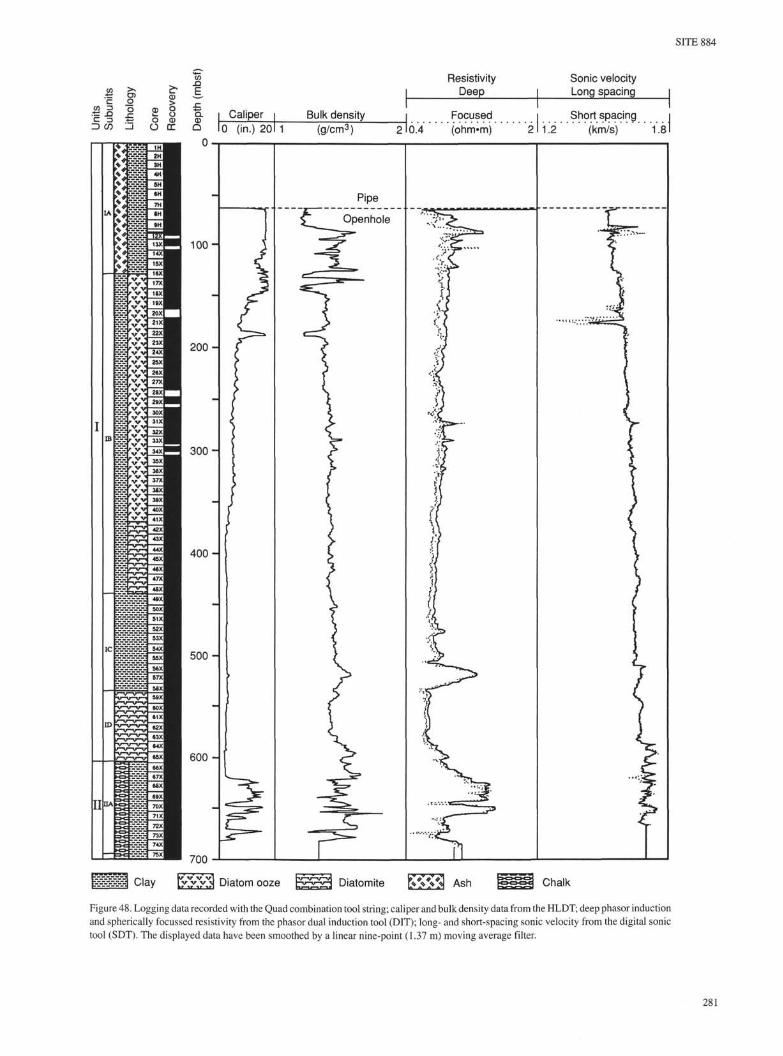
SITE 884
ID CO
>,enoo
>_i
Cù
oü
>oo
rr
α.0)
Q
ResistivityDeep
Sonic velocityLong spacing
Chalk
Figure 48. Logging data recorded with the Quad combination tool string; caliper and bulk density data from the HLDT; deep phasor inductionand spherically focussed resistivity from the phasor dual induction tool (DIT); long- and short-spacing sonic velocity from the digital sonictool (SDT). The displayed data have been smoothed by a linear nine-point (1.37 m) moving average filter.
281
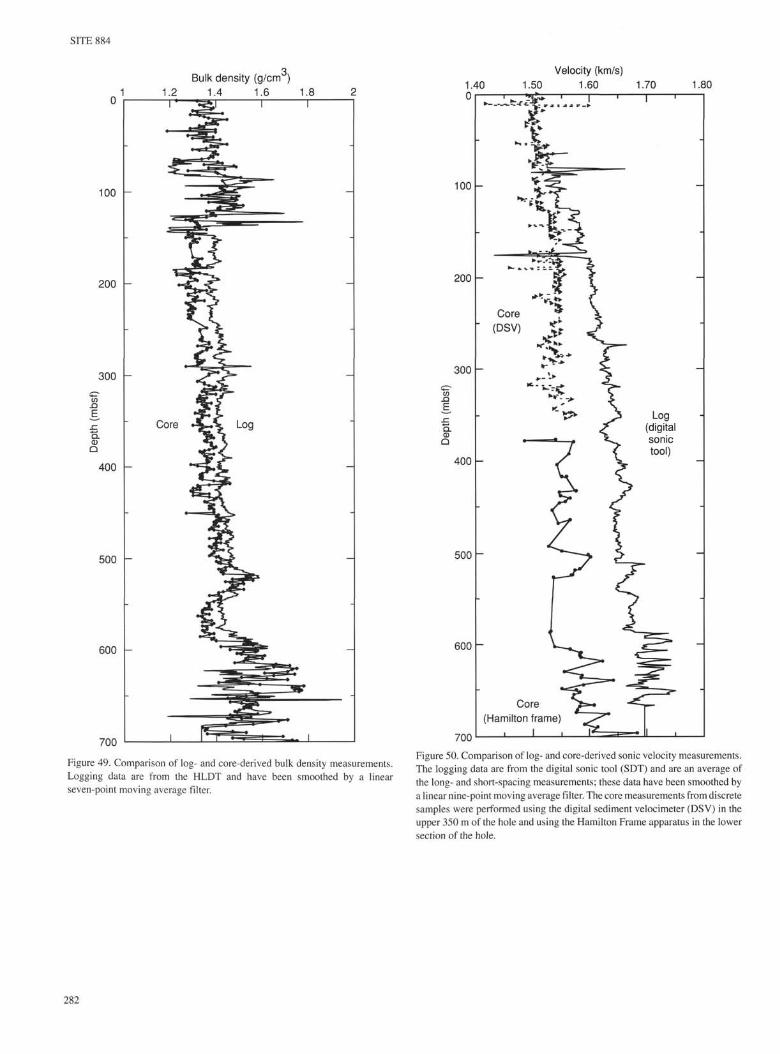
SITE 884
1.2Bulk density (g/cm )
1.4 1.6 1.
100 -
200 -
300 -
600
1.40Velocity (km/s)
1.50 1.60 1.70 1.80
100 -
200 -
300 -
Q.CDa
400 -
500 -
700
Figure 49. Comparison of log- and core-derived bulk density measurements.Logging data are from the HLDT and have been smoothed by a linearseven-point moving average filter.
400 -
500 ~
600 -
700
Figure 50. Comparison of log- and core-derived sonic velocity measurements.The logging data are from the digital sonic tool (SDT) and are an average ofthe long- and short-spacing measurements; these data have been smoothed bya linear nine-point moving average filter. The core measurements from discretesamples were performed using the digital sediment velocimeter (DSV) in theupper 350 m of the hole and using the Hamilton Frame apparatus in the lowersection of the hole.

SITE 884
Porosity (%)40 50 60 70 80 90 100
-1500 -1300 -1100 -900 -700 unit150r
Figure 51. Porosity derived from the medium phasor induction log of the phasordual induction tool (DIT) compared with core porosity measurements ondiscrete samples. The influx resistivity data and the final porosity log areunsmoothed.
-10000 -8000 -6000 -4000 -2000 050
Lith.unit
-4000 -2000 0 2000 4000 6000 8000
Figure 52. "Local" total induction BL ("B field," see text) vs. depth in Hole884E for the two successive runs. The boundaries between the main lithologicalunits (as defined from Hole 884B) are shown on the right. The local part of thetotal induction has been obtained by correcting the total induction for the maindipolar field; scale shift between runs is 6000 nT.
-1100 -900 -700 -500 -300
Figure 53. Detailed view of the "local" B field (BL) between 150 and 750 mbsfin Hole 884E for the two successive logs; scale shift between runs is 300 nT.The boundaries between the main lithological units as defined from Hole 884Bare shown on the right.
-800 -600 -800 -600 -800 -600150 t i n ij i kr I ' i ' I 450
-700 -500 -700 -500 -750 -550
Figure 54. Close-up of the "local" B field (BL) between 150 and 600 mbsf inHole 884E for the two successive logs including location of the boundariesbetween the lithological subunits of Unit I as defined from Hole 884B; scaleshift between runs is 100 nT.
283
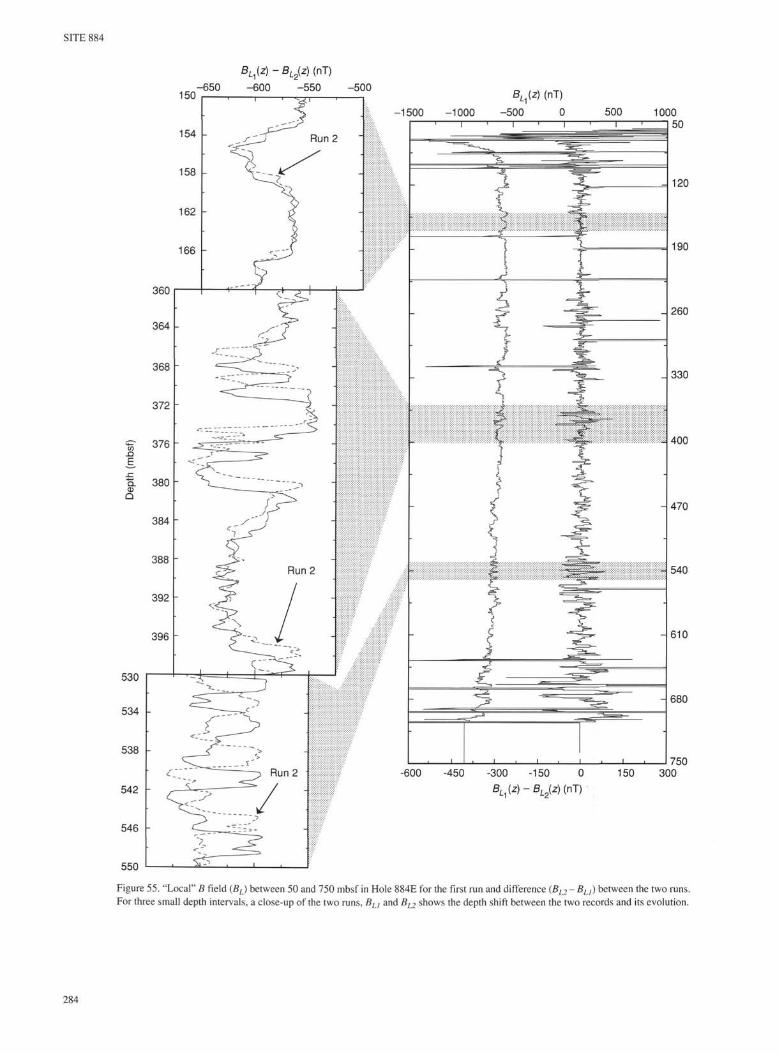
SITE 884
150
154 -
BL (z) - BL2(z) (nT)
-600 -550 -500BL {z) (nT)
-1500 -1000 -500 0 500 100050
= 120
- 470
I 540
- 610
- 680
750-600 -450 -300 -150 0
BL (z)-BL2(z)(nJ)150 300
542 -
546 -
550
Figure 55. "Local" B field (BL) between 50 and 750 mbsf in Hole 884E for the first run and difference (BL2 ~ BL between the two runs.
For three small depth intervals, a close-up of the two runs, BLI and BL2 shows the depth shift between the two records and its evolution.
284
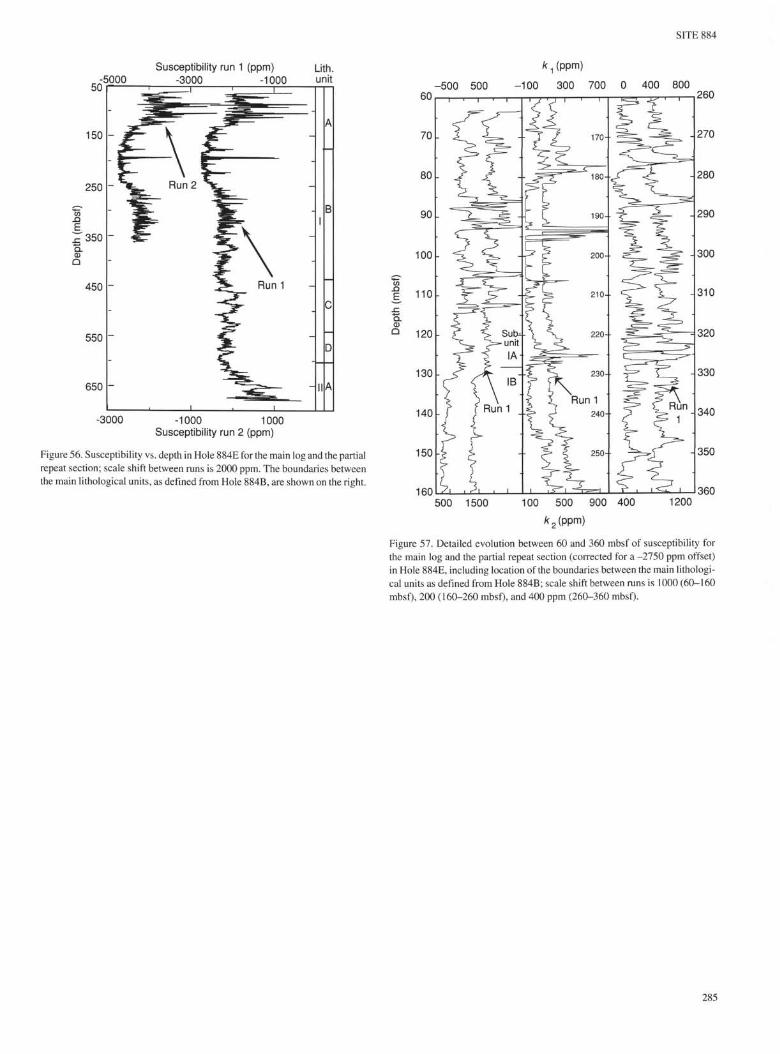
SITE 884
150
250
350
CDQ
450
550
650
Susceptibility run 1 (ppm) |_ith.-3000 -1000 unit
IIA
-3000 -1000 1000Susceptibility run 2 (ppm)
Figure 56. Susceptibility vs. depth in Hole 884E for the main log and the partialrepeat section; scale shift between runs is 2000 ppm. The boundaries betweenthe main lithological units, as defined from Hole 884B, are shown on the right.
-500 500
k 1 (ppm)
-100 300 700 0 400 800260
.270
-280
- 290
- 300
- 310
-– 320
- 330
- 340
- 350
360500 1500 100 500 900 400
/c2(ppm)
1200
Figure 57. Detailed evolution between 60 and 360 mbsf of susceptibility forthe main log and the partial repeat section (corrected for a -2750 ppm offset)in Hole 884E, including location of the boundaries between the main lithologi-cal units as defined from Hole 884B; scale shift between runs is 1000 (60-160mbsf), 200 (160-260 mbsf), and 400 ppm (260-360 mbsf).

SITE 884
200
kvk2(nl)
600 1000 1400
90
120
150
180
Differencebetween Run 1
and Run 2
210
Φ
o
240
270
300
330
360
-3000 1000-2000 -1000k -k2 (ppm)
Figure 58. Detailed evolution in Hole 884E between 60 and 360 mbsf of susceptibility k for the main log (corrected for a -2750 ppm offset) anddifference k - k2 with the partial repeat section. For three small depth intervals, a close-up of the two runs, k and k2 shows the depth shift betweenthe two records and its evolution.

SITE 884
k (ppm)
500 10001500 2000 2500
Core susceptibility(10~6 SI)
5001500 2500
B
20
40
60
80
100
120
140
150
170 -"
k (ppm)
200 400 600 800 1000
Core susceptibility(I0"6 SI)
200 600 1000
SubunitsJAIB
290 -
-1500 -1100 -700ßLi(nT)
-900 -820 -740 -660 -580 -500
Core susceptibility(10-6 SI)
200 400 600 800 10001200 200 600 1000
BL (nJ)
k (ppm)Core susceptibility
(10~6 SI)
300
320 -
300 500 700 900 1100 1300 200 600 1000450
470 -
440 -
-940 -860 -780 -700 -620 -540
590 -
-980 -900 -820 -740 -660 -580SLi(nT)
Figure 59. Detailed comparative evolution of susceptibility k (Run 1, corrected for a -2450 ppm offset), "local" B field BLI (Run 1) inHole 884E and susceptibility values obtained from core measurements in Hole 884B, including location of the boundaries between themain lithological units as defined from Hole 884B. In all plots the relative full scales are preserved, whereas the width for log data fullscale is double the one for core measurements. A. 0-150 mbsf, full-scale is 3000 ppm, 1000 nT, and 3000 I0"6 S1. B. 150-300 mbsf,full-scale is 1200 ppm, 400 nT, and 1200 I0"6 S1. C. 300-450 mbsf, full-scale is 1200 ppm, 400 nT, and 1200 I0"6 S1. D. 450-600 mbsf,full-scale is 1200 ppm, 400 nT, and 1200 I0"6 S1. E. 600-750 mbsf, full-scale is 3000 ppm, 1000 nT, and 3000 I0"6 S1.
287
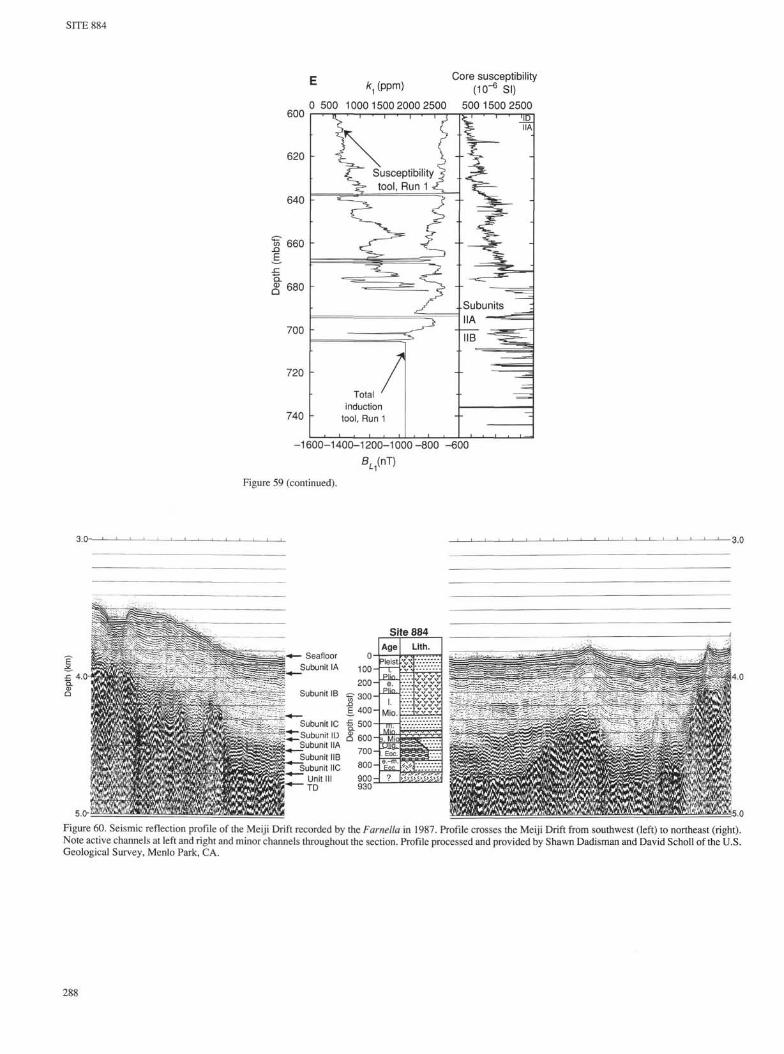
SITE 884
Core susceptibility
600
k (ppm)
0 500 1000 1500 2000 2500 500 1500 2500
(10~6 SI)
620 -
740
-1600-1400-120CM 000
Figure 59 (continued).
3 . 0 - -3.0
5.0- 5.0
Figure 60. Seismic reflection profile of the Meiji Drift recorded by the Farnella in 1987. Profile crosses the Meiji Drift from southwest (left) to northeast (right).Note active channels at left and right and minor channels throughout the section. Profile processed and provided by Shawn Dadisman and David Scholl of the U.S.Geological Survey, Menlo Park, CA.
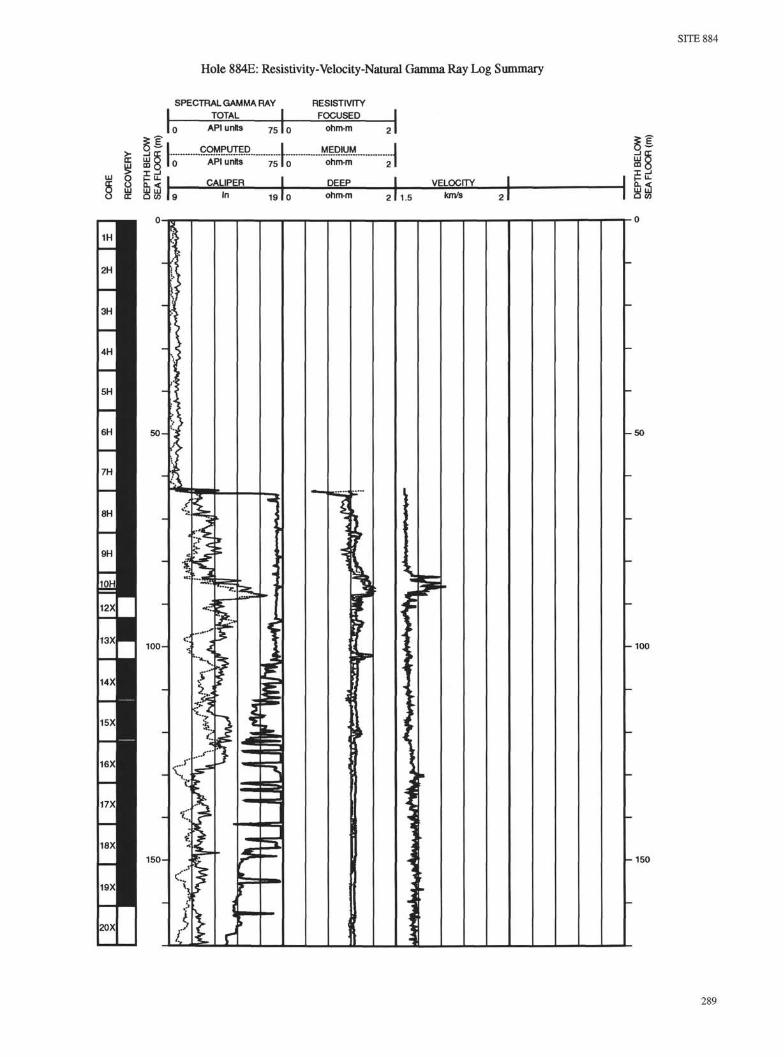
SITE 884
Hole 884E: Resistivity-Velocity-Natural Gamma Ray Log Summary
SPECTRAL GAMMA RAY
TOTAL
RESISTIVITY
FOCUSED
0 API units 75 j 0
H LU δLU S>Q
LU O E U-
§ O α. <
LU LU LUer Q co I 9
COMPUTED.
API unto 7 5 1 o
CALIPER~™!"""""
.1.5 I 0
ohm m
MEDIUM,ohm m
DEEP
13X1
14X1
15X1
16X1
17X1
18X1
19X1
20X1
o-1H
2H
3H
4H
6 H |
7H
8H
9H
IOH|
12X
100-
150-
I19 10
ohm m
VELOCITY
2 1 1.5 km/s
- 5 0
- 1 0 0
f-150
289

SITE 884
Hole 884E: Resistivity-Velocity-Natural Gamma Ray Log Summary (continued)
SPECTRAL GAMMA RAYTOTAL
API units 7 5 1 0
COMPUTED Im § 10 API units 7 5 1 0
gc 8 t < I CALIPER8 a. <ccπ S co | 9 1910
RESISTIVITYFOCUSED
ohm m
MEDIUM,ohm m
DEEP VELOCITYohm m 2 I 1.5 km/s
21X1
22)
23X1
24X1
25X1
26X1
27X1
28X
29Xf
30X1
31×l
32X1
33X1
200-
250-
- 2 0 0
-250
34X1300- -300
35X1
36X1
37X1
38X1 t

SITE 884
Hole 884E: Resistivity-Velocity-Natural Gamma Ray Log Summary (continued)
SPECTRAL GAMMA RAYTOTAL
CALIPER
RESISTIVITYFOCUSED
0 API units 751 Q ohm m
COMPUTED I MEDIUM.0 API units 751 o ohm m
DEEP VELOCITY
O co 19 In 19To ohm m 21 1.5 '<m's 2
38X1
39x1 350- -350
40X1
41X1
42X1
43X1
44X1400- -400
45X1
46X1
47X1
48X1
49X1
50X1
51X1
52X1
53×l
54X1
55X1
56x1
450-
500-
-450
- 5 0 0
291
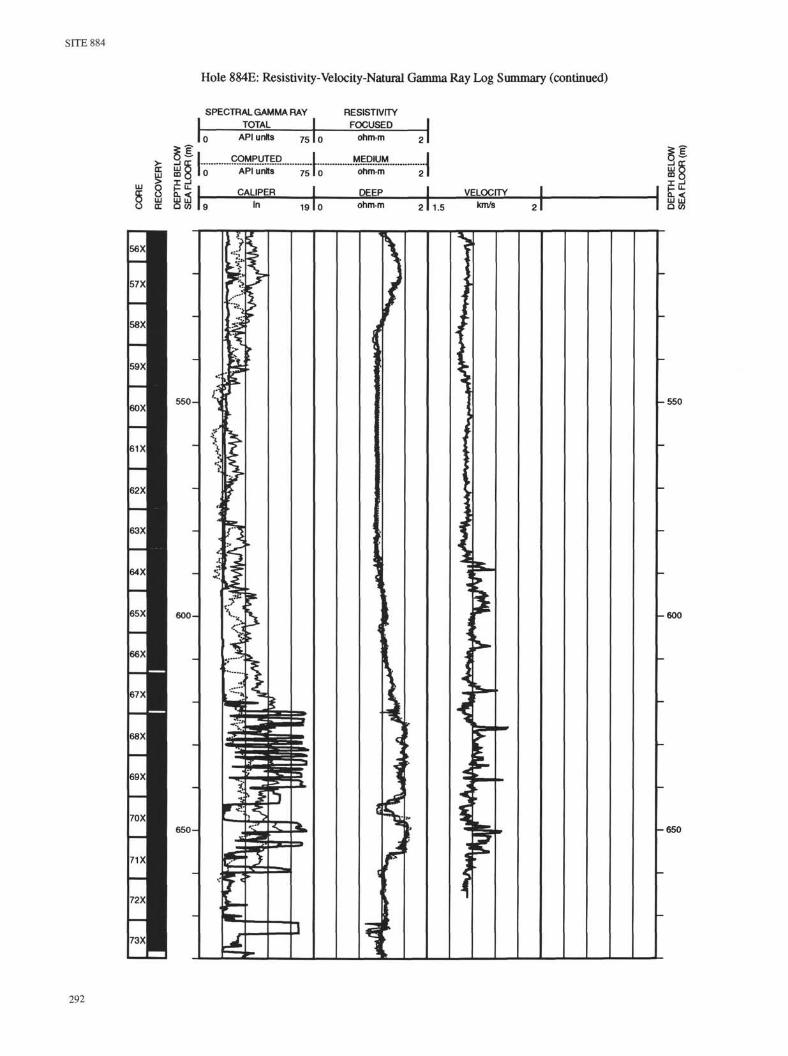
SITE 884
Hole 884E: Resistivity-Velocity-Natural Gamma Ray Log Summary (continued)
SPECTRAL GAMMA RAYTOTAL
ÜJ n
Q LUQ W 19
RESISTIVITY
FOCUSED
API units 751 o ohm m
.COMPUTED I MEDjUM£ £ > | o AF>T"uriits 75I0" öhm m""
CALIPER J DEEPIn 191 o ohm•m 2 1 1 5 km/s 2
VELOCITY
56X1
57X1
58X1
59X1* " ' » .
60X1550- -550
61X1
62X1
63)
64X1
65X• I 600- -600
66X1
67X1
68X1
69X1
70X1650- -650
71X1
72X1
73X1

SITE 884
Hole 884E: Resistivity-Velocity-Natural Gamma Ray Log Summary (continued)
SPECTRAL GAMMA RAYTOTAL
E ülLU ^
E 8 EO o. < L_UJ 111 LU 1 ^a. o co I 9
API units 75 1 0
COMPUTED I0 API units 751 o
CALIPER
RESISTIVITYFOCUSED
ohm m
MEDJUM.ohm m
DEEP VELOCITYin 19 10 ohm m 2 I 1.5 km/s
74X1
75X1
76X1
77X1
78X1
79X1
80X1
81X1
82X1
83X1
84X1
85X1
86X1
87X1
88X1
89X1
90×f
91×l
700-
750-
800-
850-
-700
-750
- 8 0 0
850
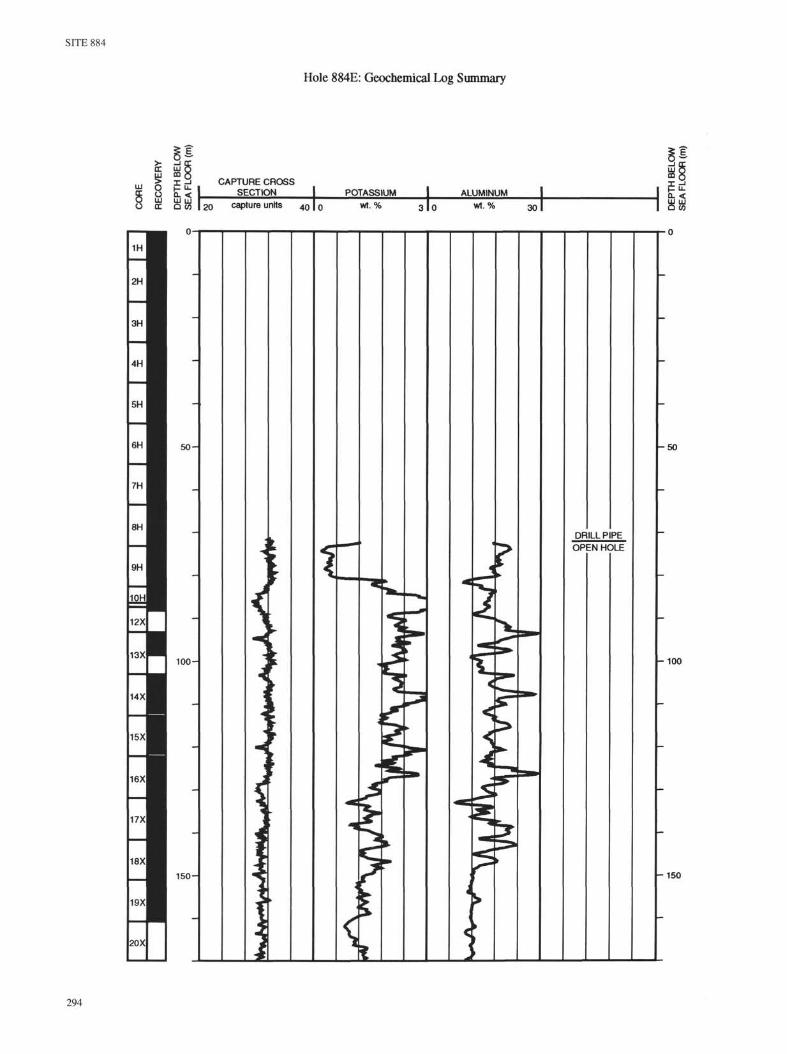
SITE 884
Hole 884E: Geochemical Log Summary
<r UJUJ CO
CAPTURE CROSSSECTION POTASSIUM
w 120 capture units 4 0 1 0 wt. % 3 1 0
ALUMINUMwt. % 30
1H
2H
3H
4H
5H
6H
7H
8H
9H
1OHJ
12)
13X|
14x1
15X1
16X1
17x1
18X1
19x1
20X1
50 -
100-
150-
j ;
DRILL PIPEOPEN HOLE
UJ UJQ (0
- 5 0
-100
-150
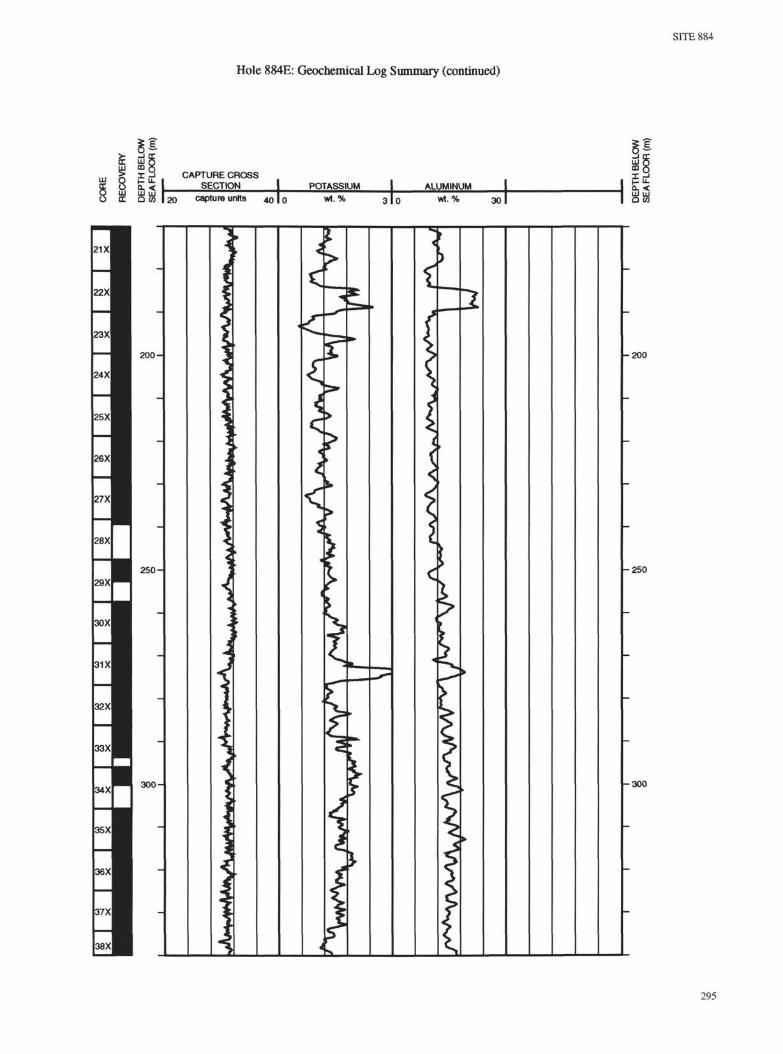
Hole 884E: Geochemical Log Summary (continued)
SITE 884
j> I 3 CAPTURE CROSSO CL < SECTION I POTASSIUME Q w 120 capture units 4010 wt. % 3
ALUMINUMwt. % 30 &25
21Xl
22X1
23X1
24X1
25X1
26X1
27X1
28X1
29X1
30X1
31X1
32X1
33X1
34)
35X1
36×l
37X1
38X1
200-
250-
300-
-200
-250
-300

SITE 884
Hole 884E: Geochemical Log Summary (continued)
>- —I CC 3 ECOC LJJ Q ID Q
m > X 3 CAPTURE CROSS X 2g δ £L< I SECTION I POTASSIUM j ALUMINUM I I t<S c o w I20 capture units 40 |o wt % 310 *t. % 301 I Q »
296
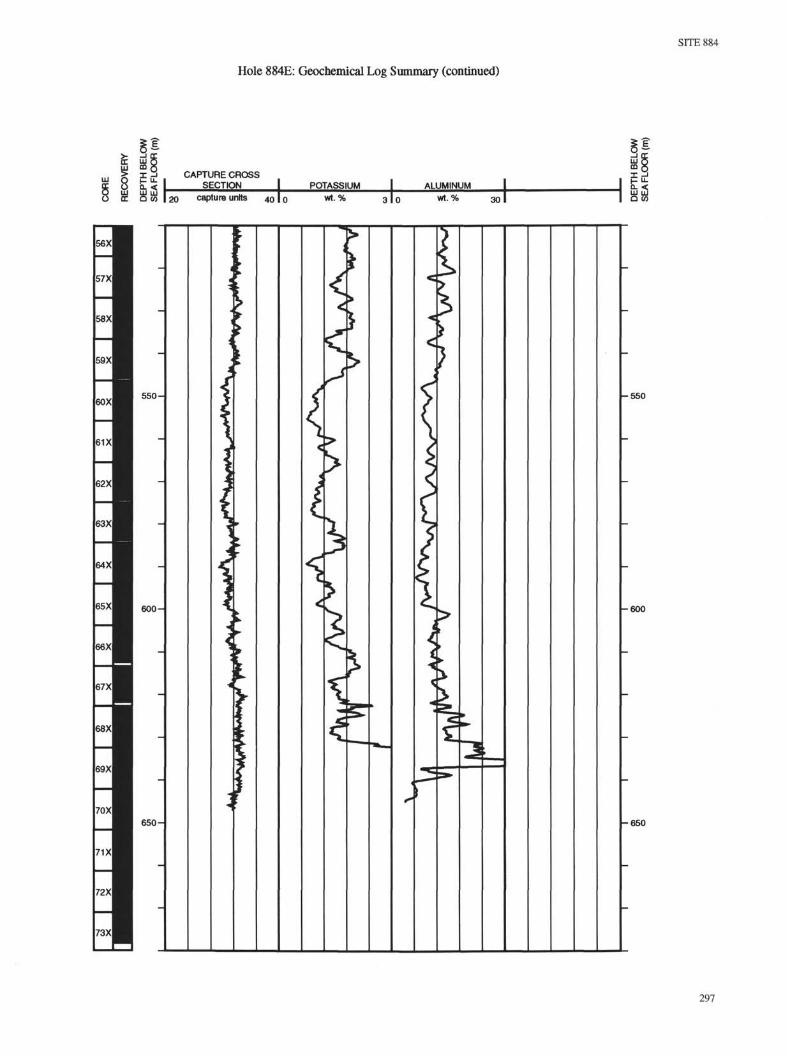
SITE 884
Hole 884E: Geochemical Log Summary (continued)
CC LU Q UJ Q
UJ ^ E , CAPTURE CROSS I 3
§ 0 a.< SECTION I POTASSIUM I ALUMINUM a. <
oc Q <o 120 capture units 40 I0 *t. % 3 I 0 wt. % 30I l o w
297

SITE 884
Hole 884E: Density-Porosity-Natural Gamma Ray Log Summary
er
LU O
O LUO OC
Q- <LU LU
SPECTRAL GAMMA RAYTOTAL
0 API units 75
COMPUTED L.NEUTRpN.PpjROSITY...0 API units 75 1100 % 40
CALIPER I BULK DENSITYin
l öPHOTOELECTRIC
EFFECTbamsVβ 10 1-6
DENSITY CORRECTION I
POTASSIUM
19 11 2 I -0.25 g/cm3
0.25 I 5
wt. %
THOR[UM.
ppm
URANIUM
ppm
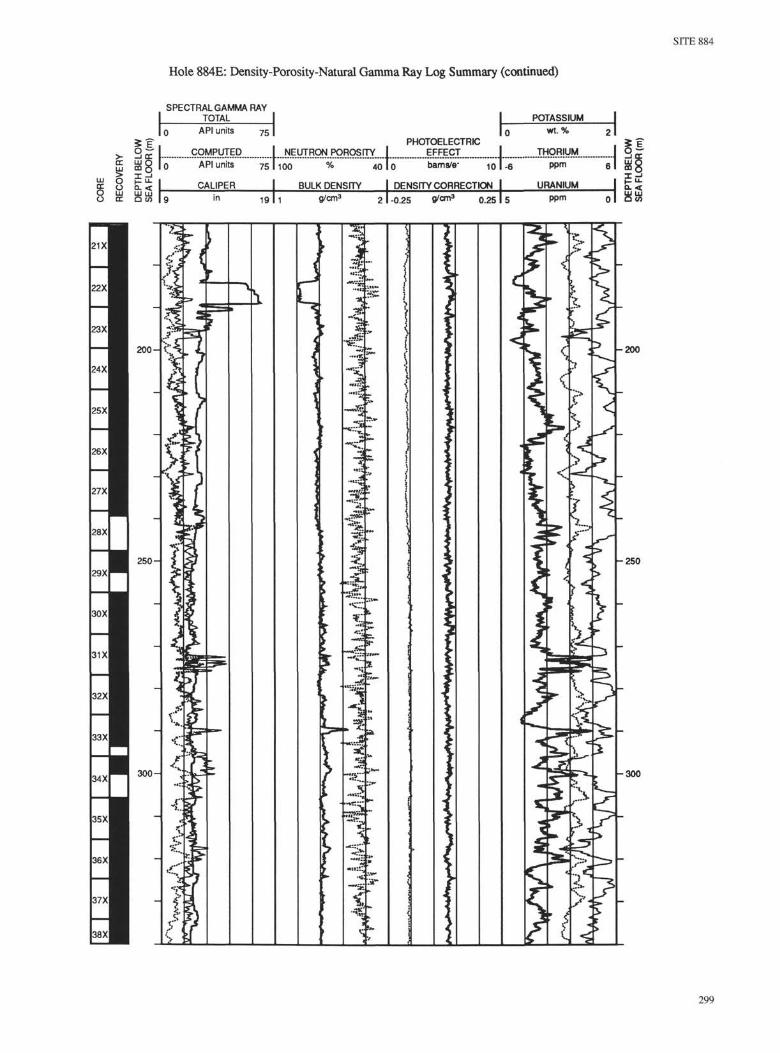
SITE 884
Hole 884E: Density-Porosity-Natural Gamma Ray Log Summary (continued)
SPECTRAL GAMMA RAYTOTAL
er UJ<-LU CQ (_
W O H ^ I£ ü Q. < IO LU LU LU | ^O IT Q CO I 9
API units
COMPUTEDAPI units
CALIPER
75 1 I0PHOTOELECTRIC
I NEUJRpN.POROSπ[Y_| EffECT I751100 % 40 To barns/β- 101-β
19 11
BULK DENSITY DENSITY CORRECTION
POTASSIUM
g/cm32 I -0.25 O/cm3
0.25 I 5
wt. %
ppm
URANIUMppm
21X1
22X1
23X1
24X1
25X1
26X1
27X1
28X
29XF
30X1
31X1
32X1
33X1
34X1
35X1
36X1
37X1
38×l
2 0 0 -
2 5 0 -
3 0 0 -
S
**..
4.
2f•
"1
j
."$"
1
5
-~> :* »r
<
V.<"*
1>
<
- 200
- 2 5 0
- 3 0 0

SITE 884
Hole 884E: Density-Porosity-Natural Gamma Ray Log Summary (continued)
SPECTRAL GAMMA RAYTOTAL POTASSIUM
API units 75
t < I CALIPERLU LU I .Q co I 9 in
..COMPUTED IAPI units 75 1100
38×l
39x1
40x1
41x1
42x1
43X1
44x1
45×l
46×l
47x1
48x1
49x1
50X1
51x1
52X1
53x1
54x1
55X1
56XJ
350-
400 -
450-
500-
PHOTOELECTRICEFFECTbams/β"
_Lo l -% 4010 Dams/θ 101 -6
BULK DENSITY I DENSITY CORRECTION
wt. %
.THORIUM.,ppm
URANIUM
19 I 1 g/cm3
2 I -0.25 g/<=™3 0.25 I 5 ppm
i••X"
J
•rtVn
"I• M : : ; ;
fin
- 3 5 0
- 4 0 0
- 4 5 0
-500
300
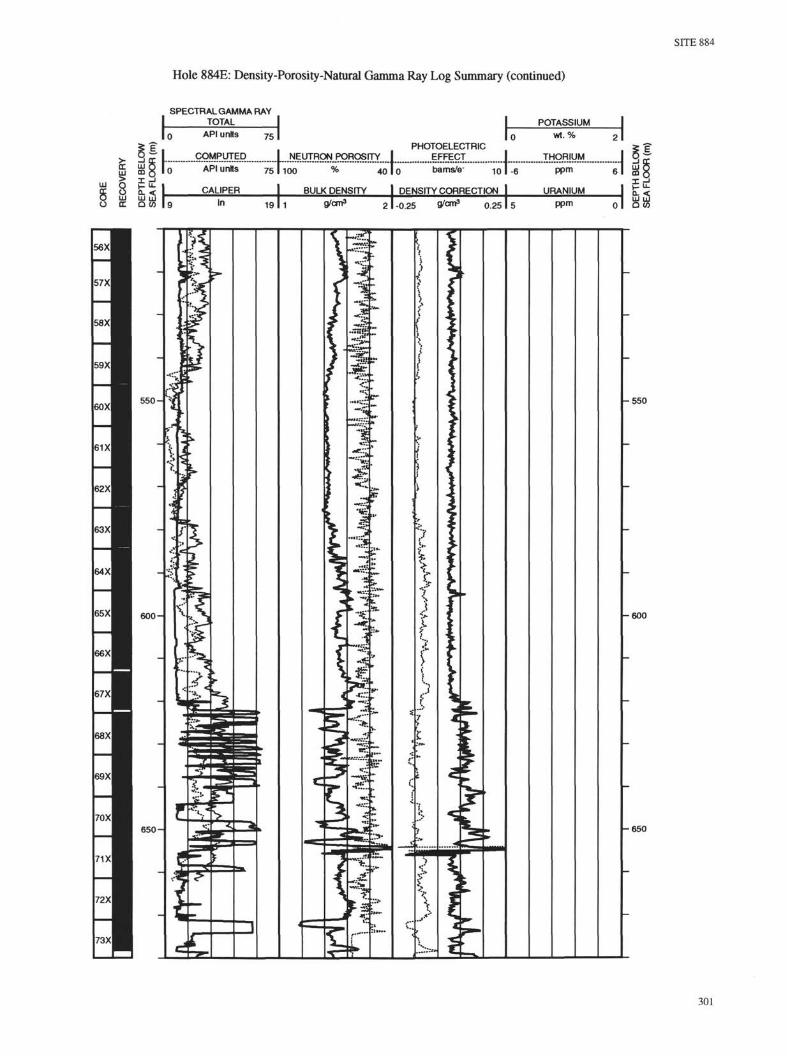
Hole 884E: Density-Porosity-Natural Gamma Ray Log Summary (continued)
SITE 884
SPECTRAL GAMMA RAYTOTAL
er 8UJ UJ r ^Q CO 9
API units
COMPUTEDAPI units
CALIPER
POTASSIUM
75
in
, l öPHOTOELECTRIC
EFFECT
bams/β~ 4Ql-
wt. %
THORIUM
ppm100 % 4 0 1 0 Dams/β 101 -6 PP™
BULK DENSITY I DENSITY CORRECTION I URANIUM
19 11 g/cm3
2 I -0.25 g/cm3
0.25 I 5 ppmQ- <LU UJ
O W
56X1
57X1
58×l
59X1
60X1
61X1
62X1
63X1
64X1
65X1
66X1
67X1
68X1
69X1
70X1
71X1
72X1
73X1
550-
600-
650-
'•*-.
- 5 5 0
- 6 0 0
- 6 5 0
301
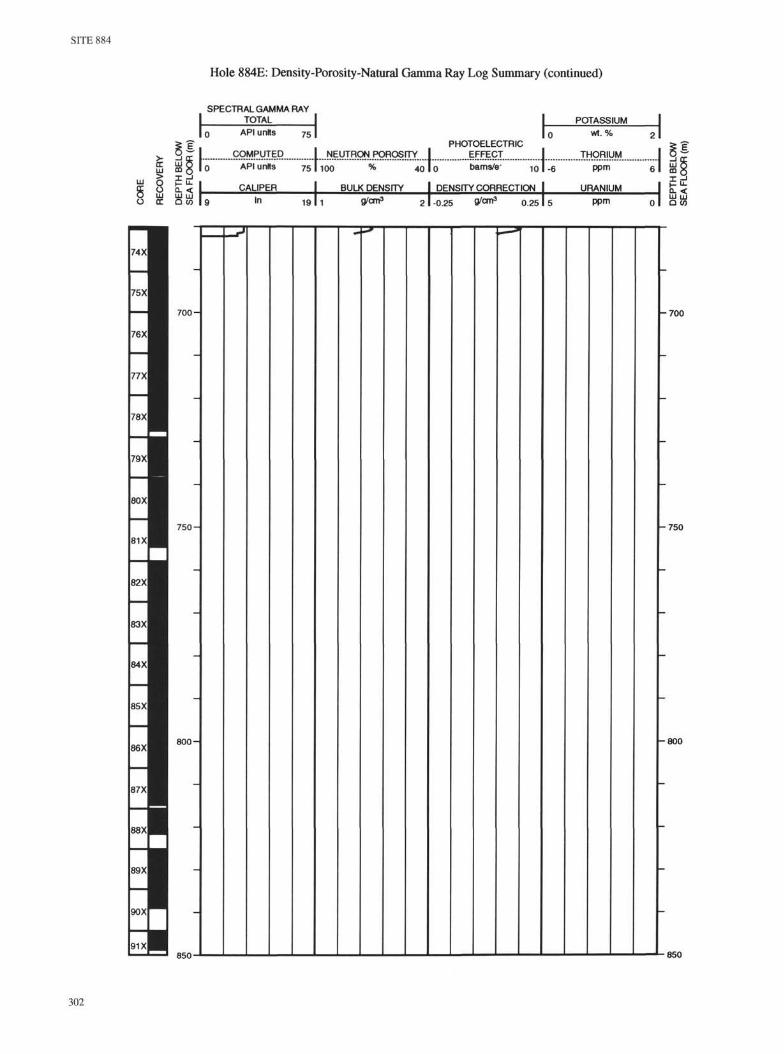
SITE 884
Hole 884E: Density-Porosity-Natural Gamma Ray Log Summary (continued)
SPECTRAL GAMMA RAYTOTAL
0 API units 75
COMPUTED
w o K ^ iSE Ü Q. < l__O LU HI LU r ^o er Q co | g
POTASSIUM
NfyjRPNPOROSITYPHOTOELECTRIC
É F : I U£CJ
wt. %
TH°R!UMAPI units 75 | 100
CALIPER
% 4010 bams/θ 101 -6 PPm
BULK DENSITY I DENSITY CORRECTION I URANIUM
in 19 11 g/cm3
2 I -0.25 ü<™* 0.25 I 5 ppmjLU
01 O
74X1
75X1
700- -700
76X1
77X1
78×l
79X1
80X1
81X1
82×l
83×l
84X1
85X1
750- -750
86X1800- -800
87X1
88×l
89×l
90X1
91X1850- 850
302