Ridge–hotspot interaction: the Pacific–Antarctic Ridge and the foundation seamounts
Upload
manchesterCategory
view
1download
0
3D seismic expression of fluidmigration andmudremobilization on the Gjallar Ridge, offshoremid-NorwayJ. P. V. Hansen,n J. A. Cartwright,w M. Huusew and O. R. Clausenn
nDepartment of Earth Sciences, University ofAarhus, DK-8000 —rhus C, Denmarkw3DLab, School of Earth, Ocean and Planetary Sciences, Cardiff University,Wales, UK
ABSTRACT
This paper presents a three-dimensional (3D) seismic analysis of sediment remobilization and £uidmigration in a 2000-km2 area above the Gjallar Ridge located in theV�ring Basin, o¡shore Norway.Three distinct types of mounded structures have been identi¢ed as resulting from focused £uid/gasmigration and associated mud remobilization and intrusion.Type A structures are gently mounded,andwe infer that these structures formed because of in situ remobilization ofMiddle Eocene toLower^Middle Oligocene ¢ne-grained sediments in response to £uid and minor sediment injectionvia deep-seated normal faults.Type B structures comprise relatively steep-sided mounds and arerestricted to the pre-Miocene interval.They are often located above narrow zones of discontinuouslow-amplitude re£ections resembling gas chimneys.Some of theTypeB structures are associatedwithstacked amplitude anomalies and possible mud volcanoes at the base Pleistocene indicating theirlong-term signi¢cance as vertical £uid conduits.TypeC structures comprise discrete mound featuresthat seem to jack up theTop Palaeocene (Top Brygge) horizon.These are similar to hydrothermalmounds found elsewhere on theNorwegianMargin and associatedwith igneous sill intrusion duringNorth Atlantic breakup.This study highlights the utility of 3D seismic data for mapping of £uid andsediment mobilization through time over large basinal areas.
INTRODUCTION
The V�ring Basin is located beneath the outer shelf andslope region o¡shore mid-Norway and contains a numberof basement ridges that may contain deepwater hydrocar-bon prospects, among them the Gjallar Ridge (Fig. 1a). Inthe wake of increased industrial (hydrocarbon) interest inthe deepwater areas, denser grids of geophysical data in-cluding three-dimensional (3D) seismic surveys have be-come available for academic investigations.
In recent years, sediment remobilization and in parti-cular mud diapirs and mud volcanoes have received con-siderable attention, often using marine geophysicaltechniques such as multibeam swath bathymetry, high-re-solution seismic pro¢ling and industrial 3D seismic data(Hjelstuen et al., 1997; Limonov et al., 1997; Pe¤ rez-Belzuzet al., 1997; Hovland et al., 1998; van Rensbergen et al., 1999,2002; Graue, 2000; Sumner &Westbrook, 2001; Dimitrov,2002; L�seth et al., 2003; Pinheiro et al., 2003; Yin et al.,2003;Davies&Stewart, 2005).This topic is considered im-portant for a general understanding of hydrocarbon mi-gration paths and the drilling hazards connected withexploration in areas characterized by sediment gas chim-neys,mud diapirs and mudvolcanoes. It is also considered
important because of the link between mudvolcanism anddiapirism and the venting of methane to the atmosphere(Kopf, 2002).
Sediment remobilization in the V�ring Basin has pre-viously been described from di¡erent levels within theCenozoic succession. Studies of seabed mud-diapirs havepreviously been carried out in theVemaDome area east ofthe Gjallar Ridge (Hovland et al., 1998), and to the south inthe southernVigrid Syncline area (Hjelstuen et al., 1997).Mud diapirism on the Gjallar Ridge has previously beenreported by Cor¢eld et al. (2004).
The present study is based on a 3D seismic survey ac-quired over theGjallar Ridge (Blystad etal., 1995).The un-derlying structure of the area is characterized by low-anglefaults and highly rotated fault blocks (Fig. 1b) (Lundin &Dore¤ , 1997; Dore¤ et al., 1999; Ren et al., 2003). This paperdescribes a suite of structures related to £uid and mud re-mobilization observed in the western part of the V�ringBasin and proposes models for their development.Thesemodels imply that multiple phases of focused upward £uid£ow occurred through chimney-like conduits, e¡ectivelybypassing thick sections of mud-dominated sediments.
GEOLOGICAL SETTING
The main structural elements of the west Norwegian mar-gin between 651Nand681450Nare shown inFig.1.The area
Correspondence: J. P.V. Hansen, Department of Earth Sciences,C. F. M�llers Alle¤ 110, University of Aarhus, DK-8000 —rhus C,Denmark. E-mail: [email protected]
BasinResearch (2005) 17, 123–139, doi: 10.1111/j.1365-2117.2005.00257.x
r 2005 Blackwell Publishing Ltd 123
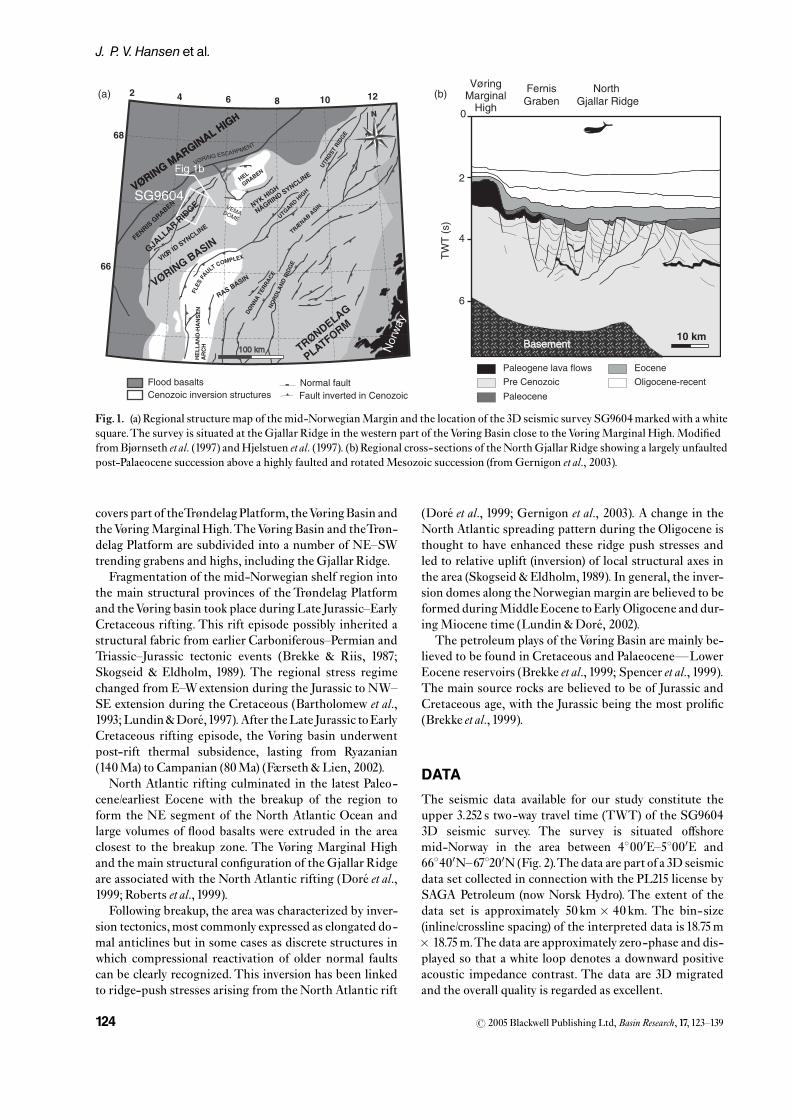
covers part of theTr�ndelagPlatform, theV�ringBasin andtheV�ringMarginal High.TheV�ring Basin and theTr�n-delag Platform are subdivided into a number of NE^SWtrending grabens and highs, including the Gjallar Ridge.
Fragmentation of the mid-Norwegian shelf region intothe main structural provinces of the Tr�ndelag Platformand theV�ring basin took place duringLate Jurassic^EarlyCretaceous rifting. This rift episode possibly inherited astructural fabric from earlier Carboniferous^Permian andTriassic^Jurassic tectonic events (Brekke & Riis, 1987;Skogseid & Eldholm, 1989). The regional stress regimechanged from E^Wextension during the Jurassic to NW^SE extension during the Cretaceous (Bartholomew et al.,1993;Lundin&Dore¤ ,1997).After theLate Jurassic toEarlyCretaceous rifting episode, the V�ring basin underwentpost-rift thermal subsidence, lasting from Ryazanian(140Ma) to Campanian (80Ma) (F�rseth & Lien, 2002).
North Atlantic rifting culminated in the latest Paleo-cene/earliest Eocene with the breakup of the region toform the NE segment of the North Atlantic Ocean andlarge volumes of £ood basalts were extruded in the areaclosest to the breakup zone. The V�ring Marginal Highand the main structural con¢guration of the Gjallar Ridgeare associated with the North Atlantic rifting (Dore¤ et al.,1999; Roberts et al., 1999).
Following breakup, the area was characterized by inver-sion tectonics,most commonly expressed as elongated do-mal anticlines but in some cases as discrete structures inwhich compressional reactivation of older normal faultscan be clearly recognized.This inversion has been linkedto ridge-push stresses arising from the North Atlantic rift
(Dore¤ et al., 1999; Gernigon et al., 2003). A change in theNorth Atlantic spreading pattern during the Oligocene isthought to have enhanced these ridge push stresses andled to relative uplift (inversion) of local structural axes inthe area (Skogseid & Eldholm,1989). In general, the inver-sion domes along theNorwegian margin are believed to beformed duringMiddleEocene toEarlyOligocene and dur-ingMiocene time (Lundin &Dore¤ , 2002).
The petroleum plays of the V�ring Basin are mainly be-lieved to be found in Cretaceous and PalaeoceneFLowerEocene reservoirs (Brekke et al., 1999; Spencer et al., 1999).The main source rocks are believed to be of Jurassic andCretaceous age, with the Jurassic being the most proli¢c(Brekke et al., 1999).
DATA
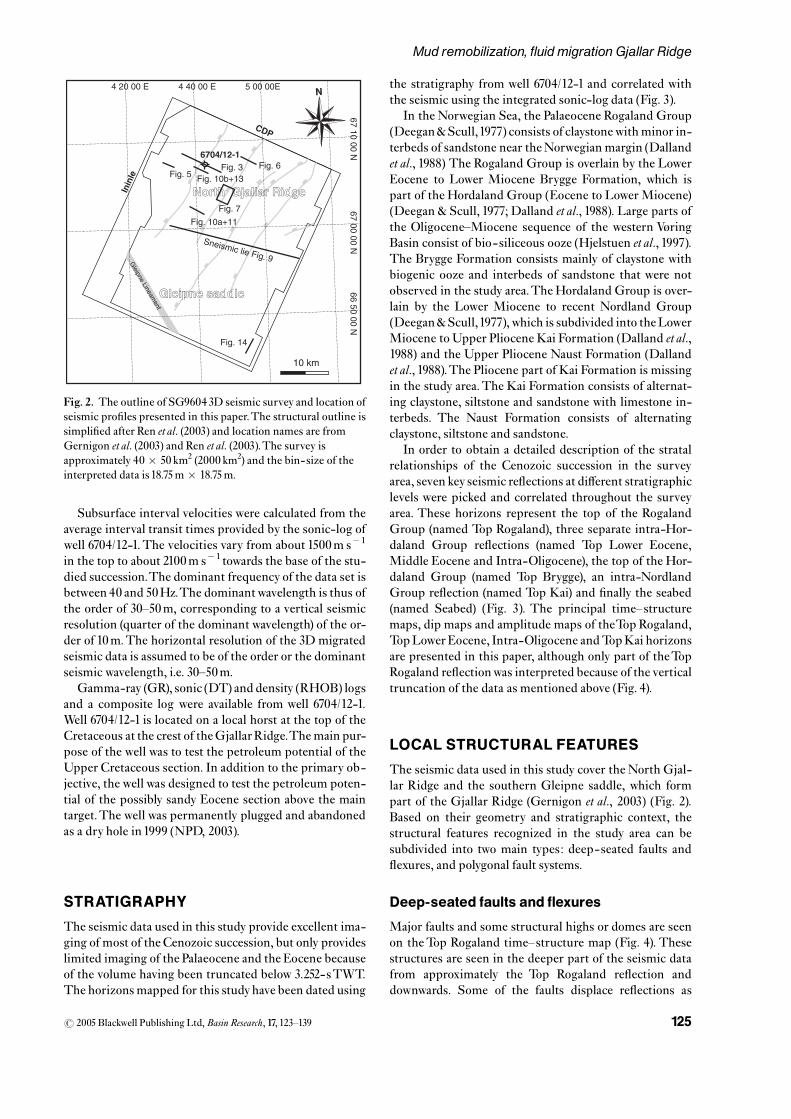
The seismic data available for our study constitute theupper 3.252 s two-way travel time (TWT) of the SG96043D seismic survey. The survey is situated o¡shoremid-Norway in the area between 41000E^51000E and661400N^671200N(Fig. 2).The data are part of a 3D seismicdata set collected in connection with the PL215 license bySAGA Petroleum (now Norsk Hydro). The extent of thedata set is approximately 50 km � 40 km. The bin-size(inline/crossline spacing) of the interpreted data is 18.75m� 18.75m.The data are approximately zero-phase and dis-played so that a white loop denotes a downward positiveacoustic impedance contrast. The data are 3D migratedand the overall quality is regarded as excellent.
6
66
68
2 4 8 10 12
Flood basalts Normal faultCenozoic inversion structures Fault inverted in Cenozoic
North Gjallar Ridge
FernisGraben
Paleogene lava flows
Paleocene
Eocene
Oligocene-recent
0
2
4
6
TW
T (
s)
BasementBasement
(a) (b)
Pre Cenozoic
VøringMarginal
High
10 km
Fig.1. (a) Regional structure map of the mid-NorwegianMargin and the location of the 3D seismic survey SG9604markedwith awhitesquare.The survey is situated at the Gjallar Ridge in the western part of theV�ring Basin close to theV�ringMarginal High.Modi¢edfromBj�rnseth etal. (1997) andHjelstuen etal. (1997). (b) Regional cross-sections of theNorthGjallar Ridge showing a largely unfaultedpost-Palaeocene succession above a highly faulted and rotatedMesozoic succession (fromGernigon et al., 2003).
r 2005 Blackwell Publishing Ltd,Basin Research, 17, 123^139124
J. P. V. Hansenet al.
Subsurface interval velocities were calculated from theaverage interval transit times provided by the sonic-log ofwell 6704/12-1.The velocities vary from about 1500m s�1
in the top to about 2100m s�1 towards the base of the stu-died succession.The dominant frequency of the data set isbetween 40 and 50Hz.The dominantwavelength is thus ofthe order of 30^50m, corresponding to a vertical seismicresolution (quarter of the dominant wavelength) of the or-der of 10m.The horizontal resolution of the 3D migratedseismic data is assumed to be of the order or the dominantseismic wavelength, i.e. 30^50m.
Gamma-ray (GR), sonic (DT) and density (RHOB) logsand a composite log were available from well 6704/12-1.Well 6704/12-1 is located on a local horst at the top of theCretaceous at the crest of theGjallarRidge.The main pur-pose of the well was to test the petroleum potential of theUpper Cretaceous section. In addition to the primary ob-jective, the well was designed to test the petroleum poten-tial of the possibly sandy Eocene section above the maintarget.The well was permanently plugged and abandonedas a dry hole in1999 (NPD, 2003).
STRATIGRAPHY
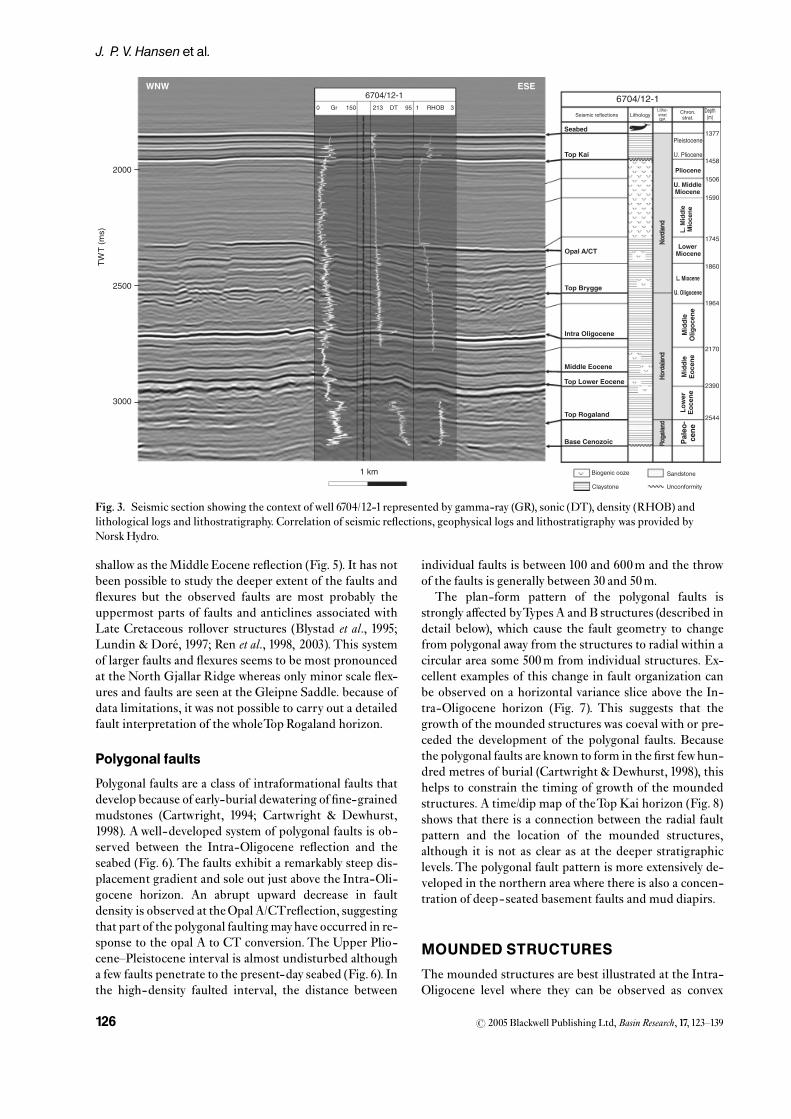
The seismic data used in this study provide excellent ima-ging of most of the Cenozoic succession, but only provideslimited imaging of the Palaeocene and the Eocene becauseof the volume having been truncated below 3.252-sTWT.The horizons mapped for this studyhave been dated using
the stratigraphy from well 6704/12-1 and correlated withthe seismic using the integrated sonic-log data (Fig. 3).
In the Norwegian Sea, the Palaeocene Rogaland Group(Deegan&Scull,1977) consists of claystonewith minor in-terbeds of sandstone near theNorwegian margin (Dallandet al., 1988) The Rogaland Group is overlain by the LowerEocene to Lower Miocene Brygge Formation, which ispart of the Hordaland Group (Eocene to Lower Miocene)(Deegan & Scull, 1977; Dalland et al., 1988). Large parts ofthe Oligocene^Miocene sequence of the western V�ringBasin consist of bio-siliceous ooze (Hjelstuen et al., 1997).The Brygge Formation consists mainly of claystone withbiogenic ooze and interbeds of sandstone that were notobserved in the study area.The Hordaland Group is over-lain by the Lower Miocene to recent Nordland Group(Deegan&Scull,1977),which is subdivided into theLowerMiocene to Upper Pliocene Kai Formation (Dalland et al.,1988) and the Upper Pliocene Naust Formation (Dallandet al., 1988).The Pliocene part of Kai Formation is missingin the study area.The Kai Formation consists of alternat-ing claystone, siltstone and sandstone with limestone in-terbeds. The Naust Formation consists of alternatingclaystone, siltstone and sandstone.
In order to obtain a detailed description of the stratalrelationships of the Cenozoic succession in the surveyarea, seven key seismic re£ections at di¡erent stratigraphiclevels were picked and correlated throughout the surveyarea. These horizons represent the top of the RogalandGroup (named Top Rogaland), three separate intra-Hor-daland Group re£ections (named Top Lower Eocene,Middle Eocene and Intra-Oligocene), the top of the Hor-daland Group (named Top Brygge), an intra-NordlandGroup re£ection (named Top Kai) and ¢nally the seabed(named Seabed) (Fig. 3). The principal time^structuremaps, dip maps and amplitude maps of theTop Rogaland,TopLowerEocene, Intra-Oligocene andTopKai horizonsare presented in this paper, although only part of theTopRogaland re£ectionwas interpreted because of the verticaltruncation of the data as mentioned above (Fig. 4).
LOCAL STRUCTURAL FEATURES
The seismic data used in this study cover the North Gjal-lar Ridge and the southern Gleipne saddle, which formpart of the Gjallar Ridge (Gernigon et al., 2003) (Fig. 2).Based on their geometry and stratigraphic context, thestructural features recognized in the study area can besubdivided into two main types: deep-seated faults and£exures, and polygonal fault systems.
Deep-seated faults and flexures
Major faults and some structural highs or domes are seenon theTop Rogaland time^structure map (Fig. 4). Thesestructures are seen in the deeper part of the seismic datafrom approximately the Top Rogaland re£ection anddownwards. Some of the faults displace re£ections as
10 km
Fig. 6
Fig. 7
Fig. 10b+13
Fig. 10a+11
Fig. 14
4 20 00 E 5 00 00E4 40 00 E
67 10 00 N67 00 00 N
66 50 00 N
6704/12-1
CDPIn
inle
N
North Gjallar Ridge
Gleipne saddleGleipne saddle
Fig. 5Fig. 3
Sneismic lie Fig. 9
Fig. 2. The outline of SG96043D seismic survey and location ofseismic pro¢les presented in this paper.The structural outline issimpli¢ed after Ren et al. (2003) and location names are fromGernigon et al. (2003) and Ren et al. (2003).The survey isapproximately 40 � 50 km2 (2000 km2) and the bin-size of theinterpreted data is 18.75m � 18.75m.
r 2005 Blackwell Publishing Ltd,Basin Research, 17, 123^139 125
Mud remobilization, fluidmigration Gjallar Ridge
shallow as theMiddle Eocene re£ection (Fig. 5). It has notbeen possible to study the deeper extent of the faults and£exures but the observed faults are most probably theuppermost parts of faults and anticlines associated withLate Cretaceous rollover structures (Blystad et al., 1995;Lundin & Dore¤ , 1997; Ren et al., 1998, 2003). This systemof larger faults and £exures seems to be most pronouncedat the North Gjallar Ridge whereas only minor scale £ex-ures and faults are seen at the Gleipne Saddle. because ofdata limitations, it was not possible to carry out a detailedfault interpretation of the wholeTop Rogaland horizon.
Polygonal faults
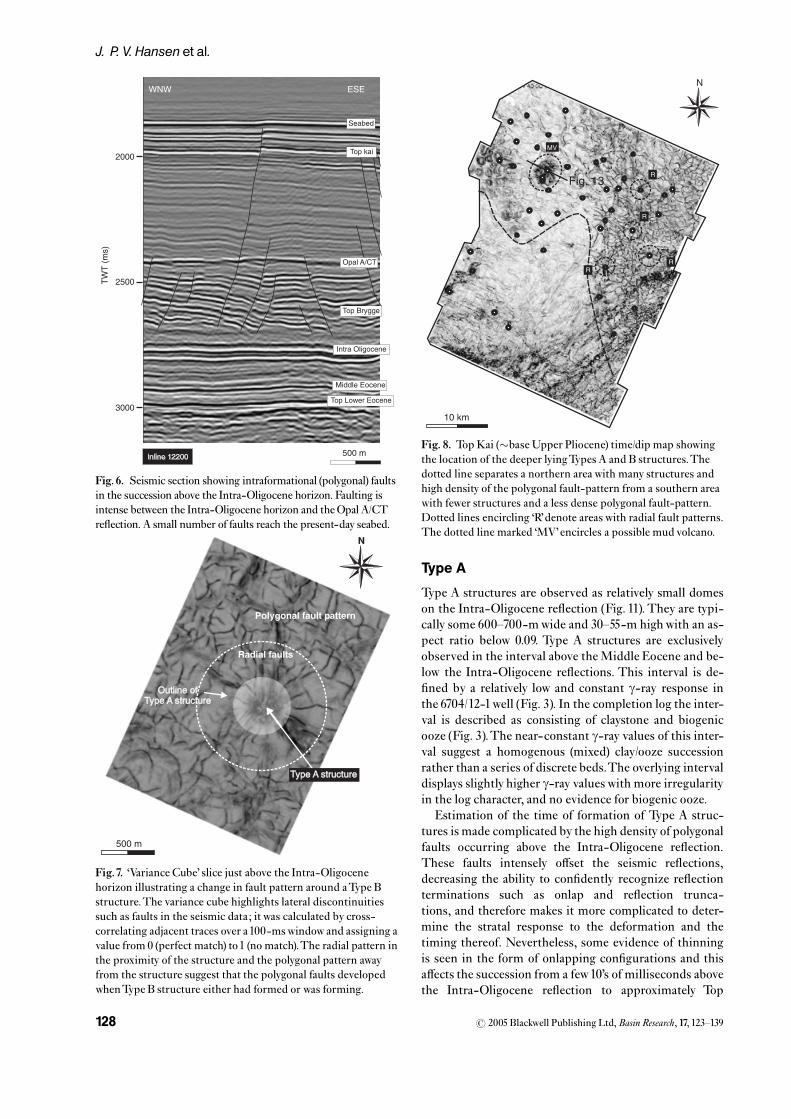
Polygonal faults are a class of intraformational faults thatdevelop because of early-burial dewatering of ¢ne-grainedmudstones (Cartwright, 1994; Cartwright & Dewhurst,1998). A well-developed system of polygonal faults is ob-served between the Intra-Oligocene re£ection and theseabed (Fig. 6).The faults exhibit a remarkably steep dis-placement gradient and sole out just above the Intra-Oli-gocene horizon. An abrupt upward decrease in faultdensity is observed at theOpal A/CTre£ection, suggestingthat part of the polygonal faulting mayhave occurred in re-sponse to the opal A to CT conversion. The Upper Plio-cene^Pleistocene interval is almost undisturbed althougha few faults penetrate to the present-day seabed (Fig. 6). Inthe high-density faulted interval, the distance between
individual faults is between 100 and 600m and the throwof the faults is generally between 30 and 50m.
The plan-form pattern of the polygonal faults isstrongly a¡ected byTypes A and B structures (described indetail below), which cause the fault geometry to changefrom polygonal away from the structures to radial within acircular area some 500m from individual structures. Ex-cellent examples of this change in fault organization canbe observed on a horizontal variance slice above the In-tra-Oligocene horizon (Fig. 7). This suggests that thegrowth of the mounded structures was coeval with or pre-ceded the development of the polygonal faults. Becausethe polygonal faults are known to form in the ¢rst fewhun-dred metres of burial (Cartwright & Dewhurst, 1998), thishelps to constrain the timing of growth of the moundedstructures. A time/dip map of theTop Kai horizon (Fig. 8)shows that there is a connection between the radial faultpattern and the location of the mounded structures,although it is not as clear as at the deeper stratigraphiclevels.The polygonal fault pattern is more extensively de-veloped in the northern area where there is also a concen-tration of deep-seated basement faults and mud diapirs.
MOUNDED STRUCTURES
The mounded structures are best illustrated at the Intra-Oligocene level where they can be observed as convex
Fig. 3. Seismic section showing the context of well 6704/12-1 represented by gamma-ray (GR), sonic (DT), density (RHOB) andlithological logs and lithostratigraphy. Correlation of seismic re£ections, geophysical logs and lithostratigraphy was provided byNorsk Hydro.
r 2005 Blackwell Publishing Ltd,Basin Research, 17, 123^139126
J. P. V. Hansenet al.

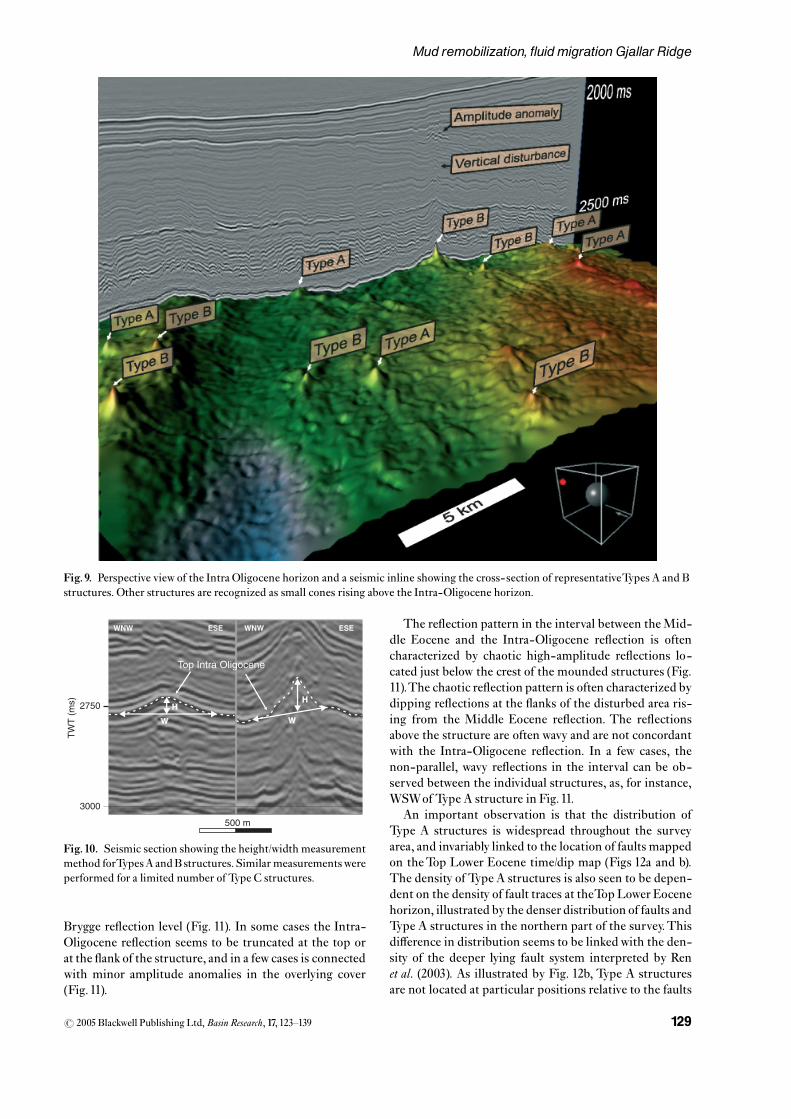
upward conical mounds, elevated above the regional levelof the horizon (Fig. 9). In this study, 50 individual
mounded structures have been recognized and analysed.The informal term‘mounded structure’ is used in a purelydescriptive sense for ease of organization of the paper andprior to discussion of their speci¢c origin.The structureshave been mapped at the Intra-Oligocene horizon andhorizon dip and amplitude maps have been produced al-lowing for the de¢nition of three di¡erent types ofmounded structures.The interpretation of some of thesestructures as types of diapir is based on the recognition ofan intrusive geometry (Hovland et al., 1998; Kopf, 2002).The classi¢cation of the three types is based on aspect ra-tio, stratigraphic level of the structures, the degreeof concentration of amplitude anomalies around the struc-tures and the stratigraphic context of the amplitudeanomalies.
The height of the mounded structures is in essence ameasurement of structural relief, made by de¢ning a da-tum linking the undisturbed stratal re£ections adjacentto the structure, and measuring the vertical elevation fromthe crest of the structure (Fig.10a).The width is measuredfrom the point where the stratal re£ections are ¢rst de-£ected upwards away from this datum (Fig. 10a). Wherethe sediments are deformed throughout the succession,the measurement of relief is made at the position of max-imum structural relief (Fig.10b).
Fig.4. Time^structure map of theTop Rogaland (�Top Palaeocene)horizon. Black areas representareas where the horizon is locateddeeper than the 3.252 s two-waytravel time data cuto¡.Yellow dotsindicate the location of Type Astructures, red dotsType Bstructures andwhite arrowsType C structures.
3000
2500
ESE
500 m
WNW
Mjo
r fau
t
a
l
TW
T (
ms)
Fig. 5. Seismic section showing a deep-seated fault withrelatively large displacement a¡ecting theTop Rogalandre£ection and showing displacement as high asMiddle Eocene.Types A andB structures are often developed in close associationwith such deep-seated faults.
r 2005 Blackwell Publishing Ltd,Basin Research, 17, 123^139 127
Mud remobilization, fluidmigration Gjallar Ridge
Type A
Type A structures are observed as relatively small domeson the Intra-Oligocene re£ection (Fig. 11).They are typi-cally some 600^700-mwide and 30^55-m highwith an as-pect ratio below 0.09. Type A structures are exclusivelyobserved in the interval above theMiddle Eocene and be-low the Intra-Oligocene re£ections. This interval is de-¢ned by a relatively low and constant g-ray response inthe 6704/12-1well (Fig. 3). In the completion log the inter-val is described as consisting of claystone and biogenicooze (Fig. 3).The near-constant g-ray values of this inter-val suggest a homogenous (mixed) clay/ooze successionrather than a series of discrete beds.The overlying intervaldisplays slightly higher g-ray values with more irregularityin the log character, and no evidence for biogenic ooze.
Estimation of the time of formation of Type A struc-tures is made complicated by the high density of polygonalfaults occurring above the Intra-Oligocene re£ection.These faults intensely o¡set the seismic re£ections,decreasing the ability to con¢dently recognize re£ectionterminations such as onlap and re£ection trunca-tions, and therefore makes it more complicated to deter-mine the stratal response to the deformation and thetiming thereof. Nevertheless, some evidence of thinningis seen in the form of onlapping con¢gurations and thisa¡ects the succession from a few10’s of milliseconds abovethe Intra-Oligocene re£ection to approximately Top
3000
2000
2500
WNW ESE
500 m
TW
T (
ms)
Fig.6. Seismic section showing intraformational (polygonal) faultsin the succession above the Intra-Oligocene horizon. Faulting isintense between the Intra-Oligocene horizon and theOpal A/CTre£ection. A small number of faults reach the present-day seabed.
N
Fig. 13
10 km
Fig. 8. TopKai (�base Upper Pliocene) time/dip map showingthe location of the deeper lyingTypes A and B structures.Thedotted line separates a northern area with many structures andhigh density of the polygonal fault-pattern from a southern areawith fewer structures and a less dense polygonal fault-pattern.Dotted lines encircling ‘R’denote areas with radial fault patterns.The dotted line marked ‘MV’encircles a possible mud volcano.
500 m
N
Type A structureType A structure
Radial faults
Polygonal fault pattern
Outline ofType A structure
Outline ofType A structure
Fig.7. ‘Variance Cube’ slice just above the Intra-Oligocenehorizon illustrating a change in fault pattern around aType Bstructure.The variance cube highlights lateral discontinuitiessuch as faults in the seismic data; it was calculated by cross-correlating adjacent traces over a100-mswindow and assigning avalue from 0 (perfect match) to1 (no match).The radial pattern inthe proximity of the structure and the polygonal pattern awayfrom the structure suggest that the polygonal faults developedwhenType B structure either had formed or was forming.
r 2005 Blackwell Publishing Ltd,Basin Research, 17, 123^139128
J. P. V. Hansenet al.
Brygge re£ection level (Fig. 11). In some cases the Intra-Oligocene re£ection seems to be truncated at the top orat the £ank of the structure, and in a few cases is connectedwith minor amplitude anomalies in the overlying cover(Fig.11).
The re£ection pattern in the interval between theMid-dle Eocene and the Intra-Oligocene re£ection is oftencharacterized by chaotic high-amplitude re£ections lo-cated just below the crest of the mounded structures (Fig.11).The chaotic re£ection pattern is often characterized bydipping re£ections at the £anks of the disturbed area ris-ing from the Middle Eocene re£ection. The re£ectionsabove the structure are often wavy and are not concordantwith the Intra-Oligocene re£ection. In a few cases, thenon-parallel, wavy re£ections in the interval can be ob-served between the individual structures, as, for instance,WSWof Type A structure in Fig.11.
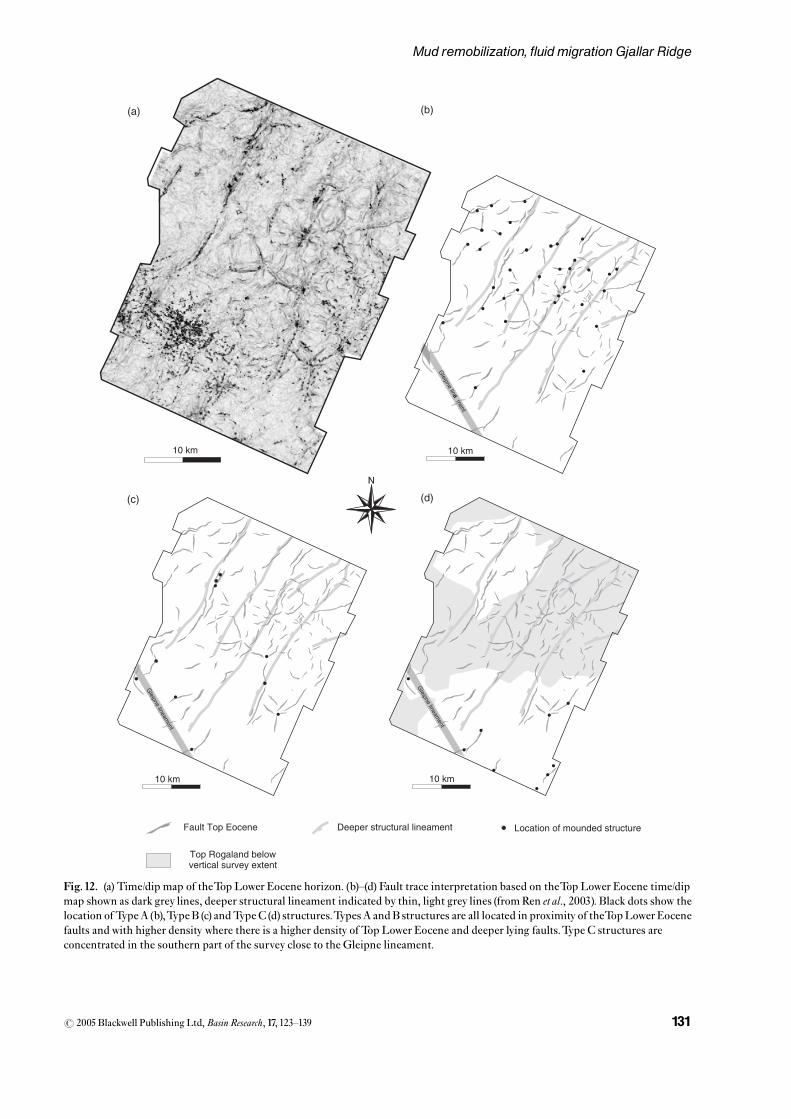
An important observation is that the distribution ofType A structures is widespread throughout the surveyarea, and invariably linked to the location of faults mappedon theTop Lower Eocene time/dip map (Figs 12a and b).The density of Type A structures is also seen to be depen-dent on the density of fault traces at theTopLower Eocenehorizon, illustrated by the denser distribution of faults andType A structures in the northern part of the survey.Thisdi¡erence in distribution seems to be linkedwith the den-sity of the deeper lying fault system interpreted by Renet al. (2003). As illustrated by Fig. 12b, Type A structuresare not located at particular positions relative to the faults
500 m
2750
TW
T (
ms)
3000
Fig.10. Seismic section showing the height/width measurementmethod forTypesA andB structures.Similar measurementswereperformed for a limited number of Type C structures.
Fig.9. Perspective view of the Intra Oligocene horizon and a seismic inline showing the cross- section of representativeTypes A and Bstructures. Other structures are recognized as small cones rising above the Intra-Oligocene horizon.
r 2005 Blackwell Publishing Ltd,Basin Research, 17, 123^139 129
Mud remobilization, fluidmigration Gjallar Ridge

such as at fault intersections, but are almost randomly po-sitioned above the upper tip line traces of the faults.
None of the three types of mound structure have so farbeen drilled in the area, and it has therefore not been pos-sible to establish their exact sediment composition.Never-theless, the 6704/12-1 well suggests that the interval ofincreased thickness de¢ningType A structures, and fromwhich it is inferred that the mudmobilized to form the do-mal structures has been derived, is mainly a clay-rich unitwith biogenic ooze.This suggests that this clay-rich oozeis the sediment composition of the mounded structures.It is worth noting that based on the petrophysical logs(Fig. 3), the lithology of the mobilized interval has a mark-edly contrasting lithology from the units immediatelyabove, indicating signi¢cant di¡erences in permeabilityand porosity between the two units.
There is no clear evidence of rim-synclines that couldbe linked to withdrawal of material from a speci¢c area tofeed the dome structure, but the wavy, non-parallel re£ec-tion con¢gurations south-east of the mounded structureseen in Fig.11are a commonly observed pattern and couldbe evidence for sediment remobilization within the inter-val.Given that all the mounded structureswithin the largestudy area are located above upper tips of faults de¢ned attheTopLowerEocene,we consider it probable that there isa direct link between the faults and the mounded struc-tures.The fault system could certainly have functioned asa migration route for deeper pore £uids and gases and per-
haps even minor volumes of £uidized sediment, whichsubsequently became trapped below the upper clay-richpart of the interval between Middle Eocene and the In-tra-Oligocene, creating a dome-like structure contem-poraneous with the sedimentation of the clay interval.The mobilization and growth of the dome were evidentlynot of a su⁄cient magnitude to lead to seal failure of theoverlying unit.
The dipping re£ections above the Middle Eocene re-£ection at the base of the chaotic seismic facies belowTypeA structures (Fig. 3) sometimes resemble the V-shapedamplitude anomalies reported from theNorthVikingGra-ben segment of the North Sea by L�seth et al. (2003).Thedipping re£ections vary in size from oneType A structureto another. By analogy with the interpretation of L�sethet al. (2003), they can be interpreted as being derived fromseismic point refractions from edges of vertical beds orsmall bed segments or as re£ections from areas with fo-cused vertical £uid or gas £ows.
The possible sediment remobilization and construc-tion of Type A structures are believed to be restrictedto the interval between the Middle Eocene and the Intra-Oligocene re£ection, with the lower part of the intervalbeing the unstable interval and the upper part thesealing part. Rare examples of amplitude anomalies inthe overlying units are ascribed to £uid escape through thetop seal and are also indicated by small breaks in theIntra-Oligocene re£ection.These may have been initiated
1 km
3000
2000
TW
T (
ms)
2500
Type A
WNW ESE
3000
2000
TW
T (
ms)
2500
Type A
Dipping reflections
Amplitudeanomalies
Fig.11. Seismic sections showing the gently mounded Type A structures.Type A structures are restricted to an interval between theMiddle Eocene and Intra-Oligocene re£ections with localized amplitude anomalies in the crest of the structure. Note how thepolygonal faults converge downward towards the crest of the structure.
r 2005 Blackwell Publishing Ltd,Basin Research, 17, 123^139130
J. P. V. Hansenet al.
Top Rogaland below vertical survey extent
Fault Top Eocene Deeper structural lineament Location of mounded structure
N
10 km
10 km
10 km
10 km
(a) (b)
(c) (d)
Fig.12. (a) Time/dip map of theTop Lower Eocene horizon. (b)^(d) Fault trace interpretation based on theTop Lower Eocene time/dipmap shown as dark grey lines, deeper structural lineament indicated by thin, light grey lines (fromRen et al., 2003). Black dots show thelocation ofTypeA (b),TypeB (c) andTypeC (d) structures.TypesA andB structures are all located in proximity of theTopLower Eocenefaults andwith higher density where there is a higher density of Top Lower Eocene and deeper lying faults.Type C structures areconcentrated in the southern part of the survey close to the Gleipne lineament.
r 2005 Blackwell Publishing Ltd,Basin Research, 17, 123^139 131
Mud remobilization, fluidmigration Gjallar Ridge
by di¡erential compaction as described by Hillier &Gosgrove (2002).
The fact that the succession above Type A structuresonly seems to be distorted to just belowTop Brygge levelsuggests that the mounded structures had an in£uence onthe depositional pattern from Middle Eocene to MiddleOligocene time.
Type A structures are not interpreted to penetrate thesuccession above and hence are not interpreted as diapirs.They can be compared geometrically with salt pillows asde¢ned byTrusheim (1960) and are therefore termed mudpillows, resulting from in situmobilization of a source layeras a result of vertical migration and impingement offocused £uid £ow. An alternative interpretation of thesestructures is that they represent small mud laccolithswith some contribution of material from deeper in thesection in addition to that remobilized within themounded unit.
Type B
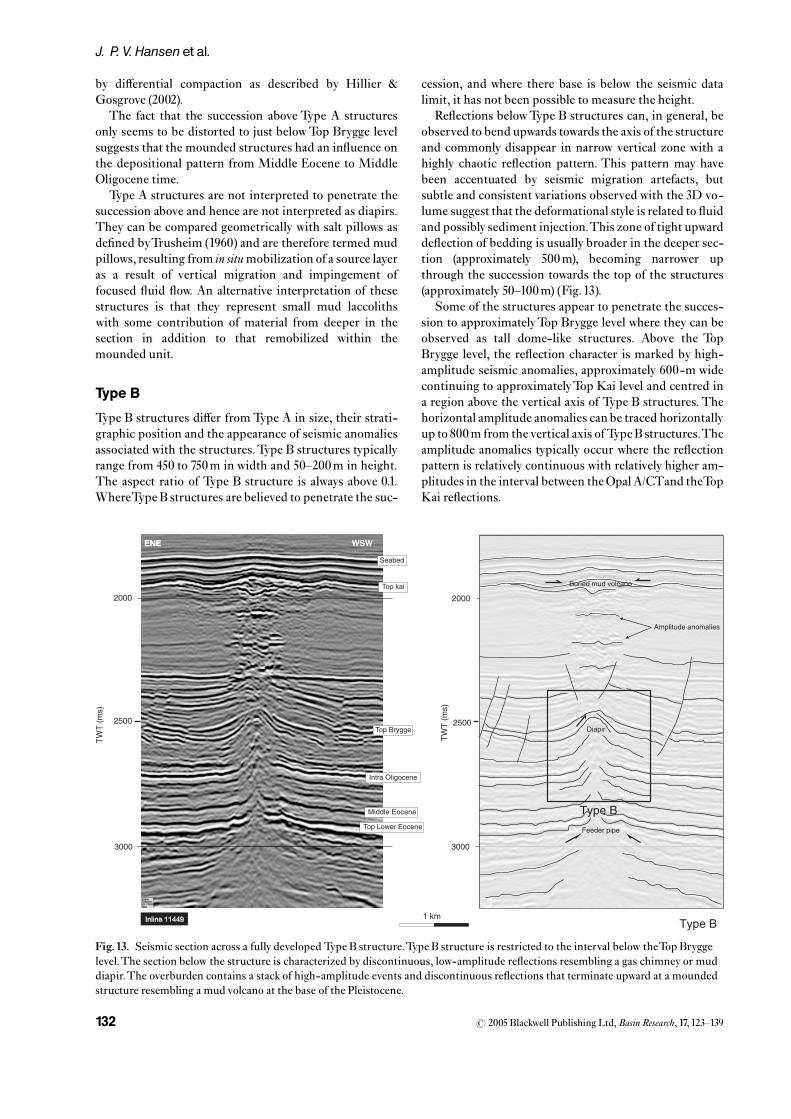
Type B structures di¡er from Type A in size, their strati-graphic position and the appearance of seismic anomaliesassociated with the structures.Type B structures typicallyrange from 450 to 750m in width and 50^200m in height.The aspect ratio of Type B structure is always above 0.1.WhereType B structures are believed to penetrate the suc-
cession, and where there base is below the seismic datalimit, it has not been possible to measure the height.
Re£ections belowType B structures can, in general, beobserved to bend upwards towards the axis of the structureand commonly disappear in narrow vertical zone with ahighly chaotic re£ection pattern. This pattern may havebeen accentuated by seismic migration artefacts, butsubtle and consistent variations observed with the 3D vo-lume suggest that the deformational style is related to £uidand possibly sediment injection.This zone of tight upwardde£ection of bedding is usually broader in the deeper sec-tion (approximately 500m), becoming narrower upthrough the succession towards the top of the structures(approximately 50^100m) (Fig.13).
Some of the structures appear to penetrate the succes-sion to approximatelyTop Brygge level where they can beobserved as tall dome-like structures. Above the TopBrygge level, the re£ection character is marked by high-amplitude seismic anomalies, approximately 600-m widecontinuing to approximatelyTop Kai level and centred ina region above the vertical axis of Type B structures. Thehorizontal amplitude anomalies can be traced horizontallyup to 800m from the vertical axis ofTypeB structures.Theamplitude anomalies typically occur where the re£ectionpattern is relatively continuous with relatively higher am-plitudes in the interval between theOpalA/CTand theTopKai re£ections.
3000
2000
TW
T (
ms)
2500
Type B
WSWENEENE
1 km
3000
2000
TW
T (
ms)
2500
Fig.13. Seismic section across a fully developed Type B structure.Type B structure is restricted to the interval below theTop Bryggelevel.The section below the structure is characterized by discontinuous, low-amplitude re£ections resembling a gas chimney or muddiapir.The overburden contains a stack of high-amplitude events and discontinuous re£ections that terminate upward at a moundedstructure resembling a mud volcano at the base of the Pleistocene.
r 2005 Blackwell Publishing Ltd,Basin Research, 17, 123^139132
J. P. V. Hansenet al.

Just below theTop Kai re£ection, an area of anomalousthickness is observed above some of Type B structures(Fig.13).The re£ection pattern in this interval is irregular,with internal downlap and external onlap con¢gurationsbeing common.The excess thickness is associated with along-wavelength (1^2 km) undulation that a¡ects the en-tire Upper Pliocene^Pleistocene interval. Apart from thelong-wavelength undulation the Upper Pliocene^Pleisto-cene interval is generally undisturbed with no signi¢cantthickness changes, except from occasional slight thinningacross the thickness anomaly.The plan-view expression ofthe disturbance of the overlying succession can be seen asa large 2 km � 3 km zone of rapidly varying dip at theTopKai time/dip map (Fig. 8).
The distribution of Type B structures is similar to thatof Type A structures in that they are found above faults attheTopLower Eocene level (Fig.12c), but additionally theyseem to follow the trend of the deeper-seated fault systemand also occur along the Gleipne lineament.
The distribution of Type B structures suggests a clearconnection with underlying structural elements, both attheTopLowerEocene level and deeper.The deformationalstyle is strongly suggestive of forceful intrusion and diapi-ric penetration of material moving upward from muchdeeper to accumulate between the Intra-Oligocene andTop Brygge markers, and in some cases at discrete levelswithin the Kai Formation (Fig.13).
The cross-sectional geometry and chaotic re£ectionpattern of the succession below the structures is reminis-cent of the seismic expression of gas chimneys andblow-out pipes as described by L�seth et al. (2001, 2003)and Gay et al. (2003). L�seth et al. (2003) interpretedthis type of structure as evidence for vertical anddeeply sourced £uid and/or gas migration. A continuationof the group of amplitude anomalies above Type Bstructures suggests that £uid and or gas continued tomigrate above level of doming at theTop Brygge marker,which could be taken to infer a later £uid migration epi-sode some time after the ¢rst phase of intrusion andgrowth of Type B structures towards the end of thePliocene (TopKai level).
The thickening that is commonly observed below theTop Kai re£ection may represent an area of near-surfacesediment remobilization as described by L�seth et al.(2003). However, the pattern of thickening seen, for exam-ple, on theTopKai time/dip map (Fig. 8) exhibits some si-milarities with mud volcanoes as described by Hovlandet al. (1998), Van Rensbergen et al. (1999), Graue (2000),Sumner &Westbrook (2001) and Yin et al. (2003). Becausethe Top Kai mounds display basal downlap and externalonlap geometries, we infer that they are more likely to re-present mud volcanoes formed at the Plio^Pleistocenetransition. The narrowness of the feeder system and thelack of deformation of re£ections within the Kai Forma-tion suggest that the mudvolcanowas sourcedvia a systemof sub-vertical fractures rather than a continuous diapiricbody, which appears to have stopped at the Top Bryggelevel (Fig.13).
The most dramatic examples of Type B structures areobserved to be located where the pre-Oligocene succes-sion shows evidence for £uid and/or gas migration fromdeeper levels in the form of vertically distributed ampli-tude anomalies.These structures are generally located onstructural highs above larger faults (Figs 4 and 12c). Be-cause of Type B structures are observed to penetrate thesuccession, they are interpreted as mud diapirs, but witha probable polyphase £uid migration history translatedinto episodes of discrete mud intrusion, the last phasebeing in the late Pliocene where a sub-vertical system ofdiscrete fractures fed mud to the seabed and gas migratedinto a number of levels within the Kai Formation (Fig.13).
Type C structures
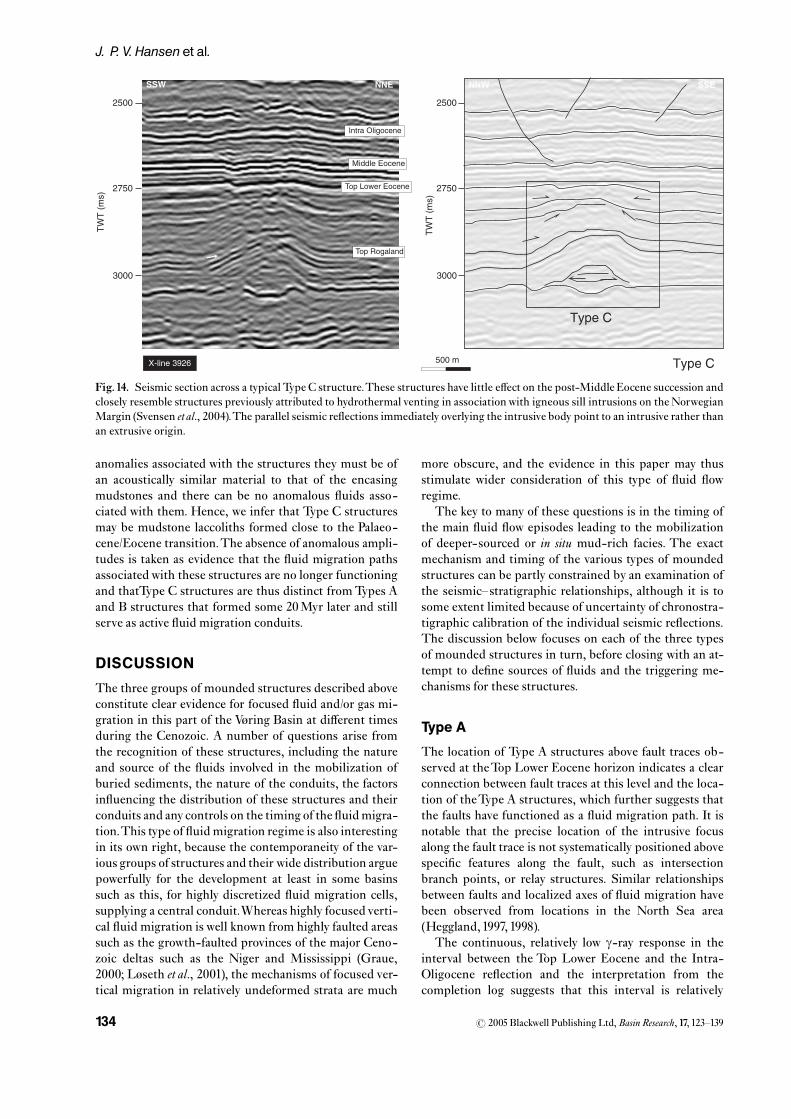
TypeC structures are seen as mounded features on theTopRogaland re£ection (Fig.14).They are typically some 800-m wide and about 100-m high, yielding an aspect ratio ofthe order of 0.125, thus falling between the size distribu-tions of Types A and B structures. A thorough descriptionof Type C structures is di⁄cult because of lack of data be-low 3252msTWT, but they are in general interpreted to berestricted below theTop Rogaland (Top Palaeocene) re£ec-tion (Fig.14).Themapping and aspect ratio measurementsof these structures are restricted to areaswhere theTopRo-galand, and the re£ection de¢ning the base of the structureare above 3252msTWT.This makes it di⁄cult to provide atrue lateral distribution pattern of Type C structures.
Most of Type C structures only have a marked e¡ect onthe succession below the Top Lower Eocene re£ection,with observation of re£ection onlaps and truncations,and only a minor in£uence on the succession above it.The ¢rst few tens of metres of the succession just abovethe mounds are in many cases undisturbed and relativelyuniform in thickness. Above this level, onlaps and internalthickness variations can be observed.The core of Type Cmounded structures shows sub-horizontal re£ections ofamplitude similar to the surrounding section. Theircross-sectional style is reminiscent of a laccolith bodywithconsiderable tight folding of strata surrounding themound axis (Fig.14). Slight depressions are often observedat the base of the structures, giving the structure an eye-shaped geometry.
There is considerable thinning of Lower Eocene strataacross Type C structures and onlap is occasionally seenclose to the Top Rogaland re£ection, suggesting that thestructures formed during the earliest Eocene. Theircross-sectional geometry and stratigraphic context are si-milar to eye-shaped mound structures described else-where on the Norwegian Margin where they have beeninterpreted as hydrothermal mounds formed above thetips of igneous intrusions emplaced during the breakupof the North Atlantic around the Palaeocene/Eocene tran-sition (Svensen et al., 2004). As there are no well calibra-tions of the structures within the study area a lithologicalinterpretation of the mounds relies on seismic facies andamplitude characteristics. Because there are no amplitude
r 2005 Blackwell Publishing Ltd,Basin Research, 17, 123^139 133
Mud remobilization, fluidmigration Gjallar Ridge
anomalies associated with the structures they must be ofan acoustically similar material to that of the encasingmudstones and there can be no anomalous £uids asso-ciated with them. Hence, we infer that Type C structuresmay be mudstone laccoliths formed close to the Palaeo-cene/Eocene transition.The absence of anomalous ampli-tudes is taken as evidence that the £uid migration pathsassociatedwith these structures are no longer functioningand thatType C structures are thus distinct fromTypes Aand B structures that formed some 20Myr later and stillserve as active £uid migration conduits.
DISCUSSION
The three groups of mounded structures described aboveconstitute clear evidence for focused £uid and/or gas mi-gration in this part of the V�ring Basin at di¡erent timesduring the Cenozoic. A number of questions arise fromthe recognition of these structures, including the natureand source of the £uids involved in the mobilization ofburied sediments, the nature of the conduits, the factorsin£uencing the distribution of these structures and theirconduits and any controls on the timing of the £uidmigra-tion.This type of £uid migration regime is also interestingin its own right, because the contemporaneity of the var-ious groups of structures and their wide distribution arguepowerfully for the development at least in some basinssuch as this, for highly discretized £uid migration cells,supplying a central conduit.Whereas highly focused verti-cal £uid migration is well known from highly faulted areassuch as the growth-faulted provinces of the major Ceno-zoic deltas such as the Niger and Mississippi (Graue,2000; L�seth et al., 2001), the mechanisms of focused ver-tical migration in relatively undeformed strata are much
more obscure, and the evidence in this paper may thusstimulate wider consideration of this type of £uid £owregime.
The key to many of these questions is in the timing ofthe main £uid £ow episodes leading to the mobilizationof deeper-sourced or in situ mud-rich facies. The exactmechanism and timing of the various types of moundedstructures can be partly constrained by an examination ofthe seismic^stratigraphic relationships, although it is tosome extent limited because of uncertainty of chronostra-tigraphic calibration of the individual seismic re£ections.The discussion below focuses on each of the three typesof mounded structures in turn, before closing with an at-tempt to de¢ne sources of £uids and the triggering me-chanisms for these structures.
Type A
The location of Type A structures above fault traces ob-served at theTop Lower Eocene horizon indicates a clearconnection between fault traces at this level and the loca-tion of theType A structures, which further suggests thatthe faults have functioned as a £uid migration path. It isnotable that the precise location of the intrusive focusalong the fault trace is not systematically positioned abovespeci¢c features along the fault, such as intersectionbranch points, or relay structures. Similar relationshipsbetween faults and localized axes of £uid migration havebeen observed from locations in the North Sea area(Heggland,1997, 1998).
The continuous, relatively low g-ray response in theinterval between the Top Lower Eocene and the Intra-Oligocene re£ection and the interpretation from thecompletion log suggests that this interval is relatively
Type C fig 102500
2750
500 m
3000
TW
T (
ms)
SSW NNE
Type C fig 102500
2750
3000
TW
T (
ms)
NNW SSE
Type C
Type C
X-line 3926
Fig.14. Seismic section across a typical Type C structure.These structures have little e¡ect on the post-Middle Eocene succession andclosely resemble structures previously attributed to hydrothermal venting in associationwith igneous sill intrusions on the NorwegianMargin (Svensen etal., 2004).The parallel seismic re£ections immediately overlying the intrusive body point to an intrusive rather thanan extrusive origin.
r 2005 Blackwell Publishing Ltd,Basin Research, 17, 123^139134
J. P. V. Hansenet al.
homogeneous and dominated by clay and biogenic ooze.The overlyingOligocene sediments are interpreted to haveacted as a barrier to further vertical migration, and the ad-dition of deeper-sourced £uids to this interval allowedpressure to build up to the point where the clay and oozeunits becamemobile and together with possible additionalinjected material were able to migrate into pillow-likemounds.
The local high-amplitude re£ections within the struc-tures are probably caused by either the presence of gas orlocal di¡erences in the digenesis and therefore di¡erencein acoustic properties (Hovland & Judd, 1988). TheV-shaped re£ections below the structures suggest eitherdiscrete refraction or £uid/gas/mud migration points, in-dicating a possible fracturing or injective behaviour of thelower part of the interval.The chaotic re£ections above theV-shaped re£ections might then be restricted areasof near-surface sediment remobilization as proposed byL�seth et al. (2003). There are no indications of sandin the interval containing the V-shaped re£ections, whichmakes it unlikely that they are sandstone injection fea-tures, even though there is a geometrical similarity to re-cently recognized conical sandstone intrusions from thenorthernNorthSea (Huuse&Mickelson, 2004).The sedi-ment instability and evidence of remobilization observedbelowType A structures could most plausibly be the resultof focused £uid injection £ow from the deeper source intothe relatively permeable (Middle Eocene) interval in amanner similar to that described by Maltman & Bolton(2003) and Owen (2003).
The presence of onlapping re£ections onto the crests ofstructures at a stratigraphic level directly above the Intra-Oligocene re£ection (Fig.11) is taken here to argue that thegeneration of Type A structures took place sometime dur-ing theMiddle Oligocene.
Type B
Type B structures exhibit clear relationships with deeperstructural elements suggesting a demarcation of £uid as-cent routes via the underlying fault system. The dome-shaped outline of the structures at the Top Brygge levelsuggests that the £uid and/or gas may have been trappedat this structural level before further vertical migration toshallower levels. This episodic ascent may well have in-volved a critical build-up of pore £uid pressure becauseof in£ation from the migrating pore £uid, to the pointwhere local sealswere breached andmigration to shallowerlevels then occurred.
The chaotic re£ection pattern above the structures isboth reminiscent of gas chimneys as described by Hegg-land (1997,1998) and L�seth et al. (2001, 2003) and also£uid/gas/mud expulsion features as described by Hovlandet al. (1998). Based on the vertical position of amplitudeanomalies associated with Type B structures, the £uid/gas/mud migration probably reached as shallow as theTopKai level. Because this level is the shallowest occurrence ofthese anomalies on all the structures, it is suggested that
the ultimate development of Type B structures resulted inmud and £uid expulsion to form mud volcanoes at theseabed in the Late Pliocene. Not all Type B structures areassociatedwith mud expulsion features and many probablyonly vented £uid andgas to shallower levels. Some ofTypeBstructures show evidence of collapse at a stratigraphic high-er level, with the characteristics of gas-seepage and pock-marks (King & MacLean, 1970; Hovland & Judd, 1988;Heggland, 1997, 1998), and this is taken as evidence for theshallow level of £uid migration and even expulsion of £uidsat the contemporaneous seabed in the Pliocene.
Any interpretation of these kinds of structures on seis-mic data needs to take into account the potential artefactsbecause of shallow gas including attenuation, scattering,high amplitudes at the top of the gas accumulation and ve-locity pull-down below (Barthold & Schˇttenhelm, 2003).The vertically distributed seismic disturbance underneaththeseType B structures is nevertheless interpreted as a gen-uine expression of the shallowgas accumulations connectedwith the vertical gas migration and not as purely artefactualproducts of the shallow imaging problems (Heggland, 1997,1998; L�seth et al., 2001;Meldahl et al., 2001).
Type B structures are interpreted as mud diapirsbecause they are observed to penetrate parts of the Palaeo-gene succession.Their probable polyphase £uidmigrationhistory is evidenced in the shallow amplitude anomaliesand occasional mud expulsion features at much youngerlevels than the main diapiric structures. It is interestingto note that at least some of the reactivated diapirs do notseem to reach the surface as diapirs as implied in earlierstudies (Cor¢eld et al., 2004: Fig. 12).They rather seem toexpel £uids and mud through a narrow sub-vertical con-duit that fed £uids to several levels within the diapir over-burden and mud to a mud volcano on the palaeo-seabed.This mode of transport has also been suggested by a de-tailed study of mud volcanism in the Caspian Sea (Davies& Stewart, 2005).
Type C
Type C structures are interpreted as mud laccoliths thatwere intruded some tens of metres below theTopRogalandhorizon when this constituted the seabed, i.e. at the Pa-laeocene/Eocene transition. The exact timing is di⁄cultto prove conclusively as only poorly de¢ned onlaps wereobserved. However, the intrusive nature of the core of themounded structures is clear from the completely invariantthickness of the plane parallel re£ection between themound core and theTopRogaland.The preferential distri-bution ofTypeC structures to the southern part of the sur-vey suggests a relationship between the deeper lyingstructures in that part of the survey, known as theGleipneSaddle, and the location of Type C structures.
Timing and source
Diapirs described in the Vema Dome and the Vigrid Syn-cline diapir ¢eld by Hjelstuen et al. (1997) and Hovlandet al. (1998) are known to have a source in the Eocene to
r 2005 Blackwell Publishing Ltd,Basin Research, 17, 123^139 135
Mud remobilization, fluidmigration Gjallar Ridge
Miocene ooze units (Brygge Formation).These ooze unitshave extremely low density and high preserved porositypromoting their susceptibility to remobilization.
In our study, there is no direct evidence of large-scalevertical transport of remobilized sediment units withinthe Brygge Formation of the size described by Hjelstuenet al. (1997) and Hovland et al. (1998) from areas furthernorth in the basin.The seismic data in our study area do,however, suggest that localized sediment remobilizationwas connected to vertical £uid/gas migration from an un-derlying source.The fact that the most pronouncedTypeBstructures are situated on top of structural highs (Fig. 4)and display vertical zones of broken and chaotic re£ectionsbelow the structures indicates that they originated from adeeper source in a manner comparable to that suggestedfrom other locations along the Norwegian margin (e.g.L�seth et al., 2003).
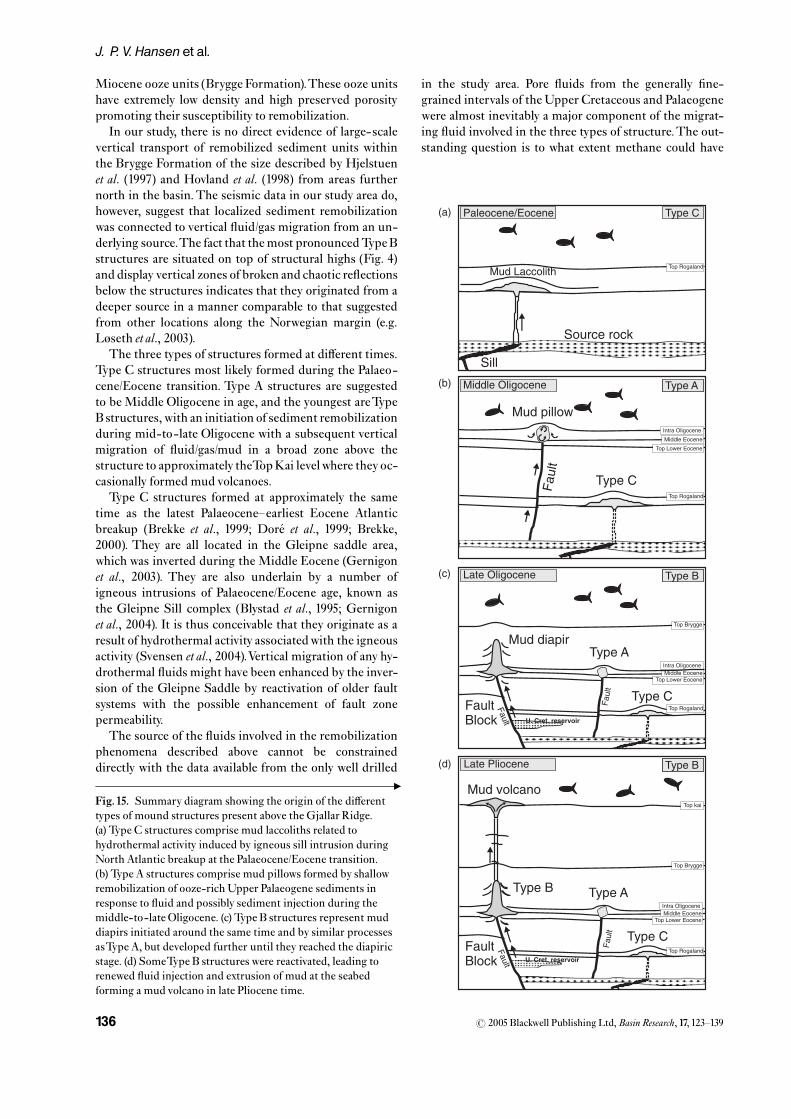
The three types of structures formed at di¡erent times.Type C structures most likely formed during the Palaeo-cene/Eocene transition. Type A structures are suggestedto be Middle Oligocene in age, and the youngest areTypeB structures,with an initiation of sediment remobilizationduring mid-to-late Oligocene with a subsequent verticalmigration of £uid/gas/mud in a broad zone above thestructure to approximately theTopKai levelwhere they oc-casionally formed mud volcanoes.
Type C structures formed at approximately the sametime as the latest Palaeocene^earliest Eocene Atlanticbreakup (Brekke et al., 1999; Dore¤ et al., 1999; Brekke,2000). They are all located in the Gleipne saddle area,which was inverted during the Middle Eocene (Gernigonet al., 2003). They are also underlain by a number ofigneous intrusions of Palaeocene/Eocene age, known asthe Gleipne Sill complex (Blystad et al., 1995; Gernigonet al., 2004). It is thus conceivable that they originate as aresult of hydrothermal activity associatedwith the igneousactivity (Svensen et al., 2004).Vertical migration of any hy-drothermal £uids might have been enhanced by the inver-sion of the Gleipne Saddle by reactivation of older faultsystems with the possible enhancement of fault zonepermeability.
The source of the £uids involved in the remobilizationphenomena described above cannot be constraineddirectly with the data available from the only well drilled
in the study area. Pore £uids from the generally ¢ne-grained intervals of the Upper Cretaceous and Palaeogenewere almost inevitably a major component of the migrat-ing £uid involved in the three types of structure.The out-standing question is to what extent methane could have
Mud Laccolith
Sill
Source rock
Middle Oligocene
Late Oligocene
Mud pillow
Fu
ta
l
Type C
Mud diapir
ltF
au
FaultBlock
FaultBlock
Late Pliocene
Mud volcano
Type A
Type C
Type B
Type C
Paleocene/Eocene
Fault
Type C
Type AType A
Type AType B
Type AType B
alt
Fu
Ful
at
(a)
(b)
(c)
(d)
Type A
Fig.15. Summary diagram showing the origin of the di¡erenttypes of mound structures present above the Gjallar Ridge.(a) Type C structures comprise mud laccoliths related tohydrothermal activity induced by igneous sill intrusion duringNorth Atlantic breakup at the Palaeocene/Eocene transition.(b) Type A structures comprise mud pillows formed by shallowremobilization of ooze-rich Upper Palaeogene sediments inresponse to £uid and possibly sediment injection during themiddle-to-late Oligocene. (c) Type B structures represent muddiapirs initiated around the same time and by similar processesasType A, but developed further until they reached the diapiricstage. (d) SomeType B structures were reactivated, leading torenewed £uid injection and extrusion of mud at the seabedforming a mud volcano in late Pliocene time.
9
r 2005 Blackwell Publishing Ltd,Basin Research, 17, 123^139136
J. P. V. Hansenet al.
been involved, as methane iswidely implicated in muddia-pirism on a global scale (Kopf, 2002).
The most obvious contribution of methane to the muddiapirism and remobilization would be from thermogenicsources during hydrocarbon generation. In general, theUpper Jurassic^Lower Cretaceous source rock in theV�ring Basin (Spekk Formation) is believed to have gener-ated oil since theEocene andgas since theNeogene (Spen-cer etal.,1999).Thiswould suggest that therewas a potentialsource of methane for each of the types of structure, espe-cially the late stage of Type B, bearing in mind that hydrothermal cracking of source rocks by igneous intrusion couldhave been a factor in the formation of Type C structures(Blystad et al., 1995; Gernigon et al., 2003; Svensen et al.,2004). Svensen etal. (2004) thus suggested that the methanederived from heating of organic-rich material of Cretac-eous/Palaeocene age by intrusive sill and dyke complexes.
Type B structures represent the clearest seismic evi-dence for the presence of methane in the system, withtheir strong association with amplitude anomalies. Asnoted earlier, these structures also represent the best ex-amples of episodic £uid migration, with episodes relatingto changes in regional stress, or to an intrinsic valve-re-lease mechanism whereby £uid pressures build up to thepoint where top seal failure occurs, and some of the £uidexcess is lost bymigration to shallower levels.TypeB struc-tures are younger than the other structures and the mid-to-late Oligocene onset phase and the subsequent Plio-cene remigration of gas to some extent correspond to thetiming of gas generation as suggested by Spencer et al.(1999) and not with the methane production caused byigneous intrusion during thePalaeocene/Eocene transition.
Notwithstanding the uncertainties in the precise natureof the £uid phases involved in the mud mobilization anddiapirism, the evidence presented from the 3D seismic vo-lume is of a clearly focused £uid migration system in thispart of the basin where vertical conduits for substantial£uid £uxes are linked to older fault structures.These olderfaults may have acted as drains for pore £uids and/or hy-drocarbon products from large areal compartments, witha localization of any underlying structural high. Thisplumbing system is by no means unique, and similar largearea 3D seismic surveys from other basins may be ex-pected to reveal similar types of £uid migration patternsas more studies like this are conducted in the near future.
CONCLUSIONS
This study de¢nes three distinct types of mounded struc-tures related to £uid and sediment mobilization withindi¡erent stratigraphic intervals:
� Type A represent mud pillows formed by shallow re-mobilization of ooze-rich Upper Palaeogene sedi-ments caused by injection of £uid and possibly gasalong deep-seated faults in the mid-Oligocene(Fig.15b).
� Type B comprises mid-to-late Oligocene mud diapirs(Fig.15c) thatwere re-activated as focus points for £uidand mud expulsion in the late Pliocene (Fig. 15d).These structures are also related to injection of £uidsand sediment via deep-seated faults, but the size ofthe structures and the longevity of £uid migrationalongTypeB structures set them apart frombothTypesA and C, which are both extinct.
� Type C comprises mud laccoliths formed by shallowmud intrusion during the Palaeocene/Eocene transi-tion (Fig. 15a). The limited vertical extent of our dataprevents an analysis of their deeper structural context,but similar structures elsewhere have been linked tocracking of hydrocarbon source rocks because ofigneous intrusion associated with North Atlanticbreakup. It is assumed that this mode of formation isalso applicable to the structures located on theGleipneSaddle.
This study furthermore demonstrates the utility of analys-ing soft- sediment deformation and £uid/gas migrationpatterns using 3D seismic data, making it possible to de-¢ne geometry with considerable precision, and more im-portantly map important relationships between focused£uid- £ow pathways and faults on the scale of a majorstructural basin element.
ACKNOWLEDGEMENTS
We thankNorskHydro for providing uswith the upper partof the SG9604 3D seismic survey, the geophysical logs andthe completion log ofwell 6704/12-1.RichardDavies andPi-eter van Rensbergen are thanked for their many insightfulcomments and suggestions that helped improve the papersubstantially. J. P.V.H. andO.R.C. acknowledge the supportof the Danish Energy Agency. J. A. C. and M. H. acknowl-edge the support of the CAPROCKS consortium.
REFERENCES
Barthold,M.S. & Schˇttenhelm, R.T.E. (2003) Shallow gasand gas seepage: expressions on seismic and other acousticdata from the Netherlands North Sea. J. Geochem. Explor.,78^79, 305^309.
Bartholomew, I.D., Peters, J.M. & Powell, C.M. (1993) Re-gional structural evolution of the North Sea; oblique slip andthe reactivation of basement lineaments. In: Petroleum Geologyof Northwest Europe; Proceedings of the 4th Conference (Ed. by J.R.Parker),TheGeol. Soc. Lond., UK, 2, 109^1122.
Bj�rnseth, H.M., Grant, S.M., Hansen, E.K., Hossack,J.R., Roberts,D.G.&Thompson,M. (1997) Structural evo-lution of theV�ring Basin, Norway, during the late Cretaceousand Paleogene. J. Geol. Soc., 154, 559^563.
Blystad, P., Brekke, H., F�rseth, R.B., Larsen, B.T., Skog-seid, J. & T�rudbakken, B. (1995) Structural elements ofthe Norwegian Sea Region.NPD-Bull., 8, 45.
Brekke,H. (2000) The tectonic evolution of the Norwegian SeaContinental Margin with emphasis on the V�ring and M�re
r 2005 Blackwell Publishing Ltd,Basin Research, 17, 123^139 137
Mud remobilization, fluidmigration Gjallar Ridge

Basins. In: Dynamics of the Norwegian Margin (Ed. by A. N�tt-vedt),Geol. Soc. Spec. Publ., Lond., 167, 295^326.
Brekke,H.,Dahlgren,D.,Nyland, B. &Magnus,C. (1999)The prospectivity of the V�ring and M�re basin on then Nor-wegian Sea continental margin. In: Petroleum Geology of North-west Europe: Proceedings of the 5th Conference (Ed. by A.J. Fleet &S.A.R. Boldy),Geol. Soc. Lond., 1, 261^274.
Brekke,H.&Riis,F. (1987)Tectonics and basin evolution of theNorwegian shelf between 621Nand 721N.NorskGeol.Tidsskrift,67, 295^322.
Cartwright, J. (1994)Episodic basin-wide £uid expulsion fromgeopressured shale sequences in the North Sea basin.Geology,22, 447^450.
Cartwright, J.A. & Dewhurst, D.N. (1998) Layer-boundcompaction faults in ¢ne-grained sediments. Geol. Soc. Am.Bull., 110, 1242^1257.
Corfield, S.M., Wheeler, W., Karpuz, R., Wilson, M. &Helland, R. (2004) Exploration 3D seismic over the GjallarRidge,Mid-Norway: visualization of structures on theNorwe-gian volcanic margin from Moho to sea£oor. In: 3D SeismicTechnology: Application to the Exploration of Sedimentary Basins(Ed. by R.J. Davies, J. Cartwright, S.A. Stewart, J.R. Underhill&M. Lappin),Geol. Soc., Lond.,Mem., 29, 177^185.
Dalland, A.,Worsley, D. & Ofstad, K. (1988) A lithostrati-graphic scheme for theMesozoic andCenozoic succession o¡-shore mid-and northern Norway.NPD-Bull., 4, 65pp.
Davies,R.J.& Stewart, S.A. (2005) Emplacement of giant mudvolcanoes in the South Caspian Basin: 3D seismic re£ectionimaging of their root zones. J Geol. Soc., Lond., 162, 1^4.
Deegan,C.E.&Scull,B.J. (1977)A standard lithostratigraphicnomenclature for the central and northern North Sea. Rep.Inst. Geol. Sci., No. 77/25; Bull. Norw. Petrol. Direct., No.1.
Dimitrov,L.I. (2002)Mudvolcanoes^the most important path-way for degassing deeply buried sediments. Earth Sci. Rev.,59(1^4), 49^76.
Dore¤ , A.G., Lundin, E.R., Jensen, L.N., Birkeland, �.,Eliassen,P.E.&Fichler,C. (1999) Principal tectonic eventsin the evolution of the northwest European Atlantic margin.In: Petroleum Geology of Northwest Europe: Proceedings of the 5thConference (Ed. by A.J. Fleet & S.A.R. Boldy), Geol. Soc. Lond.,UK, 1, 41^62.
F�rseth, R.B. & Lien, T. (2002) Cretaceous evolution in theNorwegian Sea^a period characterized by tectonic quiescence.Mar. Petrol. Geol., 19, 1005^1027.
Gay,A.,Lopez,M.,Cochonat, P., Sultan,N.,Cauquil, E.&Brigaud, F. (2003) Sinuous pockmark belt as indicator of ashallow buried turbiditic channel on the lower slope ofthe Congo basin,West African margin. In: Subsurface SedimentMobilization (Ed. by P. Van Rensbergen, R.R. Hillis & C.K.Morley),Geol. Soc. Spec. Publ., Lond., 216, 173^189.
Gernigon, L., Ringenbach, J.-C., Planke, S. & LeGall, B.(2004)Deep structures and breakup along volcanic rifted mar-gins: insights from integrated studies along the outer VoringBasin (Norway).Mar. Petrol. Geol., 21(3), 363^372.
Gernigon, L., Ringenbach, J.C., Planke, S., Le Gall, B. &Jonquet-Kolst�,H. (2003) Extension, crustal structure andmagmatism at the outer V�ring, Norwegian margin. J. Geol.Soc., 160, 197^208.
Graue, K. (2000) Mud volcanoes in deepwater Nigeria. Mar.Petrol. Geol., 17(8), 959^974.
Heggland, R. (1997) Detection of gas migration from a deepsource by the use of exploration 3D seismic data. Mar. Geol.,137(1^2), 41^47.
Heggland,R. (1998)Gas seepage as an indicator of deeper pro-spective reservoirs A study based on exploration 3D seismicdata.Mar. Petrol. Geol., 15(1), 1^9.
Hillier,R.D.&Gosgrove, J.W. (2002) Core and seismic obser-vations of overpressure-related deformationwithinEocene se-diements of the Outer Moray Firth, UKCS. Petrol. Geosci., 8,141^149.
Hjelstuen, B.O., Eldholm, O. & Skogseid, J. (1997) V�ringPlateau diapir ¢elds and their structural and depositional set-ting.Mar. Geol., 144, 33^57.
Hovland,M.& Judd,A.G. (1988)Seabed Pochmarks andSeepages,Impact on Geology, Biology and the Marine Enviroment. Grahamand Trotman Inc., London.
Hovland,M.,Nygaard,E.&Thorbjornsen,S. (1998)Pierce-ment shale diapirism in the deep-waterVemaDome area,Vor-ing basin, o¡shore Norway.Mar. Petrol. Geol., 15(3), 191^201.
Huuse, M. & Mickelson, M. (2004) Eocene sandstone intru-sions in the Tampen Spur area (Norwegian North Sea Quad34) imaged by 3D seismic data.Mar. Petrol. Geol., 21, 141^155.
King, L.H. & Maclean, B. (1970) Pockmarks on the ScotianShelf.Geol. Soc. Am. Bull., 81, 3141^3148.
Kopf, A.J. (2002) Signi¢cance of mud volcanism. Rev. Geophys.,40, 2^52.
Limonov, A.F., van Weering,T.C.E., Kenyon,N.H., Ivanov,M.K. & Meisner, L.B. (1997) Seabed morphology and gasventing in the Black Sea mudvolcano area: observations withthe MAK-1 deep-tow sidescan sonar and bottom pro¢ler.Mar. Geol., 137(1^2), 121^136.
Lundin, E.R. & Dore¤ , A.G. (1997) A tectonic model for theNorwegian margin with implications for the NE Atlantic:early cretaceous to break-up. J. Geol. Soc., 154, 545^550.
Lundin, E.R. &Dore¤ , A.G. (2002) Mid-Cenozoic post-break-up deformation in the ‘passive’ margins bordering the Norwe-gian-Greenland Sea.Mar. Petrol. Geol., 19, 79^93.
L�seth, H.,Wensaas, L., Arntsen, B., Hanken, N., Basire,C. & Graue, K. (2001) 1000m long gas blow-out pipes.In: EAGE 63rd Conference & Technical Exhibition, 11^15 June,Abstract Volume, Amsterdam,Netherlands.
L�seth,H.,Wensaas, L.,Arntsen, B. &Hovland,M. (2003)Gas and £uid injection triggering shallow mud mobilizationin the Hordaland Group, North Sea. In: Subsurface SedimentMobilization (Ed. by P. Van Rensbergen, R.R. Hillis, A.J.Maltman & C.K. Morley), Geol. Soc. Spec. Publ. Lond., 216,139^157.
Maltman, A.J. & Bolton, A. (2003) How sediments becommobilized. In: Subsurface Sediment Mobilization (Ed. by P.VanRensbergen, R.R. Hillis, A.J. Maltman & C.K. Morley), Geol.Soc. Spec. Publ. Lond., 216, 9^20.
Meldahl, P., Heggland, R., Bril, B. & de Groot, P. (2001)Identifying faults and gas chimneys using multiattributes andneural networks.Leading Edge, 20(5), 474^480.
NPD. (2003) WDSS. Wellbore: 6704/12-1. In: The NPD’s Fact-pages 2003. NPD.
Owen,G. (2003)Load structures: gravity-driven mobilization inthe shallow surface. In:Subsurface SedimentMobilization (Ed. byP.Van Rensbergen, R.R. Hillis, A.J. Maltman & C.K. Morley),Geol. Soc. Spec. Publ., Lond., 216, 21^34.
Pe¤ rez-Belzuz,F.,Alonso,B.&Ericilla,G. (1997) History ofmud diapirism and trigger mechanisms in theWestern Albor-an Sea.Tectonophysics, 282, 399^422.
Pinheiro, L.M., Ivanov, M.K., Sautkin, A., Akhmanov, G.,Magalhaes, V.H., Volkonskaya, A., Monteiro, J.H.,Somoza, L., Gardner, J., Hamouni, N. & Cunha, M.R.
r 2005 Blackwell Publishing Ltd,Basin Research, 17, 123^139138
J. P. V. Hansenet al.

(2003) Mud volcanism in the Gulf of Cadiz: results from theTTR-10 cruise.Mar. Geol., 195(1^4), 131^151.
Ren,S.,Faleide, J.I.,Eldholm,O.,Skogseid, J.&Gradstein,F. (2003) Late Cretaceous^Paleocene tectonic development oftheNW Voring Basin.Mar. Petrol. Geol., 20(2), 177^206.
Ren, S., Skogseid, J. & Eldholm, O. (1998) Late Cretaceous^Paleocene extension on the V�ring Volcanic Margin. Mar.Geophys. Res., 20(4), 313^341.
Roberts,D.G.,Thompson,M.,Mitchener, B.,Hossack, S.,Carmichael, S. & Bj�rnseth, H.-M. (1999) Palaeozoic toTertiary rift and basin dynamics: mid-Norway to the Bay ofBiscay-a new concept for hydrocarbon prospectivity in thedeep water frontier. In: Petroleum Geology of Northwest Europe:Proceedings of the 5th Conference (Ed. by A.J. Fleet & S.A.R.Boldy),Geol. Soc. Lond., 1, 7^40.
Skogseid, J. & Eldholm, O. (1989) V�ring plateau continentalMargin: Seismic interpretation stratigraphy, and verticalmovements. In: Proceedings of the Ocean Drilling Program,Scienti¢c Results (Ed. by O. Eldholm, J.Theide & E.Taylor). 104,993^1029.
Spencer, A., Birkeland, �., Knag, G.�. & Fredsted, R.(1999) Petroleum system ofm the Atlantic margin of thenorthewest Europe. In: Petroleum Geology of Northwest Europe:Proceedings of the 5th Conference (Ed. by A.J. Fleet & S.A.R.Boldy),Geol. Soc., Lond., 1, 231^246.
Sumner, R.H. & Westbrook, G.K. (2001) Mud diapirism infront of the Barbados accretionary wedge: the in£uence offracture zones and North America-South America plate mo-tions.Mar. Petrol. Geol., 18, 591^613.
Svensen, H., Planke, S., Malthe-S�rensen, A., Jamtveit,B., Myklebust, R., Eidem,T.R. & Rey, S.S. (2004) Releaseof methane from a volcanic basin as a mechanism for initialEocene global warming.Nature, 429, 542^545.
Trusheim, F. (1960) Mechanism of salt migration in NorthernGermany.Am. Assoc. Petrol. Geol. Bull., 44, 1519^1540.
Van Rensbergen, P., De Batist, M., Klerkx, J., Poort, J.,Vanneste, M., Granin, N., Khlystov, O. & Krinitsky, P.(2002) Sublacustrine mud volcanoes and methane seepscaused by dissociation of gas hydrates in Lake Baikal. Geol.Soc. Am., 30, 631^634.
Van Rensbergen, P., Morley, C.K., Ang, D.W., Q , H.T. &Lam,N.T. (1999) Structural evolution of shale diapirs from re-active rise to mud volcanism: 3D seismic data from the Baramdelta, o¡shore Brunei Darussalam.Geology, 156, 633^650.
Yin, P., Berne, S.,Vagner, P., Loubrieu, B. & Liu, Z. (2003)Mud volcanoes at the shelf margin of the East China Sea.Mar. Geol., 194(3-4), 135^149.
Manuscript Received 20 January 2004; Manuscript accepted30 September 2004.
r 2005 Blackwell Publishing Ltd,Basin Research, 17, 123^139 139
Mud remobilization, fluidmigration Gjallar Ridge
Copyright © 2022 FDOKUMEN