Ultrasonographic Findings of Mastitic and Normal Mammary Gland in Bitches
Upload
prosoparlamCategory
view
0download
0
Seediscussions,stats,andauthorprofilesforthispublicationat:http://www.researchgate.net/publication/41970089
3Dreconstructionofhistologicalsections:Applicationtomammaryglandtissue
ARTICLEinMICROSCOPYRESEARCHANDTECHNIQUE·OCTOBER2010
ImpactFactor:1.15·DOI:10.1002/jemt.20829·Source:PubMed
CITATIONS
64
READS
285
4AUTHORS:
IgnacioArganda-Carreras
UniversidaddelPaísVasco/EuskalHerrikoU…
18PUBLICATIONS1,982CITATIONS
SEEPROFILE
RodrigoFernandez-Gonzalez
UniversityofToronto
30PUBLICATIONS702CITATIONS
SEEPROFILE
ArrateMuñoz-Barrutia
UniversidaddeNavarra
65PUBLICATIONS585CITATIONS
SEEPROFILE
CarlosOrtiz-de-Solorzano
UniversidaddeNavarra
107PUBLICATIONS2,048CITATIONS
SEEPROFILE
Availablefrom:IgnacioArganda-Carreras
Retrievedon:18October2015
3D Reconstruction of Histological Sections: Applicationto Mammary Gland TissueIGNACIO ARGANDA-CARRERAS,1* RODRIGO FERNANDEZ-GONZALEZ,2 ARRATE MUNOZ-BARRUTIA,3 AND
CARLOS ORTIZ-DE-SOLORZANO3
1Biocomputing Unit, National Centre for Biotechnology (CNB-CSIC), Universidad Autonoma de Madrid, 28049 Madrid, Spain2Developmental Biology Program, Sloan-Kettering Institute, New York, New York3Cancer Imaging Laboratory, Centre for Applied Medical Research (CIMA), Pamplona, Spain
KEY WORDS computer-assisted microscopy; assisted histopathology; image registration
ABSTRACT In this article, we present a novel method for the automatic 3D reconstruction ofthick tissue blocks from 2D histological sections. The algorithm completes a high-content (multi-scale, multifeature) imaging system for simultaneous morphological and molecular analysis ofthick tissue samples. This computer-based system integrates image acquisition, annotation, regis-tration, and three-dimensional reconstruction. We present an experimental validation of this toolusing both synthetic and real data. In particular, we present the 3D reconstruction of an entiremouse mammary gland and demonstrate the integration of high-resolution molecular data.Microsc. Res. Tech. 73:1019–1029, 2010. VVC 2010 Wiley-Liss, Inc.
INTRODUCTION
The mammary gland is a ductal tree that developsduring puberty. In neonate mammals, the mammaryepithelium consists of a branched sprout contiguous tothe nipple. During puberty, there is considerablegrowth of the ductal tree, which invades and eventu-ally fills the fat pad. In the adult animal, ducts areformed by secretory, luminal epithelial cells sur-rounded by contractile myoepithelial cells. At each de-velopmental stage, the phenotype of the cells andtherefore the function of the entire gland is driven bytheir response to external factors and among those, tosteroid hormones. The interrelationship between thethree-dimensional structure of the mammary gland(macroarchitecture) and its cellular composition(microarchitecture) has been only described in a quali-tative way in studies on humans and animal models.This is mainly due to the lack of 3D imaging methodsto simultaneously capture the morphology of the glandand the phenotype of its constituent cells, defined bythe morphology and the expression of specific markerswithin the cells.
Some studies based on whole mount preparations(Bagheri-Yarmand et al., 2003; Cleary et al., 2004; Gio-vanni et al., 2004; Westerlind et al., 2002) provideglobal information on the development of the glandbased on the number and spatial distribution of its dif-ferent morphological structures: primary and second-ary ducts, lobular units, etc. Before the use of digitalimage processing, whole mount preparations wereimaged with conventional analog cameras and analyzemanually (Russo and Russo, 1978a,b). The use of digi-tal tools gave a significant boost to the analysis ofwhole mount preparations. This technology was usedin some studies of mammary gland development inrats, combining digital acquisition with manual mea-surements and counts of epithelial areas and lobularterminal units (Ip et al., 1999). However, whole mountanalysis is a low-resolution approach that works from
a 2D flat projection of the entire gland and providesonly limited morphological information that cannot becombined with information about cellular morphologyor the expression of cellular markers.
Three-dimensional microscopy—confocal, two-photon,etc.—can provide high-resolution cell morphologicaland phenotypical information, at the expense of beingonly of local extent, disconnected from the macroscopicstructure of the gland. For instance, working withhigh-numerical aperture lenses, one can, visualize andanalyze tissue volumes of �200 3 200 3 40 lm3, a verylimited volume given the size and thickness of thegland (Pawley, 2006).
Recently, Capek et al. (2009) approached the problemof combining macroscopic and microscopic data byphysically sectioning rat embryo specimens in 40-lmsections and then acquiring confocal stacks that werestitched in the x-y plane and registered in the z—verti-cal— direction, thus creating a complete digital versionof the specimen. However, this is only suitable for smalltissue volumes because of data management and anal-ysis issues. Another shortcoming of this method is thatit relies on confocal imaging of fluorescent markers,which might be the best approach for high-resolution
*Correspondence to: Ignacio Arganda-Carreras, Biocomputing Unit, NationalCentre for Biotechnology (CNB-CSIC), Universidad Autonoma de Madrid, 28049Madrid, Spain. E-mail: [email protected]
Received 14 August 2009; accepted in revised form 5 January 2010
Contract grant sponsor: Spanish Ministry of Education (MCYT Program);Contract grant number: TEC2005-04732; Contract grant sponsor: Spanish Sci-ence and Innovation Ministry; Contract grant number: MCIIN PSS-010000-2008-2; Contract grant sponsor: Marie Curie International Reintegration Grant;Contract grant number: MIRG-CT-2005-028342; Contract grant sponsor: Depart-ment of Defense and University of California Breast Cancer Research Programs;Contract grant numbers: DAMD17-00-1-0227, DAMD17-00-1-0306, 8WB-0150;Contract grant sponsors: UTE project CIMA, Spanish Ministry of Education(Ramon y Cajal fellowship).
DOI 10.1002/jemt.20829
Published online 15 March 2010 in Wiley Online Library (wileyonlinelibrary.com).
VVC 2010 WILEY-LISS, INC.
MICROSCOPY RESEARCH AND TECHNIQUE 73:1019–1029 (2010)

nuclear reconstruction or even for the 3D reconstructionof some histological structures—using autoflorescenceand low magnification—, but it is limited to a maximumtissue thickness of 200 lm using multiphoton illumina-tion, much less than the thickness of the tissue we aimto reconstruct—typically between 1 and 2 mm.
Our alternative to combine low-resolution imaging ofhistological structures with high-resolution analysis ofcellular expression relies on serial sectioning. Namely,after fixation, the tissue is embedded in paraffin andcut into thin slices (4–5 lm). The even slices arestained with hematoxylin and eosin (H&E) to highlightthe histological structures of interest, whereas the in-termediate odd sections are stained by immunohisto-chemistry using antibodies against several cellularmarkers. All even sections are imaged at low resolu-tion, registered, and the structures of interest auto-matically detected and reconstructed in 3D. Then,areas of interest of the tissue, selected based on theirthree-dimensional location or morphology, are imagedat high resolution in the intermediate odd sections.These images can then be analyzed cell by cell for thespecific markers stained in the section. This way, cellu-lar information can be traced back to the correspondinghistological structures imaged in the contiguous sec-tions. We would like to remark that this requires beingable to accurately reconstruct the tissue structuresfrom the—low-resolution—images of the even H&E-stained sections, which is the main topic of this article.
A topologically accurate rendition of a tissue requiresthat all the images of the sections are correctly aligned,ensuring the continuity of structures crossing severalsections. Manual registration of two sections is a rela-tively simple task that involves either manually rotat-ing and translating a half-transparent image over thereference image or marking sets of corresponding points—fiducial points—on both images and calculating theaffine transform that aligns the images. However, thisapproach becomes impractical when registering largetissue blocks, made of hundreds of sections. Moreover,manual registration adds certain error to the result, asthe user can bias the registration by incorrectly select-ing the fiducial points. Finally, this approach assumesthat the registration between consecutive sections canbe done using an affine transformation. However, thereare often nonlinear effects introduced during tissue sec-tioning that cannot be corrected for using an affinetransformation as described by Deverell et al. (1989),Schormann et al. (1995), and Brey et al. (2002). Exam-ples of these effects are missing sections and/or nonlin-ear distorting effects, such as tissue folding, stretching,and tearing. Another consequence of serial sectioning isthat the resolution of the images in the Z direction (i.e.,the distance between sections) is considerably lowerthan the XY resolution. This causes substantial differ-ences between the same structures in consecutive sec-tions, and consequently complicates the registrationprocess. Ourselin et al. (2001) proposed a strategy tocompensate these nonlinear effects. They compute localdisplacements between sections using a block-matchingapproach. Then, a global rigid transformation is calcu-lated from these matches as the solution of a robustregression problem. We propose instead the use of alocal nonrigid registration method to compensate fornonlinear effects. Nonrigid registration methods are
well suited for the task as complex transformations canbe modeled by them. Moreover, they are applied locallyto reduce the computational complexity and to preservethe topology of the tissue.
Several groups have developed systems to recon-struct tissues from histological sections (Capuco et al.,2002; Fiala, 2005; Haas and Fischer, 1997; Hofstadler-Deiques et al., 2005; MacKenzie-Graham et al., 2004;Streicher et al., 1997, 2000); but to the best of ourknowledge, they all rely on manual and/or rigid-bodyregistration of the images, which, as it has beenargued, is not appropriate for large tissue volumes. Inaddition, some of those studies require using severalsoftware platforms for acquisition, analysis, registra-tion, and reconstructions, adding compatibility issuesbetween platforms, and complicating the entire recon-struction process.
Other authors combined molecular and 3D morpho-logical information using episcopic methods (Weningerand Mohun, 2002; Weninger et al., 1998). These meth-ods do not require registration because all images areacquired before sectioning. However, they are quite lim-ited in terms of the extent reconstructed area, giventhat the staining that these methods allow is only super-ficial, the range of possible applications is very limited.In our previous work (Fernandez-Gonzalez et al., 2002),we presented a system that simplifies and semiauto-mates the acquisition, handling, and reconstruction ofhistological structures from fully sectioned tissue blocks.However, the registration used in that system was fullymanual, thus only allowing affine transforms, which arenot optimal for large tissue blocks.
Here, we introduce a method for the automaticreconstruction of entire tissue blocks in a way thatcould be later used to store cellular-level phenotypic in-formation. This requires the method to be automatic,work at high resolution in the vertical direction, andrely on elastic registration to account for nonlinear dis-tortions. In practice, our algorithm proceeds as follows:once the images are acquired (Section Image Acquisi-tion), they are automatically and rigidly registered(Section Rigid Registration). Next, the structures of in-terest are segmented (Section Segmentation of Struc-tures of Interest), and their resulting contours areautomatically grouped (Section Contour Grouping).Finally, the registration is locally and/or elasticallyrefined (Section Local Group Registration), and thestructures are reconstructed in 3D based on thegrouped contours (Section 3D Reconstruction). Weevaluated the system using an artificial model (SectionValidation of the Method Using a Phantom) and thenapplied it to real mammary gland tissue blocks (SectionExperiments With Real Data). We show the benefit ofusing these integrated techniques to generate novel re-alistic, smooth, and compact 3D reconstructions of his-tological tissues. We discuss the conclusions of ourapproach in Discussion Section.
MATERIALS ANDMETHODSImage Acquisition
Formalin-fixed, paraffin-embedded tissue blocks con-taining entire mouse mammary glands were fully sec-tioned at 5 lm thickness and every even sectionstained with H&E. The number of sections per blockdepended on the thickness of the tissue block, ranging
Microscopy Research and Technique
1020 I. ARGANDA-CARRERAS ET AL.

from the high tens to the low hundreds. Low-resolution(2.53 magnification) multiple-snapshot images of allthe sections were acquired using a computer-assistedwide-field microscope (Fernandez-Gonzalez et al.,2002). The size of the images depended on the size ofthe tissue sections, but ranged typically from 3,000 33,000 to 5,000 3 5,000 pixels. A background correctionalgorithm based on a phantom (Fernandez-Gonzalezet al., 2004) was used to correct the mosaic-like effectof the images caused by uneven illumination of thefield of view of the microscope. The sections were savedin either TIFF or ICS (Dean et al., 1990) format (grayscale mode) and grouped as sets of related images thatwe will refer to as cases.
Rigid Registration
We first apply an automated rigid-body registrationalgorithm to register each image to the previous imageof the block. Because of the large size of the images, weimplement a computationally efficient multiresolutionpyramidal version of the algorithm (Borgefors, 1988).
The algorithm used to calculate the optimum transfor-mation at each pyramid level is schematically describedin Figure 1. First, both target and source images aresubsampled with a factor given by the pyramid level.Second, image noise is removed using a Gaussian filter,and the image gradient is calculated with a Sobel opera-tor. Third, to determine the location of the relevantimage edges and create a binary contour map, theimages are binarized applying a modified Otsu threshold(Otsu, 1979; Rasband, 1997–2009). Finally, the inversedistance transform of the target image is computed.
To speed up the search for the maximum of thematching function, the number of rotations and trans-lations that we use depend on the pyramid level.
Using this multiresolution hierarchical algorithm,the best matching transformation is progressivelyfound, by first approaching it at low resolution in largesearch areas and then refining it at high resolution inreduced search spaces. Consequently, the reduction ofthe error in every pyramid level is implicit, as lowerlevels use higher resolution images containing more
Fig. 1. Image preprocessing for rigid registration. Both source andtarget images are subsampled (according to the pyramid level) and fil-tered with a Gaussian kernel to remove noise, their edges aredetected by a Sobel operator, and both images are also binarized by an
autothresholding function. Then, a matching function is appliedbetween the source image after a rigid-body transformation and aninverse distance transform version of the binarized target image.
Microscopy Research and Technique
10213D RECONSTRUCTION OF HISTOLOGICAL SECTIONS

image information. The efficiency of the algorithm isalso guaranteed, as the size of the search spacedecreases as the size of the subsampled imagesincreases.
Segmentation of Structures of Interest
To automatically extract the contours of the struc-tures of interest, we use a method (Fernandez-Gonza-lez et al., 2004) that combines two well-establishedschemes for interface propagation: the fast-marchingmethod (Sethian, 1996) and the level-set method(Osher and Sethian, 1988). The fast marching algo-rithm is first run to provide a quick good approxima-tion of the boundaries of the objects that we are tryingto segment. This is just a quick estimate of the segmen-tation, as the fast marching approach assumes mono-tonic speed functions—always positive or negative—.Then, the approximation provided by the fast marchingmethod is used as initial condition for the level setmethod. This is a computationally expensive algo-rithm, which is just run for just a few steps to adjustthe evolving front to the contours of the structures ofinterest.
Contour Grouping
In the segmentation step, we annotate the structuresof interest of our tissue: ducts, lymph nodes, etc. Wethen group the contours that belong to the same struc-ture so that they can be rendered together. We havedeveloped an automatic grouping algorithm, whichproceeds in two steps. The first step assigns the samegroup number to the contours of consecutive sections iftheir projected bounding boxes—minimum squaredareas containing the shapes—overlap. If there is notoverlap the contour remains ungrouped. During this
process, if the bounding box of a grouped contour over-laps an already grouped contour, then both contoursreceive the same supergroup number. Following thisidea, we iteratively create a hierarchy of groups. In thesecond step, all the remaining ungrouped contours areassigned the group and supergroup number of the clos-est grouped contour in the next section.
Shape-Based Rigid Registration
When we consider that is necessary to improve theresult of the initial rigid registration, we apply a varia-tion of the rigid-body registration, called shape rigidregistration. This method requires the sections to be al-ready segmented and represented as a binary set ofcontours corresponding to the edges of the structuresof interest (see Section Segmentation of Structures ofInterest). We use it after the grouping step described inSection Contour Grouping. Therefore, in the processdescribed in Figure 1, the results of the autothresholdof the source and target images are replaced by the bi-nary representation of the segmented contours of theimages. The rest of the algorithm does not change fromwhat has been described. Figure 2 shows the differencebetween the binary image used as input by the stand-ard and the shape rigid registration method, respec-tively. This method has two main advantages over theprevious one. First, assuming that the segmented con-tours correspond only to the relevant structures in theimage, the matching between the images will be basedonly on relevant image information, thus mitigatingthe effect of noise or artifacts. The second advantage ofthis method is its increased efficiency. As the numberof evaluation points is drastically reduced, as most ofthe pixels in the binary image are black.
Fig. 2. Graphical example of the reduction in complexity of therigid registration algorithm when using as input a binary image con-taining only the most representative contours of the structures of in-terest or containing all the gradient information above a modifiedOtsu threshold. (a) Histological section image already segmented.The contours from the structures of interest are represented in white.
(b) Binary image constructed from the contours. (c) Binary imageobtained with the preprocessing described in Section Rigid Registra-tion (subsampling and Gaussian filtering, application of the Sobel op-erator, and modified Otsu thresholding). [Color figure can be viewedin the online issue, which is available at wileyonlinelibrary.com.]
Microscopy Research and Technique
1022 I. ARGANDA-CARRERAS ET AL.

Local Group Registration
As already mentioned in the introduction, manualsectioning can produce nonlinear deformations in thetissue, such as folding, stretching, and tearing. Occa-sionally also, because of the tissue conditions orimproper maintenance of the microtome, some sectionscan be damaged and must be disposed. Consequently,there might be gaps in the sequence of sections. Allthese effects may cause heavy misalignment betweenareas that cannot be corrected by using a global affinetransformation. Therefore, we opted for combining alocal correlation-based registration method with a con-sistent elastic registration algorithm (Arganda-Carre-ras et al., 2006). As the algorithm is applied locally, thetopology is preserved and accurate results are pro-duced in a reasonable time. The selection of the struc-tures for which a consistent elastic registration algo-rithm is needed is described next.
First, we calculate a common bounding box for eachgroup of contours that were automatically grouped inthe previous step. Then, we estimate a translation off-set for each group by computing the cross-correlationbetween the content of the corresponding bounding box
in consecutive sections. In particular, we use the popu-lar phase correlation method (PCM) by Kuglin andHines (1975). It is based on the Fourier shift theorem,which states that a shift between two images results ina linear phase difference in their Fourier transform. Inconsequence, in the frequency domain, the modulus ofthe correlation has a peak at a distance from the centerthat corresponds to the applied shift. A graphicaldescription is shown in Figure 3.
Consequently, we obtained a correction vector anda correlation coefficient for each group of contoursin every section. The shift vector is computed asthe difference between the coordinates of the centerof the subimage and the coordinates of the brightestpeak in the modulus subimage. The correlation coef-ficient is calculated between the original target sub-image and the translation corrected source sub-image and does provide a measure of the accuracyof the correction vector. Correlation values lowerthan a minimum value—corresponding to stronglydistorted areas—trigger a consistent elastic registra-tion routine (Arganda-Carreras et al., 2006) thatcorrects the misalignment.
Fig. 3. Image alignment by phase correlation. (a) Selected region of a tissue section. (b) Same regionof the tissue section but shifted. (c) Modulus of the autocorrelation image. Note the peak at the imagecenter. (d) Modulus of the cross-correlation between images (a) and (b). Note how the peak is shifted. (e)Correction vector in white.
Microscopy Research and Technique
10233D RECONSTRUCTION OF HISTOLOGICAL SECTIONS

This routine simultaneously calculates the directand inverse transformations and minimizes the simi-larity error between the target and source images afterimposing a consistency constraint. Consistency hererefers to the invertibility of the transformations, in fact,this approach provides bidirectional registration—fromimage A to B or from B to A—in a single computation.Image A is elastically deformed to look as similar as pos-sible to image B, and, at the same time, the ‘‘inverse’’transformation (from B to A) is also calculated so apseudo-invertibility of the final deformation could beguaranteed. This method uses B-splines to efficientlyrepresent both images and deformations in multiresolu-tion pyramids. A powerful optimizer is used to itera-tively converge fast to the best image alignment mini-mizing an energy functional computed from the gray-scale pixel-to-pixel similarity between the images andthe consistency of the direct and inverse deformations.
3D Reconstruction
The system reconstructs the 3D structures of inter-est based on the grouping of the segmented contours,which have been aligned using the rigid and elasticregistration. The surfaces of the volume are createdwith a refined Delaunay triangulation (Boissonnat andGeiger, 1993). Some examples and validation experi-ments of the complete rendering process are shown inthe next section. Alternatively, our system offers theoption of creating a 3D binary image, containing thesegmented and aligned contours in white and the back-ground in black. This binary image can be used forfurther studies of the structures of interest such asgenerating their skeleton, counting, and measuringtheir branches, volumes, etc., as it is also shown in thenext section.
High-Resolution Acquisition
From the 3D reconstruction of the tissue, calculatedfrom the H&E-stained sections—the even sections ofthe block—we select areas of interest. These areas ofinterest—selected based on interesting morphologicalfeatures or their location within the gland—are thenimaged again with an optical wide-field microscope athigh resolution—403—in the odd sections and can beused to quantify molecular events at cellular level, asdefined by specific markers. This information can thenbe incorporated and retrieved from the 3D reconstruc-tion of the tissue. An example of this will be describedin the Results section.
RESULTSValidation of the Method Using a Phantom
We validated our registration and reconstructionprotocol using a phantom model in which we can artifi-cially simulate the most common problems found dur-ing the reconstruction of histological tissue. To thisend, we created a phantom model similar to the type ofstructures we want to render. Our phantom model wasmouse airway tree, segmented from an X-ray tomo-graphic image of a mouse chest. We stored the model ina 444 3 471 3 568 3D image and calculated the isosur-faces of the structures of interest using the ImageJ 3DViewer (Schmid, 2008), a popular open source softwarethat extracts the volume surface from the 3D imageand allows storage in virtual reality modeling language
(VRML) format. Figure 4 shows the volume. We usedthe model to study the robustness of our 3D reconstruc-tion system against variations in the direction of tissuesectioning, the loss of sections, and the presence of non-linear tissue distortions.
Direction of Sectioning. We first created three setsof artificial slices from the phantom, by sectioning it inthe x-, y-, and z-direction. Thus, we obtained three setsof images or cases that we used to test the accuracywith which our algorithm can reconstruct the originalphantom. For these three cases, we followed the stepspreviously described in the Methodology: segmenta-tion, grouping, and rendering. At this point, we did notperform any registration because the sections kept thealignment of the original 3D image.
We then compared the resulting isosurfaces with theoriginal model surface. For this we used the Hausdorffdistance (Rote, 1991), which measures how far twocompact nonempty subsets of a metric space arelocated from each other. We used the software toolboxMESH (Aspert et al., 2002) to compute the minimum,maximum, mean, and root-mean-square errors, betweenthe surfaces and to visualize the differences betweenthem. Table 1 shows the mean symmetric Haussdorfdistance between the model surface and the three surfa-
Fig. 4. Model volume generated from X-ray tomography of miceairways to validate the reconstruction method.
Microscopy Research and Technique
1024 I. ARGANDA-CARRERAS ET AL.

ces generated by our method. As can be seen from thetable values, our system produces surfaces, which areapproximately one pixel away from the original model.If we take into account that our segmented contours areone pixel thick, we can conclude that our system recon-structs the model accurately, regardless of the section-ing direction. Figure 5 shows one of the three recon-structions. The error is codified using a color code on topof the surface that represents the distance to the model.Blue areas represent perfect fit, whereas green and yel-low areas larger errors.
Missing Sections. A common problem when man-ually processing histological tissue blocks is the loss ofsections that may happen during sectioning. We
wanted to test how robust our algorithm is against thisproblem that can easily lead to loss or distortion ofsmall tissue structures. To quantify the effect of miss-ing sections, we used one of the three cases generatedpreviously and carried out 10 renderings. In the firstrendering, all sections were used. For the nth render-ing, only one of every nth section were kept. Figure 6shows the evolution of the error versus the percentageof sections used to generate the reconstruction. Using100% of the sections, we obtained 1.27 pixels of averageerror (mean symmetric Hausdorff distance), but thisnumber gradually increased up to 3.11 pixels when weused only 10% of the sections. More representative ofthis degradation is the maximum distance error, whichincreases from 8.90 when we used all the sections up to40.92 in the 10% case. Figure 7 shows a detail of the3D renderings of the synthetic case, superimposing theoriginal surface and the degraded surface from thecase of 100% of the sections down to using only 10%.We can see how the surface becomes graduallydegraded as the distance between sections increases.As the image and accompanying table shows, our algo-rithm is quite robust against the loss of one section
TABLE 1. Symmetric distance in pixels (mean, root-mean-square,and maximum) between the model surface and the 3D reconstructions
with X-, Y-, and Z-directions of sectioning
Directions X- Y- Z-
Mean 1.28 1.14 1.21RMS 1.58 1.42 1.42Max 15.11 19.79 8.9
Fig. 5. Visualization of Hausdorff distance. From left to right: histogram with color distance code scaled inmicrons (1 pixel 5 6.8 lm) and our 3D reconstruction of the x-axis sectioned case colored with the distance tothe model.
Microscopy Research and Technique
10253D RECONSTRUCTION OF HISTOLOGICAL SECTIONS

(n 5 2 case), which is the most common case, and pro-duces acceptable results even when subsampling downto n 5 5. The final decision on the subsampling ratemust be therefore taken as a trade-off between the ac-ceptable error of the reconstruction and the amount ofwork required to process the sections.
Rigid and Nonrigid Deformations. Next, wetested the robustness of our algorithm against mis-alignment between sections. To this end, we firstapplied random rigid deformations to all the sectionsof the model. Namely, we applied 620 pixels maxi-mum displacements and 6158 maximum rotations tothe sections and then registered and reconstructedthe model. We obtained a reconstructed volume simi-lar to the original model but with different orienta-tion. To measure the surface distances, we aligned thevolumes using the basic Iterative Closest Point(Zhang, 1993) method, which allowed us to matchboth reconstructions and calculate the Hausdorff dis-tance between them. Even when the entire case wasrigidly distorted, we obtained an acceptable meansymmetric distance of 3.48 pixels and maximum error
of 26.60. This results confirms that our registration isrobust against rigid distortions.
The final synthetic experiment combined rigid andnonrigid deformations. Thus, we applied the sametype of random rigid transformations used in the previ-ous experiment and added one elastic deformation(Arganda-Carreras et al., 2006) every 20 sections. Tocreate the elastic deformations, we used SplineDefor-mationGenerator. The elastically deformed sectionswere corrected using our consistent elastic registration(Arganda-Carreras et al., 2006) and then we proceededto reconstruct the case. Again, we first matched theresulting volume and the model calculating the sym-metric distance between surfaces, which amounted to3.57 pixels (maximum error 28.74). This result provesthat our registration method is robust against nonlin-ear distortions, as the distance is similar to the dis-tance of the previous experiment.
Experiments With Real Data
We finally used our algorithm to reconstruct realmammary gland tissue sections. An entire mousemammary gland was fully sectioned and stained withH&E (even sections) and alternatively with an anti-body against the estrogen receptor (ER), progesteronereceptor (PR), or Her2-neu (odd sections). The case wasmade of 205 lm sections.
Then, we imaged all H&E sections and registeredthem using the algorithm described earlier. A total of6,106 structures of interest were segmented and 821subgroups were automatically detected and distributedunder two large supergroups: the lymph node and theductal network, which were then reconstructed in 3D.Figure 8 shows two views of the entire gland. The topimage shows the result of the reconstruction before therigid and local group registration process and the bottomimage shows the gland reconstructed after registration.The effect of the registration is clear from this example,where the registered case shows much more compactand smoother volumes than the unregistered one.Fig. 6. Distance error versus section loss.
Fig. 7. Volume degradation. From top to bottom and from left to right, zoom over the 3D renderingsof the synthetic case (from using 100% of the sections down to using only 10% ). The different reconstruc-tions are shown in red, while the model is shown in translucent yellow.
Microscopy Research and Technique
1026 I. ARGANDA-CARRERAS ET AL.
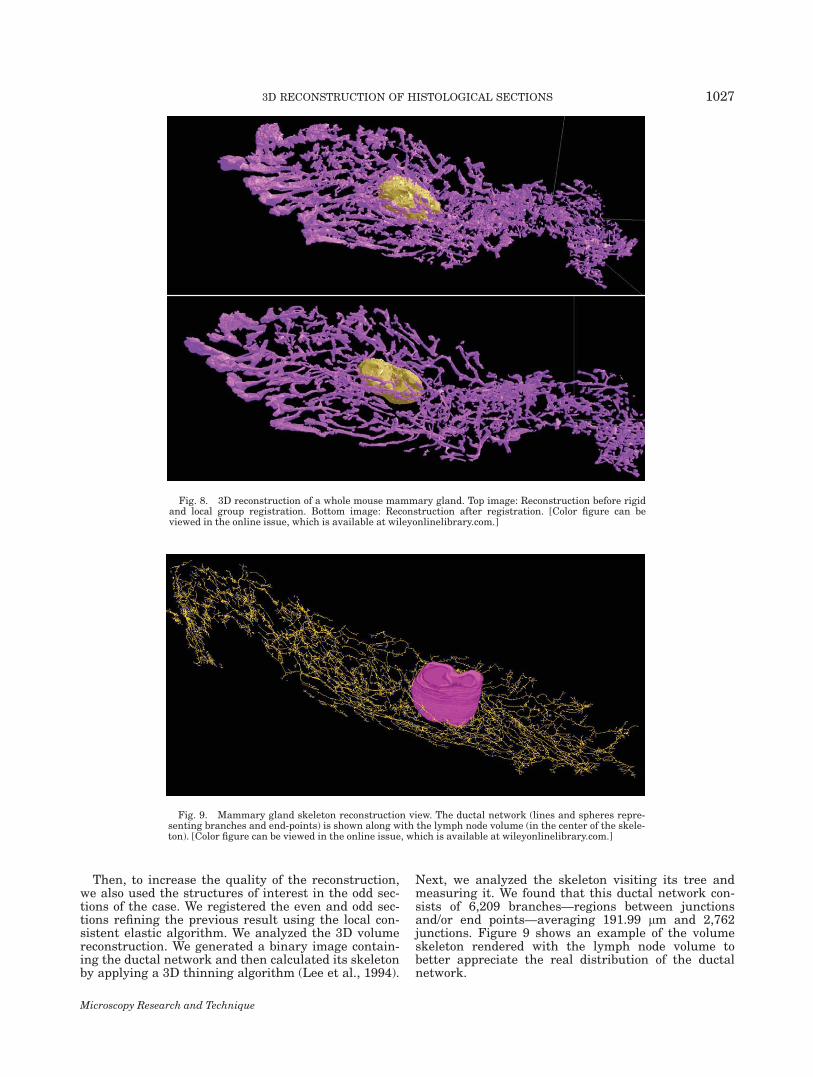
Then, to increase the quality of the reconstruction,we also used the structures of interest in the odd sec-tions of the case. We registered the even and odd sec-tions refining the previous result using the local con-sistent elastic algorithm. We analyzed the 3D volumereconstruction. We generated a binary image contain-ing the ductal network and then calculated its skeletonby applying a 3D thinning algorithm (Lee et al., 1994).
Next, we analyzed the skeleton visiting its tree andmeasuring it. We found that this ductal network con-sists of 6,209 branches—regions between junctionsand/or end points—averaging 191.99 lm and 2,762junctions. Figure 9 shows an example of the volumeskeleton rendered with the lymph node volume tobetter appreciate the real distribution of the ductalnetwork.
Fig. 8. 3D reconstruction of a whole mouse mammary gland. Top image: Reconstruction before rigidand local group registration. Bottom image: Reconstruction after registration. [Color figure can beviewed in the online issue, which is available at wileyonlinelibrary.com.]
Fig. 9. Mammary gland skeleton reconstruction view. The ductal network (lines and spheres repre-senting branches and end-points) is shown along with the lymph node volume (in the center of the skele-ton). [Color figure can be viewed in the online issue, which is available at wileyonlinelibrary.com.]
Microscopy Research and Technique
10273D RECONSTRUCTION OF HISTOLOGICAL SECTIONS
Study of Cell Distribution
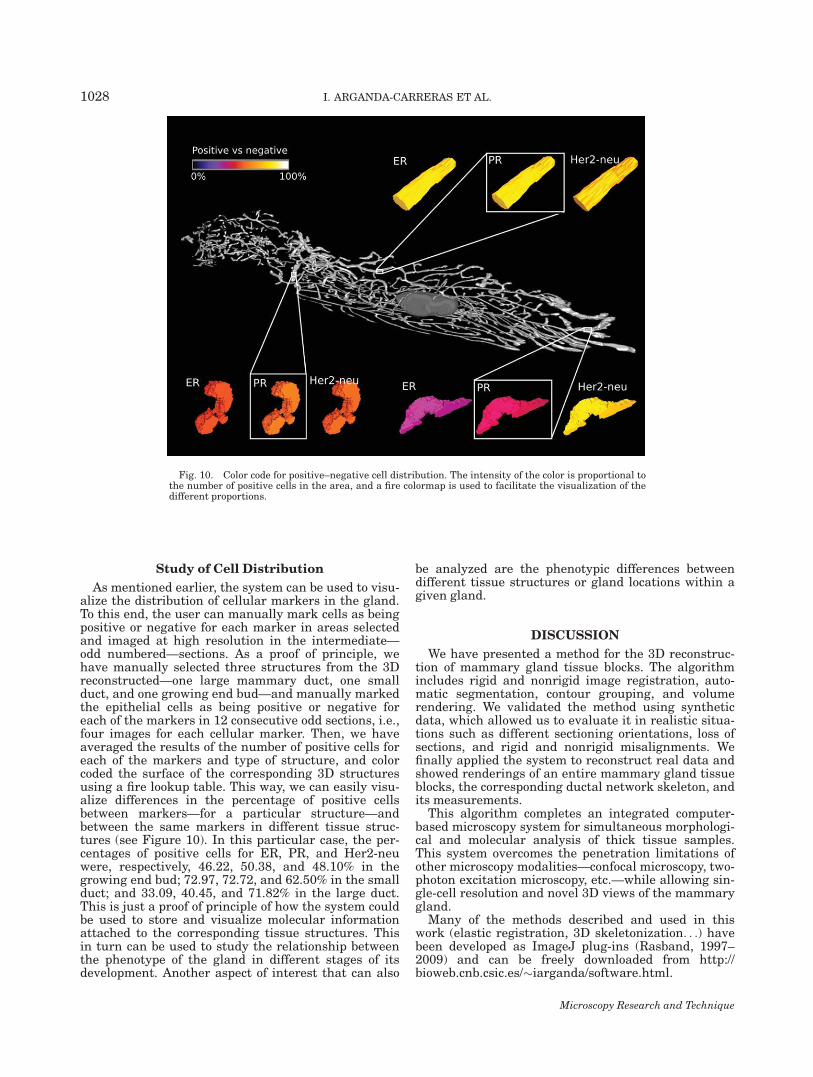
As mentioned earlier, the system can be used to visu-alize the distribution of cellular markers in the gland.To this end, the user can manually mark cells as beingpositive or negative for each marker in areas selectedand imaged at high resolution in the intermediate—odd numbered—sections. As a proof of principle, wehave manually selected three structures from the 3Dreconstructed—one large mammary duct, one smallduct, and one growing end bud—and manually markedthe epithelial cells as being positive or negative foreach of the markers in 12 consecutive odd sections, i.e.,four images for each cellular marker. Then, we haveaveraged the results of the number of positive cells foreach of the markers and type of structure, and colorcoded the surface of the corresponding 3D structuresusing a fire lookup table. This way, we can easily visu-alize differences in the percentage of positive cellsbetween markers—for a particular structure—andbetween the same markers in different tissue struc-tures (see Figure 10). In this particular case, the per-centages of positive cells for ER, PR, and Her2-neuwere, respectively, 46.22, 50.38, and 48.10% in thegrowing end bud; 72.97, 72.72, and 62.50% in the smallduct; and 33.09, 40.45, and 71.82% in the large duct.This is just a proof of principle of how the system couldbe used to store and visualize molecular informationattached to the corresponding tissue structures. Thisin turn can be used to study the relationship betweenthe phenotype of the gland in different stages of itsdevelopment. Another aspect of interest that can also
be analyzed are the phenotypic differences betweendifferent tissue structures or gland locations within agiven gland.
DISCUSSION
We have presented a method for the 3D reconstruc-tion of mammary gland tissue blocks. The algorithmincludes rigid and nonrigid image registration, auto-matic segmentation, contour grouping, and volumerendering. We validated the method using syntheticdata, which allowed us to evaluate it in realistic situa-tions such as different sectioning orientations, loss ofsections, and rigid and nonrigid misalignments. Wefinally applied the system to reconstruct real data andshowed renderings of an entire mammary gland tissueblocks, the corresponding ductal network skeleton, andits measurements.
This algorithm completes an integrated computer-based microscopy system for simultaneous morphologi-cal and molecular analysis of thick tissue samples.This system overcomes the penetration limitations ofother microscopy modalities—confocal microscopy, two-photon excitation microscopy, etc.—while allowing sin-gle-cell resolution and novel 3D views of the mammarygland.
Many of the methods described and used in thiswork (elastic registration, 3D skeletonization. . .) havebeen developed as ImageJ plug-ins (Rasband, 1997–2009) and can be freely downloaded from http://bioweb.cnb.csic.es/�iarganda/software.html.
Fig. 10. Color code for positive–negative cell distribution. The intensity of the color is proportional tothe number of positive cells in the area, and a fire colormap is used to facilitate the visualization of thedifferent proportions.
Microscopy Research and Technique
1028 I. ARGANDA-CARRERAS ET AL.

ACKNOWLEDGMENTS
Benjamin Schmid and Albert Cardona are especiallyacknowledged for providing continuous help and sup-port on ImageJ 3D Viewer. Marta Rivera-Alba is grate-fully acknowledged for her continuous biological andtechnical support.
REFERENCES
Arganda-Carreras I, Sorzano COS, Marabini R, Carazo J-M, Ortiz-deSolorzano C, Kybic J. 2006. Consistent and elastic registration ofhistological sections using vector-spline regularization. In: BeichelRR, editor. Computer vision approaches to medical image analysis,Vol. 4241 of Lecture Notes in Computer Science. Berlin/Heidelberg:Springer. pp. 85–95.
Aspert N, Santa-Cruz D, Ebrahimi T. 2002. MESH: Measuring errorsbetween surfaces using the Hausdorff distance. In: Proceedings ofthe IEEE International Conference on Multimedia and Expo, SwissFed Inst Technol, Lausanne, Switzerland, August 26–29. Vol. 1. pp.705–708
Bagheri-Yarmand R, Vadlamudi RK, Kumar R. 2003. Activating tran-scription factor 4 overexpression inhibits proliferation and differen-tiation of mammary epithelium resulting in impaired lactation andaccelerated involution. J Biol Chem 278:17421–17429.
Boissonnat J-D, Geiger B. 1993. 3-Dimensional reconstruction of com-plex shapes based on the Delaunay triangulation. In: Acharya RS,Goldgof DB, editors. Biomedical image processing and biomedicalvisualization, Vol. 1905 of Procedings of the Society of Photo-opticalInstrumentation Engineers (SPIE). SPIE - Int Soc Optical Engi-neering, San Jose, CA. pp. 964–975.
Borgefors G. 1988. Hierarchical chamfer matching: A parametricedge matching algorithm. IEEE Trans Pattern Anal Mach Intell 10:849–865.
Brey EM, King TW, Johnston C, McIntire LV, Reece GP, Patrick CW.2002. A technique for quantitative three-dimensional analysis ofmicrovascular structure. Microvasc Res 63:279–294.
Capek M, Bruza P, Janacek J, Karen P, Kubınova L, Vagnerova R.2009. Volume reconstruction of large tissue specimens from serialphysical sections using confocal microscopy and correction of cut-ting deformations by elastic registration. Microsc Res Tech 72:110–119.
Capuco AV, Ellis S, Wood DL, Akers RM, Garrett W. 2002. Postnatalmammary ductal growth: Three-dimensional imaging of cell prolif-eration, effects of estrogen treatment, and expression of steroidreceptors in prepubertal calves. Tissue Cell 34:143–154.
Cleary MP, Juneja SC, Phillips FC, Hu X, Grande JP, Maihle NJ.2004. Leptin receptor-deficient mmtv-tgf-alpha/lepr(db)lepr(db)female mice do not develop oncogene-induced mammary tumors.Exp Biol Med (Maywood) 229:182–193.
Dean P, Mascio L, Ow D, Sudar D, Mullikin J. 1990. Proposed stand-ard for image cytometry data files. Cytometry 11:561–569.
Deverell MH, Bailey N, Whimster WF. 1989. Tissue distortion inthree-dimensional reconstruction of wax or plastic embedded micro-scopic structures. Pathol Res Pract 185:598–601.
Fernandez-Gonzalez R, Deschamps T, Idica A, Malladi R, Ortiz-de-Solorzano C. 2004. Automatic segmentation of histological struc-tures in mammary gland tissue sections. J Biomed Opt 9:444–453.
Fernandez-Gonzalez R, Jones A, Garcia-Rodriguez E, Chen PY,Idica A, Locket SJ, Barcellos-Hoff MH, Ortiz-de-Solorzano C.2002. A system for combined three-dimensional morphologicaland molecular analysis of thick tissue specimens. Microsc ResTech 59:522–530.
Fiala JC. 2005. Reconstruct: a free editor for serial section microscopy.J Microsc 218(Part 1):52–61.
Giovanni CD, Nicoletti G, Landuzzi L, Astolfi A, Croci S, Comes A,Ferrini S, Meazza R, Iezzi M, Carlo ED, Musiani P, Cavallo F,Nanni P, Lollini P-L. 2004. Immunoprevention of her-2/neu trans-genic mammary carcinoma through an interleukin 12-engineeredallogeneic cell vaccine. Cancer Res 64:4001–4009.
Haas A, Fischer MS. 1997. Three-dimensional reconstruction of histo-logical sections using modern product-design software. Anat Rec249:510–516.
Hofstadler-Deiques C, Walter M, Mierlo F, Ruduit R. 2005. Softwaresystem for three-dimensional volumetric reconstruction of histologi-cal sections: A case study for the snake chondrocranium. Anat RecA 286:938–944.
Ip C, Banni S, Angioni E, Carta G, McGinley J, Thompson HJ, Bar-bano D, Bauman D. 1999. Conjugated linoleic acid-enriched butterfat alters mammary gland morphogenesis and reduces cancer riskin rats. J Nutr 129:2135–2142.
Kuglin CD, Hines DC. 1975. The phase correlation image alignmentmethod. In: Proceedings of IEEE 1975 Conference on Cyberneticsand Society, New York. pp. 163–165.
Lee T-C , Kashyap RL, Chu C-N. 1994. Building skeleton models via3-D medial surface/axis thinning algorithms. CVGIP: Graph Mod-els Image Process 56:462–478.
MacKenzie-Graham A, Lee E-F, Dinov ID, Bota M, Shattuck DW, Ruf-fins S, Yuan H, Konstantinidis F, Pitiot A, Ding Y, Hu G, Jacobs RE,Toga AW. 2004. A multimodal, multidimensional atlas of theC57BL/6J mouse brain. J Anat 204:93–102.
Osher S, Sethian JA. 1988. Fronts propagating with curvature-de-pendent speed: Algorithms based on Hamilton-Jacobi formulations.J Comput Phys 79:12–49.
Otsu N. 1979. A threshold selection method from gray-level histo-grams. IEEE Trans Syst Man Cybern 9:62–66.
Ourselin S, Roche A, Subsol G, Pennec X, Ayache N. 2001.Reconstructing a 3D structure from serial histological sections.Image and vision computing, Vol. 19 (1–2, Sp. Iss. SI), InternationalWorkshop on Biomedical Image Registration, Bled, Slovenia,pp. 25–31.
Pawley J. 2006. Handbook of biological confocal Microscopy. NewYork: Spring Science + Business Media.
Rasband W. 1997–2009. ImageJ. Bethesda, Maryland: U. S. NationalInstitutes of Health.
Rote G. 1991. Computing the minimum Hausdorff distance between2 point sets on a line under translation. Inform Process Lett 38:123–127.
Russo IH, Russo J. 1978a. Developmental stage of rat mammary-gland as determinant of it susceptibility to 7,12-dimethylbenz[a]an-thracene. J Natl Cancer Inst 61:1439–1449.
Russo J, Russo IH. 1978b. DNA labeling index and structure of ratmammary-gland as determinants of its susceptibility to carcinogen-esis. J Natl Cancer Inst 61:1451–1459.
Schmid B. 2008. Hardware-accelerated 3D visualization for ImageJ.In: ImageJ User & Developer Conference, Luxembourg.
Schormann T, Dabringhaus A, Zilles K. 1995. Statistics of deforma-tions in histology and application to improved alignment with MRI.IEEE Trans Med Imaging 14:25–35.
Sethian J. 1996. A fast marching level set method for monotonicallyadvancing fronts. Proc Natl Acad Sci USA 93:1591–1595.
Streicher J, Donat MA, Strauss B, Sporle R, Schughart K, Muller GB.2000. Computer-based three-dimensional visualization of develop-mental gene expression. Nat Genet 25:147–152.
Streicher J, Weninger WJ, Muller GB. 1997. External marker-basedautomatic congruencing: A new method of 3D reconstruction fromserial sections. Anat Rec 248:583–602.
Weninger WJ, Meng S, Streicher J, Muller GB. 1998. A new episcopicmethod for rapid 3-D reconstruction: Applications in anatomy andembryology. Anat Embriol 197:341–348.
Weninger WJ, Mohun T. 2002. Phenotyping transgenic embryos: arapid 3-D screening method based on episcopic fluorescence imagecapturing. Nat Genet 30:59–65.
Westerlind KC, McCarty HL, Gibson KJ, Strange R. 2002. Effect ofexercise on the rat mammary gland: Implications for carcinogene-sis. Acta Physiol Scand 175:147–156.
Zhang Z. 1993. Point matching for registration of free-form surfaces.In: Chetverikov D, Kropatsch WG. editors. Computer analysis ofimages and patterns, Vol. 719 of Lecture Notes in Computer Sci-ence. London, UK: Springer. pp. 460–467.
Microscopy Research and Technique
10293D RECONSTRUCTION OF HISTOLOGICAL SECTIONS
Copyright © 2022 FDOKUMEN