numerical analysis of 3d model flapping flat plate - Middle East ...
Upload
khangminh22Category
view
1download
0
3D Numerical Modeling of Geyser Formation by Release ofEntrapped Air from Horizontal Pipe into Vertical Shaft
S. N. Chan1; J. Cong2; and Joseph H. W. Lee, F.ASCE3
Abstract:Geysers are explosive eruptions of air-water mixture frommanholes in drainage systems. When the design capacity of urban stormwater drainage systems is exceeded during extreme rainfall, rapid inflows into the drainage network can lead to air-water interactions that giverise to geysers—causing damage to the water infrastructure and threatening human lives. Although extensive research has revealed the role ofentrapped air in causing large pressure transients in drainage tunnels, the mechanism of geyser formation remains elusive. In this study, anunsteady three-dimensional (3D) computational fluid dynamics (CFD) model is developed to simulate the pressure transients and air-waterinteractions during geyser events using the volume-of-fluid (VOF) technique. Extensive numerical simulations are conducted to study theair-pocket dynamics caused by release of trapped air from a horizontal tunnel into a vertical riser. Model predictions of the air-water interfacein the vertical shaft are in good agreement with laboratory measurements by a high-speed camera; the mechanism for the formation of geysersis elucidated. It is found that during a geyser event, compression of the air pocket in the riser can lead to rapid acceleration of the overlyingwater column and its expulsion from the riser; the air-pocket pressure is significantly higher than the hydrostatic pressure of the overlyingwater column, and the velocity is greater than that of a Taylor bubble. Comprehensive numerical modeling has been conducted to study theeffect of the vertical shaft diameter, the upstream pressure head and the air-pocket volume on the air-pocket dynamics; the results show thatgeyser formation is primarily controlled by the riser to tunnel diameter ratio, Dr=D. 3D CFD simulations have also been carried out for anidealized prototype drainage system; it is shown that the geyser behavior can be characterized by extremely large vertical air velocities thatresult in dispersed air-water mixtures often observed in the field. DOI: 10.1061/(ASCE)HY.1943-7900.0001416. © 2017 American Societyof Civil Engineers.
Author keywords: Geyser; Urban drainage; Hydraulic transients; Air-water interaction; Volume-of-fluid (VOF); Computational fluiddynamics (CFD) model.
Introduction
Geysers are explosive eruptions of air-water mixture from man-holes in drainage systems. When the design capacity of urban stormwater drainage systems is exceeded during heavy rainfall, rapid in-flows into the drainage network can lead to air-water interactionsthat give rise to geysers—causing damage to the water infrastruc-ture and threatening human lives. Over the past two decades,geysers have been attributed to air-water interactions—in particularthe presence of air pockets that can give rise to significant pres-sure surges (e.g., Hamam and McCorquodale 1982; Li andMcCorquodale 1999; Martin 1976; Zhou et al. 2002a, b). Morerecently, systematic investigations have demonstrated the possibil-ity of different types of air-water interactions as a function of riserand pipe diameters, and the rate of increase of inflows into anexisting pipeline partially filled with water (Wright et al. 2011;
Wright 2013, 2014; Vasconcelos and Wright 2012, 2008, 2011,2016).
Whereas the previous studies have confirmed the role of en-trapped air in causing large pressure transients, the mechanism ofgeyser formation remains elusive, primarily because of the lack ofdetailed observations. In particular, the physical mechanisms underwhich geysers are formed have not been conclusively reported orelucidated. A comprehensive series of laboratory experiments hasrecently been performed on a physical model of a simplified drain-age system (Cong 2016; Cong et al. 2017), which consists of avertical riser and a horizontal pipe connected to a constant headtank. The system is filled with water; an air pocket is then releasedinto the horizontal pipe. The trajectories of the air pockets in thehorizontal pipe and vertical riser are measured by a high speed cam-era, and pressures are measured at key locations. The experimentsshow that the vertical air-pocket motion in a geyser differs greatlyfrom that of a Taylor bubble—an air pocket rising steadily ina vertical tube under buoyancy with a thin water film around it(Davies and Taylor 1950); the mechanism of geyser formation inthe laboratory set up is elucidated. The importance of the ratio ofriser to pipeline diameter, and the volume of air in geyser formationwas also demonstrated (Cong et al. 2017).
Whereas important insights can be gained from the small-scale experiments, the extrapolation of the laboratory results tothe prototype is a difficult task that may be assisted by 3D numeri-cal modeling. It is well-recognized that computational fluid dy-namics (CFD) modeling is useful in capturing greater details ofthe physical processes than 1D models based on the rigid columnhypothesis. Nevertheless, the resolution of the fine scale flowprocesses (e.g., Taylor bubble) imposes significant computational
1Research Assistant Professor, Dept. of Civil and Environmental Engi-neering, and Junior Fellow, Institute for Advanced Study, Hong Kong Univ.of Science and Technology, Clear Water Bay, Hong Kong, China.
2Formerly, M.Phil. Student, Dept. of Civil and Environmental Engi-neering, Hong Kong Univ. of Science and Technology, Clear Water Bay,Hong Kong, China.
3Chair Professor, Dept. of Civil and Environmental Engineering,Hong Kong Univ. of Science and Technology, Clear Water Bay,Hong Kong, China (corresponding author). E-mail: [email protected]
Note. This manuscript was submitted on May 15, 2017; approved onAugust 16, 2017; published online on December 22, 2017. Discussionperiod open until May 22, 2018; separate discussions must be submittedfor individual papers. This paper is part of the Journal of Hydraulic En-gineering, © ASCE, ISSN 0733-9429.
© ASCE 04017071-1 J. Hydraul. Eng.
J. Hydraul. Eng., 2018, 144(3): 04017071
Dow
nloa
ded
from
asc
elib
rary
.org
by
Hon
g K
ong
Uni
vers
ity o
f Sc
i and
Tec
h (H
KU
ST)
on 1
2/27
/17.
Cop
yrig
ht A
SCE
. For
per
sona
l use
onl
y; a
ll ri
ghts
res
erve
d.
constraints; the formulation of the 3D numerical model is also notstraightforward—there has hitherto been relatively very few at-tempts at CFD modeling of the geyser flow. Zhou et al. (2011) per-formed two-dimensional (2D) volume of fluid (VOF) calculationson the transient flow of an air pocket trapped in a hypothetical pipe-line; the computed pressure variation compared well with experi-mental measurements. Catano-Lopera et al. (2014) conducted 3Dtwo-phase flow calculations to study the occurrence of geysers for asmall section of the Chicago tunnel and reservoir plan (TARP) sys-tem. Although the surging of the air-water mixture in the verticalriser is demonstrated, the physics of the geyser flow in the risercross section remains unresolved. For example, the details of thewater film flow surrounding the rising air pocket—which is inti-mately connected with the rapid transient nature of geysers—isnot resolved. Overall, there has been very few detailed numericalstudies of geysers, and the mechanism of geyser flow has not beensuccessfully modeled.
This paper presents a CFD study on geyser events using the two-phase VOF technique. Guided by recent experiments by Cong et al.(2017), the set-up of the CFD model will first be described. Thecomputed detailed air-water interface motion in the vertical riseris presented and compared with experimental data. The mechanismfor the formation of a geyser is elucidated for the first time alongwith the conditions that will likely lead to geyser events. A numeri-cal study is also conducted to examine the effect of shaft diameter,upstream pressure head, and the air volume impact on the formationof geysers. Finally, the model is used to compute an idealized sec-tion of a drainage system using prototype dimensions; the differ-ences between the prototype and laboratory geysers are discussed.
3D Numerical (CFD) Model
Governing Equations
The VOF model can simulate two immiscible fluids (water and air)by solving a single set of momentum equations and tracking thevolume fraction of each of the fluids throughout the domain (Hirtand Nichols 1981). The tracking of the interface between thephases is accomplished by the solution of a continuity equation forthe volume fraction of one of the phases. For the water phase, thisequation has the following form:
∂∂t ðαwρwÞ þ ∇ · ðαwρwUÞ ¼ 0 ð1Þ
where αw = volume fraction for the water phase. The volumefraction for the air phase αa will be computed based on the con-straint of:
αa þ αw ¼ 1
In a two-phase system, the average density in each cell isgiven by
ρ ¼ αwρw þ ð1 − αwÞρa ð2Þ
A single momentum equation is solved throughout the domain,and the resulting velocity field U ¼ ðu,v,wÞ is shared among thephases. The momentum equation below, is dependent on the vol-ume fractions of all phases through the properties ρ and μt.
∂∂t ðρUÞ þ ∇ · ðρUUÞ ¼ −∇Pþ∇ · ½μtð∇Uþ∇UTÞ� þ ρg ð3Þ
The turbulent dynamic viscosity μt is determined using thestandard k − ϵ turbulence model. g ¼ ð0,0, − 9.81Þ = gravitationalacceleration.
The density of air ρa is related to the air pressure using the idealgas law. For compressible flows, the ideal gas law is written as:
ρa ¼Pop þ P
RMw
Tð4Þ
where Pop = operating pressure defined as the atmosphericpressure Patm ¼ 101.325 kPa, P = local relative (or gauge) pres-sure, R ¼ 8.314 J=mol=K = universal gas constant, and Mw ¼28.966 g=mol = molecular weight of air. The water phase is treatedas incompressible with density ρw ¼ 998.2 kg=m3. The tempera-ture T (in K) is computed from the conservation of energy (temper-ature) equation:
∂∂t ðρTÞ þ∇ · ðρTUÞ ¼ ∇ ·
�μt
Prð∇TÞ
�ð5Þ
where Pr = Prandtl number = 0.85.The governing Eqs. (1) and (3) are solved numerically using
the finite volume method in the commercial CFD code ofANSYS FLUENT. The PISO (pressure-implicit with splitting of op-erators) algorithm is employed for velocity-pressure correctionwith under-relaxation factor of 0.5 for pressure and momentum,0.8 for k and ε, and 1.0 for density, temperature, and turbulent vis-cosity. A second order upwind advection scheme is used for mo-mentum, density, and temperature, whereas a first order upwindadvection scheme is used for k and ϵ. The volume fraction equation[Eq. (1)] is solved through the Geo-reconstruct scheme in FLUENT(Youngs 1982). In the geometric reconstruction approach, the stan-dard second-order scheme is used to obtain the face fluxes when-ever a cell is completely filled with one of the two phases. When thecell is near the interface between two phases, the geometricreconstruction scheme is used to determine the interface betweenfluids using a piecewise-linear approach from the volume fractionof adjacent cells. Except for the volume fraction equation, a firstorder implicit time stepping scheme is used for the marching ofthe solution with time. Convergence is declared when the normal-ized residual is less than 10−6 for temperature and 10−4 for all othervariables. Typically, approximately 10–20 iterations are requiredfor convergence in each time step.
Numerical Experiments
The laboratory experiments of Cong et al. (2017) are simulatedunder exactly the same conditions (Table 1). The physical modelis a simplified drainage system, which consists of a vertical riser ofdiameter Dr and a horizontal pipe of diameter D connected to aconstant head tank. The pipe is 6.6 m long with an inner diameterof D ¼ 0.05 m. A riser of height 1.8 m and variable diameter(Dr ¼ 0.016 − 0.046 m) is connected to the pipe with a T-junctionat x ¼ 3.47 m from the upstream. In the physical experiment, anumber of valves are used to separate the pipe into different sec-tions to allow experiments with different air volume. By opening orclosing a selected valve, air pockets of different initial lengths (orvolumes) can be formed.
Two series of numerical experiments were performed (Table 1),similar to those described in Cong et al. (2017). Two numericalexperiments (Run A1 and Run A2) are dedicated to the con-dition without an external pressure [Series A, similar to those inVasconcelos and Wright (2011)], the riser and horizontal pipeis filled with water to an initial head of H0; the downstream sec-tion of the pipe is an air pocket of length L0 and volume Vair .
© ASCE 04017071-2 J. Hydraul. Eng.
J. Hydraul. Eng., 2018, 144(3): 04017071
Dow
nloa
ded
from
asc
elib
rary
.org
by
Hon
g K
ong
Uni
vers
ity o
f Sc
i and
Tec
h (H
KU
ST)
on 1
2/27
/17.
Cop
yrig
ht A
SCE
. For
per
sona
l use
onl
y; a
ll ri
ghts
res
erve
d.
The upstream end of the pipe is a closed end. In the simulation,two riser diameters are tested: Dr ¼ 16 mm (Run A1) and40 mm (Run A2), with an initial pressure head of H0 ¼ 0.88 m,and L0 ¼ 0.61 and 1.8 m respectively. In the laboratory geysersare not observed for Series A experiments.
On the other hand, extensive numerical experiments are con-ducted with a pressurized pipe connected to a constant head reser-voir (Series B) with the initial water depth in the riser at the samelevel. A total of 15 numerical experiments (Run B1–B15) are per-formed for different riser diameters, upstream head, and initialair volumes (Table 1) corresponding to the physical experiments(Cong et al. 2017). As an independent check, an additional numeri-cal experiment (Run B16) is conducted for the experimental set upof Lewis (2011).
Model Grid
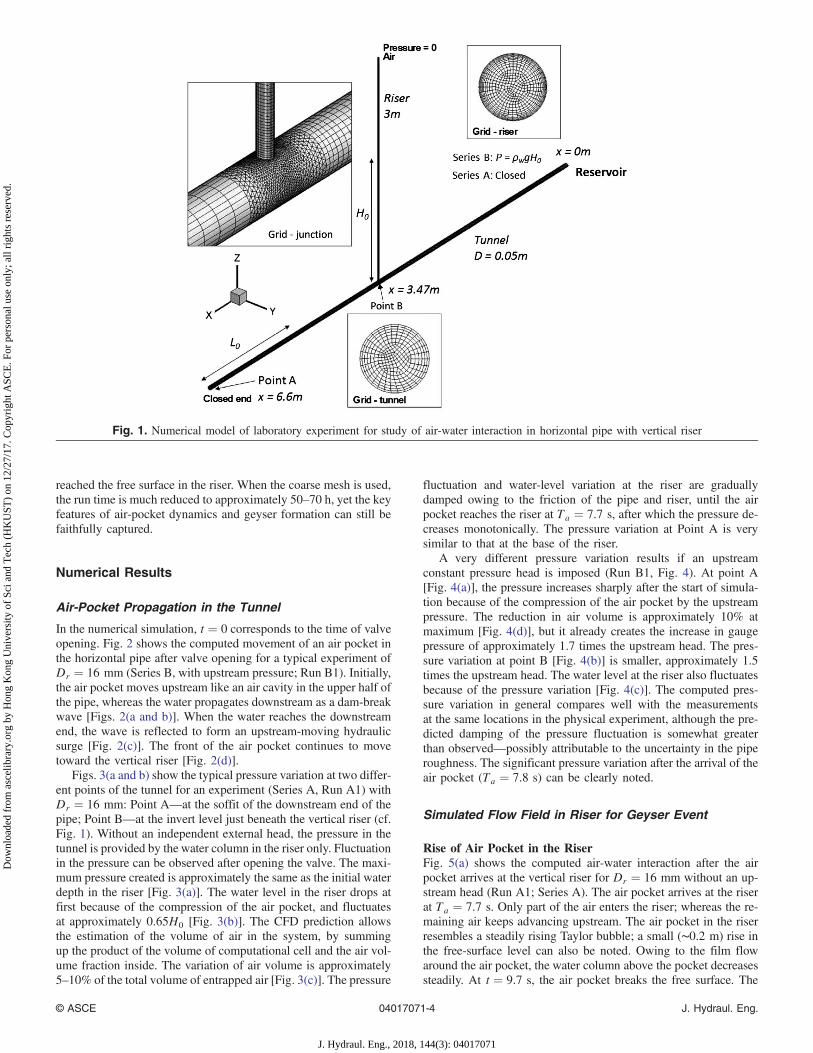
In the numerical model, the tunnel-riser system is discretized usingapproximately 100,000 boundary-fitting grid cells. A schematic di-agram of the model is shown in Fig. 1. The tunnel cross section isdiscretized using 25 cells along the diameter, with finer grid size asthe tunnel wall is approached. The riser diameter is discretized us-ing approximately 50 cells, with smallest grid size of 0.1 mm; it isfound that realistic simulation of the geyser dynamics requires agood resolution of the water film flow around the rising air pocket.The T-junction of the tunnel-riser system is discretized using tetra-hedral cells, whereas the other parts of the tunnel and riser arediscretized using hexahedral cells. To study the surging of the air-water mixture in the riser, a larger height of the riser (comparedwith the experiment) is adopted in the computational model (3.0 m)to confine the air pocket and water column within the riser during ageyser event. A relative coarse mesh (approximately 40,000 gridcells in total) is also used for a parametric numerical study on
the effect of shaft diameter, air volume and upstream pressureon the formation of geyser.
Boundary and Initial Conditions
For Series A experiment without an upstream pressure head, bothends of the tunnel (x ¼ 0 and 6.6 m, Fig. 1) are set as closed endwalls. For Series B experiments, the upstream end of the tunnel isprescribed as a pressure inlet with pressure ¼ ρwgH0 and volumefraction of water = 1, to resemble the effect of the upstream reser-voir. The top of the riser is prescribed as a pressure outlet of zero(atmospheric) pressure and volume fraction of water = 0. A smoothwall is assumed for the pipewall with roughness length of 10−3 mm.
In the simulation, an air pocket of length L0 (volume ¼πL0D2=4) near the closed end of the tunnel and a water level ofH0 at the riser are prescribed. The initial temperature is assumedto be 300 K (26.85°C). The simulation starts at time t ¼ 0, equiv-alent to the opening of the ball valve in the experiment. It is notedthat in the simulation the opening of the valve is instantaneous,whereas in the experiment the valve opening time is approximately0.5 s. The difference in valve opening time could result in a slightlyearly time of arrival of the air pocket at the riser, but the simulatedpressure transient and air-water dynamics compare well with theexperiment. Because the advection scheme of the VOF methodis explicit, the Courant criteria have to be satisfied, and the maxi-mum Cr ¼ ðuΔt=ΔxÞ ¼ 0.75, an adaptive time step is used withminimum Δt¼ 10−5 s. The run time of a quad-core parallel com-putation on a Dell workstation with an Intel i4790 3.6 GHz CPU isapproximately 360–400 h for a full simulation using the fine mesh.There may be a number of geysers when the air pocket cannot beejected completely in a single geyser, and the strength of a geyserusually decreases with time. In this study, only the first geyser willbe simulated. The simulation is stopped when the air pocket has
Table 1. Summary of Key Parameters for Numerical Experiments
Runnumber
TunneldiameterD (m)
RiserdiameterDr (m) Dr=D
Initial (A)/upstream (B)pressure head
H0 (m)
Initial lengthof air pocket
L0 (m) Va=Vwa
Maximumheight ofriseb (m)
vnetc
(m=s) Geyser
Series A, without upstream headA1d 0.05 0.016 0.32 0.88 0.61 6.77 0.80 0.270 NoA2d 0.05 0.040 0.80 0.88 1.80 4.26 0.85 0.320 No
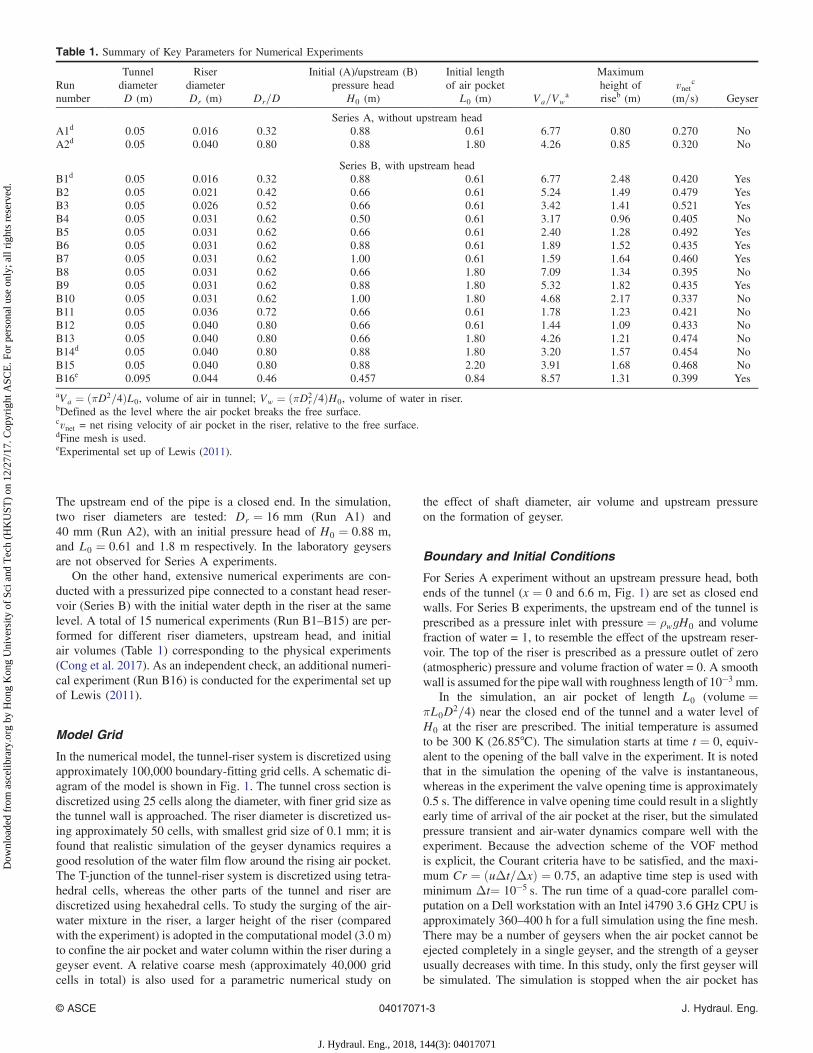
Series B, with upstream headB1d 0.05 0.016 0.32 0.88 0.61 6.77 2.48 0.420 YesB2 0.05 0.021 0.42 0.66 0.61 5.24 1.49 0.479 YesB3 0.05 0.026 0.52 0.66 0.61 3.42 1.41 0.521 YesB4 0.05 0.031 0.62 0.50 0.61 3.17 0.96 0.405 NoB5 0.05 0.031 0.62 0.66 0.61 2.40 1.28 0.492 YesB6 0.05 0.031 0.62 0.88 0.61 1.89 1.52 0.435 YesB7 0.05 0.031 0.62 1.00 0.61 1.59 1.64 0.460 YesB8 0.05 0.031 0.62 0.66 1.80 7.09 1.34 0.395 NoB9 0.05 0.031 0.62 0.88 1.80 5.32 1.82 0.435 YesB10 0.05 0.031 0.62 1.00 1.80 4.68 2.17 0.337 NoB11 0.05 0.036 0.72 0.66 0.61 1.78 1.23 0.421 NoB12 0.05 0.040 0.80 0.66 0.61 1.44 1.09 0.433 NoB13 0.05 0.040 0.80 0.66 1.80 4.26 1.21 0.474 NoB14d 0.05 0.040 0.80 0.88 1.80 3.20 1.57 0.454 NoB15 0.05 0.040 0.80 0.88 2.20 3.91 1.68 0.468 NoB16e 0.095 0.044 0.46 0.457 0.84 8.57 1.31 0.399 YesaVa ¼ ðπD2=4ÞL0, volume of air in tunnel; Vw ¼ ðπD2
r=4ÞH0, volume of water in riser.bDefined as the level where the air pocket breaks the free surface.cvnet = net rising velocity of air pocket in the riser, relative to the free surface.dFine mesh is used.eExperimental set up of Lewis (2011).
© ASCE 04017071-3 J. Hydraul. Eng.
J. Hydraul. Eng., 2018, 144(3): 04017071
Dow
nloa
ded
from
asc
elib
rary
.org
by
Hon
g K
ong
Uni
vers
ity o
f Sc
i and
Tec
h (H
KU
ST)
on 1
2/27
/17.
Cop
yrig
ht A
SCE
. For
per
sona
l use
onl
y; a
ll ri
ghts
res
erve
d.
reached the free surface in the riser. When the coarse mesh is used,the run time is much reduced to approximately 50–70 h, yet the keyfeatures of air-pocket dynamics and geyser formation can still befaithfully captured.
Numerical Results
Air-Pocket Propagation in the Tunnel
In the numerical simulation, t ¼ 0 corresponds to the time of valveopening. Fig. 2 shows the computed movement of an air pocket inthe horizontal pipe after valve opening for a typical experiment ofDr ¼ 16 mm (Series B, with upstream pressure; Run B1). Initially,the air pocket moves upstream like an air cavity in the upper half ofthe pipe, whereas the water propagates downstream as a dam-breakwave [Figs. 2(a and b)]. When the water reaches the downstreamend, the wave is reflected to form an upstream-moving hydraulicsurge [Fig. 2(c)]. The front of the air pocket continues to movetoward the vertical riser [Fig. 2(d)].
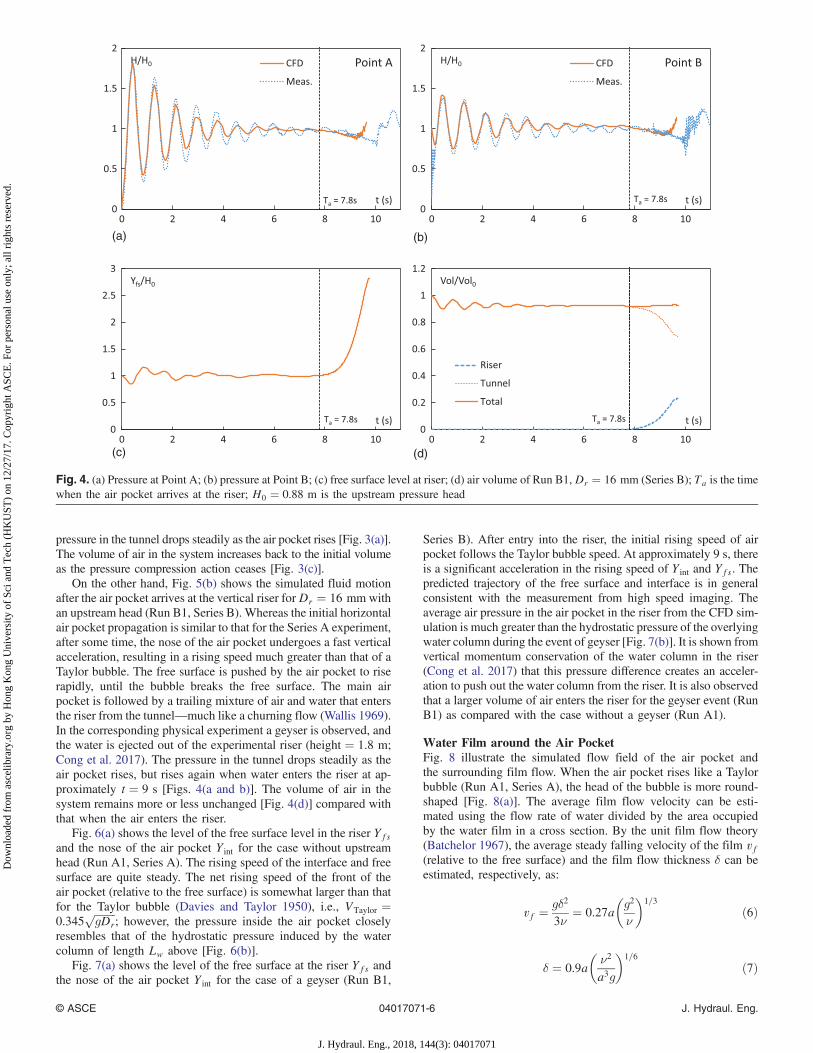
Figs. 3(a and b) show the typical pressure variation at two differ-ent points of the tunnel for an experiment (Series A, Run A1) withDr ¼ 16 mm: Point A—at the soffit of the downstream end of thepipe; Point B—at the invert level just beneath the vertical riser (cf.Fig. 1). Without an independent external head, the pressure in thetunnel is provided by the water column in the riser only. Fluctuationin the pressure can be observed after opening the valve. The maxi-mum pressure created is approximately the same as the initial waterdepth in the riser [Fig. 3(a)]. The water level in the riser drops atfirst because of the compression of the air pocket, and fluctuatesat approximately 0.65H0 [Fig. 3(b)]. The CFD prediction allowsthe estimation of the volume of air in the system, by summingup the product of the volume of computational cell and the air vol-ume fraction inside. The variation of air volume is approximately5–10% of the total volume of entrapped air [Fig. 3(c)]. The pressure
fluctuation and water-level variation at the riser are graduallydamped owing to the friction of the pipe and riser, until the airpocket reaches the riser at Ta ¼ 7.7 s, after which the pressure de-creases monotonically. The pressure variation at Point A is verysimilar to that at the base of the riser.
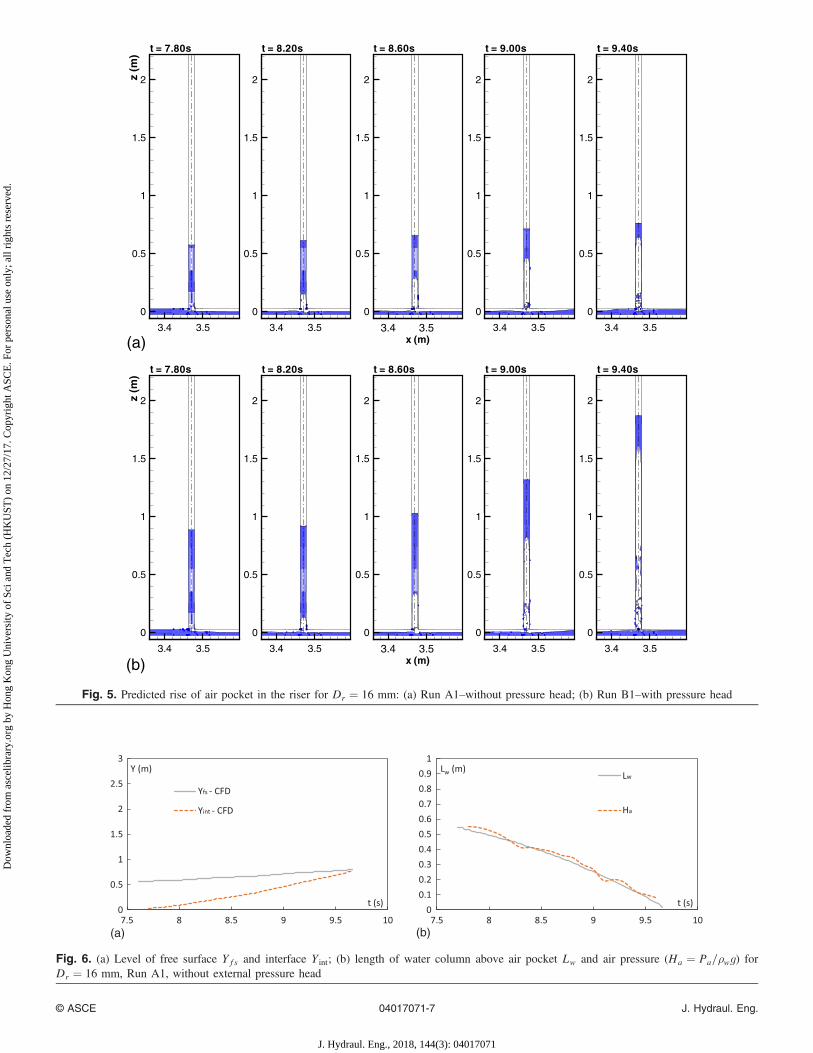
A very different pressure variation results if an upstreamconstant pressure head is imposed (Run B1, Fig. 4). At point A[Fig. 4(a)], the pressure increases sharply after the start of simula-tion because of the compression of the air pocket by the upstreampressure. The reduction in air volume is approximately 10% atmaximum [Fig. 4(d)], but it already creates the increase in gaugepressure of approximately 1.7 times the upstream head. The pres-sure variation at point B [Fig. 4(b)] is smaller, approximately 1.5times the upstream head. The water level at the riser also fluctuatesbecause of the pressure variation [Fig. 4(c)]. The computed pres-sure variation in general compares well with the measurementsat the same locations in the physical experiment, although the pre-dicted damping of the pressure fluctuation is somewhat greaterthan observed—possibly attributable to the uncertainty in the piperoughness. The significant pressure variation after the arrival of theair pocket (Ta ¼ 7.8 s) can be clearly noted.
Simulated Flow Field in Riser for Geyser Event
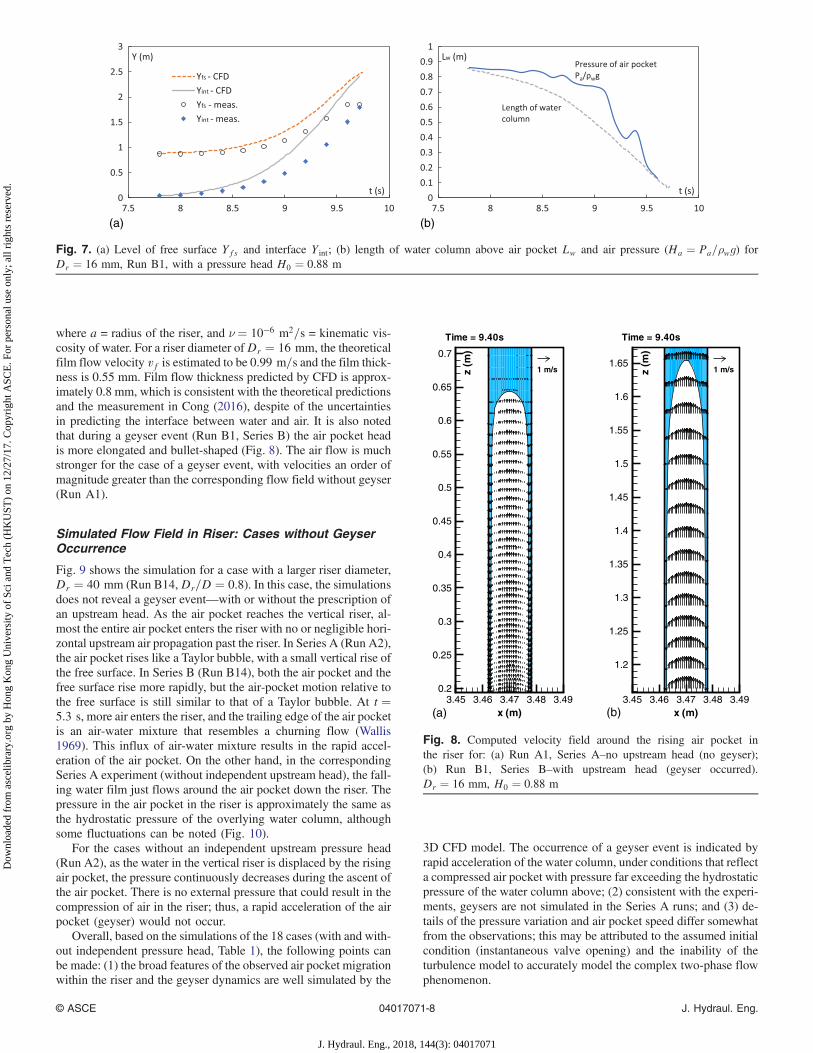
Rise of Air Pocket in the RiserFig. 5(a) shows the computed air-water interaction after the airpocket arrives at the vertical riser for Dr ¼ 16 mm without an up-stream head (Run A1; Series A). The air pocket arrives at the riserat Ta ¼ 7.7 s. Only part of the air enters the riser; whereas the re-maining air keeps advancing upstream. The air pocket in the riserresembles a steadily rising Taylor bubble; a small (∼0.2 m) rise inthe free-surface level can also be noted. Owing to the film flowaround the air pocket, the water column above the pocket decreasessteadily. At t ¼ 9.7 s, the air pocket breaks the free surface. The
Fig. 1. Numerical model of laboratory experiment for study of air-water interaction in horizontal pipe with vertical riser
© ASCE 04017071-4 J. Hydraul. Eng.
J. Hydraul. Eng., 2018, 144(3): 04017071
Dow
nloa
ded
from
asc
elib
rary
.org
by
Hon
g K
ong
Uni
vers
ity o
f Sc
i and
Tec
h (H
KU
ST)
on 1
2/27
/17.
Cop
yrig
ht A
SCE
. For
per
sona
l use
onl
y; a
ll ri
ghts
res
erve
d.
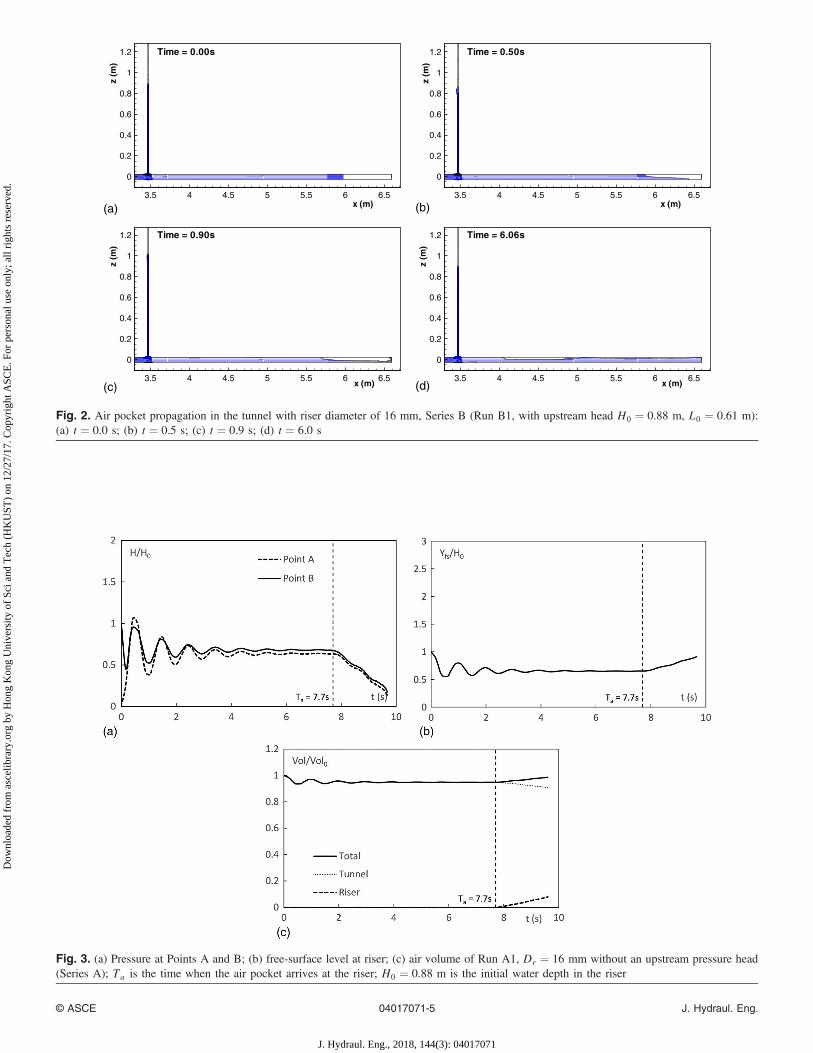
Fig. 3. (a) Pressure at Points A and B; (b) free-surface level at riser; (c) air volume of Run A1, Dr ¼ 16 mm without an upstream pressure head(Series A); Ta is the time when the air pocket arrives at the riser; H0 ¼ 0.88 m is the initial water depth in the riser
x (m)
z(m
)
3.5 4 4.5 5 5.5 6 6.5
0
0.2
0.4
0.6
0.8
1
1.2 Time = 0.00s
x (m)
z(m
)
3.5 4 4.5 5 5.5 6 6.5
0
0.2
0.4
0.6
0.8
1
1.2 Time = 0.50s
x (m)
z(m
)
3.5 4 4.5 5 5.5 6 6.5
0
0.2
0.4
0.6
0.8
1
1.2 Time = 0.90s
x (m)
z(m
)
3.5 4 4.5 5 5.5 6 6.5
0
0.2
0.4
0.6
0.8
1
1.2 Time = 6.06s
(a) (b)
(c) (d)
Fig. 2. Air pocket propagation in the tunnel with riser diameter of 16 mm, Series B (Run B1, with upstream head H0 ¼ 0.88 m, L0 ¼ 0.61 m):(a) t ¼ 0.0 s; (b) t ¼ 0.5 s; (c) t ¼ 0.9 s; (d) t ¼ 6.0 s
© ASCE 04017071-5 J. Hydraul. Eng.
J. Hydraul. Eng., 2018, 144(3): 04017071
Dow
nloa
ded
from
asc
elib
rary
.org
by
Hon
g K
ong
Uni
vers
ity o
f Sc
i and
Tec
h (H
KU
ST)
on 1
2/27
/17.
Cop
yrig
ht A
SCE
. For
per
sona
l use
onl
y; a
ll ri
ghts
res
erve
d.
pressure in the tunnel drops steadily as the air pocket rises [Fig. 3(a)].The volume of air in the system increases back to the initial volumeas the pressure compression action ceases [Fig. 3(c)].
On the other hand, Fig. 5(b) shows the simulated fluid motionafter the air pocket arrives at the vertical riser forDr ¼ 16 mmwithan upstream head (Run B1, Series B). Whereas the initial horizontalair pocket propagation is similar to that for the Series A experiment,after some time, the nose of the air pocket undergoes a fast verticalacceleration, resulting in a rising speed much greater than that of aTaylor bubble. The free surface is pushed by the air pocket to riserapidly, until the bubble breaks the free surface. The main airpocket is followed by a trailing mixture of air and water that entersthe riser from the tunnel—much like a churning flow (Wallis 1969).In the corresponding physical experiment a geyser is observed, andthe water is ejected out of the experimental riser (height ¼ 1.8 m;Cong et al. 2017). The pressure in the tunnel drops steadily as theair pocket rises, but rises again when water enters the riser at ap-proximately t ¼ 9 s [Figs. 4(a and b)]. The volume of air in thesystem remains more or less unchanged [Fig. 4(d)] compared withthat when the air enters the riser.
Fig. 6(a) shows the level of the free surface level in the riser Yfsand the nose of the air pocket Y int for the case without upstreamhead (Run A1, Series A). The rising speed of the interface and freesurface are quite steady. The net rising speed of the front of theair pocket (relative to the free surface) is somewhat larger than thatfor the Taylor bubble (Davies and Taylor 1950), i.e., VTaylor ¼0.345
ffiffiffiffiffiffiffiffigDr
p; however, the pressure inside the air pocket closely
resembles that of the hydrostatic pressure induced by the watercolumn of length Lw above [Fig. 6(b)].
Fig. 7(a) shows the level of the free surface at the riser Yfs andthe nose of the air pocket Y int for the case of a geyser (Run B1,
Series B). After entry into the riser, the initial rising speed of airpocket follows the Taylor bubble speed. At approximately 9 s, thereis a significant acceleration in the rising speed of Y int and Yfs. Thepredicted trajectory of the free surface and interface is in generalconsistent with the measurement from high speed imaging. Theaverage air pressure in the air pocket in the riser from the CFD sim-ulation is much greater than the hydrostatic pressure of the overlyingwater column during the event of geyser [Fig. 7(b)]. It is shown fromvertical momentum conservation of the water column in the riser(Cong et al. 2017) that this pressure difference creates an acceler-ation to push out the water column from the riser. It is also observedthat a larger volume of air enters the riser for the geyser event (RunB1) as compared with the case without a geyser (Run A1).
Water Film around the Air PocketFig. 8 illustrate the simulated flow field of the air pocket andthe surrounding film flow. When the air pocket rises like a Taylorbubble (Run A1, Series A), the head of the bubble is more round-shaped [Fig. 8(a)]. The average film flow velocity can be esti-mated using the flow rate of water divided by the area occupiedby the water film in a cross section. By the unit film flow theory(Batchelor 1967), the average steady falling velocity of the film vf(relative to the free surface) and the film flow thickness δ can beestimated, respectively, as:
vf ¼ gδ2
3ν¼ 0.27a
�g2
ν
�1=3
ð6Þ
δ ¼ 0.9a
�ν2
a3g
�1=6
ð7Þ
(a) (b)
(c) (d)
Fig. 4. (a) Pressure at Point A; (b) pressure at Point B; (c) free surface level at riser; (d) air volume of Run B1,Dr ¼ 16 mm (Series B); Ta is the timewhen the air pocket arrives at the riser; H0 ¼ 0.88 m is the upstream pressure head
© ASCE 04017071-6 J. Hydraul. Eng.
J. Hydraul. Eng., 2018, 144(3): 04017071
Dow
nloa
ded
from
asc
elib
rary
.org
by
Hon
g K
ong
Uni
vers
ity o
f Sc
i and
Tec
h (H
KU
ST)
on 1
2/27
/17.
Cop
yrig
ht A
SCE
. For
per
sona
l use
onl
y; a
ll ri
ghts
res
erve
d.
z(m
)
3.4 3.5
0
0.5
1
1.5
2
t = 7.80s
3.4 3.5
0
0.5
1
1.5
2
t = 8.20s
x (m)3.4 3.5
0
0.5
1
1.5
2
t = 8.60s
3.4 3.5
0
0.5
1
1.5
2
t = 9.00s
3.4 3.5
0
0.5
1
1.5
2
t = 9.40s
z(m
)
3.4 3.5
0
0.5
1
1.5
2
t = 7.80s
3.4 3.5
0
0.5
1
1.5
2
t = 8.20s
x (m)3.4 3.5
0
0.5
1
1.5
2
t = 8.60s
3.4 3.5
0
0.5
1
1.5
2
t = 9.00s
3.4 3.5
0
0.5
1
1.5
2
t = 9.40s
(a)
(b)
Fig. 5. Predicted rise of air pocket in the riser for Dr ¼ 16 mm: (a) Run A1–without pressure head; (b) Run B1–with pressure head
(a) (b)
Fig. 6. (a) Level of free surface Yfs and interface Y int; (b) length of water column above air pocket Lw and air pressure (Ha ¼ Pa=ρwg) forDr ¼ 16 mm, Run A1, without external pressure head
© ASCE 04017071-7 J. Hydraul. Eng.
J. Hydraul. Eng., 2018, 144(3): 04017071
Dow
nloa
ded
from
asc
elib
rary
.org
by
Hon
g K
ong
Uni
vers
ity o
f Sc
i and
Tec
h (H
KU
ST)
on 1
2/27
/17.
Cop
yrig
ht A
SCE
. For
per
sona
l use
onl
y; a
ll ri
ghts
res
erve
d.
where a = radius of the riser, and ν¼ 10−6 m2=s = kinematic vis-cosity of water. For a riser diameter ofDr ¼ 16 mm, the theoreticalfilm flow velocity vf is estimated to be 0.99 m=s and the film thick-ness is 0.55 mm. Film flow thickness predicted by CFD is approx-imately 0.8 mm, which is consistent with the theoretical predictionsand the measurement in Cong (2016), despite of the uncertaintiesin predicting the interface between water and air. It is also notedthat during a geyser event (Run B1, Series B) the air pocket headis more elongated and bullet-shaped (Fig. 8). The air flow is muchstronger for the case of a geyser event, with velocities an order ofmagnitude greater than the corresponding flow field without geyser(Run A1).
Simulated Flow Field in Riser: Cases without GeyserOccurrence
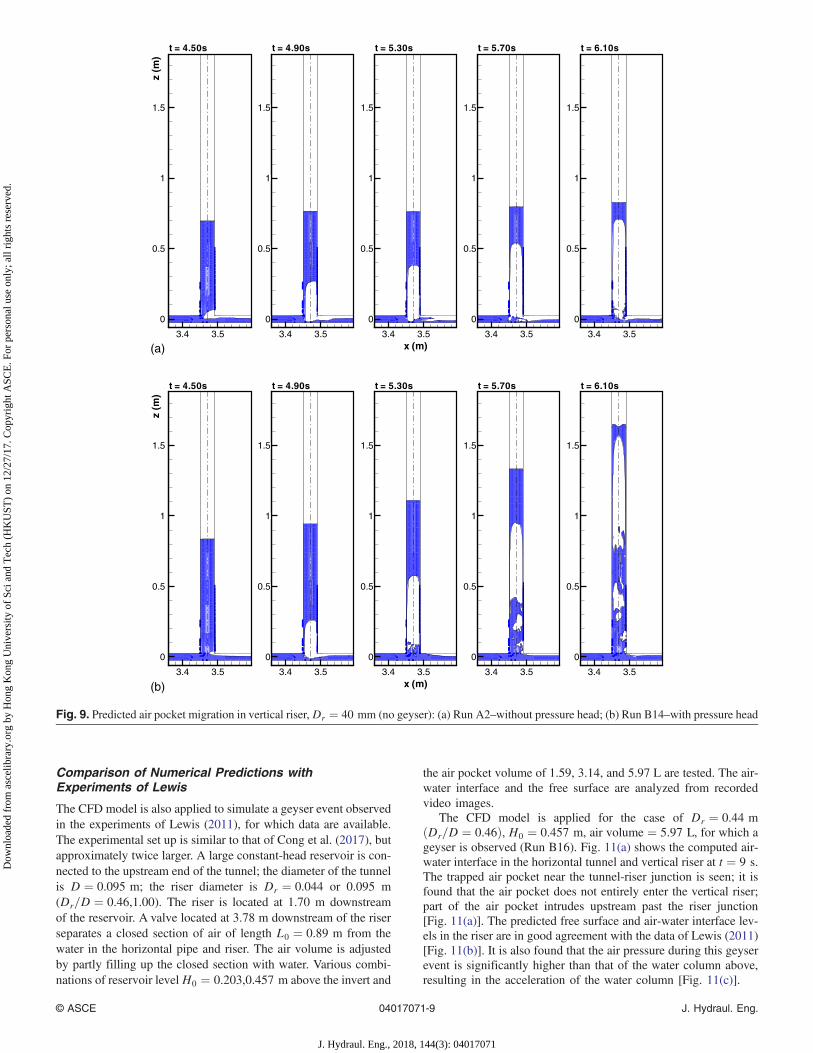
Fig. 9 shows the simulation for a case with a larger riser diameter,Dr ¼ 40 mm (Run B14,Dr=D ¼ 0.8). In this case, the simulationsdoes not reveal a geyser event—with or without the prescription ofan upstream head. As the air pocket reaches the vertical riser, al-most the entire air pocket enters the riser with no or negligible hori-zontal upstream air propagation past the riser. In Series A (Run A2),the air pocket rises like a Taylor bubble, with a small vertical rise ofthe free surface. In Series B (Run B14), both the air pocket and thefree surface rise more rapidly, but the air-pocket motion relative tothe free surface is still similar to that of a Taylor bubble. At t ¼5.3 s, more air enters the riser, and the trailing edge of the air pocketis an air-water mixture that resembles a churning flow (Wallis1969). This influx of air-water mixture results in the rapid accel-eration of the air pocket. On the other hand, in the correspondingSeries A experiment (without independent upstream head), the fall-ing water film just flows around the air pocket down the riser. Thepressure in the air pocket in the riser is approximately the same asthe hydrostatic pressure of the overlying water column, althoughsome fluctuations can be noted (Fig. 10).
For the cases without an independent upstream pressure head(Run A2), as the water in the vertical riser is displaced by the risingair pocket, the pressure continuously decreases during the ascent ofthe air pocket. There is no external pressure that could result in thecompression of air in the riser; thus, a rapid acceleration of the airpocket (geyser) would not occur.
Overall, based on the simulations of the 18 cases (with and with-out independent pressure head, Table 1), the following points canbe made: (1) the broad features of the observed air pocket migrationwithin the riser and the geyser dynamics are well simulated by the
3D CFD model. The occurrence of a geyser event is indicated byrapid acceleration of the water column, under conditions that reflecta compressed air pocket with pressure far exceeding the hydrostaticpressure of the water column above; (2) consistent with the experi-ments, geysers are not simulated in the Series A runs; and (3) de-tails of the pressure variation and air pocket speed differ somewhatfrom the observations; this may be attributed to the assumed initialcondition (instantaneous valve opening) and the inability of theturbulence model to accurately model the complex two-phase flowphenomenon.
(a) (b)
Fig. 7. (a) Level of free surface Yfs and interface Y int; (b) length of water column above air pocket Lw and air pressure (Ha ¼ Pa=ρwg) forDr ¼ 16 mm, Run B1, with a pressure head H0 ¼ 0.88 m
x (m)
z(m
)
3.45 3.46 3.47 3.48 3.490.2
0.25
0.3
0.35
0.4
0.45
0.5
0.55
0.6
0.65
0.7
1 m/s
Time = 9.40s
x (m)
z(m
)
3.45 3.46 3.47 3.48 3.49
1.2
1.25
1.3
1.35
1.4
1.45
1.5
1.55
1.6
1.651 m/s
Time = 9.40s
(a) (b)
Fig. 8. Computed velocity field around the rising air pocket inthe riser for: (a) Run A1, Series A–no upstream head (no geyser);(b) Run B1, Series B–with upstream head (geyser occurred).Dr ¼ 16 mm, H0 ¼ 0.88 m
© ASCE 04017071-8 J. Hydraul. Eng.
J. Hydraul. Eng., 2018, 144(3): 04017071
Dow
nloa
ded
from
asc
elib
rary
.org
by
Hon
g K
ong
Uni
vers
ity o
f Sc
i and
Tec
h (H
KU
ST)
on 1
2/27
/17.
Cop
yrig
ht A
SCE
. For
per
sona
l use
onl
y; a
ll ri
ghts
res
erve
d.
Comparison of Numerical Predictions withExperiments of Lewis
The CFD model is also applied to simulate a geyser event observedin the experiments of Lewis (2011), for which data are available.The experimental set up is similar to that of Cong et al. (2017), butapproximately twice larger. A large constant-head reservoir is con-nected to the upstream end of the tunnel; the diameter of the tunnelis D ¼ 0.095 m; the riser diameter is Dr ¼ 0.044 or 0.095 m(Dr=D ¼ 0.46,1.00). The riser is located at 1.70 m downstreamof the reservoir. A valve located at 3.78 m downstream of the riserseparates a closed section of air of length L0 ¼ 0.89 m from thewater in the horizontal pipe and riser. The air volume is adjustedby partly filling up the closed section with water. Various combi-nations of reservoir levelH0 ¼ 0.203,0.457 m above the invert and
the air pocket volume of 1.59, 3.14, and 5.97 L are tested. The air-water interface and the free surface are analyzed from recordedvideo images.
The CFD model is applied for the case of Dr ¼ 0.44 mðDr=D ¼ 0.46Þ, H0 ¼ 0.457 m, air volume ¼ 5.97 L, for which ageyser is observed (Run B16). Fig. 11(a) shows the computed air-water interface in the horizontal tunnel and vertical riser at t ¼ 9 s.The trapped air pocket near the tunnel-riser junction is seen; it isfound that the air pocket does not entirely enter the vertical riser;part of the air pocket intrudes upstream past the riser junction[Fig. 11(a)]. The predicted free surface and air-water interface lev-els in the riser are in good agreement with the data of Lewis (2011)[Fig. 11(b)]. It is also found that the air pressure during this geyserevent is significantly higher than that of the water column above,resulting in the acceleration of the water column [Fig. 11(c)].
3.4 3.5
0
0.5
1
1.5
t = 4.90s
3.4 3.5
0
0.5
1
1.5
t = 5.70s
3.4 3.5
0
0.5
1
1.5
t = 6.10s
z(m
)
3.4 3.5
0
0.5
1
1.5
t = 4.50s
x (m)3.4 3.5
0
0.5
1
1.5
t = 5.30s
3.4 3.5
0
0.5
1
1.5
t = 4.90s
3.4 3.5
0
0.5
1
1.5
t = 5.70s
3.4 3.5
0
0.5
1
1.5
t = 6.10s
z(m
)
3.4 3.5
0
0.5
1
1.5
t = 4.50s
x (m)3.4 3.5
0
0.5
1
1.5
t = 5.30s
(a)
(b)
Fig. 9. Predicted air pocket migration in vertical riser,Dr ¼ 40 mm (no geyser): (a) Run A2–without pressure head; (b) Run B14–with pressure head
© ASCE 04017071-9 J. Hydraul. Eng.
J. Hydraul. Eng., 2018, 144(3): 04017071
Dow
nloa
ded
from
asc
elib
rary
.org
by
Hon
g K
ong
Uni
vers
ity o
f Sc
i and
Tec
h (H
KU
ST)
on 1
2/27
/17.
Cop
yrig
ht A
SCE
. For
per
sona
l use
onl
y; a
ll ri
ghts
res
erve
d.
Effect of Shaft Diameter on Geyser Formation
Using the validated CFD model, the effect of shaft diameter, airpocket volume and upstream pressure head on the formation ofthe geyser can be studied. A relatively coarse mesh (approximately40,000 grid cells in total) is used for systematic numerical testing.In general, the numerical predictions are consistent with the exper-imental observations.
The results for the maximum height of the riser of the watercolumn in the riser, defined as the level where the air pocket breaksthrough the free surface, are presented in Table 1. It is found that ingeneral the height of the rise of the water column increases for thesmaller riser diameter, larger upstream head and larger entrappedair volume. For the same upstream pressure head of 0.66 m and airvolume of L0 ¼ 0.61 m, the height of the rise decreases from 1.5 mat Dr ¼ 0.021 m (Run B2) to 1.09 m for Dr ¼ 0.04 m (Run B12).Analysis of the pressure in the air pocket in the vertical riser sug-gests that for Dr ¼ 0.016; 0.021; 0.026, and 0.031 m (Run B1–B10), the air pressure can be significantly larger than the overlyinghydrostatic pressure under some conditions. On the other hand, forDr ¼ 0.036 and 0.04 m (Run B11–B15), the air pressure head isalways approximately given by the length of the overlying watercolumn (see Fig. 12 for four of the cases with the same pressureand air pocket volume). The extensive numerical simulations revealthe rapid acceleration of the water column (and hence a possiblegeyser event) for Dr ≤ 0.031 m (or Dr=D ≤ 0.62); this criterionis generally consistent with a heuristic analysis of the experimentalobservations (Cong et al. 2017). It is noteworthy that for Dr ¼0.021 m and 0.026 m [Run B2 and B3, Figs. 12(a and b)], the airpressure is always larger than the hydrostatic pressure, whereas forDr ¼ 0.031 m [Run B5, Fig. 12(c)] there exists significant pressurefluctuation; at times the air pressure is the same as the hydrostatic
pressure, whereas at other times it differs. The pressure fluctuation isa reflection of the complexity of the air-water interaction; it may beinterpreted as transient owing to the compression/dilation of the airpocket and gradual damping of the oscillation during the ascent ofthe air pocket.
Effect of Upstream Pressure and Air Pocket Volume onGeyser Formation
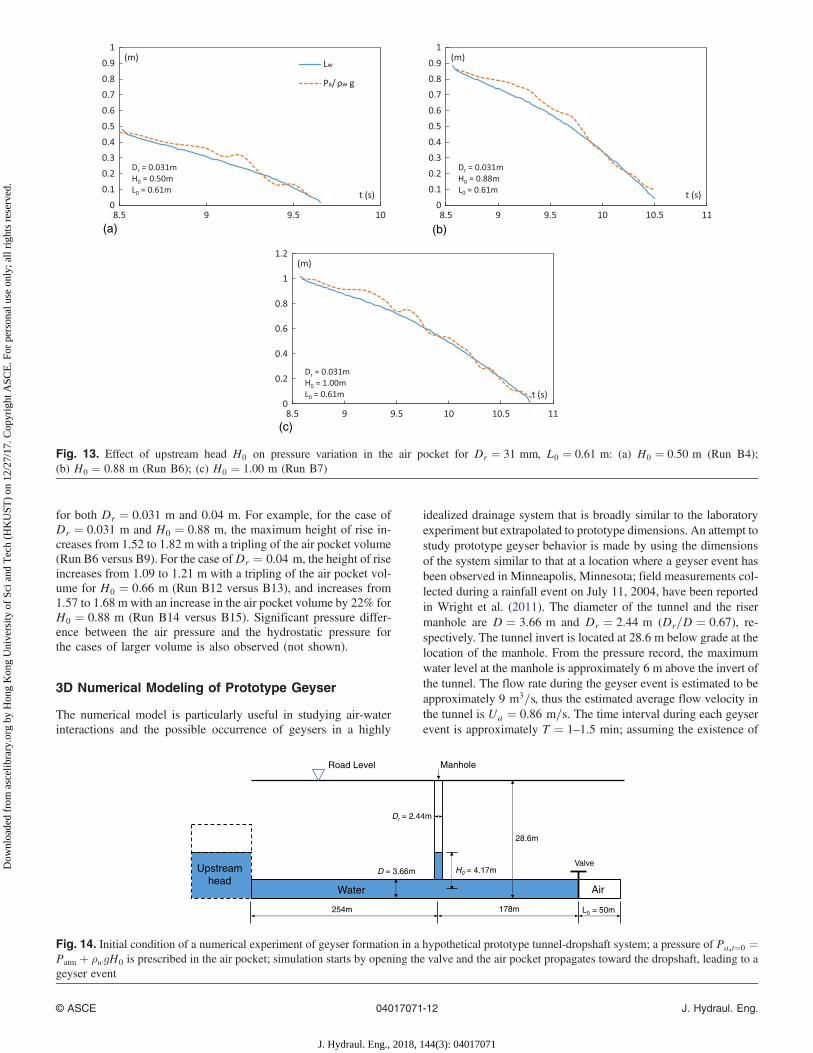
The effect of upstream pressure and air-pocket volume on geyserformation are also studied for Series B cases. With the same riserdiameter, the maximum height of rise of the water column increaseswith increasing pressure headH0 and initial air volume ðπD2=4ÞL0.A larger upstream pressure indicates that the air pocket is morecompressed in the tunnel.H0 also represents the length of the watercolumn inside the riser and the length that the air pocket has to pen-etrate through. The maximum height of rise increases from 0.96 to1.64 m for H0 ¼ 0.5–1.0 m with Dr ¼ 0.031 m and L0 ¼ 0.61 m(Run B4–B7). The height of rise is always larger than that of thepressure head H0. Fig. 13 shows the pressure variation for the casesof H0 ¼ 0.50, 0.88, and 1.0 m (Run B4, B6, and B7). It is interest-ing to note that the pressure is similar to the hydrostatic one, withoutthe fluctuations as observed in the case of H0 ¼ 0.66 [Run B5,Fig. 12(b)]. Such observation reflects that a higher pressure resultsin a longer water column (larger mass above the air pocket) in theriser resulting in smaller accelerations (for the same air pressure).For cases which geysers occur (Run B5–B7), the net air pocket ris-ing speed is generally larger than the cases without geyser (Run B4,Table 1).
On the other hand, an increase in air volume always lead to ahigher potential for geyser formation. From Table 1, the maximumheight of rise of the air pocket increases with the initial air volume
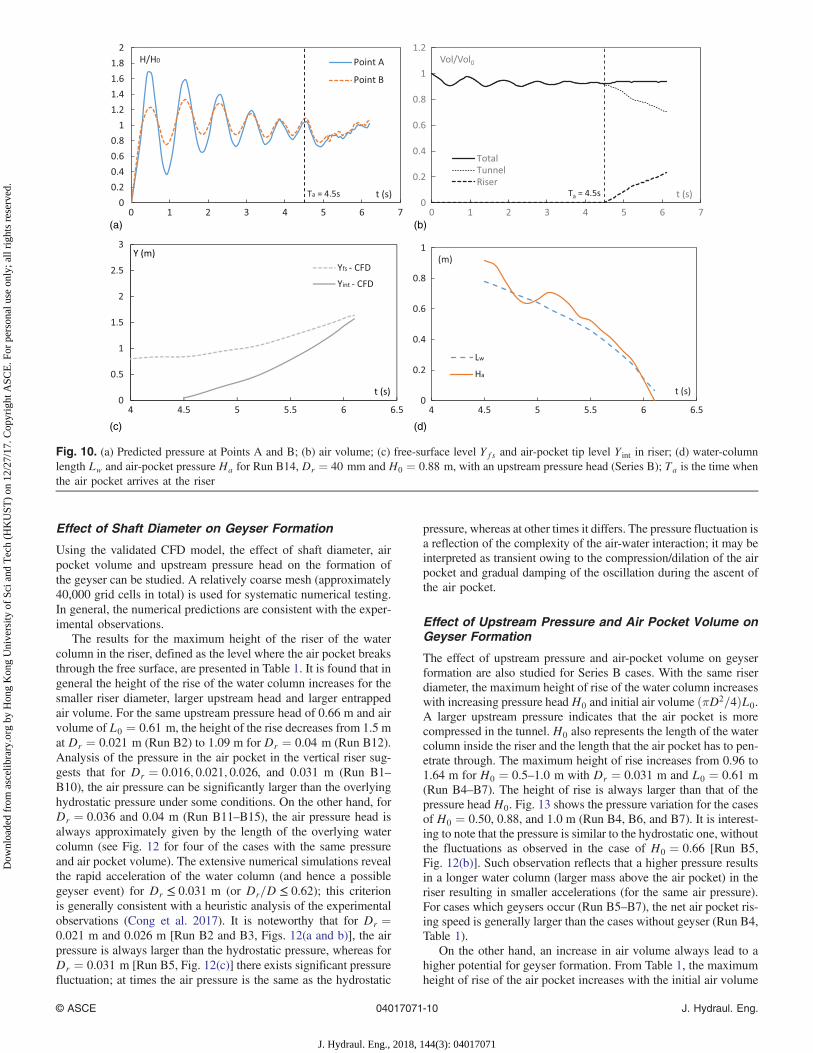
(a) (b)
(c) (d)
Fig. 10. (a) Predicted pressure at Points A and B; (b) air volume; (c) free-surface level Yfs and air-pocket tip level Y int in riser; (d) water-columnlength Lw and air-pocket pressure Ha for Run B14, Dr ¼ 40 mm and H0 ¼ 0.88 m, with an upstream pressure head (Series B); Ta is the time whenthe air pocket arrives at the riser
© ASCE 04017071-10 J. Hydraul. Eng.
J. Hydraul. Eng., 2018, 144(3): 04017071
Dow
nloa
ded
from
asc
elib
rary
.org
by
Hon
g K
ong
Uni
vers
ity o
f Sc
i and
Tec
h (H
KU
ST)
on 1
2/27
/17.
Cop
yrig
ht A
SCE
. For
per
sona
l use
onl
y; a
ll ri
ghts
res
erve
d.

(a) (b)
(c) (d)
Fig. 12. Effect of riser diameter Dr on pressure variation in the air pocket for H0 ¼ 0.66 mm, L0 ¼ 0.61 m: (a) Dr ¼ 0.021 m (Run B2);(b) Dr ¼ 0.026 m (Run B3); (c) Dr ¼ 0.031 m (Run B5); (d) Dr ¼ 0.04 m (Run B12)
x (m)z
(m)
1.5 2 2.5 3 3.5 4
0
0.5
1
1.5 Time = 9.00s
(a)
(b) (c)
Fig. 11. (a) Predicted dynamics of air pocket for Dr ¼ 44 mm, D ¼ 95 mm with an upstream pressure head H0 ¼ 0.46 m (Run B16, experimentaldata of Lewis 2011); (b) predicted and observed free-surface level Yfs and interface level Y int; (c) predicted and observed water-column length Lw andair-pocket pressure Ha
© ASCE 04017071-11 J. Hydraul. Eng.
J. Hydraul. Eng., 2018, 144(3): 04017071
Dow
nloa
ded
from
asc
elib
rary
.org
by
Hon
g K
ong
Uni
vers
ity o
f Sc
i and
Tec
h (H
KU
ST)
on 1
2/27
/17.
Cop
yrig
ht A
SCE
. For
per
sona
l use
onl
y; a
ll ri
ghts
res
erve
d.
for both Dr ¼ 0.031 m and 0.04 m. For example, for the case ofDr ¼ 0.031 m and H0 ¼ 0.88 m, the maximum height of rise in-creases from 1.52 to 1.82 m with a tripling of the air pocket volume(Run B6 versus B9). For the case ofDr ¼ 0.04 m, the height of riseincreases from 1.09 to 1.21 m with a tripling of the air pocket vol-ume for H0 ¼ 0.66 m (Run B12 versus B13), and increases from1.57 to 1.68 m with an increase in the air pocket volume by 22% forH0 ¼ 0.88 m (Run B14 versus B15). Significant pressure differ-ence between the air pressure and the hydrostatic pressure forthe cases of larger volume is also observed (not shown).
3D Numerical Modeling of Prototype Geyser
The numerical model is particularly useful in studying air-waterinteractions and the possible occurrence of geysers in a highly
idealized drainage system that is broadly similar to the laboratoryexperiment but extrapolated to prototype dimensions. An attempt tostudy prototype geyser behavior is made by using the dimensionsof the system similar to that at a location where a geyser event hasbeen observed in Minneapolis, Minnesota; field measurements col-lected during a rainfall event on July 11, 2004, have been reportedin Wright et al. (2011). The diameter of the tunnel and the risermanhole are D ¼ 3.66 m and Dr ¼ 2.44 m (Dr=D ¼ 0.67), re-spectively. The tunnel invert is located at 28.6 m below grade at thelocation of the manhole. From the pressure record, the maximumwater level at the manhole is approximately 6 m above the invert ofthe tunnel. The flow rate during the geyser event is estimated to beapproximately 9 m3=s, thus the estimated average flow velocity inthe tunnel is Ua ¼ 0.86 m=s. The time interval during each geyserevent is approximately T ¼ 1–1.5 min; assuming the existence of
(a) (b)
(c)
Fig. 13. Effect of upstream head H0 on pressure variation in the air pocket for Dr ¼ 31 mm, L0 ¼ 0.61 m: (a) H0 ¼ 0.50 m (Run B4);(b) H0 ¼ 0.88 m (Run B6); (c) H0 ¼ 1.00 m (Run B7)
AirWater
Dr = 2.44m
D = 3.66m
L0 = 50m
Upstreamhead
H0 = 4.17m
178m254m
28.6m
Valve
Road Level Manhole
Fig. 14. Initial condition of a numerical experiment of geyser formation in a hypothetical prototype tunnel-dropshaft system; a pressure of Pa,t¼0 ¼Patm þ ρwgH0 is prescribed in the air pocket; simulation starts by opening the valve and the air pocket propagates toward the dropshaft, leading to ageyser event
© ASCE 04017071-12 J. Hydraul. Eng.
J. Hydraul. Eng., 2018, 144(3): 04017071
Dow
nloa
ded
from
asc
elib
rary
.org
by
Hon
g K
ong
Uni
vers
ity o
f Sc
i and
Tec
h (H
KU
ST)
on 1
2/27
/17.
Cop
yrig
ht A
SCE
. For
per
sona
l use
onl
y; a
ll ri
ghts
res
erve
d.
(a) (b)
(c) (d)
(e) (f)
(g) (h)
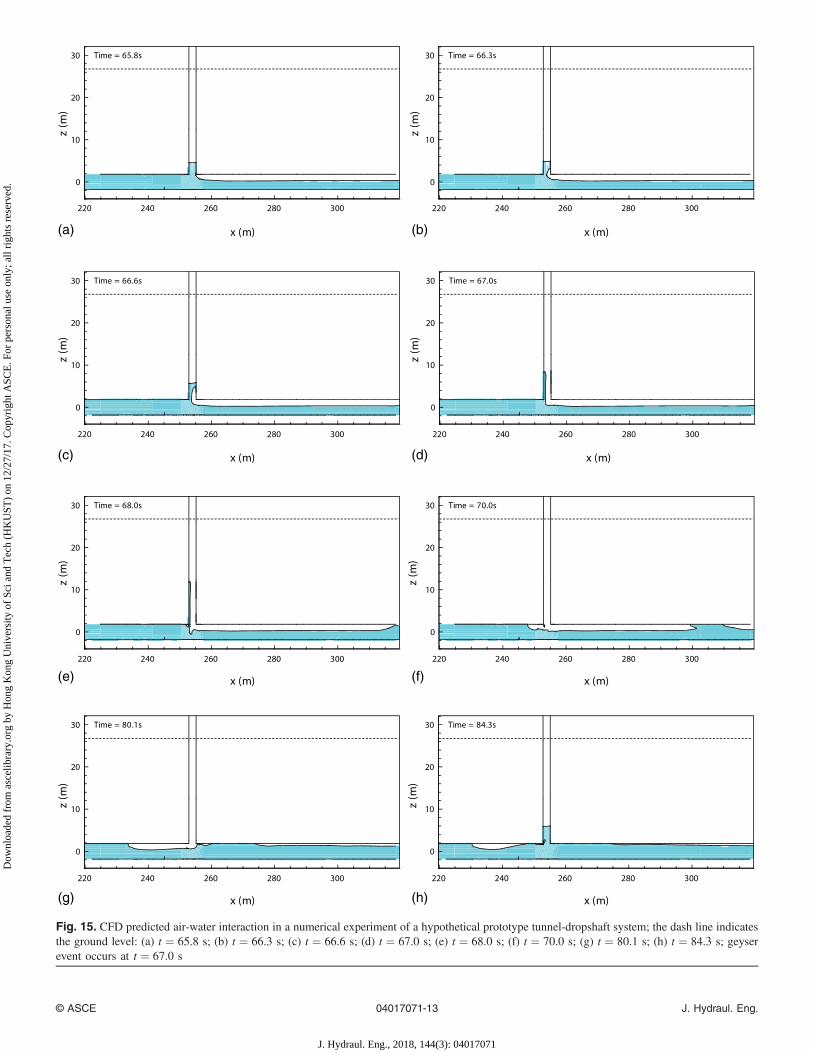
Fig. 15. CFD predicted air-water interaction in a numerical experiment of a hypothetical prototype tunnel-dropshaft system; the dash line indicatesthe ground level: (a) t ¼ 65.8 s; (b) t ¼ 66.3 s; (c) t ¼ 66.6 s; (d) t ¼ 67.0 s; (e) t ¼ 68.0 s; (f) t ¼ 70.0 s; (g) t ¼ 80.1 s; (h) t ¼ 84.3 s; geyserevent occurs at t ¼ 67.0 s
© ASCE 04017071-13 J. Hydraul. Eng.
J. Hydraul. Eng., 2018, 144(3): 04017071
Dow
nloa
ded
from
asc
elib
rary
.org
by
Hon
g K
ong
Uni
vers
ity o
f Sc
i and
Tec
h (H
KU
ST)
on 1
2/27
/17.
Cop
yrig
ht A
SCE
. For
per
sona
l use
onl
y; a
ll ri
ghts
res
erve
d.
an air pocket that occupies the upper half of the tunnel; the lengthof an air pocket can be estimated from the flow velocity andthe time interval between geyser events, L0 ≈ UaT ≈ 50–100 m(i.e., an air pocket volume in the order of 400 m3). Recent numeri-cal model investigations by Vasconcelos and Wright (2016) havedemonstrated that depending on the storm water inflow patternsand system configuration, trapped air pocket volumes in the orderof 1,000 m3 can be found in prototype drainage systems.
In the CFD simulation of a prototype analog of the laboratoryexperiment, the volume of air at the end of the pipe is specified(Fig. 14). This corresponds to a prototype/model length scale of73.2 when compared with the laboratory model of Cong et al.(2017), with Dr ¼ 0.05 m. The initial air pocket length L0 is 50 m.
The upstream pressure head is taken as 6 m above the tunnelinvert level, i.e., 4.17 m above the tunnel centerline level. It is notedthat under such pressure, the air volume is reduced by 30–40%according to the ideal gas law, i.e., PV ¼ constant. This is verydifferent from the pressure head used in the laboratory study (lessthan 1 m), with reduction in the air volume of approximately 10%.In the simulation, the initial static pressure in the air pocket is pre-scribed as the hydrostatic pressure induced by the upstream head(Pa,t¼0 ¼ Patm þ ρwgH0) to balance the upstream head pressureand minimize the pressure oscillation induced by valve opening.
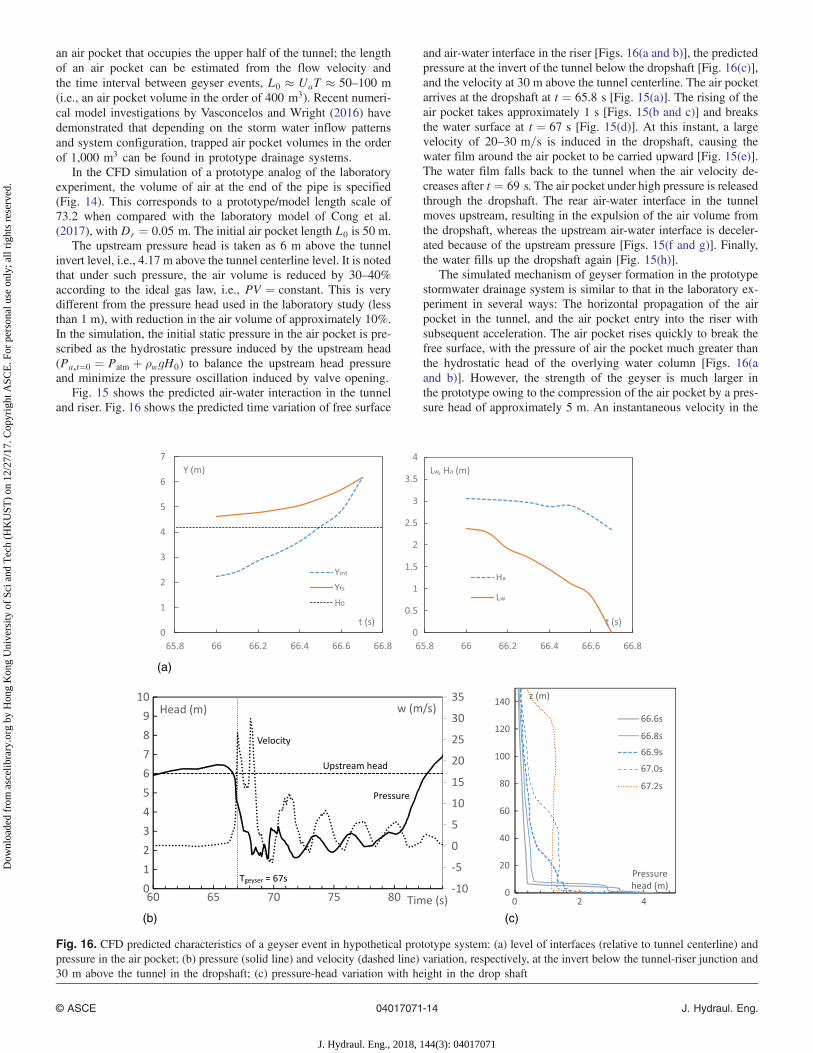
Fig. 15 shows the predicted air-water interaction in the tunneland riser. Fig. 16 shows the predicted time variation of free surface
and air-water interface in the riser [Figs. 16(a and b)], the predictedpressure at the invert of the tunnel below the dropshaft [Fig. 16(c)],and the velocity at 30 m above the tunnel centerline. The air pocketarrives at the dropshaft at t ¼ 65.8 s [Fig. 15(a)]. The rising of theair pocket takes approximately 1 s [Figs. 15(b and c)] and breaksthe water surface at t ¼ 67 s [Fig. 15(d)]. At this instant, a largevelocity of 20–30 m=s is induced in the dropshaft, causing thewater film around the air pocket to be carried upward [Fig. 15(e)].The water film falls back to the tunnel when the air velocity de-creases after t ¼ 69 s. The air pocket under high pressure is releasedthrough the dropshaft. The rear air-water interface in the tunnelmoves upstream, resulting in the expulsion of the air volume fromthe dropshaft, whereas the upstream air-water interface is deceler-ated because of the upstream pressure [Figs. 15(f and g)]. Finally,the water fills up the dropshaft again [Fig. 15(h)].
The simulated mechanism of geyser formation in the prototypestormwater drainage system is similar to that in the laboratory ex-periment in several ways: The horizontal propagation of the airpocket in the tunnel, and the air pocket entry into the riser withsubsequent acceleration. The air pocket rises quickly to break thefree surface, with the pressure of air the pocket much greater thanthe hydrostatic head of the overlying water column [Figs. 16(aand b)]. However, the strength of the geyser is much larger inthe prototype owing to the compression of the air pocket by a pres-sure head of approximately 5 m. An instantaneous velocity in the
(a)
(b) (c)
Fig. 16. CFD predicted characteristics of a geyser event in hypothetical prototype system: (a) level of interfaces (relative to tunnel centerline) andpressure in the air pocket; (b) pressure (solid line) and velocity (dashed line) variation, respectively, at the invert below the tunnel-riser junction and30 m above the tunnel in the dropshaft; (c) pressure-head variation with height in the drop shaft
© ASCE 04017071-14 J. Hydraul. Eng.
J. Hydraul. Eng., 2018, 144(3): 04017071
Dow
nloa
ded
from
asc
elib
rary
.org
by
Hon
g K
ong
Uni
vers
ity o
f Sc
i and
Tec
h (H
KU
ST)
on 1
2/27
/17.
Cop
yrig
ht A
SCE
. For
per
sona
l use
onl
y; a
ll ri
ghts
res
erve
d.
order of 20–30 m=s is generated attributable to the pressure gra-dient between the compressed air pocket and the atmosphere whenit breaks through the water surface [Fig. 16(b)]. The pressure varia-tion [Fig. 16(c)] at the dropshaft centerline shows that during thegeyser, a pressure transient is formed and propagates up the drop-shaft, in less than 1 s. According to a classification of two-phaseflow regimes in a vertical tube (Taitel et al. 1980), such largetyphoon/hurricane scale vertical velocity (in excess of ∼10 m=s)can result in the breaking up of water into small droplets and theformation of a dispersed air-water mixture that is brought to theroad surface. The predicted velocity is consistent with the roughestimation by Wright et al. (2011) from the height of the rise ofthe geyser. The predicted pressure variation is also qualitativelysimilar to that measured by a sensor installed in the tunnel invert(Wright et al. 2011).
Conclusions
A comprehensive 3D numerical study on the physics of geyserevents is conducted using a CFD model with the VOF technique.Extensive numerical simulations are conducted to study the air-pocket dynamics caused by release of trapped air from a horizontaltunnel into a vertical riser. The predicted pressure variation, the air-water interface, and the free surface level in the riser compare wellwith experimental measurements. A geyser event can be character-ized by compression of the air pocket and rapid acceleration of thewater column in the riser; a geyser event occurs for the smaller riserdiameter (Dr=D ≤ 0.62) for the case with a prescribed independentupstream constant pressure head. The rising speed of both the airpocket tip and the free surface at the riser is much greater than thosefor the cases without an independent upstream pressure head. Thepressure inside the air pocket in the riser is much greater than thehydrostatic pressure attributable to the water column above, result-ing in the water column being rapidly pushed out of the riser. Forthe case with a large riser diameter (Dr=D > 0.62), the net risingspeed of the air pocket relative to the free surface is similar to thatof a Taylor bubble, without a net acceleration created by a pres-sure difference. The extensive numerical simulations are in generalagreement with the laboratory experiments; geysers are likely tooccur for Dr=D ≤ 0.62.
The effect of riser diameter, upstream pressure head, and initialair pocket volume on geyser formation is studied through numericalexperiments. It is found that the strength of the geyser (as repre-sented by the maximum height of rise of the water column) in-creases with smaller riser diameter, greater upstream head, andlarger air pocket. The potential occurrence of a geyser, accelerationand ejection of the water column, can be reflected in the pressurein the air pocket in the vertical shaft—which will be significantlylarger than the hydrostatic pressure. The CFD model has also of-fered important insights on the details of the geyser formation in ahypothetical prototype system. In particular, it is shown that com-pressed air pockets with pressure heads of approximately 5 mcan lead to large vertical air velocities of the order of 20 m=s; suchhigh velocities may be responsible for the explosive air-water mix-tures ejected from manholes—geysers that are often observed inthe field.
Acknowledgments
This research is supported by a grant from the Hong Kong ResearchGrants Council (Project 16205114) and in part by a project onSmart Urban Water Supply Systems (SUWSS) under the Theme-based Research Scheme.
Notation
The following symbols are used in this paper:a = riser radius;Cr ¼ uΔt=Δx =Courant number;D = horizontal pipe diameter;Dr = vertical riser diameter;g = ð0,0, − 9.81Þ m=s2, gravitational acceleration;
H0 = initial water levels in the riser (Series A) or upstream head(Series B), measured from invert of tunnel;
Ha = Pa=ρwg pressure head in air pocket in riser;L0 = initial air length in the horizontal pipe;Lw = Yfs − Y int length of water column above the air pocket;k = turbulent kinetic energy;
Mw = molecular weight of air;P = gauge pressure;Pa = average pressure in air pocket;
Patm = atmospheric pressure;Pop = operating pressure;Pr = Prandtl number;R = universal gas constant;T = time interval of each geyser event in prototype;Ta = time when air pocket arrives at the riser after
valve opening;t = time from the start of experiment;U = ðu; v;wÞ ¼ velocity field;Ua = average flow velocity in tunnel in prototype;Va = πD2L0=4 initial air volume;Vw = πD2
rH0=4 initial volume of water in the riser;vf = falling velocity of water film;vnet = net rising velocity of air pocket relative to the
free surface;vTaylor = velocity of a Taylor bubble;
Yfs = free surface level in the riser;Y int = frontal level of air pocket in the riser;αa = 1 − αw volume fraction of air;αw = volume fraction of water;ϵ = turbulent kinetic energy dissipation rate;
Δt = computational time step;Δx = computational grid size;δ = water film thickness;μt = turbulent dynamic viscosity of air–water mixture;ρ = air–water mixture density;ρa = air density;ρw = water density; andν = kinematic viscosity of water.
References
ANSYS FLUENT version 15.0 [Computer software]. ANSYS, Canonsburg,PA.
Batchelor, G. K. (1967). Introduction to fluid dynamics, CambridgeUniversity Press, Cambridge, U.K.
Catano-Lopera, Y. A., et al. (2014). “Modeling of a transient event in thetunnel and reservoir plan system in Chicago, Illinois.” J. Hydraul. Eng.,10.1061/(ASCE)HY.1943-7900.0000888, 05014005.
Cong, J. (2016). “Experimental modeling of air-water interaction inhorizontal pipe with vertical riser.” M.Phil. thesis, Hong Kong Univ.of Science and Technology, Hong Kong.
Cong, J., Chan, S. N., and Lee, J. H. W. (2017). “Geyser forma-tion by release of entrapped air from horizontal pipe into vertical
© ASCE 04017071-15 J. Hydraul. Eng.
J. Hydraul. Eng., 2018, 144(3): 04017071
Dow
nloa
ded
from
asc
elib
rary
.org
by
Hon
g K
ong
Uni
vers
ity o
f Sc
i and
Tec
h (H
KU
ST)
on 1
2/27
/17.
Cop
yrig
ht A
SCE
. For
per
sona
l use
onl
y; a
ll ri
ghts
res
erve
d.
shaft.” J. Hydraul. Eng., 10.1061/(ASCE)HY.1943-7900.0001332,04017039.
Davies, R. M., and Taylor, G. I. (1950). “The mechanics of large bubblesrising through extended liquids and through liquids in tubes.” Proc.Royal Soc. London A, 200(1062), 375–390.
Hamam, M. A., and McCorquodale, A. (1982). “Transient conditions inthe transition from gravity to surcharged sewer flow.” Can. J. Civ. Eng.,9(2), 189–196.
Hirt, C. W., and Nichols, B. D. (1981). “Volume of fluid (VOF) methodfor the dynamics of free boundaries.” J. Comput. Phys., 39(1),201–225.
Lewis, J. W. (2011). “A physical investigation of air/water interactions lead-ing to geyser events in rapid filling pipelines.” Ph.D. thesis, Univ. ofMichigan, Ann Arbor, MI.
Li, J., and McCorquodale, A. (1999). “Modeling mixed flow in stormsewers.” J. Hydraul. Eng., 10.1061/(ASCE)0733-9429(1999)125:11(1170), 1170–1180.
Martin, C. S. (1976). “Entrapped air in pipelines.” Proc., 2nd Int. Conf. onPressure Surges, Vol. 2, City Univ., London, 15–27.
Taitel, Y., Barnea, D., and Dukler, A. E. (1980). “Modelling flow patterntransitions for steady upward gas–liquid flow in vertical tubes.” AIChEJ., 26(3), 345–354.
Vasconcelos, J. G., and Wright, S. J. (2008). “Rapid flow startup in filledhorizontal pipelines.” J. Hydraul. Eng., 10.1061/(ASCE)0733-9429(2008)134:7(984), 984–992.
Vasconcelos, J. G., and Wright, S. J. (2011). “Geysering generated by largeair pockets released through water-filled ventilation shafts.” J. Hydraul.Eng., 10.1061/(ASCE)HY.1943-7900.0000332, 543–555.
Vasconcelos, J. G., and Wright, S. J. (2012). “Mechanisms for air pocketentrapment in stormwater storage tunnels.” Proc., World Water andEnvironmental Resources Congress 2006, ASCE, Reston, VA.
Vasconcelos, J. G., and Wright, S. J. (2016). “Anticipating transientproblems during the rapid filling of deep stormwater storage tunnelsystems.” J. Hydraul. Eng., 10.1061/(ASCE)HY.1943-7900.0001250,06016025.
Wallis, G. B. (1969). One-dimensional two-phase flow, McGraw Hill,New York.
Wright, S. J. (2013). “Influence of air pocket volume on manhole surge.”J. Water Manage. Model., 141–155.
Wright, S. J. (2014). “Modeling rapid filling processes in stormwatertunnel systems.” Proc., DSD 25th Anniversary Int. Conf., Hong KongDrainage Services Dept., Hong Kong.
Wright, S. J., Lewis, J. W., and Vasconcelos, J. G. (2011). “Geysering inrapidly filling storm-water tunnels.” J. Hydraul. Eng., 10.1061/(ASCE)HY.1943-7900.0000245, 112–115.
Youngs, D. L. (1982). “Time-dependent multi-material flow with largefluid distortion.” Numerical methods for fluid dynamics, AcademicPress, Cambridge, MA.
Zhou, F., Hicks, F., and Steffler, P. M. (2002a). “Observations of air-waterinteraction in a rapidly filling horizontal pipe.” J. Hydraul. Eng.,10.1061/(ASCE)0733-9429(2002)128:6(635), 635–639.
Zhou, F., Hicks, F., and Steffler, P. M. (2002b). “Transient flow in arapidly filling horizontal pipe containing trapped air.” J. Hydraul.Eng., 10.1061/(ASCE)0733-9429(2002)128:6(625), 625–634.
Zhou, L., Liu, D.-Y., and Ou, C.-Q. (2011). “Simulation of flow transientsin a water filling pipe containing entrapped air pocket with VOFmodel.” Eng. Appl. Comput. Fluid Mech., 5(1), 127–140.
© ASCE 04017071-16 J. Hydraul. Eng.
J. Hydraul. Eng., 2018, 144(3): 04017071
Dow
nloa
ded
from
asc
elib
rary
.org
by
Hon
g K
ong
Uni
vers
ity o
f Sc
i and
Tec
h (H
KU
ST)
on 1
2/27
/17.
Cop
yrig
ht A
SCE
. For
per
sona
l use
onl
y; a
ll ri
ghts
res
erve
d.
Copyright © 2022 FDOKUMEN