2022 STATUS OF THE HAWAII CANNABIS INDUSTRY ...
38
Randy Gonce, HICIA Executive Director 2022 STATUS OF THE HAWAII CANNABIS INDUSTRY REPORT Paul Brewbaker, Economic Study Author TZ Economics Bill Jarvis, 2021 HICIA Board Chair CEO of Noa Botanicals Tai Cheng, 2022 HICIA Board Chair CEO of Aloha Green Apothecary 1
-
Upload
khangminh22 -
Category
Documents
-
view
1 -
download
0
Transcript of 2022 STATUS OF THE HAWAII CANNABIS INDUSTRY ...

Randy Gonce, HICIA Executive Director
2022 STATUS OF THEHAWAII CANNABIS INDUSTRY REPORT
Paul Brewbaker, Economic Study AuthorTZ Economics
Bill Jarvis, 2021 HICIA Board ChairCEO of Noa Botanicals
Tai Cheng, 2022 HICIA Board ChairCEO of Aloha Green Apothecary
1

CONTENTSAnalysis of the ReportRandy Gonce, Executive Director, HICIA
Policy RecommendationsRandy Gonce, Executive Director, HICIA
2022 Economic Report
Authored by Paul Brewbaker, TZ Economics
Since inception, Hawaiʻi's Medical Cannabis Industry has continuously faced a variety of challenges. This report and analysis highlights many of these challenges as they continue to grow and compound in difficulty year after year. The Hawaiʻi Cannabis Industry Association (HICIA) will continue to make detailed information public to assist key stakeholders in making strategic decisions that ensure the sustainability of Hawaiʻi's medical cannabis program and help set the program on a trajectory to meet its original legislative intent.
INTRODUCTION
1
2
3 Hawaii’s emerging medical cannabis industry: policy, performance, and economic impacts
2

Analysis:Limited Patient Access
Licensed Dispensary Market Segment Analysis
Since the program began, licensed medical cannabis dispensaries have averaged a 31 percent market share among registered patients under the state’s medical cannabis registry over the past four years. This leaves 20,000+ registered patients who remain unserved by dispensaries. These patients, as a result, rely heavily on the illicit market and to a lesser extent cannabis grown by themselves or their caregivers. Unfortunately, these options do not provide cannabis products that meet the level of safety patients deserve, and that are provided by licensed dispensaries.
Registered Patient Market Share Since 2016
31.0 %
69.0 %
Patients Utilizing Dispensaries Patients Obtaining Cannabis Elsewhere
Only 4 out of 10 patients obtain their medicine from the tested and regulated market
Source: DOH MedCan Monthly Tracker Report "Unique Patient Count"
3

Analysis: Limited Patient Access
Brewbaker, Page 7 - Figure 3, Hawaii’s medical cannabis industry: performance, policy, and economic impacts
2017 2018 2019 2020 2021
Avg. Annual Dispensary Patients (Statewide)
1,943 4,002 8,087 10,505 12,921
New Registered Patients
3,097 3,391 3,323 4,040
Avg. Annual New Registered Patients Patronizing Dispensaries
724 1,064 860 1,027
Data indicates that dispensaries are only capturing 26.5 percent of new registered patients. This trend indicates that market share of dispensary patients will slowly diminish over time from its current rate.
New Registered Patients New Registered Patients Patronizing Dispensaries
2017 2018 2019 2020 20210
2,000
4,000
6,000
Table 1 - Dispensary Patients and New Patients (All and Dispensary)
Figure 1 -New Registered Patients to New Dispensary Patients (Annual Average)
4

Analysis of Reportby: Randy Gonce, Executive Director, HICIA
The State of Hawaiʻi's medical cannabis program is failing to meet its main policy objectives, which is leaving patients heavily reliant on the illicit market where cannabis is untested and unregulated. This can be alleviated with statutory fixes at little or no cost to the state.
"Concern that Hawaii’s medical cannabis industry is not fulfilling its designated public policy objective of reaching a patient base and diverting them from the [illicit] market is underscored by the State of Hawaii’s official data on registered patients." Brewbaker, Page 6, Hawaii’s medical cannabis industry: performance, policy, and economic impacts
"Failure to fulfill the public policy objective of deterring [illicit] market cannabis is suggested by the fact that barely one-third of registered Hawaii medical cannabis patients (35,000) are active patients (13,000); neither grew materially during second half 2021.." Brewbaker, Page 1, Hawaii’s medical cannabis industry: performance, policy, and economic impacts
"The regulatory problems arise both from flawed mechanism design (perverse incentives), and from regulatory agency inertia (unresponsive agency)......These regulatory policies not only hinder growth of the legal medical cannabis industry, they impair the legal industry’s intended displacement illegal cannabis sales. They also limit the state tax revenues which could be gathered from legal activity." Brewbaker, Page 3 & 4, Hawaii’s medical cannabis industry: performance, policy, and economic impacts
5

Analysis Conclusions
When the dispensary license program was established in 2016, it was intended to replace the 15 year old program that did not provide guidance on how to obtain tested medicine. The new program was supposed to serve the majority of Hawaiʻi's patients with tested and regulated medicine. The current medical cannabis law allows for caregivers to grow for one patient but this provision of the program will sunset in 2023. Without easy access to licensed medical cannabis dispensaries more patients will become underserved and likely seek cannabis through untested and unregulated channels.
Furthermore...
Hawaiʻi's registered medical cannabis patients are currently at riskOver 20,000 patients are being left without access to the safe tested cannabis medicine they rely upon and are obtaining cannabis elsewhere. The licensed medical cannabis dispensary program does not currently have the appropriate regulatory structure to meet the state's policy goalsIn addition, future program growth that shows current and new patients are continuing to seek cannabis outside the tested and regulated program. In its current form, the medical cannabis industry is unsustainable and will continue to decline without substantive regulatory and statutory changesNot only is the industry not economically viable for licensees it is becoming increasingly harder to serve patients especially those in underserved populations.
1
2
3
6
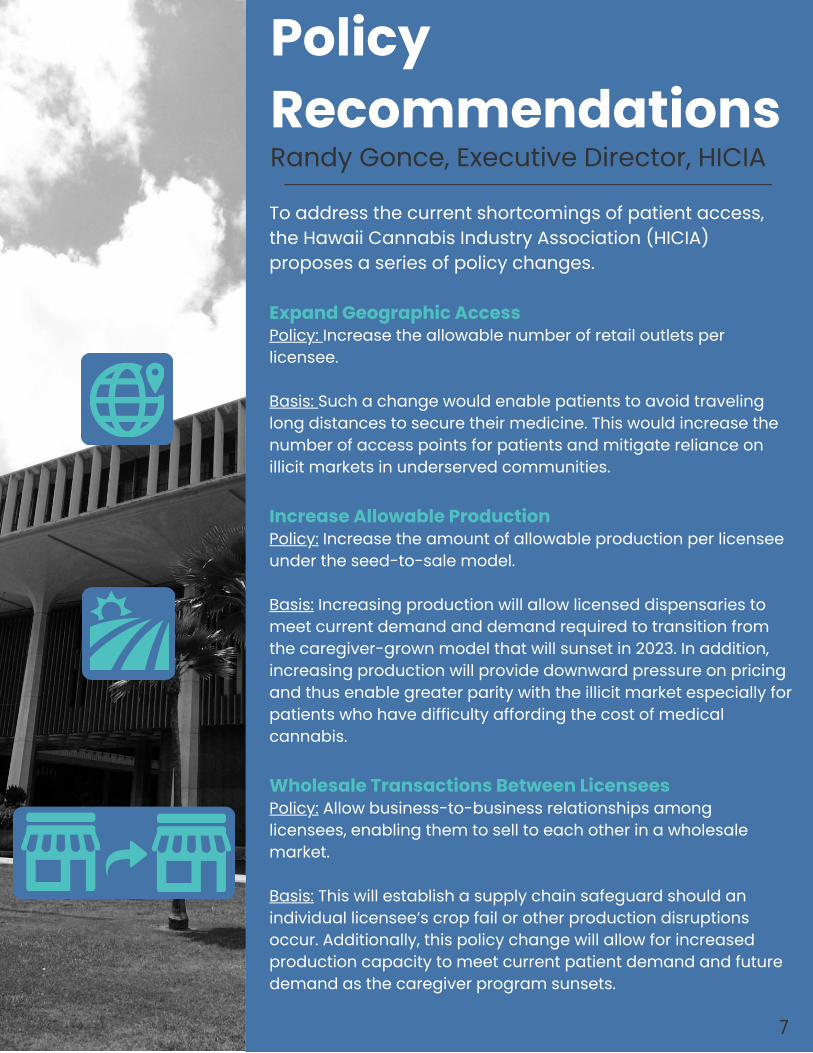
Policy RecommendationsTo address the current shortcomings of patient access, the Hawaii Cannabis Industry Association (HICIA) proposes a series of policy changes. Expand Geographic AccessPolicy: Increase the allowable number of retail outlets per licensee. Basis: Such a change would enable patients to avoid traveling long distances to secure their medicine. This would increase the number of access points for patients and mitigate reliance on illicit markets in underserved communities. Increase Allowable ProductionPolicy: Increase the amount of allowable production per licensee under the seed-to-sale model. Basis: Increasing production will allow licensed dispensaries to meet current demand and demand required to transition from the caregiver-grown model that will sunset in 2023. In addition, increasing production will provide downward pressure on pricing and thus enable greater parity with the illicit market especially for patients who have difficulty affording the cost of medical cannabis. Wholesale Transactions Between LicenseesPolicy: Allow business-to-business relationships among licensees, enabling them to sell to each other in a wholesale market. Basis: This will establish a supply chain safeguard should an individual licensee’s crop fail or other production disruptions occur. Additionally, this policy change will allow for increased production capacity to meet current patient demand and future demand as the caregiver program sunsets.
Randy Gonce, Executive Director, HICIA
7

2022 Economic Report
Authored by Paul Brewbaker, TZ Economics
In 2021, the Hawaii Cannabis Industry Association hired Paul Brewbaker at TZ Economics to conduct a study and analysis of the Hawaiʻi Medical Cannabis Industry. Utilizing a previous economic report, official Department of Health data, and privileged information from medical cannabis licensees in Hawaiʻi, Paul’s report made some crucial findings that have led HICIA to specific policy recommendations. These goals are necessary to ensure that the medical cannabis industry does not fail to meet its legislative intent and it continues to serve registered medical cannabis patients with tested and regulated medicine.
REPORT INTRODUCTION
Hawaii’s emerging medical cannabis industry: policy, performance, and economic impacts
8

Hawaii’s medical cannabis industry: performance, policy, and economic impacts
an industry report by
Paul H. Brewbaker, Ph.D., CBE TZ Economics Kailua, Hawaii
January 2022

1
Hawaii’s medical cannabis industry: performance, policy, and economic impacts
an industry report by
Paul H. Brewbaker, Ph.D., CBE TZ Economics
January 2022
Executive Summary
• Hawaii’s regulated medical cannabis industry completed its fourth year in 2021 with sales growth stalling, patient counts flattening, and tax burdens under IRS Section 280E impairing returns to capital from heavy initial and ongoing investments.
• Hawaii’s medical cannabis industry faces unduly restrictive regulation, subverting the state’s policy objective of diverting underground economic activity to legitimate channels through which medical cannabis patients can abandon the black market.
• Failure to fulfill the public policy objective of deterring black market cannabis is suggested by the fact that barely one-third of registered Hawaii medical cannabis patients (35,000) are active patients (13,000); neither grew materially during second half 2021.
• Initial industry sales and patient growth rates, while resilient throughout the COVID-19 pandemic, plateaued in 2021 because of regulatory impediments pre-empting scalability.
• In 2021 the industry was projected to record an estimated $50 million in sales and $2.25 million in direct state tax receipts.
• Estimated medical cannabis industry economic impacts through direct, indirect, and induced economic activity in 2021 included $99 million in Hawaii output, $30 million in earnings, $4.7 million in state tax revenues, and 781 jobs.

2
1. Industry performance and perceptions Like most infant industries, Hawaii’s medical cannabis industry has experienced a mix of large start-up investments in fixed capital, initially rapid sales growth, optimization of operating models, and early opportunities to scale. However, industry perceptions after only four years are a mix of frustration with inadequate regulatory “bandwidth” for further taking advantage of opportunities for economies of scale and economies of scope. Thought of further cannabis industry reform either in the prospective onshore patient base or through regulated tourism extension is on the back burner while the industry’s break-even point remains elusive.
Within only a few years of establishment and despite early growth, the industry quickly hit barriers to expansion, capped by artificially restrictive capacity constraints currently embedded in the legislative and regulatory mechanism design governing industry development. These constraints risk thwarting public policy intent of diverting underground (illegal) economic activity towards legitimate cannabis distribution channels. Anecdotal evidence of registered patient reversion to underground channels is of increasing concern, and no credible evidence of illegal cannabis distribution abatement is available. The public policy goal to enable safe medical cannabis distribution to a patient-consumer base overseen by the state Department of Health is being frustrated by regulatory inflexibility, stifling entrepreneurship and innovation.
With legislators distracted by two years of the SARS-CoV-2 pandemic, a point of no
return for some industry investors is approaching. Against large capital outlays, slowing growth of Hawaii medical cannabis sales and patient registrations has stifled investor returns. Federal tax burdens under IRS Section 280E comprised 40 percent of industry net income including state net income taxes, with heavy tax burdens even when early years’ net incomes were negative, in addition to general excise taxes, based on anonymized industry member surveys (Figure 1). Figure 1: Net income and corporate taxes as proportion of 2021 after-tax income, industry
capitalization relative 20 2018, and investor returns on capital (in percent)
-1.0
-0.5
0.0
0.5
1.0
1.5
Relative to 2021 after-tax net income (2021 = 1.0)
2018 2019 2020 20210
50
100
150
200
0.00%
0.25%
0.50%
0.75%
1.00%
2018 2019 2020 2021
Capital (2018 = 100) (right)Investor returns (%) (left)Pre-tax income
After tax income
Net income tax

3
As financial disclaimers say: past performance is no guarantee of future returns, and observers should be cautious not to conflate initial medical cannabis sales growth for profitability. Rapid early industry growth in the late-2010s dissipated quickly by 2020, and was not sustained through 2021, a year in which industry costs and inflation generally was on the rise. Notwithstanding that dismal outlook, an opportunity remains for policy adjustments which could sustain industry participants’ potential for commercial viability. But as illustrated in Figure 2, below, a mechanical non-linear projection of sales through third quarter 2021 does not bode well. Something has to give, lest this projection play itself out.
Figure 2: Risk that current Hawaii real medical cannabis sales trends might continue
Sources: Hawaii Department of Health, Hawaii Cannabis Industry Association, U.S. Bureau of Labor Statistics
(https://data.bls.gov/cgi-bin/surveymost?r9); quarterly data through 2021Q3.
The medical cannabis industry faces regulatory barriers which inhibit its timely expansion and full exploitation of economies of scale and economies of scope, as noted earlier. These constraints have impaired investor’s ability to position for future returns given the heavy, front-loaded capital formation that was required to acquire licensing, and to establish production and distribution of legal medical cannabis products in Hawaii, also as noted earlier. The regulatory problems arise both from flawed mechanism design (perverse incentives), and from regulatory agency inertia (unresponsive agency). Among the specific regulatory impediments to industry optimization are:
0
2,000
4,000
6,000
8,000
10,000
12,000
14,000
Quarterly Hawaii medical cannabis sales in thousand constant, 2020 dollars
2017 2018 2019 2020 2021 2022 2023
COVID-19
U.S. recession shaded

4
• A moratorium on additional medical cannabis retail locations
• Limitations on numbers of cannabis production facilities (e.g. clusters with buildings enumerated individually rather than as a group)
• Inability to expand cannabis production volume within facilities (numerical caps on
plant counts) • Cumbersome verification of medical identification inserting the Hawaii Department
of Health directly into doctor-patient relationships • Cumbersome reciprocity protocols (inhibiting sales to visiting out-of-state patients)
These regulatory policies not only hinder growth of the legal medical cannabis industry, they impair the legal industry’s intended displacement illegal cannabis sales. They also limit the state tax revenues which could be gathered from legal activity.
Remediation of aspects of state regulation is even more important because of the onerous burden carried by medical cannabis dispensaries under federal tax law. Unlike other industries, the medical cannabis industry is not able to deduct normal business expenses on major portions of the business. While technical in nature, the problem is a general one faced across the country in states which have adopted various forms of cannabis decriminalization. Certain production activities can be operated like other business, with costs of goods sold deducted from gross income in the financial accounting of business net income. But the Internal Revenue Code’s Section 280E prohibits such business deductions when a business is engaged in what under federal law remains trafficking of a controlled substance, distribution rather than production.
A state’s sanction of legal aspects of the production and distribution of cannabis
products—in Hawaii, medical cannabis products—does not pre-empt the federal exclusions. While many production activities in medical cannabis can be treated like other businesses, the distribution aspects of the business such as operating medical cannabis dispensaries are subjected to greater limitations on business expense deductibility. In principle, a business which has no net income or has failed to turn a profit in the industry’s early years may still face a significant federal tax burden through this anomalous exclusion of business cost deductions. Combined federal and state effective tax rates are reportedly as much as two-third to three-quarters of the incomes of those businesses which have begun to generate net incomes for their investors, and may apply when net income is negative. An informal survey of Hawaii medical cannabis industry financial performance suggests that these tax burdens from federal IRS Section 280E are compounded by state regulatory constraints which preclude scaling the industry. These twin impediments are of material concern to Hawaii’s medical cannabis industry participants, encouraging them to develop proposals for legislative and regulatory reform (see Box on next page).

5
Box 1: Industry proposals for regulatory and legislative change
To address this shortcoming of patient access, the Hawaii Cannabis Industry Association (HICIA)proposes a series of policy changes. - HB 2260: 2022 HICIA Omnibus Bill 1) Expand Geographic Access Policy: Increase the allowable number of retail outlets per licensee.
Basis: Such a change would enable patients to avoid traveling long distances to secure theirmedicine. This would increase the number of access points for patients and mitigate reliance onillicit markets in underserved communities. 2) Increase Allowable Production Policy: Increase the amount of allowable production per licensee under the seed-to-sale model.Basis: Increasing production will allow licensed dispensaries to meet current demand anddemand required to transition from the caregiver-grown model that will sunset in 2023.In addition, increasing production will provide downward pressure on pricing and thus enablegreater parity with the illicit market especially for patients who have difficulty affording the cost ofmedical cannabis. 3) Wholesale Transactions Between Licensees Policy: Allow business-to-business relationships among licensees, enabling them to sell to eachother in a wholesale market. Basis: This will establish a supply chain safeguard should an individual licensee’s crop fail orother production disruptions occur. Additionally, this policy change will allow for increasedproduction capacity to meet current patient demand and future demand as the caregiverprogram sunsets.
2022 HICIA Legislative Policy Recommendations

6
Concern that Hawaii’s medical cannabis industry is not fulfilling its designated public policy objective of reaching a patient base and diverting them from the black market is underscored by the State of Hawaii’s official data on registered patients. While patient numbers of grown, levelling off in 2021 at just under 35,000, so-called unique patient encounters are scarcely one-third of that total. As illustrated in Figure 3, these unique encounters also levelled off in 2021. It seems much too early for the industry to be reaching cruising altitude. For unique patient encounters to stall at 13,000 when the black market for cannabis in Hawaii almost certainly is larger than that, and probably with no stall in user growth, is problematic. Estimates based on an informal industry survey designed to populate elements of the production cost structure of Hawaii’s medical cannabis industry, using the transactions framework published in the State of Hawaii’s input-output model, can be combined with industry revenue estimates from sales of medical cannabis products to infer quantitative measures of industry performance. The emphasis here is not on precision, per se. Survey instruments were designed only to be representative. Financial statements of the private companies comprising Hawaii’s medical cannabis industry are not publicly available (but curiously, are collected by the state without any public audited reporting, thus far). With some reasonable assumptions the informal survey estimates of costs and DOH data on revenues can be combined to shed some light on current Hawaii medical cannabis business trends, as illustrated in Figure 4.
• State of Hawaii estimates of revenues were around $44 million in 2020 and around $49-50 million in 2021.
• Costs of intermediate goods and services (inter-industry transactions) comprised an average 44 percent of total industry outlays, and when combined with imports (1 percent), were about 45 percent total cost.
• Compensation represented just over 1/3 of total costs. • Proprietors’ incomes comprised about 2 percent of costs. • Fixed capital outlays on construction of facilities, equipment, and software were
about 1/5 of total costs, and fully 1/4 of total costs in 2021. • Intermediate goods averaged 45 percent and value-added 55 percent of costs. • A net income proxy based on the State’s revenue totals fell from 13 to 4 percent of
total revenue between 2020 and 20201, before taking into account the industry’s unique tax treatment under IRS Section 280E.
Hawaii’s medical cannabis industry has exhausted most of its infant industry momentum and now is at risk of imploding under the weight of tax burdens, having hit the wall of regulatory barriers to growth which pre-empt further exploitation of economies of scale and scope.

7
Figure 3. Hawaii medical cannabis patients exceed patient encounters (underutilization)
Figure 4. Economic decomposition of Hawaii medical cannabis industry inputs: inter-industry transactions, factor payments, estimated industry net income, 2020-2021
Sources: See Figure 2 and Hawaii Department of Business, Economic Development, and Tourism (December
2020), The Hawaii State Input-Output Study: 2017 Benchmark Report. (Differs somewhat from attributions in Figure 9 because of allocation of construction as capital formation outlays here.)
0
5
10
15
20
25
30
35
Thousand Hawaii medical cannabis patients
2018 2019 2020 2021
Total patients
Unique patientencounters
0
10
20
30
40
50
Production costs, revenue, and net income estimates, million current dollars
2020 2021
Net incomeProprietors’ incomes
Compensation
Imported inputs
Intermediate goods/services
Capital outlays

8
2. Four major findings
This paper reviews the economic data characterizing Hawaii’s medical cannabis industry as compiled since August 2017 by the Hawaii Department of Health under its regulatory oversight, and economic data gathered from informal canvasing of Hawaii’s licensed medical cannabis operators. Within four years medical cannabis in Hawaii levelled-off at an estimated $50 million in annual medical cannabis product sales during 2021, and $2.25 million in state General Excise Tax receipts, according to the Hawaii Department of Health. Both represent 12 percent increases during a year marked by uneven tourism and economic recovery, against the backdrop of incomplete vaccination and two COVID-19 variant waves of infection, Delta in the summer and Omicron at year-end.
Hawaii licensees vertically integrate cannabis agricultural production activities with downstream medical products manufacturing and dispensary-based distribution under licensed concessions offered by and monitored by the state. A previous economic analysis of Hawaii’s medical cannabis industry by Aperture Research in early 2020 documented the industry’s regulatory design, its founding characteristics, and some early growing pains, as well as investigating its wider economic impacts in Hawaii.1 The present study updates some of those earlier finding with additional years’ data and renews the look at medical cannabis industry participants’ interindustry relationships in the Hawaii economy, both features of the original industry report.
The report is organized into five sections. • The first part introduced industry perspectives on performance through 2021.
• The second part summarizes four key findings in subsequent sections of the report:
growth, constraints, resilience, and interdependence. • The third part reports on medical cannabis patient growth, with the key finding that
potential patient growth is unrealized, thwarting the objective of migrating cannabis use away from the black market towards the legitimate, regulated market.
• The fourth part reports on medical cannabis sales growth, where the deceleration of
constant-dollar industry sales growth reflects regulatory impediments. • The fifth part of the report documents the industry’s direct, indirect, and induced
economic impacts using a the State of Hawaii’s input-output model.
An appendix reflects on the context of state economic growth, short-term and long-term.
1 Steven Davenport, Ph.D. and Richard Hahn (February 3, 2020), Hawaii’s Medical Cannabis Sector: State of the Market and Economic Impacts, Aperture Research

9
Based on performance trends since the industry was launched in second half 2017, there are four major findings to which this report draws attention: growth, constraints, resilience, and interdependence. Issues raised by industry participants inform further regulatory adjustment and legislative policy-making proposals advanced by the industry (see Box 1 on page 4).
The current industry model is a medical dispensary program, licensed and regulated by the state under the Hawaii Department of Health (DOH). DOH has been slow to mature the program and, after four years of operation, profitability remains elusive for industry participants. Naturally this leads to examination of program restrictions. In retrospect, industry enabling legislation may have raised false expectations. In any event the trade association believes that the correct path forward is not unlike the one pursued initially: gathering stakeholders to hash things out and to make policy adjustments. Concerns persist regarding a variety of regulatory issues, tax structure, and enforcement of illicit activity.
Among structural impediments to more robust industry growth or success are limitations on numbers of allowed dispensaries and locations relative to population concentrations. A general impression is that more locations would relieve some constraints. A corollary challenge is that where medical dispensary locations are not enabled, patients’ sourcing activities tend to go underground. Only one-quarter to one-third of Hawaii’s potential market for medical cannabis services is being captured by legitimate providers, according to the earlier (Aperture) study. While medical cannabis market penetration has probably increased over time, the social benefit of deterring underground economic activity—mitigation of social cost spillovers associated with illicit business—should not be overlooked.
By giving the regulated industry more room to grow, adjustments to “rules-of-the-game” further could enable entrepreneurship. Simultaneously adjustment could make it increasingly feasible for the industry, through sustained profitability, to supplant dependence on external investor capital through organic earnings accumulation. Simple fixes could go a long way, such as adjustments better to align resident population or potential registered patient numbers with licensees and dispensaries, for example, or by giving licensees additional discretion. Because of its challenges, the industry’s early growth successes are fading. Further reform could bring additional economic activity into the light of day of legitimacy from the darker corners of the underground and informal economy where, customarily, they have dwelt.
The four main take-aways of this economic research of Hawaii’s nascent medical cannabis industry are enumerated, below. 2.1 Initial, rapid infant-industry growth now fading
Medical cannabis in Hawaii is hardly a mature industry. It may be approaching sustainable profitability and a move towards longer-term commercial viability, but it is not there yet. It remains an infant industry that quickly has progressed to adolescence with an established, systematic record of patient registration and sales growth. The year 2021 will probably conclude around 34,000 monthly average registered resident patients, up from 20,000 at the end of 2017, and an additional 1,000 out-of-state patients (i.e. patients who register with an out-of-state

10
address). However, only about 13,000 monthly average unique patient encounters were being recorded in 2021. Gross receipts in 2021 could approach $49-50 million, up from $44 million in 2020 and just under $18.2 million in 2018, the first full year of operations. An estimated $2.3 million is associated with 2021 sales through state taxes on gross receipts. Both patient and sales growth increasingly are constrained by regulatory impediments.
Hawaii resident medical cannabis patient growth statewide was 15.1 percent on an annualized monthly basis through September 2021, and 17.5 percent on an annualized basis including valid out-of-state patients. Year-over-year increases in the first nine months of 2021 were of similar magnitude statewide: 14.4 percent growth in resident patients, and 15.5 percent including out-of-state patients. Average statewide annual patient growth has remained relative steady, staying in 2021 at the upper end of the range established in 2018 (16 percent), 2019 (15 percent), and 2020 (13 percent), but with its much larger population Oahu patient growth has averaged 4-5 times the rate of annual increase on the Neighbor Islands.2 This imbalance was not obviously anticipated in the state’s regulatory design for the industry.
An infant industry should have rapid growth in its initial years of formation as its introduction induces “onboarding” from the underground market. Over time, industry sales growth should gradually decelerate, still positive but not growing as fast, as operations mature and the market becomes more well-defined. When fully saturated—when industry capacity has exhausted its potential for above-average growth—sales performance should settle into patterns commonly observed in the aggregate economy. In Hawaii’s case, annual growth of real gross domestic product was about 1.9 percent per annum during the 2010s, pre-pandemic. Annual growth of nominal gross domestic product of about 4.1 percent per annum characterized Hawaii during the 2010s.3 Compare the nominal growth rate of Hawaii gross product, 4 percent, to the 110 percent growth rate of (nominal) medical cannabis sales in Hawaii during 2019, the first year for which full-year sales comparisons are available (2019 over 2018). Medical cannabis sales during 2020 grew at 68 percent, in nominal terms. Nominal medical cannabis sales rose an estimated 12 percent in 2021. The industry gradually is maturing; it also may be constrained by regulatory design.
2 Oahu’s resident population is more than twice that of the Neighbor Islands combined. Oahu and Neighbor Isle pre-pandemic average daily visitor census estimates—together a de facto population when combined with residents—were roughly equivalent. Tourism is larger on the Neighbor Islands, but Oahu’s economy is still between two-thirds and three-quarters of the state’s total. 3 Constant-dollar Hawaii real GDP in 2019 was $83.509 billion, and in 2009 was $69.095 billion (in chained 2012 dollars). The 2010s compound annual real growth rate �̂�𝑅𝑒𝑎𝑙 = [𝑒𝑥𝑝(0.1(𝑙𝑛(83.509) − 𝑙𝑛(69.095)) − 1)] ∙ 100 =1.9 percent. Hawaii nominal GDP in 2019 was $97.282 billion, and in 2009 was $65.692 billion (in current dollars). The 2010s compound annual nominal growth rate �̂�𝑁𝑜𝑚𝑖𝑛𝑎𝑙 = [𝑒𝑥𝑝(0.1(𝑙𝑛(97.282) − 𝑙𝑛(65.692)) − 1)] ∙ 100 =4.0 percent. The real and nominal growth estimates are consistent with about 2 percent annual inflation, 2009-2019. See U.S. Bureau of Economic Analysis (https://www.bea.gov/data/gdp/gdp-state).

11
2.2 Capacity constraints are binding
While Hawaii medical cannabis sales growth may have been dampened by the SARS-Cov-2 coronavirus and the sharp, short recession in 2020, followed by an uneven (Hawaii) recovery in 2021, deceleration of Hawaii medical cannabis sales from 110 percent to 68 percent to 12 percent over three years, 2019-2021, also is consistent with industry maturation following an explosive launch. If so, the deceleration is sharp enough—given that patient volumes have grown more steadily—that disentangling its causal factors might be fruitful. Quantifying the portion of the growth slowdown attributable to industry maturation from the portion attributable to recession/recovery under pandemic conditions, and the portion attributable to capacity constraints, would be useful. Unfortunately, the data may not provide enough information to distinguish between the quantitative impacts of these possible causal factors.
Some mix of industry maturation and increasingly binding regulatory constraints most likely explains the medical cannabis sales growth slowdown. Pandemic-induced economic recession in 2020, including 6-7 months of tourism near-shutdown under quarantine protocols, seem unlikely to have been associated with 68 percent growth in medical cannabis sales when the very next year, with genuine economic recovery, the sales growth rate was only 12 percent. Qualitatively, a maturing medical cannabis industry and the possibility of inadequate bandwidth because of regulatory constraints seem most likely to have been operative.
A thought experiment is instructive: suppose that entry was not regulated. Suppose that
regulation focused only on certification, like safety certification in commercial passenger aviation. Then suppose that entry by certified operator was enabled, as in commercial passenger aviation. That is, suppose certified operators were free to enter and exit the industry. Would the deceleration of statewide annual medical cannabis sales growth from 110 percent to 68 percent to 12 percent, 2019-2021, be just as dramatic?4 For example, knowing that Oahu registered patient
4 Measured in terms of weight, total Hawaii medical cannabis sales grew from 1,570 pounds in 2018, the first full year of industry operation, to 3,768 pounds in 2019, and to 5,852 pounds in 2020, substantial annual increases. In terms of year-over-year percent changes, the growth rates were 140 percent (2019), 55 percent (2020), and 10 percent (2021, based on January-September totals). During the 12 months ending in September 2021, sales weight was 6,278 pounds, up from 5,475 pounds in the 12 months ending in September 2020, a 15 percent increase. That is, the same deceleration observed in medical cannabis sales revenue growth is evident in volumes. Moreover, if you divide annual total medical cannabis sales in dollars by annual weight, the resulting unit cost estimate offers additional insight. During these years the unit costs of medical cannabis sales in Hawaii were: $7,961/lb. 2017 $8,048 2018 $7,025 2019 $7,505 2020 $8,752 2021 (12 months ending Sep. 2020, compared to $7,423 in 12 months ending Sep. 2020) Unit costs fell from around $8,000 per pound to $7,000 per pound during the early phase of industry entry and rapid growth when regulatory capacity constraints presumably were not binding. But unit costs rose sharply—by 7 percent in 2020 and by 18 percent in 2021—as growth in sales volumes slowed. Rising unit costs are a classic sign of binding capacity constraints: demand outstripping supply. Indeed, as elsewhere in the post-pandemic economy, we might say that supply-chain disruptions caused medical cannabis unit costs to jump in 2021, just as container shipment costs or used and new motor vehicle costs jumped. Empty containers piled up on the wrong side of the ocean, or a lack of semiconductors to complete otherwise assembled new vehicles—causing demand to spill over

12
counts grew 4.7 times as fast as registered patients on the Neighbor Islands, 2019-2020, does it seem plausible that Oahu’s medical cannabis market was more likely to be limited by the demand side of the market (patients), or limited by the supply side of the market?
Supply constraints on the industry’s ability to expand, if originating in regulatory barriers to entry, or restrictions on scale and scope, would help explain the sharp deceleration of medical cannabis sales receipts and sales volumes (see footnote 4), beyond the expected slowdown as the industry matures and given the mixed economic performance of Hawaii’s economy during the same years. At the same time, regulatory constraints on supply would explain why sales receipt and volume growth rates are declining, while unit prices are rising: continued growth in market demand, represented by steady increase in registered patients, is clashing with restrictions on the ability of supply to keep up. More demand + constrained supply could explain the sudden, 15-18 percent increase in 2021 Hawaii medical cannabis unit prices following the cumulative decrease in unit prices, 2017-2020 (again, see footnote 4).
One possible supply constraint embedded in the structure of medical cannabis industry regulation could be regulatory restrictions in large markets (Oahu with a 1 million population versus Kauai with 70,000). Another constraint could be the interaction of regulation with geographic idiosyncrasy. On the Big Island with only two conurbations, Hilo Census-Designated-Place (CDP) population 44,000, and Kailua(-Kona) CDP population 41,000, both comprise less than half the entire island’s population. The remainder of the population inhabits a geographic area larger than all the other Hawaiian Islands’ land masses combined. Other constraints include limitations on facility dimensions (footprint), heights, or locations limiting agricultural production (growing), manufacturing (processing), or distribution (dispensaries).
The economic problem potentially imposed by such constraints has two aspects, one involving the microeconomics of production, and the other involving industrial organization. Some constraints might inhibit individual firms from optimizing production. Other constraints might render the industry insufficiently contestable.
A firm enjoys decreasing long-run average cost when it can replace smaller production facilities with larger ones and decrease unit costs of production. Lower average costs support lower prices in the presence of vigorous rivalry between industry participants. Contestable pricing can approximate theoretically-efficient competitive pricing. Even the credible threat of entry can support contestable prices. Contestability also arises from persistence of the black market in illegal cannabis sales. Prices also are influenced by the regulatory regime.
Economies of scale arise when increasing the size of an operation—the footprint or height of a greenhouse, for example—raises output proportionately by more than the
into used vehicle prices—sound a lot like regulatory constraints binding medical cannabis production and distribution. In 2021, rising unit costs were inconsistent with Hawaii’s weak economic recovery (the weakest of all U.S. states). Hawaii medical cannabis units costs increased at more than 3 times the contemporaneous mid-2021 rise in consumer price inflation, 5.0 percent in September 2021, 5.4 percent in November 2021, for the Urban Hawaii CPI-U (https://data.bls.gov/cgi-bin/surveymost?r9), up from 1.6 percent Hawaii inflation in 2019 and 2020, and only 1.8 percent as late as March 2021). On the surface, there would seem to be little reason to blame international supply chain and logistics disruptions, arising during global pandemic recovery and notorious in 2021, for rising unit costs in a home-grown medical cannabis industry with a captive onshore market in Hawaii.

13
proportionate increase in facility size and associated productive factors’ costs, such as those of workers and equipment. If inputs double in size but production increases by more than double, unit production costs decline. These increasing returns to scale often are revealed during early phases of an industry’s development through learning-by-doing, as firms build out. Early-entrant firms learn to optimize in multiple dimensions, fine-tuning their processes and procedures to settle on their most efficient configurations. A regulatory environment which inhibits this optimization risks thwarting the experimentation which ultimately fuels the processes of innovation and entrepreneurship generally.
Economies of scope, left unexploited, also may lead to higher production cost than necessary, and lower efficiency than is socially desirable. The mix of Hawaii medical cannabis products’ sales already has evolved within a few years in a manner suggesting that firms have identified economies of scope. Average cost can decline by producing a variety of outputs, a wider range of outputs, or by concentrating on a narrow but varied range of outputs after learning that some outputs are not worth the effort producing. Some product variation or differentiation may be spurious and socially wasteful, designed to enhance market power of producers of the differentiated product. But some product differentiation satisfies heterogeneous consumer preferences, enhancing welfare. Hawaii medical cannabis sales were dominated by usable products, more than half (53.9 percent) during third quarter 2021. At the same time, vaping extracts (35.4 percent) also enjoyed substantive popularity. Various edibles (5.8 percent) were not unpopular. Understandably, regulation initially might best be oriented towards control over supply, but over time as the industry matures, an emphasis on flexibility might better serve the public interest as demand grows and consumer preferences diversify.
To the extent that slower medical cannabis industry growth is an artifact of regulatory constraints it might be wise for jurisdictions to revisit their mechanism design. Relying on industry participants’ learned experiences, regulatory reform or revision can prevent the industry’s economic potential from being truncated unduly. As now configured, the State of Hawaii, varying across counties, has established non-collusive medical cannabis oligopoly, duopoly, or monopoly. This is a not uncommon approach to industry formation and development in Hawaii, for the state to limit franchises to short lists of designees. The state should now consider regulatory reform with an eye towards scaling and contestability. It would be surprising, given the industry’s rapid initial growth, if its recent deceleration were a function of demand having been saturated: supply is constrained. Slowing growth suggests that legislative and regulatory omniscience—getting it exactly right on the first try—remains elusive.
From a public policy perspective, it also would be worth remembering that the public interest ultimately is rooted in the objective of reducing social costs of the underground economy in black market cannabis sales. These are the unintended but uncompensated costs of criminalization of economic activity which could be regularized. If Hawaii is serious about not having criminals in charge of medical cannabis production or distribution, then it should confirm, revisiting with stakeholders, that its design of the regulated medical cannabis industry is ideally configured to patients’ requirements and to Hawaii’s economic development aspirations.

14
2.3 Resilience in the face of a macroeconomic/biological shock
Resilience in the presence of a major biological event, the SARS-CoV-2 pandemic explosion worldwide of the disease COVID-19 is a clear takeaway from Hawaii medical cannabis industry data for 2020 and 2021. There is no economic disruption to Hawaii since the Second World War with as dramatic an impact on real GDP growth as has been global covid pandemic. Initially, in 2020Q2, the pandemic produced a sudden stop in economic activity. Real GDP fell by 15 percent in 2020Q2, contemporaneous to the U.S. recession from February-April 2020. Economic recovery was almost as rapid, V-shaped, with real Hawaii GDP returning to about 93 percent of its pre-Covid level by mid-2021. (See Appendix 1.)
Hawaii medical cannabis sales continued growing without any obvious reaction to the
pandemic or to the macroeconomic disruption it generated. Steady sales growth and patient registration growth both continued. The resulting comparison is stark: a resilient, if emerging medical cannabis industry against the backdrop of a macroeconomy temporarily, but suddenly unraveling. Only military demobilization following World War II was worse for the Hawaii economy than the covid pandemic. Yet, medical cannabis sales in Hawaii climbed steadily and gradually approached a plateau-like summit without interruption in the pandemic years 2020 and 2021. Major portions of the Hawaii economy suffered from pandemic suppression of travel and tourism. But even those Hawaii industries not primarily exposed through tourism to pandemic recession, and even in states where tourism was a minor economic activity, the pandemic induced significant economic downturns. In Hawaii, neither in construction, nor (maybe obviously) in health services and, as it turned out, not in the Hawaii medical cannabis industry, did the pandemic decrease revenues. Fifty thousand persons in Hawaii employed in winter 2020 still were not employed at the end 2021. Medical cannabis sales in September 2021 were 150 percent higher than in February 2020.
2.4 Interdependence with other Hawaii economic activities
A final attribute of Hawaii’s medical cannabis industry, its interdependence with other industry and economic activity in Hawaii, is exploited in the fifth section of this report to quantify some of the industry’s economy-wide impacts. Like other industries, medical cannabis sources intermediate inputs from other industries, just under half of its input requirement, with just over half comprising industry value-added from labor and capital. Hawaii medical cannabis imports are tiny, so virtually all interindustry industry impacts are local. Medical cannabis is a final consumption-oriented industry, but the composition of its output is heavily oriented towards several unbundled economic activities: agricultural activity (about one-third of the total), construction (still building productive capacity, about one-quarter of the total), and a mix of distribution and services (each around one-eighth) and manufacturing (one-tenth), among others. Principally by sourcing from other industries, but also by itself comprising a basket of individual industrial activities, and because of extremely low imported inputs, the medical cannabis industry is a well-embedded and deeply-integrated new sector of Hawaii’s economy.

15
3. Patient counts
Average monthly patient counts through 2021 experienced decelerating annualized rates of increase to level off towards year-end. Registered patient growth also may be slowing because of regulatory impediments to the medical cannabis industry’s reach, defeating the regulated industry’s objective of displacing underground, unregulated, illegal activity. Unique patient counts were scarcely one-third of the registered patient total in 2021.
Beginning in fourth quarter 2018, continuous monthly enumerations of registered patients
and were tabulated by the State of Hawaii Department of Health from licensees to accompany data on patient encounters (a proxy for sales velocity) gathered at monthly frequency. Beginning in 2020, enumerations were augmented by out-of-state patient totals (comprising less than 0.9 percent of all patients, in-state and out-of-state). Patient growth was rapid but also volatile in the industry’s formative years, partly because of the lumpiness of patient access implied by discrete opening times of licensees and premises. By 2020—with the exception of COVID-19 pandemic effects—patient numbers exhibited annual growth of 10-20 percent per annum, taken as a group. Overall patient growth rates settled to high single-digits on the Neighbor Islands, with wide annual variation. Patient growth began to dissipate in 2021 (Figure 5).
• Full-year Oahu patient growth opened at nearly 9,000 registered in 2018 from the partial-year data for 2017, rising 37 percent in the first full year. Thereafter, annual patient numbers on Oahu grew at 23 percent in 2019, 24 percent in 2020, and at an annualized rate of 15.1 percent during the first three quarters of 2021 to a monthly average just under 15,700 year-to-date through September, slowing after mid-year to nil.
• Neighbor Island patient counts rose at 5.3 percent in 2018, 9.7 percent in 2019, a 4.7 percent rate in 2020. Counts rose at a 15.0 percent annualized growth rate during the first three quarters of 2021 to monthly averages stalling out around 18,000 after mid-year. Annualized growth rates were most rapid on Hawaii Island (17.9 percent), followed by Maui (14.2 percent) and Kauai (7.3 percent), but all petered out after mid-year.
• The fact that patient counts on the Neighbor Islands exceed those on Oahu is notable: Oahu’s population is more than twice (2.2) times that of the Neighbor Islands combined.5
• Unique patient counts amounted to less 40 percent of total valid patient counts (or total encounters) from 2018-2021. Fewer than half of registered patients are utilizing medical cannabis dispensaries, implying persistence of unregulated black market activity. Potential numbers of registered patients are much larger than shown in Table 1.
5 Based on intercensal estimates to be revised upon release by the U.S. Bureau of the Census of decennial census estimates in 2022, the resident population of Oahu in 2020 was 983,826 persons while the resident population of the Neighbor Islands was 443,180 persons. By statute, however, medical cannabis licenses are not allocated by the Hawaii Department of Health on a per capita basis either with respect to county resident populations nor patient counts, as there are three times as many licensees operating on the Neighbor Islands as there are on Oahu, by design. See Hawaii Department of Business, Economic Development and Tourism (https://files.hawaii.gov/dbedt/census/popestimate/2020_state_pop_hi/co-est2020-alldata.xlsx).

16
• Registered patient annual growth rates in the individual Neighbor Island counties varied from year to year and county to county, as suggested by the table below: Table 1. Annual growth rates of registered patients by county
• Statewide registered patient growth rates smooth out county-specific variation since
industry inception in 2017. Total patient growth statewide settled from 16 percent in 2018, to 15 percent in 2019, to 13 percent in 2020, and recorded 14 percent annualized growth during the first three quarters of 2021, excluding out-of-state patients, stalling over the summer. To sustain steady patient growth and substantively to displace unregulated cannabis sales will require significant regulatory relief.
Figure 5: Monthly registered medical cannabis patients in Hawaii
Source: Hawaii Department of Health (special correspondence)
percent 2018 2019 2020 2021*Avg. patients
2021 YTD
Oahu Patients 36.6 23.1 23.7 15.1 15,693Hawaii Patients -9.0 22.0 -0.4 17.9 8,608Maui Patients 27.3 -2.0 9.0 14.2 6,470Kauai Patients 5.9 4.2 12.4 7.3 2,343
*Annualized growth rate, January-September
0
5
10
15
20
25
30
35
Thousand registered patients
2018 2019 2020 2021 2022
2.4 Kauai
6.7 Maui County
9.0 Hawaii County
16.3 Oahu
COVID-19
U.S. recession shaded

17
The picture is one of robust growth in patient counts, slowing as the industry matures, imbalances relative to underlying county populations, and binding regulatory constraints in need of relief. Overall, patient counts grew during covid but stalled in mid-2021. 4. Sales trends
The market valuation of the medical cannabis industry’s economic activity in Hawaii can be summarized from a top-down perspective by examining sales performance during the last several years. As the industry evolves from adolescence to maturity in its current regulatory configuration, sales data validate lessons drawn from complementary data on registered patient counts on production and distribution capacity. Ultimately, returns on investors’ commitments, and the industry’s contributions to the economy by displacing black market activity, are rooted in the path of medical cannabis sales. Regulatory constraints are impeding that path to fulfilment.
Before turning to this analysis, it is worth recalling aspects of the industry’s rough start documented in the earlier industry economic review by Aperture Research.6 Though legislatively authorized in 2000, Hawaii’s Medical Cannabis Patient Registration Program (MCRP) took many years to evolve towards commercial production and distribution, and was originally organized around personal cultivation, or in conjunction with caregiving arrangements.7 The market for medical cannabis was established in mid-2015, with producer applications processed early in 2016.8 Approved dispensaries were introduced in 2017, following regulatory implementation delays regarding seed-to-sale tracking and testing programs to monitor dispensary activity, and customary complications associated with establishment of de novo production and distribution facilities.
Medical cannabis dispensary sales commenced in August 2017 and ramped up over several months. The current analysis was able to identify origins of a continuous sales growth trajectory slightly later in the industry’s first season, beginning with November 2017 data, converging to an early-2020s steady-state. Monthly data in this sales analysis are reported continuously from November 2017 through August or September 2021 as published by the Hawaii Department of Health and acquired through special correspondence with the Hawaii Cannabis Industry Association. Where possible data are also analyzed for complete quarters within that monthly data set (i.e. 2018Q1-2021Q2). Monthly data are seasonally adjusted using the Census Bureau’s X-13 filter. Quarterly data then are aggregated up from the seasonally adjusted monthly data. Constant-dollar estimates are deflated from the quarterly data using an interpolated Urban Hawaii Consumer Price Index for All Urban Consumers.
6 Davenport and Hahn, Aperture Research (2020) see footnote 1. 7 HRS Part IX Chapter 329. Davenport and Hahn (2020), op. cit. 8 “Effective January 1, 2015, Hawaii’s Medical Use of Cannabis Program was transferred from the Department of Public Safety to the Department of Health, pursuant to Act 177. Act 178 amends sections of Chapter 329, Hawaii Revised Statutes [HRS] Part IX, and provides for the medical use of cannabis. On July 14, 2015, Act 241 was signed into law, codified as Chapter 329D HRS. Medical Cannabis Dispensary Program (https://health.hawaii.gov/medicalcannabisdispensary/).

18
Figure 6. Monthly nominal Hawaii medical cannabis sales trend and seasonal adjustment
Figure 7. Quarterly real—inflation-adjusted—Hawaii medical cannabis sales (logs and levels)
Sources: Hawaii Department of Health, Hawaii Cannabis Industry Association, U.S. Bureau of Labor Statistics
(https://data.bls.gov/cgi-bin/surveymost?r9). Figure 6 monthly data through August 2021. Figure 7 quarterly data through 2021Q3 (including September). Nonlinear regression by TZE.
While sales have been rising steadily since industry inception, early rapid growth represents an infant industry proceeding to adolescence, with a gradual deceleration of sales growth approaching maturity and because of regulatory limitations. Both phenomena now are apparent with only a few years of industry observation. Sales grew robustly as the industry launched late in 2017, after inflation adjustment, but even in nominal terms sales volumes began decelerating by 2019. Seasonal variation in the data is corrected. Monthly, seasonally-adjusted sales volumes in 2020 and 2021(through August) exhibited a slowdown in trend rates of increase, as illustrated in the right panel of Figure 6, mapping the trend through seasonally-
0
1,000
2,000
3,000
4,000
5,000
2018 2019 2020 2021
Actual data
0
1,000
2,000
3,000
4,000
5,000
2018 2019 2020 2021
Seasonally adjustedNonlinear trend
Monthly, thousand dollars, as noted
Seasonally adjusted
0
2,000
4,000
6,000
8,000
10,000
12,000
14,000
Quarterly, thousand current dollars (in levels)
2018 2019 2020 2021
Real sales, s.a.Real trend 2 standard errors
Quarterly, thousand constant 2020 dollars(log scale)
10,0008,0006,000
4,0003,000
2,000
1,0002018 2019 2020 2021
Trend (dashed)Actual (solid curve)

19
adjusted sales data. The COVID-19 pandemic context for this deceleration in sales growth was a relevant backdrop. As it turns out, the pandemic did not affect materially medical cannabis industry growth the way it produced a Sudden Stop in the overall economy (see Appendix 1). This suggests that other impediments to expansion, such as regulation, may bind.
After deflating sales data, the smooth curvature of the trend deceleration is clear in the
left panel of Figure 7. The pattern in the data suggests that medical cannabis users’ demand was not responsive to the business cycle generally, at that time. In the case of the brief but severe recession associated with onset of the pandemic in the U.S., no obvious response to macroeconomic fluctuation appears in the left panel of Figure 7, where slopes are percent changes. Likewise, in the right panel of Figure 7, where data are depicted in levels rather than natural logarithms, the slowdown mirrors the one in the right panel of Figure 6: both are in levels rather than logs.
There was no obvious break in medical cannabis sales associated with onset of the
pandemic in Hawaii in March 2020. Three rounds of federal fiscal stimulus and relief spending between March 2020 and March 2021 also had no apparent impact, as with other consumer purchases (e.g. motor vehicles). Medical cannabis sales in Hawaii, in real, inflation-adjusted terms, were decelerating over time but were resilient when confronted by a massive economic shock. The same cannot be said of Hawaii real GDP, as in Figure 8, below. Figure 8. Quarterly real Hawaii medical cannabis sales were resilient, real Hawaii GDP was not
Sources: Hawaii Department of Health, Hawaii Cannabis Industry Association, U.S. Bureau of Labor Statistics
(https://data.bls.gov/cgi-bin/surveymost?r9), U.S. Bureau of Economic Analysis (https://www.bea.gov/data/gdp/gdp-state), business cycle dates from National Bureau of Economic Research (https://www.nber.org/research/data/us-business-cycle-expansions-and-contractions).
Index (2017Q3 = 100) (log scale)
100
96
92
88
84
80
Thousand constant 202$ (log scale)
10,000 8,000
6,000 5,000 4,000
3,000
2,000
1,000 2017 2018 2019 2020 2021
Real GDP(left scale)
Real M.C. sales(right scale)
COVID-19
U.S. recession shaded

20
Cracks in the mostly smooth time series of monthly and quarterly sales of medical cannabis in Hawaii appear in late-2020. Substantial variation in sales appear in winter and spring 2021 at a time when Hawaii COVID-19 morbidity was low, just as COVID-19 vaccination was ramping up in Hawaii. The surge in Hawaii COVID-19 morbidity and mortality from July through October 2021, during the Delta wave, is not fully covered by the medical cannabis sales data here, through third quarter 2020. All data precede the Omicron wave. Still, neither major macroeconomic turning points nor extraordinary biological shocks appear significantly to have displaced the growth path of Hawaii medical cannabis sales through 2021.9 Figure 9: Neither biological nor macroeconomic shocks dislodged medical cannabis sales
Sources: Hawaii Department of Health, Hawaii Cannabis Industry Association, U.S. Bureau of Labor Statistics
(https://data.bls.gov/cgi-bin/surveymost?r9), Johns Hopkins University (https://raw.githubusercontent.com/CSSEGISandData/COVID-19/master/csse_covid_19_data/csse_covid_19_time_series/time_series_covid19_confirmed_US.csv), Hawaii Department of Business, Economic Development, and Tourism (http://dbedt.hawaii.gov/visitor/daily-passenger-counts/); nonlinear regression by TZE.
This analysis infers that the slowdown in medical cannabis sales, as a general matter, is idiosyncratic to the industry rather than predominantly influenced by systemic, macroeconomic factors. A portion of the deceleration in real medical cannabis sales broadly may be associated with pandemic disruption and job loss, but real medical cannabis sales already were decelerating, pre-covid, continuing throughout the pandemic along the same, flattening path. If attribution is to be shared between macro and micro factors, then macro and covid factors are of secondary importance. Microeconomic factors like the possibility of an unintentional, de facto regulatory cap on industry size and sales, suggest that legislative re-examination is warranted.
9 A variety of simple econometrics tests, including tests for causality (Granger Causality), and tests for structural breaks in the sales data time series (Chow Tests), or for reactions to contemporaneous impulses such as the statewide economic lockdown late in March 2020, are not validated statistically: sales march to their own beat.
0
2,000
4,000
6,000
8,000
10,000
12,000
14,000
Quarterly real sales (thous. 2020$)
0
50
100
150
200
250
300
Average new COVID-19 daily cases/million persons
2018 2019 2020 20210
2,000
4,000
6,000
8,000
10,000
12,000
14,000
Quarterly real sales (thous. 2020$)
0
5
10
15
20
25
Average daily airpassengers (000)
2018 2019 2020 2021
Hawaii COVID-19
morbidity(right)
Passengerarrivals
(right)
Medical cannabis sales (left scale)
Medical cannabis sales (left scale)

21
Neither the brief but sharp recession in economic activity nationwide associated with the COVID-19 outbreak in America from February through April 2020, nor the more general pattern of slower than national average economic growth in Hawaii during the late 20-teens, nor the virtually unnoticed, pre-Covid decline in Hawaii real GDP from late 2018 through mid-2019, a recession specific to Hawaii, are obvious factors in contemporaneous medical cannabis sales. Rather, the following features of real Hawaii medical cannabis sales from the fall of 2017 through the fall of 2021 are the salient takeaways:
1. Real Hawaii medical cannabis sales grew at rapid rates following licensee’s initial roll-out in third quarter 2017, gradually slowing to zero by third quarter 2021.10
2. Real sales growth decelerated in a manner consistent with industry maturation, but also
suggesting that industry regulatory capacity constraints are binding.
3. Medical cannabis sales exhibited notable resilience in the face of an historic biological and macroeconomic shock to the Hawaii economy from the COVID-19 pandemic.
A rapid start, decelerating real medical cannabis sales growth, and marked resilience all are features consistent with an infant industry maturing to adolescence, but suggestive of binding regulatory constraints. Constraints may be pre-empting industry scalability. Economic inefficiencies from the inability fully to exploit economies of scale and economies of scope may be hardening. Inefficiency relative to potential county market sizes may also exist. Spatial and geographic distinctions between counties may make one-size-fits-all regulatory parameters unsuitable economic mechanism designs. Contrasts between conurbations, such as the Honolulu or the Kahului-Wailuku-Lahaina Metropolitan Statistical Areas, and the more dispersed rural geographies of Kauai and the much larger Big Island, all are distinctive. Finally, flattening sales growth in 2021 is inconsistent with economy-wide recovery from the pandemic, underscoring the need for regulatory relief.
Contemplation of regulatory design tailored to county characteristics may be fruitful.
Current regulatory design may perpetuate an excessively large and persistent underground economy of informal, unregulated cannabis production and distribution, one with recognized negative spillover costs to society. More flexibility for licensees to respond to varying local economic conditions in each county, to distinct geographies and unique conurbations, can restore the growth in registered patients, regulated sales, and displacement of black market economic activity that the Hawaii medical cannabis industry’s original enabling legislation set out as a framing objective.
10 Specifically, after seasonal adjustment and adjustment for Urban Hawaii inflation, quarterly annualized real Hawaii medical cannabis sales growth decelerated from 197 percent in 2017Q4 to 126 percent in 2018Q4, 73 percent in 2019Q4, 32 percent in 2020Q4, and 8 percent in 2021Q3, based on a nonlinear regression of the natural log of real Hawaii medical cannabis sales on time (in quarters). The corresponding quarterly log changes were 0.272 (2017Q4), 0.2024 (2018Q4), 0.137 (2019Q4), 0.069 (2020Q4), and 0.018 (2021Q3).

22
5. Hawaii medical cannabis industry economic impacts
This section of the report uses the state’s input-output (I-O) model to quantify the industry’s direct and indirect (Type 1) economic impacts, along induced (Type2) economic impacts, through backward and forward linkages to other industries and to final demand. The estimates draw on the State of Hawaii Department of Business, Economic Development, and Tourism (DBEDT) published and recently updated input-output model for Hawaii.11 The model is the most up-to-date framework for I-O analysis calibrated to Hawaii’s interindustry and economic structure, published at the end of 2020 using the most recent U.S. Census of Industry data for calibration. The DBEDT I-O model incorporates rates of labor-saving technological progress and productivity growth in its calibration of job multipliers, and the other input-output multipliers all are calibrated to current industry structure.
5.1 Input-output multiplier effects Like other industries, Hawaii’s medical cannabis industry sources intermediate inputs from other industries as well as from its own factors of production (labor and capital). This sets up one source of industry interdependence, through so-called backward linkages. Economic activity in the industry itself is not unlike distinctive industries’ activities bundled together—agriculture, manufacturing, and distribution, for example. As a final consumption-oriented industry, forward linkages to other industries may not be as significant in medical cannabis as in other industry settings, but induced economic activity provides an additional channel for impacts. Induced activity arises from earnings associated with the industry (and related industry). These channels collectively provide a basis for estimating direct, indirect, and induced economic impacts arising from the industry’s final sales, estimated to be about $50 million in 2021. The state’s input-output model provides the quantitative framework for estimating these conventional impacts through the applications of multipliers which summarize direct and indirect effects, and then augment with induced effects. Calibration of the interindustry interdependencies exhibited by Hawaii’s medical cannabis industry was facilitated by an anonymized industry survey designed to yield aggregate industry characteristics from varying patterns of individual firms. The resulting economic impacts are itemized below, based on a $49.7 million medical cannabis sales estimate for 2021. Type 1 economic impacts: direct and indirect effects
• $70.8 million in aggregate output
• $22.3 million in workers’ earnings
• $3.3 million in total state tax receipts
11 Research and Economic Analysis Division, Hawaii Department of Business, Economic Development, and Tourism (DBEDT) (December 2020), “The Hawaii State Input-Output Study: 2017 Benchmark Report,” (http://dbedt.hawaii.gov/economic/reports_studies/2017-io/).

23
• 621 jobs.
Type 2 economic impacts: direct, indirect, and induced effects
• $99.3 million in aggregate output
• $30.1 million in workers’ earnings
• $4.7 million in total state tax receipts
• 781 jobs.
The state’s input-output model is designed to incorporate effects of labor-saving technological progress in the employment impact estimates. 5.2 Evolving economic profiles To calibrate the industry’s characteristics and enable application of the state’s input-output model for estimation of economic impacts of Hawaii’s medical cannabis industry, informal surveys among industry participants were undertaken. These survey data from licensed operators provide useful insight on two facets of the industry that inform the economic impact analysis.
• One angle provides a view from the perspective of industry outlays on intermediate inputs purchases from other industries, and on aspects of firms’ own values-added through payments to factors of production: compensation of employees, proprietors’ income, capital costs, and production taxes.
• The other angle provides a view from the perspective of the industry’s final sales to consumers, corresponding informally with the idea that economic activities viewed through consumers’ purchases of medical cannabis comprise bundles of several distinct economic activities such as agriculture, manufacturing, and retail distribution.
The Hawaii Cannabis Industry Association facilitated making anonymous survey instruments available to all licensed operators from which information could be aggregated about the overall industry. The survey was a comparatively informal exercise. One would not attach as much precision to these survey results as might be expected in those found in the 2017 Economic Census for Hawaii,12 but the results remain instructive.
12 See U.S. Bureau of the Census (https://www.census.gov/programs-surveys/economic-census.html) and Hawaii DBEDT (https://census.hawaii.gov/economic-census/econo2017/).

24
From the cross-section of input costs, including purchases from suppliers, and from sales of out to final consumers, the familiar name of “input-output” models is derived. The matrix formed by looking at the industry from these two “right angles”—inputs and outputs—provides a mapping of interindustry relationships forming a basis for the economic impacts estimated in the previous section of this report. In this section details from these two industry angles are discussed in greater detail. These details form a picture of the medical cannabis industry’s structure that may be of interest to investors, consumers, and to decision-makers responsible for regulatory and other governance mechanisms.
Viewed from the perspective of medical cannabis industry outlays, the picture formed is
an industrial sector constituting 44 percent value-added, 55 percent interindustry purchases, and just 1 percent imports. The latter is of particular interest, literally a reflection of the “home-grown” status of Hawaii’s industry. It’s more than that: part of the legislative intent in establishing a medical cannabis industry in Hawaii was to offer legitimate alternatives to a black market comprising everything from home-grown to criminal enterprise-originating marijuana associated with well-known social costs. If the medical cannabis industry can thrive and scale-upward, drawing patients away from the black market and withdrawing support for criminal enterprise, benefits of legitimate economic activity and reduction in social costs associated with the black market will be generated. In addition, survey data suggesting that only 1 percent of industry outlays comprise direct imports mean that 99 percent of outlays are essentially local, and legitimate. The economy is more complex than this, of course. Imports are not a bad thing, per se. They represent access to lower-cost goods and services from outside Hawaii. But when imports represent offshore venting of onshore demand which could be satisfied competitively with home production, the interindustry benefits of that production are propagated locally. Many industries in Hawaii have higher import components, dampening their economic contributions.13
The 44 percent of Hawaii medical cannabis industry outlays comprising value-added
constitute purchases of labor and capital services. As is commonplace, employee compensation in the medical cannabis industry—about one-third of total industry outlays—comprises three-quarters of industry value-added (77 percent). Capital outlays comprise an additional 18 percent of value-added. Proprietors’ incomes comprise 5.5 percent of value-added. The overall distribution of firm outlays is illustrated in Figure 10.
13 In Hawaii, imports comprise more than 15 percent of output in such industries as agriculture (16.2 percent), construction (15.6), food services (14.1), food processing (23.4), information (19.7), and other manufacturing (61.9 percent) (Hawaii DBEDT (http://dbedt.hawaii.gov/economic/reports_studies/2017-io/)).

25
Figure 10. Representative Hawaii medical cannabis firm outlay shares: purchases, factor payments, and imported inputs (construction purchases included in interindustry component)
Within the interindustry portion of representative Hawaii medical cannabis firms’ outlays illustrated in Figure 10, the distribution of purchases also can be broken down across outsourced goods and services from other industries. Figure 11 (below) illustrates the representative pattern of purchases from those suppliers using conventional NAICS industry definitions. Medical cannabis firms rely on a diverse array of suppliers from other Hawaii industries for their intermediate inputs, a testimony to the interdependence through these so-called backward linkages of medical cannabis with the rest of the Hawaii economy. Among the notably large shares of inter-industry purchases are those characteristic of agricultural production in environmentally-controlled, indoor settings: outlays on real estate (9 percent), utilities (7.5 percent), and construction (11 percent) given that the industry is in its early stages of development, still expanding its productive capacity. The industry outsources a number of professional (3.1 percent) and business services (4 percent), among other private services (7 percent). Intermediate goods and services also are outsourced from agricultural producers (4.5 percent), manufacturers (2.5 percent), and retail and wholesale distributors (about 3 percent, combined). This aspect of the medical cannabis industry, its reliance on a wide variety of onshore producers in other industries, and very small dependence on imports for its intermediate inputs, is one of the attributes of well-embedded industries within a broad nexus of supporting sectors which economic development advocates commend.

26
Figure 11. Intermediate input purchases by NAICS industry definition (outsourcing)
Figure 12. Notional distribution of economic activities by NAICS definition
Agriculture, 4.5%
Construction, 11.2%
Manufacturing, 2.5%
Transportation, 0.3%Information, 0.5%
Utilities, 7.5%
Wholesalers, 0.5%Retailers, 2.3%Financial, 0.2%
Real estate, 8.9%
Professional, 3.1%
Business, 4.0%
Health, 0.8%
AER, 0.1%
Accommodation, 0.2%
Food, 0.3%
Other, 7.1% Government, 0.9%
Agriculture, 34.0%
Construction, 24.0%
Food processing, 2.5%
Other manufacturing, 7.5%
Transportation, 3.5%
Information, 5.0%
Utilities, 6.0%
Retail, 10.0%
Financial, 1.0%
Professional, 3.0%Business, 2.5% Other, 1.0%

27
From another angle through which the medical cannabis industry’s output can be viewed, that of an unbundled array of economic activities characteristic of diverse industries, the distribution of activities reveals a production-oriented industry still in growth mode. Growth requires expanding productive capacity, and construction is an activity in which Hawaii’s medical cannabis remains substantially engaged. Figure 12 illustrates the disaggregation revealed in informal, anonymized surveys of industry participants regarding how they see their final sales mapping across economic activities which distinguish conventional industry definitions. Firms see one-third of their output comprising agricultural production (34 percent), with one-tenth of output in associated manufacturing or processing (food products (2.5 percent), and other consumables (7.5 percent), and more than one-eighth of output devoted to distribution activities (transportation (3.5 percent), and retail (10 percent)). More than one-tenth of output is perceived by Hawaii medical cannabis firms to comprise economic activities involving various management activities (information services (5 percent), professional services (3 percent), business services (2.5 percent)). Finally, as suggested by several corroborating indications in other aspects of this research, as a young, high-growth industry a comparatively large portion—almost one-fourth of output—comprises construction activity, building capacity in greenhouses and dispensaries. As with firms’ reported outlays, which are spread across a broad range of industries in Hawaii, the economic activities in which firms identify their own output mix includes a similarly wide array of industrial activities. 6. Summary This report has estimated Hawaii’s medical cannabis industry economic impacts from a conventional methodological perspective utilizing an input-output model designed to quantify interdependence of the industry and resulting effects on output, earnings, taxes, and jobs. There is another economic impact of the medical cannabis industry which has not been quantified but is of qualitative significance, an impact raised in several places throughout this report. Legislative intent in crafting enabling statutes governing and regulating the medical cannabis industry in Hawaii was to displace underground economic activity occurring in the black market for cannabis, and to create a channel for legitimate production and distribution to fulfill patient needs. A quantitative estimate of benefits of displacing illegitimate economic activity has not been included in measured economic impacts of Hawaii’s medical cannabis industry, in this report. The nature of the underground economy is that it is inherently unmeasurable, although a literature exists on clever ways to infer its dimensions, none of which have been attempted in this analysis. Several patterns identified in this report, slowing and stalling sales, and slowing patient growth, given the industry’s initial expansion and its resilience confronted with global pandemic, suggest that Hawaii’s medical cannabis industry has flattened out because of regulatory impediments to continued growth, not because of “organic” limitations on its expansion. If so, growth of the direct, indirect, and induced economic impacts estimated here also is impeded. So also has growth of state tax revenues been constrained. The objective of displacing black market economic activity—and socioeconomic benefits of displacement which cannot easily be measured—remains unfulfilled. For Hawaii, those unrealized benefits may be the most important economic impacts waiting to be realized.

28
Appendix 1: Hawaii real GDP and massive economic shocks Hawaii real GDP hit a Sudden Stop with the 2020 pandemic but Hawaii medical cannabis sales and registered patient volumes kept on growing (see Figure 4).
Sources: Robert C. Schmitt, Table 6.1 (1976) Historical Statistics of Hawaii, based on UH Economic Research
Center work by Harry Oshima, Mitsuo Ono, Bank of Hawaii (unpublished), Yung Shang, William Albrecht, Glenn Ifuku, Hawaii DPED (1988) Hawaii’s Income and Expenditure Accounts, U.S. BEA (https://www.bea.gov/data/gdp/gdp-state), interval growth rates and 2 standard deviation bandwidths based on log changes of real GDP (or GSP, pre-1977) re-mapped to constant, 2018 dollars from NAICS data 1997-2020, SIC data 1977-1997, and prior estimates.
-40
-20
0
20
40
Estimates of real Hawaii GDP growth per annum in percent
1940 1950 1960 1970 1980 1990 2000 2010 2020
4.9% ± 319 basis points2.2% ± 290 basis points
1.8% ± 108 b.p.
6.2% ± 2,327 b.p.
−35%
56%
WW2
Demobilization
“Catch A Wave”
COVID-19Note: no Hawaii recession for 20 years
-8
-4
0
4
8
12
Annual percent changes in Hawaii real GDP and interval average growth and volatility
1955 1960 1965 1970 1975 1980 1985 1990 1995 2000 2005 2010 2015 2020*Tom Coffman (1973), Catch a wave: A case study of Hawaii's new politics, UH Press † Chris Grandy (2002), Hawai’i Becalmed: Economic Lessons of the 1990s, UH PressNote: “smooth pasting” issues complicate interpretation before and after 1997, as underlying data are not strictly comparable
Sub-Prime Bubble
4.9% ± 319 basis points (1954-83)2.2% ± 290 basis points (1983-2010)
1.8% ± 108 b.p.2010-2019
U.S. recession dates shadedHawaii Becalmed†
Catch-A-Wave*
Japan Bubble

29
The pattern of economic recession in Hawaii, because of the 2020 pandemic, measured by GDP by industry or by jobs by industry, was not as resilient as Hawaii medical cannabis sales, which continued growing in spite of the pandemic, associated recession, and sluggish recovery.
Sources: BEA, U.S. Department of Commerce (https://www.bea.gov/data/gdp/gdp-state); quarterly real data
through 2021Q1 indexed to 2019Q4 = 100. Hawaii DLIR, Hawaii DBEDT (http://dbedt.hawaii.gov/economic/mei/). Total jobs index: 1.000 (2016), 1.009 (2017), 1.013 (2018), 1.014 (2019) 0.814 (2020), 0.873 (2021), as defined above.
0
25
50
75
100
125
2018:Q1 2019:Q1 2020:Q1 2021:Q1
All other industriesRetail + wholesale
AgricultureTransportation
Agriculture
Military
Hawaii real GDP by industry indexes (2019Q4 = 100)
Accommodation, food services
Arts, ent. recr.
0.3
0.4
0.5
0.6
0.7
0.8
0.9
1.0
1.1
2016 2017 2018 2019 2020 20210.3
0.4
0.5
0.6
0.7
0.8
0.9
1.0
1.1
2016 2017 2018 2019 2020 2021
0.3
0.4
0.5
0.6
0.7
0.8
0.9
1.0
1.1
2016 2017 2018 2019 2020 2021
0.971 Construction0.937 Wholesale0.825 Retail0.778 Manufacturing
0.993 Health0.937 Professional, bus. serv.0.932 Financial0.816 Education0.723 Information
1.017 Federal0.985 County0.907 State
0.794 Other private services
Hawaii payroll employment dynamics, April-March ending in each year 2016-2020, and April-June 2021 (2016 = 1.0)
0.399 Accommodation0.3
0.4
0.5
0.6
0.7
0.8
0.9
1.0
1.1
2016 2017 2018 2019 2020 2021
0.839 Transportation0.776 Food services
0.669 Accommodation0.613 Arts, ent., recr.