2021 Integrated Report - SAAM
382
2021 Integrated Report YEARS OF EXCELLENCE SINCE 1961
-
Upload
khangminh22 -
Category
Documents
-
view
1 -
download
0
Transcript of 2021 Integrated Report - SAAM

Welcome Message00
SAAM, a Vocation of Service for the Foreign Trade Industry
01
Leadership and Governance Framework
02
Business Model03
Our Team04
Supplier Management05
Efficient Use of Natural Resources
06
Social Contribution07
Additional Information08
GRI Content Index09
Financial Statements10
2021 Integrated Report
YEARS OF EXCELLENCE
S I N C E 1 9 6 1

2021 Integrated Report
Welcome Message00
SAAM, a Vocation of Service for the Foreign Trade Industry
01
Leadership and Governance Framework
02
Business Model03
Our Team04
Supplier Management05
Efficient Use of Natural Resources
06
Social Contribution07
Additional Information08
GRI Content Index09
Financial Statements10
2
Company Identification102-1
Company Name: Sociedad Matriz SAAM S.A.
Chilean Tax ID: 76.196.718-5
Type of Company: Publicly listed corporation
Legal Address: Av. Apoquindo 4800, Torre II, piso 18, Las Condes, Santiago
Postal Code: 7560969
Telephone: +56 2 2731 8240
Website: www.saam.com
Social Media: Linkedin -SAAM S.A.
Securities Registry: 1091
Stock Exchange Ticker: SMSAAM
Independent AuditorsPricewaterhouseCoopers Consultores, Auditores SpA (PwC)
Chilean Tax ID: 81.513.400-1General Information
Risk RatingsAA-, Stable outlook (Feller Rate Risk Rating Agency)
AA-, Favorable outlook (Humphreys Risk Rating Agency)
Index ListingsSPCLXIGPA. General Stock Price Index. Groups the most important stocks listed on Santiago Exchange.
DJSI Chile. Dow Jones Sustainability™ Chile Index. Comprised of the 26 companies selected annually by S&P Dow Jones Indices with the advice of S&P Global.
DJSI MILA. Dow Jones Sustainability MILA Pacific Alliance Index. Comprised of the companies from Chile, Colombia, Mexico and Peru that have the best ESG (environmental, social and corporate governance) scores.
Contact Information102-3, 102-53
Shareholder Registry
DCV Registros S.A. Nueva Torre Santa María, Av. Los Conquistadores 1730, piso 24, Providencia, Santiago, Chile. Phone: +56 2 2393 9003
Email: [email protected]
Investor Relations
Paula Raventós, Head of Investor Relations
[email protected] or [email protected]
Address: Av. Apoquindo 4800, Torre II, piso 18, Las Condes, Santiago
Phone: +56 2 2731 8213
Media Relations
Cristina Schmidt, Corporate Sustainability and Communications Officer
[email protected] or [email protected]
Address: Av. Apoquindo 4800, Torre II, piso 18, Las Condes, Santiago
Phone: +56 2 2731 8286

2021 Integrated Report
Welcome Message00
SAAM, a Vocation of Service for the Foreign Trade Industry
01
Leadership and Governance Framework
02
Business Model03
Our Team04
Supplier Management05
Efficient Use of Natural Resources
06
Social Contribution07
Additional Information08
GRI Content Index09
Financial Statements10
3
GRI Content Index
Financial Statements
SAAM, a Vocation of Service for the Foreign Trade Industry
Leadership and Governance Framework
Business Model
Efficient Use of Natural Resources
Social Contribution
Additional Information
Welcome Message
Our Team
Supplier Management
Introduction Recent HistoryMission and Values that Guide our ActionsBoard of Directors ManagementOur Value Creation ModelOur Strategy How We Prepare our Integrated ReportShareholders and Stock Performance Membership in Associations
Our Board of DirectorsManagementEthics and IntegrityRisk ManagementCybersecurity and Innovation
Response to COVID-19Towage DivisionPort Terminals DivisionLogistics DivisionInvestments
Environmental StrategyEnvironmental InvestmentsCertificationsEmissionsEnergyBiodiversity
Community AssessmentsSocial InvestmentSpotlight InitiativesStakeholder Engagement
Articles of Incorporation and Corporate PurposeTrademarks and PatentsMaterial EventsProperties and FacilitiesCorporate StructureInformation on Subsidiaries and AssociatesGlossary
Letter from the Chairman
About UsOccupational Health and SafetyLabor RelationsTalent Attraction and DevelopmentDiversity and InclusivenessOccupational Wellbeing
Our Supply ChainSupplier PolicySubcontracting Policy
206
211
07
29
50
132
154
167
04
100
12600.
01.
09.
10.
04.
05.
06.
07.
08.
02.
03.

2021 Integrated Report
SAAM, a Vocation of Service for the Foreign Trade Industry
01
Leadership and Governance Framework
02
Business Model03
Our Team04
Supplier Management05
Efficient Use of Natural Resources
06
Social Contribution07
Additional Information08
GRI Content Index09
Financial Statements10
Welcome Message00 Milestones in 2021 include closing the acquisition of 70% of Intertug (with tug operations in Colombia, Mexico and Central America) and successfully integrating this company with swift and significant synergies, confirming our consolidation capacity in this business segment. Furthermore, progress made to modernize Aerosan after acquiring 50% in 2020 is a relevant step in preparing it as a platform to consolidate other operations in the future.
Due to our solid performance, in February 2022 Humphreys and Feller Rate upgraded the rating of SM SAAM securities and bond lines from “AA-” to “AA”, with a stable outlook.
Our operating model, implemented in 2017, has helped us to address the contingency as a more interconnected organization with centralized key activities, which has proven to be determinant in the swift implementation of measures to adapt and attain better results in all business segments.
Likewise, public health protection planning for our employees and their families, defined by the executive team and shared with the unions, was successful in keeping the supply chain running at all times, despite the adverse circumstances. For example, our company’s workers qualified for early vaccination as the inoculation processes were rolled out in different countries, thanks to coordinated action with health authorities and other stakeholders in the logistics chain.
In 2021, we celebrated our 60-year anniversary in a context still marked by the COVID-19 pandemic. Unlike the previous year, as we faced the uncertainty brought on by the unknown effects of the public health crisis on the health of our more than eight thousand employees and our operations, this past year found us better prepared to take on the new stages of the virus.
This would not have been possible had it not been for our adaptability and resilience. I am immensely proud to preside over a company whose employees and shareholders have shown enormous responsibility during this time, building safe working and family environments while keeping foreign trade services operational.
The global context of reactivation and fulfillment of our strategic plan for 2021 have enabled us to close the year with historic numbers. These record figures are not unaffected by operational challenges, given the high impact of COVID-19 on the global supply chain and the productivity of our operations. We have made significant efforts to keep our facilities in operation and we have duplicated our efforts to serve our customers.
In 2021 the company had net income of US$78.6 million, up 18% from the previous year. Excluding extraordinary effects in 2020, the improvement was 43%. Sales and EBITDA also reflect our solid management, with US$748 million (+28%) and US$268 million (+26%), respectively.
PRESIDENTE102-14
Letter from the Chairman
“Our operating model, implemented in 2017, has helped us to address the contingency with a more interconnected organization and with centralized key activities, which has proven to be determinant in the swift implementation of measures to adapt and attain better results in all business segments.”
Óscar Hasbún MartínezChairman of the Board of SM SAAM S.A.
Dear Shareholders
4

2021 Integrated Report
SAAM, a Vocation of Service for the Foreign Trade Industry
01
Leadership and Governance Framework
02
Business Model03
Our Team04
Supplier Management05
Efficient Use of Natural Resources
06
Social Contribution07
Additional Information08
GRI Content Index09
Financial Statements10
Welcome Message00
“In 2021, we launched our 2025 strategy, Build to Grow, which aims to consolidate our company as a leader in the international trade value chain.”
Immersed in this context and operating under these conditions, in 2021 we launched our Build to Grow strategy through 2025, which aims to consolidate our company as a leader in the international trade value chain, through the provision of customer-centered maritime-port and airport services with high standards of service. This strategy considers elements that are differentiated along business lines and three organization-wide themes—sustainability, talent and systems & IT—that provide continuity to international growth and expansion.
In terms of environmental, social and governance (ESG) management, we are making progress towards a shared model across all business units and countries where we operate. For this, we updated our governance and created a Sustainability and Communications Department, whose responsibilities include developing and monitoring the Global Sustainability Plan. This plan will make it possible for us to address the challenges of sustainable transformation, employee safety, talent development, stakeholder engagement and climate change adaptation, integrating the Global Compact Principles and the Sustainable Development Goals (SDGs) into our management.
Concrete initiatives in this area included conducting socio-environmental assessments at all the port terminals in Chile and two outside Chile, to define a corporate community relations model applicable to all of our operations in the Americas.
We also made progress on quantifying our scopes 1 and 2 GHG emissions at all of our operations, which will help us to establish concrete objectives and goals to cut emissions. In 2021, we successfully reduced around 13,751 tons of CO2e, which corresponds to a 6% decrease compared to the previous year.
In terms of occupational safety, we launched +Safety, an organization-wide effort across all our business units. This project aims to prevent all types of accidents in the workplace by making a cultural change within our organization. Under the premise that safety is our most
important value, this management model is based on the pillars of leadership, governance, critical risks and communication.
As evidence of these advances, our company was selected for the sixth year in a row for the Dow Jones Sustainability Index Chile (DJSI Chile) and for the fourth year in a row for the MILA Pacific Alliance Select.
In the different business areas, our SAAM Towage Division has shown solid growth and today is our largest business, representing 48% of our EBITDA, and remains one of the global leaders in the field. In 2021, sales from this unit were US$340 million (+23%) and EBITDA reached US$137 million (+14%). We have consolidated our operations in the global industry, entering the markets of Colombia, Honduras, El Salvador and Peru, strengthening our presence in Mexico and Central America and adding five state-of-the-art tugs to our fleet, increasing the efficiency and timeliness of services.
In our Port Terminal Division, we saw a significant improvement in our bottom line thanks to growth in volumes, with throughput totaling 41 million tons and 3.3 million TEUs (+26% and 12%, respectively). Sales totaled US$282 million and EBITDA reached US$105 million, +13% and +10%, respectively, with respect to year-end 2020.
Among our progress and milestones, in an effort to increase the productivity, efficiency and quality of our services, we created the Optimized Operations Department.
5

2021 Integrated Report
SAAM, a Vocation of Service for the Foreign Trade Industry
01
Leadership and Governance Framework
02
Business Model03
Our Team04
Supplier Management05
Efficient Use of Natural Resources
06
Social Contribution07
Additional Information08
GRI Content Index09
Financial Statements10
Welcome Message00
Likewise, Terminal Portuario de Guayaquil (TPG) made progress on its investment plan of around US$21 million, which contemplates the purchase of seven top-of-the-line cranes set to arrive at the terminal in 2022. These acquisitions contemplate a comprehensive process automation plan, including biometric facial recognition systems, online billing services and real time information searches, among other technologies.
San Antonio Terminal Internacional (STI) continued to implement the investment plan for US$47 million agreed with Empresa Portuaria de San Antonio, which extends its concession to 2030. Specific milestones this year included closing the purchase of 26 state-of-the-art terminal tractors to reinforce its operations and modernize the fleet, thus contributing to its consolidation as the main port terminal in Chile.
For the reporting period, the Logistics Division reported sales of US$128 million (+118%) and EBITDA of US$40 million (+221%). In addition to full integration into SM SAAM’s operating model, this year Aerosan reached an airport cargo volume of 380,515 tons, well above 2019 levels (+40%). At SAAM Logistics, as a result of the restocking process in Chile, we have also achieved growth in volumes at bonded warehouses (+22%).
After 5 years, SM SAAM closed a successful period of transformation in a context of unanticipated challenges. The figures support this: today, 83% of EBITDA is generated by consolidated operations, whereas in 2017 that figure was 41%. Between 2017 and 2021, revenue increased 1.6 times and total assets 1.2 times. Meanwhile, EBITDA grew 2.3 times with an EBITDA margin that climbed from 25% to 36%, thereby boosting the company’s profitability.
These advances are sustained by efficient management, assuming positions of control in our assets, our solid financial position and the opportunities for inorganic growth that we have taken. This places us in a privileged position to continue to propel our company into the future through our Build to Grow strategy.
As we turn 60, we are beginning a new stage that will help us to take on head first the diverse political, social, economic and technological challenges that the next six decades will bring. Likewise, we will continue to foster close, long-term, trust-based working relationships. All of these initiatives will help us to continue to grow as a company, create good jobs, care for the environment around us and serve our customers with high standards of quality and efficiency.
Óscar Hasbún MartínezChairman of the Board of SM SAAM S.A.
6
2021 Integrated Report
Welcome Message00
Leadership and Governance Framework
02
Business Model03
Our Team04
Supplier Management05
Efficient Use of Natural Resources
06
Social Contribution07
Additional Information08
GRI Content Index09
Financial Statements10
SAAM, a Vocation of Service for the Foreign Trade Industry
01
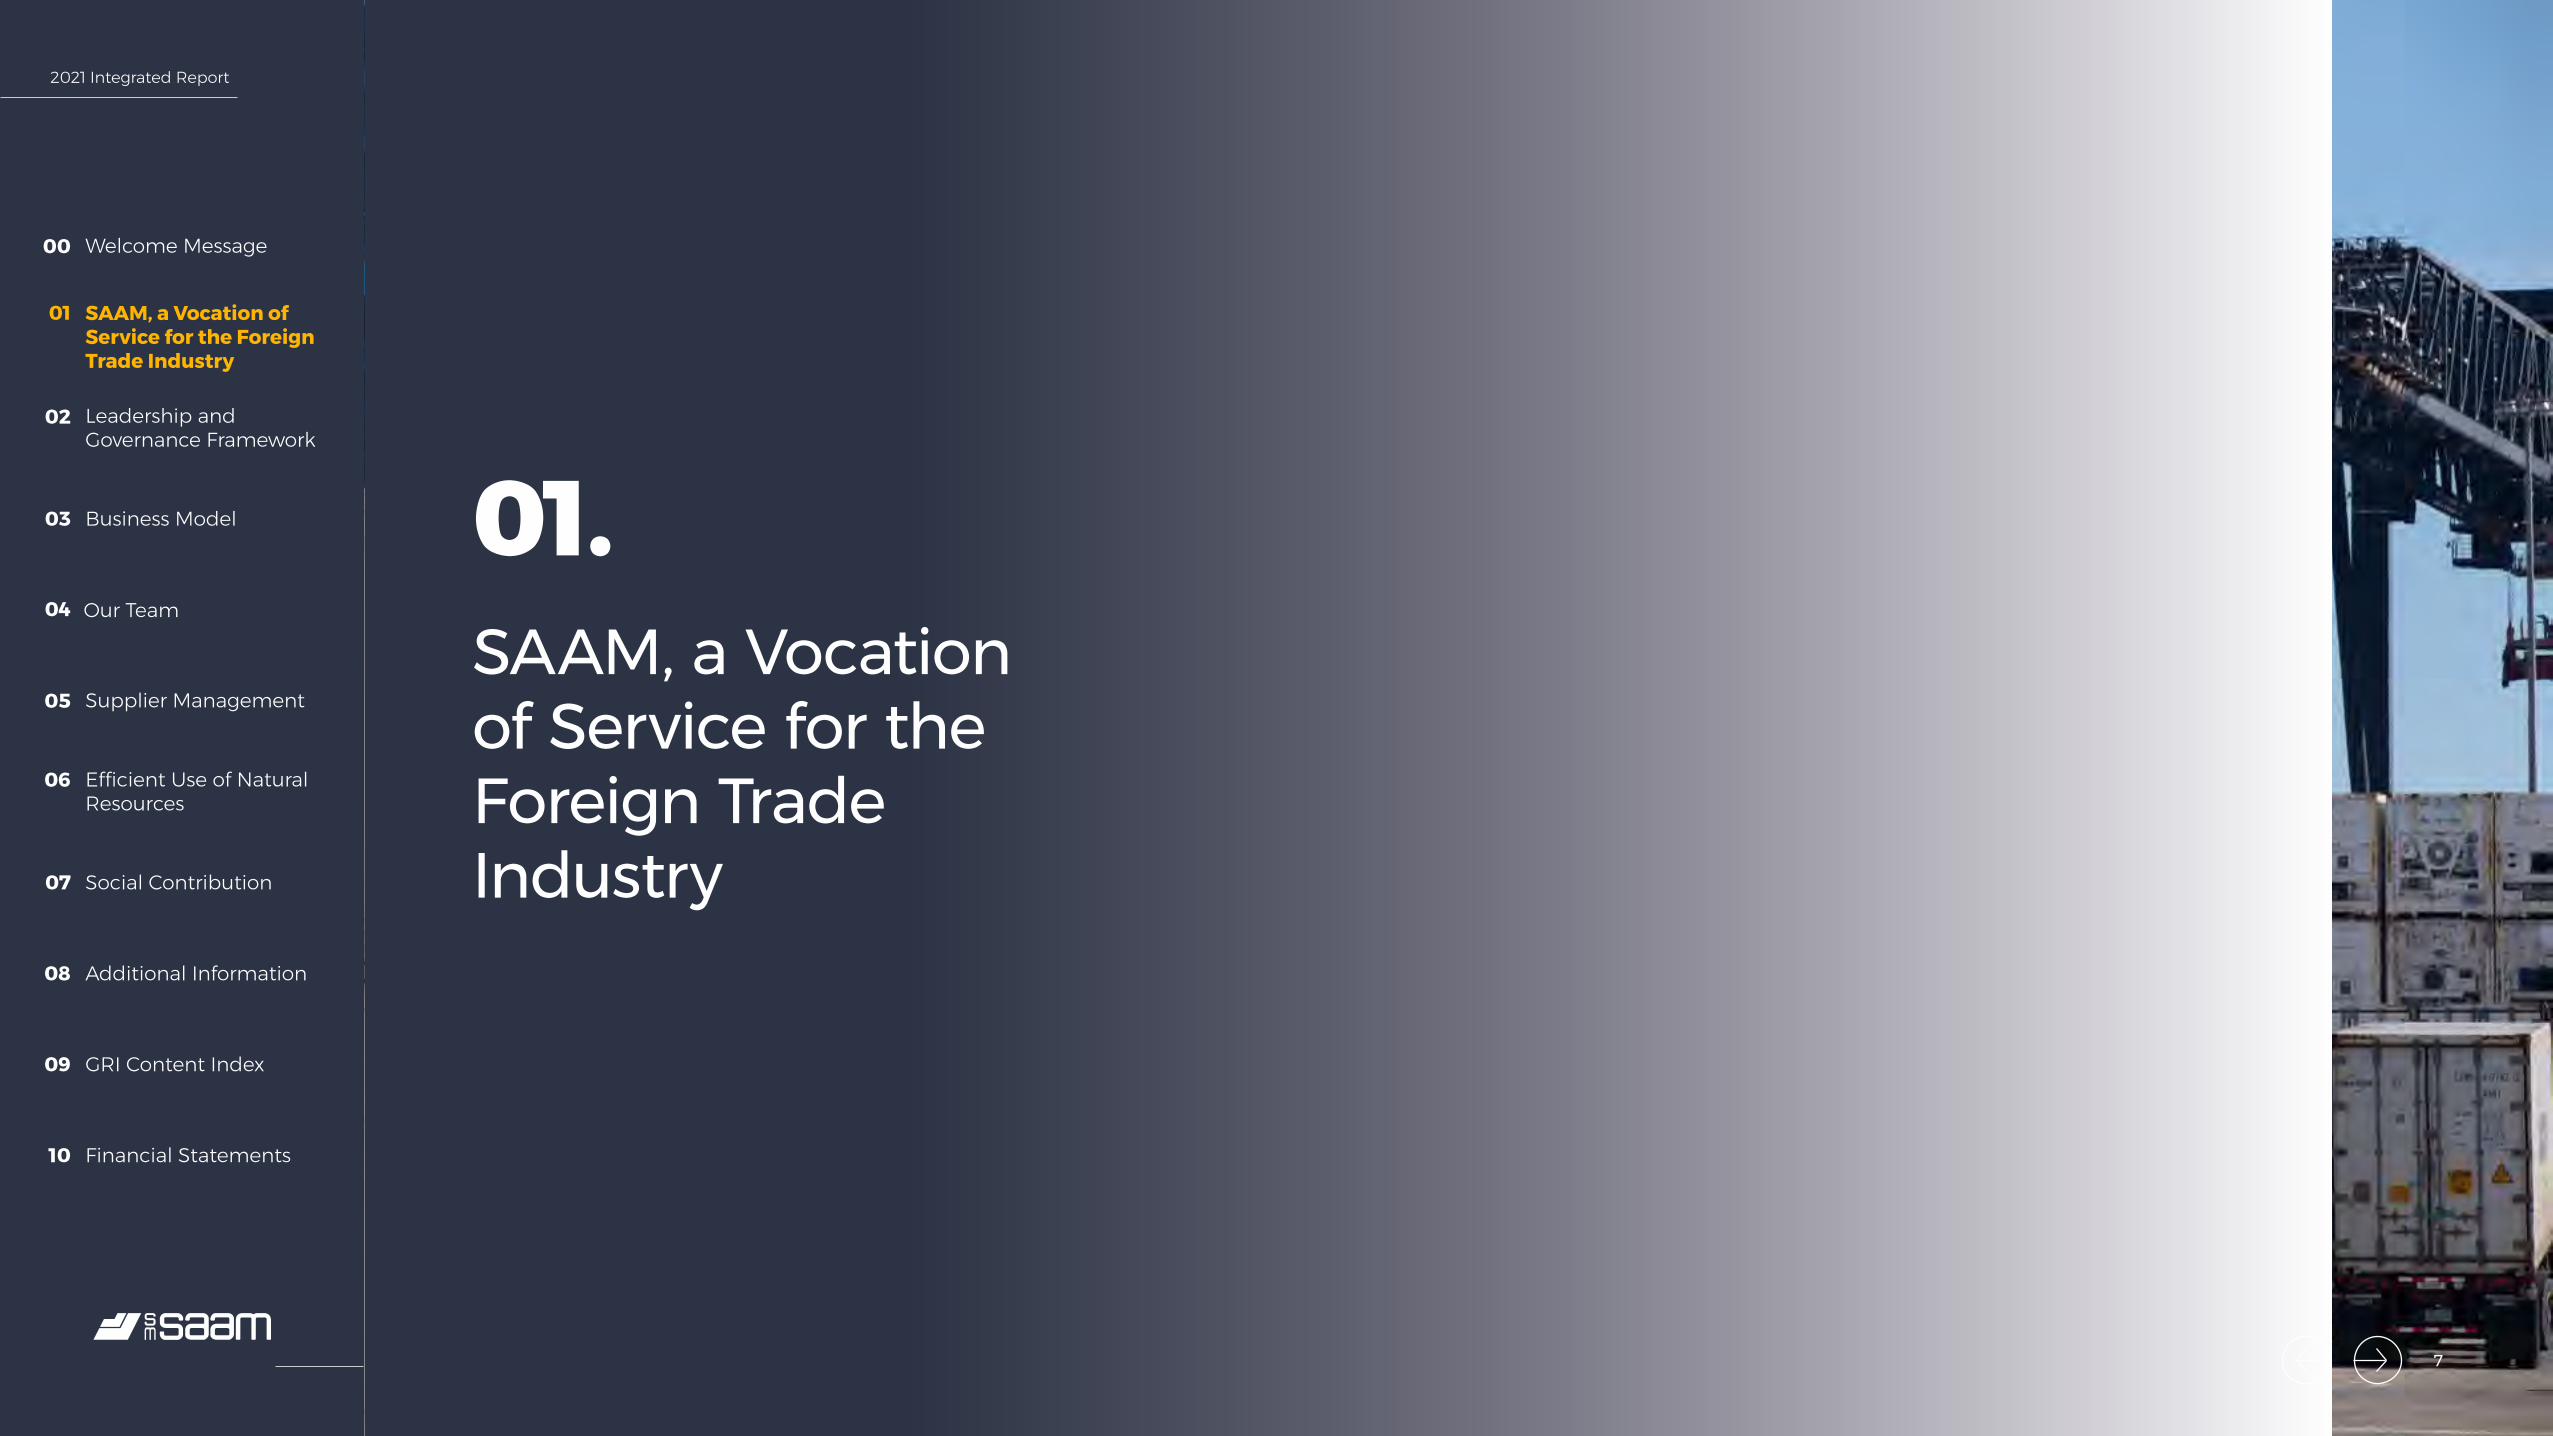
SAAM, a Vocation of Service for the Foreign Trade Industry
01.
7

2021 Integrated Report
Welcome Message00
Leadership and Governance Framework
02
Business Model03
Our Team04
Supplier Management05
Efficient Use of Natural Resources
06
Social Contribution07
Additional Information08
GRI Content Index09
Financial Statements10
SAAM, a Vocation of Service for the Foreign Trade Industry
01
IntroductionSM SAAM is a regional company based in Chile operating from Canada to Patagonia. It provides comprehensive services for international trade through three business divisions: Towage, Port Terminals and Logistics.CMF 2.2.
SM SAAM was spun off from Compañía Sud Americana de Vapores S.A. (CSAV) in 2011. In this transaction, it was given ownership of SAAM, a company founded by CSAV in 1961 to engage in maritime agency, cargo stevedoring, maritime towing and port equipment services, which was already expanding internationally.
In 2012, SM SAAM went public and in 2017 it agreed to split its subsidiary SAAM into three companies: SAAM S.A., as the successor of the tugboat business, and two new companies, SAAM Ports S.A., entrusted with the port terminals business, and SAAM Logistics S.A., responsible for the logistics business. In 2020, SAAM Logistic S.A. purchased 100% of Aerosan, an airport services company, and in 2021 SAAM S.A. acquired 70% of the Colombian company, Intertug.
8
2021 Integrated Report
Welcome Message00
Leadership and Governance Framework
02
Business Model03
Our Team04
Supplier Management05
Efficient Use of Natural Resources
06
Social Contribution07
Additional Information08
GRI Content Index09
Financial Statements10
SAAM, a Vocation of Service for the Foreign Trade Industry
01
9
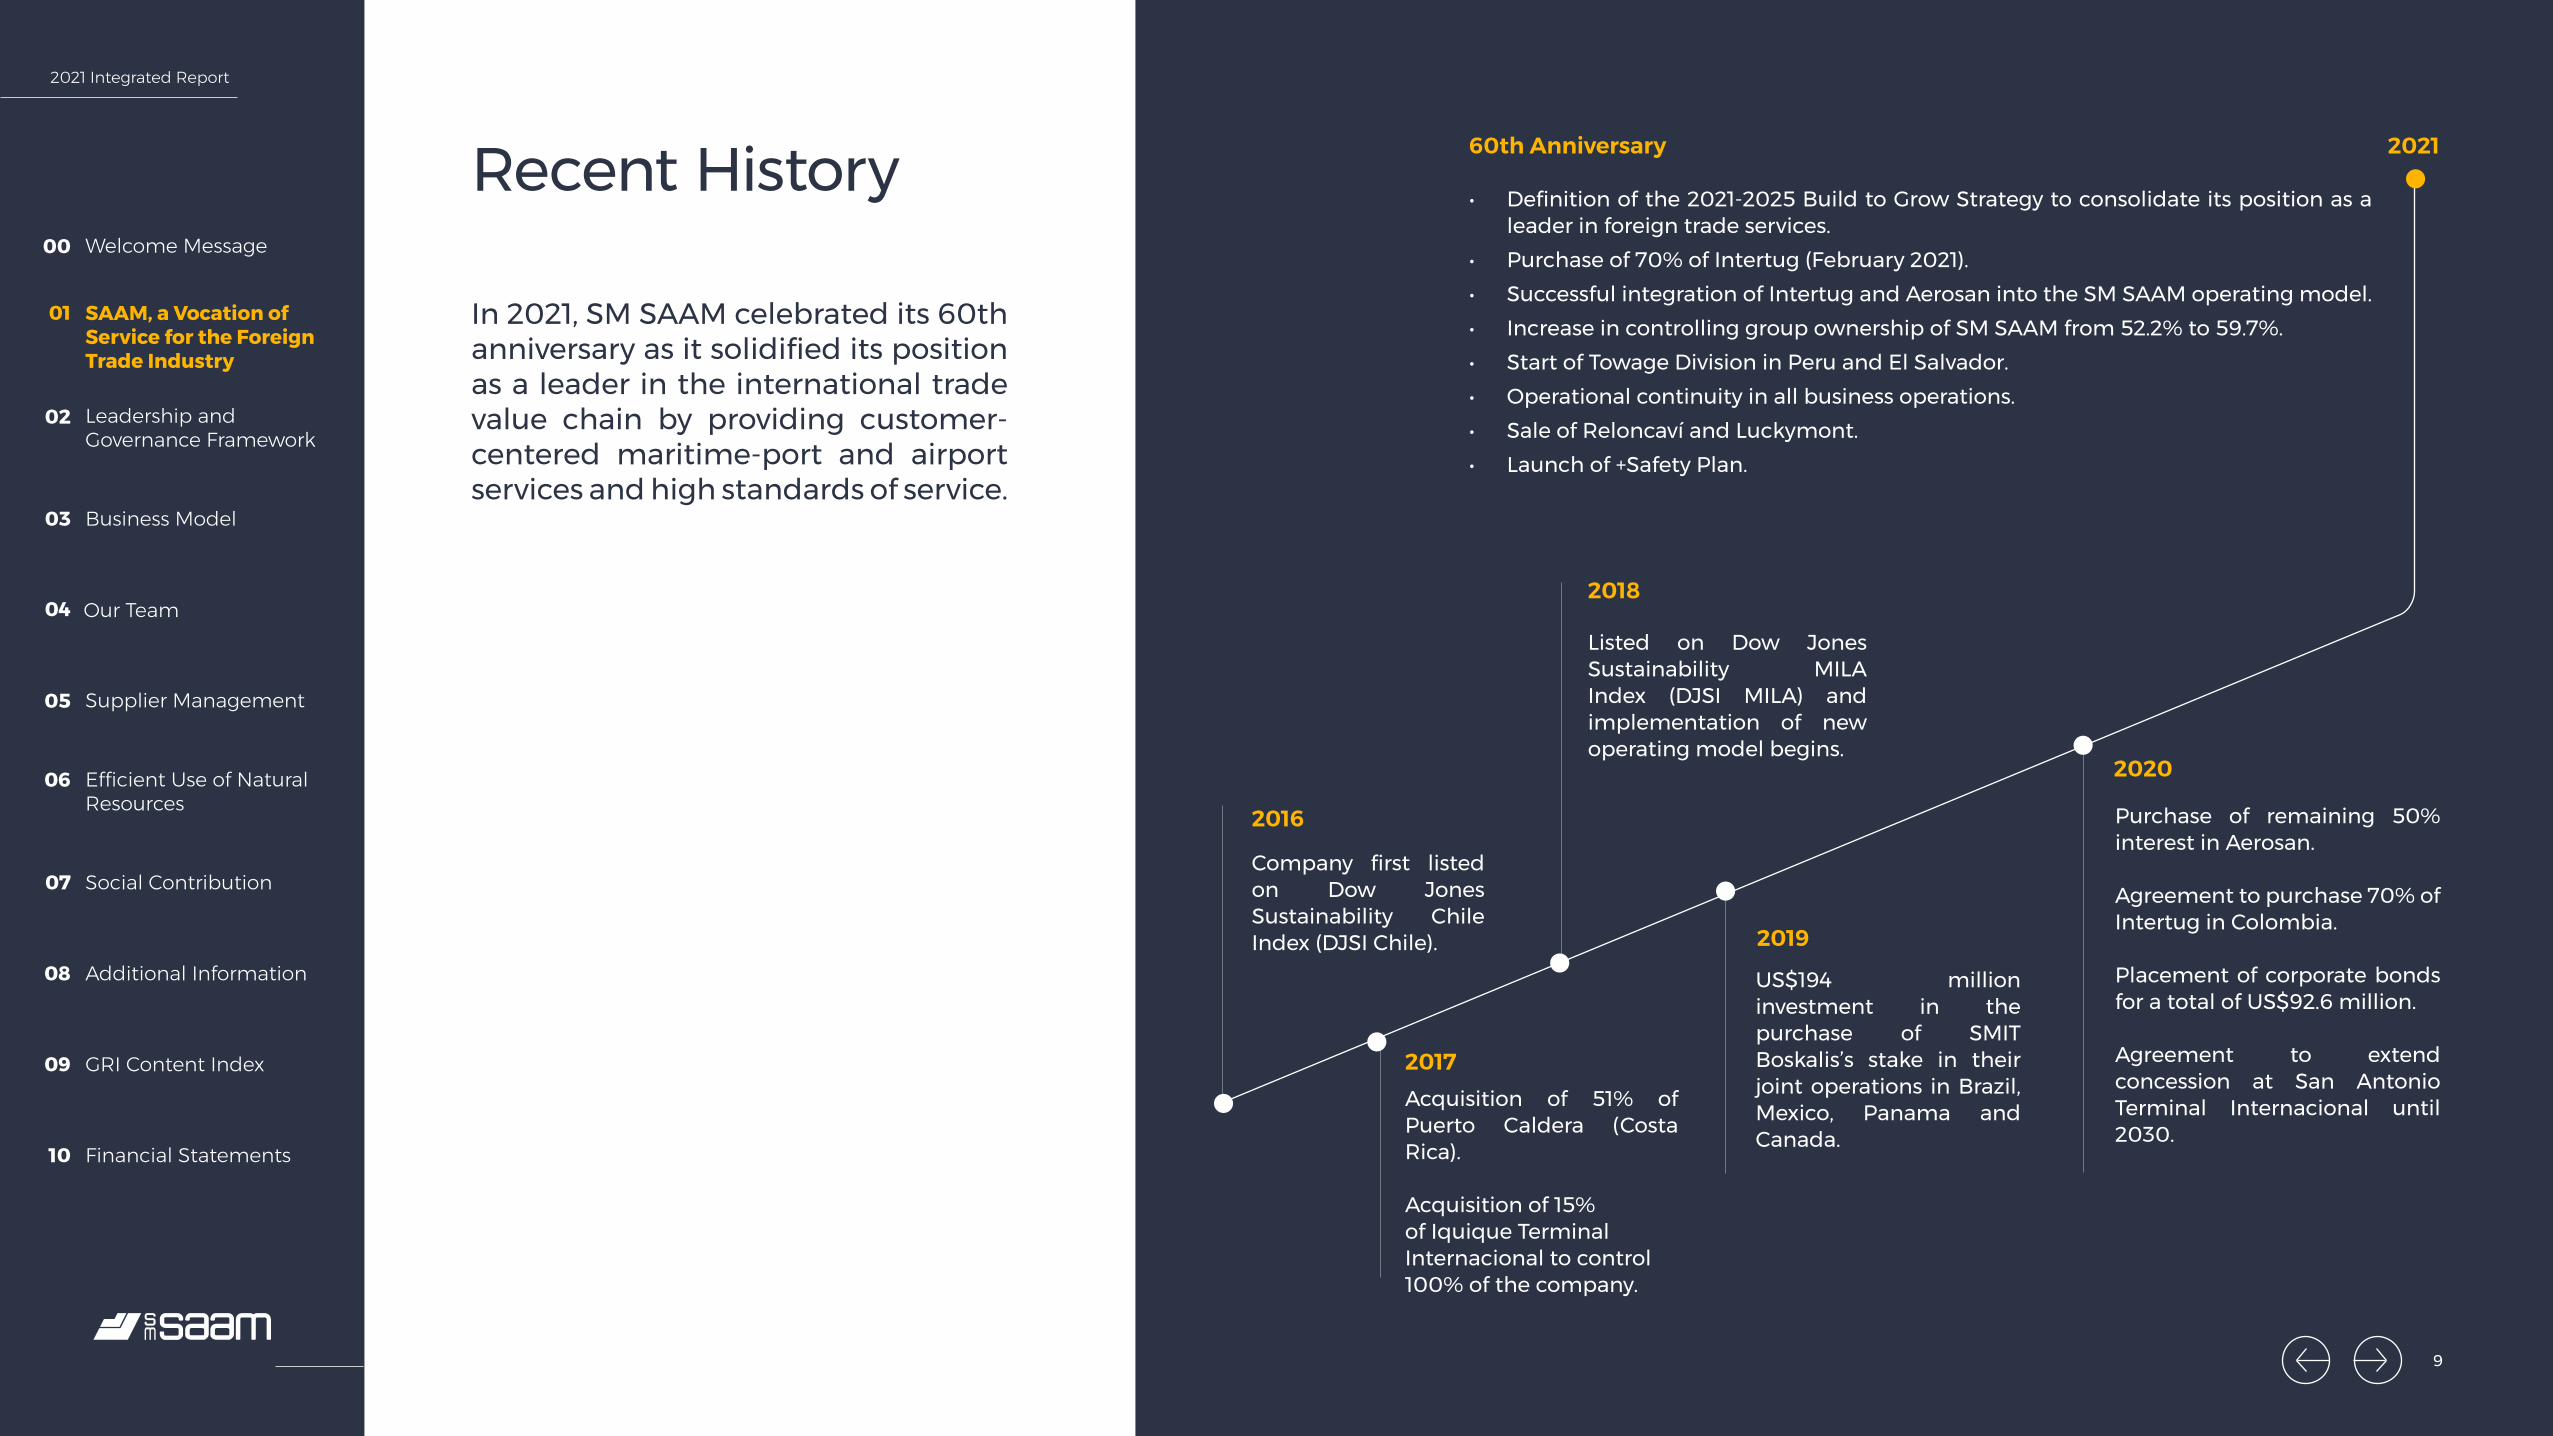
Recent History
In 2021, SM SAAM celebrated its 60th anniversary as it solidified its position as a leader in the international trade value chain by providing customer-centered maritime-port and airport services and high standards of service.
60th Anniversary
• Definition of the 2021-2025 Build to Grow Strategy to consolidate its position as a leader in foreign trade services.
• Purchase of 70% of Intertug (February 2021).• Successful integration of Intertug and Aerosan into the SM SAAM operating model.• Increase in controlling group ownership of SM SAAM from 52.2% to 59.7%.• Start of Towage Division in Peru and El Salvador.• Operational continuity in all business operations.• Sale of Reloncaví and Luckymont.• Launch of +Safety Plan.
2016
2017
2018
2019
2020
2021
Company first listed on Dow Jones Sustainability Chile Index (DJSI Chile).
Acquisition of 51% of Puerto Caldera (Costa Rica).
Acquisition of 15% of Iquique Terminal Internacional to control 100% of the company.
Listed on Dow Jones Sustainability MILA Index (DJSI MILA) and implementation of new operating model begins.
Purchase of remaining 50% interest in Aerosan.
Agreement to purchase 70% of Intertug in Colombia.
Placement of corporate bonds for a total of US$92.6 million.
Agreement to extend concession at San Antonio Terminal Internacional until 2030.
US$194 million investment in the purchase of SMIT Boskalis’s stake in their joint operations in Brazil, Mexico, Panama and Canada.

2021 Integrated Report
Welcome Message00
Leadership and Governance Framework
02
Business Model03
Our Team04
Supplier Management05
Efficient Use of Natural Resources
06
Social Contribution07
Additional Information08
GRI Content Index09
Financial Statements10
SAAM, a Vocation of Service for the Foreign Trade Industry
01
Mission and Values that Guide our Actions
Mission
To facilitate the exchange of goods that are essential to the wellbeing of people and to promote countries' economic and social development through excellent port, towage and logistics services that help make foreign trade competitive, create value for shareholders and provide opportunities to neighboring communities while respecting the environment.
Our Values
To guide the actions of those who work at SM SAAM and strengthen its culture and identity, corporate values are promoted daily. This consolidates transparent and ethical conduct that is passed on to stakeholders, in line with the Code of Ethics.
102-16
Vision
To be the leading company in port operations and towage services, and to be recognized as an important logistics operator, standing out for our industry knowledge, geographic coverage, capacity for internationalization, service quality and commitment to our customers.
Safety• We are aware of the importance of safety in our work• We identify, assess and take the necessary measures to
work in a risk-free environment, and we control hazards to our health
• We promote a culture of self-care and concern for the integrity of others
Honesty• We behave coherently and with integrity• We build trust-based and truth-based relationships• We offer only what we are able to accomplish and we strive
to achieve itRespect• We recognize the value of each person• We strive to empathize with different points of view and
specific situations, considering the opinions of others• We respect the setting in which we develop our activities.Responsibility• We take responsibility for what we do or do not do and
measure the consequences of our actions• We fulfill our commitments• We develop our tasks and obligations efficiently,
recognizing errors and correcting them in a timely mannerService• We work to provide service of excellence• We aim to fully meet the expectations of our customers• We care about identifying the needs of our customers and
placing these at the center of our work
1
2
3
4
5
Safety Honesty RespectResponsibilityService
10
2021 Integrated Report
Welcome Message00
Leadership and Governance Framework
02
Business Model03
Our Team04
Supplier Management05
Efficient Use of Natural Resources
06
Social Contribution07
Additional Information08
GRI Content Index09
Financial Statements10
SAAM, a Vocation of Service for the Foreign Trade Industry
01
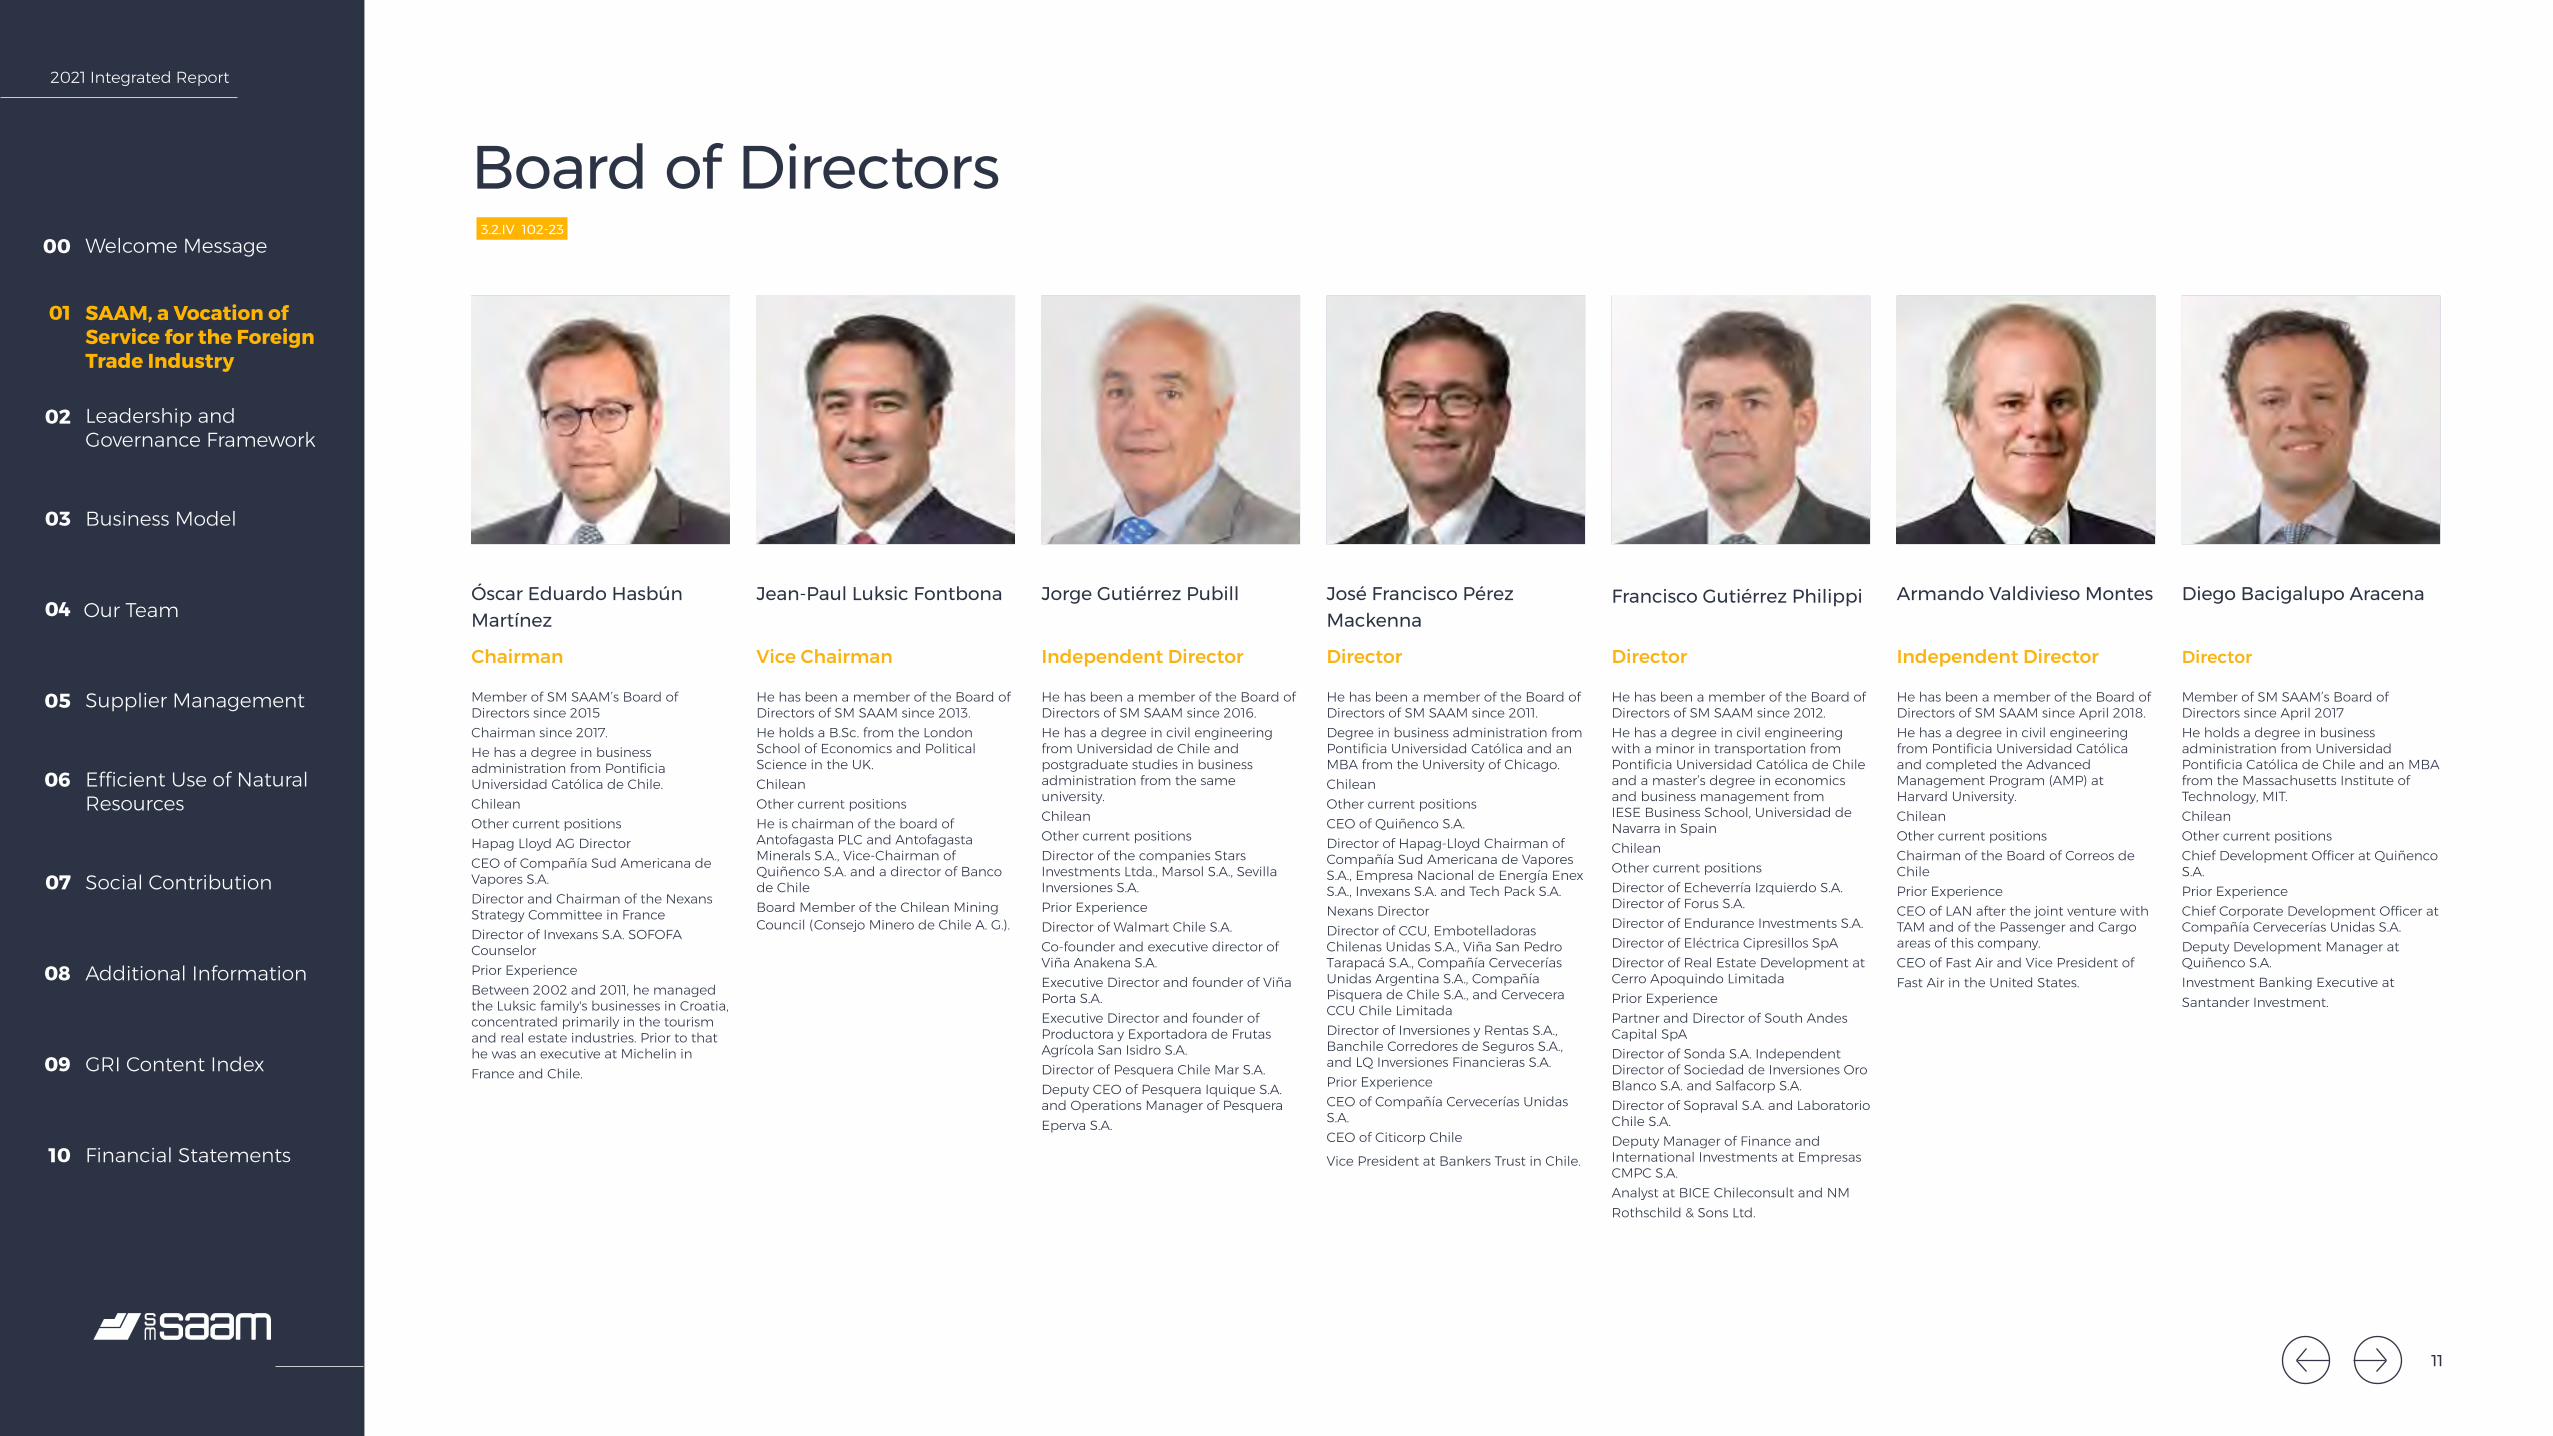
3.2.IV 102-23
Óscar Eduardo Hasbún Martínez
Jean-Paul Luksic Fontbona Jorge Gutiérrez Pubill José Francisco Pérez Mackenna
Francisco Gutiérrez Philippi Armando Valdivieso Montes Diego Bacigalupo Aracena
Board of Directors
Chairman
Member of SM SAAM’s Board of Directors since 2015 Chairman since 2017. He has a degree in business administration from Pontificia Universidad Católica de Chile. Chilean Other current positions Hapag Lloyd AG Director CEO of Compañía Sud Americana de Vapores S.A. Director and Chairman of the Nexans Strategy Committee in France Director of Invexans S.A. SOFOFA Counselor Prior Experience Between 2002 and 2011, he managed the Luksic family's businesses in Croatia, concentrated primarily in the tourism and real estate industries. Prior to that he was an executive at Michelin in France and Chile.
Vice Chairman
He has been a member of the Board of Directors of SM SAAM since 2013.He holds a B.Sc. from the London School of Economics and Political Science in the UK.ChileanOther current positions He is chairman of the board of Antofagasta PLC and Antofagasta Minerals S.A., Vice-Chairman of Quiñenco S.A. and a director of Banco de ChileBoard Member of the Chilean Mining Council (Consejo Minero de Chile A. G.).
Independent Director
He has been a member of the Board of Directors of SM SAAM since 2016. He has a degree in civil engineering from Universidad de Chile and postgraduate studies in business administration from the same university.ChileanOther current positions Director of the companies Stars Investments Ltda., Marsol S.A., Sevilla Inversiones S.A. Prior Experience Director of Walmart Chile S.A. Co-founder and executive director of Viña Anakena S.A. Executive Director and founder of Viña Porta S.A. Executive Director and founder of Productora y Exportadora de Frutas Agrícola San Isidro S.A. Director of Pesquera Chile Mar S.A. Deputy CEO of Pesquera Iquique S.A. and Operations Manager of Pesquera Eperva S.A.
Director
He has been a member of the Board of Directors of SM SAAM since 2011. Degree in business administration from Pontificia Universidad Católica and an MBA from the University of Chicago.ChileanOther current positions CEO of Quiñenco S.A. Director of Hapag-Lloyd Chairman of Compañía Sud Americana de Vapores S.A., Empresa Nacional de Energía Enex S.A., Invexans S.A. and Tech Pack S.A. Nexans Director Director of CCU, Embotelladoras Chilenas Unidas S.A., Viña San Pedro Tarapacá S.A., Compañía Cervecerías Unidas Argentina S.A., Compañía Pisquera de Chile S.A., and Cervecera CCU Chile LimitadaDirector of Inversiones y Rentas S.A., Banchile Corredores de Seguros S.A., and LQ Inversiones Financieras S.A. Prior Experience CEO of Compañía Cervecerías Unidas S.A. CEO of Citicorp Chile
Vice President at Bankers Trust in Chile.
Director
He has been a member of the Board of Directors of SM SAAM since 2012. He has a degree in civil engineering with a minor in transportation from Pontificia Universidad Católica de Chile and a master’s degree in economics and business management from IESE Business School, Universidad de Navarra in SpainChileanOther current positions Director of Echeverría Izquierdo S.A. Director of Forus S.A. Director of Endurance Investments S.A. Director of Eléctrica Cipresillos SpA Director of Real Estate Development at Cerro Apoquindo Limitada Prior Experience Partner and Director of South Andes Capital SpA Director of Sonda S.A. Independent Director of Sociedad de Inversiones Oro Blanco S.A. and Salfacorp S.A. Director of Sopraval S.A. and Laboratorio Chile S.A. Deputy Manager of Finance and International Investments at Empresas CMPC S.A. Analyst at BICE Chileconsult and NM Rothschild & Sons Ltd.
Independent Director
He has been a member of the Board of Directors of SM SAAM since April 2018. He has a degree in civil engineering from Pontificia Universidad Católica and completed the Advanced Management Program (AMP) at Harvard University.ChileanOther current positions Chairman of the Board of Correos de Chile Prior Experience CEO of LAN after the joint venture with TAM and of the Passenger and Cargo areas of this company. CEO of Fast Air and Vice President of Fast Air in the United States.
Director
Member of SM SAAM’s Board of Directors since April 2017He holds a degree in business administration from Universidad Pontificia Católica de Chile and an MBA from the Massachusetts Institute of Technology, MIT.ChileanOther current positionsChief Development Officer at Quiñenco S.A. Prior Experience Chief Corporate Development Officer at Compañía Cervecerías Unidas S.A.Deputy Development Manager at Quiñenco S.A. Investment Banking Executive at Santander Investment.
11
2021 Integrated Report
Welcome Message00
Leadership and Governance Framework
02
Business Model03
Our Team04
Supplier Management05
Efficient Use of Natural Resources
06
Social Contribution07
Additional Information08
GRI Content Index09
Financial Statements10
SAAM, a Vocation of Service for the Foreign Trade Industry
01
Management
12
2021 Integrated Report
Welcome Message00
Leadership and Governance Framework
02
Business Model03
Our Team04
Supplier Management05
Efficient Use of Natural Resources
06
Social Contribution07
Additional Information08
GRI Content Index09
Financial Statements10
SAAM, a Vocation of Service for the Foreign Trade Industry
01
15
2 8 10
11
4 12
133 6
9
7
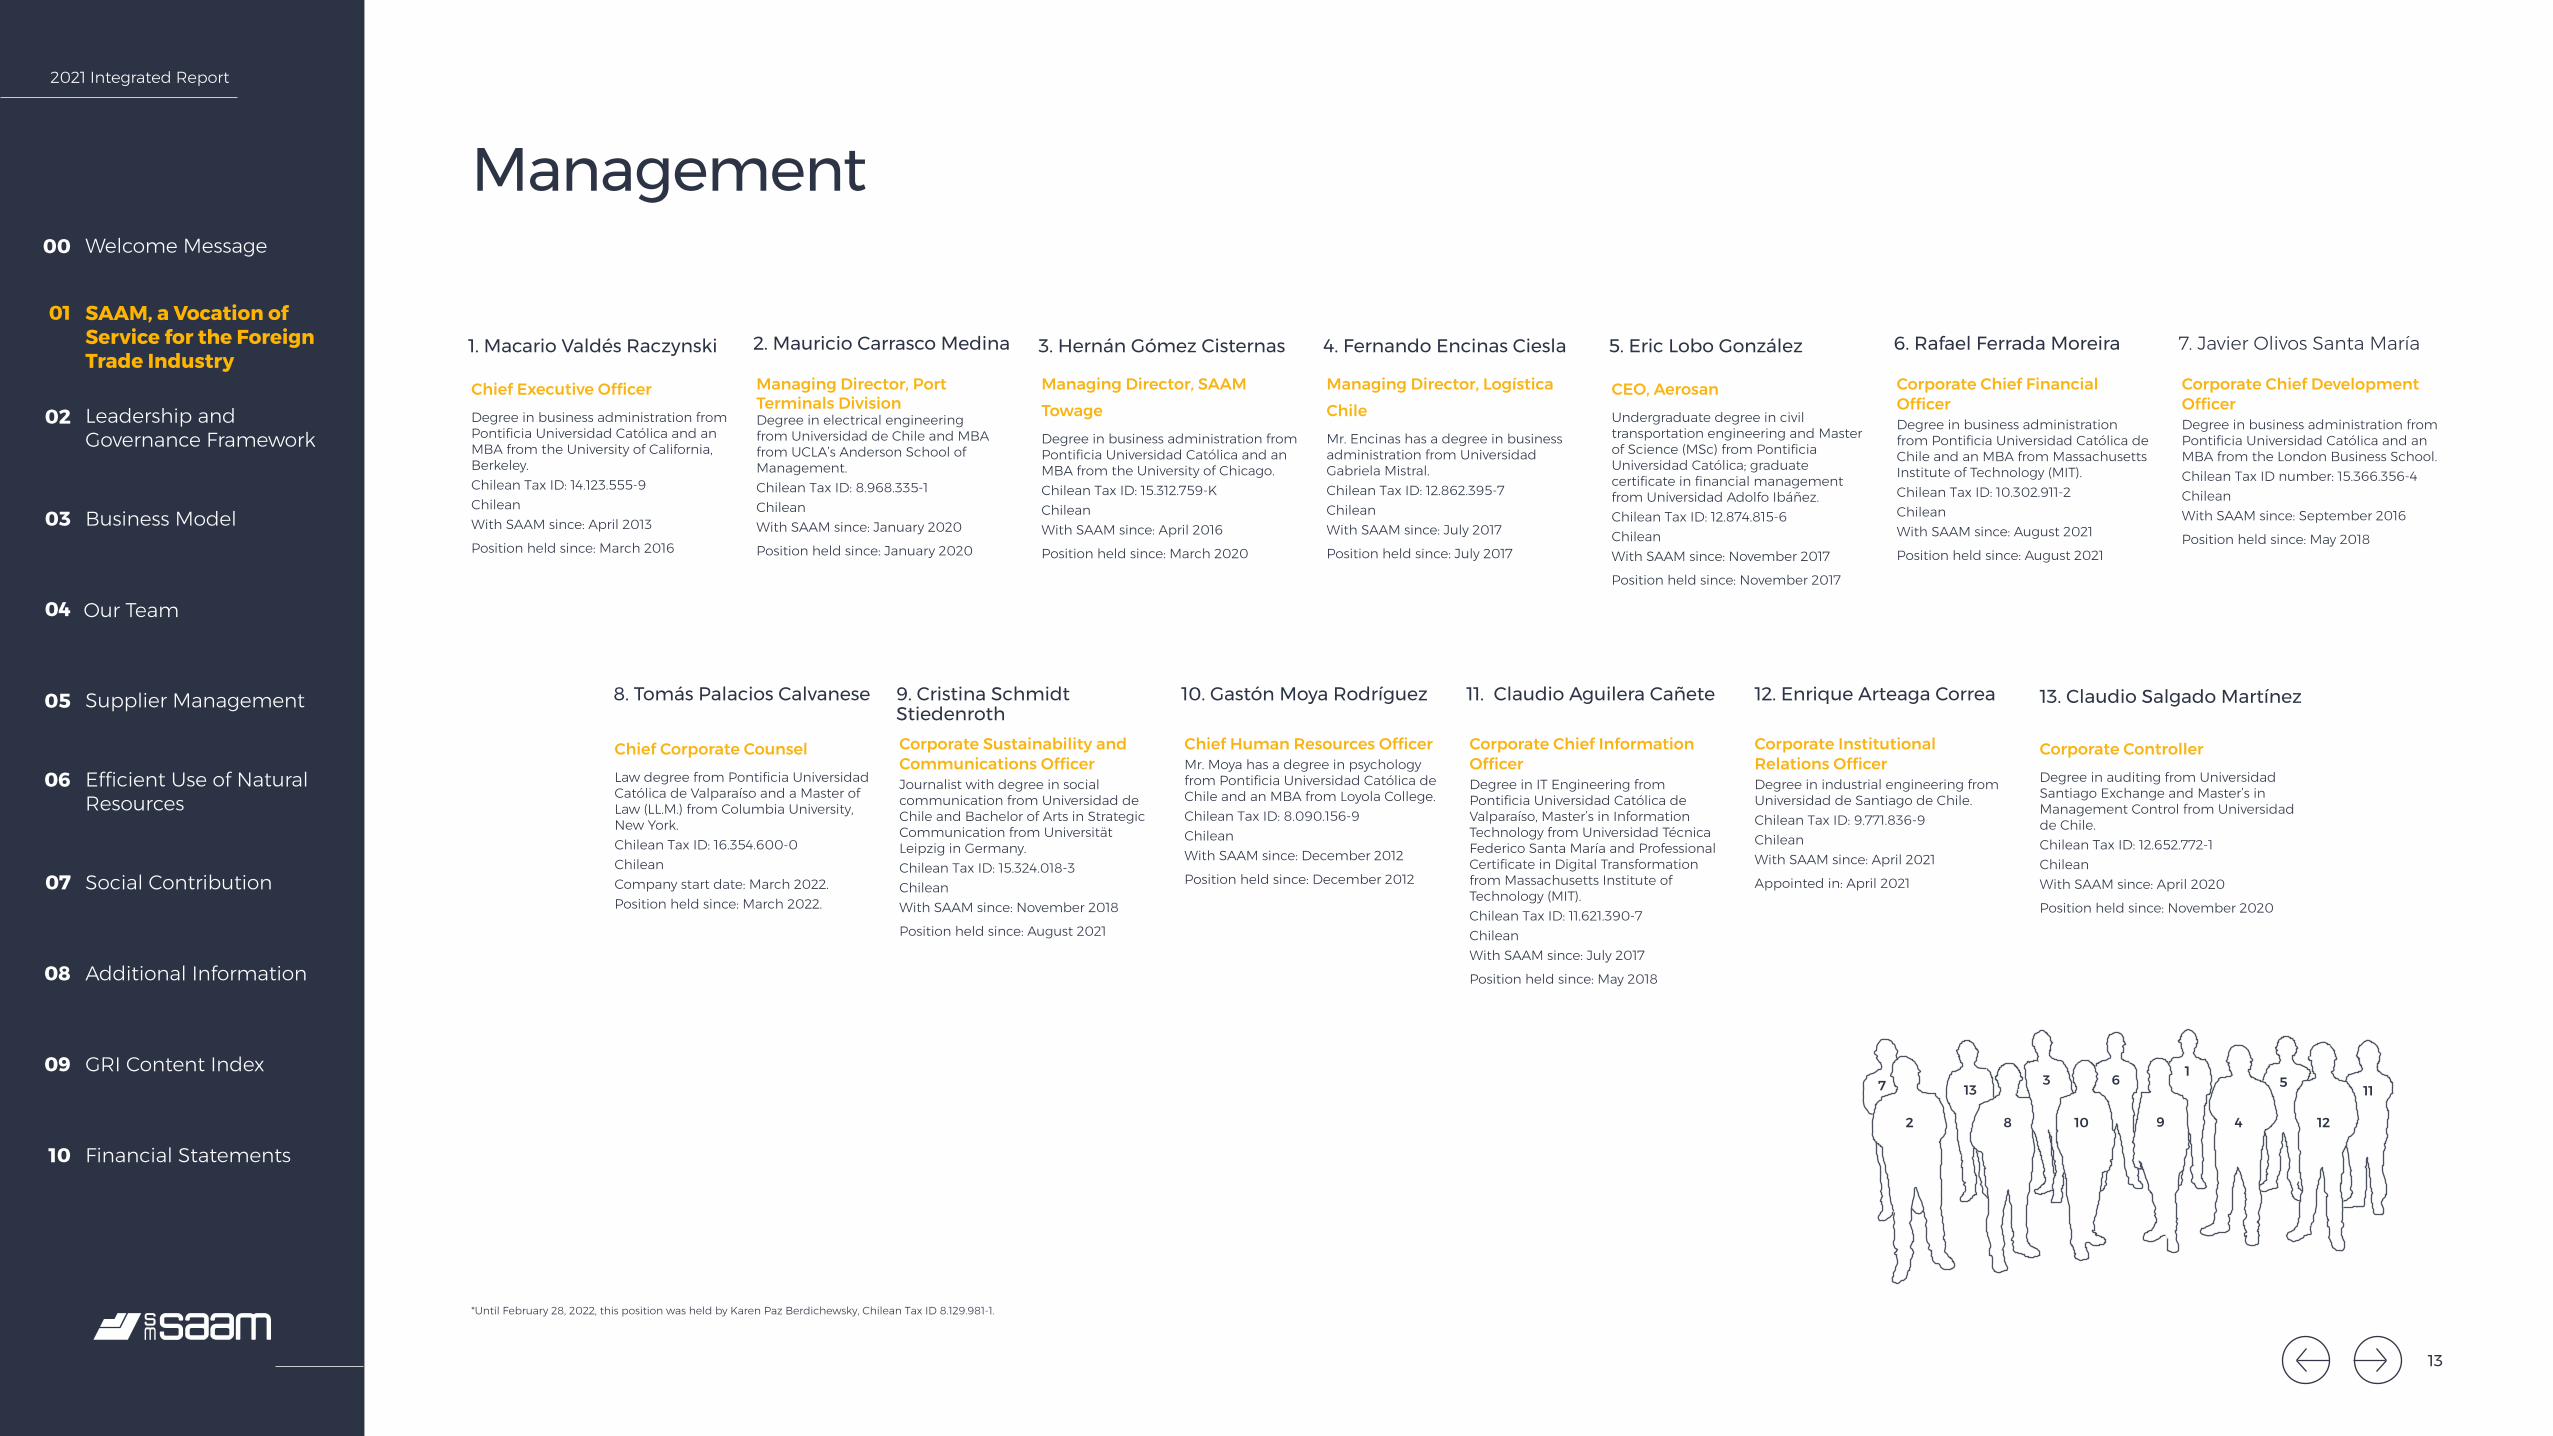
Management
1. Macario Valdés Raczynski 3. Hernán Gómez Cisternas
10. Gastón Moya Rodríguez
5. Eric Lobo González
12. Enrique Arteaga Correa
2. Mauricio Carrasco Medina
9. Cristina Schmidt Stiedenroth
8. Tomás Palacios Calvanese
4. Fernando Encinas Ciesla
11. Claudio Aguilera Cañete
6. Rafael Ferrada Moreira 7. Javier Olivos Santa María
13. Claudio Salgado Martínez
Chief Executive OfficerDegree in business administration from Pontificia Universidad Católica and an MBA from the University of California, Berkeley.Chilean Tax ID: 14.123.555-9ChileanWith SAAM since: April 2013
Position held since: March 2016
Chief Corporate CounselLaw degree from Pontificia Universidad Católica de Valparaíso and a Master of Law (LL.M.) from Columbia University, New York. Chilean Tax ID: 16.354.600-0 Chilean Company start date: March 2022. Position held since: March 2022.
Managing Director, SAAM TowageDegree in business administration from Pontificia Universidad Católica and an MBA from the University of Chicago.Chilean Tax ID: 15.312.759-KChileanWith SAAM since: April 2016
Position held since: March 2020
Chief Human Resources OfficerMr. Moya has a degree in psychology from Pontificia Universidad Católica de Chile and an MBA from Loyola College. Chilean Tax ID: 8.090.156-9ChileanWith SAAM since: December 2012
Position held since: December 2012
CEO, AerosanUndergraduate degree in civil transportation engineering and Master of Science (MSc) from Pontificia Universidad Católica; graduate certificate in financial management from Universidad Adolfo Ibáñez. Chilean Tax ID: 12.874.815-6ChileanWith SAAM since: November 2017
Position held since: November 2017
Corporate Institutional Relations OfficerDegree in industrial engineering from Universidad de Santiago de Chile.Chilean Tax ID: 9.771.836-9ChileanWith SAAM since: April 2021
Appointed in: April 2021
Managing Director, Port Terminals Division Degree in electrical engineering from Universidad de Chile and MBA from UCLA’s Anderson School of Management.Chilean Tax ID: 8.968.335-1ChileanWith SAAM since: January 2020
Position held since: January 2020
Corporate Sustainability and Communications OfficerJournalist with degree in social communication from Universidad de Chile and Bachelor of Arts in Strategic Communication from Universität Leipzig in Germany.Chilean Tax ID: 15.324.018-3ChileanWith SAAM since: November 2018
Position held since: August 2021
Managing Director, Logística ChileMr. Encinas has a degree in business administration from Universidad Gabriela Mistral.Chilean Tax ID: 12.862.395-7ChileanWith SAAM since: July 2017
Position held since: July 2017
Corporate Chief Information OfficerDegree in IT Engineering from Pontificia Universidad Católica de Valparaíso, Master’s in Information Technology from Universidad Técnica Federico Santa María and Professional Certificate in Digital Transformation from Massachusetts Institute of Technology (MIT).Chilean Tax ID: 11.621.390-7ChileanWith SAAM since: July 2017
Position held since: May 2018
Corporate Chief Financial OfficerDegree in business administration from Pontificia Universidad Católica de Chile and an MBA from Massachusetts Institute of Technology (MIT). Chilean Tax ID: 10.302.911-2Chilean With SAAM since: August 2021
Position held since: August 2021
Corporate Chief Development OfficerDegree in business administration from Pontificia Universidad Católica and an MBA from the London Business School.Chilean Tax ID number: 15.366.356-4ChileanWith SAAM since: September 2016
Position held since: May 2018
Corporate ControllerDegree in auditing from Universidad Santiago Exchange and Master’s in Management Control from Universidad de Chile.Chilean Tax ID: 12.652.772-1ChileanWith SAAM since: April 2020
Position held since: November 2020
*Until February 28, 2022, this position was held by Karen Paz Berdichewsky, Chilean Tax ID 8.129.981-1.
13
2021 Integrated Report
Welcome Message00
Leadership and Governance Framework
02
Business Model03
Our Team04
Supplier Management05
Efficient Use of Natural Resources
06
Social Contribution07
Additional Information08
GRI Content Index09
Financial Statements10
SAAM, a Vocation of Service for the Foreign Trade Industry
01
Logistics
Port Terminals
Port Terminals
Port Terminals
Port Terminals
Towage
Towage Towage
Towage
Towage
Towage
Towage
Towage
Towage
Logistics
Logistics
Logistics
USA
Panama
Colombia
Brazil
Uruguay
Canada
Mexico
Costa Rica
Ecuador
Chile
Port Terminals
Guatemala
Towage
TowageTowage
Towage
Port Terminals
Honduras
Peru
El Salvador
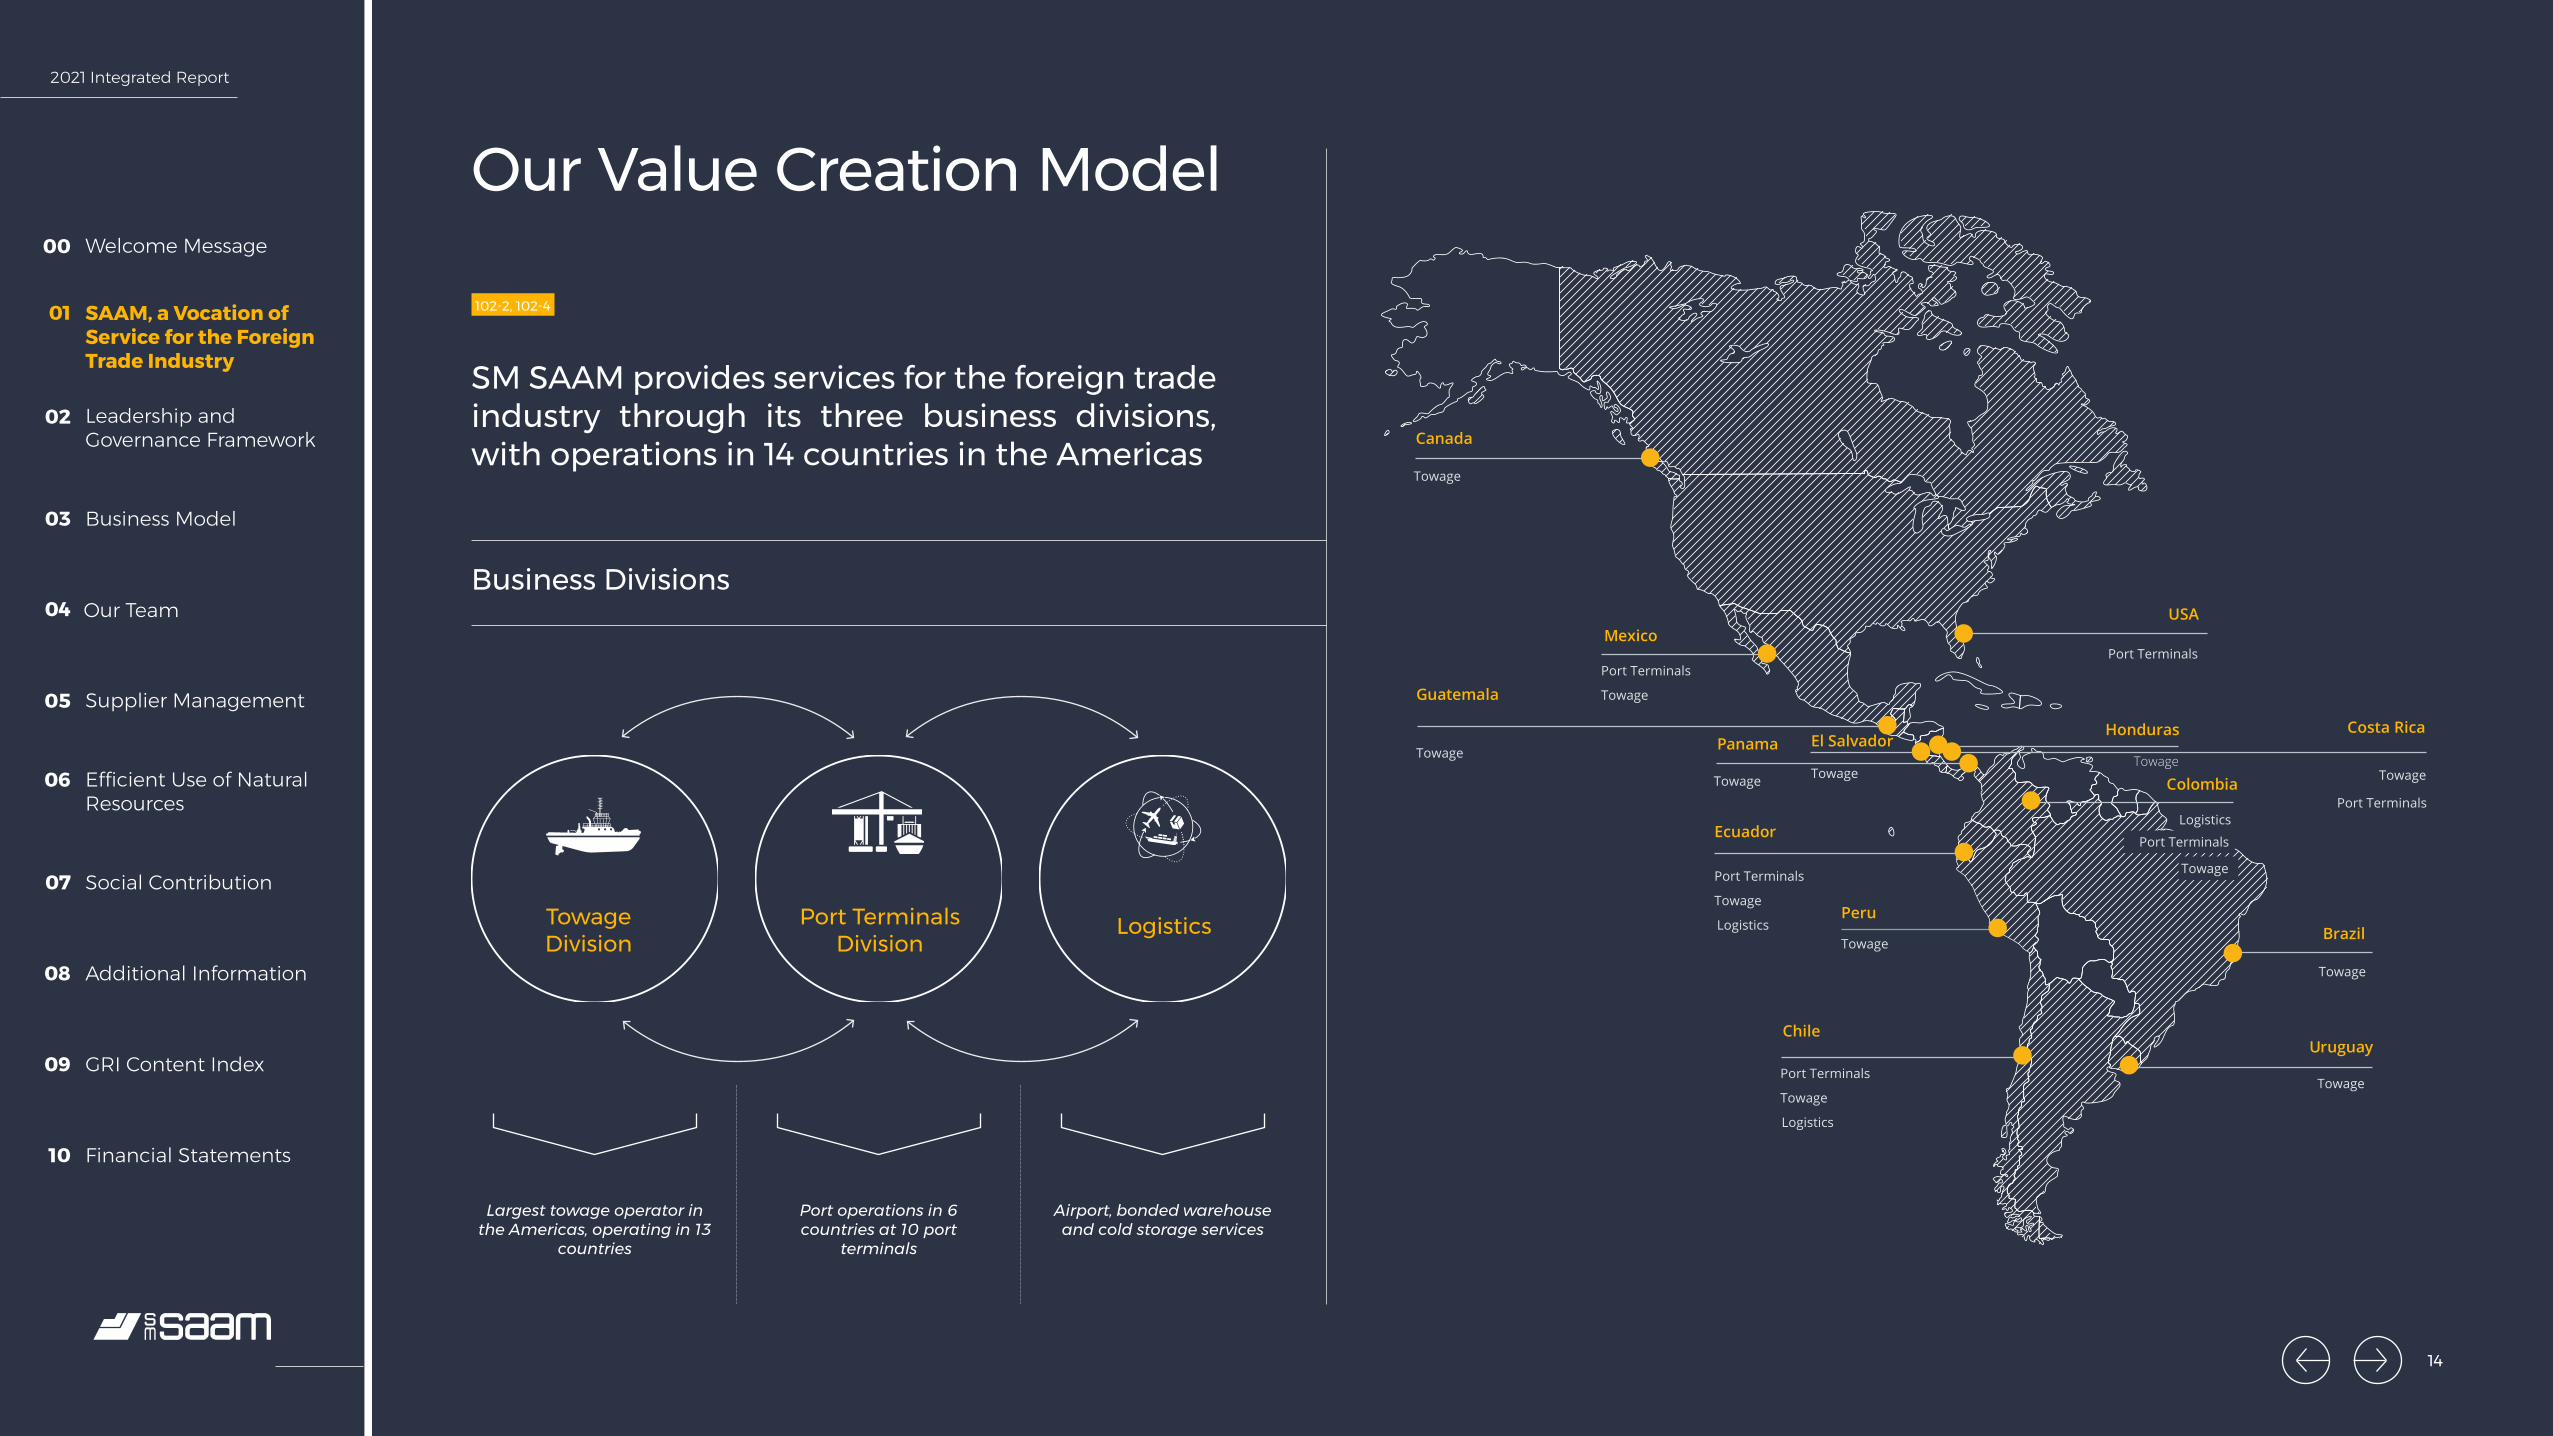
102-2, 102-4
Our Value Creation Model
SM SAAM provides services for the foreign trade industry through its three business divisions, with operations in 14 countries in the Americas
Business Divisions
Largest towage operator in the Americas, operating in 13
countries
Port operations in 6 countries at 10 port
terminals
Airport, bonded warehouse and cold storage services
Towage Division
Port Terminals Division
14
2021 Integrated Report
Welcome Message00
Leadership and Governance Framework
02
Business Model03
Our Team04
Supplier Management05
Efficient Use of Natural Resources
06
Social Contribution07
Additional Information08
GRI Content Index09
Financial Statements10
SAAM, a Vocation of Service for the Foreign Trade Industry
01
SAAM
Towag
e:SAAM Term
inals:
Bui
ld to
exp
and
Build to excel
Aerosan: SAAM Logistics:
Build to connectBuild to �y
Tale
nt
Sustainability
Systems and IT
Logistics Division
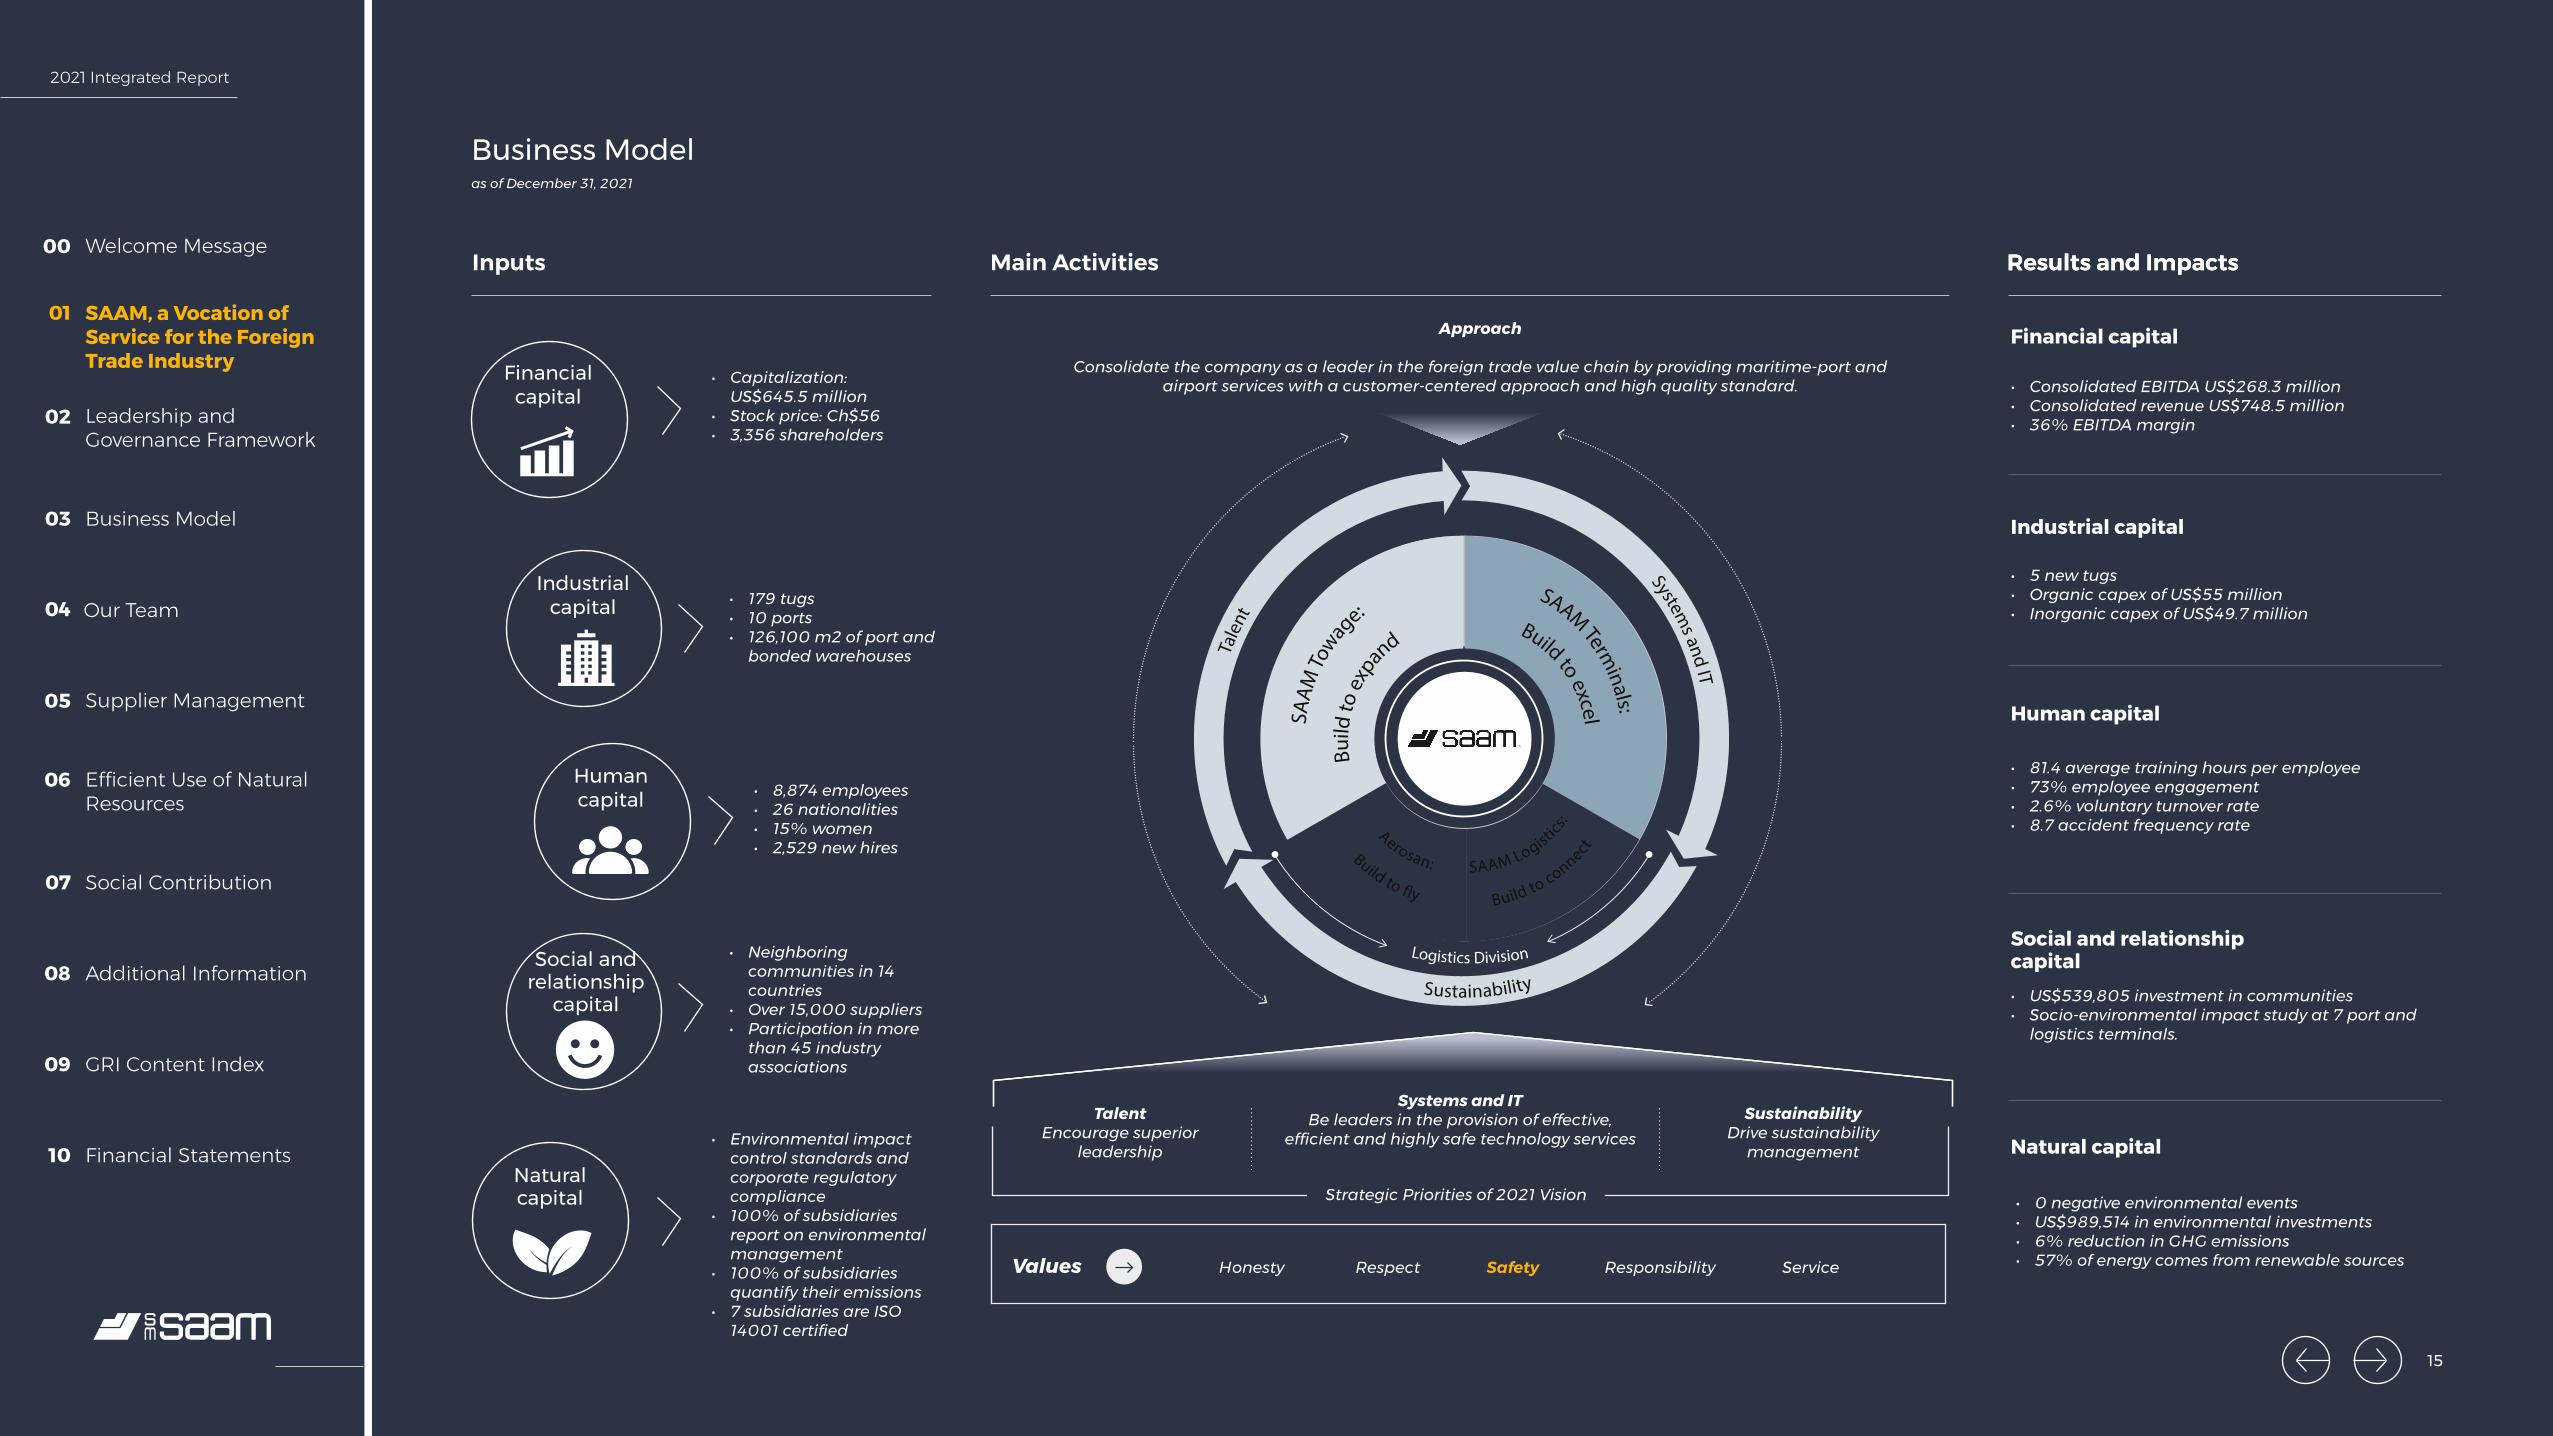
Business Model
Inputs Main Activities Results and Impacts
as of December 31, 2021
Financial capital
Financial capital
Industrial capital
Industrial capital
Human capital
Human capital
Social and relationship
capital
Social and relationship capital
Natural capital
Natural capital
Results and Impacts
• Capitalization: US$645.5 million
• Stock price: Ch$56• 3,356 shareholders
• Environmental impact control standards and corporate regulatory compliance
• 100% of subsidiaries report on environmental management
• 100% of subsidiaries quantify their emissions
• 7 subsidiaries are ISO 14001 certified
• Consolidated EBITDA US$268.3 million• Consolidated revenue US$748.5 million• 36% EBITDA margin
• 179 tugs• 10 ports• 126,100 m2 of port and
bonded warehouses
• 5 new tugs• Organic capex of US$55 million• Inorganic capex of US$49.7 million
• Neighboring communities in 14 countries
• Over 15,000 suppliers• Participation in more
than 45 industry associations
• US$539,805 investment in communities• Socio-environmental impact study at 7 port and
logistics terminals.
• 0 negative environmental events• US$989,514 in environmental investments• 6% reduction in GHG emissions• 57% of energy comes from renewable sources
• 8,874 employees• 26 nationalities • 15% women• 2,529 new hires
• 81.4 average training hours per employee• 73% employee engagement• 2.6% voluntary turnover rate• 8.7 accident frequency rate
Strategic Priorities of 2021 Vision
TalentEncourage superior
leadership
SustainabilityDrive sustainability
management
Honesty Respect Safety Responsibility Service
Approach
Consolidate the company as a leader in the foreign trade value chain by providing maritime-port and airport services with a customer-centered approach and high quality standard.
Values
Systems and ITBe leaders in the provision of effective,
efficient and highly safe technology services
15
2021 Integrated Report
Welcome Message00
Leadership and Governance Framework
02
Business Model03
Our Team04
Supplier Management05
Efficient Use of Natural Resources
06
Social Contribution07
Additional Information08
GRI Content Index09
Financial Statements10
SAAM, a Vocation of Service for the Foreign Trade Industry
01
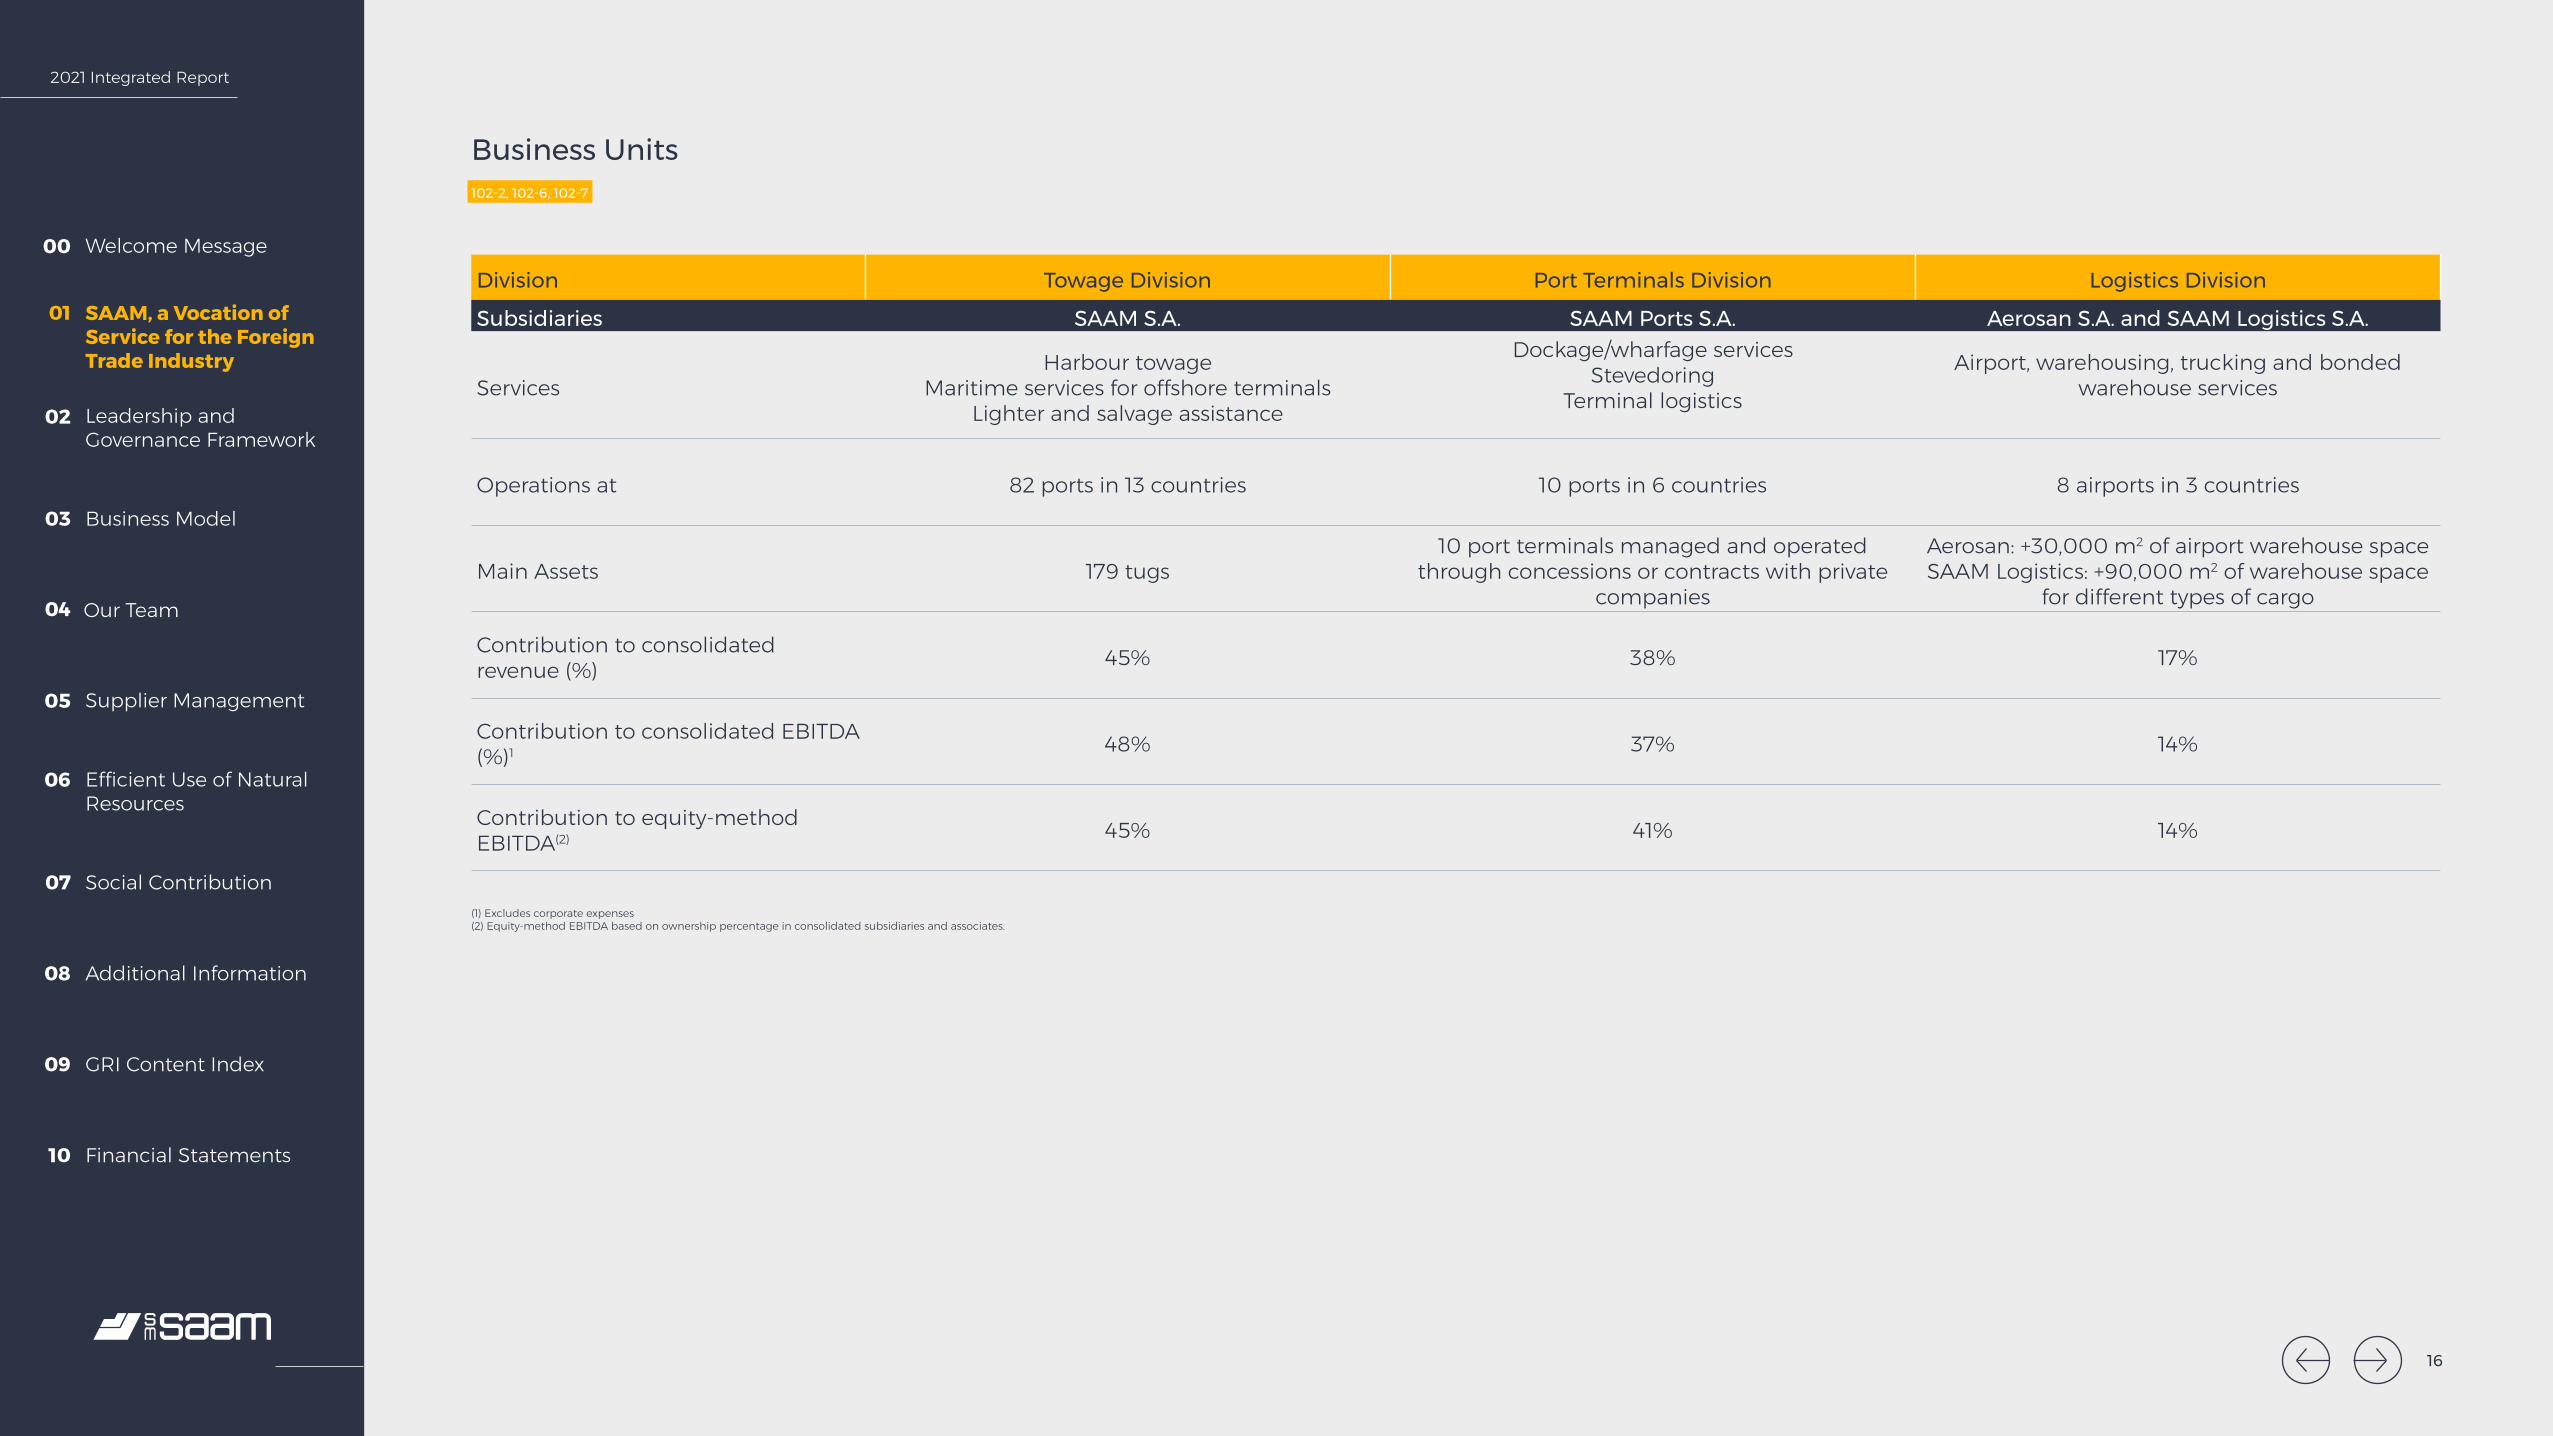
102-2, 102-6, 102-7
Business Units
Division Towage Division Port Terminals Division Logistics Division
Subsidiaries SAAM S.A. SAAM Ports S.A. Aerosan S.A. and SAAM Logistics S.A.
ServicesHarbour towage
Maritime services for offshore terminalsLighter and salvage assistance
Dockage/wharfage servicesStevedoring
Terminal logistics
Airport, warehousing, trucking and bonded warehouse services
Operations at 82 ports in 13 countries 10 ports in 6 countries 8 airports in 3 countries
Main Assets 179 tugs10 port terminals managed and operated
through concessions or contracts with private companies
Aerosan: +30,000 m2 of airport warehouse spaceSAAM Logistics: +90,000 m2 of warehouse space
for different types of cargo
Contribution to consolidated revenue (%) 45% 38% 17%
Contribution to consolidated EBITDA (%)1 48% 37% 14%
Contribution to equity-method EBITDA(2) 45% 41% 14%
(1) Excludes corporate expenses(2) Equity-method EBITDA based on ownership percentage in consolidated subsidiaries and associates.
16
2021 Integrated Report
Welcome Message00
Leadership and Governance Framework
02
Business Model03
Our Team04
Supplier Management05
Efficient Use of Natural Resources
06
Social Contribution07
Additional Information08
GRI Content Index09
Financial Statements10
SAAM, a Vocation of Service for the Foreign Trade Industry
01
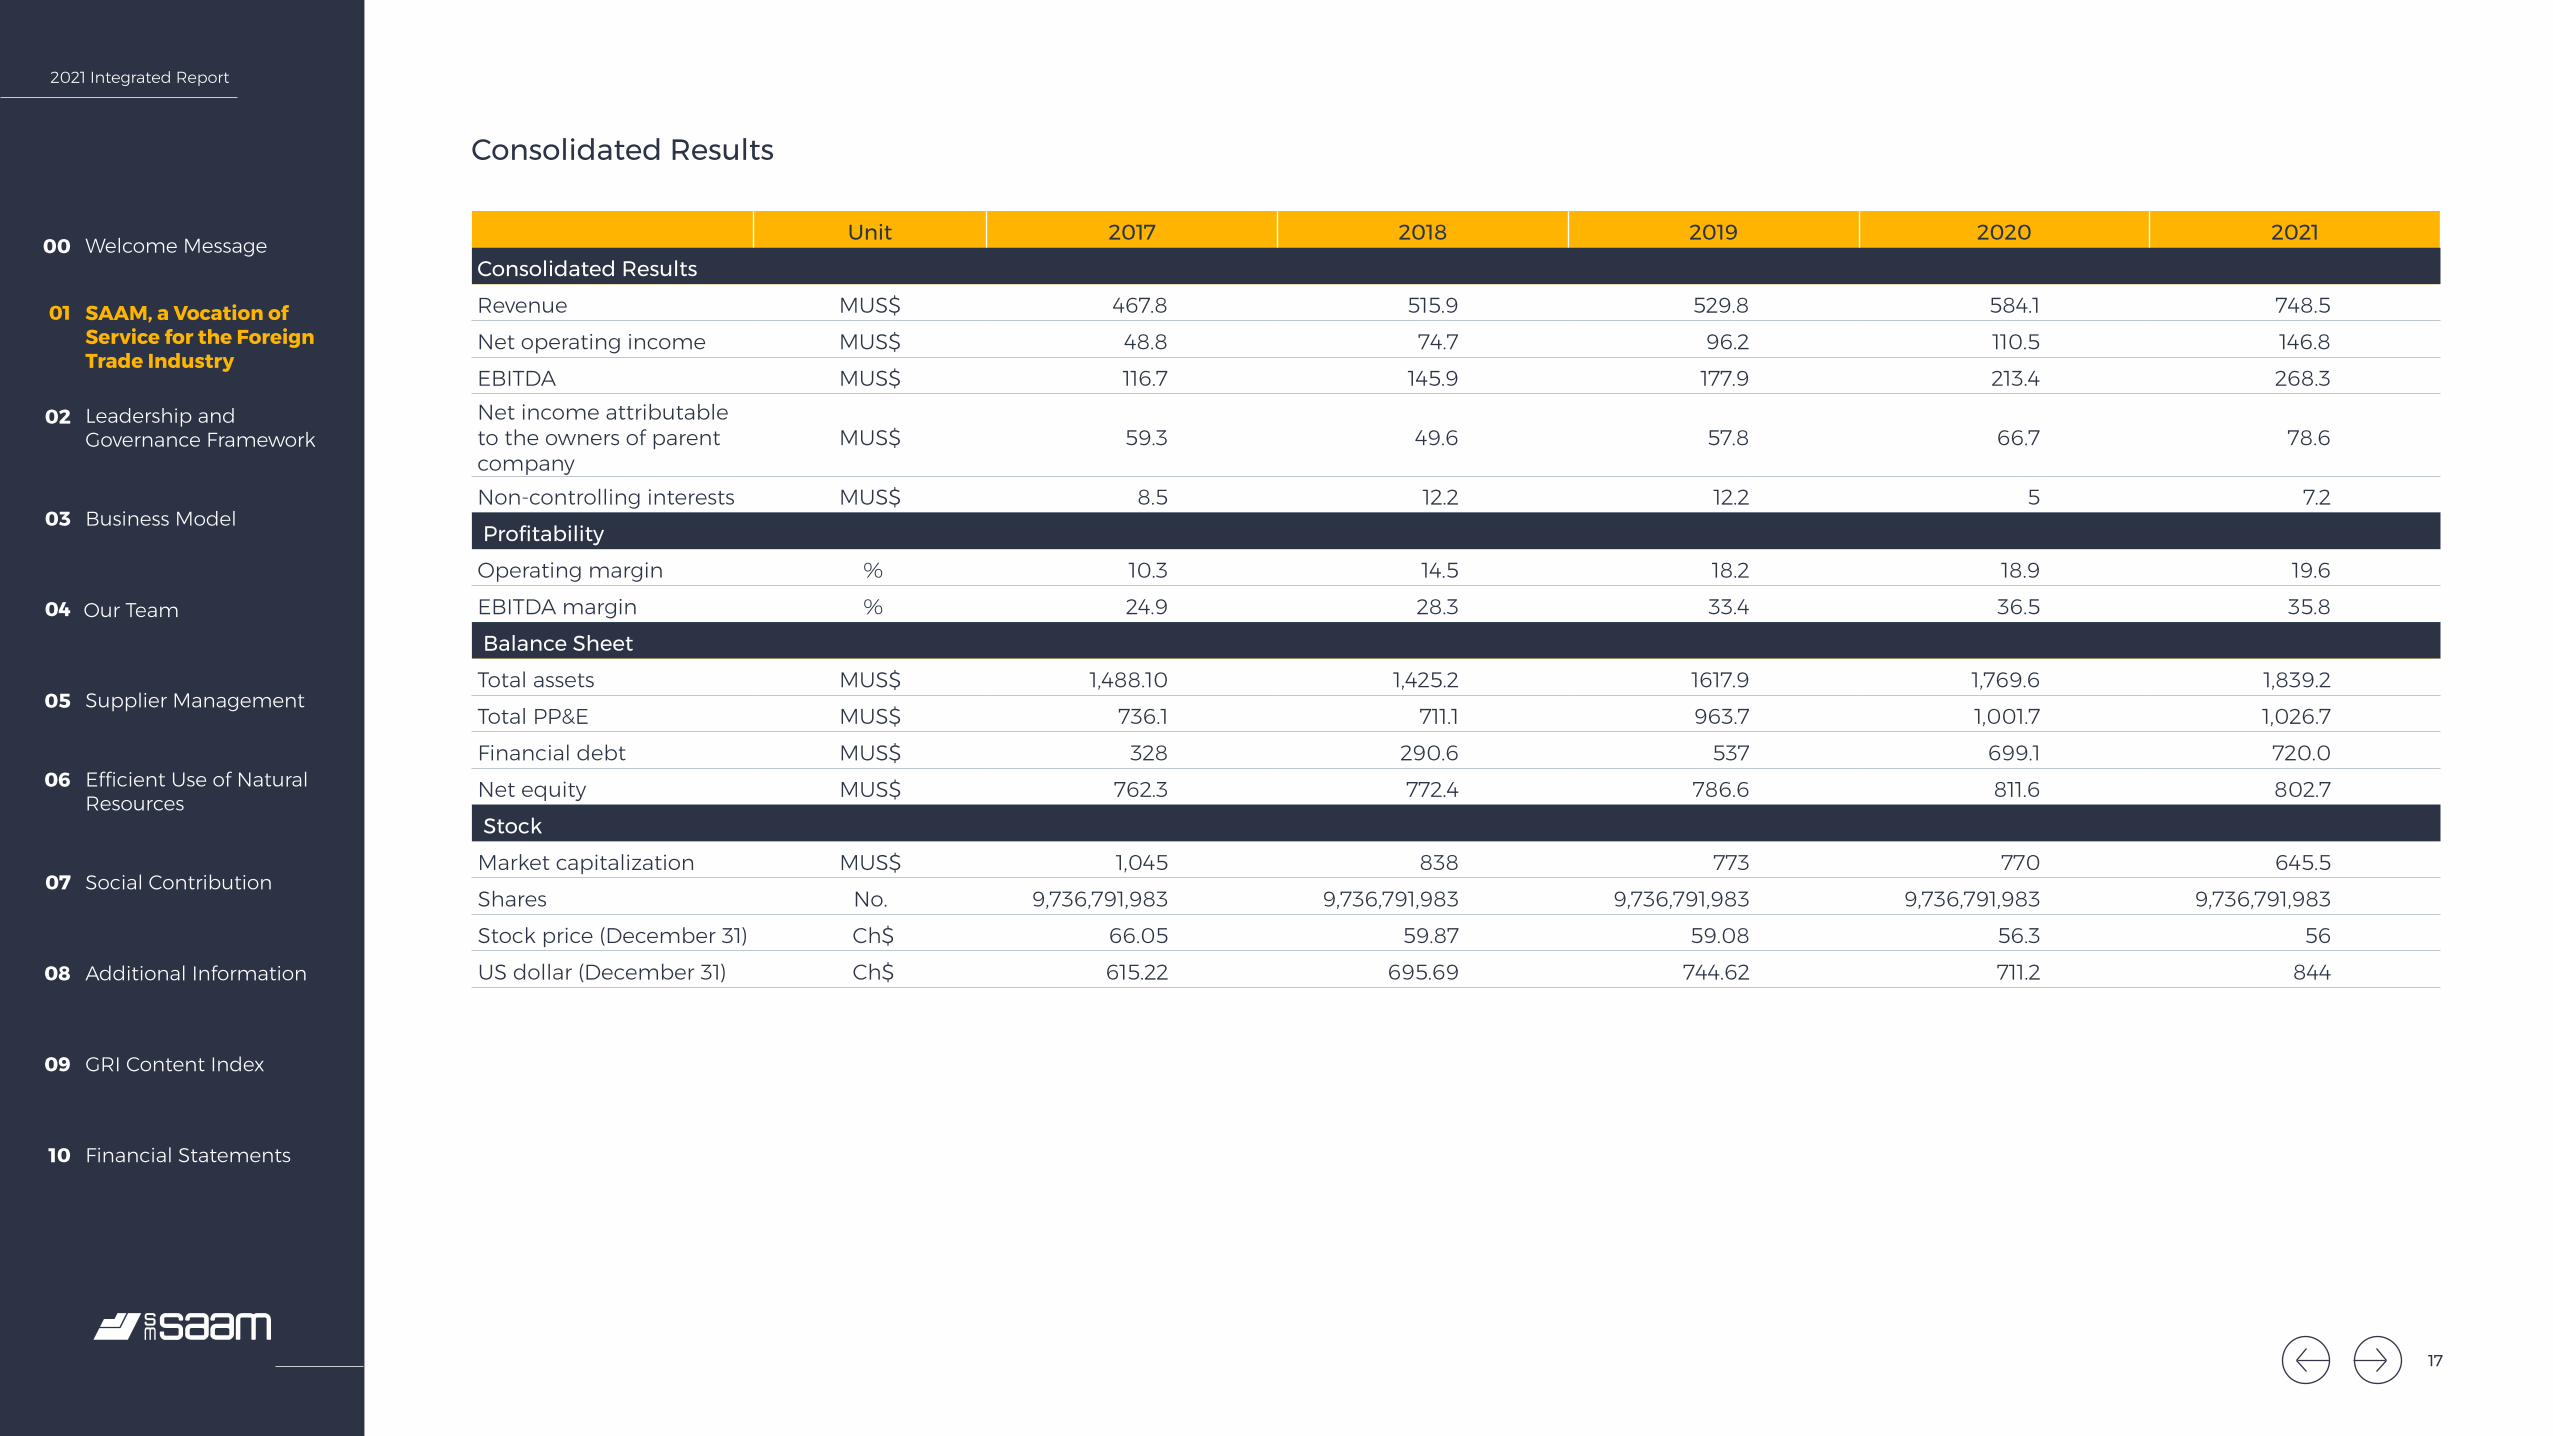
Consolidated Results
Unit 2017 2018 2019 2020 2021Consolidated ResultsRevenue MUS$ 467.8 515.9 529.8 584.1 748.5Net operating income MUS$ 48.8 74.7 96.2 110.5 146.8EBITDA MUS$ 116.7 145.9 177.9 213.4 268.3Net income attributable to the owners of parent company
MUS$ 59.3 49.6 57.8 66.7 78.6
Non-controlling interests MUS$ 8.5 12.2 12.2 5 7.2 Profitability Operating margin % 10.3 14.5 18.2 18.9 19.6EBITDA margin % 24.9 28.3 33.4 36.5 35.8 Balance Sheet Total assets MUS$ 1,488.10 1,425.2 1617.9 1,769.6 1,839.2Total PP&E MUS$ 736.1 711.1 963.7 1,001.7 1,026.7Financial debt MUS$ 328 290.6 537 699.1 720.0Net equity MUS$ 762.3 772.4 786.6 811.6 802.7 Stock Market capitalization MUS$ 1,045 838 773 770 645.5Shares No. 9,736,791,983 9,736,791,983 9,736,791,983 9,736,791,983 9,736,791,983Stock price (December 31) Ch$ 66.05 59.87 59.08 56.3 56US dollar (December 31) Ch$ 615.22 695.69 744.62 711.2 844
17
2021 Integrated Report
Welcome Message00
Leadership and Governance Framework
02
Business Model03
Our Team04
Supplier Management05
Efficient Use of Natural Resources
06
Social Contribution07
Additional Information08
GRI Content Index09
Financial Statements10
SAAM, a Vocation of Service for the Foreign Trade Industry
01
Tale
ntSustainability
Systems and IT
SAAM
Towag
e:SAAM Term
inals:
Bui
ld to
exp
and
Build to excel
Aerosan: SAAM Logistics:
Build to connectBuild to �y
Logistics Division
Develop model of competitive
capabilities
Commercial excellence
Regional growth and
consolidation
Fleet management
Standardize systems and
processes
Develop single operational excellence
model
Adopt opportunities for automation and
digitalization
Grow into new markets
Implement systems and standardize processes
Strengthen current services
Generate new
services
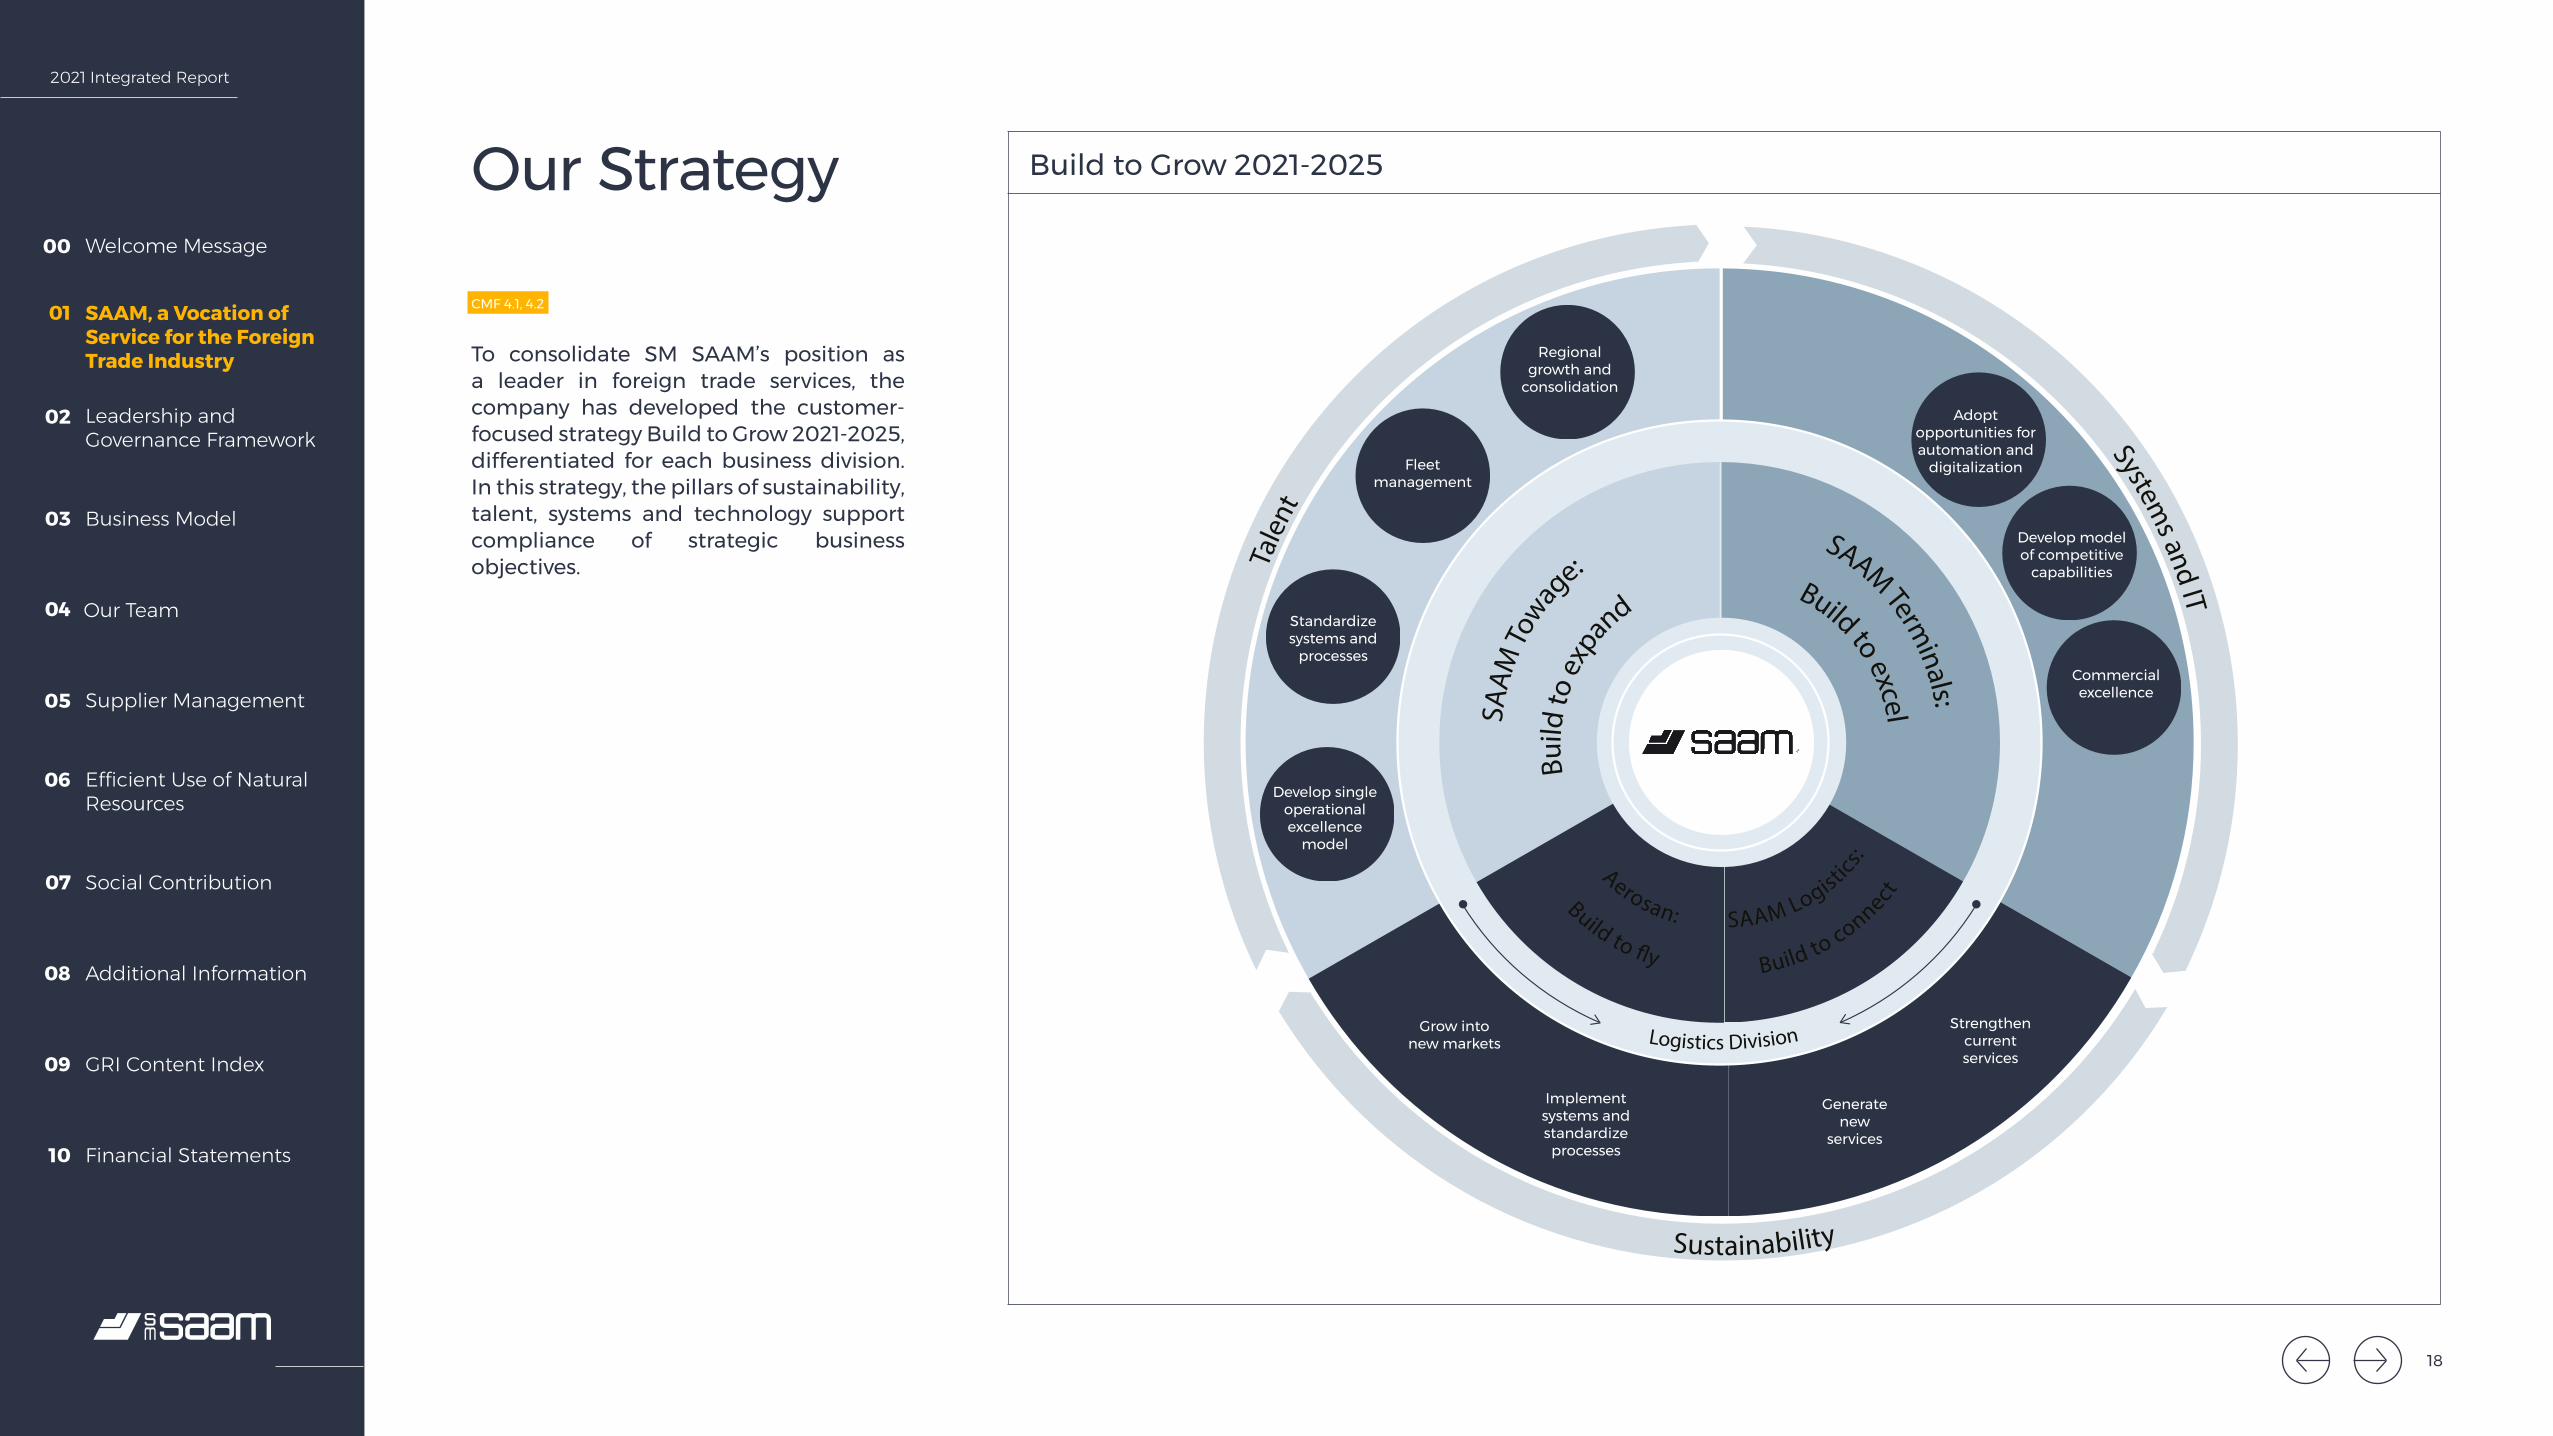
Our Strategy
CMF 4.1, 4.2
To consolidate SM SAAM’s position as a leader in foreign trade services, the company has developed the customer-focused strategy Build to Grow 2021-2025, differentiated for each business division. In this strategy, the pillars of sustainability, talent, systems and technology support compliance of strategic business objectives.
Build to Grow 2021-2025
18
2021 Integrated Report
Welcome Message00
Leadership and Governance Framework
02
Business Model03
Our Team04
Supplier Management05
Efficient Use of Natural Resources
06
Social Contribution07
Additional Information08
GRI Content Index09
Financial Statements10
SAAM, a Vocation of Service for the Foreign Trade Industry
01
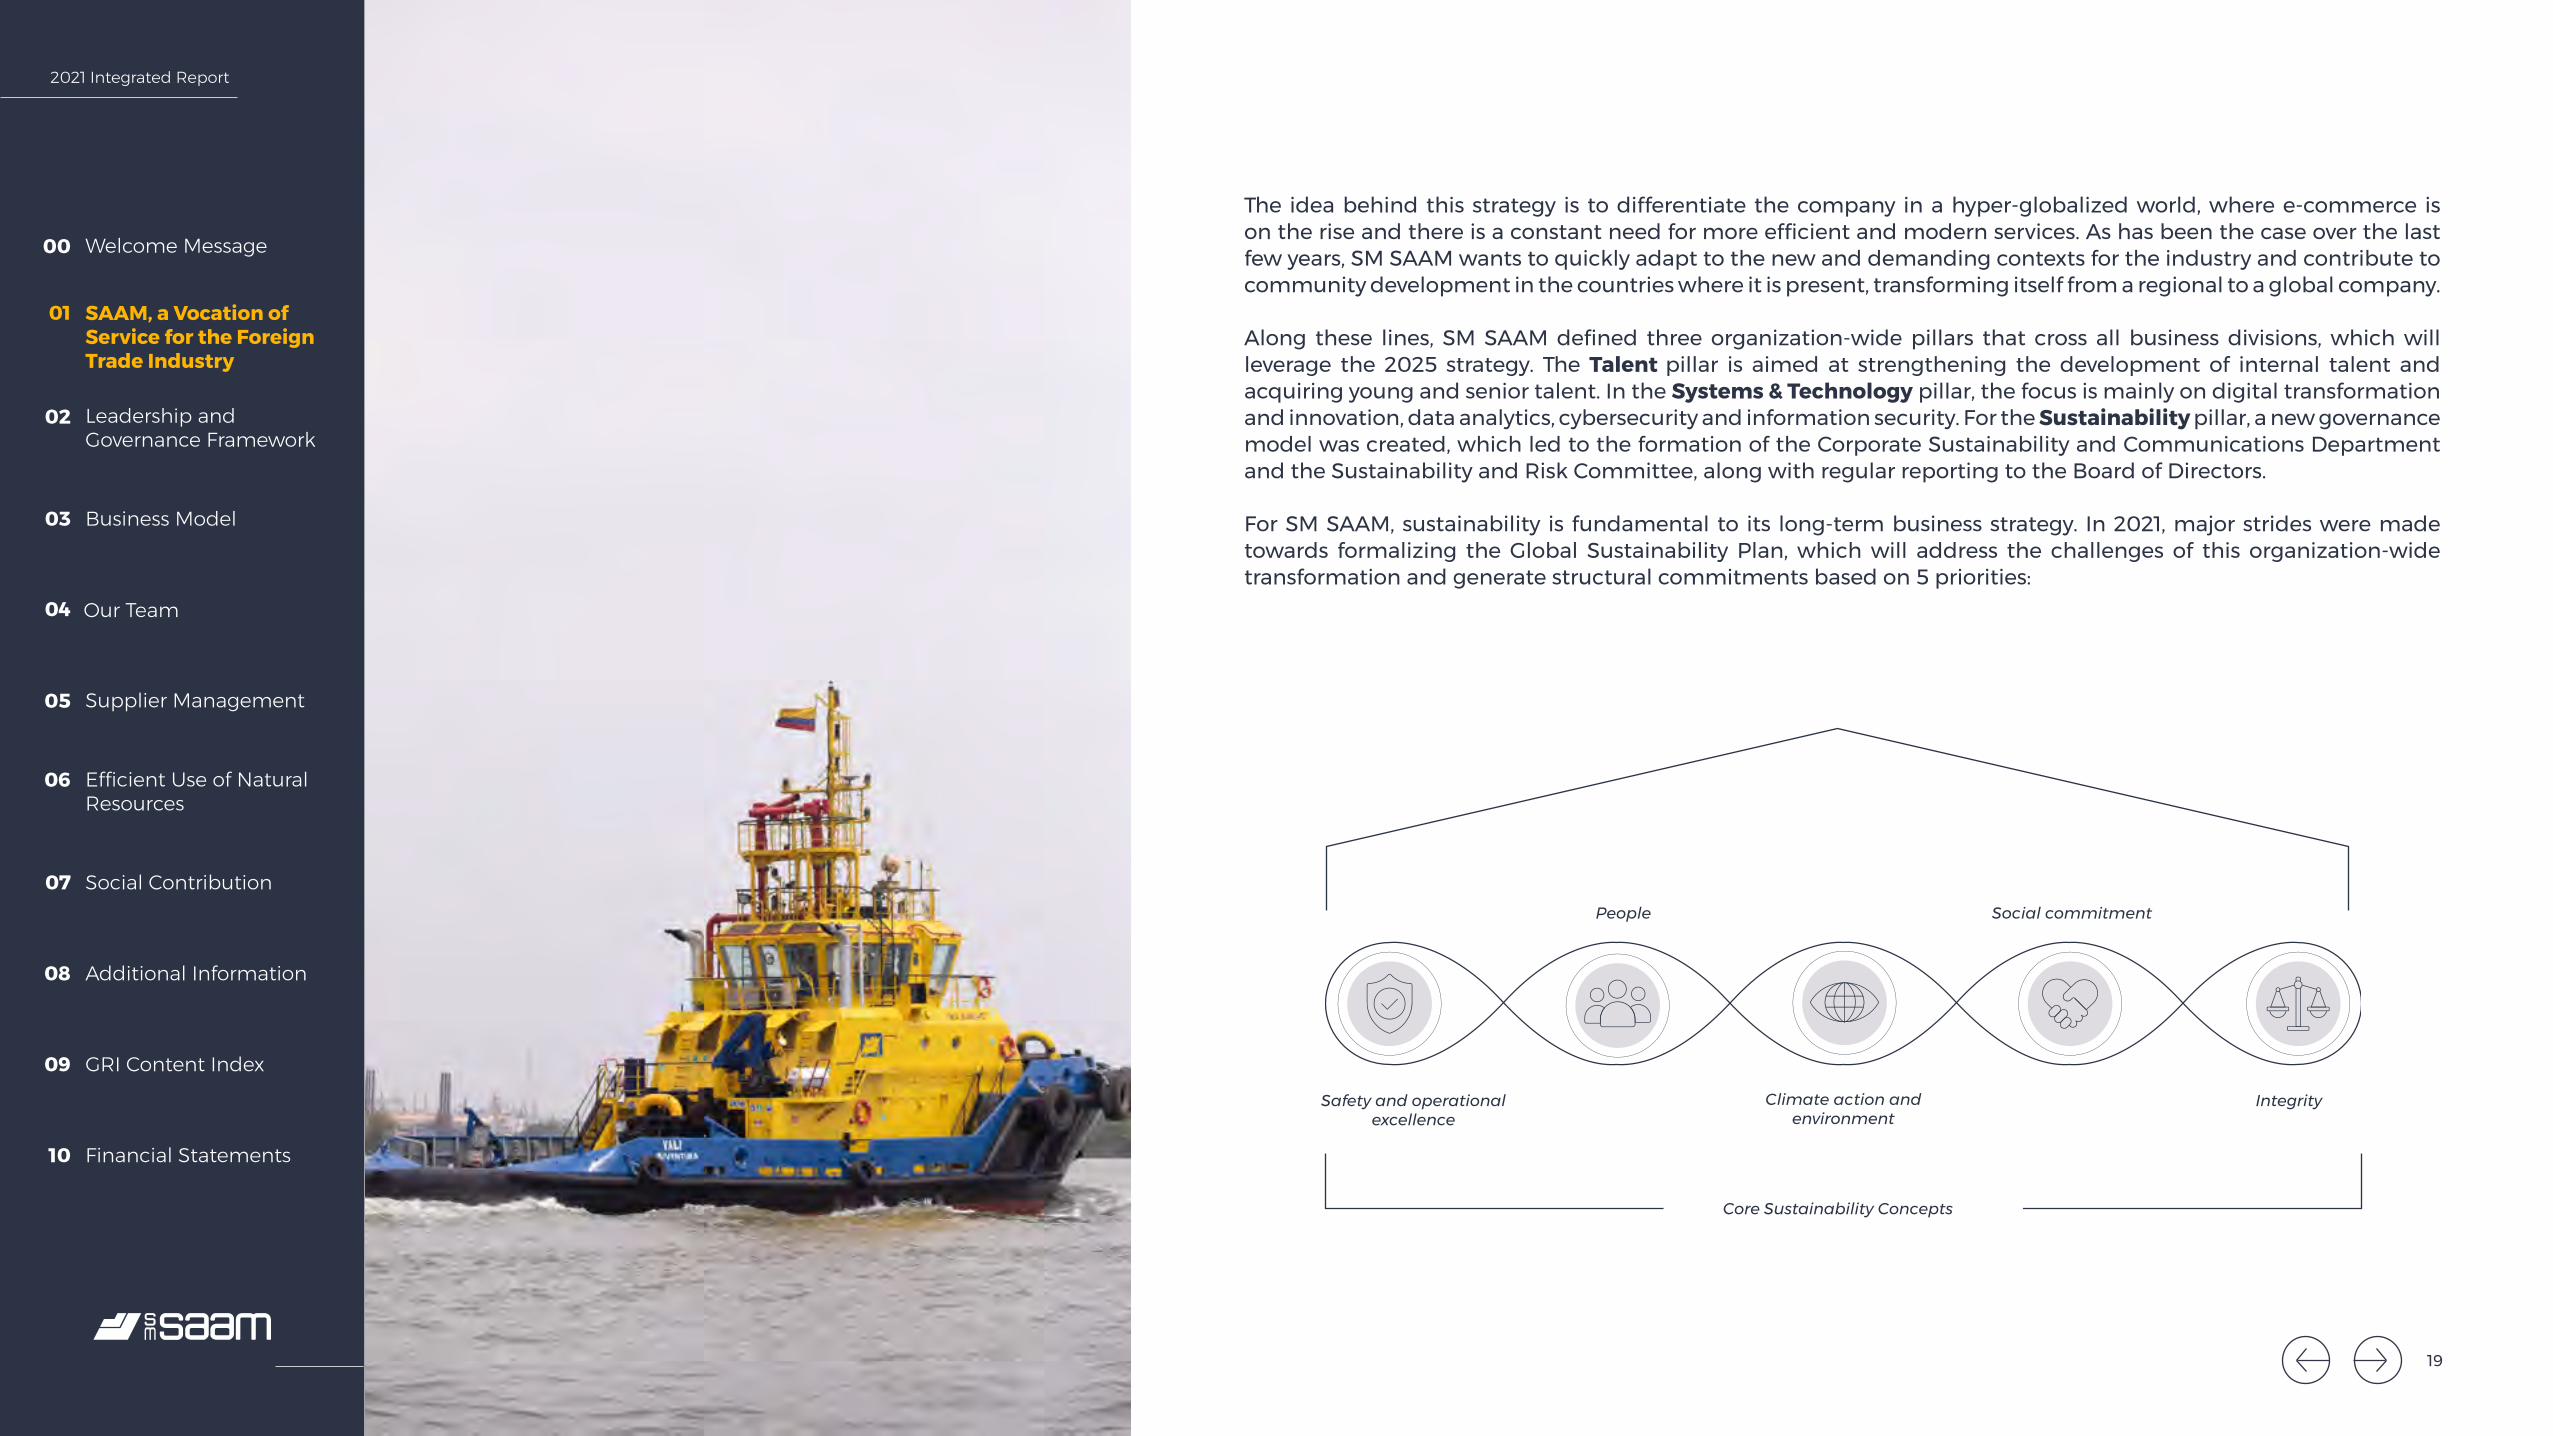
The idea behind this strategy is to differentiate the company in a hyper-globalized world, where e-commerce is on the rise and there is a constant need for more efficient and modern services. As has been the case over the last few years, SM SAAM wants to quickly adapt to the new and demanding contexts for the industry and contribute to community development in the countries where it is present, transforming itself from a regional to a global company.
Along these lines, SM SAAM defined three organization-wide pillars that cross all business divisions, which will leverage the 2025 strategy. The Talent pillar is aimed at strengthening the development of internal talent and acquiring young and senior talent. In the Systems & Technology pillar, the focus is mainly on digital transformation and innovation, data analytics, cybersecurity and information security. For the Sustainability pillar, a new governance model was created, which led to the formation of the Corporate Sustainability and Communications Department and the Sustainability and Risk Committee, along with regular reporting to the Board of Directors.
For SM SAAM, sustainability is fundamental to its long-term business strategy. In 2021, major strides were made towards formalizing the Global Sustainability Plan, which will address the challenges of this organization-wide transformation and generate structural commitments based on 5 priorities:
Safety and operational excellence
People
Climate action and environment
Social commitment
Integrity
Core Sustainability Concepts
19
2021 Integrated Report
Welcome Message00
Leadership and Governance Framework
02
Business Model03
Our Team04
Supplier Management05
Efficient Use of Natural Resources
06
Social Contribution07
Additional Information08
GRI Content Index09
Financial Statements10
SAAM, a Vocation of Service for the Foreign Trade Industry
01
The robust governance, the updated Sustainability Policy and these 5 sustainability priorities are the guidelines to defining actions aimed at generating triple-bottom-line impact (economic, social and environmental), thus contributing to the UN Sustainable Development Goals (SDGs).
As part of this development, further to the current contribution to the SDGs through company management, SM SAAM is currently defining the priority SDGs. They will then be incorporated into the business model and permeated throughout the value chain, which will go hand in hand with integration into the Global Compact Chile Network, as a clear and conclusive demonstration of the company’s commitment to the 2030 Agenda.
20
2021 Integrated Report
Welcome Message00
Leadership and Governance Framework
02
Business Model03
Our Team04
Supplier Management05
Efficient Use of Natural Resources
06
Social Contribution07
Additional Information08
GRI Content Index09
Financial Statements10
SAAM, a Vocation of Service for the Foreign Trade Industry
01
102-45, 102-46, 102-50, 102-51, 102-52, 102-54 102-48, 102-49, 102-56
How We Prepare our Integrated Report
Scope of the Report
SM SAAM prepared its third Integrated Report with information for 2021 on its economic, social, environmental and governance performance.
This document covers an annual reporting cycle that begins on January 1 and ends on December 31, 2021. The scope of the document covers information on all SM SAAM operations and the Financial Statements (see details of the companies considered in the chapter entitled Additional Information).
This report was prepared with national and international disclosure standards, requirements and frameworks. These include the principles of the International Integrated Reporting Council (IIRC), the recommendations of S&P Global Corporate Sustainability Assessment (CSA), the standards of the Global Reporting Initiative (GRI), legal requirements of the recently published General Character Standard (NCG) No. 461 from the Financial Market Commission (CMF) and the company’s own indicators.
As per indications of NCG No. 461 from the CMF, SM SAAM has decided for the first time to incorporate the standards of the Sustainability Accounting Standards Board (SASB) for the logistics and airport services and marine transportation sectors.
The data published has been validated by each of the areas involved and has not been externally assured.
21

2021 Integrated Report
Welcome Message00
Leadership and Governance Framework
02
Business Model03
Our Team04
Supplier Management05
Efficient Use of Natural Resources
06
Social Contribution07
Additional Information08
GRI Content Index09
Financial Statements10
SAAM, a Vocation of Service for the Foreign Trade Industry
01
SAFE
TY A
ND OPERATIONAL
EXCELLENCE
INTEG
RITY
SOCIAL COMMITMENT
CLIMAT
E AC
TIO
N A
ND
EN
VIRO
NM
ENT
PEOPLE
Core Sustainability
Concepts
Occupational health and
safety Customer
experience and
satisfaction
Risk management
Employee training and
developmentQuality of work life
Diversity and gender
equity
Labor relations
Emissions and climate
change
Community relations and development
Ethics and corporate integrity
Waste management
Ocean health
Energy efficiency
Supplier management
Materiality Study102-43
To identify the most relevant topics and contents, SM SAAM updated the Materiality Study in 2021, considering the following stages:
1. Identification
To provide context and identify the general reporting status of the industry, secondary information was surveyed and industry benchmarks were identified, both nationally and internationally. Internal company documentation, press and communications were also analyzed to determine the main milestones for 2021 and the relevant sustainable management topics.
2. Prioritization
To prioritize and complement the list of topics identified in the first phase, 482 SM SAAM stakeholders were interviewed. The stakeholders interviewed through surveys and phone and online interviews included workers, union representatives, executives, directors, customers, suppliers, authorities, investors and community representatives.
The scoring received by material issues in each instrument used in this fact-finding mission, and the frequency with which these issues were mentioned in interviews were used to group the issues together and classify them. The result was a list of 14 material issues, grouped around the 5 priorities of the SM SAAM Sustainability Strategy.
3. Validation102-21, 102-43 102-47
The results of the previous stages were validated by the Corporate Sustainability and Communications Department, in conjunction with the Investor Relations Area. They were also reviewed and approved by the SM SAAM Sustainability Committee, made up of the main company executives.
22

2021 Integrated Report
Welcome Message00
Leadership and Governance Framework
02
Business Model03
Our Team04
Supplier Management05
Efficient Use of Natural Resources
06
Social Contribution07
Additional Information08
GRI Content Index09
Financial Statements10
SAAM, a Vocation of Service for the Foreign Trade Industry
01
59.73%
12.3%
2.2%
23.24%
2.53%
Shareholders and Stock Performance CMF 2.3.1 2.3.2 2.3.3 2.3.4 2.3.4.III.C GRI 102-5
Pension funds
Quiñenco (Luksic group)
Local investment funds
Ownership Structure
CMF 2.3.4 I.
Sociedad Matriz SAAM S.A. (SM SAAM) is a publicly traded corporation incorporated in 2011, as a spin-off of Compañía Sudamericana de Vapores. Its shares are traded on the Chilean stock market (Santiago Exchange and Electronic Exchange) under the ticker SMSAAM.
Its principal shareholder, Quiñenco S.A., holds a total of 59.7% of the shares. This company belongs to the Luksic Group, one of Chile’s largest and most diversified economic conglomerates.
The remaining shares are owned by pension funds, local investment funds and foreign investment funds, with 2.53%, 12.3% and 2.2%, respectively, and by minority investors (the remaining 23.24%).
Sociedad Matriz SAAM S.A.’s capital amounts to US$586,506,413, divided into 9,736,791,983 single-series, nominative shares with no par value. Each share has voting rights and the shareholder or their representative can accumulate or distribute them as they deem fit.
The 9,736,791,983 shares that comprise the company’s share capital as of December 31, 2021, are distributed in 3,356 directly registered shares and depositors that have equity positions through the Central Securities Depository (DCV). Foreign investment funds
Other shareholders
23

2021 Integrated Report
Welcome Message00
Leadership and Governance Framework
02
Business Model03
Our Team04
Supplier Management05
Efficient Use of Natural Resources
06
Social Contribution07
Additional Information08
GRI Content Index09
Financial Statements10
SAAM, a Vocation of Service for the Foreign Trade Industry
01
Largest Shareholders CMF 2.3.3
As of December 31, 2021
Name No. of Subscribed Shares Ownership % Inversiones Rio Bravo S.A. 3,237,543,274 33.25%Quiñenco S.A. 2,255,897,059 23.17%BTG Pactual Chile S.A. Corredores de Bolsa 1,001,053,631 10.28%Pionero Fondo de Inversión 727,726,000 7.47%Inmobiliaria Norte Verde S.A. 322,149,301 3.31%Inversiones Gran Araucaria Dos Limitada 274,194,816 2.82%Compass Small Cap. Chile Fondo de Inversión 227,069,707 2.33%Larraín Vial S.A. Corredora de Bolsa 179,241,648 1.84%Banchile Corredores de Bolsa S. A. 148,080,845 1.52%Banco de Chile on behalf of Citi Na New York Client 113,731,825 1.17%Siglo XXI Investment Fund 93,143,864 0.96%BCI Corredores de Bolsa S.A. 75,595,959 0.78%
Control CMF 2.3.1
82.9% of the issued and paid shares of Quiñenco S.A. are held by the companies Andsberg Inversiones SpA, Ruana Copper A.G. Agencia Chile, Inversiones Orengo S.A., Inversiones Consolidadas Ltda., Inversiones Salta SpA., Inversiones Alaska Ltda., Inmobiliaria e Inversiones Río Claro S.A. and Inversiones Río Claro Ltda. The Luksburg Foundation indirectly controls 100% of Andsberg Inversiones SpA, 100% of Ruana Copper A.G. Agencia Chile and 99.76% of Inversiones Orengo S.A.
Andrónico Mariano Luksic Craig (Chilean Tax ID number 6.062.786-K) and his family control 100% of Inversiones Consolidadas Ltda. and Inversiones Alaska Ltda. Andrónico Luksic Craig’s family holds 100% of Inversiones Salta SpA. Inmobiliaria e Inversiones Río Claro S.A. and Inversiones Río Claro Ltda. are indirectly controlled by the Emian Foundation, in which the successors of the late Guillermo Antonio Luksic Craig† (Chilean Tax ID Number 6.578.597-8) have interests. There is no shareholder agreement between the controllers of the Company.
24
2021 Integrated Report
Welcome Message00
Leadership and Governance Framework
02
Business Model03
Our Team04
Supplier Management05
Efficient Use of Natural Resources
06
Social Contribution07
Additional Information08
GRI Content Index09
Financial Statements10
SAAM, a Vocation of Service for the Foreign Trade Industry
01
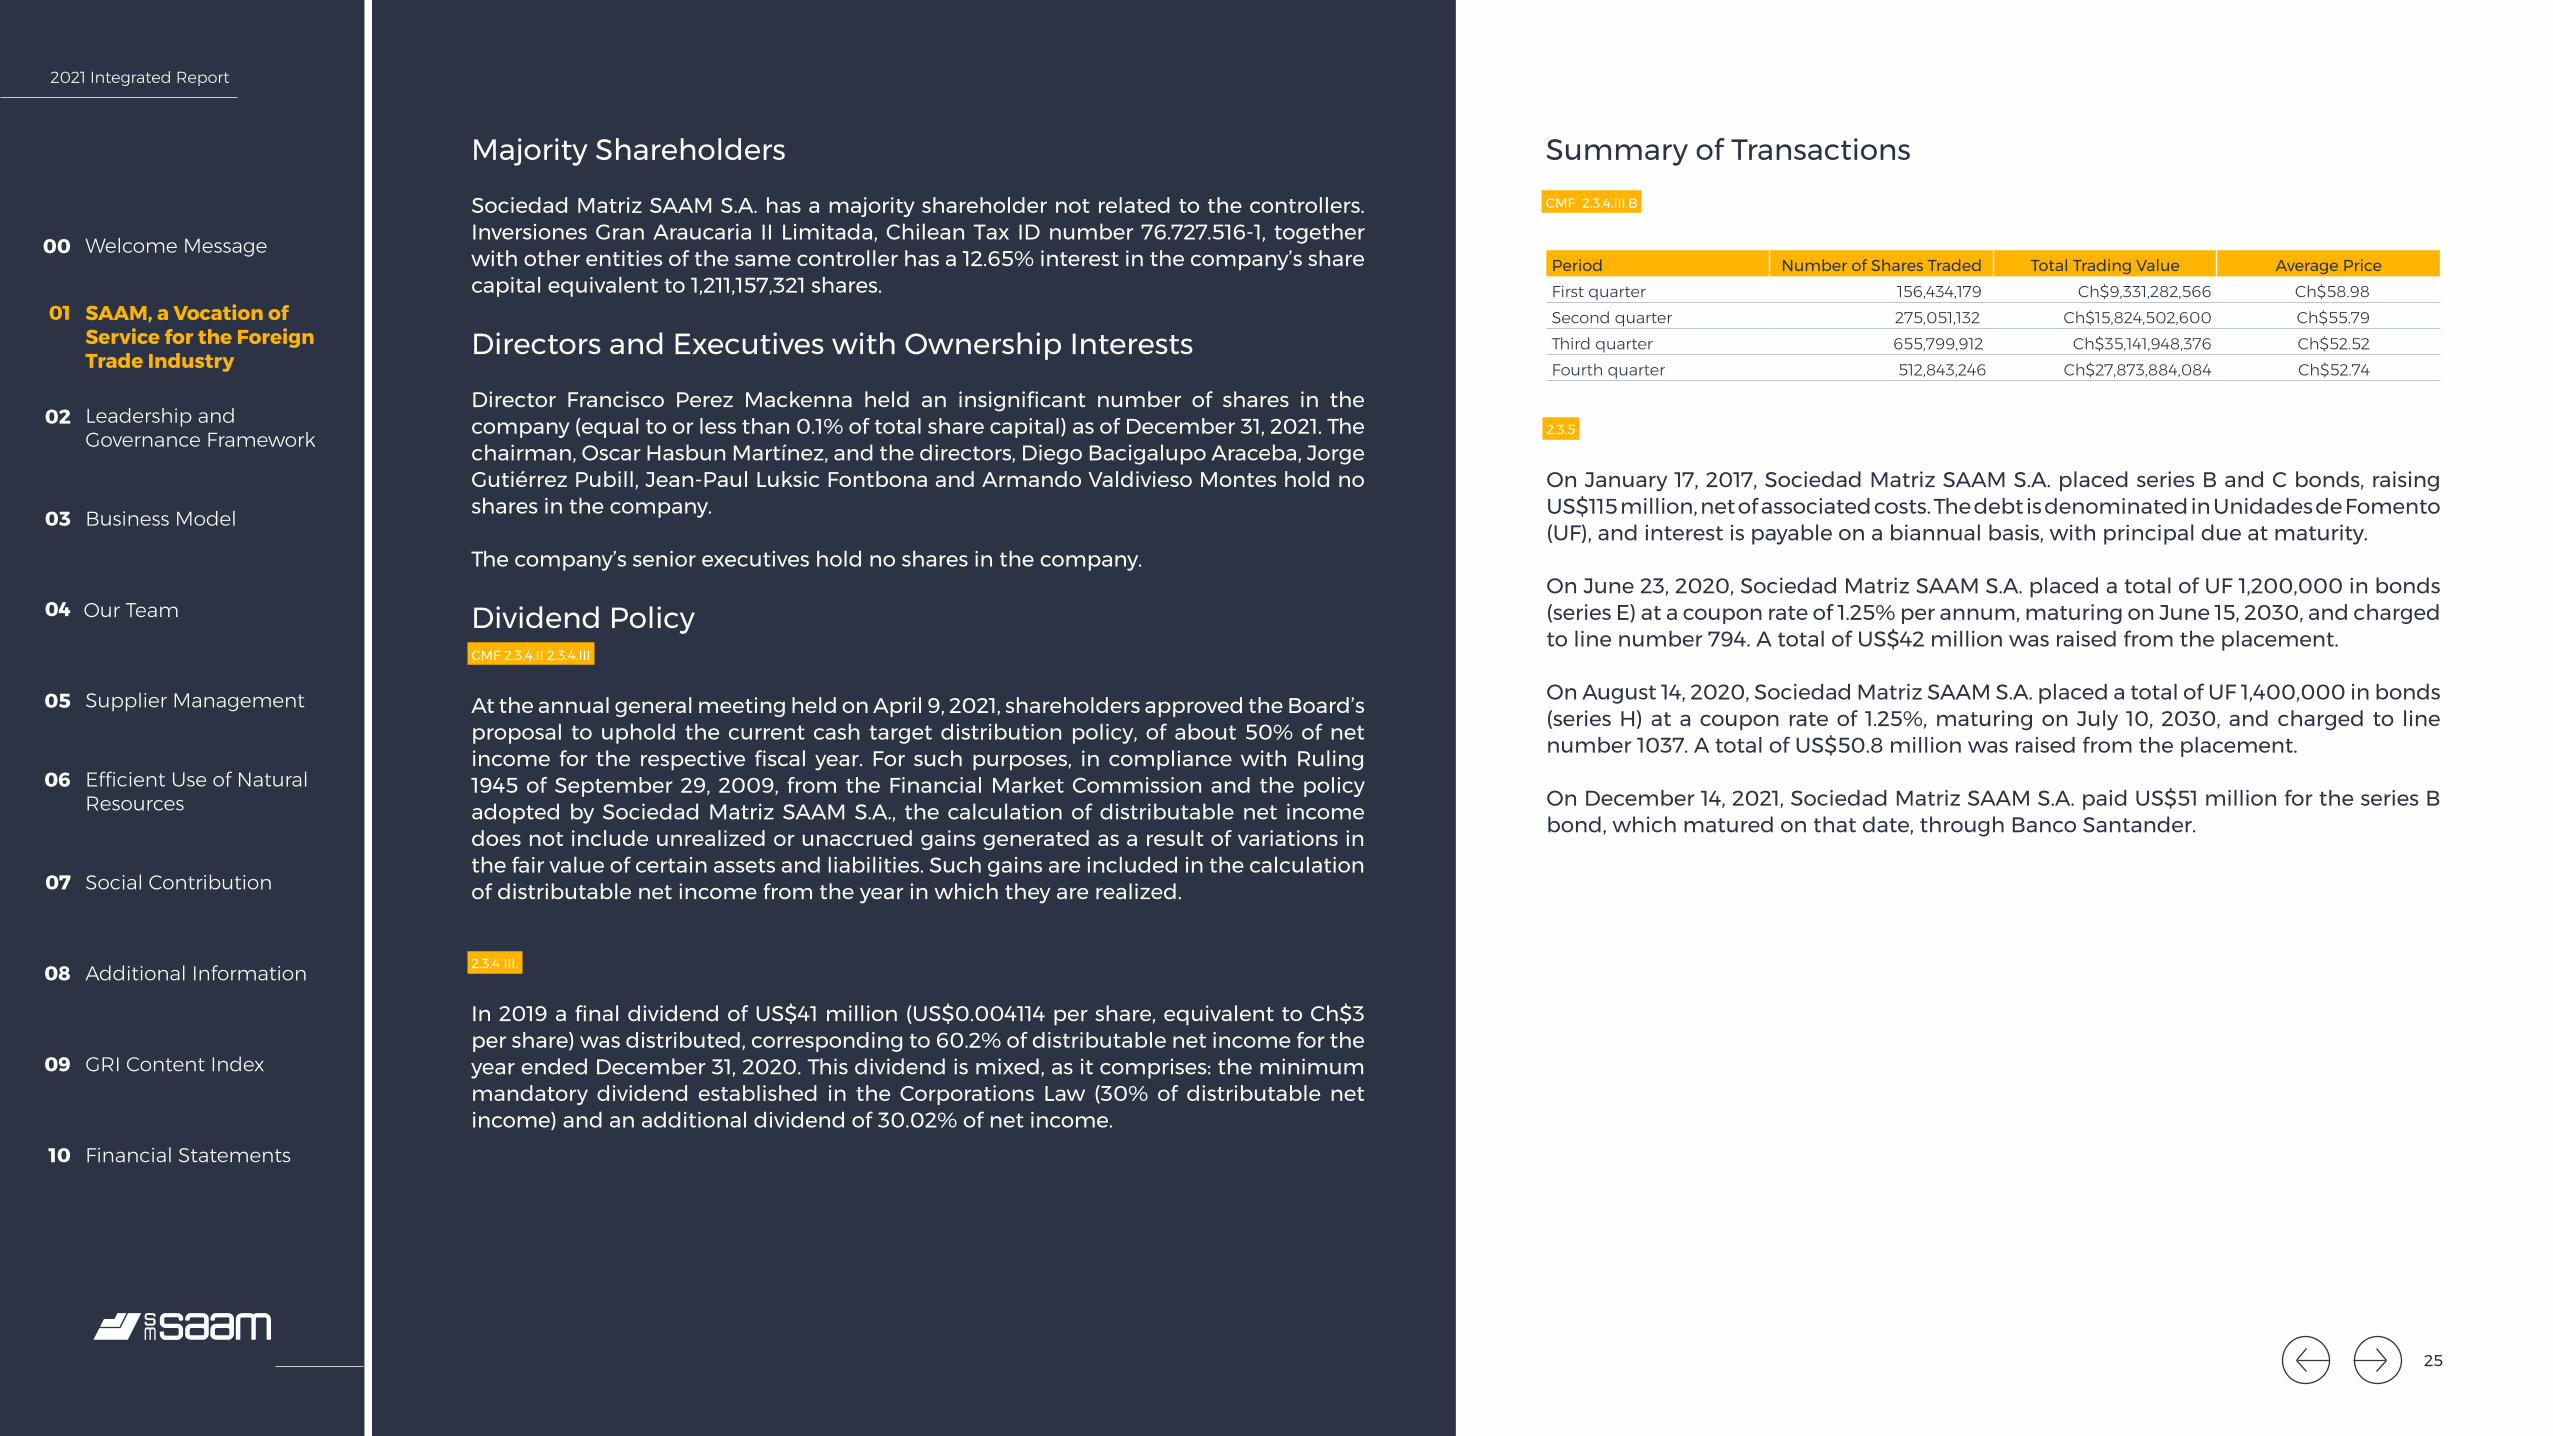
Majority Shareholders
Sociedad Matriz SAAM S.A. has a majority shareholder not related to the controllers. Inversiones Gran Araucaria II Limitada, Chilean Tax ID number 76.727.516-1, together with other entities of the same controller has a 12.65% interest in the company’s share capital equivalent to 1,211,157,321 shares.
Directors and Executives with Ownership Interests
Director Francisco Perez Mackenna held an insignificant number of shares in the company (equal to or less than 0.1% of total share capital) as of December 31, 2021. The chairman, Oscar Hasbun Martínez, and the directors, Diego Bacigalupo Araceba, Jorge Gutiérrez Pubill, Jean-Paul Luksic Fontbona and Armando Valdivieso Montes hold no shares in the company.
The company’s senior executives hold no shares in the company.
Dividend Policy CMF 2.3.4.II 2.3.4.III
At the annual general meeting held on April 9, 2021, shareholders approved the Board’s proposal to uphold the current cash target distribution policy, of about 50% of net income for the respective fiscal year. For such purposes, in compliance with Ruling 1945 of September 29, 2009, from the Financial Market Commission and the policy adopted by Sociedad Matriz SAAM S.A., the calculation of distributable net income does not include unrealized or unaccrued gains generated as a result of variations in the fair value of certain assets and liabilities. Such gains are included in the calculation of distributable net income from the year in which they are realized.
2.3.4 III.
In 2019 a final dividend of US$41 million (US$0.004114 per share, equivalent to Ch$3 per share) was distributed, corresponding to 60.2% of distributable net income for the year ended December 31, 2020. This dividend is mixed, as it comprises: the minimum mandatory dividend established in the Corporations Law (30% of distributable net income) and an additional dividend of 30.02% of net income.
Summary of TransactionsCMF 2.3.4.III.B
Period Number of Shares Traded Total Trading Value Average PriceFirst quarter 156,434,179 Ch$9,331,282,566 Ch$58.98Second quarter 275,051,132 Ch$15,824,502,600 Ch$55.79Third quarter 655,799,912 Ch$35,141,948,376 Ch$52.52Fourth quarter 512,843,246 Ch$27,873,884,084 Ch$52.74
2.3.5
On January 17, 2017, Sociedad Matriz SAAM S.A. placed series B and C bonds, raising US$115 million, net of associated costs. The debt is denominated in Unidades de Fomento (UF), and interest is payable on a biannual basis, with principal due at maturity.
On June 23, 2020, Sociedad Matriz SAAM S.A. placed a total of UF 1,200,000 in bonds (series E) at a coupon rate of 1.25% per annum, maturing on June 15, 2030, and charged to line number 794. A total of US$42 million was raised from the placement.
On August 14, 2020, Sociedad Matriz SAAM S.A. placed a total of UF 1,400,000 in bonds (series H) at a coupon rate of 1.25%, maturing on July 10, 2030, and charged to line number 1037. A total of US$50.8 million was raised from the placement.
On December 14, 2021, Sociedad Matriz SAAM S.A. paid US$51 million for the series B bond, which matured on that date, through Banco Santander.
25

2021 Integrated Report
Welcome Message00
Leadership and Governance Framework
02
Business Model03
Our Team04
Supplier Management05
Efficient Use of Natural Resources
06
Social Contribution07
Additional Information08
GRI Content Index09
Financial Statements10
SAAM, a Vocation of Service for the Foreign Trade Industry
01
$
Investor Relations3.4.III
The Investor Relations Area is responsible for investor relations and is exclusively dedicated to providing transparent, ongoing, timely, top-notch information about the company’s primary strategic, operational and financial issues. The aim is to keep domestic and foreign shareholders and investors duly informed about company performance. Furthermore, the Corporate Sustainability and Communications Department is responsible for external communications with the media.
1. Quarterly conference calls
2. Shareholders’ meetings
3. International conferences with investment banks
4. Monthly publication of operational data
5. Conference calls and webcasts
6. Virtual meetings with local investors and shareholders
7. Non-deal road shows
This structure enables effective communication between the company and financial community, looking to increase the positioning and knowledge of SM SAAM in the capital market so that it is recognized as an attractive investment opportunity.
The Investor Relations Area organizes a broad agenda of activities throughout the year and diverse opportunities for connection. This includes:
8. Investor Day
9. Integrated Annual Report
10. Email communications
11. Communication on sustainability (ESG)
12. Press releases
13. Publication of information on the website: https://www.saam.com/investors
14. Material events
26

2021 Integrated Report
Welcome Message00
Leadership and Governance Framework
02
Business Model03
Our Team04
Supplier Management05
Efficient Use of Natural Resources
06
Social Contribution07
Additional Information08
GRI Content Index09
Financial Statements10
SAAM, a Vocation of Service for the Foreign Trade Industry
01
The documentation available for investors primarily includes: presentations of quarterly results, earnings reports, historical Excel and the company’s Integrated Report, which includes the information proposed by the International Integrated Reporting Council (IIRC) Integrated Reporting Framework and references the GRI Standards. This report incorporates the commitments and actions on environmental, social and corporate governance (ESG) issues, making the company’s operations sustainable over time while always safeguarding its financial integrity.
SM SAAM is covered by sell-side analysts from two international investment banks, which periodically publish research reports and sector reports. The list of analysts and other relevant information, including financial reports, presentations for investors, information on stocks and bonds, is available at https://www.saam.com/inversionistas/
The Investor Relations Area is available to answer any question about the company in English or Spanish at [email protected] or [email protected] and by calling: +56 2 2731 8213
Social media: Linkedin (https://cl.linkedin.com/company/saam-s-a-) and website (https://www.saam.com/)
27
2021 Integrated Report
Welcome Message00
SAAM, a Vocation of Service for the Foreign Trade Industry
01
Leadership and Governance Framework
02
Business Model03
Our Team04
Supplier Management05
Efficient Use of Natural Resources
06
Social Contribution07
Additional Information08
GRI Content Index09
Financial Statements10
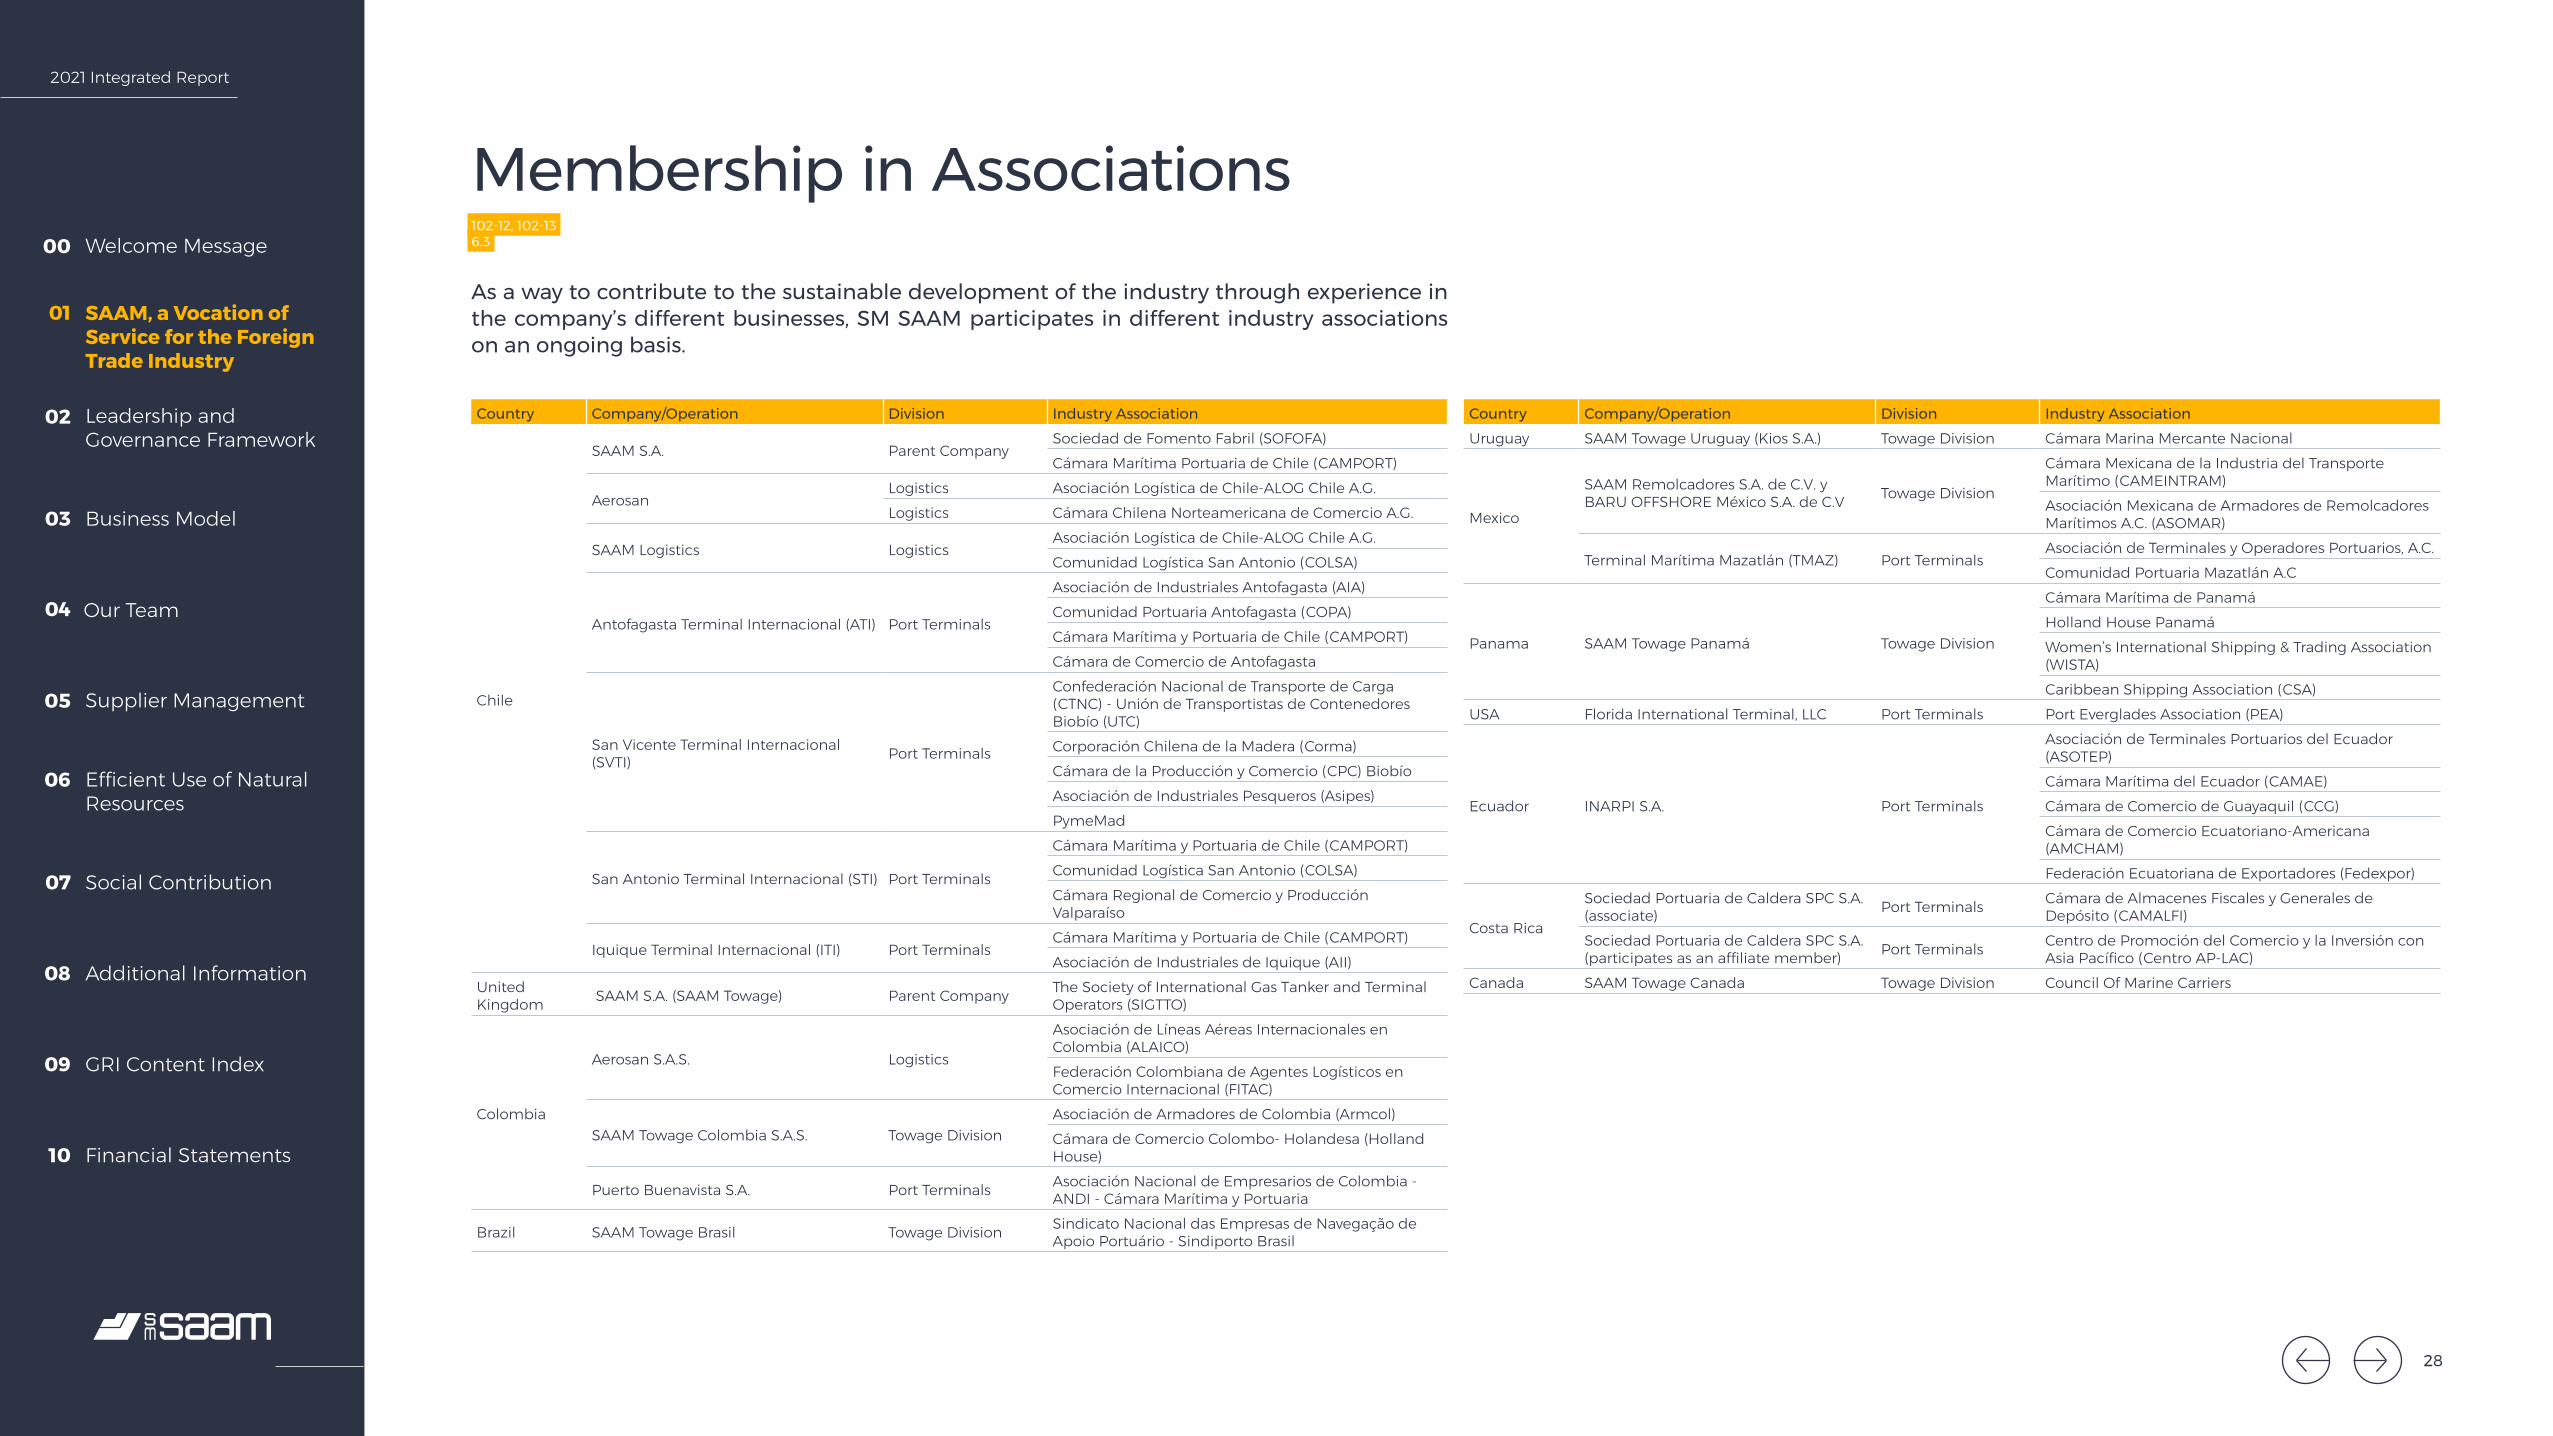
Membership in Associations102-12, 102-136.3
As a way to contribute to the sustainable development of the industry through experience in the company’s different businesses, SM SAAM participates in different industry associations on an ongoing basis.
Country Company/Operation Division Industry Association
Chile
SAAM S.A. Parent CompanySociedad de Fomento Fabril (SOFOFA)Cámara Marítima Portuaria de Chile (CAMPORT)
AerosanLogistics Asociación Logística de Chile-ALOG Chile A.G.Logistics Cámara Chilena Norteamericana de Comercio A.G.
SAAM Logistics LogisticsAsociación Logística de Chile-ALOG Chile A.G.Comunidad Logística San Antonio (COLSA)
Antofagasta Terminal Internacional (ATI) Port Terminals
Asociación de Industriales Antofagasta (AIA)Comunidad Portuaria Antofagasta (COPA)Cámara Marítima y Portuaria de Chile (CAMPORT)Cámara de Comercio de Antofagasta
San Vicente Terminal Internacional (SVTI) Port Terminals
Confederación Nacional de Transporte de Carga (CTNC) - Unión de Transportistas de Contenedores Biobío (UTC)Corporación Chilena de la Madera (Corma)Cámara de la Producción y Comercio (CPC) BiobíoAsociación de Industriales Pesqueros (Asipes)PymeMad
San Antonio Terminal Internacional (STI) Port Terminals
Cámara Marítima y Portuaria de Chile (CAMPORT)Comunidad Logística San Antonio (COLSA)Cámara Regional de Comercio y Producción Valparaíso
Iquique Terminal Internacional (ITI) Port TerminalsCámara Marítima y Portuaria de Chile (CAMPORT)Asociación de Industriales de Iquique (AII)
United Kingdom SAAM S.A. (SAAM Towage) Parent Company The Society of International Gas Tanker and Terminal
Operators (SIGTTO)
Colombia
Aerosan S.A.S. Logistics
Asociación de Líneas Aéreas Internacionales en Colombia (ALAICO)Federación Colombiana de Agentes Logísticos en Comercio Internacional (FITAC)
SAAM Towage Colombia S.A.S. Towage DivisionAsociación de Armadores de Colombia (Armcol)Cámara de Comercio Colombo- Holandesa (Holland House)
Puerto Buenavista S.A. Port Terminals Asociación Nacional de Empresarios de Colombia - ANDI - Cámara Marítima y Portuaria
Brazil SAAM Towage Brasil Towage Division Sindicato Nacional das Empresas de Navegação de Apoio Portuário - Sindiporto Brasil
Country Company/Operation Division Industry Association Uruguay SAAM Towage Uruguay (Kios S.A.) Towage Division Cámara Marina Mercante Nacional
Mexico
SAAM Remolcadores S.A. de C.V. y BARU OFFSHORE México S.A. de C.V Towage Division
Cámara Mexicana de la Industria del Transporte Marítimo (CAMEINTRAM)Asociación Mexicana de Armadores de Remolcadores Marítimos A.C. (ASOMAR)
Terminal Marítima Mazatlán (TMAZ) Port TerminalsAsociación de Terminales y Operadores Portuarios, A.C.Comunidad Portuaria Mazatlán A.C
Panama SAAM Towage Panamá Towage Division
Cámara Marítima de Panamá Holland House PanamáWomen’s International Shipping & Trading Association (WISTA)Caribbean Shipping Association (CSA)
USA Florida International Terminal, LLC Port Terminals Port Everglades Association (PEA)
Ecuador INARPI S.A. Port Terminals
Asociación de Terminales Portuarios del Ecuador (ASOTEP)Cámara Marítima del Ecuador (CAMAE)Cámara de Comercio de Guayaquil (CCG)Cámara de Comercio Ecuatoriano-Americana (AMCHAM)Federación Ecuatoriana de Exportadores (Fedexpor)
Costa Rica
Sociedad Portuaria de Caldera SPC S.A. (associate) Port Terminals Cámara de Almacenes Fiscales y Generales de
Depósito (CAMALFI)Sociedad Portuaria de Caldera SPC S.A. (participates as an affiliate member) Port Terminals Centro de Promoción del Comercio y la Inversión con
Asia Pacífico (Centro AP-LAC)Canada SAAM Towage Canada Towage Division Council Of Marine Carriers
28
2021 Integrated Report
Welcome Message00
SAAM, a Vocation of Service for the Foreign Trade Industry
01
Leadership and Governance Framework
02
Business Model03
Our Team04
Supplier Management05
Efficient Use of Natural Resources
06
Social Contribution07
Additional Information08
GRI Content Index09
Financial Statements10
Leadership and Governance
02.
29
2021 Integrated Report
Welcome Message00
SAAM, a Vocation of Service for the Foreign Trade Industry
01
Leadership and Governance Framework
02
Business Model03
Our Team04
Supplier Management05
Efficient Use of Natural Resources
06
Social Contribution07
Additional Information08
GRI Content Index09
Financial Statements10
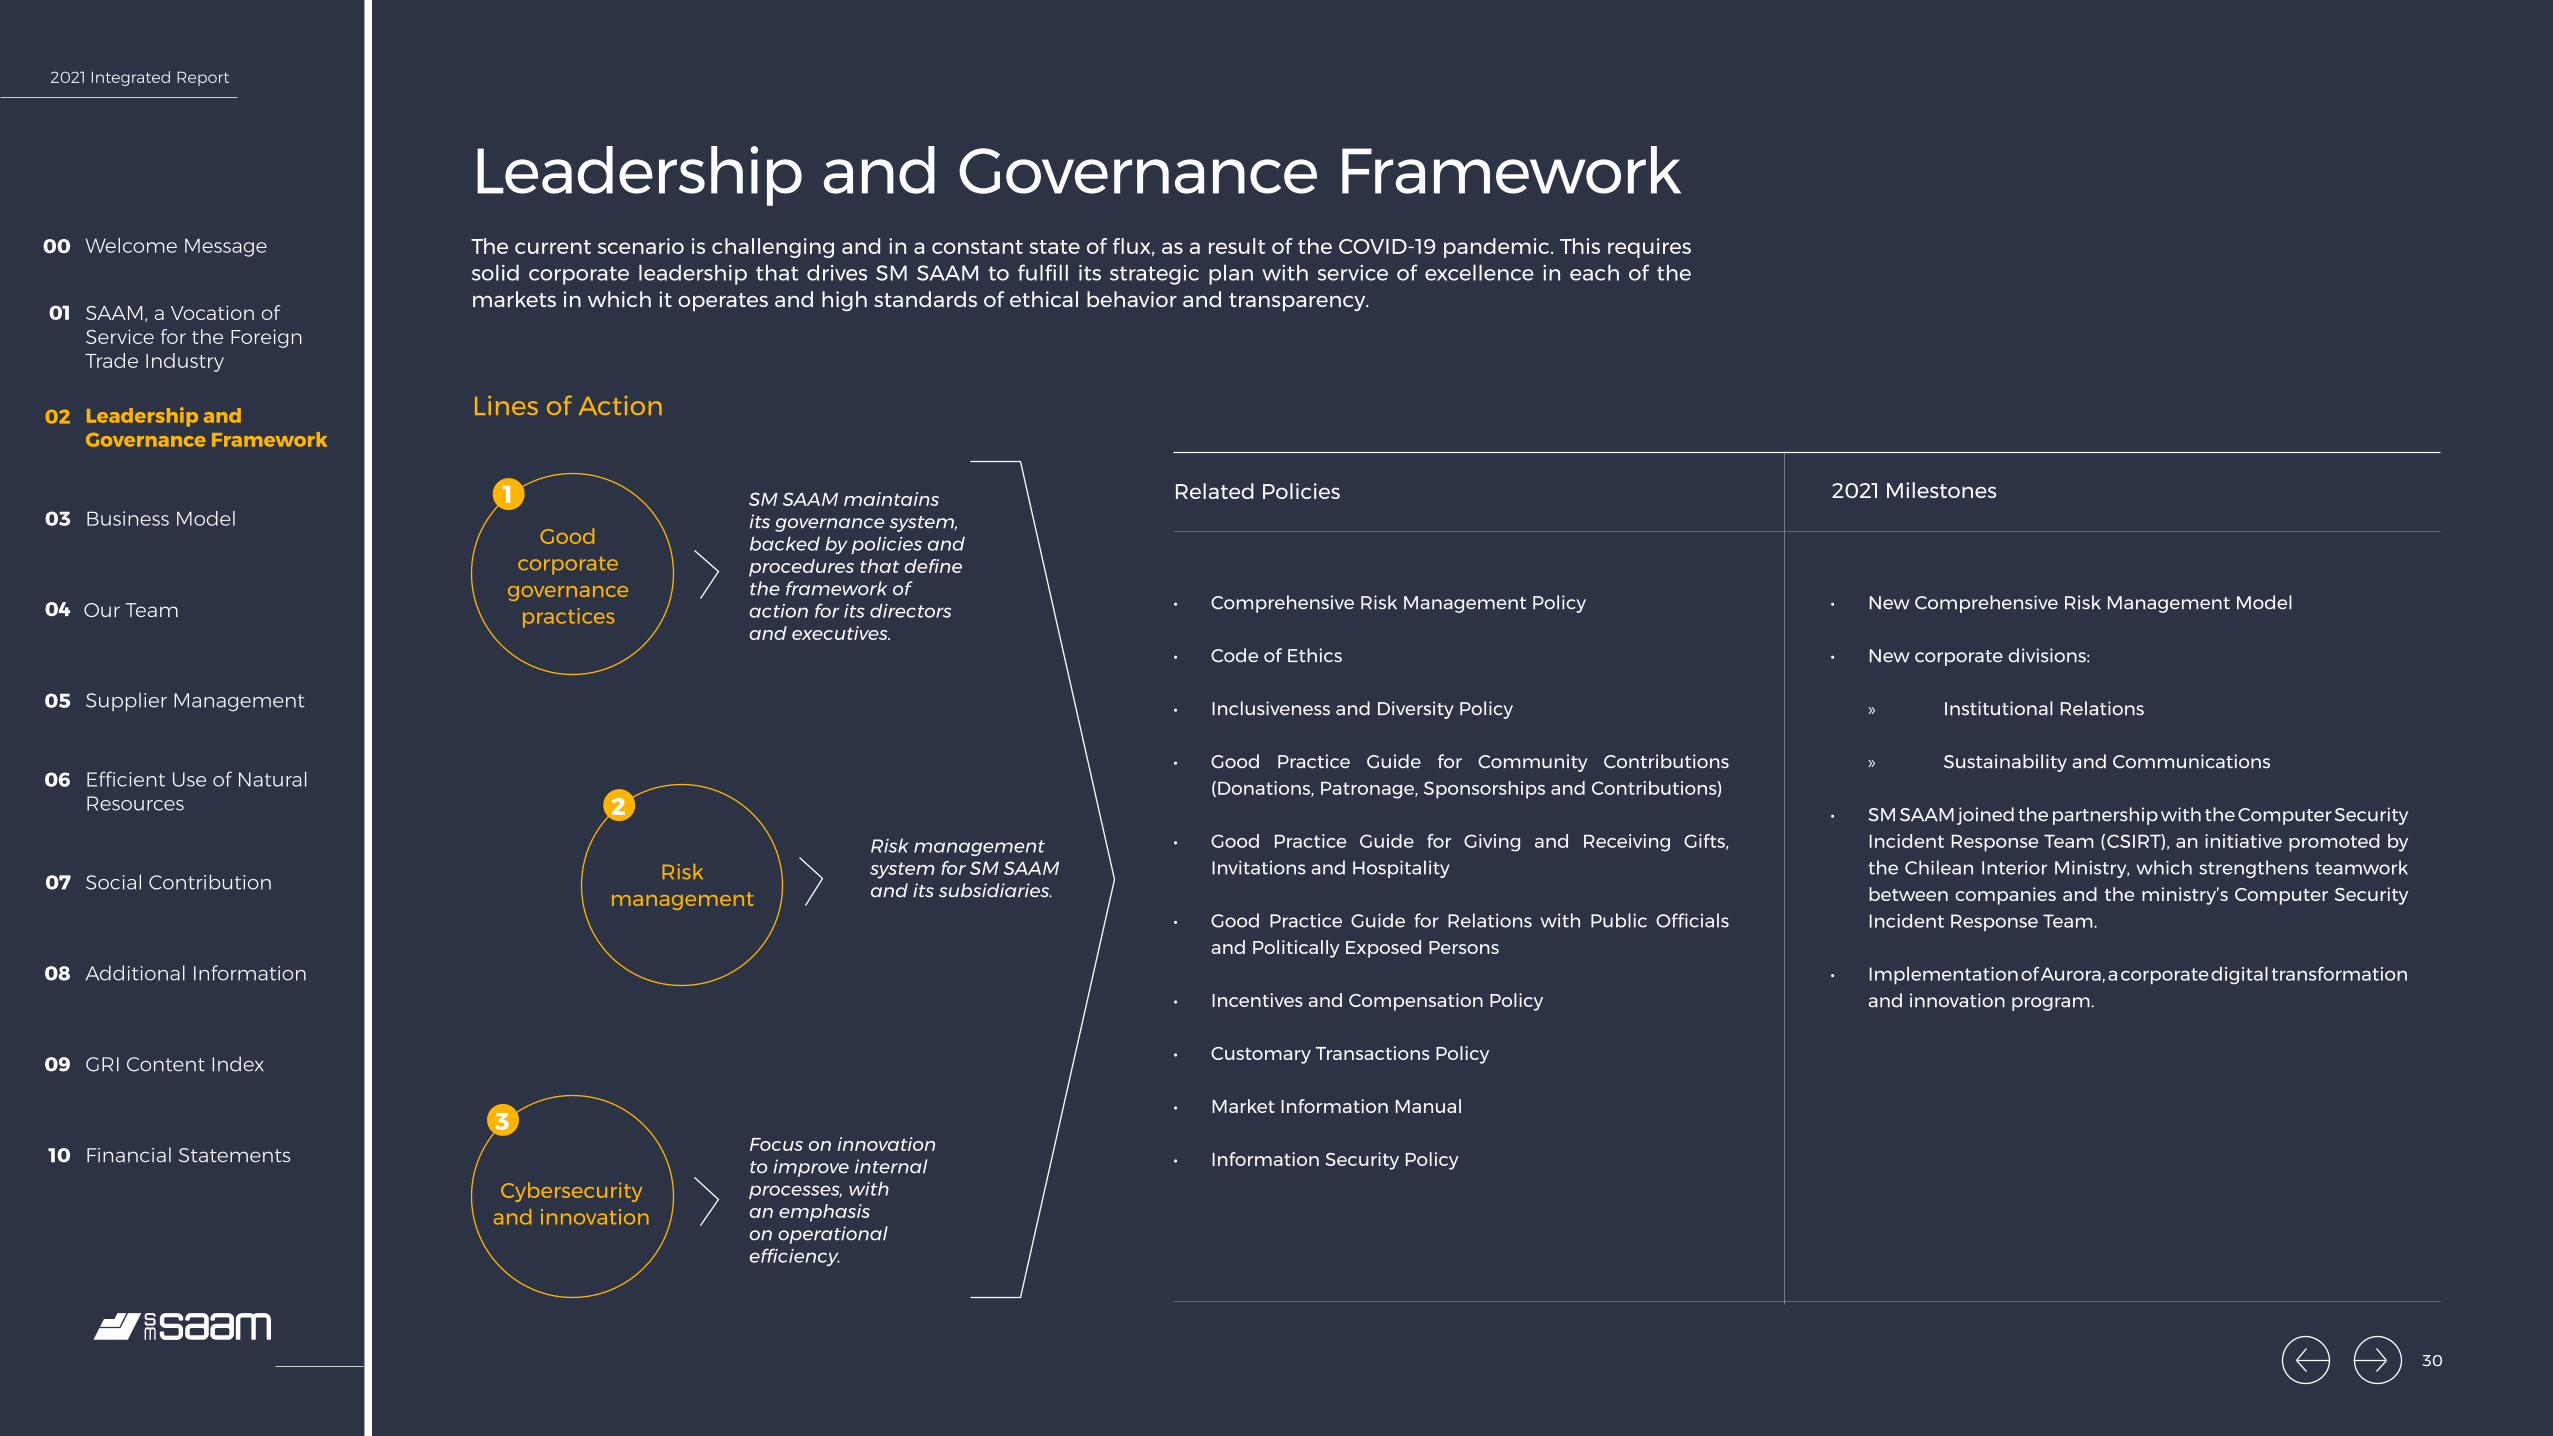
Leadership and Governance FrameworkThe current scenario is challenging and in a constant state of flux, as a result of the COVID-19 pandemic. This requires solid corporate leadership that drives SM SAAM to fulfill its strategic plan with service of excellence in each of the markets in which it operates and high standards of ethical behavior and transparency.
Lines of Action
2021 MilestonesRelated Policies
Good corporate
governance practices
Cybersecurity and innovation
Risk management
1 SM SAAM maintains its governance system, backed by policies and procedures that define the framework of action for its directors and executives.
Focus on innovation to improve internal processes, with an emphasis on operational efficiency.
Risk management system for SM SAAM and its subsidiaries.
2
3
• Comprehensive Risk Management Policy
• Code of Ethics
• Inclusiveness and Diversity Policy
• Good Practice Guide for Community Contributions (Donations, Patronage, Sponsorships and Contributions)
• Good Practice Guide for Giving and Receiving Gifts, Invitations and Hospitality
• Good Practice Guide for Relations with Public Officials and Politically Exposed Persons
• Incentives and Compensation Policy
• Customary Transactions Policy
• Market Information Manual
• Information Security Policy
• New Comprehensive Risk Management Model
• New corporate divisions:
» Institutional Relations
» Sustainability and Communications
• SM SAAM joined the partnership with the Computer Security Incident Response Team (CSIRT), an initiative promoted by the Chilean Interior Ministry, which strengthens teamwork between companies and the ministry’s Computer Security Incident Response Team.
• Implementation of Aurora, a corporate digital transformation and innovation program.
30
2021 Integrated Report
Welcome Message00
SAAM, a Vocation of Service for the Foreign Trade Industry
01
Leadership and Governance Framework
02
Business Model03
Our Team04
Supplier Management05
Efficient Use of Natural Resources
06
Social Contribution07
Additional Information08
GRI Content Index09
Financial Statements10
43%
43%
43%
43%
14%
14%
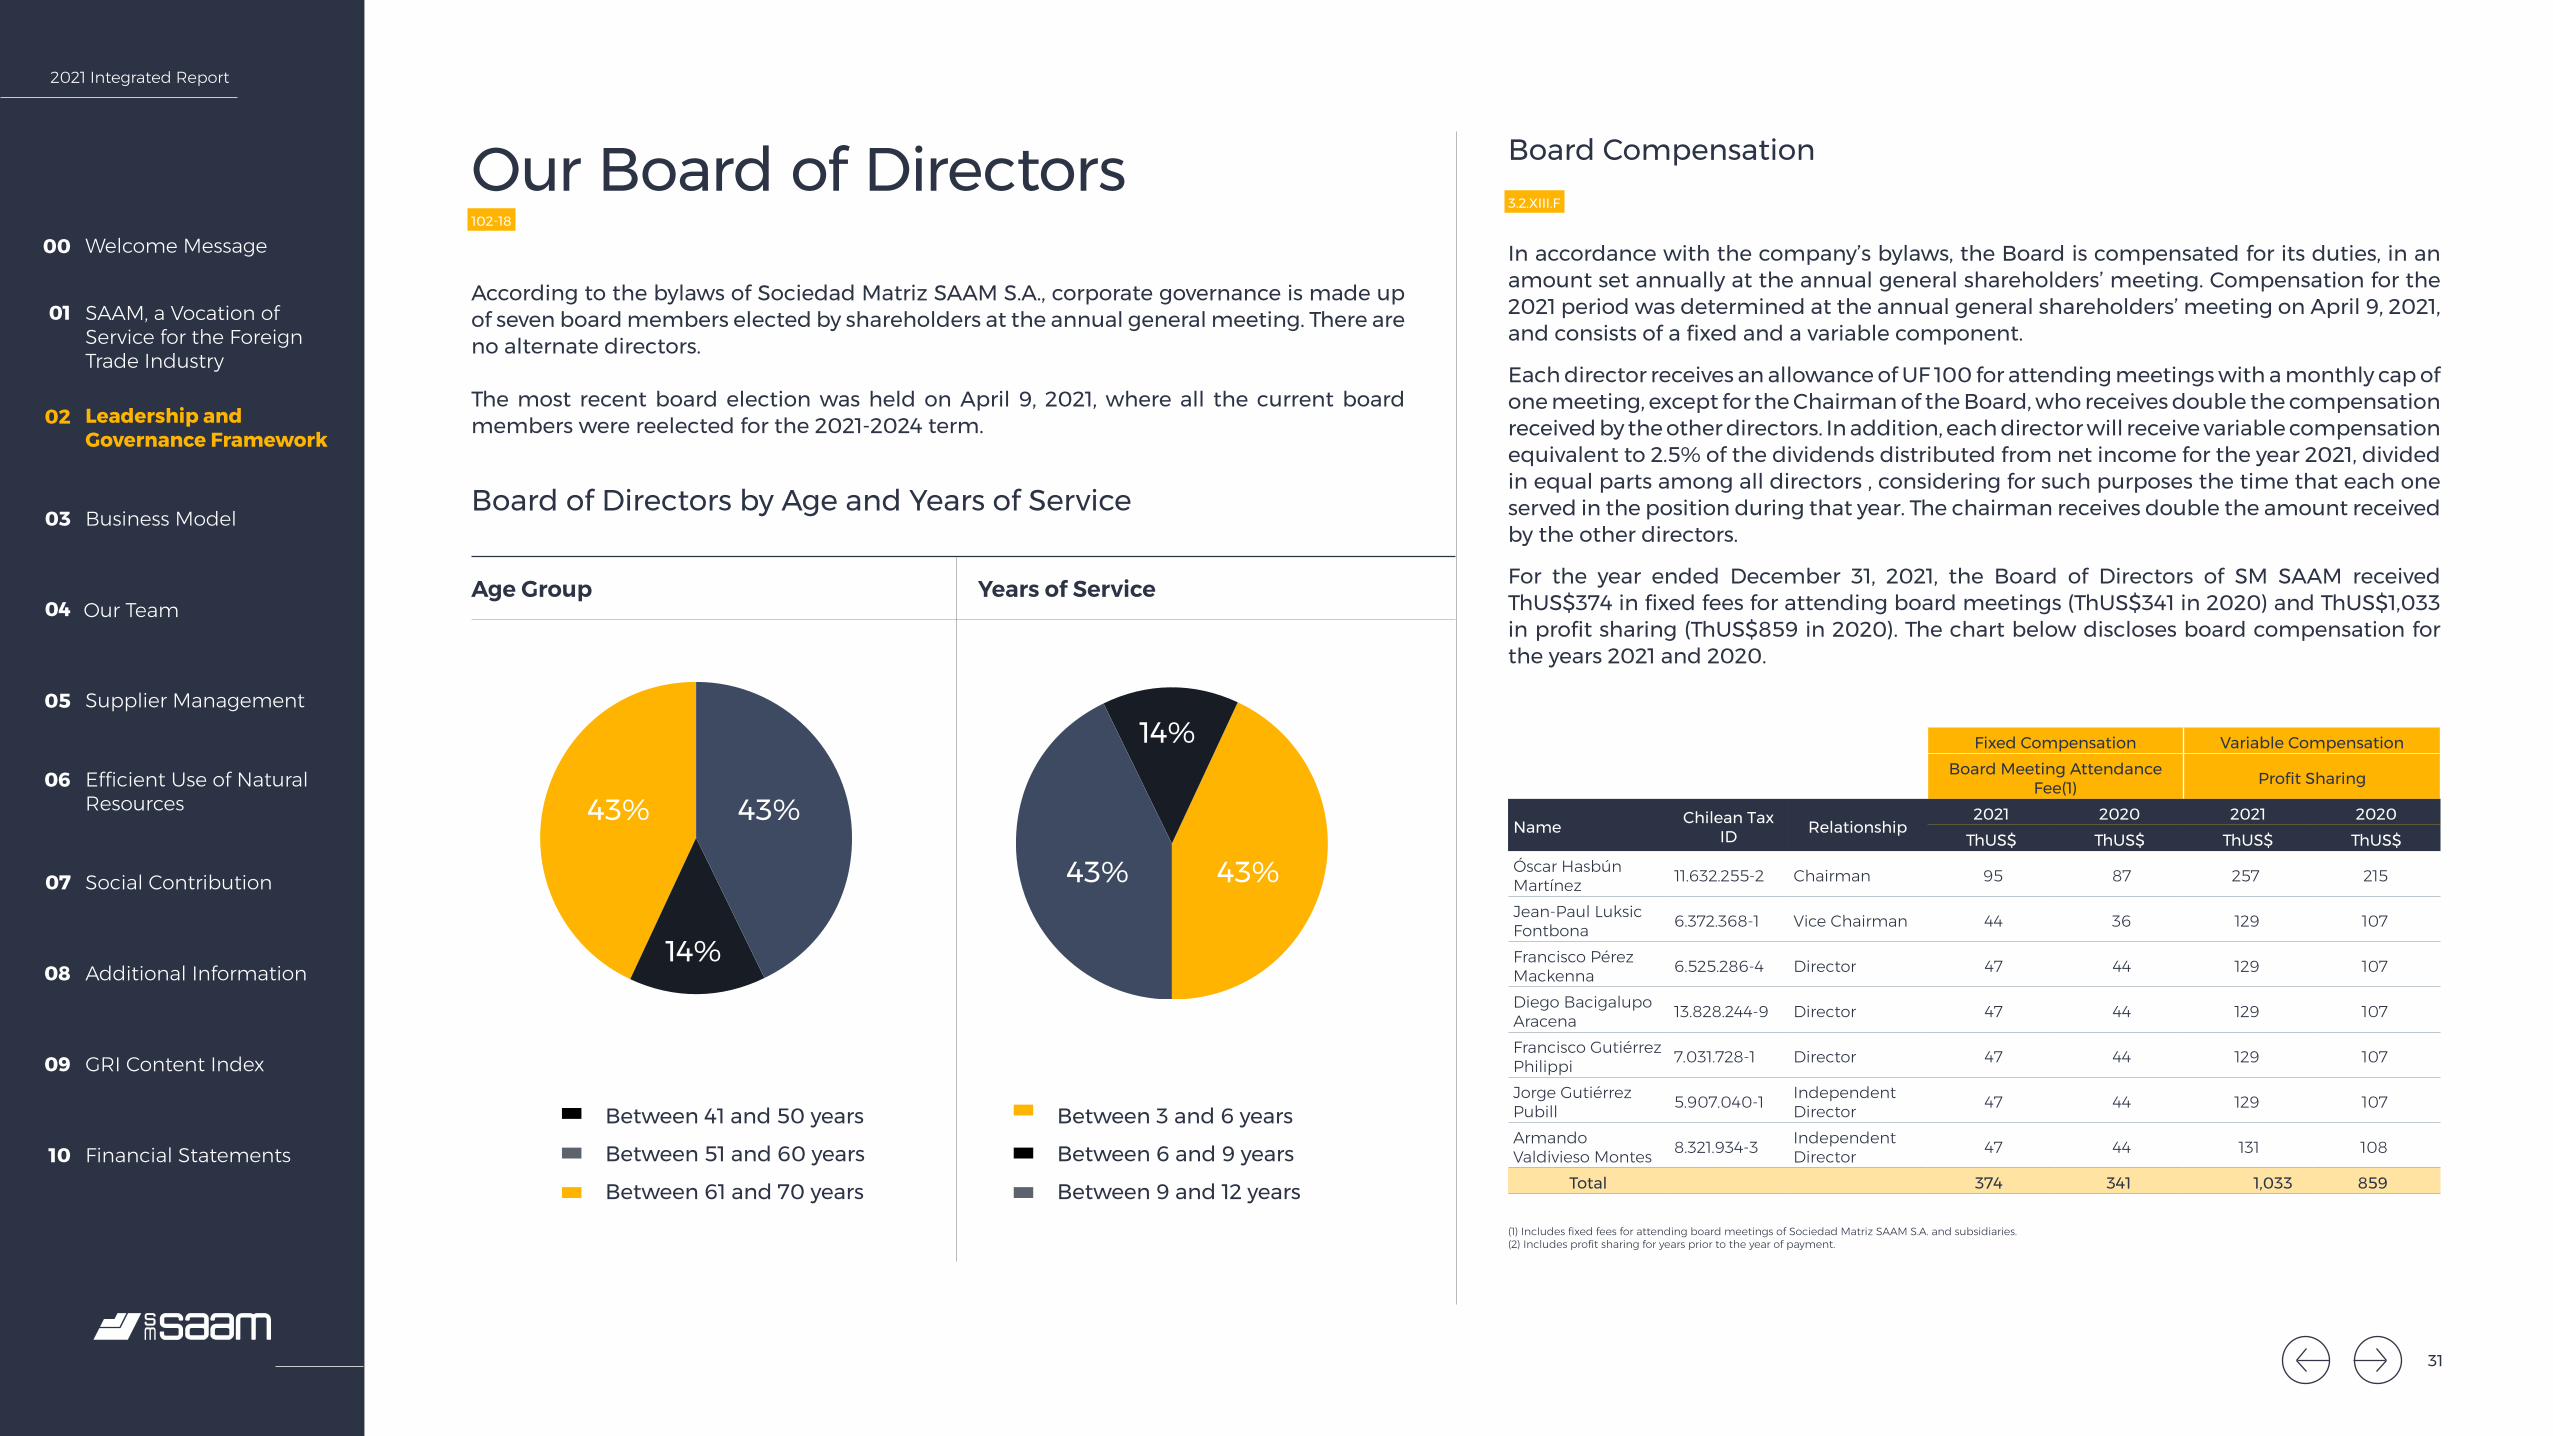
102-18
Our Board of Directors
According to the bylaws of Sociedad Matriz SAAM S.A., corporate governance is made up of seven board members elected by shareholders at the annual general meeting. There are no alternate directors.
The most recent board election was held on April 9, 2021, where all the current board members were reelected for the 2021-2024 term.
Age Group
Between 41 and 50 years
Between 51 and 60 years
Between 61 and 70 years
Between 3 and 6 years
Between 6 and 9 years
Between 9 and 12 years
Years of Service
Board Compensation3.2.XIII.F
In accordance with the company’s bylaws, the Board is compensated for its duties, in an amount set annually at the annual general shareholders’ meeting. Compensation for the 2021 period was determined at the annual general shareholders’ meeting on April 9, 2021, and consists of a fixed and a variable component.
Each director receives an allowance of UF 100 for attending meetings with a monthly cap of one meeting, except for the Chairman of the Board, who receives double the compensation received by the other directors. In addition, each director will receive variable compensation equivalent to 2.5% of the dividends distributed from net income for the year 2021, divided in equal parts among all directors , considering for such purposes the time that each one served in the position during that year. The chairman receives double the amount received by the other directors.
For the year ended December 31, 2021, the Board of Directors of SM SAAM received ThUS$374 in fixed fees for attending board meetings (ThUS$341 in 2020) and ThUS$1,033 in profit sharing (ThUS$859 in 2020). The chart below discloses board compensation for the years 2021 and 2020.
Board of Directors by Age and Years of Service
Fixed Compensation Variable CompensationBoard Meeting Attendance
Fee(1) Profit Sharing
Name Chilean Tax ID Relationship
2021 2020 2021 2020ThUS$ ThUS$ ThUS$ ThUS$
Óscar Hasbún Martínez 11.632.255-2 Chairman 95 87 257 215
Jean-Paul Luksic Fontbona 6.372.368-1 Vice Chairman 44 36 129 107
Francisco Pérez Mackenna 6.525.286-4 Director 47 44 129 107
Diego Bacigalupo Aracena 13.828.244-9 Director 47 44 129 107
Francisco Gutiérrez Philippi 7.031.728-1 Director 47 44 129 107
Jorge Gutiérrez Pubill 5.907.040-1 Independent
Director 47 44 129 107
Armando Valdivieso Montes 8.321.934-3 Independent
Director 47 44 131 108
Total 374 341 1,033 859
(1) Includes fixed fees for attending board meetings of Sociedad Matriz SAAM S.A. and subsidiaries. (2) Includes profit sharing for years prior to the year of payment.
31
2021 Integrated Report
Welcome Message00
SAAM, a Vocation of Service for the Foreign Trade Industry
01
Leadership and Governance Framework
02
Business Model03
Our Team04
Supplier Management05
Efficient Use of Natural Resources
06
Social Contribution07
Additional Information08
GRI Content Index09
Financial Statements10
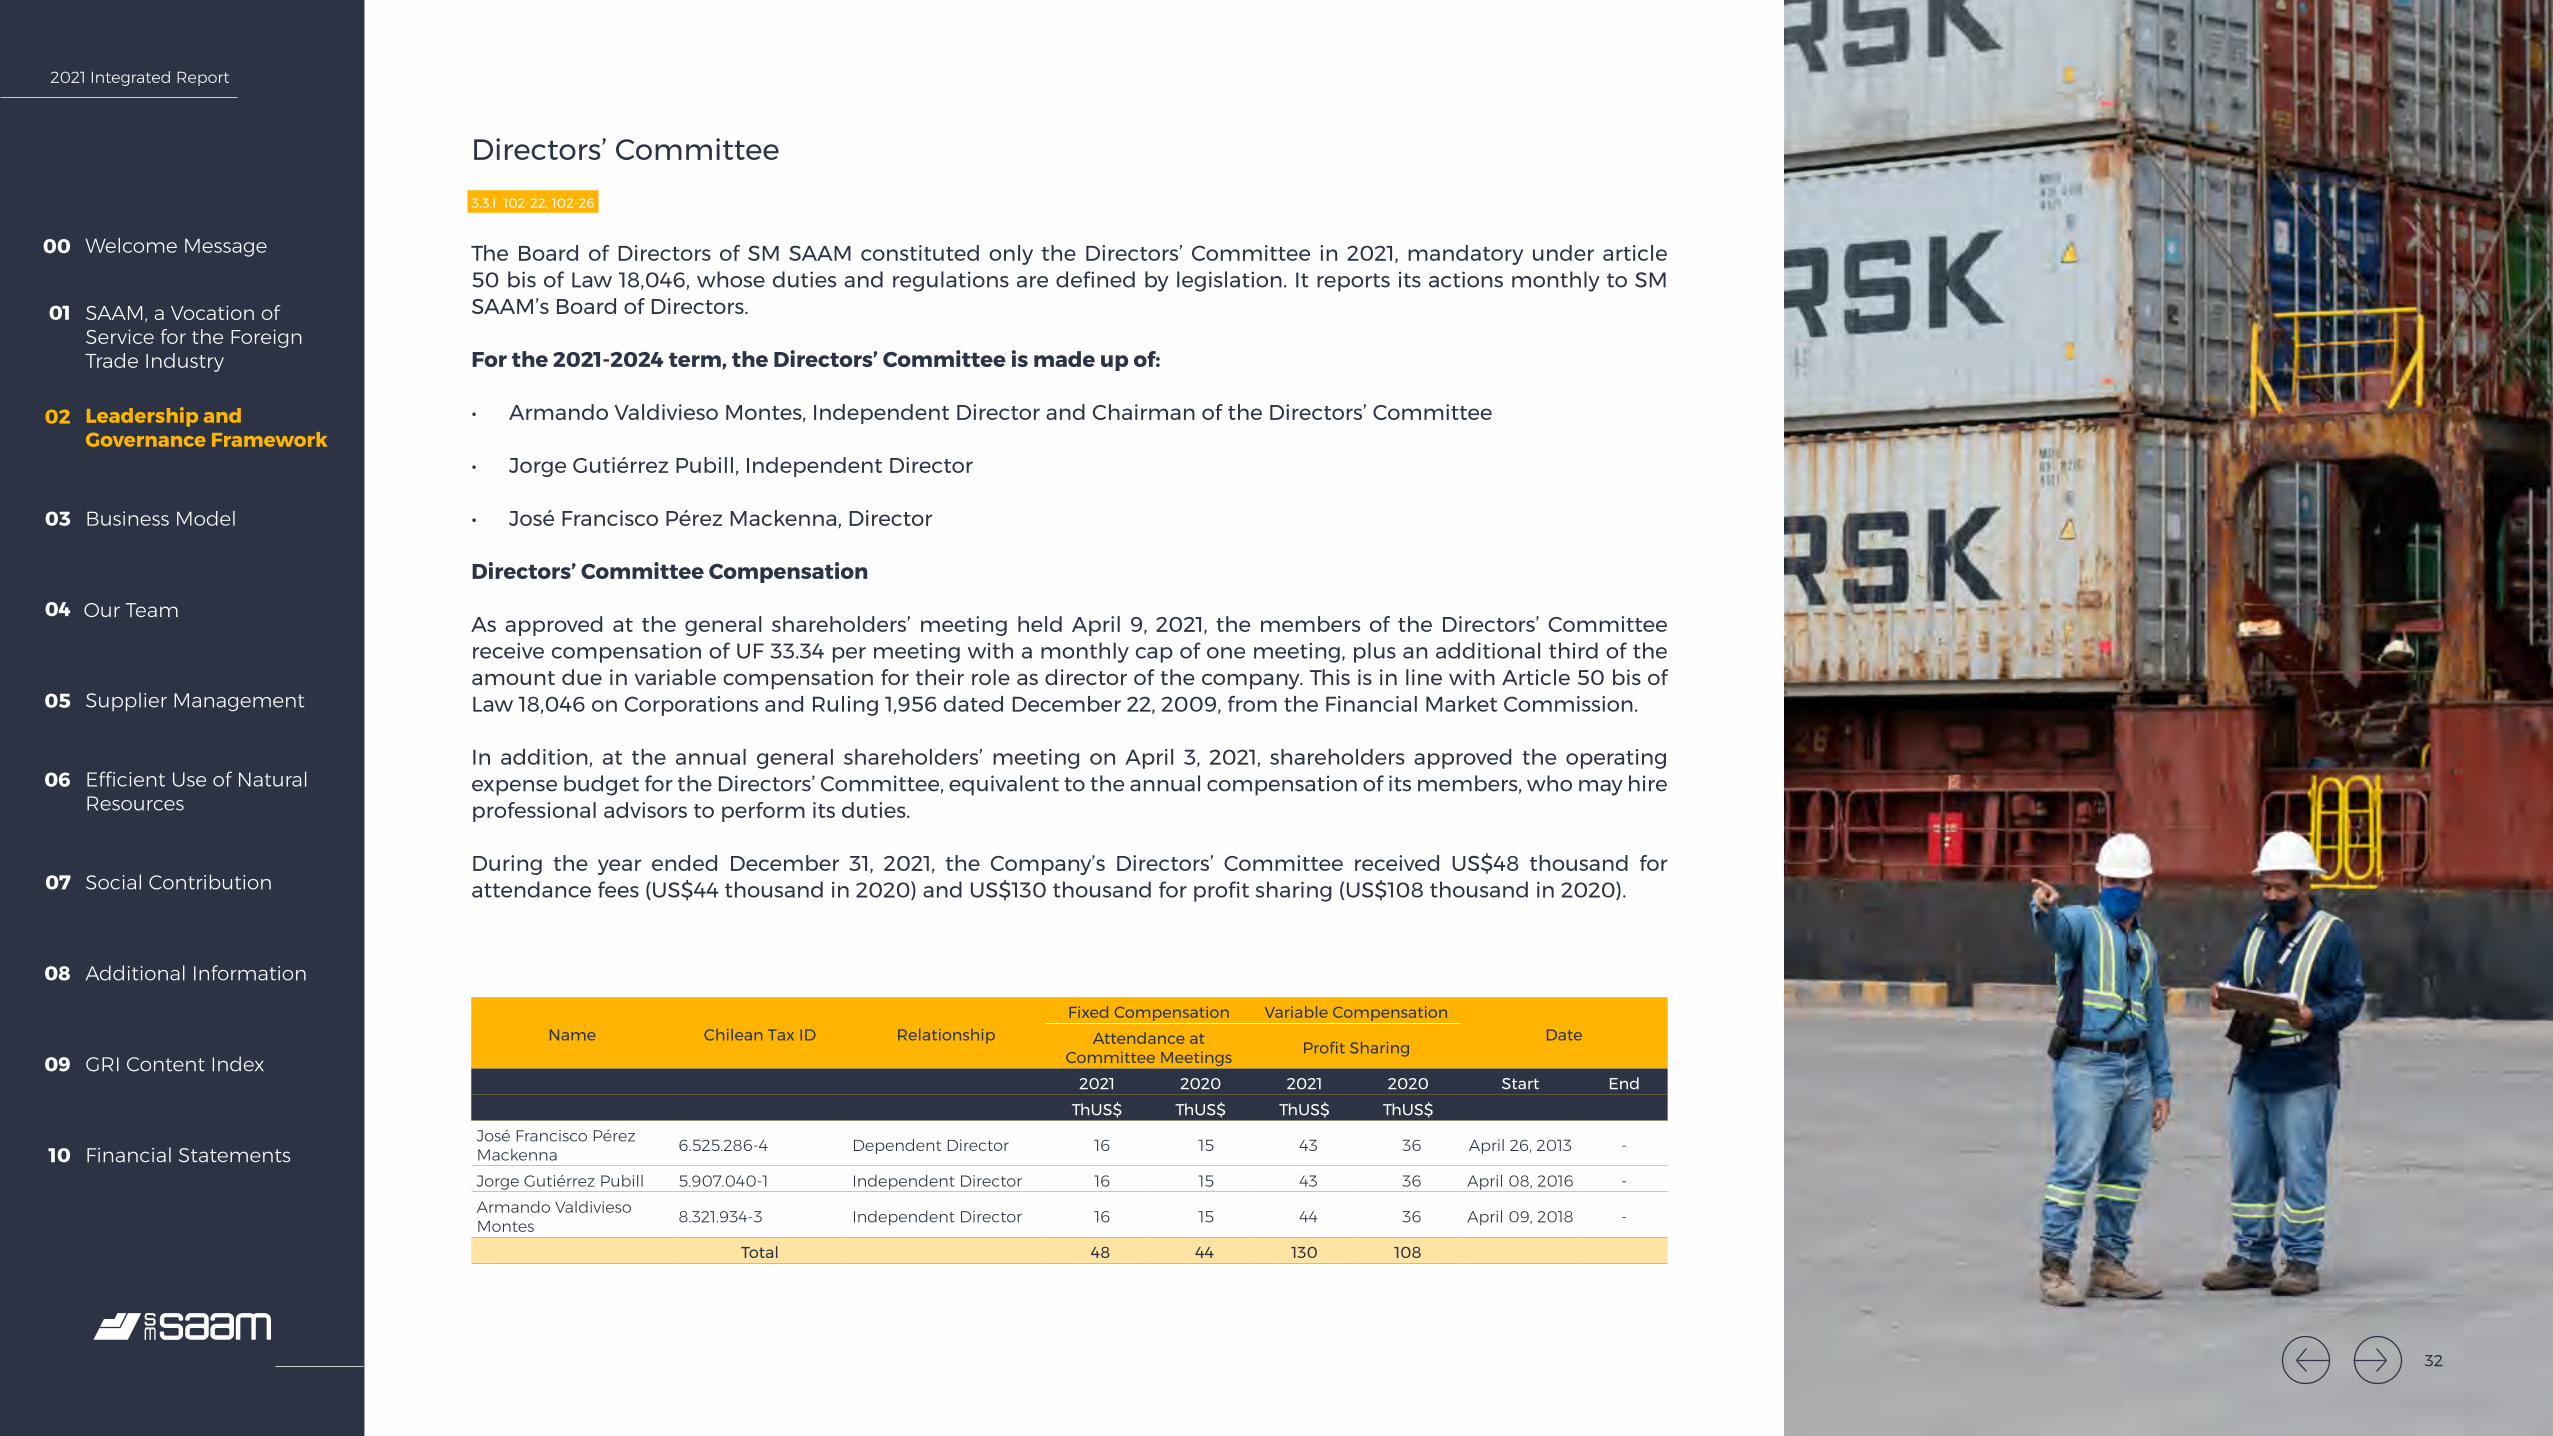
Directors’ Committee3.3.I 102-22, 102-26
The Board of Directors of SM SAAM constituted only the Directors’ Committee in 2021, mandatory under article 50 bis of Law 18,046, whose duties and regulations are defined by legislation. It reports its actions monthly to SM SAAM’s Board of Directors.
For the 2021-2024 term, the Directors’ Committee is made up of:
• Armando Valdivieso Montes, Independent Director and Chairman of the Directors’ Committee
• Jorge Gutiérrez Pubill, Independent Director
• José Francisco Pérez Mackenna, Director
Directors’ Committee Compensation
As approved at the general shareholders’ meeting held April 9, 2021, the members of the Directors’ Committee receive compensation of UF 33.34 per meeting with a monthly cap of one meeting, plus an additional third of the amount due in variable compensation for their role as director of the company. This is in line with Article 50 bis of Law 18,046 on Corporations and Ruling 1,956 dated December 22, 2009, from the Financial Market Commission.
In addition, at the annual general shareholders’ meeting on April 3, 2021, shareholders approved the operating expense budget for the Directors’ Committee, equivalent to the annual compensation of its members, who may hire professional advisors to perform its duties.
During the year ended December 31, 2021, the Company’s Directors’ Committee received US$48 thousand for attendance fees (US$44 thousand in 2020) and US$130 thousand for profit sharing (US$108 thousand in 2020).
Name Chilean Tax ID RelationshipFixed Compensation Variable Compensation
DateAttendance at Committee Meetings Profit Sharing
2021 2020 2021 2020 Start EndThUS$ ThUS$ ThUS$ ThUS$
José Francisco Pérez Mackenna 6.525.286-4 Dependent Director 16 15 43 36 April 26, 2013 -
Jorge Gutiérrez Pubill 5.907.040-1 Independent Director 16 15 43 36 April 08, 2016 -Armando Valdivieso Montes 8.321.934-3 Independent Director 16 15 44 36 April 09, 2018 -
Total 48 44 130 108
32
2021 Integrated Report
Welcome Message00
SAAM, a Vocation of Service for the Foreign Trade Industry
01
Leadership and Governance Framework
02
Business Model03
Our Team04
Supplier Management05
Efficient Use of Natural Resources
06
Social Contribution07
Additional Information08
GRI Content Index09
Financial Statements10
Directors’ Committee Annual Report
The Directors’ Committee of Sociedad Matriz SAAM S.A. devoted itself to exercising the authority and duties established in Article 50 bis of Law 18,046 during 2021, and completed the following tasks:
1. Reviewed the Consolidated Financial Statements of SM SAAM S.A. and its subsidiaries, and the associated final report issued by the independent auditors for the year ended December 31, 2020. It endorsed their presentation to the shareholders for approval. It also examined without reservations the Consolidated Financial Statements of the Company and its Subsidiaries, with the year-end closing dates of March, June and September 2021.
Reviewed the External Audit Plan for fiscal year 2021, the Limited Review Report on the Consolidated Interim Financial Statements, and the Internal Control Report for 2020.
2. Proposed that the Board suggests at the annual general shareholders’ meeting that PricewaterhouseCoopers Consultores Auditores SpA be appointed as external auditors to audit the accounting records and financial statements during 2021. The committee also proposed keeping the risk rating agencies Feller-Rate Clasificadora de Riesgo Limitada and Clasificadora de Riesgo Humphreys Limitada for the year.
3. It did not examine information on the transactions referred to in section XVI of Law 18,046.
4. Reviewed the 2021 Work Plan for the new Compliance Department and its progress reports. It also reviewed and approved the 2022 Compliance Plan. The role of the Compliance Department is to identify regulatory and compliance risks resulting from business activities and processes and to implement measures and promote practices for managing and mitigating these.
5. Reviewed the compensation system and plans for managers and senior executives.
6. Reviewed the Purchase Price Allocation (PPA) for the acquisition of 70% of the Intertug companies, which took place in January 2021.
7. Reviewed the growth plan of the internal accounting team.
8. Reviewed the content, arguments and effects of the judgment issued against PriceWaterhouseCoopers in the framework of the La Polar case.
9. Welcomed representatives from Feller Rate risk rating agency to learn about the risk rating process, its methodological considerations and reasoning behind the rating assigned to SM SAAM.
10. Prepared and approved the annual report on its management.
Committee Activities
The Directors’ Committee also completed the following actions requested by SM SAAM S.A.’s Board:
(i) Reviewed the Corporate Governance practices contained in General Regulation 385 issued by the
33

2021 Integrated Report
Welcome Message00
SAAM, a Vocation of Service for the Foreign Trade Industry
01
Leadership and Governance Framework
02
Business Model03
Our Team04
Supplier Management05
Efficient Use of Natural Resources
06
Social Contribution07
Additional Information08
GRI Content Index09
Financial Statements10
Committee Activities
The Directors’ Committee also completed the following actions requested by SM SAAM S.A.’s Board:
(i) Reviewed the Corporate Governance practices contained in General Regulation 385 issued by the Financial Markets Commission and adopted by the company.
(ii) Reviewed the respective reports and recommendations issued by the Controller on the Internal Audit Plans for 2021, monitored implementation of the respective action plans and approved the Internal Audit Plans for 2022. It also reviewed the evaluation of internal audit practices prepared by Deloitte.
(iii) Reviewed occupational health and safety and environmental progress and performance.
(iv) Reviewed the Risk Policy, risk profile, Risk Committee reports and the Risk Plan for 2021. It also reviewed the Company Risk Management Maturity report prepared by Deloitte.
The Directors’ Committee did not hire any advisors and, therefore, did not incur any expenses for this concept. It did not deem it necessary to present any type of recommendation to the company’s shareholders.
34
2021 Integrated Report
Welcome Message00
SAAM, a Vocation of Service for the Foreign Trade Industry
01
Leadership and Governance Framework
02
Business Model03
Our Team04
Supplier Management05
Efficient Use of Natural Resources
06
Social Contribution07
Additional Information08
GRI Content Index09
Financial Statements10
Directors’ Committee Participation
3.2.VI
Risk Management. SM SAAM has a Comprehensive Risk Management Policy approved by the Board of Directors in November 2019. The main aspects defined in this policy are the comprehensive risk management process, roles and responsibilities for SM SAAM, its corporate divisions and all group companies, as well as the risk appetite.
The Comprehensive Risk Management Policy also contemplates periodical reports to both the Risk Committee and the Directors’ Committee.
In the August 2021 session, the Board of Directors reviewed the annual update of the risk matrix. The Risk Unit met with the Directors’ Committee in the January, March, May, August and November sessions to review the annual risk plan and report on progress in the risk management process.
Internal Audit. As delegated by the SM SAAM Board of Directors, the Corporate Controller met with the Directors’ Committee in five sessions in 2021 to present the results of the audits carried out under the approved annual plan and the improvements to incorporate in the audited processes and in the compliance models to mitigate risk impacts, noncompliance and/or potential fraud.
The 2022 Annual Audit Plan was approved in the last session of the Directors’ Committee, held in December.
Head of Crime Prevention. In the January 2021 session, the Board of Directors ratified the assignment of the current Head of Crime Prevention for a new three-year period. This individual reported to the Directors’ Committee on the status of effectiveness of the controls that form part of the Compliance Model in the June and December 2021 sessions.
Compliance Manager. In the January 2021 session, the Directors’ Committee approved the annual Compliance Plan from this new area. In the June and December 2021 sessions, the Compliance Manager reported on the progress of the project, presenting the plan for 2022 in the December session.
External Auditors. In March 2021, the Board of Directors met with the external auditors to review the final audit report of the consolidated financial statements for SM SAAM S.A. and subsidiaries as of December 31, 2020.
35
2021 Integrated Report
Welcome Message00
SAAM, a Vocation of Service for the Foreign Trade Industry
01
Leadership and Governance Framework
02
Business Model03
Our Team04
Supplier Management05
Efficient Use of Natural Resources
06
Social Contribution07
Additional Information08
GRI Content Index09
Financial Statements10
The Directors’ Committee met with external auditors in the following sessions:
March Session:
Reviewed the final audit report of the consolidated financial statements for SM SAAM S.A. and subsidiaries as of December 31, 2020.
June Session:
Reviewed the external audit plan for 2021.
August Session:
Analyzed the limited review report of the intermediate consolidated financial statements for SM SAAM S.A. and subsidiaries as of June 31, 2021.
January 2022 Session: The committee reviewed and acknowledged the internal control report for 2021.
All of the 2021 sessions of the Board of Directors and the Directors’ Committee included the company’s Chief Executive Officer, Chief Financial Officer and Chief Counsel.3.2.VIII
During the year, the Chairman of the Board visited facilities and installations in some of the subsidiary operations such as San Antonio Terminal Internacional, San Vicente Terminal Internacional, Terminal Portuario de Guayaquil (Ecuador) and Puerto Caldera (Costa Rica).
36
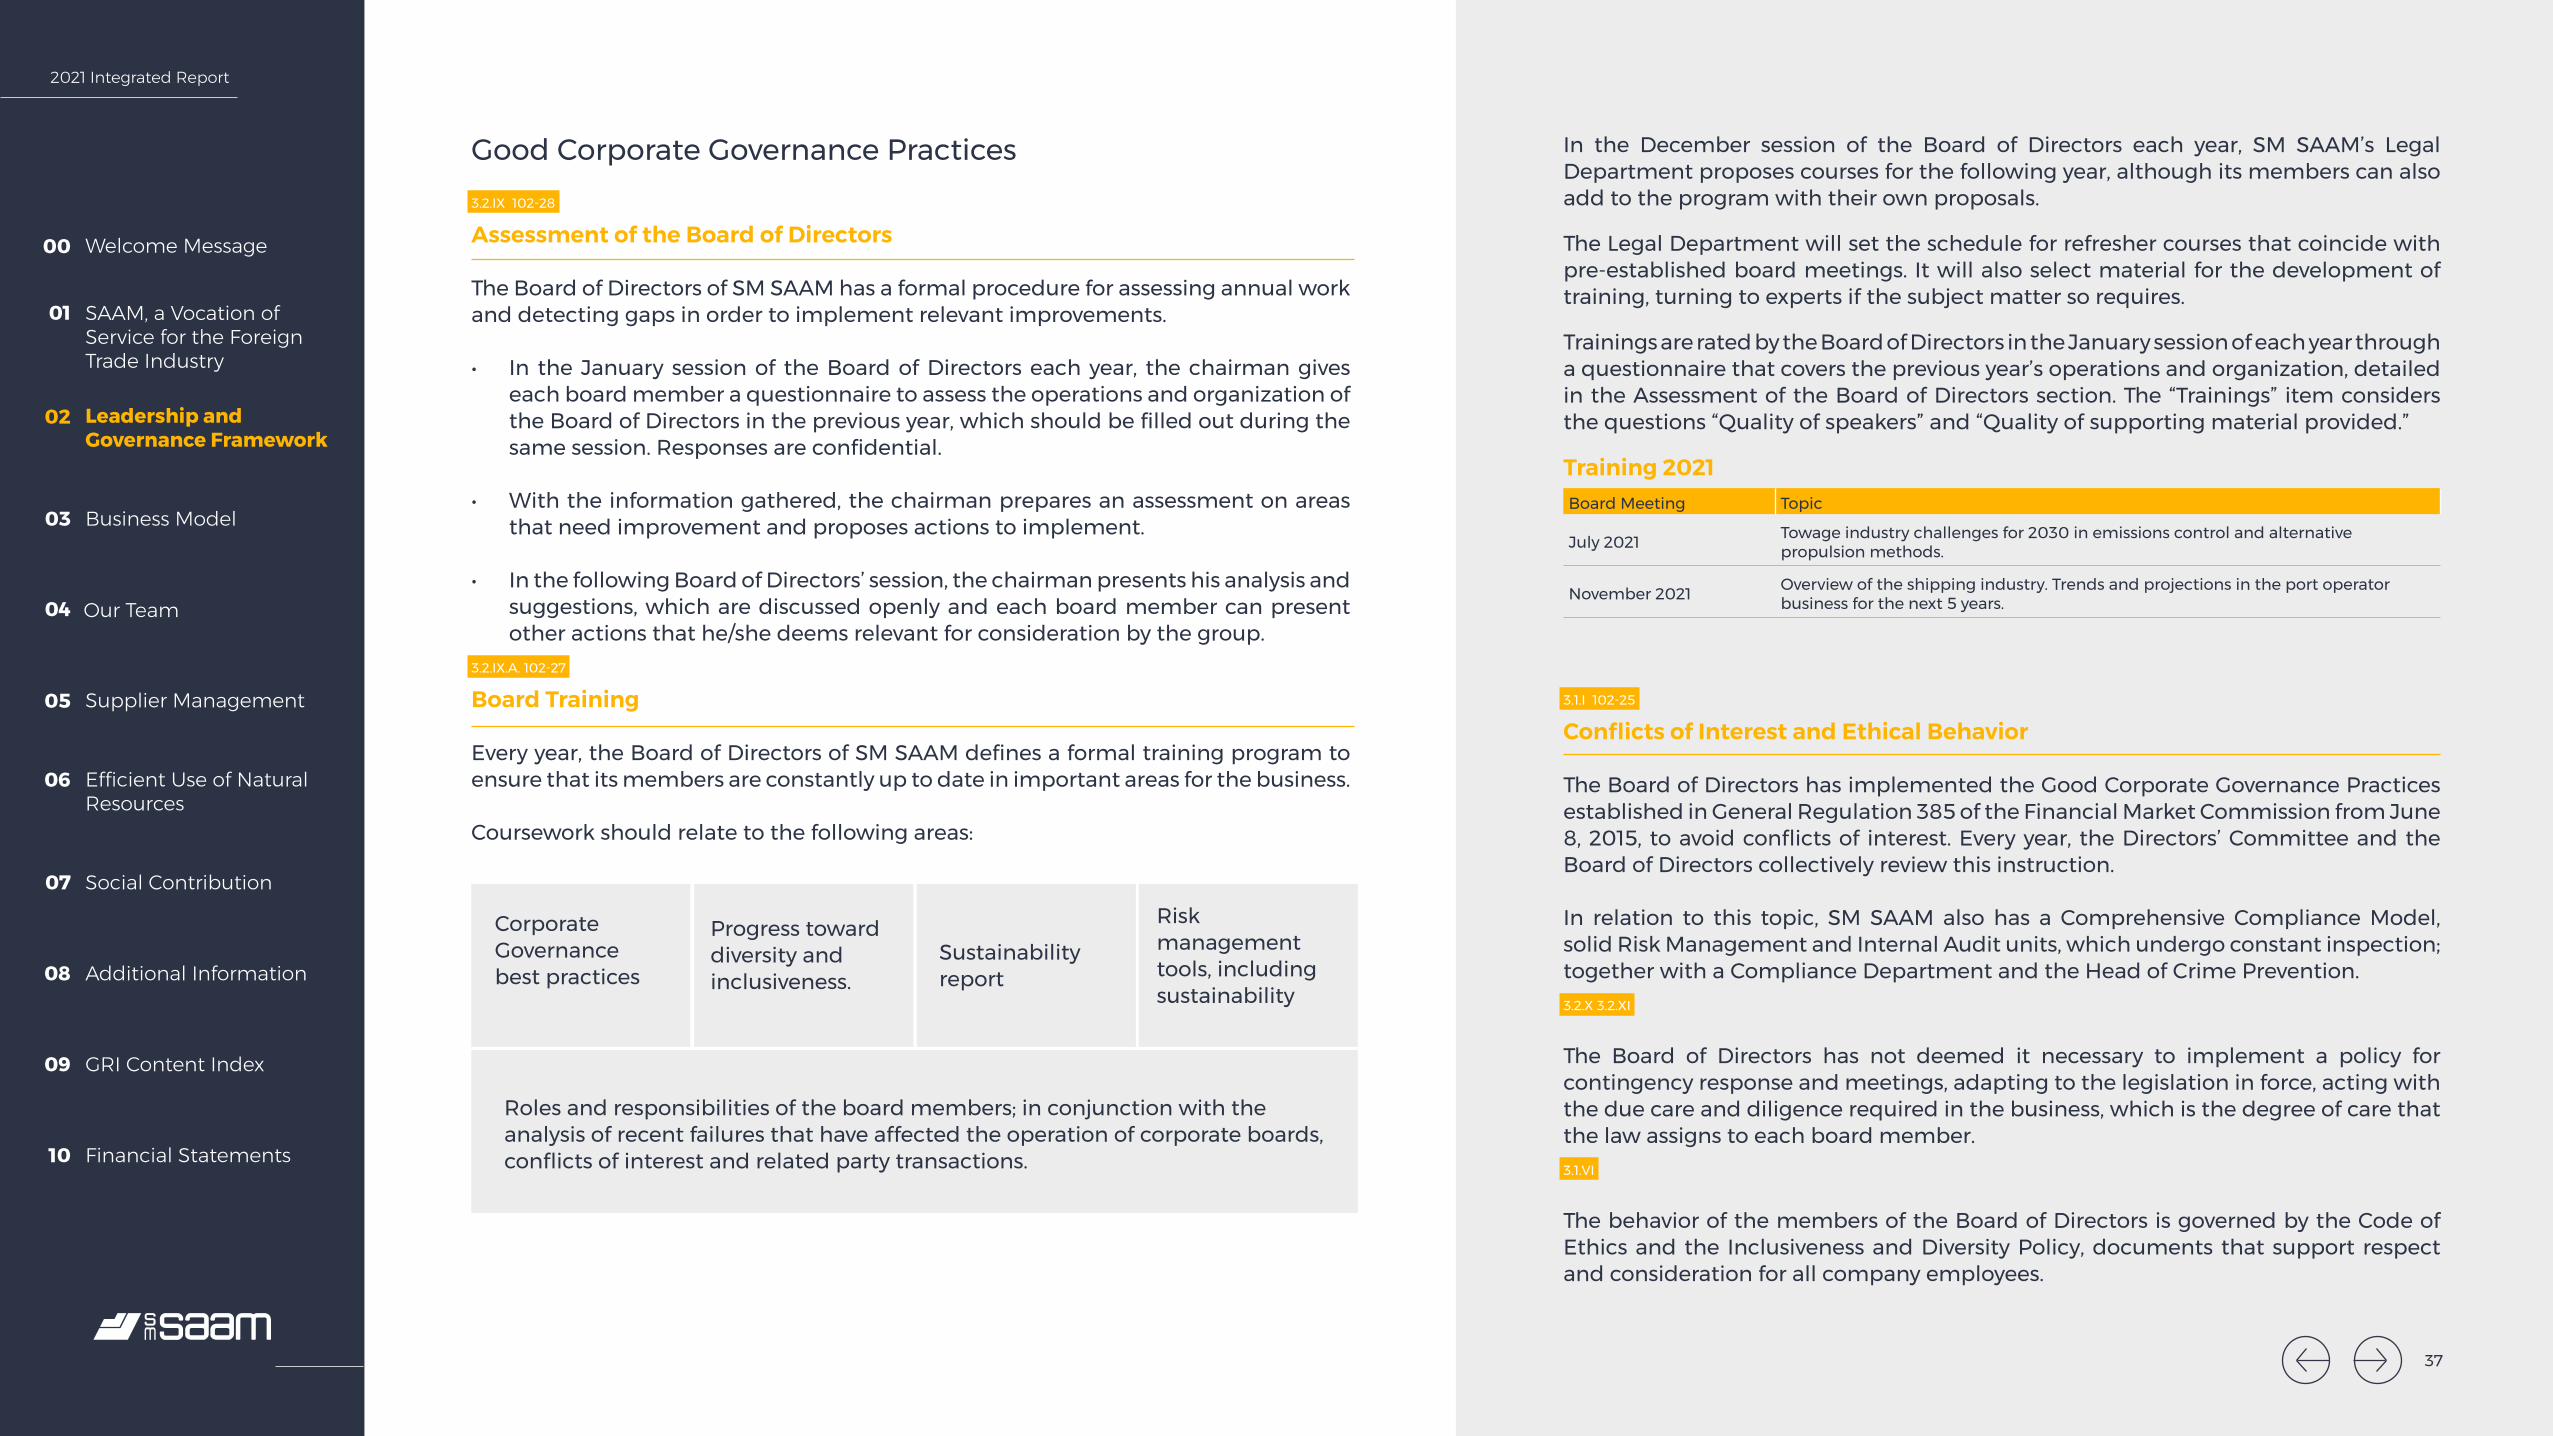
2021 Integrated Report
Welcome Message00
SAAM, a Vocation of Service for the Foreign Trade Industry
01
Leadership and Governance Framework
02
Business Model03
Our Team04
Supplier Management05
Efficient Use of Natural Resources
06
Social Contribution07
Additional Information08
GRI Content Index09
Financial Statements10
Good Corporate Governance Practices3.2.IX 102-28
Assessment of the Board of Directors
The Board of Directors of SM SAAM has a formal procedure for assessing annual work and detecting gaps in order to implement relevant improvements.
• In the January session of the Board of Directors each year, the chairman gives each board member a questionnaire to assess the operations and organization of the Board of Directors in the previous year, which should be filled out during the same session. Responses are confidential.
• With the information gathered, the chairman prepares an assessment on areas that need improvement and proposes actions to implement.
• In the following Board of Directors’ session, the chairman presents his analysis and suggestions, which are discussed openly and each board member can present other actions that he/she deems relevant for consideration by the group.
3.2.IX.A. 102-27
Board Training
Every year, the Board of Directors of SM SAAM defines a formal training program to ensure that its members are constantly up to date in important areas for the business.
Coursework should relate to the following areas:
In the December session of the Board of Directors each year, SM SAAM’s Legal Department proposes courses for the following year, although its members can also add to the program with their own proposals.
The Legal Department will set the schedule for refresher courses that coincide with pre-established board meetings. It will also select material for the development of training, turning to experts if the subject matter so requires.
Trainings are rated by the Board of Directors in the January session of each year through a questionnaire that covers the previous year’s operations and organization, detailed in the Assessment of the Board of Directors section. The “Trainings” item considers the questions “Quality of speakers” and “Quality of supporting material provided.”
Training 2021Board Meeting Topic
July 2021 Towage industry challenges for 2030 in emissions control and alternative propulsion methods.
November 2021 Overview of the shipping industry. Trends and projections in the port operator business for the next 5 years.
Corporate Governance best practices
Progress toward diversity and inclusiveness.
Sustainability report
Risk management tools, including sustainability
Roles and responsibilities of the board members; in conjunction with the analysis of recent failures that have affected the operation of corporate boards, conflicts of interest and related party transactions.
3.1.I 102-25
Conflicts of Interest and Ethical Behavior
The Board of Directors has implemented the Good Corporate Governance Practices established in General Regulation 385 of the Financial Market Commission from June 8, 2015, to avoid conflicts of interest. Every year, the Directors’ Committee and the Board of Directors collectively review this instruction.
In relation to this topic, SM SAAM also has a Comprehensive Compliance Model, solid Risk Management and Internal Audit units, which undergo constant inspection; together with a Compliance Department and the Head of Crime Prevention.3.2.X 3.2.XI
The Board of Directors has not deemed it necessary to implement a policy for contingency response and meetings, adapting to the legislation in force, acting with the due care and diligence required in the business, which is the degree of care that the law assigns to each board member. 3.1.VI
The behavior of the members of the Board of Directors is governed by the Code of Ethics and the Inclusiveness and Diversity Policy, documents that support respect and consideration for all company employees.
37

2021 Integrated Report
Welcome Message00
SAAM, a Vocation of Service for the Foreign Trade Industry
01
Leadership and Governance Framework
02
Business Model03
Our Team04
Supplier Management05
Efficient Use of Natural Resources
06
Social Contribution07
Additional Information08
GRI Content Index09
Financial Statements10
3.2.XII
Information Systems
In 2020, the company hired Diligent, which offers a digital platform where board members can safely, remotely and permanently access all the minutes of the board meetings and documents that have been analyzed in each meeting.
Advisory Services
3.2.III
The need for advisory services from external specialists for the Board of Directors is addressed on a case-by-case basis to determine the merit of hiring external experts. No advisory services were requested by the Board of Directors in 2021.
Director Appointments
3.4.I 102-24
SM SAAM is governed by current legislation, which gives shareholders the right to appoint the members of the Board of Directors in the annual general meeting. Directors hold office for three years but may be re-elected indefinitely.
The CEO publishes information about each candidate, their experience, profession or trade in a candidate fact sheet, which is opportunely sent to the candidates proposed by the shareholders, in keeping with the procedures approved by the Board of Directors.
As a result of the COVID-19 pandemic, the Board of Directors approved the use of technology as a means of remotely participating and voting in the annual general meetings held in April 2020 and 2021, given the health measures imposed by the Chilean government pursuant to General Regulation 435 and Official Interpretation 1,141, both published by the Financial Market Commission in March 2020.
Meeting Attendance
All the regular board meetings were held in 2021, with only one board member failing to attend one of these.
Two extraordinary meetings were held. The first was attended by six board members and the second had full attendance.
38

2021 Integrated Report
Welcome Message00
SAAM, a Vocation of Service for the Foreign Trade Industry
01
Leadership and Governance Framework
02
Business Model03
Our Team04
Supplier Management05
Efficient Use of Natural Resources
06
Social Contribution07
Additional Information08
GRI Content Index09
Financial Statements10
Management102-19, 102-20
In 2018, SM SAAM’s operating model was simplified to a matrix-type structure, which concentrates and strengthens support areas and standardizes all its processes. This change is what has made it possible to provide a faster response to the demands and challenges of foreign trade, especially in 2020-2021 with the COVID-19 pandemic, and to remain an agile, efficient, modern and competitive company.
The CEO is responsible for the corporate departments that provide services to the business units, and for the division managers responsible for subsidiaries and associates that operate in these areas: SAAM Towage Division (SAAM S.A.); Port Terminals Division (SAAM Ports S.A.) and Logistics Division (SAAM Logistics S.A. and Aerosan S.A.).
Executive Compensation102-35
The compensation policy for SM SAAM’s senior management team includes fixed compensation and an annual performance bonus tied to yearly targets. This performance bonus is awarded by the Board after evaluating management performance for the year and the amount is based on each person’s fixed compensation.
Total compensation, including bonuses and termination benefits for years of service, paid by SM SAAM to senior executives in 2021 was ThUS$6,502 (ThUS$7,094 in 2020). The compensation received by the company’s senior executives during 2021 and 2020 was paid by the subsidiary SAAM S.A.
In 2021, SM SAAM paid a total of ThUS$1.78 (ThUS$22 in 2020) in termination benefits for years of service. Both figures are included in the totals above.
Organizational Chart
Directors’ Committee
Board of Directors
SAAM Towage Division
The internal control area reports to the Controller. Risk management and investor and shareholder relations form part of the Finance and Administration Department. Sustainability management is the responsibility of the Corporate Sustainability and Communications Department created in 2021.
Chief Executive Officer
Executive Committee
Port Terminals Division
Logistics Division (Aerosan and SAAM
Logistics)
Sustainability and Communications
Department
Institutional Relations
Department
Finance and Administration
Department
Business Development Department
Controller Human Resources Department
Legal DepartmentIT and
Communications Department
39

2021 Integrated Report
Welcome Message00
SAAM, a Vocation of Service for the Foreign Trade Industry
01
Leadership and Governance Framework
02
Business Model03
Our Team04
Supplier Management05
Efficient Use of Natural Resources
06
Social Contribution07
Additional Information08
GRI Content Index09
Financial Statements10
Ethics and Integrity3.1.III 102-25
SM SAAM promotes the ethical behavior of all employees through the Comprehensive Ethics and Compliance Management System, led by the Compliance Department. This structure, launched in 2020, keeps the company’s business development within the legal framework and internal guidelines, aligned with corporate values.
The Comprehensive Ethics and Compliance Management System considers a Code of Ethics and a crime prevention process, which includes the participation of the Ethics Committee in its design and governance. It also has a complaint channel and periodical training programs on issues such as detection of conflicts of interest, crime prevention and defense of free competition.
The model is certified by BH Compliance.
Components of the Comprehensive Ethics and Compliance Management System:
• Code of Ethics• Compliance Model• Communication and Training Program• Complaint System• Ethics Committee
In the training program, SM SAAM periodically reinforces and trains employees on topics such as the Complaint Channel and the Code of Ethics. It also has an orientation program for new company employees.
In 2021, the company held two training courses on free competition:
Compliance Program Documents
• Code of Ethics
• Compliance Program for the Prevention of Corporate Criminal Responsibility (Law 20,393)
• Complaint Management Procedure
• Treasury Manual
• Corporate Purchasing Guide
• Supplier Onboarding Procedure
• Good Practice Guide for Community Contributions (Donations, Patronage, Sponsorships and Contributions)
• Good Practice Guide for Giving and Receiving Gifts, Invitations and Hospitality
• Good Practice Guide for Relations with Public Officials and Politically Exposed Persons
• Supplier Payment and Advance Payment Policy and Procedure
• Personnel Recruitment and Selection Policy and Procedure
• Incentives and Compensation Policy
Free Competition level 1, introduction to the topic for employees
Free Competition level 2, directed at executives and specific positions.
Code of Ethics
SM SAAM’s Code of Ethics provides guidelines for conducting business and stakeholder engagement, based on five corporate values: Safety, Honesty, Respect, Responsibility and Service. It also provides the value framework for corporate policies, internal regulations, manuals and procedures.
This framework of conduct is mandatory for workers, executives and directors in Chile and in its foreign subsidiaries. Any concerns or doubts about its interpretation can be answered by immediate supervisors, department managers, the CEO of SM SAAM, the Ethics Committee and the Compliance Department. There is also an email address to submit any queries: [email protected]
40
2021 Integrated Report
Welcome Message00
SAAM, a Vocation of Service for the Foreign Trade Industry
01
Leadership and Governance Framework
02
Business Model03
Our Team04
Supplier Management05
Efficient Use of Natural Resources
06
Social Contribution07
Additional Information08
GRI Content Index09
Financial Statements10
Compliance Program
This component of the Comprehensive Ethics and Compliance Management System involves SM SAAM and all its foreign subsidiaries. The pillars of the model comprise prevention, detection, response, supervision and monitoring activities.
This proposal has been adapted to the equivalent legislation in each country where the country has subsidiaries, and where none exist, best corporate practices are implemented. Associates, especially in Chile, are encouraged to implement this policy.
The party responsible for the Compliance Program is the Head of Crime Prevention. SM SAAM’s Board of Directors must approve the designation of this individual and the activities defined for the year.
41

2021 Integrated Report
Welcome Message00
SAAM, a Vocation of Service for the Foreign Trade Industry
01
Leadership and Governance Framework
02
Business Model03
Our Team04
Supplier Management05
Efficient Use of Natural Resources
06
Social Contribution07
Additional Information08
GRI Content Index09
Financial Statements10
Complaint Channel102-17
SM SAAM has a formal complaint process for internal and external stakeholders.
The available channels are as follows:
• Complaint system on the corporate website (www.saam.com), managed by an external supplier of international scope
• Email: [email protected]
• In-person complaint
This system is also available on the websites of subsidiaries and associates.
All complaints received are centralized in the Compliance Department for a preliminary analysis and are then referred as defined in the Complaint Referral Matrix based on the company and incident involved in the complaint. Likewise, each complaint is managed under the protocols established in the Complaint Management Procedure, which defines how each case should be managed, from reception to investigation and scaling up, where it is passed on to the Ethics Committee and evaluated for eventual penalties, closure of each event and finally reporting to oversight authorities, where relevant.
The management procedure also includes following up on reports and complaints that were derived to subsidiaries and associates that operate under the centralized complaints system, to ensure that each complaint follows the procedure in place, that corrective or improvement measures are taken and anti-retaliation measures are respected.
Complaints Received in 2021
83
24%
52%
24%
Received
Complaints dismissed
The information from complaints is finally made available to the Ethics Committee, which examines the information and determines the corresponding penalties, if relevant.
SM SAAM guarantees that all complaints will undergo an independent analysis without retaliation for the informant, and will remain confidential and anonymous, if required.
Complaints under review and resolution
Cases closed
42
2021 Integrated Report
Welcome Message00
SAAM, a Vocation of Service for the Foreign Trade Industry
01
Leadership and Governance Framework
02
Business Model03
Our Team04
Supplier Management05
Efficient Use of Natural Resources
06
Social Contribution07
Additional Information08
GRI Content Index09
Financial Statements10
3.3.1
Human Rights
Currently, SM SAAM does not have a standalone human rights policy. However, the organization supports and promotes unrestricted respect for human rights through documents such as the Code of Ethics, the Internal Order, Health and Safety Policy (IOHSP), the Sustainability Policy, the Inclusiveness and Diversity Policy and the Supplier Policy, addressing topics such as non-discrimination, freedom of association and labor rights, the prohibition of child labor and forced labor and the prohibition of all types of harassment.
These internal guidelines integrate diverse company processes, which strive constantly to ensure they are not violated anywhere across the value chain, and provide the respective formal complaint channels and procedures for their investigation and penalties.
43
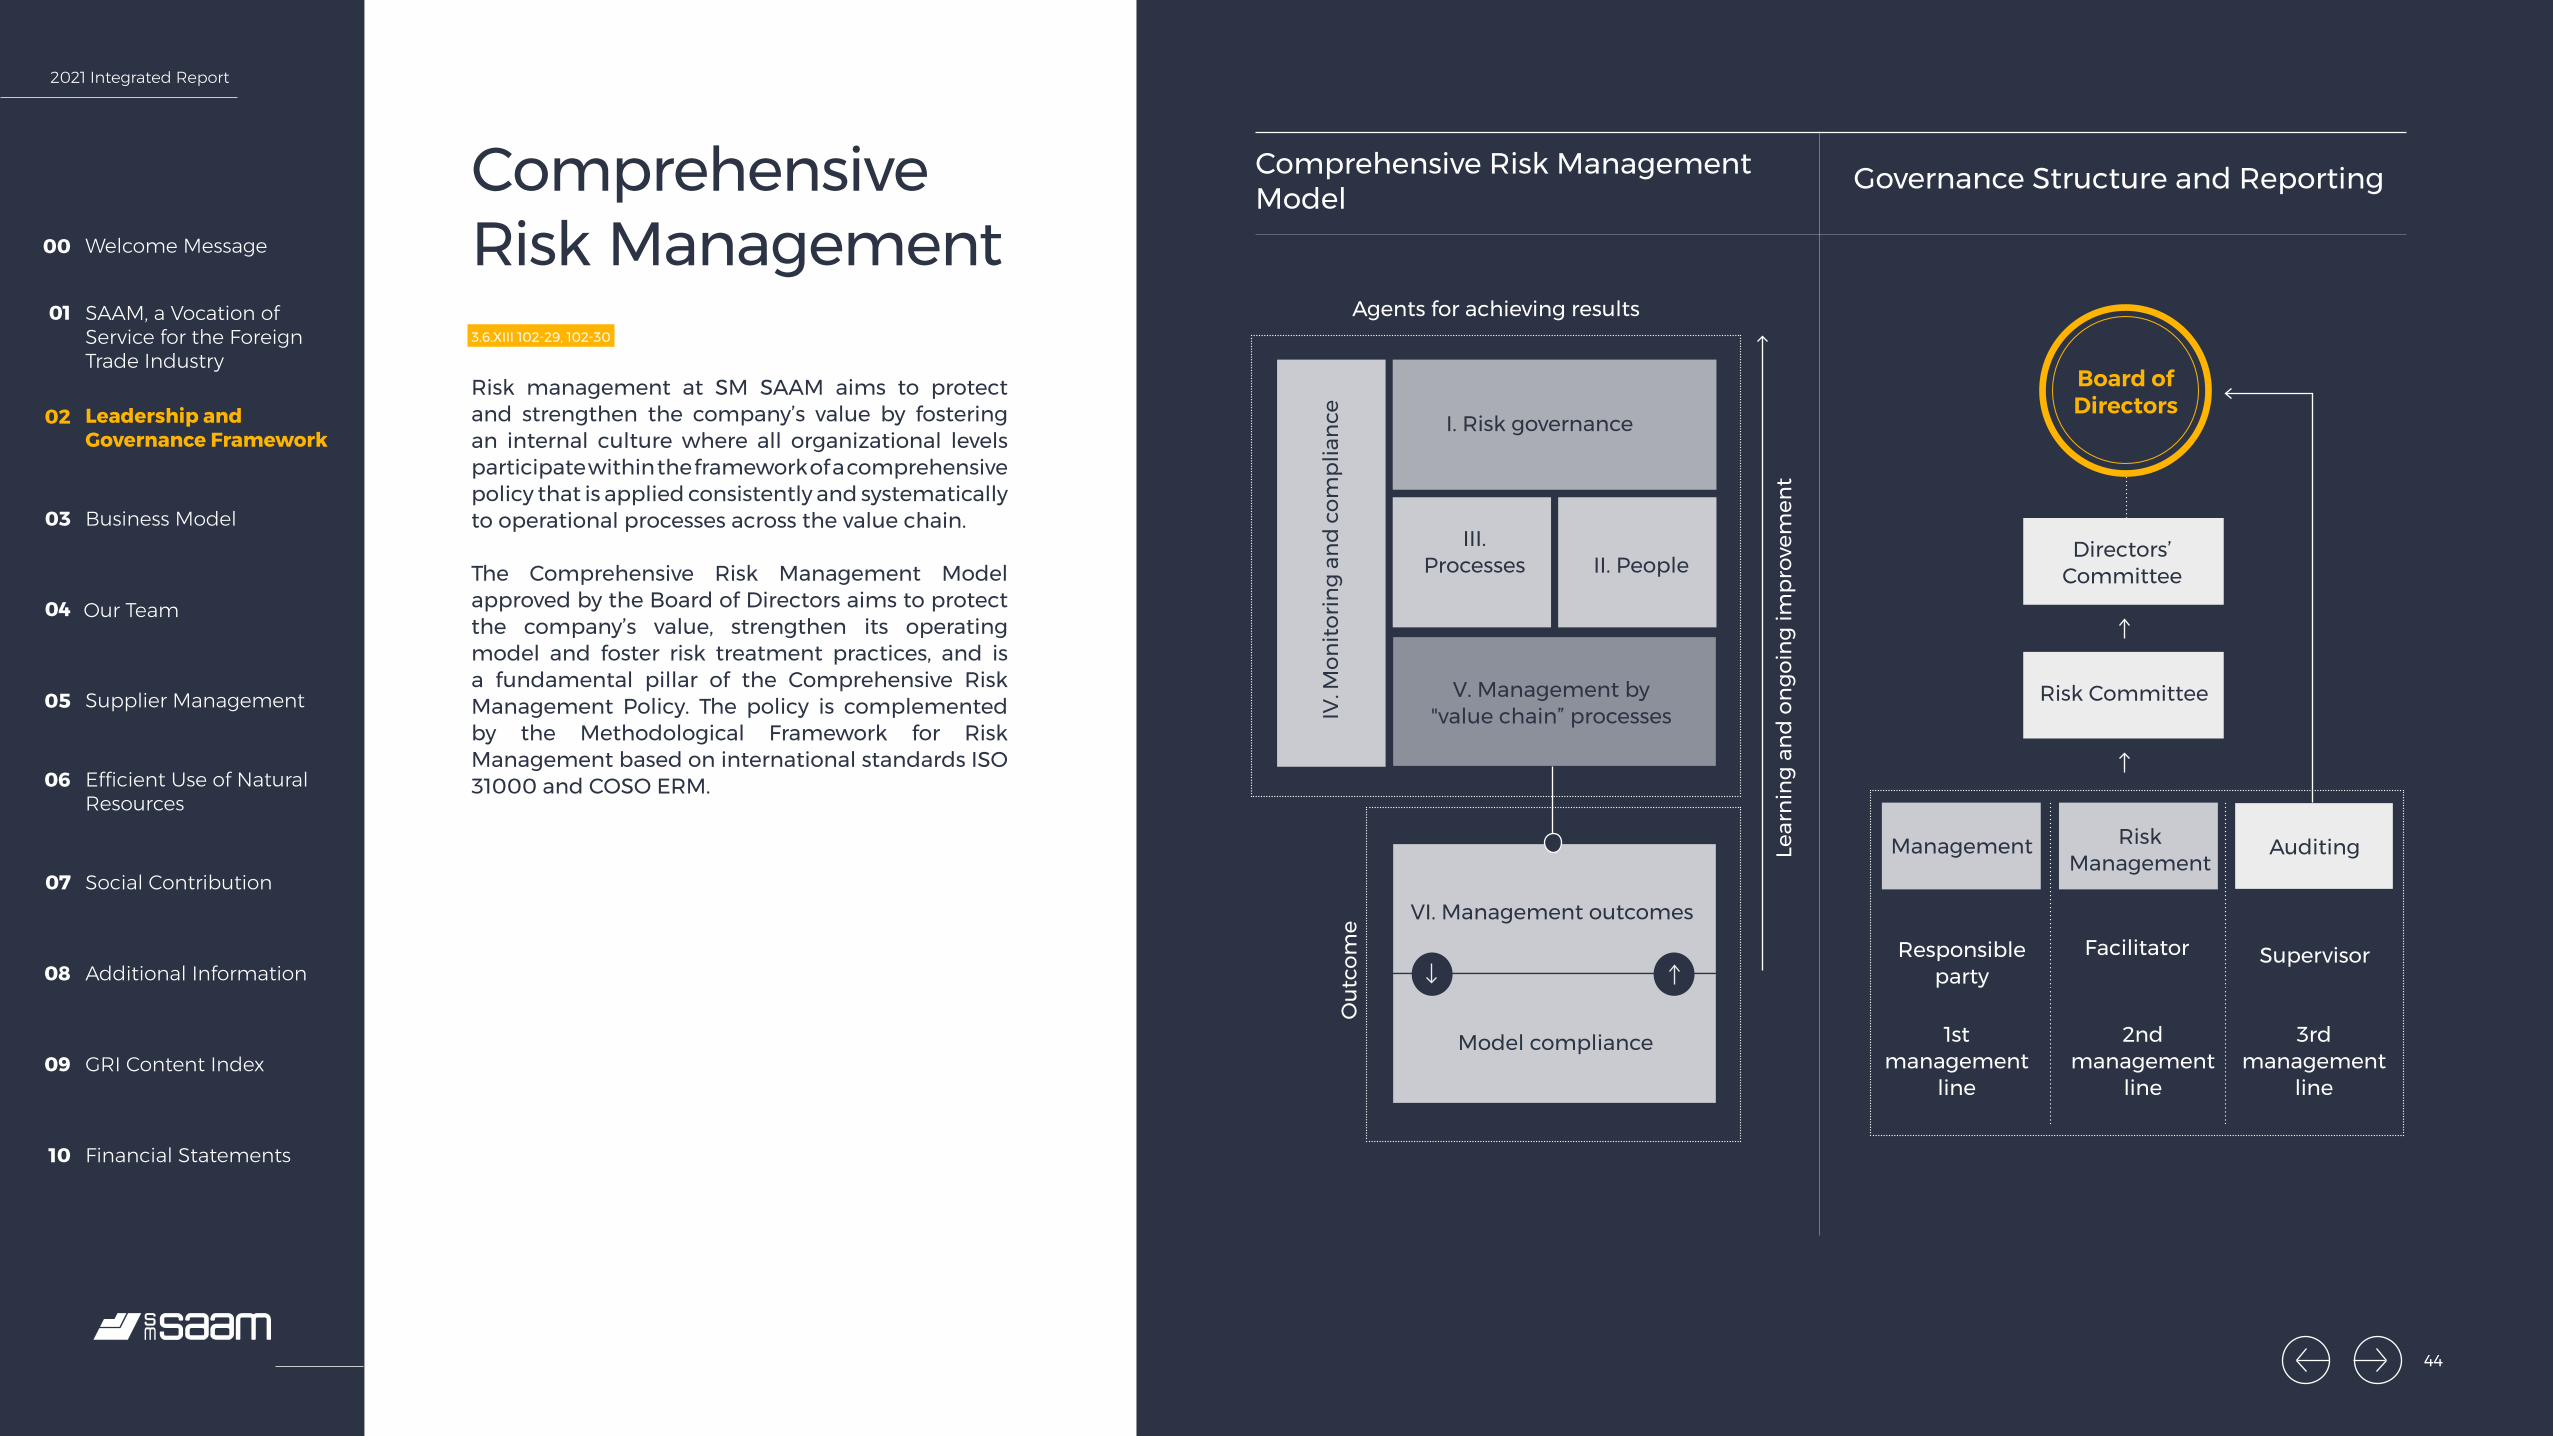
2021 Integrated Report
Welcome Message00
SAAM, a Vocation of Service for the Foreign Trade Industry
01
Leadership and Governance Framework
02
Business Model03
Our Team04
Supplier Management05
Efficient Use of Natural Resources
06
Social Contribution07
Additional Information08
GRI Content Index09
Financial Statements10
Comprehensive Risk Management3.6.XIII 102-29, 102-30
Risk management at SM SAAM aims to protect and strengthen the company’s value by fostering an internal culture where all organizational levels participate within the framework of a comprehensive policy that is applied consistently and systematically to operational processes across the value chain.
The Comprehensive Risk Management Model approved by the Board of Directors aims to protect the company’s value, strengthen its operating model and foster risk treatment practices, and is a fundamental pillar of the Comprehensive Risk Management Policy. The policy is complemented by the Methodological Framework for Risk Management based on international standards ISO 31000 and COSO ERM.
Model compliance
VI. Management outcomes
I. Risk governance
Out
com
e
Agents for achieving results
V. Management by "value chain” processes
II. People
IV. M
onito
ring
and
com
plia
nce
Lear
ning
and
ong
oing
impr
ovem
ent
III. Processes
Comprehensive Risk Management Model Governance Structure and Reporting
Board of Directors
Directors’ Committee
Risk Committee
Risk Management
Facilitator
2nd management
line
Management
Responsible party
1st management
line
Auditing
Supervisor
3rd management
line
44

2021 Integrated Report
Welcome Message00
SAAM, a Vocation of Service for the Foreign Trade Industry
01
Leadership and Governance Framework
02
Business Model03
Our Team04
Supplier Management05
Efficient Use of Natural Resources
06
Social Contribution07
Additional Information08
GRI Content Index09
Financial Statements10
Board of Directors
Ensures the existence and proper application of a comprehensive risk management process. Determines the risk profile and establishes tolerance limits for those areas that have a greater impact on the business.
Directors’ Committee
Ensures the existence and proper application of a comprehensive risk management process.
Risk Committee
Reviews and monitors implementation of the risk model and the status of mitigation plans. The CEO is chairman of the committee and reports quarterly to the Board of Directors on risk management performance and progress, changes in risk sources and likelihood of occurrence. The CEO also reports on any observations or proposals to improve the model in place.
Risk Management Process
Strategic risks at SM SAAM are identified and their possibility of occurrence is constantly being monitored. These same risks are updated annually. Each business division has its own risk matrix, which contains the impact assessment and probability determined for each reality, with measures to be implemented for each of the subsidiaries within that division. The list of 20 strategic risks include those related to free competition, cybersecurity, health and safety and environmental risks.
Risk Management Unit (Processes and Risks
Department)
Implements and maintains a proper risk management
process, based on the application of policies and procedures approved by the Board of
Directors. Reports to the Risk Committee, which in turn reports
to the Board of Directors.
2nd management line
Management (Department and Subsidiary
Management)
Implements risk management procedures in its day-to-day
management, within its scope of responsibility.
1st management line
Controller
Independent of management, the controller conducts an
independent evaluation of the comprehensive risk management
process and implementation of the policy and procedures;
prepares the annual audit plan and reports to the Board of
Directors on relevant findings.
3rd management line
FacilitatorResponsible party Supervisor
Inherent
Residual
Expected residual
2. Risk
assessment
4. Risk
management monitoring
1. Risk event
identification
5. Risk
management reporting
3. Risk response
Duties of the Risk Governance Structure
45
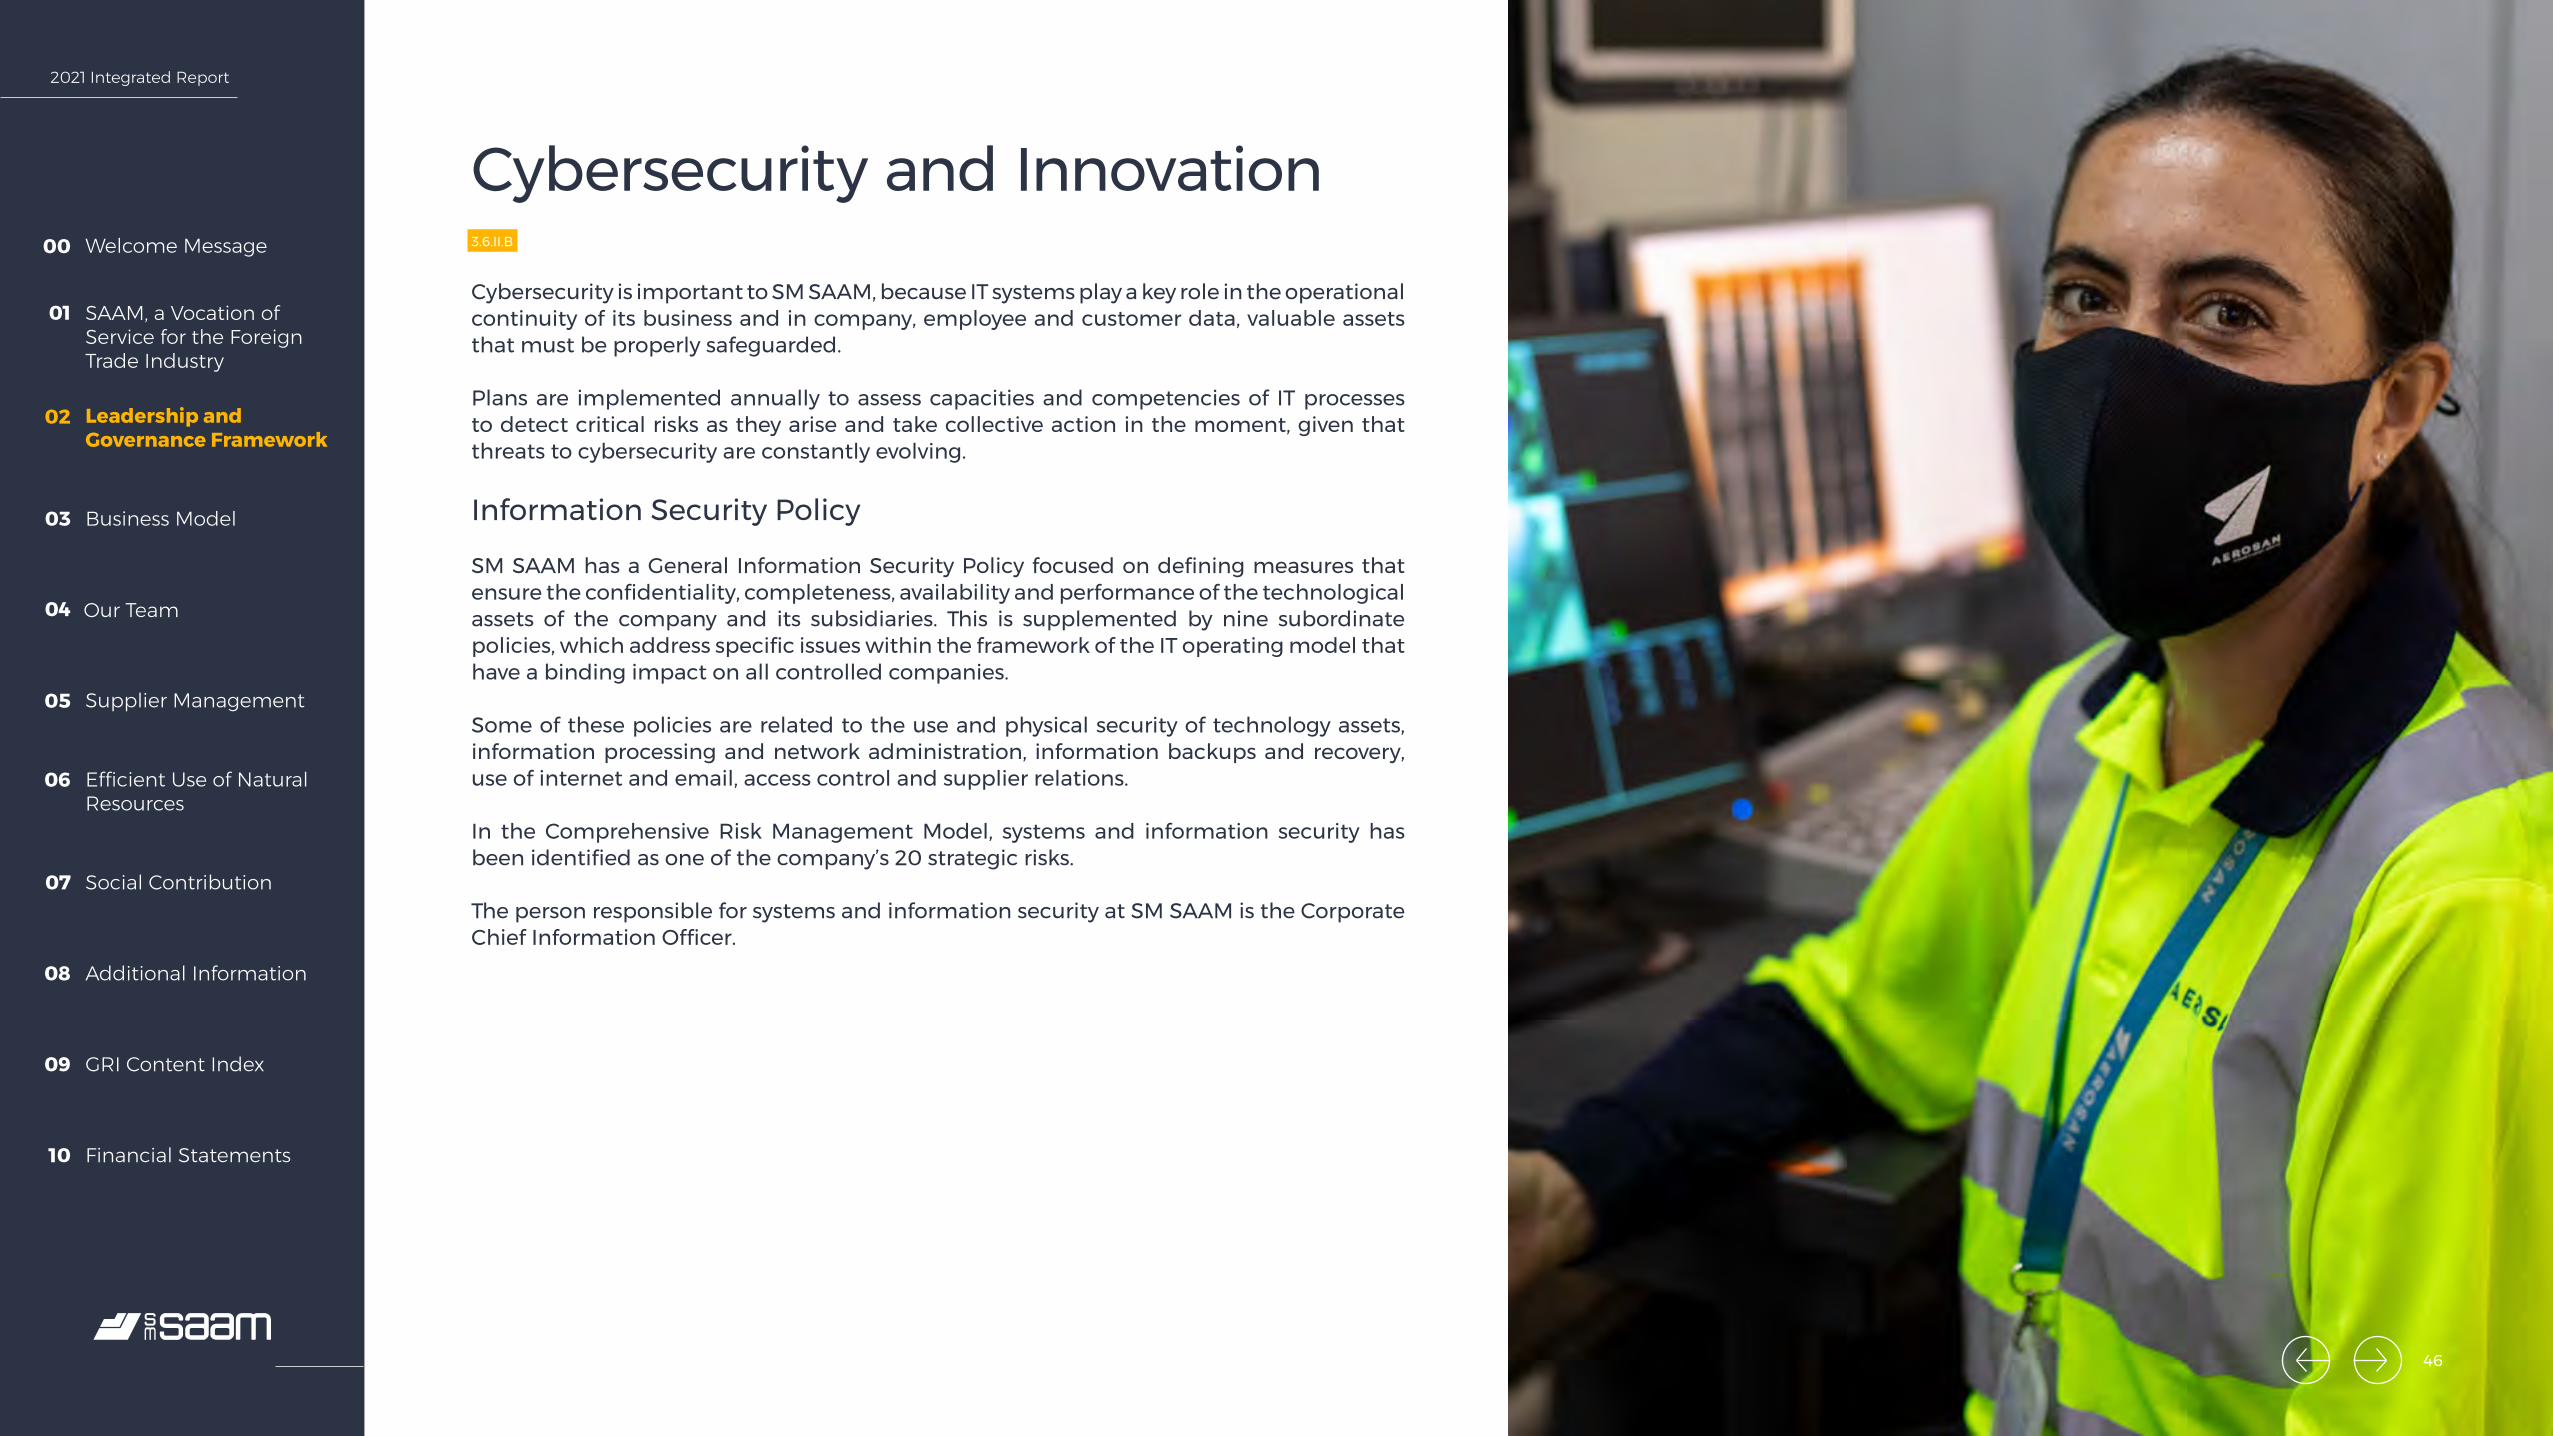
2021 Integrated Report
Welcome Message00
SAAM, a Vocation of Service for the Foreign Trade Industry
01
Leadership and Governance Framework
02
Business Model03
Our Team04
Supplier Management05
Efficient Use of Natural Resources
06
Social Contribution07
Additional Information08
GRI Content Index09
Financial Statements10
Cybersecurity and Innovation3.6.II.B
Cybersecurity is important to SM SAAM, because IT systems play a key role in the operational continuity of its business and in company, employee and customer data, valuable assets that must be properly safeguarded.
Plans are implemented annually to assess capacities and competencies of IT processes to detect critical risks as they arise and take collective action in the moment, given that threats to cybersecurity are constantly evolving.
Information Security Policy
SM SAAM has a General Information Security Policy focused on defining measures that ensure the confidentiality, completeness, availability and performance of the technological assets of the company and its subsidiaries. This is supplemented by nine subordinate policies, which address specific issues within the framework of the IT operating model that have a binding impact on all controlled companies.
Some of these policies are related to the use and physical security of technology assets, information processing and network administration, information backups and recovery, use of internet and email, access control and supplier relations.
In the Comprehensive Risk Management Model, systems and information security has been identified as one of the company’s 20 strategic risks.
The person responsible for systems and information security at SM SAAM is the Corporate Chief Information Officer.
46
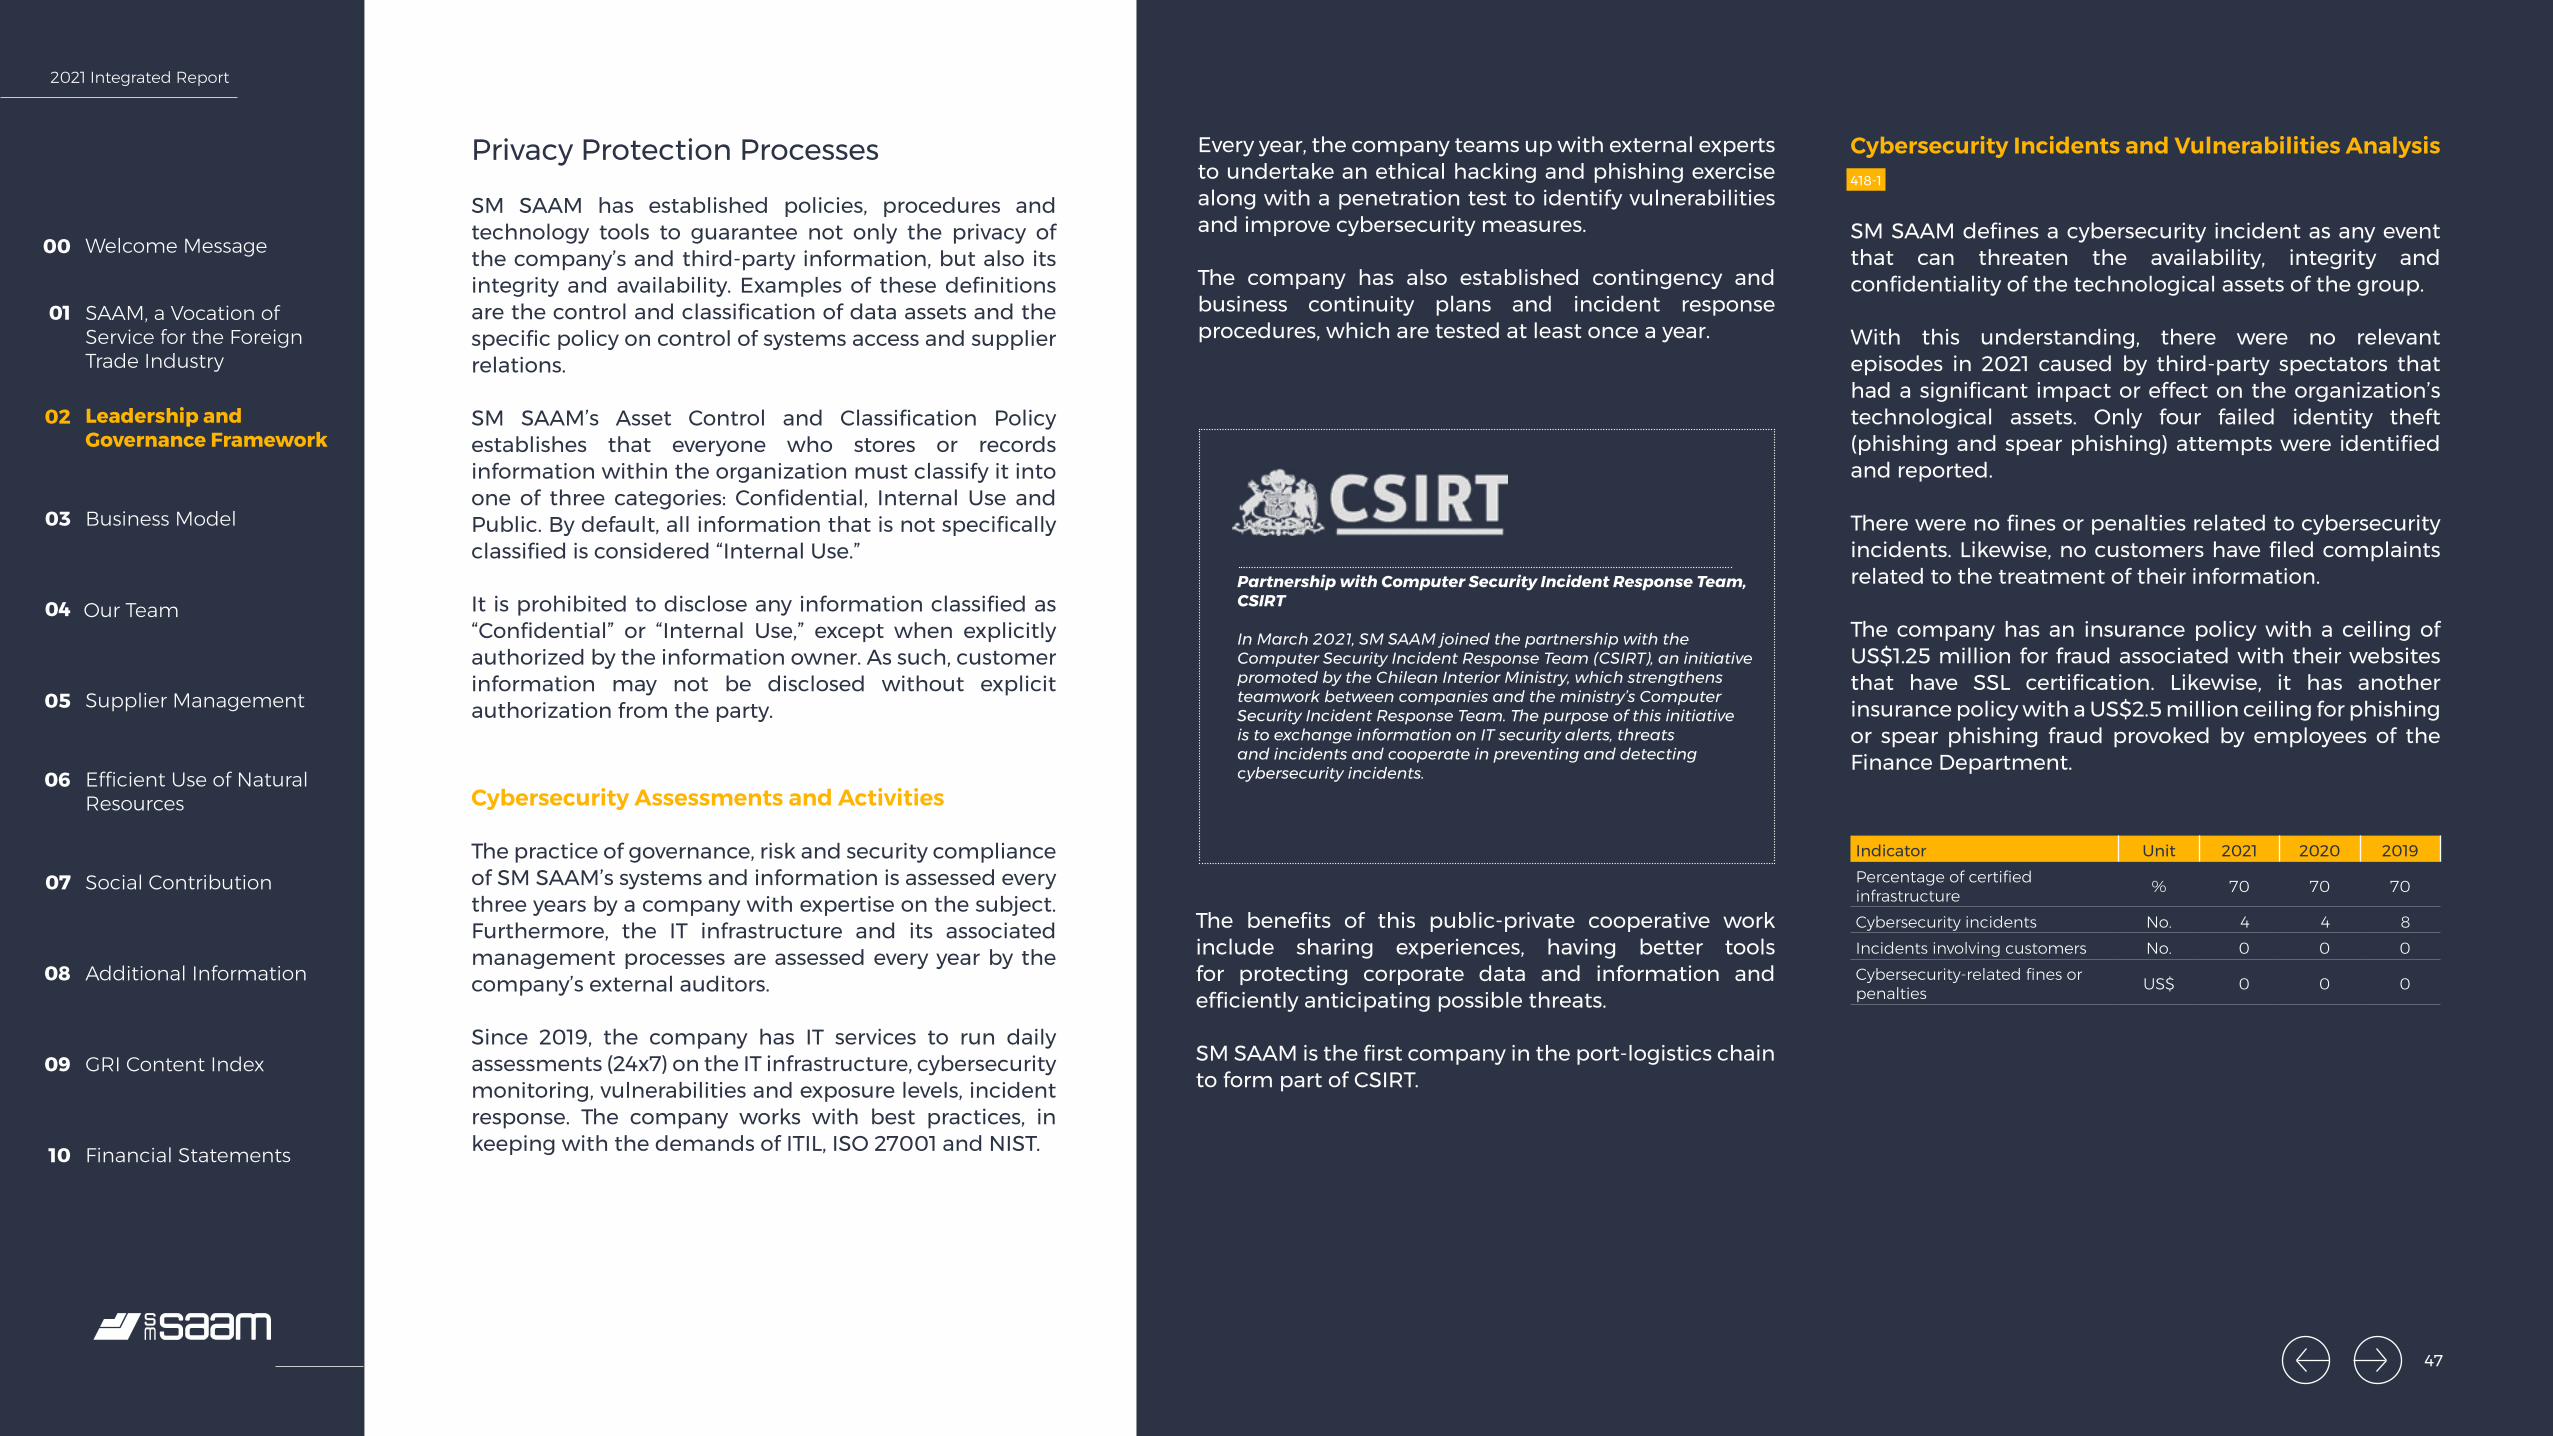
2021 Integrated Report
Welcome Message00
SAAM, a Vocation of Service for the Foreign Trade Industry
01
Leadership and Governance Framework
02
Business Model03
Our Team04
Supplier Management05
Efficient Use of Natural Resources
06
Social Contribution07
Additional Information08
GRI Content Index09
Financial Statements10
Privacy Protection Processes
SM SAAM has established policies, procedures and technology tools to guarantee not only the privacy of the company’s and third-party information, but also its integrity and availability. Examples of these definitions are the control and classification of data assets and the specific policy on control of systems access and supplier relations.
SM SAAM’s Asset Control and Classification Policy establishes that everyone who stores or records information within the organization must classify it into one of three categories: Confidential, Internal Use and Public. By default, all information that is not specifically classified is considered “Internal Use.”
It is prohibited to disclose any information classified as “Confidential” or “Internal Use,” except when explicitly authorized by the information owner. As such, customer information may not be disclosed without explicit authorization from the party.
Cybersecurity Assessments and Activities
The practice of governance, risk and security compliance of SM SAAM’s systems and information is assessed every three years by a company with expertise on the subject. Furthermore, the IT infrastructure and its associated management processes are assessed every year by the company’s external auditors.
Since 2019, the company has IT services to run daily assessments (24x7) on the IT infrastructure, cybersecurity monitoring, vulnerabilities and exposure levels, incident response. The company works with best practices, in keeping with the demands of ITIL, ISO 27001 and NIST.
Every year, the company teams up with external experts to undertake an ethical hacking and phishing exercise along with a penetration test to identify vulnerabilities and improve cybersecurity measures.
The company has also established contingency and business continuity plans and incident response procedures, which are tested at least once a year.
The benefits of this public-private cooperative work include sharing experiences, having better tools for protecting corporate data and information and efficiently anticipating possible threats.
SM SAAM is the first company in the port-logistics chain to form part of CSIRT.
Partnership with Computer Security Incident Response Team, CSIRT
In March 2021, SM SAAM joined the partnership with the Computer Security Incident Response Team (CSIRT), an initiative promoted by the Chilean Interior Ministry, which strengthens teamwork between companies and the ministry’s Computer Security Incident Response Team. The purpose of this initiative is to exchange information on IT security alerts, threats and incidents and cooperate in preventing and detecting cybersecurity incidents.
Cybersecurity Incidents and Vulnerabilities Analysis 418-1
SM SAAM defines a cybersecurity incident as any event that can threaten the availability, integrity and confidentiality of the technological assets of the group.
With this understanding, there were no relevant episodes in 2021 caused by third-party spectators that had a significant impact or effect on the organization’s technological assets. Only four failed identity theft (phishing and spear phishing) attempts were identified and reported.
There were no fines or penalties related to cybersecurity incidents. Likewise, no customers have filed complaints related to the treatment of their information.
The company has an insurance policy with a ceiling of US$1.25 million for fraud associated with their websites that have SSL certification. Likewise, it has another insurance policy with a US$2.5 million ceiling for phishing or spear phishing fraud provoked by employees of the Finance Department.
Indicator Unit 2021 2020 2019Percentage of certified infrastructure % 70 70 70
Cybersecurity incidents No. 4 4 8Incidents involving customers No. 0 0 0Cybersecurity-related fines or penalties US$ 0 0 0
47

2021 Integrated Report
Welcome Message00
SAAM, a Vocation of Service for the Foreign Trade Industry
01
Leadership and Governance Framework
02
Business Model03
Our Team04
Supplier Management05
Efficient Use of Natural Resources
06
Social Contribution07
Additional Information08
GRI Content Index09
Financial Statements10
Digital Transformation & Innovation
3.1.V
Scanning, analyzing, validating opportunities, planning, prioritizing, experimenting and evaluating results.
Seeking partnerships. Managing transformation projects.
SM SAAM promotes and facilitates innovation with Aurora, a corporate digital transformation and innovation strategy launched in 2021 to create differentiating capacities throughout the company by incorporating innovation and technological development in business decision making and operations management.
The aim is to boost efficiency in the organization, create new sources of income and increase adaptation to changes in the industry, which would lead to the creation of more value for employees and customers, while contributing to the sustainability of the businesses.
Under the Aurora framework, 59 digital transformation projects were evaluated in 2021 under the agile methodology. Of these, 26 were implemented or are in the implementation process, and cover areas such as customer service, operational efficiency and optimization of internal processes.
For carrying these out, a Digital Transformation and Innovation Committee was created, led by the Corporate Chief Information Officer with participation of the division and business area managers, as well as corporate managers from the Development and Human Resources departments.
The Digital Transformation Office is the operating branch of this program. It is joined by representatives of the IT and Communications Department and the digital leaders of the business areas, who have the important mission to be the entry points for transformation initiatives and to internally support change management and outreach.
Specifically, this team is in charge of:
48
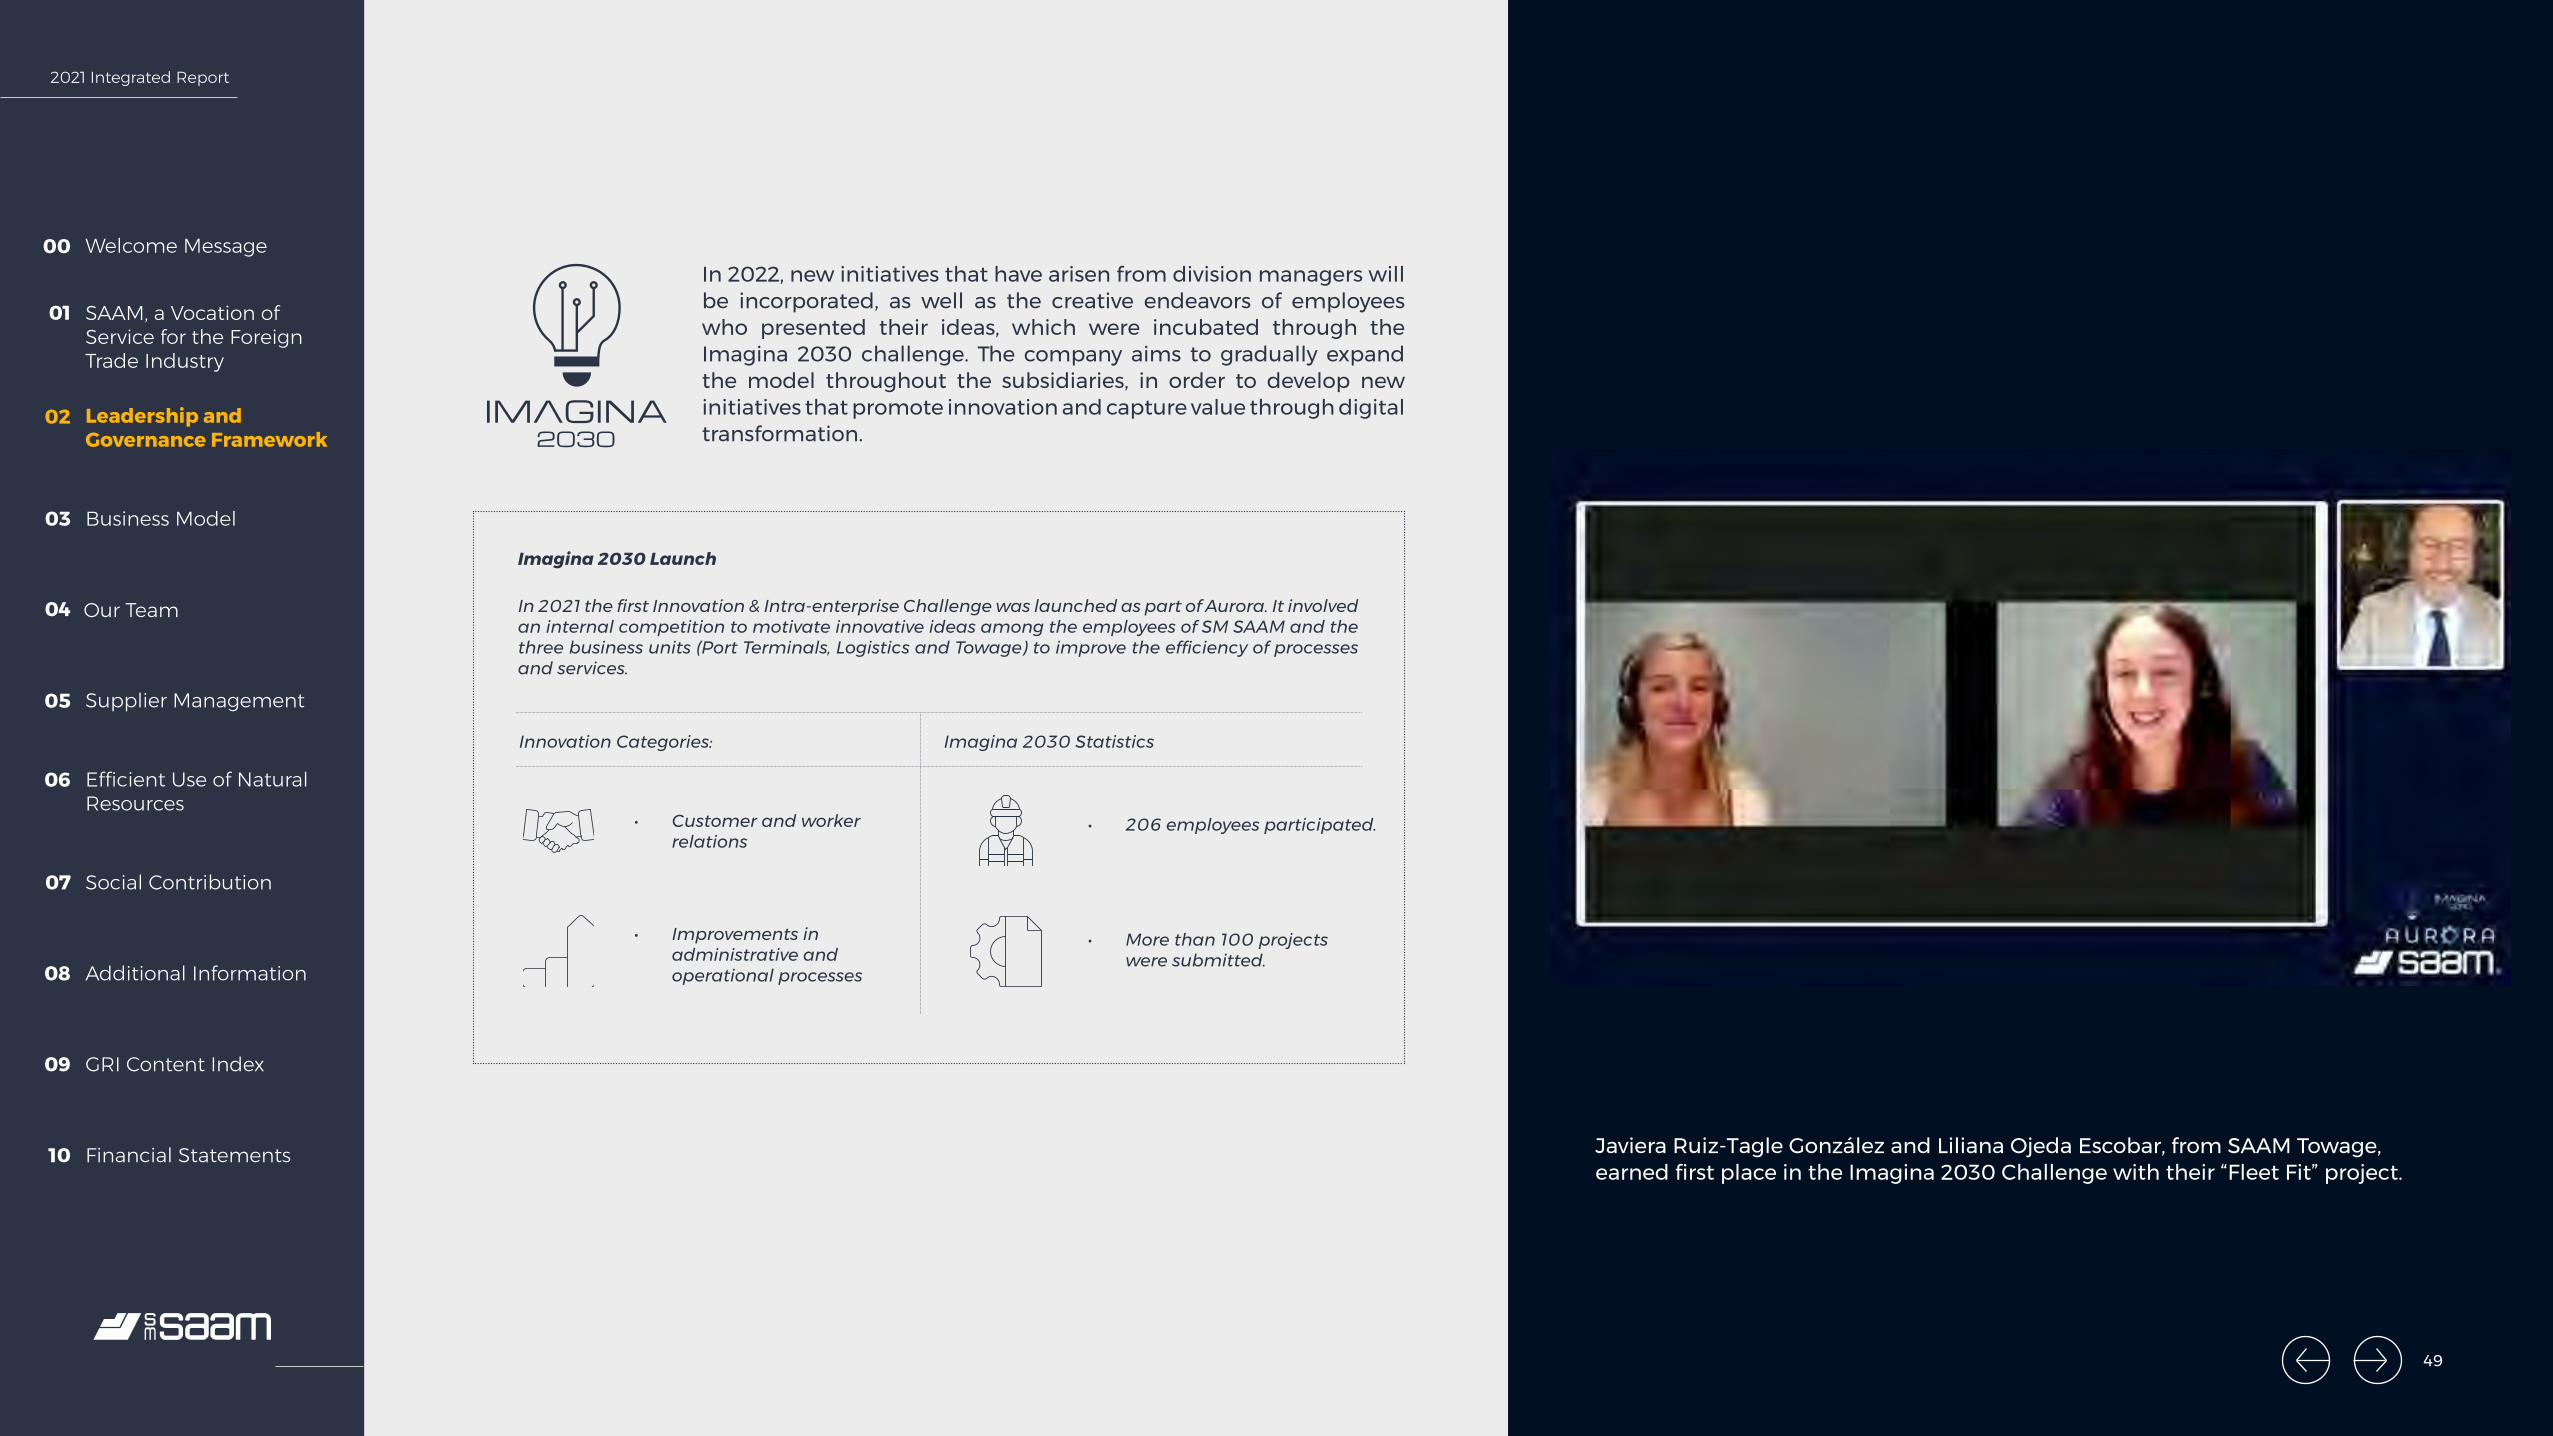
2021 Integrated Report
Welcome Message00
SAAM, a Vocation of Service for the Foreign Trade Industry
01
Leadership and Governance Framework
02
Business Model03
Our Team04
Supplier Management05
Efficient Use of Natural Resources
06
Social Contribution07
Additional Information08
GRI Content Index09
Financial Statements10
Imagina 2030 Launch
In 2021 the first Innovation & Intra-enterprise Challenge was launched as part of Aurora. It involved an internal competition to motivate innovative ideas among the employees of SM SAAM and the three business units (Port Terminals, Logistics and Towage) to improve the efficiency of processes and services.
In 2022, new initiatives that have arisen from division managers will be incorporated, as well as the creative endeavors of employees who presented their ideas, which were incubated through the Imagina 2030 challenge. The company aims to gradually expand the model throughout the subsidiaries, in order to develop new initiatives that promote innovation and capture value through digital transformation.
• Customer and worker relations
Innovation Categories: Imagina 2030 Statistics
• Improvements in administrative and operational processes
• 206 employees participated.
• More than 100 projects were submitted.
Javiera Ruiz-Tagle González and Liliana Ojeda Escobar, from SAAM Towage, earned first place in the Imagina 2030 Challenge with their “Fleet Fit” project.
49

2021 Integrated Report
Welcome Message00
SAAM, a Vocation of Service for the Foreign Trade Industry
01
Leadership and Governance Framework
02
Business Model03
Our Team04
Supplier Management05
Efficient Use of Natural Resources
06
Social Contribution07
Additional Information08
GRI Content Index09
Financial Statements10
50
03.Business Model
50
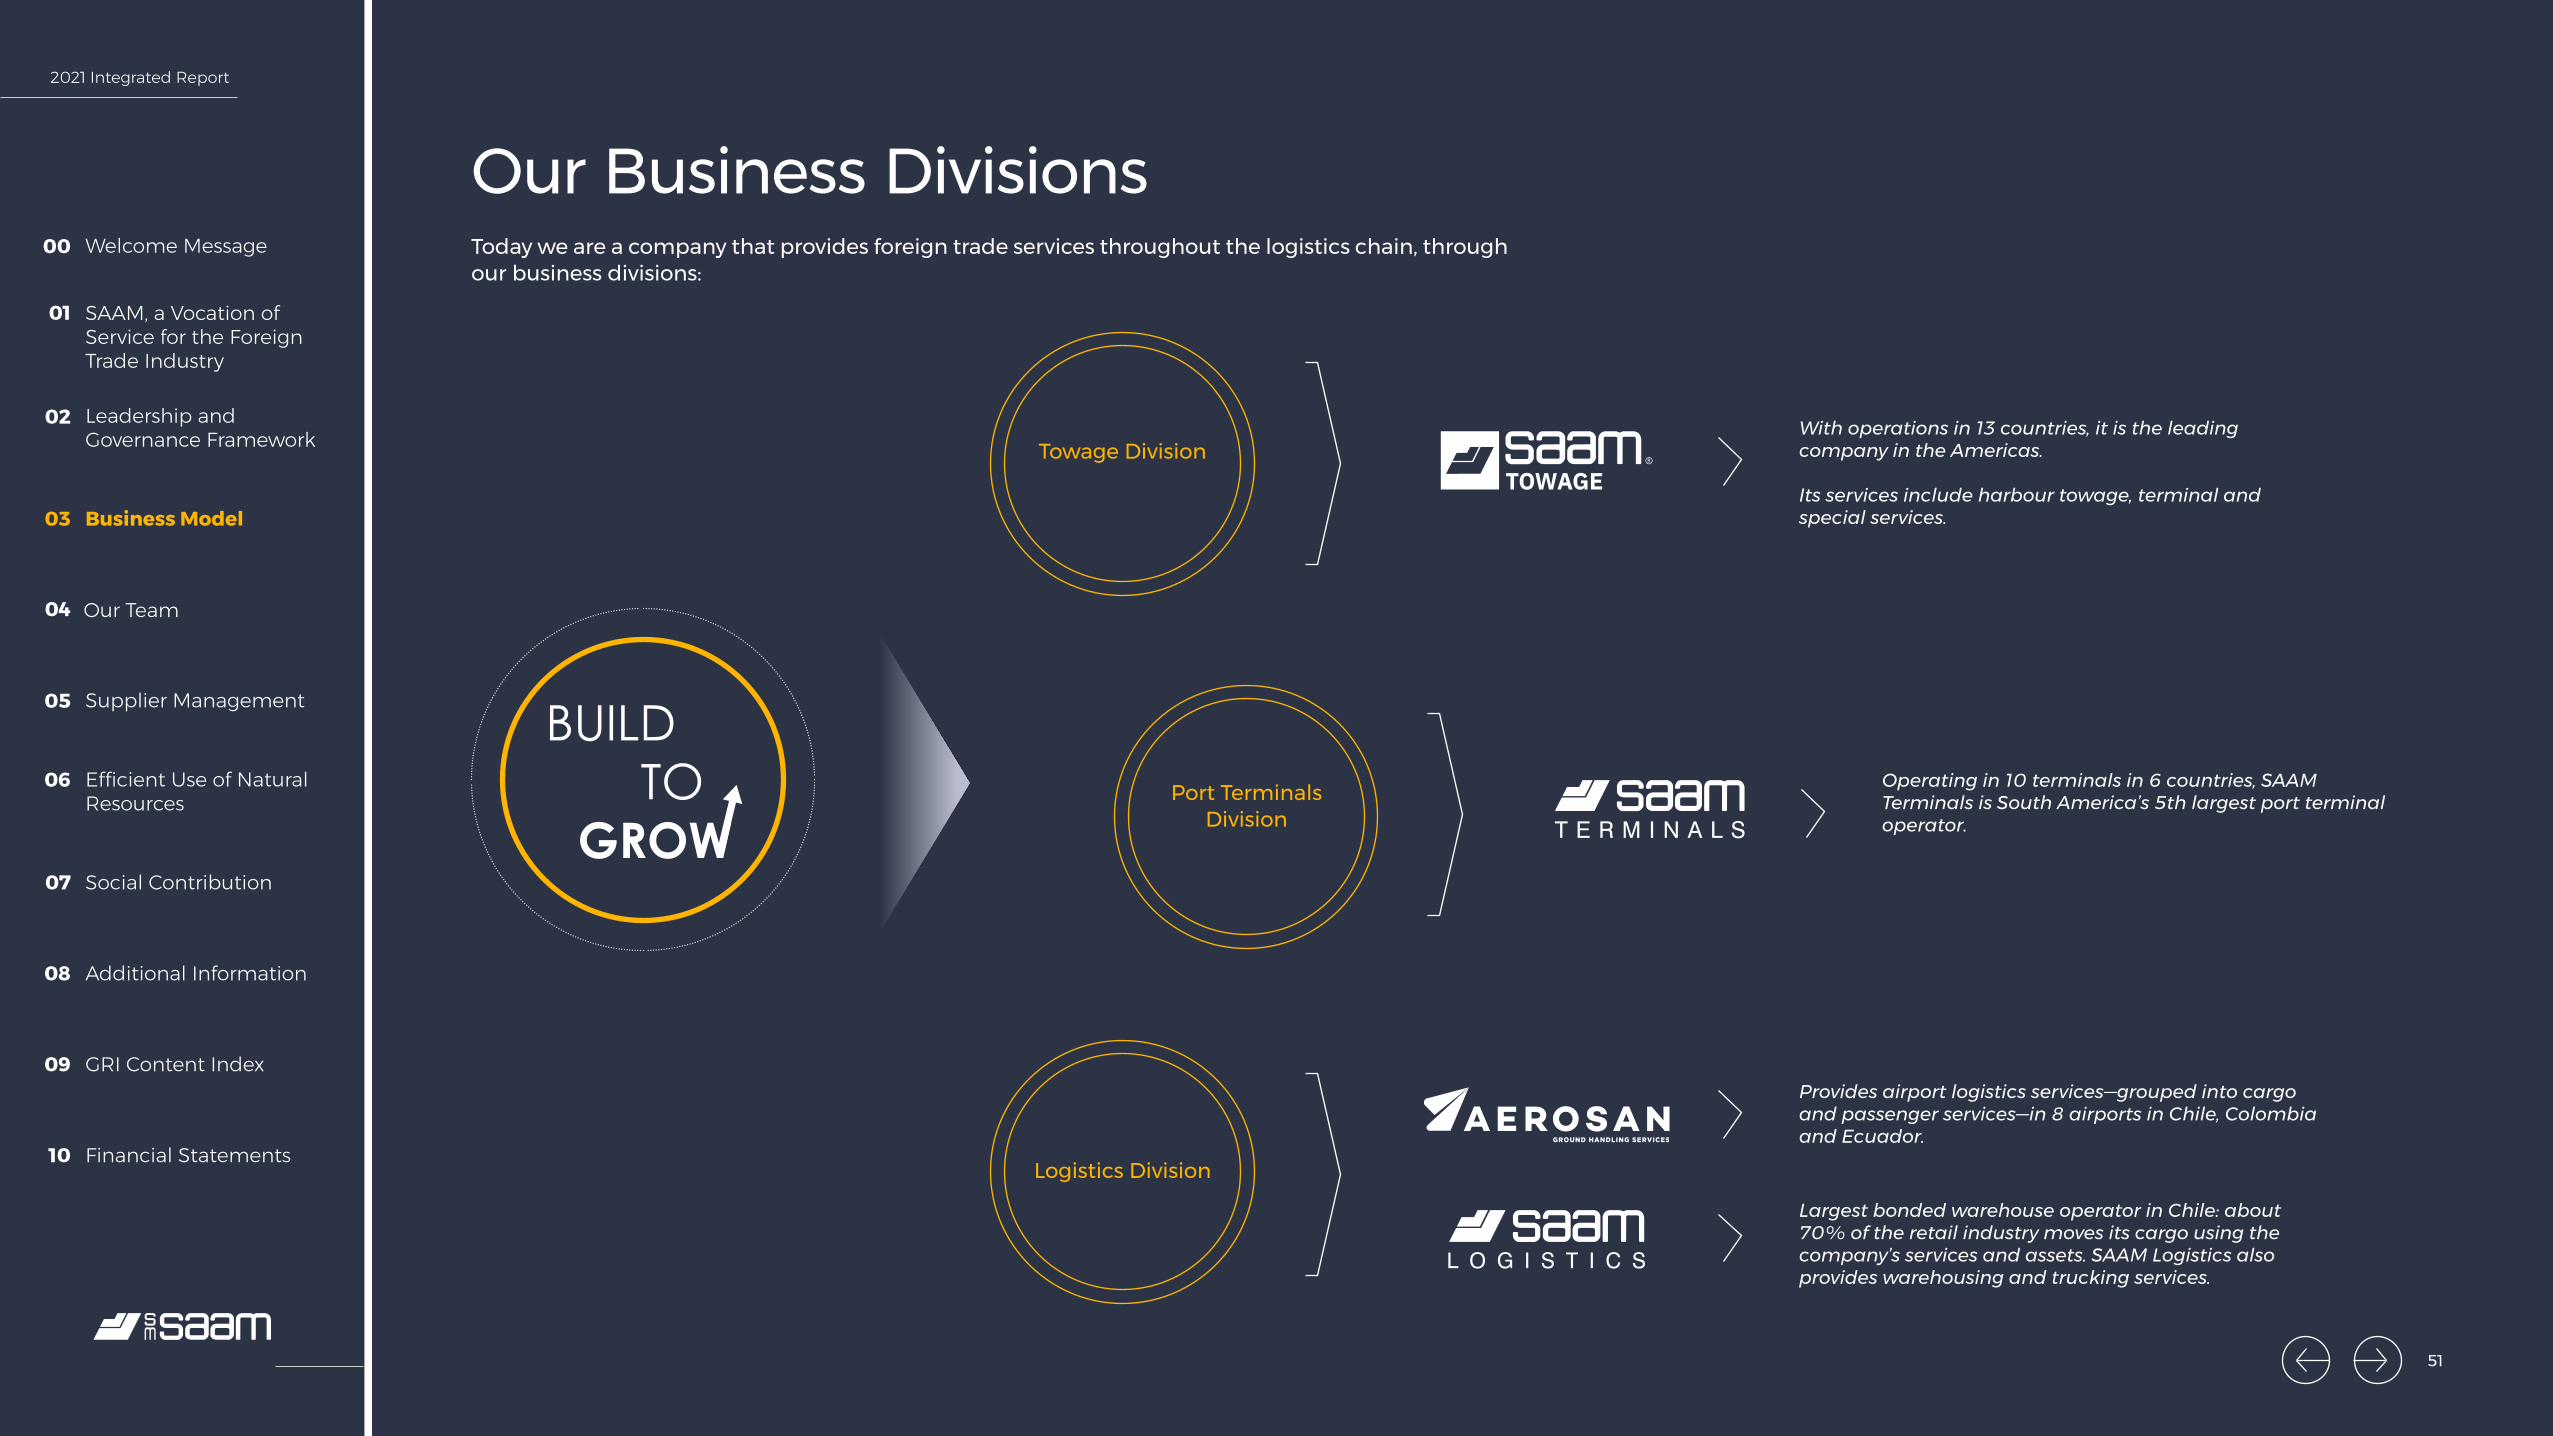
2021 Integrated Report
Welcome Message00
SAAM, a Vocation of Service for the Foreign Trade Industry
01
Leadership and Governance Framework
02
Business Model03
Our Team04
Supplier Management05
Efficient Use of Natural Resources
06
Social Contribution07
Additional Information08
GRI Content Index09
Financial Statements10
Our Business DivisionsToday we are a company that provides foreign trade services throughout the logistics chain, through our business divisions:
Towage Division
Logistics Division
Port Terminals Division
With operations in 13 countries, it is the leading company in the Americas.
Its services include harbour towage, terminal and special services.
Operating in 10 terminals in 6 countries, SAAM Terminals is South America’s 5th largest port terminal operator.
Provides airport logistics services—grouped into cargo and passenger services—in 8 airports in Chile, Colombia and Ecuador.
Largest bonded warehouse operator in Chile: about 70% of the retail industry moves its cargo using the company’s services and assets. SAAM Logistics also provides warehousing and trucking services.
51
2021 Integrated Report
Welcome Message00
SAAM, a Vocation of Service for the Foreign Trade Industry
01
Leadership and Governance Framework
02
Business Model03
Our Team04
Supplier Management05
Efficient Use of Natural Resources
06
Social Contribution07
Additional Information08
GRI Content Index09
Financial Statements10
Response to COVID-19In the second year of the pandemic, with all the challenges imposed on foreign trade by the effects of COVID-19, caring for our employees continued to be the priority for the organization. SM SAAM continued to strengthen health and safety measures and protocols to protect the wellbeing of individuals and ensure continuity of operations, closing out 2021 with a positive balance.
The effects of the pandemic have brought about a scenario with high demand due to the restocking process, which puts pressure on the entire logistics chain. Teams from each division addressed this to offer the best customer service.
Commitment to People• Strengthening health and safety protocols.
• Communication and self-care campaigns for workers and their families.
• Trainings related to COVID-19. In the second year of the pandemic, strict health protocols were maintained and work continued with unions and workers to prioritize safeguarding the health of employees and continuity in the logistics chain.
• Protective measures and special shifts were coordinated to continue to work during the pandemic.
• The port terminals, as well as Aerosan and SAAM Logistics in Chile, earned the COVID-19 seal from the Chilean Safety Association (ACHS), which confirms compliance with all the health requirements requested by the Health Ministry (Minsal) and the Superintendency of Social Security (Suseso), and with the infection prevention standards measured by this entity.
Operational Continuity
• Efforts to simplify the corporate structure and centralize management in recent years enabled us to respond quickly to the crisis, demonstrating the flexibility and resilience of SM SAAM’s operations.
Support for the Vaccination Process
• On a worker level, in coordination with the local health centers, the companies in the group facilitated the vaccination process.
• Aerosan assumed the challenge of managing the COVID-19 vaccination process in the three countries where it operates. Operations centered around unloading these products from the airplanes in various airports and moving them through customs processes in as little time as possible to ensure the maintenance of safeguards required for these vaccines.
52
2021 Integrated Report
Welcome Message00
SAAM, a Vocation of Service for the Foreign Trade Industry
01
Leadership and Governance Framework
02
Business Model03
Our Team04
Supplier Management05
Efficient Use of Natural Resources
06
Social Contribution07
Additional Information08
GRI Content Index09
Financial Statements10
Towage Division
53

2021 Integrated Report
Welcome Message00
SAAM, a Vocation of Service for the Foreign Trade Industry
01
Leadership and Governance Framework
02
Business Model03
Our Team04
Supplier Management05
Efficient Use of Natural Resources
06
Social Contribution07
Additional Information08
GRI Content Index09
Financial Statements10
Canada
HondurasColombia
Costa Rica
UruguayChile
Mexico
Brazil
Guatemala
Ecuador
Peru
PanamaEl Salvador
179 tugs
13 countries
82 ports
1967 employees
TowageDivision
Key Figures
With operations in 13 countries and 82 ports, the Towage Division, under the brand name SAAM Towage, is the largest operator of towage services in the Americas, backed by 60 years of experience in the industry. With a fleet of 179 tugs, it provides harbour towage services, maritime support for offshore terminals, barge and salvage assistance and special services.
SAAM Towage has assisted with the diverse needs of maritime operations under this brand since 2019, offering reliability, operational excellence, and well-trained ground staff and crew that are highly committed to safety.
54
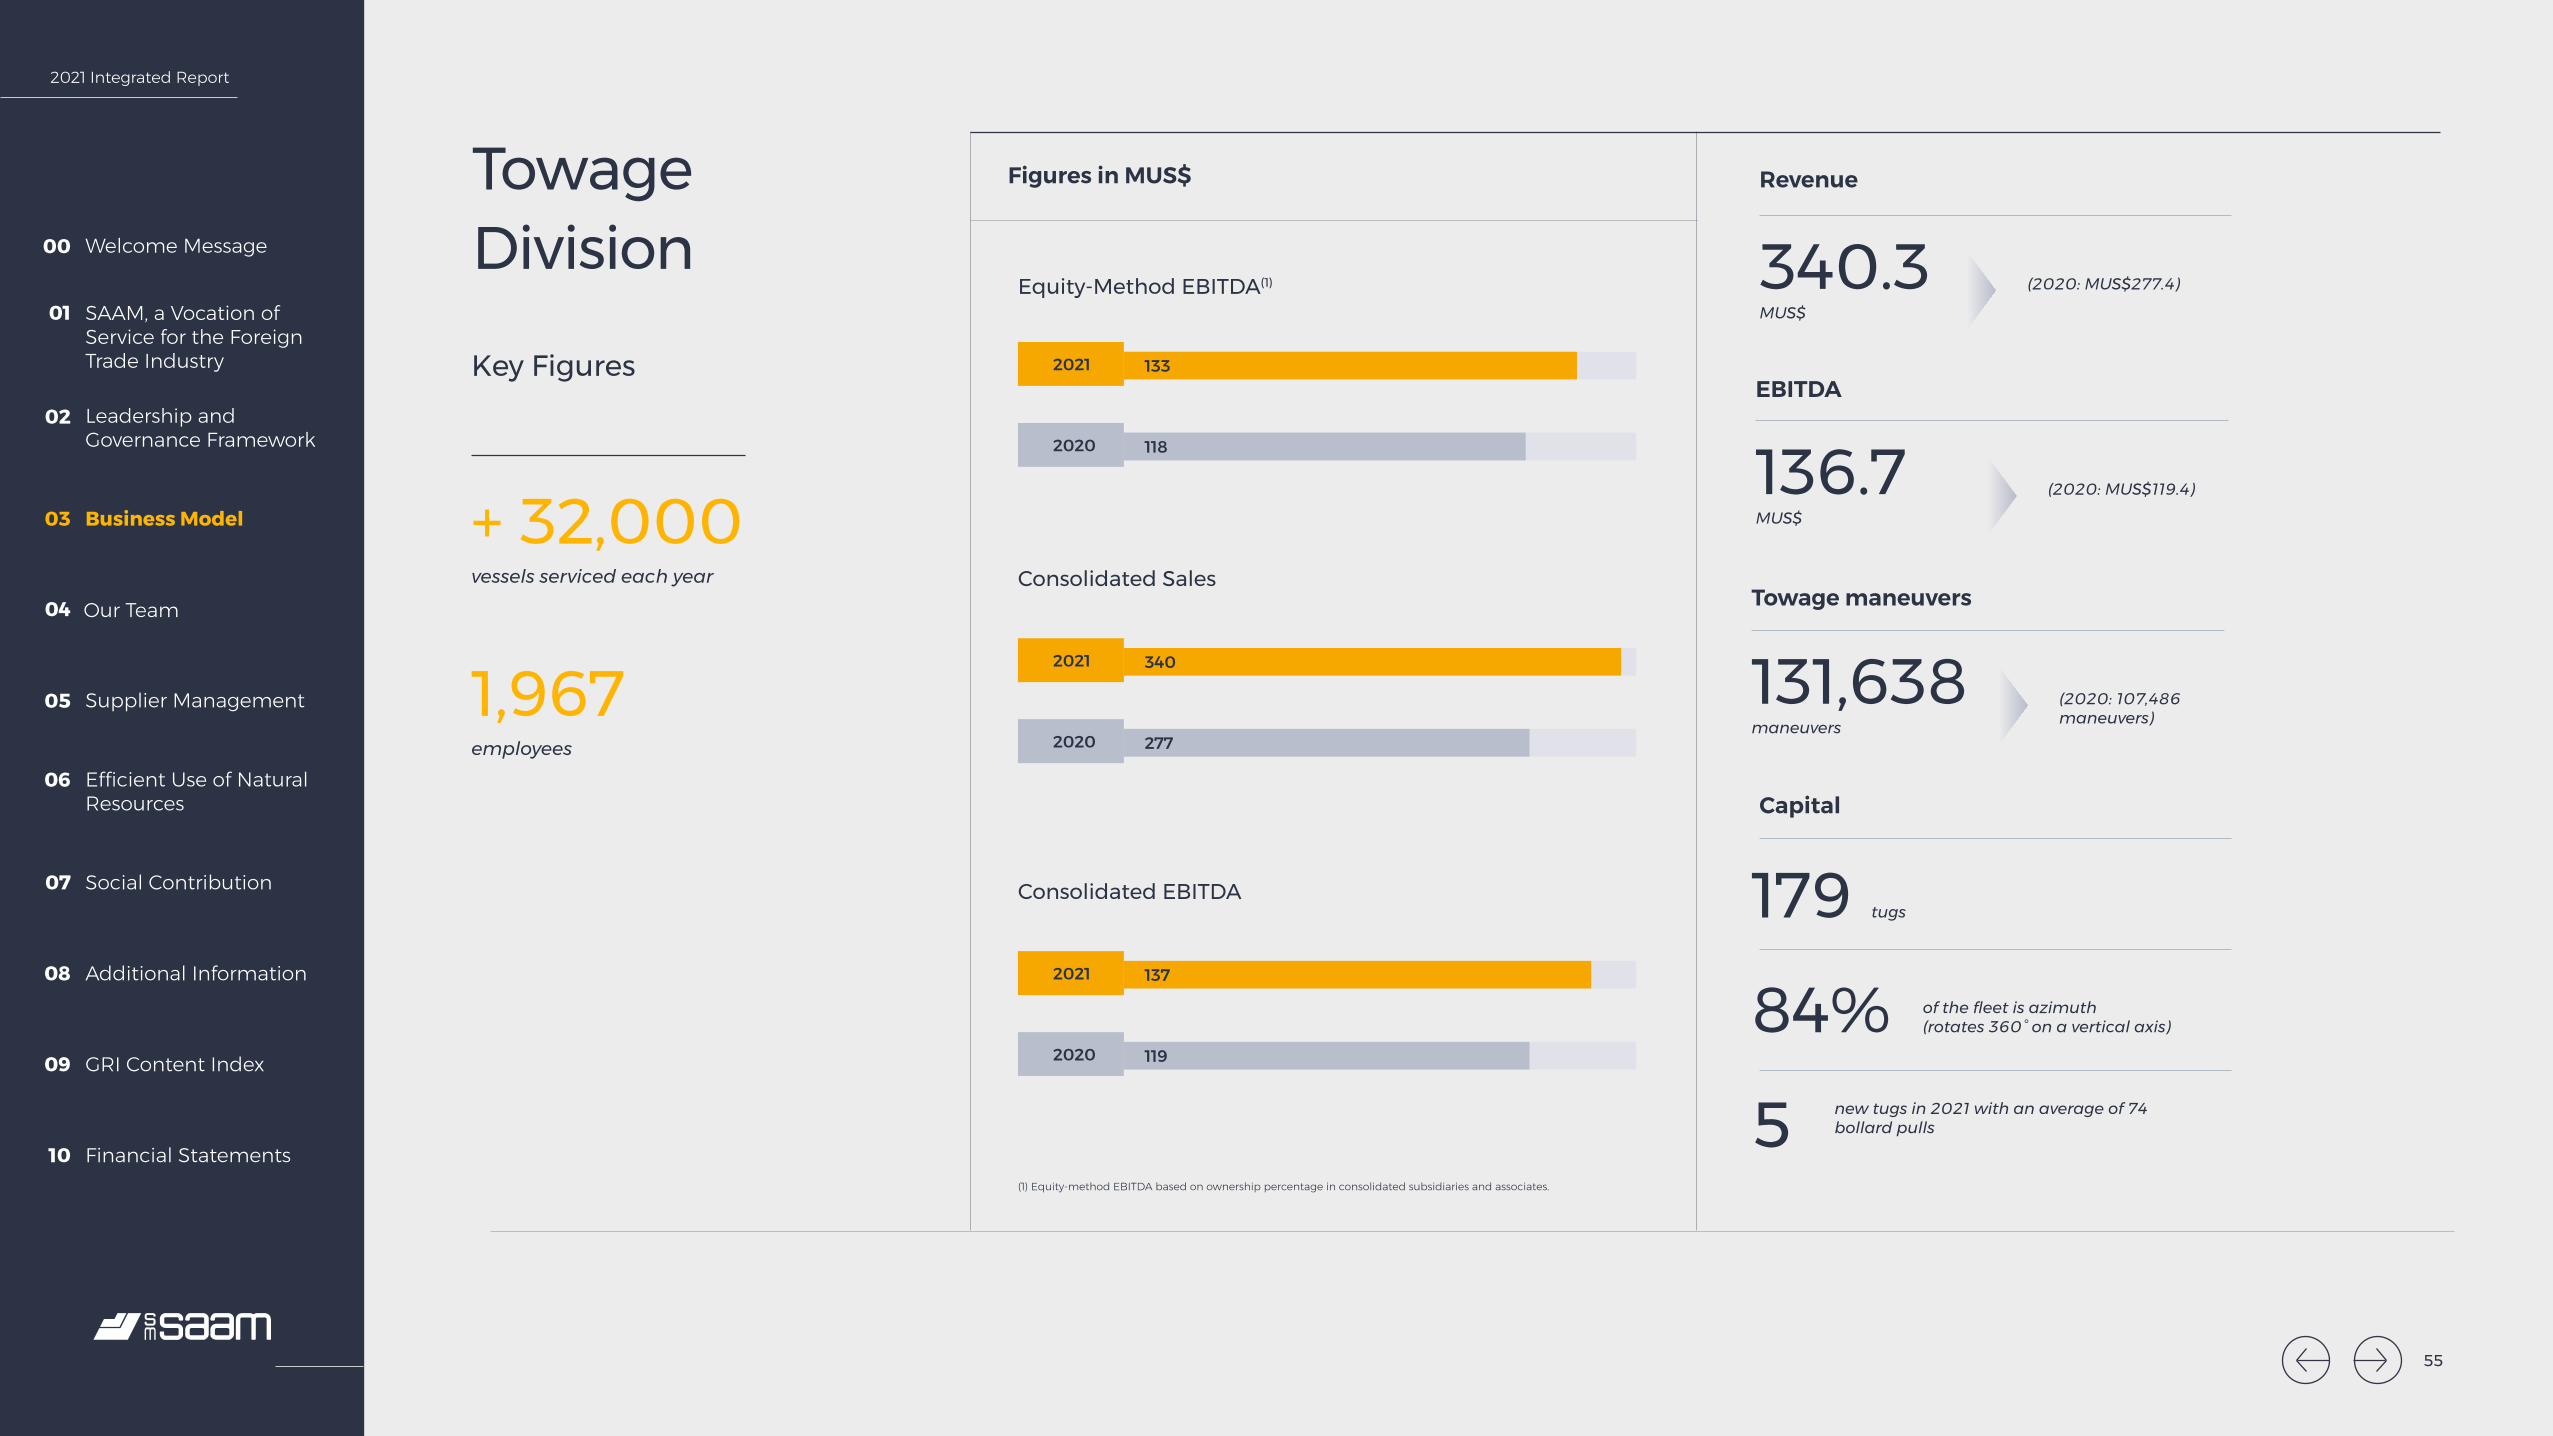
2021 Integrated Report
Welcome Message00
SAAM, a Vocation of Service for the Foreign Trade Industry
01
Leadership and Governance Framework
02
Business Model03
Our Team04
Supplier Management05
Efficient Use of Natural Resources
06
Social Contribution07
Additional Information08
GRI Content Index09
Financial Statements10
TowageDivision
Key Figures
Figures in MUS$ Revenue
EBITDA
Towage maneuvers
MUS$
MUS$
maneuvers
340.3
136.7
131,638
(2020: MUS$277.4)
(2020: MUS$119.4)
(2020: 107,486 maneuvers)
vessels serviced each year
employees
+ 32,000
1,967Capital
84%
179
5
of the fleet is azimuth(rotates 360° on a vertical axis)
tugs
new tugs in 2021 with an average of 74 bollard pulls
Equity-Method EBITDA(1)
Consolidated Sales
Consolidated EBITDA
1332021
1182020
3402021
2772020
1372021
1192020
(1) Equity-method EBITDA based on ownership percentage in consolidated subsidiaries and associates.
55

2021 Integrated Report
Welcome Message00
SAAM, a Vocation of Service for the Foreign Trade Industry
01
Leadership and Governance Framework
02
Business Model03
Our Team04
Supplier Management05
Efficient Use of Natural Resources
06
Social Contribution07
Additional Information08
GRI Content Index09
Financial Statements10
Services
Harbour Towage
• Boat berthing services for a wide range of vessels and cargo
• Standby services
• Vessel assistance and escort services for oil tankers
• Fire extinguishing and hydrocarbon pollution control.
Maritime Services for Onshore and Offshore Terminals
• Berthing and deberthing of tankers (Oil&Gas)• Assistance with ship-to-ship (STS) operations• Assistance with single point mooring (SPM) operations• Maritime services for onshore and offshore terminals• Direct and indirect escort• Positioning and anchoring of oil and gas platforms
Special Services
• Ocean towage
• Barge and salvage assistance
• Marine support for infrastructure works
• Emergency response, rescue and salvage
• Positioning and anchoring
C2.3. 6.1.I
tugs in the Southern Cone
tugs in the Caribbean
35
50 Special Services HubThe demand for special services has been an integral part of the industry. In 2021, SAAM Towage unveiled its Special Services Hub with a large regional fleet to support the needs of the shipping industry.
This unit offers a range of 50 tugs in the Caribbean and 35 tugs in the Southern Cone (from Chile to Ecuador), which reduces the transportation time and costs
and minimizes the operating risk inherent to special operations.
It plays a unique role in the Caribbean region, Chile, Peru and Ecuador in the special operations, salvage, rescue and emergency response markets and is available at all times.
56
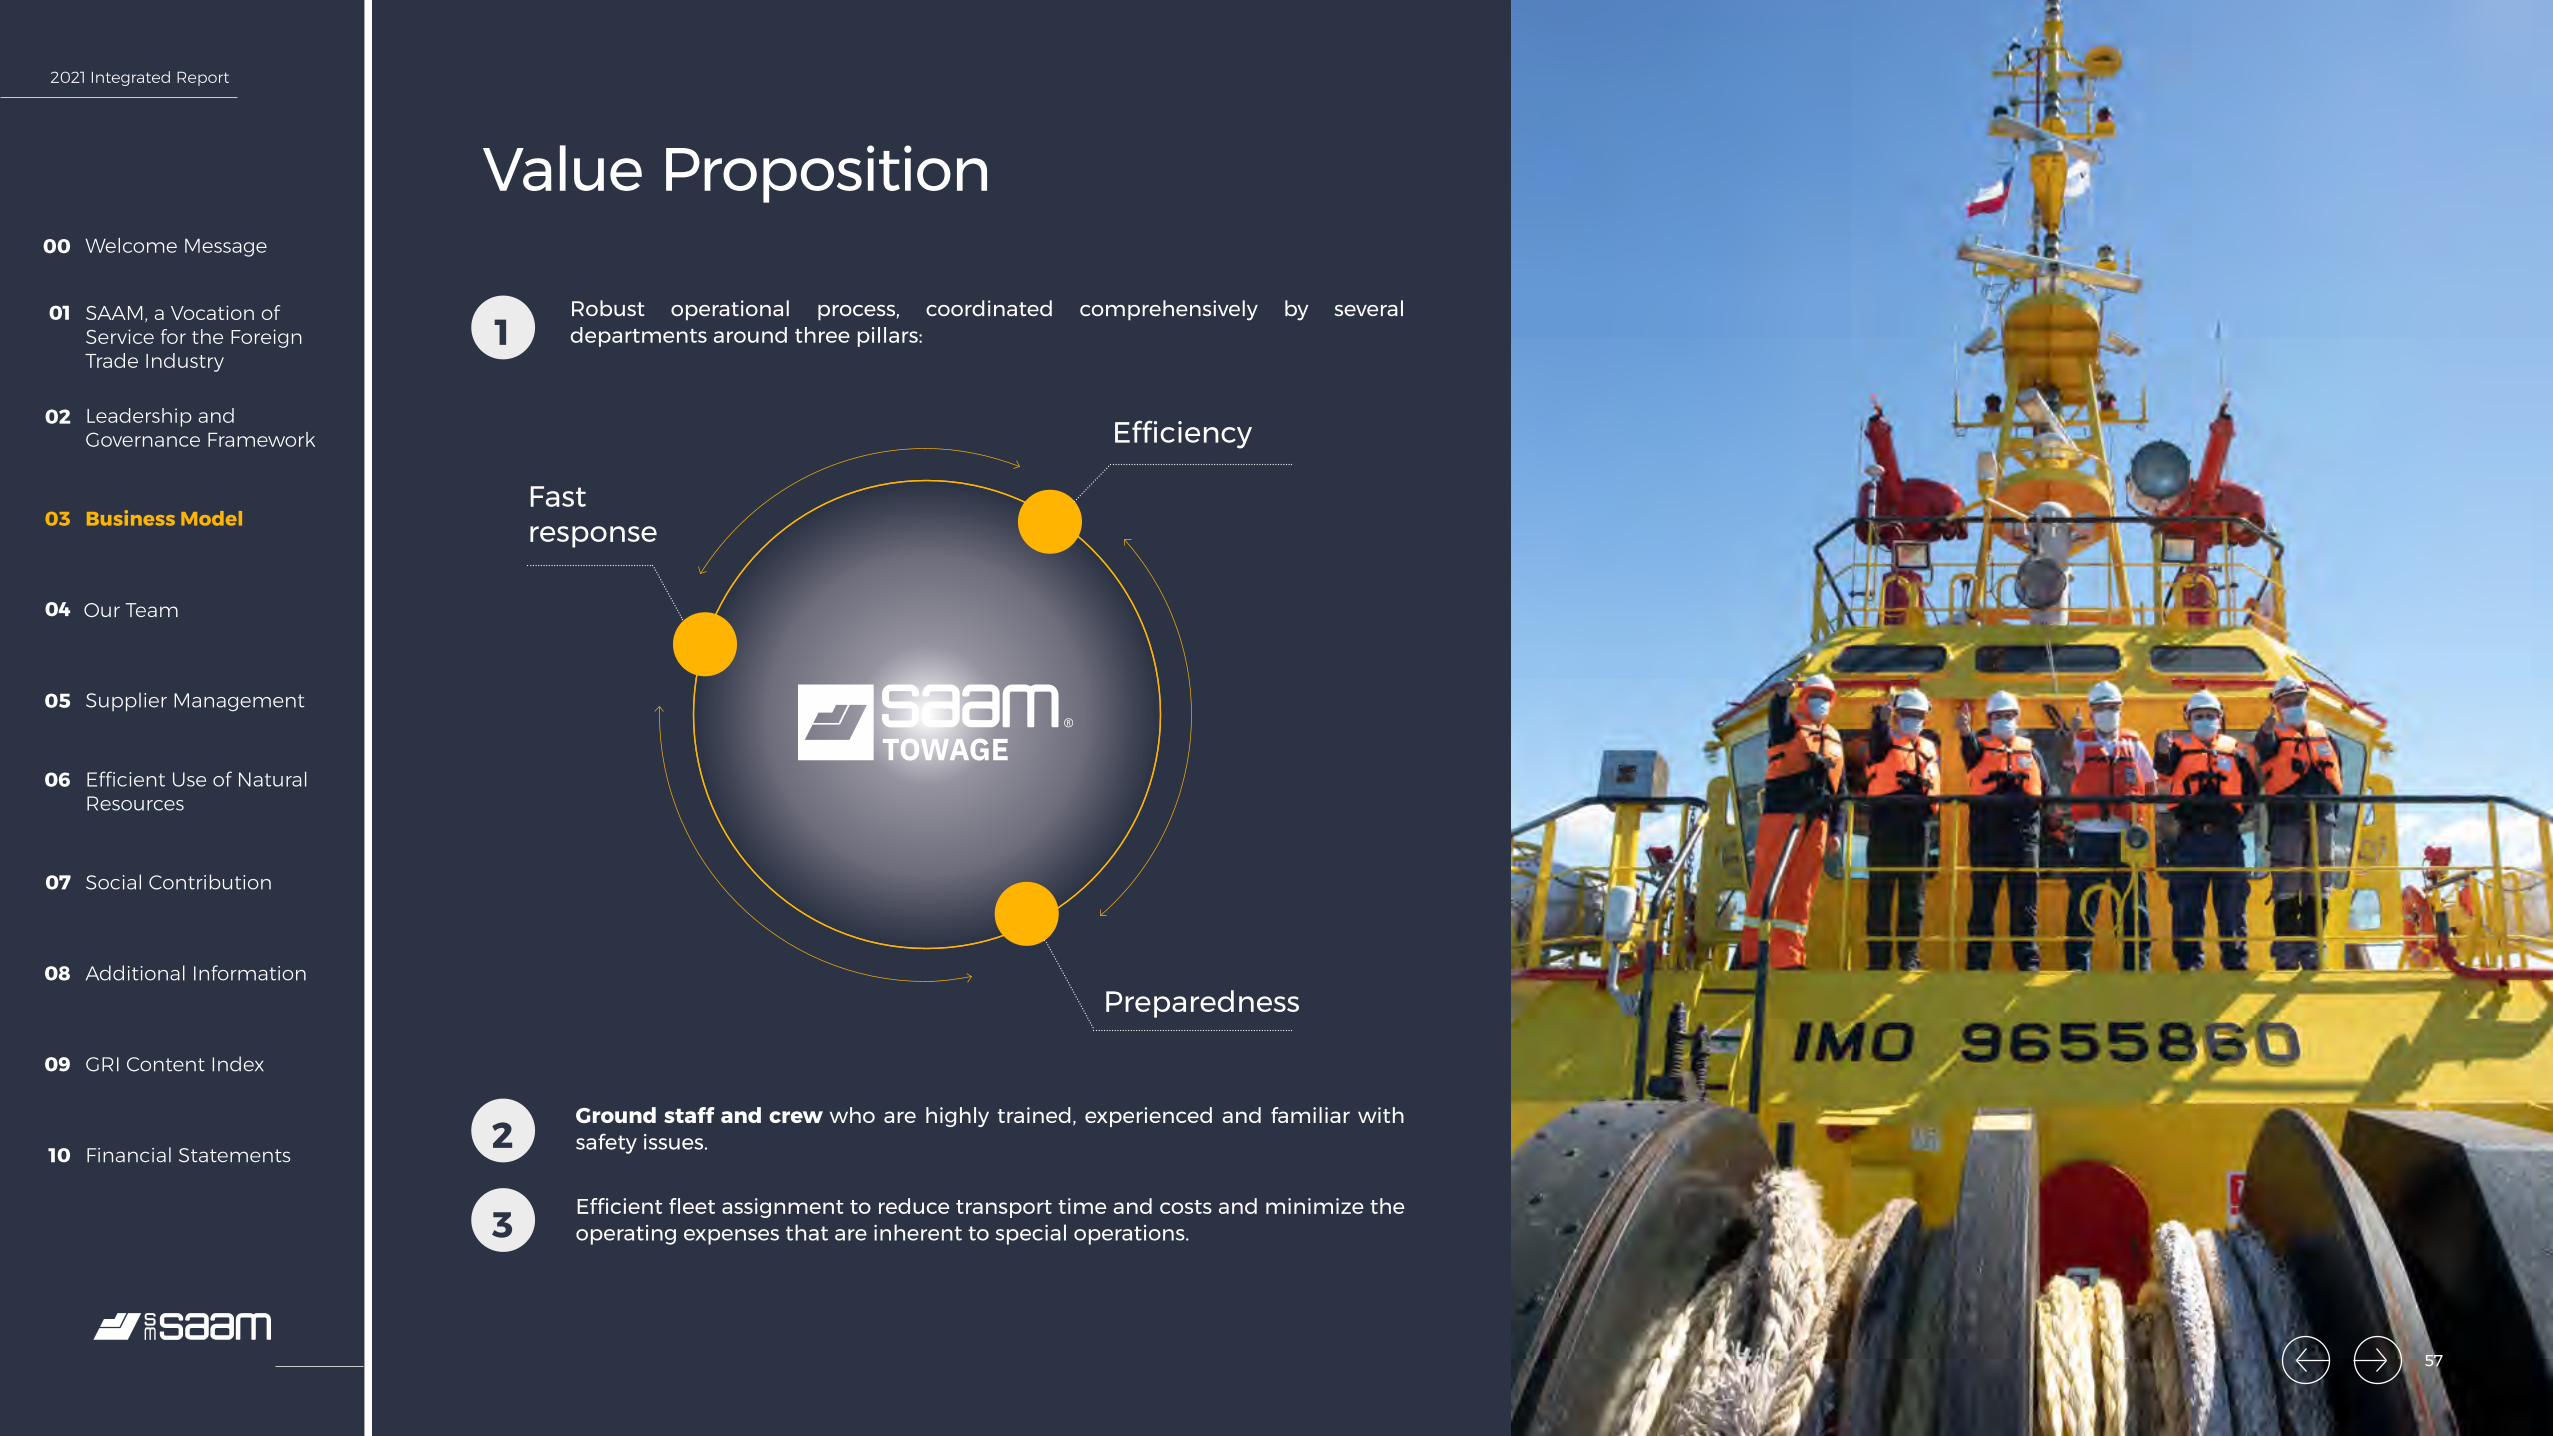
2021 Integrated Report
Welcome Message00
SAAM, a Vocation of Service for the Foreign Trade Industry
01
Leadership and Governance Framework
02
Business Model03
Our Team04
Supplier Management05
Efficient Use of Natural Resources
06
Social Contribution07
Additional Information08
GRI Content Index09
Financial Statements10
Value Proposition
Robust operational process, coordinated comprehensively by several departments around three pillars:
Efficiency
Fast response
Preparedness
Ground staff and crew who are highly trained, experienced and familiar with safety issues.
Efficient fleet assignment to reduce transport time and costs and minimize the operating expenses that are inherent to special operations.
1
2
3
57
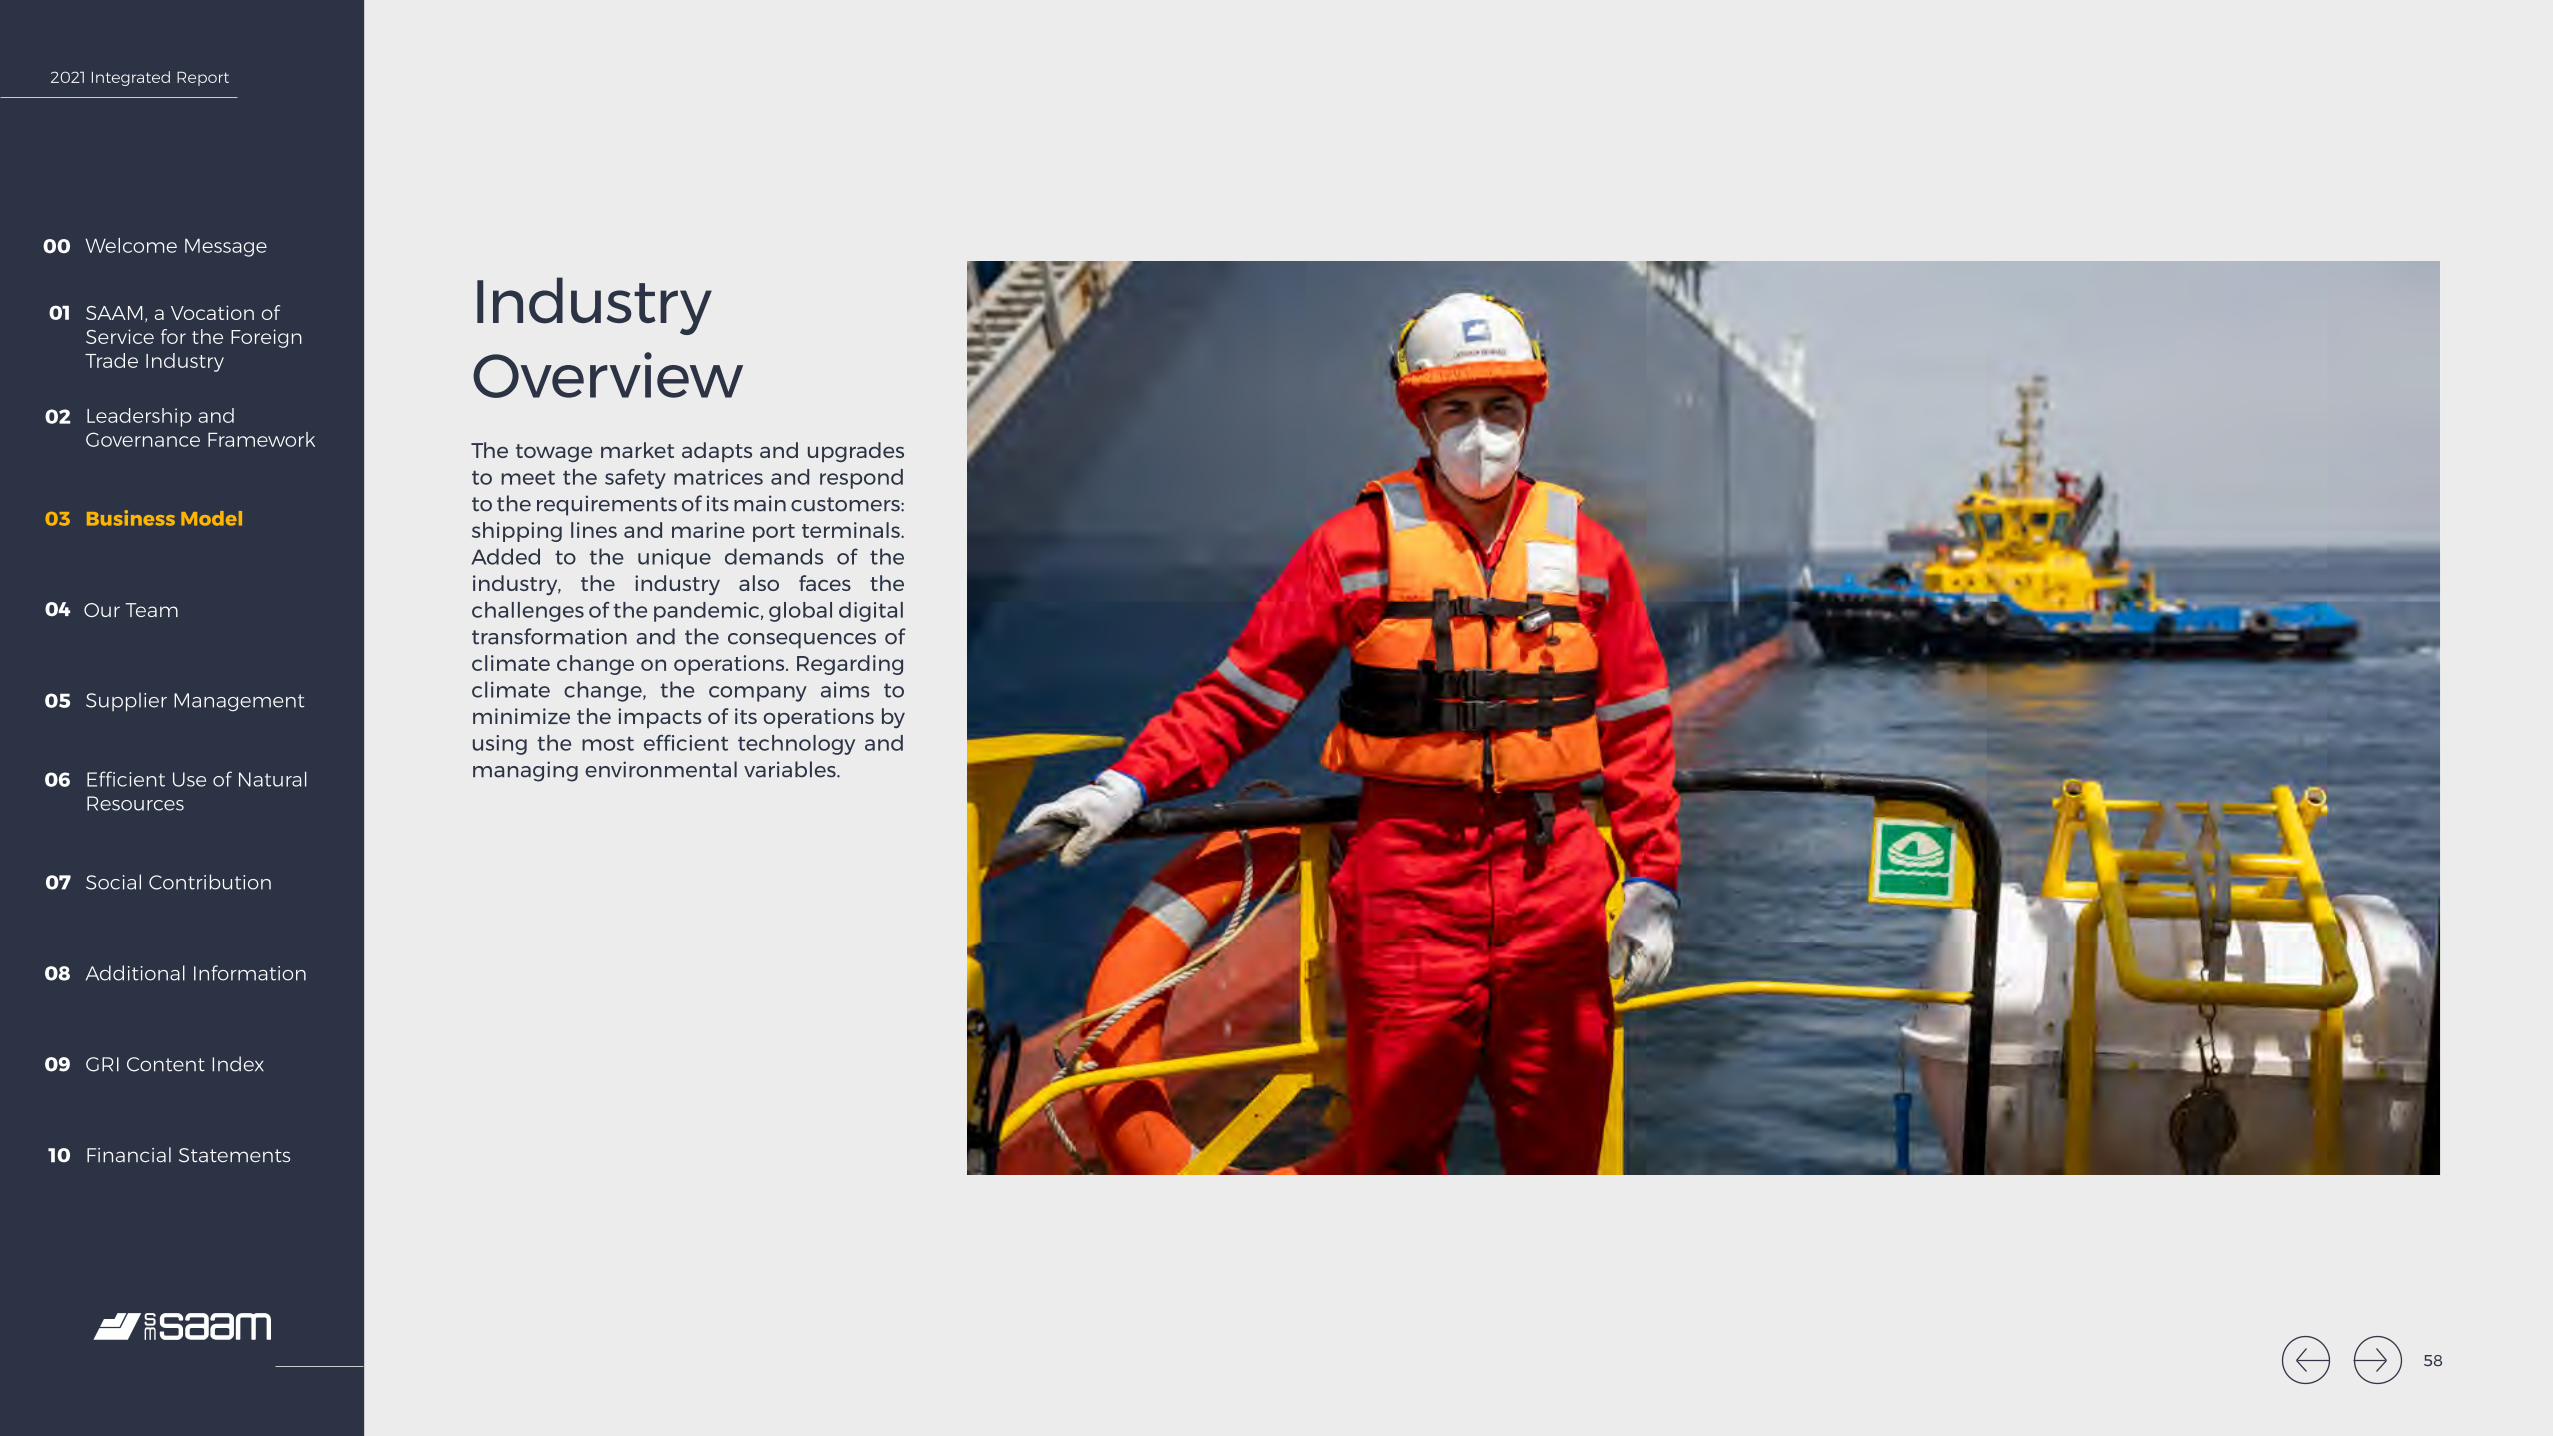
2021 Integrated Report
Welcome Message00
SAAM, a Vocation of Service for the Foreign Trade Industry
01
Leadership and Governance Framework
02
Business Model03
Our Team04
Supplier Management05
Efficient Use of Natural Resources
06
Social Contribution07
Additional Information08
GRI Content Index09
Financial Statements10
Industry OverviewThe towage market adapts and upgrades to meet the safety matrices and respond to the requirements of its main customers: shipping lines and marine port terminals. Added to the unique demands of the industry, the industry also faces the challenges of the pandemic, global digital transformation and the consequences of climate change on operations. Regarding climate change, the company aims to minimize the impacts of its operations by using the most efficient technology and managing environmental variables.
58
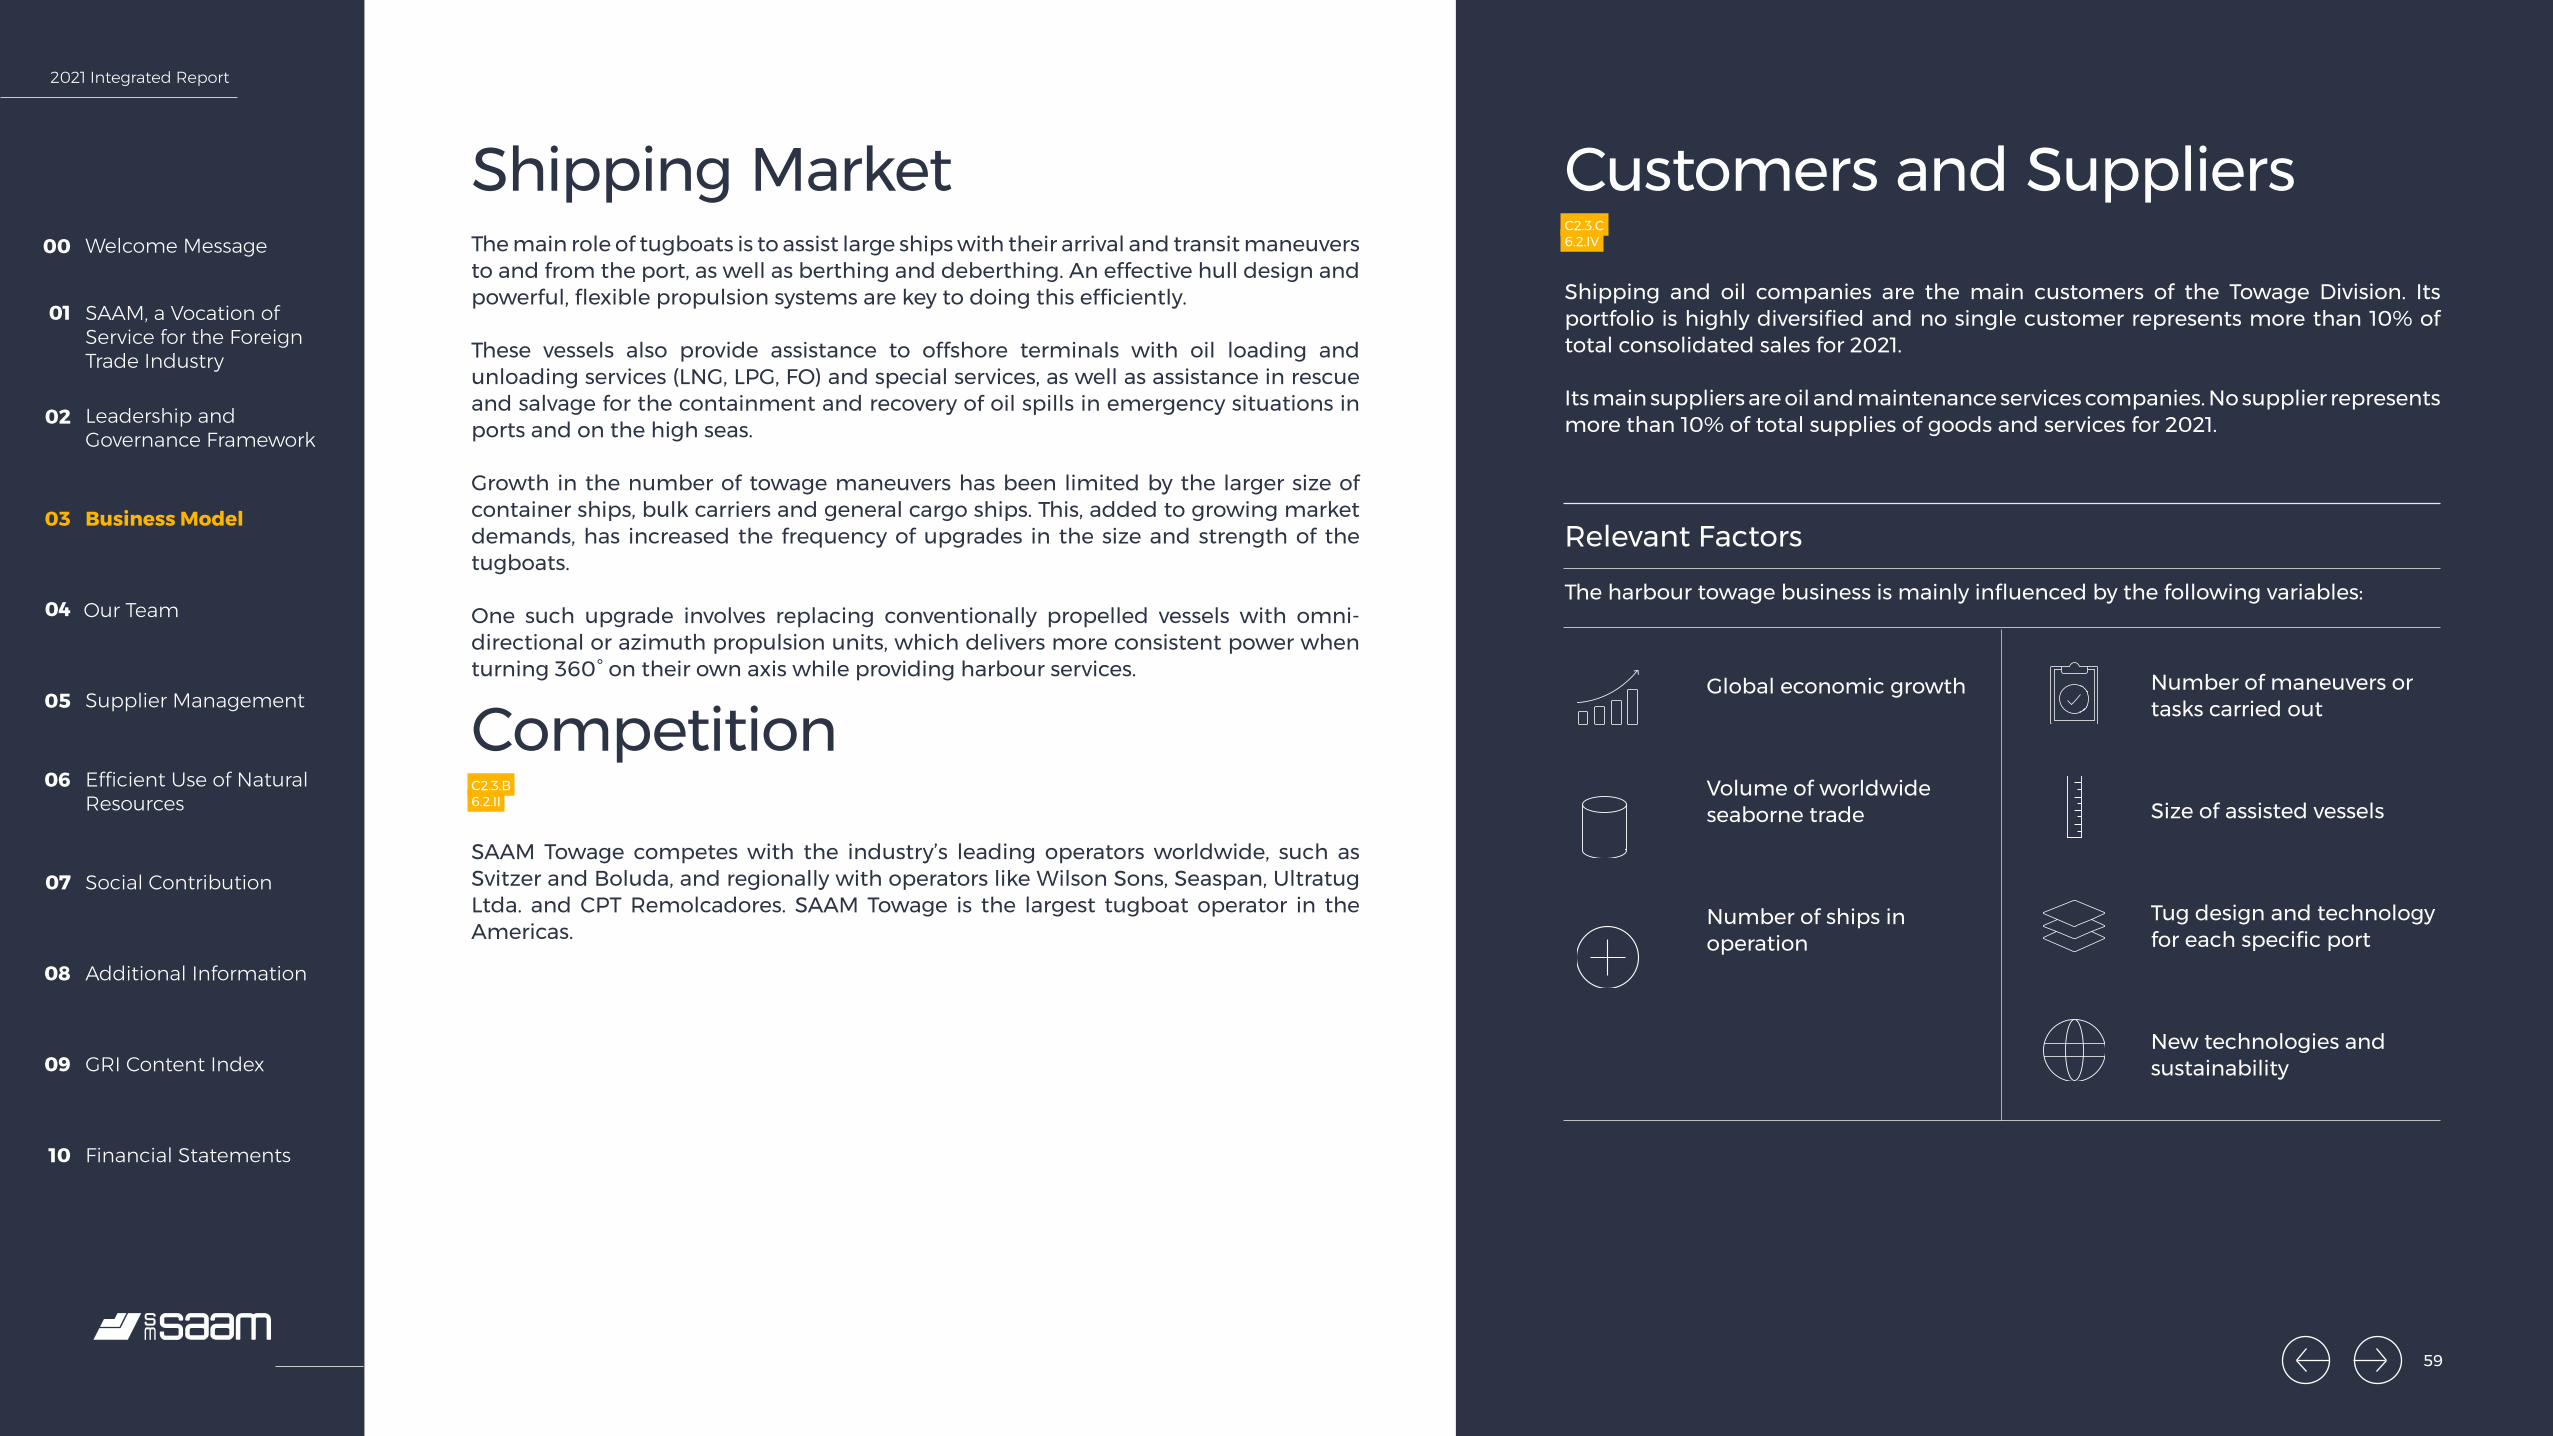
2021 Integrated Report
Welcome Message00
SAAM, a Vocation of Service for the Foreign Trade Industry
01
Leadership and Governance Framework
02
Business Model03
Our Team04
Supplier Management05
Efficient Use of Natural Resources
06
Social Contribution07
Additional Information08
GRI Content Index09
Financial Statements10
Shipping Market The main role of tugboats is to assist large ships with their arrival and transit maneuvers to and from the port, as well as berthing and deberthing. An effective hull design and powerful, flexible propulsion systems are key to doing this efficiently.
These vessels also provide assistance to offshore terminals with oil loading and unloading services (LNG, LPG, FO) and special services, as well as assistance in rescue and salvage for the containment and recovery of oil spills in emergency situations in ports and on the high seas.
Growth in the number of towage maneuvers has been limited by the larger size of container ships, bulk carriers and general cargo ships. This, added to growing market demands, has increased the frequency of upgrades in the size and strength of the tugboats.
One such upgrade involves replacing conventionally propelled vessels with omni-directional or azimuth propulsion units, which delivers more consistent power when turning 360° on their own axis while providing harbour services.
CompetitionC2.3.B6.2.II
SAAM Towage competes with the industry’s leading operators worldwide, such as Svitzer and Boluda, and regionally with operators like Wilson Sons, Seaspan, Ultratug Ltda. and CPT Remolcadores. SAAM Towage is the largest tugboat operator in the Americas.
Customers and SuppliersC2.3.C6.2.IV
Shipping and oil companies are the main customers of the Towage Division. Its portfolio is highly diversified and no single customer represents more than 10% of total consolidated sales for 2021.
Its main suppliers are oil and maintenance services companies. No supplier represents more than 10% of total supplies of goods and services for 2021.
Relevant Factors
The harbour towage business is mainly influenced by the following variables:
Global economic growth
Volume of worldwide seaborne trade
Number of ships in operation
Number of maneuvers or tasks carried out
Size of assisted vessels
Tug design and technology for each specific port
New technologies and sustainability
59
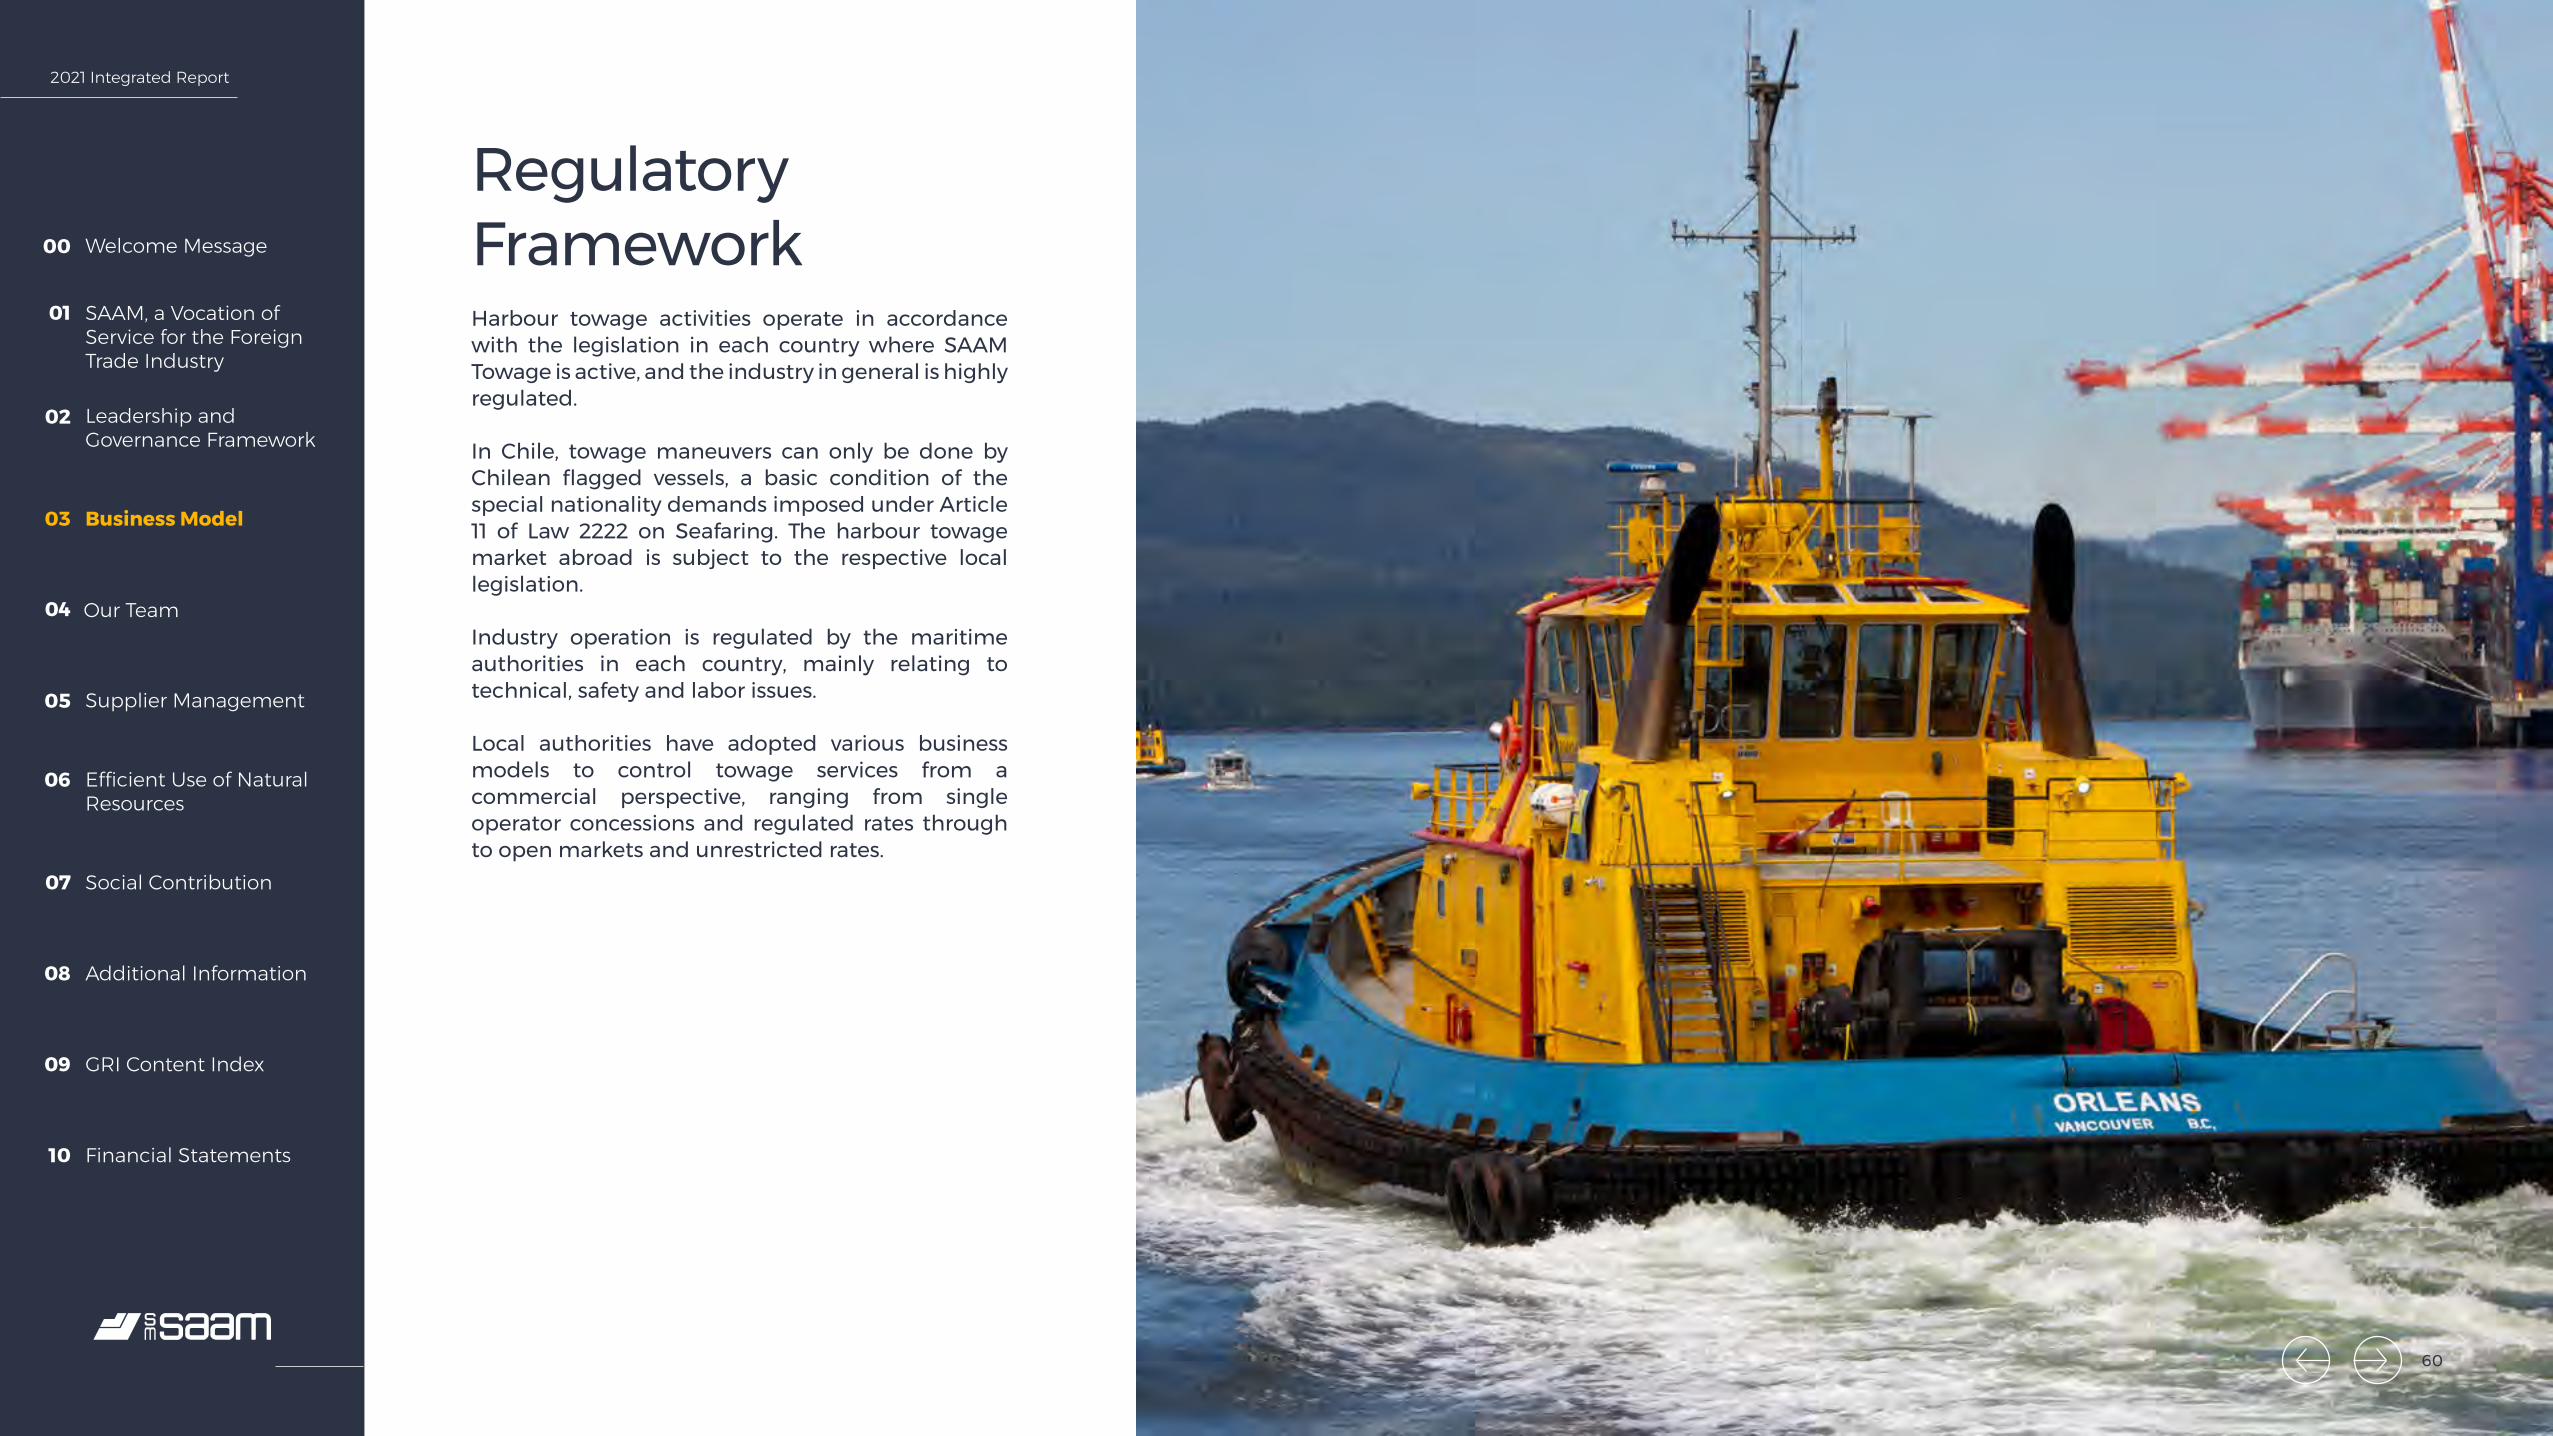
2021 Integrated Report
Welcome Message00
SAAM, a Vocation of Service for the Foreign Trade Industry
01
Leadership and Governance Framework
02
Business Model03
Our Team04
Supplier Management05
Efficient Use of Natural Resources
06
Social Contribution07
Additional Information08
GRI Content Index09
Financial Statements10
Regulatory FrameworkHarbour towage activities operate in accordance with the legislation in each country where SAAM Towage is active, and the industry in general is highly regulated.
In Chile, towage maneuvers can only be done by Chilean flagged vessels, a basic condition of the special nationality demands imposed under Article 11 of Law 2222 on Seafaring. The harbour towage market abroad is subject to the respective local legislation.
Industry operation is regulated by the maritime authorities in each country, mainly relating to technical, safety and labor issues.
Local authorities have adopted various business models to control towage services from a commercial perspective, ranging from single operator concessions and regulated rates through to open markets and unrestricted rates.
60

2021 Integrated Report
Welcome Message00
SAAM, a Vocation of Service for the Foreign Trade Industry
01
Leadership and Governance Framework
02
Business Model03
Our Team04
Supplier Management05
Efficient Use of Natural Resources
06
Social Contribution07
Additional Information08
GRI Content Index09
Financial Statements10
2021 Towage Division Milestones BE
SAAM Towage strengthened its leadership in the Americas by entering the El Salvador market to support the liquefied natural gas (LNG) terminal requirements in Acajutla, resuming operation in Peru and acquiring 70% of Intertug in Colombia, with access to Honduras and Topolobampo in Mexico.
Start of Operations in Peru: two tugs were added with a contract for the terminal plus entry into the Callao, Bayovar and Matarani ports, brining its total fleet to six vessels in this country.
Completion of the Intertug Transaction: the purchase of 70% of the Intertug operations in January 2021 led to SAAM’s entry into Colombia, Honduras and the port of Topolobampo in Mexico.
New Structure of the Special Services Hub in the Caribbean, Chile, Peru and Ecuador: the focus was on meeting the needs of the special services market in the region and providing strategic management to develop business and market intelligence, by strengthening rescue and emergency response capabilities.
61
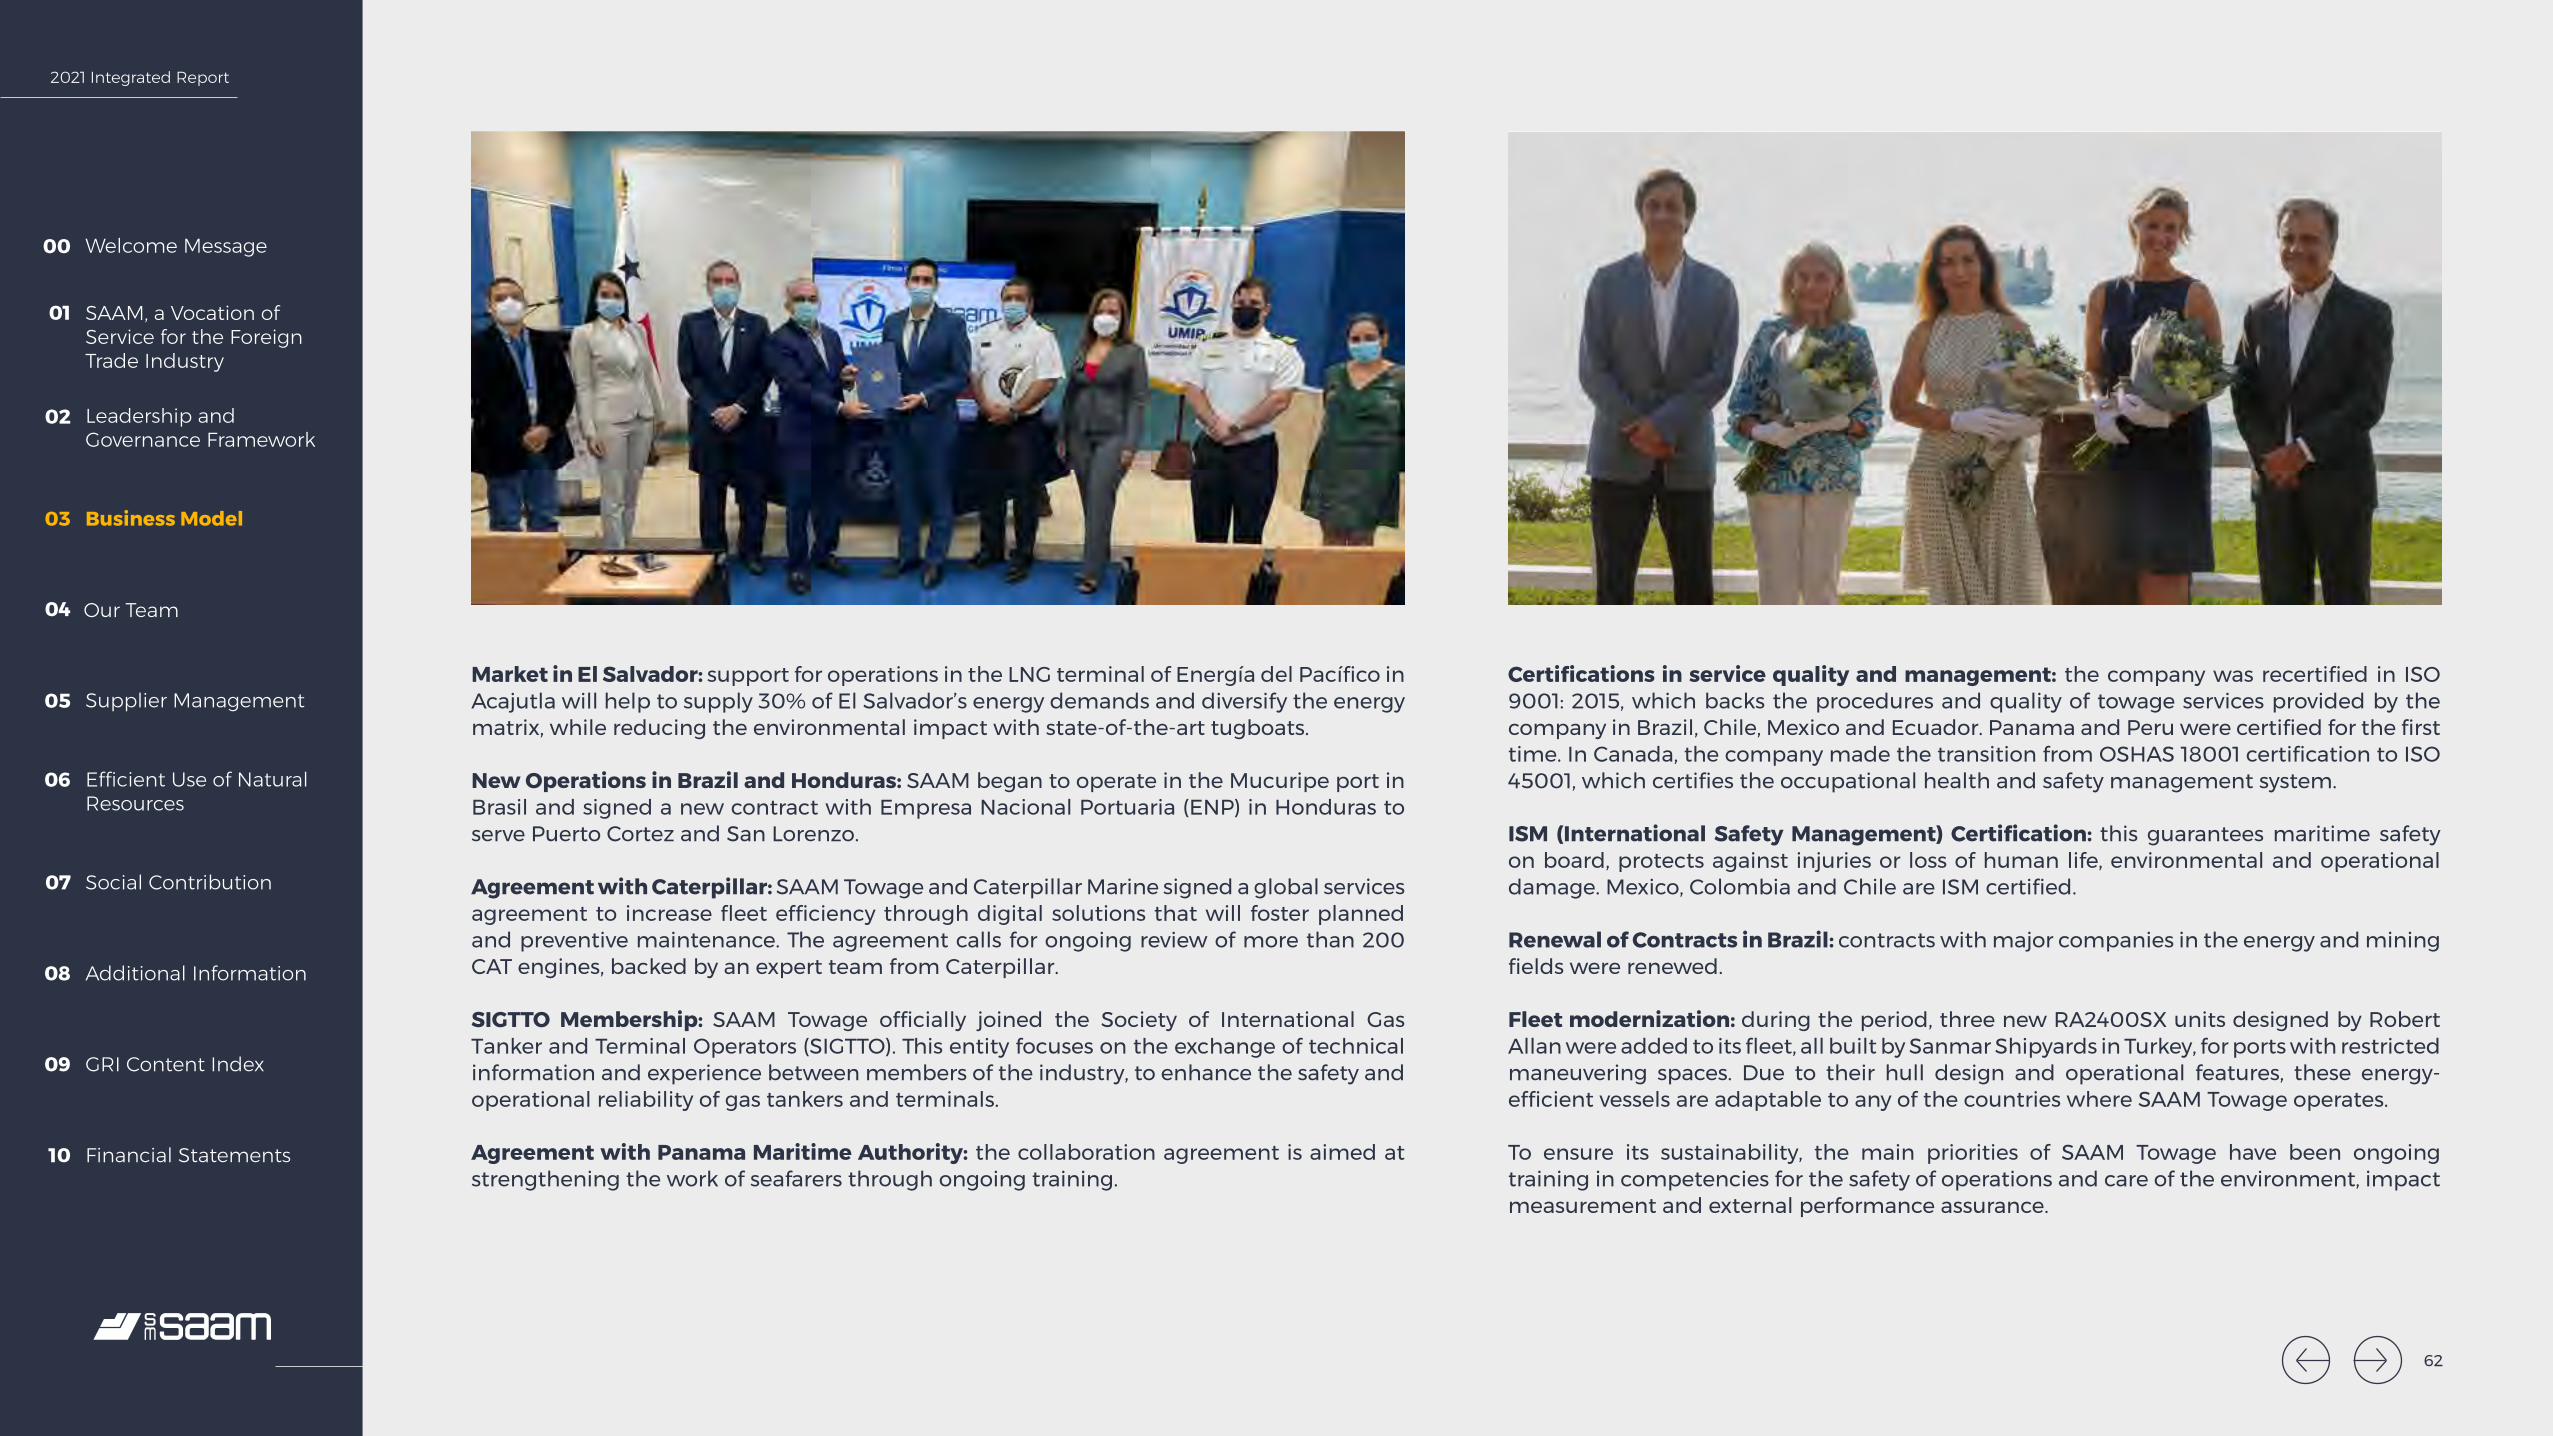
2021 Integrated Report
Welcome Message00
SAAM, a Vocation of Service for the Foreign Trade Industry
01
Leadership and Governance Framework
02
Business Model03
Our Team04
Supplier Management05
Efficient Use of Natural Resources
06
Social Contribution07
Additional Information08
GRI Content Index09
Financial Statements10
Market in El Salvador: support for operations in the LNG terminal of Energía del Pacífico in Acajutla will help to supply 30% of El Salvador’s energy demands and diversify the energy matrix, while reducing the environmental impact with state-of-the-art tugboats.
New Operations in Brazil and Honduras: SAAM began to operate in the Mucuripe port in Brasil and signed a new contract with Empresa Nacional Portuaria (ENP) in Honduras to serve Puerto Cortez and San Lorenzo.
Agreement with Caterpillar: SAAM Towage and Caterpillar Marine signed a global services agreement to increase fleet efficiency through digital solutions that will foster planned and preventive maintenance. The agreement calls for ongoing review of more than 200 CAT engines, backed by an expert team from Caterpillar.
SIGTTO Membership: SAAM Towage officially joined the Society of International Gas Tanker and Terminal Operators (SIGTTO). This entity focuses on the exchange of technical information and experience between members of the industry, to enhance the safety and operational reliability of gas tankers and terminals.
Agreement with Panama Maritime Authority: the collaboration agreement is aimed at strengthening the work of seafarers through ongoing training.
Certifications in service quality and management: the company was recertified in ISO 9001: 2015, which backs the procedures and quality of towage services provided by the company in Brazil, Chile, Mexico and Ecuador. Panama and Peru were certified for the first time. In Canada, the company made the transition from OSHAS 18001 certification to ISO 45001, which certifies the occupational health and safety management system.
ISM (International Safety Management) Certification: this guarantees maritime safety on board, protects against injuries or loss of human life, environmental and operational damage. Mexico, Colombia and Chile are ISM certified.
Renewal of Contracts in Brazil: contracts with major companies in the energy and mining fields were renewed.
Fleet modernization: during the period, three new RA2400SX units designed by Robert Allan were added to its fleet, all built by Sanmar Shipyards in Turkey, for ports with restricted maneuvering spaces. Due to their hull design and operational features, these energy-efficient vessels are adaptable to any of the countries where SAAM Towage operates.
To ensure its sustainability, the main priorities of SAAM Towage have been ongoing training in competencies for the safety of operations and care of the environment, impact measurement and external performance assurance.
62
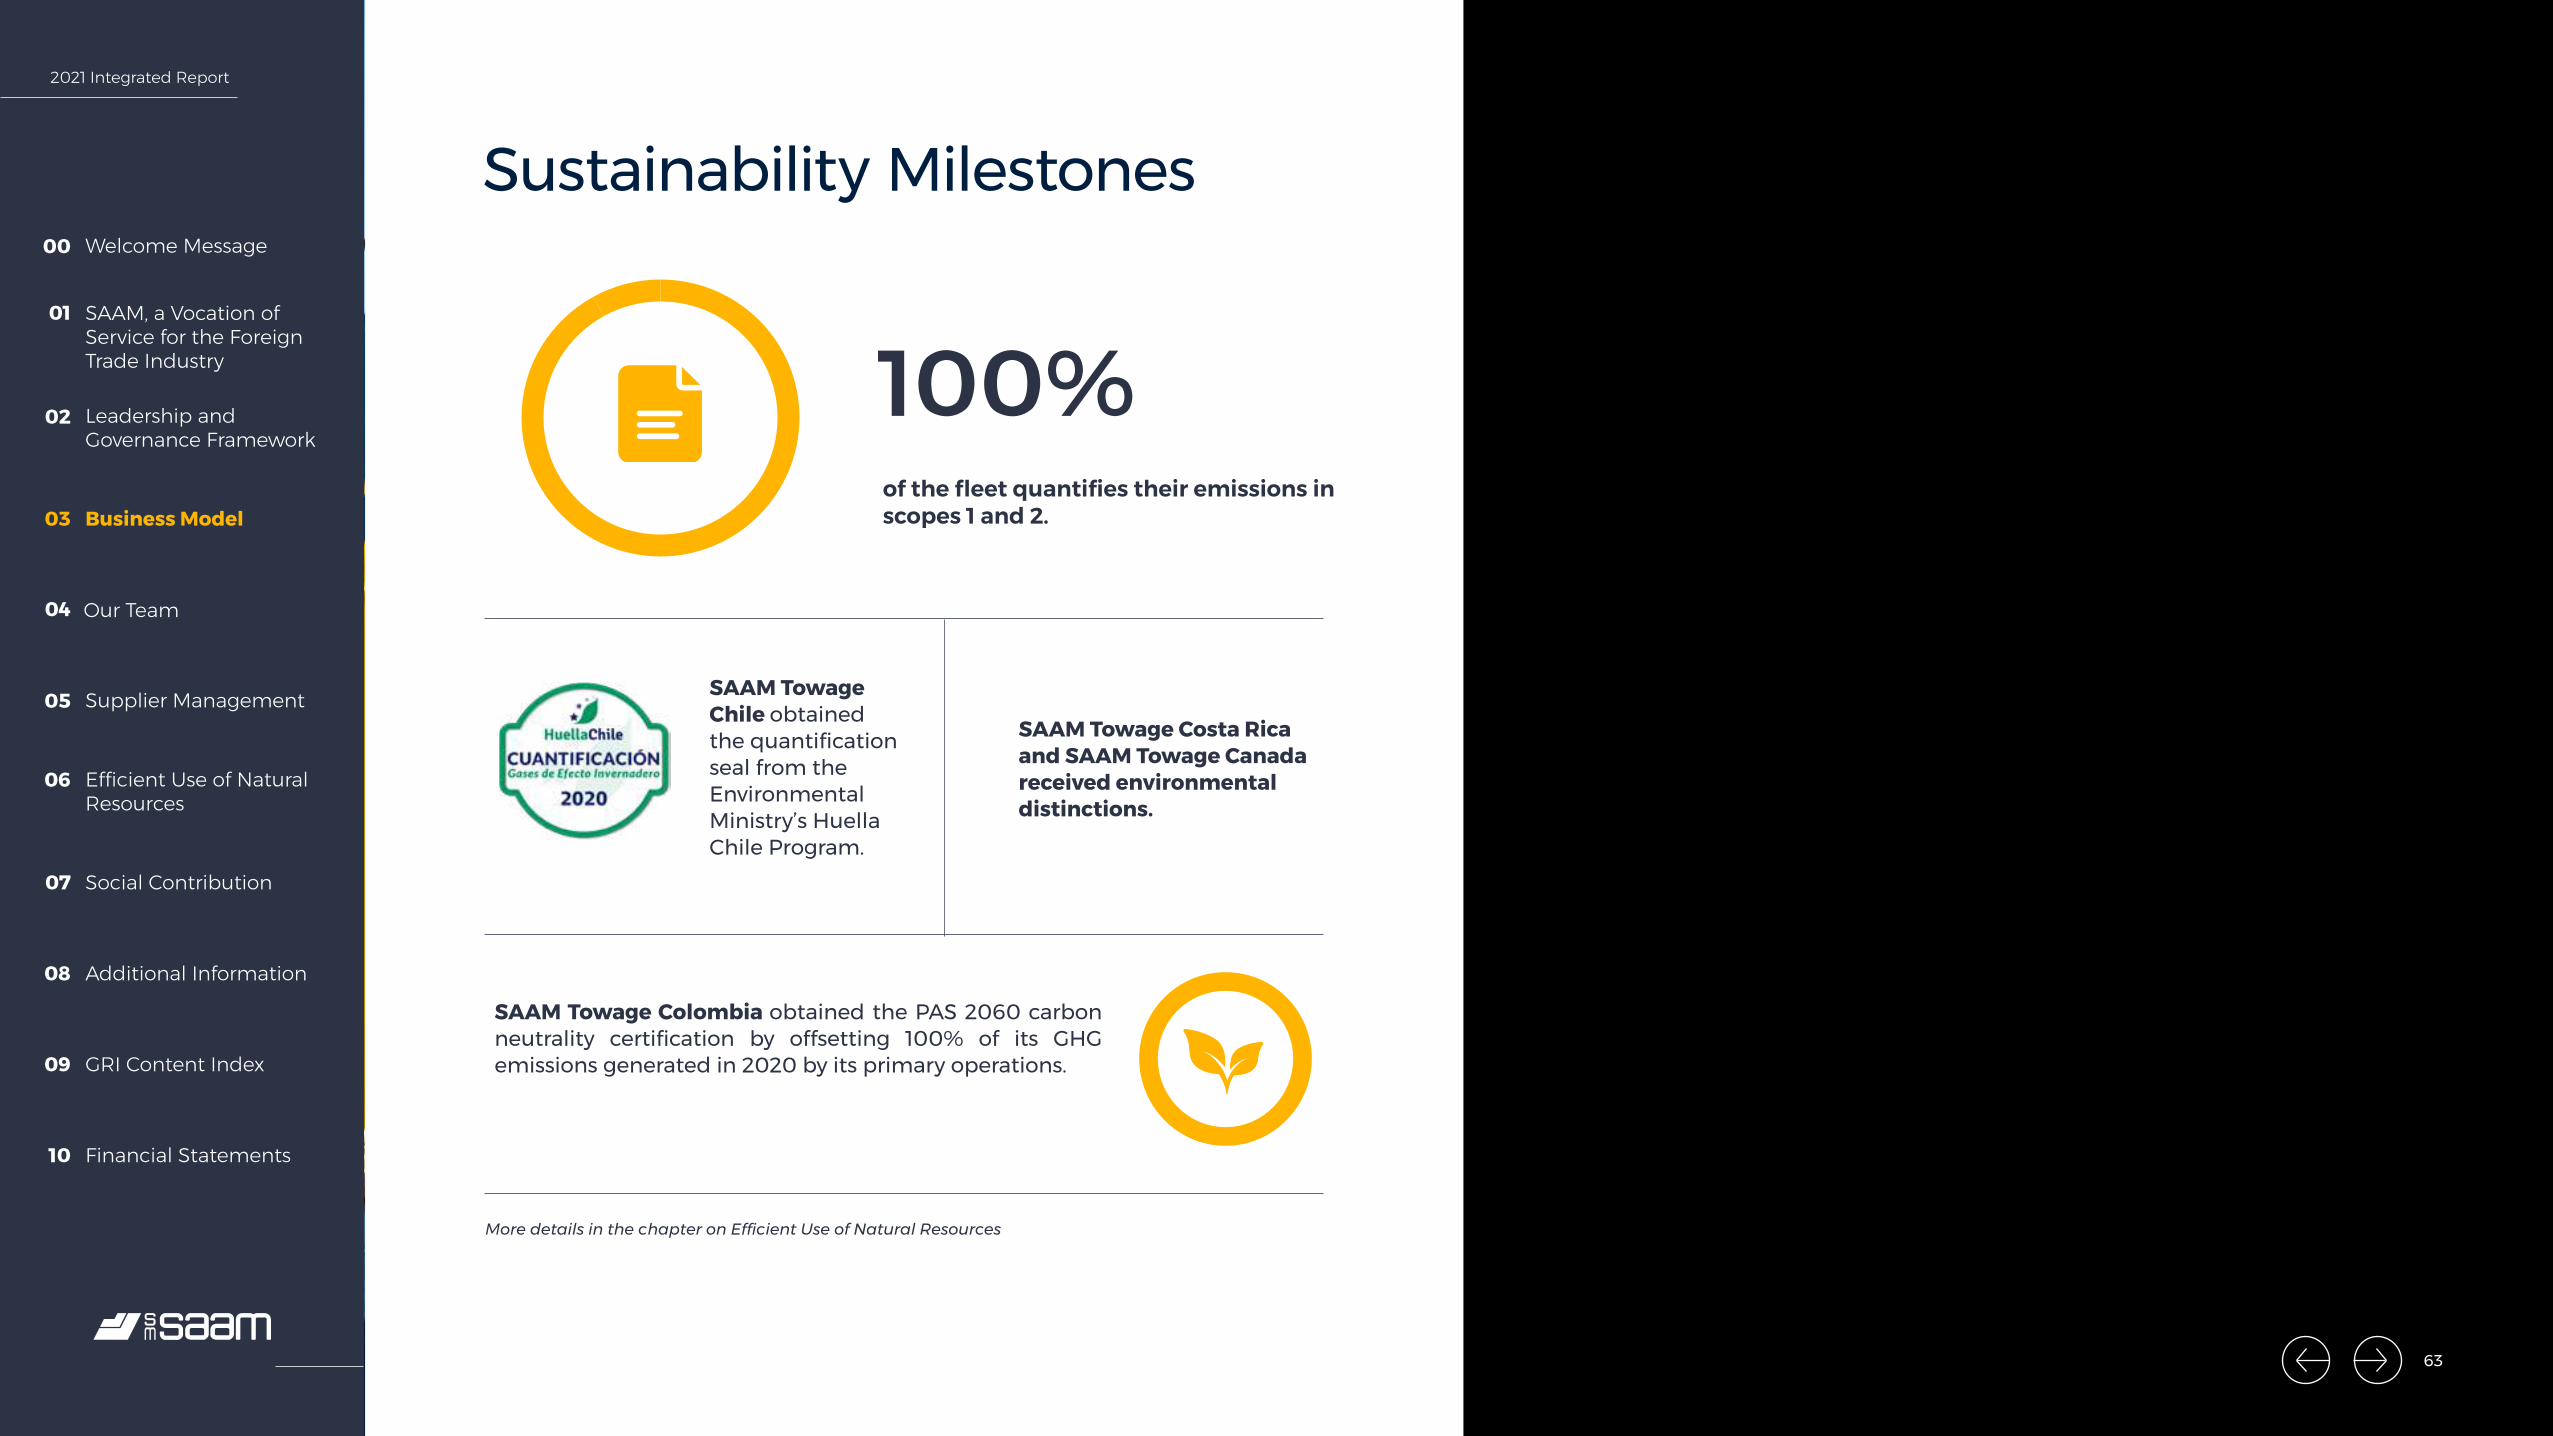
2021 Integrated Report
Welcome Message00
SAAM, a Vocation of Service for the Foreign Trade Industry
01
Leadership and Governance Framework
02
Business Model03
Our Team04
Supplier Management05
Efficient Use of Natural Resources
06
Social Contribution07
Additional Information08
GRI Content Index09
Financial Statements10
100%
Sustainability Milestones
of the fleet quantifies their emissions in scopes 1 and 2.
SAAM Towage Chile obtained the quantification seal from the Environmental Ministry’s Huella Chile Program.
SAAM Towage Colombia obtained the PAS 2060 carbon neutrality certification by offsetting 100% of its GHG emissions generated in 2020 by its primary operations.
SAAM Towage Costa Rica and SAAM Towage Canada received environmental distinctions.
More details in the chapter on Efficient Use of Natural Resources
63
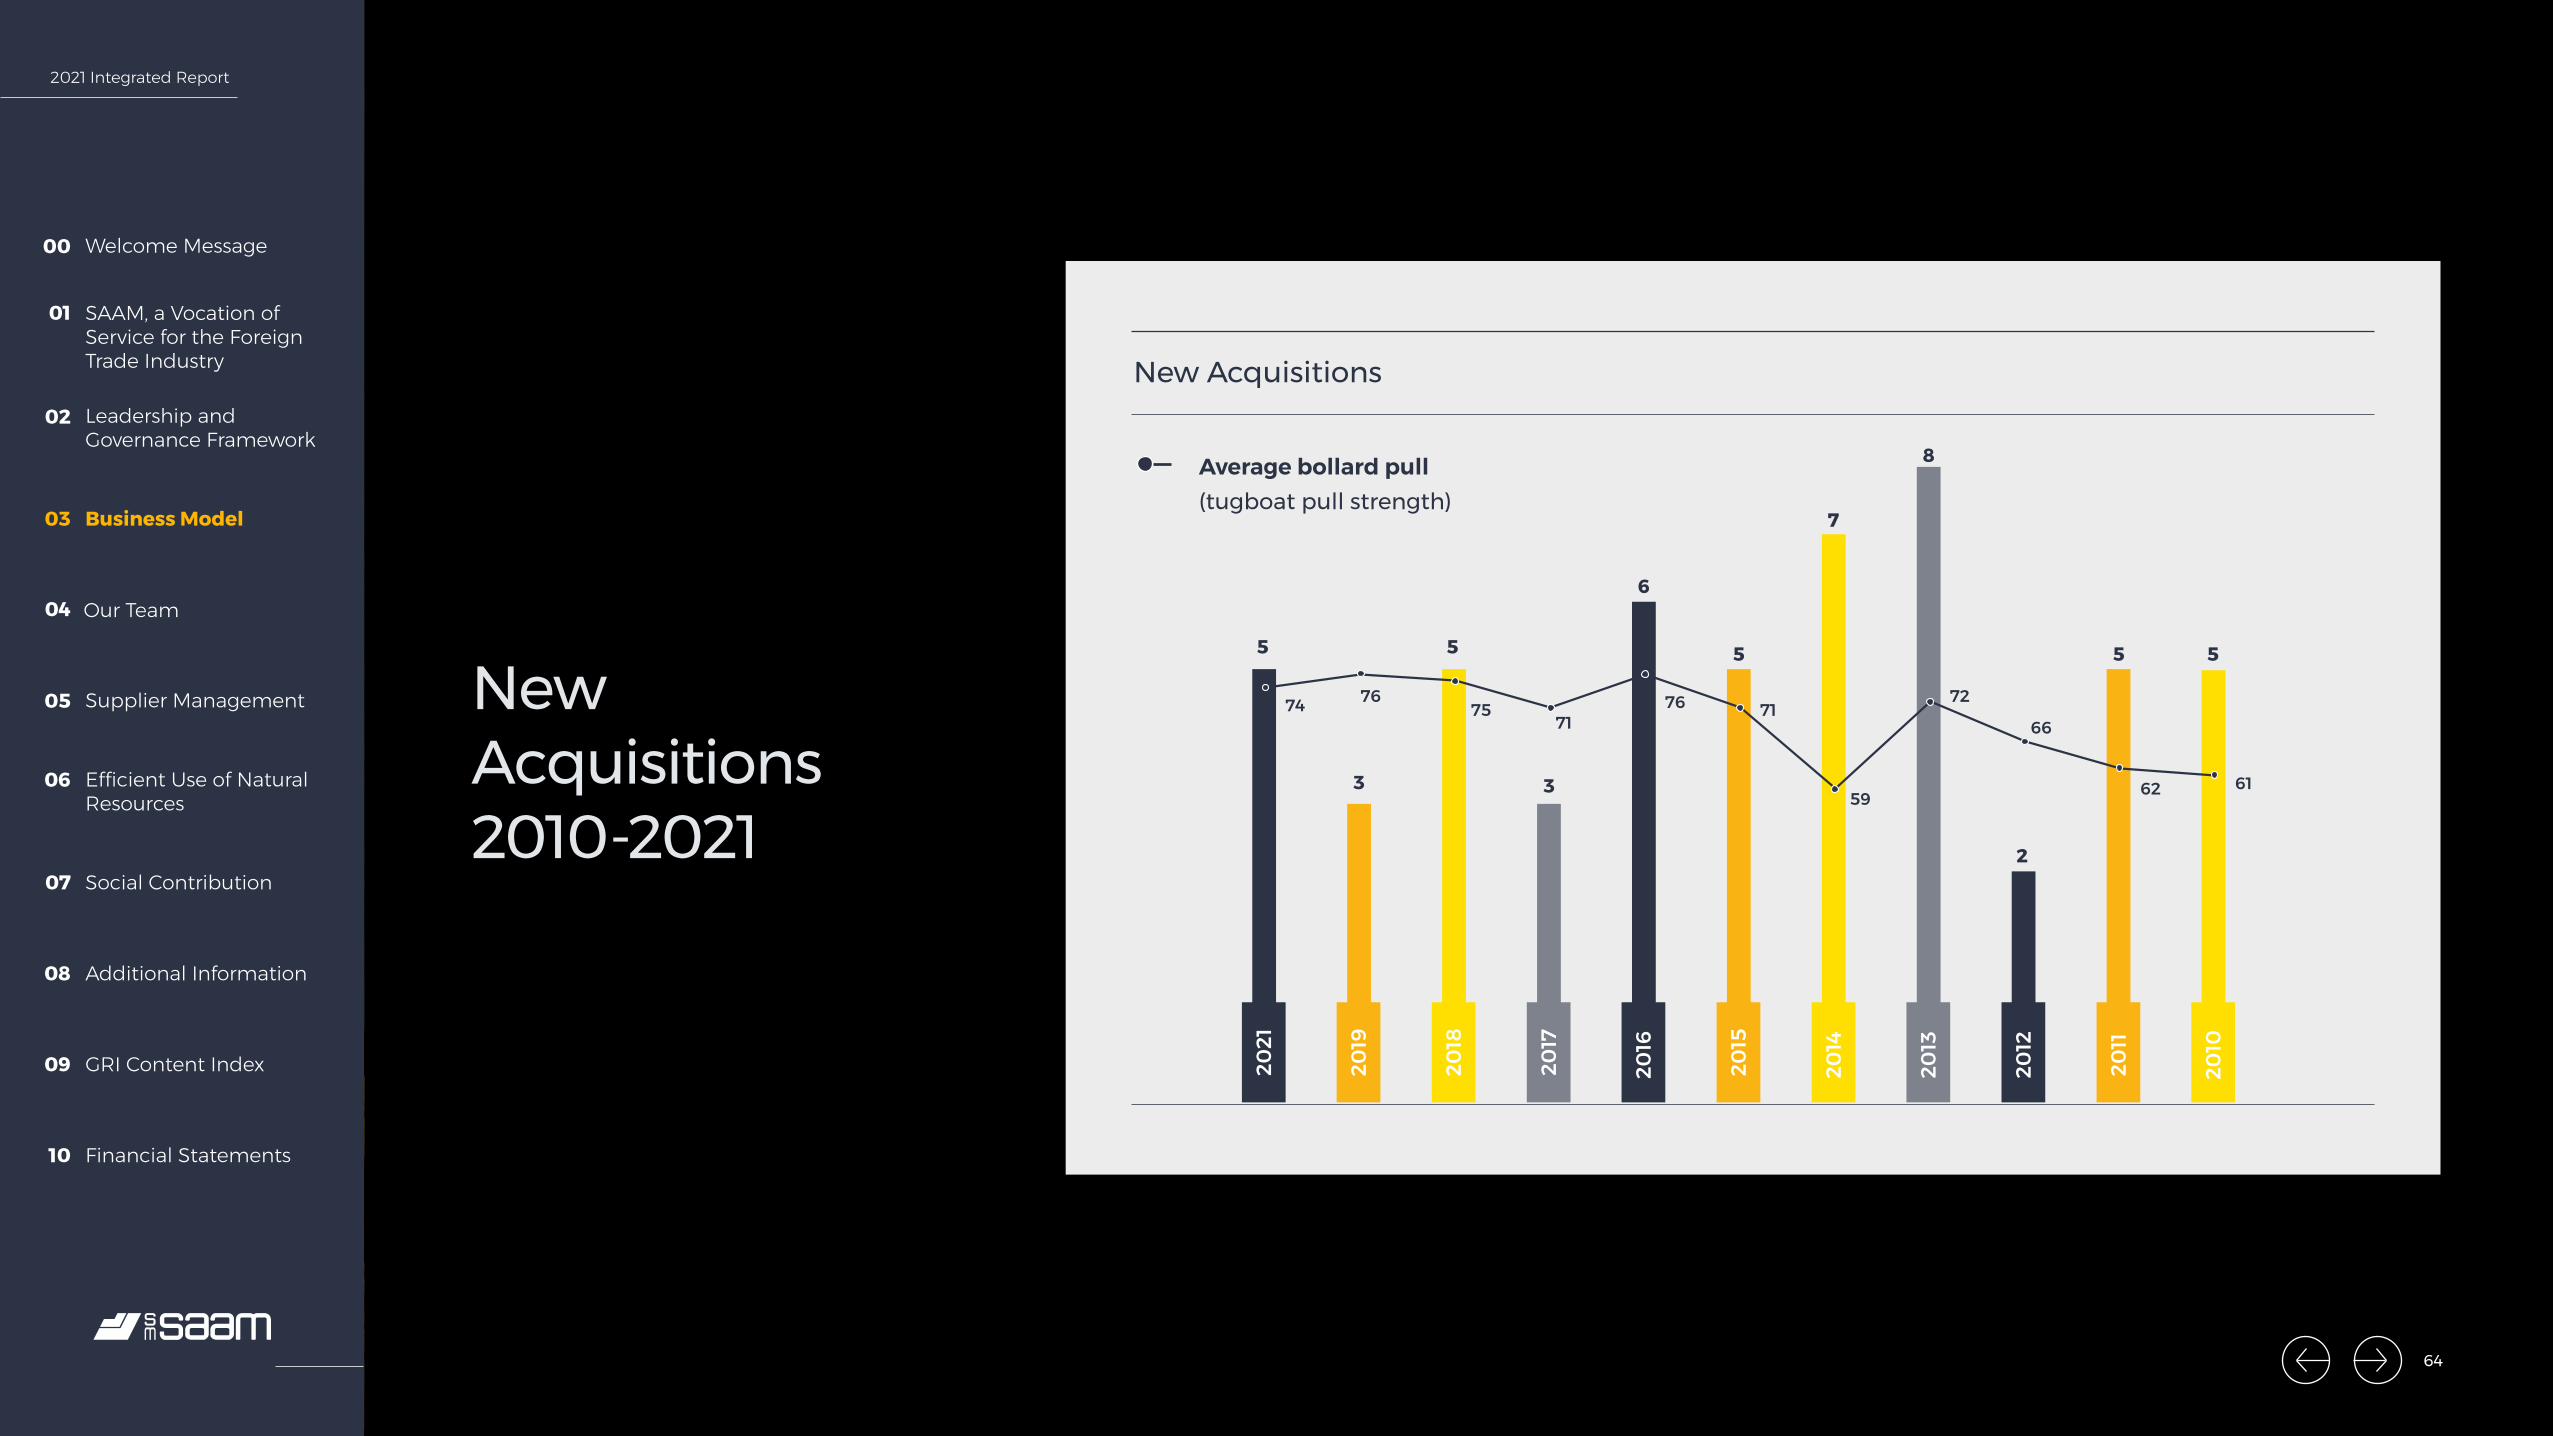
2021 Integrated Report
Welcome Message00
SAAM, a Vocation of Service for the Foreign Trade Industry
01
Leadership and Governance Framework
02
Business Model03
Our Team04
Supplier Management05
Efficient Use of Natural Resources
06
Social Contribution07
Additional Information08
GRI Content Index09
Financial Statements10
2021
74 7675
7176 71
72
66
62 6159
5 5
3
6
3
55
3
7
8
2
2019
2018
2017
2016
2015
2014
2013
2012
2011
2010
5
New Acquisitions 2010-2021
Average bollard pull (tugboat pull strength)
New Acquisitions
64
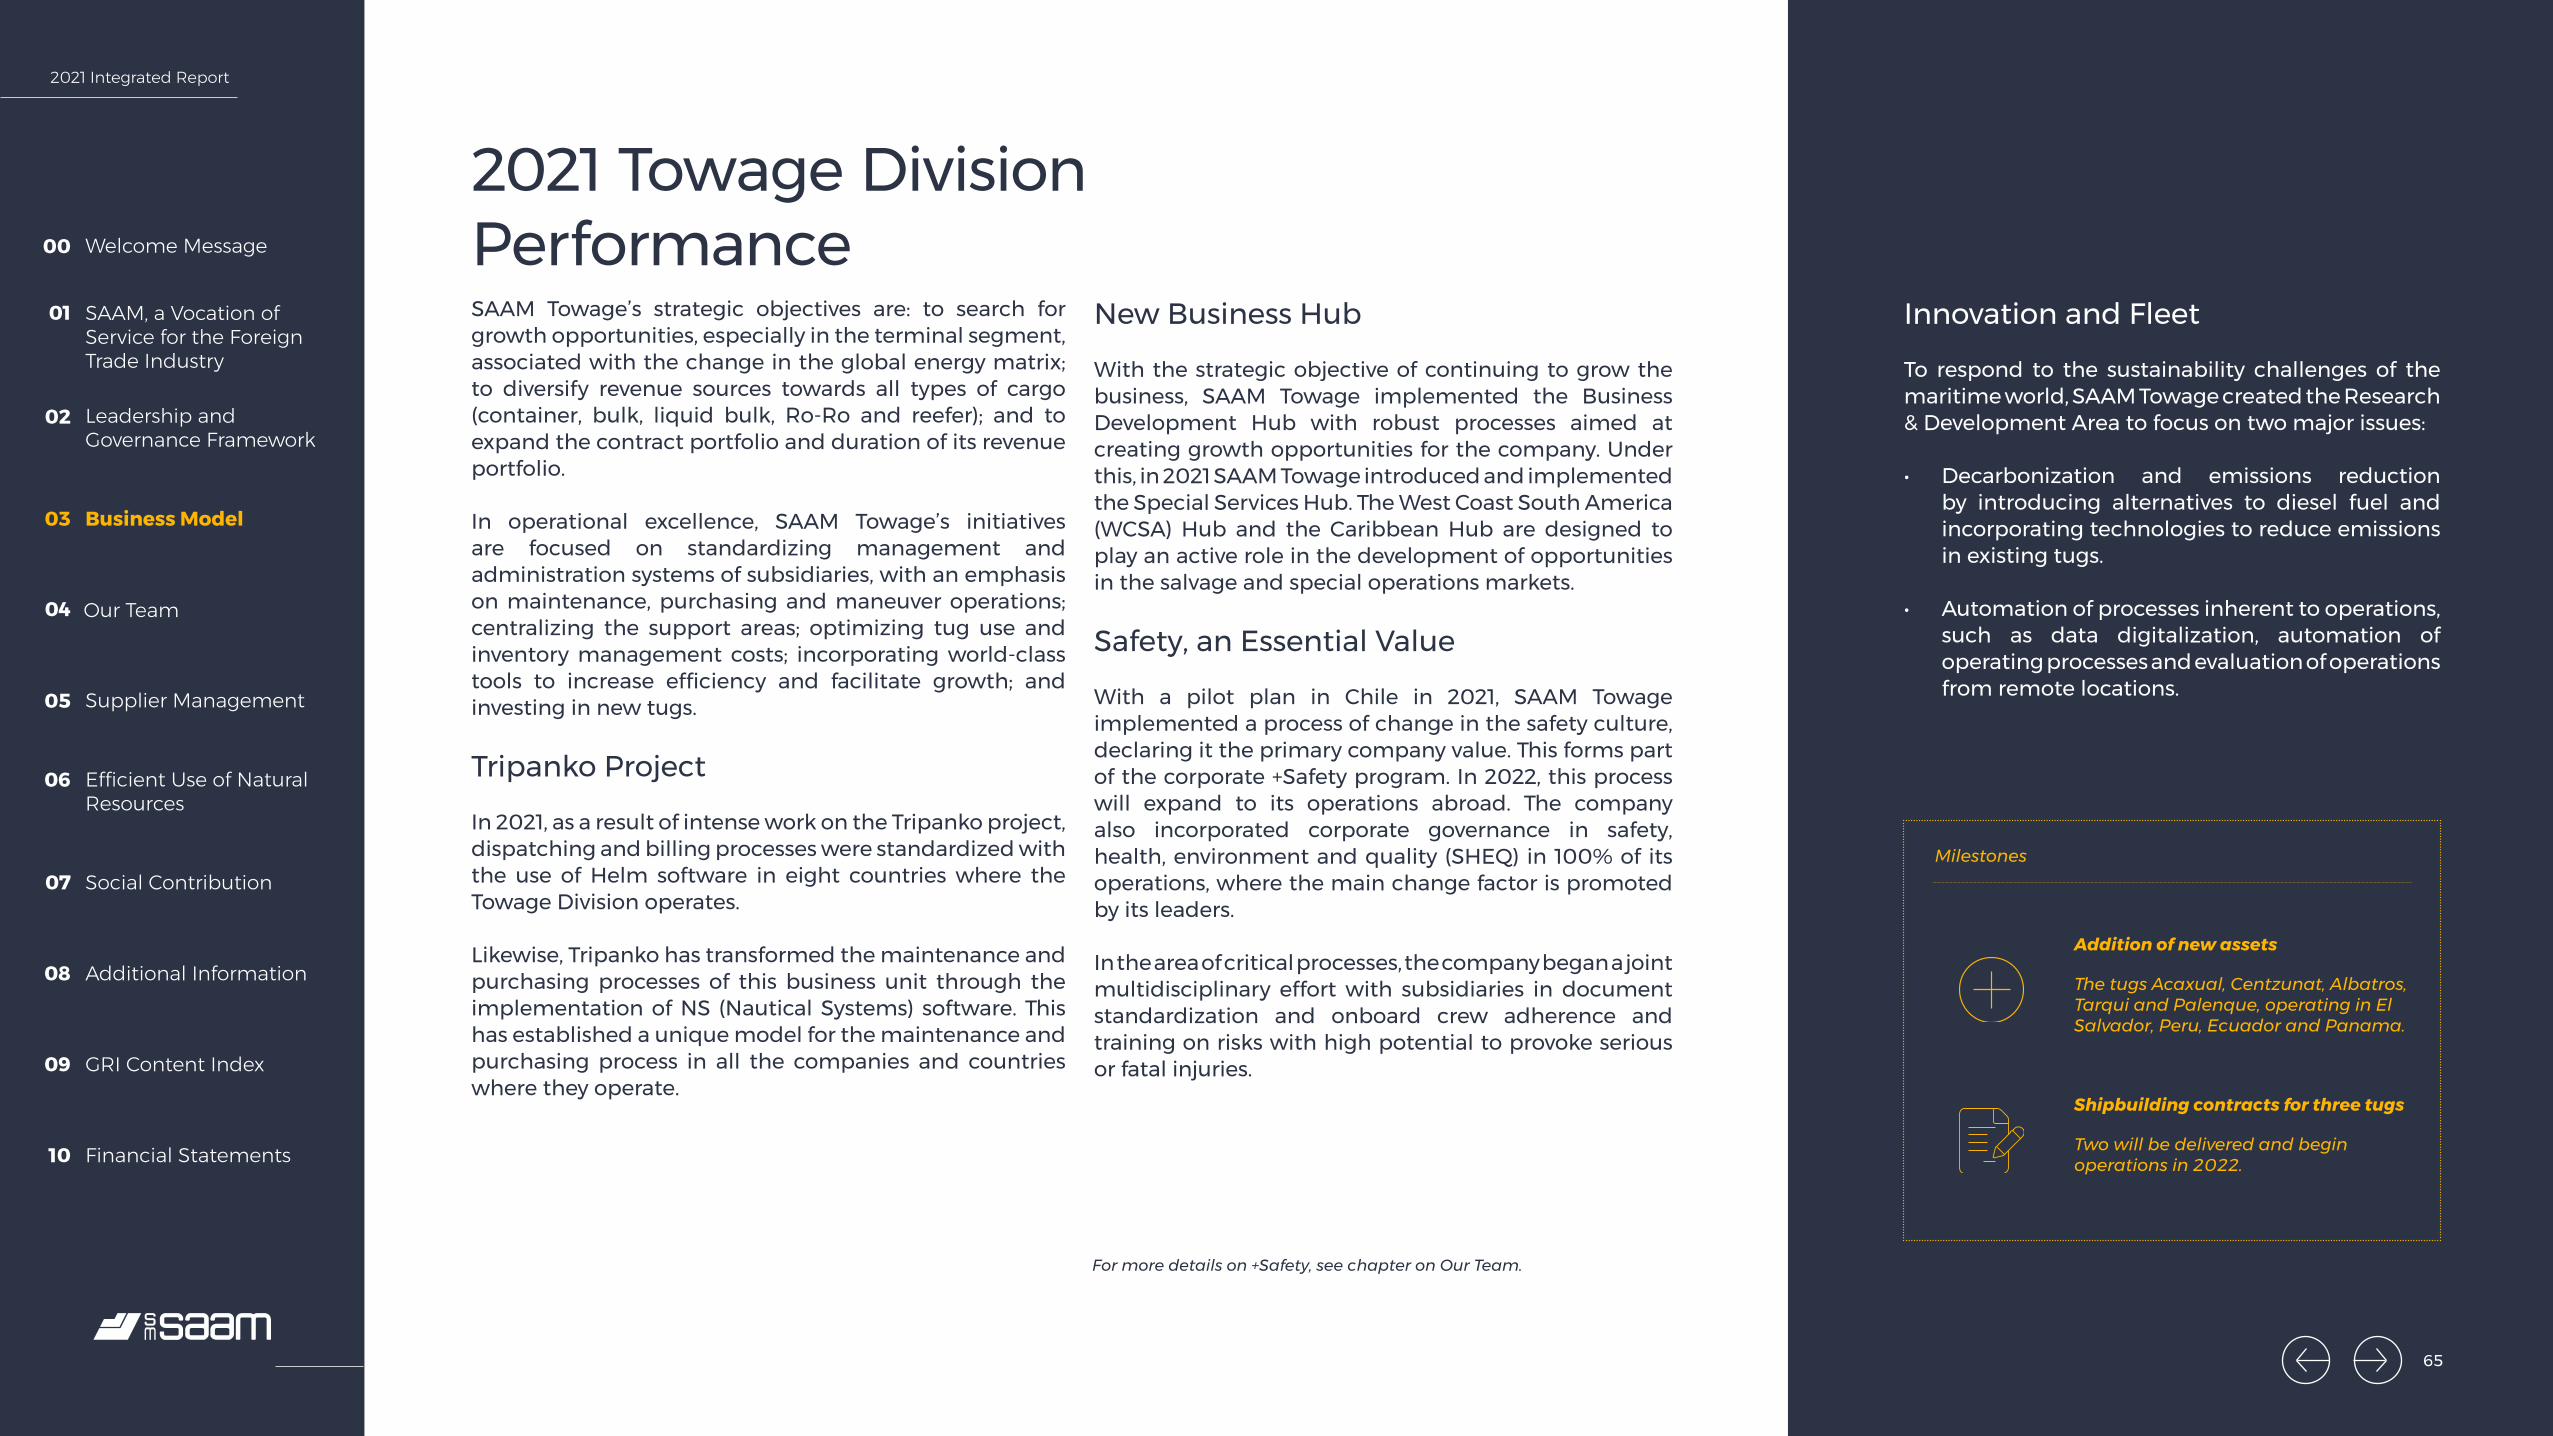
2021 Integrated Report
Welcome Message00
SAAM, a Vocation of Service for the Foreign Trade Industry
01
Leadership and Governance Framework
02
Business Model03
Our Team04
Supplier Management05
Efficient Use of Natural Resources
06
Social Contribution07
Additional Information08
GRI Content Index09
Financial Statements10
2021 Towage Division PerformanceSAAM Towage’s strategic objectives are: to search for growth opportunities, especially in the terminal segment, associated with the change in the global energy matrix; to diversify revenue sources towards all types of cargo (container, bulk, liquid bulk, Ro-Ro and reefer); and to expand the contract portfolio and duration of its revenue portfolio.
In operational excellence, SAAM Towage’s initiatives are focused on standardizing management and administration systems of subsidiaries, with an emphasis on maintenance, purchasing and maneuver operations; centralizing the support areas; optimizing tug use and inventory management costs; incorporating world-class tools to increase efficiency and facilitate growth; and investing in new tugs.
Tripanko Project
In 2021, as a result of intense work on the Tripanko project, dispatching and billing processes were standardized with the use of Helm software in eight countries where the Towage Division operates.
Likewise, Tripanko has transformed the maintenance and purchasing processes of this business unit through the implementation of NS (Nautical Systems) software. This has established a unique model for the maintenance and purchasing process in all the companies and countries where they operate.
Innovation and Fleet
To respond to the sustainability challenges of the maritime world, SAAM Towage created the Research & Development Area to focus on two major issues:
• Decarbonization and emissions reduction by introducing alternatives to diesel fuel and incorporating technologies to reduce emissions in existing tugs.
• Automation of processes inherent to operations, such as data digitalization, automation of operating processes and evaluation of operations from remote locations.
Milestones
Addition of new assets
The tugs Acaxual, Centzunat, Albatros, Tarqui and Palenque, operating in El Salvador, Peru, Ecuador and Panama.
Shipbuilding contracts for three tugs
Two will be delivered and begin operations in 2022.
For more details on +Safety, see chapter on Our Team.
New Business Hub
With the strategic objective of continuing to grow the business, SAAM Towage implemented the Business Development Hub with robust processes aimed at creating growth opportunities for the company. Under this, in 2021 SAAM Towage introduced and implemented the Special Services Hub. The West Coast South America (WCSA) Hub and the Caribbean Hub are designed to play an active role in the development of opportunities in the salvage and special operations markets.
Safety, an Essential Value
With a pilot plan in Chile in 2021, SAAM Towage implemented a process of change in the safety culture, declaring it the primary company value. This forms part of the corporate +Safety program. In 2022, this process will expand to its operations abroad. The company also incorporated corporate governance in safety, health, environment and quality (SHEQ) in 100% of its operations, where the main change factor is promoted by its leaders.
In the area of critical processes, the company began a joint multidisciplinary effort with subsidiaries in document standardization and onboard crew adherence and training on risks with high potential to provoke serious or fatal injuries.
65

2021 Integrated Report
Welcome Message00
SAAM, a Vocation of Service for the Foreign Trade Industry
01
Leadership and Governance Framework
02
Business Model03
Our Team04
Supplier Management05
Efficient Use of Natural Resources
06
Social Contribution07
Additional Information08
GRI Content Index09
Financial Statements10
Assets Added Construction or Acquisition Agreements
TugShipyard
Description
Description
Description
Destination
Destination
SAAM Tarqui
Halcón III
SAAM Acaxual
Mataquito II
SAAM Centzunat
SAAM Palenque
SAAM Albatros
Tug measuring 23 m in length, model RA2300MM with 67 TBP
Operations in Ecuador
Tug measuring 32 m in length, model RA3200W with 80 TBP
El Salvador LNG operation
Tug measuring 32 m in length, model RA3200W with 80 TBP
Rampart 2400SX
Tug measuring 24 m in length with two CAT 3516C
engines and Kongsberg US255FP azimuth thrusters and fire fighting 1 notation, which makes it an energy-
efficient and highly maneuverable tug.
Chile
RAstar 2900SX
With a length of 29 m, dynamic winch with constant
tension and external fire fighting class 1 notation, two
CAT 3516C engines with 2525 kW and Kongsberg US255FP azimuth thrusters, this vessel makes it possible to operate in specialized fuel and LNG
terminals.
Chile
El Salvador LNG operation
Tug measuring 24 m in length, model RA2400SX with 70 TBP
Operations in Panama
Tug measuring 24 m in length, model RA2400SX with 70 TBP
Operations in Peru
66

2021 Integrated Report
Welcome Message00
SAAM, a Vocation of Service for the Foreign Trade Industry
01
Leadership and Governance Framework
02
Business Model03
Our Team04
Supplier Management05
Efficient Use of Natural Resources
06
Social Contribution07
Additional Information08
GRI Content Index09
Financial Statements10
340
277
207
189
2021
2020
2019
2018
37
38
26
22
2021
2020
2019
2018
137
119
78
67
2021
2020
2019
2018
40%
43%
38%
36%
131,628
107,490
110,747
104,508
2021
2020
2019
2018
2021 Results Revenue (MUS$) (1) Net Income (1)
EBITDA (MUS$) (1) Maneuvers (2)
The reactivation of the industry worldwide has implied a 22% increase in volume in towage maneuvers, which supports the positive results obtained in the division, with US$340 million in revenue, equal to a 23% increase over 2020 and EBITDA of US$137 million, 14% more than the previous year.
(1) Consolidated figures. November 2019 acquisition of the remaining 50% from Brazil and 49% from Canada, Mexico and Panama. February 2021 acquisition of 70% of Intertug.(2) Full volumes of subsidiaries and associates.
EBITDA margin
67
2021 Integrated Report
Welcome Message00
SAAM, a Vocation of Service for the Foreign Trade Industry
01
Leadership and Governance Framework
02
Business Model03
Our Team04
Supplier Management05
Efficient Use of Natural Resources
06
Social Contribution07
Additional Information08
GRI Content Index09
Financial Statements10
68
Port Terminals Division
68

2021 Integrated Report
Welcome Message00
SAAM, a Vocation of Service for the Foreign Trade Industry
01
Leadership and Governance Framework
02
Business Model03
Our Team04
Supplier Management05
Efficient Use of Natural Resources
06
Social Contribution07
Additional Information08
GRI Content Index09
Financial Statements10
Port Terminals Division
(1) Equity-method EBITDA based on ownership percentage in consolidated companies and associates.(2) Includes the full figures from consolidated companies and associates.
Figures (MUS$)
Equity-Method EBITDA(1)
Consolidated Sales
Consolidated EBITDA
Container throughput (tons)(2)Operations in Employees (2) Container throughput (TEU) (2)
millioncountries ports million41 6 3,999 10 3.3
Through a robust and diversified portfolio, aimed at meeting the requirements of the most important foreign trade industries in six countries in the Americas, SM SAAM’s Port Terminals Division offers safe services, supported by highly efficient management with high standards of efficiency and competitive advantage.
Operational excellence, service quality and productivity respond to a vast knowledge of the environment and activity in emerging markets, together with multipurpose port infrastructure specialized in containerized cargo.
(2020: 34 million) (2020: 3.0 million)
Port Terminal Portfolio
Florida International Terminal Florida, United States (70%)
Sociedad Portuaria Caldera Caldera, Costa Rica (51%)
Puerto Buenavista Cartagena de Indias, Colombia (33%)
Terminal Portuario Guayaquil Guayaquil, Ecuador (100%)
Iquique Terminal Internacional Iquique, Chile (100%)
Antofagasta Terminal Internacional Antofagasta, Chile (35%)
San Antonio Terminal Internacional San Antonio, Chile (50%)
San Vicente Terminal Internacional Talcahuano, Chile (50%)
Portuaria Corral Corral, Chile (50%)
Mazatlan Maritime Terminal Mazatlán, Mexico (100%)
1192021
982020
2502021
2822020
1052021
952020
69
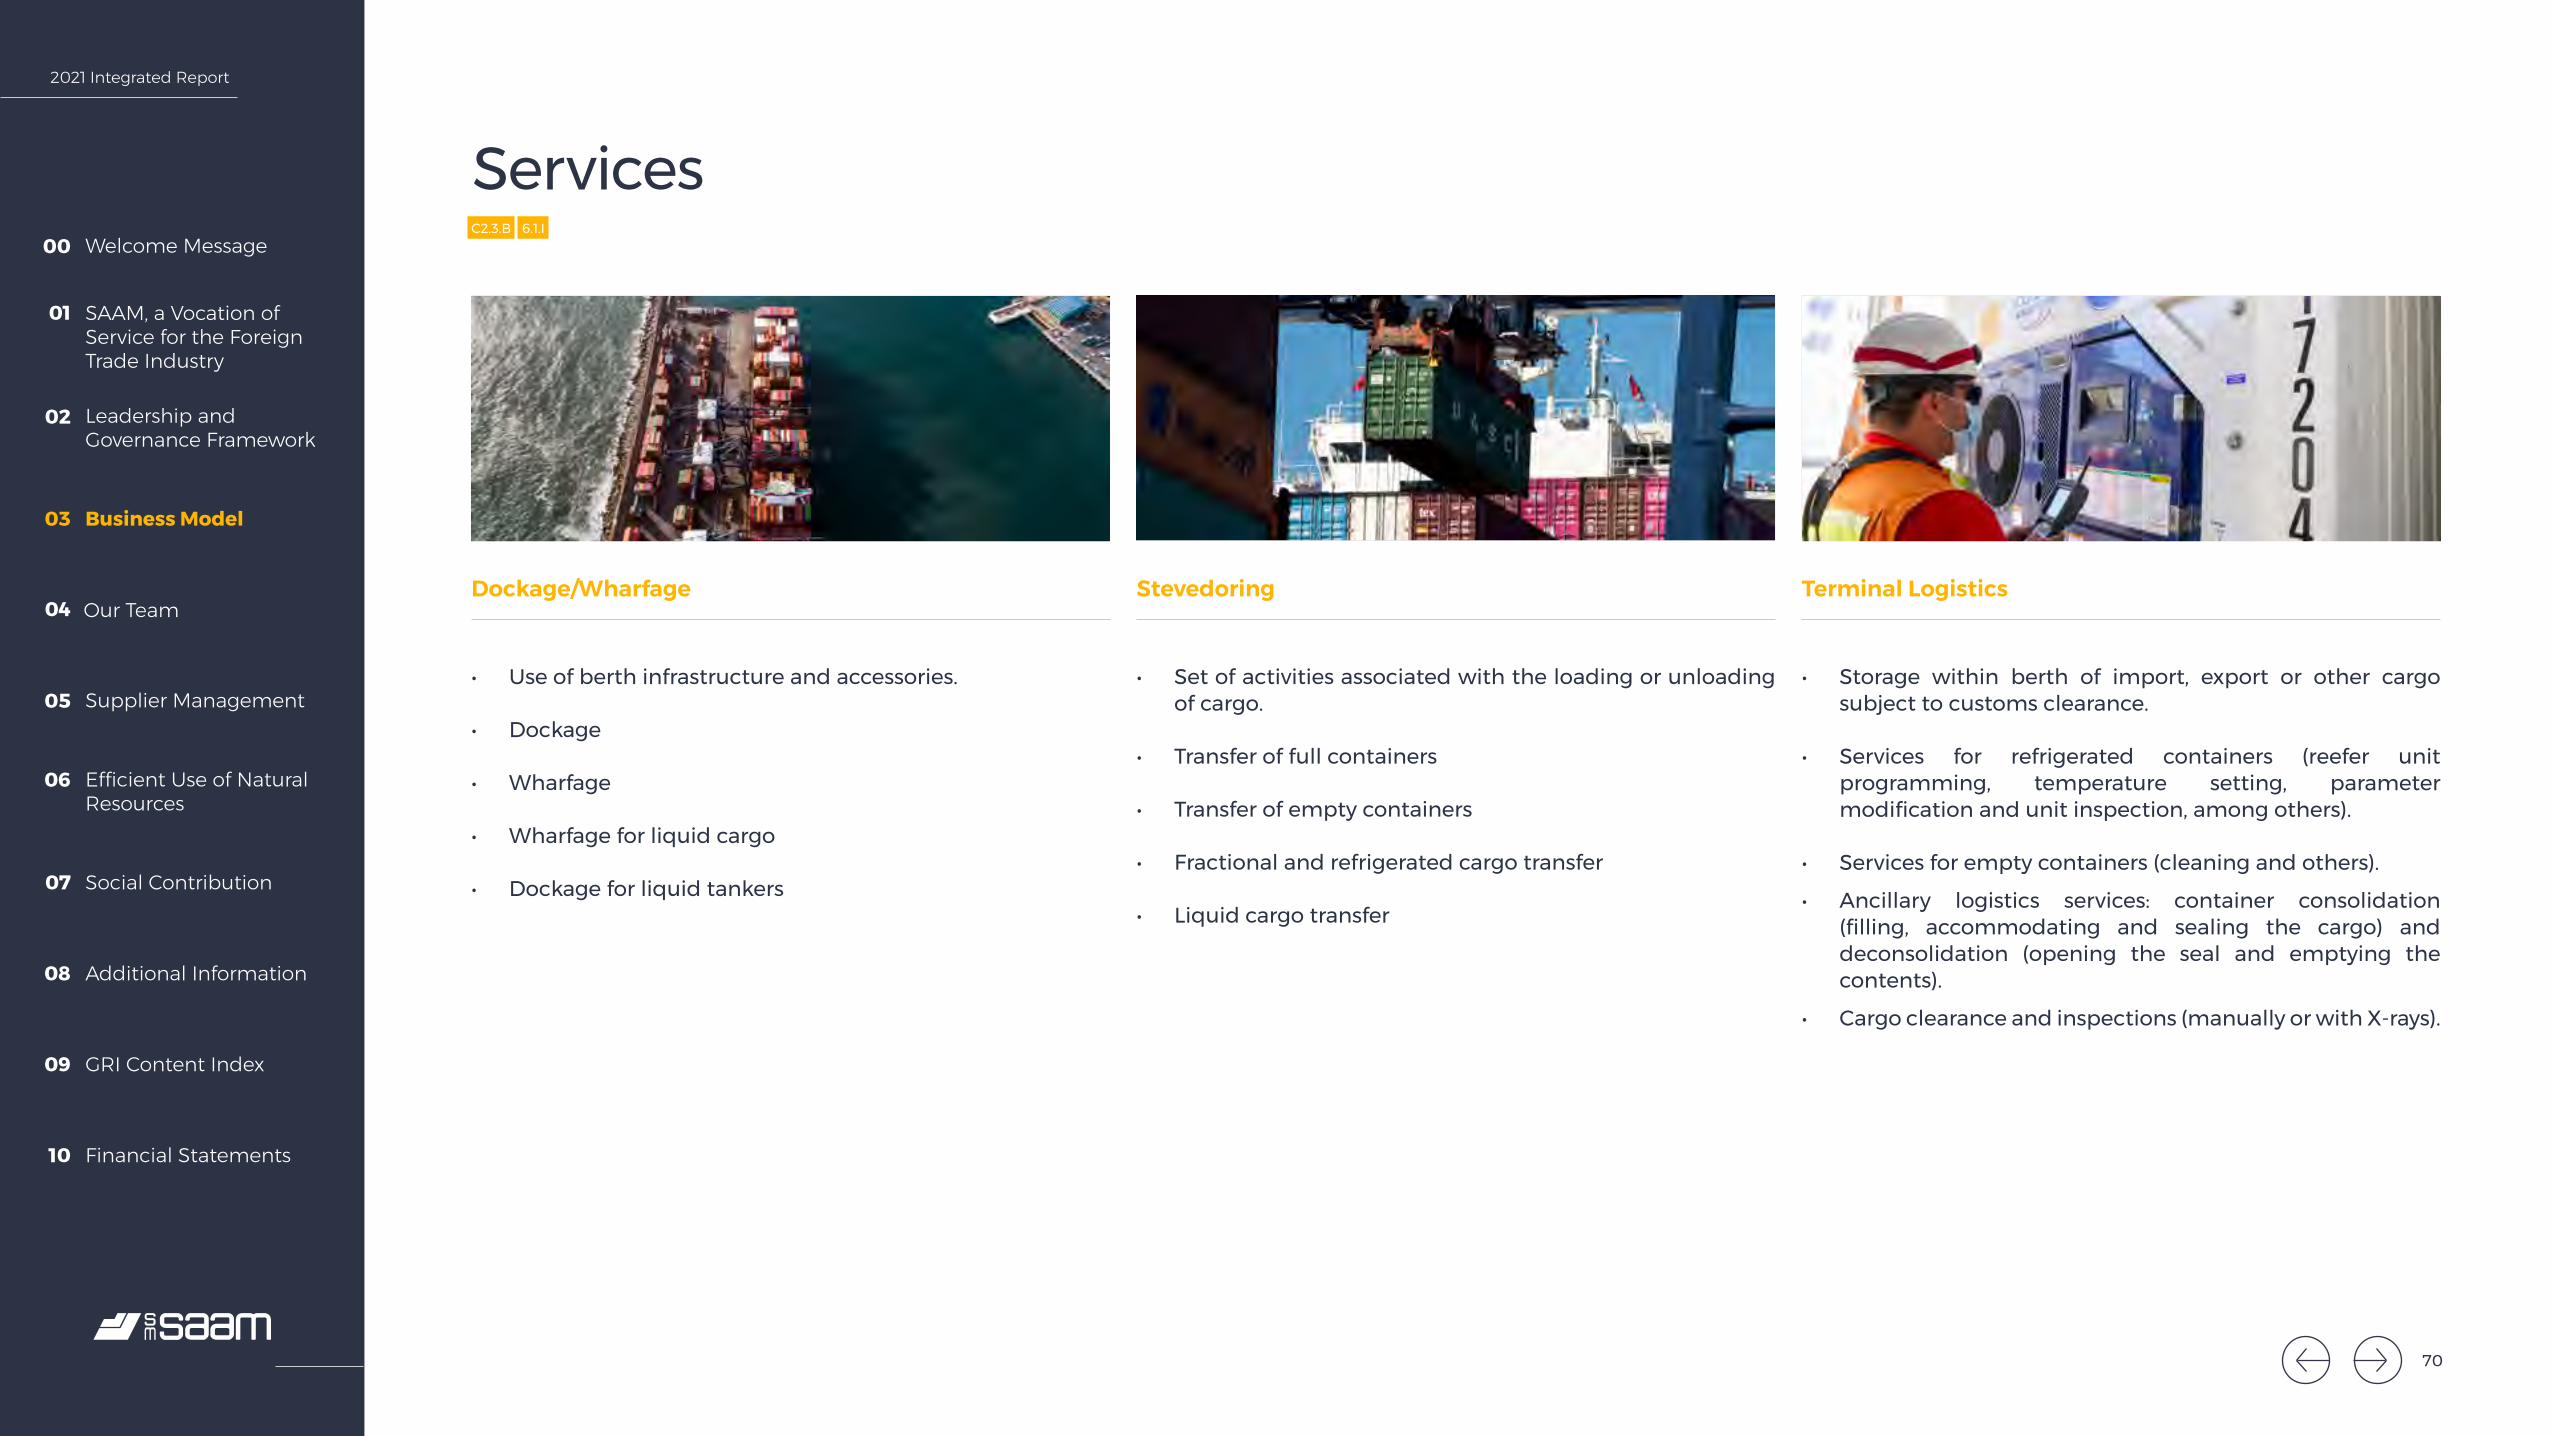
2021 Integrated Report
Welcome Message00
SAAM, a Vocation of Service for the Foreign Trade Industry
01
Leadership and Governance Framework
02
Business Model03
Our Team04
Supplier Management05
Efficient Use of Natural Resources
06
Social Contribution07
Additional Information08
GRI Content Index09
Financial Statements10
C2.3.B 6.1.I
Services
Dockage/Wharfage
• Use of berth infrastructure and accessories.
• Dockage
• Wharfage
• Wharfage for liquid cargo
• Dockage for liquid tankers
Stevedoring
• Set of activities associated with the loading or unloading of cargo.
• Transfer of full containers
• Transfer of empty containers
• Fractional and refrigerated cargo transfer
• Liquid cargo transfer
Terminal Logistics
• Storage within berth of import, export or other cargo subject to customs clearance.
• Services for refrigerated containers (reefer unit programming, temperature setting, parameter modification and unit inspection, among others).
• Services for empty containers (cleaning and others).
• Ancillary logistics services: container consolidation (filling, accommodating and sealing the cargo) and deconsolidation (opening the seal and emptying the contents).
• Cargo clearance and inspections (manually or with X-rays).
70
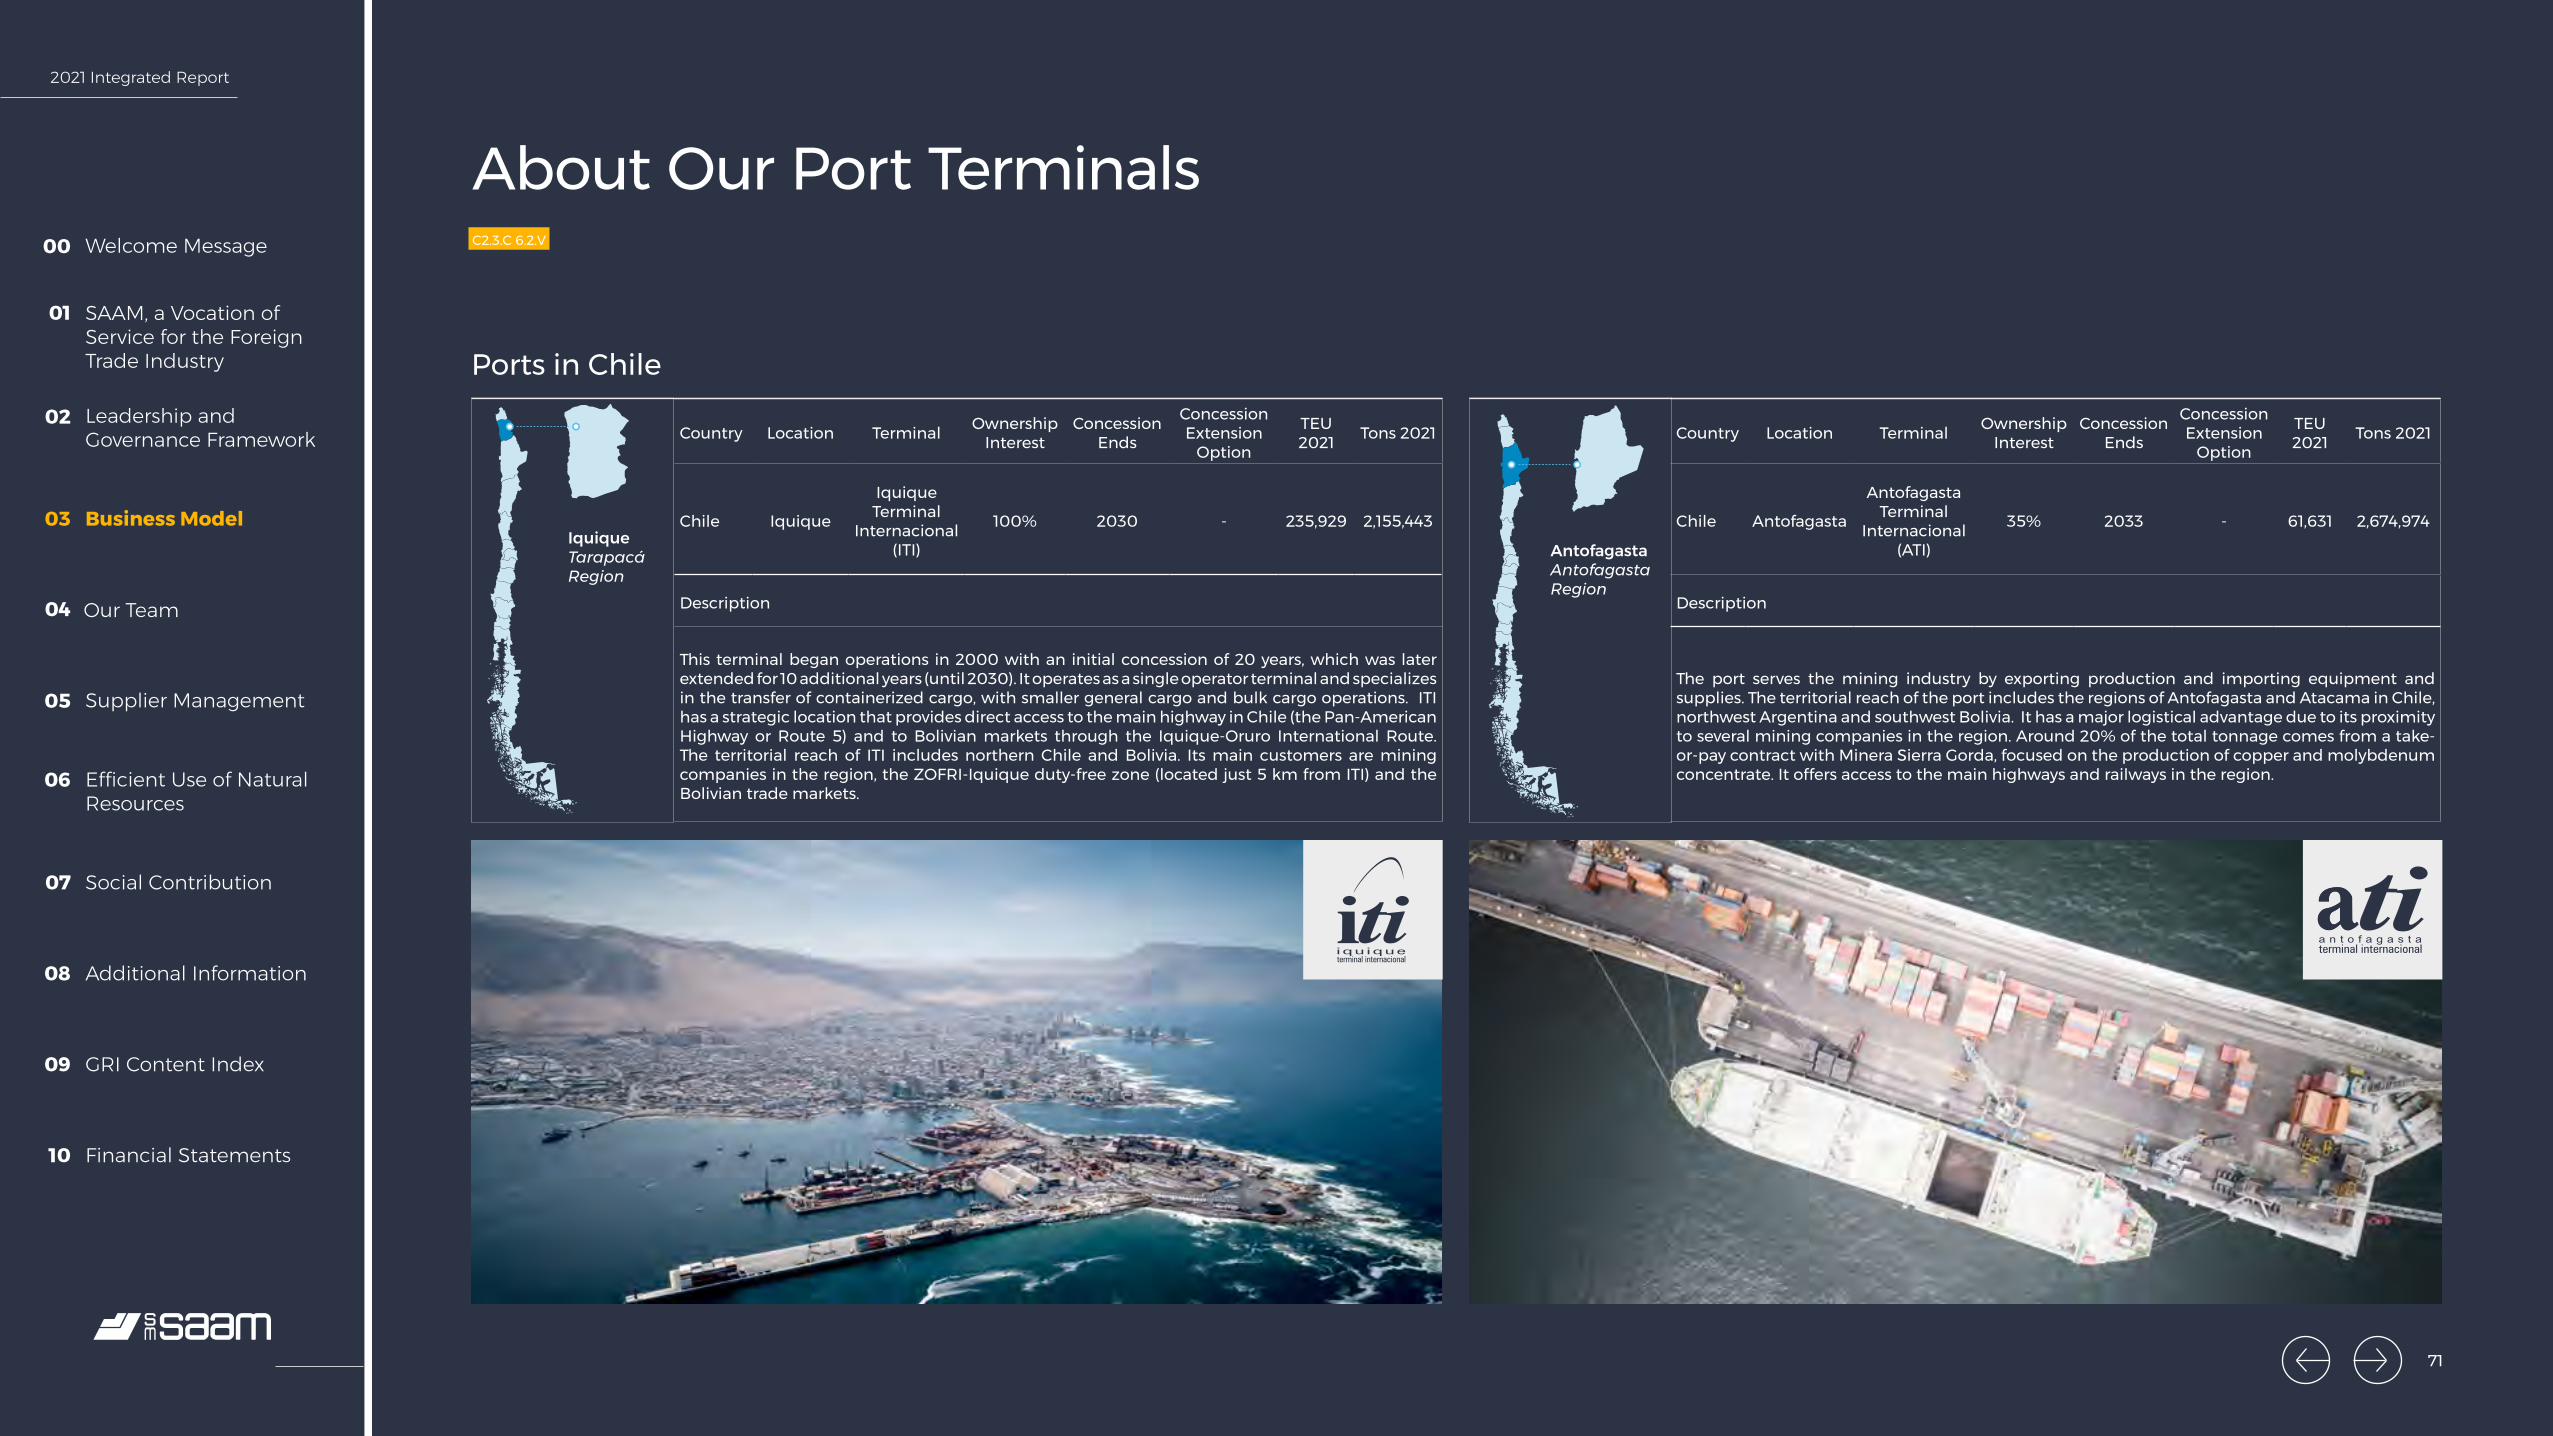
2021 Integrated Report
Welcome Message00
SAAM, a Vocation of Service for the Foreign Trade Industry
01
Leadership and Governance Framework
02
Business Model03
Our Team04
Supplier Management05
Efficient Use of Natural Resources
06
Social Contribution07
Additional Information08
GRI Content Index09
Financial Statements10
Country Location Terminal Ownership Interest
Concession Ends
Concession Extension
Option
TEU 2021 Tons 2021
Chile Iquique
Iquique Terminal
Internacional (ITI)
100% 2030 - 235,929 2,155,443
Description
This terminal began operations in 2000 with an initial concession of 20 years, which was later extended for 10 additional years (until 2030). It operates as a single operator terminal and specializes in the transfer of containerized cargo, with smaller general cargo and bulk cargo operations. ITI has a strategic location that provides direct access to the main highway in Chile (the Pan-American Highway or Route 5) and to Bolivian markets through the Iquique-Oruro International Route. The territorial reach of ITI includes northern Chile and Bolivia. Its main customers are mining companies in the region, the ZOFRI-Iquique duty-free zone (located just 5 km from ITI) and the Bolivian trade markets.
Country Location Terminal Ownership Interest
Concession Ends
Concession Extension
Option
TEU 2021 Tons 2021
Chile Antofagasta
Antofagasta Terminal
Internacional (ATI)
35% 2033 - 61,631 2,674,974
Description
The port serves the mining industry by exporting production and importing equipment and supplies. The territorial reach of the port includes the regions of Antofagasta and Atacama in Chile, northwest Argentina and southwest Bolivia. It has a major logistical advantage due to its proximity to several mining companies in the region. Around 20% of the total tonnage comes from a take-or-pay contract with Minera Sierra Gorda, focused on the production of copper and molybdenum concentrate. It offers access to the main highways and railways in the region.
Iquique Tarapacá Region
Antofagasta Antofagasta Region
Ports in Chile
About Our Port TerminalsC2.3.C 6.2.V
71
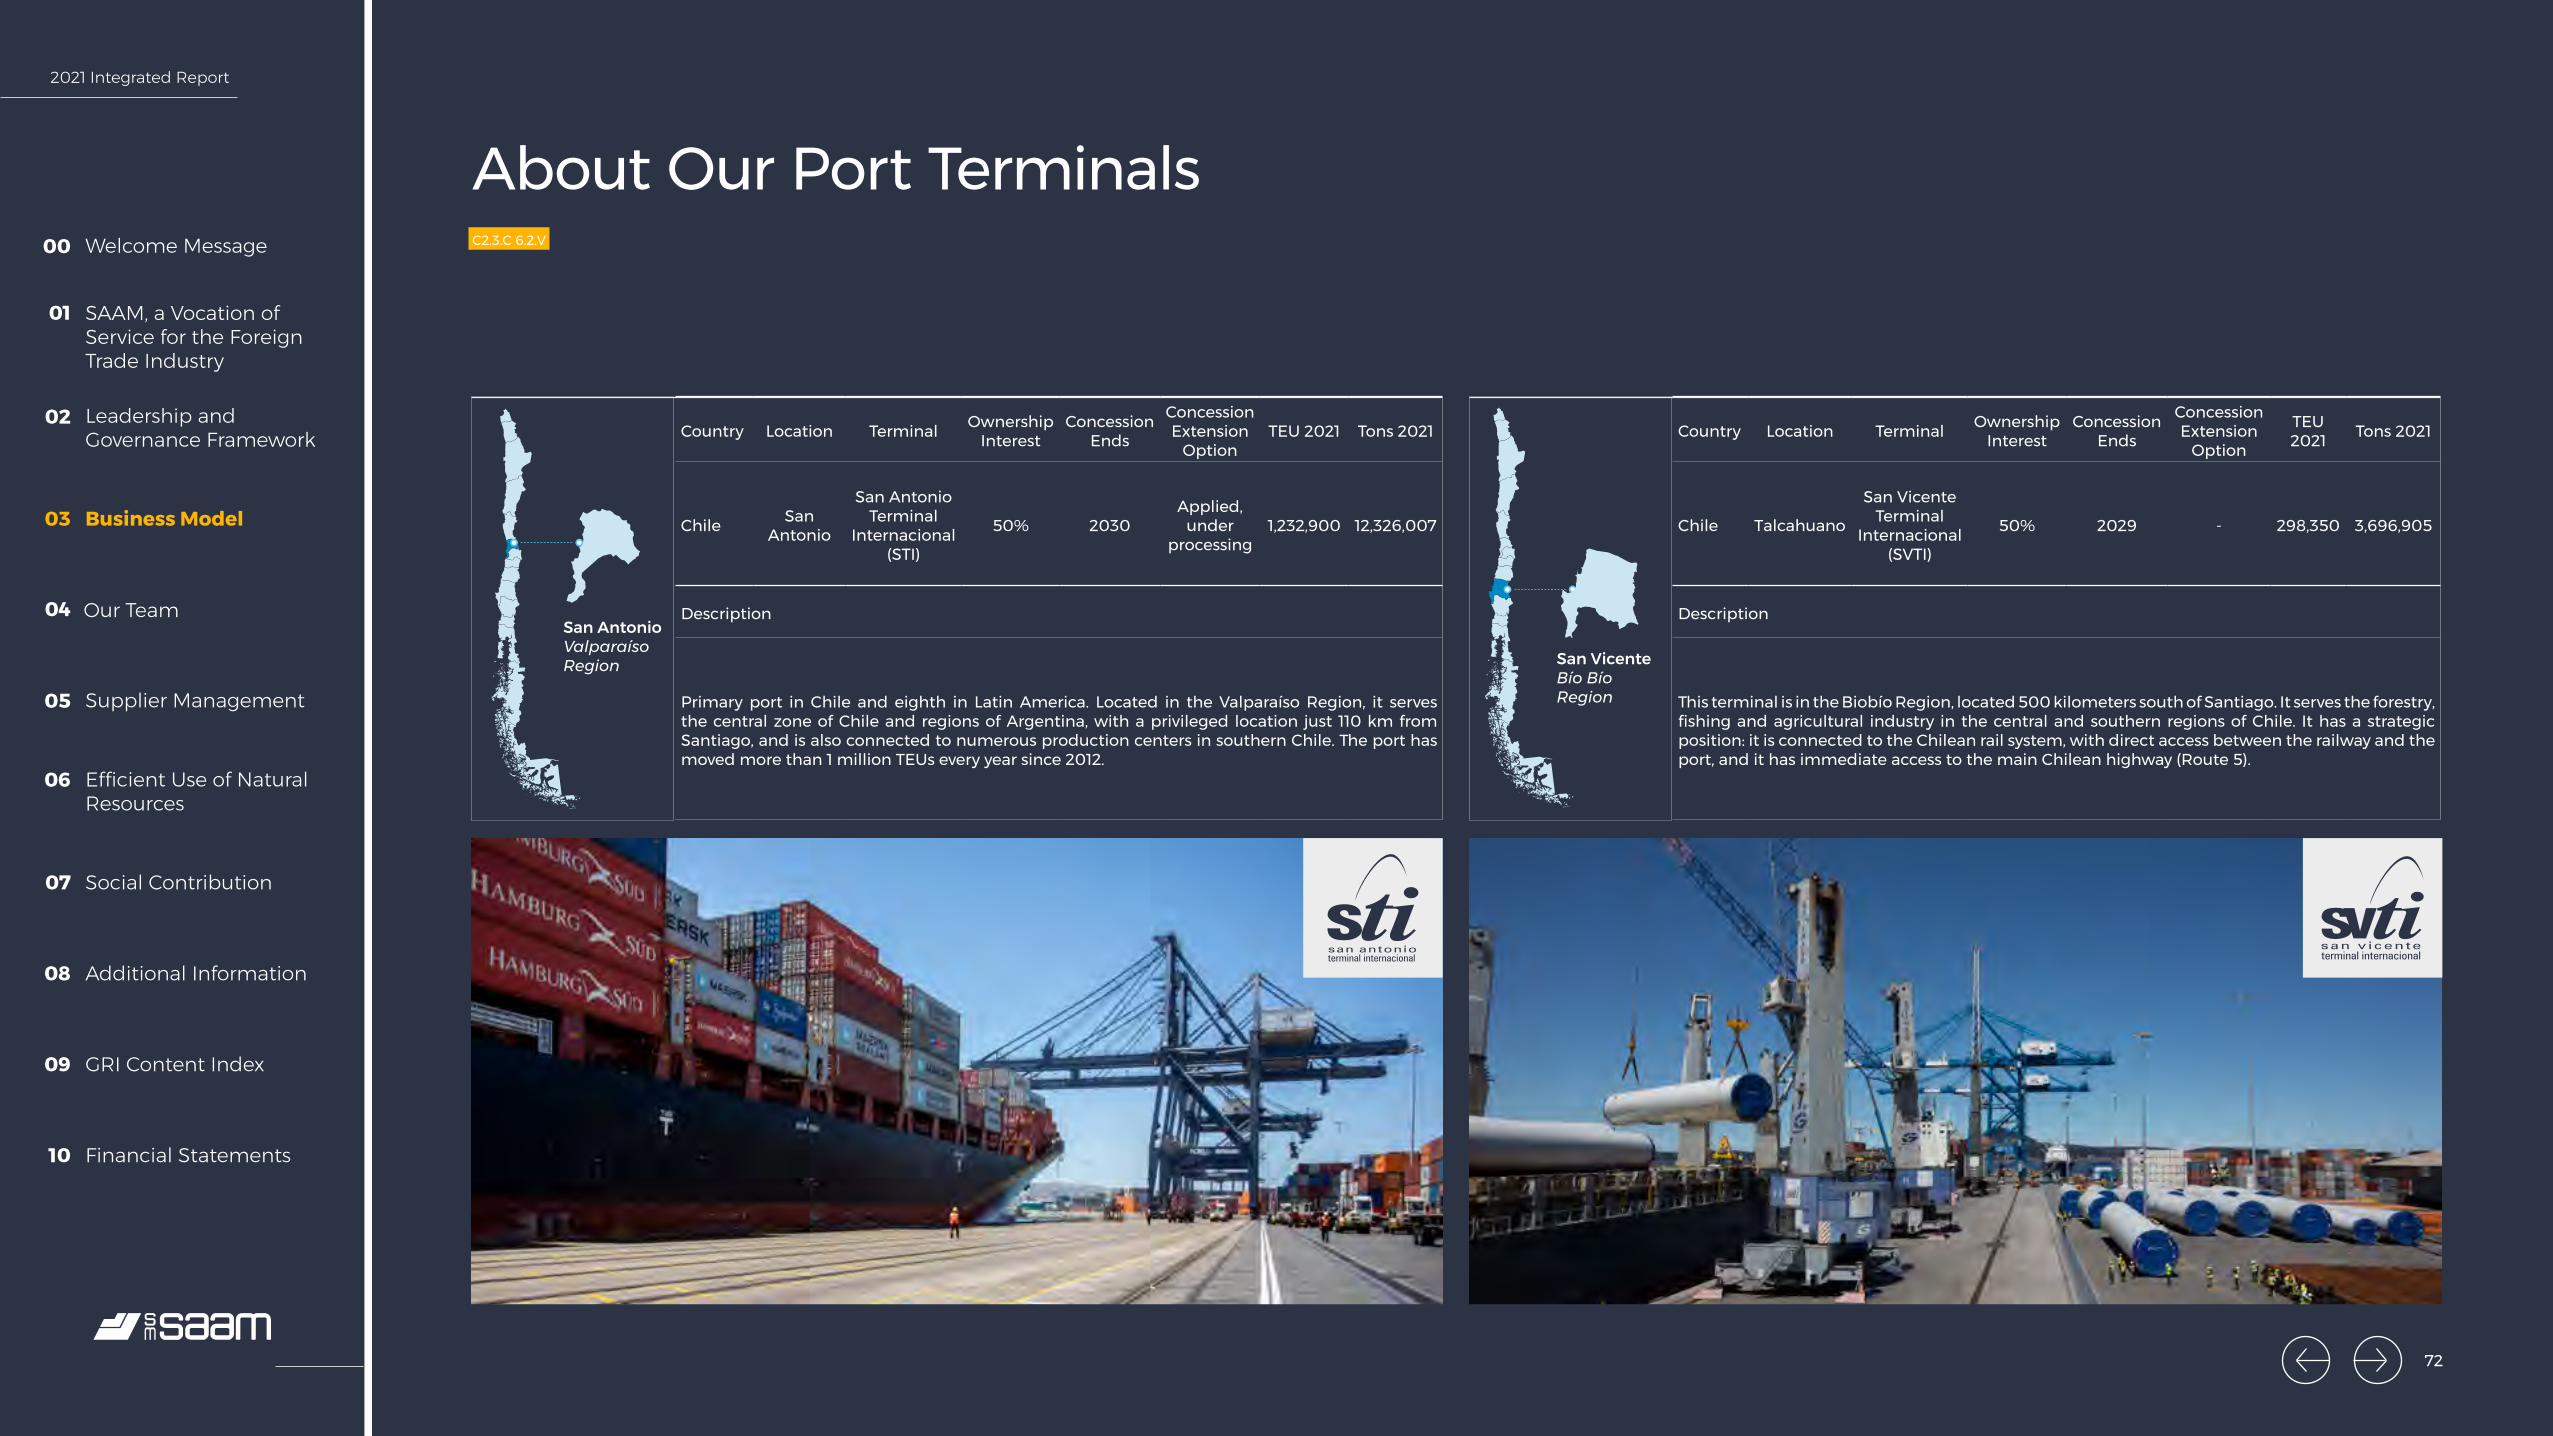
2021 Integrated Report
Welcome Message00
SAAM, a Vocation of Service for the Foreign Trade Industry
01
Leadership and Governance Framework
02
Business Model03
Our Team04
Supplier Management05
Efficient Use of Natural Resources
06
Social Contribution07
Additional Information08
GRI Content Index09
Financial Statements10
Country Location Terminal Ownership Interest
Concession Ends
Concession Extension
OptionTEU 2021 Tons 2021
Chile San Antonio
San Antonio Terminal
Internacional (STI)
50% 2030Applied,
under processing
1,232,900 12,326,007
Description
Primary port in Chile and eighth in Latin America. Located in the Valparaíso Region, it serves the central zone of Chile and regions of Argentina, with a privileged location just 110 km from Santiago, and is also connected to numerous production centers in southern Chile. The port has moved more than 1 million TEUs every year since 2012.
Country Location Terminal Ownership Interest
Concession Ends
Concession Extension
Option
TEU 2021 Tons 2021
Chile Talcahuano
San Vicente Terminal
Internacional (SVTI)
50% 2029 - 298,350 3,696,905
Description
This terminal is in the Biobío Region, located 500 kilometers south of Santiago. It serves the forestry, fishing and agricultural industry in the central and southern regions of Chile. It has a strategic position: it is connected to the Chilean rail system, with direct access between the railway and the port, and it has immediate access to the main Chilean highway (Route 5).
San Antonio Valparaíso Region San Vicente
Bío Bío Region
About Our Port TerminalsC2.3.C 6.2.V
72

2021 Integrated Report
Welcome Message00
SAAM, a Vocation of Service for the Foreign Trade Industry
01
Leadership and Governance Framework
02
Business Model03
Our Team04
Supplier Management05
Efficient Use of Natural Resources
06
Social Contribution07
Additional Information08
GRI Content Index09
Financial Statements10
About Our Port TerminalsC2.3.C 6.2.V
Country Location Terminal Ownership Interest
Concession Ends
Concession Extension
OptionTEU 2021 Tons 2021
Chile Corral Portuaria Corral 50% Private - N/A 1,108,223
Description
The main cargo moved here are wood chips, exported to Asian markets. It provides comprehensive services (chipping, transportation, storage and loading) through its related companies.
Country Location Terminal Ownership Interest
Concession Ends
Concession Extension
OptionTEU 2021 Tons 2021
USA Florida, USA
Florida International Terminal (FIT)
70% 2025 5+5 years 264,039 2,057,490
Description
This port specializes in container management and general cargo in the southern area of Port Everglades, which is connected to the main highways and railways. Port Everglades is currently making improvements to terminal access (the draft will increase from 12.8 m to 14.6 m) and infrastructure. It has the largest facilities and equipment in the terminal (dock and yard civil works, STS cranes) and is responsible for related investments. FIT has priority use in one of the spaces.
Corral Los Ríos Region
MiamiState of Florida
International Ports
73

2021 Integrated Report
Welcome Message00
SAAM, a Vocation of Service for the Foreign Trade Industry
01
Leadership and Governance Framework
02
Business Model03
Our Team04
Supplier Management05
Efficient Use of Natural Resources
06
Social Contribution07
Additional Information08
GRI Content Index09
Financial Statements10
About Our Port TerminalsC2.3.C 6.2.V
Country Location Terminal Ownership Interest
Concession Ends
Concession Extension
OptionTEU 2021 Tons 2021
Mexico Mazatlán
Terminal Marítima Mazatlán (TMAZ)
100% 2032 12 years 42,147 917,689
Description
This terminal is connected to the east coast of Mexico and the southern part of the United States along the Mazatlán-Matamoros freeway. Multipurpose port located in the state of Sinaloa. The main activities are agriculture, livestock farming, fishing and mining. It is one of the main vehicle ports in Mexico, serving the main OEMs.
Country Location Terminal Ownership Interest
Concession Ends
Concession Extension
OptionTEU 2021 Tons 2021
Costa Rica Caldera Puerto
Caldera 51% 2026 - 270,506 6,075,595
Description
Main terminal on the Pacific Coast of Costa Rica and the country’s second largest in terms of cargo movement. Strategic location on the Pacific Coast of Costa Rica. Proximity and good connectivity to the city of San Jose. Main cargo includes containers, vehicles and bulk cargo, such as cereals and fertilizer. It is made up of two separate concessions: SPGC (bulk terminal) and SPC (general cargo and containers). The concession ends in 2026.
CalderaPuntarenas Province
MazatlánSinaloa State
74
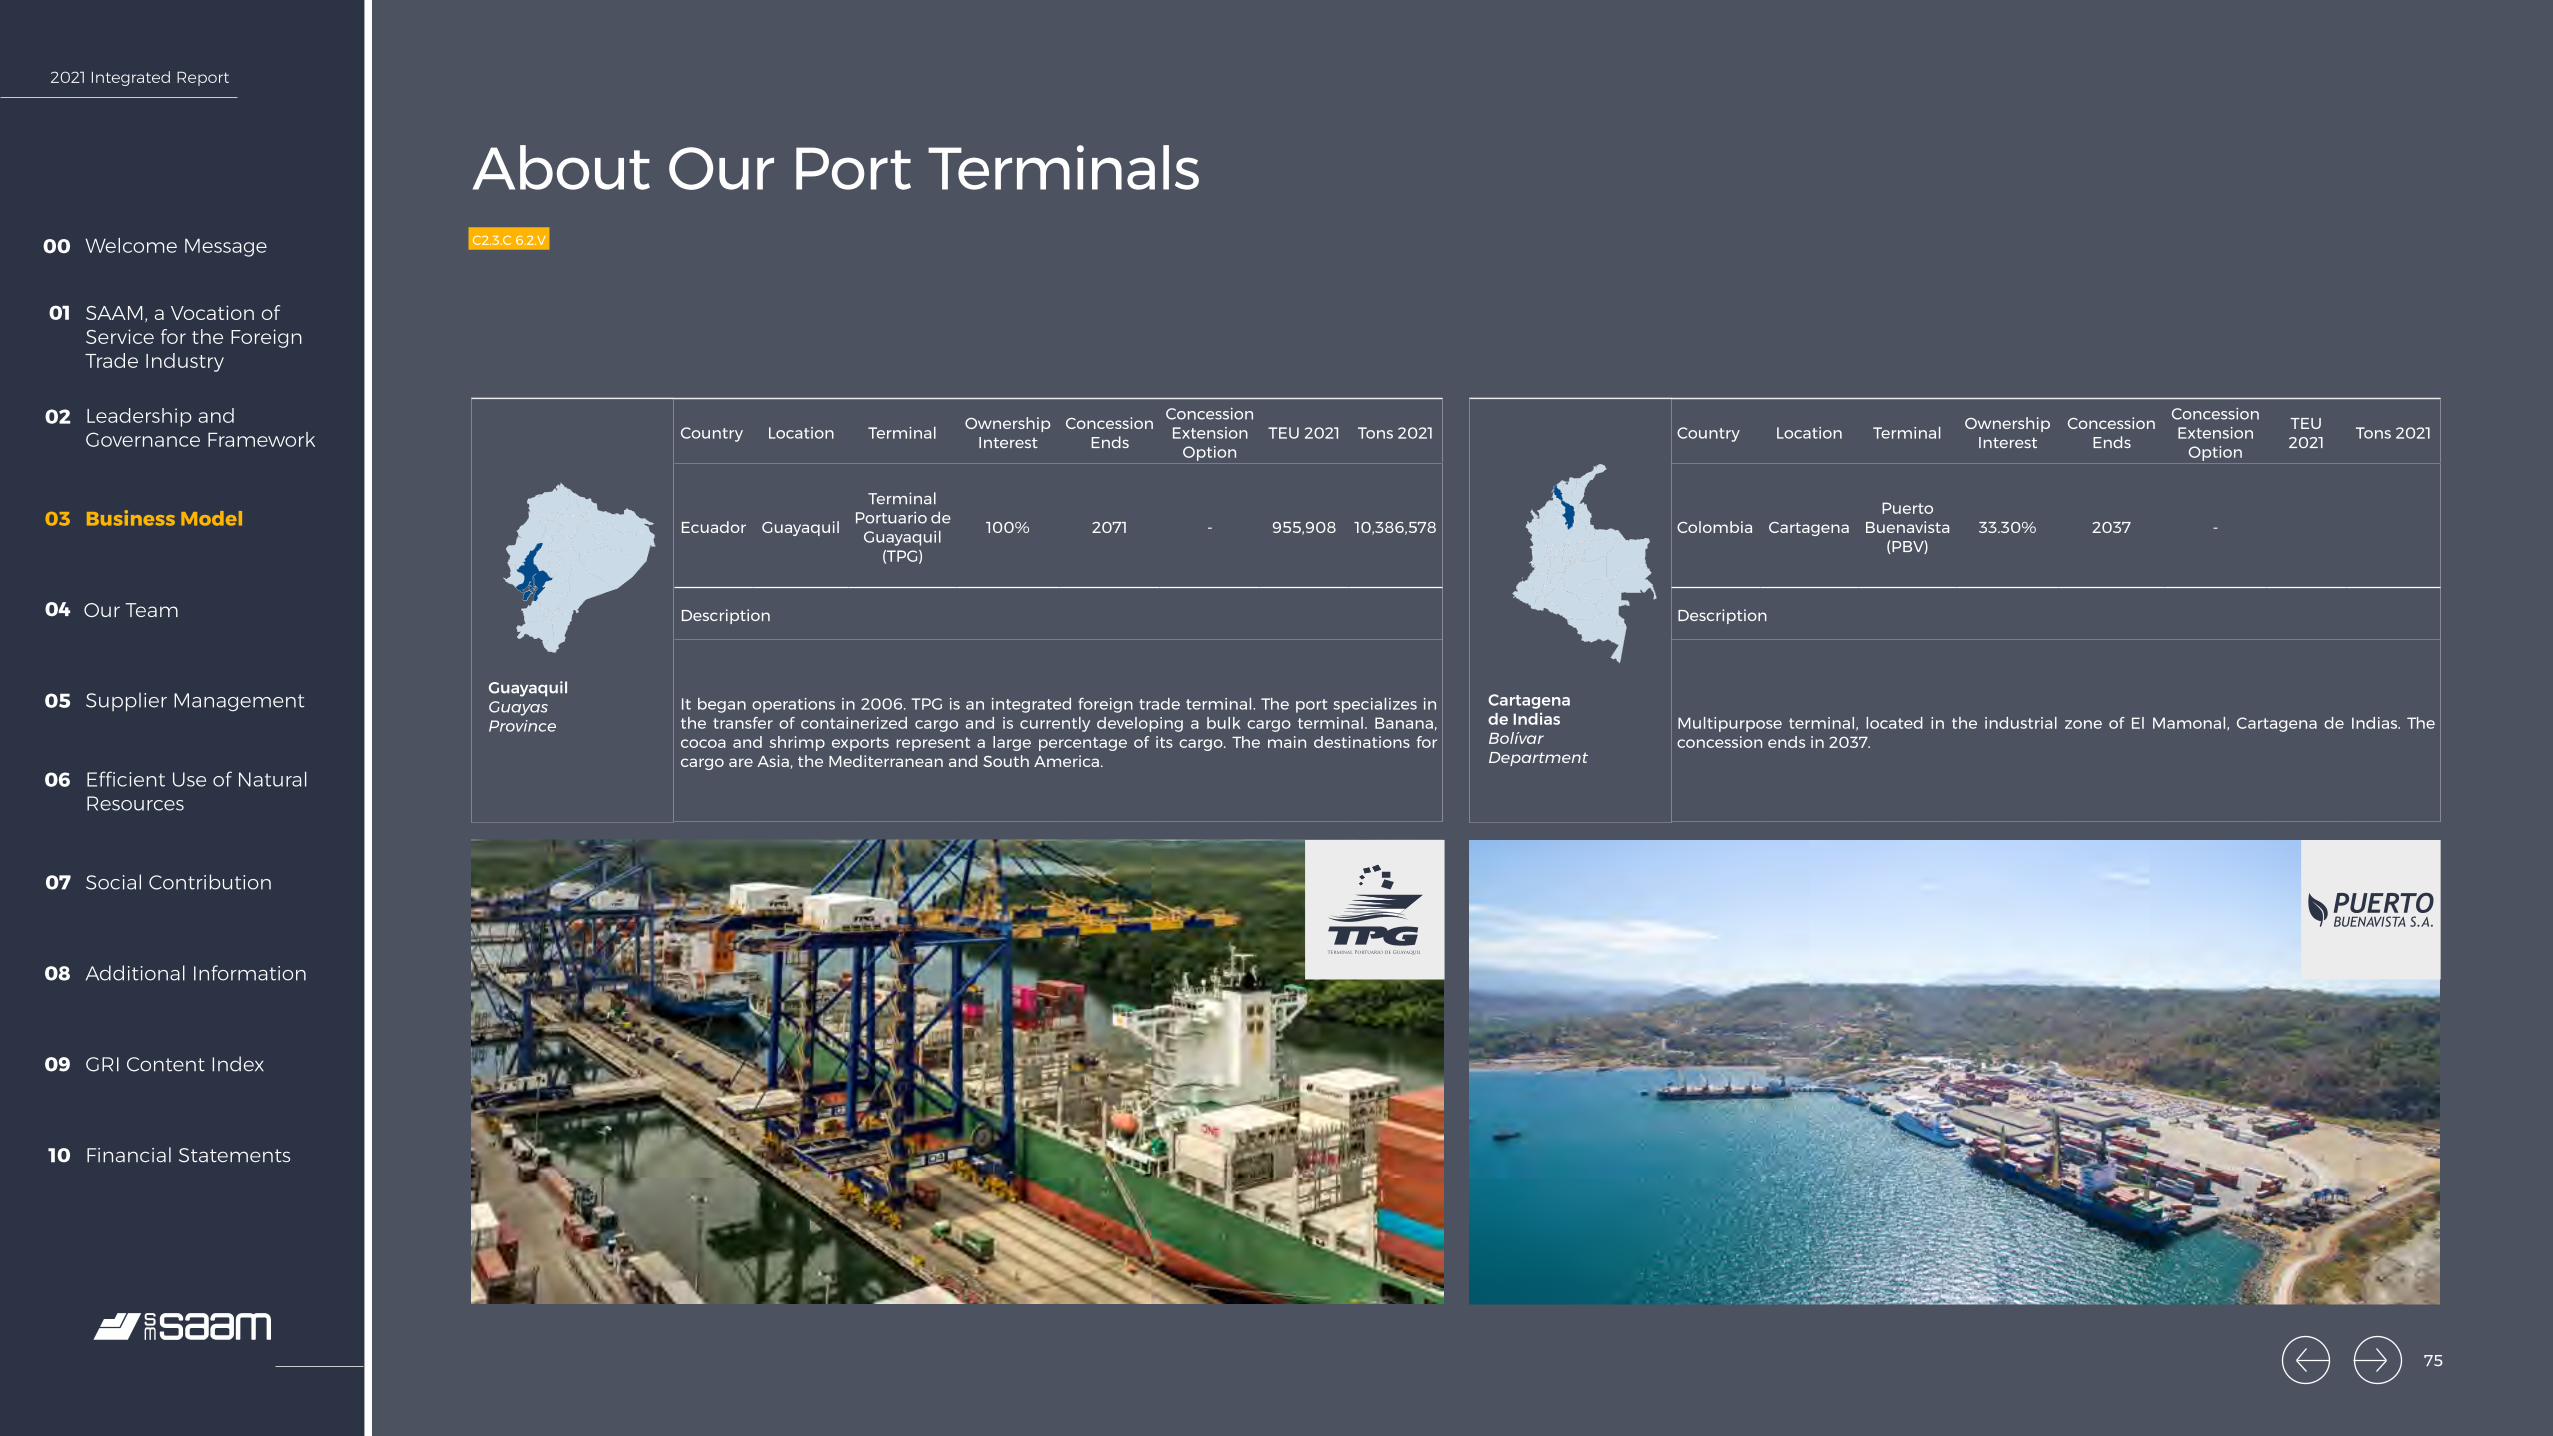
2021 Integrated Report
Welcome Message00
SAAM, a Vocation of Service for the Foreign Trade Industry
01
Leadership and Governance Framework
02
Business Model03
Our Team04
Supplier Management05
Efficient Use of Natural Resources
06
Social Contribution07
Additional Information08
GRI Content Index09
Financial Statements10
About Our Port TerminalsC2.3.C 6.2.V
Country Location Terminal Ownership Interest
Concession Ends
Concession Extension
Option
TEU 2021 Tons 2021
Colombia CartagenaPuerto
Buenavista (PBV)
33.30% 2037 -
Description
Multipurpose terminal, located in the industrial zone of El Mamonal, Cartagena de Indias. The concession ends in 2037.
Cartagenade IndiasBolívar Department
Country Location Terminal Ownership Interest
Concession Ends
Concession Extension
OptionTEU 2021 Tons 2021
Ecuador Guayaquil
Terminal Portuario de
Guayaquil (TPG)
100% 2071 - 955,908 10,386,578
Description
It began operations in 2006. TPG is an integrated foreign trade terminal. The port specializes in the transfer of containerized cargo and is currently developing a bulk cargo terminal. Banana, cocoa and shrimp exports represent a large percentage of its cargo. The main destinations for cargo are Asia, the Mediterranean and South America.
GuayaquilGuayas Province
75
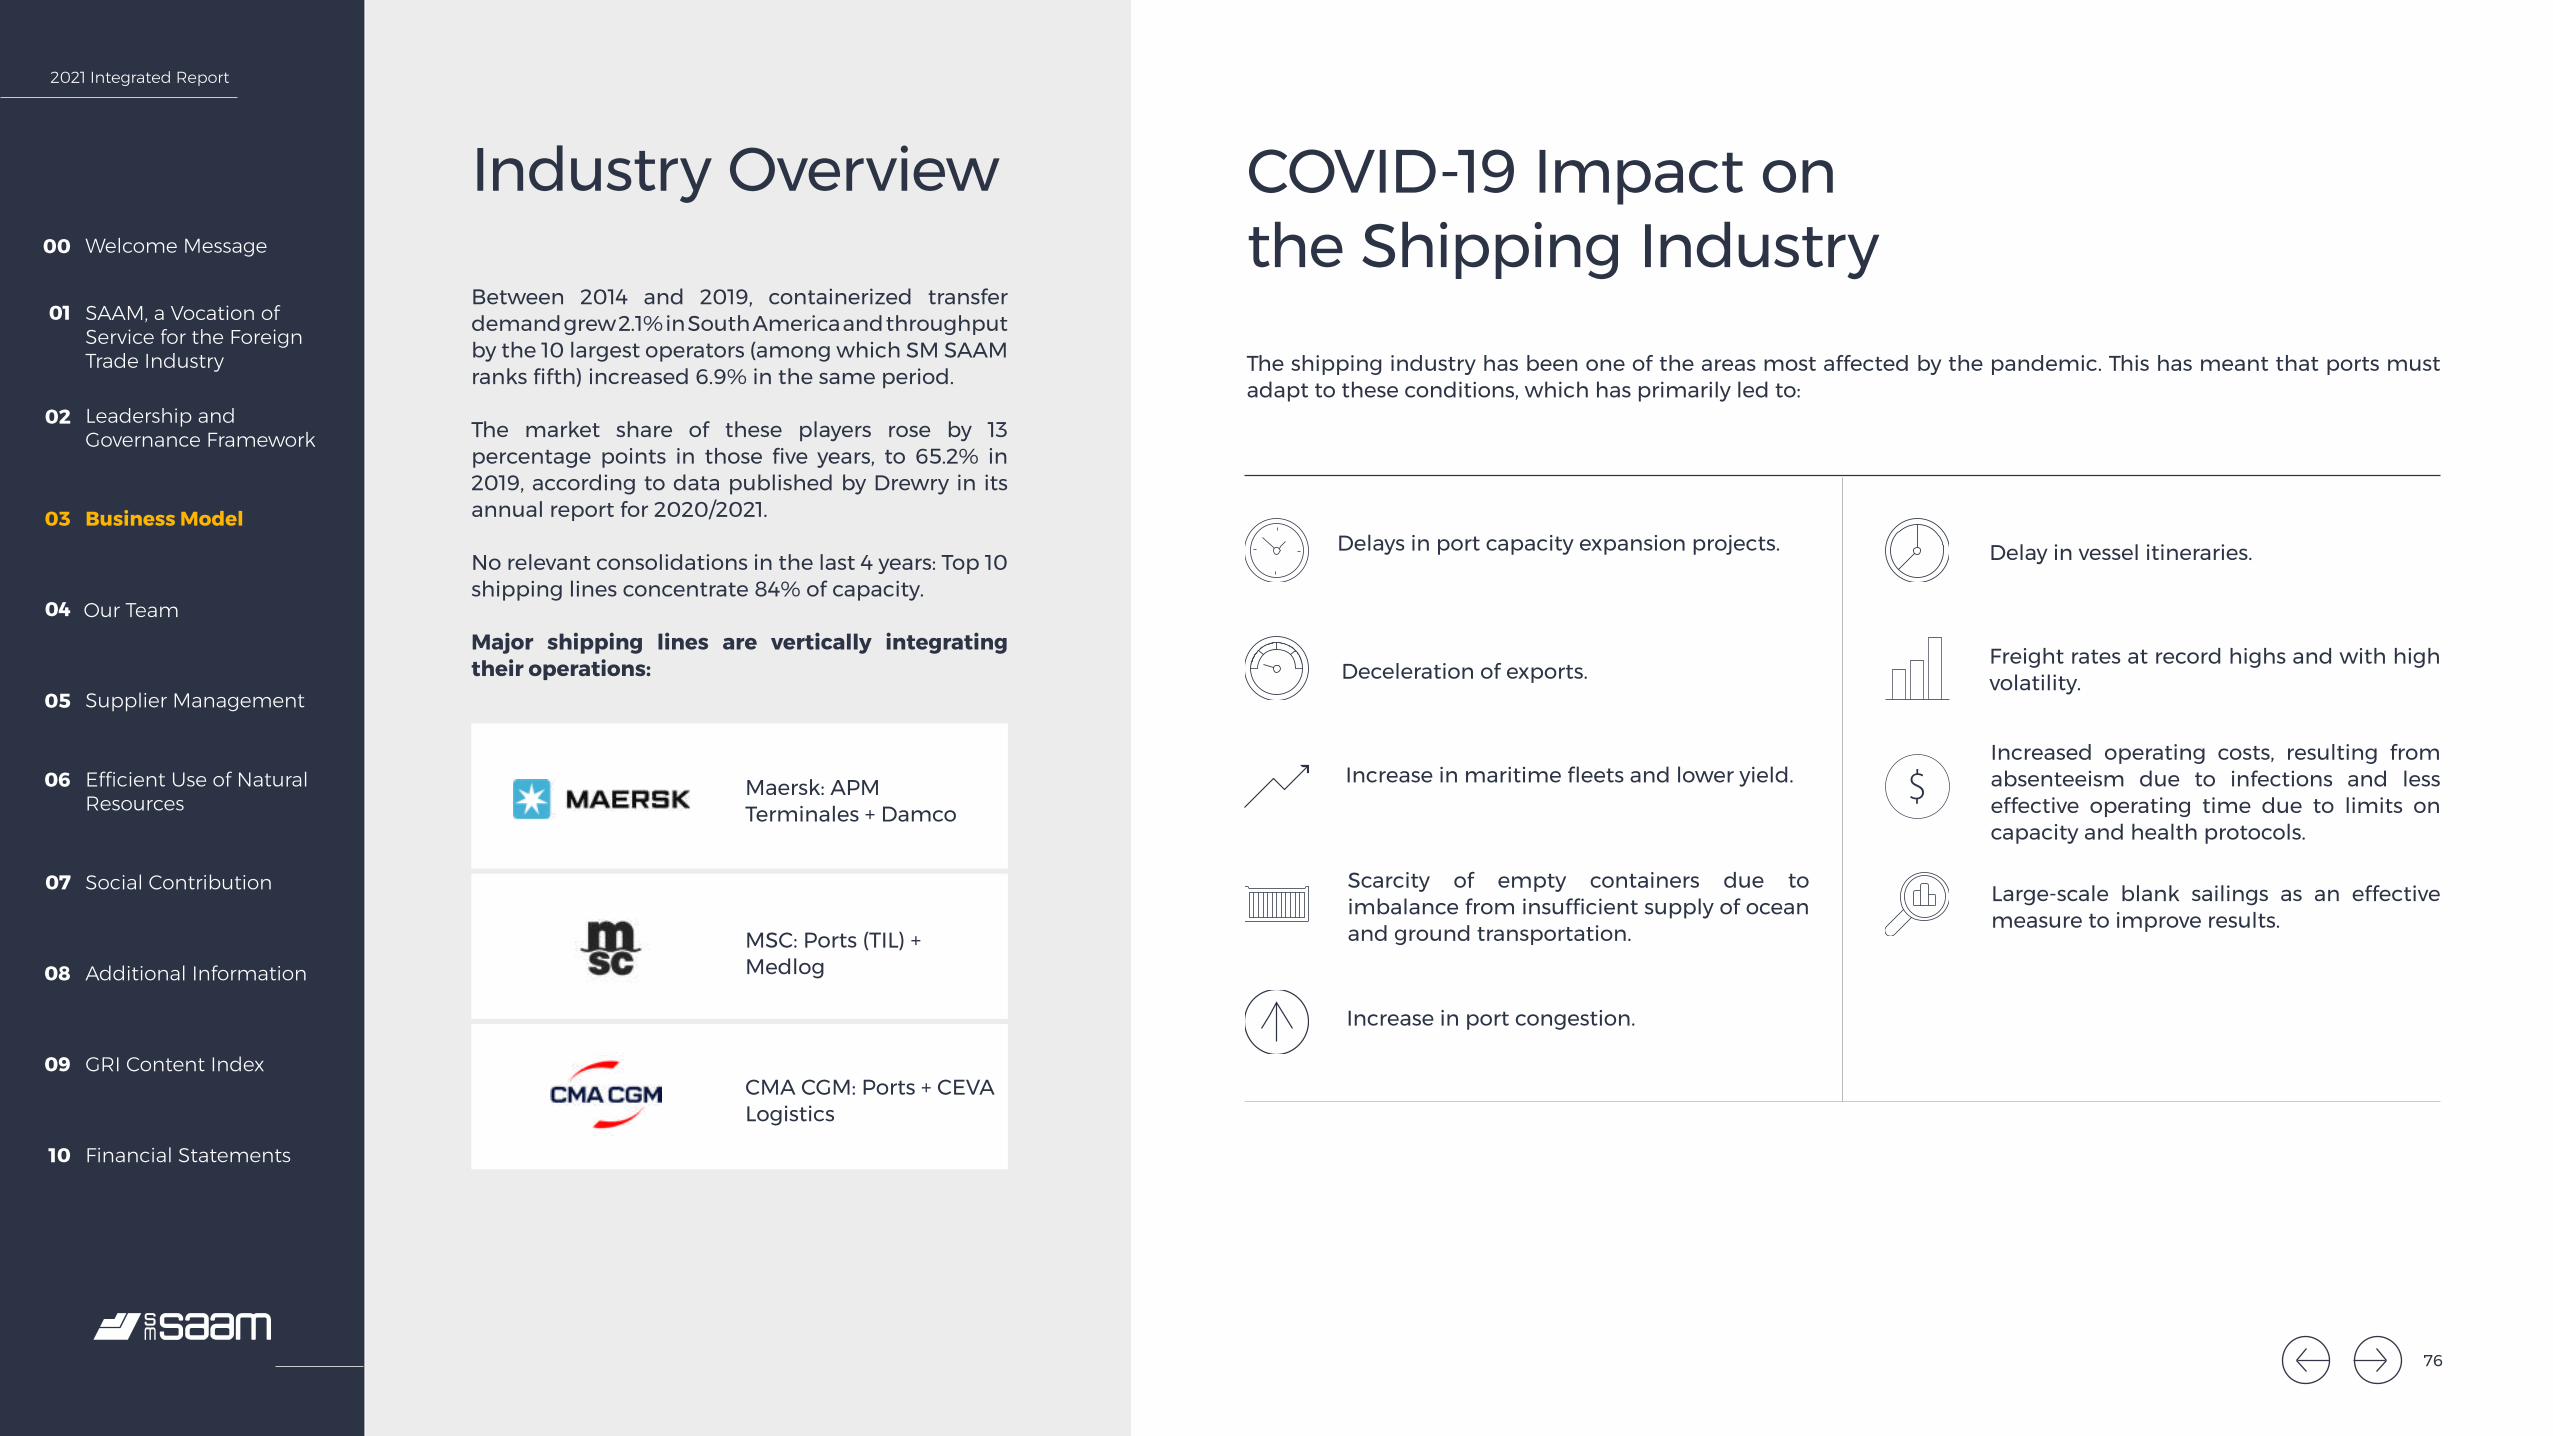
2021 Integrated Report
Welcome Message00
SAAM, a Vocation of Service for the Foreign Trade Industry
01
Leadership and Governance Framework
02
Business Model03
Our Team04
Supplier Management05
Efficient Use of Natural Resources
06
Social Contribution07
Additional Information08
GRI Content Index09
Financial Statements10
Industry Overview
Between 2014 and 2019, containerized transfer demand grew 2.1% in South America and throughput by the 10 largest operators (among which SM SAAM ranks fifth) increased 6.9% in the same period.
The market share of these players rose by 13 percentage points in those five years, to 65.2% in 2019, according to data published by Drewry in its annual report for 2020/2021.
No relevant consolidations in the last 4 years: Top 10 shipping lines concentrate 84% of capacity.
Major shipping lines are vertically integrating their operations:
Maersk: APM Terminales + Damco
COVID-19 Impact on the Shipping Industry
MSC: Ports (TIL) + Medlog
CMA CGM: Ports + CEVA Logistics
The shipping industry has been one of the areas most affected by the pandemic. This has meant that ports must adapt to these conditions, which has primarily led to:
Delays in port capacity expansion projects. Delay in vessel itineraries.
Deceleration of exports.
Increase in maritime fleets and lower yield.
Scarcity of empty containers due to imbalance from insufficient supply of ocean and ground transportation.
Increase in port congestion.
Freight rates at record highs and with high volatility.
Increased operating costs, resulting from absenteeism due to infections and less effective operating time due to limits on capacity and health protocols.
Large-scale blank sailings as an effective measure to improve results.
76

2021 Integrated Report
Welcome Message00
SAAM, a Vocation of Service for the Foreign Trade Industry
01
Leadership and Governance Framework
02
Business Model03
Our Team04
Supplier Management05
Efficient Use of Natural Resources
06
Social Contribution07
Additional Information08
GRI Content Index09
Financial Statements10
Nor
thC
entr
alSo
uth
Country Location Terminal Competitors
Ecuador Guayaquil Terminal Portuario Guayaquil (TPG)
Contecon, Dole Food Company and DP World Posorja
Mexico Mazatlán Terminal Marítima Mazatlán (TMAZ)
Puerto Lázaro Cárdenas and Puerto Manzanillo
USA Florida, USA Florida International Terminal (FIT)
Crowley Mediterranean Shipping Company and Sun Terminals (Port Everglades); and the Miami port terminals
Competition C2.3.B6.2.II
The port market where SM SAAM operates is highly competitive, both in Chile and in other countries where its subsidiaries and associates are located. Its main local and international competitors include private ports for public use and publicly concessioned ports.
Area Location Terminals Competitors
North Iquique and Antofagasta
Iquique Terminal Internacional (ITI) and Antofagasta Terminal Internacional (ATI)
Puerto Arica, Puerto Angamos and Puerto Mejillones
Central San Antonio San Antonio Terminal Internacional (STI)
Terminal Pacífico Sur and DP World
South Talcahuano and Corral
San Vicente Terminal Internacional (SVTI) and Portuaria Corral
Puerto Coronel, DP World Lirquén and Portuaria Cabo Froward
Chile is a success case in port competitiveness in Latin America and around the world, because it has well-established concession contracts that have made the terminals that move the most cargo in the country, in the Fifth Region, highly competitive.
Competition in Chile Competition Elsewhere in the Americas
77
2021 Integrated Report
Welcome Message00
SAAM, a Vocation of Service for the Foreign Trade Industry
01
Leadership and Governance Framework
02
Business Model03
Our Team04
Supplier Management05
Efficient Use of Natural Resources
06
Social Contribution07
Additional Information08
GRI Content Index09
Financial Statements10
Port Terminals Customers and SuppliersC2.3.C6.2.IV
Regulatory FrameworkLaw 19,542 of 1997 modernized the state port sector in Chile and regulated private participation in developing, maintaining and operating berths owned by state port companies.
Public tendering of port concessions has promoted long-term investment and ensured that basic services provided by successful bidders are performed under competitive, high-quality and transparent conditions, in order to maximize their direct benefit to end users.
The tender processes where SAAM Ports S.A. have been awarded concessions in Chile are San Antonio Terminal Internacional, San Vicente Terminal Internacional, Antofagasta Terminal Internacional and Iquique Terminal Internacional. Accordingly, these concession contracts have established provisions to ensure non-discriminatory and equal access to port services, rate-setting criteria that promote competitiveness and high-quality standards.
This is the most relevant regulation relating to free competition, securing the structural safeguards required to protect horizontal and vertical integration.
In addition, the Port of Corral operates under the maritime concessions regime regulated by DFL 340 from 1960, complemented by its regulation contained in DS (M) No. 9, 2018, of the National Defense Ministry.
In the other countries where SAAM Ports S.A. operates, there are regulatory frameworks that regulate the industry, promote investments and improve productivity and competitiveness in the sector through a concession system with private operators. Port and state authorities inspect concessionaires, primarily in free competition issues. Generally, port operations managed by the Port Terminal Division abroad are governed by principles covering user non-discrimination, published regulated rates and structural safeguards that protect horizontal and vertical integration.
SM SAAM’s main customers in the port terminal market are shipping companies and companies in the mining, forestry and fruit industry. In 2021 two customers represented more than 10% of total consolidated sales.
The most important suppliers for the company are from the engineering, construction and port equipment fields. None of these concentrate more than 10% of purchasing of goods and services for the year.
Relevant Factors
Volume of worldwide seaborne trade
Consolidation of customers and operators drives the integration of services and networks.
Larger vessels strain the capabilities of the entire ecosystem.
New production hubs are transforming the global logistics chain.
Market Share In South America, SAAM Ports (the subsidiary for the Port Terminals Division) is the fifth most relevant player, with market share of 6.8% at the end of 2019 (Source: Drewry 2020).
78
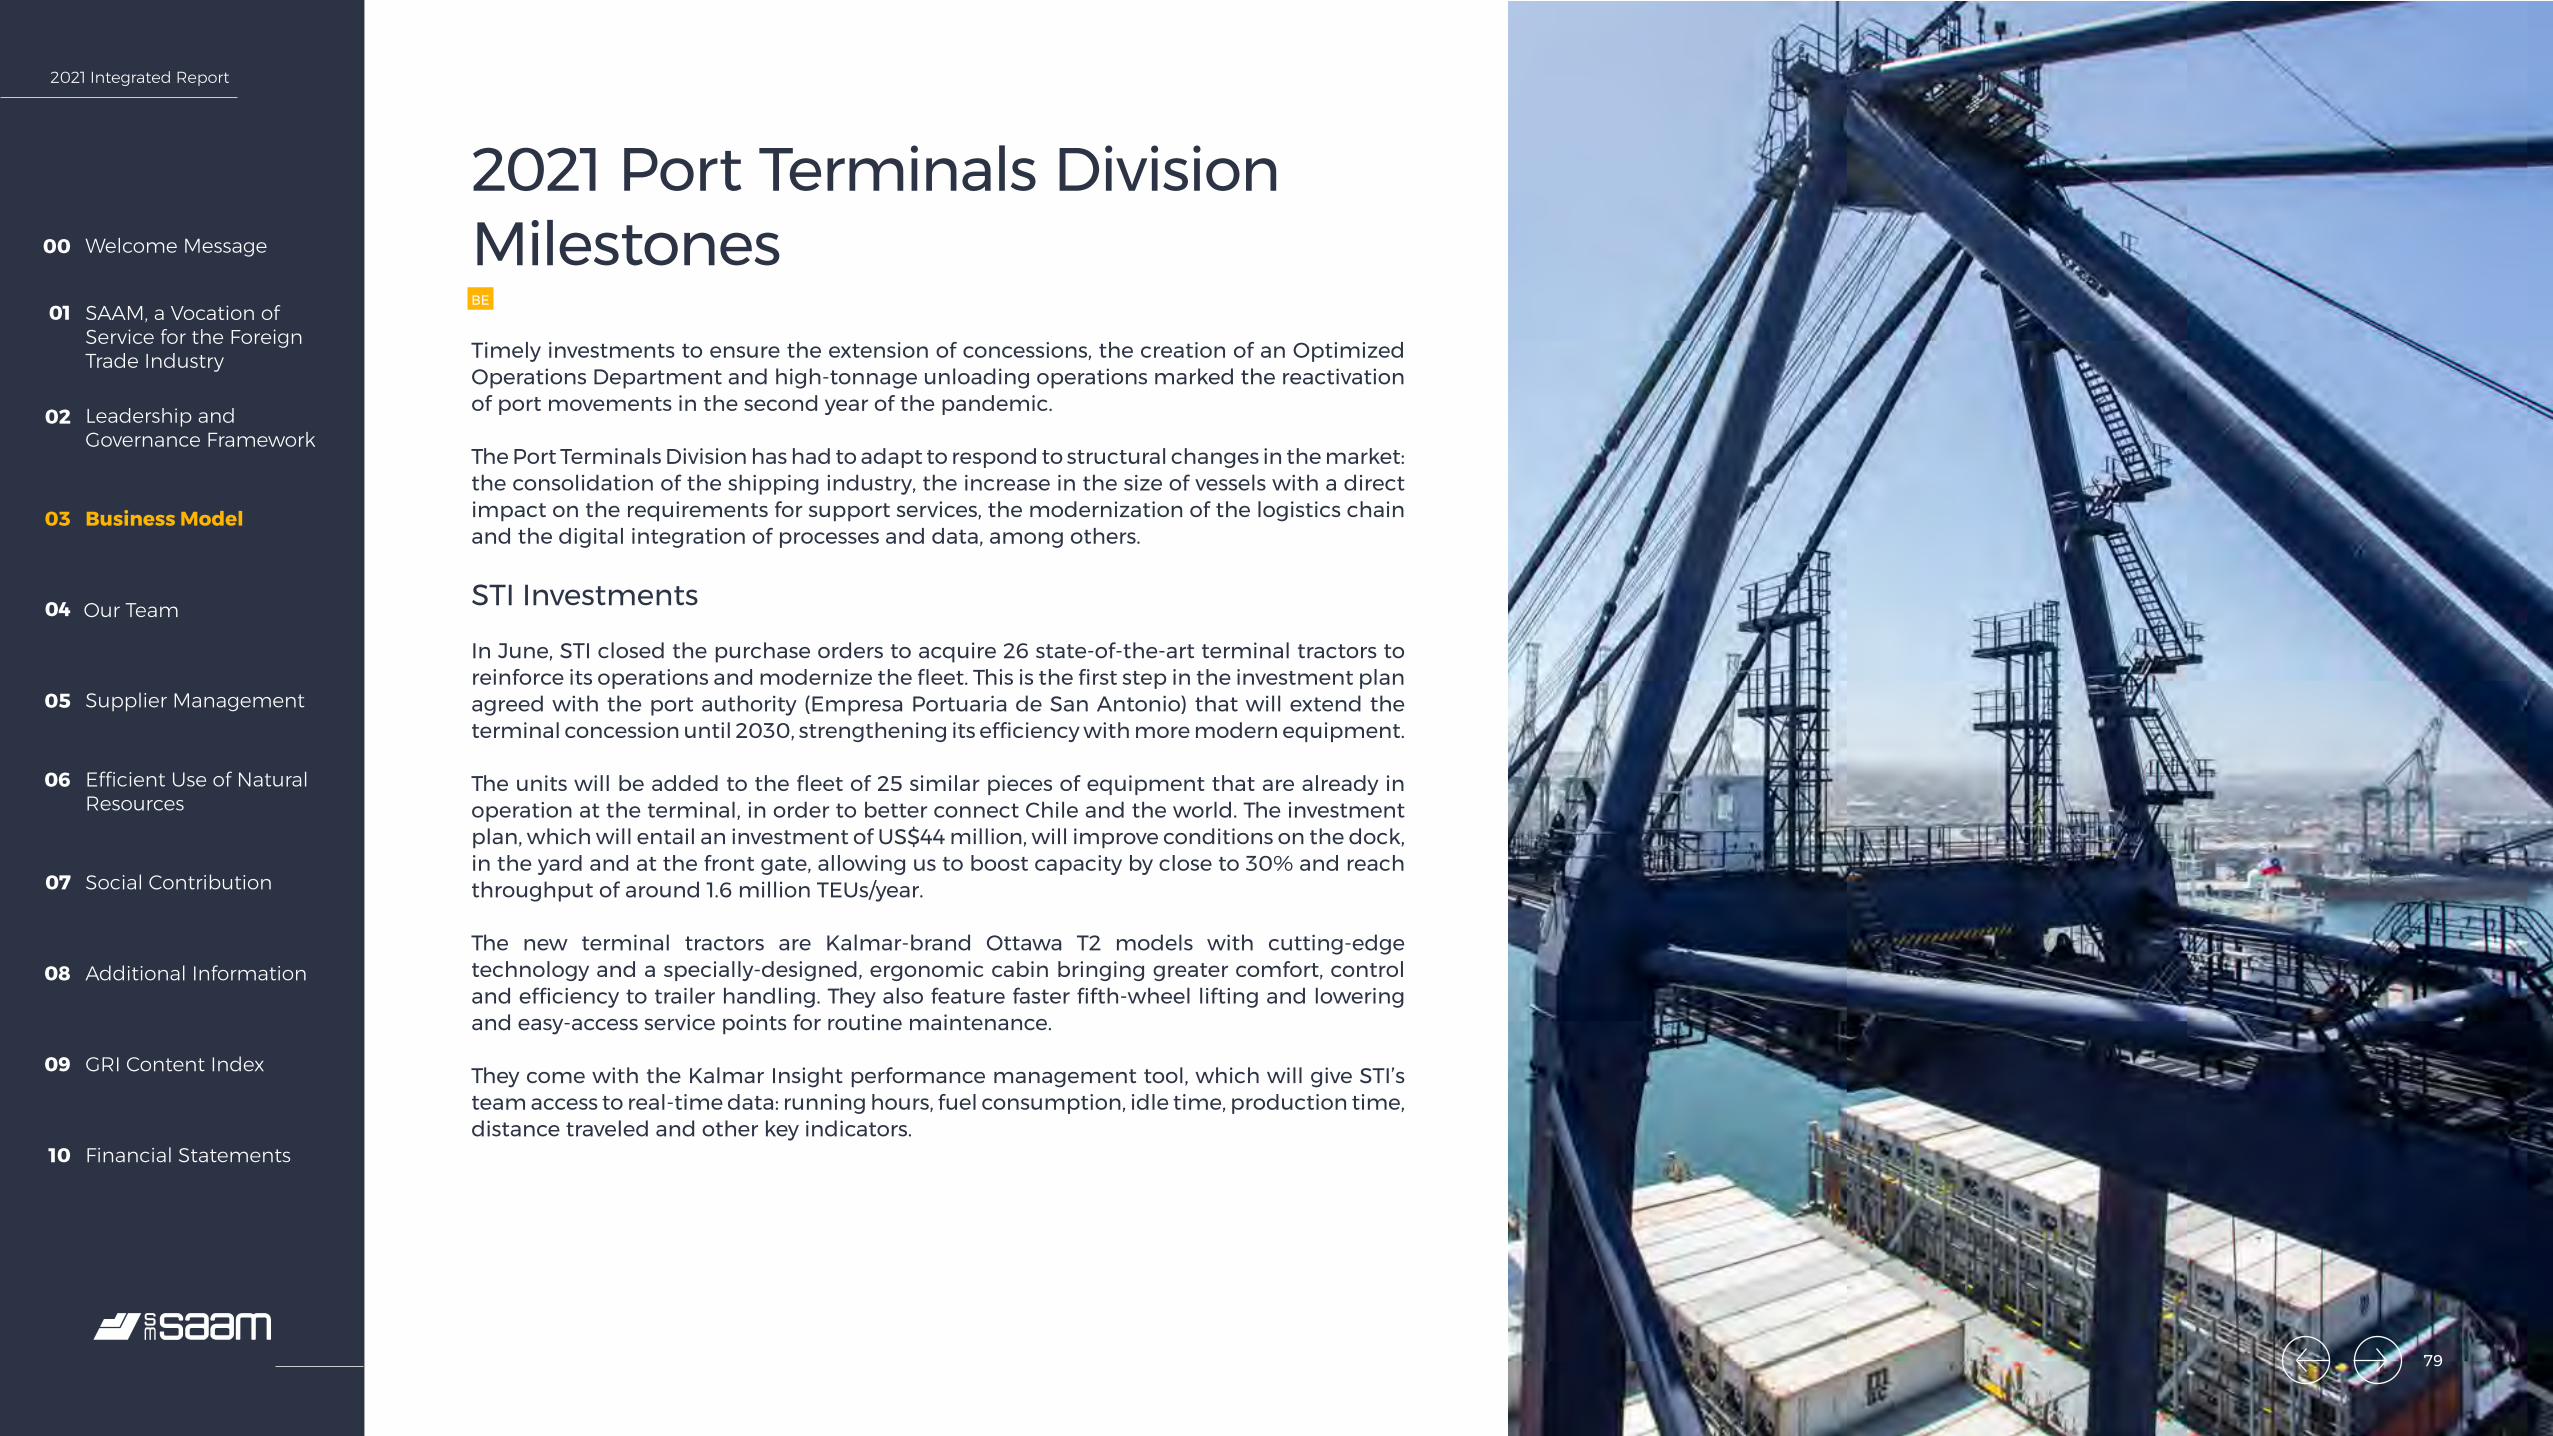
2021 Integrated Report
Welcome Message00
SAAM, a Vocation of Service for the Foreign Trade Industry
01
Leadership and Governance Framework
02
Business Model03
Our Team04
Supplier Management05
Efficient Use of Natural Resources
06
Social Contribution07
Additional Information08
GRI Content Index09
Financial Statements10
2021 Port Terminals Division MilestonesBE
Timely investments to ensure the extension of concessions, the creation of an Optimized Operations Department and high-tonnage unloading operations marked the reactivation of port movements in the second year of the pandemic.
The Port Terminals Division has had to adapt to respond to structural changes in the market: the consolidation of the shipping industry, the increase in the size of vessels with a direct impact on the requirements for support services, the modernization of the logistics chain and the digital integration of processes and data, among others.
STI Investments
In June, STI closed the purchase orders to acquire 26 state-of-the-art terminal tractors to reinforce its operations and modernize the fleet. This is the first step in the investment plan agreed with the port authority (Empresa Portuaria de San Antonio) that will extend the terminal concession until 2030, strengthening its efficiency with more modern equipment.
The units will be added to the fleet of 25 similar pieces of equipment that are already in operation at the terminal, in order to better connect Chile and the world. The investment plan, which will entail an investment of US$44 million, will improve conditions on the dock, in the yard and at the front gate, allowing us to boost capacity by close to 30% and reach throughput of around 1.6 million TEUs/year.
The new terminal tractors are Kalmar-brand Ottawa T2 models with cutting-edge technology and a specially-designed, ergonomic cabin bringing greater comfort, control and efficiency to trailer handling. They also feature faster fifth-wheel lifting and lowering and easy-access service points for routine maintenance.
They come with the Kalmar Insight performance management tool, which will give STI’s team access to real-time data: running hours, fuel consumption, idle time, production time, distance traveled and other key indicators.
79

2021 Integrated Report
Welcome Message00
SAAM, a Vocation of Service for the Foreign Trade Industry
01
Leadership and Governance Framework
02
Business Model03
Our Team04
Supplier Management05
Efficient Use of Natural Resources
06
Social Contribution07
Additional Information08
GRI Content Index09
Financial Statements10
State-of-the-Art crane at TPG
In 2021, Terminal Portuario de Guayaquil (TPG) acquired a new STS crane to ensure continuity of services to larger vessels in Guayaquil. This is added to the purchase of more equipment for repositioning containers in the empty container deposit service.
The announcement was made in May in the frame work of an investment agreement for US$23 million between TPG and the government of Ecuador. The unit (Super Post Panamax) will complement other investments already made, including extending the berth, dredging and purchasing new equipment valued at close to US$17 million.
The investment is part of a US$160 million construction and development plan which has doubled terminal capacity, with 42% market share in Ecuador, with the aim to strengthen Guayaquil as an area of influence for foreign trade on the Pacific Coast. The acquisition will add to the five cranes already at the terminal.
New Department
In October, SM SAAM’s Port Terminals Division announced the creation of the Optimized Operations Department, for the design and implementation of strategies to improve the quality of service, ensure operational excellence and increase productivity and efficiency at the ports where the company is present.
80
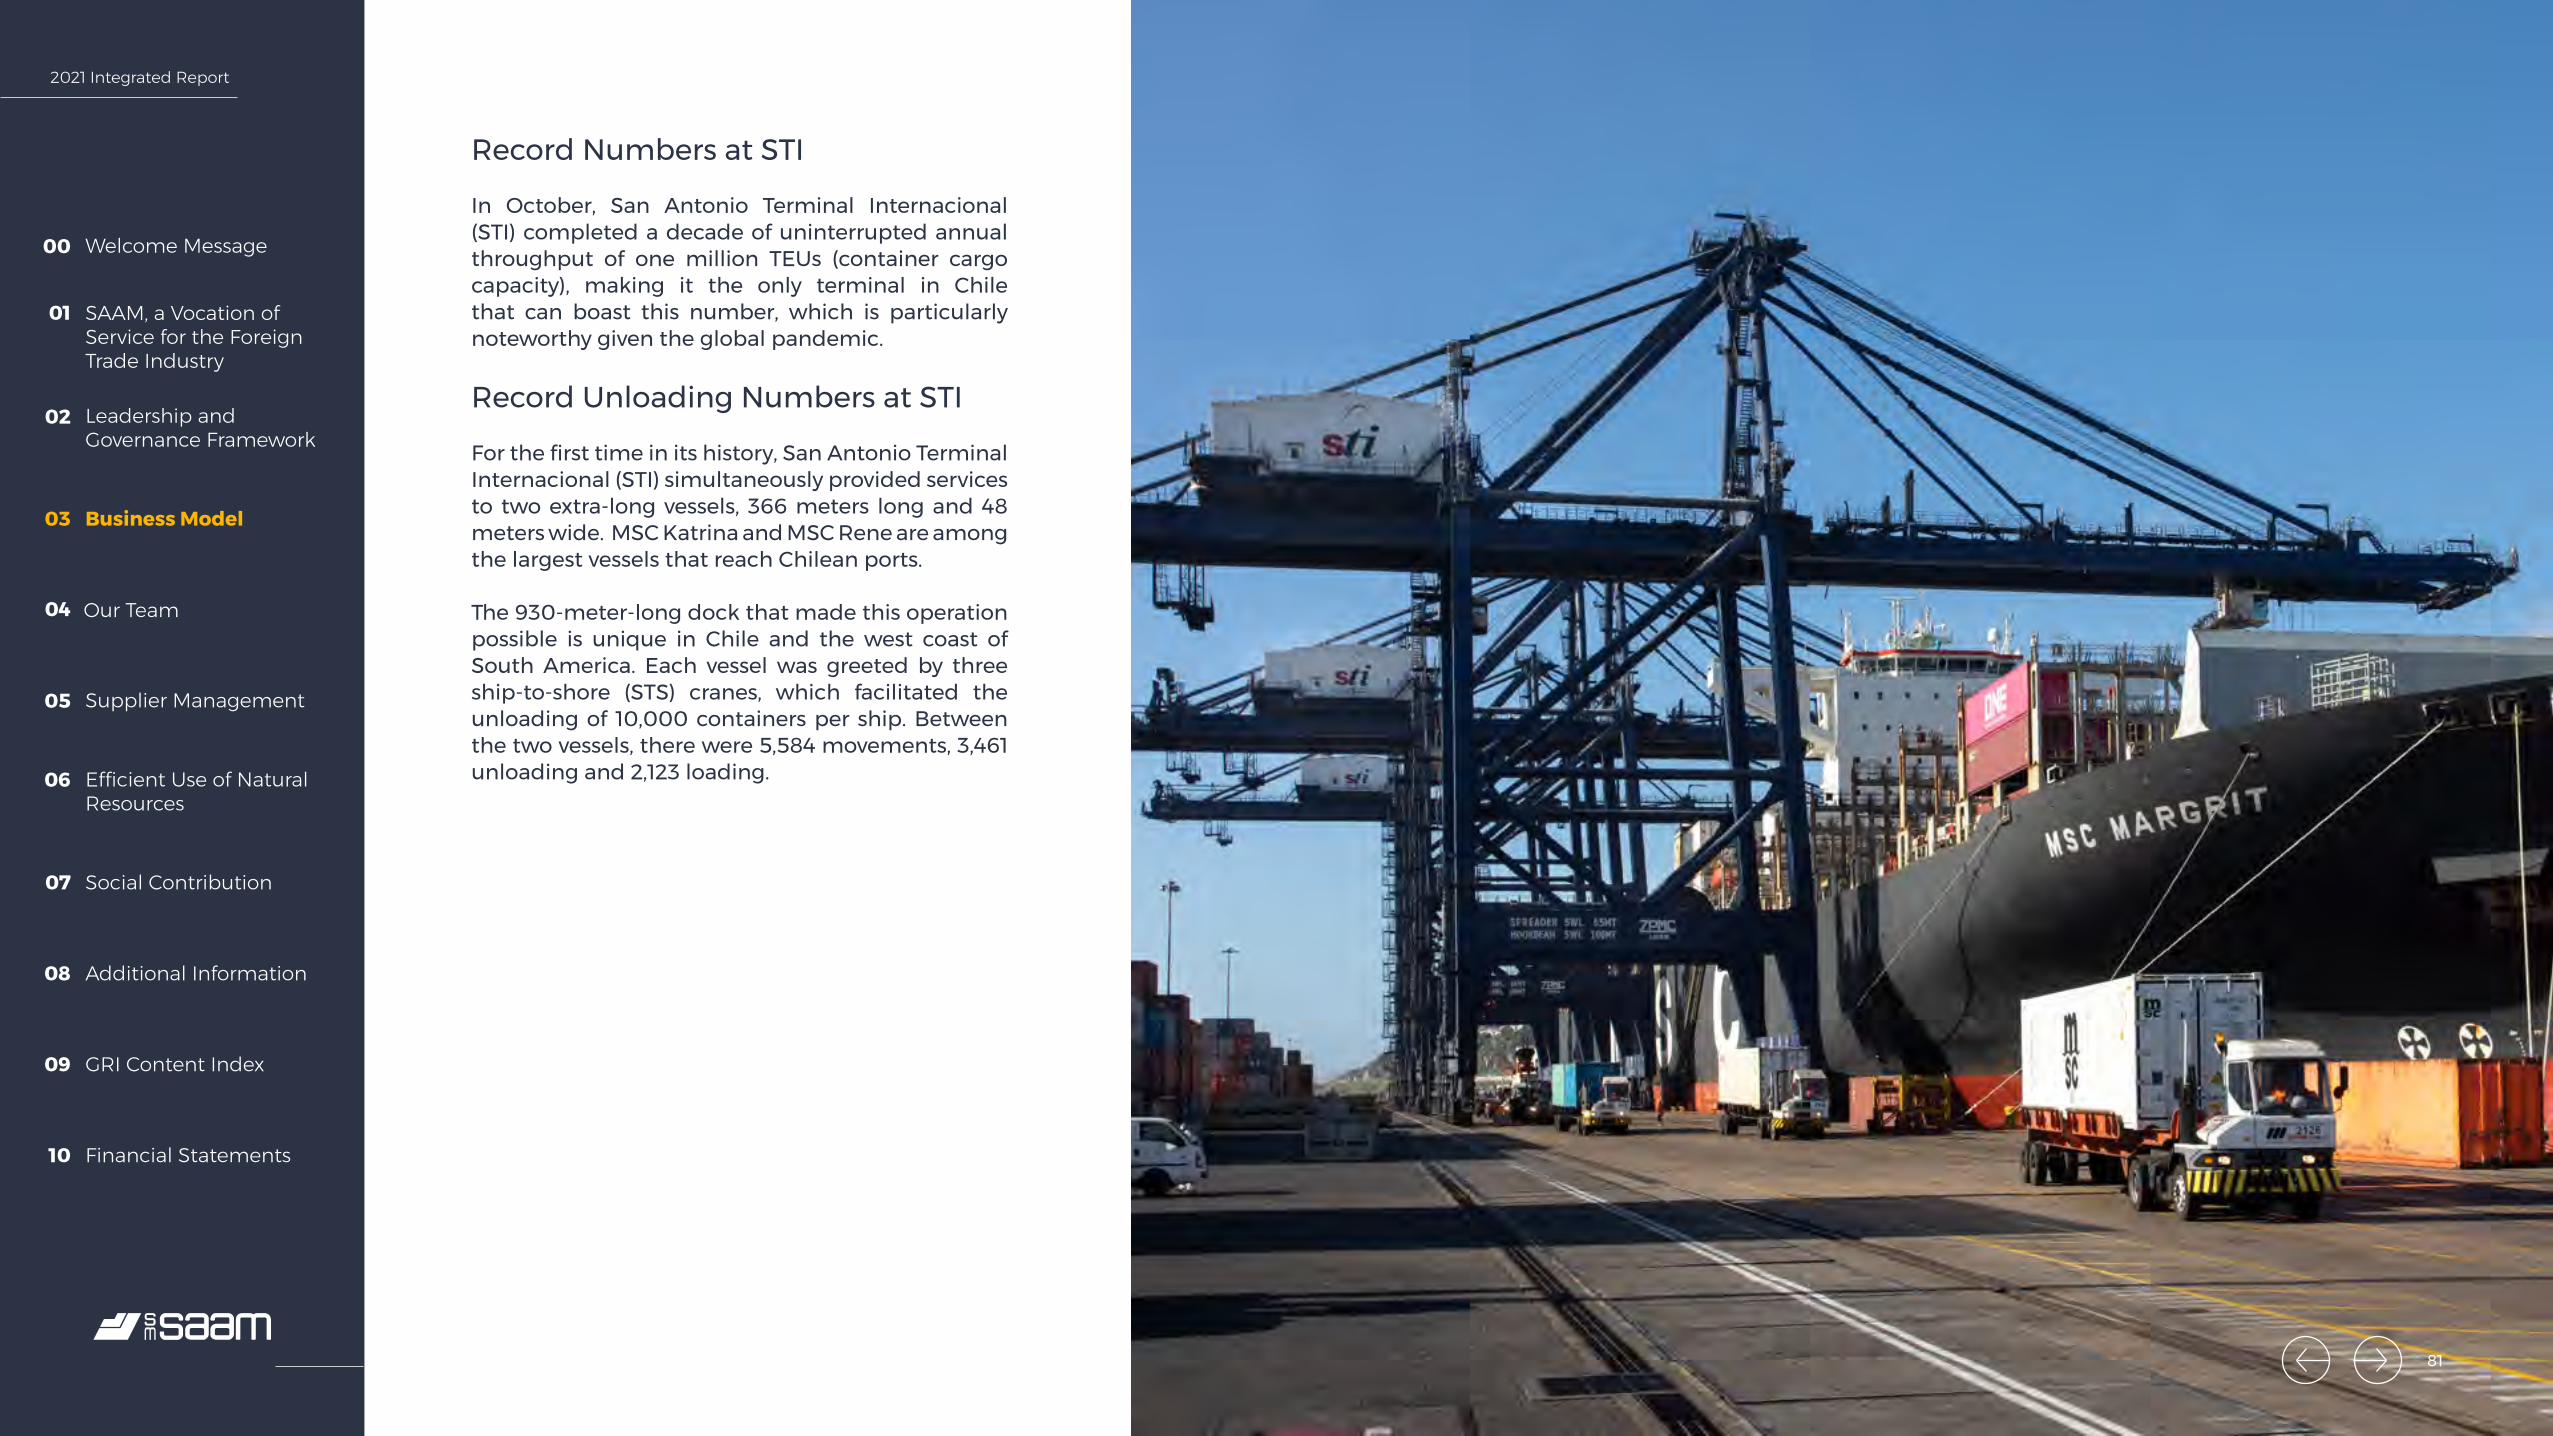
2021 Integrated Report
Welcome Message00
SAAM, a Vocation of Service for the Foreign Trade Industry
01
Leadership and Governance Framework
02
Business Model03
Our Team04
Supplier Management05
Efficient Use of Natural Resources
06
Social Contribution07
Additional Information08
GRI Content Index09
Financial Statements10
Record Numbers at STI
In October, San Antonio Terminal Internacional (STI) completed a decade of uninterrupted annual throughput of one million TEUs (container cargo capacity), making it the only terminal in Chile that can boast this number, which is particularly noteworthy given the global pandemic.
Record Unloading Numbers at STI
For the first time in its history, San Antonio Terminal Internacional (STI) simultaneously provided services to two extra-long vessels, 366 meters long and 48 meters wide. MSC Katrina and MSC Rene are among the largest vessels that reach Chilean ports.
The 930-meter-long dock that made this operation possible is unique in Chile and the west coast of South America. Each vessel was greeted by three ship-to-shore (STS) cranes, which facilitated the unloading of 10,000 containers per ship. Between the two vessels, there were 5,584 movements, 3,461 unloading and 2,123 loading.
81

2021 Integrated Report
Welcome Message00
SAAM, a Vocation of Service for the Foreign Trade Industry
01
Leadership and Governance Framework
02
Business Model03
Our Team04
Supplier Management05
Efficient Use of Natural Resources
06
Social Contribution07
Additional Information08
GRI Content Index09
Financial Statements10
Sustainability Milestones
Three terminals received the Emissions Reduction Seal, granted by the Huella Chile Program from the Environment Ministry: ATI (for the second year in a row), ITI and SVTI.
All terminals quantify their emissions. Of these, 4 terminals in Chile received the Huella Chile Quantification Seal (ITI, ATI, STI and SVTI).
ATI maintained the Clean Production certification granted by the Sustainability and Climate Change Agency (Agencia de Sustentabilidad y Cambio Climático, ASCC) from the Chilean Economy Ministry.
ITI promoted the Tarapacá entrepreneur tournament “Nada Nos Detiene”.
SVTI became the first port in Chile certified by Giro Limpio, reducing GHG emissions through idle time management).
Portuaria Corral and Chile a Fondo developed the lending and specialized advisory services program “Juntos por Corral,” to start up or reactivate local SMEs.
More details in the chapters on Efficient Use of Natural Resources and Social Contribution
82
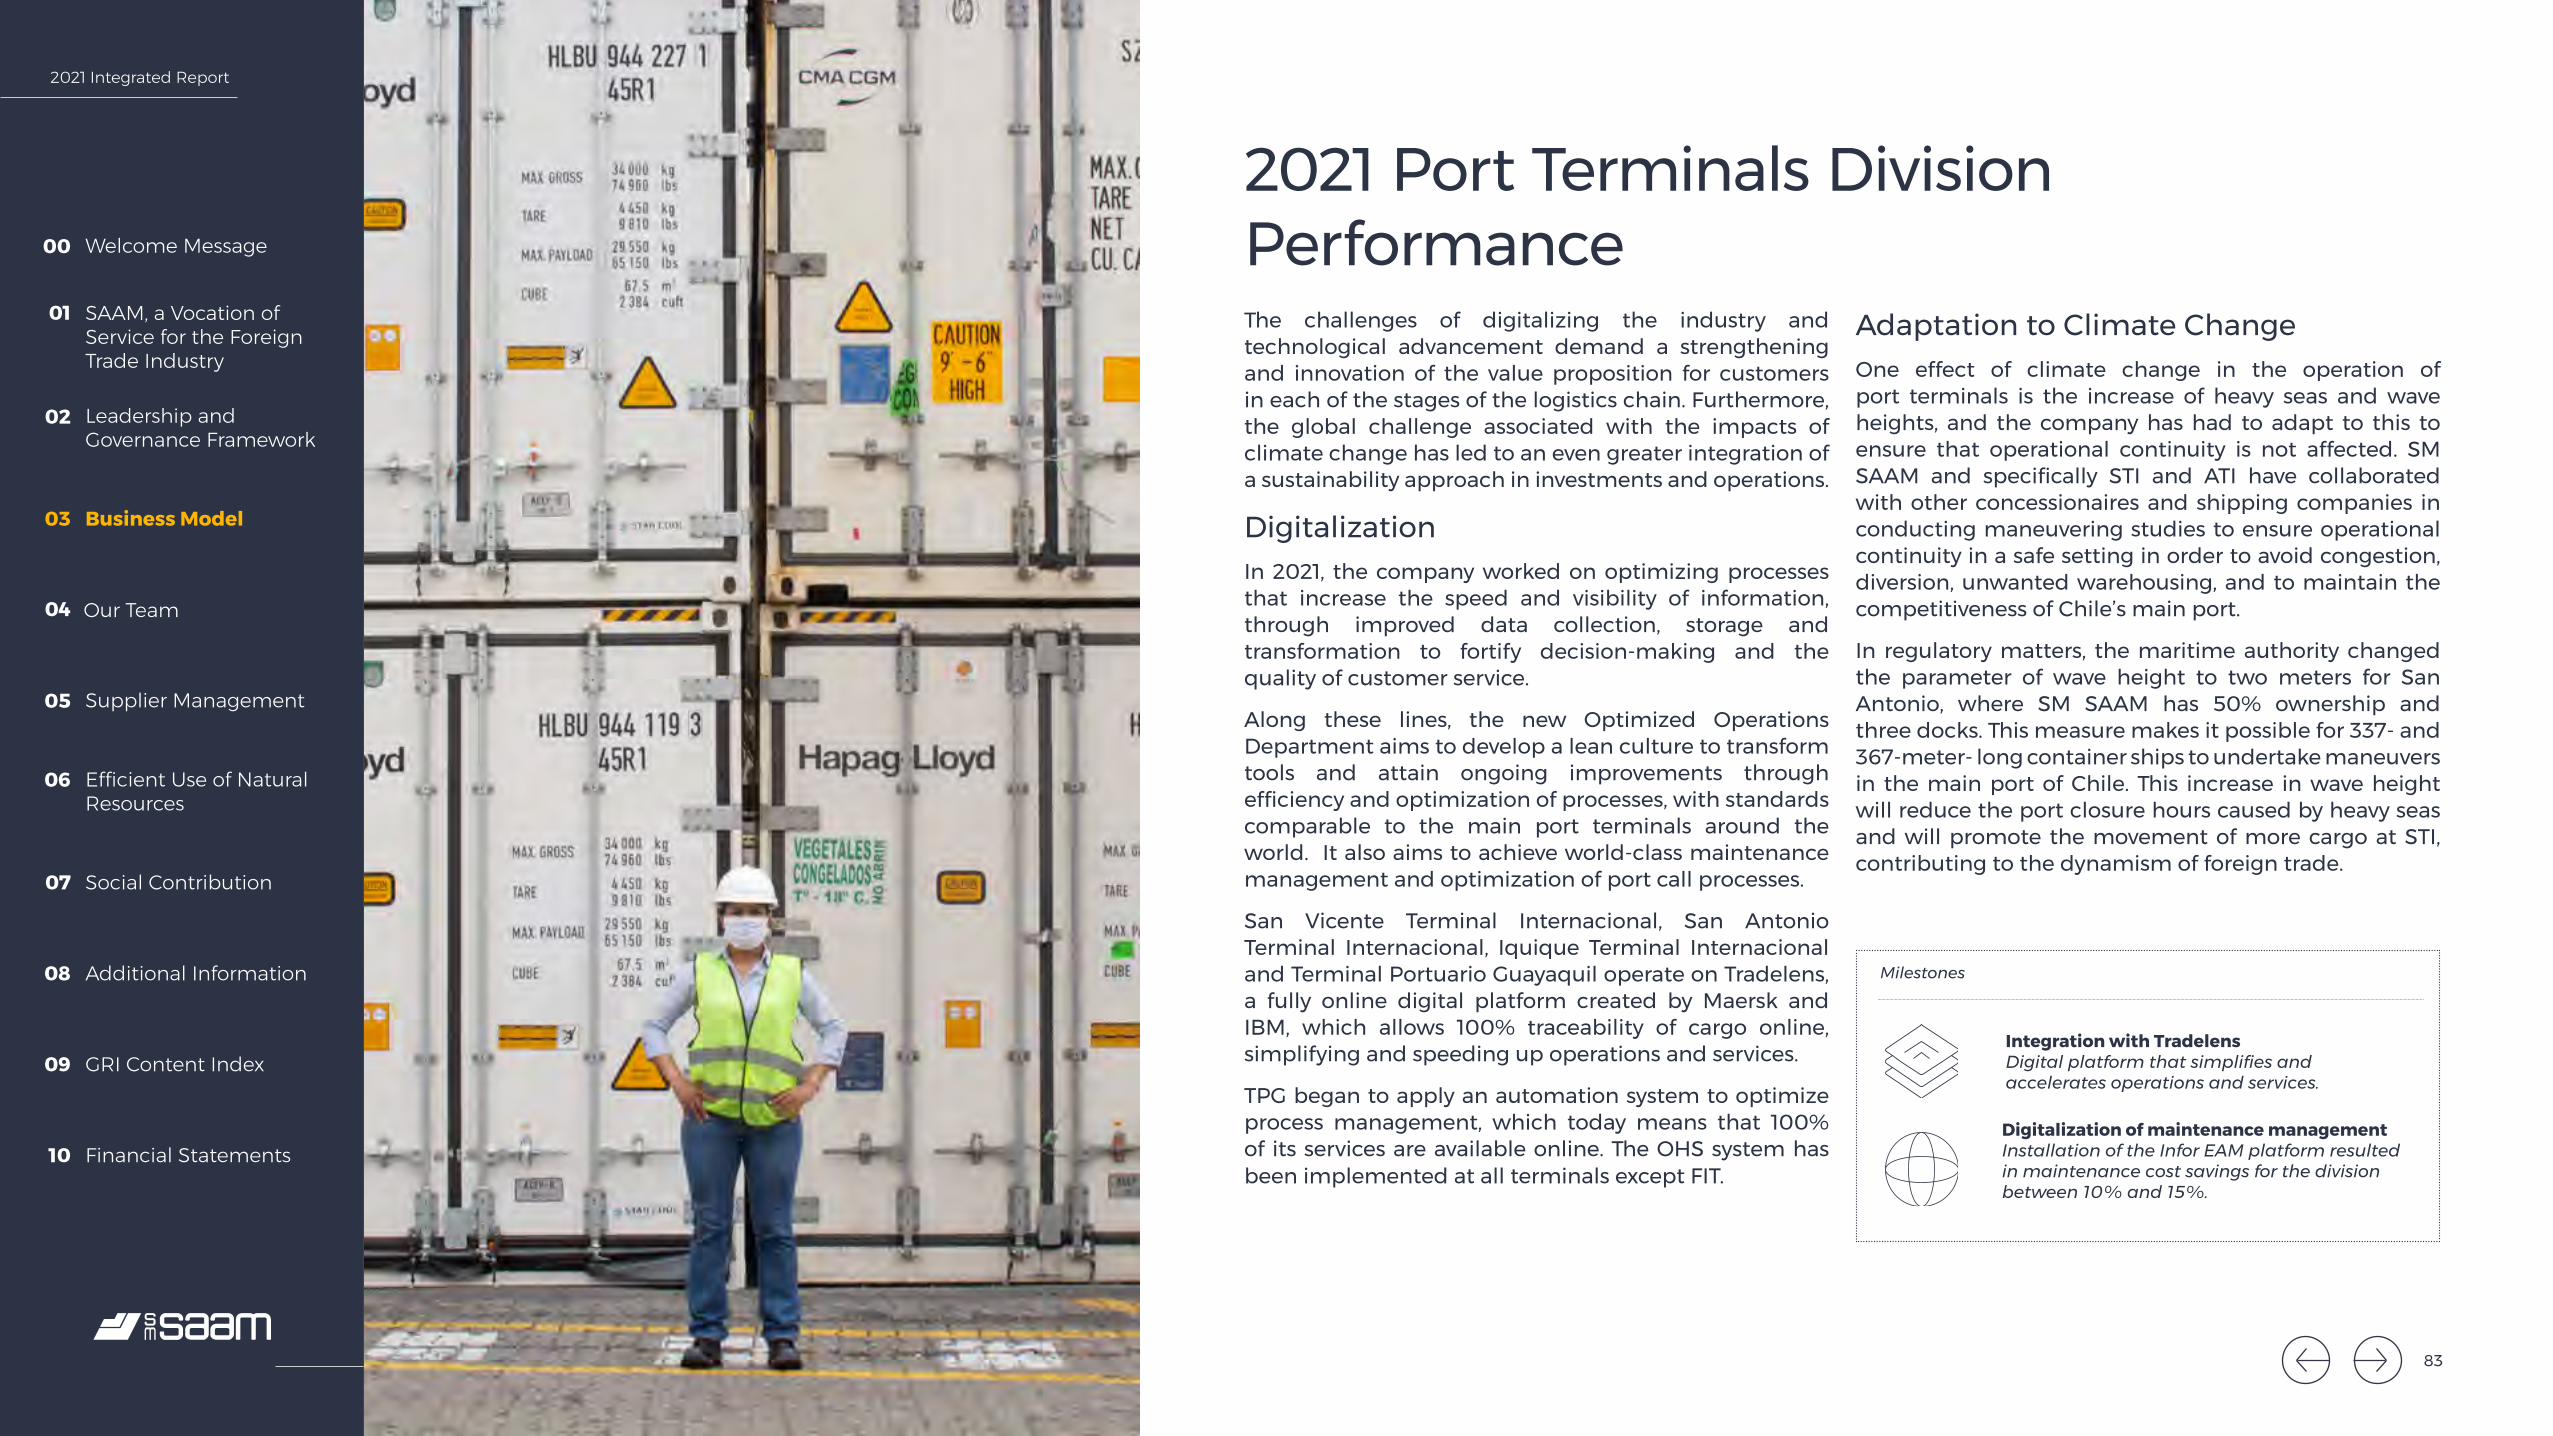
2021 Integrated Report
Welcome Message00
SAAM, a Vocation of Service for the Foreign Trade Industry
01
Leadership and Governance Framework
02
Business Model03
Our Team04
Supplier Management05
Efficient Use of Natural Resources
06
Social Contribution07
Additional Information08
GRI Content Index09
Financial Statements10
2021 Port Terminals Division Performance
Adaptation to Climate ChangeOne effect of climate change in the operation of port terminals is the increase of heavy seas and wave heights, and the company has had to adapt to this to ensure that operational continuity is not affected. SM SAAM and specifically STI and ATI have collaborated with other concessionaires and shipping companies in conducting maneuvering studies to ensure operational continuity in a safe setting in order to avoid congestion, diversion, unwanted warehousing, and to maintain the competitiveness of Chile’s main port.
In regulatory matters, the maritime authority changed the parameter of wave height to two meters for San Antonio, where SM SAAM has 50% ownership and three docks. This measure makes it possible for 337- and 367-meter- long container ships to undertake maneuvers in the main port of Chile. This increase in wave height will reduce the port closure hours caused by heavy seas and will promote the movement of more cargo at STI, contributing to the dynamism of foreign trade.
Milestones
Integration with TradelensDigital platform that simplifies and accelerates operations and services.
Digitalization of maintenance managementInstallation of the Infor EAM platform resulted in maintenance cost savings for the division between 10% and 15%.
The challenges of digitalizing the industry and technological advancement demand a strengthening and innovation of the value proposition for customers in each of the stages of the logistics chain. Furthermore, the global challenge associated with the impacts of climate change has led to an even greater integration of a sustainability approach in investments and operations.
DigitalizationIn 2021, the company worked on optimizing processes that increase the speed and visibility of information, through improved data collection, storage and transformation to fortify decision-making and the quality of customer service.
Along these lines, the new Optimized Operations Department aims to develop a lean culture to transform tools and attain ongoing improvements through efficiency and optimization of processes, with standards comparable to the main port terminals around the world. It also aims to achieve world-class maintenance management and optimization of port call processes.
San Vicente Terminal Internacional, San Antonio Terminal Internacional, Iquique Terminal Internacional and Terminal Portuario Guayaquil operate on Tradelens, a fully online digital platform created by Maersk and IBM, which allows 100% traceability of cargo online, simplifying and speeding up operations and services.
TPG began to apply an automation system to optimize process management, which today means that 100% of its services are available online. The OHS system has been implemented at all terminals except FIT.
83
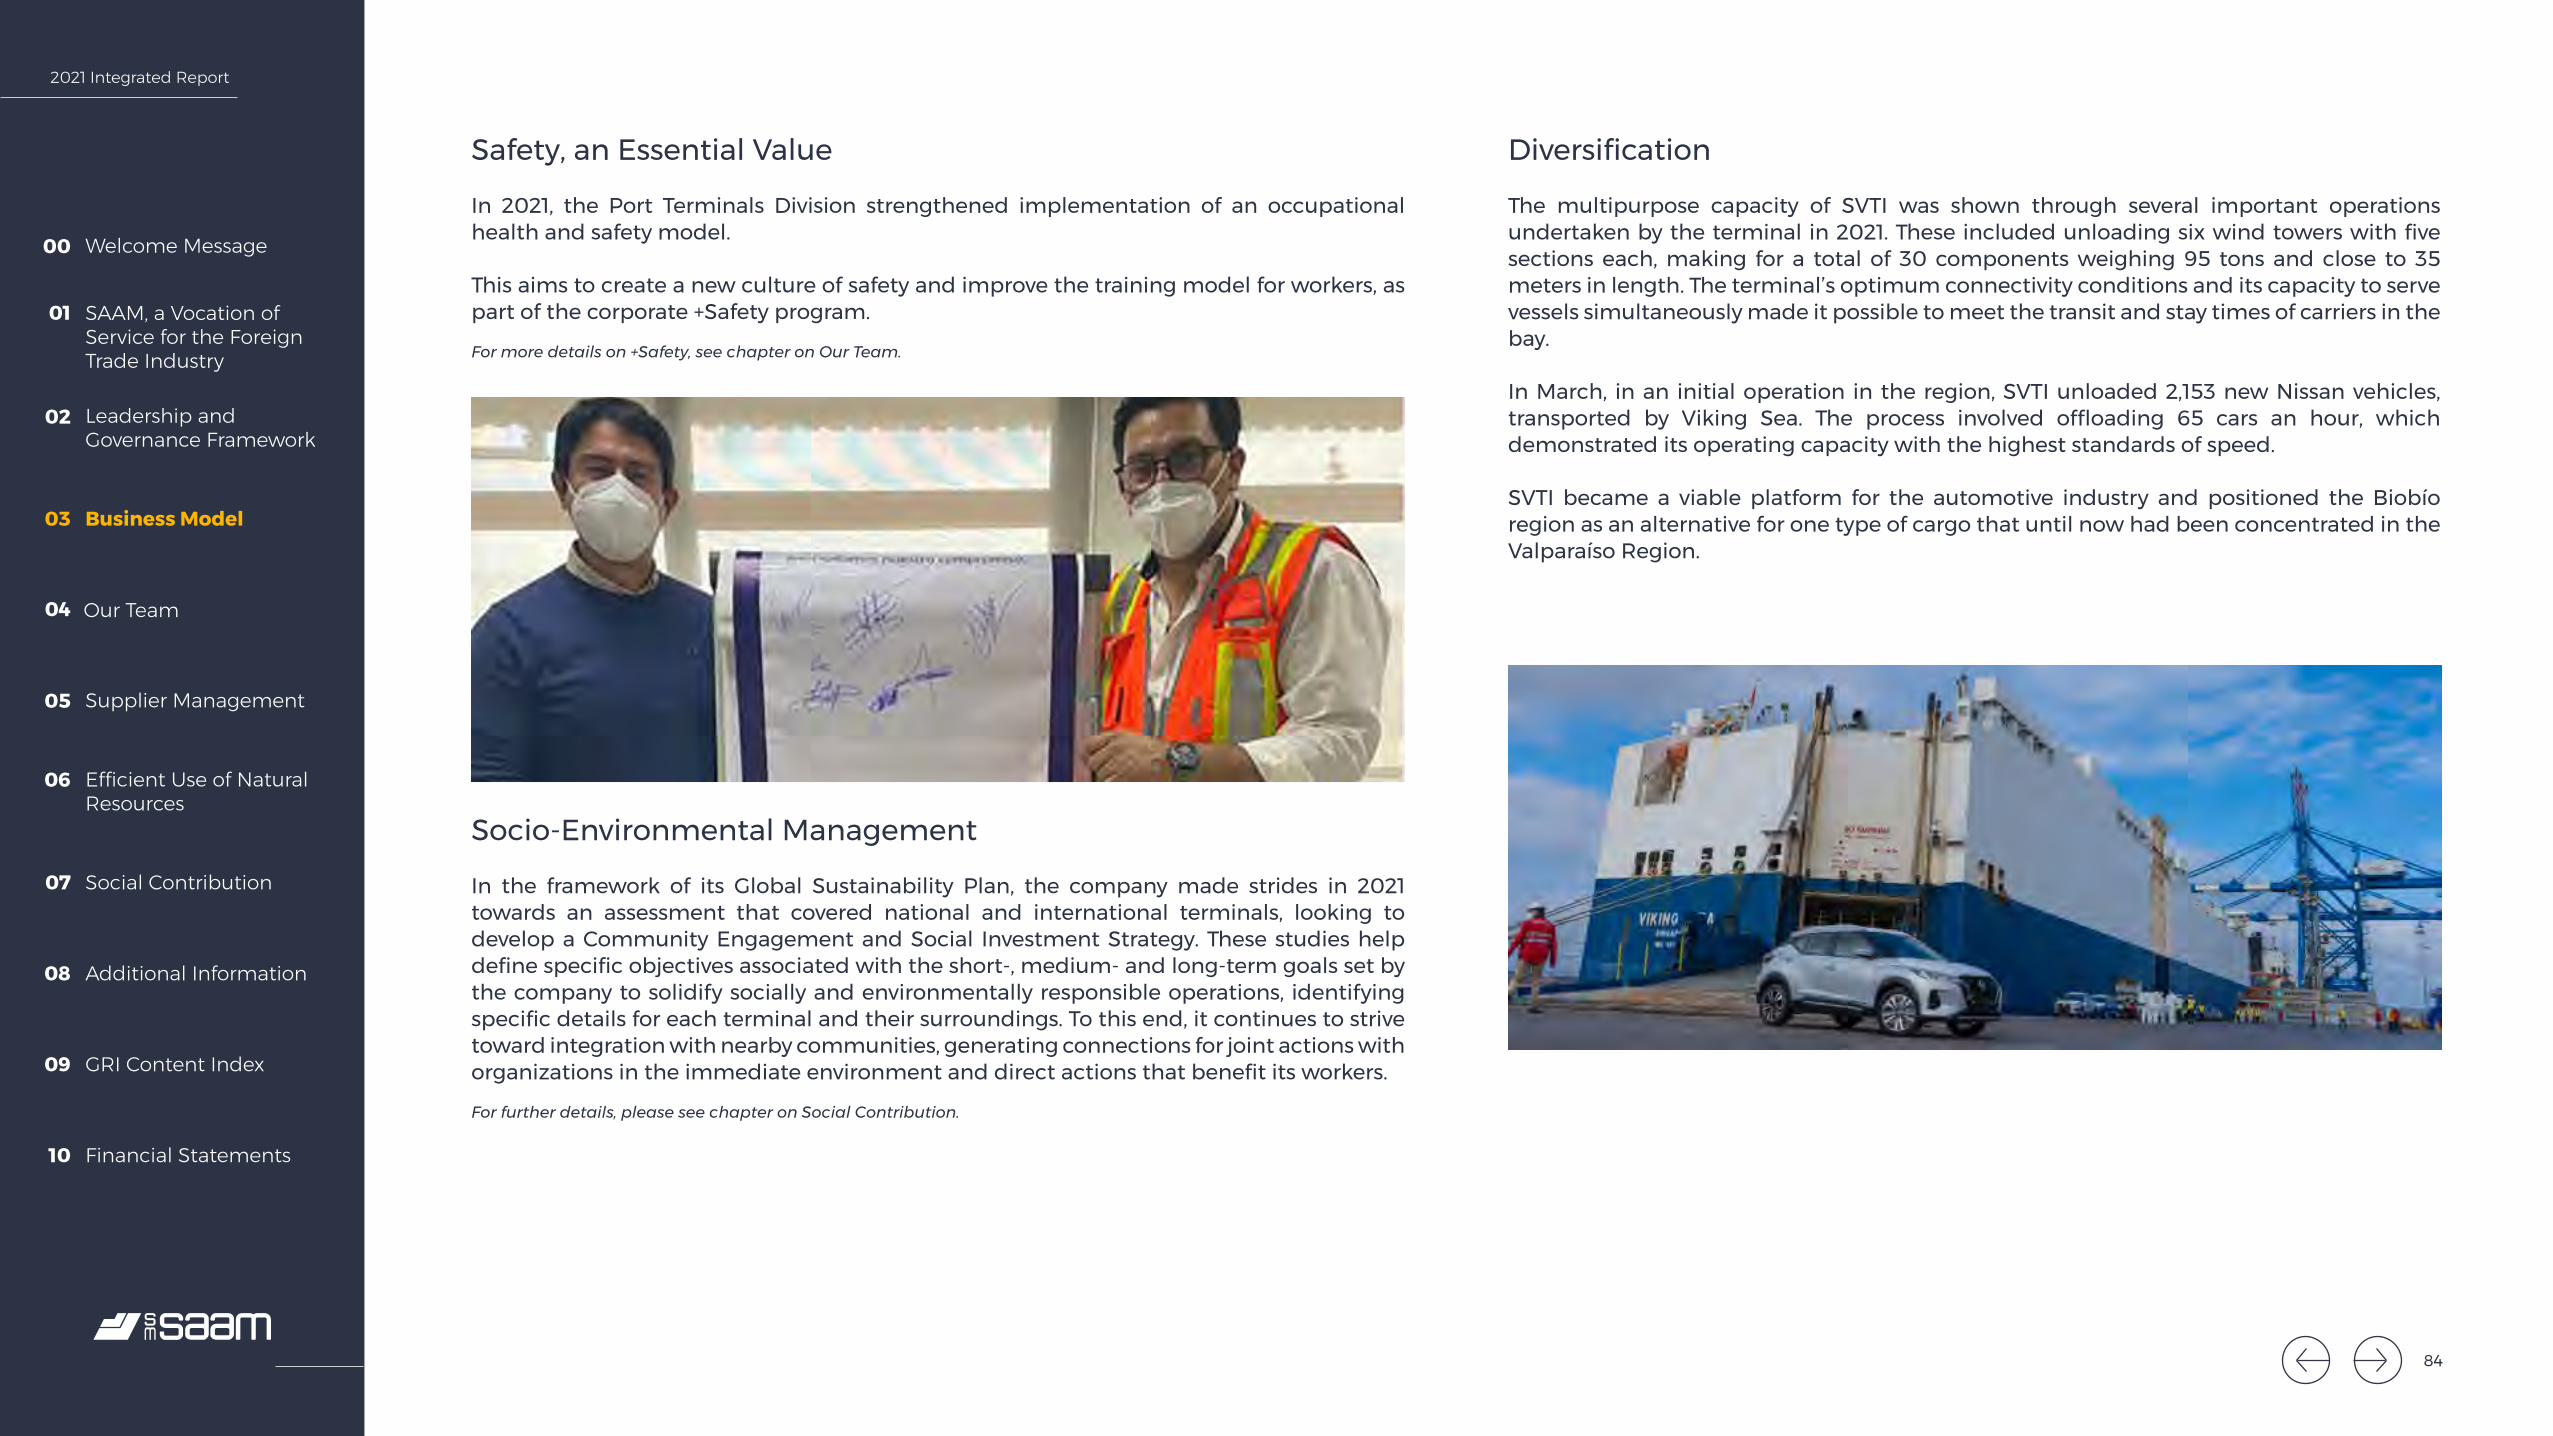
2021 Integrated Report
Welcome Message00
SAAM, a Vocation of Service for the Foreign Trade Industry
01
Leadership and Governance Framework
02
Business Model03
Our Team04
Supplier Management05
Efficient Use of Natural Resources
06
Social Contribution07
Additional Information08
GRI Content Index09
Financial Statements10
Safety, an Essential Value
In 2021, the Port Terminals Division strengthened implementation of an occupational health and safety model.
This aims to create a new culture of safety and improve the training model for workers, as part of the corporate +Safety program.
For more details on +Safety, see chapter on Our Team.
Socio-Environmental Management
In the framework of its Global Sustainability Plan, the company made strides in 2021 towards an assessment that covered national and international terminals, looking to develop a Community Engagement and Social Investment Strategy. These studies help define specific objectives associated with the short-, medium- and long-term goals set by the company to solidify socially and environmentally responsible operations, identifying specific details for each terminal and their surroundings. To this end, it continues to strive toward integration with nearby communities, generating connections for joint actions with organizations in the immediate environment and direct actions that benefit its workers.
For further details, please see chapter on Social Contribution.
Diversification
The multipurpose capacity of SVTI was shown through several important operations undertaken by the terminal in 2021. These included unloading six wind towers with five sections each, making for a total of 30 components weighing 95 tons and close to 35 meters in length. The terminal’s optimum connectivity conditions and its capacity to serve vessels simultaneously made it possible to meet the transit and stay times of carriers in the bay.
In March, in an initial operation in the region, SVTI unloaded 2,153 new Nissan vehicles, transported by Viking Sea. The process involved offloading 65 cars an hour, which demonstrated its operating capacity with the highest standards of speed.
SVTI became a viable platform for the automotive industry and positioned the Biobío region as an alternative for one type of cargo that until now had been concentrated in the Valparaíso Region.
84
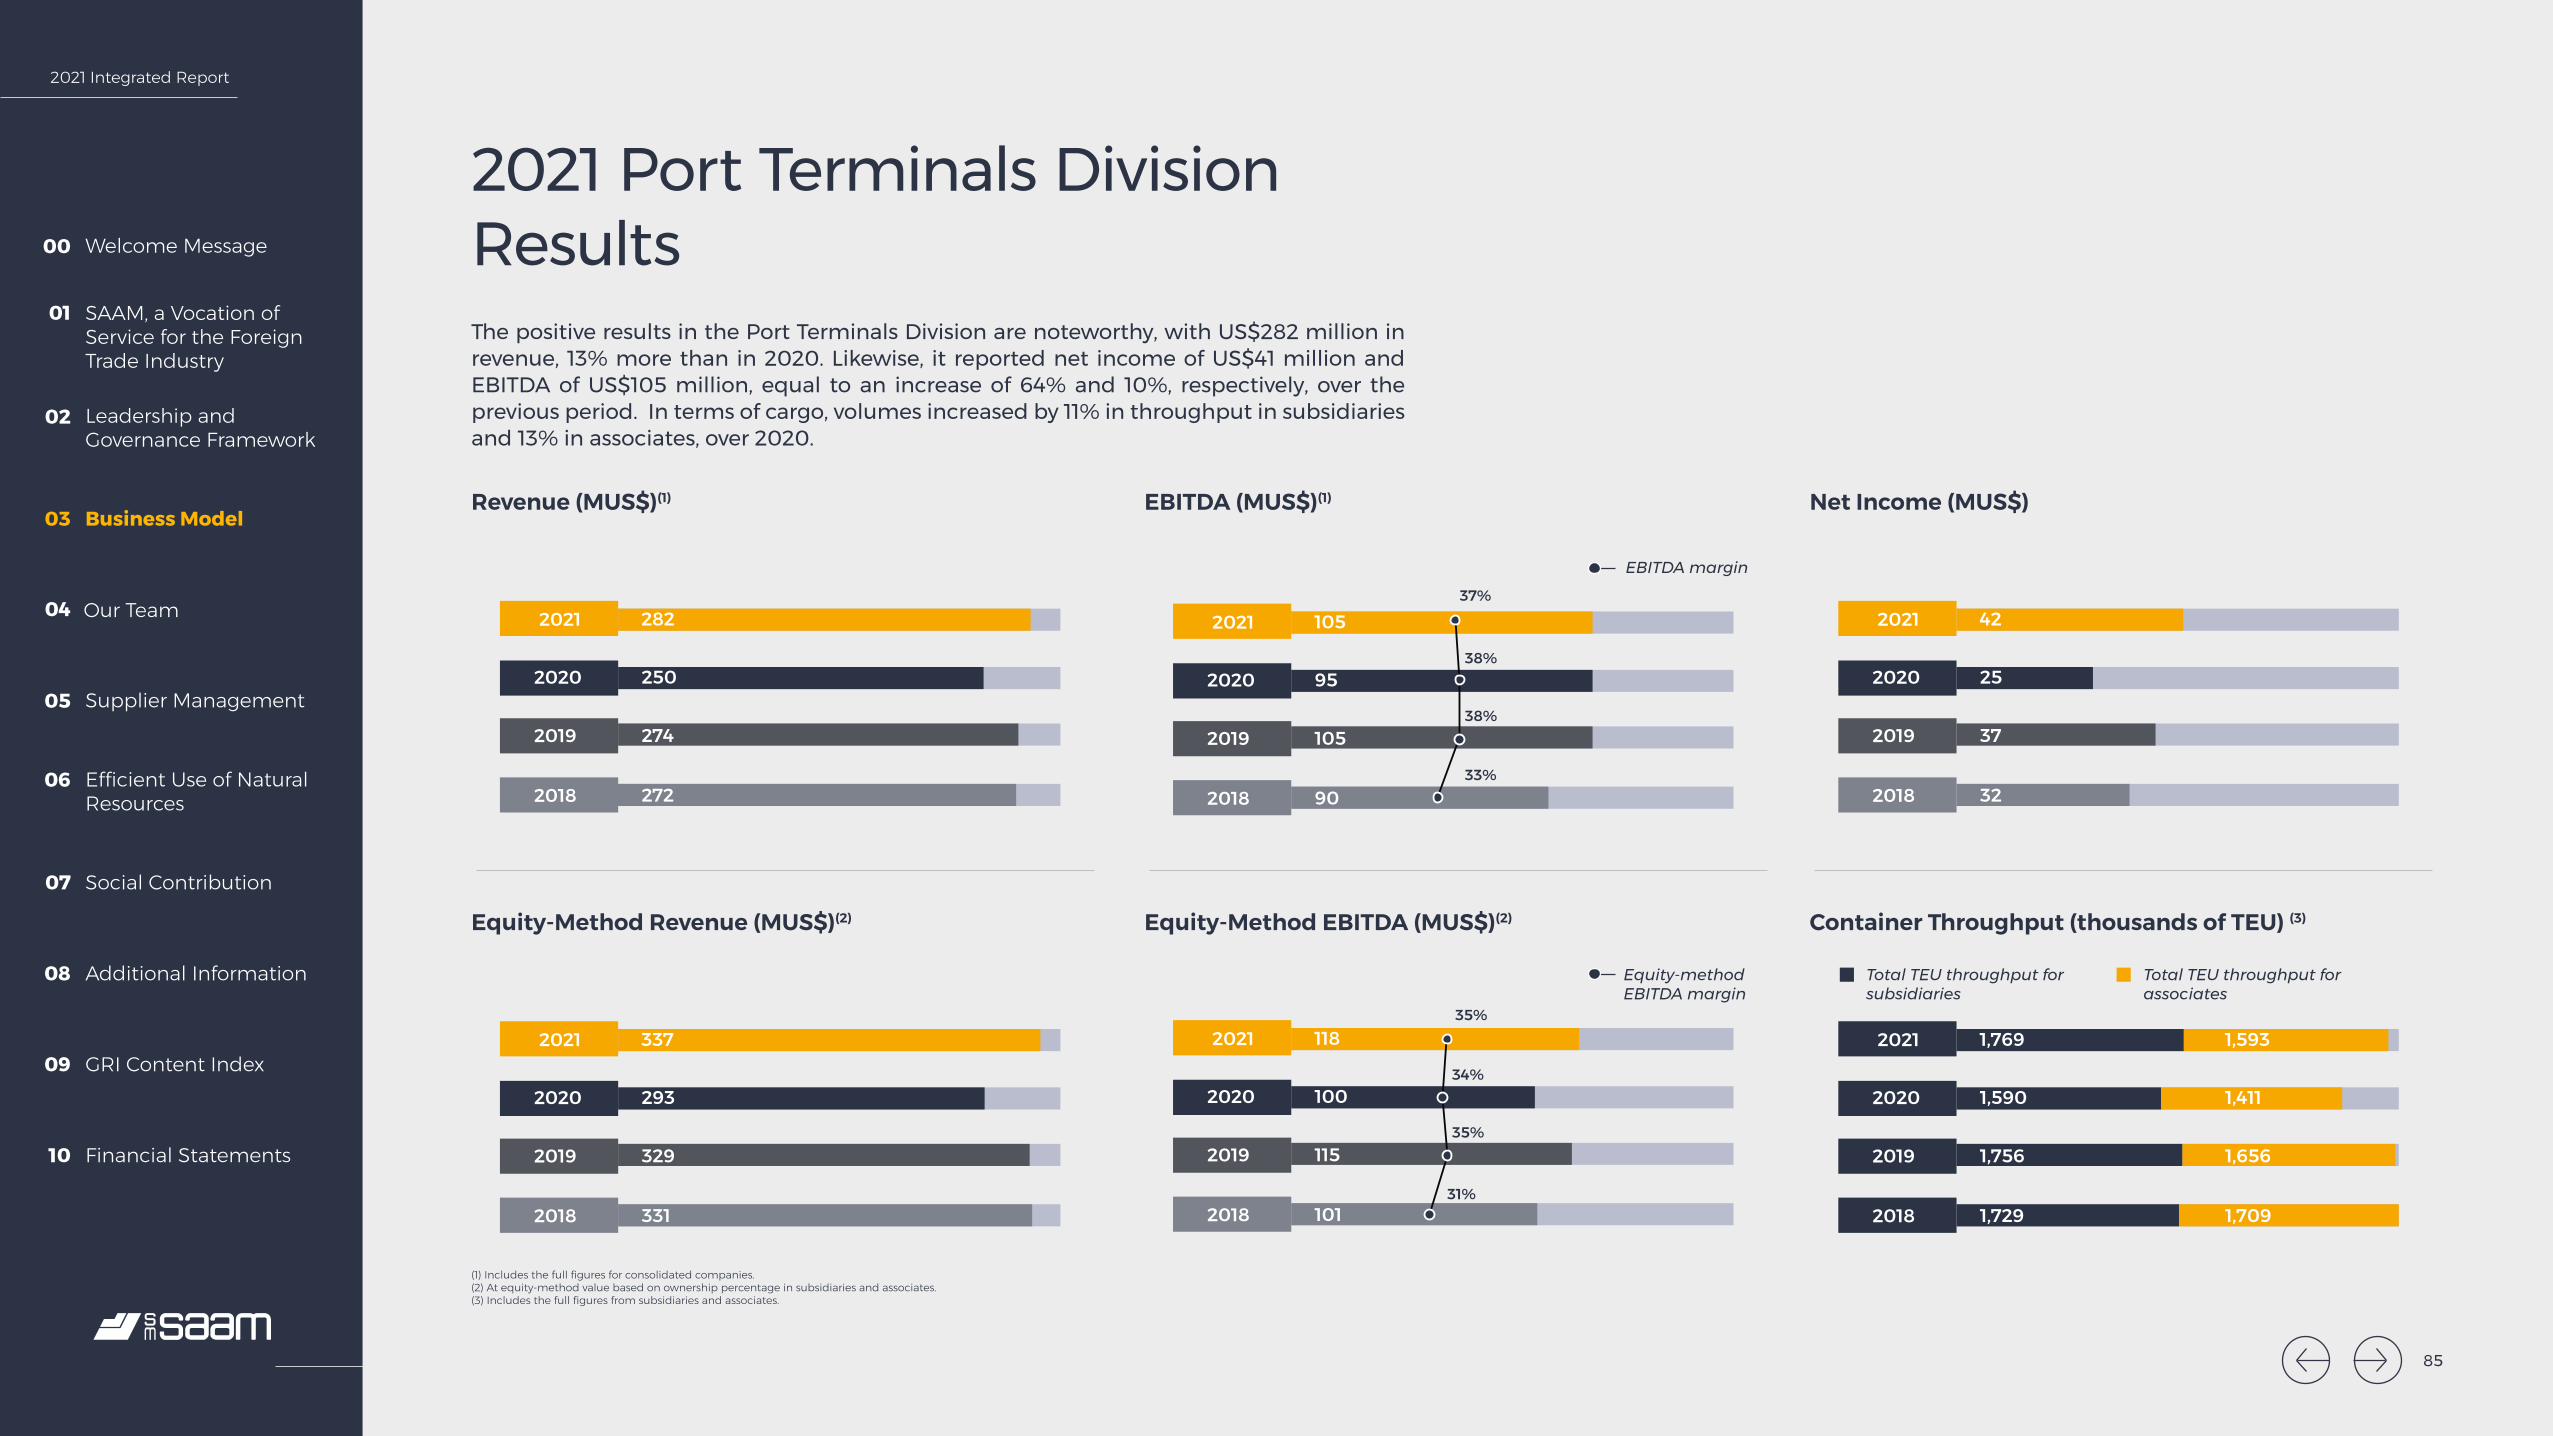
2021 Integrated Report
Welcome Message00
SAAM, a Vocation of Service for the Foreign Trade Industry
01
Leadership and Governance Framework
02
Business Model03
Our Team04
Supplier Management05
Efficient Use of Natural Resources
06
Social Contribution07
Additional Information08
GRI Content Index09
Financial Statements10
282
250
274
272
2021
2020
2019
2018
105
95
105
90
37%
38%
38%
33%
2021
2020
2019
2018
42
25
37
32
2021
2020
2019
2018
337
293
329
331
2021
2020
2019
2018
118
100
115
101
2021
2020
2019
2018
35%
35%
31%
34%
1,769
1,590
1,756
1,729
2021
2020
2019
2018
1,593
1,411
1,656
1,709
2021 Port Terminals Division Results
Revenue (MUS$)(1) EBITDA (MUS$)(1) Net Income (MUS$)
Equity-Method Revenue (MUS$)(2) Equity-Method EBITDA (MUS$)(2) Container Throughput (thousands of TEU) (3)
The positive results in the Port Terminals Division are noteworthy, with US$282 million in revenue, 13% more than in 2020. Likewise, it reported net income of US$41 million and EBITDA of US$105 million, equal to an increase of 64% and 10%, respectively, over the previous period. In terms of cargo, volumes increased by 11% in throughput in subsidiaries and 13% in associates, over 2020.
EBITDA margin
Equity-method EBITDA margin
Total TEU throughput for subsidiaries
Total TEU throughput for associates
(1) Includes the full figures for consolidated companies. (2) At equity-method value based on ownership percentage in subsidiaries and associates.(3) Includes the full figures from subsidiaries and associates.
85
2021 Integrated Report
Welcome Message00
SAAM, a Vocation of Service for the Foreign Trade Industry
01
Leadership and Governance Framework
02
Business Model03
Our Team04
Supplier Management05
Efficient Use of Natural Resources
06
Social Contribution07
Additional Information08
GRI Content Index09
Financial Statements10
86
Logistics Division
86
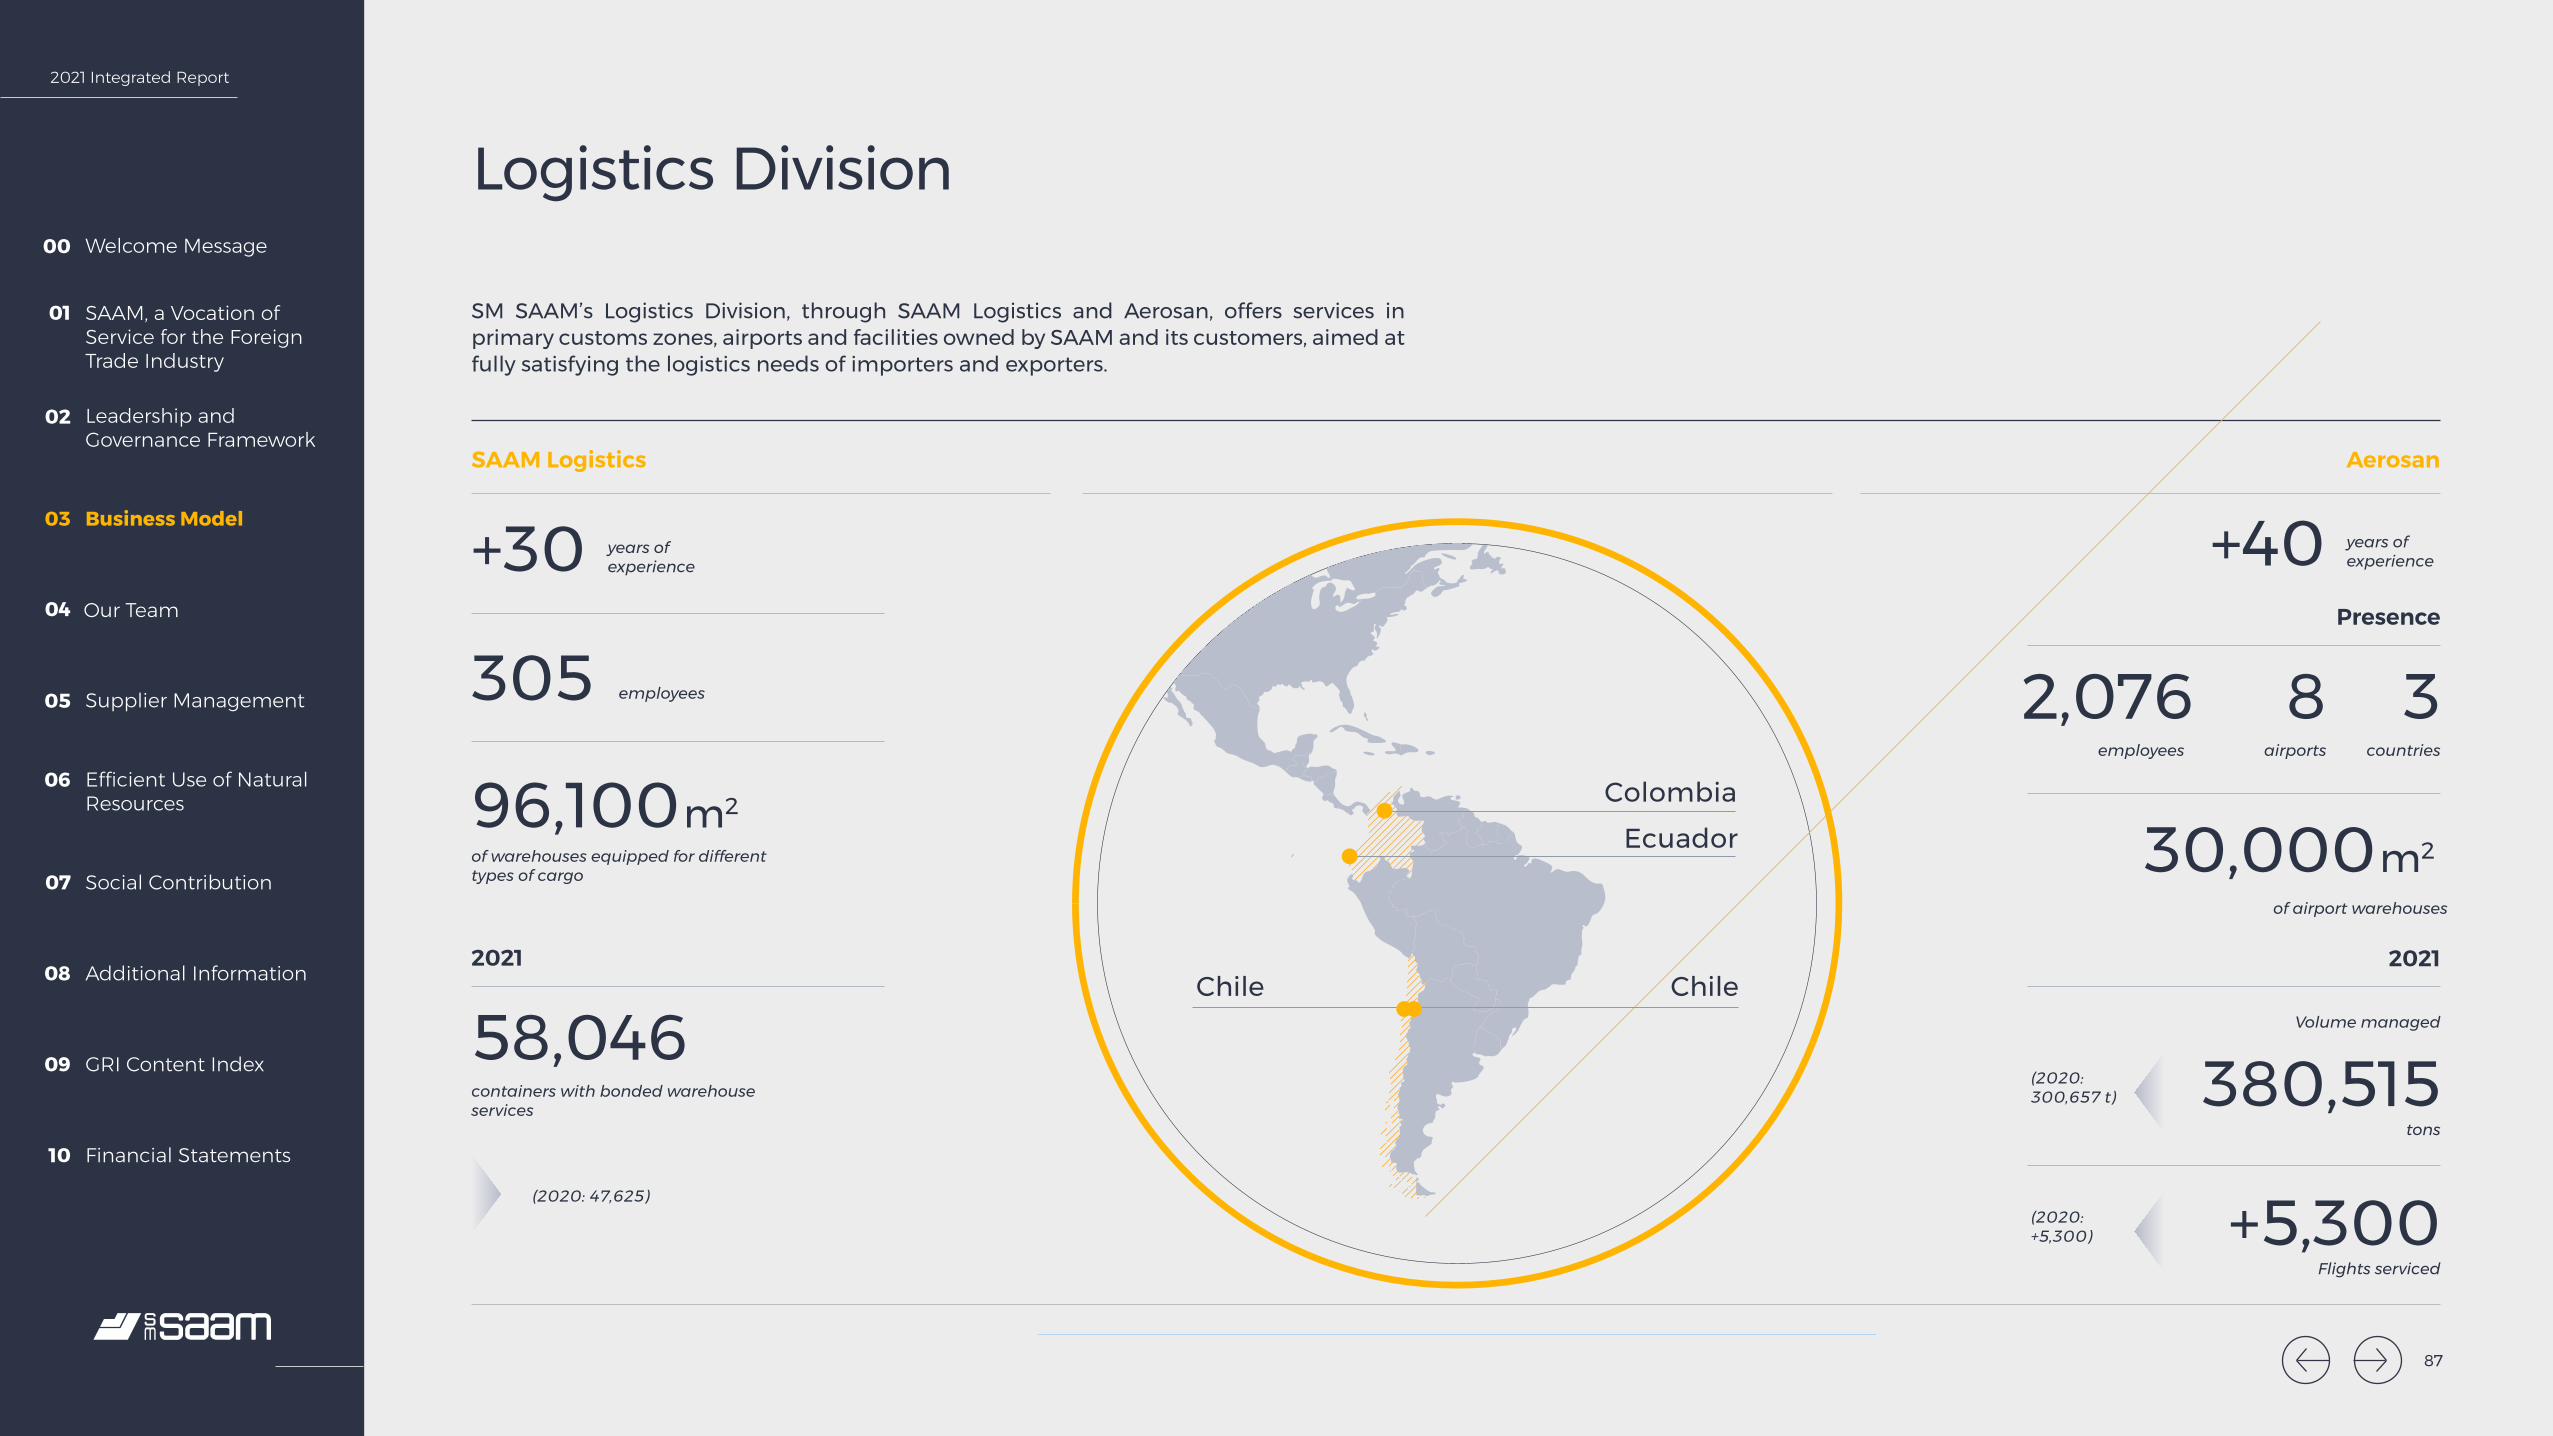
2021 Integrated Report
Welcome Message00
SAAM, a Vocation of Service for the Foreign Trade Industry
01
Leadership and Governance Framework
02
Business Model03
Our Team04
Supplier Management05
Efficient Use of Natural Resources
06
Social Contribution07
Additional Information08
GRI Content Index09
Financial Statements10
Logistics Division
SAAM Logistics Aerosan
Colombia
Chile Chile
Ecuador
2021
Presence
2021
years of experience
years of experience
employees
of warehouses equipped for different types of cargo
containers with bonded warehouse services
airportsemployees
of airport warehouses
countries
Volume managed
Flights serviced
tons
+30 +40
305
96,100 m2 30,000 m2
58,046
82,076 3
380,515
+5,300
SM SAAM’s Logistics Division, through SAAM Logistics and Aerosan, offers services in primary customs zones, airports and facilities owned by SAAM and its customers, aimed at fully satisfying the logistics needs of importers and exporters.
(2020: 47,625)
(2020: 300,657 t)
(2020: +5,300)
87
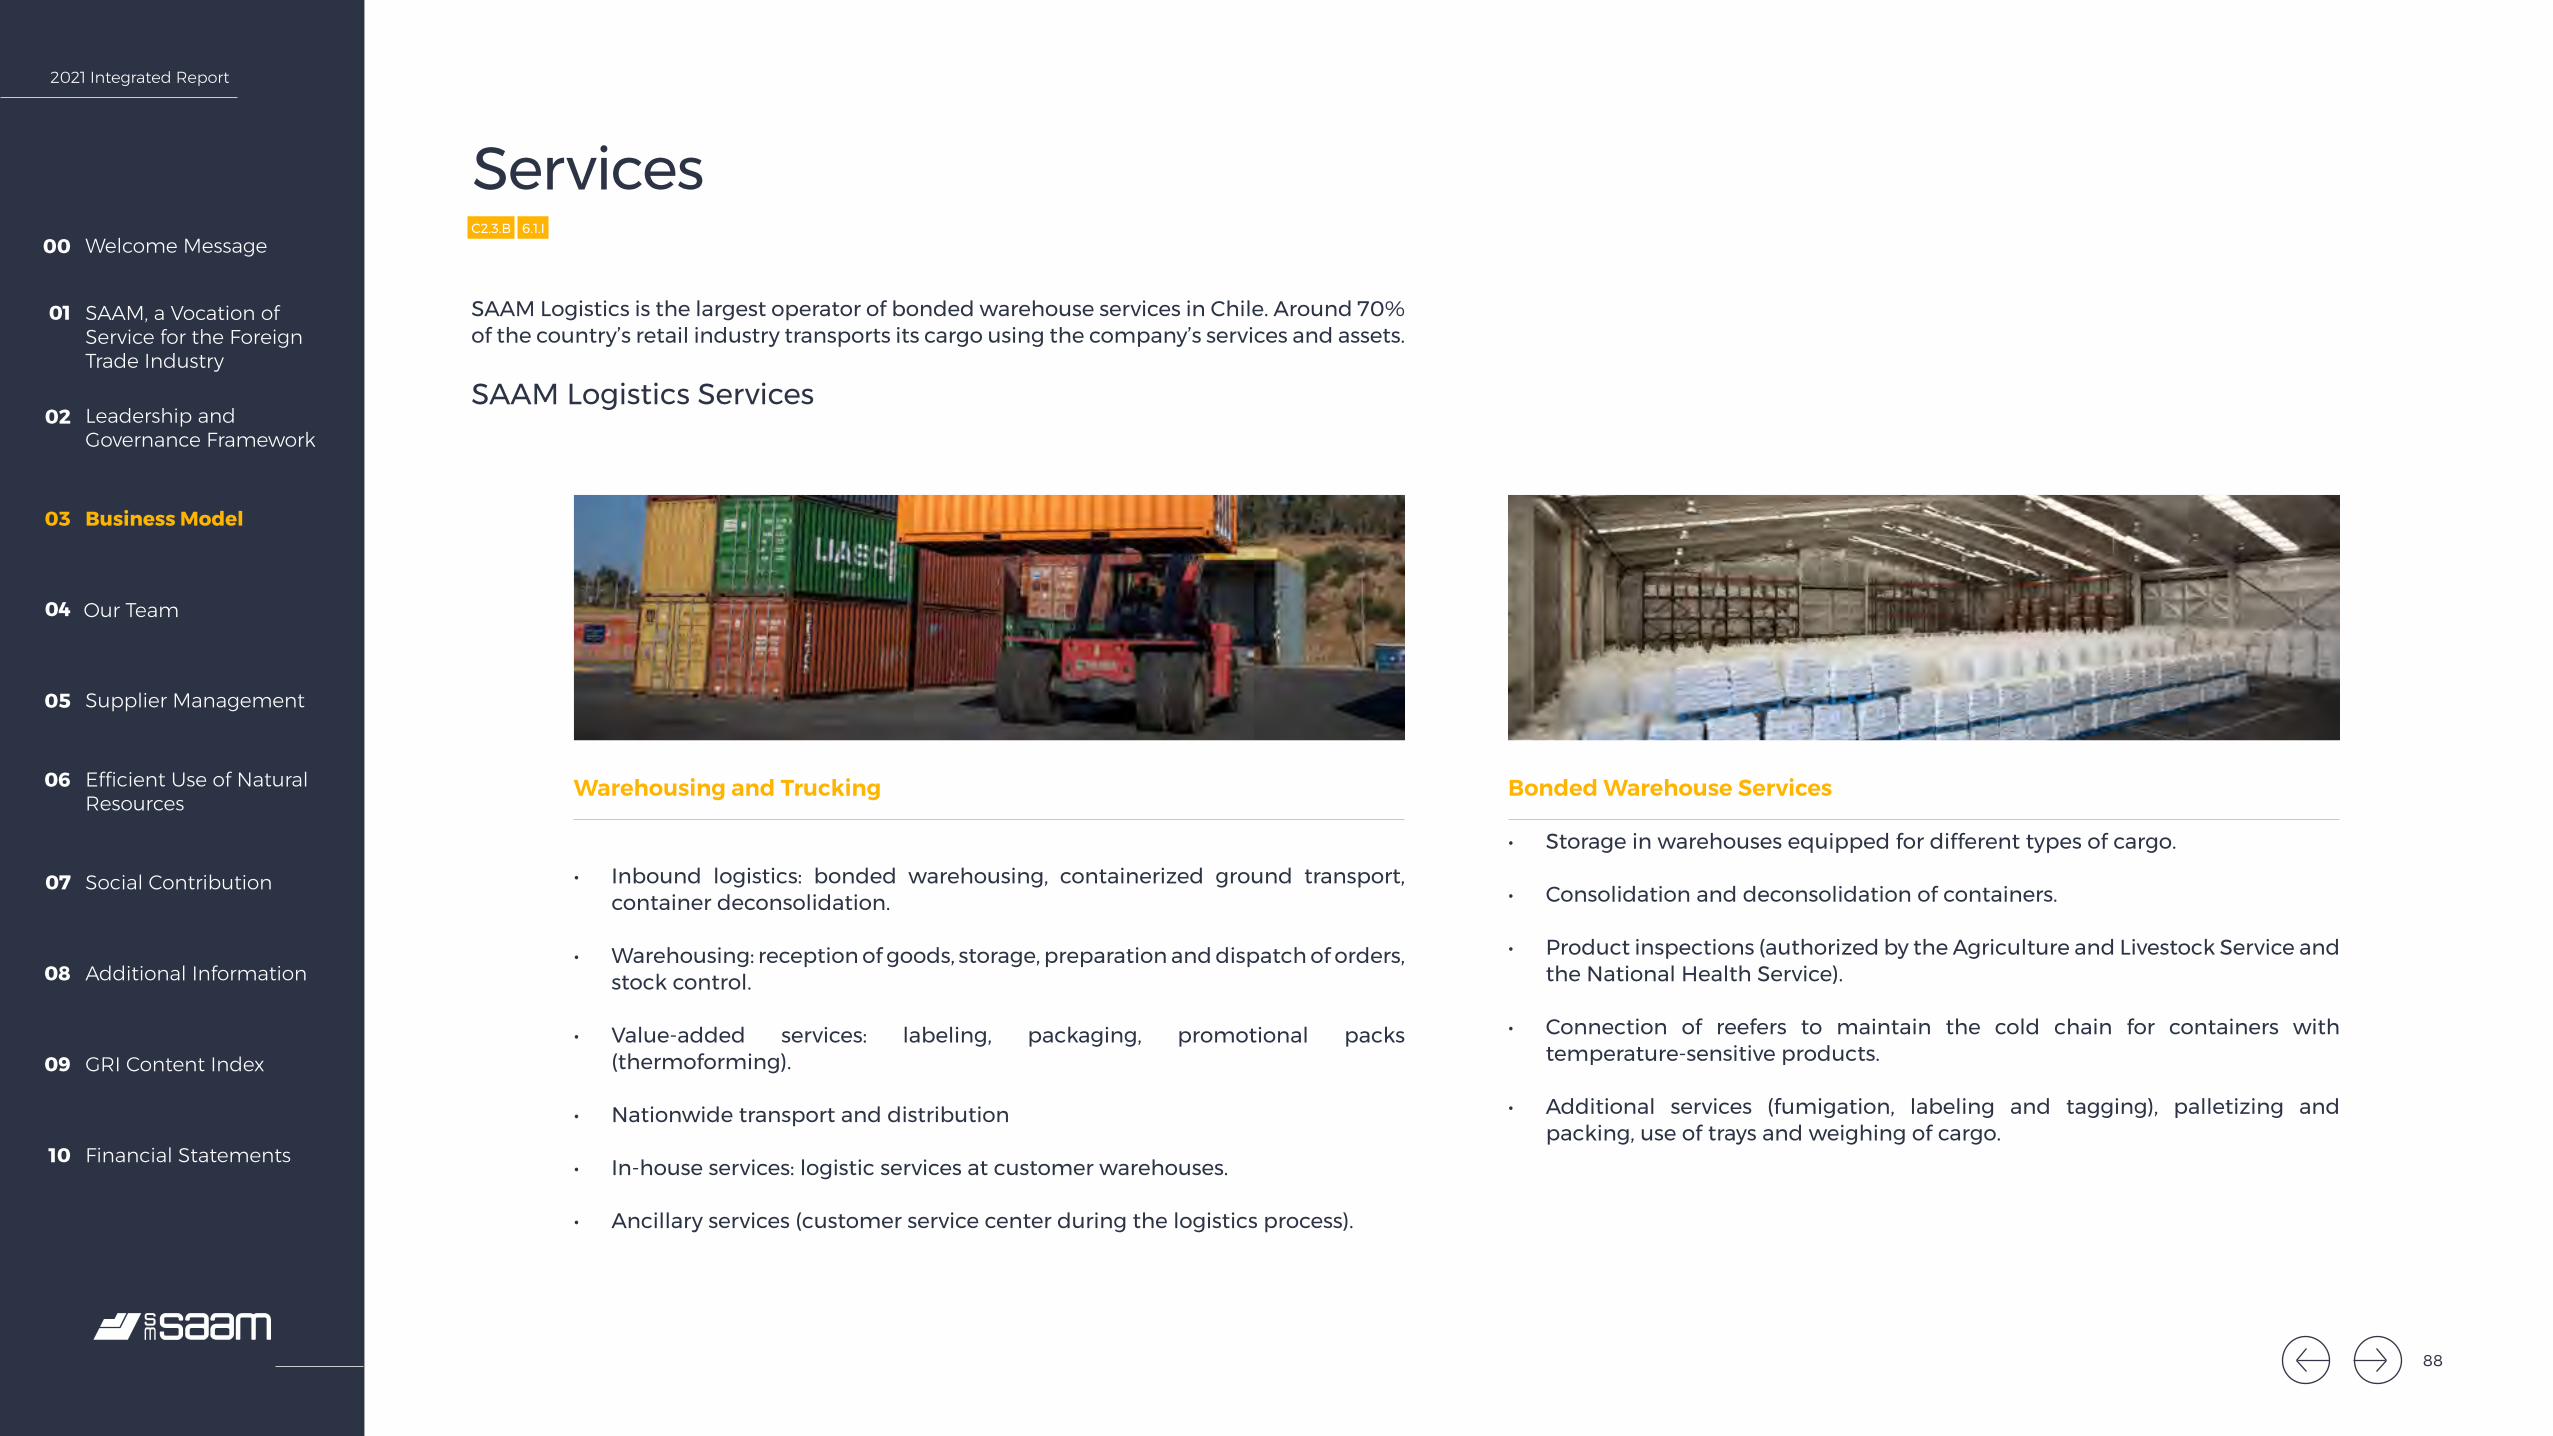
2021 Integrated Report
Welcome Message00
SAAM, a Vocation of Service for the Foreign Trade Industry
01
Leadership and Governance Framework
02
Business Model03
Our Team04
Supplier Management05
Efficient Use of Natural Resources
06
Social Contribution07
Additional Information08
GRI Content Index09
Financial Statements10
C2.3.B 6.1.I
Services
Warehousing and Trucking
• Inbound logistics: bonded warehousing, containerized ground transport, container deconsolidation.
• Warehousing: reception of goods, storage, preparation and dispatch of orders, stock control.
• Value-added services: labeling, packaging, promotional packs (thermoforming).
• Nationwide transport and distribution
• In-house services: logistic services at customer warehouses.
• Ancillary services (customer service center during the logistics process).
Bonded Warehouse Services
• Storage in warehouses equipped for different types of cargo.
• Consolidation and deconsolidation of containers.
• Product inspections (authorized by the Agriculture and Livestock Service and the National Health Service).
• Connection of reefers to maintain the cold chain for containers with temperature-sensitive products.
• Additional services (fumigation, labeling and tagging), palletizing and packing, use of trays and weighing of cargo.
SAAM Logistics is the largest operator of bonded warehouse services in Chile. Around 70% of the country’s retail industry transports its cargo using the company’s services and assets.
SAAM Logistics Services
88

2021 Integrated Report
Welcome Message00
SAAM, a Vocation of Service for the Foreign Trade Industry
01
Leadership and Governance Framework
02
Business Model03
Our Team04
Supplier Management05
Efficient Use of Natural Resources
06
Social Contribution07
Additional Information08
GRI Content Index09
Financial Statements10
C2.3.B 6.1.I
Services
Cargo Services
• Acceptance of general and perishable cargo, security control, scanning and X-ray, handling of fresh products in cold storage, consolidation according to customer requirements and automated temperature, weight, measurement and volume records.
• Cargo deconsolidation, document management, warehousing, management of medical products, hazardous goods and animals.
• Inventory tracking and product dispatch as defined by the local legislation of each airport.
• General assistance for aircraft (cleaning, refueling of supplies, free storage).
Passenger Services
• Passenger check-in, baggage checking and handling, special passenger assistance, catering and fuel coordination, among others.
• Full assistance for special passenger and general cargo flights.
Technological Solutions
• Cold storage and temperature controlled chambers for cold chain monitoring and management.
• Online traceability and integration with airlines and government authorities.
• Specialized services for pharmaceutical products and medical devices.
Aerosan provides logistics services in physical and documentary management of export, import, domestic and bonded warehouse cargo, together with aircraft ramp services and passenger processing.
It also offers courses certified by IATA (International Air Transport Association) for the handling of hazardous goods, aviation safety and tarmac operations, among others, because its value proposition relies on the work of a highly qualified team.
Aerosan Services
89
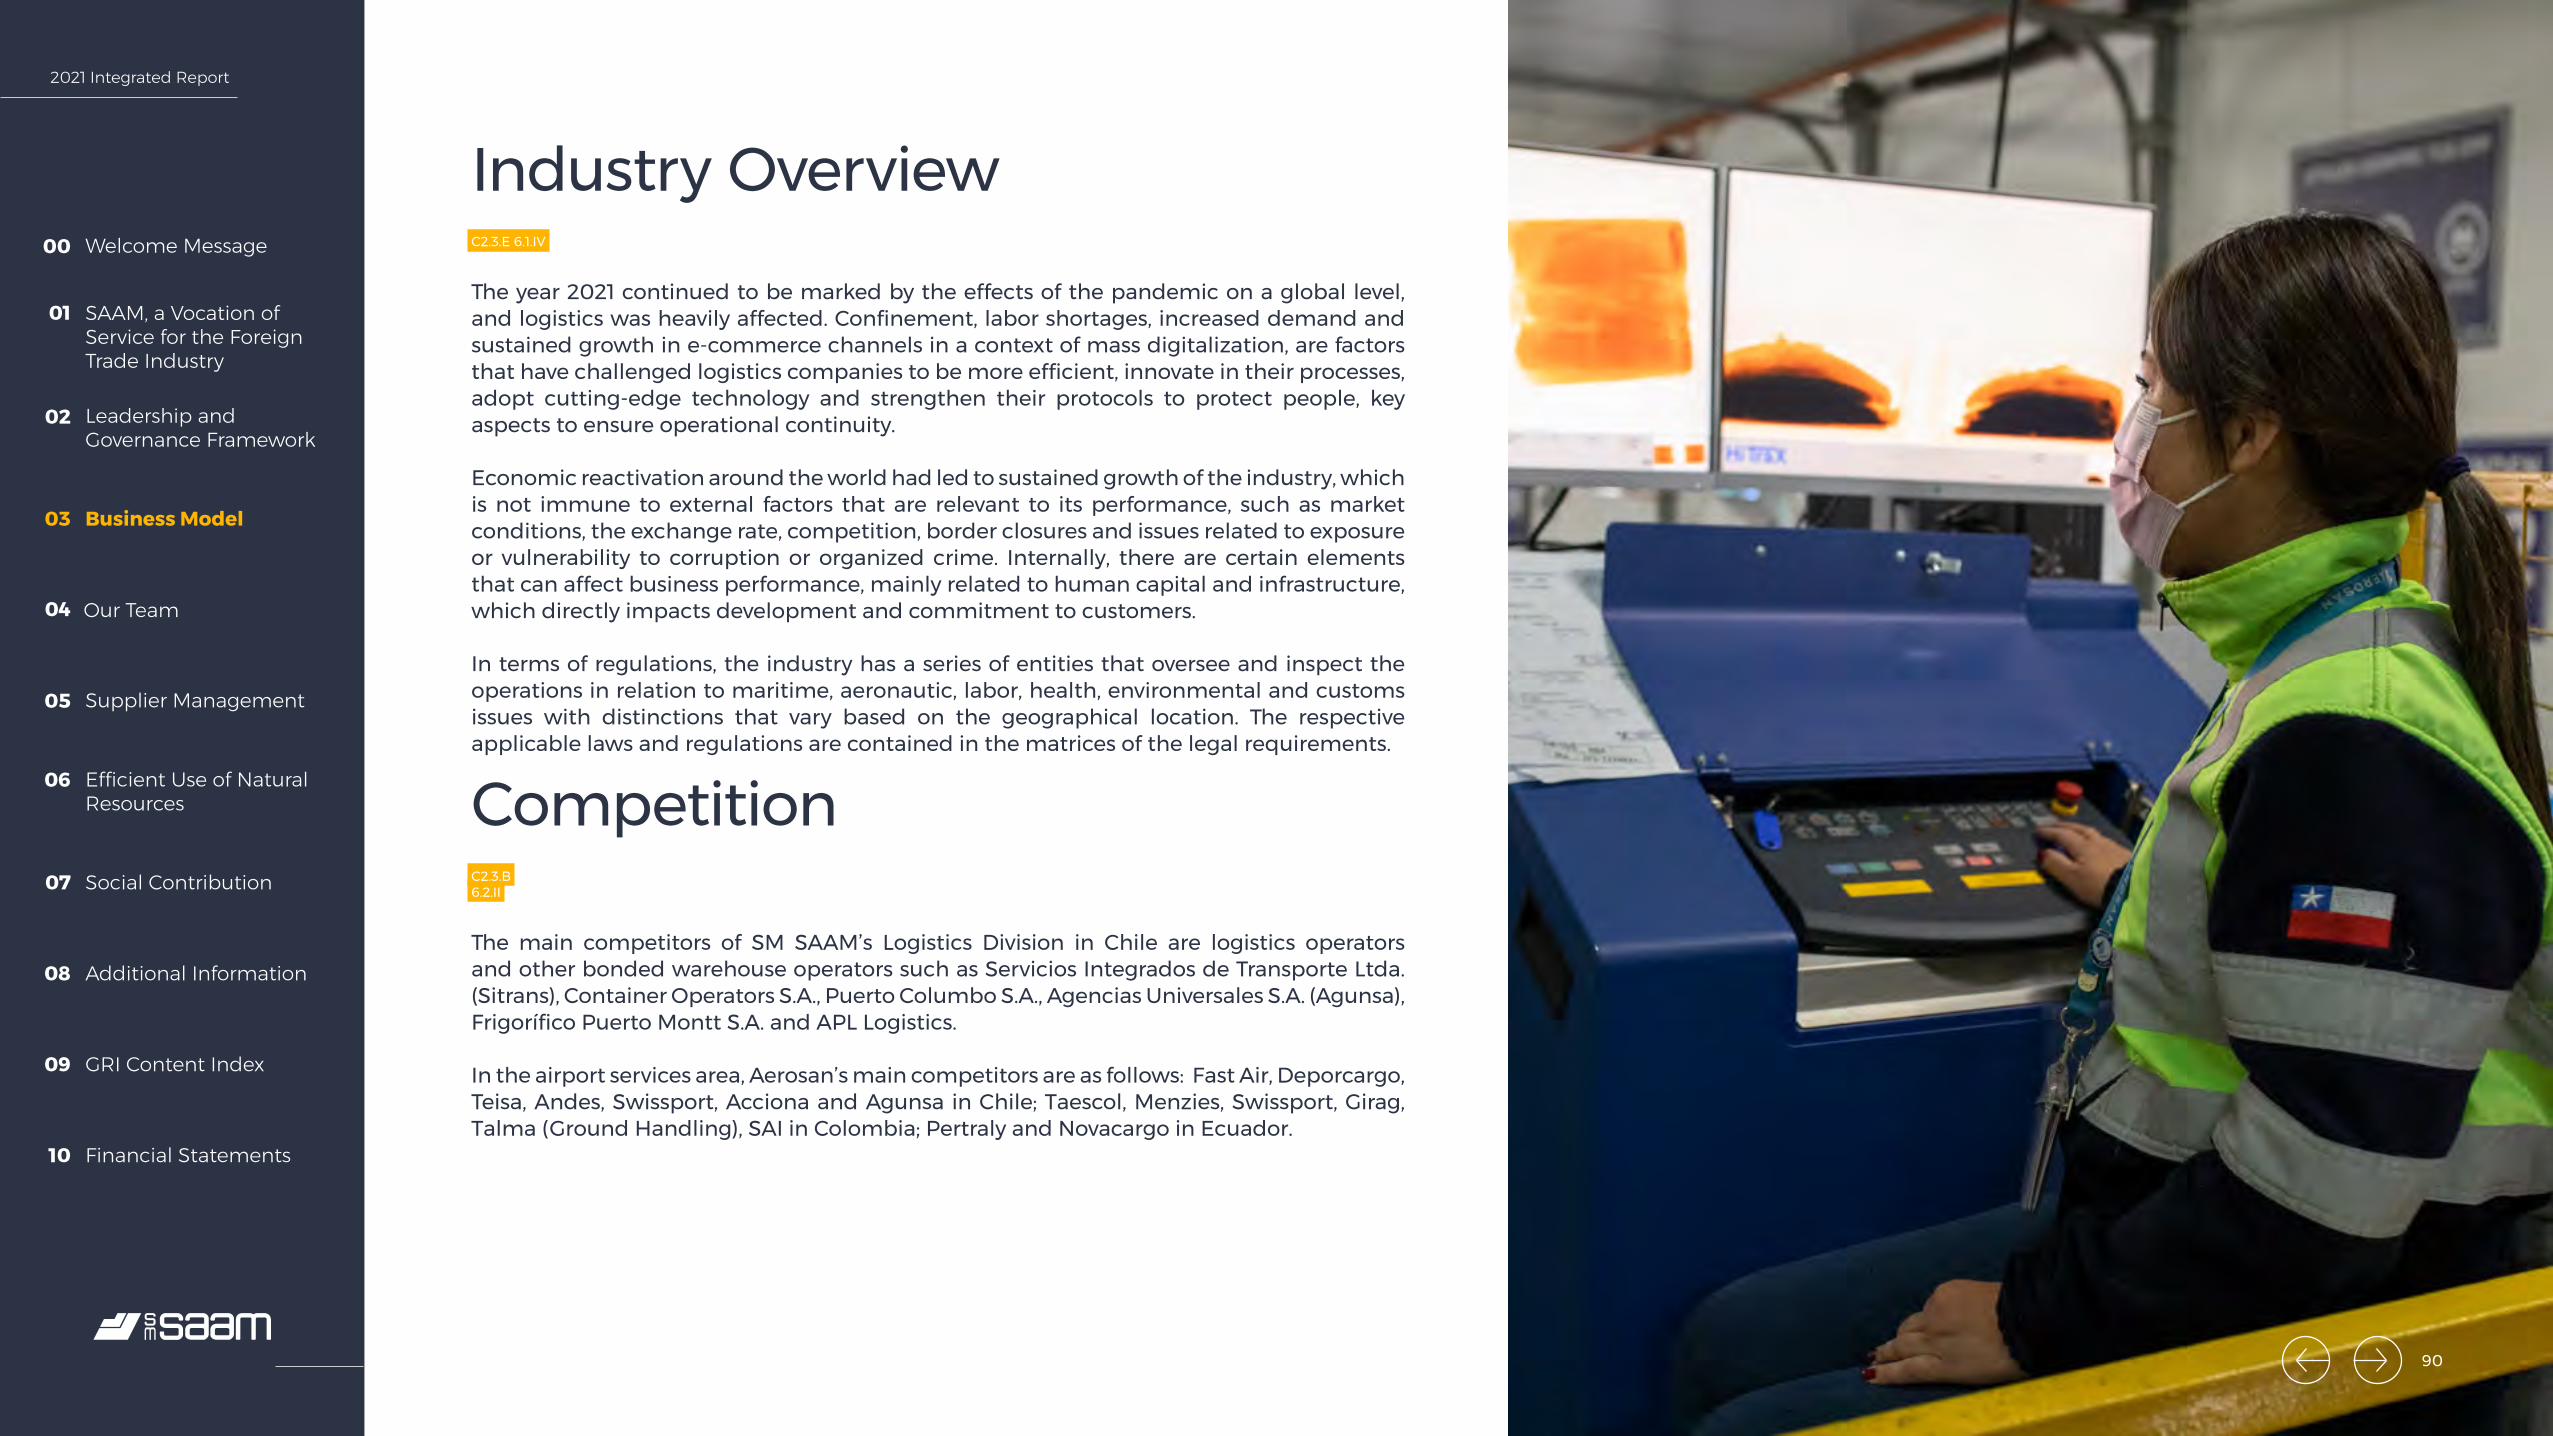
2021 Integrated Report
Welcome Message00
SAAM, a Vocation of Service for the Foreign Trade Industry
01
Leadership and Governance Framework
02
Business Model03
Our Team04
Supplier Management05
Efficient Use of Natural Resources
06
Social Contribution07
Additional Information08
GRI Content Index09
Financial Statements10
Industry OverviewC2.3.E 6.1.IV
The year 2021 continued to be marked by the effects of the pandemic on a global level, and logistics was heavily affected. Confinement, labor shortages, increased demand and sustained growth in e-commerce channels in a context of mass digitalization, are factors that have challenged logistics companies to be more efficient, innovate in their processes, adopt cutting-edge technology and strengthen their protocols to protect people, key aspects to ensure operational continuity.
Economic reactivation around the world had led to sustained growth of the industry, which is not immune to external factors that are relevant to its performance, such as market conditions, the exchange rate, competition, border closures and issues related to exposure or vulnerability to corruption or organized crime. Internally, there are certain elements that can affect business performance, mainly related to human capital and infrastructure, which directly impacts development and commitment to customers.
In terms of regulations, the industry has a series of entities that oversee and inspect the operations in relation to maritime, aeronautic, labor, health, environmental and customs issues with distinctions that vary based on the geographical location. The respective applicable laws and regulations are contained in the matrices of the legal requirements.
CompetitionC2.3.B6.2.II
The main competitors of SM SAAM’s Logistics Division in Chile are logistics operators and other bonded warehouse operators such as Servicios Integrados de Transporte Ltda. (Sitrans), Container Operators S.A., Puerto Columbo S.A., Agencias Universales S.A. (Agunsa), Frigorífico Puerto Montt S.A. and APL Logistics.
In the airport services area, Aerosan’s main competitors are as follows: Fast Air, Deporcargo, Teisa, Andes, Swissport, Acciona and Agunsa in Chile; Taescol, Menzies, Swissport, Girag, Talma (Ground Handling), SAI in Colombia; Pertraly and Novacargo in Ecuador.
90
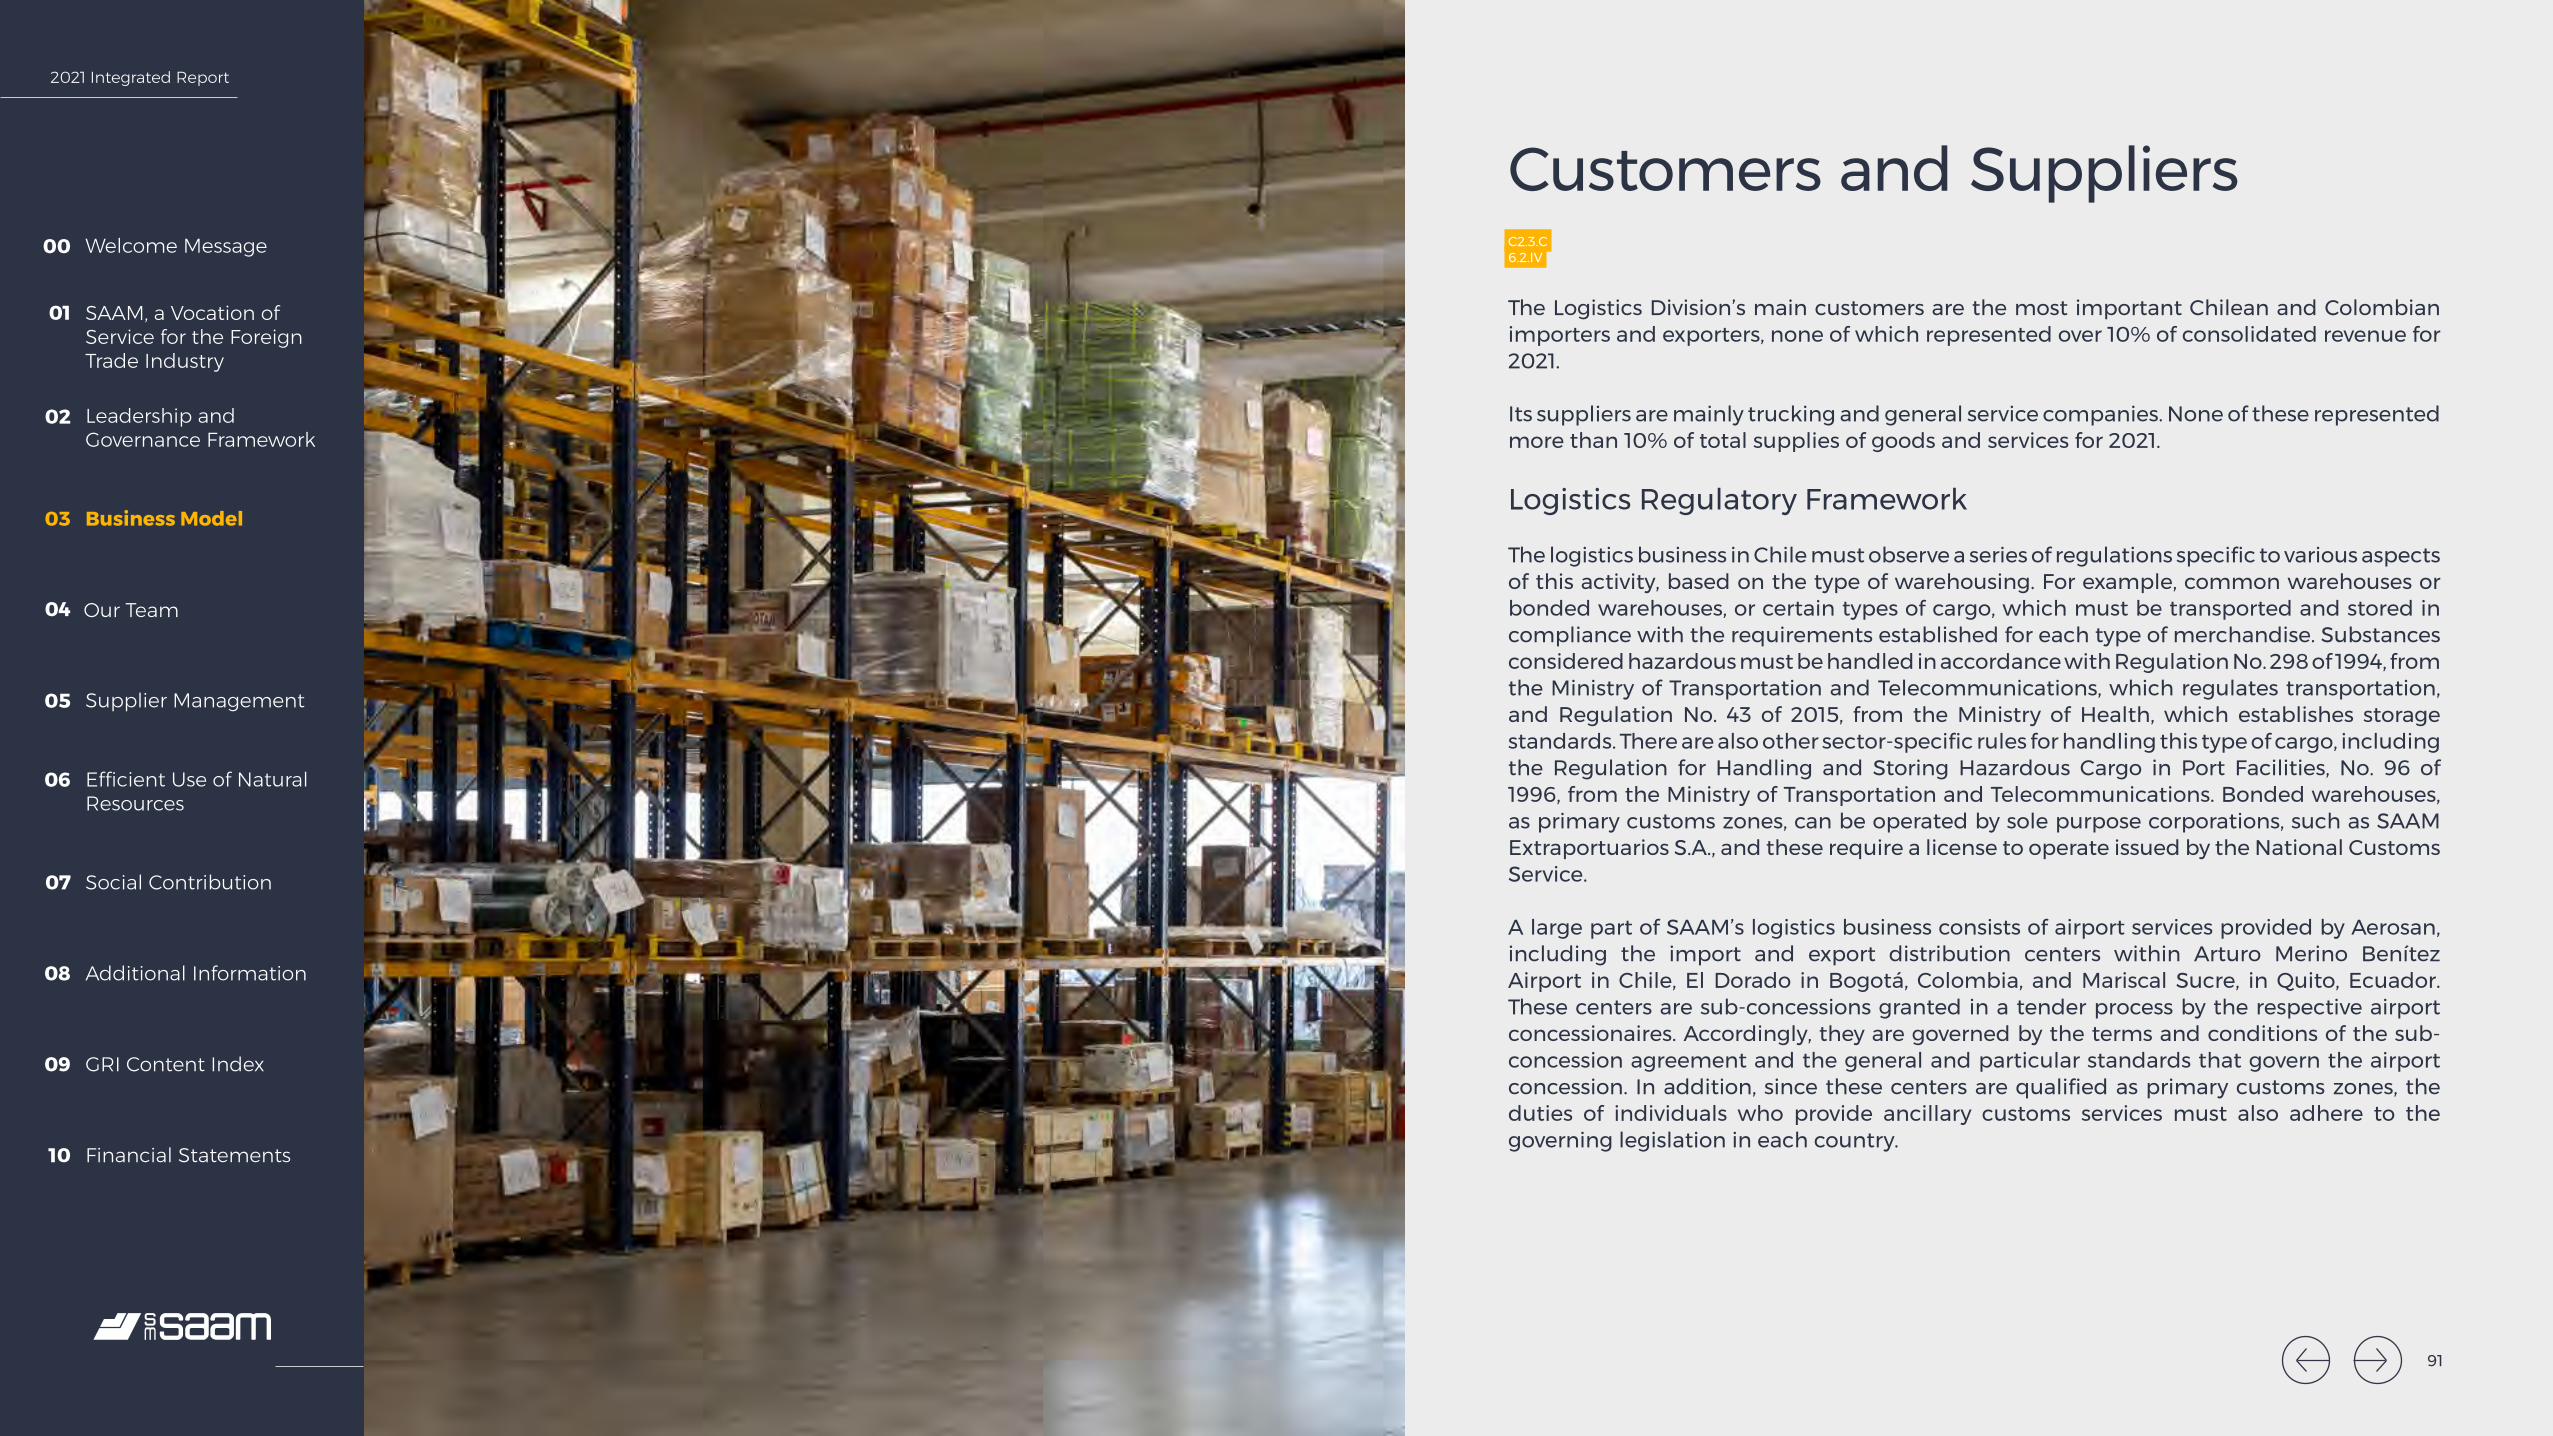
2021 Integrated Report
Welcome Message00
SAAM, a Vocation of Service for the Foreign Trade Industry
01
Leadership and Governance Framework
02
Business Model03
Our Team04
Supplier Management05
Efficient Use of Natural Resources
06
Social Contribution07
Additional Information08
GRI Content Index09
Financial Statements10
Customers and SuppliersC2.3.C6.2.IV
The Logistics Division’s main customers are the most important Chilean and Colombian importers and exporters, none of which represented over 10% of consolidated revenue for 2021.
Its suppliers are mainly trucking and general service companies. None of these represented more than 10% of total supplies of goods and services for 2021.
Logistics Regulatory Framework
The logistics business in Chile must observe a series of regulations specific to various aspects of this activity, based on the type of warehousing. For example, common warehouses or bonded warehouses, or certain types of cargo, which must be transported and stored in compliance with the requirements established for each type of merchandise. Substances considered hazardous must be handled in accordance with Regulation No. 298 of 1994, from the Ministry of Transportation and Telecommunications, which regulates transportation, and Regulation No. 43 of 2015, from the Ministry of Health, which establishes storage standards. There are also other sector-specific rules for handling this type of cargo, including the Regulation for Handling and Storing Hazardous Cargo in Port Facilities, No. 96 of 1996, from the Ministry of Transportation and Telecommunications. Bonded warehouses, as primary customs zones, can be operated by sole purpose corporations, such as SAAM Extraportuarios S.A., and these require a license to operate issued by the National Customs Service.
A large part of SAAM’s logistics business consists of airport services provided by Aerosan, including the import and export distribution centers within Arturo Merino Benítez Airport in Chile, El Dorado in Bogotá, Colombia, and Mariscal Sucre, in Quito, Ecuador. These centers are sub-concessions granted in a tender process by the respective airport concessionaires. Accordingly, they are governed by the terms and conditions of the sub-concession agreement and the general and particular standards that govern the airport concession. In addition, since these centers are qualified as primary customs zones, the duties of individuals who provide ancillary customs services must also adhere to the governing legislation in each country.
91

2021 Integrated Report
Welcome Message00
SAAM, a Vocation of Service for the Foreign Trade Industry
01
Leadership and Governance Framework
02
Business Model03
Our Team04
Supplier Management05
Efficient Use of Natural Resources
06
Social Contribution07
Additional Information08
GRI Content Index09
Financial Statements10
Relevant Factors
Customs efficiency.
Quality of infrastructure and logistics services.
Real-time traceability of shipments.
Compliance with the agreed service levels at each stage of the logistics chain.
Management through operational indicators.
Digitalization and processes.
92
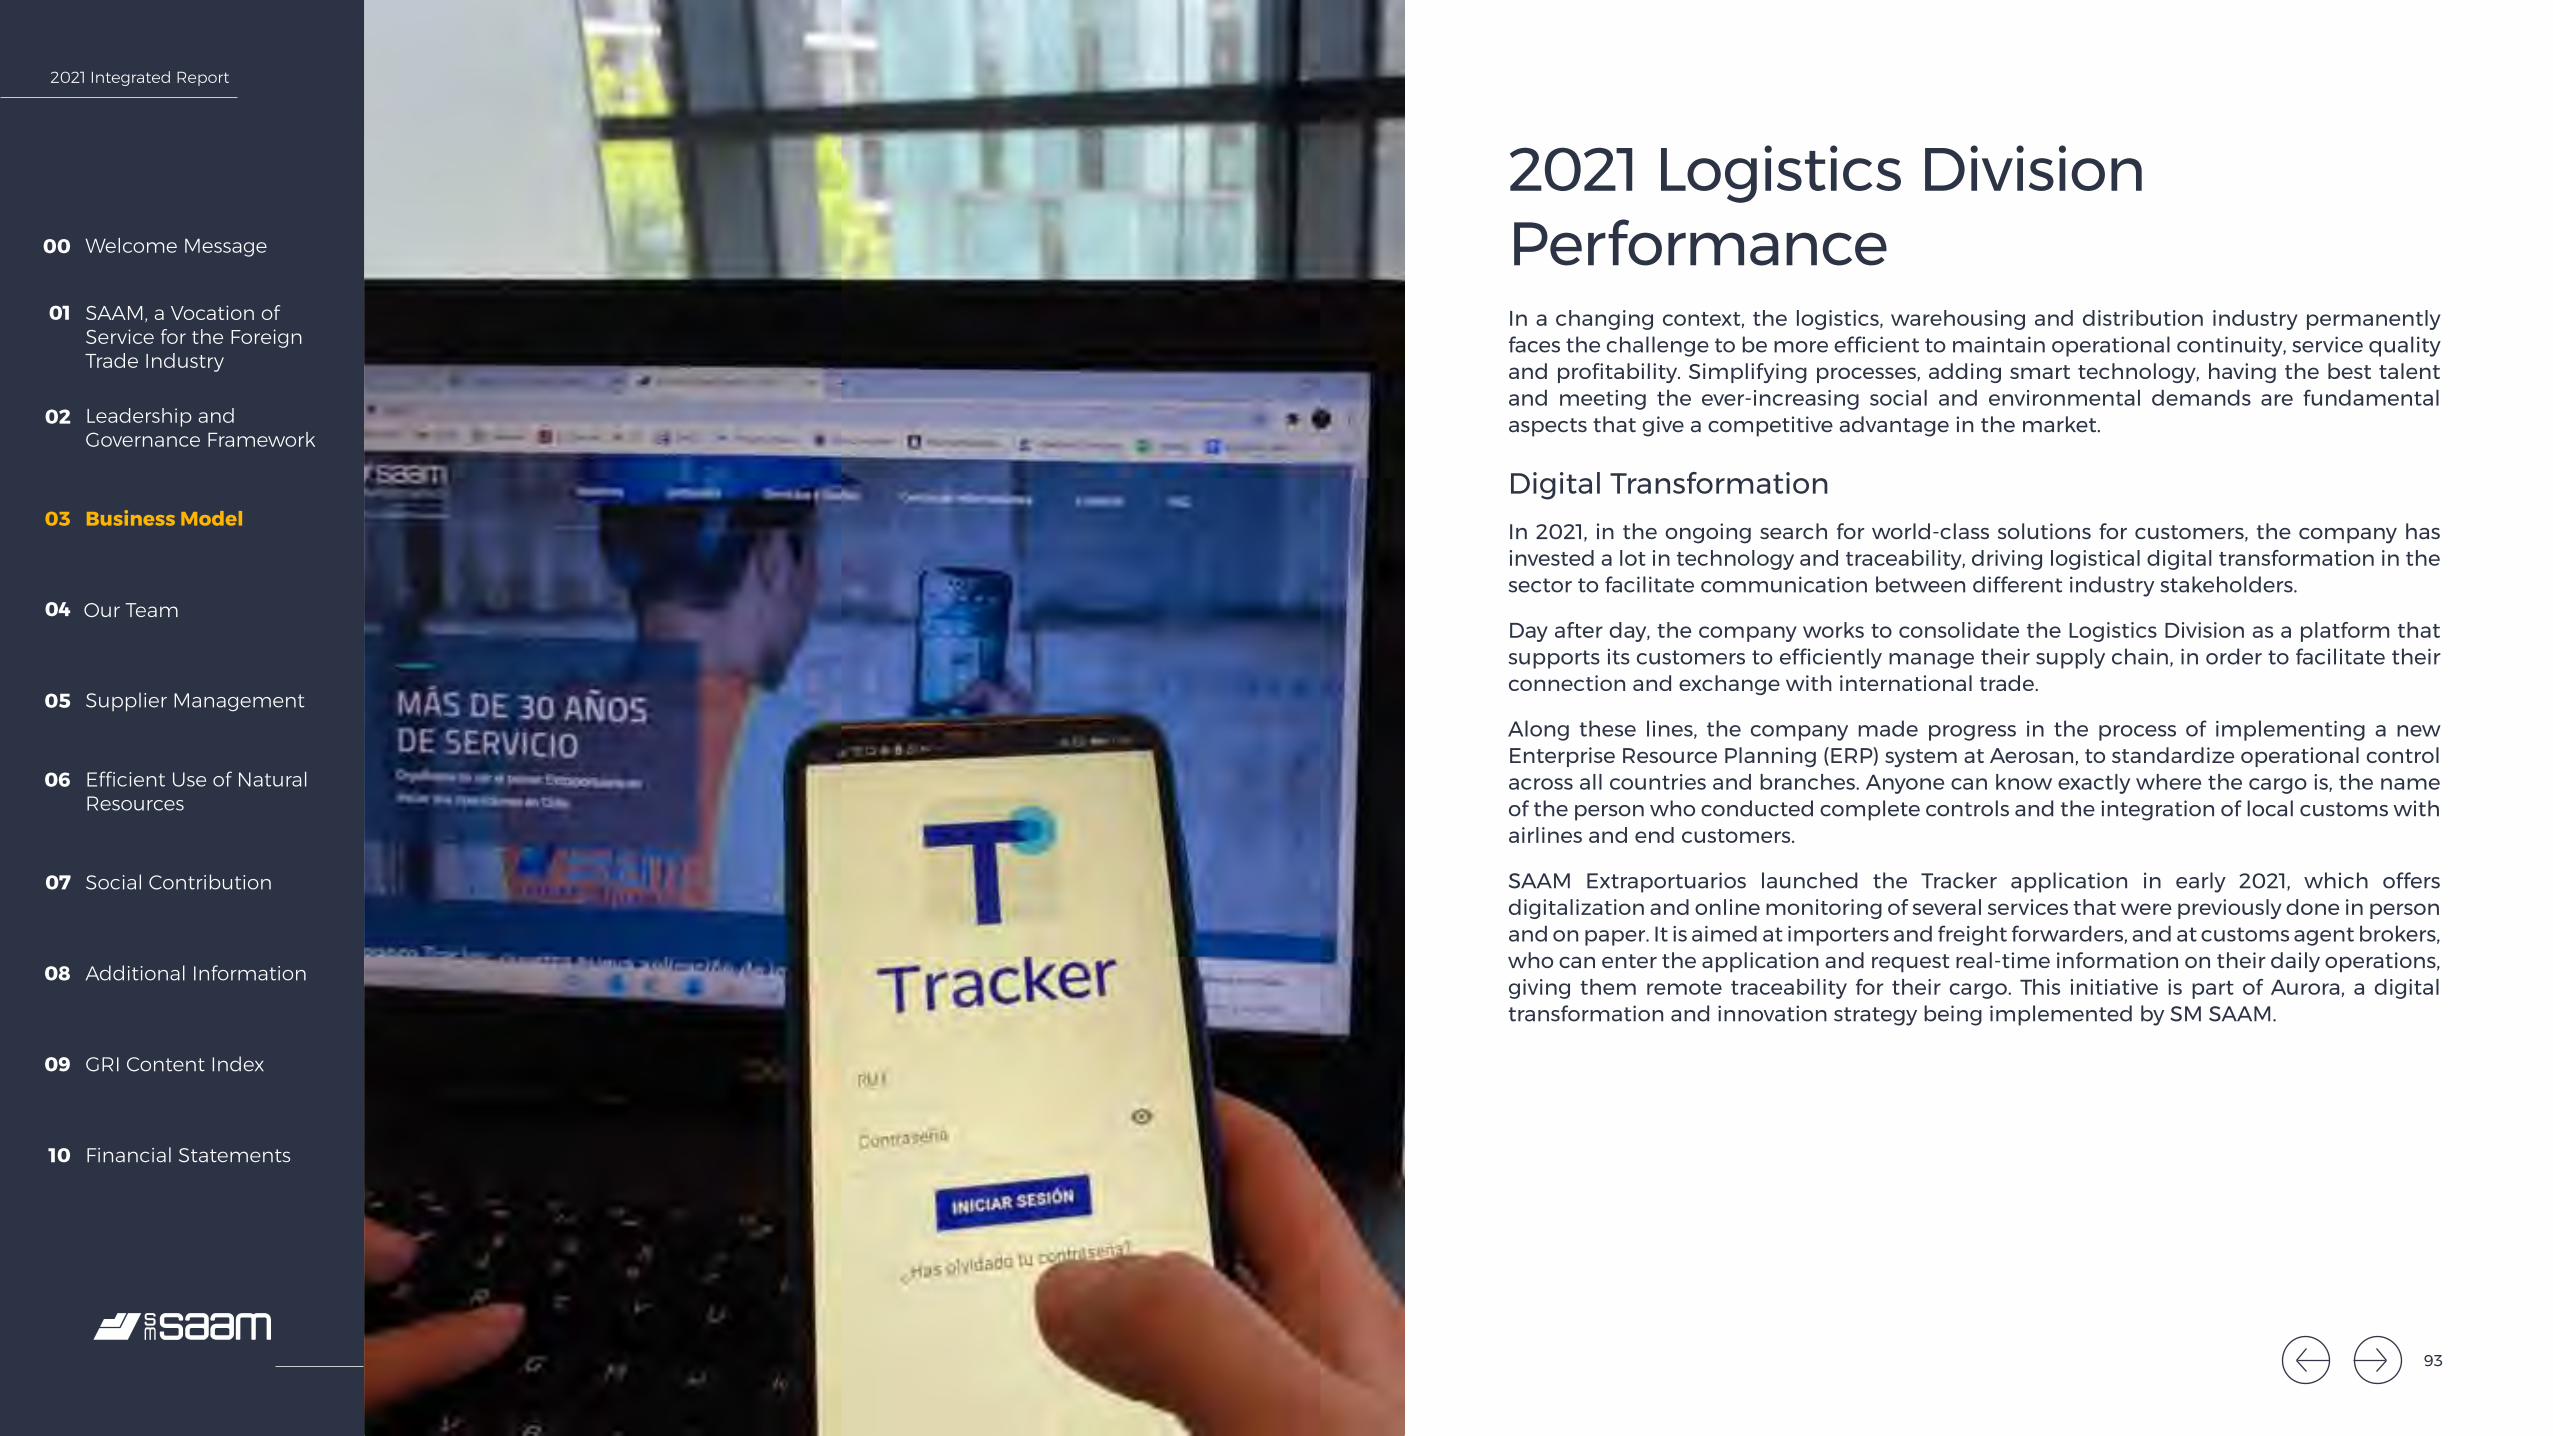
2021 Integrated Report
Welcome Message00
SAAM, a Vocation of Service for the Foreign Trade Industry
01
Leadership and Governance Framework
02
Business Model03
Our Team04
Supplier Management05
Efficient Use of Natural Resources
06
Social Contribution07
Additional Information08
GRI Content Index09
Financial Statements10
2021 Logistics Division PerformanceIn a changing context, the logistics, warehousing and distribution industry permanently faces the challenge to be more efficient to maintain operational continuity, service quality and profitability. Simplifying processes, adding smart technology, having the best talent and meeting the ever-increasing social and environmental demands are fundamental aspects that give a competitive advantage in the market.
Digital TransformationIn 2021, in the ongoing search for world-class solutions for customers, the company has invested a lot in technology and traceability, driving logistical digital transformation in the sector to facilitate communication between different industry stakeholders.
Day after day, the company works to consolidate the Logistics Division as a platform that supports its customers to efficiently manage their supply chain, in order to facilitate their connection and exchange with international trade.
Along these lines, the company made progress in the process of implementing a new Enterprise Resource Planning (ERP) system at Aerosan, to standardize operational control across all countries and branches. Anyone can know exactly where the cargo is, the name of the person who conducted complete controls and the integration of local customs with airlines and end customers.
SAAM Extraportuarios launched the Tracker application in early 2021, which offers digitalization and online monitoring of several services that were previously done in person and on paper. It is aimed at importers and freight forwarders, and at customs agent brokers, who can enter the application and request real-time information on their daily operations, giving them remote traceability for their cargo. This initiative is part of Aurora, a digital transformation and innovation strategy being implemented by SM SAAM.
93
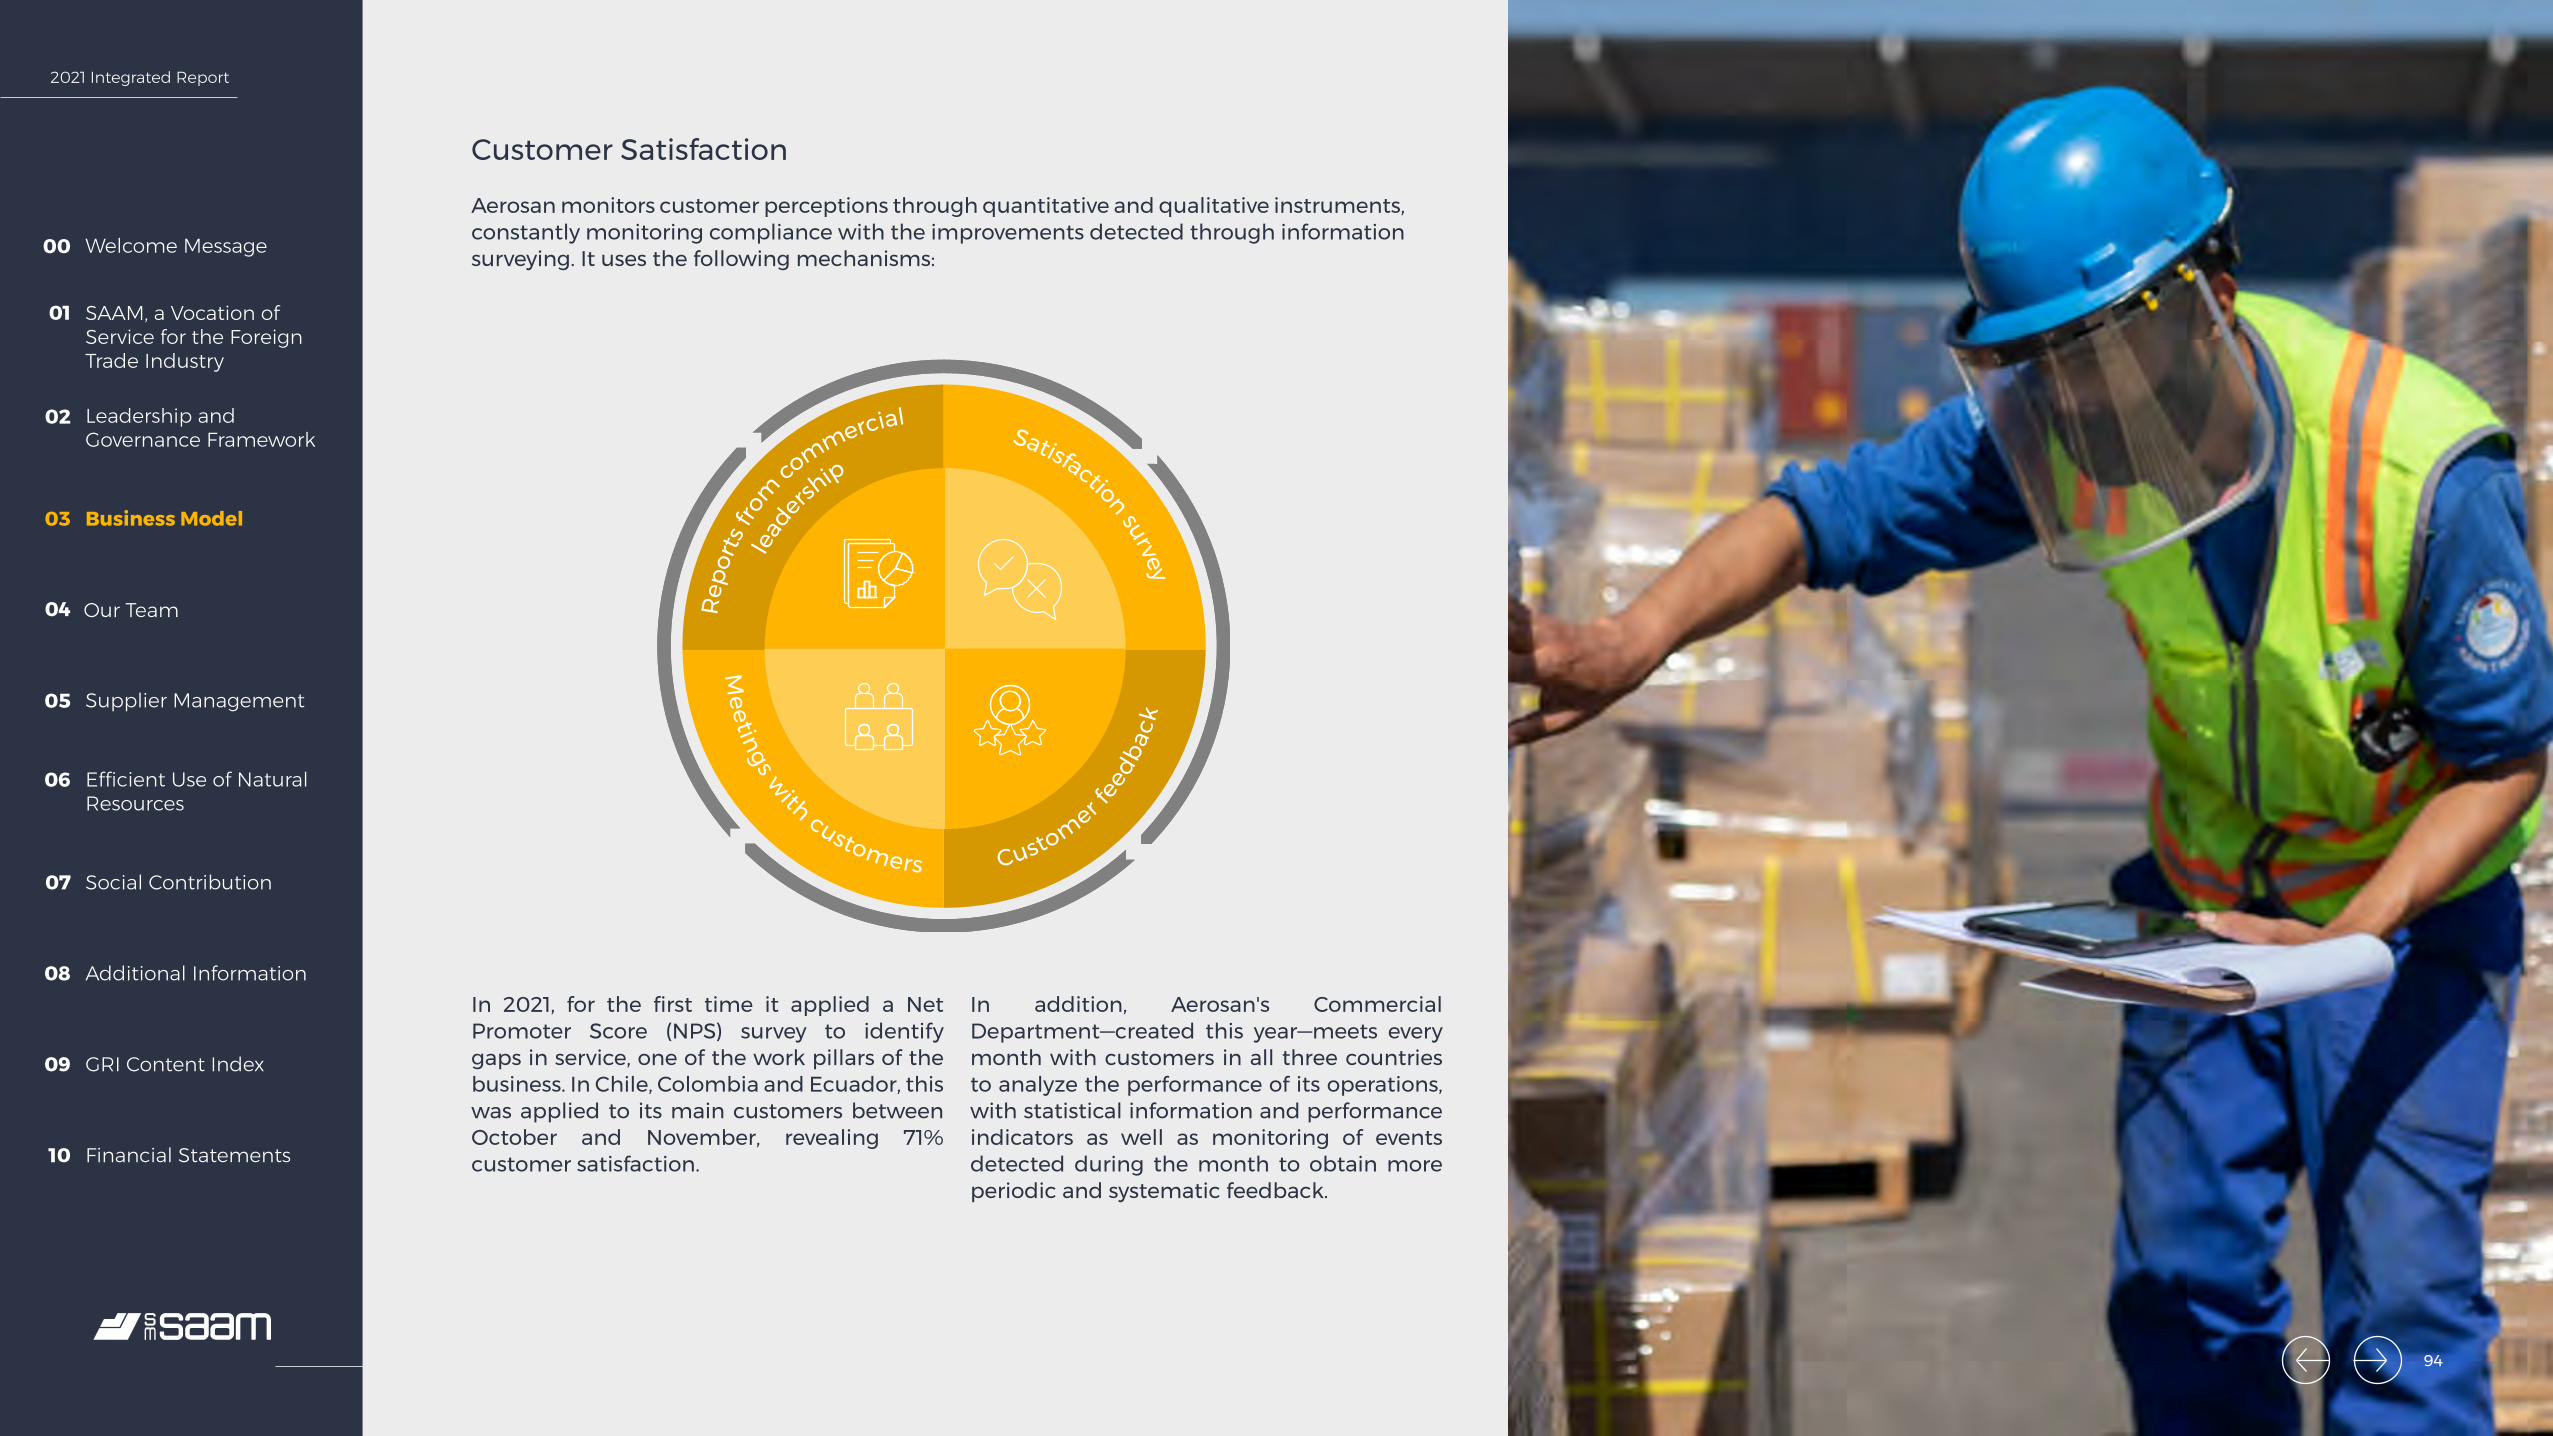
2021 Integrated Report
Welcome Message00
SAAM, a Vocation of Service for the Foreign Trade Industry
01
Leadership and Governance Framework
02
Business Model03
Our Team04
Supplier Management05
Efficient Use of Natural Resources
06
Social Contribution07
Additional Information08
GRI Content Index09
Financial Statements10
Meetings with customers Customer f
eedb
ack
Satisfaction survey
Rep
orts
from
commercial
lead
ership
Customer Satisfaction
Aerosan monitors customer perceptions through quantitative and qualitative instruments, constantly monitoring compliance with the improvements detected through information surveying. It uses the following mechanisms:
In 2021, for the first time it applied a Net Promoter Score (NPS) survey to identify gaps in service, one of the work pillars of the business. In Chile, Colombia and Ecuador, this was applied to its main customers between October and November, revealing 71% customer satisfaction.
In addition, Aerosan's Commercial Department—created this year—meets every month with customers in all three countries to analyze the performance of its operations, with statistical information and performance indicators as well as monitoring of events detected during the month to obtain more periodic and systematic feedback.
94
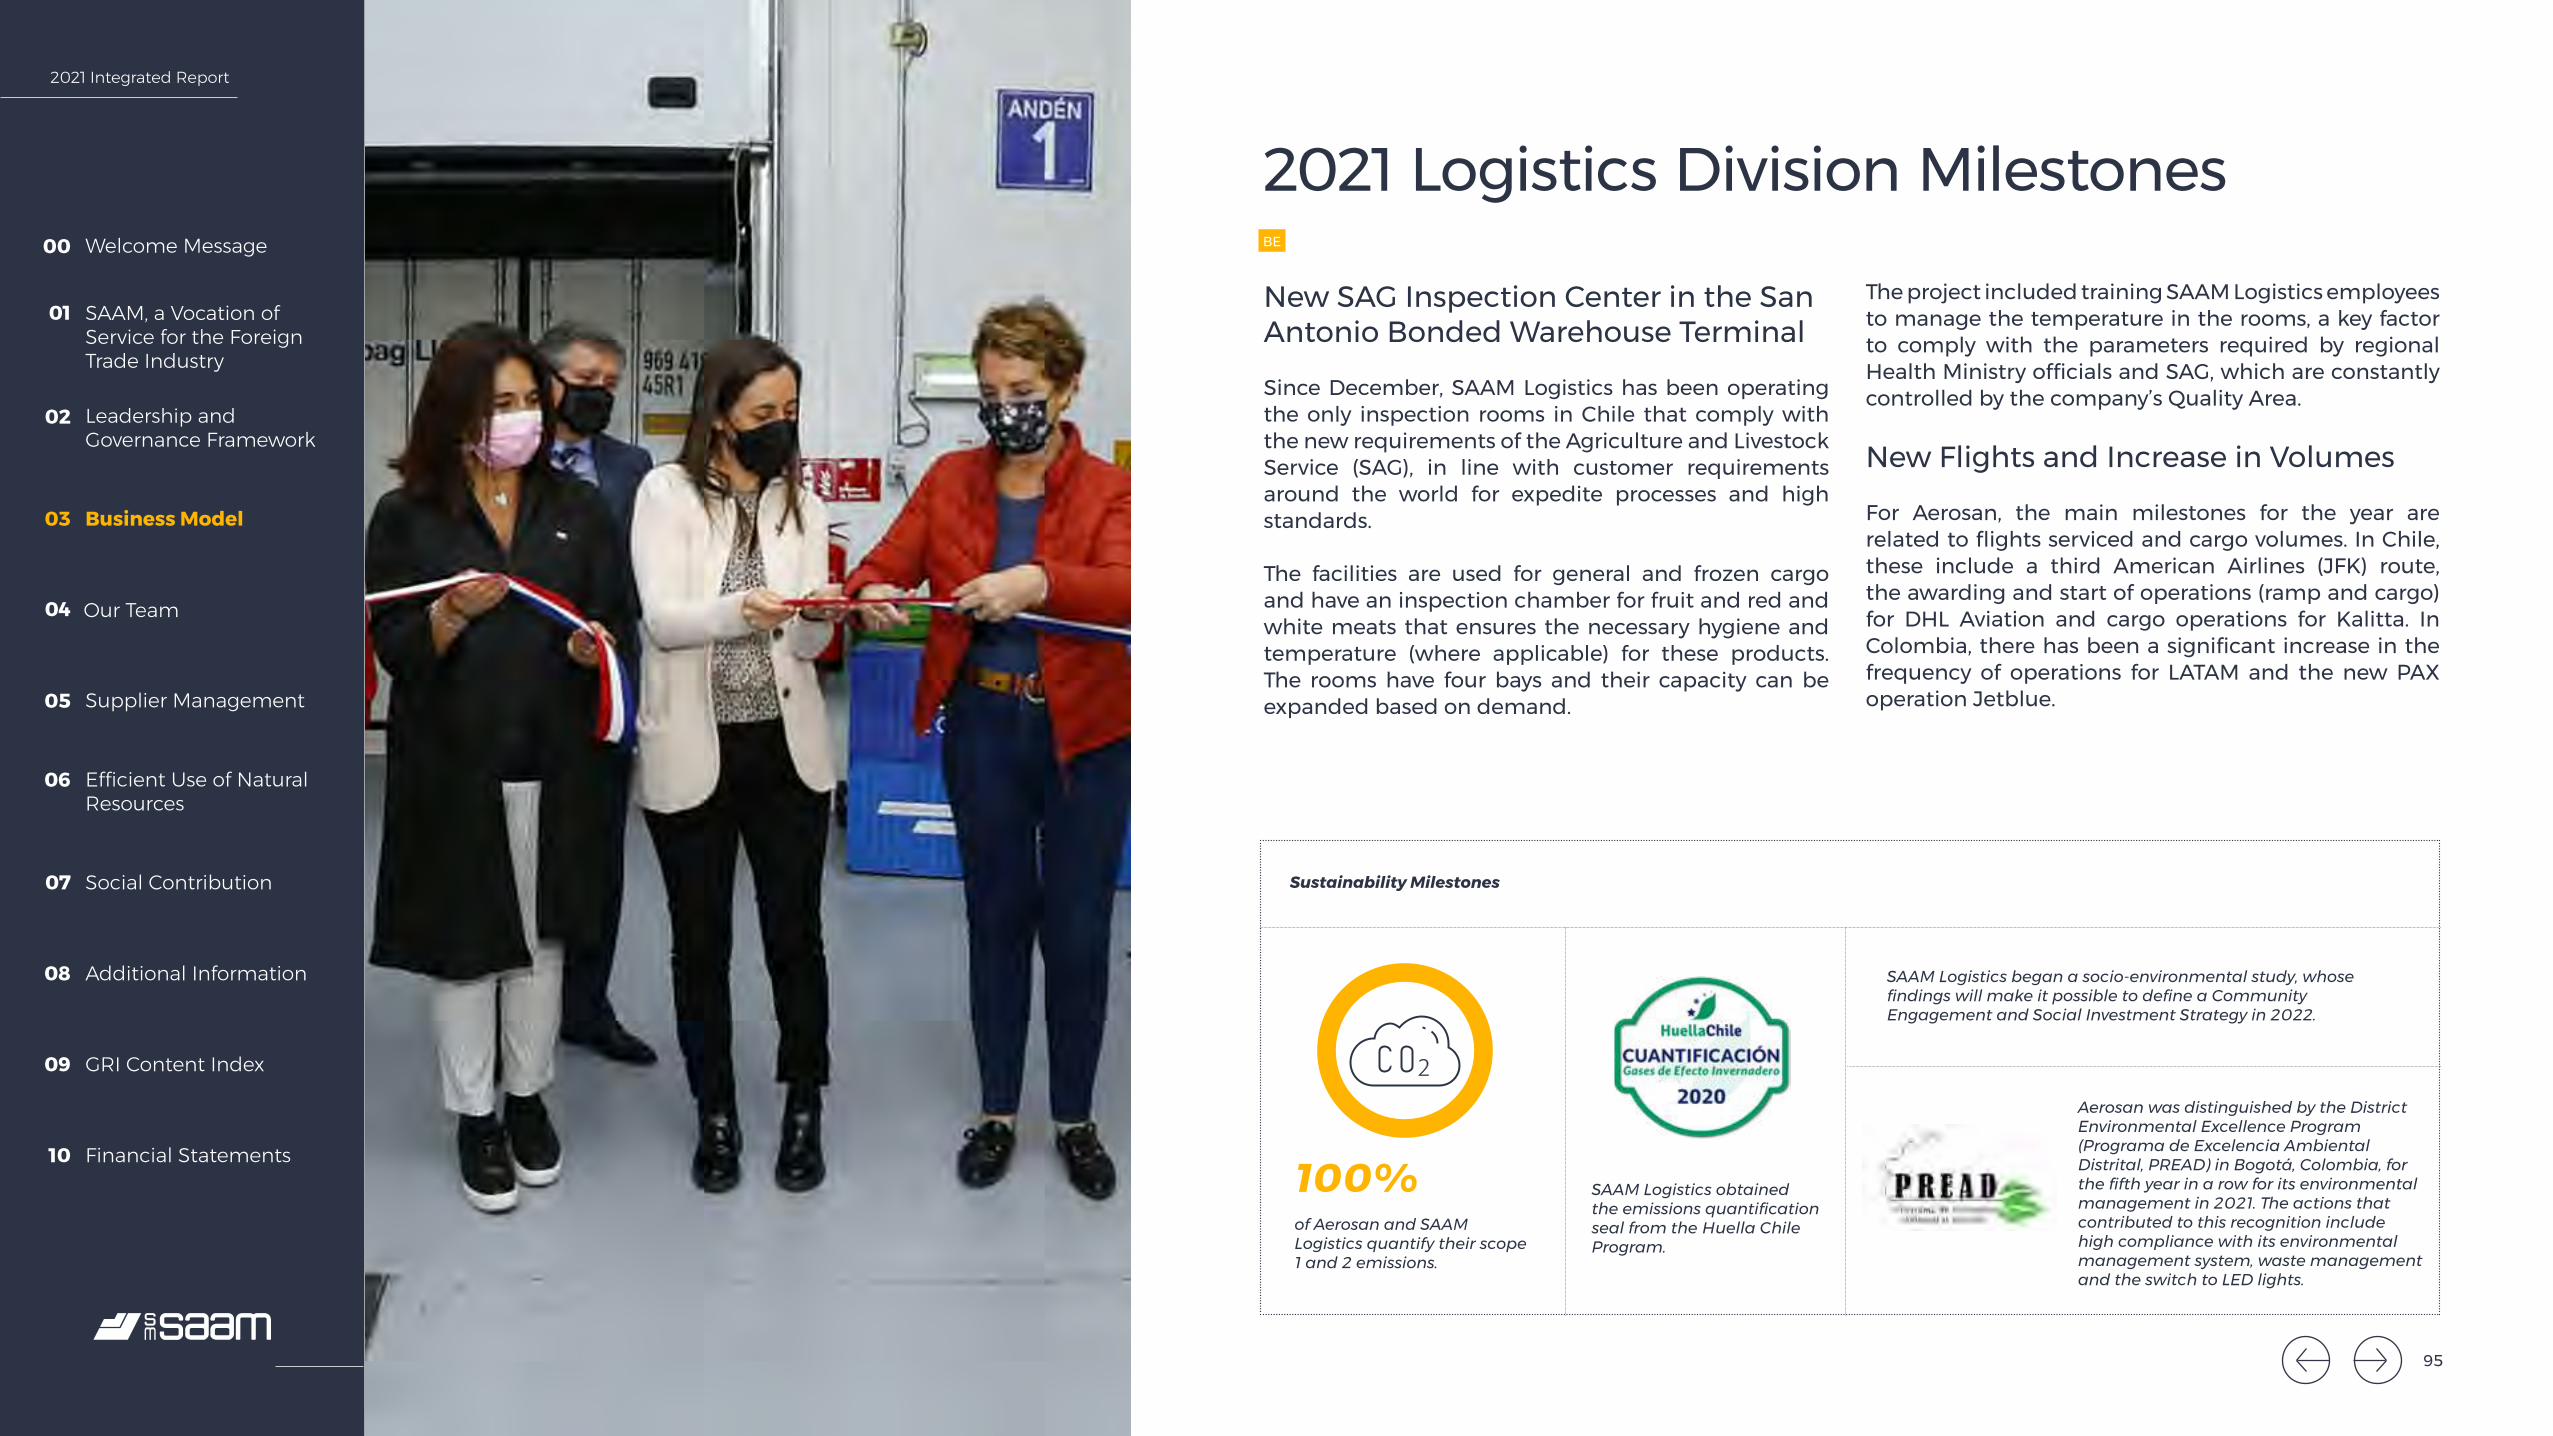
2021 Integrated Report
Welcome Message00
SAAM, a Vocation of Service for the Foreign Trade Industry
01
Leadership and Governance Framework
02
Business Model03
Our Team04
Supplier Management05
Efficient Use of Natural Resources
06
Social Contribution07
Additional Information08
GRI Content Index09
Financial Statements10
2021 Logistics Division Milestones BE
Sustainability Milestones
The project included training SAAM Logistics employees to manage the temperature in the rooms, a key factor to comply with the parameters required by regional Health Ministry officials and SAG, which are constantly controlled by the company’s Quality Area.
New Flights and Increase in Volumes
For Aerosan, the main milestones for the year are related to flights serviced and cargo volumes. In Chile, these include a third American Airlines (JFK) route, the awarding and start of operations (ramp and cargo) for DHL Aviation and cargo operations for Kalitta. In Colombia, there has been a significant increase in the frequency of operations for LATAM and the new PAX operation Jetblue.
100%
of Aerosan and SAAM Logistics quantify their scope 1 and 2 emissions.
SAAM Logistics obtained the emissions quantification seal from the Huella Chile Program.
SAAM Logistics began a socio-environmental study, whose findings will make it possible to define a Community Engagement and Social Investment Strategy in 2022.
Aerosan was distinguished by the District Environmental Excellence Program (Programa de Excelencia Ambiental Distrital, PREAD) in Bogotá, Colombia, for the fifth year in a row for its environmental management in 2021. The actions that contributed to this recognition include high compliance with its environmental management system, waste management and the switch to LED lights.
New SAG Inspection Center in the San Antonio Bonded Warehouse Terminal
Since December, SAAM Logistics has been operating the only inspection rooms in Chile that comply with the new requirements of the Agriculture and Livestock Service (SAG), in line with customer requirements around the world for expedite processes and high standards.
The facilities are used for general and frozen cargo and have an inspection chamber for fruit and red and white meats that ensures the necessary hygiene and temperature (where applicable) for these products. The rooms have four bays and their capacity can be expanded based on demand.
95
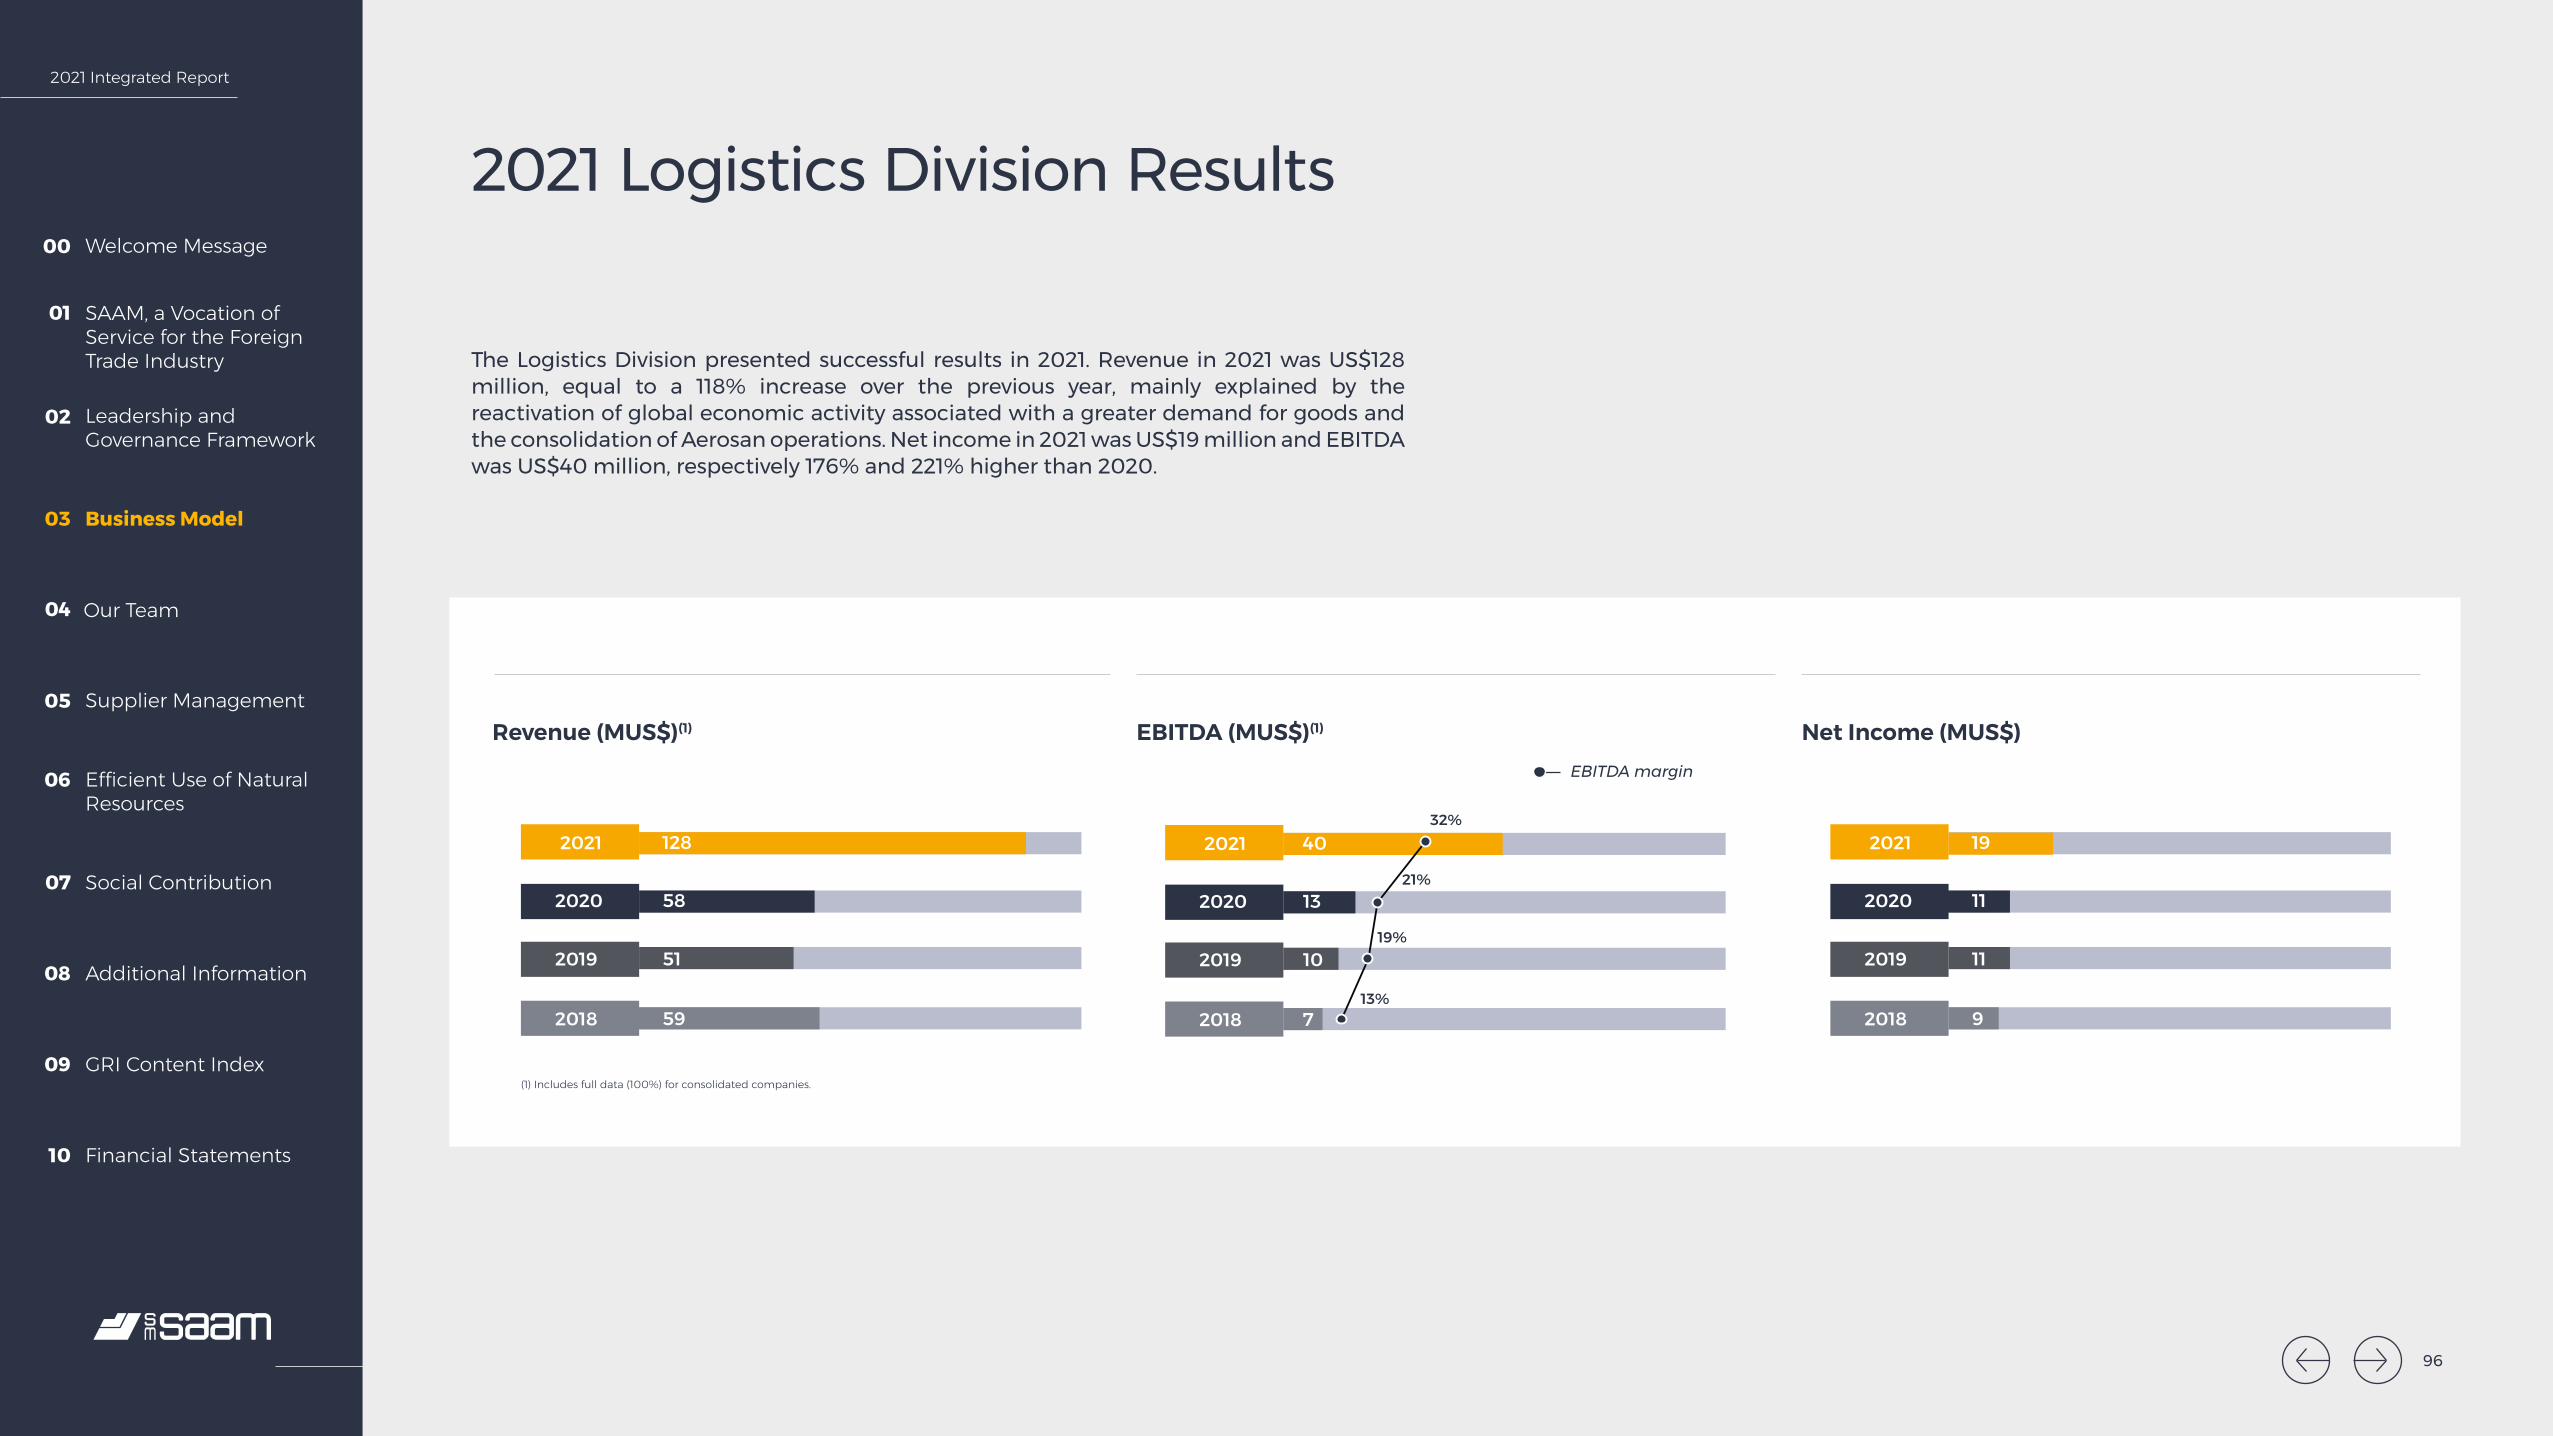
2021 Integrated Report
Welcome Message00
SAAM, a Vocation of Service for the Foreign Trade Industry
01
Leadership and Governance Framework
02
Business Model03
Our Team04
Supplier Management05
Efficient Use of Natural Resources
06
Social Contribution07
Additional Information08
GRI Content Index09
Financial Statements10
40
13
10
7
32%
21%
19%
13%
2021
2020
2019
2018
128
58
51
59
2021
2020
2019
2018
19
11
11
9
2021
2020
2019
2018
2021 Logistics Division Results
EBITDA (MUS$)(1)Revenue (MUS$)(1) Net Income (MUS$)
The Logistics Division presented successful results in 2021. Revenue in 2021 was US$128 million, equal to a 118% increase over the previous year, mainly explained by the reactivation of global economic activity associated with a greater demand for goods and the consolidation of Aerosan operations. Net income in 2021 was US$19 million and EBITDA was US$40 million, respectively 176% and 221% higher than 2020.
EBITDA margin
(1) Includes full data (100%) for consolidated companies.
96
2021 Integrated Report
Welcome Message00
SAAM, a Vocation of Service for the Foreign Trade Industry
01
Leadership and Governance Framework
02
Business Model03
Our Team04
Supplier Management05
Efficient Use of Natural Resources
06
Social Contribution07
Additional Information08
GRI Content Index09
Financial Statements10
Investments
97

2021 Integrated Report
Welcome Message00
SAAM, a Vocation of Service for the Foreign Trade Industry
01
Leadership and Governance Framework
02
Business Model03
Our Team04
Supplier Management05
Efficient Use of Natural Resources
06
Social Contribution07
Additional Information08
GRI Content Index09
Financial Statements10
Investments4.3
Investment Policy
Company investments are focused on maintaining and improving competitiveness, increasing efficiency and promoting the sustainability of its businesses. Likewise, each investment in port terminals, logistics or towage services seeks to improve the service level provided to customers and keep high operational levels.
The merit of each investment is analyzed, and a decision is made based on a business case, whether to upgrade, maintain or expand operating capacities. Several key variables are considered for approval, such as profitability, impact on the level of services provided to customers and the associated financing structure. Likewise, the company is also constantly searching for new inorganic investments that can complement its portfolio.
Based on this, all significant investments are reviewed and approved by an Investment Committee on a corporate level, taking care to maintain a healthy capital and financing structure that is in line with the business profile.
98

2021 Integrated Report
Welcome Message00
SAAM, a Vocation of Service for the Foreign Trade Industry
01
Leadership and Governance Framework
02
Business Model03
Our Team04
Supplier Management05
Efficient Use of Natural Resources
06
Social Contribution07
Additional Information08
GRI Content Index09
Financial Statements10
Investment Plan
In 2021, the Board of Directors of SM SAAM approved the purchase of cranes, port equipment and additional tugs to maintain operational capacity and satisfy operations in the markets where it is present. Overall, in addition to the customary purchase of operating fixed assets, US$65 million were approved and are expected to materialize in 2022 and 2023.
Consolidated numbers ThUS$(1) Investments approved in 2020 Investments approved in 2021Equipment purchases 43,900 8,316Tender/contract negotiation 0 25,736Infrastructure improvements 2,518 800Technology improvements 2,067 1,335Equipment upgrades 2,379 29,446Total 50,864 65,633
Financing Policy
SM SAAM S.A. and its subsidiaries finance their operations and investments themselves and with dividends from related companies. The company can also self-finance through the sale of assets and/or emission of new debt and shares.
In terms of the capital structure, the company aims to maintain a healthy and adequate debt-equity ratio, in accordance with the businesses it operates. In financial obligations, the company prioritizes financing in keeping with the nature of its operations and the corresponding assets and future cash generation profiles.
Insurance Policy
SM SAAM’s insurance is managed in accordance with its risk parameters and appetite, which are coherent and complementary to the company’s comprehensive risk management.
SM SAAM’s insurance policies are contracted with global leaders in the insurance industry, to cover risks related to the civil liability of the operation, the health of its employees, property and relevant assets such as tugboat infrastructure, buildings, machinery and vehicles in general, among others.
Insurance policies are contracted after an analysis process that is approved by a Management Award Committee. The committee makes sure that the process is consistent with our compliance model.
(1) The amounts approved are referential and may vary or decrease. Investments may take place over more than one year.
99
2021 Integrated Report
Welcome Message00
SAAM, a Vocation of Service for the Foreign Trade Industry
01
Leadership and Governance Framework
02
Business Model03
Our Team04
Supplier Management05
Efficient Use of Natural Resources
06
Social Contribution07
Additional Information08
GRI Content Index09
Financial Statements10
100
04.Our Team
100
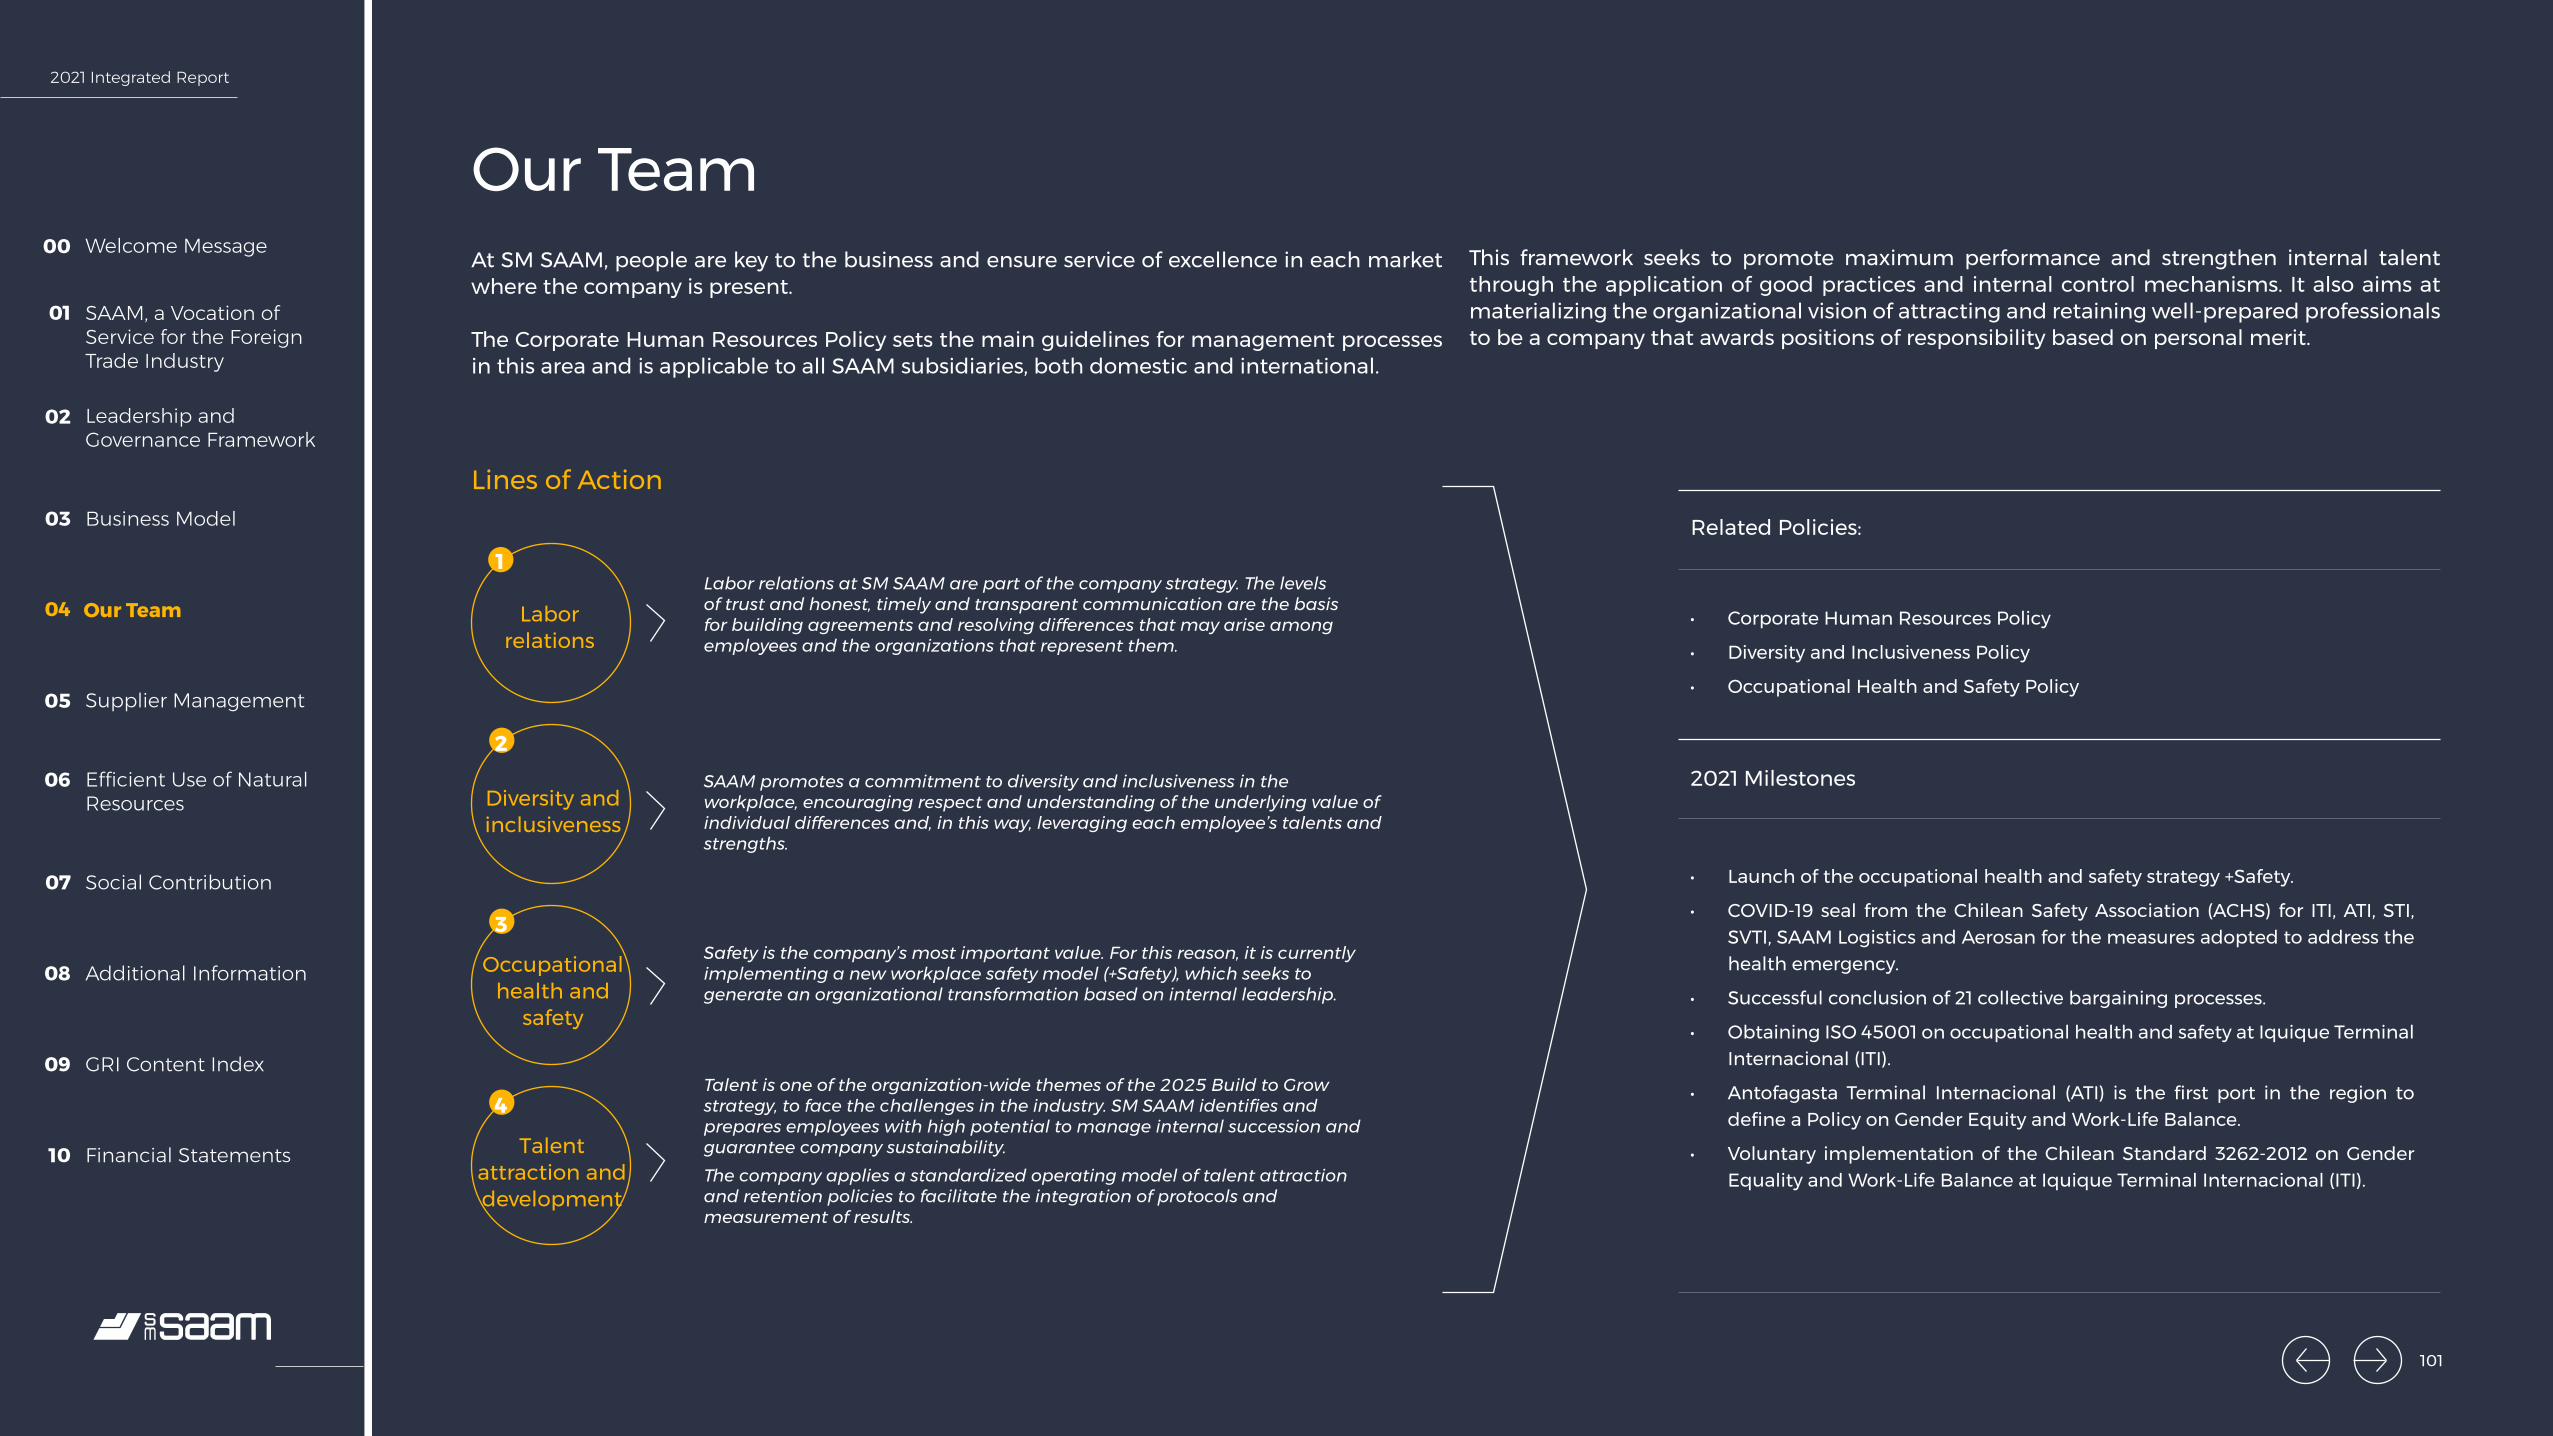
2021 Integrated Report
Welcome Message00
SAAM, a Vocation of Service for the Foreign Trade Industry
01
Leadership and Governance Framework
02
Business Model03
Our Team04
Supplier Management05
Efficient Use of Natural Resources
06
Social Contribution07
Additional Information08
GRI Content Index09
Financial Statements10
101
Lines of Action
2021 Milestones
Related Policies:
Labor relations
Diversity and inclusiveness
Occupational health and
safety
Talent attraction and development
1Labor relations at SM SAAM are part of the company strategy. The levels of trust and honest, timely and transparent communication are the basis for building agreements and resolving differences that may arise among employees and the organizations that represent them.
SAAM promotes a commitment to diversity and inclusiveness in the workplace, encouraging respect and understanding of the underlying value of individual differences and, in this way, leveraging each employee’s talents and strengths.
Safety is the company’s most important value. For this reason, it is currently implementing a new workplace safety model (+Safety), which seeks to generate an organizational transformation based on internal leadership.
Talent is one of the organization-wide themes of the 2025 Build to Grow strategy, to face the challenges in the industry. SM SAAM identifies and prepares employees with high potential to manage internal succession and guarantee company sustainability.The company applies a standardized operating model of talent attraction and retention policies to facilitate the integration of protocols and measurement of results.
2
3
4
• Corporate Human Resources Policy
• Diversity and Inclusiveness Policy
• Occupational Health and Safety Policy
• Launch of the occupational health and safety strategy +Safety.
• COVID-19 seal from the Chilean Safety Association (ACHS) for ITI, ATI, STI, SVTI, SAAM Logistics and Aerosan for the measures adopted to address the health emergency.
• Successful conclusion of 21 collective bargaining processes.
• Obtaining ISO 45001 on occupational health and safety at Iquique Terminal Internacional (ITI).
• Antofagasta Terminal Internacional (ATI) is the first port in the region to define a Policy on Gender Equity and Work-Life Balance.
• Voluntary implementation of the Chilean Standard 3262-2012 on Gender Equality and Work-Life Balance at Iquique Terminal Internacional (ITI).
Our TeamAt SM SAAM, people are key to the business and ensure service of excellence in each market where the company is present.
The Corporate Human Resources Policy sets the main guidelines for management processes in this area and is applicable to all SAAM subsidiaries, both domestic and international.
This framework seeks to promote maximum performance and strengthen internal talent through the application of good practices and internal control mechanisms. It also aims at materializing the organizational vision of attracting and retaining well-prepared professionals to be a company that awards positions of responsibility based on personal merit.
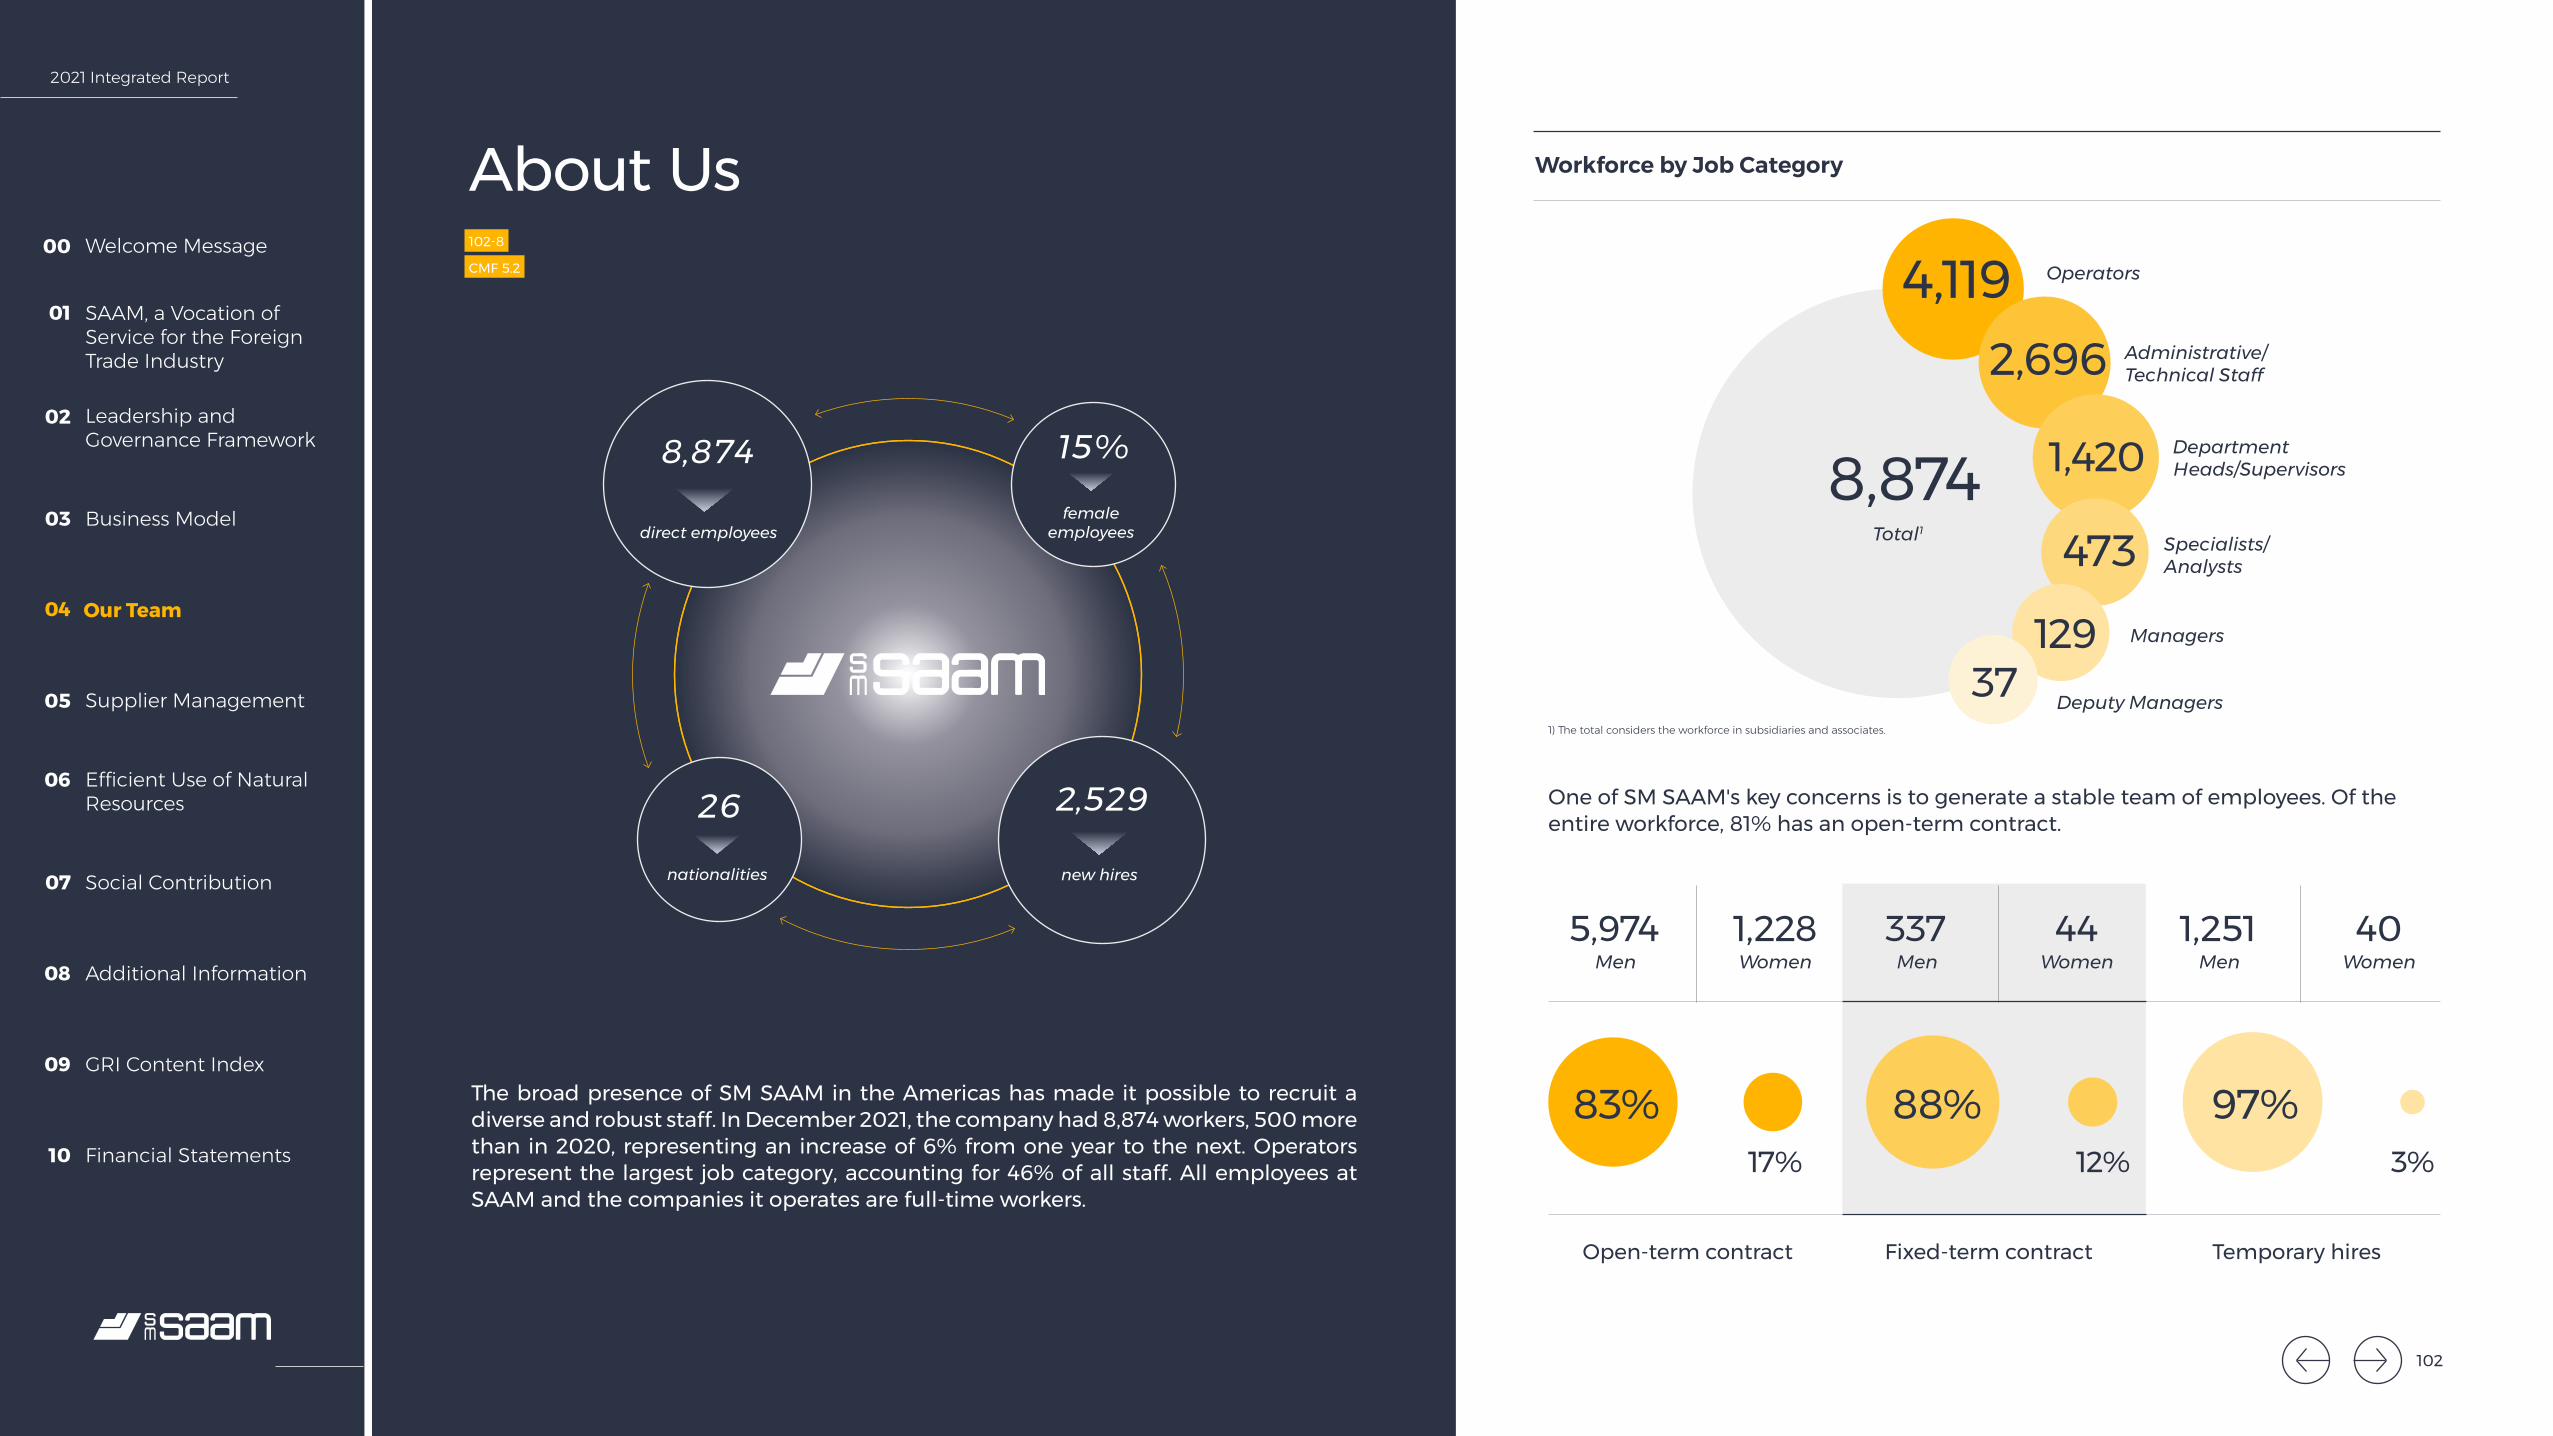
2021 Integrated Report
Welcome Message00
SAAM, a Vocation of Service for the Foreign Trade Industry
01
Leadership and Governance Framework
02
Business Model03
Our Team04
Supplier Management05
Efficient Use of Natural Resources
06
Social Contribution07
Additional Information08
GRI Content Index09
Financial Statements10
About Us102-8
CMF 5.2
The broad presence of SM SAAM in the Americas has made it possible to recruit a diverse and robust staff. In December 2021, the company had 8,874 workers, 500 more than in 2020, representing an increase of 6% from one year to the next. Operators represent the largest job category, accounting for 46% of all staff. All employees at SAAM and the companies it operates are full-time workers.
Chile
8,874
Chile
2,529
direct employees
new hires
15%
female employees
Chile
26
nationalities
One of SM SAAM's key concerns is to generate a stable team of employees. Of the entire workforce, 81% has an open-term contract.
8,874
4,1192,696
1,420
473
12937
5,974 337 1,2511,228 44 40
Total1
Operators
Administrative/Technical Staff
Department Heads/Supervisors
Specialists/Analysts
Managers
Men Men MenWomen Women Women
Deputy Managers
Workforce by Job Category
Open-term contract Fixed-term contract Temporary hires
1) The total considers the workforce in subsidiaries and associates.
83% 88% 97%17% 12% 3%
102
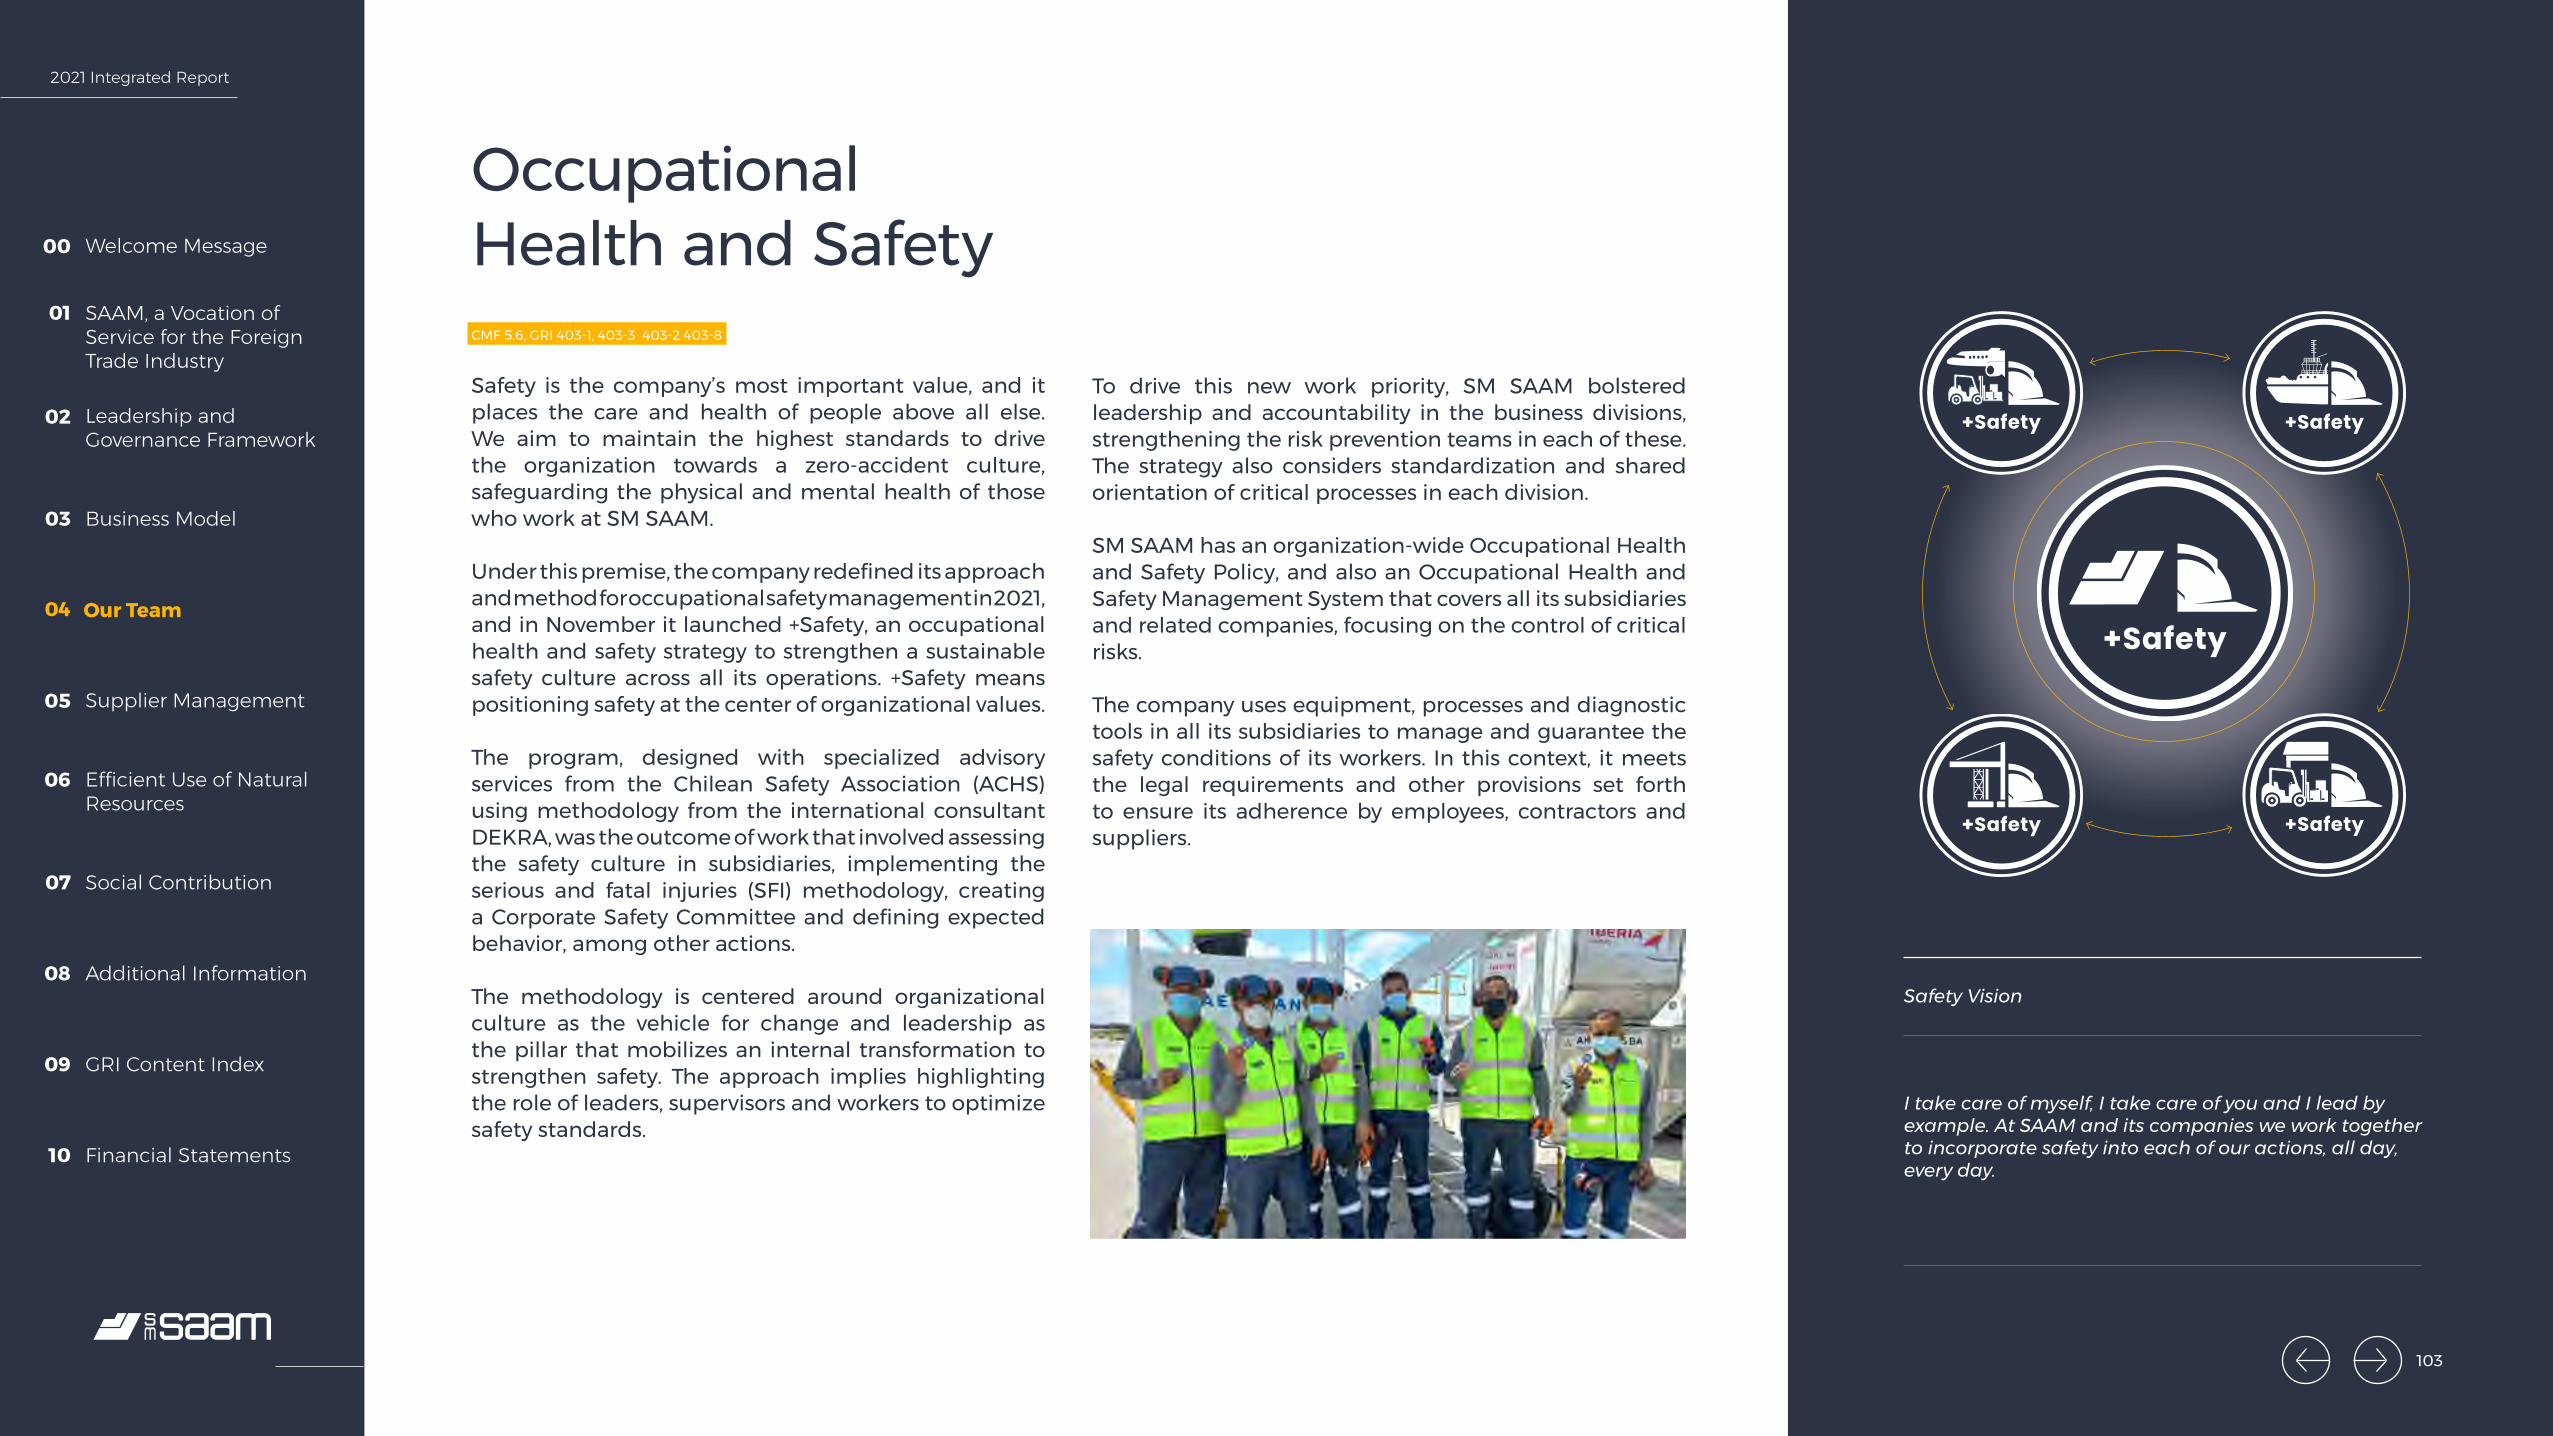
2021 Integrated Report
Welcome Message00
SAAM, a Vocation of Service for the Foreign Trade Industry
01
Leadership and Governance Framework
02
Business Model03
Our Team04
Supplier Management05
Efficient Use of Natural Resources
06
Social Contribution07
Additional Information08
GRI Content Index09
Financial Statements10
Occupational Health and Safety CMF 5.6, GRI 403-1, 403-3 403-2 403-8
Safety is the company’s most important value, and it places the care and health of people above all else. We aim to maintain the highest standards to drive the organization towards a zero-accident culture, safeguarding the physical and mental health of those who work at SM SAAM.
Under this premise, the company redefined its approach and method for occupational safety management in 2021, and in November it launched +Safety, an occupational health and safety strategy to strengthen a sustainable safety culture across all its operations. +Safety means positioning safety at the center of organizational values.
The program, designed with specialized advisory services from the Chilean Safety Association (ACHS) using methodology from the international consultant DEKRA, was the outcome of work that involved assessing the safety culture in subsidiaries, implementing the serious and fatal injuries (SFI) methodology, creating a Corporate Safety Committee and defining expected behavior, among other actions.
The methodology is centered around organizational culture as the vehicle for change and leadership as the pillar that mobilizes an internal transformation to strengthen safety. The approach implies highlighting the role of leaders, supervisors and workers to optimize safety standards.
To drive this new work priority, SM SAAM bolstered leadership and accountability in the business divisions, strengthening the risk prevention teams in each of these. The strategy also considers standardization and shared orientation of critical processes in each division.
SM SAAM has an organization-wide Occupational Health and Safety Policy, and also an Occupational Health and Safety Management System that covers all its subsidiaries and related companies, focusing on the control of critical risks.
The company uses equipment, processes and diagnostic tools in all its subsidiaries to manage and guarantee the safety conditions of its workers. In this context, it meets the legal requirements and other provisions set forth to ensure its adherence by employees, contractors and suppliers.
Safety Vision
I take care of myself, I take care of you and I lead by example. At SAAM and its companies we work together to incorporate safety into each of our actions, all day, every day.
103
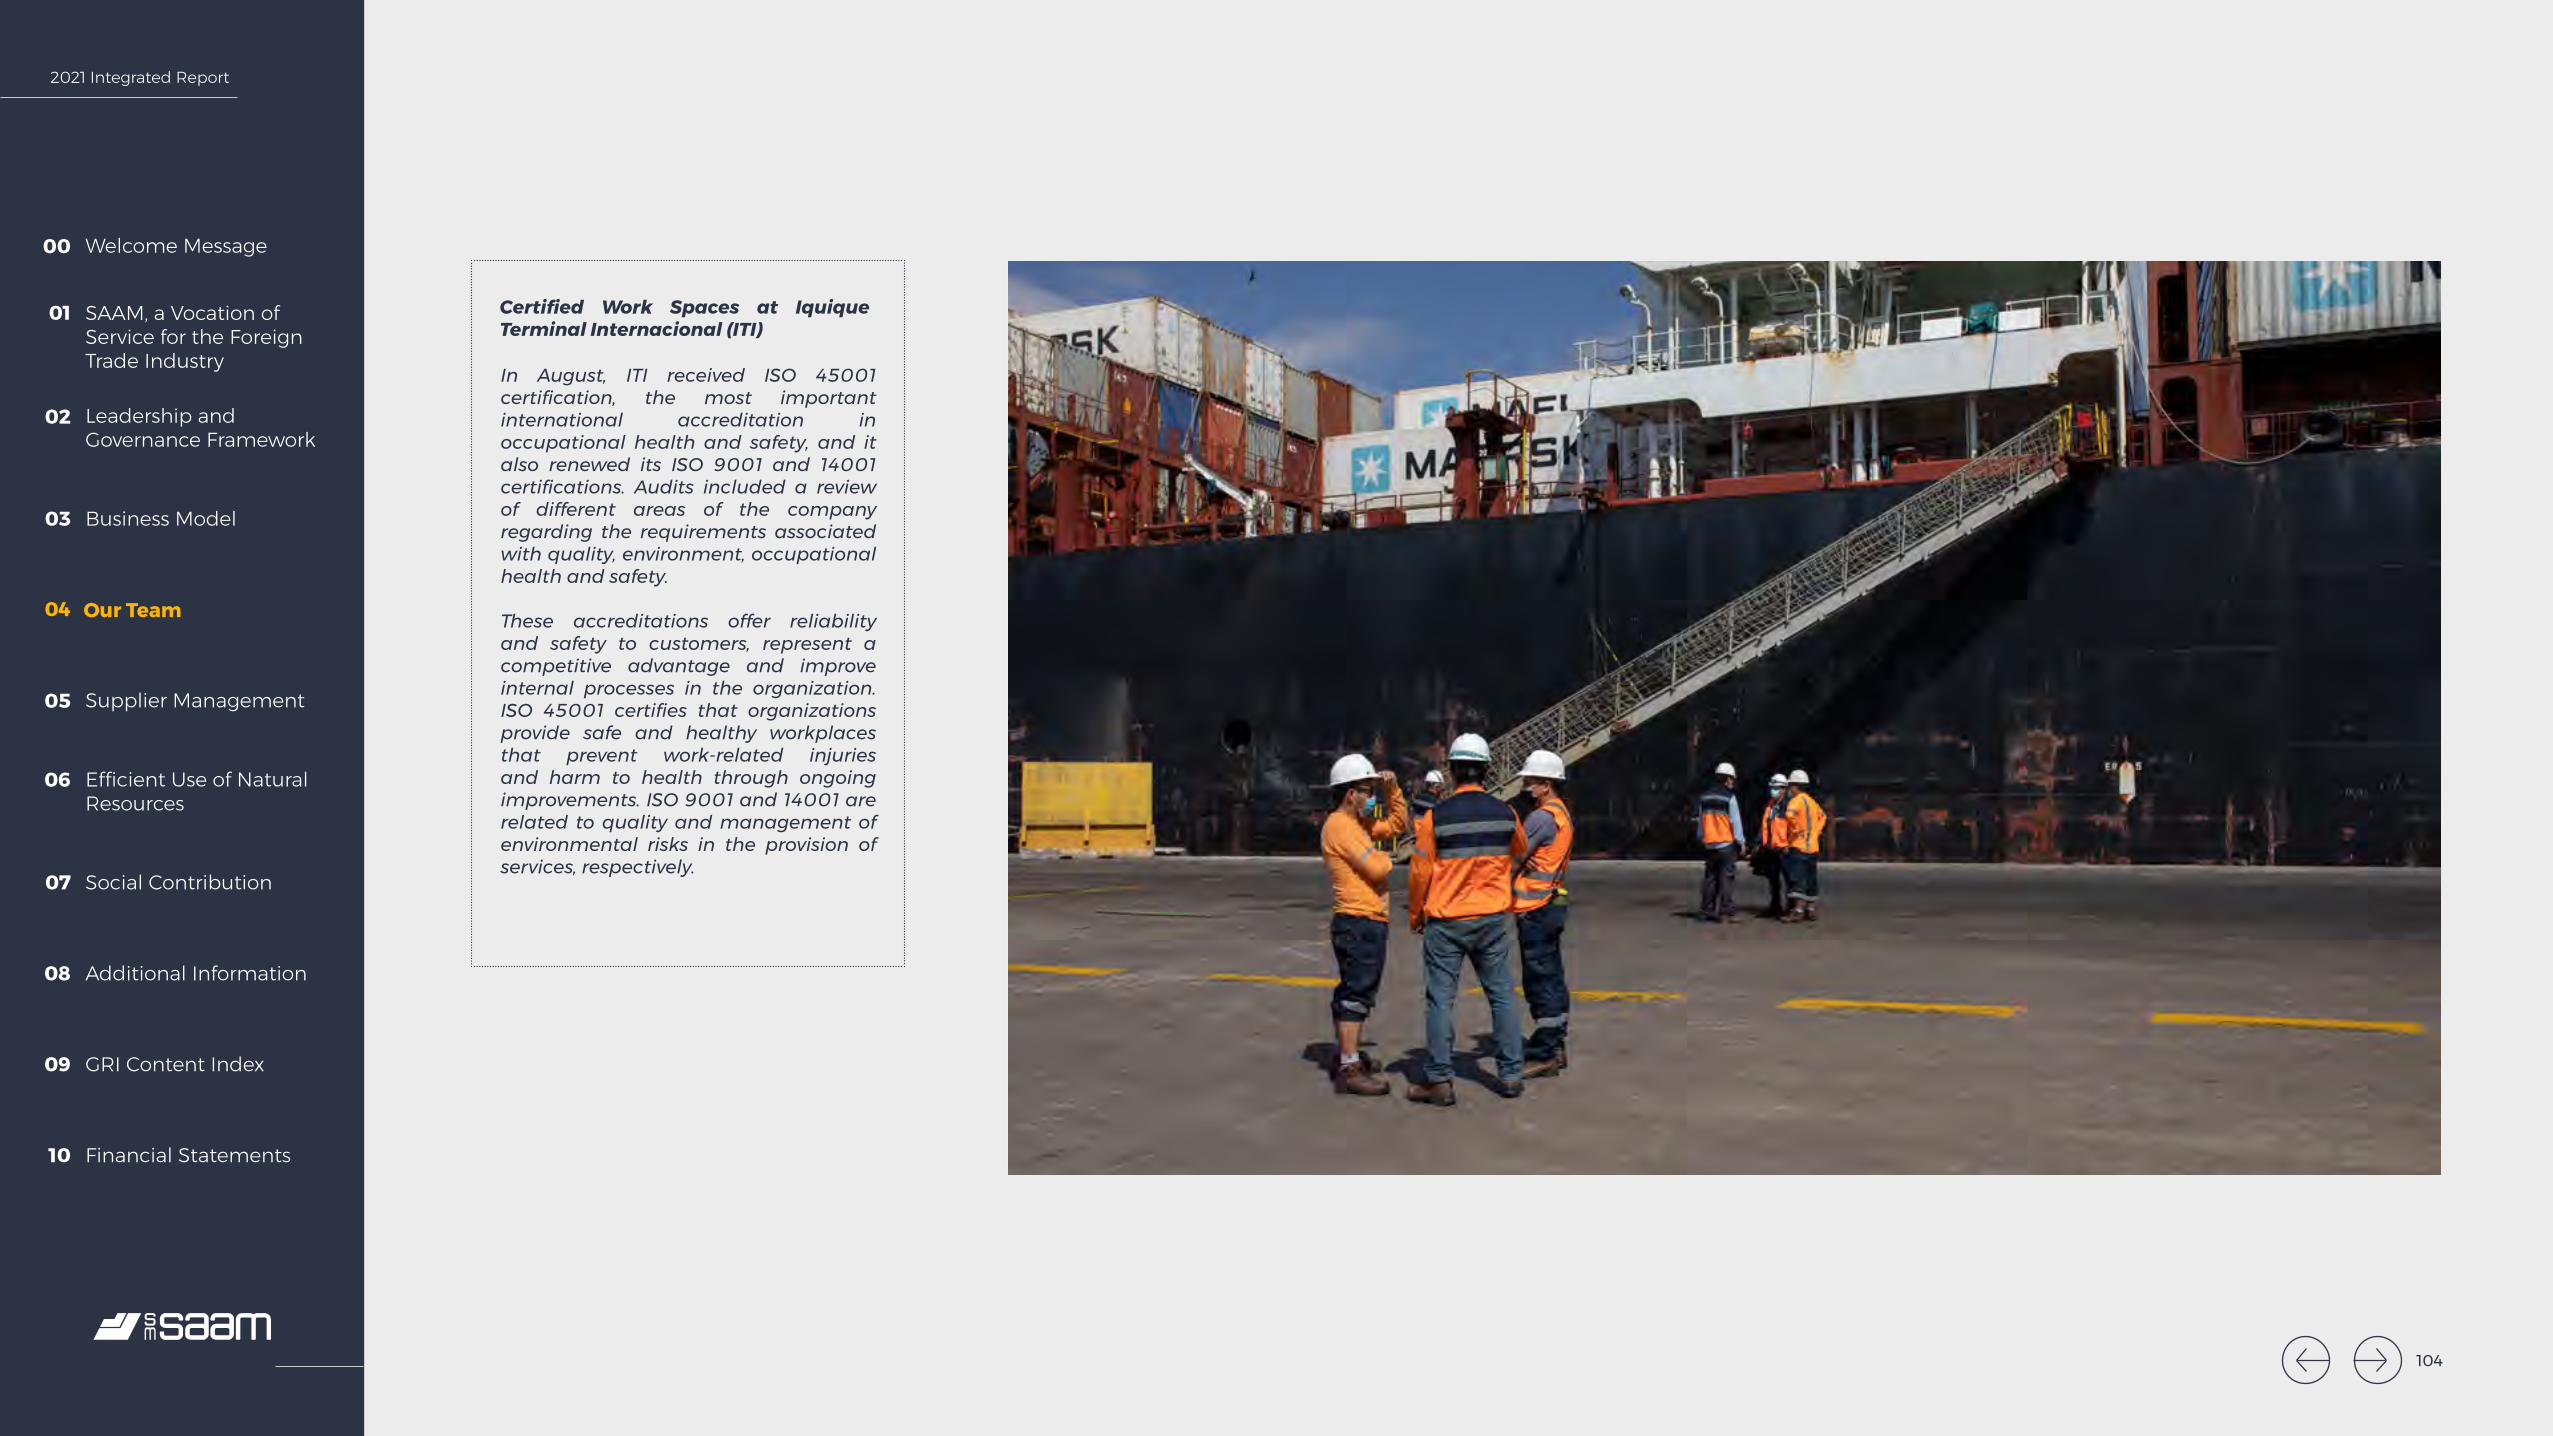
2021 Integrated Report
Welcome Message00
SAAM, a Vocation of Service for the Foreign Trade Industry
01
Leadership and Governance Framework
02
Business Model03
Our Team04
Supplier Management05
Efficient Use of Natural Resources
06
Social Contribution07
Additional Information08
GRI Content Index09
Financial Statements10
Certified Work Spaces at Iquique Terminal Internacional (ITI)
In August, ITI received ISO 45001 certification, the most important international accreditation in occupational health and safety, and it also renewed its ISO 9001 and 14001 certifications. Audits included a review of different areas of the company regarding the requirements associated with quality, environment, occupational health and safety.
These accreditations offer reliability and safety to customers, represent a competitive advantage and improve internal processes in the organization. ISO 45001 certifies that organizations provide safe and healthy workplaces that prevent work-related injuries and harm to health through ongoing improvements. ISO 9001 and 14001 are related to quality and management of environmental risks in the provision of services, respectively.
104
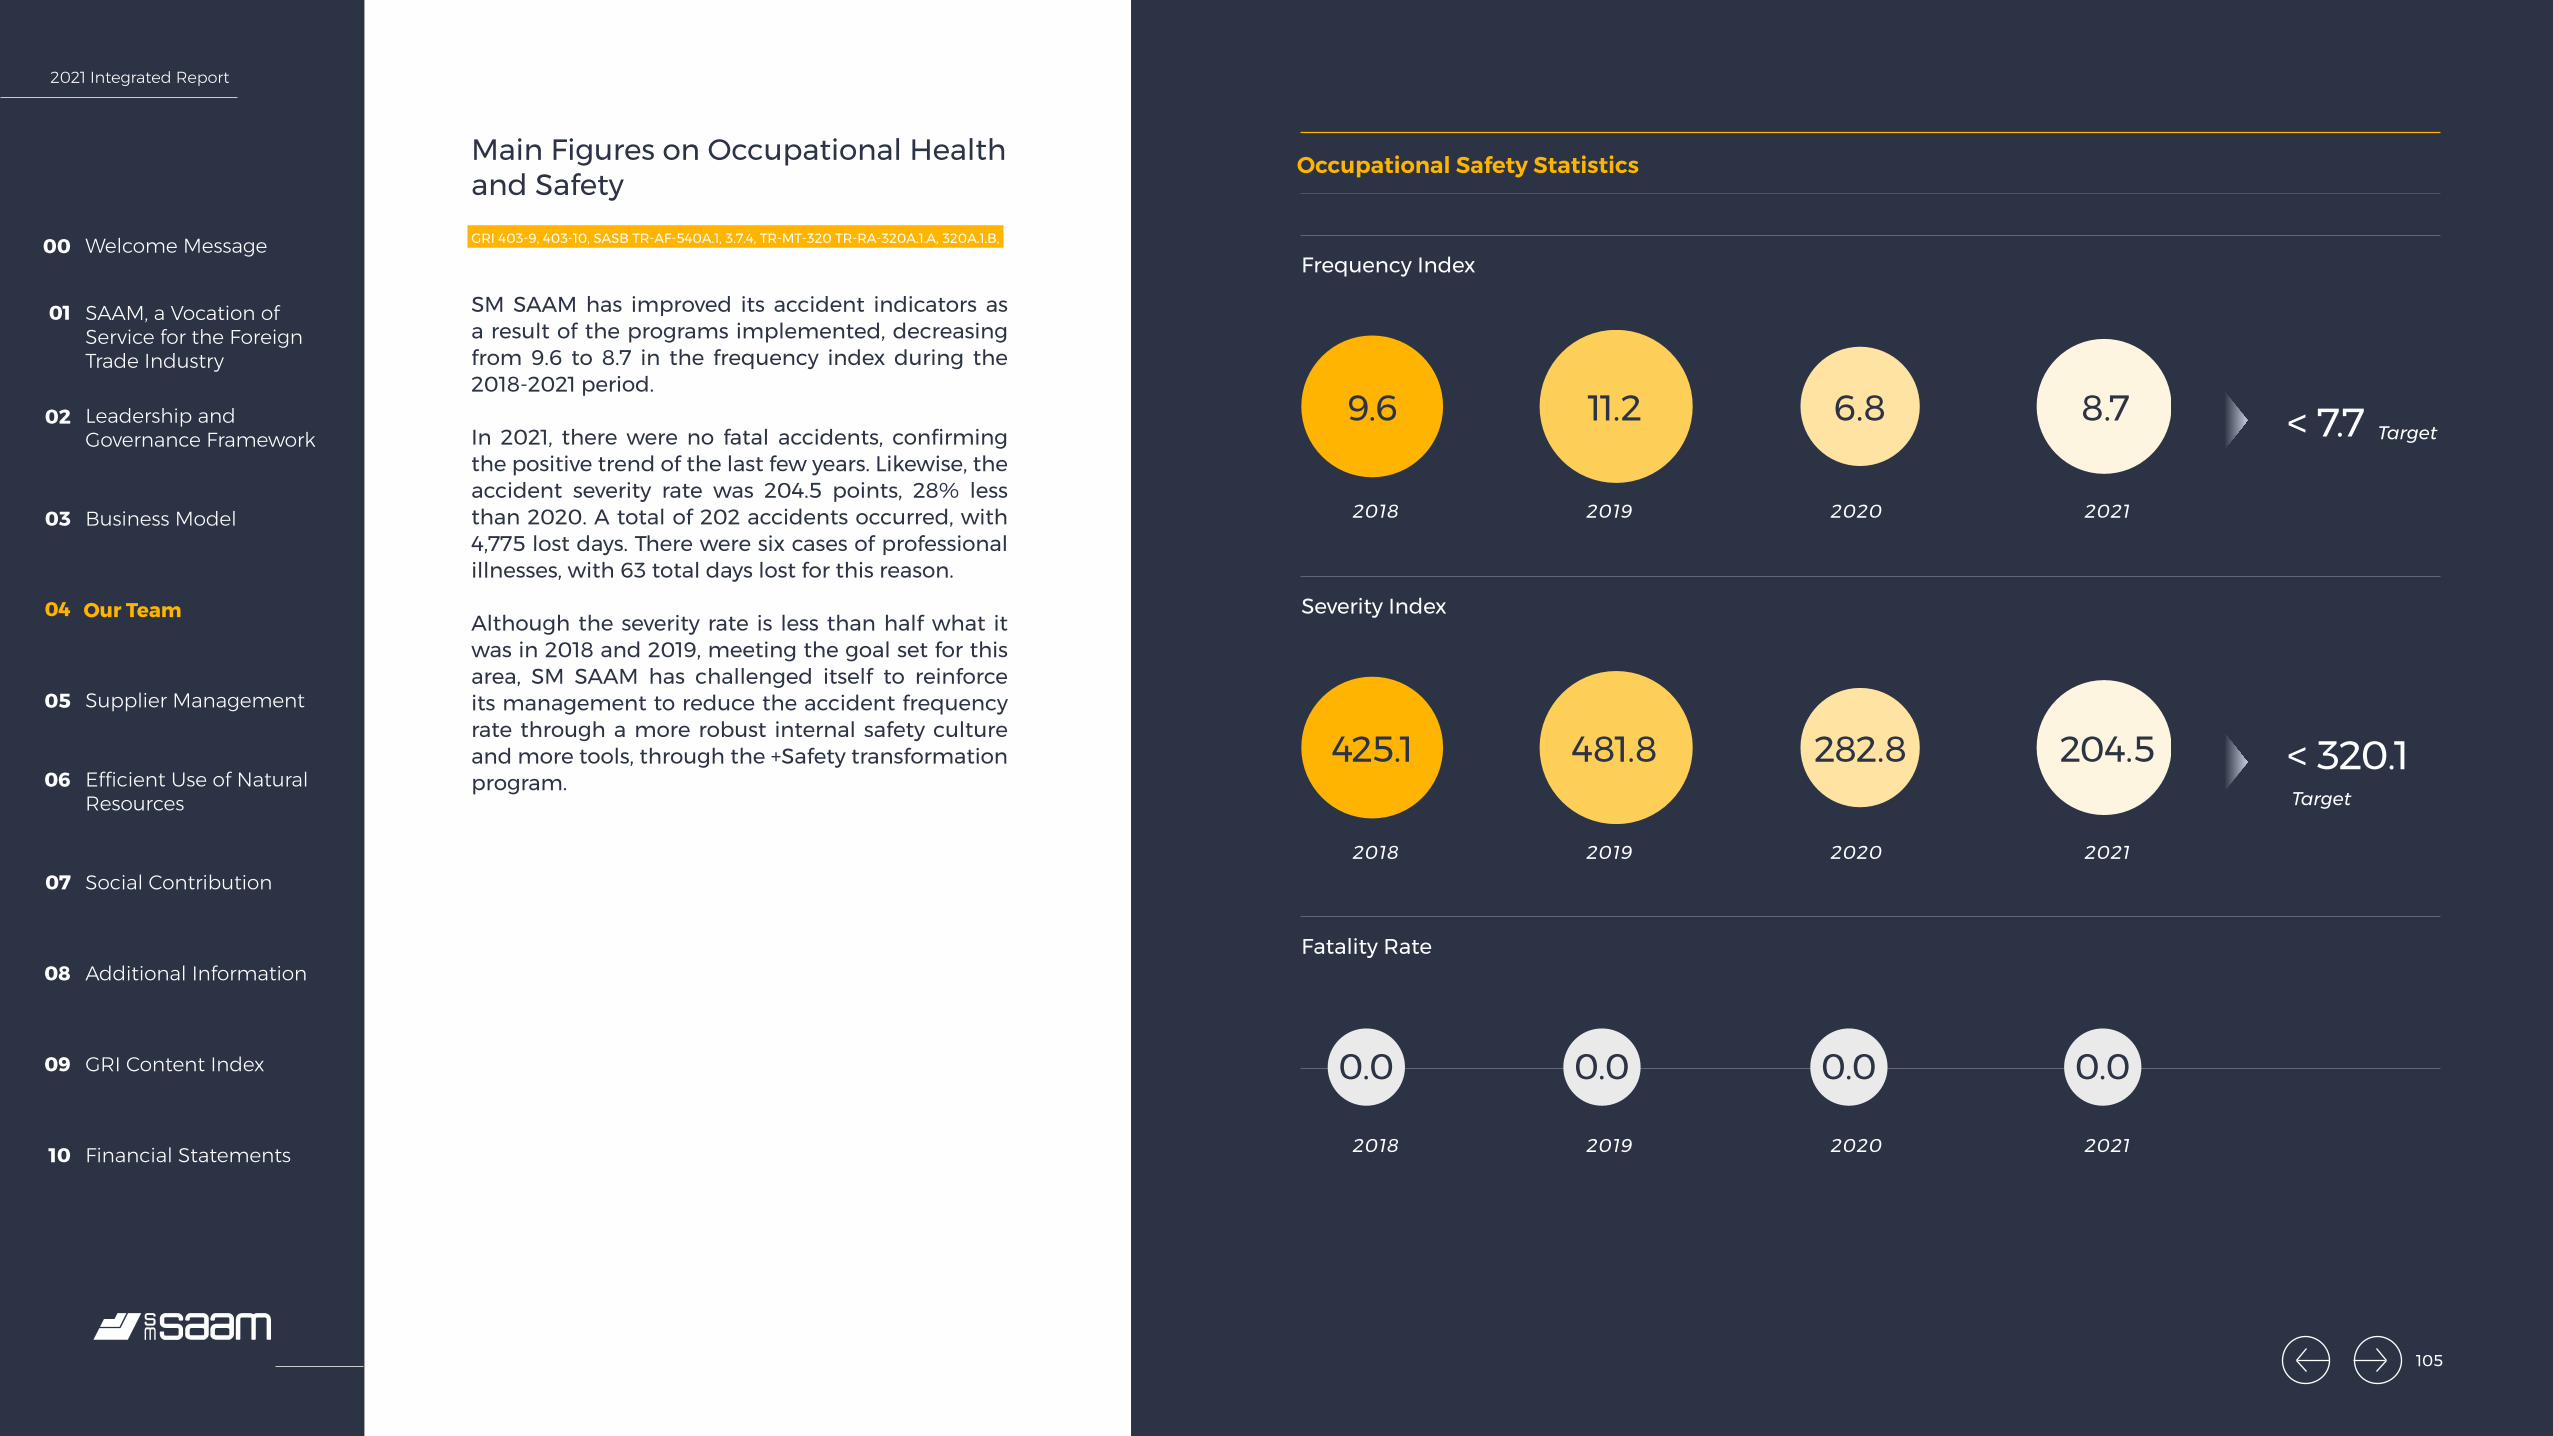
2021 Integrated Report
Welcome Message00
SAAM, a Vocation of Service for the Foreign Trade Industry
01
Leadership and Governance Framework
02
Business Model03
Our Team04
Supplier Management05
Efficient Use of Natural Resources
06
Social Contribution07
Additional Information08
GRI Content Index09
Financial Statements10
Main Figures on Occupational Health and SafetyGRI 403-9, 403-10, SASB TR-AF-540A.1, 3.7.4, TR-MT-320 TR-RA-320A.1.A, 320A.1.B, 320A.1.C, 540A.1
SM SAAM has improved its accident indicators as a result of the programs implemented, decreasing from 9.6 to 8.7 in the frequency index during the 2018-2021 period.
In 2021, there were no fatal accidents, confirming the positive trend of the last few years. Likewise, the accident severity rate was 204.5 points, 28% less than 2020. A total of 202 accidents occurred, with 4,775 lost days. There were six cases of professional illnesses, with 63 total days lost for this reason.
Although the severity rate is less than half what it was in 2018 and 2019, meeting the goal set for this area, SM SAAM has challenged itself to reinforce its management to reduce the accident frequency rate through a more robust internal safety culture and more tools, through the +Safety transformation program.
Occupational Safety Statistics
Frequency Index
Severity Index
Fatality Rate
2018
2018
2018
2019
2019
2019
2020
2020
2020
2021
2021
2021
Target
Target
9.6
425.1
11.2
481.8
6.8
282.8
8.7
204.5
< 7.7
< 320.1
0.0 0.0 0.0 0.0
105

2021 Integrated Report
Welcome Message00
SAAM, a Vocation of Service for the Foreign Trade Industry
01
Leadership and Governance Framework
02
Business Model03
Our Team04
Supplier Management05
Efficient Use of Natural Resources
06
Social Contribution07
Additional Information08
GRI Content Index09
Financial Statements10
Toxic Spill Drills
Measuring response times and operating capacities were the objectives of a drill for hazardous substance spills, organized in November by Iquique Terminal Internacional (ITI) in coordination with the maritime authority.
The exercise, which was conducted inside a special port facility, simulated the spill and discharge of gas from a corrosive, toxic liquid from a container, resulting in an injured person. The objective was to measure coordination levels, organization, communication, connection with different entities and response times.
In November, close to 20 workers at STI participated in an emergency drill in the bay of the Port of San Antonio, with a simulation of a hydrocarbon spill. The activity was organized by the Port Capitan’s Office and provided opportunities to improve processes and conditions in the event of possible risk situations.
SAAM Towage Colombia, Highlighted in Health and Safety
In August, the Colombian Safety Council (CCS) highlighted our work in 2020 and ranked SAAM Towage Colombia as the second best company, among 300, in safety, health and environmental management.
106
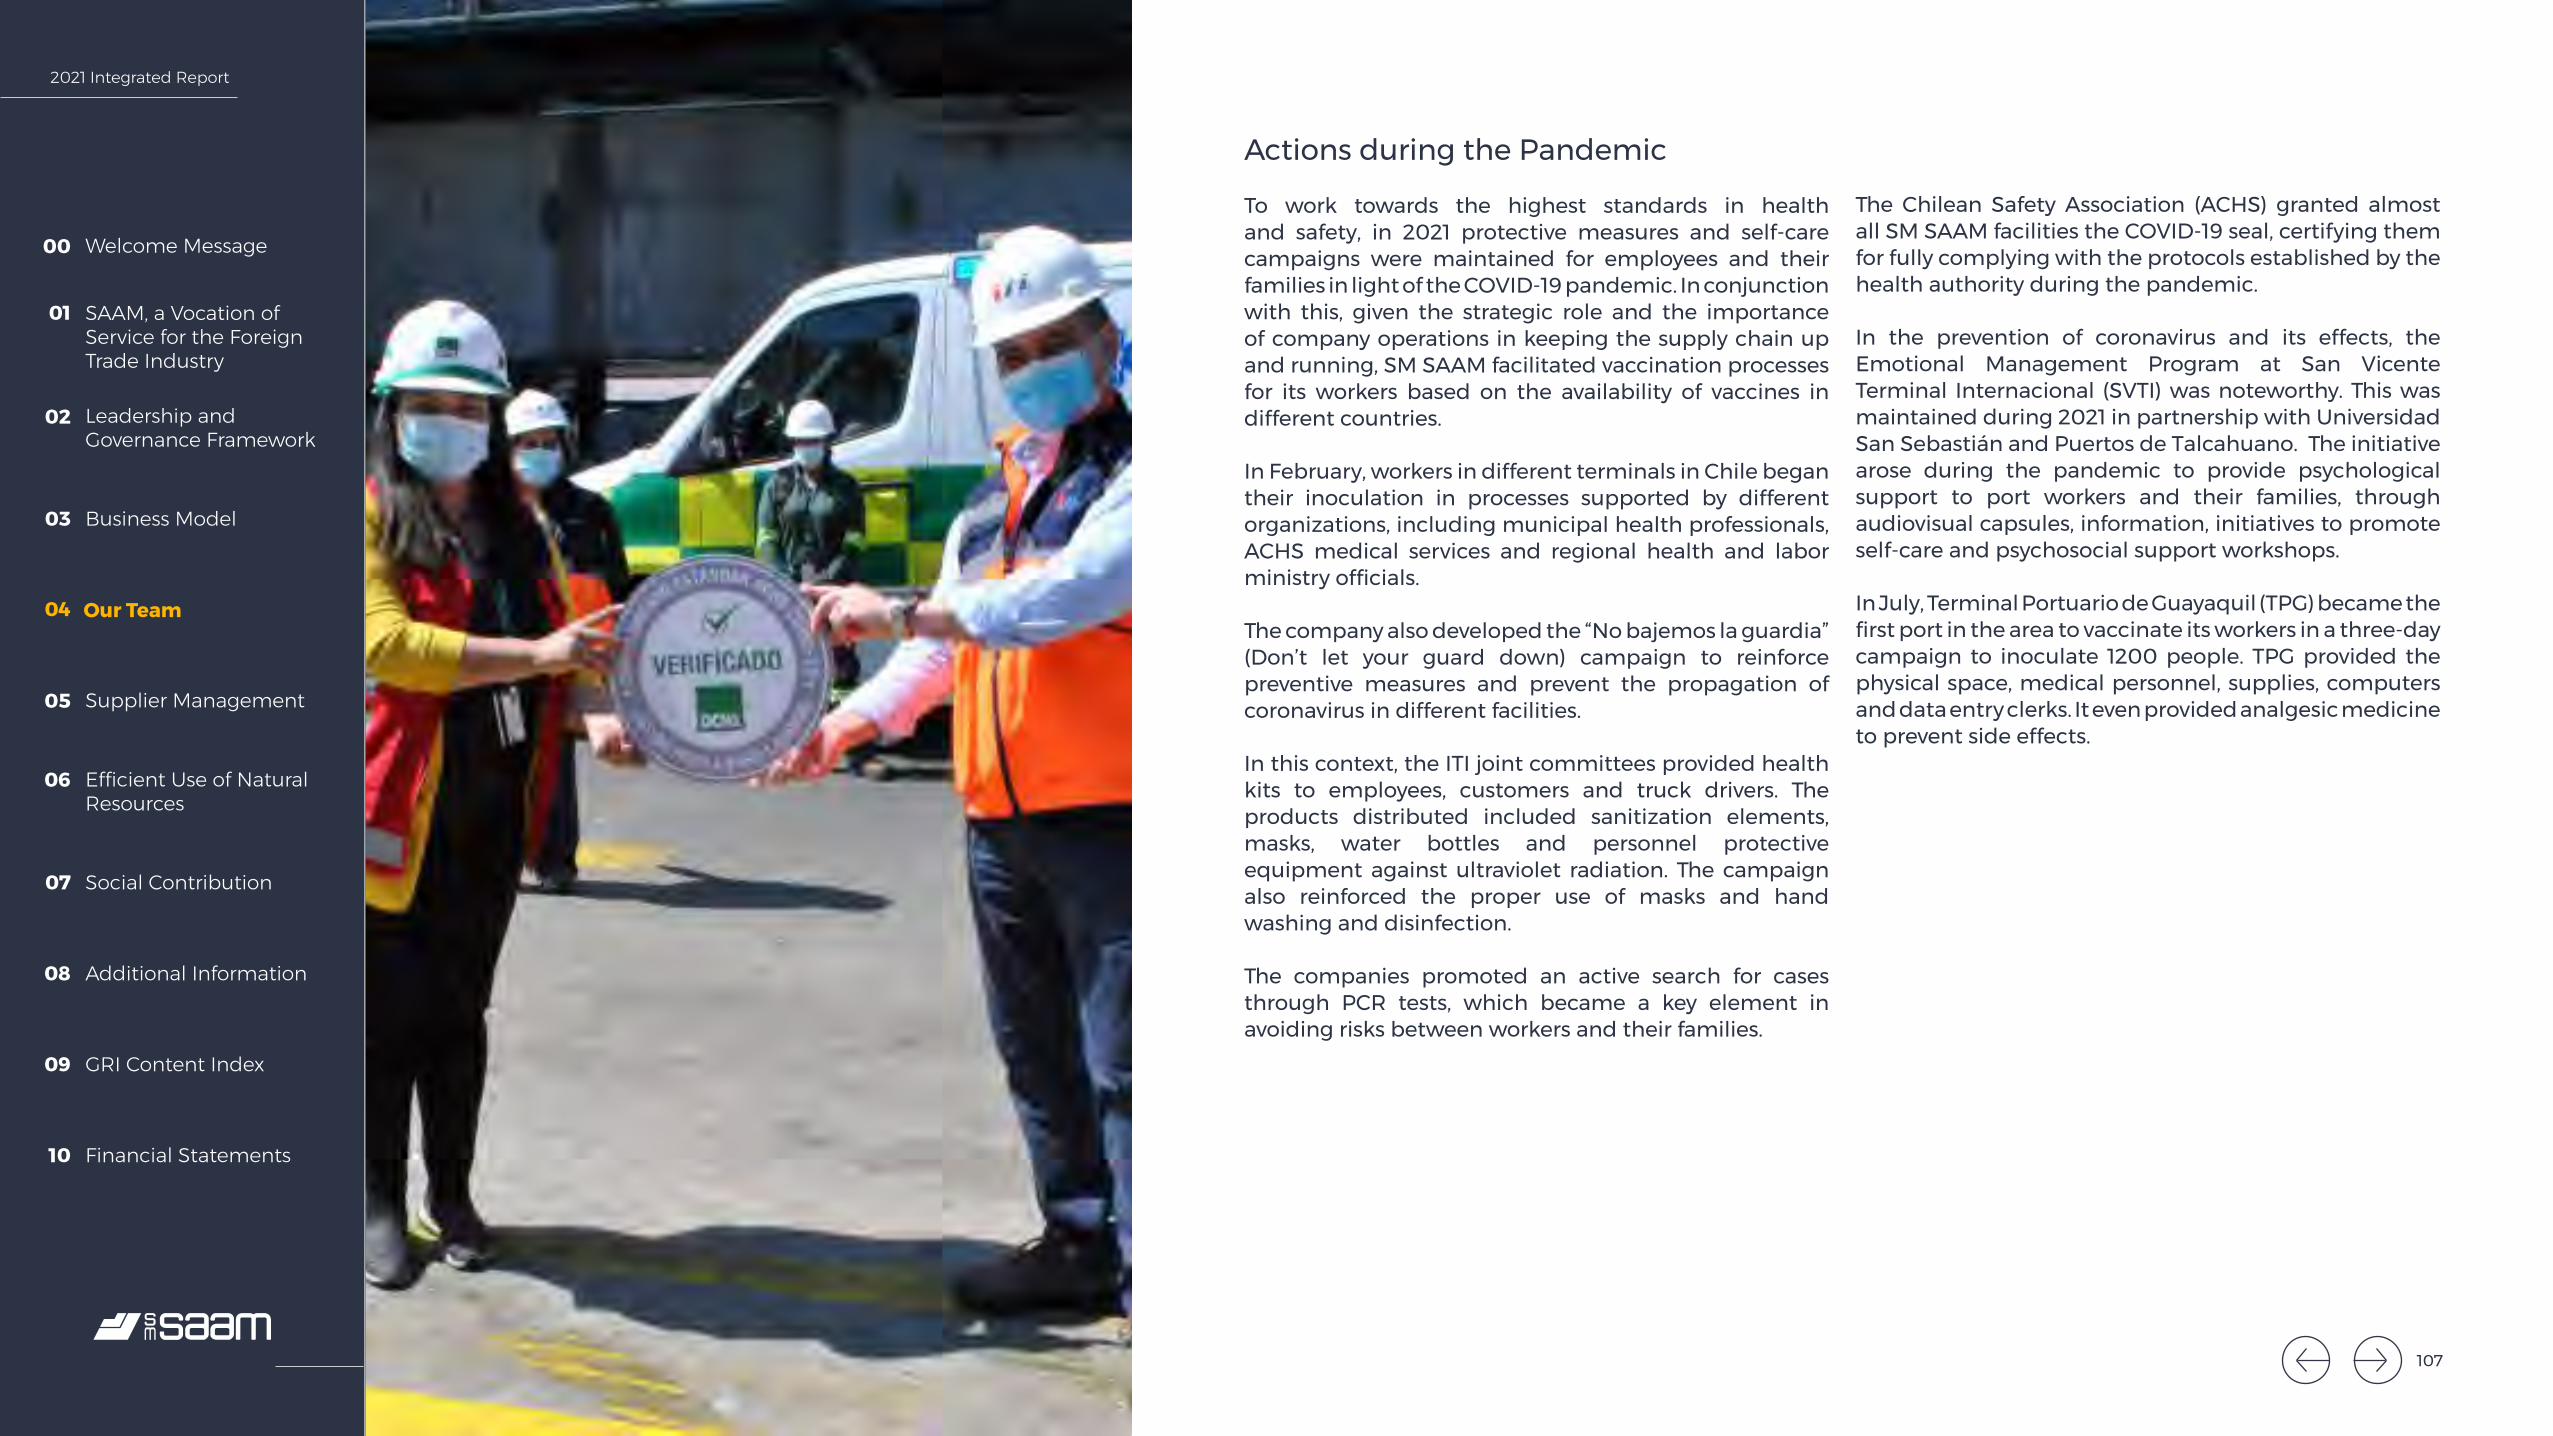
2021 Integrated Report
Welcome Message00
SAAM, a Vocation of Service for the Foreign Trade Industry
01
Leadership and Governance Framework
02
Business Model03
Our Team04
Supplier Management05
Efficient Use of Natural Resources
06
Social Contribution07
Additional Information08
GRI Content Index09
Financial Statements10
Actions during the Pandemic
To work towards the highest standards in health and safety, in 2021 protective measures and self-care campaigns were maintained for employees and their families in light of the COVID-19 pandemic. In conjunction with this, given the strategic role and the importance of company operations in keeping the supply chain up and running, SM SAAM facilitated vaccination processes for its workers based on the availability of vaccines in different countries.
In February, workers in different terminals in Chile began their inoculation in processes supported by different organizations, including municipal health professionals, ACHS medical services and regional health and labor ministry officials.
The company also developed the “No bajemos la guardia” (Don’t let your guard down) campaign to reinforce preventive measures and prevent the propagation of coronavirus in different facilities.
In this context, the ITI joint committees provided health kits to employees, customers and truck drivers. The products distributed included sanitization elements, masks, water bottles and personnel protective equipment against ultraviolet radiation. The campaign also reinforced the proper use of masks and hand washing and disinfection.
The companies promoted an active search for cases through PCR tests, which became a key element in avoiding risks between workers and their families.
The Chilean Safety Association (ACHS) granted almost all SM SAAM facilities the COVID-19 seal, certifying them for fully complying with the protocols established by the health authority during the pandemic.
In the prevention of coronavirus and its effects, the Emotional Management Program at San Vicente Terminal Internacional (SVTI) was noteworthy. This was maintained during 2021 in partnership with Universidad San Sebastián and Puertos de Talcahuano. The initiative arose during the pandemic to provide psychological support to port workers and their families, through audiovisual capsules, information, initiatives to promote self-care and psychosocial support workshops.
In July, Terminal Portuario de Guayaquil (TPG) became the first port in the area to vaccinate its workers in a three-day campaign to inoculate 1200 people. TPG provided the physical space, medical personnel, supplies, computers and data entry clerks. It even provided analgesic medicine to prevent side effects.
107
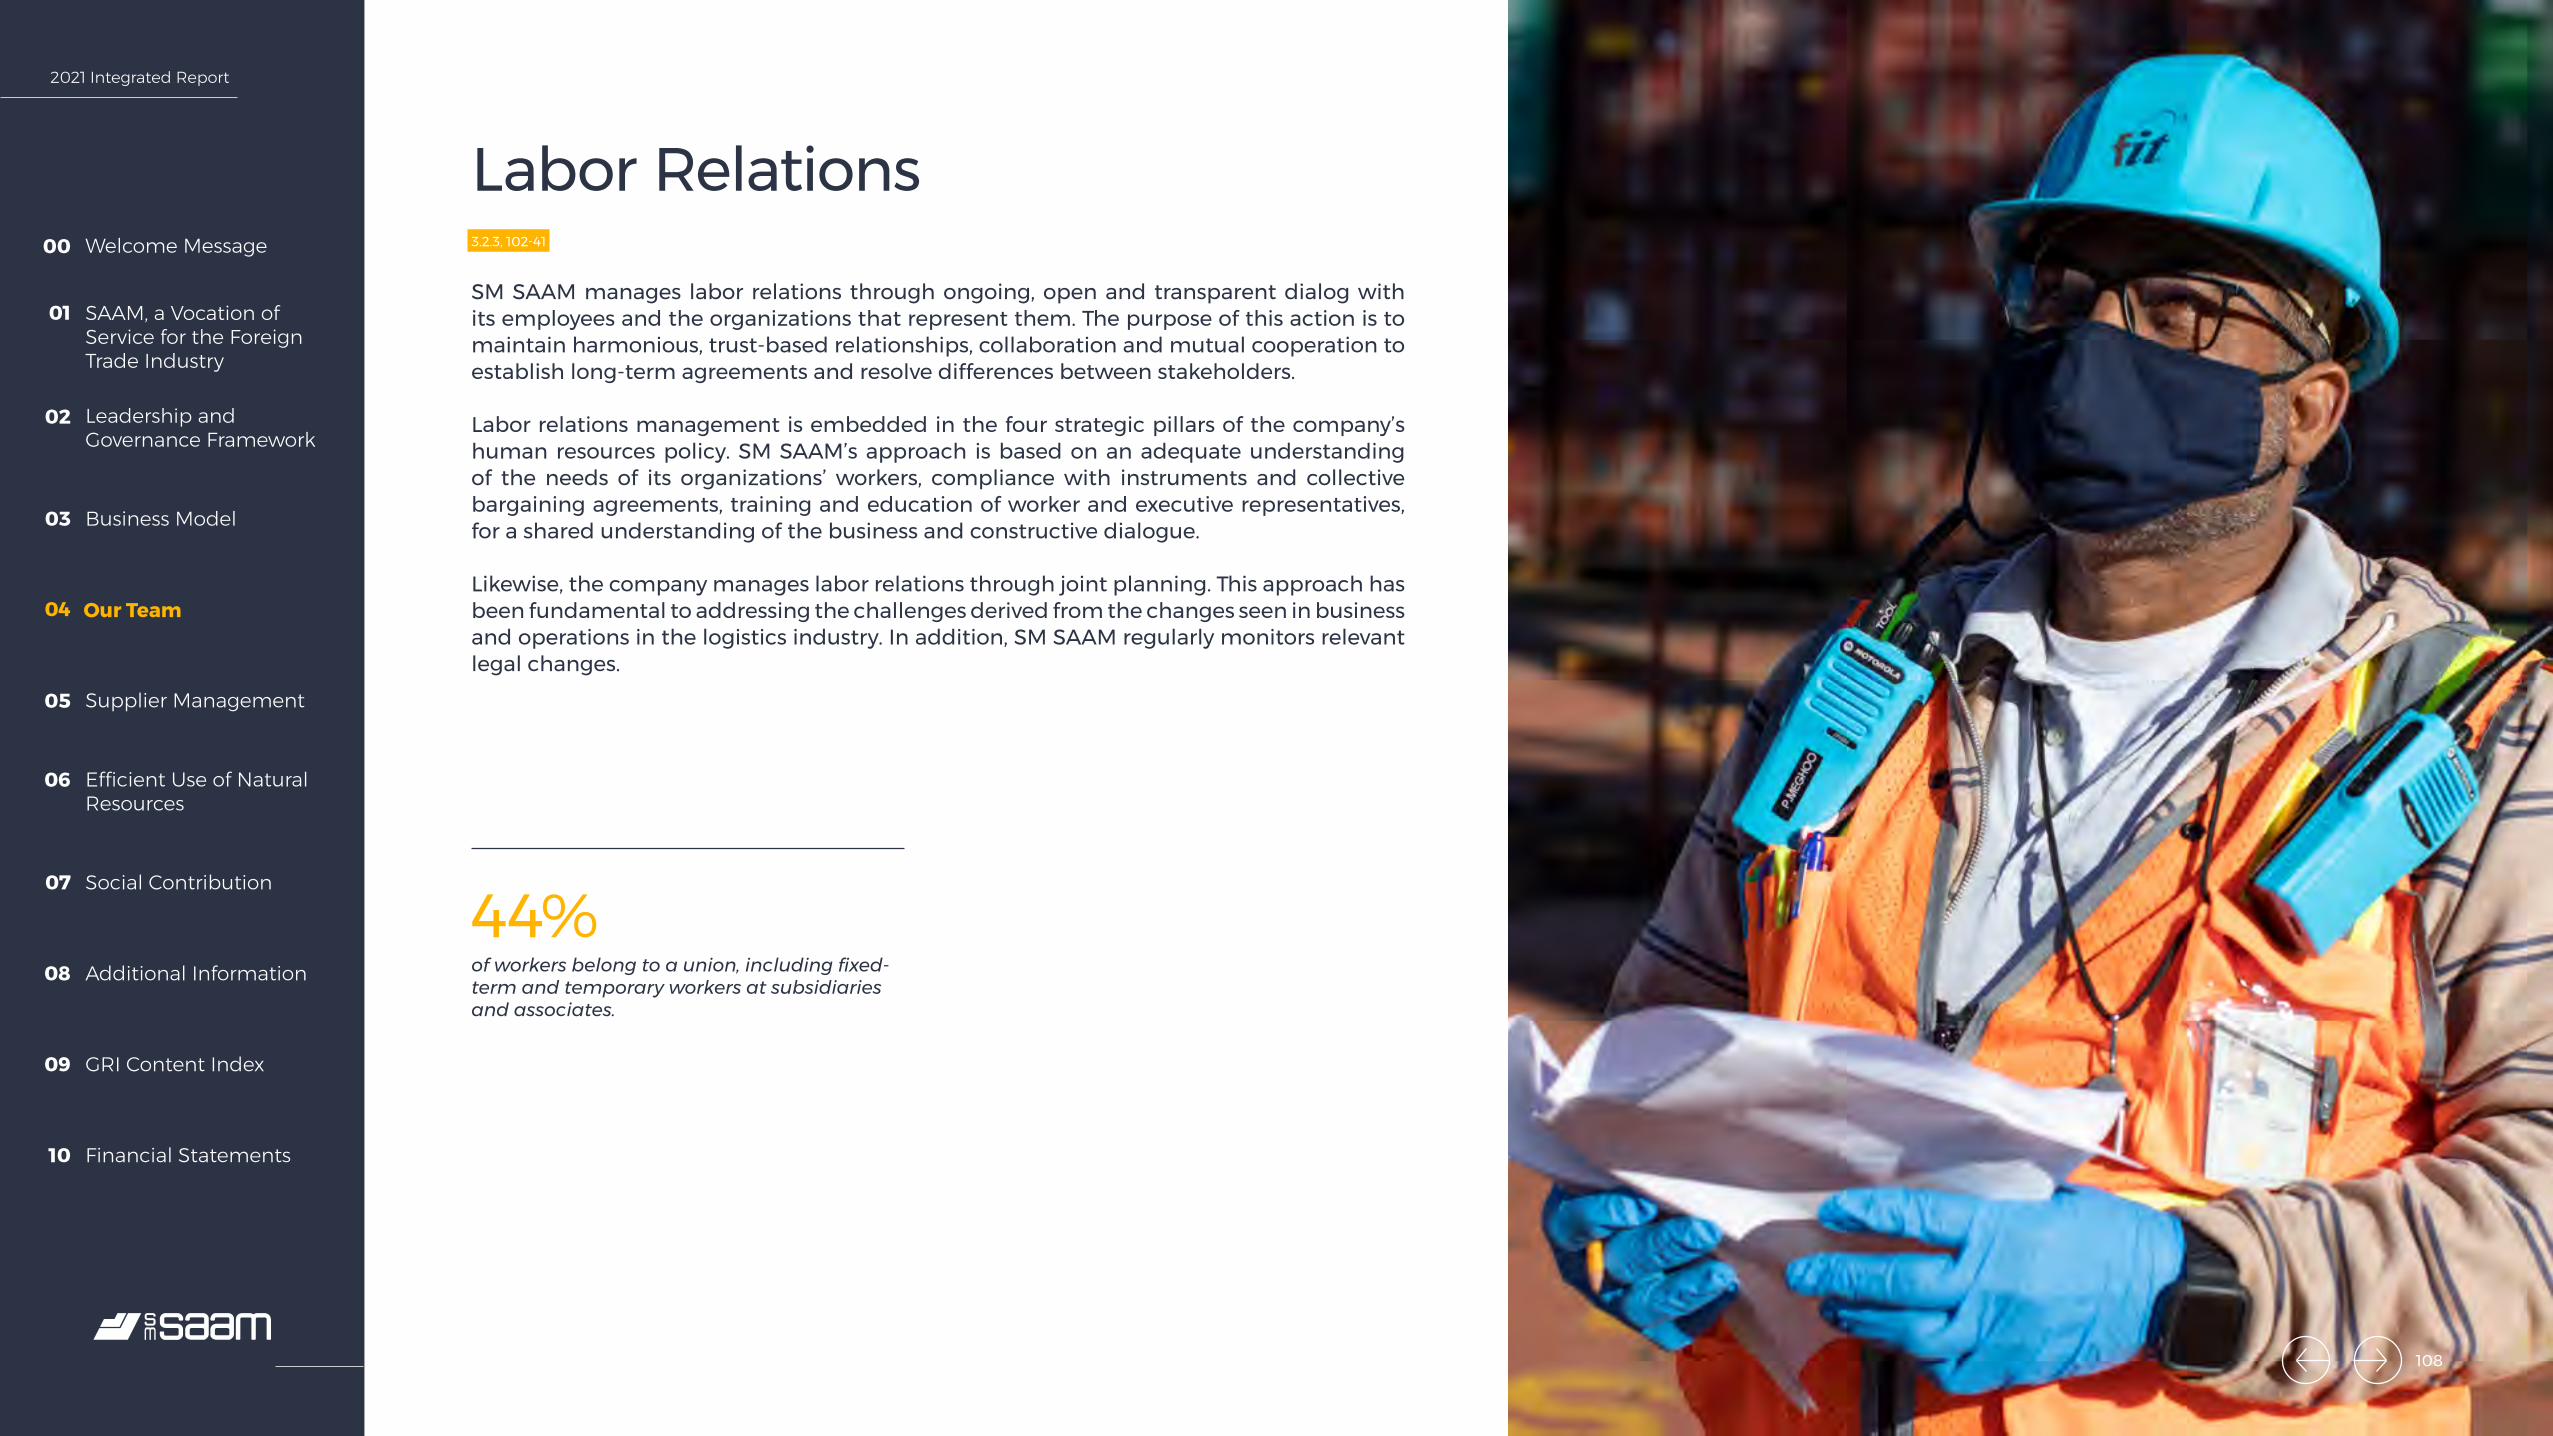
2021 Integrated Report
Welcome Message00
SAAM, a Vocation of Service for the Foreign Trade Industry
01
Leadership and Governance Framework
02
Business Model03
Our Team04
Supplier Management05
Efficient Use of Natural Resources
06
Social Contribution07
Additional Information08
GRI Content Index09
Financial Statements10
44%
Labor Relations 3.2.3, 102-41
SM SAAM manages labor relations through ongoing, open and transparent dialog with its employees and the organizations that represent them. The purpose of this action is to maintain harmonious, trust-based relationships, collaboration and mutual cooperation to establish long-term agreements and resolve differences between stakeholders.
Labor relations management is embedded in the four strategic pillars of the company’s human resources policy. SM SAAM’s approach is based on an adequate understanding of the needs of its organizations’ workers, compliance with instruments and collective bargaining agreements, training and education of worker and executive representatives, for a shared understanding of the business and constructive dialogue.
Likewise, the company manages labor relations through joint planning. This approach has been fundamental to addressing the challenges derived from the changes seen in business and operations in the logistics industry. In addition, SM SAAM regularly monitors relevant legal changes.
of workers belong to a union, including fixed-term and temporary workers at subsidiaries and associates.
108
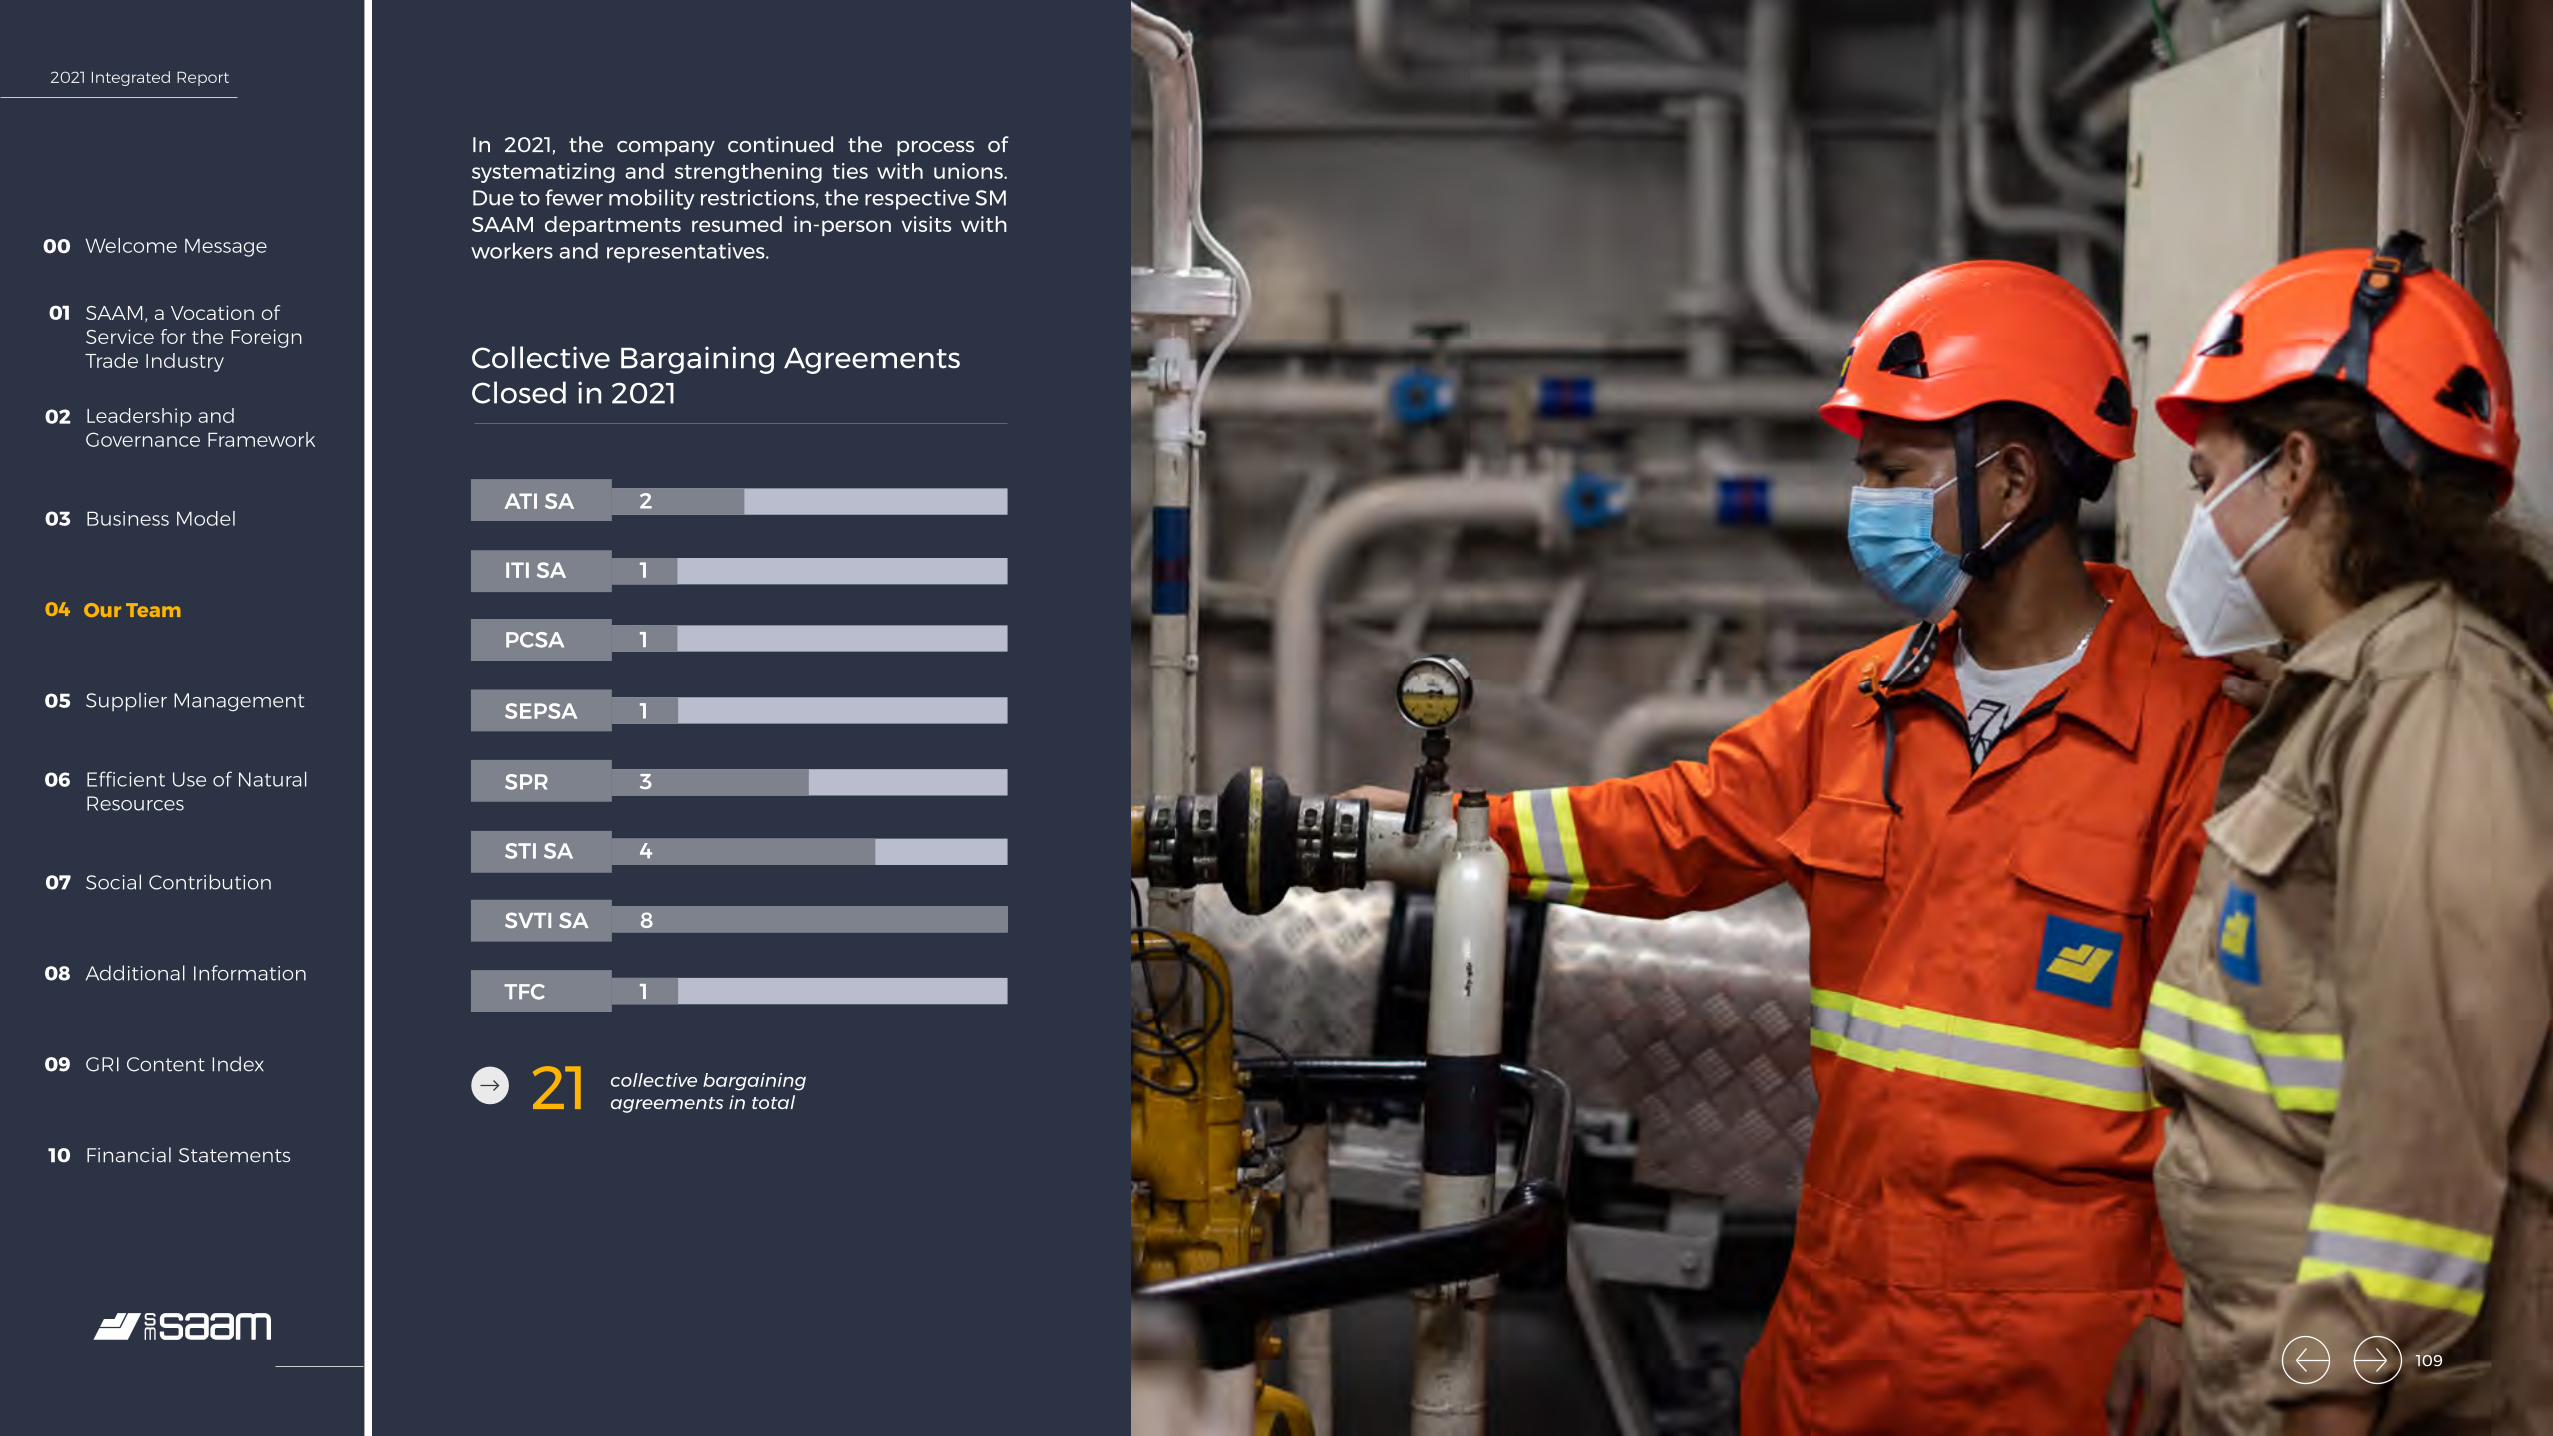
2021 Integrated Report
Welcome Message00
SAAM, a Vocation of Service for the Foreign Trade Industry
01
Leadership and Governance Framework
02
Business Model03
Our Team04
Supplier Management05
Efficient Use of Natural Resources
06
Social Contribution07
Additional Information08
GRI Content Index09
Financial Statements10
21
2
1
1
1
ATI SA
ITI SA
PCSA
SEPSA
3
4
8
1
SPR
STI SA
SVTI SA
TFC
collective bargaining agreements in total
Collective Bargaining Agreements Closed in 2021
In 2021, the company continued the process of systematizing and strengthening ties with unions. Due to fewer mobility restrictions, the respective SM SAAM departments resumed in-person visits with workers and representatives.
109
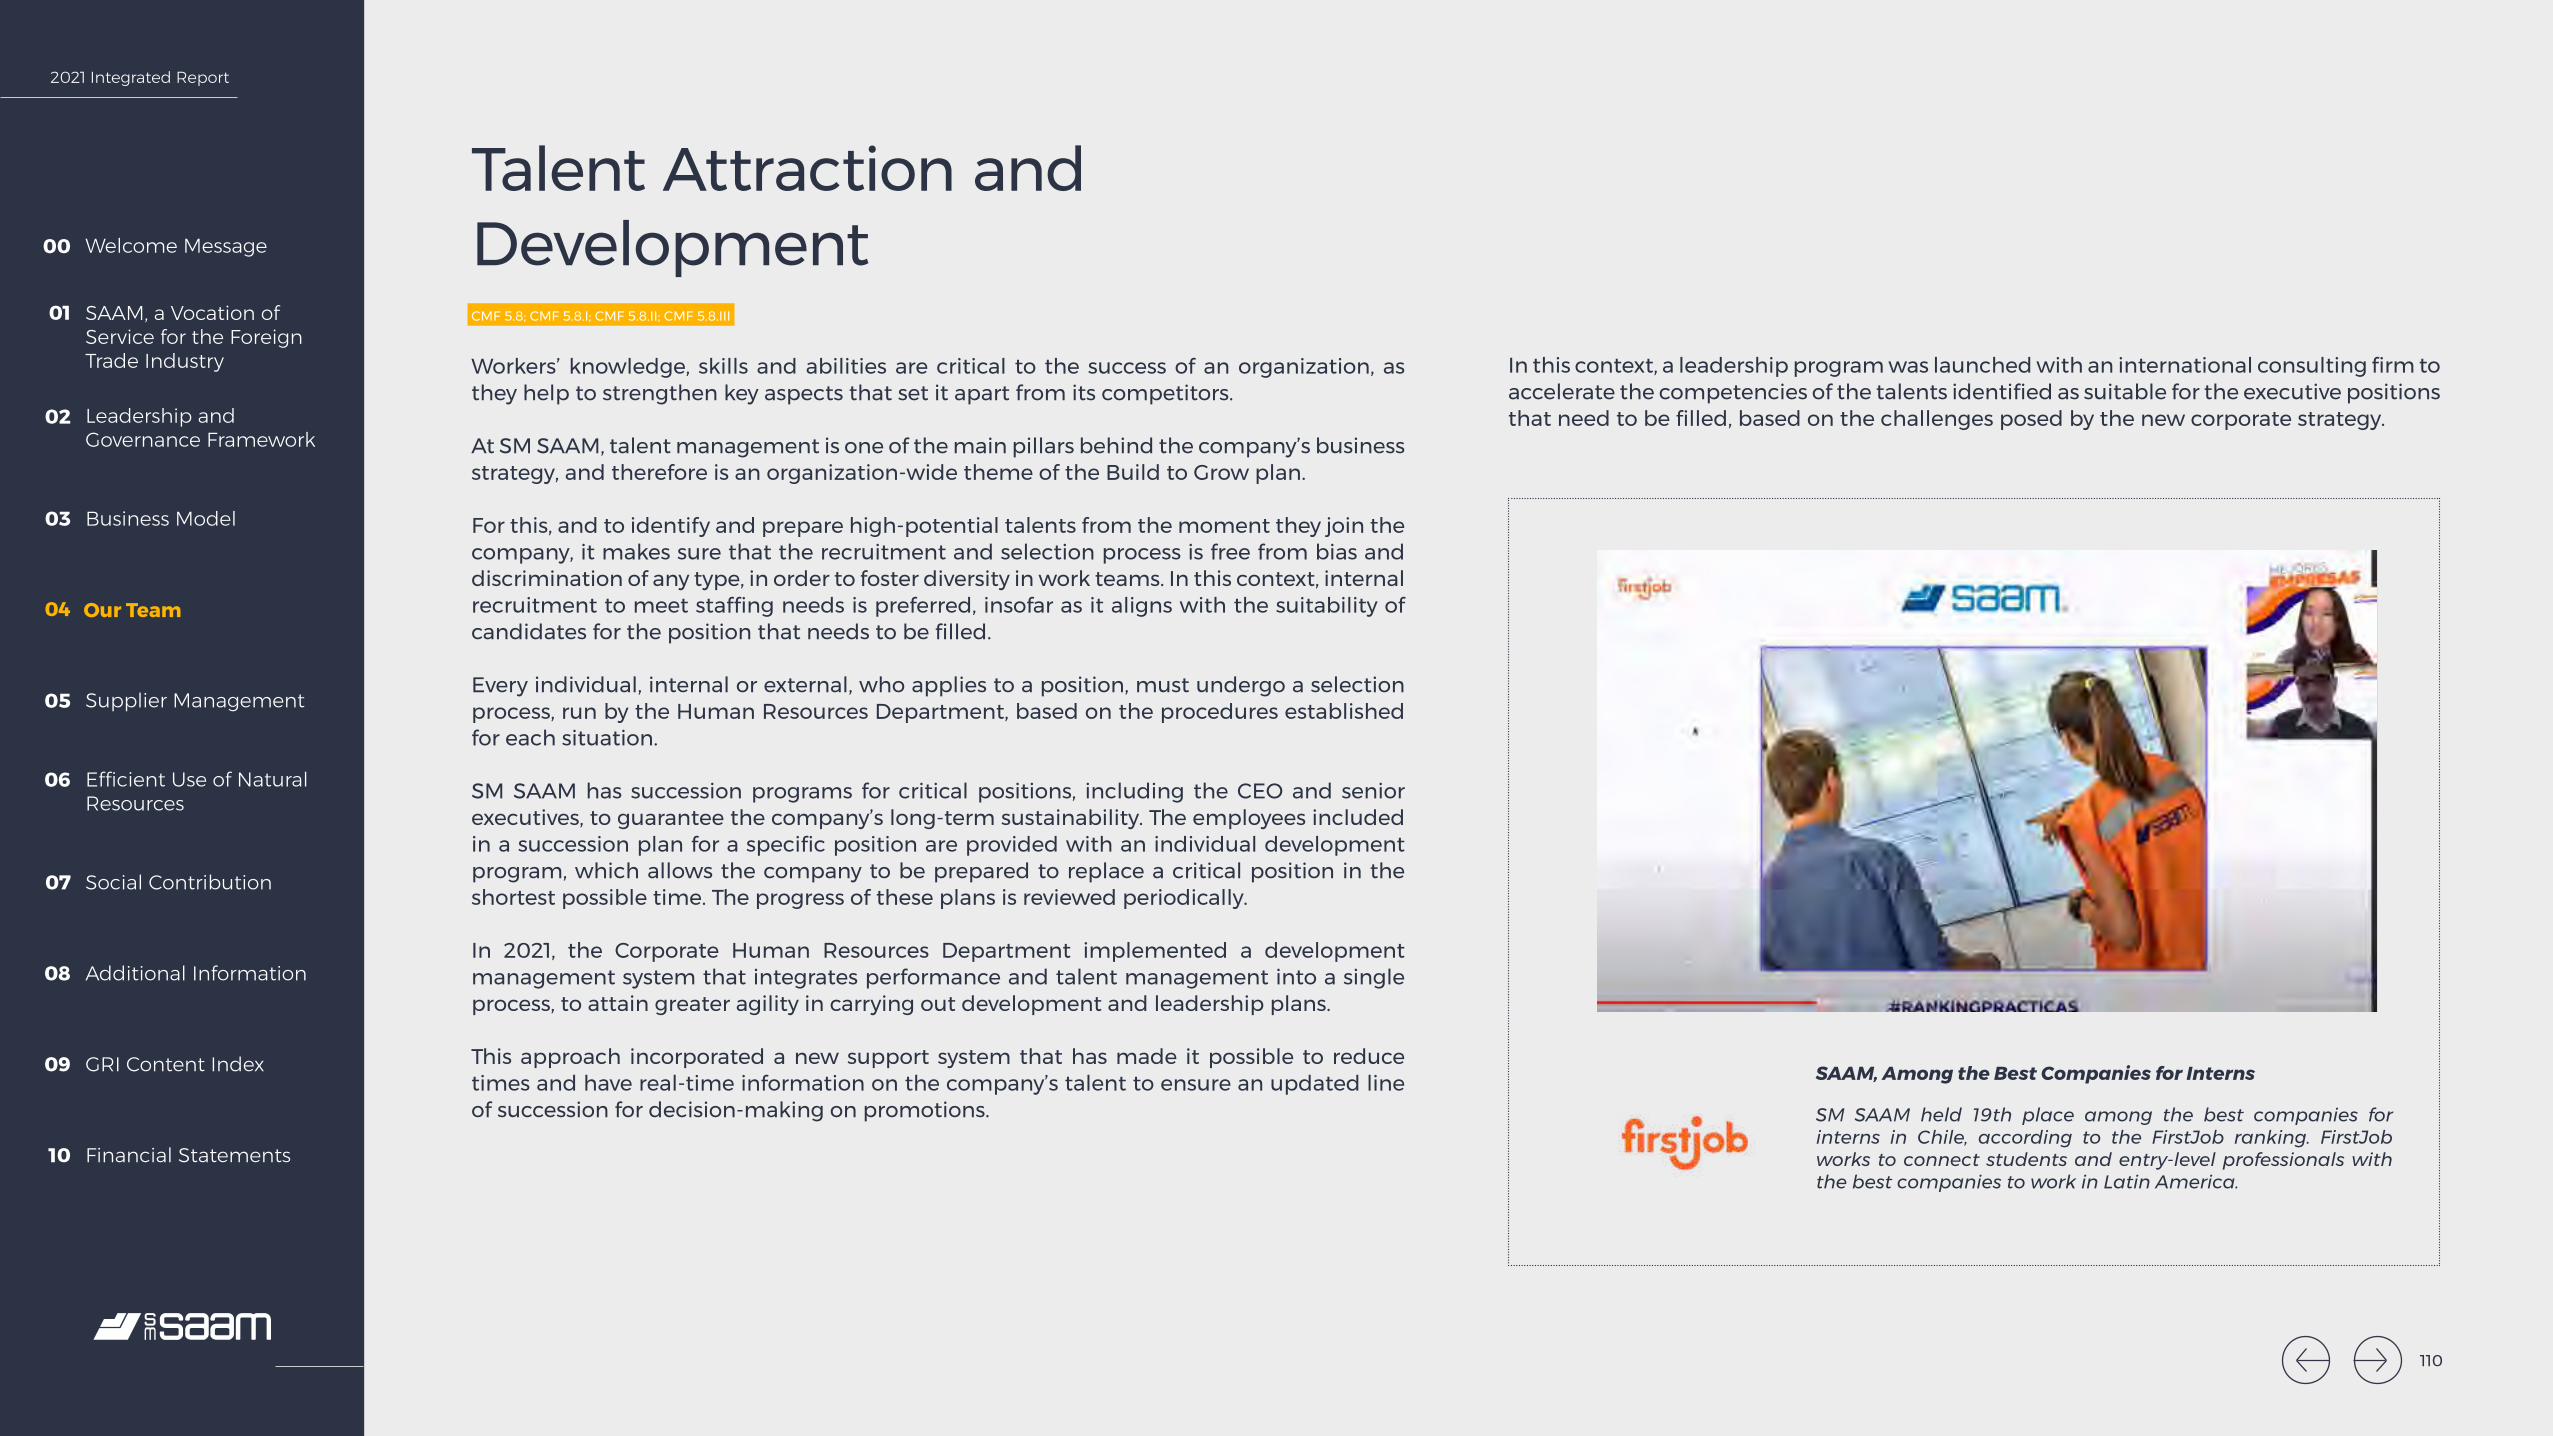
2021 Integrated Report
Welcome Message00
SAAM, a Vocation of Service for the Foreign Trade Industry
01
Leadership and Governance Framework
02
Business Model03
Our Team04
Supplier Management05
Efficient Use of Natural Resources
06
Social Contribution07
Additional Information08
GRI Content Index09
Financial Statements10
Talent Attraction and DevelopmentCMF 5.8; CMF 5.8.I; CMF 5.8.II; CMF 5.8.III
Workers’ knowledge, skills and abilities are critical to the success of an organization, as they help to strengthen key aspects that set it apart from its competitors.
At SM SAAM, talent management is one of the main pillars behind the company’s business strategy, and therefore is an organization-wide theme of the Build to Grow plan.
For this, and to identify and prepare high-potential talents from the moment they join the company, it makes sure that the recruitment and selection process is free from bias and discrimination of any type, in order to foster diversity in work teams. In this context, internal recruitment to meet staffing needs is preferred, insofar as it aligns with the suitability of candidates for the position that needs to be filled.
Every individual, internal or external, who applies to a position, must undergo a selection process, run by the Human Resources Department, based on the procedures established for each situation.
SM SAAM has succession programs for critical positions, including the CEO and senior executives, to guarantee the company’s long-term sustainability. The employees included in a succession plan for a specific position are provided with an individual development program, which allows the company to be prepared to replace a critical position in the shortest possible time. The progress of these plans is reviewed periodically.
In 2021, the Corporate Human Resources Department implemented a development management system that integrates performance and talent management into a single process, to attain greater agility in carrying out development and leadership plans.
This approach incorporated a new support system that has made it possible to reduce times and have real-time information on the company’s talent to ensure an updated line of succession for decision-making on promotions.
In this context, a leadership program was launched with an international consulting firm to accelerate the competencies of the talents identified as suitable for the executive positions that need to be filled, based on the challenges posed by the new corporate strategy.
SAAM, Among the Best Companies for Interns
SM SAAM held 19th place among the best companies for interns in Chile, according to the FirstJob ranking. FirstJob works to connect students and entry-level professionals with the best companies to work in Latin America.
110
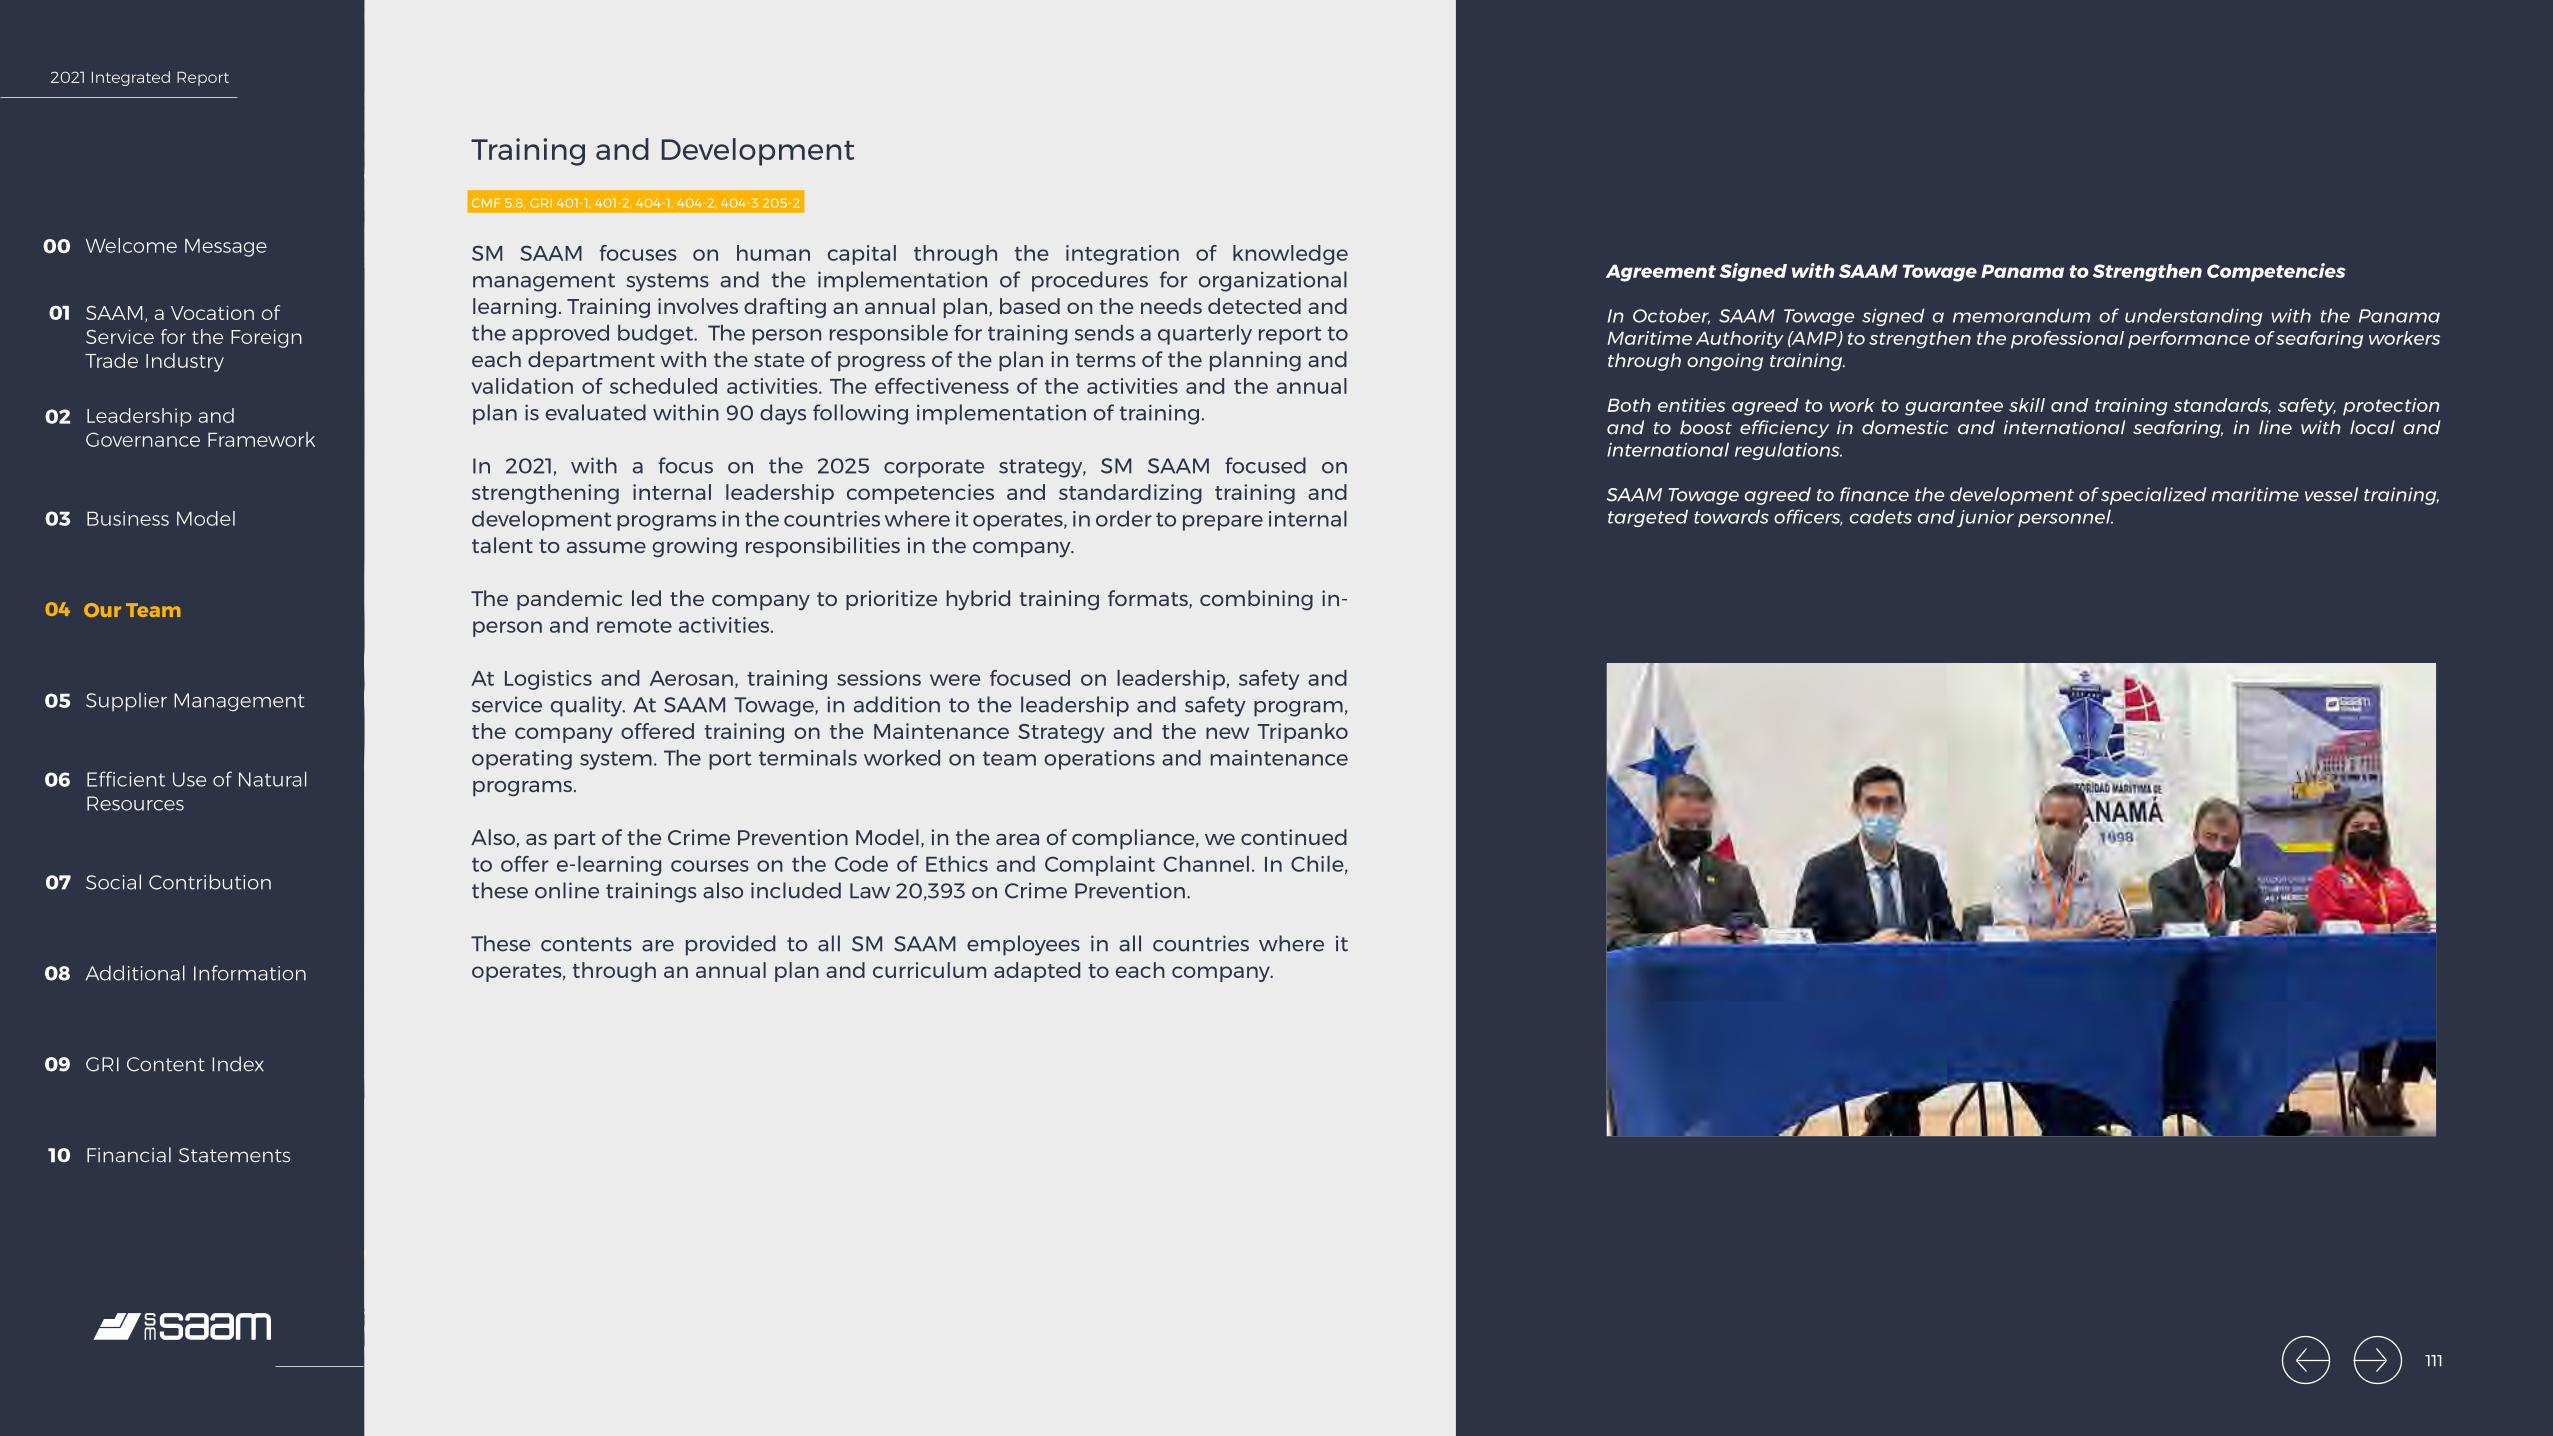
2021 Integrated Report
Welcome Message00
SAAM, a Vocation of Service for the Foreign Trade Industry
01
Leadership and Governance Framework
02
Business Model03
Our Team04
Supplier Management05
Efficient Use of Natural Resources
06
Social Contribution07
Additional Information08
GRI Content Index09
Financial Statements10
Training and Development CMF 5.8, GRI 401-1, 401-2, 404-1, 404-2, 404-3 205-2
SM SAAM focuses on human capital through the integration of knowledge management systems and the implementation of procedures for organizational learning. Training involves drafting an annual plan, based on the needs detected and the approved budget. The person responsible for training sends a quarterly report to each department with the state of progress of the plan in terms of the planning and validation of scheduled activities. The effectiveness of the activities and the annual plan is evaluated within 90 days following implementation of training.
In 2021, with a focus on the 2025 corporate strategy, SM SAAM focused on strengthening internal leadership competencies and standardizing training and development programs in the countries where it operates, in order to prepare internal talent to assume growing responsibilities in the company.
The pandemic led the company to prioritize hybrid training formats, combining in-person and remote activities.
At Logistics and Aerosan, training sessions were focused on leadership, safety and service quality. At SAAM Towage, in addition to the leadership and safety program, the company offered training on the Maintenance Strategy and the new Tripanko operating system. The port terminals worked on team operations and maintenance programs.
Also, as part of the Crime Prevention Model, in the area of compliance, we continued to offer e-learning courses on the Code of Ethics and Complaint Channel. In Chile, these online trainings also included Law 20,393 on Crime Prevention.
These contents are provided to all SM SAAM employees in all countries where it operates, through an annual plan and curriculum adapted to each company.
Agreement Signed with SAAM Towage Panama to Strengthen Competencies
In October, SAAM Towage signed a memorandum of understanding with the Panama Maritime Authority (AMP) to strengthen the professional performance of seafaring workers through ongoing training.
Both entities agreed to work to guarantee skill and training standards, safety, protection and to boost efficiency in domestic and international seafaring, in line with local and international regulations.
SAAM Towage agreed to finance the development of specialized maritime vessel training, targeted towards officers, cadets and junior personnel.
111
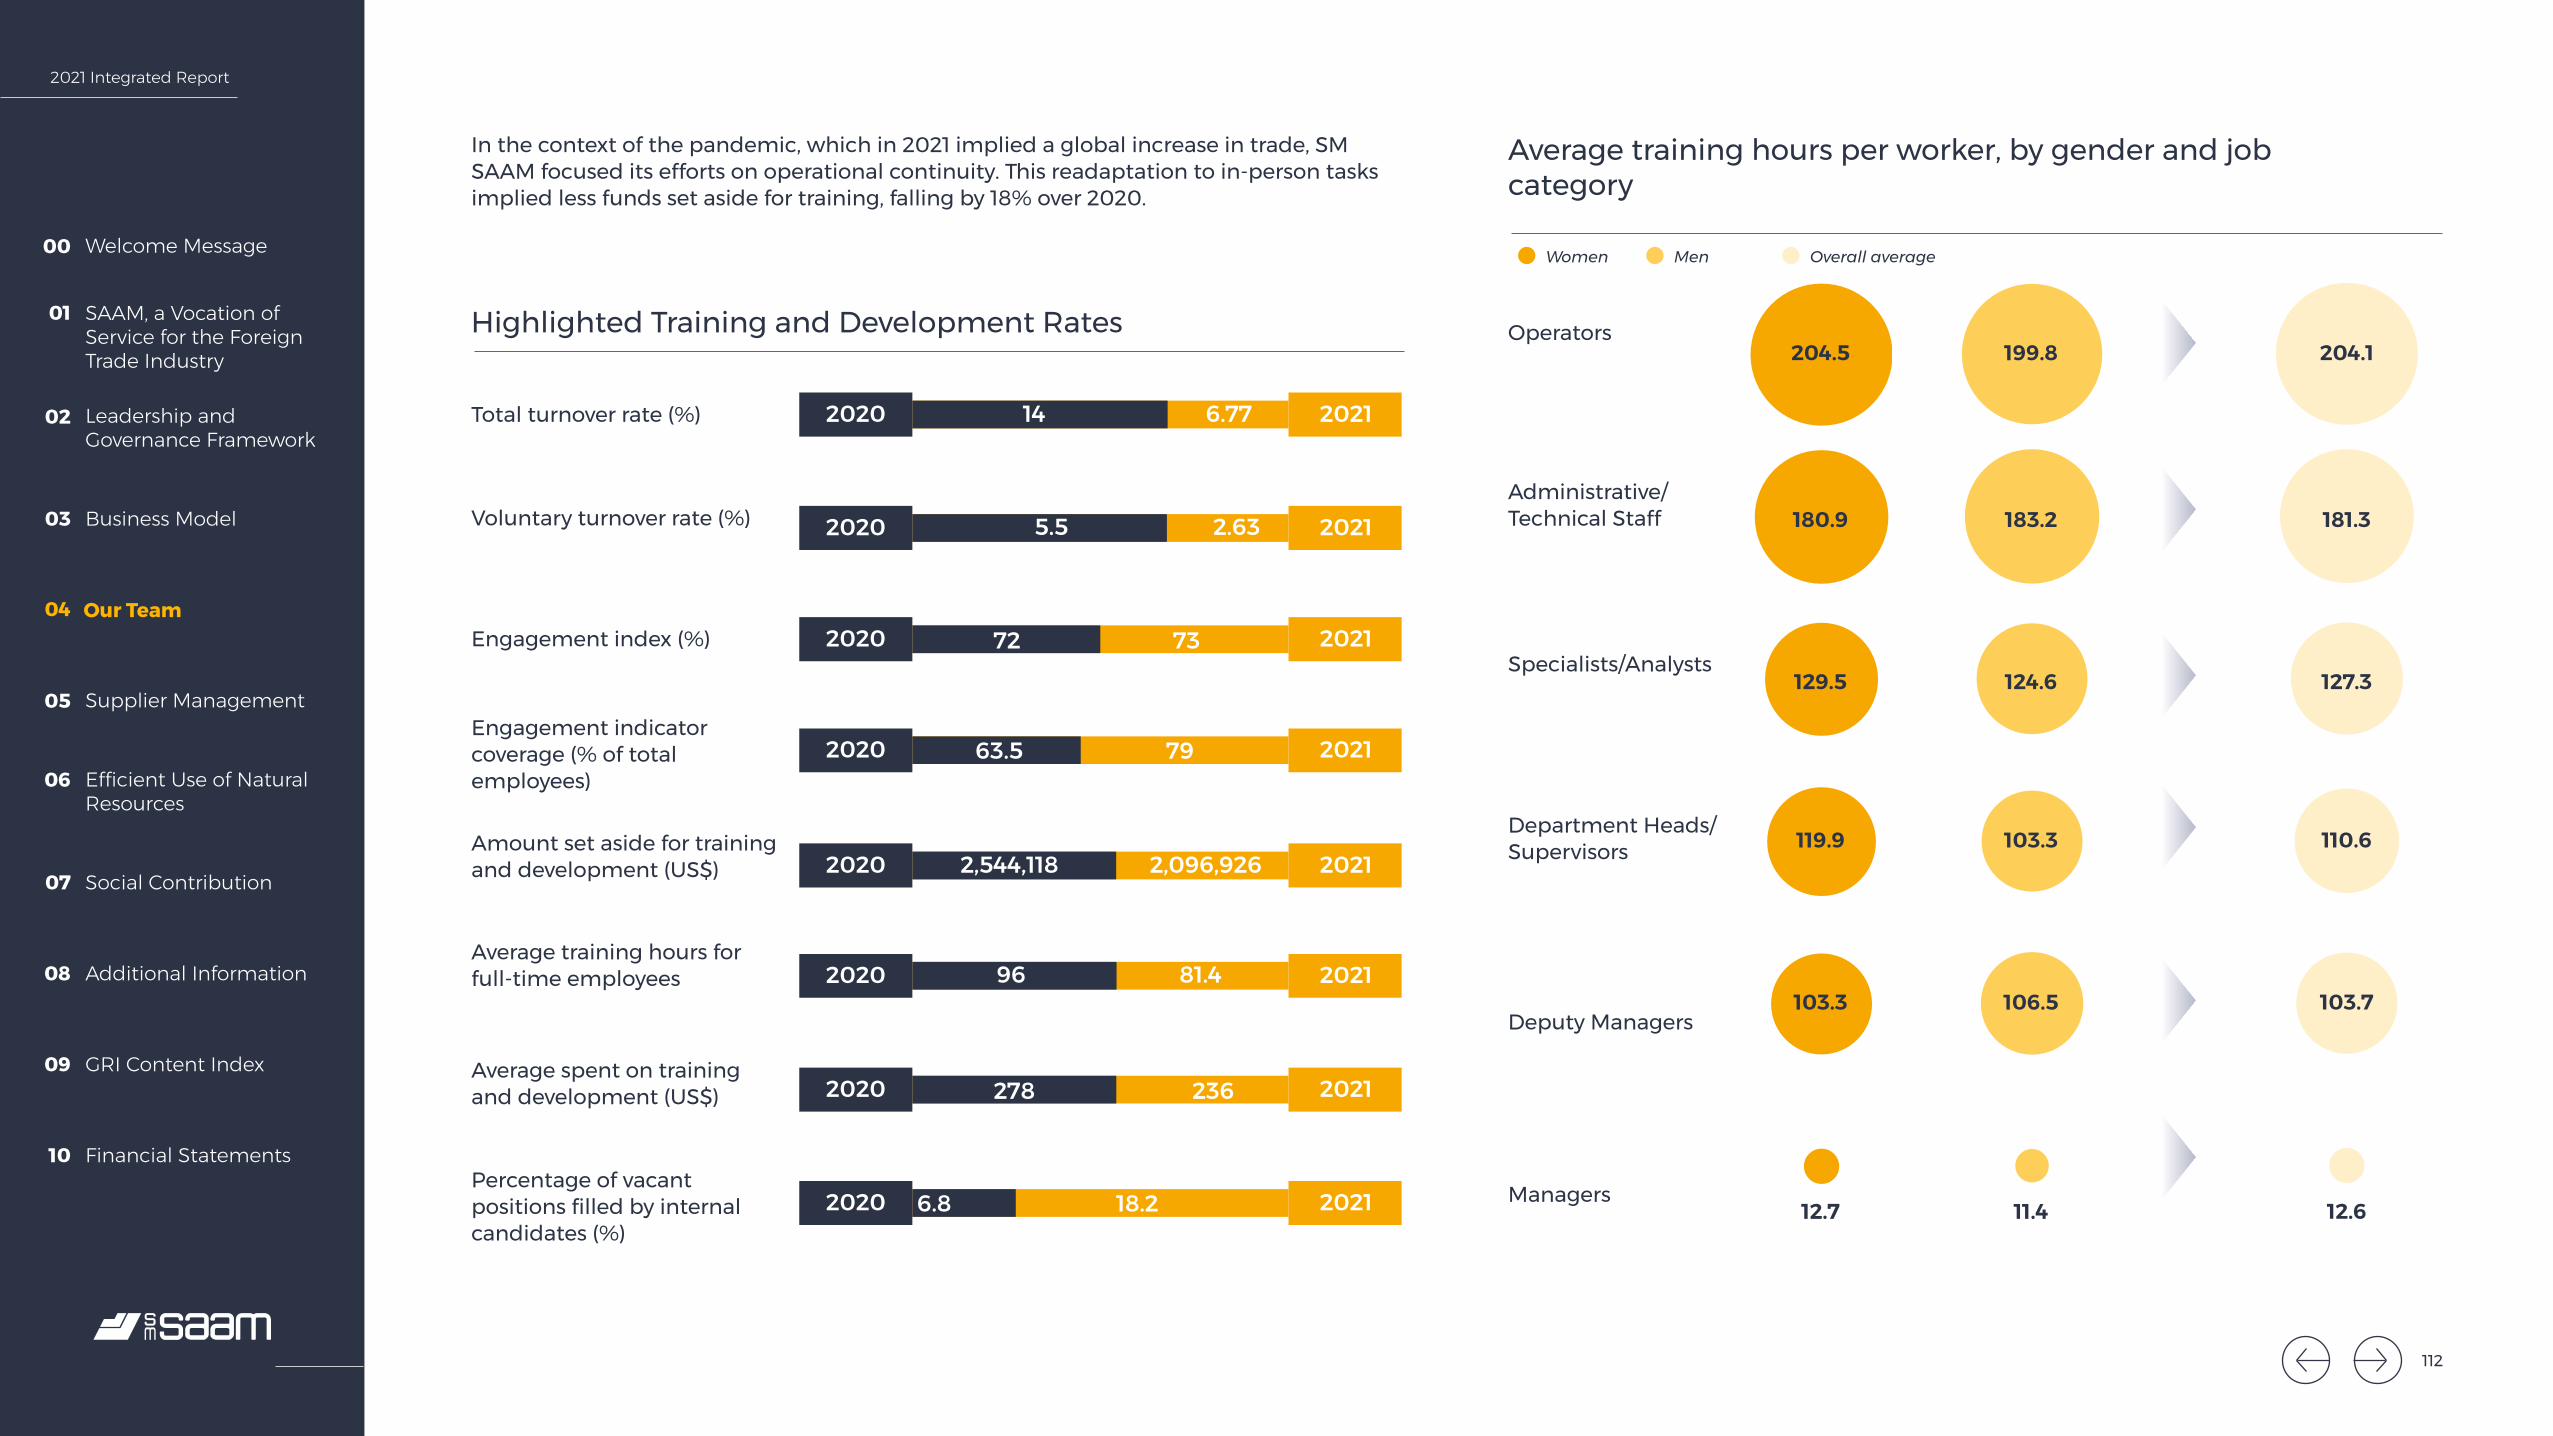
2021 Integrated Report
Welcome Message00
SAAM, a Vocation of Service for the Foreign Trade Industry
01
Leadership and Governance Framework
02
Business Model03
Our Team04
Supplier Management05
Efficient Use of Natural Resources
06
Social Contribution07
Additional Information08
GRI Content Index09
Financial Statements10
112
204.1
181.3
127.3
110.6
103.7
12.6
204.5
180.9
129.5
119.9
103.3
12.7
199.8
183.2
124.6
103.3
106.5
11.4
14 6.77
5.5 2.63
72 73
63.5 79
2,544,118 2,096,926
96 81.4
278 236
6.8 18.2
2020 2021
2020 2021
2020 2021
2020 2021
2020 2021
2020 2021
2020 2021
2020 2021
14 6.77
5.5 2.63
72 73
63.5 79
2,544,118 2,096,926
96 81.4
278 236
6.8 18.2
2020 2021
2020 2021
2020 2021
2020 2021
2020 2021
2020 2021
2020 2021
2020 2021
14 6.77
5.5 2.63
72 73
63.5 79
2,544,118 2,096,926
96 81.4
278 236
6.8 18.2
2020 2021
2020 2021
2020 2021
2020 2021
2020 2021
2020 2021
2020 2021
2020 2021
14 6.77
5.5 2.63
72 73
63.5 79
2,544,118 2,096,926
96 81.4
278 236
6.8 18.2
2020 2021
2020 2021
2020 2021
2020 2021
2020 2021
2020 2021
2020 2021
2020 2021
14 6.77
5.5 2.63
72 73
63.5 79
2,544,118 2,096,926
96 81.4
278 236
6.8 18.2
2020 2021
2020 2021
2020 2021
2020 2021
2020 2021
2020 2021
2020 2021
2020 2021
14 6.77
5.5 2.63
72 73
63.5 79
2,544,118 2,096,926
96 81.4
278 236
6.8 18.2
2020 2021
2020 2021
2020 2021
2020 2021
2020 2021
2020 2021
2020 2021
2020 2021
14 6.77
5.5 2.63
72 73
63.5 79
2,544,118 2,096,926
96 81.4
278 236
6.8 18.2
2020 2021
2020 2021
2020 2021
2020 2021
2020 2021
2020 2021
2020 2021
2020 2021
14 6.77
5.5 2.63
72 73
63.5 79
2,544,118 2,096,926
96 81.4
278 236
6.8 18.2
2020 2021
2020 2021
2020 2021
2020 2021
2020 2021
2020 2021
2020 2021
2020 2021
Highlighted Training and Development Rates
Average training hours per worker, by gender and job category
In the context of the pandemic, which in 2021 implied a global increase in trade, SM SAAM focused its efforts on operational continuity. This readaptation to in-person tasks implied less funds set aside for training, falling by 18% over 2020.
Total turnover rate (%)
Operators
Women Men Overall average
Administrative/Technical Staff
Specialists/Analysts
Department Heads/Supervisors
Deputy Managers
Managers
Voluntary turnover rate (%)
Engagement index (%)
Engagement indicator coverage (% of total employees)
Amount set aside for training and development (US$)
Average training hours for full-time employees
Average spent on training and development (US$)
Percentage of vacant positions filled by internal candidates (%)
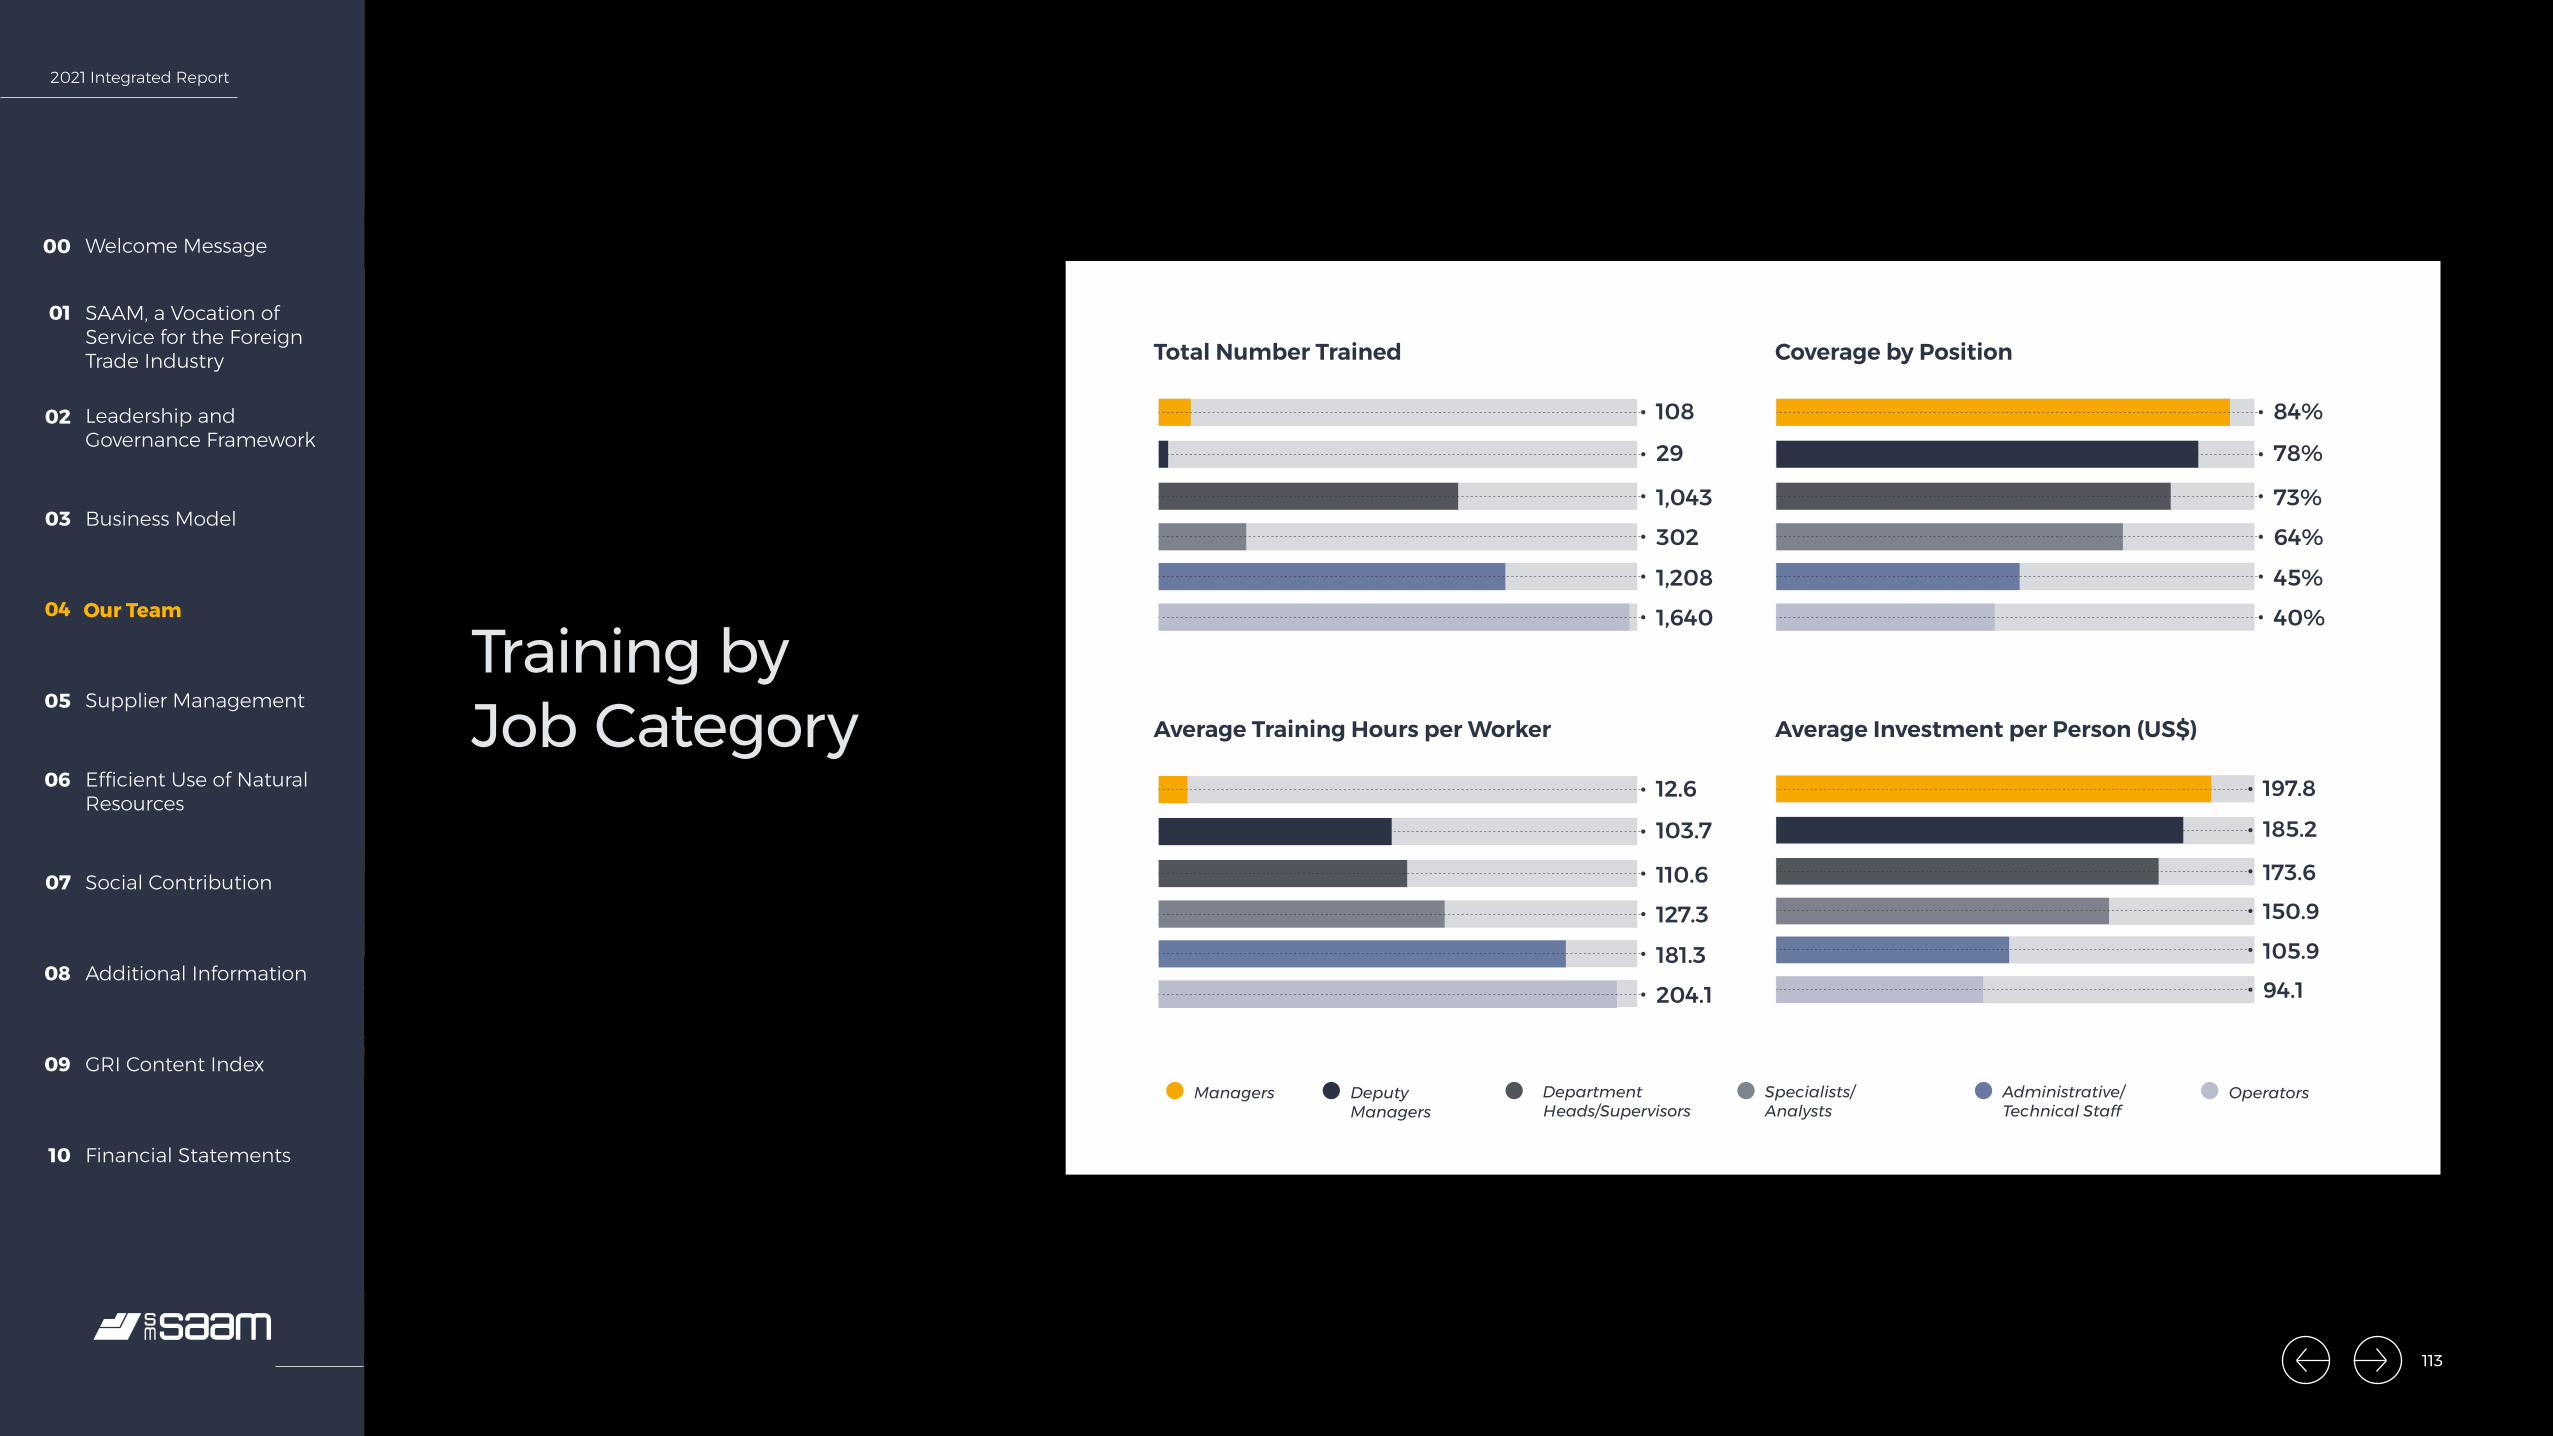
2021 Integrated Report
Welcome Message00
SAAM, a Vocation of Service for the Foreign Trade Industry
01
Leadership and Governance Framework
02
Business Model03
Our Team04
Supplier Management05
Efficient Use of Natural Resources
06
Social Contribution07
Additional Information08
GRI Content Index09
Financial Statements10
108
29
1,043
302
1,208
1,640
12.6
103.7
110.6
127.3
181.3
204.1
84%
78%
73%
64%
45%
40%
197.8
185.2
173.6
150.9
105.9
94.1
Managers Deputy Managers
Department Heads/Supervisors
Specialists/Analysts
Administrative/Technical Staff
Operators
Total Number Trained
Average Training Hours per Worker
Coverage by Position
Average Investment per Person (US$)
Training by Job Category
113
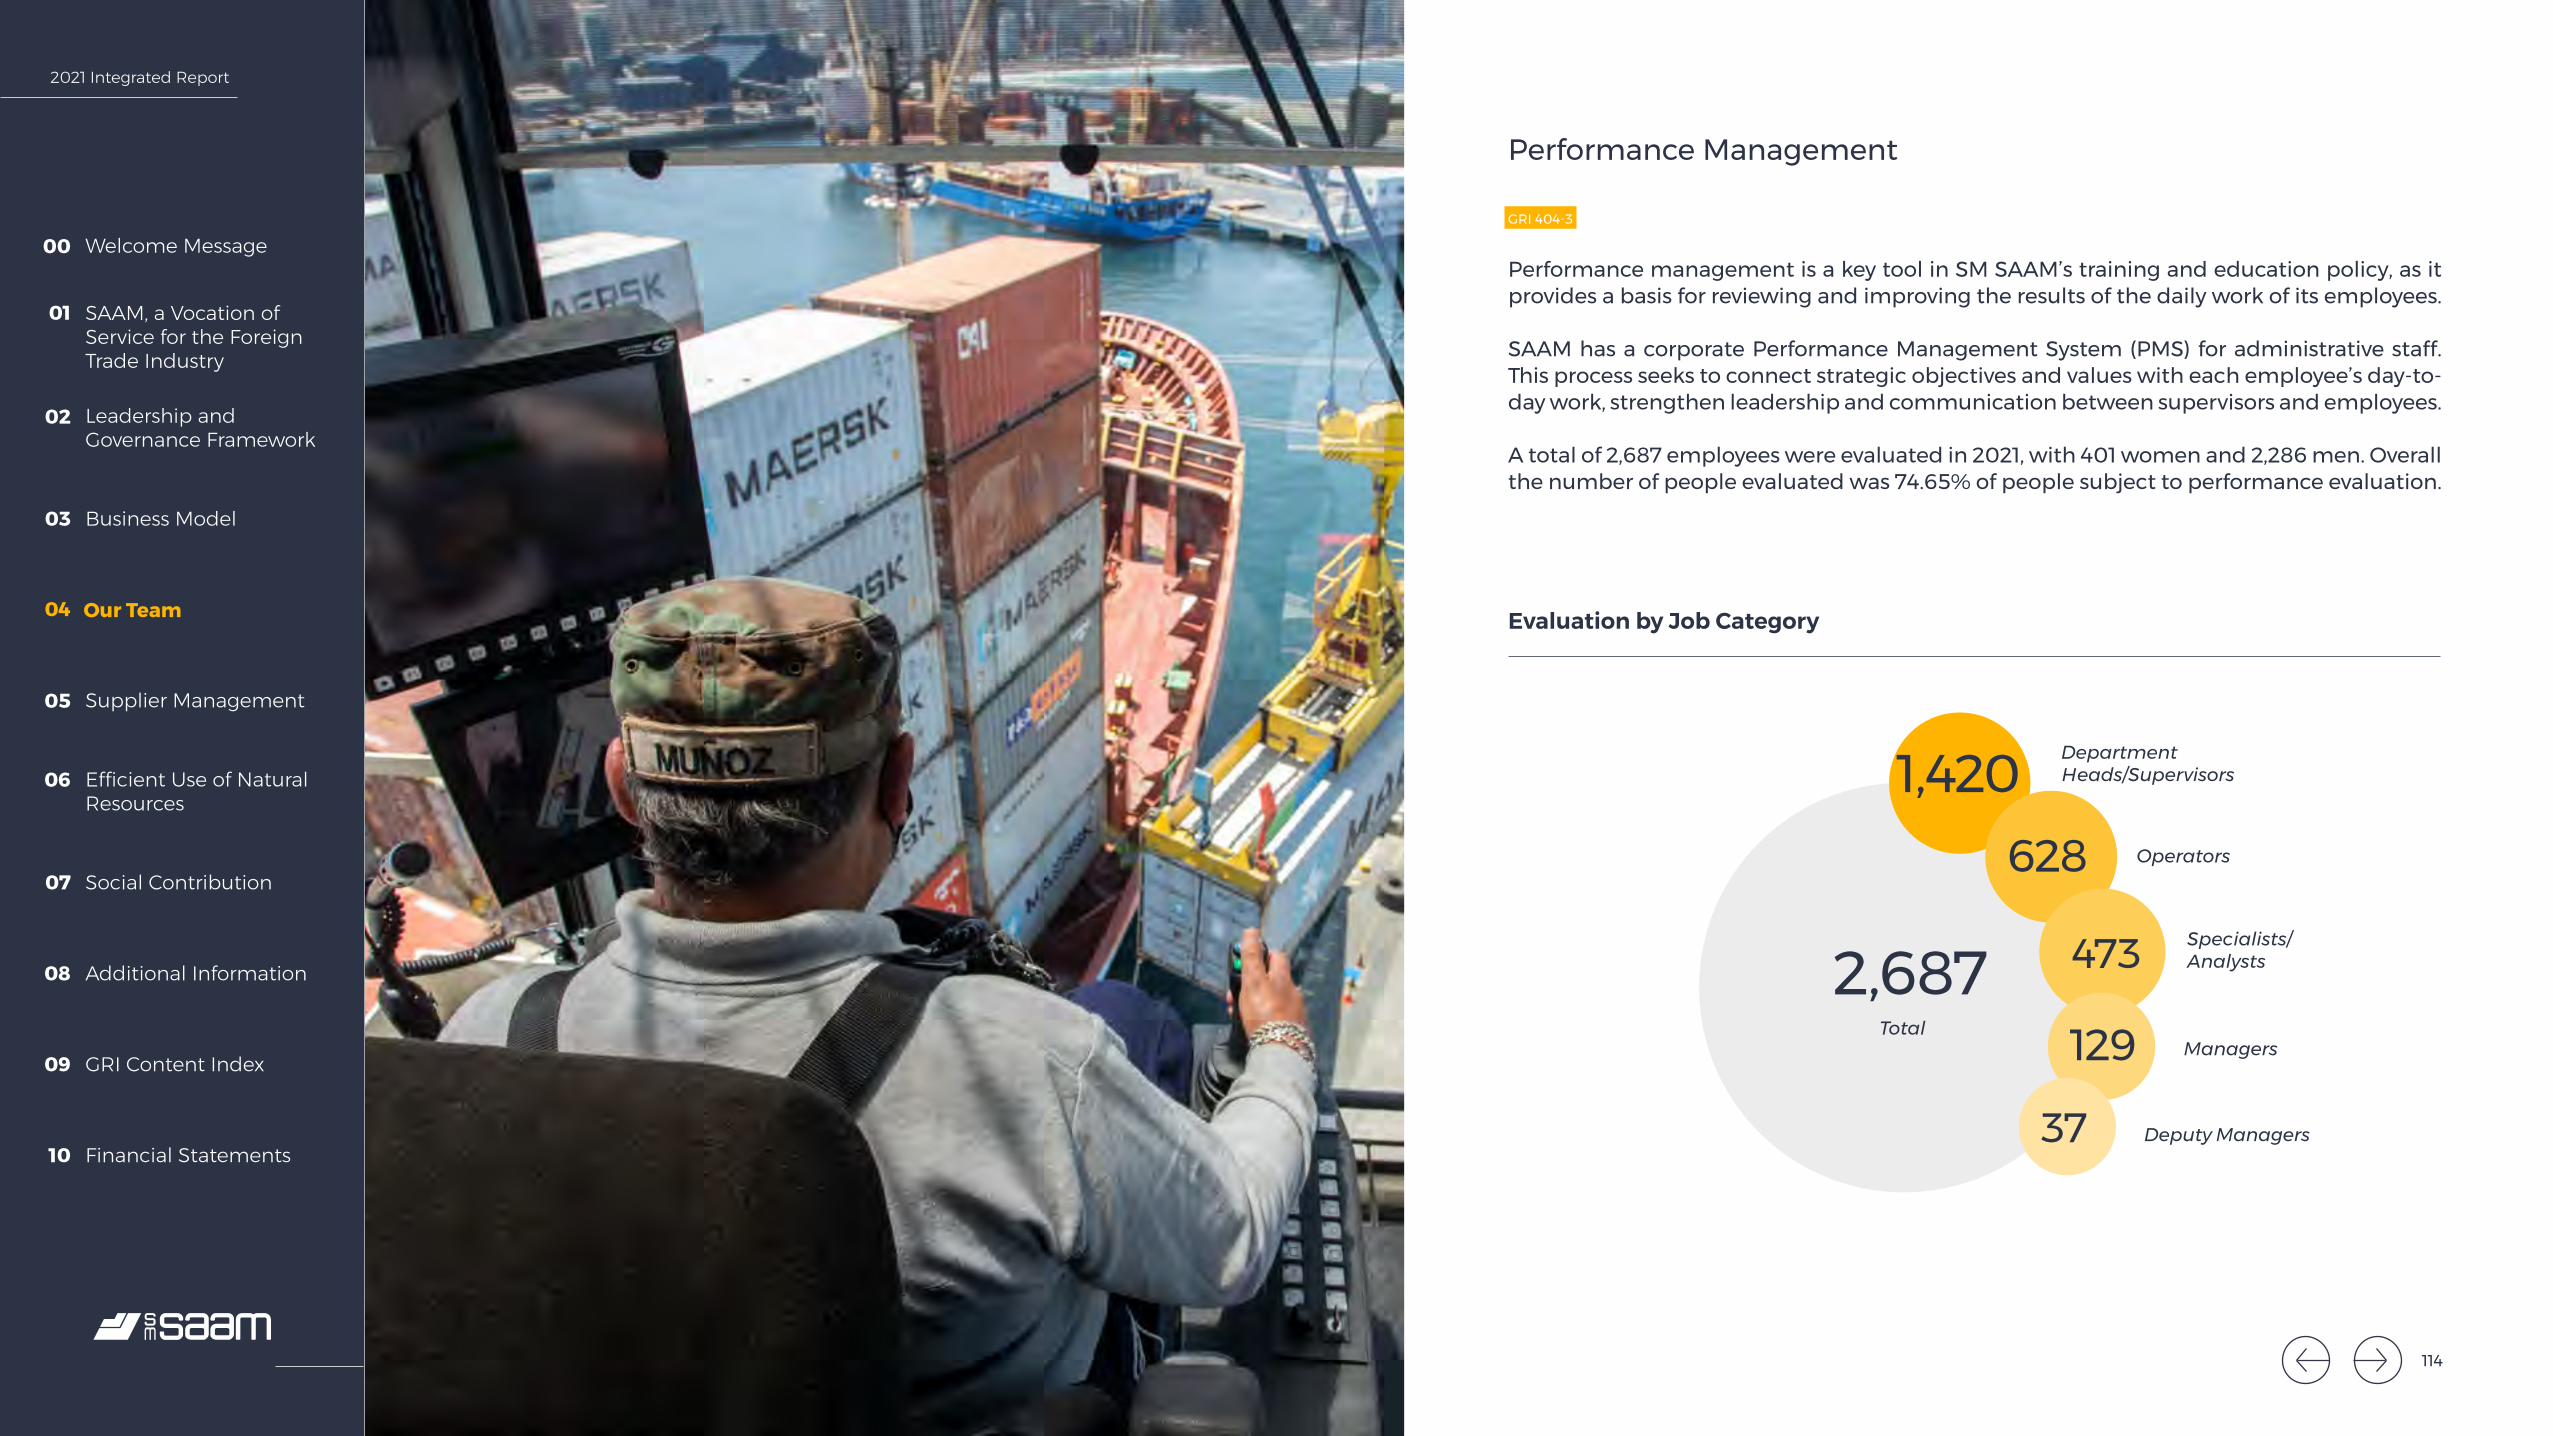
2021 Integrated Report
Welcome Message00
SAAM, a Vocation of Service for the Foreign Trade Industry
01
Leadership and Governance Framework
02
Business Model03
Our Team04
Supplier Management05
Efficient Use of Natural Resources
06
Social Contribution07
Additional Information08
GRI Content Index09
Financial Statements10
Performance Management
GRI 404-3
Performance management is a key tool in SM SAAM’s training and education policy, as it provides a basis for reviewing and improving the results of the daily work of its employees.
SAAM has a corporate Performance Management System (PMS) for administrative staff. This process seeks to connect strategic objectives and values with each employee’s day-to-day work, strengthen leadership and communication between supervisors and employees.
A total of 2,687 employees were evaluated in 2021, with 401 women and 2,286 men. Overall the number of people evaluated was 74.65% of people subject to performance evaluation.
Evaluation by Job Category
2,687
1,420628
473
129
37
Total
Operators
Department Heads/Supervisors
Specialists/Analysts
Managers
Deputy Managers
114
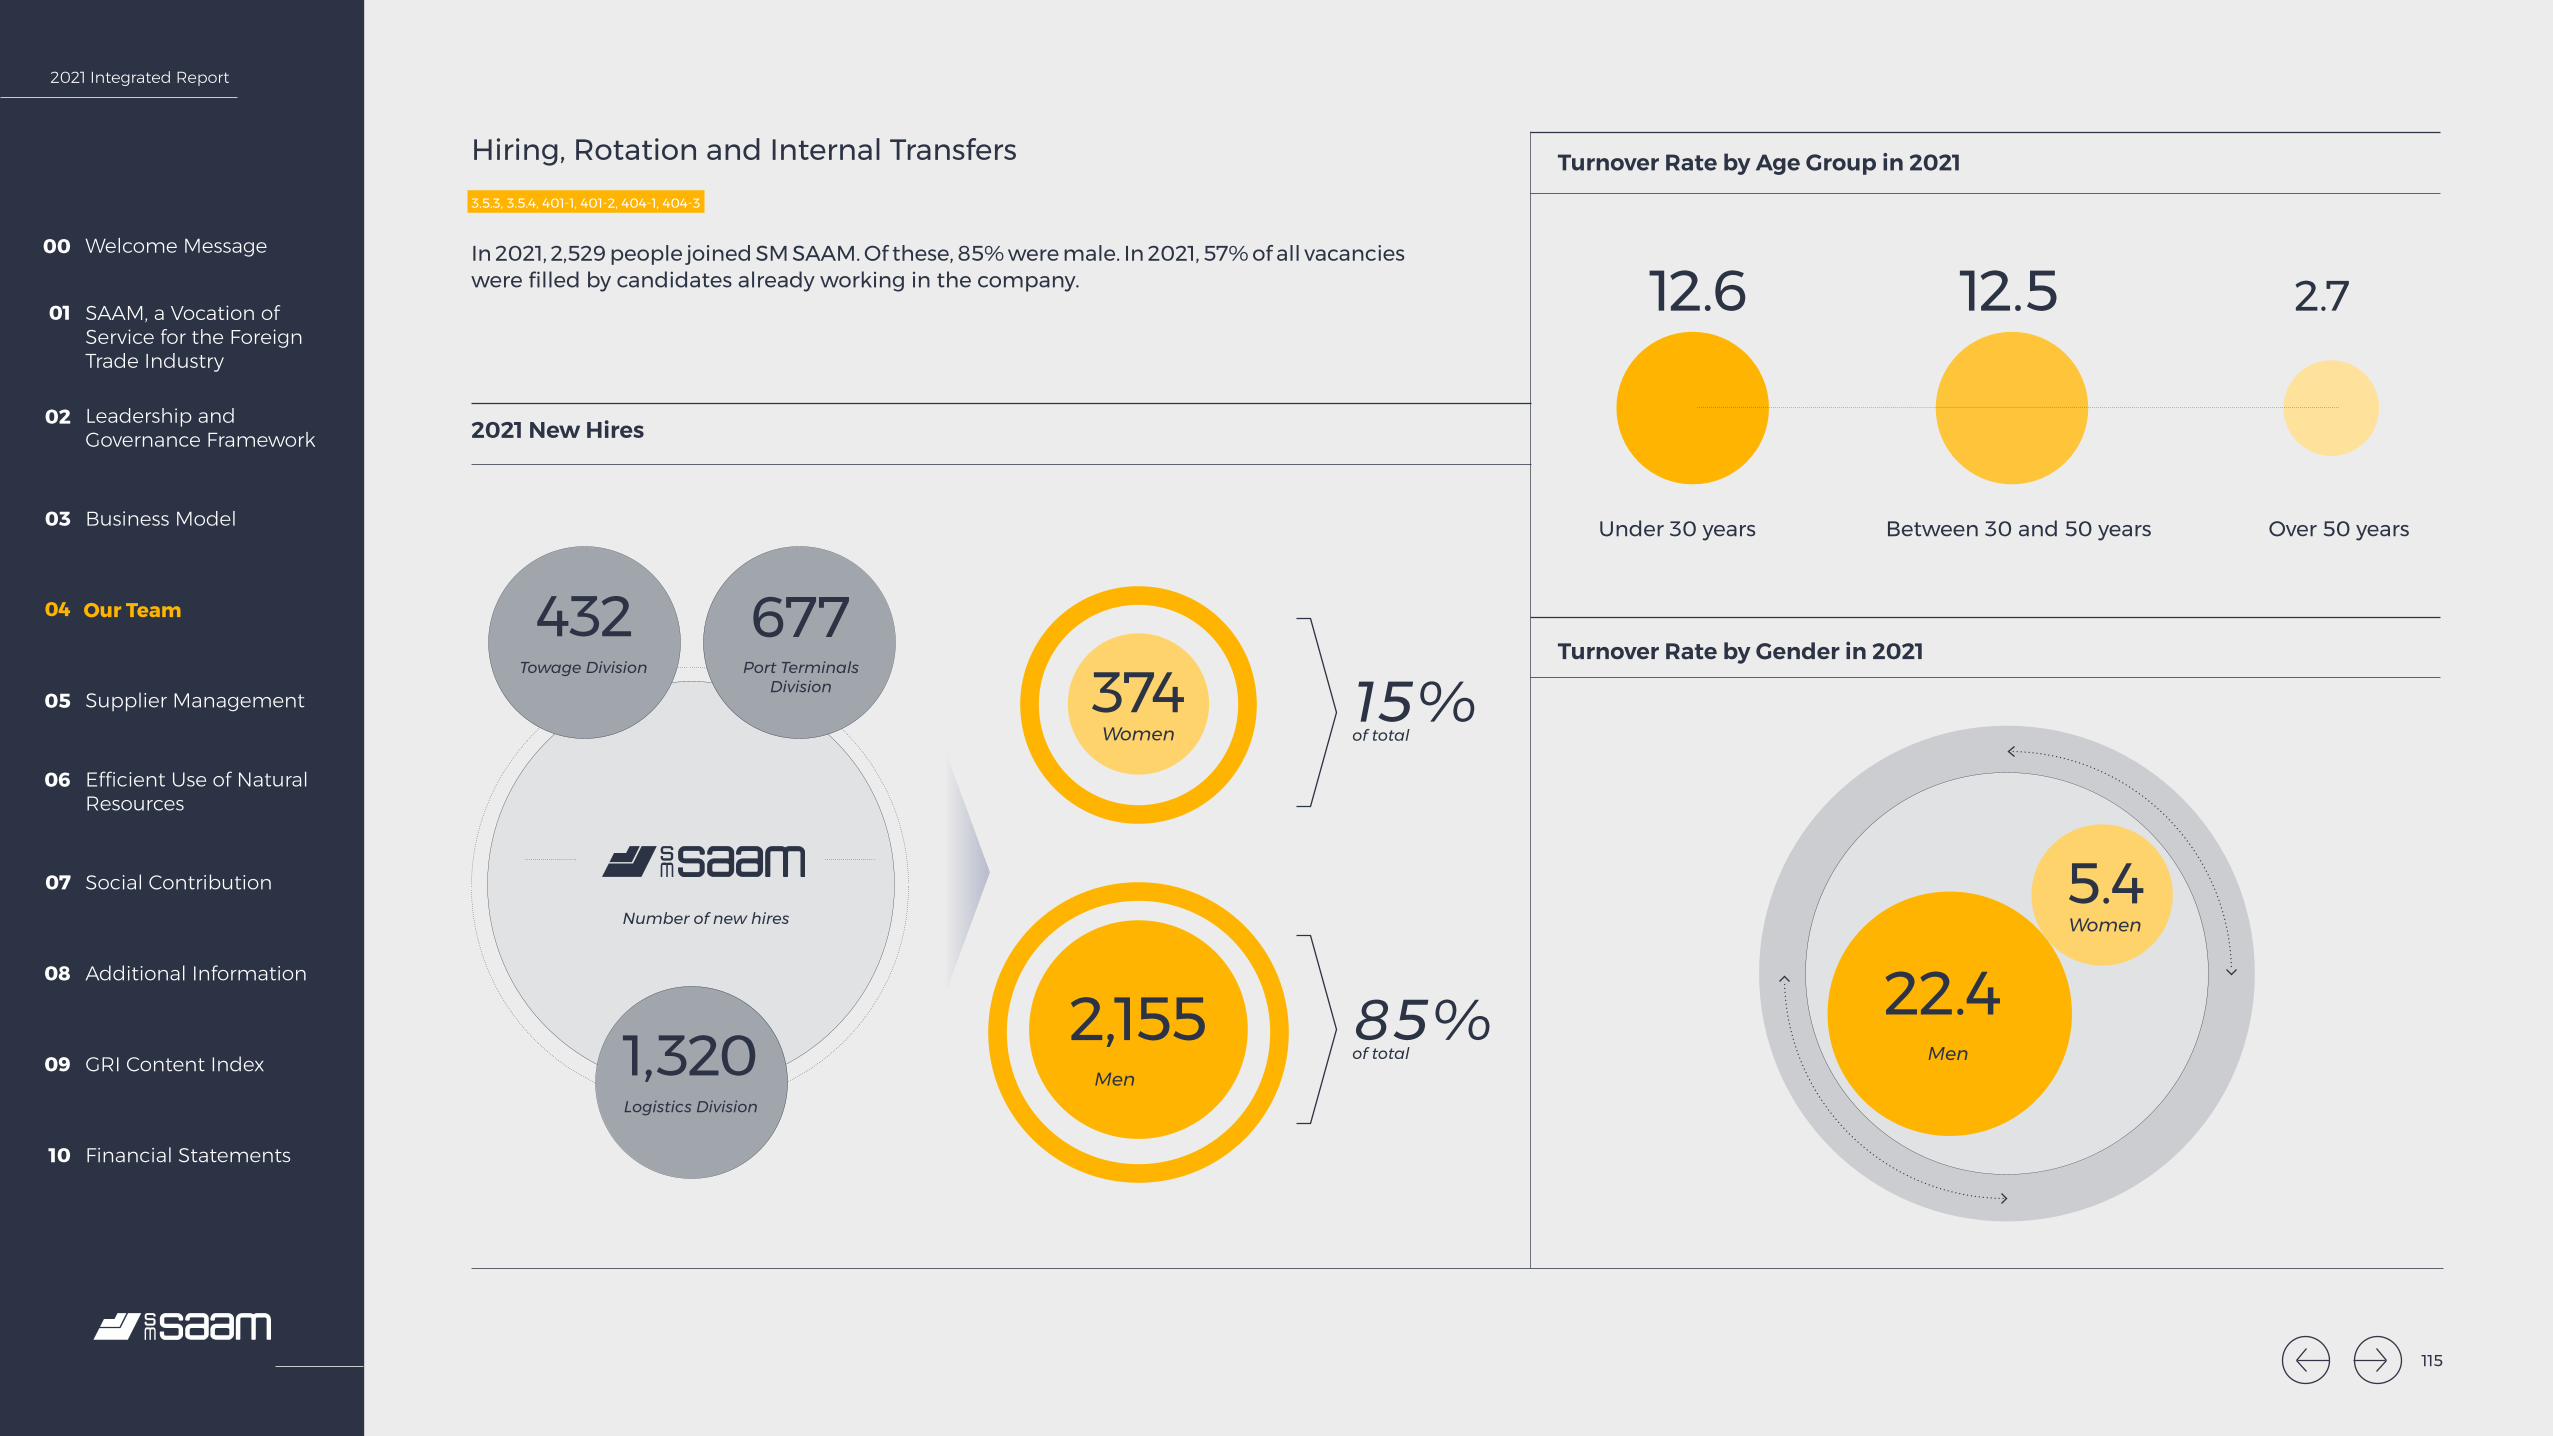
2021 Integrated Report
Welcome Message00
SAAM, a Vocation of Service for the Foreign Trade Industry
01
Leadership and Governance Framework
02
Business Model03
Our Team04
Supplier Management05
Efficient Use of Natural Resources
06
Social Contribution07
Additional Information08
GRI Content Index09
Financial Statements10
Hiring, Rotation and Internal Transfers3.5.3, 3.5.4, 401-1, 401-2, 404-1, 404-3
In 2021, 2,529 people joined SM SAAM. Of these, 85% were male. In 2021, 57% of all vacancies were filled by candidates already working in the company.
Turnover Rate by Gender in 2021
Turnover Rate by Age Group in 2021
2,155
374 15% of total
85% of total
Men
Women
Number of new hires
2021 New Hires
Under 30 years Between 30 and 50 years Over 50 years
22.4
5.4
12.6 12.5 2.7
Men
Women
432
1,320
677Towage Division
Logistics Division
Port Terminals Division
115
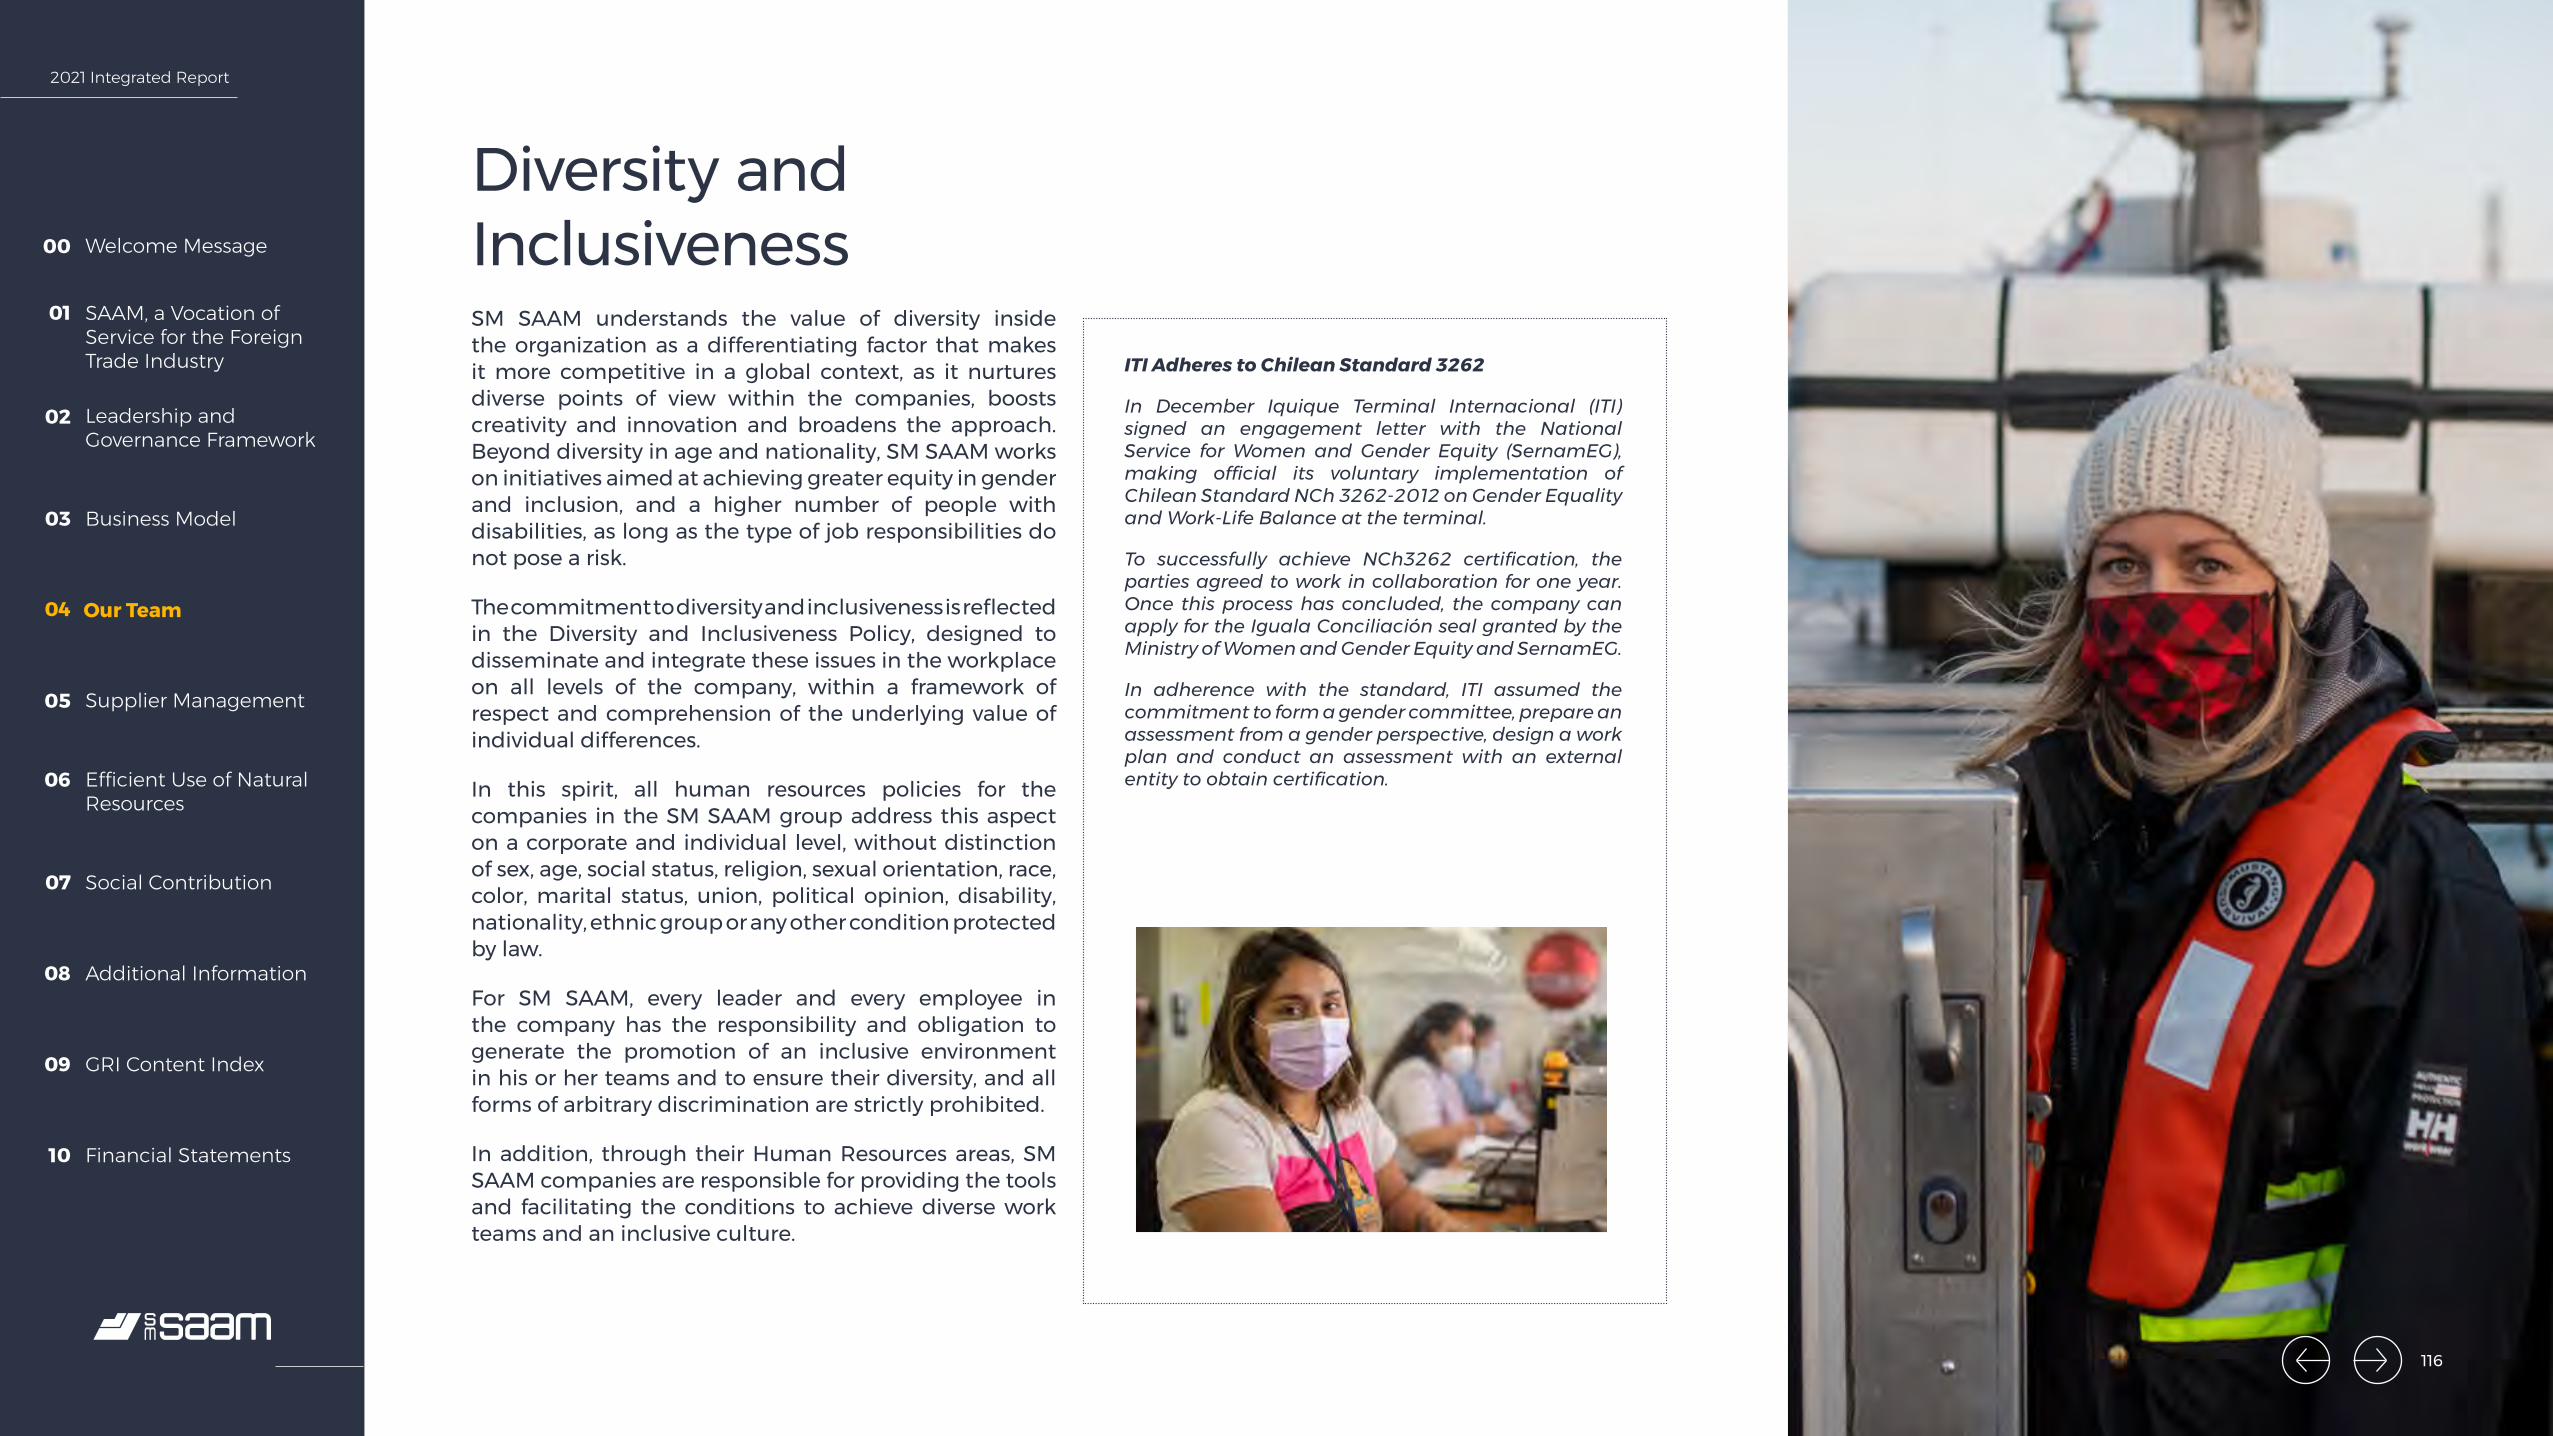
2021 Integrated Report
Welcome Message00
SAAM, a Vocation of Service for the Foreign Trade Industry
01
Leadership and Governance Framework
02
Business Model03
Our Team04
Supplier Management05
Efficient Use of Natural Resources
06
Social Contribution07
Additional Information08
GRI Content Index09
Financial Statements10
Diversity and InclusivenessSM SAAM understands the value of diversity inside the organization as a differentiating factor that makes it more competitive in a global context, as it nurtures diverse points of view within the companies, boosts creativity and innovation and broadens the approach. Beyond diversity in age and nationality, SM SAAM works on initiatives aimed at achieving greater equity in gender and inclusion, and a higher number of people with disabilities, as long as the type of job responsibilities do not pose a risk.
The commitment to diversity and inclusiveness is reflected in the Diversity and Inclusiveness Policy, designed to disseminate and integrate these issues in the workplace on all levels of the company, within a framework of respect and comprehension of the underlying value of individual differences.
In this spirit, all human resources policies for the companies in the SM SAAM group address this aspect on a corporate and individual level, without distinction of sex, age, social status, religion, sexual orientation, race, color, marital status, union, political opinion, disability, nationality, ethnic group or any other condition protected by law.
For SM SAAM, every leader and every employee in the company has the responsibility and obligation to generate the promotion of an inclusive environment in his or her teams and to ensure their diversity, and all forms of arbitrary discrimination are strictly prohibited.
In addition, through their Human Resources areas, SM SAAM companies are responsible for providing the tools and facilitating the conditions to achieve diverse work teams and an inclusive culture.
ITI Adheres to Chilean Standard 3262
In December Iquique Terminal Internacional (ITI) signed an engagement letter with the National Service for Women and Gender Equity (SernamEG), making official its voluntary implementation of Chilean Standard NCh 3262-2012 on Gender Equality and Work-Life Balance at the terminal.
To successfully achieve NCh3262 certification, the parties agreed to work in collaboration for one year. Once this process has concluded, the company can apply for the Iguala Conciliación seal granted by the Ministry of Women and Gender Equity and SernamEG.
In adherence with the standard, ITI assumed the commitment to form a gender committee, prepare an assessment from a gender perspective, design a work plan and conduct an assessment with an external entity to obtain certification.
116
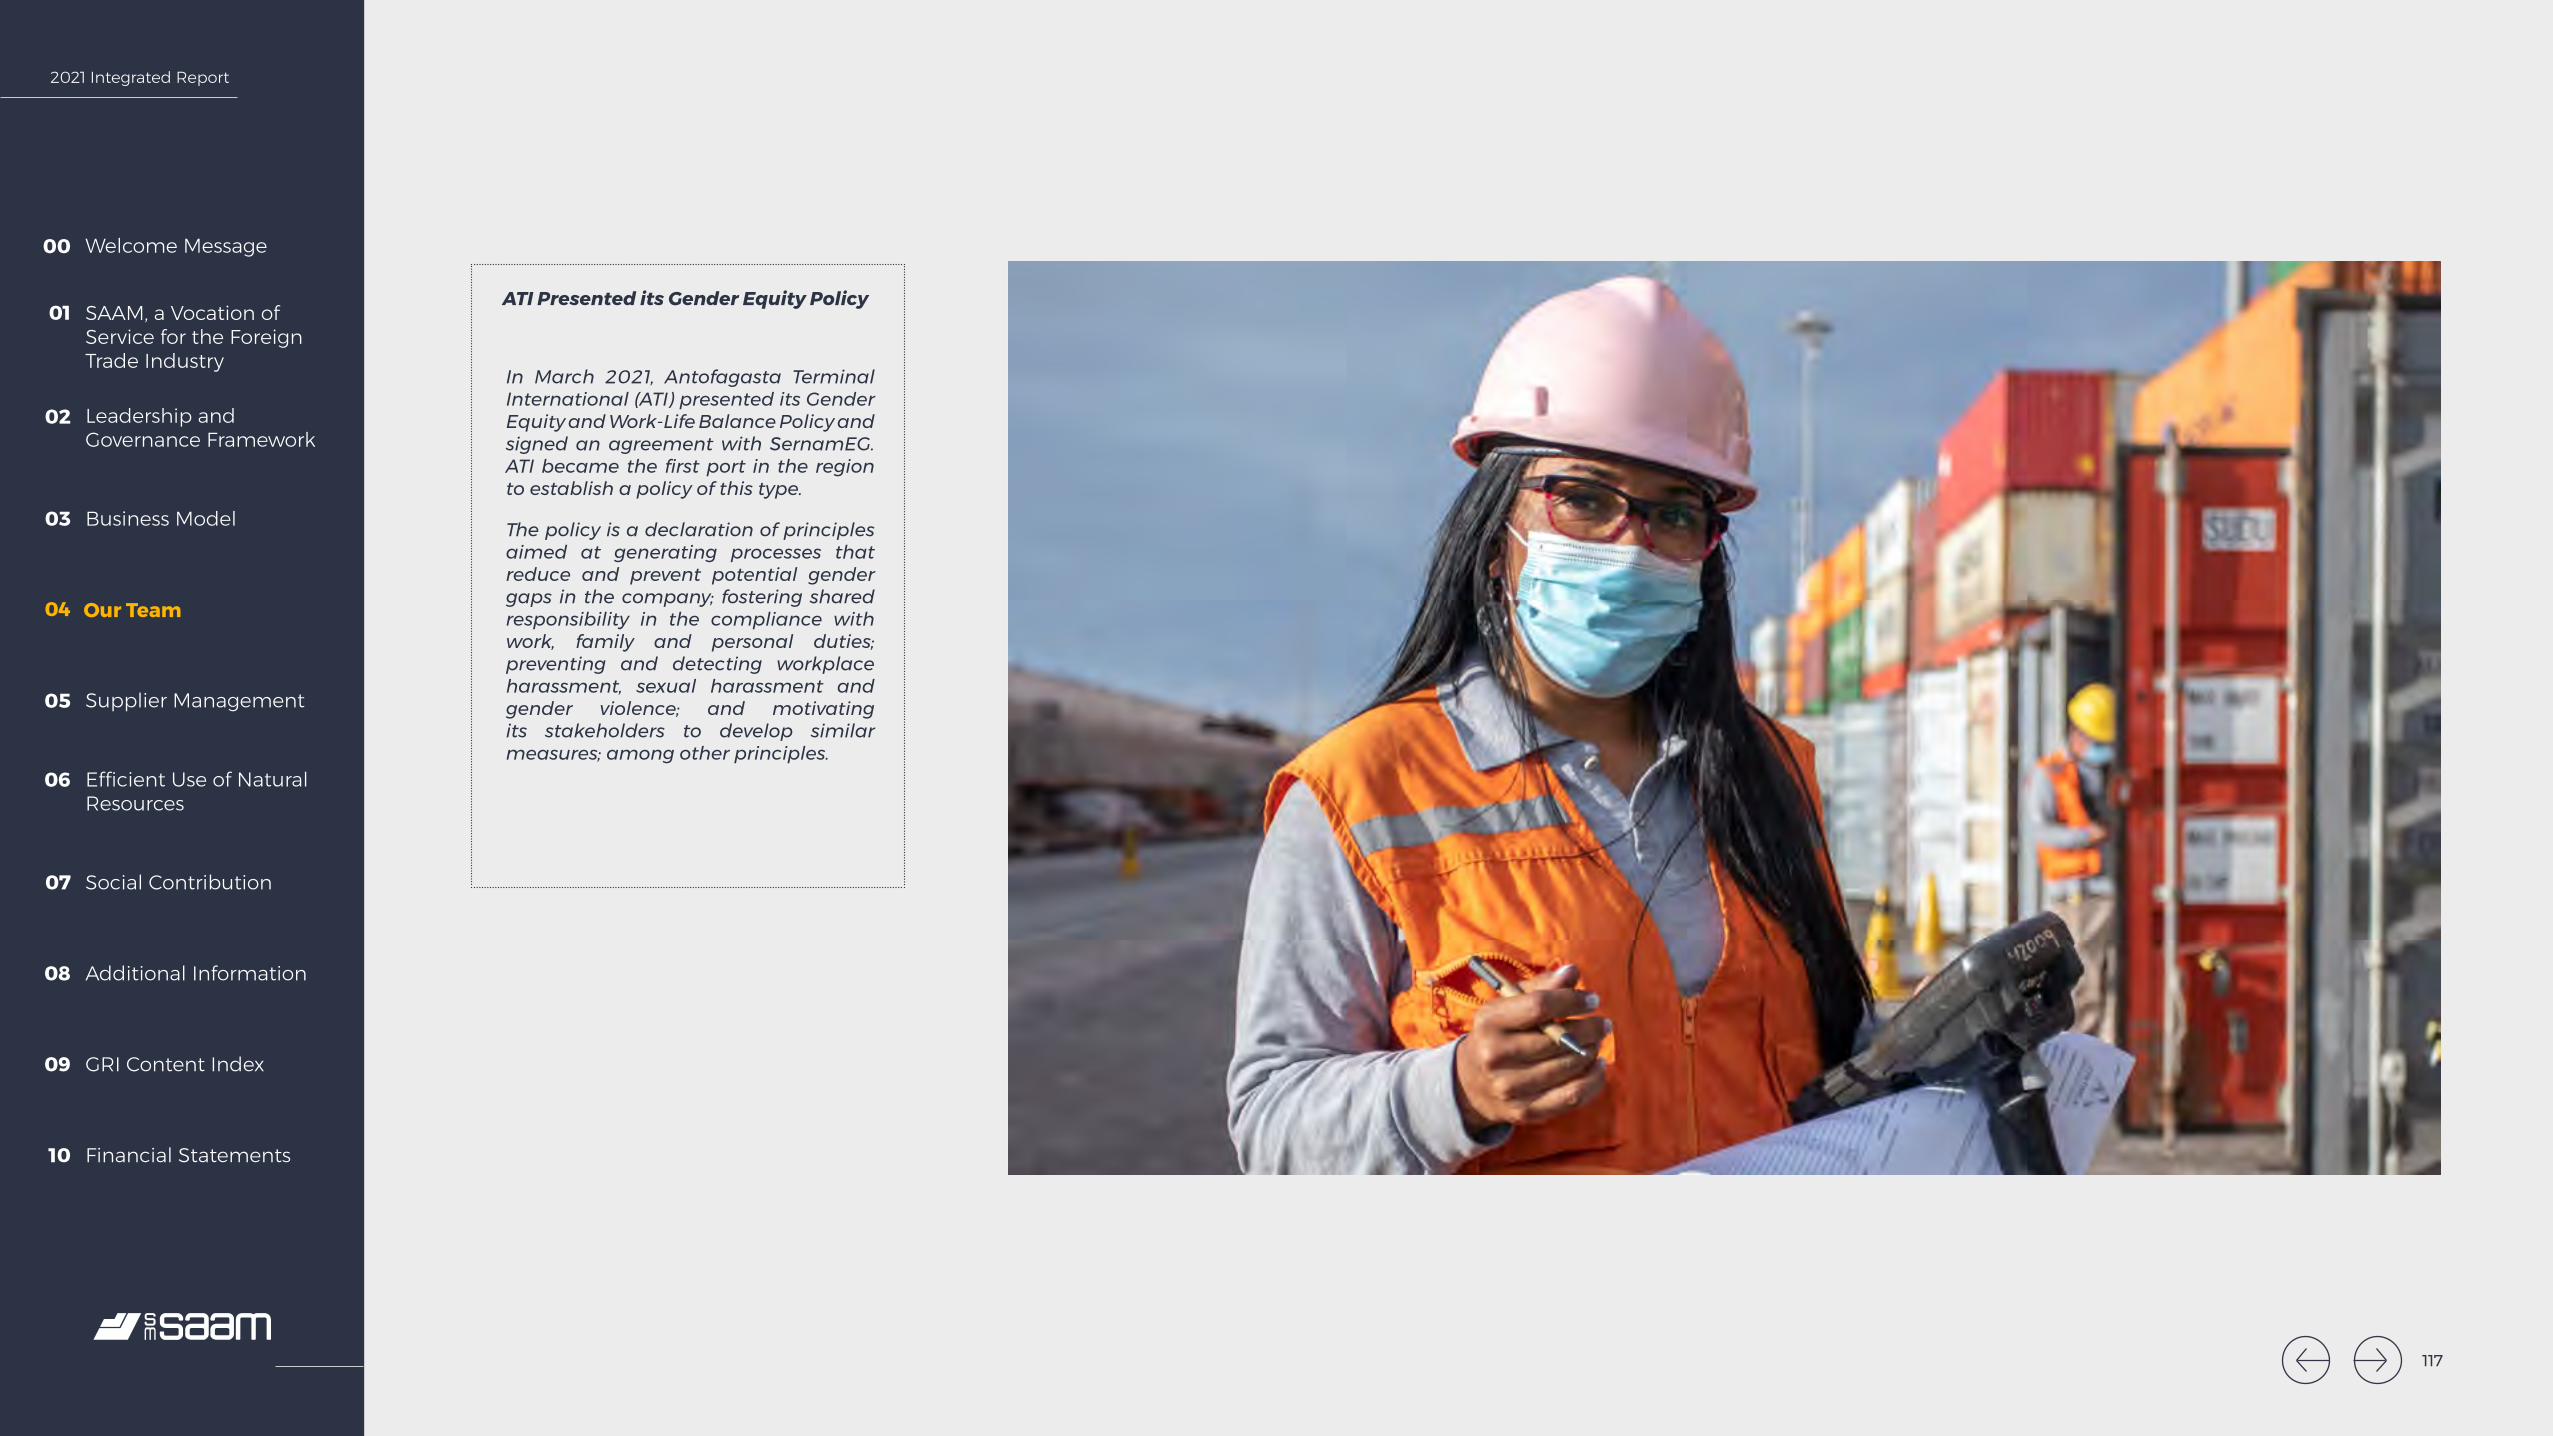
2021 Integrated Report
Welcome Message00
SAAM, a Vocation of Service for the Foreign Trade Industry
01
Leadership and Governance Framework
02
Business Model03
Our Team04
Supplier Management05
Efficient Use of Natural Resources
06
Social Contribution07
Additional Information08
GRI Content Index09
Financial Statements10
ATI Presented its Gender Equity Policy
In March 2021, Antofagasta Terminal International (ATI) presented its Gender Equity and Work-Life Balance Policy and signed an agreement with SernamEG. ATI became the first port in the region to establish a policy of this type.
The policy is a declaration of principles aimed at generating processes that reduce and prevent potential gender gaps in the company; fostering shared responsibility in the compliance with work, family and personal duties; preventing and detecting workplace harassment, sexual harassment and gender violence; and motivating its stakeholders to develop similar measures; among other principles.
117
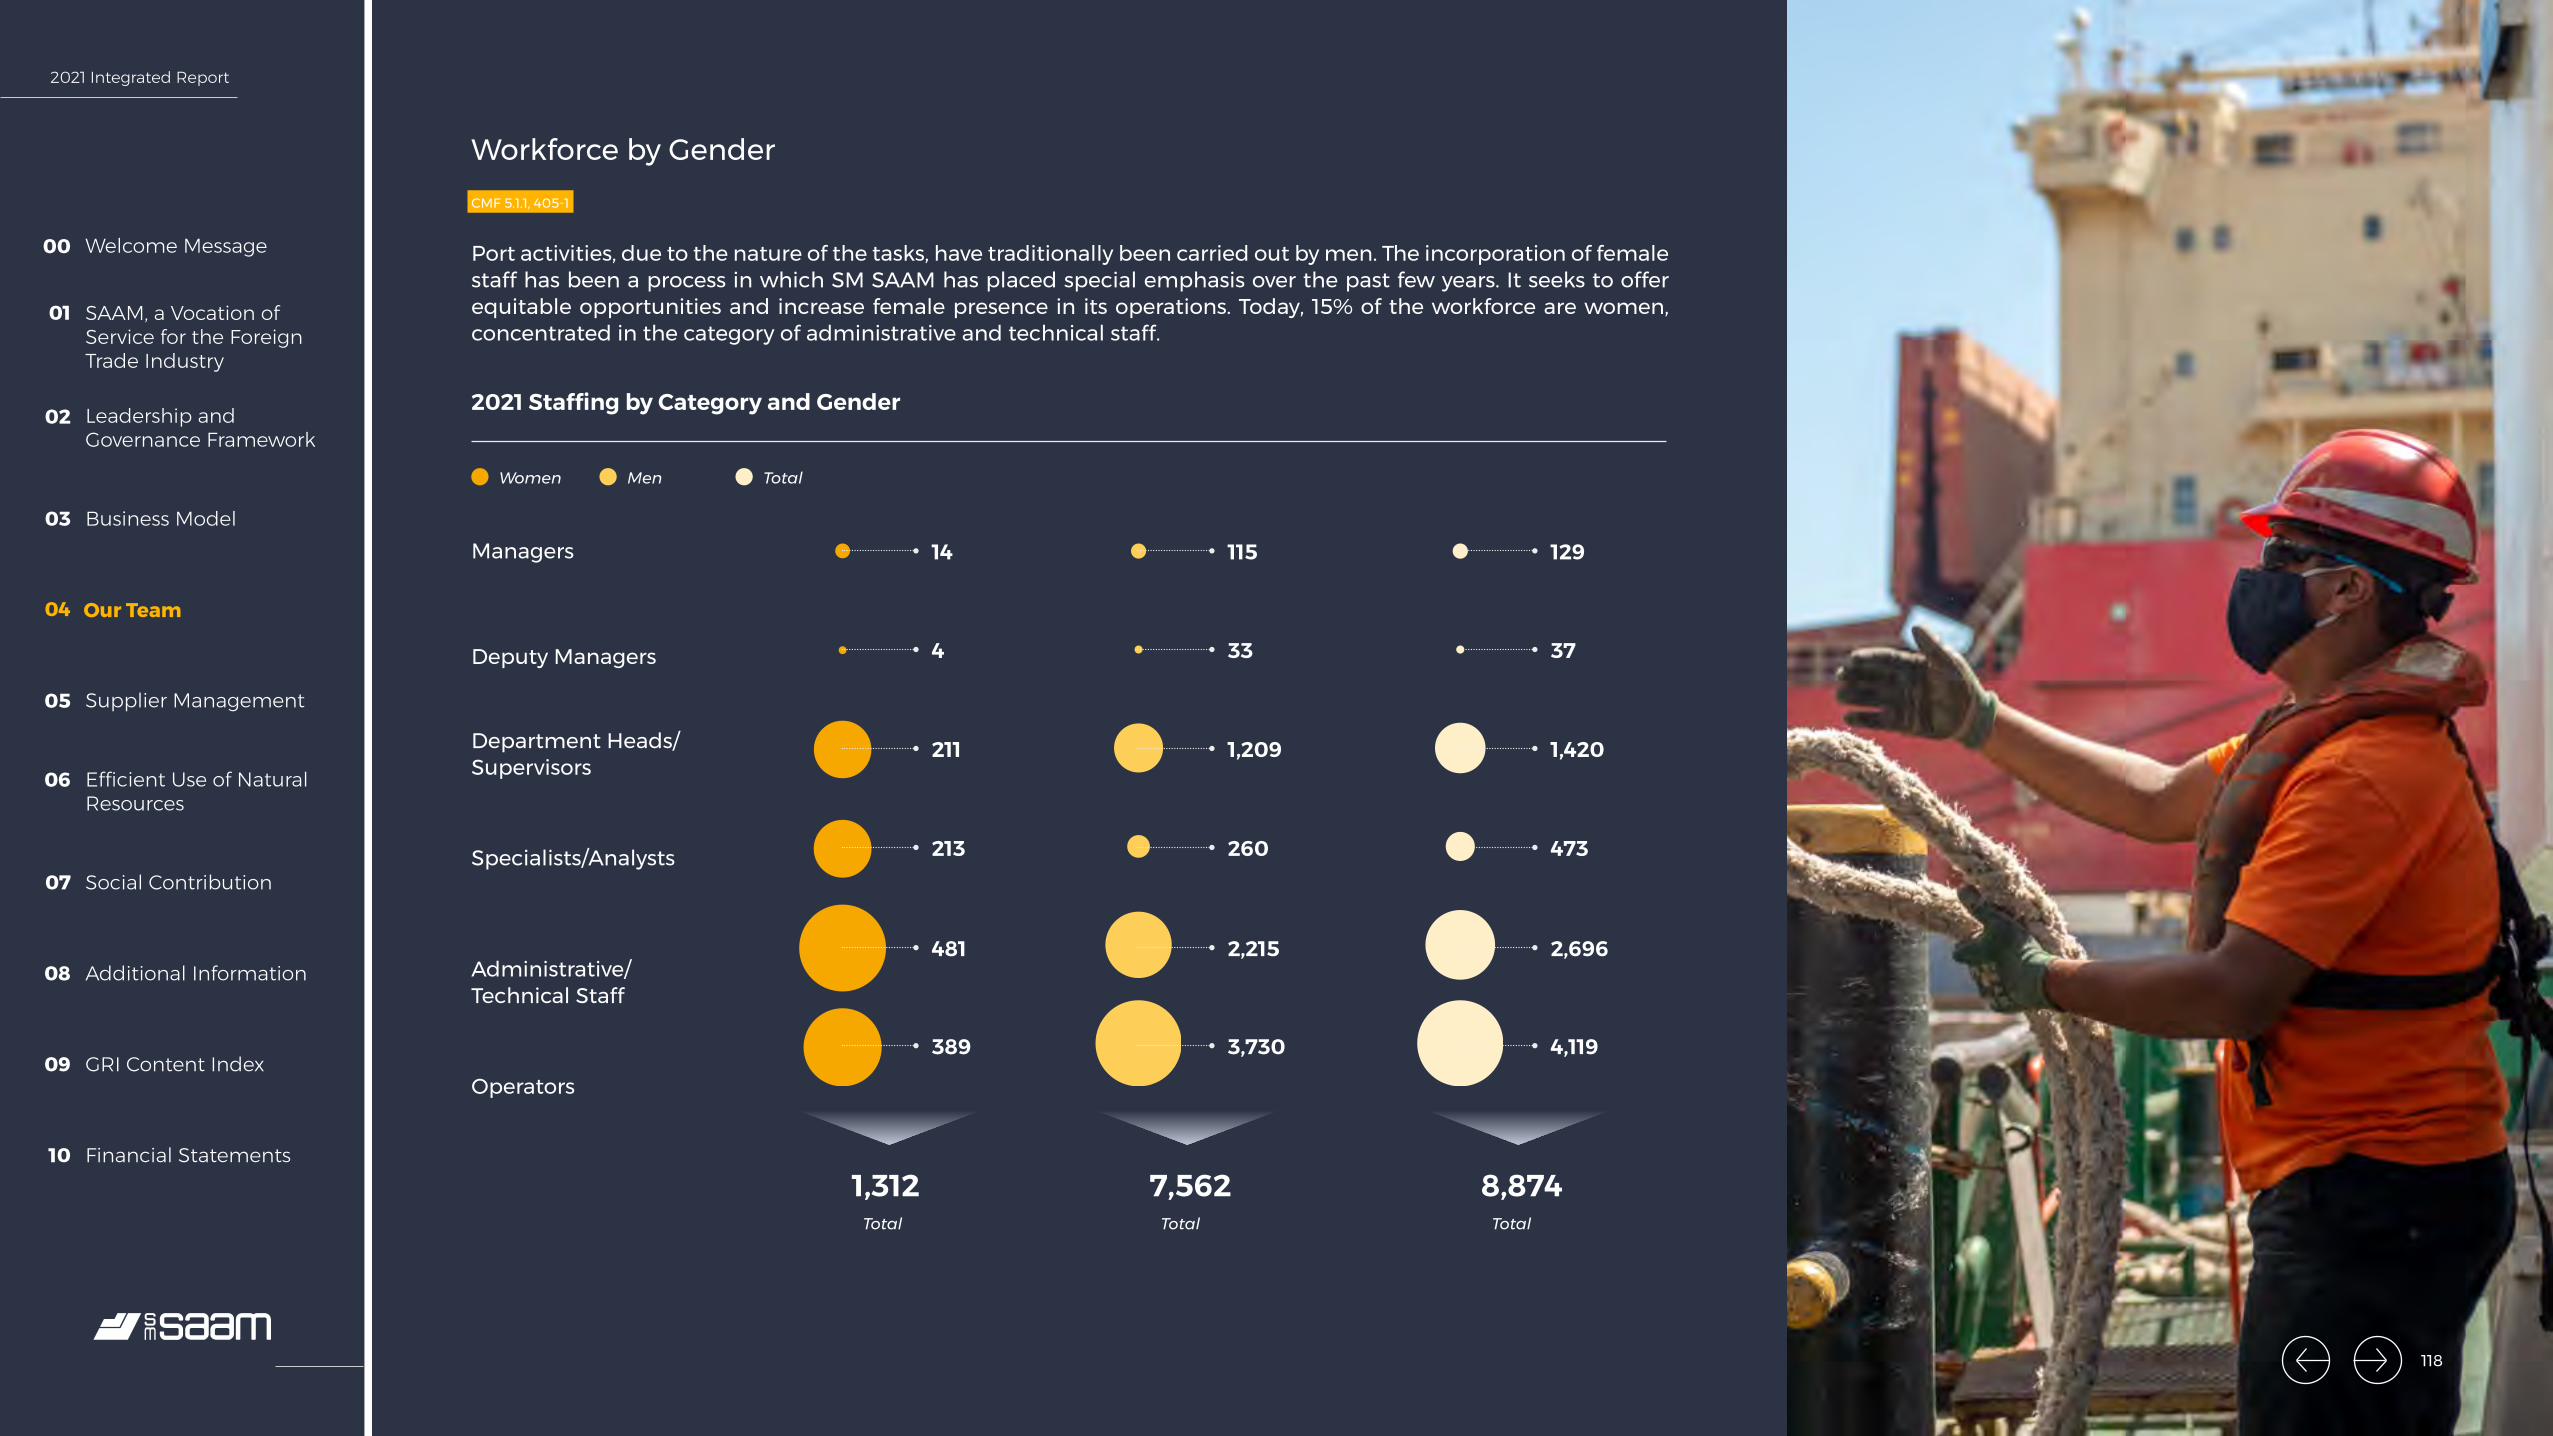
2021 Integrated Report
Welcome Message00
SAAM, a Vocation of Service for the Foreign Trade Industry
01
Leadership and Governance Framework
02
Business Model03
Our Team04
Supplier Management05
Efficient Use of Natural Resources
06
Social Contribution07
Additional Information08
GRI Content Index09
Financial Statements10
Workforce by GenderCMF 5.1.1, 405-1
Port activities, due to the nature of the tasks, have traditionally been carried out by men. The incorporation of female staff has been a process in which SM SAAM has placed special emphasis over the past few years. It seeks to offer equitable opportunities and increase female presence in its operations. Today, 15% of the workforce are women, concentrated in the category of administrative and technical staff.
2021 Staffing by Category and Gender
Women Men Total
Total Total Total
Operators
Administrative/Technical Staff
Specialists/Analysts
Department Heads/Supervisors
Deputy Managers
Managers 14 115 129
4 33 37
211 1,209 1,420
213
1,312 7,562 8,874
260 473
481 2,215 2,696
389 3,730 4,119
118
2021 Integrated Report
Welcome Message00
SAAM, a Vocation of Service for the Foreign Trade Industry
01
Leadership and Governance Framework
02
Business Model03
Our Team04
Supplier Management05
Efficient Use of Natural Resources
06
Social Contribution07
Additional Information08
GRI Content Index09
Financial Statements10
NationalityCMF 5.1.2, 405-1
Due to its widespread presence in the region, global focus and multiplicity of functions, SM SAAM employs staff from 26 countries and five continents. Chile accounts for the largest share of this, with 50%, followed by Colombia with 18%, and Ecuador with 10%.
For more details on the workforce by nationality and job category, see section “Additional Information.”
119
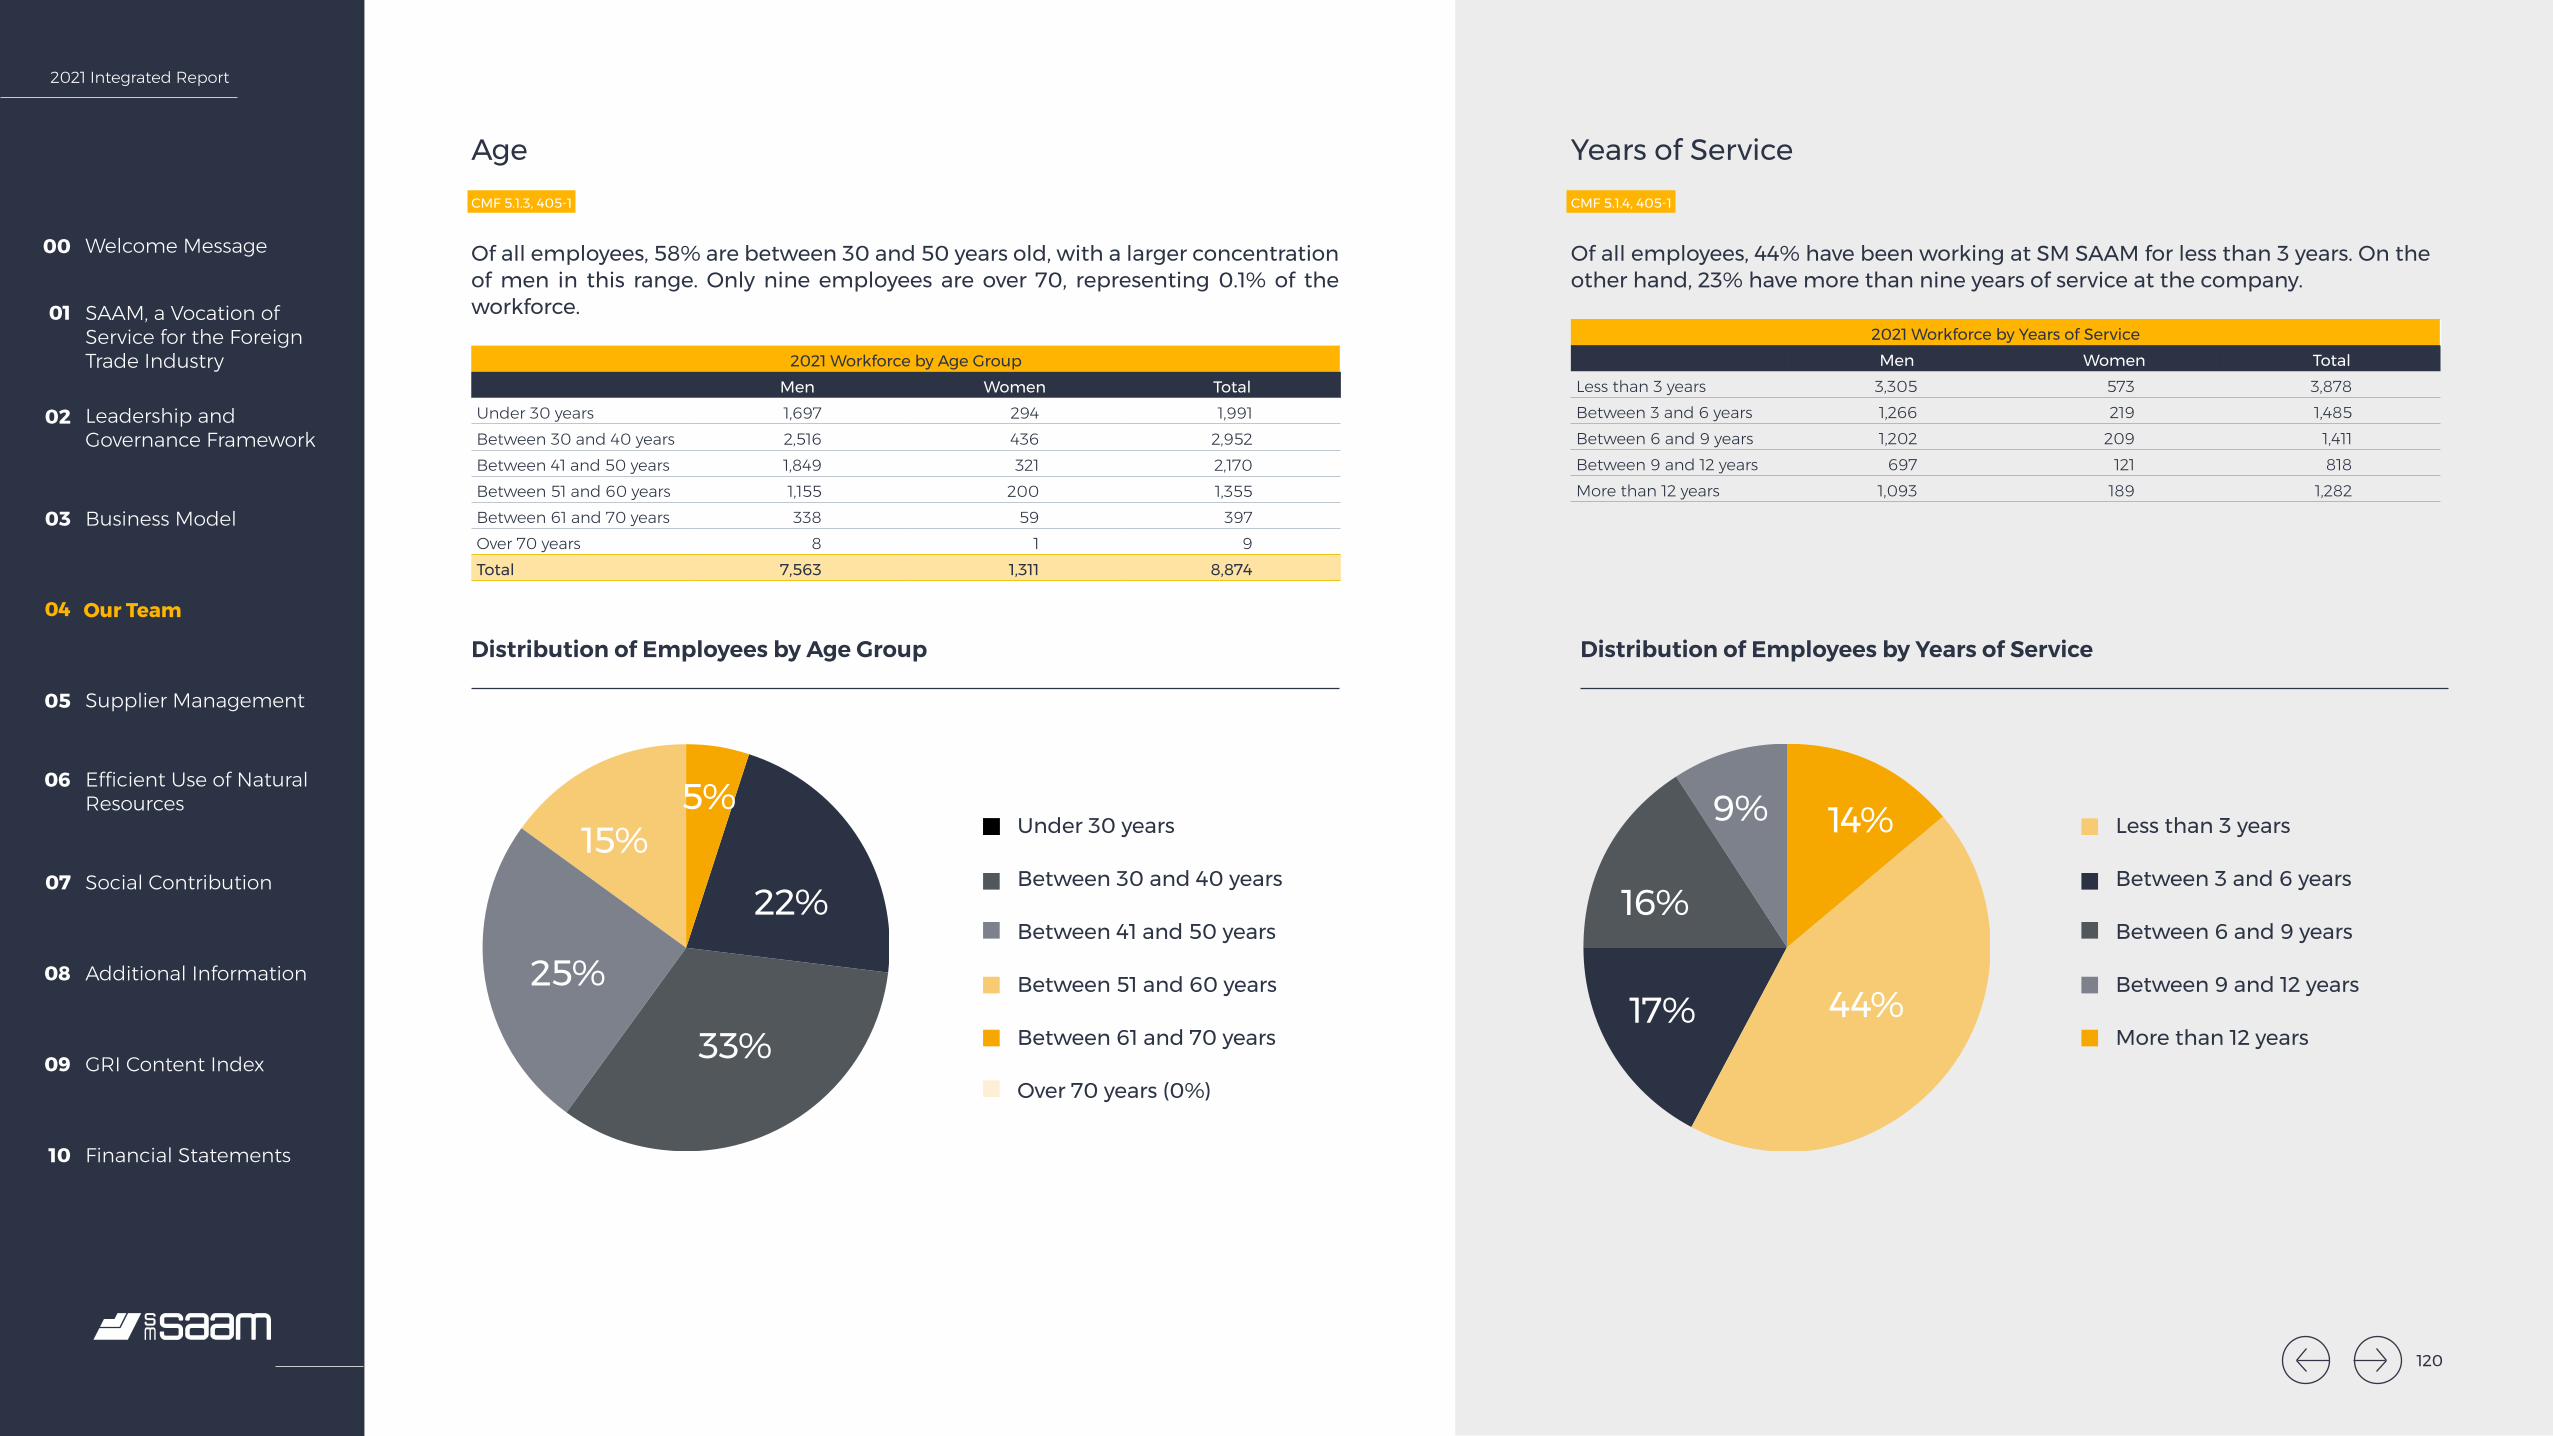
2021 Integrated Report
Welcome Message00
SAAM, a Vocation of Service for the Foreign Trade Industry
01
Leadership and Governance Framework
02
Business Model03
Our Team04
Supplier Management05
Efficient Use of Natural Resources
06
Social Contribution07
Additional Information08
GRI Content Index09
Financial Statements10
Age CMF 5.1.3, 405-1
Of all employees, 58% are between 30 and 50 years old, with a larger concentration of men in this range. Only nine employees are over 70, representing 0.1% of the workforce.
2021 Workforce by Age GroupMen Women Total
Under 30 years 1,697 294 1,991 Between 30 and 40 years 2,516 436 2,952 Between 41 and 50 years 1,849 321 2,170 Between 51 and 60 years 1,155 200 1,355 Between 61 and 70 years 338 59 397 Over 70 years 8 1 9 Total 7,563 1,311 8,874
Under 30 years
Between 30 and 40 years
Between 41 and 50 years
Between 51 and 60 years
Between 61 and 70 years
Over 70 years (0%)
Less than 3 years
Between 3 and 6 years
Between 6 and 9 years
Between 9 and 12 years
More than 12 years
22%
33%
25%
15%5%
Distribution of Employees by Age Group Distribution of Employees by Years of Service
Years of Service CMF 5.1.4, 405-1
Of all employees, 44% have been working at SM SAAM for less than 3 years. On the other hand, 23% have more than nine years of service at the company.
2021 Workforce by Years of ServiceMen Women Total
Less than 3 years 3,305 573 3,878Between 3 and 6 years 1,266 219 1,485Between 6 and 9 years 1,202 209 1,411Between 9 and 12 years 697 121 818More than 12 years 1,093 189 1,282
44%17%
16%
9% 14%
120
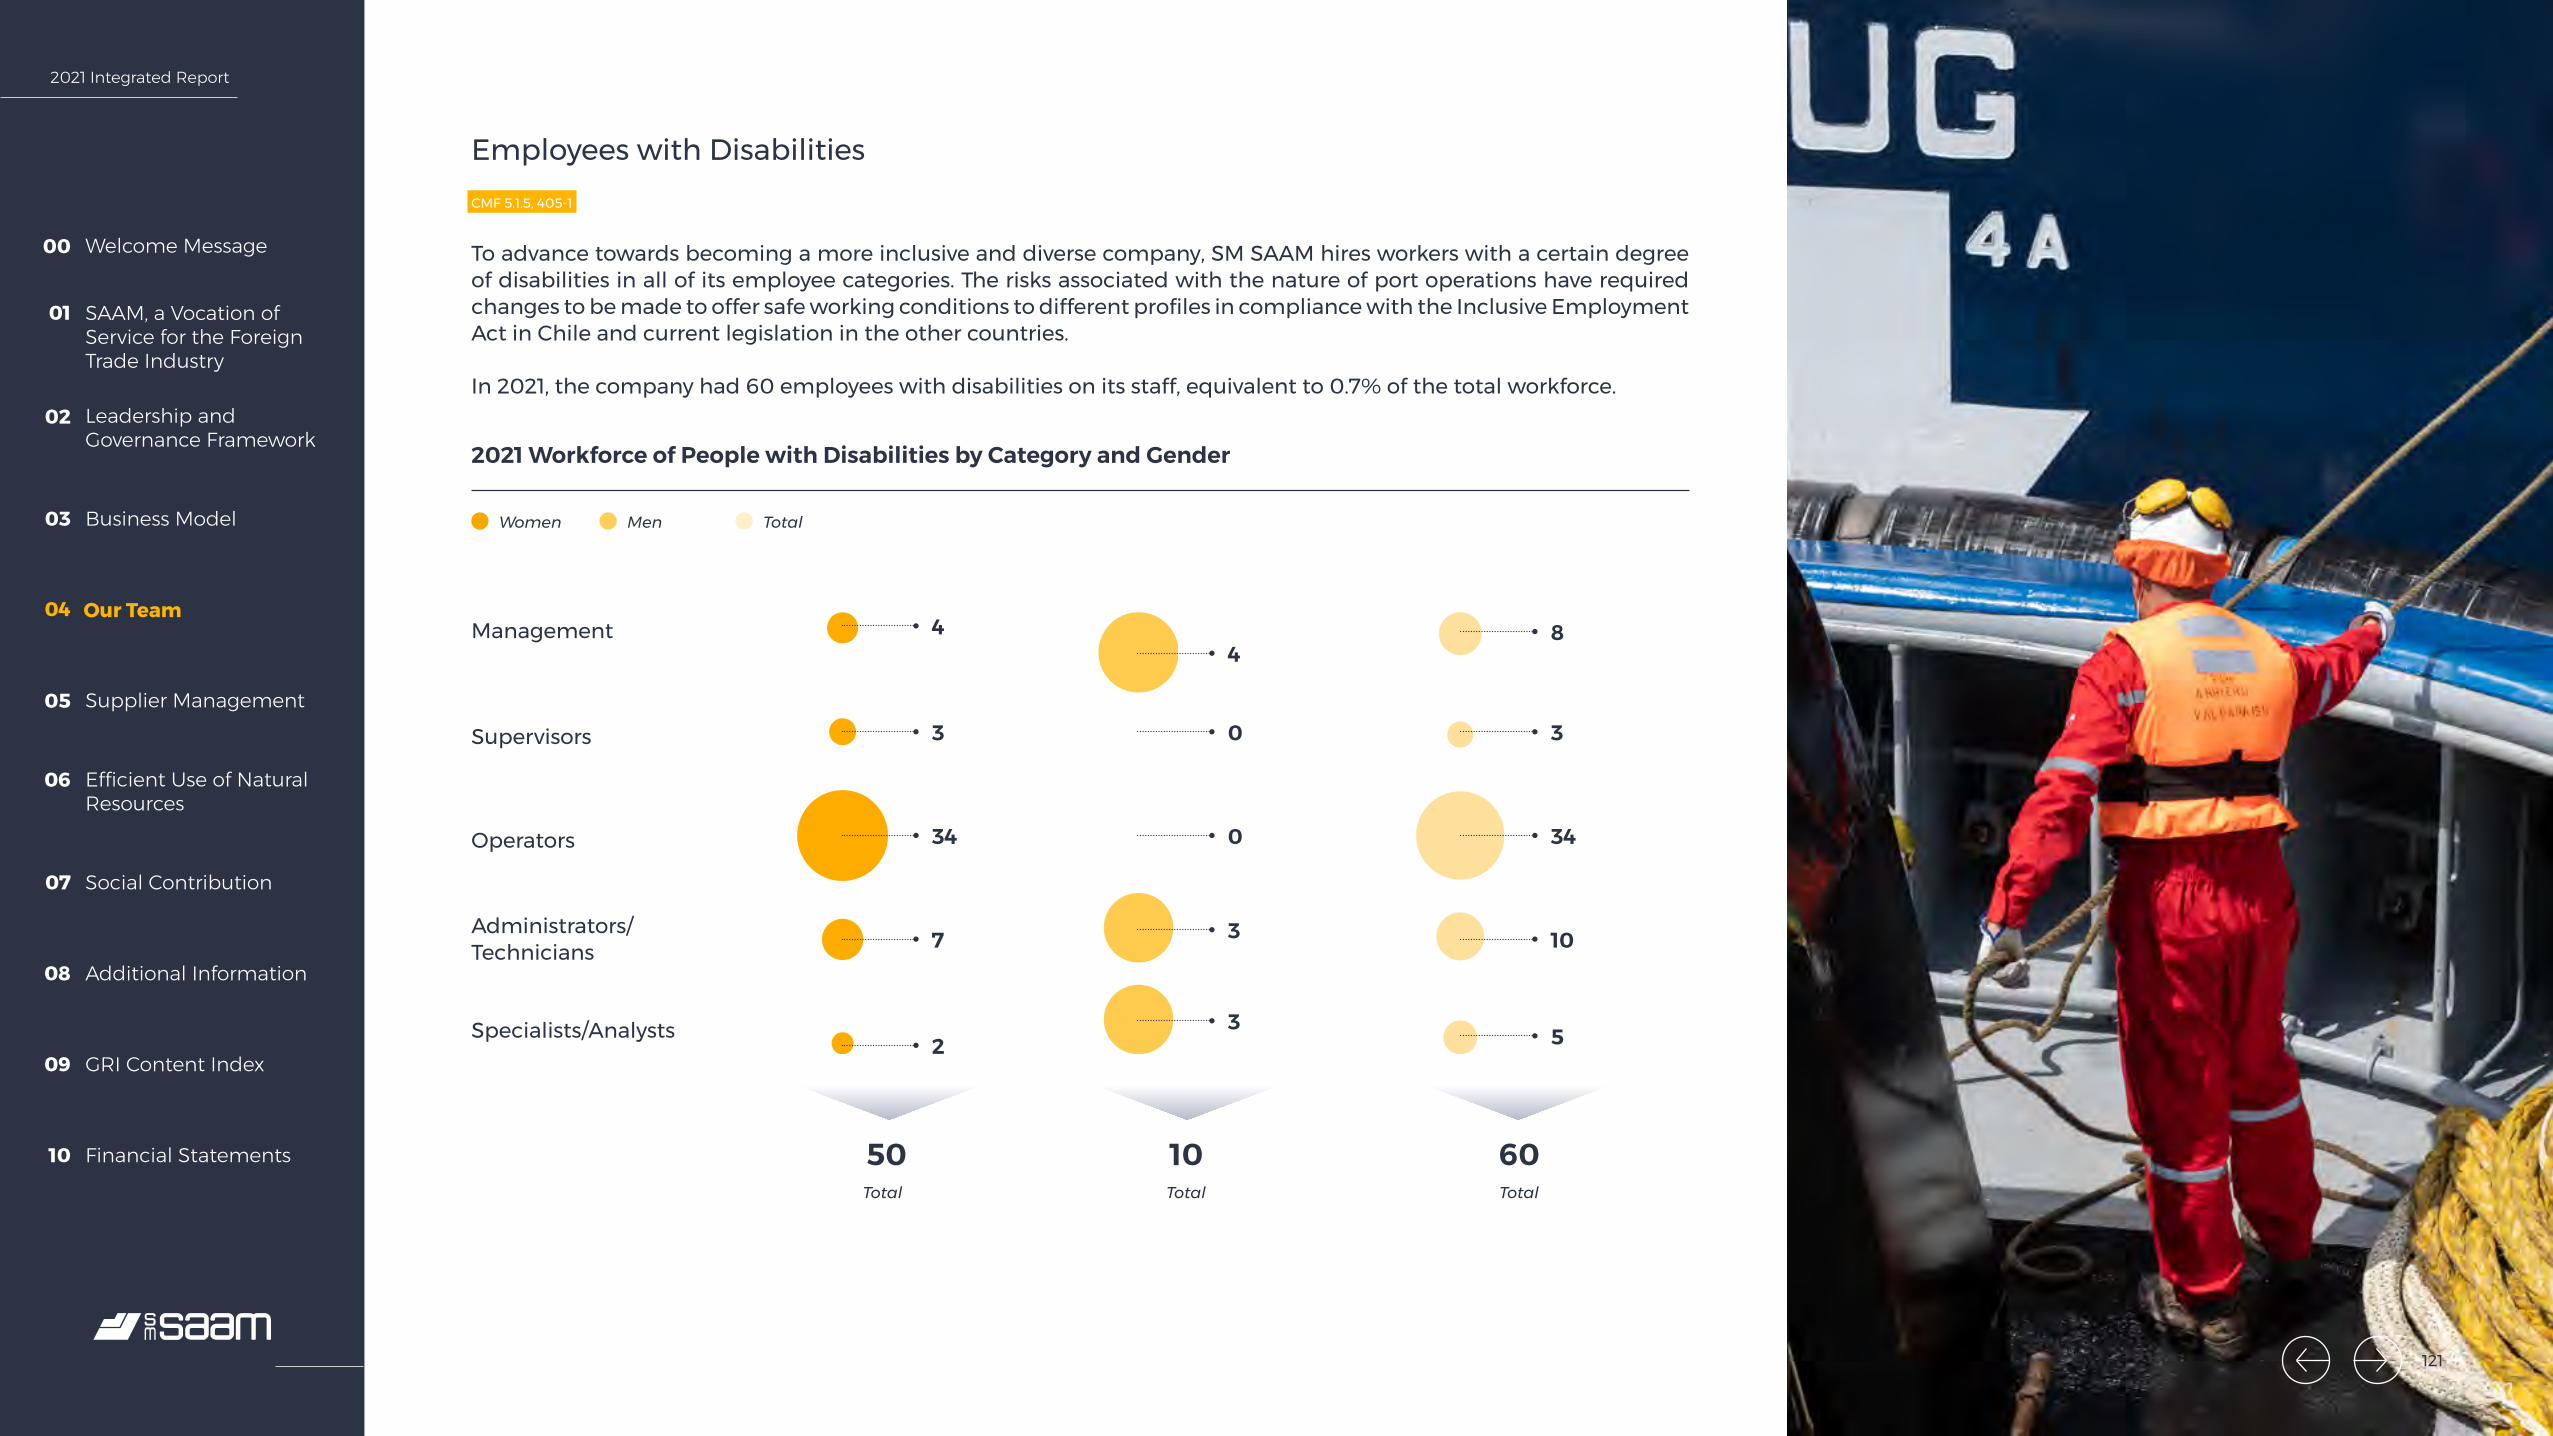
2021 Integrated Report
Welcome Message00
SAAM, a Vocation of Service for the Foreign Trade Industry
01
Leadership and Governance Framework
02
Business Model03
Our Team04
Supplier Management05
Efficient Use of Natural Resources
06
Social Contribution07
Additional Information08
GRI Content Index09
Financial Statements10
Employees with DisabilitiesCMF 5.1.5, 405-1
To advance towards becoming a more inclusive and diverse company, SM SAAM hires workers with a certain degree of disabilities in all of its employee categories. The risks associated with the nature of port operations have required changes to be made to offer safe working conditions to different profiles in compliance with the Inclusive Employment Act in Chile and current legislation in the other countries.
In 2021, the company had 60 employees with disabilities on its staff, equivalent to 0.7% of the total workforce.
2021 Workforce of People with Disabilities by Category and Gender
Women Men Total
Total Total Total
Specialists/Analysts
Administrators/Technicians
Operators
Supervisors
Management 44
8
3 0 3
34 0 34
7
50 10 60
3 10
23
5
121

2021 Integrated Report
Welcome Message00
SAAM, a Vocation of Service for the Foreign Trade Industry
01
Leadership and Governance Framework
02
Business Model03
Our Team04
Supplier Management05
Efficient Use of Natural Resources
06
Social Contribution07
Additional Information08
GRI Content Index09
Financial Statements10
Compensation and Salary Equity by GenderCMF 5.4.1, 5.4.2, 405-2
The following chart shows the ratio of average base salary for women in comparison to men in the same position and years of service.
2021 Salary Gap by Category and Gender
Managers
Deputy Managers
Department Heads/Supervisors
Specialists/Analysts
Administrative/Technical Staff
Total105.1%
105.22%
93.65%
101.49%
96.83%
87.33%
1) The calculation of the salary gap is obtained from the formula (base salary for men/base salary for women)*100.2) Information is for SAAM’s corporate workforce (excluding subsidiaries and associates).
122

2021 Integrated Report
Welcome Message00
SAAM, a Vocation of Service for the Foreign Trade Industry
01
Leadership and Governance Framework
02
Business Model03
Our Team04
Supplier Management05
Efficient Use of Natural Resources
06
Social Contribution07
Additional Information08
GRI Content Index09
Financial Statements10
Ratio of Annual Total Compensation102-35, 102-38, 102-39
SM SAAM remunerates the performance and relative contribution of its workers through monetary and non-monetary (benefits and recognition) compensation. Salary levels are associated with an organizational structure and are proposed as part of people management.
In 2021, the ratio of the total annual compensation increase for the best paid employee in comparison to the average total annual salary increase for all employees was 0.98%.
(1) This number considers SAAM S.A. workers.
123

2021 Integrated Report
Welcome Message00
SAAM, a Vocation of Service for the Foreign Trade Industry
01
Leadership and Governance Framework
02
Business Model03
Our Team04
Supplier Management05
Efficient Use of Natural Resources
06
Social Contribution07
Additional Information08
GRI Content Index09
Financial Statements10
Preventing Workplace and Sexual Harassment CMF 5.5
The prevention of workplace and sexual harassment is defined in a protocol for the entire company, to ensure that any employee, regardless of the country, can file a harassment complaint, either as a direct victim or to provide information for someone who is a victim.
This procedure extends to external contractors or even customers who feel that they are victims of harassment or have been witness to a situation of harassment towards someone in the company.
Complaints received through the complaint system in a timely manner are analyzed by a corporate Ethics Committee, made up of the Chief Executive Officer, Compliance Manager, Chief Counsel and Chief Human Resources Officer. This body determines the relevance of the resolutions and penalties and notifies the parties (informant and accused) of the outcome of the action.
The company holds training cycles related to workplace and sexual harassment.
“No Estás Sola” (You are not Alone) Campaign
In December, STI joined the “No estás sola” campaign, initiated by the Ministry of Women and Gender Equity to support victims of gender violence. In the port area, with a traditional predominance of men, today women are in charge of cranes and unions, tasks that used to be essentially masculine.
On this occasion, fliers were distributed to representatives of female port workers at STI and terminal managers to invite them to be agents of change with a campaign that publicizes the orientation hotlines and communication channels with regional attention centers.
STI has worked to open spaces for women through organization-wide training, from documentation tasks to operation of heavy machinery. “It has been very gratifying. My co-workers are very inclusive and we make a good team. Here, the female port worker is empowered, strong and we command respect,” said Katherine Tapia, a reach stacker operator who has been working at the port for eight years.
124

2021 Integrated Report
Welcome Message00
SAAM, a Vocation of Service for the Foreign Trade Industry
01
Leadership and Governance Framework
02
Business Model03
Our Team04
Supplier Management05
Efficient Use of Natural Resources
06
Social Contribution07
Additional Information08
GRI Content Index09
Financial Statements10
Occupational Wellbeing CMF 5.7
In November 2021, SM SAAM celebrated its 60th anniversary. In the context of this anniversary, the company looked to carry out initiatives to bring it closer to its employees. Competitions were held, there was a commemoration of the date the company was founded—November 15—across the offices, and there was an in-person end-of-year celebration, the first since the pandemic began.
In 2021, the +Connected initiative was launched, which involved organizing monthly virtual breakfasts with the CEO of SAAM and five representatives of different departments to talk without an agenda on issues of interest or subjects of concern, to foster the knowledge of teams and build closeness, delivering a breakfast box to the house of participants at each session. By the end of the year, this activity became in-person where possible depending on sanitary restrictions. The issues addressed were transmitted to the corresponding area to create opportunities for improvement.
SM SAAM gives its employees benefits, primarily determined in the collective or individual employment agreements, based on the particular market in each country. The importance of the family is reflected in paternity leaves of absence. In 2021, 103 employees made use of their paternity leave, using an average of 721 days.
Employees using Paternity Leave by Position and Gender in 2021
In the area of health, different divisions periodically hold preventive medical screenings. For example, in 2021, opthalmologic campaigns were held at SVTI and breast cancer campaigns at STI.
10373
30
Total
Men
Women
125

2021 Integrated Report
Welcome Message00
SAAM, a Vocation of Service for the Foreign Trade Industry
01
Leadership and Governance Framework
02
Business Model03
Our Team04
Supplier Management05
Efficient Use of Natural Resources
06
Social Contribution07
Additional Information08
GRI Content Index09
Financial Statements10
05.
126
Supplier Management
126

2021 Integrated Report
Welcome Message00
SAAM, a Vocation of Service for the Foreign Trade Industry
01
Leadership and Governance Framework
02
Business Model03
Our Team04
Supplier Management05
Efficient Use of Natural Resources
06
Social Contribution07
Additional Information08
GRI Content Index09
Financial Statements10
Lines of Action
2021 MilestonesRelated Policies
Supply management
Trust-based collaborative relationships
1The challenging and changing market conditions where SM SAAM operates are constantly propelling the comprehensive management of its supply and logistics chain, to keep its costs competitive, while respecting the sustainability of its activities.
Through existing policies, the company aims to create strong bonds of trust with suppliers and contractors, to move forward together towards compliance with shared objectives.
2
• Corporate Procurement Guide
• Supplier Policy for SM SAAM, its subsidiaries and associates
• Goods and Services Purchasing Procedure
• Award Committee Policy
• Contract and master data management
• Corporate Insurance and Claims Policy
• Supplier Onboarding and Registration Policy and Procedure
• Subcontracting Policy
• Corporate contract between SAAM Towage and its global partner for asset maintenance and management.
• Consolidation of savings and benefits.
• Increasing the scope of central and strategic categories.
• Innovation and digitalization. Go Live for the BI project for purchase processing data and total cost of claims.
• Infor EAM platform active across all port terminals.
• Acquisition of NS5 Purchasing Platform for SAAM Towage Division.
• Functional model for governance of supply processes at port terminals.
Supplier ManagementSM SAAM’s ongoing strategic objective is to act in a socially responsible way based on its corporate values.
In keeping with the company’s Supplier and Contractor Policy, the commitment toward its external partners is professional, transparent and based on respect. SM SAAM and its companies set out to work with suppliers and contractors that contribute to sustainable development and that are economically, environmentally and socially responsible, fostering and strengthening relationships with suppliers and contractors who are committed to the proposed principles and who apply similar standards in their activities and the management of their own suppliers, contractors and subcontractors.
SM SAAM’s suppliers are strategic partners in each of the businesses where the company operates. This has been key to maintaining operational continuity in highly uncertain times on a global level due to the pandemic. An ongoing collaborative effort with its regional and local suppliers has made it possible to keep the supply chain going, with a focus on operational excellence and an emerging and thriving sustainability component in each of the stages of the goods and services supply process.
127

2021 Integrated Report
Welcome Message00
SAAM, a Vocation of Service for the Foreign Trade Industry
01
Leadership and Governance Framework
02
Business Model03
Our Team04
Supplier Management05
Efficient Use of Natural Resources
06
Social Contribution07
Additional Information08
GRI Content Index09
Financial Statements10
Our Supply Chain102-9 102-10
SM SAAM has a Corporate Procurement Guide that establishes the structural bases for policies and procedures aimed at a coherent aligned management in Chile and in all its operations abroad. This document also sets the terms and conditions for the Supplier Policy as one of the management pillars for the supply chain.
In this, the company establishes an ongoing assessment of its suppliers throughout the supply process and throughout the relationship, focusing on building a connection with them. The assessment considers critical indicators such as financial capacity, level of service committed, accident rate, certifications of quality and on the environment, risks and compliance. The entire process is aligned with the Crime Prevention Model.
Given the group’s regional structure, during the provision of goods or services, the companies serve as contract managers and are responsible for ensuring the quality of the supplier service, in adherence with corporate policies and values.
+ 15,000active suppliers
On a global level, there are more than 15,000 active suppliers who provide services to SAAM’s different business units.
128

2021 Integrated Report
Welcome Message00
SAAM, a Vocation of Service for the Foreign Trade Industry
01
Leadership and Governance Framework
02
Business Model03
Our Team04
Supplier Management05
Efficient Use of Natural Resources
06
Social Contribution07
Additional Information08
GRI Content Index09
Financial Statements10
SM SAAM’s goal is for its suppliers to share its principles and values through unrestricted respect for human rights, environmental standards, rejection of forced or compulsory labor and child labor, assurance of good standards of working conditions, compensation and occupational health and safety. Likewise, it supports the existence of business ethics, compliance and sustainability models.
In alignment with this, in 2021, the terms and conditions were defined for the first Supplier Code of Conduct for SAAM and its companies, whether for short-, medium- or long-term suppliers, regardless of size or transaction amount. By formalizing a transparent and open engagement standard with its supplier market, it builds a solid relationship and consolidates a sustainable supply chain.
SAAM Towage Corporate Contract with Caterpillar Marine
A 2021 milestone is the signing of a global services agreement in October to increase the fleet efficiency of company tugs through digital solutions that will foster planned and preventive maintenance.
The importance of this contract is that it establishes the terms and conditions for a partnership to continue to provide safe, efficient and more environmentally friendly service. It also strengthens the company’s digital transformation strategy, key to optimizing operational support and maintenance processes.
The agreement calls for ongoing review of more than 200 CAT engines, backed by an expert team from Caterpillar. In addition, it will benefit from technical support through fleet management services and other new technologies, to generate continuous improvements.
This contract fortifies the strategic, long-term partnership between SM SAAM and Caterpillar Marine, particularly in the towage business.
129

2021 Integrated Report
Welcome Message00
SAAM, a Vocation of Service for the Foreign Trade Industry
01
Leadership and Governance Framework
02
Business Model03
Our Team04
Supplier Management05
Efficient Use of Natural Resources
06
Social Contribution07
Additional Information08
GRI Content Index09
Financial Statements10
Supplier PolicyWe are committed to building relationships with our suppliers based on trust, communication, collaboration and mutual benefit, expecting high levels of quality and added value from them and, at the same time, collaborating with their growth and development. This includes:
Developing a strategic relationship with those suppliers that share our principles and values of integrity and sustainability for our operations.
Encouraging high standards of quality, safety, health and wellbeing for contractors and subcontractors, just like we do with our own employees.
Guaranteeing transparency, equal opportunities, open communication, competitiveness and decisions based on technical, professional and ethical criteria.
Evaluating the performance of our suppliers on an ongoing basis.
Considering local suppliers and contractors in order to contribute to their economic development and quality of life.
Complying with payment terms agreed with each supplier, with special attention to entrepreneurs and SME suppliers.
Rejecting child labor at any point in our supply chain. The only exception we will consider is professional internships accredited by educational institutions.
130
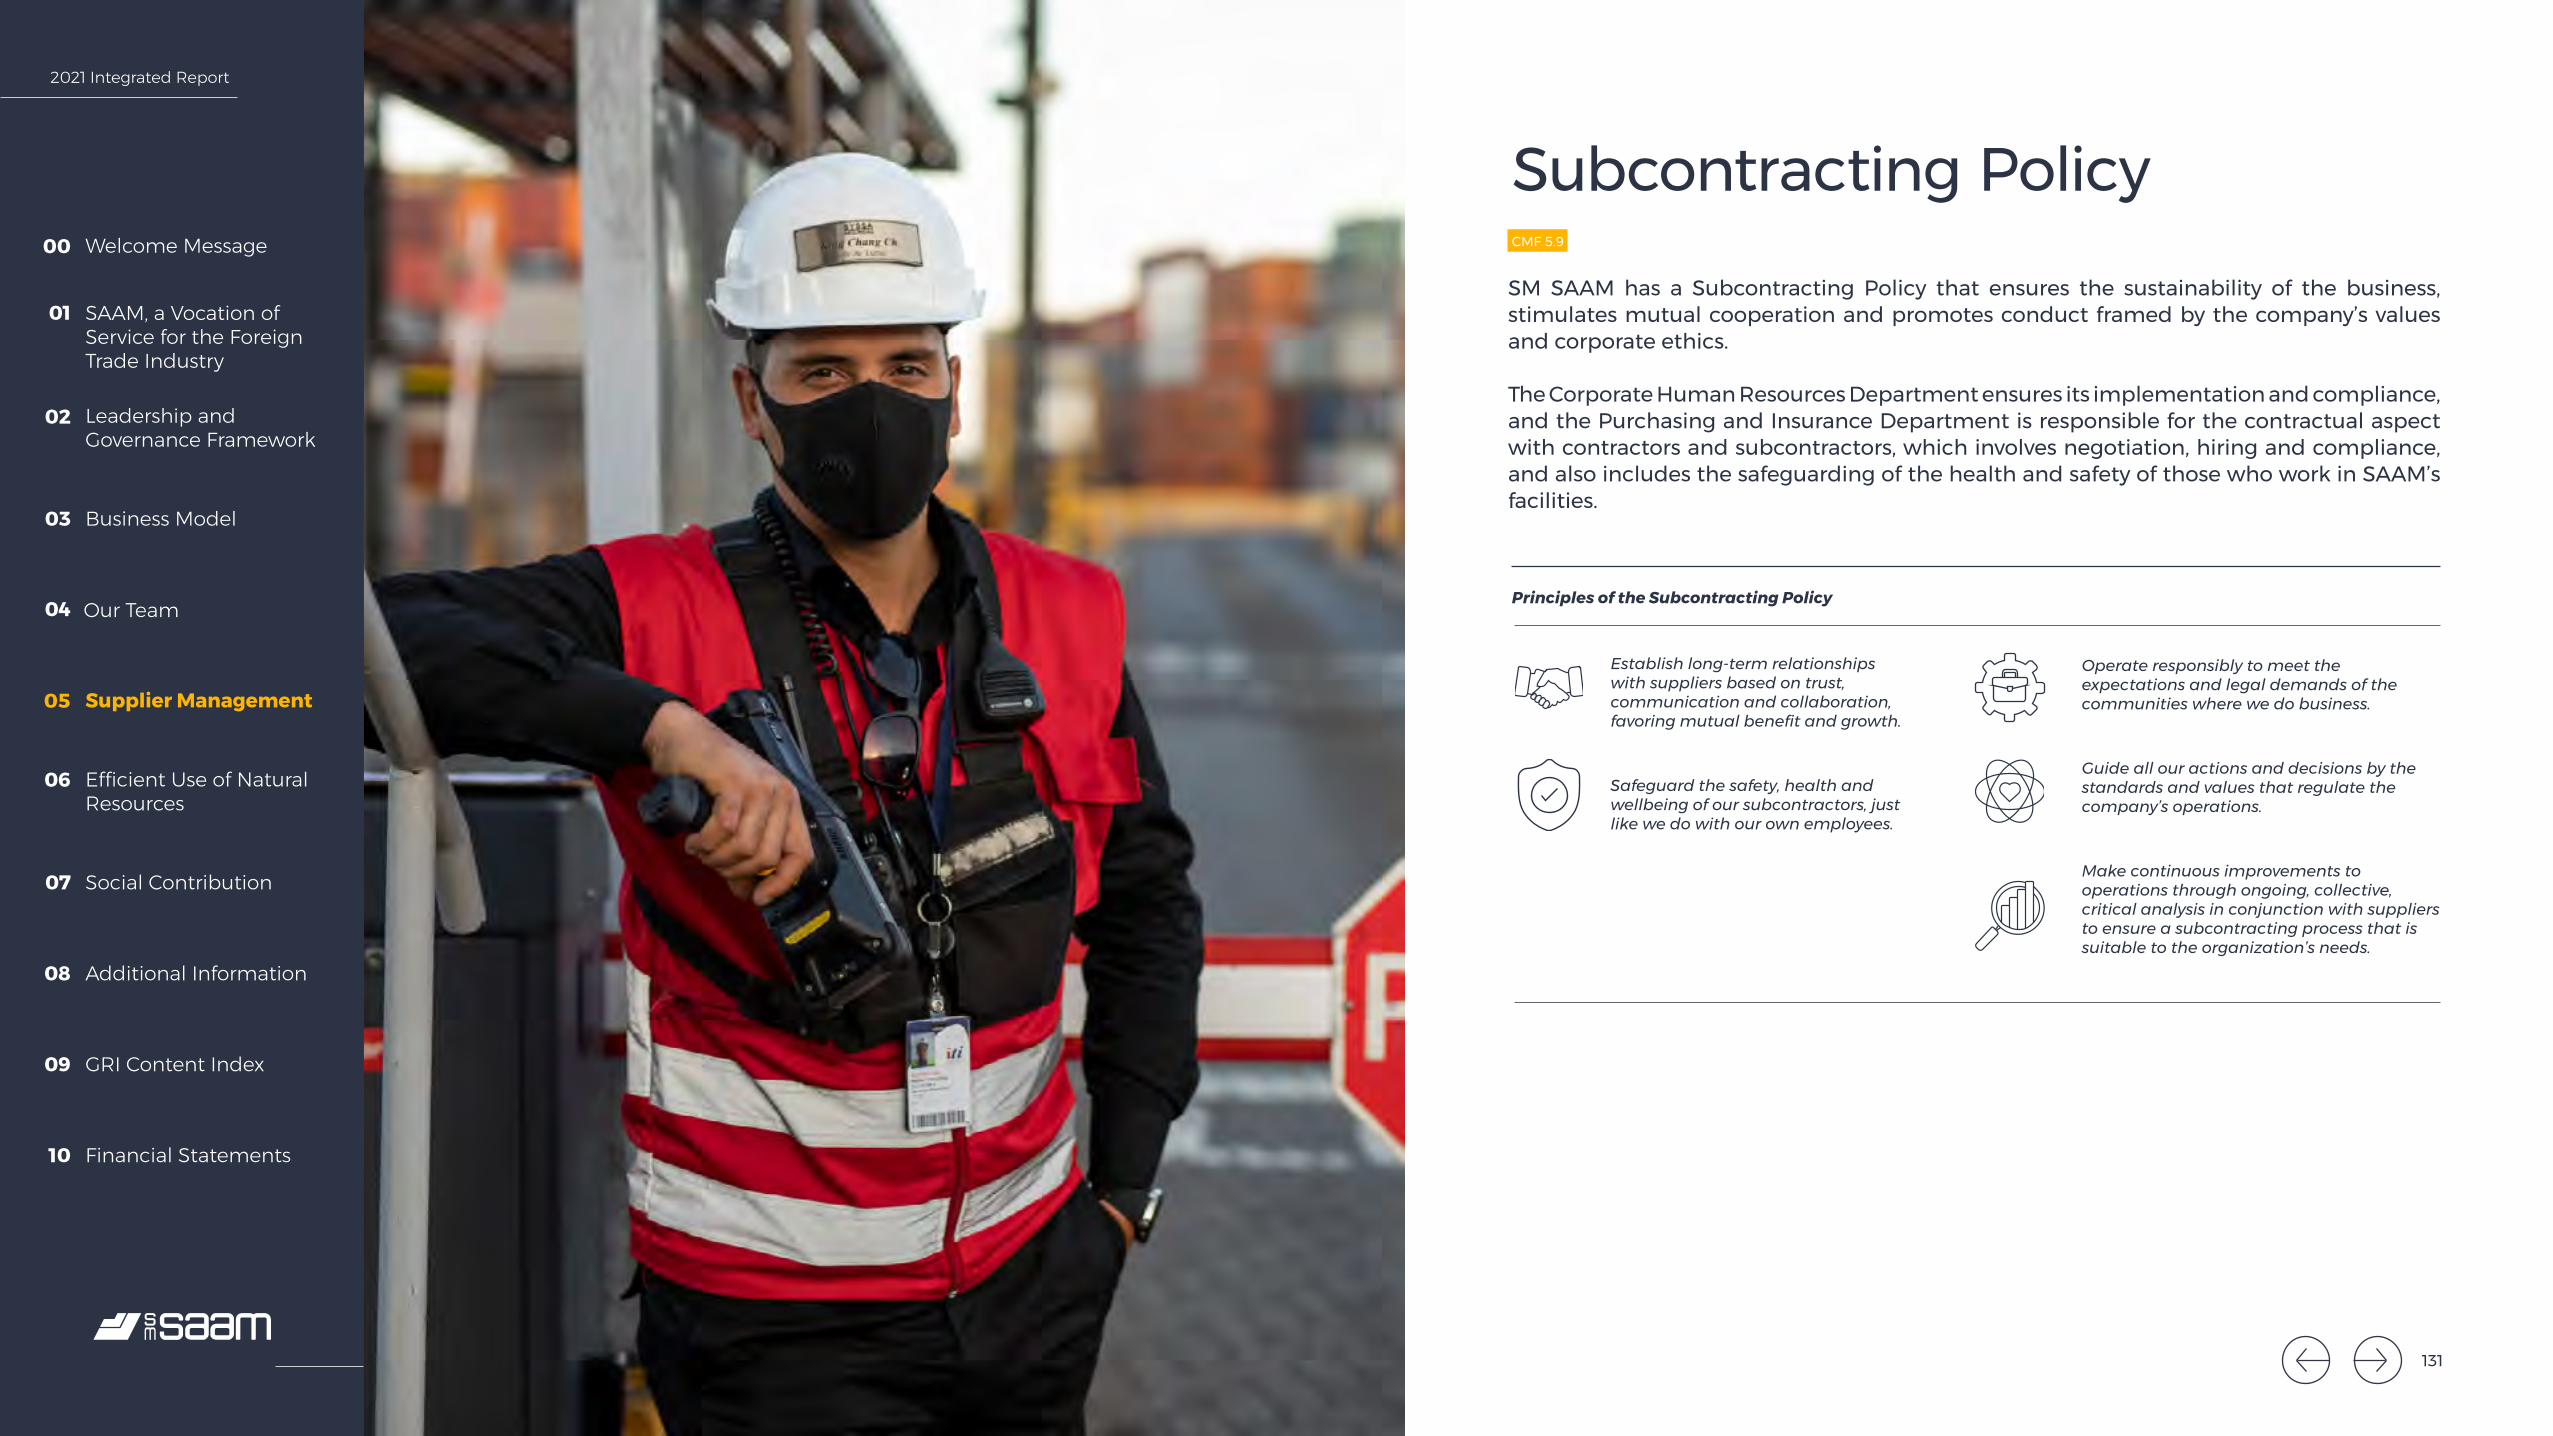
2021 Integrated Report
Welcome Message00
SAAM, a Vocation of Service for the Foreign Trade Industry
01
Leadership and Governance Framework
02
Business Model03
Our Team04
Supplier Management05
Efficient Use of Natural Resources
06
Social Contribution07
Additional Information08
GRI Content Index09
Financial Statements10
Principles of the Subcontracting Policy
Establish long-term relationships with suppliers based on trust, communication and collaboration, favoring mutual benefit and growth.
Safeguard the safety, health and wellbeing of our subcontractors, just like we do with our own employees.
Operate responsibly to meet the expectations and legal demands of the communities where we do business.
Guide all our actions and decisions by the standards and values that regulate the company’s operations.
Make continuous improvements to operations through ongoing, collective, critical analysis in conjunction with suppliers to ensure a subcontracting process that is suitable to the organization’s needs.
Subcontracting PolicyCMF 5.9
SM SAAM has a Subcontracting Policy that ensures the sustainability of the business, stimulates mutual cooperation and promotes conduct framed by the company’s values and corporate ethics.
The Corporate Human Resources Department ensures its implementation and compliance, and the Purchasing and Insurance Department is responsible for the contractual aspect with contractors and subcontractors, which involves negotiation, hiring and compliance, and also includes the safeguarding of the health and safety of those who work in SAAM’s facilities.
131

2021 Integrated Report
Welcome Message00
SAAM, a Vocation of Service for the Foreign Trade Industry
01
Leadership and Governance Framework
02
Business Model03
Our Team04
Supplier Management05
Efficient Use of Natural Resources
06
Social Contribution07
Additional Information08
GRI Content Index09
Financial Statements10
06.
132
Efficient Use of Natural Resources
132
2021 Integrated Report
Welcome Message00
SAAM, a Vocation of Service for the Foreign Trade Industry
01
Leadership and Governance Framework
02
Business Model03
Our Team04
Supplier Management05
Efficient Use of Natural Resources
06
Social Contribution07
Additional Information08
GRI Content Index09
Financial Statements10
Efficient Use of Natural Resources102-11
Environmental protection is a concern for SM SAAM that transcends all its business units. The company understands that its operations impact the environment and, therefore, it works to generate initiatives to mitigate these while always keeping its eye on operational excellence.
As part of the sustainability, climate action and environment theme, in an effort to formalize the initiatives implemented and create a balance between businesses, community and environment, in late 2021 the company began to develop its environmental strategy, which will define a roadmap with a focus on: emissions and climate change, circular economy and waste management and water efficiency.
133
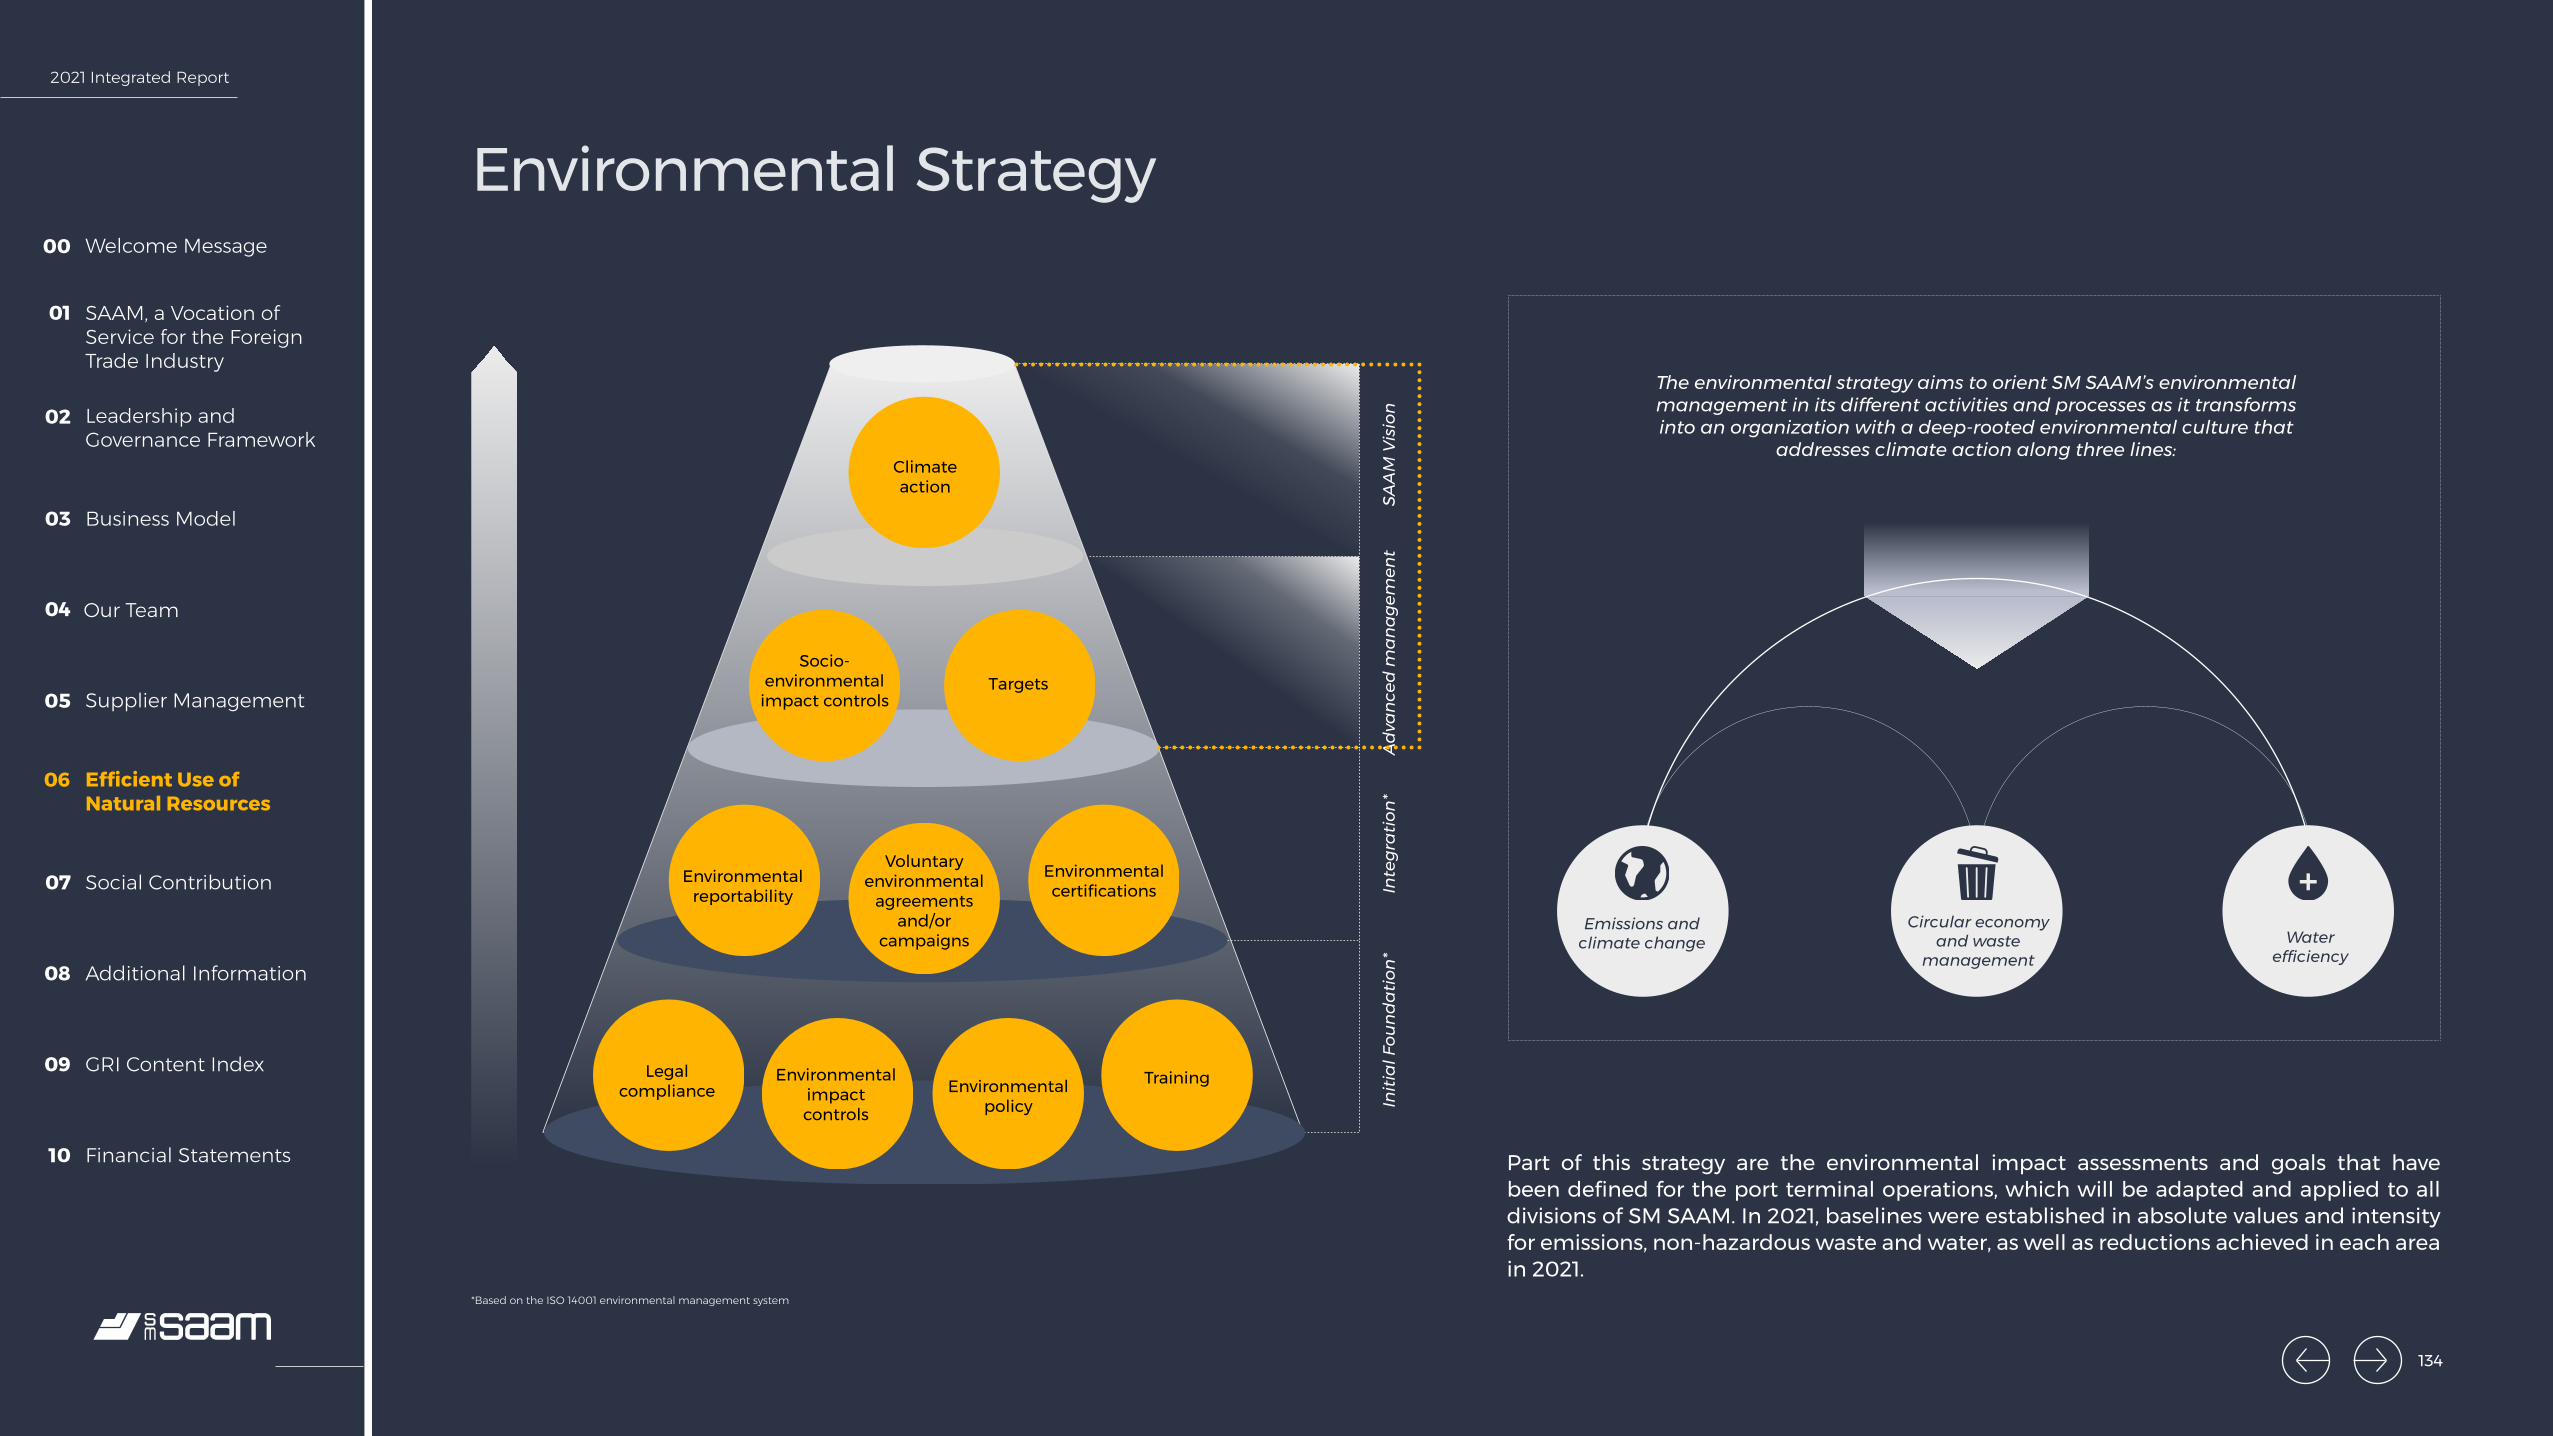
2021 Integrated Report
Welcome Message00
SAAM, a Vocation of Service for the Foreign Trade Industry
01
Leadership and Governance Framework
02
Business Model03
Our Team04
Supplier Management05
Efficient Use of Natural Resources
06
Social Contribution07
Additional Information08
GRI Content Index09
Financial Statements10
Climate action
Socio-environmental
impact controlsTargets
Environmental reportability
Legal compliance
Environmental impact controls
Environmental policy
Training
Voluntary environmental
agreements and/or
campaigns
Environmental certifications
Initi
al F
ound
atio
n*In
tegr
atio
n*Ad
vanc
ed m
anag
emen
tSA
AM
Vis
ion
Environmental Strategy
Emissions and climate change
Circular economy and waste
managementWater
efficiency
The environmental strategy aims to orient SM SAAM’s environmental management in its different activities and processes as it transforms into an organization with a deep-rooted environmental culture that
addresses climate action along three lines:
Part of this strategy are the environmental impact assessments and goals that have been defined for the port terminal operations, which will be adapted and applied to all divisions of SM SAAM. In 2021, baselines were established in absolute values and intensity for emissions, non-hazardous waste and water, as well as reductions achieved in each area in 2021.
*Based on the ISO 14001 environmental management system
134

2021 Integrated Report
Welcome Message00
SAAM, a Vocation of Service for the Foreign Trade Industry
01
Leadership and Governance Framework
02
Business Model03
Our Team04
Supplier Management05
Efficient Use of Natural Resources
06
Social Contribution07
Additional Information08
GRI Content Index09
Financial Statements10
Lines of Action
2021 Milestones
Related Policies
Emissions and climate change
Circular economy and waste
management
Water efficiency
1
Climate change is currently the greatest global challenge. The latest report from the Intergovernmental Panel on Climate Change (IPCC) highlighted how global warming will change the planet over the next few decades and assured that the causes lie with human life and modernity.
In light of this, there is a global call to adopt immediate measures to reduce GHG (greenhouse gas) emissions. SM SAAM has joined this call with actions to reduce and mitigate CO2 levels, the main element responsible for climate change.
The overexploitation and saturation of landfills has reached unprecedented levels around the world. This, added to the increase in population growth, and subsequent increase in consumption, triggers global alerts.
To contribute to the reduction of waste deposited in landfills and motivate the development of a circular economy in each operation, SM SAAM has launched initiatives to increase the reuse, recycling and recovery of waste generated, resulting in a positive impact for the community.
The global population, in constant growth, will demand more water, as the first essential resource for life and the development of communities.
The context of constant water scarcity threatens the future and exposes it as one of the primary physical risks of climate change.
To protect it, SM SAAM has adopted measures in its processes and technologies that contribute to more efficient use.
2
3
• Environmental Policy
• Sustainability Policy
• Definition of the themes of the Environmental Strategy.
• All operations quantified their Greenhouse Gas Emissions (GHG) in scopes 1 and 2.
• 6% reduction in GHG emissions company-wide since 2020.
• Seals given in quantification and reduction in emissions from Huella Chile for Antofagasta Terminal Internacional (ATI), San Vicente Terminal Internacional (SVTI) and Iquique Terminal Internacional (ITI).
• Seals given in quantification of emissions from Huella Chile for San Antonio Terminal Internacional (STI), SAAM Logistics (Renca) and SAAM Towage Chile.
• Progress toward carbon neutrality in the SAAM Towage Colombia operation in Cartagena.
• Giro Limpio certified San Vicente Terminal Internacional (SVTI), first port terminal in Chile to hold this distinction.
• Start of the ISO 50001 certification process at Iquique Terminal Internacional (ITI) and San Antonio Terminal Internacional (STI).
• Distinction to Aerosan in Bogotá granted by the District Environmental Excellence Program (Programa de Excelencia Ambiental Distrital, PREAD) in the “Environmental excellence” category.
• Recognition of SAAM Towage Costa Rica for its environmental management, from the Blue Ecological Flag Program (Programa Bandera Azul Ecológica or PBAE), in the Climate Change category.
• Blue Circle Award to SAAM Towage Canada.
• Start of circular economy pilot at Iquique Terminal Internacional (ITI).
135
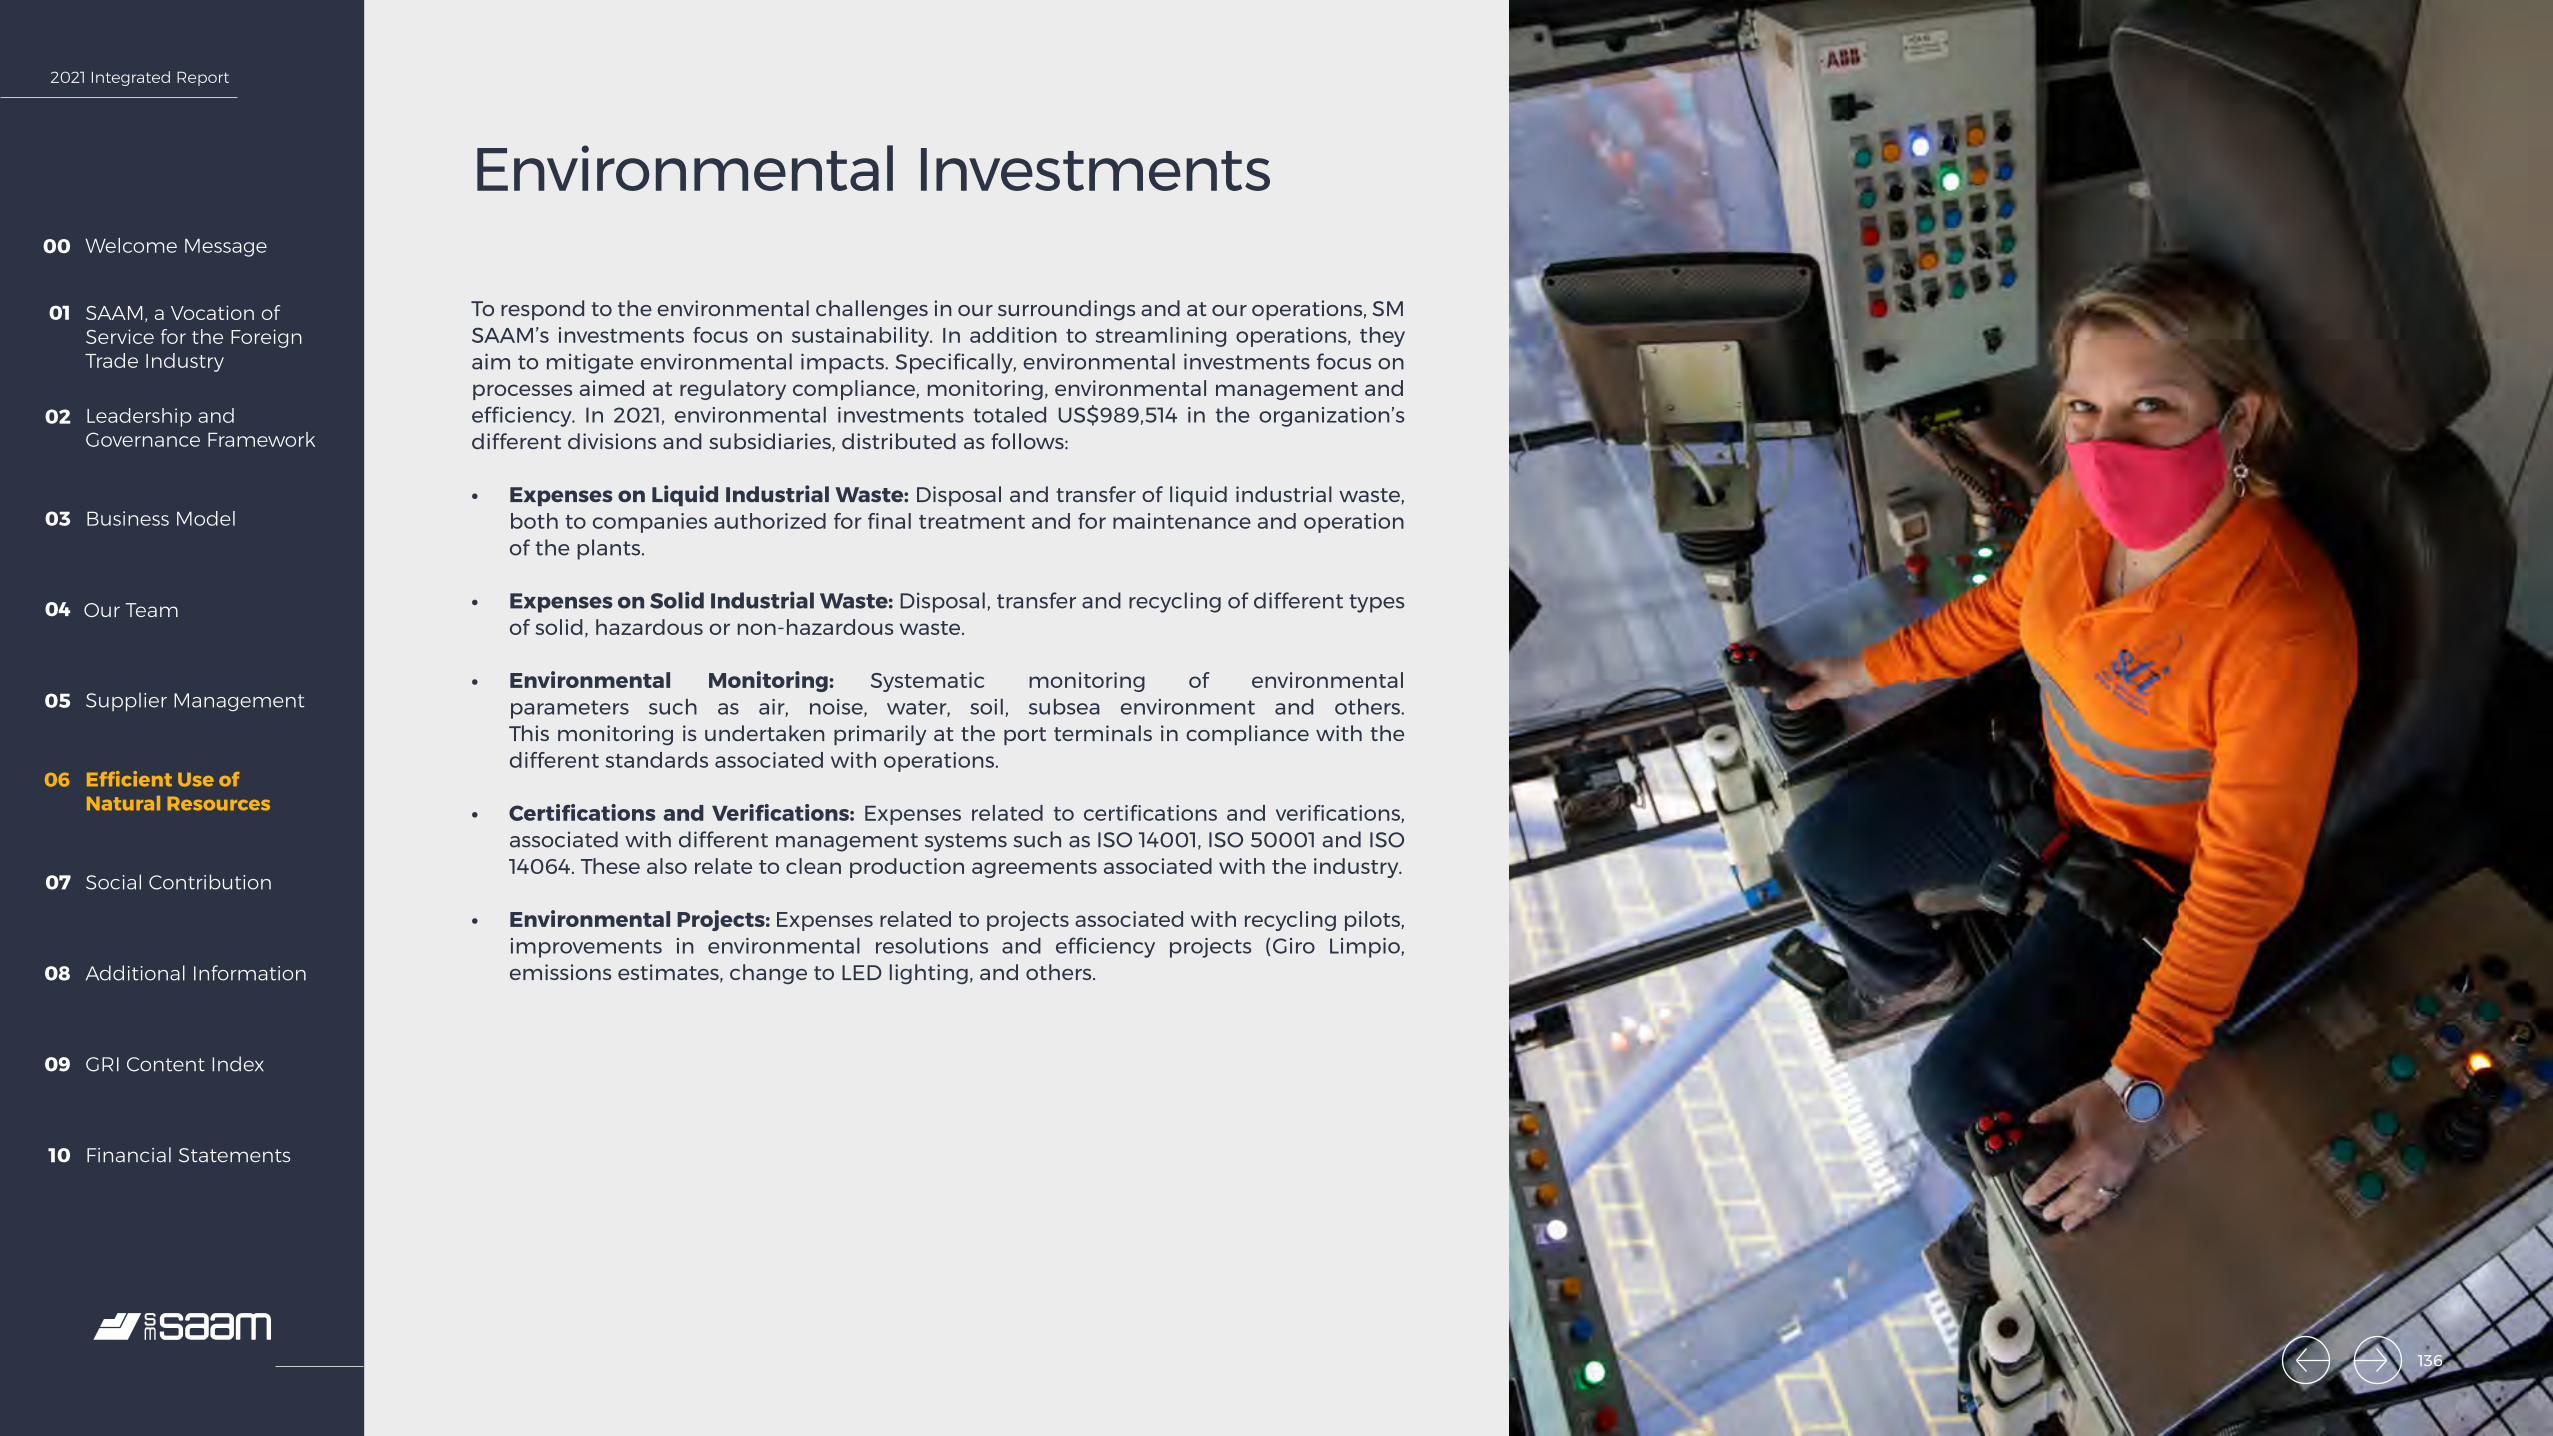
2021 Integrated Report
Welcome Message00
SAAM, a Vocation of Service for the Foreign Trade Industry
01
Leadership and Governance Framework
02
Business Model03
Our Team04
Supplier Management05
Efficient Use of Natural Resources
06
Social Contribution07
Additional Information08
GRI Content Index09
Financial Statements10
Environmental Investments
To respond to the environmental challenges in our surroundings and at our operations, SM SAAM’s investments focus on sustainability. In addition to streamlining operations, they aim to mitigate environmental impacts. Specifically, environmental investments focus on processes aimed at regulatory compliance, monitoring, environmental management and efficiency. In 2021, environmental investments totaled US$989,514 in the organization’s different divisions and subsidiaries, distributed as follows:
• Expenses on Liquid Industrial Waste: Disposal and transfer of liquid industrial waste, both to companies authorized for final treatment and for maintenance and operation of the plants.
• Expenses on Solid Industrial Waste: Disposal, transfer and recycling of different types of solid, hazardous or non-hazardous waste.
• Environmental Monitoring: Systematic monitoring of environmental parameters such as air, noise, water, soil, subsea environment and others. This monitoring is undertaken primarily at the port terminals in compliance with the different standards associated with operations.
• Certifications and Verifications: Expenses related to certifications and verifications, associated with different management systems such as ISO 14001, ISO 50001 and ISO 14064. These also relate to clean production agreements associated with the industry.
• Environmental Projects: Expenses related to projects associated with recycling pilots, improvements in environmental resolutions and efficiency projects (Giro Limpio, emissions estimates, change to LED lighting, and others.
136
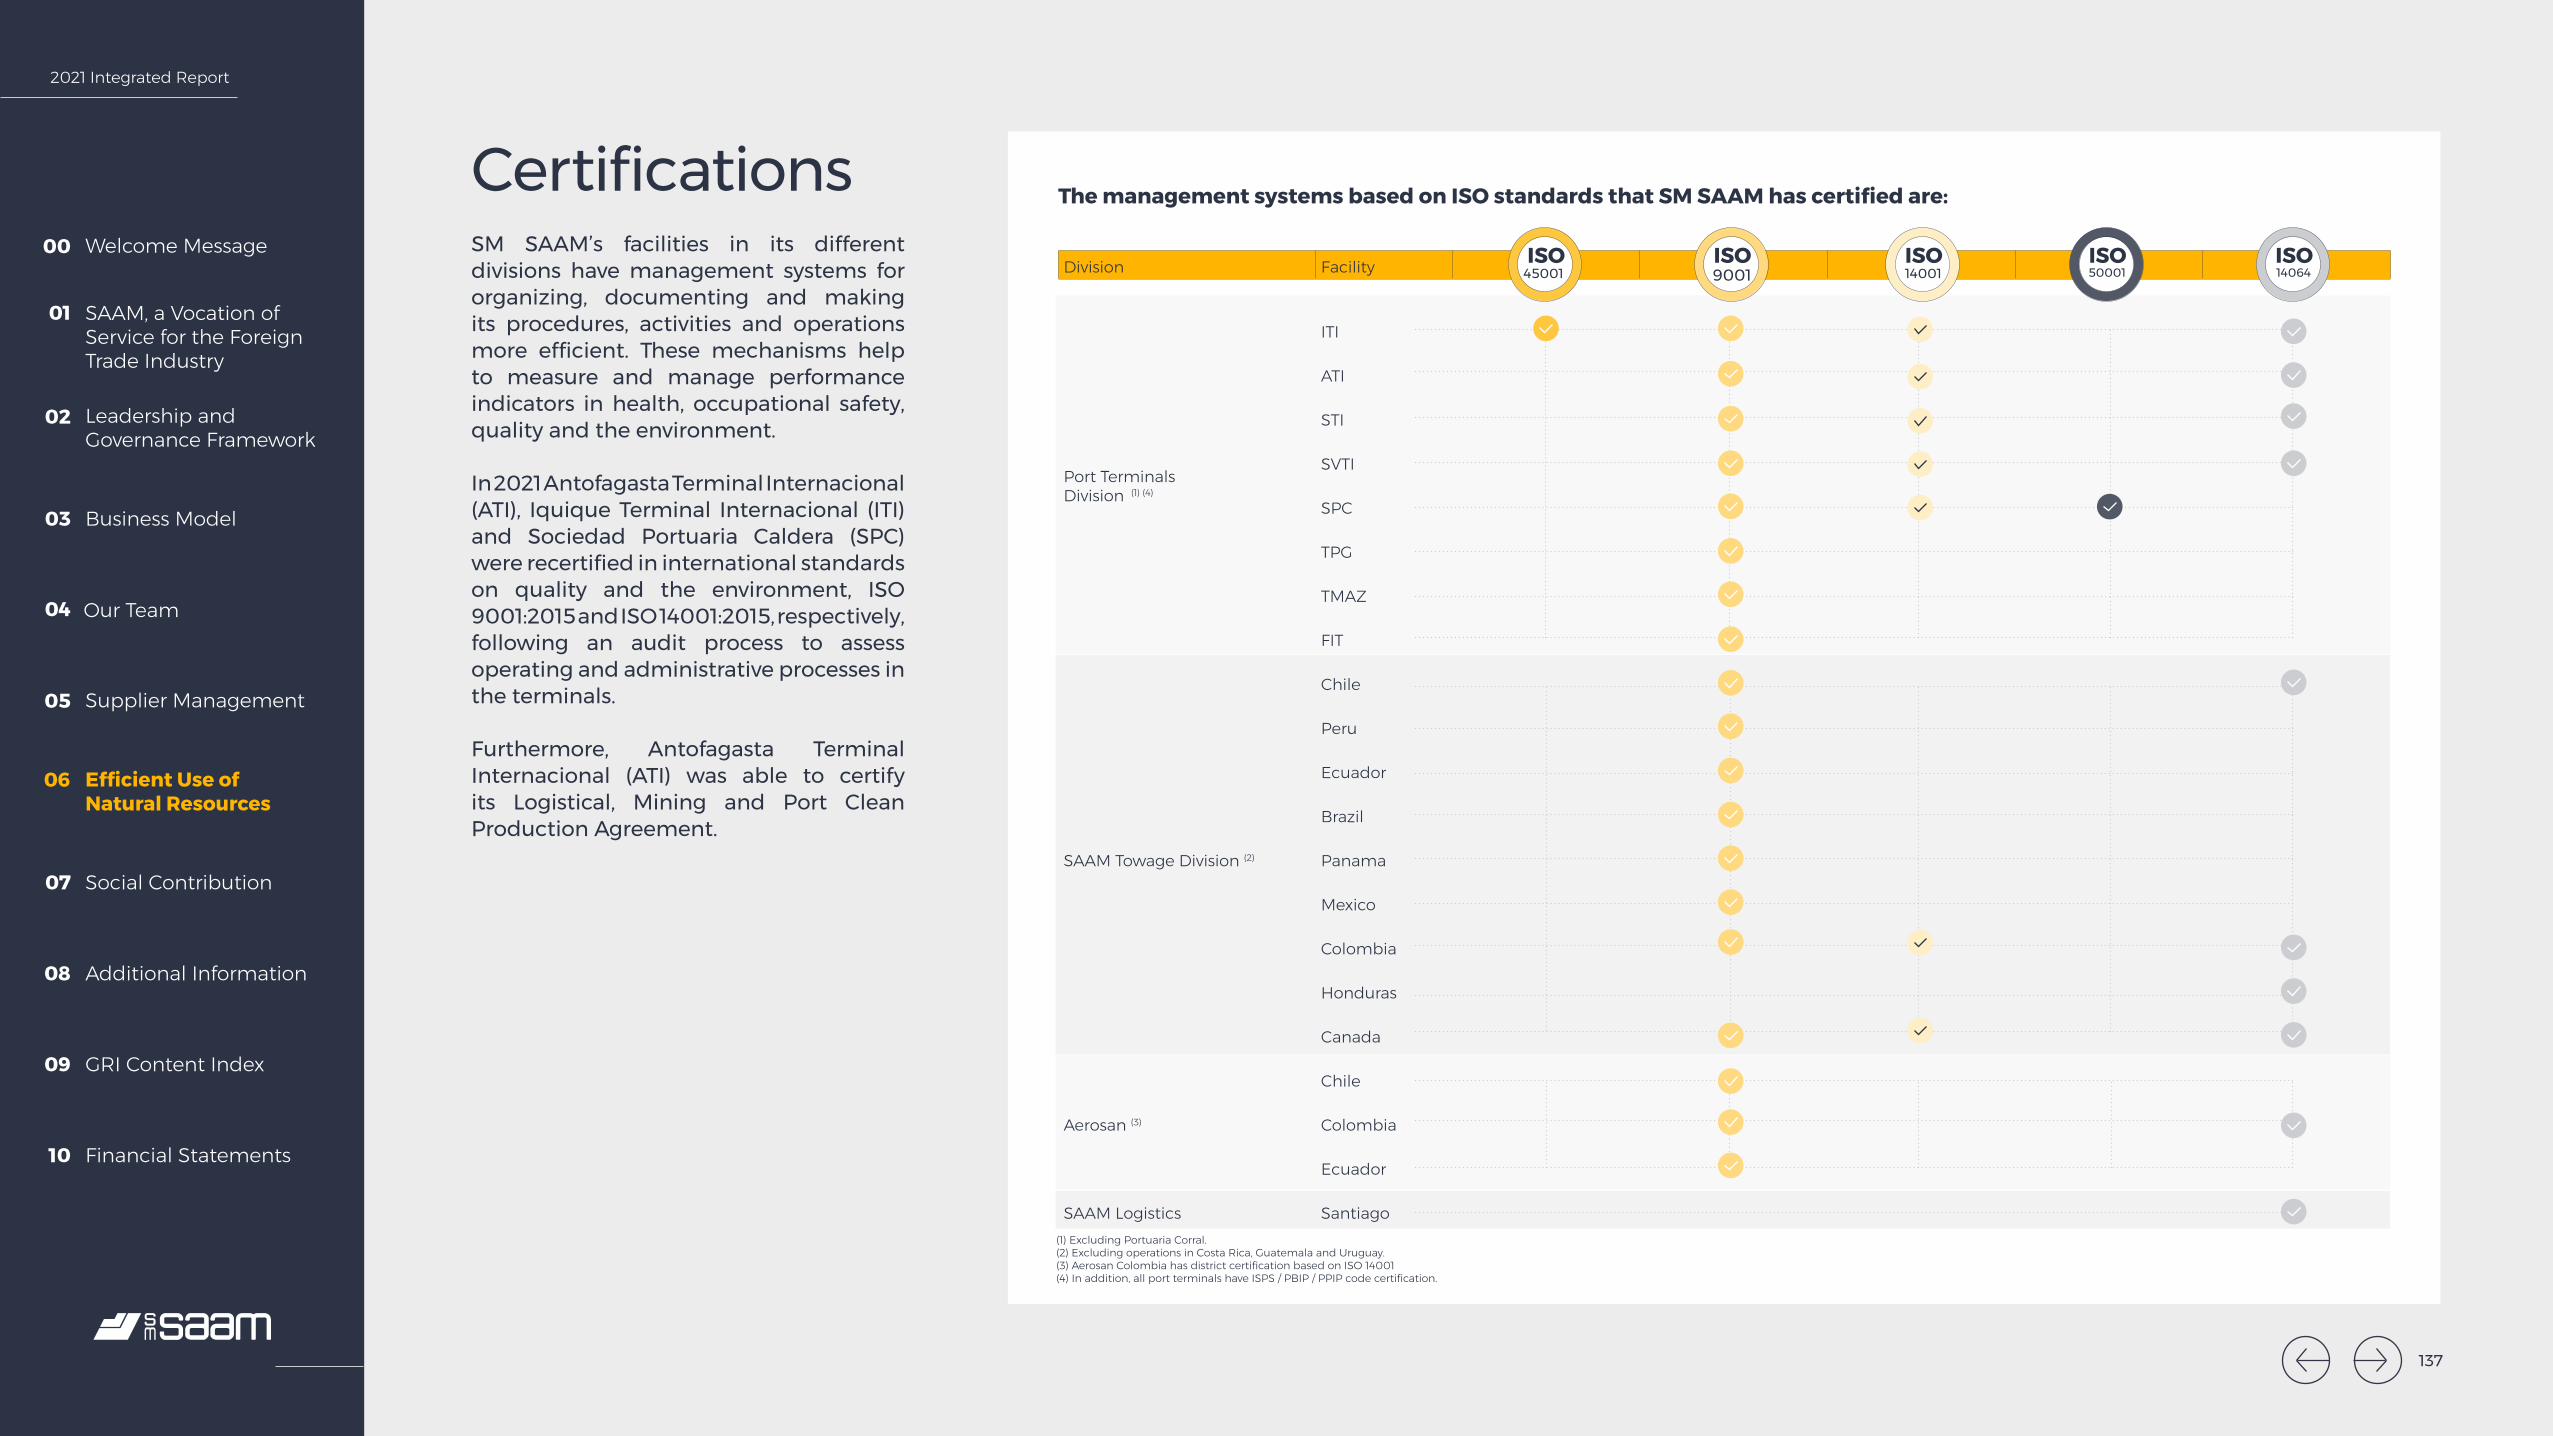
2021 Integrated Report
Welcome Message00
SAAM, a Vocation of Service for the Foreign Trade Industry
01
Leadership and Governance Framework
02
Business Model03
Our Team04
Supplier Management05
Efficient Use of Natural Resources
06
Social Contribution07
Additional Information08
GRI Content Index09
Financial Statements10
Certifications SM SAAM’s facilities in its different divisions have management systems for organizing, documenting and making its procedures, activities and operations more efficient. These mechanisms help to measure and manage performance indicators in health, occupational safety, quality and the environment.
In 2021 Antofagasta Terminal Internacional (ATI), Iquique Terminal Internacional (ITI) and Sociedad Portuaria Caldera (SPC) were recertified in international standards on quality and the environment, ISO 9001:2015 and ISO 14001:2015, respectively, following an audit process to assess operating and administrative processes in the terminals.
Furthermore, Antofagasta Terminal Internacional (ATI) was able to certify its Logistical, Mining and Port Clean Production Agreement.
The management systems based on ISO standards that SM SAAM has certified are:
Division Facility 9001 14001 50001 14064
Port Terminals Division (1) (4)
ITI
ATI
STI
SVTI
SPC
TPG
TMAZ
FIT
SAAM Towage Division (2)
Chile
Peru
Ecuador
Brazil
Panama
Mexico
Colombia
Honduras
Canada
Aerosan (3)
Chile
Colombia
Ecuador
SAAM Logistics Santiago (1) Excluding Portuaria Corral.(2) Excluding operations in Costa Rica, Guatemala and Uruguay. (3) Aerosan Colombia has district certification based on ISO 14001(4) In addition, all port terminals have ISPS / PBIP / PPIP code certification.
ISOISO ISO ISO ISO900145001 14001 50001 14064
137
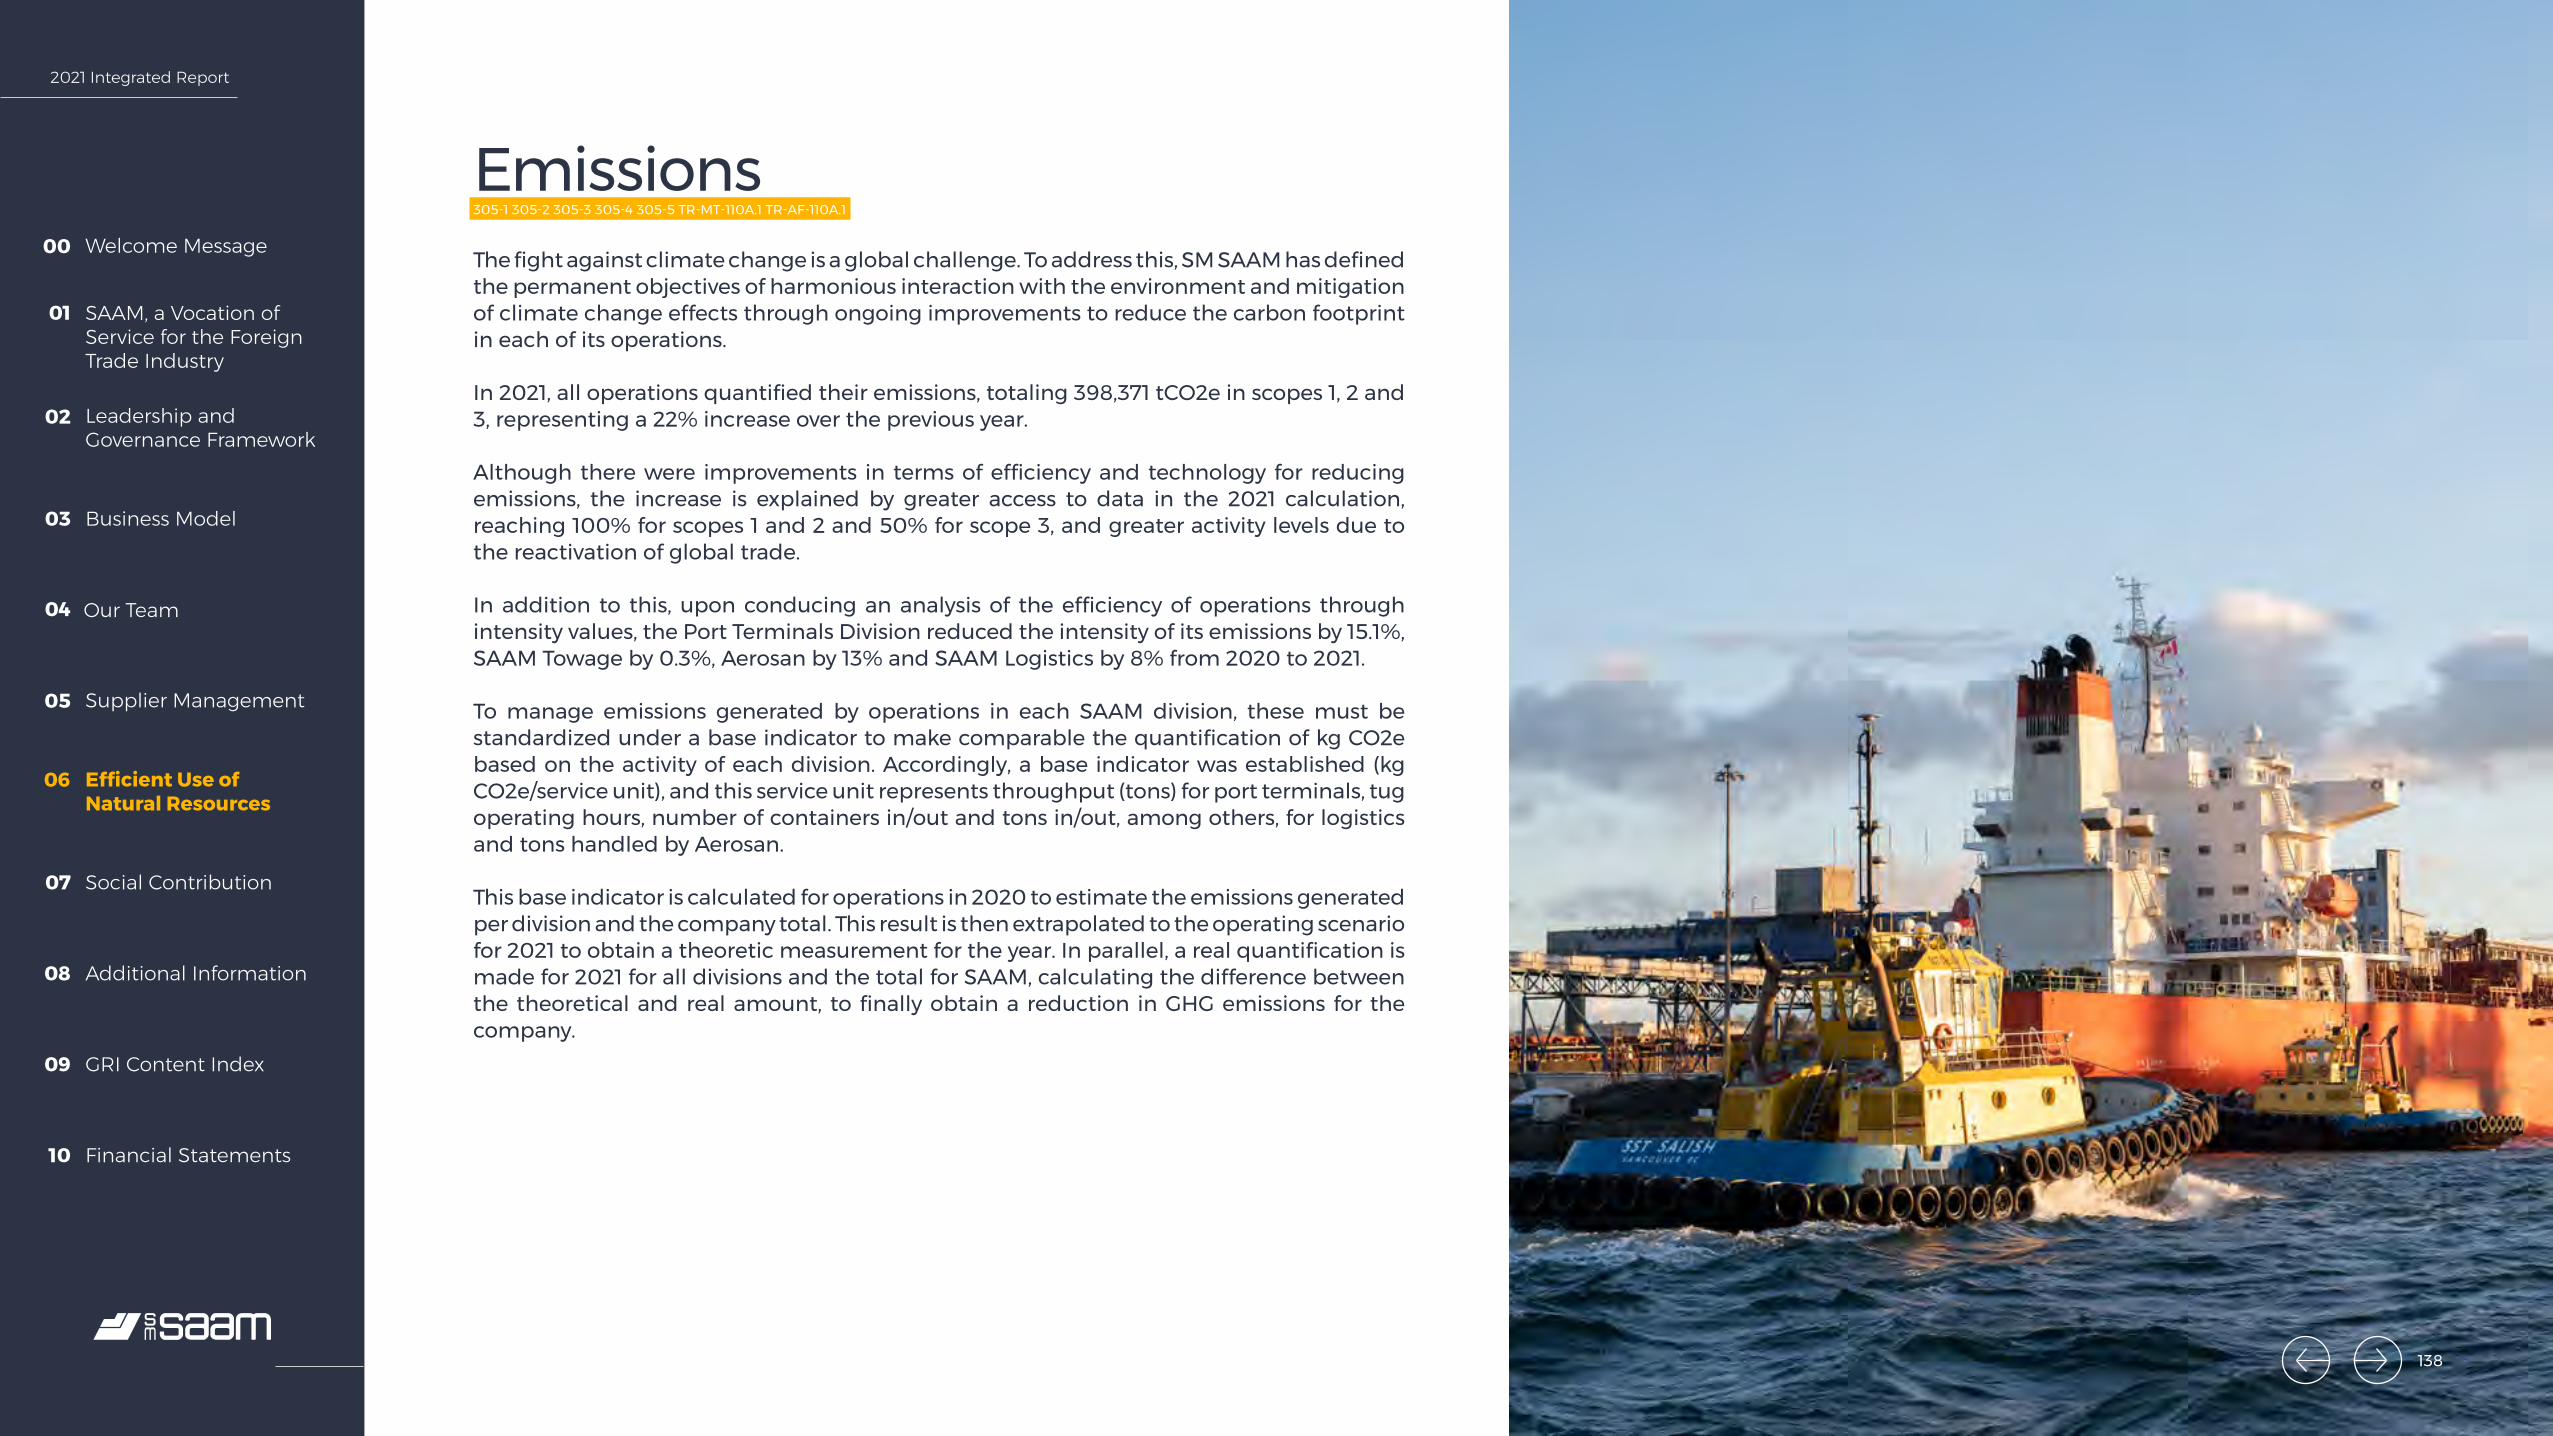
2021 Integrated Report
Welcome Message00
SAAM, a Vocation of Service for the Foreign Trade Industry
01
Leadership and Governance Framework
02
Business Model03
Our Team04
Supplier Management05
Efficient Use of Natural Resources
06
Social Contribution07
Additional Information08
GRI Content Index09
Financial Statements10
Emissions305-1 305-2 305-3 305-4 305-5 TR-MT-110A.1 TR-AF-110A.1
The fight against climate change is a global challenge. To address this, SM SAAM has defined the permanent objectives of harmonious interaction with the environment and mitigation of climate change effects through ongoing improvements to reduce the carbon footprint in each of its operations.
In 2021, all operations quantified their emissions, totaling 398,371 tCO2e in scopes 1, 2 and 3, representing a 22% increase over the previous year.
Although there were improvements in terms of efficiency and technology for reducing emissions, the increase is explained by greater access to data in the 2021 calculation, reaching 100% for scopes 1 and 2 and 50% for scope 3, and greater activity levels due to the reactivation of global trade.
In addition to this, upon conducing an analysis of the efficiency of operations through intensity values, the Port Terminals Division reduced the intensity of its emissions by 15.1%, SAAM Towage by 0.3%, Aerosan by 13% and SAAM Logistics by 8% from 2020 to 2021.
To manage emissions generated by operations in each SAAM division, these must be standardized under a base indicator to make comparable the quantification of kg CO2e based on the activity of each division. Accordingly, a base indicator was established (kg CO2e/service unit), and this service unit represents throughput (tons) for port terminals, tug operating hours, number of containers in/out and tons in/out, among others, for logistics and tons handled by Aerosan.
This base indicator is calculated for operations in 2020 to estimate the emissions generated per division and the company total. This result is then extrapolated to the operating scenario for 2021 to obtain a theoretic measurement for the year. In parallel, a real quantification is made for 2021 for all divisions and the total for SAAM, calculating the difference between the theoretical and real amount, to finally obtain a reduction in GHG emissions for the company.
138
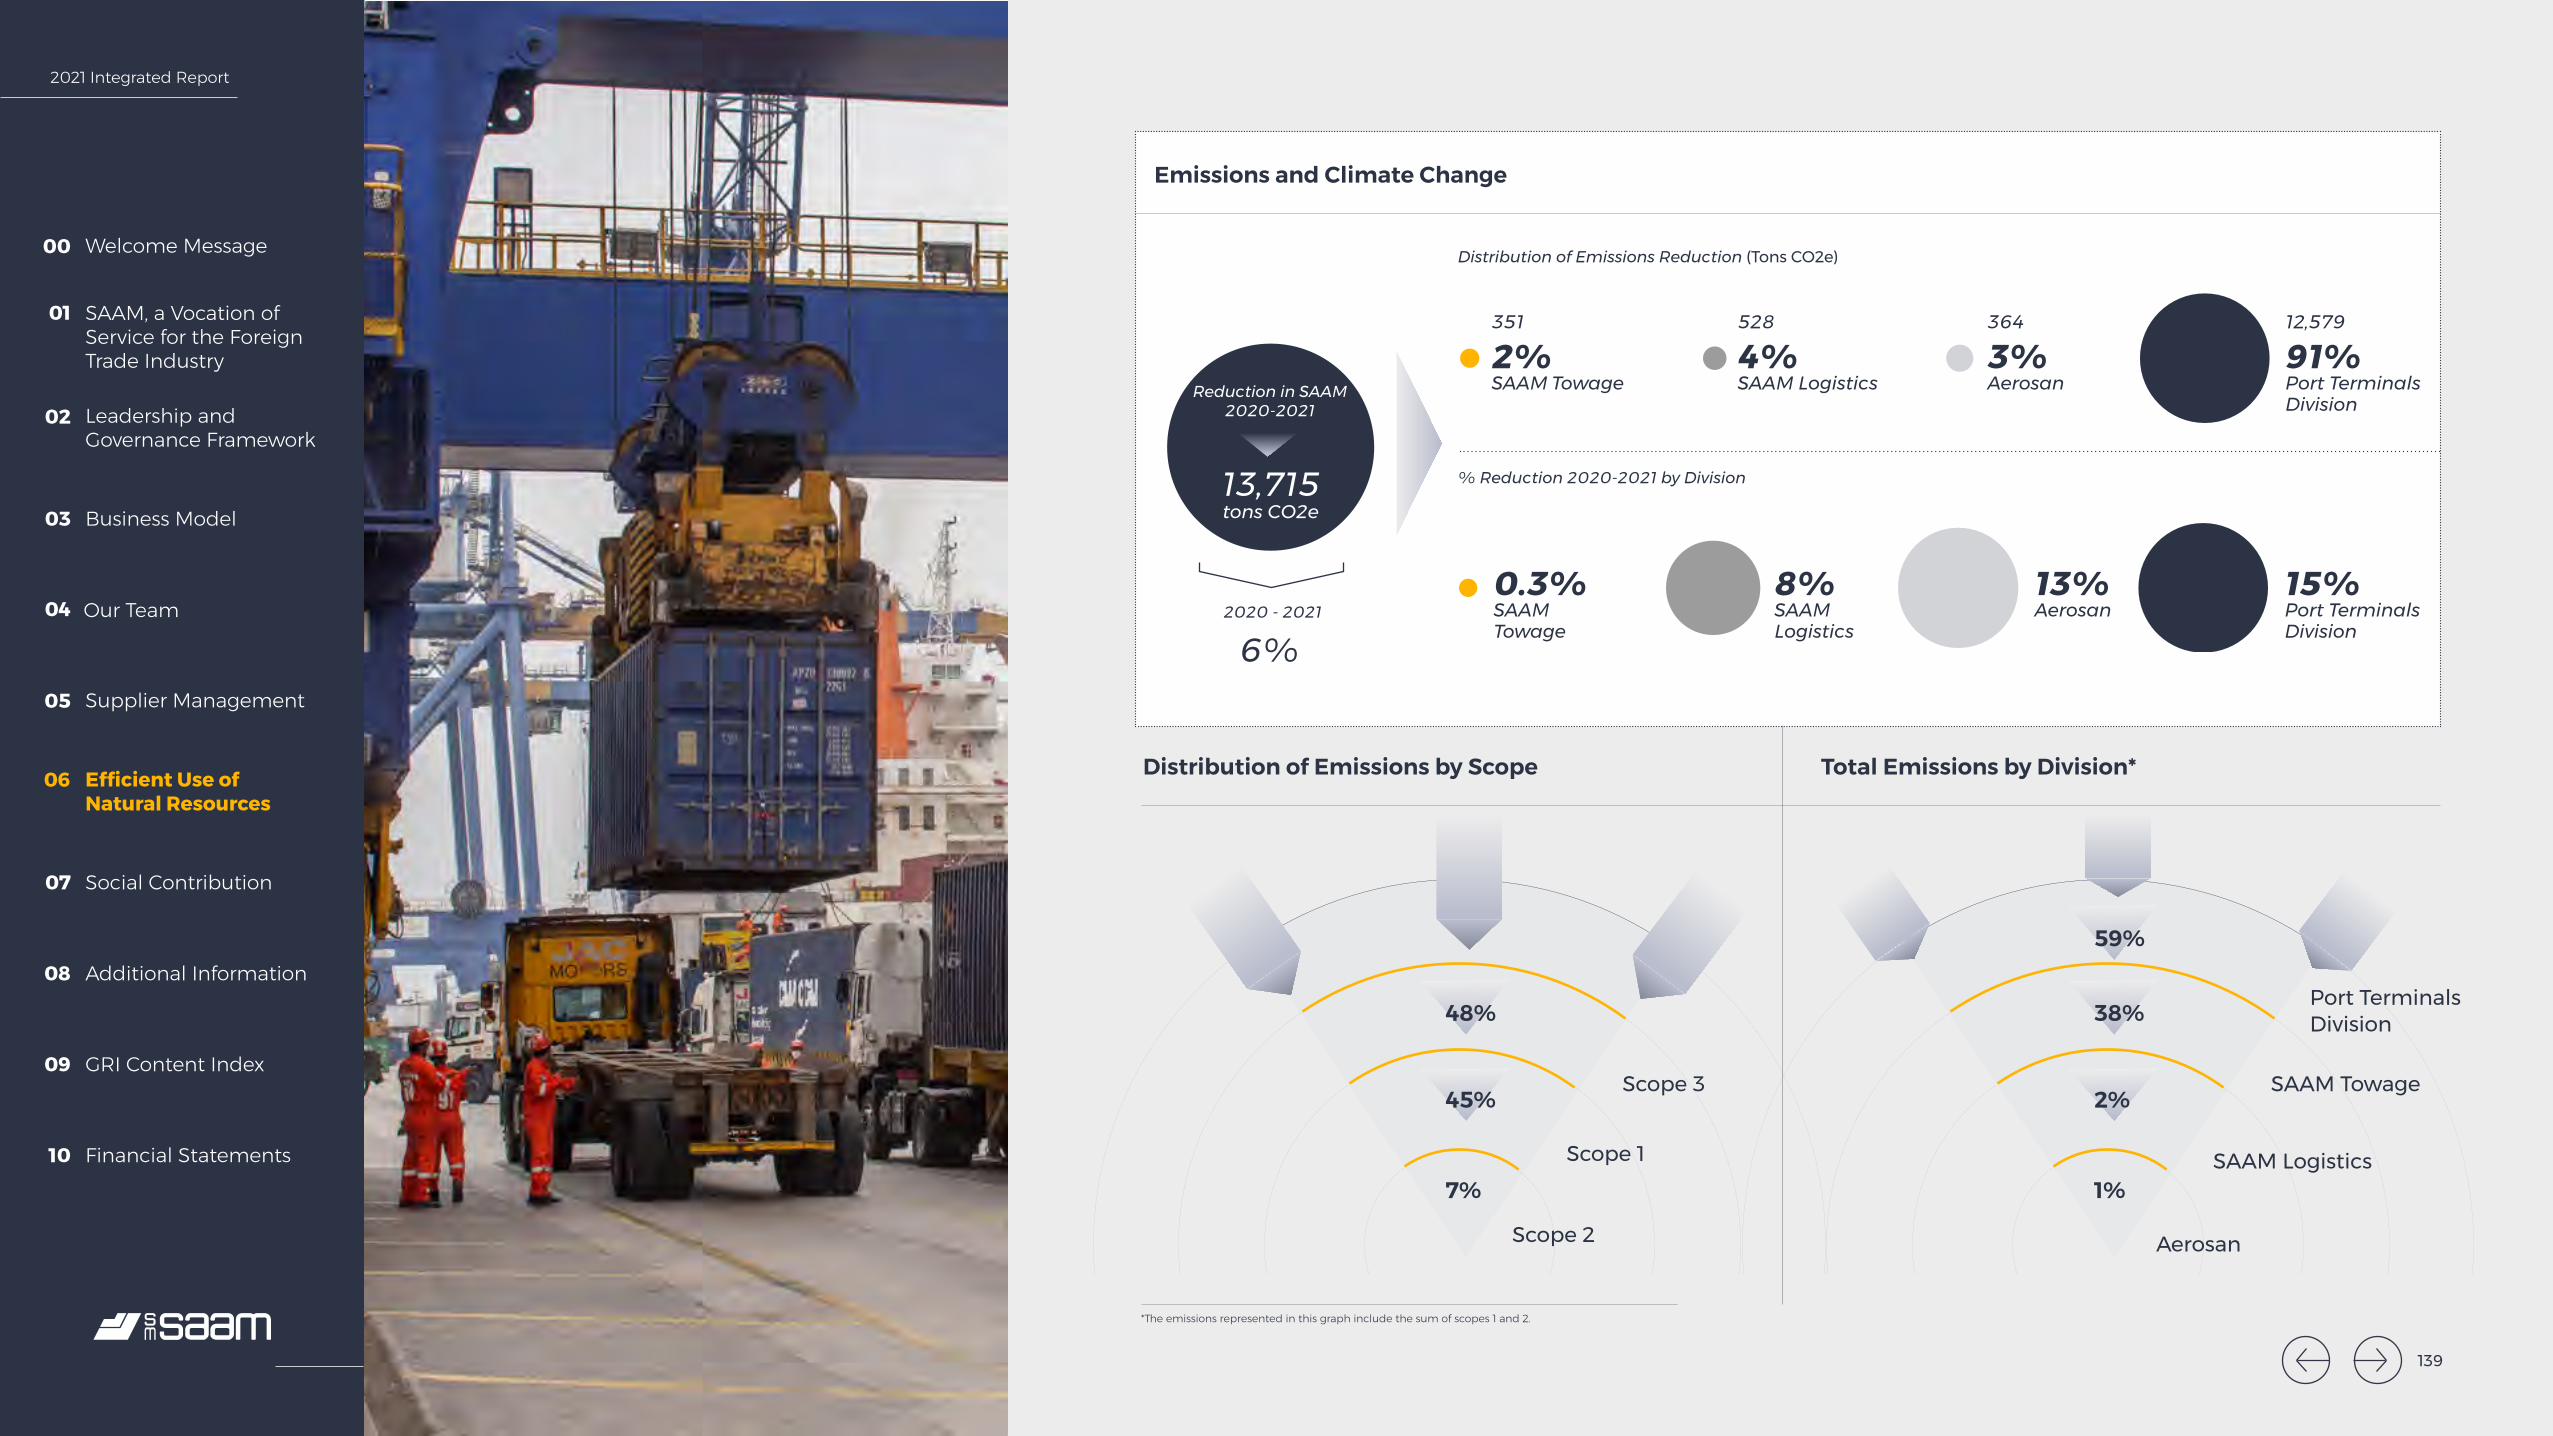
2021 Integrated Report
Welcome Message00
SAAM, a Vocation of Service for the Foreign Trade Industry
01
Leadership and Governance Framework
02
Business Model03
Our Team04
Supplier Management05
Efficient Use of Natural Resources
06
Social Contribution07
Additional Information08
GRI Content Index09
Financial Statements10
48%
45%
7%Scope 1
Scope 2
Scope 3
Distribution of Emissions by Scope
Emissions and Climate Change
Distribution of Emissions Reduction (Tons CO2e)
Total Emissions by Division*
38%
59%
2%
1%
Port Terminals Division
SAAM Towage
Aerosan
SAAM Logistics
*The emissions represented in this graph include the sum of scopes 1 and 2.
13,715 tons CO2e
Reduction in SAAM 2020-2021
% Reduction 2020-2021 by Division
12,579
91%Port Terminals Division
364
3%Aerosan
528
4%SAAM Logistics
351
2%SAAM Towage
0.3% SAAM Towage
8% SAAM Logistics
13% Aerosan
15% Port TerminalsDivision
6%2020 - 2021
139
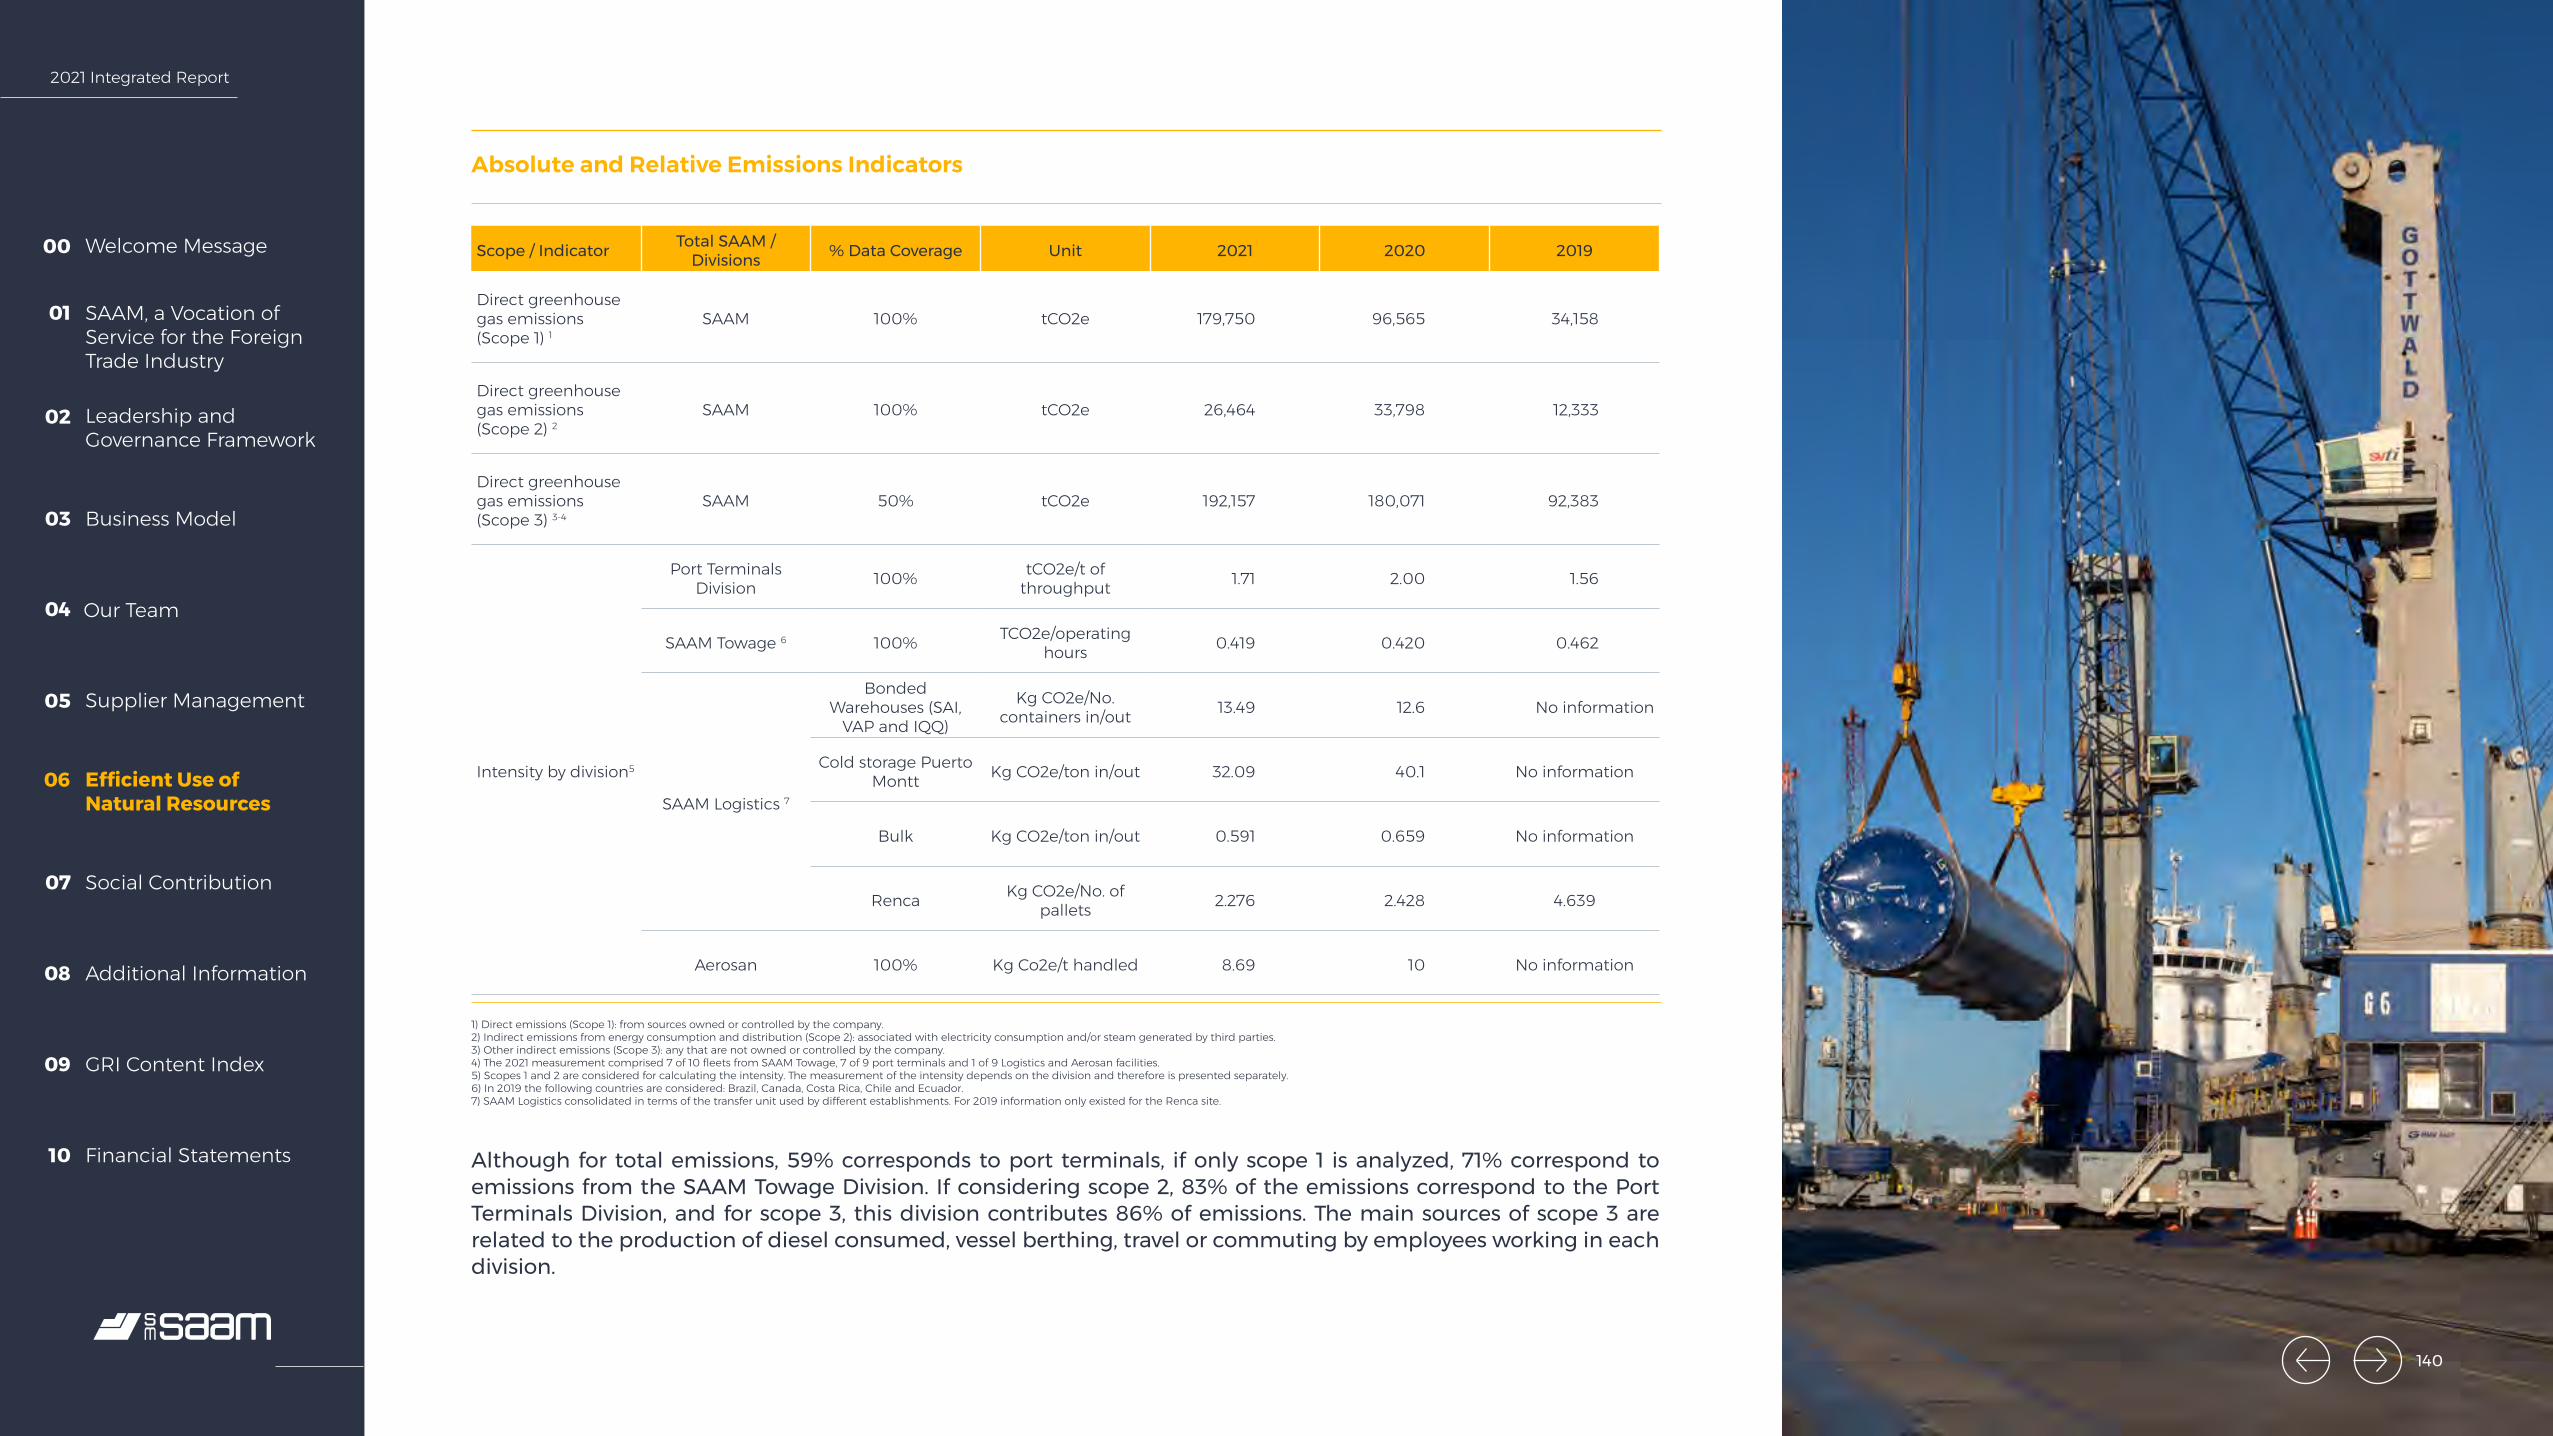
2021 Integrated Report
Welcome Message00
SAAM, a Vocation of Service for the Foreign Trade Industry
01
Leadership and Governance Framework
02
Business Model03
Our Team04
Supplier Management05
Efficient Use of Natural Resources
06
Social Contribution07
Additional Information08
GRI Content Index09
Financial Statements10
Absolute and Relative Emissions Indicators
Scope / Indicator Total SAAM / Divisions % Data Coverage Unit 2021 2020 2019
Direct greenhouse gas emissions (Scope 1) 1
SAAM 100% tCO2e 179,750 96,565 34,158
Direct greenhouse gas emissions (Scope 2) 2
SAAM 100% tCO2e 26,464 33,798 12,333
Direct greenhouse gas emissions (Scope 3) 3-4
SAAM 50% tCO2e 192,157 180,071 92,383
Intensity by division5
Port Terminals Division 100% tCO2e/t of
throughput 1.71 2.00 1.56
SAAM Towage 6 100% TCO2e/operating hours 0.419 0.420 0.462
SAAM Logistics 7
Bonded Warehouses (SAI,
VAP and IQQ)
Kg CO2e/No. containers in/out 13.49 12.6 No information
Cold storage Puerto Montt Kg CO2e/ton in/out 32.09 40.1 No information
Bulk Kg CO2e/ton in/out 0.591 0.659 No information
Renca Kg CO2e/No. of pallets 2.276 2.428 4.639
Aerosan 100% Kg Co2e/t handled 8.69 10 No information
1) Direct emissions (Scope 1): from sources owned or controlled by the company.2) Indirect emissions from energy consumption and distribution (Scope 2): associated with electricity consumption and/or steam generated by third parties.3) Other indirect emissions (Scope 3): any that are not owned or controlled by the company.4) The 2021 measurement comprised 7 of 10 fleets from SAAM Towage, 7 of 9 port terminals and 1 of 9 Logistics and Aerosan facilities.5) Scopes 1 and 2 are considered for calculating the intensity. The measurement of the intensity depends on the division and therefore is presented separately.6) In 2019 the following countries are considered: Brazil, Canada, Costa Rica, Chile and Ecuador. 7) SAAM Logistics consolidated in terms of the transfer unit used by different establishments. For 2019 information only existed for the Renca site.
Although for total emissions, 59% corresponds to port terminals, if only scope 1 is analyzed, 71% correspond to emissions from the SAAM Towage Division. If considering scope 2, 83% of the emissions correspond to the Port Terminals Division, and for scope 3, this division contributes 86% of emissions. The main sources of scope 3 are related to the production of diesel consumed, vessel berthing, travel or commuting by employees working in each division.
140
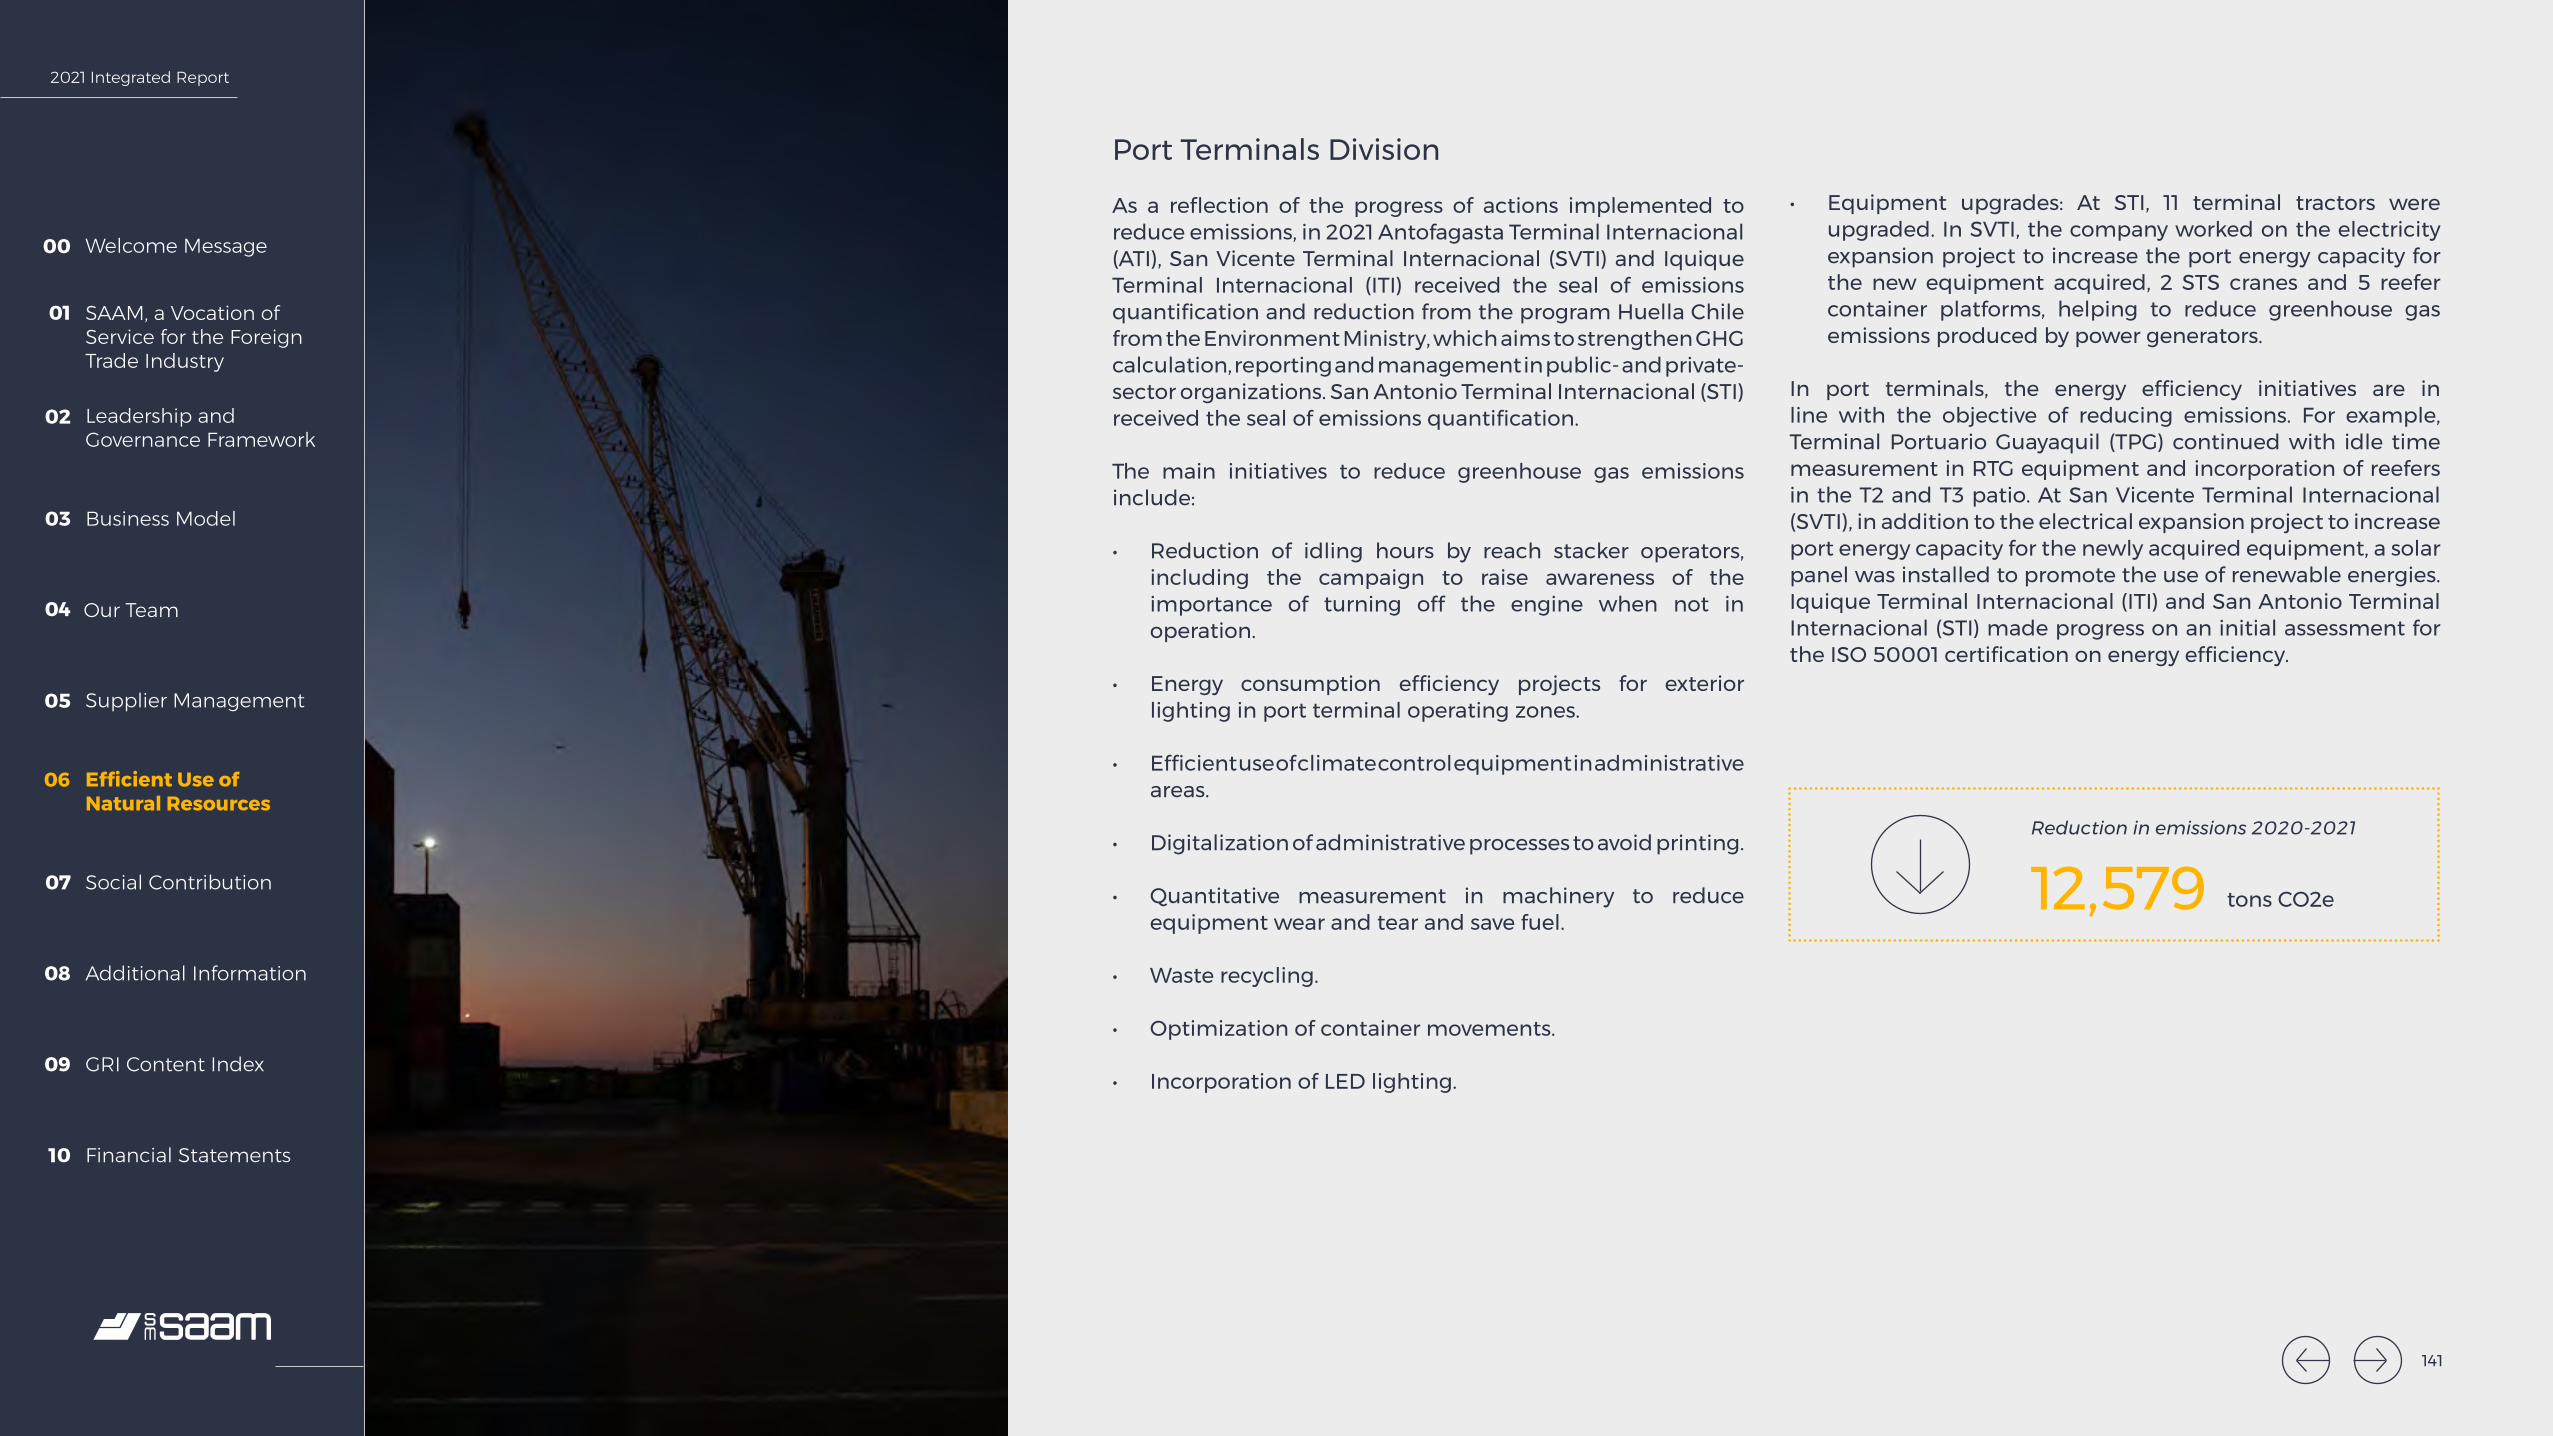
2021 Integrated Report
Welcome Message00
SAAM, a Vocation of Service for the Foreign Trade Industry
01
Leadership and Governance Framework
02
Business Model03
Our Team04
Supplier Management05
Efficient Use of Natural Resources
06
Social Contribution07
Additional Information08
GRI Content Index09
Financial Statements10
tons CO2e
Port Terminals Division
As a reflection of the progress of actions implemented to reduce emissions, in 2021 Antofagasta Terminal Internacional (ATI), San Vicente Terminal Internacional (SVTI) and Iquique Terminal Internacional (ITI) received the seal of emissions quantification and reduction from the program Huella Chile from the Environment Ministry, which aims to strengthen GHG calculation, reporting and management in public- and private-sector organizations. San Antonio Terminal Internacional (STI) received the seal of emissions quantification.
The main initiatives to reduce greenhouse gas emissions include:
• Reduction of idling hours by reach stacker operators, including the campaign to raise awareness of the importance of turning off the engine when not in operation.
• Energy consumption efficiency projects for exterior lighting in port terminal operating zones.
• Efficient use of climate control equipment in administrative areas.
• Digitalization of administrative processes to avoid printing.
• Quantitative measurement in machinery to reduce equipment wear and tear and save fuel.
• Waste recycling.
• Optimization of container movements.
• Incorporation of LED lighting.
• Equipment upgrades: At STI, 11 terminal tractors were upgraded. In SVTI, the company worked on the electricity expansion project to increase the port energy capacity for the new equipment acquired, 2 STS cranes and 5 reefer container platforms, helping to reduce greenhouse gas emissions produced by power generators.
In port terminals, the energy efficiency initiatives are in line with the objective of reducing emissions. For example, Terminal Portuario Guayaquil (TPG) continued with idle time measurement in RTG equipment and incorporation of reefers in the T2 and T3 patio. At San Vicente Terminal Internacional (SVTI), in addition to the electrical expansion project to increase port energy capacity for the newly acquired equipment, a solar panel was installed to promote the use of renewable energies. Iquique Terminal Internacional (ITI) and San Antonio Terminal Internacional (STI) made progress on an initial assessment for the ISO 50001 certification on energy efficiency.
12,579Reduction in emissions 2020-2021
141
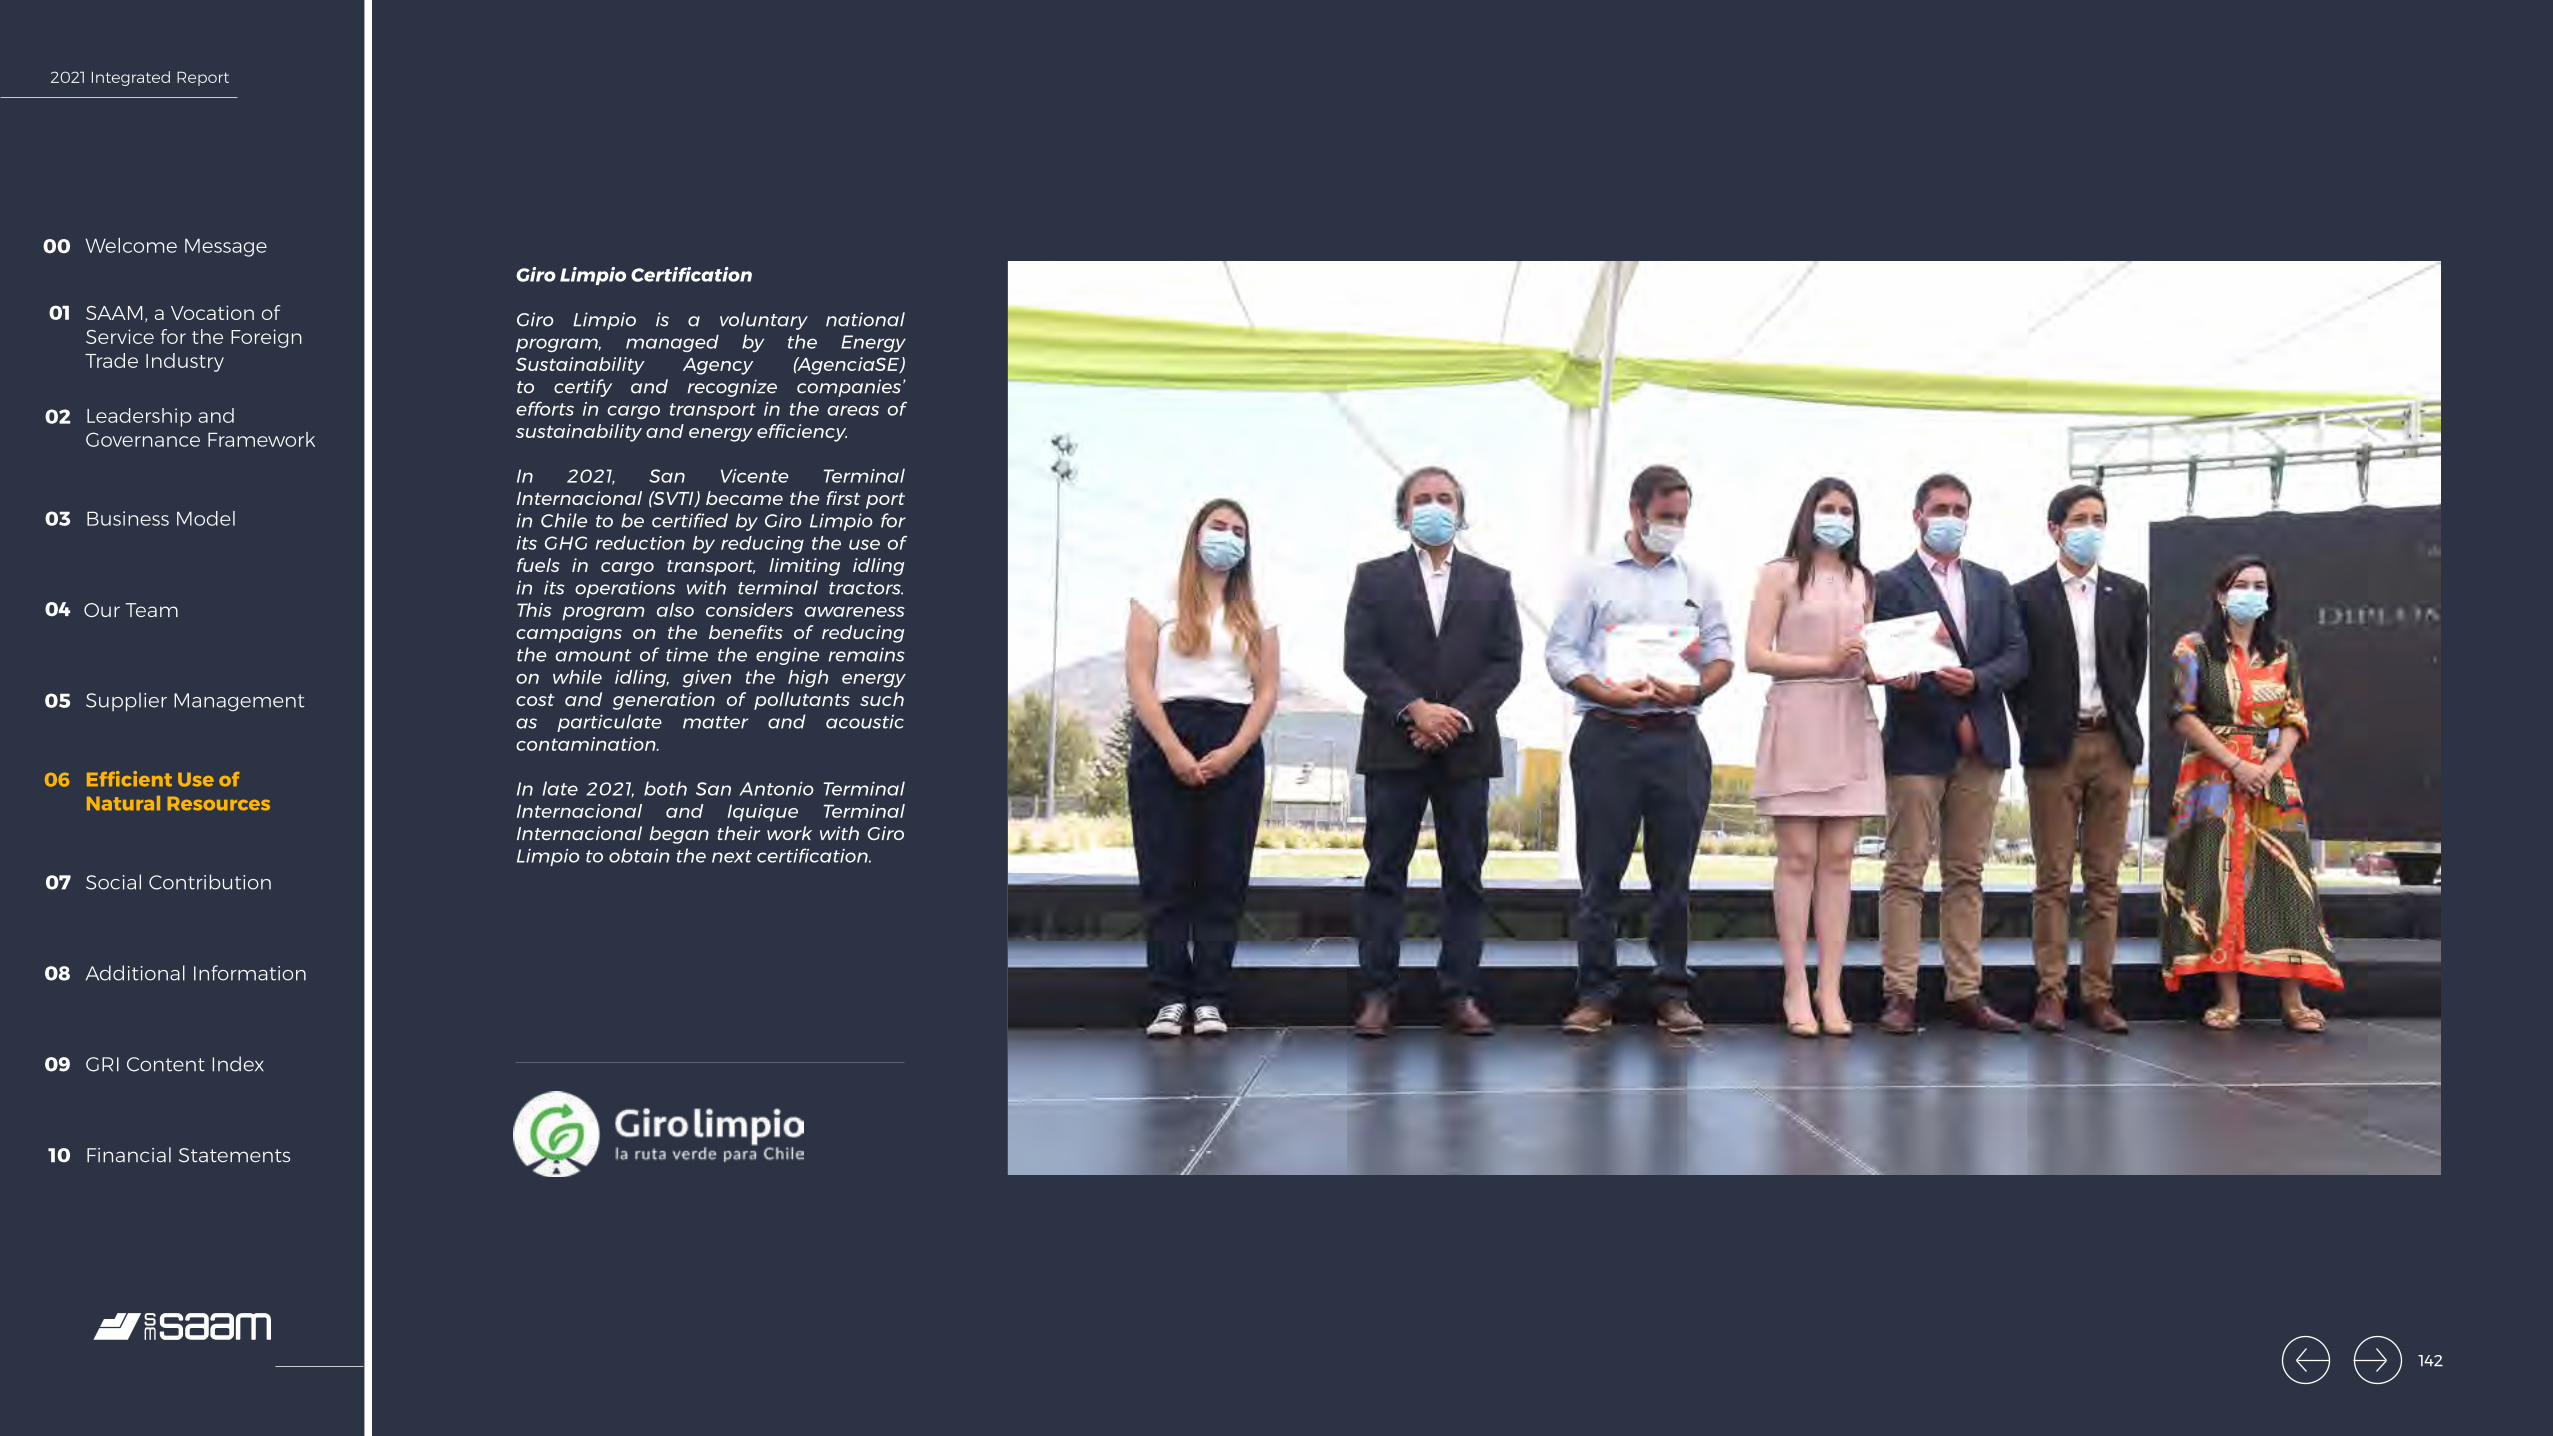
2021 Integrated Report
Welcome Message00
SAAM, a Vocation of Service for the Foreign Trade Industry
01
Leadership and Governance Framework
02
Business Model03
Our Team04
Supplier Management05
Efficient Use of Natural Resources
06
Social Contribution07
Additional Information08
GRI Content Index09
Financial Statements10
Giro Limpio Certification
Giro Limpio is a voluntary national program, managed by the Energy Sustainability Agency (AgenciaSE) to certify and recognize companies’ efforts in cargo transport in the areas of sustainability and energy efficiency.
In 2021, San Vicente Terminal Internacional (SVTI) became the first port in Chile to be certified by Giro Limpio for its GHG reduction by reducing the use of fuels in cargo transport, limiting idling in its operations with terminal tractors. This program also considers awareness campaigns on the benefits of reducing the amount of time the engine remains on while idling, given the high energy cost and generation of pollutants such as particulate matter and acoustic contamination.
In late 2021, both San Antonio Terminal Internacional and Iquique Terminal Internacional began their work with Giro Limpio to obtain the next certification.
142

2021 Integrated Report
Welcome Message00
SAAM, a Vocation of Service for the Foreign Trade Industry
01
Leadership and Governance Framework
02
Business Model03
Our Team04
Supplier Management05
Efficient Use of Natural Resources
06
Social Contribution07
Additional Information08
GRI Content Index09
Financial Statements10
351
SAAM Towage Costa Rica Recognized for Environmental Management
SAAM Towage Costa Rica was recognized for its environmental management by the Blue Ecological Flag Program (Programa Bandera Azul Ecológica or PBAE), in the Climate Change category, with a white star and another silver one, to document the progress of its sustainability policy and its efforts to reduce the impact of its processes, such as fuel reductions, water treatment, energy treatment, waste management, use of products with less environmental impact, among others.
The PBAE award encourages the formation of local committees, healthy competition and community organizing to care for the environment, in order to benefit present and future generations. More than 5 thousand companies apply for this award’s different categories, which evaluates hygienic and environmental conditions in order to mitigate and adapt to climate change.
tons CO2e
Reduction 2021-2020
Towage Division
In 2021, SAAM Towage Chile was recognized by Huella Chile for the fourth time for quantifying emissions in 2020. Its main initiatives were speed control in free sailing and ground supply in ports where tugs berth. The verification was backed by Bureau Veritas, which reviewed the annual quantification of 21 tugs that operate in 13 ports in Chile.
Along these lines, SAAM Towage Colombia made progress toward ISO 14064 certification for operations in Colombia and Honduras. Together with this, it processed the PAS 2060 carbon neutrality certification and greenhouse gas (GHG) offsetting assurance for its largest operation in Cartagena. Both certifications were granted in early 2022. The initiatives undertaken in Cartagena, which enabled it to apply for certification, include: improvements in operating efficiency and maneuver planning; LED lighting on vessels and training staff in their efficient use; supporting local economies in neighboring communities; recovery of deforested lands through the program Asociación de la Costa Atlántica y Los Andes, and Carbono Caracolí bonds.
SAAM Towage Canada received the Blue Circle Award, created by the Port of Vancouver to acknowledge members of the port community in the area who form part of local environmental programs like EcoAction and Energy Action. This reflects the work undertaken to strengthen the company’s environmental policies, focused primarily on the efficient use of energy and reduction of atmospheric emissions.
143

2021 Integrated Report
Welcome Message00
SAAM, a Vocation of Service for the Foreign Trade Industry
01
Leadership and Governance Framework
02
Business Model03
Our Team04
Supplier Management05
Efficient Use of Natural Resources
06
Social Contribution07
Additional Information08
GRI Content Index09
Financial Statements10
322.91tons CO2e
Logistics Division
SAAM Logistics
For the third year in a row, SAAM Logistics also received the seal of quantification from the Huella Chile program, for the measurement of its GHG emissions at its operations. The main emissions mitigation initiatives implemented in this division are prioritizing cargo transport by railroad from San Antonio to Santiago. SAAM Logistics also contributed to environmental protection by buying from ecological suppliers that reduce its environmental footprint, such as Idea-Tec, a company that manufactures paints from recycled Styrofoam and gave SAAM Logistics an environmental contribution certificate for the reduction of 366.6 kg of CO2, recycling 92.4 kg of Styrofoam.
Reduction in emissions 2020-2021
144
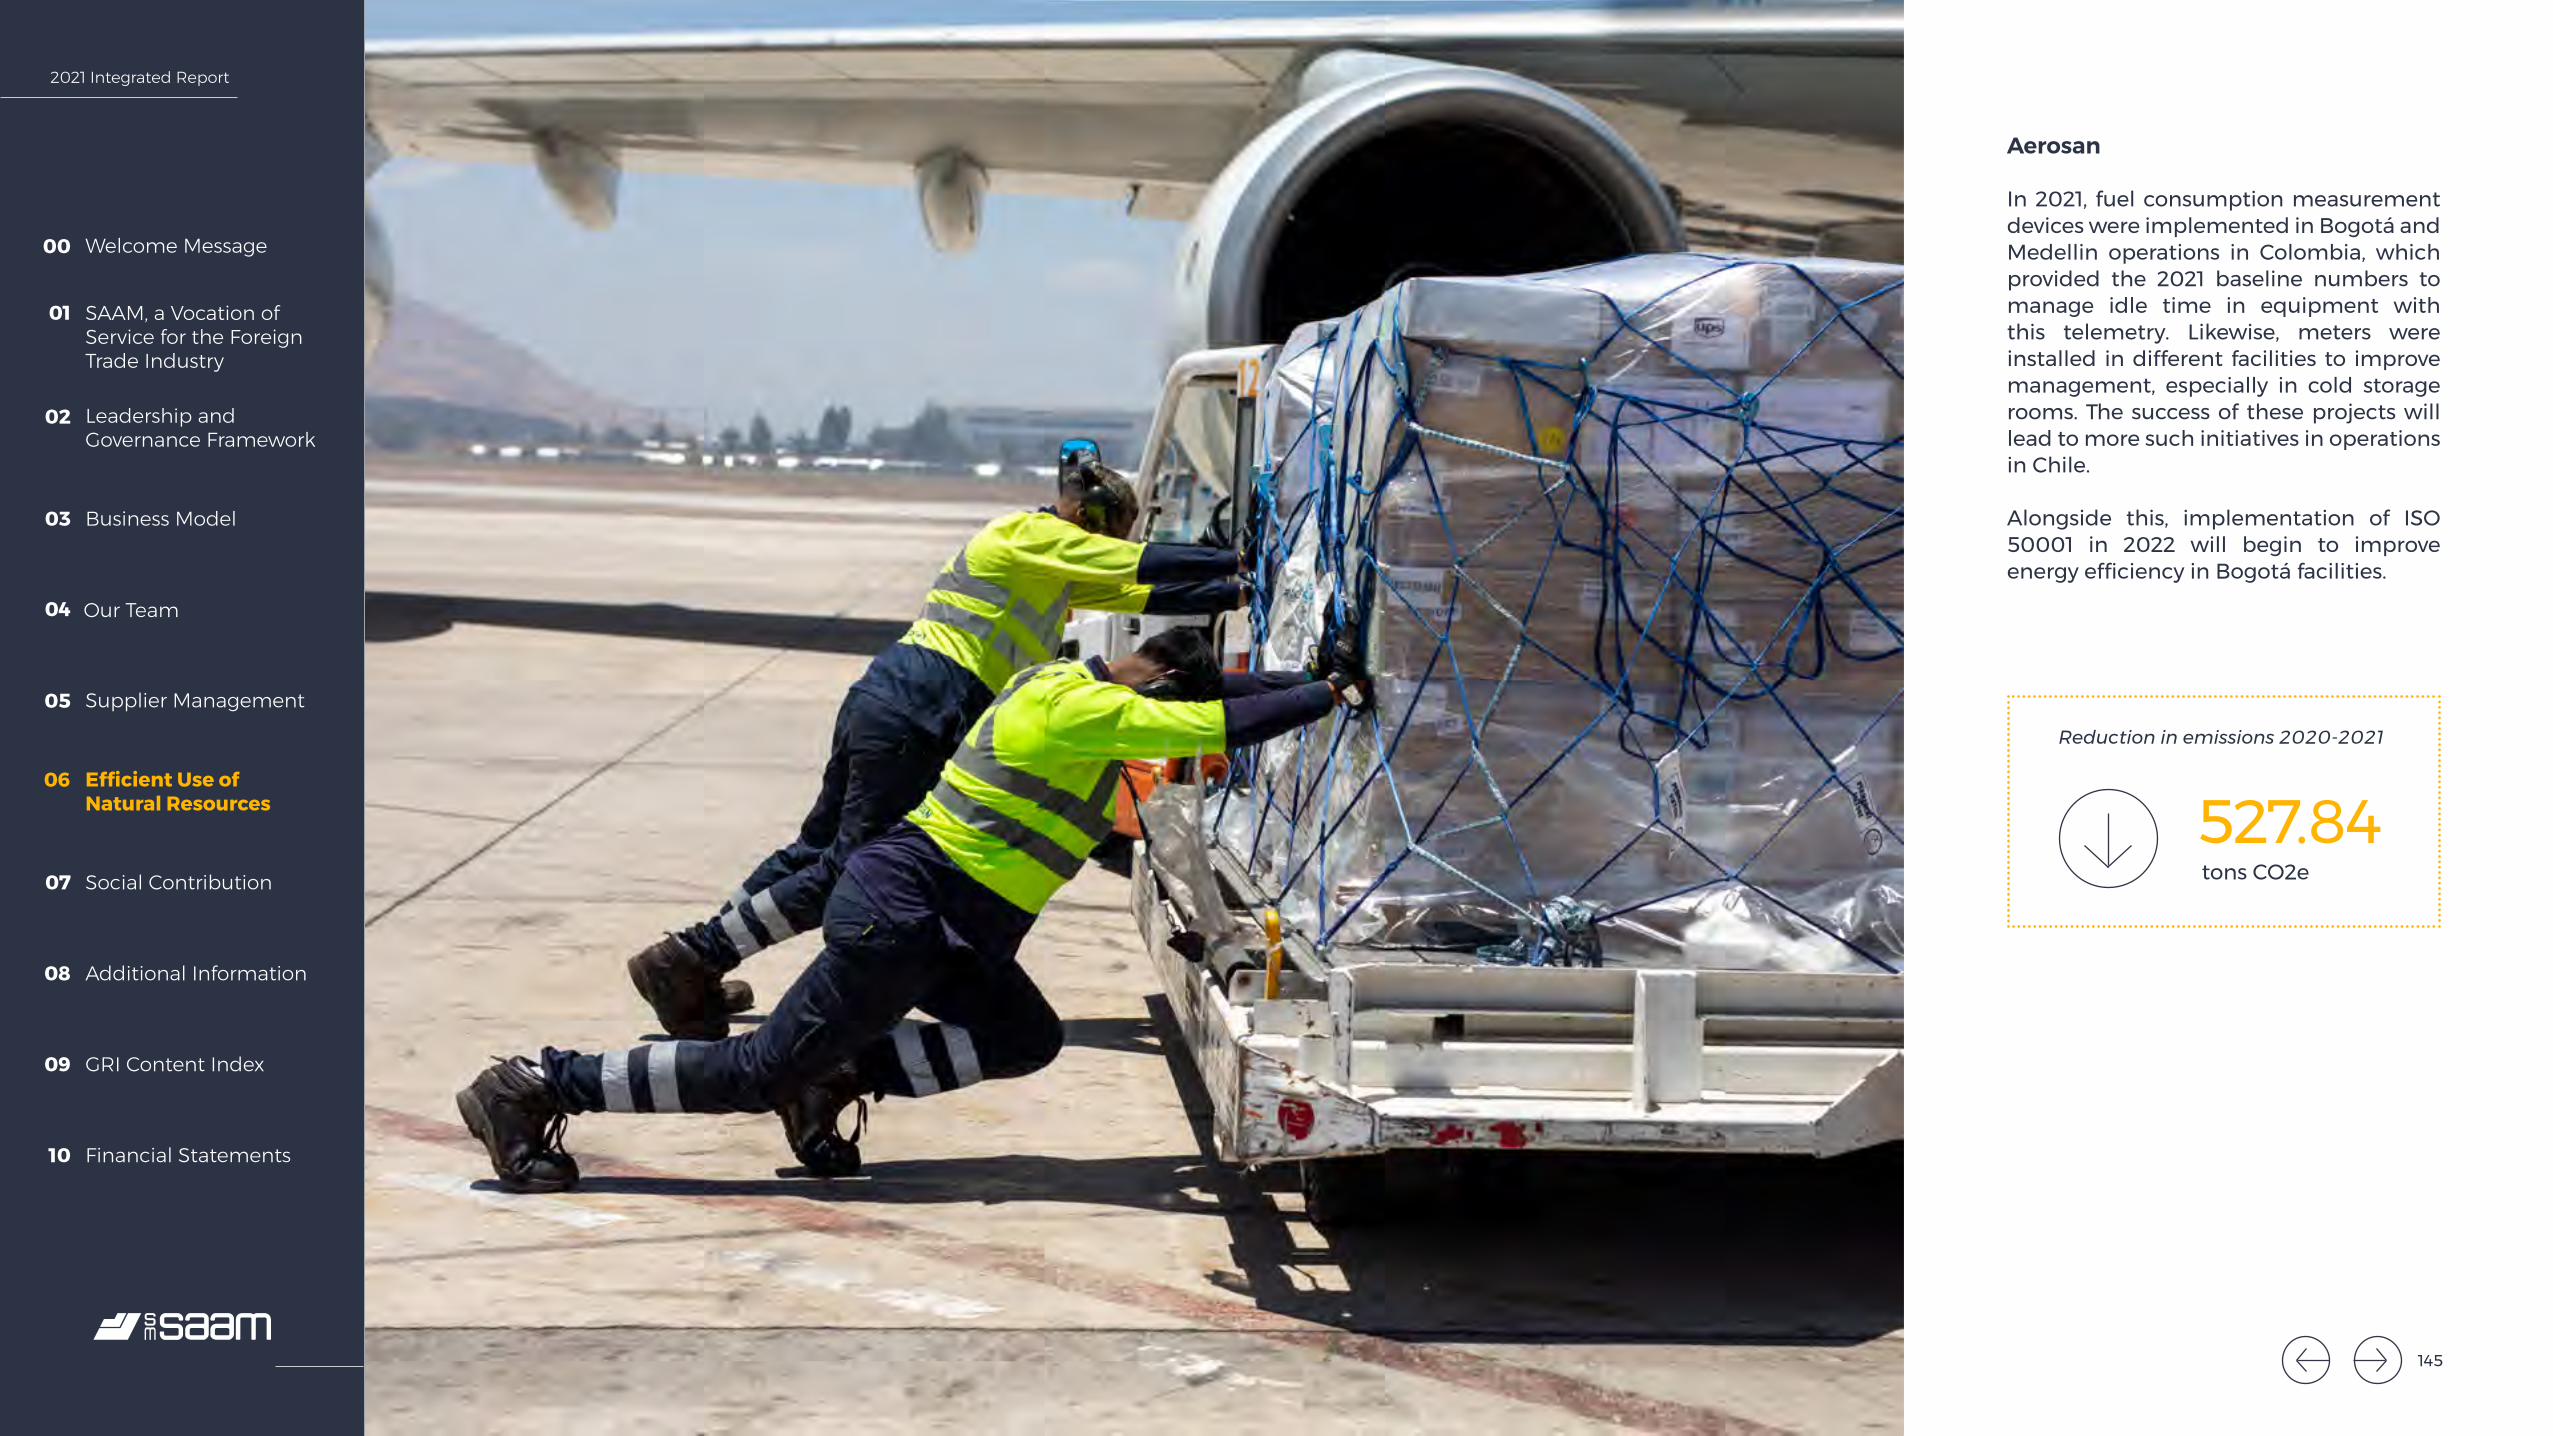
2021 Integrated Report
Welcome Message00
SAAM, a Vocation of Service for the Foreign Trade Industry
01
Leadership and Governance Framework
02
Business Model03
Our Team04
Supplier Management05
Efficient Use of Natural Resources
06
Social Contribution07
Additional Information08
GRI Content Index09
Financial Statements10
527.84tons CO2e
Aerosan
In 2021, fuel consumption measurement devices were implemented in Bogotá and Medellin operations in Colombia, which provided the 2021 baseline numbers to manage idle time in equipment with this telemetry. Likewise, meters were installed in different facilities to improve management, especially in cold storage rooms. The success of these projects will lead to more such initiatives in operations in Chile.
Alongside this, implementation of ISO 50001 in 2022 will begin to improve energy efficiency in Bogotá facilities.
Reduction in emissions 2020-2021
145
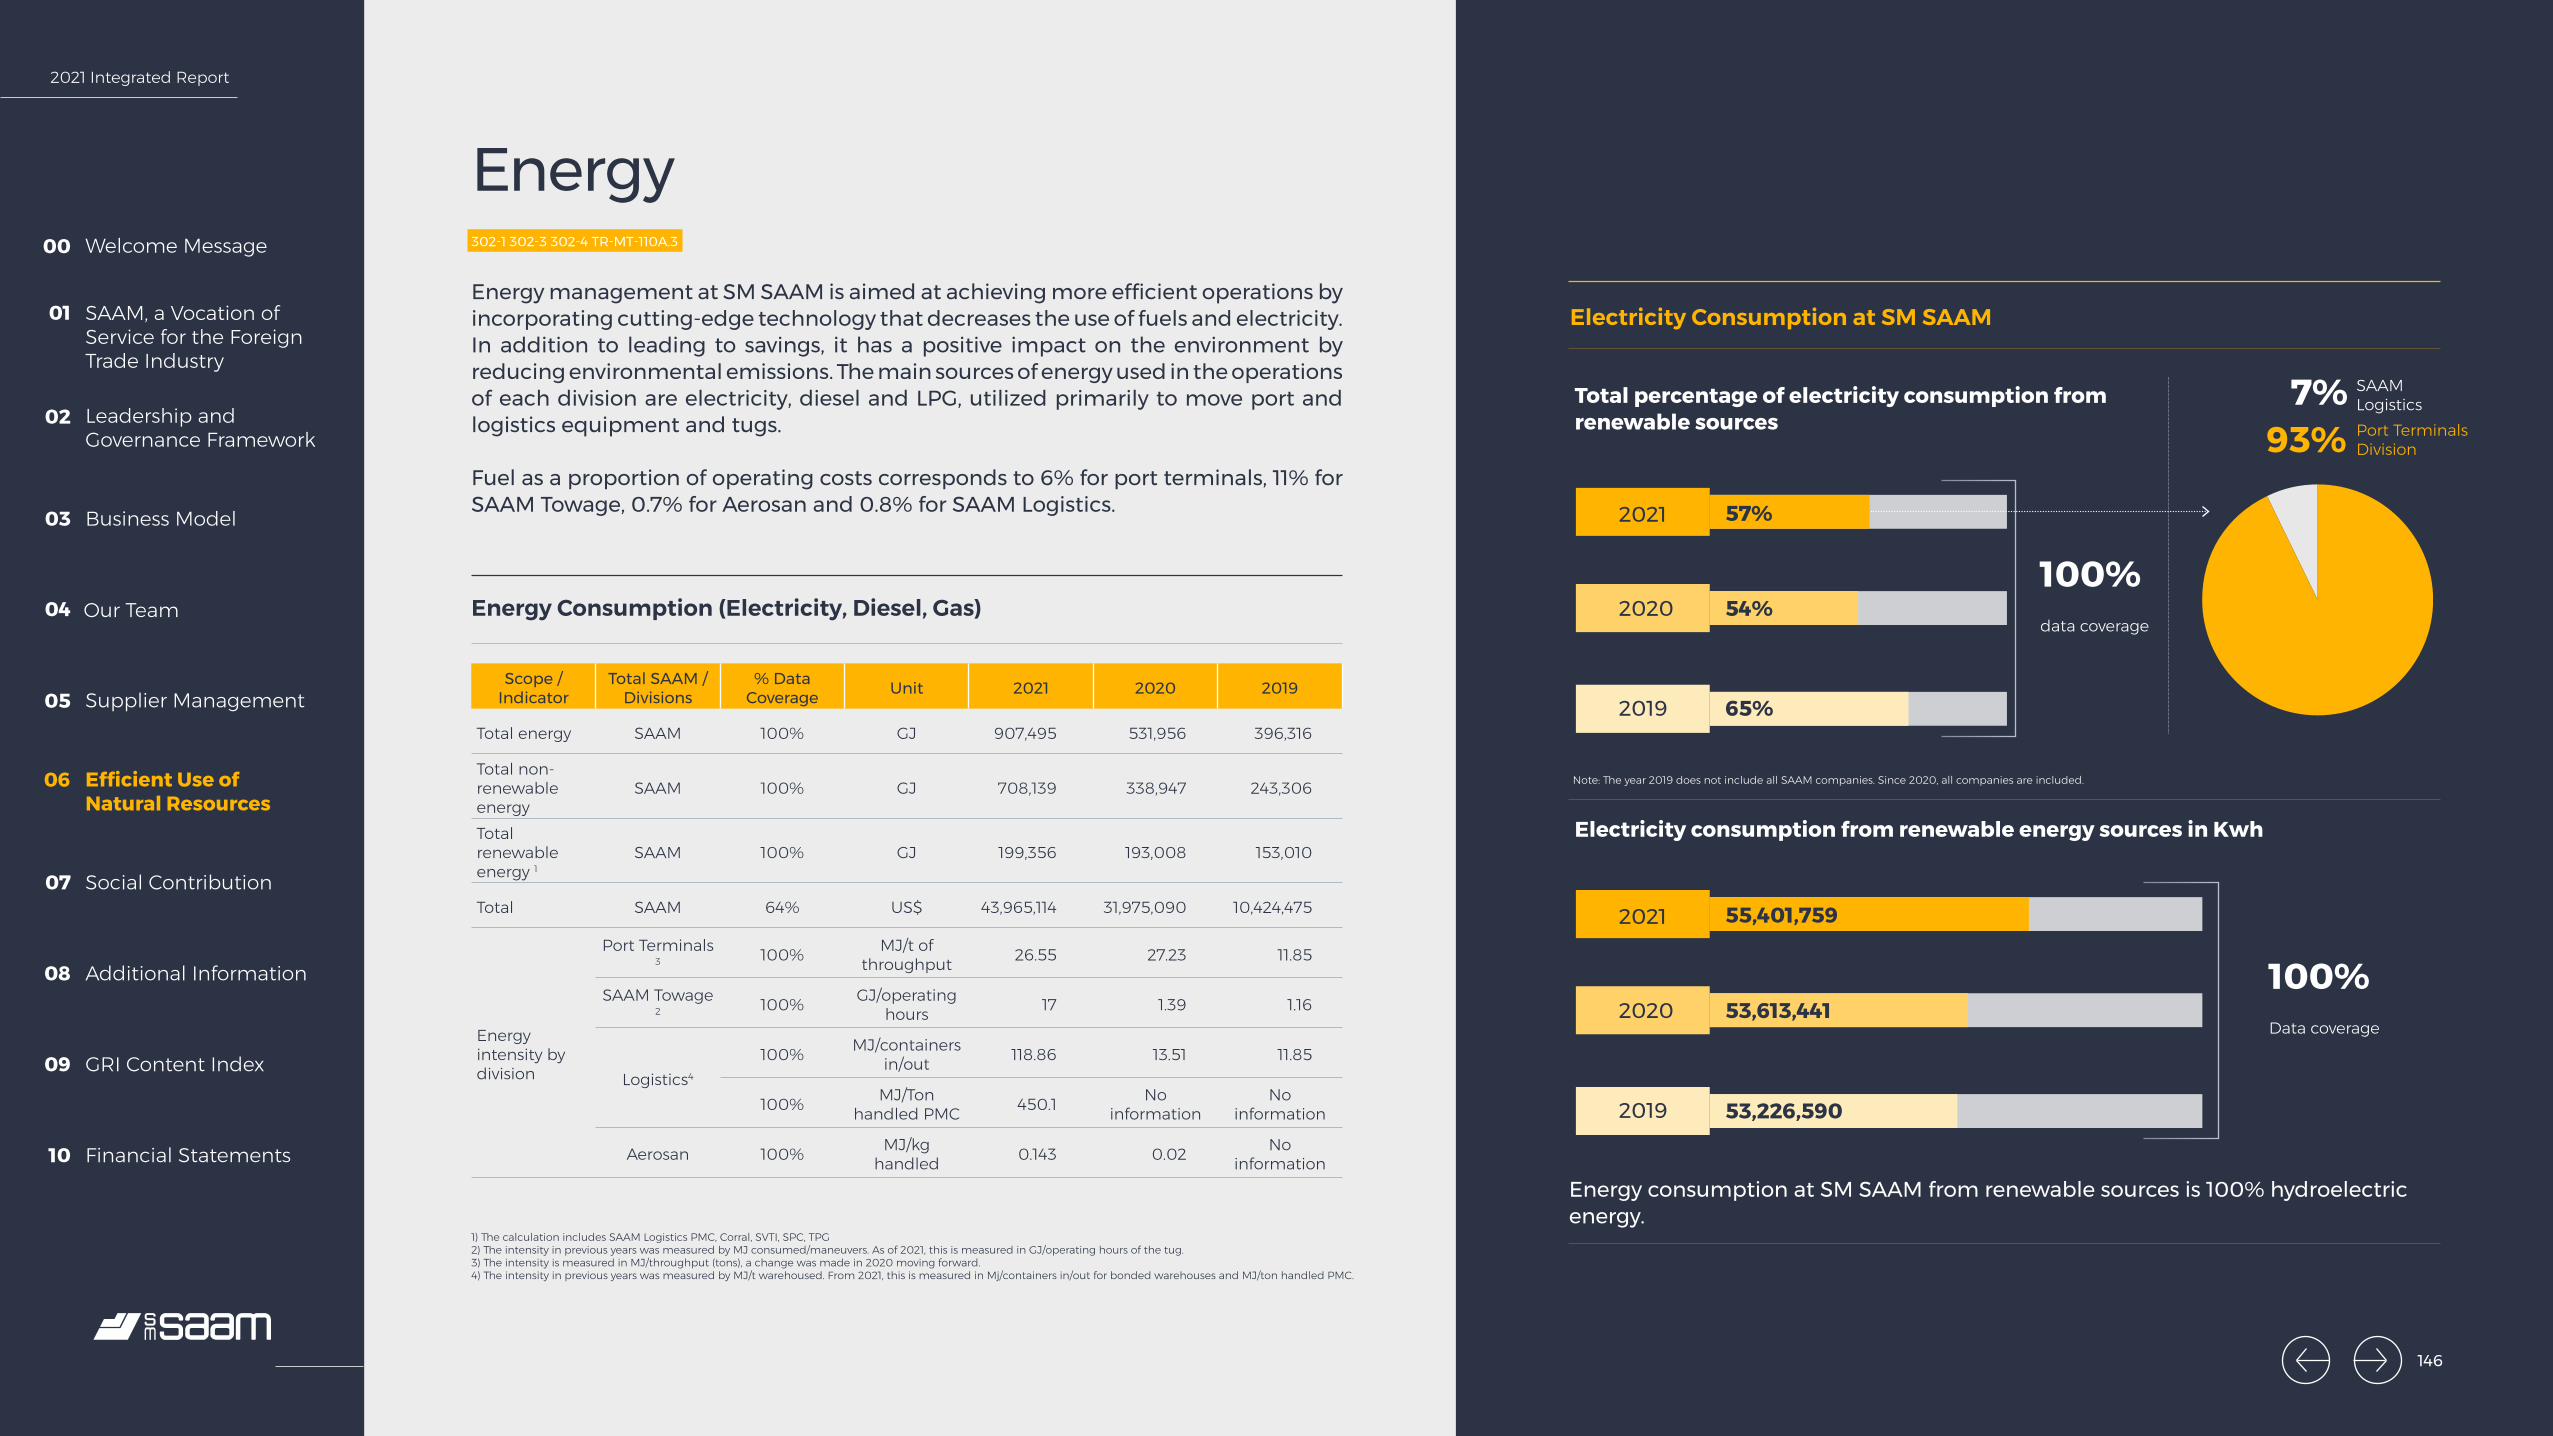
2021 Integrated Report
Welcome Message00
SAAM, a Vocation of Service for the Foreign Trade Industry
01
Leadership and Governance Framework
02
Business Model03
Our Team04
Supplier Management05
Efficient Use of Natural Resources
06
Social Contribution07
Additional Information08
GRI Content Index09
Financial Statements10
Energy302-1 302-3 302-4 TR-MT-110A.3
Energy management at SM SAAM is aimed at achieving more efficient operations by incorporating cutting-edge technology that decreases the use of fuels and electricity. In addition to leading to savings, it has a positive impact on the environment by reducing environmental emissions. The main sources of energy used in the operations of each division are electricity, diesel and LPG, utilized primarily to move port and logistics equipment and tugs.
Fuel as a proportion of operating costs corresponds to 6% for port terminals, 11% for SAAM Towage, 0.7% for Aerosan and 0.8% for SAAM Logistics.
Energy Consumption (Electricity, Diesel, Gas)
Scope / Indicator
Total SAAM / Divisions
% Data Coverage Unit 2021 2020 2019
Total energy SAAM 100% GJ 907,495 531,956 396,316
Total non-renewable energy
SAAM 100% GJ 708,139 338,947 243,306
Total renewable energy 1
SAAM 100% GJ 199,356 193,008 153,010
Total SAAM 64% US$ 43,965,114 31,975,090 10,424,475
Energy intensity by division
Port Terminals 3 100% MJ/t of
throughput 26.55 27.23 11.85
SAAM Towage 2 100% GJ/operating
hours 17 1.39 1.16
Logistics4 100% MJ/containers
in/out 118.86 13.51 11.85
100% MJ/Ton handled PMC 450.1 No
informationNo
information
Aerosan 100% MJ/kg handled 0.143 0.02 No
information
Electricity Consumption at SM SAAM
1) The calculation includes SAAM Logistics PMC, Corral, SVTI, SPC, TPG2) The intensity in previous years was measured by MJ consumed/maneuvers. As of 2021, this is measured in GJ/operating hours of the tug.3) The intensity is measured in MJ/throughput (tons), a change was made in 2020 moving forward.4) The intensity in previous years was measured by MJ/t warehoused. From 2021, this is measured in Mj/containers in/out for bonded warehouses and MJ/ton handled PMC.
Total percentage of electricity consumption from renewable sources
Electricity consumption from renewable energy sources in Kwh
2021
2021 55,401,759
2020
2020
54%
53,613,441
2019
2019
65%
53,226,590
data coverage
Data coverage
100%
100%
Energy consumption at SM SAAM from renewable sources is 100% hydroelectric energy.
Note: The year 2019 does not include all SAAM companies. Since 2020, all companies are included.
57%
Port Terminals Division
SAAM Logistics
93%7%
146

2021 Integrated Report
Welcome Message00
SAAM, a Vocation of Service for the Foreign Trade Industry
01
Leadership and Governance Framework
02
Business Model03
Our Team04
Supplier Management05
Efficient Use of Natural Resources
06
Social Contribution07
Additional Information08
GRI Content Index09
Financial Statements10
Water303-2 303-3 303-5
Water consumption at SM SAAM primarily comes from external suppliers. The main consumption is linked to equipment, facilities, truck and container washing. Domestic and operational actions implemented in the different divisions to reduce consumption include: installing flushometers in toilets to reduce flush water, controlling all bathrooms and showers to detect leaks and repair them immediately, installing timed or automatic faucets to prevent these being left open, conducting monthly reviews of water mains, valves and other elements to supply water to vessels to detect water leaks, and optimizing water used for washing to recirculate and recycle it.
In 2021, water consumption was 6% less than in 2020, thanks to the water efficiency initiatives implemented. Of all consumption, 75% corresponds to port terminals, 13% to towage and 12% to logistics.
Water Withdrawal and Consumption by Source (m3)
*The water used at SAAM establishments comes wholly from third-party sources, corresponding to potable water sanitation companies. There is no consumption of sur-face water, groundwater, sea water or water produced by the company because the facilities are in urban locations.
Water Withdrawal andConsumption by Source
% Data Cover-age Unit 2021 2020 2019
Third-party supply 100% m3 323,309 344,554 282,065Total 100% m3 323,309 344,554 282,065
On Course to 2022: Water Efficiency
In its Port Terminals and SAAM Logistics, SAAM has set the objective of measuring, controlling and establishing goals for water consumption as part of its environmental strategy. The year 2020 was set as a baseline and a comparative intensity exercise was conducted using 2020 and 2021 data, with the following results:
98,705 M3
Reduction at SAAM
2020 - 2021
Distribution of Reduction of Potable Water Consumption (liters)
% Reduction 2020-2021 by Division
56% SAAM Logistics
30,195
31% SAAM Logistics
22% Port Terminals
68,555
69% Port Terminals
26%2020 - 2021
147

2021 Integrated Report
Welcome Message00
SAAM, a Vocation of Service for the Foreign Trade Industry
01
Leadership and Governance Framework
02
Business Model03
Our Team04
Supplier Management05
Efficient Use of Natural Resources
06
Social Contribution07
Additional Information08
GRI Content Index09
Financial Statements10
% DataCoverage 1 Unit 2021 2020 2019
a. Total solid waste generated 86% kg 6,486,725 5,211,179 3,767,853
b. Total waste used, recycled or sold 86% kg 2,629,471 2,295,138 1,235,056
Total solid waste eliminated (a-b) 86% kg 3,857,254 2,916,041 2,532,797
Total percentage of waste recycled 86% kg 44% 44% 33%
Waste306-1 306-2 306-3 306-4 306-5 301-3
The nature of waste produced depends directly on the type of operation. It also depends on the type of port terminal. For example, waste could include food waste, wood, metal or other elements.
Total solid waste generated by SM SAAM in 2021 was 6,486,725 kg, up 19.6% from 2020. Although there was a 24% increase in the generation of non-hazardous solid waste as a consequence of greater activity in each division in a context of reactivating global trade, it is important to note that recycling in subsidiaries increased overall by 13%, which reaffirms the objectives laid out for recycling and the organization’s position to promote environmental protection.
The generation of liquid waste was 1,676,758 liters, which was 48% higher than the previous period.
11) The measurement in 2021 includes 9 terminals, 7 tugboat fleets and 2 logistics companies. The 2020 and 2019 measurement includes 8 terminals, 7 tugboat fleets and 2 logistics companies.
1: In 2020, there is no variation in the recycling intensity (kg recycled/ ton transferred)
Type of Waste Recycled
Metal and aluminum
Tires
Other
Plastics
Wood and paper
46%
4%
12%
5%
33%
2,629,471Kg
2021 Recycling
Distribution of Recycling (Kg)
% Recycling by Division in 2021
117,903
5% SAAM
Towage
14% SAAM
Towage
30,590
1% SAAM
Logistics
37% SAAM
Logistics
113,755
4% Aerosan
37% Aerosan
2,413,111
90% Port Terminals
Division
42% Port Terminals
Division
Circular Economy and Waste Management
44%of waste is recycled1
148
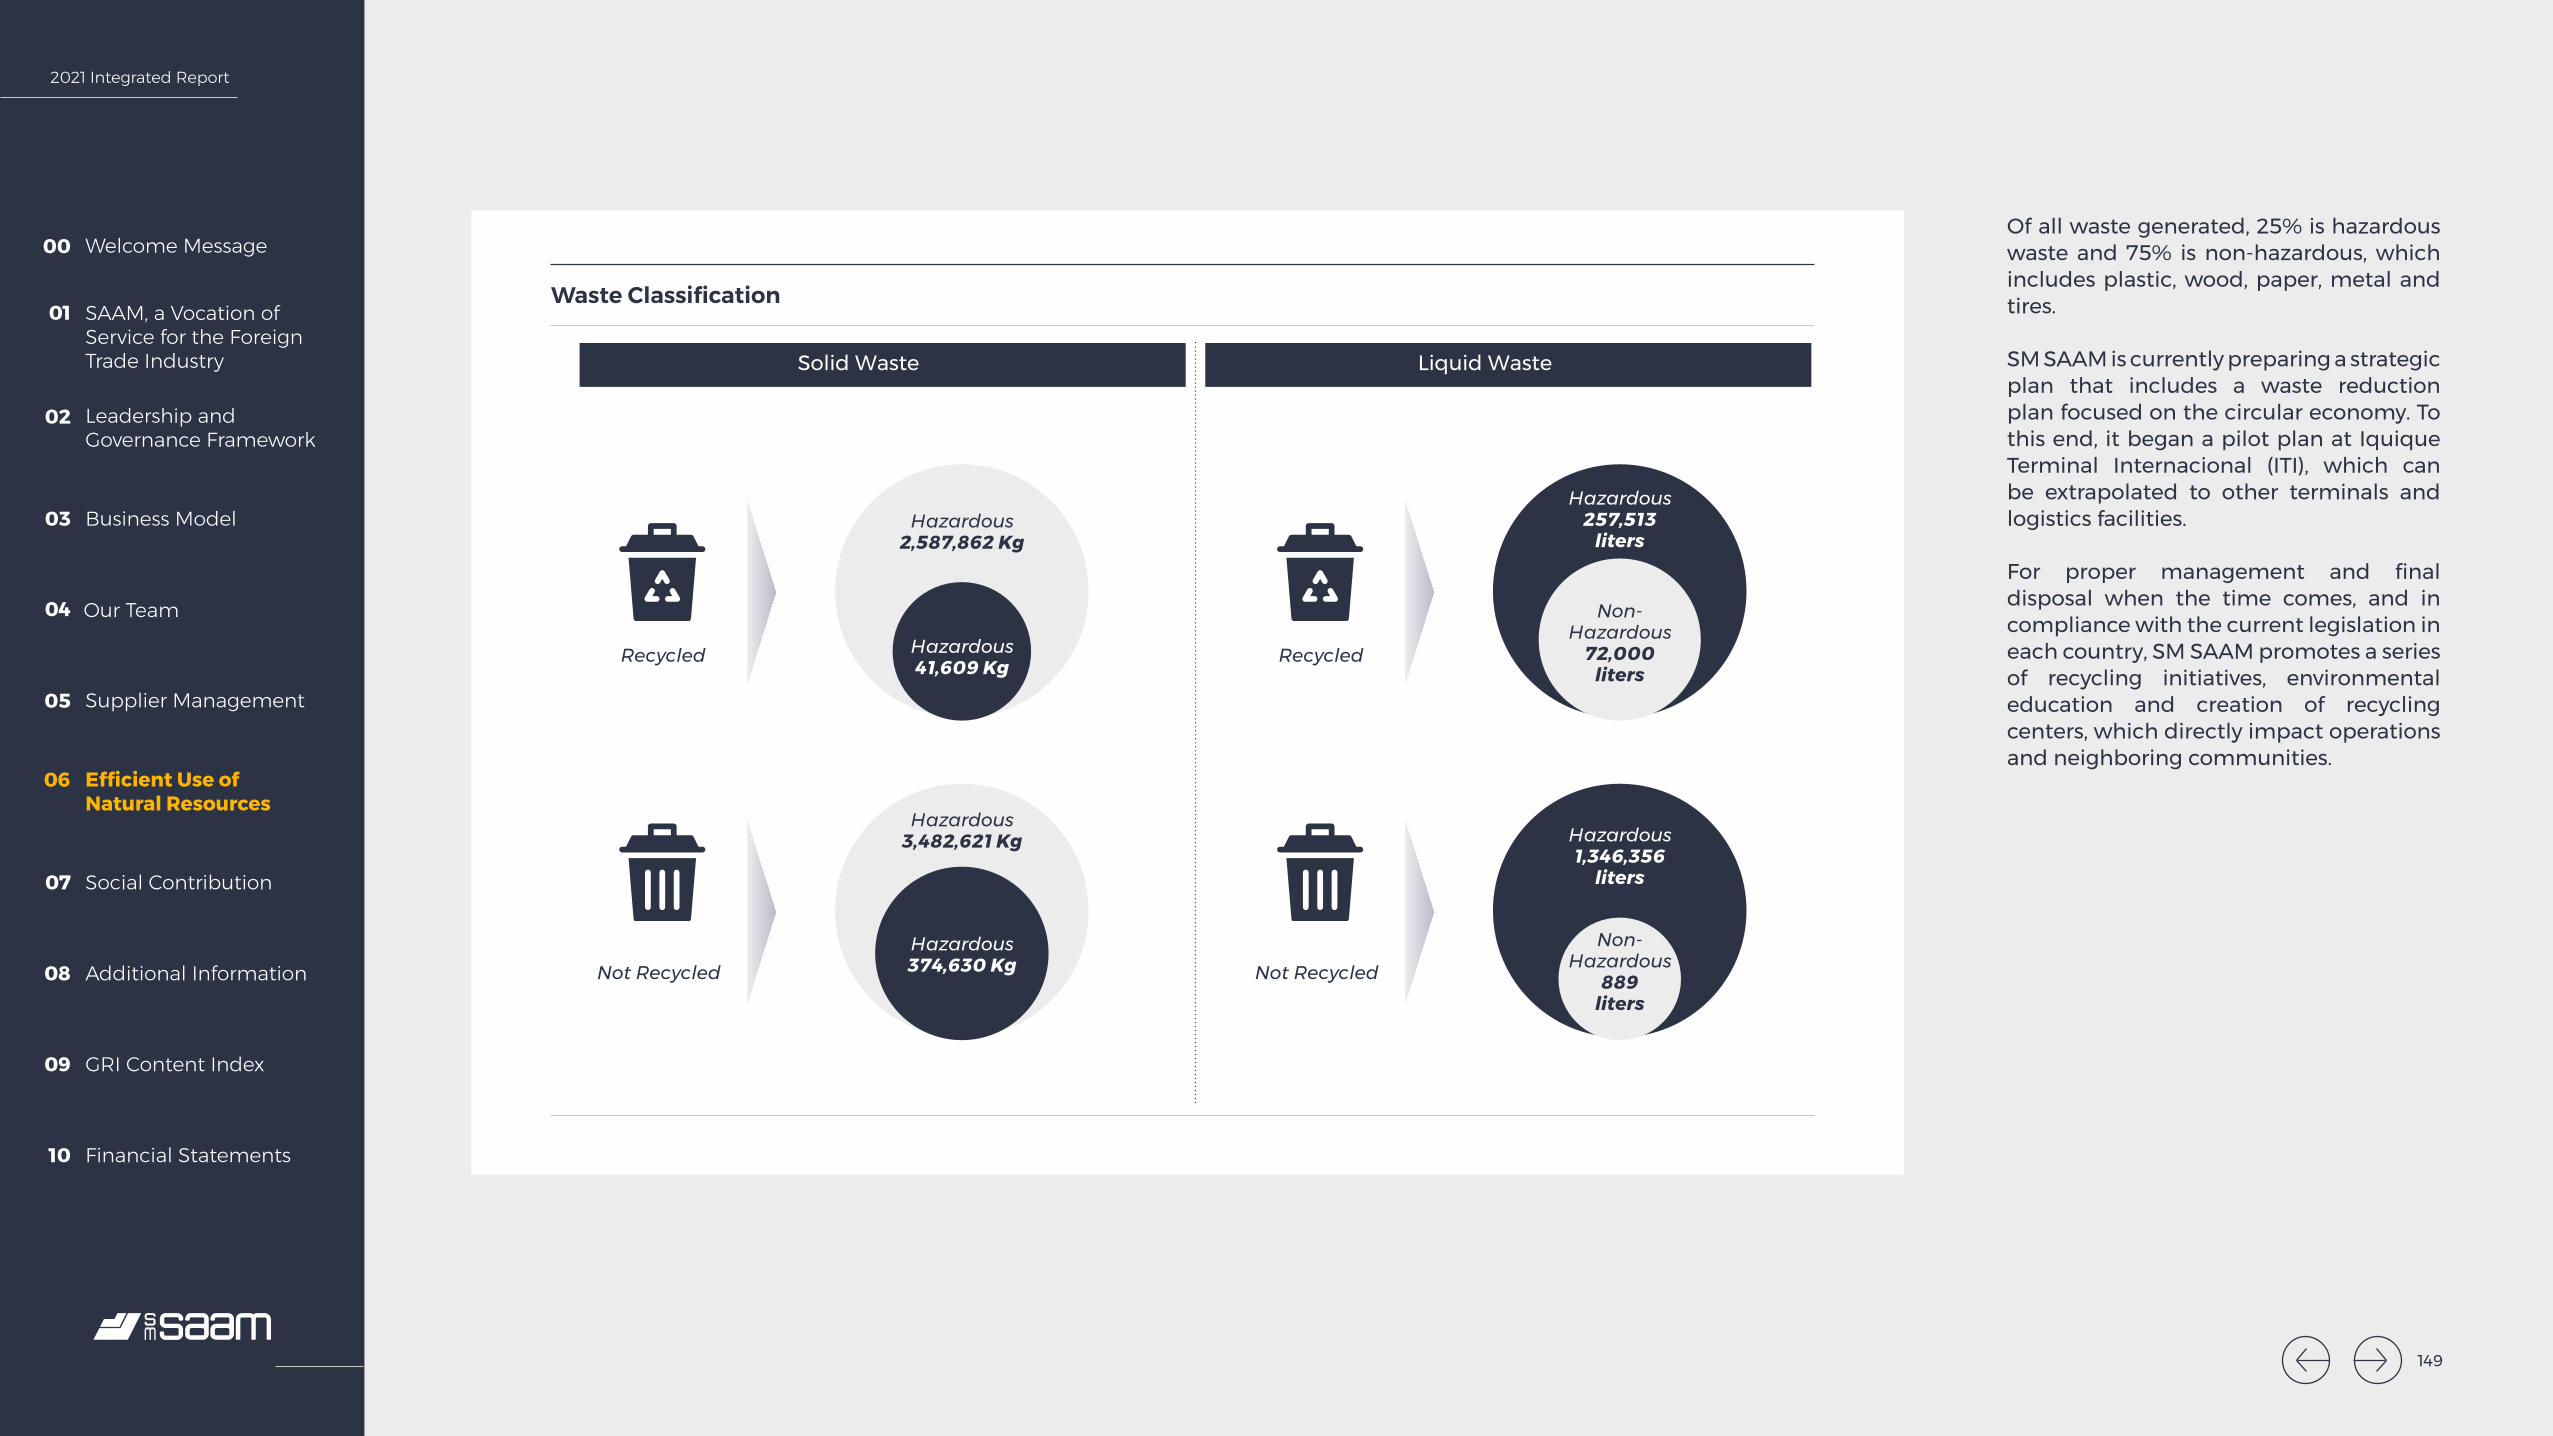
2021 Integrated Report
Welcome Message00
SAAM, a Vocation of Service for the Foreign Trade Industry
01
Leadership and Governance Framework
02
Business Model03
Our Team04
Supplier Management05
Efficient Use of Natural Resources
06
Social Contribution07
Additional Information08
GRI Content Index09
Financial Statements10
Of all waste generated, 25% is hazardous waste and 75% is non-hazardous, which includes plastic, wood, paper, metal and tires.
SM SAAM is currently preparing a strategic plan that includes a waste reduction plan focused on the circular economy. To this end, it began a pilot plan at Iquique Terminal Internacional (ITI), which can be extrapolated to other terminals and logistics facilities.
For proper management and final disposal when the time comes, and in compliance with the current legislation in each country, SM SAAM promotes a series of recycling initiatives, environmental education and creation of recycling centers, which directly impact operations and neighboring communities.
41.609 Kg
2.587.862 Kg
374.630 Kg
3.482.621 Kg
257.513litros 72.000
litros
1.346.356litros
889litros
Solid Waste
Peligrosos No Peligrosos Peligrosos No Peligrosos Peligrosos No Peligrosos Peligrosos No Peligrosos
Liquid Waste
Residuos sólidos reciclados Residuos sólidos no reciclados Residuos líquidos reciclados Residuos líquidos no reciclados
! !
!
!
Waste Classification
Hazardous41,609 Kg
Hazardous2,587,862 Kg
Non-Hazardous
72,000 liters
Hazardous257,513
liters
Non-Hazardous
889 liters
Hazardous1,346,356
liters
Hazardous374,630 Kg
Hazardous3,482,621 Kg
Not Recycled Not Recycled
Recycled Recycled
149
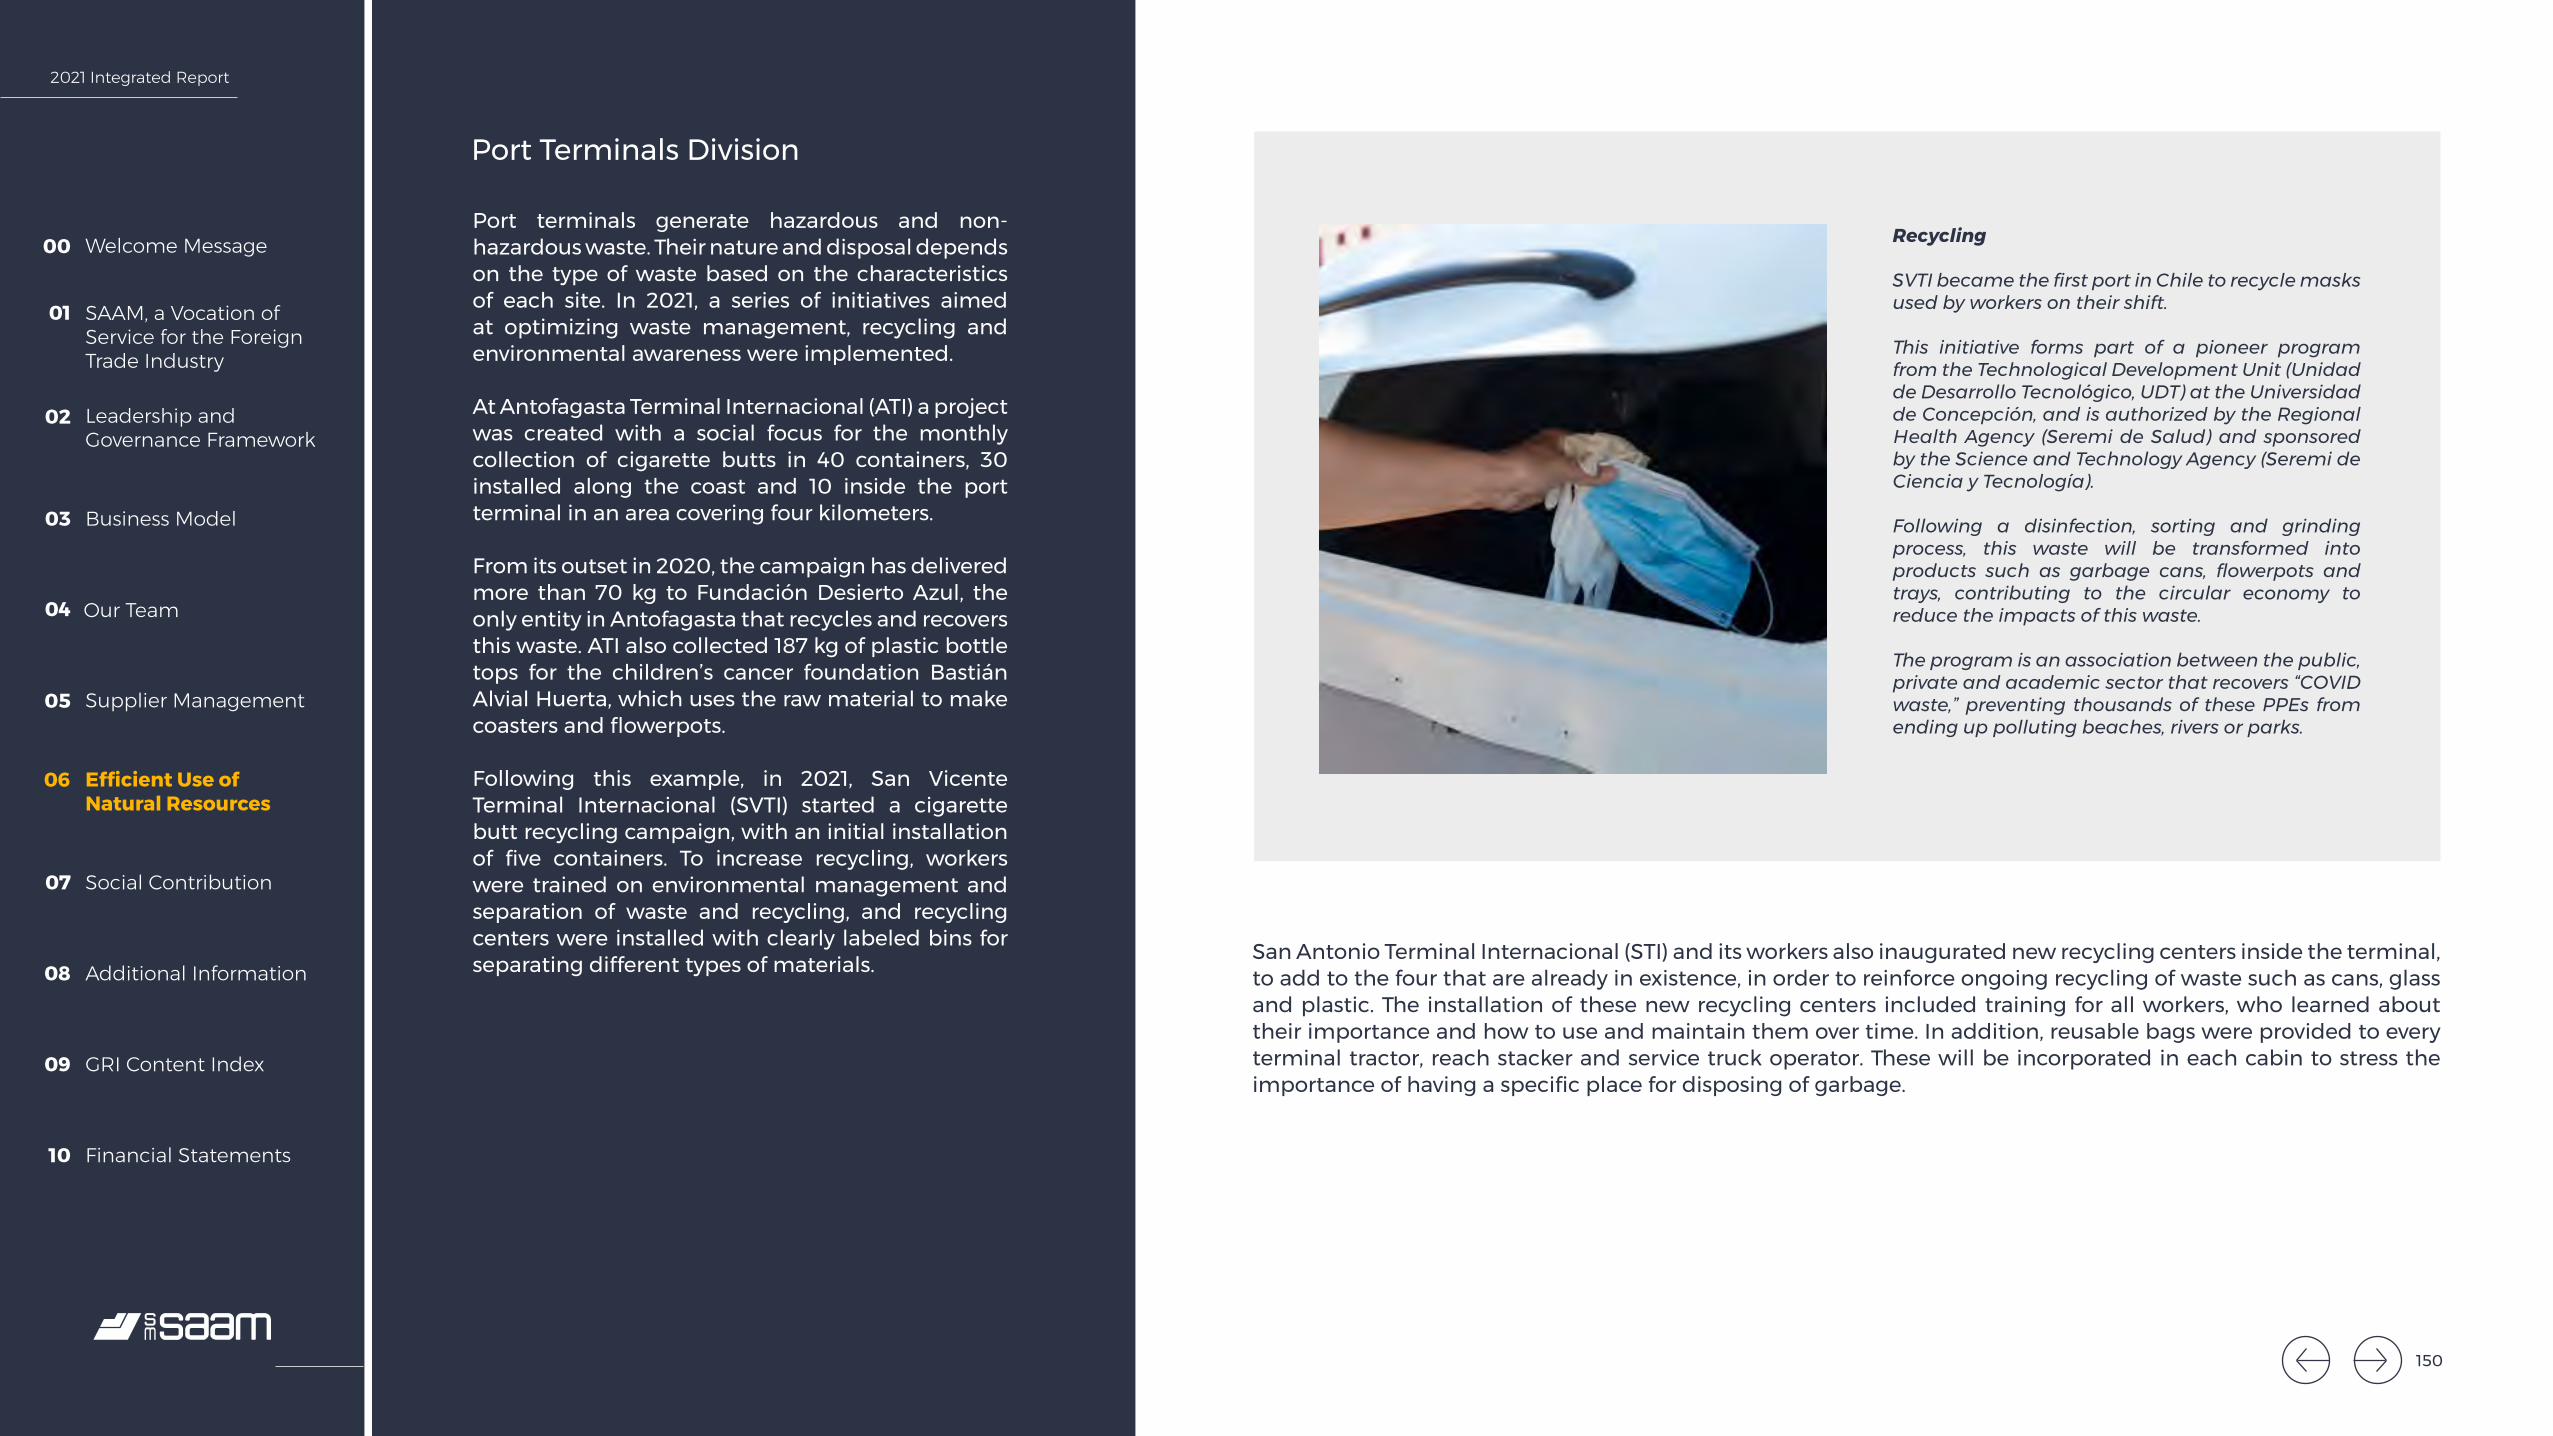
2021 Integrated Report
Welcome Message00
SAAM, a Vocation of Service for the Foreign Trade Industry
01
Leadership and Governance Framework
02
Business Model03
Our Team04
Supplier Management05
Efficient Use of Natural Resources
06
Social Contribution07
Additional Information08
GRI Content Index09
Financial Statements10
Port Terminals Division
Port terminals generate hazardous and non-hazardous waste. Their nature and disposal depends on the type of waste based on the characteristics of each site. In 2021, a series of initiatives aimed at optimizing waste management, recycling and environmental awareness were implemented.
At Antofagasta Terminal Internacional (ATI) a project was created with a social focus for the monthly collection of cigarette butts in 40 containers, 30 installed along the coast and 10 inside the port terminal in an area covering four kilometers.
From its outset in 2020, the campaign has delivered more than 70 kg to Fundación Desierto Azul, the only entity in Antofagasta that recycles and recovers this waste. ATI also collected 187 kg of plastic bottle tops for the children’s cancer foundation Bastián Alvial Huerta, which uses the raw material to make coasters and flowerpots.
Following this example, in 2021, San Vicente Terminal Internacional (SVTI) started a cigarette butt recycling campaign, with an initial installation of five containers. To increase recycling, workers were trained on environmental management and separation of waste and recycling, and recycling centers were installed with clearly labeled bins for separating different types of materials.San Vicente Terminal Internacional, Pioneer in Mask
Recycling
SVTI became the first port in Chile to recycle masks used by workers on their shift.
This initiative forms part of a pioneer program from the Technological Development Unit (Unidad de Desarrollo Tecnológico, UDT) at the Universidad de Concepción, and is authorized by the Regional Health Agency (Seremi de Salud) and sponsored by the Science and Technology Agency (Seremi de Ciencia y Tecnología).
Following a disinfection, sorting and grinding process, this waste will be transformed into products such as garbage cans, flowerpots and trays, contributing to the circular economy to reduce the impacts of this waste.
The program is an association between the public, private and academic sector that recovers “COVID waste,” preventing thousands of these PPEs from ending up polluting beaches, rivers or parks.
San Antonio Terminal Internacional (STI) and its workers also inaugurated new recycling centers inside the terminal, to add to the four that are already in existence, in order to reinforce ongoing recycling of waste such as cans, glass and plastic. The installation of these new recycling centers included training for all workers, who learned about their importance and how to use and maintain them over time. In addition, reusable bags were provided to every terminal tractor, reach stacker and service truck operator. These will be incorporated in each cabin to stress the importance of having a specific place for disposing of garbage.Progress in Circular Economy in Iquique Terminal Internacional
150
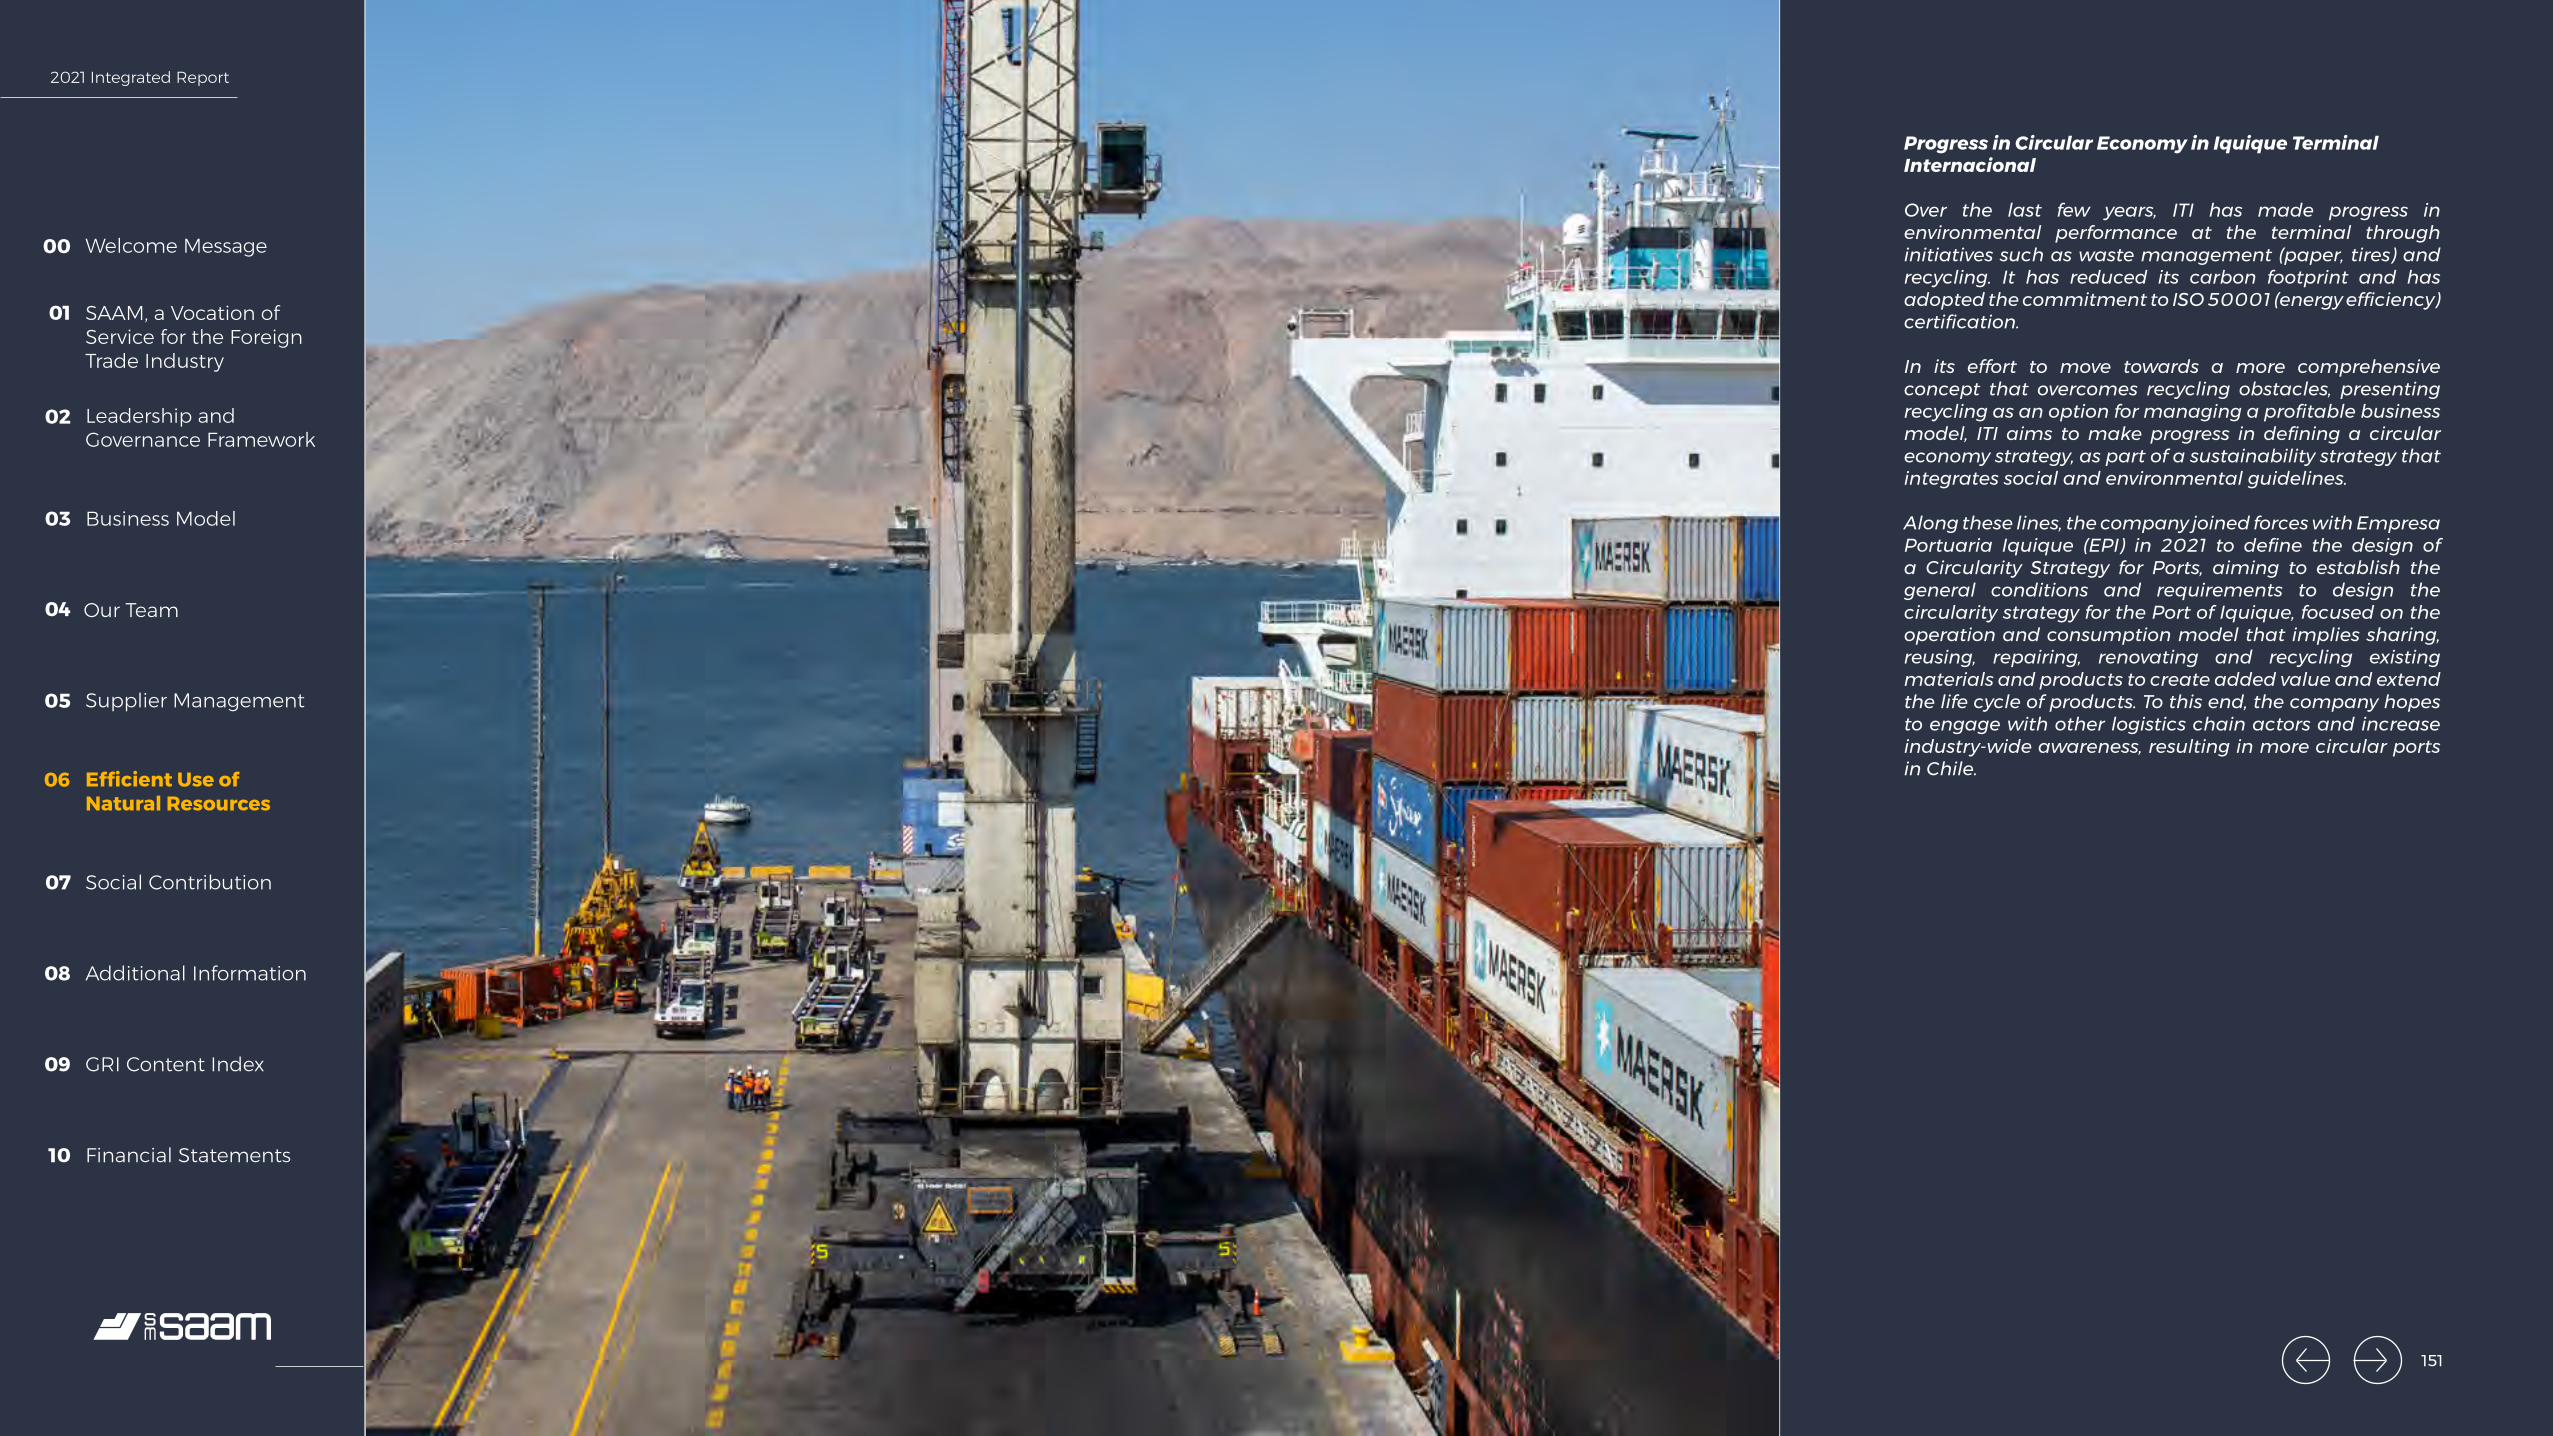
2021 Integrated Report
Welcome Message00
SAAM, a Vocation of Service for the Foreign Trade Industry
01
Leadership and Governance Framework
02
Business Model03
Our Team04
Supplier Management05
Efficient Use of Natural Resources
06
Social Contribution07
Additional Information08
GRI Content Index09
Financial Statements10
Progress in Circular Economy in Iquique Terminal Internacional
Over the last few years, ITI has made progress in environmental performance at the terminal through initiatives such as waste management (paper, tires) and recycling. It has reduced its carbon footprint and has adopted the commitment to ISO 50001 (energy efficiency) certification.
In its effort to move towards a more comprehensive concept that overcomes recycling obstacles, presenting recycling as an option for managing a profitable business model, ITI aims to make progress in defining a circular economy strategy, as part of a sustainability strategy that integrates social and environmental guidelines.
Along these lines, the company joined forces with Empresa Portuaria Iquique (EPI) in 2021 to define the design of a Circularity Strategy for Ports, aiming to establish the general conditions and requirements to design the circularity strategy for the Port of Iquique, focused on the operation and consumption model that implies sharing, reusing, repairing, renovating and recycling existing materials and products to create added value and extend the life cycle of products. To this end, the company hopes to engage with other logistics chain actors and increase industry-wide awareness, resulting in more circular ports in Chile.
151
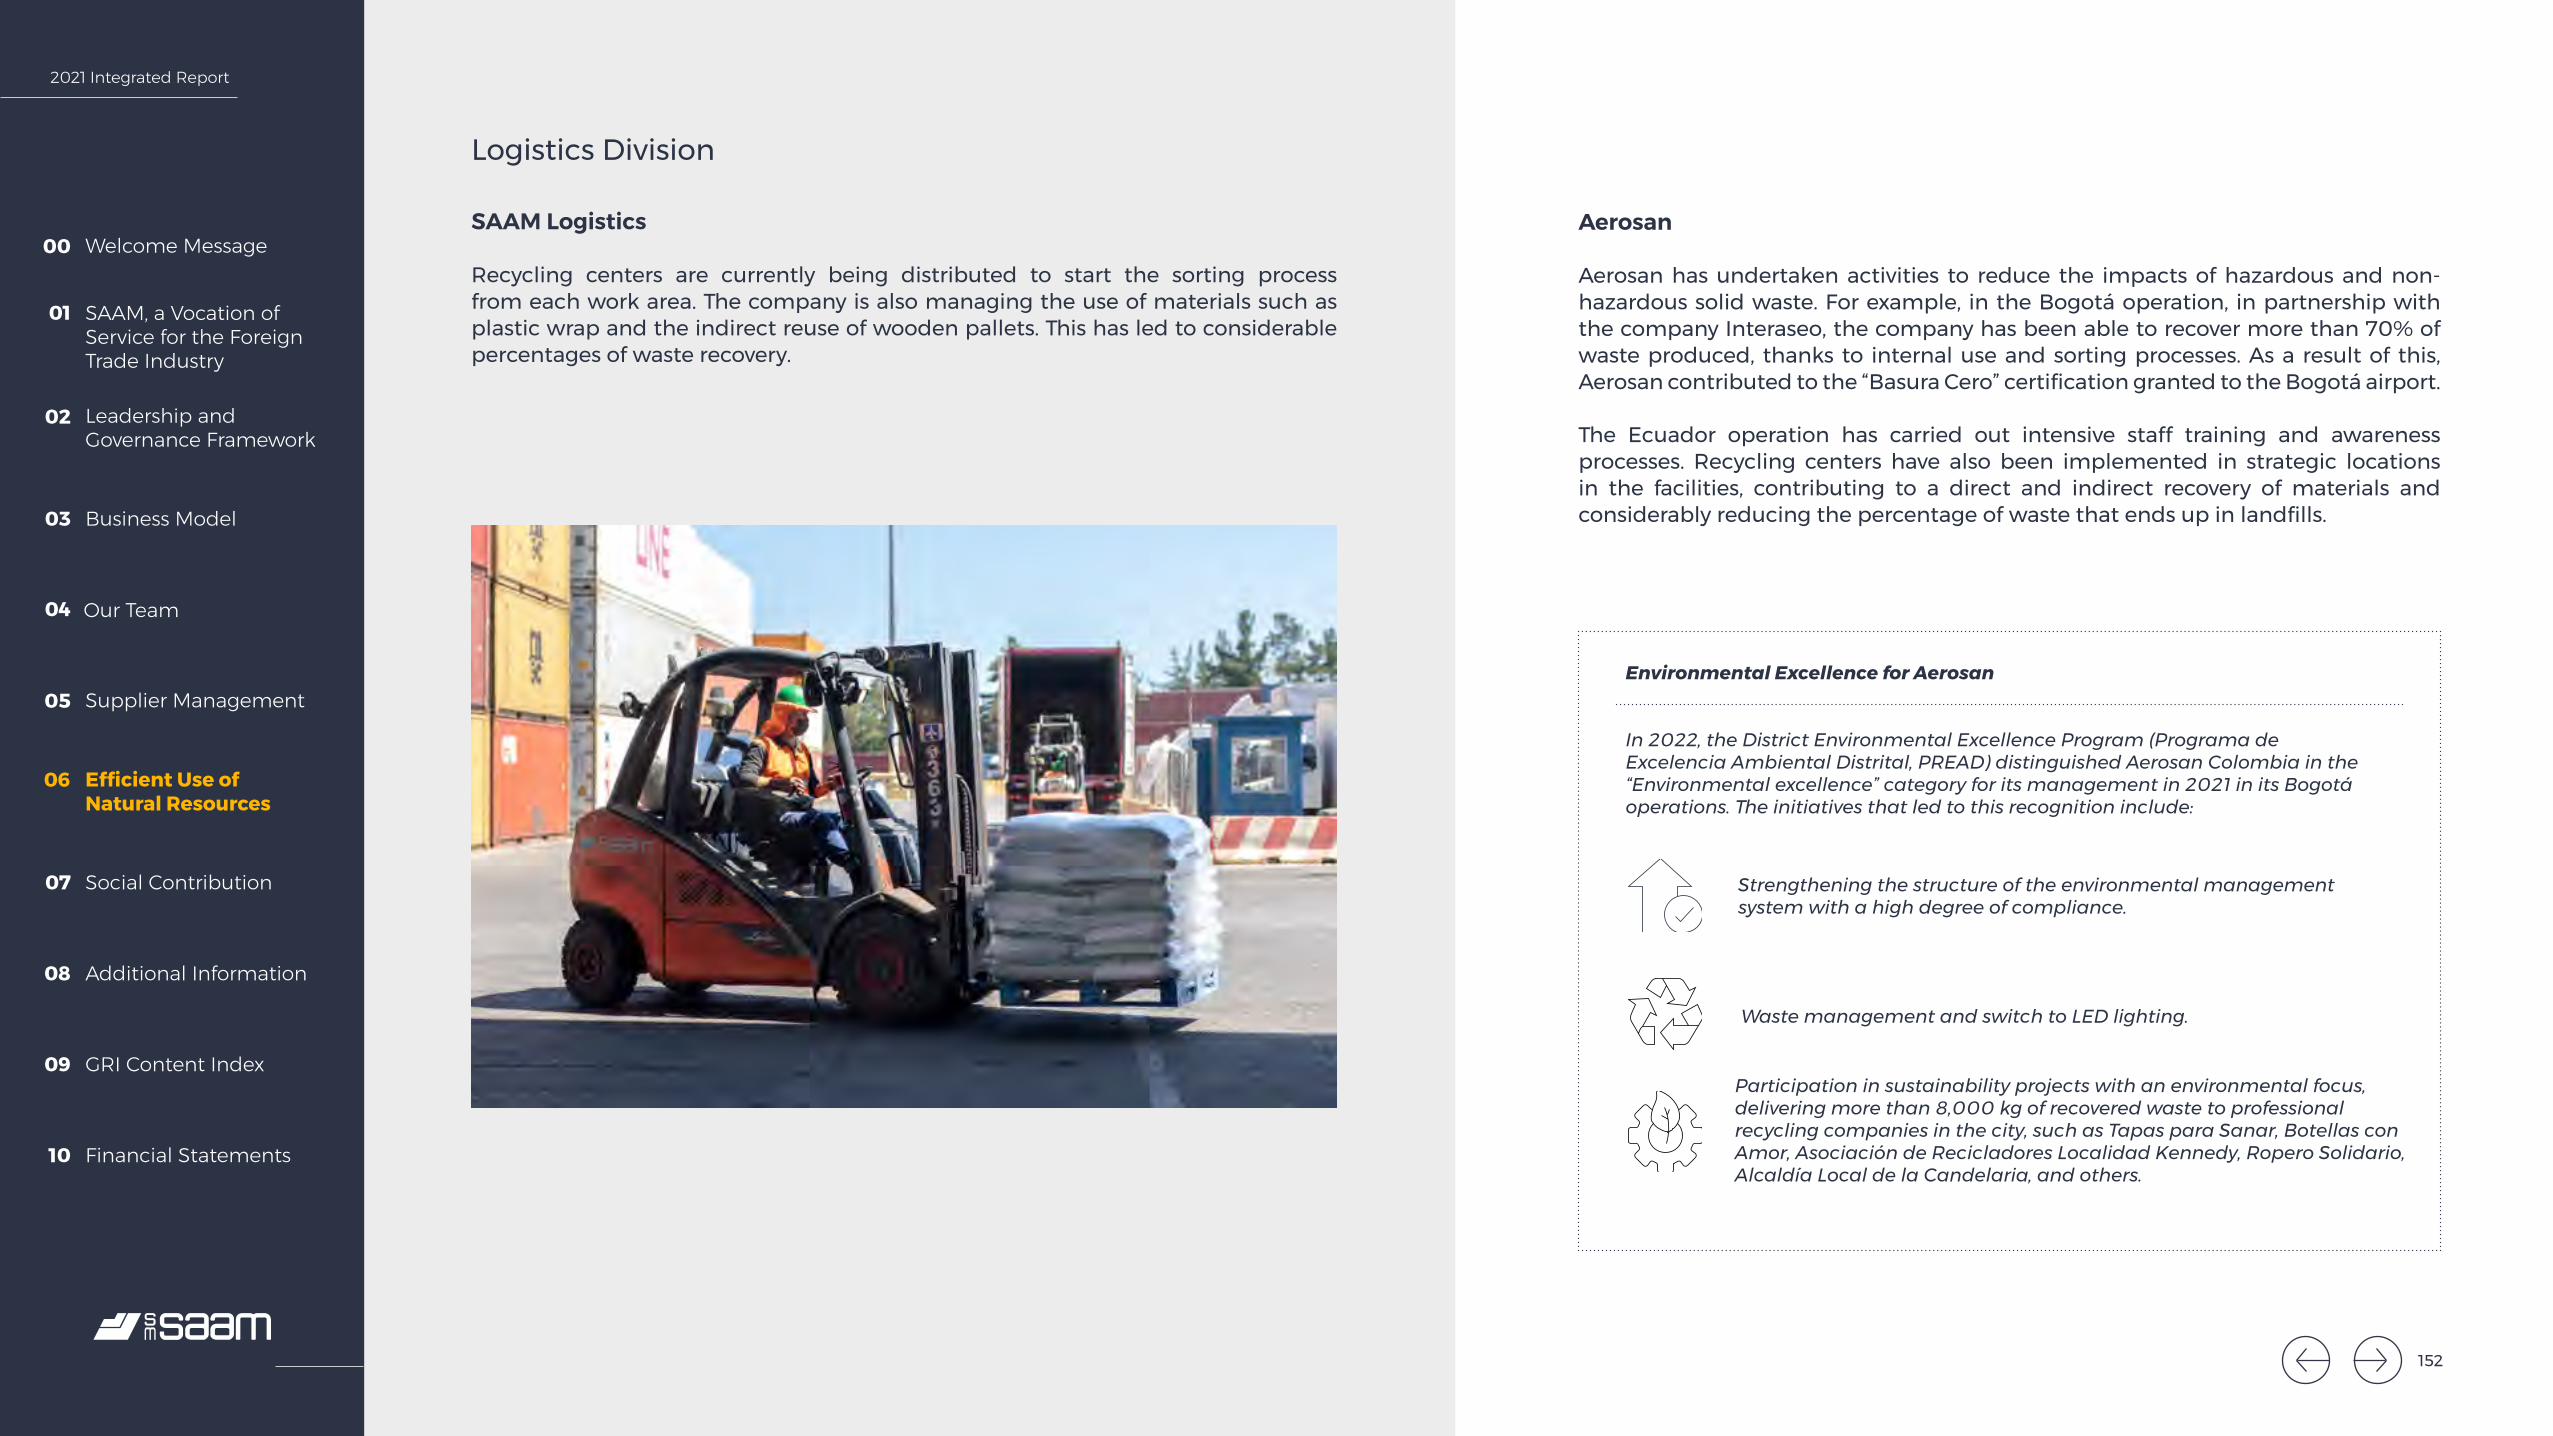
2021 Integrated Report
Welcome Message00
SAAM, a Vocation of Service for the Foreign Trade Industry
01
Leadership and Governance Framework
02
Business Model03
Our Team04
Supplier Management05
Efficient Use of Natural Resources
06
Social Contribution07
Additional Information08
GRI Content Index09
Financial Statements10
Logistics Division
SAAM Logistics
Recycling centers are currently being distributed to start the sorting process from each work area. The company is also managing the use of materials such as plastic wrap and the indirect reuse of wooden pallets. This has led to considerable percentages of waste recovery.
Aerosan
Aerosan has undertaken activities to reduce the impacts of hazardous and non-hazardous solid waste. For example, in the Bogotá operation, in partnership with the company Interaseo, the company has been able to recover more than 70% of waste produced, thanks to internal use and sorting processes. As a result of this, Aerosan contributed to the “Basura Cero” certification granted to the Bogotá airport.
The Ecuador operation has carried out intensive staff training and awareness processes. Recycling centers have also been implemented in strategic locations in the facilities, contributing to a direct and indirect recovery of materials and considerably reducing the percentage of waste that ends up in landfills.
Environmental Excellence for Aerosan
In 2022, the District Environmental Excellence Program (Programa de Excelencia Ambiental Distrital, PREAD) distinguished Aerosan Colombia in the “Environmental excellence” category for its management in 2021 in its Bogotá operations. The initiatives that led to this recognition include:
Strengthening the structure of the environmental management system with a high degree of compliance.
Waste management and switch to LED lighting.
Participation in sustainability projects with an environmental focus, delivering more than 8,000 kg of recovered waste to professional recycling companies in the city, such as Tapas para Sanar, Botellas con Amor, Asociación de Recicladores Localidad Kennedy, Ropero Solidario, Alcaldía Local de la Candelaria, and others.
152

2021 Integrated Report
Welcome Message00
SAAM, a Vocation of Service for the Foreign Trade Industry
01
Leadership and Governance Framework
02
Business Model03
Our Team04
Supplier Management05
Efficient Use of Natural Resources
06
Social Contribution07
Additional Information08
GRI Content Index09
Financial Statements10
Biodiversity304-1 304-2
Each of the divisions of SM SAAM contributes to the protection of biodiversity, taking measures to ensure it does not negatively impact local flora and fauna, mainly different bird or marine animal species that may be affected by the operations. Each facility places emphasis on protecting the environment, an aspect that is present in the respective environmental impact and risk matrices, primarily in protected areas or areas with endangered fauna. Steps are taken to avoid affecting marine species through preventive measures and also to implement measures in response to specific incidents. For example, if cetaceans are sighted, tug captains must notify maritime authorities.
Some port terminals are located close to environmentally protected areas. For example, Puerto Caldera in Costa Rica is close to Tivives (although it falls outside its area of interest), which is considered to be the last representative bastion of tropical dry forest in existence in the South Pacific zone. The wharf at Terminal Portuario de Guayaquil (TPG) in Ecuador is near the protected area of Manglares El Salado, a productive fauna reserve. To operate in the Guayas River, TPG has different environmental compliance strategies and an emergency plan that details actions to take in response to an environmental event. Above all, it takes preventive safety measures in its operations to prevent incidents. In Chile, the Portuaria Corral operation is near areas classified as special tourism zones. The primary potential impact of Portuaria Corral is associated with chip spillage, and there are a series of preventive measures in place, such as cleaning shores after each shipment or the use of tarps for river transport.
The operating centers in the SAAM Towage Division are not located in protected areas or areas with high biodiversity value, and operations are predominantly in port areas, which have already been altered by mankind. Operations are carried out in strict adherence to local standards and specific procedures to reduce environmental risk. Updated nautical charts are used for travel between ports to avoid sailing through protected or conservation areas. However, in both Ecuador and Mexico, ships sail through areas close to protected zones (mangroves and coral reefs, respectively). These vessels have environmental permits for this and emergency plans or calls to action, which are practiced through drills throughout the year to ensure a swift and effective response when an incident occurs.
The SAAM Logistics and Aerosan facilities are located in areas with considerable human intervention and therefore do not represent a hazard to biodiversity. As with the other companies, these subsidiaries also have environmental impact and risk matrices to evaluate environmental aspects and determine solutions when breaches occur.
In 2021, there were no incidents in company operations that had any significant effect on biodiversity, nor were any fines or penalties applied. Iquique Terminal Internacional reported a sighting of a wounded kelp gull. This led to a rescue operation, medical treatment and transfer to the rescue center authorized by the Agriculture and Livestock Service (SAG) in Antofagasta for its rehabilitation.
153
2021 Integrated Report
Welcome Message00
SAAM, a Vocation of Service for the Foreign Trade Industry
01
Leadership and Governance Framework
02
Business Model03
Our Team04
Supplier Management05
Efficient Use of Natural Resources
06
Social Contribution07
Additional Information08
GRI Content Index09
Financial Statements10
154
07.Social Contribution
154
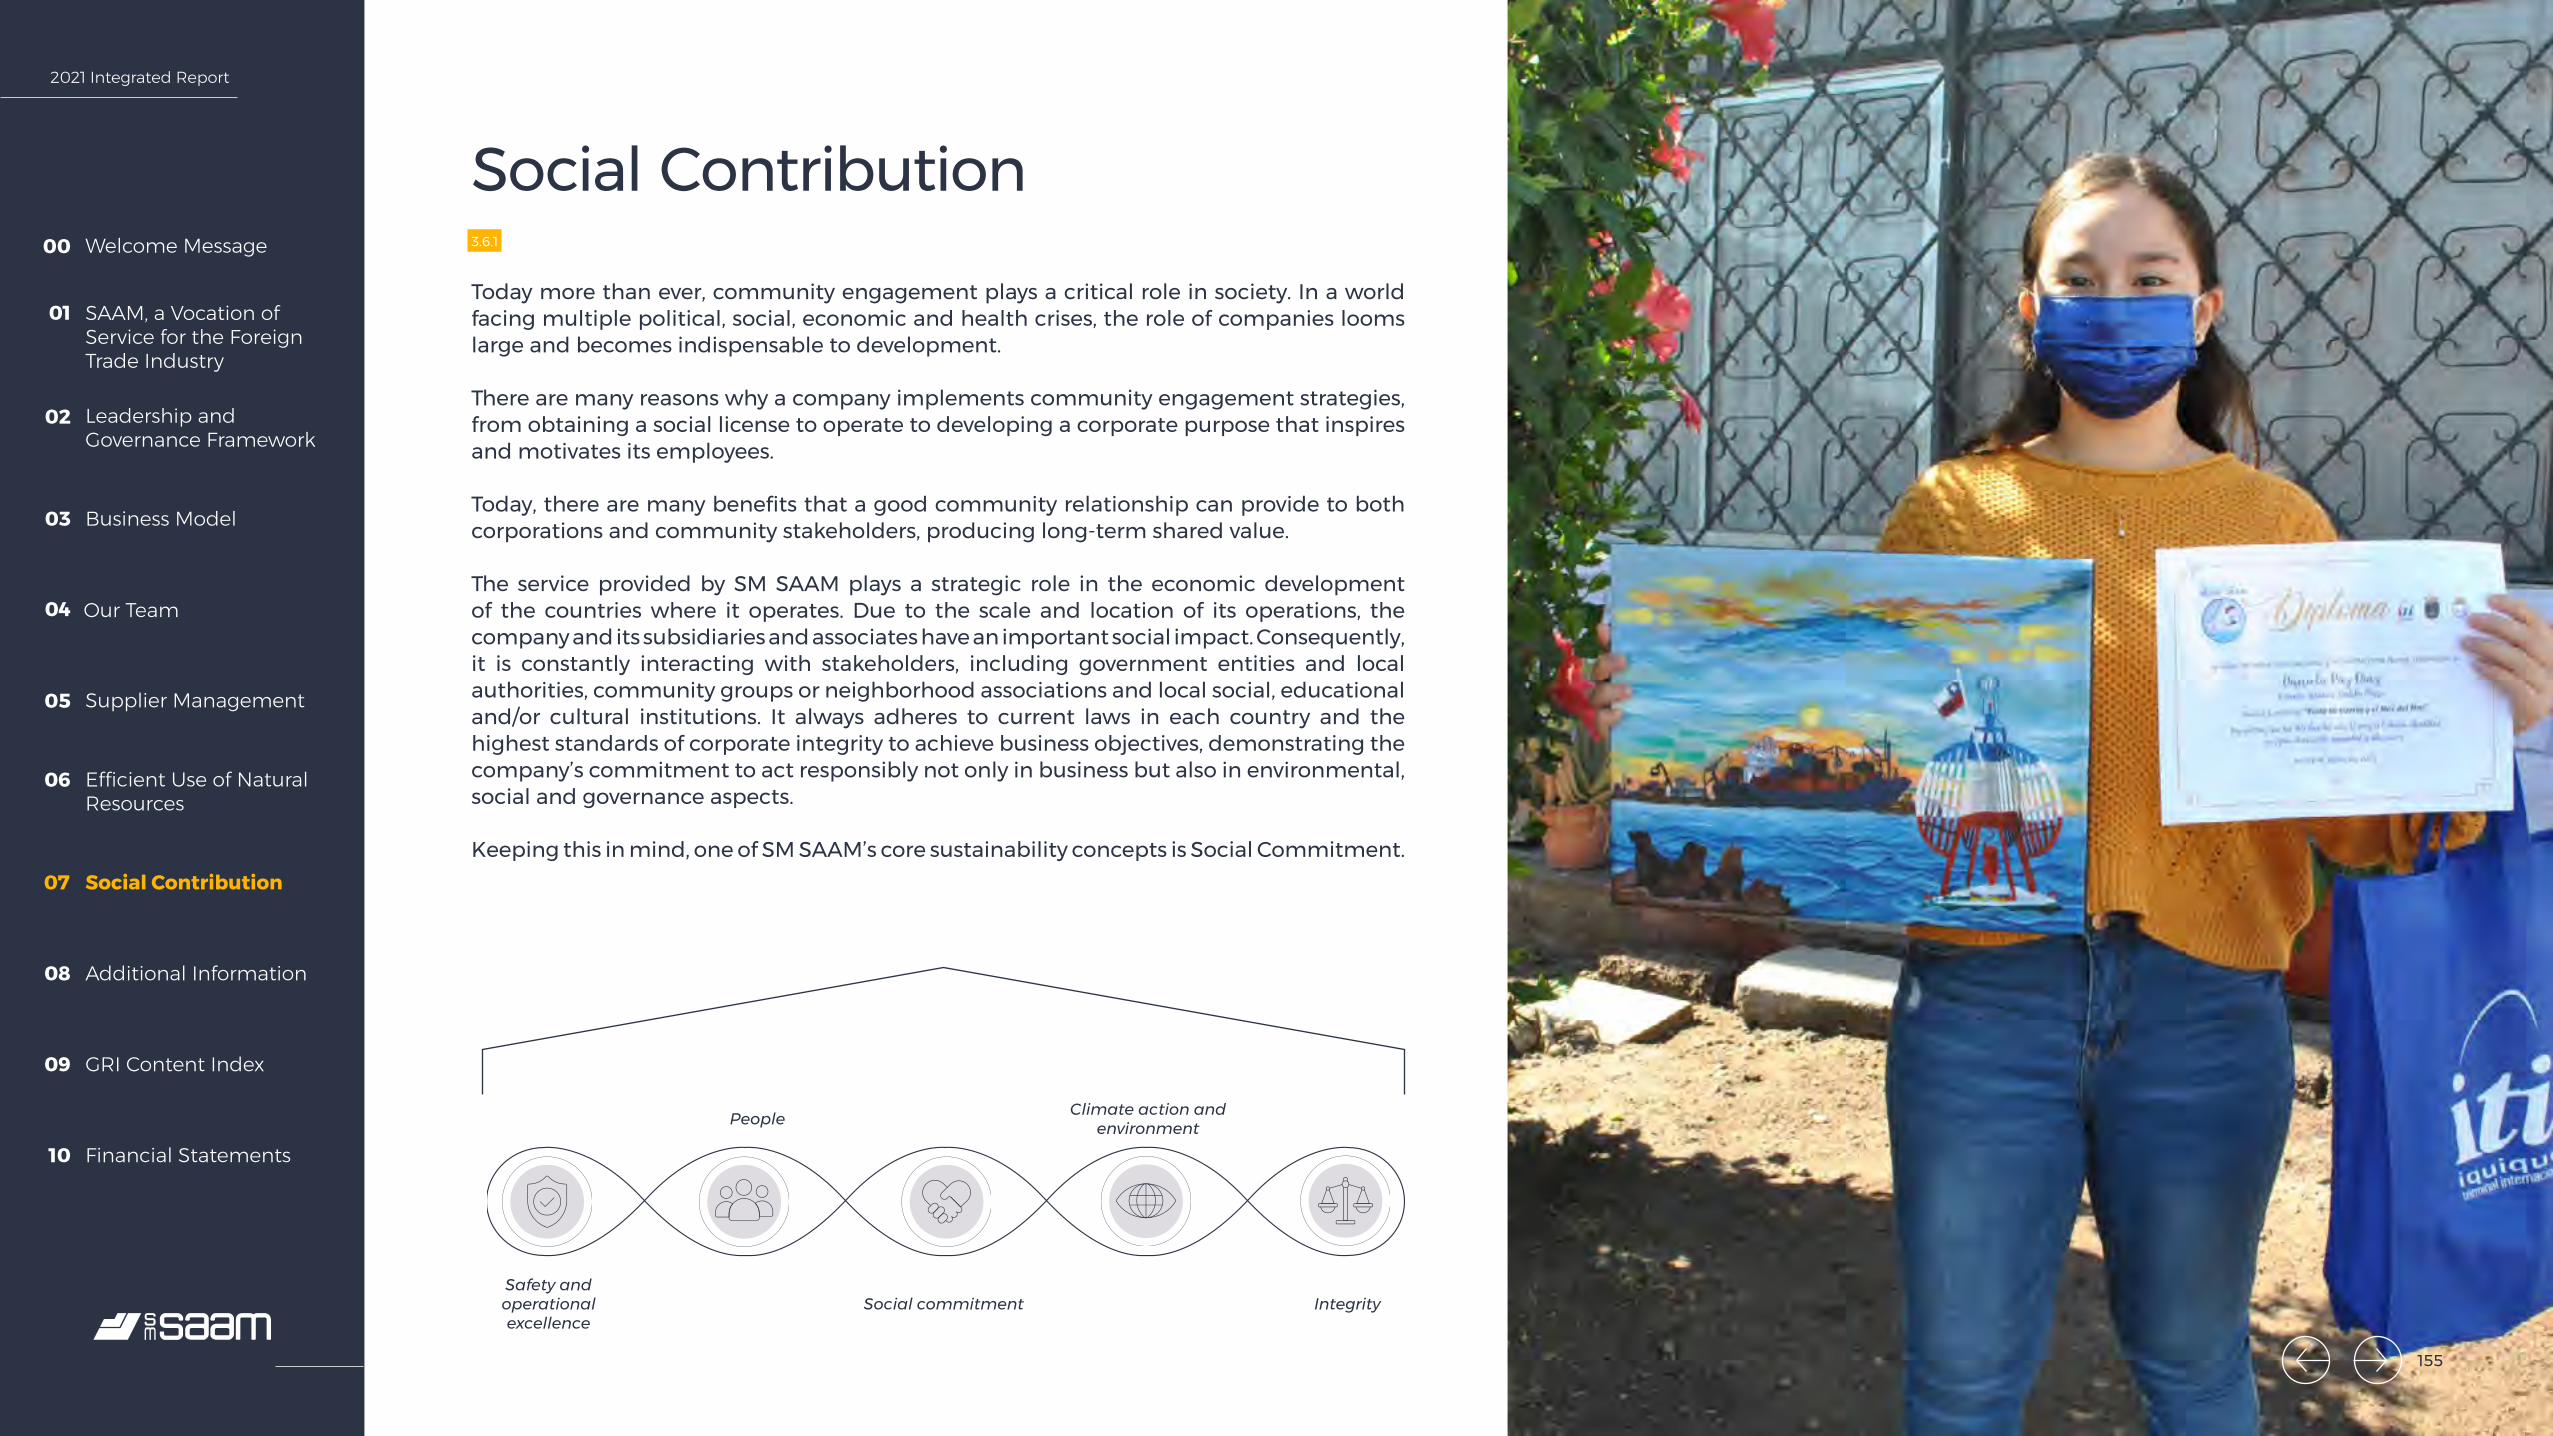
2021 Integrated Report
Welcome Message00
SAAM, a Vocation of Service for the Foreign Trade Industry
01
Leadership and Governance Framework
02
Business Model03
Our Team04
Supplier Management05
Efficient Use of Natural Resources
06
Social Contribution07
Additional Information08
GRI Content Index09
Financial Statements10
Social Contribution3.6.1
Today more than ever, community engagement plays a critical role in society. In a world facing multiple political, social, economic and health crises, the role of companies looms large and becomes indispensable to development.
There are many reasons why a company implements community engagement strategies, from obtaining a social license to operate to developing a corporate purpose that inspires and motivates its employees.
Today, there are many benefits that a good community relationship can provide to both corporations and community stakeholders, producing long-term shared value.
The service provided by SM SAAM plays a strategic role in the economic development of the countries where it operates. Due to the scale and location of its operations, the company and its subsidiaries and associates have an important social impact. Consequently, it is constantly interacting with stakeholders, including government entities and local authorities, community groups or neighborhood associations and local social, educational and/or cultural institutions. It always adheres to current laws in each country and the highest standards of corporate integrity to achieve business objectives, demonstrating the company’s commitment to act responsibly not only in business but also in environmental, social and governance aspects.
Keeping this in mind, one of SM SAAM’s core sustainability concepts is Social Commitment.
Safety and operational excellence
People Climate action and environment
Social commitment Integrity
155

2021 Integrated Report
Welcome Message00
SAAM, a Vocation of Service for the Foreign Trade Industry
01
Leadership and Governance Framework
02
Business Model03
Our Team04
Supplier Management05
Efficient Use of Natural Resources
06
Social Contribution07
Additional Information08
GRI Content Index09
Financial Statements10
Community AssessmentsAs part of work to define a Global Sustainability Plan and establish the bases for a Community Engagement and Social Investment Strategy, several companies in the group prepared socio-environmental assessments: Iquique Terminal Internacional (ITI), Antofagasta Terminal Internacional (ATI), San Antonio Terminal Internacional (STI), San Vicente Terminal Internacional (SVTI), Portuaria Corral and SAAM Logistics in Chile; Puerto Caldera, in Costa Rica, and Terminal Portuario de Guayaquil (TPG), in Ecuador. The purpose of these assessments is to gather information needed to define indicators and guidelines that further the impact of the social initiatives of the entire company, and to prepare community engagement plans that respond to the particularities of each territory in which the company operates.
Core Work Concepts in Community Assessments
All of the assessments used a mixed data collection technique, combining qualitative and quantitative tools to gather in-depth perceptions of the company from the community, as well as the needs and expectations they have regarding the operations of the companies operated by SM SAAM. These included surveys, in-depth interviews and focus groups.
Each SAAM company worked independently on the assessments, prioritizing local consultants for their thorough knowledge of the community near each operation, but respecting the core lines of action and data collection techniques. This approach aims to obtain a comprehensive vision but with a local outlook.
The first results of the information survey have identified that the priority actions for stakeholders are economic and social development, environmental protection, education and wellbeing.
Identification of area of influence
Mapping impacts and risks
Stakeholder mapping Opportunities and recommendations
156
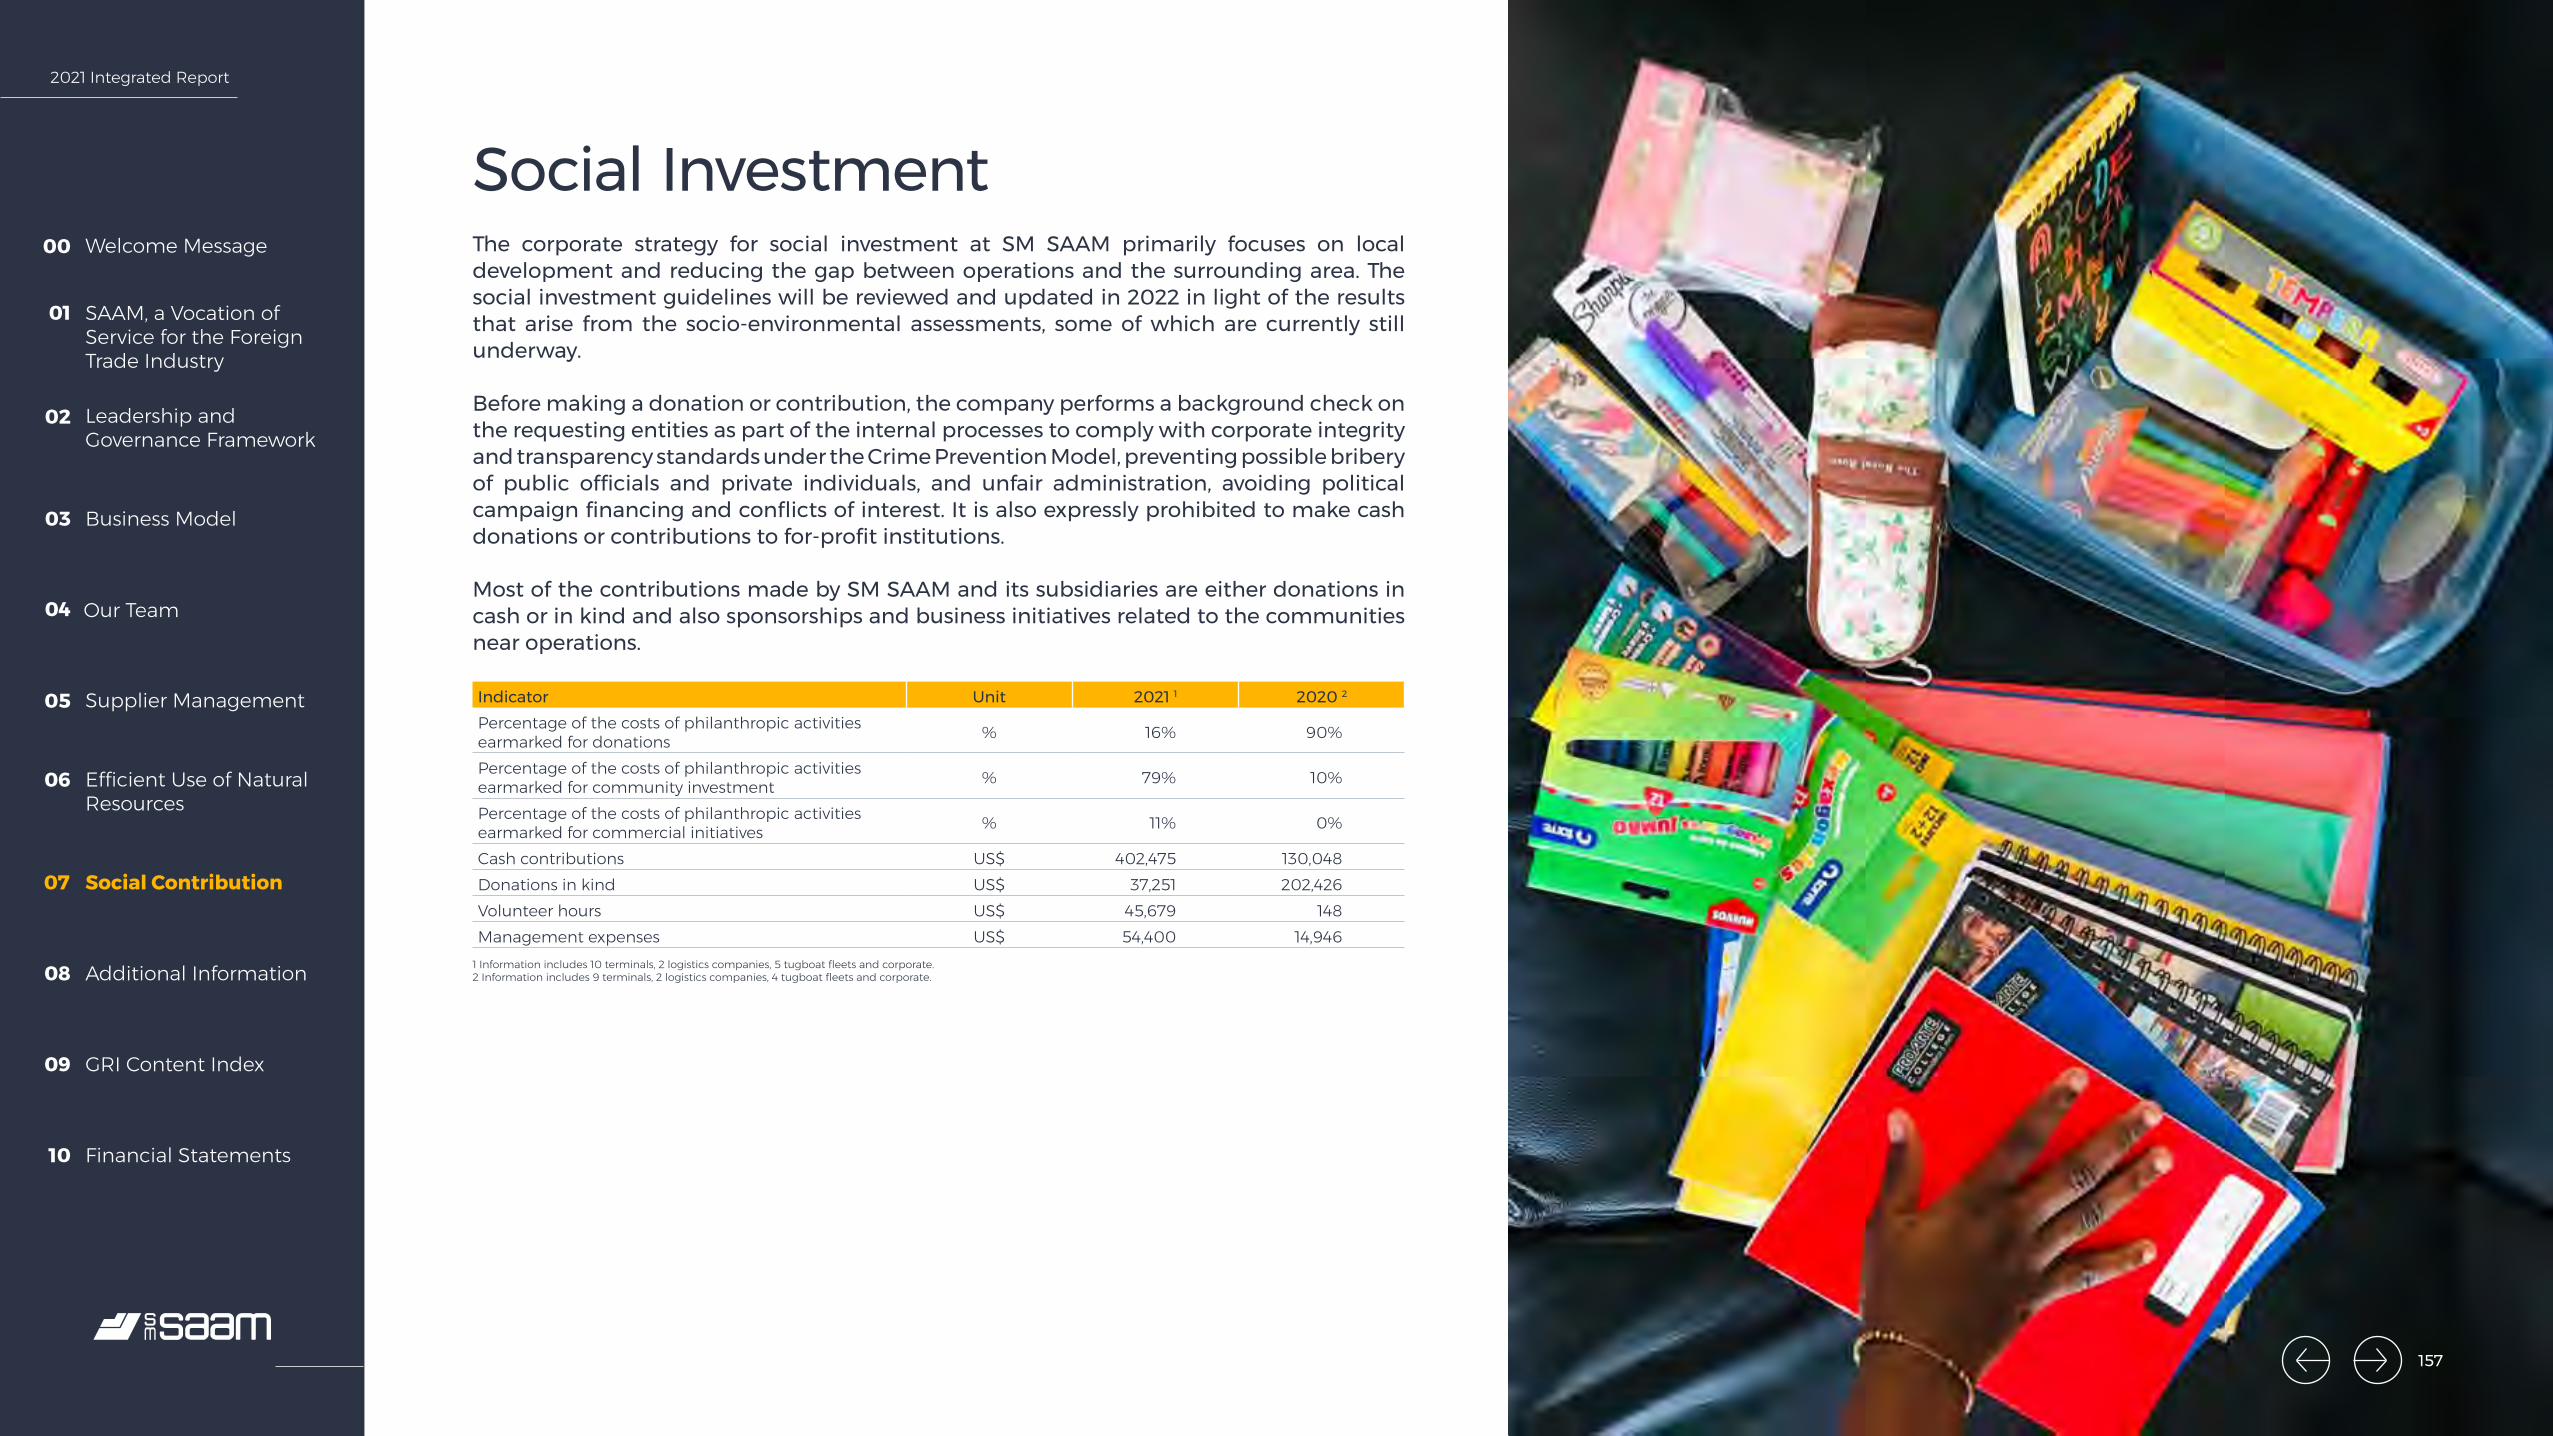
2021 Integrated Report
Welcome Message00
SAAM, a Vocation of Service for the Foreign Trade Industry
01
Leadership and Governance Framework
02
Business Model03
Our Team04
Supplier Management05
Efficient Use of Natural Resources
06
Social Contribution07
Additional Information08
GRI Content Index09
Financial Statements10
Social InvestmentThe corporate strategy for social investment at SM SAAM primarily focuses on local development and reducing the gap between operations and the surrounding area. The social investment guidelines will be reviewed and updated in 2022 in light of the results that arise from the socio-environmental assessments, some of which are currently still underway.
Before making a donation or contribution, the company performs a background check on the requesting entities as part of the internal processes to comply with corporate integrity and transparency standards under the Crime Prevention Model, preventing possible bribery of public officials and private individuals, and unfair administration, avoiding political campaign financing and conflicts of interest. It is also expressly prohibited to make cash donations or contributions to for-profit institutions.
Most of the contributions made by SM SAAM and its subsidiaries are either donations in cash or in kind and also sponsorships and business initiatives related to the communities near operations.
Indicator Unit 2021 1 2020 2
Percentage of the costs of philanthropic activities earmarked for donations % 16% 90%
Percentage of the costs of philanthropic activities earmarked for community investment % 79% 10%
Percentage of the costs of philanthropic activities earmarked for commercial initiatives % 11% 0%
Cash contributions US$ 402,475 130,048Donations in kind US$ 37,251 202,426Volunteer hours US$ 45,679 148Management expenses US$ 54,400 14,946
1 Information includes 10 terminals, 2 logistics companies, 5 tugboat fleets and corporate.2 Information includes 9 terminals, 2 logistics companies, 4 tugboat fleets and corporate.
157

2021 Integrated Report
Welcome Message00
SAAM, a Vocation of Service for the Foreign Trade Industry
01
Leadership and Governance Framework
02
Business Model03
Our Team04
Supplier Management05
Efficient Use of Natural Resources
06
Social Contribution07
Additional Information08
GRI Content Index09
Financial Statements10
Spotlight Initiatives413.1, 413-2
The communities present in the area of influence of each of the SM SAAM operations are relevant stakeholders, making it critical to maintain harmonious and enriching relationships with them, based on mutual respect and dialogue. This relationship is a display of the value placed in SM SAAM’s companies by the nearby communities, pushing the companies to increasingly minimize the negative impacts associated with operations.
For this connection to span time, different communication channels have been opened up with the communities: visits to facilities, meetings with media presence, the annual report, participation in programs with universities in the area and school and professional training centers, social networks, website, complaint system, community events, volunteer actions, participation in working groups and local programs.
The impacts of SM SAAM’s operations are most visible in nearby communities. The primary negative impacts identified relate to traffic and other externalities associated with the constant flow of heavy vehicles, such as noise, suspended particles and the deterioration of road infrastructure; visual contamination; waste generation and light and acoustic contamination associated with port operations. The primary positive impacts relate to local job creation, contribution to local and regional economic development, human capital development, job stability and promotion of environmental protection through environmental initiatives.
Community Dialogue WorkshopIn September, four Community Dialogue workshops were held, focused on division managing directors, their direct teams and heads of community engagement for port terminals, SAAM Logistics and Aerosan. The purpose of the activity, which was organized by an external consultant, was to incorporate specific tools into stakeholder engagement in the processes that arise throughout the value chain.
In light of this, SM SAAM aims to work hand in hand with community representatives in a context of ongoing dialogue that leads to reportable mitigation measures to foster trust towards the company and a relationship of collaboration and shared vision for local development.
158

2021 Integrated Report
Welcome Message00
SAAM, a Vocation of Service for the Foreign Trade Industry
01
Leadership and Governance Framework
02
Business Model03
Our Team04
Supplier Management05
Efficient Use of Natural Resources
06
Social Contribution07
Additional Information08
GRI Content Index09
Financial Statements10
Relevant Initiatives by Division
Each division and its subsidiaries run their own community engagement programs under SM SAAM’s corporate guidelines, in an effort to contribute to the sustainable development of the territories where the country operates.
Similar to 2020, the commitment towards communities in 2021 was marked by initiatives aimed at supporting the prevention of COVID-19 among employees and the community and buffering its effects through social micro-credit and entrepreneur stimulus programs.
159

2021 Integrated Report
Welcome Message00
SAAM, a Vocation of Service for the Foreign Trade Industry
01
Leadership and Governance Framework
02
Business Model03
Our Team04
Supplier Management05
Efficient Use of Natural Resources
06
Social Contribution07
Additional Information08
GRI Content Index09
Financial Statements10
Port Terminals Division
Ports have grown more diverse and increasingly integrated into the nearby communities. SM SAAM has developed connections for joint actions with organizations in the immediate surroundings and direct actions that benefit its workers. Contributions vary from donations to schools, firefighters and municipal associations, beach cleaning, donation of recycled port materials, support for entrepreneurs to specific topics related to education, tourism and
At Antofagasta Terminal Internacional (ATI), the cigarette butt recycling community project was noteworthy in the protection of the Antofagasta coastline, implemented in conjunction with Fundación Desierto Azul. The project involves manufacturing bins to collect cigarette butts along 4 kilometers of coastline.
At San Vicente Terminal Internacional the company also supported the COVID-19 vaccination process, generating a strategic partnerships with Cesfam San Vicente to collaborate with the immunization process for port workers. Through company volunteers, a beach cleanup operation was carried out along the coastline near port operations.
Iquique Terminal Internacional (ITI) continued to collaborate with beach cleanup, vaccination campaigns and COVID-19 PCR testing for the port community and support for education through training workshops for Port Operation students.
infrastructure. Due to the health emergency, the ports also supported vaccination processes for their employees and nearby communities. Terminals in Chile started this process early—in February—among its workers, providing incentives with diverse vaccination campaigns for the two initial doses and the booster.
At San Antonio Terminal Internacional (STI), the company maintained activities to support sports clubs, food drives, materials for neighborhood committees and local health campaigns. STI also assisted with the acquisition of a fire truck, equipment for heavy lifting and support, personal protection and intervention systems and hoses to benefit the San Antonio Fire Department.
160
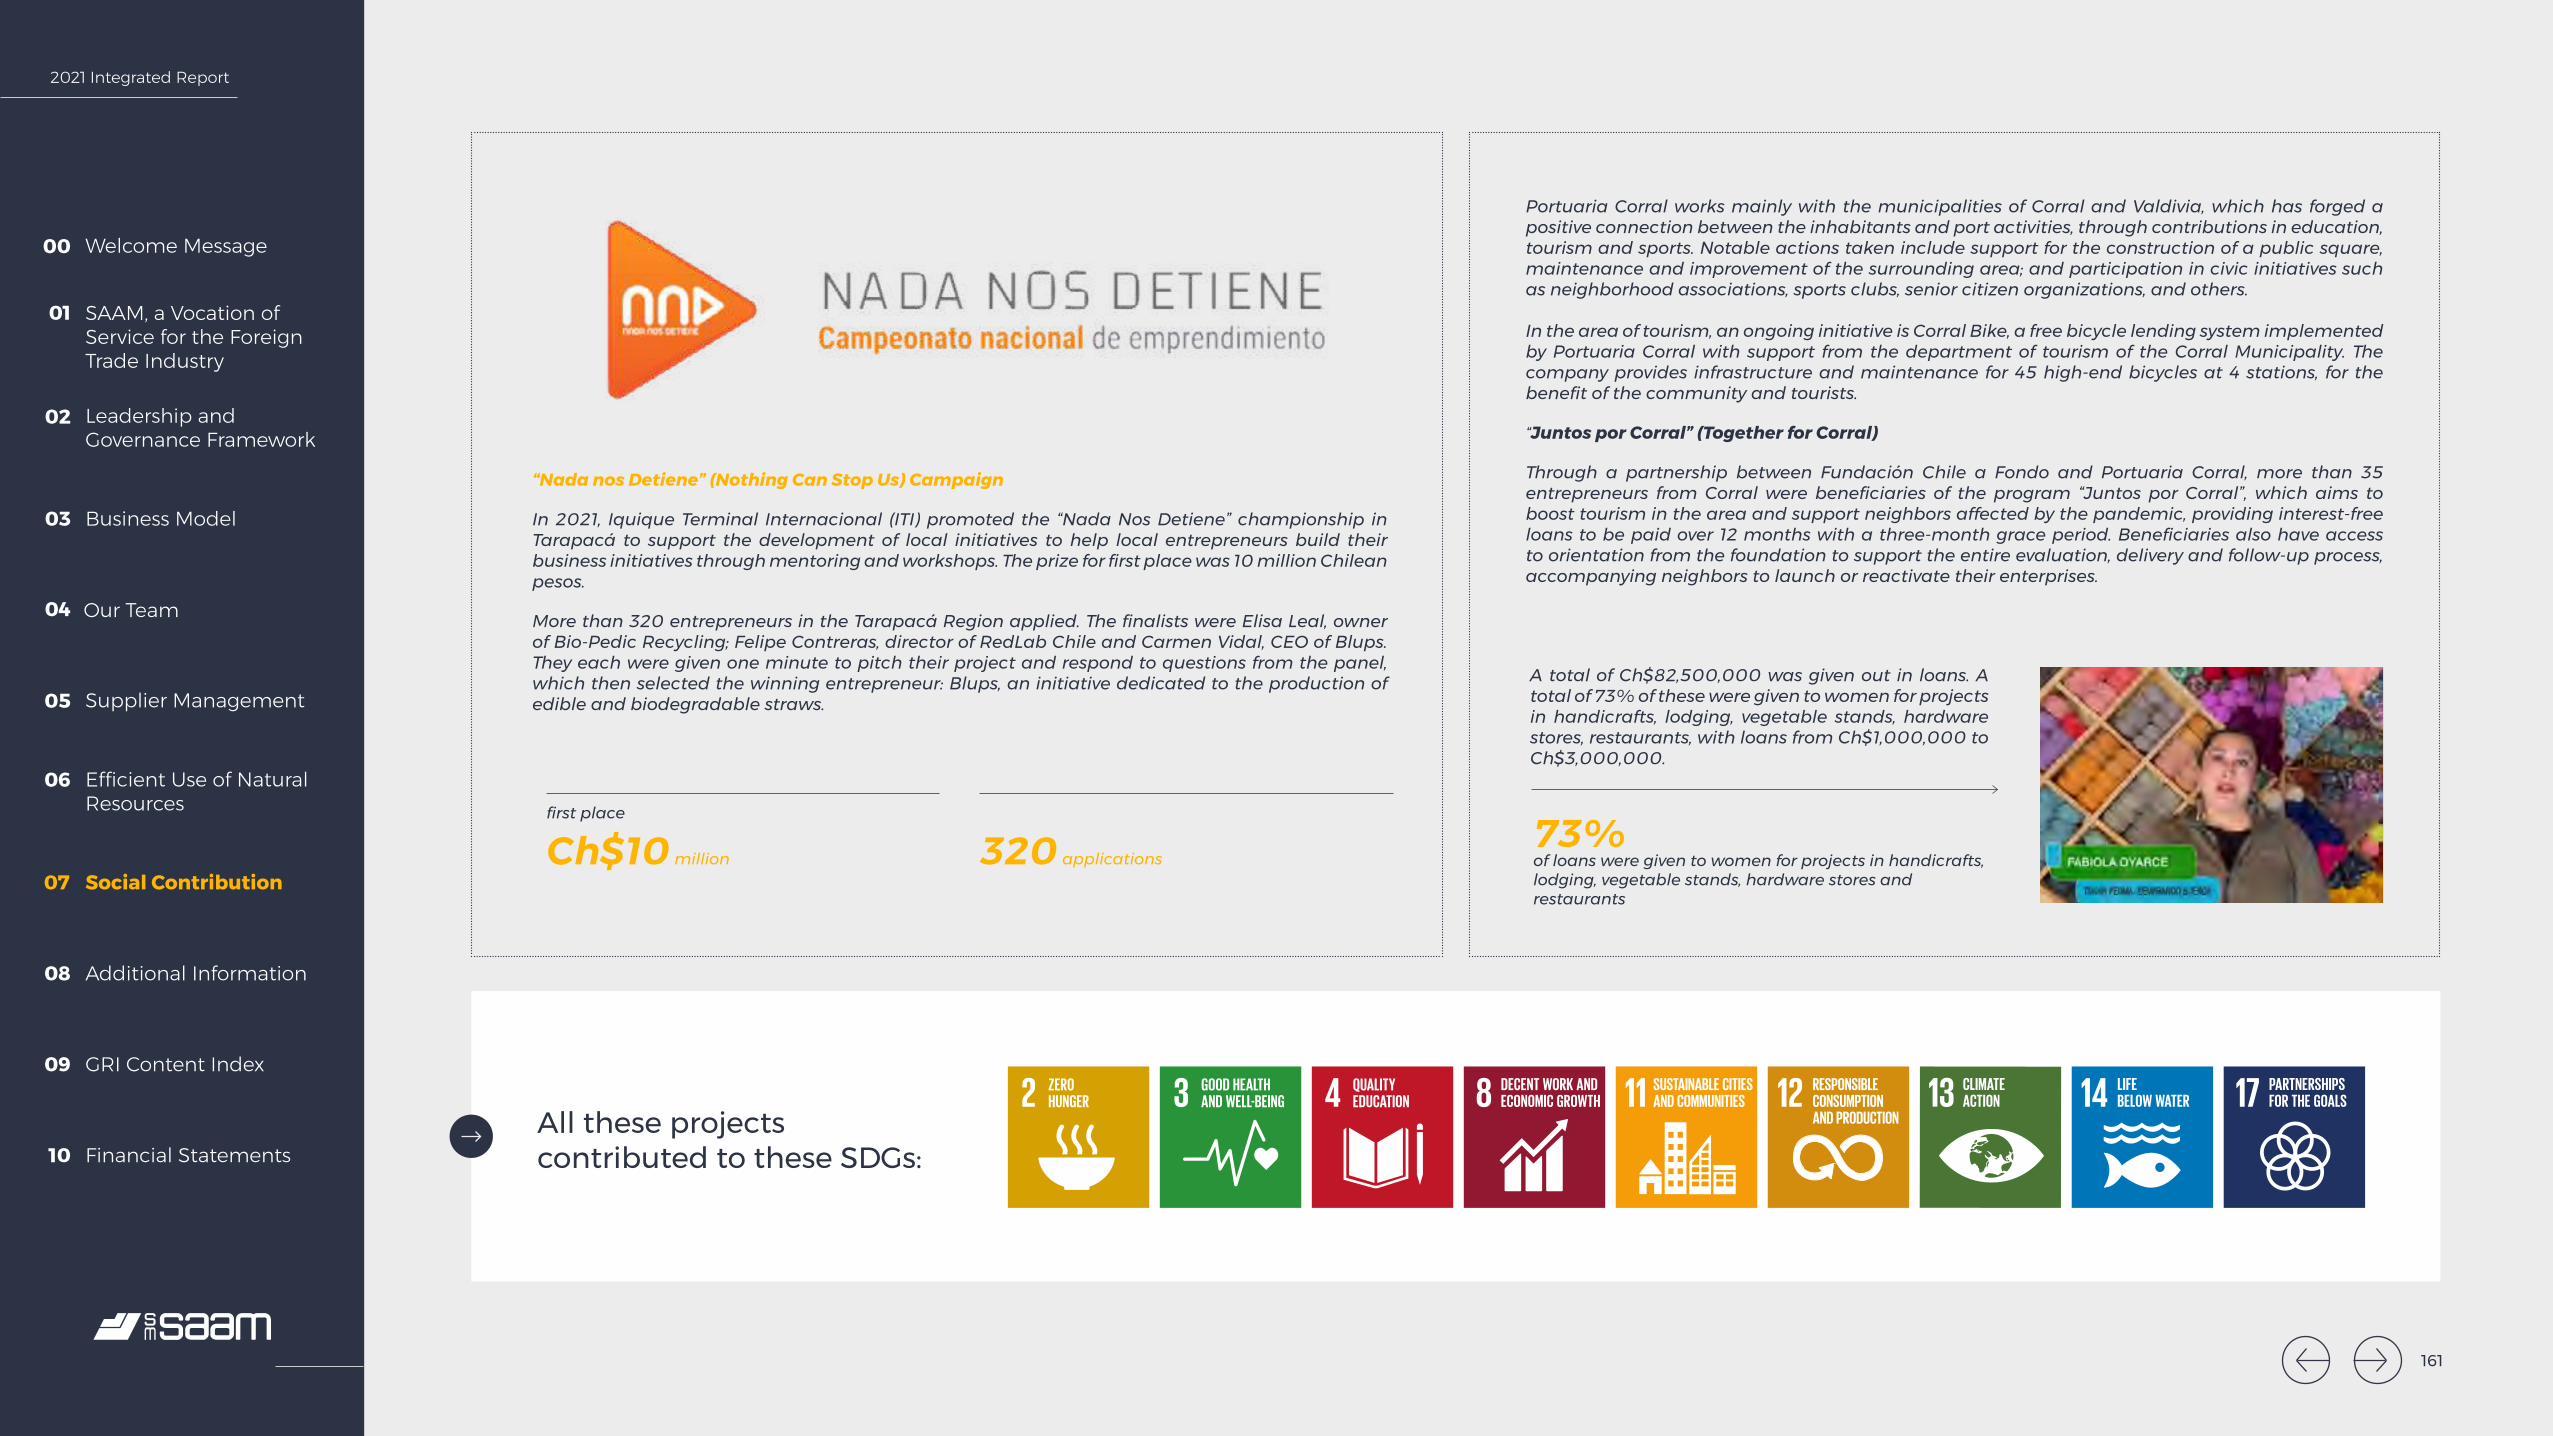
2021 Integrated Report
Welcome Message00
SAAM, a Vocation of Service for the Foreign Trade Industry
01
Leadership and Governance Framework
02
Business Model03
Our Team04
Supplier Management05
Efficient Use of Natural Resources
06
Social Contribution07
Additional Information08
GRI Content Index09
Financial Statements10
“Nada nos Detiene” (Nothing Can Stop Us) Campaign
In 2021, Iquique Terminal Internacional (ITI) promoted the “Nada Nos Detiene” championship in Tarapacá to support the development of local initiatives to help local entrepreneurs build their business initiatives through mentoring and workshops. The prize for first place was 10 million Chilean pesos.
More than 320 entrepreneurs in the Tarapacá Region applied. The finalists were Elisa Leal, owner of Bio-Pedic Recycling; Felipe Contreras, director of RedLab Chile and Carmen Vidal, CEO of Blups. They each were given one minute to pitch their project and respond to questions from the panel, which then selected the winning entrepreneur: Blups, an initiative dedicated to the production of edible and biodegradable straws.
Ch$10 million 320 applications
first place
73% of loans were given to women for projects in handicrafts, lodging, vegetable stands, hardware stores and restaurants
Portuaria Corral works mainly with the municipalities of Corral and Valdivia, which has forged a positive connection between the inhabitants and port activities, through contributions in education, tourism and sports. Notable actions taken include support for the construction of a public square, maintenance and improvement of the surrounding area; and participation in civic initiatives such as neighborhood associations, sports clubs, senior citizen organizations, and others.
In the area of tourism, an ongoing initiative is Corral Bike, a free bicycle lending system implemented by Portuaria Corral with support from the department of tourism of the Corral Municipality. The company provides infrastructure and maintenance for 45 high-end bicycles at 4 stations, for the benefit of the community and tourists.
“Juntos por Corral” (Together for Corral)
Through a partnership between Fundación Chile a Fondo and Portuaria Corral, more than 35 entrepreneurs from Corral were beneficiaries of the program “Juntos por Corral”, which aims to boost tourism in the area and support neighbors affected by the pandemic, providing interest-free loans to be paid over 12 months with a three-month grace period. Beneficiaries also have access to orientation from the foundation to support the entire evaluation, delivery and follow-up process, accompanying neighbors to launch or reactivate their enterprises.
A total of Ch$82,500,000 was given out in loans. A total of 73% of these were given to women for projects in handicrafts, lodging, vegetable stands, hardware stores, restaurants, with loans from Ch$1,000,000 to Ch$3,000,000.
All these projects contributed to these SDGs:
161
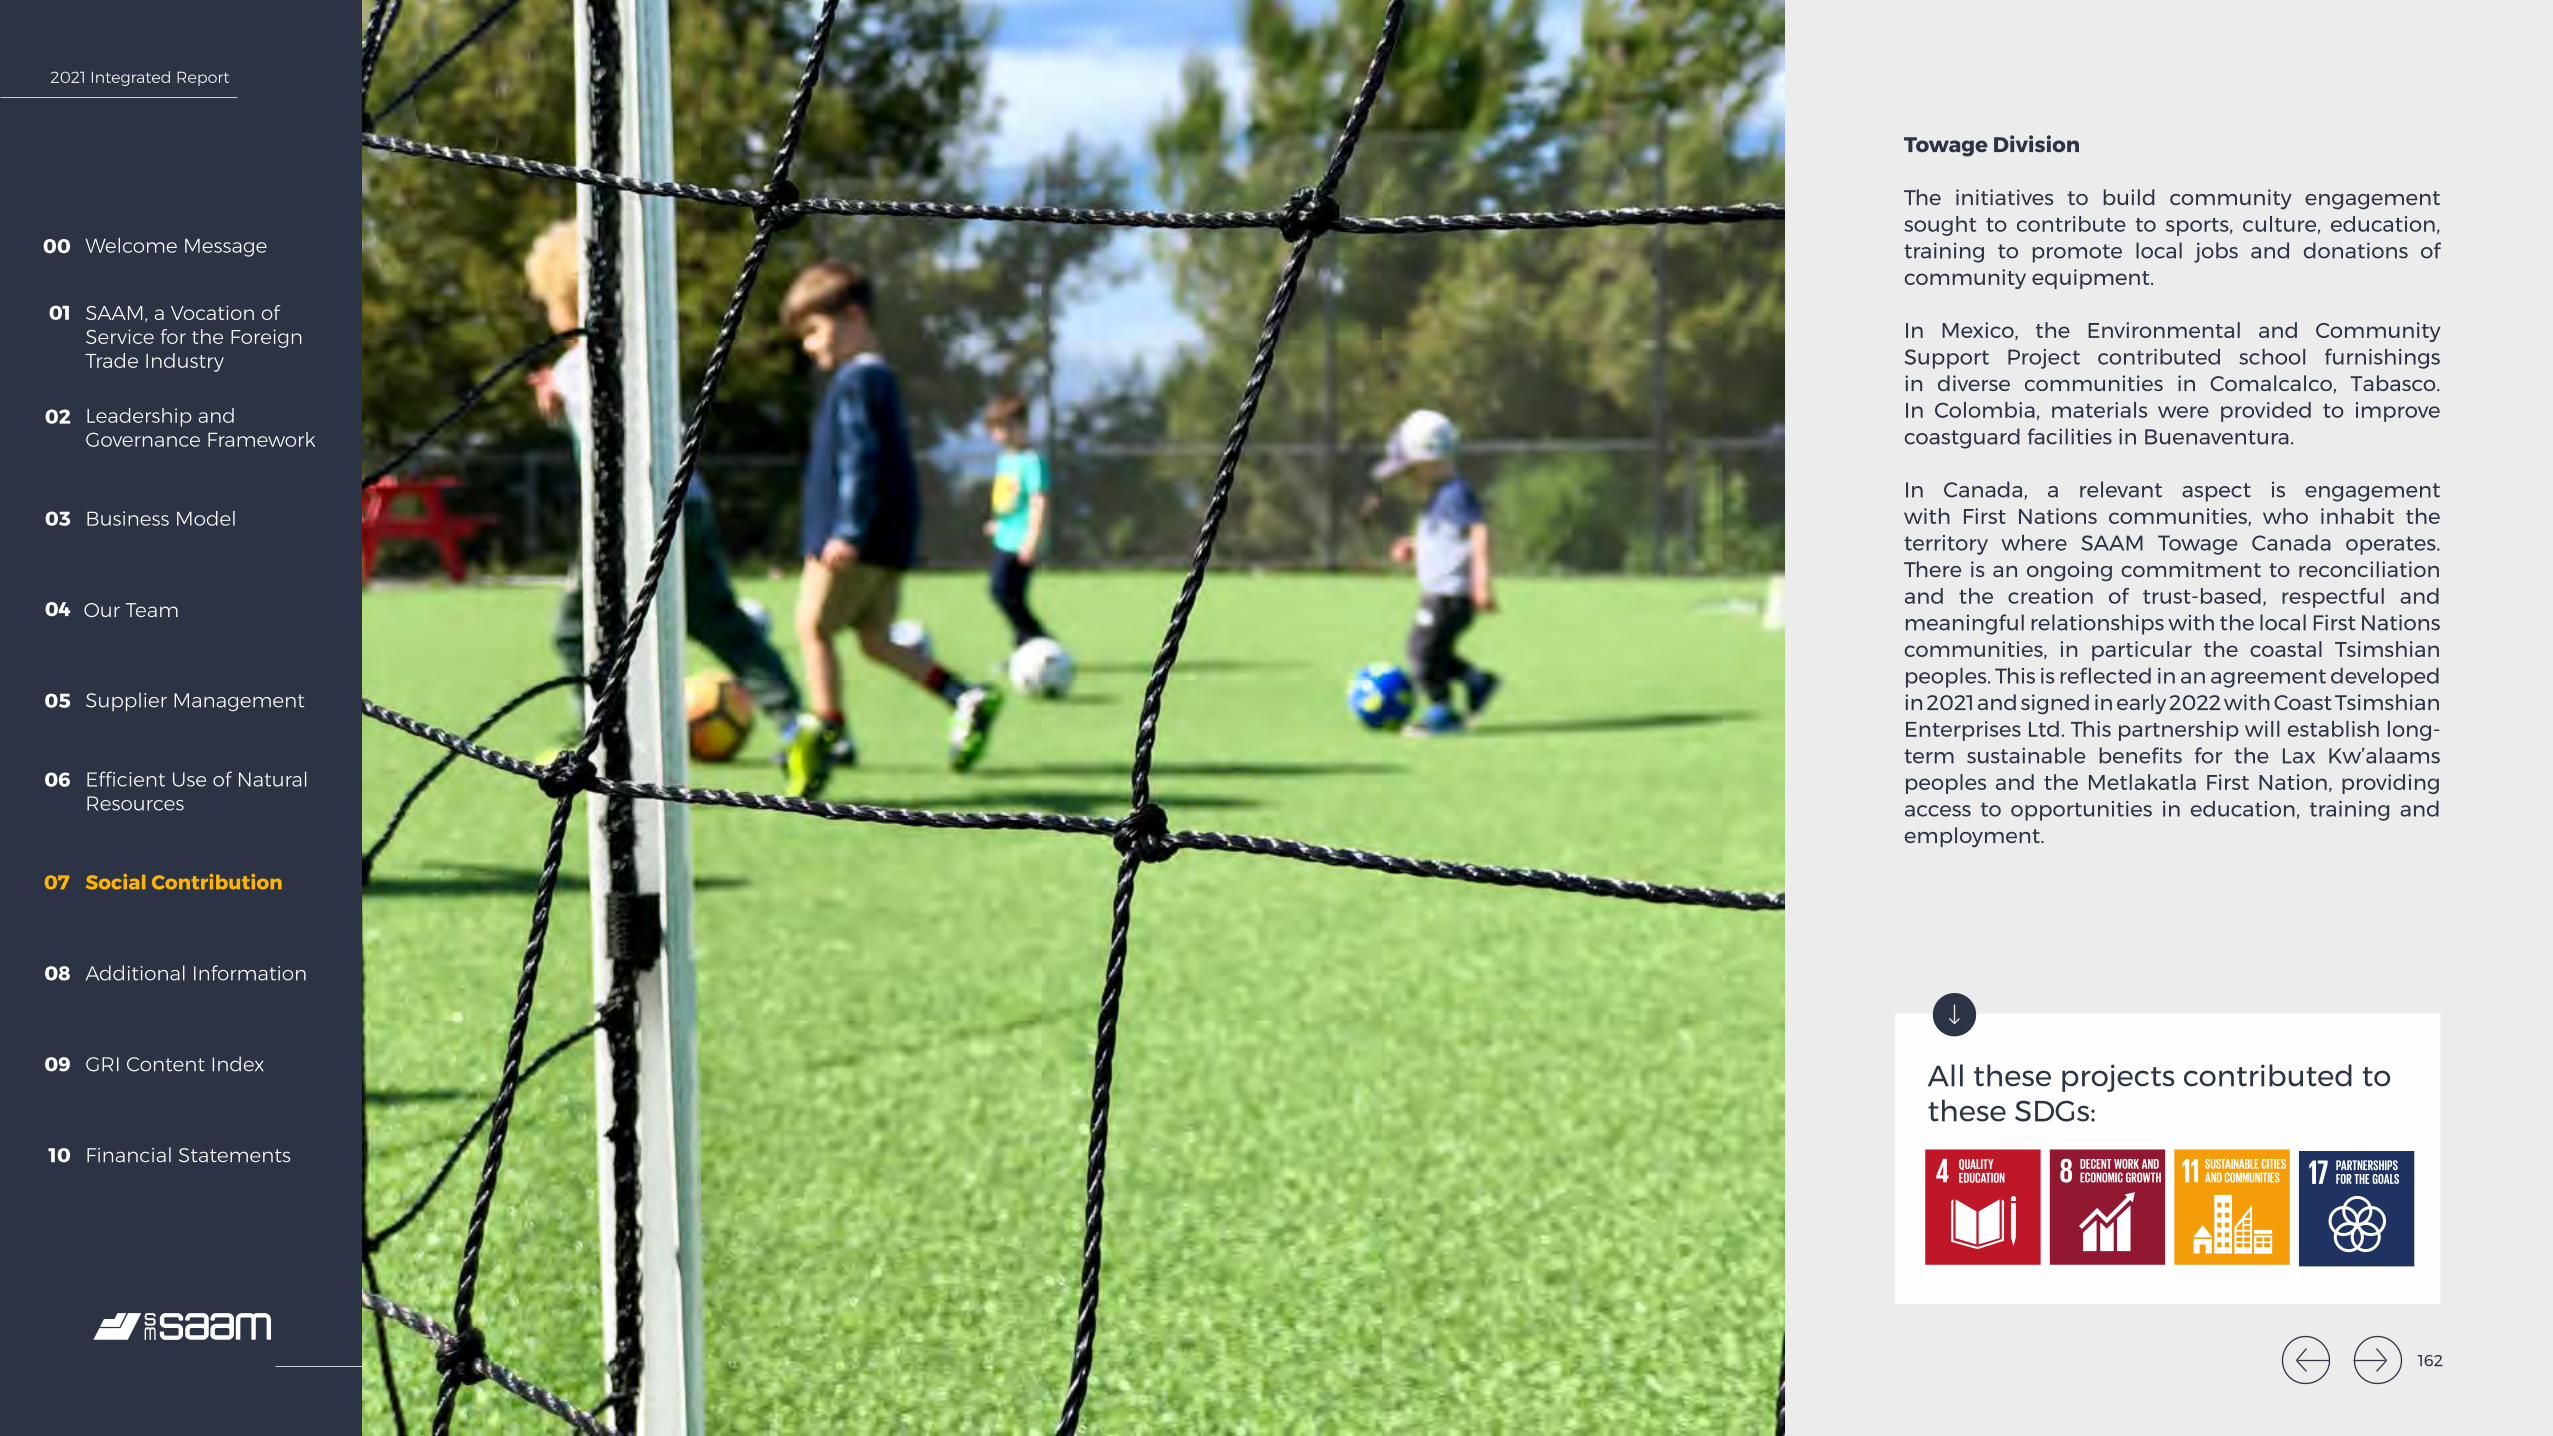
2021 Integrated Report
Welcome Message00
SAAM, a Vocation of Service for the Foreign Trade Industry
01
Leadership and Governance Framework
02
Business Model03
Our Team04
Supplier Management05
Efficient Use of Natural Resources
06
Social Contribution07
Additional Information08
GRI Content Index09
Financial Statements10
Towage Division
The initiatives to build community engagement sought to contribute to sports, culture, education, training to promote local jobs and donations of community equipment.
In Mexico, the Environmental and Community Support Project contributed school furnishings in diverse communities in Comalcalco, Tabasco. In Colombia, materials were provided to improve coastguard facilities in Buenaventura.
In Canada, a relevant aspect is engagement with First Nations communities, who inhabit the territory where SAAM Towage Canada operates. There is an ongoing commitment to reconciliation and the creation of trust-based, respectful and meaningful relationships with the local First Nations communities, in particular the coastal Tsimshian peoples. This is reflected in an agreement developed in 2021 and signed in early 2022 with Coast Tsimshian Enterprises Ltd. This partnership will establish long-term sustainable benefits for the Lax Kw’alaams peoples and the Metlakatla First Nation, providing access to opportunities in education, training and employment.
All these projects contributed to these SDGs:
162

2021 Integrated Report
Welcome Message00
SAAM, a Vocation of Service for the Foreign Trade Industry
01
Leadership and Governance Framework
02
Business Model03
Our Team04
Supplier Management05
Efficient Use of Natural Resources
06
Social Contribution07
Additional Information08
GRI Content Index09
Financial Statements10
SAAM Logistics and Aerosan
Activities in 2021 focused on donations to foundations and organizations, such as Fundación Laura Vicuña, Fundación Abrázame and neighborhood associations in Chile.
The company supported Asociación Casa de la Madre y el Niño in Colombia, and donated water through LATE to the children’s home, Amor, Paz y Alegría in Renca, Chile.
In particular, Aerosan supported technical-professional education through different activities to bring airport operations to students, such as internships and specific certification tasks in technical competencies, without the need for them to be enrolled in higher education. A donation was also made to the Colombian Air Force to set up training rooms, among other activities.
All these projects contributed to these SDGs:
163
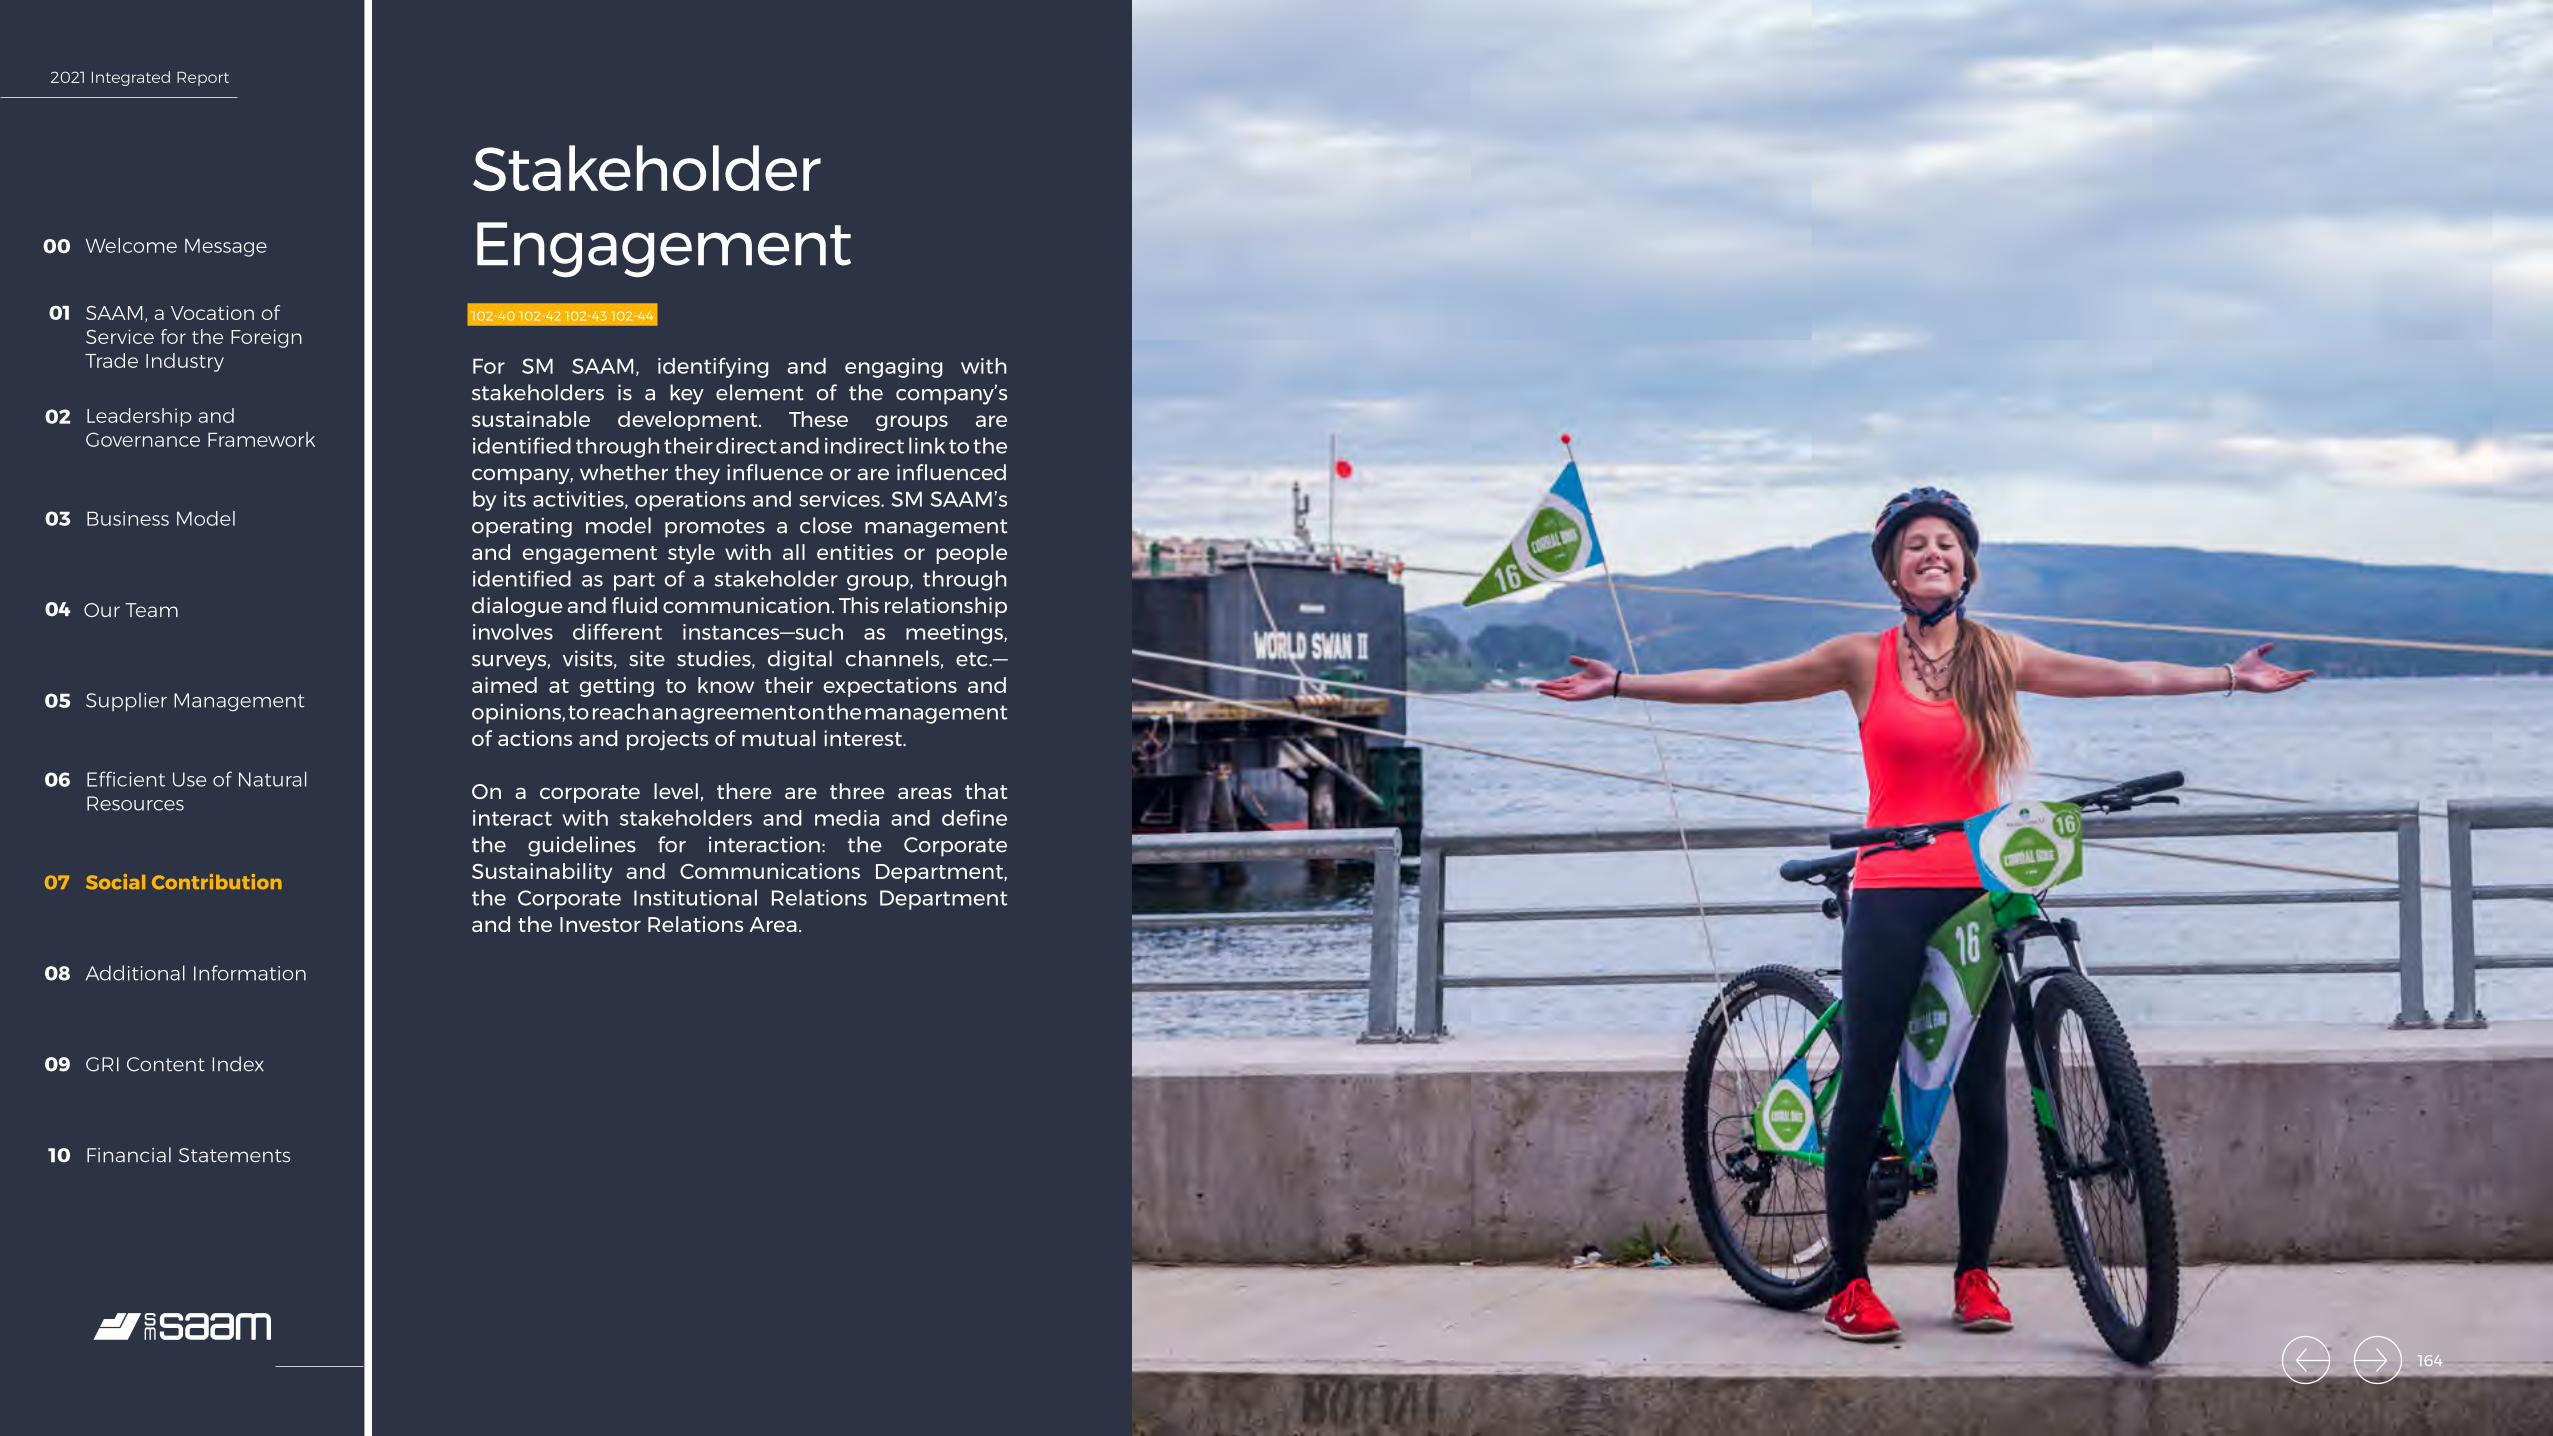
2021 Integrated Report
Welcome Message00
SAAM, a Vocation of Service for the Foreign Trade Industry
01
Leadership and Governance Framework
02
Business Model03
Our Team04
Supplier Management05
Efficient Use of Natural Resources
06
Social Contribution07
Additional Information08
GRI Content Index09
Financial Statements10
Stakeholder Engagement102-40 102-42 102-43 102-44
For SM SAAM, identifying and engaging with stakeholders is a key element of the company’s sustainable development. These groups are identified through their direct and indirect link to the company, whether they influence or are influenced by its activities, operations and services. SM SAAM’s operating model promotes a close management and engagement style with all entities or people identified as part of a stakeholder group, through dialogue and fluid communication. This relationship involves different instances—such as meetings, surveys, visits, site studies, digital channels, etc.—aimed at getting to know their expectations and opinions, to reach an agreement on the management of actions and projects of mutual interest.
On a corporate level, there are three areas that interact with stakeholders and media and define the guidelines for interaction: the Corporate Sustainability and Communications Department, the Corporate Institutional Relations Department and the Investor Relations Area.
164

2021 Integrated Report
Welcome Message00
SAAM, a Vocation of Service for the Foreign Trade Industry
01
Leadership and Governance Framework
02
Business Model03
Our Team04
Supplier Management05
Efficient Use of Natural Resources
06
Social Contribution07
Additional Information08
GRI Content Index09
Financial Statements10
Stakeholders, Engagement Channels and Issues of Interest
Shareholders and investors
Authorities
CustomersEmployees and
unions
News media
Contractors and suppliersLocal
communities
Civil society
Individuals and entities that invest or could invest in SM SAAM.These include Quiñenco, pension fund managers, domestic and foreign investment funds, among others.
• Annual general and extraordinary shareholder meetings
• Meetings, conference calls and webcasts
• Digital channels and social media
• News media • Corporate publications
(annual report, quarterly earnings report, presentations, monthly operational data, Material Events)
• Non-deal road shows • Investor Day
Individuals and organizations in charge of designing public policies or legislation, regulation and oversight within the scope of the company’s business. National, regional and local governments of the countries in which SM SAAM conducts operations.
• Official channels established by each law
• Meetings, fairs and events
• Visits to operations• Corporate publications• Reports and
responses to specific requirements
• Inspection visits• Digital channels and
social media• News media • Complaint system
Shipping lines and companies involved in foreign trade.In the case of tugs, customers also include companies involved in the oil and gas extraction industry.
• Meetings, fairs and events
• Service surveys• Visits to our operations• Corporate publications• Digital channels and
social media• News media• Complaint system
Company workers and organizations that represent them.
• Quarterly earnings presentation
• Working groups and committees
• Internal communication channels
• Commitment surveys• Focus groups• Meetings and in-person
and virtual events• Events and internal
campaigns• Digital channels and
social media• News media• Complaint system
People and organizations within the area of influence of the operations conducted by SM SAAM, its subsidiaries and associates.
• Visits to facilities• Digital channels and
social media• Corporate volunteering• Corporate events• Environmental
education campaigns• Participation in social
programs• News media • Complaint system
Companies that supply SM SAAM and its companies with equipment, raw materials, goods and services. Includes contractors and subcontractors.
• Meetings, fairs and events
• Digital channels and social media
• Mass media• Complaint system
Domestic, international and specialized news media.
• Meetings, fairs and events
• Press releases• Response to requests• Digital channels and
social media• Visits to facilities• Complaint system
Organizations and institutions other than authorities that represent interests or causes linked directly or indirectly to the company’s area of action, such as trade associations, universities and training centers, NGOs, foundations and others.
• Meetings, fairs and events
• Visits to our operations• Corporate publications• Digital channels and
social media• News media • Participation in social
or environmental programs
• Complaint system
Stak
ehol
ders
Des
crip
tion
Enga
gem
ent c
hann
els
165
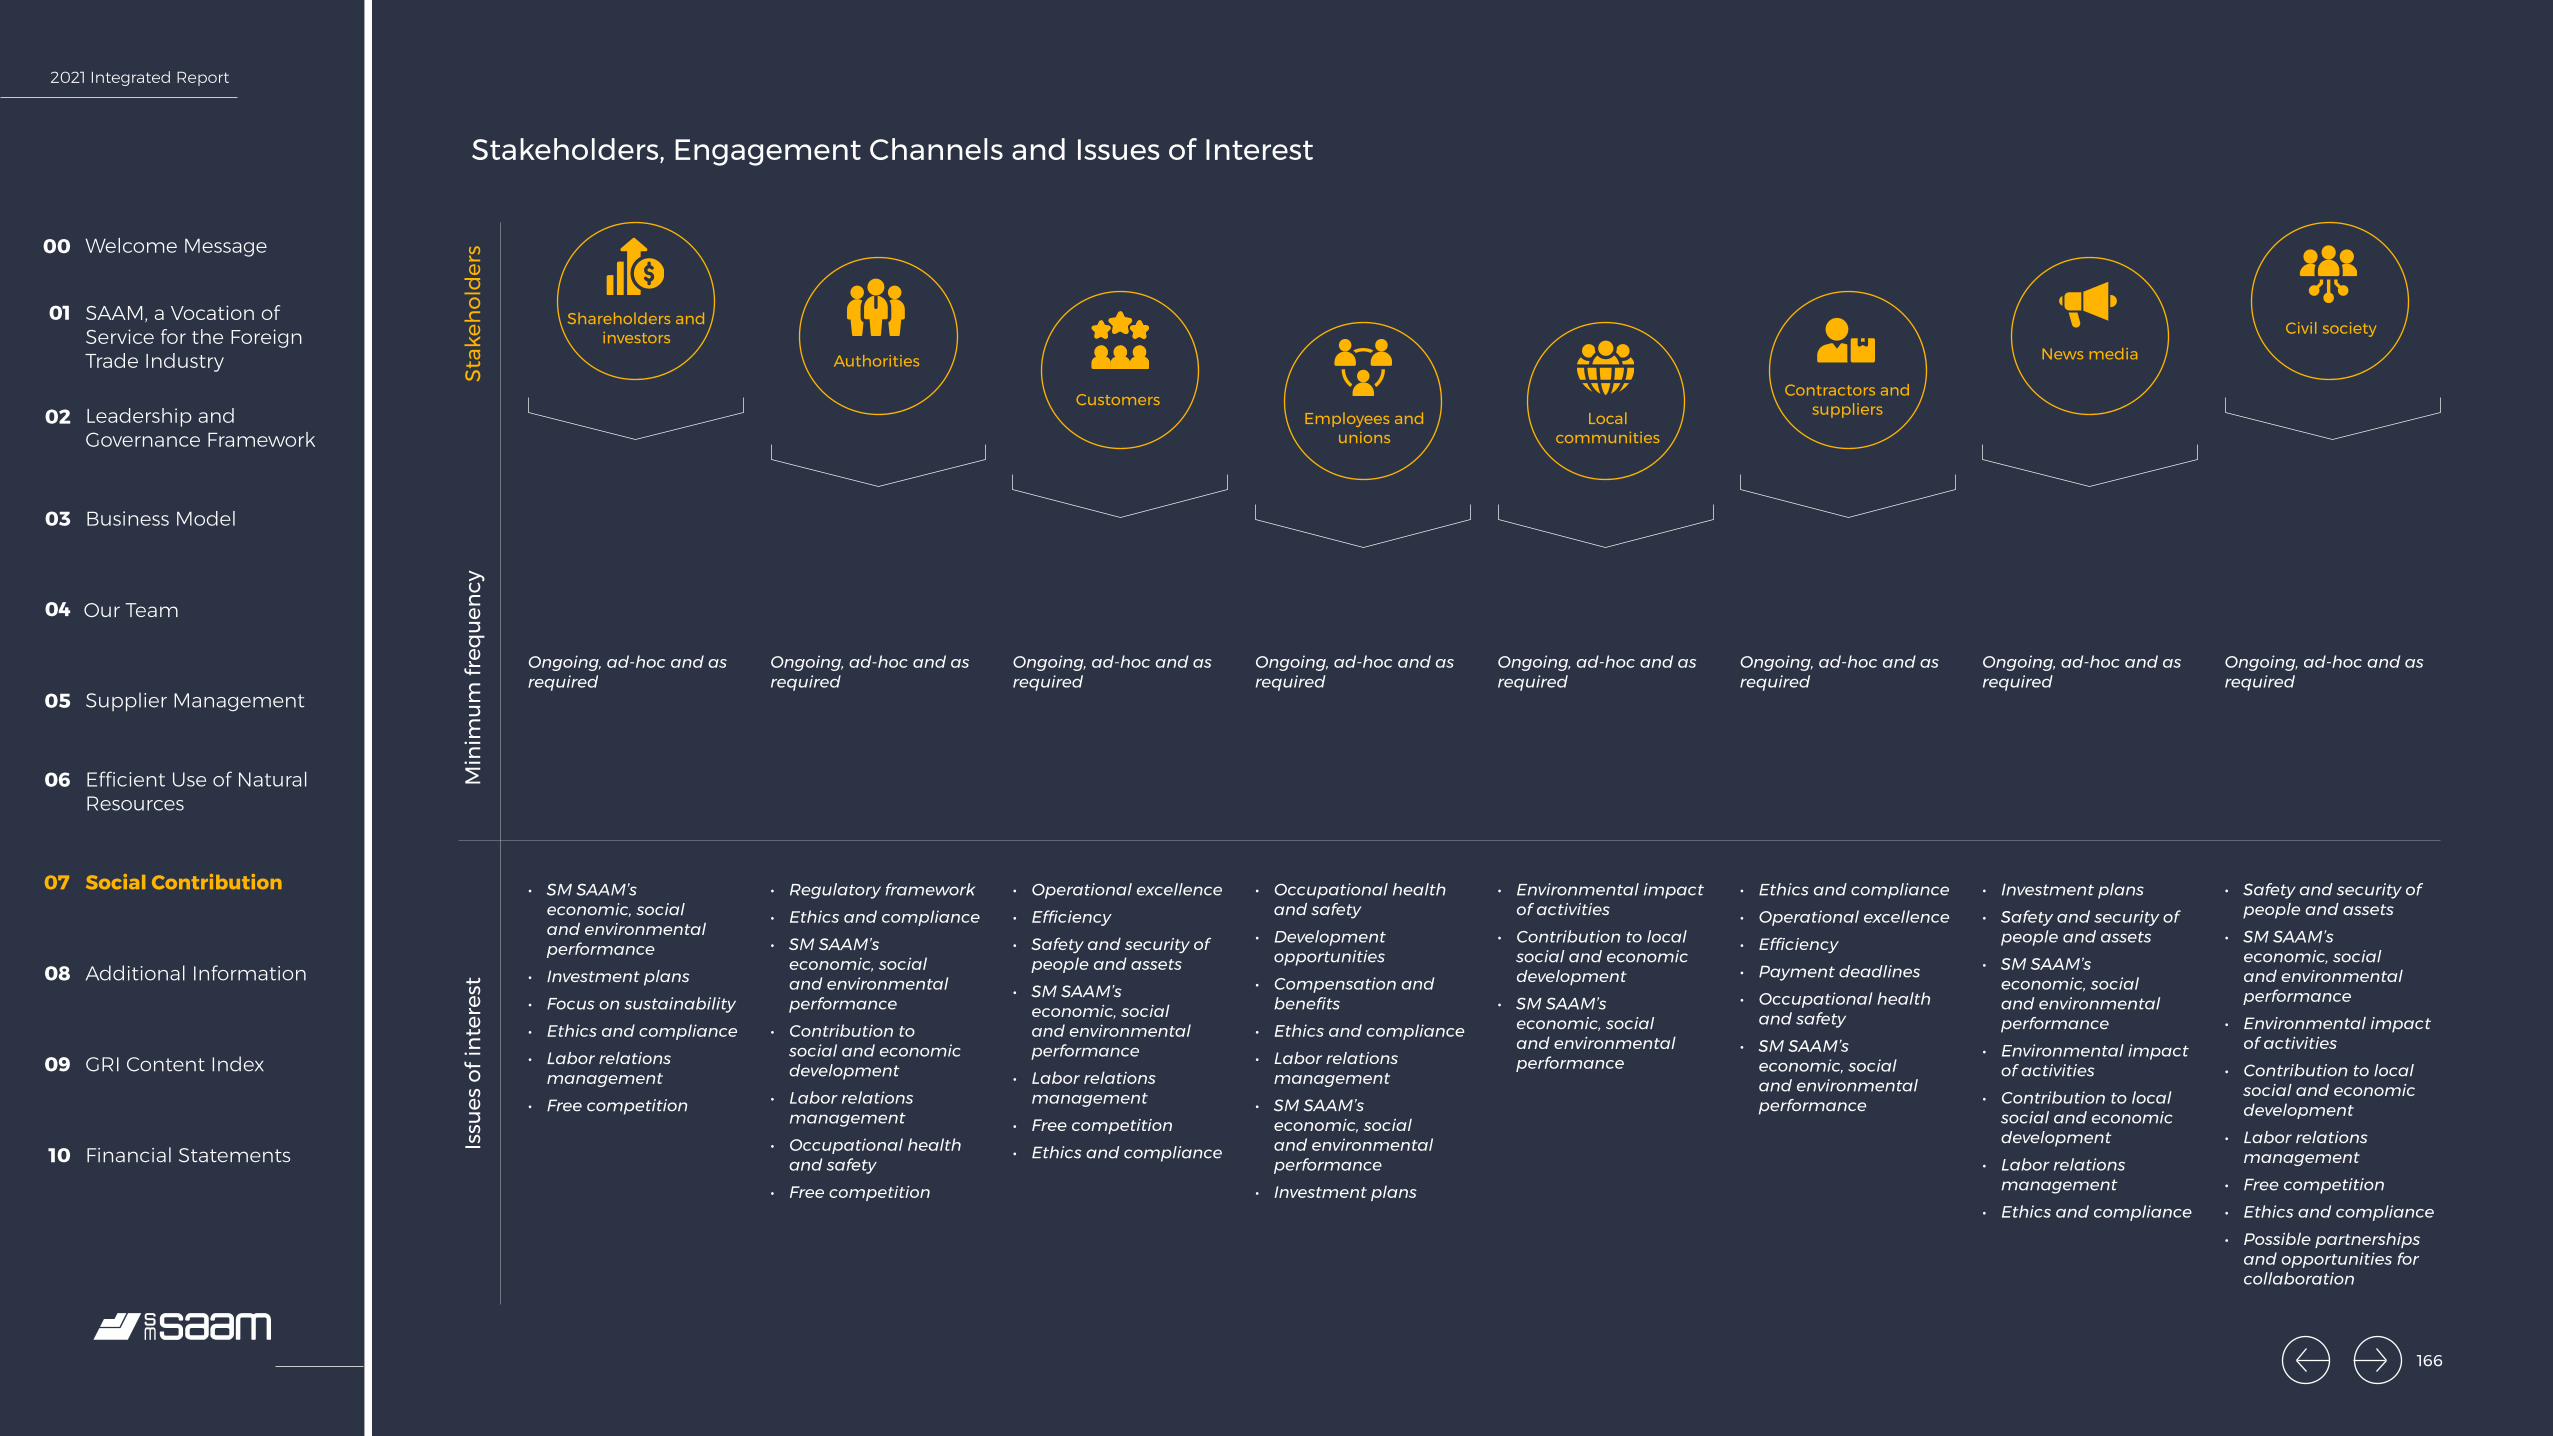
2021 Integrated Report
Welcome Message00
SAAM, a Vocation of Service for the Foreign Trade Industry
01
Leadership and Governance Framework
02
Business Model03
Our Team04
Supplier Management05
Efficient Use of Natural Resources
06
Social Contribution07
Additional Information08
GRI Content Index09
Financial Statements10
Stakeholders, Engagement Channels and Issues of Interest
Shareholders and investors
Authorities
CustomersEmployees and
unions
News media
Contractors and suppliersLocal
communities
Civil society
Ongoing, ad-hoc and as required
• SM SAAM’s economic, social and environmental performance
• Investment plans• Focus on sustainability• Ethics and compliance• Labor relations
management• Free competition
Ongoing, ad-hoc and as required
• Regulatory framework• Ethics and compliance• SM SAAM’s
economic, social and environmental performance
• Contribution to social and economic development
• Labor relations management
• Occupational health and safety
• Free competition
Ongoing, ad-hoc and as required
• Operational excellence• Efficiency• Safety and security of
people and assets• SM SAAM’s
economic, social and environmental performance
• Labor relations management
• Free competition• Ethics and compliance
Ongoing, ad-hoc and as required
• Occupational health and safety
• Development opportunities
• Compensation and benefits
• Ethics and compliance• Labor relations
management• SM SAAM’s
economic, social and environmental performance
• Investment plans
Ongoing, ad-hoc and as required
• Environmental impact of activities
• Contribution to local social and economic development
• SM SAAM’s economic, social and environmental performance
Ongoing, ad-hoc and as required
• Ethics and compliance• Operational excellence• Efficiency• Payment deadlines• Occupational health
and safety• SM SAAM’s
economic, social and environmental performance
Ongoing, ad-hoc and as required
• Investment plans• Safety and security of
people and assets• SM SAAM’s
economic, social and environmental performance
• Environmental impact of activities
• Contribution to local social and economic development
• Labor relations management
• Ethics and compliance
Ongoing, ad-hoc and as required
• Safety and security of people and assets
• SM SAAM’s economic, social and environmental performance
• Environmental impact of activities
• Contribution to local social and economic development
• Labor relations management
• Free competition• Ethics and compliance• Possible partnerships
and opportunities for collaboration
Stak
ehol
ders
Min
imum
freq
uenc
yIs
sues
of i
nter
est
166

2021 Integrated Report
Welcome Message00
SAAM, a Vocation of Service for the Foreign Trade Industry
01
Leadership and Governance Framework
02
Business Model03
Our Team04
Supplier Management05
Efficient Use of Natural Resources
06
Social Contribution07
Additional Information08
GRI Content Index09
Financial Statements10
167
08.Additional Information
167
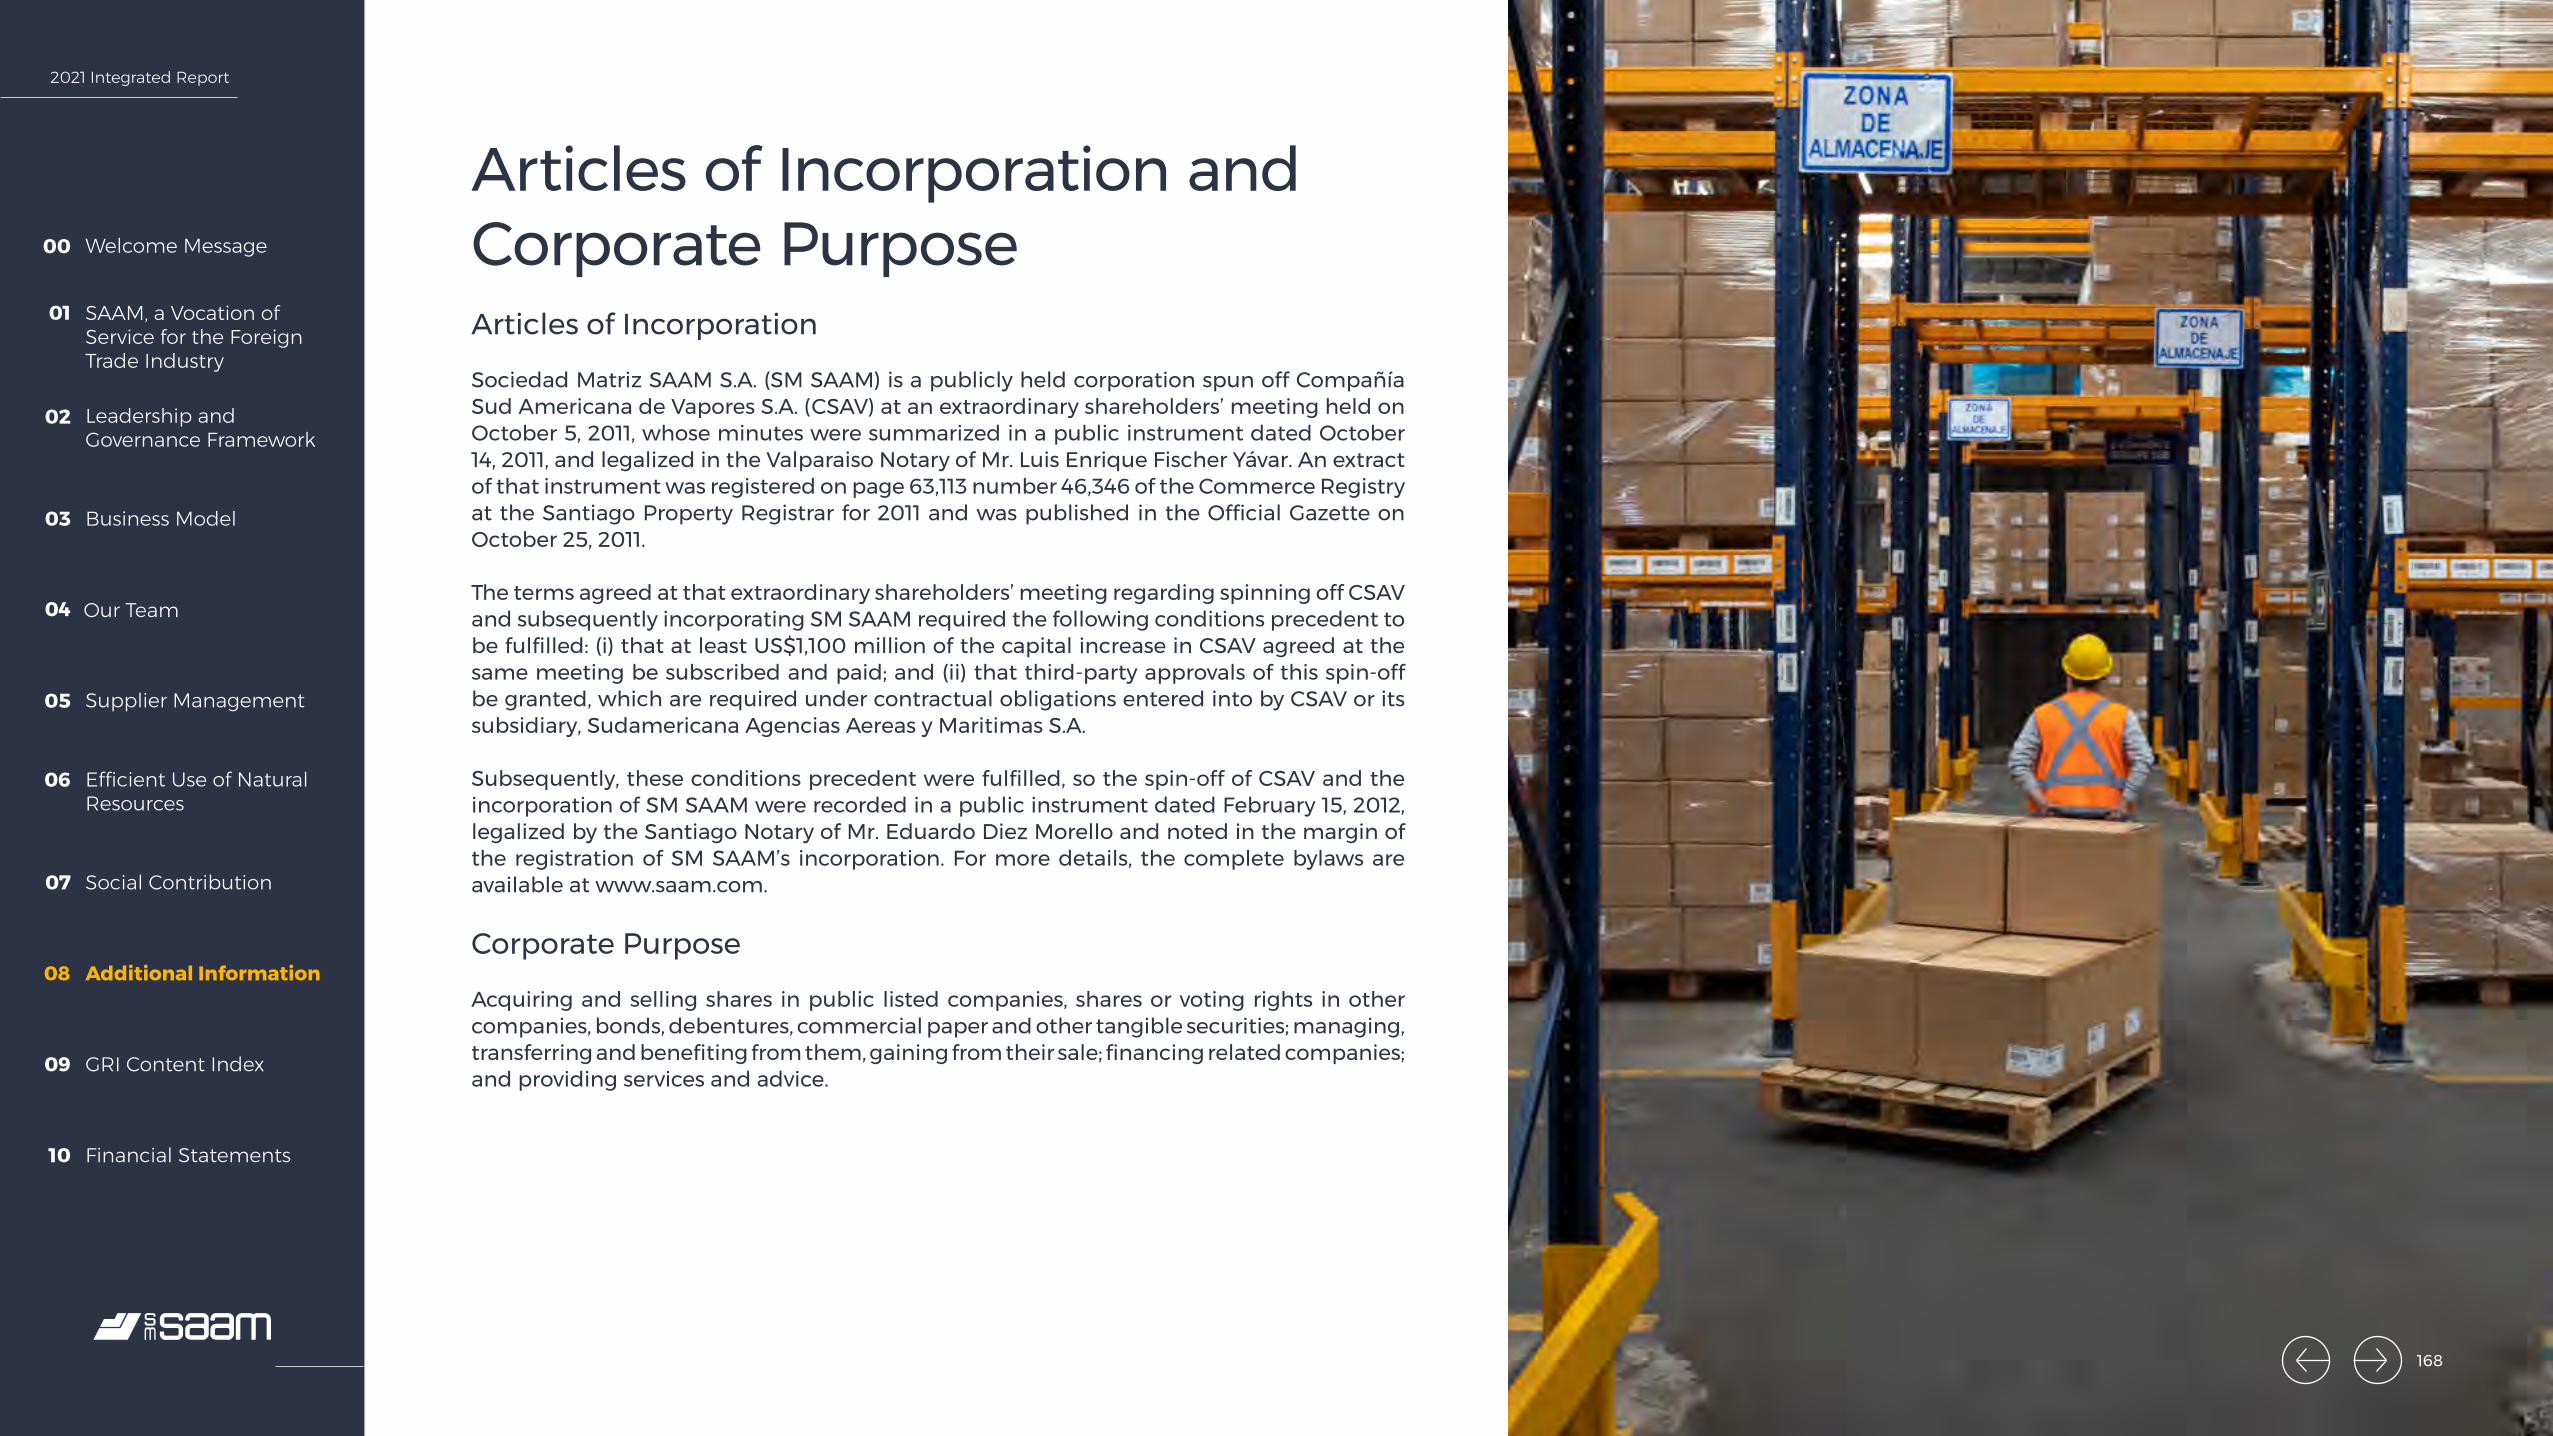
2021 Integrated Report
Welcome Message00
SAAM, a Vocation of Service for the Foreign Trade Industry
01
Leadership and Governance Framework
02
Business Model03
Our Team04
Supplier Management05
Efficient Use of Natural Resources
06
Social Contribution07
Additional Information08
GRI Content Index09
Financial Statements10
Articles of Incorporation and Corporate PurposeArticles of Incorporation
Sociedad Matriz SAAM S.A. (SM SAAM) is a publicly held corporation spun off Compañía Sud Americana de Vapores S.A. (CSAV) at an extraordinary shareholders’ meeting held on October 5, 2011, whose minutes were summarized in a public instrument dated October 14, 2011, and legalized in the Valparaiso Notary of Mr. Luis Enrique Fischer Yávar. An extract of that instrument was registered on page 63,113 number 46,346 of the Commerce Registry at the Santiago Property Registrar for 2011 and was published in the Official Gazette on October 25, 2011.
The terms agreed at that extraordinary shareholders’ meeting regarding spinning off CSAV and subsequently incorporating SM SAAM required the following conditions precedent to be fulfilled: (i) that at least US$1,100 million of the capital increase in CSAV agreed at the same meeting be subscribed and paid; and (ii) that third-party approvals of this spin-off be granted, which are required under contractual obligations entered into by CSAV or its subsidiary, Sudamericana Agencias Aereas y Maritimas S.A.
Subsequently, these conditions precedent were fulfilled, so the spin-off of CSAV and the incorporation of SM SAAM were recorded in a public instrument dated February 15, 2012, legalized by the Santiago Notary of Mr. Eduardo Diez Morello and noted in the margin of the registration of SM SAAM’s incorporation. For more details, the complete bylaws are available at www.saam.com.
Corporate Purpose
Acquiring and selling shares in public listed companies, shares or voting rights in other companies, bonds, debentures, commercial paper and other tangible securities; managing, transferring and benefiting from them, gaining from their sale; financing related companies; and providing services and advice.
168
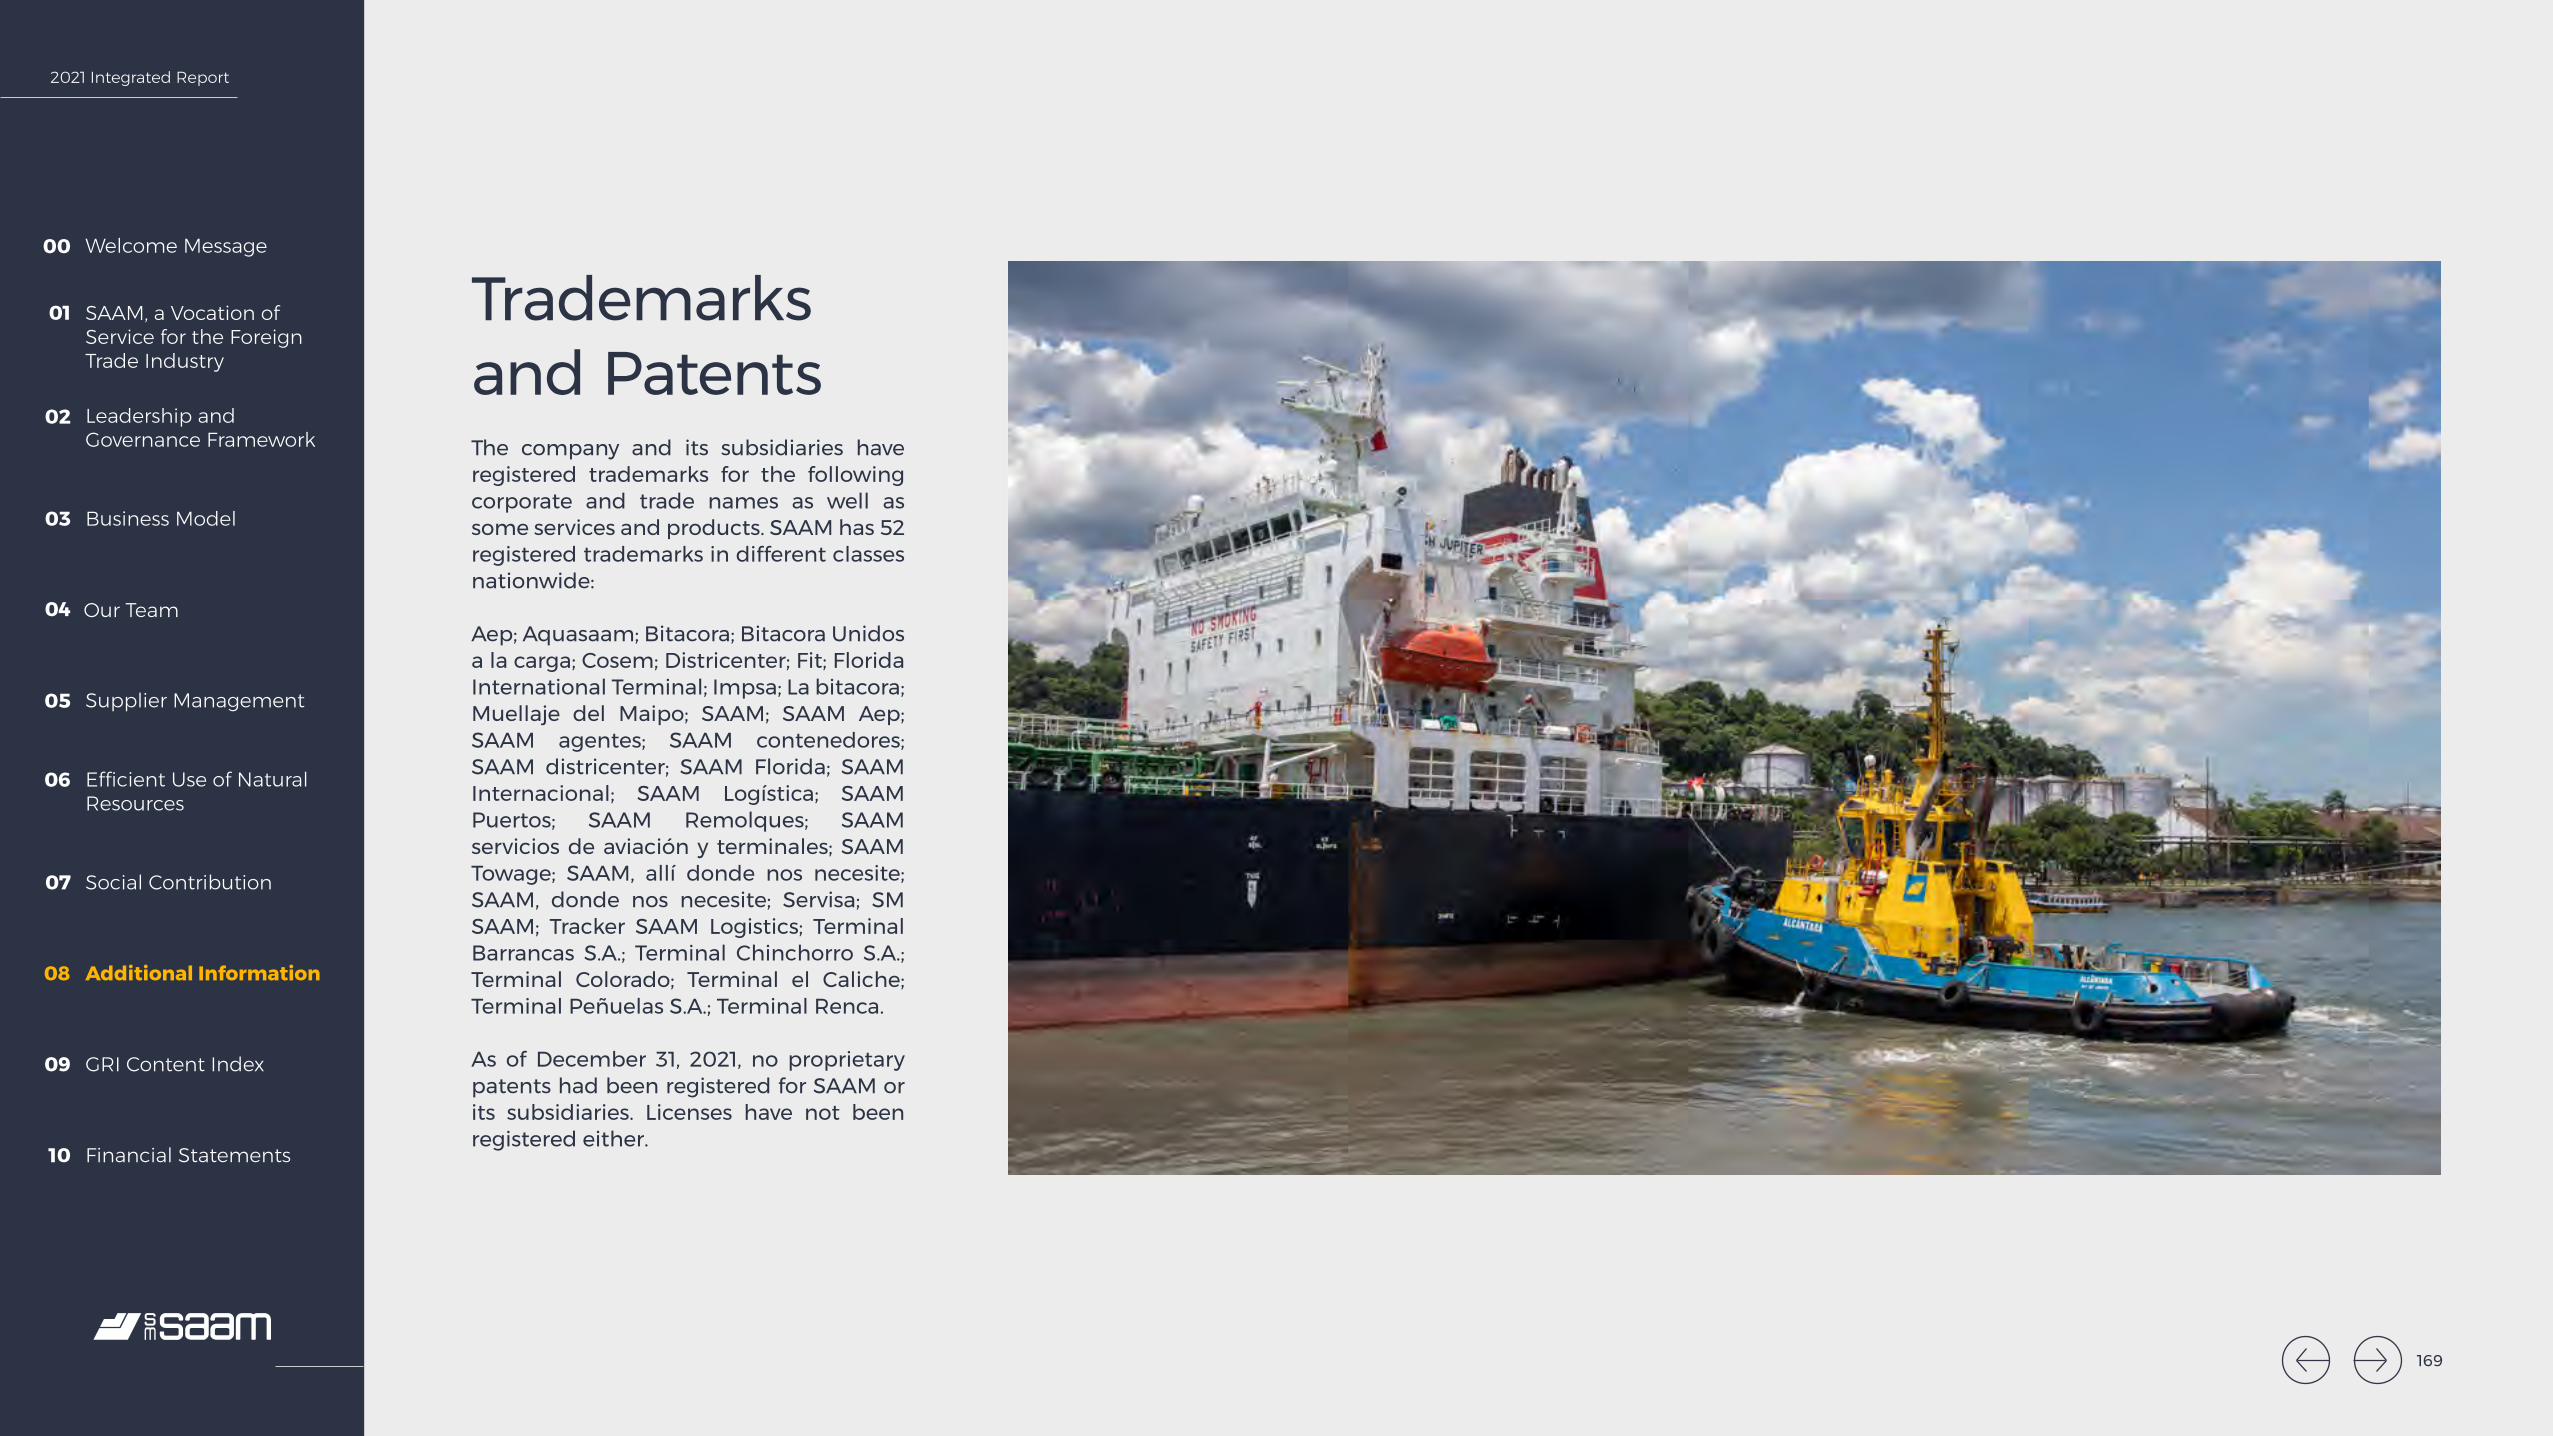
2021 Integrated Report
Welcome Message00
SAAM, a Vocation of Service for the Foreign Trade Industry
01
Leadership and Governance Framework
02
Business Model03
Our Team04
Supplier Management05
Efficient Use of Natural Resources
06
Social Contribution07
Additional Information08
GRI Content Index09
Financial Statements10
Trademarks and PatentsThe company and its subsidiaries have registered trademarks for the following corporate and trade names as well as some services and products. SAAM has 52 registered trademarks in different classes nationwide:
Aep; Aquasaam; Bitacora; Bitacora Unidos a la carga; Cosem; Districenter; Fit; Florida International Terminal; Impsa; La bitacora; Muellaje del Maipo; SAAM; SAAM Aep; SAAM agentes; SAAM contenedores; SAAM districenter; SAAM Florida; SAAM Internacional; SAAM Logística; SAAM Puertos; SAAM Remolques; SAAM servicios de aviación y terminales; SAAM Towage; SAAM, allí donde nos necesite; SAAM, donde nos necesite; Servisa; SM SAAM; Tracker SAAM Logistics; Terminal Barrancas S.A.; Terminal Chinchorro S.A.; Terminal Colorado; Terminal el Caliche; Terminal Peñuelas S.A.; Terminal Renca.
As of December 31, 2021, no proprietary patents had been registered for SAAM or its subsidiaries. Licenses have not been registered either.
169
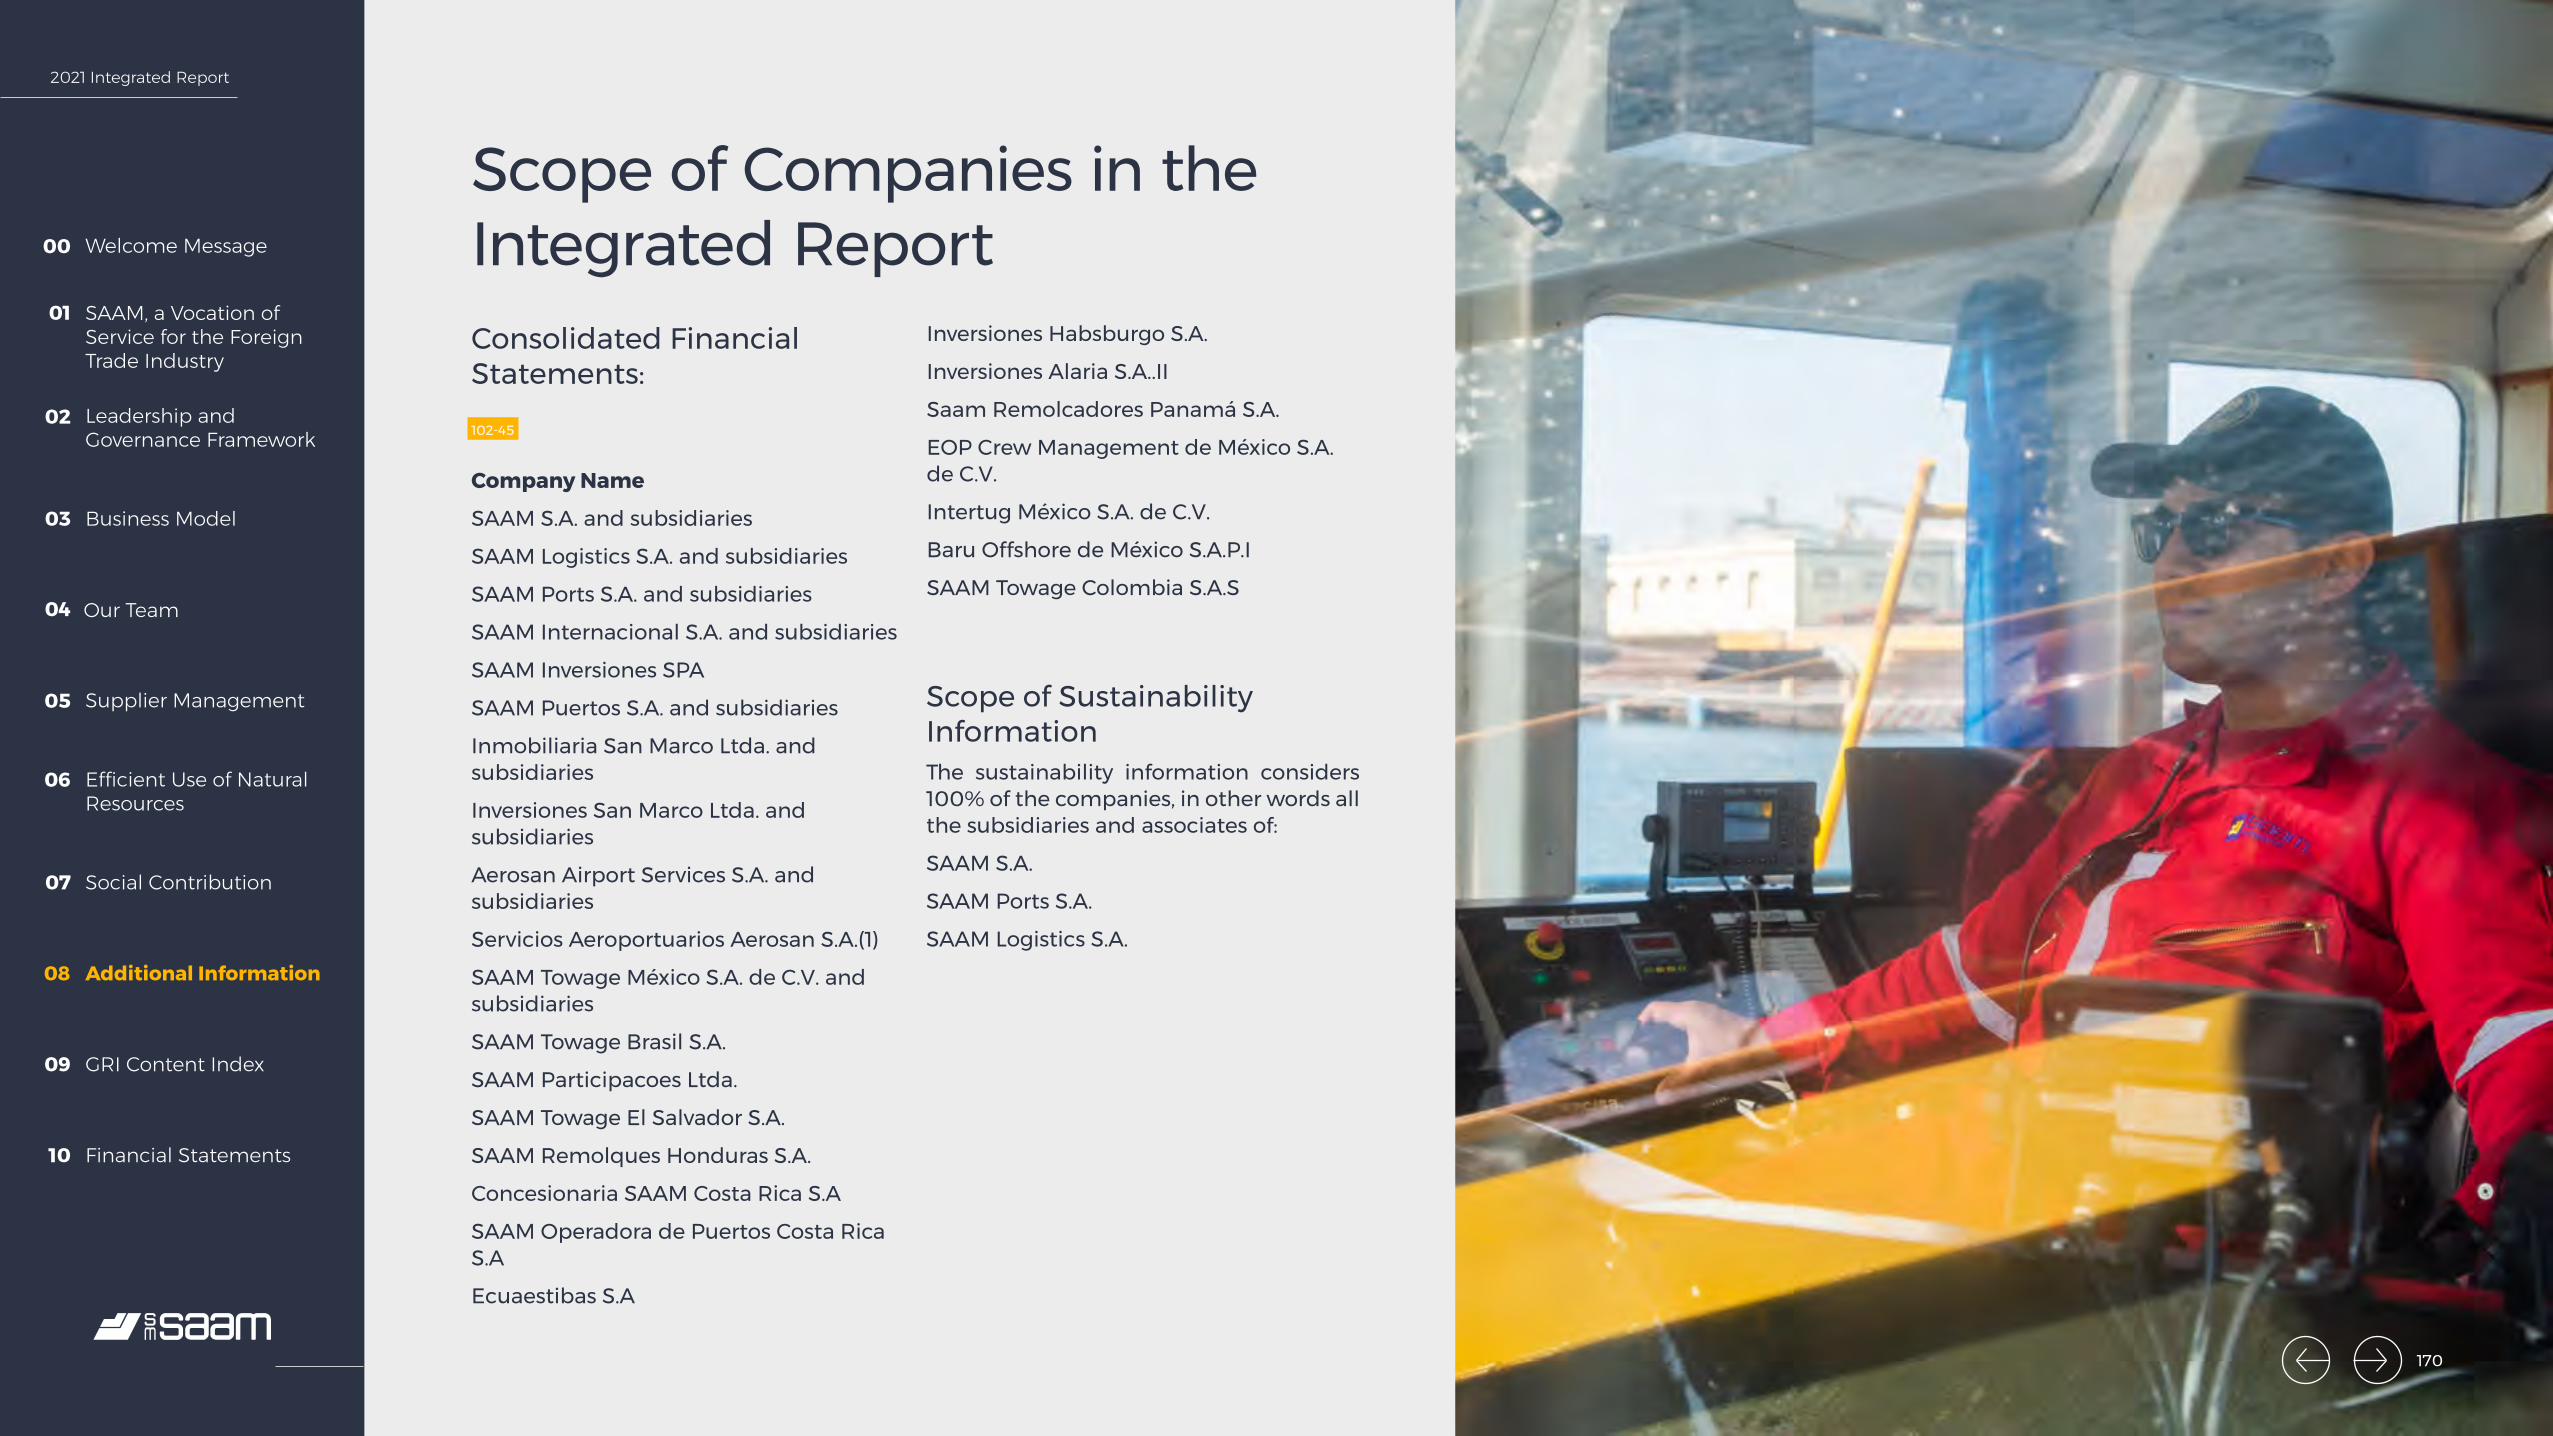
2021 Integrated Report
Welcome Message00
SAAM, a Vocation of Service for the Foreign Trade Industry
01
Leadership and Governance Framework
02
Business Model03
Our Team04
Supplier Management05
Efficient Use of Natural Resources
06
Social Contribution07
Additional Information08
GRI Content Index09
Financial Statements10
Scope of Companies in the Integrated ReportConsolidated Financial Statements:102-45
Company Name
SAAM S.A. and subsidiaries
SAAM Logistics S.A. and subsidiaries
SAAM Ports S.A. and subsidiaries
SAAM Internacional S.A. and subsidiaries
SAAM Inversiones SPA
SAAM Puertos S.A. and subsidiaries
Inmobiliaria San Marco Ltda. and subsidiaries
Inversiones San Marco Ltda. and subsidiaries
Aerosan Airport Services S.A. and subsidiaries
Servicios Aeroportuarios Aerosan S.A.(1)
SAAM Towage México S.A. de C.V. and subsidiaries
SAAM Towage Brasil S.A.
SAAM Participacoes Ltda.
SAAM Towage El Salvador S.A.
SAAM Remolques Honduras S.A.
Concesionaria SAAM Costa Rica S.A
SAAM Operadora de Puertos Costa Rica S.A
Ecuaestibas S.A
Inversiones Habsburgo S.A.
Inversiones Alaria S.A..II
Saam Remolcadores Panamá S.A.
EOP Crew Management de México S.A. de C.V.
Intertug México S.A. de C.V.
Baru Offshore de México S.A.P.I
SAAM Towage Colombia S.A.S
Scope of Sustainability InformationThe sustainability information considers 100% of the companies, in other words all the subsidiaries and associates of:
SAAM S.A.
SAAM Ports S.A.
SAAM Logistics S.A.
170
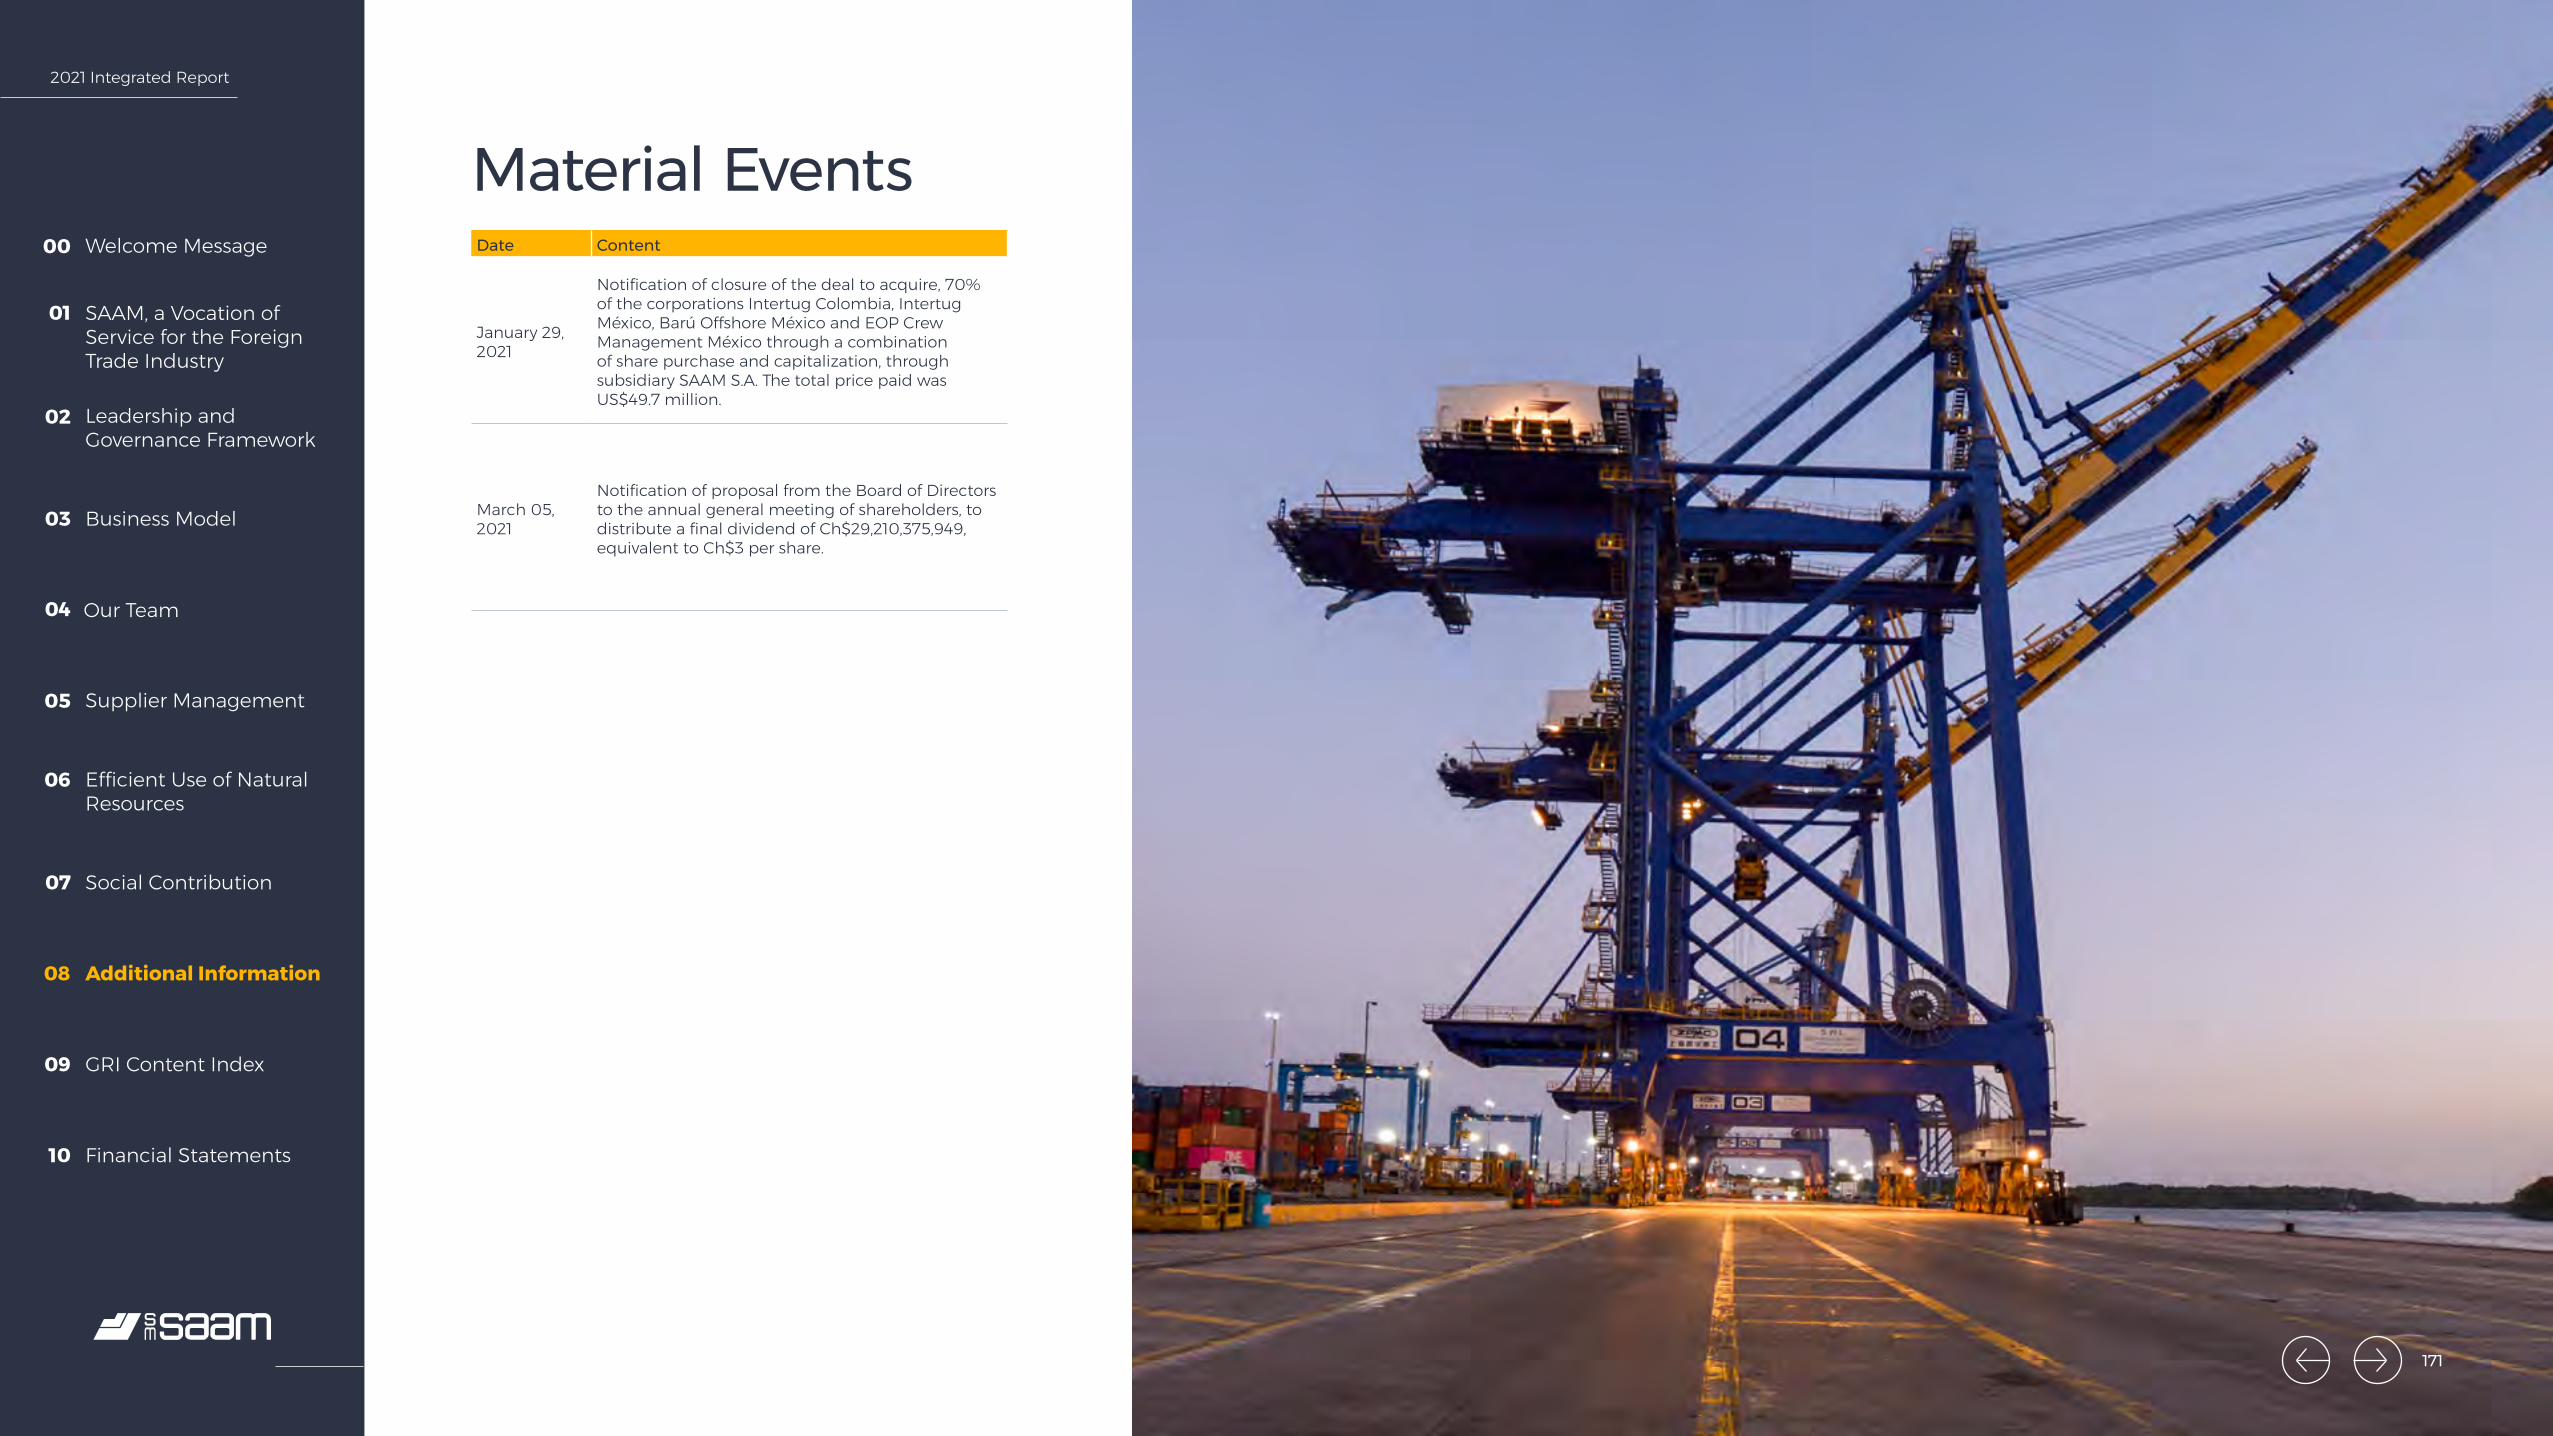
2021 Integrated Report
Welcome Message00
SAAM, a Vocation of Service for the Foreign Trade Industry
01
Leadership and Governance Framework
02
Business Model03
Our Team04
Supplier Management05
Efficient Use of Natural Resources
06
Social Contribution07
Additional Information08
GRI Content Index09
Financial Statements10
Material EventsDate Content
January 29, 2021
Notification of closure of the deal to acquire, 70% of the corporations Intertug Colombia, Intertug México, Barú Offshore México and EOP Crew Management México through a combination of share purchase and capitalization, through subsidiary SAAM S.A. The total price paid was US$49.7 million.
March 05, 2021
Notification of proposal from the Board of Directors to the annual general meeting of shareholders, to distribute a final dividend of Ch$29,210,375,949, equivalent to Ch$3 per share.
171
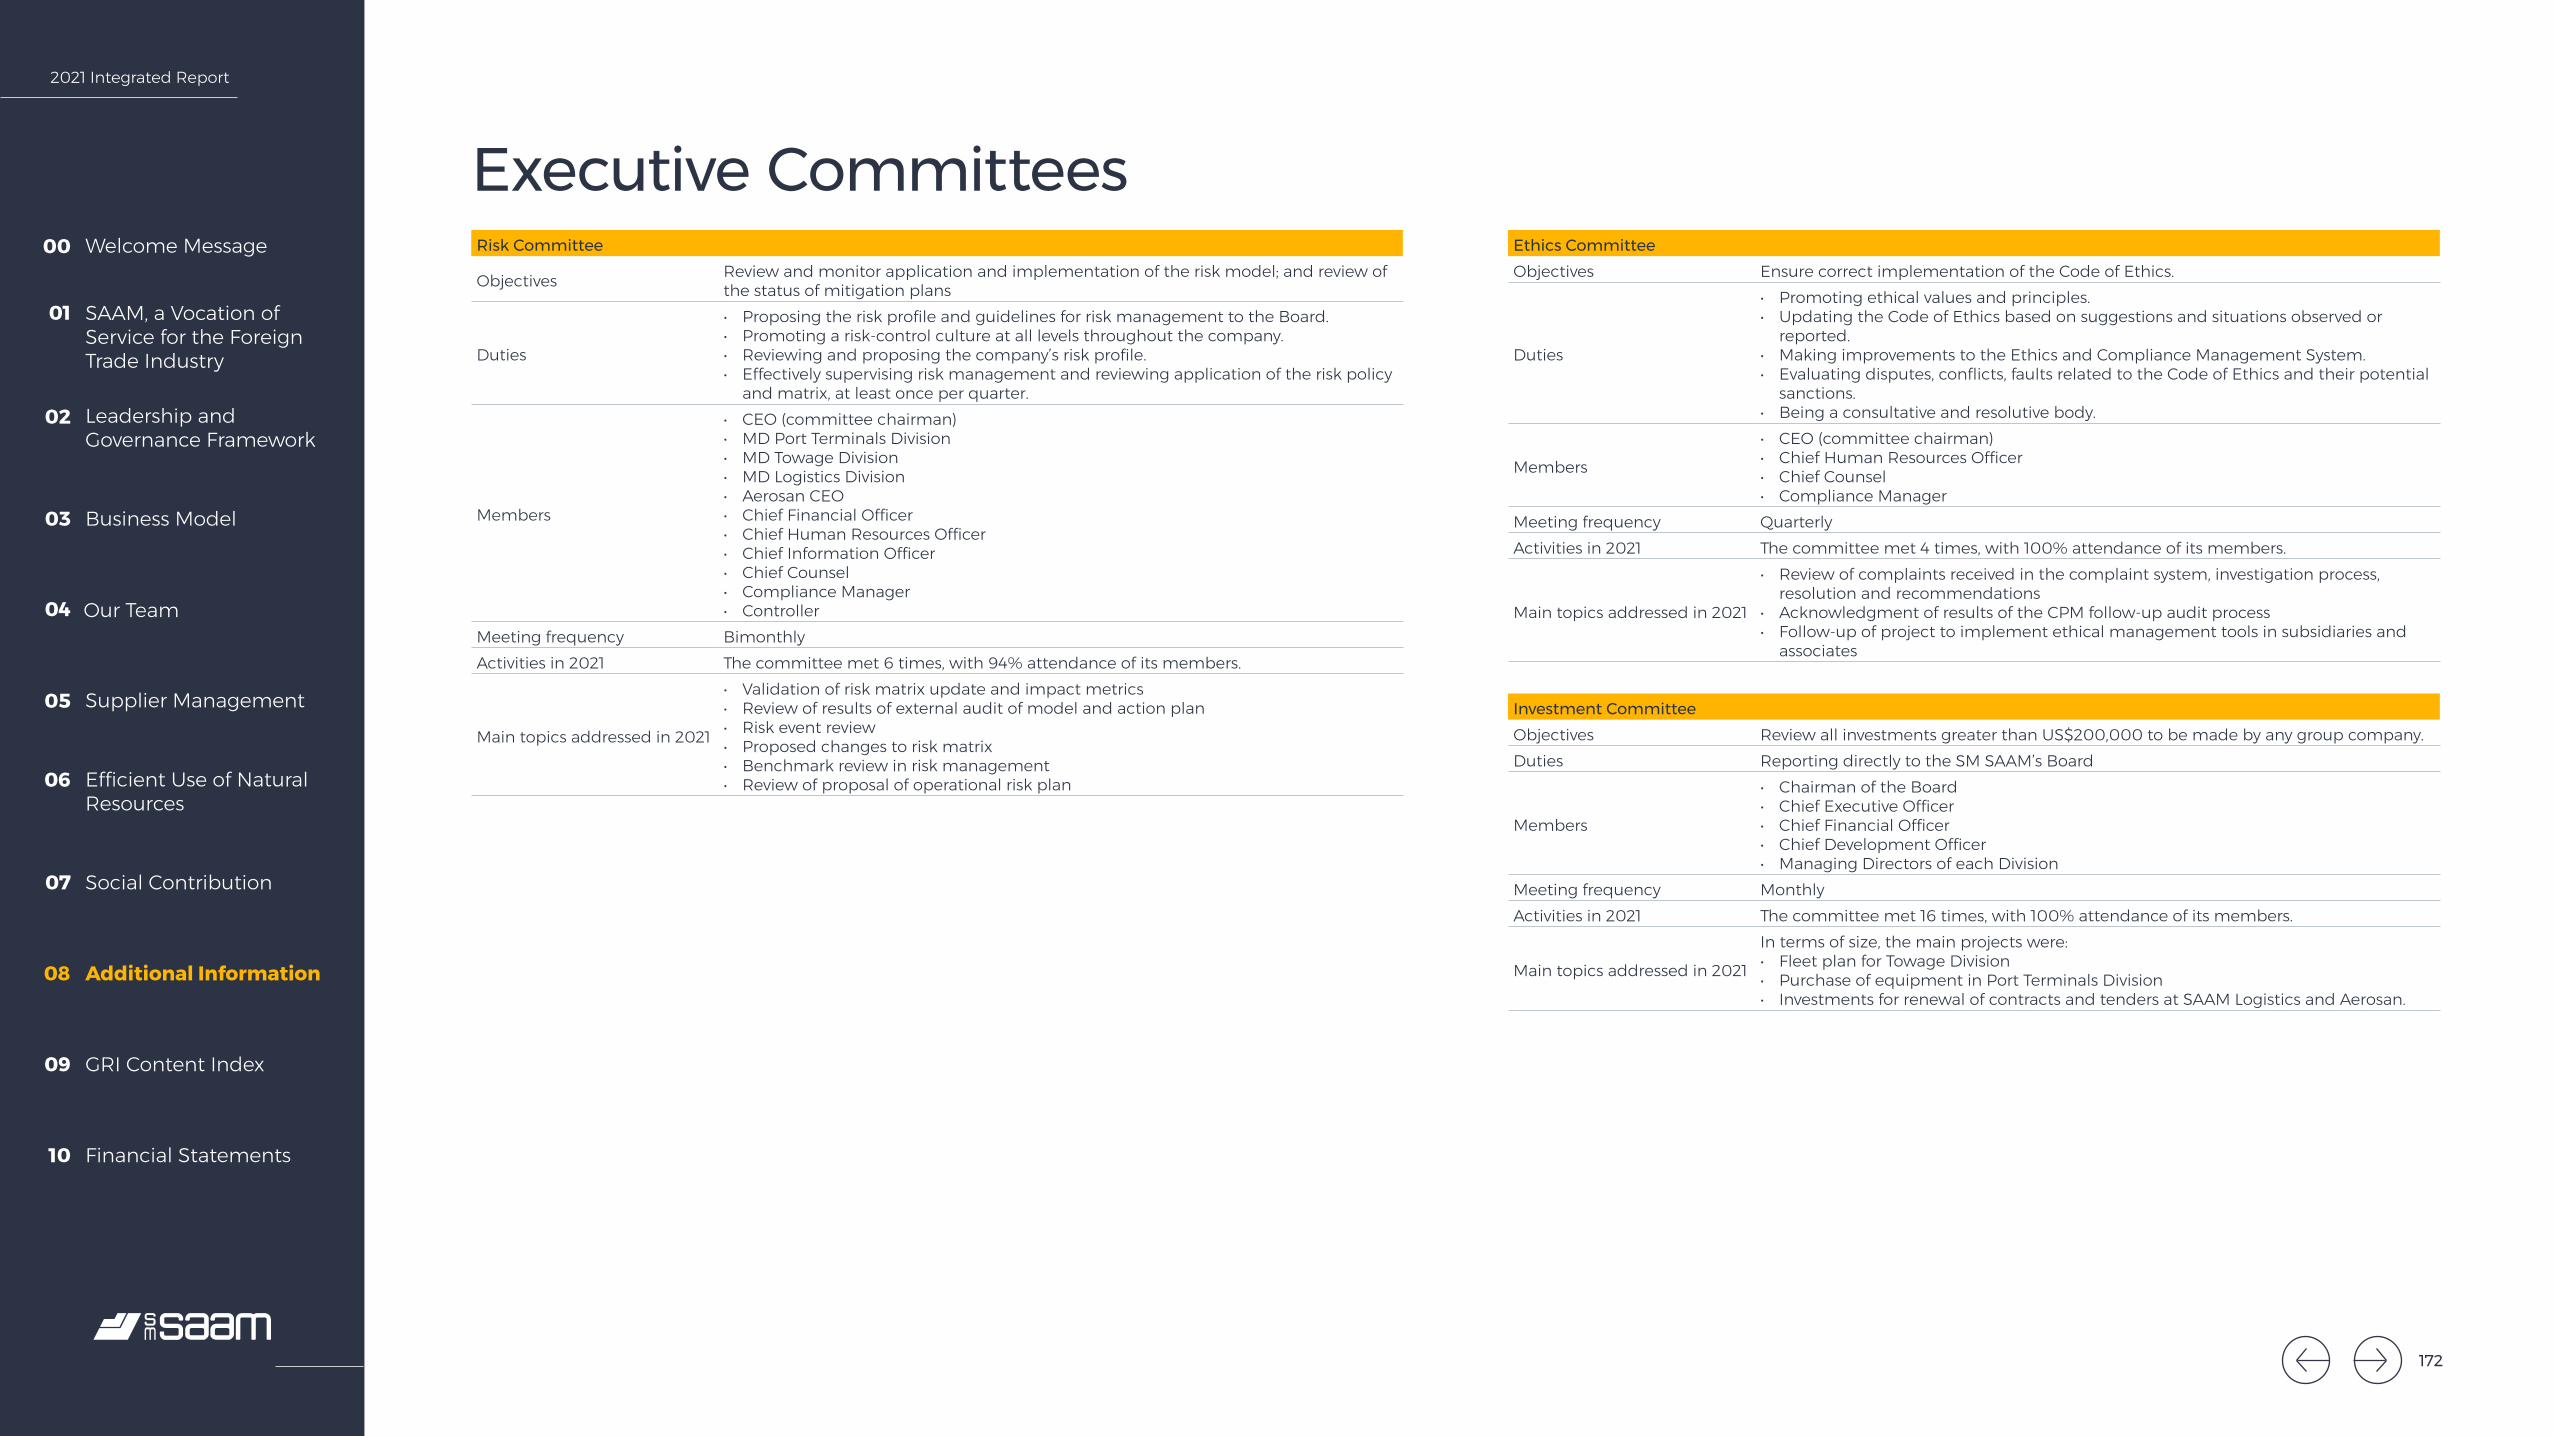
2021 Integrated Report
Welcome Message00
SAAM, a Vocation of Service for the Foreign Trade Industry
01
Leadership and Governance Framework
02
Business Model03
Our Team04
Supplier Management05
Efficient Use of Natural Resources
06
Social Contribution07
Additional Information08
GRI Content Index09
Financial Statements10
Executive CommitteesRisk Committee
Objectives Review and monitor application and implementation of the risk model; and review of the status of mitigation plans
Duties
• Proposing the risk profile and guidelines for risk management to the Board.• Promoting a risk-control culture at all levels throughout the company.• Reviewing and proposing the company’s risk profile.• Effectively supervising risk management and reviewing application of the risk policy
and matrix, at least once per quarter.
Members
• CEO (committee chairman)• MD Port Terminals Division• MD Towage Division• MD Logistics Division• Aerosan CEO• Chief Financial Officer• Chief Human Resources Officer• Chief Information Officer• Chief Counsel• Compliance Manager• Controller
Meeting frequency BimonthlyActivities in 2021 The committee met 6 times, with 94% attendance of its members.
Main topics addressed in 2021
• Validation of risk matrix update and impact metrics• Review of results of external audit of model and action plan• Risk event review• Proposed changes to risk matrix• Benchmark review in risk management• Review of proposal of operational risk plan
Ethics CommitteeObjectives Ensure correct implementation of the Code of Ethics.
Duties
• Promoting ethical values and principles.• Updating the Code of Ethics based on suggestions and situations observed or
reported.• Making improvements to the Ethics and Compliance Management System.• Evaluating disputes, conflicts, faults related to the Code of Ethics and their potential
sanctions.• Being a consultative and resolutive body.
Members
• CEO (committee chairman)• Chief Human Resources Officer• Chief Counsel• Compliance Manager
Meeting frequency QuarterlyActivities in 2021 The committee met 4 times, with 100% attendance of its members.
Main topics addressed in 2021
• Review of complaints received in the complaint system, investigation process, resolution and recommendations
• Acknowledgment of results of the CPM follow-up audit process • Follow-up of project to implement ethical management tools in subsidiaries and
associates
Investment CommitteeObjectives Review all investments greater than US$200,000 to be made by any group company.Duties Reporting directly to the SM SAAM’s Board
Members
• Chairman of the Board• Chief Executive Officer• Chief Financial Officer• Chief Development Officer• Managing Directors of each Division
Meeting frequency MonthlyActivities in 2021 The committee met 16 times, with 100% attendance of its members.
Main topics addressed in 2021
In terms of size, the main projects were: • Fleet plan for Towage Division• Purchase of equipment in Port Terminals Division• Investments for renewal of contracts and tenders at SAAM Logistics and Aerosan.
172

2021 Integrated Report
Welcome Message00
SAAM, a Vocation of Service for the Foreign Trade Industry
01
Leadership and Governance Framework
02
Business Model03
Our Team04
Supplier Management05
Efficient Use of Natural Resources
06
Social Contribution07
Additional Information08
GRI Content Index09
Financial Statements10
Information Security Committee
ObjectivesIdentify the objectives and strategies related to information security for SAAM and its subsidiaries, as well as to direct and monitor information security practices within the companies and continually improve related processes.
Duties
• Proposing improvements in methodology and processes for information security.• Identifying and proposing corrective and preventive actions for information security
incidents that may occur.• Presenting initiatives to augment information security.• Promoting the dissemination and support of information security.• Supervising implementation of procedures and standards related to information
security.• Arbitrating conflicts involving information security matters and associated risks,
proposing solutions to them.• Coordinating action plans for treating incidents and risks related to information
assets.• Staying informed on trends, standards and security methods that help detect new
information security risks.• Informing IT division heads of improvement opportunities in information security
and relevant incidents and solution management.
Members
• Chief Information Officer• Head of IT Security Department• Head of IT Operations Department• Head of IT Applications and Architecture Department
Frequency MonthlyActivities in 2021 The committee met 10 times, with 100% attendance of its members.
Main topics addressed in 2021
• Analysis and follow-up of information security and cybersecurity incidents reported during the period.
• Periodic review of the General Information Security Policy and its subordinate policies.
• Follow-up and control of deployment of SOC (Security Operation Center) and NOC (Network Operation Center) managed services within SAAM and its subsidiaries.
• Review of results of the annual Ethical Hacking and Ethical Phishing process for SAAM and its subsidiaries, and follow up on the derived action plans.
• Follow up on the deployment of the information security course in the subsidiaries.• Planning and control of the annual awareness program on cybersecurity and
cybersecurity awareness month.• Definition of information security and cybersecurity KPIs for SAAM and its
subsidiaries.• Follow-up of the cooperation agreement on information security matters between
SAAM and the Chilean Ministry of the Interior and Public Security.• Follow-up on cybersecurity projects.
Digital Transformation and Innovation Committee
ObjectivesImprove the value proposition and competitive advantage of SAAM and its subsidiaries by making strategic decisions aimed at the transformation, execution and measurement of its digital and innovation component.
Duties
• Define and review the digital strategy of SAAM and its subsidiaries.• Monitor compliance with the digital transformation and innovation roadmap drawn
up for SAAM and its subsidiaries.• Validate proposals for new digital initiatives or projects within SAAM and its
subsidiaries, focusing on increasing operational efficiency, improving customer experience and creating new business opportunities.
• Review progress in the implementation and deployment of the various digital initiatives or projects.
Members
• Chief Executive Officer• Chief Information Officer• MD SAAM Towage• MD Port Terminals Division• MD Logistics Division• Aerosan CEO• Chief Development Officer• Chief Human Resources Officer• Corporate Chief Financial Officer
Meeting frequency BimonthlyActivities in 2021 The committee met 6 times, with 100% attendance of its members.
Main topics addressed in 2021
• Conformation of the Digital Transformation and Innovation Office.• Definition of governance and focus areas for 2021.• Follow-up and control of insignia initiatives.• Follow-up and control of the funnel of digital transformation and innovation
projects, with top-down strategy.• Presentation and implementation of internal innovation challenge, Imagina 2030,
including management through a specialized platform, and the incubation of initiatives presented by workers with a bottom-up strategy.
• Meetings with respective sponsors by business division.• Retrospective and results of the year’s programs, which gave rise to the 2022
strategy.• Incorporation of new initiatives for monitoring and reporting to the committee, such
as managing initiatives to improve customer experience and asset security.
173

2021 Integrated Report
Welcome Message00
SAAM, a Vocation of Service for the Foreign Trade Industry
01
Leadership and Governance Framework
02
Business Model03
Our Team04
Supplier Management05
Efficient Use of Natural Resources
06
Social Contribution07
Additional Information08
GRI Content Index09
Financial Statements10
Sustainability Committee
Objectives Drive the transformation of the organization towards a sustainable business model in all its business units.
Duties
• Define the objectives of the Global Sustainability Plan• Make strategic decision on the plan• Allocate resources• Provide executive sponsorship for program• Lead the organization’s transformation• Evaluate progress on the Universal Sustainability Plan
Members
• CEO (committee chairman)• MD SAAM Towage• MD Port Terminals Division• MD Logistics Division• Aerosan CEO • Corporate Sustainability and Communications Officer• Corporate Chief Financial Officer• Chief Human Resources Officer• Compliance Manager
Meeting frequency BimonthlyActivities in 2021 The committee met once, with 100% attendance of its members.Main topics addressed in 2021 • Election of members of the Sustainability Committee.
Safety Committee
Objectives • Achieve a safe and accident-free work environment.• Foster close leadership, self-care, collaborative work.
Duties • Maintaining operational discipline and control of the risk of professional illnesses and accidents
Members
• Chief Executive Officer• Business Unit Managers• Chief Human Resources Officer• Corporate Sustainability and Communications Officer• Corporate Chief Financial Officer
Meeting frequency MonthlyActivities in 2021 In 2021, there were 3 sessions, with 100% attendance.
Main topics addressed in 2021
• A new safety strategy, +Safety, was defined.• New safety management tools and management reporting methods were defined.• The results of the implementation of the new security strategy were reviewed.• The communications plan for the new safety strategy was reviewed.
174
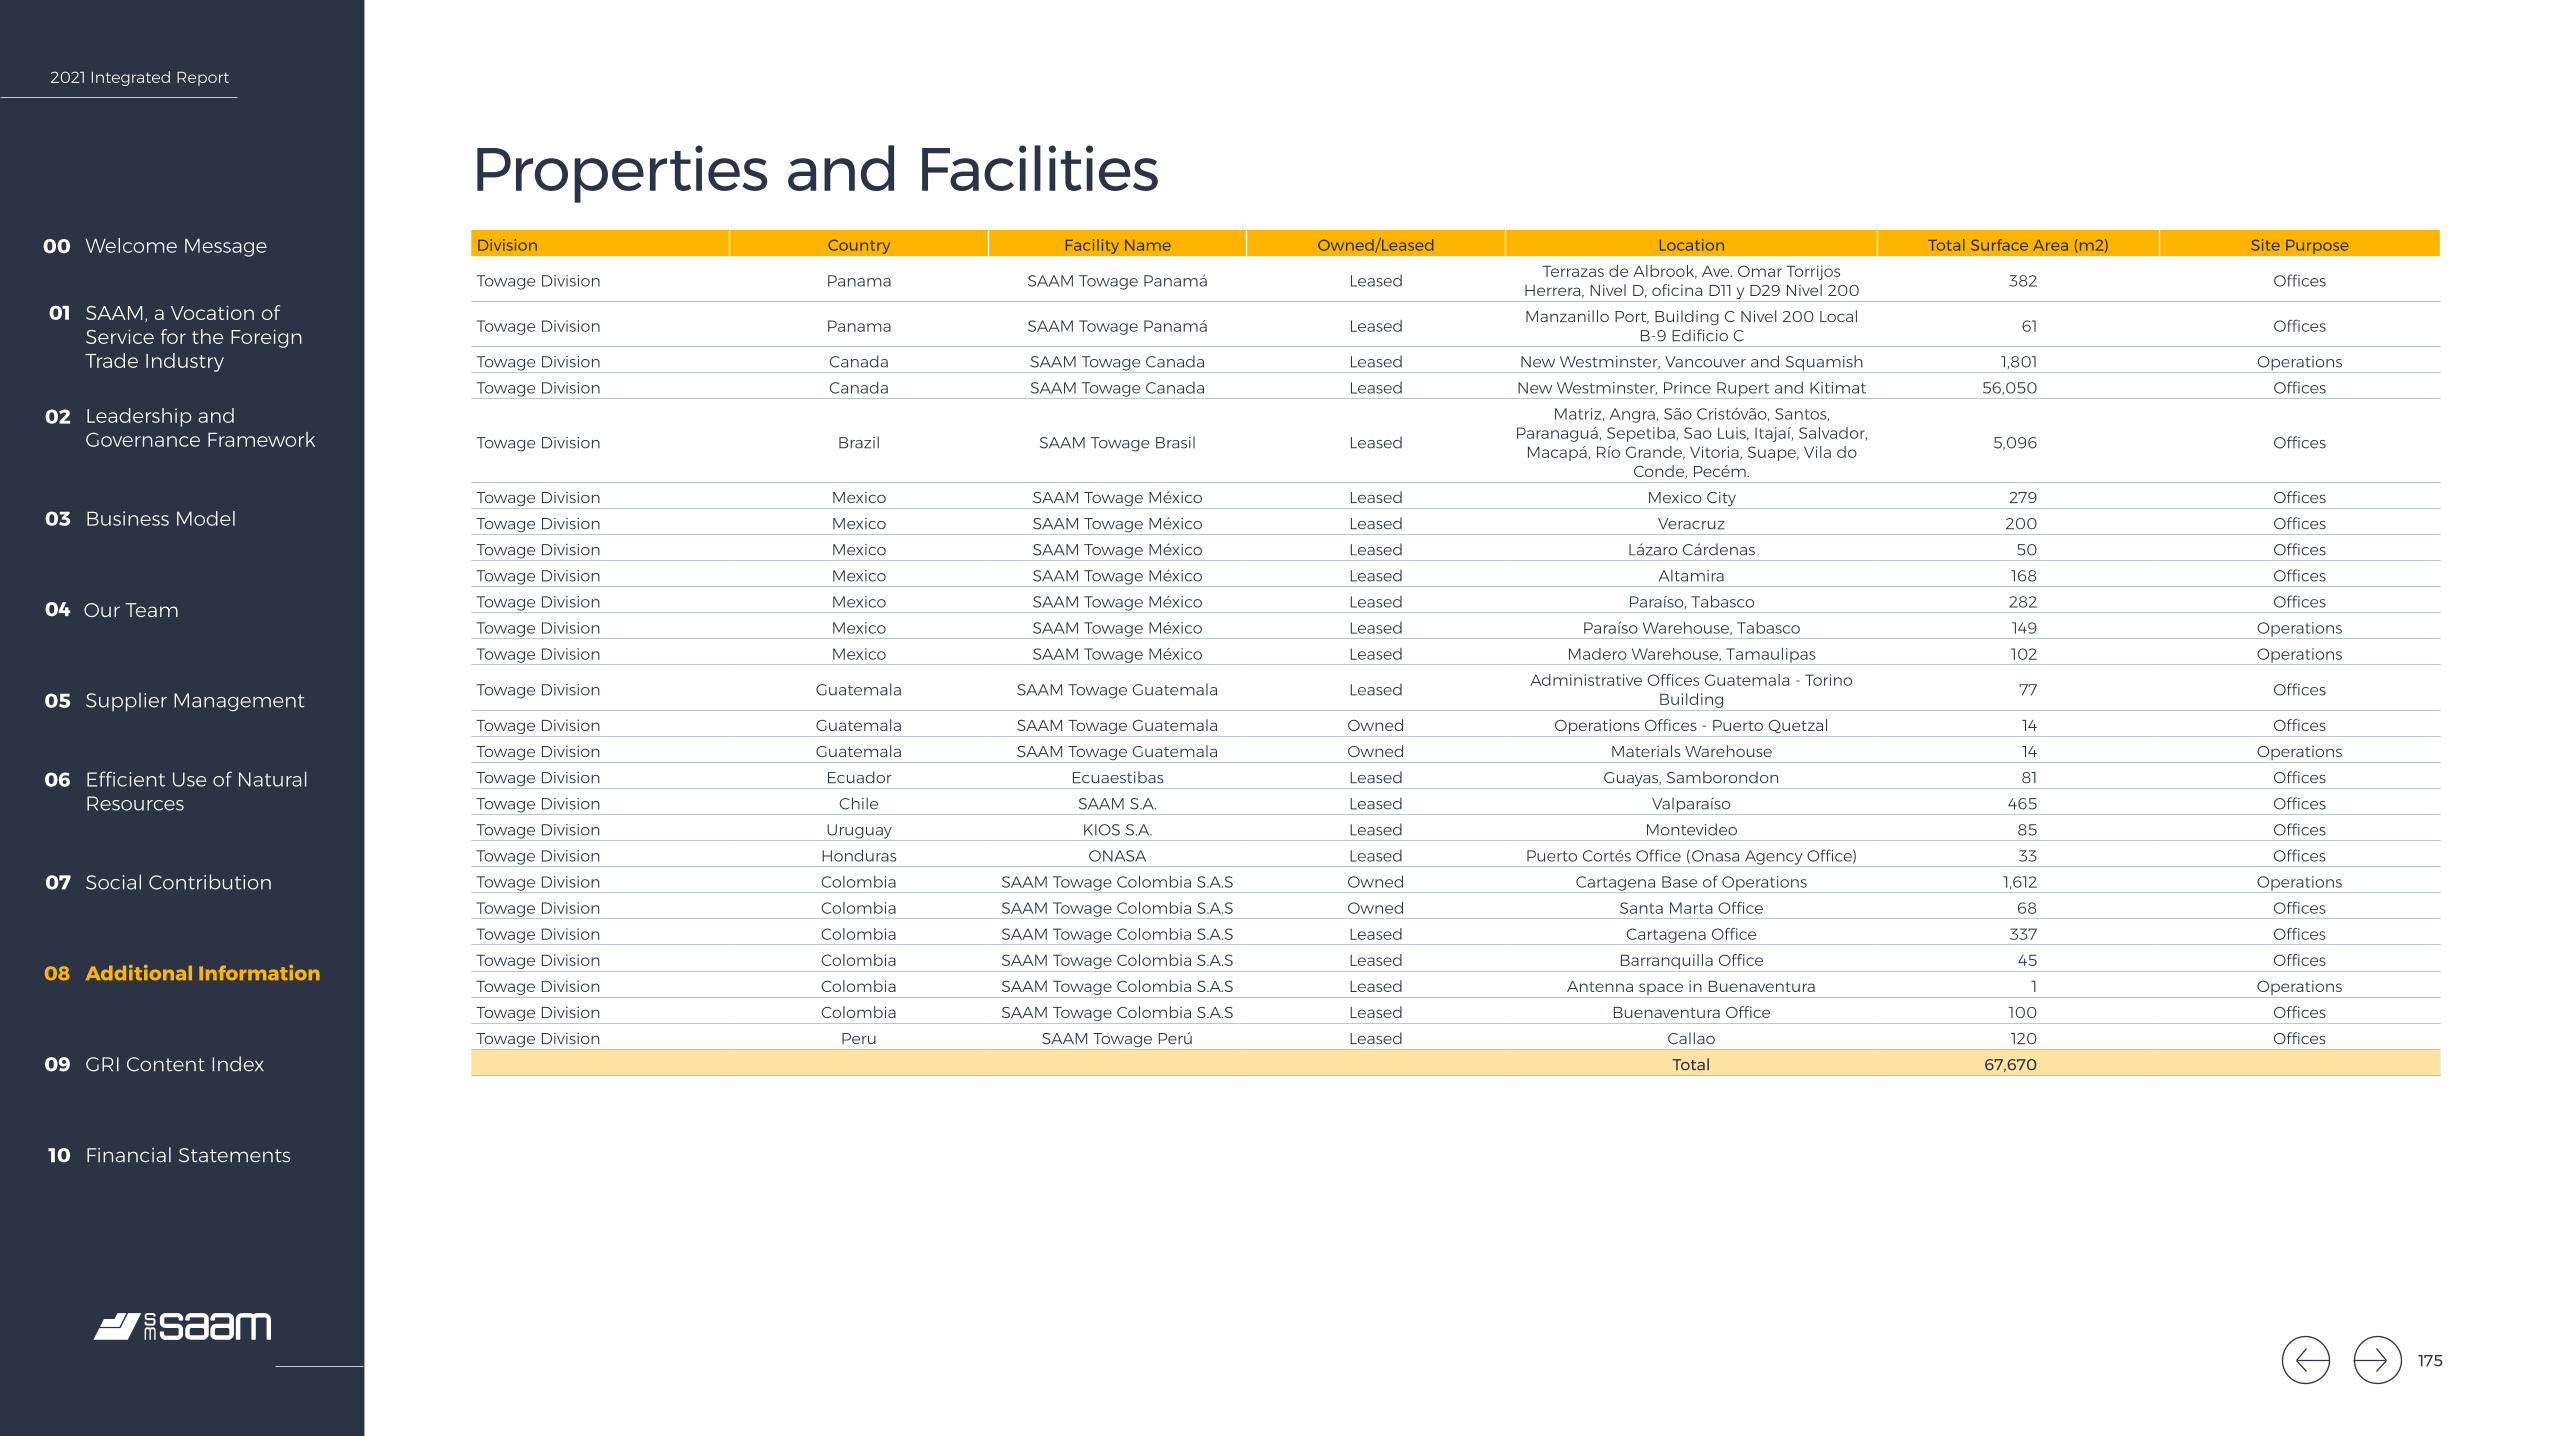
2021 Integrated Report
Welcome Message00
SAAM, a Vocation of Service for the Foreign Trade Industry
01
Leadership and Governance Framework
02
Business Model03
Our Team04
Supplier Management05
Efficient Use of Natural Resources
06
Social Contribution07
Additional Information08
GRI Content Index09
Financial Statements10
Properties and FacilitiesDivision Country Facility Name Owned/Leased Location Total Surface Area (m2) Site Purpose
Towage Division Panama SAAM Towage Panamá Leased Terrazas de Albrook, Ave. Omar Torrijos Herrera, Nivel D, oficina D11 y D29 Nivel 200 382 Offices
Towage Division Panama SAAM Towage Panamá Leased Manzanillo Port, Building C Nivel 200 Local B-9 Edificio C 61 Offices
Towage Division Canada SAAM Towage Canada Leased New Westminster, Vancouver and Squamish 1,801 OperationsTowage Division Canada SAAM Towage Canada Leased New Westminster, Prince Rupert and Kitimat 56,050 Offices
Towage Division Brazil SAAM Towage Brasil Leased
Matriz, Angra, São Cristóvão, Santos, Paranaguá, Sepetiba, Sao Luis, Itajaí, Salvador,
Macapá, Río Grande, Vitoria, Suape, Vila do Conde, Pecém.
5,096 Offices
Towage Division Mexico SAAM Towage México Leased Mexico City 279 OfficesTowage Division Mexico SAAM Towage México Leased Veracruz 200 OfficesTowage Division Mexico SAAM Towage México Leased Lázaro Cárdenas 50 OfficesTowage Division Mexico SAAM Towage México Leased Altamira 168 OfficesTowage Division Mexico SAAM Towage México Leased Paraíso, Tabasco 282 OfficesTowage Division Mexico SAAM Towage México Leased Paraíso Warehouse, Tabasco 149 OperationsTowage Division Mexico SAAM Towage México Leased Madero Warehouse, Tamaulipas 102 Operations
Towage Division Guatemala SAAM Towage Guatemala Leased Administrative Offices Guatemala - Torino Building 77 Offices
Towage Division Guatemala SAAM Towage Guatemala Owned Operations Offices - Puerto Quetzal 14 OfficesTowage Division Guatemala SAAM Towage Guatemala Owned Materials Warehouse 14 OperationsTowage Division Ecuador Ecuaestibas Leased Guayas, Samborondon 81 OfficesTowage Division Chile SAAM S.A. Leased Valparaíso 465 OfficesTowage Division Uruguay KIOS S.A. Leased Montevideo 85 OfficesTowage Division Honduras ONASA Leased Puerto Cortés Office (Onasa Agency Office) 33 OfficesTowage Division Colombia SAAM Towage Colombia S.A.S Owned Cartagena Base of Operations 1,612 OperationsTowage Division Colombia SAAM Towage Colombia S.A.S Owned Santa Marta Office 68 OfficesTowage Division Colombia SAAM Towage Colombia S.A.S Leased Cartagena Office 337 OfficesTowage Division Colombia SAAM Towage Colombia S.A.S Leased Barranquilla Office 45 OfficesTowage Division Colombia SAAM Towage Colombia S.A.S Leased Antenna space in Buenaventura 1 OperationsTowage Division Colombia SAAM Towage Colombia S.A.S Leased Buenaventura Office 100 OfficesTowage Division Peru SAAM Towage Perú Leased Callao 120 Offices
Total 67,670
175

2021 Integrated Report
Welcome Message00
SAAM, a Vocation of Service for the Foreign Trade Industry
01
Leadership and Governance Framework
02
Business Model03
Our Team04
Supplier Management05
Efficient Use of Natural Resources
06
Social Contribution07
Additional Information08
GRI Content Index09
Financial Statements10
Division Country Facility Name Own/Leased Location Total Surface Area (m2) Site PurposePort Terminals Chile Iquique Terminal Internacional (ITI) Leased Iquique 135,000 OperationsPort Terminals Chile Antofagasta Terminal Internacional (ATI) Leased Antofagasta 97,000 OperationsPort Terminals Chile San Antonio Terminal Internacional (STI) Leased San Antonio 298,000 OperationsPort Terminals Chile San Vicente Terminal Internacional (SVTI) Leased Talcahuano 371,000 OperationsPort Terminals Chile Portuaria Corral Leased Valdivia, Corral 100,000 OperationsPort Terminals Ecuador Terminal Portuario Guayaquil (TPG) Leased Guayaquil 262,000 OperationsPort Terminals Colombia Puerto Buenavista (PBV) Leased Cartagena de Indias 62,000 OperationsPort Terminals Costa Rica Puerto Caldera Leased Caldera 270,000 OperationsPort Terminals Mexico Terminal Maritima Mazatlán (TMAZ) Leased Mazatlan, Sinaloa 157,782 OperationsPort Terminals USA Florida International Terminal (FIT) Leased Port Everglades, Florida 190,000 Operations
Total 1,942,782
Division Country Facility Name Owned/Leased Location Total Surface Area (m2) Site Purpose
Logistics Chile Inmobiliaria San Marco OwnedIquique, Valparaíso, San Antonio, Santiago, Puerto Montt, Puerto
Chacabuco, Punta Arenas 454,456.00 Operations
Logistics Chile Inmobiliaria San Marco Owned Valparaíso 725.80 Offices
Logistics Chile Inmobiliaria San Marco Owned
Arica, Antofagasta, Coquimbo, Valparaíso, Santiago, San Antonio, Talcahuano, Chacabuco, Calbuco,
Punta Arenas
320,284.50 Third Party Lease (and available for lease)
Logistics Chile Inmobiliaria San Marco Owned San Antonio, Calbuco 3,642,000.00 Development projects
Logistics Chile Aerosan Leased Arturo Merino Benitez Airport 88.00 Offices
Logistics Chile Aerosan Leased Arturo Merino Benitez Airport (Santiago) 13,628.11 Operations
Logistics Ecuador Aronem Leased Mariscal Sucre Airport (Quito) 2,304.00 Operations
Logistics Colombia Transaereo Leased
Loading terminal El Dorado International Airport (Bogotá) and
Ernesto Cortissoz International Airport (Barranquilla)
9,575.03 Operations
Logistics Colombia Transaereo Leased 461.73 OfficesLogistics Chile Reloncaví Leased Talcahuano 2,000.00 WorkshopsLogistics Chile Reloncaví Leased Talcahuano 300.00 OfficesLogistics Chile Reloncaví Leased Valdivia 1,000.00 Offices / machine shopLogistics Chile Reloncaví Owned Puerto Montt 1,500.00 WorkshopsLogistics Uruguay Luckymont Leased Punta Pereira 30,000.00 Operations
Total 4,448,323.17
Division Country Facility Name Own/Leased Location Total Surface Area (m2) Site PurposeLogistics Ecuador Aerosan Leased Mariscal Sucre Airport 2,500 OperationsLogistics Chile Aerosan Leased Arturo Merino Benitez Airport 88 Offices
Logistics Chile Aerosan Leased Arturo Merino Benitez Airport (Santiago) 13,628 Operations
Total 16,216
176
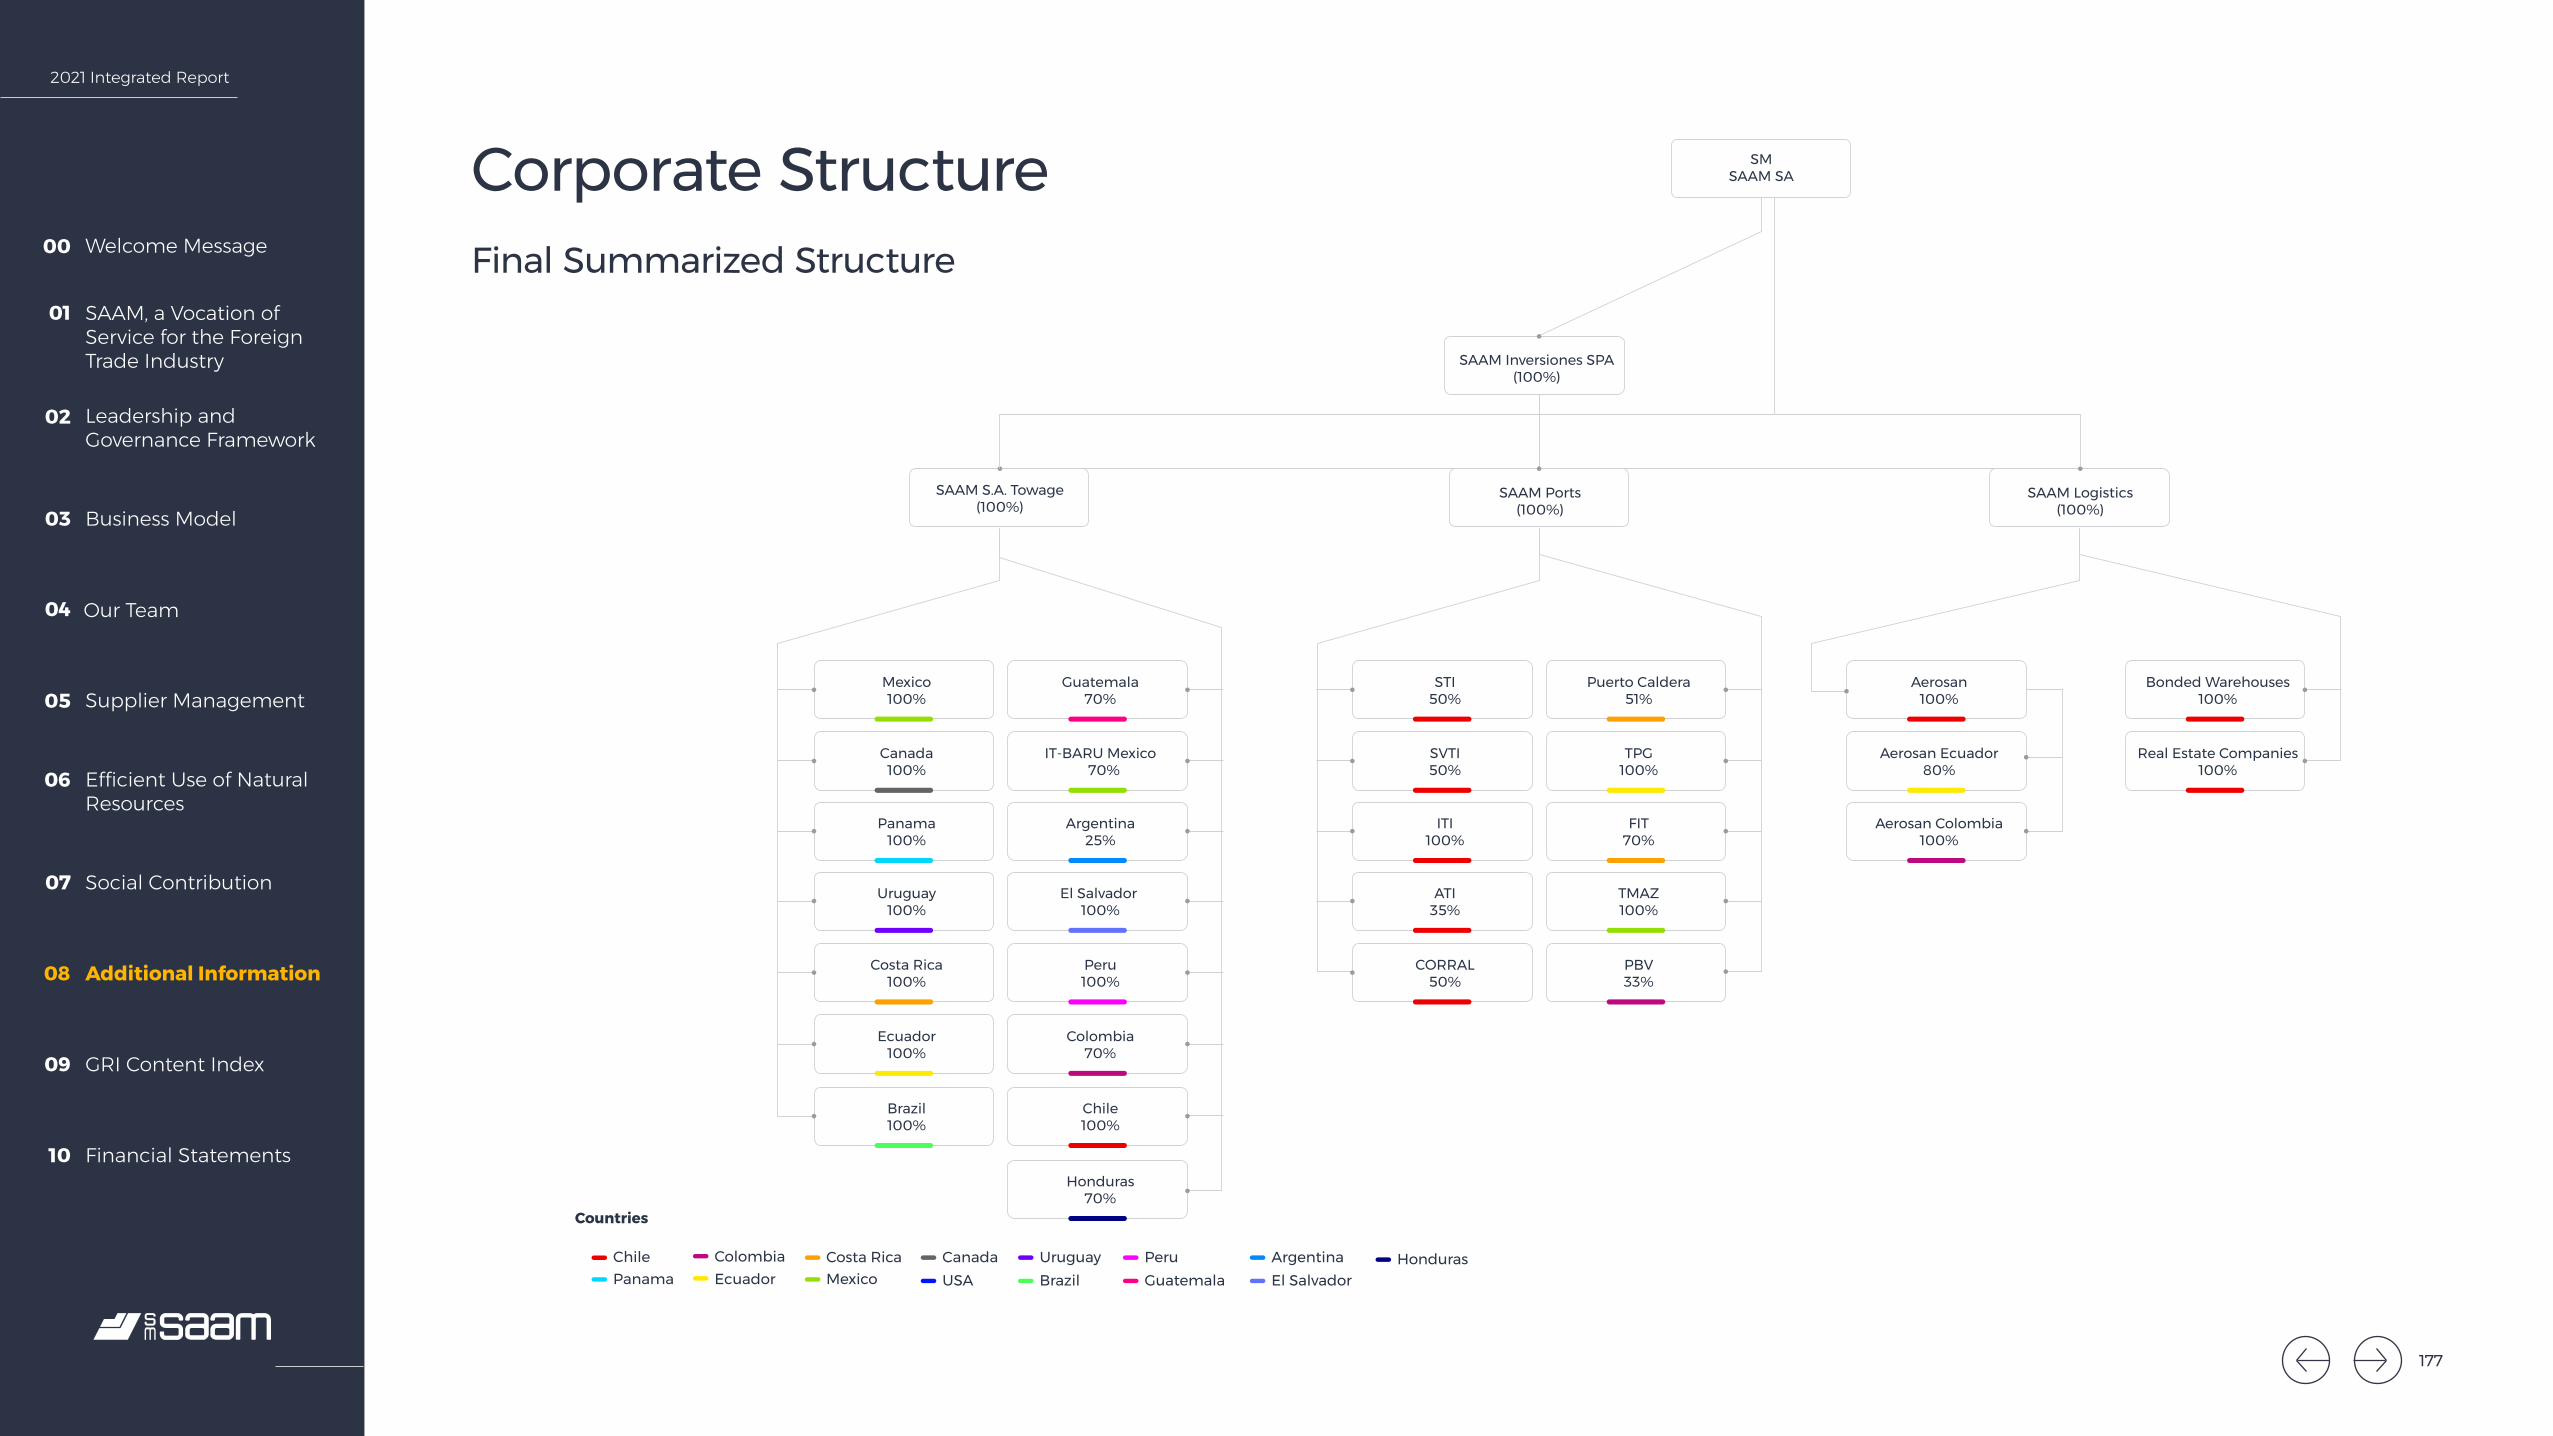
2021 Integrated Report
Welcome Message00
SAAM, a Vocation of Service for the Foreign Trade Industry
01
Leadership and Governance Framework
02
Business Model03
Our Team04
Supplier Management05
Efficient Use of Natural Resources
06
Social Contribution07
Additional Information08
GRI Content Index09
Financial Statements10
SAAM S.A. Towage (100%)
SAAM Ports (100%)
SAAM Logistics (100%)
Chile
Countries
PanamaColombiaEcuador Mexico
Costa Rica CanadaUSA
UruguayBrazil
PeruGuatemala
ArgentinaEl Salvador
SAAM Inversiones SPA (100%)
SMSAAM SA
Mexico100%
Canada100%
Panama100%
Uruguay100%
Costa Rica100%
Ecuador100%
Brazil100%
Guatemala70%
IT-BARU Mexico 70%
Argentina25%
El Salvador 100%
Peru100%
Colombia70%
Chile100%
Honduras70%
STI50%
SVTI50%
ITI100%
ATI35%
CORRAL50%
Puerto Caldera51%
TPG100%
FIT70%
TMAZ100%
PBV33%
Aerosan100%
Aerosan Ecuador80%
Aerosan Colombia100%
Bonded Warehouses100%
Real Estate Companies100%
Honduras
Corporate StructureFinal Summarized Structure
177
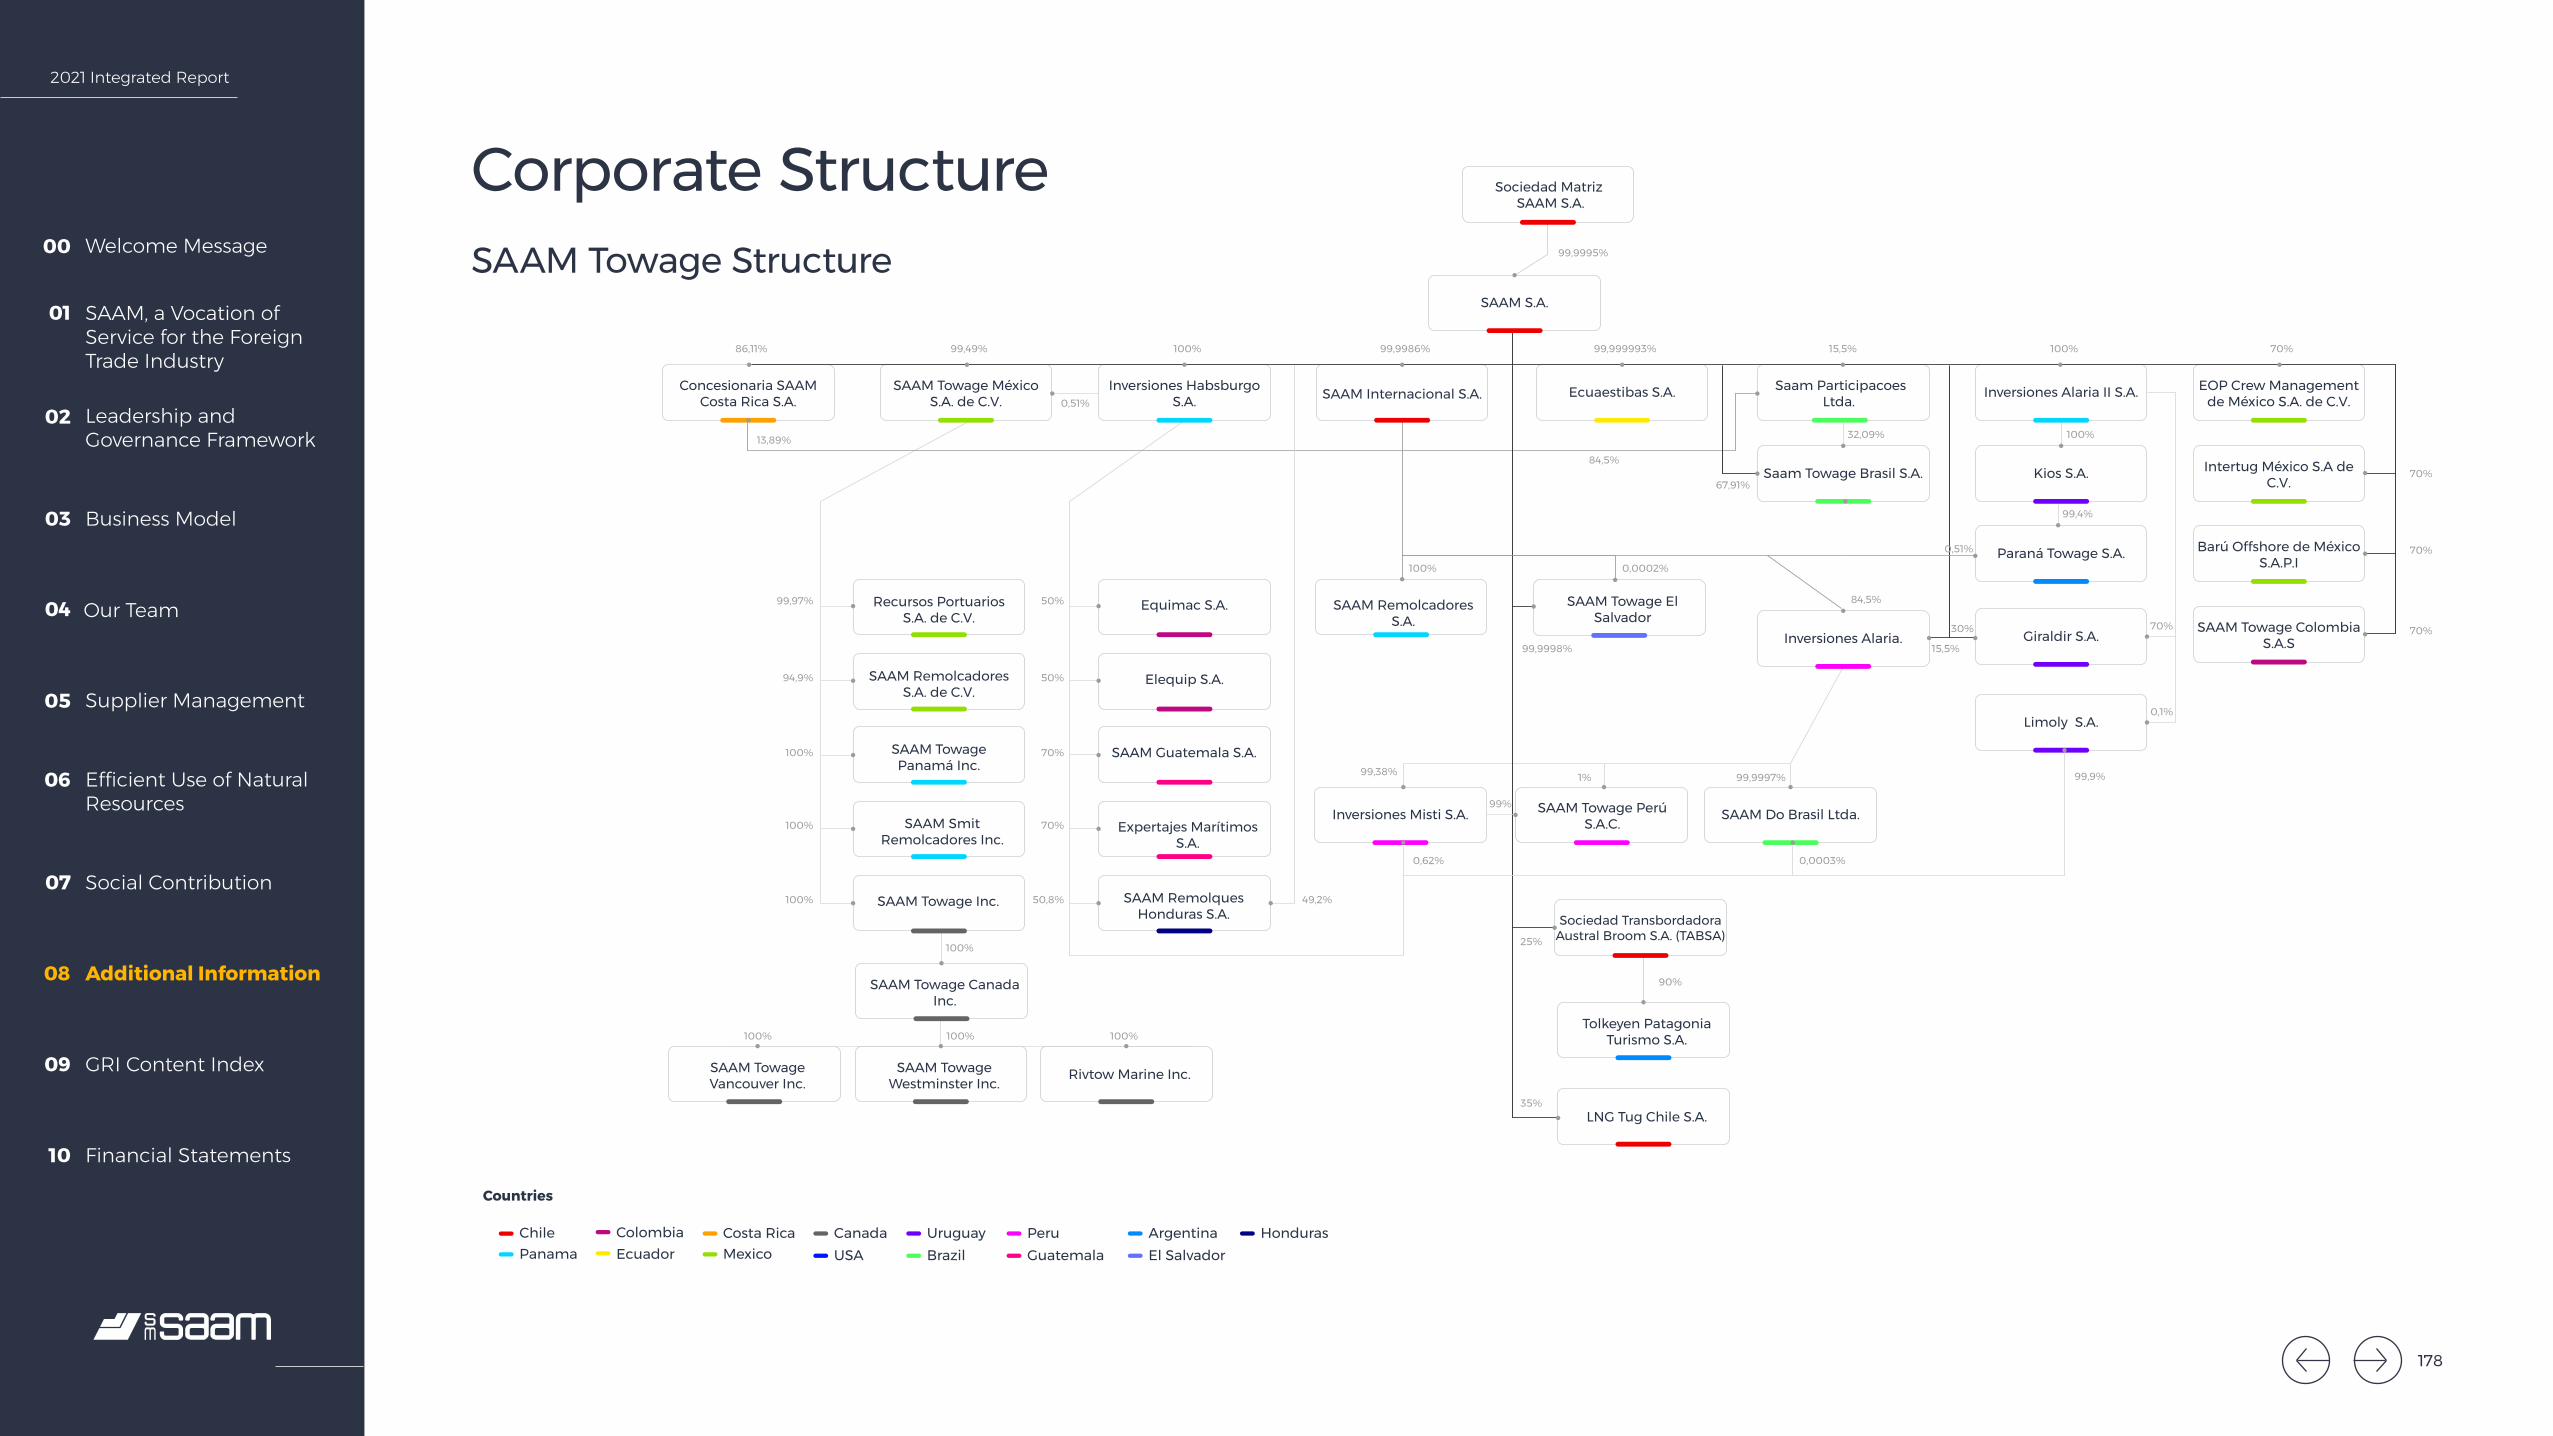
2021 Integrated Report
Welcome Message00
SAAM, a Vocation of Service for the Foreign Trade Industry
01
Leadership and Governance Framework
02
Business Model03
Our Team04
Supplier Management05
Efficient Use of Natural Resources
06
Social Contribution07
Additional Information08
GRI Content Index09
Financial Statements10
Kios S.A.
Giraldir S.A.
Limoly S.A.
Paraná Towage S.A.
99,4%
Chile
Countries
PanamaColombiaEcuador Mexico
Costa Rica CanadaUSA
UruguayBrazil
PeruGuatemala
Argentina HondurasEl Salvador
Sociedad Matriz SAAM S.A.
SAAM S.A.
99,9995%
Concesionaria SAAM Costa Rica S.A.
86,11%
SAAM Towage México S.A. de C.V.
99,49%
Inversiones Habsburgo S.A.
100%
0,51%SAAM Internacional S.A.
99,9986%
SAAM Remolcadores S.A.
Equimac S.A.
Elequip S.A.
SAAM Guatemala S.A.
Expertajes Marítimos S.A.
SAAM Remolques Honduras S.A.
Recursos Portuarios S.A. de C.V.
SAAM Remolcadores S.A. de C.V.
SAAM Towage Panamá Inc.
SAAM Smit Remolcadores Inc.
SAAM Towage Inc.
99,9998%
13,89%
0,0002%100%
50%
50%
70%
70%
50,8%
99,97%
94,9%
100%
100%
100%
100%
100% 100% 100%
49,2%
SAAM Towage El Salvador
90%
Tolkeyen Patagonia Turismo S.A.
SAAM Towage Canada Inc.
SAAM Towage Vancouver Inc.
SAAM Towage Westminster Inc. Rivtow Marine Inc.
LNG Tug Chile S.A.
Sociedad Transbordadora Austral Broom S.A. (TABSA)25%
35%
Ecuaestibas S.A.
99,999993%
Saam Participacoes Ltda.
15,5%
Inversiones Alaria II S.A.
100%
EOP Crew Management de México S.A. de C.V.
70%
70%
100%
70%
70%70%30%
15,5%
99,38%
0,62% 0,0003%
99,9%1%
99%
99,9997%
0,1%
Intertug México S.A de C.V.
Barú Offshore de México S.A.P.I
SAAM Towage Colombia S.A.S
Saam Towage Brasil S.A.
32,09%
67,91%
84,5%
Inversiones Alaria.
Inversiones Misti S.A. SAAM Towage Perú S.A.C. SAAM Do Brasil Ltda.
84,5%
0,51%
Corporate StructureSAAM Towage Structure
178

2021 Integrated Report
Welcome Message00
SAAM, a Vocation of Service for the Foreign Trade Industry
01
Leadership and Governance Framework
02
Business Model03
Our Team04
Supplier Management05
Efficient Use of Natural Resources
06
Social Contribution07
Additional Information08
GRI Content Index09
Financial Statements10
Sociedad Matriz SAAM S.A.
Chile
Countries
SAAM Ports S.A.
SAAM Puertos S.A.
Iquique Terminal Internacional S.A.
Mexico
99,9995%
99,75%
99,9%
99,735%
98%2%
94,32%
100%
5,68%
100%
51%
99%
ColombiaEcuador
Costa RicaUSA
Terminal Marítima Mazatlán S.A. de C.V.
Recursos Portuarios Mazatlán S.A. de C.V.
SAAM Operadora de Puertos Costa Rica S.A.
Sociedad Portuaria Granelera de Caldera S.A.
San Antonio Terminal Internacional S.A.50%
San Vicente Terminal Internacional S.A.50%
Antofagasta Terminal Internacional S.A.35%
Inmobiliaria Sepbio Ltda (SVTI)50%
Muellaje del Maipo S.A. (STI)50%
Serv Port y Extraport Bío Bío Ltda. (SVTI)50%
Puerto Buenavista S.A.33,33%
99,875%Inarpi S.A.99,9889% Transportes TPG S.A.
100%SPR Los Ríos SpA
99,5%0,5%
0,5%
0,5%
0,5%
Muellaje ITI S.A.
99,5%Muellaje STI S.A.
99,5%Muellaje SVTI S.A.
99,5%Muellaje ATI S.A.
Muellaje del Loa S.A.
Terminal El Colorado S.A.
99%
Portuaria Corral S.A.50%
SAAM Florida Inc.70%
50%
Florida International Terminal LLC
Transportes Fluviales Corral S.A.
51%Sociedad Portuaria
Caldera S.A.
SAAM Inversiones Portuarias Costa Rica S.A.
Corporate StructurePort Terminals Structure
179

2021 Integrated Report
Welcome Message00
SAAM, a Vocation of Service for the Foreign Trade Industry
01
Leadership and Governance Framework
02
Business Model03
Our Team04
Supplier Management05
Efficient Use of Natural Resources
06
Social Contribution07
Additional Information08
GRI Content Index09
Financial Statements10
Sociedad Matriz SAAM S.A.
SAAM Logistics S.A.
99%
99%
99%
99%
99%
99%
99,5%
1%
99,695% 50%
0,305%
99,99945% 100%
0,005%
1%
98%
99,995%
0,005%
95%
98%
50%
50%
5%
80%
1%
1%
1%
1%
1%
1%
0,5%
1%
1%
99,995%
0,00055%
Inversiones San Marco Ltda.
COSEM S.A.
Servicios de Personal Portales S.A. (SEPSA)
Terminal Las Golondrinas S.A.
SAAM Extraportuarios S.A.
Aquasaam S.A.
Inmobiliaria San Marco Ltda.
Inmobiliaria Maritima Portuaria Ltda. (IMPSA)
SAAM Inversiones SpA.
Servicios logísticos Limitada.
Airport Investment SRL
Aerosan S.A.S (Ex Transaereo)
Aronem Air Cargo S.A.
Servicios Aeroportuarios Aerosan S.A.
Servicios de Aviación Ltda. (SERVIAIR)
Aerosan Airport Services S.A.
Chile
Countries
PanamaColombiaEcuador
Inmobiliaria Carriel Ltda.
Corporate StructureLogistics Structure
180

2021 Integrated Report
Welcome Message00
SAAM, a Vocation of Service for the Foreign Trade Industry
01
Leadership and Governance Framework
02
Business Model03
Our Team04
Supplier Management05
Efficient Use of Natural Resources
06
Social Contribution07
Additional Information08
GRI Content Index09
Financial Statements10
Information on Subsidiaries and AssociatesSM SAAM Subsidiaries and AssociatesChilean Companies
SAAM S.A. Company name: SAAM S.A.Type of entity: Privately held corporationSubscribed and paid-in share capital: US$78,364,572.40Ownership interest: 100%Investment as a percentage of the parent company’s net assets: 40.80%
Corporate purpose:
/a/ Directly performing or through other companies of all kinds of maritime towage and launch activities, including the construction, acquisition, development and operation of tugs, launches and lighters, as well as providing towage, maneuvering and transport services, including assistance, salvage, pilotage, supply and support to vessels, naval vessels, offshore operations and the maritime industry in general; /b/ Acting as representative of national or foreign companies; and in particular, representing shipowners and shipping companies in general in providing agency services and attending merchant, special or any other ships, and providing agency services for freight, passenger and tourism; /c/ Acquiring, purchasing, selling and disposing of shares in corporations, shares or rights in other companies, bonds, debentures, commercial paper and other transferable securities; administering, transferring, benefiting from, receiving their income and gaining from their sale and disposal; granting financing to related companies and providing all kinds of services and advising in Chile and abroad; and /d/ Carrying out any other activities related to the company’s business, acting on its own behalf or on behalf of third parties and/or associate or in participation with third parties.
Board of Directors: Óscar Hasbún Martínez (1), Macario Valdés Raczynski (2) and Hernán Gómez Cisternas
Chief Executive Officer: Hernán Gómez CisternasMain contracts with the parent company:
Providing administration and accounting services, financial and tax advice, legal advice, internal audit services and public relations advice.
SAAM LOGISTICS S.A.Company name: SAAM Logistics S.A.Type of entity: Privately held corporationSubscribed and paid-in share capital: US$24,805,307.15
Ownership interest: 100%Investment as a percentage of the parent company’s net assets:
10.98%
Corporate purpose:
i) Rendering of logistic services for storage, transportation, distribution and assembly of sets of parts or kits, of products or inputs of any kind or nature, including the rendering of complementary services to such products such as packaging, marking, selection, weighing, classification, fumigation, certifications, temperature controls and others of similar nature; ii) Rendering of logistic services related to the procurement, availability, delivery, distribution, storage and information management of products of any nature; iii) Render ancillary services required by cargo and containers, such as consolidation and deconsolidation, stowage and unstowage in transport vehicles, loading and unloading of goods, connections to specialized plants, certifications and temperature controls and the performance of intermediate operations in port enclosures and on docked or touring vessels, such as stowage, stacking, horizontal and vertical displacements and other tasks related to the loading or unloading of vessels and naval artifacts; iv) Rendering of container handling services such as cleaning, greasing, maintenance, repairs and modifications; v) Providing technical assistance and consulting services, including administration, management, supply, planning, organization, surveys, systems and technology projects related to transportation and warehousing activities; vi) Leasing of containers and packing elements and of cranes or cargo handling equipment in general; vii) Importing, exporting, commercialization of products and supplies of any nature, and representing them; viii) Management of transportation services in general, whether domestic or international, and the rendering of services as ship agent, stevedoring agent or wharfage company, shipping agent, forwarding agent or freight forwarder, and others of a similar nature; ix) Acquisition, purchase, and sale of products and supplies of any nature, and assuming their representation; viii) Management of transportation services in general, whether domestic or international, and the rendering of services as ship agent, stevedoring agent or wharfage company, shipping agent, forwarding agent or freight forwarder, and others of a similar nature; ix) The acquisition, purchase, sale and disposal of shares of corporations, shares or rights in other companies, bonds, debentures, bills of exchange and other marketable securities; manage, transfer, exploit them, collect proceeds and obtain benefits from their sale and disposal; as well as the granting of financing to related companies; and x) Other activities connected with company’s line of business, being able to act on its own account or on behalf of others and/or in association or participation with third parties and participate as a shareholder or partner in other companies.
Board of Directors: Óscar Hasbún Martínez (1), Macario Valdés Raczynski (2) and Hernán Gómez CisternasChief Executive Officer: Fernando Encinas Ciesla
181

2021 Integrated Report
Welcome Message00
SAAM, a Vocation of Service for the Foreign Trade Industry
01
Leadership and Governance Framework
02
Business Model03
Our Team04
Supplier Management05
Efficient Use of Natural Resources
06
Social Contribution07
Additional Information08
GRI Content Index09
Financial Statements10
SAAM PORTS S.A.Company name: SAAM Ports S.A.Type of entity: Privately held corporationSubscribed and paid-in share capital: US$40,181,686.18
Ownership interest: 100%Investment as a percentage of the parent company’s net assets:
23.85%
Corporate purpose:
/a/ Directly, or through other companies, performing any port activity, including constructing, acquiring, developing, operating and benefiting from ports and port terminals, providing port services, including mobilization services, shipping, loading and unloading of merchandise, warehousing and storage, wharfage services, attending to vessels and the embarkation and disembarkation of passengers; /b/ acquiring, investing, operating and/or managing companies engaged in operating ports and/or port terminals, for its own benefit or on behalf of third parties or associated with third parties; and /c/ performing any other investments or tasks necessary, useful, ancillary or related to the above.
Board of Directors: Óscar Hasbún Martínez (1), Macario Valdés Raczynski (2) and Hernán Gómez CisternasChief Executive Officer: Mauricio Carrasco Medina
ANTOFAGASTA TERMINAL INTERNACIONAL S.A.Company name: Antofagasta Terminal Internacional S.A.Type of entity: Privately held corporation, registered in the special register of reporting entities.Subscribed and paid-in share capital: US$7,000,000
Ownership interest: 35.00%Investment as a percentage of the parent company’s net assets:
0.55%
Corporate purpose: Developing, maintaining and operating Berth 2 at the port of Antofagasta. Wharfage and storage for this berth.
Board of Directors:
Standing members: Mauricio Carrasco Medina, Felipe Irarrázaval Ovalle, Juan Esteban Bilbao García, Felipe Barison Kahn, Luis Mancilla Pérez, Katharina Jenny Arroyo, Exequiel Ramírez Tapia and Macario Valdés Raczynski (2)Alternates: María Cecilia Hernández Vera, Hernán Gómez Cisternas, Andrés Marambio Taylor, Diego Urenda Salamanca, Rodrigo Faura Soletic, Javier Olivos Santa María, Rafael Ferrada Moreira (3) and Mark Bindhoff Daetz
Chief Executive Officer: Juan Pablo Santibáñez Vivar
AQUASAAM S.A.Company name: Aquasaam S.A.Type of entity: Privately held corporationSubscribed and paid-in share capital: Ch$8,009,400,337
Ownership interest: 100%Investment as a percentage of the parent company’s net assets:
0.00%
Corporate purpose:
Consulting and executing engineering projects of any nature, particularly in the maritime sector, providing construction, development, assembly and maintenance services for rafts and boats, mooring services, maintenance and repair of nets and other services related to the salmon industry, and representation and marketing of implements and attachments used mainly in the salmon industry and fish-farming in general.
Board of Directors: Javier Olivos Santa María, Hernán Gómez Cisternas, Fernando Encinas Ciesla and Roberto Bravo Sánchez
Chief Executive Officer: Fernando Encinas Ciesla
AEROSAN AIRPORT SERVICES S.A.Company Name: Aerosan Airport Services S.A. Type of entity: Privately held corporationSubscribed and paid-in share capital: US$4,479,276.40
Ownership interest: 100%Investment as a percentage of the parent company’s net assets:
0.92%
Corporate purpose:Attending to aircraft, freight and passengers at airports, airport maintenance, vessel maintenance and repair, cargo handling and its reception, storage, shipping and delivery. Providing land transport for passengers and cargo to and from airports.
Board of Directors: Macario Valdés Raczynski (2), Rafael Ferrada Moreira (3), Javier Olivos Santa MaríaChief Executive Officer: Eric Lobo González
182
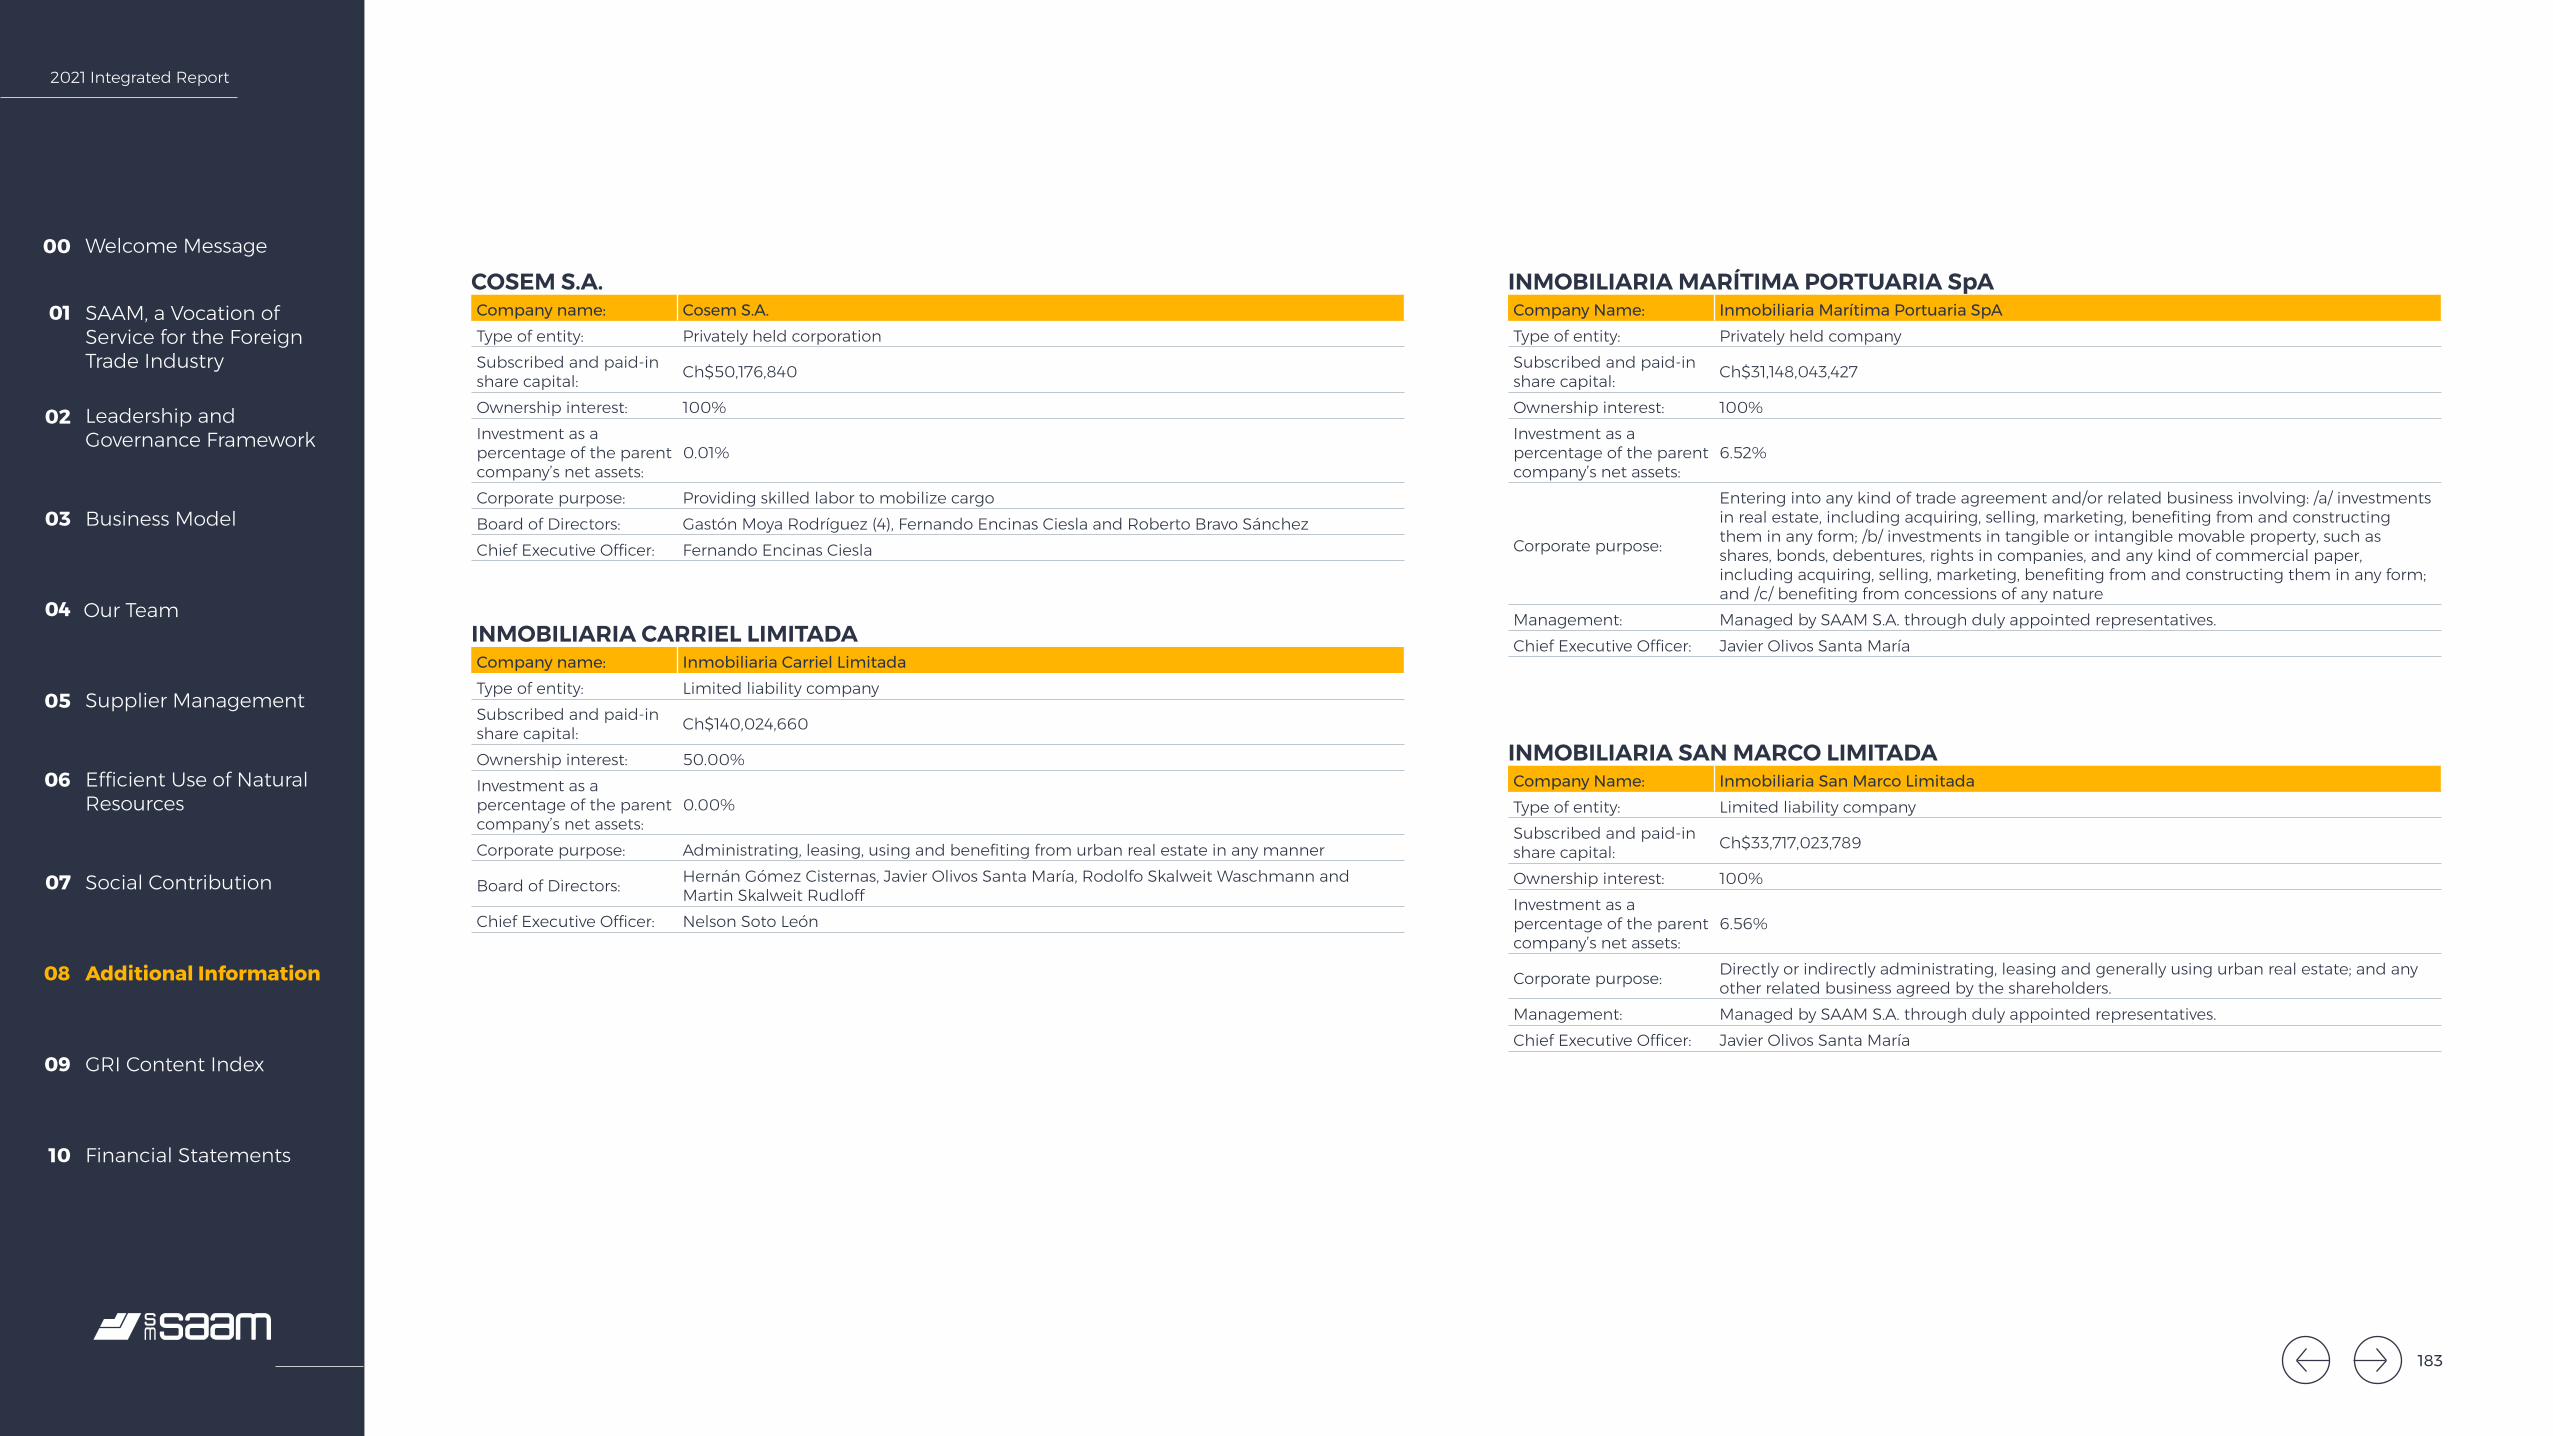
2021 Integrated Report
Welcome Message00
SAAM, a Vocation of Service for the Foreign Trade Industry
01
Leadership and Governance Framework
02
Business Model03
Our Team04
Supplier Management05
Efficient Use of Natural Resources
06
Social Contribution07
Additional Information08
GRI Content Index09
Financial Statements10
COSEM S.A.Company name: Cosem S.A.Type of entity: Privately held corporationSubscribed and paid-in share capital: Ch$50,176,840
Ownership interest: 100%Investment as a percentage of the parent company’s net assets:
0.01%
Corporate purpose: Providing skilled labor to mobilize cargoBoard of Directors: Gastón Moya Rodríguez (4), Fernando Encinas Ciesla and Roberto Bravo SánchezChief Executive Officer: Fernando Encinas Ciesla
INMOBILIARIA MARÍTIMA PORTUARIA SpACompany Name: Inmobiliaria Marítima Portuaria SpA Type of entity: Privately held companySubscribed and paid-in share capital: Ch$31,148,043,427
Ownership interest: 100%Investment as a percentage of the parent company’s net assets:
6.52%
Corporate purpose:
Entering into any kind of trade agreement and/or related business involving: /a/ investments in real estate, including acquiring, selling, marketing, benefiting from and constructing them in any form; /b/ investments in tangible or intangible movable property, such as shares, bonds, debentures, rights in companies, and any kind of commercial paper, including acquiring, selling, marketing, benefiting from and constructing them in any form; and /c/ benefiting from concessions of any nature
Management: Managed by SAAM S.A. through duly appointed representatives.Chief Executive Officer: Javier Olivos Santa María
INMOBILIARIA SAN MARCO LIMITADACompany Name: Inmobiliaria San Marco LimitadaType of entity: Limited liability companySubscribed and paid-in share capital: Ch$33,717,023,789
Ownership interest: 100%Investment as a percentage of the parent company’s net assets:
6.56%
Corporate purpose: Directly or indirectly administrating, leasing and generally using urban real estate; and any other related business agreed by the shareholders.
Management: Managed by SAAM S.A. through duly appointed representatives.Chief Executive Officer: Javier Olivos Santa María
INMOBILIARIA CARRIEL LIMITADACompany name: Inmobiliaria Carriel LimitadaType of entity: Limited liability companySubscribed and paid-in share capital: Ch$140,024,660
Ownership interest: 50.00%Investment as a percentage of the parent company’s net assets:
0.00%
Corporate purpose: Administrating, leasing, using and benefiting from urban real estate in any manner
Board of Directors: Hernán Gómez Cisternas, Javier Olivos Santa María, Rodolfo Skalweit Waschmann and Martin Skalweit Rudloff
Chief Executive Officer: Nelson Soto León
183
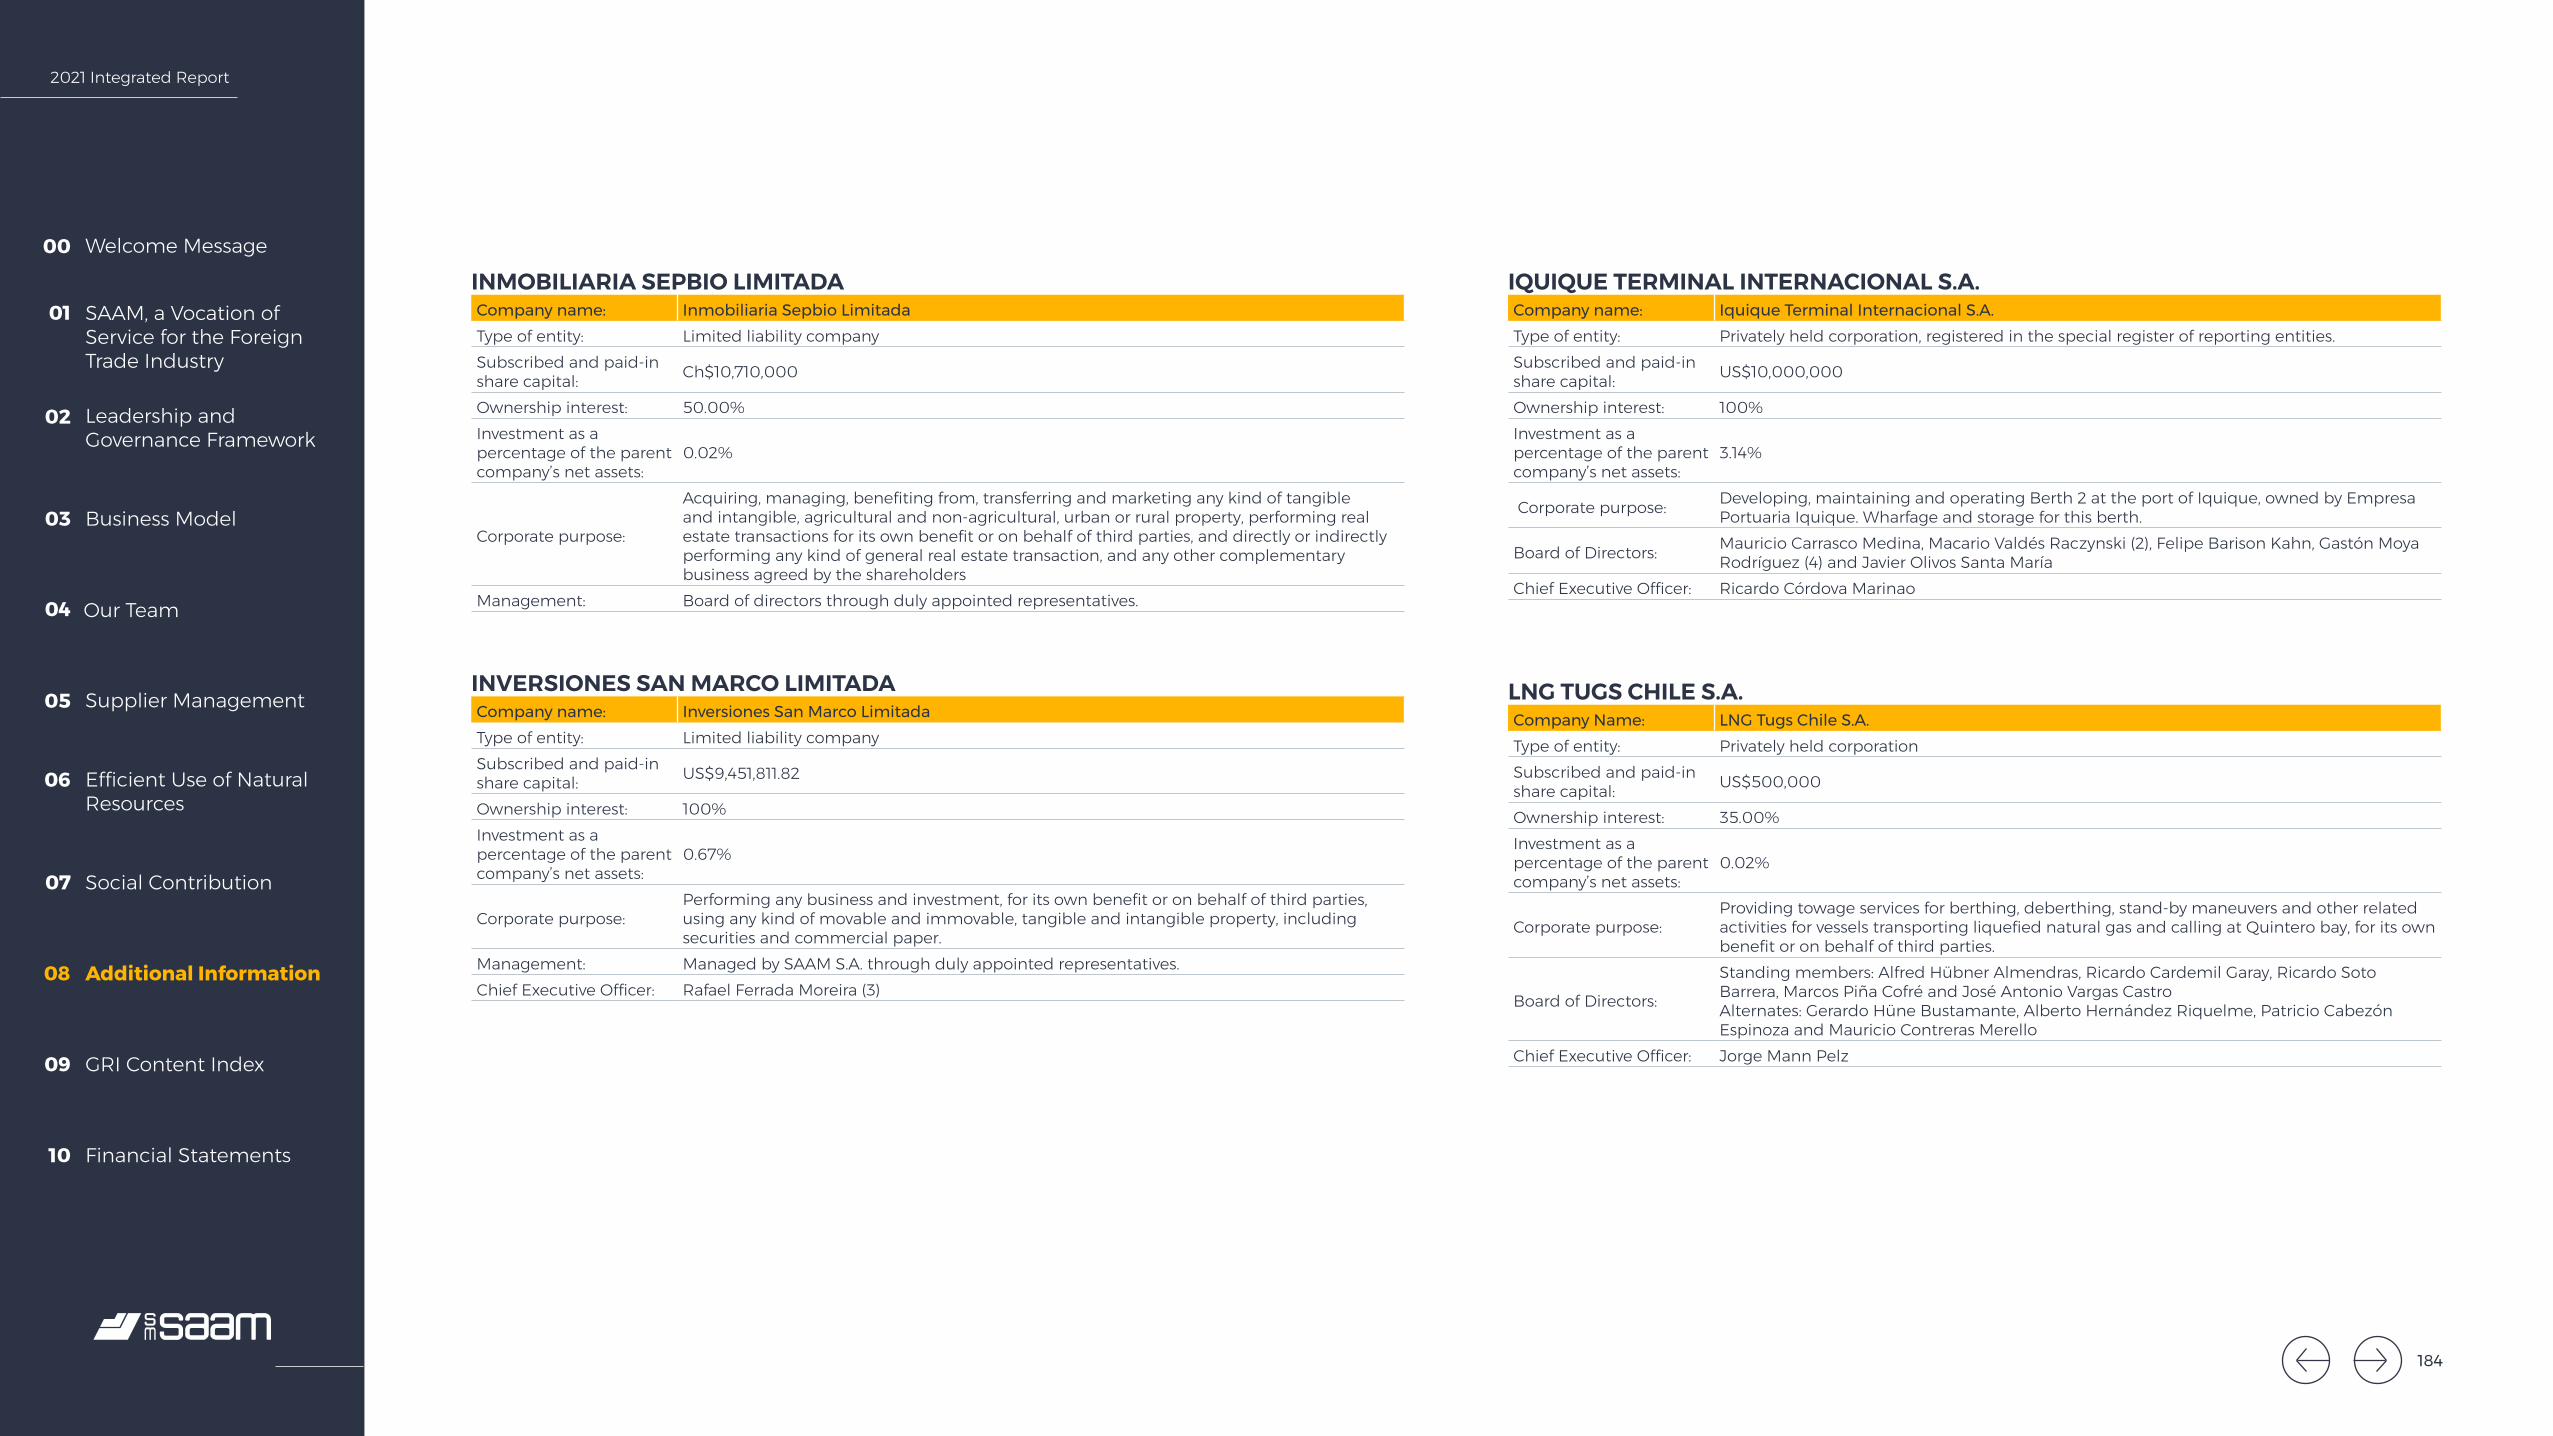
2021 Integrated Report
Welcome Message00
SAAM, a Vocation of Service for the Foreign Trade Industry
01
Leadership and Governance Framework
02
Business Model03
Our Team04
Supplier Management05
Efficient Use of Natural Resources
06
Social Contribution07
Additional Information08
GRI Content Index09
Financial Statements10
INMOBILIARIA SEPBIO LIMITADACompany name: Inmobiliaria Sepbio LimitadaType of entity: Limited liability companySubscribed and paid-in share capital: Ch$10,710,000
Ownership interest: 50.00%Investment as a percentage of the parent company’s net assets:
0.02%
Corporate purpose:
Acquiring, managing, benefiting from, transferring and marketing any kind of tangible and intangible, agricultural and non-agricultural, urban or rural property, performing real estate transactions for its own benefit or on behalf of third parties, and directly or indirectly performing any kind of general real estate transaction, and any other complementary business agreed by the shareholders
Management: Board of directors through duly appointed representatives.
IQUIQUE TERMINAL INTERNACIONAL S.A.Company name: Iquique Terminal Internacional S.A.Type of entity: Privately held corporation, registered in the special register of reporting entities.Subscribed and paid-in share capital: US$10,000,000
Ownership interest: 100%Investment as a percentage of the parent company’s net assets:
3.14%
Corporate purpose: Developing, maintaining and operating Berth 2 at the port of Iquique, owned by Empresa Portuaria Iquique. Wharfage and storage for this berth.
Board of Directors: Mauricio Carrasco Medina, Macario Valdés Raczynski (2), Felipe Barison Kahn, Gastón Moya Rodríguez (4) and Javier Olivos Santa María
Chief Executive Officer: Ricardo Córdova Marinao
LNG TUGS CHILE S.A.Company Name: LNG Tugs Chile S.A.Type of entity: Privately held corporationSubscribed and paid-in share capital: US$500,000
Ownership interest: 35.00%Investment as a percentage of the parent company’s net assets:
0.02%
Corporate purpose:Providing towage services for berthing, deberthing, stand-by maneuvers and other related activities for vessels transporting liquefied natural gas and calling at Quintero bay, for its own benefit or on behalf of third parties.
Board of Directors:
Standing members: Alfred Hübner Almendras, Ricardo Cardemil Garay, Ricardo Soto Barrera, Marcos Piña Cofré and José Antonio Vargas CastroAlternates: Gerardo Hüne Bustamante, Alberto Hernández Riquelme, Patricio Cabezón Espinoza and Mauricio Contreras Merello
Chief Executive Officer: Jorge Mann Pelz
INVERSIONES SAN MARCO LIMITADACompany name: Inversiones San Marco LimitadaType of entity: Limited liability companySubscribed and paid-in share capital: US$9,451,811.82
Ownership interest: 100%Investment as a percentage of the parent company’s net assets:
0.67%
Corporate purpose:Performing any business and investment, for its own benefit or on behalf of third parties, using any kind of movable and immovable, tangible and intangible property, including securities and commercial paper.
Management: Managed by SAAM S.A. through duly appointed representatives.Chief Executive Officer: Rafael Ferrada Moreira (3)
184
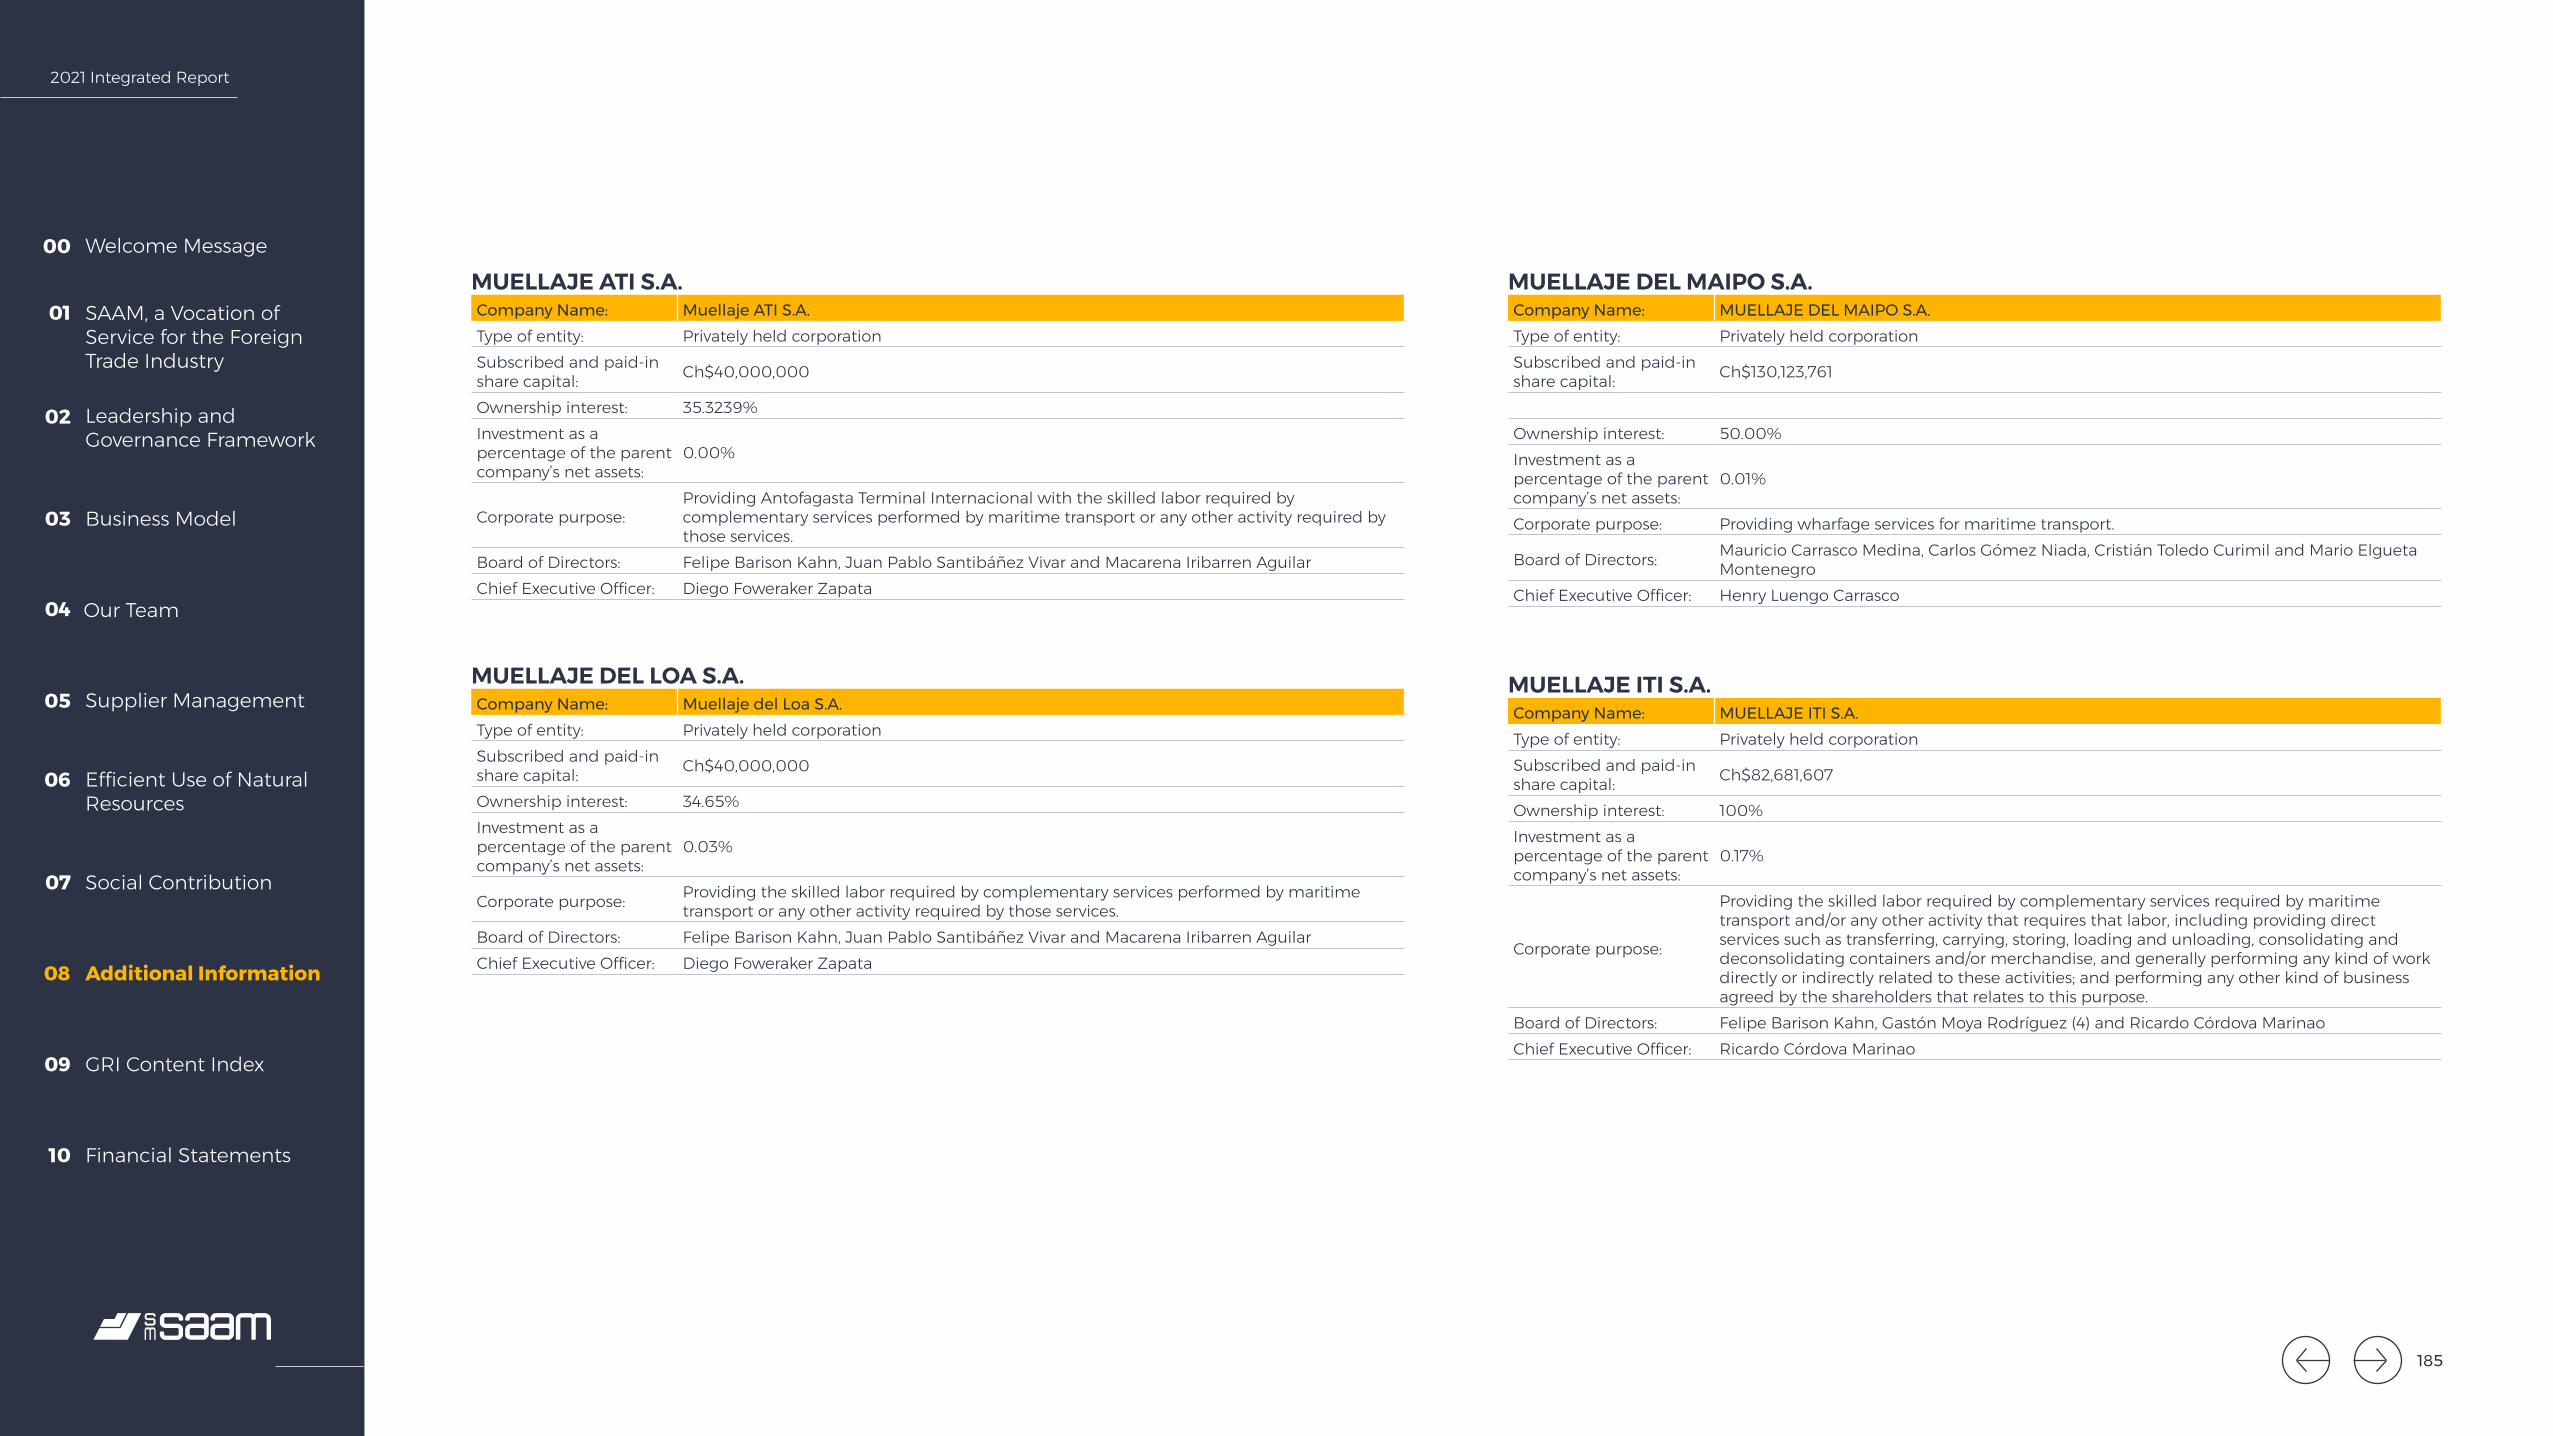
2021 Integrated Report
Welcome Message00
SAAM, a Vocation of Service for the Foreign Trade Industry
01
Leadership and Governance Framework
02
Business Model03
Our Team04
Supplier Management05
Efficient Use of Natural Resources
06
Social Contribution07
Additional Information08
GRI Content Index09
Financial Statements10
MUELLAJE ATI S.A.Company Name: Muellaje ATI S.A.Type of entity: Privately held corporationSubscribed and paid-in share capital: Ch$40,000,000
Ownership interest: 35.3239%Investment as a percentage of the parent company’s net assets:
0.00%
Corporate purpose:Providing Antofagasta Terminal Internacional with the skilled labor required by complementary services performed by maritime transport or any other activity required by those services.
Board of Directors: Felipe Barison Kahn, Juan Pablo Santibáñez Vivar and Macarena Iribarren AguilarChief Executive Officer: Diego Foweraker Zapata
MUELLAJE DEL MAIPO S.A.Company Name: MUELLAJE DEL MAIPO S.A.Type of entity: Privately held corporationSubscribed and paid-in share capital: Ch$130,123,761
Ownership interest: 50.00%Investment as a percentage of the parent company’s net assets:
0.01%
Corporate purpose: Providing wharfage services for maritime transport.
Board of Directors: Mauricio Carrasco Medina, Carlos Gómez Niada, Cristián Toledo Curimil and Mario Elgueta Montenegro
Chief Executive Officer: Henry Luengo Carrasco
MUELLAJE ITI S.A.Company Name: MUELLAJE ITI S.A.Type of entity: Privately held corporationSubscribed and paid-in share capital: Ch$82,681,607
Ownership interest: 100%Investment as a percentage of the parent company’s net assets:
0.17%
Corporate purpose:
Providing the skilled labor required by complementary services required by maritime transport and/or any other activity that requires that labor, including providing direct services such as transferring, carrying, storing, loading and unloading, consolidating and deconsolidating containers and/or merchandise, and generally performing any kind of work directly or indirectly related to these activities; and performing any other kind of business agreed by the shareholders that relates to this purpose.
Board of Directors: Felipe Barison Kahn, Gastón Moya Rodríguez (4) and Ricardo Córdova MarinaoChief Executive Officer: Ricardo Córdova Marinao
MUELLAJE DEL LOA S.A.Company Name: Muellaje del Loa S.A.Type of entity: Privately held corporationSubscribed and paid-in share capital: Ch$40,000,000
Ownership interest: 34.65%Investment as a percentage of the parent company’s net assets:
0.03%
Corporate purpose: Providing the skilled labor required by complementary services performed by maritime transport or any other activity required by those services.
Board of Directors: Felipe Barison Kahn, Juan Pablo Santibáñez Vivar and Macarena Iribarren AguilarChief Executive Officer: Diego Foweraker Zapata
185
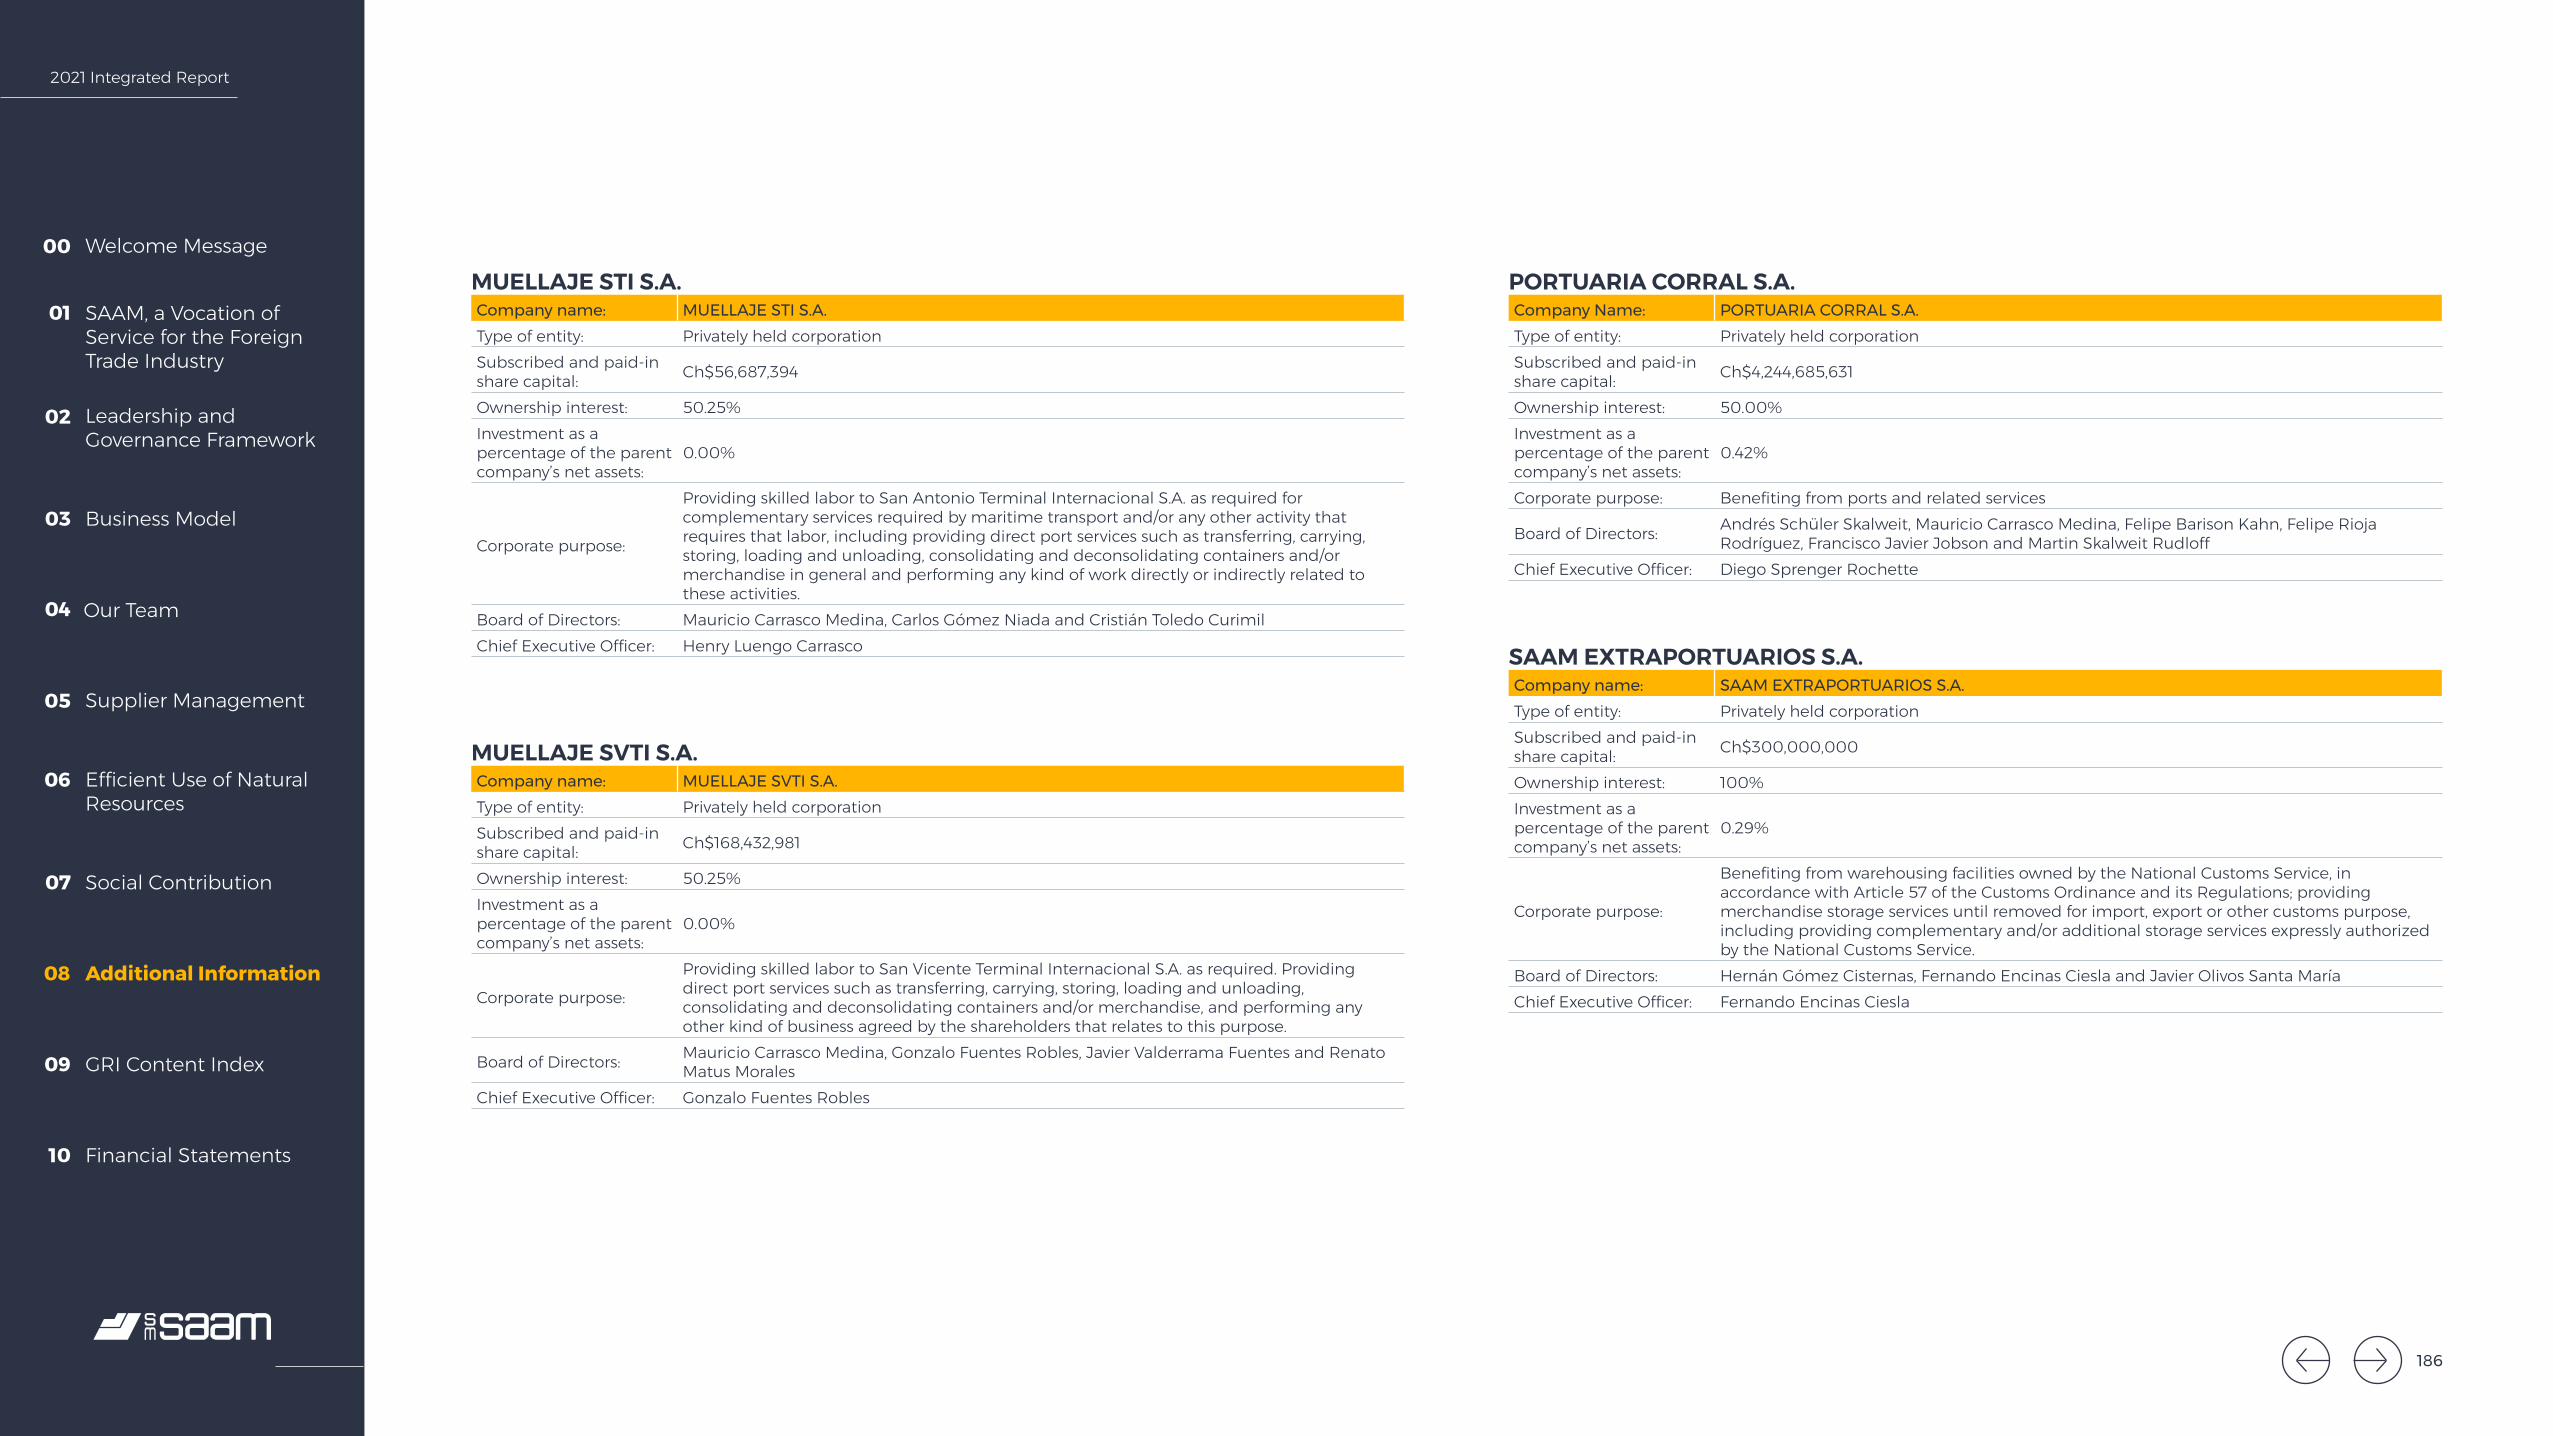
2021 Integrated Report
Welcome Message00
SAAM, a Vocation of Service for the Foreign Trade Industry
01
Leadership and Governance Framework
02
Business Model03
Our Team04
Supplier Management05
Efficient Use of Natural Resources
06
Social Contribution07
Additional Information08
GRI Content Index09
Financial Statements10
MUELLAJE STI S.A.Company name: MUELLAJE STI S.A.Type of entity: Privately held corporationSubscribed and paid-in share capital: Ch$56,687,394
Ownership interest: 50.25%Investment as a percentage of the parent company’s net assets:
0.00%
Corporate purpose:
Providing skilled labor to San Antonio Terminal Internacional S.A. as required for complementary services required by maritime transport and/or any other activity that requires that labor, including providing direct port services such as transferring, carrying, storing, loading and unloading, consolidating and deconsolidating containers and/or merchandise in general and performing any kind of work directly or indirectly related to these activities.
Board of Directors: Mauricio Carrasco Medina, Carlos Gómez Niada and Cristián Toledo CurimilChief Executive Officer: Henry Luengo Carrasco
PORTUARIA CORRAL S.A.Company Name: PORTUARIA CORRAL S.A.Type of entity: Privately held corporationSubscribed and paid-in share capital: Ch$4,244,685,631
Ownership interest: 50.00%Investment as a percentage of the parent company’s net assets:
0.42%
Corporate purpose: Benefiting from ports and related services
Board of Directors: Andrés Schüler Skalweit, Mauricio Carrasco Medina, Felipe Barison Kahn, Felipe Rioja Rodríguez, Francisco Javier Jobson and Martin Skalweit Rudloff
Chief Executive Officer: Diego Sprenger Rochette
SAAM EXTRAPORTUARIOS S.A.Company name: SAAM EXTRAPORTUARIOS S.A.Type of entity: Privately held corporationSubscribed and paid-in share capital: Ch$300,000,000
Ownership interest: 100%Investment as a percentage of the parent company’s net assets:
0.29%
Corporate purpose:
Benefiting from warehousing facilities owned by the National Customs Service, in accordance with Article 57 of the Customs Ordinance and its Regulations; providing merchandise storage services until removed for import, export or other customs purpose, including providing complementary and/or additional storage services expressly authorized by the National Customs Service.
Board of Directors: Hernán Gómez Cisternas, Fernando Encinas Ciesla and Javier Olivos Santa MaríaChief Executive Officer: Fernando Encinas Ciesla
MUELLAJE SVTI S.A.Company name: MUELLAJE SVTI S.A.Type of entity: Privately held corporationSubscribed and paid-in share capital: Ch$168,432,981
Ownership interest: 50.25%Investment as a percentage of the parent company’s net assets:
0.00%
Corporate purpose:
Providing skilled labor to San Vicente Terminal Internacional S.A. as required. Providing direct port services such as transferring, carrying, storing, loading and unloading, consolidating and deconsolidating containers and/or merchandise, and performing any other kind of business agreed by the shareholders that relates to this purpose.
Board of Directors: Mauricio Carrasco Medina, Gonzalo Fuentes Robles, Javier Valderrama Fuentes and Renato Matus Morales
Chief Executive Officer: Gonzalo Fuentes Robles
186

2021 Integrated Report
Welcome Message00
SAAM, a Vocation of Service for the Foreign Trade Industry
01
Leadership and Governance Framework
02
Business Model03
Our Team04
Supplier Management05
Efficient Use of Natural Resources
06
Social Contribution07
Additional Information08
GRI Content Index09
Financial Statements10
SAAM INTERNACIONAL S.A.Company name: SAAM INTERNACIONAL S.A.Type of entity: Privately held corporationSubscribed and paid-in share capital: US$2,383,736.09
Ownership interest: 100%Investment as a percentage of the parent company’s net assets:
4.11%
Corporate purpose:Investing abroad in any kind of movable or immovable, tangible or intangible property, in particular purchasing and selling rights and shares, and managing and benefiting from those assets and investments abroad.
Board of Directors: Macario Valdés Raczynski (2), Rafael Ferrada Moreira (3) and Hernán Gómez CisternasChief Executive Officer: Hernán Gómez Cisternas
SAAM PUERTOS S.A.Company name: SAAM Puertos S.A.Type of entity: Privately held corporationSubscribed and paid-in share capital: US$47,810,000
Ownership interest: 100%Investment as a percentage of the parent company’s net assets:
19.33%
Corporate purpose: Providing port services, either directly or through companies.Board of Directors: Óscar Hasbún Martínez (1), Macario Valdés Raczynski (2) and Hernán Gómez CisternasChief Executive Officer: Mauricio Carrasco Medina
SAN ANTONIO TERMINAL INTERNACIONAL S.A.Company name: San Antonio Terminal Internacional S.A.Type of entity: Privately held corporation, registered in the special register of reporting entities.Subscribed and paid-in share capital: US$33,700,000
Ownership interest: 50.00%Investment as a percentage of the parent company’s net assets:
2.90%
Corporate purpose: Developing, maintaining and benefiting from the Molo Sur berth at the port of San Antonio, owned by Empresa Portuaria San Antonio. Providing wharfage and storage for this berth.
Board of Directors:
Standing members: Mauricio Carrasco Medina, Carlos Urriola Tam, Óscar Hasbún Martínez (1), Macario Valdés Raczynski (2), Jaime Neal and John AldayaAlternates: Felipe Barison Kahn, Juan Carlos Croston, Rafael Ferrada Moreira (3), Hernán Gómez Cisternas, Rigoberto Espinosa and Matthew McCardell
Chief Executive Officer: Rodrigo Galleguillos Zúñiga
SAAM INVERSIONES S.p.A.Company name: SAAM Inversiones SpA.Type of entity: Privately held companySubscribed and paid-in share capital: US$2,437,000
Ownership interest: 100%Investment as a percentage of the parent company’s net assets:
0.00%
Corporate purpose:
a) Carrying out all kinds of business and investing, on its own behalf or on behalf of others, in all kinds of movable and immovable, tangible and intangible property including transferable securities and commercial paper; b) participating in national or foreign companies or communities with any purpose, and managing them; c) carrying out any other necessary, profitable, complementary or related investments or activities that relate to those indicated above.
Management: Managed by SAAM S.A. through duly appointed representatives.Chief Executive Officer: Rafael Ferrada Moreira (3)
187
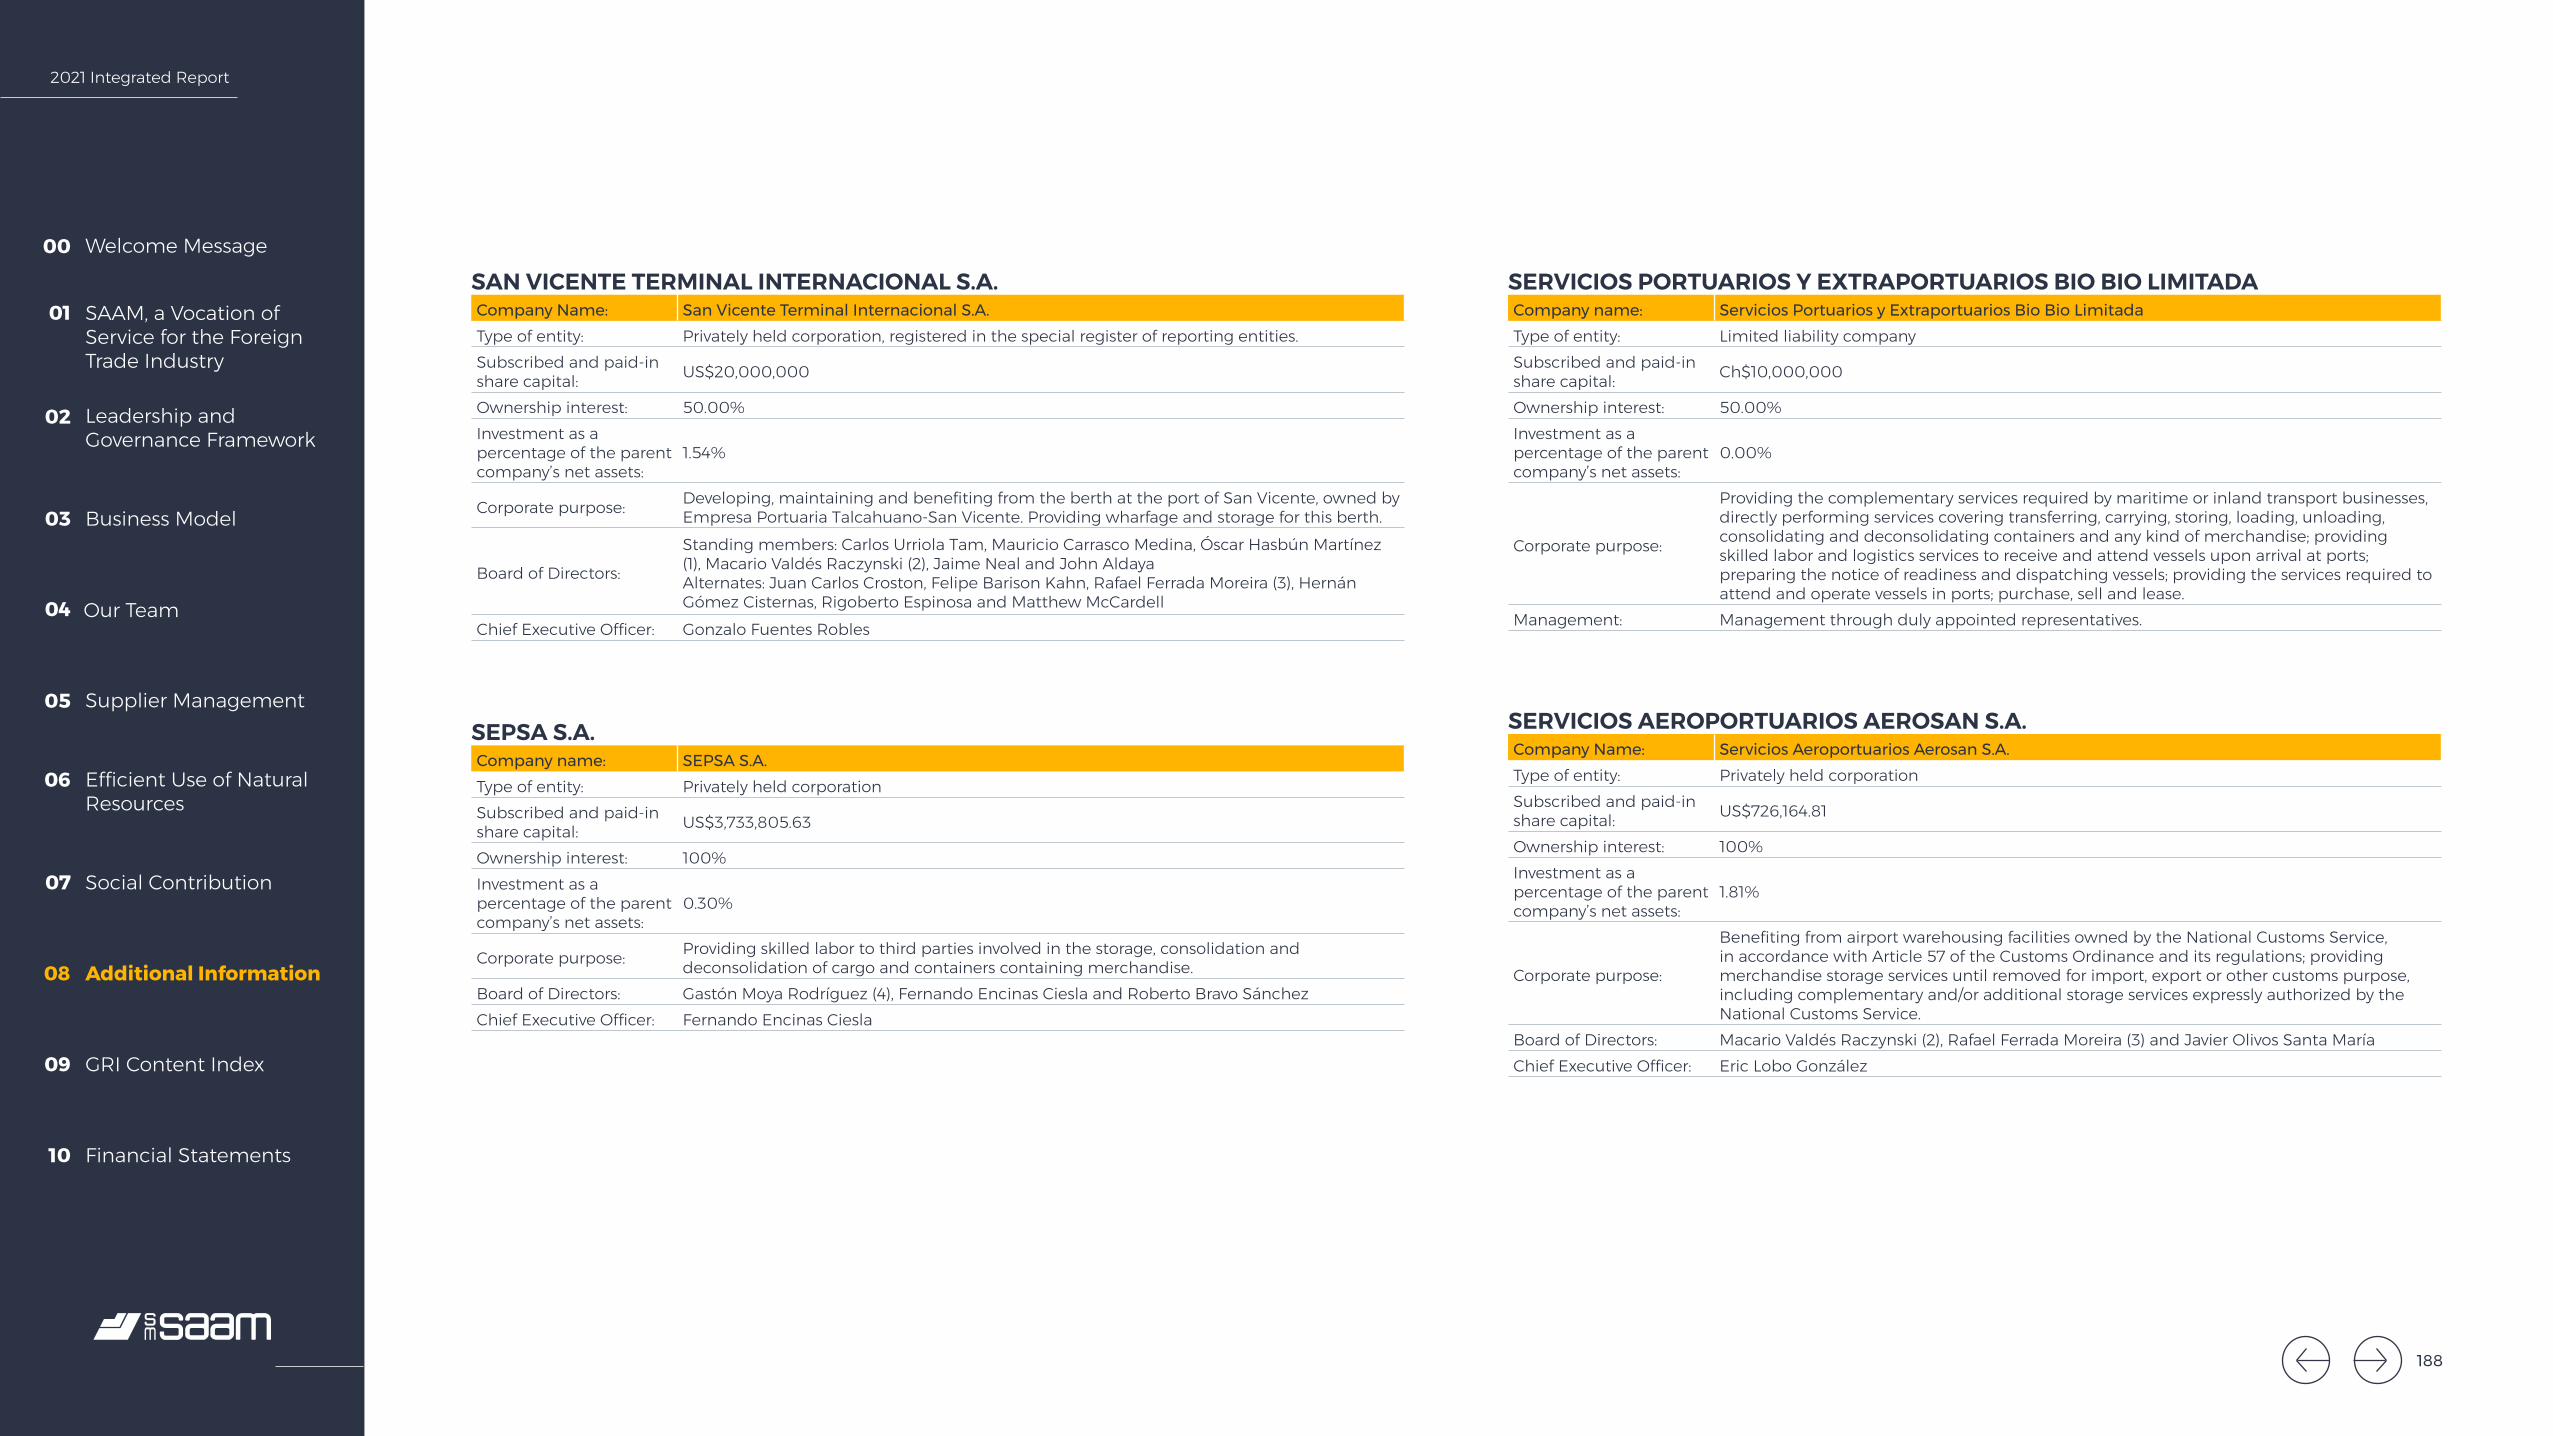
2021 Integrated Report
Welcome Message00
SAAM, a Vocation of Service for the Foreign Trade Industry
01
Leadership and Governance Framework
02
Business Model03
Our Team04
Supplier Management05
Efficient Use of Natural Resources
06
Social Contribution07
Additional Information08
GRI Content Index09
Financial Statements10
SAN VICENTE TERMINAL INTERNACIONAL S.A.Company Name: San Vicente Terminal Internacional S.A.Type of entity: Privately held corporation, registered in the special register of reporting entities.Subscribed and paid-in share capital: US$20,000,000
Ownership interest: 50.00%Investment as a percentage of the parent company’s net assets:
1.54%
Corporate purpose: Developing, maintaining and benefiting from the berth at the port of San Vicente, owned by Empresa Portuaria Talcahuano-San Vicente. Providing wharfage and storage for this berth.
Board of Directors:
Standing members: Carlos Urriola Tam, Mauricio Carrasco Medina, Óscar Hasbún Martínez (1), Macario Valdés Raczynski (2), Jaime Neal and John AldayaAlternates: Juan Carlos Croston, Felipe Barison Kahn, Rafael Ferrada Moreira (3), Hernán Gómez Cisternas, Rigoberto Espinosa and Matthew McCardell
Chief Executive Officer: Gonzalo Fuentes Robles
SERVICIOS PORTUARIOS Y EXTRAPORTUARIOS BIO BIO LIMITADACompany name: Servicios Portuarios y Extraportuarios Bio Bio LimitadaType of entity: Limited liability companySubscribed and paid-in share capital: Ch$10,000,000
Ownership interest: 50.00%Investment as a percentage of the parent company’s net assets:
0.00%
Corporate purpose:
Providing the complementary services required by maritime or inland transport businesses, directly performing services covering transferring, carrying, storing, loading, unloading, consolidating and deconsolidating containers and any kind of merchandise; providing skilled labor and logistics services to receive and attend vessels upon arrival at ports; preparing the notice of readiness and dispatching vessels; providing the services required to attend and operate vessels in ports; purchase, sell and lease.
Management: Management through duly appointed representatives.
SERVICIOS AEROPORTUARIOS AEROSAN S.A.Company Name: Servicios Aeroportuarios Aerosan S.A.Type of entity: Privately held corporationSubscribed and paid-in share capital: US$726,164.81
Ownership interest: 100%Investment as a percentage of the parent company’s net assets:
1.81%
Corporate purpose:
Benefiting from airport warehousing facilities owned by the National Customs Service, in accordance with Article 57 of the Customs Ordinance and its regulations; providing merchandise storage services until removed for import, export or other customs purpose, including complementary and/or additional storage services expressly authorized by the National Customs Service.
Board of Directors: Macario Valdés Raczynski (2), Rafael Ferrada Moreira (3) and Javier Olivos Santa MaríaChief Executive Officer: Eric Lobo González
SEPSA S.A.Company name: SEPSA S.A.Type of entity: Privately held corporationSubscribed and paid-in share capital: US$3,733,805.63
Ownership interest: 100%Investment as a percentage of the parent company’s net assets:
0.30%
Corporate purpose: Providing skilled labor to third parties involved in the storage, consolidation and deconsolidation of cargo and containers containing merchandise.
Board of Directors: Gastón Moya Rodríguez (4), Fernando Encinas Ciesla and Roberto Bravo SánchezChief Executive Officer: Fernando Encinas Ciesla
188

2021 Integrated Report
Welcome Message00
SAAM, a Vocation of Service for the Foreign Trade Industry
01
Leadership and Governance Framework
02
Business Model03
Our Team04
Supplier Management05
Efficient Use of Natural Resources
06
Social Contribution07
Additional Information08
GRI Content Index09
Financial Statements10
SERVICIOS DE AVIACIÓN LIMITADACompany name: Servicios de Aviación LimitadaType of entity: Limited liability companySubscribed and paid-in share capital: Ch$19,306,473
Ownership interest: 100%Investment as a percentage of the parent company’s net assets:
0.00%
Corporate purpose: Providing skilled labor for airport services.Management: Managed by Aerosan Airport Services S.A. through duly appointed representatives.Chief Executive Officer: Eric Lobo González
SPR LOS RÍOS S.p.A.Company Name: SPR Los Ríos S.p.A.Type of entity: Privately held companySubscribed and paid-in share capital: Ch$1,000,000
Ownership interest: 50.00%Investment as a percentage of the parent company’s net assets:
0.00%
Corporate purpose: Stevedore service in the port of Corral and other, dockage/wharfage servicesManagement: Managed by Portuaria Corral S.A. through duly appointed representatives.Chief Executive Officer: Diego Sprenger Rochette
SOCIEDAD TRANSBORDADORA AUSTRAL BROOM S.A.Company name: Sociedad Transbordadora Austral Broom S.A.Type of entity: Privately held corporationSubscribed and paid-in share capital: Ch$15,403,397,240
Ownership interest: 25.00%Investment as a percentage of the parent company’s net assets:
1.19%
Corporate purpose: Providing maritime transport for cargo, vehicles and passengers in the Straits of Magellan or other parts of Chile.
Board of Directors:
Standing members: Pedro Lecaros Menéndez, James Wells Muñoz, Cecilia Glusevic Ferreira and Felipe Rioja Rodríguez Alternates: Gerardo Alvarez Zenteno, Andrés Núñez Sorensen, Roberto Peragallo Guajardo and Macario Valdés Raczynski (2)
Chief Executive Officer: Cristóbal Larraín
SERVICIOS LOGÍSTICOS LIMITADACompany Name: Servicios Logísticos LimitadaType of entity: Limited liability companySubscribed and paid-in share capital: US$98,569.34
Ownership interest: 100%Investment as a percentage of the parent company’s net assets:
0.07%
Corporate purpose:
Providing logistics services, personnel management services, airport services, aircraft leasing, air transport, representation and third party warehouse management, air, land and sea freight, courier services, general sales agents, equipment and machinery leasing, travel agency, IT solutions, storage and distribution and other related services.
Management: Managed by Aerosan Airport Services S.A. through duly appointed representatives.Chief Executive Officer: Eric Lobo González
189

2021 Integrated Report
Welcome Message00
SAAM, a Vocation of Service for the Foreign Trade Industry
01
Leadership and Governance Framework
02
Business Model03
Our Team04
Supplier Management05
Efficient Use of Natural Resources
06
Social Contribution07
Additional Information08
GRI Content Index09
Financial Statements10
TERMINAL EL COLORADO S.A.Company name: Terminal El Colorado S.A.Type of entity: Privately held corporationSubscribed and paid-in share capital: Ch$10,000,000
Ownership interest: 100%Investment as a percentage of the parent company’s net assets:
0.00%
Corporate purpose:Providing services related to national and international cargo transport, such as full or empty container storage, container maintenance, and complementary cargo and container services.
Board of Directors: Felipe Barison Kahn, Fernando Encinas Ciesla and Gastón Moya Rodríguez (4)Chief Executive Officer: Felipe Barison Kahn
TRANSPORTES FLUVIALES CORRAL S.A.Company Name: Transportes Fluviales Corral S.A.Type of entity: Privately held corporationSubscribed and paid-in share capital: Ch$1,533,416,974
Ownership interest: 50.00%Investment as a percentage of the parent company’s net assets:
0.18%
Corporate purpose: Providing maritime, river and related transport services.
Board of Directors: Andrés Schüler Skalweit, Mauricio Carrasco Medina, Felipe Barison Kahn, Felipe Rioja Rodríguez, Francisco Javier Jobson and Martin Skalweit Rudloff
Chief Executive Officer: Diego Sprenger Rochette
TERMINAL LAS GOLONDRINAS S.A.Company name: Terminal Las Golondrinas S.A.Type of entity: Privately held corporationSubscribed and paid-in share capital: Ch$10,000,000
Ownership interest: 100%Investment as a percentage of the parent company’s net assets:
0.00%
Corporate purpose:Providing services related to national and international cargo transport, such as full or empty container storage, container maintenance, and complementary cargo and container services.
Board of Directors: Fernando Encinas Ciesla, Gastón Moya Rodríguez (4) and Roberto Bravo SánchezChief Executive Officer: Fernando Encinas Ciesla
190
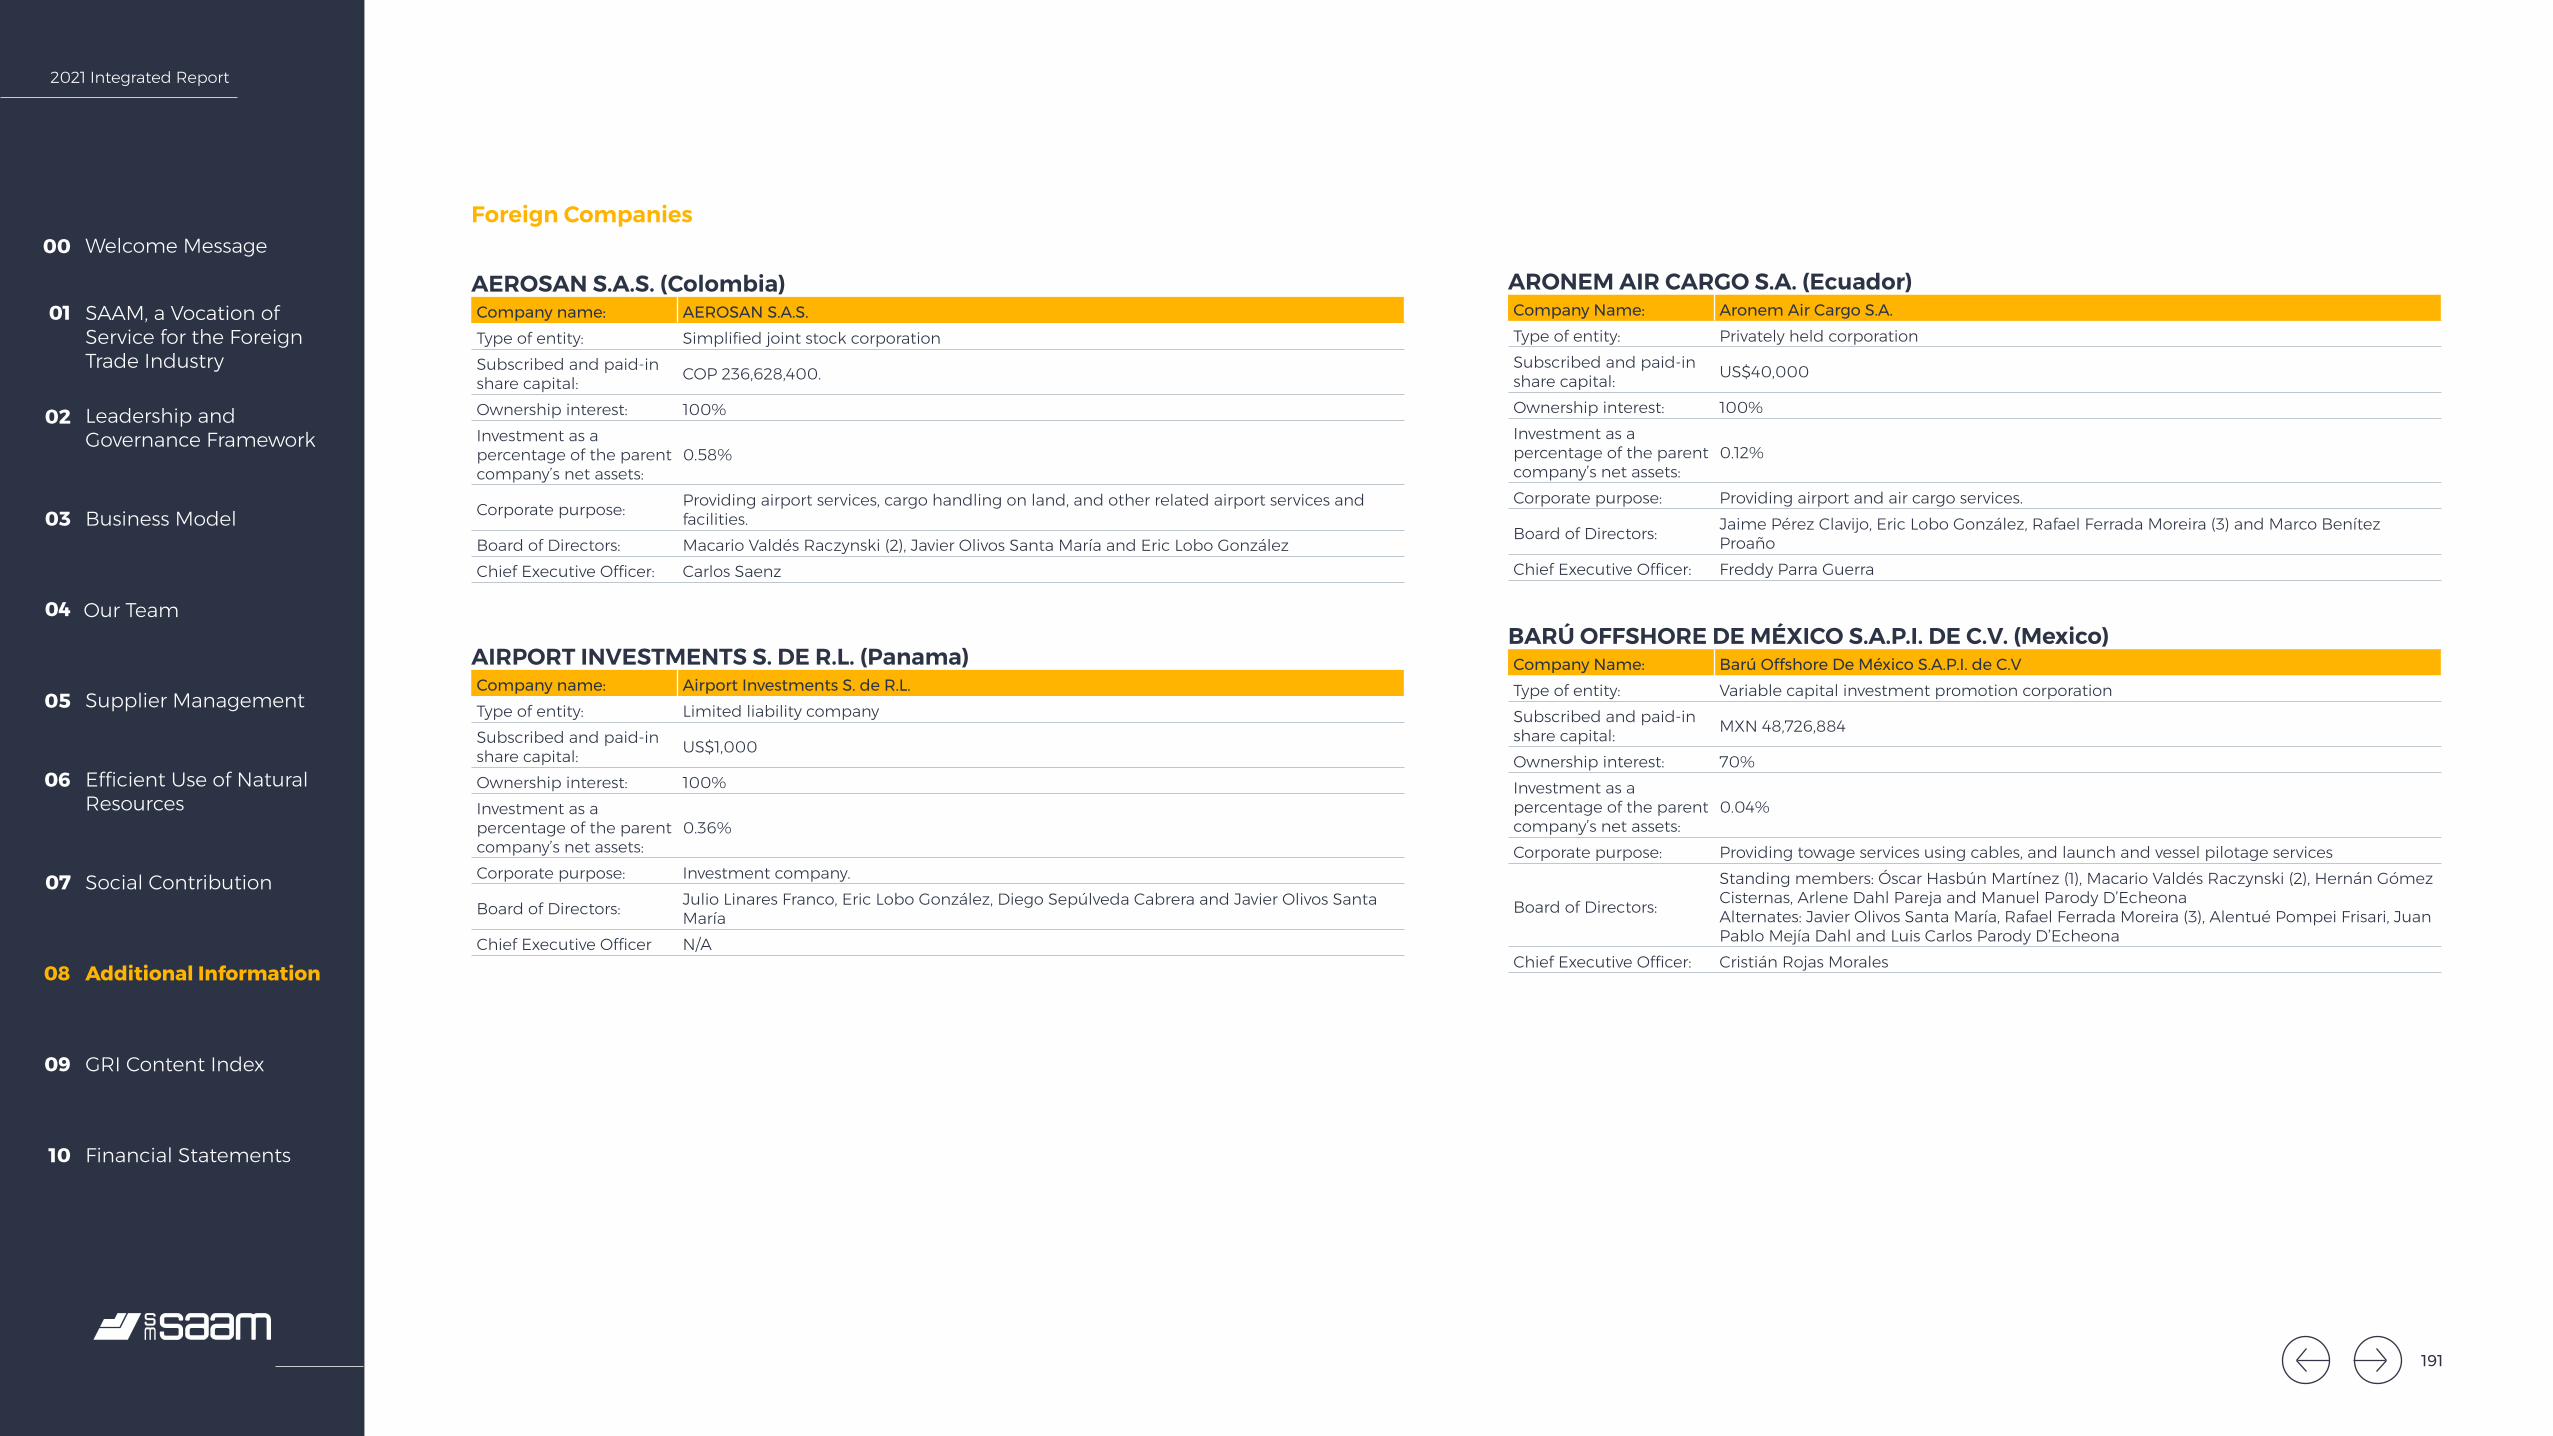
2021 Integrated Report
Welcome Message00
SAAM, a Vocation of Service for the Foreign Trade Industry
01
Leadership and Governance Framework
02
Business Model03
Our Team04
Supplier Management05
Efficient Use of Natural Resources
06
Social Contribution07
Additional Information08
GRI Content Index09
Financial Statements10
Foreign Companies
AEROSAN S.A.S. (Colombia)Company name: AEROSAN S.A.S.Type of entity: Simplified joint stock corporationSubscribed and paid-in share capital: COP 236,628,400.
Ownership interest: 100%Investment as a percentage of the parent company’s net assets:
0.58%
Corporate purpose: Providing airport services, cargo handling on land, and other related airport services and facilities.
Board of Directors: Macario Valdés Raczynski (2), Javier Olivos Santa María and Eric Lobo GonzálezChief Executive Officer: Carlos Saenz
AIRPORT INVESTMENTS S. DE R.L. (Panama)Company name: Airport Investments S. de R.L.Type of entity: Limited liability company Subscribed and paid-in share capital: US$1,000
Ownership interest: 100%Investment as a percentage of the parent company’s net assets:
0.36%
Corporate purpose: Investment company.
Board of Directors: Julio Linares Franco, Eric Lobo González, Diego Sepúlveda Cabrera and Javier Olivos Santa María
Chief Executive Officer N/A
ARONEM AIR CARGO S.A. (Ecuador)Company Name: Aronem Air Cargo S.A. Type of entity: Privately held corporationSubscribed and paid-in share capital: US$40,000
Ownership interest: 100%Investment as a percentage of the parent company’s net assets:
0.12%
Corporate purpose: Providing airport and air cargo services.
Board of Directors: Jaime Pérez Clavijo, Eric Lobo González, Rafael Ferrada Moreira (3) and Marco Benítez Proaño
Chief Executive Officer: Freddy Parra Guerra
BARÚ OFFSHORE DE MÉXICO S.A.P.I. DE C.V. (Mexico)Company Name: Barú Offshore De México S.A.P.I. de C.VType of entity: Variable capital investment promotion corporationSubscribed and paid-in share capital: MXN 48,726,884
Ownership interest: 70%Investment as a percentage of the parent company’s net assets:
0.04%
Corporate purpose: Providing towage services using cables, and launch and vessel pilotage services
Board of Directors:
Standing members: Óscar Hasbún Martínez (1), Macario Valdés Raczynski (2), Hernán Gómez Cisternas, Arlene Dahl Pareja and Manuel Parody D’EcheonaAlternates: Javier Olivos Santa María, Rafael Ferrada Moreira (3), Alentué Pompei Frisari, Juan Pablo Mejía Dahl and Luis Carlos Parody D’Echeona
Chief Executive Officer: Cristián Rojas Morales
191

2021 Integrated Report
Welcome Message00
SAAM, a Vocation of Service for the Foreign Trade Industry
01
Leadership and Governance Framework
02
Business Model03
Our Team04
Supplier Management05
Efficient Use of Natural Resources
06
Social Contribution07
Additional Information08
GRI Content Index09
Financial Statements10
CONCESIONARIA SAAM COSTA RICA S.A. (Costa Rica)Company name: Concesionaria SAAM Costa Rica S.A.Type of entity: Privately held corporationSubscribed and paid-in share capital: US$2,500,000
Ownership interest: 100%Investment as a percentage of the parent company’s net assets:
0.37%
Corporate purpose: Providing transportation, agency, towage, salvage, attendance, shipwreck removal, pilot, launch and cabotage services.
Board of Directors: Hernán Gómez Cisternas, Macario Valdés Raczynski (2) and Rafael Ferrada Moreira (3)Chief Executive Officer: Joaquín Dueñas Pardo
EOP CREW MANAGEMENT DE MÉXICO S.A. DE C.V. (Mexico)Company name: EOP Crew Management de México S.A. de C.V.Type of entity: Private Mexican corporation. Subscribed and paid-in share capital: MXN 50,000
Ownership interest: 70%Investment as a percentage of the parent company’s net assets:
0.04%
Corporate purpose: Providing technological and laboring services, technical advice, training personnel and providing administrative services.
Board of Directors:
Standing members: Óscar Hasbún Martínez (1), Macario Valdés Raczynski (2), Hernán Gómez Cisternas, Arlene Dahl Pareja and Manuel Parody D’EcheonaAlternates: Javier Olivos Santa María, Rafael Ferrada Moreira (3), Alentué Pompei Frisari, Juan Pablo Mejía Dahl and Luis Carlos Parody D’Echeona
Chief Executive Officer: Cristián Rojas Morales
ELEQUIP S.A. (Colombia)Company Name: Elequip S.A. (in liquidation) Type of entity: Privately held corporation Subscribed and paid-in share capital: COP 992,674,600
Ownership interest: 50.00%Investment as a percentage of the parent company’s net assets:
0.00%
Corporate purpose: Benefiting from operating equipment used in stevedoring and complementary services.
Liquidator: Principal: Jaime Alberto VargasAlternate: Harold Colino
ECUAESTIBAS S.A. (Ecuador)Company Name: Ecuaestibas S.A.Type of entity: Privately held corporation Subscribed and paid-in share capital: US$586,640
Ownership interest: 100%Investment as a percentage of the parent company’s net assets:
0.60%
Corporate purpose: Providing any kind of port service, such as port operator and/or providing complementary services.
Board of Directors: Macario Valdés Raczynski (2), Hernán Gómez Cisternas and Javier Olivos Santa MaríaChief Executive Officer: Juan Alfredo Illingworth
192
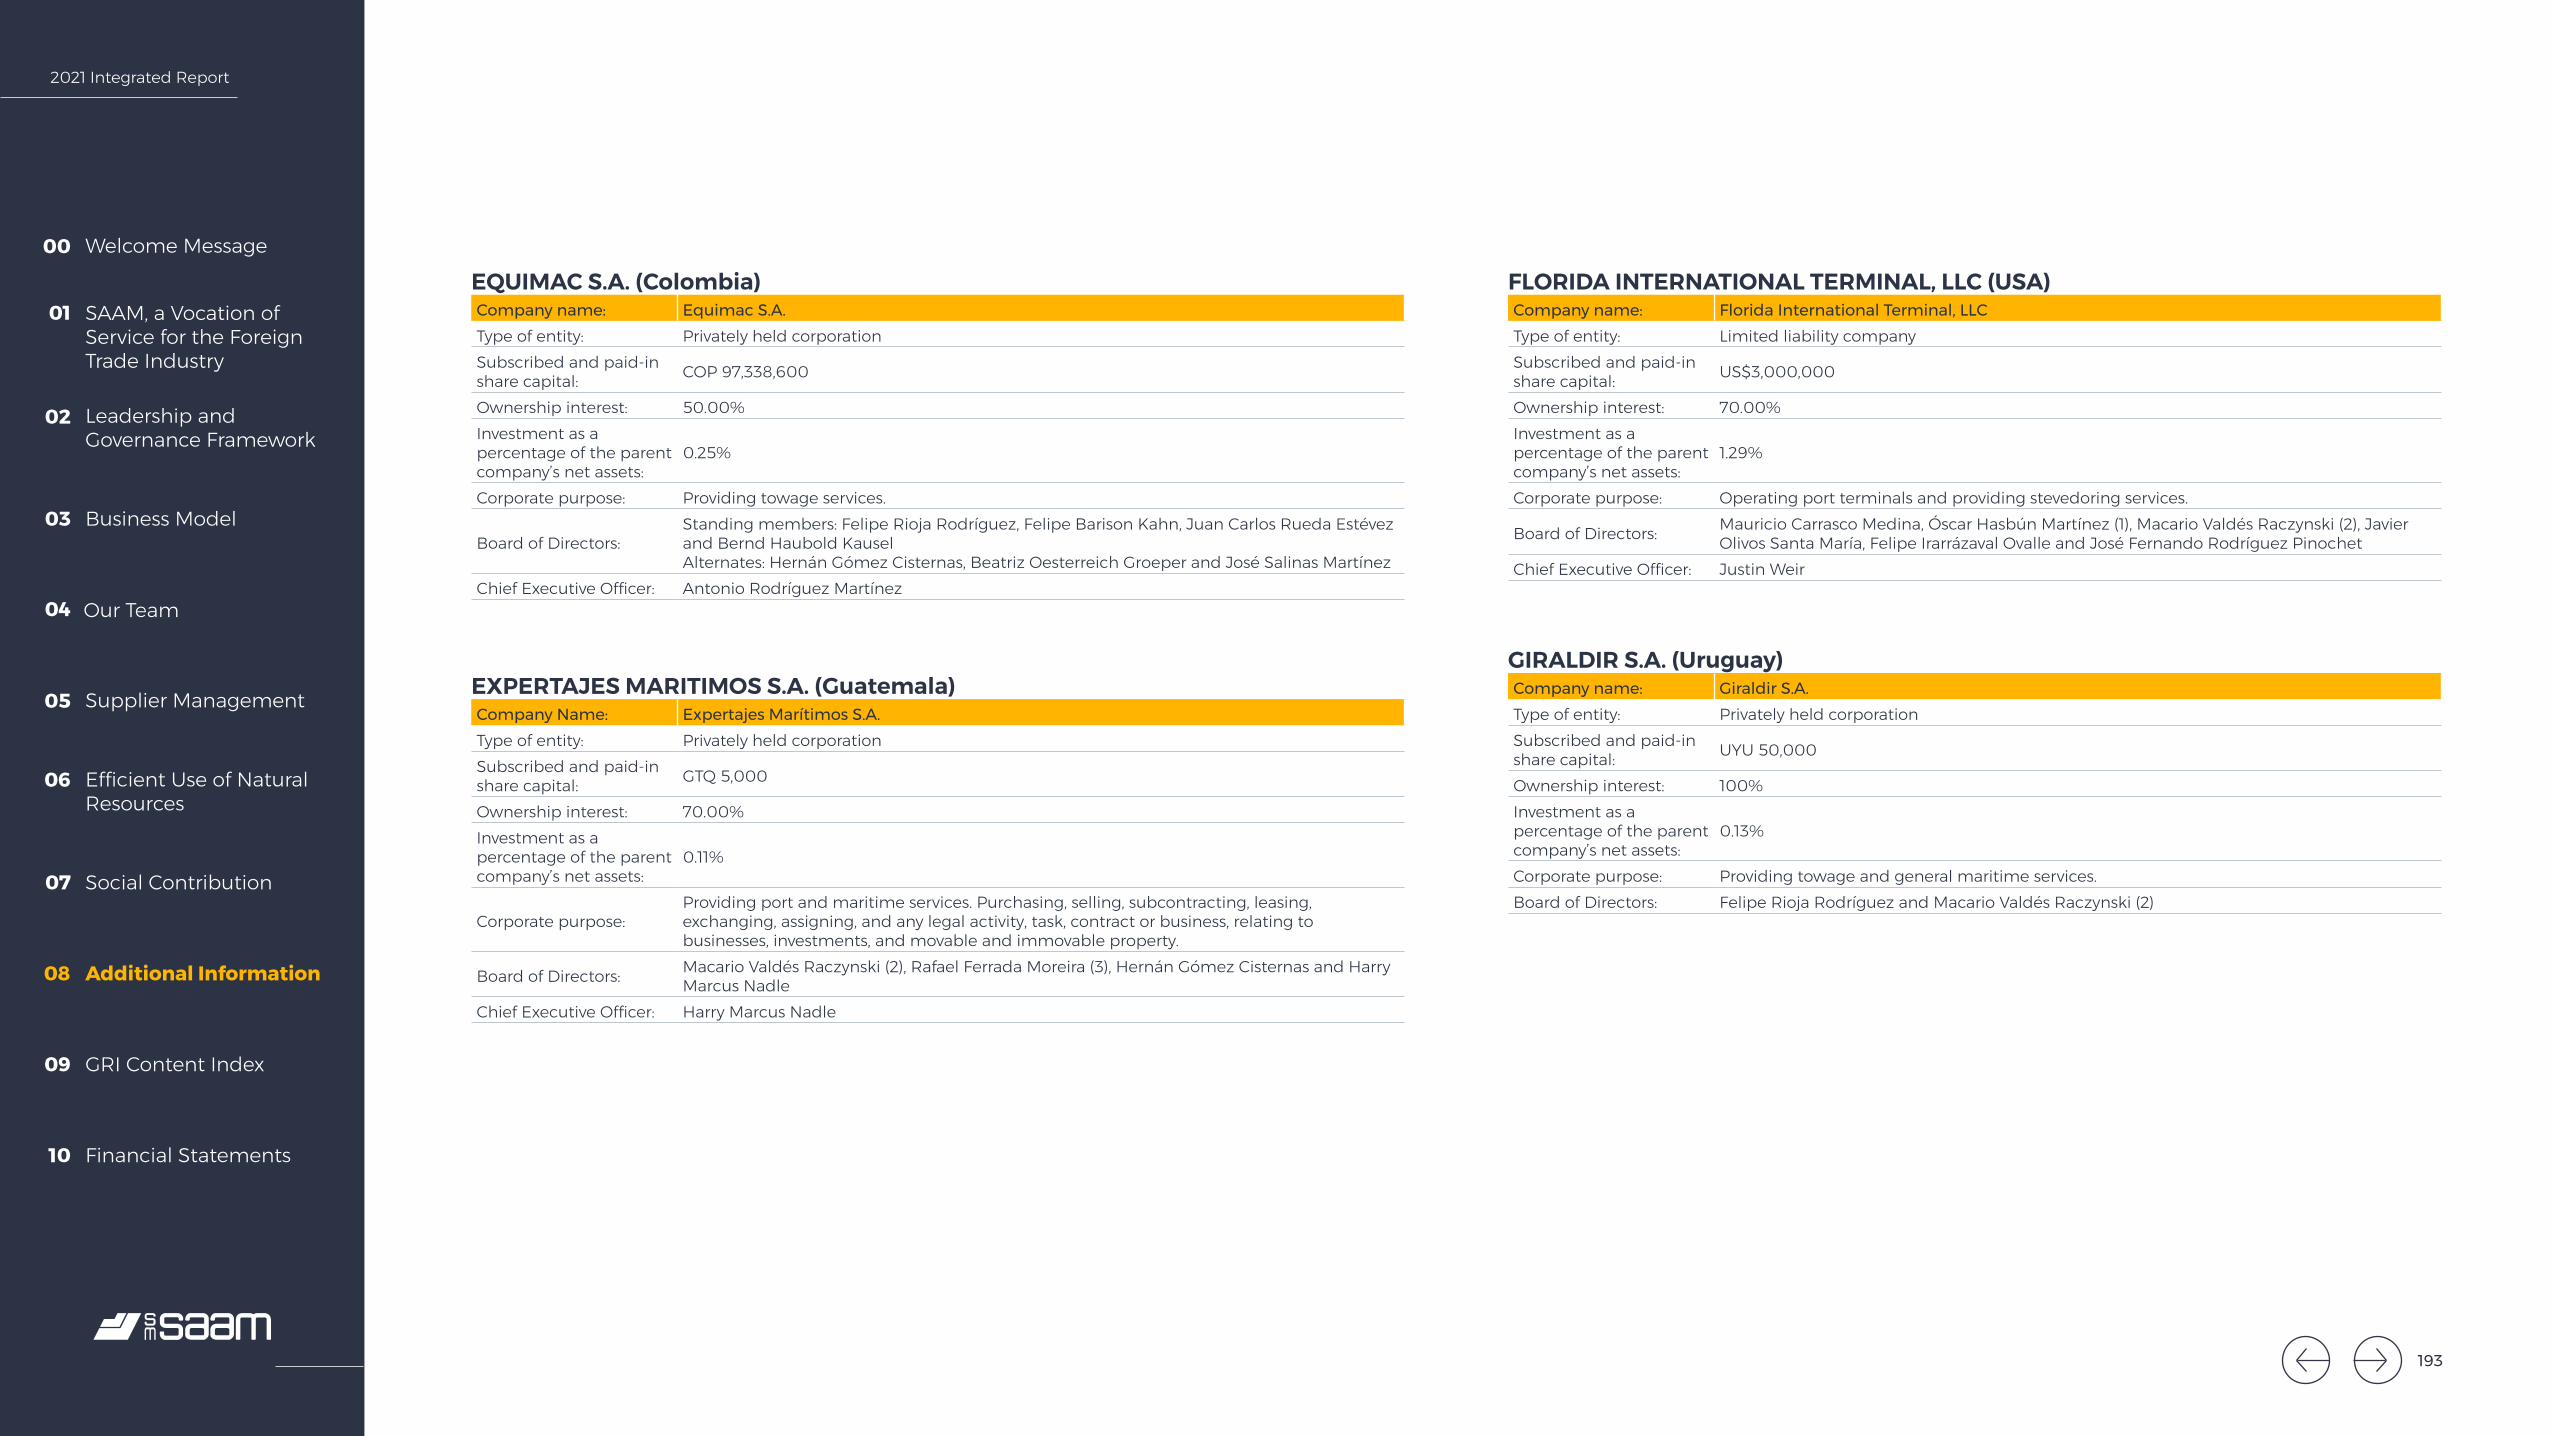
2021 Integrated Report
Welcome Message00
SAAM, a Vocation of Service for the Foreign Trade Industry
01
Leadership and Governance Framework
02
Business Model03
Our Team04
Supplier Management05
Efficient Use of Natural Resources
06
Social Contribution07
Additional Information08
GRI Content Index09
Financial Statements10
EQUIMAC S.A. (Colombia)Company name: Equimac S.A.Type of entity: Privately held corporation Subscribed and paid-in share capital: COP 97,338,600
Ownership interest: 50.00%Investment as a percentage of the parent company’s net assets:
0.25%
Corporate purpose: Providing towage services.
Board of Directors:Standing members: Felipe Rioja Rodríguez, Felipe Barison Kahn, Juan Carlos Rueda Estévez and Bernd Haubold KauselAlternates: Hernán Gómez Cisternas, Beatriz Oesterreich Groeper and José Salinas Martínez
Chief Executive Officer: Antonio Rodríguez Martínez
FLORIDA INTERNATIONAL TERMINAL, LLC (USA)Company name: Florida International Terminal, LLCType of entity: Limited liability company Subscribed and paid-in share capital: US$3,000,000
Ownership interest: 70.00%Investment as a percentage of the parent company’s net assets:
1.29%
Corporate purpose: Operating port terminals and providing stevedoring services.
Board of Directors: Mauricio Carrasco Medina, Óscar Hasbún Martínez (1), Macario Valdés Raczynski (2), Javier Olivos Santa María, Felipe Irarrázaval Ovalle and José Fernando Rodríguez Pinochet
Chief Executive Officer: Justin Weir
GIRALDIR S.A. (Uruguay)Company name: Giraldir S.A.Type of entity: Privately held corporation Subscribed and paid-in share capital: UYU 50,000
Ownership interest: 100%Investment as a percentage of the parent company’s net assets:
0.13%
Corporate purpose: Providing towage and general maritime services.Board of Directors: Felipe Rioja Rodríguez and Macario Valdés Raczynski (2)
EXPERTAJES MARITIMOS S.A. (Guatemala)Company Name: Expertajes Marítimos S.A. Type of entity: Privately held corporation Subscribed and paid-in share capital: GTQ 5,000
Ownership interest: 70.00%Investment as a percentage of the parent company’s net assets:
0.11%
Corporate purpose:Providing port and maritime services. Purchasing, selling, subcontracting, leasing, exchanging, assigning, and any legal activity, task, contract or business, relating to businesses, investments, and movable and immovable property.
Board of Directors: Macario Valdés Raczynski (2), Rafael Ferrada Moreira (3), Hernán Gómez Cisternas and Harry Marcus Nadle
Chief Executive Officer: Harry Marcus Nadle
193
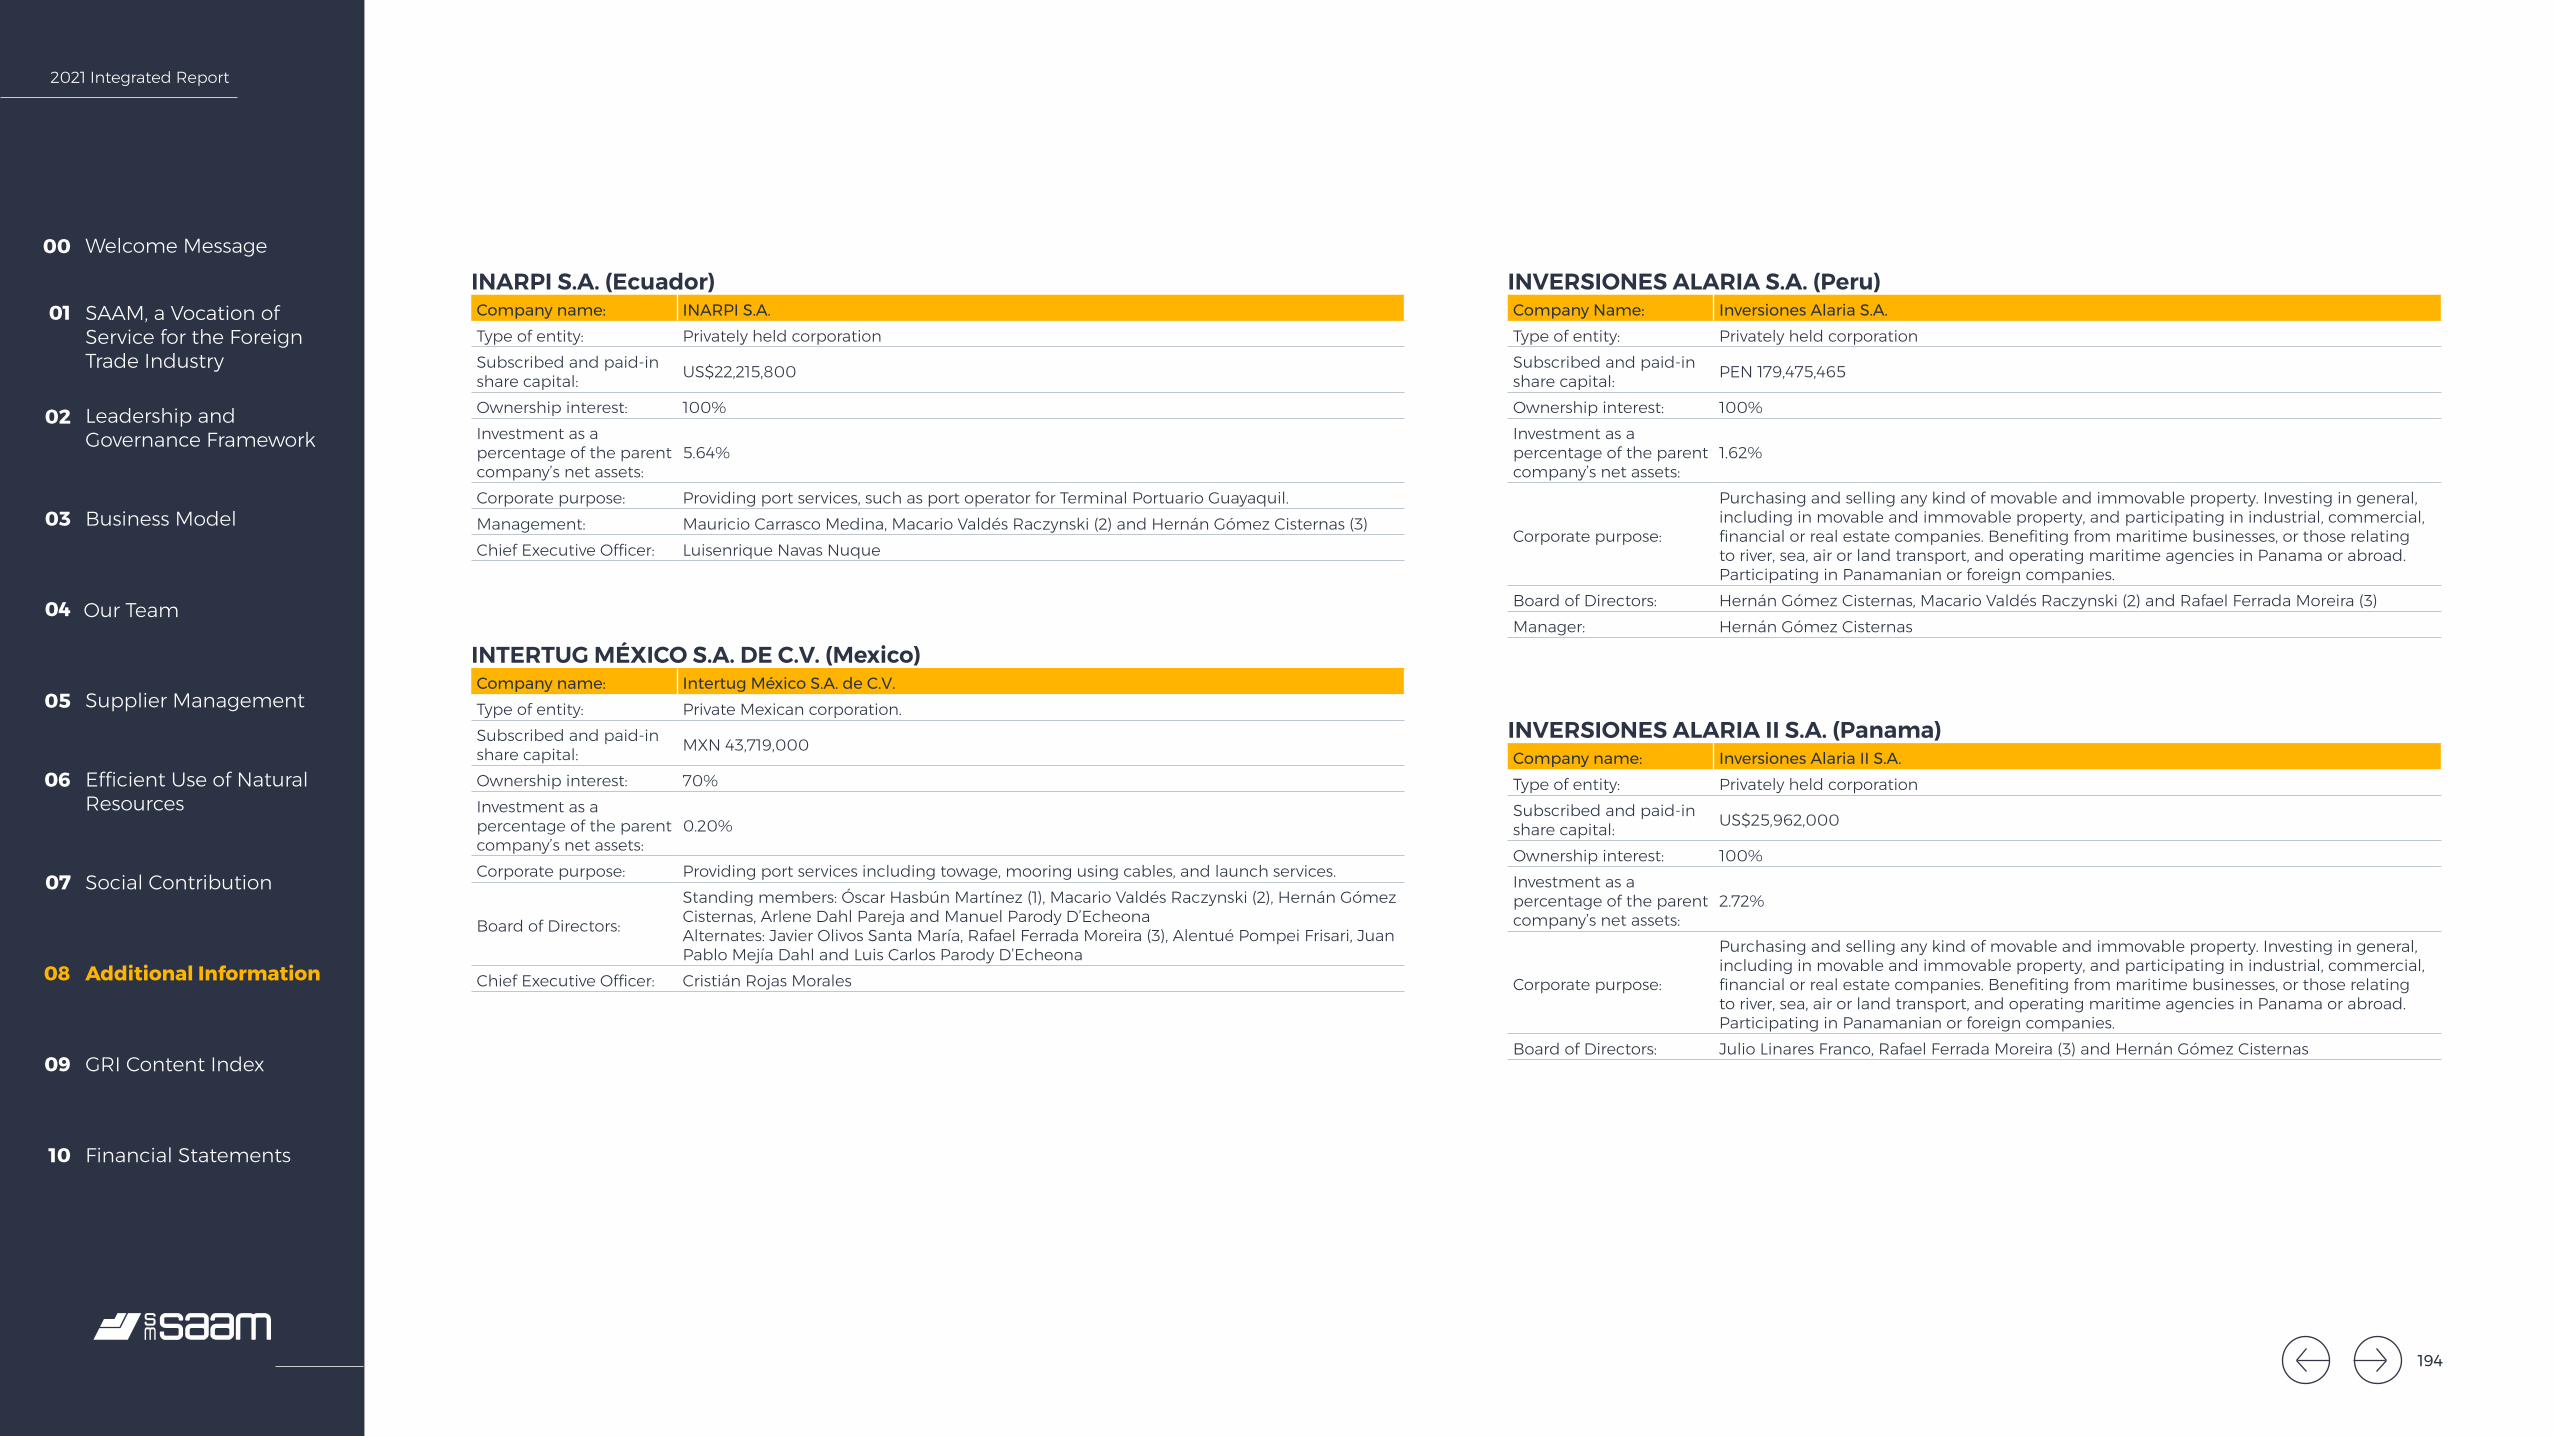
2021 Integrated Report
Welcome Message00
SAAM, a Vocation of Service for the Foreign Trade Industry
01
Leadership and Governance Framework
02
Business Model03
Our Team04
Supplier Management05
Efficient Use of Natural Resources
06
Social Contribution07
Additional Information08
GRI Content Index09
Financial Statements10
INARPI S.A. (Ecuador)Company name: INARPI S.A.Type of entity: Privately held corporation Subscribed and paid-in share capital: US$22,215,800
Ownership interest: 100%Investment as a percentage of the parent company’s net assets:
5.64%
Corporate purpose: Providing port services, such as port operator for Terminal Portuario Guayaquil.Management: Mauricio Carrasco Medina, Macario Valdés Raczynski (2) and Hernán Gómez Cisternas (3)Chief Executive Officer: Luisenrique Navas Nuque
INVERSIONES ALARIA S.A. (Peru)Company Name: Inversiones Alaria S.A.Type of entity: Privately held corporation Subscribed and paid-in share capital: PEN 179,475,465
Ownership interest: 100%Investment as a percentage of the parent company’s net assets:
1.62%
Corporate purpose:
Purchasing and selling any kind of movable and immovable property. Investing in general, including in movable and immovable property, and participating in industrial, commercial, financial or real estate companies. Benefiting from maritime businesses, or those relating to river, sea, air or land transport, and operating maritime agencies in Panama or abroad. Participating in Panamanian or foreign companies.
Board of Directors: Hernán Gómez Cisternas, Macario Valdés Raczynski (2) and Rafael Ferrada Moreira (3) Manager: Hernán Gómez Cisternas
INVERSIONES ALARIA II S.A. (Panama)Company name: Inversiones Alaria II S.A.Type of entity: Privately held corporation Subscribed and paid-in share capital: US$25,962,000
Ownership interest: 100%Investment as a percentage of the parent company’s net assets:
2.72%
Corporate purpose:
Purchasing and selling any kind of movable and immovable property. Investing in general, including in movable and immovable property, and participating in industrial, commercial, financial or real estate companies. Benefiting from maritime businesses, or those relating to river, sea, air or land transport, and operating maritime agencies in Panama or abroad. Participating in Panamanian or foreign companies.
Board of Directors: Julio Linares Franco, Rafael Ferrada Moreira (3) and Hernán Gómez Cisternas
INTERTUG MÉXICO S.A. DE C.V. (Mexico)Company name: Intertug México S.A. de C.V.Type of entity: Private Mexican corporation. Subscribed and paid-in share capital: MXN 43,719,000
Ownership interest: 70%Investment as a percentage of the parent company’s net assets:
0.20%
Corporate purpose: Providing port services including towage, mooring using cables, and launch services.
Board of Directors:
Standing members: Óscar Hasbún Martínez (1), Macario Valdés Raczynski (2), Hernán Gómez Cisternas, Arlene Dahl Pareja and Manuel Parody D’EcheonaAlternates: Javier Olivos Santa María, Rafael Ferrada Moreira (3), Alentué Pompei Frisari, Juan Pablo Mejía Dahl and Luis Carlos Parody D’Echeona
Chief Executive Officer: Cristián Rojas Morales
194

2021 Integrated Report
Welcome Message00
SAAM, a Vocation of Service for the Foreign Trade Industry
01
Leadership and Governance Framework
02
Business Model03
Our Team04
Supplier Management05
Efficient Use of Natural Resources
06
Social Contribution07
Additional Information08
GRI Content Index09
Financial Statements10
INVERSIONES HABSBURGO S.A. (Panama)Company Name: Inversiones Habsburgo S.A.Type of entity: Privately held corporation Subscribed and paid-in share capital: US$170,961.71
Ownership interest: 100%Investment as a percentage of the parent company’s net assets
6.76%
Corporate purpose:
Purchasing and selling any kind of movable and immovable property. Investing in general, including in movable and immovable property, and participating in industrial, commercial, financial or real estate companies. Benefiting from maritime businesses, or those relating to river, sea, air or land transport, and operating maritime agencies in Panama or abroad. Participating in Panamanian or foreign companies.
Board of Directors: Julio Linares Franco, Rafael Ferrada Moreira (3) and Hernán Gómez Cisternas
KIOS S.A. (Uruguay)Company name: Kios S.A.Type of entity: Privately held corporation Subscribed and paid-in share capital: UYU 138,000,000
Ownership interest: 100%Investment as a percentage of the parent company’s net assets:
2.56%
Corporate purpose: Providing towage services in general.Board of Directors: Felipe Rioja Rodríguez, Fernando Capurro Sarasketa and Francisco Licio SiniscalchiChief Executive Officer: Francisco Licio Siniscalchi
LIMOLY S.A. (Uruguay)Company name: LIMOLY S.A.Type of entity: Privately held corporation Subscribed and paid-in share capital: UYU 400,000
Ownership interest: 100%Investment as a percentage of the parent company’s net assets:
0.10%
Corporate purpose: Industrializing and commercializing merchandise, leased goods, works and services.Board of Directors: Felipe Rioja Rodríguez and Macario Valdés Raczynski (2)
INVERSIONES MISTI S.A. (Peru)Company Name: Inversiones Misti S.A.Type of entity: Privately held corporation Subscribed and paid-in share capital: PEN 648,029
Ownership interest: 100%Investment as a percentage of the parent company’s net assets:
0.31%
Corporate purpose:
Operating maritime and port businesses, which includes providing loading, unloading, storage, port operator, weighing, and launch services, vessel ownership and agency, port equipment, cargo and container transport and handling services, etc. Participating in other companies.
Board of Directors: Hernán Gómez Cisternas, Macario Valdés Raczynski (2) and Rafael Ferrada Moreira (3)Chief Executive Officer: Hernán Gómez Cisternas
195

2021 Integrated Report
Welcome Message00
SAAM, a Vocation of Service for the Foreign Trade Industry
01
Leadership and Governance Framework
02
Business Model03
Our Team04
Supplier Management05
Efficient Use of Natural Resources
06
Social Contribution07
Additional Information08
GRI Content Index09
Financial Statements10
PARANA TOWAGE S.A. (Argentina)Company name: Parana Towage S.A.Type of entity: Privately held corporation Subscribed and paid-in share capital: ARS 12,000
Ownership interest: 100%Investment as a percentage of the parent company’s net assets:
0.02%
Corporate purpose: Providing maritime services in general.Board of Directors: Fernando Capurro Sarasketa, Jorge Portela and Sergio PezChief Executive Officer: Fernando Capurro Sarasketa
RECURSOS PORTUARIOS MAZATLÁN S.A. DE C.V. (Mexico)Company name: Recursos Portuarios Mazatlán S.A. DE C.V.Type of entity: Private Mexican corporation. Subscribed and paid-in share capital: MXN 50,000
Ownership interest: 100%Investment as a percentage of the parent company’s net assets:
0.00%
Corporate purpose: Providing technological and laboring services, technical advice, training personnel and providing administrative services.
Board of Directors: Mauricio Carrasco Medina, Rafael Ferrada Moreira (3) and Macario Valdés Raczynski (2)Chief Executive Officer: Mauricio Ortiz Medina
RECURSOS PORTUARIOS S.A. DE C.V. (Mexico)Company name: Recursos Portuarios S.A. DE C.V.Type of entity: Private Mexican corporation. Subscribed and paid-in share capital: MXN 5,729,116
Ownership interest: 100%Investment as a percentage of the parent company’s net assets:
0.05%
Corporate purpose: Providing technological and laboring services, technical advice, training personnel and providing administrative services.
Board of Directors: Cristián Rojas MoralesChief Executive Officer: Cristián Rojas Morales
PUERTO BUENAVISTA S.A. (Colombia)Company Name: Puerto Buenavista S.A.Type of entity: Privately held corporation Subscribed and paid-in share capital: COP 49,557,000
Ownership interest: 33.33%Investment as a percentage of the parent company’s net assets:
0.25%
Corporate purpose:
Investing in port construction, maintenance and administration. Providing loading, unloading and storage services at ports, other services directly related to ports and all other activities that port companies are permitted to perform by virtue of Law 01/91 and its supplementary regulations.
Board of Directors:
Standing members: Liliana Cavelier Medina, Antonio Varela Diaz, Juan Manuel Camargo González, Andrés Osorio Barrera, Felipe Barison Kahn and Javier Olivos Santa MaríaAlternates: Jean Claude Hane, Christiaan Rijksen, Carlos Castaño Muñoz, Santiago Valderrama Pérez, Mauricio Carrasco Medina and Rafael Ferrada Moreira (3)
Chief Executive Officer: Alberto Acuña
196
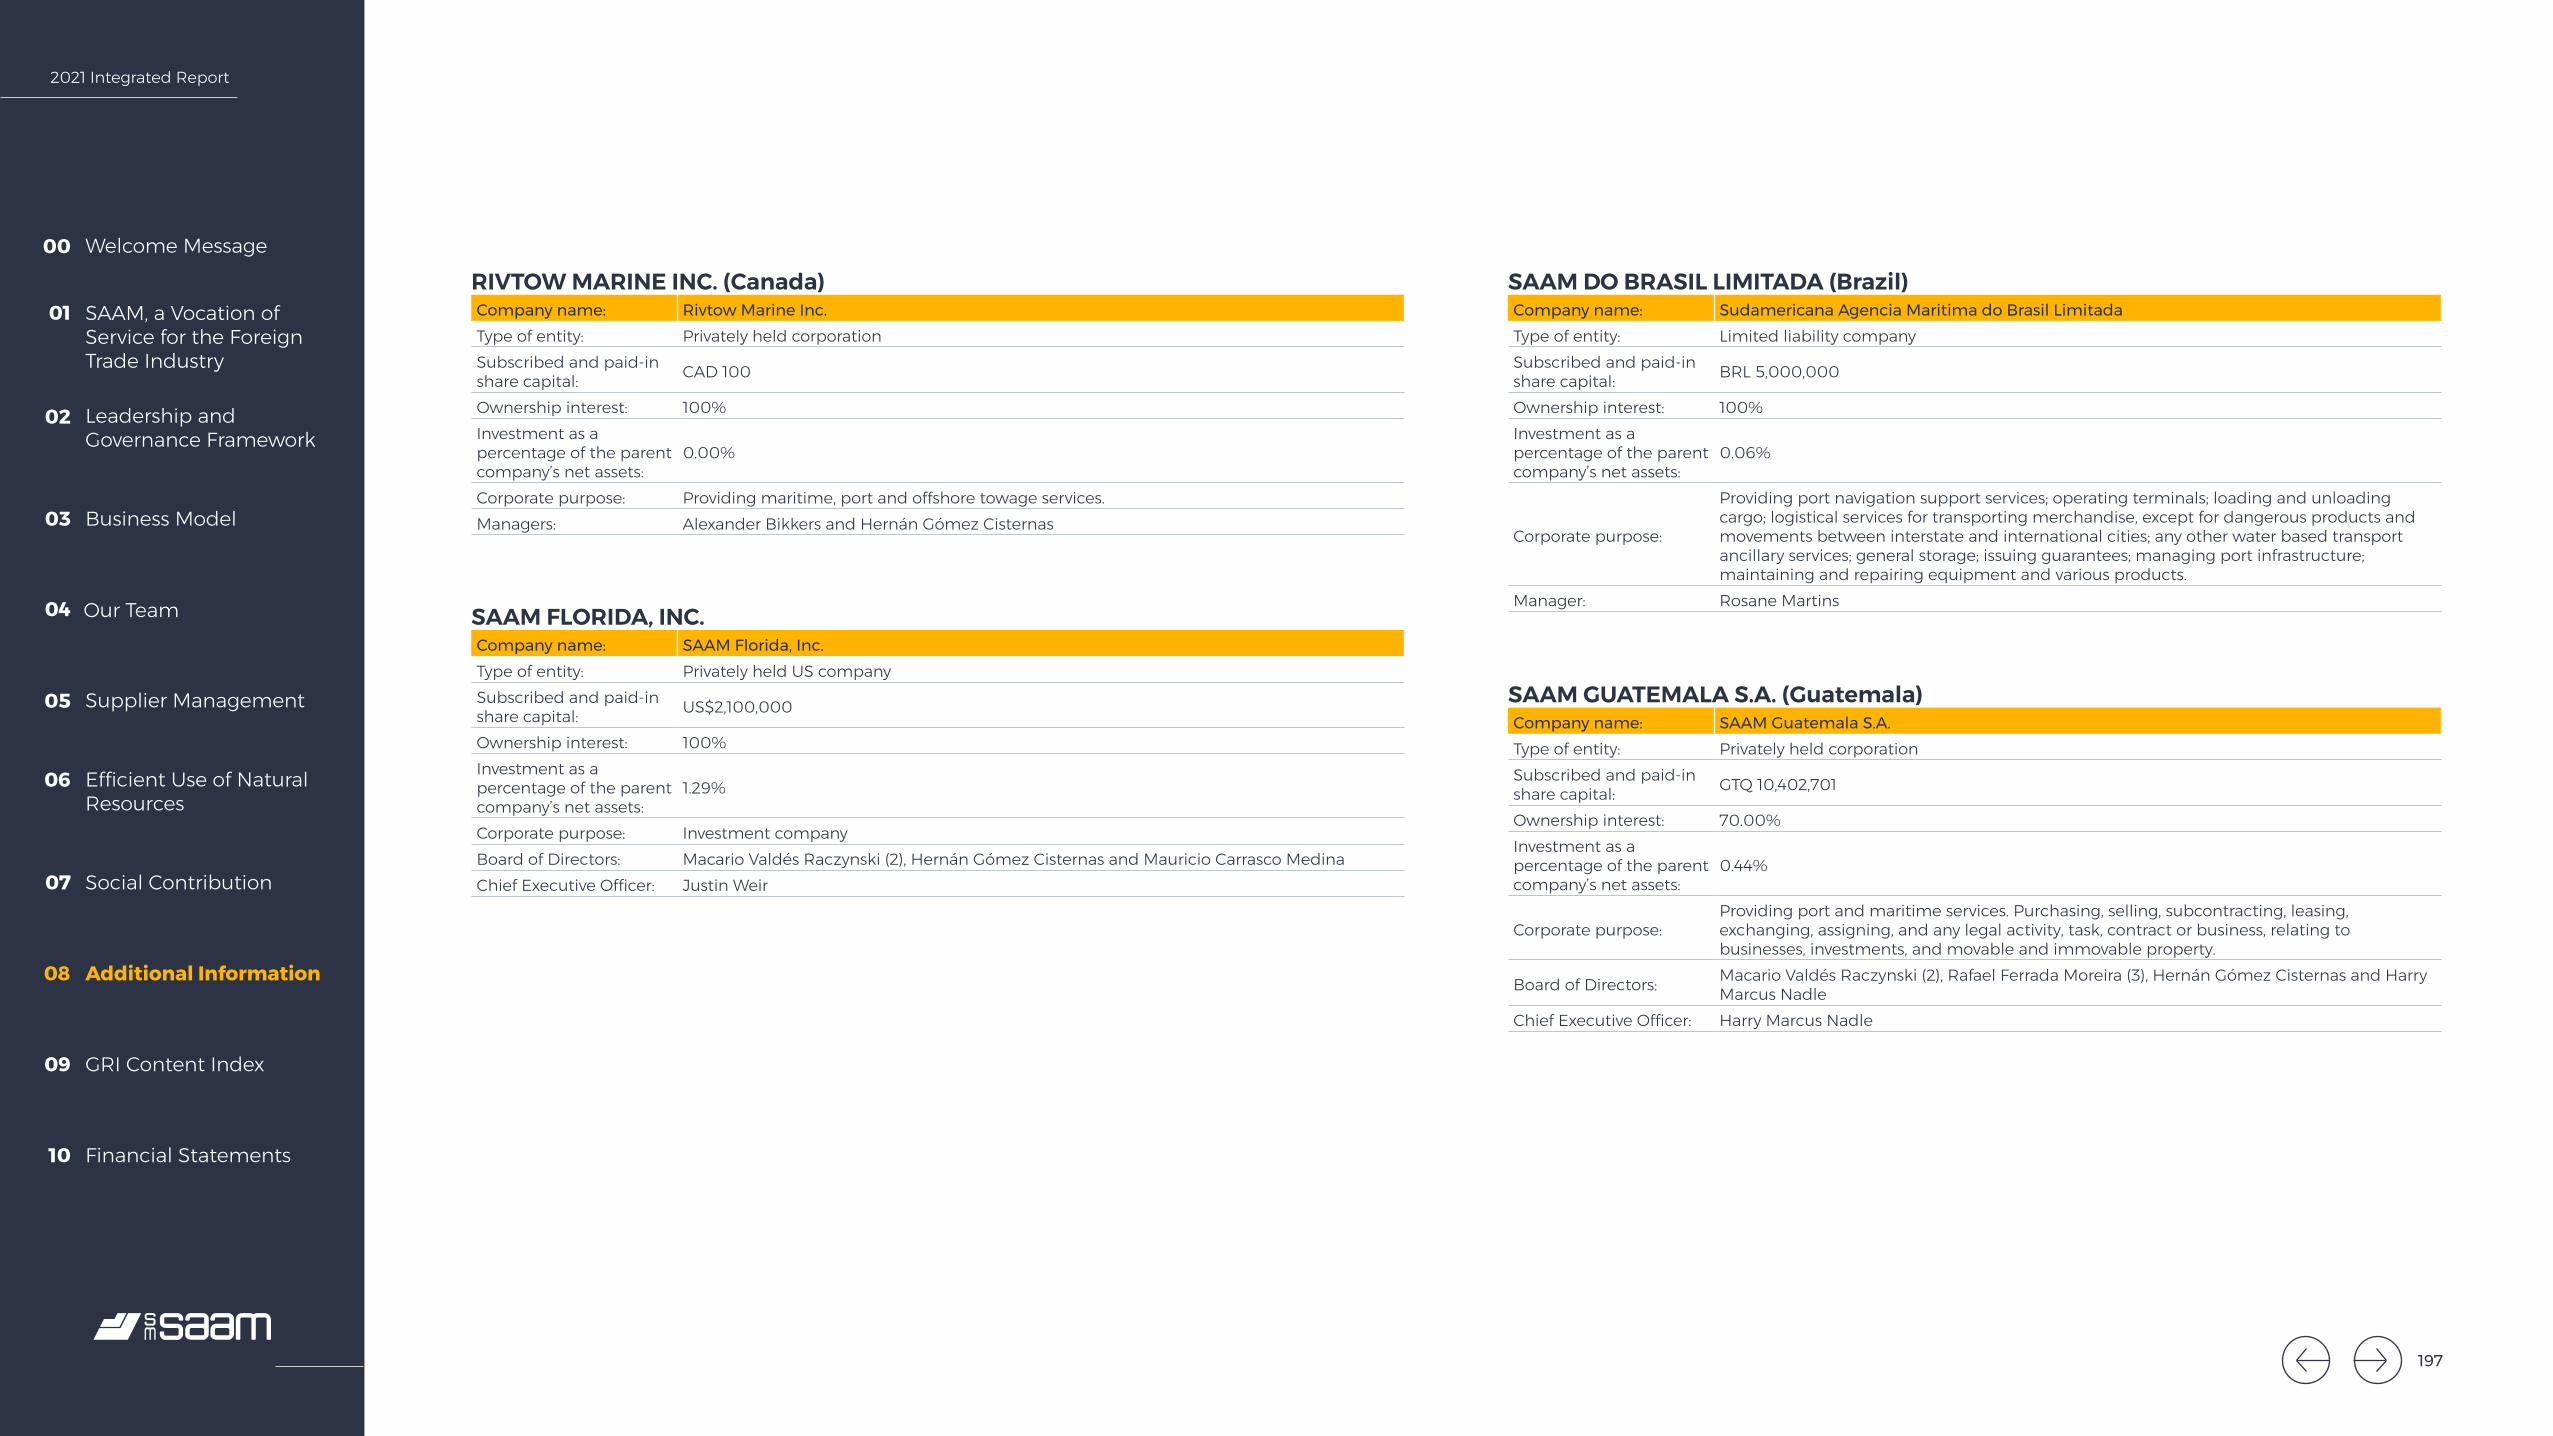
2021 Integrated Report
Welcome Message00
SAAM, a Vocation of Service for the Foreign Trade Industry
01
Leadership and Governance Framework
02
Business Model03
Our Team04
Supplier Management05
Efficient Use of Natural Resources
06
Social Contribution07
Additional Information08
GRI Content Index09
Financial Statements10
RIVTOW MARINE INC. (Canada)Company name: Rivtow Marine Inc.Type of entity: Privately held corporation Subscribed and paid-in share capital: CAD 100
Ownership interest: 100%Investment as a percentage of the parent company’s net assets:
0.00%
Corporate purpose: Providing maritime, port and offshore towage services.Managers: Alexander Bikkers and Hernán Gómez Cisternas
SAAM DO BRASIL LIMITADA (Brazil)Company name: Sudamericana Agencia Maritima do Brasil LimitadaType of entity: Limited liability company Subscribed and paid-in share capital: BRL 5,000,000
Ownership interest: 100%Investment as a percentage of the parent company’s net assets:
0.06%
Corporate purpose:
Providing port navigation support services; operating terminals; loading and unloading cargo; logistical services for transporting merchandise, except for dangerous products and movements between interstate and international cities; any other water based transport ancillary services; general storage; issuing guarantees; managing port infrastructure; maintaining and repairing equipment and various products.
Manager: Rosane Martins
SAAM GUATEMALA S.A. (Guatemala)Company name: SAAM Guatemala S.A.Type of entity: Privately held corporation Subscribed and paid-in share capital: GTQ 10,402,701
Ownership interest: 70.00%Investment as a percentage of the parent company’s net assets:
0.44%
Corporate purpose:Providing port and maritime services. Purchasing, selling, subcontracting, leasing, exchanging, assigning, and any legal activity, task, contract or business, relating to businesses, investments, and movable and immovable property.
Board of Directors: Macario Valdés Raczynski (2), Rafael Ferrada Moreira (3), Hernán Gómez Cisternas and Harry Marcus Nadle
Chief Executive Officer: Harry Marcus Nadle
SAAM FLORIDA, INC.Company name: SAAM Florida, Inc.Type of entity: Privately held US companySubscribed and paid-in share capital: US$2,100,000
Ownership interest: 100%Investment as a percentage of the parent company’s net assets:
1.29%
Corporate purpose: Investment companyBoard of Directors: Macario Valdés Raczynski (2), Hernán Gómez Cisternas and Mauricio Carrasco MedinaChief Executive Officer: Justin Weir
197

2021 Integrated Report
Welcome Message00
SAAM, a Vocation of Service for the Foreign Trade Industry
01
Leadership and Governance Framework
02
Business Model03
Our Team04
Supplier Management05
Efficient Use of Natural Resources
06
Social Contribution07
Additional Information08
GRI Content Index09
Financial Statements10
SAAM INVERSIONES PORTUARIAS COSTA RICA S.A. (Costa Rica)Company name: SAAM Inversiones Portuarias Costa Rica S.A.Type of entity: Privately held corporation Subscribed and paid-in share capital: CRC 10,000.00
Ownership interest: 100%Investment as a percentage of the parent company’s net assets:
0.00%
Corporate purpose:
Trading in general. Purchasing, selling, leasing, producing, distributing, transforming, industrializing, importing, exporting, and generally conducting its business in compliance with the laws of the Republic of Costa Rica; acquiring, selling and encumbering the immovable property required to develop its business and granting any kind of commercial contract.
Board of Directors: Mauricio Carrasco Medina, Macario Valdés Raczynski (2) and Hernán Gómez Cisternas
SAAM PARTICIPACOES LIMITADA (Brazil)Company name: SAAM Participacoes LimitadaType of entity: Limited liability company Subscribed and paid-in share capital: BRL 20,000,000
Ownership interest: 100%Investment as a percentage of the parent company’s net assets:
3.18%
Corporate purpose: Participating in other companies as a partner or shareholder.Manager: Rosane Martins
SAAM REMOLCADORES S.A. (Panama)Company name: SAAM Remolcadores S.A.Type of entity: Privately held corporation Subscribed and paid-in share capital: US$10,000
Ownership interest: 100%Investment as a percentage of the parent company’s net assets:
0.19%
Corporate purpose: Providing towage services to any port by private contract or public concession.Board of Directors: Julio Linares Franco, Rafael Ferrada Moreira (3) and Hernán Gómez Cisternas
SAAM REMOLCADORES S.A. DE C.V. (Mexico)Company name: SAAM Remolcadores S.A. de C.V.Type of entity: Private Mexican corporation. Subscribed and paid-in share capital: MXN 67,112,513
Ownership interest: 100%Investment as a percentage of the parent company’s net assets:
1%
Corporate purpose: Providing towage services using cables, and launch and vessel pilotage servicesBoard of Directors: Cristián Rojas Morales, David Foulkes WoodChief Executive Officer: Cristián Rojas Morales
SAAM OPERADORA DE PUERTOS EMPRESA DE ESTIBA Y DESESTIBA COSTA RICA S.A. (Costa Rica)Company name: SAAM Operadora de Puertos Empresa de Estiba y Desestiba Costa Rica S.A.Type of entity: Privately held corporation Subscribed and paid-in share capital: CRC 26,932,170
Ownership interest: 100%Investment as a percentage of the parent company’s net assets:
4.58%
Corporate purpose:
Trading in general. Purchasing, selling, leasing, producing, distributing, transforming, industrializing, importing, exporting, and generally conducting its business in compliance with the laws of the Republic of Costa Rica; acquiring, selling and encumbering the immovable property required to develop its business and granting any kind of commercial contract.
Board of Directors: Mauricio Carrasco Medina, Macario Valdés Raczynski (2) and Rafael Ferrada Moreira (3)
198
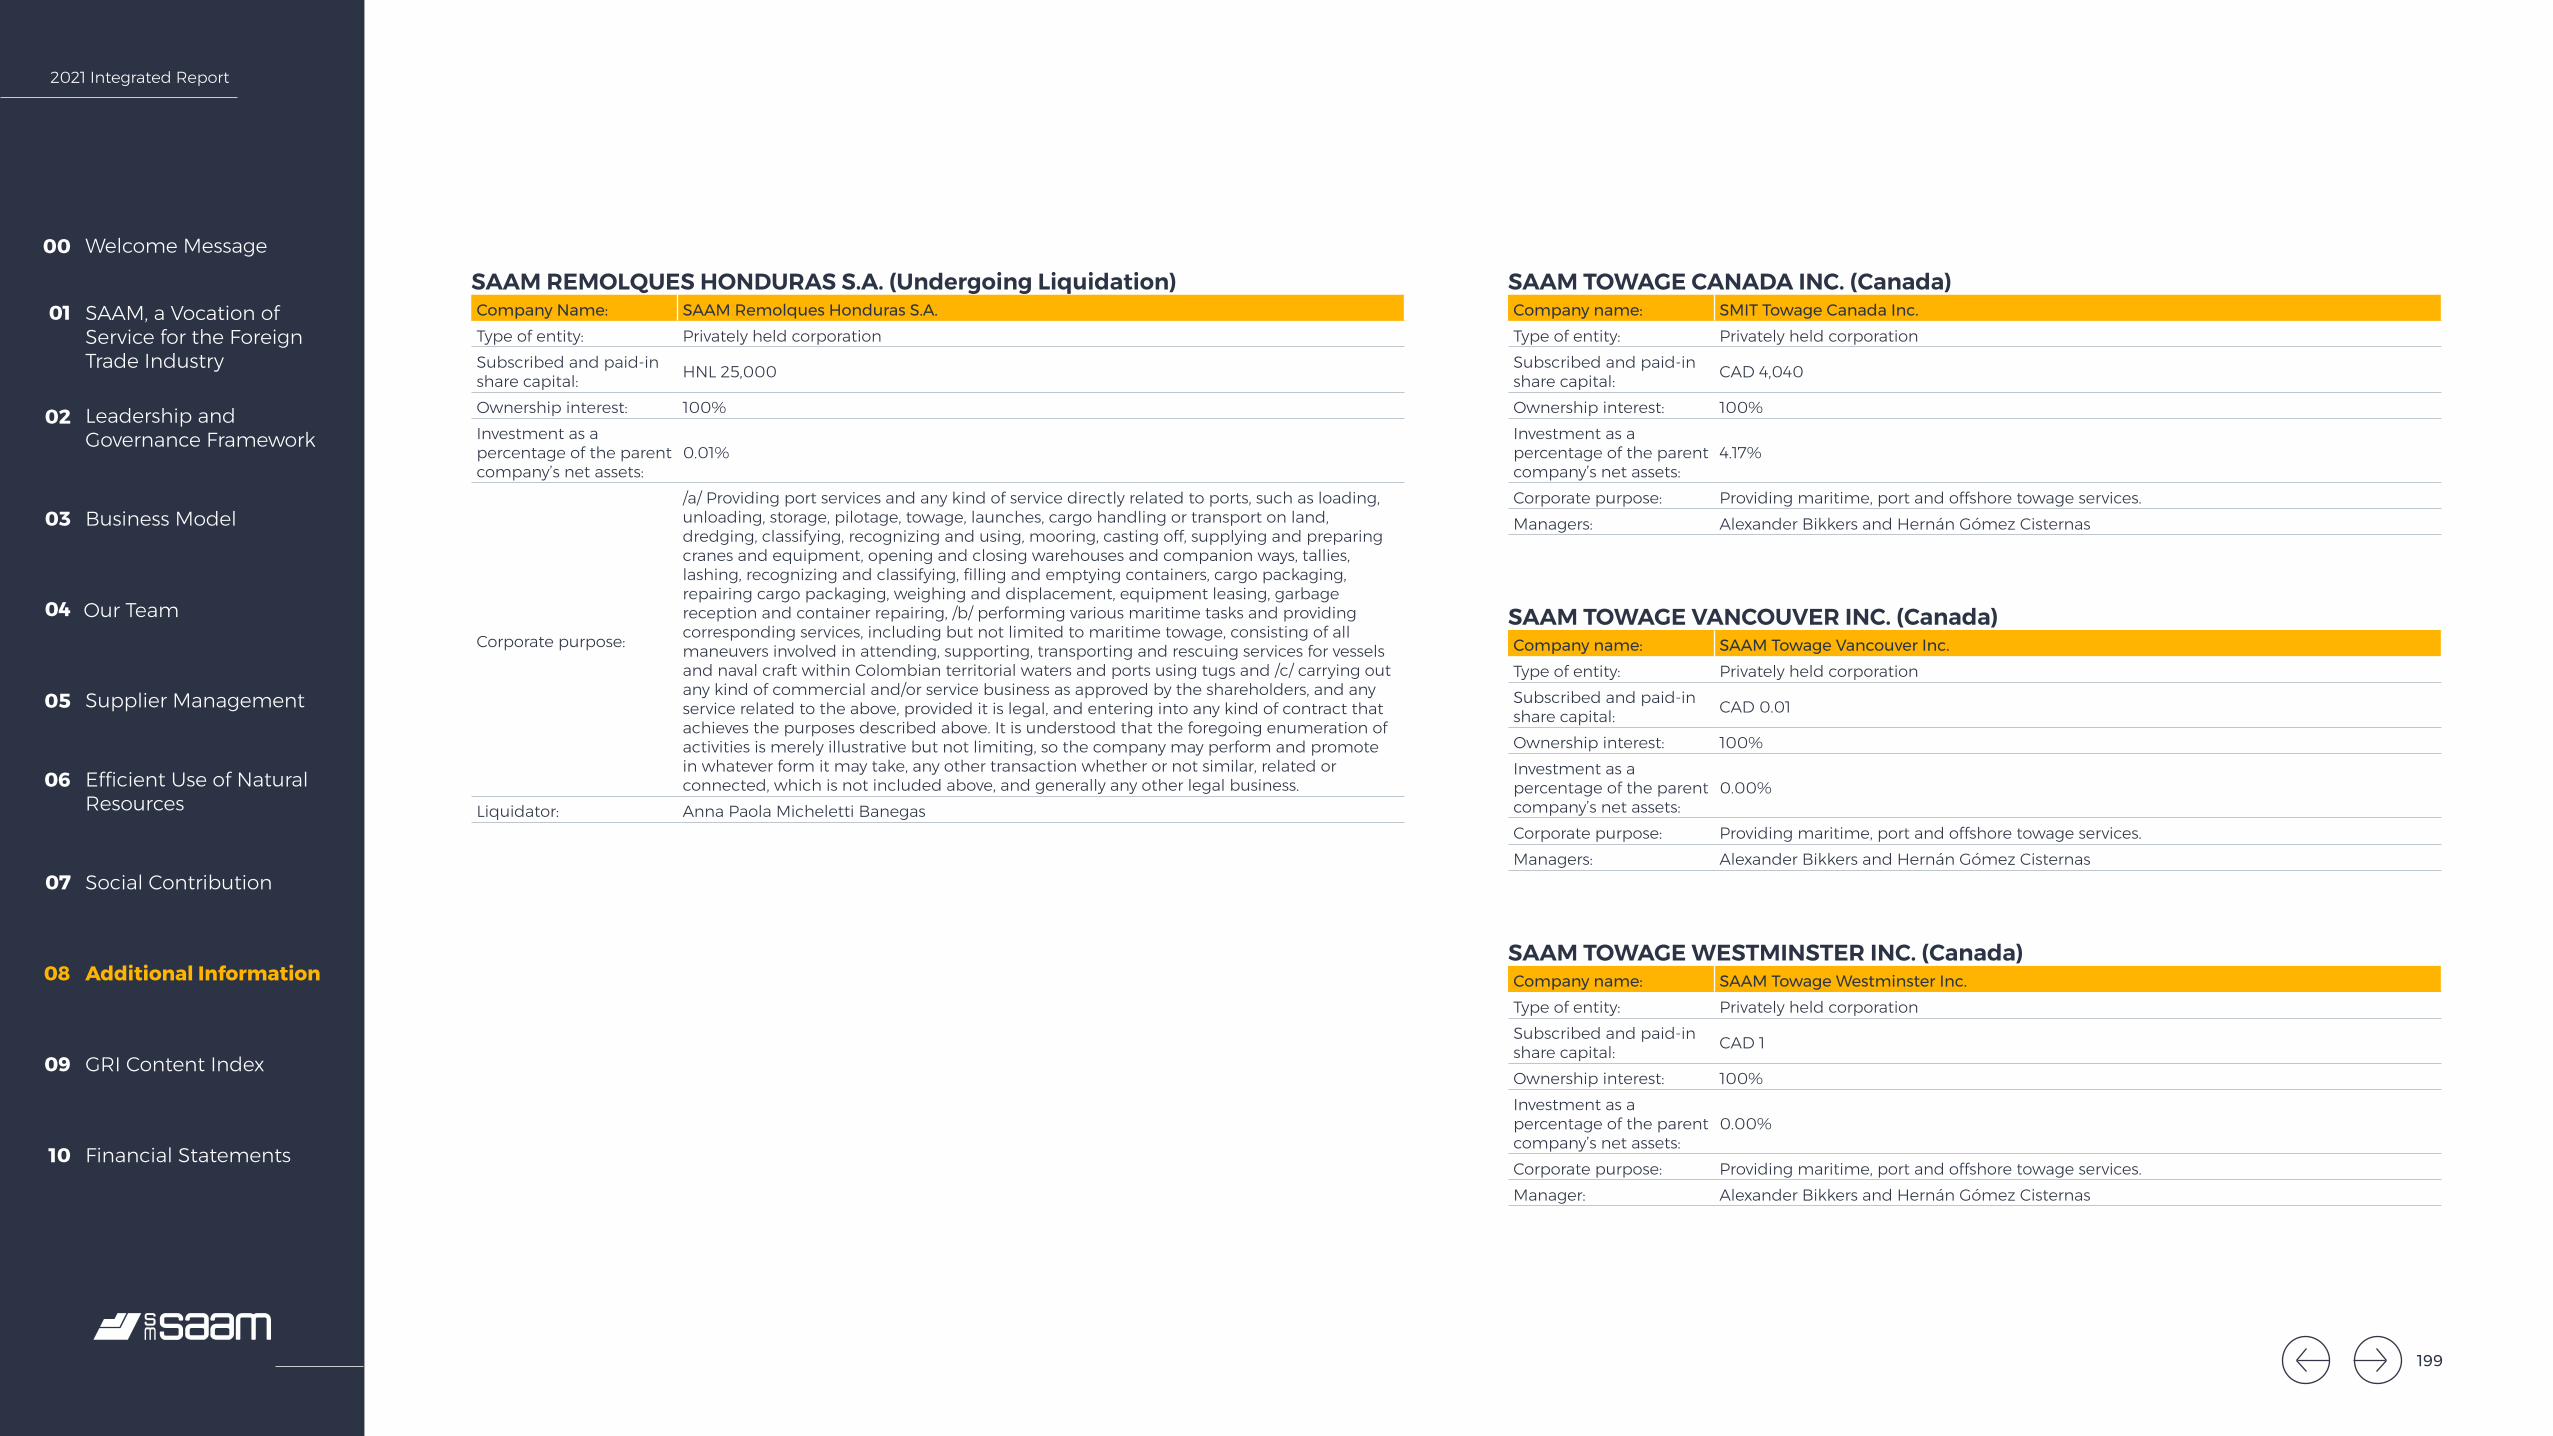
2021 Integrated Report
Welcome Message00
SAAM, a Vocation of Service for the Foreign Trade Industry
01
Leadership and Governance Framework
02
Business Model03
Our Team04
Supplier Management05
Efficient Use of Natural Resources
06
Social Contribution07
Additional Information08
GRI Content Index09
Financial Statements10
SAAM REMOLQUES HONDURAS S.A. (Undergoing Liquidation)Company Name: SAAM Remolques Honduras S.A.Type of entity: Privately held corporation Subscribed and paid-in share capital: HNL 25,000
Ownership interest: 100%Investment as a percentage of the parent company’s net assets:
0.01%
Corporate purpose:
/a/ Providing port services and any kind of service directly related to ports, such as loading, unloading, storage, pilotage, towage, launches, cargo handling or transport on land, dredging, classifying, recognizing and using, mooring, casting off, supplying and preparing cranes and equipment, opening and closing warehouses and companion ways, tallies, lashing, recognizing and classifying, filling and emptying containers, cargo packaging, repairing cargo packaging, weighing and displacement, equipment leasing, garbage reception and container repairing, /b/ performing various maritime tasks and providing corresponding services, including but not limited to maritime towage, consisting of all maneuvers involved in attending, supporting, transporting and rescuing services for vessels and naval craft within Colombian territorial waters and ports using tugs and /c/ carrying out any kind of commercial and/or service business as approved by the shareholders, and any service related to the above, provided it is legal, and entering into any kind of contract that achieves the purposes described above. It is understood that the foregoing enumeration of activities is merely illustrative but not limiting, so the company may perform and promote in whatever form it may take, any other transaction whether or not similar, related or connected, which is not included above, and generally any other legal business.
Liquidator: Anna Paola Micheletti Banegas
SAAM TOWAGE CANADA INC. (Canada)Company name: SMIT Towage Canada Inc.Type of entity: Privately held corporation Subscribed and paid-in share capital: CAD 4,040
Ownership interest: 100%Investment as a percentage of the parent company’s net assets:
4.17%
Corporate purpose: Providing maritime, port and offshore towage services.Managers: Alexander Bikkers and Hernán Gómez Cisternas
SAAM TOWAGE VANCOUVER INC. (Canada)Company name: SAAM Towage Vancouver Inc.Type of entity: Privately held corporation Subscribed and paid-in share capital: CAD 0.01
Ownership interest: 100%Investment as a percentage of the parent company’s net assets:
0.00%
Corporate purpose: Providing maritime, port and offshore towage services.Managers: Alexander Bikkers and Hernán Gómez Cisternas
SAAM TOWAGE WESTMINSTER INC. (Canada)Company name: SAAM Towage Westminster Inc.Type of entity: Privately held corporation Subscribed and paid-in share capital: CAD 1
Ownership interest: 100%Investment as a percentage of the parent company’s net assets:
0.00%
Corporate purpose: Providing maritime, port and offshore towage services.Manager: Alexander Bikkers and Hernán Gómez Cisternas
199
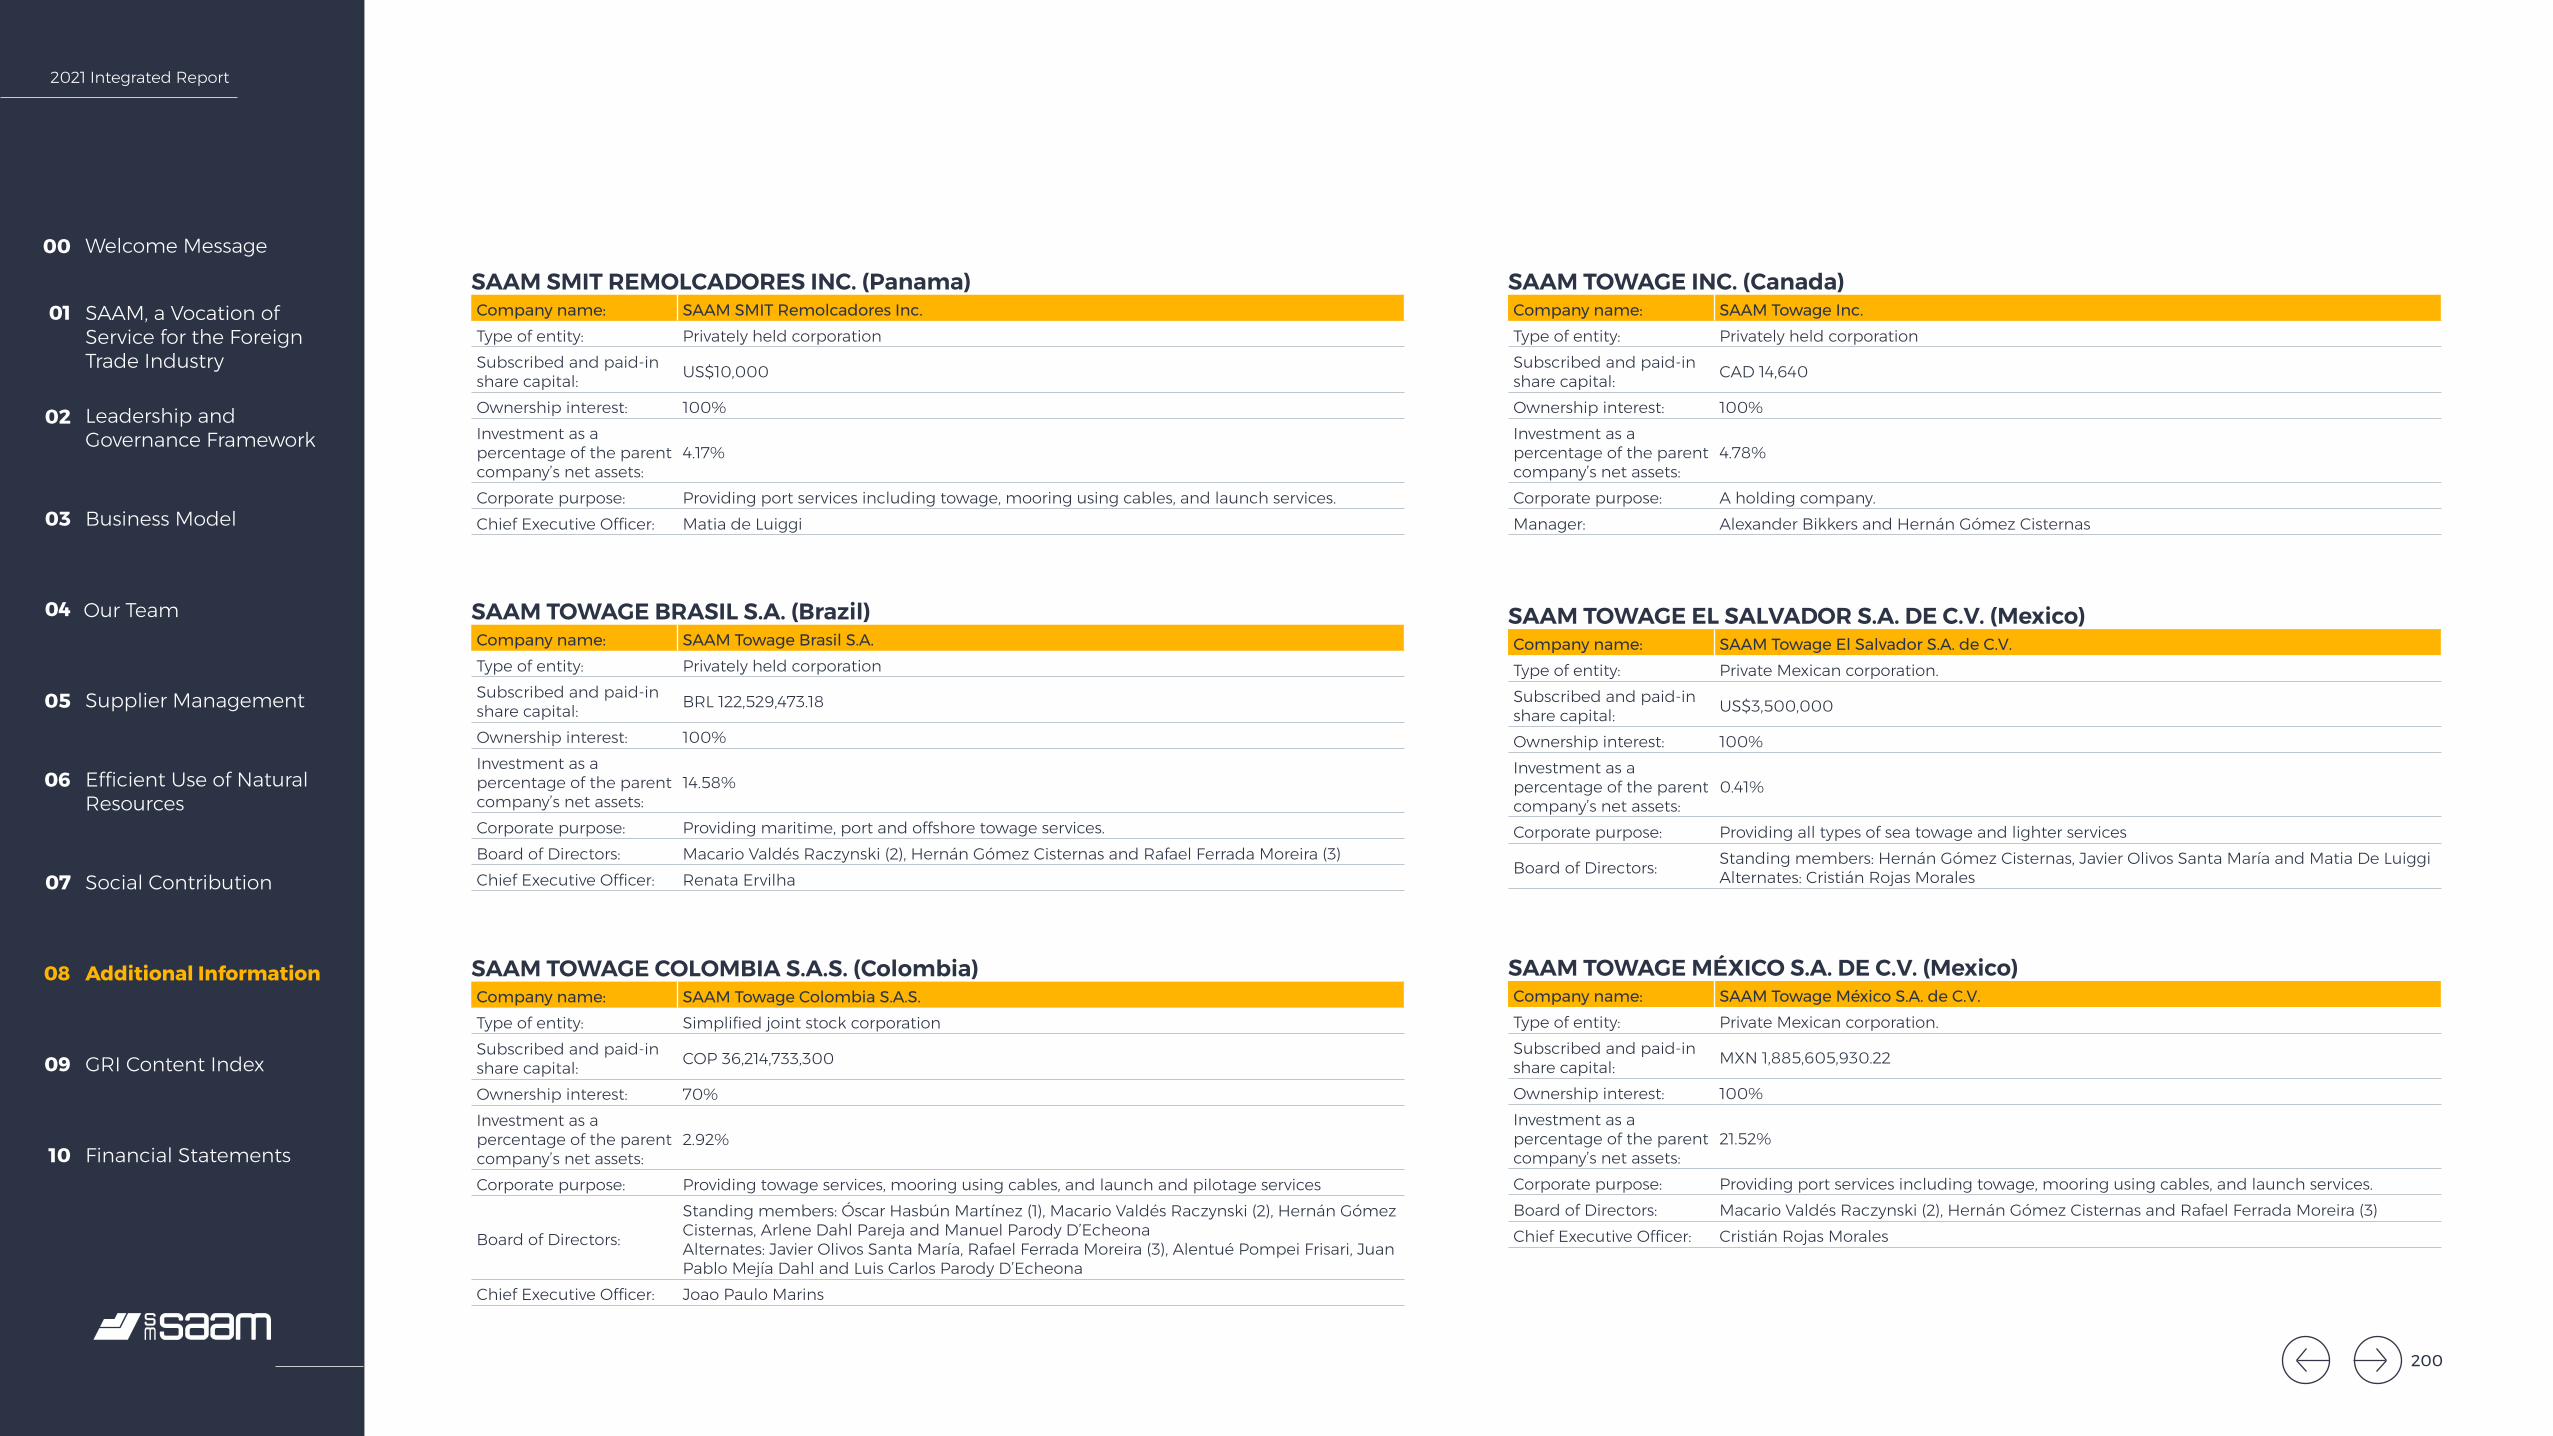
2021 Integrated Report
Welcome Message00
SAAM, a Vocation of Service for the Foreign Trade Industry
01
Leadership and Governance Framework
02
Business Model03
Our Team04
Supplier Management05
Efficient Use of Natural Resources
06
Social Contribution07
Additional Information08
GRI Content Index09
Financial Statements10
SAAM SMIT REMOLCADORES INC. (Panama)Company name: SAAM SMIT Remolcadores Inc.Type of entity: Privately held corporation Subscribed and paid-in share capital: US$10,000
Ownership interest: 100%Investment as a percentage of the parent company’s net assets:
4.17%
Corporate purpose: Providing port services including towage, mooring using cables, and launch services.Chief Executive Officer: Matia de Luiggi
SAAM TOWAGE INC. (Canada)Company name: SAAM Towage Inc.Type of entity: Privately held corporationSubscribed and paid-in share capital: CAD 14,640
Ownership interest: 100%Investment as a percentage of the parent company’s net assets:
4.78%
Corporate purpose: A holding company.Manager: Alexander Bikkers and Hernán Gómez Cisternas
SAAM TOWAGE EL SALVADOR S.A. DE C.V. (Mexico)Company name: SAAM Towage El Salvador S.A. de C.V.Type of entity: Private Mexican corporation. Subscribed and paid-in share capital: US$3,500,000
Ownership interest: 100%Investment as a percentage of the parent company’s net assets:
0.41%
Corporate purpose: Providing all types of sea towage and lighter services
Board of Directors: Standing members: Hernán Gómez Cisternas, Javier Olivos Santa María and Matia De LuiggiAlternates: Cristián Rojas Morales
SAAM TOWAGE MÉXICO S.A. DE C.V. (Mexico)Company name: SAAM Towage México S.A. de C.V.Type of entity: Private Mexican corporation. Subscribed and paid-in share capital: MXN 1,885,605,930.22
Ownership interest: 100%Investment as a percentage of the parent company’s net assets:
21.52%
Corporate purpose: Providing port services including towage, mooring using cables, and launch services.Board of Directors: Macario Valdés Raczynski (2), Hernán Gómez Cisternas and Rafael Ferrada Moreira (3)Chief Executive Officer: Cristián Rojas Morales
SAAM TOWAGE BRASIL S.A. (Brazil)Company name: SAAM Towage Brasil S.A. Type of entity: Privately held corporation Subscribed and paid-in share capital: BRL 122,529,473.18
Ownership interest: 100%Investment as a percentage of the parent company’s net assets:
14.58%
Corporate purpose: Providing maritime, port and offshore towage services.Board of Directors: Macario Valdés Raczynski (2), Hernán Gómez Cisternas and Rafael Ferrada Moreira (3)Chief Executive Officer: Renata Ervilha
SAAM TOWAGE COLOMBIA S.A.S. (Colombia)Company name: SAAM Towage Colombia S.A.S.Type of entity: Simplified joint stock corporation Subscribed and paid-in share capital: COP 36,214,733,300
Ownership interest: 70%Investment as a percentage of the parent company’s net assets:
2.92%
Corporate purpose: Providing towage services, mooring using cables, and launch and pilotage services
Board of Directors:
Standing members: Óscar Hasbún Martínez (1), Macario Valdés Raczynski (2), Hernán Gómez Cisternas, Arlene Dahl Pareja and Manuel Parody D’EcheonaAlternates: Javier Olivos Santa María, Rafael Ferrada Moreira (3), Alentué Pompei Frisari, Juan Pablo Mejía Dahl and Luis Carlos Parody D’Echeona
Chief Executive Officer: Joao Paulo Marins
200

2021 Integrated Report
Welcome Message00
SAAM, a Vocation of Service for the Foreign Trade Industry
01
Leadership and Governance Framework
02
Business Model03
Our Team04
Supplier Management05
Efficient Use of Natural Resources
06
Social Contribution07
Additional Information08
GRI Content Index09
Financial Statements10
SAAM TOWAGE PANAMA, INC. (Panama)Company name: SAAM Towage Panama Inc.Type of entity: Privately held corporation Subscribed and paid-in share capital: US$66,752,787
Ownership interest: 100%Investment as a percentage of the parent company’s net assets:
6.54%
Corporate purpose:Providing general maritime services, including towage, pilotage, launches, pollution and fire control, rescue, communications, and maritime traffic control services at ports in the Republic of Panama.
Board of Directors: Matia de Luiggi, Hernán Gómez Cisternas and Kathar Arenas CarrerasChief Executive Officer: Matia de Luiggi
SOCIEDAD PORTUARIA DE CALDERA (SPC) S.A.Company name: Sociedad Portuaria de Caldera (SPC) S.A.Type of entity: Privately held corporationSubscribed and paid-in share capital: US$1,000,000
Ownership interest: 51.00%Investment as a percentage of the parent company’s net assets:
1.69%
Corporate purpose:
Exclusively executing the public service concession contract for the Caldera Terminal awarded following International Public Tender number zero one-two thousand one-INCOP, under which it can buy, sell, receive as a pledge or mortgage, lend, lease, encumber or dispose of the property and rights it owns; receiving fiduciary property, and acting as trustor, trustee or beneficiary; granting loans to its subsidiaries using its own funds, provided that the prevailing economic and financial conditions allow it and a pecuniary benefit is received; granting bonds or guarantees of any kind, provided they benefit the company; all in the broadest manner to best fulfill these purposes. Performing its business in any country in the world.
Board of Directors:
Standing members: Macario Valdés Raczynski (2), Gerardo Ramírez Steller, José Pablo Chávez Zamora, Mauricio Carrasco Medina, Amparo Pinzón Nieto, Óscar Hasbún Martínez (1) and Felipe Rioja RodríguezAlternates: Hernán Gómez Cisternas, Miguel Ramírez Steller, Mónica Chávez Zamora, Felipe Barison Kahn, Óscar David Isaza and Javier Olivos Santa María
Chief Executive Officer: Ricardo Ospina León
SAAM TOWAGE PERÚ S.A.C. (Peru)Company name: SAAM Towage Perú S.A.C.Type of entity: Privately held corporationSubscribed and paid-in share capital: PEN 44,761,000
Ownership interest: 100%Investment as a percentage of the parent company’s net assets:
0.89%
Corporate purpose: Engaging in all kinds of business and activities related to the towage, pilotage and launching all types of vessels and floating devices used in sea, river and lake areas.
Board of Directors: Macario Valdés Raczynski (2), Hernán Gómez Cisternas and Rafael Ferrada Moreira (3)Chief Executive Officer: Cristián Cifuentes Buono-core
201

2021 Integrated Report
Welcome Message00
SAAM, a Vocation of Service for the Foreign Trade Industry
01
Leadership and Governance Framework
02
Business Model03
Our Team04
Supplier Management05
Efficient Use of Natural Resources
06
Social Contribution07
Additional Information08
GRI Content Index09
Financial Statements10
SOCIEDAD PORTUARIA GRANELERA DE CALDERA (SPGC) S.A.Company name: Sociedad Portuaria Granelera de Caldera (SPGC) S.A.Type of entity: Privately held corporationSubscribed and paid-in share capital: US$10,000,000
Ownership interest: 51.00%Investment as a percentage of the parent company’s net assets:
1.48%
Corporate purpose:
Exclusively executing the public service concession contract for the Puerto Caldera Bulk Terminal awarded following International Public Tender number zero three-two thousand one-CNC, in accordance with the law governing Public Works Concessions for Public Services, under which it can buy, sell, receive as a pledge or mortgage, lend, lease, encumber or dispose of the property and rights it owns; receiving fiduciary property, and acting as trustor, trustee or beneficiary; granting loans to its subsidiaries using its own funds, provided that the prevailing economic and financial conditions allow it and a pecuniary benefit is received; granting bonds or guarantees of any kind, provided they benefit the company; all in the broadest manner to best fulfill these purposes. Performing its business in any country in the world.
Board of Directors:
Standing members: Macario Valdés Raczynski (2), Gerardo Ramírez Steller, José Pablo Chávez Zamora, Mauricio Carrasco Medina, Amparo Pinzón Nieto, Óscar Hasbún Martínez (1) and Felipe Rioja RodríguezAlternates: Hernán Gómez Cisternas, Miguel Ramírez Steller, Mónica Chávez Zamora, Felipe Barison Kahn, Óscar David Isaza and Javier Olivos Santa María
Chief Executive Officer: Ricardo Ospina León
TERMINAL MARÍTIMA MAZATLÁN S.A. DE C.V. (Mexico)Company name: Terminal Marítima Mazatlán S.A. de C.V.Type of entity: Private Mexican corporation. Subscribed and paid-in share capital: MXN 401,558,470
Ownership interest: 100%Investment as a percentage of the parent company’s net assets:
2.04%
Corporate purpose:Benefiting from publicly owned goods, developing and building port facilities; operating the port concession at Puerto Mazatlan, Sinaloa; providing port, trade and representative services, and other services.
Board of Directors: Mauricio Carrasco Medina, Macario Valdés Raczynski (2) and Rafael Ferrada Moreira (3)Chief Executive Officer: Mauricio Ortiz Medina
TPG TRANSPORTES S.A. (Ecuador) Company name: TPG Transportes S.A.Type of entity: Privately held corporation Subscribed and paid-in share capital: US$800
Ownership interest: 100%Investment as a percentage of the parent company’s net assets:
0.14%
Corporate purpose: Providing transport for heavy cargoManagement: Board of directors through duly appointed representatives.Chief Executive Officer: Nelson Arancibia Rojas
TOLKEYEN PATAGONIA TURISMO S.A. (Argentina)Company Name: Tolkeyen Patagonia Turismo S.A.Type of entity: Privately held corporation Subscribed and paid-in share capital: ARS 4,000,000
Ownership interest: 24.75%Investment as a percentage of the parent company’s net assets:
0.00%
Corporate purpose: Providing services related to tourism, trade, accommodations, transport, exports and imports, etc.
Manager: Felipe Rioja RodríguezChief Executive Officer: César Rojas Velásquez
Notes:A) Directors and senior executives of Sociedad Matriz SAAM S.A. who also hold these positions in subsidiaries and associated companies:(1) Óscar Hasbún Martínez Chairman of the Board(2) Macario Valdés Raczynski Chief Executive Officer(3) Rafael Ferrada Moreira Chief Financial Officer(4) Gastón Moya Rodríguez Chief Human Resource OfficerB) Currency symbols
Ch$ : Chilean peso COP : Colombian pesoUS$ : US dollar UYU : Uruguayan pesoARS : Argentinean peso MXN : Mexican pesoPEN : Peruvian new soles GTQ : Quetzal (Guatemala)BRL : Brazilian real HNL : Honduran lempiraCRC : Costa Rican colon CAD : Canadian dollar
202

2021 Integrated Report
Welcome Message00
SAAM, a Vocation of Service for the Foreign Trade Industry
01
Leadership and Governance Framework
02
Business Model03
Our Team04
Supplier Management05
Efficient Use of Natural Resources
06
Social Contribution07
Additional Information08
GRI Content Index09
Financial Statements10
Supplementary Information on PeopleSM SAAM employed a total of 8,874 people as of December 31, 2021.
Workforce by Division
8,874 (1)Total
3,999 1,967
164 2,744
11 13
02 00Gender Nationality
Management Diversity
Age Years in Position
Men Chileans
Women Foreigners
< 30 years
30 - 40 years
41 - 50 years
< 3 years
Between 3 and 6 years
Between 6 and 9 years
39%
39%46%46%
15% 15%
51 - 60 years
61 - 70 years
> 70 years
Between 9 and 12 years
> 12 years
(1) figures consider headcount from subsidiaries and associates
Corporate
Port Terminals Division Towage Division
Logistics Division
203
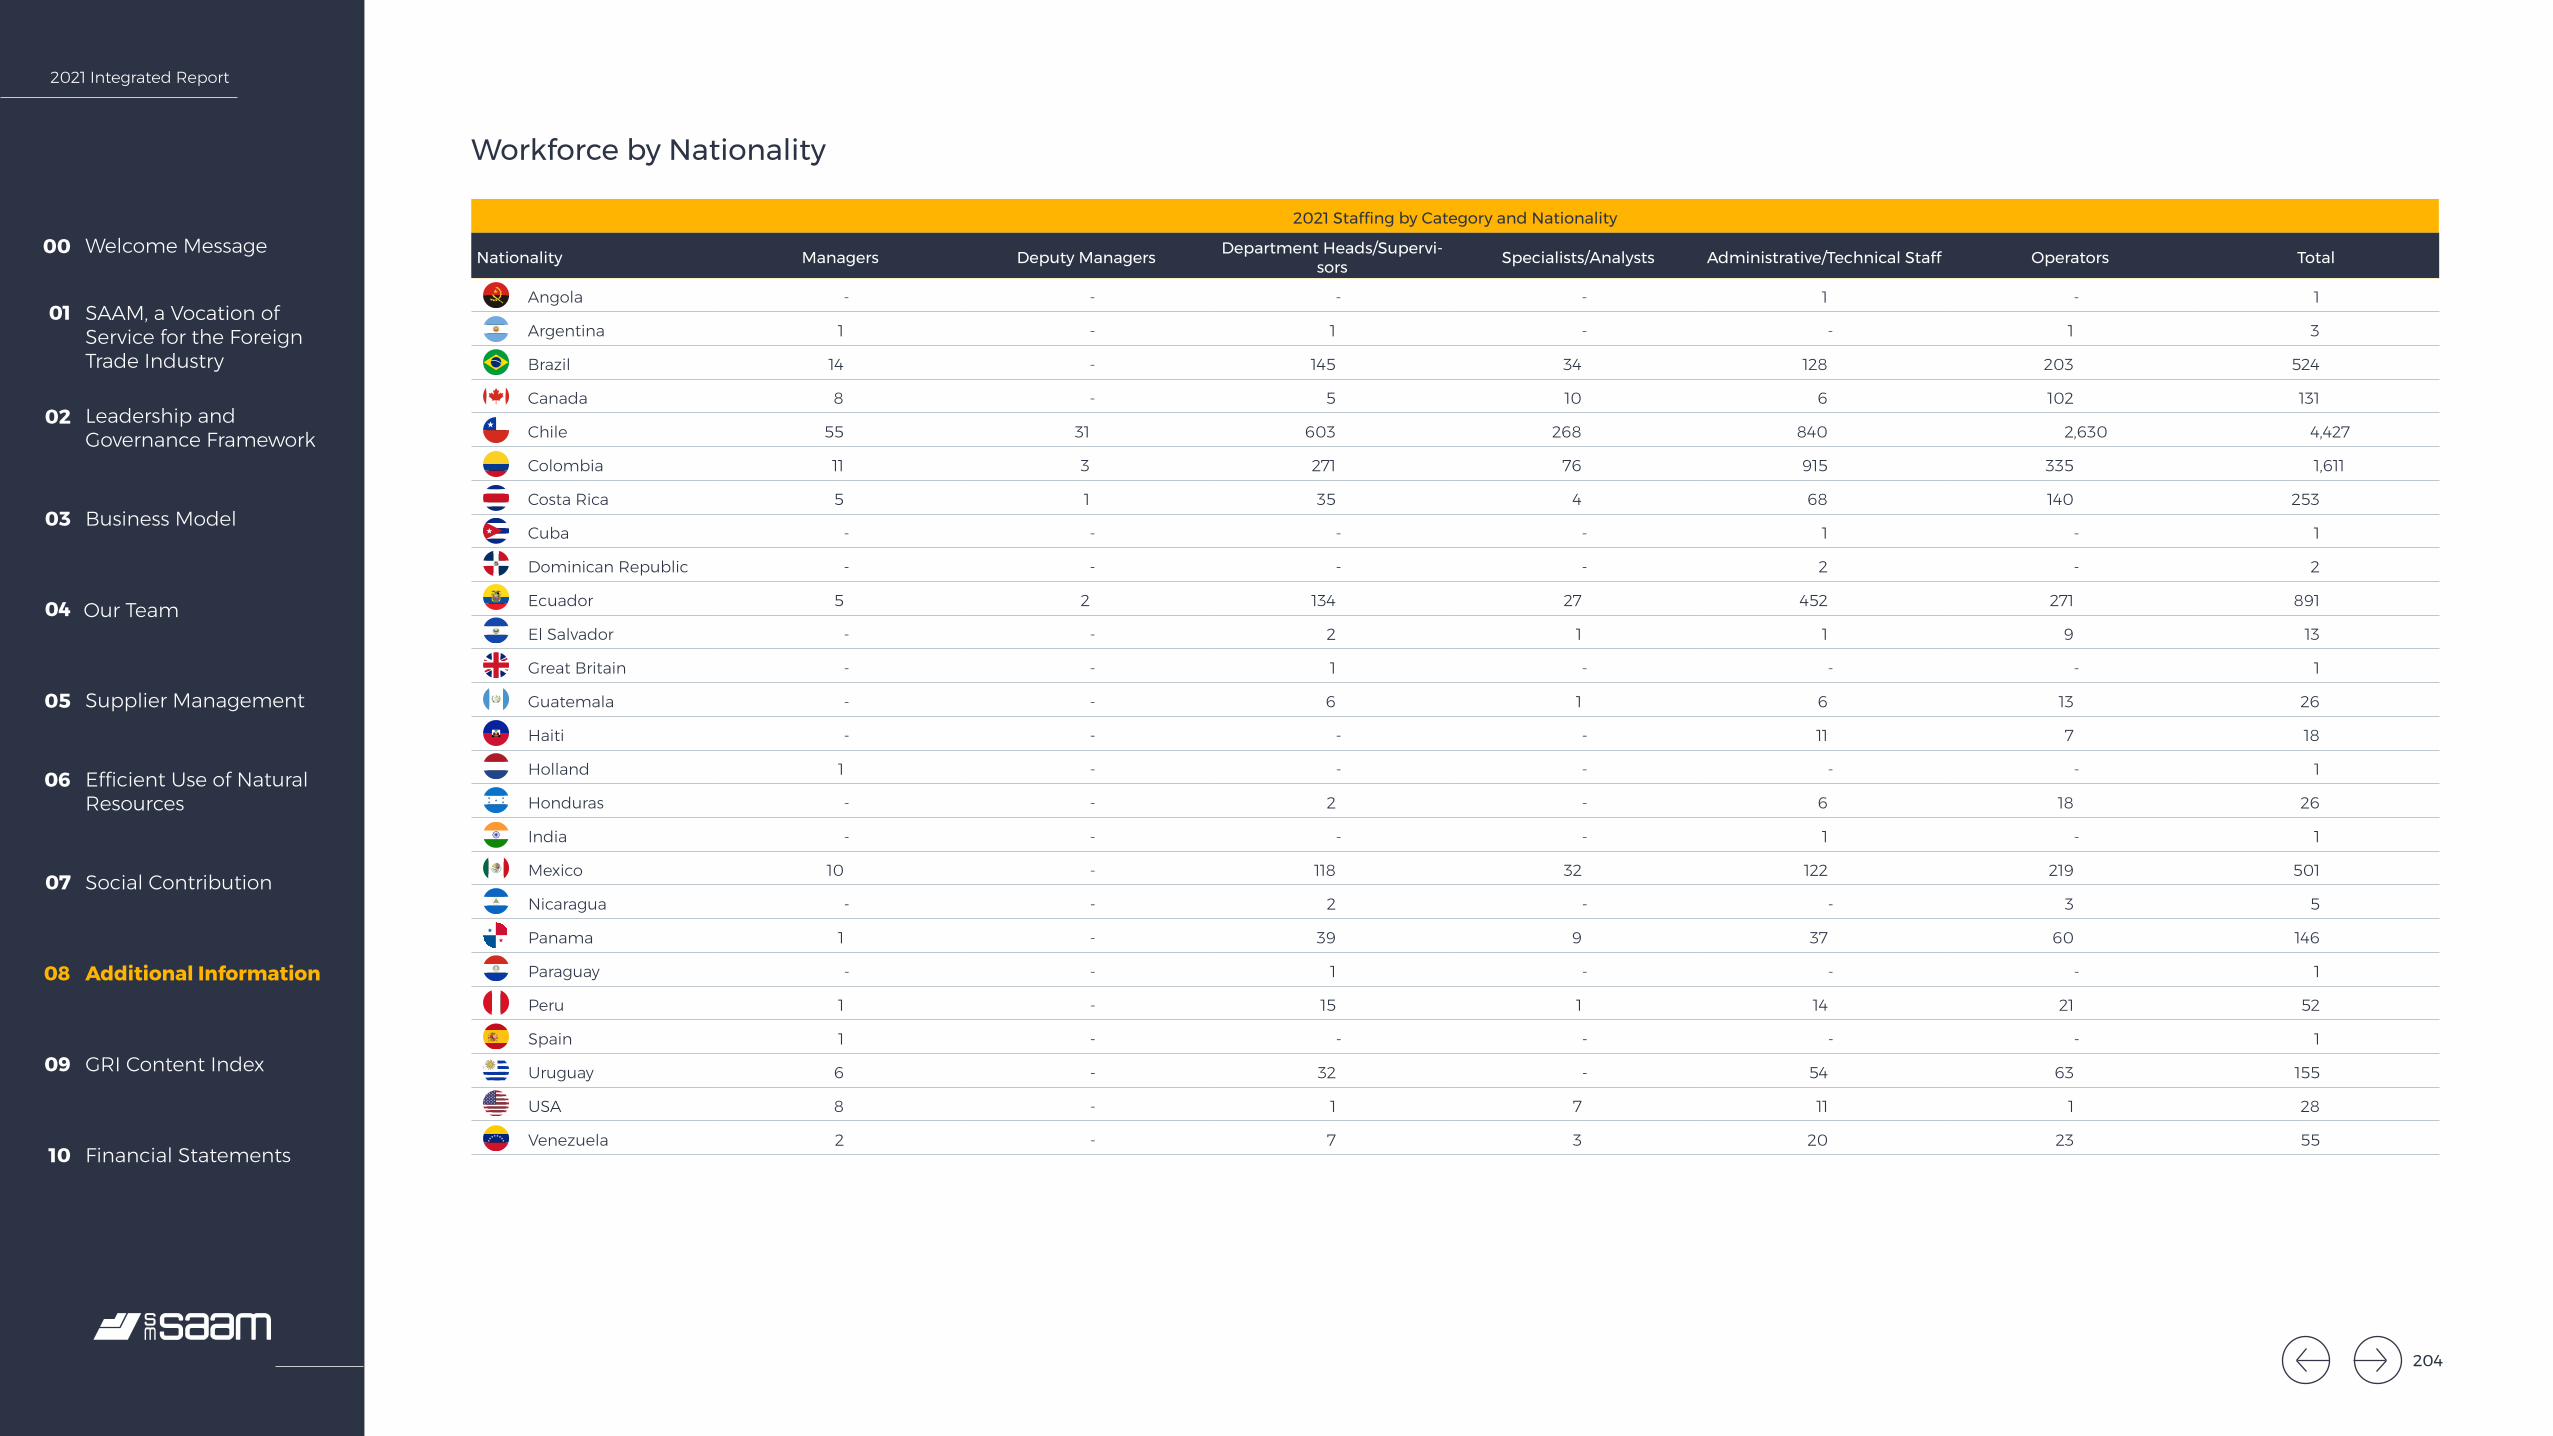
2021 Integrated Report
Welcome Message00
SAAM, a Vocation of Service for the Foreign Trade Industry
01
Leadership and Governance Framework
02
Business Model03
Our Team04
Supplier Management05
Efficient Use of Natural Resources
06
Social Contribution07
Additional Information08
GRI Content Index09
Financial Statements10
2021 Staffing by Category and Nationality
Nationality Managers Deputy Managers Department Heads/Supervi-sors Specialists/Analysts Administrative/Technical Staff Operators Total
Angola - - - - 1 - 1
Argentina 1 - 1 - - 1 3
Brazil 14 - 145 34 128 203 524
Canada 8 - 5 10 6 102 131
Chile 55 31 603 268 840 2,630 4,427
Colombia 11 3 271 76 915 335 1,611
Costa Rica 5 1 35 4 68 140 253
Cuba - - - - 1 - 1
Dominican Republic - - - - 2 - 2
Ecuador 5 2 134 27 452 271 891
El Salvador - - 2 1 1 9 13
Great Britain - - 1 - - - 1
Guatemala - - 6 1 6 13 26
Haiti - - - - 11 7 18
Holland 1 - - - - - 1
Honduras - - 2 - 6 18 26
India - - - - 1 - 1
Mexico 10 - 118 32 122 219 501
Nicaragua - - 2 - - 3 5
Panama 1 - 39 9 37 60 146
Paraguay - - 1 - - - 1
Peru 1 - 15 1 14 21 52
Spain 1 - - - - - 1
Uruguay 6 - 32 - 54 63 155
USA 8 - 1 7 11 1 28
Venezuela 2 - 7 3 20 23 55
Workforce by Nationality
204
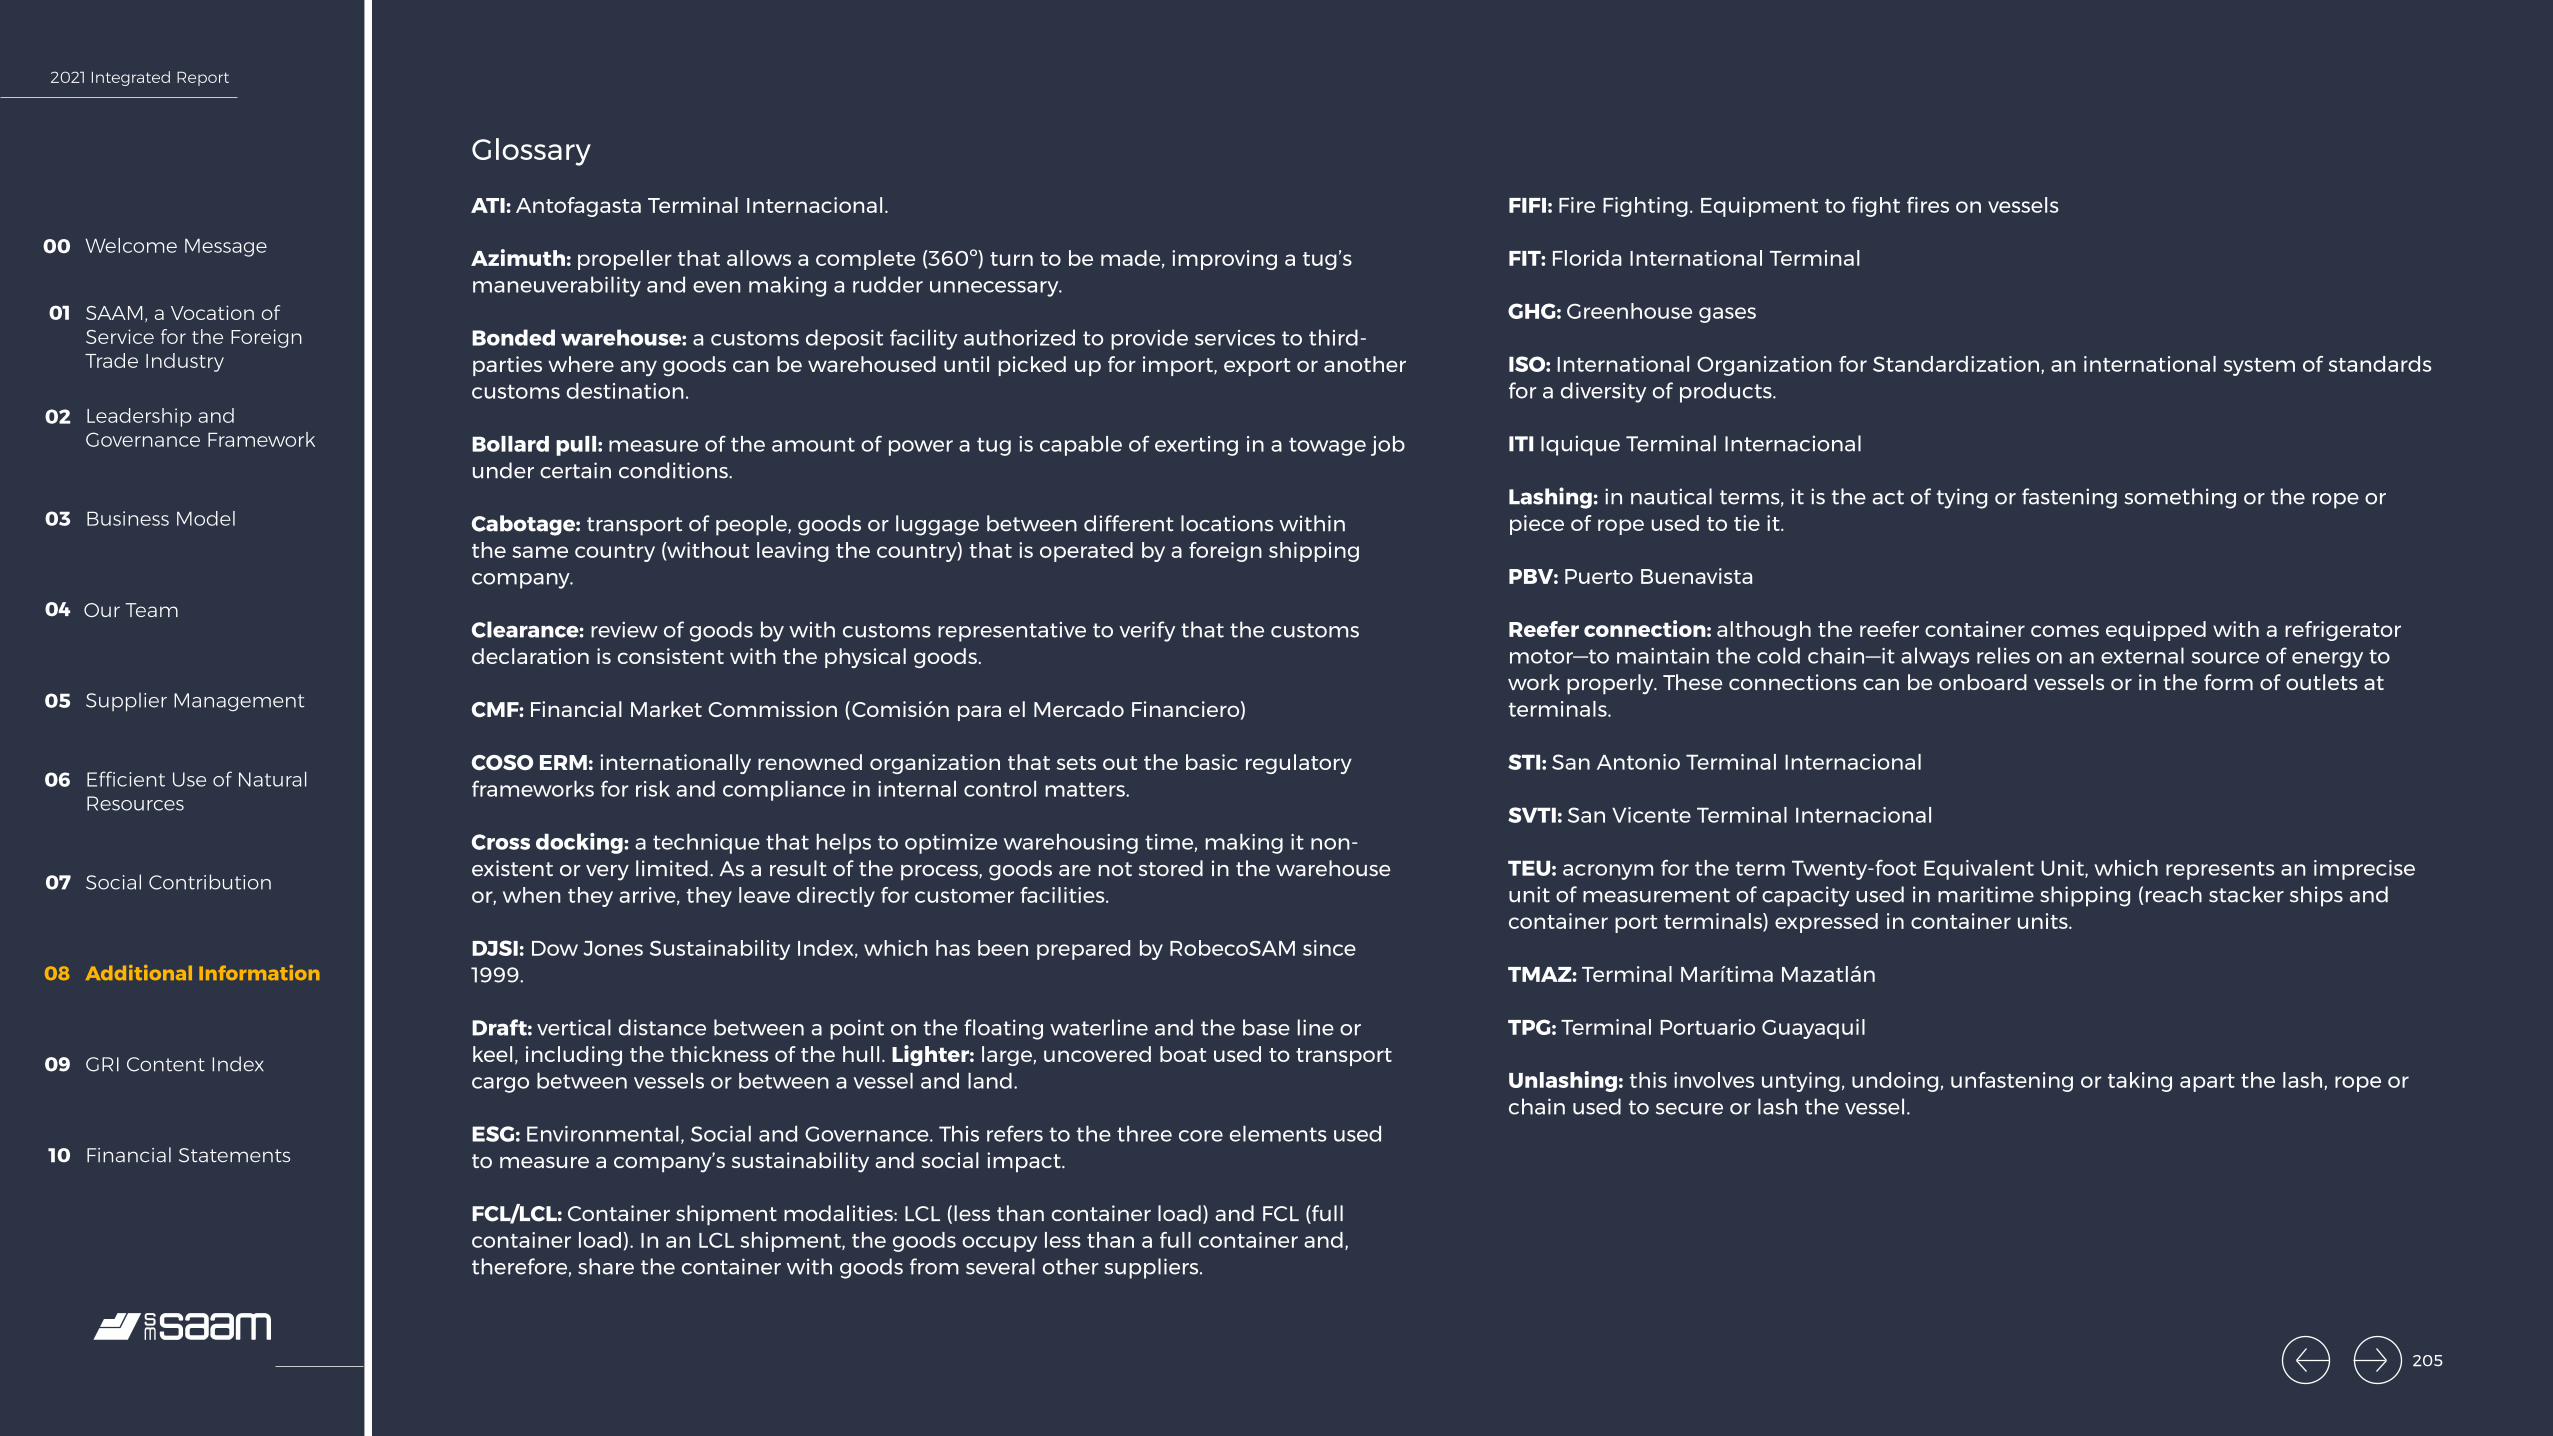
2021 Integrated Report
Welcome Message00
SAAM, a Vocation of Service for the Foreign Trade Industry
01
Leadership and Governance Framework
02
Business Model03
Our Team04
Supplier Management05
Efficient Use of Natural Resources
06
Social Contribution07
Additional Information08
GRI Content Index09
Financial Statements10
Glossary
ATI: Antofagasta Terminal Internacional.
Azimuth: propeller that allows a complete (360º) turn to be made, improving a tug’s maneuverability and even making a rudder unnecessary.
Bonded warehouse: a customs deposit facility authorized to provide services to third-parties where any goods can be warehoused until picked up for import, export or another customs destination.
Bollard pull: measure of the amount of power a tug is capable of exerting in a towage job under certain conditions.
Cabotage: transport of people, goods or luggage between different locations within the same country (without leaving the country) that is operated by a foreign shipping company.
Clearance: review of goods by with customs representative to verify that the customs declaration is consistent with the physical goods.
CMF: Financial Market Commission (Comisión para el Mercado Financiero)
COSO ERM: internationally renowned organization that sets out the basic regulatory frameworks for risk and compliance in internal control matters.
Cross docking: a technique that helps to optimize warehousing time, making it non-existent or very limited. As a result of the process, goods are not stored in the warehouse or, when they arrive, they leave directly for customer facilities.
DJSI: Dow Jones Sustainability Index, which has been prepared by RobecoSAM since 1999.
Draft: vertical distance between a point on the floating waterline and the base line or keel, including the thickness of the hull. Lighter: large, uncovered boat used to transport cargo between vessels or between a vessel and land.
ESG: Environmental, Social and Governance. This refers to the three core elements used to measure a company’s sustainability and social impact.
FCL/LCL: Container shipment modalities: LCL (less than container load) and FCL (full container load). In an LCL shipment, the goods occupy less than a full container and, therefore, share the container with goods from several other suppliers.
FIFI: Fire Fighting. Equipment to fight fires on vessels
FIT: Florida International Terminal
GHG: Greenhouse gases
ISO: International Organization for Standardization, an international system of standards for a diversity of products.
ITI Iquique Terminal Internacional
Lashing: in nautical terms, it is the act of tying or fastening something or the rope or piece of rope used to tie it.
PBV: Puerto Buenavista
Reefer connection: although the reefer container comes equipped with a refrigerator motor—to maintain the cold chain—it always relies on an external source of energy to work properly. These connections can be onboard vessels or in the form of outlets at terminals.
STI: San Antonio Terminal Internacional
SVTI: San Vicente Terminal Internacional
TEU: acronym for the term Twenty-foot Equivalent Unit, which represents an imprecise unit of measurement of capacity used in maritime shipping (reach stacker ships and container port terminals) expressed in container units.
TMAZ: Terminal Marítima Mazatlán
TPG: Terminal Portuario Guayaquil
Unlashing: this involves untying, undoing, unfastening or taking apart the lash, rope or chain used to secure or lash the vessel.
205
2021 Integrated Report
Welcome Message00
SAAM, a Vocation of Service for the Foreign Trade Industry
01
Leadership and Governance Framework
02
Business Model03
Our Team04
Supplier Management05
Efficient Use of Natural Resources
06
Social Contribution07
Additional Information08
GRI Content Index09
Financial Statements10
206
09.GRI Content Index
206

2021 Integrated Report
Welcome Message00
SAAM, a Vocation of Service for the Foreign Trade Industry
01
Leadership and Governance Framework
02
Business Model03
Our Team04
Supplier Management05
Efficient Use of Natural Resources
06
Social Contribution07
Additional Information08
GRI Content Index09
Financial Statements10
102-55
Material Issue Disclosure Category Indicator Description DJSI Category Page
- GRI 102: General Disclosures
Disclosure 102-1 Report the name of the organization 2Disclosure 102-2 Activities, brands, products and services 14, 16Disclosure 102-3 Location of headquarters 2Disclosure 102-4 Location of operations 4Disclosure 102-5 Ownership and legal form 23Disclosure 102-6 Markets served 16Disclosure 102-7 Scale of the organization 16Disclosure 102-11 Precautionary principle or approach Climate Strategy 133Disclosure 102-12 External initiatives 28Disclosure 102-13 Membership in associations 28Disclosure 102-14 Statement from senior decision-makers Corporate governanceDisclosure 102-16 Values, principles, standards, and norms of behavior Corporate governance 10Disclosure 102-18 Governance structure Corporate governance 31Disclosure 102-19 Delegation of responsibility Corporate governance 39Disclosure 102-20 Executive-level positions with responsibility for economic, environmental and social topics Corporate governance 39Disclosure 102-21 Processes for consultation with stakeholders on economic, environmental and social topics Corporate governance 22Disclosure 102-22 Composition of the highest governance body and its committees Corporate governance 32Disclosure 102-23 Chair of the highest governance body Corporate governance 11Disclosure 102-24 Nominating and selecting the highest governance body Corporate governance 38Disclosure 102-26 Role of highest governance body in setting purpose, values, and strategy Corporate governance 32Disclosure 102-27 Collective knowledge of the highest governance body. Corporate governance 16, 37Disclosure 102-28 Performance evaluation process for highest governance body. Corporate governance 37Disclosure 102-38 Ratio of annual total compensation Labor practice indicators 123Disclosure 102-39 Ratio of percentage increase in annual total compensation Labor practice indicators 123Disclosure 102-40 List of stakeholder groups Stakeholder engagement 164Disclosure 102-42 Identifying and selecting stakeholders Stakeholder engagement 164Disclosure 102-43 Approach to stakeholder engagement Stakeholder engagement 22, 164Disclosure 102-44 Key issues and concerns raised Stakeholder engagement 164Disclosure 102-45 Entities included in the consolidated financial statements 170Disclosure 102-46 Defining report content and topic boundaries Materiality 21Disclosure 102-47 List of material issues MaterialityDisclosure 102-48 Restatements of information 22Disclosure 102-49 Changes in reporting 21Disclosure 102-50 Reporting period 21Disclosure 102-51 Date of most recent report 21Disclosure 102-52 Reporting cycle 21Disclosure 102-53 Contact point for questions regarding the report 2Disclosure 102-54 Claims of reporting in accordance with the GRI standards 21Disclosure 102-55 GRI Content Index 207Disclosure 102-56 External assurance 21
207
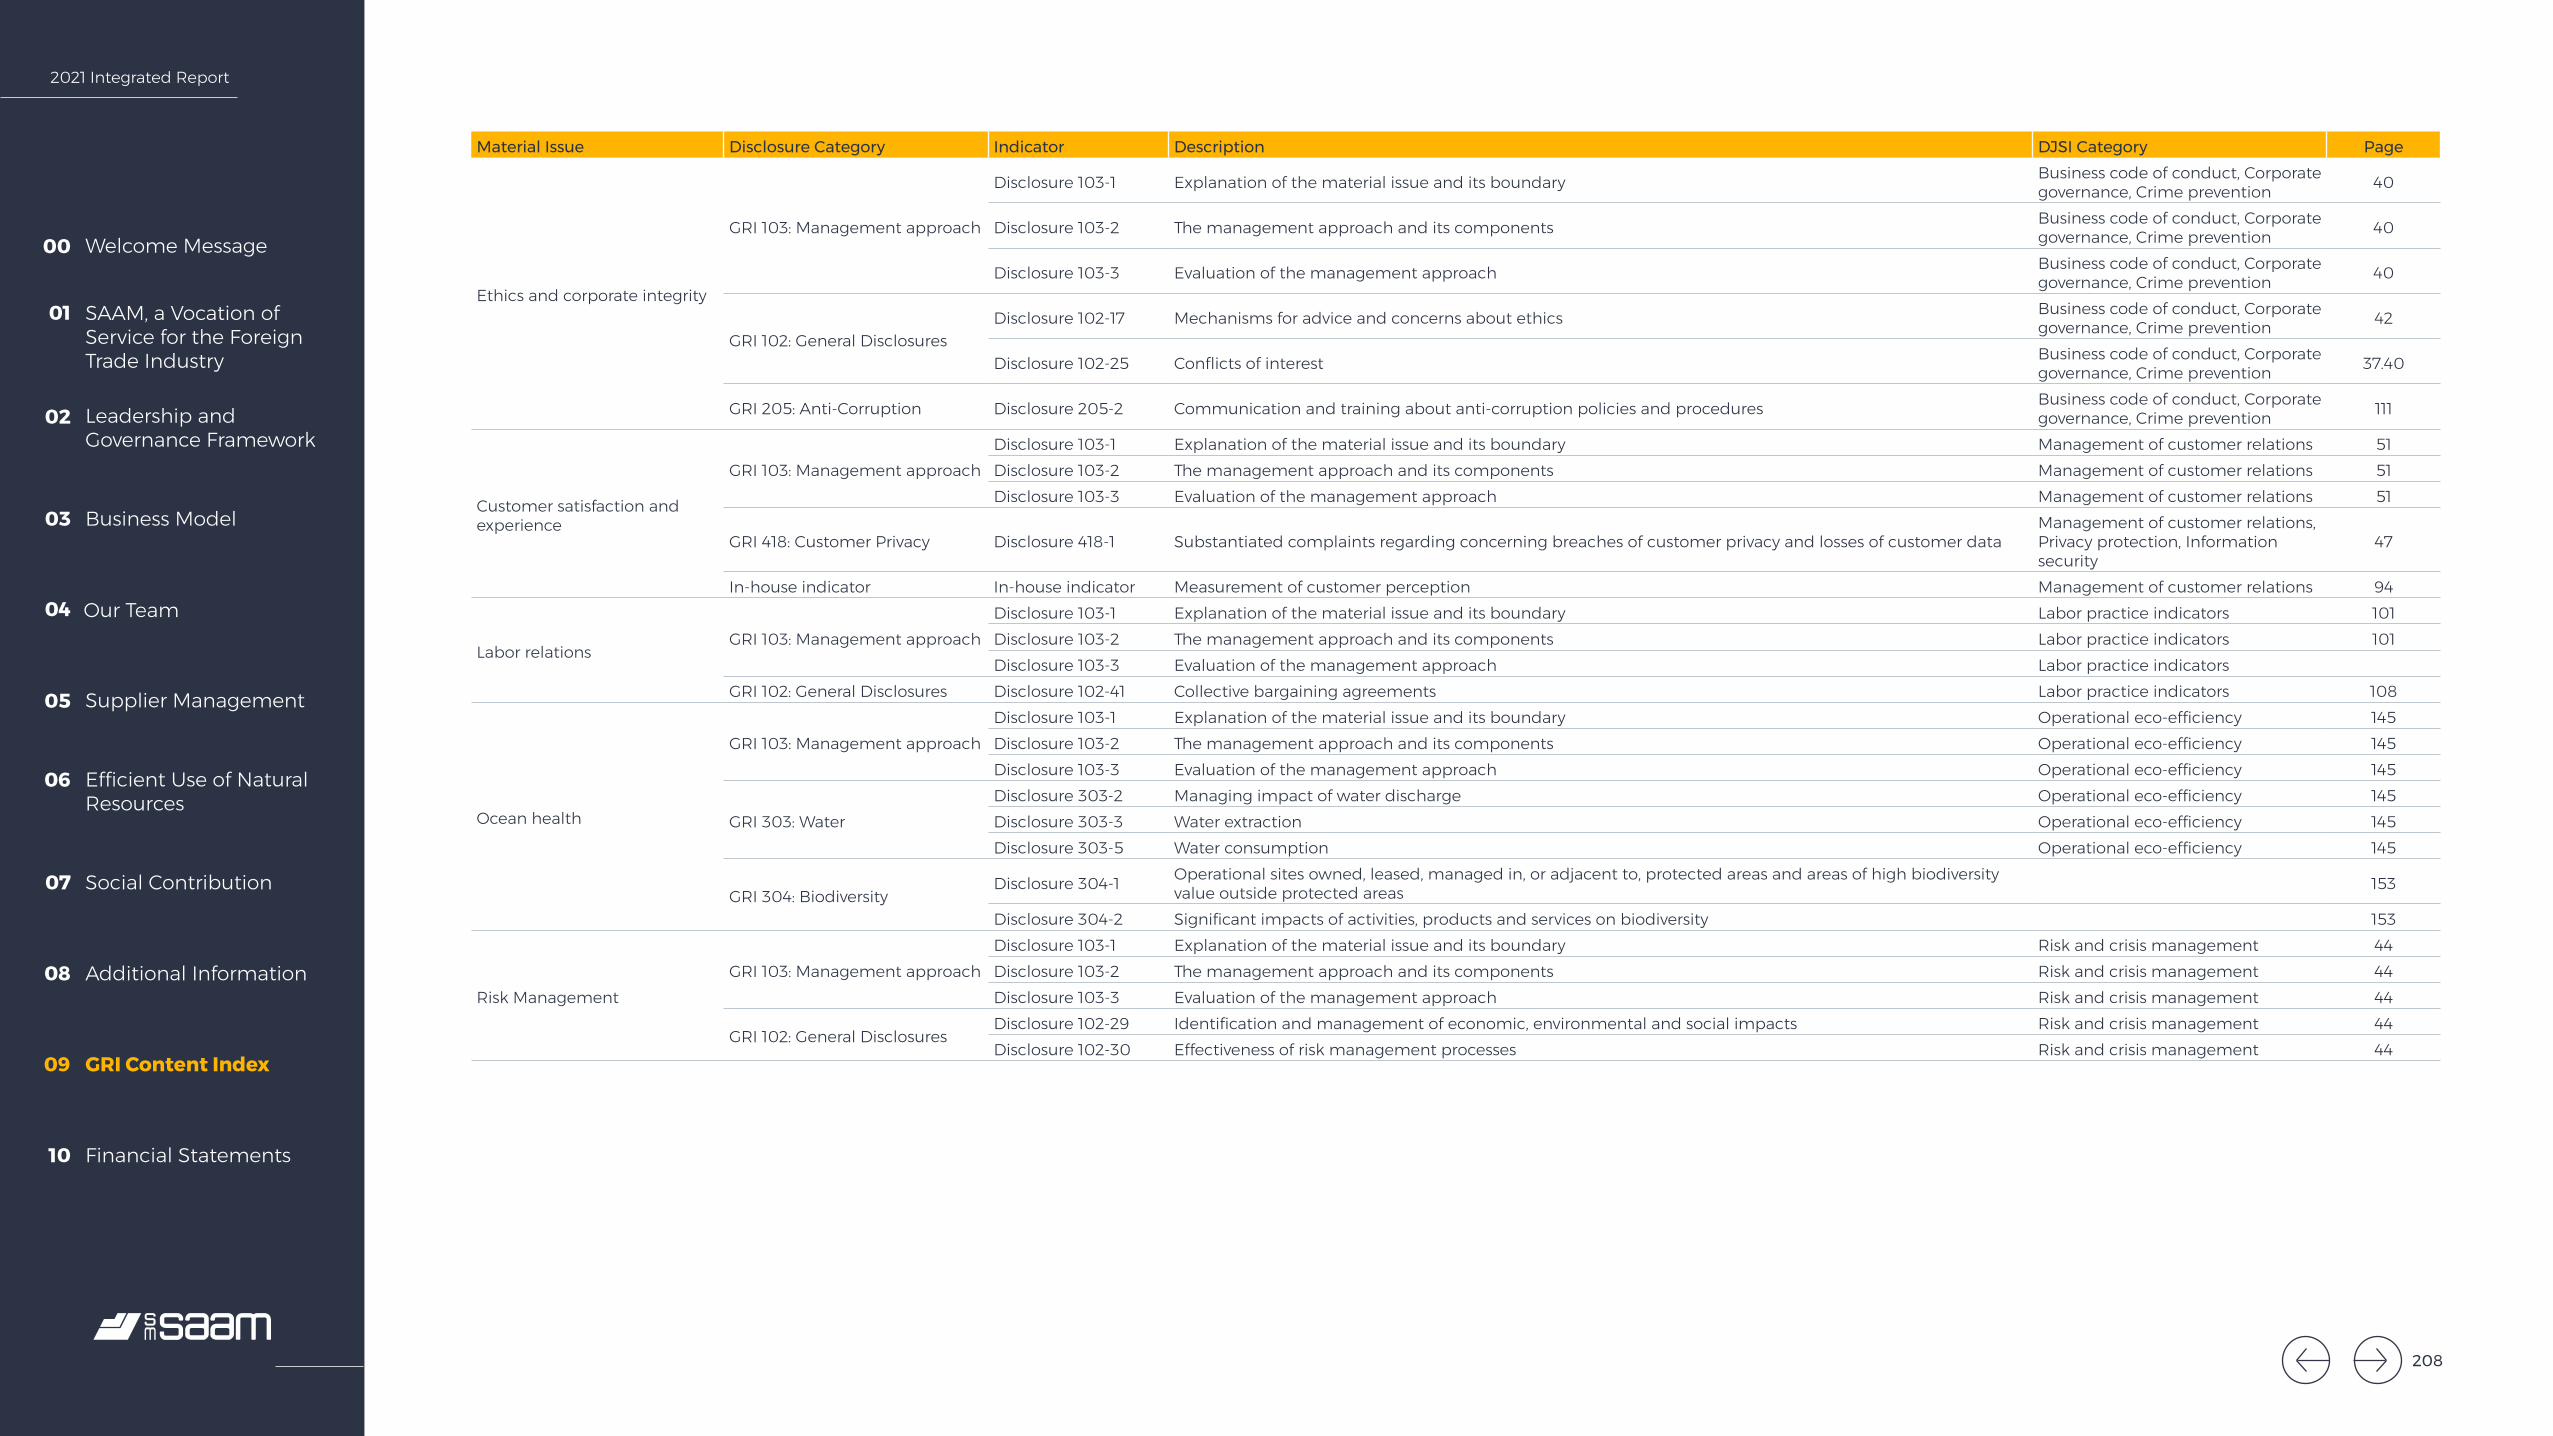
2021 Integrated Report
Welcome Message00
SAAM, a Vocation of Service for the Foreign Trade Industry
01
Leadership and Governance Framework
02
Business Model03
Our Team04
Supplier Management05
Efficient Use of Natural Resources
06
Social Contribution07
Additional Information08
GRI Content Index09
Financial Statements10
Material Issue Disclosure Category Indicator Description DJSI Category Page
Ethics and corporate integrity
GRI 103: Management approach
Disclosure 103-1 Explanation of the material issue and its boundary Business code of conduct, Corporate governance, Crime prevention 40
Disclosure 103-2 The management approach and its components Business code of conduct, Corporate governance, Crime prevention 40
Disclosure 103-3 Evaluation of the management approach Business code of conduct, Corporate governance, Crime prevention 40
GRI 102: General DisclosuresDisclosure 102-17 Mechanisms for advice and concerns about ethics Business code of conduct, Corporate
governance, Crime prevention 42
Disclosure 102-25 Conflicts of interest Business code of conduct, Corporate governance, Crime prevention 37.40
GRI 205: Anti-Corruption Disclosure 205-2 Communication and training about anti-corruption policies and procedures Business code of conduct, Corporate governance, Crime prevention 111
Customer satisfaction and experience
GRI 103: Management approachDisclosure 103-1 Explanation of the material issue and its boundary Management of customer relations 51Disclosure 103-2 The management approach and its components Management of customer relations 51Disclosure 103-3 Evaluation of the management approach Management of customer relations 51
GRI 418: Customer Privacy Disclosure 418-1 Substantiated complaints regarding concerning breaches of customer privacy and losses of customer dataManagement of customer relations, Privacy protection, Information security
47
In-house indicator In-house indicator Measurement of customer perception Management of customer relations 94
Labor relationsGRI 103: Management approach
Disclosure 103-1 Explanation of the material issue and its boundary Labor practice indicators 101Disclosure 103-2 The management approach and its components Labor practice indicators 101Disclosure 103-3 Evaluation of the management approach Labor practice indicators
GRI 102: General Disclosures Disclosure 102-41 Collective bargaining agreements Labor practice indicators 108
Ocean health
GRI 103: Management approachDisclosure 103-1 Explanation of the material issue and its boundary Operational eco-efficiency 145Disclosure 103-2 The management approach and its components Operational eco-efficiency 145Disclosure 103-3 Evaluation of the management approach Operational eco-efficiency 145
GRI 303: WaterDisclosure 303-2 Managing impact of water discharge Operational eco-efficiency 145Disclosure 303-3 Water extraction Operational eco-efficiency 145Disclosure 303-5 Water consumption Operational eco-efficiency 145
GRI 304: BiodiversityDisclosure 304-1 Operational sites owned, leased, managed in, or adjacent to, protected areas and areas of high biodiversity
value outside protected areas 153
Disclosure 304-2 Significant impacts of activities, products and services on biodiversity 153
Risk ManagementGRI 103: Management approach
Disclosure 103-1 Explanation of the material issue and its boundary Risk and crisis management 44Disclosure 103-2 The management approach and its components Risk and crisis management 44Disclosure 103-3 Evaluation of the management approach Risk and crisis management 44
GRI 102: General DisclosuresDisclosure 102-29 Identification and management of economic, environmental and social impacts Risk and crisis management 44Disclosure 102-30 Effectiveness of risk management processes Risk and crisis management 44
208
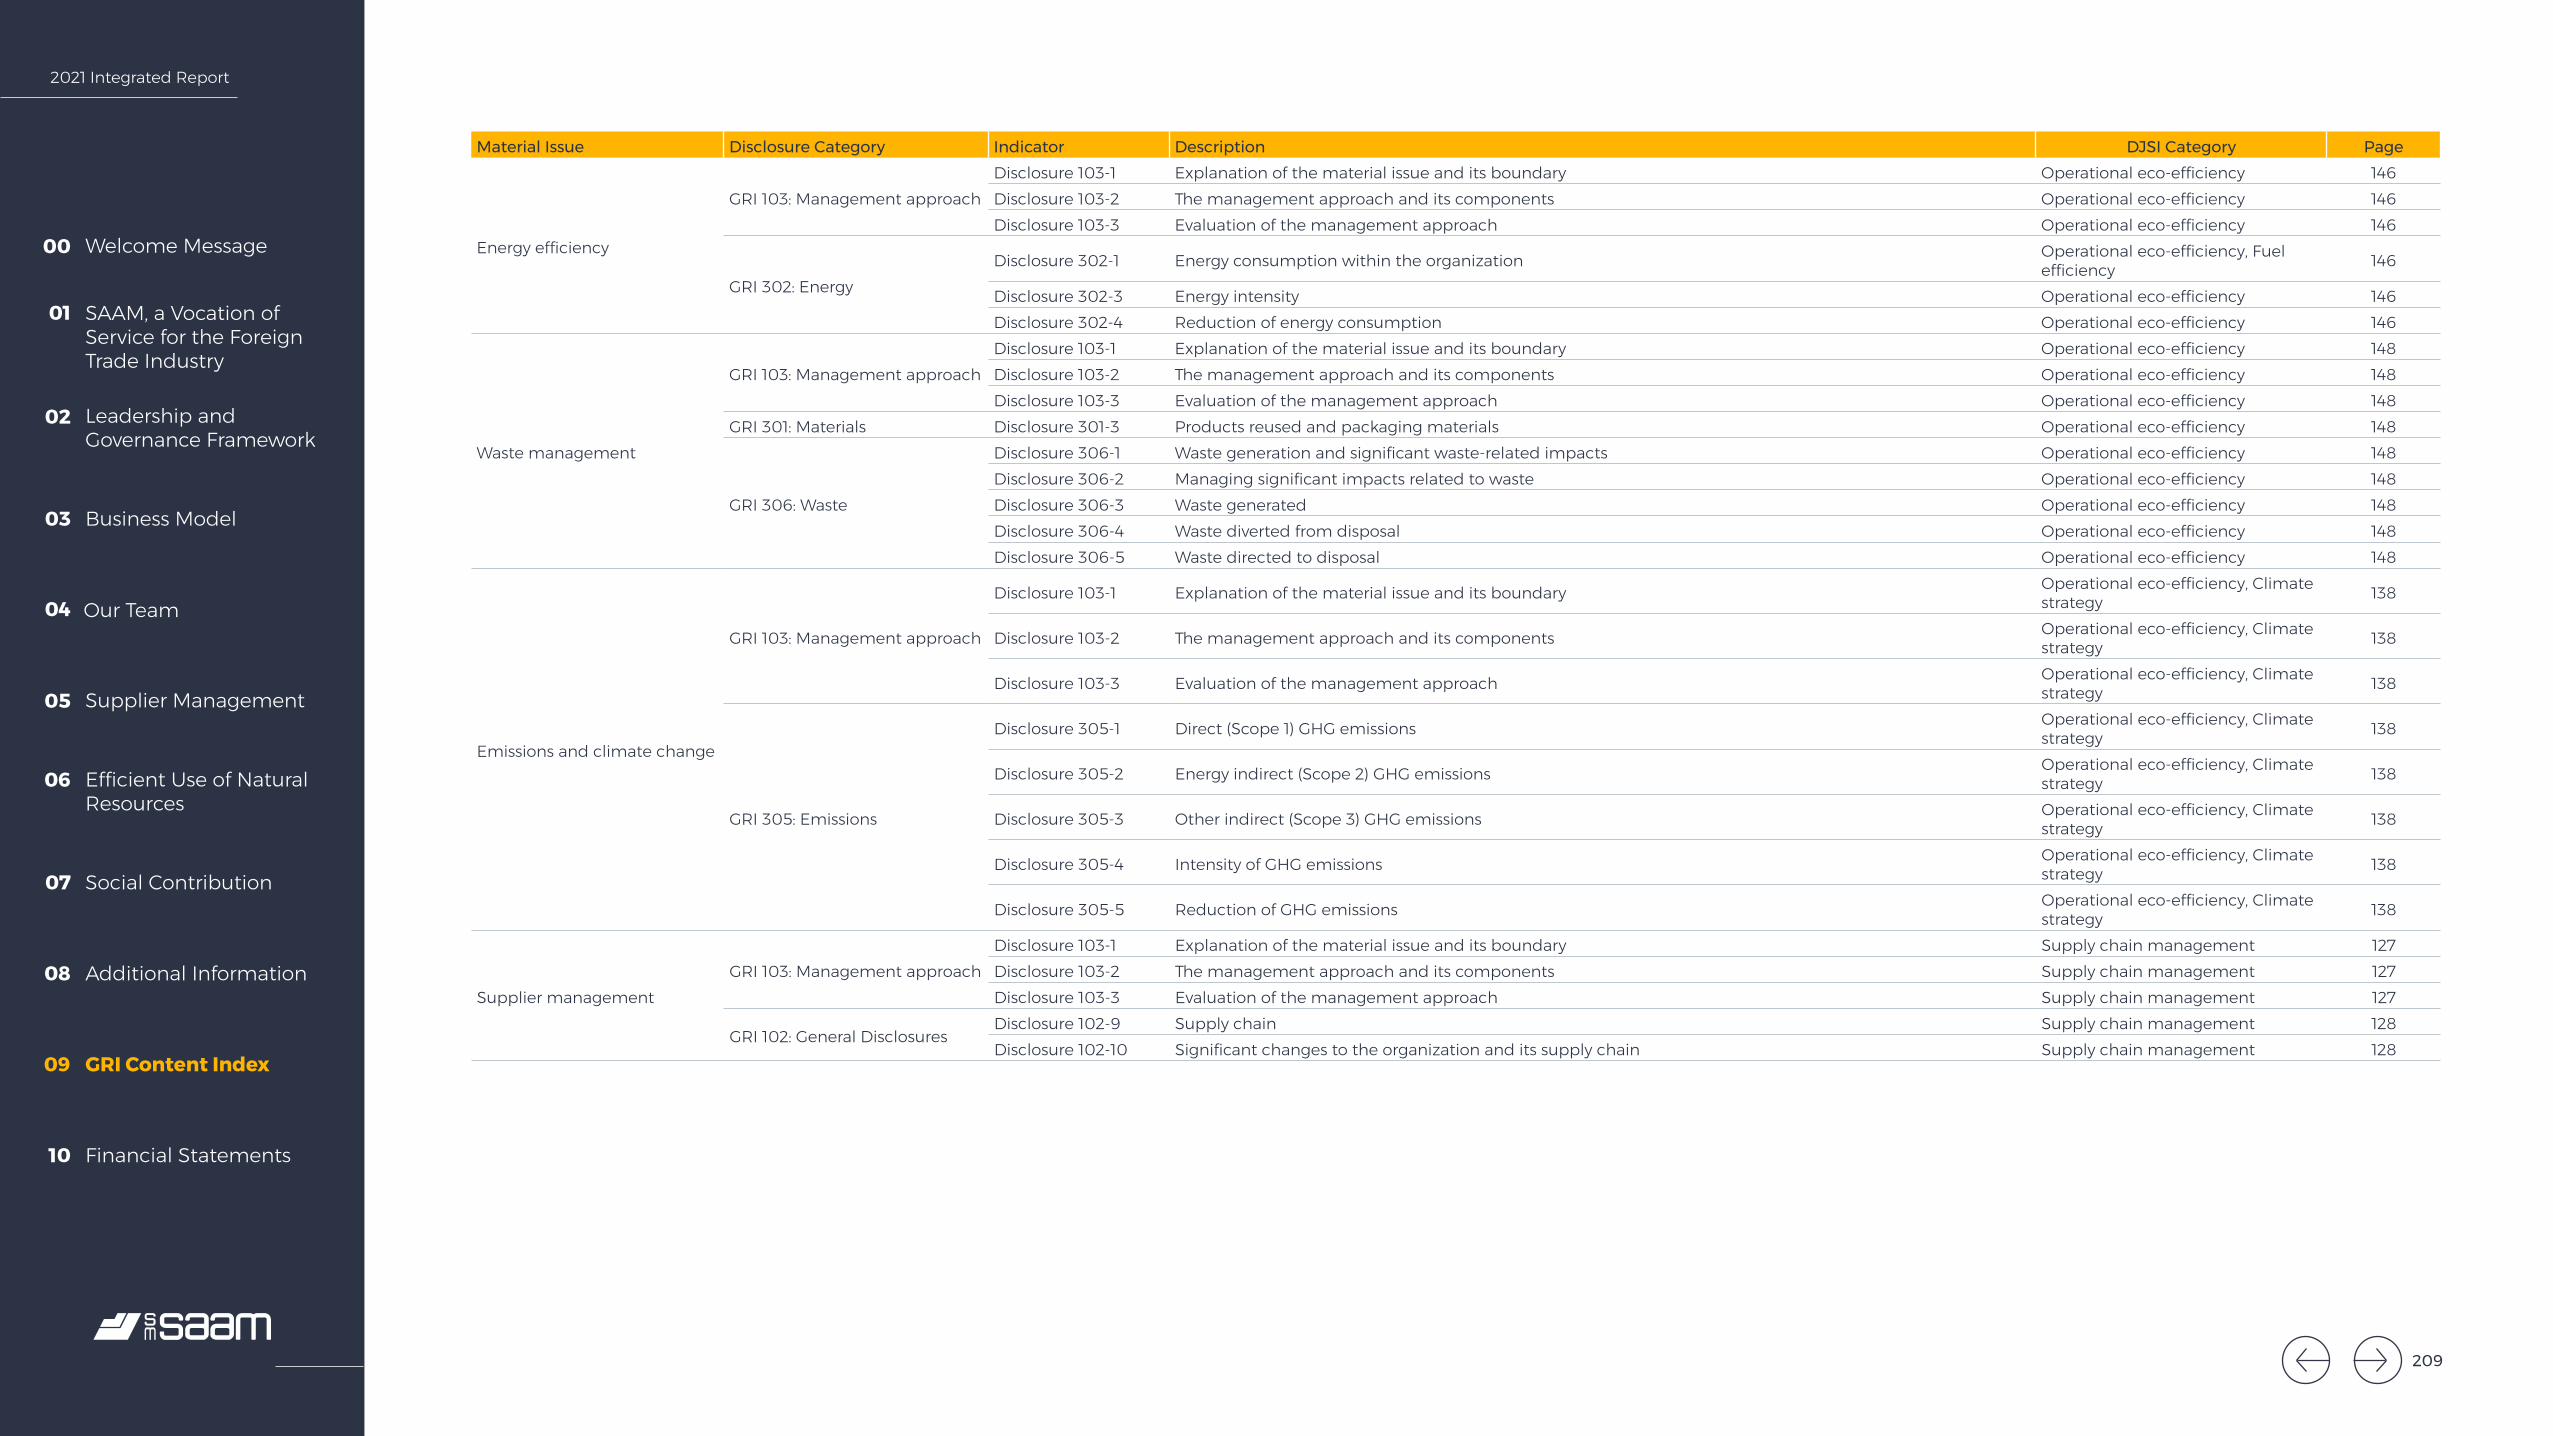
2021 Integrated Report
Welcome Message00
SAAM, a Vocation of Service for the Foreign Trade Industry
01
Leadership and Governance Framework
02
Business Model03
Our Team04
Supplier Management05
Efficient Use of Natural Resources
06
Social Contribution07
Additional Information08
GRI Content Index09
Financial Statements10
Material Issue Disclosure Category Indicator Description DJSI Category Page
Energy efficiency
GRI 103: Management approachDisclosure 103-1 Explanation of the material issue and its boundary Operational eco-efficiency 146Disclosure 103-2 The management approach and its components Operational eco-efficiency 146Disclosure 103-3 Evaluation of the management approach Operational eco-efficiency 146
GRI 302: EnergyDisclosure 302-1 Energy consumption within the organization Operational eco-efficiency, Fuel
efficiency 146
Disclosure 302-3 Energy intensity Operational eco-efficiency 146Disclosure 302-4 Reduction of energy consumption Operational eco-efficiency 146
Waste management
GRI 103: Management approachDisclosure 103-1 Explanation of the material issue and its boundary Operational eco-efficiency 148Disclosure 103-2 The management approach and its components Operational eco-efficiency 148Disclosure 103-3 Evaluation of the management approach Operational eco-efficiency 148
GRI 301: Materials Disclosure 301-3 Products reused and packaging materials Operational eco-efficiency 148
GRI 306: Waste
Disclosure 306-1 Waste generation and significant waste-related impacts Operational eco-efficiency 148Disclosure 306-2 Managing significant impacts related to waste Operational eco-efficiency 148Disclosure 306-3 Waste generated Operational eco-efficiency 148Disclosure 306-4 Waste diverted from disposal Operational eco-efficiency 148Disclosure 306-5 Waste directed to disposal Operational eco-efficiency 148
Emissions and climate change
GRI 103: Management approach
Disclosure 103-1 Explanation of the material issue and its boundary Operational eco-efficiency, Climate strategy 138
Disclosure 103-2 The management approach and its components Operational eco-efficiency, Climate strategy 138
Disclosure 103-3 Evaluation of the management approach Operational eco-efficiency, Climate strategy 138
GRI 305: Emissions
Disclosure 305-1 Direct (Scope 1) GHG emissions Operational eco-efficiency, Climate strategy 138
Disclosure 305-2 Energy indirect (Scope 2) GHG emissions Operational eco-efficiency, Climate strategy 138
Disclosure 305-3 Other indirect (Scope 3) GHG emissions Operational eco-efficiency, Climate strategy 138
Disclosure 305-4 Intensity of GHG emissions Operational eco-efficiency, Climate strategy 138
Disclosure 305-5 Reduction of GHG emissions Operational eco-efficiency, Climate strategy 138
Supplier managementGRI 103: Management approach
Disclosure 103-1 Explanation of the material issue and its boundary Supply chain management 127Disclosure 103-2 The management approach and its components Supply chain management 127Disclosure 103-3 Evaluation of the management approach Supply chain management 127
GRI 102: General DisclosuresDisclosure 102-9 Supply chain Supply chain management 128Disclosure 102-10 Significant changes to the organization and its supply chain Supply chain management 128
209

2021 Integrated Report
Welcome Message00
SAAM, a Vocation of Service for the Foreign Trade Industry
01
Leadership and Governance Framework
02
Business Model03
Our Team04
Supplier Management05
Efficient Use of Natural Resources
06
Social Contribution07
Additional Information08
GRI Content Index09
Financial Statements10
Material Issue Disclosure Category Indicator Description DJSI Category Page
Occupational health and safety
GRI 103: Management approachDisclosure 103-1 Explanation of the material issue and its boundary Occupational health and safety 101Disclosure 103-2 The management approach and its components Occupational health and safety 101Disclosure 103-3 Evaluation of the management approach Occupational health and safety 101
GRI 401: Employment Disclosure 401-3 Parental leave Occupational health and safety 103
GRI 403: Occupational health and safety
Disclosure 403-1 Occupational health and safety management system. Occupational health and safety 103Disclosure 403-2 Hazards Identification, Risk Assessments and Incident Investigations Occupational health and safety 103Disclosure 403-3 Occupational health services Occupational health and safety 103Disclosure 403-8 Workers covered by an occupational health and safety management system Occupational health and safety 105Disclosure 403-9 Injuries from workplace accidents. Occupational health and safety 105Disclosure 403-10 Occupational illness and disease Occupational health and safety 101
Worker training and development
GRI 103: Management approach
Disclosure 103-1 Explanation of the material issue and its boundary Talent attraction and development, Human capital development 101
Disclosure 103-2 The management approach and its components Talent attraction and development, Human capital development 101
Disclosure 103-3 Evaluation of the management approach Talent attraction and development, Human capital development 111, 115
GRI 404: Training and education
Disclosure 404-1 Average hours of training per year per employee Talent attraction and development, Human capital development 111
Disclosure 404-2 Programs for upgrading employee skills and transition assistance programs Talent attraction and development, Human capital development 111, 114, 115
Disclosure 404-3 Percentage of employees receiving regular performance and career development reviews Talent attraction and development, Human capital development 101
Diversity and gender equity
GRI 103: Management approachDisclosure 103-1 Explanation of the material issue and its boundary 101Disclosure 103-2 The management approach and its components 101Disclosure 103-3 Evaluation of the management approach 102
GRI 102: General DisclosuresDisclosure 102-8 Information on employees and other workers 123Disclosure 102-35 Remuneration policies 39Disclosure 102-36 Process for determining remuneration
GRI 401: Employment Disclosure 401-1 New employee hires and employee turnover 111
GRI 405: Diversity and equal opportunity
Disclosure 405-1 Diversity of governance bodies and employees Labor practice indicators 118, 119, 120, 121
Disclosure 405-2 Ratio of basic salary and remuneration of women to men Labor practice indicators 122
Quality of work lifeGRI 103: Management approach
Disclosure 103-1 Explanation of the material issue and its boundary 125Disclosure 103-2 The management approach and its components 125Disclosure 103-3 Evaluation of the management approach 125
GRI 401: Employment Disclosure 401-2 Benefits provided to full-time employees that are not provided to temporary or part-time employees 11
Impacts on local communities
GRI 103: Management approach
Disclosure 103-1 Explanation of the material issue and its boundary Corporate citizenship and philanthropy 155
Disclosure 103-2 The management approach and its components Corporate citizenship and philanthropy 155
Disclosure 103-3 Evaluation of the management approach Corporate citizenship and philanthropy 155
GRI 413: Local CommunitiesDisclosure 413-1 Operations with local community engagement, impact assessments, and development programs Corporate citizenship and
philanthropy 158
Disclosure 413-2 Operations with significant actual and potential negative impacts on local communities Corporate citizenship and philanthropy 158
210
2021 Integrated Report
Welcome Message00
SAAM, a Vocation of Service for the Foreign Trade Industry
01
Leadership and Governance Framework
02
Business Model03
Our Team04
Supplier Management05
Efficient Use of Natural Resources
06
Social Contribution07
Additional Information08
GRI Content Index09
Financial Statements10
211
10.Financial Statements
211211
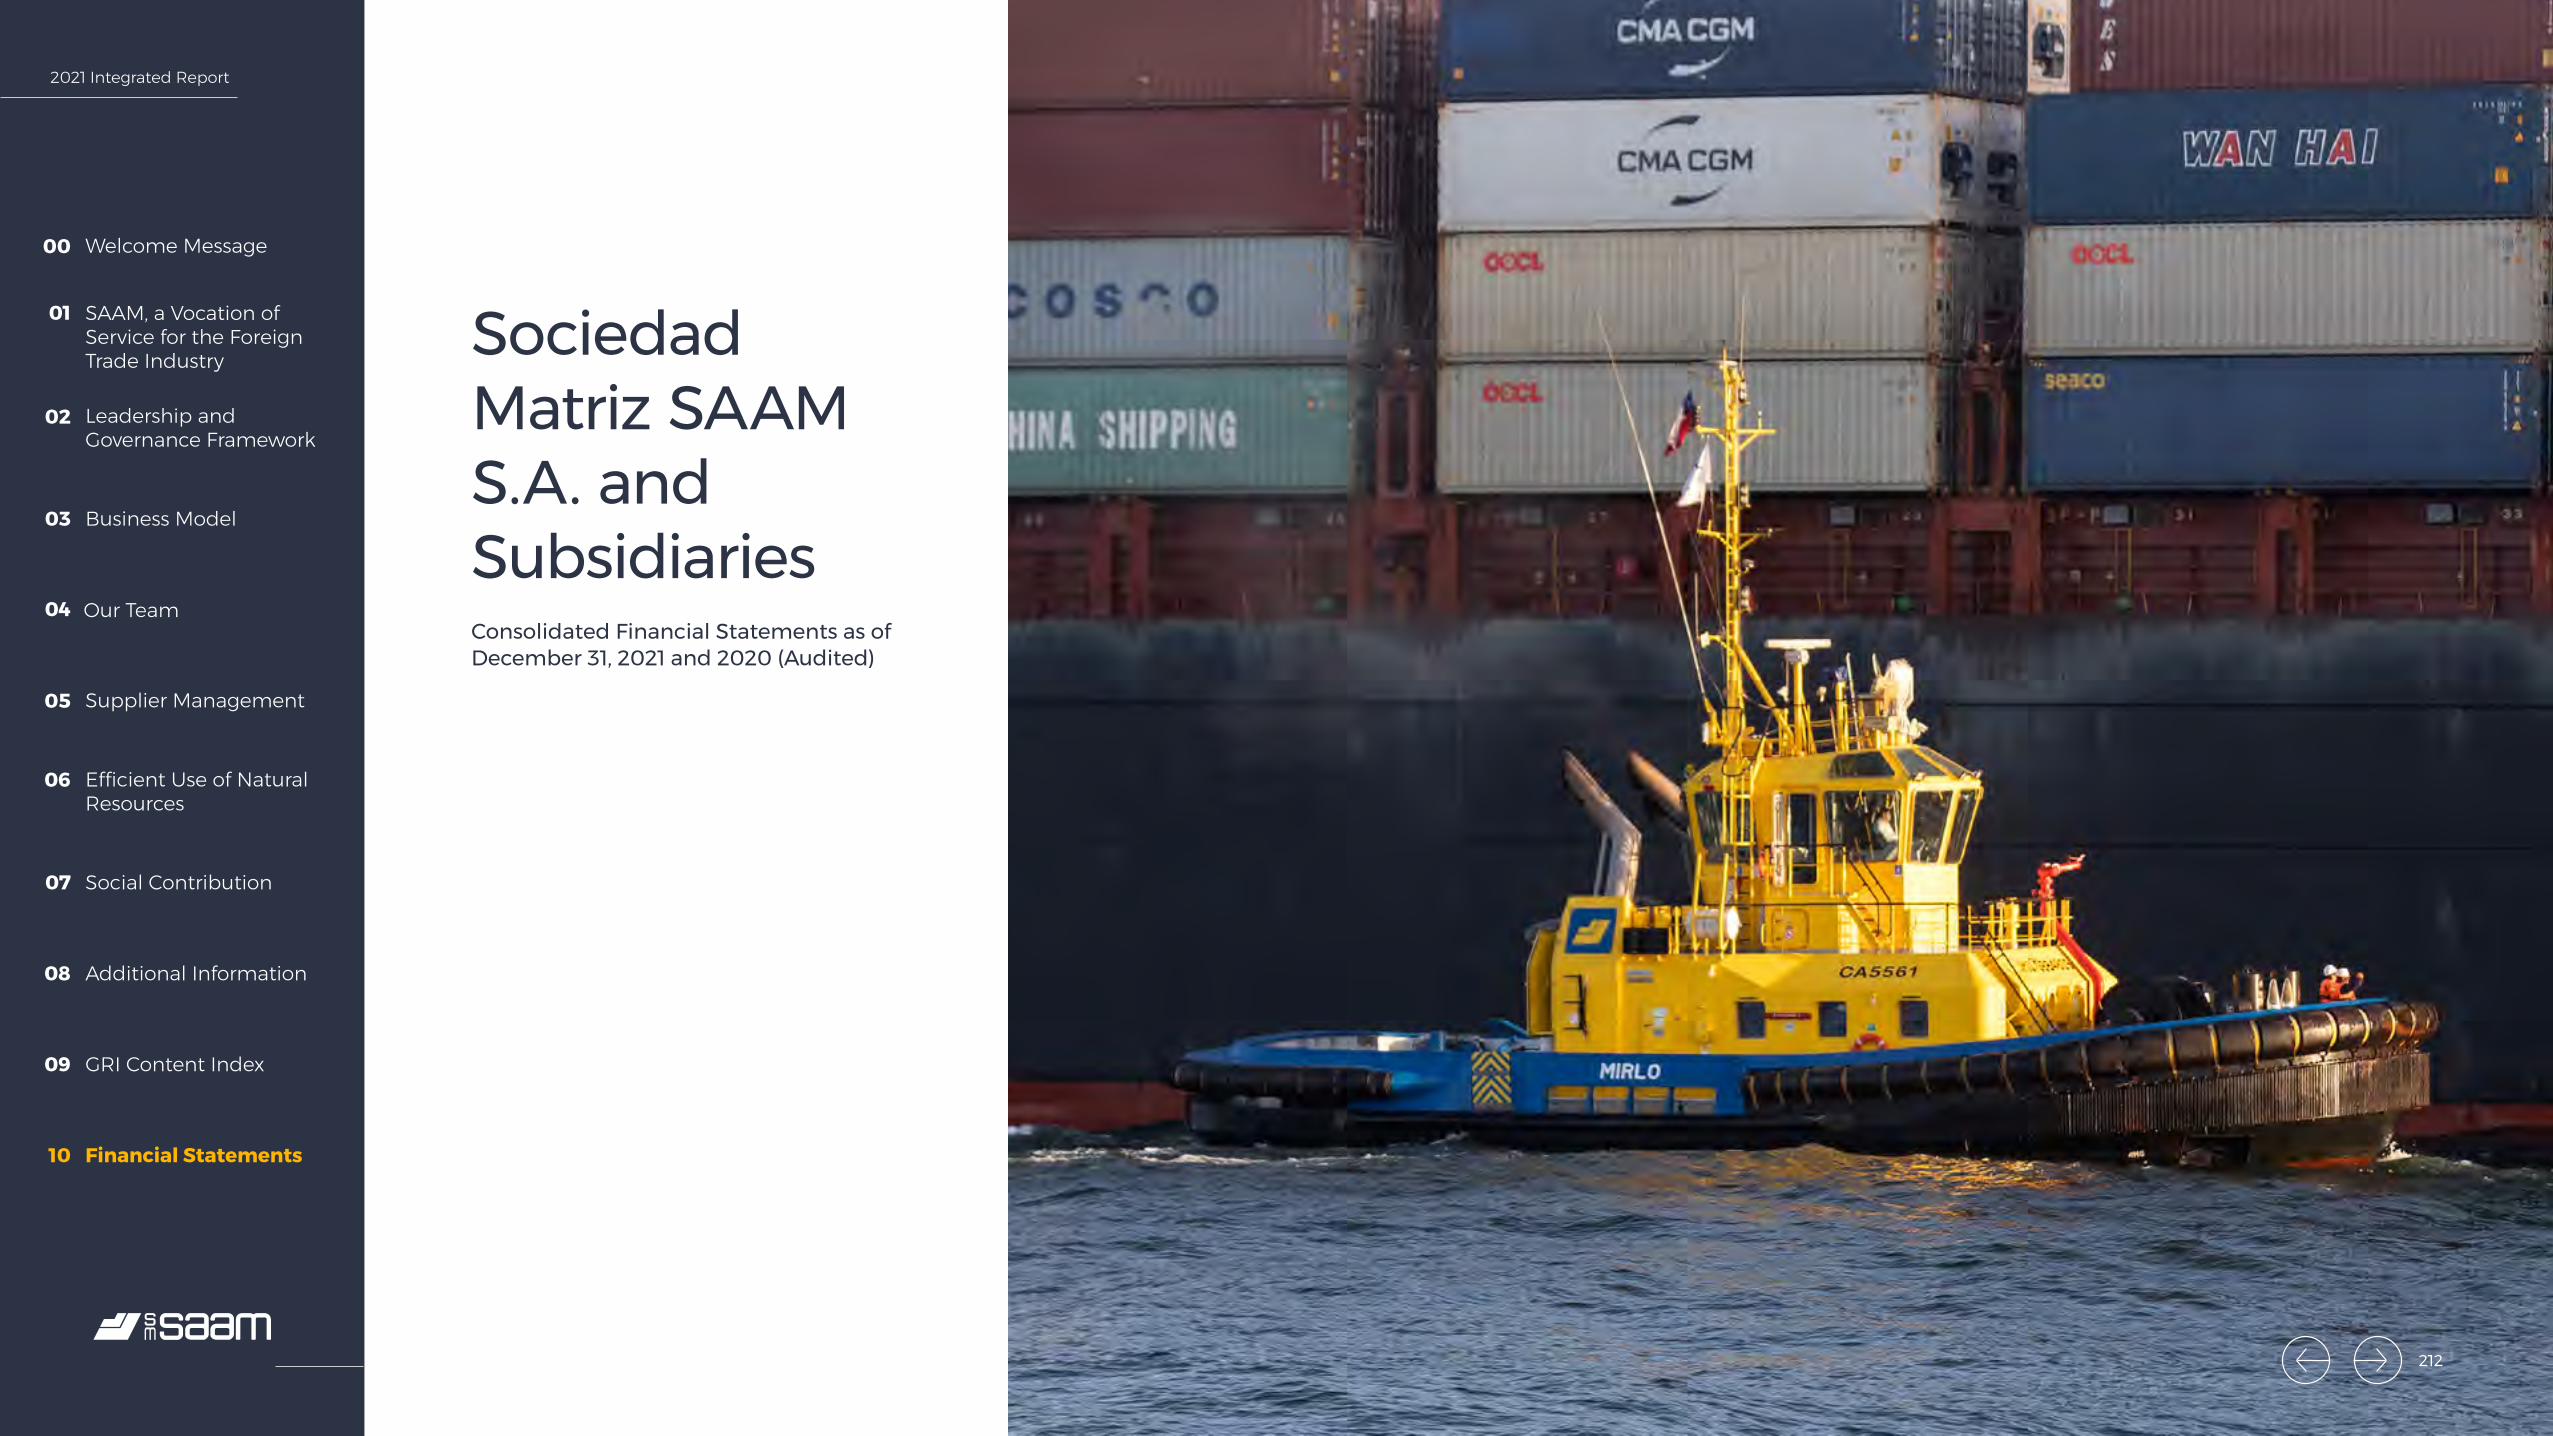
2021 Integrated Report
Welcome Message00
SAAM, a Vocation of Service for the Foreign Trade Industry
01
Leadership and Governance Framework
02
Business Model03
Our Team04
Supplier Management05
Efficient Use of Natural Resources
06
Social Contribution07
Additional Information08
GRI Content Index09
Financial Statements10
Sociedad Matriz SAAM S.A. and SubsidiariesConsolidated Financial Statements as of December 31, 2021 and 2020 (Audited)
212212

2021 Integrated Report
Welcome Message00
SAAM, a Vocation of Service for the Foreign Trade Industry
01
Leadership and Governance Framework
02
Business Model03
Our Team04
Supplier Management05
Efficient Use of Natural Resources
06
Social Contribution07
Additional Information08
GRI Content Index09
Financial Statements10
Santiago, March 11, 2022 Sociedad Matriz SAAM S.A. 2
Opinion
In our opinion, the consolidated financial statements referred to above present fairly, in all material respects, the financial position of Sociedad Matriz SAAM S.A. and subsidiaries as of December 31, 2021 and 2020, and the results of their operations and cash flows for the years then ended, in accordance with International Financial Reporting Standards (IFRS).
INDEPENDENT AUDITOR’S REPORT
Santiago, March 11, 2022 (Free translation from the original in Spanish)
To the Shareholders and Directors Sociedad Matriz SAAM S.A.
We have audited the accompanying consolidated financial statements of Sociedad Matriz SAAM S.A. and subsidiaries, which comprise the consolidated statements of financial position as of December 31, 2021 and 2020 and the corresponding consolidated statements of comprehensive income by function, changes in equity and cash flows for the years then ended, and the related notes to the consolidated financial statements.
Management’s responsibility for the consolidated financial statements
Management is responsible for the preparation and fair presentation of these consolidated financial statements in accordance with International Financial Reporting Standards (IFRS). This responsibility includes the design, implementation and maintenance of a relevant internal control for the preparation and fair presentation of consolidated financial statements that are free from material misstatement, whether due to fraud or error.
Auditor’s responsibility
Our responsibility is to express an opinion on these consolidated financial statements based on our audits. We conducted our audits in accordance with Chilean generally accepted auditing standards. Those standards require that we plan and perform the audit to obtain reasonable assurance about whether the consolidated financial statements are free from material misstatement.
An audit involves performing procedures to obtain audit evidence about the amounts and disclosures in the consolidated financial statements. The procedures selected depend on the auditor’s judgment, including the assessment of the risks of material misstatements of the consolidated financial statements, whether due to fraud or error. In making those risk assessments, the auditor considers internal control relevant to the entity’s preparation and fair presentation of the consolidated financial statements in order to design audit procedures that are appropriate in the circumstances, but not for the purpose of expressing an opinion on the effectiveness of the entity’s internal control. Consequently, we do not express such an opinion. An audit also includes evaluating the appropriateness of accounting policies used and the reasonableness of significant accounting estimates made by management, as well as evaluating the overall presentation of the consolidated financial statements.
We believe that the audit evidence we have obtained is sufficient and appropriate to provide a basis for our opinion.
213
2021 Integrated Report
Welcome Message00
SAAM, a Vocation of Service for the Foreign Trade Industry
01
Leadership and Governance Framework
02
Business Model03
Our Team04
Supplier Management05
Efficient Use of Natural Resources
06
Social Contribution07
Additional Information08
GRI Content Index09
Financial Statements10
Sociedad Matriz SAAM S.A. and SubsidiariesContent
Independent Auditors’ Review Report
Consolidated Statements of Financial Position
Consolidated Statements of Income by Function
Consolidated Statements of Cash Flows
Consolidated Statements of Changes in Equity
Notes to the Consolidated Financial Statements
ThUS$ (expressed in thousands of US dollars)
214214
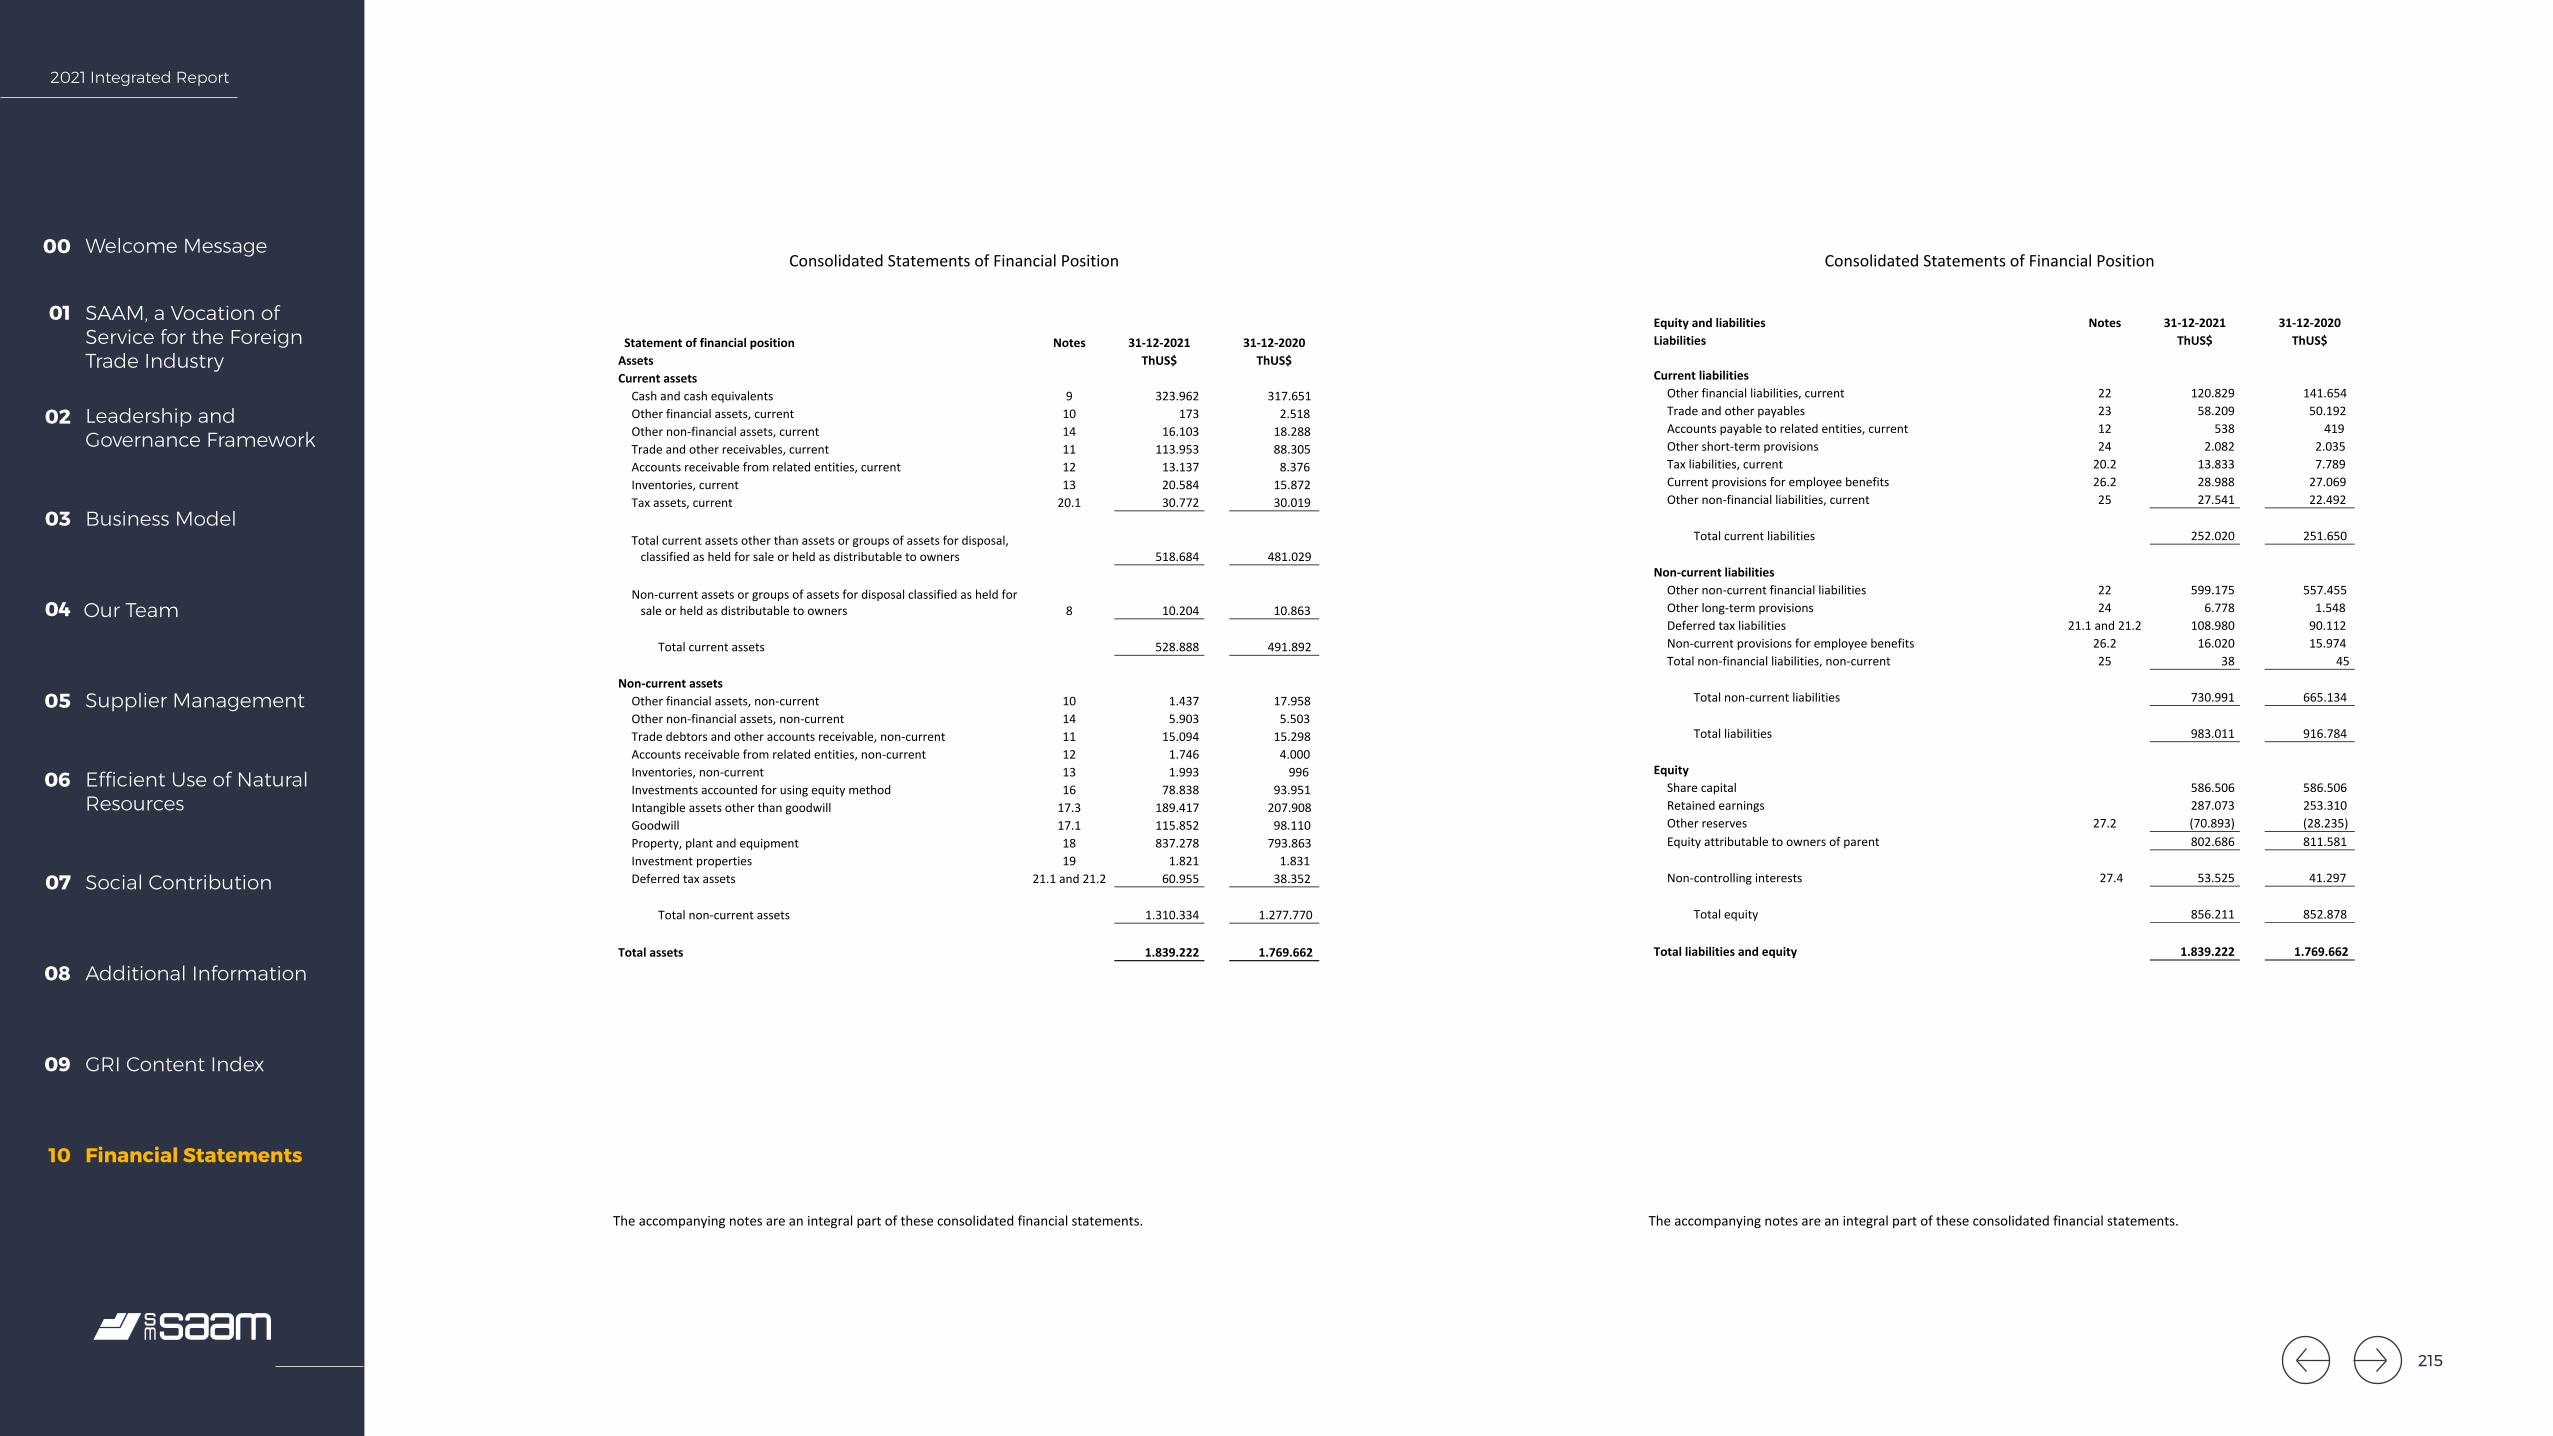
2021 Integrated Report
Welcome Message00
SAAM, a Vocation of Service for the Foreign Trade Industry
01
Leadership and Governance Framework
02
Business Model03
Our Team04
Supplier Management05
Efficient Use of Natural Resources
06
Social Contribution07
Additional Information08
GRI Content Index09
Financial Statements10
SOCIEDAD MATRIZ SAAM S.A. AND SUBSIDIARIES
Consolidated Statements of Financial Position
The accompanying notes are an integral part of these consolidated financial statements.
Statement of financial position Notes 31-12-2021 31-12-2020Assets ThUS$ ThUS$Current assets
Cash and cash equivalents 9 323.962 317.651 Other financial assets, current 10 173 2.518 Other non-financial assets, current 14 16.103 18.288 Trade and other receivables, current 11 113.953 88.305 Accounts receivable from related entities, current 12 13.137 8.376 Inventories, current 13 20.584 15.872 Tax assets, current 20.1 30.772 30.019
Total current assets other than assets or groups of assets for disposal, classified as held for sale or held as distributable to owners 518.684 481.029
Non-current assets or groups of assets for disposal classified as held for sale or held as distributable to owners 8 10.204 10.863
Total current assets 528.888 491.892
Non-current assets Other financial assets, non-current 10 1.437 17.958 Other non-financial assets, non-current 14 5.903 5.503 Trade debtors and other accounts receivable, non-current 11 15.094 15.298 Accounts receivable from related entities, non-current 12 1.746 4.000 Inventories, non-current 13 1.993 996 Investments accounted for using equity method 16 78.838 93.951 Intangible assets other than goodwill 17.3 189.417 207.908 Goodwill 17.1 115.852 98.110 Property, plant and equipment 18 837.278 793.863 Investment properties 19 1.821 1.831 Deferred tax assets 21.1 and 21.2 60.955 38.352
Total non-current assets 1.310.334 1.277.770
Total assets 1.839.222 1.769.662
SOCIEDAD MATRIZ SAAM S.A. AND SUBSIDIARIES
Consolidated Statements of Financial Position
The accompanying notes are an integral part of these consolidated financial statements.
Equity and liabilities Notes 31-12-2021 31-12-2020Liabilities ThUS$ ThUS$
Current liabilities Other financial liabilities, current 22 120.829 141.654 Trade and other payables 23 58.209 50.192 Accounts payable to related entities, current 12 538 419 Other short-term provisions 24 2.082 2.035 Tax liabilities, current 20.2 13.833 7.789 Current provisions for employee benefits 26.2 28.988 27.069 Other non-financial liabilities, current 25 27.541 22.492
Total current liabilities 252.020 251.650
Non-current liabilities Other non-current financial liabilities 22 599.175 557.455 Other long-term provisions 24 6.778 1.548 Deferred tax liabilities 21.1 and 21.2 108.980 90.112 Non-current provisions for employee benefits 26.2 16.020 15.974 Total non-financial liabilities, non-current 25 38 45
Total non-current liabilities 730.991 665.134
Total liabilities 983.011 916.784
Equity Share capital 586.506 586.506 Retained earnings 287.073 253.310 Other reserves 27.2 (70.893) (28.235) Equity attributable to owners of parent 802.686 811.581
Non-controlling interests 27.4 53.525 41.297
Total equity 856.211 852.878
Total liabilities and equity 1.839.222 1.769.662
215
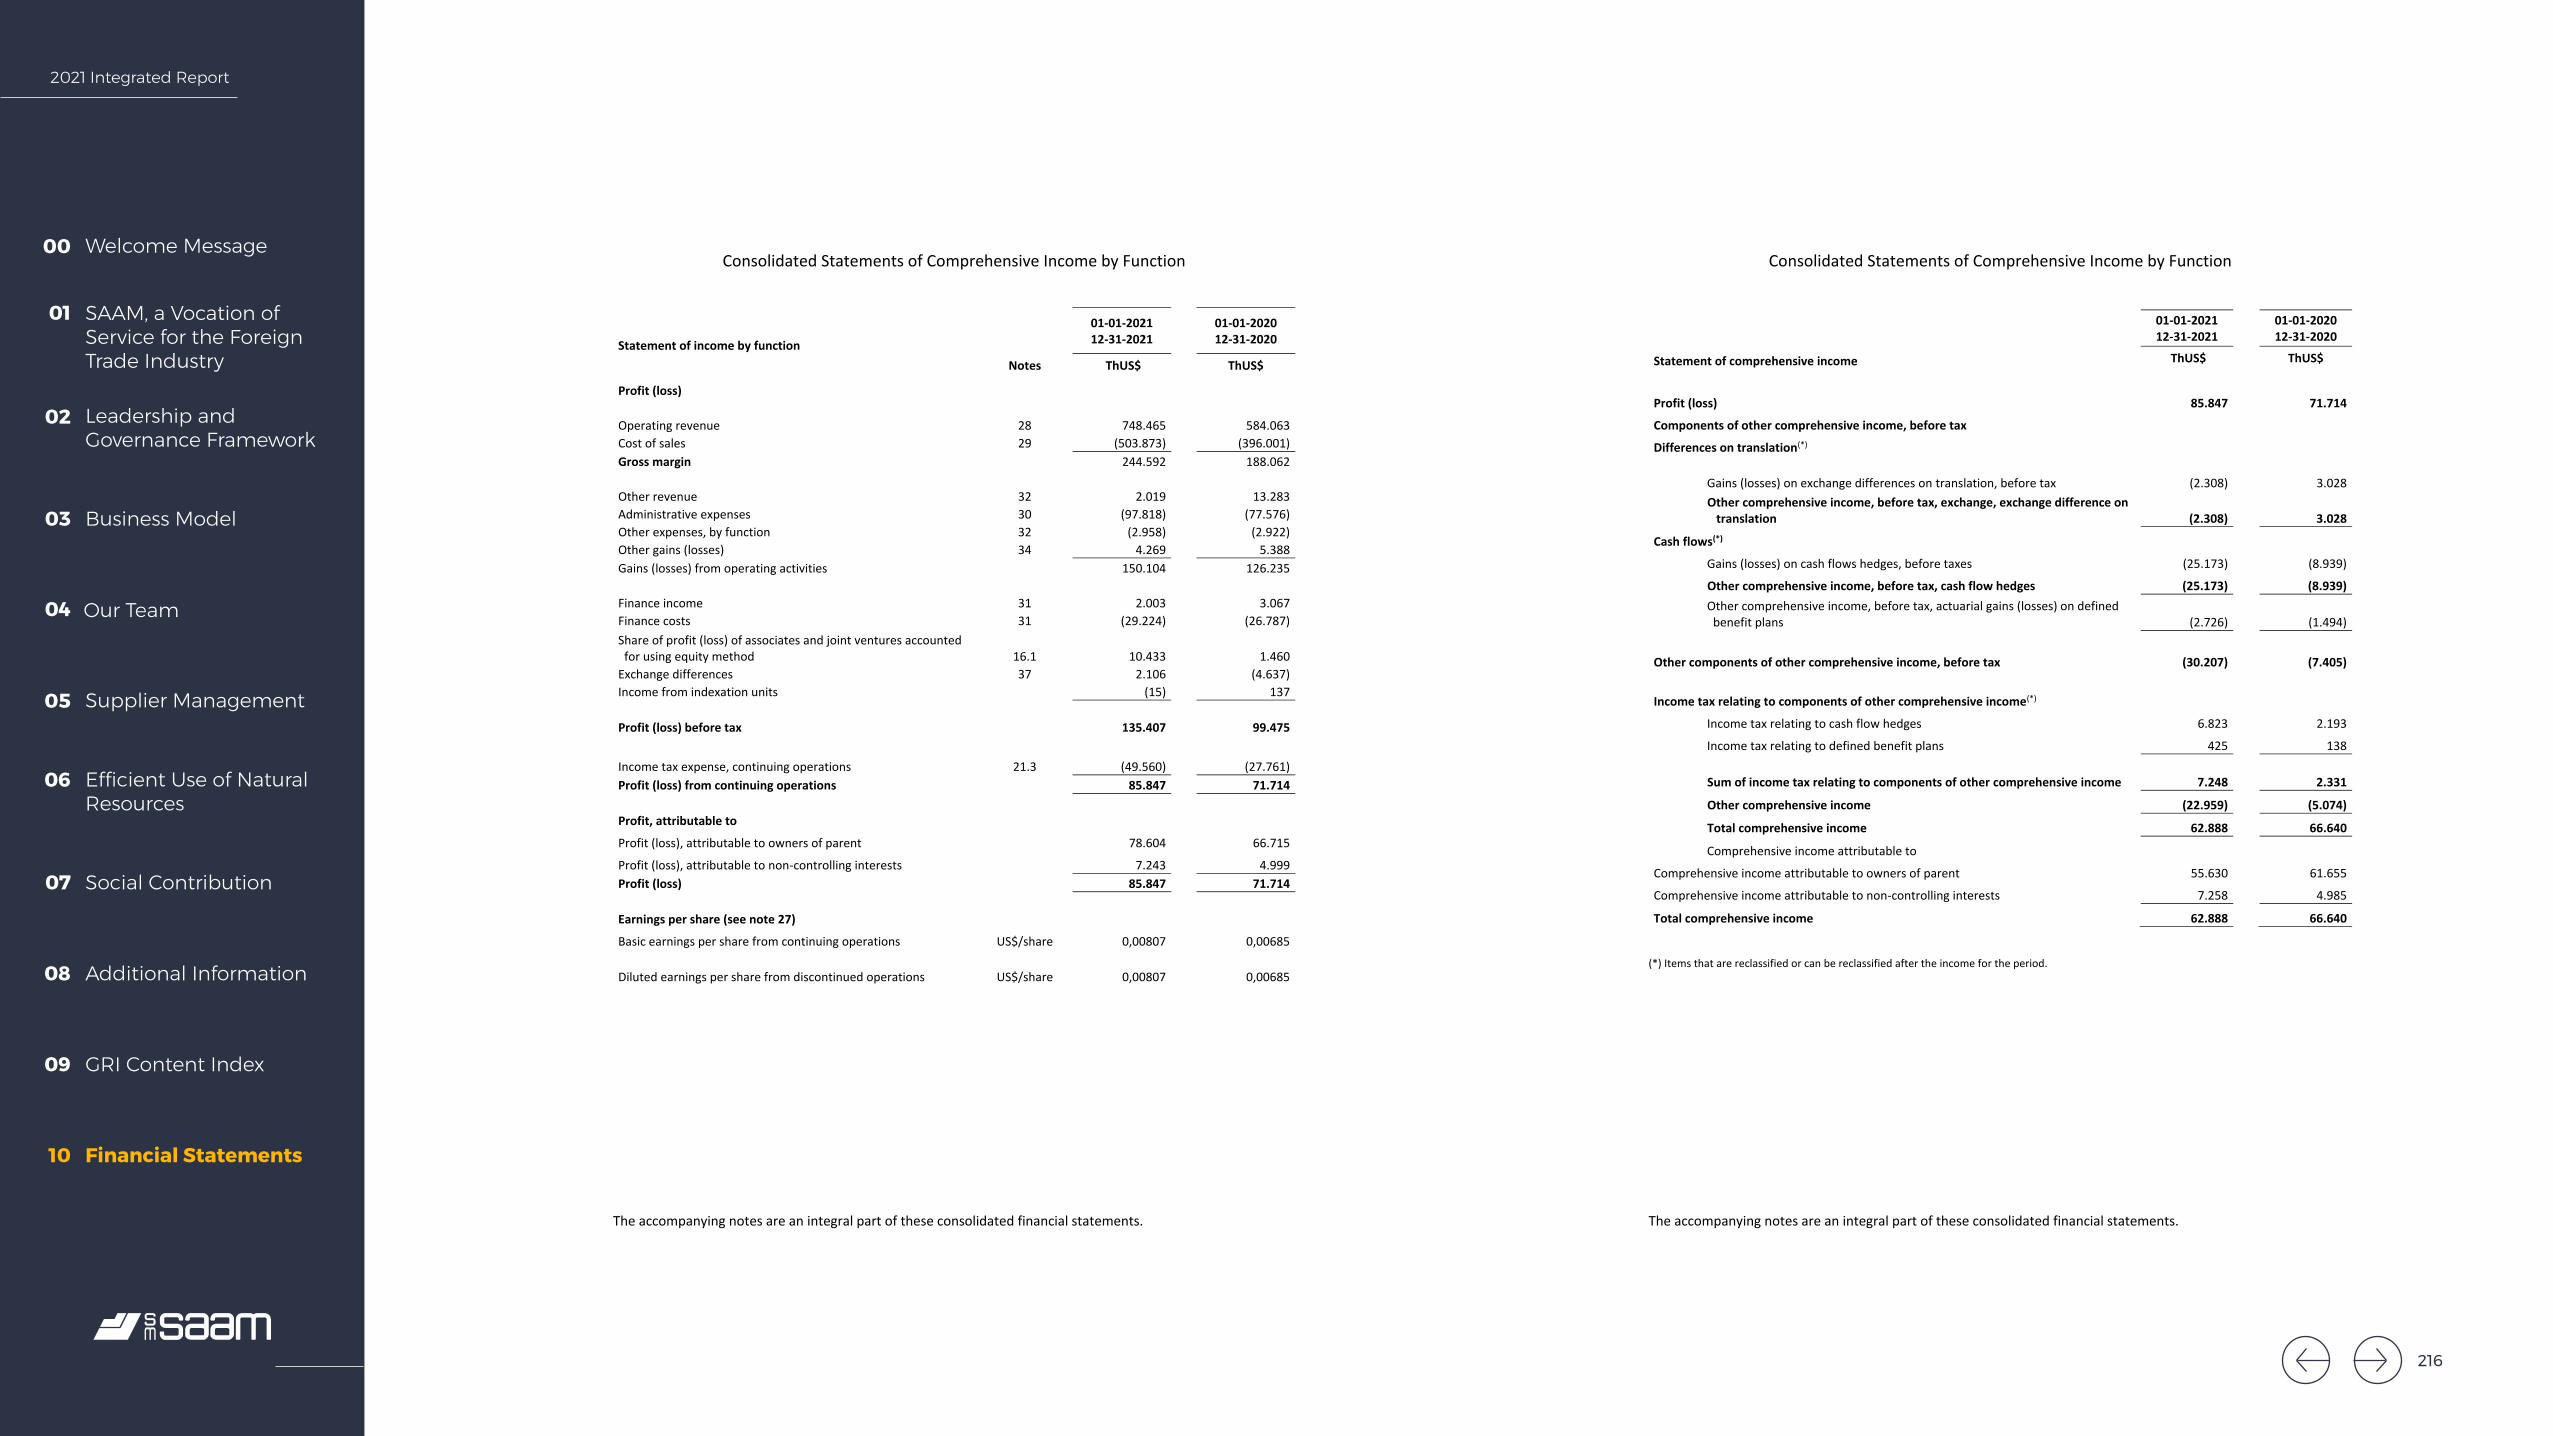
2021 Integrated Report
Welcome Message00
SAAM, a Vocation of Service for the Foreign Trade Industry
01
Leadership and Governance Framework
02
Business Model03
Our Team04
Supplier Management05
Efficient Use of Natural Resources
06
Social Contribution07
Additional Information08
GRI Content Index09
Financial Statements10
SOCIEDAD MATRIZ SAAM S.A. AND SUBSIDIARIES
Consolidated Statements of Comprehensive Income by Function
The accompanying notes are an integral part of these consolidated financial statements.
01-01-202112-31-2021
01-01-202012-31-2020Statement of income by function
Notes ThUS$ ThUS$
Profit (loss)
Operating revenue 28 748.465 584.063 Cost of sales 29 (503.873) (396.001) Gross margin 244.592 188.062
Other revenue 32 2.019 13.283 Administrative expenses 30 (97.818) (77.576) Other expenses, by function 32 (2.958) (2.922) Other gains (losses) 34 4.269 5.388 Gains (losses) from operating activities 150.104 126.235
Finance income 31 2.003 3.067 Finance costs 31 (29.224) (26.787) Share of profit (loss) of associates and joint ventures accounted for using equity method 16.1 10.433 1.460 Exchange differences 37 2.106 (4.637) Income from indexation units (15) 137
Profit (loss) before tax 135.407 99.475
Income tax expense, continuing operations 21.3 (49.560) (27.761) Profit (loss) from continuing operations 85.847 71.714
Profit, attributable to Profit (loss), attributable to owners of parent 78.604 66.715 Profit (loss), attributable to non-controlling interests 7.243 4.999 Profit (loss) 85.847 71.714
Earnings per share (see note 27) Basic earnings per share from continuing operations US$/share 0,00807 0,00685
Diluted earnings per share from discontinued operations US$/share 0,00807 0,00685
SOCIEDAD MATRIZ SAAM S.A. AND SUBSIDIARIES
Consolidated Statements of Comprehensive Income by Function
The accompanying notes are an integral part of these consolidated financial statements.
01-01-202112-31-2021
01-01-202012-31-2020
Statement of comprehensive income ThUS$ ThUS$
Profit (loss) 85.847 71.714 Components of other comprehensive income, before tax Differences on translation(*)
Gains (losses) on exchange differences on translation, before tax (2.308) 3.028 Other comprehensive income, before tax, exchange, exchange difference on translation (2.308) 3.028
Cash flows(*) Gains (losses) on cash flows hedges, before taxes (25.173) (8.939) Other comprehensive income, before tax, cash flow hedges (25.173) (8.939) Other comprehensive income, before tax, actuarial gains (losses) on defined benefit plans (2.726) (1.494)
Other components of other comprehensive income, before tax (30.207) (7.405)
Income tax relating to components of other comprehensive income(*) Income tax relating to cash flow hedges 6.823 2.193 Income tax relating to defined benefit plans 425 138
Sum of income tax relating to components of other comprehensive income 7.248 2.331 Other comprehensive income (22.959) (5.074) Total comprehensive income 62.888 66.640 Comprehensive income attributable to
Comprehensive income attributable to owners of parent 55.630 61.655 Comprehensive income attributable to non-controlling interests 7.258 4.985
Total comprehensive income 62.888 66.640
(*) Items that are reclassified or can be reclassified after the income for the period.
216

2021 Integrated Report
Welcome Message00
SAAM, a Vocation of Service for the Foreign Trade Industry
01
Leadership and Governance Framework
02
Business Model03
Our Team04
Supplier Management05
Efficient Use of Natural Resources
06
Social Contribution07
Additional Information08
GRI Content Index09
Financial Statements10
SOCIEDAD MATRIZ SAAM S.A. AND SUBSIDIARIES
Consolidated Statements of Cash Flows
The accompanying notes are an integral part of these consolidated financial statements.
01-01-202112-31-2021
01-01-202012-31-2020
Statement of cash flows, direct method ThUS$ ThUS$Cash flows from (used in) operating activities
Classes of cash receipts from operating activities Receipts from sales of goods and rendering of services 778.315 627.119 Receipts from premiums and claims, annuities and other policy benefits 2.295 2.024
Other cash receipts from operating activities 344 582
Classes of payments Payments to suppliers for goods and services (320.163) (214.244) Payments to and on behalf of employees (165.198) (152.277) Payments for premiums and claims, annuities and other policy benefits (10.801) (9.596) Payments for concession (17.376) (16.775) Payments for operating leasing (16.462) (8.634) Other cash payments from operating activities (34.836) (22.985)
Net cash flows from (used in) operating activities 216.118 205.214 Interest paid (889) - Interest received 717 499 Income taxes refund (paid) (43.261) (44.195)
Net cash flows from (used in) operating activities 172.685 161.518
Cash flows from (used in) investing activities Cash flows used in obtaining control of subsidiaries or other businesses 17.2 (27.657) (19.089) Cash flows used in purchase of non-controlling interests 34 8.869 - Proceeds from sales of property, plant and equipment 39 3.418 1.753 Proceeds from sales of intangible assets 219 - Purchases de property, plant and equipment 39 (52.489) (59.547) Purchase of intangible assets 39 (2.609) (2.058) Dividends received 39 17.878 9.389 Interest received 140 496 Interest paid (4) -
Other inflows (outflows) of cash (2.399) (3.577) Cash flows from sale of non-current assets held for sale 39 1.102 5.137
Net cash flows from (used in) investing activities (53.532) (67.496)
Cash flows from (used in) financing activities Proceeds from long-term borrowings 39 122.142 114.636 Proceeds from short-term borrowings 39 29.966 3.500 Proceeds from issuance of other financial liabilities (2.480) - Repayments of borrowings 39 (115.540) (63.810) Dividends paid 39 (51.738) (39.896) Payment of bonus (51.311) - Payment of lease liabilities (19.372) (1.414) Interest paid (14.141) (16.946) Other inflows (outflows) of cash, classified as financing activities (9.682) (2.666)
Net cash flows from (used in) financing activities (112.156) (6596)
Net increase (decrease) in cash and cash equivalents before effect of exchange rate changes 6.997 87.426
Effect of exchange rate changes on cash and cash equivalents (686) 653
Net increase (decrease) in cash and cash equivalents 6.311 88.079
Cash and cash equivalents at beginning of period 317.651 229.572
Cash and cash equivalents at end of period 9 323.962 317.651
217
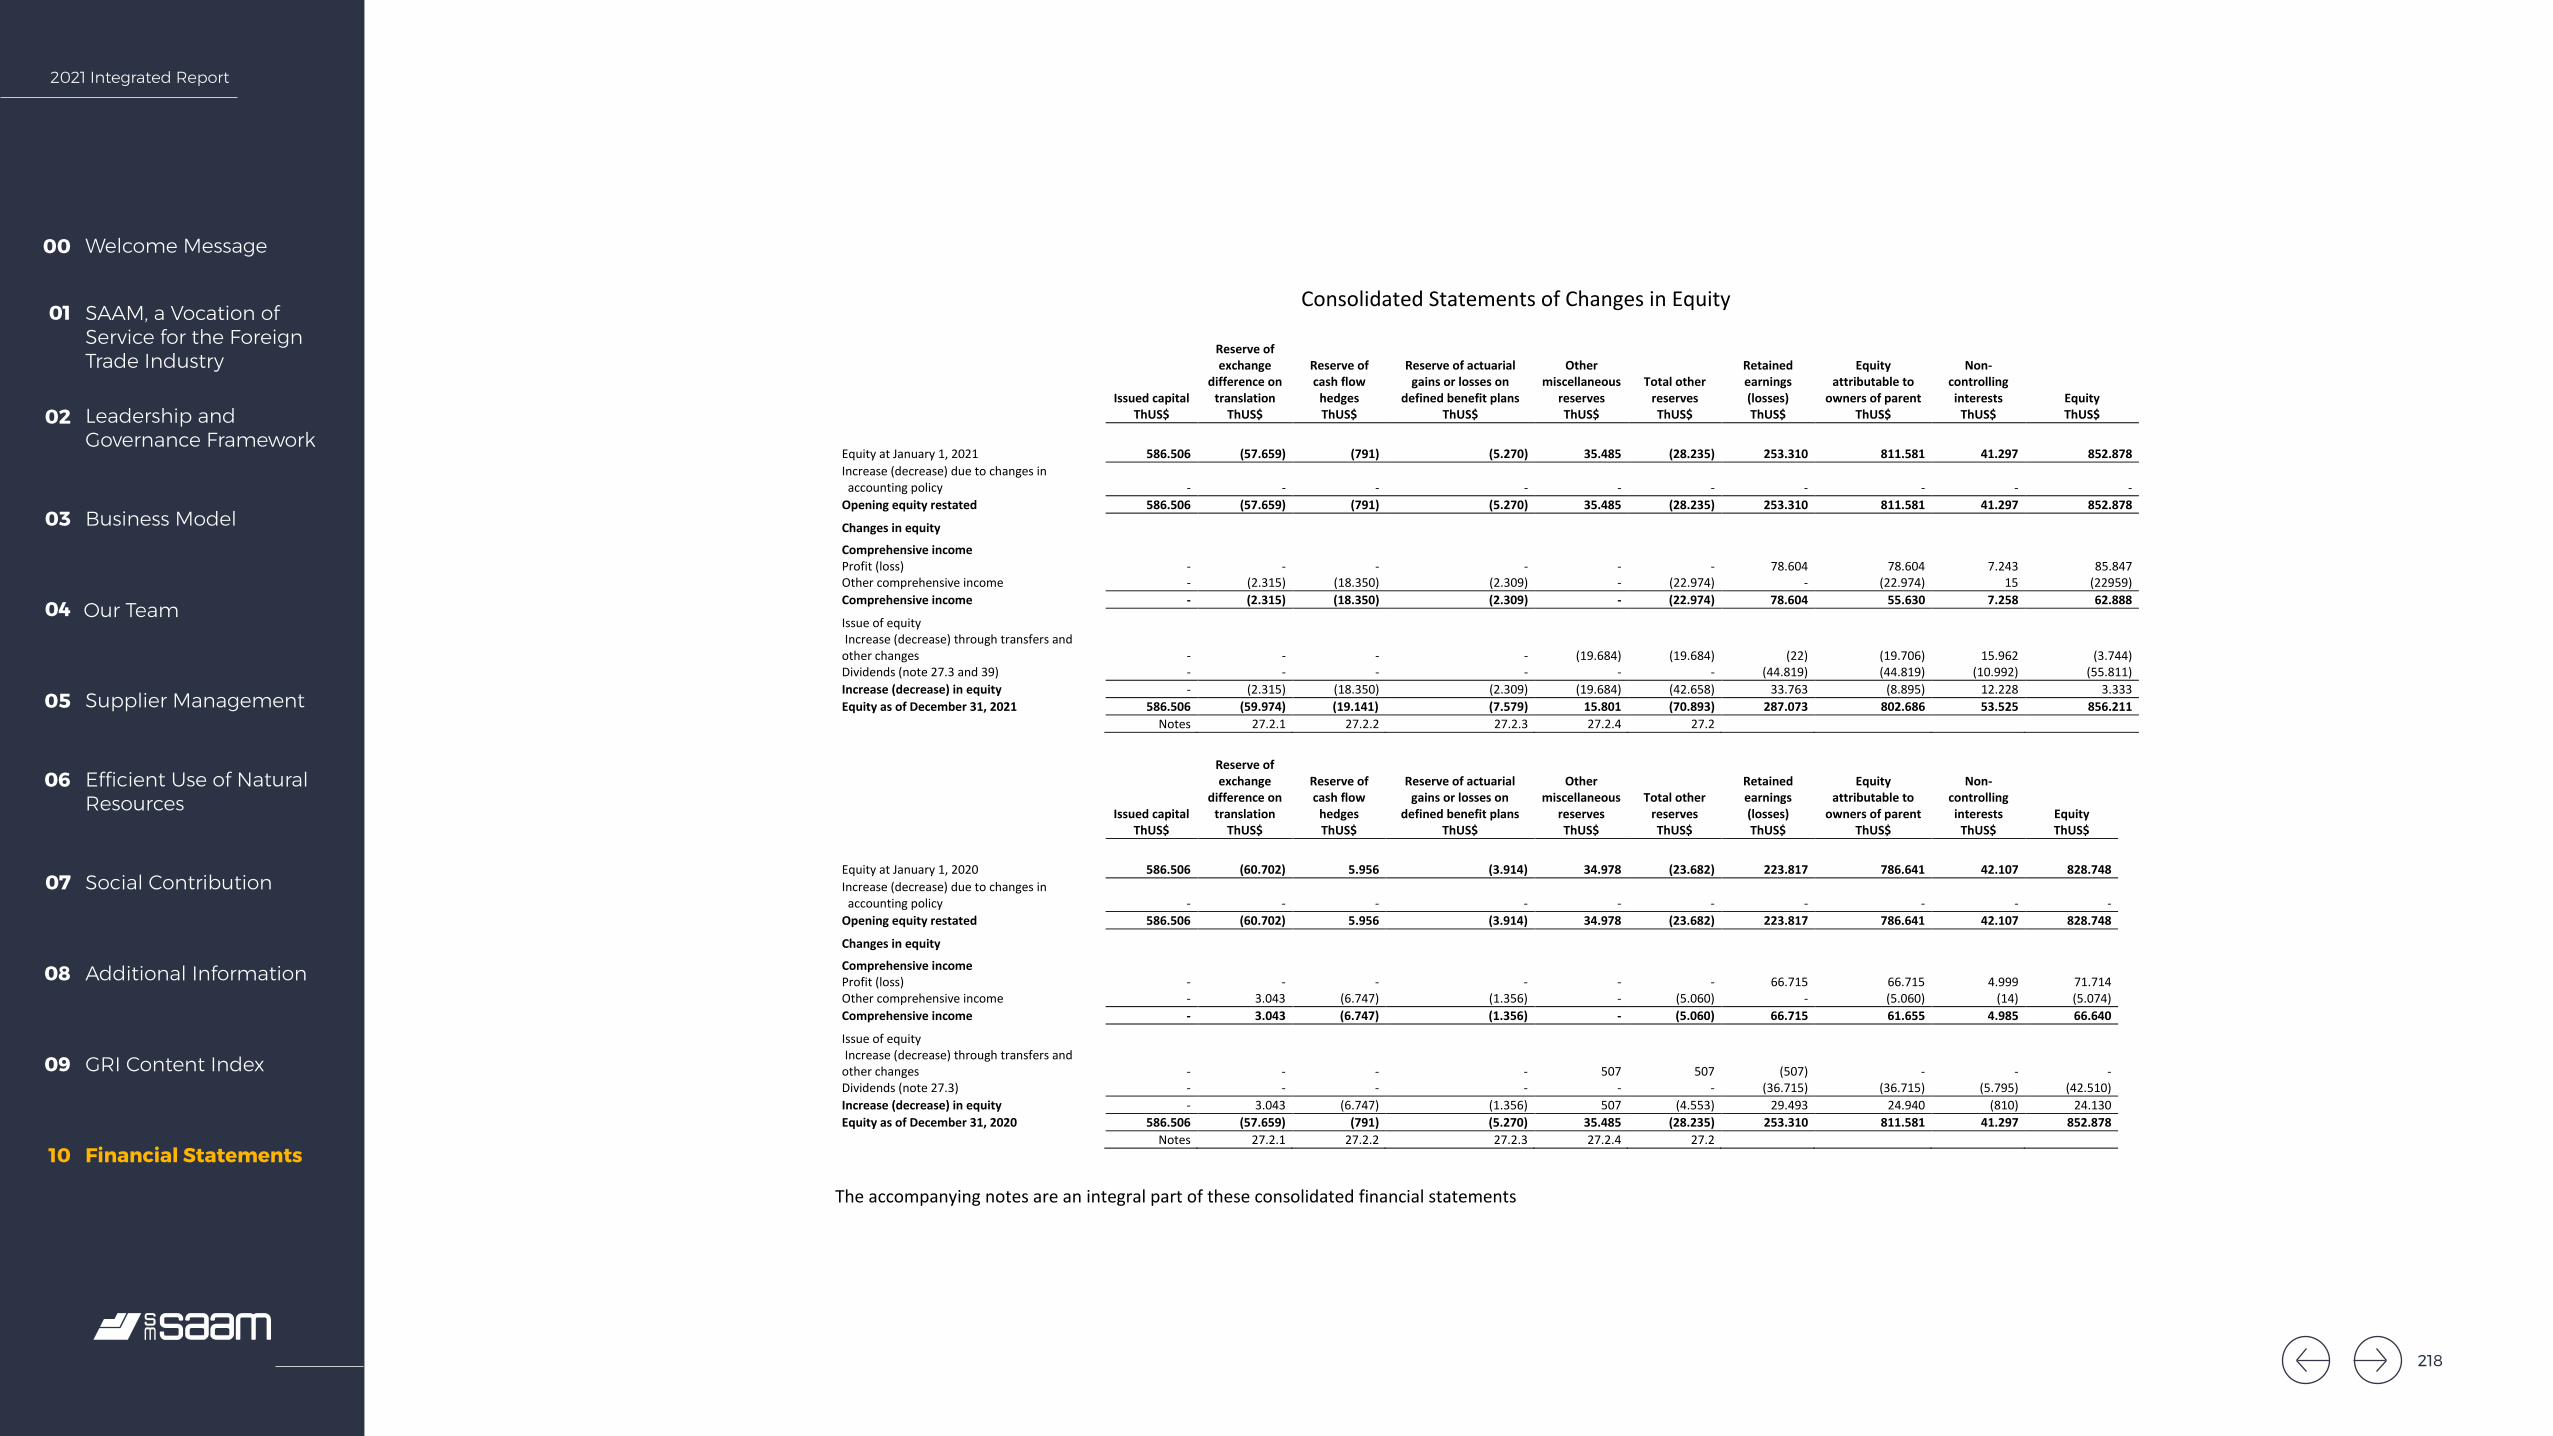
2021 Integrated Report
Welcome Message00
SAAM, a Vocation of Service for the Foreign Trade Industry
01
Leadership and Governance Framework
02
Business Model03
Our Team04
Supplier Management05
Efficient Use of Natural Resources
06
Social Contribution07
Additional Information08
GRI Content Index09
Financial Statements10
SOCIEDAD MATRIZ SAAM S.A. AND SUBSIDIARIES
Consolidated Statements of Changes in Equity
The accompanying notes are an integral part of these consolidated financial statements
Issued capital
Reserve of exchange
difference on translation
Reserve of cash flow
hedges
Reserve of actuarial gains or losses on
defined benefit plans
Other miscellaneous
reserves Total other
reserves
Retained earnings (losses)
Equity attributable to
owners of parent
Non-controlling interests Equity
ThUS$ ThUS$ ThUS$ ThUS$ ThUS$ ThUS$ ThUS$ ThUS$ ThUS$ ThUS$
Equity at January 1, 2021 586.506 (57.659) (791) (5.270) 35.485 (28.235) 253.310 811.581 41.297 852.878 Increase (decrease) due to changes in accounting policy - - - - - - - - - - Opening equity restated 586.506 (57.659) (791) (5.270) 35.485 (28.235) 253.310 811.581 41.297 852.878 Changes in equity Comprehensive income Profit (loss) - - - - - - 78.604 78.604 7.243 85.847 Other comprehensive income - (2.315) (18.350) (2.309) - (22.974) - (22.974) 15 (22959) Comprehensive income - (2.315) (18.350) (2.309) - (22.974) 78.604 55.630 7.258 62.888 Issue of equity Increase (decrease) through transfers and other changes - - - - (19.684) (19.684) (22) (19.706) 15.962 (3.744) Dividends (note 27.3 and 39) - - - - - - (44.819) (44.819) (10.992) (55.811) Increase (decrease) in equity - (2.315) (18.350) (2.309) (19.684) (42.658) 33.763 (8.895) 12.228 3.333 Equity as of December 31, 2021 586.506 (59.974) (19.141) (7.579) 15.801 (70.893) 287.073 802.686 53.525 856.211
Notes 27.2.1 27.2.2 27.2.3 27.2.4 27.2
Issued capital
Reserve of exchange
difference on translation
Reserve of cash flow
hedges
Reserve of actuarial gains or losses on
defined benefit plans
Other miscellaneous
reserves Total other
reserves
Retained earnings (losses)
Equity attributable to
owners of parent
Non-controlling interests Equity
ThUS$ ThUS$ ThUS$ ThUS$ ThUS$ ThUS$ ThUS$ ThUS$ ThUS$ ThUS$
Equity at January 1, 2020 586.506 (60.702) 5.956 (3.914) 34.978 (23.682) 223.817 786.641 42.107 828.748 Increase (decrease) due to changes in accounting policy - - - - - - - - - - Opening equity restated 586.506 (60.702) 5.956 (3.914) 34.978 (23.682) 223.817 786.641 42.107 828.748 Changes in equity Comprehensive income Profit (loss) - - - - - - 66.715 66.715 4.999 71.714 Other comprehensive income - 3.043 (6.747) (1.356) - (5.060) - (5.060) (14) (5.074) Comprehensive income - 3.043 (6.747) (1.356) - (5.060) 66.715 61.655 4.985 66.640 Issue of equity Increase (decrease) through transfers and other changes - - - - 507 507 (507) - - - Dividends (note 27.3) - - - - - - (36.715) (36.715) (5.795) (42.510) Increase (decrease) in equity - 3.043 (6.747) (1.356) 507 (4.553) 29.493 24.940 (810) 24.130 Equity as of December 31, 2020 586.506 (57.659) (791) (5.270) 35.485 (28.235) 253.310 811.581 41.297 852.878
Notes 27.2.1 27.2.2 27.2.3 27.2.4 27.2
218
2021 Integrated Report
Welcome Message00
SAAM, a Vocation of Service for the Foreign Trade Industry
01
Leadership and Governance Framework
02
Business Model03
Our Team04
Supplier Management05
Efficient Use of Natural Resources
06
Social Contribution07
Additional Information08
GRI Content Index09
Financial Statements10
SOCIEDAD MATRIZ SAAM S.A. AND SUBSIDIARIES Notes to the Consolidated Financial Statements
11
Note 1 Corporate Information
Sociedad Matriz SAAM S.A. was incorporated on February 15, 2012. Its bylaws are recorded in a public deed dated October 14, 2011, executed at the Valparaiso Notary's office of Mr. Luis Enrique Fischer Yávar, to which the minutes of the aforementioned Extraordinary Shareholders' Meeting on October 5, 2011 were abridged.
Sociedad Matriz SAAM SA, (hereinafter SM SAAM or the Company) is the holder of approximately 99.9995% of the shares in which the capital of SAAM SA, a closed corporation, is distributed, whose main corporate purpose is the provision of related to foreign trade, mainly in the tugboat, ports and logistics businesses.
The stock certificates of Sociedad Matriz SAAM SA, Rut 76.196.718-5, registered in the Securities Registry of the Commission for the Financial Market (Former Superintendency of Securities and Insurance) under No. 1,091, began to be traded on March 1, 2012 and its capital was divided into 9,736,791,983 shares.
The Company’s domicile is established at Avenida Apoquindo 4800 Torre II Piso 18, Las Condes, Santiago. Its corporate purpose is the acquisition, purchase, sale and disposal of shares of corporations, shares or rights in other companies, bonds, debentures, commercial paper and other transferable securities; administer, transfer, exploit them, perceive their fruits and take advantage of their sale and disposal; as well as the granting of financing to related companies and the provision of all kinds of services and advisory services, thus being classified as an investment company whose economic activity code corresponds to No. 1,300.
These consolidated financial statements include the indirect subsidiary, Iquique Terminal Internacional S.A., inscribed in the Register of Reporting Entities under No. 57 (Law No. 20,382) of the Commission for the Financial Market. The remaining indirect subsidiaries are not directly subject to the control of such Commission
Hereinafter “Sociedad Matriz SAAM S.A. and Subsidiaries” will be named as SM SAAM, the Company. The Company conducts its business through the direct subsidiaries SAAM S.A., SAAM Ports S.A. and SAAM Logistics S.A., providing tugboat and port terminals and logistics services, respectively.
SM SAAM is controlled since January 11, 2016 by the Quiñenco group, according to the provisions of articles 97 and 99 of the Securities Market Law No. 18,045, with 52.20% ownership through the following companies:
Company Ownership interest N° of shares Quiñenco S.A. 23.17% 2,255,897,059 Inversiones Rio Bravo S.A. 33.25% 3,237,543,274 Inmobiliaria Norte Verde S.A. 3.31% 322,149,301 Total Quiñenco Group 59.73% 5,815,589,634
As of December 31, 2021, SM SAAM has 3.356 shareholders inscribed in its register (3,352 shareholders as of December 31, 2020).
SOCIEDAD MATRIZ SAAM S.A. AND SUBSIDIARIES Notes to the Consolidated Financial Statements
12
Note 1 Corporate Information (continued)
On 30 January 2020, the World Health Organization designated the outbreak of coronavirus disease 2019 ("COVID-19") as a public health emergency of international concern. Sanitary measures and restrictions on mobility were taken in most countries that affected all economic activities, including the preparation and production of products, as well as international trade. In Chile, on March 18, 2020, a State of Constitutional Disaster Emergency has been declared throughout the country , which was lifted on September 30, 2021. Although some of the measures have gradually begun to be lifted health, both locally and internationally, there are still certain restrictions, such as the free movement of people and the closure of borders. Similarly, the consequences in the main centers of services and production worldwide continue to affect international trade.
In relation to the previous paragraph, it has been observed, among other effects, volatility in the exchange rate and in stock and commodity indices, in addition to other effects in the international financial market. It should be noted that most countries have continued to make progress in vaccinating their populations, which makes it possible to reduce the risks of the spread of the pandemic. From the beginning, the Company has adopted health measures aimed at reducing the spread of COVID-19, in accordance with the instructions of the health authority, with a focus on the health of employees, their families and the community in general, as well as on give continuity to its operations and support the normalization of international trade.
At the date of issuance of these financial statements, the Company's operations have not suffered significant effects as a result of the situation described. Likewise, it is not possible to predict weather there may be additional impacts in the future.
NOTE 2 Basis of Presentation of the Consolidated Financial Statements
a. Statement on compliance
The consolidated financial statements as of December 31, 2021 have been prepared inaccordance with International Financial Reporting Standards (IFRS) issued by theInternational Accounting Standard Board (IASB) and approved by its Board in session heldon March 11, 2022.
b. Basis of preparation of the Consolidated Financial Statements
These consolidated financial statements faithfully reflect the financial position of SociedadMatriz SAAM S.A. and its subsidiaries as of December 31, 2021 and December 31, 2020,the comprehensive income by function, changes in equity and cash flows for the periodsended December 31, 2021 and 2020.
These consolidated financial statements have been prepared under the principle of an ongoing concern, based on the principle of historic cost, except for the items that arerecognized at fair value.
219

2021 Integrated Report
Welcome Message00
SAAM, a Vocation of Service for the Foreign Trade Industry
01
Leadership and Governance Framework
02
Business Model03
Our Team04
Supplier Management05
Efficient Use of Natural Resources
06
Social Contribution07
Additional Information08
GRI Content Index09
Financial Statements10
SOCIEDAD MATRIZ SAAM S.A. AND SUBSIDIARIES Notes to the Consolidated Financial Statements
13
NOTE 2 Basis of presentation of the Consolidated Financial Statements (continued)
The carrying amount of assets and liabilities, hedged with the operations that qualify for hedge accounting, is adjusted to reflect changes in fair value in relation to the risks covered.
c. Use of estimates and judgments
In the preparation of these consolidated financial statements certain critical accountingestimates have been used to quantify certain assets, liabilities, income and expenses andcommitments. The areas involving a higher degree of judgment or complexity or areas inwhich the assumptions and estimates are significant for the financial statements aredescribed below:
1. The assessment of impairment losses of specific assets. (See notes, 3.1c, 3.9e, 3.10e,3.20d).
2. The assumptions used in the actuarial calculation of the employee benefit liabilities.(See note 26.3).
3. Useful lives of property, plant and equipment and intangible assets. (See notes 3.9d,3.10c ).
4. The probability of occurrence and valuation of certain liabilities and contingencies(See note 24 and 36).
5. El fair value of specific financial instruments (See Note 3.20b, 3.20c, 3.21).6. The probability of recoverability of deferred tax assets (See Note 21).
These estimates are made according to the best information available over the facts analysed.
In any case, it possible that events that might take place in the future oblige to modify those estimates in the next years, which, if it occurs, would be made prospectively, recognizing the effects of the change in the future financial statements.
SOCIEDAD MATRIZ SAAM S.A. AND SUBSIDIARIES Notes to the Consolidated Financial Statements
14
NOTE 3 Summary de Accounting Policies applied 3.1.- Basis of consolidation
a) Subsidiaries
The Subsidiaries are all entities controlled by SM SAAM. Control exists when the Company has the power to direct the financial and operational policies of the entity with the purpose of obtaining benefits from its activities. In assessing whether SM SAAM controls another entity, the existence and effect of potential voting rights that are currently exercised or convertible in shares or other instruments that allow exercising the control of another entity, are considered. It is understood that SM SAAM has control of a subsidiary when it holds more than 50% interest. The subsidiaries are consolidated from the date that control is transferred to SM SAAM and are excluded from the consolidation on the date it ceases.
b) Transactions eliminated from consolidation Intercompany balances and any unrealized income or expense arising from their transactions are eliminated during the preparation of the consolidated statements. Unrealized gains or losses from transactions with companies whose investment is recognized under the equity method are eliminated in the percentage their equity interest.
c) Investments in associates and joint ventures (equity method)
The associates are those entities where the Company has significant influence, but not control over financial and operating policies. It is assumed that there is significant influence when SM SAAM owns between 20% and 50% of the voting rights of another entity. Joint ventures are those entities in which SM SAAM has joint control over its activities, established by contractual agreements and which requires unanimous consent to make financial, operational and strategic decisions. Investments in associates and joint ventures are recognized according to the equity method and initially recognized at cost. The investment of SM SAAM, if any, includes the goodwill identified in the acquisition, net of any accumulated impairment loss. An investment will be accounted for using the equity method, from the date it becomes an associate or joint venture. At the time of the acquisition of the investment, any difference between the cost of the investment and the part of the entity in the net fair value of the identifiable assets and liabilities of the investee will be accounted for as goodwill and included in the book amount of the investment.
220
2021 Integrated Report
Welcome Message00
SAAM, a Vocation of Service for the Foreign Trade Industry
01
Leadership and Governance Framework
02
Business Model03
Our Team04
Supplier Management05
Efficient Use of Natural Resources
06
Social Contribution07
Additional Information08
GRI Content Index09
Financial Statements10
SOCIEDAD MATRIZ SAAM S.A. AND SUBSIDIARIES Notes to the Consolidated Financial Statements
15
NOTE 3 Summary of Accounting Policies applied, continued
3.1.- Basis of consolidation, continued
c) Investments in associates and joint ventures (equity method), continued
The requirements of IAS 28 are applied to determine whether it is necessary to recognizean impairment loss with respect to the investments of the company in associates or jointventures. When necessary, the entire carrying amount of the investment (includinggoodwill) is tested for impairment in accordance with IAS 36 Impairment of assets, as asingle asset by comparing its recoverable amount (the higher of the value in use and fairvalue less costs to sell) with their book value. Any impairment loss recognized is part ofthe book value of the investment. Any reversal of such impairment loss recognized inaccordance with IAS 36 increases the value of the investment, based on the recoverableamount of the investment.
The Company discontinues the use of the equity method, on the date when theinvestment ceases to be an associate or joint venture, or when the investment is classifiedas held for sale.
The consolidated financial statements include the equity in earnings and participation inthe equity movements of the investments recognized according to the equity method,after making adjustments to align the accounting criteria of those associated with thoseof SM SAAM, from the date when significant influence and / or joint control begin.
When the equity in the losses generated in the associates exceeds the book value of thatequity interest, including any long-term investment, said investment is reduced to zeroand the recognition of more losses is discontinued except in the case that SM SAAM hasthe obligation or has made payments on behalf of the company in which it participates.
When the Company reduces its equity interest in an associate or joint venture, andcontinues to use the equity method, the effects that had previously been recognized inother comprehensive income must be reclassified to profit or loss according to theproportion of the equity interest reduction in said associate or joint venture.
When a Group company enters into transactions with an associate or joint venture, gainsor losses resulting from transactions with the associate or joint venture are recognized inthe consolidated financial statements of the Company only to the extent of the equityinterests of third parties of the associate or joint venture.
SOCIEDAD MATRIZ SAAM S.A. AND SUBSIDIARIES Notes to the Consolidated Financial Statements
16
NOTE 3 Summary of Accounting Policies applied, continued
3.1.- Basis of Consolidation, continued
d) Changes in the Company's shares in existing subsidiaries
Changes in ownership interests of a controller in a subsidiary that do not result in loss of control are equity transaction. Any difference between the fair value of the consideration transferred and the book value of the assigned interest is recognized directly in equity and attributed to the owners of parent.
When the control of a subsidiary is lost, a gain or loss is recognized in income and is calculated as the difference between (i) the aggregate of the fair value of the consideration received and the fair value of any retained interest; and (ii) the previous carrying amount of the assets (including goodwill), and liabilities of the subsidiary and any non-controlling interest.
3.2 Entities included in the consolidation
These consolidated financial statements include the following subsidiaries:
12-31-2021 12-31-2020Tax N° Company Country Functional
Currency Direct Indirect Total Total
92.048.000-4 Saam S.A. and Subsidiaries Chile US Dollar 99.9995% 0.0005% 100.00% 100.00% 76.729.932-K SAAM Logística S.A. and Subsidiaries Chile US Dollar 99.99945% 0.0055% 100.00% 100.00% 76.757.003-1 SAAM Puertos S.A. and Subsidiaries Chile US Dollar 99.9995% 0.0005% 100.00% 100.00% 96.973.180-0 76.479.537-7
SAAM Internacional S.A. and Subsidiaries SAAM Inversiones SPA
Chile Chile
US Dollar US Dollar
- 100.00%
100.00% -
100.00% 100.00%
100.00% 100.00%
76.002.201-2 SAAM Puertos S.A. and subsidiaries Chile US Dollar - 100.00% 100.00% 100.00% 76.708.840-K Inmobiliaria San Marco Ltda. y subsidiary Chile US Dollar - 100.00% 100.00% 100.00% 96.720.220-7 Inversiones San Marco Ltda. and subsidiaries Chile US Dollar - 100.00% 100.00% 100.00% 96.885.450-K Aerosan Airport Services S.A. and subsidiaries(1) Chile US Dollar - 100.00% 100.00% 100.00% 94.058.000-5 Servicios Aeroportuarios Aerosan S.A.(1) Chile US Dollar - 100.00% 100.00% 100.00% 0-E SAAM Remolques S.A. de C.V. and Subsidiaries(2) Mexico US Dollar - 100.00% 100.00% 100.00% 0-E SAAM Towage Brasil S.A. and Subsidiaries2) Brazil US Dollar - 100.00% 100.00% 100.00% 0-E Concesionaria SAAM Costa Rica S.A. Costa Rica US Dollar - 100.00% 100.00% 100.00% 0-E Ecuaestibas S.A. Ecuador US Dollar - 100.00% 100.00% 100.00% 0-E SAAM Remolcadores Colombia S.A. Colombia US Dollar - 100.00% 100.00% 100.00% 0-E Inversiones Habsburgo S.A. Panama US Dollar - 100.00% 100.00% 100.00% 0-E Inversiones Alaria S.A. II Panama US Dollar - 100.00% 100.00% 100.00% 0-E Saam Remolcadores Panamá S.A. Panama US Dollar - 100.00% 100.00% 100.00% 0-E EOP Crew Management de México S.A. de C.V. (2) México US Dollar - 70% 70% - 0-E Intertug México S.A. de C.V. (2) México US Dollar - 70% 70% - 0-E Baru Offshore de México S.A.P.I (2) México US Dollar - 70% 70% - 0-E SAAM Towage Colombia S.A.S (2) Colombia US Dollar - 70% 70% -
To ensure uniformity in the presentation of the consolidated financial statements of SM SAAM, the subsidiaries included in the consolidation and its subsidiaries have adopted the same accounting criteria as the parent company.
(1) Dated August 20, 2020, SM SAAM, through its subsidiary SAAM Logistics S.A. ("SAAMLogística"), signed a contract to acquire the shares owned by American Airlines Inc. inAerosan Airport Services S.A. and Servicios Aeroportuarios Aerosan S.A. (collectively"Aerosan"), representing 50% of the paid-in capital stock of each. As a result, SM SAAMnow controls 100% of these companies, in compliance with the terms and conditionsagreed between the parties.
221

2021 Integrated Report
Welcome Message00
SAAM, a Vocation of Service for the Foreign Trade Industry
01
Leadership and Governance Framework
02
Business Model03
Our Team04
Supplier Management05
Efficient Use of Natural Resources
06
Social Contribution07
Additional Information08
GRI Content Index09
Financial Statements10
SOCIEDAD MATRIZ SAAM S.A. AND SUBSIDIARIES Notes to the Consolidated Financial Statements
17
NOTE 3 Summary of Accounting Policies applied, continued
3.2 Entities included in the consolidation, continued
The total price paid for the acquisition of the Aerosan Group was US$ 32 million, the cash disbursement of which was made through equity and bank financing (Note 17.2).
(2) On January 29, 2021, SM SAAM, through its subsidiary SAAM S.A., materialized theacquisition of control of International Tug S.A.S. (Intertug Colombia), Intertug Mexico S.A.de C.V., Baru Offshore de México, S.A.P.I. of C.V. and EOP Crew Management de MexicoS.A. of C.V. for a total of ThUS$ 49,191 in purchase of shares and capital increase. Withthis transaction, SM SAAM controls a 70% stake in each of the companies (Note 17.2).
3.3 Presentation currency and functional currency
a) Functional Currency
The consolidated financial statements are presented in United States dollars which is thefunctional currency or SM SAAM. Each group entity has determined its functional currencybased on the currency of the main economic environment in which it operates.
The items in a currency other than the functional currency are considered transactions inforeign currency and are initially recorded at the exchange rate of the transaction date,at the end of each period the monetary assets and liabilities in foreign currency aretranslated at the exchange rate of the closing date, non-monetary items in foreigncurrency remain translated at the exchange rate of the transaction date.
The exchange differences account in the consolidated statement of comprehensiveincome by function includes the recognition of exchange rate changes in foreign currencyassets and liabilities.
b) Presentation currency
Group entities with a functional currency other than the currency of SM SAAM musttranslate, at the reporting date, their results and statement of financial position at thepresentation currency of the parent through the translation of their assets and liabilitiesat the exchange rate of closing date and its results at the average exchange rate. The maincompanies reporting in U.S. dollar presentation currency are SAAM Towage Canada Inc.and Subsidiaries, whose functional currency is the Canadian dollar, and Terminal MarítimaMazatlán, whose functional currency is the Mexican peso, , Expertajes Marítimos whereits functional currency is the Guatemalan quetzal, Aerosan S.A.S where its functionalcurrency is the Colombian peso, and finally Aquasaam, whose functional currency is theChilean peso.
SOCIEDAD MATRIZ SAAM S.A. AND SUBSIDIARIES Notes to the Consolidated Financial Statements
18
NOTE 3 Summary of Accounting Policies applied, continued
3.3 Presentation currency and functional currency, continued
The exchange differences that arise from the translation to the presentation currency are recognized as a separate component of the equity, in other comprehensive income, in the reserve account of exchange differences on translation.
3.4 Translation basis for transactions in foreign currency and indexed
The principal foreign currency assets and liabilities are stated at their equivalent value in dollars, calculated at the following closing exchange rates.
Currency 12-31-2021 12-31-2020Chilean peso 844.69 710.95 Mexican peso 20.5383 19.9265 Canadian dollar 1.2783 1.2764 Brazilian real 5.5689 5.1768
The assets and liabilities indexed in Unidades de Fomento (UF) have been valued at the following dollar values at the balance sheet date.
Closing date of the financial statements 12-31-2021US$
12-31-2020US$
Dollars per UF 36.69 40.89
222
2021 Integrated Report
Welcome Message00
SAAM, a Vocation of Service for the Foreign Trade Industry
01
Leadership and Governance Framework
02
Business Model03
Our Team04
Supplier Management05
Efficient Use of Natural Resources
06
Social Contribution07
Additional Information08
GRI Content Index09
Financial Statements10
SOCIEDAD MATRIZ SAAM S.A. AND SUBSIDIARIES Notes to the Consolidated Financial Statements
19
NOTE 3 Summary of Accounting Policies applied, continued
3.5 Business combinations
The acquisition method is used to account for all business combinations, regardless of whether equity instruments or other assets are acquired. The consideration transferred for the acquisition of a subsidiary comprises:
● Fair values of transferred assets.● Liabilities incurred to the former owners of the acquired business.● Equity investments issued by the Company.● Fair value of any asset or liability resulting from a contingent consideration
arrangement.● Fair value of any pre-existing interest in the subsidiary.
Identifiable assets acquired and liabilities and contingent liabilities assumed in a business combination are initially measured at fair value at the acquisition date, with limited exceptions. The Company recognizes any non-controlling interest in the acquired entity on an acquisition-by-acquisition basis at either fair value or at the non-controlling shareholders' proportionate interest in the net identifiable assets of the acquired entity.
Acquisition-related costs are expensed.
In addition, this includes the excess of:
● The consideration transferred● The amount recognized of any non-controlling interest in the acquiree.● The fair value at the acquisition date of any previous equity interest in the
acquired entity over the fair value of the identifiable net assets acquired isrecorded as goodwill. If these amounts are less than the fair value of theidentifiable net assets of the acquired entity, the difference is recognized directlyin the statement of net income as a purchase on advantageous terms.
When payment of any portion of the acquisition price is deferred, amounts payable in the future will be discounted to their present value. The discount rate used will be the entity's incremental loan rate, which is the rate at which a similar loan could be obtained from an independent lender under comparable terms and conditions.
SOCIEDAD MATRIZ SAAM S.A. AND SUBSIDIARIES Notes to the Consolidated Financial Statements
20
NOTE 3 Summary of Accounting Policies applied, continued
3.5 Business combinations, continued
Contingent consideration is classified as either equity or financial liabilities. Amounts classified as financial liabilities are subsequently measured at fair value with changes in fair value recognized in income.
If the business combination is carried out in stages, the acquisition-date carrying amount of the acquirer's previously recognized interest is remeasured at fair value at the acquisition date. Gains or losses resulting from such revaluation are recognized in income.
3.6 Cash and cash equivalents
The Company considers cash and cash equivalents to be cash balances held in cash and bank current accounts, time deposits and other financial investments that are expected to be settled in less than 90 days. Also included in this item are those investments related to cash management, such as repurchase and resale agreements whose maturity is as defined above.
The bank overdraft lines used are included in short-term loans under current liabilities.
3.7 Trade and other receivables
Trade receivables are recognized at fair value, less impairment losses.
This classification also includes non-commercial debts, such as sundry debtors, loans to personnel and other entities abroad.
3.8 Inventories
Inventories are valued at the lower of cost or net realizable value. The cost of inventories is based on the FIFO (first in, first out) method, and includes the cost of acquiring inventories and other costs incurred in moving them to their current location and conditions.
Spare parts are valued at historical acquisition cost and recognized in income, mainly through the FIFO method and weighted average price (WAP).
Low-turnover spare parts, mainly those that are used in the repair and maintenance of the Company's main assets, tugs and cranes, constitute strategic inventories, and given their unpredictable demand, they are classified as non-current inventory.
223
2021 Integrated Report
Welcome Message00
SAAM, a Vocation of Service for the Foreign Trade Industry
01
Leadership and Governance Framework
02
Business Model03
Our Team04
Supplier Management05
Efficient Use of Natural Resources
06
Social Contribution07
Additional Information08
GRI Content Index09
Financial Statements10
SOCIEDAD MATRIZ SAAM S.A. AND SUBSIDIARIES Notes to the Consolidated Financial Statements
21
NOTE 3 Summary of Accounting Policies applied, continued
3.9 Intangible assets
These are identifiable non-monetary assets without physical appearance that come from commercial transactions. Only intangible assets whose costs can be reasonably estimated objectively and from which it is probable that future economic benefits will flow are recognized.
Intangible assets with finite useful lives are initially recognized at acquisition or development cost and will be valued at cost less accumulated amortization and any impairment losses.
a) Port concessions
Port concession assets that are recognized under IFRIC12 are recorded as intangible assetsas they have the right to collect revenues based on use. The cost of these relatedintangible assets includes the mandatory infrastructure works defined in the concessioncontract and the current value of all minimum contract payments. Accordingly, a financialliability is recorded at present value equivalent to the value of the recognized intangibleasset.
These consolidated financial statements contain port concession agreements registeredwith indirect subsidiaries Iquique Terminal Internacional S.A. and Maritime TerminalMazatlán S.A. of C.V., Sociedad Portuaria Caldera S.A. and Sociedad Portuaria Granelerade Caldera S.A. (See note 35).
The associates that record port concession agreements in their financial statements areAntofagasta Terminal Internacional S.A., San Antonio Terminal Internacional S.A. and SanVicente Terminal Internacional S.A. and Puerto Buenavista S.A.
b) Relationship with clients
Intangible assets called "Customer Relationships" arise from business combinations andthey are amortized over the estimated period that benefits will be received from thecurrent customer portfolio in each company at the acquisition date. These assets areamortized as of July 1, 2014 (ST Canada) and November 1, 2019 (ST Brazil) and November1, 2020 (Aerosan Airport Services and Servicios Aeroportuarios Aerosan) and January 29,2021, which are the dates these transactions took place. (See note 17.4)
SOCIEDAD MATRIZ SAAM S.A. AND SUBSIDIARIES Notes to the Consolidated Financial Statements
22
NOTE 3 Summary of accounting policies applied, continued
3.9 Intangible assets, continued
c) Goodwill
Goodwill represents the difference between the acquisition value of the shares or rightsof subsidiaries, associates and joint ventures and the fair value of the identifiablecontingent assets and liabilities at the acquisition date. Goodwill related to acquisitions ofassociates and joint ventures is included in investments accounted for under the equitymethod and joint ventures.
Goodwill arising on acquisitions of subsidiaries, joint ventures and businesses associatedwith functional currencies other than the U.S. dollar is valued in the functional currencyof the acquired company, translating it into U.S. dollars at the exchange rate prevailing atthe date of the statement of financial position.
Goodwill is not amortized, and at the end of each accounting period. It is estimatedwhether there are indications of impairment that could reduce its recoverable value to anamount lower than the recorded cost, in which case an impairment adjustment is made.
As of the closing date of these consolidated financial statements, there are no signs ofimpairment that imply any adjustment.
d) Amortization of intangible assets
Depreciation is recognized in the profit and loss accounts based on the straight-linemethod of depreciation over the estimated use or duration of the period of right of usein the case of concessions, counted from the date on which the asset is available for use.
The estimated useful lives by asset class are as follows:
Class Minimum Range
Maximum Range
Goodwill Indefinite Water rights Indefinite Licenses and franchises 5 years 20 years Port concessions (Note 35) Concession period For the operation of tugboat (Note 35) Concession period Relationships with customers (Note 17.3) 10 years 15 years Contracts and other (Note 17.3) 3 years 5 years Software 3 years 7 years
224

2021 Integrated Report
Welcome Message00
SAAM, a Vocation of Service for the Foreign Trade Industry
01
Leadership and Governance Framework
02
Business Model03
Our Team04
Supplier Management05
Efficient Use of Natural Resources
06
Social Contribution07
Additional Information08
GRI Content Index09
Financial Statements10
SOCIEDAD MATRIZ SAAM S.A. AND SUBSIDIARIES Notes to the Consolidated Financial Statements
23
NOTE 3 Summary of Accounting Policies applied, continued
3.9 Intangible assets, continued
e) Impairment of intangible assets
Intangible assets with indefinite useful lives are valued at cost and are tested annually forimpairment.
At the year-end, or when deemed necessary, the Company and its subsidiaries evaluatewhether there are signs of impairment in their assets. If there are such indicators, anestimate of the recoverable amount of such assets is made. The recoverable amount ofan asset is the higher of the fair value less cost to sell and the value in use.
To determine the fair value less costs to sell, independent expert reports and / or availableobjective information are used. To determine the value in use, the estimated future cashflows are discounted at the WACC rate of the Company.
As of the closing date, SM SAAM S.A. and its subsidiaries do not present evidence ofimpairment due to significant changes such as a decrease in market value, obsolescence,physical damage, market return, etc. that may affect the valuation of intangible assets,other than those already recognized in this year.
3.10 Property, Plant and Equipment
a) Recognition and measurement
Items of property, plant and equipment are measured at acquisition cost, less accumulated depreciation and impairment losses, where appropriate.
Cost includes expenses attributed directly to the acquisition of the asset. The cost of self-built assets includes the cost of materials, direct labor, financial expenses related to external financing that are directly attributable, until the normal start-up of said asset, and any other cost directly allocated to the process of making the asset fit for its use, and the costs of dismantling and removing the items and restoring the place where they are located.
When the significant parts of an item of property, plant and equipment have different useful lives, they are recorded as separate elements within the subledger of property, plant and equipment.
Gains and losses on the sale of an item of property, plant and equipment are determined by comparing the selling price to the book value of property plant and equipment and are recognized net within “other gains (losses)”.
SOCIEDAD MATRIZ SAAM S.A. AND SUBSIDIARIES Notes to the Consolidated Financial Statements
24
NOTE 3 Summary of Accounting Policies applied, continued
3.10 Property, plant and equipment, continued
b) Subsequent costs
The cost for replacing part of an item of property, plant and equipment is recognized inits carrying amount if it is possible that the future economic benefits incorporated withinthe part will flow in more than one period to SM SAAM and its cost can be measuredreliably.
The costs of daily maintenance of property, plant and equipment are recognized in incomewhen incurred.
Subsequent to the acquisition, only disbursements incurred that increase the economicuseful life of the asset or its economic capacity and that are different from routinemaintenance will be capitalized.
c) Depreciation and useful lives
Depreciation is recognized in the consolidated statement of income by function based onthe method of straight-line depreciation over the useful lives of each item of property,plant and equipment. This is the method that best reflects the use and consumption ofthe good
The estimated useful lives for the current periods are as follows:Class Range years
Minimum Maximum Building and constructions 40 80 Infrastructure of port terminals(1) Concession period Facilities and improvements in leased property Lease period Vessels, tugboats, barges and lighters 10 30 Machinery 5 15 Transport equipment 3 10 Office machinery 1 3 Furniture, fixtures and accessories 3 5 Financial and Operating leases IFRS 16 Contract period
(1) Includes assets not controllable by the entity granting the concession. The useful livesof these assets may exceed the concession period when the asset is transferable orsaleable to other operations of the Company.
225
2021 Integrated Report
Welcome Message00
SAAM, a Vocation of Service for the Foreign Trade Industry
01
Leadership and Governance Framework
02
Business Model03
Our Team04
Supplier Management05
Efficient Use of Natural Resources
06
Social Contribution07
Additional Information08
GRI Content Index09
Financial Statements10
SOCIEDAD MATRIZ SAAM S.A. AND SUBSIDIARIES Notes to the Consolidated Financial Statements
25
NOTE 3 Summary of Accounting Policies applied, continued
3.10 Property, plant and equipment, continued
d) Leases
The Company recognizes contracts that meet the definition of a lease as an asset with aright-of-use and a liability for a lease on the date on which the underlying asset is availablefor use.
Right-of-use assets are measured at cost including the following:
● The amount of the initial measurement of the lease liability;● Initial direct costs
Right-of-use assets are recognized in the statement of financial position under Property, plant and equipment (See Note 18.1).
Lease liabilities include the net present value of the following payments:
● Essentially fixed payments● Variable payments based on an index or rate;● Call options at the exercise price, when these are reasonably certain to be exercised.
The Company determines the present value of the lease payments using the rates implicit in the underlying lease contracts, using the incremental interest rate.
Lease liabilities are recognized in the statement of financial position under current and non-current other financial liabilities (See Note 22). Interest accrued on financial liabilities is recognized in the consolidated statement of net income under "Financial costs".
For operating lease liabilities IFRS 16, capital installments and interest paid are recognized in the consolidated statement of cash flow as "Payments of liabilities under operating leases" and "Interest paid" in the Cash flow from operating activities. For financial lease liabilities, capital installments and interest paid are recognized in the consolidated statement of cash flow as "Payments of liabilities under finance leases" and "Interest paid" in the Cash flow from financing activities.
The Company does not have any embedded leases in contracts that require separation.
SOCIEDAD MATRIZ SAAM S.A. AND SUBSIDIARIES Notes to the Consolidated Financial Statements
26
NOTE 3 Summary of Accounting Policies applied, continued
3.10 Property, plant and equipment, continued
e) Impairment of property, plant and equipment
At the year-end, or when deemed necessary, the Company and its subsidiary evaluate whether there are signs of impairment in their assets, such as significant decreases in value, indicators of obsolescence or physical deterioration, changes in the legal, economic or technological environment in which the asset operates. If there are such indicators, an estimate of the recoverable amount of such assets is made. The recoverable amount of an asset is the higher of the fair value less cost to sell and the value in use. To determine the fair value less costs to sell, independent expert reports and / or available objective information are used. To determine the value in use, the estimated future cash flows are discounted at the WACC rate of the Company. In the case of assets that do not generate cash flows independently, the impairment will be evaluated based on the grouping of assets that generate identifiable flows (cash generating units). In the event that the recoverable amount of the asset is lower than the net book value, the corresponding adjustment for impairment will be recorded with a charge to income, leaving the asset recorded at its recoverable value. In the case of revalued assets, impairment losses are recognized with a charge to equity up to the amount of the previous revaluation. Impairment losses recognized in prior periods will be evaluated at each year-end, in order to determine any indication that the loss has decreased or disappeared, recognizing the reversal with credit to results unless an asset is recorded at the revalued amount, in which case the reversal is credited to equity. As of the closing date, SM SAAM S.A. and its subsidiaries do not present evidence of impairment due to significant changes such as a decrease in market value, obsolescence, physical damage, market return, etc. that may affect the valuation of Property, Plant and Equipment, other than those already recognized in this fiscal year.
3.11 Investment properties
Investment properties are real estate held for the purpose of obtaining rent for lease or to obtain capital appreciation in the investment or both at the same time, but not for sale in the normal course of business, use in the production or supply of goods or services, or for administrative purposes. Investment properties are valued at cost less accumulated depreciation and accumulated impairment losses. When the use of a property changes, the value is reclassified to the item of the balance sheet that best reflects the new use of the property.
226
2021 Integrated Report
Welcome Message00
SAAM, a Vocation of Service for the Foreign Trade Industry
01
Leadership and Governance Framework
02
Business Model03
Our Team04
Supplier Management05
Efficient Use of Natural Resources
06
Social Contribution07
Additional Information08
GRI Content Index09
Financial Statements10
SOCIEDAD MATRIZ SAAM S.A. AND SUBSIDIARIES Notes to the Consolidated Financial Statements
27
NOTE 3 Summary of Accounting Policies applied, continued
3.12 Provisions
A provision is recognised when there is a legal or constructive obligation as a result of a past event and it is likely that a resource disbursement, including economic benefits, will be required to settle the obligation, and its value can be reliably estimated. The amount for which the provision is recognized corresponds to the best estimate at the end of the reporting period of the expenditure required to settle the obligation. When the estimated payment time is long term and can be estimated with sufficient reliability, the provision is recorded at its current value, discounting estimated cash flows at a market interest rate that reflects the specific risks of the obligation.
Provisions must be reviewed at the end of each reporting period, and adjusted accordingly to reflect at all times the best estimate available.
3.13 Financial liabilities
These liabilities are initially recognized at their transaction value. The costs incurred that are directly attributable to the transaction are amortized during the period of the loan and are presented net of the liability. They are measured at amortized cost, using the effective interest rate method (annual equivalent charge).
3.14 Trade and other payables
Included in this item are the amounts pending payment for commercial purchases and related expenses, in addition to non-commercial debts, such as sundry creditors, withholdings related to the remuneration of personnel and others.
3.15 Employee benefits
a) Defined benefit plans
Some of the Company’s subsidiaries are obliged to pay severance indemnities under thecollective bargaining agreements. This obligation is provisioned applying the actuarialvalue method of the accrued cost of the benefit, at a nominal annual discount rate of5.65%, considering estimates such as future permanence, mortality rate of the workersand future wage increases, determined on the basis of actuarial calculations.
All assumptions are reviewed once a year. In the determination of the discount rate, theinterest rates of the instruments issued by the Central Bank of Chile are considered asreference. The mortality rate is based on publicly available mortality tables for thecountry. Future salary and pension increases are based on projected future increases inthe inflation rate for the country. (See details of the actuarial assumptions used in Note26.3 and 26.4).
SOCIEDAD MATRIZ SAAM S.A. AND SUBSIDIARIES Notes to the Consolidated Financial Statements
28
NOTE 3 Summary of Accounting Policies applied, continued
3.15 Employee benefits, continued
b) Short-term benefits
Obligations for short-term employee benefits are measured on an undiscounted basis andaccounted for in the statement of income by function as the related service is accrued.
3.16 Revenue from operating activities and costs of sales
The revenue from ordinary activities and the cost of sales derived from the provision of services, is recognized in income on accrual basis.
Revenue from ordinary activities is recognized only to the extent that it can be reliably measured and it is probable that the economic benefits will flow to the Company regardless of when the effective recovery occurs.
The costs of sales associated with the services rendered are recognized on an accrual basis directly to the respective business areas of the Company.
Revenue from ordinary activities and cost of sales are recognized net of discounts.
3.17 Financial income and financial costs
Finance income is recognized in the statement of comprehensive income by function according to its accrual.
Financial costs are generally taken to the statement of net income when they are incurred, except those that finance the construction or development of qualifying assets that require a substantial period to prepare them for use, and those related to the actuarial cost of staff benefits.
3.18 Income tax
The Company and its subsidiaries in Chile account for income tax based on the net taxable income determined according to the rules established in the Income Tax Law. This calculation for foreign subsidiaries complies with the laws in their respective countries.
3.19 Deferred taxes
Deferred tax assets and liabilities are recognized using the statement of financial position method, determining the temporary differences between the book value of the assets and liabilities and their tax base and are recorded as set forth in IAS 12 "Income tax".
227
2021 Integrated Report
Welcome Message00
SAAM, a Vocation of Service for the Foreign Trade Industry
01
Leadership and Governance Framework
02
Business Model03
Our Team04
Supplier Management05
Efficient Use of Natural Resources
06
Social Contribution07
Additional Information08
GRI Content Index09
Financial Statements10
SOCIEDAD MATRIZ SAAM S.A. AND SUBSIDIARIES Notes to the Consolidated Financial Statements
29
NOTE 3 Summary of Accounting Policies applied, continued
3.19 Deferred taxes, continued
Deferred taxes are measured at the tax rates expected to be applied to the temporary difference when they are reversed based on laws approved or to be approved on the closing date of each financial statement.
3.20 Investments and other financial assets
a.1) Classification
SM SAAM classifies its financial assets in the following measurement categories:
● Those that are subsequently valued at fair value (either through othercomprehensive income, or through profit and loss), and
● Those that are valued at amortized cost.
The classification depends on the Company's business model for the management of financial assets and on the contractual terms of the cash flows.
For assets measured at fair value, gains and losses are recorded in profit or loss or in other comprehensive income. For investments in equity instruments that are not held for trading, this will depend on whether the Company has made an irrevocable decision at initial recognition to record the investment at fair value through other comprehensive income. The Company will reclassify debt instruments when, and only when, its business model for asset management changes.
a.2) Recognition
Routine purchases and sales of financial assets are recognized as of the transaction date, which is the date that the Company commits to purchase or sell the asset. Financial assets are de-recognized when the rights to receive cash flows from the financial asset have expired or have been transferred and the Company has transferred substantially all risks and rewards of ownership.
a.3) Measurement
Financial assets are valued at initial recognition at fair value plus transaction costs directly attributable to the acquisition of the financial asset, in the case of a financial asset that is not recognized at fair value through profit or loss. Transaction costs of financial assets recognized at fair value through profit and loss are recorded in the statement of net income. Financial assets with embedded derivatives are considered in their entirety when determining whether cash flows are only payments of principal and interest.
SOCIEDAD MATRIZ SAAM S.A. AND SUBSIDIARIES Notes to the Consolidated Financial Statements
30
NOTE 3 Summary of Accounting Policies applied, continued
3.20 Investments and other financial assets, continued
b) Non-derivative financial instruments Financial instruments are classified at the time of initial recognition as a financial asset, a financial liability or an equity instrument, in accordance with the economic fund of the contractual agreement. Likewise, and for the purpose of their valuation, financial instruments are classified in the categories of financial assets at fair value through profit or loss, loans and accounts receivable, investments held to maturity and financial liabilities. The classification in the previous categories is made according to the characteristics of the instrument and the purpose that determined its acquisition. SM SAAM derecognizes a financial liability when its contractual obligations are cancelled or expire. After the initial recognition, the non-derivative financial instruments are measured as described below:
b.1) Financial assets at fair value through profit or loss
An instrument is classified at fair value through profit or loss if it is held for trading or is designated as such since its initial recognition. A financial asset or liability is classified as held for trading if:
• It is acquired or incurred primarily for the purpose of selling or repurchasing it in the immediate future,
• It is part of a portfolio of identified financial instruments, which are managed jointly and for which there is evidence of a recent pattern of obtaining short-term benefits or,
• It is a derivative, except for a derivative that has been designated as a hedging instrument and meets the conditions to be effective.
228

2021 Integrated Report
Welcome Message00
SAAM, a Vocation of Service for the Foreign Trade Industry
01
Leadership and Governance Framework
02
Business Model03
Our Team04
Supplier Management05
Efficient Use of Natural Resources
06
Social Contribution07
Additional Information08
GRI Content Index09
Financial Statements10
SOCIEDAD MATRIZ SAAM S.A. AND SUBSIDIARIES Notes to the Consolidated Financial Statements
31
NOTE 3 Summary of Accounting Policies applied, continued
3.20 Investments and other financial assets, continued
b) Non-derivative financial instruments, continued
b.1) Financial assets at fair value through profit or loss, continued
Financial assets at fair value through profit or loss are initially recognized at fair value. Transaction costs directly attributable to the purchase or issue are recognized as an expense when incurred. Subsequent to their initial recognition, they are recognized at fair value by recording the changes in results.
c) Other
Other non-derivative financial instruments, which include accounts receivable and loans, are measured at amortized cost using the effective interest method, less any impairment loss.
d) Impairment of financial assets
The provisions for doubtful debts are determined based on the expected loss of the assets, determined by evaluating the historical payment behaviour of the clients of the various segments that make up the portfolio. For this evaluation, recoverability matrices are elaborated consisting of age tranches, which show the percentages of doubtful debts that are expected to occur during the life of the asset and are recognized from the initial moment.
Loans and accounts receivable are included in "Trade and other receivables” in the consolidated statement of financial position, except those with maturities exceeding twelve months from the closing date that are classified as trade and other receivables, non-current. They are accounted for at amortized cost using the effective interest rate method, with this corresponding to their initial fair value.
The effective interest rate method is a method of calculating the amortized cost of a financial asset or liability and of allocating the financial income or expense over the relevant period. The effective interest rate is the discount rate that exactly matches the estimated cash flows receivable or payable over the expected life of the financial instrument (or when appropriate in a shorter period) with the net carrying amount of the financial asset or financial liability.
SOCIEDAD MATRIZ SAAM S.A. AND SUBSIDIARIES Notes to the Consolidated Financial Statements
32
NOTE 3 Summary of Accounting Policies applied, continued
3.20 Investments and other financial assets, continued
d) Impairment of financial assets, continued
Current trade accounts are not discounted The Company has determined that the calculation of amortized cost does not differ from the invoiced amount because the transaction has no significant associated costs.
3.21 Derivative financial instruments and hedge activities.
a) Financial derivative instruments
Derivative financial instruments to hedge foreign currency risk exposure and the interest rate are initially recognized at fair value. The costs of attributable transactions are recognized in the income statement when incurred. After the initial recognition, the non-derivative financial instruments are measured at fair value, and their changes are recorded as described below:
a.1) Fair value hedge
Derivative financial instruments that satisfy hedge accounting criteria are initially recognized at fair value plus / minus the transaction costs that are directly attributable to contracting or issuing the instrument, as appropriate. Changes in the fair value of derivatives that are designated and qualify as fair value hedges are recorded in the consolidated statement of net income, together with any change in the fair value of the hedged asset or liability that are attributable to the hedged risk.
a2) Cash flow hedge
The effective portion of changes in the fair value of derivatives that are designated and qualify as cash flow hedges are recognized in the statement of other comprehensive income. Any loss or gain related to the ineffective portion is recognized immediately in the consolidated statement of net income within other income (losses). The amounts accumulated in equity are reclassified to the statement of net income in the periods in which the protected item impacts the statement of net income.
Variable interest rate hedges that are recognized in the statement of other comprehensive income are reclassified to the statement of net income within financial expenses as the associated debts accrue interest.
Foreign currency hedges that are recognized in the statement of other comprehensive income are reclassified to the statement of net income as the hedged items are impacted by changes in exchange rates and affect the statement of net income.
229
2021 Integrated Report
Welcome Message00
SAAM, a Vocation of Service for the Foreign Trade Industry
01
Leadership and Governance Framework
02
Business Model03
Our Team04
Supplier Management05
Efficient Use of Natural Resources
06
Social Contribution07
Additional Information08
GRI Content Index09
Financial Statements10
SOCIEDAD MATRIZ SAAM S.A. AND SUBSIDIARIES Notes to the Consolidated Financial Statements
33
NOTE 3 Summary of Accounting Policies applied, continued
3.21 Derivative financial instruments and hedge activities, continued a2) Cash flow hedge, continued When a hedge instrument matures, or is sold, or when it no longer satisfies hedge accounting criteria, any gain or loss accumulated in the statement of other comprehensive income until that point remains in the statement of other comprehensive income and is recognized when the forecast transaction is finally recognized in the consolidated statement of net income. When the forecast transaction is not expected to occur, any accumulated gain or loss accumulated in the statement of other comprehensive income is recognized immediately in the consolidated statement of net income within other income (losses). a.3) Derivatives not designated as hedges Hedge accounting is not applicable to derivative instruments that financially cover monetary assets and liabilities denominated in foreign currencies. Changes in the fair value of such derivatives are recognized in the statement of net income by function within foreign exchange differences.
Derivative financial instruments that do not satisfy hedge accounting criteria are classified and valued as financial assets or liabilities at fair value through profit and loss.
3.22 Non-current assets held for sale.
Non-current assets, or groups of assets and / or liabilities, that are expected to be recovered mainly through sales instead of being recovered through their continuous use are classified as available for sale and valued at the lower of carrying amount and fair value less costs to sell. Immediately prior to this classification, the assets, or elements of an available-for-sale group, are valued at the lower of carrying amount and fair value less cost to sell. Any impairment loss in a group for disposal is first allocated to goodwill, and then to the remaining assets and liabilities based on apportionment. Impairment losses in the initial classification of available for sale and gains or losses subsequent to such classification, are recognized in profit or loss. Gains are only recognized once the accumulated impairment losses are covered.
SOCIEDAD MATRIZ SAAM S.A. AND SUBSIDIARIES Notes to the Consolidated Financial Statements
34
NOTE 3 Summary of Accounting Policies applied, continued
3.23 Determination of fair values
Some criteria and accounting disclosures of the Group require that the fair value of certain financial assets be determined in accordance with the following:
a) Financial assets
The fair value of financial assets at fair value through profit or loss and financial assetsavailable for sale are determined at market value.
b) Trade and other receivables
Considering that trade receivables are due within 120 days less than, it is estimated thattheir fair value does not differ significantly from their book value.
c) Derivatives
The fair value of derivative contracts is based on their quoted price.
3.24 Minimum dividend
As of December 31, 2021, and December 31, 2020, the Company has provisioned the minimum dividend according to Article 79 of Chilean Corporate Law, which establishes that listed corporations should distribute an annual cash dividend to their shareholders, in proportion to their shares or the proportion established in the company's by-laws if it has preferred shares, of at least 30% of net income for each period, except when accumulated losses from prior years must be absorbed, and unless unanimously agreed otherwise by shareholders of all issued shares. SM SAAM determines the amount of minimum dividends to be paid to its shareholders during the next year, and it is recorded under “Other non-financial liabilities, current” with a charge to an item included in Equity called “Retained Earnings (Losses)”.
3.25 Environment
If there are environmental liabilities, they are recorded based on the current interpretation of environmental laws and regulations, when it is probable that an obligation will occur and the amount of said liability can be calculated reliably.
The disbursements associated with the environment protection are recognized in income when incurred.
230

2021 Integrated Report
Welcome Message00
SAAM, a Vocation of Service for the Foreign Trade Industry
01
Leadership and Governance Framework
02
Business Model03
Our Team04
Supplier Management05
Efficient Use of Natural Resources
06
Social Contribution07
Additional Information08
GRI Content Index09
Financial Statements10
SOCIEDAD MATRIZ SAAM S.A. AND SUBSIDIARIES Notes to the Consolidated Financial Statements
35
NOTE 3 Summary of Accounting Policies applied, continued
3.26 New accounting pronouncements
Standards, interpretations and amendments that are mandatory for the first time for financial periods beginning on January 1, 2021.
Amendments and improvements
Amendments to IFRS 9, IAS 39, IFRS 7, IFRS 4 and IFRS 16 "Reform of the reference interest rate (IBOR) - Phase 2". Published August 2020. Addresses issues that arise during interest rate benchmark reform, including the replacement of a benchmark rate with an alternative.
Amendment to IFRS 16 "Rental Concessions" Published in March 2021. This amendment extends for one year the period of application of the practical file of IFRS 16 Leases (contained in the amendment to said standard published in May 2020), with the purpose of helping tenants account for rental concessions related to Covid-19. The initial coverage of the amendment is extended from June 30, 2021 to June 30, 2022. The amendment is effective for annual periods beginning on or after April 1, 2021, however, early adoption is permitted. including for financial statements whose issue has not been authorized as of March 31, 2021.
Amendment to IFRS 4 “Insurance contracts”: postponement of IFRS 9 (issued on June 25, 2020). This amendment defers the date of application of IFRS 17 by two years until January 1, 2023 and changes the date set for the temporary exemption in IFRS 4 to apply IFRS 9 "Financial Instruments" until January 1, 2023.
SOCIEDAD MATRIZ SAAM S.A. AND SUBSIDIARIES Notes to the Consolidated Financial Statements
36
NOTE 3 Summary of Accounting Policies applied, continued
3.26 New accounting pronouncements, continued
Standards and interpretations Mandatory for years starting on
Amendment to IFRS 3, “Business Combinations” minor amendments were made to IFRS 3 to update the references to the Conceptual Framework for financial information, without changing the requirements of business combinations.
01/01/2022
Amendment to IAS 16, "Property, Plant and Equipment" prohibits companies from deducting from the cost of property, plant, and equipment the income received from the sale of items produced while the company is preparing the asset for its intended use. The company must recognize such sales revenue and related costs in profit or loss for the year.
01/01/2022
Amendment to IAS 37, “Provisions, contingent liabilities and contingent assets” clarifies for onerous contracts what unavoidable costs a company must include to assess whether a contract will generate losses.
01/01/2022
Annual improvements to the IFRS standards cycle 2018-2020. The following improvements were completed in May 2020:
- IFRS 9 Financial instruments: it clarifies which fees should be included in the 10% test for derecognition of financial liabilities.- IFRS 16 Leases: modification of illustrative example 13 to remove the illustration of lessor payments in relation to lease improvements, to clear any confusion regarding the treatment of lease incentives.- IFRS 1 First-time Adoption of International Financial Reporting Standards: it allows entities that havemeasured their assets and liabilities at the carrying amounts recorded in the accounting books of theirparent to also measure cumulative exchange differences on translation using the amounts reported by the parent. This amendment will also apply to associates and joint ventures that have taken the same IFRS 1exemption.- IAS 41 Agriculture: elimination of the requirement for entities to exclude tax cash flows when measuringfair value under IAS 41. This amendment intends to align with the standard's requirement of discountingcash flows after tax.
01/01/2022
IFRS 17 “Insurance Contracts”. Published in May 2017, it replaces the current IFRS 4. IFRS 17 will mainly change the accounting for all entities that issue insurance contracts and investment contracts with discretionary participation features. The standard applies to annual periods beginning on or after January 1, 2023, allowing early application as long as IFRS 9, "Financial Instruments" is applied.
01/01/2023
Amendment to IAS 1 "Presentation of financial statements" on the classification of liabilities". This amendment clarifies that liabilities will be classified as current or non-current depending on the rights that exist at the end of the reporting period. The classification is not affected. by the entity's expectations or events after the reporting date (for example, receipt of a waiver or breach of covenant). The amendment also clarifies what IAS 1 means when it refers to the "settlement" of a liability the amendment must be applied retrospectively in accordance with IAS 8. Effective date of initial application January 1, 2022 however, said date was deferred to January 1, 2024.
01/01/2024
Amendments to IAS 1 "Presentation of financial statements" and IAS 8 "Accounting Policies, Changes in Accounting Estimates and Errors", published in February 2021. The amendments are intended to improve accounting policy disclosures and help users of the financial statements to distinguish between changes in accounting estimates and changes in accounting policies.
01/01/2023
Modification of IAS 12 - Deferred taxes related to assets and liabilities arising from a single transaction. These amendments require companies to recognize deferred taxes on transactions that, on initial recognition, give rise to equal amounts of taxable and deductible temporary differences.
01/01/2023
Amendment to IFRS 10 “Consolidated Financial Statements” and IAS 28 “Investments in Associates and Joint Ventures”. Published in September 2014. This amendment addresses an inconsistency between the requirements of IFRS 10 and those of IAS 28 in the treatment of the sale or contribution of assets between an investor and its associate or joint venture. The main consequence of the amendments is that a full gain or loss is recognized when the transaction involves a business (whether in a subsidiary or not) and a partial gain or loss when the transaction involves assets that do not constitute a business, even if these assets are in a subsidiary. Early application is allowed.
undetermined
The management of the Company believes that adoption of the standards, amendments and interpretations described above will not have a significant impact on the consolidated financial statements of the Company in the period of first-time adoption.
231

2021 Integrated Report
Welcome Message00
SAAM, a Vocation of Service for the Foreign Trade Industry
01
Leadership and Governance Framework
02
Business Model03
Our Team04
Supplier Management05
Efficient Use of Natural Resources
06
Social Contribution07
Additional Information08
GRI Content Index09
Financial Statements10
SOCIEDAD MATRIZ SAAM S.A. AND SUBSIDIARIES Notes to the Consolidated Financial Statements
37
NOTE 4 Accounting change
During the year from January 1 to December 31, 2021, the Company has applied the accounting principles uniformly in relation to year 2020.
NOTE 5 Risk management
The risks arising from the Company's operations are credit risk, liquidity risk, market risk, currency risk, operational risk and capital management risk. The Company manages exposure to them in accordance with its strategy.
SM SAAM manages its risks with the purpose of identifying and analysing the risks faced by the Company, setting limits and appropriate risk controls.
The Company's sources of financing are mainly comprised of shareholders' equity, financial debts from loans and leasing operations, and accounts payable plus cash flows from operations. Financing should have a balanced short and long term structure, a low risk exposure and repayments that match the Company’s cash flow, in order to mitigate the effects of risk.
a) Credit risk
Credit risk is the risk of financial loss for the Company in the event that a customer or counterparty to a financial instrument fails to meet its contractual obligations. It arises mainly from accounts receivable from customers. Credit is regularly reviewed in order to apply the controls defined by the Company and monitor the condition of the outstanding accounts receivable.
Services are provided to customers under market conditions, which involves simple credit that does not exceed 90 days on average in SAAM Logistics, 30 days in SAAM Puertos and 60 days in SAAM S.A. These transactions are not concentrated in relevant customers; instead, the Company's customers are quite atomized, which allows the risk to be distributed.
The Company has defined customer categories with respect to their arrears based on defined default criteria, which further define the corresponding collection measures and when they are exhausted, legal collection. Default is based on the customers' inability to pay their obligations on the dates they fall due. When the credit period expires, the Company will classify the debtor within the established default ranges and apply the expected loss percentages defined by the Company.
The Company applies the simplified approach of IFRS 9 to measure expected credit losses using an expected loss provision over the life of the instrument for all receivables.
SOCIEDAD MATRIZ SAAM S.A. AND SUBSIDIARIES Notes to the Consolidated Financial Statements
38
NOTE 5 Risk management, continued
a) Credit risk, continued
Expected credit losses are measured by grouping receivables by their shared credit risk characteristics and days overdue. Therefore, the Company has concluded that the expected loss rates for receivables are a reasonable approximation of the loss rates for these assets.
For the 2021 period, the reassessment of the expected loss rates was made as of September 30, 2021, based on the payment profiles of accounts receivable as of March 31, 2021 in a period of 6 months after that date, considering the corresponding historical credit losses experienced within the current period. Historical loss rates are adjusted to reflect current and prospective information on various macroeconomic and customer-specific factors that affect their ability to settle receivables, such as the status of the country, industry, inflation, bankruptcy, and other factors. The Company analyses the specific market situation of each customer where necessary and has determined specific events that could affect their creditworthiness, resulting in higher risk factors where appropriate.
The estimation techniques and assumptions have not been amended during the year.
On this basis, the provision for losses as of December 31, 2021 and December 31, 2020 was as follows.
Segment Category Ranges Average %
Expected loss SAAM S.A.
Average % Expected loss SAAM Puertos
S.A.
Average % Expected loss
SAAM Logístics S.A.
Bucket 1
A1 On time 0,25 0,16 0,15 A2 1 - 30 d 1,64 1,66 2,05 A3 31 - 60 d 4,85 3,41 4,47 A4 61 - 90 d 8,60 5,41 7,55
Bucket 2 B1 91 - 120 d 16,38 25,66 14,80 B2 121 - 180 d 26,52 32,91 23,87 B3 181 - 240 d 48,81 43,41 35,73
Bucket 3 C1 241 - 300 d 72,10 71,16 59,70 C2 301 - 360 d 84,45 84,66 75,82 C3 Más de 360 d 100 100 100
Note: For those documents in judicial collection, protested checks and other related documents, 100% of the expected loss is directly applied.
Currently, the determination of the percentages of expected loss due to the impairment of accounts receivable is carried out separately by each company composing the SAAM Group. This is because each Company behaves differently in the loans granted and in its collection management.
Receivables are written off when there is no reasonable expectation of recovery. Indicators that there is no reasonable expectation of recovery include, among others, the debtor's failure to suggest a payment plan with the Company and the impossibility of making contractual payments for a period exceeding 360 days past due, in addition to external and judicial collection efforts.
232
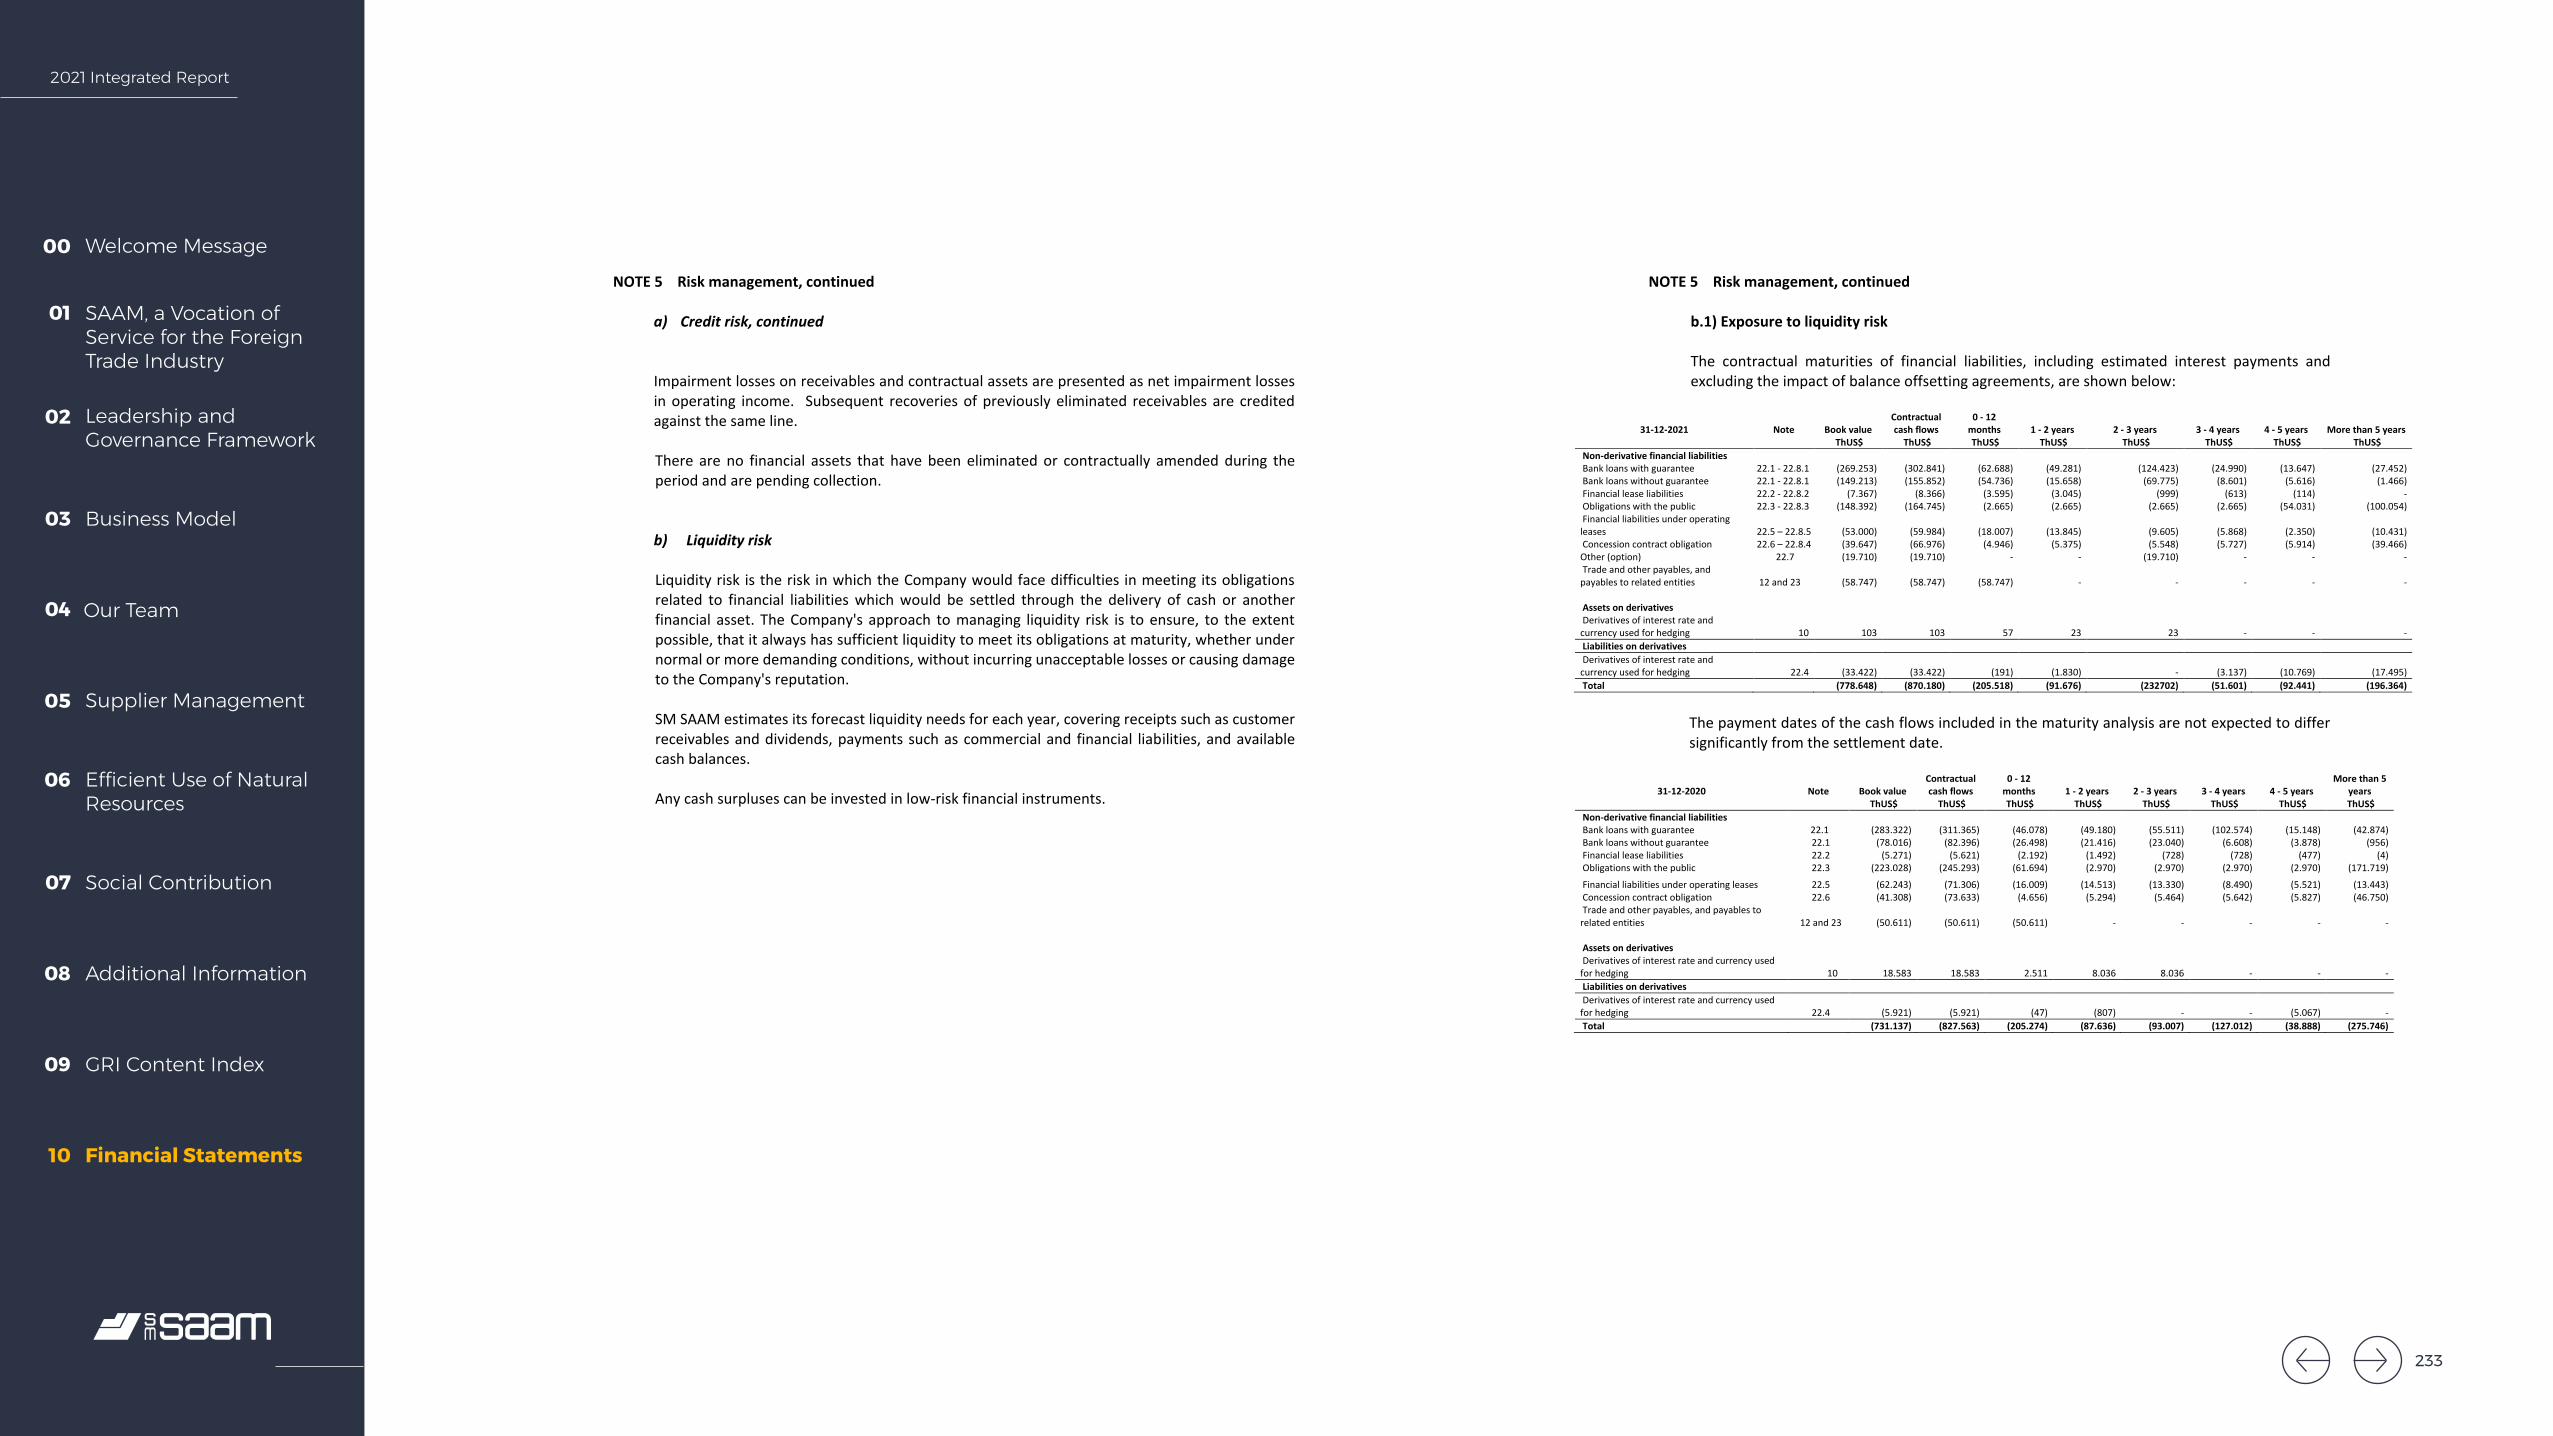
2021 Integrated Report
Welcome Message00
SAAM, a Vocation of Service for the Foreign Trade Industry
01
Leadership and Governance Framework
02
Business Model03
Our Team04
Supplier Management05
Efficient Use of Natural Resources
06
Social Contribution07
Additional Information08
GRI Content Index09
Financial Statements10
SOCIEDAD MATRIZ SAAM S.A. AND SUBSIDIARIES Notes to the Consolidated Financial Statements
39
NOTE 5 Risk management, continued
a) Credit risk, continued
Impairment losses on receivables and contractual assets are presented as net impairment losses in operating income. Subsequent recoveries of previously eliminated receivables are credited against the same line.
There are no financial assets that have been eliminated or contractually amended during the period and are pending collection.
b) Liquidity risk
Liquidity risk is the risk in which the Company would face difficulties in meeting its obligations related to financial liabilities which would be settled through the delivery of cash or another financial asset. The Company's approach to managing liquidity risk is to ensure, to the extent possible, that it always has sufficient liquidity to meet its obligations at maturity, whether under normal or more demanding conditions, without incurring unacceptable losses or causing damage to the Company's reputation.
SM SAAM estimates its forecast liquidity needs for each year, covering receipts such as customer receivables and dividends, payments such as commercial and financial liabilities, and available cash balances.
Any cash surpluses can be invested in low-risk financial instruments.
SOCIEDAD MATRIZ SAAM S.A. AND SUBSIDIARIES Notes to the Consolidated Financial Statements
40
NOTE 5 Risk management, continued
b.1) Exposure to liquidity risk
The contractual maturities of financial liabilities, including estimated interest payments and excluding the impact of balance offsetting agreements, are shown below:
31-12-2021 Note Book value Contractual cash flows
0 - 12 months 1 - 2 years 2 - 3 years 3 - 4 years 4 - 5 years More than 5 years
ThUS$ ThUS$ ThUS$ ThUS$ ThUS$ ThUS$ ThUS$ ThUS$ Non-derivative financial liabilities Bank loans with guarantee 22.1 - 22.8.1 (269.253) (302.841) (62.688) (49.281) (124.423) (24.990) (13.647) (27.452) Bank loans without guarantee 22.1 - 22.8.1 (149.213) (155.852) (54.736) (15.658) (69.775) (8.601) (5.616) (1.466) Financial lease liabilities 22.2 - 22.8.2 (7.367) (8.366) (3.595) (3.045) (999) (613) (114) - Obligations with the public 22.3 - 22.8.3 (148.392) (164.745) (2.665) (2.665) (2.665) (2.665) (54.031) (100.054) Financial liabilities under operating leases 22.5 – 22.8.5 (53.000) (59.984) (18.007) (13.845) (9.605) (5.868) (2.350) (10.431) Concession contract obligation 22.6 – 22.8.4 (39.647) (66.976) (4.946) (5.375) (5.548) (5.727) (5.914) (39.466) Other (option) 22.7 (19.710) (19.710) - - (19.710) - - - Trade and other payables, and payables to related entities 12 and 23 (58.747) (58.747) (58.747) - - - - -
Assets on derivatives Derivatives of interest rate and currency used for hedging 10 103 103 57 23 23 - - - Liabilities on derivatives Derivatives of interest rate and currency used for hedging 22.4 (33.422) (33.422) (191) (1.830) - (3.137) (10.769) (17.495) Total (778.648) (870.180) (205.518) (91.676) (232702) (51.601) (92.441) (196.364)
The payment dates of the cash flows included in the maturity analysis are not expected to differ significantly from the settlement date.
31-12-2020 Note Book value Contractual cash flows
0 - 12 months 1 - 2 years 2 - 3 years 3 - 4 years 4 - 5 years
More than 5 years
ThUS$ ThUS$ ThUS$ ThUS$ ThUS$ ThUS$ ThUS$ ThUS$ Non-derivative financial liabilities Bank loans with guarantee 22.1 (283.322) (311.365) (46.078) (49.180) (55.511) (102.574) (15.148) (42.874) Bank loans without guarantee 22.1 (78.016) (82.396) (26.498) (21.416) (23.040) (6.608) (3.878) (956) Financial lease liabilities 22.2 (5.271) (5.621) (2.192) (1.492) (728) (728) (477) (4) Obligations with the public 22.3 (223.028) (245.293) (61.694) (2.970) (2.970) (2.970) (2.970) (171.719) Financial liabilities under operating leases 22.5 (62.243) (71.306) (16.009) (14.513) (13.330) (8.490) (5.521) (13.443) Concession contract obligation 22.6 (41.308) (73.633) (4.656) (5.294) (5.464) (5.642) (5.827) (46.750) Trade and other payables, and payables to related entities 12 and 23 (50.611) (50.611) (50.611) - - - - -
Assets on derivatives Derivatives of interest rate and currency used for hedging 10 18.583 18.583 2.511 8.036 8.036 - - - Liabilities on derivatives Derivatives of interest rate and currency used for hedging 22.4 (5.921) (5.921) (47) (807) - - (5.067) - Total (731.137) (827.563) (205.274) (87.636) (93.007) (127.012) (38.888) (275.746)
233
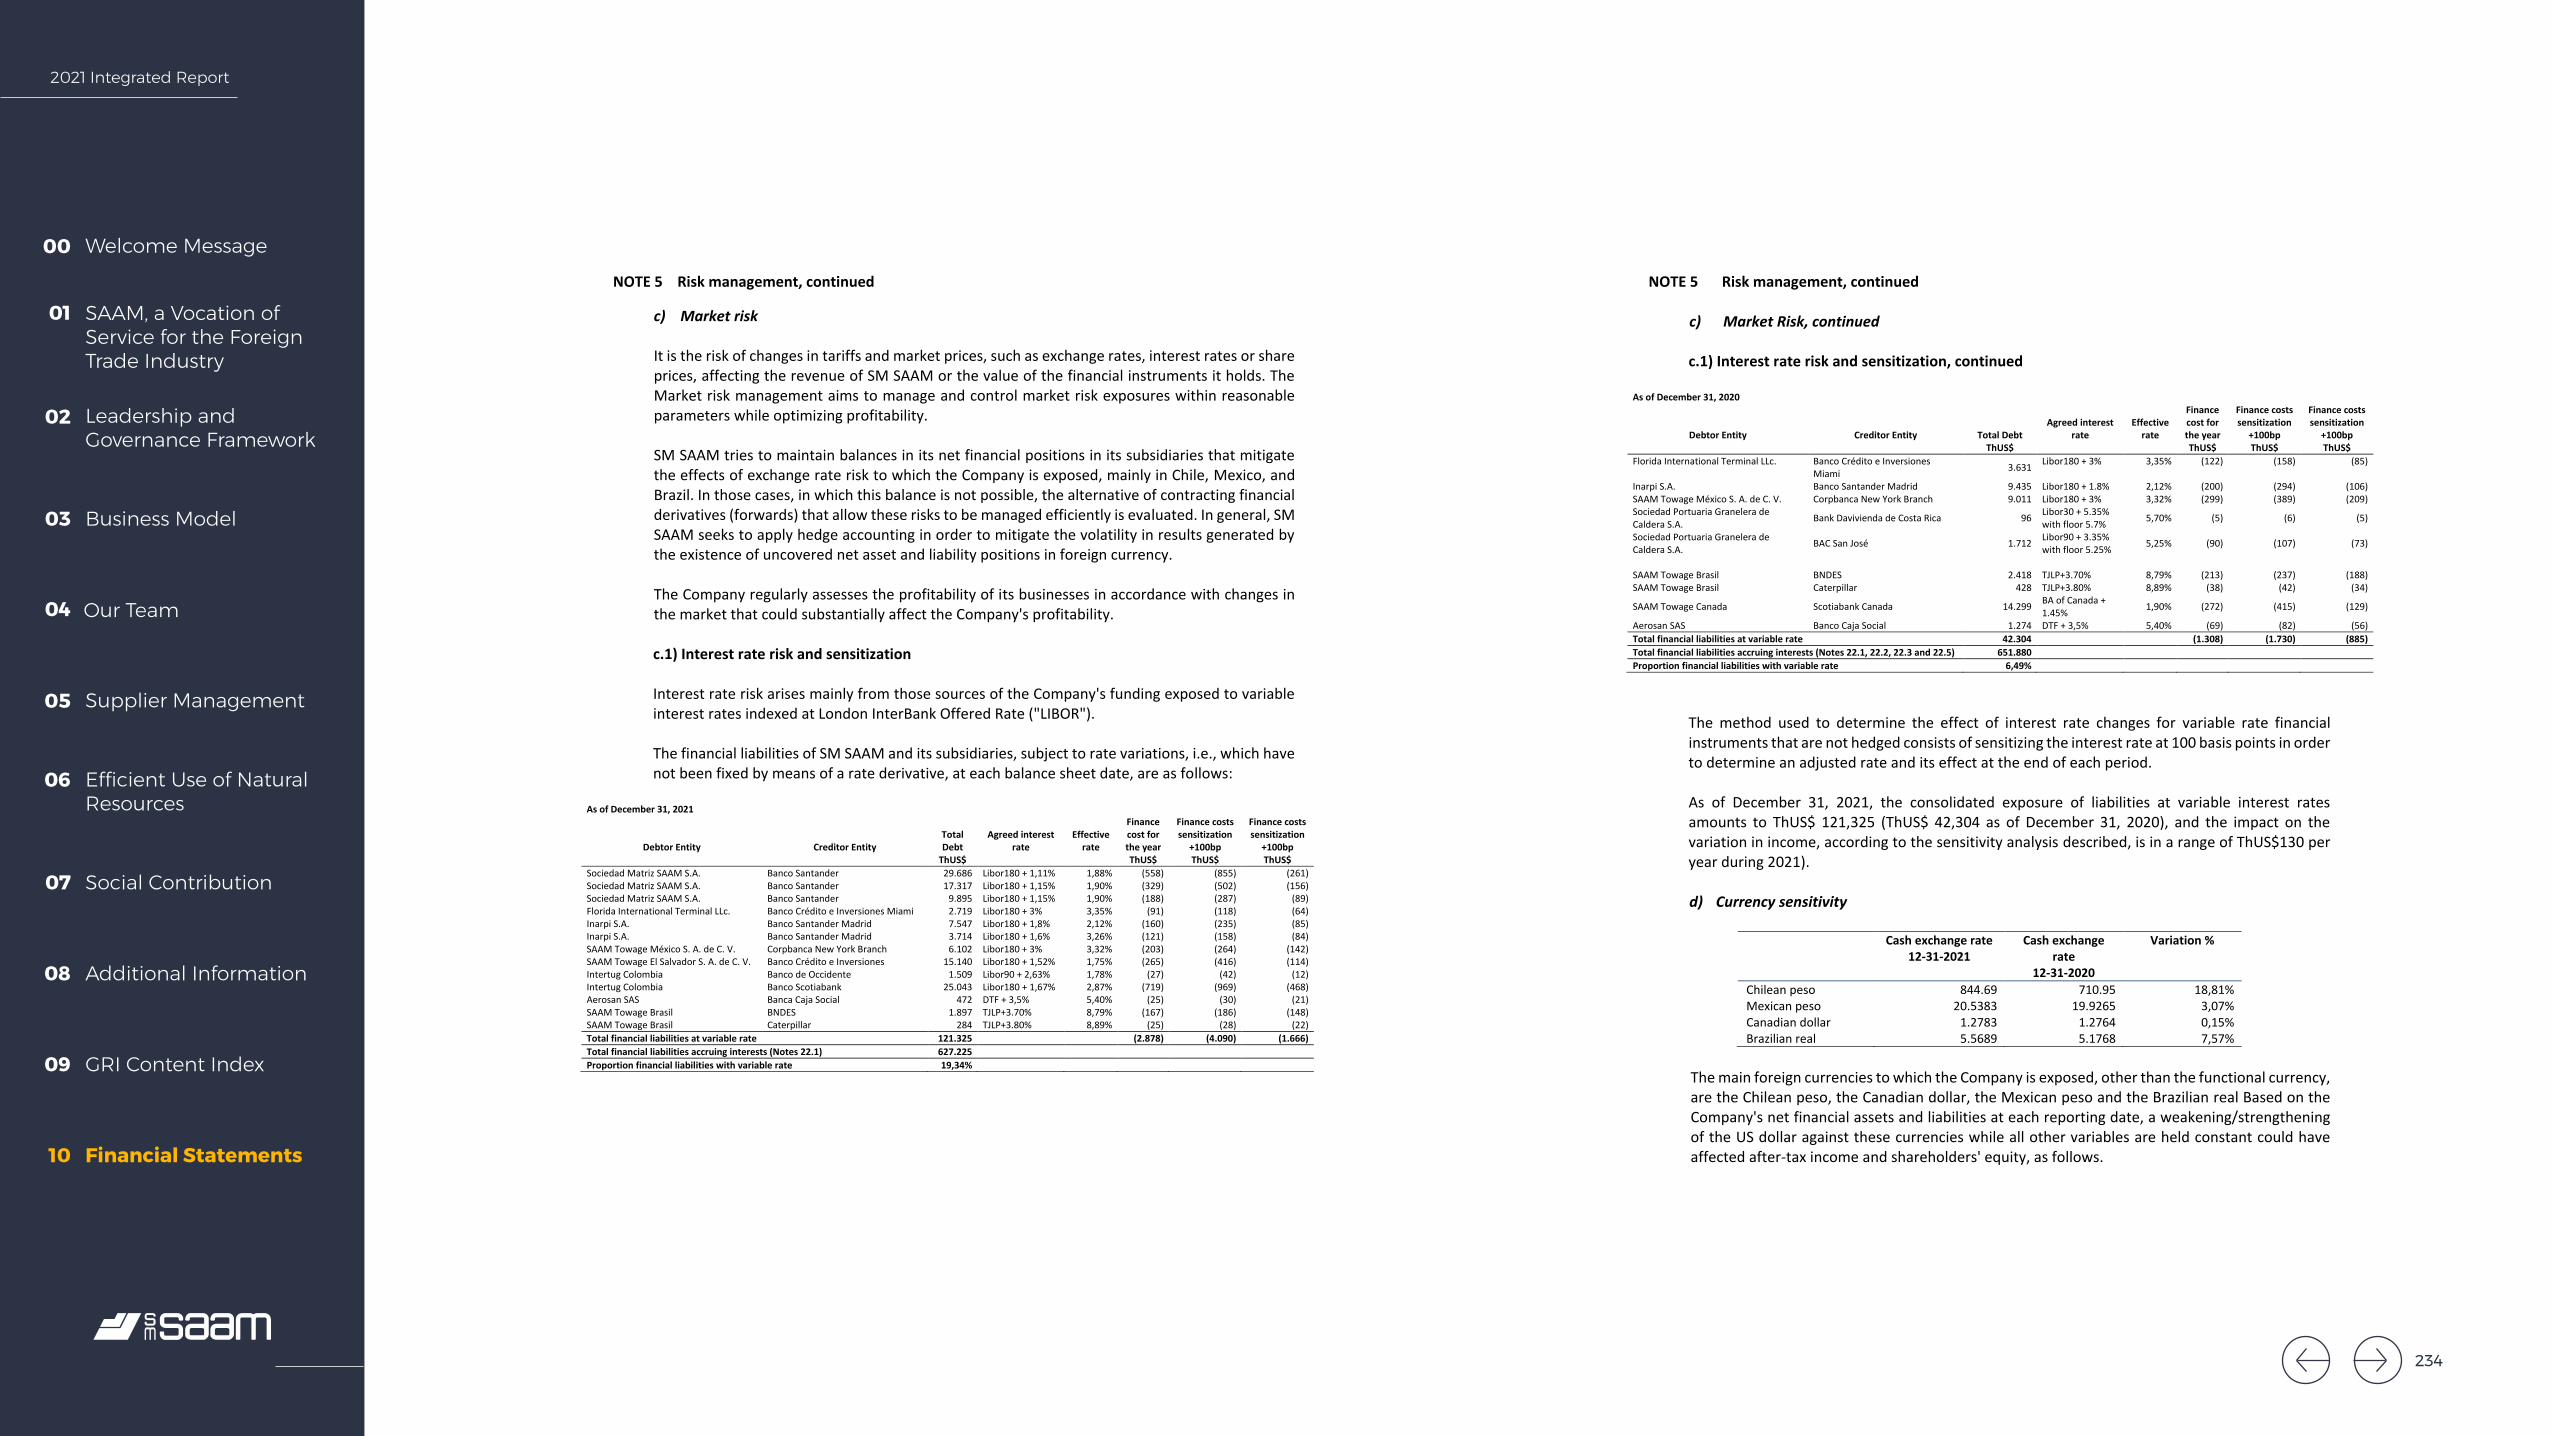
2021 Integrated Report
Welcome Message00
SAAM, a Vocation of Service for the Foreign Trade Industry
01
Leadership and Governance Framework
02
Business Model03
Our Team04
Supplier Management05
Efficient Use of Natural Resources
06
Social Contribution07
Additional Information08
GRI Content Index09
Financial Statements10
SOCIEDAD MATRIZ SAAM S.A. AND SUBSIDIARIES Notes to the Consolidated Financial Statements
41
NOTE 5 Risk management, continued
c) Market risk
It is the risk of changes in tariffs and market prices, such as exchange rates, interest rates or share prices, affecting the revenue of SM SAAM or the value of the financial instruments it holds. The Market risk management aims to manage and control market risk exposures within reasonable parameters while optimizing profitability.
SM SAAM tries to maintain balances in its net financial positions in its subsidiaries that mitigate the effects of exchange rate risk to which the Company is exposed, mainly in Chile, Mexico, and Brazil. In those cases, in which this balance is not possible, the alternative of contracting financial derivatives (forwards) that allow these risks to be managed efficiently is evaluated. In general, SM SAAM seeks to apply hedge accounting in order to mitigate the volatility in results generated by the existence of uncovered net asset and liability positions in foreign currency.
The Company regularly assesses the profitability of its businesses in accordance with changes in the market that could substantially affect the Company's profitability.
c.1) Interest rate risk and sensitization
Interest rate risk arises mainly from those sources of the Company's funding exposed to variable interest rates indexed at London InterBank Offered Rate ("LIBOR").
The financial liabilities of SM SAAM and its subsidiaries, subject to rate variations, i.e., which have not been fixed by means of a rate derivative, at each balance sheet date, are as follows:
As of December 31, 2021
Debtor Entity Creditor Entity Total Debt
Agreed interest rate
Effective rate
Finance cost for the year
Finance costs sensitization
+100bp
Finance costs sensitization
+100bpThUS$ ThUS$ ThUS$ ThUS$
Sociedad Matriz SAAM S.A. Banco Santander 29.686 Libor180 + 1,11% 1,88% (558) (855) (261) Sociedad Matriz SAAM S.A. Banco Santander 17.317 Libor180 + 1,15% 1,90% (329) (502) (156) Sociedad Matriz SAAM S.A. Banco Santander 9.895 Libor180 + 1,15% 1,90% (188) (287) (89) Florida International Terminal LLc. Banco Crédito e Inversiones Miami 2.719 Libor180 + 3% 3,35% (91) (118) (64) Inarpi S.A. Banco Santander Madrid 7.547 Libor180 + 1,8% 2,12% (160) (235) (85) Inarpi S.A. Banco Santander Madrid 3.714 Libor180 + 1,6% 3,26% (121) (158) (84) SAAM Towage México S. A. de C. V. Corpbanca New York Branch 6.102 Libor180 + 3% 3,32% (203) (264) (142) SAAM Towage El Salvador S. A. de C. V. Banco Crédito e Inversiones 15.140 Libor180 + 1,52% 1,75% (265) (416) (114) Intertug Colombia Banco de Occidente 1.509 Libor90 + 2,63% 1,78% (27) (42) (12) Intertug Colombia Banco Scotiabank 25.043 Libor180 + 1,67% 2,87% (719) (969) (468) Aerosan SAS Banca Caja Social 472 DTF + 3,5% 5,40% (25) (30) (21) SAAM Towage Brasil BNDES 1.897 TJLP+3.70% 8,79% (167) (186) (148) SAAM Towage Brasil Caterpillar 284 TJLP+3.80% 8,89% (25) (28) (22) Total financial liabilities at variable rate 121.325 (2.878) (4.090) (1.666) Total financial liabilities accruing interests (Notes 22.1) 627.225 Proportion financial liabilities with variable rate 19,34%
SOCIEDAD MATRIZ SAAM S.A. AND SUBSIDIARIES Notes to the Consolidated Financial Statements
42
NOTE 5 Risk management, continued
c) Market Risk, continued
c.1) Interest rate risk and sensitization, continued
As of December 31, 2020
Debtor Entity Creditor Entity Total Debt Agreed interest
rate Effective
rate
Finance cost for the year
Finance costs sensitization
+100bp
Finance costs sensitization
+100bpThUS$ ThUS$ ThUS$ ThUS$
Florida International Terminal LLc. Banco Crédito e Inversiones Miami 3.631 Libor180 + 3% 3,35% (122) (158) (85)
Inarpi S.A. Banco Santander Madrid 9.435 Libor180 + 1.8% 2,12% (200) (294) (106) SAAM Towage México S. A. de C. V. Corpbanca New York Branch 9.011 Libor180 + 3% 3,32% (299) (389) (209) Sociedad Portuaria Granelera de Caldera S.A. Bank Davivienda de Costa Rica 96 Libor30 + 5.35%
with floor 5.7% 5,70% (5) (6) (5)
Sociedad Portuaria Granelera de Caldera S.A. BAC San José 1.712 Libor90 + 3.35%
with floor 5.25% 5,25% (90) (107) (73)
SAAM Towage Brasil BNDES 2.418 TJLP+3.70% 8,79% (213) (237) (188) SAAM Towage Brasil Caterpillar 428 TJLP+3.80% 8,89% (38) (42) (34)
SAAM Towage Canada Scotiabank Canada 14.299 BA of Canada + 1.45% 1,90% (272) (415) (129)
Aerosan SAS Banco Caja Social 1.274 DTF + 3,5% 5,40% (69) (82) (56) Total financial liabilities at variable rate 42.304 (1.308) (1.730) (885) Total financial liabilities accruing interests (Notes 22.1, 22.2, 22.3 and 22.5) 651.880 Proportion financial liabilities with variable rate 6,49%
The method used to determine the effect of interest rate changes for variable rate financial instruments that are not hedged consists of sensitizing the interest rate at 100 basis points in order to determine an adjusted rate and its effect at the end of each period.
As of December 31, 2021, the consolidated exposure of liabilities at variable interest rates amounts to ThUS$ 121,325 (ThUS$ 42,304 as of December 31, 2020), and the impact on the variation in income, according to the sensitivity analysis described, is in a range of ThUS$130 per year during 2021).
d) Currency sensitivity
Cash exchange rate 12-31-2021
Cash exchange rate
12-31-2020
Variation %
Chilean peso 844.69 710.95 18,81% Mexican peso 20.5383 19.9265 3,07% Canadian dollar 1.2783 1.2764 0,15% Brazilian real 5.5689 5.1768 7,57%
The main foreign currencies to which the Company is exposed, other than the functional currency, are the Chilean peso, the Canadian dollar, the Mexican peso and the Brazilian real Based on the Company's net financial assets and liabilities at each reporting date, a weakening/strengthening of the US dollar against these currencies while all other variables are held constant could have affected after-tax income and shareholders' equity, as follows.
234
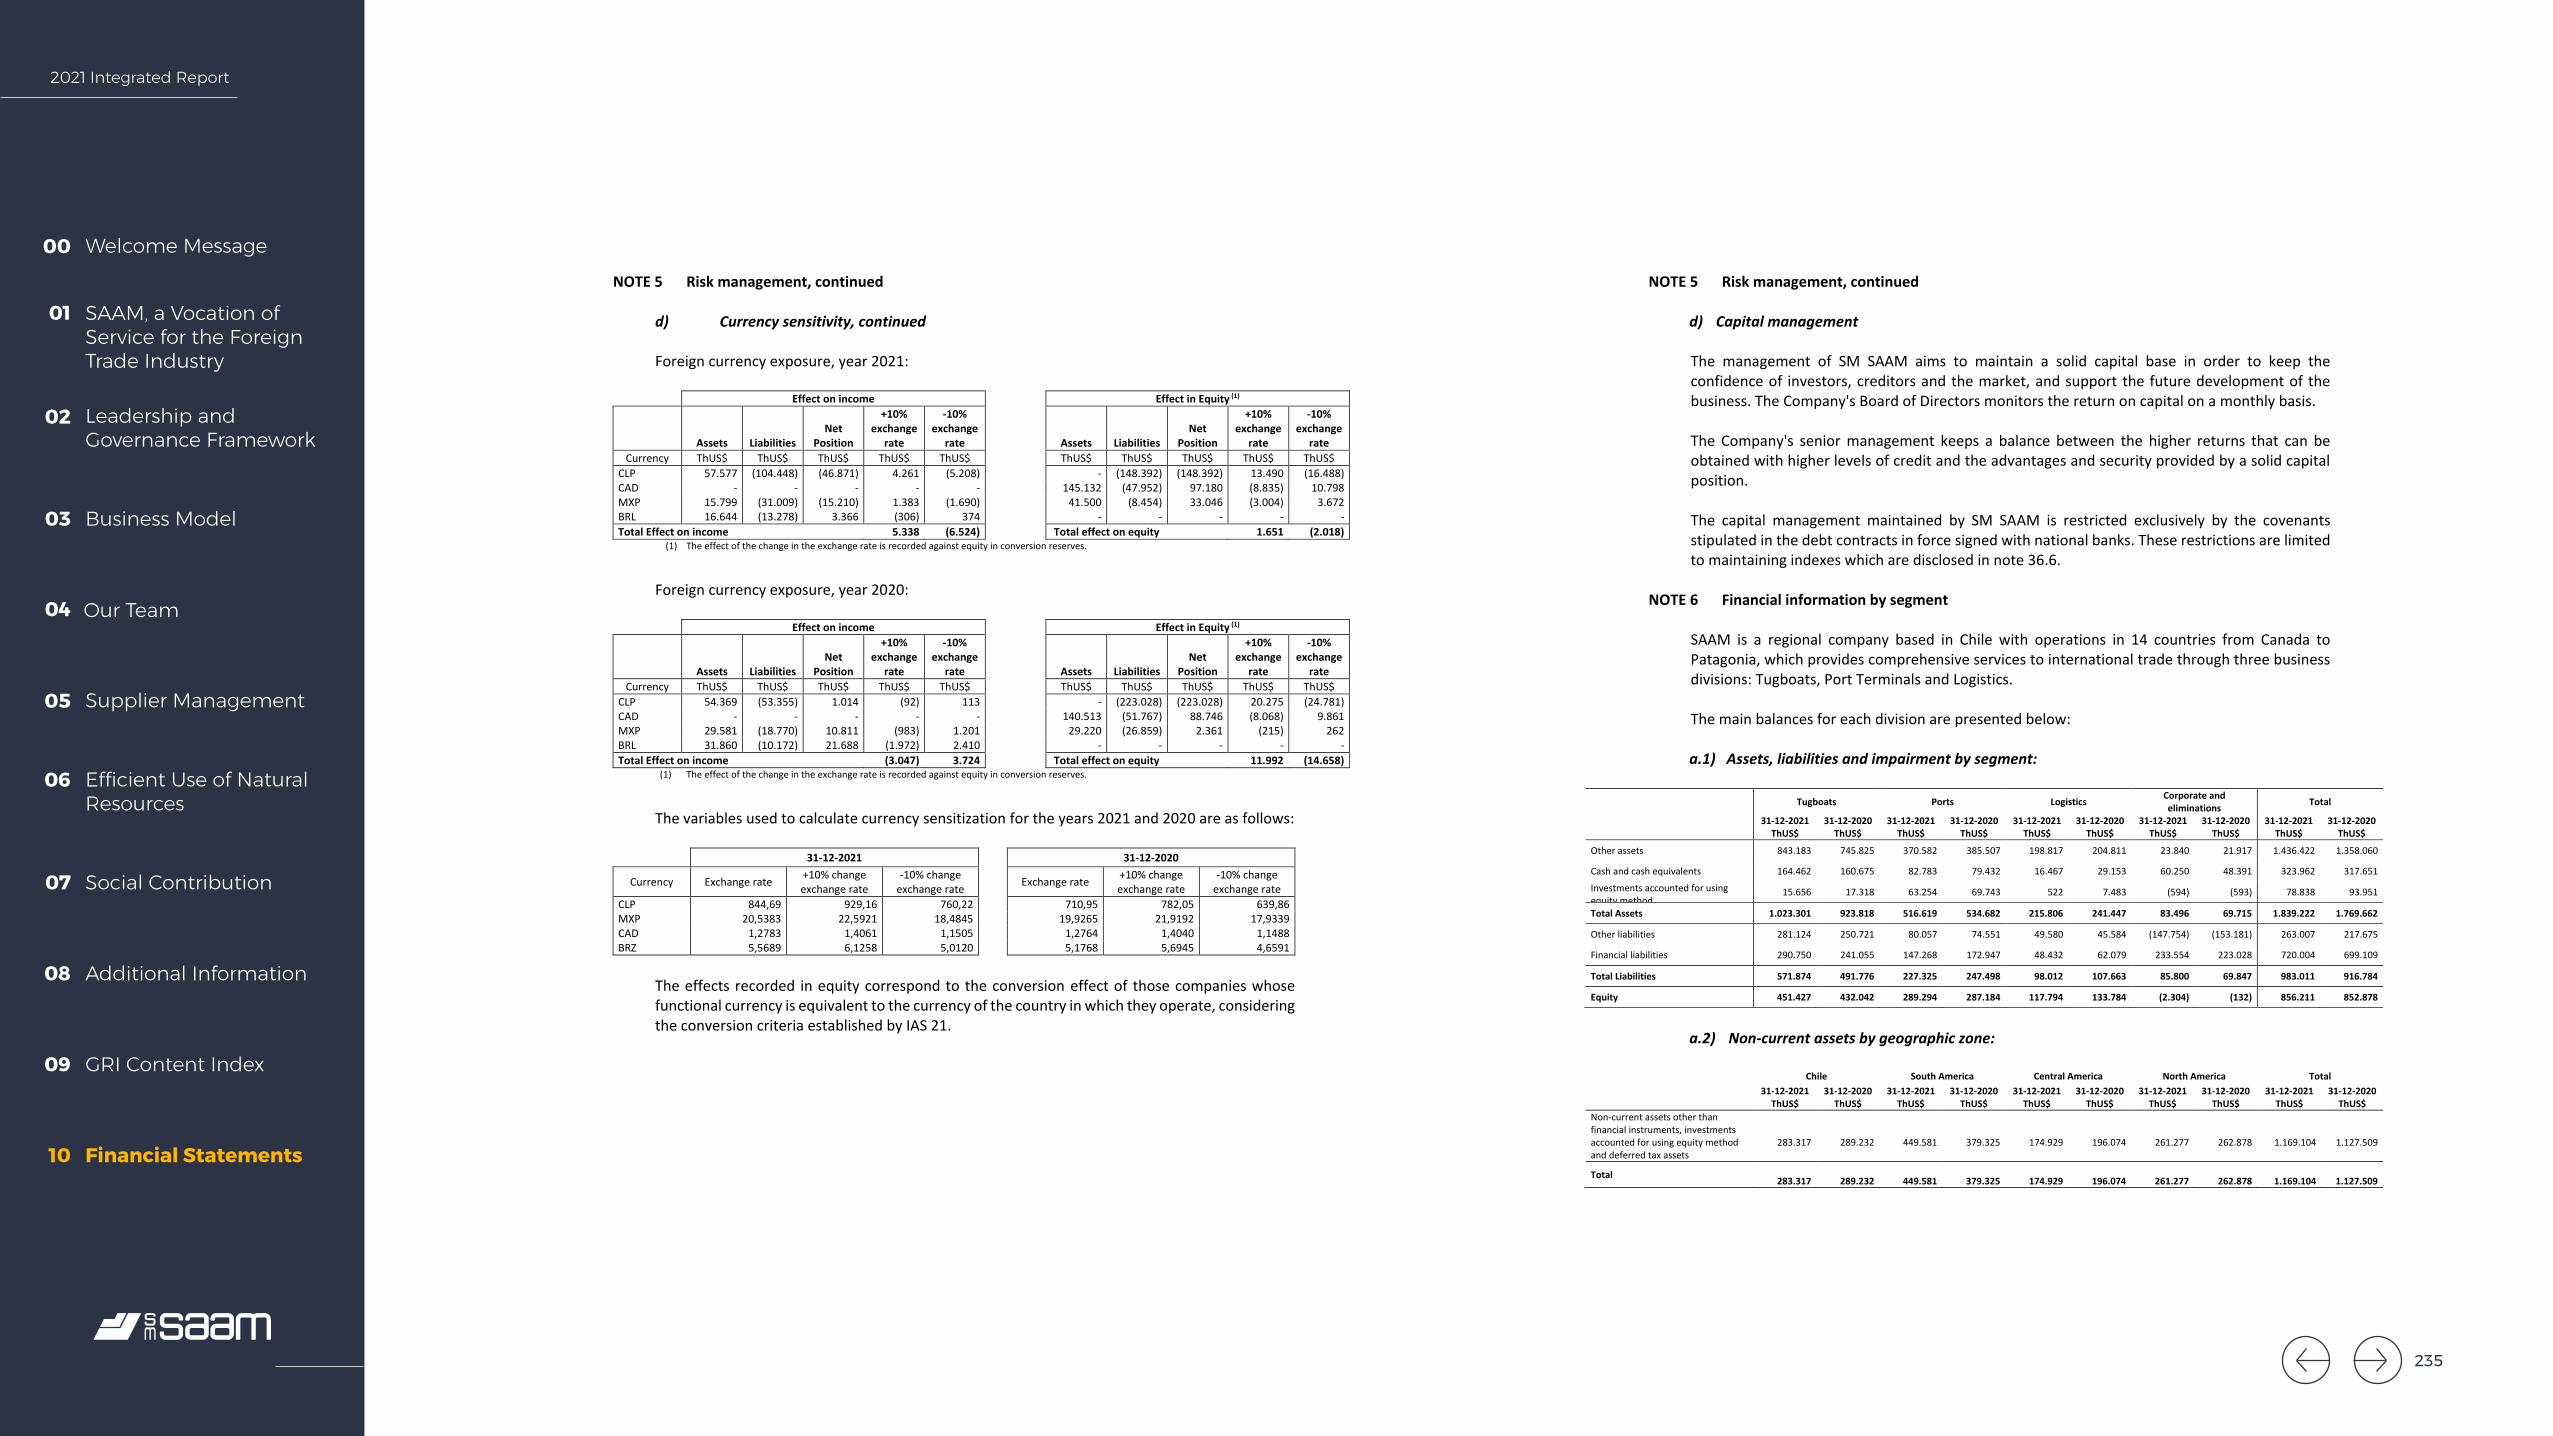
2021 Integrated Report
Welcome Message00
SAAM, a Vocation of Service for the Foreign Trade Industry
01
Leadership and Governance Framework
02
Business Model03
Our Team04
Supplier Management05
Efficient Use of Natural Resources
06
Social Contribution07
Additional Information08
GRI Content Index09
Financial Statements10
SOCIEDAD MATRIZ SAAM S.A. AND SUBSIDIARIES Notes to the Consolidated Financial Statements
43
NOTE 5 Risk management, continued
d) Currency sensitivity, continued
Foreign currency exposure, year 2021:
Effect on income Effect in Equity (1)
Assets Liabilities Net
Position
+10% exchange
rate
-10% exchange
rate Assets Liabilities Net
Position
+10% exchange
rate
-10% exchange
rate Currency ThUS$ ThUS$ ThUS$ ThUS$ ThUS$ ThUS$ ThUS$ ThUS$ ThUS$ ThUS$
CLP 57.577 (104.448) (46.871) 4.261 (5.208) - (148.392) (148.392) 13.490 (16.488) CAD - - - - - 145.132 (47.952) 97.180 (8.835) 10.798 MXP 15.799 (31.009) (15.210) 1.383 (1.690) 41.500 (8.454) 33.046 (3.004) 3.672 BRL 16.644 (13.278) 3.366 (306) 374 - - - - - Total Effect on income 5.338 (6.524) Total effect on equity 1.651 (2.018)
(1) The effect of the change in the exchange rate is recorded against equity in conversion reserves.
Foreign currency exposure, year 2020:
Effect on income Effect in Equity (1)
Assets Liabilities Net
Position
+10% exchange
rate
-10% exchange
rate Assets Liabilities Net
Position
+10% exchange
rate
-10% exchange
rate Currency ThUS$ ThUS$ ThUS$ ThUS$ ThUS$ ThUS$ ThUS$ ThUS$ ThUS$ ThUS$
CLP 54.369 (53.355) 1.014 (92) 113 - (223.028) (223.028) 20.275 (24.781) CAD - - - - - 140.513 (51.767) 88.746 (8.068) 9.861 MXP 29.581 (18.770) 10.811 (983) 1.201 29.220 (26.859) 2.361 (215) 262 BRL 31.860 (10.172) 21.688 (1.972) 2.410 - - - - - Total Effect on income (3.047) 3.724 Total effect on equity 11.992 (14.658)
(1) The effect of the change in the exchange rate is recorded against equity in conversion reserves.
The variables used to calculate currency sensitization for the years 2021 and 2020 are as follows:
31-12-2021 31-12-2020
Currency Exchange rate +10% changeexchange rate
-10% change exchange rate Exchange rate +10% change
exchange rate-10% change
exchange rateCLP 844,69 929,16 760,22 710,95 782,05 639,86 MXP 20,5383 22,5921 18,4845 19,9265 21,9192 17,9339 CAD 1,2783 1,4061 1,1505 1,2764 1,4040 1,1488 BRZ 5,5689 6,1258 5,0120 5,1768 5,6945 4,6591
The effects recorded in equity correspond to the conversion effect of those companies whose functional currency is equivalent to the currency of the country in which they operate, considering the conversion criteria established by IAS 21.
SOCIEDAD MATRIZ SAAM S.A. AND SUBSIDIARIES Notes to the Consolidated Financial Statements
44
NOTE 5 Risk management, continued
d) Capital management
The management of SM SAAM aims to maintain a solid capital base in order to keep the confidence of investors, creditors and the market, and support the future development of the business. The Company's Board of Directors monitors the return on capital on a monthly basis.
The Company's senior management keeps a balance between the higher returns that can be obtained with higher levels of credit and the advantages and security provided by a solid capital position.
The capital management maintained by SM SAAM is restricted exclusively by the covenants stipulated in the debt contracts in force signed with national banks. These restrictions are limited to maintaining indexes which are disclosed in note 36.6.
NOTE 6 Financial information by segment
SAAM is a regional company based in Chile with operations in 14 countries from Canada to Patagonia, which provides comprehensive services to international trade through three business divisions: Tugboats, Port Terminals and Logistics.
The main balances for each division are presented below:
a.1) Assets, liabilities and impairment by segment:
Tugboats Ports Logistics Corporate and eliminations Total
31-12-2021 31-12-2020 31-12-2021 31-12-2020 31-12-2021 31-12-2020 31-12-2021 31-12-2020 31-12-2021 31-12-2020 ThUS$ ThUS$ ThUS$ ThUS$ ThUS$ ThUS$ ThUS$ ThUS$ ThUS$ ThUS$
Other assets 843.183 745.825 370.582 385.507 198.817 204.811 23.840 21.917 1.436.422 1.358.060
Cash and cash equivalents 164.462 160.675 82.783 79.432 16.467 29.153 60.250 48.391 323.962 317.651 Investments accounted for using equity method
15.656 17.318 63.254 69.743 522 7.483 (594) (593) 78.838 93.951
Total Assets 1.023.301 923.818 516.619 534.682 215.806 241.447 83.496 69.715 1.839.222 1.769.662
Other liabilities 281.124 250.721 80.057 74.551 49.580 45.584 (147.754) (153.181) 263.007 217.675
Financial liabilities 290.750 241.055 147.268 172.947 48.432 62.079 233.554 223.028 720.004 699.109
Total Liabilities 571.874 491.776 227.325 247.498 98.012 107.663 85.800 69.847 983.011 916.784
Equity 451.427 432.042 289.294 287.184 117.794 133.784 (2.304) (132) 856.211 852.878
a.2) Non-current assets by geographic zone:
Chile South America Central America North America Total 31-12-2021 31-12-2020 31-12-2021 31-12-2020 31-12-2021 31-12-2020 31-12-2021 31-12-2020 31-12-2021 31-12-2020
ThUS$ ThUS$ ThUS$ ThUS$ ThUS$ ThUS$ ThUS$ ThUS$ ThUS$ ThUS$ Non-current assets other than financial instruments, investments accounted for using equity method and deferred tax assets
283.317 289.232 449.581 379.325 174.929 196.074 261.277 262.878 1.169.104 1.127.509
Total 283.317 289.232 449.581 379.325 174.929 196.074 261.277 262.878 1.169.104 1.127.509
235
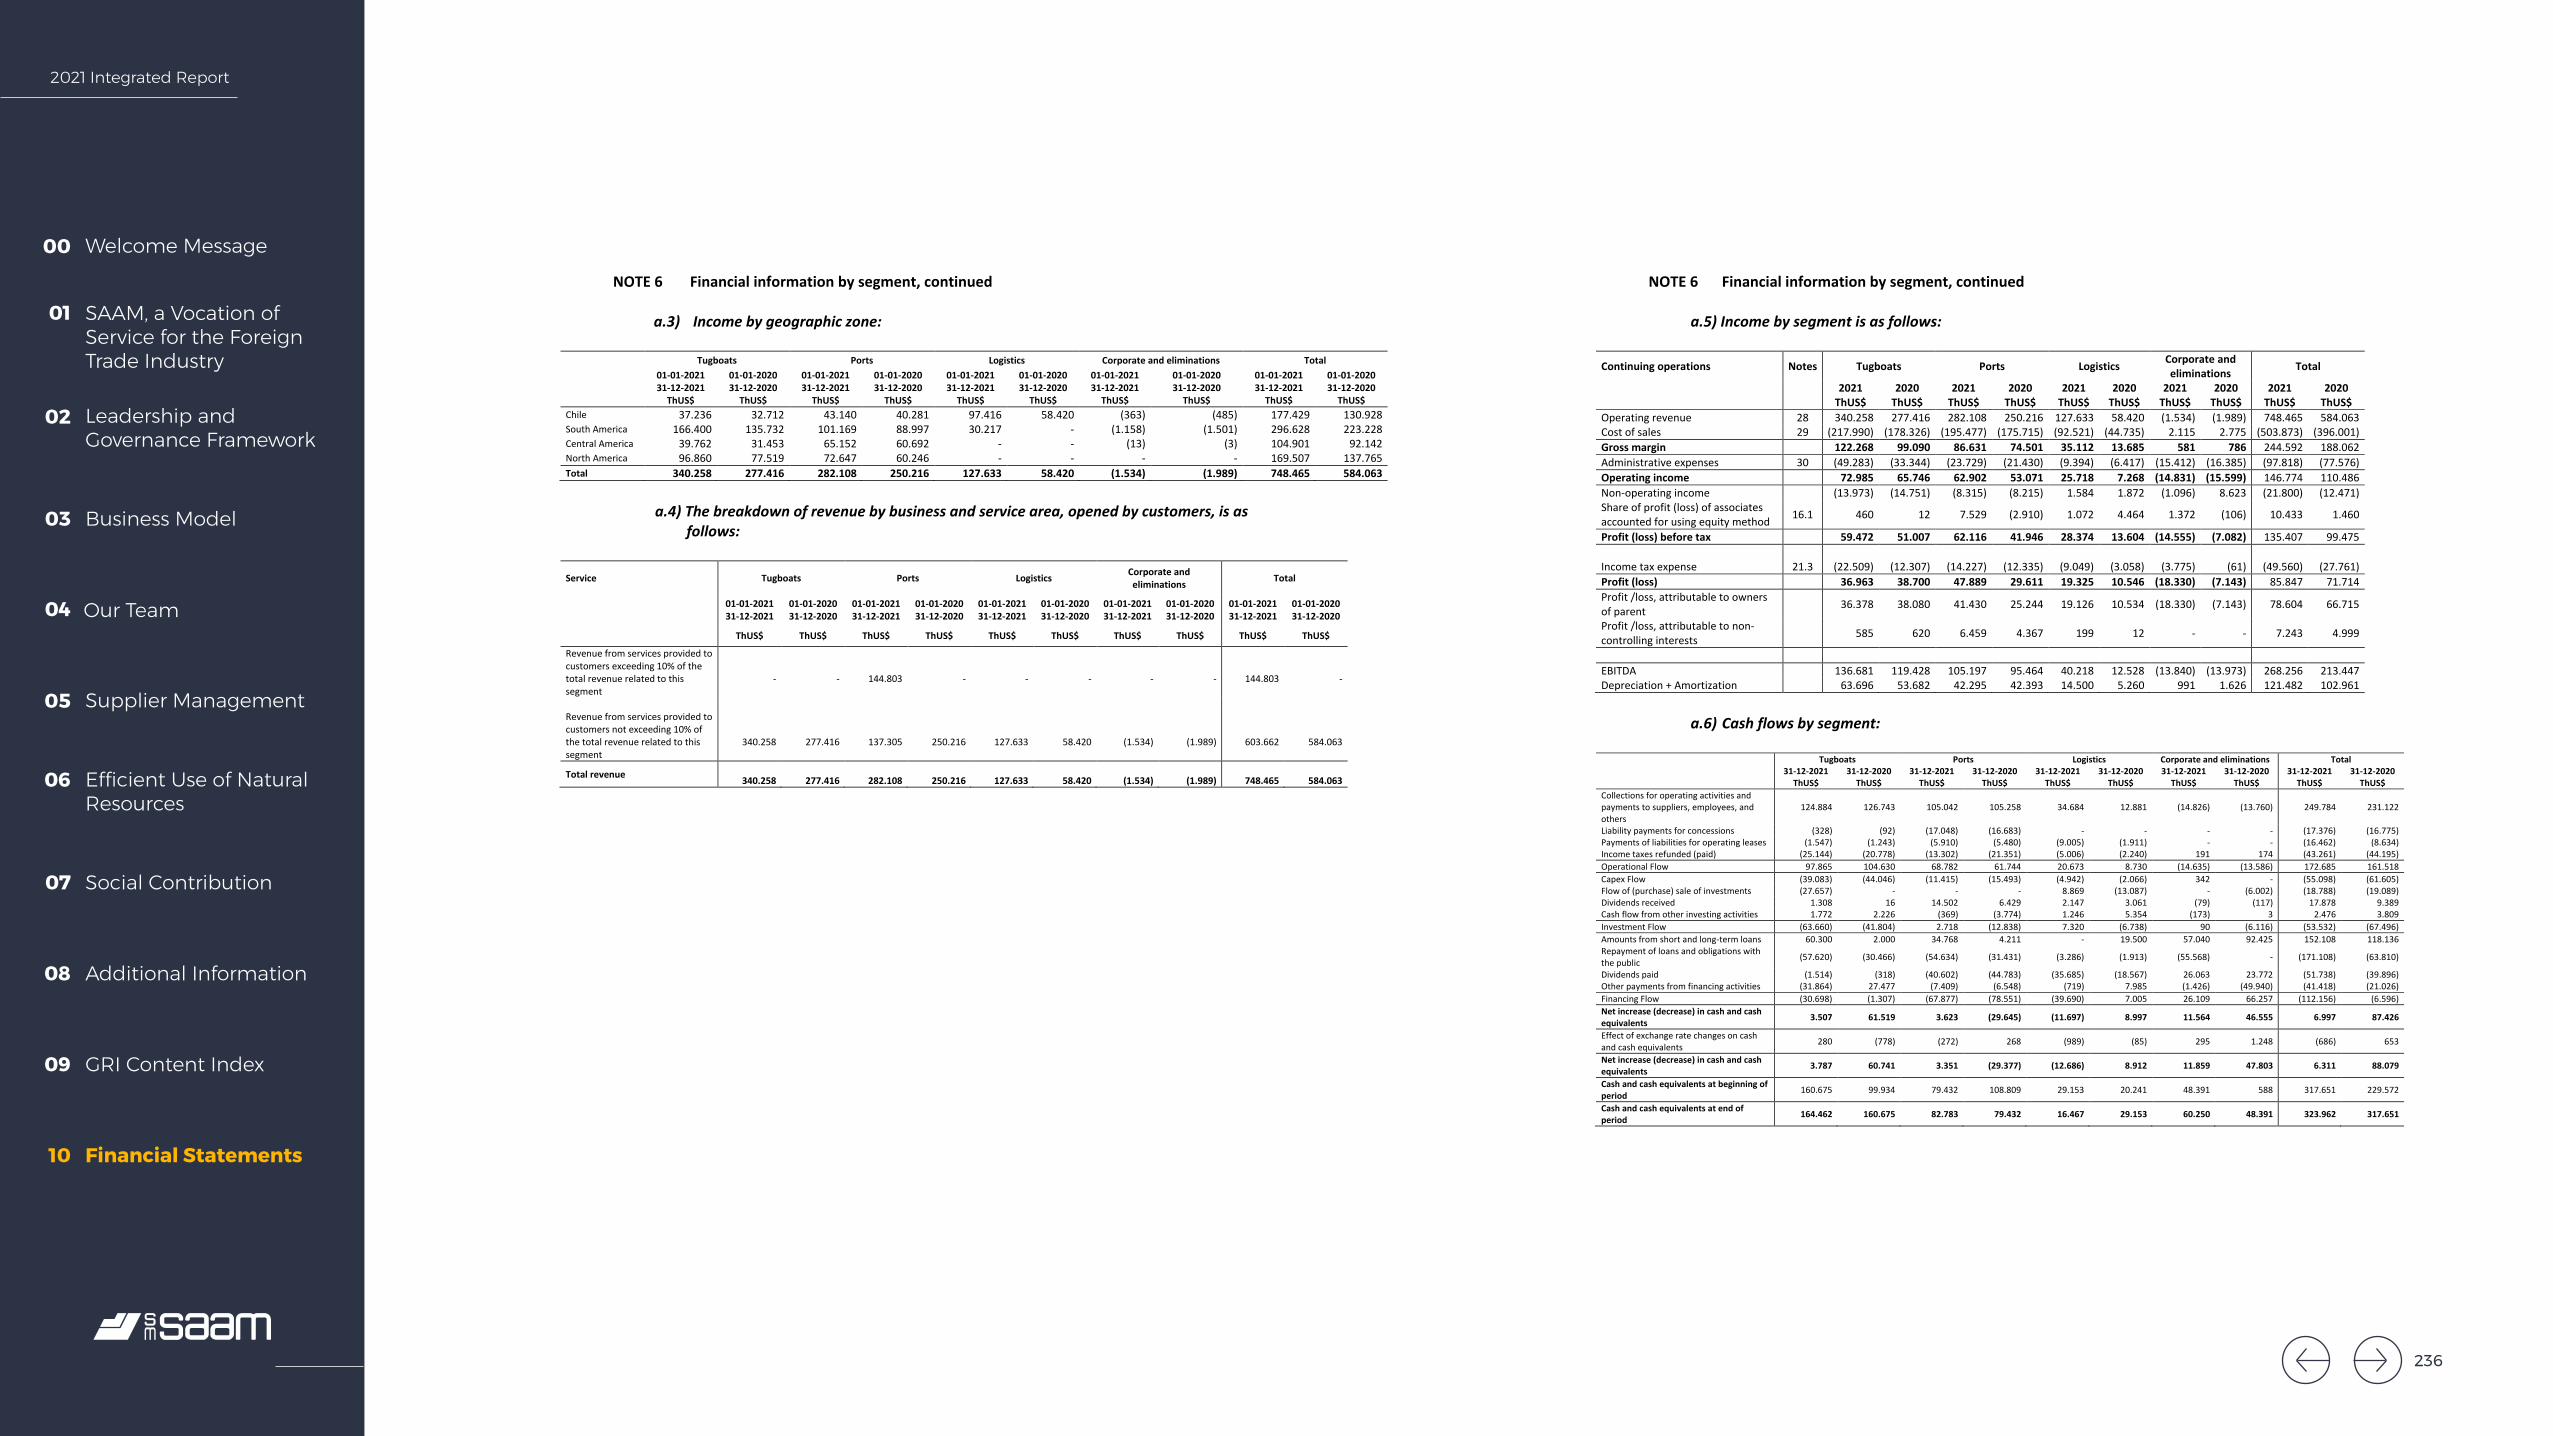
2021 Integrated Report
Welcome Message00
SAAM, a Vocation of Service for the Foreign Trade Industry
01
Leadership and Governance Framework
02
Business Model03
Our Team04
Supplier Management05
Efficient Use of Natural Resources
06
Social Contribution07
Additional Information08
GRI Content Index09
Financial Statements10
SOCIEDAD MATRIZ SAAM S.A. AND SUBSIDIARIES Notes to the Consolidated Financial Statements
45
NOTE 6 Financial information by segment, continued
a.3) Income by geographic zone:
Tugboats Ports Logistics Corporate and eliminations Total 01-01-2021 31-12-2021
01-01-2020 31-12-2020
01-01-2021 31-12-2021
01-01-2020 31-12-2020
01-01-2021 31-12-2021
01-01-2020 31-12-2020
01-01-2021 31-12-2021
01-01-2020 01-01-2021 31-12-2021
01-01-2020 31-12-2020
ThUS$ ThUS$ ThUS$ ThUS$ ThUS$ ThUS$ ThUS$ 31-12-2020
ThUS$ ThUS$ ThUS$ Chile 37.236 32.712 43.140 40.281 97.416 58.420 (363) (485) 177.429 130.928 South America 166.400 135.732 101.169 88.997 30.217 - (1.158) (1.501) 296.628 223.228 Central America 39.762 31.453 65.152 60.692 - - (13) (3) 104.901 92.142 North America 96.860 77.519 72.647 60.246 - - - - 169.507 137.765 Total 340.258 277.416 282.108 250.216 127.633 58.420 (1.534) (1.989) 748.465 584.063
a.4) The breakdown of revenue by business and service area, opened by customers, is asfollows:
Service Tugboats Ports Logistics Corporate and eliminations Total
01-01-2021 31-12-2021
01-01-2020 31-12-2020
01-01-2021 31-12-2021
01-01-202031-12-2020
01-01-2021 31-12-2021
01-01-2020 31-12-2020
01-01-2021 31-12-2021
01-01-2020 31-12-2020
01-01-202131-12-2021
01-01-2020 31-12-2020
ThUS$ ThUS$ ThUS$ ThUS$ ThUS$ ThUS$ ThUS$ ThUS$ ThUS$ ThUS$
Revenue from services provided to customers exceeding 10% of the total revenue related to this segment
- - 144.803 - - - - - 144.803 -
Revenue from services provided to customers not exceeding 10% of the total revenue related to this segment
340.258 277.416 137.305 250.216 127.633 58.420 (1.534) (1.989) 603.662 584.063
Total revenue 340.258 277.416 282.108 250.216 127.633 58.420 (1.534) (1.989) 748.465 584.063
SOCIEDAD MATRIZ SAAM S.A. AND SUBSIDIARIES Notes to the Consolidated Financial Statements
46
NOTE 6 Financial information by segment, continued
a.5) Income by segment is as follows:
Continuing operations Notes Tugboats Ports Logistics Corporate and eliminations Total
2021 2020 2021 2020 2021 2020 2021 2020 2021 2020 ThUS$ ThUS$ ThUS$ ThUS$ ThUS$ ThUS$ ThUS$ ThUS$ ThUS$ ThUS$ Operating revenue 28 340.258 277.416 282.108 250.216 127.633 58.420 (1.534) (1.989) 748.465 584.063 Cost of sales 29 (217.990) (178.326) (195.477) (175.715) (92.521) (44.735) 2.115 2.775 (503.873) (396.001) Gross margin 122.268 99.090 86.631 74.501 35.112 13.685 581 786 244.592 188.062 Administrative expenses 30 (49.283) (33.344) (23.729) (21.430) (9.394) (6.417) (15.412) (16.385) (97.818) (77.576) Operating income 72.985 65.746 62.902 53.071 25.718 7.268 (14.831) (15.599) 146.774 110.486 Non-operating income (13.973) (14.751) (8.315) (8.215) 1.584 1.872 (1.096) 8.623 (21.800) (12.471) Share of profit (loss) of associates accounted for using equity method 16.1 460 12 7.529 (2.910) 1.072 4.464 1.372 (106) 10.433 1.460
Profit (loss) before tax 59.472 51.007 62.116 41.946 28.374 13.604 (14.555) (7.082) 135.407 99.475
Income tax expense 21.3 (22.509) (12.307) (14.227) (12.335) (9.049) (3.058) (3.775) (61) (49.560) (27.761) Profit (loss) 36.963 38.700 47.889 29.611 19.325 10.546 (18.330) (7.143) 85.847 71.714 Profit /loss, attributable to owners of parent 36.378 38.080 41.430 25.244 19.126 10.534 (18.330) (7.143) 78.604 66.715
Profit /loss, attributable to non-controlling interests 585 620 6.459 4.367 199 12 - - 7.243 4.999
EBITDA 136.681 119.428 105.197 95.464 40.218 12.528 (13.840) (13.973) 268.256 213.447 Depreciation + Amortization 63.696 53.682 42.295 42.393 14.500 5.260 991 1.626 121.482 102.961
a.6) Cash flows by segment:
Tugboats Ports Logistics Corporate and eliminations Total 31-12-2021 31-12-2020 31-12-2021 31-12-2020 31-12-2021 31-12-2020 31-12-2021 31-12-2020 31-12-2021 31-12-2020 ThUS$ ThUS$ ThUS$ ThUS$ ThUS$ ThUS$ ThUS$ ThUS$ ThUS$ ThUS$ Collections for operating activities and payments to suppliers, employees, and others
124.884 126.743 105.042 105.258 34.684 12.881 (14.826) (13.760) 249.784 231.122
Liability payments for concessions (328) (92) (17.048) (16.683) - - - - (17.376) (16.775) Payments of liabilities for operating leases (1.547) (1.243) (5.910) (5.480) (9.005) (1.911) - - (16.462) (8.634) Income taxes refunded (paid) (25.144) (20.778) (13.302) (21.351) (5.006) (2.240) 191 174 (43.261) (44.195) Operational Flow 97.865 104.630 68.782 61.744 20.673 8.730 (14.635) (13.586) 172.685 161.518 Capex Flow (39.083) (44.046) (11.415) (15.493) (4.942) (2.066) 342 - (55.098) (61.605) Flow of (purchase) sale of investments (27.657) - - - 8.869 (13.087) - (6.002) (18.788) (19.089) Dividends received 1.308 16 14.502 6.429 2.147 3.061 (79) (117) 17.878 9.389 Cash flow from other investing activities 1.772 2.226 (369) (3.774) 1.246 5.354 (173) 3 2.476 3.809 Investment Flow (63.660) (41.804) 2.718 (12.838) 7.320 (6.738) 90 (6.116) (53.532) (67.496) Amounts from short and long-term loans 60.300 2.000 34.768 4.211 - 19.500 57.040 92.425 152.108 118.136 Repayment of loans and obligations with the public (57.620) (30.466) (54.634) (31.431) (3.286) (1.913) (55.568) - (171.108) (63.810)
Dividends paid (1.514) (318) (40.602) (44.783) (35.685) (18.567) 26.063 23.772 (51.738) (39.896) Other payments from financing activities (31.864) 27.477 (7.409) (6.548) (719) 7.985 (1.426) (49.940) (41.418) (21.026) Financing Flow (30.698) (1.307) (67.877) (78.551) (39.690) 7.005 26.109 66.257 (112.156) (6.596) Net increase (decrease) in cash and cash equivalents 3.507 61.519 3.623 (29.645) (11.697) 8.997 11.564 46.555 6.997 87.426
Effect of exchange rate changes on cash and cash equivalents 280 (778) (272) 268 (989) (85) 295 1.248 (686) 653
Net increase (decrease) in cash and cash equivalents 3.787 60.741 3.351 (29.377) (12.686) 8.912 11.859 47.803 6.311 88.079
Cash and cash equivalents at beginning of period 160.675 99.934 79.432 108.809 29.153 20.241 48.391 588 317.651 229.572
Cash and cash equivalents at end of period 164.462 160.675 82.783 79.432 16.467 29.153 60.250 48.391 323.962 317.651
236

2021 Integrated Report
Welcome Message00
SAAM, a Vocation of Service for the Foreign Trade Industry
01
Leadership and Governance Framework
02
Business Model03
Our Team04
Supplier Management05
Efficient Use of Natural Resources
06
Social Contribution07
Additional Information08
GRI Content Index09
Financial Statements10
SOCIEDAD MATRIZ SAAM S.A. AND SUBSIDIARIES Notes to the Consolidated Financial Statements
47
NOTE 7 Fair value of financial assets and liabilities
a) Composition of financial assets and liabilities:
31-12-2021 31-12-2020 Financial assets and liabilities Notes Book value Fair value Book value Fair value ThUS$ ThUS$ ThUS$ ThUS$ Cash and cash equivalents 9 323.962 323.962 317.651 317.651
Derivative instruments and other 10 a and 10 b
1.610 1.610 20.476 20.476
Trade and other receivables 11 129.047 129.047 103.603 103.603 Accounts receivable from related entities 12 14.883 14.883 12.376 12.376 Total financial assets 469.502 469.502 454.106 454.106
Bank loans 22.1 (418.466) (415.482) (361.338) (364.306) Financial lease 22.2 (7.367) (7.367) (5.271) (5.271) Obligations with the public 22.3 (148.392) (131.491) (223.028) (234.976) Hedging liabilities 22.4 (33.422) (33.422) (5.921) (5.921) Operating leases (IFRS 16) 22.5 (53.000) (53.000) (62.243) (62.243) Concession contract obligation 22.6 (39.647) (39.647) (41.308) (41.308) Other (option) 22.7 (19.710) (19.710) - - Trade and other payables 23 (58.209) (58.209) (50.192) (50.192) Accounts payable to related entities 12 (538) (538) (419) (419) Total financial liabilities (778.751) (758.866) (749.720) (764.636) Net financial position (309.249) (289.364) (295.614) (310.530)
The book value of current accounts receivable, cash and cash equivalents, and other financial assets and liabilities is approximated to fair value due to the short-term nature of these instruments, and for accounts receivable, given that any recoverability loss is already reflected in the impairment provisions. The fair value of non-derivative assets and liabilities that are not quoted in active markets is estimated through the use of discounted cash calculated on observable market variables as of the date of the financial statements. The fair value of derivative instruments is estimated through the use of discounts of future cash flows, determined on the basis of observable market information or on variants and prices obtained from third parties.
SOCIEDAD MATRIZ SAAM S.A. AND SUBSIDIARIES Notes to the Consolidated Financial Statements
48
NOTE 7 Fair value of financial assets and liabilities, continued
b) Financial instruments by category:
31-12-2021 Fair value through profit
or loss
Cash and cash equivalents,
loans and accounts
receivable Hedge
derivatives Total ThUS$ ThUS$ ThUS$ ThUS$
Marketable securities and investments in other companies 88 - - 88 Hedging assets - - 103 103 Other financial assets 1.419 - - 1.419 Total other financial assets 1.507 - 103 1.610 Cash and cash equivalents - 323.962 - 323.962 Trade and other receivables - 129.047 - 129.047 Accounts receivable from related entities - 14.883 - 14.883 Total financial assets 1.507 467.892 103 469.502
31-12-2021 Fair value through profit
or loss
Financial liabilities
measured at amortized
cost Hedge
derivatives Total ThUS$ ThUS$ ThUS$ ThUS$
Bank loans (note 22.1) - 418.466 - 418.466 Obligations with the public (note 22.3) - 148.392 - 148.392 Financial lease (note 22.2) - 7.367 - 7.367 Operating leases (IFRS 16) (note 22.5) - 53.000 - 53.000 Hedging liabilities (note 22.4) - - 33.422 33.422 Concession contract obligation (note 22.6) - 39.647 - 39.647 Other (option) (note 22.7) - 19.710 - 19.710 Total other financial liabilities - 686.582 33.422 720.004 Trade and other payables - 58.209 - 58.209 Accounts payable to related entities - 538 - 538 Total financial liabilities - 745.329 33.422 778.751
237

2021 Integrated Report
Welcome Message00
SAAM, a Vocation of Service for the Foreign Trade Industry
01
Leadership and Governance Framework
02
Business Model03
Our Team04
Supplier Management05
Efficient Use of Natural Resources
06
Social Contribution07
Additional Information08
GRI Content Index09
Financial Statements10
SOCIEDAD MATRIZ SAAM S.A. AND SUBSIDIARIES Notes to the Consolidated Financial Statements
49
NOTE 7 Fair value of financial assets and liabilities, continued
b) Financial instruments by category, continued:
31-12-2020 Fair value through profit
or loss
Cash and cash equivalents,
loans and accounts
receivable Hedge
derivatives Total ThUS$ ThUS$ ThUS$ ThUS$
Marketable securities and investments in other companies 88 - - 88 Hedging assets (note 10a and 10b) - - 18.583 18.583 Other financial assets 1.805 - - 1.805 Total other financial assets (note 10) 1.893 - 18.583 20.476 Cash and cash equivalents (note 9) - 317.651 - 317.651 Trade and other receivables (note 11a) - 103.603 - 103.603 Accounts receivable from related entities (note 12) - 12.376 - 12.376 Total financial assets 1.893 433.630 18.583 454.106
31-12-2020 Fair value through profit
or loss
Financial liabilities
measured at amortized
cost Hedge
derivatives Total ThUS$ ThUS$ ThUS$ ThUS$
Bank loans - 361.338 - 361.338 Obligations with the public - 223.028 - 223.028 Financial lease - 5.271 - 5.271 Operating leases (IFRS 16) - 62.243 - 62.243 Hedging liabilities - - 5.921 5.921 Concession contract obligation - 41.308 - 41.308 Total other financial liabilities - 693.188 5.921 699.109 Trade and other payables - 50.192 - 50.192 Accounts payable to related entities - 419 - 419 Total financial liabilities - 743.799 5.921 749.720
Fair Value Hierarchies The company categorizes its financial assets and liabilities according to the levels defined in IFRS 13, which are mentioned below:
a) Level 1: Quoted prices in active markets for identical assets and liabilities to which the entity can have access on the valuation date.
b) Level 2: Data other than the quoted prices included in Level 1 and the most recent prices that can be observed in the asset or liability.
c) Level 3: Data that cannot be observed in assets or liabilities.
The fair value of bank loans and obligations with the public have hierarchy level 2.
SOCIEDAD MATRIZ SAAM S.A. AND SUBSIDIARIES Notes to the Consolidated Financial Statements
50
NOTE 7 Fair value of financial assets and liabilities, continued At the end of each period, the Company presents the following structure for obtaining the fair value of its financial instruments recorded at fair value:
31-12-2021 Fair value Fair Value Hierarchy Level 1 Level 2 Level 3
ThUS$ ThUS ThUS$ ThUS$ Marketable securities and investments in other companies 88 88 - - Hedging assets 103 - 103 - Other financial assets 1.419 - 1.419 - Financial assets (note 10) 1.610 88 1.522 - Financial derivative instruments (note 22.7) 19.710 - 19.710 - Hedging liabilities (note 22.4) 33.422 - 33.422 - Financial liabilities 53.132 - 53.132 -
31-12-2020 Fair value Fair Value Hierarchy Level 1 Level 2 Level 3
ThUS$ ThUS ThUS$ ThUS$ Marketable securities and investments in other companies 88 88 - - Hedging assets 18.583 - 18.583 - Other financial assets 1.805 - 1.805 - Financial assets 20.476 88 20.388 - Financial derivative instruments - - - - Hedging liabilities 5.921 - 5.921 - Financial liabilities 5.921 - 5.921 -
NOTE 8 Non-current assets held for sale
A part of the property, plant and equipment is presented as a disposal group of assets held for sale in compliance with the commitment assumed by the management. The detail of non-current assets held for sale is as follows: 31-12-2021 31-12-2020 ThUS$ ThUS$ Land 8.490 8.814 Real estates 1.073 941 Tugboats - 443 Machinery 594 612 Other assets held for sale 47 53 Total Non-current Assets classified as assets held for sale 10.204 10.863
31-12-2021 31-12-2020 ThUS$ ThUS$ Opening balance 10.863 11.629 Transfers from property, plant and equipment (Note 18.3) (b) 621 624 Disposals assets held for sale (a) (1.240) (1.398) Increment for business combination 99 - Presentation currency (139) 8 Total Non-current Assets classified as assets held for sale 10.204 10.863
See details of letters (a) and (b) in the following table.
238

2021 Integrated Report
Welcome Message00
SAAM, a Vocation of Service for the Foreign Trade Industry
01
Leadership and Governance Framework
02
Business Model03
Our Team04
Supplier Management05
Efficient Use of Natural Resources
06
Social Contribution07
Additional Information08
GRI Content Index09
Financial Statements10
SOCIEDAD MATRIZ SAAM S.A. AND SUBSIDIARIES Notes to the Consolidated Financial Statements
51
NOTE 8 Non-current assets held for sale, continued 31-12-2021
Sales realization (a) Concept Sales
disposition (b) Concept
ThUS$ ThUS$ Soc. Concesionaria Costa Rica S.A. 443 RAM Nicoya - - Intertug Colombia 99 Tugboat - - Inmobiliaria Maritima Portuaria S.A. 72 Punta Arenas office - - Inmobiliaria Maritima Portuaria S.A. 37 Arica Land - - Inmobiliaria Maritima Portuaria S.A. 45 Arica office (76) Office, warehouses in Arica Inmobiliaria Maritima Portuaria S.A. 253 Chacabuco office (253) Chacabuco office Inmobiliaria Maritima Portuaria S.A. 198 Quintero Land (198) Quintero Land Inmobiliaria Maritima Portuaria S.A. 43 Quintero Construction (43) Quintero Construction Inmobiliaria Maritima Portuaria S.A. - - (2) Quintero Construction SAAM Logistics S.A. 31 Crane (49) Crane SAAM S.A. 19 Machinery - - Total 1.240 (621)
31-12-2020
Sales realization (a) Concept Sales
disposition (b) Concept
ThUS$
ThUS$
Soc. Concesionaria Costa Rica S.A. - - (443) RAM Nicoya Inmobiliaria Maritima Portuaria S.A. - - (41) Ex agency Punta Arenas Inmobiliaria Maritima Portuaria S.A. - - (68) Arica land Inmobiliaria Maritima Portuaria S.A. 1.384 Blanco building N° 895, Vlpo. - - SAAM Logistics S.A. 14 Expendable assets (72) Crane y Expendable assets
Total 1.398 (624) -
NOTE 9 Cash and cash equivalents Cash and cash equivalents are detailed as follows: 31-12-2021 31-12-2020 ThUS$ ThUS$ Cash in hand 201 103 Bank balances 135.682 160.892 Short-term deposits 187.869 154.598 Other cash and cash equivalents 210 2.058 Total cash and cash equivalents 323.962 317.651
Cash and cash equivalents include cash and bank checking accounts. Short term deposits are at fixed term with banking institutions and are recorded at their investment value plus the corresponding interest accrued at the year end. The detail of cash and cash equivalents by currency is as follows: 31-12-2021 31-12-2020 ThUS$ ThUS$ US Dollar 293.727 292.312 Canadian dollar 6.802 6.537 Chilean peso 7.741 6.540 Brazilian real 1.897 3.616 Mexican peso 3.829 1.409 Colombian peso 4.782 4.133 Other currencies 5.184 3.104 Total cash and cash equivalents by currency 323.962 317.651
SOCIEDAD MATRIZ SAAM S.A. AND SUBSIDIARIES Notes to the Consolidated Financial Statements
52
NOTE 10 Other financial assets, current and non-current Financial assets in 2021 and 2020 are mainly interest rate derivative contracts, which are valued at fair value.
31-12-2021 31-12-2020 ThUS$ ThUS$ Total other financial assets, current (Note 10.a) 173 2.518 Total other financial assets, non-current (Note 10.b) 1.437 17.958 Total other financial assets 1.610 20.476
a) Other financial assets, current
The detail of Other financial assets, current is as follows: 31-12-2021 31-12-2020 ThUS$ ThUS$ Interest rate derivative (swap) (1) 57 2.511 Term deposits over 90 days 7 7 Operation financial guarantees (2) 109 Total other financial assets at fair value, current 173 2.518
(1) Corresponds to rate hedging derivative contracts (swap), signed by ST Canada S.A., to minimize the risk of rate variation in uncovered balance sheet
items. In 2020, it corresponds to rate hedging derivative contracts (swap), signed by SAAM S.A., to minimize the risk of rate variation in uncovered
balance sheet items.
(2) Correspond to investment fund guarantees, which belong to Sociedad Portuaria de Caldera for ThUS$46 and Sociedad Portuaria Granelera de Caldera for
ThUS$63.
b) Other financial assets, non-current
31-12-2021 31-12-2020 ThUS$ ThUS$ Non-current CCSWAP Derivative (1) 46 16.072 Investment in companies 81 81 Financial guarantees 875 1.236 Other financial assets 435 569 Total other financial assets, non-current 1.437 17.958
(1) Corresponds to rate hedging derivative contracts (swap), signed by ST Canada S.A and Scotiabank., to minimize the risk of rate variation in uncovered balance items. In
2020, it corresponds to the fair value associated with the Cross Currency Swap contract, signed between SM SAAM S.A., BCI and Banco Santander, taken to minimize
the risk of rate and exchange rate variations.
239
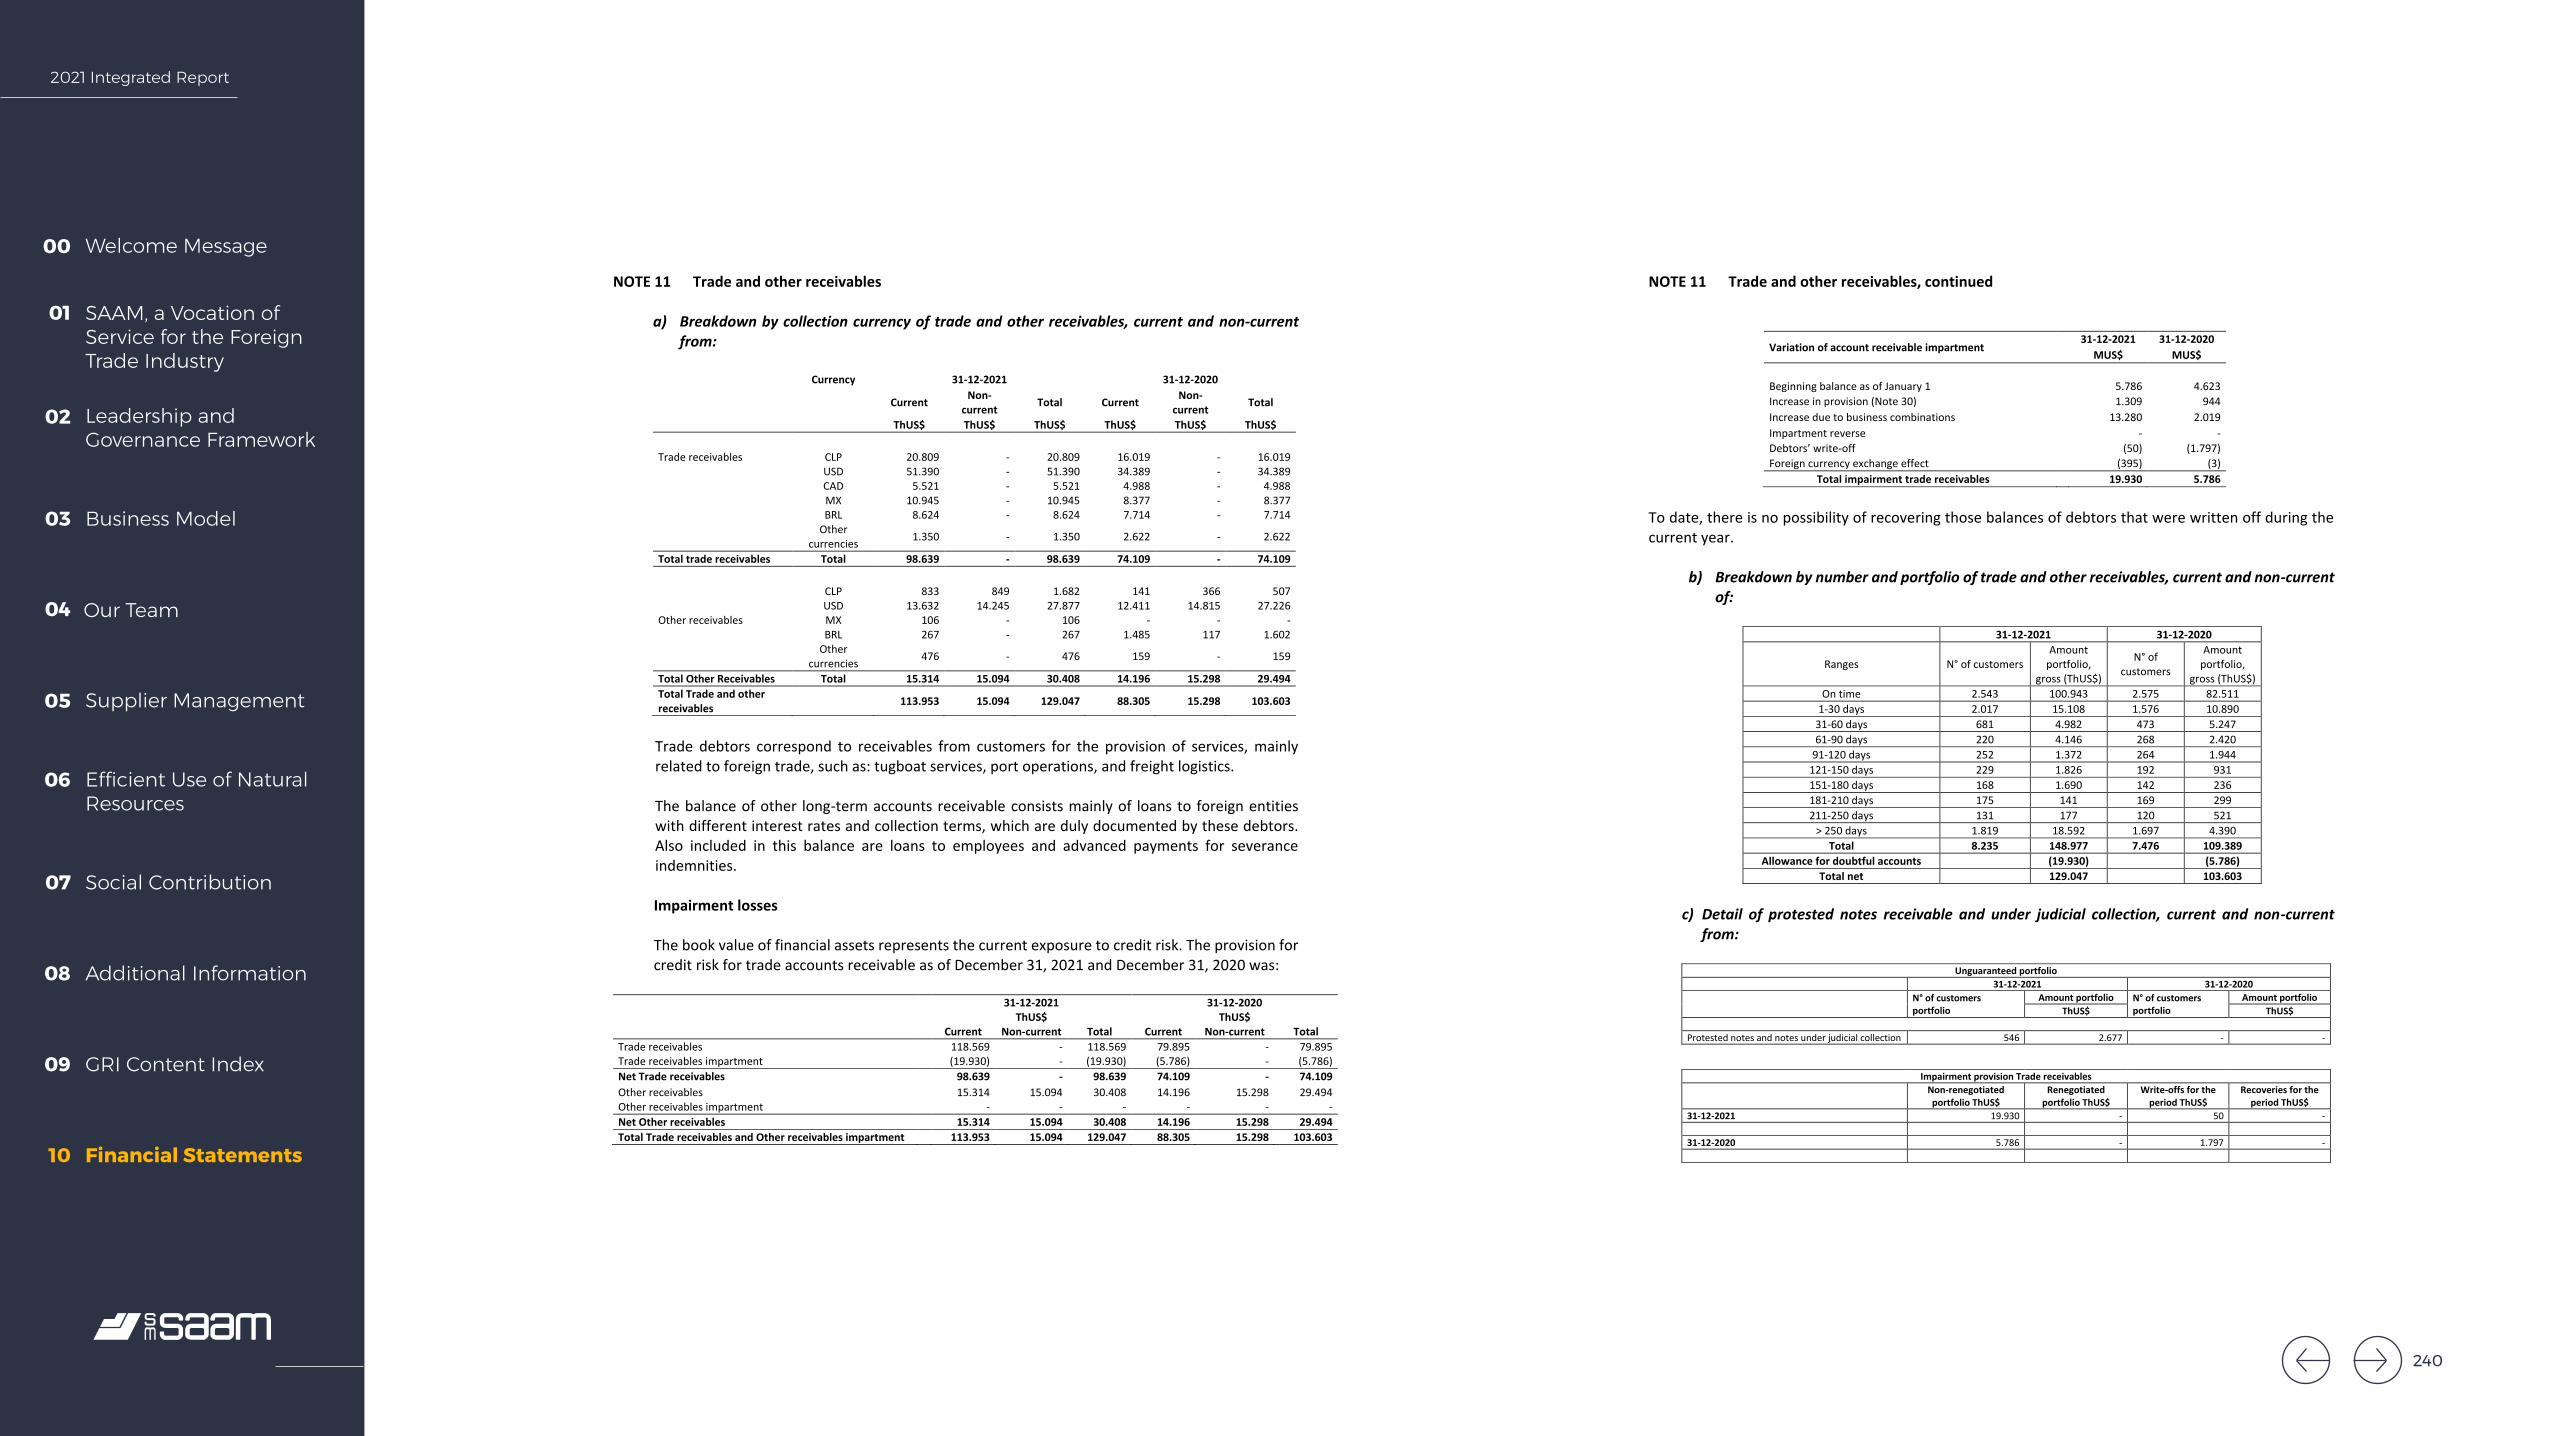
2021 Integrated Report
Welcome Message00
SAAM, a Vocation of Service for the Foreign Trade Industry
01
Leadership and Governance Framework
02
Business Model03
Our Team04
Supplier Management05
Efficient Use of Natural Resources
06
Social Contribution07
Additional Information08
GRI Content Index09
Financial Statements10
SOCIEDAD MATRIZ SAAM S.A. AND SUBSIDIARIES Notes to the Consolidated Financial Statements
53
NOTE 11 Trade and other receivables a) Breakdown by collection currency of trade and other receivables, current and non-current
from: Currency 31-12-2021 31-12-2020
Current Non-current Total Current Non-
current Total
ThUS$ ThUS$ ThUS$ ThUS$ ThUS$ ThUS$
Trade receivables CLP 20.809 - 20.809 16.019 - 16.019 USD 51.390 - 51.390 34.389 - 34.389 CAD 5.521 - 5.521 4.988 - 4.988 MX 10.945 - 10.945 8.377 - 8.377 BRL 8.624 - 8.624 7.714 - 7.714
Other
currencies 1.350 - 1.350 2.622 - 2.622
Total trade receivables Total 98.639 - 98.639 74.109 - 74.109
Other receivables
CLP 833 849 1.682 141 366 507 USD 13.632 14.245 27.877 12.411 14.815 27.226 MX 106 - 106 - - -
BRL 267 - 267 1.485 117 1.602
Other
currencies 476 - 476 159 - 159
Total Other Receivables Total 15.314 15.094 30.408 14.196 15.298 29.494 Total Trade and other receivables 113.953 15.094 129.047 88.305 15.298 103.603
Trade debtors correspond to receivables from customers for the provision of services, mainly related to foreign trade, such as: tugboat services, port operations, and freight logistics. The balance of other long-term accounts receivable consists mainly of loans to foreign entities with different interest rates and collection terms, which are duly documented by these debtors. Also included in this balance are loans to employees and advanced payments for severance indemnities. Impairment losses The book value of financial assets represents the current exposure to credit risk. The provision for credit risk for trade accounts receivable as of December 31, 2021 and December 31, 2020 was:
31-12-2021 31-12-2020 ThUS$ ThUS$
Current Non-current Total Current Non-current Total Trade receivables
118.569 - 118.569 79.895 - 79.895
Trade receivables impartment
(19.930) - (19.930) (5.786) - (5.786) Net Trade receivables
98.639 - 98.639 74.109 - 74.109
Other receivables
15.314 15.094 30.408 14.196 15.298 29.494 Other receivables impartment
- - - - - -
Net Other receivables
15.314 15.094 30.408 14.196 15.298 29.494 Total Trade receivables and Other receivables impartment
113.953 15.094 129.047 88.305 15.298 103.603
SOCIEDAD MATRIZ SAAM S.A. AND SUBSIDIARIES Notes to the Consolidated Financial Statements
54
NOTE 11 Trade and other receivables, continued
Variation of account receivable impartment
31-12-2021 31-12-2020 MUS$ MUS$
Beginning balance as of January 1
5.786 4.623 Increase in provision (Note 30)
1.309 944
Increase due to business combinations
13.280 2.019 Impartment reverse
- -
Debtors’ write-off
(50) (1.797) Foreign currency exchange effect
(395) (3)
Total impairment trade receivables
19.930 5.786 To date, there is no possibility of recovering those balances of debtors that were written off during the current year.
b) Breakdown by number and portfolio of trade and other receivables, current and non-current
of:
31-12-2021 31-12-2020
Ranges N° of customers Amount
portfolio, gross (ThUS$)
N° of customers
Amount portfolio,
gross (ThUS$) On time 2.543 100.943 2.575 82.511
1-30 days 2.017 15.108 1.576 10.890 31-60 days 681 4.982 473 5.247 61-90 days 220 4.146 268 2.420
91-120 days 252 1.372 264 1.944 121-150 days 229 1.826 192 931 151-180 days 168 1.690 142 236 181-210 days 175 141 169 299 211-250 days 131 177 120 521
> 250 days 1.819 18.592 1.697 4.390 Total 8.235 148.977 7.476 109.389
Allowance for doubtful accounts
(19.930)
(5.786) Total net
129.047
103.603
c) Detail of protested notes receivable and under judicial collection, current and non-current
from:
Unguaranteed portfolio 31-12-2021 31-12-2020
N° of customers portfolio
Amount portfolio N° of customers portfolio
Amount portfolio ThUS$ ThUS$
Protested notes and notes under judicial collection 546 2.677 - -
Impairment provision Trade receivables
Non-renegotiated portfolio ThUS$
Renegotiated portfolio ThUS$
Write-offs for the period ThUS$
Recoveries for the period ThUS$
31-12-2021 19.930 - 50 - 31-12-2020 5.786 - 1.797 -
240
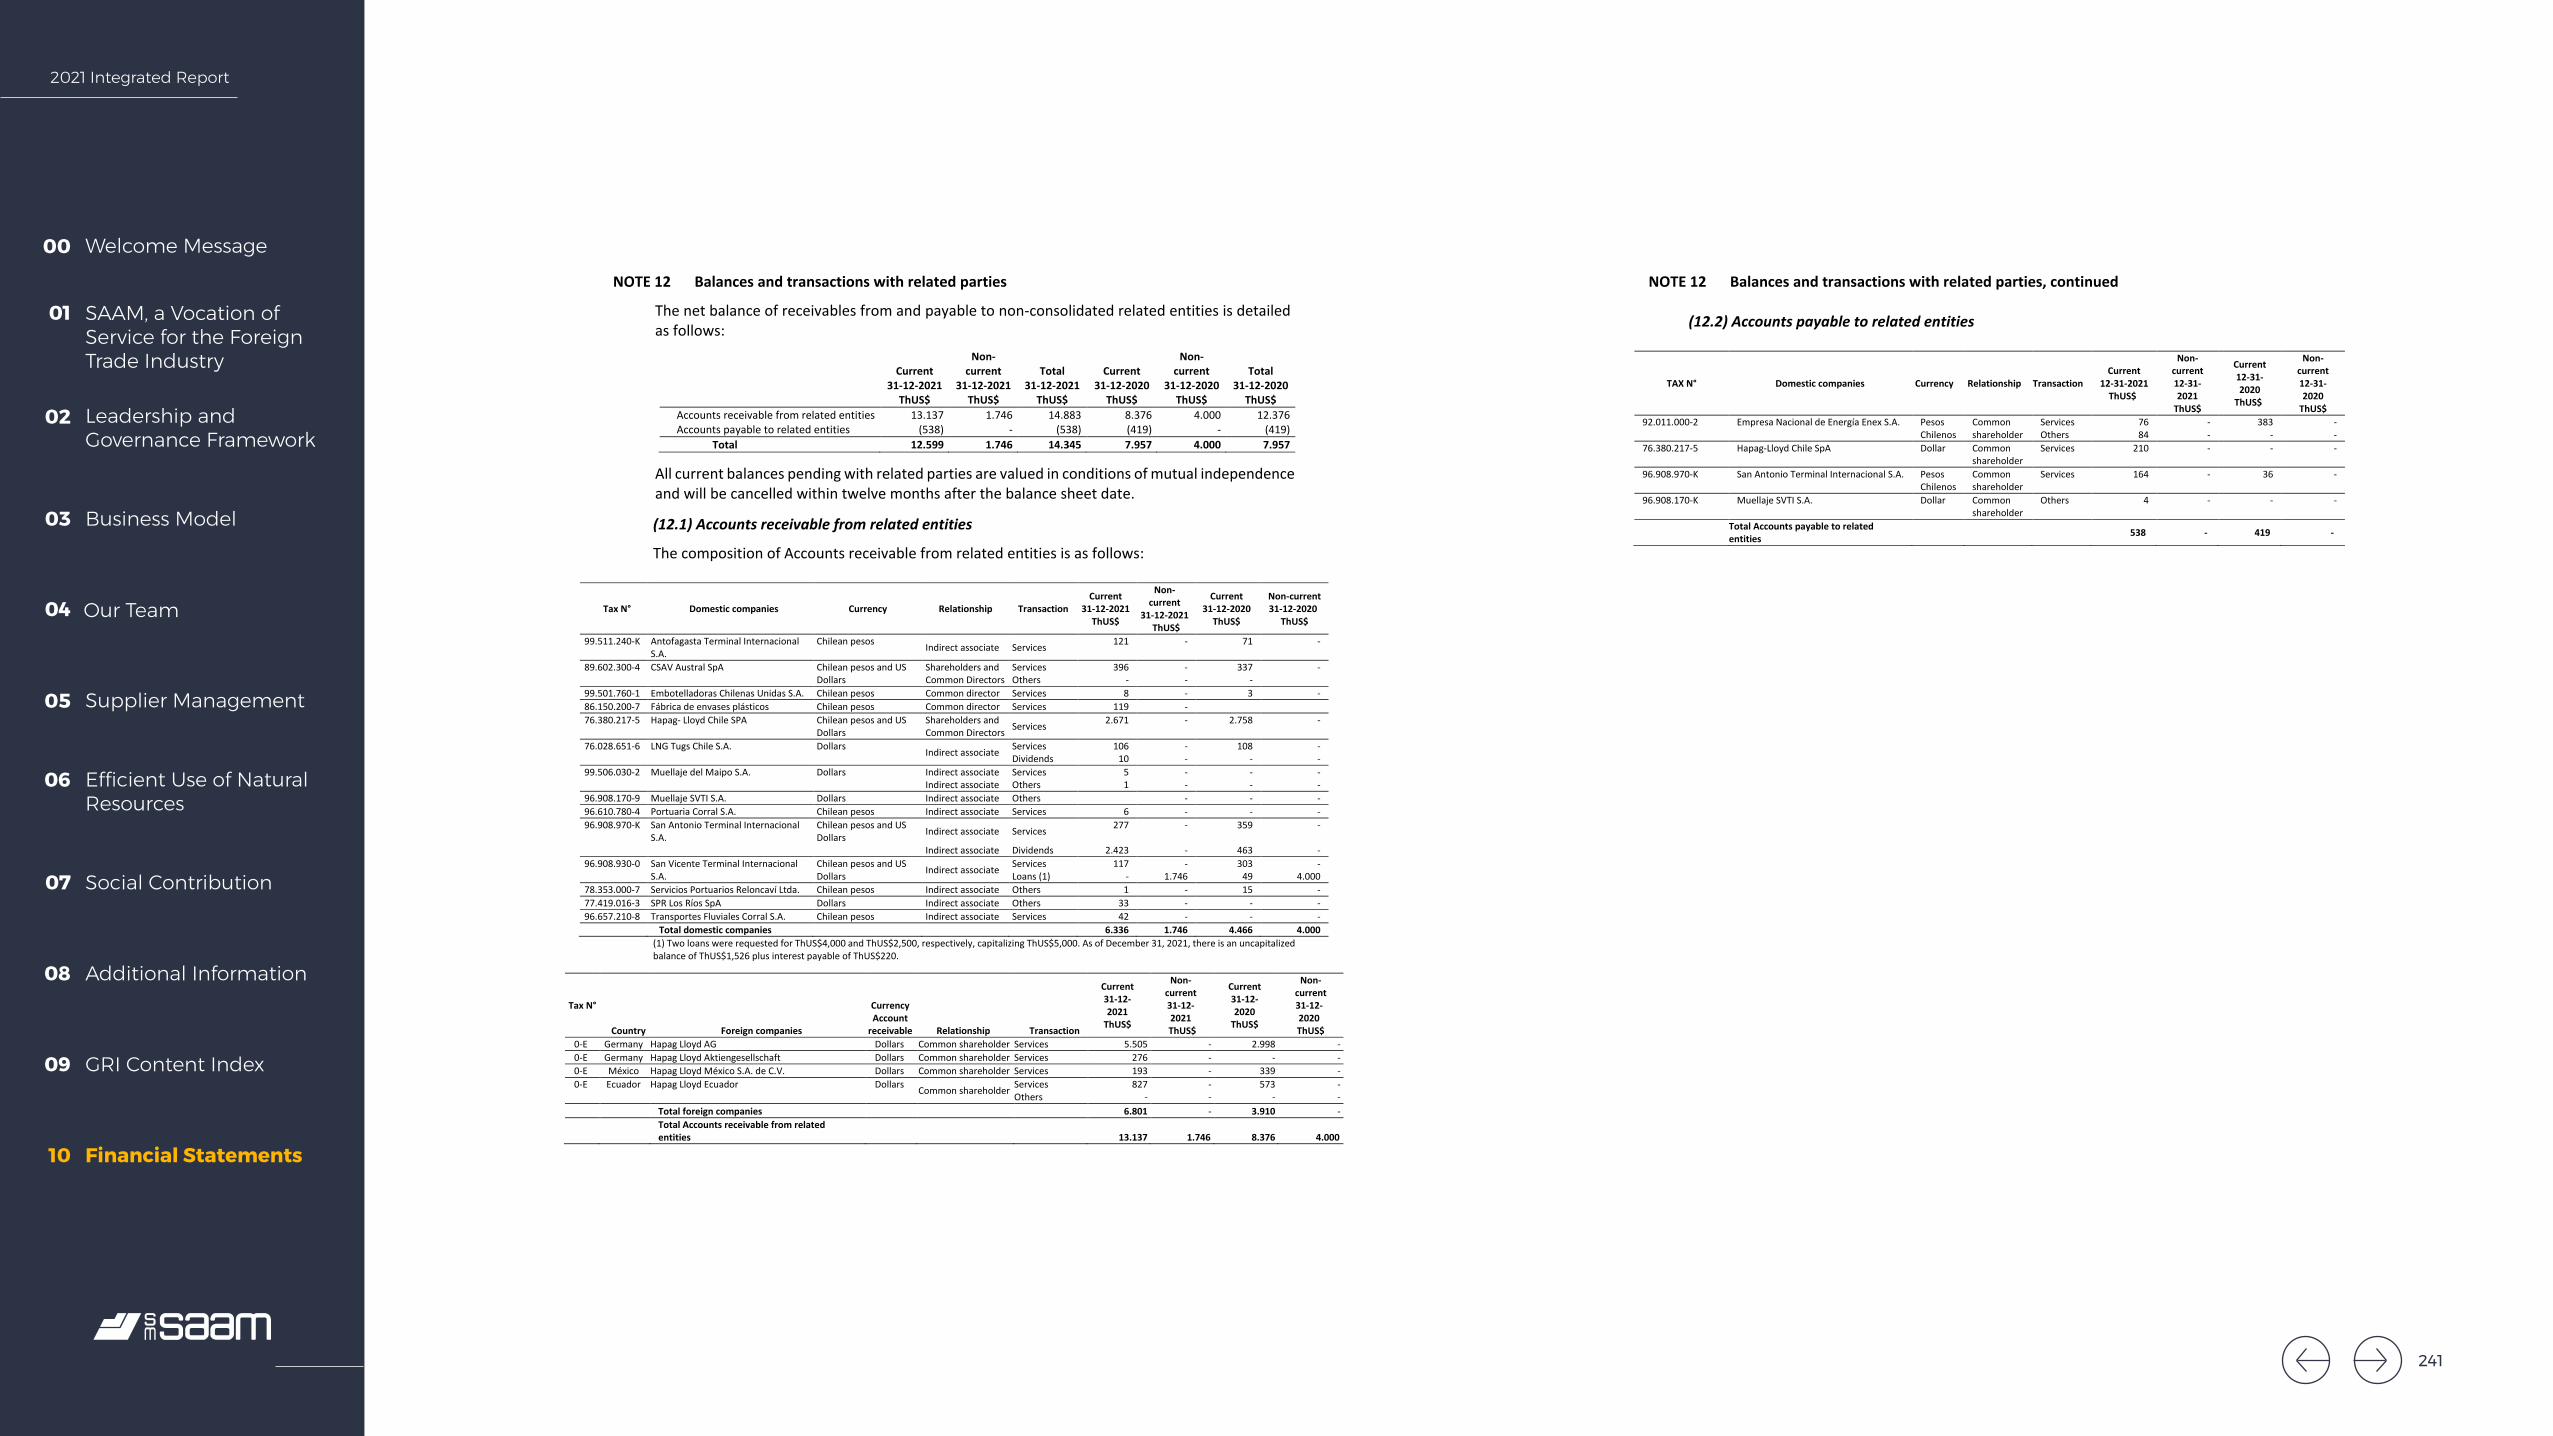
2021 Integrated Report
Welcome Message00
SAAM, a Vocation of Service for the Foreign Trade Industry
01
Leadership and Governance Framework
02
Business Model03
Our Team04
Supplier Management05
Efficient Use of Natural Resources
06
Social Contribution07
Additional Information08
GRI Content Index09
Financial Statements10
SOCIEDAD MATRIZ SAAM S.A. AND SUBSIDIARIES Notes to the Consolidated Financial Statements
55
NOTE 12 Balances and transactions with related parties
The net balance of receivables from and payable to non-consolidated related entities is detailed as follows:
Current Non-
current Total Current Non-
current Total 31-12-2021 31-12-2021 31-12-2021 31-12-2020 31-12-2020 31-12-2020
ThUS$ ThUS$ ThUS$ ThUS$ ThUS$ ThUS$ Accounts receivable from related entities 13.137 1.746 14.883 8.376 4.000 12.376 Accounts payable to related entities (538) - (538) (419) - (419)
Total 12.599 1.746 14.345 7.957 4.000 7.957
All current balances pending with related parties are valued in conditions of mutual independence and will be cancelled within twelve months after the balance sheet date.
(12.1) Accounts receivable from related entities
The composition of Accounts receivable from related entities is as follows:
Tax N° Domestic companies Currency Relationship Transaction Current
31-12-2021 ThUS$
Non-current
31-12-2021 ThUS$
Current 31-12-2020
ThUS$
Non-current 31-12-2020
ThUS$
99.511.240-K Antofagasta Terminal Internacional S.A.
Chilean pesos Indirect associate Services 121 - 71 -
89.602.300-4 CSAV Austral SpA Chilean pesos and US Dollars
Shareholders and Common Directors
Services Others
396 -
- -
337 -
-
99.501.760-1 Embotelladoras Chilenas Unidas S.A. Chilean pesos Common director Services 8 - 3 - 86.150.200-7 Fábrica de envases plásticos Chilean pesos Common director Services 119 - 76.380.217-5 Hapag- Lloyd Chile SPA Chilean pesos and US
Dollars Shareholders and Common Directors Services 2.671 - 2.758 -
76.028.651-6 LNG Tugs Chile S.A. Dollars Indirect associate Services Dividends
106 10
- -
108 -
- -
99.506.030-2 Muellaje del Maipo S.A. Dollars Indirect associate Services 5 - - - Indirect associate Others 1 - - -
96.908.170-9 Muellaje SVTI S.A. Dollars Indirect associate Others - - - 96.610.780-4 Portuaria Corral S.A. Chilean pesos Indirect associate Services 6 - - - 96.908.970-K San Antonio Terminal Internacional
S.A. Chilean pesos and US Dollars Indirect associate Services 277 - 359 -
Indirect associate Dividends 2.423 - 463 - 96.908.930-0 San Vicente Terminal Internacional
S.A. Chilean pesos and US Dollars Indirect associate Services
Loans (1) 117
- -
1.746 303
49 -
4.000 78.353.000-7 Servicios Portuarios Reloncaví Ltda. Chilean pesos Indirect associate Others 1 - 15 - 77.419.016-3 SPR Los Ríos SpA Dollars Indirect associate Others 33 - - - 96.657.210-8 Transportes Fluviales Corral S.A. Chilean pesos Indirect associate Services 42 - - -
Total domestic companies 6.336 1.746 4.466 4.000 (1) Two loans were requested for ThUS$4,000 and ThUS$2,500, respectively, capitalizing ThUS$5,000. As of December 31, 2021, there is an uncapitalized balance of ThUS$1,526 plus interest payable of ThUS$220.
Tax N°
Country Foreign companies
Currency Account
receivable Relationship Transaction
Current 31-12-2021
ThUS$
Non-current 31-12-2021 ThUS$
Current 31-12-2020
ThUS$
Non-current 31-12-2020 ThUS$
0-E Germany Hapag Lloyd AG Dollars Common shareholder Services 5.505 - 2.998 - 0-E Germany Hapag Lloyd Aktiengesellschaft Dollars Common shareholder Services 276 - - - 0-E México Hapag Lloyd México S.A. de C.V. Dollars Common shareholder Services 193 - 339 - 0-E Ecuador Hapag Lloyd Ecuador Dollars Common shareholder Services
Others 827
- - -
573 -
- -
Total foreign companies 6.801 - 3.910 -
Total Accounts receivable from related entities
13.137 1.746 8.376 4.000
SOCIEDAD MATRIZ SAAM S.A. AND SUBSIDIARIES Notes to the Consolidated Financial Statements
56
NOTE 12 Balances and transactions with related parties, continued
(12.2) Accounts payable to related entities
TAX N° Domestic companies Currency Relationship Transaction Current
12-31-2021 ThUS$
Non-current 12-31-2021
ThUS$
Current 12-31-2020
ThUS$
Non-current 12-31-2020
ThUS$ 92.011.000-2 Empresa Nacional de Energía Enex S.A. Pesos
Chilenos Common shareholder
Services Others
76 84
- -
383 -
- -
76.380.217-5 Hapag-Lloyd Chile SpA Dollar Common shareholder
Services 210 - - -
96.908.970-K San Antonio Terminal Internacional S.A. Pesos Chilenos
Common shareholder
Services 164 - 36 -
96.908.170-K Muellaje SVTI S.A. Dollar Common shareholder
Others 4 - - -
Total Accounts payable to related entities 538 - 419 -
241
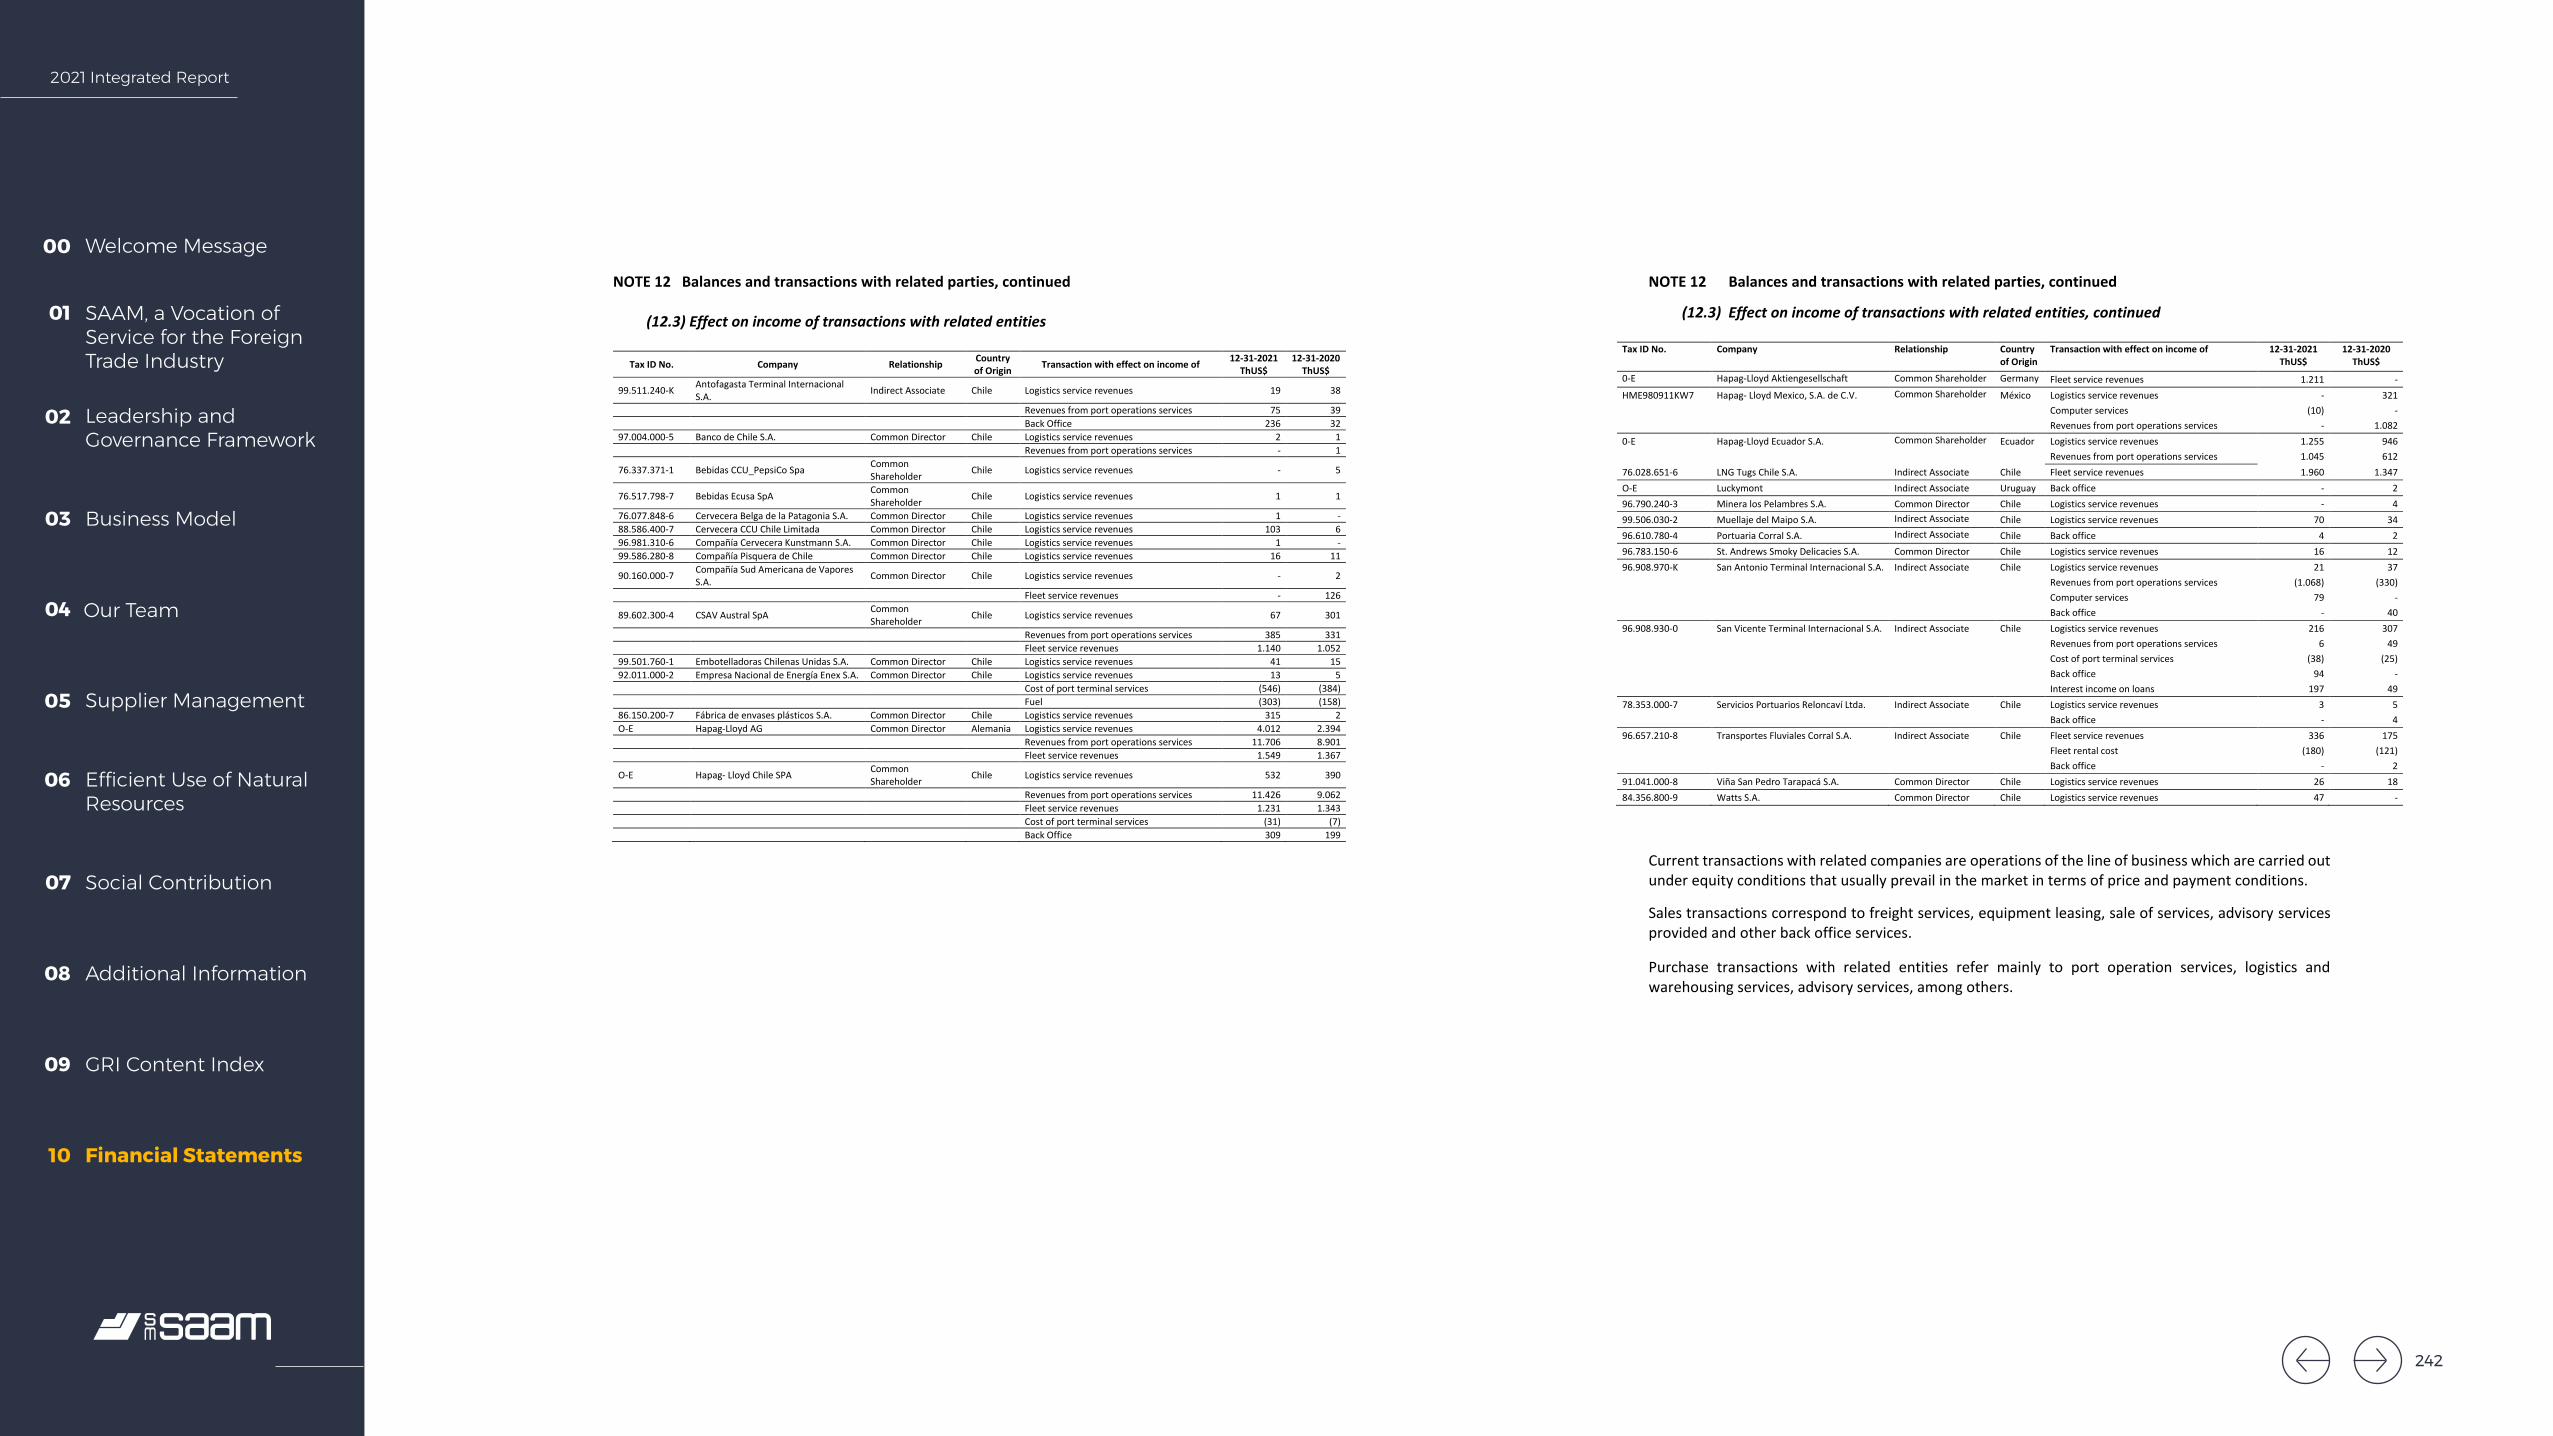
2021 Integrated Report
Welcome Message00
SAAM, a Vocation of Service for the Foreign Trade Industry
01
Leadership and Governance Framework
02
Business Model03
Our Team04
Supplier Management05
Efficient Use of Natural Resources
06
Social Contribution07
Additional Information08
GRI Content Index09
Financial Statements10
SOCIEDAD MATRIZ SAAM S.A. AND SUBSIDIARIES Notes to the Consolidated Financial Statements
57
NOTE 12 Balances and transactions with related parties, continued
(12.3) Effect on income of transactions with related entities
Tax ID No. Company Relationship Country of Origin Transaction with effect on income of 12-31-2021
ThUS$ 12-31-2020
ThUS$
99.511.240-K Antofagasta Terminal Internacional S.A. Indirect Associate Chile Logistics service revenues 19 38
Revenues from port operations services 75 39 Back Office 236 32 97.004.000-5 Banco de Chile S.A. Common Director Chile Logistics service revenues 2 1 Revenues from port operations services - 1
76.337.371-1 Bebidas CCU_PepsiCo Spa Common Shareholder Chile Logistics service revenues - 5
76.517.798-7 Bebidas Ecusa SpA Common Shareholder Chile Logistics service revenues 1 1
76.077.848-6 Cervecera Belga de la Patagonia S.A. Common Director Chile Logistics service revenues 1 - 88.586.400-7 Cervecera CCU Chile Limitada Common Director Chile Logistics service revenues 103 6 96.981.310-6 Compañía Cervecera Kunstmann S.A. Common Director Chile Logistics service revenues 1 - 99.586.280-8 Compañía Pisquera de Chile Common Director Chile Logistics service revenues 16 11
90.160.000-7 Compañía Sud Americana de Vapores S.A. Common Director Chile Logistics service revenues - 2
Fleet service revenues - 126
89.602.300-4 CSAV Austral SpA Common Shareholder Chile Logistics service revenues 67 301
Revenues from port operations services 385 331 Fleet service revenues 1.140 1.052 99.501.760-1 Embotelladoras Chilenas Unidas S.A. Common Director Chile Logistics service revenues 41 15 92.011.000-2 Empresa Nacional de Energía Enex S.A. Common Director Chile Logistics service revenues 13 5 Cost of port terminal services (546) (384) Fuel (303) (158) 86.150.200-7 Fábrica de envases plásticos S.A. Common Director Chile Logistics service revenues 315 2 O-E Hapag-Lloyd AG Common Director Alemania Logistics service revenues 4.012 2.394 Revenues from port operations services 11.706 8.901 Fleet service revenues 1.549 1.367
O-E Hapag- Lloyd Chile SPA Common Shareholder Chile Logistics service revenues 532 390
Revenues from port operations services 11.426 9.062 Fleet service revenues 1.231 1.343 Cost of port terminal services (31) (7) Back Office 309 199
SOCIEDAD MATRIZ SAAM S.A. AND SUBSIDIARIES Notes to the Consolidated Financial Statements
58
NOTE 12 Balances and transactions with related parties, continued
(12.3) Effect on income of transactions with related entities, continued
Tax ID No. Company Relationship Country of Origin
Transaction with effect on income of 12-31-2021 ThUS$
12-31-2020 ThUS$
0-E Hapag-Lloyd Aktiengesellschaft Common Shareholder Germany Fleet service revenues 1.211 - HME980911KW7 Hapag- Lloyd Mexico, S.A. de C.V. Common Shareholder México Logistics service revenues - 321
Computer services (10) - Revenues from port operations services - 1.082 0-E Hapag-Lloyd Ecuador S.A. Common Shareholder Ecuador Logistics service revenues 1.255 946
Revenues from port operations services 1.045 612 76.028.651-6 LNG Tugs Chile S.A. Indirect Associate Chile Fleet service revenues 1.960 1.347 O-E Luckymont Indirect Associate Uruguay Back office - 2 96.790.240-3 Minera los Pelambres S.A. Common Director Chile Logistics service revenues - 4 99.506.030-2 Muellaje del Maipo S.A. Indirect Associate Chile Logistics service revenues 70 34 96.610.780-4 Portuaria Corral S.A. Indirect Associate Chile Back office 4 2 96.783.150-6 St. Andrews Smoky Delicacies S.A. Common Director Chile Logistics service revenues 16 12 96.908.970-K San Antonio Terminal Internacional S.A. Indirect Associate Chile Logistics service revenues 21 37
Revenues from port operations services (1.068) (330) Computer services 79 -
Back office - 40 96.908.930-0 San Vicente Terminal Internacional S.A. Indirect Associate Chile Logistics service revenues 216 307
Revenues from port operations services 6 49 Cost of port terminal services (38) (25) Back office 94 -
Interest income on loans 197 49 78.353.000-7 Servicios Portuarios Reloncaví Ltda. Indirect Associate Chile Logistics service revenues 3 5 Back office - 4 96.657.210-8 Transportes Fluviales Corral S.A. Indirect Associate Chile Fleet service revenues 336 175
Fleet rental cost (180) (121) Back office - 2 91.041.000-8 Viña San Pedro Tarapacá S.A. Common Director Chile Logistics service revenues 26 18 84.356.800-9 Watts S.A. Common Director Chile Logistics service revenues 47 -
Current transactions with related companies are operations of the line of business which are carried out under equity conditions that usually prevail in the market in terms of price and payment conditions.
Sales transactions correspond to freight services, equipment leasing, sale of services, advisory services provided and other back office services. Purchase transactions with related entities refer mainly to port operation services, logistics and warehousing services, advisory services, among others.
242
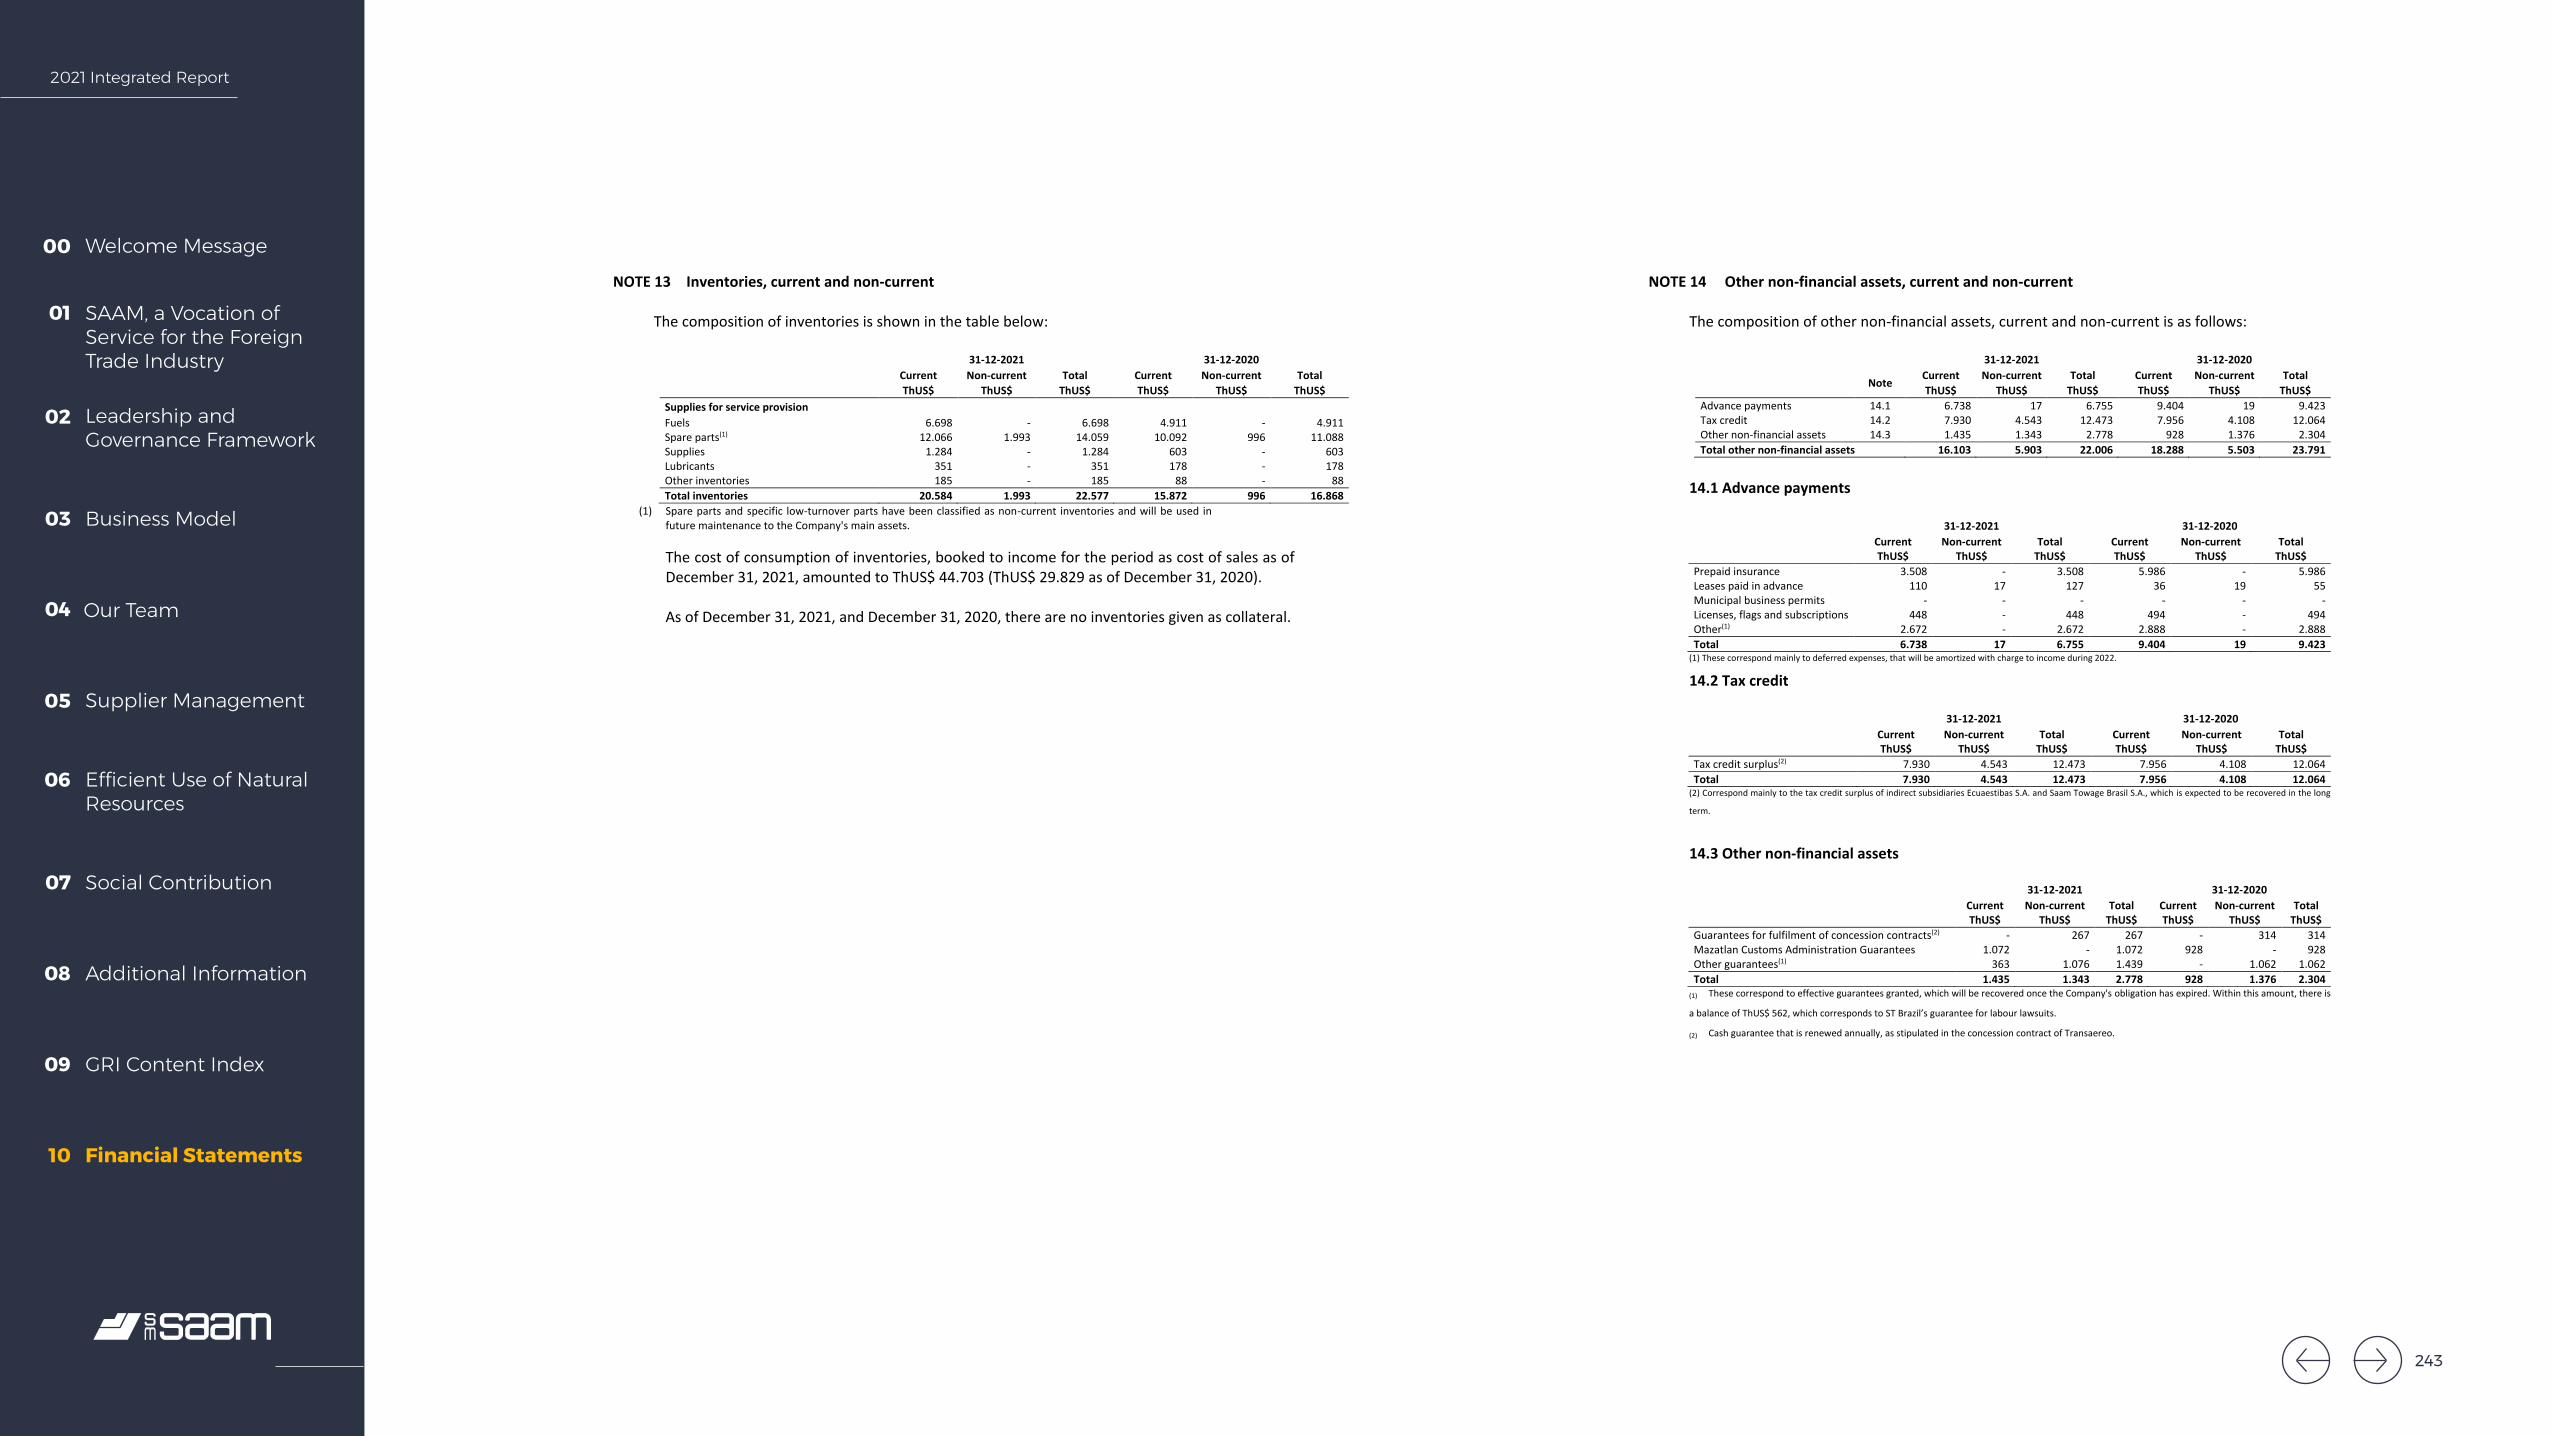
2021 Integrated Report
Welcome Message00
SAAM, a Vocation of Service for the Foreign Trade Industry
01
Leadership and Governance Framework
02
Business Model03
Our Team04
Supplier Management05
Efficient Use of Natural Resources
06
Social Contribution07
Additional Information08
GRI Content Index09
Financial Statements10
SOCIEDAD MATRIZ SAAM S.A. AND SUBSIDIARIES Notes to the Consolidated Financial Statements
59
NOTE 13 Inventories, current and non-current The composition of inventories is shown in the table below:
31-12-2021 31-12-2020
Current Non-current Total Current Non-current Total ThUS$ ThUS$ ThUS$ ThUS$ ThUS$ ThUS$
Supplies for service provision Fuels 6.698 - 6.698 4.911 - 4.911 Spare parts(1) 12.066 1.993 14.059 10.092 996 11.088 Supplies 1.284 - 1.284 603 - 603 Lubricants 351 - 351 178 - 178 Other inventories 185 - 185 88 - 88 Total inventories 20.584 1.993 22.577 15.872 996 16.868
(1) Spare parts and specific low-turnover parts have been classified as non-current inventories and will be used in future maintenance to the Company's main assets. The cost of consumption of inventories, booked to income for the period as cost of sales as of December 31, 2021, amounted to ThUS$ 44.703 (ThUS$ 29.829 as of December 31, 2020). As of December 31, 2021, and December 31, 2020, there are no inventories given as collateral.
SOCIEDAD MATRIZ SAAM S.A. AND SUBSIDIARIES Notes to the Consolidated Financial Statements
60
NOTE 14 Other non-financial assets, current and non-current The composition of other non-financial assets, current and non-current is as follows:
31-12-2021 31-12-2020
Note Current Non-current Total Current Non-current Total ThUS$ ThUS$ ThUS$ ThUS$ ThUS$ ThUS$
Advance payments 14.1 6.738 17 6.755 9.404 19 9.423 Tax credit 14.2 7.930 4.543 12.473 7.956 4.108 12.064 Other non-financial assets 14.3 1.435 1.343 2.778 928 1.376 2.304 Total other non-financial assets 16.103 5.903 22.006 18.288 5.503 23.791
14.1 Advance payments 31-12-2021 31-12-2020 Current Non-current Total Current Non-current Total ThUS$ ThUS$ ThUS$ ThUS$ ThUS$ ThUS$ Prepaid insurance 3.508 - 3.508 5.986 - 5.986 Leases paid in advance 110 17 127 36 19 55 Municipal business permits - - - - - - Licenses, flags and subscriptions 448 - 448 494 - 494 Other(1) 2.672 - 2.672 2.888 - 2.888 Total 6.738 17 6.755 9.404 19 9.423
(1) These correspond mainly to deferred expenses, that will be amortized with charge to income during 2022.
14.2 Tax credit 31-12-2021 31-12-2020 Current Non-current Total Current Non-current Total ThUS$ ThUS$ ThUS$ ThUS$ ThUS$ ThUS$ Tax credit surplus(2) 7.930 4.543 12.473 7.956 4.108 12.064 Total 7.930 4.543 12.473 7.956 4.108 12.064
(2) Correspond mainly to the tax credit surplus of indirect subsidiaries Ecuaestibas S.A. and Saam Towage Brasil S.A., which is expected to be recovered in the long
term.
14.3 Other non-financial assets
31-12-2021 31-12-2020 Current Non-current Total Current Non-current Total ThUS$ ThUS$ ThUS$ ThUS$ ThUS$ ThUS$ Guarantees for fulfilment of concession contracts(2) - 267 267 - 314 314 Mazatlan Customs Administration Guarantees 1.072 - 1.072 928 - 928 Other guarantees(1) 363 1.076 1.439 - 1.062 1.062 Total 1.435 1.343 2.778 928 1.376 2.304
(1) These correspond to effective guarantees granted, which will be recovered once the Company's obligation has expired. Within this amount, there is
a balance of ThUS$ 562, which corresponds to ST Brazil’s guarantee for labour lawsuits.
(2) Cash guarantee that is renewed annually, as stipulated in the concession contract of Transaereo.
243
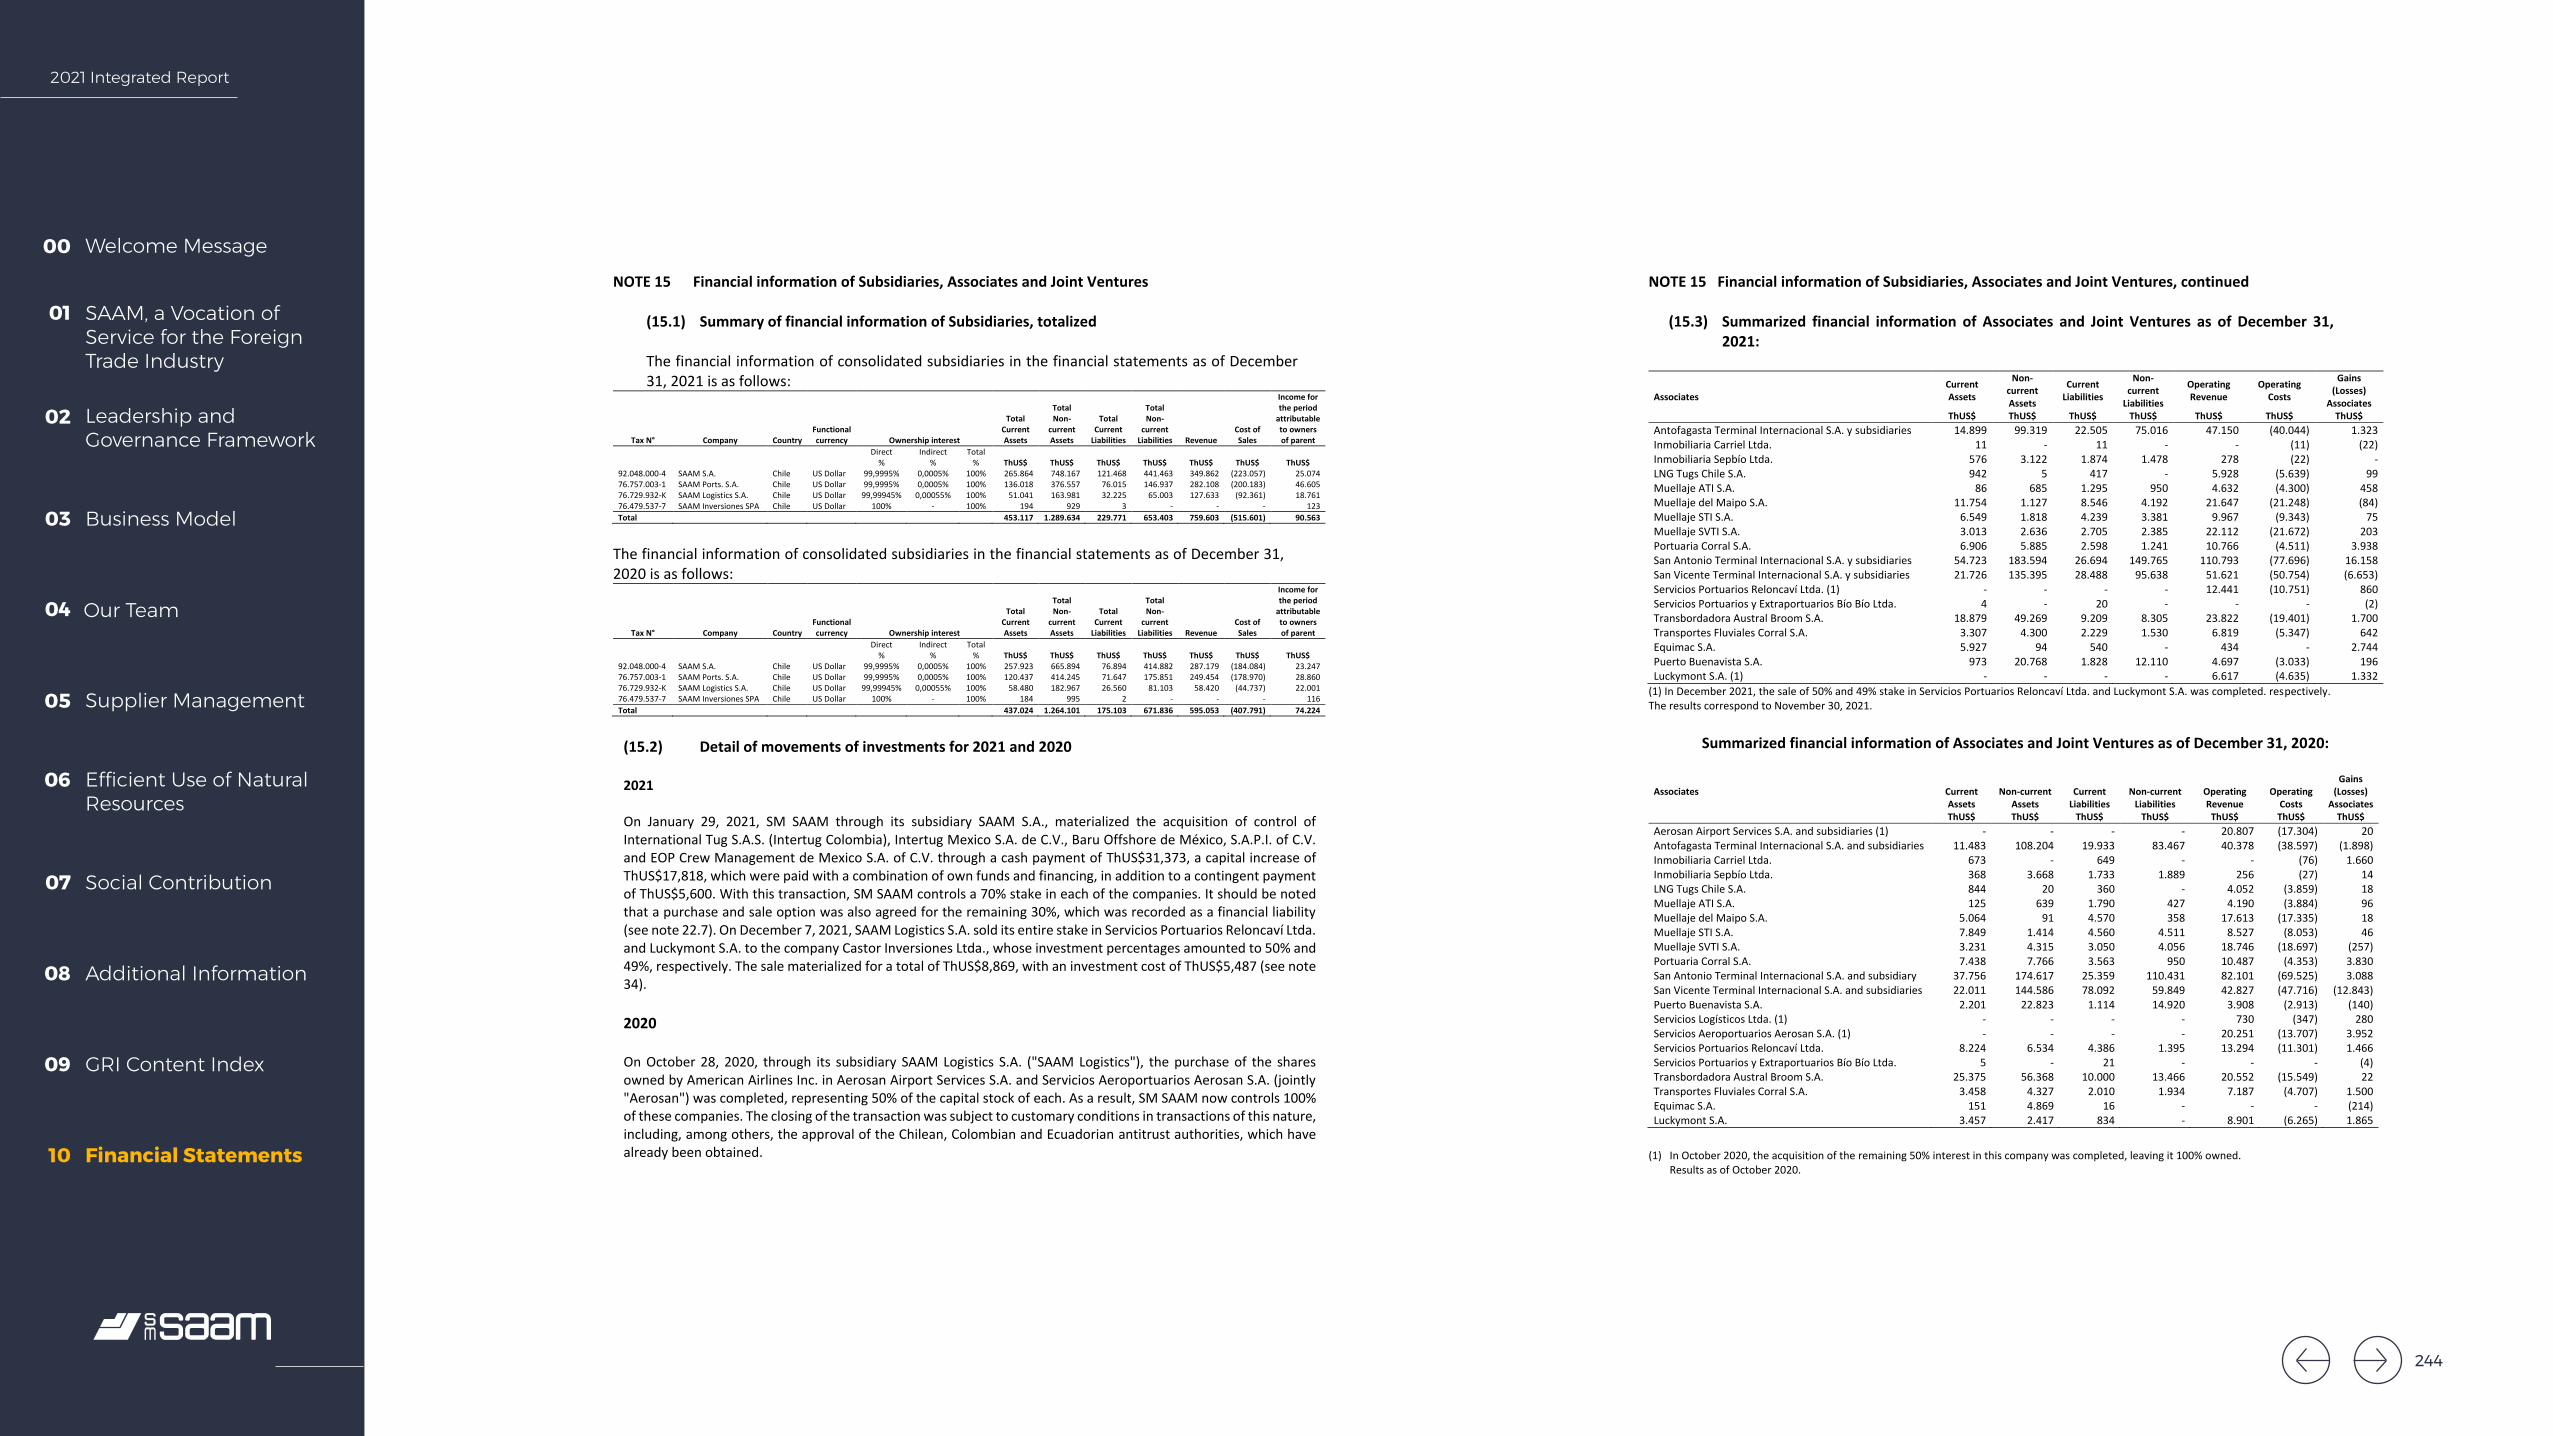
2021 Integrated Report
Welcome Message00
SAAM, a Vocation of Service for the Foreign Trade Industry
01
Leadership and Governance Framework
02
Business Model03
Our Team04
Supplier Management05
Efficient Use of Natural Resources
06
Social Contribution07
Additional Information08
GRI Content Index09
Financial Statements10
SOCIEDAD MATRIZ SAAM S.A. AND SUBSIDIARIES Notes to the Consolidated Financial Statements
61
NOTE 15 Financial information of Subsidiaries, Associates and Joint Ventures
(15.1) Summary of financial information of Subsidiaries, totalized
The financial information of consolidated subsidiaries in the financial statements as of December 31, 2021 is as follows:
Tax N° Company Country Functional currency Ownership interest
Total Current Assets
Total Non-
current Assets
Total Current
Liabilities
Total Non-
current Liabilities Revenue
Cost of Sales
Income for the period
attributable to owners of parent
Direct Indirect Total % % % ThUS$ ThUS$ ThUS$ ThUS$ ThUS$ ThUS$ ThUS$
92.048.000-4 SAAM S.A. Chile US Dollar 99,9995% 0,0005% 100% 265.864 748.167 121.468 441.463 349.862 (223.057) 25.074 76.757.003-1 SAAM Ports. S.A. Chile US Dollar 99,9995% 0,0005% 100% 136.018 376.557 76.015 146.937 282.108 (200.183) 46.605 76.729.932-K SAAM Logistics S.A. Chile US Dollar 99,99945% 0,00055% 100% 51.041 163.981 32.225 65.003 127.633 (92.361) 18.761 76.479.537-7 SAAM Inversiones SPA Chile US Dollar 100% - 100% 194 929 3 - - - 123 Total 453.117 1.289.634 229.771 653.403 759.603 (515.601) 90.563
The financial information of consolidated subsidiaries in the financial statements as of December 31, 2020 is as follows:
Tax N° Company Country Functional currency Ownership interest
Total Current Assets
Total Non-
current Assets
Total Current
Liabilities
Total Non-
current Liabilities Revenue
Cost of Sales
Income for the period
attributable to owners of parent
Direct Indirect Total % % % ThUS$ ThUS$ ThUS$ ThUS$ ThUS$ ThUS$ ThUS$
92.048.000-4 SAAM S.A. Chile US Dollar 99,9995% 0,0005% 100% 257.923 665.894 76.894 414.882 287.179 (184.084) 23.247 76.757.003-1 SAAM Ports. S.A. Chile US Dollar 99,9995% 0,0005% 100% 120.437 414.245 71.647 175.851 249.454 (178.970) 28.860 76.729.932-K SAAM Logistics S.A. Chile US Dollar 99,99945% 0,00055% 100% 58.480 182.967 26.560 81.103 58.420 (44.737) 22.001 76.479.537-7 SAAM Inversiones SPA Chile US Dollar 100% - 100% 184 995 2 - - - 116 Total 437.024 1.264.101 175.103 671.836 595.053 (407.791) 74.224
(15.2) Detail of movements of investments for 2021 and 2020 2021 On January 29, 2021, SM SAAM through its subsidiary SAAM S.A., materialized the acquisition of control of International Tug S.A.S. (Intertug Colombia), Intertug Mexico S.A. de C.V., Baru Offshore de México, S.A.P.I. of C.V. and EOP Crew Management de Mexico S.A. of C.V. through a cash payment of ThUS$31,373, a capital increase of ThUS$17,818, which were paid with a combination of own funds and financing, in addition to a contingent payment of ThUS$5,600. With this transaction, SM SAAM controls a 70% stake in each of the companies. It should be noted that a purchase and sale option was also agreed for the remaining 30%, which was recorded as a financial liability (see note 22.7). On December 7, 2021, SAAM Logistics S.A. sold its entire stake in Servicios Portuarios Reloncaví Ltda. and Luckymont S.A. to the company Castor Inversiones Ltda., whose investment percentages amounted to 50% and 49%, respectively. The sale materialized for a total of ThUS$8,869, with an investment cost of ThUS$5,487 (see note 34). 2020 On October 28, 2020, through its subsidiary SAAM Logistics S.A. ("SAAM Logistics"), the purchase of the shares owned by American Airlines Inc. in Aerosan Airport Services S.A. and Servicios Aeroportuarios Aerosan S.A. (jointly "Aerosan") was completed, representing 50% of the capital stock of each. As a result, SM SAAM now controls 100% of these companies. The closing of the transaction was subject to customary conditions in transactions of this nature, including, among others, the approval of the Chilean, Colombian and Ecuadorian antitrust authorities, which have already been obtained.
SOCIEDAD MATRIZ SAAM S.A. AND SUBSIDIARIES Notes to the Consolidated Financial Statements
62
NOTE 15 Financial information of Subsidiaries, Associates and Joint Ventures, continued
(15.3) Summarized financial information of Associates and Joint Ventures as of December 31, 2021:
Associates Current Assets
Non-current Assets
Current Liabilities
Non-current
Liabilities
Operating Revenue
Operating Costs
Gains (Losses)
Associates ThUS$ ThUS$ ThUS$ ThUS$ ThUS$ ThUS$ ThUS$
Antofagasta Terminal Internacional S.A. y subsidiaries 14.899 99.319 22.505 75.016 47.150 (40.044) 1.323 Inmobiliaria Carriel Ltda. 11 - 11 - - (11) (22) Inmobiliaria Sepbío Ltda. 576 3.122 1.874 1.478 278 (22) - LNG Tugs Chile S.A. 942 5 417 - 5.928 (5.639) 99 Muellaje ATI S.A. 86 685 1.295 950 4.632 (4.300) 458 Muellaje del Maipo S.A. 11.754 1.127 8.546 4.192 21.647 (21.248) (84) Muellaje STI S.A. 6.549 1.818 4.239 3.381 9.967 (9.343) 75 Muellaje SVTI S.A. 3.013 2.636 2.705 2.385 22.112 (21.672) 203 Portuaria Corral S.A. 6.906 5.885 2.598 1.241 10.766 (4.511) 3.938 San Antonio Terminal Internacional S.A. y subsidiaries 54.723 183.594 26.694 149.765 110.793 (77.696) 16.158 San Vicente Terminal Internacional S.A. y subsidiaries 21.726 135.395 28.488 95.638 51.621 (50.754) (6.653) Servicios Portuarios Reloncaví Ltda. (1) - - - - 12.441 (10.751) 860 Servicios Portuarios y Extraportuarios Bío Bío Ltda. 4 - 20 - - - (2) Transbordadora Austral Broom S.A. 18.879 49.269 9.209 8.305 23.822 (19.401) 1.700 Transportes Fluviales Corral S.A. 3.307 4.300 2.229 1.530 6.819 (5.347) 642 Equimac S.A. 5.927 94 540 - 434 - 2.744 Puerto Buenavista S.A. 973 20.768 1.828 12.110 4.697 (3.033) 196 Luckymont S.A. (1) - - - - 6.617 (4.635) 1.332
(1) In December 2021, the sale of 50% and 49% stake in Servicios Portuarios Reloncaví Ltda. and Luckymont S.A. was completed. respectively. The results correspond to November 30, 2021.
Summarized financial information of Associates and Joint Ventures as of December 31, 2020:
Associates Current Assets
Non-current Assets
Current Liabilities
Non-current Liabilities
Operating Revenue
Operating Costs
Gains (Losses)
Associates ThUS$ ThUS$ ThUS$ ThUS$ ThUS$ ThUS$ ThUS$ Aerosan Airport Services S.A. and subsidiaries (1) - - - - 20.807 (17.304) 20 Antofagasta Terminal Internacional S.A. and subsidiaries 11.483 108.204 19.933 83.467 40.378 (38.597) (1.898) Inmobiliaria Carriel Ltda. 673 - 649 - - (76) 1.660 Inmobiliaria Sepbío Ltda. 368 3.668 1.733 1.889 256 (27) 14 LNG Tugs Chile S.A. 844 20 360 - 4.052 (3.859) 18 Muellaje ATI S.A. 125 639 1.790 427 4.190 (3.884) 96 Muellaje del Maipo S.A. 5.064 91 4.570 358 17.613 (17.335) 18 Muellaje STI S.A. 7.849 1.414 4.560 4.511 8.527 (8.053) 46 Muellaje SVTI S.A. 3.231 4.315 3.050 4.056 18.746 (18.697) (257) Portuaria Corral S.A. 7.438 7.766 3.563 950 10.487 (4.353) 3.830 San Antonio Terminal Internacional S.A. and subsidiary 37.756 174.617 25.359 110.431 82.101 (69.525) 3.088 San Vicente Terminal Internacional S.A. and subsidiaries 22.011 144.586 78.092 59.849 42.827 (47.716) (12.843) Puerto Buenavista S.A. 2.201 22.823 1.114 14.920 3.908 (2.913) (140) Servicios Logísticos Ltda. (1) - - - - 730 (347) 280 Servicios Aeroportuarios Aerosan S.A. (1) - - - - 20.251 (13.707) 3.952 Servicios Portuarios Reloncaví Ltda. 8.224 6.534 4.386 1.395 13.294 (11.301) 1.466 Servicios Portuarios y Extraportuarios Bío Bío Ltda. 5 - 21 - - - (4) Transbordadora Austral Broom S.A. 25.375 56.368 10.000 13.466 20.552 (15.549) 22 Transportes Fluviales Corral S.A. 3.458 4.327 2.010 1.934 7.187 (4.707) 1.500 Equimac S.A. 151 4.869 16 - - - (214) Luckymont S.A. 3.457 2.417 834 - 8.901 (6.265) 1.865
(1) In October 2020, the acquisition of the remaining 50% interest in this company was completed, leaving it 100% owned.
Results as of October 2020.
244
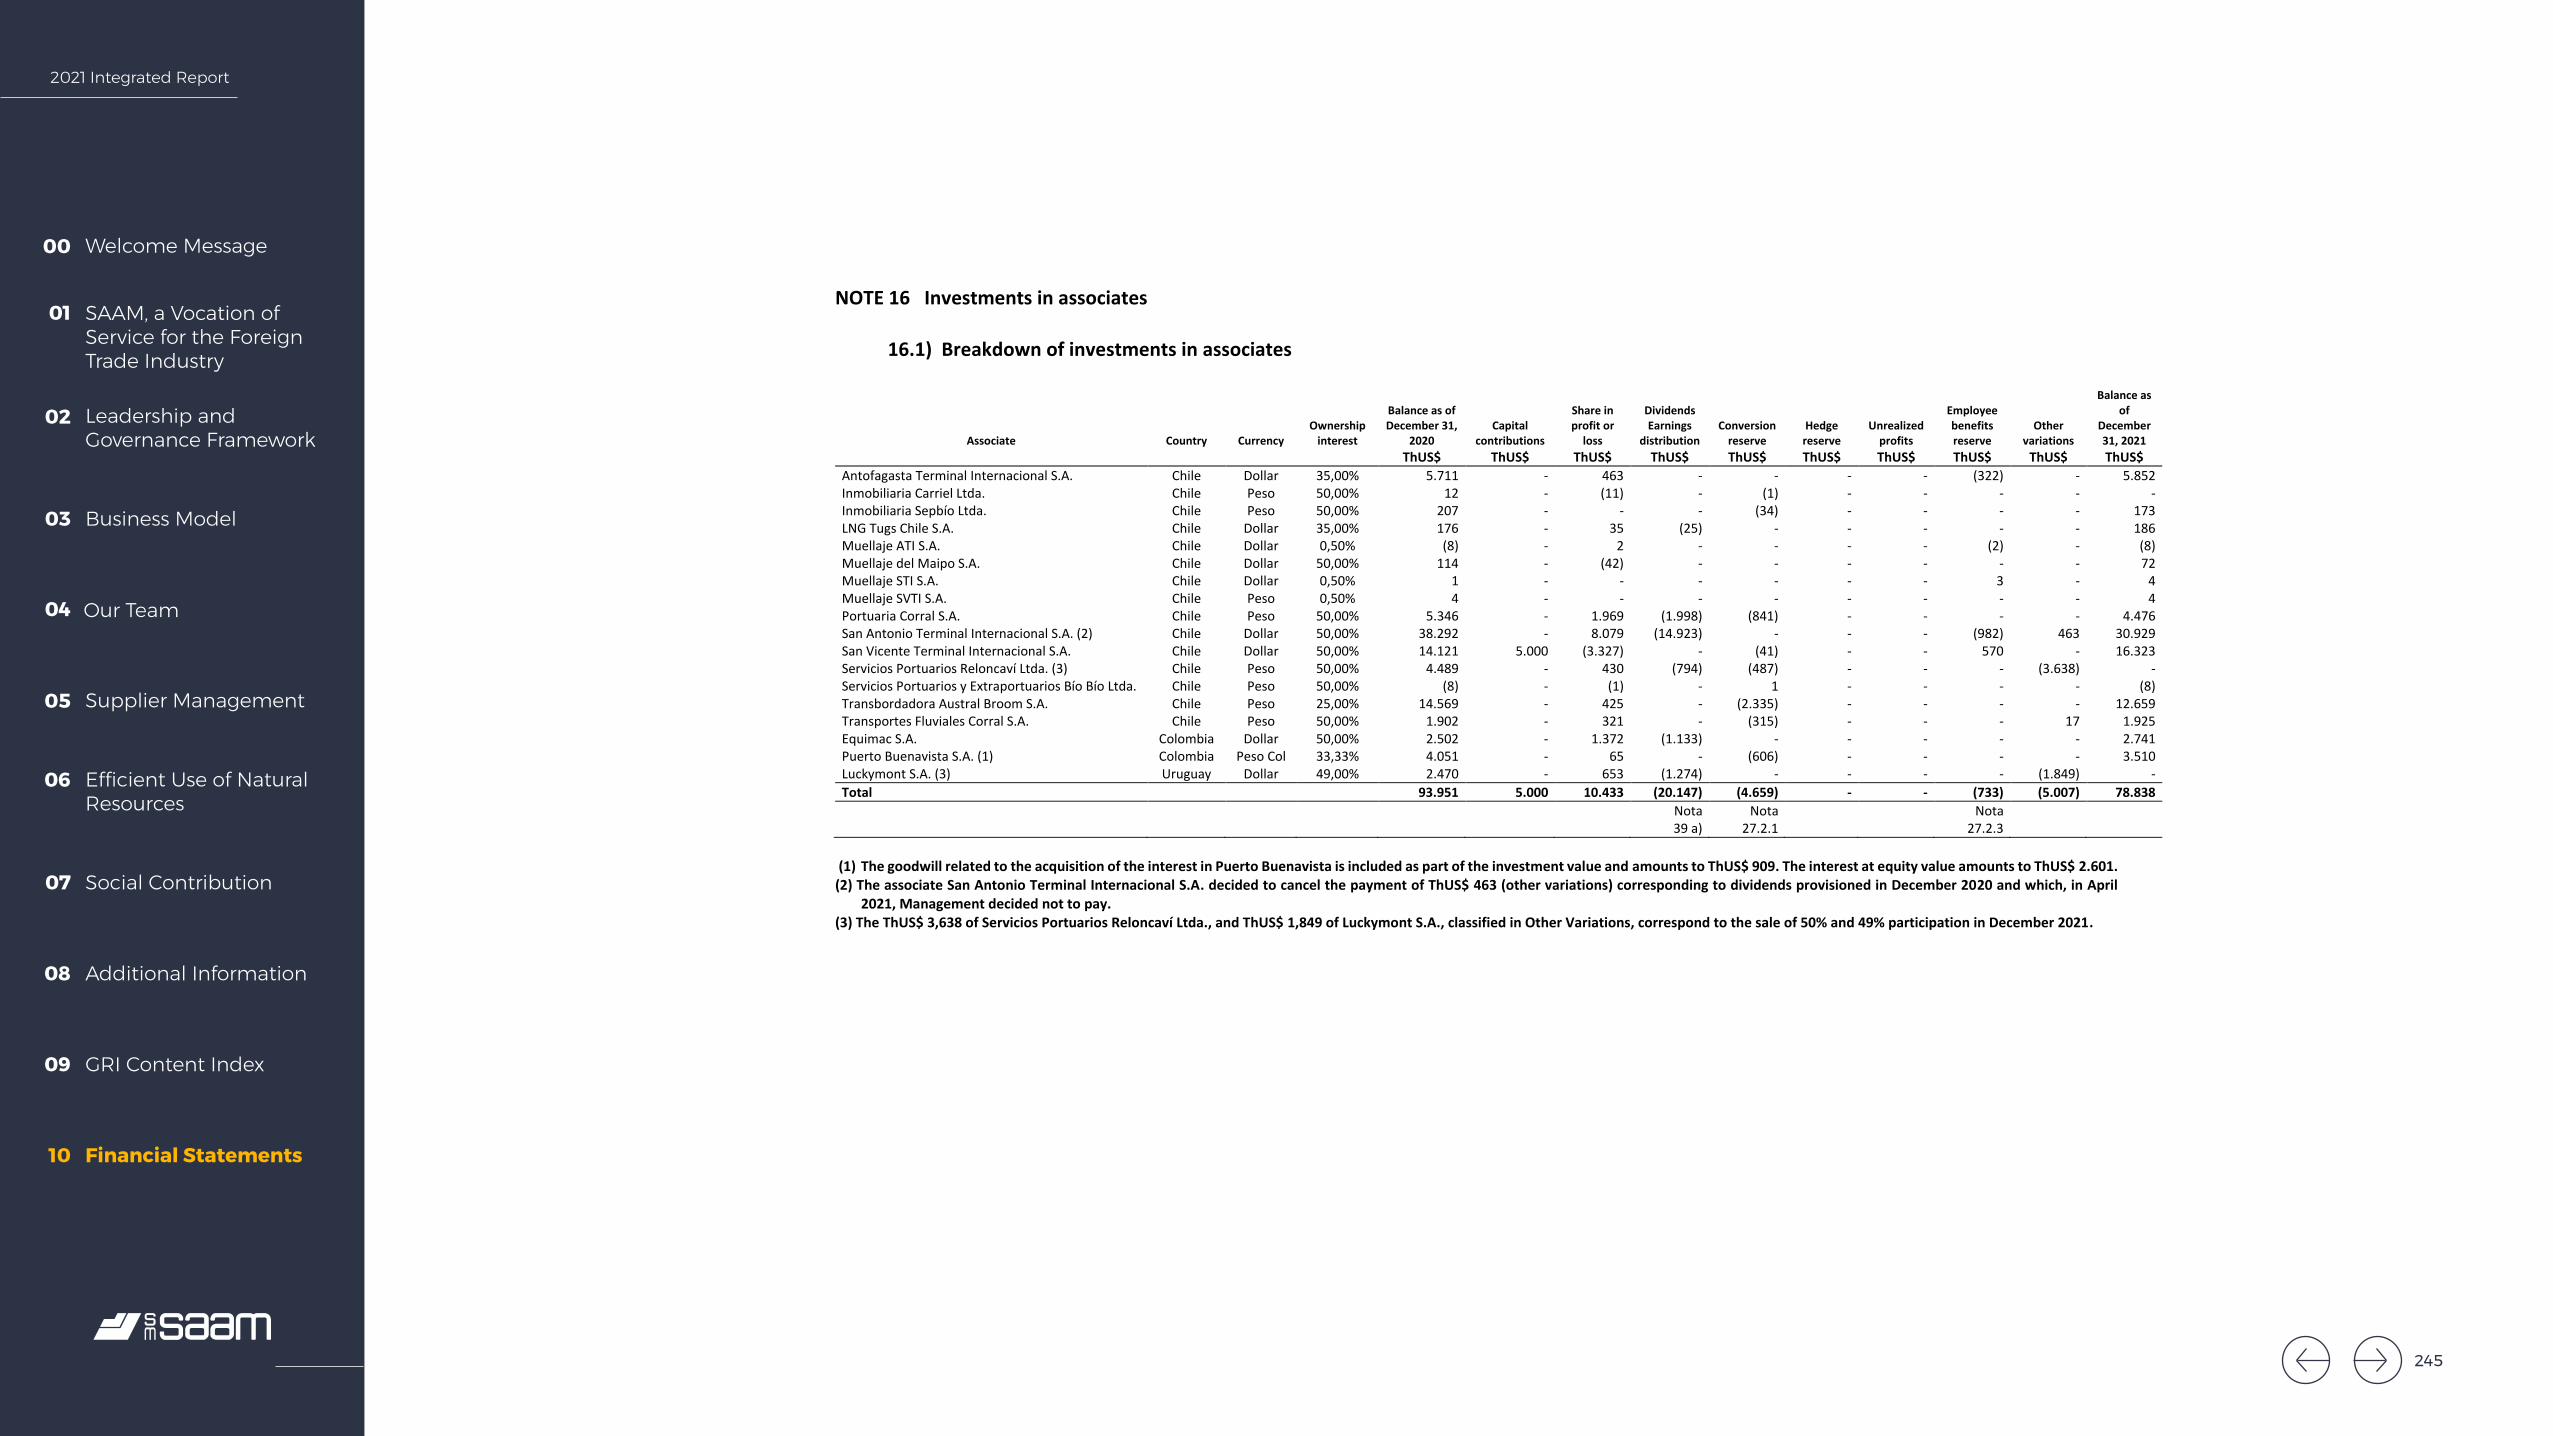
2021 Integrated Report
Welcome Message00
SAAM, a Vocation of Service for the Foreign Trade Industry
01
Leadership and Governance Framework
02
Business Model03
Our Team04
Supplier Management05
Efficient Use of Natural Resources
06
Social Contribution07
Additional Information08
GRI Content Index09
Financial Statements10
SOCIEDAD MATRIZ SAAM S.A. AND SUBSIDIARIES Notes to the Consolidated Financial Statements
63
NOTE 16 Investments in associates
16.1) Breakdown of investments in associates
Associate Country Currency Ownership
interest
Balance as of December 31,
2020 Capital
contributions
Share in profit or
loss
Dividends Earnings
distribution Conversion
reserve Hedge reserve
Unrealized profits
Employee benefits reserve
Other variations
Balance as of
December 31, 2021
ThUS$ ThUS$ ThUS$ ThUS$ ThUS$ ThUS$ ThUS$ ThUS$ ThUS$ ThUS$ Antofagasta Terminal Internacional S.A. Chile Dollar 35,00% 5.711 - 463 - - - - (322) - 5.852 Inmobiliaria Carriel Ltda. Chile Peso 50,00% 12 - (11) - (1) - - - - - Inmobiliaria Sepbío Ltda. Chile Peso 50,00% 207 - - - (34) - - - - 173 LNG Tugs Chile S.A. Chile Dollar 35,00% 176 - 35 (25) - - - - - 186 Muellaje ATI S.A. Chile Dollar 0,50% (8) - 2 - - - - (2) - (8) Muellaje del Maipo S.A. Chile Dollar 50,00% 114 - (42) - - - - - - 72 Muellaje STI S.A. Chile Dollar 0,50% 1 - - - - - - 3 - 4 Muellaje SVTI S.A. Chile Peso 0,50% 4 - - - - - - - - 4 Portuaria Corral S.A. Chile Peso 50,00% 5.346 - 1.969 (1.998) (841) - - - - 4.476 San Antonio Terminal Internacional S.A. (2) Chile Dollar 50,00% 38.292 - 8.079 (14.923) - - - (982) 463 30.929 San Vicente Terminal Internacional S.A. Chile Dollar 50,00% 14.121 5.000 (3.327) - (41) - - 570 - 16.323 Servicios Portuarios Reloncaví Ltda. (3) Chile Peso 50,00% 4.489 - 430 (794) (487) - - - (3.638) - Servicios Portuarios y Extraportuarios Bío Bío Ltda. Chile Peso 50,00% (8) - (1) - 1 - - - - (8) Transbordadora Austral Broom S.A. Chile Peso 25,00% 14.569 - 425 - (2.335) - - - - 12.659 Transportes Fluviales Corral S.A. Chile Peso 50,00% 1.902 - 321 - (315) - - - 17 1.925 Equimac S.A. Colombia Dollar 50,00% 2.502 - 1.372 (1.133) - - - - - 2.741 Puerto Buenavista S.A. (1) Colombia Peso Col 33,33% 4.051 - 65 - (606) - - - - 3.510 Luckymont S.A. (3) Uruguay Dollar 49,00% 2.470 - 653 (1.274) - - - - (1.849) - Total 93.951 5.000 10.433 (20.147) (4.659) - - (733) (5.007) 78.838
Nota Nota Nota 39 a) 27.2.1 27.2.3
(1) The goodwill related to the acquisition of the interest in Puerto Buenavista is included as part of the investment value and amounts to ThUS$ 909. The interest at equity value amounts to ThUS$ 2.601. (2) The associate San Antonio Terminal Internacional S.A. decided to cancel the payment of ThUS$ 463 (other variations) corresponding to dividends provisioned in December 2020 and which, in April
2021, Management decided not to pay. (3) The ThUS$ 3,638 of Servicios Portuarios Reloncaví Ltda., and ThUS$ 1,849 of Luckymont S.A., classified in Other Variations, correspond to the sale of 50% and 49% participation in December 2021.
245
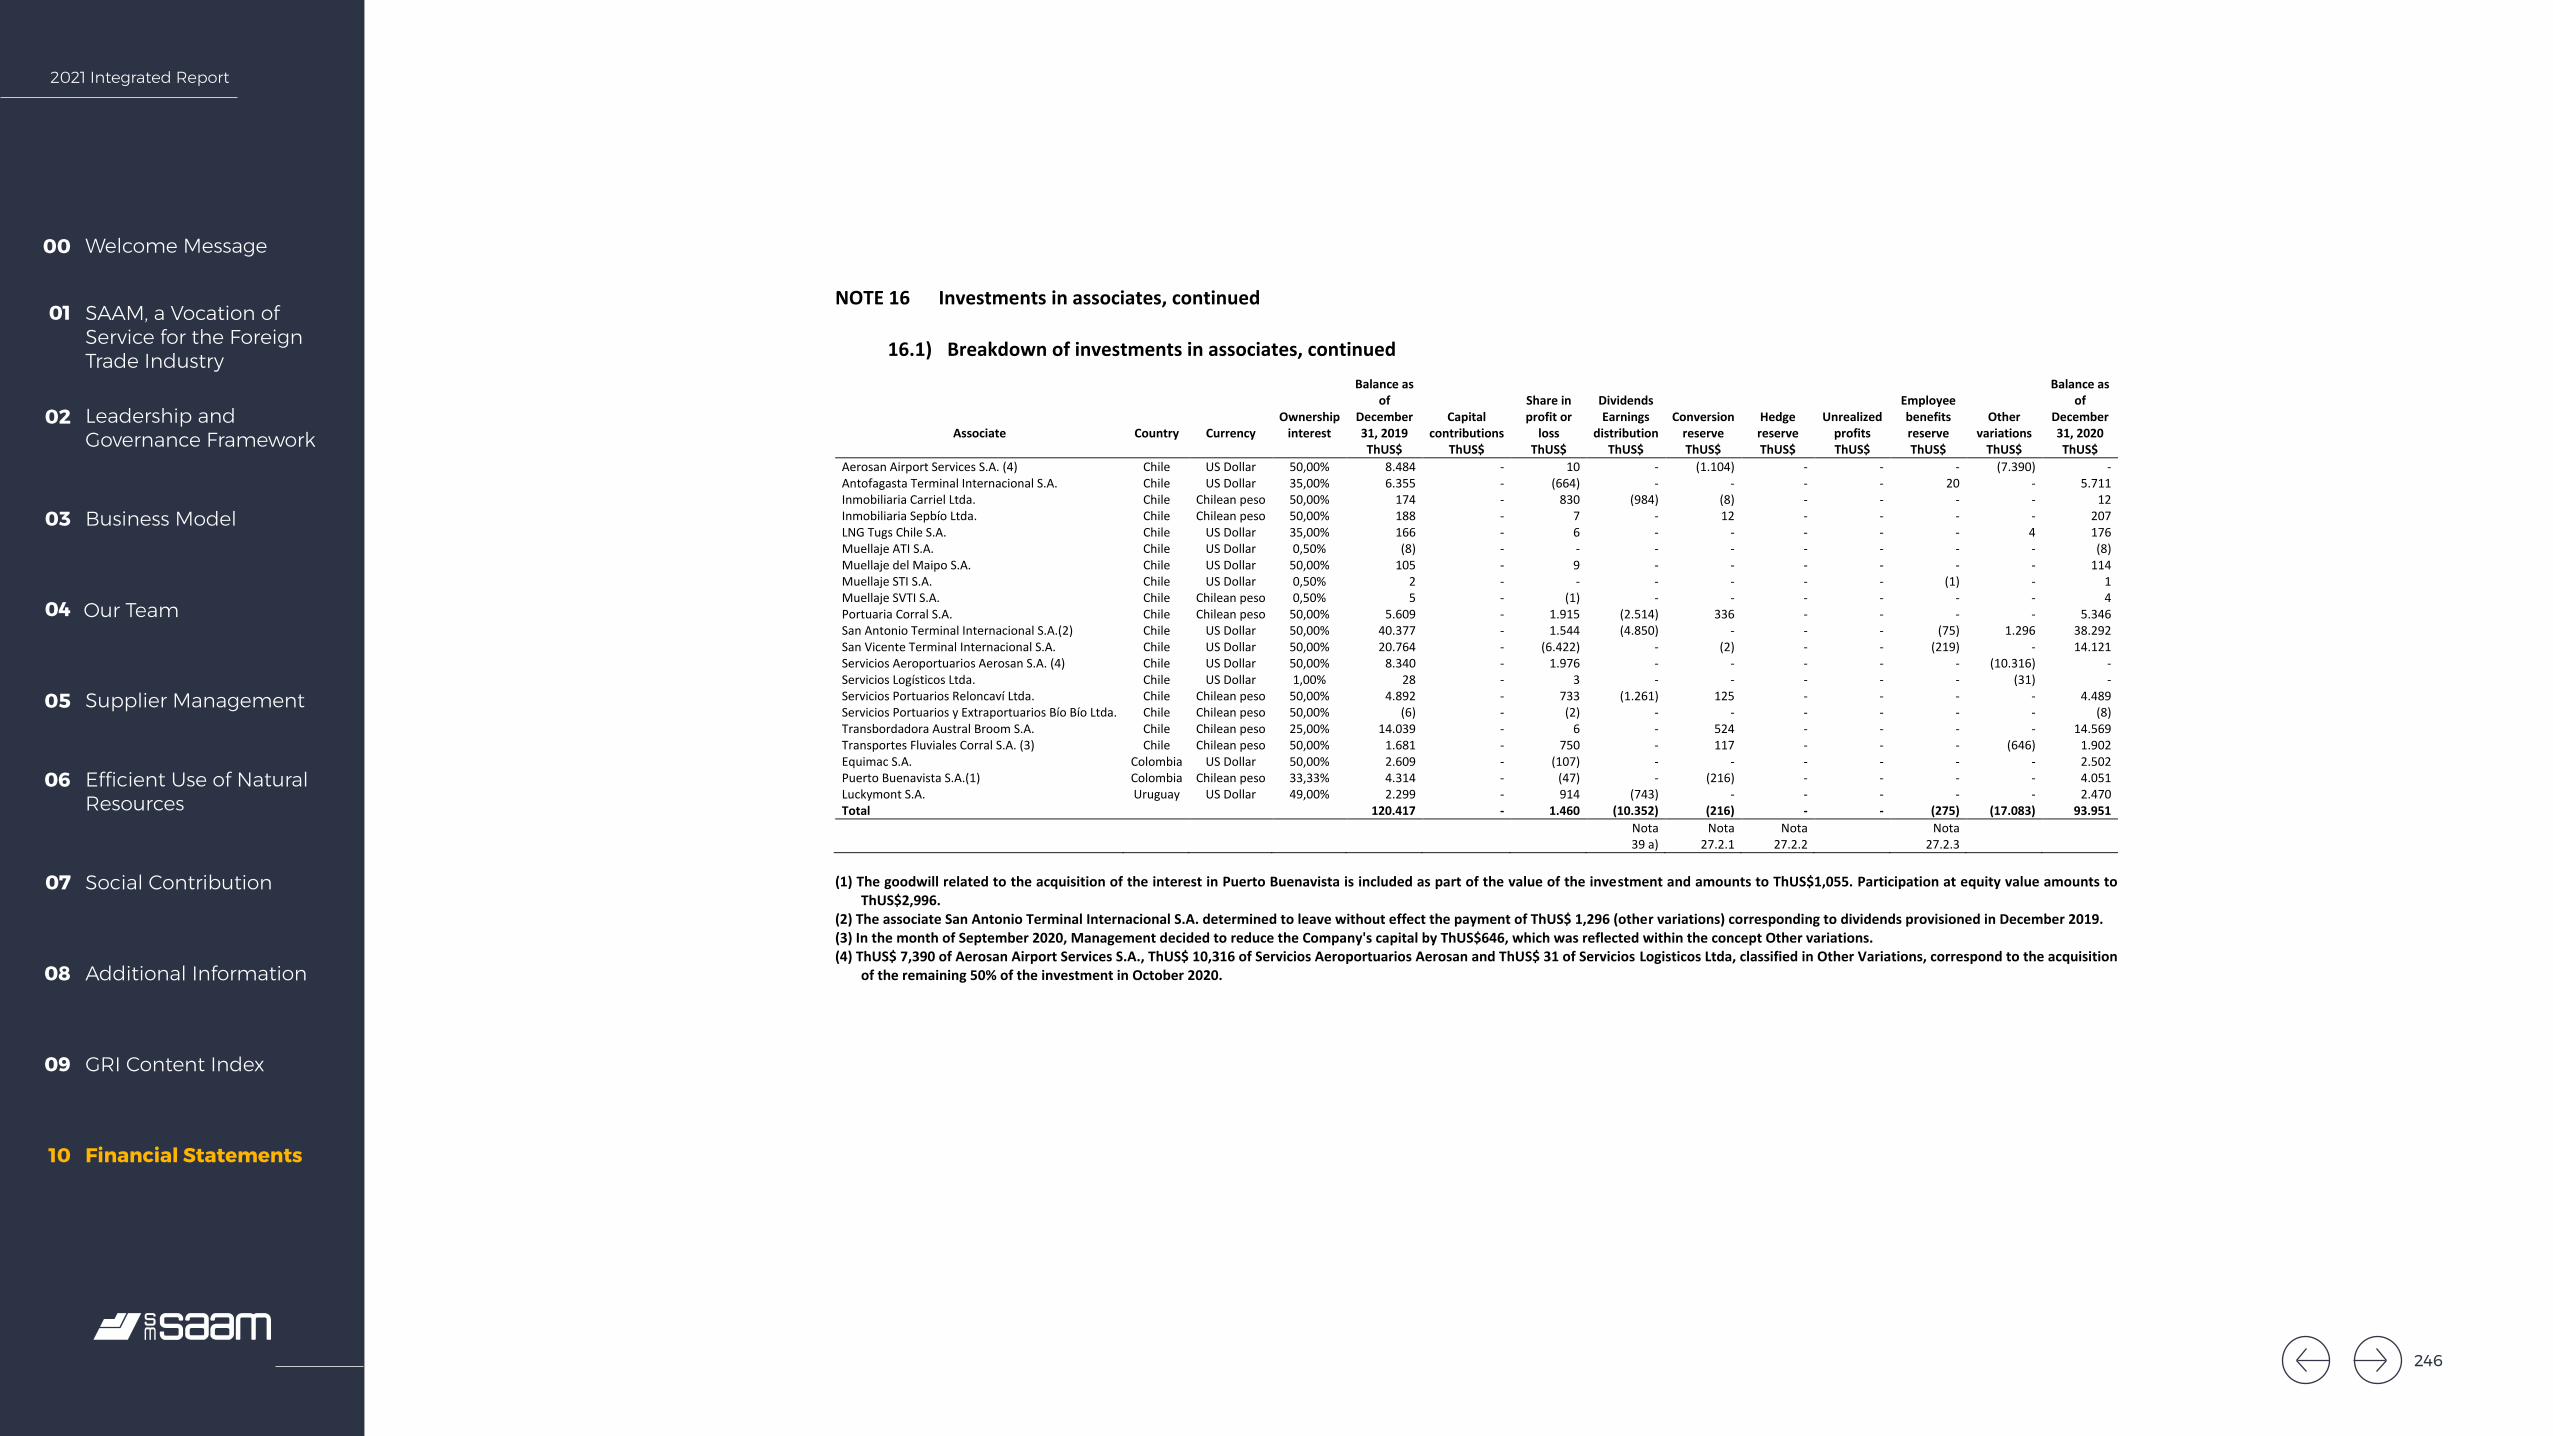
2021 Integrated Report
Welcome Message00
SAAM, a Vocation of Service for the Foreign Trade Industry
01
Leadership and Governance Framework
02
Business Model03
Our Team04
Supplier Management05
Efficient Use of Natural Resources
06
Social Contribution07
Additional Information08
GRI Content Index09
Financial Statements10
SOCIEDAD MATRIZ SAAM S.A. AND SUBSIDIARIES Notes to the Consolidated Financial Statements
64
NOTE 16 Investments in associates, continued
16.1) Breakdown of investments in associates, continued
Associate Country Currency Ownership
interest
Balance as of
December 31, 2019
Capital contributions
Share in profit or
loss
Dividends Earnings
distribution Conversion
reserve Hedge reserve
Unrealized profits
Employee benefits reserve
Other variations
Balance as of
December 31, 2020
ThUS$ ThUS$ ThUS$ ThUS$ ThUS$ ThUS$ ThUS$ ThUS$ ThUS$ ThUS$ Aerosan Airport Services S.A. (4) Chile US Dollar 50,00% 8.484 - 10 - (1.104) - - - (7.390) - Antofagasta Terminal Internacional S.A. Chile US Dollar 35,00% 6.355 - (664) - - - - 20 - 5.711 Inmobiliaria Carriel Ltda. Chile Chilean peso 50,00% 174 - 830 (984) (8) - - - - 12 Inmobiliaria Sepbío Ltda. Chile Chilean peso 50,00% 188 - 7 - 12 - - - - 207 LNG Tugs Chile S.A. Chile US Dollar 35,00% 166 - 6 - - - - - 4 176 Muellaje ATI S.A. Chile US Dollar 0,50% (8) - - - - - - - - (8) Muellaje del Maipo S.A. Chile US Dollar 50,00% 105 - 9 - - - - - - 114 Muellaje STI S.A. Chile US Dollar 0,50% 2 - - - - - - (1) - 1 Muellaje SVTI S.A. Chile Chilean peso 0,50% 5 - (1) - - - - - - 4 Portuaria Corral S.A. Chile Chilean peso 50,00% 5.609 - 1.915 (2.514) 336 - - - - 5.346 San Antonio Terminal Internacional S.A.(2) Chile US Dollar 50,00% 40.377 - 1.544 (4.850) - - - (75) 1.296 38.292 San Vicente Terminal Internacional S.A. Chile US Dollar 50,00% 20.764 - (6.422) - (2) - - (219) - 14.121 Servicios Aeroportuarios Aerosan S.A. (4) Chile US Dollar 50,00% 8.340 - 1.976 - - - - - (10.316) - Servicios Logísticos Ltda. Chile US Dollar 1,00% 28 - 3 - - - - - (31) - Servicios Portuarios Reloncaví Ltda. Chile Chilean peso 50,00% 4.892 - 733 (1.261) 125 - - - - 4.489 Servicios Portuarios y Extraportuarios Bío Bío Ltda. Chile Chilean peso 50,00% (6) - (2) - - - - - - (8) Transbordadora Austral Broom S.A. Chile Chilean peso 25,00% 14.039 - 6 - 524 - - - - 14.569 Transportes Fluviales Corral S.A. (3) Chile Chilean peso 50,00% 1.681 - 750 - 117 - - - (646) 1.902 Equimac S.A. Colombia US Dollar 50,00% 2.609 - (107) - - - - - - 2.502 Puerto Buenavista S.A.(1) Colombia Chilean peso 33,33% 4.314 - (47) - (216) - - - - 4.051 Luckymont S.A. Uruguay US Dollar 49,00% 2.299 - 914 (743) - - - - - 2.470 Total 120.417 - 1.460 (10.352) (216) - - (275) (17.083) 93.951
Nota Nota Nota Nota 39 a) 27.2.1 27.2.2 27.2.3
(1) The goodwill related to the acquisition of the interest in Puerto Buenavista is included as part of the value of the investment and amounts to ThUS$1,055. Participation at equity value amounts to
ThUS$2,996. (2) The associate San Antonio Terminal Internacional S.A. determined to leave without effect the payment of ThUS$ 1,296 (other variations) corresponding to dividends provisioned in December 2019. (3) In the month of September 2020, Management decided to reduce the Company's capital by ThUS$646, which was reflected within the concept Other variations. (4) ThUS$ 7,390 of Aerosan Airport Services S.A., ThUS$ 10,316 of Servicios Aeroportuarios Aerosan and ThUS$ 31 of Servicios Logisticos Ltda, classified in Other Variations, correspond to the acquisition
of the remaining 50% of the investment in October 2020.
246
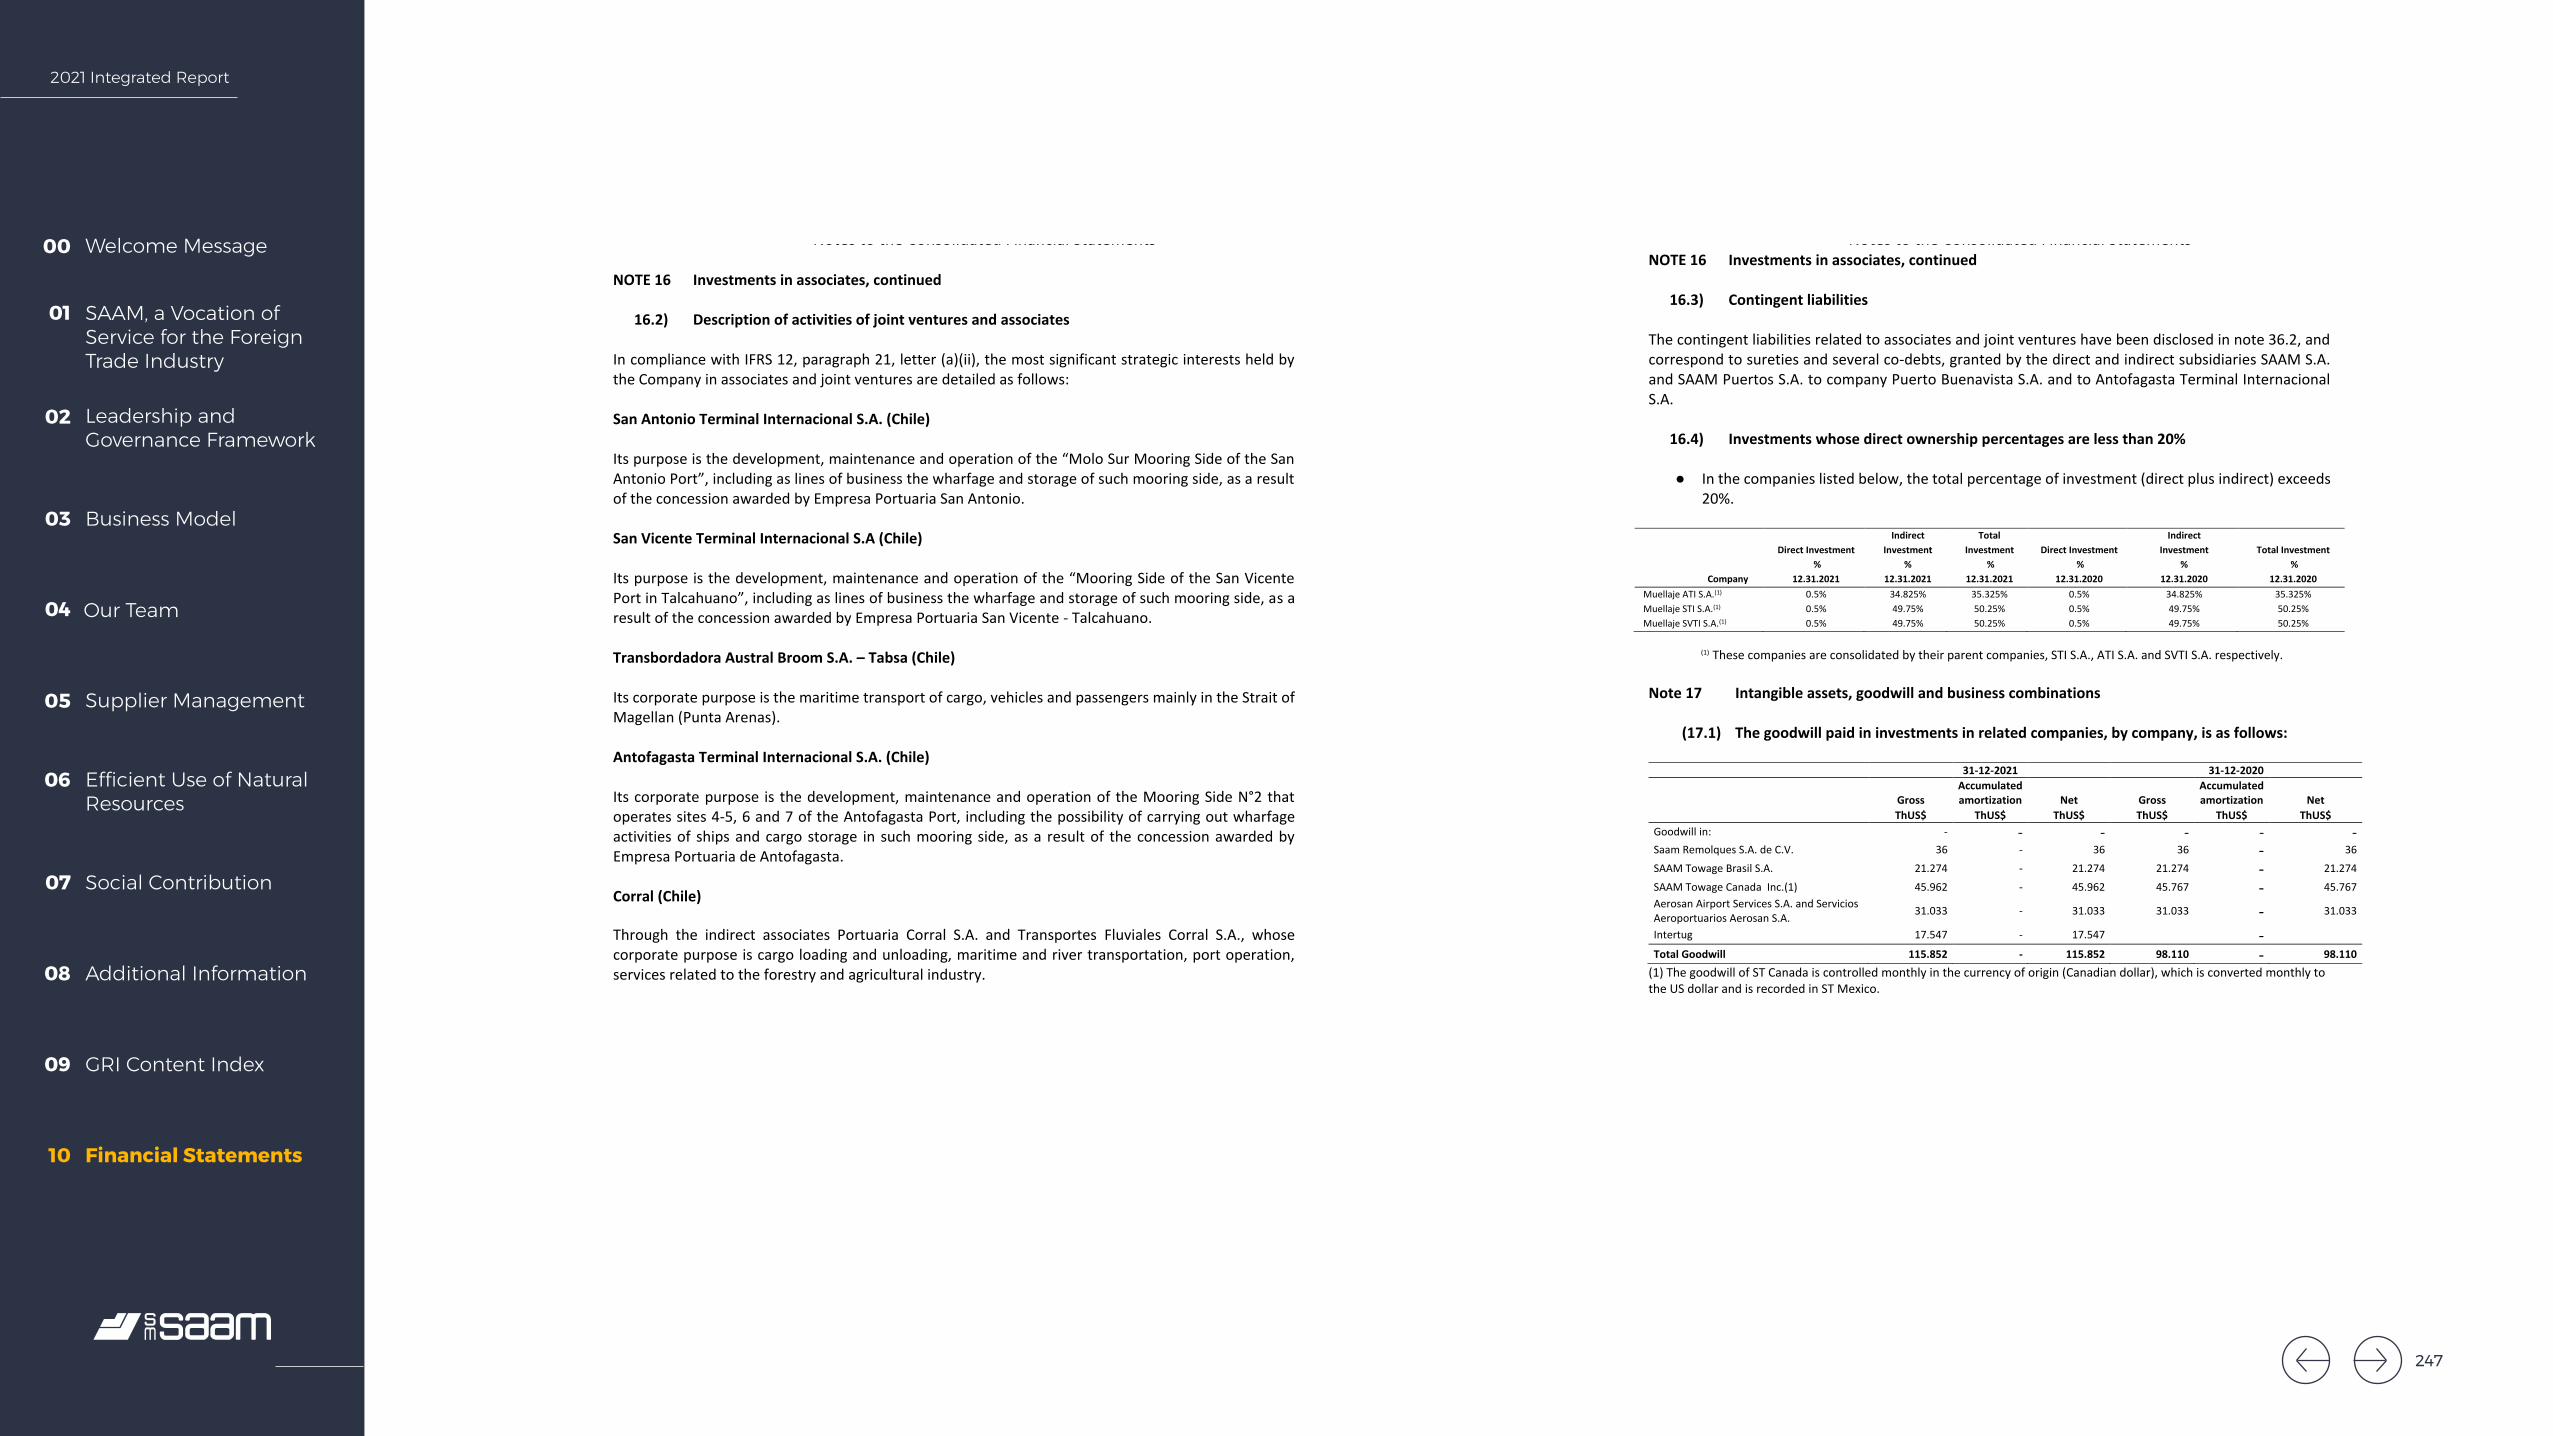
2021 Integrated Report
Welcome Message00
SAAM, a Vocation of Service for the Foreign Trade Industry
01
Leadership and Governance Framework
02
Business Model03
Our Team04
Supplier Management05
Efficient Use of Natural Resources
06
Social Contribution07
Additional Information08
GRI Content Index09
Financial Statements10
SOCIEDAD MATRIZ SAAM S.A. AND SUBSIDIARIES Notes to the Consolidated Financial Statements
65
NOTE 16 Investments in associates, continued
16.2) Description of activities of joint ventures and associates
In compliance with IFRS 12, paragraph 21, letter (a)(ii), the most significant strategic interests held by the Company in associates and joint ventures are detailed as follows:
San Antonio Terminal Internacional S.A. (Chile)
Its purpose is the development, maintenance and operation of the “Molo Sur Mooring Side of the San Antonio Port”, including as lines of business the wharfage and storage of such mooring side, as a result of the concession awarded by Empresa Portuaria San Antonio.
San Vicente Terminal Internacional S.A (Chile)
Its purpose is the development, maintenance and operation of the “Mooring Side of the San Vicente Port in Talcahuano”, including as lines of business the wharfage and storage of such mooring side, as a result of the concession awarded by Empresa Portuaria San Vicente - Talcahuano.
Transbordadora Austral Broom S.A. – Tabsa (Chile)
Its corporate purpose is the maritime transport of cargo, vehicles and passengers mainly in the Strait of Magellan (Punta Arenas).
Antofagasta Terminal Internacional S.A. (Chile)
Its corporate purpose is the development, maintenance and operation of the Mooring Side N°2 that operates sites 4-5, 6 and 7 of the Antofagasta Port, including the possibility of carrying out wharfage activities of ships and cargo storage in such mooring side, as a result of the concession awarded by Empresa Portuaria de Antofagasta.
Corral (Chile)
Through the indirect associates Portuaria Corral S.A. and Transportes Fluviales Corral S.A., whose corporate purpose is cargo loading and unloading, maritime and river transportation, port operation, services related to the forestry and agricultural industry.
SOCIEDAD MATRIZ SAAM S.A. AND SUBSIDIARIES Notes to the Consolidated Financial Statements
66
NOTE 16 Investments in associates, continued
16.3) Contingent liabilities The contingent liabilities related to associates and joint ventures have been disclosed in note 36.2, and correspond to sureties and several co-debts, granted by the direct and indirect subsidiaries SAAM S.A. and SAAM Puertos S.A. to company Puerto Buenavista S.A. and to Antofagasta Terminal Internacional S.A.
16.4) Investments whose direct ownership percentages are less than 20%
● In the companies listed below, the total percentage of investment (direct plus indirect) exceeds 20%.
Company
Direct Investment %
12.31.2021
Indirect Investment
% 12.31.2021
Total Investment
% 12.31.2021
Direct Investment %
12.31.2020
Indirect Investment
% 12.31.2020
Total Investment %
12.31.2020 Muellaje ATI S.A.(1) 0.5% 34.825% 35.325% 0.5% 34.825% 35.325% Muellaje STI S.A.(1) 0.5% 49.75% 50.25% 0.5% 49.75% 50.25% Muellaje SVTI S.A.(1) 0.5% 49.75% 50.25% 0.5% 49.75% 50.25%
(1) These companies are consolidated by their parent companies, STI S.A., ATI S.A. and SVTI S.A. respectively. Note 17 Intangible assets, goodwill and business combinations
(17.1) The goodwill paid in investments in related companies, by company, is as follows:
31-12-2021 31-12-2020
Gross Accumulated amortization Net Gross
Accumulated amortization Net
ThUS$ ThUS$ ThUS$ ThUS$ ThUS$ ThUS$ Goodwill in: - - - - - - Saam Remolques S.A. de C.V. 36 - 36 36 - 36 SAAM Towage Brasil S.A. 21.274 - 21.274 21.274 - 21.274 SAAM Towage Canada Inc.(1) 45.962 - 45.962 45.767 - 45.767 Aerosan Airport Services S.A. and Servicios Aeroportuarios Aerosan S.A. 31.033 - 31.033 31.033 - 31.033
Intertug 17.547 - 17.547 - Total Goodwill 115.852 - 115.852 98.110 - 98.110
(1) The goodwill of ST Canada is controlled monthly in the currency of origin (Canadian dollar), which is converted monthly to the US dollar and is recorded in ST Mexico.
247
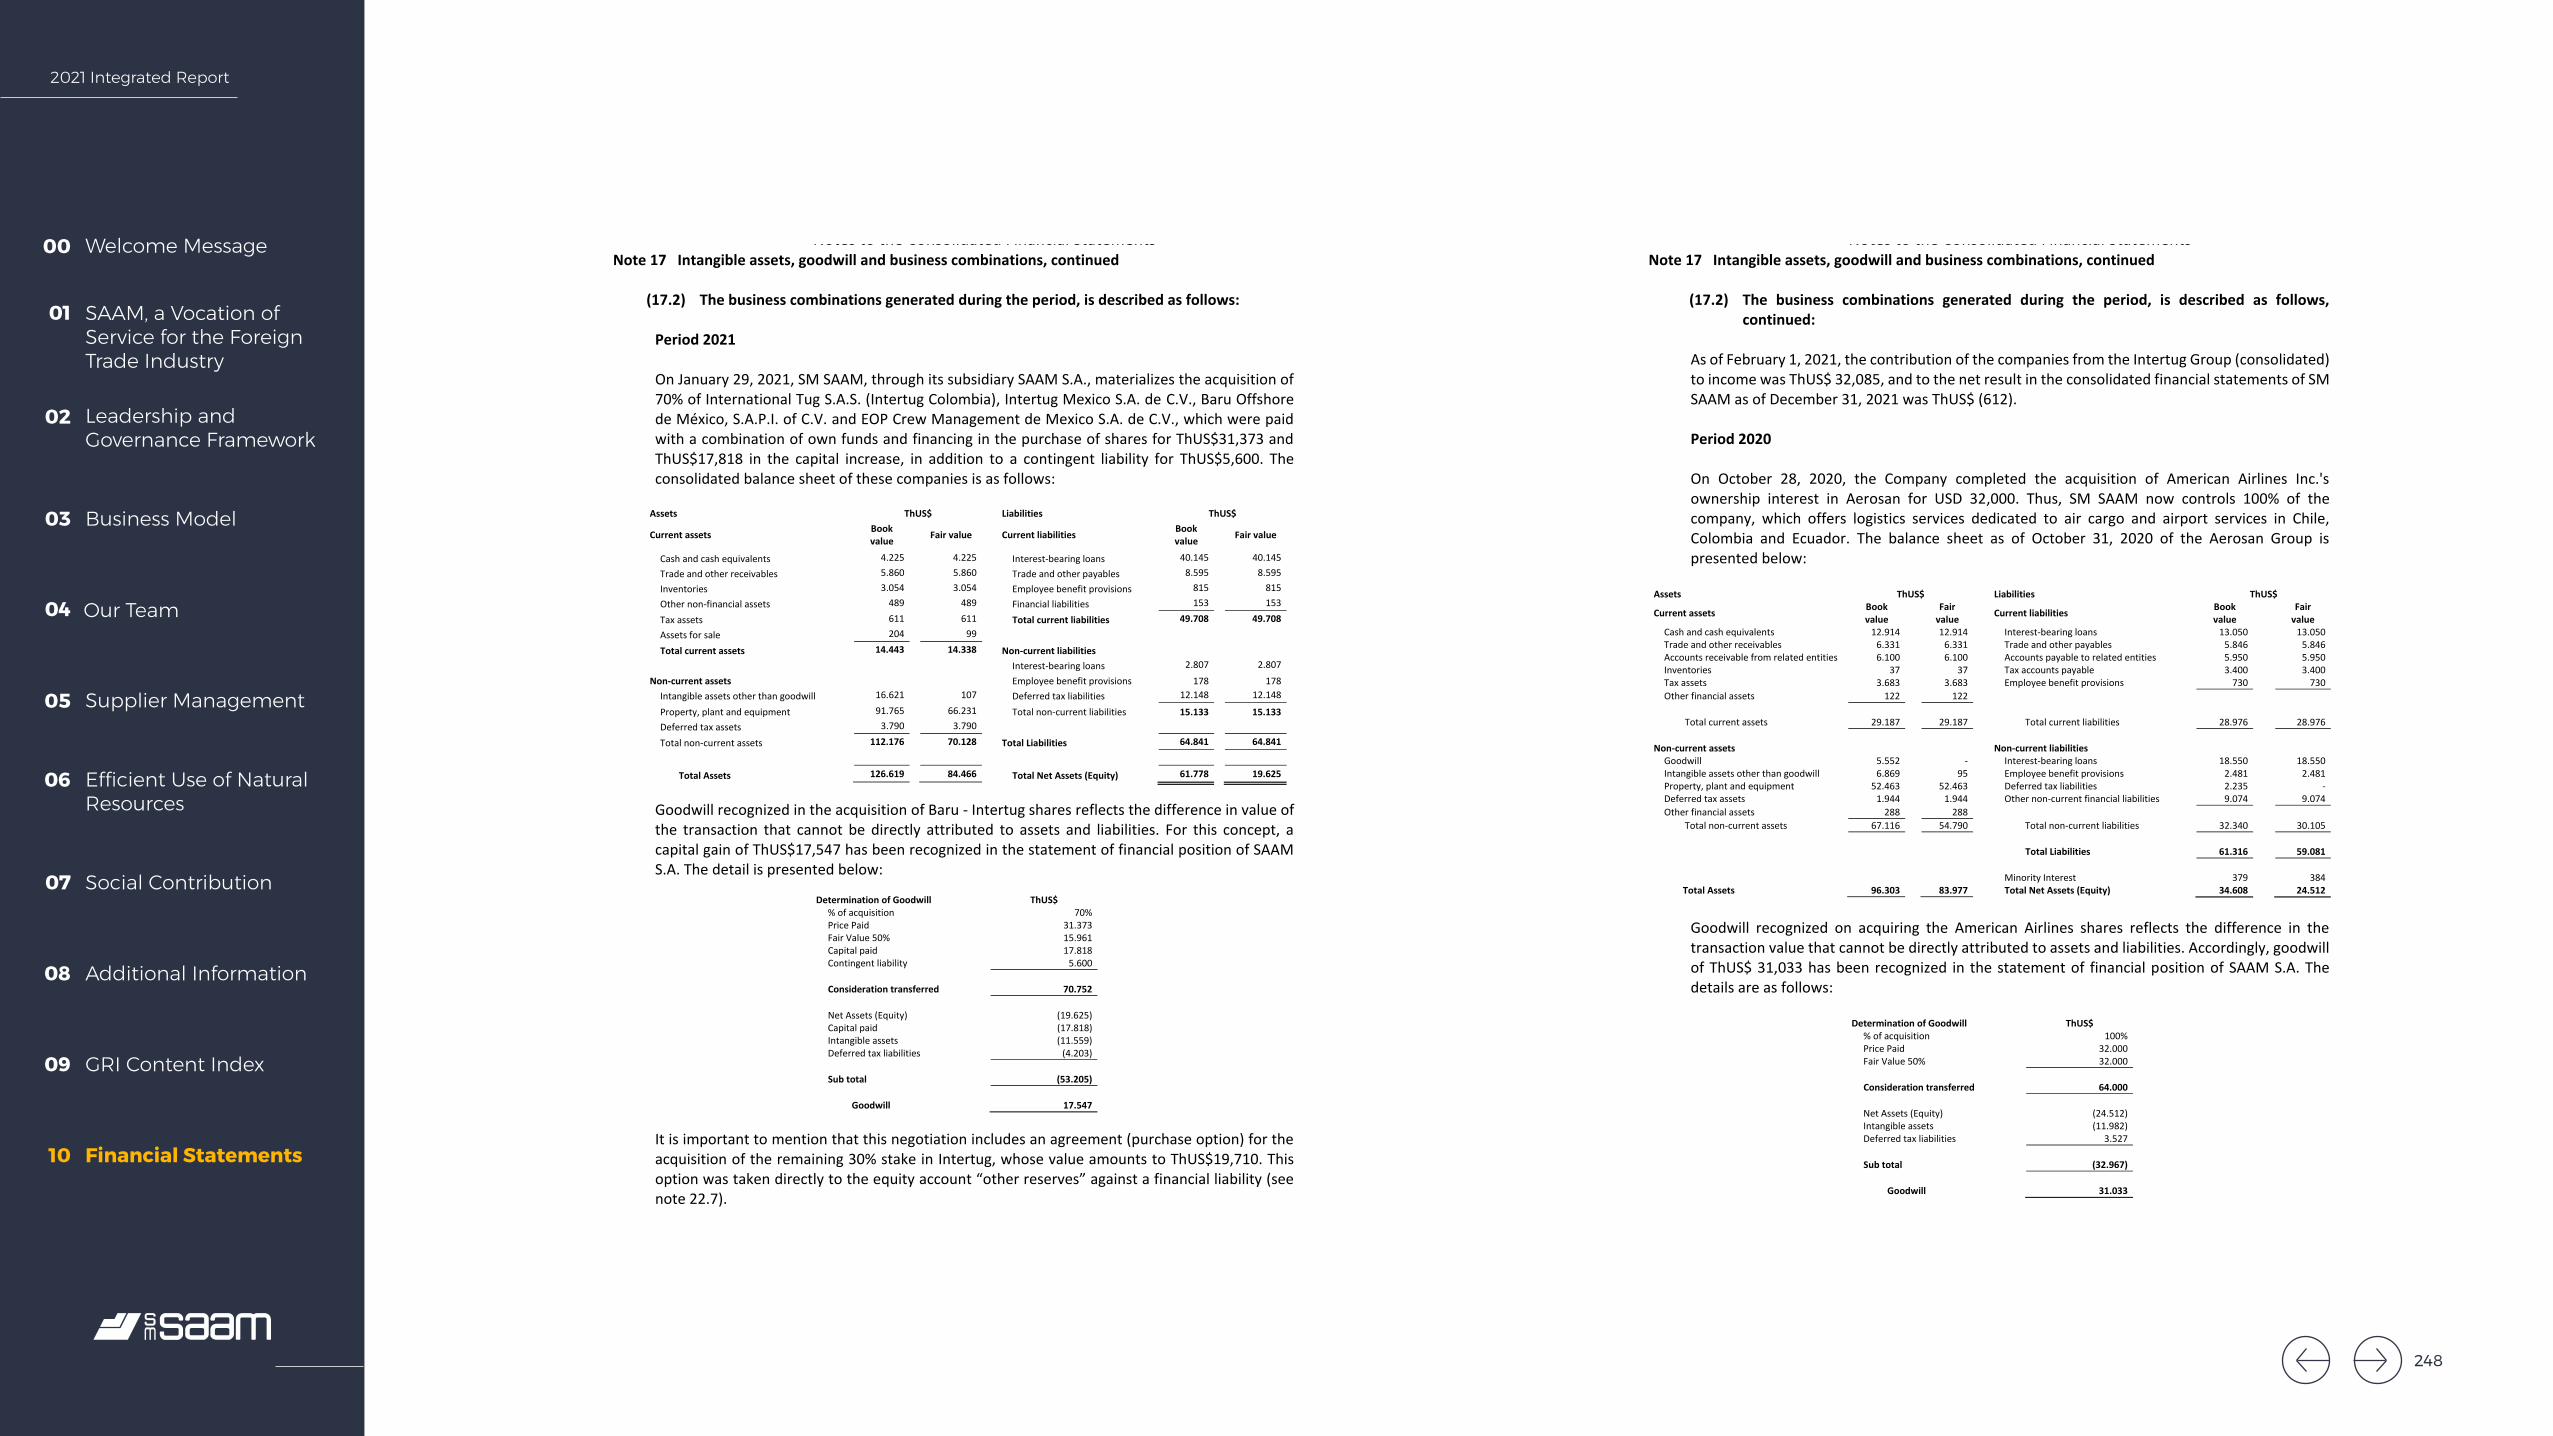
2021 Integrated Report
Welcome Message00
SAAM, a Vocation of Service for the Foreign Trade Industry
01
Leadership and Governance Framework
02
Business Model03
Our Team04
Supplier Management05
Efficient Use of Natural Resources
06
Social Contribution07
Additional Information08
GRI Content Index09
Financial Statements10
SOCIEDAD MATRIZ SAAM S.A. AND SUBSIDIARIES Notes to the Consolidated Financial Statements
67
Note 17 Intangible assets, goodwill and business combinations, continued
(17.2) The business combinations generated during the period, is described as follows:
Period 2021 On January 29, 2021, SM SAAM, through its subsidiary SAAM S.A., materializes the acquisition of 70% of International Tug S.A.S. (Intertug Colombia), Intertug Mexico S.A. de C.V., Baru Offshore de México, S.A.P.I. of C.V. and EOP Crew Management de Mexico S.A. de C.V., which were paid with a combination of own funds and financing in the purchase of shares for ThUS$31,373 and ThUS$17,818 in the capital increase, in addition to a contingent liability for ThUS$5,600. The consolidated balance sheet of these companies is as follows:
Assets ThUS$ Liabilities ThUS$
Current assets Book value
Fair value
Current liabilities Book value
Fair value
Cash and cash equivalents 4.225 4.225 Interest-bearing loans 40.145 40.145 Trade and other receivables 5.860 5.860 Trade and other payables 8.595 8.595 Inventories 3.054 3.054 Employee benefit provisions 815 815 Other non-financial assets 489 489 Financial liabilities 153 153 Tax assets 611 611 Total current liabilities 49.708 49.708 Assets for sale 204 99
Total current assets 14.443 14.338 Non-current liabilities
Interest-bearing loans 2.807 2.807
Non-current assets Employee benefit provisions 178 178
Intangible assets other than goodwill 16.621 107 Deferred tax liabilities 12.148 12.148 Property, plant and equipment 91.765 66.231 Total non-current liabilities 15.133 15.133 Deferred tax assets 3.790 3.790 Total non-current assets 112.176 70.128 Total Liabilities 64.841 64.841
Total Assets 126.619 84.466 Total Net Assets (Equity) 61.778 19.625
Goodwill recognized in the acquisition of Baru - Intertug shares reflects the difference in value of the transaction that cannot be directly attributed to assets and liabilities. For this concept, a capital gain of ThUS$17,547 has been recognized in the statement of financial position of SAAM S.A. The detail is presented below:
Determination of Goodwill ThUS$ % of acquisition 70% Price Paid 31.373 Fair Value 50% 15.961 Capital paid 17.818 Contingent liability 5.600
Consideration transferred 70.752
Net Assets (Equity) (19.625) Capital paid (17.818) Intangible assets (11.559) Deferred tax liabilities (4.203)
Sub total (53.205)
Goodwill 17.547
It is important to mention that this negotiation includes an agreement (purchase option) for the acquisition of the remaining 30% stake in Intertug, whose value amounts to ThUS$19,710. This option was taken directly to the equity account “other reserves” against a financial liability (see note 22.7).
SOCIEDAD MATRIZ SAAM S.A. AND SUBSIDIARIES Notes to the Consolidated Financial Statements
68
Note 17 Intangible assets, goodwill and business combinations, continued
(17.2) The business combinations generated during the period, is described as follows,
continued: As of February 1, 2021, the contribution of the companies from the Intertug Group (consolidated) to income was ThUS$ 32,085, and to the net result in the consolidated financial statements of SM SAAM as of December 31, 2021 was ThUS$ (612). Period 2020 On October 28, 2020, the Company completed the acquisition of American Airlines Inc.'s ownership interest in Aerosan for USD 32,000. Thus, SM SAAM now controls 100% of the company, which offers logistics services dedicated to air cargo and airport services in Chile, Colombia and Ecuador. The balance sheet as of October 31, 2020 of the Aerosan Group is presented below:
Assets ThUS$ Liabilities ThUS$
Current assets Book value Fair
value Current liabilities Book value Fair
value Cash and cash equivalents 12.914 12.914 Interest-bearing loans 13.050 13.050 Trade and other receivables 6.331 6.331 Trade and other payables 5.846 5.846 Accounts receivable from related entities 6.100 6.100 Accounts payable to related entities 5.950 5.950 Inventories 37 37 Tax accounts payable 3.400 3.400 Tax assets 3.683 3.683 Employee benefit provisions 730 730 Other financial assets 122 122
Total current assets 29.187 29.187 Total current liabilities 28.976 28.976
Non-current assets Non-current liabilities Goodwill 5.552 - Interest-bearing loans 18.550 18.550 Intangible assets other than goodwill 6.869 95 Employee benefit provisions 2.481 2.481 Property, plant and equipment 52.463 52.463 Deferred tax liabilities 2.235 - Deferred tax assets 1.944 1.944 Other non-current financial liabilities 9.074 9.074 Other financial assets 288 288
Total non-current assets 67.116 54.790 Total non-current liabilities 32.340 30.105 Total Liabilities 61.316 59.081
Minority Interest 379 384 Total Assets 96.303 83.977 Total Net Assets (Equity) 34.608 24.512
Goodwill recognized on acquiring the American Airlines shares reflects the difference in the transaction value that cannot be directly attributed to assets and liabilities. Accordingly, goodwill of ThUS$ 31,033 has been recognized in the statement of financial position of SAAM S.A. The details are as follows:
Determination of Goodwill ThUS$
% of acquisition 100% Price Paid 32.000 Fair Value 50% 32.000
Consideration transferred 64.000
Net Assets (Equity) (24.512) Intangible assets (11.982) Deferred tax liabilities 3.527
Sub total (32.967)
Goodwill 31.033
248
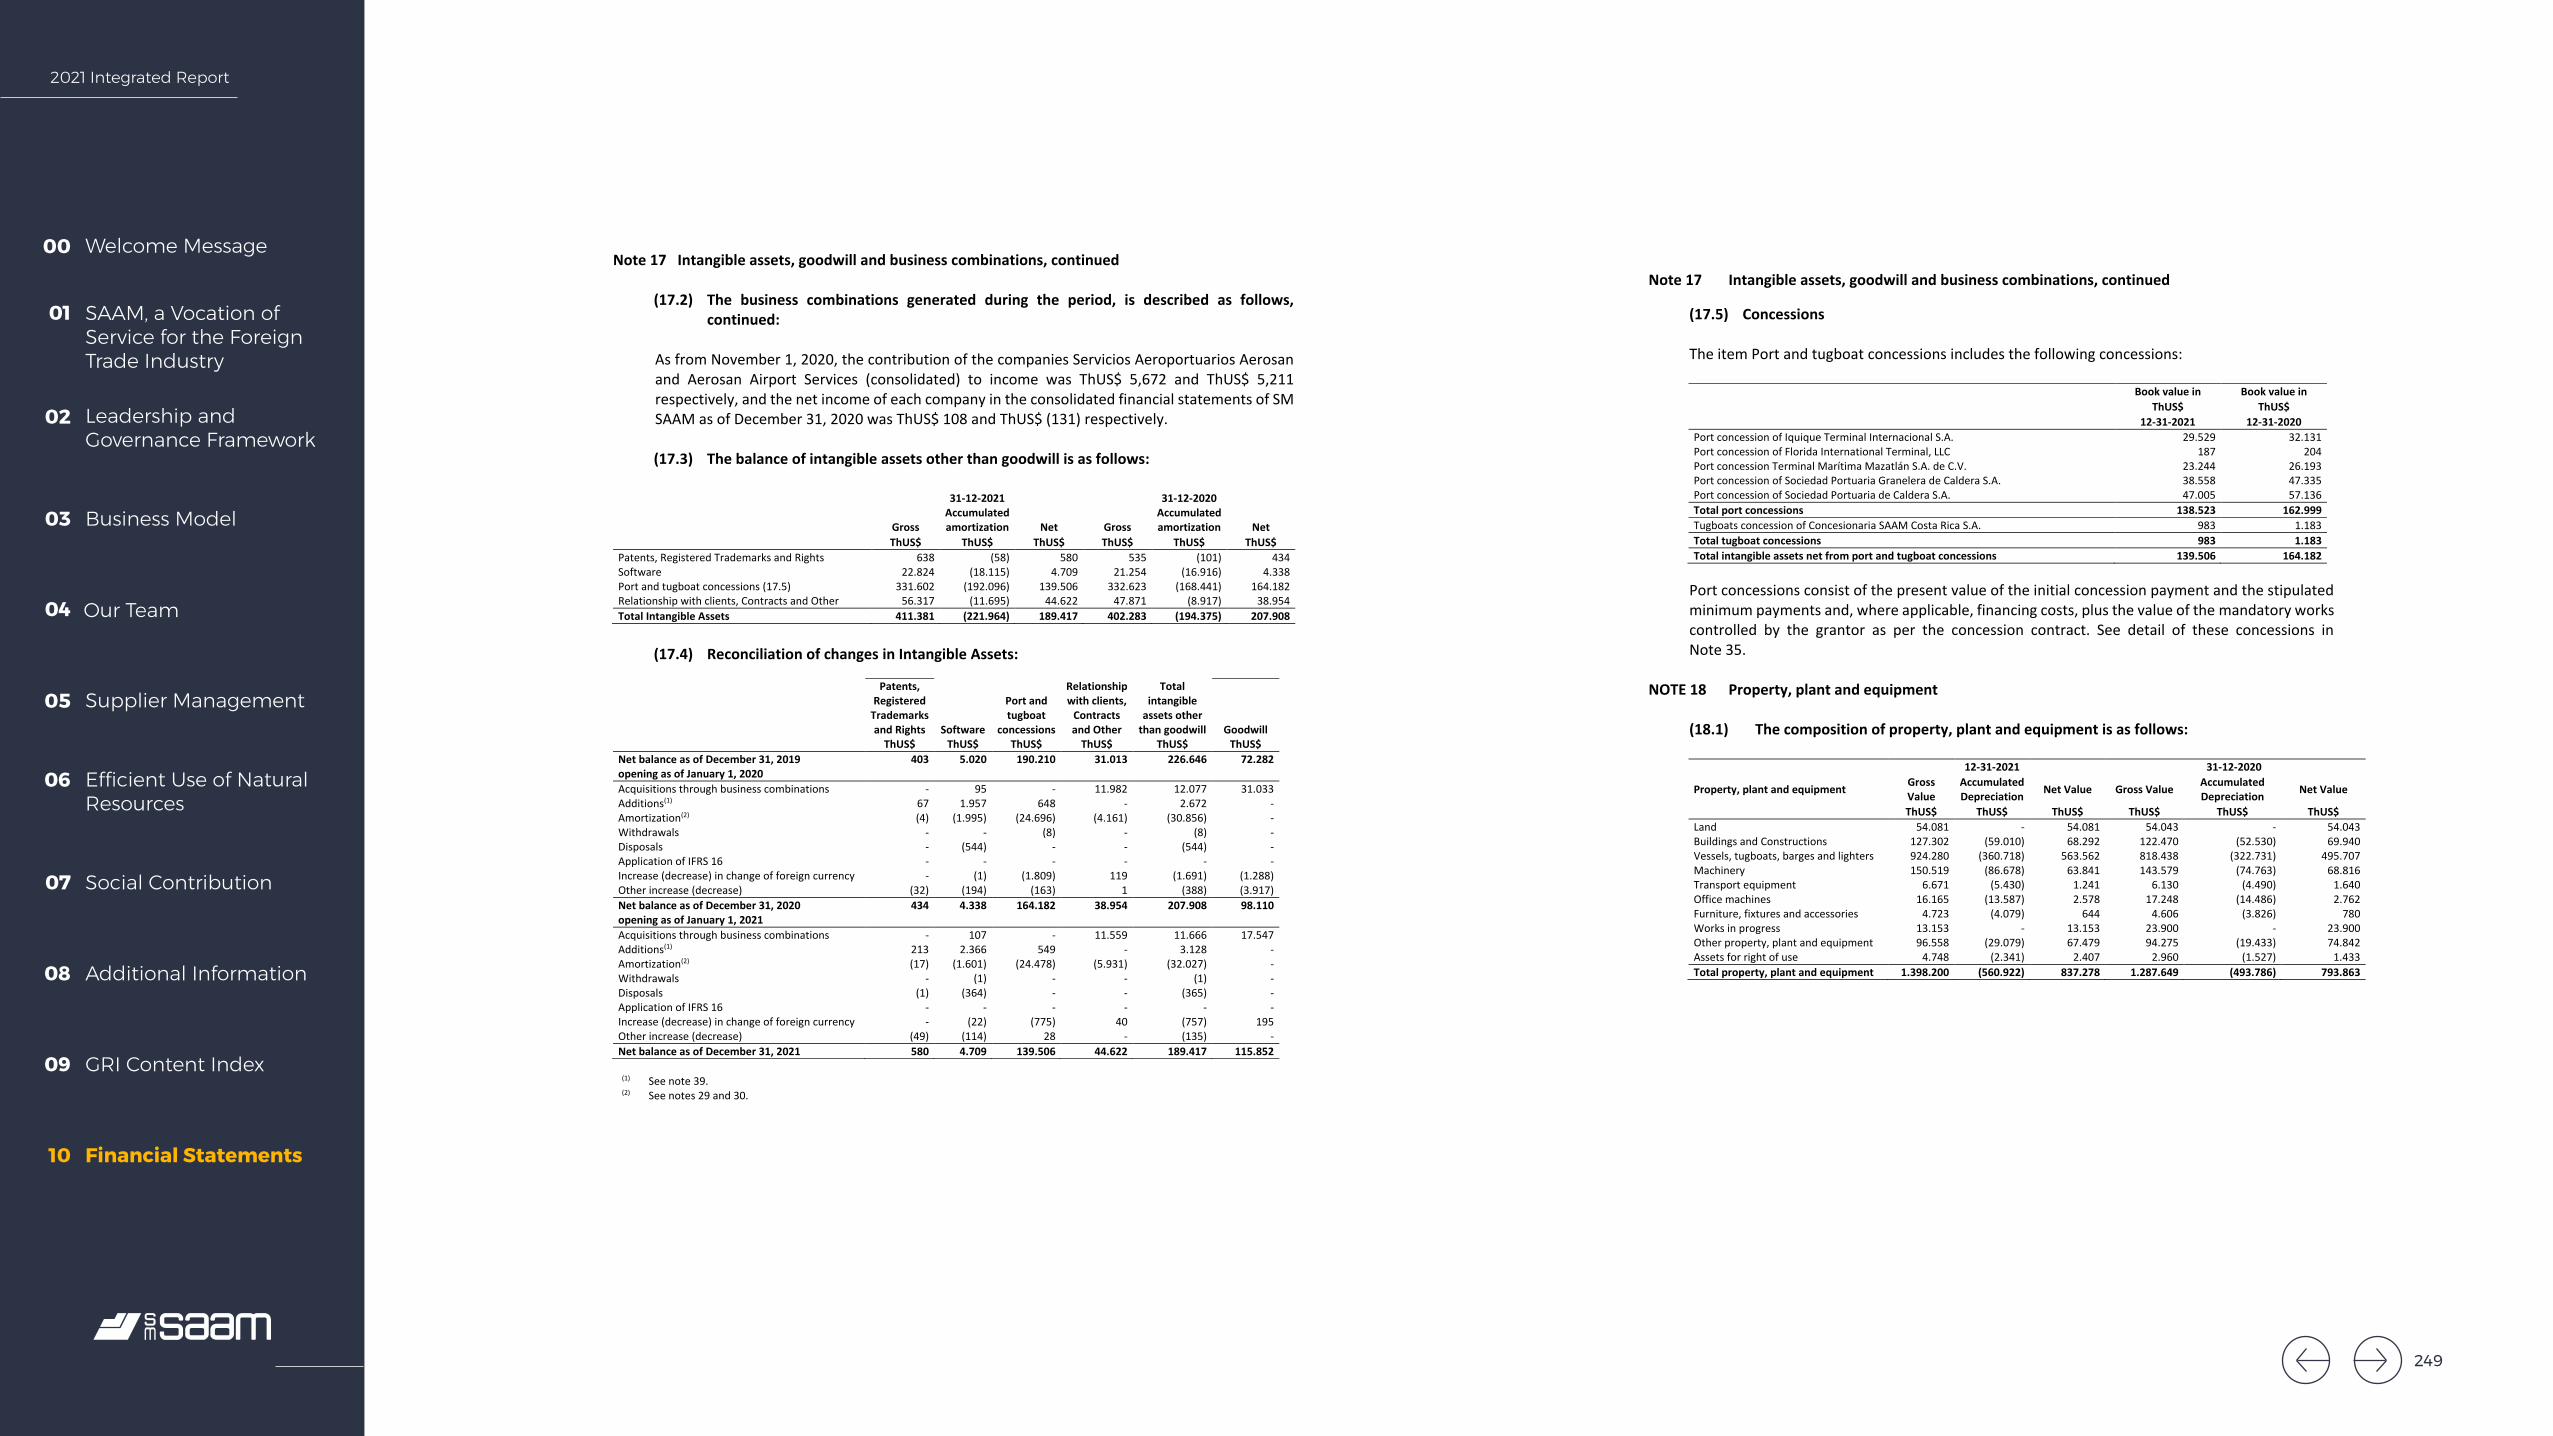
2021 Integrated Report
Welcome Message00
SAAM, a Vocation of Service for the Foreign Trade Industry
01
Leadership and Governance Framework
02
Business Model03
Our Team04
Supplier Management05
Efficient Use of Natural Resources
06
Social Contribution07
Additional Information08
GRI Content Index09
Financial Statements10
SOCIEDAD MATRIZ SAAM S.A. AND SUBSIDIARIES Notes to the Consolidated Financial Statements
69
Note 17 Intangible assets, goodwill and business combinations, continued
(17.2) The business combinations generated during the period, is described as follows,
continued: As from November 1, 2020, the contribution of the companies Servicios Aeroportuarios Aerosan and Aerosan Airport Services (consolidated) to income was ThUS$ 5,672 and ThUS$ 5,211 respectively, and the net income of each company in the consolidated financial statements of SM SAAM as of December 31, 2020 was ThUS$ 108 and ThUS$ (131) respectively. (17.3) The balance of intangible assets other than goodwill is as follows:
31-12-2021 31-12-2020
Gross Accumulated amortization Net Gross
Accumulated amortization Net
ThUS$ ThUS$ ThUS$ ThUS$ ThUS$ ThUS$ Patents, Registered Trademarks and Rights 638 (58) 580 535 (101) 434 Software 22.824 (18.115) 4.709 21.254 (16.916) 4.338 Port and tugboat concessions (17.5) 331.602 (192.096) 139.506 332.623 (168.441) 164.182 Relationship with clients, Contracts and Other 56.317 (11.695) 44.622 47.871 (8.917) 38.954 Total Intangible Assets 411.381 (221.964) 189.417 402.283 (194.375) 207.908
(17.4) Reconciliation of changes in Intangible Assets:
Patents,
Registered Trademarks and Rights Software
Port and tugboat
concessions
Relationship with clients,
Contracts and Other
Total intangible
assets other than goodwill Goodwill
ThUS$ ThUS$ ThUS$ ThUS$ ThUS$ ThUS$ Net balance as of December 31, 2019 403 5.020 190.210 31.013 226.646 72.282 opening as of January 1, 2020 Acquisitions through business combinations - 95 - 11.982 12.077 31.033 Additions(1) 67 1.957 648 - 2.672 - Amortization(2) (4) (1.995) (24.696) (4.161) (30.856) - Withdrawals - - (8) - (8) - Disposals - (544) - - (544) - Application of IFRS 16 - - - - - - Increase (decrease) in change of foreign currency - (1) (1.809) 119 (1.691) (1.288) Other increase (decrease) (32) (194) (163) 1 (388) (3.917) Net balance as of December 31, 2020 434 4.338 164.182 38.954 207.908 98.110 opening as of January 1, 2021 Acquisitions through business combinations - 107 - 11.559 11.666 17.547 Additions(1) 213 2.366 549 - 3.128 - Amortization(2) (17) (1.601) (24.478) (5.931) (32.027) - Withdrawals - (1) - - (1) - Disposals (1) (364) - - (365) - Application of IFRS 16 - - - - - - Increase (decrease) in change of foreign currency - (22) (775) 40 (757) 195 Other increase (decrease) (49) (114) 28 - (135) - Net balance as of December 31, 2021 580 4.709 139.506 44.622 189.417 115.852
(1) See note 39. (2) See notes 29 and 30.
SOCIEDAD MATRIZ SAAM S.A. AND SUBSIDIARIES Notes to the Consolidated Financial Statements
70
Note 17 Intangible assets, goodwill and business combinations, continued
(17.5) Concessions The item Port and tugboat concessions includes the following concessions:
Book value in Book value in
ThUS$ ThUS$ 12-31-2021 12-31-2020
Port concession of Iquique Terminal Internacional S.A. 29.529 32.131 Port concession of Florida International Terminal, LLC 187 204 Port concession Terminal Marítima Mazatlán S.A. de C.V. 23.244 26.193 Port concession of Sociedad Portuaria Granelera de Caldera S.A. 38.558 47.335 Port concession of Sociedad Portuaria de Caldera S.A. 47.005 57.136 Total port concessions 138.523 162.999 Tugboats concession of Concesionaria SAAM Costa Rica S.A. 983 1.183 Total tugboat concessions 983 1.183 Total intangible assets net from port and tugboat concessions 139.506 164.182
Port concessions consist of the present value of the initial concession payment and the stipulated minimum payments and, where applicable, financing costs, plus the value of the mandatory works controlled by the grantor as per the concession contract. See detail of these concessions in Note 35.
NOTE 18 Property, plant and equipment
(18.1) The composition of property, plant and equipment is as follows:
Property, plant and equipment
12-31-2021 31-12-2020 Gross Value
Accumulated Depreciation Net Value Gross Value Accumulated
Depreciation Net Value
ThUS$ ThUS$ ThUS$ ThUS$ ThUS$ ThUS$ Land 54.081 - 54.081 54.043 - 54.043 Buildings and Constructions 127.302 (59.010) 68.292 122.470 (52.530) 69.940 Vessels, tugboats, barges and lighters 924.280 (360.718) 563.562 818.438 (322.731) 495.707 Machinery 150.519 (86.678) 63.841 143.579 (74.763) 68.816 Transport equipment 6.671 (5.430) 1.241 6.130 (4.490) 1.640 Office machines 16.165 (13.587) 2.578 17.248 (14.486) 2.762 Furniture, fixtures and accessories 4.723 (4.079) 644 4.606 (3.826) 780 Works in progress 13.153 - 13.153 23.900 - 23.900 Other property, plant and equipment 96.558 (29.079) 67.479 94.275 (19.433) 74.842 Assets for right of use 4.748 (2.341) 2.407 2.960 (1.527) 1.433 Total property, plant and equipment 1.398.200 (560.922) 837.278 1.287.649 (493.786) 793.863
249

2021 Integrated Report
Welcome Message00
SAAM, a Vocation of Service for the Foreign Trade Industry
01
Leadership and Governance Framework
02
Business Model03
Our Team04
Supplier Management05
Efficient Use of Natural Resources
06
Social Contribution07
Additional Information08
GRI Content Index09
Financial Statements10
SOCIEDAD MATRIZ SAAM S.A. AND SUBSIDIARIES Notes to the Consolidated Financial Statements
71
NOTE 18 Property, plant and equipment
(18.1) Composition of property, plant and equipment, continued The item "Buildings and constructions" includes buildings and offices intended for administrative use and those intended for operation such as warehouses and container terminals. Likewise, the Company maintains assets under the modality of financial leasing and assets by right of use (IFRS 16) in the following Property, plant and equipment accounts:
Property, plant and equipment lease
31-12-2021
Machinery Ships, Tugboats, barges and boats
Other property, plant and
equipment Total net
ThUS$ ThUS$ ThUS$ ThUS$ SAAM Towage Colombia S.A.S - 5.117 - 5.117 Iquique Terminal Internacional S.A. 2.292 - - 2.292 Aerosan S.A.S - - 716 716 Florida International Terminal, Llc. 457 - - 457 Aerosan Airport Services S.A. 423 - - 423 Total Property, plant and equipment in lease 3.172 5.117 716 9.005
Right of use IFRS 16
31-12-2021
Land Buildings and Constructions Machinery Ships, Tugboats,
barges and boats Transport
equipment
Other property, plant and
equipment Total net
ThUS$ ThUS$ ThUS$ ThUS$ ThUS$ Servicios Aeroportuarios Aerosan S.A. - - - - - 21.101 21.101 SAAM S.A. - 1.155 - - - - 1.155 Ecuaestibas S.A. - 12 - - 22 - 34 Saam Towage Brasil - 1.079 - 1.924 148 - 3.151 Saam Towage Colombia S.A. - 338 - - - - 338 Aerosan Airport Services S.A. - - 791 - - - 791 Transaereo Ltda. - 4.345 - - - - 4.345 Aronem Air Cargo S.A. - 814 - - - - 814 Saam Towage México S.A. de C.V. - 80 - - 233 - 313 Saam Towage Canadá 2.128 - - - - 22 2.150 Saam Towage Panamá - - - - - 270 270 Sociedad Portuaria de Caldera S.A. - - - - 22 - 22 Kios S.A. - 55 - - - - 55 Iquique Terminal Internacional S.A. - - - - 126 - 126 Inarpi S.A. 16.163 13 - - 156 - 16.332 Florida International Terminal, Llc. (1) - 14.873 798 - 811 - 16.482 Total Right of Use 18.291 22.764 1.589 1.924 1.518 21.393 67.479
(1) In the item Buildings and Constructions of FIT, it corresponds to the agreement of the right of use to operate in the container terminal of Port Everglades Florida USA.
(18.2) Agreements of purchase and construction of assets: The item “Constructions in progress” classifies the disbursements made for operational constructions to support the Company's operations. As of December 31, 2021, these correspond to:
Assets under construction
31-12-2021 Description
ThUS$ Inarpi S.A. 7.229 Purchase STS crane ThUS$ 6,110, scanner ThUS$ 362 and RTG qualification ThUS$ 270, other projects ThUS$ 487. Servicios Aeroportuarios Aerosan S.A. 3.339 Import and export warehouse project, in addition to the "CDE Ball Transfer" project. Baru Offshore de México S.A.P.I. de C. V. 691 Overhaul Ram Tanok. Ecuaestibas S.A. 314 Overhaul Ram Jarocho and major repair Ram Jarocho. SAAM Logistics S.A. 272 Renca Railway Project, in addition to reconditioning of cranes. SAAM S.A. 248 Bow winch Ram Aguila and Carena Ram Quetro. Florida International Terminal, Llc. 222 Project "Reefer Bank": bank of electrical outlets for refrigerated containers. Inmobiliaria Marítima Portuaria Ltda. 192 Urbanization of drinking water in Placilla ThUS$ 175, access Terminal Renca ThUS$ 9 and pavement Lot 4 SAI ThUS$ 8. SAAM Towage Perú S.A.C. 176 Carina Ram Taura Aerosan Airport Services S.A. 153 Dollies Project (cars for aerial containers), in addition to drawbar and air conditioning. Inversiones Habsburgo S.A. 148 Carena Ram San Felipe. Other assets in construction 169 Projects in ST Panama, Kios, AEP, IT Mexico, ITI, Aronem, Concesionaria SAAM Costa Rica and Aerosan S.A.S. Total Assets in construction 13.153
250
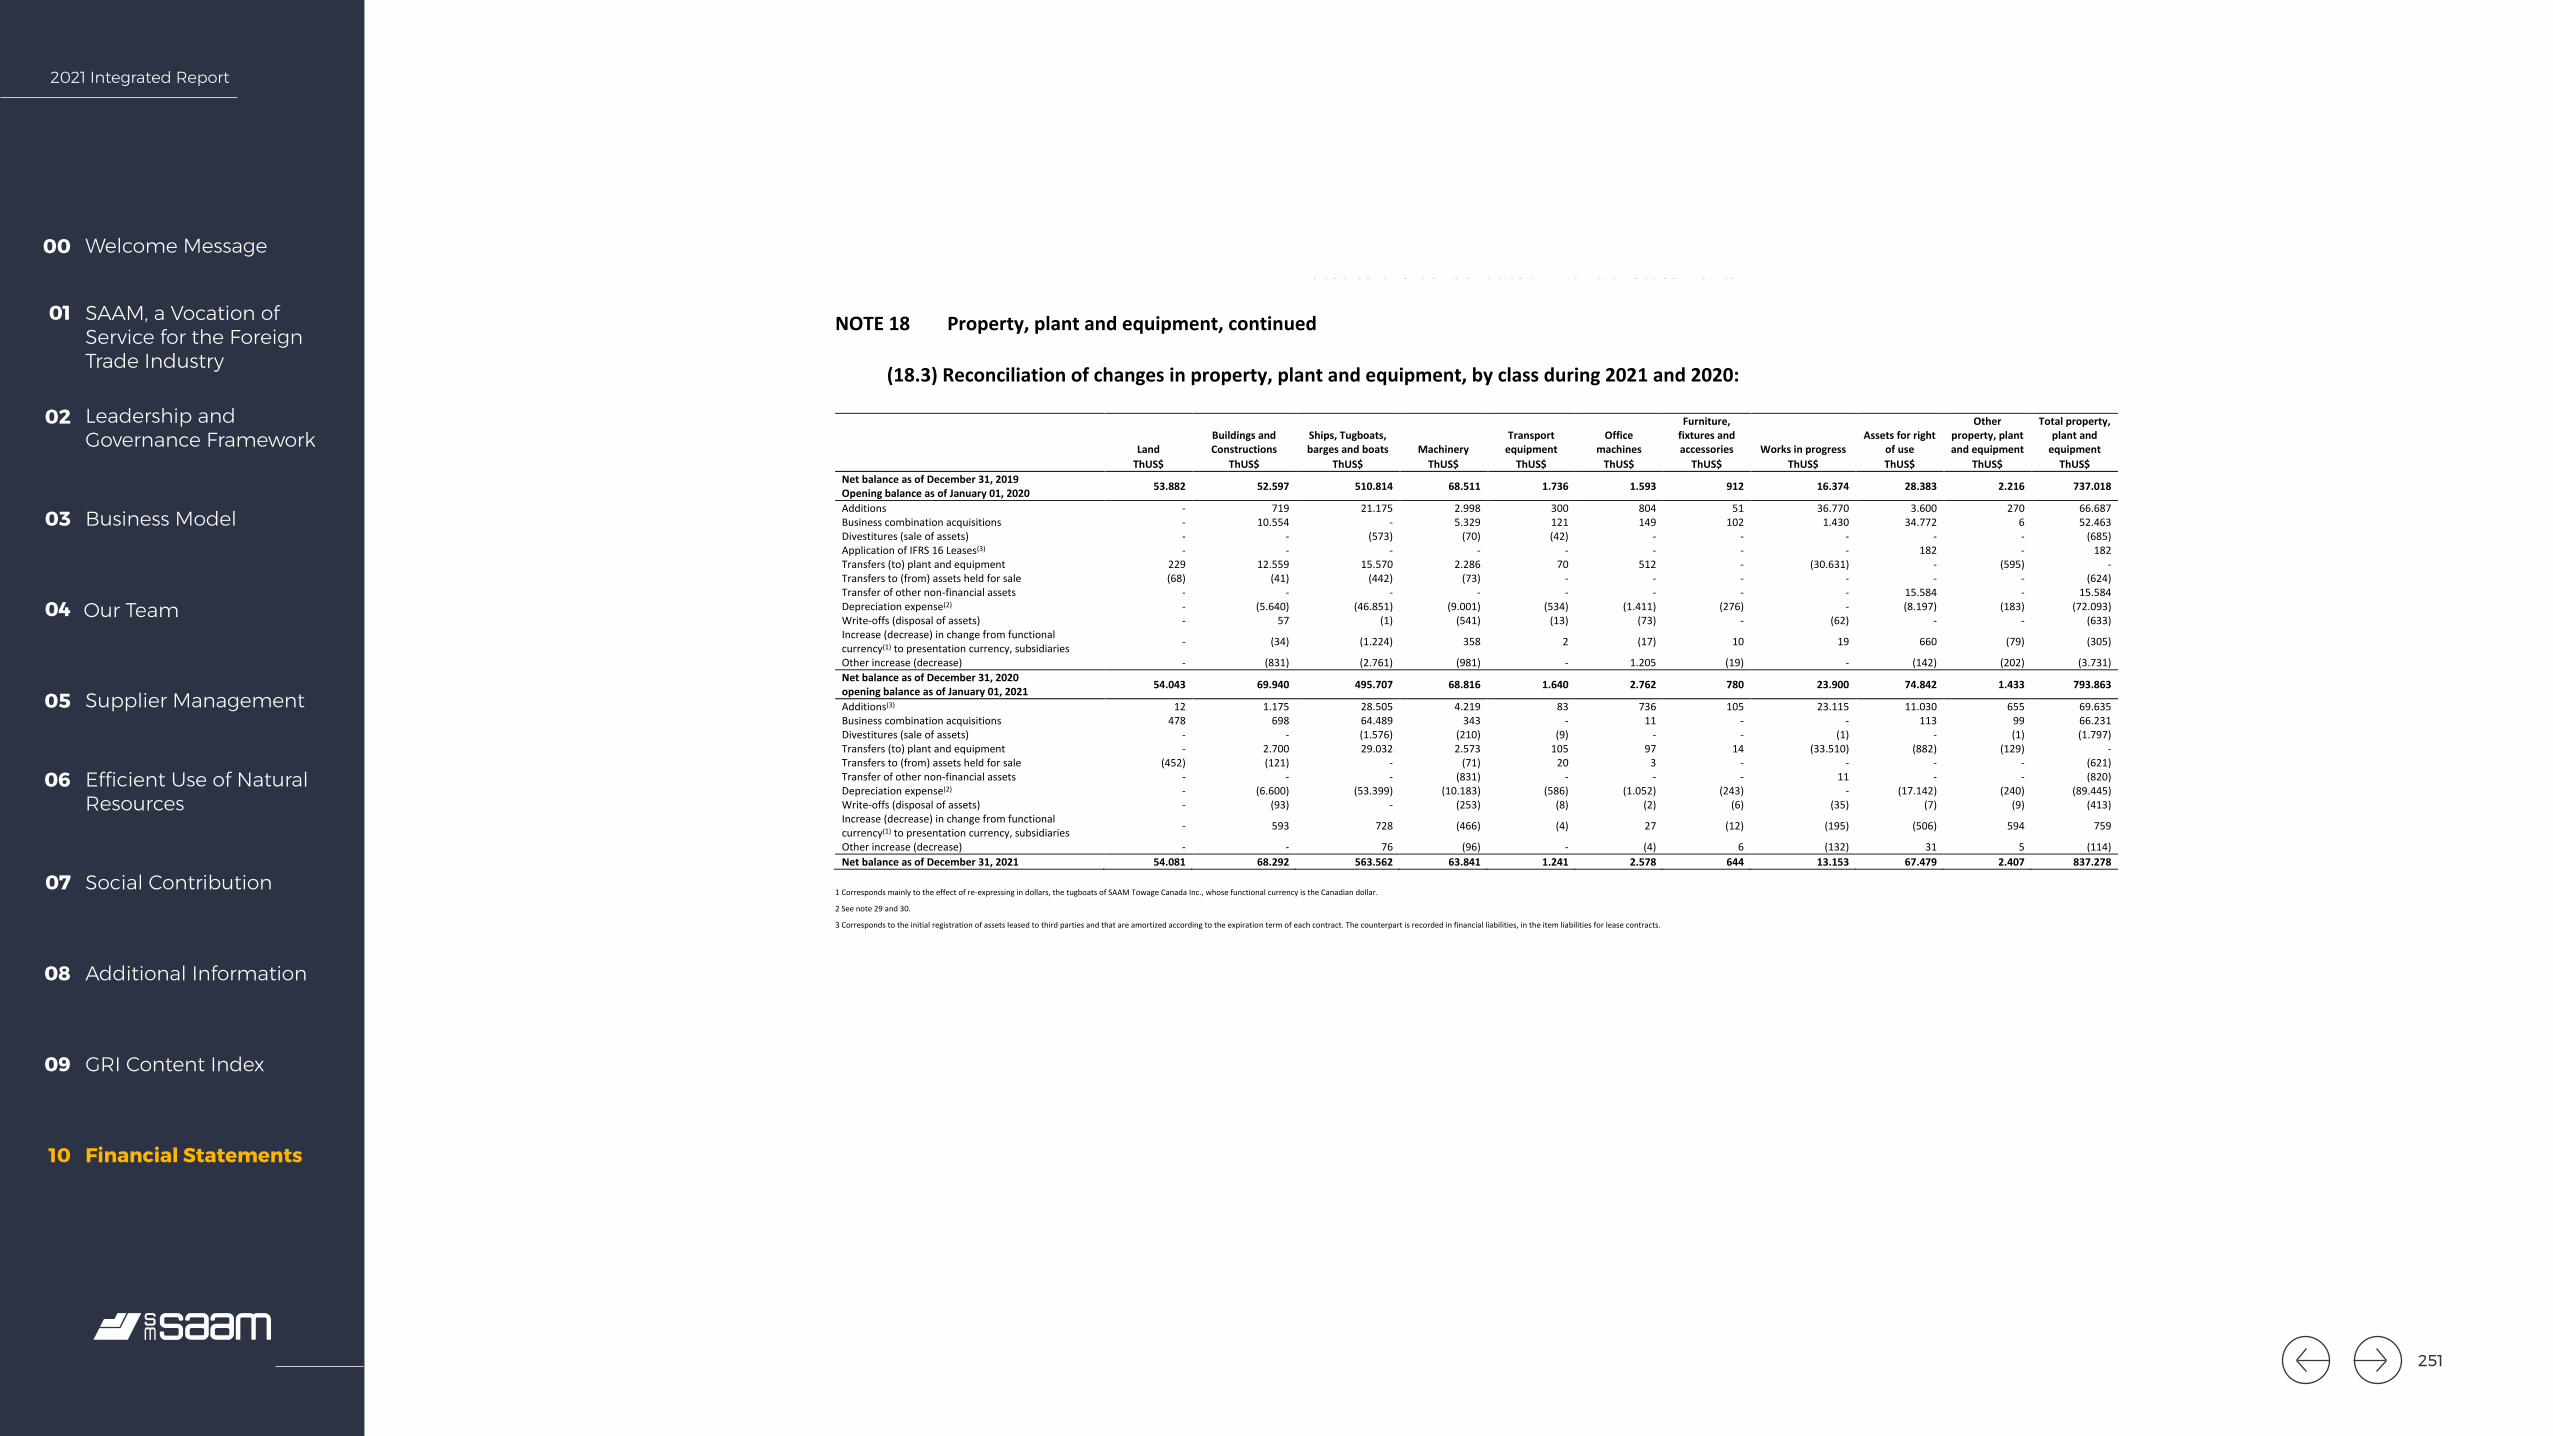
2021 Integrated Report
Welcome Message00
SAAM, a Vocation of Service for the Foreign Trade Industry
01
Leadership and Governance Framework
02
Business Model03
Our Team04
Supplier Management05
Efficient Use of Natural Resources
06
Social Contribution07
Additional Information08
GRI Content Index09
Financial Statements10
SOCIEDAD MATRIZ SAAM S.A. AND SUBSIDIARIES Notes to the Consolidated Financial Statements
72
NOTE 18 Property, plant and equipment, continued
(18.3) Reconciliation of changes in property, plant and equipment, by class during 2021 and 2020:
Land Buildings and Constructions
Ships, Tugboats, barges and boats Machinery
Transport equipment
Office machines
Furniture, fixtures and accessories Works in progress
Assets for right of use
Other property, plant and equipment
Total property, plant and
equipment ThUS$ ThUS$ ThUS$ ThUS$ ThUS$ ThUS$ ThUS$ ThUS$ ThUS$ ThUS$ ThUS$
Net balance as of December 31, 2019 Opening balance as of January 01, 2020 53.882 52.597 510.814 68.511 1.736 1.593 912 16.374 28.383 2.216 737.018
Additions - 719 21.175 2.998 300 804 51 36.770 3.600 270 66.687 Business combination acquisitions - 10.554 - 5.329 121 149 102 1.430 34.772 6 52.463 Divestitures (sale of assets) - - (573) (70) (42) - - - - - (685) Application of IFRS 16 Leases(3) - - - - - - - - 182 - 182 Transfers (to) plant and equipment 229 12.559 15.570 2.286 70 512 - (30.631) - (595) - Transfers to (from) assets held for sale (68) (41) (442) (73) - - - - - - (624) Transfer of other non-financial assets - - - - - - - - 15.584 - 15.584 Depreciation expense(2) - (5.640) (46.851) (9.001) (534) (1.411) (276) - (8.197) (183) (72.093) Write-offs (disposal of assets) - 57 (1) (541) (13) (73) - (62) - - (633) Increase (decrease) in change from functional currency(1) to presentation currency, subsidiaries - (34) (1.224) 358 2 (17) 10 19 660 (79) (305)
Other increase (decrease) - (831) (2.761) (981) - 1.205 (19) - (142) (202) (3.731) Net balance as of December 31, 2020 opening balance as of January 01, 2021 54.043 69.940 495.707 68.816 1.640 2.762 780 23.900 74.842 1.433 793.863
Additions(3) 12 1.175 28.505 4.219 83 736 105 23.115 11.030 655 69.635 Business combination acquisitions 478 698 64.489 343 - 11 - - 113 99 66.231 Divestitures (sale of assets) - - (1.576) (210) (9) - - (1) - (1) (1.797) Transfers (to) plant and equipment - 2.700 29.032 2.573 105 97 14 (33.510) (882) (129) - Transfers to (from) assets held for sale (452) (121) - (71) 20 3 - - - - (621) Transfer of other non-financial assets - - - (831) - - - 11 - - (820) Depreciation expense(2) - (6.600) (53.399) (10.183) (586) (1.052) (243) - (17.142) (240) (89.445) Write-offs (disposal of assets) - (93) - (253) (8) (2) (6) (35) (7) (9) (413) Increase (decrease) in change from functional currency(1) to presentation currency, subsidiaries - 593 728 (466) (4) 27 (12) (195) (506) 594 759
Other increase (decrease) - - 76 (96) - (4) 6 (132) 31 5 (114) Net balance as of December 31, 2021 54.081 68.292 563.562 63.841 1.241 2.578 644 13.153 67.479 2.407 837.278
1 Corresponds mainly to the effect of re-expressing in dollars, the tugboats of SAAM Towage Canada Inc., whose functional currency is the Canadian dollar.
2 See note 29 and 30.
3 Corresponds to the initial registration of assets leased to third parties and that are amortized according to the expiration term of each contract. The counterpart is recorded in financial liabilities, in the item liabilities for lease contracts.
251
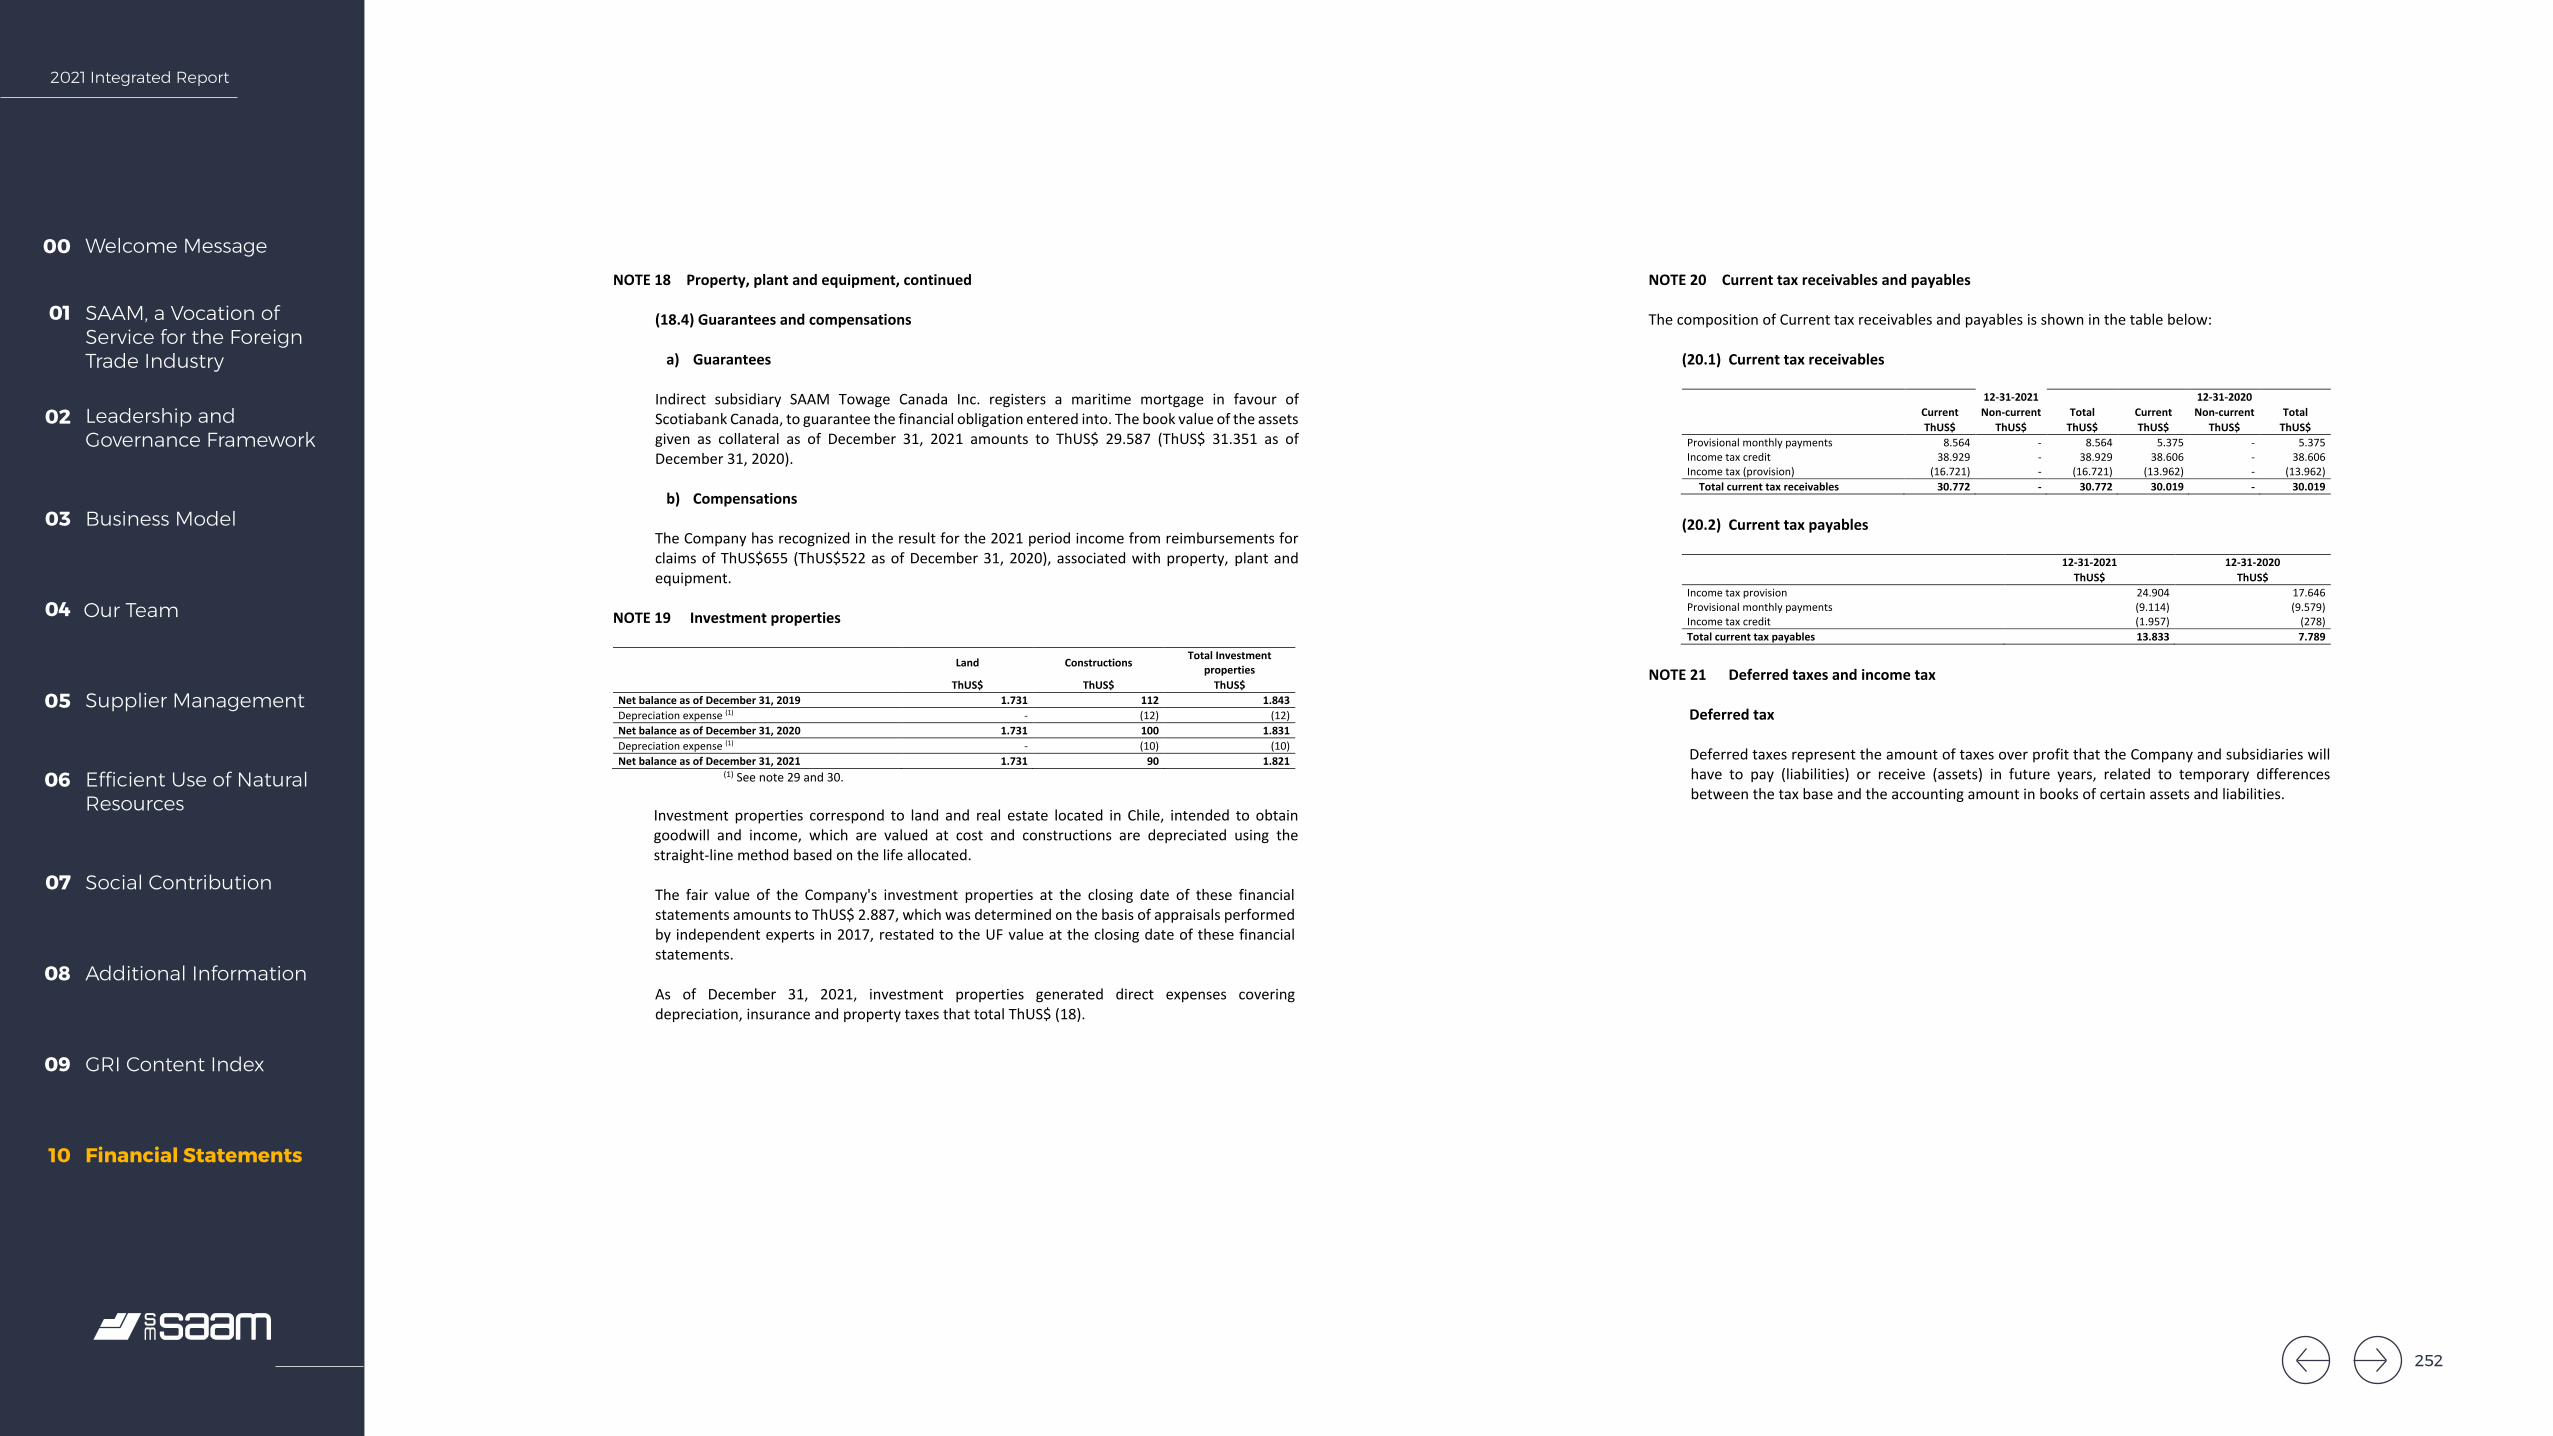
2021 Integrated Report
Welcome Message00
SAAM, a Vocation of Service for the Foreign Trade Industry
01
Leadership and Governance Framework
02
Business Model03
Our Team04
Supplier Management05
Efficient Use of Natural Resources
06
Social Contribution07
Additional Information08
GRI Content Index09
Financial Statements10
SOCIEDAD MATRIZ SAAM S.A. AND SUBSIDIARIES Notes to the Consolidated Financial Statements
73
NOTE 18 Property, plant and equipment, continued
(18.4) Guarantees and compensations
a) Guarantees Indirect subsidiary SAAM Towage Canada Inc. registers a maritime mortgage in favour of Scotiabank Canada, to guarantee the financial obligation entered into. The book value of the assets given as collateral as of December 31, 2021 amounts to ThUS$ 29.587 (ThUS$ 31.351 as of December 31, 2020).
b) Compensations The Company has recognized in the result for the 2021 period income from reimbursements for claims of ThUS$655 (ThUS$522 as of December 31, 2020), associated with property, plant and equipment.
NOTE 19 Investment properties
Land Constructions Total Investment properties
ThUS$ ThUS$ ThUS$ Net balance as of December 31, 2019 1.731 112 1.843 Depreciation expense (1) - (12) (12) Net balance as of December 31, 2020 1.731 100 1.831 Depreciation expense (1) - (10) (10) Net balance as of December 31, 2021 1.731 90 1.821
(1) See note 29 and 30. Investment properties correspond to land and real estate located in Chile, intended to obtain goodwill and income, which are valued at cost and constructions are depreciated using the straight-line method based on the life allocated. The fair value of the Company's investment properties at the closing date of these financial statements amounts to ThUS$ 2.887, which was determined on the basis of appraisals performed by independent experts in 2017, restated to the UF value at the closing date of these financial statements. As of December 31, 2021, investment properties generated direct expenses covering depreciation, insurance and property taxes that total ThUS$ (18).
SOCIEDAD MATRIZ SAAM S.A. AND SUBSIDIARIES Notes to the Consolidated Financial Statements
74
NOTE 20 Current tax receivables and payables The composition of Current tax receivables and payables is shown in the table below: (20.1) Current tax receivables
12-31-2021 12-31-2020
Current Non-current Total Current Non-current Total ThUS$ ThUS$ ThUS$ ThUS$ ThUS$ ThUS$
Provisional monthly payments 8.564 - 8.564 5.375 - 5.375 Income tax credit 38.929 - 38.929 38.606 - 38.606 Income tax (provision) (16.721) - (16.721) (13.962) - (13.962)
Total current tax receivables 30.772 - 30.772 30.019 - 30.019
(20.2) Current tax payables
12-31-2021 12-31-2020 ThUS$ ThUS$
Income tax provision 24.904 17.646 Provisional monthly payments (9.114) (9.579) Income tax credit (1.957) (278) Total current tax payables 13.833 7.789
NOTE 21 Deferred taxes and income tax
Deferred tax Deferred taxes represent the amount of taxes over profit that the Company and subsidiaries will have to pay (liabilities) or receive (assets) in future years, related to temporary differences between the tax base and the accounting amount in books of certain assets and liabilities.
252
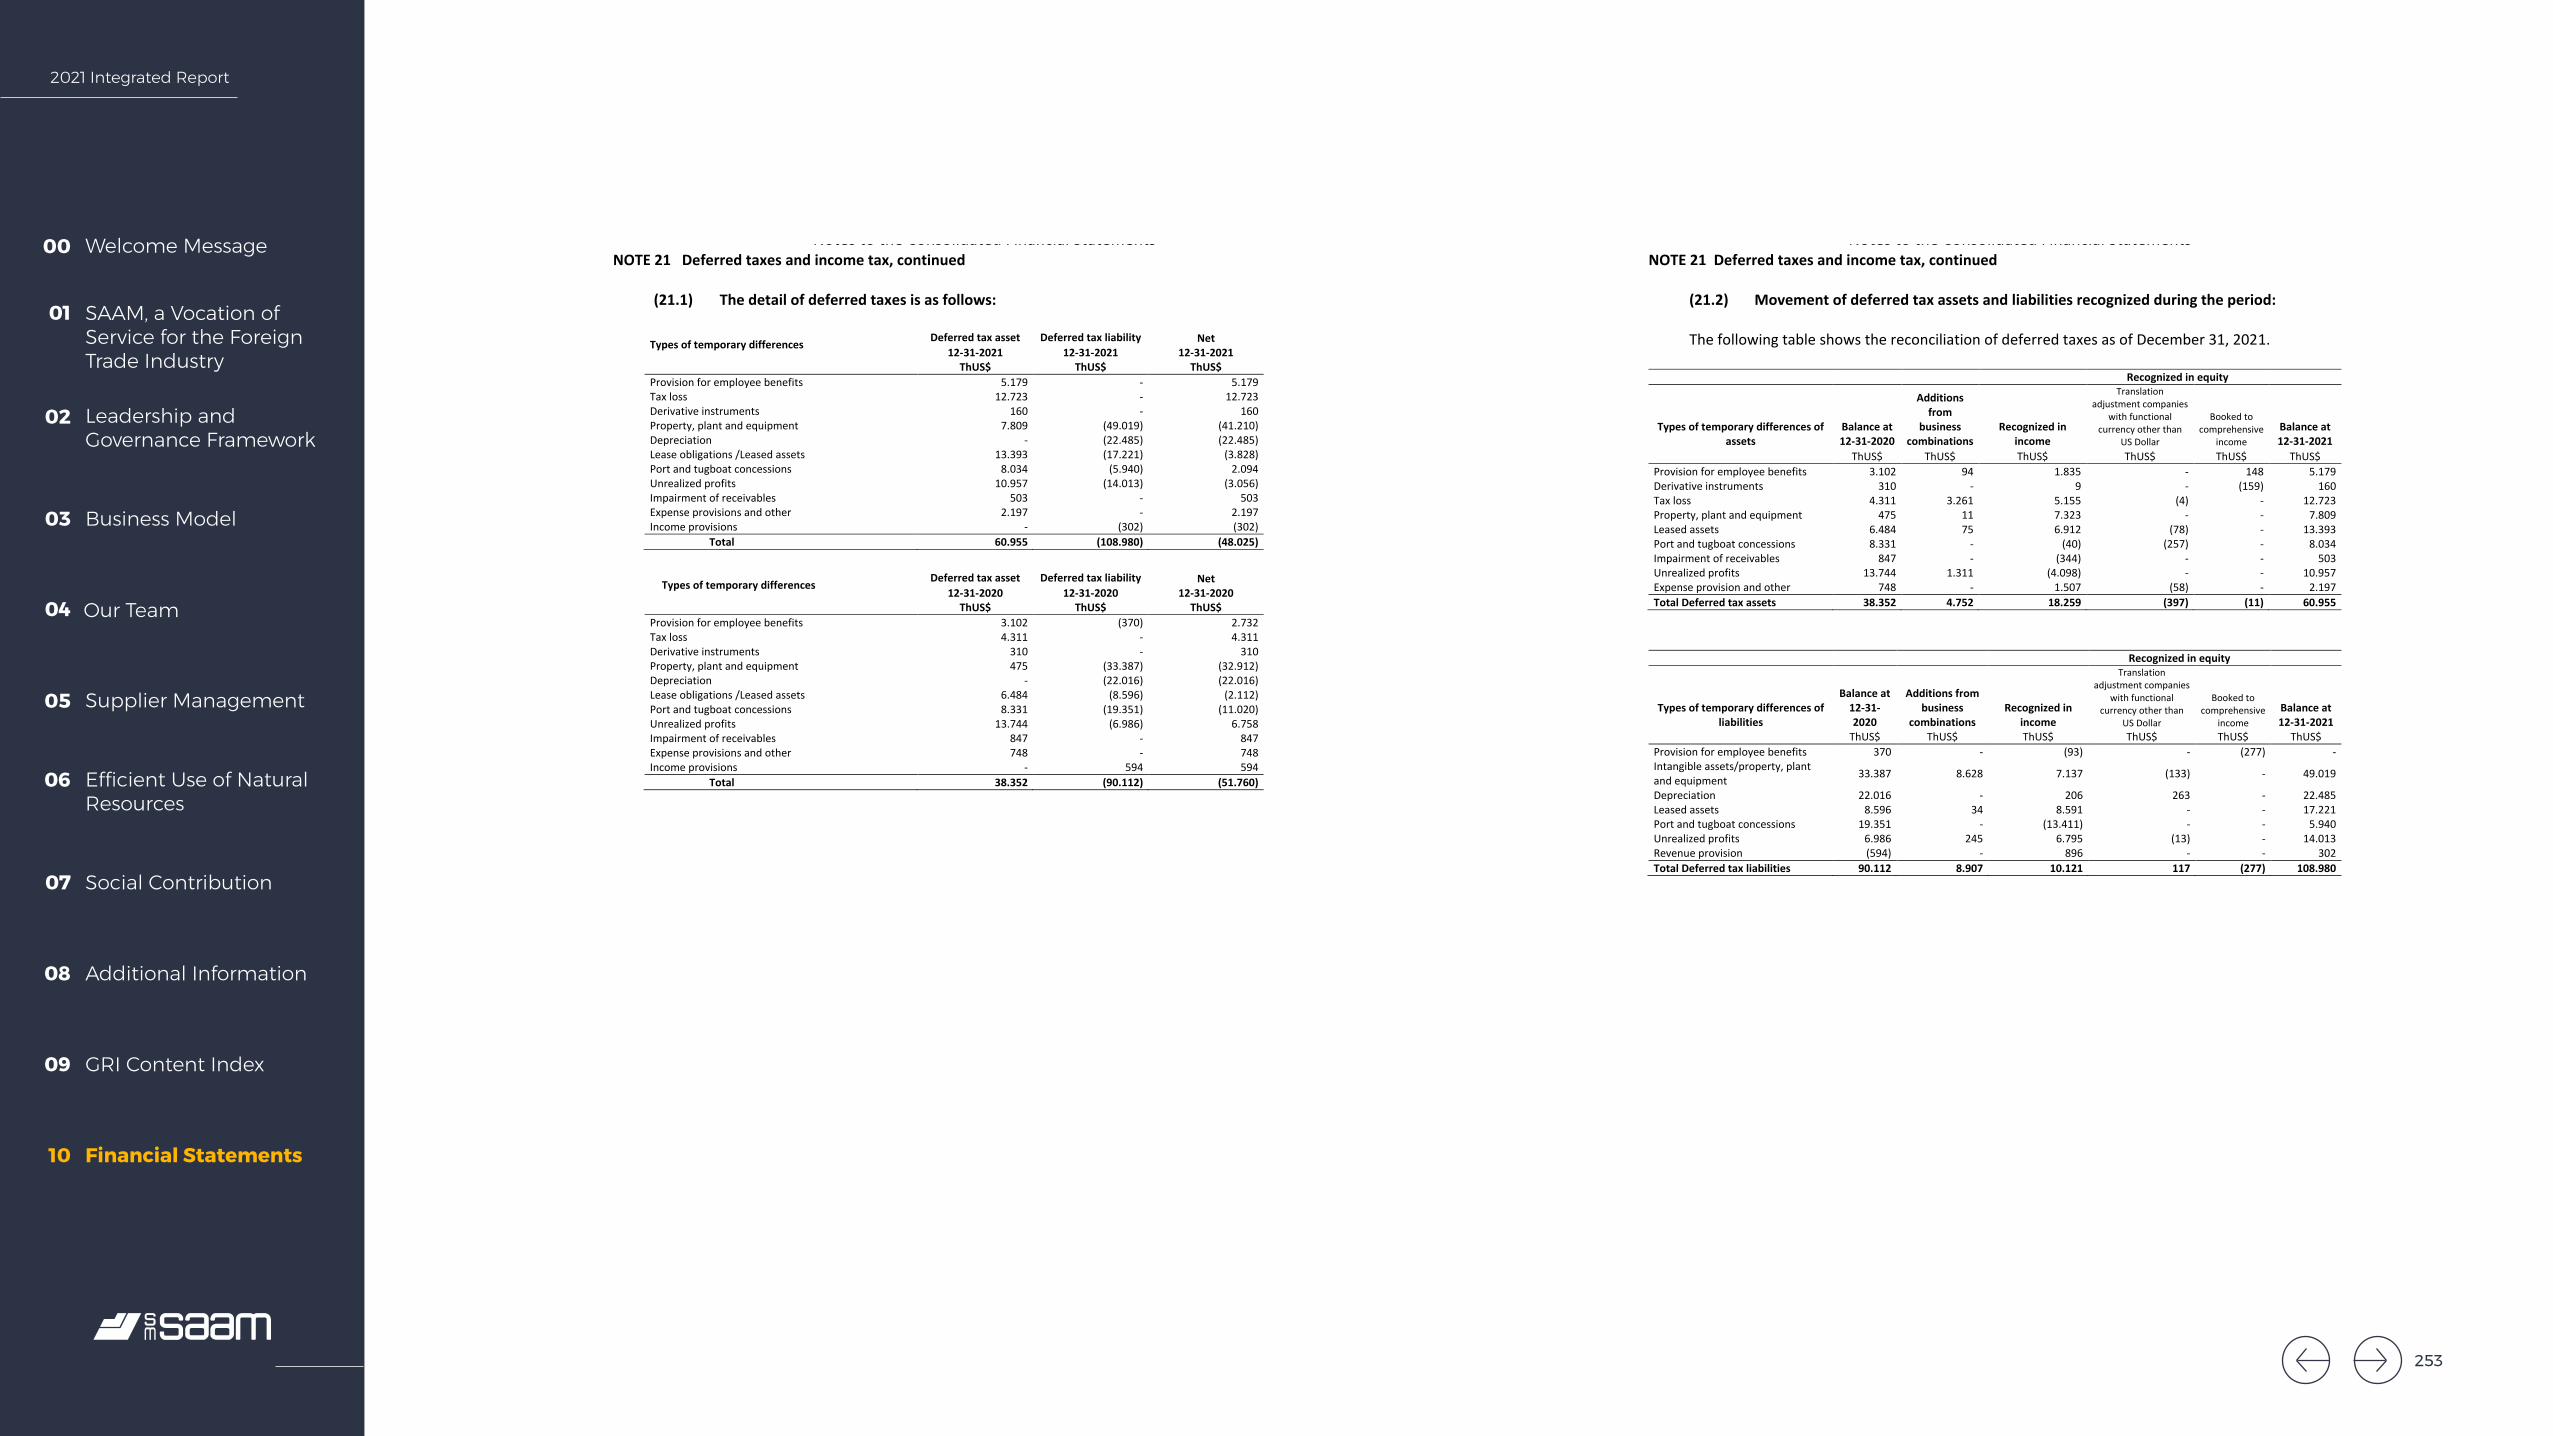
2021 Integrated Report
Welcome Message00
SAAM, a Vocation of Service for the Foreign Trade Industry
01
Leadership and Governance Framework
02
Business Model03
Our Team04
Supplier Management05
Efficient Use of Natural Resources
06
Social Contribution07
Additional Information08
GRI Content Index09
Financial Statements10
SOCIEDAD MATRIZ SAAM S.A. AND SUBSIDIARIES Notes to the Consolidated Financial Statements
75
NOTE 21 Deferred taxes and income tax, continued (21.1) The detail of deferred taxes is as follows:
Types of temporary differences Deferred tax asset Deferred tax liability
Net 12-31-2021 12-31-2021 12-31-2021
ThUS$ ThUS$ ThUS$ Provision for employee benefits 5.179 - 5.179 Tax loss 12.723 - 12.723 Derivative instruments 160 - 160 Property, plant and equipment 7.809 (49.019) (41.210) Depreciation - (22.485) (22.485) Lease obligations /Leased assets 13.393 (17.221) (3.828) Port and tugboat concessions 8.034 (5.940) 2.094 Unrealized profits 10.957 (14.013) (3.056) Impairment of receivables 503 - 503 Expense provisions and other 2.197 - 2.197 Income provisions - (302) (302)
Total 60.955 (108.980) (48.025)
Types of temporary differences Deferred tax asset Deferred tax liability
Net 12-31-2020 12-31-2020 12-31-2020
ThUS$ ThUS$ ThUS$ Provision for employee benefits 3.102 (370) 2.732 Tax loss 4.311 - 4.311 Derivative instruments 310 - 310 Property, plant and equipment 475 (33.387) (32.912) Depreciation - (22.016) (22.016) Lease obligations /Leased assets 6.484 (8.596) (2.112) Port and tugboat concessions 8.331 (19.351) (11.020) Unrealized profits 13.744 (6.986) 6.758 Impairment of receivables 847 - 847 Expense provisions and other 748 - 748 Income provisions - 594 594
Total 38.352 (90.112) (51.760)
SOCIEDAD MATRIZ SAAM S.A. AND SUBSIDIARIES Notes to the Consolidated Financial Statements
76
NOTE 21 Deferred taxes and income tax, continued (21.2) Movement of deferred tax assets and liabilities recognized during the period: The following table shows the reconciliation of deferred taxes as of December 31, 2021.
Recognized in equity
Types of temporary differences of assets
Balance at 12-31-2020
Additions from
business combinations
Recognized in income
Translation adjustment companies
with functional currency other than
US Dollar
Booked to comprehensive
income Balance at 12-31-2021
ThUS$ ThUS$ ThUS$ ThUS$ ThUS$ ThUS$ Provision for employee benefits 3.102 94 1.835 - 148 5.179 Derivative instruments 310 - 9 - (159) 160 Tax loss 4.311 3.261 5.155 (4) - 12.723 Property, plant and equipment 475 11 7.323 - - 7.809 Leased assets 6.484 75 6.912 (78) - 13.393 Port and tugboat concessions 8.331 - (40) (257) - 8.034 Impairment of receivables 847 - (344) - - 503 Unrealized profits 13.744 1.311 (4.098) - - 10.957 Expense provision and other 748 - 1.507 (58) - 2.197 Total Deferred tax assets 38.352 4.752 18.259 (397) (11) 60.955
Recognized in equity
Types of temporary differences of liabilities
Balance at 12-31-2020
Additions from business
combinations Recognized in
income
Translation adjustment companies
with functional currency other than
US Dollar
Booked to comprehensive
income Balance at 12-31-2021
ThUS$ ThUS$ ThUS$ ThUS$ ThUS$ ThUS$ Provision for employee benefits 370 - (93) - (277) - Intangible assets/property, plant and equipment 33.387 8.628 7.137 (133) - 49.019
Depreciation 22.016 - 206 263 - 22.485 Leased assets 8.596 34 8.591 - - 17.221 Port and tugboat concessions 19.351 - (13.411) - - 5.940 Unrealized profits 6.986 245 6.795 (13) - 14.013 Revenue provision (594) - 896 - - 302 Total Deferred tax liabilities 90.112 8.907 10.121 117 (277) 108.980
253
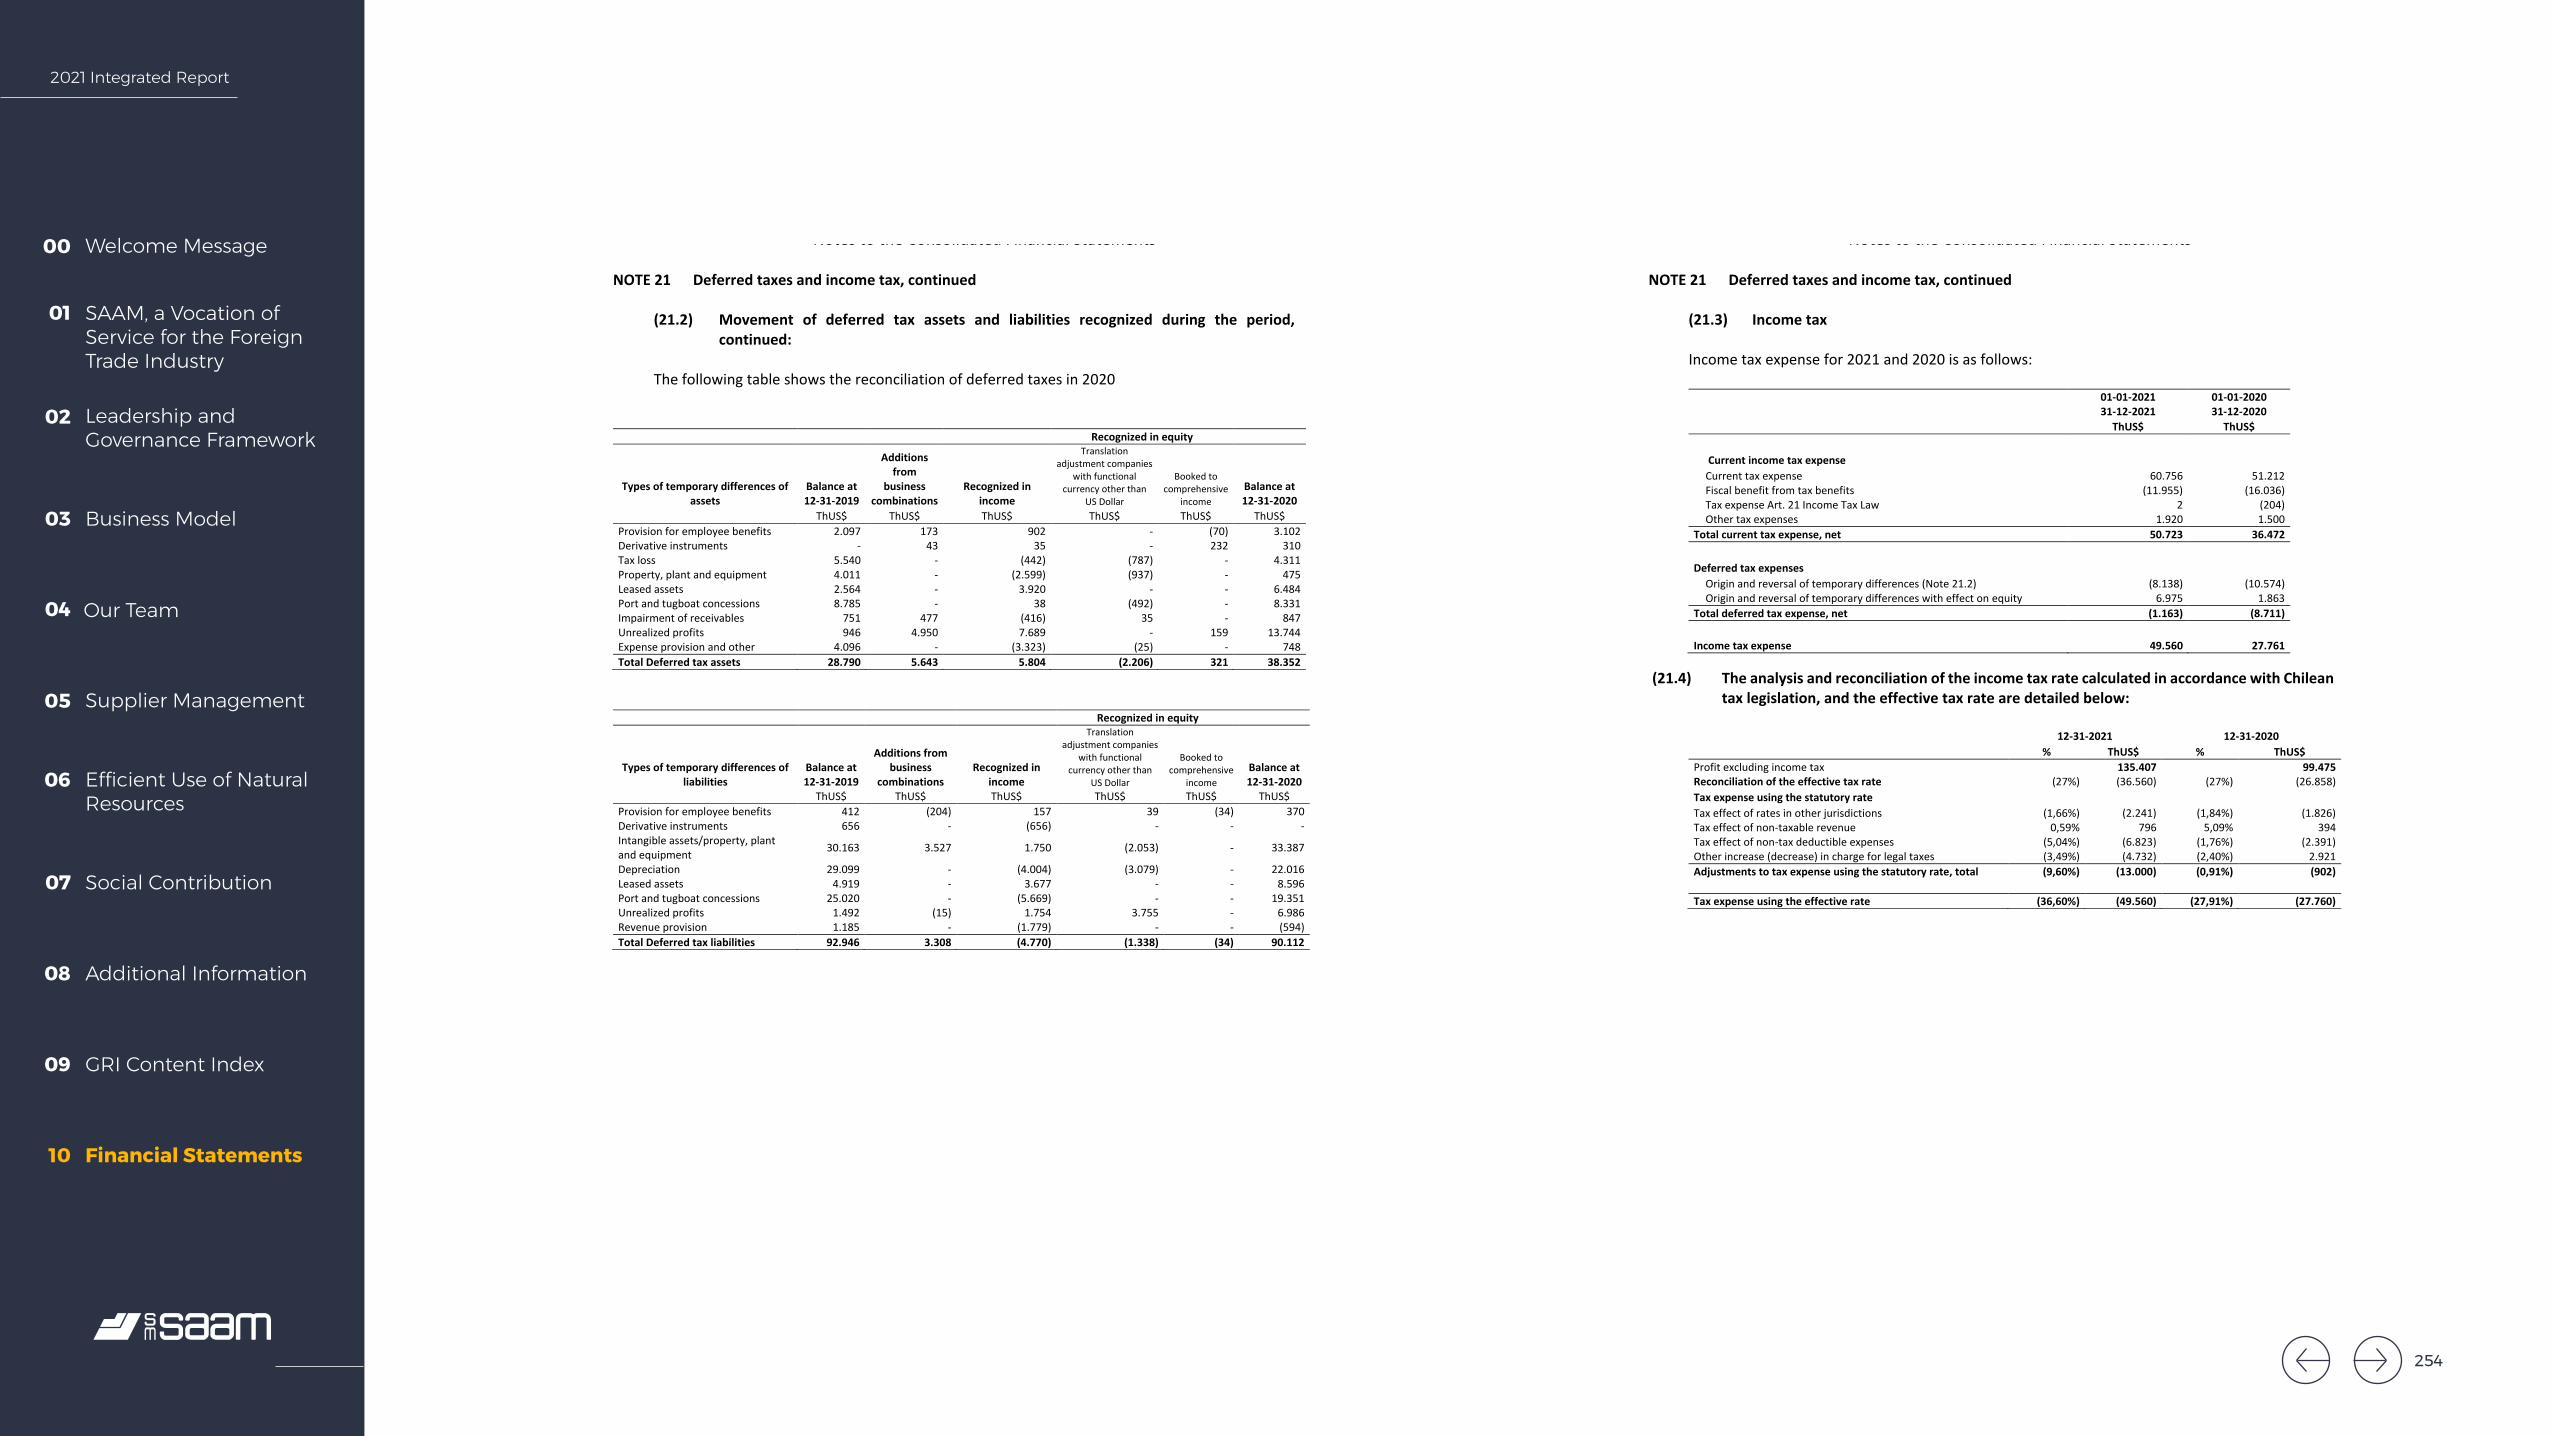
2021 Integrated Report
Welcome Message00
SAAM, a Vocation of Service for the Foreign Trade Industry
01
Leadership and Governance Framework
02
Business Model03
Our Team04
Supplier Management05
Efficient Use of Natural Resources
06
Social Contribution07
Additional Information08
GRI Content Index09
Financial Statements10
SOCIEDAD MATRIZ SAAM S.A. AND SUBSIDIARIES Notes to the Consolidated Financial Statements
77
NOTE 21 Deferred taxes and income tax, continued
(21.2) Movement of deferred tax assets and liabilities recognized during the period,
continued: The following table shows the reconciliation of deferred taxes in 2020
Recognized in equity
Types of temporary differences of assets
Balance at 12-31-2019
Additions from
business combinations
Recognized in income
Translation adjustment companies
with functional currency other than
US Dollar
Booked to comprehensive
income Balance at 12-31-2020
ThUS$ ThUS$ ThUS$ ThUS$ ThUS$ ThUS$ Provision for employee benefits 2.097 173 902 - (70) 3.102 Derivative instruments - 43 35 - 232 310 Tax loss 5.540 - (442) (787) - 4.311 Property, plant and equipment 4.011 - (2.599) (937) - 475 Leased assets 2.564 - 3.920 - - 6.484 Port and tugboat concessions 8.785 - 38 (492) - 8.331 Impairment of receivables 751 477 (416) 35 - 847 Unrealized profits 946 4.950 7.689 - 159 13.744 Expense provision and other 4.096 - (3.323) (25) - 748 Total Deferred tax assets 28.790 5.643 5.804 (2.206) 321 38.352
Recognized in equity
Types of temporary differences of liabilities
Balance at 12-31-2019
Additions from business
combinations Recognized in
income
Translation adjustment companies
with functional currency other than
US Dollar
Booked to comprehensive
income Balance at 12-31-2020
ThUS$ ThUS$ ThUS$ ThUS$ ThUS$ ThUS$ Provision for employee benefits 412 (204) 157 39 (34) 370 Derivative instruments 656 - (656) - - - Intangible assets/property, plant and equipment 30.163 3.527 1.750 (2.053) - 33.387
Depreciation 29.099 - (4.004) (3.079) - 22.016 Leased assets 4.919 - 3.677 - - 8.596 Port and tugboat concessions 25.020 - (5.669) - - 19.351 Unrealized profits 1.492 (15) 1.754 3.755 - 6.986 Revenue provision 1.185 - (1.779) - - (594) Total Deferred tax liabilities 92.946 3.308 (4.770) (1.338) (34) 90.112
SOCIEDAD MATRIZ SAAM S.A. AND SUBSIDIARIES Notes to the Consolidated Financial Statements
78
NOTE 21 Deferred taxes and income tax, continued
(21.3) Income tax
Income tax expense for 2021 and 2020 is as follows:
01-01-2021 31-12-2021
01-01-2020 31-12-2020
ThUS$ ThUS$
Current income tax expense Current tax expense 60.756 51.212 Fiscal benefit from tax benefits (11.955) (16.036) Tax expense Art. 21 Income Tax Law 2 (204) Other tax expenses 1.920 1.500
Total current tax expense, net 50.723 36.472
Deferred tax expenses Origin and reversal of temporary differences (Note 21.2) (8.138) (10.574) Origin and reversal of temporary differences with effect on equity 6.975 1.863
Total deferred tax expense, net (1.163) (8.711)
Income tax expense 49.560 27.761
(21.4) The analysis and reconciliation of the income tax rate calculated in accordance with Chilean tax legislation, and the effective tax rate are detailed below:
12-31-2021 12-31-2020 % ThUS$ % ThUS$ Profit excluding income tax 135.407 99.475 Reconciliation of the effective tax rate (27%) (36.560) (27%) (26.858) Tax expense using the statutory rate Tax effect of rates in other jurisdictions (1,66%) (2.241) (1,84%) (1.826) Tax effect of non-taxable revenue 0,59% 796 5,09% 394 Tax effect of non-tax deductible expenses (5,04%) (6.823) (1,76%) (2.391) Other increase (decrease) in charge for legal taxes (3,49%) (4.732) (2,40%) 2.921 Adjustments to tax expense using the statutory rate, total (9,60%) (13.000) (0,91%) (902) Tax expense using the effective rate (36,60%) (49.560) (27,91%) (27.760)
254
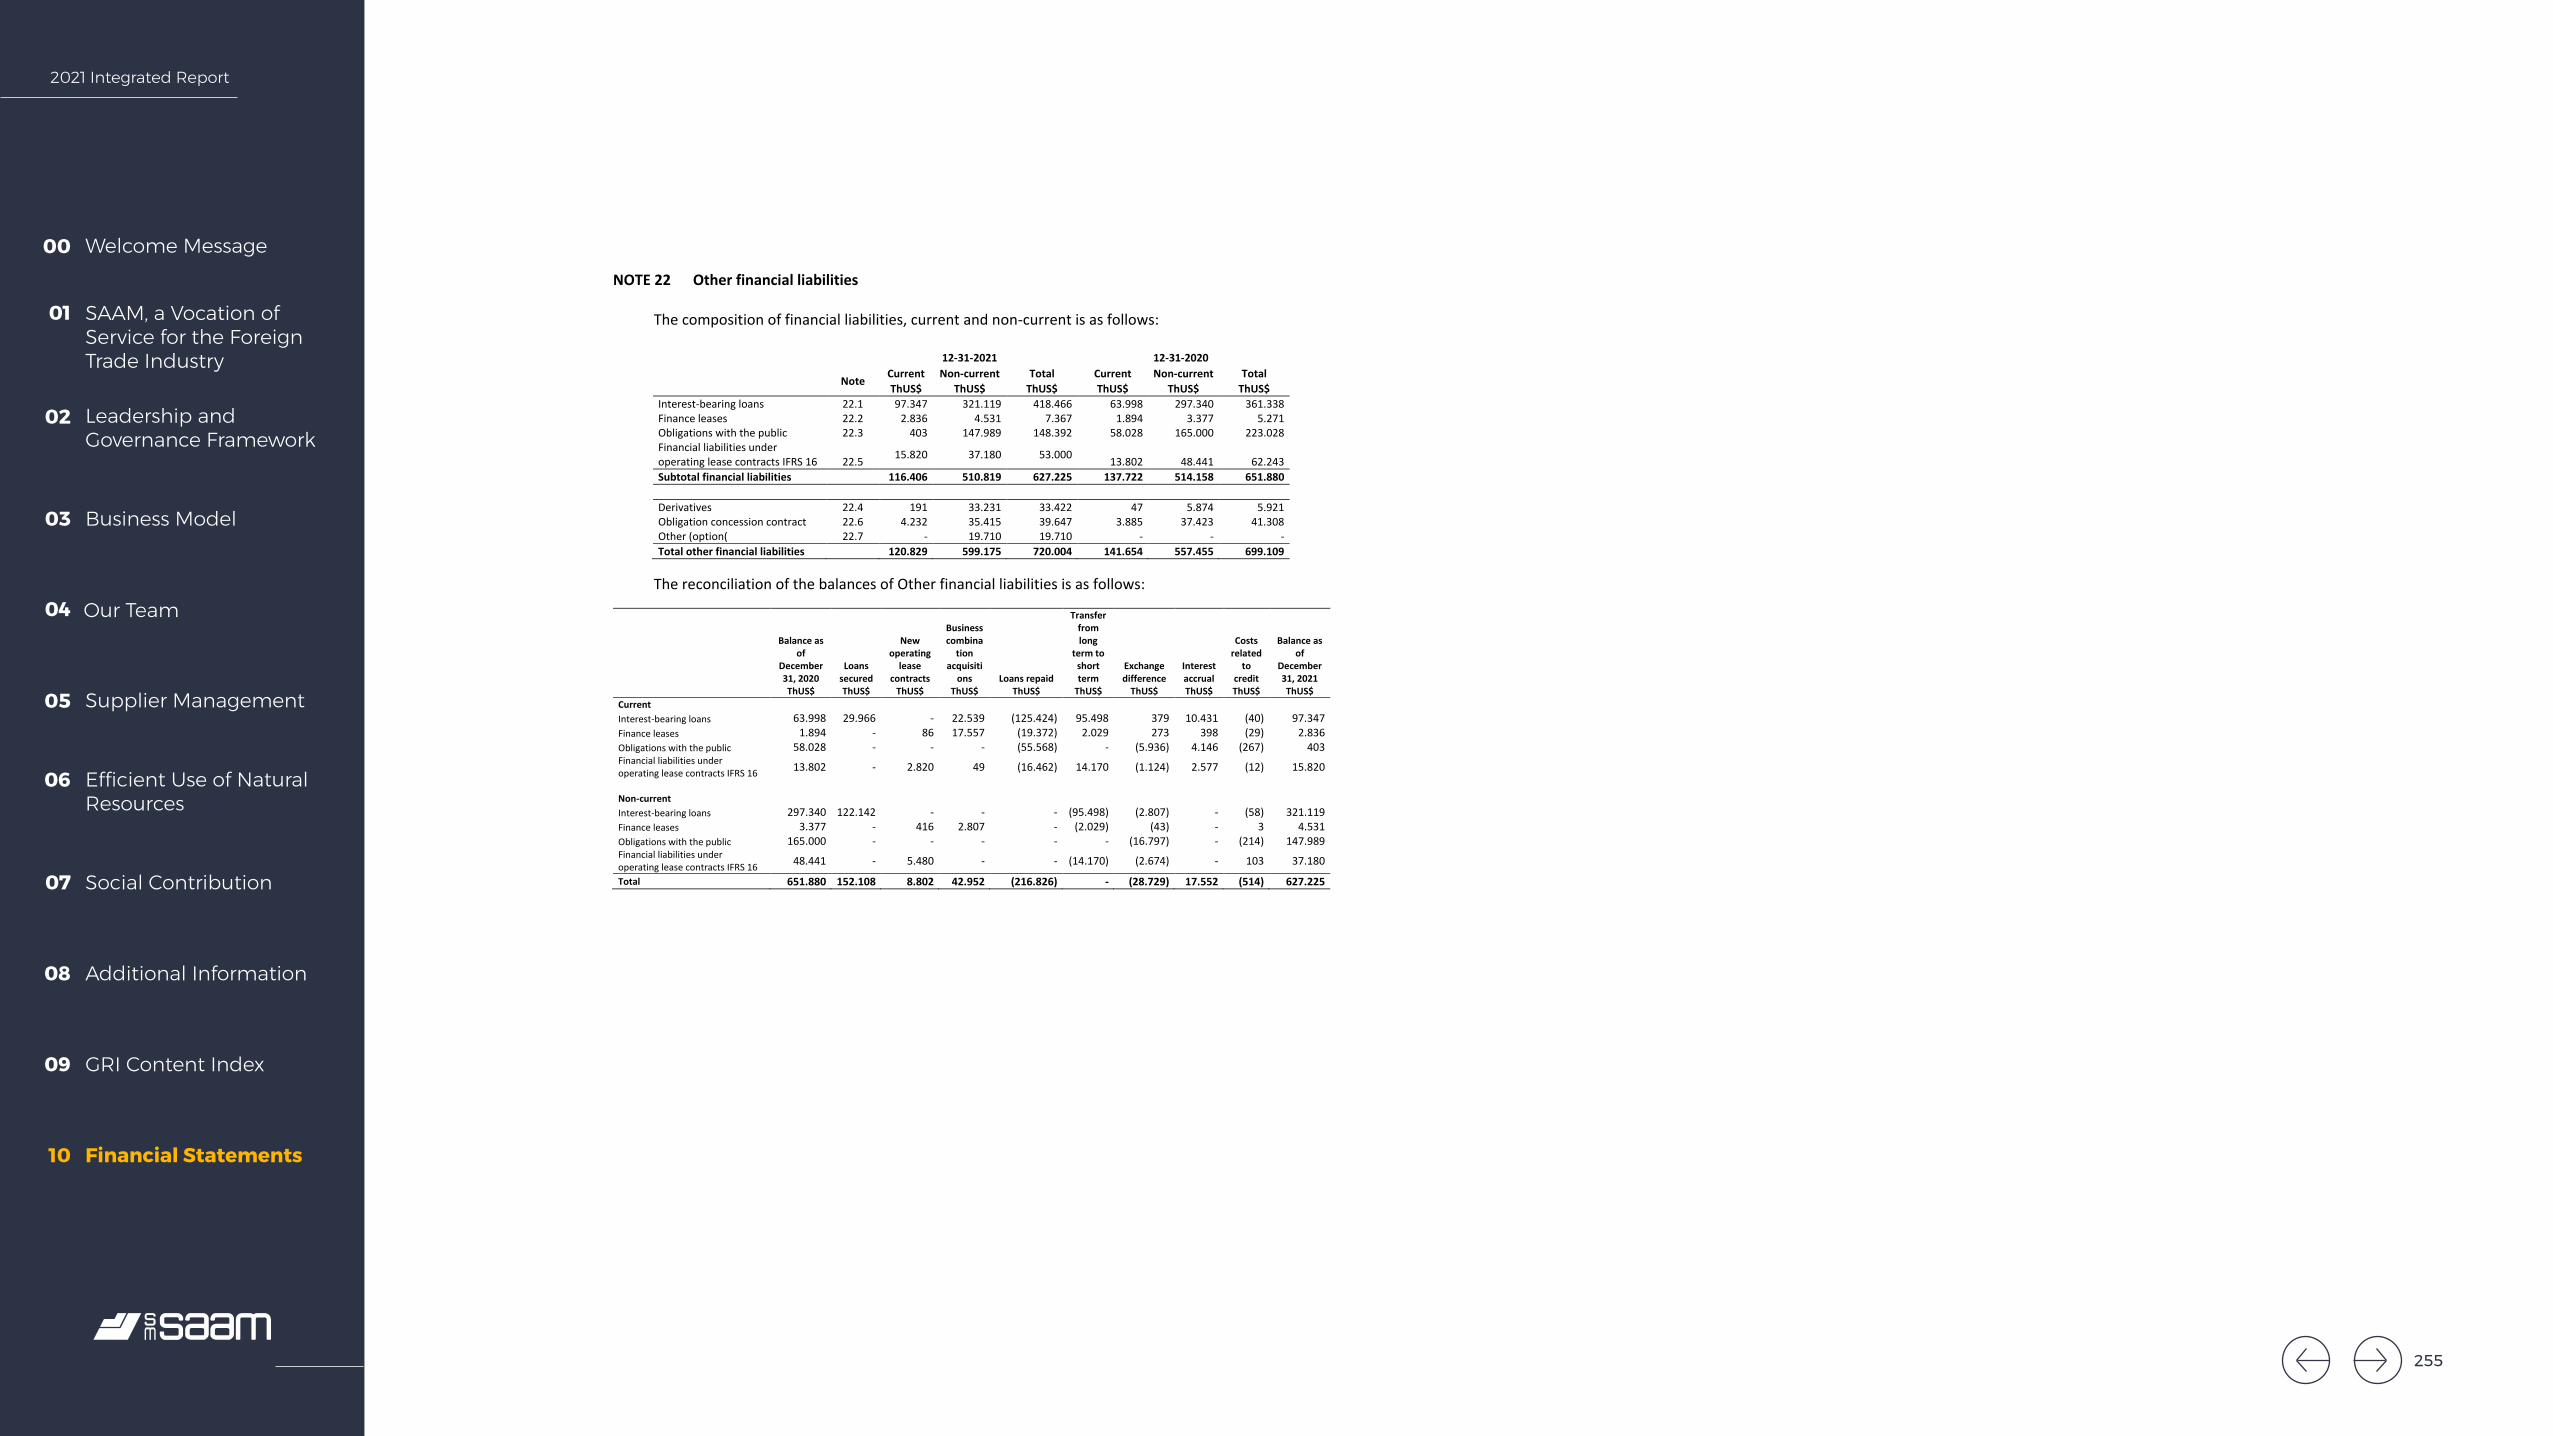
2021 Integrated Report
Welcome Message00
SAAM, a Vocation of Service for the Foreign Trade Industry
01
Leadership and Governance Framework
02
Business Model03
Our Team04
Supplier Management05
Efficient Use of Natural Resources
06
Social Contribution07
Additional Information08
GRI Content Index09
Financial Statements10
SOCIEDAD MATRIZ SAAM S.A. AND SUBSIDIARIES Notes to the Consolidated Financial Statements
79
NOTE 22 Other financial liabilities
The composition of financial liabilities, current and non-current is as follows: 12-31-2021 12-31-2020
Note Current Non-current Total Current Non-current Total ThUS$ ThUS$ ThUS$ ThUS$ ThUS$ ThUS$
Interest-bearing loans 22.1 97.347 321.119 418.466 63.998 297.340 361.338 Finance leases 22.2 2.836 4.531 7.367 1.894 3.377 5.271 Obligations with the public 22.3 403 147.989 148.392 58.028 165.000 223.028 Financial liabilities under operating lease contracts IFRS 16 22.5 15.820 37.180 53.000 13.802 48.441 62.243 Subtotal financial liabilities 116.406 510.819 627.225 137.722 514.158 651.880 Derivatives 22.4 191 33.231 33.422 47 5.874 5.921 Obligation concession contract 22.6 4.232 35.415 39.647 3.885 37.423 41.308 Other (option( 22.7 - 19.710 19.710 - - - Total other financial liabilities 120.829 599.175 720.004 141.654 557.455 699.109
The reconciliation of the balances of Other financial liabilities is as follows:
Balance as of
December 31, 2020
Loans secured
New operating
lease contracts
Business combina
tion acquisiti
ons Loans repaid
Transfer from long
term to short term
Exchange difference
Interest accrual
Costs related
to credit
Balance as of
December 31, 2021
ThUS$ ThUS$ ThUS$ ThUS$ ThUS$ ThUS$ ThUS$ ThUS$ ThUS$ ThUS$ Current Interest-bearing loans 63.998 29.966 - 22.539 (125.424) 95.498 379 10.431 (40) 97.347 Finance leases 1.894 - 86 17.557 (19.372) 2.029 273 398 (29) 2.836 Obligations with the public 58.028 - - - (55.568) - (5.936) 4.146 (267) 403 Financial liabilities under operating lease contracts IFRS 16 13.802 - 2.820 49 (16.462) 14.170 (1.124) 2.577 (12) 15.820
Non-current Interest-bearing loans 297.340 122.142 - - - (95.498) (2.807) - (58) 321.119 Finance leases 3.377 - 416 2.807 - (2.029) (43) - 3 4.531 Obligations with the public 165.000 - - - - - (16.797) - (214) 147.989 Financial liabilities under operating lease contracts IFRS 16 48.441 - 5.480 - - (14.170) (2.674) - 103 37.180
Total 651.880 152.108 8.802 42.952 (216.826) - (28.729) 17.552 (514) 627.225
255

2021 Integrated Report
Welcome Message00
SAAM, a Vocation of Service for the Foreign Trade Industry
01
Leadership and Governance Framework
02
Business Model03
Our Team04
Supplier Management05
Efficient Use of Natural Resources
06
Social Contribution07
Additional Information08
GRI Content Index09
Financial Statements10
SOCIEDAD MATRIZ SAAM S.A. AND SUBSIDIARIES Notes to the Consolidated Financial Statements
80
NOTE 22 Other financial liabilities, continued
(22.1) Bank interest-bearing loans The balance of bank loans current as of December 31, 2021 is as follows:
(1) Effective rate is an IRR of the projected flows, which considers for variable rates the rate of the closing day of the period and also the effective flow on receipt (with expenses associated with the issue + surplus in the case of bonds) (2) Corresponds to financial liabilities, on which the company has minimized the risk of interest rate and currency fluctuations, by contracting derivative hedging instruments (swaps). (3) Loans subject to compliance with covenants, disclosed in note 36.6
De btor Ta x N° De btor e ntityCountry de btor
Cre ditor Ta x N°
Cre ditor e ntity (ba nks)
Cre ditor c ountry Curre nc y Amortiza tion type
Up to 9 0 da ys
More tha n 9 0 da ys to 1
ye a r
Curre nt portion
1 to 2 ye a rs
2 to 3 ye a rs
3 to 4 ye a rs
4 to 5 ye a rs
Ove r 5 ye a rs
Non- c urre nt portion Tota l De bt Inte re st ra te Inte re st ra te
ThUS$ ThUS$ ThUS$ ThUS$ ThUS$ ThUS$ ThUS$ ThUS$ ThUS$ ThUS$ Contra c t Effe c tive (1)76.196.718- 5 Sociedad Matriz SAAM S.A. (3) Chile 97.036.000- K Banco Santander Chile US Dollar Semiannually - 13 13 - 29.673 - - - 29.673 29.686 Libor180 + 1,11% 1,88%76.196.718- 5 Sociedad Matriz SAAM S.A. (3) Chile 97.036.000- K Banco Santander Chile US Dollar Semiannually - 8 8 - 17.309 - - - 17.309 17.317 Libor180 + 1,15% 1,90%76.196.718- 5 Sociedad Matriz SAAM S.A. (3) Chile 97.036.000- K Banco Santander Chile US Dollar Semiannually - 4 4 - 9.891 - - - 9.891 9.895 Libor180 + 1,15% 1,90%
92.048.000- 4 SAAM S.A. (2 y 3) Chile 97.018.000- 1 Banco Scotiabank Chile US Dollar Semiannually - 10.049 10.049 10.000 10.000 54.632 - - 74.632 84.681 Libor180 + 1,46% 2,03%76.729.932- k SAAM Logistics S.A. (2 y 3) Chile 97.004.000- 5 Banco de Chile Chile CLP Semiannually - 4.159 4.159 4.113 8.226 - - - 12.339 16.498 1,71% 2,01%
0- E Florida International Terminal, Llc.(3) USA 97.006.000- 6 Banco Crédito e Inversiones
EE.UU US Dollar Semiannually 508 447 955 893 871 - - - 1.764 2.719 Libor180 + 3% 3,35%
0- E Florida International Terminal, Llc.(3) USA 0- E Bank of America EE.UU US Dollar Monthly 54 164 218 224 231 238 245 - 938 1.156 2,89% 2,93%0- E Florida International Terminal, Llc.(3) USA 0- E Bank of America EE.UU US Dollar Monthly 30 80 110 123 127 131 146 - 527 637 2,97% 3,01%
96.915.330- 0 Iquique Terminal Internacional S.A. Chile 97.006.000- 6 Banco Crédito e Inversiones
Chile US Dollar Quarterly 585 583 1.168 - - - - - - 1.168 3,47% 4,04%
0- E Ecuaestibas S.A. Ecuador 97.006.000- 6 Banco Crédito e Inversiones
Chile US Dollar Semiannually - 714 714 700 700 700 700 - 2.800 3.514 3,09% 3,36%
0- E Inarpi S.A. Ecuador 97.030.000- 7 Banco Estado Chile US Dollar Semiannually 987 947 1.934 947 - - - - 947 2.881 3,21% 3,38%0- E Inarpi S.A. Ecuador 97.030.000- 7 Banco Estado Chile US Dollar Semiannually - 1.909 1.909 1.875 1.875 1.875 938 - 6.563 8.472 3,95% 4,10%0- E Inarpi S.A. Ecuador 0- E Banco Santander Madrid España US Dollar Semiannually - 1.907 1.907 1.880 1.880 1.880 - - 5.640 7.547 Libor180 + 1,8% 2,12%0- E Inarpi S.A. Ecuador 97.030.000- 7 Banco Estado Chile US Dollar Semiannually 1.755 1.667 3.422 3.333 1.667 - - - 5.000 8.422 4,07% 4,28%
0- E Inarpi S.A.(2 y 3) Ecuador 97.006.000- 6 Banco Crédito e Inversiones
EE.UU US Dollar Semiannually 4.132 4.000 8.132 8.000 8.000 - - - 16.000 24.132 Libor180 + 1,6% 1,90%
0- E Inarpi S.A. Ecuador 0- E Banco Santander Madrid España US Dollar Semiannually - 472 472 463 463 463 463 1.390 3.242 3.714 Libor180 + 1,6% 3,26%0- E Sociedad Portuaria de Caldera S.A. (2 y 3) Costa Rica 0- E Banco Davivienda Costa Rica US Dollar Monthly 283 849 1.132 1.172 1.218 1.266 873 - 4.529 5.661 4,00% 4,00%
0- E Sociedad Portuaria Granelera de Caldera S.A. (2 y 3)
Costa Rica 0- E Banco Davivienda Costa Rica US Dollar Monthly 937 2.811 3.748 3.880 4.031 4.190 2.885 - 14.986 18.734 4,00% 4,00%
0- E SAAM Towage México S.A. de C.V.(3) Mexico 0- E Corpbanca New York Branch
EE.UU US Dollar Semiannually 3.102 3.000 6.102 - - - - - - 6.102 Libor180 + 3% 3,32%
0- E SAAM Towage México S.A. de C.V. (3) Mexico 0- E Corpbanca New York Branch
EE.UU US Dollar Semiannually - 3.071 3.071 3.000 3.000 3.000 3.000 - 12.000 15.071 2,90% 2,90%
0- E SAAM Towage México S.A. de C.V. Mexico 0- E Santander México México US Dollar Al vencimiento 1.000 - 1.000 - - - - - - 1.000 3,10% 3,10%0- E SAAM Towage México S.A. de C.V. Mexico 0- E Santander México México US Dollar Al vencimiento 1.000 - 1.000 - - - - - - 1.000 3,10% 3,10%
0- E SAAM Towage El Salvador S.A. de C.V. El Salvador 97.006.000- 6 Banco Crédito e Inversiones
EE.UU US Dollar Al vencimiento - 1.847 1.847 1.698 1.694 9.308 593 - 13.293 15.140 Libor180 + 1,52% 1,75%
0- E SAAM Towage Canadá Inc(3) Canada 0- E Scotiabank Canada Canada Canadian dollar
Monthly 362 1.085 1.447 1.446 10.005 - - - 11.451 12.898 BA de Canadá + 1,45%
1,90%
0- E SAAM Towage Canadá Inc(2 y 3) Canada 0- E Scotiabank Canada Canada Canadian dollar
Monthly 250 749 999 999 11.971 - - - 12.970 13.969 BA de Canadá + 1,45%
1,90%
0- E SAAM Towage Panamá (3) Panama NL803281183B01
Banco Rabobank Holanda US Dollar Semiannually 471 - 471 - - - - - - 471 3,45% 5,71%
96.885.450- K Aerosan Airport Services S.A. Chile Banco Santander Chile US Dollar Monthly 250 749 999 418 - - - - 418 1.417 4,20% 4,67%0- E Intertug Colombia Colombia 0- E Banco de Occidente Colombia US Dollar To maturity 1.509 - 1.509 - - - - - - 1.509 Libor90 + 2,63% 1,78%0- E Intertug Colombia Colombia 0- E Banco Scotiabank Colombia US Dollar To maturity 25.043 - 25.043 - - - - - - 25.043 Libor180 + 1,67% 2,87%0- E Aerosan SAS Colombia 0- E Banco Caja Social Colombia CLP Quarterly 178 294 472 - - - - - - 472 DTF + 3,5 5,40%
Subtota l 4 2 .4 3 6 4 1.5 7 8 8 4 .0 14 4 5 .16 4 12 2 .8 3 2 7 7 .6 8 3 9 .8 4 3 1.3 9 0 2 5 6 .9 12 3 4 0 .9 2 6
256

2021 Integrated Report
Welcome Message00
SAAM, a Vocation of Service for the Foreign Trade Industry
01
Leadership and Governance Framework
02
Business Model03
Our Team04
Supplier Management05
Efficient Use of Natural Resources
06
Social Contribution07
Additional Information08
GRI Content Index09
Financial Statements10
SOCIEDAD MATRIZ SAAM S.A. AND SUBSIDIARIES Notes to the Consolidated Financial Statements
81
NOTE 22 Other financial liabilities, continued
(22.1) Bank interest-bearing loans, continued The balance of bank loans current as of December 31, 2021 is as follows, continued:
De btor Ta x N° De btor e ntityCountry de btor
Cre ditor Ta x N°
Cre ditor e ntity (ba nks)
Cre ditor c ountry Curre nc y Amortiza tion type
Up to 9 0 da ys
More tha n 9 0 da ys to 1
ye a r
Curre nt portion
1 to 2 ye a rs
2 to 3 ye a rs
3 to 4 ye a rs
4 to 5 ye a rs
Ove r 5 ye a rs
Non- c urre nt portion Tota l De bt Inte re st ra te
Inte re st ra te
ThUS$ ThUS$ ThUS$ ThUS$ ThUS$ ThUS$ ThUS$ ThUS$ ThUS$ ThUS$ Contra c t Effe c tive0- E SAAM Towage Brasil (2y3) Brasil 0- E BNDES Brazil US Dollar Monthly 330 946 1.276 1.262 1.262 1.262 1.262 421 5.469 6.745 3,7% 3,7%0- E SAAM Towage Brasil (2y3) Brasil 0- E BNDES Brazil US Dollar Monthly 396 1.136 1.532 1.514 1.514 1.514 1.514 505 6.561 8.093 3,7% 3,7%0- E SAAM Towage Brasil (2y3) Brasil 0- E BNDES Brazil Real Monthly 98 265 363 354 354 354 354 118 1.534 1.897 TJLP+3,70% 8,79%0- E SAAM Towage Brasil (2y3) Brasil 0- E BNDES Brazil US Dollar Monthly 294 824 1.118 1.099 1.099 1.099 1.099 7.403 11.799 12.917 2,6% 2,6%0- E SAAM Towage Brasil (2y3) Brasil 0- E BNDES Brazil US Dollar Monthly 213 583 796 777 777 777 777 5.276 8.384 9.180 3,6% 3,6%0- E SAAM Towage Brasil (2y3) Brasil 0- E Caterpillar Brazil US Dollar Monthly 104 307 411 409 155 44 - - 608 1.019 3,8% 3,8%0- E SAAM Towage Brasil (2y3) Brasil 0- E Caterpillar Brazil US Dollar Monthly 127 374 501 498 191 54 - - 743 1.244 3,8% 3,8%0- E SAAM Towage Brasil (2y3) Brasil 0- E Caterpillar Brazil Real Monthly 30 85 115 114 43 12 - - 169 284 TJLP+3,80% 8,89%0- E SAAM Towage Brasil (2) Brasil 0- E Banco Do Brasil Brazil US Dollar Monthly 323 894 1.217 1.193 1.193 1.193 1.193 2.491 7.263 8.480 3,5% 3,5%0- E SAAM Towage Brasil (2) Brasil 0- E Banco Do Brasil Brazil US Dollar Monthly 220 606 826 808 808 808 808 1.795 5.027 5.853 3,6% 3,6%0- E SAAM Towage Brasil (2) Brasil 0- E BNDES Brazil US Dollar Monthly 109 320 429 285 - - - - 285 714 4,4% 4,4%0- E SAAM Towage Brasil (2) Brasil 0- E BNDES Brazil US Dollar Monthly 325 877 1.202 1.169 1.169 1.169 1.169 6.992 11.668 12.870 3,7% 3,7%0- E SAAM Towage Brasil (2) Brasil 0- E Banco Do Brasil Brazil US Dollar Monthly 905 2.642 3.547 3.523 1.174 - - - 4.697 8.244 3,8% 3,8%
Subtota l 3 .4 7 4 9 .8 5 9 13 .3 3 3 13 .0 0 5 9 .7 3 9 8 .2 8 6 8 .17 6 2 5 .0 0 1 6 4 .2 0 7 7 7 .5 4 0 Tota l ba nk loa ns 4 5 .9 10 5 1.4 3 7 9 7 .3 4 7 5 8 .16 9 13 2 .5 7 1 8 5 .9 6 9 18 .0 19 2 6 .3 9 1 3 2 1.119 4 18 .4 6 6
257

2021 Integrated Report
Welcome Message00
SAAM, a Vocation of Service for the Foreign Trade Industry
01
Leadership and Governance Framework
02
Business Model03
Our Team04
Supplier Management05
Efficient Use of Natural Resources
06
Social Contribution07
Additional Information08
GRI Content Index09
Financial Statements10
SOCIEDAD MATRIZ SAAM S.A. AND SUBSIDIARIES Notes to the Consolidated Financial Statements
82
NOTE 22 Other financial liabilities, continued
(22.1) Bank interest-bearing loans, continued The balance of bank loans current as of December 31, 2020 is as follows:
(1) Effective rate is a IRR of the projected flows, which considers for variable rates the rate of the closing day of the period and also the cash flow on receipt (with expenses related to the issue + surplus in case of bonds). (2) Corresponds to financial liabilities on which the company has minimized the risk of interest rate fluctuation by contracting derivative hedging instruments (swaps). (3) Loans subject to compliance with covenants, disclosed in note 36.6.
De btor Ta x ID N° De btor e ntity
Country de btor
Cre ditor Ta x ID N°
Cre ditor e ntity (ba nks)
Cre ditor c ountry Curre nc y Amortiza tion type
Up to 9 0 da ys
More tha n 9 0 da ys up
to 1 ye a r
Tota l c urre nt
1 to 2 ye a rs
2 to 3 ye a rs
3 to 4 ye a rs
4 to 5 ye a rs
More tha n 5 ye a rs
Tota l Non-c urre nt Tota l De bt Inte re st ra te Inte re st ra te
ThUS$ ThUS$ ThUS$ ThUS$ ThUS$ ThUS$ ThUS$ ThUS$ ThUS$ ThUS$ Contra c t Effe c tive (1)
92.048.000- 4 SAAM S.A. (2 and 3) Chile 97.018.000- 1 Banco Scotiabank Chile US Dollar Semiannually - 10.087 10.087 9.793 9.793 64.835 - - 84.421 94.508 Libor180 + 1.46%
2,03%
76.729.932- K SAAM Logistics S.A. (2 and 3) Chile 97.004.000- 5 Banco de Chile Chile Chilean peso Semiannually 55 - 55 4.886 4.886 9.775 - - 19.547 19.602 1,71% 2,01%
0- E Florida International Terminal, Llc.(3) USA 97.006.000- 6 Banco Crédito e Inversiones
USA US Dollar Semiannually 513 439 952 893 893 893 - - 2.679 3.631 Libor180 + 3% 3,35%
96.915.330- 0 Iquique Terminal Internacional S.A. Chile 97.006.000- 6 Banco Crédito e Inversiones
Chile US Dollar Quarterly 588 1.741 2.329 1.164 - - - - 1.164 3.493 3,47% 4,04%
0- E Inarpi S.A. Ecuador 97.030.000- 7 Banco Estado Chile US Dollar Semiannually 1.015 947 1.962 1.895 947 - - - 2.842 4.804 3,21% 3,38%0- E Inarpi S.A. Ecuador 97.030.000- 7 Banco Estado Chile US Dollar Semiannually 42 1.875 1.917 1.875 1.875 1.875 1.875 936 8.436 10.353 3,95% 4,10%
0- E Inarpi S.A. Ecuador 0- E Banco Santander Madrid
Spain US Dollar Semiannually 35 1.880 1.915 1.880 1.880 1.880 1.880 - 7.520 9.435 Libor180 + 1.8% 2,12%
0- E Inarpi S.A. Ecuador 97.030.000- 7 Banco Estado Chile US Dollar Semiannually 1.790 1.667 3.457 3.333 3.333 1.669 - - 8.335 11.792 4,07% 4,28%
0- E Inarpi S.A. (2 and 3) Ecuador 97.006.000- 6 Banco Crédito e Inversiones
USA US Dollar Semiannually 4.189 4.000 8.189 8.000 8.000 8.000 - - 24.000 32.189 Libor180 + 1.6% 1,90%
0- E Sociedad Portuaria de Caldera S.A.(3) Costa Rica 0- E Bac San José Costa Rica US Dollar Monthly 69 212 281 295 311 327 344 240 1.517 1.798 5,00% 5,19%0- E Sociedad Portuaria de Caldera S.A.(3) Costa Rica 0- E Bac San José Costa Rica US Dollar Monthly 123 637 760 799 840 885 930 645 4.099 4.859 5,00% 5,19%0- E Sociedad Portuaria Granelera de Caldera S.A.(2) Costa Rica 0- E Bac San Jose Costa Rica US Dollar Quarterly 705 2.196 2.901 3.058 3.216 3.379 3.555 4.863 18.071 20.972 5,00% 5,38%
0- E Sociedad Portuaria Granelera de Caldera S.A.(2) Costa Rica 0- EBanco Davivienda Costa Rica Costa Rica US Dollar Monthly 96 - 96 - - - - - - 96
Libor30 + 5.35% with floor
5.7% 5,70%
0- E Sociedad Portuaria Granelera de Caldera S.A.(2) Costa Rica 0- E Bac San Jose Costa Rica US Dollar Quarterly 188 580 768 810 134 - - - 944 1.712 Libor90 +
3.35% with floor 5.25%
5,25%
0- E SAAM Towage México S.A. de C.V.(3) Mexico 0- E Corpbanca New York Branch
USA US Dollar Semiannually 11 3.000 3.011 6.000 - - - - 6.000 9.011 Libor180 + 3% 3,32%
0- E SAAM Towage México S.A. de C.V. Mexico 0- E Santander México Mexico US Dollar Monthly 1.000 - 1.000 - - - - - - 1.000 3,09% 3,10%0- E SAAM Towage México S.A. de C.V. Mexico 0- E Santander México Mexico US Dollar Monthly 1.000 - 1.000 - - - - - - 1.000 3,10% 3,10%
0- E SAAM Towage Canadá Inc(3) Canada 0- E Scotiabank Canada Canada Canadian dollar
Monthly 359 1.077 1.436 1.436 11.427 - - - 12.863 14.299 BA of Canada + 1.45%
1,90%
0- E SAAM Towage Canadá Inc (2 and 3) Canada 0- E Scotiabank Canada Canada Canadian dollar
Monthly 248 744 992 992 12.810 - - - 13.802 14.794 BA of Canada + 1.45%
1,90%
0- E SAAM Towage Panamá (3) Panama NL803281183B01
Banco Rabobank Holland US Dollar Semiannually - 944 944 468 - - - - 468 1.412 3,45% 5,71%
96.885.450- K Aerosan Airport Services S.A. Chile Banco Santander Chile US Dollar Monthly 255 745 1.000 1.000 420 - - - 1.420 2.420 4,20% 4,67%
96.885.450- K Aerosan Airport Services S.A. Chile 97.006.000- 6 Banco Crédito e Inversiones
Chile US Dollar Semiannually - 602 602 - - - - - - 602 2,10% 2,97%
94.058.000- 5 Servic ios Aeroportuarios Aerosan S.A. Chile 97.006.000- 6 Banco Crédito e Inversiones
Chile US Dollar Semiannually - 903 903 - - - - - - 903 2,10% 2,97%
0- E Aerosan SAS Colombia 0- E Banco Caja Social Colombia Colombian Peso
Quarterly 183 546 729 545 - - - - 545 1.274 DTF + 3.5 5,40%
Tota l 12 .4 6 4 3 4 .8 2 2 4 7 .2 8 6 4 9 .12 2 6 0 .7 6 5 9 3 .5 18 8 .5 8 4 6 .6 8 4 2 18 .6 7 3 2 6 5 .9 5 9
258

2021 Integrated Report
Welcome Message00
SAAM, a Vocation of Service for the Foreign Trade Industry
01
Leadership and Governance Framework
02
Business Model03
Our Team04
Supplier Management05
Efficient Use of Natural Resources
06
Social Contribution07
Additional Information08
GRI Content Index09
Financial Statements10
SOCIEDAD MATRIZ SAAM S.A. AND SUBSIDIARIES Notes to the Consolidated Financial Statements
83
NOTE 22 Other financial liabilities, continued
(22.1) Bank interest-bearing loans, continued
The balance of bank loans current as of December 31, 2020 is as follows, continued:
(1) Effective rate is a IRR of the projected flows, which considers for variable rates the rate of the closing day of the period and also the cash flow on receipt (with expenses related to the issue + surplus in case of bonds). (2) Corresponds to financial liabilities on which the company has minimized the risk of interest rate fluctuation by contracting derivative hedging instruments (swaps). (3) Loans subject to compliance with covenants, disclosed in note 36.6.
De btor Ta x ID N° De btor e ntity
Country de btor
Cre ditor Ta x ID N°
Cre ditor e ntity (ba nks)
Cre ditor c ountry Curre nc y Amortiza tion type
Up to 9 0 da ys
More tha n 9 0 da ys up
to 1 ye a r
Tota l c urre nt
1 to 2 ye a rs
2 to 3 ye a rs
3 to 4 ye a rs
4 to 5 ye a rs
More tha n 5 ye a rs
Tota l Non-c urre nt Tota l De bt Inte re st ra te
Inte re st ra te
ThUS$ ThUS$ ThUS$ ThUS$ ThUS$ ThUS$ ThUS$ ThUS$ ThUS$ ThUS$ Contra c t Effe c tive (1)
0- E SAAM Towage Brasil (2and3) Brazil 0- E BNDES Brazil US Dollar Monthly 333 946 1.279 1.262 1.262 1.262 1.262 1.682 6.730 8.009 3,7% 3,7%0- E SAAM Towage Brasil (2and3) Brazil 0- E BNDES Brazil US Dollar Monthly 399 1.136 1.535 1.514 1.514 1.514 1.514 2.019 8.075 9.610 3,7% 3,7%0- E SAAM Towage Brasil (2and3) Brazil 0- E BNDES Brazil Real Monthly 106 285 391 380 380 380 380 507 2.027 2.418 TJLP+3.70% 8,79%0- E SAAM Towage Brasil (2and3) Brazil 0- E BNDES Brazil US Dollar Monthly 287 824 1.111 1.099 1.099 1.099 1.099 8.502 12.898 14.009 2,6% 2,6%0- E SAAM Towage Brasil (2and3) Brazil 0- E BNDES Brazil US Dollar Monthly 214 583 797 777 777 777 777 6.053 9.161 9.958 3,6% 3,6%0- E SAAM Towage Brasil (2and3) Brazil 0- E Caterpillar Brazil US Dollar Monthly 105 307 412 409 409 155 44 - 1.017 1.429 3,8% 3,8%0- E SAAM Towage Brasil (2and3) Brazil 0- E Caterpillar Brazil US Dollar Monthly 128 374 502 498 498 191 54 - 1.241 1.743 3,8% 3,8%0- E SAAM Towage Brasil (2and3) Brazil 0- E Caterpillar Brazil Real Monthly 33 92 125 122 122 46 13 - 303 428 TJLP+3.80% 8,89%0- E SAAM Towage Brasil (2) Brazil 0- E Banco Do Brasil Brazil US Dollar Monthly 327 894 1.221 1.193 1.193 1.193 1.193 3.684 8.456 9.677 3,5% 3,5%0- E SAAM Towage Brasil (2) Brazil 0- E Banco Do Brasil Brazil US Dollar Monthly 222 606 828 808 808 808 808 2.603 5.835 6.663 3,6% 3,6%0- E TUG Brasil Apoio Maritimo (2) Brazil 0- E BNDES Brazil US Dollar Monthly 110 320 430 427 285 - - - 712 1.142 4,4% 4,4%0- E TUG Brasil Apoio Maritimo (2) Brazil 0- E BNDES Brazil US Dollar Monthly 339 910 1.249 1.213 1.213 1.213 1.213 8.461 13.313 14.562 3,7% 3,7%0- E TUG Brasil Apoio Maritimo (2) Brazil 0- E BNDES Brazil US Dollar Monthly 47 136 183 181 181 181 136 - 679 862 5,5% 5,5%0- E TUG Brasil Apoio Maritimo (2) Brazil 0- E Banco Do Brasil Brazil US Dollar Monthly 915 2.642 3.557 3.523 3.523 1.174 - - 8.220 11.777 3,8% 3,8%
0- E SAAM Towage Brasil Brazil 0- E Banco Santander Brasil
Brazil US Dollar At maturity - 3.092 3.092 - - - - - - 3.092 3,5% 3,5%
Subtota l 3 .5 6 5 13 .14 7 16 .7 12 13 .4 0 6 13 .2 6 4 9 .9 9 3 8 .4 9 3 3 3 .5 11 7 8 .6 6 7 9 5 .3 7 9 Tota l ba nk loa ns 16 .0 2 9 4 7 .9 6 9 6 3 .9 9 8 6 2 .5 2 8 7 4 .0 2 9 10 3 .5 11 17 .0 7 7 4 0 .19 5 2 9 7 .3 4 0 3 6 1.3 3 8
259

2021 Integrated Report
Welcome Message00
SAAM, a Vocation of Service for the Foreign Trade Industry
01
Leadership and Governance Framework
02
Business Model03
Our Team04
Supplier Management05
Efficient Use of Natural Resources
06
Social Contribution07
Additional Information08
GRI Content Index09
Financial Statements10
SOCIEDAD MATRIZ SAAM S.A. AND SUBSIDIARIES Notes to the Consolidated Financial Statements
84
NOTE 22 Other financial liabilities, continued (22.2) Finance leases payable
Finance lease liabilities payable as of December 31, 2021 are as follows:
Finance lease liabilities payable as of December 31, 2020 are as follows:
Up to 9 0 da ys
More tha n 9 0 da ys to 1 ye a r
Tota l c urre nt
1 to 2 ye a rs 2 to 3 ye a rs
3 to 4 ye a rs
4 to 5 ye a rs
Ove r 5 ye a rs
Tota l Non-c urre nt
Tota l De bt Inte re st ra te
Inte re st ra te
ThUS$ ThUS$ ThUS$ ThUS$ ThUS$ ThUS$ ThUS$ ThUS$ ThUS$ ThUS$ Contra c t Effe c tive
97.006.000- 6 BCI 96.915.330- 0 Iquique Terminal Internacional S.A.
Chile US Dollar Monthly 131 401 532 554 577 347 - - 1.478 2.010 2,86% 2,86%
0- E Wells Fargo Equipment Finance, Inc. O- E Florida International Terminal LLC
EE.UU US Dollar Monthly 125 213 338 22 - - - - 22 360 3,74% 3,74%
0- E TD Bank O- E Florida International Terminal LLC
EE.UU US Dollar Monthly 189 127 316 - - - - - - 316 3,30% 3,65%
97.080.000- k Banco Bice 94.058.000- 5Servic ios Aeroportuarios Aerosan
Chile US Dollar Monthly 11 34 45 47 48 50 4 - 149 194 3,68% 3,68%
97.080.000- k Banco Bice 94.058.000- 5Servic ios Aeroportuarios Aerosan
Chile US Dollar Monthly 14 42 56 57 59 62 - - 178 234 3,68% 3,68%
0- E Itaú 0- E Aerosan SAS Colombia Colombian Peso
Monthly 28 84 112 136 136 136 102 - 510 622 6,21% 6,39%
0- E CSI 0- E Aerosan SAS Colombia Colombian Peso
Monthly 2 7 9 - - - - - - 9 8,16% 8,47%
0- E Banco de Occidente 0- E Aerosan SAS Colombia Colombian Peso
Monthly 8 23 31 31 31 - - - 62 93 9,49% 9,73%
0- E Bancolombia Panamá 0- E Intertug Colombia Colombia US Dollar Semianually 345 324 669 972 35 - - - 1.007 1.676 4,79% 4,85%
0- E Bancolombia Panamá 0- E Intertug Colombia Colombia US Dollar Semianually 375 353 728 1.059 66 - - - 1.125 1.853 4,55% 4,60%
Tota le s 1.2 2 8 1.6 0 8 2 .8 3 6 2 .8 7 8 9 5 2 5 9 5 10 6 - 4 .5 3 1 7 .3 6 7
Cre ditor Ta x N° Ba nk or Fina nc ia l institution
De btor Ta x N° De btor e ntity
Country de btor Curre nc y
Amortiza tion type
Up to 9 0 da ys
More tha n 9 0 da ys up to 1 ye a r
Tota l c urre nt
1 to 2 ye a rs
2 to 3 ye a rs
3 to 4 ye a rs
4 to 5 ye a rs
More tha n 5 ye a rs
Tota l Non-c urre nt Tota l De bt
Inte re st ra te
Inte re st ra te
ThUS$ ThUS$ ThUS$ ThUS$ ThUS$ ThUS$ ThUS$ ThUS$ ThUS$ ThUS$ Contra c t Effe c tive
97.006.000- 6 BCI 96.915.330- 0 Iquique Terminal Internacional S.A. Chile US Dollar Monthly 126 385 511 532 554 577 346 - 2.009 2.520 2,86% 2,86%
0- E Wells Fargo Equipment Finance, Inc.
O- E Florida International Terminal, Llc. USA US Dollar Monthly 181 557 738 316 - - - - 316 1.054 3,74% 3,74%
0- E TD Bank O- E Florida International Terminal, Llc. USA US Dollar Monthly 116 360 476 330 21 - - - 351 827 3,30% 3,65%
97.080.000- K Banco Bice 94.058.000- 5 Servic ios Aeroportuarios Aerosan Chile US Dollar Monthly 15 46 61 68 68 68 68 - 272 333 3,68% 3,68%
97.080.000- K Banco Bice 94.058.000- 5 Servic ios Aeroportuarios Aerosan Chile US Dollar Monthly 10 33 43 48 48 48 48 4 196 239 3,68% 3,68%
0- E Itaú 0- E Aerosan SAS Colombia Colombian Peso
Monthly 14 42 56 56 56 56 56 - 224 280 6,21% 3,39%
0- E CSI 0- E Aerosan SAS Colombia Colombian Peso
Monthly 2 7 9 9 - - - - 9 18 8,16% 8,47%
Tota l 4 6 4 1.4 3 0 1.8 9 4 1.3 5 9 7 4 7 7 4 9 5 18 4 3 .3 7 7 5 .2 7 1
Amortiza tion type
Country de btor
Cre ditor Ta x N°
Ba nk or Fina nc ia l institution
De btor Ta x N°
De btor e ntity Curre nc y
260

2021 Integrated Report
Welcome Message00
SAAM, a Vocation of Service for the Foreign Trade Industry
01
Leadership and Governance Framework
02
Business Model03
Our Team04
Supplier Management05
Efficient Use of Natural Resources
06
Social Contribution07
Additional Information08
GRI Content Index09
Financial Statements10
SOCIEDAD MATRIZ SAAM S.A. AND SUBSIDIARIES Notes to the Consolidated Financial Statements
85
NOTE 22 Other financial liabilities, continued
(22.3) Obligations with the public
Obligations with the public as of December 31, 2021 and December 31, 2020 are as follows: December 2021
December 2020
On January 17, 2017, the Company placed Series B and C bonds, collecting ThUS$ 115,013, net of related costs. The debt is agreed in Unidades de Fomento (UF), with semi-annual maturity for interest and principal payment at maturity. On June 23, 2020, SM SAAM made a placement of SM SAAM Series E bonds. These bonds were placed for a total amount of UF 1,200,000, at a placement rate of 1.25% per annum, maturing on June 15, 2030 and charged to line number 794. The collection from the bond placement amounted to ThUS$ 42,175. On August 14, 2020, SM SAAM carried out a bond placement for UF 1,400,000 corresponding to series H, at a placement rate of 1.25%, maturing on July 10, 2030 and charged to line number 1037. The collection from the placement amounted to ThUS$ 50,882. On December 14, 2021, SM SAAM paid the series B bond that was due on that date, through a loan with Banco Santander (see note 22.1).
Debtor Tax N° Debtor entity
Country debtor
Registra tion number Series Maturity Currency
Amortiza tion type
Effec tive ra te Nomina l ra te
Up to 90 days
More than 90 days to 1
year
Current portion
1 to 2 years
2 to 3 years
3 to 4 years
4 to 5 years
Over 5 years
Non-current portion
Tota l Debt
ThUS$ ThUS$ ThUS$ ThUS$ ThUS$ ThUS$ ThUS$ ThUS$ ThUS$ ThUS$
76.196.718- 5Sociedad Matriz SAAM S.A. Chile 794
Series C 2026 UF Semiannually 2,39% 2,80% - 63 63 - - - 52.375 - 52.375 52.438
76.196.718- 5Sociedad Matriz SAAM S.A. Chile 794 Series E 2030 UF Semiannually 1,25% 1,30% - 25 25 - - - - 44.122 44.122 44.147
76.196.718- 5Sociedad Matriz SAAM S.A. Chile 1037
Series H 2030 UF Semiannually 1,25% 1,30% 315 - 315 - - - - 51.492 51.492 51.807
Tota l 315 88 403 - - - 52 .375 95 .614 147 .989 148 .392
De btor Ta x ID N° De btor e ntity
Country de btor
Re gistra tion numbe r Se rie s Ma turity Curre nc y
Amortiza tion type
Effe c tive ra te Nomina l ra te
Up to 9 0 da ys
More tha n 9 0 da ys up
to 1 ye a r
Tota l c urre nt
1 to 2 ye a rs
2 to 3 ye a rs
3 to 4 ye a rs
4 to 5 ye a rs
More tha n 5 ye a rs
Tota l Non-c urre nt Tota l De bt
ThUS$ ThUS$ ThUS$ ThUS$ ThUS$ ThUS$ ThUS$ ThUS$ ThUS$ ThUS$
76.196.718- 5Sociedad Matriz SAAM S.A. Chile 793
Series B 2021 UF Semiannually 2,07% 2,60% - 57.579 57.579 - - - - - - 57.579
76.196.718- 5Sociedad Matriz SAAM S.A. Chile 794
Series C 2026 UF Semiannually 2,39% 2,80% - 70 70 - - - - 58.444 58.444 58.514
76.196.718- 5Sociedad Matriz SAAM S.A. Chile 794 Series E 2030 UF Semiannually 1,25% 1,30% - 28 28 - - - - 49.172 49.172 49.200
76.196.718- 5Sociedad Matriz SAAM S.A. Chile 1037
Series H 2030 UF Semiannually 1,25% 1,30% 351 - 351 - - - - 57.384 57.384 57.735
Tota l 3 5 1 5 7 .6 7 7 5 8 .0 2 8 - - - - 16 5 .0 0 0 16 5 .0 0 0 2 2 3 .0 2 8
261

2021 Integrated Report
Welcome Message00
SAAM, a Vocation of Service for the Foreign Trade Industry
01
Leadership and Governance Framework
02
Business Model03
Our Team04
Supplier Management05
Efficient Use of Natural Resources
06
Social Contribution07
Additional Information08
GRI Content Index09
Financial Statements10
SOCIEDAD MATRIZ SAAM S.A. AND SUBSIDIARIES Notes to the Consolidated Financial Statements
86
NOTE 22 Other financial liabilities, continued
(22.4) Derivatives
As of December 31, 2021 and December 31, 2020, the composition of derivatives is as follows: December 2021
December 2020
"Interest rate swaps" contains the derivatives held by the Company to hedge against interest rate risks, which meet the hedge accounting criteria, except for ST Canada, which does not meet the accounting criteria. therefore, it is treated as a derivative investment instrument. To verify compliance with these requirements, the effectiveness of the hedges has been verified and confirmed and, therefore, the hedge reserve has been recognized in equity in other comprehensive income.
Hedge Notional value Up to 90 days More than 90 days to 1 year Total current 1 to 2 years 2 to 3 years 3 to 4 years 4 to 5 years Over 5 years Total Non-
current Total liabilities
ThUS$ ThUS$ ThUS$ ThUS$ ThUS$ ThUS$ ThUS$ ThUS$ ThUS$ ThUS$
Santander 97.036.000-K SM SAAM S.A. Chi le UF Swap 2.600.000 - - - - - - 10.769 7.834 18.603 18.603
BCI 97.006.000-6 SM SAAM S.A. Chi le UF Swap 1.400.000 - - - - - - - 9.661 9.661 9.661
Santander 97.036.000-K SAAM S.A. Chi le US Dollar Swap 85.000.000 - - - 1.308 - - 1.308 1.308
Banco Chi le 92.048.000-4 SAAM Logistics S.A. Chi le CLP Swap 18.000.000 - - - - - 3.137 - - 3.137 3.137
BCI 96.915.330-0 Inarpi Ecuador US Dollar Swap 24.132.000 - - - 391 - - - - 391 391
Scotiabank 0-E ST Canadá Canadá CAD Swap 26.686.908 - 191 191 131 - - - - 131 322
Totales - 191 191 1.830 - 3.137 10.769 17.495 33.231 33.422
Creditor entity Debtor Tax N° Debtor entity Country debtor Currency
Hedge Notional value Up to 90 daysMore than 90 days up to 1
yearTotal current 1 to 2 years 2 to 3 years 3 to 4 years 4 to 5 years More than 5
yearsTotal Non-
current Total liabilities
ThUS$ ThUS$ ThUS$ ThUS$ ThUS$ ThUS$ ThUS$ ThUS$
US Dol lar Inter. Rate Swap 95.000.000 - - - - - - 4.040 - 4.040 4.040 US Dol lar Inter. Rate Swap 32.000.000 - - - - - - 1.027 - 1.027 1.027 Canadian
dol lar Inter. Rate Swap 21.200.007 - 47 47 807 - - - - 807 854
- 47 47 807 - - 5.067 - 5.874 5.921
Currency
262
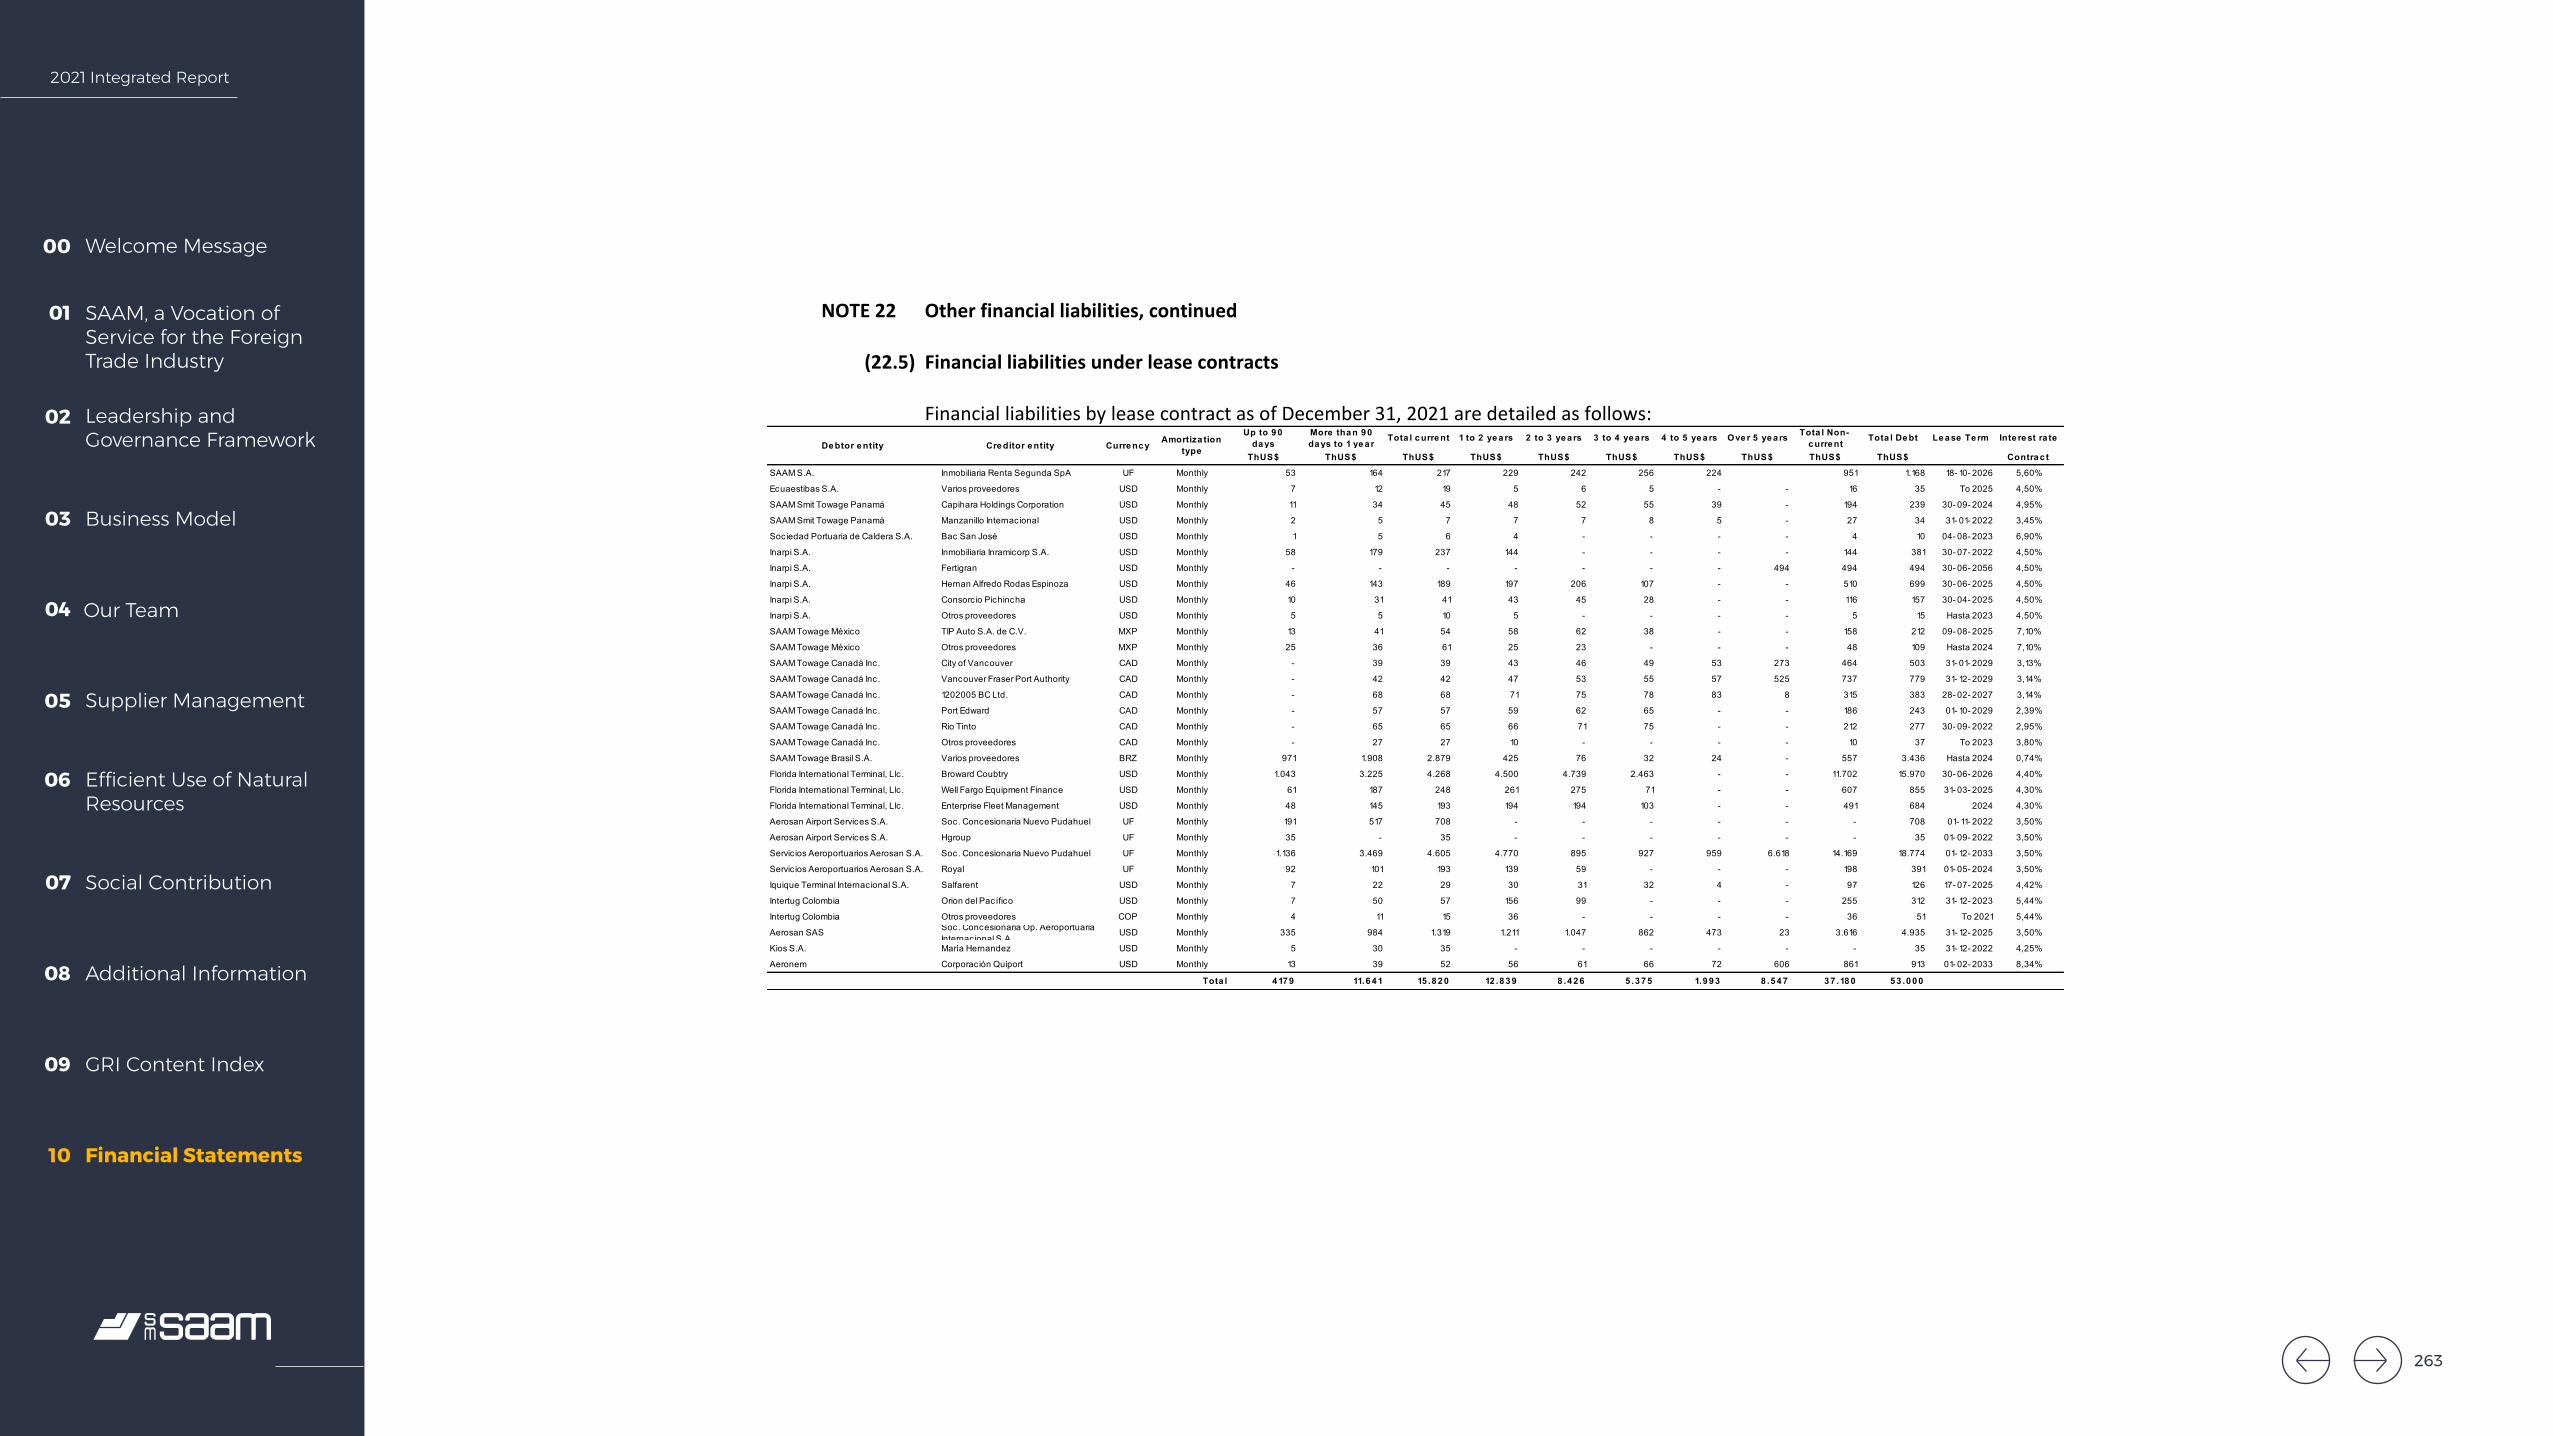
2021 Integrated Report
Welcome Message00
SAAM, a Vocation of Service for the Foreign Trade Industry
01
Leadership and Governance Framework
02
Business Model03
Our Team04
Supplier Management05
Efficient Use of Natural Resources
06
Social Contribution07
Additional Information08
GRI Content Index09
Financial Statements10
SOCIEDAD MATRIZ SAAM S.A. AND SUBSIDIARIES Notes to the Consolidated Financial Statements
87
NOTE 22 Other financial liabilities, continued
(22.5) Financial liabilities under lease contracts
Financial liabilities by lease contract as of December 31, 2021 are detailed as follows:
Up to 9 0 da ys
More tha n 9 0 da ys to 1 ye a r
Tota l c urre nt 1 to 2 ye a rs 2 to 3 ye a rs 3 to 4 ye a rs 4 to 5 ye a rs Ove r 5 ye a rs Tota l Non-c urre nt
Tota l De bt Le a se Te rm Inte re st ra te
ThUS$ ThUS$ ThUS$ ThUS$ ThUS$ ThUS$ ThUS$ ThUS$ ThUS$ ThUS$ Contra c t
SAAM S.A. Inmobiliaria Renta Segunda SpA UF Monthly 53 164 217 229 242 256 224 951 1.168 18- 10- 2026 5,60%
Ecuaestibas S.A. Varios proveedores USD Monthly 7 12 19 5 6 5 - - 16 35 To 2025 4,50%
SAAM Smit Towage Panamá Capihara Holdings Corporation USD Monthly 11 34 45 48 52 55 39 - 194 239 30- 09- 2024 4,95%
SAAM Smit Towage Panamá Manzanillo Internacional USD Monthly 2 5 7 7 7 8 5 - 27 34 31- 01- 2022 3,45%
Sociedad Portuaria de Caldera S.A. Bac San José USD Monthly 1 5 6 4 - - - - 4 10 04- 08- 2023 6,90%
Inarpi S.A. Inmobiliaria Inramicorp S.A. USD Monthly 58 179 237 144 - - - - 144 381 30- 07- 2022 4,50%
Inarpi S.A. Fertigran USD Monthly - - - - - - - 494 494 494 30- 06- 2056 4,50%
Inarpi S.A. Hernan Alfredo Rodas Espinoza USD Monthly 46 143 189 197 206 107 - - 510 699 30- 06- 2025 4,50%
Inarpi S.A. Consorcio Pichincha USD Monthly 10 31 41 43 45 28 - - 116 157 30- 04- 2025 4,50%
Inarpi S.A. Otros proveedores USD Monthly 5 5 10 5 - - - - 5 15 Hasta 2023 4,50%
SAAM Towage México TIP Auto S.A. de C.V. MXP Monthly 13 41 54 58 62 38 - - 158 212 09- 08- 2025 7,10%
SAAM Towage México Otros proveedores MXP Monthly 25 36 61 25 23 - - - 48 109 Hasta 2024 7,10%
SAAM Towage Canadá Inc. City of Vancouver CAD Monthly - 39 39 43 46 49 53 273 464 503 31- 01- 2029 3,13%
SAAM Towage Canadá Inc. Vancouver Fraser Port Authority CAD Monthly - 42 42 47 53 55 57 525 737 779 31- 12- 2029 3,14%
SAAM Towage Canadá Inc. 1202005 BC Ltd. CAD Monthly - 68 68 71 75 78 83 8 315 383 28- 02- 2027 3,14%
SAAM Towage Canadá Inc. Port Edward CAD Monthly - 57 57 59 62 65 - - 186 243 01- 10- 2029 2,39%
SAAM Towage Canadá Inc. Rio Tinto CAD Monthly - 65 65 66 71 75 - - 212 277 30- 09- 2022 2,95%
SAAM Towage Canadá Inc. Otros proveedores CAD Monthly - 27 27 10 - - - - 10 37 To 2023 3,80%
SAAM Towage Brasil S.A. Varios proveedores BRZ Monthly 971 1.908 2.879 425 76 32 24 - 557 3.436 Hasta 2024 0,74%
Florida International Terminal, Llc. Broward Coubtry USD Monthly 1.043 3.225 4.268 4.500 4.739 2.463 - - 11.702 15.970 30- 06- 2026 4,40%
Florida International Terminal, Llc. Well Fargo Equipment Finance USD Monthly 61 187 248 261 275 71 - - 607 855 31- 03- 2025 4,30%
Florida International Terminal, Llc. Enterprise Fleet Management USD Monthly 48 145 193 194 194 103 - - 491 684 2024 4,30%
Aerosan Airport Services S.A. Soc. Concesionaria Nuevo Pudahuel UF Monthly 191 517 708 - - - - - - 708 01- 11- 2022 3,50%
Aerosan Airport Services S.A. Hgroup UF Monthly 35 - 35 - - - - - - 35 01- 09- 2022 3,50%
Servic ios Aeroportuarios Aerosan S.A. Soc. Concesionaria Nuevo Pudahuel UF Monthly 1.136 3.469 4.605 4.770 895 927 959 6.618 14.169 18.774 01- 12- 2033 3,50%
Servic ios Aeroportuarios Aerosan S.A. Royal UF Monthly 92 101 193 139 59 - - - 198 391 01- 05- 2024 3,50%
Iquique Terminal Internacional S.A. Salfarent USD Monthly 7 22 29 30 31 32 4 - 97 126 17- 07- 2025 4,42%
Intertug Colombia Orion del Pacífico USD Monthly 7 50 57 156 99 - - - 255 312 31- 12- 2023 5,44%
Intertug Colombia Otros proveedores COP Monthly 4 11 15 36 - - - - 36 51 To 2021 5,44%
Aerosan SAS Soc. Concesionaria Op. Aeroportuaria Internacional S.A.
USD Monthly 335 984 1.319 1.211 1.047 862 473 23 3.616 4.935 31- 12- 2025 3,50%
Kios S.A. María Hernandez USD Monthly 5 30 35 - - - - - - 35 31- 12- 2022 4,25%
Aeronem Corporación Quiport USD Monthly 13 39 52 56 61 66 72 606 861 913 01- 02- 2033 8,34%
Tota l 4 17 9 11.6 4 1 15 .8 2 0 12 .8 3 9 8 .4 2 6 5 .3 7 5 1.9 9 3 8 .5 4 7 3 7 .18 0 5 3 .0 0 0
De btor e ntity Cre ditor e ntity Curre nc yAmortiza tion
type
263
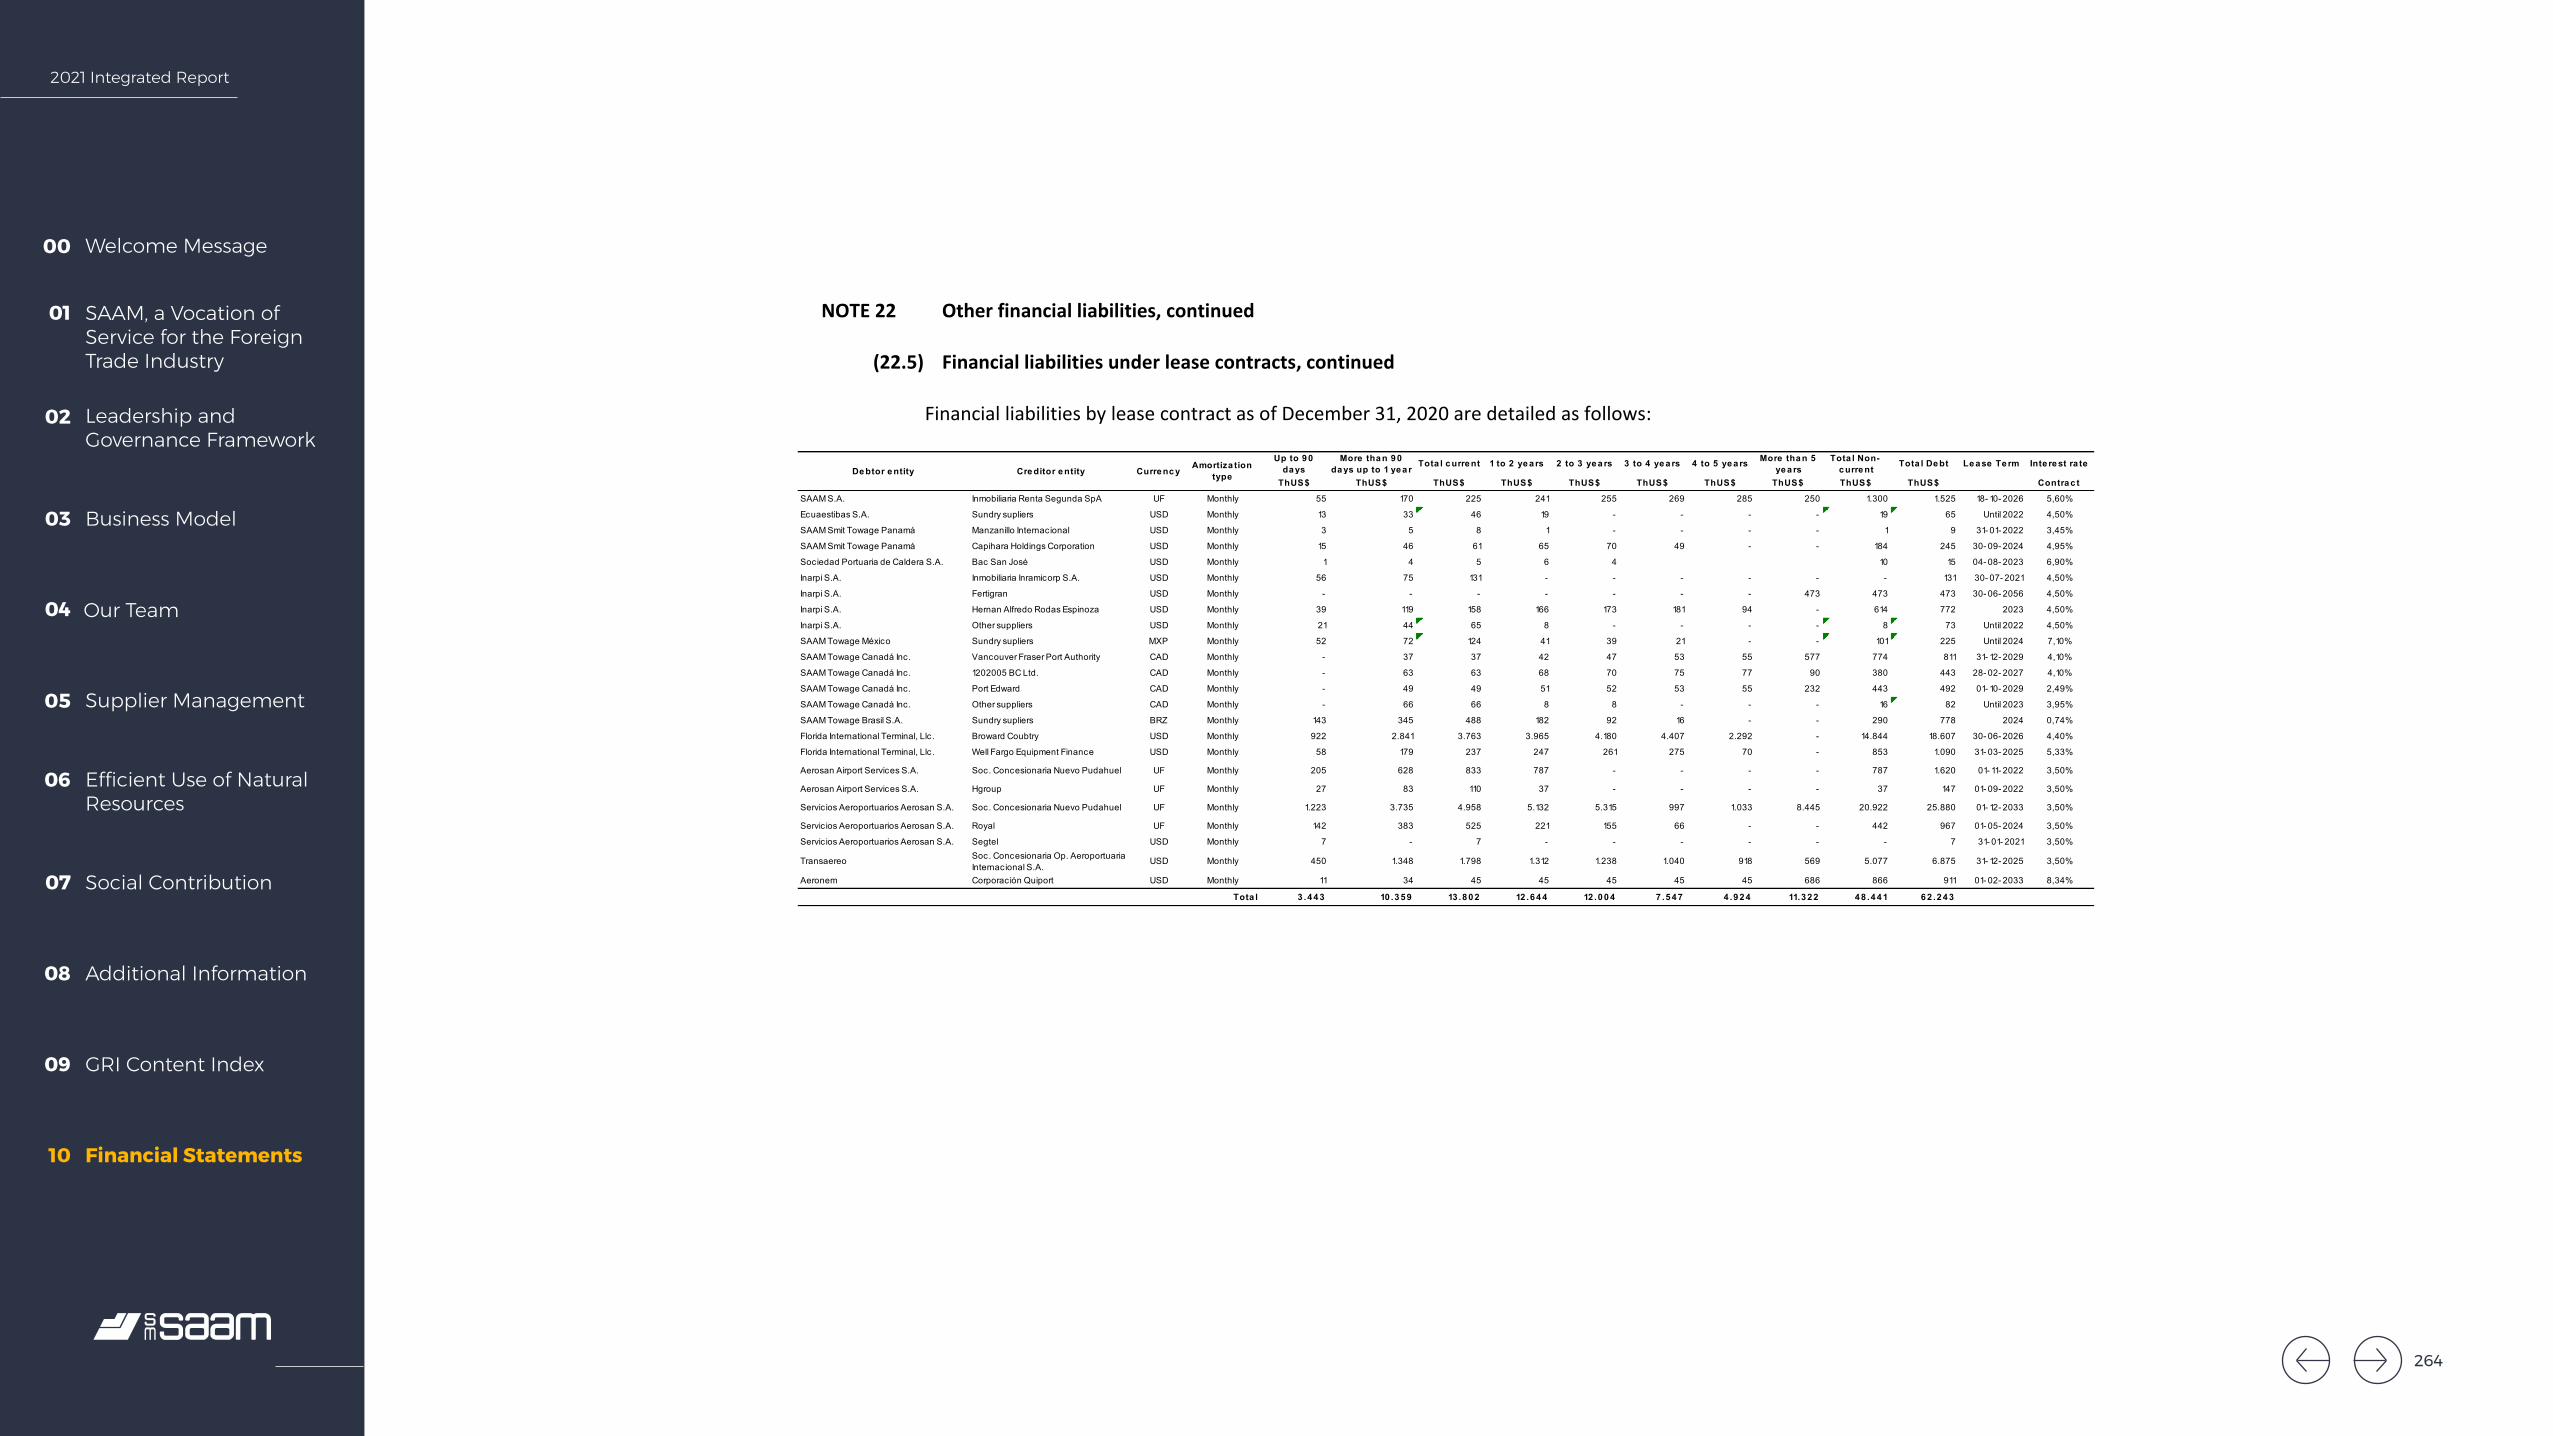
2021 Integrated Report
Welcome Message00
SAAM, a Vocation of Service for the Foreign Trade Industry
01
Leadership and Governance Framework
02
Business Model03
Our Team04
Supplier Management05
Efficient Use of Natural Resources
06
Social Contribution07
Additional Information08
GRI Content Index09
Financial Statements10
SOCIEDAD MATRIZ SAAM S.A. AND SUBSIDIARIES Notes to the Consolidated Financial Statements
88
NOTE 22 Other financial liabilities, continued
(22.5) Financial liabilities under lease contracts, continued
Financial liabilities by lease contract as of December 31, 2020 are detailed as follows:
Up to 9 0 da ys
More tha n 9 0 da ys up to 1 ye a r
Tota l c urre nt 1 to 2 ye a rs 2 to 3 ye a rs 3 to 4 ye a rs 4 to 5 ye a rs More tha n 5 ye a rs
Tota l Non-c urre nt
Tota l De bt Le a se Te rm Inte re st ra te
ThUS$ ThUS$ ThUS$ ThUS$ ThUS$ ThUS$ ThUS$ ThUS$ ThUS$ ThUS$ Contra c t
SAAM S.A. Inmobiliaria Renta Segunda SpA UF Monthly 55 170 225 241 255 269 285 250 1.300 1.525 18- 10- 2026 5,60%
Ecuaestibas S.A. Sundry supliers USD Monthly 13 33 46 19 - - - - 19 65 Until 2022 4,50%
SAAM Smit Towage Panamá Manzanillo Internacional USD Monthly 3 5 8 1 - - - - 1 9 31- 01- 2022 3,45%
SAAM Smit Towage Panamá Capihara Holdings Corporation USD Monthly 15 46 61 65 70 49 - - 184 245 30- 09- 2024 4,95%
Sociedad Portuaria de Caldera S.A. Bac San José USD Monthly 1 4 5 6 4 10 15 04- 08- 2023 6,90%
Inarpi S.A. Inmobiliaria Inramicorp S.A. USD Monthly 56 75 131 - - - - - - 131 30- 07- 2021 4,50%
Inarpi S.A. Fertigran USD Monthly - - - - - - - 473 473 473 30- 06- 2056 4,50%
Inarpi S.A. Hernan Alfredo Rodas Espinoza USD Monthly 39 119 158 166 173 181 94 - 614 772 2023 4,50%
Inarpi S.A. Other suppliers USD Monthly 21 44 65 8 - - - - 8 73 Until 2022 4,50%
SAAM Towage México Sundry supliers MXP Monthly 52 72 124 41 39 21 - - 101 225 Until 2024 7,10%
SAAM Towage Canadá Inc. Vancouver Fraser Port Authority CAD Monthly - 37 37 42 47 53 55 577 774 811 31- 12- 2029 4,10%
SAAM Towage Canadá Inc. 1202005 BC Ltd. CAD Monthly - 63 63 68 70 75 77 90 380 443 28- 02- 2027 4,10%
SAAM Towage Canadá Inc. Port Edward CAD Monthly - 49 49 51 52 53 55 232 443 492 01- 10- 2029 2,49%
SAAM Towage Canadá Inc. Other suppliers CAD Monthly - 66 66 8 8 - - - 16 82 Until 2023 3,95%
SAAM Towage Brasil S.A. Sundry supliers BRZ Monthly 143 345 488 182 92 16 - - 290 778 2024 0,74%
Florida International Terminal, Llc. Broward Coubtry USD Monthly 922 2.841 3.763 3.965 4.180 4.407 2.292 - 14.844 18.607 30- 06- 2026 4,40%
Florida International Terminal, Llc. Well Fargo Equipment Finance USD Monthly 58 179 237 247 261 275 70 - 853 1.090 31- 03- 2025 5,33%
Aerosan Airport Services S.A. Soc. Concesionaria Nuevo Pudahuel UF Monthly 205 628 833 787 - - - - 787 1.620 01- 11- 2022 3,50%
Aerosan Airport Services S.A. Hgroup UF Monthly 27 83 110 37 - - - - 37 147 01- 09- 2022 3,50%
Servicios Aeroportuarios Aerosan S.A. Soc. Concesionaria Nuevo Pudahuel UF Monthly 1.223 3.735 4.958 5.132 5.315 997 1.033 8.445 20.922 25.880 01- 12- 2033 3,50%
Servicios Aeroportuarios Aerosan S.A. Royal UF Monthly 142 383 525 221 155 66 - - 442 967 01- 05- 2024 3,50%
Servicios Aeroportuarios Aerosan S.A. Segtel USD Monthly 7 - 7 - - - - - - 7 31- 01- 2021 3,50%
Transaereo Soc. Concesionaria Op. Aeroportuaria Internacional S.A.
USD Monthly 450 1.348 1.798 1.312 1.238 1.040 918 569 5.077 6.875 31- 12- 2025 3,50%
Aeronem Corporación Quiport USD Monthly 11 34 45 45 45 45 45 686 866 911 01- 02- 2033 8,34%
Tota l 3 .4 4 3 10 .3 5 9 13 .8 0 2 12 .6 4 4 12 .0 0 4 7 .5 4 7 4 .9 2 4 11.3 2 2 4 8 .4 4 1 6 2 .2 4 3
De btor e ntity Cre ditor e ntity Curre nc yAmortiza tion
type
264
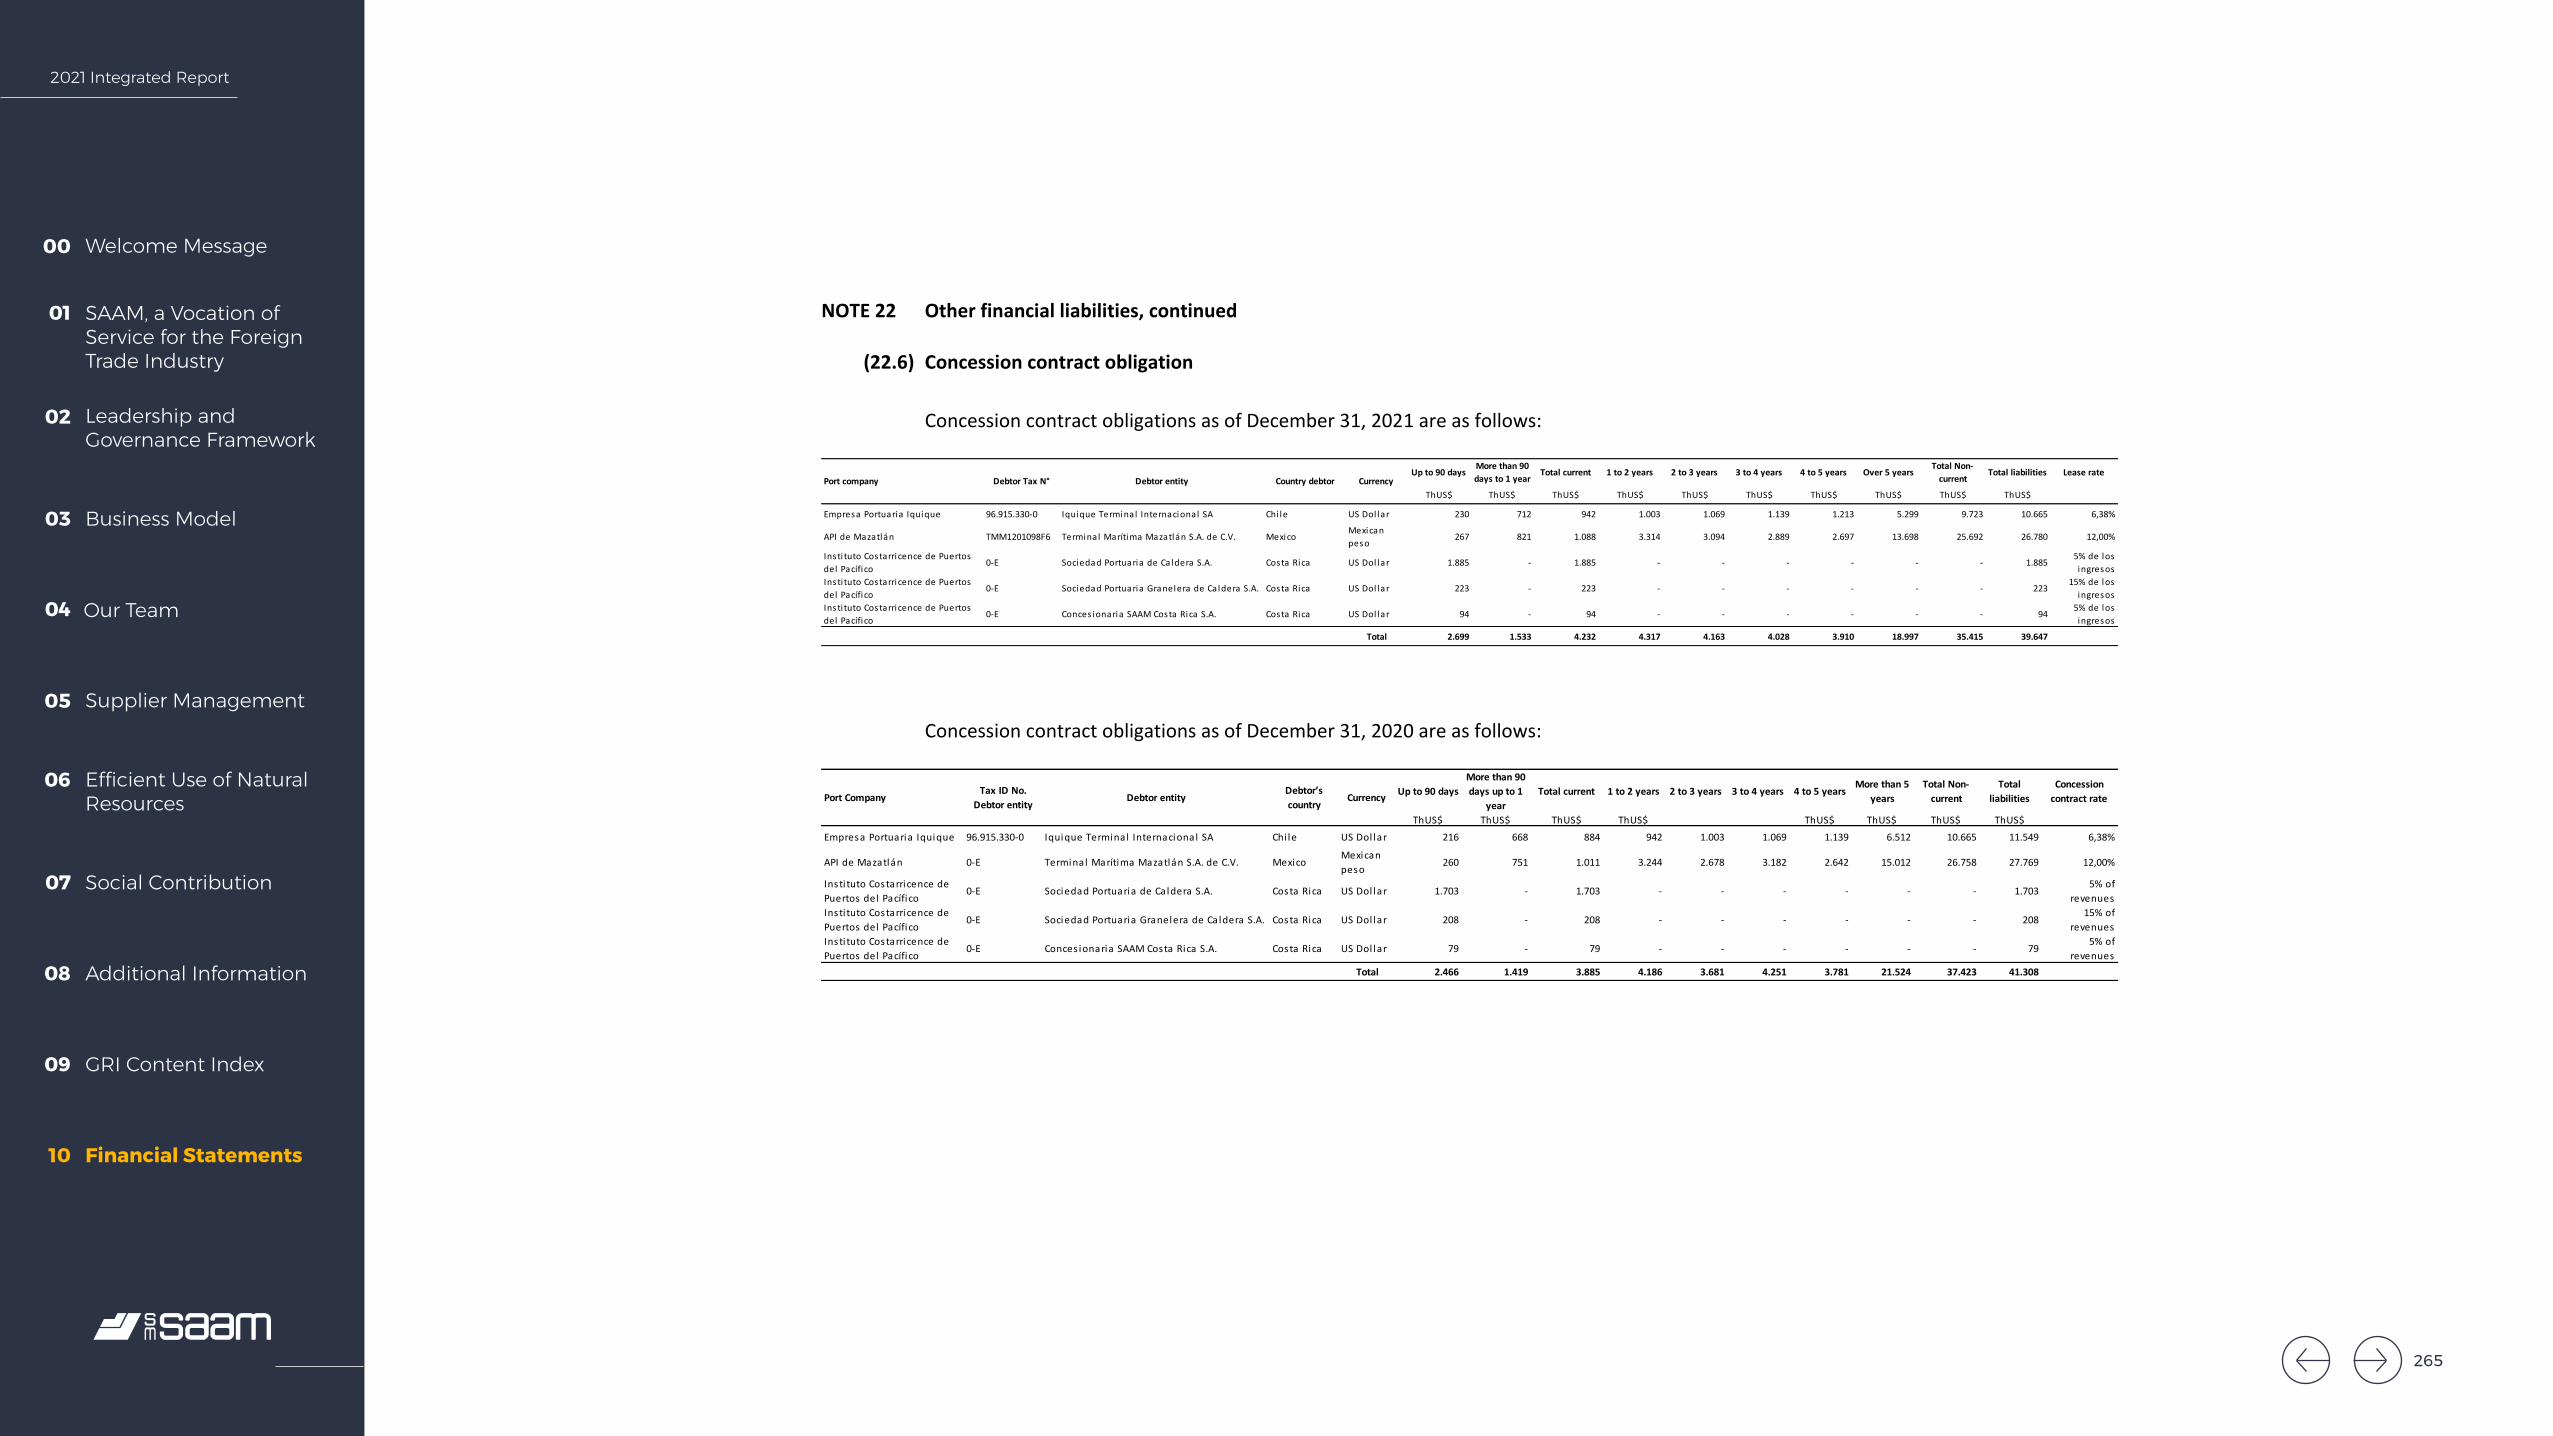
2021 Integrated Report
Welcome Message00
SAAM, a Vocation of Service for the Foreign Trade Industry
01
Leadership and Governance Framework
02
Business Model03
Our Team04
Supplier Management05
Efficient Use of Natural Resources
06
Social Contribution07
Additional Information08
GRI Content Index09
Financial Statements10
SOCIEDAD MATRIZ SAAM S.A. AND SUBSIDIARIES Notes to the Consolidated Financial Statements
89
NOTE 22 Other financial liabilities, continued
(22.6) Concession contract obligation
Concession contract obligations as of December 31, 2021 are as follows:
Concession contract obligations as of December 31, 2020 are as follows:
Up to 90 days More than 90 days to 1 year Total current 1 to 2 years 2 to 3 years 3 to 4 years 4 to 5 years Over 5 years Total Non-
current Total liabilities Lease rate
ThUS$ ThUS$ ThUS$ ThUS$ ThUS$ ThUS$ ThUS$ ThUS$ ThUS$ ThUS$
Empresa Portuaria Iquique 96.915.330-0 Iquique Terminal Internacional SA Chi le US Dol lar 230 712 942 1.003 1.069 1.139 1.213 5.299 9.723 10.665 6,38%
API de Mazatlán TMM1201098F6 Terminal Marítima Mazatlán S.A. de C.V. Mexico Mexican peso 267 821 1.088 3.314 3.094 2.889 2.697 13.698 25.692 26.780 12,00%
Insti tuto Costarricence de Puertos del Pacífico 0-E Sociedad Portuaria de Caldera S.A. Costa Rica US Dol lar 1.885 - 1.885 - - - - - - 1.885 5% de los
ingresosInsti tuto Costarricence de Puertos del Pacífico 0-E Sociedad Portuaria Granelera de Caldera S.A. Costa Rica US Dol lar 223 - 223 - - - - - - 223 15% de los
ingresosInsti tuto Costarricence de Puertos del Pacífico 0-E Conces ionaria SAAM Costa Rica S.A. Costa Rica US Dol lar 94 - 94 - - - - - - 94 5% de los
ingresosTotal 2.699 1.533 4.232 4.317 4.163 4.028 3.910 18.997 35.415 39.647
Port company Debtor Tax N° Debtor entity Country debtor Currency
Up to 90 daysMore than 90 days up to 1
yearTotal current 1 to 2 years 2 to 3 years 3 to 4 years 4 to 5 years More than 5
yearsTotal Non-
currentTotal
liabilitiesConcession
contract rate
ThUS$ ThUS$ ThUS$ ThUS$ ThUS$ ThUS$ ThUS$ ThUS$Empresa Portuaria Iquique 96.915.330-0 Iquique Terminal Internacional SA Chi le US Dol lar 216 668 884 942 1.003 1.069 1.139 6.512 10.665 11.549 6,38%
API de Mazatlán 0-E Terminal Marítima Mazatlán S.A. de C.V. Mexico Mexican peso 260 751 1.011 3.244 2.678 3.182 2.642 15.012 26.758 27.769 12,00%
Insti tuto Costarricence de Puertos del Pacífico 0-E Sociedad Portuaria de Caldera S.A. Costa Rica US Dol lar 1.703 - 1.703 - - - - - - 1.703 5% of
revenuesInsti tuto Costarricence de Puertos del Pacífico 0-E Sociedad Portuaria Granelera de Caldera S.A. Costa Rica US Dol lar 208 - 208 - - - - - - 208 15% of
revenuesInsti tuto Costarricence de Puertos del Pacífico 0-E Conces ionaria SAAM Costa Rica S.A. Costa Rica US Dol lar 79 - 79 - - - - - - 79 5% of
revenuesTotal 2.466 1.419 3.885 4.186 3.681 4.251 3.781 21.524 37.423 41.308
Port Company Tax ID No. Debtor entity Debtor entity Debtor’s
country Currency
265

2021 Integrated Report
Welcome Message00
SAAM, a Vocation of Service for the Foreign Trade Industry
01
Leadership and Governance Framework
02
Business Model03
Our Team04
Supplier Management05
Efficient Use of Natural Resources
06
Social Contribution07
Additional Information08
GRI Content Index09
Financial Statements10
SOCIEDAD MATRIZ SAAM S.A. AND SUBSIDIARIES Notes to the Consolidated Financial Statements
90
NOTE 22 Other financial liabilities, continued
(22.7) Other liabilities (option)
For the 2020 period, the Company does not record a balance in Other liabilities (option).
Given that it was determined not to recognize the fair value of the Option for accounting purposes, the accounting for the acquisition of the remaining 30% of the company in the future must be recorded in accordance with the provisions of IFRS 10. According to said standard, if there is transactions with minority shareholders that do not result in changes in the control of the subsidiary, the difference between the amount paid or received and the minority interest is recorded directly in equity.
This financial liability recognized by the subsidiary SAAM S.A. corresponds to an Option for the expected value to be paid for the remaining 30% interest in Intertug. The valuation of this financial liability will be made on the date on which the term of the transaction expires.
This type of Options is considered as an equity instrument. Since there is no cash payment, then no record should be made in the balance sheet or income statement for changes in the value of the premium, this applies to years after accounting and periods prior to the exercise of the Option.
Up to 90 days More than 90 days to 1 year Total current 1 to 2 years 2 to 3 years Over 3 years Total Non-
current Total liabilities
ThUS$ ThUS$ ThUS$ ThUS$ ThUS$ ThUS$ ThUS$ ThUS$
SAAM S.A. 97.036.000-K Clear Ocean Investment S.A. / Bellomare Ventures Inc.
Chile US Dol lar Option - - - - 19.710 - 19.710 19.710
Total - - - - 19.710 - 19.710 19.710
OperationDebtor entity Debtor Tax N° Creditor entity Country debtor Currency
266
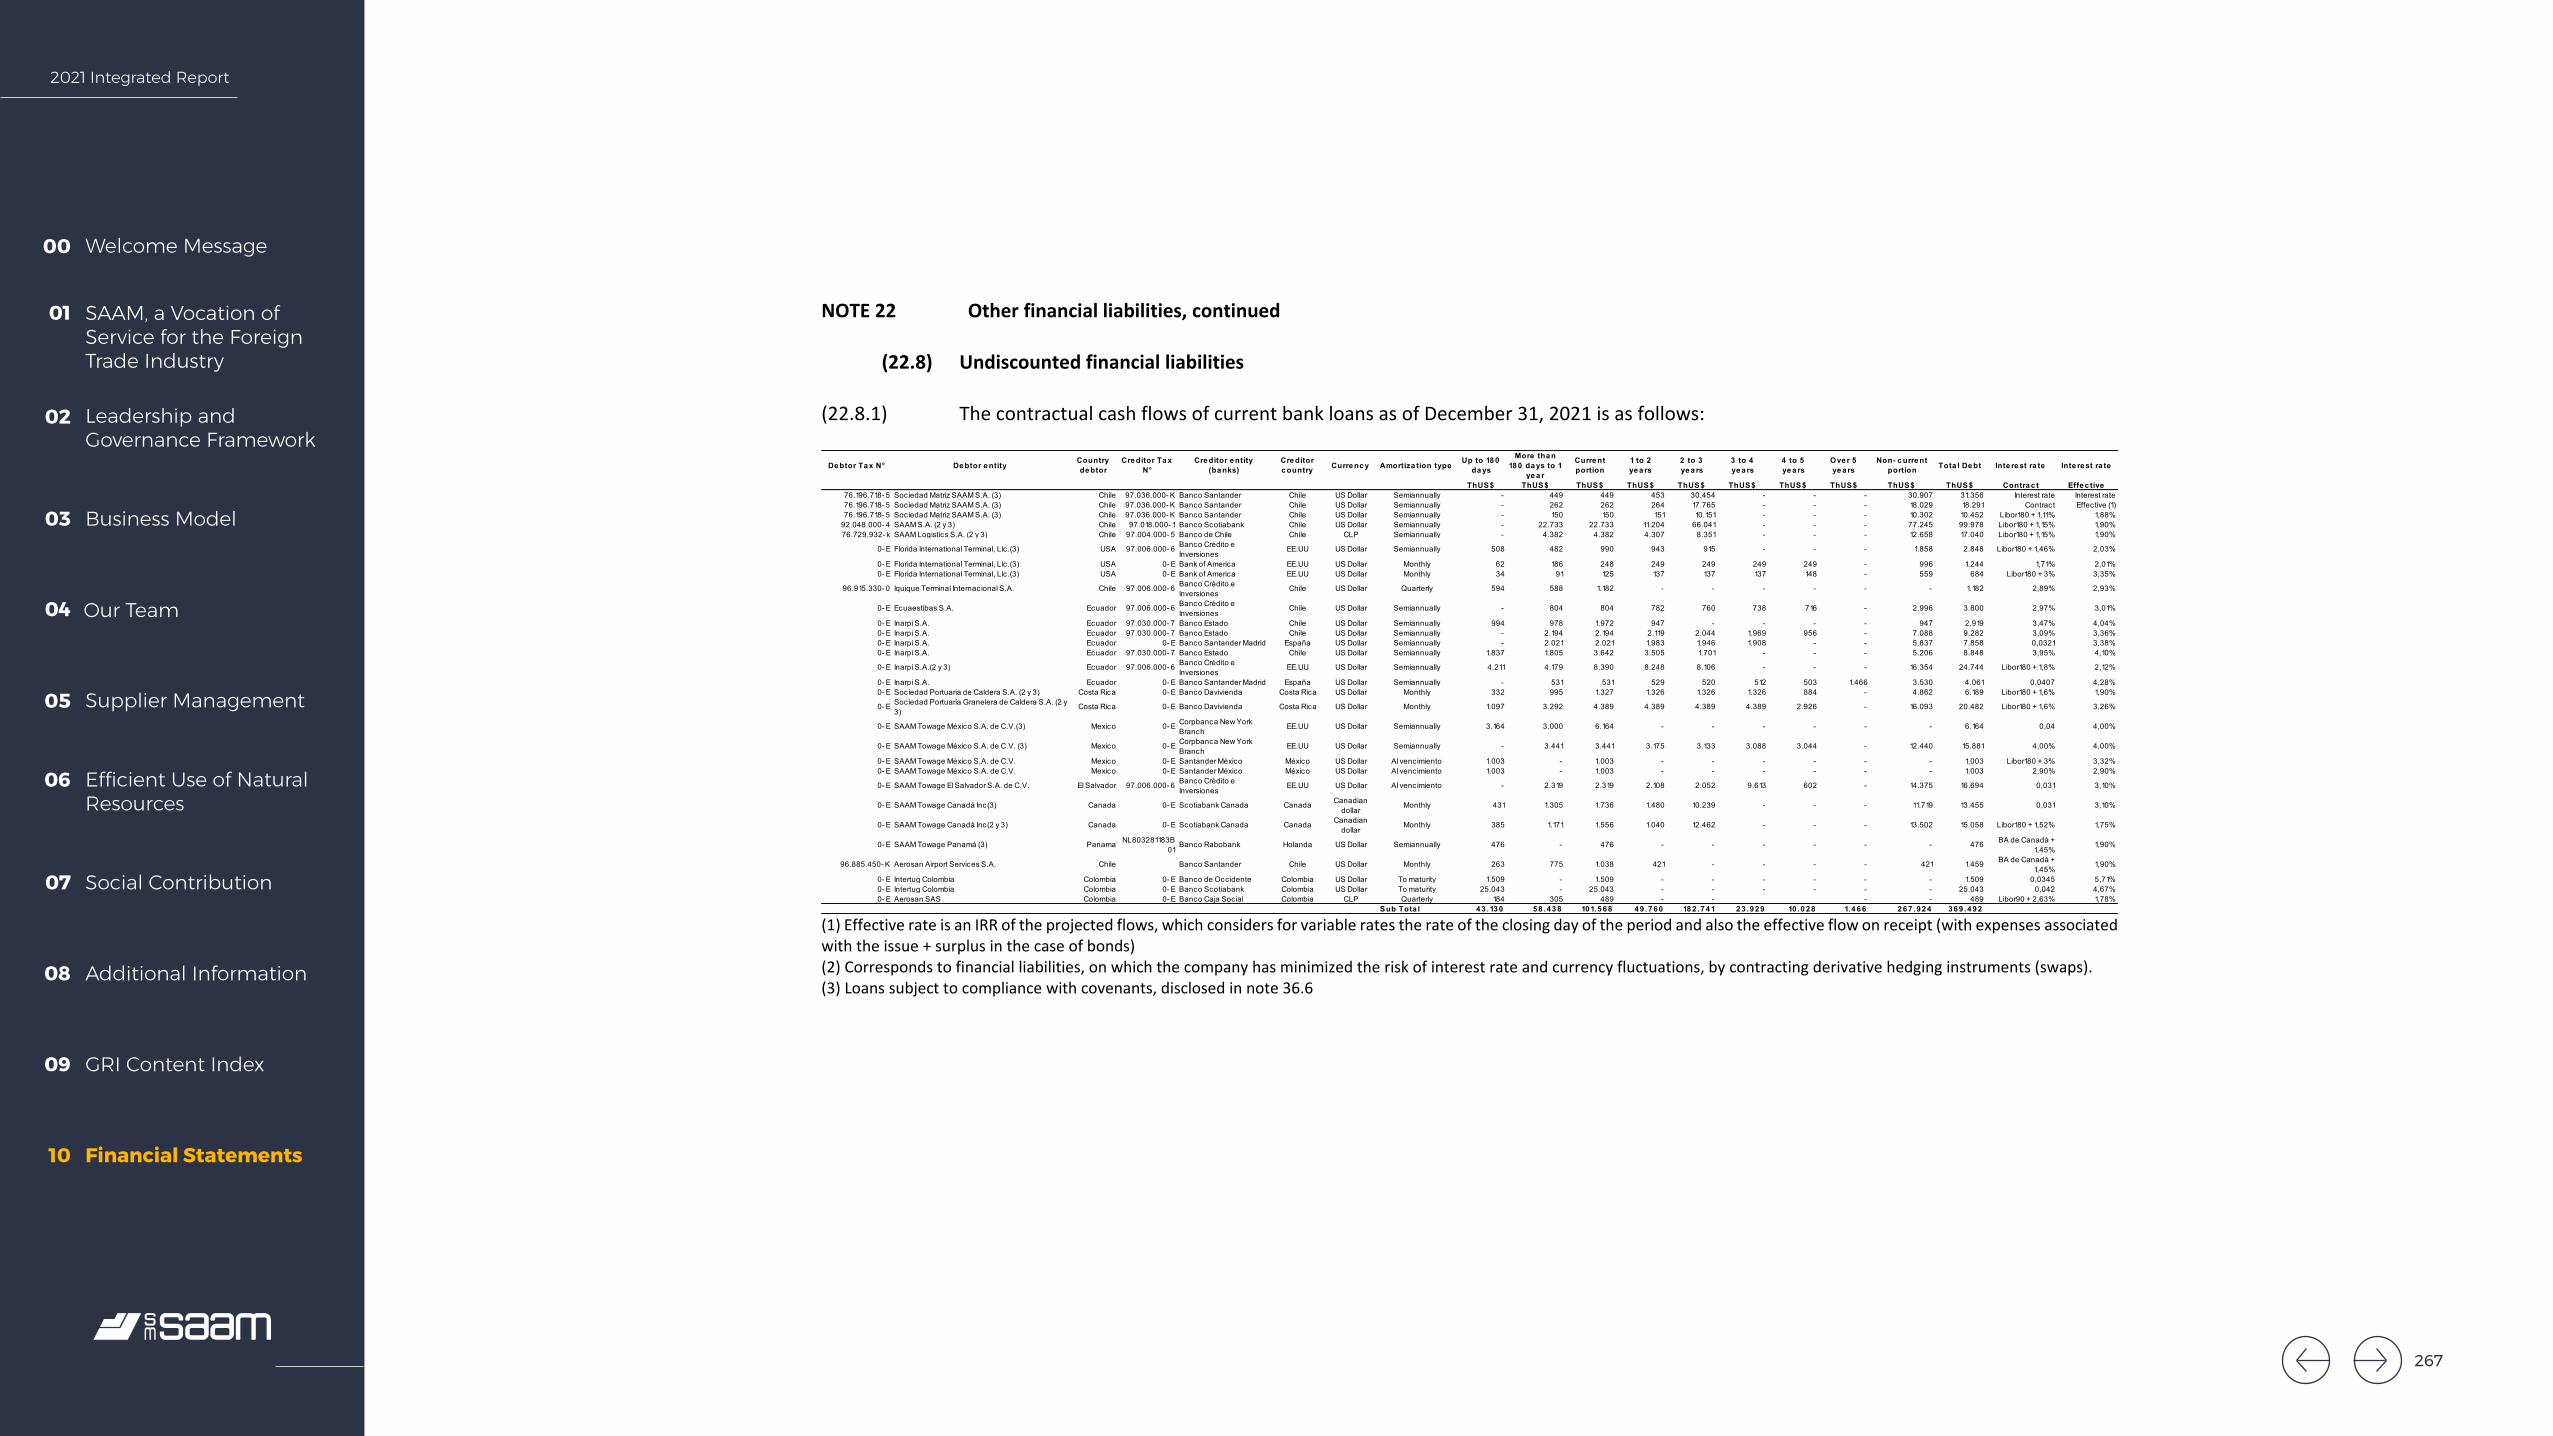
2021 Integrated Report
Welcome Message00
SAAM, a Vocation of Service for the Foreign Trade Industry
01
Leadership and Governance Framework
02
Business Model03
Our Team04
Supplier Management05
Efficient Use of Natural Resources
06
Social Contribution07
Additional Information08
GRI Content Index09
Financial Statements10
SOCIEDAD MATRIZ SAAM S.A. AND SUBSIDIARIES Notes to the Consolidated Financial Statements
91
NOTE 22 Other financial liabilities, continued
(22.8) Undiscounted financial liabilities
(22.8.1) The contractual cash flows of current bank loans as of December 31, 2021 is as follows:
(1) Effective rate is an IRR of the projected flows, which considers for variable rates the rate of the closing day of the period and also the effective flow on receipt (with expenses associated with the issue + surplus in the case of bonds) (2) Corresponds to financial liabilities, on which the company has minimized the risk of interest rate and currency fluctuations, by contracting derivative hedging instruments (swaps). (3) Loans subject to compliance with covenants, disclosed in note 36.6
De btor Ta x N° De btor e ntityCountry de btor
Cre ditor Ta x N°
Cre ditor e ntity (ba nks)
Cre ditor c ountry Curre nc y Amortiza tion type
Up to 18 0 da ys
More tha n 18 0 da ys to 1
ye a r
Curre nt portion
1 to 2 ye a rs
2 to 3 ye a rs
3 to 4 ye a rs
4 to 5 ye a rs
Ove r 5 ye a rs
Non- c urre nt portion Tota l De bt Inte re st ra te Inte re st ra te
ThUS$ ThUS$ ThUS$ ThUS$ ThUS$ ThUS$ ThUS$ ThUS$ ThUS$ ThUS$ Contra c t Effe c tive76.196.718- 5 Sociedad Matriz SAAM S.A. (3) Chile 97.036.000- K Banco Santander Chile US Dollar Semiannually - 449 449 453 30.454 - - - 30.907 31.356 Interest rate Interest rate 76.196.718- 5 Sociedad Matriz SAAM S.A. (3) Chile 97.036.000- K Banco Santander Chile US Dollar Semiannually - 262 262 264 17.765 - - - 18.029 18.291 Contract Effective (1)76.196.718- 5 Sociedad Matriz SAAM S.A. (3) Chile 97.036.000- K Banco Santander Chile US Dollar Semiannually - 150 150 151 10.151 - - - 10.302 10.452 Libor180 + 1,11% 1,88%
92.048.000- 4 SAAM S.A. (2 y 3) Chile 97.018.000- 1 Banco Scotiabank Chile US Dollar Semiannually - 22.733 22.733 11.204 66.041 - - - 77.245 99.978 Libor180 + 1,15% 1,90%76.729.932- k SAAM Logistics S.A. (2 y 3) Chile 97.004.000- 5 Banco de Chile Chile CLP Semiannually - 4.382 4.382 4.307 8.351 - - - 12.658 17.040 Libor180 + 1,15% 1,90%
0- E Florida International Terminal, Llc.(3) USA 97.006.000- 6 Banco Crédito e Inversiones
EE.UU US Dollar Semiannually 508 482 990 943 915 - - - 1.858 2.848 Libor180 + 1,46% 2,03%
0- E Florida International Terminal, Llc.(3) USA 0- E Bank of America EE.UU US Dollar Monthly 62 186 248 249 249 249 249 - 996 1.244 1,71% 2,01%0- E Florida International Terminal, Llc.(3) USA 0- E Bank of America EE.UU US Dollar Monthly 34 91 125 137 137 137 148 - 559 684 Libor180 + 3% 3,35%
96.915.330- 0 Iquique Terminal Internacional S.A. Chile 97.006.000- 6 Banco Crédito e Inversiones
Chile US Dollar Quarterly 594 588 1.182 - - - - - - 1.182 2,89% 2,93%
0- E Ecuaestibas S.A. Ecuador 97.006.000- 6 Banco Crédito e Inversiones
Chile US Dollar Semiannually - 804 804 782 760 738 716 - 2.996 3.800 2,97% 3,01%
0- E Inarpi S.A. Ecuador 97.030.000- 7 Banco Estado Chile US Dollar Semiannually 994 978 1.972 947 - - - - 947 2.919 3,47% 4,04%0- E Inarpi S.A. Ecuador 97.030.000- 7 Banco Estado Chile US Dollar Semiannually - 2.194 2.194 2.119 2.044 1.969 956 - 7.088 9.282 3,09% 3,36%0- E Inarpi S.A. Ecuador 0- E Banco Santander Madrid España US Dollar Semiannually - 2.021 2.021 1.983 1.946 1.908 - - 5.837 7.858 0,0321 3,38%0- E Inarpi S.A. Ecuador 97.030.000- 7 Banco Estado Chile US Dollar Semiannually 1.837 1.805 3.642 3.505 1.701 - - - 5.206 8.848 3,95% 4,10%
0- E Inarpi S.A.(2 y 3) Ecuador 97.006.000- 6 Banco Crédito e Inversiones
EE.UU US Dollar Semiannually 4.211 4.179 8.390 8.248 8.106 - - - 16.354 24.744 Libor180 + 1,8% 2,12%
0- E Inarpi S.A. Ecuador 0- E Banco Santander Madrid España US Dollar Semiannually - 531 531 529 520 512 503 1.466 3.530 4.061 0,0407 4,28%0- E Sociedad Portuaria de Caldera S.A. (2 y 3) Costa Rica 0- E Banco Davivienda Costa Rica US Dollar Monthly 332 995 1.327 1.326 1.326 1.326 884 - 4.862 6.189 Libor180 + 1,6% 1,90%
0- E Sociedad Portuaria Granelera de Caldera S.A. (2 y 3)
Costa Rica 0- E Banco Davivienda Costa Rica US Dollar Monthly 1.097 3.292 4.389 4.389 4.389 4.389 2.926 - 16.093 20.482 Libor180 + 1,6% 3,26%
0- E SAAM Towage México S.A. de C.V.(3) Mexico 0- E Corpbanca New York Branch
EE.UU US Dollar Semiannually 3.164 3.000 6.164 - - - - - - 6.164 0,04 4,00%
0- E SAAM Towage México S.A. de C.V. (3) Mexico 0- E Corpbanca New York Branch
EE.UU US Dollar Semiannually - 3.441 3.441 3.175 3.133 3.088 3.044 - 12.440 15.881 4,00% 4,00%
0- E SAAM Towage México S.A. de C.V. Mexico 0- E Santander México México US Dollar Al vencimiento 1.003 - 1.003 - - - - - - 1.003 Libor180 + 3% 3,32%0- E SAAM Towage México S.A. de C.V. Mexico 0- E Santander México México US Dollar Al vencimiento 1.003 - 1.003 - - - - - - 1.003 2,90% 2,90%
0- E SAAM Towage El Salvador S.A. de C.V. El Salvador 97.006.000- 6 Banco Crédito e Inversiones
EE.UU US Dollar Al vencimiento - 2.319 2.319 2.108 2.052 9.613 602 - 14.375 16.694 0,031 3,10%
0- E SAAM Towage Canadá Inc(3) Canada 0- E Scotiabank Canada Canada Canadian dollar
Monthly 431 1.305 1.736 1.480 10.239 - - - 11.719 13.455 0,031 3,10%
0- E SAAM Towage Canadá Inc(2 y 3) Canada 0- E Scotiabank Canada Canada Canadian dollar
Monthly 385 1.171 1.556 1.040 12.462 - - - 13.502 15.058 Libor180 + 1,52% 1,75%
0- E SAAM Towage Panamá (3) Panama NL803281183B01
Banco Rabobank Holanda US Dollar Semiannually 476 - 476 - - - - - - 476 BA de Canadá + 1,45%
1,90%
96.885.450- K Aerosan Airport Services S.A. Chile Banco Santander Chile US Dollar Monthly 263 775 1.038 421 - - - - 421 1.459 BA de Canadá + 1,45%
1,90%
0- E Intertug Colombia Colombia 0- E Banco de Occidente Colombia US Dollar To maturity 1.509 - 1.509 - - - - - - 1.509 0,0345 5,71%0- E Intertug Colombia Colombia 0- E Banco Scotiabank Colombia US Dollar To maturity 25.043 - 25.043 - - - - - - 25.043 0,042 4,67%0- E Aerosan SAS Colombia 0- E Banco Caja Social Colombia CLP Quarterly 184 305 489 - - - - 489 Libor90 + 2,63% 1,78%
Sub Tota l 4 3 .13 0 5 8 .4 3 8 10 1.5 6 8 4 9 .7 6 0 18 2 .7 4 1 2 3 .9 2 9 10 .0 2 8 1.4 6 6 2 6 7 .9 2 4 3 6 9 .4 9 2
267

2021 Integrated Report
Welcome Message00
SAAM, a Vocation of Service for the Foreign Trade Industry
01
Leadership and Governance Framework
02
Business Model03
Our Team04
Supplier Management05
Efficient Use of Natural Resources
06
Social Contribution07
Additional Information08
GRI Content Index09
Financial Statements10
SOCIEDAD MATRIZ SAAM S.A. AND SUBSIDIARIES Notes to the Consolidated Financial Statements
92
(22.8) Undiscounted financial liabilities, continued
(22.8.1) The contractual cash flows of bank loans current as of December 31, 2021 is as follows, continued:
(1) Effective rate is an IRR of the projected flows, which considers for variable rates the rate of the closing day of the period and also the effective flow on receipt (with expenses associatedwith the issue + surplus in the case of bonds)(2) Corresponds to financial liabilities, on which the company has minimized the risk of interest rate and currency fluctuations, by contracting derivative hedging instruments (swaps).(3) Loans subject to compliance with covenants, disclosed in note 36.6
De btor Ta x N° De btor e ntityCountry de btor
Cre ditor Ta x N°
Cre ditor e ntity (ba nks)
Cre ditor c ountry Curre nc y Amortiza tion type
Up to 9 0 da ys
More tha n 9 0 da ys to 1
ye a r
Curre nt portion
1 to 2 ye a rs
2 to 3 ye a rs
3 to 4 ye a rs
4 to 5 ye a rs
Ove r 5 ye a rs
Non- c urre nt portion Tota l De bt Inte re st ra te
Inte re st ra te
ThUS$ ThUS$ ThUS$ ThUS$ ThUS$ ThUS$ ThUS$ ThUS$ ThUS$ ThUS$ Contra c t Effe c tive0- E SAAM Towage Brasil (2y3) Brasil 0- E BNDES Brazil US Dollar Monthly 377 1.117 1.494 1.445 1.398 1.351 1.303 424 5.921 7.415 3,7% 3,7%0- E SAAM Towage Brasil (2y3) Brasil 0- E BNDES Brazil US Dollar Monthly 452 1.340 1.792 1.734 1.678 1.621 1.564 509 7.106 8.898 3,7% 3,7%0- E SAAM Towage Brasil (2y3) Brasil 0- E BNDES Brazil Real Monthly 132 388 520 485 452 418 384 120 1.859 2.379 TJLP+3,70% 8,79%0- E SAAM Towage Brasil (2y3) Brasil 0- E BNDES Brazil US Dollar Monthly 357 1.067 1.424 1.393 1.365 1.336 1.308 8.068 13.470 14.894 2,6% 2,6%0- E SAAM Towage Brasil (2y3) Brasil 0- E BNDES Brazil US Dollar Monthly 276 823 1.099 1.068 1.040 1.012 984 5.938 10.042 11.141 3,6% 3,6%0- E SAAM Towage Brasil (2y3) Brasil 0- E Caterpillar Brazil US Dollar Monthly 112 329 441 425 160 44 - - 629 1.070 3,8% 3,8%0- E SAAM Towage Brasil (2y3) Brasil 0- E Caterpillar Brazil US Dollar Monthly 136 401 537 518 196 55 - - 769 1.306 3,8% 3,8%0- E SAAM Towage Brasil (2y3) Brasil 0- E Caterpillar Brazil Real Monthly 34 100 134 124 46 12 - - 182 316 TJLP+3,80% 8,89%0- E SAAM Towage Brasil (2) Brasil 0- E Banco Do Brasil Brazil US Dollar Monthly 371 1.102 1.473 1.431 1.390 1.346 1.304 2.604 8.075 9.548 3,5% 3,5%0- E SAAM Towage Brasil (2) Brasil 0- E Banco Do Brasil Brazil US Dollar Monthly 254 754 1.008 978 949 919 890 1.883 5.619 6.627 3,6% 3,6%0- E SAAM Towage Brasil (2) Brasil 0- E BNDES Brazil US Dollar Monthly 116 340 456 290 - - - - 290 746 4,4% 4,4%0- E SAAM Towage Brasil (2) Brasil 0- E BNDES Brazil US Dollar Monthly 428 1.275 1.703 1.648 1.599 1.548 1.498 7.906 14.199 15.902 3,7% 3,7%0- E SAAM Towage Brasil (2) Brasil 0- E Banco Do Brasil Brazil US Dollar Monthly 955 2.820 3.775 3.640 1.184 - - - 4.824 8.599 3,8% 3,8%
Subtota l 4.000 11.856 15 .8 5 6 15 .17 9 11.4 5 7 9 .6 6 2 9 .2 3 5 2 7 .4 5 2 7 2 .9 8 5 8 8 .8 4 1 Tota l ba nk loa ns 4 7 13 0 70.294 117 .4 2 4 6 4 .9 3 9 19 4 .19 8 3 3 .5 9 1 19 .2 6 3 2 8 .9 18 3 4 0 .9 0 9 4 5 8 .3 3 3
268
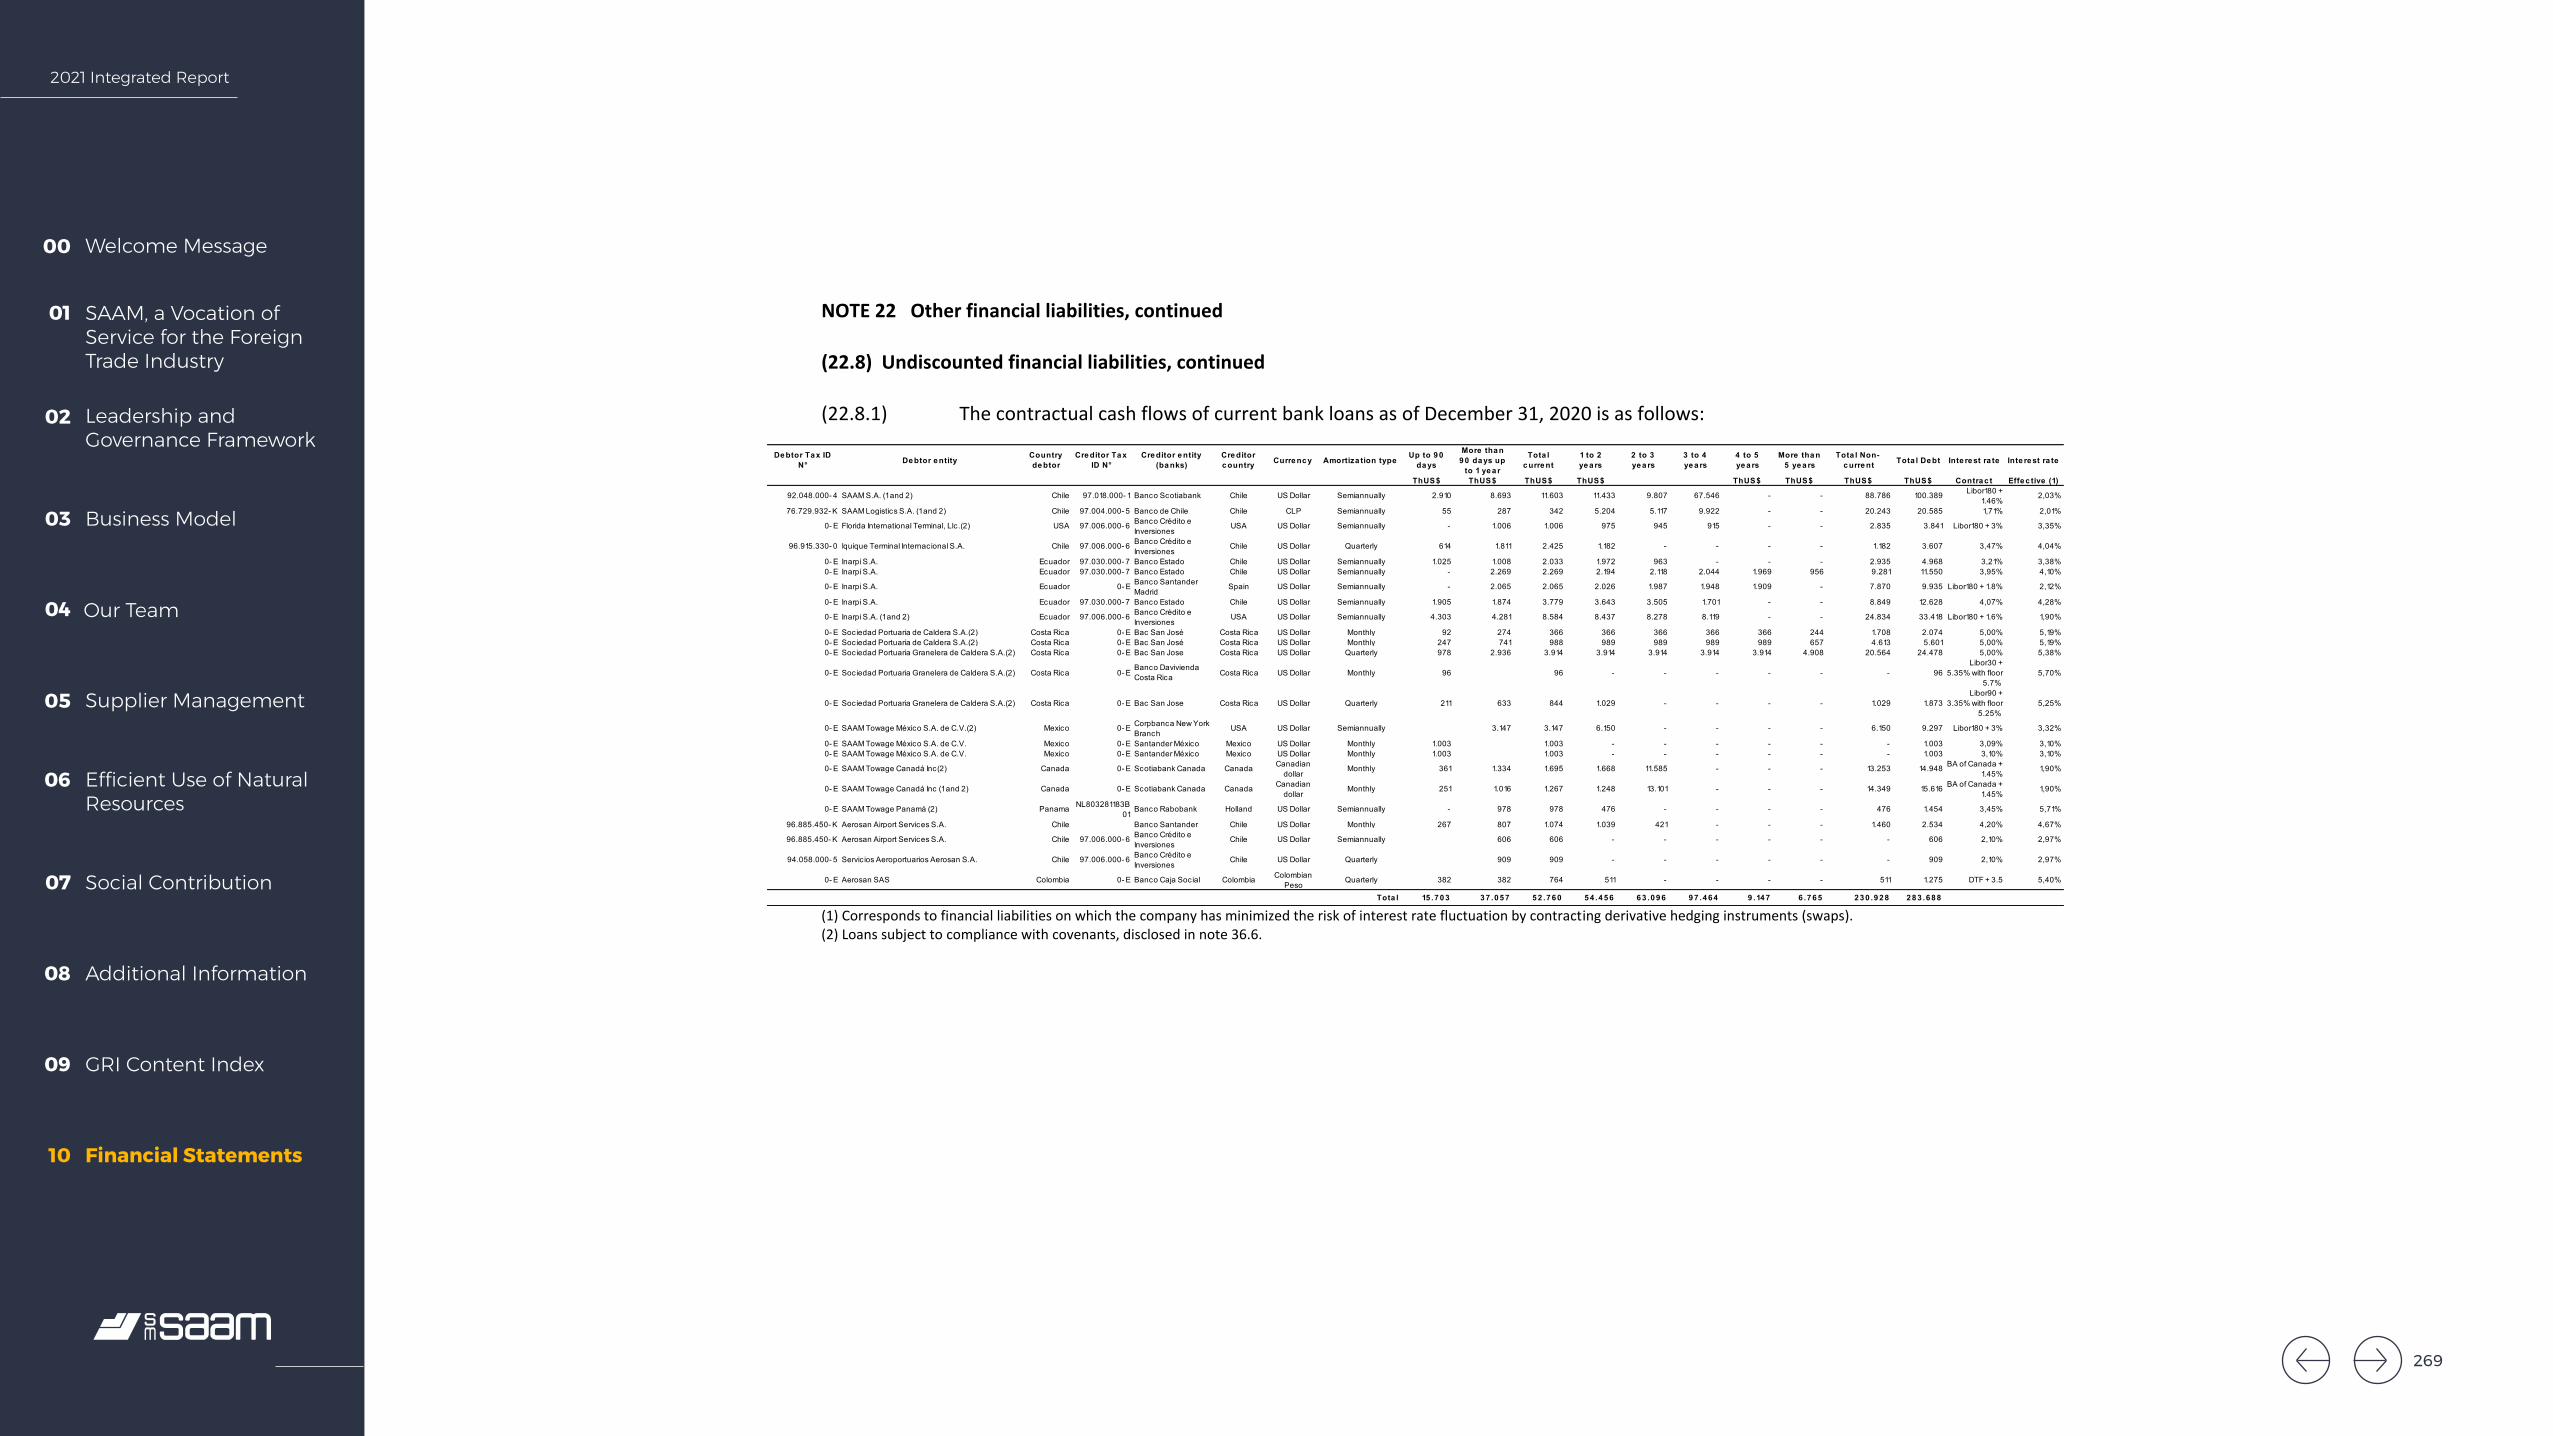
2021 Integrated Report
Welcome Message00
SAAM, a Vocation of Service for the Foreign Trade Industry
01
Leadership and Governance Framework
02
Business Model03
Our Team04
Supplier Management05
Efficient Use of Natural Resources
06
Social Contribution07
Additional Information08
GRI Content Index09
Financial Statements10
SOCIEDAD MATRIZ SAAM S.A. AND SUBSIDIARIES Notes to the Consolidated Financial Statements
93
NOTE 22 Other financial liabilities, continued (22.8) Undiscounted financial liabilities, continued (22.8.1) The contractual cash flows of current bank loans as of December 31, 2020 is as follows:
(1) Corresponds to financial liabilities on which the company has minimized the risk of interest rate fluctuation by contracting derivative hedging instruments (swaps). (2) Loans subject to compliance with covenants, disclosed in note 36.6.
De btor Ta x ID N° De btor e ntity
Country de btor
Cre ditor Ta x ID N°
Cre ditor e ntity (ba nks)
Cre ditor c ountry Curre nc y Amortiza tion type
Up to 9 0 da ys
More tha n 9 0 da ys up
to 1 ye a r
Tota l c urre nt
1 to 2 ye a rs
2 to 3 ye a rs
3 to 4 ye a rs
4 to 5 ye a rs
More tha n 5 ye a rs
Tota l Non-c urre nt Tota l De bt Inte re st ra te Inte re st ra te
ThUS$ ThUS$ ThUS$ ThUS$ ThUS$ ThUS$ ThUS$ ThUS$ Contra c t Effe c tive (1)
92.048.000- 4 SAAM S.A. (1 and 2) Chile 97.018.000- 1 Banco Scotiabank Chile US Dollar Semiannually 2.910 8.693 11.603 11.433 9.807 67.546 - - 88.786 100.389 Libor180 + 1.46%
2,03%
76.729.932- K SAAM Logistics S.A. (1 and 2) Chile 97.004.000- 5 Banco de Chile Chile CLP Semiannually 55 287 342 5.204 5.117 9.922 - - 20.243 20.585 1,71% 2,01%
0- E Florida International Terminal, Llc.(2) USA 97.006.000- 6 Banco Crédito e Inversiones
USA US Dollar Semiannually - 1.006 1.006 975 945 915 - - 2.835 3.841 Libor180 + 3% 3,35%
96.915.330- 0 Iquique Terminal Internacional S.A. Chile 97.006.000- 6 Banco Crédito e Inversiones
Chile US Dollar Quarterly 614 1.811 2.425 1.182 - - - - 1.182 3.607 3,47% 4,04%
0- E Inarpi S.A. Ecuador 97.030.000- 7 Banco Estado Chile US Dollar Semiannually 1.025 1.008 2.033 1.972 963 - - - 2.935 4.968 3,21% 3,38%0- E Inarpi S.A. Ecuador 97.030.000- 7 Banco Estado Chile US Dollar Semiannually - 2.269 2.269 2.194 2.118 2.044 1.969 956 9.281 11.550 3,95% 4,10%
0- E Inarpi S.A. Ecuador 0- E Banco Santander Madrid
Spain US Dollar Semiannually - 2.065 2.065 2.026 1.987 1.948 1.909 - 7.870 9.935 Libor180 + 1.8% 2,12%
0- E Inarpi S.A. Ecuador 97.030.000- 7 Banco Estado Chile US Dollar Semiannually 1.905 1.874 3.779 3.643 3.505 1.701 - - 8.849 12.628 4,07% 4,28%
0- E Inarpi S.A. (1 and 2) Ecuador 97.006.000- 6 Banco Crédito e Inversiones
USA US Dollar Semiannually 4.303 4.281 8.584 8.437 8.278 8.119 - - 24.834 33.418 Libor180 + 1.6% 1,90%
0- E Sociedad Portuaria de Caldera S.A.(2) Costa Rica 0- E Bac San José Costa Rica US Dollar Monthly 92 274 366 366 366 366 366 244 1.708 2.074 5,00% 5,19%0- E Sociedad Portuaria de Caldera S.A.(2) Costa Rica 0- E Bac San José Costa Rica US Dollar Monthly 247 741 988 989 989 989 989 657 4.613 5.601 5,00% 5,19%0- E Sociedad Portuaria Granelera de Caldera S.A.(2) Costa Rica 0- E Bac San Jose Costa Rica US Dollar Quarterly 978 2.936 3.914 3.914 3.914 3.914 3.914 4.908 20.564 24.478 5,00% 5,38%
0- E Sociedad Portuaria Granelera de Caldera S.A.(2) Costa Rica 0- EBanco Davivienda Costa Rica Costa Rica US Dollar Monthly 96 96 - - - - - - 96
Libor30 + 5.35% with floor
5.7% 5,70%
0- E Sociedad Portuaria Granelera de Caldera S.A.(2) Costa Rica 0- E Bac San Jose Costa Rica US Dollar Quarterly 211 633 844 1.029 - - - - 1.029 1.873 Libor90 +
3.35% with floor 5.25%
5,25%
0- E SAAM Towage México S.A. de C.V.(2) Mexico 0- E Corpbanca New York Branch
USA US Dollar Semiannually 3.147 3.147 6.150 - - - - 6.150 9.297 Libor180 + 3% 3,32%
0- E SAAM Towage México S.A. de C.V. Mexico 0- E Santander México Mexico US Dollar Monthly 1.003 1.003 - - - - - - 1.003 3,09% 3,10%0- E SAAM Towage México S.A. de C.V. Mexico 0- E Santander México Mexico US Dollar Monthly 1.003 1.003 - - - - - - 1.003 3,10% 3,10%
0- E SAAM Towage Canadá Inc(2) Canada 0- E Scotiabank Canada Canada Canadian dollar
Monthly 361 1.334 1.695 1.668 11.585 - - - 13.253 14.948 BA of Canada + 1.45%
1,90%
0- E SAAM Towage Canadá Inc (1 and 2) Canada 0- E Scotiabank Canada Canada Canadian dollar
Monthly 251 1.016 1.267 1.248 13.101 - - - 14.349 15.616 BA of Canada + 1.45%
1,90%
0- E SAAM Towage Panamá (2) Panama NL803281183B01
Banco Rabobank Holland US Dollar Semiannually - 978 978 476 - - - - 476 1.454 3,45% 5,71%
96.885.450- K Aerosan Airport Services S.A. Chile Banco Santander Chile US Dollar Monthly 267 807 1.074 1.039 421 - - - 1.460 2.534 4,20% 4,67%
96.885.450- K Aerosan Airport Services S.A. Chile 97.006.000- 6 Banco Crédito e Inversiones
Chile US Dollar Semiannually 606 606 - - - - - - 606 2,10% 2,97%
94.058.000- 5 Servic ios Aeroportuarios Aerosan S.A. Chile 97.006.000- 6 Banco Crédito e Inversiones
Chile US Dollar Quarterly 909 909 - - - - - - 909 2,10% 2,97%
0- E Aerosan SAS Colombia 0- E Banco Caja Social Colombia Colombian Peso
Quarterly 382 382 764 511 - - - - 511 1.275 DTF + 3.5 5,40%
Tota l 15 .7 0 3 3 7 .0 5 7 5 2 .7 6 0 5 4 .4 5 6 6 3 .0 9 6 9 7 .4 6 4 9 .14 7 6 .7 6 5 2 3 0 .9 2 8 2 8 3 .6 8 8
269
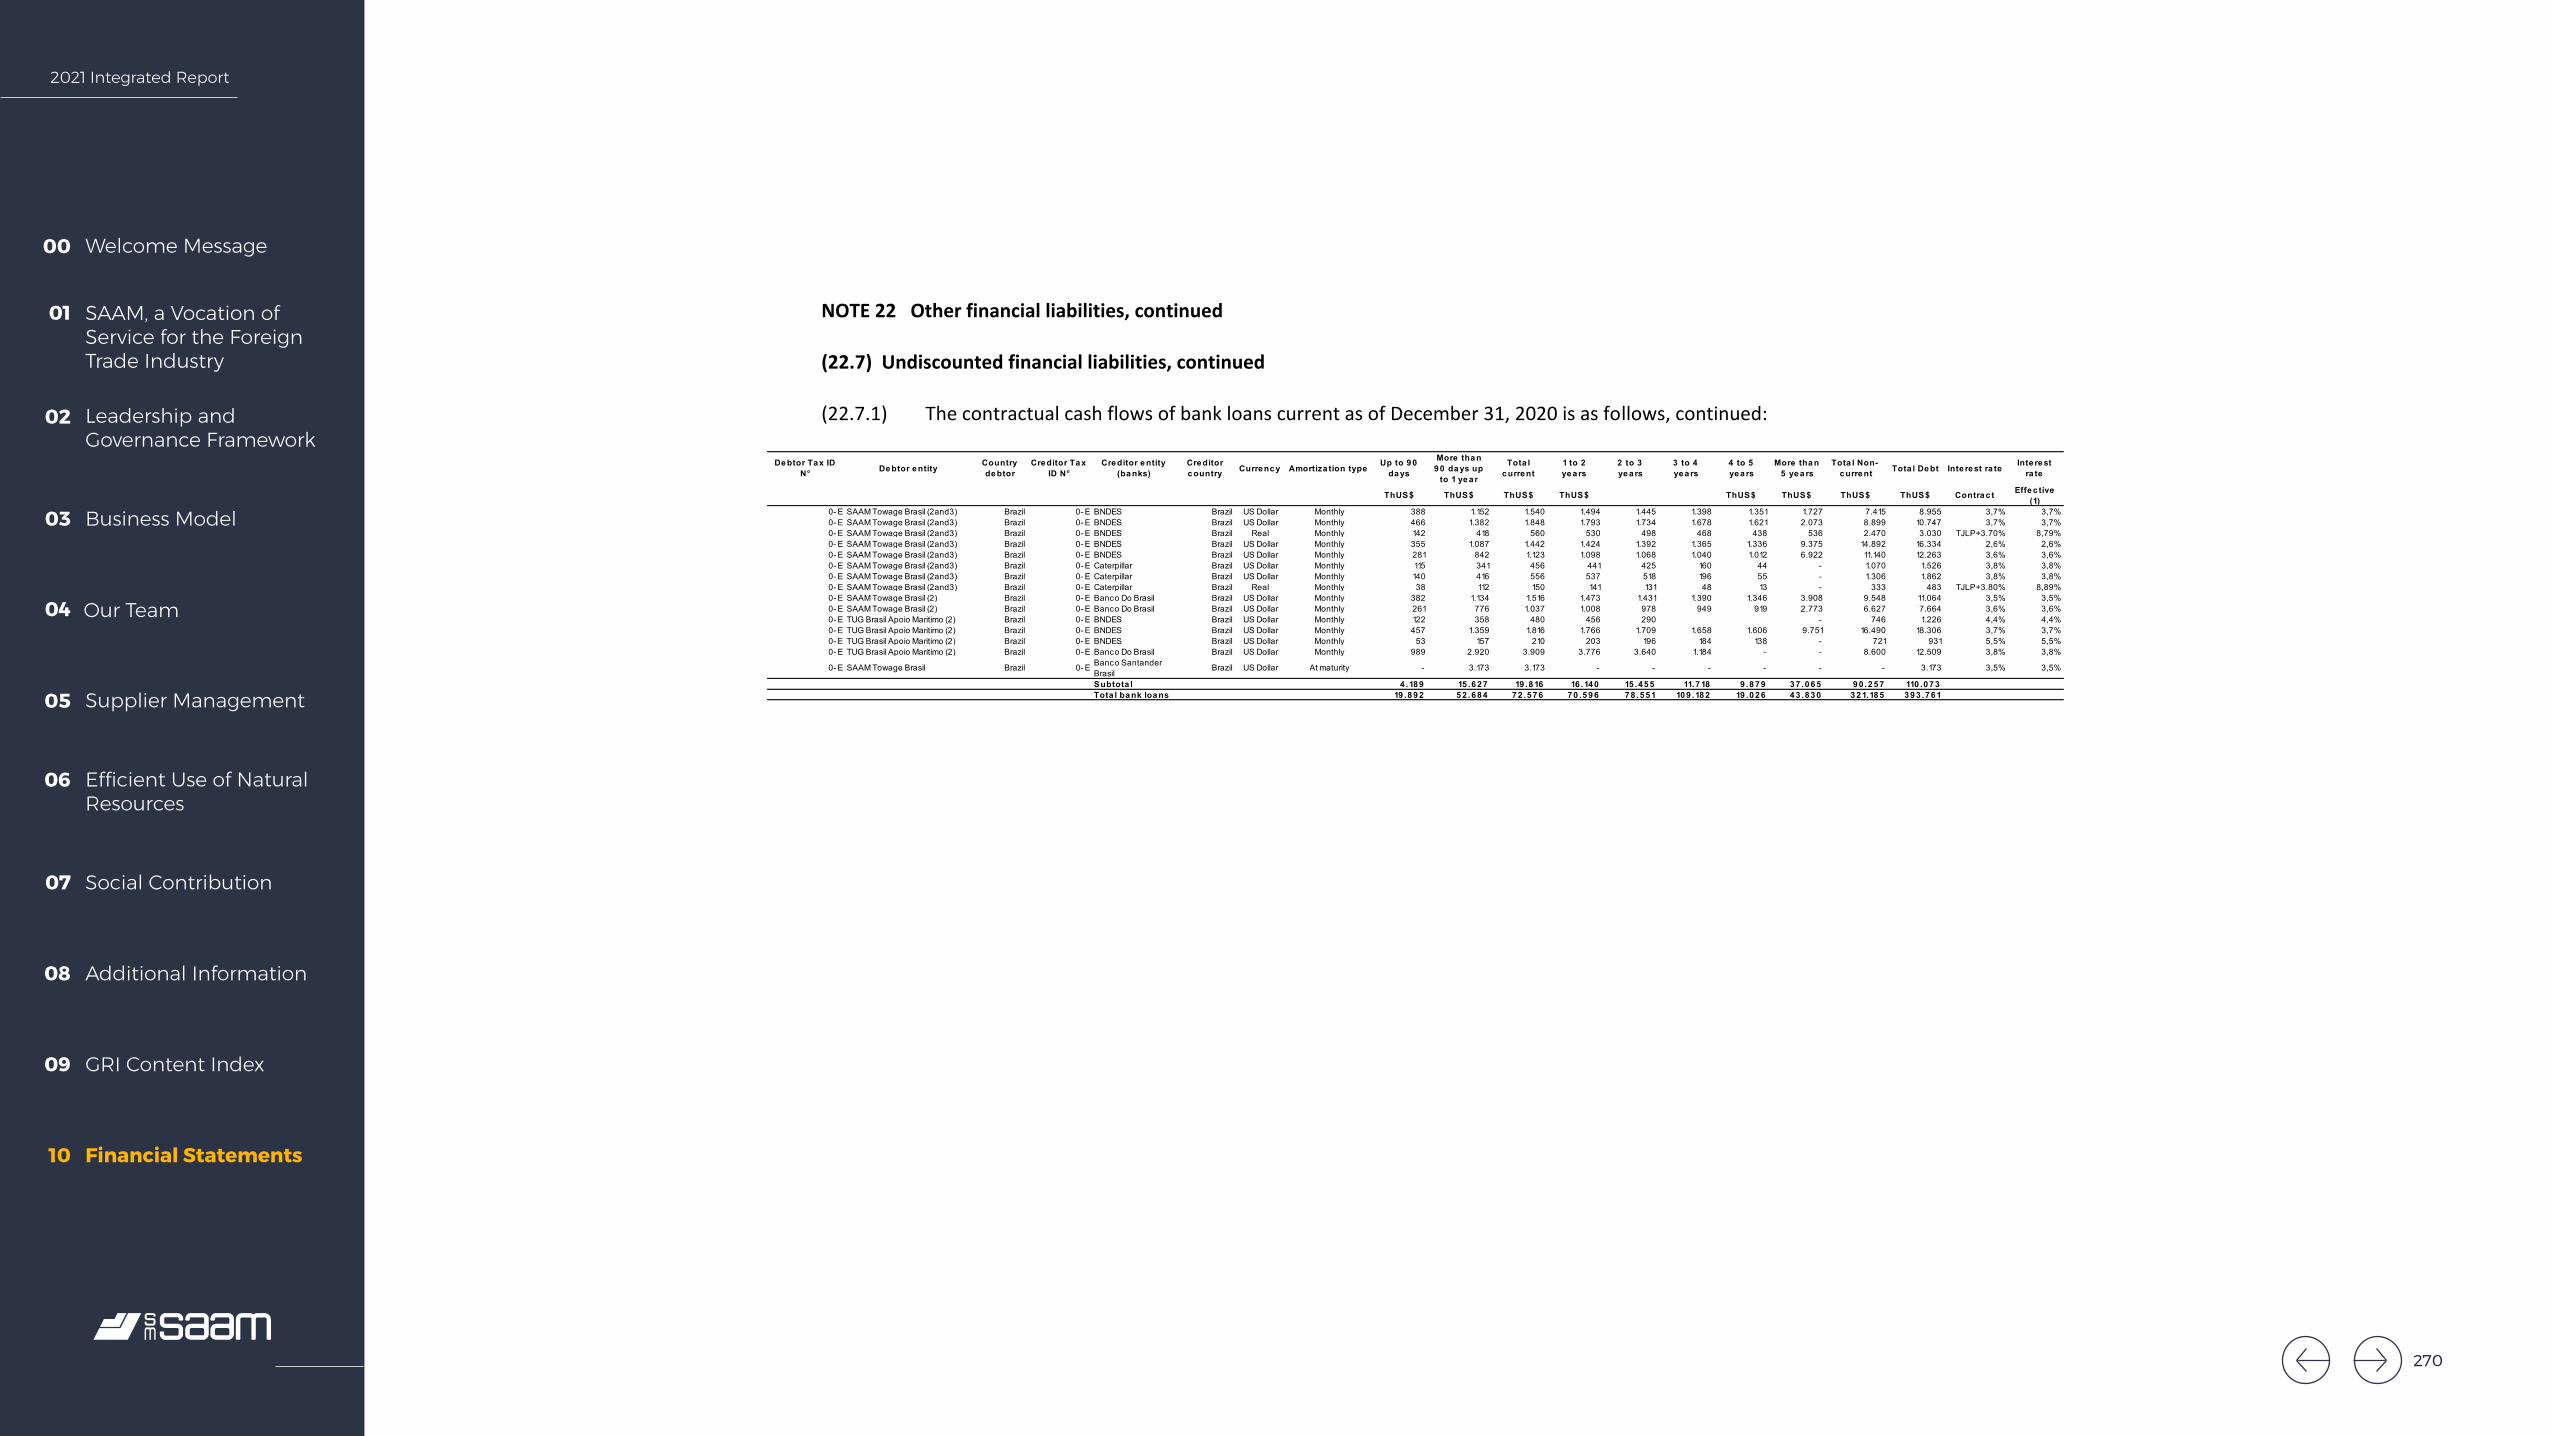
2021 Integrated Report
Welcome Message00
SAAM, a Vocation of Service for the Foreign Trade Industry
01
Leadership and Governance Framework
02
Business Model03
Our Team04
Supplier Management05
Efficient Use of Natural Resources
06
Social Contribution07
Additional Information08
GRI Content Index09
Financial Statements10
SOCIEDAD MATRIZ SAAM S.A. AND SUBSIDIARIES Notes to the Consolidated Financial Statements
94
NOTE 22 Other financial liabilities, continued
(22.7) Undiscounted financial liabilities, continued
(22.7.1) The contractual cash flows of bank loans current as of December 31, 2020 is as follows, continued:
De btor Ta x ID N° De btor e ntity
Country de btor
Cre ditor Ta x ID N°
Cre ditor e ntity (ba nks)
Cre ditor c ountry Curre nc y Amortiza tion type
Up to 9 0 da ys
More tha n 9 0 da ys up
to 1 ye a r
Tota l c urre nt
1 to 2 ye a rs
2 to 3 ye a rs
3 to 4 ye a rs
4 to 5 ye a rs
More tha n 5 ye a rs
Tota l Non-c urre nt Tota l De bt Inte re st ra te
Inte re st ra te
ThUS$ ThUS$ ThUS$ ThUS$ ThUS$ ThUS$ ThUS$ ThUS$ Contra c t Effe c tive (1)
0- E SAAM Towage Brasil (2and3) Brazil 0- E BNDES Brazil US Dollar Monthly 388 1.152 1.540 1.494 1.445 1.398 1.351 1.727 7.415 8.955 3,7% 3,7%0- E SAAM Towage Brasil (2and3) Brazil 0- E BNDES Brazil US Dollar Monthly 466 1.382 1.848 1.793 1.734 1.678 1.621 2.073 8.899 10.747 3,7% 3,7%0- E SAAM Towage Brasil (2and3) Brazil 0- E BNDES Brazil Real Monthly 142 418 560 530 498 468 438 536 2.470 3.030 TJLP+3.70% 8,79%0- E SAAM Towage Brasil (2and3) Brazil 0- E BNDES Brazil US Dollar Monthly 355 1.087 1.442 1.424 1.392 1.365 1.336 9.375 14.892 16.334 2,6% 2,6%0- E SAAM Towage Brasil (2and3) Brazil 0- E BNDES Brazil US Dollar Monthly 281 842 1.123 1.098 1.068 1.040 1.012 6.922 11.140 12.263 3,6% 3,6%0- E SAAM Towage Brasil (2and3) Brazil 0- E Caterpillar Brazil US Dollar Monthly 115 341 456 441 425 160 44 - 1.070 1.526 3,8% 3,8%0- E SAAM Towage Brasil (2and3) Brazil 0- E Caterpillar Brazil US Dollar Monthly 140 416 556 537 518 196 55 - 1.306 1.862 3,8% 3,8%0- E SAAM Towage Brasil (2and3) Brazil 0- E Caterpillar Brazil Real Monthly 38 112 150 141 131 48 13 - 333 483 TJLP+3.80% 8,89%0- E SAAM Towage Brasil (2) Brazil 0- E Banco Do Brasil Brazil US Dollar Monthly 382 1.134 1.516 1.473 1.431 1.390 1.346 3.908 9.548 11.064 3,5% 3,5%0- E SAAM Towage Brasil (2) Brazil 0- E Banco Do Brasil Brazil US Dollar Monthly 261 776 1.037 1.008 978 949 919 2.773 6.627 7.664 3,6% 3,6%0- E TUG Brasil Apoio Maritimo (2) Brazil 0- E BNDES Brazil US Dollar Monthly 122 358 480 456 290 - 746 1.226 4,4% 4,4%0- E TUG Brasil Apoio Maritimo (2) Brazil 0- E BNDES Brazil US Dollar Monthly 457 1.359 1.816 1.766 1.709 1.658 1.606 9.751 16.490 18.306 3,7% 3,7%0- E TUG Brasil Apoio Maritimo (2) Brazil 0- E BNDES Brazil US Dollar Monthly 53 157 210 203 196 184 138 - 721 931 5,5% 5,5%0- E TUG Brasil Apoio Maritimo (2) Brazil 0- E Banco Do Brasil Brazil US Dollar Monthly 989 2.920 3.909 3.776 3.640 1.184 - - 8.600 12.509 3,8% 3,8%
0- E SAAM Towage Brasil Brazil 0- E Banco Santander Brasil
Brazil US Dollar At maturity - 3.173 3.173 - - - - - - 3.173 3,5% 3,5%
Subtota l 4 .18 9 15 .6 2 7 19 .8 16 16 .14 0 15 .4 5 5 11.7 18 9 .8 7 9 3 7 .0 6 5 9 0 .2 5 7 110 .0 7 3 Tota l ba nk loa ns 19 .8 9 2 5 2 .6 8 4 7 2 .5 7 6 7 0 .5 9 6 7 8 .5 5 1 10 9 .18 2 19 .0 2 6 4 3 .8 3 0 3 2 1.18 5 3 9 3 .7 6 1
270

2021 Integrated Report
Welcome Message00
SAAM, a Vocation of Service for the Foreign Trade Industry
01
Leadership and Governance Framework
02
Business Model03
Our Team04
Supplier Management05
Efficient Use of Natural Resources
06
Social Contribution07
Additional Information08
GRI Content Index09
Financial Statements10
SOCIEDAD MATRIZ SAAM S.A. AND SUBSIDIARIES Notes to the Consolidated Financial Statements
95
NOTE 22 Other financial liabilities, continued (22.8) Undiscounted financial liabilities, continued (22.8.2) The contractual cash flows of finance leases payable as of December 31, 2021 is as follows:
(22.8.2) The contractual cash flows of finance leases payable as of December 31, 2020 is as follows:
Up to 9 0 da ys
More tha n 9 0 da ys to 1 ye a r
Tota l c urre nt
1 to 2 ye a rs 2 to 3 ye a rs
3 to 4 ye a rs
4 to 5 ye a rs
Ove r 5 ye a rs
Tota l Non-c urre nt
Tota l De bt Inte re st ra te
Inte re st ra te
ThUS$ ThUS$ ThUS$ ThUS$ ThUS$ ThUS$ ThUS$ ThUS$ ThUS$ ThUS$ Contra c t Effe c tive
97.006.000- 6 BCI 96.915.330- 0 Iquique Terminal Internacional S.A.
Chile US Dollar Monthly 151 453 604 604 604 352 - - 1.560 2.164 2,86% 2,86%
0- E Wells Fargo Equipment Finance, Inc. O- E Florida International Terminal LLC
EE.UU US Dollar Monthly 128 385 513 22 - - - - 22 535 3,74% 3,74%
0- E TD Bank O- E Florida International Terminal LLC
EE.UU US Dollar Monthly 189 507 696 - - - - - - 696 3,30% 3,65%
97.080.000- k Banco Bice 94.058.000- 5Servic ios Aeroportuarios Aerosan
Chile US Dollar Monthly 13 38 51 51 51 51 4 - 157 208 3,68% 3,68%
97.080.000- k Banco Bice 94.058.000- 5Servic ios Aeroportuarios Aerosan
Chile US Dollar Monthly 16 47 63 63 63 63 - - 189 252 3,68% 3,68%
0- E Itaú 0- E Aerosan SAS Colombia Colombian Peso
Monthly 30 90 120 147 147 147 110 - 551 671 6,21% 6,39%
0- E CSI 0- E Aerosan SAS Colombia Colombian Peso
Monthly 3 8 11 - - - - - - 11 8,16% 8,47%
0- E Banco de Occidente 0- E Aerosan SAS Colombia Colombian Peso
Monthly 8 25 33 34 34 - - - 68 101 9,49% 9,73%
0- E Bancolombia Panamá 0- E Intertug Colombia Colombia US Dollar Semianually 364 357 721 1.017 36 - - - 1.053 1.774 4,79% 4,85%
0- E Bancolombia Panamá 0- E Intertug Colombia Colombia US Dollar Semianually 395 388 783 1.107 64 - - - 1.171 1.954 4,55% 4,60%
Tota l 1.2 9 7 2 .2 9 8 3 .5 9 5 3 .0 4 5 9 9 9 6 13 114 - 4 .7 7 1 8 .3 6 6
Curre nc yAmortiza tion
typeCre ditor Ta x
N° Ba nk or Fina nc ia l institutionDe btor Ta x
N° De btor e ntityCountry de btor
Up to 9 0 da ys
More tha n 9 0 da ys to 1 ye a r
Tota l c urre nt
1 to 2 ye a rs 2 to 3 ye a rs
3 to 4 ye a rs
4 to 5 ye a rs
Ove r 5 ye a rs
Tota l Non-c urre nt
Tota l De bt Inte re st ra te
Inte re st ra te
ThUS$ ThUS$ ThUS$ ThUS$ ThUS$ ThUS$ ThUS$ ThUS$ ThUS$ ThUS$ Contra c t Effe c tive
97.006.000- 6 BCI 96.915.330- 0 Iquique Terminal Internacional S.A.
Chile US Dollar Monthly 151 453 604 604 604 604 351 - 2.163 2.767 2,86% 2,86%
0- E Wells Fargo Equipment Finance, Inc. O- E Florida International Terminal LLC
EE.UU US Dollar Monthly 191 574 765 319 - - - - 319 1.084 3,74% 3,74%
0- E TD Bank O- E Florida International Terminal LLC
EE.UU US Dollar Monthly 126 381 507 339 - - - - 339 846 3,30% 3,65%
94058000- 5 Banco Bice 94.058.000- 5Servic ios Aeroportuarios Aerosan
Chile US Dollar Monthly 19 55 74 73 73 73 74 - 293 367 3,68% 3,68%
94058000- 5 Banco Bice 94.058.000- 5Servic ios Aeroportuarios Aerosan
Chile US Dollar Monthly 12 38 50 51 51 51 52 4 209 259 3,68% 3,68%
0- E Itaú 0- E Transaereo Colombia Colombian Peso
Monthly 18 165 183 67 67 67 67 - 268 451 6,21% 3,39%
0- E CSI 0- E Transaereo Colombia Colombian Peso
Monthly 3 7 10 9 - - - - 9 19 8,16% 8,47%
Tota l 5 2 0 1.6 7 3 2 .19 3 1.4 6 2 7 9 5 7 9 5 5 4 4 4 3 .6 0 0 5 .7 9 3
Curre nc yAmortiza tion
typeCre ditor Ta x
N° Ba nk or Fina nc ia l institutionDe btor Ta x
N° De btor e ntityCountry de btor
271

2021 Integrated Report
Welcome Message00
SAAM, a Vocation of Service for the Foreign Trade Industry
01
Leadership and Governance Framework
02
Business Model03
Our Team04
Supplier Management05
Efficient Use of Natural Resources
06
Social Contribution07
Additional Information08
GRI Content Index09
Financial Statements10
SOCIEDAD MATRIZ SAAM S.A. AND SUBSIDIARIES Notes to the Consolidated Financial Statements
96
NOTE 22 Other financial liabilities, continued (22.8) Undiscounted financial liabilities, continued (22.8.3) The contractual flow of obligations with the public as of December 31, 2021 and December 31,
2020 are detailed as follows: December 2021
December 2020
(22.8.4) The contractual flow of obligations by concession contract as of December 31, 2021 and
December 31, 2020 are detailed as follows: December 2021
December 2020
Debtor Tax N° Debtor entity
Country debtor
Registra tion number Series Maturity Currency
Amortiza tion type
Up to 90 days
More than 90 days to 1 year
Current portion 1 to 2 years
2 to 3 years
3 to 4 years
4 to 5 years
Over 5 years
Non-current portion
Tota l Debt
ThUS$ ThUS$ ThUS$ ThUS$ ThUS$ ThUS$ ThUS$ ThUS$ ThUS$ ThUS$
76.196.718- 5Sociedad Matriz SAAM S.A. Chile 794
Series C 2026 UF Semiannually - 1.428 1.428 1.428 1.428 1.428 52.794 - 57.078 58.506
76.196.718- 5Sociedad Matriz SAAM S.A. Chile 794 Series E 2030 UF Semiannually - 571 571 571 571 571 571 46.025 48.309 48.880
76.196.718- 5Sociedad Matriz SAAM S.A. Chile 1037
Series H 2030 UF Semiannually 333 333 666 666 666 666 666 54.029 56.693 57.359
333 2 .332 2 .665 2 .665 2 .665 2 .665 54 .031 100 .054 162 .080 164 .745
De btor Ta x N° De btor e ntity
Country de btor
Re gistra tion numbe r Se rie s Ma turity Curre nc y
Amortiza tion type
Up to 9 0 da ys
More tha n 9 0 da ys up to 1
ye a r
Tota l c urre nt 1 to 2 ye a rs
2 to 3 ye a rs
3 to 4 ye a rs
4 to 5 ye a rs
More tha n 5 ye a rs
Tota l Non-c urre nt
Tota l lia bilitie s
ThUS$ ThUS$ ThUS$ ThUS$ ThUS$ ThUS$ ThUS$ ThUS$ ThUS$ ThUS$
76.196.718- 5Sociedad Matriz SAAM S.A. Chile 793
Series B 2021 UF Semiannually - 58.724 58.724 - - - - - - 58.724
76.196.718- 5Sociedad Matriz SAAM S.A. Chile 794
Series C 2026 UF Semiannually - 1.592 1.592 1.592 1.592 1.592 1.592 58.837 65.205 66.797
76.196.718- 5Sociedad Matriz SAAM S.A. Chile 794 Series E 2030 UF Semiannually - 636 636 636 636 636 636 51.928 54.472 55.108
76.196.718- 5Sociedad Matriz SAAM S.A. Chile 1037
Series H 2030 UF Semiannually 371 371 742 742 742 742 742 60.954 63.922 64.664
Tota l 3 7 1 6 1.3 2 3 6 1.6 9 4 2 .9 7 0 2 .9 7 0 2 .9 7 0 2 .9 7 0 17 1.7 19 18 3 .5 9 9 2 4 5 .2 9 3
Up to 90 days More than 90 days to 1 year Total current 1 to 3 years 2 to 3 years 3 to 4 years 4 to 5 years Over 5 years Total Non-
current Total liabilities Lease rate
ThUS$ ThUS$ ThUS$ ThUS$ ThUS$ ThUS$ ThUS$ ThUS$ ThUS$ ThUS$
Empresa Portuaria Iquique 96.915.330-0 ITI SA Chi le US Dol lar 400 1.200 1.600 1.600 1.600 1.600 1.600 6.000 12.400 14.000 6,38%
API de Mazatlán TMM1201098F6 Terminal Marítima Mazatlán S.A. de C.V. Mexico Mexican peso 318 826 1.144 3.775 3.948 4.127 4.314 33.466 49.630 50.774 12,00%
Insti tuto Costarricence de Puertos del Pacífico 0-E Sociedad Portuaria de Caldera S.A. Costa Rica US Dol lar 1.885 - 1.885 - - - - - - 1.885 5% de los
ingresos Insti tuto Costarricence de Puertos del Pacífico 0-E Sociedad Portuaria Granelera de Caldera S.A. Costa Rica US Dol lar 223 - 223 - - - - - - 223 15% de los
ingresos Insti tuto Costarricence de Puertos del Pacífico Conces ionaria SAAM Costa Rica S.A. Costa Rica US Dol lar 94 - 94 - - - - - - 94 5% de los
ingresos Total 2.920 2.026 4.946 5.375 5.548 5.727 5.914 39.466 62.030 66.976
Port company Debtor Tax N° Debtor entity Country debtor Currency
Up to 90 days More than 90 days to 1 year Total current 1 to 3 years 3 to 5 years Over 5 years Total Non-
current Total liabilities Lease rate
ThUS$ ThUS$ ThUS$ ThUS$ ThUS$ ThUS$ ThUS$ ThUS$
Empresa Portuaria Iquique 96.915.330-0 ITI SA Chi le US Dol lar 400 1.200 1.600 1.600 1.600 1.600 1.600 8.000 14.400 16.000 6,38%
API de Mazatlán TMM1201098F6 Terminal Marítima Mazatlán S.A. de C.V. Mexico Mexican peso 263 803 1.066 3.694 3.864 4.042 4.227 38.750 54.577 55.643 12,00%
Insti tuto Costarricence de Puertos del Pacífico 0-E Sociedad Portuaria de Caldera S.A. Costa Rica US Dol lar 1.703 - 1.703 - - - - - - 1.703 5% de los
ingresos Insti tuto Costarricence de Puertos del Pacífico 0-E Sociedad Portuaria Granelera de Caldera S.A. Costa Rica US Dol lar 208 - 208 - - - - - - 208 15% de los
ingresos Insti tuto Costarricence de Puertos del Pacífico 0-E Conces ionaria SAAM Costa Rica S.A. Costa Rica US Dol lar 79 - 79 - - - - - - 79 5% de los
ingresos Total 2.653 2.003 4.656 5.294 5.464 5.642 5.827 46.750 68.977 73.633
Port company Debtor Tax N° Debtor entity Country debtor Currency
272

2021 Integrated Report
Welcome Message00
SAAM, a Vocation of Service for the Foreign Trade Industry
01
Leadership and Governance Framework
02
Business Model03
Our Team04
Supplier Management05
Efficient Use of Natural Resources
06
Social Contribution07
Additional Information08
GRI Content Index09
Financial Statements10
SOCIEDAD MATRIZ SAAM S.A. AND SUBSIDIARIES Notes to the Consolidated Financial Statements
97
NOTE 22 Other financial liabilities, continued (22.8) Undiscounted financial liabilities, continued (22.8.5) The contractual flow of financial liabilities by lease contract as of December 31, 2021 is as follows:
Up to 9 0 da ys
More tha n 9 0 da ys to 1 ye a r
Tota l c urre nt 1 to 2 ye a rs 2 to 3 ye a rs 3 to 4 ye a rs 4 to 5 ye a rs Ove r 5 ye a rs Tota l Non-c urre nt
Tota l De bt Le a se Te rm Inte re st ra te
ThUS$ ThUS$ ThUS$ ThUS$ ThUS$ ThUS$ ThUS$ ThUS$ ThUS$ ThUS$ Contra c tSAAM S.A. Inmobiliaria Renta Segunda SpA UF Monthly 69 206 275 274 274 274 228 - 1.050 1.325 18- 10- 2026 5,60%
Ecuaestibas S.A. Varios proveedores USD Monthly 7 12 19 6 6 5 - - 17 36 Hasta 2025 4,50%
SAAM Smit Towage Panamá Capihara Holdings Corporation USD Monthly 14 42 56 57 57 59 40 - 213 269 30- 09- 2024 4,95%
SAAM Smit Towage Panamá Manzanillo Internacional USD Monthly 2 6 8 8 8 8 8 - 32 40 44592 3,45%
Sociedad Portuaria de Caldera S.A. Bac San José USD Monthly 2 9 11 7 - - - - 7 18 04- 08- 2023 6,90%
Inarpi S.A. Inmobiliaria Inramicorp S.A. USD Monthly 63 188 251 146 - - - - 146 397 30- 07- 2022 4,50%
Inarpi S.A. Fertigran USD Monthly - - - - - - - 1.440 1.440 1.440 30- 06- 2056 4,50%
Inarpi S.A. Hernan Alfredo Rodas Espinoza USD Monthly 54 162 216 216 216 108 - - 540 756 30- 06- 2025 4,50%
Inarpi S.A. Consorcio Pichincha USD Monthly 12 36 48 47 47 29 - - 123 171 30- 04- 2025 4,50%
Inarpi S.A. Otros proveedores USD Monthly 5 5 10 5 - - - - 5 15 Hasta 2023 4,50%
SAAM Towage México TIP Auto S.A. de C.V. MXP Monthly 17 51 68 67 74 39 - - 180 248 09- 08- 2025 7,10%
SAAM Towage México Otros proveedores MXP Monthly 27 40 67 27 23 - - - 50 117 Hasta 2024 7,10%
SAAM Towage Canadá Inc. City of Vancouver CAD Monthly 4 51 55 44 48 51 55 281 479 534 31- 01- 2029 3,13%
SAAM Towage Canadá Inc. Vancouver Fraser Port Authority CAD Monthly 6 61 67 49 55 57 59 541 761 828 31- 12- 2029 3,14%
SAAM Towage Canadá Inc. 1202005 BC Ltd. CAD Monthly 3 77 80 73 78 80 85 9 325 405 28- 02- 2027 3,14%
SAAM Towage Canadá Inc. Port Edward CAD Monthly 1 61 62 61 64 66 - - 191 253 01- 10- 2029 2,39%
SAAM Towage Canadá Inc. Rio Tinto CAD Monthly - 65 65 66 71 75 - - 212 277 30- 09- 2022 2,95%
SAAM Towage Canadá Inc. Otros proveedores CAD Monthly - 27 27 11 - - - - 11 38 Hasta 2023 3,80%
SAAM Towage Brasil S.A. Varios proveedores BRZ Monthly 971 1.908 2.879 425 76 32 24 - 557 3.436 16- 07- 1905 0,74%
Florida International Terminal, Llc. Broward Coubtry USD Monthly 1.250 3.751 5.001 5.002 5.002 2.501 - - 12.505 17.506 46203 0,044
Florida International Terminal, Llc. Well Fargo Equipment Finance USD Monthly 72 215 287 286 286 72 - - 644 931 31- 03- 2025 4,30%
Florida International Terminal, Llc. Enterprise Fleet Management USD Monthly 58 282 340 194 194 106 - - 494 834 16- 07- 1905 4,30%
Aerosan Airport Services S.A. Soc. Concesionaria Nuevo Pudahuel UF Monthly 196 524 720 - - - - - - 720 01- 11- 2022 3,50%
Aerosan Airport Services S.A. Hgroup UF Monthly 36 - 36 - - - - - - 36 01- 09- 2022 3,50%
Servic ios Aeroportuarios Aerosan S.A. Soc. Concesionaria Nuevo Pudahuel UF Monthly 1.297 3.892 5.189 4.858 1.541 1.209 1.209 7.357 16.174 21.363 01- 12- 2033 3,50%
Servic ios Aeroportuarios Aerosan S.A. Royal UF Monthly 95 108 203 144 60 - - - 204 407 01- 05- 2024 3,50%
Iquique Terminal Internacional S.A. Salfarent USD Monthly 8 24 32 32 32 32 4 - 100 132 17- 07- 2025 4,42%
Intertug Colombia Orion del Pacífico USD Monthly 10 60 70 173 102 - - - 275 345 31- 12- 2023 5,44%
Intertug Colombia Otros proveedores COP Monthly 4 13 17 39 - - - - 39 56 Hasta 2021 5,44%
Aerosan SAS Soc. Concesionaria Op. Aeroportuaria Internacional S.A.
USD Monthly 337 1.349 1.686 1.314 1.136 934 512 25 3.921 5.607 46022 3,50%
Kios S.A. María Hernandez USD Monthly 5 30 35 - - - - - - 35 31- 12- 2022 4,25%
Aeronem Corporación Quiport USD Monthly 32 95 127 126 126 126 126 778 1.282 1.409 01- 02- 2033 8,34%
4 6 5 7 13 3 5 0 18 .0 0 7 13 .7 5 7 9 .5 7 6 5 .8 6 3 2 .3 5 0 10 .4 3 1 4 1.9 7 7 5 9 .9 8 4
De btor e ntity Cre ditor e ntity Curre nc yAmortiza tion
type
273

2021 Integrated Report
Welcome Message00
SAAM, a Vocation of Service for the Foreign Trade Industry
01
Leadership and Governance Framework
02
Business Model03
Our Team04
Supplier Management05
Efficient Use of Natural Resources
06
Social Contribution07
Additional Information08
GRI Content Index09
Financial Statements10
SOCIEDAD MATRIZ SAAM S.A. AND SUBSIDIARIES Notes to the Consolidated Financial Statements
98
NOTE 22 Other financial liabilities, continued (22.8) Undiscounted financial liabilities, continued (22.8.5) The contractual flow of financial liabilities by lease contract as of December 31, 2020 is as follows:
Up to 9 0 da ys
More tha n 9 0 da ys to 1 ye a r
Tota l c urre nt 1 to 2 ye a rs 2 to 3 ye a rs 3 to 4 ye a rs 4 to 5 ye a rs Ove r 5 ye a rs Tota l Non-c urre nt
Tota l De bt Le a se Te rm Inte re st ra te
ThUS$ ThUS$ ThUS$ ThUS$ ThUS$ ThUS$ ThUS$ ThUS$ ThUS$ ThUS$ Contra c t
SAAM S.A. Inmobiliaria Renta Segunda SpA UF Monthly 55 170 225 241 255 269 285 250 1.300 1.525 18- 10- 2026 5,60%
Ecuaestibas S.A. Varios proveedores USD Monthly 13 35 48 19 - - - - 19 67 Hasta 2022 4,50%
SAAM Smit Towage Panamá Manzanillo Internacional USD Monthly 2 6 8 1 - - - - 1 9 31- 01- 2022 3,45%
SAAM Smit Towage Panamá Capihara Holdings Corporation USD Monthly 18 54 72 73 75 50 - - 198 270 30- 09- 2024 4,95%
Sociedad Portuaria de Caldera S.A. Bac San José USD Monthly 2 5 7 8 5 - - - 13 20 04- 08- 2023 6,90%
Inarpi S.A. Inmobiliaria Inramicorp S.A. USD Monthly 57 76 133 - - - - - - 133 30- 07- 2021 4,50%
Inarpi S.A. Fertigran USD Monthly - - - - - - - 1.440 1.440 1.440 30- 06- 2056 4,50%
Inarpi S.A. Hernan Alfredo Rodas Espinoza USD Monthly 48 142 190 190 190 190 142 712 902 2023 4,50%
Inarpi S.A. Otros proveedores USD Monthly 22 48 70 8 - - - - 8 78 Hasta 2022 4,50%
SAAM Towage México Varios proveedores MXP Monthly 56 78 134 46 45 19 - - 110 244 Hasta 2024 7,10%
SAAM Towage Canadá Inc. Vancouver Fraser Port Authority CAD Monthly - 38 38 43 48 55 56 595 797 835 31- 12- 2029 4,10%
SAAM Towage Canadá Inc. 1202005 BC Ltd. CAD Monthly - 65 65 70 72 77 80 93 392 457 28- 02- 2027 4,10%
SAAM Towage Canadá Inc. Port Edward CAD Monthly - 50 50 52 53 55 56 238 454 504 01- 10- 2029 2,49%
SAAM Towage Canadá Inc. Otros proveedores CAD Monthly - 69 69 9 9 - - - 18 87 Hasta 2023 3,95%
SAAM Towage Brasil S.A. Varios proveedores BRZ Monthly 143 344 487 192 103 26 - - 321 808 2024 0,74%
Florida International Terminal, Llc. Broward Coubtry USD Monthly 1.164 3.493 4.657 4.657 4.657 4.657 2.329 - 16.300 20.957 30- 06- 2026 4,40%
Florida International Terminal, Llc. Well Fargo Equipment Finance USD Monthly 72 215 287 286 286 286 72 - 930 1.217 31- 03- 2025 5,33%
Aerosan Airport Services S.A. Soc. Concesionaria Nuevo Pudahuel UF Monthly 219 656 875 803 - - - - 803 1.678 01- 11- 2022 3,50%
Aerosan Airport Services S.A. Hgroup UF Monthly 29 85 114 40 - - - - 40 154 01- 09- 2022 3,50%
Servic ios Aeroportuarios Aerosan S.A. Soc. Concesionaria Nuevo Pudahuel UF Monthly 1.446 4.707 6.153 5.783 5.783 1.348 1.348 9.547 23.809 29.962 01- 12- 2033 3,50%
Servic ios Aeroportuarios Aerosan S.A. Royal UF Monthly 139 417 556 226 160 160 67 - 613 1.169 01- 05- 2024 3,50%
Servic ios Aeroportuarios Aerosan S.A. Segtel USD Monthly 7 - 7 - - - - - - 7 31- 01- 2021 3,50%
Aerosan SAS Soc. Concesionaria Op. Aeroportuaria Internacional S.A.
USD Monthly 430 1.289 1.719 1.721 1.544 1.253 1.041 594 6.153 7.872 31- 12- 2025 3,50%
Aeronem Corporación Quiport USD Monthly 11 34 45 45 45 45 45 686 866 911 01- 02- 2033 8,34%
Tota l 4 .0 2 4 12 .3 0 6 16 .3 3 0 14 .5 9 5 13 .3 8 4 8 .5 0 9 5 .5 2 1 13 .4 4 3 5 5 .4 5 2 7 1.7 8 2
De btor e ntity Cre ditor e ntity Curre nc yAmortiza tion
type
274

2021 Integrated Report
Welcome Message00
SAAM, a Vocation of Service for the Foreign Trade Industry
01
Leadership and Governance Framework
02
Business Model03
Our Team04
Supplier Management05
Efficient Use of Natural Resources
06
Social Contribution07
Additional Information08
GRI Content Index09
Financial Statements10
SOCIEDAD MATRIZ SAAM S.A. AND SUBSIDIARIES Notes to the Consolidated Financial Statements
99
NOTE 23 Trade and other payables
The composition of the balance of trade and other payables is shown in the following table:
12-31-2021 12-31-2020
Current Non-current Total Current Non-current Total ThUS$ ThUS$ ThUS$ ThUS$ ThUS$ ThUS$
Trade creditors 45.756 - 45.756 37.150 - 37.150 Other accounts payable 12.453 - 12.453 13.042 - 13.042
Total trade and other payables 58.209 - 58.209 50.192 - 50.192 Other accounts payable mainly correspond to obligations with third parties usual concepts not directly related to operations. Trade creditors with up-to-date payments and payments due as of December 31, 2021 and December 31, 2020 are detailed in the following tables: a) Trade creditors with up-to-date payments
Amounts as per payment terms
Type of supplier
Up to 30 days ThUS$
31-60 days ThUS$
61-90 days ThUS$
91-120 days ThUS$
Total up-to -date payments
ThUS$ 12.31.2021 Goods 4.028 747 140 - 4.915 Services 37.257 629 218 642 38.746 Total 41.285 1.376 358 642 43.661
Amounts as per payment terms
Type of supplier
Up to 30 days ThUS$
31-60 days ThUS$
61-90 days ThUS$
91-120 days ThUS$
Total up-to -date payments
ThUS$ 12.31.2020 Goods 3.603 873 221 9 4.706 Services 27.643 1.068 590 2.454 31.755 Total 31.246 1.941 811 2.463 36.461
SOCIEDAD MATRIZ SAAM S.A. AND SUBSIDIARIES Notes to the Consolidated Financial Statements
100
NOTE 23 Trade and other payables, continued
b) Trade creditors with overdue payments(1):
Amounts as per payment terms
Type of supplier
Up to 30 days ThUS$
31-60 days ThUS$
61-90 days ThUS$
91-120 days ThUS$
121-180 days ThUS$
Over 180 days ThUS$
Total overdue
payments ThUS$
12.31.2021 Services 1.480 387 96 41 8 83 2.095 Total 1.480 387 96 41 8 83 2.095
Amounts as per payment terms
Type of supplier
Up to 30 days ThUS$
31-60 days ThUS$
61-90 days ThUS$
91-120 days ThUS$
121-180 days ThUS$
Over 180 days ThUS$
Total overdue
payments ThUS$
12.31.2020 Services 399 74 35 166 4 11 689 Total 399 74 35 166 4 11 689
(1) The Company has a solid liquidity situation, which allows it to meet its obligations with its multiple suppliers without major inconveniences. Consequently, the amounts shown as creditors with payments due as of December 31, 2021 and December 31, 2020, are mainly due to cases in which there are invoices with differences in documentary conciliation, which for the most part, end up being resolved in the short term.
NOTE 24 Provisions
12-31-2021 12-31-2020 Current Non-current Total Current Non-current Total
ThUS$ ThUS$ ThUS$ ThUS$ ThUS$ ThUS$ Legal provisions(1) - 1.127 1.127 - 1.501 1.501 Dismantling, restoration and rehabilitation(2) - 51 51 - 47 47 Profit sharing (3) 1.326 - 1.326 940 - 940 Contingent liability - 5.600 5.600 Other provisions 756 - 756 1.095 - 1.095
Total provisions 2.082 6.778 8.860 2.035 1.548 3.583
(1) Provision of ThUS$ 1,127 (ThUS$ 1,501 in 2020) by the indirect subsidiary SAAM do Brasil Ltda. and SAAM Towage Brasil S.A., which correspond to labor lawsuits in both companies. See note 36.5. (2) Corresponds to the provision for dismantling of offices located in Terminal Puerto Guayaquil. (3) Profit sharing is determined based on 2.5 percent over the amount of dividends that are distributed debited against profits for the year. (see note 33). (4) Corresponds to the contingent liability for the acquisition of Intertug. See note 17.2.
275
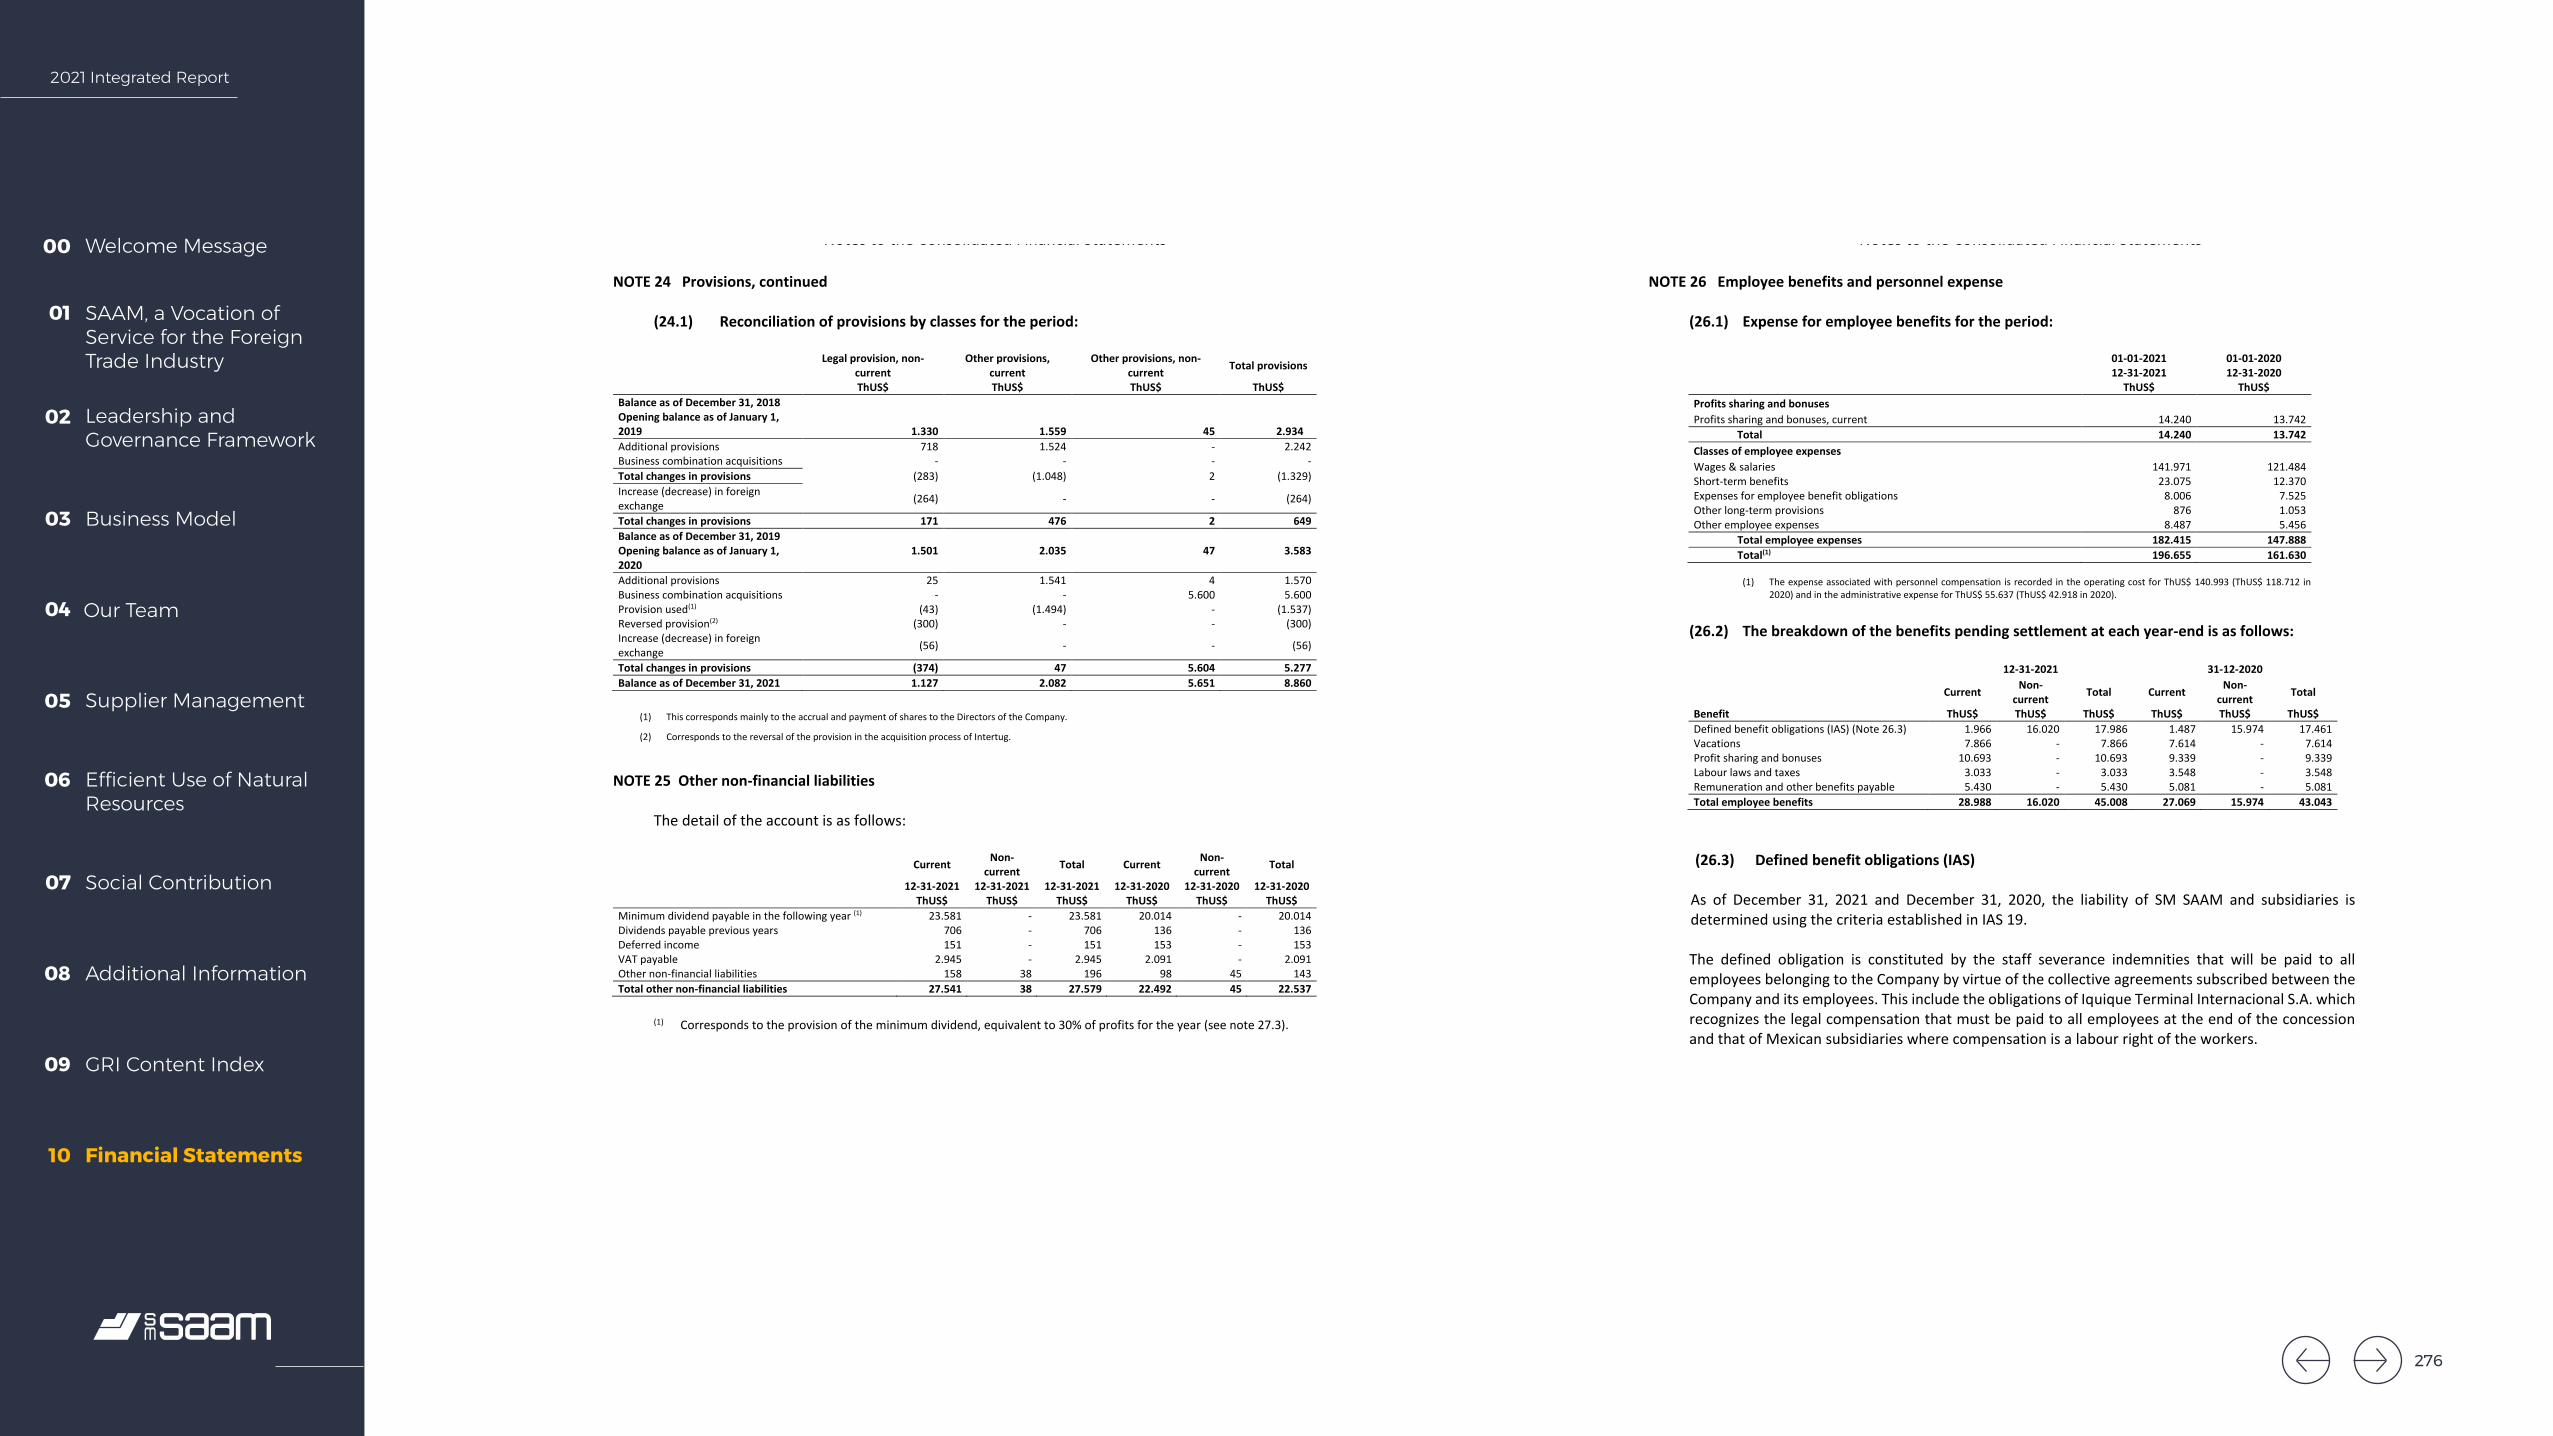
2021 Integrated Report
Welcome Message00
SAAM, a Vocation of Service for the Foreign Trade Industry
01
Leadership and Governance Framework
02
Business Model03
Our Team04
Supplier Management05
Efficient Use of Natural Resources
06
Social Contribution07
Additional Information08
GRI Content Index09
Financial Statements10
SOCIEDAD MATRIZ SAAM S.A. AND SUBSIDIARIES Notes to the Consolidated Financial Statements
101
NOTE 24 Provisions, continued
(24.1) Reconciliation of provisions by classes for the period:
Legal provision, non-current
Other provisions, current
Other provisions, non-current Total provisions
ThUS$ ThUS$ ThUS$ ThUS$ Balance as of December 31, 2018 Opening balance as of January 1, 2019 1.330 1.559 45 2.934 Additional provisions 718 1.524 - 2.242 Business combination acquisitions - - - - Total changes in provisions (283) (1.048) 2 (1.329) Increase (decrease) in foreign exchange (264) - - (264)
Total changes in provisions 171 476 2 649 Balance as of December 31, 2019 Opening balance as of January 1, 2020
1.501 2.035 47 3.583
Additional provisions 25 1.541 4 1.570 Business combination acquisitions - - 5.600 5.600 Provision used(1) (43) (1.494) - (1.537) Reversed provision(2) (300) - - (300) Increase (decrease) in foreign exchange (56) - - (56)
Total changes in provisions (374) 47 5.604 5.277 Balance as of December 31, 2021 1.127 2.082 5.651 8.860
(1) This corresponds mainly to the accrual and payment of shares to the Directors of the Company.
(2) Corresponds to the reversal of the provision in the acquisition process of Intertug.
NOTE 25 Other non-financial liabilities
The detail of the account is as follows: Current Non-
current Total Current Non-current Total
12-31-2021 12-31-2021 12-31-2021 12-31-2020 12-31-2020 12-31-2020 ThUS$ ThUS$ ThUS$ ThUS$ ThUS$ ThUS$
Minimum dividend payable in the following year (1) 23.581 - 23.581 20.014 - 20.014 Dividends payable previous years 706 - 706 136 - 136 Deferred income 151 - 151 153 - 153 VAT payable 2.945 - 2.945 2.091 - 2.091 Other non-financial liabilities 158 38 196 98 45 143 Total other non-financial liabilities 27.541 38 27.579 22.492 45 22.537
(1) Corresponds to the provision of the minimum dividend, equivalent to 30% of profits for the year (see note 27.3).
SOCIEDAD MATRIZ SAAM S.A. AND SUBSIDIARIES Notes to the Consolidated Financial Statements
102
NOTE 26 Employee benefits and personnel expense
(26.1) Expense for employee benefits for the period:
01-01-2021 12-31-2021
01-01-2020 12-31-2020
ThUS$ ThUS$ Profits sharing and bonuses Profits sharing and bonuses, current 14.240 13.742
Total 14.240 13.742 Classes of employee expenses Wages & salaries 141.971 121.484 Short-term benefits 23.075 12.370 Expenses for employee benefit obligations 8.006 7.525 Other long-term provisions 876 1.053 Other employee expenses 8.487 5.456
Total employee expenses 182.415 147.888 Total(1) 196.655 161.630
(1) The expense associated with personnel compensation is recorded in the operating cost for ThUS$ 140.993 (ThUS$ 118.712 in
2020) and in the administrative expense for ThUS$ 55.637 (ThUS$ 42.918 in 2020).
(26.2) The breakdown of the benefits pending settlement at each year-end is as follows:
12-31-2021 31-12-2020
Current Non-current Total Current Non-
current Total
Benefit ThUS$ ThUS$ ThUS$ ThUS$ ThUS$ ThUS$ Defined benefit obligations (IAS) (Note 26.3) 1.966 16.020 17.986 1.487 15.974 17.461 Vacations 7.866 - 7.866 7.614 - 7.614 Profit sharing and bonuses 10.693 - 10.693 9.339 - 9.339 Labour laws and taxes 3.033 - 3.033 3.548 - 3.548 Remuneration and other benefits payable 5.430 - 5.430 5.081 - 5.081 Total employee benefits 28.988 16.020 45.008 27.069 15.974 43.043
(26.3) Defined benefit obligations (IAS)
As of December 31, 2021 and December 31, 2020, the liability of SM SAAM and subsidiaries is determined using the criteria established in IAS 19.
The defined obligation is constituted by the staff severance indemnities that will be paid to all employees belonging to the Company by virtue of the collective agreements subscribed between the Company and its employees. This include the obligations of Iquique Terminal Internacional S.A. which recognizes the legal compensation that must be paid to all employees at the end of the concession and that of Mexican subsidiaries where compensation is a labour right of the workers.
276

2021 Integrated Report
Welcome Message00
SAAM, a Vocation of Service for the Foreign Trade Industry
01
Leadership and Governance Framework
02
Business Model03
Our Team04
Supplier Management05
Efficient Use of Natural Resources
06
Social Contribution07
Additional Information08
GRI Content Index09
Financial Statements10
SOCIEDAD MATRIZ SAAM S.A. AND SUBSIDIARIES Notes to the Consolidated Financial Statements
103
NOTE 26 Employee benefits and personnel expense, continued (26.3) Defined benefit obligations (IAS), continued
The actuarial valuation is based on the following parameters and percentages:
● Discount rate used 5.65% ● Salary increase rate varies between 4.10% and 5.25% ● Average turnover rate of the group that ranges between 0.62% and 8.47% for voluntary
retirement and 1.85% and 13.05% for dismissal. ● Mortality table rv-2014
The changes in the obligation payable to the personnel corresponding to defined benefits are shown in the following table:
Present value of defined benefit plant obligations 12-31-2021 12-31-2020 ThUS$ ThUS$
Balances as of January 1 17.461 11.618 Business combination acquisitions 178 2.481 Service cost 2.430 3.267 Interest cost (Note 31) 582 211 Actuarial (gains) losses 1.434 343 Changes in foreign exchange (2.390) 361 Payroll liquidations (1.709) (820) Total present value of defined benefit plan obligation 17.986 17.461
Current obligation (*) 1.966 1.487 Non-current obligation 16.020 15.974
Total obligation 17.986 17.461 (*) Corresponds to the best estimate of the Company regarding the amount to be paid during the following twelve months.
(26.4) Sensitivity analysis actuarial variables
The method used to quantify the effect it would have on the provision for staff severance indemnities, considers an increase and decrease of 10 per cent, in the actuarial variables used in the calculation of the provision. The main actuarial variables used by SM SAAM to measure this liability, and those used in the sensitivity analysis, are the following:
Actuarial assumption 10% Current -10% Discount rate 6,22% 5,65% 5,09%
Rate of salary increase 5,15% 4,69% 4,22%
(*) Turnover rate due to resignation 0,68% - 9,32% 0,62% - 8,47% 0,56% - 7,62%
(*) Turnover rate due to dismissal 2,04% -14,36% 1,85% -13,05% 1,67% - 11,75% (*) The turnover rates for resignation and dismissal considered in the analysis include the different variables applied to each company.
SOCIEDAD MATRIZ SAAM S.A. AND SUBSIDIARIES Notes to the Consolidated Financial Statements
104
NOTE 26 Employee benefits and personnel expense, continued (26.4) Sensitivity analysis actuarial variables, continued
The results of the analysis, considering the variations described above, are summarized in the following table: Effect of 10% increase in the variables used in the actuarial calculation ThUS$ Accounting balance as of 12.31.2021 17.986 Actuarial variation 49 Balance after actuarial variation 18.035
Effect of 10% decrease in the variables used in the actuarial calculation ThUS$ Accounting balance as of 12.31.2021 17.986 Actuarial variation (82) Balance after actuarial variation 17.904
NOTE 27 Equity and reserves As of December 31, 2021 the authorized share capital comprises 9,736,791,983 shares. All the
shares issued are fully paid-in:
Number of shares
Series Number of shares subscribed
Number of shares paid
Number of voting shares
SINGLE 9,736,791,983 9,736,791,983 9,736,791,983
These shares have no par value and the Company does not own any treasury shares. Earnings per share are calculated based on the profit attributable to the owners of the parent divided by the number of shares subscribed and paid. 27.1) Share capital
In number of shares year 2021 Common shares
Subscribed and paid-in as of January 1 9,736,791,983
Subscribed and paid 9,736,791,983
277

2021 Integrated Report
Welcome Message00
SAAM, a Vocation of Service for the Foreign Trade Industry
01
Leadership and Governance Framework
02
Business Model03
Our Team04
Supplier Management05
Efficient Use of Natural Resources
06
Social Contribution07
Additional Information08
GRI Content Index09
Financial Statements10
SOCIEDAD MATRIZ SAAM S.A. AND SUBSIDIARIES Notes to the Consolidated Financial Statements
105
NOTE 27 Equity and reserves, continued 27.2) Reserves
12-31-2021 12-31-2020 ThUS$ ThUS$
Reserve of exchange difference on translation (Note 27.2.1) (59.974) (57.659) Reserve of cash flow hedges (Note 27.2.2) (19.141) (791) Reserve of actuarial gains or losses on defined benefit plans (Note 27.2.3) (7.579) (5.270) Other miscellaneous reserves (Note 27.2.4) 15.801 35.485 Total (70.893) (28.235)
Explanation of movements: 27.2.1) Reserve of exchange difference on translation The translation reserve is produced by the translation of the financial statements of subsidiaries and associates of a functional currency other than the functional currency of the parent.
31-12-2021 31-12-2020 ThUS$ THUS$
Initial balance (57.659) (60.702) Variation of: Associated (Nota 16.1) (4.659) (216) Subsidiaries(*) 2.344 3.259
Total (59.974) (57.659) (*) Corresponds mainly to ThUS$ 1,924 of Servicios Portuarios Reloncaví for translation differences recognized on the sale of the investment and to the effects of conversion in the indirect subsidiary Saam Towage Canada Inc., whose functional currency is the Canadian dollar.
27.2.2) Reserve of cash flow hedges The hedge reserve includes the recording of the effective part, with respect to changes in the fair value of the derivative financial instruments and the hedged item, associated with future transactions.
12-31-2021 12-31-2020 ThUS$ ThUS$
Opening balance (791) 5.956 Result charged to comprehensive income of the period of:
Subsidiaries 1.696 (4.742) Company own derivatives(1) (20.046) (2.005) Total (19.141) (791)
(1) Corresponds mainly to the hedge reserve of Sociedad Matriz Saam, associated with the CCSWAP derivative, contracted for the placement of bonds in January 2017, June and August 2020.
SOCIEDAD MATRIZ SAAM S.A. AND SUBSIDIARIES Notes to the Consolidated Financial Statements
106
NOTE 27 Equity and reserves, continued 27.2) Reserves, continued 27.2.3 Reserve of actuarial gains or losses on defined benefit plans The reserve of actuarial gains for defined benefits includes the variation of the actuarial values of the provision of defined benefits to the Company's personnel.
12-31-2021 12-31-2020 ThUS$ ThUS$
Opening balance (5.270) (3.914) Increase due to changes in values of the estimate of defined benefit of: Associates (Note 16.1) (733) (275) Subsidiaries (1.576) (1.081)
Total (7.579) (5.270) 27.2.4) Other miscellaneous reserves The balance of other miscellaneous reserves as of December 31, 2021 was ThUS$ 15.801 (ThUS$ 35.485 as of December 31, 2020).
a) In the CSAV division, the financial value of the investment in SAAM as of January 1, 2012, amounting to ThUS $ 603,349, was assigned as sole asset to Sociedad Matriz SAAM S.A. In the opening balance sheet of Sociedad Matriz SAAM S.A. as of February 15, 2012, the difference between the initial equity of the company and its share capital of ThUS $ 586,506, established in the incorporation bylaws of October 5, 2011, is presented in the equity of SM SAAM in other reserves in the amount of ThUS $ 16,843.
b) The recognition of additional reserves of ThUS$ 3,763, in conformity with the current legal regulations in countries where foreign subsidiaries operate.
c) Additionally, as a result of the association agreement with Boskalis, dated July 1, 2014, as a result of the change in ownership without loss of control in the indirect subsidiary SAAM Remolques S.A. of C.V., meant to recognize credit in other reserves for ThUS $ 40,171.
d) On April 26 and 27, 2016, the Company acquired 1% of the rights of Inversiones San Marco Ltda. And Inmobiliaria San Marco Ltda., respectively. This transaction, which corresponds to an increase in the controlling percentage, meant recognizing a charge in other reserves for ThUS$ 1,325.
e) On May 16, 2017, the Company acquired the non-controlling interest in Kios S.A., this transaction generated a charge on reserves of ThUS$ 4,211.
f) Finally, on June 9, 2017, the Company acquired 15% of the shares of Iquique Terminal Internacional S.A. reaching 100% ownership interest in the port of Iquique. This transaction generated an effect on reserves of ThUS$ 7,204.
278
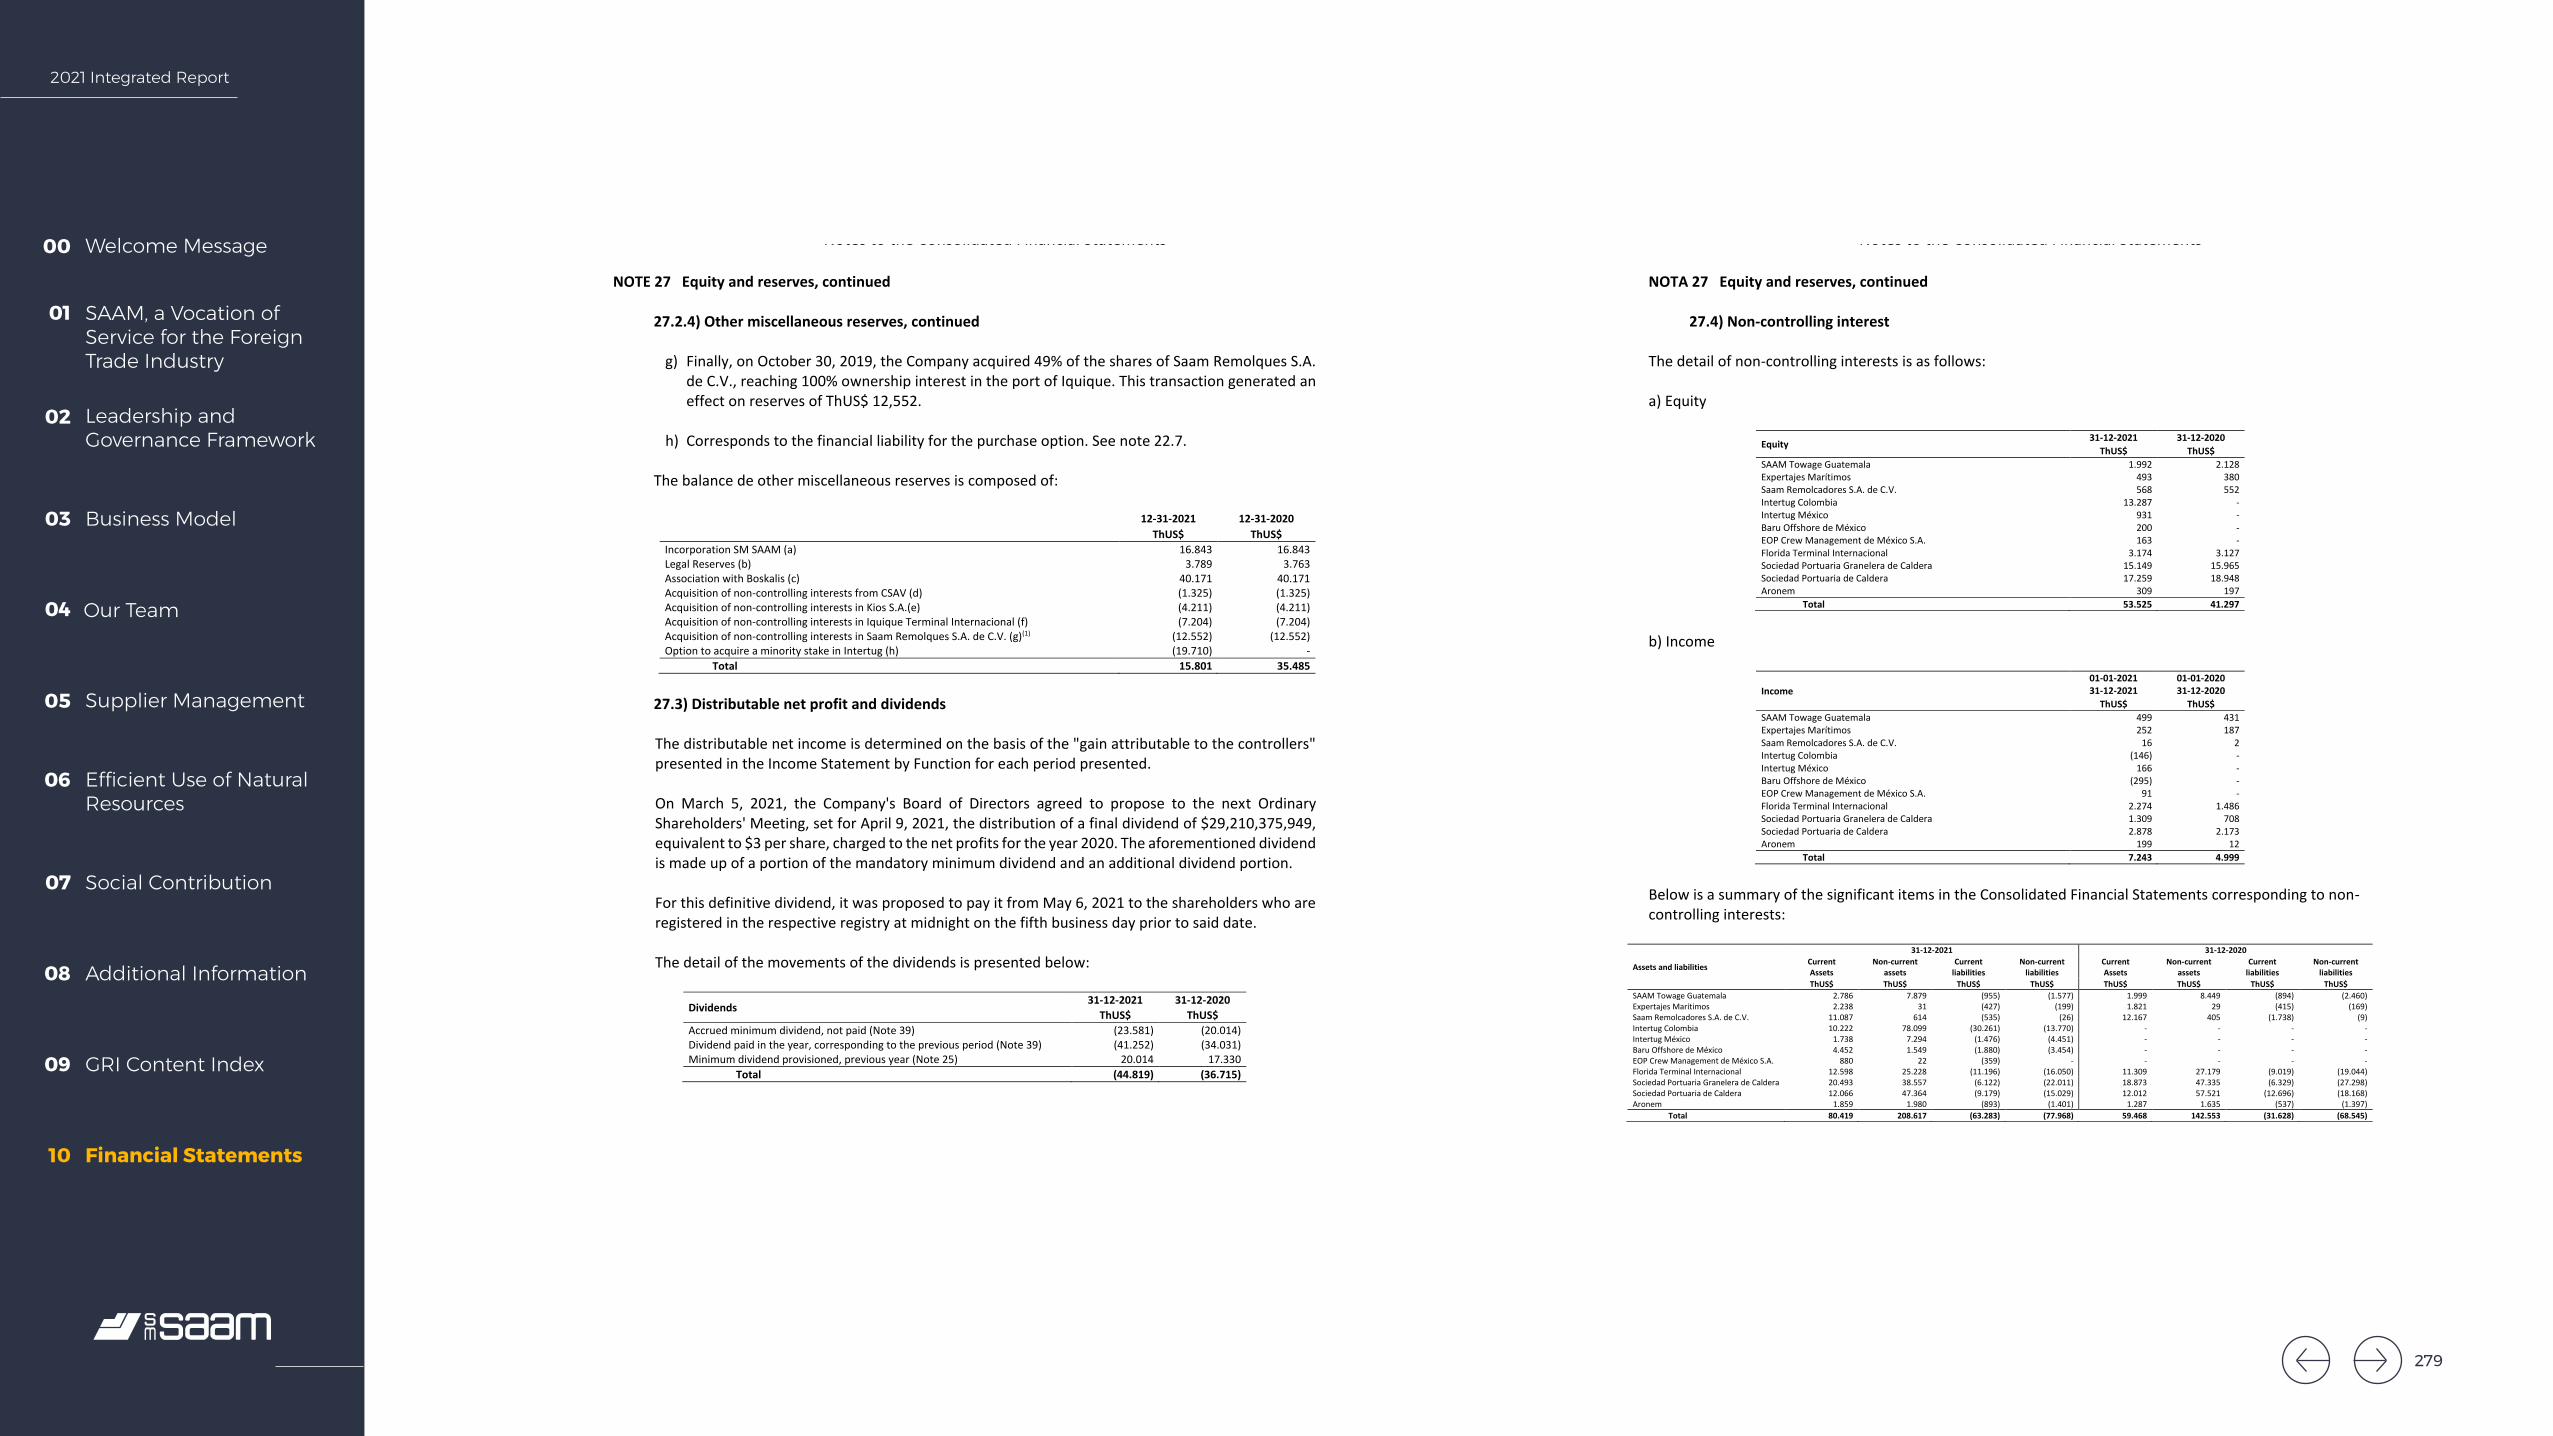
2021 Integrated Report
Welcome Message00
SAAM, a Vocation of Service for the Foreign Trade Industry
01
Leadership and Governance Framework
02
Business Model03
Our Team04
Supplier Management05
Efficient Use of Natural Resources
06
Social Contribution07
Additional Information08
GRI Content Index09
Financial Statements10
SOCIEDAD MATRIZ SAAM S.A. AND SUBSIDIARIES Notes to the Consolidated Financial Statements
107
NOTE 27 Equity and reserves, continued
27.2.4) Other miscellaneous reserves, continued
g) Finally, on October 30, 2019, the Company acquired 49% of the shares of Saam Remolques S.A.de C.V., reaching 100% ownership interest in the port of Iquique. This transaction generated aneffect on reserves of ThUS$ 12,552.
h) Corresponds to the financial liability for the purchase option. See note 22.7.
The balance de other miscellaneous reserves is composed of:
12-31-2021 12-31-2020ThUS$ ThUS$
Incorporation SM SAAM (a) 16.843 16.843 Legal Reserves (b) 3.789 3.763 Association with Boskalis (c) 40.171 40.171 Acquisition of non-controlling interests from CSAV (d) (1.325) (1.325) Acquisition of non-controlling interests in Kios S.A.(e) (4.211) (4.211) Acquisition of non-controlling interests in Iquique Terminal Internacional (f) (7.204) (7.204) Acquisition of non-controlling interests in Saam Remolques S.A. de C.V. (g)(1) (12.552) (12.552) Option to acquire a minority stake in Intertug (h) (19.710) -
Total 15.801 35.485
27.3) Distributable net profit and dividends
The distributable net income is determined on the basis of the "gain attributable to the controllers" presented in the Income Statement by Function for each period presented.
On March 5, 2021, the Company's Board of Directors agreed to propose to the next Ordinary Shareholders' Meeting, set for April 9, 2021, the distribution of a final dividend of $29,210,375,949, equivalent to $3 per share, charged to the net profits for the year 2020. The aforementioned dividend is made up of a portion of the mandatory minimum dividend and an additional dividend portion.
For this definitive dividend, it was proposed to pay it from May 6, 2021 to the shareholders who are registered in the respective registry at midnight on the fifth business day prior to said date.
The detail of the movements of the dividends is presented below:
Dividends 31-12-2021 31-12-2020ThUS$ ThUS$
Accrued minimum dividend, not paid (Note 39) (23.581) (20.014) Dividend paid in the year, corresponding to the previous period (Note 39) (41.252) (34.031) Minimum dividend provisioned, previous year (Note 25) 20.014 17.330
Total (44.819) (36.715)
SOCIEDAD MATRIZ SAAM S.A. AND SUBSIDIARIES Notes to the Consolidated Financial Statements
108
NOTA 27 Equity and reserves, continued
27.4) Non-controlling interest
The detail of non-controlling interests is as follows:
a) Equity
Equity 31-12-2021 31-12-2020 ThUS$ ThUS$
SAAM Towage Guatemala 1.992 2.128 Expertajes Marítimos 493 380 Saam Remolcadores S.A. de C.V. 568 552 Intertug Colombia 13.287 - Intertug México 931 - Baru Offshore de México 200 - EOP Crew Management de México S.A. 163 - Florida Terminal Internacional 3.174 3.127 Sociedad Portuaria Granelera de Caldera 15.149 15.965 Sociedad Portuaria de Caldera 17.259 18.948 Aronem 309 197
Total 53.525 41.297
b) Income
Income 01-01-2021 31-12-2021
01-01-2020 31-12-2020
ThUS$ ThUS$ SAAM Towage Guatemala 499 431 Expertajes Marítimos 252 187 Saam Remolcadores S.A. de C.V. 16 2 Intertug Colombia (146) - Intertug México 166 - Baru Offshore de México (295) - EOP Crew Management de México S.A. 91 - Florida Terminal Internacional 2.274 1.486 Sociedad Portuaria Granelera de Caldera 1.309 708 Sociedad Portuaria de Caldera 2.878 2.173 Aronem 199 12
Total 7.243 4.999
Below is a summary of the significant items in the Consolidated Financial Statements corresponding to non-controlling interests:
Assets and liabilities
31-12-2021 31-12-2020 Current Assets
Non-current assets
Current liabilities
Non-current liabilities
Current Assets
Non-current assets
Current liabilities
Non-current liabilities
ThUS$ ThUS$ ThUS$ ThUS$ ThUS$ ThUS$ ThUS$ ThUS$ SAAM Towage Guatemala 2.786 7.879 (955) (1.577) 1.999 8.449 (894) (2.460) Expertajes Marítimos 2.238 31 (427) (199) 1.821 29 (415) (169) Saam Remolcadores S.A. de C.V. 11.087 614 (535) (26) 12.167 405 (1.738) (9) Intertug Colombia 10.222 78.099 (30.261) (13.770) - - - - Intertug México 1.738 7.294 (1.476) (4.451) - - - - Baru Offshore de México 4.452 1.549 (1.880) (3.454) - - - - EOP Crew Management de México S.A. 880 22 (359) - - - - - Florida Terminal Internacional 12.598 25.228 (11.196) (16.050) 11.309 27.179 (9.019) (19.044) Sociedad Portuaria Granelera de Caldera 20.493 38.557 (6.122) (22.011) 18.873 47.335 (6.329) (27.298) Sociedad Portuaria de Caldera 12.066 47.364 (9.179) (15.029) 12.012 57.521 (12.696) (18.168) Aronem 1.859 1.980 (893) (1.401) 1.287 1.635 (537) (1.397)
Total 80.419 208.617 (63.283) (77.968) 59.468 142.553 (31.628) (68.545)
279
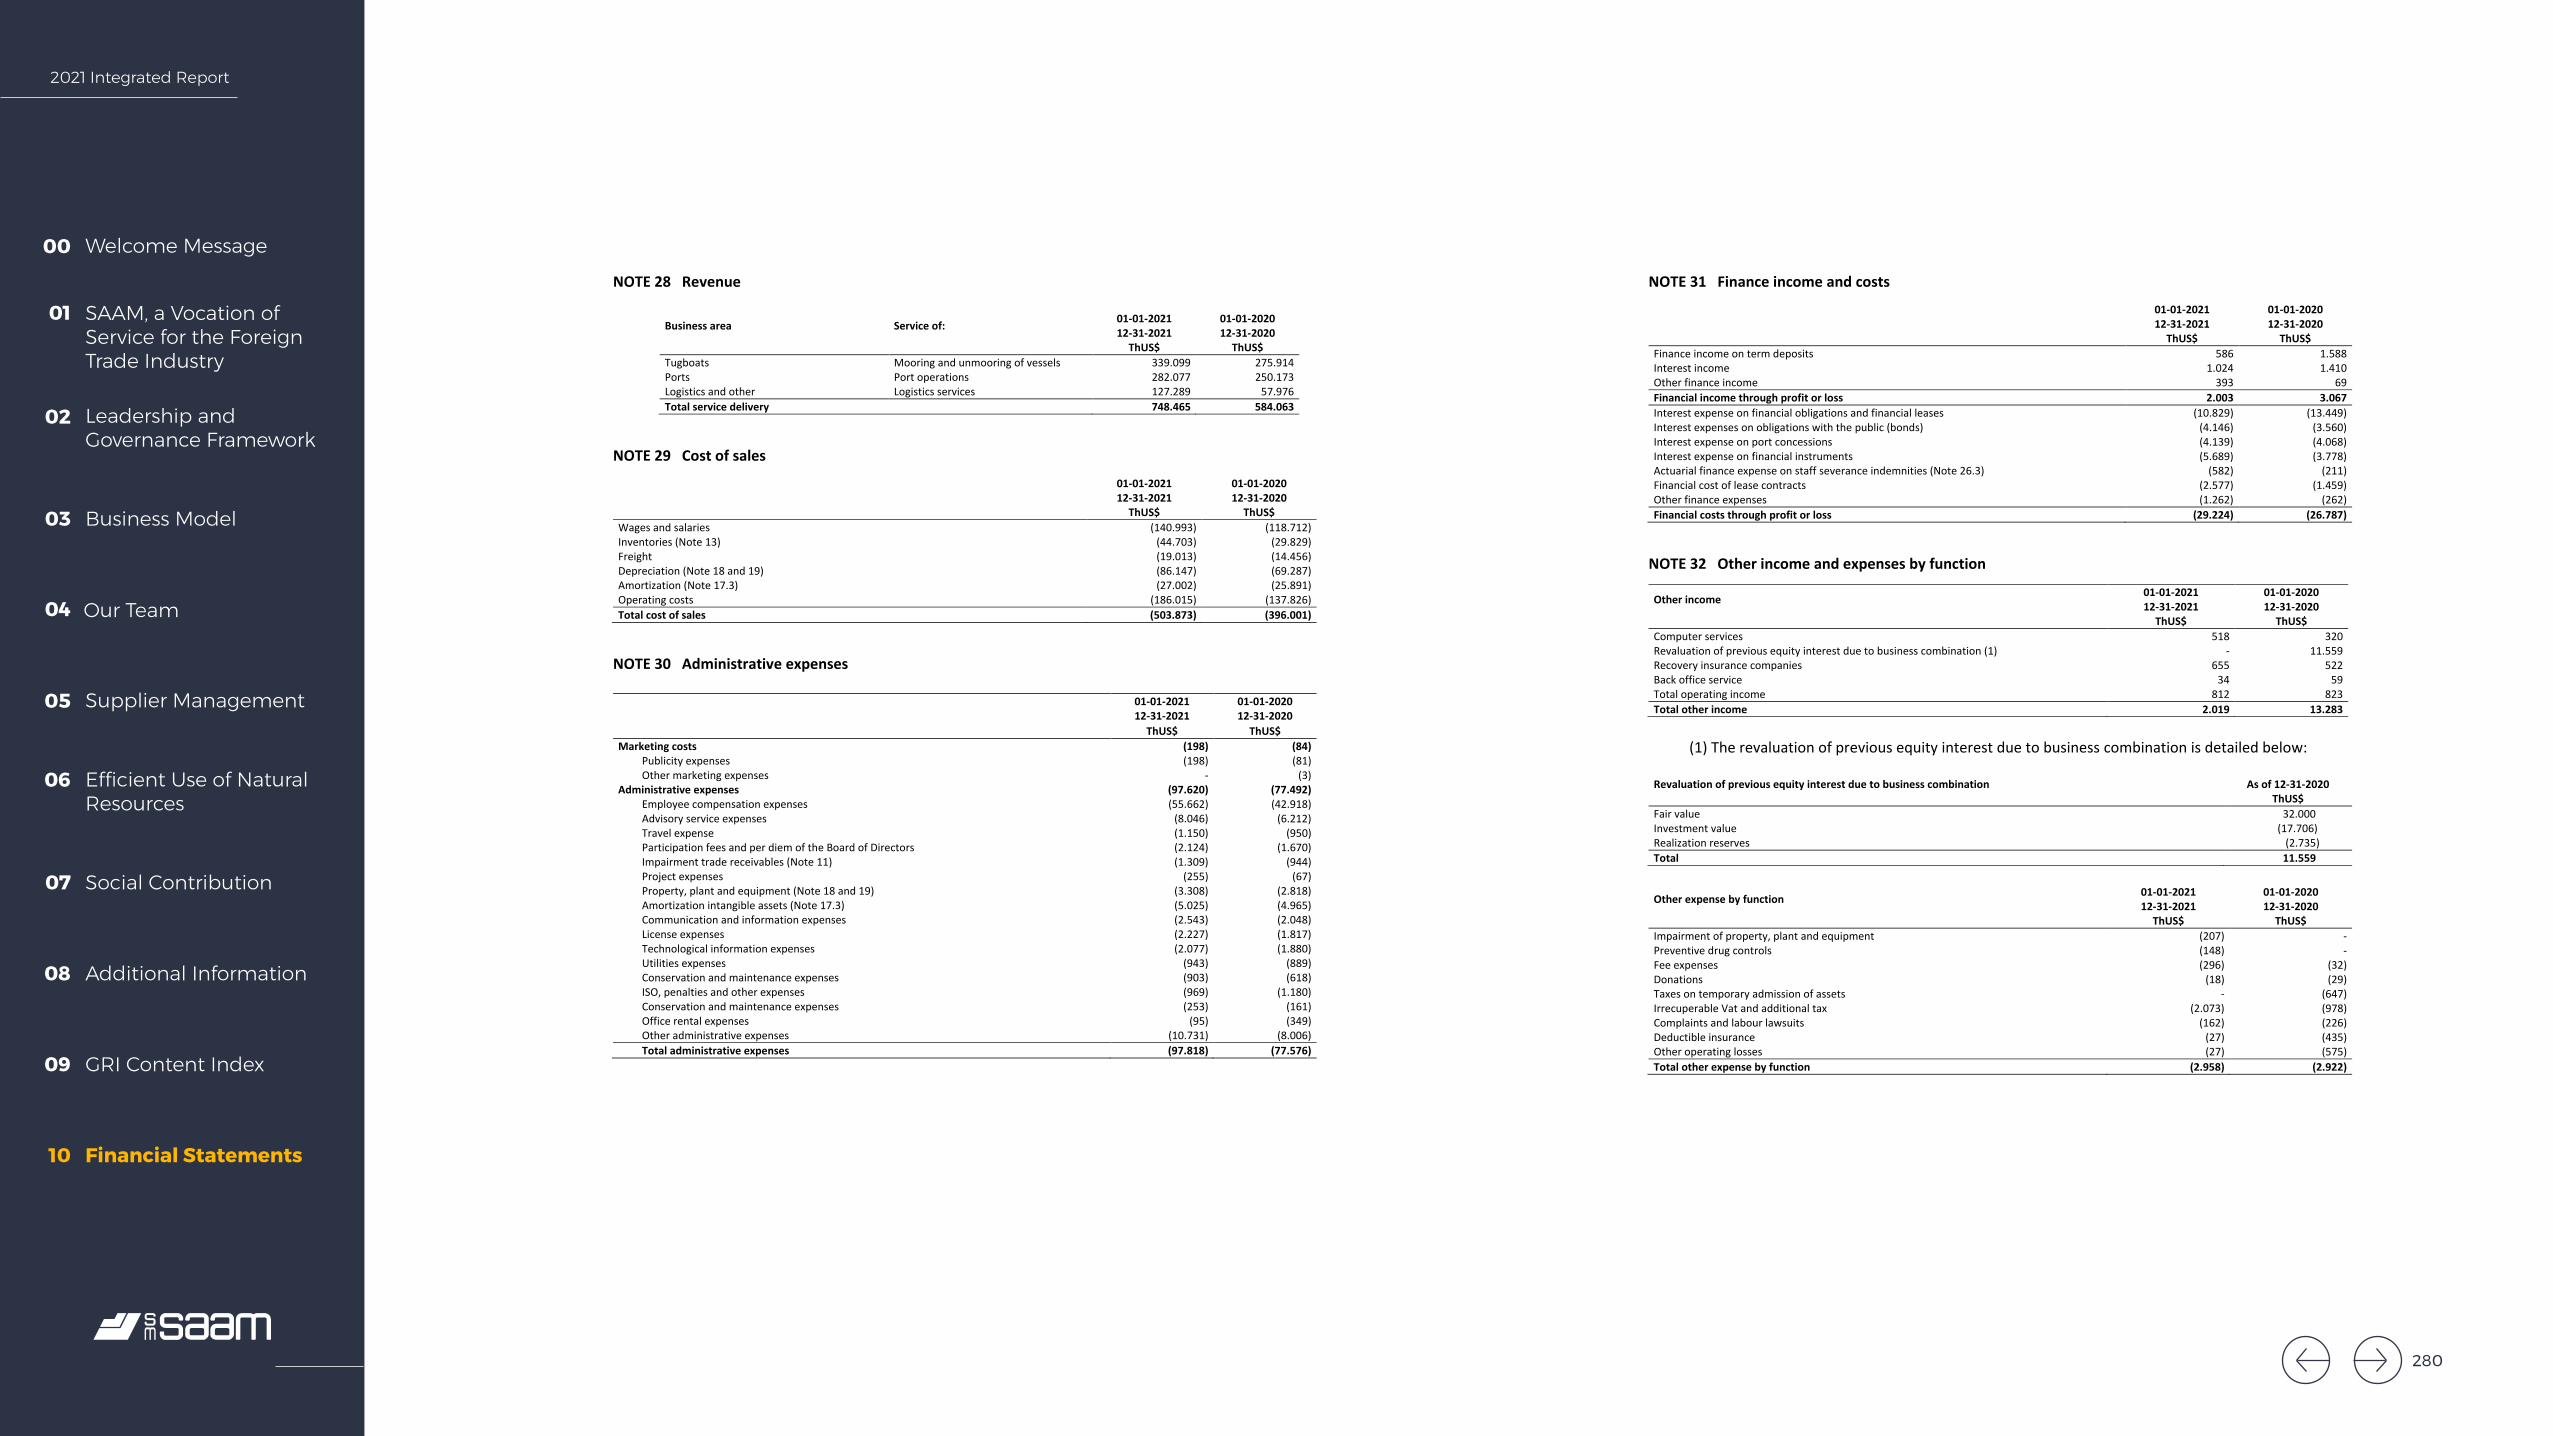
2021 Integrated Report
Welcome Message00
SAAM, a Vocation of Service for the Foreign Trade Industry
01
Leadership and Governance Framework
02
Business Model03
Our Team04
Supplier Management05
Efficient Use of Natural Resources
06
Social Contribution07
Additional Information08
GRI Content Index09
Financial Statements10
SOCIEDAD MATRIZ SAAM S.A. AND SUBSIDIARIES Notes to the Consolidated Financial Statements
109
NOTE 28 Revenue
Business area Service of: 01-01-2021 12-31-2021
01-01-2020 12-31-2020
ThUS$ ThUS$ Tugboats Mooring and unmooring of vessels 339.099 275.914 Ports Port operations 282.077 250.173 Logistics and other Logistics services 127.289 57.976 Total service delivery 748.465 584.063
NOTE 29 Cost of sales
01-01-2021 12-31-2021
01-01-2020 12-31-2020
ThUS$ ThUS$ Wages and salaries (140.993) (118.712) Inventories (Note 13) (44.703) (29.829) Freight (19.013) (14.456) Depreciation (Note 18 and 19) (86.147) (69.287) Amortization (Note 17.3) (27.002) (25.891) Operating costs (186.015) (137.826) Total cost of sales (503.873) (396.001)
NOTE 30 Administrative expenses
01-01-2021 12-31-2021
01-01-2020 12-31-2020
ThUS$ ThUS$ Marketing costs (198) (84)
Publicity expenses (198) (81) Other marketing expenses - (3)
Administrative expenses (97.620) (77.492) Employee compensation expenses (55.662) (42.918) Advisory service expenses (8.046) (6.212) Travel expense (1.150) (950) Participation fees and per diem of the Board of Directors (2.124) (1.670) Impairment trade receivables (Note 11) (1.309) (944) Project expenses (255) (67) Property, plant and equipment (Note 18 and 19) (3.308) (2.818) Amortization intangible assets (Note 17.3) (5.025) (4.965) Communication and information expenses (2.543) (2.048) License expenses (2.227) (1.817) Technological information expenses (2.077) (1.880) Utilities expenses (943) (889) Conservation and maintenance expenses (903) (618) ISO, penalties and other expenses (969) (1.180) Conservation and maintenance expenses (253) (161) Office rental expenses (95) (349) Other administrative expenses (10.731) (8.006) Total administrative expenses (97.818) (77.576)
SOCIEDAD MATRIZ SAAM S.A. AND SUBSIDIARIES Notes to the Consolidated Financial Statements
110
NOTE 31 Finance income and costs 01-01-202112-31-2021
01-01-202012-31-2020
ThUS$ ThUS$Finance income on term deposits 586 1.588 Interest income 1.024 1.410 Other finance income 393 69 Financial income through profit or loss 2.003 3.067 Interest expense on financial obligations and financial leases (10.829) (13.449) Interest expenses on obligations with the public (bonds) (4.146) (3.560) Interest expense on port concessions (4.139) (4.068) Interest expense on financial instruments (5.689) (3.778) Actuarial finance expense on staff severance indemnities (Note 26.3) (582) (211) Financial cost of lease contracts (2.577) (1.459) Other finance expenses (1.262) (262) Financial costs through profit or loss (29.224) (26.787)
NOTE 32 Other income and expenses by function
Other income 01-01-202112-31-2021
01-01-202012-31-2020
ThUS$ ThUS$Computer services 518 320 Revaluation of previous equity interest due to business combination (1) - 11.559 Recovery insurance companies 655 522 Back office service 34 59 Total operating income 812 823 Total other income 2.019 13.283
(1) The revaluation of previous equity interest due to business combination is detailed below:
Revaluation of previous equity interest due to business combination As of 12-31-2020 ThUS$
Fair value 32.000 Investment value (17.706) Realization reserves (2.735) Total 11.559
Other expense by function 01-01-202112-31-2021
01-01-202012-31-2020
ThUS$ ThUS$Impairment of property, plant and equipment (207) - Preventive drug controls (148) - Fee expenses (296) (32) Donations (18) (29) Taxes on temporary admission of assets - (647) Irrecuperable Vat and additional tax (2.073) (978) Complaints and labour lawsuits (162) (226) Deductible insurance (27) (435) Other operating losses (27) (575) Total other expense by function (2.958) (2.922)
280

2021 Integrated Report
Welcome Message00
SAAM, a Vocation of Service for the Foreign Trade Industry
01
Leadership and Governance Framework
02
Business Model03
Our Team04
Supplier Management05
Efficient Use of Natural Resources
06
Social Contribution07
Additional Information08
GRI Content Index09
Financial Statements10
SOCIEDAD MATRIZ SAAM S.A. AND SUBSIDIARIES Notes to the Consolidated Financial Statements
111
NOTE 33 Board of Directors and key management personnel
For these purposes, SM SAAM has defined as key personnel those persons who have authority and responsibility to plan, direct and control the Company's activities, including directors and managers who make up the Company's management. As of December 31, 2021 the Company’s management is composed of 27 executives (7 Directors and 20 managers). These professionals received compensation and other benefits, which are detailed below:
01-01-2021 12-31-2021
01-01-2020 12-31-2020
ThUS$ ThUS$ Wages & salaries 4.162 3.753 Administrators’ fees 423 385 Interests 2.906 2.354 Total 7.491 6.492
The following amounts paid as of December 31, 2021 and 2020 are recorded as Compensation for Directors of the Company:
Director Tax ID Relationship Company
Participation paid in profits
for the year 2020
Board Assistance
Participation paid in profits
for the year 2019
Board Assistance
31-12-2021 31-12-2021 31-12-2020 31-12-2020 ThUS$ ThUS$ ThUS$ ThUS$
Oscar Hasbún Martínez 11.632.255-2 President SM SAAM 257 95 215 64 Jean-Paul Luksic Fontbona 6.372.368-1 Vice-president SM SAAM 129 44 107 25 Francisco Gutiérrez Ph. 7.031.728-1 Director SM SAAM 129 47 107 32 Francisco Pérez Mackenna 6.525.286-4 Director SM SAAM 172 63 143 43 Jorge Gutiérrez Pubill 5.907.040-1 Director SM SAAM 172 63 143 43 Diego Bacigalupo Aracena 13.828.244-9 Director SM SAAM 129 47 107 32 Armando Valdivieso Montes 8.321.934-3 Director SM SAAM 175 63 144 43 Totals 1.163 422 966 282
As of December 31, 2021, the Company has provisioned a total amount of ThUS$1,326 (ThUS$940 as of December 31, 2020) for accrued participation on profits for the year 2021, which will be paid to the Directors of SM SAAM in the following year (note 24). During the 2021 period, the Company's Board of Directors determined to pay the shareholders, the Profit Sharing for the year 2020, equivalent to 61.83%.
SOCIEDAD MATRIZ SAAM S.A. AND SUBSIDIARIES Notes to the Consolidated Financial Statements
112
NOTE 34 Other gains (losses)
01-01-2021 12-31-2021
01-01-2020 12-31-2020
ThUS$ ThUS$ Proceeds from disposal of assets (Note 39.a) 711 4.791 Write-offs of assets (413) (627) Profit from sale of non-controlling interests(1) 605 - Dividends held-for-sale investments 1.458 - Profit (loss) on sale of held-for-sale assets (Note 39.a) 1.114 - Profit from disposal of inventories 123 542 Other gains (losses) 671 682 Total other gains (losses) 4.269 5.388
(1) The profit on the sale of non-controlling interests corresponds to the sale of 50% and 49% of participation in the associates Servicios Portuarios Reloncaví S.A. and Luckymont S.A. respectively. The detail is presented below:
Servicios Portuarios Reloncaví S.A. Luckymont S.A. Total
ThUS$ ThUS$ ThUS$ Selling price ThUS$ (a) 4.925 3.944 8.869 Investment Cost ThUS$ (b) (3.638) (1.849) (5.487) Realization reserves ThUS$ (1.924) - (1.924) Profit before tax ThUS$ (637) 2.095 1.458
(a) See investment cash flow (b) See note 16.1
NOTE 35 Concession agreement of services and others The non-renewal of any of the port concessions is a long-term risk, which will depend on future market conditions and negotiations with port authorities. All port concessions to date have been renewed. This has been the product of having reached and maintained a certain operational standard, which is more than fulfilled by SM SAAM in its places of operation. Additionally, the company has concessions in the tugboat business in Costa Rica and Mexico. The concession agreements and rights of use of the following terminals are described below: Iquique Terminal Internacional S.A. (Chile) Empresa Portuaria Iquique (EPI) through the "Concession Contract for the Mooring Front number 2 of the Port of Iquique", dated May 3, 2000, granted the indirect subsidiary Iquique Terminal Internacional S.A. (ITI) an exclusive concession to develop, maintain and exploit the mooring front, including the right to collect from users basic rates for utilities, and special rates for special services rendered at said mooring front. The original term of the contract was 20 years, starting from the date of delivery of the mooring front, materialized on July 1, 2000. The Company extended the term for a period of 10 additional years, due to the execution of the infrastructure projects stipulated in the concession contract.
281
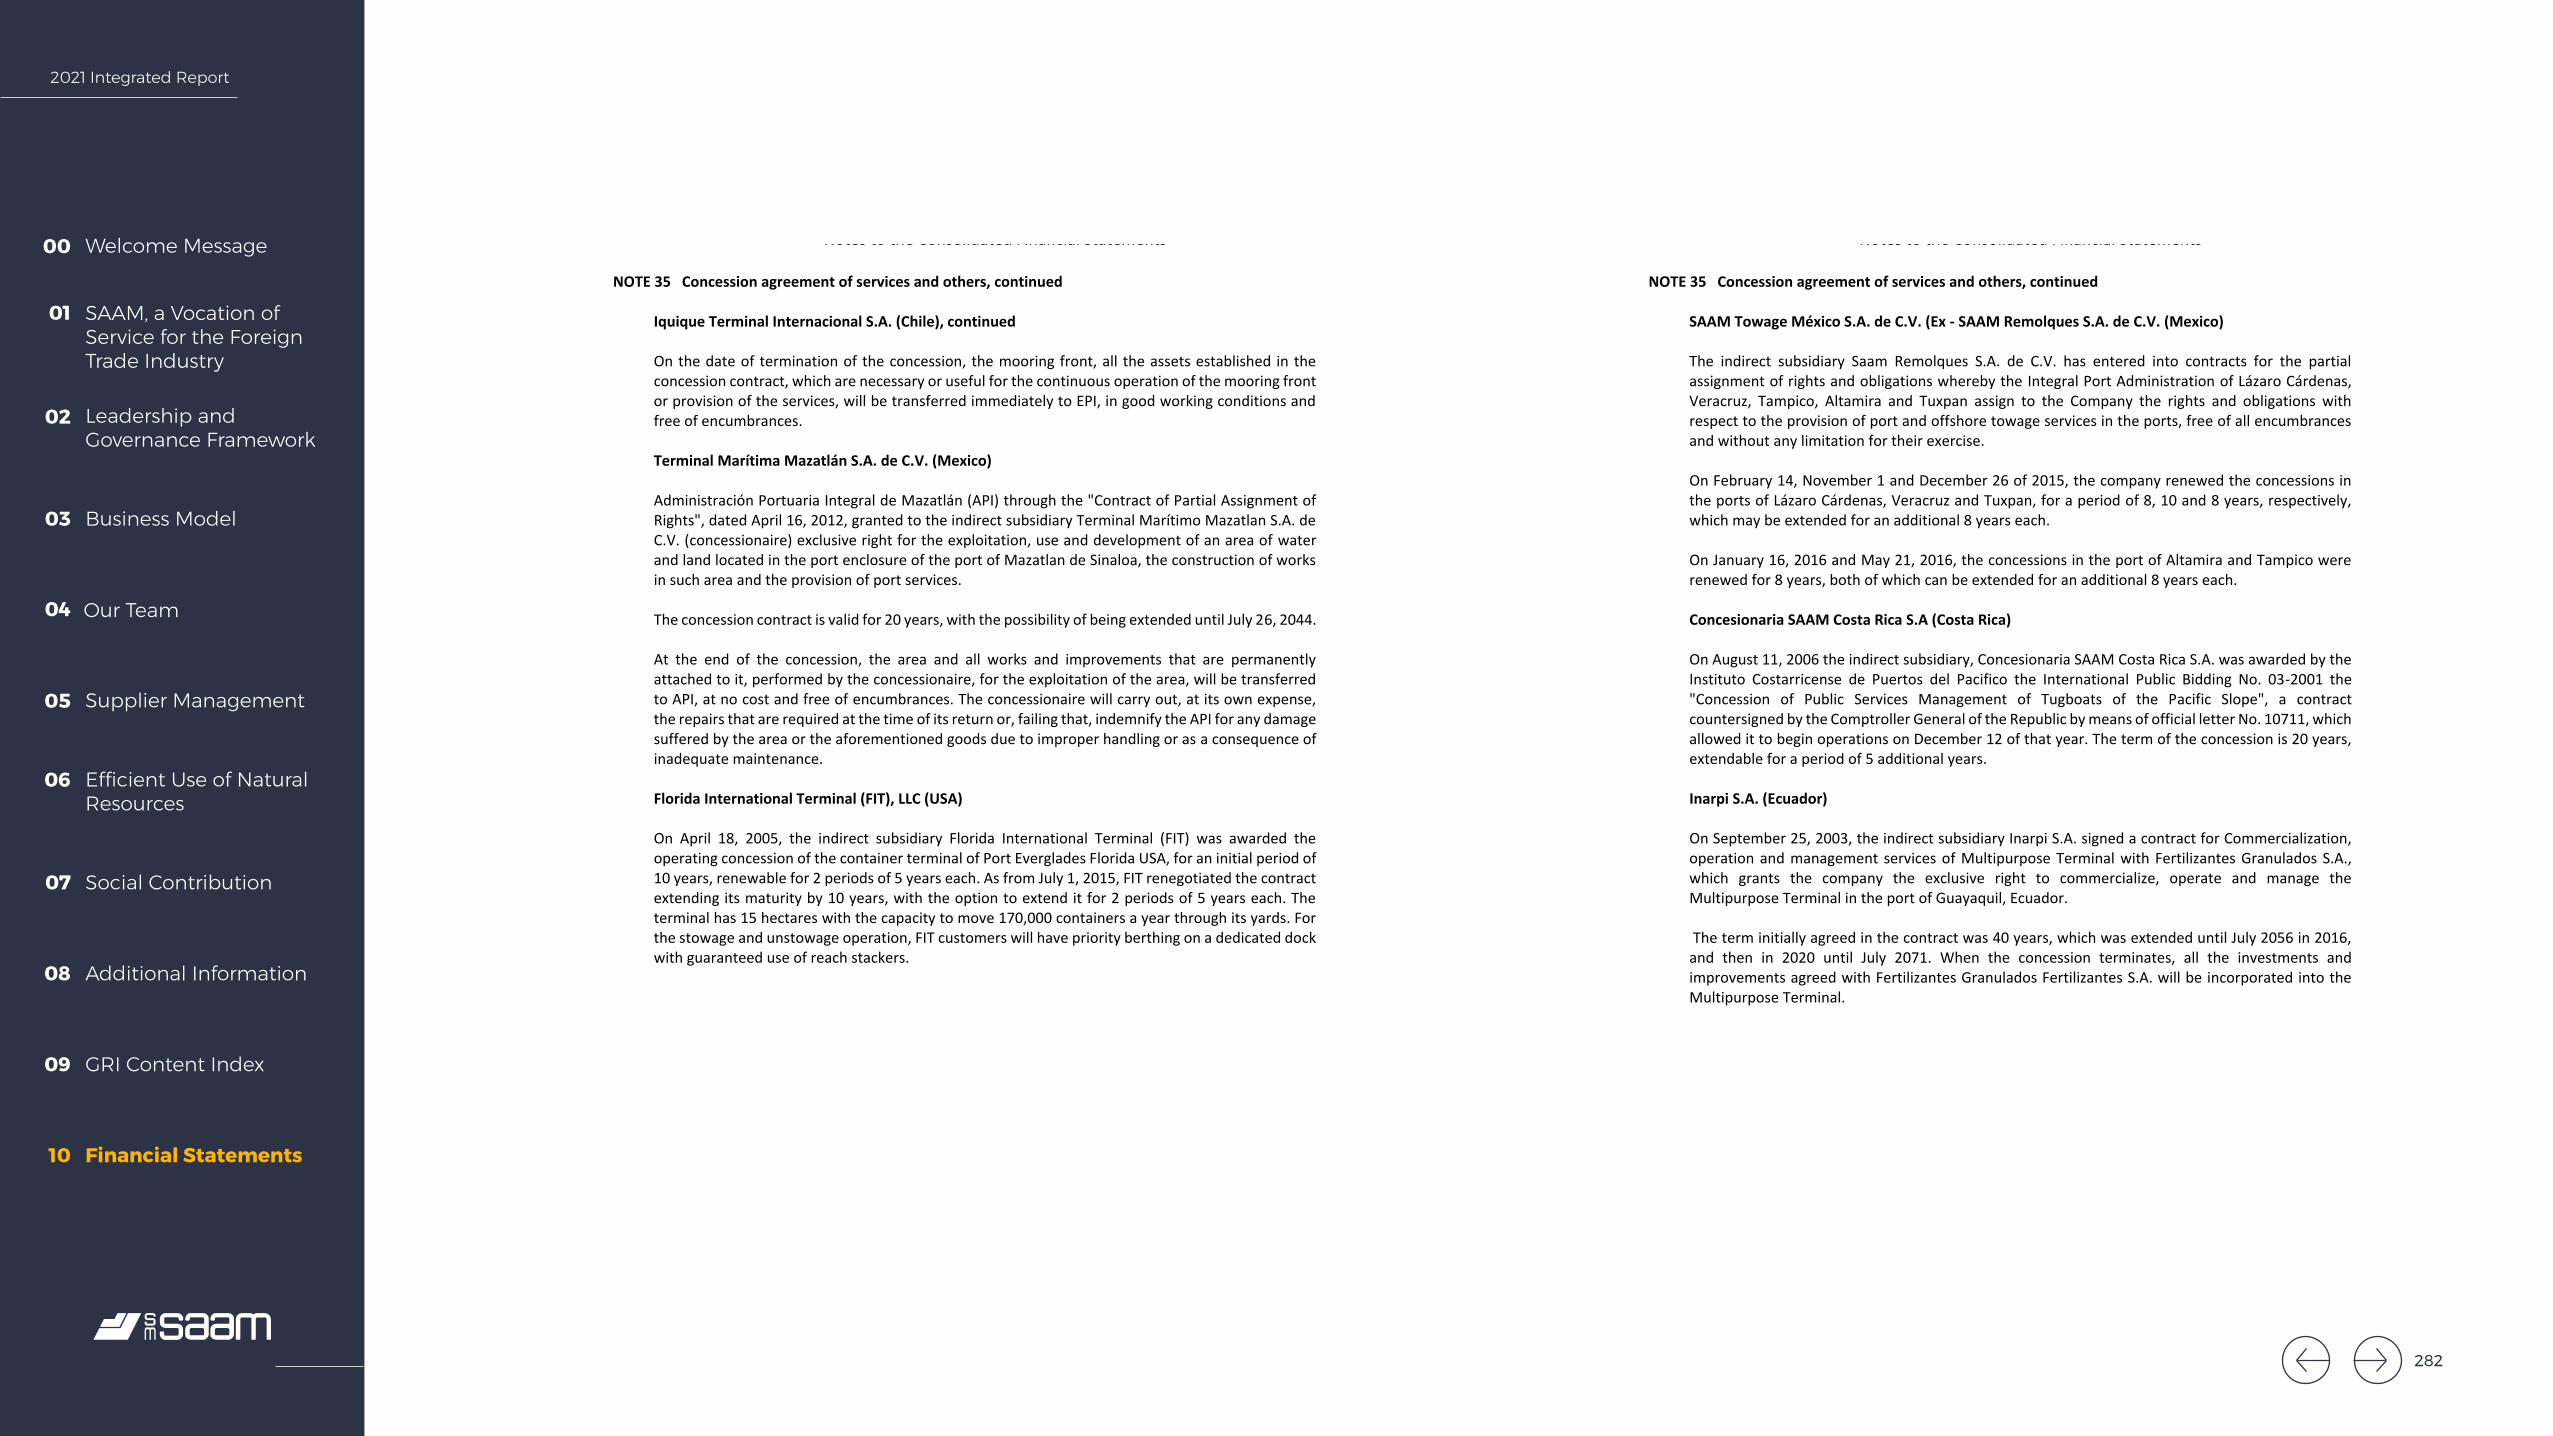
2021 Integrated Report
Welcome Message00
SAAM, a Vocation of Service for the Foreign Trade Industry
01
Leadership and Governance Framework
02
Business Model03
Our Team04
Supplier Management05
Efficient Use of Natural Resources
06
Social Contribution07
Additional Information08
GRI Content Index09
Financial Statements10
SOCIEDAD MATRIZ SAAM S.A. AND SUBSIDIARIES Notes to the Consolidated Financial Statements
113
NOTE 35 Concession agreement of services and others, continued
Iquique Terminal Internacional S.A. (Chile), continued
On the date of termination of the concession, the mooring front, all the assets established in the concession contract, which are necessary or useful for the continuous operation of the mooring front or provision of the services, will be transferred immediately to EPI, in good working conditions and free of encumbrances.
Terminal Marítima Mazatlán S.A. de C.V. (Mexico) Administración Portuaria Integral de Mazatlán (API) through the "Contract of Partial Assignment of Rights", dated April 16, 2012, granted to the indirect subsidiary Terminal Marítimo Mazatlan S.A. de C.V. (concessionaire) exclusive right for the exploitation, use and development of an area of water and land located in the port enclosure of the port of Mazatlan de Sinaloa, the construction of works in such area and the provision of port services. The concession contract is valid for 20 years, with the possibility of being extended until July 26, 2044. At the end of the concession, the area and all works and improvements that are permanently attached to it, performed by the concessionaire, for the exploitation of the area, will be transferred to API, at no cost and free of encumbrances. The concessionaire will carry out, at its own expense, the repairs that are required at the time of its return or, failing that, indemnify the API for any damage suffered by the area or the aforementioned goods due to improper handling or as a consequence of inadequate maintenance. Florida International Terminal (FIT), LLC (USA)
On April 18, 2005, the indirect subsidiary Florida International Terminal (FIT) was awarded the operating concession of the container terminal of Port Everglades Florida USA, for an initial period of 10 years, renewable for 2 periods of 5 years each. As from July 1, 2015, FIT renegotiated the contract extending its maturity by 10 years, with the option to extend it for 2 periods of 5 years each. The terminal has 15 hectares with the capacity to move 170,000 containers a year through its yards. For the stowage and unstowage operation, FIT customers will have priority berthing on a dedicated dock with guaranteed use of reach stackers.
SOCIEDAD MATRIZ SAAM S.A. AND SUBSIDIARIES Notes to the Consolidated Financial Statements
114
NOTE 35 Concession agreement of services and others, continued
SAAM Towage México S.A. de C.V. (Ex - SAAM Remolques S.A. de C.V. (Mexico)
The indirect subsidiary Saam Remolques S.A. de C.V. has entered into contracts for the partial assignment of rights and obligations whereby the Integral Port Administration of Lázaro Cárdenas, Veracruz, Tampico, Altamira and Tuxpan assign to the Company the rights and obligations with respect to the provision of port and offshore towage services in the ports, free of all encumbrances and without any limitation for their exercise.
On February 14, November 1 and December 26 of 2015, the company renewed the concessions in the ports of Lázaro Cárdenas, Veracruz and Tuxpan, for a period of 8, 10 and 8 years, respectively, which may be extended for an additional 8 years each.
On January 16, 2016 and May 21, 2016, the concessions in the port of Altamira and Tampico were renewed for 8 years, both of which can be extended for an additional 8 years each.
Concesionaria SAAM Costa Rica S.A (Costa Rica)
On August 11, 2006 the indirect subsidiary, Concesionaria SAAM Costa Rica S.A. was awarded by the Instituto Costarricense de Puertos del Pacifico the International Public Bidding No. 03-2001 the "Concession of Public Services Management of Tugboats of the Pacific Slope", a contract countersigned by the Comptroller General of the Republic by means of official letter No. 10711, which allowed it to begin operations on December 12 of that year. The term of the concession is 20 years, extendable for a period of 5 additional years.
Inarpi S.A. (Ecuador)
On September 25, 2003, the indirect subsidiary Inarpi S.A. signed a contract for Commercialization, operation and management services of Multipurpose Terminal with Fertilizantes Granulados S.A., which grants the company the exclusive right to commercialize, operate and manage the Multipurpose Terminal in the port of Guayaquil, Ecuador.
The term initially agreed in the contract was 40 years, which was extended until July 2056 in 2016, and then in 2020 until July 2071. When the concession terminates, all the investments and improvements agreed with Fertilizantes Granulados Fertilizantes S.A. will be incorporated into the Multipurpose Terminal.
282

2021 Integrated Report
Welcome Message00
SAAM, a Vocation of Service for the Foreign Trade Industry
01
Leadership and Governance Framework
02
Business Model03
Our Team04
Supplier Management05
Efficient Use of Natural Resources
06
Social Contribution07
Additional Information08
GRI Content Index09
Financial Statements10
SOCIEDAD MATRIZ SAAM S.A. AND SUBSIDIARIES Notes to the Consolidated Financial Statements
115
NOTE 35 Concession agreement of services and others, continued
Sociedad Portuaria de Caldera (Costa Rica) On 8 February 2017, SM SAAM acquired 51% of the shares of Compañía Portuaria Granelera de Caldera S.A., hereinafter SPGC, SPGC's main activities include the provision of bulk product loading and unloading services, as well as the design, planning, financing, construction, maintenance and operation of the new Bulk Terminal at Puerto Caldera, under the public works concession with public services regime, as established in the "Public Works Concession Contract with Public Services for the Construction and Operation of the Bulk Terminal at Puerto Caldera", signed on April 19, 2006, with the Instituto Costarricense de Puertos del Pacífico (INCOP). The term of the contract is 20 years, valid until August 11, 2026, with the option to extend the term of the concession for up to 30 additional years. At the end of the concession contract, all infrastructure works and all of the rights over the acquired goods, must be delivered to the INCOP free of liens. Sociedad Portuaria de Caldera (Costa Rica) On February 8, 2017, SM SAAM acquired 51% of the shares of Compañía Sociedad Portuaria de Caldera S.A., hereinafter SPC. The main activities of Sociedad Portuaria de Caldera (SPC), S.A. (the Company or 'SPC') include the provision of services related to the commercial scales made by all types of vessels requesting berthing in posts one, two and three in the Port of Caldera in Costa Rica, as well as the services required in relation to the general cargo, containers, vehicles, “saqueria” (cargo handling) and sobre chasis (placing the container on the truck), in port facilities such as loading and unloading, mooring, unmooring, demurrage, wharfage, stowage, unloading, transfer and storage of cargo, as well as vessel and ship services, under the concession regime for the management of public services, as established in the "Public Services Management Concession Contract for the Puerto Caldera Terminal", signed on March 30, 2006., with the Costa Rican Institute of Ports of the Pacific (INCOP). The term of the contract is 20 years, valid until August 11, 2026, with the option to extend the term of the concession for up to 5 additional years. At the end of the concession contract, all infrastructure works and all of the rights over the acquired goods, must be delivered to the INCOP free of liens.
283
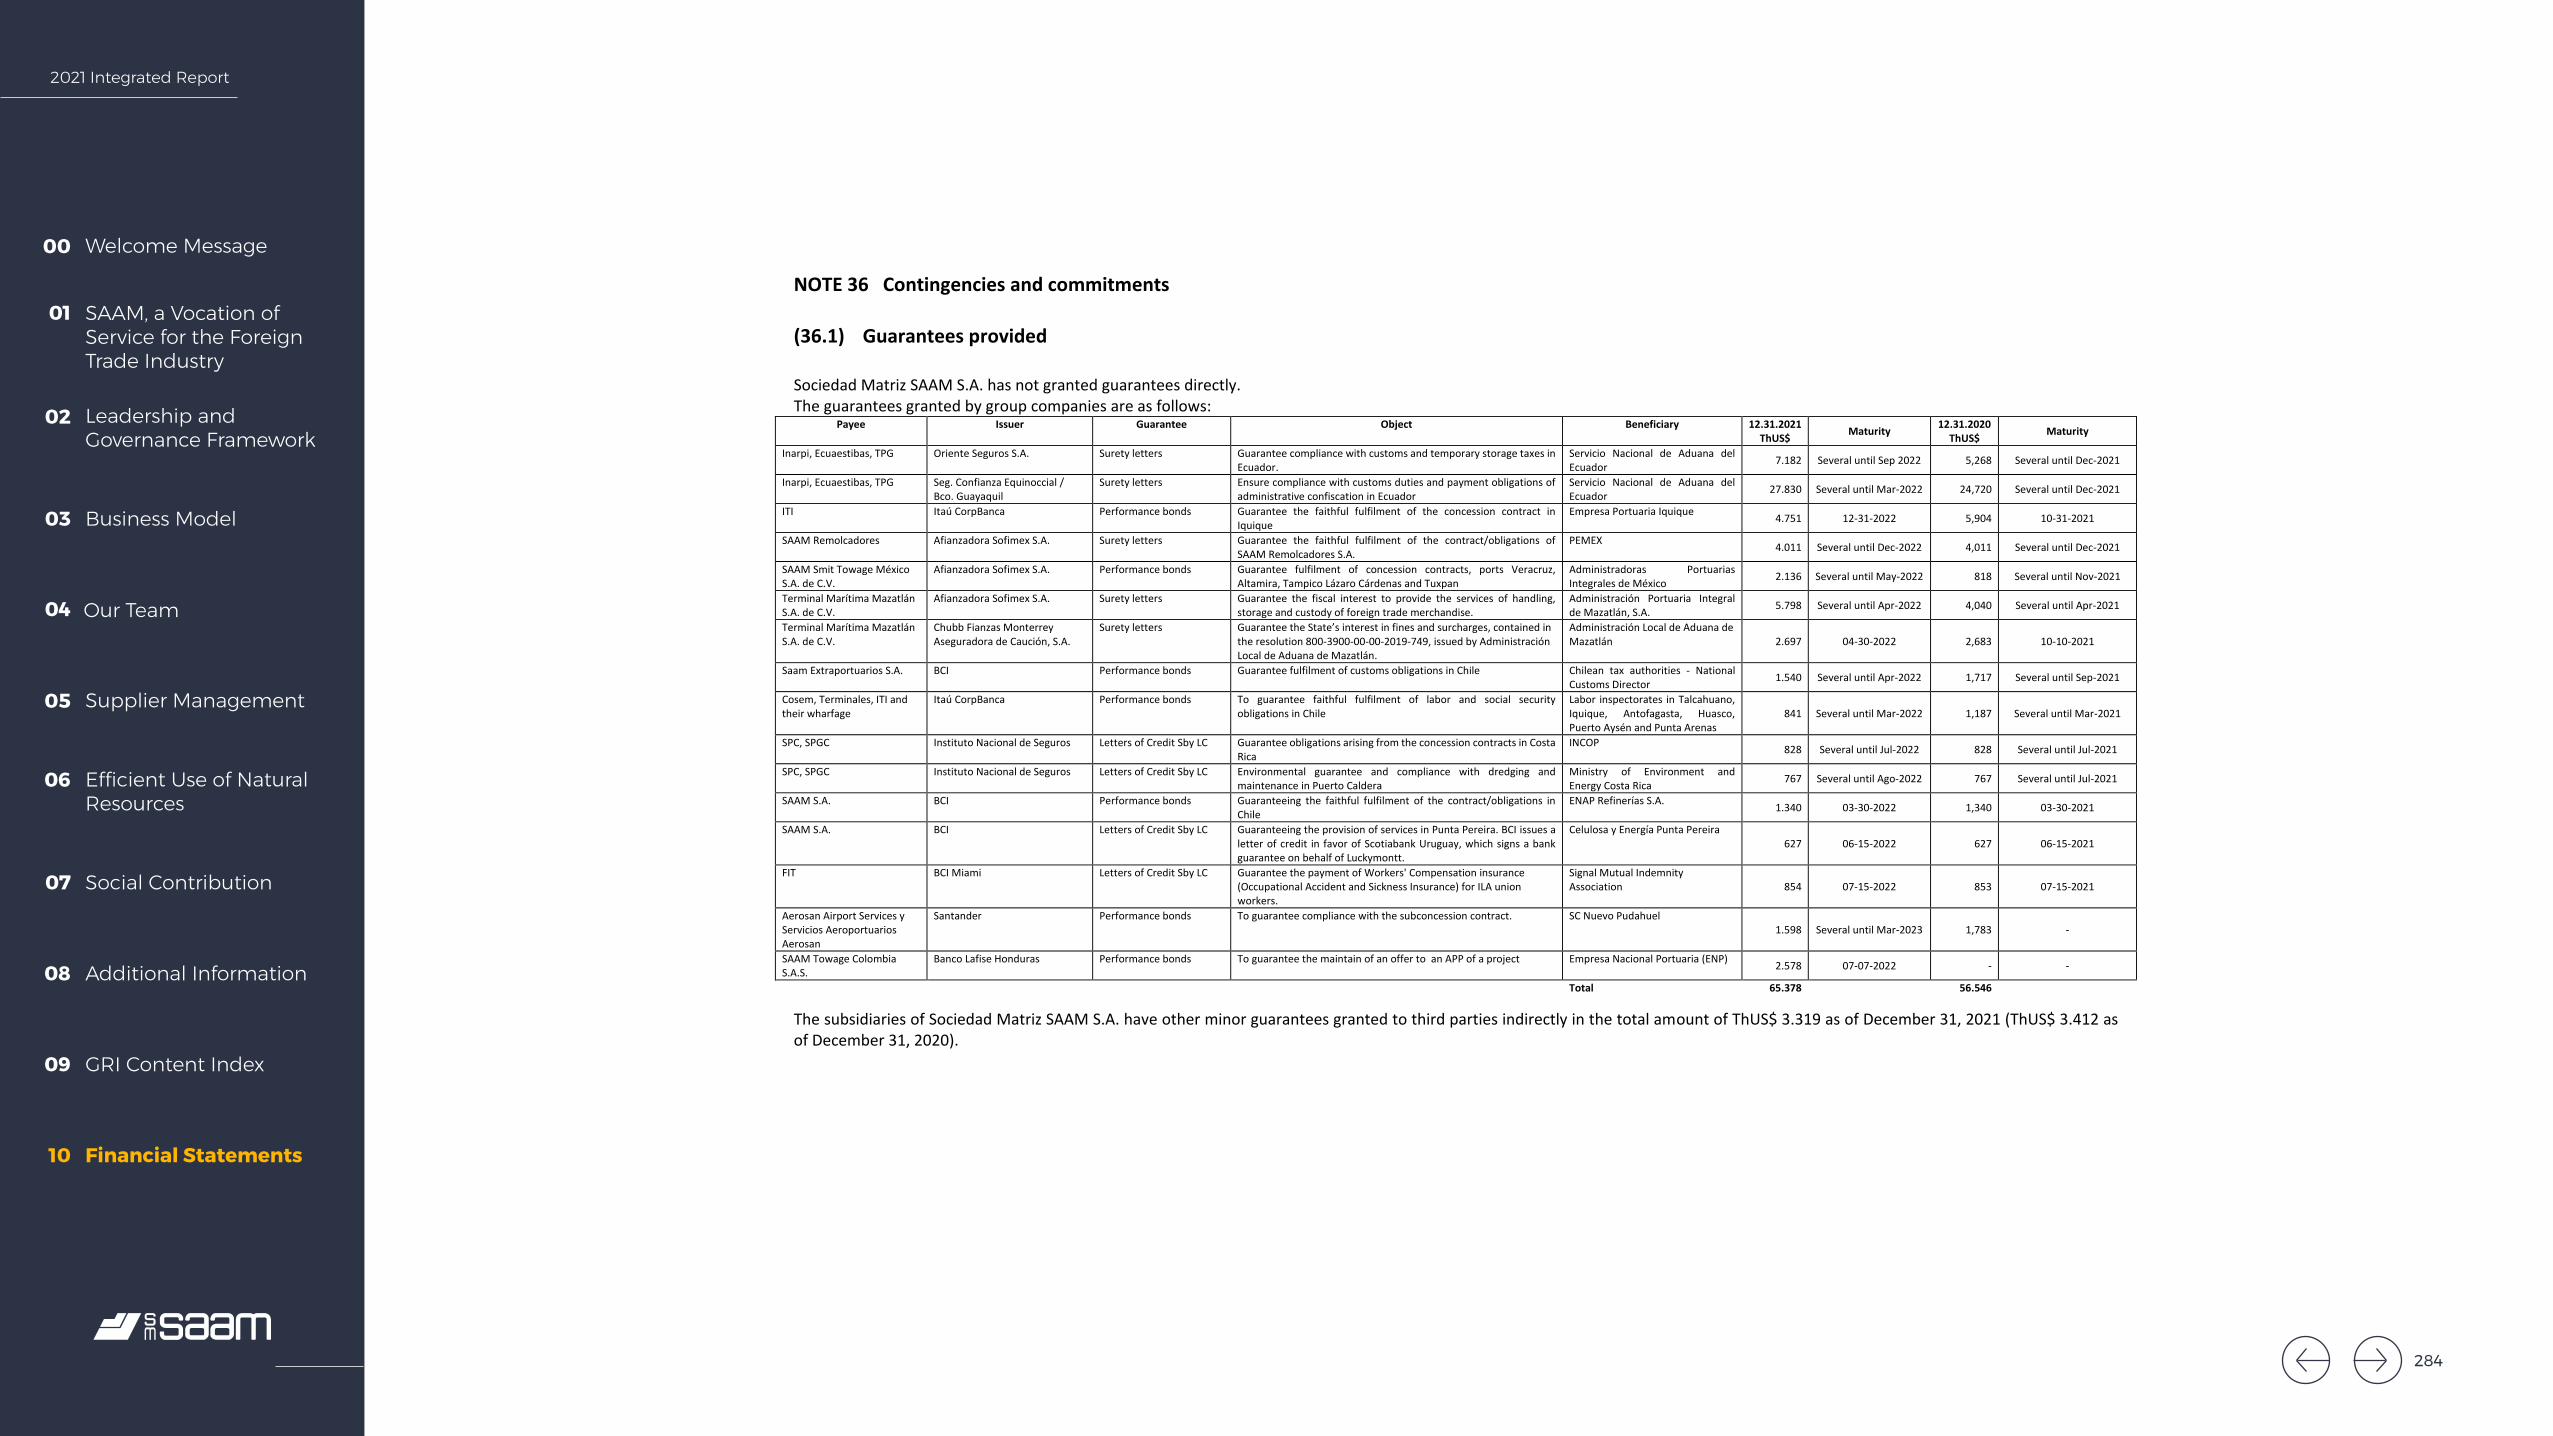
2021 Integrated Report
Welcome Message00
SAAM, a Vocation of Service for the Foreign Trade Industry
01
Leadership and Governance Framework
02
Business Model03
Our Team04
Supplier Management05
Efficient Use of Natural Resources
06
Social Contribution07
Additional Information08
GRI Content Index09
Financial Statements10
SOCIEDAD MATRIZ SAAM S.A. AND SUBSIDIARIES Notes to the Consolidated Financial Statements
116
NOTE 36 Contingencies and commitments (36.1) Guarantees provided
Sociedad Matriz SAAM S.A. has not granted guarantees directly. The guarantees granted by group companies are as follows:
Payee Issuer Guarantee Object Beneficiary 12.31.2021 ThUS$ Maturity 12.31.2020
ThUS$ Maturity
Inarpi, Ecuaestibas, TPG Oriente Seguros S.A. Surety letters Guarantee compliance with customs and temporary storage taxes in Ecuador.
Servicio Nacional de Aduana del Ecuador 7.182 Several until Sep 2022 5,268 Several until Dec-2021
Inarpi, Ecuaestibas, TPG Seg. Confianza Equinoccial / Bco. Guayaquil
Surety letters Ensure compliance with customs duties and payment obligations of administrative confiscation in Ecuador
Servicio Nacional de Aduana del Ecuador 27.830 Several until Mar-2022 24,720 Several until Dec-2021
ITI Itaú CorpBanca Performance bonds Guarantee the faithful fulfilment of the concession contract in Iquique
Empresa Portuaria Iquique 4.751 12-31-2022 5,904 10-31-2021
SAAM Remolcadores Afianzadora Sofimex S.A. Surety letters Guarantee the faithful fulfilment of the contract/obligations of SAAM Remolcadores S.A.
PEMEX 4.011 Several until Dec-2022 4,011 Several until Dec-2021
SAAM Smit Towage México S.A. de C.V.
Afianzadora Sofimex S.A. Performance bonds Guarantee fulfilment of concession contracts, ports Veracruz, Altamira, Tampico Lázaro Cárdenas and Tuxpan
Administradoras Portuarias Integrales de México 2.136 Several until May-2022 818 Several until Nov-2021
Terminal Marítima Mazatlán S.A. de C.V.
Afianzadora Sofimex S.A. Surety letters Guarantee the fiscal interest to provide the services of handling, storage and custody of foreign trade merchandise.
Administración Portuaria Integral de Mazatlán, S.A. 5.798 Several until Apr-2022 4,040 Several until Apr-2021
Terminal Marítima Mazatlán S.A. de C.V.
Chubb Fianzas Monterrey Aseguradora de Caución, S.A.
Surety letters Guarantee the State’s interest in fines and surcharges, contained in the resolution 800-3900-00-00-2019-749, issued by Administración Local de Aduana de Mazatlán.
Administración Local de Aduana de Mazatlán 2.697 04-30-2022 2,683 10-10-2021
Saam Extraportuarios S.A. BCI Performance bonds Guarantee fulfilment of customs obligations in Chile Chilean tax authorities - National Customs Director 1.540 Several until Apr-2022 1,717 Several until Sep-2021
Cosem, Terminales, ITI and their wharfage
Itaú CorpBanca Performance bonds To guarantee faithful fulfilment of labor and social security obligations in Chile
Labor inspectorates in Talcahuano, Iquique, Antofagasta, Huasco, Puerto Aysén and Punta Arenas
841 Several until Mar-2022 1,187 Several until Mar-2021
SPC, SPGC Instituto Nacional de Seguros Letters of Credit Sby LC Guarantee obligations arising from the concession contracts in Costa Rica
INCOP 828 Several until Jul-2022 828 Several until Jul-2021
SPC, SPGC Instituto Nacional de Seguros Letters of Credit Sby LC Environmental guarantee and compliance with dredging and maintenance in Puerto Caldera
Ministry of Environment and Energy Costa Rica 767 Several until Ago-2022 767 Several until Jul-2021
SAAM S.A. BCI Performance bonds Guaranteeing the faithful fulfilment of the contract/obligations in Chile
ENAP Refinerías S.A. 1.340 03-30-2022 1,340 03-30-2021
SAAM S.A. BCI Letters of Credit Sby LC Guaranteeing the provision of services in Punta Pereira. BCI issues a letter of credit in favor of Scotiabank Uruguay, which signs a bank guarantee on behalf of Luckymontt.
Celulosa y Energía Punta Pereira 627 06-15-2022 627 06-15-2021
FIT BCI Miami Letters of Credit Sby LC Guarantee the payment of Workers' Compensation insurance (Occupational Accident and Sickness Insurance) for ILA union workers.
Signal Mutual Indemnity Association 854 07-15-2022 853 07-15-2021
Aerosan Airport Services y Servicios Aeroportuarios Aerosan
Santander Performance bonds To guarantee compliance with the subconcession contract. SC Nuevo Pudahuel 1.598 Several until Mar-2023 1,783 -
SAAM Towage Colombia S.A.S.
Banco Lafise Honduras Performance bonds To guarantee the maintain of an offer to an APP of a project Empresa Nacional Portuaria (ENP) 2.578 07-07-2022 - -
Total 65.378 56.546
The subsidiaries of Sociedad Matriz SAAM S.A. have other minor guarantees granted to third parties indirectly in the total amount of ThUS$ 3.319 as of December 31, 2021 (ThUS$ 3.412 as of December 31, 2020).
284
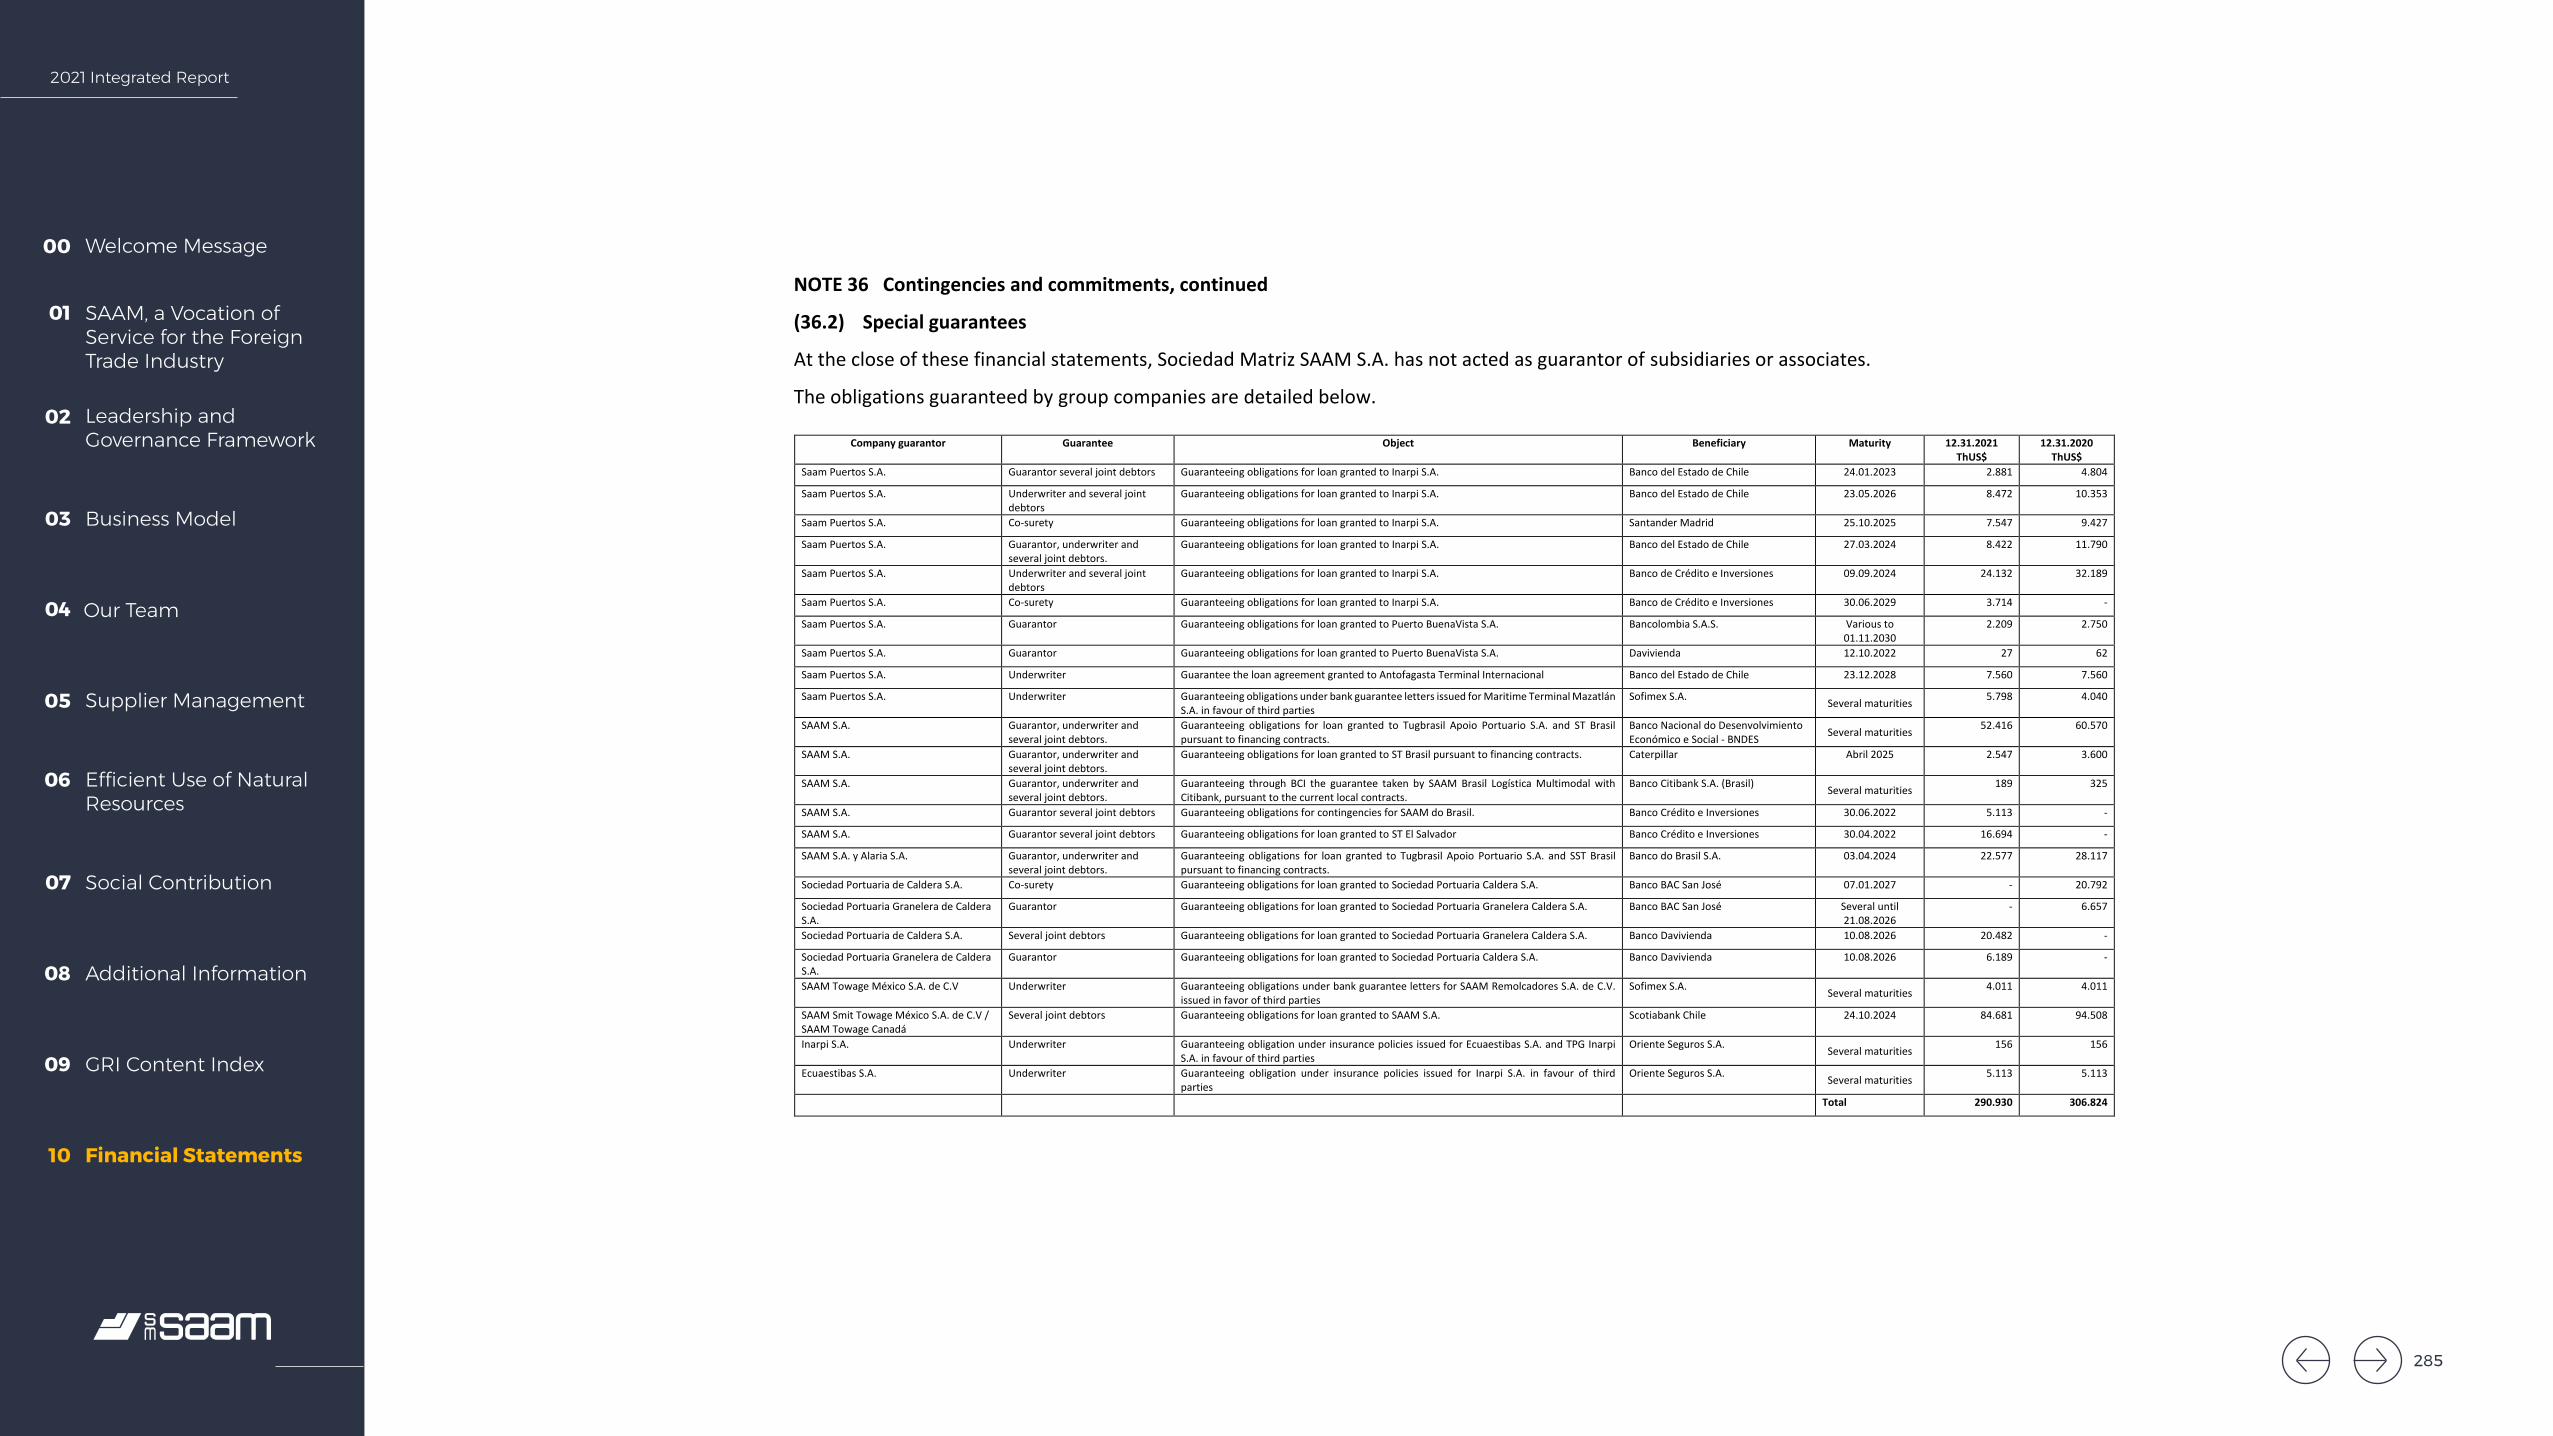
2021 Integrated Report
Welcome Message00
SAAM, a Vocation of Service for the Foreign Trade Industry
01
Leadership and Governance Framework
02
Business Model03
Our Team04
Supplier Management05
Efficient Use of Natural Resources
06
Social Contribution07
Additional Information08
GRI Content Index09
Financial Statements10
SOCIEDAD MATRIZ SAAM S.A. AND SUBSIDIARIES Notes to the Consolidated Financial Statements
117
NOTE 36 Contingencies and commitments, continued
(36.2) Special guarantees
At the close of these financial statements, Sociedad Matriz SAAM S.A. has not acted as guarantor of subsidiaries or associates.
The obligations guaranteed by group companies are detailed below.
Company guarantor Guarantee Object Beneficiary Maturity 12.31.2021 ThUS$
12.31.2020 ThUS$
Saam Puertos S.A. Guarantor several joint debtors Guaranteeing obligations for loan granted to Inarpi S.A. Banco del Estado de Chile 24.01.2023 2.881 4.804
Saam Puertos S.A. Underwriter and several joint debtors
Guaranteeing obligations for loan granted to Inarpi S.A. Banco del Estado de Chile 23.05.2026 8.472 10.353
Saam Puertos S.A. Co-surety Guaranteeing obligations for loan granted to Inarpi S.A. Santander Madrid 25.10.2025 7.547 9.427
Saam Puertos S.A. Guarantor, underwriter and several joint debtors.
Guaranteeing obligations for loan granted to Inarpi S.A. Banco del Estado de Chile 27.03.2024 8.422 11.790
Saam Puertos S.A. Underwriter and several joint debtors
Guaranteeing obligations for loan granted to Inarpi S.A. Banco de Crédito e Inversiones 09.09.2024 24.132 32.189
Saam Puertos S.A. Co-surety Guaranteeing obligations for loan granted to Inarpi S.A. Banco de Crédito e Inversiones 30.06.2029 3.714 -
Saam Puertos S.A. Guarantor Guaranteeing obligations for loan granted to Puerto BuenaVista S.A. Bancolombia S.A.S. Various to 01.11.2030
2.209 2.750
Saam Puertos S.A. Guarantor Guaranteeing obligations for loan granted to Puerto BuenaVista S.A. Davivienda 12.10.2022 27 62
Saam Puertos S.A. Underwriter Guarantee the loan agreement granted to Antofagasta Terminal Internacional Banco del Estado de Chile 23.12.2028 7.560 7.560
Saam Puertos S.A. Underwriter Guaranteeing obligations under bank guarantee letters issued for Maritime Terminal Mazatlán S.A. in favour of third parties
Sofimex S.A. Several maturities 5.798 4.040
SAAM S.A. Guarantor, underwriter and several joint debtors.
Guaranteeing obligations for loan granted to Tugbrasil Apoio Portuario S.A. and ST Brasil pursuant to financing contracts.
Banco Nacional do Desenvolvimiento Económico e Social - BNDES Several maturities 52.416 60.570
SAAM S.A. Guarantor, underwriter and several joint debtors.
Guaranteeing obligations for loan granted to ST Brasil pursuant to financing contracts. Caterpillar Abril 2025 2.547 3.600
SAAM S.A. Guarantor, underwriter and several joint debtors.
Guaranteeing through BCI the guarantee taken by SAAM Brasil Logística Multimodal with Citibank, pursuant to the current local contracts.
Banco Citibank S.A. (Brasil) Several maturities 189 325
SAAM S.A. Guarantor several joint debtors Guaranteeing obligations for contingencies for SAAM do Brasil. Banco Crédito e Inversiones 30.06.2022 5.113 -
SAAM S.A. Guarantor several joint debtors Guaranteeing obligations for loan granted to ST El Salvador Banco Crédito e Inversiones 30.04.2022 16.694 -
SAAM S.A. y Alaria S.A. Guarantor, underwriter and several joint debtors.
Guaranteeing obligations for loan granted to Tugbrasil Apoio Portuario S.A. and SST Brasil pursuant to financing contracts.
Banco do Brasil S.A. 03.04.2024 22.577 28.117
Sociedad Portuaria de Caldera S.A. Co-surety Guaranteeing obligations for loan granted to Sociedad Portuaria Caldera S.A. Banco BAC San José 07.01.2027 - 20.792
Sociedad Portuaria Granelera de Caldera S.A.
Guarantor Guaranteeing obligations for loan granted to Sociedad Portuaria Granelera Caldera S.A. Banco BAC San José Several until 21.08.2026
- 6.657
Sociedad Portuaria de Caldera S.A. Several joint debtors Guaranteeing obligations for loan granted to Sociedad Portuaria Granelera Caldera S.A. Banco Davivienda 10.08.2026 20.482 -
Sociedad Portuaria Granelera de Caldera S.A.
Guarantor Guaranteeing obligations for loan granted to Sociedad Portuaria Caldera S.A. Banco Davivienda 10.08.2026 6.189 -
SAAM Towage México S.A. de C.V Underwriter Guaranteeing obligations under bank guarantee letters for SAAM Remolcadores S.A. de C.V. issued in favor of third parties
Sofimex S.A. Several maturities 4.011 4.011
SAAM Smit Towage México S.A. de C.V / SAAM Towage Canadá
Several joint debtors Guaranteeing obligations for loan granted to SAAM S.A. Scotiabank Chile 24.10.2024 84.681 94.508
Inarpi S.A. Underwriter Guaranteeing obligation under insurance policies issued for Ecuaestibas S.A. and TPG Inarpi S.A. in favour of third parties
Oriente Seguros S.A. Several maturities 156 156
Ecuaestibas S.A. Underwriter Guaranteeing obligation under insurance policies issued for Inarpi S.A. in favour of third parties
Oriente Seguros S.A. Several maturities 5.113 5.113
Total 290.930 306.824
285

2021 Integrated Report
Welcome Message00
SAAM, a Vocation of Service for the Foreign Trade Industry
01
Leadership and Governance Framework
02
Business Model03
Our Team04
Supplier Management05
Efficient Use of Natural Resources
06
Social Contribution07
Additional Information08
GRI Content Index09
Financial Statements10
SOCIEDAD MATRIZ SAAM S.A. AND SUBSIDIARIES Notes to the Consolidated Financial Statements
118
NOTE 36 Contingencies and commitments, continued
(36.3) Pledges and mortgages
At the close of these financial statements, Sociedad Matriz SAAM S.A. had not stablished any pledges or mortgages. The obligations guaranteed by the pledge of assets of the group companies are detailed below.
Company Guarantee Object Beneficiary Maturity 31.12.2021 ThUS$
31.12.2020 ThUS$
Saam Puertos S.A. Pledge on shares of STI S.A. Guaranteeing obligations for loan granted Banco de Crédito e Inversiones 31.03.2025 57.614 42.254
Saam Puertos S.A. Pledge on shares of ATI S.A. Guaranteeing obligations for loan granted Banco Estado 23.12.2028 21.897 24.091
SAAM Towage Canadá Inc. Maritime mortgage Guaranteeing obligations for loan granted Banco Scotiabank Canadá 30.11.2023 12.898 14.385
SAAM Towage Canadá Inc. Maritime mortgage Guaranteeing obligations for loan granted Banco Scotiabank Canadá 30.10.2023 13.969 14.880
SAAM Towage Panamá Inc. Maritime mortgage Guaranteeing obligations for loan granted Banco Rabobank 16.11.2022 471 1.412
SAAM Towage Brasil Equipment and machinery pledge Guaranteeing obligations for loan granted (contract 7.2.0019.1) Banco Nacional do Desnvolvimiento Económico e Social - BNDES
apr 2027 16.735 20.037
SAAM Towage Brasil Equipment and machinery pledge Guaranteeing obligations for loan granted (contract 17.2.0356.1) Banco Nacional do Desnvolvimiento Económico e Social - BNDES
Jun 2034 22.097 23.967
SAAM Towage Brasil Equipment and machinery pledge Guaranteeing obligations for loan granted (contract Ato Notarial 2) Caterpillar apr 2025 2.547 3.600
SAAM Towage Brasil Equipment and machinery pledge Guaranteeing obligations for loan granted (contract 20/00586-5) Banco Do Brasil nov 2030 14.333 16.340
SAAM Towage Brasil Equipment and machinery pledge Guaranteeing obligations for loan granted (contract 10.2.1323.1) Banco Nacional do Desnvolvimiento Económico e Social - BNDES
feb 2033 12.870 14.652
SAAM Towage Brasil Equipment and machinery pledge Guaranteeing obligations for loan granted (contract 13.2.0651.1) Banco Nacional do Desnvolvimiento Económico e Social - BNDES
Sep 2025 714 862
SAAM Towage Brasil Equipment and machinery pledge Guaranteeing obligations for loan granted (contract 7.2.0853.1) Banco Nacional do Desnvolvimiento Económico e Social - BNDES
Ago 2023 - 1.142
SAAM Towage Brasil Equipment and machinery pledge Guaranteeing obligations for loan granted (contract 20/00503-2) Banco Do Brasil apr 2024 8.244 11.777
Sociedad Portuaria de Caldera S.A. Equipment and machinery pledge Guaranteeing obligations for loan granted Banco BAC San José 21.08.2026 - 4.859
Kios S.A. Guarantee deposit Guaranteeing obligation as port operator in Uruguay, under Decree Nº413 of September 1, 1992.
Administración Nacional de Puertos - 270 258
Inarpi S.A. Pledge cranes STS Guaranteeing obligations for loan granted Banco Santander 25.10.2025 7.547 9.425
Total 192.206 203.941
286
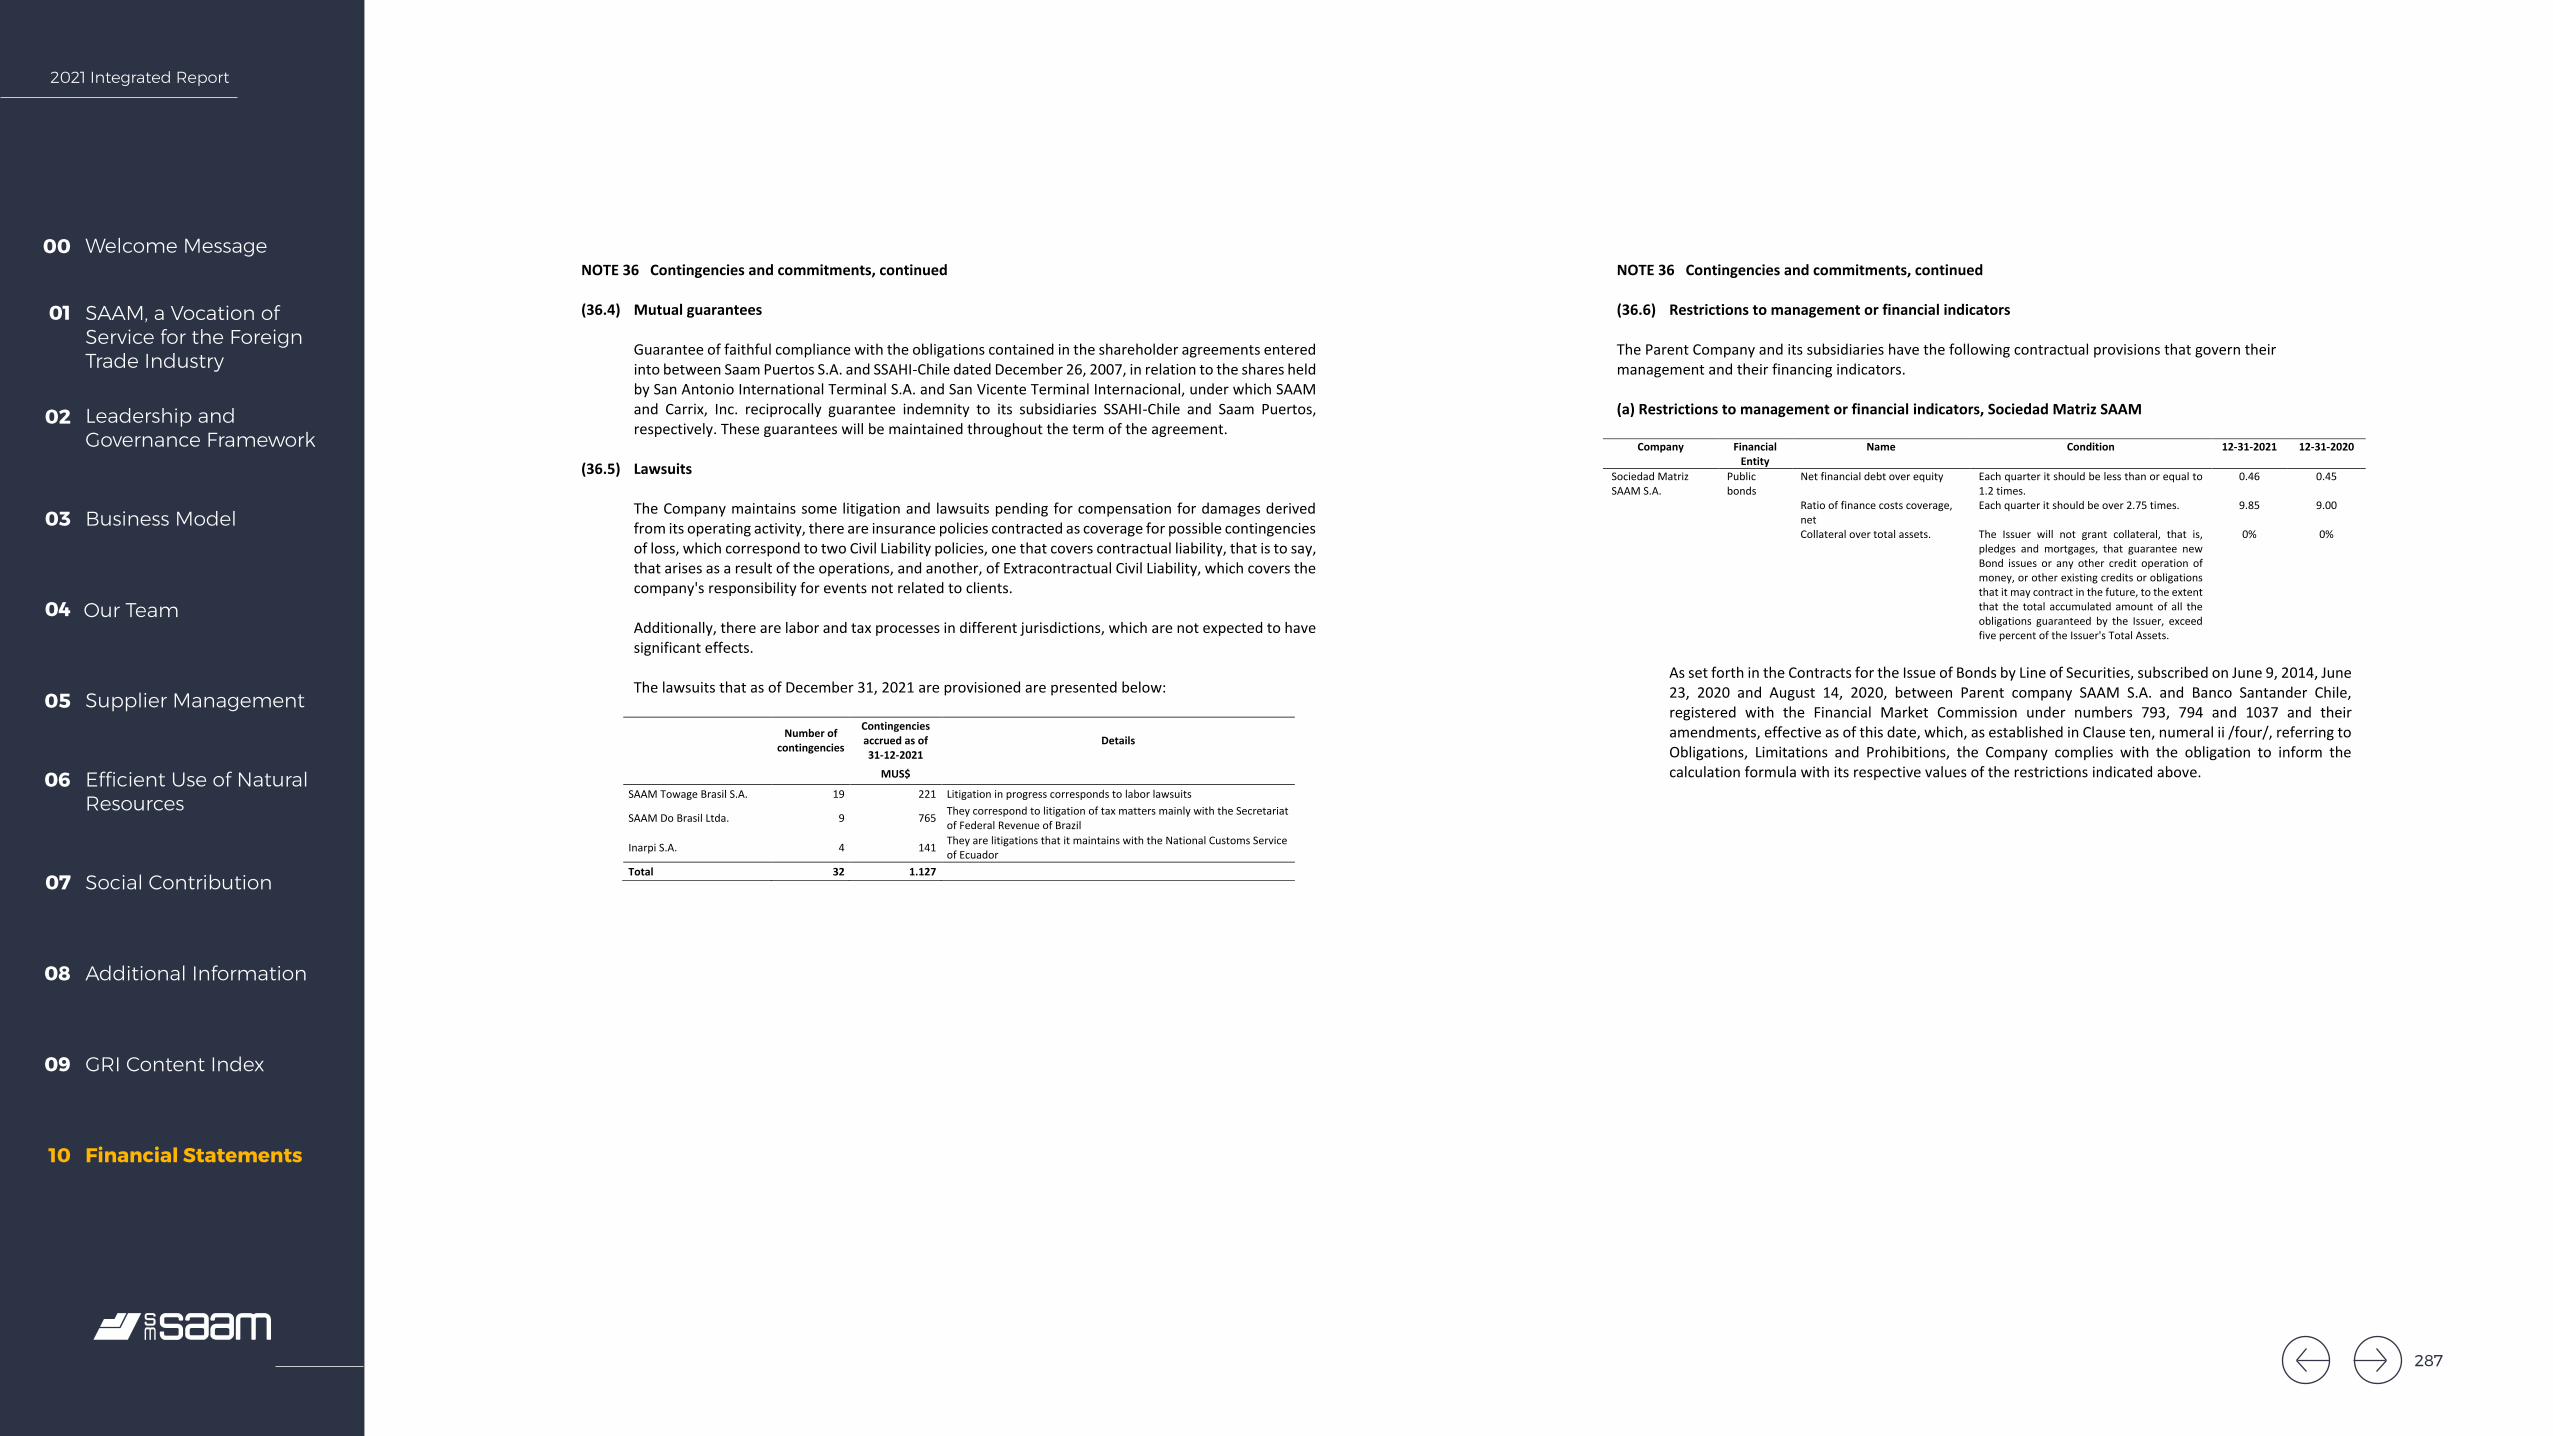
2021 Integrated Report
Welcome Message00
SAAM, a Vocation of Service for the Foreign Trade Industry
01
Leadership and Governance Framework
02
Business Model03
Our Team04
Supplier Management05
Efficient Use of Natural Resources
06
Social Contribution07
Additional Information08
GRI Content Index09
Financial Statements10
SOCIEDAD MATRIZ SAAM S.A. AND SUBSIDIARIES Notes to the Consolidated Financial Statements
119
NOTE 36 Contingencies and commitments, continued
(36.4) Mutual guarantees
Guarantee of faithful compliance with the obligations contained in the shareholder agreements entered into between Saam Puertos S.A. and SSAHI-Chile dated December 26, 2007, in relation to the shares held by San Antonio International Terminal S.A. and San Vicente Terminal Internacional, under which SAAM and Carrix, Inc. reciprocally guarantee indemnity to its subsidiaries SSAHI-Chile and Saam Puertos, respectively. These guarantees will be maintained throughout the term of the agreement.
(36.5) Lawsuits
The Company maintains some litigation and lawsuits pending for compensation for damages derived from its operating activity, there are insurance policies contracted as coverage for possible contingencies of loss, which correspond to two Civil Liability policies, one that covers contractual liability, that is to say, that arises as a result of the operations, and another, of Extracontractual Civil Liability, which covers the company's responsibility for events not related to clients.
Additionally, there are labor and tax processes in different jurisdictions, which are not expected to have significant effects.
The lawsuits that as of December 31, 2021 are provisioned are presented below:
Number of contingencies
Contingencies accrued as of 31-12-2021
Details
MUS$SAAM Towage Brasil S.A. 19 221 Litigation in progress corresponds to labor lawsuits
SAAM Do Brasil Ltda. 9 765 They correspond to litigation of tax matters mainly with the Secretariat of Federal Revenue of Brazil
Inarpi S.A. 4 141 They are litigations that it maintains with the National Customs Service of Ecuador
Total 32 1.127
SOCIEDAD MATRIZ SAAM S.A. AND SUBSIDIARIES Notes to the Consolidated Financial Statements
120
NOTE 36 Contingencies and commitments, continued
(36.6) Restrictions to management or financial indicators
The Parent Company and its subsidiaries have the following contractual provisions that govern their management and their financing indicators.
(a) Restrictions to management or financial indicators, Sociedad Matriz SAAM
Company Financial Entity
Name Condition 12-31-2021 12-31-2020
Sociedad Matriz SAAM S.A.
Public bonds
Net financial debt over equity Each quarter it should be less than or equal to 1.2 times.
0.46 0.45
Ratio of finance costs coverage, net
Each quarter it should be over 2.75 times. 9.85 9.00
Collateral over total assets. The Issuer will not grant collateral, that is, pledges and mortgages, that guarantee new Bond issues or any other credit operation of money, or other existing credits or obligations that it may contract in the future, to the extent that the total accumulated amount of all the obligations guaranteed by the Issuer, exceed five percent of the Issuer's Total Assets.
0% 0%
As set forth in the Contracts for the Issue of Bonds by Line of Securities, subscribed on June 9, 2014, June 23, 2020 and August 14, 2020, between Parent company SAAM S.A. and Banco Santander Chile, registered with the Financial Market Commission under numbers 793, 794 and 1037 and their amendments, effective as of this date, which, as established in Clause ten, numeral ii /four/, referring to Obligations, Limitations and Prohibitions, the Company complies with the obligation to inform the calculation formula with its respective values of the restrictions indicated above.
287

2021 Integrated Report
Welcome Message00
SAAM, a Vocation of Service for the Foreign Trade Industry
01
Leadership and Governance Framework
02
Business Model03
Our Team04
Supplier Management05
Efficient Use of Natural Resources
06
Social Contribution07
Additional Information08
GRI Content Index09
Financial Statements10
SOCIEDAD MATRIZ SAAM S.A. AND SUBSIDIARIES Notes to the Consolidated Financial Statements
121
NOTE 36 Contingencies and commitments, continued (36.6) Restrictions to management or financial indicators, continued
(a) Restrictions to management or financial indicators, Sociedad Matriz SAAM, continued
1. Leverage Ratio
To date, ThUS$ 12.31.2021 12.31.2020 Other financial liabilities, current 120,829 141,654 Other financial liabilities, non-current 599,175 557,455 Cash and cash equivalents (323,962) (317,651) Net financial debt [A] 396,042 381,458 Total equity [B] 856,211 852,878 Net financial debt/Equity [A]/[B] <=1.2 0.46 0.45
2. Ratio of finance costs coverage, net
Last twelve months, ThUS$ 12.31.2021 12.31.2020 Gross profit 244,592) 188,062 Administrative expenses (97,818) (77,576) Depreciation and amortization 121,482 102,961 EBITDA [A] 268,256 213,447 Financial costs 29,224 26,787 Financial income (2,003) (3,067) Net financial expense [B] 27,221 23,720 EBITDA/Net financial expense [A]/[B] >=2.75 9,85 9.00
3. Ratio of collateral over total assets.
To date, ThUS$ 12.31.2021 12.31.2020 Collateral considered for purposes of limitation [A] - - Total assets [B] 1,824,120 1,769,662 Collateral/Total assets [A]/[B] 0% 0%
288
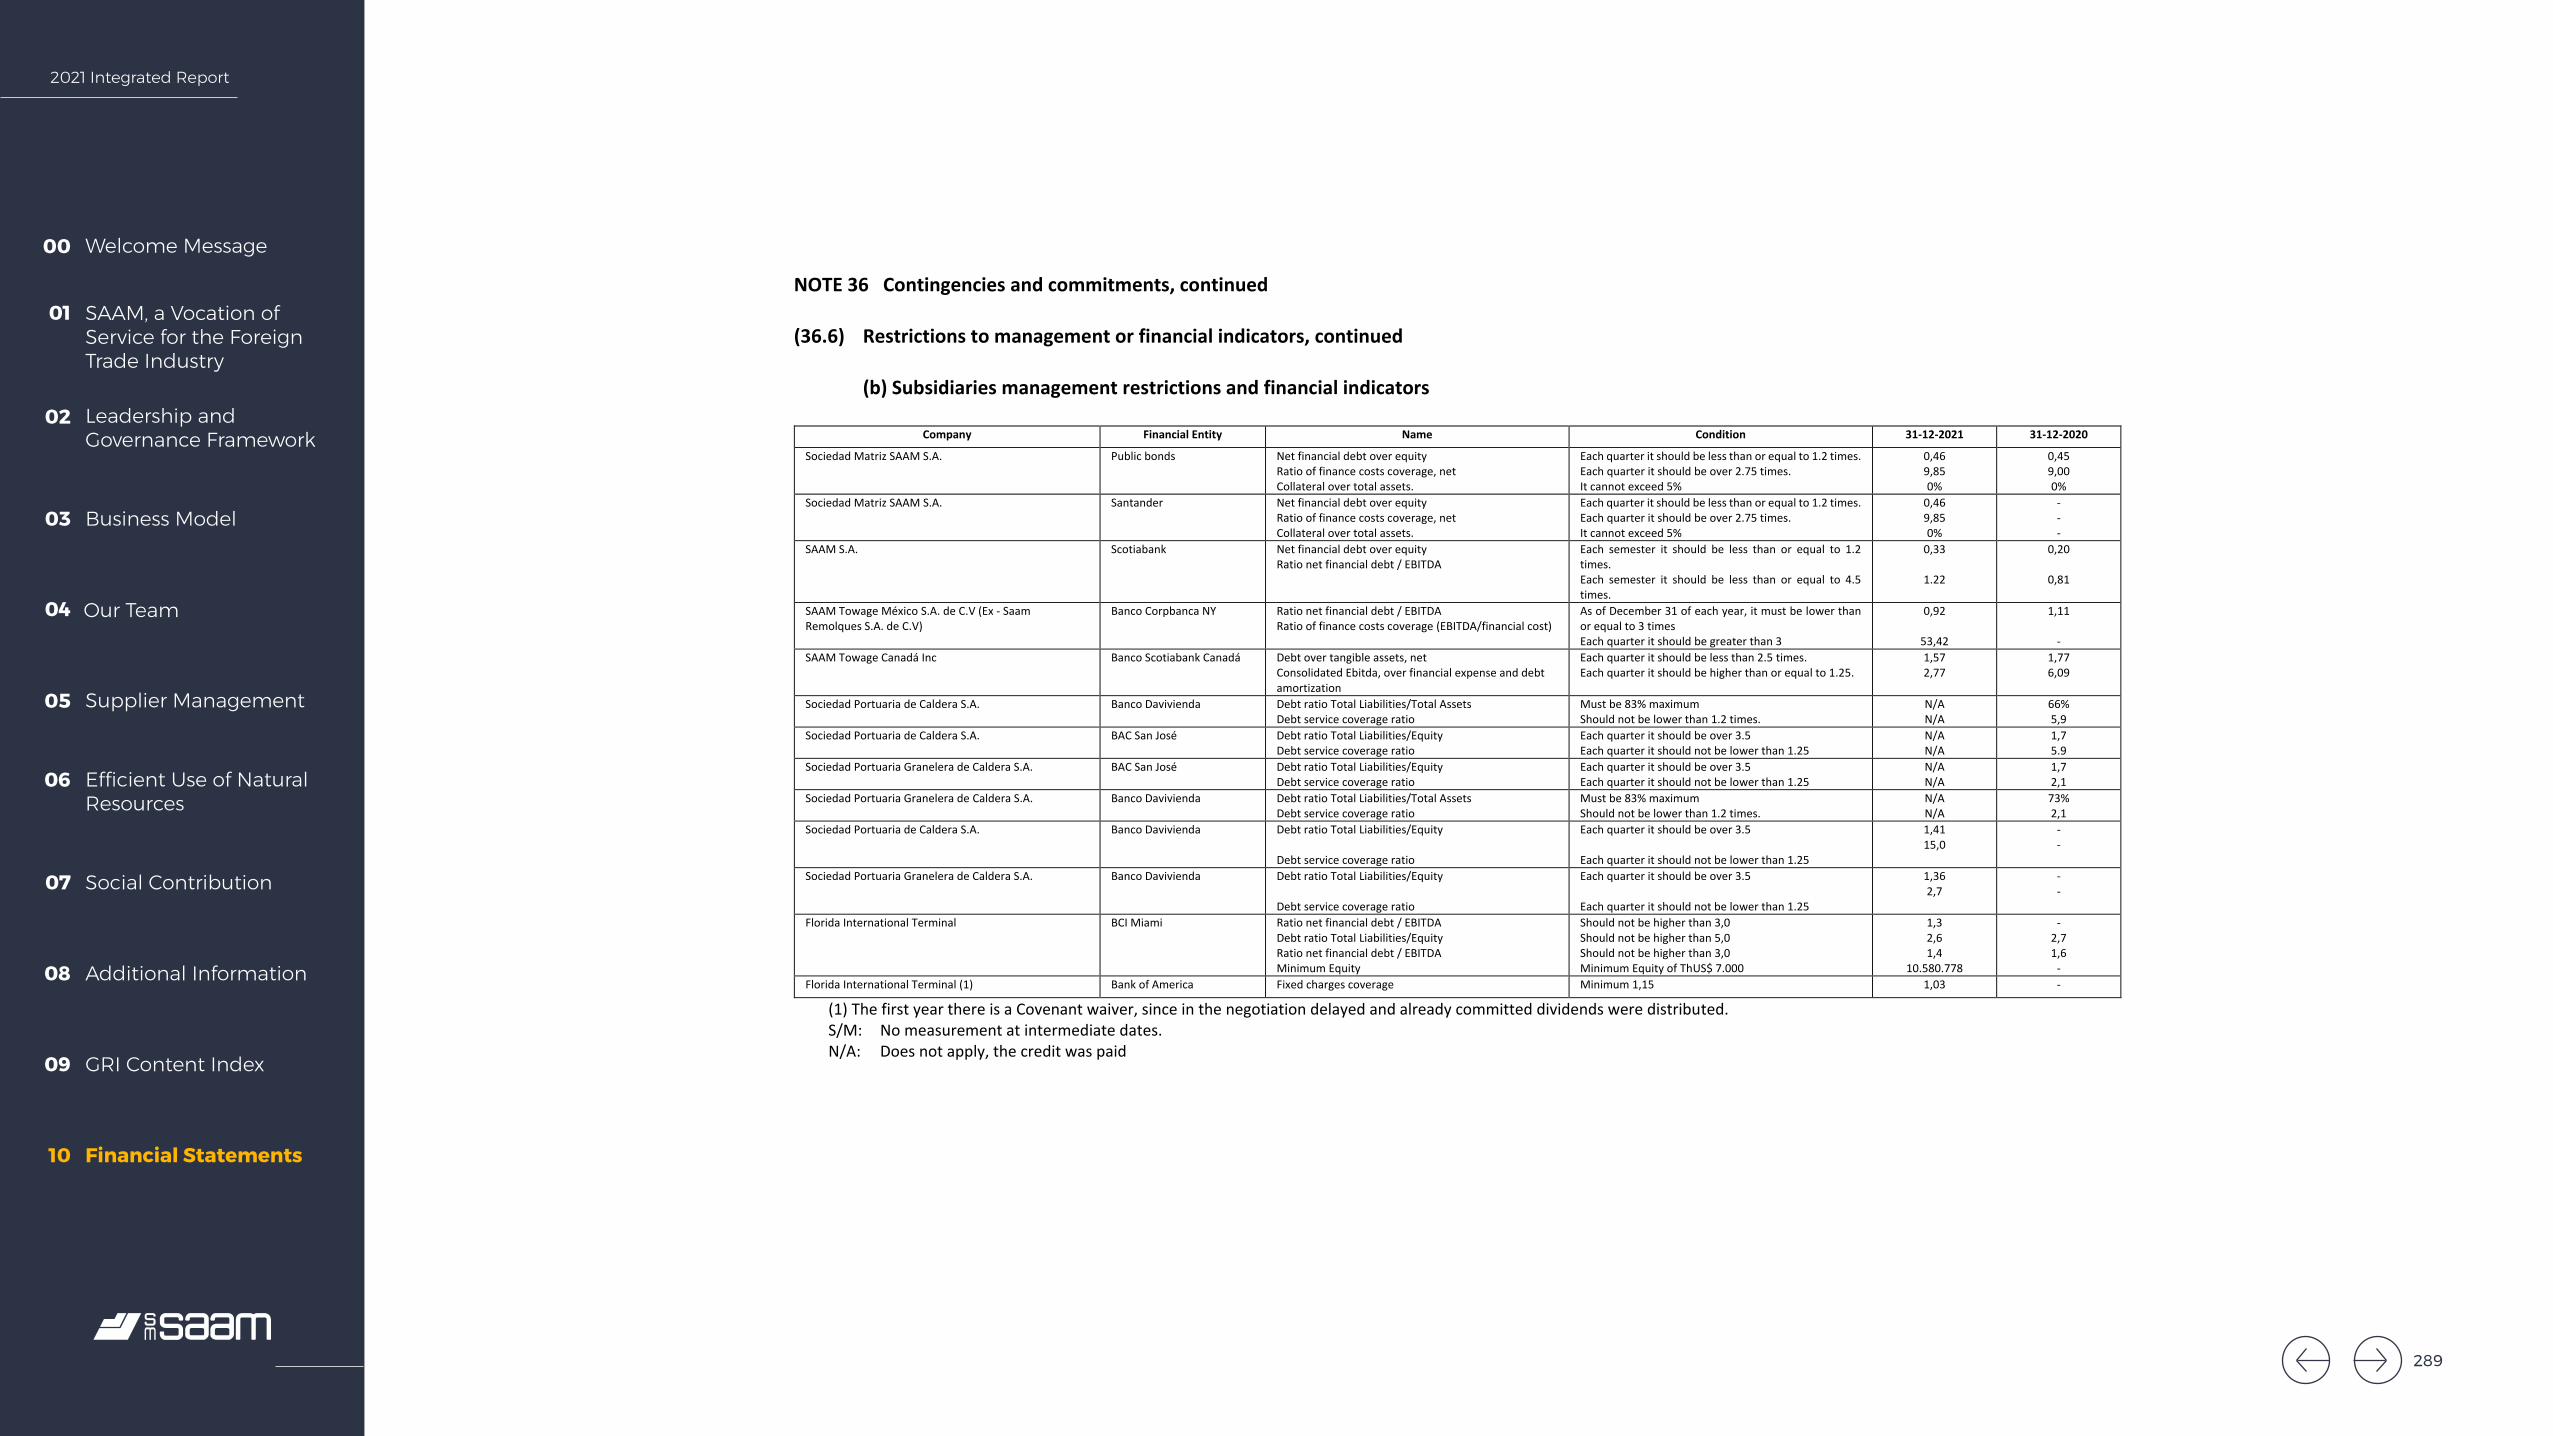
2021 Integrated Report
Welcome Message00
SAAM, a Vocation of Service for the Foreign Trade Industry
01
Leadership and Governance Framework
02
Business Model03
Our Team04
Supplier Management05
Efficient Use of Natural Resources
06
Social Contribution07
Additional Information08
GRI Content Index09
Financial Statements10
SOCIEDAD MATRIZ SAAM S.A. AND SUBSIDIARIES Notes to the Consolidated Financial Statements
122
NOTE 36 Contingencies and commitments, continued (36.6) Restrictions to management or financial indicators, continued
(b) Subsidiaries management restrictions and financial indicators
Company Financial Entity Name Condition 31-12-2021 31-12-2020
Sociedad Matriz SAAM S.A. Public bonds Net financial debt over equity Ratio of finance costs coverage, net Collateral over total assets.
Each quarter it should be less than or equal to 1.2 times. Each quarter it should be over 2.75 times. It cannot exceed 5%
0,46 9,85 0%
0,45 9,00 0%
Sociedad Matriz SAAM S.A. Santander Net financial debt over equity Ratio of finance costs coverage, net Collateral over total assets.
Each quarter it should be less than or equal to 1.2 times. Each quarter it should be over 2.75 times. It cannot exceed 5%
0,46 9,85 0%
- - -
SAAM S.A. Scotiabank Net financial debt over equity Ratio net financial debt / EBITDA
Each semester it should be less than or equal to 1.2 times. Each semester it should be less than or equal to 4.5 times.
0,33
1.22
0,20
0,81
SAAM Towage México S.A. de C.V (Ex - Saam Remolques S.A. de C.V)
Banco Corpbanca NY
Ratio net financial debt / EBITDA Ratio of finance costs coverage (EBITDA/financial cost)
As of December 31 of each year, it must be lower than or equal to 3 times Each quarter it should be greater than 3
0,92
53,42
1,11 -
SAAM Towage Canadá Inc Banco Scotiabank Canadá Debt over tangible assets, net Consolidated Ebitda, over financial expense and debt amortization
Each quarter it should be less than 2.5 times. Each quarter it should be higher than or equal to 1.25.
1,57 2,77
1,77 6,09
Sociedad Portuaria de Caldera S.A. Banco Davivienda Debt ratio Total Liabilities/Total Assets Debt service coverage ratio
Must be 83% maximum Should not be lower than 1.2 times.
N/A N/A
66% 5,9
Sociedad Portuaria de Caldera S.A. BAC San José Debt ratio Total Liabilities/Equity Debt service coverage ratio
Each quarter it should be over 3.5 Each quarter it should not be lower than 1.25
N/A N/A
1,7 5.9
Sociedad Portuaria Granelera de Caldera S.A. BAC San José Debt ratio Total Liabilities/Equity Debt service coverage ratio
Each quarter it should be over 3.5 Each quarter it should not be lower than 1.25
N/A N/A
1,7 2,1
Sociedad Portuaria Granelera de Caldera S.A. Banco Davivienda Debt ratio Total Liabilities/Total Assets Debt service coverage ratio
Must be 83% maximum Should not be lower than 1.2 times.
N/A N/A
73% 2,1
Sociedad Portuaria de Caldera S.A. Banco Davivienda Debt ratio Total Liabilities/Equity Debt service coverage ratio
Each quarter it should be over 3.5 Each quarter it should not be lower than 1.25
1,41 15,0
- -
Sociedad Portuaria Granelera de Caldera S.A. Banco Davivienda Debt ratio Total Liabilities/Equity Debt service coverage ratio
Each quarter it should be over 3.5 Each quarter it should not be lower than 1.25
1,36 2,7
- -
Florida International Terminal BCI Miami Ratio net financial debt / EBITDA Debt ratio Total Liabilities/Equity Ratio net financial debt / EBITDA Minimum Equity
Should not be higher than 3,0 Should not be higher than 5,0 Should not be higher than 3,0 Minimum Equity of ThUS$ 7.000
1,3 2,6 1,4
10.580.778
- 2,7 1,6
- Florida International Terminal (1) Bank of America Fixed charges coverage Minimum 1,15 1,03 -
(1) The first year there is a Covenant waiver, since in the negotiation delayed and already committed dividends were distributed. S/M: No measurement at intermediate dates. N/A: Does not apply, the credit was paid
289

2021 Integrated Report
Welcome Message00
SAAM, a Vocation of Service for the Foreign Trade Industry
01
Leadership and Governance Framework
02
Business Model03
Our Team04
Supplier Management05
Efficient Use of Natural Resources
06
Social Contribution07
Additional Information08
GRI Content Index09
Financial Statements10
SOCIEDAD MATRIZ SAAM S.A. AND SUBSIDIARIES Notes to the Consolidated Financial Statements
123
NOTE 36 Contingencies and commitments, continued
(36.6) Restrictions to management or financial indicators, continued
(b) Subsidiaries management restrictions and financial indicators, continued
Company Financial Entity Name Condition 31-12-2021 31-12-2020Inarpi BCI Miami Cost interest coverage ratio
Ratio net financial debt / EBITDA Minimum Equity
As of December 31 of each year, it must be lower than or equal to 3 times As of December 31 of each year, it must be lower than or equal to 4,5 times As of December 31 of each year, SAAM Puertos must have a minimums equity of ThUS$ 140.000
13,98
1,55
208.875
11,81
2,12
207.995
SAAM Towage Brasil BNDES Total liabilities / Total assets It should be 80% as maximum 37,7% 42,1% SAAM Towage Brasil Caterpillar Total liabilities / Total assets It should be 80% as maximum 37,7% 42,1% Intertug Colombia Banco Scotiabank Ratio financial debt / EBITDA
Ratio of unencumbered assets / unsecured debt It should be lower than 3,5 times It should be greater or equal than 1,25 times
2,49 2,51
- -
Ecuaestibas BCI Minimum Equity Minimum equity of SAAM S.A. ThUS$ 285.000 433.467.145 Intertug México (2) API de México Minimum Equity Minimum de 30 million of Mexicans pesos (USD
1.460.686 as of 31 December 2021) 3.103.677 -
(2) The Intertug Mexico concession contract is subject to a covenant related to compliance with minimum equity conditions.S/M: No measurement at intermediate dates.N/A: Does not apply, the credit was paid
290
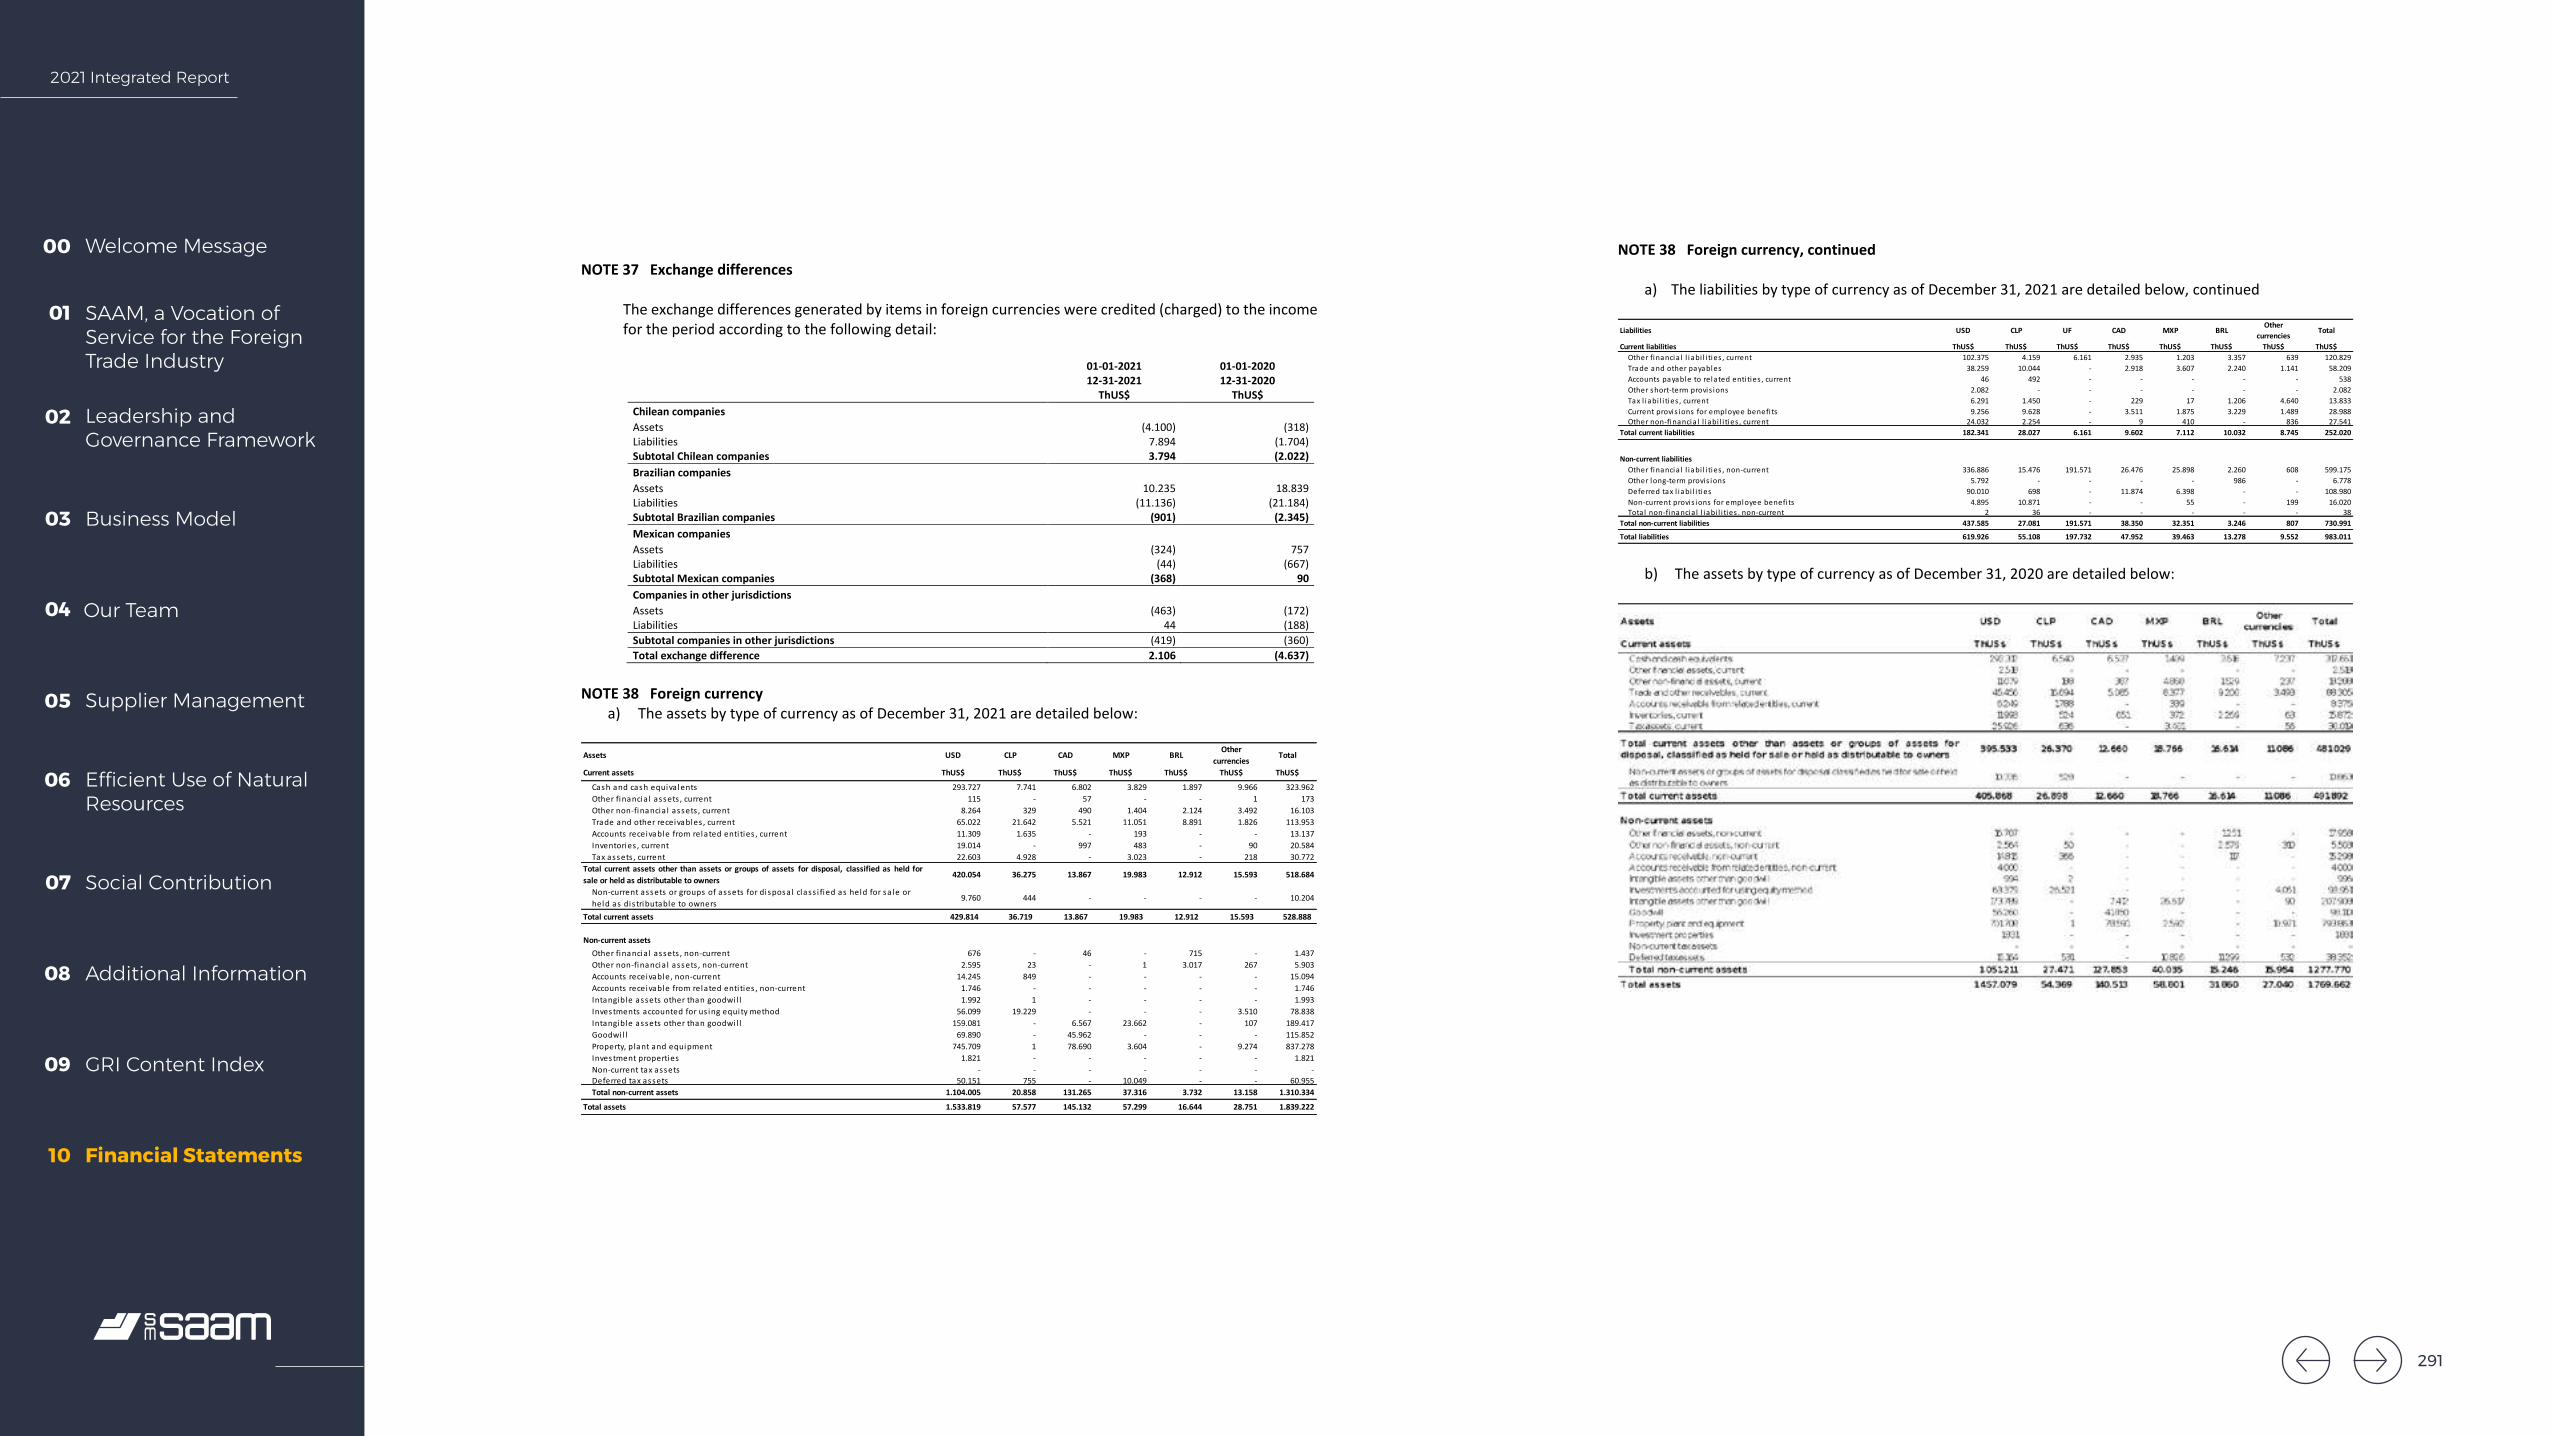
2021 Integrated Report
Welcome Message00
SAAM, a Vocation of Service for the Foreign Trade Industry
01
Leadership and Governance Framework
02
Business Model03
Our Team04
Supplier Management05
Efficient Use of Natural Resources
06
Social Contribution07
Additional Information08
GRI Content Index09
Financial Statements10
SOCIEDAD MATRIZ SAAM S.A. AND SUBSIDIARIES Notes to the Consolidated Financial Statements
124
NOTE 37 Exchange differences
The exchange differences generated by items in foreign currencies were credited (charged) to the income for the period according to the following detail:
01-01-202112-31-2021
01-01-202012-31-2020
ThUS$ ThUS$Chilean companies Assets (4.100) (318) Liabilities 7.894 (1.704) Subtotal Chilean companies 3.794 (2.022) Brazilian companies Assets 10.235 18.839 Liabilities (11.136) (21.184) Subtotal Brazilian companies (901) (2.345) Mexican companies Assets (324) 757 Liabilities (44) (667) Subtotal Mexican companies (368) 90 Companies in other jurisdictions Assets (463) (172) Liabilities 44 (188) Subtotal companies in other jurisdictions (419) (360) Total exchange difference 2.106 (4.637)
NOTE 38 Foreign currency a) The assets by type of currency as of December 31, 2021 are detailed below:
Assets USD CLP CAD MXP BRL Other currencies Total
Current assets ThUS$ ThUS$ ThUS$ ThUS$ ThUS$ ThUS$ ThUS$Cash and cash equiva lents 293.727 7.741 6.802 3.829 1.897 9.966 323.962 Other financia l assets , current 115 - 57 - - 1 173 Other non-financia l assets , current 8.264 329 490 1.404 2.124 3.492 16.103 Trade and other receivables , current 65.022 21.642 5.521 11.051 8.891 1.826 113.953 Accounts receivable from related enti ties , current 11.309 1.635 - 193 - - 13.137 Inventories , current 19.014 - 997 483 - 90 20.584 Tax assets , current 22.603 4.928 - 3.023 - 218 30.772
Total current assets other than assets or groups of assets for disposal, classified as held forsale or held as distributable to owners 420.054 36.275 13.867 19.983 12.912 15.593 518.684
Non-current assets or groups of assets for disposal class i fied as held for sa le or held as dis tributable to owners 9.760 444 - - - - 10.204
Total current assets 429.814 36.719 13.867 19.983 12.912 15.593 528.888
Non-current assetsOther financia l assets , non-current 676 - 46 - 715 - 1.437 Other non-financia l assets , non-current 2.595 23 - 1 3.017 267 5.903 Accounts receivable, non-current 14.245 849 - - - - 15.094 Accounts receivable from related enti ties , non-current 1.746 - - - - - 1.746 Intangible assets other than goodwi l l 1.992 1 - - - - 1.993 Investments accounted for us ing equity method 56.099 19.229 - - - 3.510 78.838 Intangible assets other than goodwi l l 159.081 - 6.567 23.662 - 107 189.417 Goodwi l l 69.890 - 45.962 - - - 115.852 Property, plant and equipment 745.709 1 78.690 3.604 - 9.274 837.278 Investment properties 1.821 - - - - - 1.821 Non-current tax assets - - - - - - - Deferred tax assets 50.151 755 - 10.049 - - 60.955 Total non-current assets 1.104.005 20.858 131.265 37.316 3.732 13.158 1.310.334
Total assets 1.533.819 57.577 145.132 57.299 16.644 28.751 1.839.222
SOCIEDAD MATRIZ SAAM S.A. AND SUBSIDIARIES Notes to the Consolidated Financial Statements
125
NOTE 38 Foreign currency, continued
a) The liabilities by type of currency as of December 31, 2021 are detailed below, continued
b) The assets by type of currency as of December 31, 2020 are detailed below:
Liabilities USD CLP UF CAD MXP BRL Other currencies Total
Current liabilities ThUS$ ThUS$ ThUS$ ThUS$ ThUS$ ThUS$ ThUS$ ThUS$Other financia l l iabi l i ties , current 102.375 4.159 6.161 2.935 1.203 3.357 639 120.829 Trade and other payables 38.259 10.044 - 2.918 3.607 2.240 1.141 58.209 Accounts payable to related enti ties , current 46 492 - - - - - 538 Other short-term provis ions 2.082 - - - - - - 2.082 Tax l iabi l i ties , current 6.291 1.450 - 229 17 1.206 4.640 13.833 Current provis ions for employee benefi ts 9.256 9.628 - 3.511 1.875 3.229 1.489 28.988 Other non-financia l l iabi l i ties , current 24.032 2.254 - 9 410 - 836 27.541
Total current liabilities 182.341 28.027 6.161 9.602 7.112 10.032 8.745 252.020
Non-current liabilitiesOther financia l l iabi l i ties , non-current 336.886 15.476 191.571 26.476 25.898 2.260 608 599.175 Other long-term provis ions 5.792 - - - - 986 - 6.778 Deferred tax l iabi l i ties 90.010 698 - 11.874 6.398 - - 108.980 Non-current provis ions for employee benefi ts 4.895 10.871 - - 55 - 199 16.020 Total non-financia l l iabi l i ties , non-current 2 36 - - - - - 38
Total non-current liabilities 437.585 27.081 191.571 38.350 32.351 3.246 807 730.991 Total liabilities 619.926 55.108 197.732 47.952 39.463 13.278 9.552 983.011
291
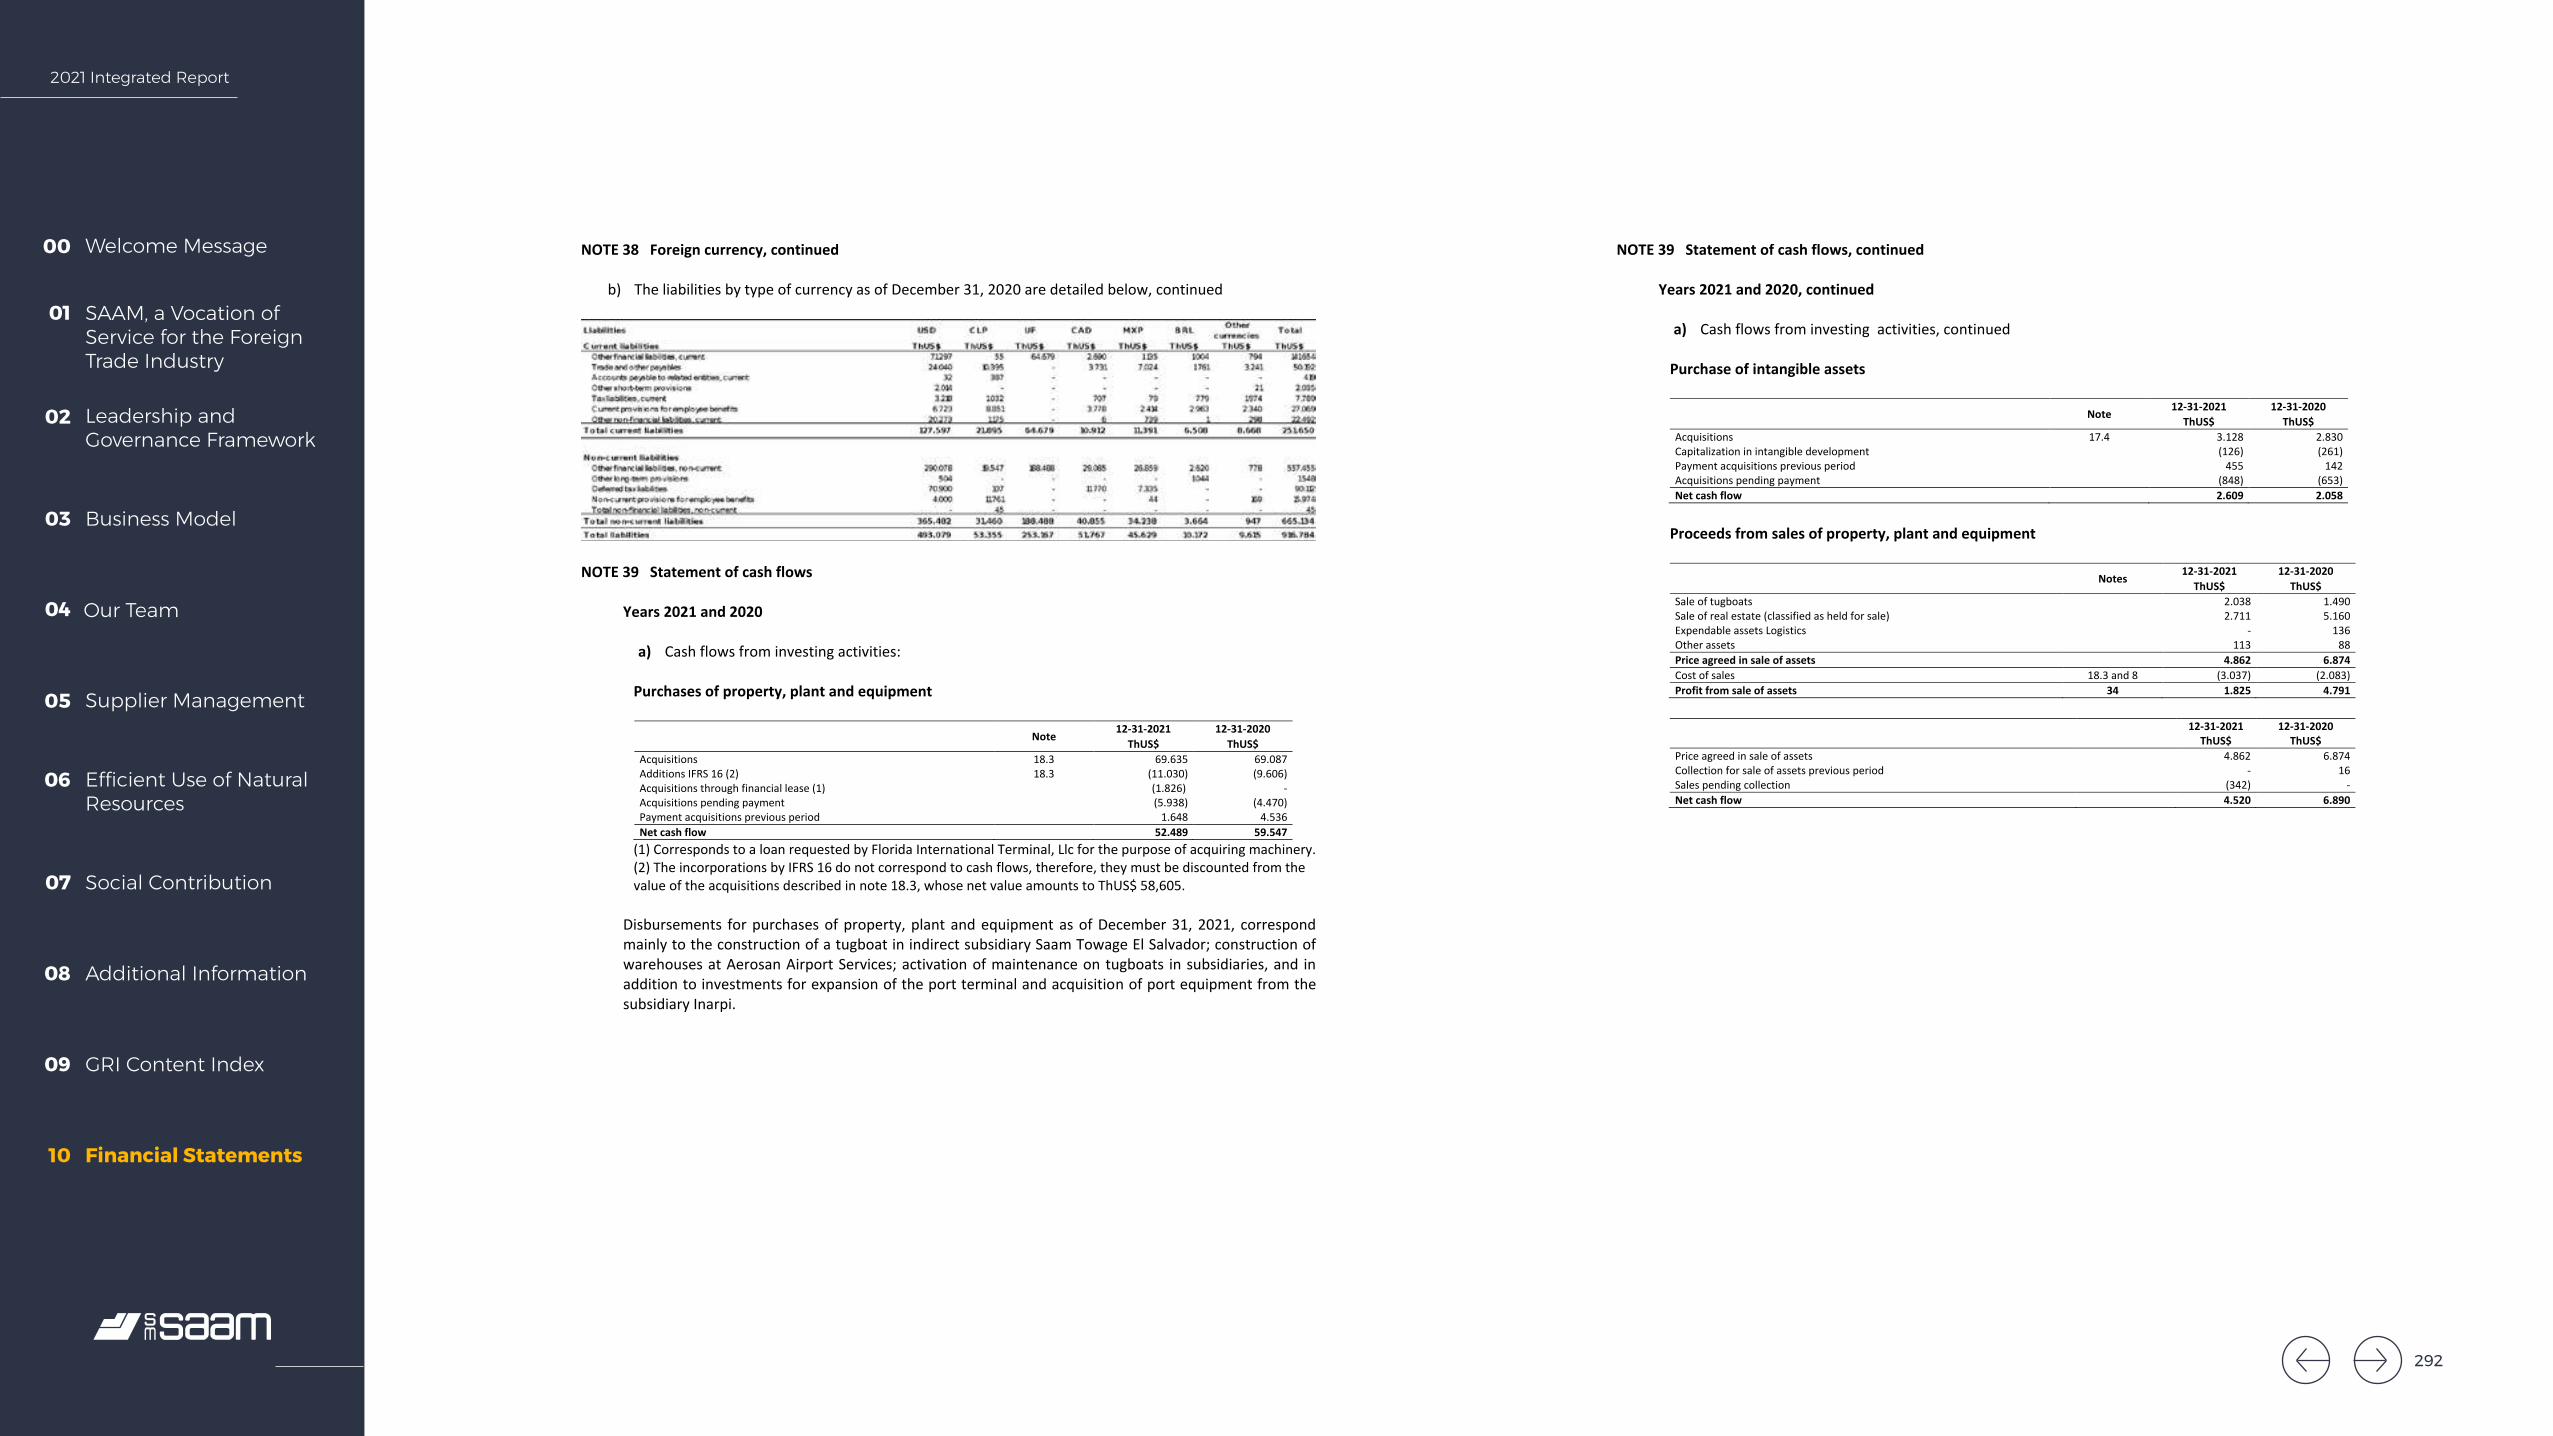
2021 Integrated Report
Welcome Message00
SAAM, a Vocation of Service for the Foreign Trade Industry
01
Leadership and Governance Framework
02
Business Model03
Our Team04
Supplier Management05
Efficient Use of Natural Resources
06
Social Contribution07
Additional Information08
GRI Content Index09
Financial Statements10
SOCIEDAD MATRIZ SAAM S.A. AND SUBSIDIARIES Notes to the Consolidated Financial Statements
126
NOTE 38 Foreign currency, continued
b) The liabilities by type of currency as of December 31, 2020 are detailed below, continued
NOTE 39 Statement of cash flows
Years 2021 and 2020
a) Cash flows from investing activities:
Purchases of property, plant and equipment
Note 12-31-2021 12-31-2020ThUS$ ThUS$
Acquisitions 18.3 69.635 69.087 Additions IFRS 16 (2) 18.3 (11.030) (9.606) Acquisitions through financial lease (1) (1.826) - Acquisitions pending payment (5.938) (4.470) Payment acquisitions previous period 1.648 4.536 Net cash flow 52.489 59.547
(1) Corresponds to a loan requested by Florida International Terminal, Llc for the purpose of acquiring machinery.(2) The incorporations by IFRS 16 do not correspond to cash flows, therefore, they must be discounted from thevalue of the acquisitions described in note 18.3, whose net value amounts to ThUS$ 58,605.
Disbursements for purchases of property, plant and equipment as of December 31, 2021, correspond mainly to the construction of a tugboat in indirect subsidiary Saam Towage El Salvador; construction of warehouses at Aerosan Airport Services; activation of maintenance on tugboats in subsidiaries, and in addition to investments for expansion of the port terminal and acquisition of port equipment from the subsidiary Inarpi.
SOCIEDAD MATRIZ SAAM S.A. AND SUBSIDIARIES Notes to the Consolidated Financial Statements
127
NOTE 39 Statement of cash flows, continued
Years 2021 and 2020, continued
a) Cash flows from investing activities, continued
Purchase of intangible assets
Note 12-31-2021 12-31-2020ThUS$ ThUS$
Acquisitions 17.4 3.128 2.830 Capitalization in intangible development (126) (261) Payment acquisitions previous period 455 142 Acquisitions pending payment (848) (653) Net cash flow 2.609 2.058
Proceeds from sales of property, plant and equipment
Notes 12-31-2021 12-31-2020ThUS$ ThUS$
Sale of tugboats 2.038 1.490 Sale of real estate (classified as held for sale) 2.711 5.160 Expendable assets Logistics - 136 Other assets 113 88 Price agreed in sale of assets 4.862 6.874 Cost of sales 18.3 and 8 (3.037) (2.083) Profit from sale of assets 34 1.825 4.791
12-31-2021 12-31-2020ThUS$ ThUS$
Price agreed in sale of assets 4.862 6.874 Collection for sale of assets previous period - 16 Sales pending collection (342) - Net cash flow 4.520 6.890
292

2021 Integrated Report
Welcome Message00
SAAM, a Vocation of Service for the Foreign Trade Industry
01
Leadership and Governance Framework
02
Business Model03
Our Team04
Supplier Management05
Efficient Use of Natural Resources
06
Social Contribution07
Additional Information08
GRI Content Index09
Financial Statements10
SOCIEDAD MATRIZ SAAM S.A. AND SUBSIDIARIES Notes to the Consolidated Financial Statements
128
NOTE 39 Statement of cash flows, continued
Years 2021 and 2020, continued
a) Cash flows from investing activities, continued:
Dividends received Note 12-31-2021 12-31-2020 ThUS$ ThUS$ Dividends agreed upon: LNG Tugs Chile S.A. 25 - Portuaria Corral S.A. 1.998 2.514 Inmobiliaria Carriel Ltda. - 984 San Antonio Terminal Internacional S.A. 14.923 4.850 Servicios Portuarios Reloncaví Ltda. 794 1.261 Equimac S.A. 1.133 - Luckymont S.A. 1.274 743 Total dividends agreed upon in the period 16.1 20.147 10.352 (-) Dividends pending collection 12.1 - LNG Tugs Chile S.A. (10) - San Antonio Terminal Internacional S.A. (2.423) (445) (+) Dividends received, agreed upon in the previous period - - LNG Tugs Chile S.A. - 4 SAAM Towage Brasil - - Servicios Portuarios Reloncaví Ltda. - - (+) Dividends held-for-sale investments - -
Consolidation SAAM Towage Brasil S.A. - -
Effect of exchange rate 164 (522) Net cash flow 17.878 9.389
b) Cash flows from financing activities
Dividends paid Note 12-31-2021 12-31-2020 ThUS$ ThUS$ Dividends agreed upon: Sociedad Matriz SAAM S.A. (1) (21.238) (16.697) Florida International Terminal, Llc (2.227) (1.779) Sociedad Portuaria Granelera de Caldera S.A. (2.123) (1.312) Aronem Air Cargo S.A. (100) (145) Sociedad Portuaria de Caldera S.A. (4.566) (2.240) SAAM Guatemala S.A. (634) - Expertajes Marítimos S.A. (142) (323) Internacional TUG S.A.S. (1.200) - Total dividends agreed upon in the period (32.230) (22.496) (+) Minimum dividends provisioned Sociedad Matriz SAAM S.A. 25 (23.581) (20.014) Total dividends agreed upon and provisioned in the year (55.811) (42.510) (+) Dividends provisioned pending payment 23.581 20.014 (-) Dividends paid and agreed upon or provisioned in the previous year (20.014) (17.334) (-) Dividends pending payment 706 136 Exchange rate effect (200) (201) Net cash flow (51.738) (39.895) (1) The sum of the agreed dividends and paid dividends (agreed in the previous year), whose amount amounts to ThUS$ 41,252, correspond to the dividend paid in the year 2021. See note 27.3
SOCIEDAD MATRIZ SAAM S.A. AND SUBSIDIARIES Notes to the Consolidated Financial Statements
129
NOTE 39 Statement of cash flows, continued
Years 2021 and 2020, continued
b) Cash flows from financing activities, continued
Proceeds from long and short-term loans, loan repayments
12-31-2021 12-31-2020ThUS$ ThUS$
Proceeds from long-term borrowings Sociedad Matriz Saam S.A. (1) 57.040 92.425 Ecuaestibas S.A. 3.500 - SAAM Towage México S.A. de C.V. 15.000 - Florida International Terminal Llc. 1.896 1.443 SAAM Towage El Salvador S.A. 15.000 - Sociedad Portuaria Granelera de Caldera S.A. 20.000 - Sociedad Portuaria de Caldera S.A. 6.000 - Inarpi S.A. 3.706 - Saam Logistics S.A. - 18.000 Iquique Terminal Internacional S.A. - 2.768 Total proceeds from long-term financing 122.142 114.636
Total proceeds from short-term borrowing: Servicios Aeroportuarios Aerosan S.A. - 900 Aerosan Airport Services S.A. - 600 Internacional TUG S.A.S. 26.500 - Baru Offshore de México S.A.P.I. de C.V. 301 - Inarpi S.A. 1.777 - SAAM Towage México S.A. de C.V. - 2.000 Terminal Maritima Mazatlan 1.388 - Total proceeds from short-term financing 29.966 3.500
Loan repayment SAAM Towage Brasil S.A. (16.360) (13.672) SAAM Towage México S.A. de C.V. (3.000) (9.956) SAAM Towage Canadá Inc. (3.077) (902) SAAM Towage Panamá Inc. (936) (936) SAAM S.A. (11.577) (5.000) Inarpi S.A. (18.760) (17.983) Servicios Aeroportuarios Aerosan S.A. (913) (921) Iquique Terminal Internacional S.A. (2.425) (5.202) Sociedad Portuaria Caldera S.A. (6.996) (2.688) Sociedad Portuaria Granelera de Caldera S.A. (24.043) (4.666) Florida International Terminal Llc. (1.006) (893) Baru Offshore de México S.A.P.I. de C.V. (689) - Internacional TUG S.A.S. (21.981) - Aerosan Airport Services S.A. (1.689) (615) Servicios Logísticos Ltda. - (203) Terminal Maritima Mazatlán S.A. de C.V. (1.404) - Transaereo Ltda. (684) (173) Total loan repayment (115.540) (63.810)
(1) On June 23 and August 14, through the Santiago Stock Exchange, under the modality of automatic matching of firm offers of fixed income instruments (telerenta), a placement of SM SAAM bonds corresponding to series E and H, respectively, was made. These bonds were placed for a total amount of UF 1,200,000 and UF 1,400,000, at a placement rate of 1.25% per annum (both bonds), maturing on June 15 and July 10, 2030 and charged to line number 794 and 1037. The flows obtained from the bond placement amounted to ThUS$ 42,175 and ThUS$ 50,882 respectively.
On December 20, 2021, a loan was obtained from SM SAAM, in three different promissory notes of ThUS$30,000, ThUS$17,500 and ThUS$10,000 with Banco Santander with semi-annual interest payments and principal payment at maturity.
293

2021 Integrated Report
Welcome Message00
SAAM, a Vocation of Service for the Foreign Trade Industry
01
Leadership and Governance Framework
02
Business Model03
Our Team04
Supplier Management05
Efficient Use of Natural Resources
06
Social Contribution07
Additional Information08
GRI Content Index09
Financial Statements10
SOCIEDAD MATRIZ SAAM S.A. AND SUBSIDIARIES Notes to the Consolidated Financial Statements
130
Note 40 Environment
Ports, tugboats and logistics operations are subject to various environmental laws. Failure to comply with said laws may result in the imposition of administrative sanctions, which may include, among others, the closure of facilities that do not comply, the cancellation of operating licenses, as well as the imposition of sanctions and fines when companies act with negligence or recklessness in relation to environmental issues. The approval of more severe environmental laws and regulations could require additional investments to comply with these regulations and, consequently, alter investment plans. To mitigate this risk, SM SAAM and its subsidiaries have taken out civil liability insurance in favor of third parties, for damages and/or fines for pollution, associated with their fleet of tugboats.
The main accumulated environmental expenses as of December 31, 2021, in the Company's Divisions, are distributed as follows:
1. RILES expenses (11.9%)
Disposal and transfer of liquid industrial waste to authorized companies for its final treatment, as well as for plant maintenance and operation.
2. RISES expenses (55,2%)
This Item is related to the disposal and transfer of the different types of solid waste, whether hazardous or non-hazardous, it should be noted that the costs related to recycling are also included in this section.
3. Environmental Monitoring Expenses (18,4%)
This item includes the systematic monitoring of different environmental parameters distributed in different components such as Air, Noise, Water, Soil, Underwater Environment and others. These monitoring are carried out mainly in our port terminals and seek to comply with the different regulations associated with our operations.
4. Certifications and verifications: (8,6%)
Expenses related to certifications and verifications associated with different management systems such as ISO 14001, ISO 50001, ISO 14064, as well as clean production agreements (APL) associated with our industry.
5. Expenses Environmental Projects (6,0%)
Expenses related to projects associated with recycling pilots, improvements in environmental resolutions, efficiency projects such as Giro Limpio, atmospheric modeling, emissions estimation, change of lighting to LED, etc.
SOCIEDAD MATRIZ SAAM S.A. AND SUBSIDIARIES Notes to the Consolidated Financial Statements
131
Note 40 Environment, continued
As of December 31, 2021, expenses related to the environment are as follows:
Item Environment Expenses Description Accumulated
Expenses as of 12-31-2021 ThUS$
1 RILEs Disposal and transfer of liquids 97
2 Treatment plant maintenance and control expenses 21 3
RISEs
Disposal and transfer of hazardous solid waste 190 4 Disposal and transfer of non-hazardous solid waste 316 5 Recycling recycled non-hazardous solid waste 29 6 Recycling recycled hazardous solid waste 11 7
Environmental monitoring
Water (Sea, rivers, lakes, etc.) 37 8 Air (fixed and mobile sources) 73 9 Noise 21
10 underwater environment 25 11 Others 26 12
Certifications and verifications
ISO 14001 25 13 ISO50001 6 14 ISO 14064 15 15 Others 39 16 Environmental
projects Environmental infrastructure projects 30
17 Environmental equipment projects - 18 Others 29
Total 990
NOTE 41 Subsequent events
Between January 1, 2022 and the date on which these consolidated Financial Statements were issued, no significant financial or other events have occurred that might affect the proper presentation and/or interpretation thereof.
294

2021 Integrated Report
Welcome Message00
SAAM, a Vocation of Service for the Foreign Trade Industry
01
Leadership and Governance Framework
02
Business Model03
Our Team04
Supplier Management05
Efficient Use of Natural Resources
06
Social Contribution07
Additional Information08
GRI Content Index09
Financial Statements10
Sociedad Matriz SAAM S.A. Earnings Report on the Consolidated Financial Statements
Corresponding to the Year Ended December 31, 2021, in thousands of US dollars
Information about Conference Call
March 15, 2022, 11:00 a.m. Chile - 9:00 a.m. EST, the Company will present its results for 2021. Please use the following link to join the call:
SMSAAM2021INVESTORCONFERENCECALL
The financial information to be presented will be available at www.saam.com in the Investors section.
A Q&A feature will be available during the presentation to submit questions, which will be answered at the end.
295295
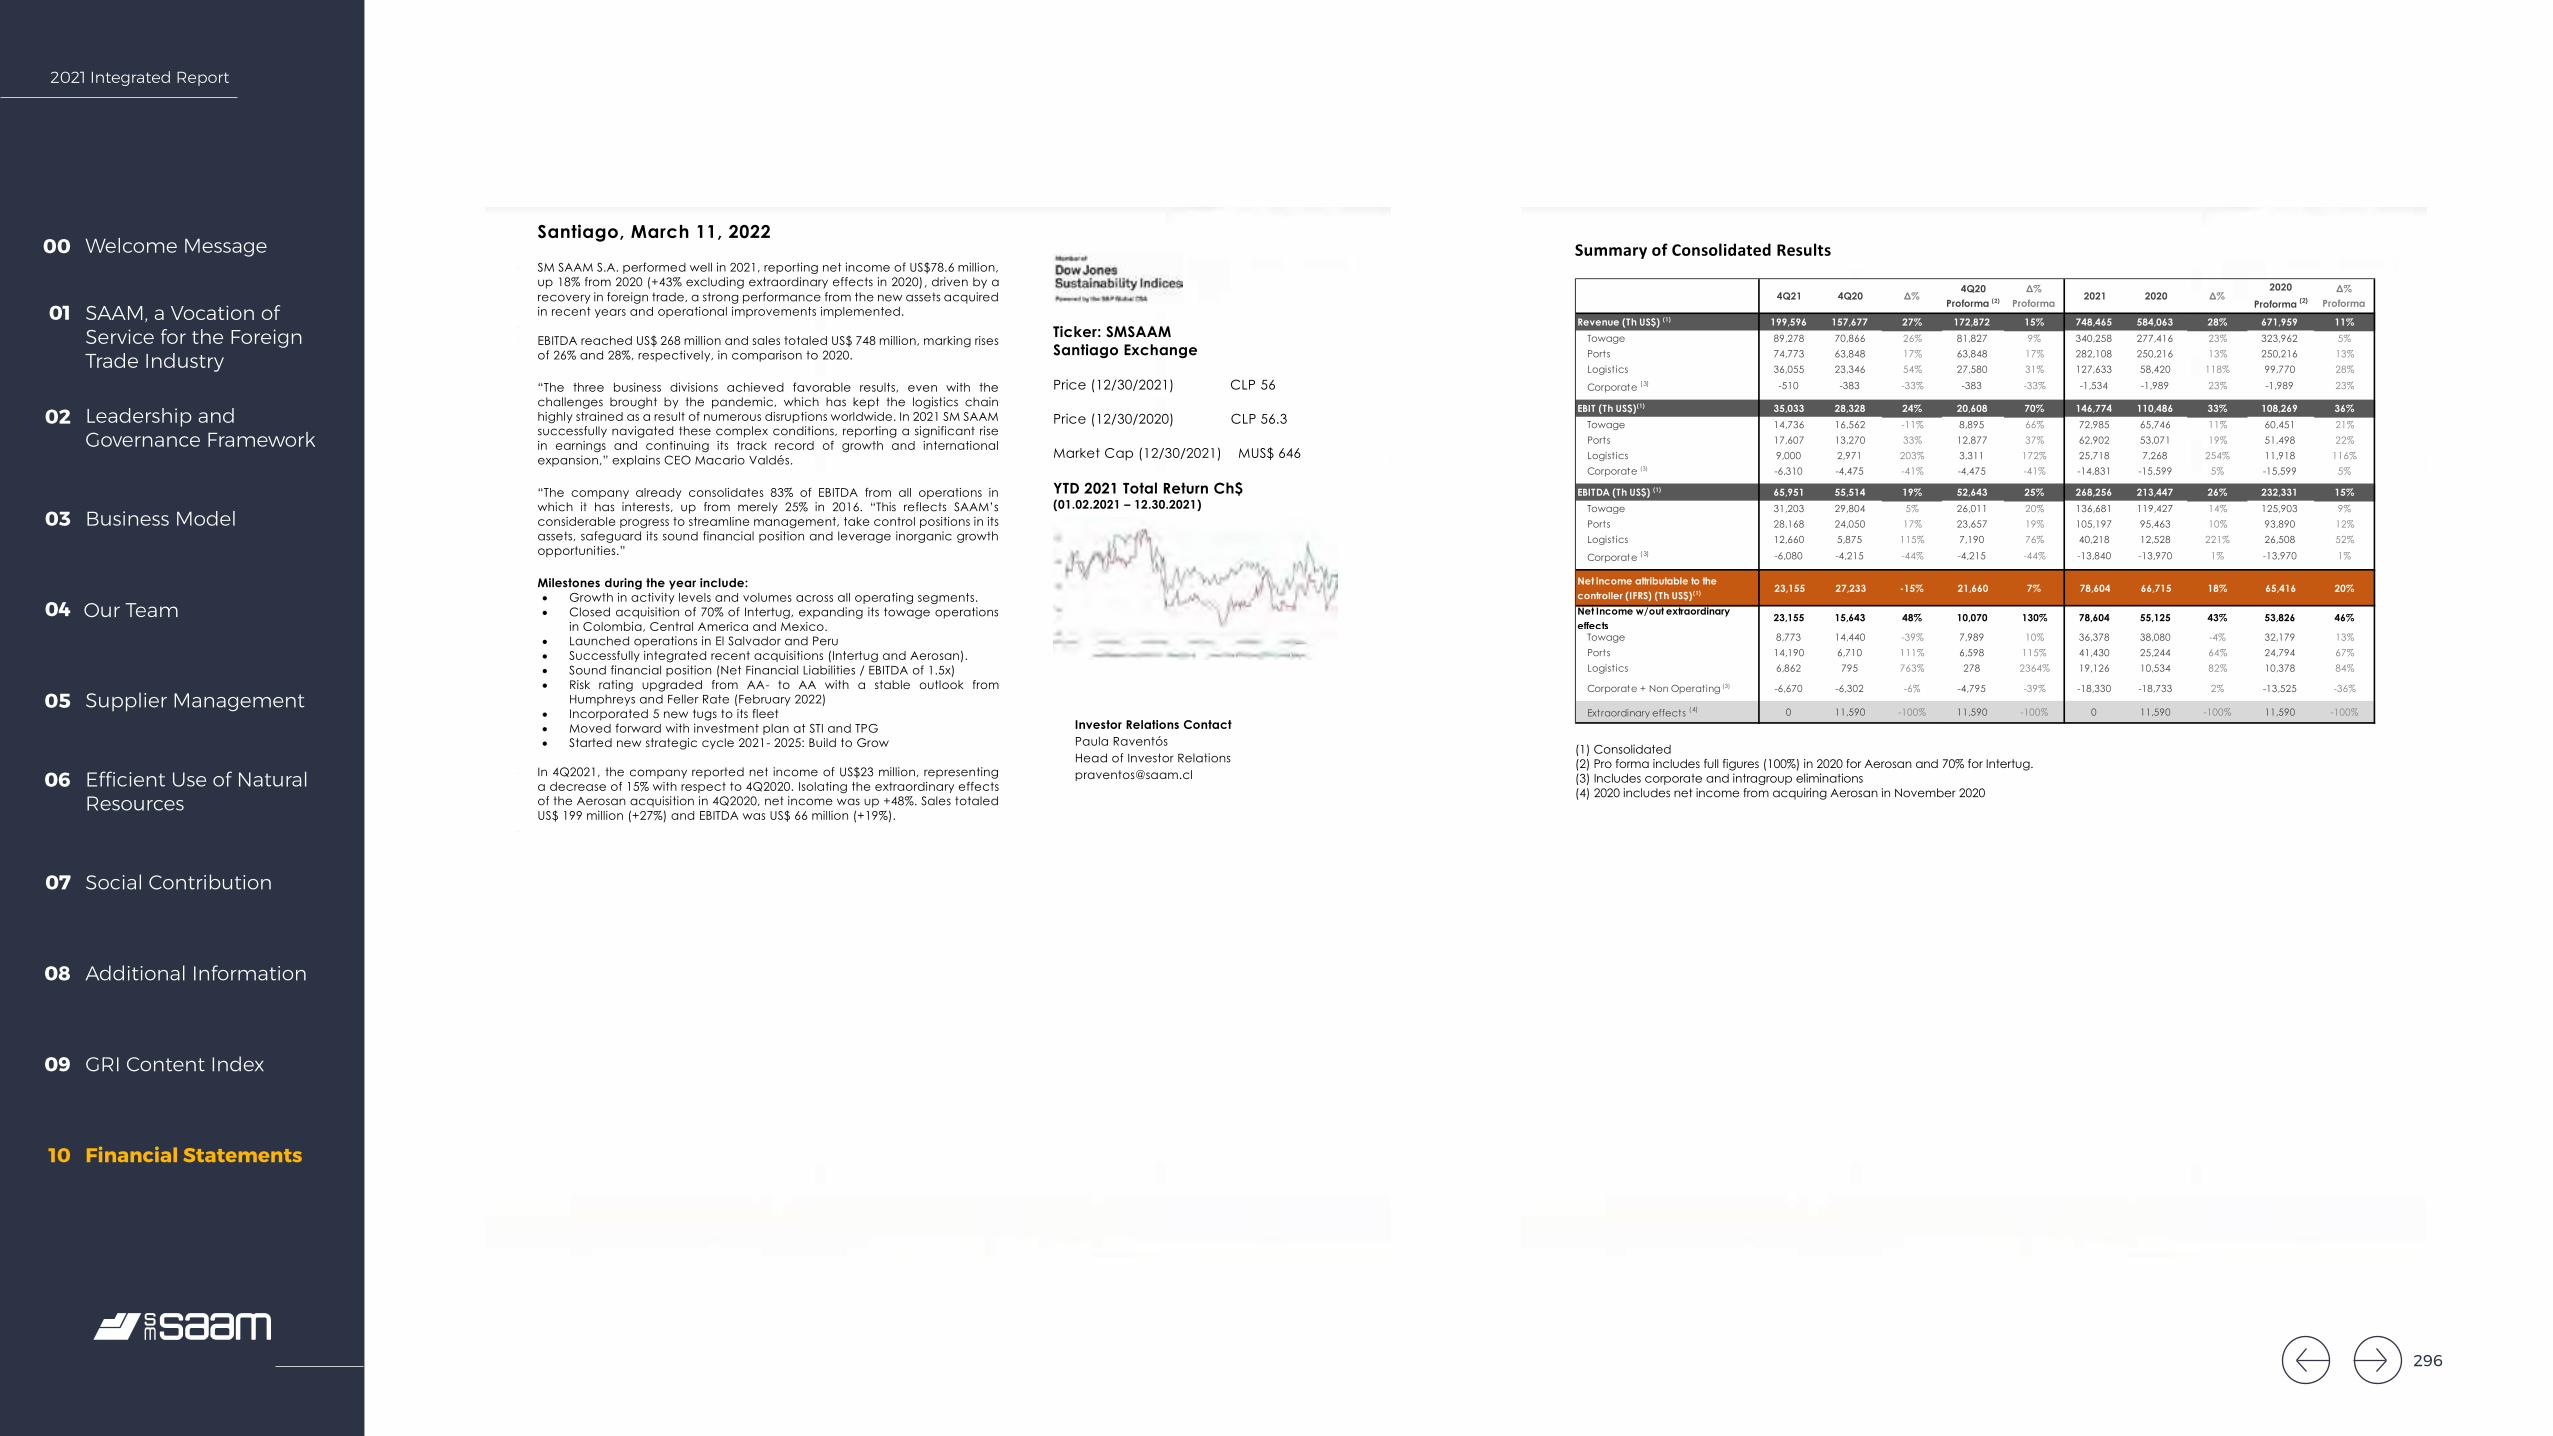
2021 Integrated Report
Welcome Message00
SAAM, a Vocation of Service for the Foreign Trade Industry
01
Leadership and Governance Framework
02
Business Model03
Our Team04
Supplier Management05
Efficient Use of Natural Resources
06
Social Contribution07
Additional Information08
GRI Content Index09
Financial Statements10
Earn ings Report four th quarte r 2021
2
Santiago, March 11, 2022
- SM SAAM S.A. performed well in 2021, reporting net income of US$78.6 million, up 18% from 2020 (+43% excluding extraordinary effects in 2020) , driven by a recovery in foreign trade, a strong performance from the new assets acquired in recent years and operational improvements implemented.
- - EBITDA reached US$ 268 million and sales totaled US$ 748 million, marking rises
of 26% and 28%, respectively, in comparison to 2020.
“The three business divisions achieved favorable results, even with the challenges brought by the pandemic, which has kept the logistics chain highly strained as a result of numerous disruptions worldwide. In 2021 SM SAAM successfully navigated these complex conditions, reporting a significant rise in earnings and continuing its track record of growth and international expansion,” explains CEO Macario Valdés.
“The company already consolidates 83% of EBITDA from all operations in which it has interests, up from merely 25% in 2016. “This reflects SAAM’s considerable progress to streamline management, take control positions in its assets, safeguard its sound financial position and leverage inorganic growth opportunities.”
Milestones during the year include: • Growth in activity levels and volumes across all operating segments. • Closed acquisition of 70% of Intertug, expanding its towage operations
in Colombia, Central America and Mexico. • Launched operations in El Salvador and Peru • Successfully integrated recent acquisitions (Intertug and Aerosan). • Sound financial position (Net Financial Liabilities / EBITDA of 1.5x) • Risk rating upgraded from AA- to AA with a stable outlook from
Humphreys and Feller Rate (February 2022) • Incorporated 5 new tugs to its fleet • Moved forward with investment plan at STI and TPG • Started new strategic cycle 2021- 2025: Build to Grow
- In 4Q2021, the company reported net income of US$23 million, representing
a decrease of 15% with respect to 4Q2020. Isolating the extraordinary effects of the Aerosan acquisition in 4Q2020, net income was up +48%. Sales totaled US$ 199 million (+27%) and EBITDA was US$ 66 million (+19%).
-
Ticker: SMSAAM Santiago Exchange
Price (12/30/2021) CLP 56
Price (12/30/2020) CLP 56.3
Market Cap (12/30/2021) MUS$ 646
YTD 2021 Total Return Ch$ (01.02.2021 – 12.30.2021)
Investor Relations Contact Paula Raventós Head of Investor Relations [email protected]
Investor Relations Contact Paula Raventós Head of Investor Relations [email protected]
Earn ings Report four th quarte r 2021
3
Summary of Consolidated Results
(1) Consolidated (2) Pro forma includes full figures (100%) in 2020 for Aerosan and 70% for Intertug. (3) Includes corporate and intragroup eliminations (4) 2020 includes net income from acquiring Aerosan in November 2020
Revenue (Th US$) (1) 199,596 157,677 27% 172,872 15% 748,465 584,063 28% 671,959 11%Towage 89,278 70,866 26% 81,827 9% 340,258 277,416 23% 323,962 5%Ports 74,773 63,848 17% 63,848 17% 282,108 250,216 13% 250,216 13%Logistics 36,055 23,346 54% 27,580 31% 127,633 58,420 118% 99,770 28%
Corporate (3) -510 -383 -33% -383 -33% -1,534 -1,989 23% -1,989 23%
EBIT (Th US$)(1) 35,033 28,328 24% 20,608 70% 146,774 110,486 33% 108,269 36%Towage 14,736 16,562 -11% 8,895 66% 72,985 65,746 11% 60,451 21%Ports 17,607 13,270 33% 12,877 37% 62,902 53,071 19% 51,498 22%Logistics 9,000 2,971 203% 3,311 172% 25,718 7,268 254% 11,918 116%Corporate (3) -6,310 -4,475 -41% -4,475 -41% -14,831 -15,599 5% -15,599 5%
EBITDA (Th US$) (1) 65,951 55,514 19% 52,643 25% 268,256 213,447 26% 232,331 15%Towage 31,203 29,804 5% 26,011 20% 136,681 119,427 14% 125,903 9%Ports 28,168 24,050 17% 23,657 19% 105,197 95,463 10% 93,890 12%Logistics 12,660 5,875 115% 7,190 76% 40,218 12,528 221% 26,508 52%
Corporate (3) -6,080 -4,215 -44% -4,215 -44% -13,840 -13,970 1% -13,970 1%
Net income attributable to the controller (IFRS) (Th US$)(1) 23,155 27,233 -15% 21,660 7% 78,604 66,715 18% 65,416 20%
Net Income w/out extraordinary effects
23,155 15,643 48% 10,070 130% 78,604 55,125 43% 53,826 46%
Towage 8,773 14,440 -39% 7,989 10% 36,378 38,080 -4% 32,179 13%Ports 14,190 6,710 111% 6,598 115% 41,430 25,244 64% 24,794 67%Logistics 6,862 795 763% 278 2364% 19,126 10,534 82% 10,378 84%
Corporate + Non Operating (3) -6,670 -6,302 -6% -4,795 -39% -18,330 -18,733 2% -13,525 -36%
Extraordinary effects (4) 0 11,590 -100% 11,590 -100% 0 11,590 -100% 11,590 -100%
Δ% 4Q20
Proforma (2)
Δ% Proforma
2020 Proforma (2)
Δ% Proforma
2020 Δ% 20214Q204Q21
296
2021 Integrated Report
Welcome Message00
SAAM, a Vocation of Service for the Foreign Trade Industry
01
Leadership and Governance Framework
02
Business Model03
Our Team04
Supplier Management05
Efficient Use of Natural Resources
06
Social Contribution07
Additional Information08
GRI Content Index09
Financial Statements10
Contents
SUMMARY OF CONSOLIDATED FINANCIAL RESULTS
CONSOLIDATED CASH FLOW
FINANCIAL POSITION
PORT TERMINALS DIVISION RESULTS
LOGISTICS DIVISION RESULTS
MARKET ANALYSIS
RISK FACTORS
CONSOLIDATED FINANCIAL INDICATORS
Earnings AnalysisChapter 01
Note (1):
Financial results correspond to consolidated financial data under IFRS in US dollars. Financial results of associates are presented at 100%.
297

2021 Integrated Report
Welcome Message00
SAAM, a Vocation of Service for the Foreign Trade Industry
01
Leadership and Governance Framework
02
Business Model03
Our Team04
Supplier Management05
Efficient Use of Natural Resources
06
Social Contribution07
Additional Information08
GRI Content Index09
Financial Statements10
Earn ings Report four th quarte r 2021
6
Summary of Consolidated Financial Results
(1) Consol idated (2) Pro forma includes ful l f igures (100%) in 2020 for Aerosan and 70% for Intertug. (3) 2020 includes net income from acqui r in g Aerosan (4) Equity-method EBITDA based on ownership percentage in consolidated companies and associates.
SALES
↑
↑
QUARTERLY: Consolidated sales for the quarter were up US$ 41.9 million (+27%) to US$199.6 million due to higher business volumes in all three divisions and to consolidating the newly acquired Aerosan operations in November 2020 and the Intertug operations in February 2021. Using comparable figures for both periods, revenue increased US$26.7 million (+15%) due mainly to higher import and export volumes and a different service mix favoring port terminals, towage services and airport services .
CUMULATIVE: For 12M2021, sales were up US$164.4 million (+28%) to US$748.5 million due primarily to consolidating the operations acquired from Aerosan and Intertug. Using comparable figures for both periods, sales increased US$76.5 million (+11%) due to greater business volumes in all three business divisions thanks to a recovery in foreign trade and a different service mix.
COST OF SALES
QUARTERLY: Cost of sales for the quarter increased US$27.2 million (+25%) to US$134.4 million, in line with increased business and the effect of consolidating Aerosan and Intertug. Using comparable figures for both periods, costs were up US$15.6 million (+13%) due to increased business across the three business divisions, as well as higher personnel costs, mostly because of congestion; increased fuel costs due to higher prices; and start-up costs for new towage operations.
CUMULATIVE: For 12M2021, costs increased US$107.9 million (+27%), to US$503.9 million, explained by increased business and the effect of consolidating Aerosan and Intertug. Using comparable figures for both periods, costs were up US$40.3 million (+9%) due to recovering business volumes across the three business divisions, higher personnel costs because of higher volume s and COVID-19, increased fuel costs due to higher prices and start-up costs for new operations.
ADMINISTRATIVE EXPENSES
QUARTERLY: Administrative expenses for the quarter increased US$7.9 million (+36%) to US$30.2 million, explained mostly by consolidating Aerosan and Intertug. Using comparable figures for both periods, expenses were down US$3.3 million ( -10%) due to a high basis of comparison explained by new operations and acquired subsidiaries.
CUMULATIVE: For 12M2021, expenses were up US$20.2 million (+26%) to US$97.8 million due to consolidating Aerosan and Intertug and increased business across all divisions. Using comparable figures, expenses fell US$2.3 million (-2%) as a result of a high basis of comparison in 2020 because of new acquisitions and operations.
Consolidated Financial Statement (Ths US$) (1) 4Q21 4Q20 Δ%
4Q20 Proforma (2)
Δ% Proforma
2021 2020 Δ% 2020
Proforma (2)Δ%
Proforma
Revenues 199,596 157,677 27% 172,872 15% 748,465 584,062 28% 671,959 11%Cost of Sales -134,388 -107,157 -25% -118,756 -13% -503,873 -396,001 -27% -463,528 -9%
Administrativ e expenses -30,175 -22,192 -36% -33,508 10% -97,818 -77,576 -26% -100,162 2%
Net operating income 35,033 28,328 24% 20,608 70% 146,774 110,486 33% 108,269 36%Depreciation & Amortization 30,916 27,186 14% 32,035 -3% 121,480 102,961 18% 124,062 -2%
EBITDA 65,949 55,514 19% 52,643 25% 268,254 213,447 26% 232,331 15%EBITDA Mg 33.0% 35.2% 30.5% 35.8% 36.5% 35%
Share of net income (loss) of associates
6,571 -298 -204 10,432 1,460 615% -529 2071%
Non-operating results + Taxes -16,135 -11,126 -45% -11,661 -38% -71,358 -51,821 -38% -50,252 -42%
Minotiry Interest 2,312 1,261 83% -1,327 274% 7,243 4,999 45% 3,659 98%Net income excluding extraordinary effects
23,155 15,643 48% 10,070 130% 78,604 55,126 43% 53,826 46%
Extraordinary effects (3) 0 11,590 11,590 0 11,590 -100% 11,590 -100%
Net income attributable to the controller
23,155 27,233 -15% 21,660 7% 78,604 66,716 18% 65,416 20%
Equity method EBITDA (4) 71,389 57,517 24% 54,962 30% 278,200 225,451 23% 234,292 19%
Earn ings Report four th quarte r 2021
7
EBITDA
↑
↑
QUARTERLY: Consolidated EBITDA reached US$65.9 million (+19%), marking a rise of US$10.4 million due mainly to increased business during the period and consolidating Aerosan and Intertug. Using comparable figures, EBITDA was up US$13.3 million (+25%) due to improved performances from the three business divisions, which benefited from recovering port throughput and more tons handled in airport services, as well as increased maneuvers in the Towage Division and lower administrative expenses.
o The EBITDA margin fell 217 bps to 33%, mostly due to a different service mix and the larger relative weight of the Logistics Division
CUMULATIVE: For 12M2021, EBITDA reached US$268.3 million (+26%), an increase of US$54.8 million. The rise is due to an improved performance from the three business divisions and, partially, to consolidating Aerosan and Intertug. Using comparable figures, EBITDA rose US$35.9 million (+15%) due to greater business volumes in the Logistics, Port Terminals and Towage divisions.
o The EBITDA manger fell 70 bps to 36%, mostly due to a different service mix and the larger relative weight of the Logistics Division. .
INVESTMENTS IN ASSOCIATES
QUARTERLY: The Company’s share of associate results was income of US$6.5 million, up US$6.9 million, fully offsetting the effect of consolidating Aerosan starting in November 2020. Isolating Aerosan's 2020 results, associate net income increased US$6.8 million, explained by recovering results at Chilean port terminals, which were affected in 2020 by lower business volumes stemming from the pandemic. CUMULATIVE: The Company’s share of associate results was income of US$10.4 million, marking a rise of US$8.9 million for the period. Isolating Aerosan’s 2020 results, associate income was up US$10.9 million, explained by recovering results at Chilean port terminals.
NON-OPERATING RESULTS + TAXES (EXCLUDES INVESTMENTS IN ASSOCIATES) QUARTERLY: Non-operating results and taxes generated a larger expense of US$5.0 million mainly due to higher taxes because
of improved results for the year. . In 4Q2020, a lower tax expense was generated associated with the annual deferred tax effect of US$3.6 million. CUMULATIVE: For 12M2021, non-operating results and taxes generated a larger expense of US$19.5 million mainly due to higher taxes because of improved results from the business divisions. Using comparable figures, the expense was US$21 million larger due to an increase in current taxes because of increased earnings and, to a lesser extent, to variations in deferred taxes. In 2020, a lower tax expense was generated associated with the annual deferred tax effect of US$3.6 million.
NET INCOME
↑
QUARTERLY: Net income attributable to the controller was US$23.2 million, down US$4 million with respect to 4Q2020 ( -15%) due to a high basis of comparison in 4Q2020 when there was an extraordinary gain of US$11.6 million from the acquisition of Aerosan. Isolating that effect, net income climbed US$1.5 million (+7%) due to a solid performance from all three business divisions-- Port Terminals, Logistics, and Towage--related to larger business volumes partly because of a recovery in foreign trade in economies around the world, as well as a strong performance from the new assets acquired in recent years and operational improvements implemented. CUMULATIVE: For 12M2021, net income attributable to the controller reached US$78.6 million, up US$11.9 million (+18%) from the 2020 figure of US$66.7 million. Excluding the extraordinary gain of US$11.6 million from the Aerosan acquisition in 4Q202 0, net income was up US$23.5 million (+43%) from 2020. Using comparable figures for Intertug and Aerosan and excluding these extraordinary effects in 2020, net income increased US$25 million (+46%).
298
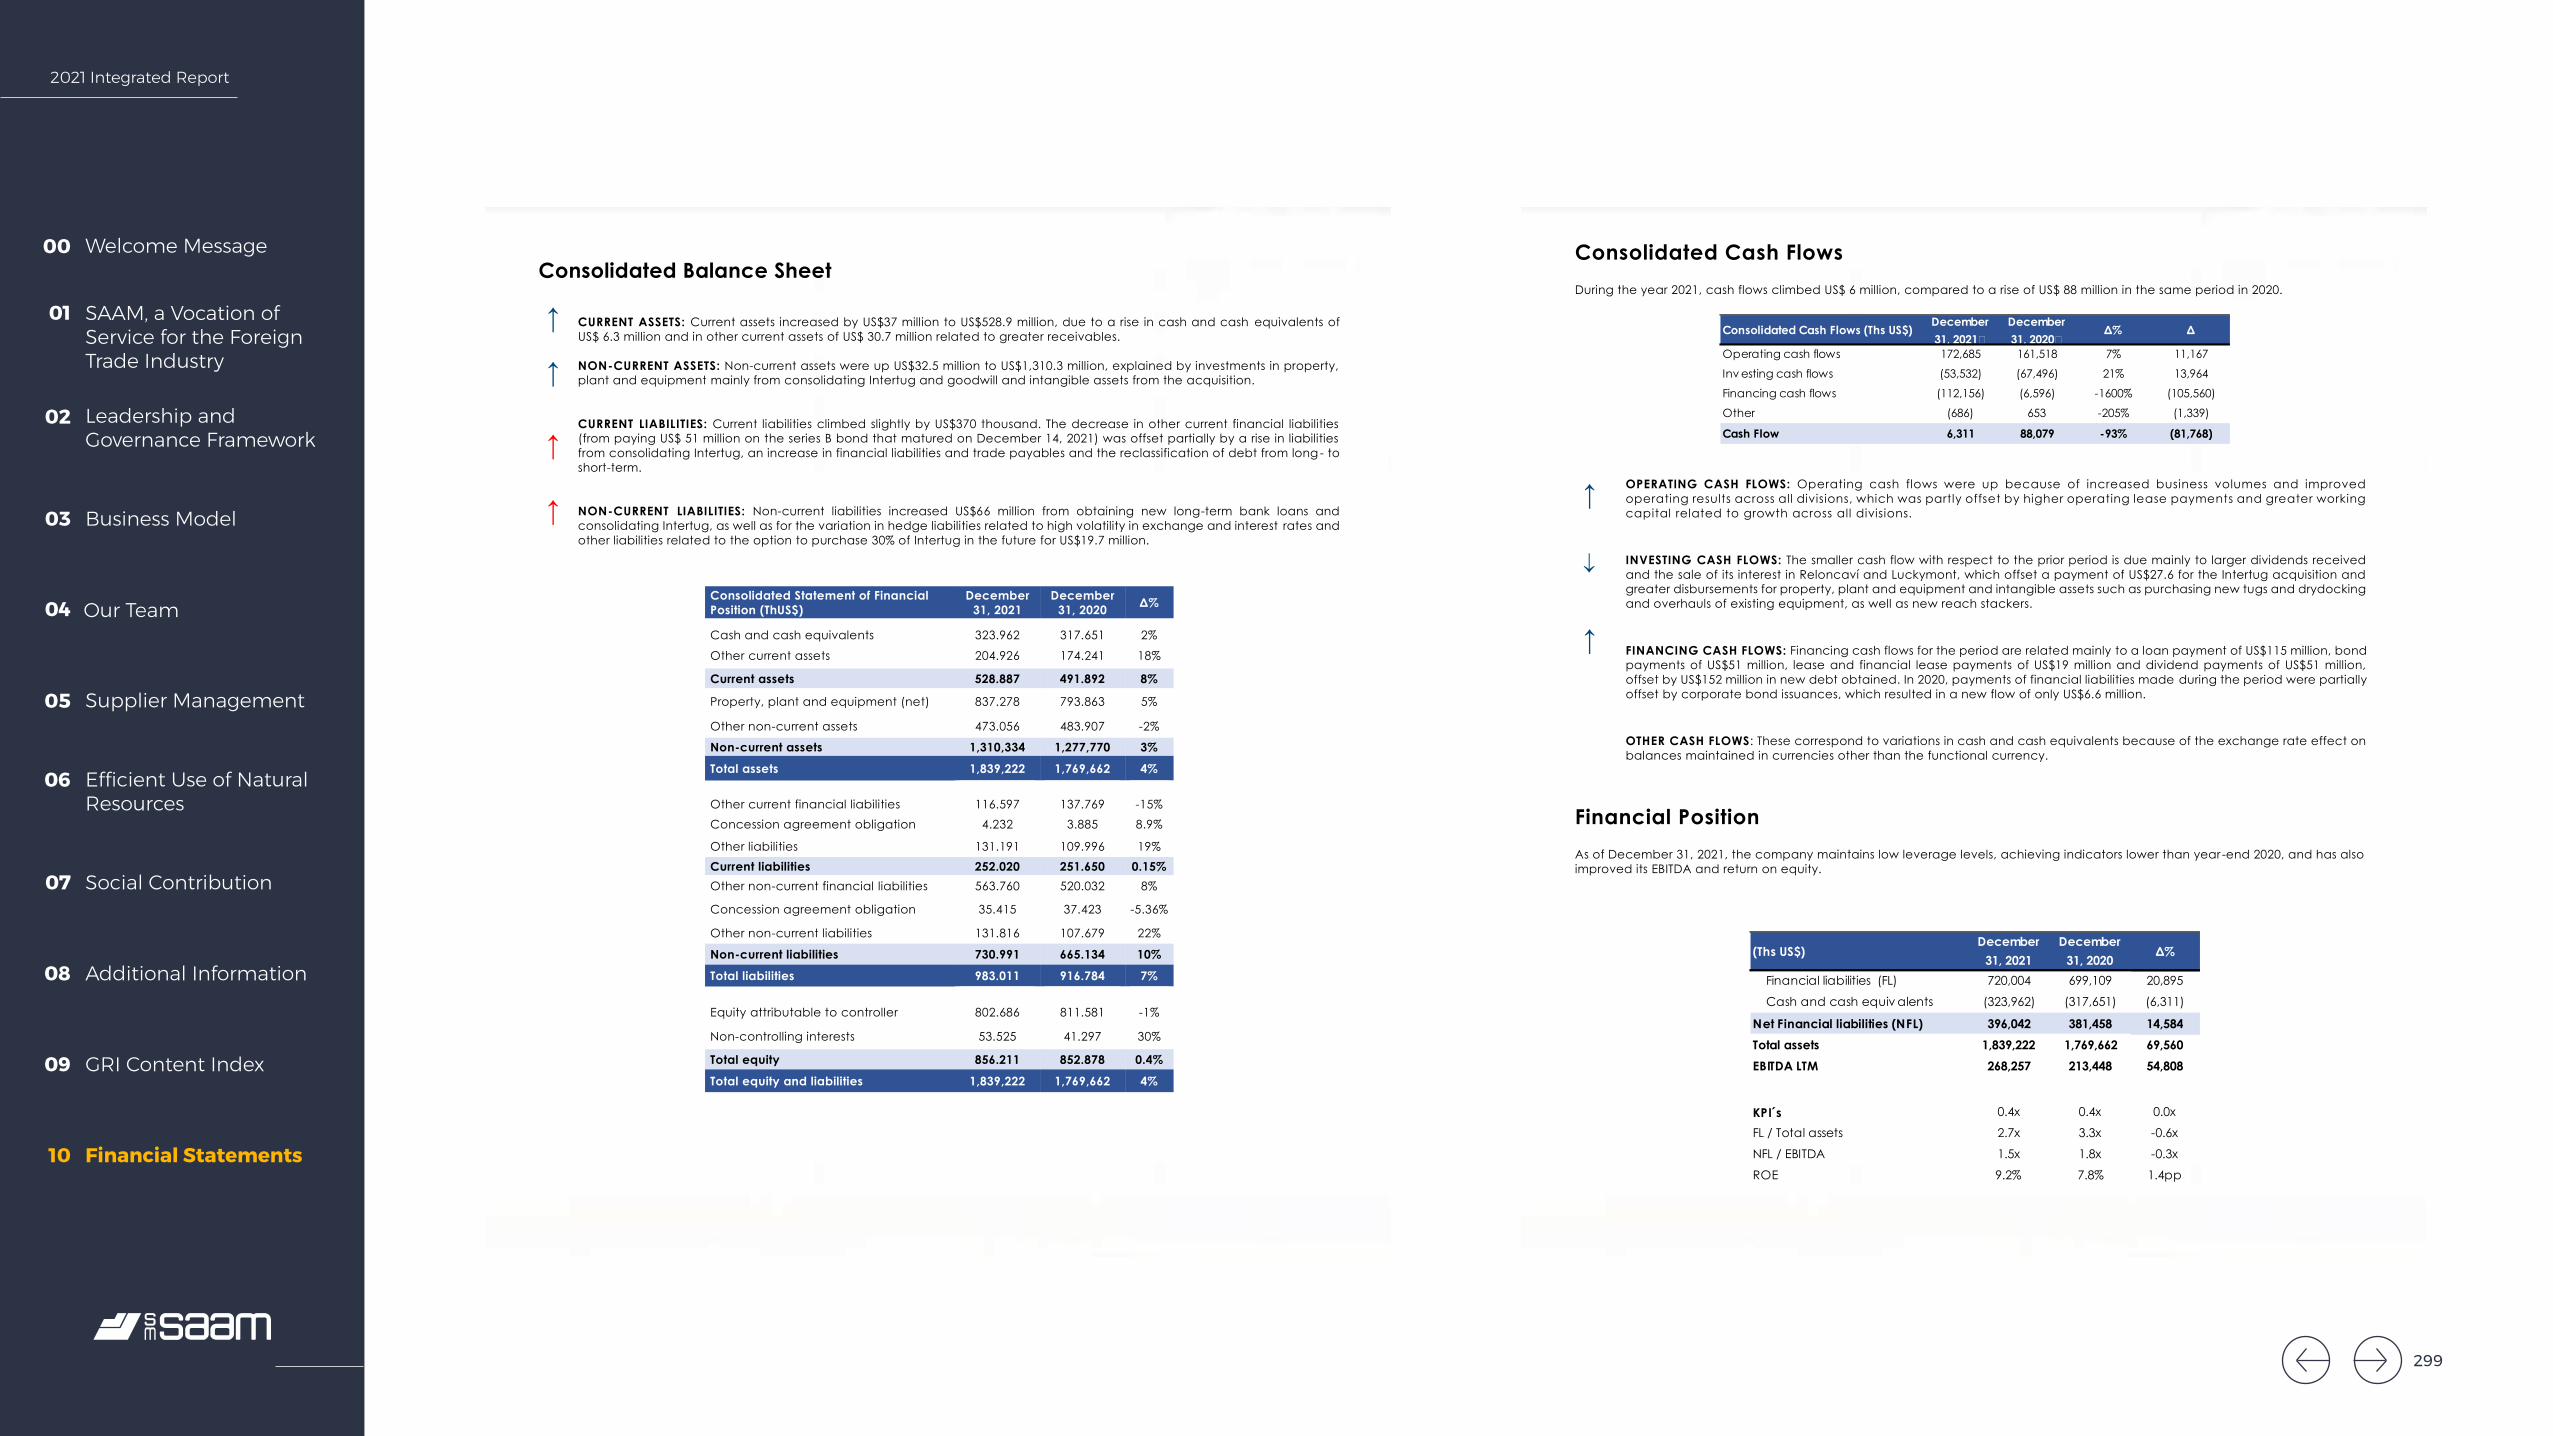
2021 Integrated Report
Welcome Message00
SAAM, a Vocation of Service for the Foreign Trade Industry
01
Leadership and Governance Framework
02
Business Model03
Our Team04
Supplier Management05
Efficient Use of Natural Resources
06
Social Contribution07
Additional Information08
GRI Content Index09
Financial Statements10
Earn ings Report four th quarte r 2021
8
Consolidated Balance Sheet
Consolidated Statement of Financial Position (ThUS$)
December 31, 2021
December 31, 2020 Δ%
Cash and cash equivalents 323.962 317.651 2%
Other current assets 204.926 174.241 18%
Current assets 528.887 491.892 8%
Property, plant and equipment (net) 837.278 793.863 5%
Other non-current assets 473.056 483.907 -2%
Non-current assets 1,310,334 1,277,770 3%
Total assets 1,839,222 1,769,662 4%
Other current financial liabilities 116.597 137.769 -15% Concession agreement obligation 4.232 3.885 8.9%
Other liabilities 131.191 109.996 19% Current liabilities 252.020 251.650 0.15% Other non-current financial liabilities 563.760 520.032 8%
Concession agreement obligation 35.415 37.423 -5.36%
Other non-current liabilities 131.816 107.679 22%
Non-current liabilities 730.991 665.134 10%
Total liabilities 983.011 916.784 7%
Equity attributable to controller 802.686 811.581 -1%
Non-controlling interests 53.525 41.297 30%
Total equity 856.211 852.878 0.4%
Total equity and liabilities 1,839,222 1,769,662 4%
↑
↑
↑ ↑
CURRENT ASSETS: Current assets increased by US$37 million to US$528.9 million, due to a rise in cash and cash equivalents of US$ 6.3 million and in other current assets of US$ 30.7 million related to greater receivables. NON-CURRENT ASSETS: Non-current assets were up US$32.5 million to US$1,310.3 million, explained by investments in property, plant and equipment mainly from consolidating Intertug and goodwill and intangible assets from the acquisition. CURRENT LIABILITIES: Current liabilities climbed slightly by US$370 thousand. The decrease in other current financial liabilities (from paying US$ 51 million on the series B bond that matured on December 14, 2021) was offset partially by a rise in liabilities from consolidating Intertug, an increase in financial liabilities and trade payables and the reclassification of debt from long - to short-term. NON-CURRENT LIABILITIES: Non-current liabilities increased US$66 million from obtaining new long-term bank loans and consolidating Intertug, as well as for the variation in hedge liabilities related to high volatility in exchange and interest rates and other liabilities related to the option to purchase 30% of Intertug in the future for US$19.7 million.
Earn ings Report four th quarte r 2021
9
Consolidated Cash Flows During the year 2021, cash flows climbed US$ 6 million, compared to a rise of US$ 88 million in the same period in 2020.
↑
↑
OPERATING CASH FLOWS: Operating cash flows were up because of increased business volumes and improved operating results across all divisions, which was partly offset by higher operating lease payments and greater working capital related to growth across all divisions.
INVESTING CASH FLOWS: The smaller cash flow with respect to the prior period is due mainly to larger dividends received and the sale of its interest in Reloncaví and Luckymont, which offset a payment of US$27.6 for the Intertug acquisition and greater disbursements for property, plant and equipment and intangible assets such as purchasing new tugs and drydocking and overhauls of existing equipment, as well as new reach stackers.
FINANCING CASH FLOWS: Financing cash flows for the period are related mainly to a loan payment of US$115 million, bond payments of US$51 million, lease and financial lease payments of US$19 million and dividend payments of US$51 million, offset by US$152 million in new debt obtained. In 2020, payments of financial liabilities made during the period were partially offset by corporate bond issuances, which resulted in a new flow of only US$6.6 million.
OTHER CASH FLOWS: These correspond to variations in cash and cash equivalents because of the exchange rate effect on balances maintained in currencies other than the functional currency.
Financial Position As of December 31, 2021, the company maintains low leverage levels, achieving indicators lower than year -end 2020, and has also improved its EBITDA and return on equity.
Consolidated Cash Flows (Ths US$)December 31, 2021�
December 31, 2020�
Δ% Δ
Operating cash flows 172,685 161,518 7% 11,167
Inv esting cash flows (53,532) (67,496) 21% 13,964
Financing cash flows (112,156) (6,596) -1600% (105,560)
Other (686) 653 -205% (1,339)
Cash Flow 6,311 88,079 -93% (81,768)
(Ths US$)December
31, 2021December
31, 2020Δ%
Financial liabilities (FL) 720,004 699,109 20,895
Cash and cash equiv alents (323,962) (317,651) (6,311)
Net Financial liabilities (NFL) 396,042 381,458 14,584Total assets 1,839,222 1,769,662 69,560EBITDA LTM 268,257 213,448 54,808
KPI s 0.4x 0.4x 0.0x
FL / Total assets 2.7x 3.3x -0.6x
NFL / EBITDA 1.5x 1.8x -0.3x
ROE 9.2% 7.8% 1.4pp
299

2021 Integrated Report
Welcome Message00
SAAM, a Vocation of Service for the Foreign Trade Industry
01
Leadership and Governance Framework
02
Business Model03
Our Team04
Supplier Management05
Efficient Use of Natural Resources
06
Social Contribution07
Additional Information08
GRI Content Index09
Financial Statements10
Earn ings Report four th quarte r 2021
10
Consolidated Towage Division Results
(1) Includes full data (100%) for consolidated companies. 2021 f igures include 100% of Intertug figures start ing in February 2021 (2) Pro forma considers Intertug figures in 2020 (3) Proportional EBITDA based on ownership percentage in consolidated companies and associates. Excludes f igures from TABSA and LNG Tug
SALES
↑ ↑
QUARTERLY: Consolidated revenue for the Towage Division reached US$89.3 million, up US$18.4 million (+26%) as a result of business volume growth and the effect of consolidating operations in Intertug. Using comparable figures, revenue increased US$7.4 million, explained by a 3% increase in port maneuvers due to recovery in foreign trade, a different service mix and, t o a lesser extent, revenue from operations in Uruguay (barge business) and new operations in El Salvador and Peru.
CUMULATIVE: For 12M2021, revenue was up US$62.8 million (+23%) to US$340.3 million, generated by growth in port maneuvers and having consolidated Intertug. Using comparable figures, revenue increased US$16.3 million, explained by a +5% increase in maneuvers due to recovering activity levels, a different service mix and, to a lesser extent, new operations in El Salvador and Peru. These effects offset the increase in special services in 2020.
COST OF SALES
QUARTERLY: Cost of sales reached US$59.6 million, up US$14 million due to greater business volumes and having consolidated Intertug. Using comparable figures, costs increased US$5.7 million due to increases in fuel costs because of higher prices, subcontracting costs related to greater maneuver volumes, personnel costs related to COVID-19 and increased business and start-up costs for operations in Peru.
CUMULATIVE: For 12M2021, costs were up US$39.6 million to US$217.9 million due to recovering activity levels and Intertug. Using comparable figures for both periods, costs rose US$4.2 million due to increases in fuel costs because of higher prices, subcontracting and start-up expenses for operations in Peru.
EBITDA
↑
QUARTERLY: The Towage Division reported EBITDA of US$ 31.2 million, marking an increase of US$1.4 million (+5%) due to greater business volumes and consolidating Intertug. Using comparable figures, EBITDA was up US$5.2 million because of greater business volumes, a different service mix and lower administrative expenses explained by a high basis of comparison due to new operations and the subsidiaries acquired.
o The EBITDA margin was 35%, 316 bps more than the same comparable period.
Consolidated Financial Statement (Ths US$) (1) 4Q21 4Q20 Δ%
4Q20 Proforma (2)
Δ% Proforma
2021 2020 Δ% 2020
Proforma (2)Δ%
Proforma
Tug mov es # 34,057 27,821 22% 32,927 3% 131,638 107,486 22% 125,531 5%
Tugboats # 179 149 20% 173 3% 179 149 20% 173 3%
Revenues 89,278 70,866 26% 81,827 9% 340,258 277,416 23% 323,962 5%Cost of Sales -59,578 -45,537 -31% -53,926 -10% -217,990 -178,326 -22% -213,730 -2%
Administrativ e expenses -14,964 -8,767 -71% -19,006 21% -49,283 -33,344 -48% -49,780 1%
Net operating income 14,736 16,562 -11% 8,895 66% 72,985 65,746 11% 60,451 21%Depreciation&Amortization 16,467 13,242 24% 17,115 -4% 63,696 53,681 19% 65,452 -3%
EBITDA 31,203 29,804 5% 26,011 20% 136,681 119,427 14% 125,903 9%EBITDA Mg 35.0% 42.1% 31.8% 40.2% 43.0% 38.9%
Share of net income (loss) of associates
387 -74 622% -74 622% 460 12 3733% 12 3733%
Non-operating results + Taxes -6,203 -1,886 -229% -3,275 -89% -36,482 -27,058 -35% -29,084 -25%
Minotiry Interest 147 162 -10% -2,443 106% 585 620 -6% -801 173%
Net income attributable to the controller
8,773 14,440 -39% 7,989 10% 36,378 38,080 -4% 32,179 13%
Equity method EBITDA (3) 30,696 29,632 4% 26,993 14% 132,650 118,262 12% 122,433 8%
Earn ings Report four th quarte r 2021
11
↑
CUMULATIVE: For 12M2021, EBITDA rose US$17.2 million (+14%), to US$136.7 million. Using comparable figures, EBITDA was up US$10.8 million because of growth in maneuvers and a different service mix, which offset the increase in special services in 2020 and the higher operating costs in 2021.
o The EBITDA margin was 40%, 130 bps more than the same comparable period.
SHARE OF NET INCOME (LOSS) OF ASSOCIATES
QUARTERLY: The division's share of associate results was income of US$387 thousand for the period, marking an increase of US$461 thousand versus the prior period as a result of reduced business at Transbordadoras Austral Broom.
CUMULATIVE: For 12M2021, its share of associate results was income of US$460 thousand, up US$448 thousand from 2020, explained by recovered activity at Transbordadoras Austral Broom.
NET INCOME
↑
QUARTERLY: The Towage Division reported net income of US$8.7 million, up US$5.6 million (+39%) due to a smaller tax expense in 4Q2020 because of annual deferred taxes of US$3.6 million. Using comparable figures, net income was up US$785 thousand due to greater business volumes and lower administrative expenses explained by a high basis of comparison due to the new operations and subsidiaries acquired, which offset the start -up costs for the new operations.
CUMULATIVE: The Towage Division reported net income of US$36.4 million, up US$1.7 million (+4%) due to a smaller tax expense in 4Q2020 because of annual deferred taxes. Using comparable figures, net income rose US$4.2 million due to growth in business volumes and a different service mix, which offset a drop in special services and start-up costs of new operations.
300
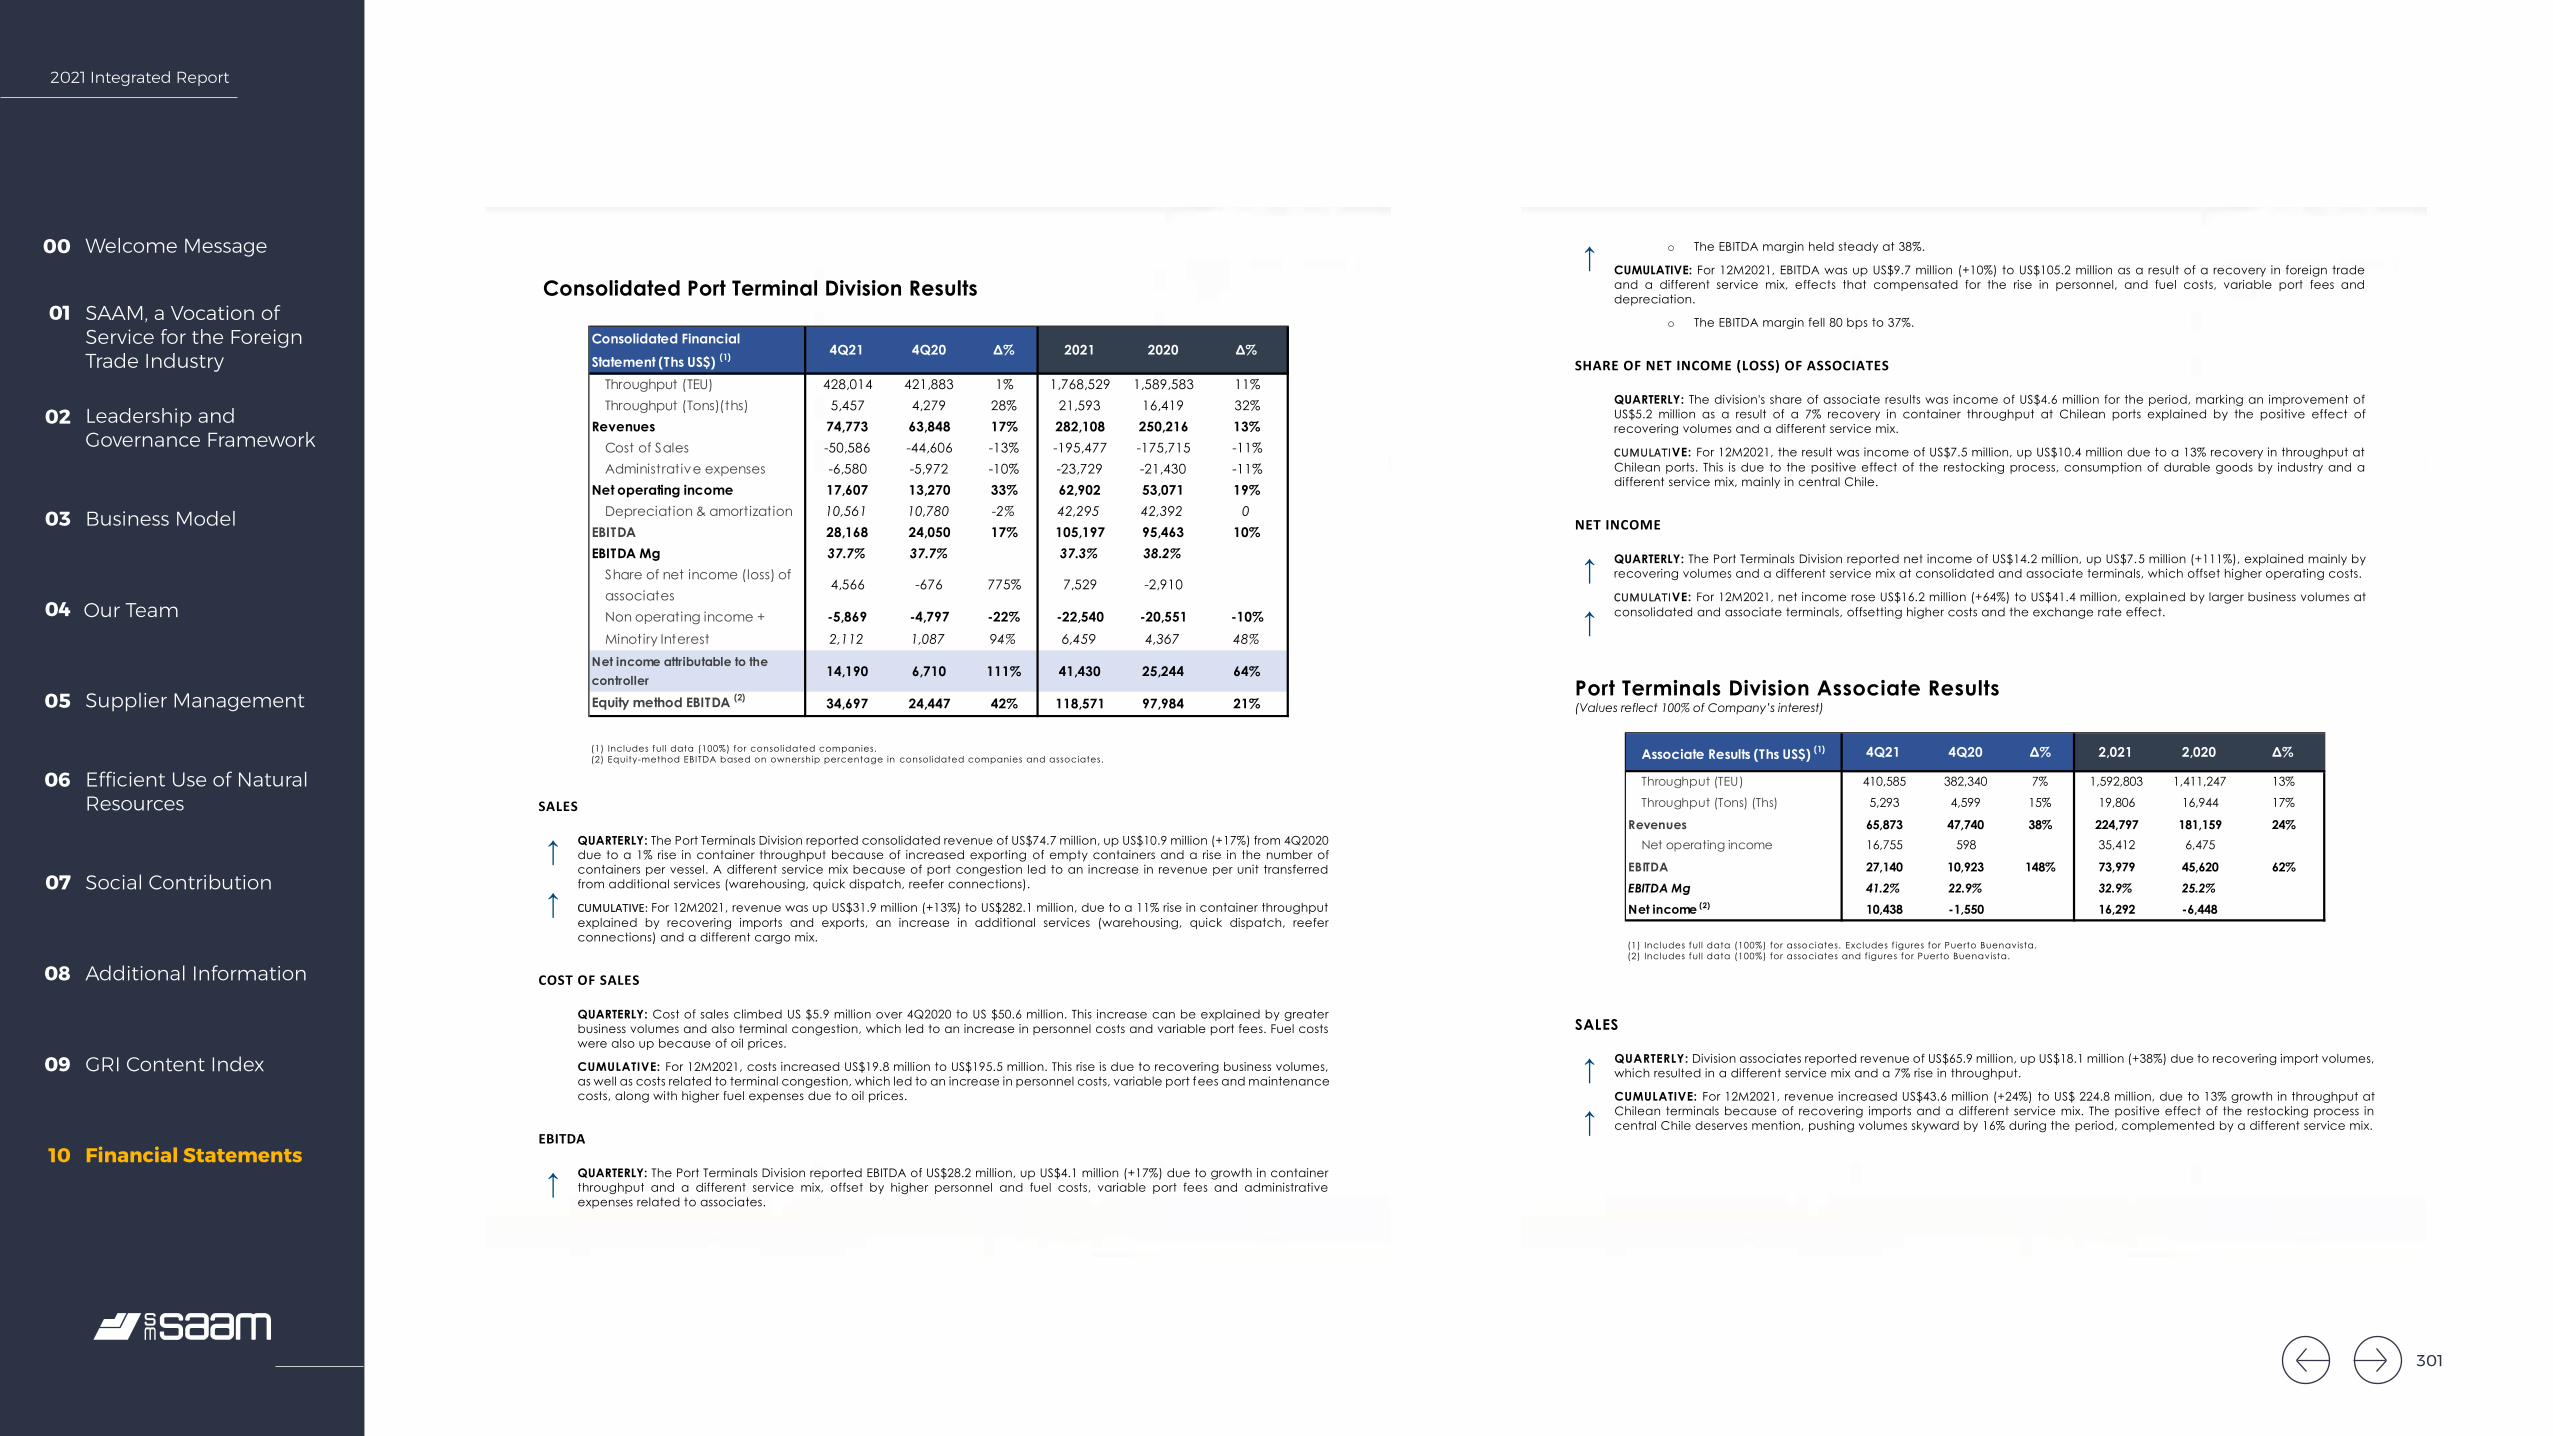
2021 Integrated Report
Welcome Message00
SAAM, a Vocation of Service for the Foreign Trade Industry
01
Leadership and Governance Framework
02
Business Model03
Our Team04
Supplier Management05
Efficient Use of Natural Resources
06
Social Contribution07
Additional Information08
GRI Content Index09
Financial Statements10
Earn ings Report four th quarte r 2021
12
Consolidated Port Terminal Division Results
(1) Includes full data (100%) for consolidated companies. (2) Equity-method EBITDA based on ownership percentage in consolidated companies and associates.
SALES
↑
↑
QUARTERLY: The Port Terminals Division reported consolidated revenue of US$74.7 million, up US$10.9 million (+17%) from 4Q2020 due to a 1% rise in container throughput because of increased exporting of empty containers and a rise in the number of containers per vessel. A different service mix because of port congestion led to an increase in revenue per unit transferred from additional services (warehousing, quick dispatch, reefer connections).
CCUUMMUULLAATTIIVVEE:: For 12M2021, revenue was up US$31.9 million (+13%) to US$282.1 million, due to a 11% rise in container throughput explained by recovering imports and exports, an increase in additional services (warehousing, quick dispatch, reefer connections) and a different cargo mix.
COST OF SALES
QUARTERLY: Cost of sales climbed US $5.9 million over 4Q2020 to US $50.6 million. This increase can be explained by greater business volumes and also terminal congestion, which led to an increase in personnel costs and variable port fees. Fuel costs were also up because of oil prices.
CUMULATIVE: For 12M2021, costs increased US$19.8 million to US$195.5 million. This rise is due to recovering business volumes, as well as costs related to terminal congestion, which led to an increase in personnel costs, variable port fees and maintenance costs, along with higher fuel expenses due to oil prices.
EBITDA
↑
QUARTERLY: The Port Terminals Division reported EBITDA of US$28.2 million, up US$4.1 million (+17%) due to growth in container throughput and a different service mix, offset by higher personnel and fuel costs, variable port fees and administrative expenses related to associates.
Consolidated Financial Statement (Ths US$) (1) 4Q21 4Q20 Δ% 2021 2020 Δ%
Throughput (TEU) 428,014 421,883 1% 1,768,529 1,589,583 11%Throughput (Tons)(ths) 5,457 4,279 28% 21,593 16,419 32%
Revenues 74,773 63,848 17% 282,108 250,216 13%Cost of Sales -50,586 -44,606 -13% -195,477 -175,715 -11%Administrative expenses -6,580 -5,972 -10% -23,729 -21,430 -11%
Net operating income 17,607 13,270 33% 62,902 53,071 19%Depreciation & amortization 10,561 10,780 -2% 42,295 42,392 0
EBITDA 28,168 24,050 17% 105,197 95,463 10%EBITDA Mg 37.7% 37.7% 37.3% 38.2%
Share of net income (loss) of associates
4,566 -676 775% 7,529 -2,910
Non operating income + -5,869 -4,797 -22% -22,540 -20,551 -10%Minotiry Interest 2,112 1,087 94% 6,459 4,367 48%
Net income attributable to the controller
14,190 6,710 111% 41,430 25,244 64%
Equity method EBITDA (2) 34,697 24,447 42% 118,571 97,984 21%
Earn ings Report four th quarte r 2021
13
↑ o The EBITDA margin held steady at 38%.
CUMULATIVE: For 12M2021, EBITDA was up US$9.7 million (+10%) to US$105.2 million as a result of a recovery in foreign trade and a different service mix, effects that compensated for the rise in personnel, and fuel costs, variable port fees and depreciation.
o The EBITDA margin fell 80 bps to 37%.
SHARE OF NET INCOME (LOSS) OF ASSOCIATES
QUARTERLY: The division's share of associate results was income of US$4.6 million for the period, marking an improvement of US$5.2 million as a result of a 7% recovery in container throughput at Chilean ports explained by the positive effect of recovering volumes and a different service mix.
CCUUMMUULLAATTIIVE: For 12M2021, the result was income of US$7.5 million, up US$10.4 million due to a 13% recovery in throughput at Chilean ports. This is due to the positive effect of the restocking process, consumption of durable goods by industry and a different service mix, mainly in central Chile.
NET INCOME
↑
↑
QUARTERLY: The Port Terminals Division reported net income of US$14.2 million, up US$7.5 million (+111%), explained mainly by recovering volumes and a different service mix at consolidated and associate terminals, which offset higher operating costs.
CCUUMMUULLAATTIIVE: For 12M2021, net income rose US$16.2 million (+64%) to US$41.4 million, explained by larger business volumes at consolidated and associate terminals, offsetting higher costs and the exchange rate effect.
Port Terminals Division Associate Results (Values reflect 100% of Company’s interest)
(1) Includes full data (100%) for associates. Excludes f igures for Puerto Buenavista. (2) Includes full data (100%) for associates and figures for Puerto Buenavista.
SALES
↑
↑
QUARTERLY: Division associates reported revenue of US$65.9 million, up US$18.1 million (+38%) due to recovering import volumes, which resulted in a different service mix and a 7% rise in throughput.
CUMULATIVE: For 12M2021, revenue increased US$43.6 million (+24%) to US$ 224.8 million, due to 13% growth in throughput at Chilean terminals because of recovering imports and a different service mix. The positive effect of the restocking process in central Chile deserves mention, pushing volumes skyward by 16% during the period, complemented by a different service mix.
Associate Results (Ths US$) (1) 4Q21 4Q20 Δ% 2,021 2,020 Δ%
Throughput (TEU) 410,585 382,340 7% 1,592,803 1,411,247 13%
Throughput (Tons) (Ths) 5,293 4,599 15% 19,806 16,944 17%
Revenues 65,873 47,740 38% 224,797 181,159 24%Net operating income 16,755 598 35,412 6,475
EBITDA 27,140 10,923 148% 73,979 45,620 62%EBITDA Mg 41.2% 22.9% 32.9% 25.2%Net income (2) 10,438 -1,550 16,292 -6,448
301
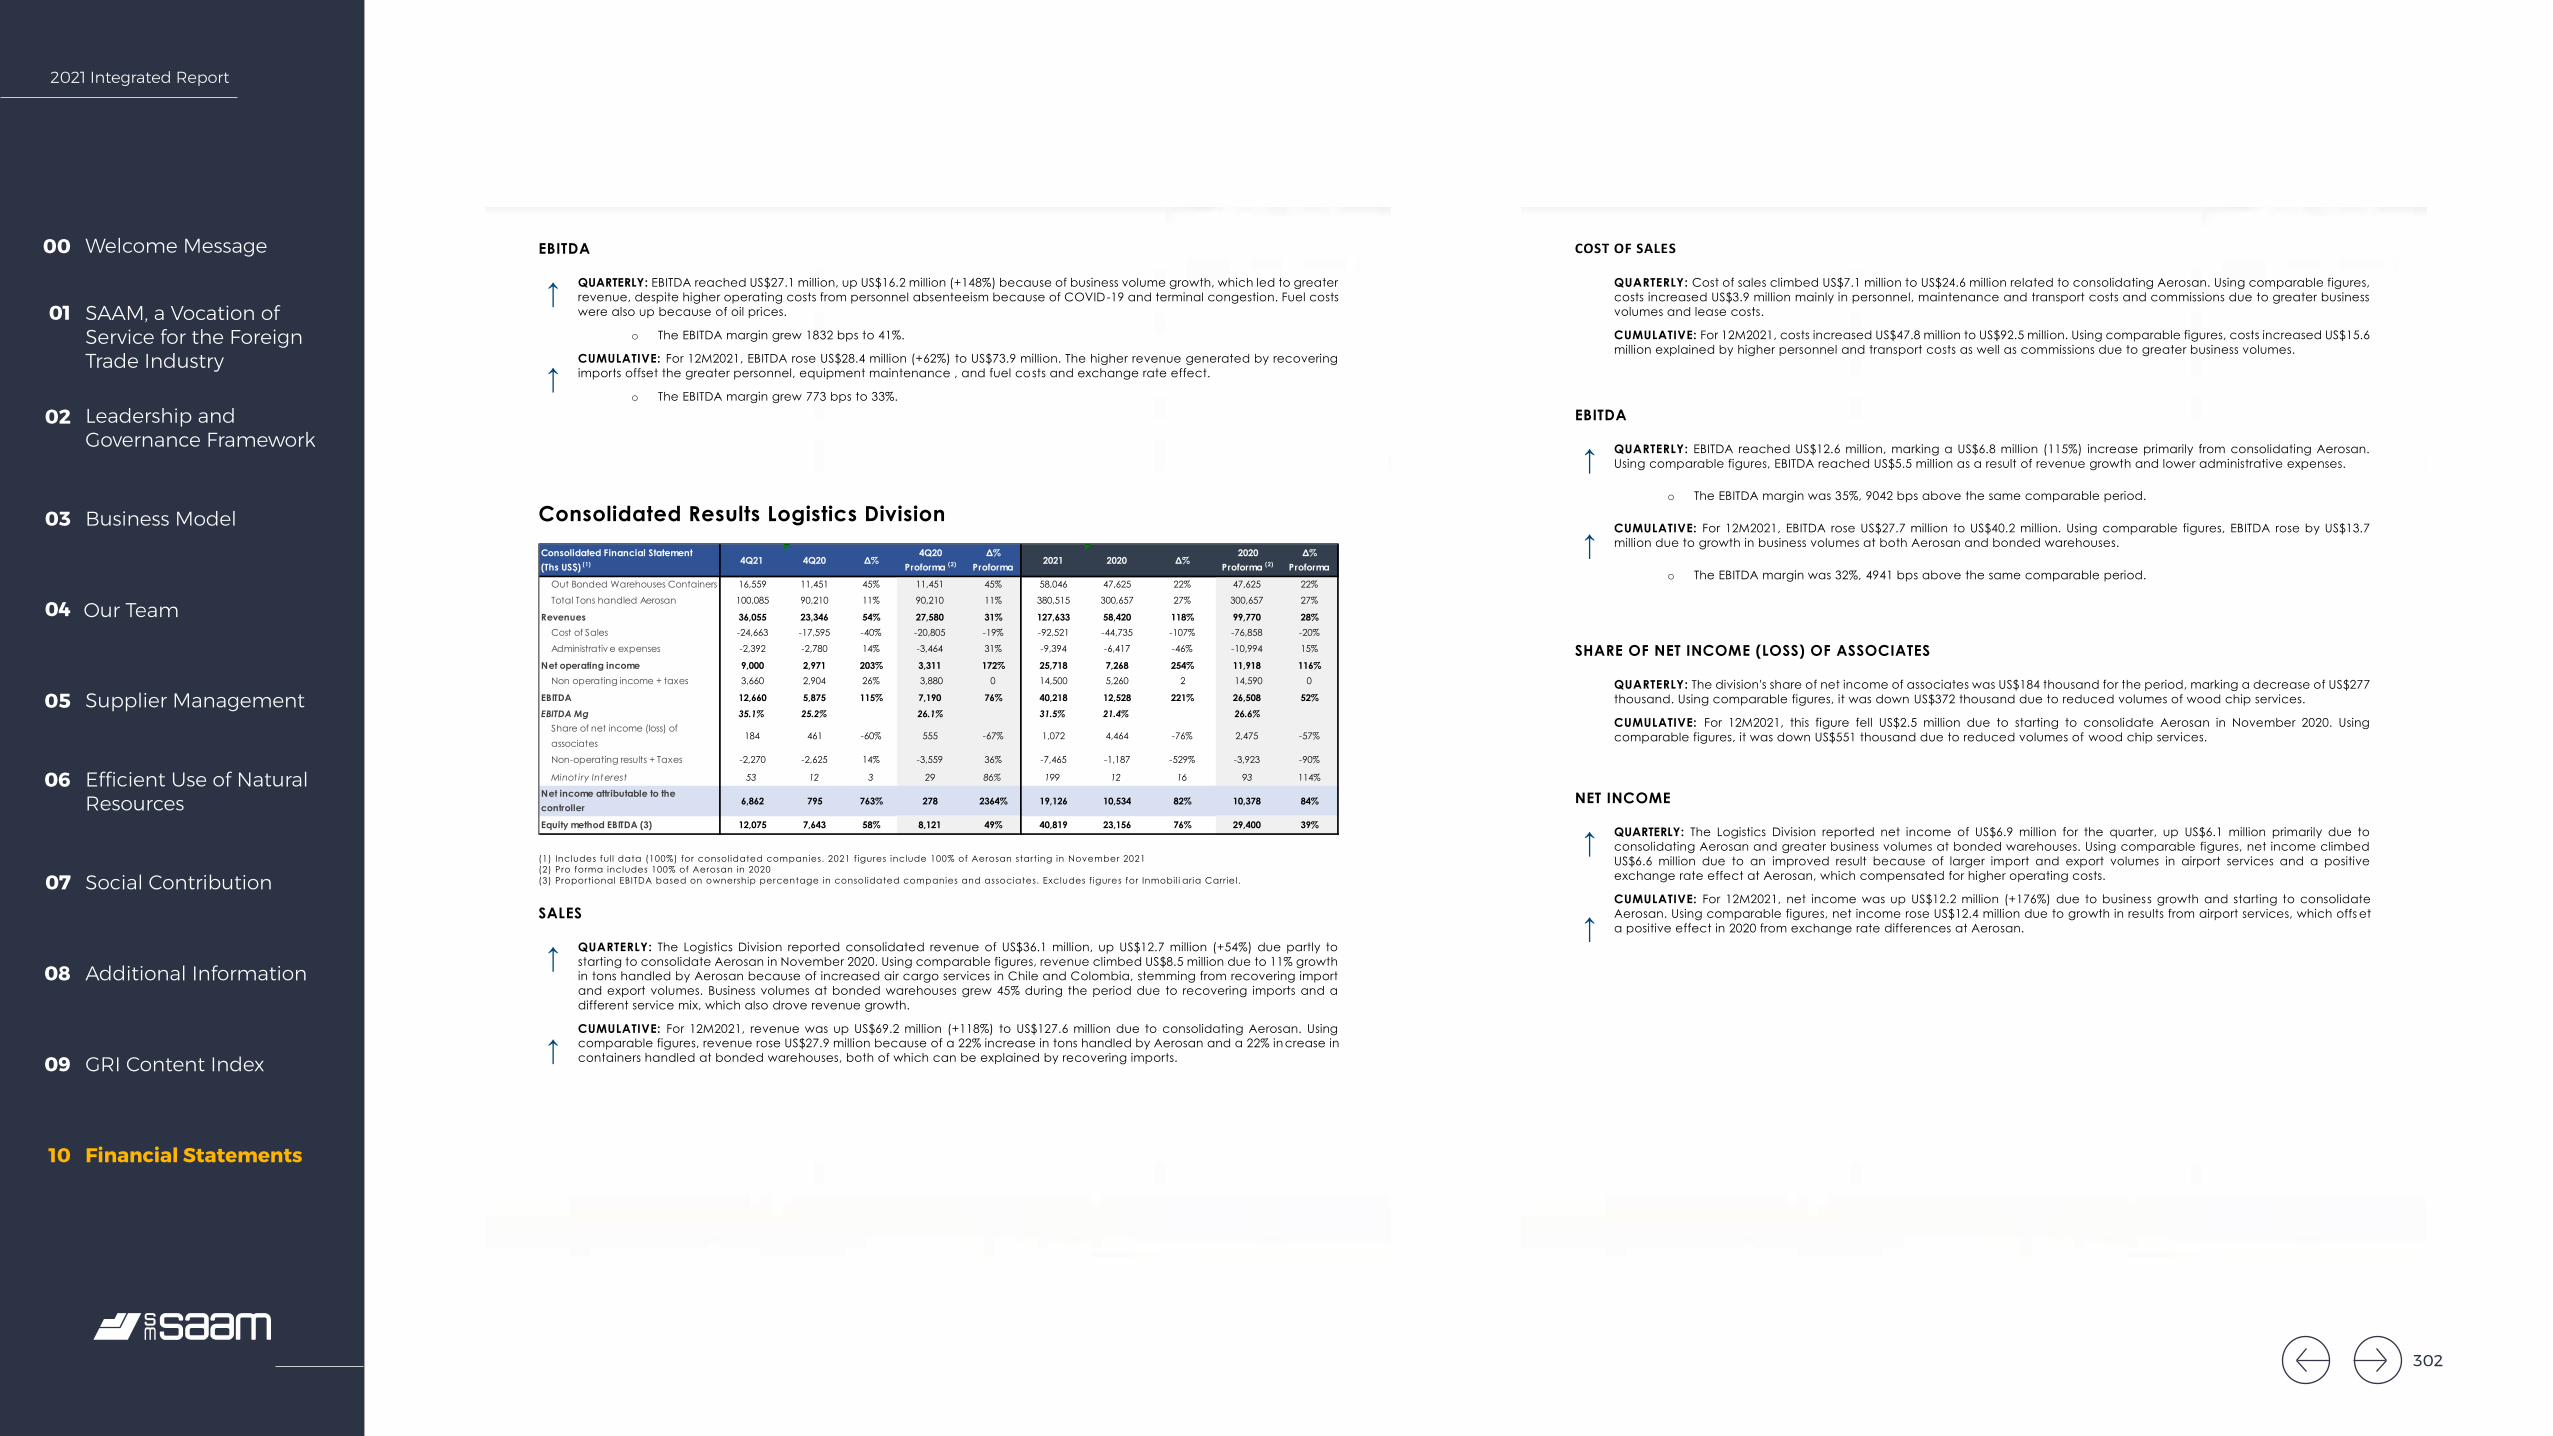
2021 Integrated Report
Welcome Message00
SAAM, a Vocation of Service for the Foreign Trade Industry
01
Leadership and Governance Framework
02
Business Model03
Our Team04
Supplier Management05
Efficient Use of Natural Resources
06
Social Contribution07
Additional Information08
GRI Content Index09
Financial Statements10
Earn ings Report four th quarte r 2021
14
EBITDA
↑
↑
QUARTERLY: EBITDA reached US$27.1 million, up US$16.2 million (+148%) because of business volume growth, which led to greater revenue, despite higher operating costs from personnel absenteeism because of COVID-19 and terminal congestion. Fuel costs were also up because of oil prices.
o The EBITDA margin grew 1832 bps to 41%.
CUMULATIVE: For 12M2021, EBITDA rose US$28.4 million (+62%) to US$73.9 million. The higher revenue generated by recovering imports offset the greater personnel, equipment maintenance , and fuel costs and exchange rate effect.
o The EBITDA margin grew 773 bps to 33%.
Consolidated Results Logistics Division
(1) Includes full data (100%) for consolidated companies. 2021 f igures include 100% of Aerosan starting in November 2021 (2) Pro forma includes 100% of Aerosan in 2020 (3) Proportional EBITDA based on ownership percentage in consolidated companies and associates. Excludes f igures for Inmobil i aria Carriel.
SALES
↑
↑
QUARTERLY: The Logistics Division reported consolidated revenue of US$36.1 million, up US$12.7 million (+54%) due partly to starting to consolidate Aerosan in November 2020. Using comparable figures, revenue climbed US$8.5 million due to 11% growth in tons handled by Aerosan because of increased air cargo services in Chile and Colombia, stemming from recovering import and export volumes. Business volumes at bonded warehouses grew 45% during the period due to recovering imports and a different service mix, which also drove revenue growth.
CUMULATIVE: For 12M2021, revenue was up US$69.2 million (+118%) to US$127.6 million due to consolidating Aerosan. Using comparable figures, revenue rose US$27.9 million because of a 22% increase in tons handled by Aerosan and a 22% increase in containers handled at bonded warehouses, both of which can be explained by recovering imports.
Consolidated Financial Statement (Ths US$) (1) 4Q21 4Q20 Δ%
4Q20 Proforma (2)
Δ% Proforma
2021 2020 Δ% 2020
Proforma (2)Δ%
Proforma
Out Bonded Warehouses Containers 16,559 11,451 45% 11,451 45% 58,046 47,625 22% 47,625 22%
Total Tons handled Aerosan 100,085 90,210 11% 90,210 11% 380,515 300,657 27% 300,657 27%
Revenues 36,055 23,346 54% 27,580 31% 127,633 58,420 118% 99,770 28%Cost of Sales -24,663 -17,595 -40% -20,805 -19% -92,521 -44,735 -107% -76,858 -20%
Administrativ e expenses -2,392 -2,780 14% -3,464 31% -9,394 -6,417 -46% -10,994 15%
Net operating income 9,000 2,971 203% 3,311 172% 25,718 7,268 254% 11,918 116%Non operating income + taxes 3,660 2,904 26% 3,880 0 14,500 5,260 2 14,590 0
EBITDA 12,660 5,875 115% 7,190 76% 40,218 12,528 221% 26,508 52%EBITDA Mg 35.1% 25.2% 26.1% 31.5% 21.4% 26.6%
Share of net income (loss) of associates
184 461 -60% 555 -67% 1,072 4,464 -76% 2,475 -57%
Non-operating results + Taxes -2,270 -2,625 14% -3,559 36% -7,465 -1,187 -529% -3,923 -90%
Minot iry Interest 53 12 3 29 86% 199 12 16 93 114%
Net income attributable to the controller
6,862 795 763% 278 2364% 19,126 10,534 82% 10,378 84%
Equity method EBITDA (3) 12,075 7,643 58% 8,121 49% 40,819 23,156 76% 29,400 39%
Earn ings Report four th quarte r 2021
15
COST OF SALES
QUARTERLY: Cost of sales climbed US$7.1 million to US$24.6 million related to consolidating Aerosan. Using comparable figures, costs increased US$3.9 million mainly in personnel, maintenance and transport costs and commissions due to greater business volumes and lease costs.
CUMULATIVE: For 12M2021, costs increased US$47.8 million to US$92.5 million. Using comparable figures, costs increased US$15.6 million explained by higher personnel and transport costs as well as commissions due to greater business volumes.
EBITDA
↑
↑
QUARTERLY: EBITDA reached US$12.6 million, marking a US$6.8 million (115%) increase primarily from consolidating Aerosan. Using comparable figures, EBITDA reached US$5.5 million as a result of revenue growth and lower administrative expenses.
o The EBITDA margin was 35%, 9042 bps above the same comparable period.
CUMULATIVE: For 12M2021, EBITDA rose US$27.7 million to US$40.2 million. Using comparable figures, EBITDA rose by US$13.7 million due to growth in business volumes at both Aerosan and bonded warehouses.
o The EBITDA margin was 32%, 4941 bps above the same comparable period.
SHARE OF NET INCOME (LOSS) OF ASSOCIATES
QUARTERLY: The division's share of net income of associates was US$184 thousand for the period, marking a decrease of US$277 thousand. Using comparable figures, it was down US$372 thousand due to reduced volumes of wood chip services.
CUMULATIVE: For 12M2021, this figure fell US$2.5 million due to starting to consolidate Aerosan in November 2020. Using comparable figures, it was down US$551 thousand due to reduced volumes of wood chip services.
NET INCOME
↑
↑
QUARTERLY: The Logistics Division reported net income of US$6.9 million for the quarter, up US$6.1 million primarily due to consolidating Aerosan and greater business volumes at bonded warehouses. Using comparable figures, net income climbed US$6.6 million due to an improved result because of larger import and export volumes in airport services and a positive exchange rate effect at Aerosan, which compensated for higher operating costs.
CUMULATIVE: For 12M2021, net income was up US$12.2 million (+176%) due to business growth and starting to consolidate Aerosan. Using comparable figures, net income rose US$12.4 million due to growth in results from airport services, which offs et a positive effect in 2020 from exchange rate differences at Aerosan.
302
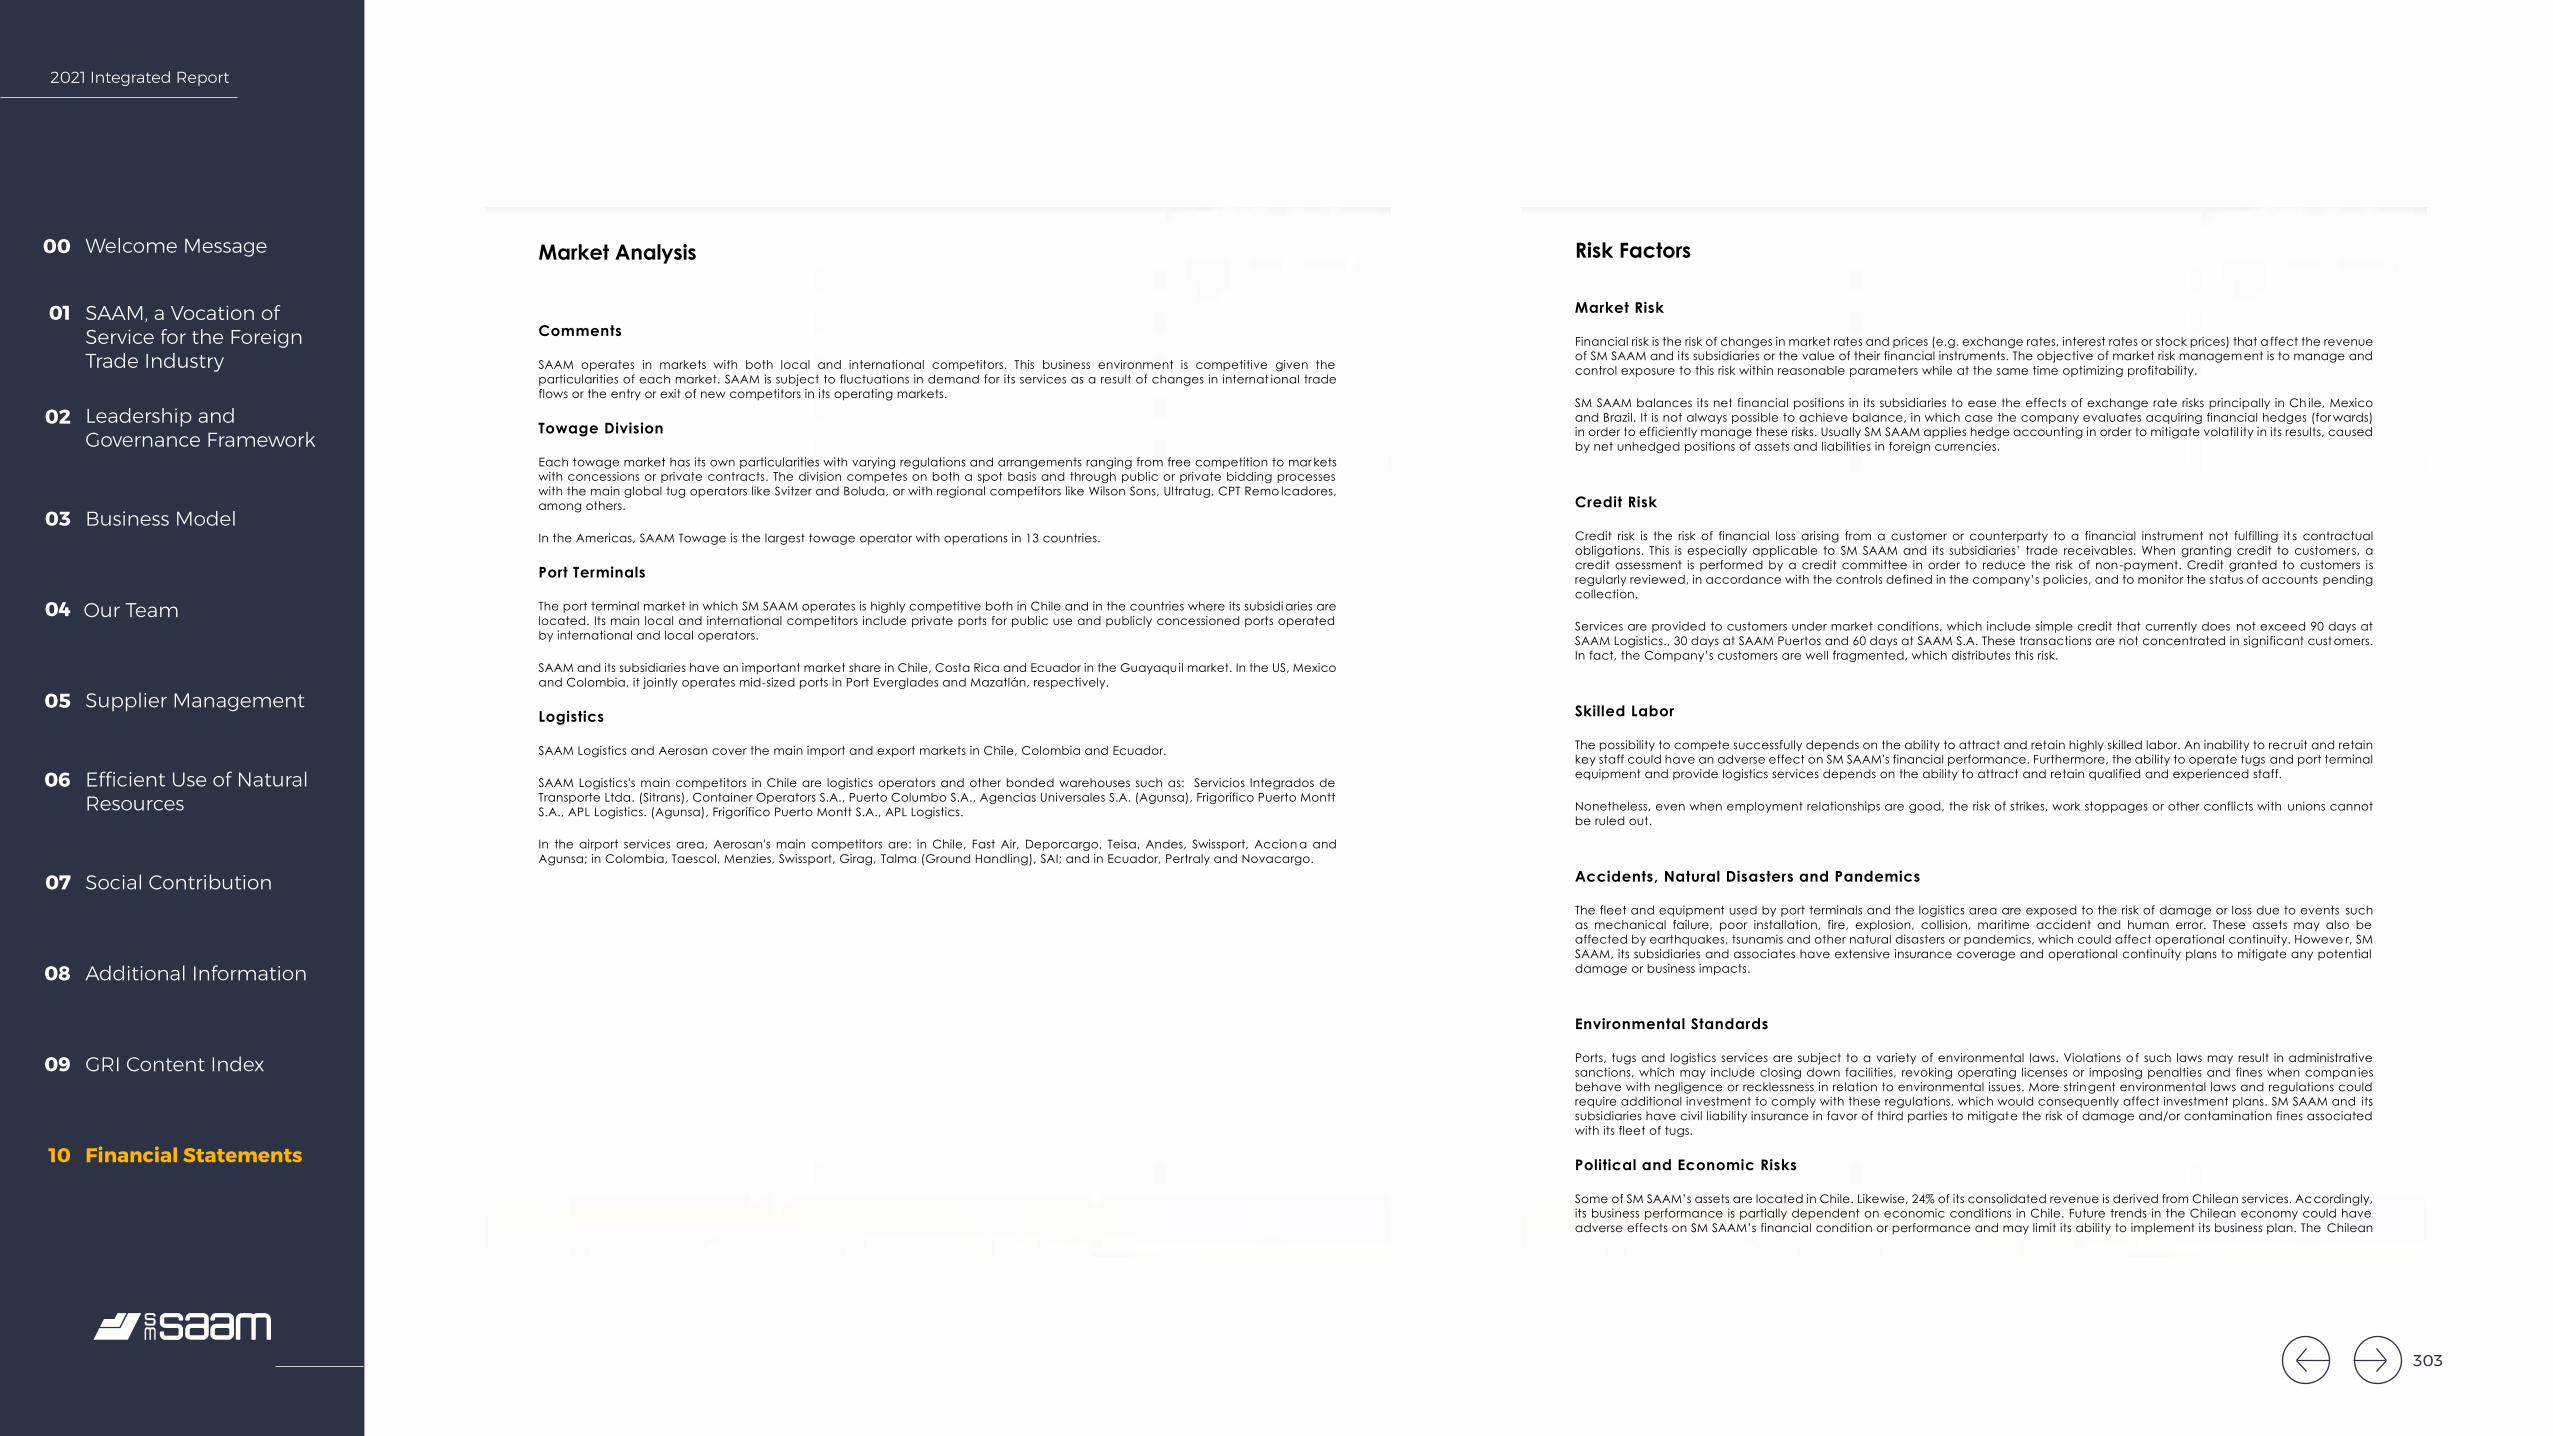
2021 Integrated Report
Welcome Message00
SAAM, a Vocation of Service for the Foreign Trade Industry
01
Leadership and Governance Framework
02
Business Model03
Our Team04
Supplier Management05
Efficient Use of Natural Resources
06
Social Contribution07
Additional Information08
GRI Content Index09
Financial Statements10
Earn ings Report four th quarte r 2021
16
Market Analysis
Comments
SAAM operates in markets with both local and international competitors. This business environment is competitive given the particularities of each market. SAAM is subject to fluctuations in demand for its services as a result of changes in internat ional trade flows or the entry or exit of new competitors in its operating markets.
Towage Division
Each towage market has its own particularities with varying regulations and arrangements ranging from free competition to mar kets with concessions or private contracts. The division competes on both a spot basis and through public or private bidding processes with the main global tug operators like Svitzer and Boluda, or with regional competitors like Wilson Sons, Ultratug, CPT Remo lcadores, among others.
In the Americas, SAAM Towage is the largest towage operator with operations in 13 countries.
Port Terminals
The port terminal market in which SM SAAM operates is highly competitive both in Chile and in the countries where its subsidi aries are located. Its main local and international competitors include private ports for public use and publicly concessioned ports operated by international and local operators.
SAAM and its subsidiaries have an important market share in Chile, Costa Rica and Ecuador in the Guayaquil market. In the US, Mexico and Colombia, it jointly operates mid-sized ports in Port Everglades and Mazatlán, respectively.
Logistics
SAAM Logistics and Aerosan cover the main import and export markets in Chile, Colombia and Ecuador.
SAAM Logistics's main competitors in Chile are logistics operators and other bonded warehouses such as: Servicios Integrados de Transporte Ltda. (Sitrans), Container Operators S.A., Puerto Columbo S.A., Agencias Universales S.A. (Agunsa), Frigorífico Puerto Montt S.A., APL Logistics. (Agunsa), Frigorífico Puerto Montt S.A., APL Logistics.
In the airport services area, Aerosan's main competitors are: in Chile, Fast Air, Deporcargo, Teisa, Andes, Swissport, Accion a and Agunsa; in Colombia, Taescol, Menzies, Swissport, Girag, Talma (Ground Handling), SAI; and in Ecuador, Pertraly and Novacargo.
Earn ings Report four th quarte r 2021
17
Risk Factors
Market Risk
Financial risk is the risk of changes in market rates and prices (e.g. exchange rates, interest rates or stock prices) that a ffect the revenue of SM SAAM and its subsidiaries or the value of their financial instruments. The objective of market risk management is to manage and control exposure to this risk within reasonable parameters while at the same time optimizing profitability.
SM SAAM balances its net financial positions in its subsidiaries to ease the effects of exchange rate risks principally in Ch ile, Mexico and Brazil. It is not always possible to achieve balance, in which case the company evaluates acquiring financial hedges (for wards) in order to efficiently manage these risks. Usually SM SAAM applies hedge accounting in order to mitigate volatil ity in its results, caused by net unhedged positions of assets and liabilities in foreign currencies.
Credit Risk
Credit risk is the risk of financial loss arising from a customer or counterparty to a financial instrument not fulfilling it s contractual obligations. This is especially applicable to SM SAAM and its subsidiaries’ trade receivables. When granting credit to customer s, a credit assessment is performed by a credit committee in order to reduce the risk of non-payment. Credit granted to customers is regularly reviewed, in accordance with the controls defined in the company’s policies, and to monitor the status of accounts pending collection.
Services are provided to customers under market conditions, which include simple credit that currently does not exceed 90 days at SAAM Logistics., 30 days at SAAM Puertos and 60 days at SAAM S.A. These transactions are not concentrated in significant cust omers. In fact, the Company’s customers are well fragmented, which distributes this risk.
Skilled Labor
The possibility to compete successfully depends on the ability to attract and retain highly skilled labor. An inability to recruit and retain key staff could have an adverse effect on SM SAAM's financial performance. Furthermore, the ability to operate tugs and port terminal equipment and provide logistics services depends on the ability to attract and retain qualified and experienced staff.
Nonetheless, even when employment relationships are good, the risk of strikes, work stoppages or other conflicts with unions cannot be ruled out.
Accidents, Natural Disasters and Pandemics
The fleet and equipment used by port terminals and the logistics area are exposed to the risk of damage or loss due to events such as mechanical failure, poor installation, fire, explosion, collision, maritime accident and human error. These assets may also be affected by earthquakes, tsunamis and other natural disasters or pandemics, which could affect operational continuity. Howeve r, SM SAAM, its subsidiaries and associates have extensive insurance coverage and operational continuity plans to mitigate any potential damage or business impacts.
Environmental Standards
Ports, tugs and logistics services are subject to a variety of environmental laws. Violations o f such laws may result in administrative sanctions, which may include closing down facilities, revoking operating licenses or imposing penalties and fines when compan ies behave with negligence or recklessness in relation to environmental issues. More stringent environmental laws and regulations could require additional investment to comply with these regulations, which would consequently affect investment plans. SM SAAM and its subsidiaries have civil liability insurance in favor of third parties to mitigate the risk of damage and/or contamination fines associated with its fleet of tugs.
Political and Economic Risks
Some of SM SAAM’s assets are located in Chile. Likewise, 24% of its consolidated revenue is derived from Chilean services. Accordingly, its business performance is partially dependent on economic conditions in Chile. Future trends in the Chilean economy could have adverse effects on SM SAAM’s financial condition or performance and may limit its ability to implement its business plan. The Chilean
303
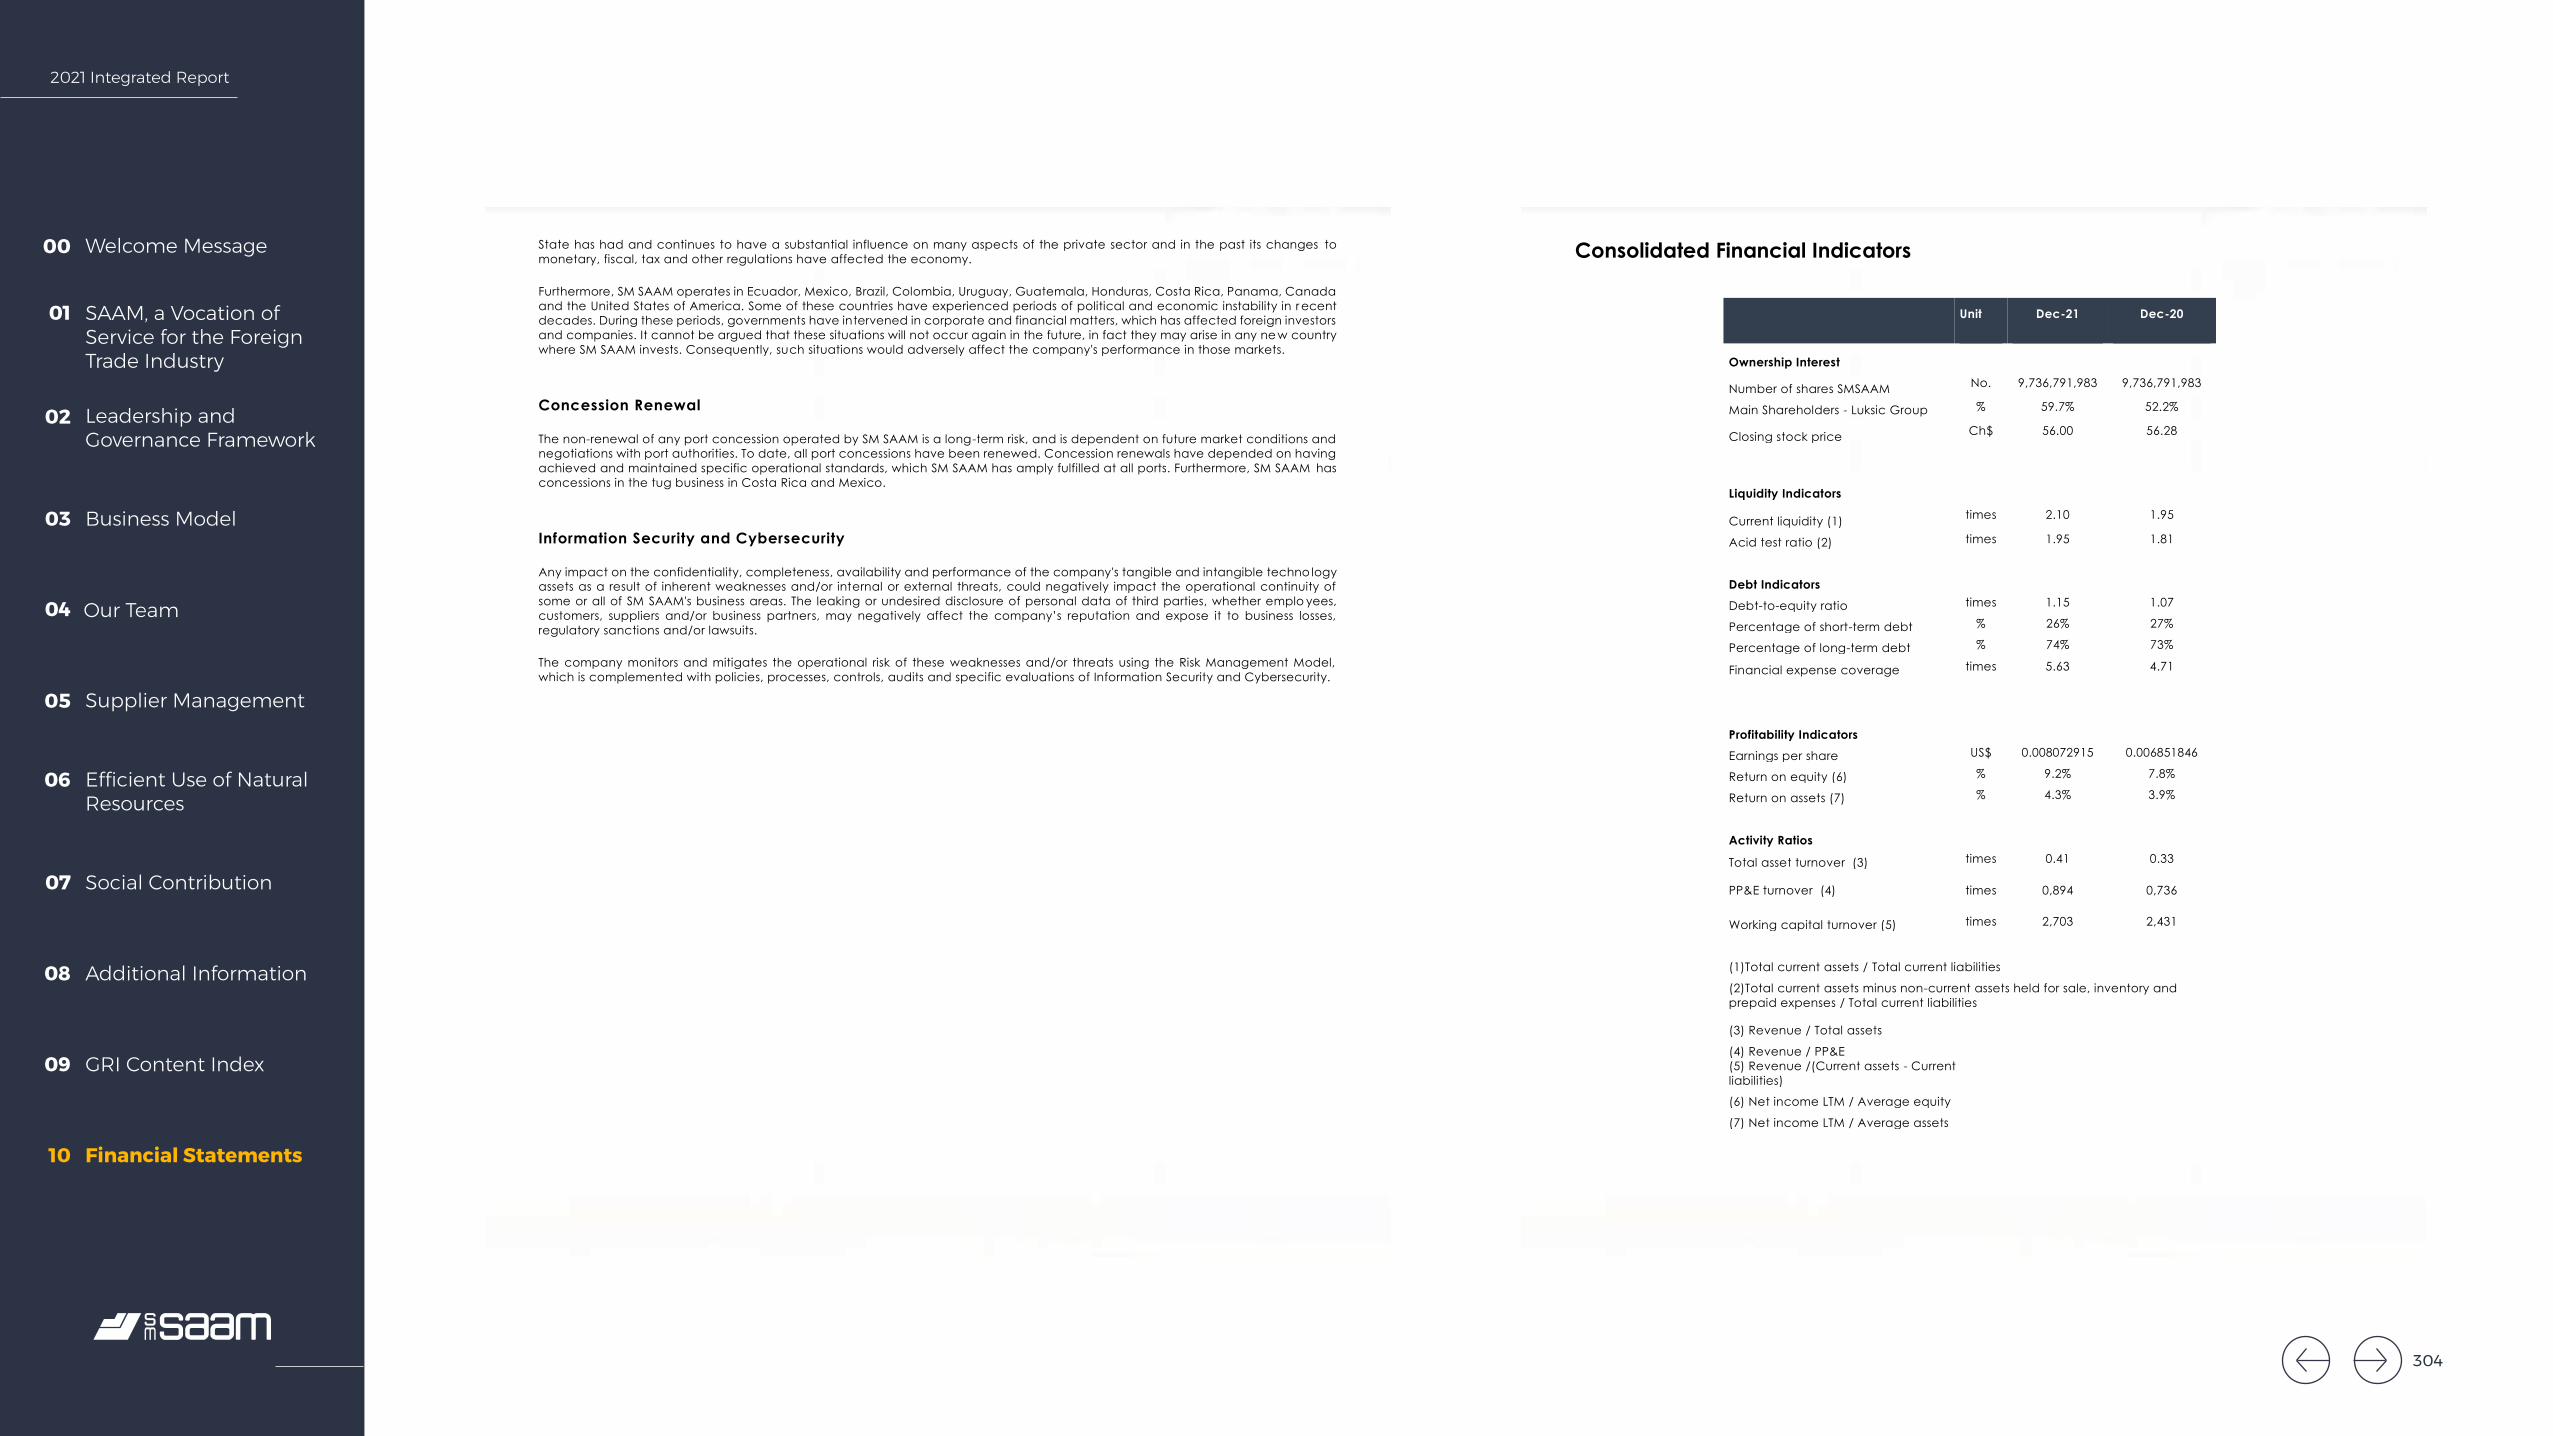
2021 Integrated Report
Welcome Message00
SAAM, a Vocation of Service for the Foreign Trade Industry
01
Leadership and Governance Framework
02
Business Model03
Our Team04
Supplier Management05
Efficient Use of Natural Resources
06
Social Contribution07
Additional Information08
GRI Content Index09
Financial Statements10
Earn ings Report four th quarte r 2021
18
State has had and continues to have a substantial influence on many aspects of the private sector and in the past its changes to monetary, fiscal, tax and other regulations have affected the economy.
Furthermore, SM SAAM operates in Ecuador, Mexico, Brazil, Colombia, Uruguay, Guatemala, Honduras, Costa Rica, Panama, Canada and the United States of America. Some of these countries have experienced periods of political and economic instability in r ecent decades. During these periods, governments have intervened in corporate and financial matters, which has affected foreign investors and companies. It cannot be argued that these situations will not occur again in the future, in fact they may arise in any ne w country where SM SAAM invests. Consequently, such situations would adversely affect the company's performance in those markets.
Concession Renewal
The non-renewal of any port concession operated by SM SAAM is a long-term risk, and is dependent on future market conditions and negotiations with port authorities. To date, all port concessions have been renewed. Concession renewals have depended on having achieved and maintained specific operational standards, which SM SAAM has amply fulfilled at all ports. Furthermore, SM SAAM has concessions in the tug business in Costa Rica and Mexico.
Information Security and Cybersecurity
Any impact on the confidentiality, completeness, availability and performance of the company's tangible and intangible techno logy assets as a result of inherent weaknesses and/or internal or external threats, could negatively impact the operational continuity of some or all of SM SAAM's business areas. The leaking or undesired disclosure of personal data of third parties, whether emplo yees, customers, suppliers and/or business partners, may negatively affect the company’s reputation and expose it to business losses, regulatory sanctions and/or lawsuits.
The company monitors and mitigates the operational risk of these weaknesses and/or threats using the Risk Management Model, which is complemented with policies, processes, controls, audits and specific evaluations of Information Security and Cybersecurity.
Earn ings Report four th quarte r 2021
19
Consolidated Financial Indicators
Unit Dec-21 Dec-20
Ownership Interest
Number of shares SMSAAM No. 9,736,791,983 9,736,791,983
Main Shareholders - Luksic Group % 59.7% 52.2%
Closing stock price Ch$ 56.00 56.28
Liquidity Indicators
Current liquidity (1) times 2.10 1.95
Acid test ratio (2) times 1.95 1.81
Debt Indicators Debt-to-equity ratio times 1.15 1.07
Percentage of short-term debt % 26% 27%
Percentage of long-term debt % 74% 73%
Financial expense coverage times 5.63 4.71
Profitability Indicators Earnings per share US$ 0.008072915 0.006851846
Return on equity (6) % 9.2% 7.8%
Return on assets (7) % 4.3% 3.9%
Activity Ratios Total asset turnover (3) times 0.41 0.33
PP&E turnover (4) times 0,894 0,736
Working capital turnover (5) times 2,703 2,431
(1)Total current assets / Total current liabilities (2)Total current assets minus non-current assets held for sale, inventory and prepaid expenses / Total current liabilities
(3) Revenue / Total assets
(4) Revenue / PP&E
(5) Revenue /(Current assets - Current liabilities)
(6) Net income LTM / Average equity
(7) Net income LTM / Average assets
304
2021 Integrated Report
Welcome Message00
SAAM, a Vocation of Service for the Foreign Trade Industry
01
Leadership and Governance Framework
02
Business Model03
Our Team04
Supplier Management05
Efficient Use of Natural Resources
06
Social Contribution07
Additional Information08
GRI Content Index09
Financial Statements10
Sociedad Matriz SAAM S.A. and SubsidiariesReport required by General Character Standard No. 30 from the Financial Market Commission
Summarized Consolidated Financial Statements for SAAM S.A.
as of December 31, 2021 and 2020
305305

2021 Integrated Report
Welcome Message00
SAAM, a Vocation of Service for the Foreign Trade Industry
01
Leadership and Governance Framework
02
Business Model03
Our Team04
Supplier Management05
Efficient Use of Natural Resources
06
Social Contribution07
Additional Information08
GRI Content Index09
Financial Statements10
SAAM S.A. AND SUBSIDIARIES
CONTENTS
Report of Independent Auditors Consolidated Statements of Financial Position Consolidated Statements of Comprehensive Income by Function Consolidated Statements of Cash Flow Consolidated Statements of Changes in Equity Notes to the Consolidated Financial Statements
ThUS$ = Thousands of US dollars.
INDEPENDENT AUDITOR’S REPORT (A free translation from the original in Spanish)
Santiago, March 11, 2022
To the Shareholders and Directors Sociedad Matriz SAAM S.A.
As external auditors of Sociedad Matriz SAAM S.A and subsidiaries, we have audited its consolidated financial statements as of December 31, 2021 and 2020, over which we reported on March 11, 2022. The financial statements in abridged form, prepared in accordance with the provisions of General Rule (GRS) No. 30, Section II.2.1, paragraph A.4.2, issued by the Superintendence of Securities and Insurance (now Financial Market Commission - CMF), of the subsidiary SAAM S.A. and subsidiaries and its accompanying notes on "accounting policies applied” and "related party transactions” attached hereto, are consistent, in all material respects, with the information contained in the consolidated financial statements that we have audited.
The preparation of such abridged financial statements, which include the accounting policies applied and transactions with related parties, is the responsibility of the Management of Sociedad Matriz SAAM S.A. and SAAM S.A.
We report that the aforementioned abridged financial statements and its notes on "accounting policies applied" and "related party transactions" of SAAM S.A. and subsidiaries, attached hereto, correspond to those that were used in the consolidation process carried out by Sociedad Matriz SAAM S.A. as of December 31, 2021 and 2020.
This report has been prepared bearing in mind the requirements of NCG 30, Section II.2.1, paragraph A.4.2, and relates exclusively to Sociedad Matriz SAAM S.A. and is issued solely for the information and use of its Senior Management and the Financial Market Commission, and therefore has not been prepared for use, nor should it be used, by any user other than those indicated.
Digitally signed by Jonathan Douglas Yeomans Gibbons RUT: 13.473.972-k. The digital certificate is embedded in the electronic version of this document.
306
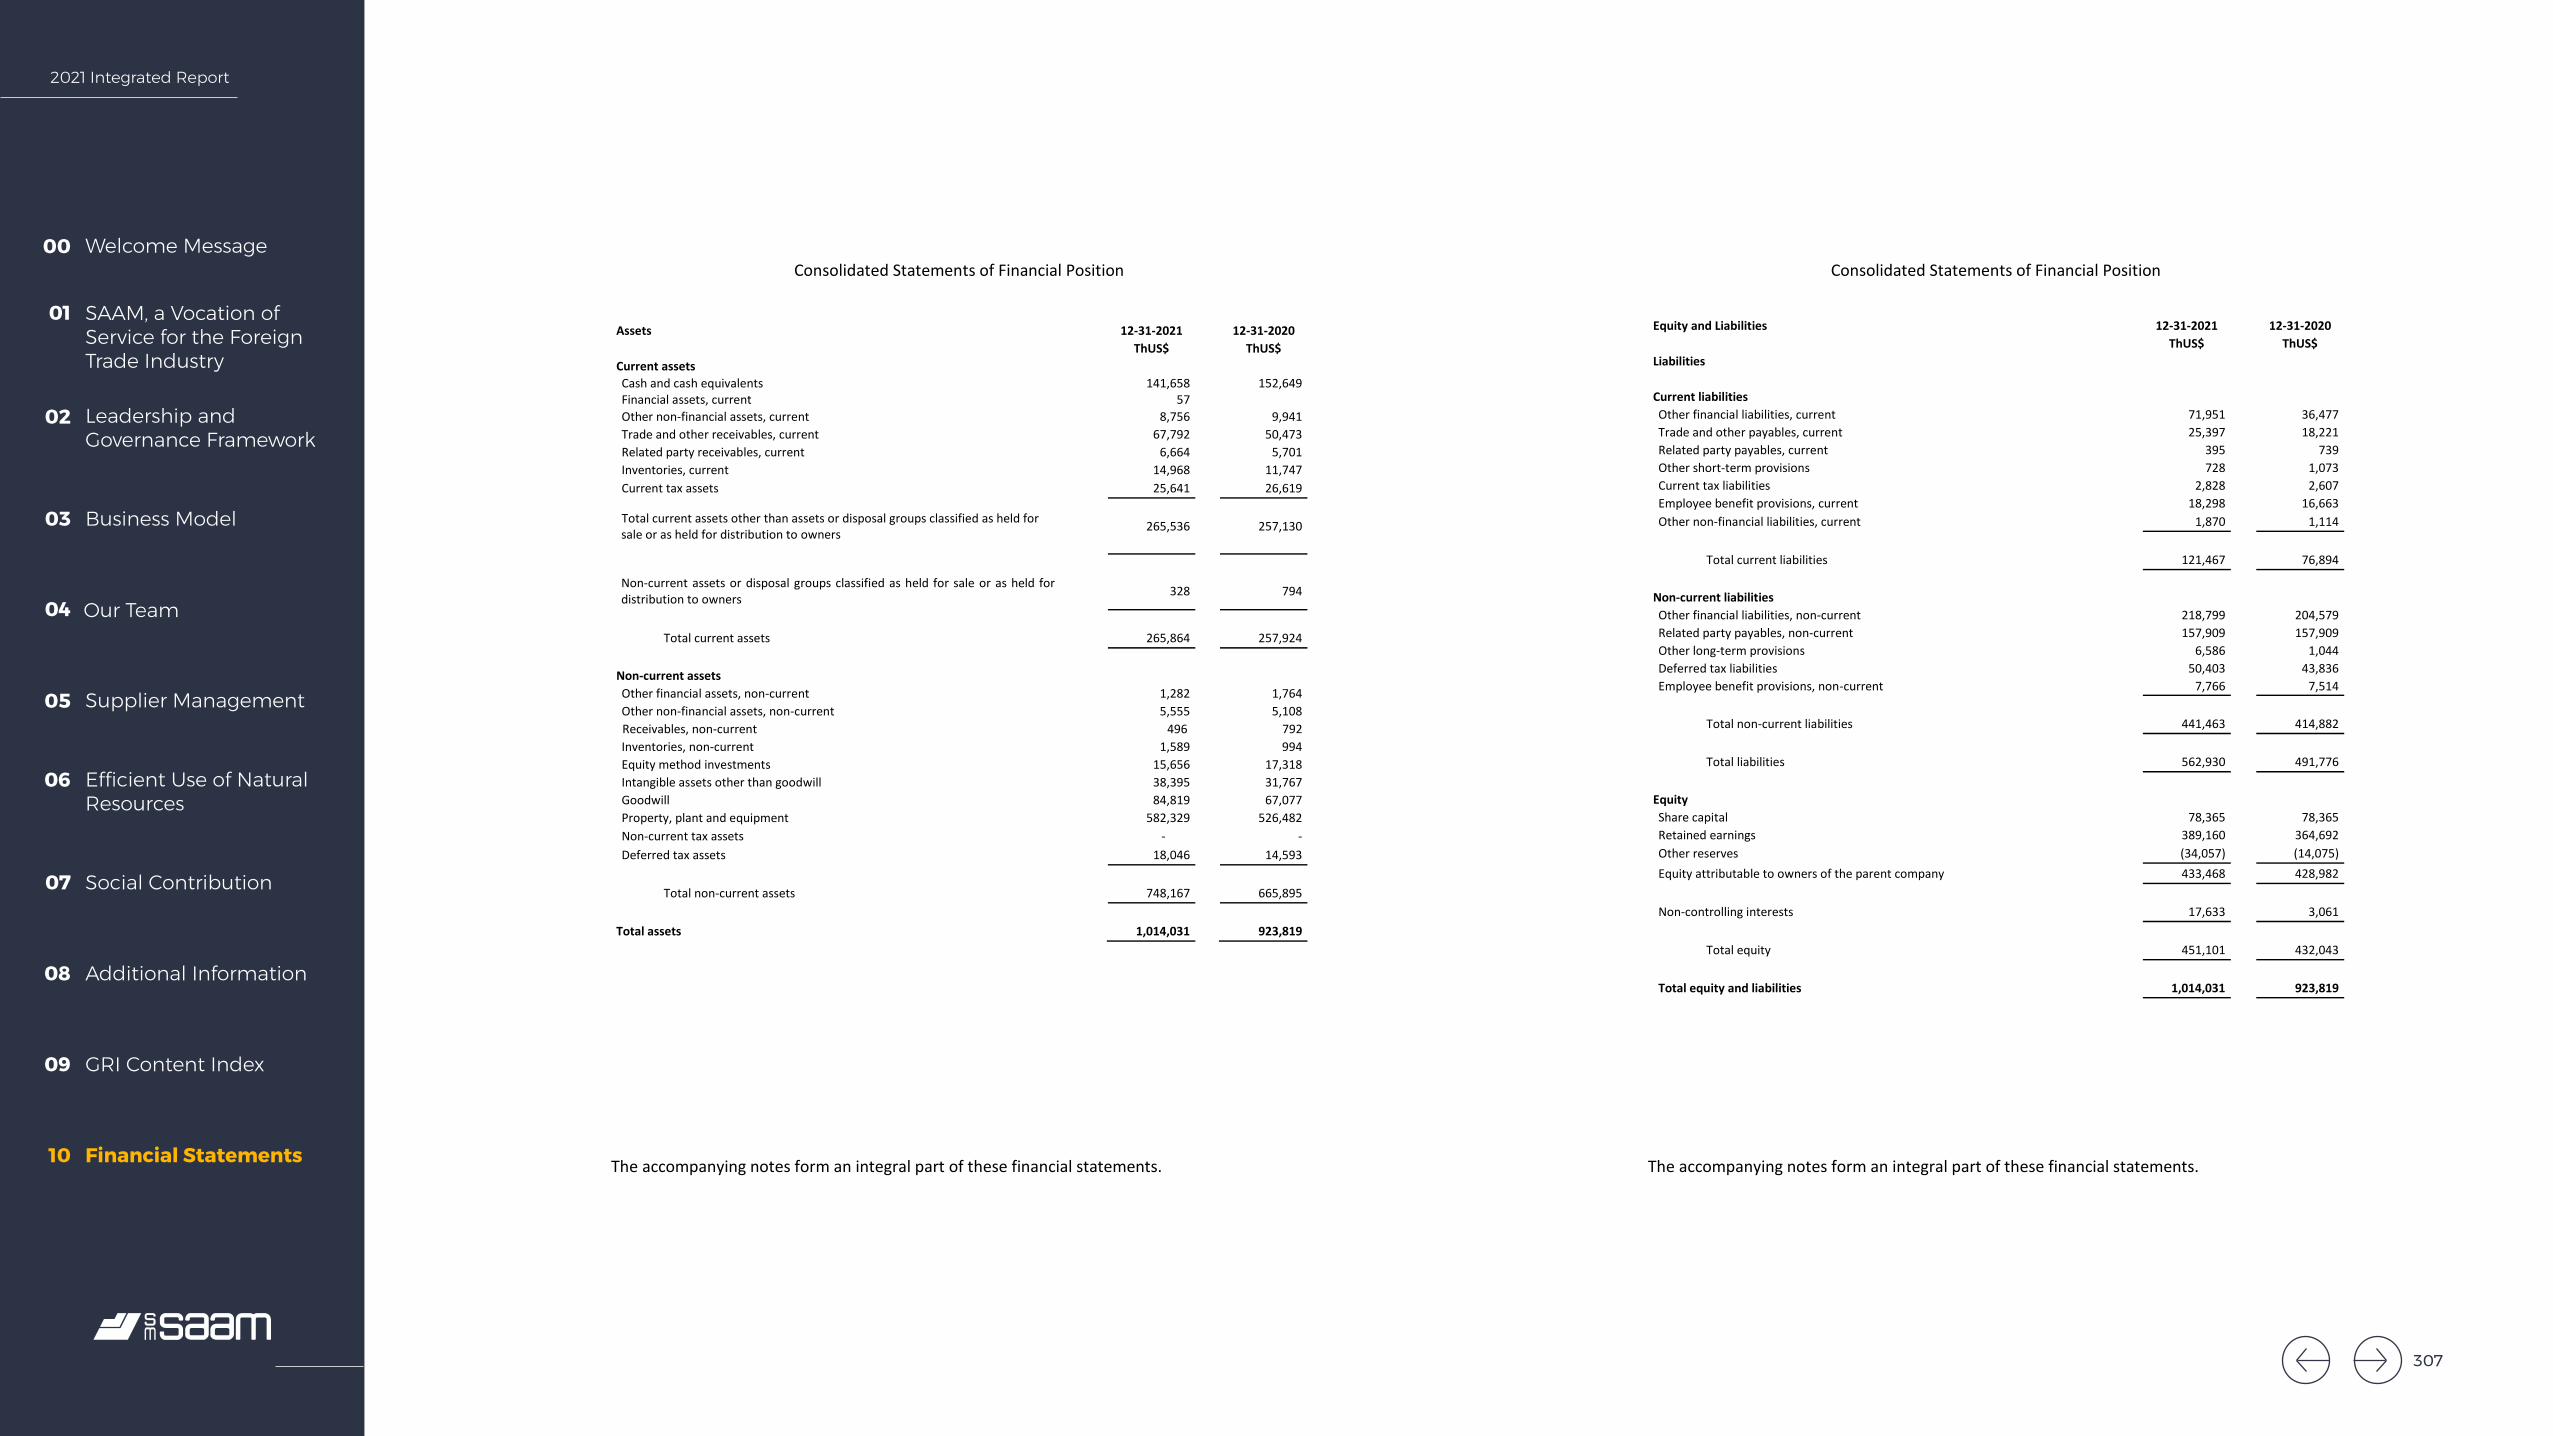
2021 Integrated Report
Welcome Message00
SAAM, a Vocation of Service for the Foreign Trade Industry
01
Leadership and Governance Framework
02
Business Model03
Our Team04
Supplier Management05
Efficient Use of Natural Resources
06
Social Contribution07
Additional Information08
GRI Content Index09
Financial Statements10
SAAM S.A. AND SUBSIDIARIES
Consolidated Statements of Financial Position
The accompanying notes form an integral part of these financial statements.
3
Assets 12-31-2021 12-31-2020ThUS$ ThUS$
Current assets Cash and cash equivalents Financial assets, current
141,658 57
152,649
Other non-financial assets, current 8,756 9,941 Trade and other receivables, current 67,792 50,473 Related party receivables, current 6,664 5,701 Inventories, current 14,968 11,747 Current tax assets 25,641 26,619
Total current assets other than assets or disposal groups classified as held for sale or as held for distribution to owners 265,536 257,130
Non-current assets or disposal groups classified as held for sale or as held for distribution to owners 328 794
Total current assets 265,864 257,924
Non-current assets Other financial assets, non-current 1,282 1,764 Other non-financial assets, non-current 5,555 5,108
Receivables, non-current 496 792 Inventories, non-current 1,589 994 Equity method investments 15,656 17,318 Intangible assets other than goodwill 38,395 31,767 Goodwill 84,819 67,077 Property, plant and equipment 582,329 526,482 Non-current tax assets - - Deferred tax assets 18,046 14,593
Total non-current assets 748,167 665,895
Total assets 1,014,031 923,819
SAAM S.A. AND SUBSIDIARIES
Consolidated Statements of Financial Position
The accompanying notes form an integral part of these financial statements.
4
Equity and Liabilities 12-31-2021 12-31-2020
ThUS$ ThUS$ Liabilities Current liabilities Other financial liabilities, current 71,951 36,477 Trade and other payables, current 25,397 18,221 Related party payables, current 395 739 Other short-term provisions 728 1,073 Current tax liabilities 2,828 2,607 Employee benefit provisions, current 18,298 16,663 Other non-financial liabilities, current 1,870 1,114
Total current liabilities 121,467 76,894
Non-current liabilities Other financial liabilities, non-current 218,799 204,579 Related party payables, non-current 157,909 157,909 Other long-term provisions 6,586 1,044 Deferred tax liabilities 50,403 43,836 Employee benefit provisions, non-current 7,766 7,514
Total non-current liabilities 441,463 414,882
Total liabilities 562,930 491,776
Equity Share capital 78,365 78,365 Retained earnings 389,160 364,692 Other reserves (34,057) (14,075) Equity attributable to owners of the parent company 433,468 428,982
Non-controlling interests 17,633 3,061
Total equity 451,101 432,043
Total equity and liabilities 1,014,031 923,819
307
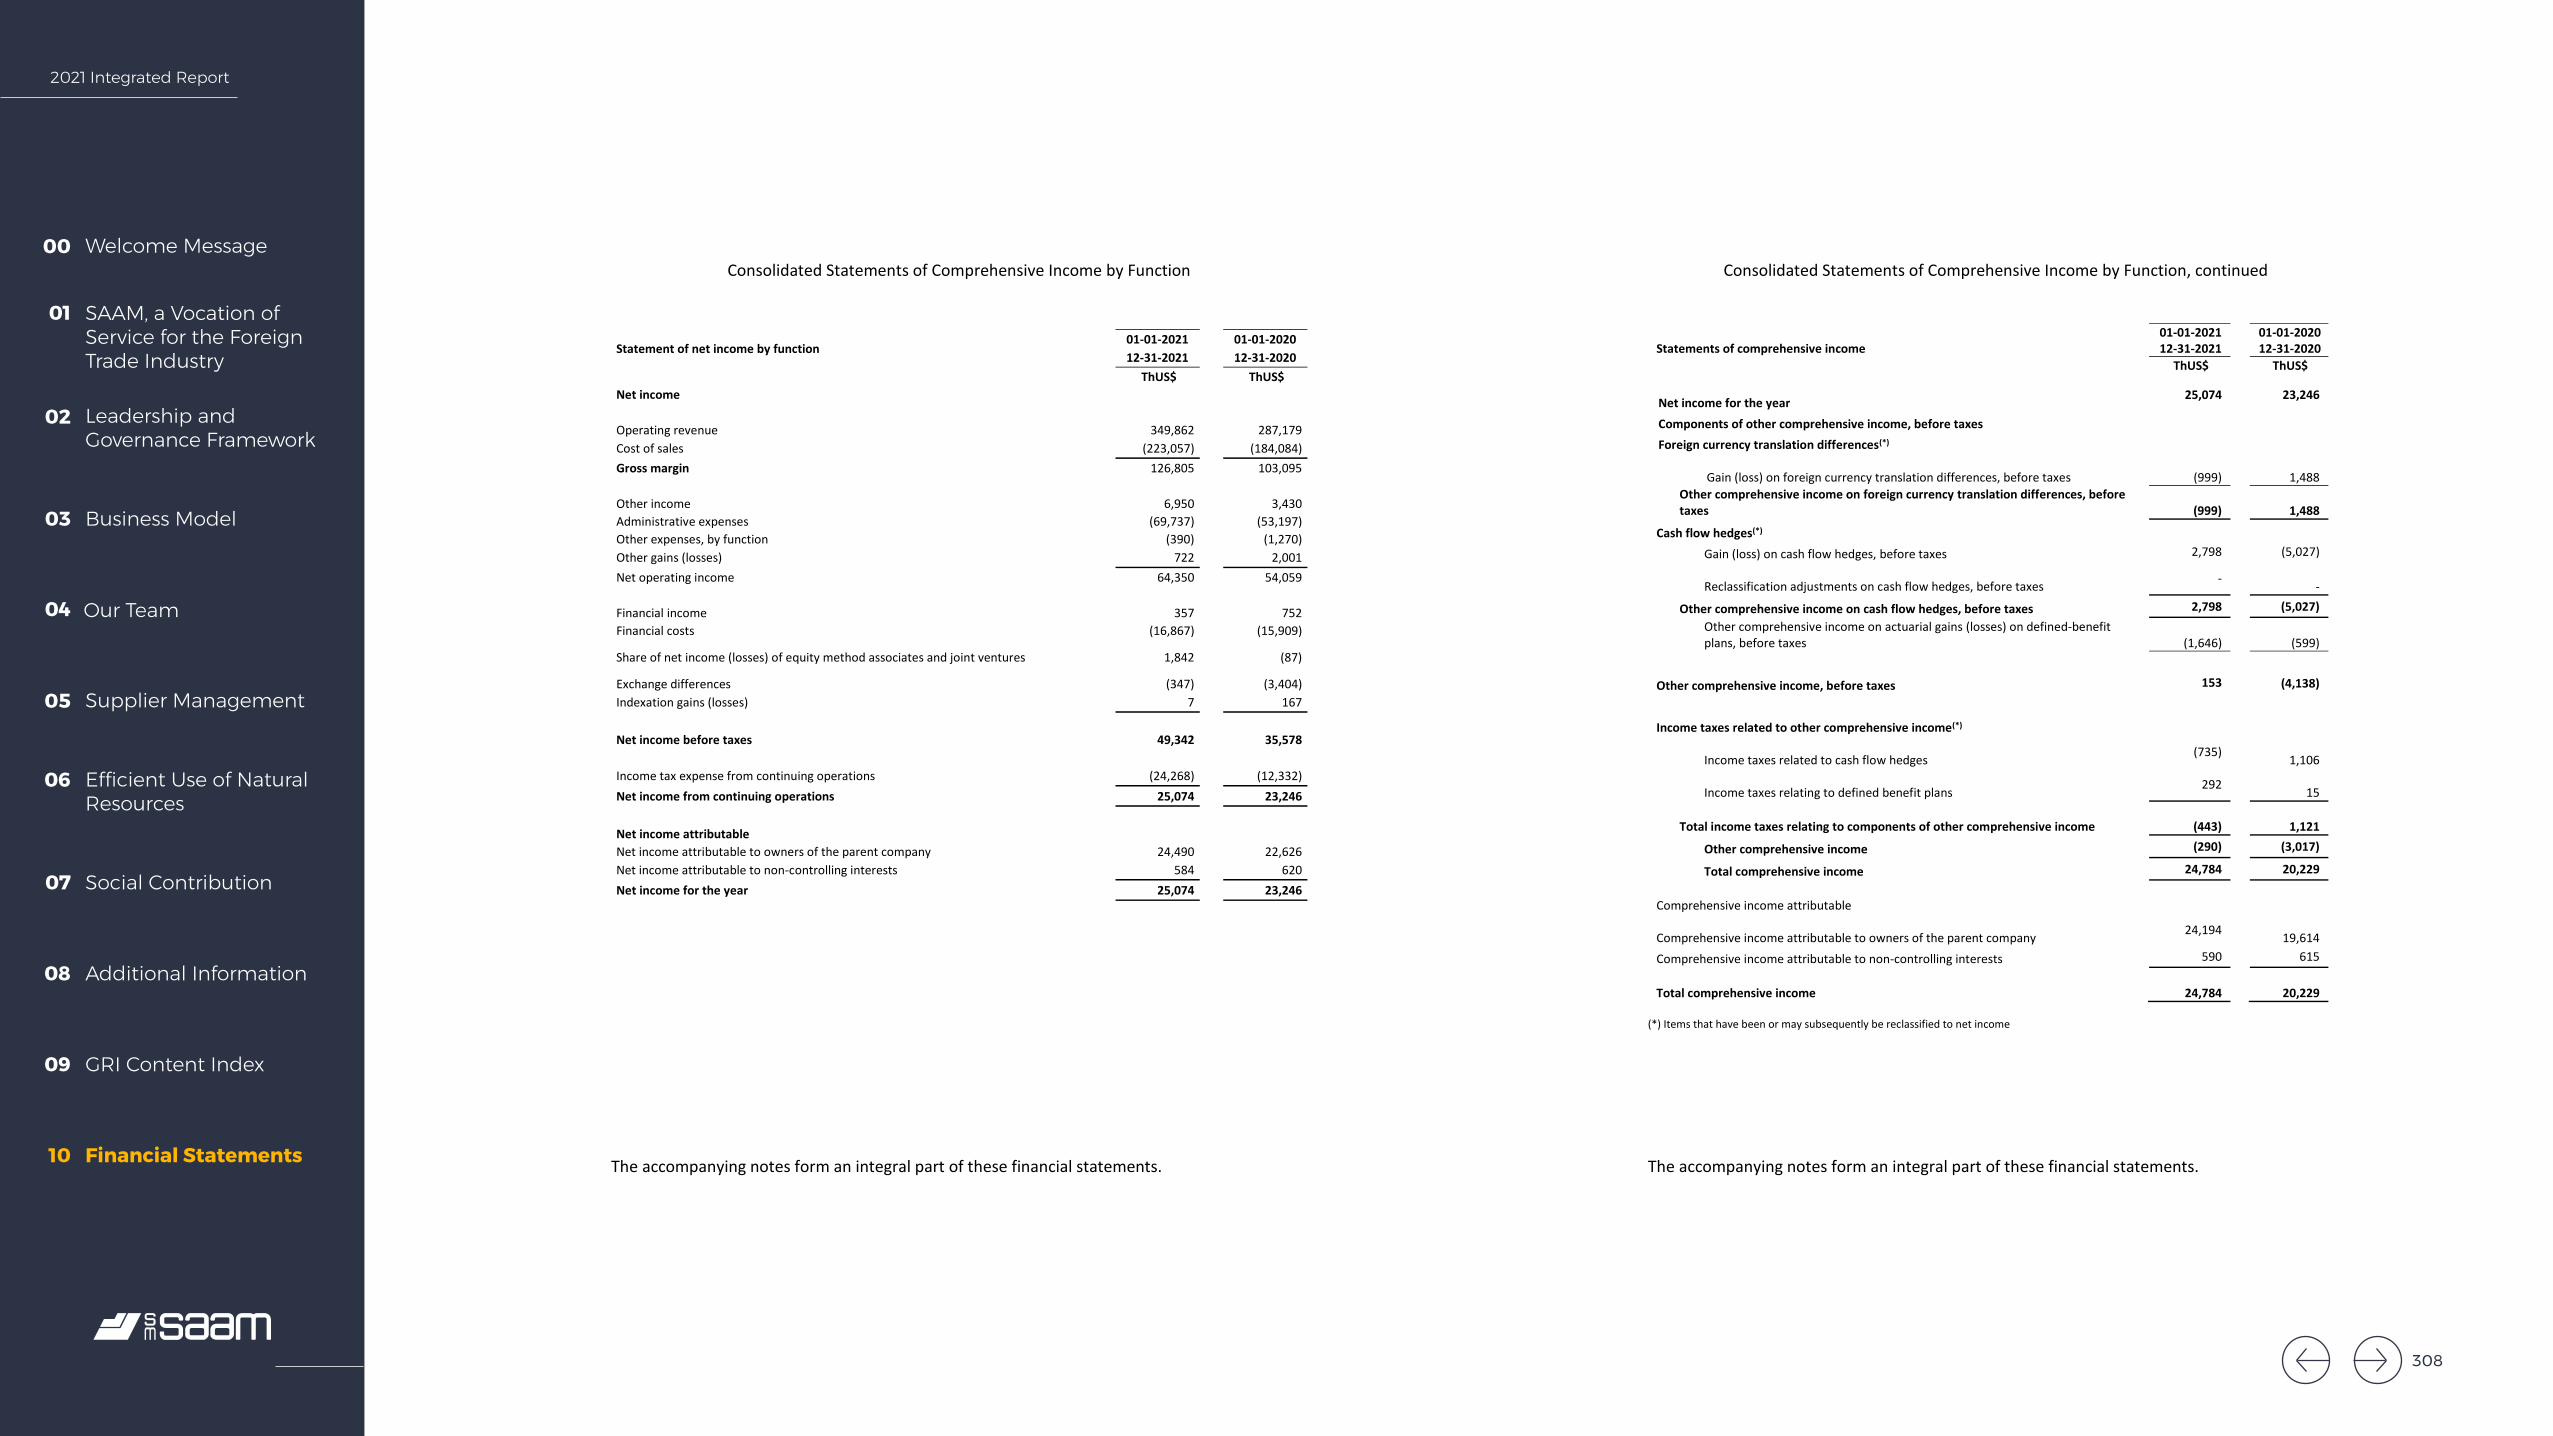
2021 Integrated Report
Welcome Message00
SAAM, a Vocation of Service for the Foreign Trade Industry
01
Leadership and Governance Framework
02
Business Model03
Our Team04
Supplier Management05
Efficient Use of Natural Resources
06
Social Contribution07
Additional Information08
GRI Content Index09
Financial Statements10
SAAM S.A. AND SUBSIDIARIES
Consolidated Statements of Comprehensive Income by Function
The accompanying notes form an integral part of these financial statements.
5
Statement of net income by function 01-01-2021 01-01-2020
12-31-2021 12-31-2020 ThUS$ ThUS$
Net income Operating revenue 349,862 287,179 Cost of sales (223,057) (184,084) Gross margin 126,805 103,095
Other income 6,950 3,430 Administrative expenses (69,737) (53,197) Other expenses, by function (390) (1,270) Other gains (losses) 722 2,001 Net operating income 64,350 54,059
Financial income 357 752 Financial costs (16,867) (15,909)
Share of net income (losses) of equity method associates and joint ventures 1,842 (87)
Exchange differences (347) (3,404) Indexation gains (losses) 7 167
Net income before taxes 49,342 35,578
Income tax expense from continuing operations (24,268) (12,332) Net income from continuing operations 25,074 23,246
Net income attributable Net income attributable to owners of the parent company 24,490 22,626 Net income attributable to non-controlling interests 584 620 Net income for the year 25,074 23,246
SAAM S.A. AND SUBSIDIARIES
Consolidated Statements of Comprehensive Income by Function, continued
The accompanying notes form an integral part of these financial statements.
6
Statements of comprehensive income 01-01-2021 12-31-2021
01-01-2020 12-31-2020
ThUS$ ThUS$ Net income for the year 25,074 23,246
Components of other comprehensive income, before taxes
Foreign currency translation differences(*)
Gain (loss) on foreign currency translation differences, before taxes (999)
1,488
Other comprehensive income on foreign currency translation differences, before taxes (999)
1,488
Cash flow hedges(*)
Gain (loss) on cash flow hedges, before taxes 2,798 (5,027)
Reclassification adjustments on cash flow hedges, before taxes - -
Other comprehensive income on cash flow hedges, before taxes 2,798 (5,027) Other comprehensive income on actuarial gains (losses) on defined-benefit plans, before taxes (1,646)
(599)
Other comprehensive income, before taxes 153 (4,138)
Income taxes related to other comprehensive income(*)
Income taxes related to cash flow hedges (735) 1,106
Income taxes relating to defined benefit plans 292 15
Total income taxes relating to components of other comprehensive income (443)
1,121
Other comprehensive income (290) (3,017)
Total comprehensive income 24,784 20,229 Comprehensive income attributable
Comprehensive income attributable to owners of the parent company 24,194 19,614
Comprehensive income attributable to non-controlling interests 590 615
Total comprehensive income 24,784
20,229
(*) Items that have been or may subsequently be reclassified to net income
308
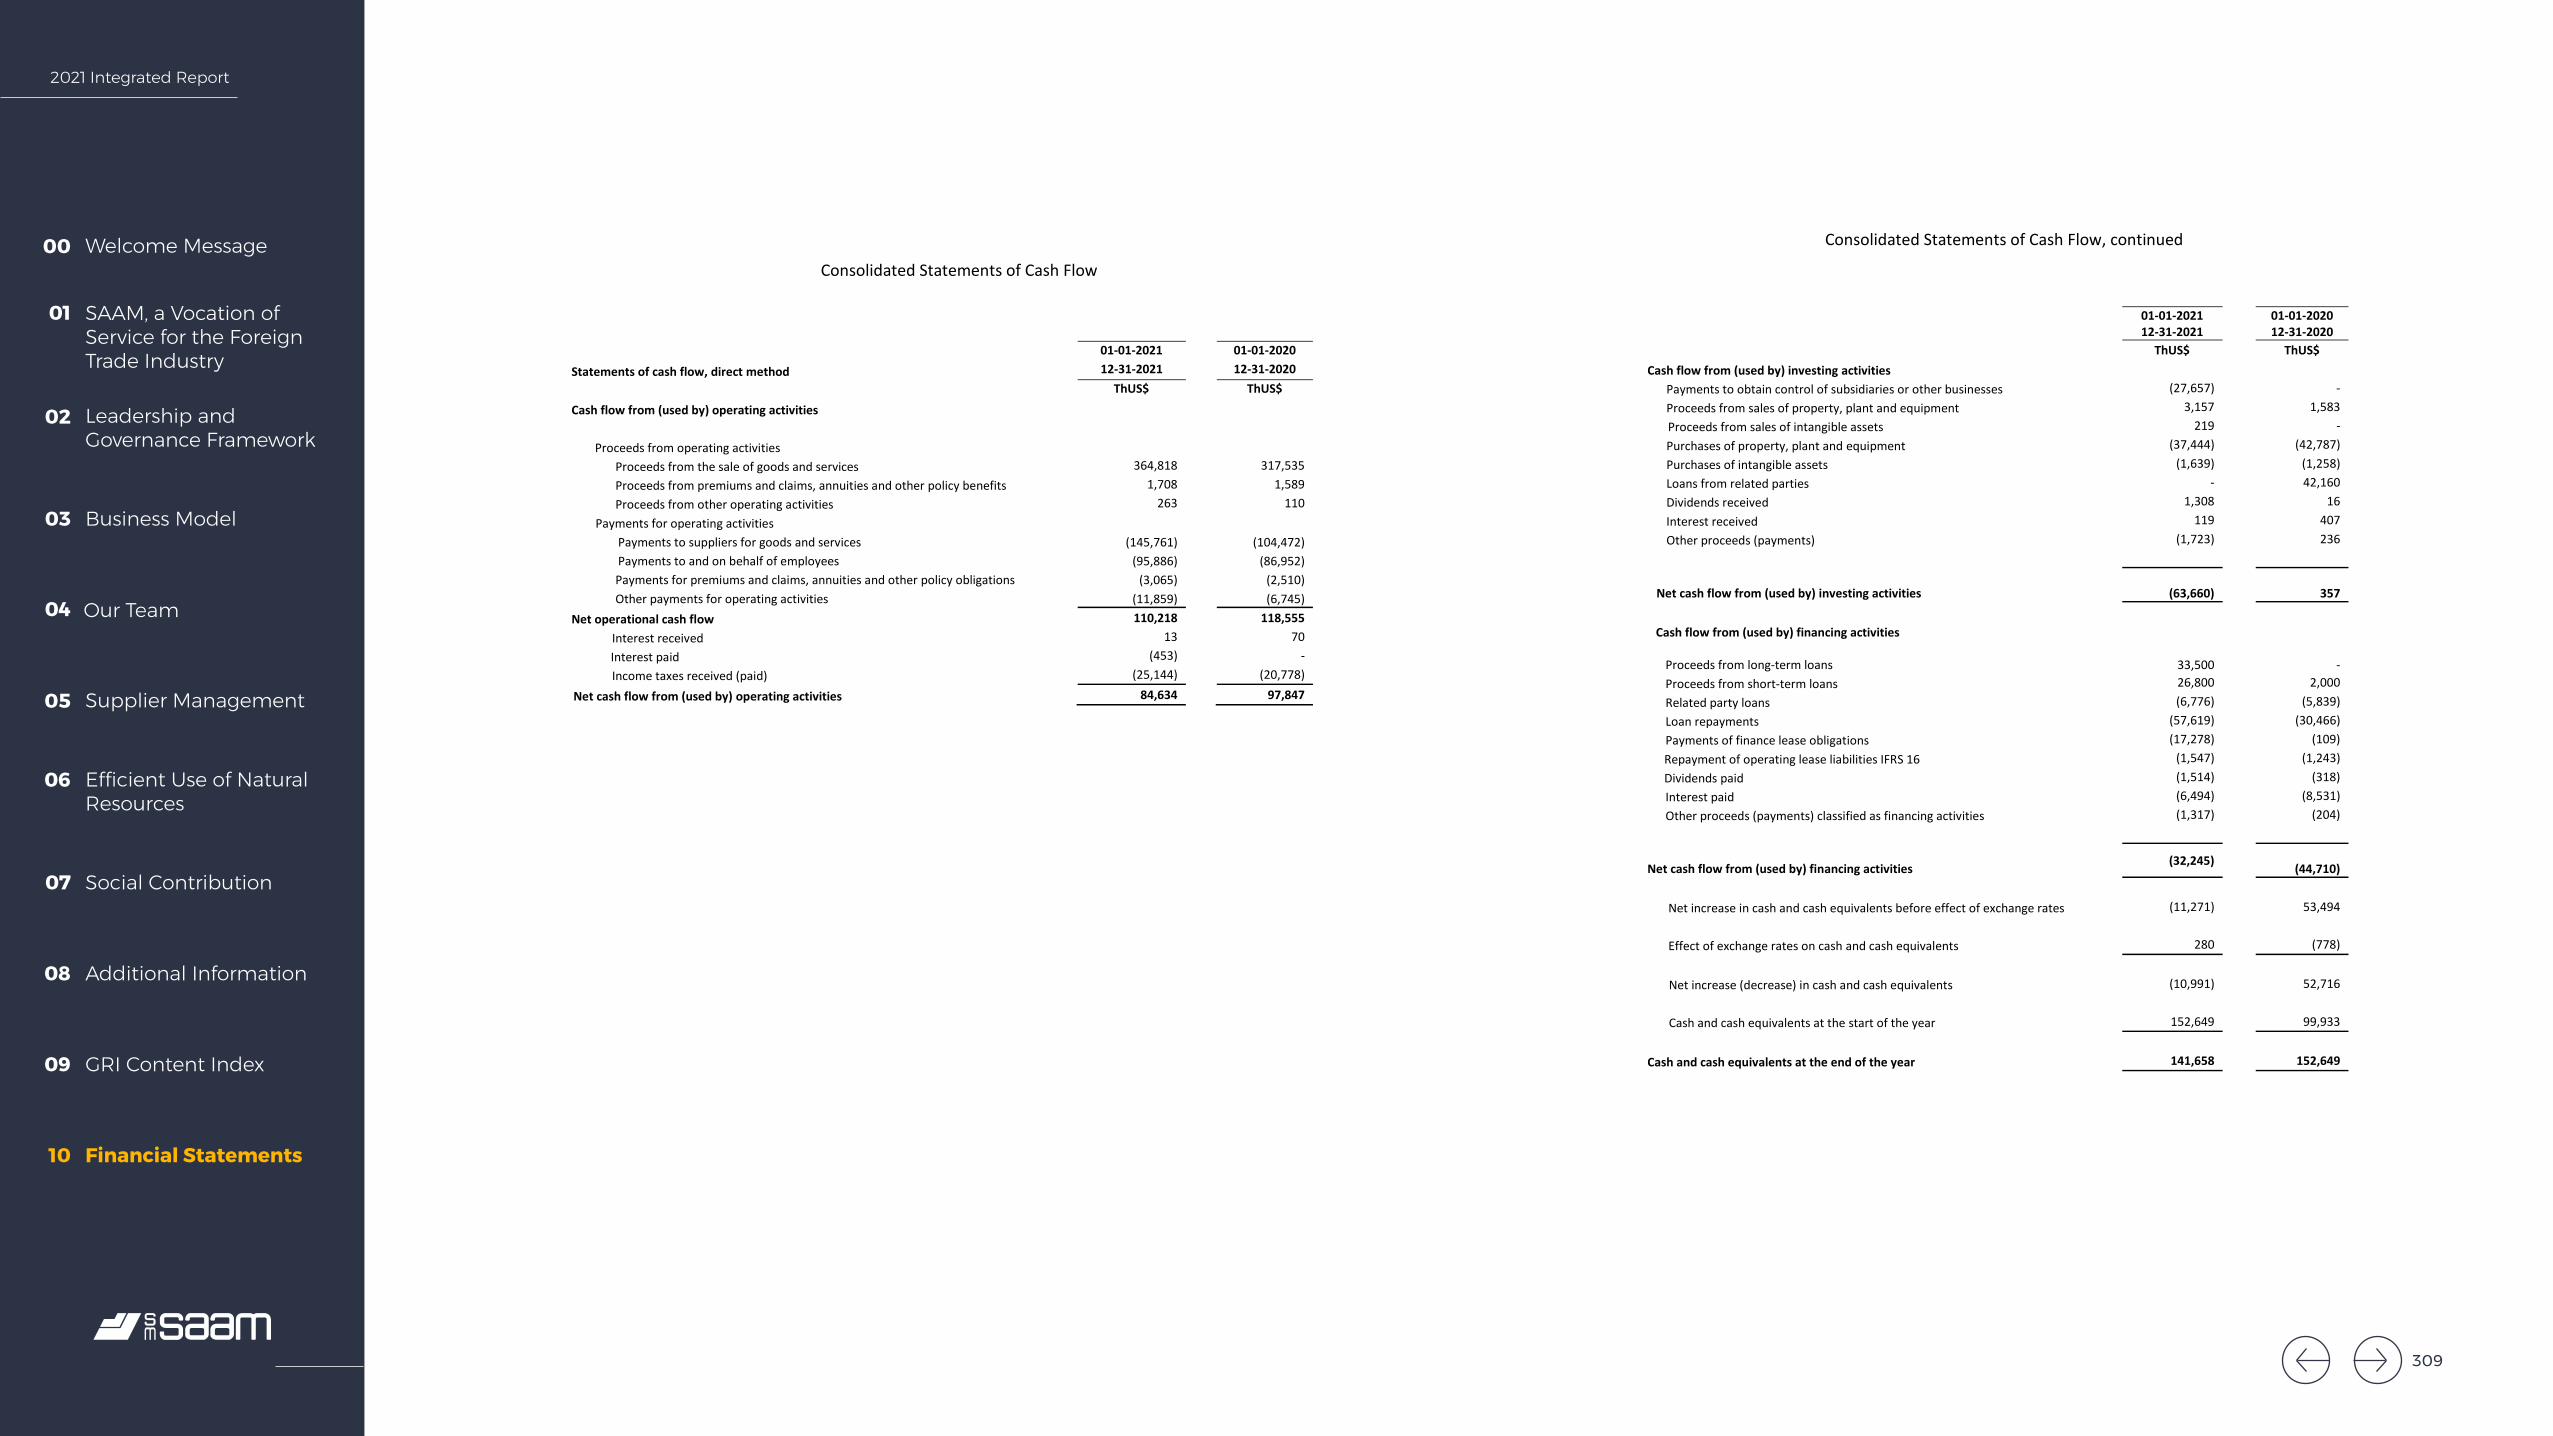
2021 Integrated Report
Welcome Message00
SAAM, a Vocation of Service for the Foreign Trade Industry
01
Leadership and Governance Framework
02
Business Model03
Our Team04
Supplier Management05
Efficient Use of Natural Resources
06
Social Contribution07
Additional Information08
GRI Content Index09
Financial Statements10
SAAM S.A. AND SUBSIDIARIES
Consolidated Statements of Cash Flow
40
01-01-2021 01-01-2020 Statements of cash flow, direct method 12-31-2021 12-31-2020 ThUS$ ThUS$ Cash flow from (used by) operating activities
Proceeds from operating activities Proceeds from the sale of goods and services 364,818 317,535 Proceeds from premiums and claims, annuities and other policy benefits 1,708 1,589 Proceeds from other operating activities 263 110
Payments for operating activities Payments to suppliers for goods and services (145,761) (104,472) Payments to and on behalf of employees (95,886) (86,952) Payments for premiums and claims, annuities and other policy obligations (3,065) (2,510) Other payments for operating activities (11,859) (6,745)
Net operational cash flow 110,218 118,555 Interest received 13 70
Interest paid (453) - Income taxes received (paid) (25,144) (20,778)
Net cash flow from (used by) operating activities 84,634 97,847
SAAM S.A. AND SUBSIDIARIES
Consolidated Statements of Cash Flow, continued
40
01-01-2021 12-31-2021
01-01-2020 12-31-2020
ThUS$ ThUS$ Cash flow from (used by) investing activities
Payments to obtain control of subsidiaries or other businesses (27,657) - Proceeds from sales of property, plant and equipment 3,157 1,583
Proceeds from sales of intangible assets 219 - Purchases of property, plant and equipment (37,444) (42,787) Purchases of intangible assets (1,639) (1,258) Loans from related parties - 42,160 Dividends received 1,308 16 Interest received 119 407 Other proceeds (payments) (1,723) 236
Net cash flow from (used by) investing activities (63,660)
357
Cash flow from (used by) financing activities
Proceeds from long-term loans 33,500
-
Proceeds from short-term loans 26,800 2,000 Related party loans (6,776) (5,839) Loan repayments (57,619) (30,466) Payments of finance lease obligations (17,278) (109) Repayment of operating lease liabilities IFRS 16 (1,547) (1,243) Dividends paid (1,514) (318) Interest paid (6,494) (8,531) Other proceeds (payments) classified as financing activities (1,317) (204)
Net cash flow from (used by) financing activities (32,245) (44,710)
Net increase in cash and cash equivalents before effect of exchange rates (11,271) 53,494 Effect of exchange rates on cash and cash equivalents 280 (778) Net increase (decrease) in cash and cash equivalents (10,991) 52,716 Cash and cash equivalents at the start of the year 152,649 99,933
Cash and cash equivalents at the end of the year 141,658 152,649
309
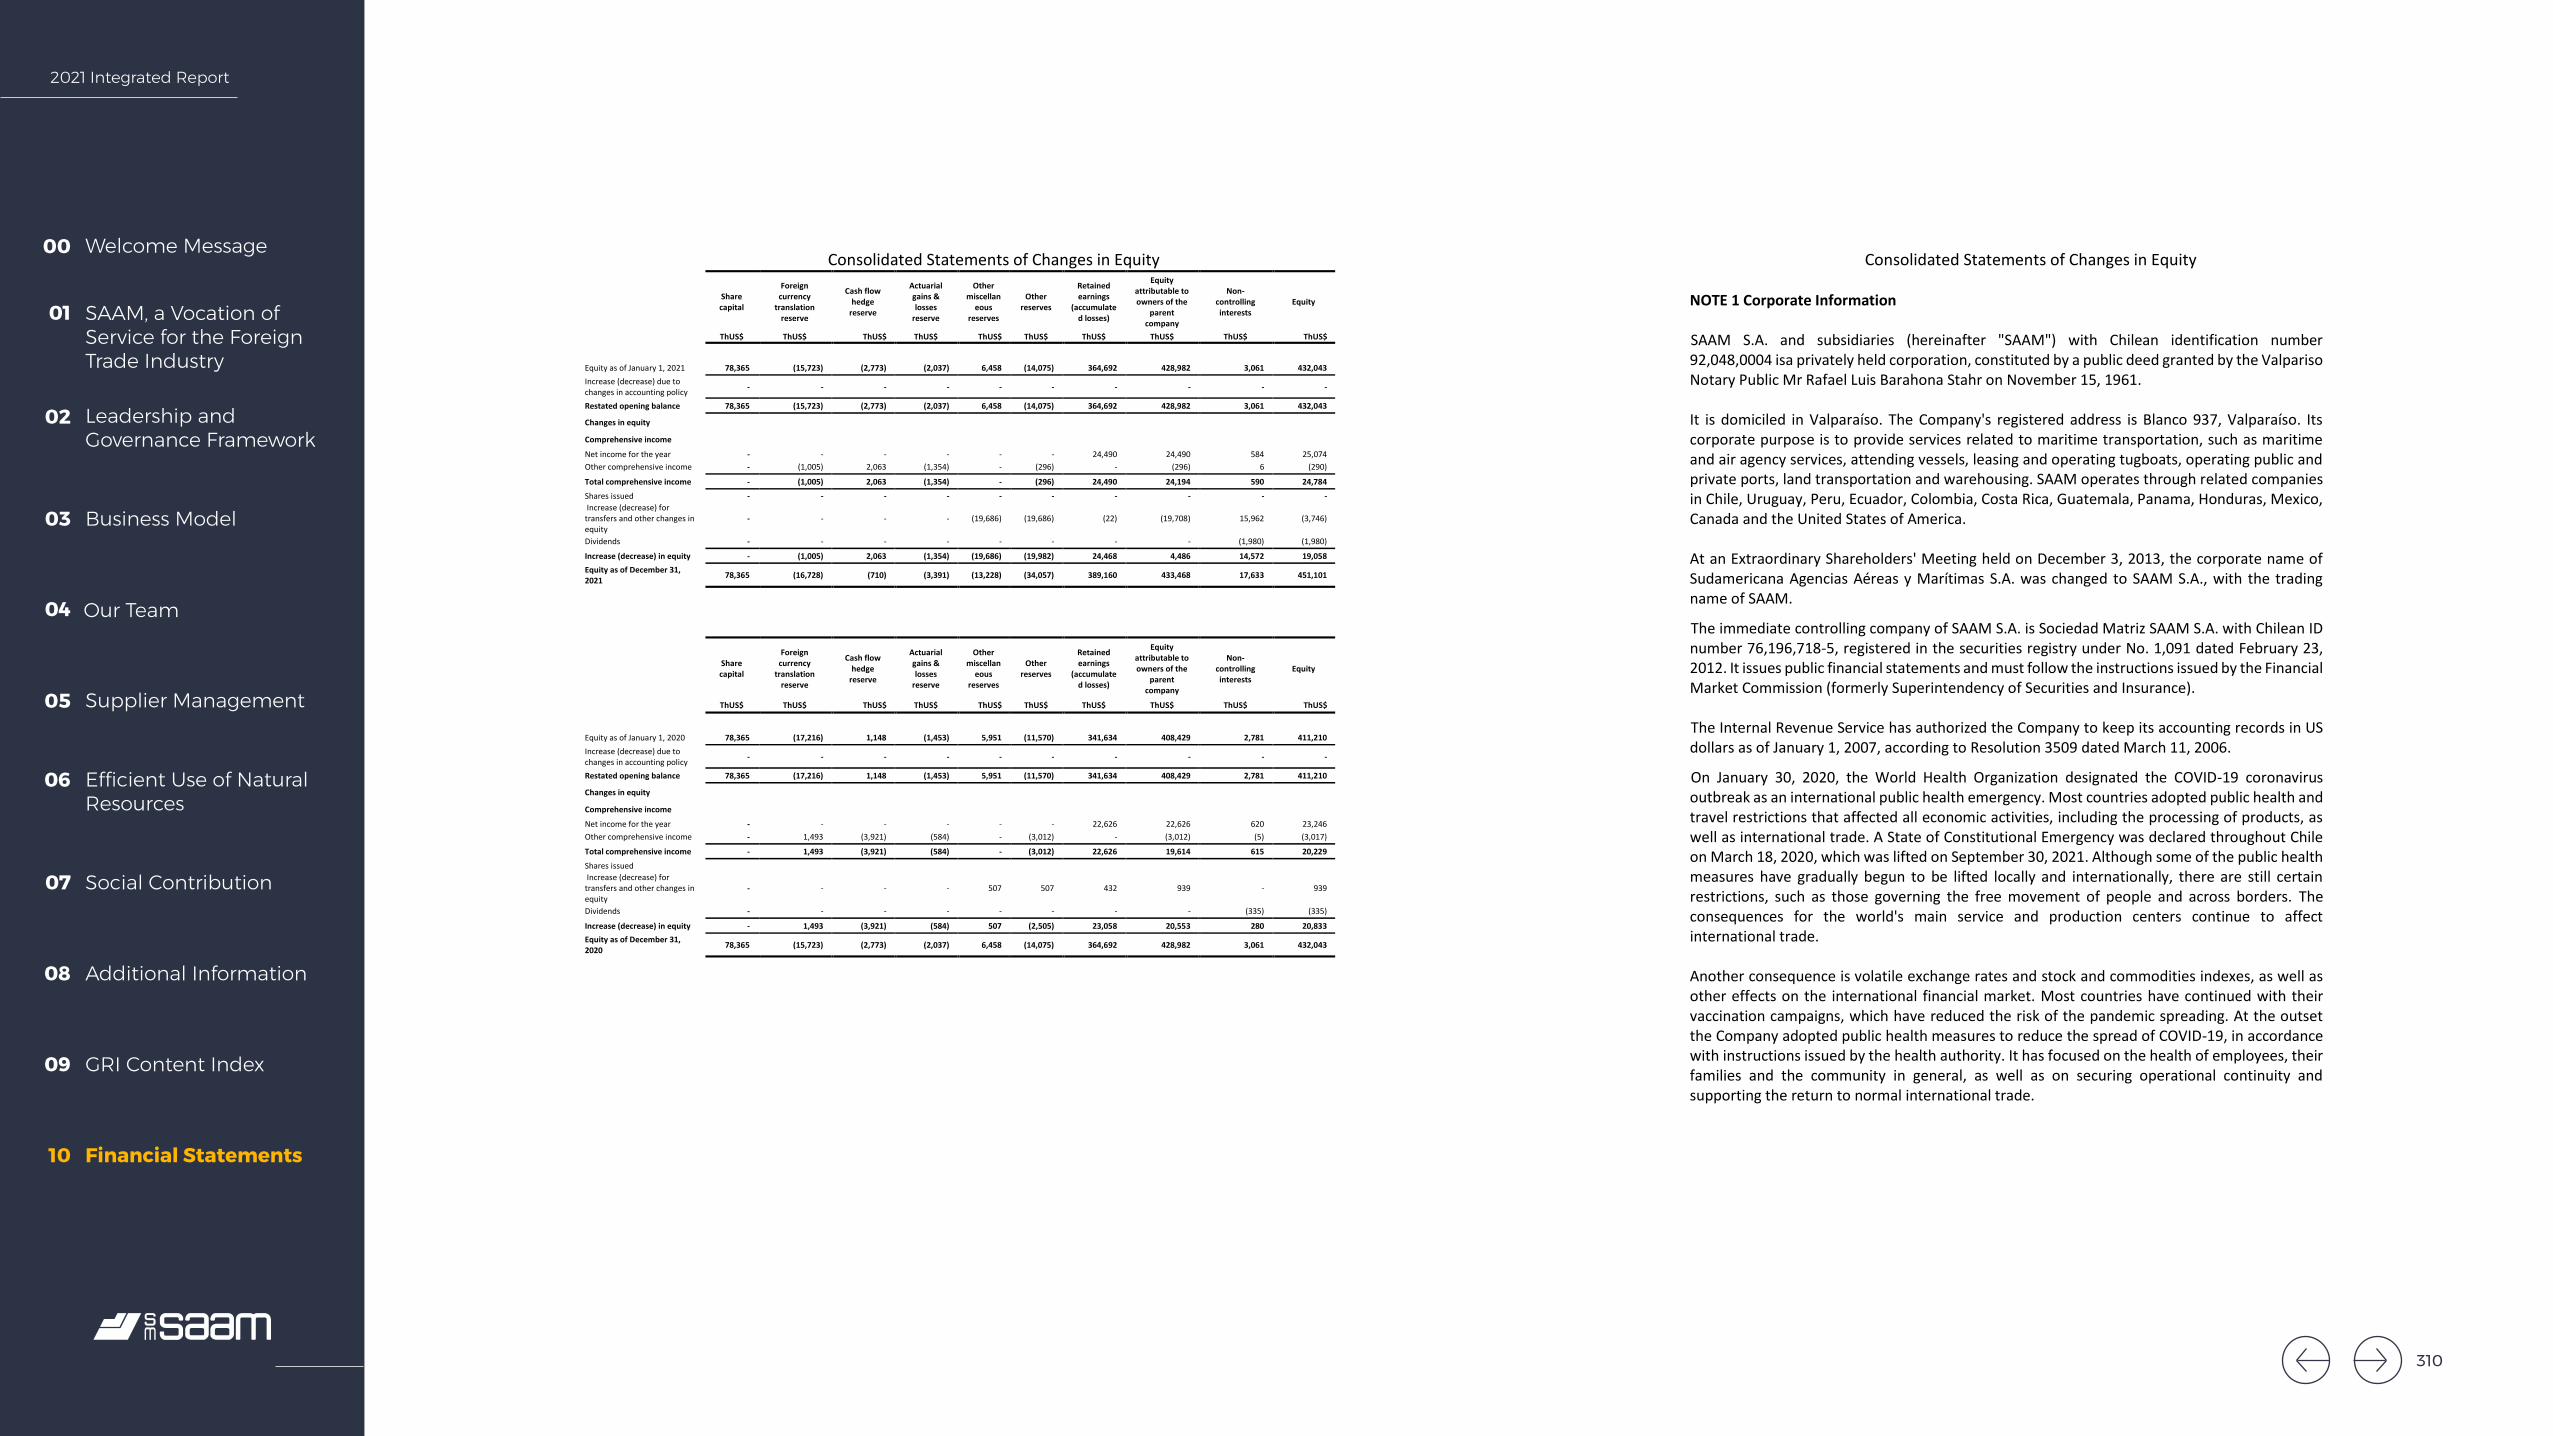
2021 Integrated Report
Welcome Message00
SAAM, a Vocation of Service for the Foreign Trade Industry
01
Leadership and Governance Framework
02
Business Model03
Our Team04
Supplier Management05
Efficient Use of Natural Resources
06
Social Contribution07
Additional Information08
GRI Content Index09
Financial Statements10
SAAM S.A. AND SUBSIDIARIES
Consolidated Statements of Changes in Equity
9
Share capital
Foreign currency
translation reserve
Cash flow hedge
reserve
Actuarial gains & losses
reserve
Other miscellan
eous reserves
Other reserves
Retained earnings
(accumulated losses)
Equity attributable to owners of the
parent company
Non-controlling interests
Equity
ThUS$ ThUS$ ThUS$ ThUS$ ThUS$ ThUS$ ThUS$ ThUS$ ThUS$ ThUS$
Equity as of January 1, 2021 78,365 (15,723) (2,773) (2,037) 6,458 (14,075) 364,692 428,982 3,061 432,043 Increase (decrease) due to changes in accounting policy - - - - - - - - - -
Restated opening balance 78,365 (15,723) (2,773) (2,037) 6,458 (14,075) 364,692 428,982 3,061 432,043
Changes in equity Comprehensive income Net income for the year - - - - - - 24,490 24,490 584 25,074 Other comprehensive income - (1,005) 2,063 (1,354) - (296) - (296) 6 (290)
Total comprehensive income - (1,005) 2,063 (1,354) - (296) 24,490 24,194 590 24,784 Shares issued - - - - - - - - - - Increase (decrease) for transfers and other changes in equity
- - - - (19,686) (19,686) (22) (19,708) 15,962 (3,746)
Dividends - - - - - - - - (1,980) (1,980) Increase (decrease) in equity - (1,005) 2,063 (1,354) (19,686) (19,982) 24,468 4,486 14,572 19,058 Equity as of December 31, 2021 78,365 (16,728) (710) (3,391) (13,228) (34,057) 389,160 433,468 17,633 451,101
Share capital
Foreign currency
translation reserve
Cash flow hedge
reserve
Actuarial gains & losses
reserve
Other miscellan
eous reserves
Other reserves
Retained earnings
(accumulated losses)
Equity attributable to owners of the
parent company
Non-controlling interests
Equity
ThUS$ ThUS$ ThUS$ ThUS$ ThUS$ ThUS$ ThUS$ ThUS$ ThUS$ ThUS$
Equity as of January 1, 2020 78,365 (17,216) 1,148 (1,453) 5,951 (11,570) 341,634 408,429 2,781 411,210 Increase (decrease) due to changes in accounting policy - - - - - - - - - -
Restated opening balance 78,365 (17,216) 1,148 (1,453) 5,951 (11,570) 341,634 408,429 2,781 411,210
Changes in equity Comprehensive income Net income for the year - - - - - - 22,626 22,626 620 23,246 Other comprehensive income - 1,493 (3,921) (584) - (3,012) - (3,012) (5) (3,017) Total comprehensive income - 1,493 (3,921) (584) - (3,012) 22,626 19,614 615 20,229 Shares issued Increase (decrease) for transfers and other changes in equity
- - - - 507 507 432 939 - 939
Dividends - - - - - - - - (335) (335)
Increase (decrease) in equity - 1,493 (3,921) (584) 507 (2,505) 23,058 20,553 280 20,833 Equity as of December 31, 2020 78,365 (15,723) (2,773) (2,037) 6,458 (14,075) 364,692 428,982 3,061 432,043
SAAM S.A. AND SUBSIDIARIES
Consolidated Statements of Changes in Equity
40
NOTE 1 Corporate Information SAAM S.A. and subsidiaries (hereinafter "SAAM") with Chilean identification number 92,048,0004 isa privately held corporation, constituted by a public deed granted by the Valpariso Notary Public Mr Rafael Luis Barahona Stahr on November 15, 1961. It is domiciled in Valparaíso. The Company's registered address is Blanco 937, Valparaíso. Its corporate purpose is to provide services related to maritime transportation, such as maritime and air agency services, attending vessels, leasing and operating tugboats, operating public and private ports, land transportation and warehousing. SAAM operates through related companies in Chile, Uruguay, Peru, Ecuador, Colombia, Costa Rica, Guatemala, Panama, Honduras, Mexico, Canada and the United States of America. At an Extraordinary Shareholders' Meeting held on December 3, 2013, the corporate name of Sudamericana Agencias Aéreas y Marítimas S.A. was changed to SAAM S.A., with the trading name of SAAM. The immediate controlling company of SAAM S.A. is Sociedad Matriz SAAM S.A. with Chilean ID number 76,196,718-5, registered in the securities registry under No. 1,091 dated February 23, 2012. It issues public financial statements and must follow the instructions issued by the Financial Market Commission (formerly Superintendency of Securities and Insurance). The Internal Revenue Service has authorized the Company to keep its accounting records in US dollars as of January 1, 2007, according to Resolution 3509 dated March 11, 2006. On January 30, 2020, the World Health Organization designated the COVID-19 coronavirus outbreak as an international public health emergency. Most countries adopted public health and travel restrictions that affected all economic activities, including the processing of products, as well as international trade. A State of Constitutional Emergency was declared throughout Chile on March 18, 2020, which was lifted on September 30, 2021. Although some of the public health measures have gradually begun to be lifted locally and internationally, there are still certain restrictions, such as those governing the free movement of people and across borders. The consequences for the world's main service and production centers continue to affect international trade. Another consequence is volatile exchange rates and stock and commodities indexes, as well as other effects on the international financial market. Most countries have continued with their vaccination campaigns, which have reduced the risk of the pandemic spreading. At the outset the Company adopted public health measures to reduce the spread of COVID-19, in accordance with instructions issued by the health authority. It has focused on the health of employees, their families and the community in general, as well as on securing operational continuity and supporting the return to normal international trade.
310

2021 Integrated Report
Welcome Message00
SAAM, a Vocation of Service for the Foreign Trade Industry
01
Leadership and Governance Framework
02
Business Model03
Our Team04
Supplier Management05
Efficient Use of Natural Resources
06
Social Contribution07
Additional Information08
GRI Content Index09
Financial Statements10
SAAM S.A. AND SUBSIDIARIES
Notes to the Consolidated Financial Statements
11
NOTE 1 Corporate information, continued As of the date these financial statements were issued, the Company's business has not suffered any significant effects as a result of this situation, but it is not possible to predict whether there may be additional impacts in the future.
NOTE 2 Presentation basis for the consolidated financial statements a. Statement of compliance
The consolidated financial statements as of December 31, 2021 have been prepared in accordance with International Financial Reporting Standards (IFRS) issued by the International Accounting Standard Board (IASB) and approved by its Board at a meeting on March 11, 2022. b. Presentation basis for the consolidated financial statements These consolidated financial statements faithfully reflect the financial position of SAAM S.A. and its subsidiaries as of December 31, 2021 and 2020, the comprehensive income by function, changes in equity and cash flows for the years ended December 31, 2021 and 2020. These consolidated financial statements have been prepared under the principle of an ongoing concern, based on the principle of historic cost, except for the items that are recognized at fair value. The book values of assets and liabilities hedged with transactions that qualify for hedge accounting are adjusted to reflect changes in the fair value in relation to the hedged risks.
SAAM S.A. AND SUBSIDIARIES
Notes to the Consolidated Financial Statements
12
NOTE 2 Presentation Basis of the Consolidated Financial Statements, continued
c. Estimates and Judgments Several critical accounting estimates have been used to prepare these consolidated financial statements, to quantify specific assets, liabilities, income, expenses and commitments. The areas that involve a greater degree of judgment or complexity, or the areas in which the assumptions and estimates are significant for the consolidated financial statements are described as follows:
1. The evaluation of potential impairment losses on specific assets. 2. The assumptions used in the actuarial calculation of employee benefits liabilities. 3. Useful lives of property, plant and equipment and intangible assets. 4. The probability that certain liabilities and contingencies will materialize and their
valuations. 5. The fair value of certain financial instruments. 6. The probability of recovery of deferred tax assets.
These estimates are based on the best available information. In any event, it is possible that future events may require that such estimates are amended in future years. If required, such amendments would be made prospectively, such that the effects of the change would be recognized in future financial statements.
311
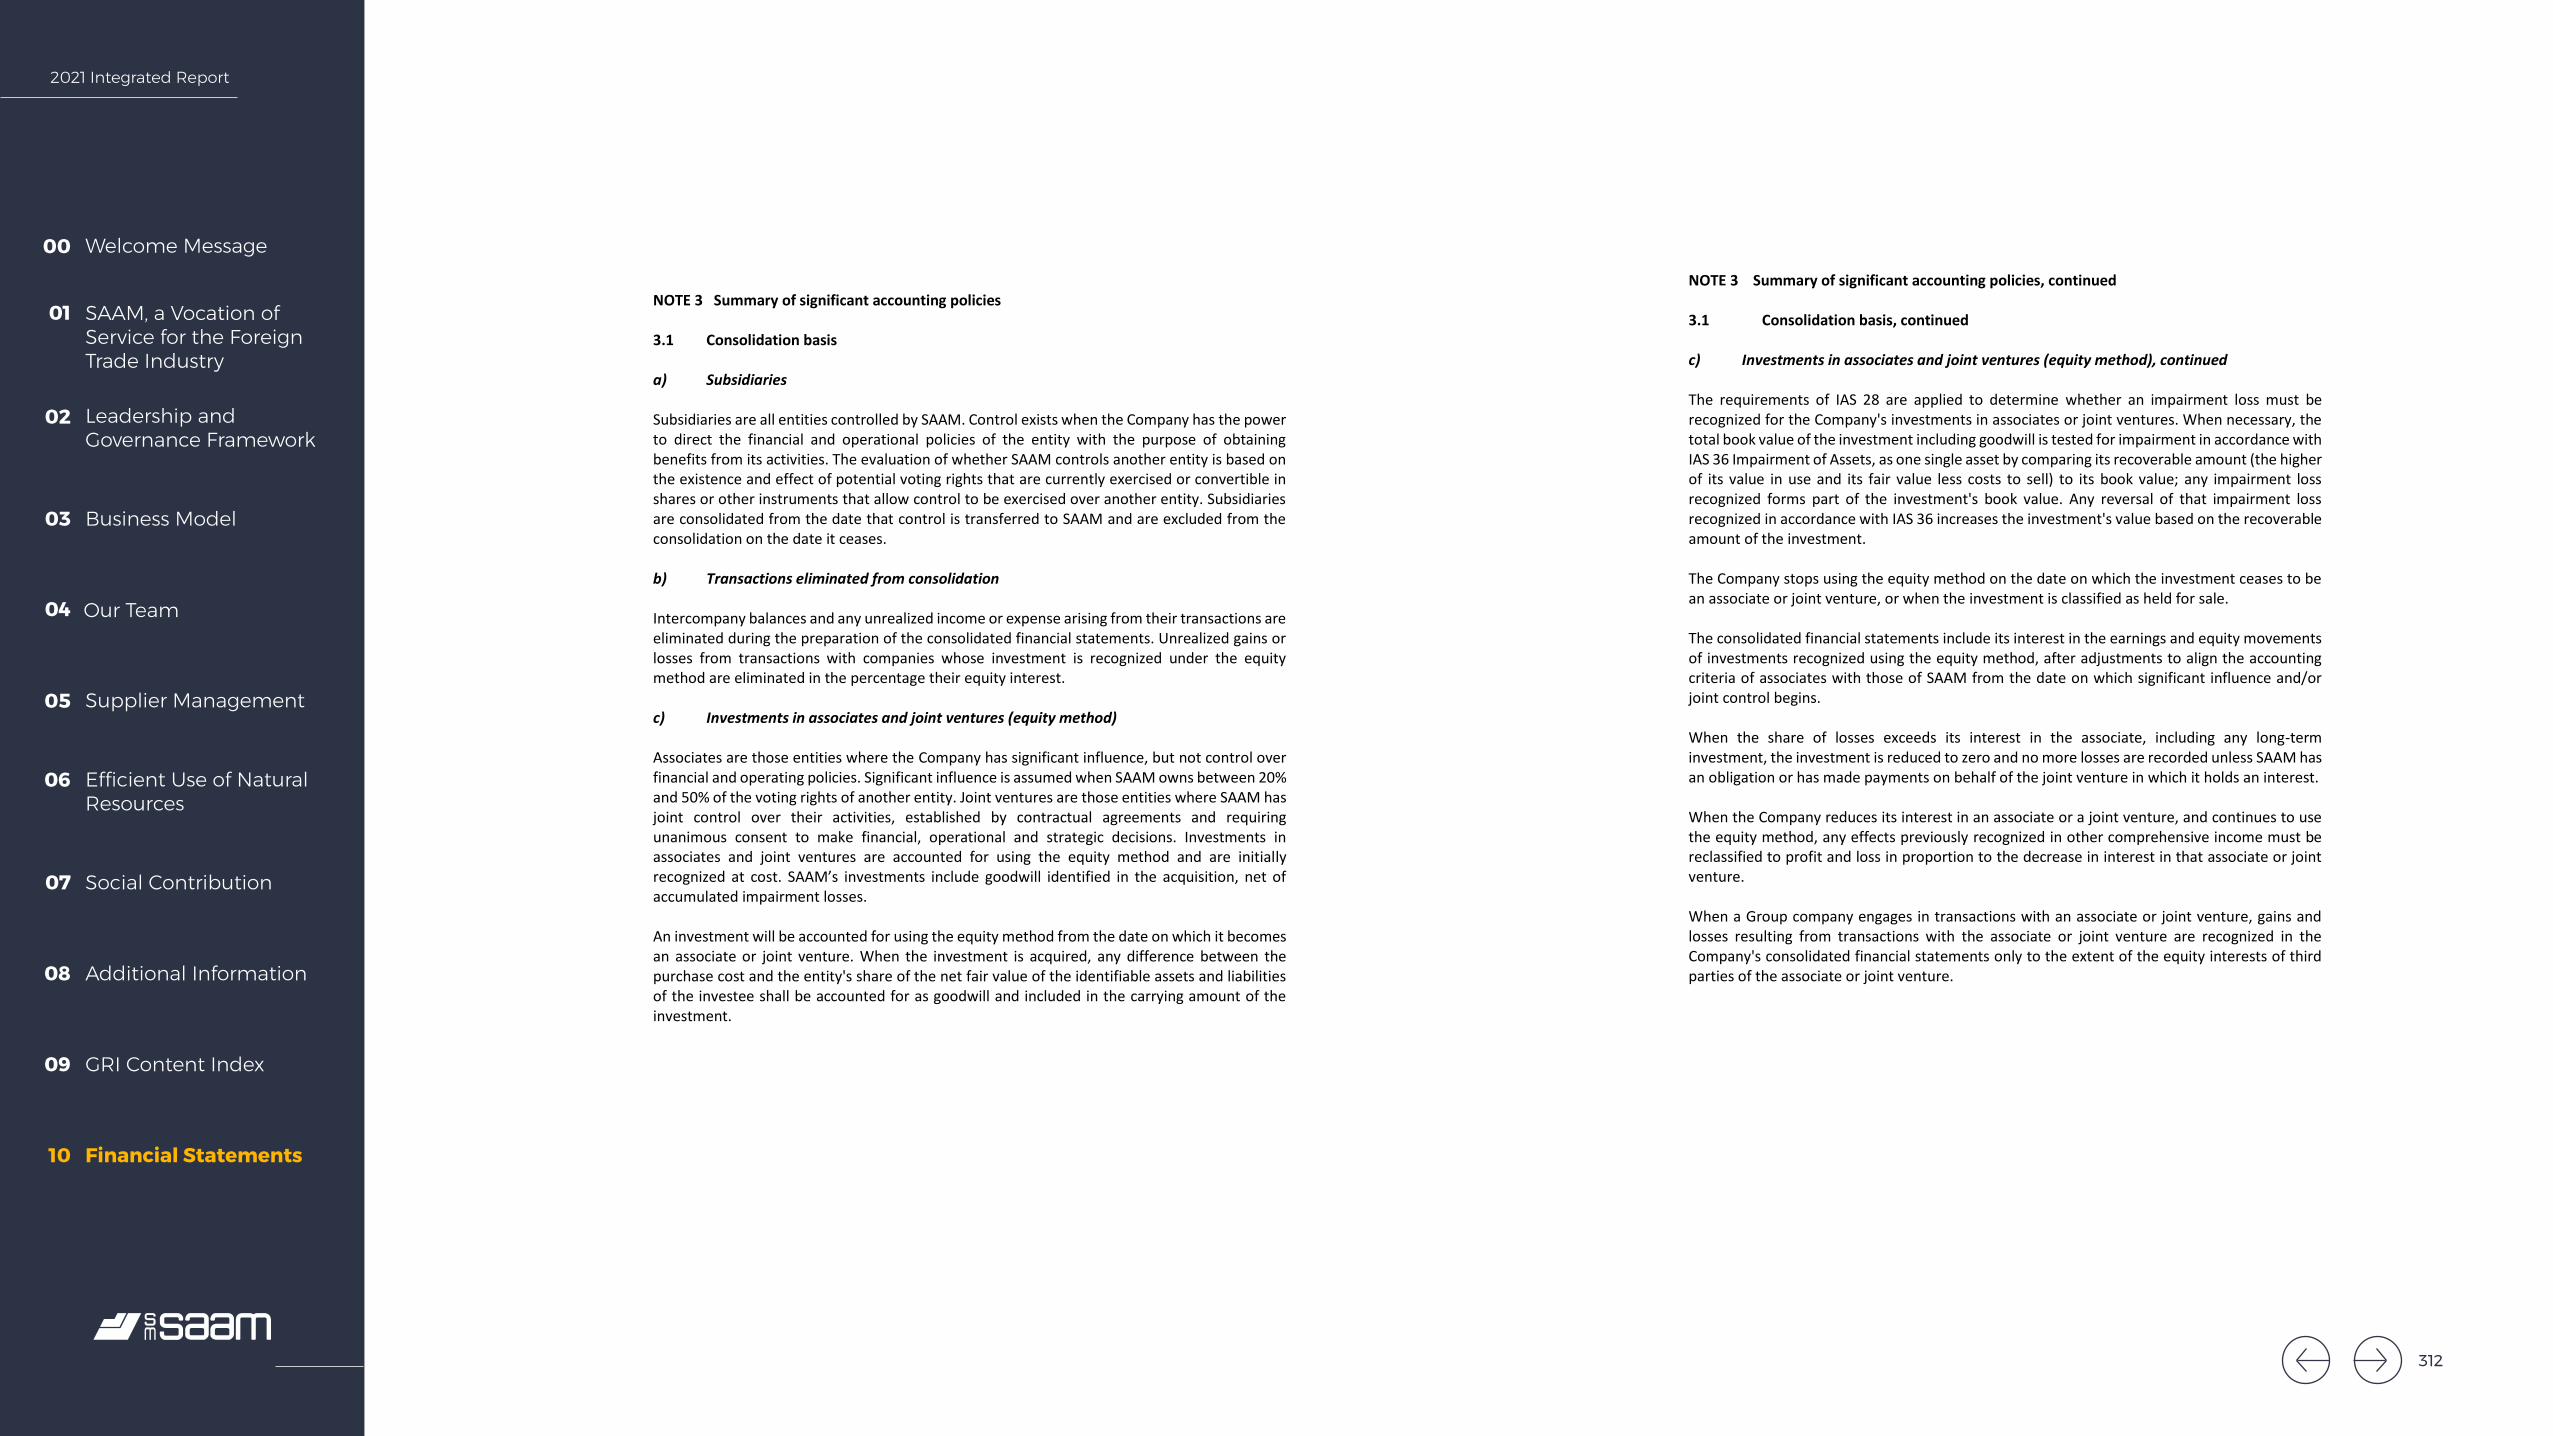
2021 Integrated Report
Welcome Message00
SAAM, a Vocation of Service for the Foreign Trade Industry
01
Leadership and Governance Framework
02
Business Model03
Our Team04
Supplier Management05
Efficient Use of Natural Resources
06
Social Contribution07
Additional Information08
GRI Content Index09
Financial Statements10
SAAM S.A. AND SUBSIDIARIES
Notes to the Consolidated Financial Statements
13
NOTE 3 Summary of significant accounting policies 3.1 Consolidation basis a) Subsidiaries Subsidiaries are all entities controlled by SAAM. Control exists when the Company has the power to direct the financial and operational policies of the entity with the purpose of obtaining benefits from its activities. The evaluation of whether SAAM controls another entity is based on the existence and effect of potential voting rights that are currently exercised or convertible in shares or other instruments that allow control to be exercised over another entity. Subsidiaries are consolidated from the date that control is transferred to SAAM and are excluded from the consolidation on the date it ceases. b) Transactions eliminated from consolidation Intercompany balances and any unrealized income or expense arising from their transactions are eliminated during the preparation of the consolidated financial statements. Unrealized gains or losses from transactions with companies whose investment is recognized under the equity method are eliminated in the percentage their equity interest.
c) Investments in associates and joint ventures (equity method) Associates are those entities where the Company has significant influence, but not control over financial and operating policies. Significant influence is assumed when SAAM owns between 20% and 50% of the voting rights of another entity. Joint ventures are those entities where SAAM has joint control over their activities, established by contractual agreements and requiring unanimous consent to make financial, operational and strategic decisions. Investments in associates and joint ventures are accounted for using the equity method and are initially recognized at cost. SAAM’s investments include goodwill identified in the acquisition, net of accumulated impairment losses. An investment will be accounted for using the equity method from the date on which it becomes an associate or joint venture. When the investment is acquired, any difference between the purchase cost and the entity's share of the net fair value of the identifiable assets and liabilities of the investee shall be accounted for as goodwill and included in the carrying amount of the investment.
SAAM S.A. AND SUBSIDIARIES
Notes to the Consolidated Financial Statements
14
NOTE 3 Summary of significant accounting policies, continued 3.1 Consolidation basis, continued c) Investments in associates and joint ventures (equity method), continued The requirements of IAS 28 are applied to determine whether an impairment loss must be recognized for the Company's investments in associates or joint ventures. When necessary, the total book value of the investment including goodwill is tested for impairment in accordance with IAS 36 Impairment of Assets, as one single asset by comparing its recoverable amount (the higher of its value in use and its fair value less costs to sell) to its book value; any impairment loss recognized forms part of the investment's book value. Any reversal of that impairment loss recognized in accordance with IAS 36 increases the investment's value based on the recoverable amount of the investment. The Company stops using the equity method on the date on which the investment ceases to be an associate or joint venture, or when the investment is classified as held for sale. The consolidated financial statements include its interest in the earnings and equity movements of investments recognized using the equity method, after adjustments to align the accounting criteria of associates with those of SAAM from the date on which significant influence and/or joint control begins. When the share of losses exceeds its interest in the associate, including any long-term investment, the investment is reduced to zero and no more losses are recorded unless SAAM has an obligation or has made payments on behalf of the joint venture in which it holds an interest. When the Company reduces its interest in an associate or a joint venture, and continues to use the equity method, any effects previously recognized in other comprehensive income must be reclassified to profit and loss in proportion to the decrease in interest in that associate or joint venture. When a Group company engages in transactions with an associate or joint venture, gains and losses resulting from transactions with the associate or joint venture are recognized in the Company's consolidated financial statements only to the extent of the equity interests of third parties of the associate or joint venture.
312

2021 Integrated Report
Welcome Message00
SAAM, a Vocation of Service for the Foreign Trade Industry
01
Leadership and Governance Framework
02
Business Model03
Our Team04
Supplier Management05
Efficient Use of Natural Resources
06
Social Contribution07
Additional Information08
GRI Content Index09
Financial Statements10
SAAM S.A. AND SUBSIDIARIES
Notes to the Consolidated Financial Statements
15
NOTE 3 Summary of significant accounting policies, continued
3.1 Consolidation basis, continued d) Changes in Company's interests in current subsidiaries Changes in a parent company's ownership interest in a subsidiary that do not result in a loss of control are equity transactions. Any difference between the fair value of the acquisition price and the book value of that interest is recognized directly in equity and attributed to the owners of the parent company. When the control of a subsidiary is lost, a gain or loss is recognized in net income and is calculated as the difference between (i) the aggregate of the fair value of the selling price and the fair value of any retained interest; and (ii) the previous book value of the assets (including goodwill), and liabilities of the subsidiary and any non-controlling interest. 3.2 Entities included in consolidation These consolidated financial statements include the following subsidiaries:
12-31-2021 12-31-2020 Chilean ID number
Company Name Country Functional currency
Direct Indirect Total Total
96,973,180-0 SAAM Internacional S.A. and Subsidiaries
Chile US dollars 100.00% - 100.00% 100.00%
Foreign SAAM Towage México S.A. de C.V. and Subsidiaries
Mexico US dollars 99.49% 0.51% 100.00% 100.00%
Foreign Concesionaria SAAM Costa Rica S.A Costa Rica US dollars 86.11% 13.89% 100.00% 100.00% Foreign Ecuaestibas S.A Ecuador US dollars 100.00% - 100.00% 100.00% Foreign SAAM Remolcadores Colombia S.A. Colombia US dollars 100.00% - 100.00% 100.00% Foreign Inversiones Habsburgo S.A. Panama US dollars 100.00% - 100.00% 100.00% Foreign Inversiones Alaria S.A..II Panama US dollars 100.00% - 100.00% 100.00% Foreign Saam Remolcadores Panamá S.A. Panama US dollars - 100.00% 100.00% 100.00% Foreign SAAM Towage Brasil S.A. and
Subsidiaries Brazil US dollars 67.91% 32.09% 100.00% 100.00%
Foreign SAAM Towage El Salvador S.A. de C.V. El Salvador US dollars 100.00% - 100.00% 100.00% Foreign EOP(1) Mexico US dollars 70.00% - 70.00% - Foreign Intertug Mexico(1) Mexico US dollars 70.00% - 70.00% - Foreign Baru Mexico(1) Mexico US dollars 70.00% - 70.00% - Foreign Intertug Colombia (1) Colombia US dollars 70.00% - 70.00% -
The subsidiaries included in the consolidation have adopted the same accounting criteria as the parent company, in order to ensure uniformity in the presentation of the consolidated financial statements of SAAM. (1) On January 29, 2021, SAAM acquired control of International Tug S.A.S. (Intertug Colombia), Intertug México S.A. de C.V., Baru Offshore de México, S.A.P.I. de C.V. and EOP Crew Management de México S.A. de C.V. for a total of ThUS$49,191 in share purchases and capital increases. This transaction gives SAAM a 70% interest in each company.
SAAM S.A. AND SUBSIDIARIES
Notes to the Consolidated Financial Statements
16
NOTE 3 Summary of significant accounting policies, continued
3.3 Functional and presentation currency a) Functional currency The consolidated financial statements are presented in US dollars, which is the functional currency of SAAM. Each group entity has determined its functional currency based on the currency of the primary economic environment in which it operates. Items in a currency other than the functional currency are considered to be foreign currency transactions and are initially recorded at the exchange rate on the transaction date. At the end of each period, monetary assets and liabilities in foreign currency are translated at the closing exchange rate, and non-monetary items in foreign currency are remain translated at the exchange rate on the transaction date. The exchange differences account in the consolidated statement of comprehensive income by function includes the effects of exchange rate changes on the value of assets and liabilities in foreign currencies. b) Presentation currency As of the reporting date, group entities with a functional currency other than the currency of SAAM must translate their results and statement of financial position to the presentation currency of the parent company by translating their assets and liabilities at the closing exchange rate and their results at the average exchange rate. The company reporting in the presentation currency is SAAM Marine Canada Inc. and subsidiaries, and their functional currency is the Canadian dollar. Exchange differences arising from the translation into the presentation currency are recognized as a separate component of equity, in other comprehensive income, in the reserve account of exchange differences on translation.
313

2021 Integrated Report
Welcome Message00
SAAM, a Vocation of Service for the Foreign Trade Industry
01
Leadership and Governance Framework
02
Business Model03
Our Team04
Supplier Management05
Efficient Use of Natural Resources
06
Social Contribution07
Additional Information08
GRI Content Index09
Financial Statements10
SAAM S.A. AND SUBSIDIARIES
Notes to the Consolidated Financial Statements
17
NOTE 3 Summary of significant accounting policies, continued
3.4 Translation basis for transactions in foreign currencies and indexed units The principal foreign currency assets and liabilities are stated at their equivalent value in US dollars, calculated at the following closing exchange rates.
Currency 12-31-2021 12-31-2020 Chilean peso 844.69 710.95 Mexican peso 20.5383 19.9265 Canadian dollar 1.2783 1.2764 Brazilian real 5.5689 5.1768
The assets and liabilities indexed in Unidades de Fomento (UF) were presented in US dollars at the following values at the reporting date
Closing date 12-31-2021
US$ 12-31-2020
US$ UF / US$ 36.69 40.89
3.5 Business combinations The acquisition method is used to account for all business combinations, regardless of whether equity instruments or other assets are acquired. The acquisition price of a subsidiary comprises: ● Fair values of the transferred assets. ● Liabilities incurred by the former owners of the acquired business. ● Interests issued by the Company. ● Fair value of any asset or liability resulting from a contingent arrangement. ● Fair value of any pre-existing interest in the subsidiary. Identifiable assets, liabilities and contingencies acquired in a business combination are initially valued at fair value as of the acquisition date, with limited exceptions. The Company recognizes any non-controlling interest in the acquired entity on a purchase by purchase basis either at its fair value or at the non-controlling shareholders' proportional share of the acquired entity's net identifiable assets.
SAAM S.A. AND SUBSIDIARIES
Notes to the Consolidated Financial Statements
18
NOTE 3 Summary of significant accounting policies, continued 3.5 Business combinations, continued Costs relating to the acquisition are accounted for as expenses, which also includes the excess of:
• Acquisition price. • Any non-controlling interest in the acquired entity. • The fair value at the acquisition date of any previous equity interest in the acquired entity
over the fair value of the identifiable net assets acquired is recorded as goodwill. If these amounts are less than the fair value of the identifiable net assets of the acquired entity, the difference is recognized directly in the statement of net income as a purchase on advantageous terms.
When payment of any portion of the acquisition price is deferred, amounts payable in the future will be discounted to their present value. The discount rate used will be the entity's incremental loan rate, which is the rate at which a similar loan could be obtained from an independent lender under comparable terms and conditions. Any contingent acquisition price is classified as either capital or financial liabilities. The amounts classified as financial liabilities are subsequently valued at fair value with changes in profit and loss. If the business combination occurs in stages, the fair value as of the acquisition date of the interest previously held by the acquirer is revalued at fair value as of the acquisition date. Any gain or loss arising from that revaluation is recognized in the statement of net income. 3.6 Cash and cash equivalents The Company's cash and cash equivalents consist of cash on hand and in bank checking accounts, time deposits and other financial investments that mature within 90 days. They also include cash management investments, such as covenants with repurchase and resale agreements that mature before the same deadline. Bank overdrafts are included in short-term loans under current liabilities. Cash and cash equivalents in the financial statements include cash, bank checking accounts, and other highly liquid short-term investments that mature within three months that can be quickly liquidated and have no significant risk of changes in value.
314
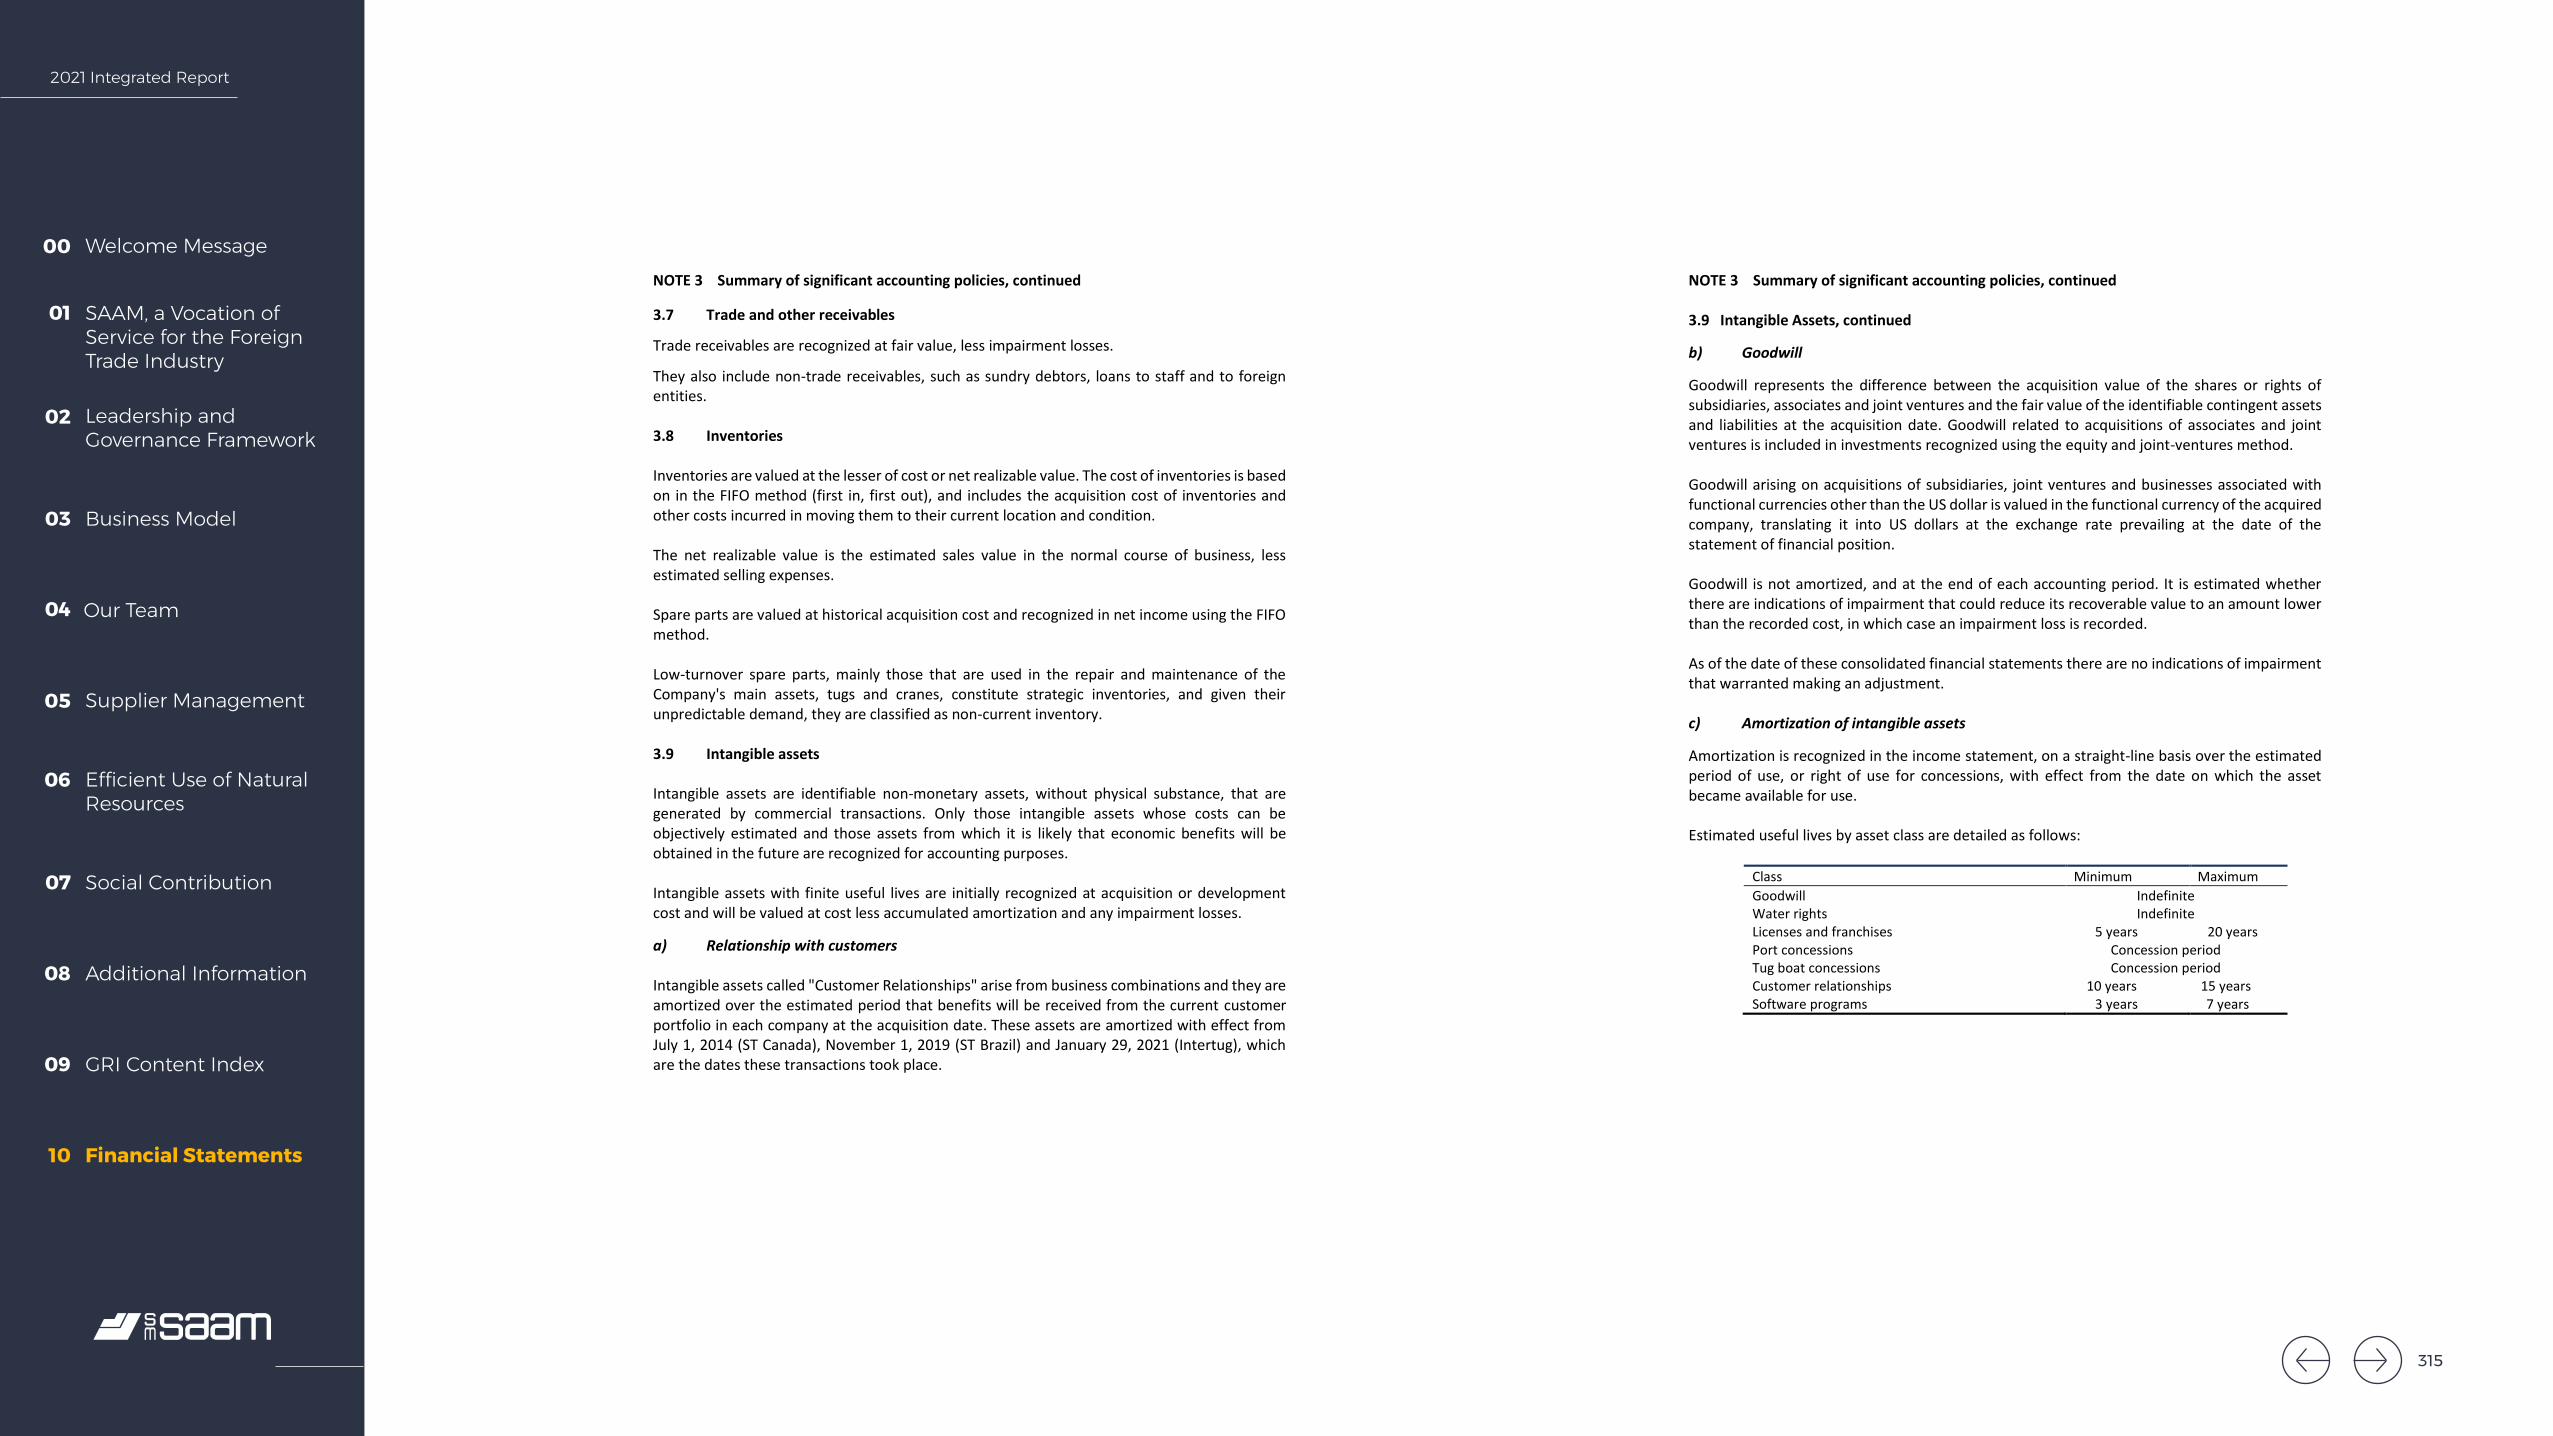
2021 Integrated Report
Welcome Message00
SAAM, a Vocation of Service for the Foreign Trade Industry
01
Leadership and Governance Framework
02
Business Model03
Our Team04
Supplier Management05
Efficient Use of Natural Resources
06
Social Contribution07
Additional Information08
GRI Content Index09
Financial Statements10
SAAM S.A. AND SUBSIDIARIES
Notes to the Consolidated Financial Statements
19
NOTE 3 Summary of significant accounting policies, continued 3.7 Trade and other receivables
Trade receivables are recognized at fair value, less impairment losses.
They also include non-trade receivables, such as sundry debtors, loans to staff and to foreign entities.
3.8 Inventories Inventories are valued at the lesser of cost or net realizable value. The cost of inventories is based on in the FIFO method (first in, first out), and includes the acquisition cost of inventories and other costs incurred in moving them to their current location and condition. The net realizable value is the estimated sales value in the normal course of business, less estimated selling expenses. Spare parts are valued at historical acquisition cost and recognized in net income using the FIFO method. Low-turnover spare parts, mainly those that are used in the repair and maintenance of the Company's main assets, tugs and cranes, constitute strategic inventories, and given their unpredictable demand, they are classified as non-current inventory. 3.9 Intangible assets Intangible assets are identifiable non-monetary assets, without physical substance, that are generated by commercial transactions. Only those intangible assets whose costs can be objectively estimated and those assets from which it is likely that economic benefits will be obtained in the future are recognized for accounting purposes. Intangible assets with finite useful lives are initially recognized at acquisition or development cost and will be valued at cost less accumulated amortization and any impairment losses.
a) Relationship with customers Intangible assets called "Customer Relationships" arise from business combinations and they are amortized over the estimated period that benefits will be received from the current customer portfolio in each company at the acquisition date. These assets are amortized with effect from July 1, 2014 (ST Canada), November 1, 2019 (ST Brazil) and January 29, 2021 (Intertug), which are the dates these transactions took place.
SAAM S.A. AND SUBSIDIARIES
Notes to the Consolidated Financial Statements
20
NOTE 3 Summary of significant accounting policies, continued 3.9 Intangible Assets, continued
b) Goodwill
Goodwill represents the difference between the acquisition value of the shares or rights of subsidiaries, associates and joint ventures and the fair value of the identifiable contingent assets and liabilities at the acquisition date. Goodwill related to acquisitions of associates and joint ventures is included in investments recognized using the equity and joint-ventures method. Goodwill arising on acquisitions of subsidiaries, joint ventures and businesses associated with functional currencies other than the US dollar is valued in the functional currency of the acquired company, translating it into US dollars at the exchange rate prevailing at the date of the statement of financial position. Goodwill is not amortized, and at the end of each accounting period. It is estimated whether there are indications of impairment that could reduce its recoverable value to an amount lower than the recorded cost, in which case an impairment loss is recorded. As of the date of these consolidated financial statements there are no indications of impairment that warranted making an adjustment. c) Amortization of intangible assets
Amortization is recognized in the income statement, on a straight-line basis over the estimated period of use, or right of use for concessions, with effect from the date on which the asset became available for use. Estimated useful lives by asset class are detailed as follows:
Class Minimum Maximum Goodwill Indefinite Water rights Indefinite Licenses and franchises 5 years 20 years Port concessions Concession period Tug boat concessions Concession period Customer relationships 10 years 15 years Software programs 3 years 7 years
315

2021 Integrated Report
Welcome Message00
SAAM, a Vocation of Service for the Foreign Trade Industry
01
Leadership and Governance Framework
02
Business Model03
Our Team04
Supplier Management05
Efficient Use of Natural Resources
06
Social Contribution07
Additional Information08
GRI Content Index09
Financial Statements10
SAAM S.A. AND SUBSIDIARIES
Notes to the Consolidated Financial Statements
21
NOTE 3 Summary of significant accounting policies, continued 3.9 Intangible Assets, continued
d) Impairment of intangible assets Intangible assets with indefinite useful lives are valued at cost and tested annually for impairment. At the year end, or when deemed necessary, the Company and its subsidiaries evaluate whether there are indicators of impairment in their assets. If there are such indications, the Company estimates the recoverable value of the asset. An asset’s recoverable value is the greater of its value in use or its fair value less selling costs. Fair value less selling costs is determined using independent expert reports or available objective information. Value in use is determined using estimated future cash flows discounted at the Company's WACC rate. As of the reporting date, SAAM was not aware of any evidence of impairment due to significant changes, such as a decrease in market value, obsolescence, physical damage, market return, etc. that may affect the valuation of intangible assets, other than those already recognized this year.
3.10 Property, plant and equipment a) Recognition and measurement Items of property, plant and equipment are measured at cost minus accumulated depreciation and impairment losses, where appropriate. Cost includes expenses directly attributed to the asset’s acquisition. The cost of self-built assets includes the cost of materials, direct labor, financial expenses related to external financing that are directly attributable until the asset is commissioned, and any other cost directly allocated to the process of making the asset fit for its use, and the costs of dismantling and removing the assets and restoring the place where they are located. When the significant parts of an item of property, plant and equipment have different useful lives, they are recorded as separate elements within the sub-ledger of property, plant and equipment. Gains or losses on the sale of an item of property, plant and equipment are determined by comparing the sales price with the book value of property, plant and equipment and are recognized within “other income (losses)” in the statement of net income.
SAAM S.A. AND SUBSIDIARIES
Notes to the Consolidated Financial Statements
22
NOTE 3 Summary of significant accounting policies, continued 3.10 Property, plant and equipment b) Subsequent costs The cost of replacing an item of property, plant and equipment is recognized in its book value if the future economic benefits will be received in more than one period and its cost can be measured reliably. The costs of daily maintenance of property, plant and equipment are recognized in the statement of net income when incurred. Subsequent to the acquisition, only disbursements incurred that increase the economic useful life of the asset or its economic capacity and that are different from routine maintenance will be capitalized. c) Depreciation and useful lives Depreciation is recognized in the consolidated statement of net income by function using the straight-line depreciation method over the useful lives of each item of property, plant and equipment. This is the method that best reflects the use and consumption of the asset. The estimated useful lives for the current periods are as follows.
Class Range in years Minimum Maximum Buildings and construction 40 80 Port terminal infrastructure(1) Concession period Leasehold facilities and property improvements Lease term Vessels, tugboats, barges and lighters 10 30 Machinery 5 15 Transport trucks 3 10 Office equipment 1 3 Furniture, fixtures and fittings 3 5
(1) Includes assets not controllable by the entity granting the concession. The useful lives of these assets may exceed the concession period when the asset is transferable to another Company business.
316

2021 Integrated Report
Welcome Message00
SAAM, a Vocation of Service for the Foreign Trade Industry
01
Leadership and Governance Framework
02
Business Model03
Our Team04
Supplier Management05
Efficient Use of Natural Resources
06
Social Contribution07
Additional Information08
GRI Content Index09
Financial Statements10
SAAM S.A. AND SUBSIDIARIES
Notes to the Consolidated Financial Statements
23
NOTE 3 Summary of significant accounting policies, continued d) Leases
The Company recognizes contracts that meet the definition of a lease as a right-of-use asset and a lease liability on the date on which the underlying asset is available for use. Right-of-use assets are valued at cost including the following.
• The initial lease liability • The initial direct costs
Right-of-use assets are recognized in the statement of financial position under property, plant and equipment. Lease liabilities include the net present value of the following payments.
• Essentially fixed payments • Variable payments based on an index or rate • Call options at the exercise price, when these are reasonably certain to be exercised.
The Company determines the present value of the lease payments using the rate implicit in the underlying lease contracts, using the incremental interest rate. Lease liabilities are recognized in the statement of financial position under other current and non-current financial liabilities. Interest accrued on financial liabilities is recognized in the consolidated statement of net income under "Financial costs". Capital and interest installments paid are recognized in the consolidated statement of cash flow as "Payments of liabilities under finance leases" and "Interest paid" in the Cash Flow from Financing Activities. The Company does not have any embedded leases in contracts that require separation. e) Impairment of property, plant and equipment
At the end of each year, or when deemed necessary, the Company and its subsidiaries evaluate whether there are indications of impairment in their assets, such as significant decreases in value, indicators of obsolescence or physical deterioration, or changes in the legal, economic or technological environment in which the asset is used. If there are such indications, the Company estimates the recoverable value of the asset. An asset’s recoverable value is the greater of its value in use or its fair value less selling costs.
Fair value less selling costs is determined using independent expert reports or available objective information. Value in use is determined using estimated future cash flows discounted at the Company's WACC rate.
SAAM S.A. AND SUBSIDIARIES
Notes to the Consolidated Financial Statements
24
NOTE 3 Summary of significant accounting policies, continued
3.10 Property, plant and equipment, continued e) Impairment of property, plant and equipment The impairment of assets that do not generate independent cash flows is assessed by grouping assets that generate identifiable flows (cash generating units).
If the recoverable amount of the asset is less than its net book value, the corresponding impairment adjustment is recognized in the statement of net income, leaving the asset at its recoverable amount.
Impairment losses on revalued assets are recognized in equity up to the previous revaluation. Impairment losses recognized in prior periods will be evaluated at each year-end, in order to determine any indication that the loss has decreased or disappeared, recognizing the reversal with credit to the statement of net income unless an asset is recorded at the revalued amount, in which case the reversal is credited to equity. As of the reporting date, SAAM is not aware of any evidence of impairment due to significant changes, such as a decrease in market value, obsolescence, physical damage, market return, etc. that may affect the valuation of property, plant and equipment, other than those already recognized this year. 3.11 Investment property Investment properties are held to receive rental income, to benefit from capital appreciation, or both, but not for sale in the normal course of business, use in production or supply of goods or services, or for administrative purposes. Investment properties are valued at cost less accumulated depreciation and accumulated impairment losses. When the use of a property changes, its value is reclassified to the item in the statement of financial position that best reflects its new use.
317
2021 Integrated Report
Welcome Message00
SAAM, a Vocation of Service for the Foreign Trade Industry
01
Leadership and Governance Framework
02
Business Model03
Our Team04
Supplier Management05
Efficient Use of Natural Resources
06
Social Contribution07
Additional Information08
GRI Content Index09
Financial Statements10
SAAM S.A. AND SUBSIDIARIES
Notes to the Consolidated Financial Statements
25
NOTE 3 Summary of significant accounting policies, continued 3.12 Provisions A provision is recognized when there is a legal or constructive obligation as a result of a past event and it is likely that a resource disbursement, including economic benefits, will be required to settle the obligation, and its value can be reliably estimated. The provision is the best estimate of the amount payable, as of the reporting date. When the estimated payment period is long term and can be estimated with sufficient reliability, the provision is recorded at its present value, discounting the estimated payment flows at a market interest rate that reflects the specific risks of the obligation. Provisions should be reviewed at the end of each reporting period and adjusted accordingly to reflect the best available estimate at any given time. 3.13 Financial liabilities These liabilities are initially recognized at the transaction value. Costs incurred that are directly attributable to the transaction are depreciated over the period of the loan and presented as a reduction in the liability. They are valued at amortized cost, using the effective interest rate method. 3.14 Trade and other payables, current
These include payables for trade purchases and related expenses, plus non-trade payables, such as sundry creditors, retentions from staff remuneration and others. 3.15 Employee benefits a) Defined benefit plans The Company is obliged to pay severance indemnities under the collective bargaining agreements. This obligation is provided for by applying the actuarial value method to the accrued cost of the benefit, with a nominal annual discount rate of 5.65%, considering estimates such as future tenure, employee mortality rate and future salary increases, determined on the basis of actuarial calculations. Discount rates are determined by reference to market interest curves.
SAAM S.A. AND SUBSIDIARIES
Notes to the Consolidated Financial Statements
26
NOTE 3 Summary of significant accounting policies, continued 3.15 Employee benefits, continued a) Defined benefit plans, continued The present value of the obligation is determined by actuarial valuations. Actuarial valuation involves making assumptions about the discount rate, future salary increases, mortality rates and future pension increases. All assumptions are reviewed once a year. The discount rate is based on the interest rates for instruments issued by the Central Bank of Chile. The mortality rate is based on publicly available mortality tables for the country. Future increases in salaries and pensions are based on projected future increases in the inflation rate for the country. b) Short-term benefits Short-term employee benefit obligations are measured on an undiscounted basis and accounted for in the statement of net income by function as the related service is accrued. 3.16 Operating revenue and costs of sales Operating revenue and costs of sales from providing services are recognized in the statement of net income on an accrual basis. Operating revenue is recognized only to the extent that it can be reliably measured and it is probable that financial benefits will flow to the Company regardless of when that occurs. The cost of sales associated with the services provided are recognized on an accrual basis directly to the respective business areas of the Company. Operating revenue and costs of sales are recognized net of discounts. 3.17 Financial income and financial costs Financial income is recognized in the statement of comprehensive income by function on an accrual basis. Financial costs are generally taken to the statement of net income when they are incurred, except those that finance the construction or development of qualifying assets that require a substantial period to prepare them for use, and those related to the actuarial cost of staff benefits.
318
2021 Integrated Report
Welcome Message00
SAAM, a Vocation of Service for the Foreign Trade Industry
01
Leadership and Governance Framework
02
Business Model03
Our Team04
Supplier Management05
Efficient Use of Natural Resources
06
Social Contribution07
Additional Information08
GRI Content Index09
Financial Statements10
SAAM S.A. AND SUBSIDIARIES
Notes to the Consolidated Financial Statements
27
NOTE 3 Summary of significant accounting policies, continued
3.18 Corporate income taxes The Company and its subsidiaries in Chile account for income tax based on net taxable income determined according to the rules established in Income Tax Law. This calculation for foreign subsidiaries complies with the laws in their respective countries. 3.19 Deferred taxes Deferred tax assets and liabilities are recognized using the statement of financial position method. Temporary differences between the book value of the assets and liabilities and their tax base are recorded as established in IAS 12 "Income tax". Deferred taxes are valued at tax rates expected to be applied when temporary differences are reversed, based on laws that have been approved or are about to be approved as of each reporting date. 3.20 Investments and other financial assets a.1) Classification SAAM classifies its financial assets into the following categories. • Those that are subsequently valued at fair value (either through other comprehensive
income, or through profit and loss), and • Those that are valued at amortized cost. This valuation depends on the business model used by the Company to manage the financial assets and the contractual terms of the cash flows. Gains and losses on assets valued at fair value will be recorded in the statement of net income or other comprehensive income. Gains and losses on investments in equity instruments that are not held for trading will depend on whether the Company has made an irrevocable decision at initial recognition to record the investment at fair value through other comprehensive income. The Company only reclassifies debt instruments when it changes its business model for managing those assets.
SAAM S.A. AND SUBSIDIARIES
Notes to the Consolidated Financial Statements
28
NOTE 3 Summary of significant accounting policies, continued 3.20 Investments and other financial assets, continued a.2) Recognition Routine purchases and sales of financial assets are recognized as of the transaction date, which is the date that the Company commits to purchase or sell the asset. Financial assets are de-recognized when the rights to receive cash flows from the financial asset have expired or have been transferred and the Company has transferred substantially all risks and rewards of ownership. a.3) Measurement Financial assets are valued at initial recognition at fair value plus transaction costs directly attributable to the acquisition of the financial asset, in the case of a financial asset that is not recognized at fair value through profit or loss. Transaction costs of financial assets recognized at fair value through profit and loss are recorded in the statement of net income. Financial assets with embedded derivatives are considered in their entirety when determining whether cash flows are only payments of principal and interest. b) Non-derivative financial instruments Financial instruments are classified on initial recognition as a financial asset, financial liability or equity instrument, in accordance with the substance of the contractual arrangement. Also, financial instruments are classified for valuation purposes into four categories, financial assets at fair value through profit or loss, loans and receivables, investments held-to-maturity and financial liabilities. This classification depends on the characteristics of the instrument and the purpose for its acquisition. SAAM derecognizes a financial liability when its contractual obligations are settled or expire. After initial recognition, non-derivative financial instruments are valued as follows.
319
2021 Integrated Report
Welcome Message00
SAAM, a Vocation of Service for the Foreign Trade Industry
01
Leadership and Governance Framework
02
Business Model03
Our Team04
Supplier Management05
Efficient Use of Natural Resources
06
Social Contribution07
Additional Information08
GRI Content Index09
Financial Statements10
SAAM S.A. AND SUBSIDIARIES
Notes to the Consolidated Financial Statements
29
NOTE 3 Summary of significant accounting policies, continued
3.20 Investments and other financial assets, continued b.1) Financial assets at fair value through profit and loss Financial assets at fair value through profit and loss are financial assets held for trading, or are designated as such upon initial recognition. A financial asset or liability is classified as held for trading if:
• It is acquired or incurred primarily for the purpose of selling or repurchasing it in the immediate future.
• It is part of a portfolio of identified financial instruments, which are managed together and for which there is evidence of a recent pattern of short-term profit.
• It is a derivative, except a derivative that has been designated as a hedging instrument and meets the conditions to be effective.
Financial assets at fair value through profit and loss are financial assets held for trading, or are designated as such upon initial recognition. A financial asset or liability is classified as held for trading if:
• It is acquired or incurred primarily for the purpose of selling or repurchasing it in the immediate future.
• It is part of a portfolio of identified financial instruments, which are managed together and for which there is evidence of a recent pattern of short-term profit.
• It is a derivative, except a derivative that has been designated as a hedging instrument and meets the conditions to be effective.
Financial assets at fair value through profit or loss are initially recorded at fair value. Transaction costs directly attributable to the purchase or issue are recognized as an expense when incurred. Subsequent to initial recognition, they are recognized at fair value with changes recorded in the statement of net income.
c) Other items
Other non-derivative financial instruments including loans and receivables are valued at amortized cost using the effective interest rate method, less any impairment loss.
SAAM S.A. AND SUBSIDIARIES
Notes to the Consolidated Financial Statements
30
NOTE 3 Summary of significant accounting policies, continued 3.20 Investments and other financial assets, continued d) Financial asset impairment Provisions for doubtful debts are based on the expected losses, by evaluating the historical payment behavior of customers in the various portfolio segments. They are evaluated by preparing recoverability matrices composed of age ranges, which show expected uncollectibility percentages during the life of the asset and are recognized from the outset. Loans and receivables are included in "Trade and other receivables" in the consolidated statement of financial position, except for those maturing more than 12 months after the closing date, which are classified as non-current trade and other receivables. They are recorded at amortized cost in accordance with the effective interest rate method and this is their initial fair value.
The effective interest rate method is a method of calculating the amortized cost of a financial asset or liability and of allocating the financial income or expense over the corresponding period. The effective interest rate is the discount rate that exactly matches the estimated cash flows receivable or payable over the expected life of the financial instrument (or when appropriate over a shorter period) with the net book value of the financial asset or financial liability.
Current trade receivables are not discounted. The Company has determined that amortized cost does not differ from the amount invoiced because the transaction does not involve any significant costs. 3.21 Derivatives and hedge transactions a) Derivative financial instruments Derivative financial instruments used to hedge risk exposure in foreign currency and interest rates are initially recognized at fair value. Attributable transaction costs are recognized in the statement of net income when they are incurred. After initial recognition, derivative financial instruments are measured at fair value, and any changes are recorded as follows.
320
2021 Integrated Report
Welcome Message00
SAAM, a Vocation of Service for the Foreign Trade Industry
01
Leadership and Governance Framework
02
Business Model03
Our Team04
Supplier Management05
Efficient Use of Natural Resources
06
Social Contribution07
Additional Information08
GRI Content Index09
Financial Statements10
SAAM S.A. AND SUBSIDIARIES
Notes to the Consolidated Financial Statements
31
NOTE 3 Summary of significant accounting policies, continued 3.21 Derivatives and hedge transactions, continued a.1) Fair value hedges Derivative financial instruments that satisfy hedge accounting criteria are initially recognized at fair value plus / minus the transaction costs that are directly attributable to contracting or issuing the instrument, as appropriate. Changes in the fair value of derivatives that are designated and qualify as fair value hedges are recorded in the consolidated statement of net income, together with any change in the fair value of the hedged asset or liability that are attributable to the hedged risk. a.2) Cash flow hedges The effective portion of changes in the fair value of derivatives that are designated and qualify as cash flow hedges are recognized in the statement of other comprehensive income. Any loss or gain related to the ineffective portion is recognized immediately in the consolidated statement of income within other income (losses). The amounts accumulated in equity are reclassified to the statement of net income in the periods in which the protected item impacts the statement of net income. Variable interest rate hedges that are recognized in the statement of other comprehensive income are reclassified to the statement of net income within financial expenses as the associated debts accrue interest. Foreign currency hedges that are recognized in the statement of other comprehensive income are reclassified to the statement of net income as the hedged items are impacted by changes in exchange rates and affect the statement of net income. When a hedge instrument matures, or is sold, or when it no longer satisfies hedge accounting criteria, any gain or loss accumulated in the statement of other comprehensive income until that point remains in the statement of other comprehensive income and is recognized when the forecast transaction is finally recognized in the consolidated statement of net income. When the forecast transaction is not expected to occur, any accumulated gain or loss accumulated in the statement of other comprehensive income is recognized immediately in the consolidated statement of net income within other income (losses). a.3) Derivatives not designated as hedges Hedge accounting is not applicable to derivative instruments that financially cover monetary assets and liabilities denominated in foreign currencies. Changes in the fair value of such derivatives are recognized in the statement of net income by function within foreign exchange differences.
SAAM S.A. AND SUBSIDIARIES
Notes to the Consolidated Financial Statements
32
NOTE 3 Summary of significant accounting policies, continued 3.21 Derivatives and hedge transactions, continued a.3) Derivatives not designated as hedges, continued Derivative financial instruments that do not satisfy hedge accounting criteria are classified and valued as financial assets or liabilities at fair value through profit and loss. 3.22 Non-current assets held for sale
Non-current assets, or groups of assets and liabilities, that are expected to be recovered principally through sales rather than through continuous use, are classified as held for sale and are valued at the lower of their book value and fair value less selling costs. Immediately prior to this classification, these assets or disposal groups are valued at the lower of their book value and fair value less selling costs. Any impairment loss in a disposal group is first allocated to goodwill, and then to the remaining assets and liabilities on a pro rata basis. Impairment losses when initially classified as held for sale and subsequent gains or losses are recognized in the statement of net income. Gains are only recognized when accumulated impairment losses are covered. 3.23 Determination of fair values Some criteria and accounting disclosures of the Group require that the fair value of certain financial assets be determined as follows. a) Financial assets The fair value of financial assets at fair value through profit and loss and financial assets held for sale is market value. b) Trade and other receivables As trade receivables are collected within 120 days, their fair value is not estimated to differ significantly from their book value. c) Derivatives The fair value of derivative contracts is based on their quoted price.
321

2021 Integrated Report
Welcome Message00
SAAM, a Vocation of Service for the Foreign Trade Industry
01
Leadership and Governance Framework
02
Business Model03
Our Team04
Supplier Management05
Efficient Use of Natural Resources
06
Social Contribution07
Additional Information08
GRI Content Index09
Financial Statements10
SAAM S.A. AND SUBSIDIARIES
Notes to the Consolidated Financial Statements
33
NOTE 3 Summary of significant accounting policies, continued 3.24 Minimum dividend The Company records a liability for its dividends, in accordance with the accounting policy of its parent company SM SAAM S.A., which is based on Corporations Law. 3.25 Environment Any environmental liabilities are based on the current interpretation of environmental laws and regulations, when it is probable that an obligation will arise and the amount of such liability can be reliably estimated. Disbursements related to environmental protection are charged to the consolidated income statement when they are incurred. 3.26 New accounting pronouncements. a) Standards, interpretations and amendments that are mandatory for the first time for financial periods beginning on January 1, 2021. Amendments and improvements
Amendment to IFRS 9, IAS 39, IFRS 7, IFRS 4 and IFRS 16 "Reference Rate Reform (IBOR)" - Phase 2 - issued in August 2020. Addresses issues that arise during the reform of benchmark interest rates, including the replacement of one benchmark rate with an alternative. Amendment to IFRS 16 “Lease concessions” - issued in March 2021. This amendment extends by one year the application period for the practical exemption to IFRS 16 Leases, which was contained in the amendment to that standard issued in May 2020, with the purpose of assisting lessees to account for lease concession reductions related to COVID-19. The amendment coverage was extended from June 30, 2021 to June 30, 2022. The amendment is effective for annual periods beginning on or after April 1, 2021. However, early adoption is permitted even for financial statements not authorized for issue as of March 31, 2021. Amendment to IFRS4 "Insurance contracts": deferral of IFRS 9 issued on June 25, 2020. This amendment defers the application date of IFRS 17 by two years until January 1, 2023 and changes the date of the temporary exemption in IFRS 4 from applying IFRS 9 "Financial instruments" to January 1, 2023.
SAAM S.A. AND SUBSIDIARIES
Notes to the Consolidated Financial Statements
34
Standards and interpretations Mandatory for annual periods beginning
Amendment to IFRS 3, "Business Combinations". Minor amendments were made to IFRS 3 to update the references to the Conceptual Framework for Financial Reporting, without changing the requirements for business combinations.
01/01/2022
Amendment to IAS 16, "Property, plant and equipment" prohibits companies from deducting from the cost of property, plant and equipment the proceeds from the sale of items produced while the company is preparing the asset for its intended use. The Company should recognize such sales revenues and related costs in net income for the year.
01/01/2022
Amendment to IAS 37, "Provisions, contingent liabilities and contingent assets" clarifies which unavoidable costs a company must include under onerous contracts, to assess whether a contract will generate losses.
01/01/2022
Annual improvements to IFRS standards 2018-2020 cycle. The following improvements were completed in May 2020: -IFRS 9 Financial Instruments: clarifies which fees should be included in the 10% test for derecognition of financial liabilities. -IFRS 16 Leases: amendment of Illustrative Example 13 to remove the lessor payments illustration in relation to leasehold improvements, to eliminate any confusion about the treatment of lease incentives. -IFRS 1 First-time Adoption of International Financial Reporting Standards: allows companies that have measured their assets and liabilities at their parent company´s book values, to also measure cumulative translation differences using the amounts reported by the parent company. This amendment will also apply to associates and joint ventures that have adopted the same IFRS 1 exemption. -IAS 41 Agriculture: elimination of the requirement for companies to exclude cash flows for tax purposes when measuring fair value under IAS 41. This amendment is intended to align IAS 41 with the requirement in the standard to discount after-tax cash flows
01/01/2022
IFRS 17 “Insurance Contracts" - issued in May 2017, replaces IFRS 4. IFRS 17 will change the accounting for all companies that issue insurance contracts and investment contracts with discretionary participation features. The standard applies to annual periods beginning on or after 1 January 2023, and early application is permitted for companies that apply IFRS 9, "Financial Instruments".
01/01/2023
Amendment to IAS 1 "Presentation of financial statements” regarding the classification of liabilities. This amendment clarifies that liabilities will be classified as current or non-current depending on the rights at the end of the reporting period. Classification is not affected by the company's expectations or events after the reporting date, for example receipt of a waiver or failure to comply with a covenant. The amendment also clarifies what IAS 1 means when it refers to the "settlement" of a liability. The amendment should be applied retrospectively in accordance with IAS 8. The initial application date was January 1, 2022. However, that date was deferred to January 1, 2024.
01/01/2024
Amendments to IAS 1 “Presentation of Financial Statements" and IAS 8 "Accounting Policies, Changes in Accounting Estimates and Errors" - issued in February 2021. The amendments are intended to improve disclosures of accounting policies and to help users of financial statements to distinguish between changes in accounting estimates and changes in accounting policies.
01/01/2023
Amendment to IAS 12 “Deferred Taxes Relating to Assets and Liabilities Arising from a Single Transaction.” These amendments require companies to recognize deferred taxes on transactions that result in equal amounts of taxable and deductible temporary differences upon initial recognition.
01/01/2023
Amendments to IFRS 10 “Consolidated Financial Statements” and IAS 28 “Investments in Associates and Joint Ventures.” - issued in September 2014. This amendment addresses an inconsistency between the requirements of IFRS 10 and IAS 28 in the treatment of the sale or provision of goods between an investor and its associate or joint venture. The main consequence of these amendments is that they recognize a full gain or a loss when the transaction involves a business (whether or not in a subsidiary) and a partial gain or loss when the transaction involves assets that do not constitute a business, even if these assets are in a subsidiary. Early adoption is permitted.
Undetermined
322
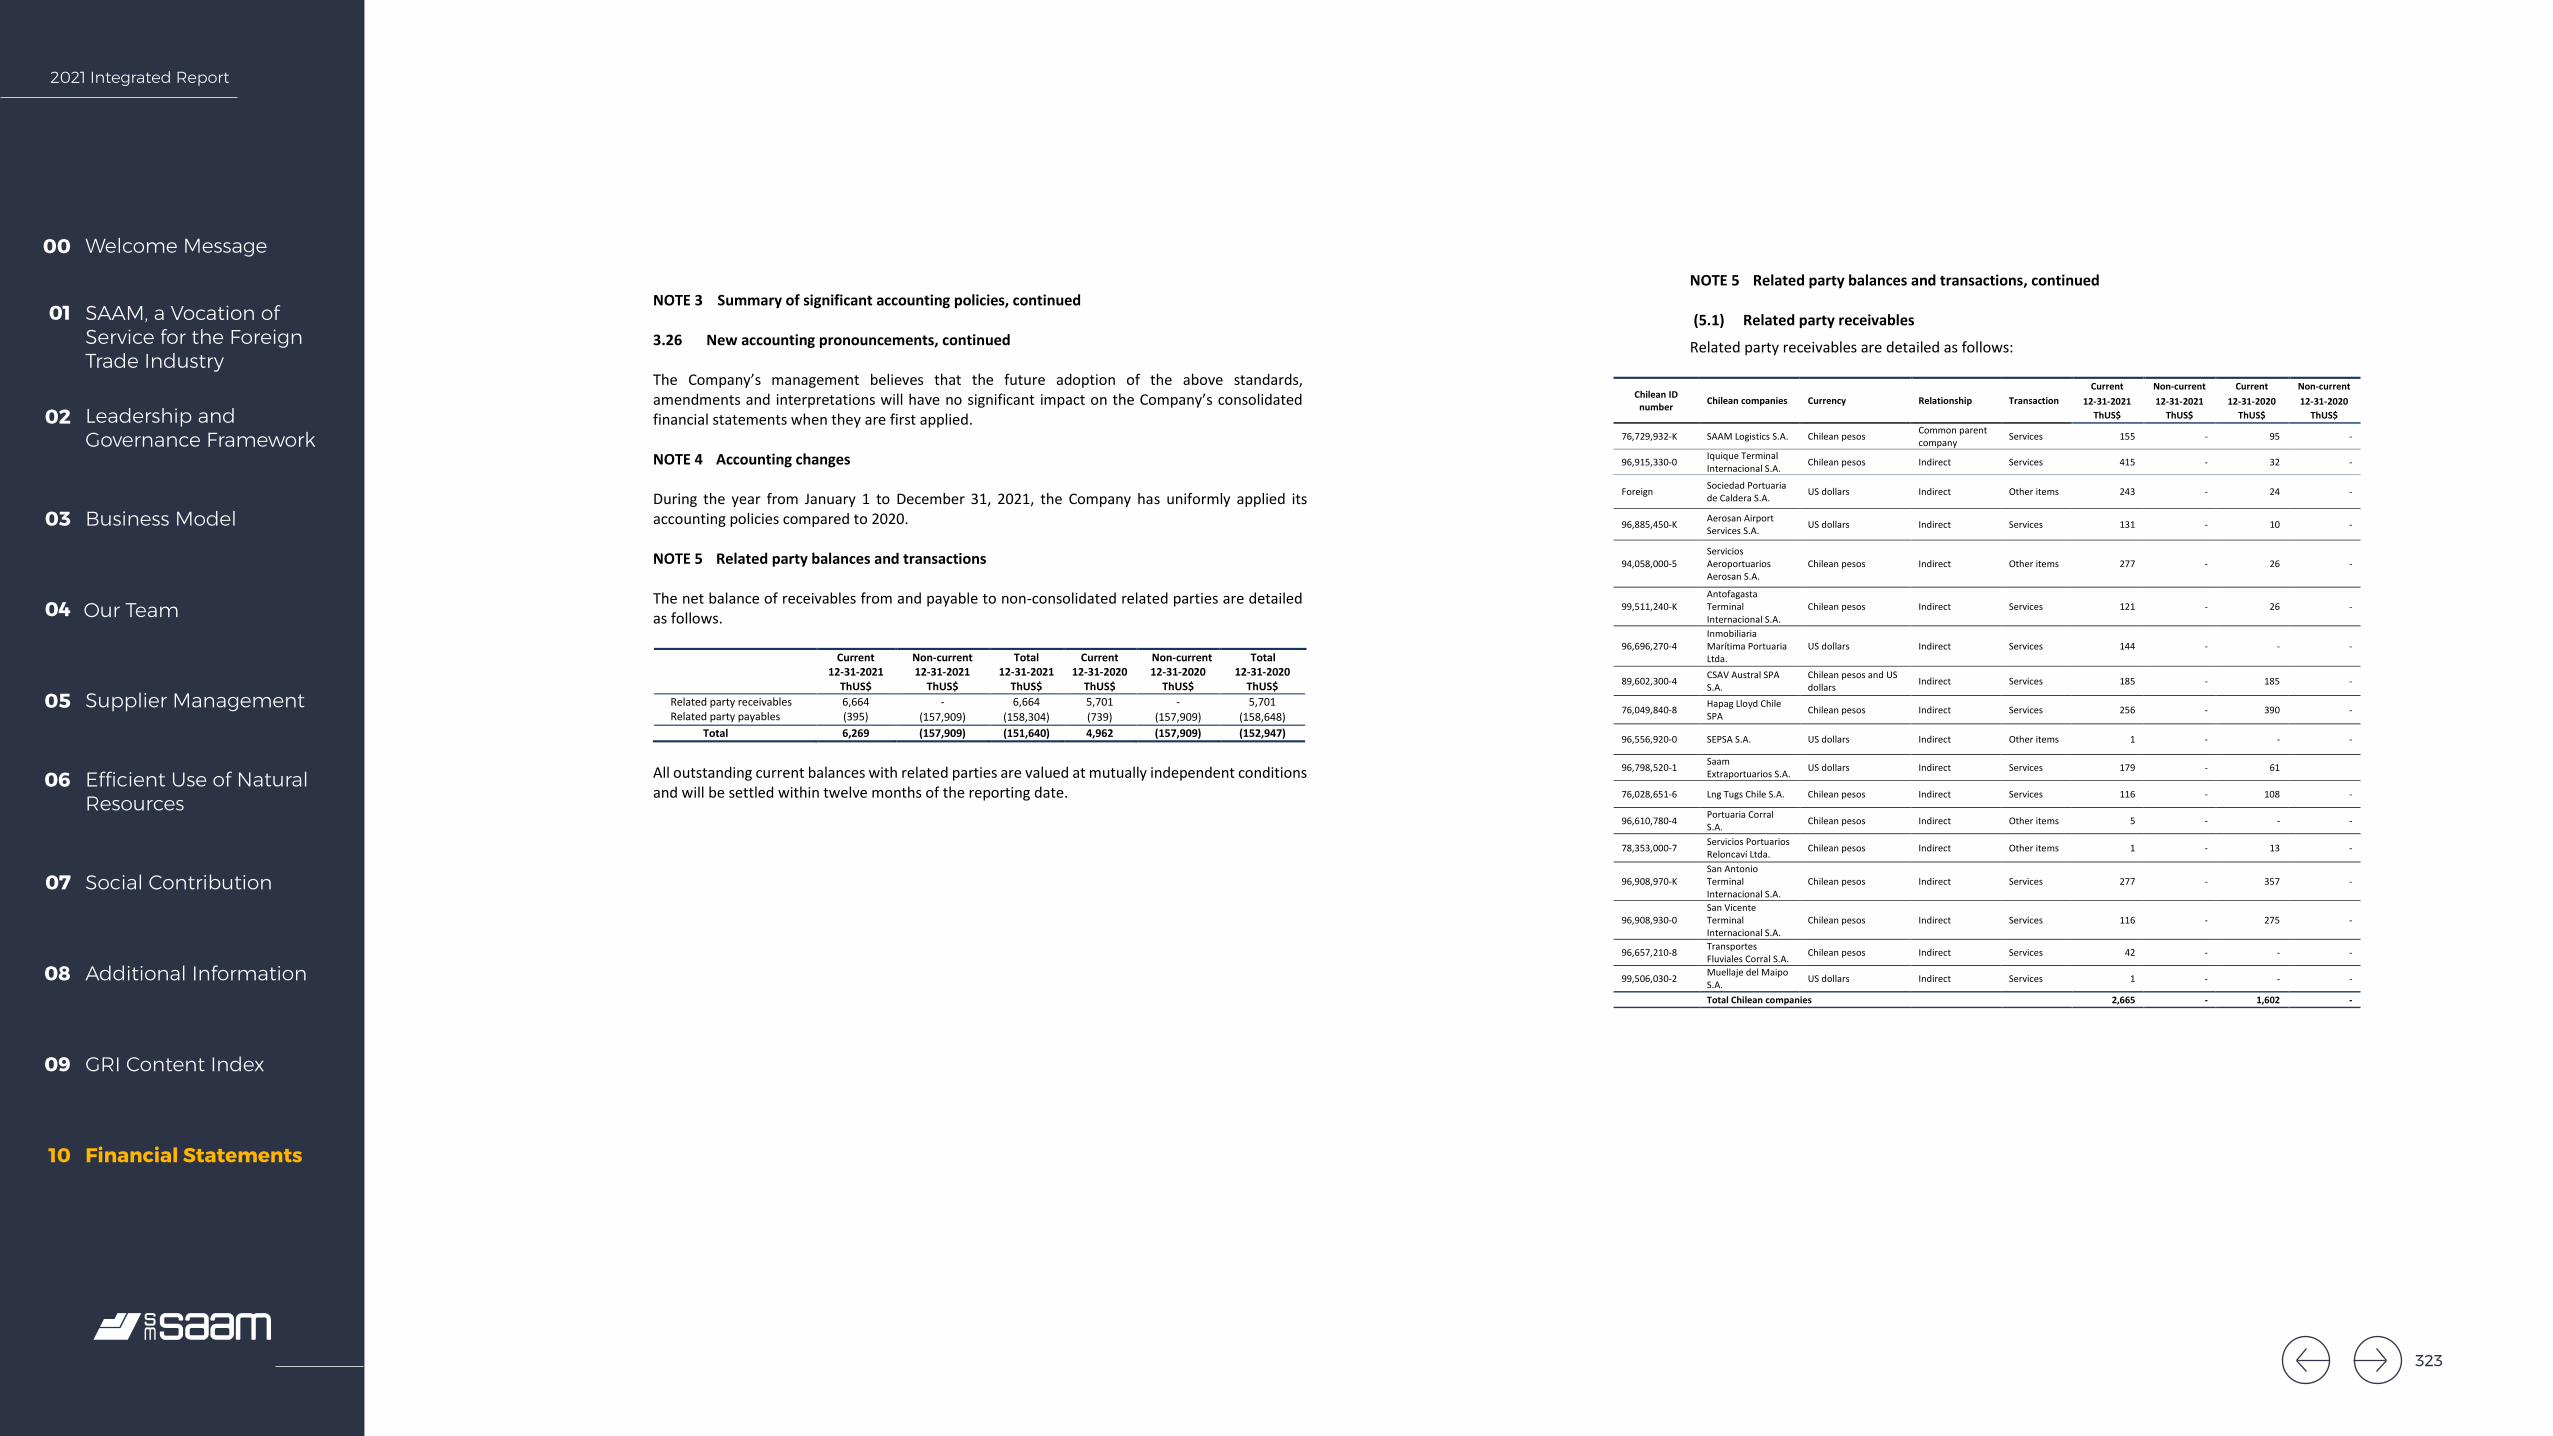
2021 Integrated Report
Welcome Message00
SAAM, a Vocation of Service for the Foreign Trade Industry
01
Leadership and Governance Framework
02
Business Model03
Our Team04
Supplier Management05
Efficient Use of Natural Resources
06
Social Contribution07
Additional Information08
GRI Content Index09
Financial Statements10
SAAM S.A. AND SUBSIDIARIES
Notes to the Consolidated Financial Statements
35
NOTE 3 Summary of significant accounting policies, continued 3.26 New accounting pronouncements, continued The Company’s management believes that the future adoption of the above standards, amendments and interpretations will have no significant impact on the Company’s consolidated financial statements when they are first applied. NOTE 4 Accounting changes During the year from January 1 to December 31, 2021, the Company has uniformly applied its accounting policies compared to 2020. NOTE 5 Related party balances and transactions The net balance of receivables from and payable to non-consolidated related parties are detailed as follows.
Current Non-current Total Current Non-current Total 12-31-2021 12-31-2021 12-31-2021 12-31-2020 12-31-2020 12-31-2020 ThUS$ ThUS$ ThUS$ ThUS$ ThUS$ ThUS$
Related party receivables 6,664 - 6,664 5,701 - 5,701 Related party payables (395) (157,909) (158,304) (739) (157,909) (158,648)
Total 6,269 (157,909) (151,640) 4,962 (157,909) (152,947)
All outstanding current balances with related parties are valued at mutually independent conditions and will be settled within twelve months of the reporting date.
SAAM S.A. AND SUBSIDIARIES
Notes to the Consolidated Financial Statements
36
NOTE 5 Related party balances and transactions, continued (5.1) Related party receivables
Related party receivables are detailed as follows:
Chilean ID number Chilean companies Currency Relationship Transaction
Current Non-current Current Non-current 12-31-2021 12-31-2021 12-31-2020 12-31-2020
ThUS$ ThUS$ ThUS$ ThUS$
76,729,932-K SAAM Logistics S.A. Chilean pesos Common parent company Services 155 - 95 -
96,915,330-0 Iquique Terminal Internacional S.A. Chilean pesos Indirect Services 415 - 32 -
Foreign Sociedad Portuaria de Caldera S.A. US dollars Indirect Other items 243 - 24 -
96,885,450-K Aerosan Airport Services S.A. US dollars Indirect Services 131 - 10 -
94,058,000-5 Servicios Aeroportuarios Aerosan S.A.
Chilean pesos Indirect Other items 277 - 26 -
99,511,240-K Antofagasta Terminal Internacional S.A.
Chilean pesos Indirect Services 121 - 26 -
96,696,270-4 Inmobiliaria Marítima Portuaria Ltda.
US dollars Indirect Services 144 - - -
89,602,300-4 CSAV Austral SPA S.A.
Chilean pesos and US dollars Indirect Services 185 - 185 -
76,049,840-8 Hapag Lloyd Chile SPA Chilean pesos Indirect Services 256 - 390 -
96,556,920-0 SEPSA S.A. US dollars Indirect Other items 1 - - -
96,798,520-1 Saam Extraportuarios S.A. US dollars Indirect Services 179 - 61
76,028,651-6 Lng Tugs Chile S.A. Chilean pesos Indirect Services 116 - 108 -
96,610,780-4 Portuaria Corral S.A. Chilean pesos Indirect Other items 5 - - -
78,353,000-7 Servicios Portuarios Reloncaví Ltda. Chilean pesos Indirect Other items 1 - 13 -
96,908,970-K San Antonio Terminal Internacional S.A.
Chilean pesos Indirect Services 277 - 357 -
96,908,930-0 San Vicente Terminal Internacional S.A.
Chilean pesos Indirect Services 116 - 275 -
96,657,210-8 Transportes Fluviales Corral S.A. Chilean pesos Indirect Services 42 - - -
99,506,030-2 Muellaje del Maipo S.A. US dollars Indirect Services 1 - - -
Total Chilean companies 2,665 - 1,602 -
323
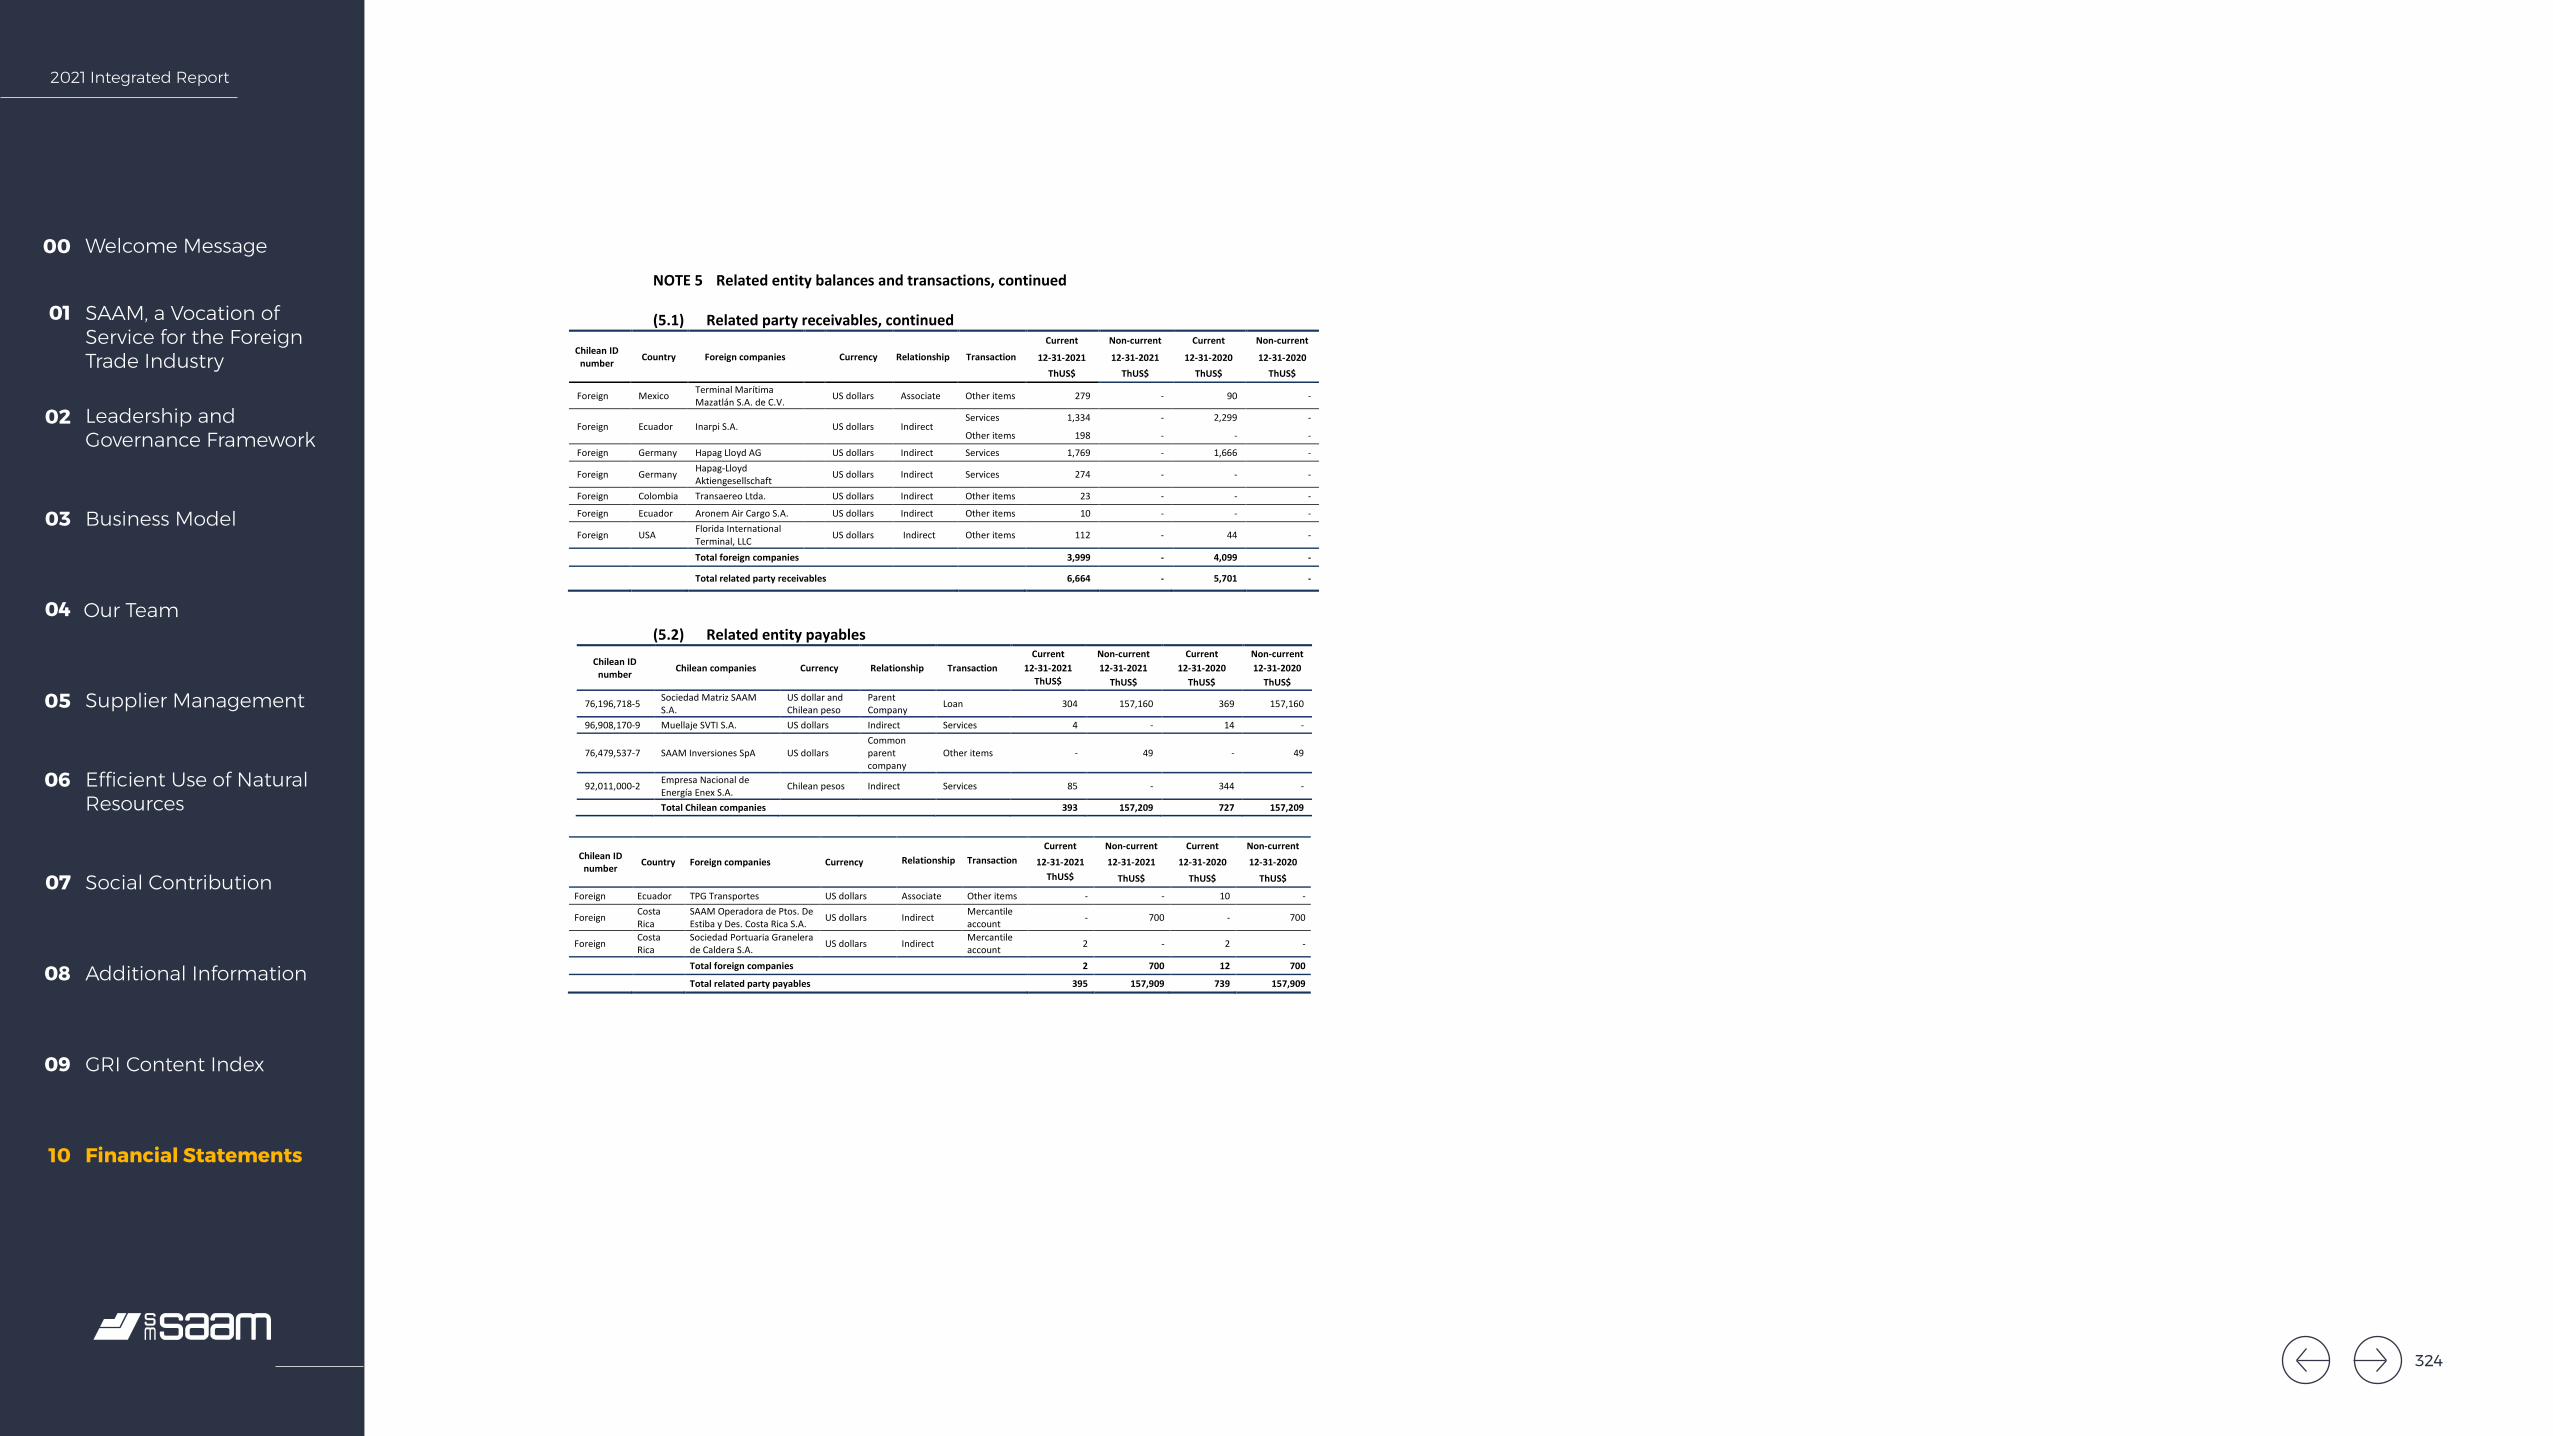
2021 Integrated Report
Welcome Message00
SAAM, a Vocation of Service for the Foreign Trade Industry
01
Leadership and Governance Framework
02
Business Model03
Our Team04
Supplier Management05
Efficient Use of Natural Resources
06
Social Contribution07
Additional Information08
GRI Content Index09
Financial Statements10
SAAM S.A. AND SUBSIDIARIES
Notes to the Consolidated Financial Statements
37
NOTE 5 Related entity balances and transactions, continued (5.1) Related party receivables, continued
Chilean ID number Country Foreign companies
Currency Relationship Transaction Current Non-current Current Non-current
12-31-2021 12-31-2021 12-31-2020 12-31-2020 ThUS$ ThUS$ ThUS$ ThUS$
Foreign Mexico Terminal Marítima Mazatlán S.A. de C.V.
US dollars Associate Other items 279 - 90 -
Foreign Ecuador Inarpi S.A.
US dollars Indirect Services 1,334 - 2,299 -
Other items 198 - - - Foreign Germany Hapag Lloyd AG US dollars Indirect Services 1,769 - 1,666 -
Foreign Germany Hapag-Lloyd Aktiengesellschaft
US dollars Indirect Services 274 - - -
Foreign Colombia Transaereo Ltda. US dollars Indirect Other items 23 - - -
Foreign Ecuador Aronem Air Cargo S.A. US dollars Indirect Other items 10 - - -
Foreign USA Florida International Terminal, LLC
US dollars Indirect Other items 112 - 44 -
Total foreign companies 3,999 - 4,099 -
Total related party receivables 6,664 - 5,701 -
(5.2) Related entity payables
Chilean ID number Chilean companies Currency Relationship Transaction
Current Non-current Current Non-current 12-31-2021 12-31-2021 12-31-2020 12-31-2020
ThUS$ ThUS$ ThUS$ ThUS$
76,196,718-5 Sociedad Matriz SAAM S.A.
US dollar and Chilean peso
Parent Company Loan 304 157,160 369 157,160
96,908,170-9 Muellaje SVTI S.A. US dollars Indirect Services 4 - 14 -
76,479,537-7 SAAM Inversiones SpA US dollars Common parent company
Other items - 49 - 49
92,011,000-2 Empresa Nacional de Energía Enex S.A. Chilean pesos Indirect Services 85 - 344 -
Total Chilean companies 393 157,209 727 157,209
Chilean ID
number Country Foreign companies Currency Relationship
Transaction
Current Non-current Current Non-current 12-31-2021 12-31-2021 12-31-2020 12-31-2020
ThUS$ ThUS$ ThUS$ ThUS$
Foreign Ecuador TPG Transportes US dollars Associate Other items - - 10 -
Foreign Costa Rica
SAAM Operadora de Ptos. De Estiba y Des. Costa Rica S.A. US dollars Indirect Mercantile
account - 700 - 700
Foreign Costa Rica
Sociedad Portuaria Granelera de Caldera S.A. US dollars Indirect Mercantile
account 2 - 2 -
Total foreign companies 2 700 12 700 Total related party payables 395 157,909 739 157,909
324

2021 Integrated Report
Welcome Message00
SAAM, a Vocation of Service for the Foreign Trade Industry
01
Leadership and Governance Framework
02
Business Model03
Our Team04
Supplier Management05
Efficient Use of Natural Resources
06
Social Contribution07
Additional Information08
GRI Content Index09
Financial Statements10
SAAM S.A. AND SUBSIDIARIES
Notes to the Consolidated Financial Statements
38
NOTE 5 Related party balances and transactions, continued (5.3) Effects on the statement of net income of transactions with related parties
Chilean ID number Company Relationship Country Transactions 12-31-2021 12-31-2020 ThUS$ ThUS$ 90,160,000-7 Compañía Sudamericana de Vapores S.A. Indirect Chile Towage - 126 Foreign Hapag Lloyd Chile SPA Indirect Chile Port operations - 749 Towage 1,231 1,343 Logistics 31 - 89,602,300-4 CSAV Austral SPA S.A. Indirect Chile Towage 1,140 1,052 96,908,970-K San Antonio Terminal Internacional S.A. Indirect Chile IT services 79 81 SAAM group consultancy services - 40 96,908,930-0 San Vicente Terminal Internacional S.A. Indirect Chile IT services 94 79
SAAM group consultancy services - 25 Port terminal services (33) (22) Towage 6 -
99,511,240-K Antofagasta Terminal Internacional S.A. Indirect Chile IT services 236 144 SAAM group consultancy services - 32
Foreign Hapag Lloyd AG Indirect Germany Towage 1,549 1,367 Foreign Aronem Air Cargo S.A. Indirect Ecuador IT services 6 - 78,353,000-7 Servicios Portuarios Reloncaví Ltda. Indirect Chile SAAM group consultancy services - 4 96,885,450-K Aerosan Airport Services S.A. Indirect Chile SAAM group consultancy services 255 - IT services 8 - 96,657,210-8 Transportes Fluviales Corral S.A. Indirect Chile Towage 336 175 Fleet rental cost (180) (121) 76,028,651-6 LNG Tugs Chile S.A. Indirect Chile Towage 1,960 1,347 Foreign Luckymont S.A. Indirect Uruguay SAAM group consultancy services - 1
86,712,100-5 Cosem S.A. Indirect Chile Third-party staff - 98 Foreign Florida International Terminal, LLC. Indirect USA IT services 77 66 Foreign Inarpi S.A. Indirect Ecuador Port Services 9,472 8,869 Fleet services 1,158 1,501 Leases 132 132
IT services 201 179 SAAM group consultancy services 792 16
96,696,270-4 Inmobiliaria Marítima Portuaria Ltda. Indirect Chile SAAM group consultancy services 195 32 Lease expenses (233) (261)
325
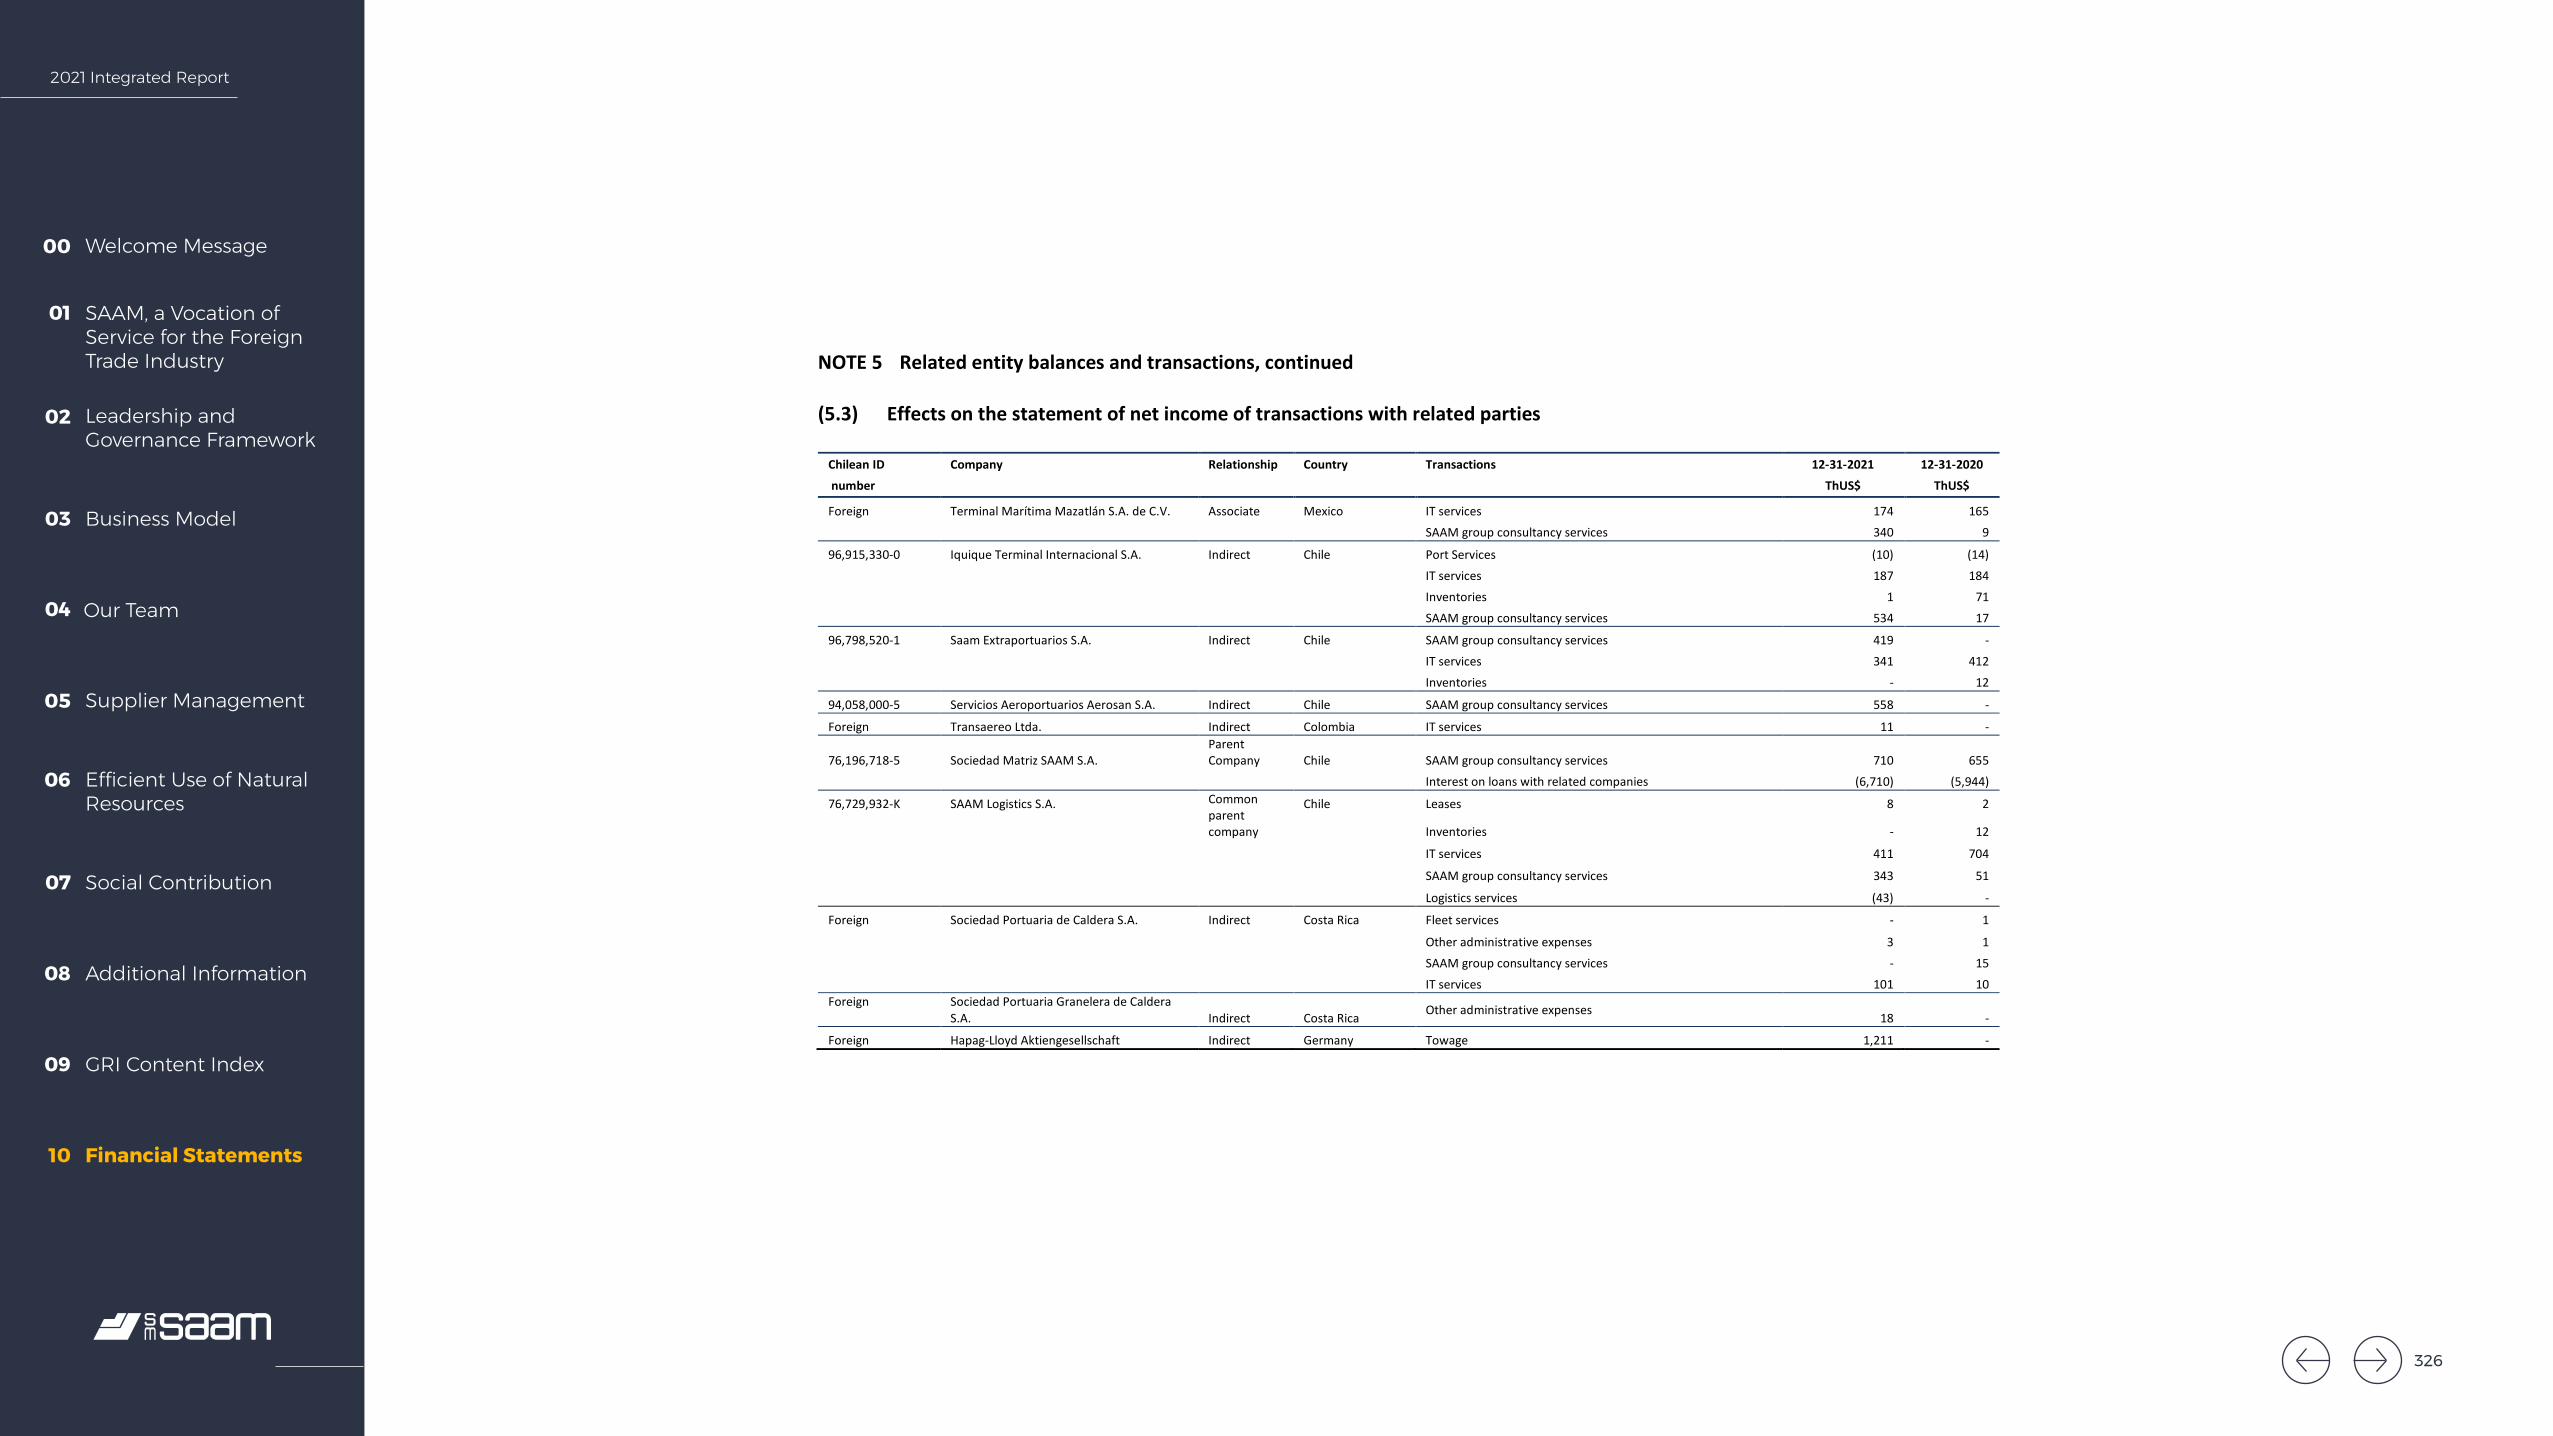
2021 Integrated Report
Welcome Message00
SAAM, a Vocation of Service for the Foreign Trade Industry
01
Leadership and Governance Framework
02
Business Model03
Our Team04
Supplier Management05
Efficient Use of Natural Resources
06
Social Contribution07
Additional Information08
GRI Content Index09
Financial Statements10
SAAM S.A. AND SUBSIDIARIES
Notes to the Consolidated Financial Statements
39
NOTE 5 Related entity balances and transactions, continued (5.3) Effects on the statement of net income of transactions with related parties
Chilean ID Company Relationship Country Transactions 12-31-2021 12-31-2020 number ThUS$ ThUS$
Foreign Terminal Marítima Mazatlán S.A. de C.V. Associate Mexico IT services 174 165 SAAM group consultancy services 340 9 96,915,330-0 Iquique Terminal Internacional S.A. Indirect Chile Port Services (10) (14) IT services 187 184 Inventories 1 71 SAAM group consultancy services 534 17 96,798,520-1 Saam Extraportuarios S.A. Indirect Chile SAAM group consultancy services 419 - IT services 341 412 Inventories - 12
94,058,000-5 Servicios Aeroportuarios Aerosan S.A. Indirect Chile SAAM group consultancy services 558 - Foreign Transaereo Ltda. Indirect Colombia IT services 11 -
76,196,718-5 Sociedad Matriz SAAM S.A. Parent Company Chile SAAM group consultancy services 710 655
Interest on loans with related companies (6,710) (5,944) 76,729,932-K SAAM Logistics S.A. Common
parent company
Chile Leases 8 2
Inventories - 12 IT services 411 704 SAAM group consultancy services 343 51 Logistics services (43) -
Foreign Sociedad Portuaria de Caldera S.A. Indirect Costa Rica Fleet services - 1 Other administrative expenses 3 1
SAAM group consultancy services - 15 IT services 101 10 Foreign Sociedad Portuaria Granelera de Caldera
S.A. Indirect Costa Rica Other administrative expenses 18 - Foreign Hapag-Lloyd Aktiengesellschaft Indirect Germany Towage 1,211 -
326
2021 Integrated Report
Welcome Message00
SAAM, a Vocation of Service for the Foreign Trade Industry
01
Leadership and Governance Framework
02
Business Model03
Our Team04
Supplier Management05
Efficient Use of Natural Resources
06
Social Contribution07
Additional Information08
GRI Content Index09
Financial Statements10
SAAM S.A. AND SUBSIDIARIES
Consolidated Statements of Changes in Equity
40
NOTE 5 Related entity balances and transactions, continued (5.3) Effects on the statement of net income of transactions with related parties Current transactions with related companies are business transactions carried out under equal conditions that usually prevail in the market in terms of price and payment terms.
Sales transactions are freight services, equipment leasing, software sales, advisory services provided by SAAM to related companies Purchase transactions with related entities refer mainly to port operation services, logistics and warehousing services, advisory services and other transactions. (5.4) Director's remuneration
The directors of SAAM do not receive any remuneration.
327
2021 Integrated Report
Welcome Message00
SAAM, a Vocation of Service for the Foreign Trade Industry
01
Leadership and Governance Framework
02
Business Model03
Our Team04
Supplier Management05
Efficient Use of Natural Resources
06
Social Contribution07
Additional Information08
GRI Content Index09
Financial Statements10
Sociedad Matriz SAAM S.A. and SubsidiariesReport required by General Character Standard No. 30 from the Financial Market Commission
Summarized Consolidated Financial Statements for SAAM Ports S.A.
As of December 31, 2021
328328

2021 Integrated Report
Welcome Message00
SAAM, a Vocation of Service for the Foreign Trade Industry
01
Leadership and Governance Framework
02
Business Model03
Our Team04
Supplier Management05
Efficient Use of Natural Resources
06
Social Contribution07
Additional Information08
GRI Content Index09
Financial Statements10
INDEPENDENT AUDITOR’S REPORT (A free translation from the original in Spanish) Santiago, March 11, 2022 To the Shareholders and Directors Sociedad Matriz SAAM S.A. As external auditors of Sociedad Matriz SAAM S.A and subsidiaries, we have audited its consolidated financial statements as of December 31, 2021 and 2020, over which we reported on March 11, 2022. The financial statements in abridged form, prepared in accordance with the provisions of General Rule (GRS) No. 30, Section II.2.1, paragraph A.4.2, issued by the Superintendence of Securities and Insurance (now Financial Market Commission - CMF), of the subsidiary SAAM Ports S.A. and subsidiaries and its accompanying notes on "accounting policies applied” and "related party transactions” attached hereto, are consistent, in all material respects, with the information contained in the consolidated financial statements that we have audited. The preparation of such abridged financial statements, which include the accounting policies applied and transactions with related parties, is the responsibility of the Management of Sociedad Matriz SAAM S.A. and SAAM Ports S.A. We report that the aforementioned abridged financial statements and its notes on "accounting policies applied" and "related party transactions" of SAAM Ports S.A. and subsidiaries, attached hereto, correspond to those that were used in the consolidation process carried out by Sociedad Matriz SAAM S.A. as of December 31, 2021 and 2020. This report has been prepared bearing in mind the requirements of NCG 30, Section II.2.1, paragraph A.4.2, and relates exclusively to Sociedad Matriz SAAM S.A. and is issued solely for the information and use of its Senior Management and the Financial Market Commission, and therefore has not been prepared for use, nor should it be used, by any user other than those indicated.
Digitally signed by Jonathan Douglas Yeomans Gibbons RUT: 13.473.972-k. The digital certificate is embedded in the electronic version of this document.
SAAM PORTS S.A. AND SUBSIDIARIES
CONTENTS
Report of Independent Auditors Consolidated Statements of Financial Position Consolidated Statements of Comprehensive Income by Function Consolidated Statements of Cash Flow Consolidated Statements of Changes in Equity Notes to the Consolidated Financial Statements
329

2021 Integrated Report
Welcome Message00
SAAM, a Vocation of Service for the Foreign Trade Industry
01
Leadership and Governance Framework
02
Business Model03
Our Team04
Supplier Management05
Efficient Use of Natural Resources
06
Social Contribution07
Additional Information08
GRI Content Index09
Financial Statements10
SAAM PORTS S.A. AND SUBSIDIARIES
Consolidated Statements of Financial Position
The accompanying notes form an integral part of these financial statements.
1
Statement of Financial Position 12-31-2021 12-31-2020
Assets ThUS$ ThUS$
Current assets
Cash and cash equivalents 86,373 80,597 Other financial assets, current 110 - Other non-financial assets, current 6,753 7,851 Trade and other receivables, current 27,652 22,561 Related party receivables, current 9,666 5,229 Inventories, current 5,045 3,566 Current tax assets 419 630 Total current assets other than assets or disposal groups classified as held for sale or as held for distribution to owners 136,018 120,434
Non-current assets or groups of assets classified as held-for-sale or held-for-distribution to the owners - 3
Total current assets 136,018 120,437
Non-current assets Other financial assets, non-current 147 115 Other non-financial assets, non-current 81 86 Trade and other receivables, non-current 14,217 14,140 Related party receivables, non-current 2,446 4,700 Equity method associates 63,254 69,743 Intangible assets other than goodwill 139,496 163,485 Goodwill - - Property, plant and equipment 144,652 149,547 Investment property - - Inventories, non-current 402 - Deferred tax assets 11,864 12,429
Total non-current assets 376,559 414,245
Total assets 512,577 534,682
SAAM PORTS S.A. AND SUBSIDIARIES
Consolidated Statements of Financial Position
The accompanying notes form an integral part of these financial statements.
2
Equity and Liabilities 12-31-2021 12-31-2020
Liabilities ThUS$ ThUS$
Current liabilities Other financial liabilities, current 35,657 35,412 Trade and other payables 22,881 22,719 Related party payables, current 2,627 2,528 Other short-term provisions 28 25 Current tax liabilities 7,476 3,949 Employee benefit provisions 7,141 6,711 Other non-financial liabilities, current 206 303
Total current liabilities 76,016 71,647
Non-current liabilities Other financial liabilities, non-current 111,610 137,534 Related party payables, non-current 192 504 Deferred tax liabilities 30,051 34,431 Employee benefit provisions, non-current 5,084 3,381 Other non-financial liabilities, non-current - -
Total non-current liabilities 146,937 175,850
Total liabilities 222,953 247,497 Equity
Share capital 40,182 40,182 Retained earnings 219,510 211,076 Other reserves (6,264) (2,710)
Equity attributable to owners of the parent company 253,428 248,548 Non-controlling interests 36,196 38,637 Total equity 289,624 287,185
Total equity and liabilities 512,577 534,682
330
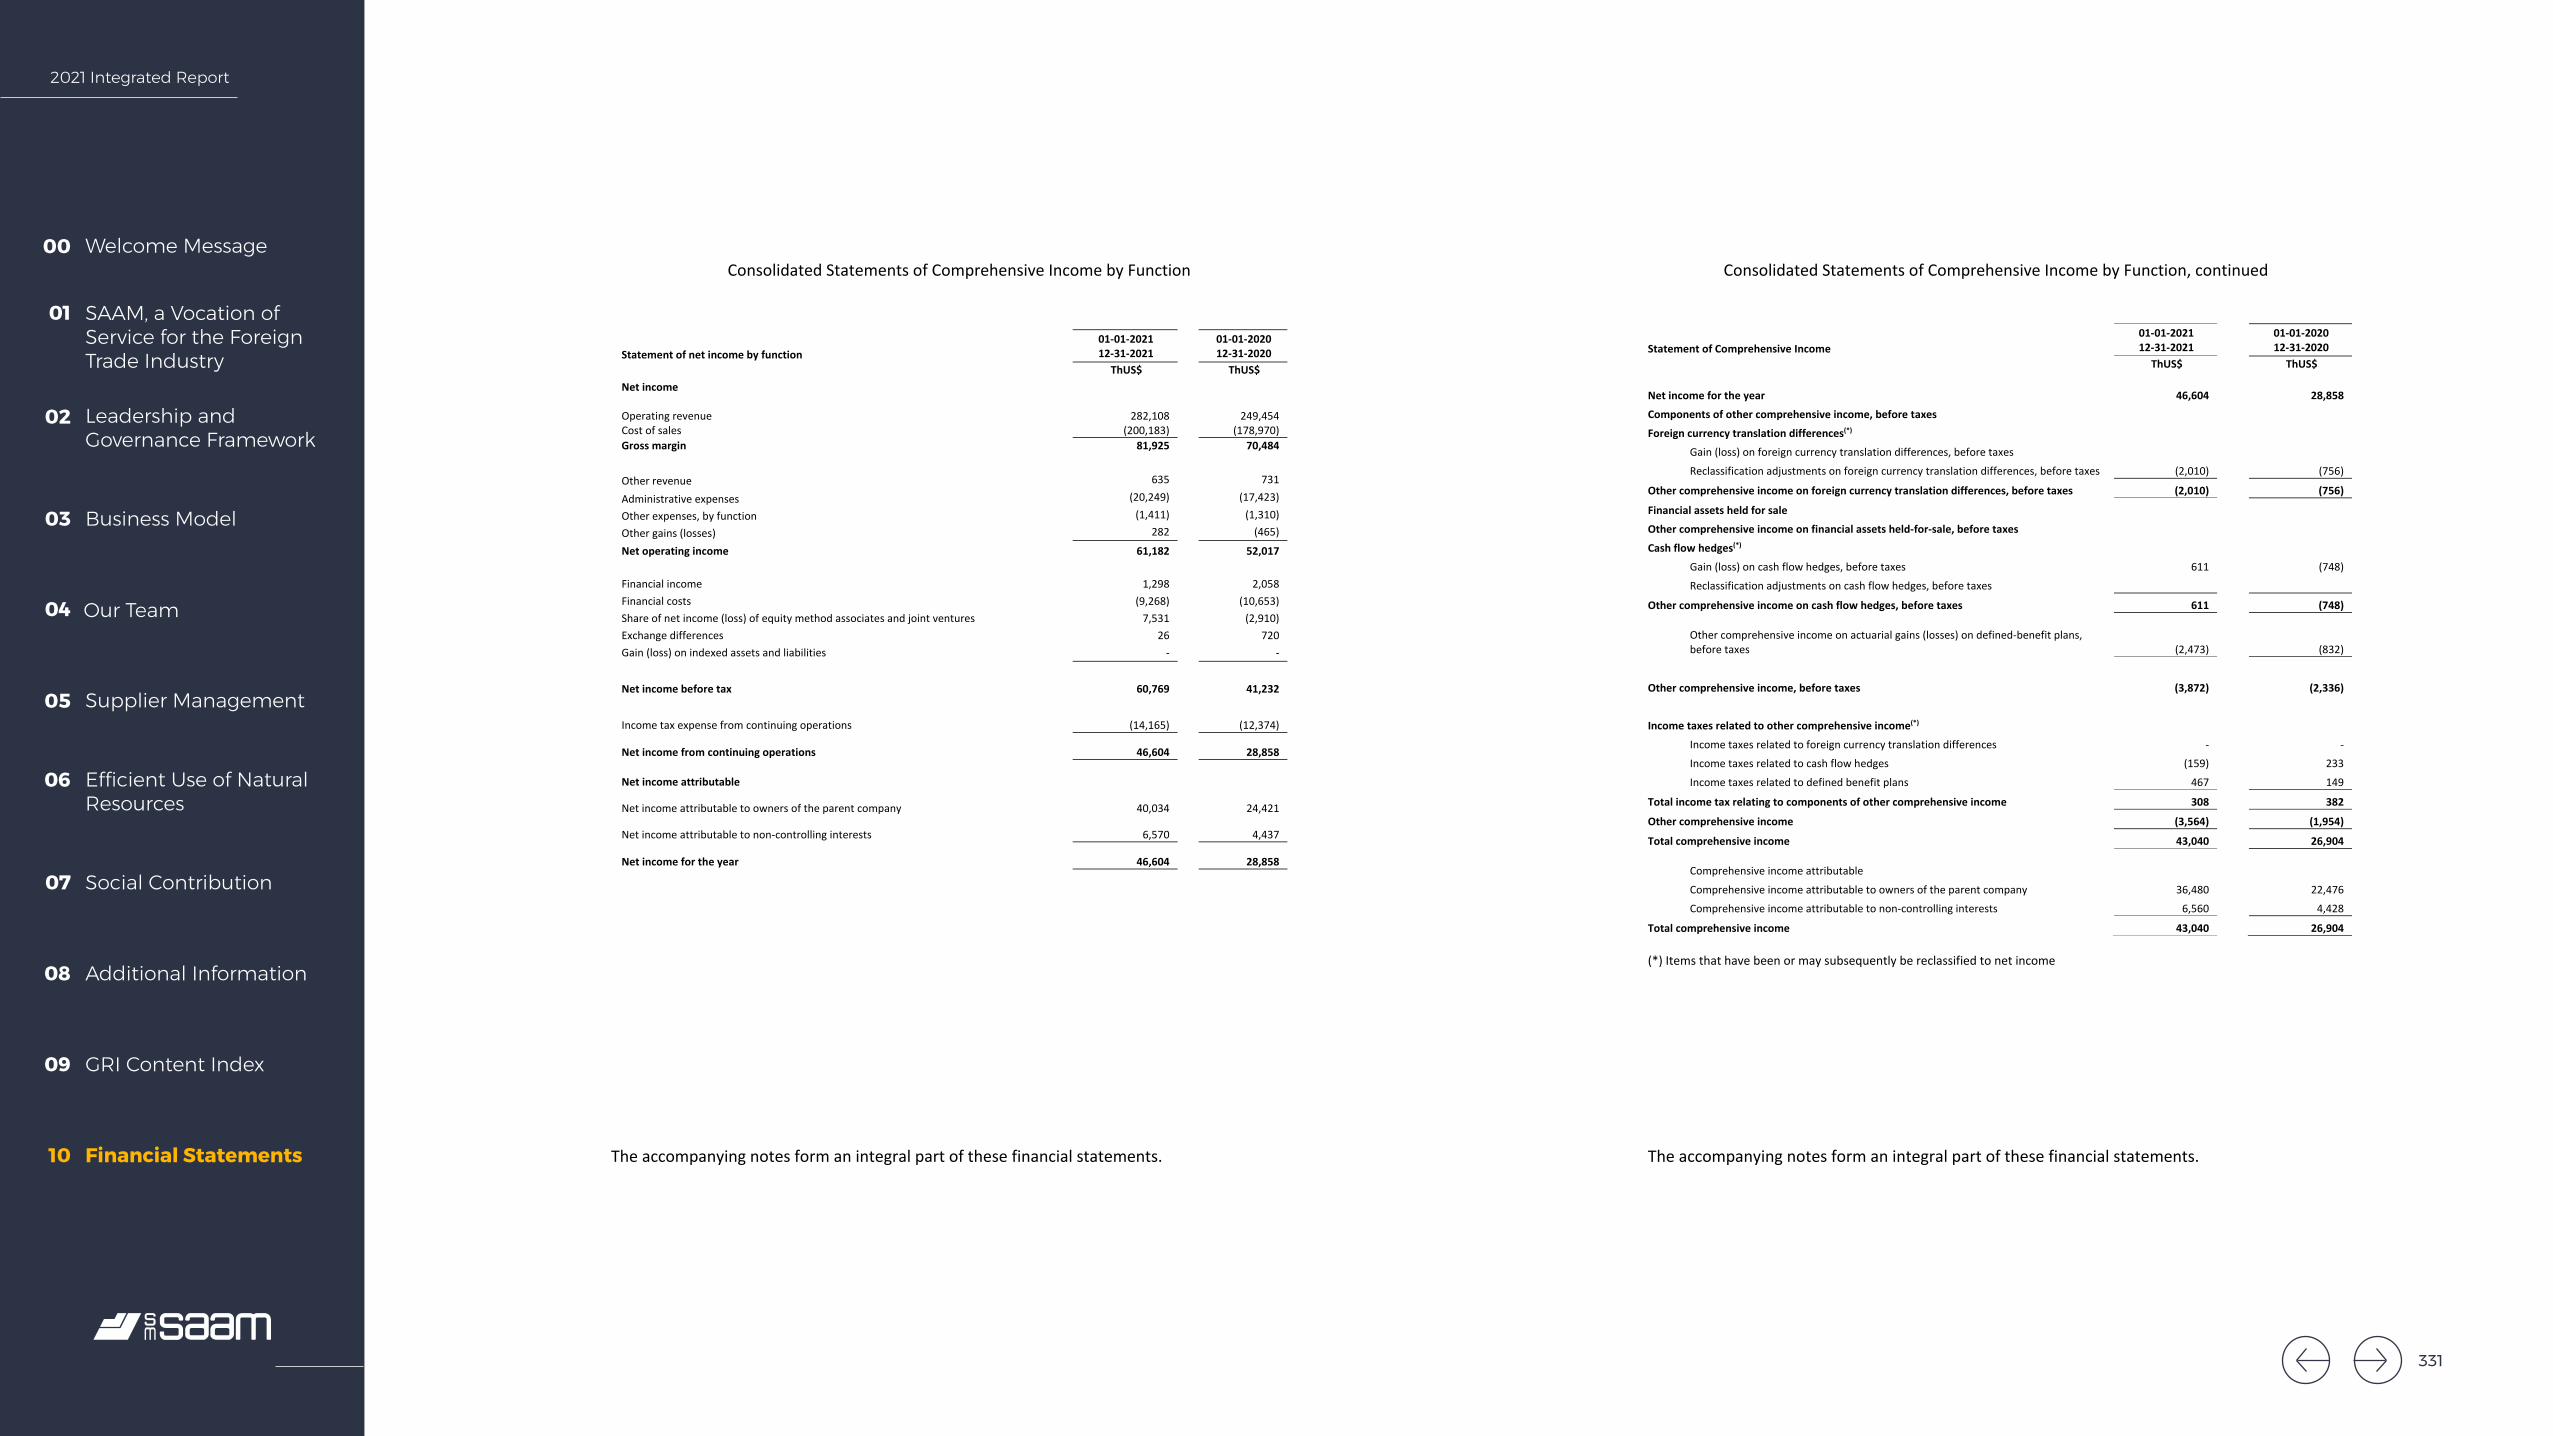
2021 Integrated Report
Welcome Message00
SAAM, a Vocation of Service for the Foreign Trade Industry
01
Leadership and Governance Framework
02
Business Model03
Our Team04
Supplier Management05
Efficient Use of Natural Resources
06
Social Contribution07
Additional Information08
GRI Content Index09
Financial Statements10
SAAM PORTS S.A. AND SUBSIDIARIES
Consolidated Statements of Comprehensive Income by Function
The accompanying notes form an integral part of these financial statements.
3
Statement of net income by function 01-01-2021
12-31-2021 01-01-2020
12-31-2020
ThUS$ ThUS$ Net income Operating revenue 282,108
249,454 Cost of sales (200,183) (178,970) Gross margin 81,925 70,484 Other revenue 635 731
Administrative expenses (20,249) (17,423)
Other expenses, by function (1,411) (1,310) Other gains (losses) 282 (465)
Net operating income 61,182 52,017 Financial income 1,298 2,058 Financial costs (9,268) (10,653) Share of net income (loss) of equity method associates and joint ventures 7,531 (2,910) Exchange differences 26 720 Gain (loss) on indexed assets and liabilities - -
Net income before tax 60,769 41,232
Income tax expense from continuing operations (14,165) (12,374)
Net income from continuing operations 46,604
28,858 Net income attributable
Net income attributable to owners of the parent company
40,034
24,421
Net income attributable to non-controlling interests
6,570
4,437
Net income for the year
46,604
28,858
SAAM PORTS S.A. AND SUBSIDIARIES
Consolidated Statements of Comprehensive Income by Function, continued
The accompanying notes form an integral part of these financial statements.
4
(*) Items that have been or may subsequently be reclassified to net income
Statement of Comprehensive Income 01-01-2021 12-31-2021
01-01-2020 12-31-2020
ThUS$ ThUS$ Net income for the year 46,604
28,858
Components of other comprehensive income, before taxes
Foreign currency translation differences(*)
Gain (loss) on foreign currency translation differences, before taxes
Reclassification adjustments on foreign currency translation differences, before taxes (2,010) (756)
Other comprehensive income on foreign currency translation differences, before taxes (2,010) (756)
Financial assets held for sale
Other comprehensive income on financial assets held-for-sale, before taxes
Cash flow hedges(*)
Gain (loss) on cash flow hedges, before taxes 611 (748)
Reclassification adjustments on cash flow hedges, before taxes
Other comprehensive income on cash flow hedges, before taxes 611 (748) Other comprehensive income on actuarial gains (losses) on defined-benefit plans, before taxes (2,473)
(832)
Other comprehensive income, before taxes (3,872) (2,336)
Income taxes related to other comprehensive income(*)
Income taxes related to foreign currency translation differences - -
Income taxes related to cash flow hedges (159) 233
Income taxes related to defined benefit plans 467 149
Total income tax relating to components of other comprehensive income 308 382
Other comprehensive income (3,564) (1,954)
Total comprehensive income 43,040 26,904 Comprehensive income attributable
Comprehensive income attributable to owners of the parent company 36,480 22,476
Comprehensive income attributable to non-controlling interests 6,560 4,428
Total comprehensive income 43,040 26,904
331
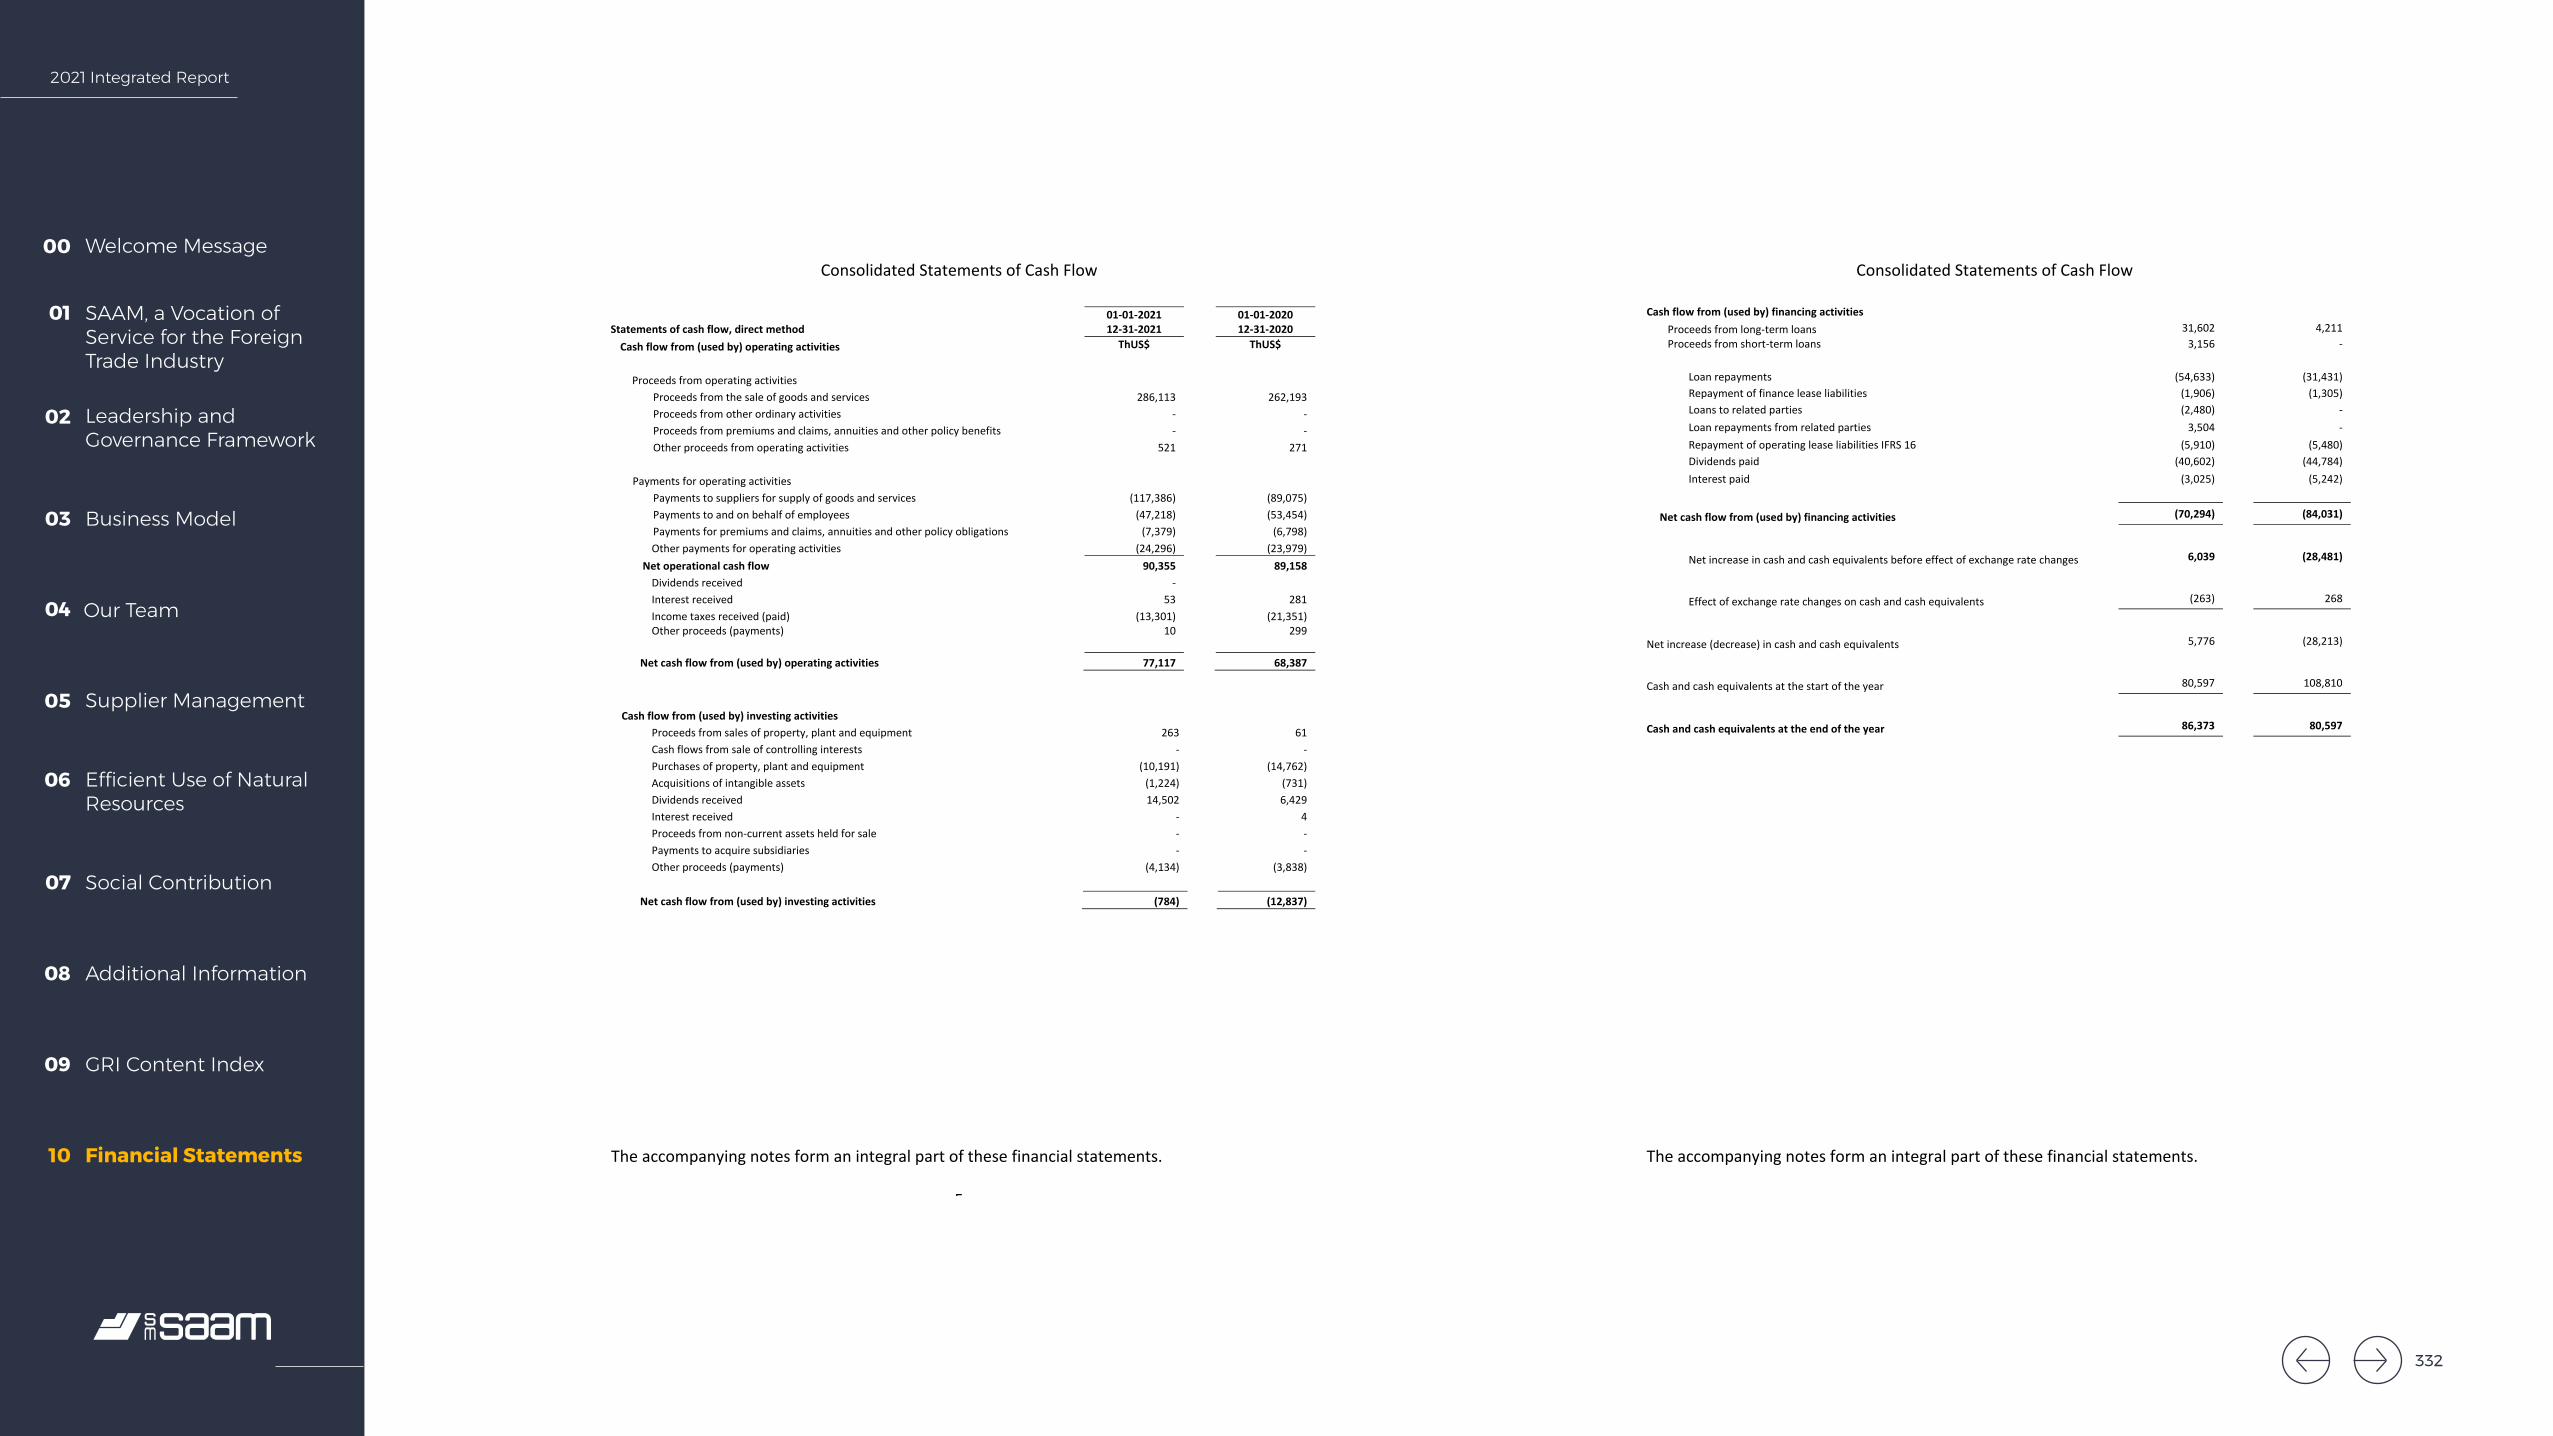
2021 Integrated Report
Welcome Message00
SAAM, a Vocation of Service for the Foreign Trade Industry
01
Leadership and Governance Framework
02
Business Model03
Our Team04
Supplier Management05
Efficient Use of Natural Resources
06
Social Contribution07
Additional Information08
GRI Content Index09
Financial Statements10
SAAM PORTS S.A. AND SUBSIDIARIES
Consolidated Statements of Cash Flow
The accompanying notes form an integral part of these financial statements.
5
Statements of cash flow, direct method 01-01-2021 12-31-2021
01-01-2020 12-31-2020
Cash flow from (used by) operating activities ThUS$ ThUS$
Proceeds from operating activities
Proceeds from the sale of goods and services 286,113 262,193 Proceeds from other ordinary activities - - Proceeds from premiums and claims, annuities and other policy benefits - - Other proceeds from operating activities 521 271
Payments for operating activities
Payments to suppliers for supply of goods and services (117,386) (89,075) Payments to and on behalf of employees (47,218) (53,454) Payments for premiums and claims, annuities and other policy obligations (7,379) (6,798) Other payments for operating activities (24,296) (23,979)
Net operational cash flow 90,355 89,158 Dividends received - Interest received 53 281 Income taxes received (paid) (13,301) (21,351) Other proceeds (payments) 10
299
Net cash flow from (used by) operating activities 77,117 68,387
Cash flow from (used by) investing activities Proceeds from sales of property, plant and equipment 263 61 Cash flows from sale of controlling interests - - Purchases of property, plant and equipment (10,191) (14,762) Acquisitions of intangible assets (1,224) (731) Dividends received 14,502 6,429 Interest received - 4 Proceeds from non-current assets held for sale - - Payments to acquire subsidiaries - - Other proceeds (payments) (4,134) (3,838)
Net cash flow from (used by) investing activities (784) (12,837)
SAAM PORTS S.A. AND SUBSIDIARIES
Consolidated Statements of Cash Flow
The accompanying notes form an integral part of these financial statements.
6
Cash flow from (used by) financing activities Proceeds from long-term loans 31,602 4,211 Proceeds from short-term loans 3,156 -
Loan repayments (54,633)
(31,431) Repayment of finance lease liabilities (1,906) (1,305) Loans to related parties (2,480) - Loan repayments from related parties 3,504 - Repayment of operating lease liabilities IFRS 16 (5,910) (5,480) Dividends paid (40,602) (44,784) Interest paid (3,025) (5,242)
Net cash flow from (used by) financing activities (70,294) (84,031)
Net increase in cash and cash equivalents before effect of exchange rate changes 6,039 (28,481)
Effect of exchange rate changes on cash and cash equivalents (263) 268
Net increase (decrease) in cash and cash equivalents 5,776 (28,213)
Cash and cash equivalents at the start of the year 80,597 108,810
Cash and cash equivalents at the end of the year 86,373 80,597
332

2021 Integrated Report
Welcome Message00
SAAM, a Vocation of Service for the Foreign Trade Industry
01
Leadership and Governance Framework
02
Business Model03
Our Team04
Supplier Management05
Efficient Use of Natural Resources
06
Social Contribution07
Additional Information08
GRI Content Index09
Financial Statements10
Share capital Foreign currency
translation reserve
Cash flow hedge reserve
Actuarial gains and losses on
defined benefit plans reserve
Other reserves
Total other reserves
Retained earnings
Equity attributable to
equity holders of parent company
Non-controlling interests Equity
ThUS$ ThUS$ ThUS$ ThUS$ ThUS$ ThUS$ ThUS$ ThUS$ ThUS$ ThUS$ Equity as of January 1, 2021 40,182 (8,276) 9 (2,162) 7,719 (2,710) 211,076 248,548 38,637 287,185 Increase (decrease) due to changes in accounting policy - - - - - - - - - -
Restated opening balance 40,182 (8,276) 9 (2,162) 7,719 (2,710) 211,076 248,548 38,637 287,185 Changes in equity Comprehensive income Net income - - - - - - 40,034 40,034 6,570 46,604 Other comprehensive income - (1,999) 452 (2,007) (3,554) - (3,554) (10) (3,564) Total comprehensive income (1,999) 452 (2,007) (3,554) 40,034 36,480 6,560 43,040 Increase (decrease) for transfers and other changes in equity
Dividends - - - - - - (31,600) (31,600) (9,001) (40,601) Increase (decrease) in equity - (1,999) 452 (2,007) - (3,554) 8,434 4,880 (2,441) 2,439 Equity as of December 31, 2021 40,182 (10,275) 461 (4,169) 7,719 (6,264) 219,510 253,428 36,196 289,624
Share capital Foreign currency
translation reserve
Cash flow hedge reserve
Actuarial gains and losses on
defined benefit plans reserve
Other reserves
Total other reserves
Retained earnings
Equity attributable to
equity holders of parent company
Non-controlling interests Equity
ThUS$ ThUS$ ThUS$ ThUS$ ThUS$ ThUS$ ThUS$ ThUS$ ThUS$ ThUS$ Equity as of January 1, 2020 40,182 (7,525) 522 (1,481) 7,713 (771) 227,149 266,560 39,990 306,550 Increase (decrease) due to changes in accounting policy - - - - - - - - - -
Restated opening balance 40,182 (7,525) 522 (1,481) 7,713 (771) 227,149 266,560 39,990 306,550 Changes in equity Comprehensive income Net income - - - - - - 24,421 24,421 4,437 28,858 Other comprehensive income (751) (513) (681) (1,945) - (1,945) (9) (1,954) Total comprehensive income - (751) (513) (681) - (1,945) 24,421 22,476 4,428 26,904 Increase (decrease) for transfers and other changes in equity - - - - 6 6 (594) (588) (327) (915)
Dividends - - - - - - (39,900) (39,900) (5,454) (45,354) Increase (decrease) in equity - (751) (513) (681) 6 (1,939) (16,073) (18,012) (1,353) (19,365) Equity as of December 31, 2020 40,182 (8,276) 9 (2,162) 7,719 (2,710) 211,076 248,548 38,637 287,185
333

2021 Integrated Report
Welcome Message00
SAAM, a Vocation of Service for the Foreign Trade Industry
01
Leadership and Governance Framework
02
Business Model03
Our Team04
Supplier Management05
Efficient Use of Natural Resources
06
Social Contribution07
Additional Information08
GRI Content Index09
Financial Statements10
SAAM PORTS S.A. AND SUBSIDIARIES
Notes to the Consolidated Financial Statements
8
NOTE 1 Corporate Information
SAAM Ports S.A. and subsidiaries (hereinafter “SAAM Ports”) Chilean ID Number 76,757,003-1 is a privately-held corporation, formed by public deed on July 1, 2017, as a result of the division of SAAM S.A. Its domicile is in Chile. The Company's registered address is Av. Apoquindo 4800, office 1801, Las Condes, Santiago. Its corporate purpose is to operate ports directly or through other companies. The company currently operates ports indirectly. The immediate controlling company of SAAM Ports S.A. is Sociedad Matriz SAAM S.A., (hereinafter “SM-SAAM”) holder of 70,737,318 shares. Its Chilean ID Number is 76,196,718-5. It is an investment business, registered in the securities registry under No. 1,091 dated February 23, 2012. It issues public financial statements and must follow the instructions issued by the Financial Market Commission (formerly Superintendency of Securities and Insurance).
These financial statements include the indirect subsidiary, Iquique Terminal Internacional S.A. registered under No. 57 in the Register of Reporting Entities (Law 20,382) of the Financial Market Commission. The remaining subsidiaries are not directly subject to that Commission's control. These financial statements should be analyzed together with the consolidated financial statements of SM-SAAM, considering the company’s operational and financial integration with other companies of the SM-SAAM group. On January 30, 2020, the World Health Organization designated the COVID-19 coronavirus outbreak as an international public health emergency. Most countries adopted public health and travel restrictions that affected all economic activities, including the processing of products, as well as international trade. A State of Constitutional Emergency was declared throughout Chile on March 18, 2020, which was lifted on September 30, 2021. Although some of the public health measures have gradually begun to be lifted locally and internationally, there are still certain restrictions, such as those governing the free movement of people and across borders. The consequences for the world's main service and production centers continue to affect international trade.
SAAM PORTS S.A. AND SUBSIDIARIES
Notes to the Consolidated Financial Statements
9
NOTE 1 Corporate information, continued
Another consequence is volatile exchange rates and stock and commodities indexes, as well as other effects on the international financial market. Most countries have continued with their vaccination campaigns, which have reduced the risk of the pandemic spreading. At the outset the Company adopted public health measures to reduce the spread of COVID-19, in accordance with instructions issued by the health authority. It has focused on the health of employees, their families and the community in general, as well as on securing operational continuity and supporting the return to normal international trade. As of the date these financial statements were issued, the Company's business has not suffered any significant effects as a result of this situation, but it is not possible to predict whether there may be additional impacts in the future.
NOTE 2 Presentation basis for the consolidated financial statements
a. Statement of compliance
The consolidated financial statements as of December 31, 2021 have been prepared in accordance with International Financial Reporting Standards (IFRS) issued by the International Accounting Standard Board (IASB) and approved by its Board at a meeting on March 11, 2022. b. Basis of Preparation of the Consolidated Financial Statements These consolidated financial statements faithfully reflect the financial position of SAAM Ports and its subsidiaries as of December 31, 2021 and December 31, 2020, the comprehensive income by function, changes in equity and cash flows for the years ended December 31, 2021 and 2020. These consolidated financial statements have been prepared under the principle of an ongoing concern, based on the principle of historic cost, except for the items that are recognized at fair value. The book values of assets and liabilities hedged with transactions that qualify for hedge accounting are adjusted to reflect changes in the fair value in relation to the hedged risks.
334
2021 Integrated Report
Welcome Message00
SAAM, a Vocation of Service for the Foreign Trade Industry
01
Leadership and Governance Framework
02
Business Model03
Our Team04
Supplier Management05
Efficient Use of Natural Resources
06
Social Contribution07
Additional Information08
GRI Content Index09
Financial Statements10
SAAM PORTS S.A. AND SUBSIDIARIES
Notes to the Consolidated Financial Statements
10
NOTE 2 Presentation Basis of the Consolidated Financial Statements, continued
c. Estimates and Judgments The preparation of these consolidated financial statements required a number of critical accounting estimates to quantify certain assets, liabilities, income, expenses and commitments. The areas that involve a greater degree of judgment or complexity, or the areas in which the assumptions and estimates are significant for the consolidated financial statements are detailed as follows: 1. The evaluation of potential impairment losses on specific assets. 2. The assumptions used in the actuarial calculation of employee benefits liabilities. 3. Useful lives of property, plant and equipment and intangible assets. 4. The probability that certain liabilities and contingencies will materialize and their valuations. 5. The fair value of certain financial instruments. 6. The probability of recovery of deferred tax assets. These estimates are made on the basis of the best available information about the matters being analyzed. In any event, it is possible that future events may make it necessary to modify such estimates in future periods. If necessary, such modifications would be made prospectively, such that the effects of the change would be recognized in future financial statements.
SAAM PORTS S.A. AND SUBSIDIARIES
Notes to the Consolidated Financial Statements
11
NOTE 3 Summary of significant accounting policies
3.1 Basis of Consolidation.
a) Subsidiaries Subsidiaries are all entities controlled by SAAM Ports. Control exists when the Company has the power to direct the financial and operational policies of the entity with the purpose of obtaining benefits from its activities. The evaluation of whether SAAM Ports controls another entity is based on the existence and effect of potential voting rights that are currently exercised or convertible in shares or other instruments that allow control to be exercised over another entity. Subsidiaries are consolidated from the date that control is transferred to SAAM Ports and are excluded from the consolidation on the date it ceases. b) Transactions eliminated from consolidation Intercompany balances and any unrealized income or expense arising from their transactions are eliminated during the preparation of the consolidated financial statements. Unrealized gains or losses from transactions with companies whose investment is recognized under the equity method are eliminated in the percentage their equity interest. c) Investments in associates and joint ventures (equity method) Associates are those entities where the Company has significant influence, but not control over financial and operating policies. Significant influence is assumed when SAAM Ports owns between 20% and 50% of the voting rights of another entity. Joint ventures are those entities where SAAM Ports has joint control over their activities, established by contractual agreements and requiring unanimous consent to make financial, operational and strategic decisions. Investments in associates and joint ventures are accounted for using the equity method and are initially recognized at cost. SAAM Ports’s investments include goodwill identified in the acquisition, net of accumulated impairment losses. An investment will be accounted for using the equity method from the date on which it becomes an associate or joint venture. When the investment is acquired, any difference between the purchase cost and the entity's share of the net fair value of the identifiable assets and liabilities of the investee shall be accounted for as goodwill and included in the carrying amount of the investment.
335

2021 Integrated Report
Welcome Message00
SAAM, a Vocation of Service for the Foreign Trade Industry
01
Leadership and Governance Framework
02
Business Model03
Our Team04
Supplier Management05
Efficient Use of Natural Resources
06
Social Contribution07
Additional Information08
GRI Content Index09
Financial Statements10
SAAM PORTS S.A. AND SUBSIDIARIES
Notes to the Consolidated Financial Statements
12
NOTE 3 Summary of significant accounting policies, continued
3.1 Basis of Consolidation, continued c) Investments in associates and joint ventures (equity method), continued The requirements of IAS 28 are applied to determine whether an impairment loss must be recognized for the Company's investments in associates or joint ventures. When necessary, the total book value of the investment including goodwill is tested for impairment in accordance with IAS 36 Impairment of Assets, as one single asset by comparing its recoverable amount (the higher of its value in use and its fair value less costs to sell) to its book value; any impairment loss recognized forms part of the investment's book value. Any reversal of that impairment loss recognized in accordance with IAS 36 increases the investment's value based on the recoverable amount of the investment. The Company stops using the equity method on the date on which the investment ceases to be an associate or joint venture, or when the investment is classified as held for sale. The consolidated financial statements include its interest in the earnings and equity movements of investments recognized using the equity method, after adjustments to align the accounting criteria of associates with those of SAAM Ports, from the date on which significant influence and/or joint control begins. When the share of losses exceeds its interest in the associate, including any long-term investment, the investment is reduced to zero and no more losses are recorded unless SAAM Ports has an obligation or has made payments on behalf of the joint venture in which it holds an interest. When the Company reduces its interest in an associate or a joint venture, and continues to use the equity method, any effects previously recognized in other comprehensive income must be reclassified to profit and loss in proportion to the decrease in interest in that associate or joint venture. When a Group company engages in transactions with an associate or joint venture, gains and losses resulting from transactions with the associate or joint venture are recognized in the Company's consolidated financial statements only to the extent of the equity interests of third parties of the associate or joint venture.
SAAM PORTS S.A. AND SUBSIDIARIES
Notes to the Consolidated Financial Statements
13
NOTE 3 Summary of significant accounting policies, continued
3.1 Basis of Consolidation, continued d) Changes in Company's interests in current subsidiaries Changes in a parent's ownership interest in a subsidiary that do not result in a loss of control are equity transactions. Any difference between the fair value of the acquisition price and the book value of that interest is recognized directly in equity and attributed to the owners of the parent company. When the control of a subsidiary is lost, a gain or loss is recognized in net income and is calculated as the difference between (i) the aggregate of the fair value of the selling price and the fair value of any retained interest; and (ii) the previous book value of the assets (including goodwill), and liabilities of the subsidiary and any non-controlling interest. These consolidated financial statements include the following subsidiaries:
% Ownership
Chilean ID Number
Company name Country Functional currency
12-31-2021
12-31-2020
Direct Indirect Total Total 96,915,330-0 SAAM Puertos S.A. Chile US dollar 99.75% - 99.75% 99.75%
Foreign SAAM Operadora de Puertos Empresa de Estiba y Desestiba Costa Rica S.A.
Costa Rica US dollar 94.32% 5.68% 100% 100%
The subsidiaries included in the consolidation and their subsidiaries have adopted the same accounting criteria as the parent company, in order to ensure uniformity in the presentation of the consolidated financial statements of SAAM Ports.
336
2021 Integrated Report
Welcome Message00
SAAM, a Vocation of Service for the Foreign Trade Industry
01
Leadership and Governance Framework
02
Business Model03
Our Team04
Supplier Management05
Efficient Use of Natural Resources
06
Social Contribution07
Additional Information08
GRI Content Index09
Financial Statements10
SAAM PORTS S.A. AND SUBSIDIARIES
Notes to the Consolidated Financial Statements
14
NOTE 3 Summary of significant accounting policies, continued
3.2 Functional and presentation currency a) Functional currency The consolidated financial statements are presented in US dollars, which is the functional currency of SAAM Ports. Each group entity has determined its functional currency based on the currency of the primary economic environment in which it operates. Items in a currency other than the functional currency are considered to be foreign currency transactions and are initially recorded at the exchange rate on the transaction date. At the end of each period, monetary assets and liabilities in foreign currency are translated at the closing exchange rate, and non-monetary items in foreign currency are remain translated at the exchange rate on the transaction date. The exchange differences account in the consolidated statement of comprehensive income by function includes the effects of exchange rate changes on the value of assets and liabilities in foreign currencies. b) Presentation currency As of the reporting date, Group entities with a functional currency other than the currency of SAAM Ports must translate their results and statement of financial position to the presentation currency of the parent company by translating their assets and liabilities at the closing exchange rate and their results at the average exchange rate. The functional currency of Terminal Marítima Mazatlán is the Mexican peso. Exchange differences arising from the translation into the presentation currency are recognized as a separate component of equity, in other comprehensive income, in the reserve account of exchange differences on translation.
3.3 Translation basis for transactions in foreign currencies and indexed units The principal foreign currency assets and liabilities are stated at their equivalent value in US dollars, calculated at the following closing exchange rates.
Currency 12-31-2021 12-31-2020 Chilean peso 844.69 710.95 Mexican peso 20.5383 19.9265
SAAM PORTS S.A. AND SUBSIDIARIES
Notes to the Consolidated Financial Statements
15
NOTE 3 Summary of significant accounting policies, continued
3.3 Translation basis for transactions in foreign currencies and indexed units, continued
The assets and liabilities indexed in Unidades de Fomento (UF) were presented in US dollars at the following values at the reporting date
Closing date 12-31-2021 US$
12-31-2020 US$
UF / US$ 36.69 40.89
3.4 Cash and cash equivalents
The Company's cash and cash equivalents consist of cash on hand and in bank checking accounts, time deposits and other financial investments that mature within 90 days. They also include cash management investments, such as covenants with repurchase and resale agreements that mature before the same deadline. Bank overdrafts are included in short-term loans under current liabilities.
3.5 Trade and other receivables
Trade receivables are recognized at fair value, less impairment losses.
They also include non-trade receivables, such as sundry debtors, loans to staff and to foreign entities.
3.6 Inventories
Inventories are valued at the lesser of cost or net realizable value. The cost of inventories is based on in the FIFO method (first in, first out), and includes the acquisition cost of inventories and other costs incurred in moving them to their current location and condition.
337
2021 Integrated Report
Welcome Message00
SAAM, a Vocation of Service for the Foreign Trade Industry
01
Leadership and Governance Framework
02
Business Model03
Our Team04
Supplier Management05
Efficient Use of Natural Resources
06
Social Contribution07
Additional Information08
GRI Content Index09
Financial Statements10
SAAM PORTS S.A. AND SUBSIDIARIES
Notes to the Consolidated Financial Statements
16
NOTE 3 Summary of significant accounting policies, continued
3.6 Inventories, continued Spare parts are valued at historical acquisition cost and recognized in the income statement using the PEPS method. Low-turnover spare parts, mainly those that are used in the repair and maintenance of the Company's main assets, tugs and cranes, constitute strategic inventories, and given their unpredictable demand, they are classified as non-current inventory.
3.7 Intangible assets Intangible assets are identifiable non-monetary assets, without physical substance, that are generated by commercial transactions. Only those intangible assets whose costs can be objectively estimated and those assets from which it is likely that economic benefits will be obtained in the future are recognized for accounting purposes. Intangible assets with finite useful lives are initially recognized at acquisition or development cost and will be valued at cost less accumulated amortization and any impairment losses. a) Port concessions
Port concession assets that are recognized under IFRIC12 are recorded as intangible assets as they have the right to collect revenues based on use. The cost of these intangible assets includes mandatory infrastructure works defined in the concession contract and the present value of all of the contract’s minimum payments. Therefore, a non-financial liability equivalent to the value of the recognized intangible asset is recorded at present value. These consolidated financial statements contain port concession agreements recorded by indirect subsidiaries Iquique Terminal Internacional S.A., Terminal Marítima Mazatlán S.A. de C.V., Sociedad Portuaria Granelera de Caldera S.A. and Sociedad Portuaria de Caldera S.A. The associates that record port concession agreements in their financial statements are Antofagasta Terminal Internacional S.A., San Antonio Terminal Internacional S.A. and San Vicente Terminal Internacional S.A.
SAAM PORTS S.A. AND SUBSIDIARIES
Notes to the Consolidated Financial Statements
17
NOTE 3 Summary of significant accounting policies, continued
3.7 Intangible assets, continued b) Relationship with customers Intangible assets called "Customer Relationships" arise from business combinations and they are amortized over the estimated period that benefits will be received from the current customer portfolio in each company at the acquisition date. These assets have been amortized since July 1, 2014, the date on which these business combinations took place. c) Goodwill Goodwill represents the difference between the acquisition value of the shares or rights of subsidiaries, associates and joint ventures and the fair value of the identifiable contingent assets and liabilities at the acquisition date. Goodwill related to acquisitions of associates and joint ventures is included in investments recognized using the equity and joint-ventures method. Goodwill arising on acquisitions of subsidiaries, joint ventures and businesses associated with functional currencies other than the US dollar is valued in the functional currency of the acquired company, translating it into US dollars at the exchange rate prevailing at the date of the statement of financial position.
Goodwill is not amortized, and at the end of each accounting period. It is estimated whether there are indications of impairment that could reduce its recoverable value to an amount lower than the recorded cost, in which case an impairment loss is recorded.
As of the date of these consolidated financial statements there are no indications of impairment that warranted making an adjustment.
3.7.1 Amortization of intangible assets
Amortization is recognized in the income statement, on a straight-line basis over the estimated period of use, or right of use for concessions, with effect from the date on which the asset became available for use. Estimated useful lives by asset class are detailed as follows:
Class Minimum Maximum Goodwill Indefinite Water rights Indefinite Licenses and franchises 5 years 20 years Port concessions Concession period Customer relationships 10 years 15 years Computer software 3 years 7 years
338

2021 Integrated Report
Welcome Message00
SAAM, a Vocation of Service for the Foreign Trade Industry
01
Leadership and Governance Framework
02
Business Model03
Our Team04
Supplier Management05
Efficient Use of Natural Resources
06
Social Contribution07
Additional Information08
GRI Content Index09
Financial Statements10
SAAM PORTS S.A. AND SUBSIDIARIES
Notes to the Consolidated Financial Statements
18
NOTE 3 Summary of significant accounting policies, continued
3.7 Intangible assets, continued
3.7.2 Impairment of intangibles Intangible assets with indefinite useful lives are valued at cost and tested annually for impairment. At the year end, or when deemed necessary, the Company and its subsidiaries evaluate whether there are indicators of impairment in their assets. If there are such indications, the Company estimates the recoverable value of the asset. An asset’s recoverable value is the greater of its value in use or its fair value less selling costs. Fair value less selling costs is determined using independent expert reports or available objective information. Value in use is determined using estimated future cash flows discounted at the Company's WACC rate. As of the reporting date, SAAM Ports and its subsidiaries are not aware of any evidence of impairment due to significant changes, such as a decrease in market value, obsolescence, physical damage, market return, etc. that may affect the valuation of intangible assets, other than those already recognized this year.
3.8 Property, plant and equipment
a) Recognition and measurement
Items of property, plant and equipment are measured at cost minus accumulated depreciation and impairment losses, where appropriate.
Cost includes expenses attributed directly to the acquisition of the asset. The cost of self-built assets includes the cost of materials, direct labor, financial expenses related to external financing that are directly attributable until the asset is commissioned, and any other cost directly allocated to the process of making the asset fit for its use, and the costs of dismantling and removing the assets and restoring the place where they are located. When the significant parts of an item of property, plant and equipment have different useful lives, they are recorded as separate elements within the sub-ledger of property, plant and equipment. Gains or losses on the sale of an item of property, plant and equipment are determined by comparing the sales price with the book value of property, plant and equipment and are recognized within “other income (losses)” in the statement of net income.
SAAM PORTS S.A. AND SUBSIDIARIES
Notes to the Consolidated Financial Statements
19
NOTE 3 Summary of significant accounting policies, continued 3.8 Property, plant and equipment, continued
b) Subsequent costs
The cost for replacing part of an item of property, plant and equipment is recognized in its carrying amount if it is possible that the future economic benefits incorporated within the part will flow in more than one period to SAAM Ports and its cost can be measured reliably
The costs of daily maintenance of property, plant and equipment are recognized in the statement of net income when incurred.
Subsequent to the acquisition, only disbursements incurred that increase the economic useful life of the asset or its economic capacity and that are different from routine maintenance will be capitalized. c) Depreciation and Useful Lives
Depreciation is recognized in the consolidated statement of net income by function using the straight-line depreciation method over the useful lives of each item of property, plant and equipment. This is the method that best reflects the use and consumption of the asset.
The estimated useful lives for the current periods are as follows.
Class Range in years
Minimum Maximum
Buildings 40 80 Port terminal infrastructure(1) Concession period Leasehold facilities and property improvements Lease term Machinery and operating equipment 5 15 Vehicles 3 10 Furniture and equipment 3 5 Office equipment 1 3
(1) Includes assets not controllable by the entity granting the concession. The useful lives of these assets may exceed the concession period when the asset is transferable to other operations of the Company.
d) Leases
The Company recognizes contracts that comply with the definition of a lease as a right-of-use asset and a lease liability on the date that the underlying asset becomes available for use.
Right-of-use assets are measured at their cost including the following: • The initial lease liability. • The initial direct costs
339
2021 Integrated Report
Welcome Message00
SAAM, a Vocation of Service for the Foreign Trade Industry
01
Leadership and Governance Framework
02
Business Model03
Our Team04
Supplier Management05
Efficient Use of Natural Resources
06
Social Contribution07
Additional Information08
GRI Content Index09
Financial Statements10
SAAM PORTS S.A. AND SUBSIDIARIES
Notes to the Consolidated Financial Statements
20
NOTE 3 Summary of significant accounting policies, continued 3.8 Property, plant and equipment, continued
d) Leases, continued Right-of-use assets are recognized in the statement of financial position under property, plant and equipment. Lease liabilities include the net present value of the following payments. • Essentially fixed payments • Variable payments based on an index or rate • Call options at the exercise price, when these are reasonably certain to be exercised. The Company determines the present value of the lease payments using the rate implicit in the underlying lease contracts, using the incremental interest rate. Lease liabilities are recognized in the statement of financial position under current and non-current other financial liabilities. Interest accrued on financial liabilities is recognized in the consolidated statement of net income under "Financial costs". Capital and interest installments paid are recognized in the consolidated statement of cash flow as "Payments of liabilities under finance leases" and "Interest paid" in the Cash Flow from Financing Activities. The Company does not have any embedded leases in contracts that require separation. e) Impairment of property, plant and equipment Assets are evaluated for indications of impairment, such as significant decreases in value, indicators of obsolescence or physical deterioration, or changes in the legal, economic or technological environment in which the asset is used. If there are such indications, the Company estimates the recoverable value of the asset. An asset’s recoverable value is the greater of its value in use or its fair value less selling costs. Fair value less selling costs is determined using independent expert reports or available objective information.
SAAM PORTS S.A. AND SUBSIDIARIES
Notes to the Consolidated Financial Statements
21
NOTE 3 Summary of significant accounting policies, continued 3.8 Property, plant and equipment, continued
e) Impairment of property, plant and equipment, continued The impairment of assets that do not generate independent cash flows is assessed by grouping assets that generate identifiable flows (cash generating units). If the recoverable amount of the asset is less than its net book value, the corresponding impairment adjustment is recognized in the statement of net income, leaving the asset at its recoverable amount.
Impairment losses recognized in prior periods will be evaluated at each year-end, in order to determine any indication that the loss has decreased or disappeared, recognizing the reversal with credit to the statement of net income unless an asset is recorded at the revalued amount, in which case the reversal is credited to equity. As of the reporting date, SAAM Ports and its subsidiaries are not aware of any evidence of impairment due to significant changes, such as a decrease in market value, obsolescence, physical damage, market return, etc. that may affect the valuation of property, plant and equipment, other than those already recognized this year.
3.9 Provisions
A provision is recognized when there is a legal or constructive obligation as a result of a past event and it is likely that a resource disbursement, including economic benefits, will be required to settle the obligation, and its value can be reliably estimated. The provision is the best estimate of the amount payable, as of the reporting date. When the estimated payment period is long term and can be estimated with sufficient reliability, the provision is recorded at its present value, discounting the estimated payment flows at a market interest rate that reflects the specific risks of the obligation. Provisions should be reviewed at the end of each reporting period and adjusted accordingly to reflect the best available estimate at any given time.
340
2021 Integrated Report
Welcome Message00
SAAM, a Vocation of Service for the Foreign Trade Industry
01
Leadership and Governance Framework
02
Business Model03
Our Team04
Supplier Management05
Efficient Use of Natural Resources
06
Social Contribution07
Additional Information08
GRI Content Index09
Financial Statements10
SAAM PORTS S.A. AND SUBSIDIARIES
Notes to the Consolidated Financial Statements
22
NOTE 3 Summary of significant accounting policies, continued
3.10 Other financial liabilities These liabilities are initially recognized at the transaction value. Costs incurred that are directly attributable to the transaction are depreciated over the period of the loan and presented as a reduction in the liability. They are valued at amortized cost, using the effective interest rate method.
3.11 Trade and other payables
These are payables for trade purchases and related expenses, plus non-trade payables, such as sundry creditors, retentions from staff remuneration and other payables.
3.12 Employee benefits
a) Defined benefit plans
SAAM Ports pays severance indemnities under its collective bargaining agreements. This obligation is provided for by applying the actuarial value method to the accrued cost of the benefit, with a nominal annual discount rate ranging from 0.43% to 1.56%, considering estimates such as future tenure, employee mortality rate and future salary increases, determined on the basis of actuarial calculations. Discount rates are determined by reference to market interest curves. All assumptions are reviewed once a year. The discount rate is based on the interest rates for instruments issued by the Central Bank of Chile. The mortality rate is based on the mortality tables for the country, which are publicly available. Future increases in salaries and pensions are based on projected future increases in the inflation rate for the country.
SAAM PORTS S.A. AND SUBSIDIARIES
Notes to the Consolidated Financial Statements
23
NOTE 3 Summary of significant accounting policies, continued
3.12 Employee benefits, continued
b) Short-term benefits Short-term employee benefit obligations are measured on an undiscounted basis and accounted for in the statement of net income by function as the related service is accrued.
3.13 Operating revenue and costs of sales Operating revenue and costs of sales from providing services are recognized in the statement of net income on an accrual basis. Operating revenue is recognized only to the extent that it can be reliably measured and it is probable that financial benefits will flow to the Company regardless of when that occurs. The cost of sales associated with the services provided are recognized on an accrual basis directly to the respective business areas of the Company. Operating revenue and costs of sales are recognized net of discounts.
3.14 Financial income and financial costs
Financial income is recognized in the statement of comprehensive income by function on an accrual basis. Financial costs are generally taken to the statement of net income when they are incurred, except those that finance the construction or development of qualifying assets that require a substantial period to prepare them for use, and those related to the actuarial cost of staff benefits.
3.15 Corporate income tax The Company and its subsidiaries in Chile account for income tax based on net taxable income determined according to the rules established in Income Tax Law. This calculation for foreign subsidiaries complies with the laws in their respective countries.
341
2021 Integrated Report
Welcome Message00
SAAM, a Vocation of Service for the Foreign Trade Industry
01
Leadership and Governance Framework
02
Business Model03
Our Team04
Supplier Management05
Efficient Use of Natural Resources
06
Social Contribution07
Additional Information08
GRI Content Index09
Financial Statements10
SAAM PORTS S.A. AND SUBSIDIARIES
Notes to the Consolidated Financial Statements
24
NOTE 3 Summary of significant accounting policies, continued
3.16 Deferred tax
Deferred tax assets and liabilities are recognized using the statement of financial position method. Temporary differences between the book value of the assets and liabilities and their tax base are recorded as established in IAS 12 "Income tax". Deferred taxes are valued at tax rates expected to be applied when temporary differences are reversed, based on laws that have been approved or are about to be approved as of each reporting date.
3.17 Investments and other financial assets a.1) Classification SAAM Ports classifies its financial assets into the following categories. • Those measured subsequently at fair value (either through other comprehensive income or through profit or loss), and • Those measured at amortized cost. This valuation depends on the business model used by the Company to manage the financial assets and the contractual terms of the cash flows. For assets measured at fair value, gains and losses are recorded in profit or loss or in other comprehensive income. Gains and losses on investments in equity instruments that are not held for trading will depend on whether the Company has made an irrevocable decision at initial recognition to record the investment at fair value through other comprehensive income. The Company only reclassifies debt instruments when it changes its business model for managing those assets.
SAAM PORTS S.A. AND SUBSIDIARIES
Notes to the Consolidated Financial Statements
25
NOTE 3 Summary of significant accounting policies, continued
3.17 Investments and other financial assets, continued a.2) Recognition Routine purchases and sales of financial assets are recognized as of the transaction date, which is the date that the Company commits to purchase or sell the asset. Financial assets are de-recognized when the rights to receive cash flows from the financial asset have expired or have been transferred and the Company has transferred substantially all risks and rewards of ownership. a.3) Measurement Financial assets are valued at initial recognition at fair value plus transaction costs directly attributable to the acquisition of the financial asset, in the case of a financial asset that is not recognized at fair value through profit or loss. Transaction costs of financial assets recognized at fair value through profit and loss are recorded in the statement of net income. Financial assets with embedded derivatives are considered in full when determining whether the cash flows are solely payments of principal and interest. b) Non-derivative financial instruments Financial instruments are classified on initial recognition as a financial asset, financial liability or equity instrument, in accordance with the substance of the contractual arrangement. Also, financial instruments are classified for valuation purposes into four categories, financial assets at fair value through profit or loss, loans and receivables, investments held-to-maturity and financial liabilities. This classification depends on the characteristics of the instrument and the purpose for its acquisition. SAAM Ports de-recognizes a financial liability when its contractual obligations are settled or expire. After initial recognition, non-derivative financial instruments are measured as described below.
342
2021 Integrated Report
Welcome Message00
SAAM, a Vocation of Service for the Foreign Trade Industry
01
Leadership and Governance Framework
02
Business Model03
Our Team04
Supplier Management05
Efficient Use of Natural Resources
06
Social Contribution07
Additional Information08
GRI Content Index09
Financial Statements10
SAAM PORTS S.A. AND SUBSIDIARIES
Notes to the Consolidated Financial Statements
26
NOTE 3 Summary of significant accounting policies, continued
3.17 Investments and other financial assets, continued b.1) Financial assets at fair value through profit and loss Financial assets at fair value through profit and loss are financial assets held for trading, or are designated as such upon initial recognition. A financial asset or liability is classified as held for trading if: • It is acquired or incurred primarily for the purpose of selling or repurchasing it in the immediate future. • It is part of a portfolio of identified financial instruments, which are managed together and for which there is evidence of a recent pattern of short-term profit. • It is a derivative, except a derivative that has been designated as a hedging instrument and meets the conditions to be effective.
Financial assets at fair value through profit or loss are initially recorded at fair value. Transaction costs directly attributable to the purchase or issue are recognized as an expense when incurred. Subsequent to initial recognition, they are recognized at fair value with changes recorded in the statement of net income.
c) Others
Other non-derivative financial instruments including loans and receivables are valued at amortized cost using the effective interest rate method, less any impairment loss.
SAAM PORTS S.A. AND SUBSIDIARIES
Notes to the Consolidated Financial Statements
27
NOTE 3 Summary of significant accounting policies, continued
3.17 Investments and other financial assets, continued d) Financial Asset Impairment Provisions for doubtful debts are based on the expected losses, by evaluating the historical payment behavior of customers in the various portfolio segments. They are evaluated by preparing recoverability matrices composed of age ranges, which show expected uncollectibility percentages during the life of the asset and are recognized from the outset. Loans and receivables are included in "Trade and other receivables" in the consolidated statement of financial position, except for those maturing more than 12 months after the closing date, which are classified as non-current trade and other receivables. They are recorded at amortized cost in accordance with the effective interest rate method and this is their initial fair value.
The effective interest rate method is a method of calculating the amortized cost of a financial asset or liability and of allocating the financial income or expense over the corresponding period. The effective interest rate is the discount rate that exactly matches the estimated cash flows receivable or payable over the expected life of the financial instrument (or when appropriate over a shorter period) with the net book value of the financial asset or financial liability.
Current trade receivables are not discounted. The Company has determined that amortized cost does not differ from the amount invoiced because the transaction does not involve any significant costs.
3.18 Derivatives and hedge transactions a) Derivative financial instruments Derivative financial instruments used to hedge risk exposure in foreign currency and interest rates are initially recognized at fair value. Attributable transaction costs are recognized in the statement of net income when they are incurred. After initial recognition, derivative financial instruments are measured at fair value, and any changes are recorded as described below:
343

2021 Integrated Report
Welcome Message00
SAAM, a Vocation of Service for the Foreign Trade Industry
01
Leadership and Governance Framework
02
Business Model03
Our Team04
Supplier Management05
Efficient Use of Natural Resources
06
Social Contribution07
Additional Information08
GRI Content Index09
Financial Statements10
SAAM PORTS S.A. AND SUBSIDIARIES
Notes to the Consolidated Financial Statements
28
NOTE 3 Summary of significant accounting policies, continued
3.18 Derivatives and hedge transactions, continued a.1) Fair value hedges Derivative financial instruments that satisfy hedge accounting criteria are initially recognized at fair value plus / minus the transaction costs that are directly attributable to contracting or issuing the instrument, as appropriate. Changes in the fair value of derivatives that are designated and qualify as fair value hedges are recorded in the consolidated statement of net income, together with any change in the fair value of the hedged asset or liability that are attributable to the hedged risk. a.2) Cash flow hedges The effective portion of changes in the fair value of derivatives that are designated and qualify as cash flow hedges are recognized in the statement of other comprehensive income. Any loss or gain related to the ineffective portion is recognized immediately in the consolidated statement of income within other income (losses). The amounts accumulated in equity are reclassified to the statement of net income in the periods in which the protected item impacts the statement of net income. Variable interest rate hedges that are recognized in the statement of other comprehensive income are reclassified to the statement of net income within financial expenses as the associated debts accrue interest. Foreign currency hedges that are recognized in the statement of other comprehensive income are reclassified to the statement of net income as the hedged items are impacted by changes in exchange rates and affect the statement of net income.
When a hedge instrument matures, or is sold, or when it no longer satisfies hedge accounting criteria, any gain or loss accumulated in the statement of other comprehensive income until that point remains in the statement of other comprehensive income and is recognized when the forecast transaction is finally recognized in the consolidated statement of net income. When the forecast transaction is not expected to occur, any accumulated gain or loss accumulated in the statement of other comprehensive income is recognized immediately in the consolidated statement of net income within other income (losses). a.3) Derivatives not designated as hedges Hedge accounting is not applicable to derivative instruments that financially cover monetary assets and liabilities denominated in foreign currencies. Changes in the fair value of such derivatives are recognized in the statement of net income by function within foreign exchange differences.
SAAM PORTS S.A. AND SUBSIDIARIES
Notes to the Consolidated Financial Statements
29
NOTE 3 Summary of significant accounting policies, continued
3.18 Derivatives and hedge transactions, continued a.3) Derivatives not designated as hedges, continued Derivative financial instruments that do not satisfy hedge accounting criteria are classified and valued as financial assets or liabilities at fair value through profit and loss.
3.19 Non-current assets held for sale
Non-current assets, or groups of assets and liabilities, that are expected to be recovered principally through sales rather than through continuous use, are classified as held for sale and are valued at the lower of their book value and fair value less selling costs. Immediately prior to this classification, these assets or disposal groups are valued at the lower of their book value and fair value less selling costs. Any impairment loss in a disposal group is first allocated to goodwill, and then to the remaining assets and liabilities on a pro rata basis. Impairment losses when initially classified as held for sale and subsequent gains or losses are recognized in the statement of net income. Gains are only recognized when accumulated impairment losses are covered.
3.20 Determination of fair values
Some criteria and accounting disclosures of the Group require that the fair value of certain financial assets be determined as follows. a) Financial assets The fair value of financial assets at fair value through profit and loss and available-for-sale financial assets is determined at market value. b) Trade and other receivables As trade receivables are collected within 120 days, their fair value is not estimated to differ significantly from their book value. c) Derivatives The fair value of derivative contracts is based on their quoted price.
344
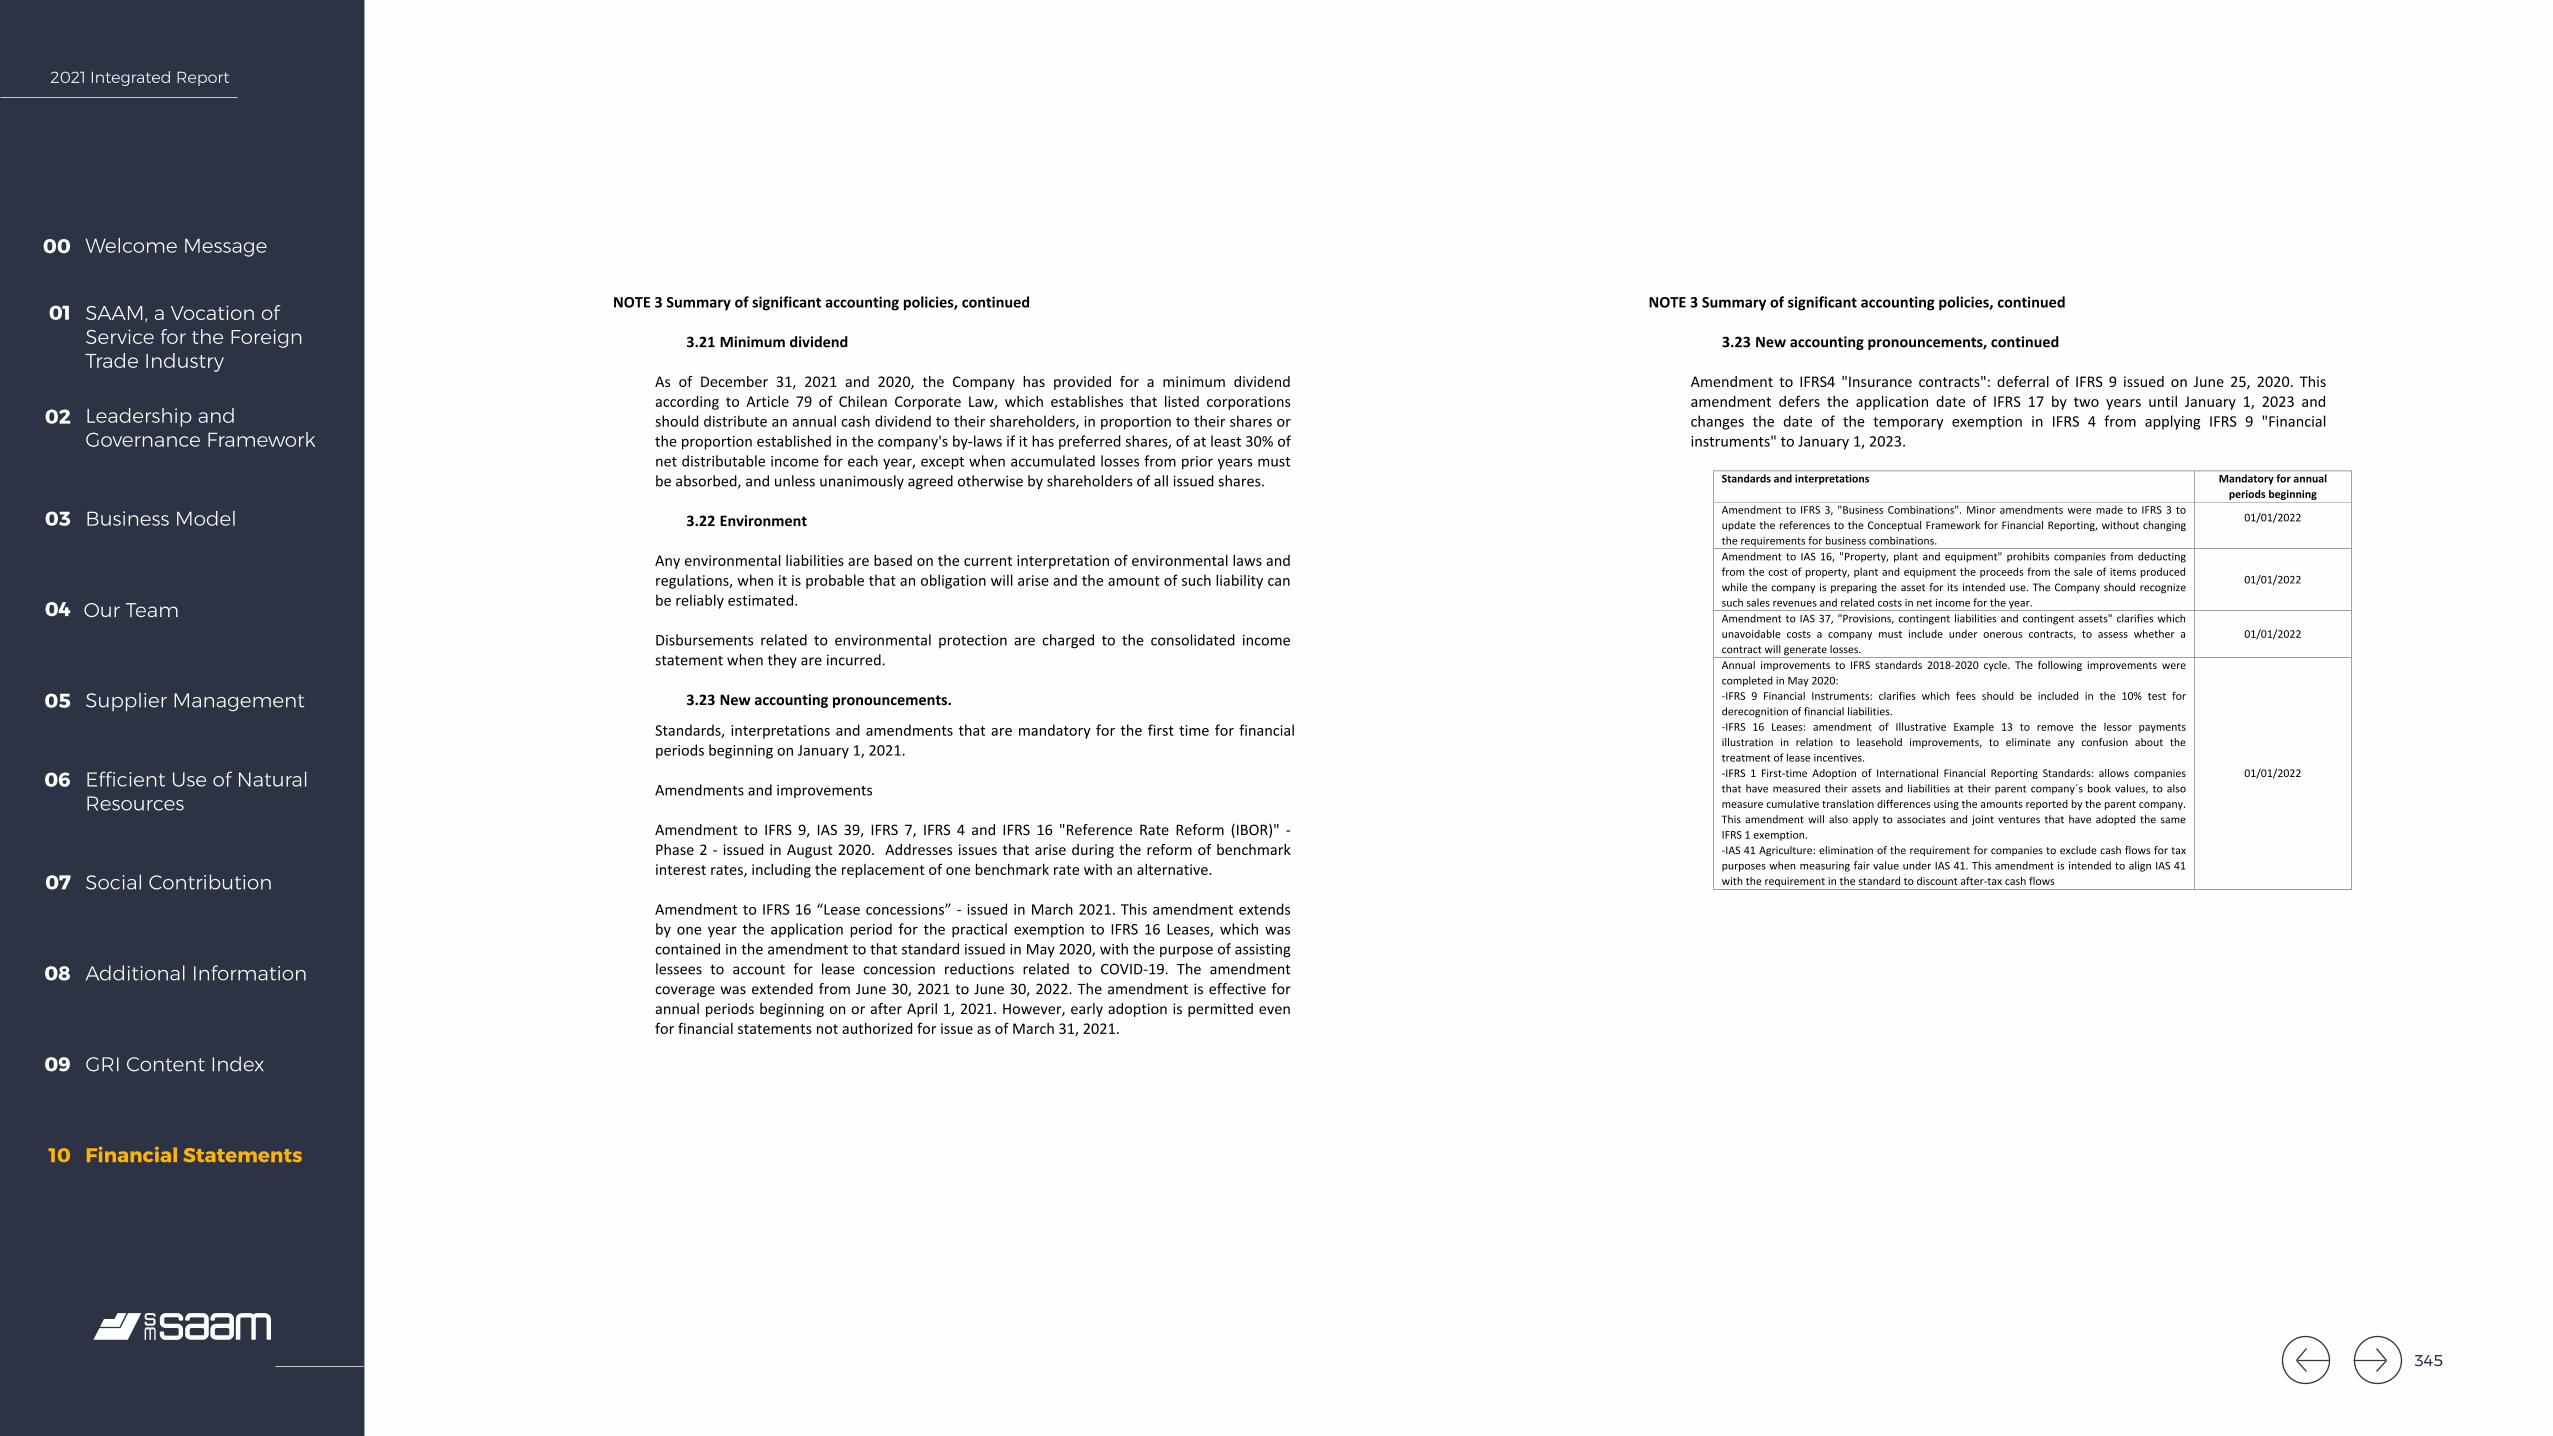
2021 Integrated Report
Welcome Message00
SAAM, a Vocation of Service for the Foreign Trade Industry
01
Leadership and Governance Framework
02
Business Model03
Our Team04
Supplier Management05
Efficient Use of Natural Resources
06
Social Contribution07
Additional Information08
GRI Content Index09
Financial Statements10
SAAM PORTS S.A. AND SUBSIDIARIES
Notes to the Consolidated Financial Statements
30
NOTE 3 Summary of significant accounting policies, continued
3.21 Minimum dividend As of December 31, 2021 and 2020, the Company has provided for a minimum dividend according to Article 79 of Chilean Corporate Law, which establishes that listed corporations should distribute an annual cash dividend to their shareholders, in proportion to their shares or the proportion established in the company's by-laws if it has preferred shares, of at least 30% of net distributable income for each year, except when accumulated losses from prior years must be absorbed, and unless unanimously agreed otherwise by shareholders of all issued shares.
3.22 Environment Any environmental liabilities are based on the current interpretation of environmental laws and regulations, when it is probable that an obligation will arise and the amount of such liability can be reliably estimated. Disbursements related to environmental protection are charged to the consolidated income statement when they are incurred.
3.23 New accounting pronouncements.
Standards, interpretations and amendments that are mandatory for the first time for financial periods beginning on January 1, 2021. Amendments and improvements Amendment to IFRS 9, IAS 39, IFRS 7, IFRS 4 and IFRS 16 "Reference Rate Reform (IBOR)" - Phase 2 - issued in August 2020. Addresses issues that arise during the reform of benchmark interest rates, including the replacement of one benchmark rate with an alternative. Amendment to IFRS 16 “Lease concessions” - issued in March 2021. This amendment extends by one year the application period for the practical exemption to IFRS 16 Leases, which was contained in the amendment to that standard issued in May 2020, with the purpose of assisting lessees to account for lease concession reductions related to COVID-19. The amendment coverage was extended from June 30, 2021 to June 30, 2022. The amendment is effective for annual periods beginning on or after April 1, 2021. However, early adoption is permitted even for financial statements not authorized for issue as of March 31, 2021.
SAAM PORTS S.A. AND SUBSIDIARIES
Notes to the Consolidated Financial Statements
31
NOTE 3 Summary of significant accounting policies, continued
3.23 New accounting pronouncements, continued
Amendment to IFRS4 "Insurance contracts": deferral of IFRS 9 issued on June 25, 2020. This amendment defers the application date of IFRS 17 by two years until January 1, 2023 and changes the date of the temporary exemption in IFRS 4 from applying IFRS 9 "Financial instruments" to January 1, 2023.
Standards and interpretations Mandatory for annual
periods beginning Amendment to IFRS 3, "Business Combinations". Minor amendments were made to IFRS 3 to update the references to the Conceptual Framework for Financial Reporting, without changing the requirements for business combinations.
01/01/2022
Amendment to IAS 16, "Property, plant and equipment" prohibits companies from deducting from the cost of property, plant and equipment the proceeds from the sale of items produced while the company is preparing the asset for its intended use. The Company should recognize such sales revenues and related costs in net income for the year.
01/01/2022
Amendment to IAS 37, "Provisions, contingent liabilities and contingent assets" clarifies which unavoidable costs a company must include under onerous contracts, to assess whether a contract will generate losses.
01/01/2022
Annual improvements to IFRS standards 2018-2020 cycle. The following improvements were completed in May 2020: -IFRS 9 Financial Instruments: clarifies which fees should be included in the 10% test for derecognition of financial liabilities. -IFRS 16 Leases: amendment of Illustrative Example 13 to remove the lessor payments illustration in relation to leasehold improvements, to eliminate any confusion about the treatment of lease incentives. -IFRS 1 First-time Adoption of International Financial Reporting Standards: allows companies that have measured their assets and liabilities at their parent company´s book values, to also measure cumulative translation differences using the amounts reported by the parent company. This amendment will also apply to associates and joint ventures that have adopted the same IFRS 1 exemption. -IAS 41 Agriculture: elimination of the requirement for companies to exclude cash flows for tax purposes when measuring fair value under IAS 41. This amendment is intended to align IAS 41 with the requirement in the standard to discount after-tax cash flows
01/01/2022
345

2021 Integrated Report
Welcome Message00
SAAM, a Vocation of Service for the Foreign Trade Industry
01
Leadership and Governance Framework
02
Business Model03
Our Team04
Supplier Management05
Efficient Use of Natural Resources
06
Social Contribution07
Additional Information08
GRI Content Index09
Financial Statements10
SAAM PORTS S.A. AND SUBSIDIARIES
Notes to the Consolidated Financial Statements
32
NOTE 3 Summary of significant accounting policies, continued 3.23 New accounting pronouncements, continued
Standards and interpretations Mandatory for annual
periods beginning IFRS 17 “Insurance Contracts" - issued in May 2017, replaces IFRS 4. IFRS 17 will change the accounting for all companies that issue insurance contracts and investment contracts with discretionary participation features. The standard applies to annual periods beginning on or after 1 January 2023, and early application is permitted for companies that apply IFRS 9, "Financial Instruments".
01/01/2023
Amendment to IAS 1 "Presentation of financial statements” regarding the classification of liabilities. This amendment clarifies that liabilities will be classified as current or non-current depending on the rights at the end of the reporting period. Classification is not affected by the company's expectations or events after the reporting date, for example receipt of a waiver or failure to comply with a covenant. The amendment also clarifies what IAS 1 means when it refers to the "settlement" of a liability. The amendment should be applied retrospectively in accordance with IAS 8. The initial application date was January 1, 2022. However, that date was deferred to January 1, 2024.
01/01/2024
Amendments to IAS 1 “Presentation of Financial Statements" and IAS 8 "Accounting Policies, Changes in Accounting Estimates and Errors" - issued in February 2021. The amendments are intended to improve disclosures of accounting policies and to help users of financial statements to distinguish between changes in accounting estimates and changes in accounting policies.
01/01/2023
Amendment to IAS 12 “Deferred Taxes Relating to Assets and Liabilities Arising from a Single Transaction.” These amendments require companies to recognize deferred taxes on transactions that result in equal amounts of taxable and deductible temporary differences upon initial recognition.
01/01/2023
Amendments to IFRS 10 “Consolidated Financial Statements” and IAS 28 “Investments in Associates and Joint Ventures.” - issued in September 2014. This amendment addresses an inconsistency between the requirements of IFRS 10 and IAS 28 in the treatment of the sale or provision of goods between an investor and its associate or joint venture. The main consequence of these amendments is that they recognize a full gain or a loss when the transaction involves a business (whether or not in a subsidiary) and a partial gain or loss when the transaction involves assets that do not constitute a business, even if these assets are in a subsidiary. Early adoption is permitted.
Undetermined
Management believes that the future adoption of these standards, amendments and interpretations will have no significant impact on the Company’s consolidated financial statements when they are first applied.
NOTE 4 Accounting changes
During the year from January 1 to December 31, 2021, the Company has uniformly applied its accounting policies compared to 2020.
SAAM PORTS S.A. AND SUBSIDIARIES
Notes to the Consolidated Financial Statements
33
NOTE 5 Related party balances and transactions
The net balance of receivables from and payable to non-consolidated related parties are detailed as follows.
Current Non-
current Total Current Non-current Total
12-31-2021 12-31-2021 12-31-2021 12-31-2020 12-31-2020 12-31-2020 ThUS$ ThUS$ ThUS$ ThUS$ ThUS$ ThUS$
Related party receivables 9,666 2,446 12,112 5,229 4,700 9,929 Related party payables (2,627) - (2,627) (2,528) - (2,528)
Total 7,039 2,446 9,485 2,701 4,700 7,401
All outstanding current balances with related parties are valued at mutually independent conditions and will be settled within twelve months of the reporting date.
(5.1) Related party receivables
Related party receivables are detailed as follows:
Chilean ID number
Chilean companies Relationship Currency Transaction
Current Non-Current Current Non-Current 12.31.2021 12.31.2021 12.31.2020 12.31.2020
ThUS$ ThUS$ ThUS$ ThUS$
89,602,300-4 CSAV Austral SpA Indirect
Chilean pesos
and US dollars
Total 118 - 75 -
Services 118 - 75 -
99,511,240-K
Antofagasta Terminal Internacional S.A.
Indirect associate US dollar
Total - - 45 -
Services - - 45 -
96,908,970-K
San Antonio Terminal Internacional S.A.
Indirect associate US dollar
Total 2,423 - 463 -
Dividend 2,423 - 463 -
96,798,520-1 Saam Extraportuarios S.A.
Indirect US dollar Total 2 - 4 -
Services 2 - 4 -
96,908,930-0
San Vicente Terminal Internacional S.A.
Indirect associate US dollar
Total - 1,746 50 4,000
Services - 1,746 50 4,000
Total Chilean companies Total 2,543 1,746 637 4,000
346
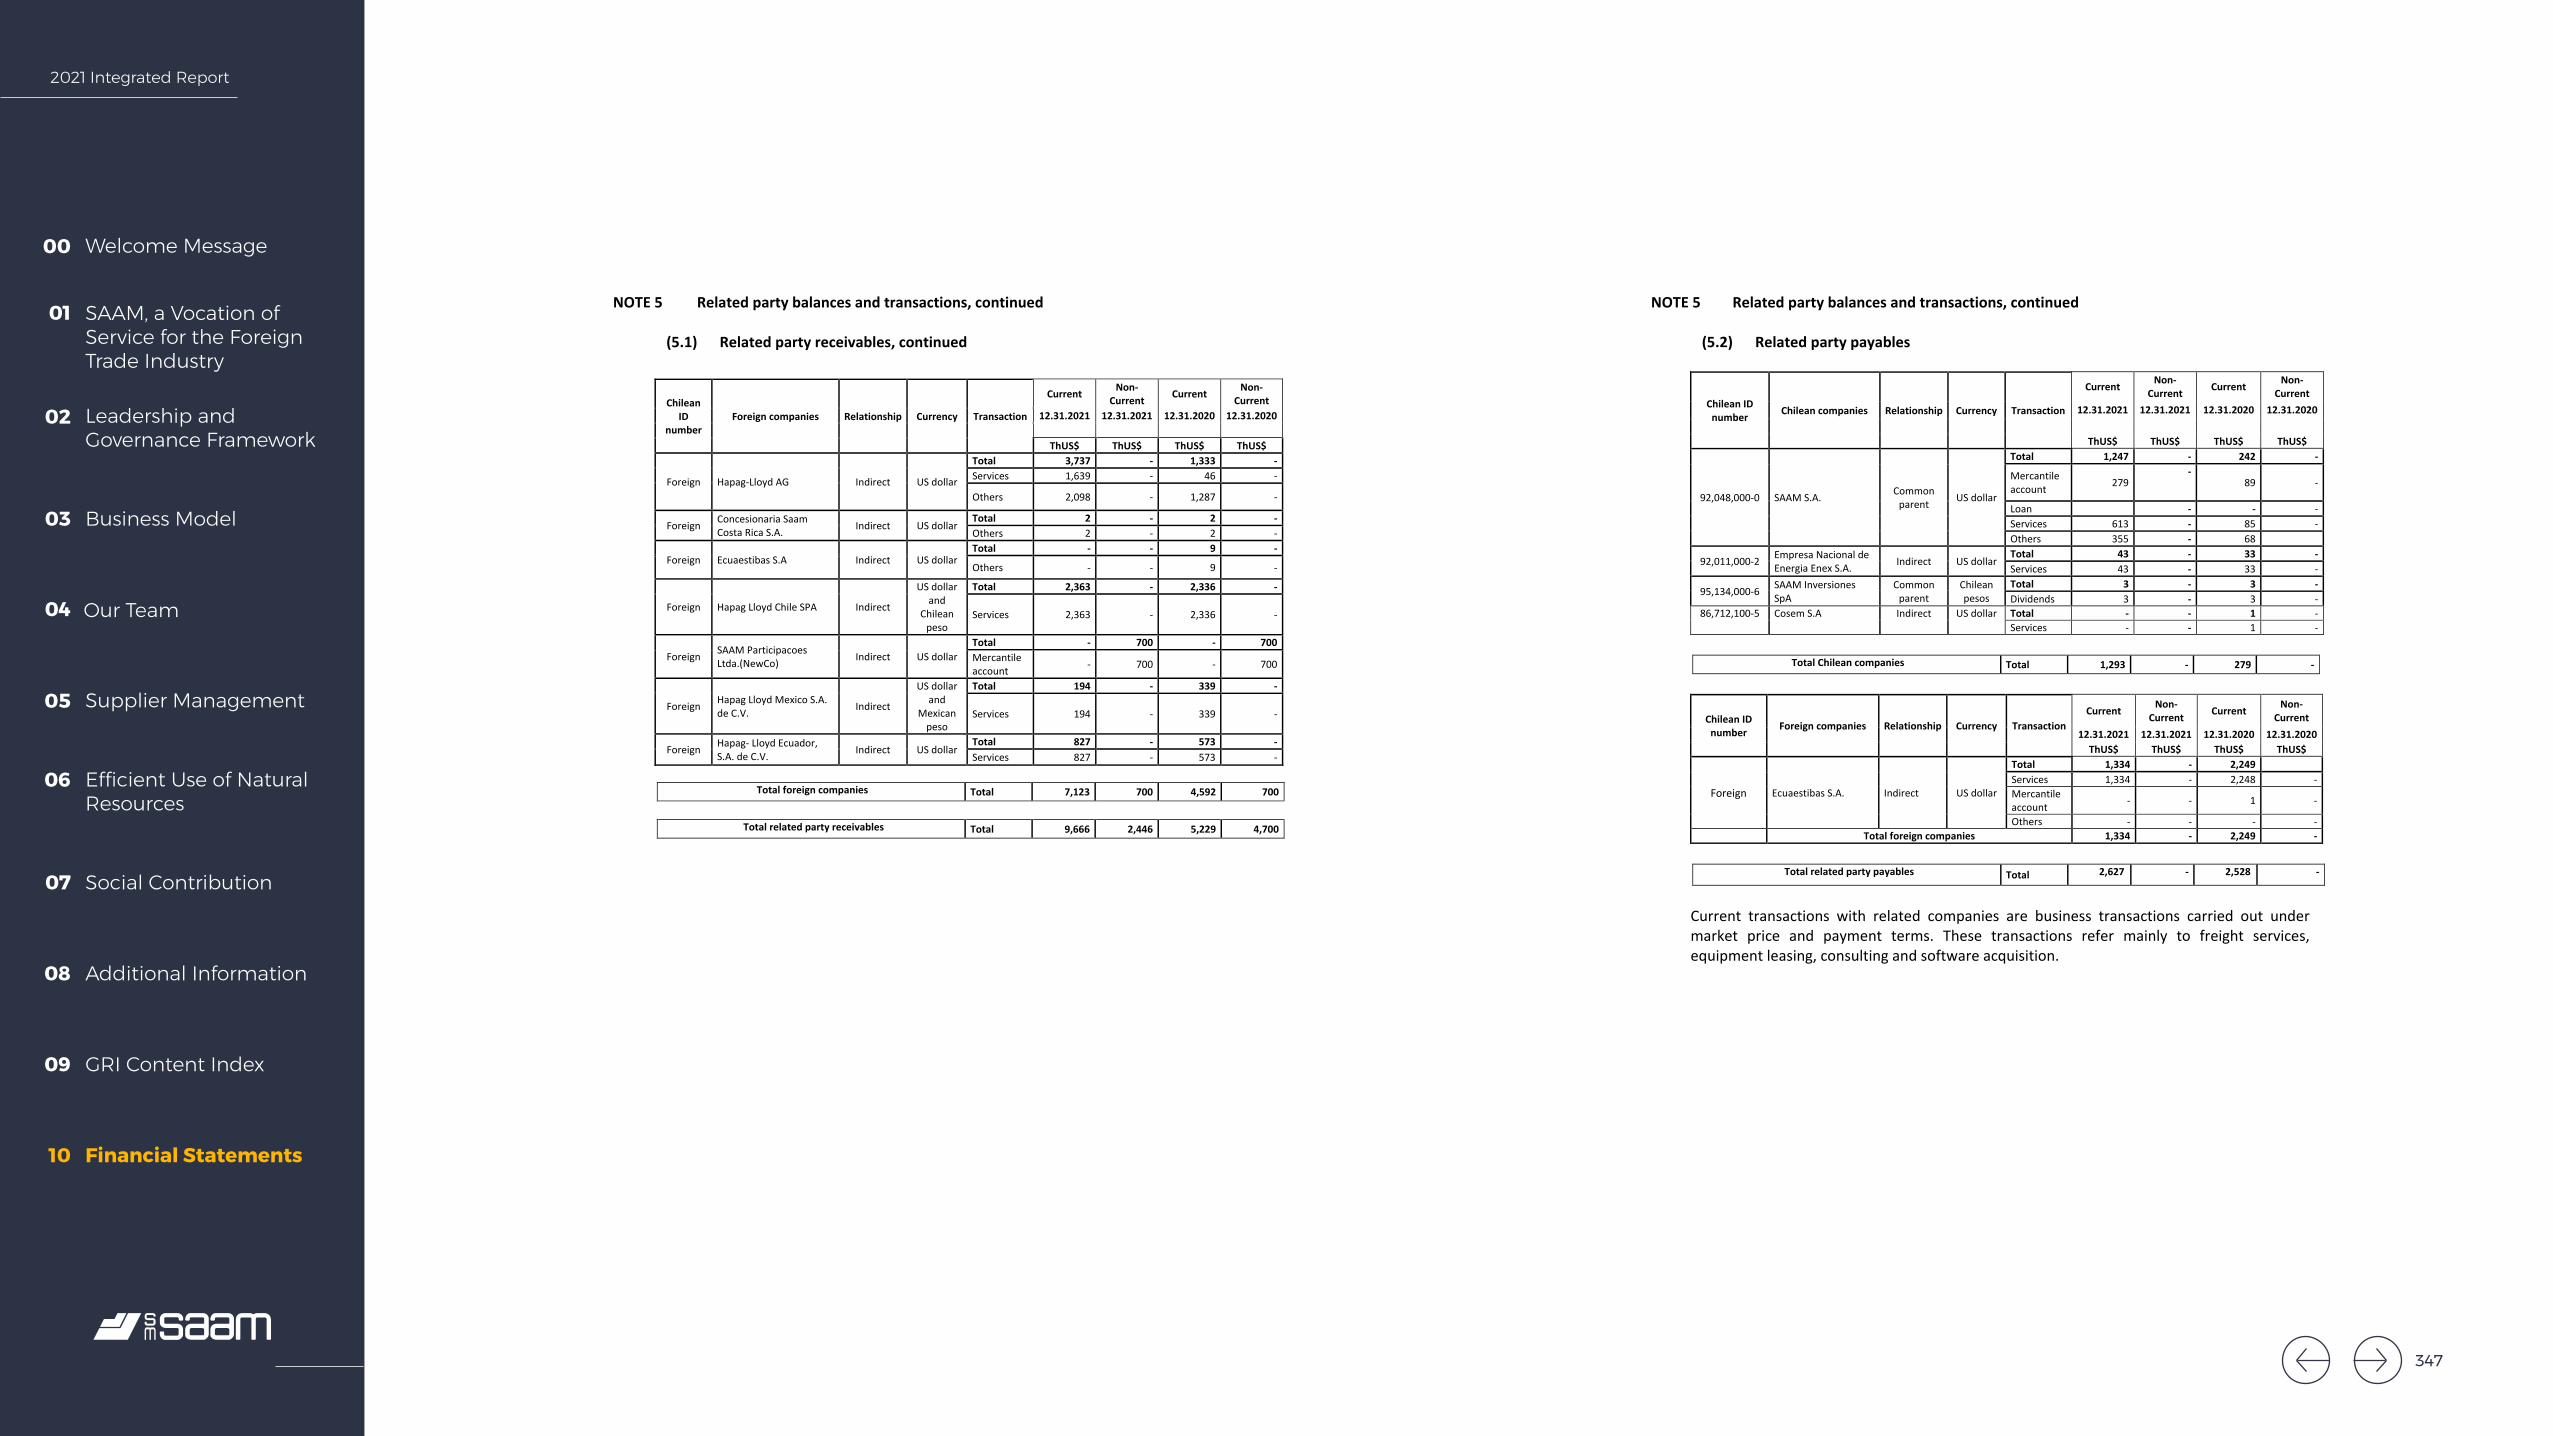
2021 Integrated Report
Welcome Message00
SAAM, a Vocation of Service for the Foreign Trade Industry
01
Leadership and Governance Framework
02
Business Model03
Our Team04
Supplier Management05
Efficient Use of Natural Resources
06
Social Contribution07
Additional Information08
GRI Content Index09
Financial Statements10
SAAM PORTS S.A. AND SUBSIDIARIES
Notes to the Consolidated Financial Statements
34
NOTE 5 Related party balances and transactions, continued (5.1) Related party receivables, continued
Chilean ID
number Foreign companies Relationship Currency Transaction
Current Non-Current Current Non-
Current 12.31.2021 12.31.2021 12.31.2020 12.31.2020
ThUS$ ThUS$ ThUS$ ThUS$
Foreign Hapag-Lloyd AG Indirect US dollar
Total 3,737 - 1,333 - Services 1,639 - 46 -
Others 2,098 - 1,287 -
Foreign Concesionaria Saam Costa Rica S.A. Indirect US dollar
Total 2 - 2 - Others 2 - 2 -
Foreign Ecuaestibas S.A Indirect US dollar Total - - 9 -
Others - - 9 -
Foreign Hapag Lloyd Chile SPA Indirect
US dollar and
Chilean peso
Total 2,363 - 2,336 -
Services 2,363 - 2,336 -
Foreign SAAM Participacoes Ltda.(NewCo) Indirect US dollar
Total - 700 - 700 Mercantile account - 700 - 700
Foreign Hapag Lloyd Mexico S.A. de C.V. Indirect
US dollar and
Mexican peso
Total 194 - 339 -
Services 194 - 339 -
Foreign Hapag- Lloyd Ecuador, S.A. de C.V. Indirect US dollar
Total 827 - 573 - Services 827 - 573 -
Total foreign companies Total 7,123 700 4,592 700
Total related party receivables Total 9,666 2,446 5,229 4,700
SAAM PORTS S.A. AND SUBSIDIARIES
Notes to the Consolidated Financial Statements
35
NOTE 5 Related party balances and transactions, continued (5.2) Related party payables
Chilean ID number Chilean companies Relationship Currency Transaction
Current Non-Current Current Non-
Current 12.31.2021 12.31.2021 12.31.2020 12.31.2020
ThUS$ ThUS$ ThUS$ ThUS$
92,048,000-0 SAAM S.A. Common parent
US dollar
Total 1,247 - 242 -
Mercantile account 279
- 89 -
Loan - - - Services 613 - 85 - Others 355 - 68
92,011,000-2 Empresa Nacional de Energia Enex S.A. Indirect US dollar
Total 43 - 33 - Services 43 - 33 -
95,134,000-6 SAAM Inversiones SpA
Common parent
Chilean pesos
Total 3 - 3 - Dividends 3 - 3 -
86,712,100-5 Cosem S.A Indirect US dollar Total - - 1 - Services - - 1 -
Total Chilean companies Total 1,293 - 279 -
Chilean ID number Foreign companies Relationship Currency Transaction
Current Non-Current Current Non-
Current 12.31.2021 12.31.2021 12.31.2020 12.31.2020
ThUS$ ThUS$ ThUS$ ThUS$
Foreign Ecuaestibas S.A. Indirect US dollar
Total 1,334 - 2,249 Services 1,334 - 2,248 - Mercantile account - - 1 -
Others - - - - Total foreign companies 1,334 - 2,249 -
Total related party payables Total 2,627 - 2,528 -
Current transactions with related companies are business transactions carried out under market price and payment terms. These transactions refer mainly to freight services, equipment leasing, consulting and software acquisition.
347

2021 Integrated Report
Welcome Message00
SAAM, a Vocation of Service for the Foreign Trade Industry
01
Leadership and Governance Framework
02
Business Model03
Our Team04
Supplier Management05
Efficient Use of Natural Resources
06
Social Contribution07
Additional Information08
GRI Content Index09
Financial Statements10
SAAM PORTS S.A. AND SUBSIDIARIES
Notes to the Consolidated Financial Statements
36
NOTE 5 Related party balances and transactions, continued
(5.3) Effects on the statement of net income of transactions with related parties
Sales transactions are transfer, wharfage and warehousing services provided to related companies. Payment terms between related companies are 30 days from invoicing, interest-free and in US dollars.
Chilean ID number Company Relationship Country Transactions with effect on net income 2021.12 2020.12
ThUS$ ThUS$
99,511,240-K Antofagasta Terminal Internacional S.A. Associate Chile Revenue from port operation services 75 39
97,004,000-5 Banco de Chile S.A. Common director Chile Revenue from port operation services - 1
Foreign Concesionaria SAAM Costa Rica S.A. Subsidiary Costa Rica Revenue from port operation services 3 3
Back Office 19 -
89,602,300-4 CSAV Austral SpA Common shareholder Chile Revenue from port operation services 385 331
Foreign Ecuaestibas S.A. Subsidiary Ecuador Leasing machinery and equipment 8,869 8,869 Leasing warehouses and land 132 132 Port terminal service costs 1,158 1,503
92,011,000-2 Empresa Nacional de Energía Enex S.A.
Common director Chile Port terminal service costs 546 384
Foreign Hapag-Lloyd AG Common director Germany Revenue from warehousing and maintenance
services 77 5
Revenue from refrigerated terminal services 3,761 2,286 Revenue from port operation services 11,467 8,853
Revenue from bulk cargo and warehousing services 174 102
Revenue from port equipment services 239 48
96,696,270-4 Inmobiliaria Marítima Portuaria Ltda. Subsidiary Chile Office rental expenses 83 83
96,798,520-1 Saam Extraportuarios S.A. Subsidiary Chile Revenue from port operation services 18 27
96,908,930-0 San Vicente Terminal Internacional S.A. Associate Chile Port terminal service costs 3 3
Revenue from interest on loans to related companies 197 49
Foreign Hapag Lloyd Chile SPA Common shareholder Chile Revenue from port operation services 8,075 6,920
Revenue from port equipment services 949 395 Port terminal service costs - 7
Foreign Hapag Lloyd Mexico S.A. de C.V.
Common shareholder MEXICO Revenue from warehousing and maintenance
services - 176
Revenue from refrigerated terminal services - 145
Revenue from port operation services Systems maintenance costs
- 10
1,082 -
SAAM PORTS S.A. AND SUBSIDIARIES
Notes to the Consolidated Financial Statements
37
NOTE 5 Related party balances and transactions, continued
(5.3) Effects on the statement of net income of transactions with related parties
Chilean ID number Company Relationship Country Transactions with effect on net income 2021.12 2020.12
ThUS$ ThUS$
92,048,000-4 SAAM S.A. Subsidiary Chile Revenue from port operation services 10 14 Port terminal service costs 1 87 Systems maintenance costs 449 424 Consulting services - 2 Information technology expenses 293 168
Back-Office SAAM Back-Office subsidiaries
873 792 36
Other administrative expenses - 16
Foreign Hapag Lloyd Ecuador S.A. Common shareholder Ecuador Revenue from warehousing and maintenance
services 1,166 907
Revenue from port operation services 906 464
Revenue from bulk cargo and warehousing services 89 39
Revenue from port equipment services 139 148
(5.4) Director's remuneration
As of December 31, 2021 and 2020 there were no remuneration for Board members.
348
2021 Integrated Report
Welcome Message00
SAAM, a Vocation of Service for the Foreign Trade Industry
01
Leadership and Governance Framework
02
Business Model03
Our Team04
Supplier Management05
Efficient Use of Natural Resources
06
Social Contribution07
Additional Information08
GRI Content Index09
Financial Statements10
Sociedad Matriz SAAM S.A. and SubsidiariesReport required by General Character Standard No. 30 from the Financial Market Commission
Summarized Consolidated Financial Statements for SAAM Logistics S.A.
As of December 31, 2021
349349

2021 Integrated Report
Welcome Message00
SAAM, a Vocation of Service for the Foreign Trade Industry
01
Leadership and Governance Framework
02
Business Model03
Our Team04
Supplier Management05
Efficient Use of Natural Resources
06
Social Contribution07
Additional Information08
GRI Content Index09
Financial Statements10
INDEPENDENT AUDITOR’S REPORT (A free translation from the original in Spanish) Santiago, March 11, 2022 To the Shareholders and Directors Sociedad Matriz SAAM S.A. As external auditors of Sociedad Matriz SAAM S.A and subsidiaries, we have audited its consolidated financial statements as of December 31, 2021 and 2020, over which we reported on March 11, 2022. The financial statements in abridged form, prepared in accordance with the provisions of General Rule (GRS) No. 30, Section II.2.1, paragraph A.4.2, issued by the Superintendence of Securities and Insurance (now Financial Market Commission - CMF), of the subsidiary SAAM Logistics S.A. and subsidiaries and its accompanying notes on "accounting policies applied” and "related party transactions” attached hereto, are consistent, in all material respects, with the information contained in the consolidated financial statements that we have audited. The preparation of such abridged financial statements, which include the accounting policies applied and transactions with related parties, is the responsibility of the Management of Sociedad Matriz SAAM S.A. and SAAM Logistics S.A. We report that the aforementioned abridged financial statements and its notes on "accounting policies applied" and "related party transactions" of SAAM Logistics S.A. and subsidiaries, attached hereto, correspond to those that were used in the consolidation process carried out by Sociedad Matriz SAAM S.A. as of December 31, 2021 and 2020. This report has been prepared bearing in mind the requirements of NCG 30, Section II.2.1, paragraph A.4.2, and relates exclusively to Sociedad Matriz SAAM S.A. and is issued solely for the information and use of its Senior Management and the Financial Market Commission, and therefore has not been prepared for use, nor should it be used, by any user other than those indicated.
Digitally signed by Jonathan Douglas Yeomans Gibbons RUT: 13.473.972-k. The digital certificate is embedded in the electronic version of this document.
SAAM LOGISTICS S.A. AND SUBSIDIARIES
CONTENTS
Report of Independent Auditors Consolidated Statements of Financial Position Consolidated Statements of Comprehensive Income by Function Consolidated Statements of Cash Flow Consolidated Statements of Changes in Equity Notes to the consolidated financial statements
ThUS$ = Thousands of US dollars.
350

2021 Integrated Report
Welcome Message00
SAAM, a Vocation of Service for the Foreign Trade Industry
01
Leadership and Governance Framework
02
Business Model03
Our Team04
Supplier Management05
Efficient Use of Natural Resources
06
Social Contribution07
Additional Information08
GRI Content Index09
Financial Statements10
SAAM LOGISTICS S.A. Y SUBSIDIARIAS
Consolidated Statements of Financial Position
The accompanying notes form an integral part of these financial statements.
3
Statement of financial position 12-31-2021 12-31-2020
Assets ThUS$ ThUS$
Current assets
Cash and cash equivalents 16,467 29,154 Other financial assets, current 7 7 Other non-financial assets, current 586 495 Trade and other receivables, current 18,510 15,272 Related party receivables, current 313 157 Inventories, current 571 559 Current tax assets 4,711 2,770 Total current assets other than assets or disposal groups classified as held for sale or as held for distribution to owners 41,165 48,414
Non-current assets or groups of assets classified as held-for-sale or held-for-distribution to owners 9,876 10,067
Total current assets 51,041 58,481
Non-current assets Other financial assets, non-current 7 1,096 Other non-financial assets, non-current 267 310 Trade and other receivables, non-current 382 366 Inventory, non-current 1 2 Equity method investments 522 7,483 Intangible assets other than goodwill 11,527 12,658 Goodwill 31,029 31,029 Property, plant and equipment 110,318 117,856 Investment property 1,821 1,831 Deferred tax assets 8,106 10,336 Total non-current assets 163,980 182,967 Total assets 215,021 241,448
SAAM LOGISTICS S.A. Y SUBSIDIARIAS
Consolidated Statements of Financial Position
The accompanying notes form an integral part of these financial statements.
4
Equity and Liabilities 12-31-2021 12-31-2020
Liabilities ThUS$ ThUS$
Current liabilities Other financial liabilities, current 12,794 11,738 Trade and other payables, current 9,724 9,214 Related party payables, current 1,619 377 Current tax liabilities 2,911 613 Employee benefit provisions, current 3,550 3,694 Other non-financial liabilities, current 1,627 925
Total current liabilities 32,225 26,561
Non-current liabilities
Other financial liabilities, non-current 35,637 50,343 Related party payables, non-current 14,000 14,000 Deferred tax liabilities 12,158 11,637 Employee benefit provisions, non-current 3,170 5,078 Other non-financial liabilities, non-current 38 45 Total non-current liabilities 65,003 81,103 Total liabilities 97,228 107,664
Equity Share capital 24,805 24,805 Retained earnings 88,066 105,023 Other reserves 3,775 2,853
Equity attributable to owners of the parent company 116,646 132,681
Non-controlling interests 1,147 1,103 Total equity 117,793 133,784
Total equity and liabilities 215,021 241,448
351

2021 Integrated Report
Welcome Message00
SAAM, a Vocation of Service for the Foreign Trade Industry
01
Leadership and Governance Framework
02
Business Model03
Our Team04
Supplier Management05
Efficient Use of Natural Resources
06
Social Contribution07
Additional Information08
GRI Content Index09
Financial Statements10
SAAM LOGISTICS S.A. Y SUBSIDIARIAS
Consolidated Statements of Comprehensive Income by Function
The accompanying notes form an integral part of these financial statements.
5
Statement of net income by function 01-01-2021
12-31-2021 01-01-2020
12-31-2020
ThUS$ ThUS$
Net income Operating revenue 127,633
58,420
Cost of sales (92,361) (44,737)
Gross margin 35,272 13,683
Other income 140 11,692
Administrative expenses (9,949) (6,366)
Other expenses, by function (1,157) (317)
Other gains (losses) 3,264 3,866
Net operating income 27,570 22,558
Financial income 139 190
Financial costs (2,668) (214)
Share of net income (loss) of equity method associates and joint ventures 1,163 4,519
Exchange differences 2,164 (1,965)
Indexation gains (losses) 80 (31)
Net income before taxes 28,448 25,057
Income tax expense from continuing operations (9,687) (3,058)
Net income from continuing operations 18,761 21,999 Net income attributable
Net income attributable to owners of the parent company 18,435 21,880
Net income attributable to non-controlling interests 326 119
Net income for the year 18,761 21,999
SAAM LOGISTICS S.A. Y SUBSIDIARIAS
Consolidated Statements of Comprehensive Income by Function, continued
The accompanying notes form an integral part of these financial statements.
6
(*) Items that have been or may subsequently be reclassified to net income
Statements of comprehensive income 01-01-2021 12-31-2021
01-01-2020 12-31-2020
ThUS$ ThUS$
Net income for the year 18,761
21,999
Components of other comprehensive income, before taxes
Foreign currency translation differences(*)
Gain (loss) on foreign currency translation differences, before taxes 698 2,291 Reclassification adjustments on foreign currency translation differences, before taxes -
-
Other comprehensive income on foreign currency translation differences, before taxes 698
2,291
Financial assets held for sale
Other comprehensive income on financial assets held-for-sale, before taxes
Cash flow hedges(*)
Gain (loss) on cash flow hedges, before taxes (1,120) (418)
Reclassification adjustments on cash flow hedges, before taxes - -
Other comprehensive income on cash flow hedges, before taxes (1,120) (418) Other comprehensive income on actuarial gains (losses) on defined-benefit plans, before taxes 1,386
(65)
Other comprehensive income, before taxes 964 1,808
Income taxes related to other comprehensive income(*)
Income taxes related to foreign currency translation differences - -
Income taxes related to cash flow hedges 303 -
Income taxes relating to defined benefit plans (334) 86
Total income tax relating to components of other comprehensive income (31) 86
Other comprehensive income 933 1,894
Total comprehensive income 19,694 23,893
Comprehensive income attributable
Comprehensive income attributable to owners of the parent company 19,357 23,773
Comprehensive income attributable to non-controlling interests 337 120
Total comprehensive income 19,694 23,893
352

2021 Integrated Report
Welcome Message00
SAAM, a Vocation of Service for the Foreign Trade Industry
01
Leadership and Governance Framework
02
Business Model03
Our Team04
Supplier Management05
Efficient Use of Natural Resources
06
Social Contribution07
Additional Information08
GRI Content Index09
Financial Statements10
SAAM LOGISTICS S.A. Y SUBSIDIARIAS
Consolidated Statements of Cash Flow
The accompanying notes form an integral part of these financial statements.
7
Statements of cash flow, direct method
01-01-2021 12-31-2021
ThUS$
01-01-2020 12-31-2020
ThUS$ Cash flow from (used by) operating activities
Proceeds from operating activities
Proceeds from the sale of goods and services 145,144 81,284 Proceeds from other ordinary activities 56 27 Proceeds from premiums and claims, annuities and other policy benefits 66 162 Proceeds from other operating activities 15 71
Payments for operating activities Payments to suppliers for goods and services (73,761) (49,031) Payments to and on behalf of employees (22,095) (11,870) Payments for premiums and claims, annuities and other policy obligations (340) (288)
Other payments for operating activities (14,269) (5,760) Net operational cash flow 34,816 14,595
Dividends received - - Interest received 7 81 Income taxes received (paid) (5,006) (2,240) Other proceeds (payments) (139) (1,796)
Net cash flow from (used by) operating activities 29,678 10,640
SAAM LOGISTICS S.A. Y SUBSIDIARIAS
Consolidated Statements of Cash Flow, continued
The accompanying notes form an integral part of these financial statements. 8
01-01-2021 12-31-2021
01-01-2020 12-31-2020
ThUS$ ThUS$
Cash flow from (used by) investing activities
Proceeds from sales of property, plant and equipment 171 108 Proceeds from sales of non-controlling interests 8,811 - Purchases of property, plant and equipment (4,855) (1,997) Acquisitions of intangible assets (87) (69) Dividends received 2,146 3,061 Interest received 21 85 Proceeds from non-current assets held for sale 1,102 5,137 Payments to acquire subsidiaries - (13,087) Other proceeds (payments) 11 25
Net cash flow from (used in) investing activities 7,320 (6,737)
Cash flow from (used by) financing activities
Dividends paid (35,685) (18,565)
Payment of lease liabilities IFRS 16 (9,006) (1,929) Proceeds from long-term loans - 18,000 Proceeds from short-term loans - 1,500
Proceeds from related party loans - 8,000 Loan repayments (3,985) (1,913) Other proceeds (payments) classified as financing activities (20) -
Net cash flow from (used by) financing activities (48,696) 5,093
Net increase in cash and cash equivalents before effect of exchange rates (11,698) 8,996
Effect of exchange rates on cash and cash equivalents (989) (84)
Net increase (decrease) in cash and cash equivalents (12,687) 8,912
Cash and cash equivalents at the start of the year 29,154 20,242
Cash and cash equivalents at the end of the year 16,467 29,154
353

2021 Integrated Report
Welcome Message00
SAAM, a Vocation of Service for the Foreign Trade Industry
01
Leadership and Governance Framework
02
Business Model03
Our Team04
Supplier Management05
Efficient Use of Natural Resources
06
Social Contribution07
Additional Information08
GRI Content Index09
Financial Statements10
SAAM LOGISTICS S.A. Y SUBSIDIARIAS
Consolidated Statements of Changes in Equity
The accompanying notes form an integral part of these financial statements. 9
Share capital
Foreign currency
translation reserve
Cash flow hedge
reserve
Actuarial gains and losses on
defined benefit plans reserve
Other miscellaneous
reserves Total other
reserves
Retained earnings
(accumulated losses)
Equity attributable to
equity holders of parent company
Non-Controlling
Interests Equity ThUS$ ThUS$ ThUS$ ThUS$ ThUS$ ThUS$ ThUS$ ThUS$ ThUS$ ThUS$ Equity as of January 1, 2021 24,805 (1,185) (15) (705) 4,758 2,853 105,023 132,681 1,103 133,784 Increase (decrease) due to changes in accounting policy - - - - - - - - - -
Restated opening balance 24,805 (1,185) (15) (705) 4,758 2,853 105,023 132,681 1,103 133,784 Changes in equity Comprehensive income Net income for the year - - - - - - 18,435 18,435 326 18,761 Other comprehensive income - 698 (817) 1,041 - 922 - 922 11 933 Total comprehensive income 698 (817) 1,041 - 922 18,435 19,357 337 19,694 Increase (decrease) for transfers and other changes in equity
-
-
-
-
-
- - - - -
Dividends - - - - - - (35,392) (35,392) (293) (35,685) Increase (decrease) in equity - 698 (817) 1,041 - 922 (16,957) (16,035) 44 (15,991) Equity as of December 31, 2021 24,805 (487) (832) 336 4,758 3,775 88,066 116,646 1,147 117,793
Share capital
Foreign currency
translation reserve
Cash flow hedge
reserve
Actuarial gains and losses on
defined benefit plans reserve
Other miscellaneous
reserves Other
reserves
Retained earnings
(accumulated losses)
Equity attributable to
equity holders of parent company
Non-Controlling
Interests Equity ThUS$ ThUS$ ThUS$ ThUS$ ThUS$ ThUS$ ThUS$ ThUS$ ThUS$ ThUS$ Equity as of January 1, 2020 24,805 (3,476) 292 (613) 4,757 960 101,395 127,160 933 128,093 Increase (decrease) due to changes in accounting policy - - - - - - - - - -
Restated opening balance 24,805 (3,476) 292 (613) 4,757 960 101,395 127,160 933 128,093 Changes in equity Comprehensive income Net income for the year - - - - - - 21,880 21,880 119 21,999 Other comprehensive income - 2,291 (307) (92) 1 1,893 1,893 1 1,894 Total comprehensive income 2,291 (307) (92) 1 1,893 21,880 23,773 120 23,893 Increase (decrease) for transfers and other changes in equity
-
-
-
-
-
- (2) (2) 346 344
Dividends - - - - - - (18,250) (18,250) (296) (18,546) Increase (decrease) in equity - 2,291 (307) (92) 1 1,893 3,628 5,521 170 5,691 Equity as of December 31, 2020 24,805 (1,185) (15) (705) 4,758 2,853 105,023 132,681 1,103 133,784
SAAM LOGISTICS S.A. Y SUBSIDIARIAS
Notes to the Consolidated Financial Statements
10
NOTE 1 Corporate Information
SAAM Logistics S.A. and subsidiaries (hereinafter “SAAM Logistics”) was incorporated on March 21, 2017. Its bylaws are recorded in a public deed dated March 21, 2017 granted at the ofices of the thirty-fourth Santiago Notary Mr. Eduardo Javier Diez Morello. The Company’s domicile is Avenida Apoquindo 4800 Tower 2, Floor 18, Las Condes, Santiago. Its corporate purpose is to provide logistics services, such as warehousing, transportation, distribution and assembly. The immediate controlling company of SAAM Logistics S.A. is Sociedad Matriz SAAM S.A. with Chilean ID Number 76,196,718-5, which is an investment business, registered in the securities registry under No. 1,091 dated February 23, 2012. It issues public financial statements and must follow the instructions issued by the Financial Market Commission (formerly Superintendency of Securities and Insurance). These financial statements should be analyzed together with the consolidated financial statements of Sociedad Matriz SAAM S.A., considering the company’s operational and financial integration with other companies in the Sociedad Matriz SAAM S.A. group. On January 30, 2020, the World Health Organization designated the COVID-19 coronavirus outbreak as an international public health emergency. Most countries adopted public health and travel restrictions that affected all economic activities, including the processing of products, as well as international trade. A State of Constitutional Emergency was declared throughout Chile on March 18, 2020, which was lifted on September 30, 2021. Although some of the public health measures have gradually begun to be lifted locally and internationally, there are still certain restrictions, such as those governing the free movement of people and across borders. The consequences for the world's main service and production centers continue to affect international trade. Another consequence is volatile exchange rates and stock and commodities indexes, as well as other effects on the international financial market. Most countries have continued with their vaccination campaigns, which have reduced the risk of the pandemic spreading. At the outset the Company adopted public health measures to reduce the spread of COVID-19, in accordance with instructions issued by the health authority. It has focused on the health of employees, their families and the community in general, as well as on securing operational continuity and supporting the return to normal international trade. As of the date these financial statements were issued, the Company's business has not suffered any significant effects as a result of this situation, but it is not possible to predict whether there may be additional impacts in the future.
354
2021 Integrated Report
Welcome Message00
SAAM, a Vocation of Service for the Foreign Trade Industry
01
Leadership and Governance Framework
02
Business Model03
Our Team04
Supplier Management05
Efficient Use of Natural Resources
06
Social Contribution07
Additional Information08
GRI Content Index09
Financial Statements10
SAAM LOGISTICS S.A. Y SUBSIDIARIAS
Notes to the Consolidated Financial Statements
11
NOTE 2 Presentation basis for the consolidated financial statements
a. Statement of compliance
The consolidated financial statements as of December 31, 2021 have been prepared in accordance with International Financial Reporting Standards (IFRS) issued by the International Accounting Standard Board (IASB) and approved by its Board at a meeting on March 11, 2022.
b. Presentation basis for the consolidated financial statements
These consolidated financial statements faithfully reflect the financial position of SAAM Logistics S.A. and its subsidiaries as of December 31, 2021 and 2020, the comprehensive income by function, changes in equity and cash flows for the years ended December 31, 2021 and 2020. These consolidated financial statements have been prepared under the principle of an ongoing concern, based on the principle of historic cost, except for the items that are recognized at fair value. The book values of assets and liabilities hedged with transactions that qualify for hedge accounting are adjusted to reflect changes in the fair value in relation to the hedged risks.
c. Estimates and Judgments
The preparation of these consolidated financial statements required a number of critical accounting estimates to quantify certain assets, liabilities, income, expenses and commitments. The areas that involve a greater degree of judgment or complexity, or the areas in which the assumptions and estimates are significant for the consolidated financial statements are described as follows: 1. The evaluation of potential impairment losses on specific assets. 2. The assumptions used in the actuarial calculation of employee benefits liabilities. 3. Useful lives of property, plant and equipment and intangible assets. 4. The probability that certain liabilities and contingencies will materialize and their valuations. 5. The fair value of certain financial instruments. 6. The probability of recovery of deferred tax assets.
These estimates are based on the best available information. In any event, it is possible that future events may require that such estimates are amended in future years. If required, such amendments would be made prospectively, such that the effects of the change would be recognized in future financial statements.
SAAM LOGISTICS S.A. Y SUBSIDIARIAS
Notes to the Consolidated Financial Statements
12
Note 3 – Summary of significant accounting policies
3.1 Basis of Consolidation.
a) Subsidiaries
Subsidiaries are all entities controlled by SAAM Logistics. Control exists when the Company has the power to direct the financial and operational policies of the entity with the purpose of obtaining benefits from its activities. The evaluation of whether SAAM Logistics controls another entity is based on the existence and effect of potential voting rights that are currently exercised or convertible in shares or other instruments that allow control to be exercised over another entity. Subsidiaries are consolidated from the date that control is transferred to SAAM Logistics and are excluded from the consolidation on the date it ceases.
b) Transactions eliminated from consolidation Intercompany balances and any unrealized income or expense arising from their transactions are eliminated during the preparation of the consolidated financial statements. Unrealized gains or losses from transactions with companies whose investment is recognized under the equity method are eliminated in the percentage their equity interest.
c) Investments in associates and joint ventures (equity method)
Associates are those entities where the Company has significant influence, but not control over financial and operating policies. Significant influence is assumed when SAAM Logistics owns between 20% and 50% of the voting rights of another entity. Joint ventures are those entities where SAAM Logistics has joint control over their activities, established by contractual agreements and requiring unanimous consent to make financial, operational and strategic decisions. Investments in associates and joint ventures are accounted for using the equity method and are initially recognized at cost. SAAM Logistics’ investments include goodwill identified in the acquisition, net of accumulated impairment losses. An investment will be accounted for using the equity method from the date on which it becomes an associate or joint venture. When the investment is acquired, any difference between the purchase cost and the entity's share of the net fair value of the identifiable assets and liabilities of the investee shall be accounted for as goodwill and included in the carrying amount of the investment.
355
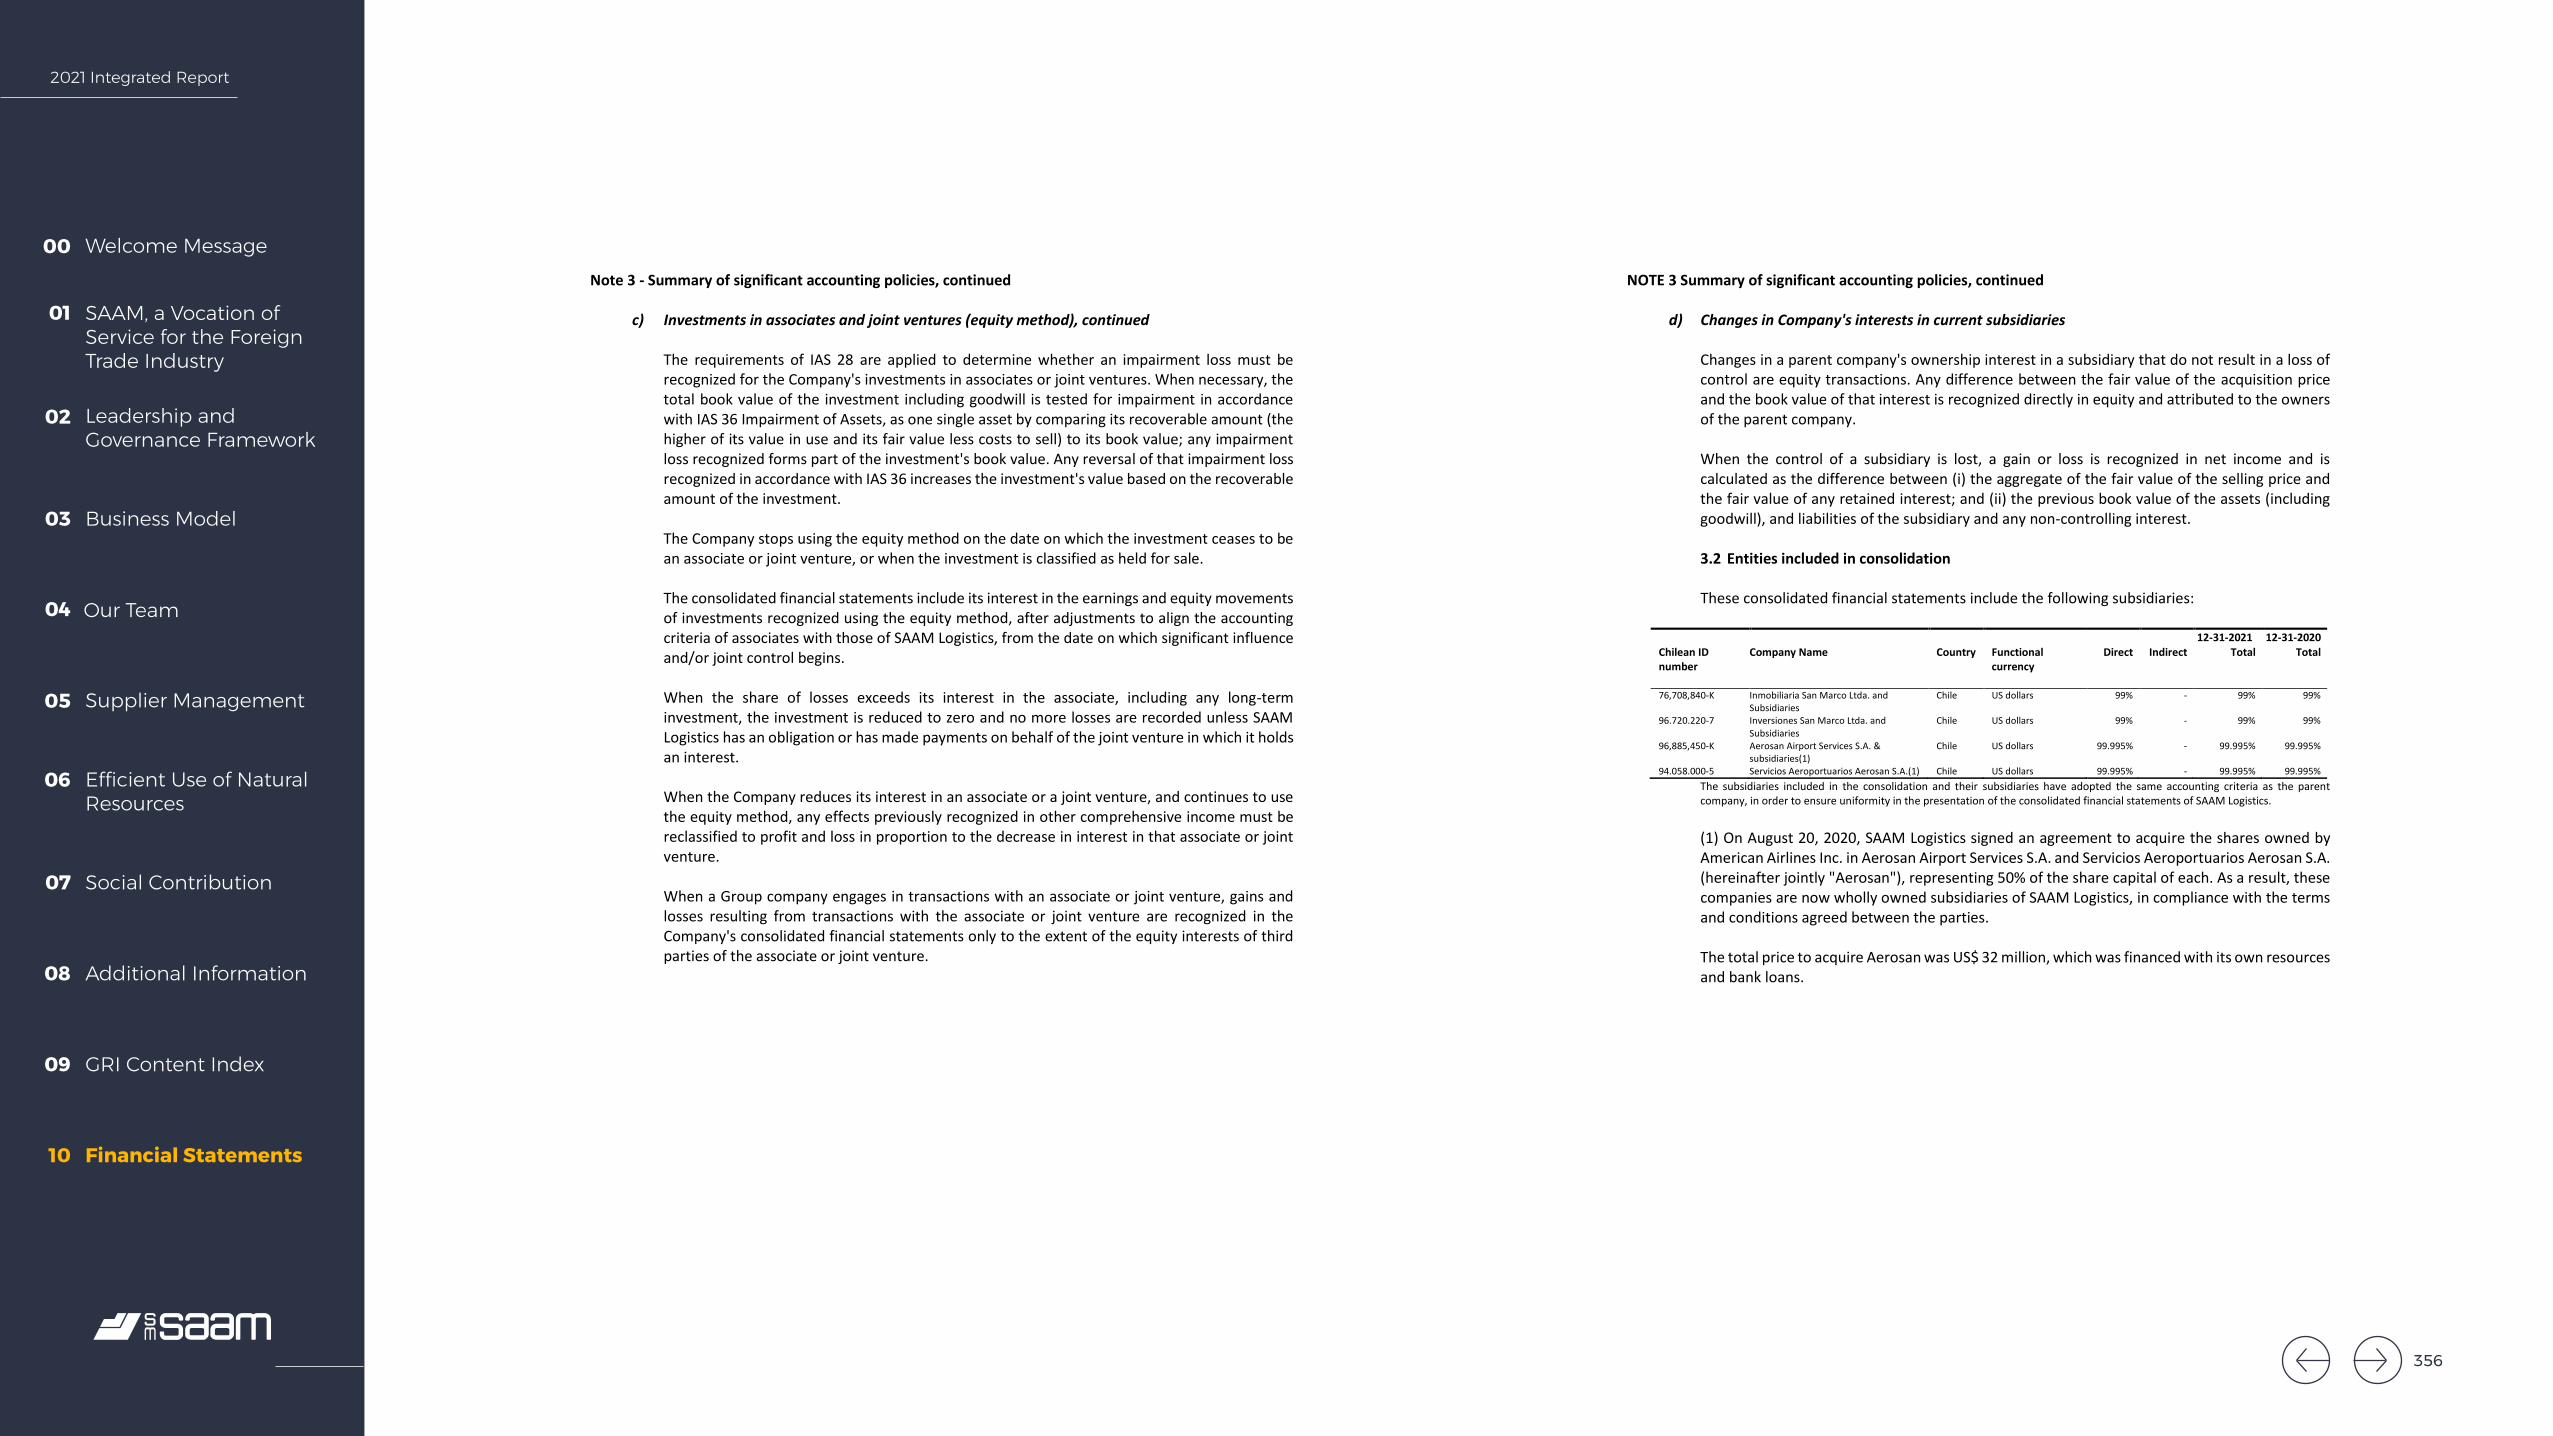
2021 Integrated Report
Welcome Message00
SAAM, a Vocation of Service for the Foreign Trade Industry
01
Leadership and Governance Framework
02
Business Model03
Our Team04
Supplier Management05
Efficient Use of Natural Resources
06
Social Contribution07
Additional Information08
GRI Content Index09
Financial Statements10
SAAM LOGISTICS S.A. Y SUBSIDIARIAS
Notes to the Consolidated Financial Statements
13
Note 3 - Summary of significant accounting policies, continued
c) Investments in associates and joint ventures (equity method), continued
The requirements of IAS 28 are applied to determine whether an impairment loss must be recognized for the Company's investments in associates or joint ventures. When necessary, the total book value of the investment including goodwill is tested for impairment in accordance with IAS 36 Impairment of Assets, as one single asset by comparing its recoverable amount (the higher of its value in use and its fair value less costs to sell) to its book value; any impairment loss recognized forms part of the investment's book value. Any reversal of that impairment loss recognized in accordance with IAS 36 increases the investment's value based on the recoverable amount of the investment. The Company stops using the equity method on the date on which the investment ceases to be an associate or joint venture, or when the investment is classified as held for sale.
The consolidated financial statements include its interest in the earnings and equity movements of investments recognized using the equity method, after adjustments to align the accounting criteria of associates with those of SAAM Logistics, from the date on which significant influence and/or joint control begins. When the share of losses exceeds its interest in the associate, including any long-term investment, the investment is reduced to zero and no more losses are recorded unless SAAM Logistics has an obligation or has made payments on behalf of the joint venture in which it holds an interest. When the Company reduces its interest in an associate or a joint venture, and continues to use the equity method, any effects previously recognized in other comprehensive income must be reclassified to profit and loss in proportion to the decrease in interest in that associate or joint venture. When a Group company engages in transactions with an associate or joint venture, gains and losses resulting from transactions with the associate or joint venture are recognized in the Company's consolidated financial statements only to the extent of the equity interests of third parties of the associate or joint venture.
SAAM LOGISTICS S.A. Y SUBSIDIARIAS
Notes to the Consolidated Financial Statements
14
NOTE 3 Summary of significant accounting policies, continued
d) Changes in Company's interests in current subsidiaries
Changes in a parent company's ownership interest in a subsidiary that do not result in a loss of control are equity transactions. Any difference between the fair value of the acquisition price and the book value of that interest is recognized directly in equity and attributed to the owners of the parent company. When the control of a subsidiary is lost, a gain or loss is recognized in net income and is calculated as the difference between (i) the aggregate of the fair value of the selling price and the fair value of any retained interest; and (ii) the previous book value of the assets (including goodwill), and liabilities of the subsidiary and any non-controlling interest. 3.2 Entities included in consolidation
These consolidated financial statements include the following subsidiaries:
12-31-2021 12-31-2020 Chilean ID number
Company Name Country Functional currency
Direct Indirect Total Total
76,708,840-K Inmobiliaria San Marco Ltda. and Subsidiaries
Chile US dollars 99% - 99% 99%
96.720.220-7 Inversiones San Marco Ltda. and Subsidiaries
Chile US dollars 99% - 99% 99%
96,885,450-K Aerosan Airport Services S.A. & subsidiaries(1)
Chile US dollars 99.995% - 99.995% 99.995%
94.058.000-5 Servicios Aeroportuarios Aerosan S.A.(1) Chile US dollars 99.995% - 99.995% 99.995% The subsidiaries included in the consolidation and their subsidiaries have adopted the same accounting criteria as the parent company, in order to ensure uniformity in the presentation of the consolidated financial statements of SAAM Logistics. (1) On August 20, 2020, SAAM Logistics signed an agreement to acquire the shares owned by American Airlines Inc. in Aerosan Airport Services S.A. and Servicios Aeroportuarios Aerosan S.A. (hereinafter jointly "Aerosan"), representing 50% of the share capital of each. As a result, these companies are now wholly owned subsidiaries of SAAM Logistics, in compliance with the terms and conditions agreed between the parties. The total price to acquire Aerosan was US$ 32 million, which was financed with its own resources and bank loans.
356
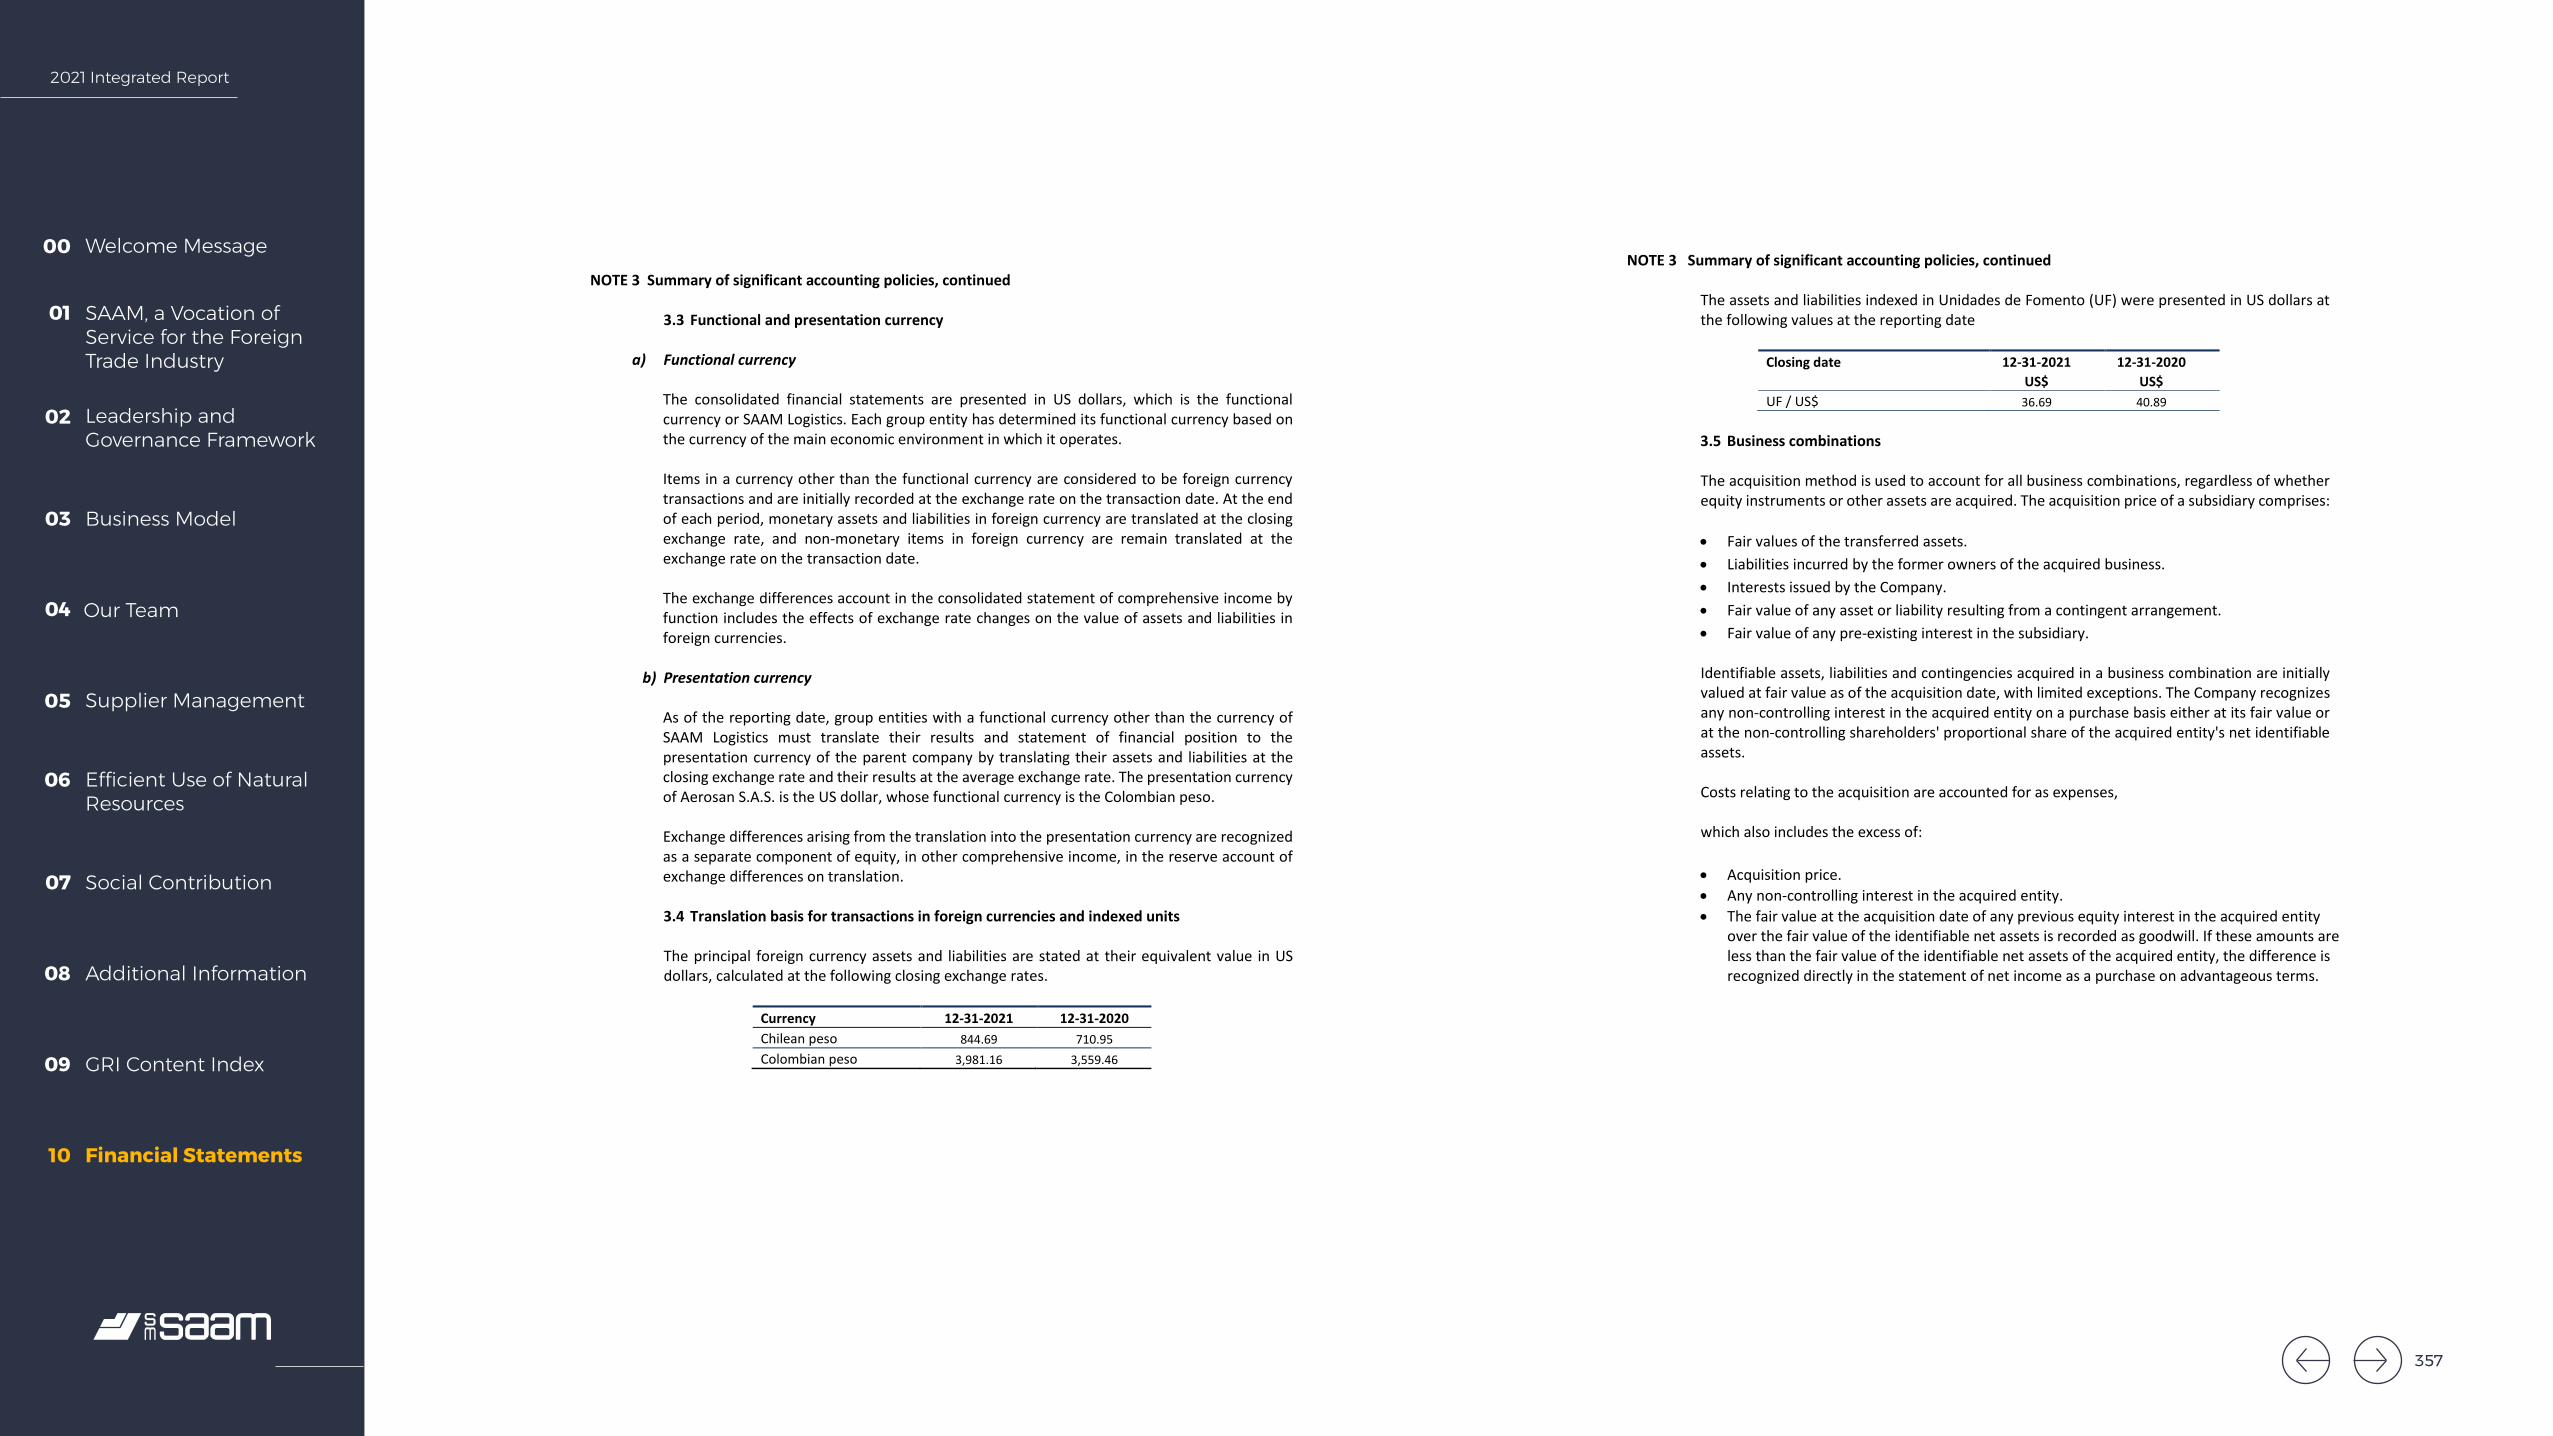
2021 Integrated Report
Welcome Message00
SAAM, a Vocation of Service for the Foreign Trade Industry
01
Leadership and Governance Framework
02
Business Model03
Our Team04
Supplier Management05
Efficient Use of Natural Resources
06
Social Contribution07
Additional Information08
GRI Content Index09
Financial Statements10
SAAM LOGISTICS S.A. Y SUBSIDIARIAS
Notes to the Consolidated Financial Statements
15
NOTE 3 Summary of significant accounting policies, continued
3.3 Functional and presentation currency
a) Functional currency The consolidated financial statements are presented in US dollars, which is the functional currency or SAAM Logistics. Each group entity has determined its functional currency based on the currency of the main economic environment in which it operates.
Items in a currency other than the functional currency are considered to be foreign currency transactions and are initially recorded at the exchange rate on the transaction date. At the end of each period, monetary assets and liabilities in foreign currency are translated at the closing exchange rate, and non-monetary items in foreign currency are remain translated at the exchange rate on the transaction date.
The exchange differences account in the consolidated statement of comprehensive income by function includes the effects of exchange rate changes on the value of assets and liabilities in foreign currencies.
b) Presentation currency
As of the reporting date, group entities with a functional currency other than the currency of SAAM Logistics must translate their results and statement of financial position to the presentation currency of the parent company by translating their assets and liabilities at the closing exchange rate and their results at the average exchange rate. The presentation currency of Aerosan S.A.S. is the US dollar, whose functional currency is the Colombian peso. Exchange differences arising from the translation into the presentation currency are recognized as a separate component of equity, in other comprehensive income, in the reserve account of exchange differences on translation.
3.4 Translation basis for transactions in foreign currencies and indexed units
The principal foreign currency assets and liabilities are stated at their equivalent value in US dollars, calculated at the following closing exchange rates.
Currency 12-31-2021 12-31-2020 Chilean peso 844.69 710.95 Colombian peso 3,981.16 3,559.46
SAAM LOGISTICS S.A. Y SUBSIDIARIAS
Notes to the Consolidated Financial Statements
16
NOTE 3 Summary of significant accounting policies, continued The assets and liabilities indexed in Unidades de Fomento (UF) were presented in US dollars at the following values at the reporting date
Closing date 12-31-2021
US$ 12-31-2020
US$ UF / US$ 36.69 40.89
3.5 Business combinations
The acquisition method is used to account for all business combinations, regardless of whether equity instruments or other assets are acquired. The acquisition price of a subsidiary comprises: • Fair values of the transferred assets. • Liabilities incurred by the former owners of the acquired business. • Interests issued by the Company. • Fair value of any asset or liability resulting from a contingent arrangement. • Fair value of any pre-existing interest in the subsidiary.
Identifiable assets, liabilities and contingencies acquired in a business combination are initially valued at fair value as of the acquisition date, with limited exceptions. The Company recognizes any non-controlling interest in the acquired entity on a purchase basis either at its fair value or at the non-controlling shareholders' proportional share of the acquired entity's net identifiable assets. Costs relating to the acquisition are accounted for as expenses, which also includes the excess of:
• Acquisition price. • Any non-controlling interest in the acquired entity. • The fair value at the acquisition date of any previous equity interest in the acquired entity
over the fair value of the identifiable net assets is recorded as goodwill. If these amounts are less than the fair value of the identifiable net assets of the acquired entity, the difference is recognized directly in the statement of net income as a purchase on advantageous terms.
357
2021 Integrated Report
Welcome Message00
SAAM, a Vocation of Service for the Foreign Trade Industry
01
Leadership and Governance Framework
02
Business Model03
Our Team04
Supplier Management05
Efficient Use of Natural Resources
06
Social Contribution07
Additional Information08
GRI Content Index09
Financial Statements10
SAAM LOGISTICS S.A. Y SUBSIDIARIAS
Notes to the Consolidated Financial Statements
17
NOTE 3 Summary of significant accounting policies, continued When payment of any portion of the acquisition price is deferred, amounts payable in the future will be discounted to their present value. The discount rate used will be the entity's incremental loan rate, which is the rate at which a similar loan could be obtained from an independent lender under comparable terms and conditions.
Any contingent acquisition price is classified as either capital or financial liabilities. The amounts classified as financial liabilities are subsequently valued at fair value with changes in profit and loss. If the business combination occurs in stages, the fair value as of the acquisition date of the interest previously held by the acquirer is revalued at fair value as of the acquisition date. Any gain or loss arising from that revaluation is recognized in the statement of net income.
3.6 Cash and cash equivalents
The Company's cash and cash equivalents consist of cash on hand and in bank checking accounts,
time deposits and other financial investments that mature within 90 days. They also include cash management investments, such as covenants with repurchase and resale agreements that mature before the same deadline.
Bank overdrafts are included in short-term loans under current liabilities.
3.7 Trade and other receivables Trade receivables are recognized at fair value, less impairment losses. They also include non-trade receivables, such as sundry debtors, loans to staff and to foreign
entities.
3.8 Inventories
Inventories are valued at the lesser of cost or net realizable value. The cost of inventories is based on in the FIFO method (first in, first out), and includes the acquisition cost of inventories and other costs incurred in moving them to their current location and condition.
Spare parts are valued at historical acquisition cost and recognized in net income using the FIFO method.
SAAM LOGISTICS S.A. Y SUBSIDIARIAS
Notes to the Consolidated Financial Statements
18
NOTE 3 Summary of significant accounting policies, continued Low-turnover spare parts, mainly those that are used in the repair and maintenance of the Company's main assets, such as cranes, constitute strategic inventories, and given their unpredictable demand, they are classified as non-current inventories. 3.9 Intangible assets Intangible assets are identifiable non-monetary assets, without physical substance, that are generated by commercial transactions. Only those intangible assets whose costs can be objectively estimated and those assets from which it is likely that economic benefits will be obtained in the future are recognized for accounting purposes. Intangible assets with finite useful lives are initially recognized at acquisition or development cost and will be valued at cost less accumulated amortization and any impairment losses.
a) Relationship with customers
Intangible assets called "Customer Relationships" arise from business combinations and they are amortized over the estimated period that benefits will be received from the current customer portfolio in each company at the acquisition date. These assets are amortized as of November 1, 2020 (Aerosan Airport Services and Servicios Aeroportuarios Aerosan).
b) Goodwill
Goodwill represents the difference between the acquisition value of the shares or rights of subsidiaries, associates and joint ventures and the fair value of the identifiable contingent assets and liabilities at the acquisition date. Goodwill related to acquisitions of associates and joint ventures is included in investments recognized using the equity and joint-ventures method. Goodwill arising on acquisitions of subsidiaries, joint ventures and businesses associated with functional currencies other than the US dollar is valued in the functional currency of the acquired company, translating it into US dollars at the exchange rate prevailing at the date of the statement of financial position. Goodwill is not amortized, and at the end of each accounting period. It is estimated whether there are indications of impairment that could reduce its recoverable value to an amount lower than the recorded cost, in which case an impairment loss is recorded. As of the date of these consolidated financial statements there are no indications of impairment that warranted making an adjustment.
358
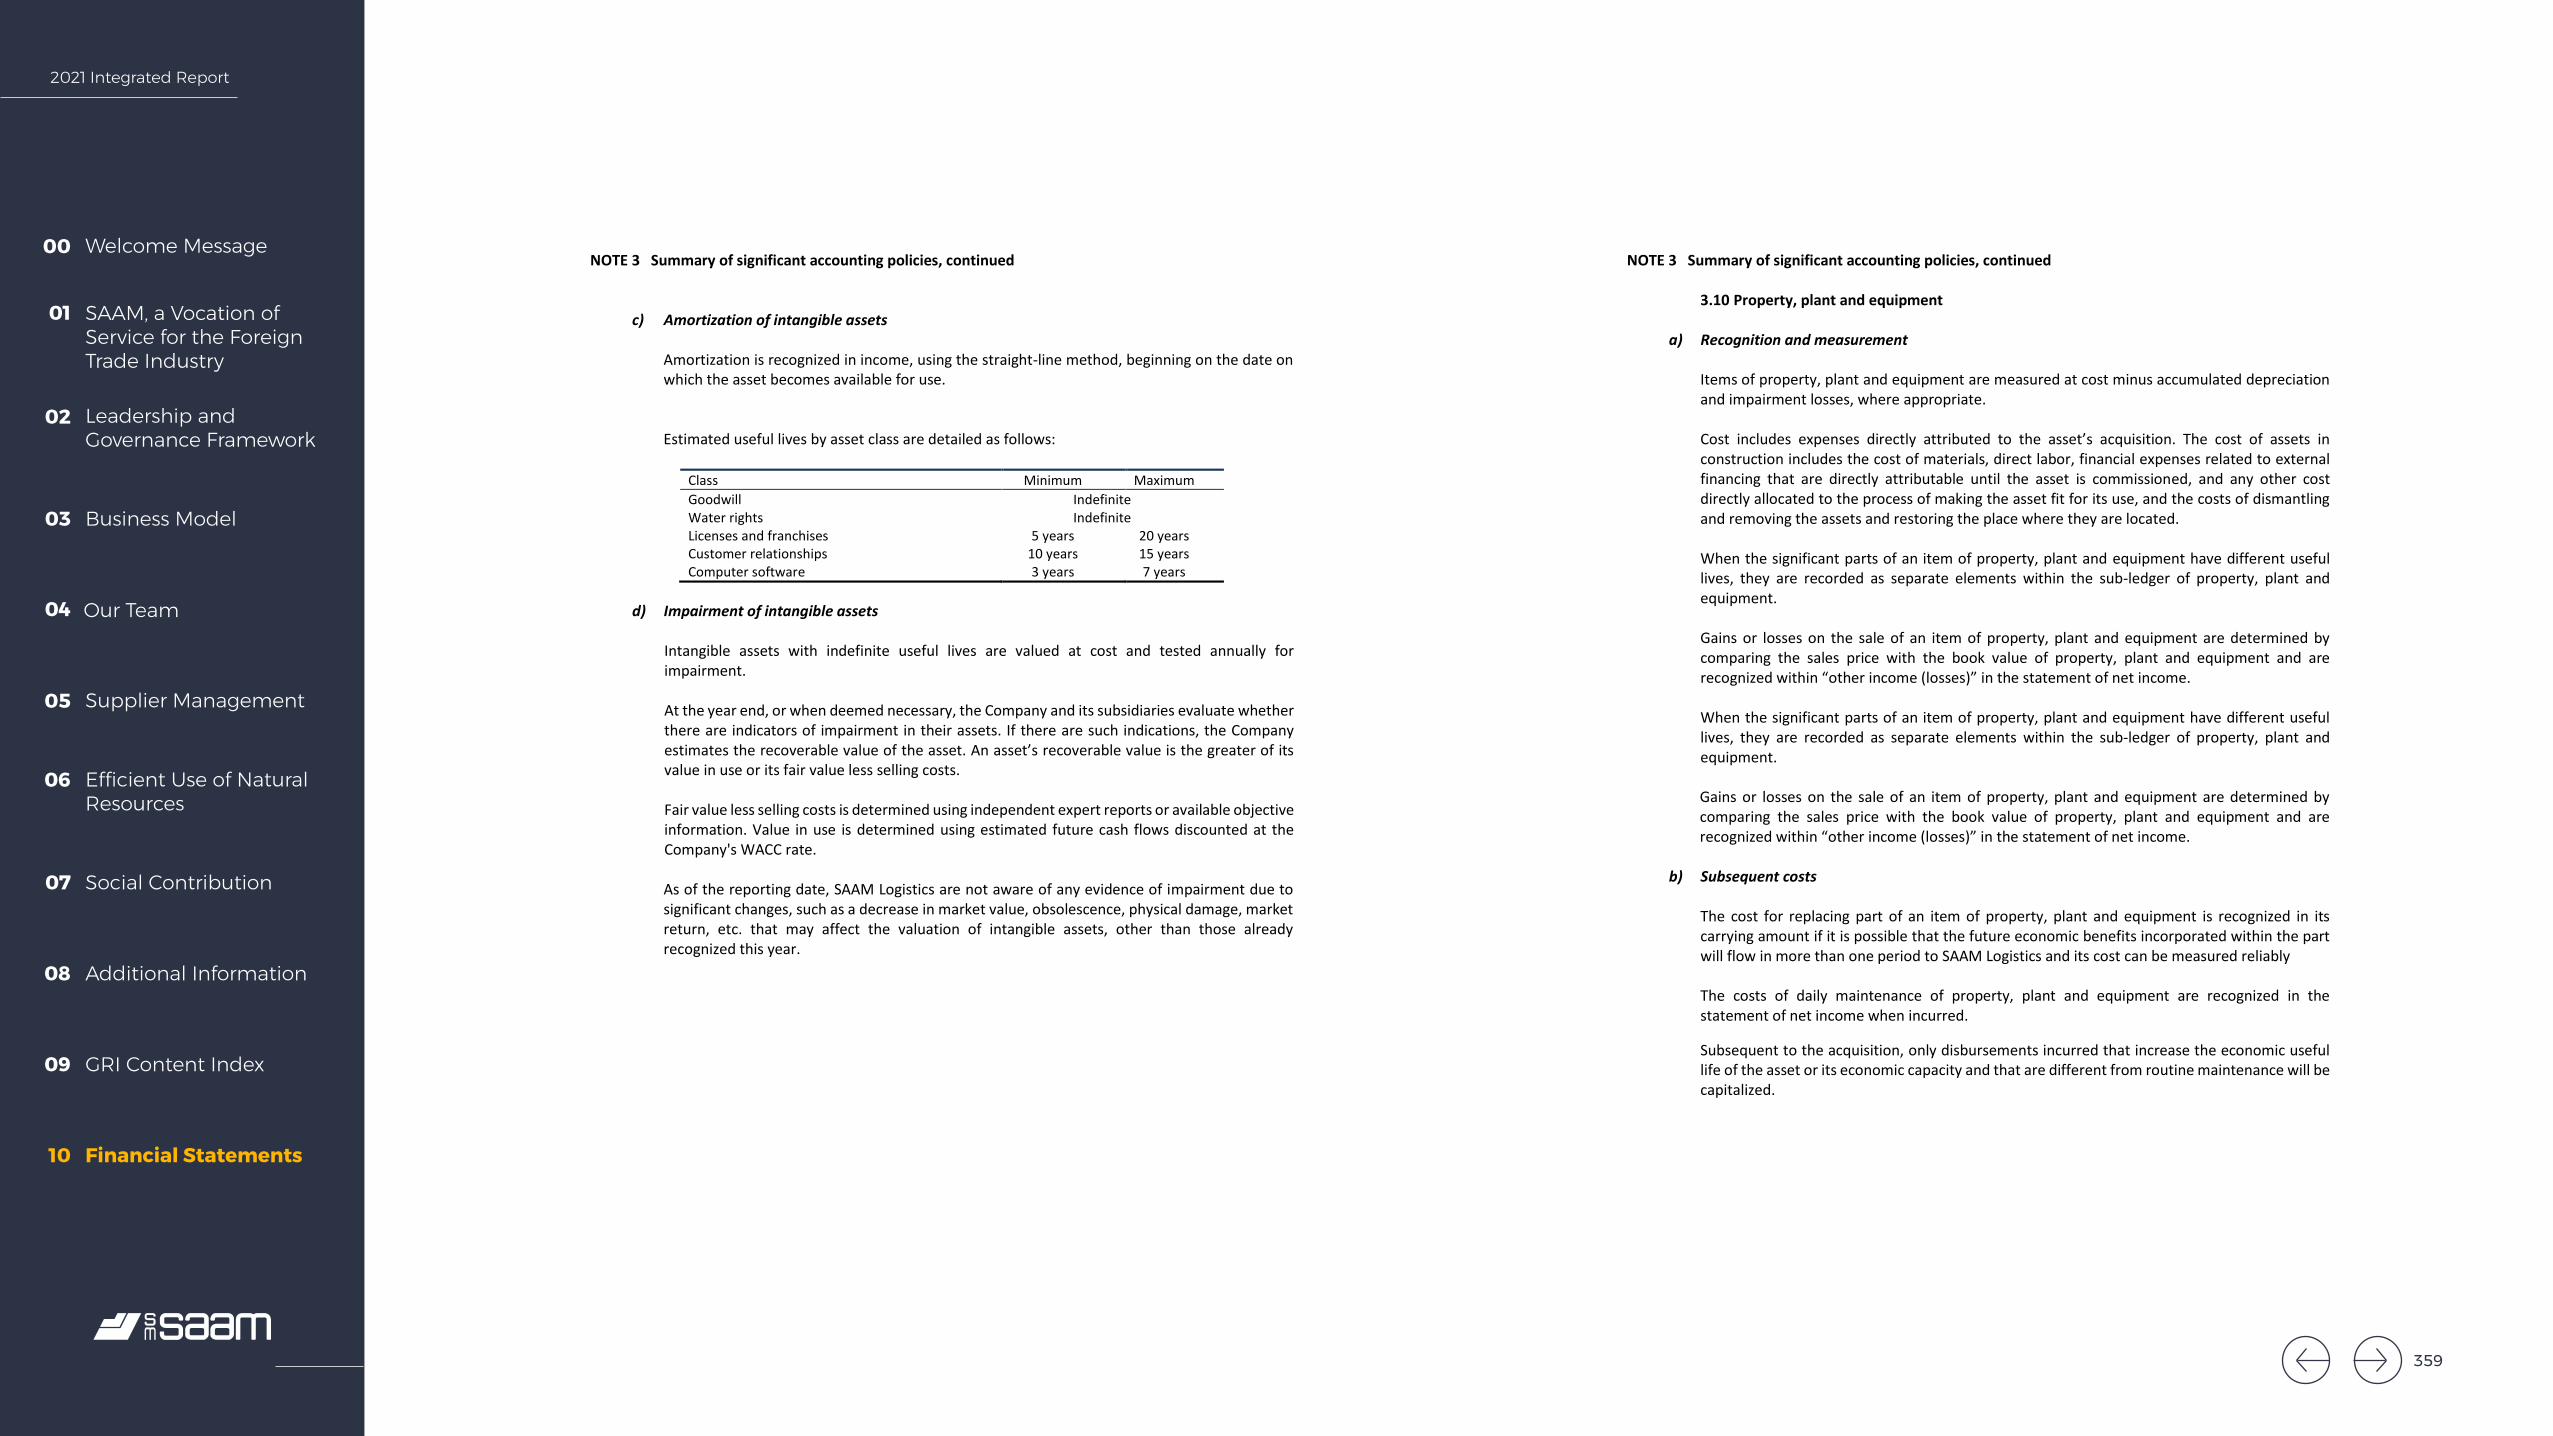
2021 Integrated Report
Welcome Message00
SAAM, a Vocation of Service for the Foreign Trade Industry
01
Leadership and Governance Framework
02
Business Model03
Our Team04
Supplier Management05
Efficient Use of Natural Resources
06
Social Contribution07
Additional Information08
GRI Content Index09
Financial Statements10
SAAM LOGISTICS S.A. Y SUBSIDIARIAS
Notes to the Consolidated Financial Statements
19
NOTE 3 Summary of significant accounting policies, continued
c) Amortization of intangible assets Amortization is recognized in income, using the straight-line method, beginning on the date on which the asset becomes available for use.
Estimated useful lives by asset class are detailed as follows:
Class Minimum Maximum Goodwill Indefinite Water rights Indefinite Licenses and franchises 5 years 20 years Customer relationships 10 years 15 years Computer software 3 years 7 years
d) Impairment of intangible assets
Intangible assets with indefinite useful lives are valued at cost and tested annually for impairment. At the year end, or when deemed necessary, the Company and its subsidiaries evaluate whether there are indicators of impairment in their assets. If there are such indications, the Company estimates the recoverable value of the asset. An asset’s recoverable value is the greater of its value in use or its fair value less selling costs.
Fair value less selling costs is determined using independent expert reports or available objective information. Value in use is determined using estimated future cash flows discounted at the Company's WACC rate. As of the reporting date, SAAM Logistics are not aware of any evidence of impairment due to significant changes, such as a decrease in market value, obsolescence, physical damage, market return, etc. that may affect the valuation of intangible assets, other than those already recognized this year.
SAAM LOGISTICS S.A. Y SUBSIDIARIAS
Notes to the Consolidated Financial Statements
20
NOTE 3 Summary of significant accounting policies, continued 3.10 Property, plant and equipment
a) Recognition and measurement
Items of property, plant and equipment are measured at cost minus accumulated depreciation and impairment losses, where appropriate. Cost includes expenses directly attributed to the asset’s acquisition. The cost of assets in construction includes the cost of materials, direct labor, financial expenses related to external financing that are directly attributable until the asset is commissioned, and any other cost directly allocated to the process of making the asset fit for its use, and the costs of dismantling and removing the assets and restoring the place where they are located. When the significant parts of an item of property, plant and equipment have different useful lives, they are recorded as separate elements within the sub-ledger of property, plant and equipment. Gains or losses on the sale of an item of property, plant and equipment are determined by comparing the sales price with the book value of property, plant and equipment and are recognized within “other income (losses)” in the statement of net income.
When the significant parts of an item of property, plant and equipment have different useful lives, they are recorded as separate elements within the sub-ledger of property, plant and equipment.
Gains or losses on the sale of an item of property, plant and equipment are determined by comparing the sales price with the book value of property, plant and equipment and are recognized within “other income (losses)” in the statement of net income.
b) Subsequent costs
The cost for replacing part of an item of property, plant and equipment is recognized in its carrying amount if it is possible that the future economic benefits incorporated within the part will flow in more than one period to SAAM Logistics and its cost can be measured reliably The costs of daily maintenance of property, plant and equipment are recognized in the statement of net income when incurred.
Subsequent to the acquisition, only disbursements incurred that increase the economic useful life of the asset or its economic capacity and that are different from routine maintenance will be capitalized.
359

2021 Integrated Report
Welcome Message00
SAAM, a Vocation of Service for the Foreign Trade Industry
01
Leadership and Governance Framework
02
Business Model03
Our Team04
Supplier Management05
Efficient Use of Natural Resources
06
Social Contribution07
Additional Information08
GRI Content Index09
Financial Statements10
SAAM LOGISTICS S.A. Y SUBSIDIARIAS
Notes to the Consolidated Financial Statements
21
NOTE 3 Summary of significant accounting policies, continued
c) Depreciation and useful lives
Depreciation is recognized in the consolidated statement of net income by function using the straight-line depreciation method over the useful lives of each item of property, plant and equipment. This is the method that best reflects the use and consumption of the asset. The estimated useful lives for the current periods are as follows.
Class Range in years Minimum Maximum Buildings and construction 40 80 Leasehold property improvements Lease term Machinery 5 15 Transport trucks 3 10 Office equipment 1 3 Furniture, fixtures and fittings 3 5
d) Leases
The Company recognizes contracts that meet the definition of a lease as a right-of-use asset and a lease liability on the date on which the underlying asset is available for use. Right-of-use assets are valued at cost including the following.
• The initial lease liability • The initial direct costs
Right-of-use assets are recognized in the statement of financial position under property, plant and equipment. Lease liabilities include the net present value of the following payments.
• Essentially fixed payments • Variable payments based on an index or rate • Call options at the exercise price, when these are reasonably certain to be exercised.
The Company determines the present value of the lease payments using the rate implicit in the underlying lease contracts, using the incremental interest rate.
SAAM LOGISTICS S.A. Y SUBSIDIARIAS
Notes to the Consolidated Financial Statements
22
NOTE 3 Summary of significant accounting policies, continued Lease liabilities are recognized in the statement of financial position under other current and non-current financial liabilities. Interest accrued on financial liabilities is recognized in the consolidated statement of net income under "Financial costs". Capital and interest installments paid are recognized in the consolidated statement of cash flow as "Payments of liabilities under finance leases" and "Interest paid" in the Cash Flow from Financing Activities. The Company does not have any embedded leases in contracts that require separation.
e) Impairment of property, plant and equipment
Assets are evaluated for indications of impairment, such as significant decreases in value, indicators of obsolescence or physical deterioration, or changes in the legal, economic or technological environment in which the asset is used. If there are such indications, the Company estimates the recoverable value of the asset. An asset’s recoverable value is the greater of its value in use or its fair value less selling costs. Fair value less selling costs is determined using independent expert reports or available objective information. The impairment of assets that do not generate independent cash flows is assessed by grouping assets that generate identifiable flows (cash generating units). If the recoverable amount of the asset is less than its net book value, the corresponding impairment adjustment is recognized in the statement of net income, leaving the asset at its recoverable amount. Impairment losses recognized in prior periods will be evaluated at each year-end, in order to determine any indication that the loss has decreased or disappeared, recognizing the reversal with credit to the statement of net income unless an asset is recorded at the revalued amount, in which case the reversal is credited to equity. As of the reporting date, SAAM Logistics are not aware of any evidence of impairment due to significant changes, such as a decrease in market value, obsolescence, physical damage, market return, etc. that may affect the valuation of property, plant and equipment, other than those already recognized this year.
360
2021 Integrated Report
Welcome Message00
SAAM, a Vocation of Service for the Foreign Trade Industry
01
Leadership and Governance Framework
02
Business Model03
Our Team04
Supplier Management05
Efficient Use of Natural Resources
06
Social Contribution07
Additional Information08
GRI Content Index09
Financial Statements10
SAAM LOGISTICS S.A. Y SUBSIDIARIAS
Notes to the Consolidated Financial Statements
23
NOTE 3 Summary of significant accounting policies, continued
3.11 Investment property
Investment properties are held to receive rental income, to benefit from capital appreciation, or both, but not for sale in the normal course of business, use in production or supply of goods or services, or for administrative purposes. Investment properties are valued at cost less accumulated depreciation and accumulated impairment losses. When the use of a property changes, its value is reclassified to the item in the statement of financial position that best reflects its new use. 3.12 Provisions A provision is recognized when there is a legal or constructive obligation as a result of a past event and it is likely that a resource disbursement, including economic benefits, will be required to settle the obligation, and its value can be reliably estimated. The provision is the best estimate of the amount payable, as of the reporting date.
When the estimated payment period is long term and can be estimated with sufficient reliability, the provision is recorded at its present value, discounting the estimated payment flows at a market interest rate that reflects the specific risks of the obligation. Provisions should be reviewed at the end of each reporting period and adjusted accordingly to reflect the best available estimate at any given time. 3.13 Other financial liabilities These liabilities are initially recognized at the transaction value. Costs incurred that are directly attributable to the transaction are depreciated over the period of the loan and presented as a reduction in the liability. They are valued at amortized cost, using the effective interest rate method. 3.14 Trade and other payables, current These include payables for trade purchases and related expenses, plus non-trade payables, such as sundry creditors, retentions from staff remuneration and others.
SAAM LOGISTICS S.A. Y SUBSIDIARIAS
Notes to the Consolidated Financial Statements
24
NOTE 3 Summary of significant accounting policies, continued
3.15 Employee benefits a) Defined benefit plans
The Company is obliged to pay severance indemnities under the collective bargaining agreements. This obligation is provided for by applying the actuarial value method to the accrued cost of the benefit, with a nominal annual discount rate of 5.65%, considering estimates such as future tenure, employee mortality rate and future salary increases, determined on the basis of actuarial calculations. Discount rates are determined by reference to market interest curves.
b) Defined benefit plans, continued
The present value of the obligation is determined by actuarial valuations. Actuarial valuation involves making assumptions about the discount rate, future salary increases, mortality rates and future pension increases. All assumptions are reviewed once a year. The discount rate is based on the interest rates for instruments issued by the Central Bank of Chile. The mortality rate is based on publicly available mortality tables for the country. Future increases in salaries and pensions are based on projected future increases in the inflation rate for the country.
c) Short-term benefits
Short-term employee benefit obligations are measured on an undiscounted basis and accounted for in the statement of net income by function as the related service is accrued.
3.16 Operating revenue and costs of sales
Operating revenue and costs of sales from providing services are recognized in the statement of net income on an accrual basis.
Operating revenue is recognized only to the extent that it can be reliably measured and it is probable that financial benefits will flow to the Company regardless of when that occurs. The cost of sales associated with the services provided are recognized on an accrual basis directly to the respective business areas of the Company. Operating revenue and costs of sales are recognized net of discounts.
361
2021 Integrated Report
Welcome Message00
SAAM, a Vocation of Service for the Foreign Trade Industry
01
Leadership and Governance Framework
02
Business Model03
Our Team04
Supplier Management05
Efficient Use of Natural Resources
06
Social Contribution07
Additional Information08
GRI Content Index09
Financial Statements10
SAAM LOGISTICS S.A. Y SUBSIDIARIAS
Notes to the Consolidated Financial Statements
25
NOTE 3 Summary of significant accounting policies, continued
3.17 Financial income and financial costs
Financial income is recognized in the statement of comprehensive income by function on an accrual basis. Financial costs are generally taken to the statement of net income when they are incurred, except those that finance the construction or development of qualifying assets that require a substantial period to prepare them for use, and those related to the actuarial cost of staff benefits.
3.18 Corporate income tax
The Company and its subsidiaries in Chile account for income tax based on net taxable income determined according to the rules established in Income Tax Law. This calculation for foreign subsidiaries complies with the laws in their respective countries. 3.19 Deferred tax Deferred tax assets and liabilities are recognized using the statement of financial position method. Temporary differences between the book value of the assets and liabilities and their tax base are recorded as established in IAS 12 "Income tax". Deferred taxes are valued at tax rates expected to be applied when temporary differences are reversed, based on laws that have been approved or are about to be approved as of each reporting date. 3.20 Investments and other financial assets
a.1) Classification
SAAM Logistics classifies its financial assets into the following categories. • Those that are subsequently valued at fair value (either through other comprehensive
income, or through profit and loss), and • Those that are valued at amortized cost. This valuation depends on the business model used by the Company to manage the financial assets and the contractual terms of the cash flows.
SAAM LOGISTICS S.A. Y SUBSIDIARIAS
Notes to the Consolidated Financial Statements
26
NOTE 3 Summary of significant accounting policies, continued Gains and losses on assets valued at fair value will be recorded in the statement of net income or other comprehensive income. Gains and losses on investments in equity instruments that are not held for trading will depend on whether the Company has made an irrevocable decision at initial recognition to record the investment at fair value through other comprehensive income. The Company only reclassifies debt instruments when it changes its business model for managing those assets. a.2) Recognition Routine purchases and sales of financial assets are recognized as of the transaction date, which is the date that the Company commits to purchase or sell the asset. Financial assets are de-recognized when the rights to receive cash flows from the financial asset have expired or have been transferred and the Company has transferred substantially all risks and rewards of ownership. a.3) Measurement Financial assets are valued at initial recognition at fair value plus transaction costs directly attributable to the acquisition of the financial asset, in the case of a financial asset that is not recognized at fair value through profit or loss. Transaction costs of financial assets recognized at fair value through profit and loss are recorded in the statement of net income. Financial assets with embedded derivatives are considered in their entirety when determining whether cash flows are only payments of principal and interest. b) Non-derivative financial instruments Financial instruments are classified on initial recognition as a financial asset, financial liability or equity instrument, in accordance with the substance of the contractual arrangement. Also, financial instruments are classified for valuation purposes into four categories, financial assets at fair value through profit or loss, loans and receivables, investments held-to-maturity and financial liabilities. This classification depends on the characteristics of the instrument and the purpose for its acquisition. SAAM Logistics derecognizes a financial liability when its contractual obligations are settled or expire. After initial recognition, non-derivative financial instruments are valued as follows.
362
2021 Integrated Report
Welcome Message00
SAAM, a Vocation of Service for the Foreign Trade Industry
01
Leadership and Governance Framework
02
Business Model03
Our Team04
Supplier Management05
Efficient Use of Natural Resources
06
Social Contribution07
Additional Information08
GRI Content Index09
Financial Statements10
SAAM LOGISTICS S.A. Y SUBSIDIARIAS
Notes to the Consolidated Financial Statements
27
NOTE 3 Summary of significant accounting policies, continued b.1) Financial assets at fair value through profit and loss Financial assets at fair value through profit and loss are financial assets held for trading, or are designated as such upon initial recognition. A financial asset or liability is classified as held for trading if: • It is acquired or incurred primarily for the purpose of selling or repurchasing it in the immediate future. • It is part of a portfolio of identified financial instruments, which are managed together and for which there is evidence of a recent pattern of short-term profit. • It is a derivative, except a derivative that has been designated as a hedging instrument and meets the conditions to be effective. Financial assets at fair value through profit or loss are initially recorded at fair value. Transaction costs directly attributable to the purchase or issue are recognized as an expense when incurred. Subsequent to initial recognition, they are recognized at fair value with changes recorded in the statement of net income. c) Others Other non-derivative financial instruments including loans and receivables are valued at amortized cost using the effective interest rate method, less any impairment loss. d) Financial asset impairment Provisions for doubtful debts are based on the expected losses, by evaluating the historical payment behavior of customers in the various portfolio segments. They are evaluated by preparing recoverability matrices composed of age ranges, which show expected uncollectibility percentages during the life of the asset and are recognized from the outset.
Loans and receivables are included in "Trade and other receivables" in the consolidated statement of financial position, except for those maturing more than 12 months after the closing date, which are classified as non-current trade and other receivables. They are recorded at amortized cost in accordance with the effective interest rate method and this is their initial fair value.
SAAM LOGISTICS S.A. Y SUBSIDIARIAS
Notes to the Consolidated Financial Statements
28
NOTE 3 Summary of significant accounting policies, continued The effective interest rate method is a method of calculating the amortized cost of a financial asset or liability and of allocating the financial income or expense over the corresponding period. The effective interest rate is the discount rate that exactly matches the estimated cash flows receivable or payable over the expected life of the financial instrument (or when appropriate over a shorter period) with the net book value of the financial asset or financial liability. Current trade receivables are not discounted. The Company has determined that amortized cost does not differ from the amount invoiced because the transaction does not involve any significant costs.
3.21 Derivatives and hedge transactions
a) Derivative financial instruments
Derivative financial instruments used to hedge risk exposure in foreign currency and interest rates are initially recognized at fair value. Attributable transaction costs are recognized in the statement of net income when they are incurred. After initial recognition, derivative financial instruments are measured at fair value, and any changes are recorded as follows.
a.1) Fair value hedges Derivative financial instruments that satisfy hedge accounting criteria are initially recognized at fair value plus / minus the transaction costs that are directly attributable to contracting or issuing the instrument, as appropriate. Changes in the fair value of derivatives that are designated and qualify as fair value hedges are recorded in the consolidated statement of net income, together with any change in the fair value of the hedged asset or liability that are attributable to the hedged risk.
a.2) Cash flow hedges
The effective portion of changes in the fair value of derivatives that are designated and qualify as cash flow hedges are recognized in the statement of other comprehensive income. Any loss or gain related to the ineffective portion is recognized immediately in the consolidated statement of income within other income (losses). The amounts accumulated in equity are reclassified to the statement of net income in the periods in which the protected item impacts the statement of net income. Variable interest rate hedges that are recognized in the statement of other comprehensive income are reclassified to the statement of net income within financial expenses as the associated debts accrue interest.
363

2021 Integrated Report
Welcome Message00
SAAM, a Vocation of Service for the Foreign Trade Industry
01
Leadership and Governance Framework
02
Business Model03
Our Team04
Supplier Management05
Efficient Use of Natural Resources
06
Social Contribution07
Additional Information08
GRI Content Index09
Financial Statements10
SAAM LOGISTICS S.A. Y SUBSIDIARIAS
Notes to the Consolidated Financial Statements
29
NOTE 3 Summary of significant accounting policies, continued Foreign currency hedges that are recognized in the statement of other comprehensive income are reclassified to the statement of net income as the hedged items are impacted by changes in exchange rates and affect the statement of net income. When a hedge instrument matures, or is sold, or when it no longer satisfies hedge accounting criteria, any gain or loss accumulated in the statement of other comprehensive income until that point remains in the statement of other comprehensive income and is recognized when the forecast transaction is finally recognized in the consolidated statement of net income. When the forecast transaction is not expected to occur, any accumulated gain or loss accumulated in the statement of other comprehensive income is recognized immediately in the consolidated statement of net income within other income (losses). a.3) Derivatives not designated as hedges Hedge accounting is not applicable to derivative instruments that financially cover monetary assets and liabilities denominated in foreign currencies. Changes in the fair value of such derivatives are recognized in the statement of net income by function within foreign exchange differences. Derivative financial instruments that do not satisfy hedge accounting criteria are classified and valued as financial assets or liabilities at fair value through profit and loss. 3.22 Non-current assets held for sale
Non-current assets, or groups of assets and liabilities, that are expected to be recovered principally through sales rather than through continuous use, are classified as held for sale and are valued at the lower of their book value and fair value less selling costs. Immediately prior to this classification, these assets or disposal groups are valued at the lower of their book value and fair value less selling costs. Any impairment loss in a disposal group is first allocated to goodwill, and then to the remaining assets and liabilities on a pro rata basis. Impairment losses when initially classified as held for sale and subsequent gains or losses are recognized in the statement of net income. Gains are only recognized when accumulated impairment losses are covered.
SAAM LOGISTICS S.A. Y SUBSIDIARIAS
Notes to the Consolidated Financial Statements
30
NOTE 3 Summary of significant accounting policies, continued 3.23 Determination of fair values Some criteria and accounting disclosures of the Group require that the fair value of certain financial assets be determined as follows. a) Financial assets The fair value of financial assets at fair value through profit and loss and financial assets held for sale is market value. b) Trade and other receivables As trade receivables are collected within 120 days, their fair value is not estimated to differ significantly from their book value. c) Derivatives The fair value of derivative contracts is based on their quoted price.
3.24 Minimum dividend
The Company records a liability for its dividends, in accordance with the accounting policy of its parent company SM SAAM S.A., which is based on Corporations Law. 3.25 Environment
Any environmental liabilities are based on the current interpretation of environmental laws and regulations, when it is probable that an obligation will arise and the amount of such liability can be reliably estimated. Disbursements related to environmental protection are charged to the consolidated income statement when they are incurred.
364
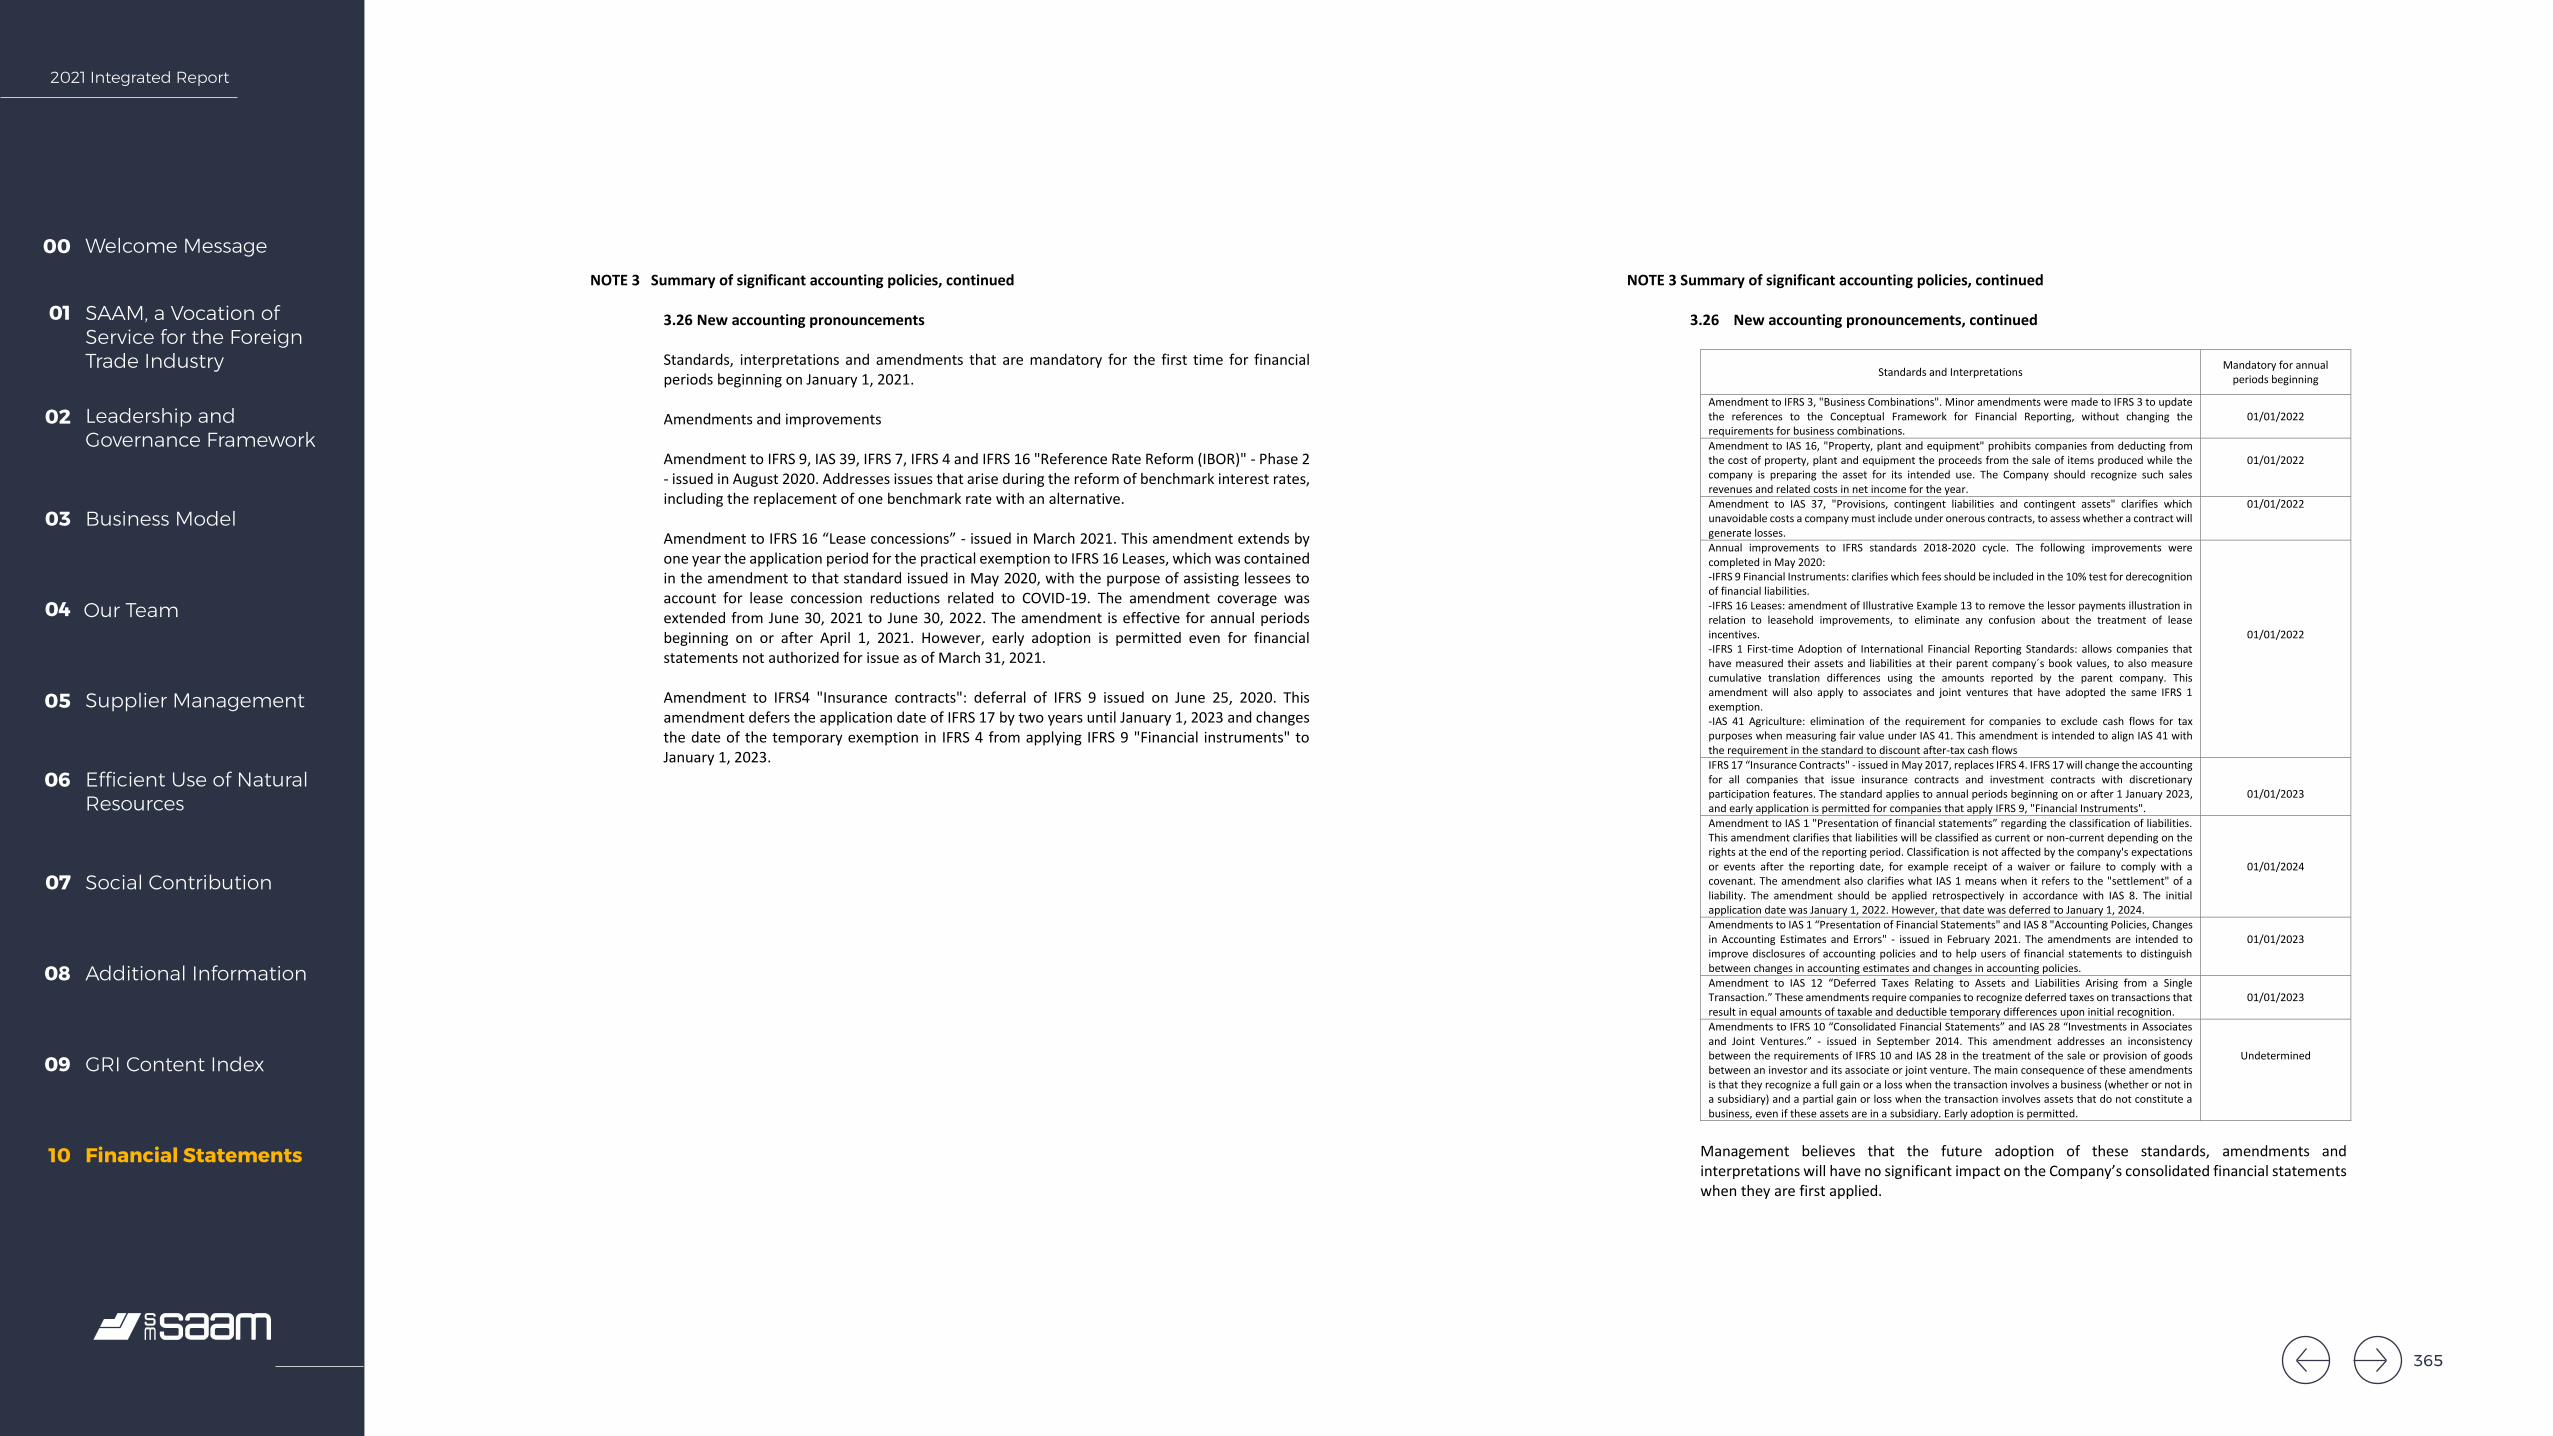
2021 Integrated Report
Welcome Message00
SAAM, a Vocation of Service for the Foreign Trade Industry
01
Leadership and Governance Framework
02
Business Model03
Our Team04
Supplier Management05
Efficient Use of Natural Resources
06
Social Contribution07
Additional Information08
GRI Content Index09
Financial Statements10
SAAM LOGISTICS S.A. Y SUBSIDIARIAS
Notes to the Consolidated Financial Statements
31
NOTE 3 Summary of significant accounting policies, continued
3.26 New accounting pronouncements
Standards, interpretations and amendments that are mandatory for the first time for financial periods beginning on January 1, 2021. Amendments and improvements Amendment to IFRS 9, IAS 39, IFRS 7, IFRS 4 and IFRS 16 "Reference Rate Reform (IBOR)" - Phase 2 - issued in August 2020. Addresses issues that arise during the reform of benchmark interest rates, including the replacement of one benchmark rate with an alternative. Amendment to IFRS 16 “Lease concessions” - issued in March 2021. This amendment extends by one year the application period for the practical exemption to IFRS 16 Leases, which was contained in the amendment to that standard issued in May 2020, with the purpose of assisting lessees to account for lease concession reductions related to COVID-19. The amendment coverage was extended from June 30, 2021 to June 30, 2022. The amendment is effective for annual periods beginning on or after April 1, 2021. However, early adoption is permitted even for financial statements not authorized for issue as of March 31, 2021. Amendment to IFRS4 "Insurance contracts": deferral of IFRS 9 issued on June 25, 2020. This amendment defers the application date of IFRS 17 by two years until January 1, 2023 and changes the date of the temporary exemption in IFRS 4 from applying IFRS 9 "Financial instruments" to January 1, 2023.
SAAM LOGISTICS S.A. Y SUBSIDIARIAS
Notes to the Consolidated Financial Statements
32
NOTE 3 Summary of significant accounting policies, continued
3.26 New accounting pronouncements, continued
Standards and Interpretations Mandatory for annual periods beginning
Amendment to IFRS 3, "Business Combinations". Minor amendments were made to IFRS 3 to update the references to the Conceptual Framework for Financial Reporting, without changing the requirements for business combinations.
01/01/2022
Amendment to IAS 16, "Property, plant and equipment" prohibits companies from deducting from the cost of property, plant and equipment the proceeds from the sale of items produced while the company is preparing the asset for its intended use. The Company should recognize such sales revenues and related costs in net income for the year.
01/01/2022
Amendment to IAS 37, "Provisions, contingent liabilities and contingent assets" clarifies which unavoidable costs a company must include under onerous contracts, to assess whether a contract will generate losses.
01/01/2022
Annual improvements to IFRS standards 2018-2020 cycle. The following improvements were completed in May 2020: -IFRS 9 Financial Instruments: clarifies which fees should be included in the 10% test for derecognition of financial liabilities. -IFRS 16 Leases: amendment of Illustrative Example 13 to remove the lessor payments illustration in relation to leasehold improvements, to eliminate any confusion about the treatment of lease incentives. -IFRS 1 First-time Adoption of International Financial Reporting Standards: allows companies that have measured their assets and liabilities at their parent company´s book values, to also measure cumulative translation differences using the amounts reported by the parent company. This amendment will also apply to associates and joint ventures that have adopted the same IFRS 1 exemption. -IAS 41 Agriculture: elimination of the requirement for companies to exclude cash flows for tax purposes when measuring fair value under IAS 41. This amendment is intended to align IAS 41 with the requirement in the standard to discount after-tax cash flows
01/01/2022
IFRS 17 “Insurance Contracts" - issued in May 2017, replaces IFRS 4. IFRS 17 will change the accounting for all companies that issue insurance contracts and investment contracts with discretionary participation features. The standard applies to annual periods beginning on or after 1 January 2023, and early application is permitted for companies that apply IFRS 9, "Financial Instruments".
01/01/2023
Amendment to IAS 1 "Presentation of financial statements” regarding the classification of liabilities. This amendment clarifies that liabilities will be classified as current or non-current depending on the rights at the end of the reporting period. Classification is not affected by the company's expectations or events after the reporting date, for example receipt of a waiver or failure to comply with a covenant. The amendment also clarifies what IAS 1 means when it refers to the "settlement" of a liability. The amendment should be applied retrospectively in accordance with IAS 8. The initial application date was January 1, 2022. However, that date was deferred to January 1, 2024.
01/01/2024
Amendments to IAS 1 “Presentation of Financial Statements" and IAS 8 "Accounting Policies, Changes in Accounting Estimates and Errors" - issued in February 2021. The amendments are intended to improve disclosures of accounting policies and to help users of financial statements to distinguish between changes in accounting estimates and changes in accounting policies.
01/01/2023
Amendment to IAS 12 “Deferred Taxes Relating to Assets and Liabilities Arising from a Single Transaction.” These amendments require companies to recognize deferred taxes on transactions that result in equal amounts of taxable and deductible temporary differences upon initial recognition.
01/01/2023
Amendments to IFRS 10 “Consolidated Financial Statements” and IAS 28 “Investments in Associates and Joint Ventures.” - issued in September 2014. This amendment addresses an inconsistency between the requirements of IFRS 10 and IAS 28 in the treatment of the sale or provision of goods between an investor and its associate or joint venture. The main consequence of these amendments is that they recognize a full gain or a loss when the transaction involves a business (whether or not in a subsidiary) and a partial gain or loss when the transaction involves assets that do not constitute a business, even if these assets are in a subsidiary. Early adoption is permitted.
Undetermined
Management believes that the future adoption of these standards, amendments and interpretations will have no significant impact on the Company’s consolidated financial statements when they are first applied.
365

2021 Integrated Report
Welcome Message00
SAAM, a Vocation of Service for the Foreign Trade Industry
01
Leadership and Governance Framework
02
Business Model03
Our Team04
Supplier Management05
Efficient Use of Natural Resources
06
Social Contribution07
Additional Information08
GRI Content Index09
Financial Statements10
SAAM LOGISTICS S.A. Y SUBSIDIARIAS
Notes to the Consolidated Financial Statements
33
NOTE 4 Accounting changes
During the year from January 1 to December 31, 2021, the Company has uniformly applied its accounting policies compared to 2020.
NOTE 5 Related party balances and transactions
The net balance of receivables from and payable to non-consolidated related parties are detailed as follows.
Current Non-current Total Current Non-current Total
12-31-2021 12-31-2021 12-31-2021 12-31-2020 12-31-2020 12-31-2020 ThUS$ ThUS$ ThUS$ ThUS$ ThUS$ ThUS$
Related party receivables 313 - 313 157 - 157 Related party payables (1,619) (14,000) (15,619) (377) (14,000) (14,377)
Total (1,306) (14,000) (15,306) (220) (14,000) (14,220)
All outstanding current balances with related parties are valued at mutually independent conditions and will be settled within twelve months of the reporting date.
5.1 Related party receivables
Related party receivables are detailed as follows:
Chilean ID Chilean companies Currency Relationship Transaction
Current Non-current
Current Non-current
number 12-31-2021 12-31-2021 12-31-2020 12-31-2020 ThUS$ ThUS$ ThUS$ ThUS$
92,048,000-4 SAAM S.A. Chilean pesos US dollars
Subsidiary Services Mercantile account
- -
- -
- 14
- -
99,511,240-K Antofagasta Terminal Internacional S.A.
Chilean pesos Indirect associate Services - - 1 -
86,150,200-7 Fábrica de Envases Plásticos S.A. Chilean pesos Subsidiary Services 119 -
- -
89,602,300-4 CSAV Austral SpA Chilean pesos and US dollars
Common shareholder
Services 94 - 76 -
99,501,760-1 Embotelladoras Chilenas Unidas S.A.
Chilean pesos Director in common
Services 8 - 3 -
99,506,030-2 Muellaje del Maipo S.A. Chilean pesos Indirect associate Services 5 - - -
96,610,780-4 Portuaria Corral S.A. US dollars Subsidiary Others 1 - - -
96,908,970-K San Antonio Terminal Internacional S.A.
Chilean pesos and US dollars
Indirect associate Services
- - 3 -
94,058,000-5 San Vicente Terminal Internacional S.A.
US dollars Indirect associate Services Dividend
1 - 27 -
77,419,016-3 SPR Los Rios SpA. Chilean pesos Subsidiary Others 33 - - -
76,380,217-5 Hapag Lloyd Chile SPA Chilean pesos Common shareholder
Services
52 - 32 -
96,677,790-7 Terminal El Colorado S.A. Chilean pesos Associate Services - - 1 -
Total Chilean companies 313 157
SAAM LOGISTICS S.A. Y SUBSIDIARIAS
Notes to the Consolidated Financial Statements
34
NOTE 5 Related entity balances and transactions, continued 5.2 Related party payables Related party payables are detailed as follows:
Chilean ID number Chilean companies Currency Relationship Transaction
Current 12-31-2021
ThUS$
Non-current 12-31-2021
ThUS$
Current 12-31-2020
ThUS$
Non-current 12-31-2020
ThUS$ 96,915,330-0 Iquique Terminal Internacional S.A. US dollars Director in
common Services 2 - 4 -
92,011,000-2 Empresa Nacional de Energía Enex S.A. Chilean pesos
Director in common
Services 34 - 6 -
76,479,537-7 SAAM Inversiones SpA US dollars Common parent Services 3 - 5 -
92,048,000-4 SAAM S.A.
US dollars Common parent Others 920 - 191 -
76,380,217-5 Hapag Lloyd Chile SPA Chilean pesos
Common shareholder
Services
210 - -
96,908,970-K San Antonio Terminal Internacional S.A. Chilean pesos
Indirect associate
Others Services
164 - 36 -
76196718-5 Sociedad Matriz SAAM S.A. US dollars Parent company Loans 286 14,000 135 14,000 Total Chilean companies 1,619 14,000 377 14,000
366

2021 Integrated Report
Welcome Message00
SAAM, a Vocation of Service for the Foreign Trade Industry
01
Leadership and Governance Framework
02
Business Model03
Our Team04
Supplier Management05
Efficient Use of Natural Resources
06
Social Contribution07
Additional Information08
GRI Content Index09
Financial Statements10
SAAM LOGISTICS S.A. Y SUBSIDIARIAS
Notes to the Consolidated Financial Statements
35
Note 5 Related entity balances and transactions, continued 5.3 Effects on the statement of net income of transactions with related parties
Chilean ID number Company Relationship Country Transactions
12-31-2021
ThUS$ 12-31-2020
ThUS$ 92,048,000-4 SAAM S.A. Common
parent Chile Logistics
Port operations Port terminal services
- 262
(2,569)
1 361
(1,182) 96.915.330-0 Iquique Terminal Internacional S.A. Director in
common Chile Contracted logistics
Port terminal service costs 83
(18) 83
(27) 90,160,000-7 Compañía Sudamericana de Vapores S.A. Shareholders
and/or director Chile Logistics - 2
76,049,840-8 Happag Lloyd S.A. Shareholders and/or director
Chile Port operations Contracted logistics Documentation services
413 428
(2,402)
315 135
(1,137) 89,602,300-4 CSAV Austral SPA S.A. Shareholders
and/or director Chile Logistics 357 301
96,908,970-K San Antonio Terminal Internacional S.A. Indirect associate
Chile Logistics Port terminal services
21 (1,068)
37 (330)
76,077,848-6 Cervecera Belga de la Patagonia Director in common
Chile Logistics 1 -
96,908,930-0
San Vicente Terminal Internacional S.A. Indirect associate
Chile Logistics Port terminal services
216 (5)
283
99,511,240-K
Antofagasta Terminal Internacional S.A. Indirect associate
Chile Port operations 19 38
92,011,000-2 Empresa Nacional de Energía ENEX S.A Director in common
Chile Logistics 313 163
97,004,000-5 Banco de Chile S.A. Director in
common Chile Logistics 2 1
91,041,000-8 Viña San Pedro Tarapacá S.A. Director in common
Chile Logistics
26 18
99,586,280-8 Compañía Pisquera de Chile S.A. Common shareholder
Chile Logistics 16 11
96,783,150-6 St. Andrews Smoky Delicacies S.A. Director in common
Chile Logistics
16 12
99,501,760-1 Embotelladoras Chilenas Unidas S.A. Director in common
Chile Logistics 41 15
88,586,400-7 Cervecera CCU Chile Limitada Director in common
Chile Logistics 103 -
78,353,000-7 Servicios Portuarios Reloncaví Ltda. Indirect associate
Chile Leases 5
5
99,506,030-2 Muellaje del Maipo S.A. Indirect associate
Chile Leases
70
34
96,790,240-3
Minera los Pelambres S.A.
Common shareholder
Chile Logistics 1 4
81,148,200-5 Ferrocarriles de Antofagasta a Bolivia S.A. Director in common
Chile Logistics 1 0
90,413,000-1 Compañía Cervecerías Unidas S.A. Common shareholder
Chile Logistics - 6
86,150,200-7 Fábrica de Envases Plásticos S.A. Common shareholder
Chile Logistics 315 2
84,356,800-9 Watts S.A. Director in common
Chile Logistics 47 -
96,981,310-6 Compañía Cervecera Kunstmann S.A. Director in common
Chile Logistics 1 -
N/A Bebidas Ecusa SpA Associate Chile Logistics 1 2 94,058,000-5 Servicios Aeroportuarios Aerosan S.A. Subsidiary Chile Logistics - 1 76,196,718-5 Sociedad Matriz SAAM S.A. Parent
company Chile Loan 494 87
76,337,371-1 Bebidas CCU_PepsiCo SpA Common shareholder
Chile Logistics - 5
SAAM LOGISTICS S.A. Y SUBSIDIARIAS
Notes to the Consolidated Financial Statements
36
NOTE 5 Related entity balances and transactions, continued 5.3 Effects on the statement of net income of transactions with related parties, continued
Current transactions with related companies are business transactions carried out under equal conditions that usually prevail in the market in terms of price and payment terms. Sales transactions are freight services, equipment leasing, software sales, advisory services provided by the subsidiary SAAM Logistics S.A. and its subsidiaries to related companies Purchase transactions with related entities refer mainly to port operation services, logistics and warehousing services, advisory services and other transactions.
5.4 Director's remuneration
The directors of SAAM Logistics S.A. do not receive any remuneration.
367

2021 Integrated Report
Welcome Message00
SAAM, a Vocation of Service for the Foreign Trade Industry
01
Leadership and Governance Framework
02
Business Model03
Our Team04
Supplier Management05
Efficient Use of Natural Resources
06
Social Contribution07
Additional Information08
GRI Content Index09
Financial Statements10
Sociedad Matriz SAAM S.A. and SubsidiariesReport required by General Character Standard No. 30 from the Financial Market Commission
Summarized Financial Statements SAAM Inversiones SPA
As of December 31, 2021
368

2021 Integrated Report
Welcome Message00
SAAM, a Vocation of Service for the Foreign Trade Industry
01
Leadership and Governance Framework
02
Business Model03
Our Team04
Supplier Management05
Efficient Use of Natural Resources
06
Social Contribution07
Additional Information08
GRI Content Index09
Financial Statements10
INDEPENDENT AUDITOR’S REPORT (A free translation from the original in Spanish)
Santiago, March 11, 2022
To the Shareholders and Directors Sociedad Matriz SAAM S.A.
As external auditors of Sociedad Matriz SAAM S.A and subsidiaries, we have audited its consolidated financial statements as of December 31, 2021 and 2020, over which we reported on March 11, 2022. The financial statements in abridged form, prepared in accordance with the provisions of General Rule (GRS) No. 30, Section II.2.1, paragraph A.4.2, issued by the Superintendence of Securities and Insurance (now Financial Market Commission - CMF), of the subsidiary SAAM Inversiones S.p.A. and its accompanying notes on "accounting policies applied” and "related party transactions” attached hereto, are consistent, in all material respects, with the information contained in the consolidated financial statements that we have audited.
The preparation of such abridged financial statements, which include the accounting policies applied and transactions with related parties, is the responsibility of the Management of Sociedad Matriz SAAM S.A. and SAAM Inversiones S.p.A.
We report that the aforementioned abridged financial statements and its notes on "accounting policies applied" and "related party transactions" of SAAM Inversiones S.p.A. attached hereto, correspond to those that were used in the consolidation process carried out by Sociedad Matriz SAAM S.A. as of December 31, 2021 and 2020.
This report has been prepared bearing in mind the requirements of NCG 30, Section II.2.1, paragraph A.4.2, and relates exclusively to Sociedad Matriz SAAM S.A. and is issued solely for the information and use of its Senior Management and the Financial Market Commission, and therefore has not been prepared for use, nor should it be used, by any user other than those indicated.
Digitally signed by Jonathan Douglas Yeomans Gibbons RUT: 13.473.972-k. The digital certificate is embedded in the electronic version of this document.
SAAM INVERSIONES SPA
CONTENTS
Report of Independent Auditors Statements of Financial Position
Statements of Comprehensive Income, by Function Statements of Cash Flow Statements of Changes in Equity Notes to the Financial Statements
ThUS$ = Thousands of US dollars
369
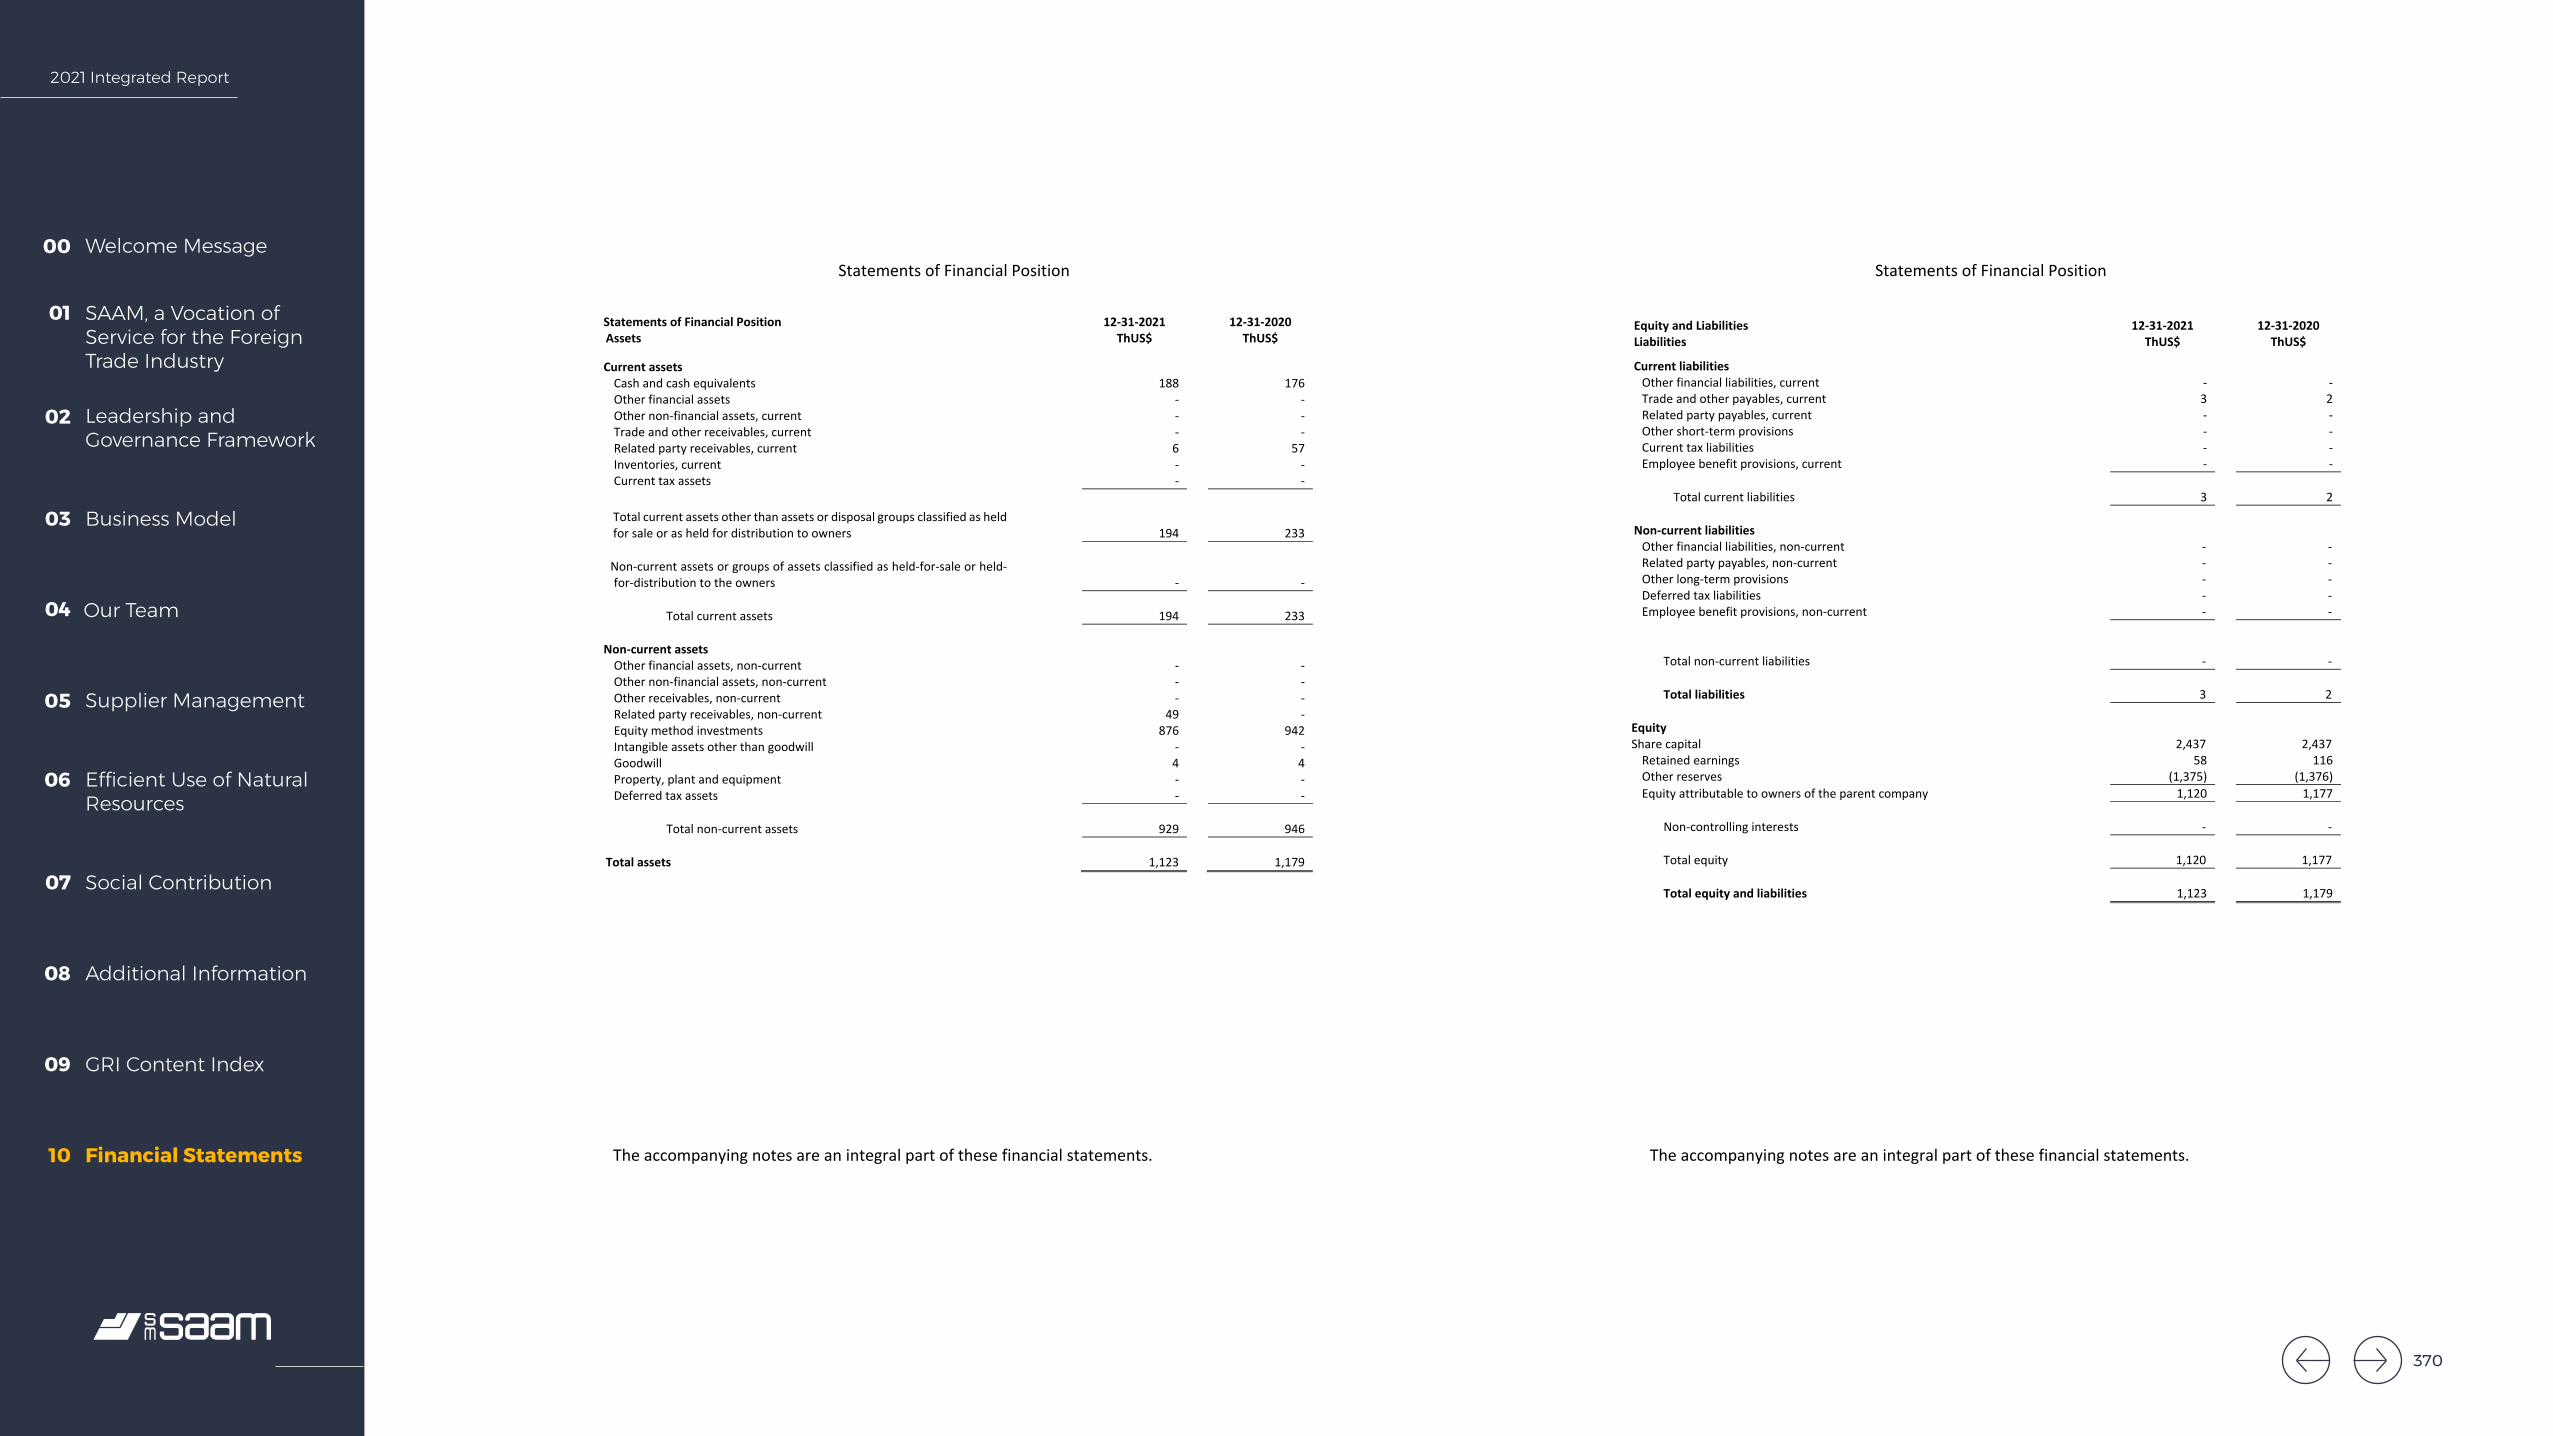
2021 Integrated Report
Welcome Message00
SAAM, a Vocation of Service for the Foreign Trade Industry
01
Leadership and Governance Framework
02
Business Model03
Our Team04
Supplier Management05
Efficient Use of Natural Resources
06
Social Contribution07
Additional Information08
GRI Content Index09
Financial Statements10
SAAM INVERSIONES SPA
Statements of Financial Position
The accompanying notes are an integral part of these financial statements.
3
Statements of Financial Position
12-31-2021
12-31-2020 Assets ThUS$ ThUS$
Current assets
Cash and cash equivalents 188 176 Other financial assets - - Other non-financial assets, current - - Trade and other receivables, current - - Related party receivables, current 6 57 Inventories, current - - Current tax assets - - Total current assets other than assets or disposal groups classified as held for sale or as held for distribution to owners 194 233
Non-current assets or groups of assets classified as held-for-sale or held-for-distribution to the owners -
-
Total current assets 194 233
Non-current assets
Other financial assets, non-current - - Other non-financial assets, non-current - - Other receivables, non-current - - Related party receivables, non-current 49 - Equity method investments 876 942 Intangible assets other than goodwill - - Goodwill 4 4 Property, plant and equipment - - Deferred tax assets - -
Total non-current assets 929 946
Total assets 1,123 1,179
SAAM INVERSIONES SPA
Statements of Financial Position
The accompanying notes are an integral part of these financial statements.
4
Equity and Liabilities
12-31-2021
12-31-2020 Liabilities ThUS$ ThUS$ Current liabilities
Other financial liabilities, current - - Trade and other payables, current 3 2 Related party payables, current - - Other short-term provisions - - Current tax liabilities - - Employee benefit provisions, current - -
Total current liabilities 3 2
Non-current liabilities
Other financial liabilities, non-current - - Related party payables, non-current - - Other long-term provisions - - Deferred tax liabilities - - Employee benefit provisions, non-current - -
Total non-current liabilities - -
Total liabilities 3 2
Equity Share capital 2,437 2,437
Retained earnings 58 116 Other reserves (1,375) (1,376) Equity attributable to owners of the parent company 1,120 1,177
Non-controlling interests - - Total equity 1,120 1,177 Total equity and liabilities 1,123 1,179
370
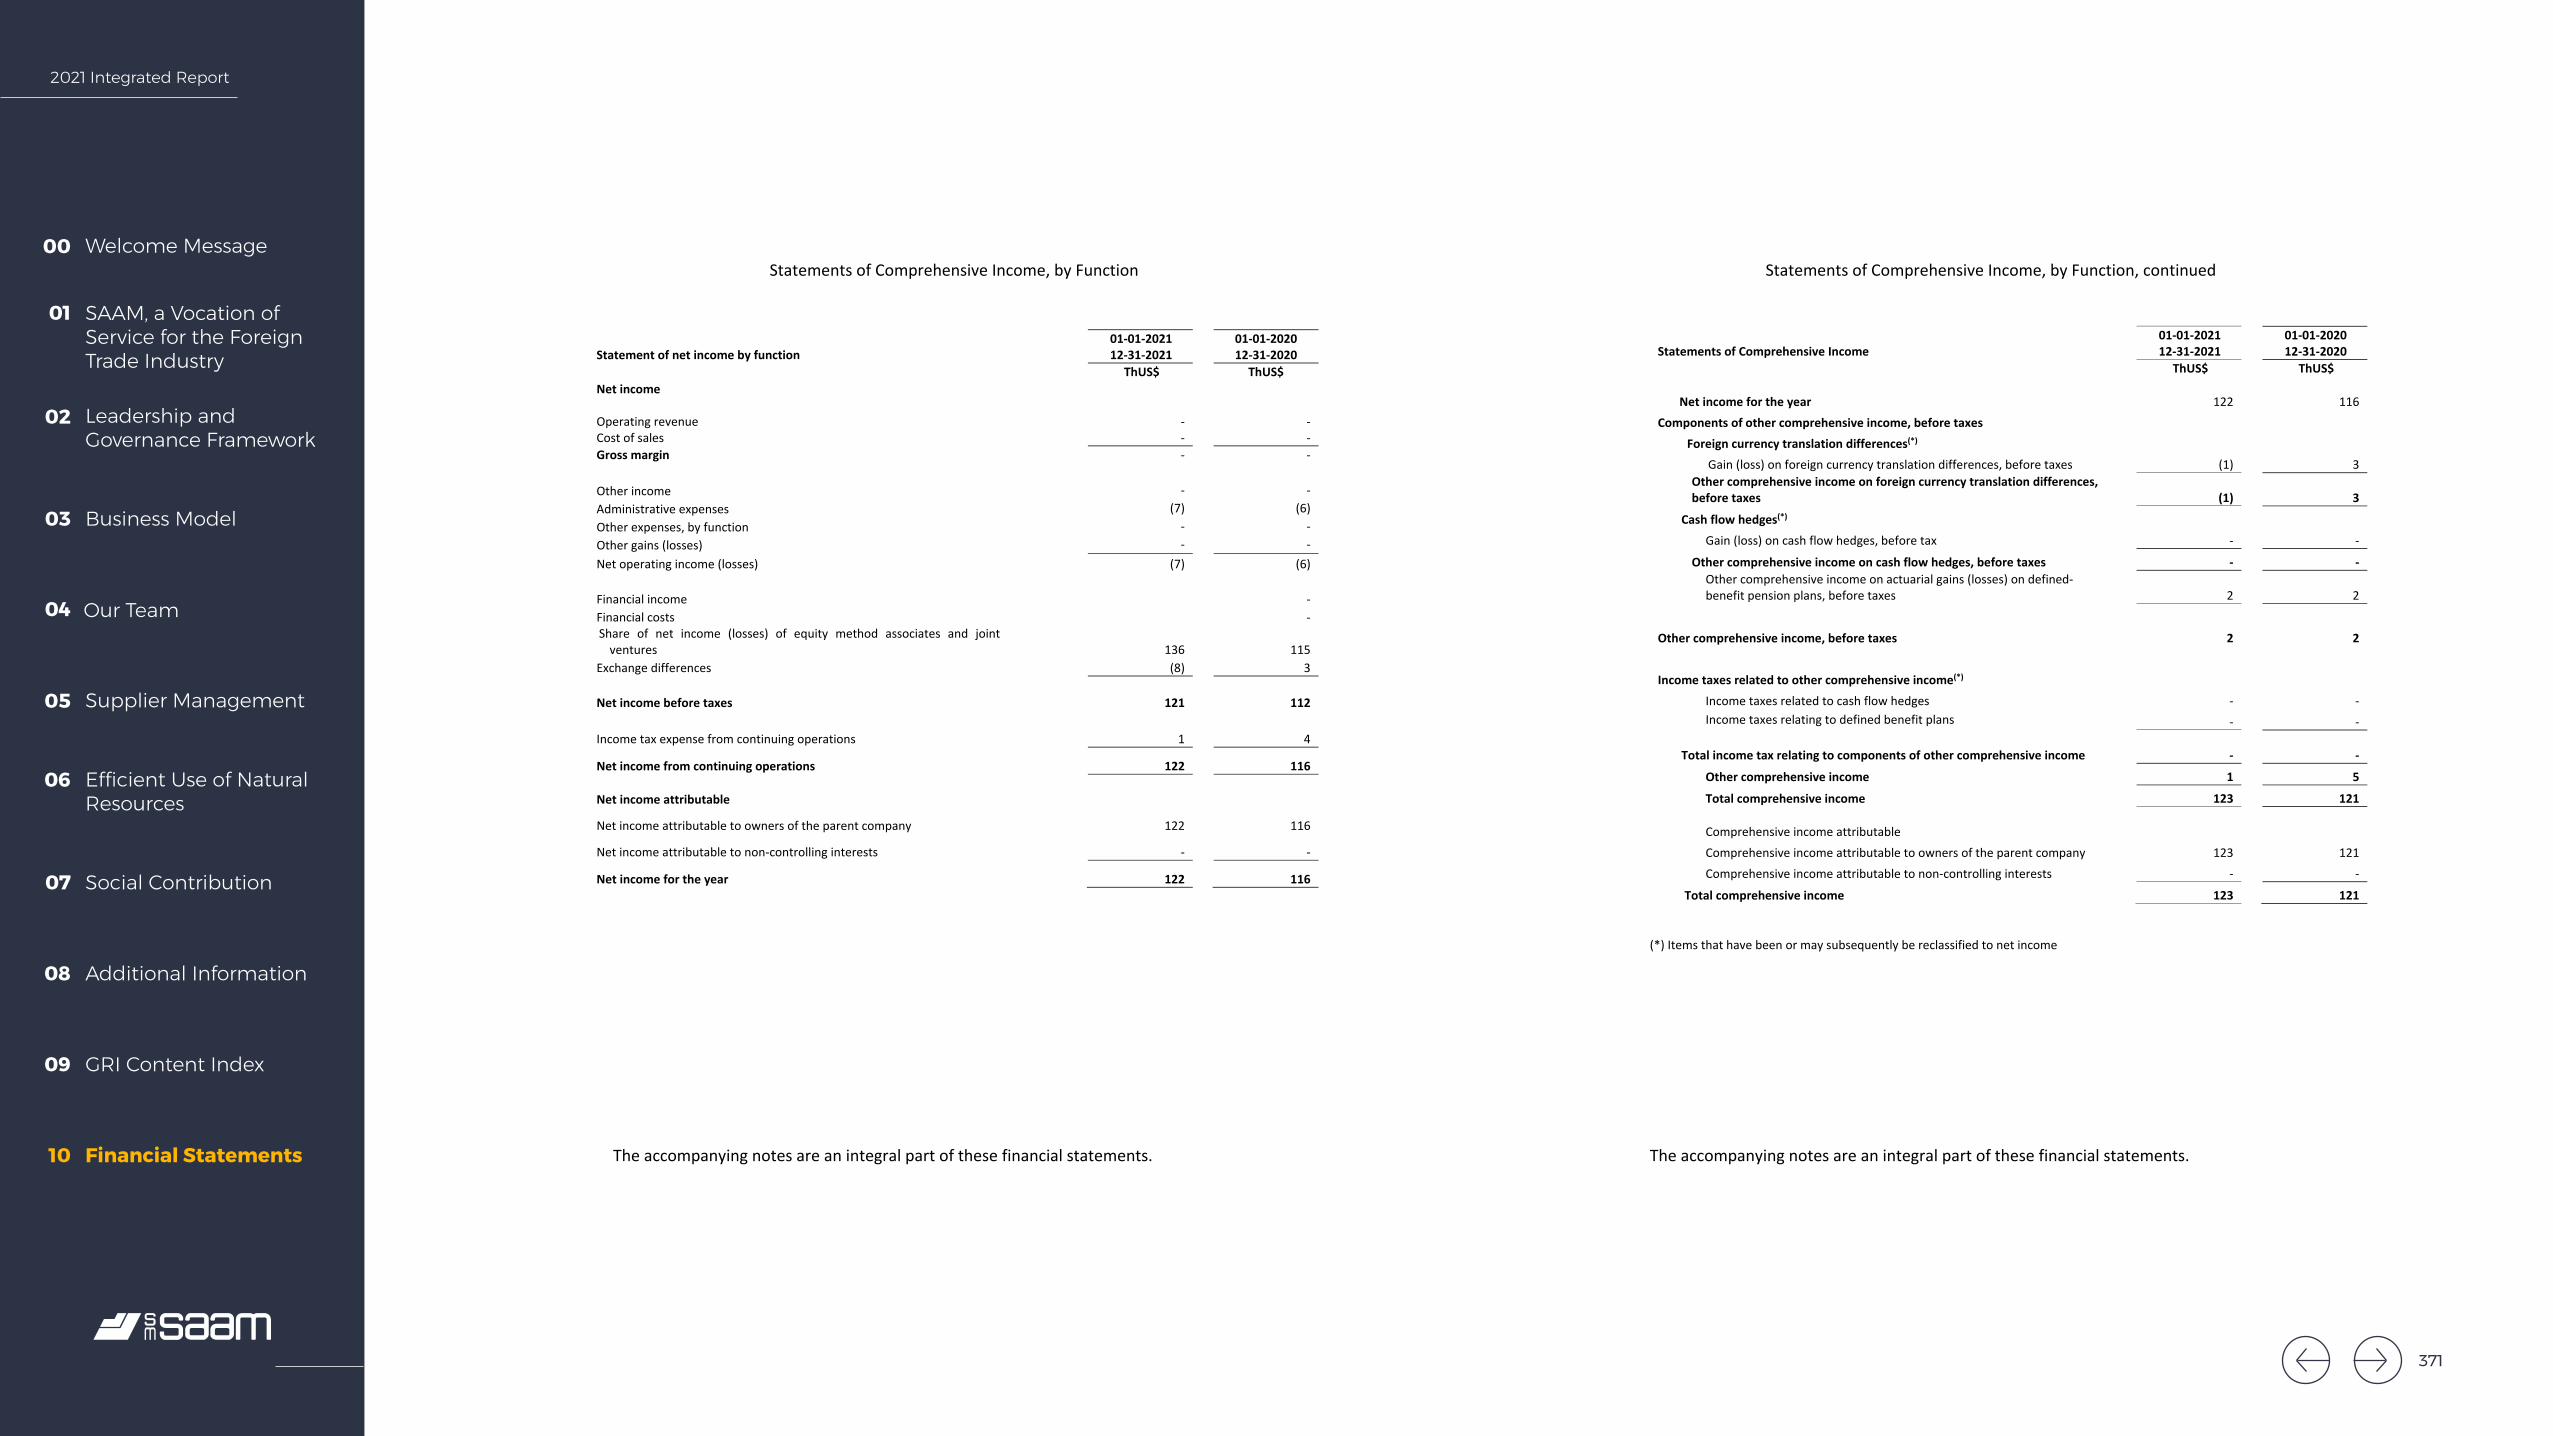
2021 Integrated Report
Welcome Message00
SAAM, a Vocation of Service for the Foreign Trade Industry
01
Leadership and Governance Framework
02
Business Model03
Our Team04
Supplier Management05
Efficient Use of Natural Resources
06
Social Contribution07
Additional Information08
GRI Content Index09
Financial Statements10
SAAM INVERSIONES SPA
Statements of Comprehensive Income, by Function
The accompanying notes are an integral part of these financial statements.
5
Statement of net income by function 01-01-2021
12-31-2021 01-01-2020
12-31-2020 ThUS$ ThUS$ Net income Operating revenue -
- Cost of sales - - Gross margin - - Other income - - Administrative expenses (7) (6) Other expenses, by function - - Other gains (losses) - - Net operating income (losses) (7) (6) Financial income - Financial costs - Share of net income (losses) of equity method associates and joint
ventures 136
115 Exchange differences (8) 3 Net income before taxes 121 112 Income tax expense from continuing operations 1 4
Net income from continuing operations 122
116 Net income attributable
Net income attributable to owners of the parent company
122
116
Net income attributable to non-controlling interests
-
-
Net income for the year
122
116
SAAM INVERSIONES SPA
Statements of Comprehensive Income, by Function, continued
The accompanying notes are an integral part of these financial statements.
6
(*) Items that have been or may subsequently be reclassified to net income
Statements of Comprehensive Income 01-01-2021
12-31-2021 01-01-2020
12-31-2020 ThUS$ ThUS$
Net income for the year
122
116
Components of other comprehensive income, before taxes Foreign currency translation differences(*)
Gain (loss) on foreign currency translation differences, before taxes (1) 3 Other comprehensive income on foreign currency translation differences, before taxes
(1)
3
Cash flow hedges(*) Gain (loss) on cash flow hedges, before tax - -
Other comprehensive income on cash flow hedges, before taxes - - Other comprehensive income on actuarial gains (losses) on defined-benefit pension plans, before taxes
2
2
Other comprehensive income, before taxes 2 2 Income taxes related to other comprehensive income(*)
Income taxes related to cash flow hedges - - Income taxes relating to defined benefit plans - -
Total income tax relating to components of other comprehensive income -
-
Other comprehensive income 1 5
Total comprehensive income 123 121
Comprehensive income attributable
Comprehensive income attributable to owners of the parent company 123 121 Comprehensive income attributable to non-controlling interests - -
Total comprehensive income 123 121
371
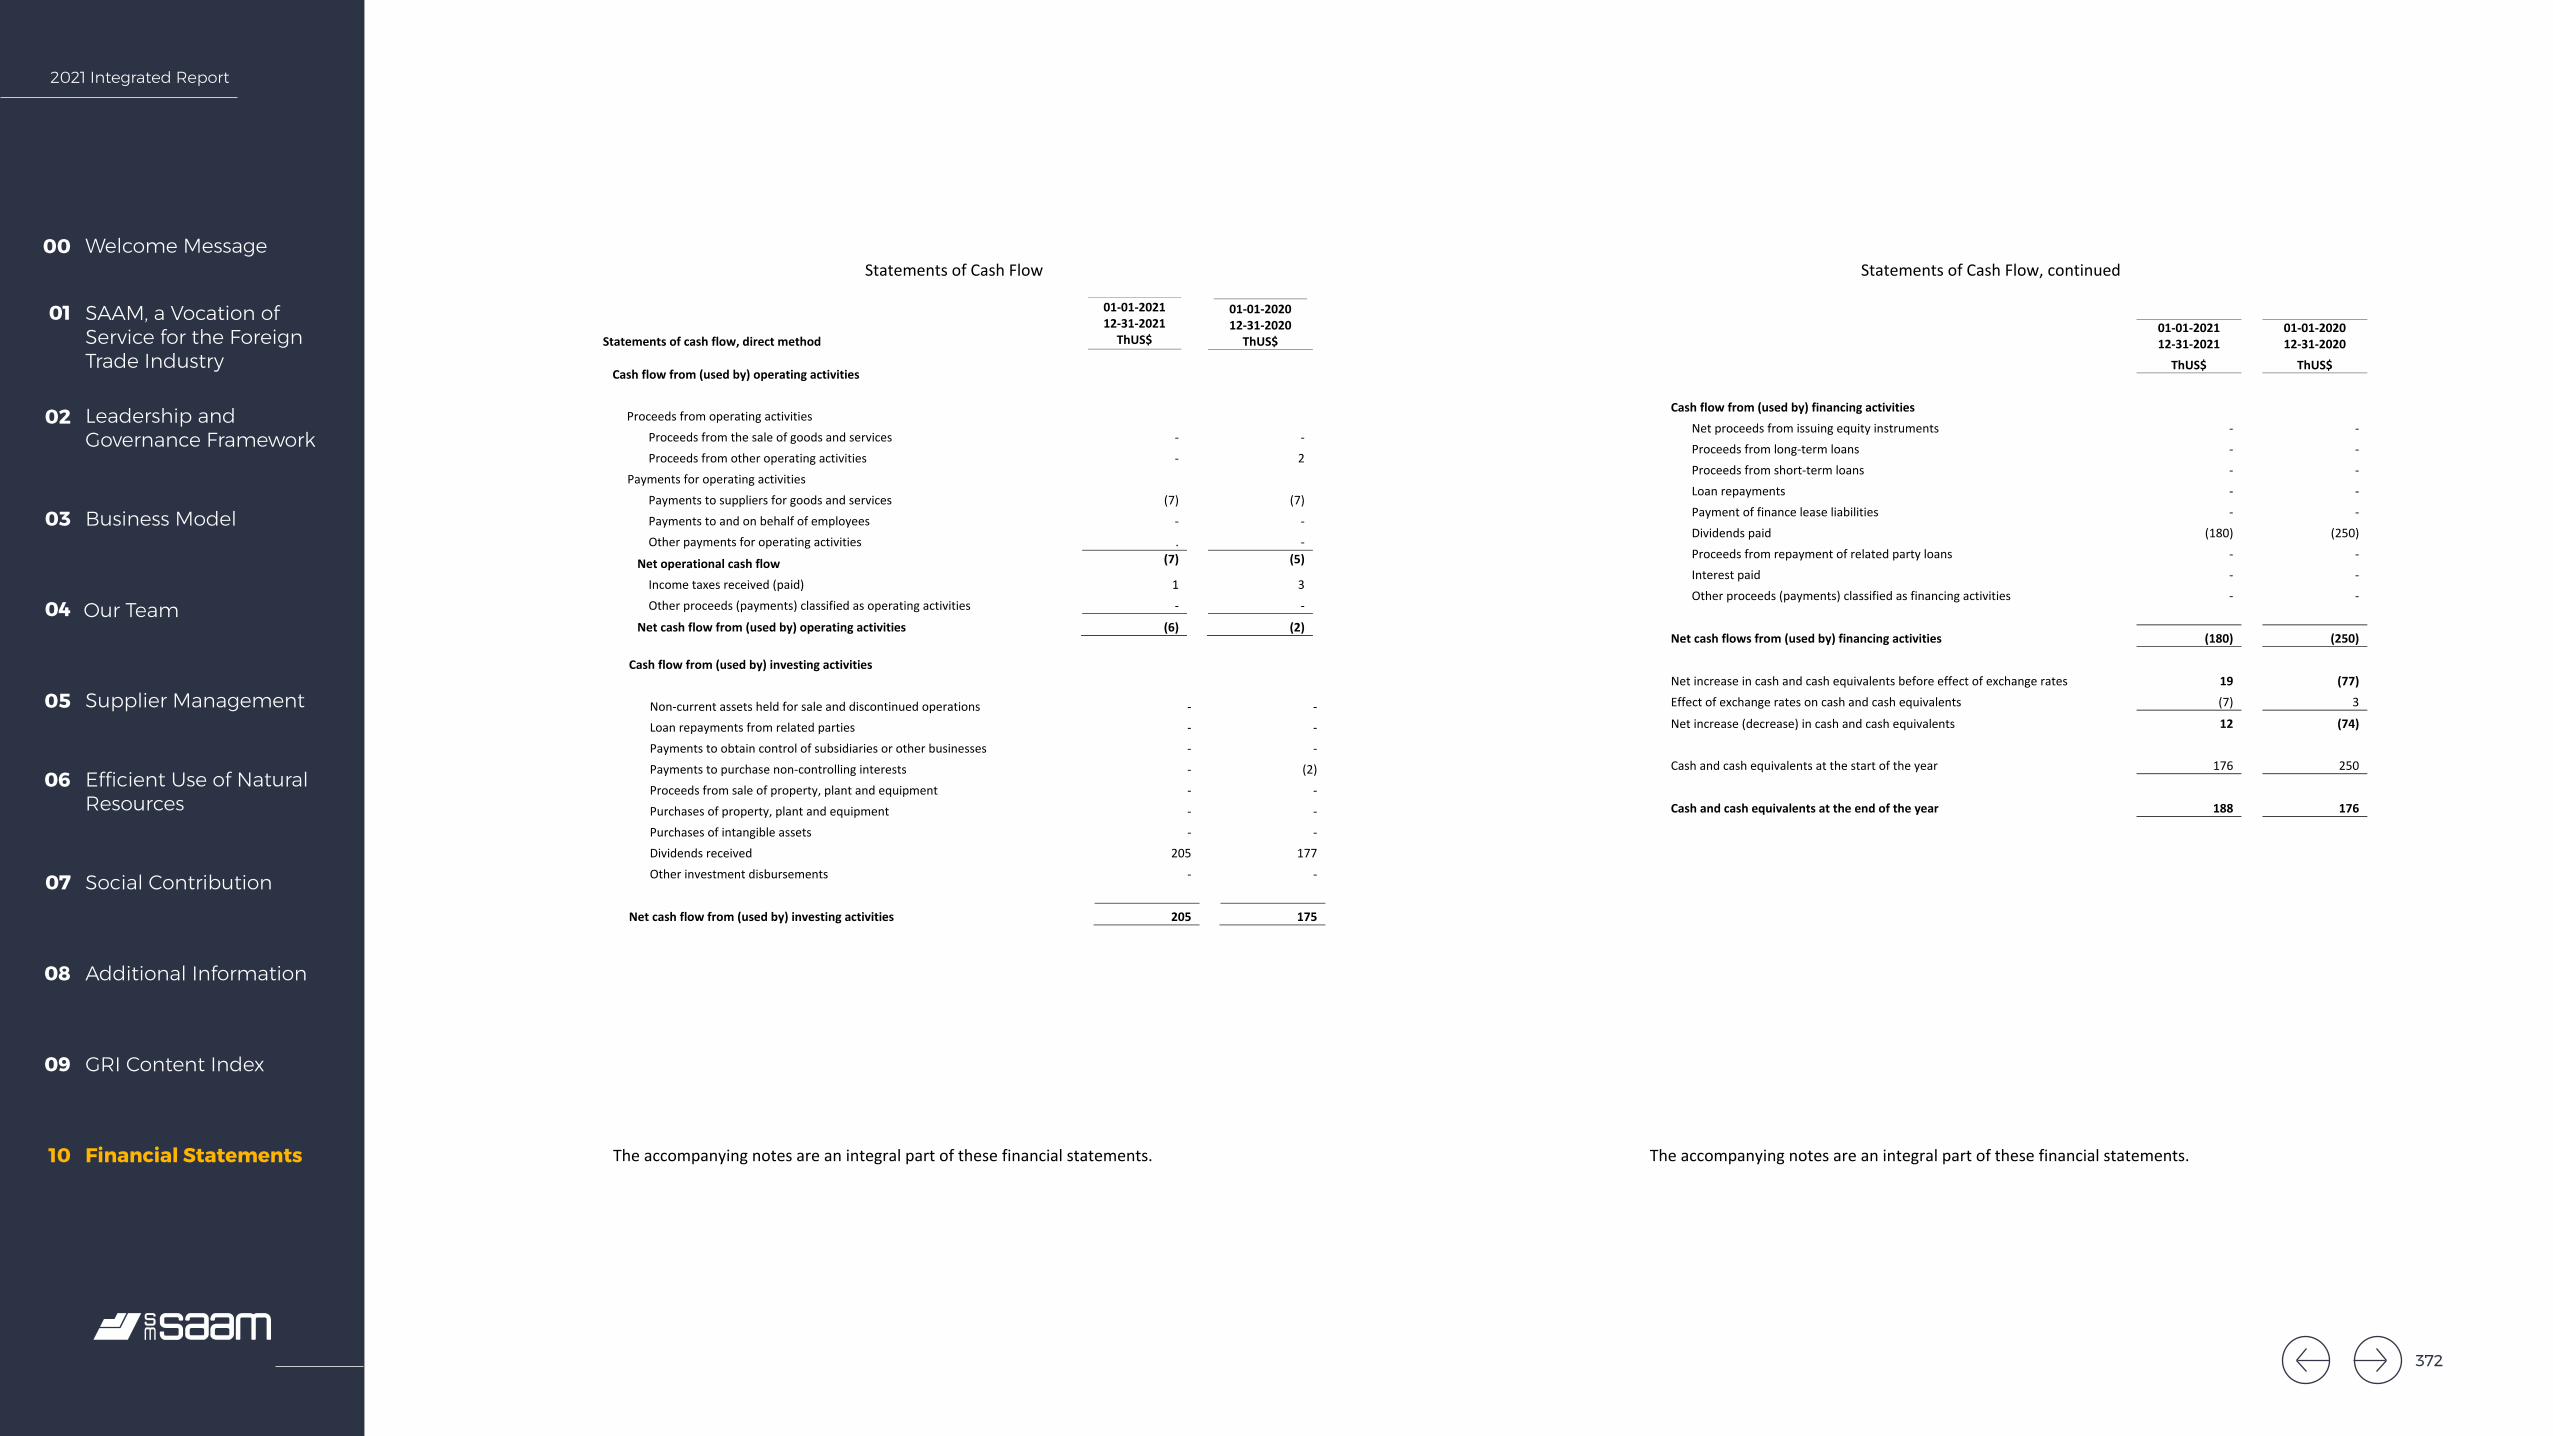
2021 Integrated Report
Welcome Message00
SAAM, a Vocation of Service for the Foreign Trade Industry
01
Leadership and Governance Framework
02
Business Model03
Our Team04
Supplier Management05
Efficient Use of Natural Resources
06
Social Contribution07
Additional Information08
GRI Content Index09
Financial Statements10
SAAM INVERSIONES SPA
Statements of Cash Flow
The accompanying notes are an integral part of these financial statements.
7
Statements of cash flow, direct method
01-01-2021 12-31-2021
ThUS$
01-01-2020 12-31-2020
ThUS$ Cash flow from (used by) operating activities
Proceeds from operating activities
Proceeds from the sale of goods and services - - Proceeds from other operating activities - 2
Payments for operating activities Payments to suppliers for goods and services (7) (7) Payments to and on behalf of employees - - Other payments for operating activities . -
Net operational cash flow (7) (5)
Income taxes received (paid) 1 3 Other proceeds (payments) classified as operating activities - -
Net cash flow from (used by) operating activities (6) (2)
Cash flow from (used by) investing activities
Non-current assets held for sale and discontinued operations - - Loan repayments from related parties - - Payments to obtain control of subsidiaries or other businesses - - Payments to purchase non-controlling interests - (2) Proceeds from sale of property, plant and equipment - - Purchases of property, plant and equipment - - Purchases of intangible assets - - Dividends received 205 177 Other investment disbursements - -
Net cash flow from (used by) investing activities 205 175
SAAM INVERSIONES SPA
Statements of Cash Flow, continued
The accompanying notes are an integral part of these financial statements.
8
01-01-2021 12-31-2021
01-01-2020 12-31-2020
ThUS$ ThUS$
Cash flow from (used by) financing activities
Net proceeds from issuing equity instruments - - Proceeds from long-term loans - - Proceeds from short-term loans - - Loan repayments - - Payment of finance lease liabilities - - Dividends paid (180) (250) Proceeds from repayment of related party loans - - Interest paid - - Other proceeds (payments) classified as financing activities - -
Net cash flows from (used by) financing activities (180) (250)
Net increase in cash and cash equivalents before effect of exchange rates 19 (77) Effect of exchange rates on cash and cash equivalents (7) 3
Net increase (decrease) in cash and cash equivalents 12 (74) Cash and cash equivalents at the start of the year 176 250
Cash and cash equivalents at the end of the year 188 176
372
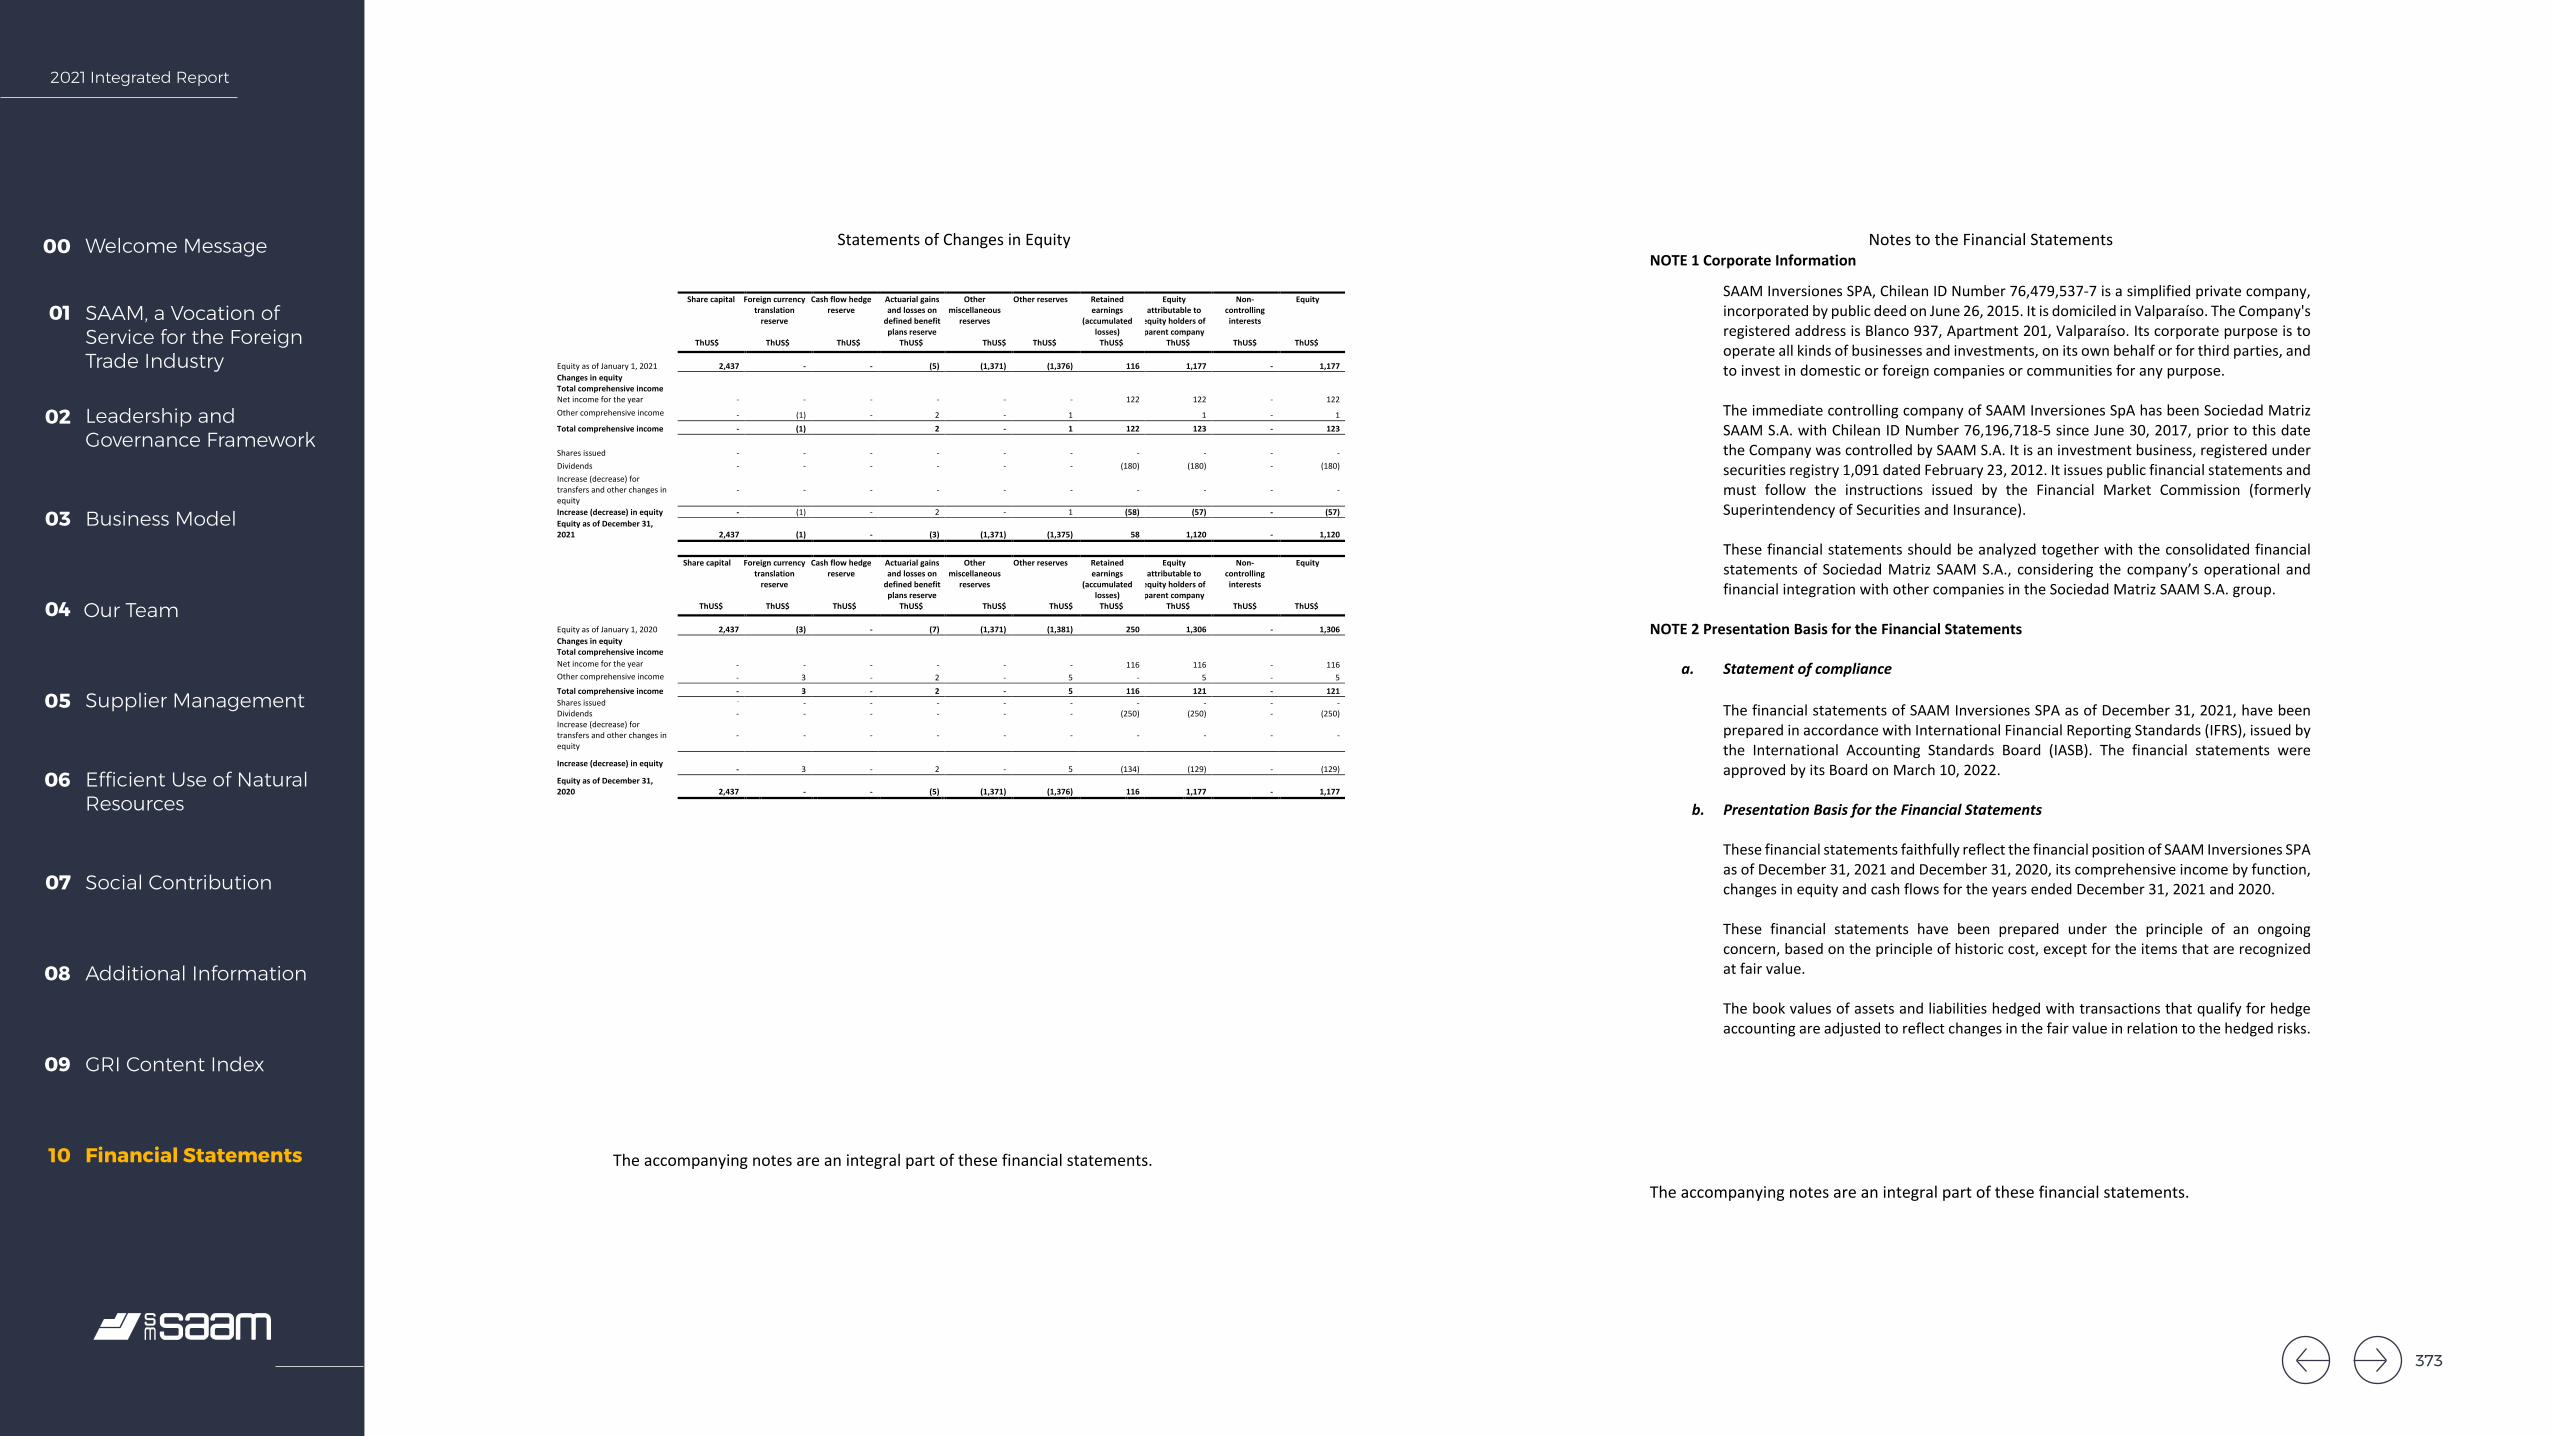
2021 Integrated Report
Welcome Message00
SAAM, a Vocation of Service for the Foreign Trade Industry
01
Leadership and Governance Framework
02
Business Model03
Our Team04
Supplier Management05
Efficient Use of Natural Resources
06
Social Contribution07
Additional Information08
GRI Content Index09
Financial Statements10
SAAM INVERSIONES SPA
Statements of Changes in Equity
The accompanying notes are an integral part of these financial statements.
9
Share capital Foreign currency translation
reserve
Cash flow hedge reserve
Actuarial gains and losses on
defined benefit plans reserve
Other miscellaneous
reserves
Other reserves Retained earnings
(accumulated losses)
Equity attributable to
equity holders of parent company
Non-controlling interests
Equity
ThUS$ ThUS$ ThUS$ ThUS$ ThUS$ ThUS$ ThUS$ ThUS$ ThUS$ ThUS$ Equity as of January 1, 2021 2,437 - - (5) (1,371) (1,376) 116 1,177 - 1,177 Changes in equity Total comprehensive income Net income for the year - - - - - - 122 122 - 122 Other comprehensive income - (1) - 2 - 1 1 - 1 Total comprehensive income - (1) 2 - 1 122 123 - 123 Shares issued - - - - - - - - - - Dividends - - - - - - (180) (180) - (180)
Increase (decrease) for transfers and other changes in equity
- - - - - - - - - -
Increase (decrease) in equity - (1) - 2 - 1 (58) (57) - (57) Equity as of December 31, 2021 2,437 (1) - (3) (1,371) (1,375) 58 1,120 - 1,120
Share capital Foreign currency translation
reserve
Cash flow hedge reserve
Actuarial gains and losses on
defined benefit plans reserve
Other miscellaneous
reserves
Other reserves Retained earnings
(accumulated losses)
Equity attributable to
equity holders of parent company
Non-controlling interests
Equity
ThUS$ ThUS$ ThUS$ ThUS$ ThUS$ ThUS$ ThUS$ ThUS$ ThUS$ ThUS$ Equity as of January 1, 2020 2,437 (3) - (7) (1,371) (1,381) 250 1,306 - 1,306 Changes in equity Total comprehensive income Net income for the year - - - - - - 116 116 - 116 Other comprehensive income - 3 - 2 - 5 - 5 - 5 Total comprehensive income - 3 - 2 - 5 116 121 - 121 Shares issued - - - - - - - - - - Dividends - - - - - - (250) (250) - (250)
Increase (decrease) for transfers and other changes in equity
- - - - - - - - - -
Increase (decrease) in equity - 3 - 2 - 5 (134) (129) - (129)
Equity as of December 31, 2020 2,437 - - (5) (1,371) (1,376) 116 1,177 - 1,177
SAAM INVERSIONES SPA
Notes to the Financial Statements
The accompanying notes are an integral part of these financial statements.
10
NOTE 1 Corporate Information
SAAM Inversiones SPA, Chilean ID Number 76,479,537-7 is a simplified private company, incorporated by public deed on June 26, 2015. It is domiciled in Valparaíso. The Company's registered address is Blanco 937, Apartment 201, Valparaíso. Its corporate purpose is to operate all kinds of businesses and investments, on its own behalf or for third parties, and to invest in domestic or foreign companies or communities for any purpose. The immediate controlling company of SAAM Inversiones SpA has been Sociedad Matriz SAAM S.A. with Chilean ID Number 76,196,718-5 since June 30, 2017, prior to this date the Company was controlled by SAAM S.A. It is an investment business, registered under securities registry 1,091 dated February 23, 2012. It issues public financial statements and must follow the instructions issued by the Financial Market Commission (formerly Superintendency of Securities and Insurance). These financial statements should be analyzed together with the consolidated financial statements of Sociedad Matriz SAAM S.A., considering the company’s operational and financial integration with other companies in the Sociedad Matriz SAAM S.A. group.
NOTE 2 Presentation Basis for the Financial Statements
a. Statement of compliance
The financial statements of SAAM Inversiones SPA as of December 31, 2021, have been prepared in accordance with International Financial Reporting Standards (IFRS), issued by the International Accounting Standards Board (IASB). The financial statements were approved by its Board on March 10, 2022.
b. Presentation Basis for the Financial Statements These financial statements faithfully reflect the financial position of SAAM Inversiones SPA as of December 31, 2021 and December 31, 2020, its comprehensive income by function, changes in equity and cash flows for the years ended December 31, 2021 and 2020. These financial statements have been prepared under the principle of an ongoing concern, based on the principle of historic cost, except for the items that are recognized at fair value. The book values of assets and liabilities hedged with transactions that qualify for hedge accounting are adjusted to reflect changes in the fair value in relation to the hedged risks.
373
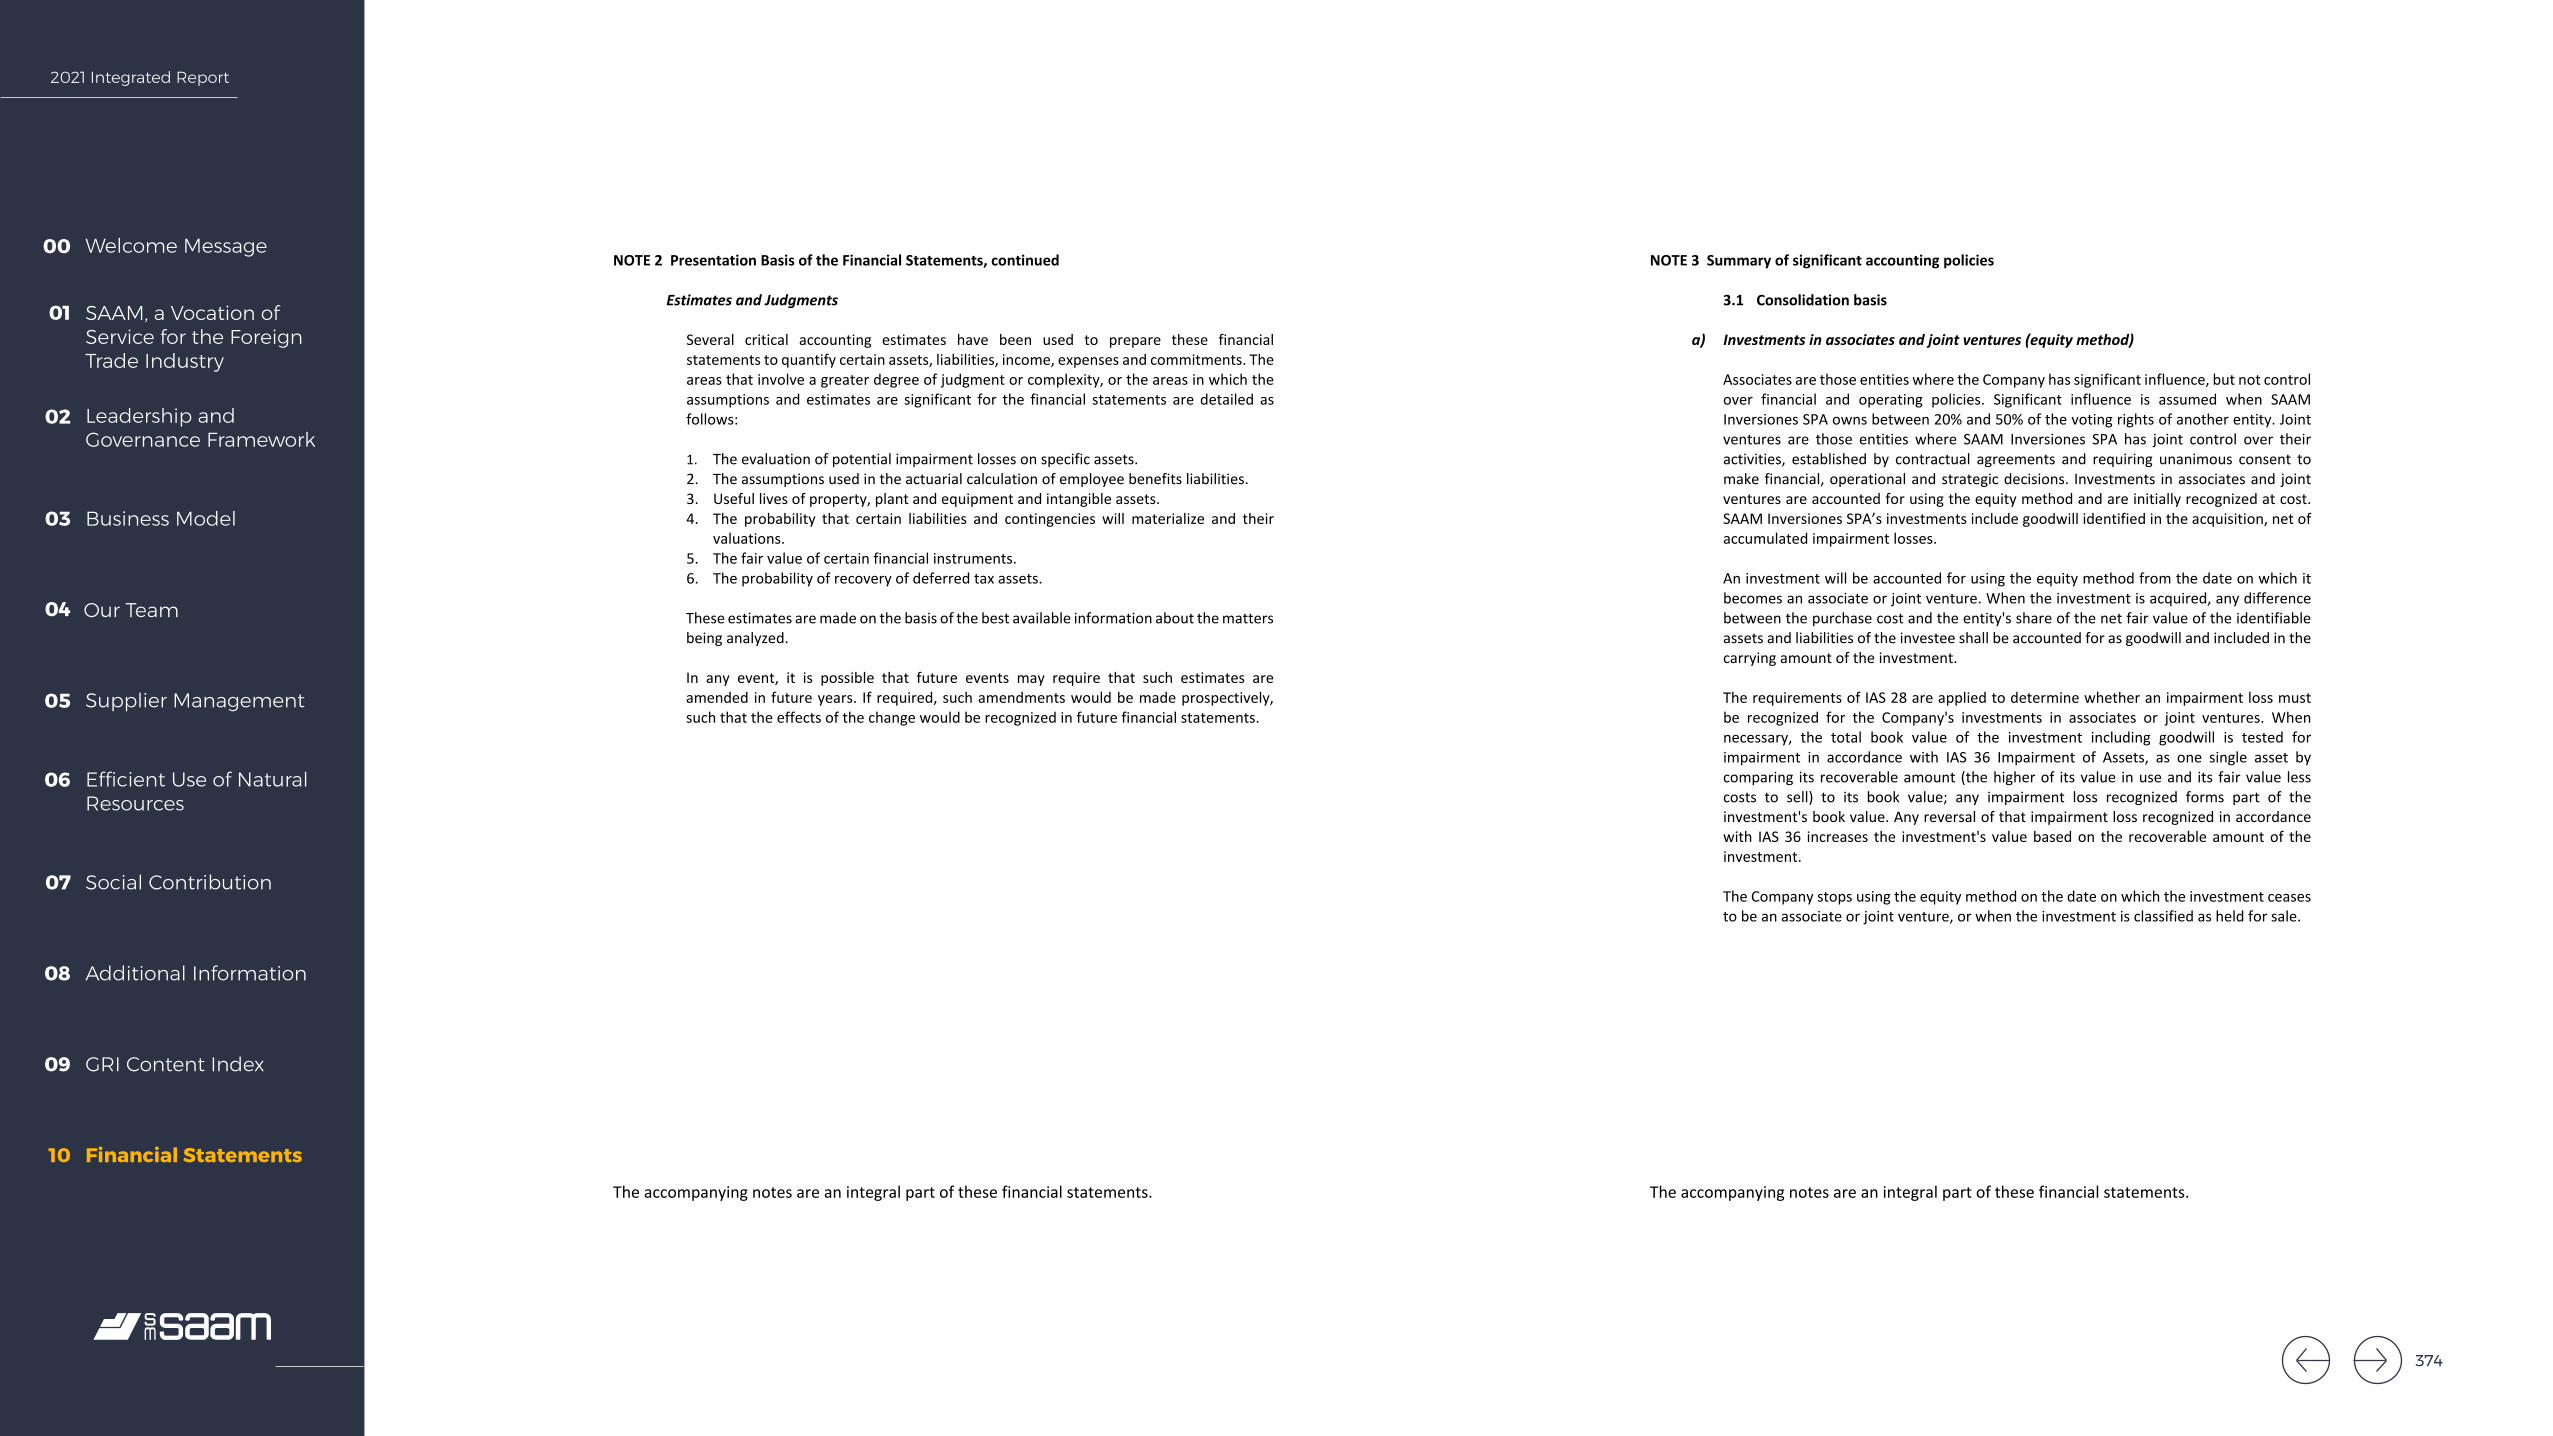
2021 Integrated Report
Welcome Message00
SAAM, a Vocation of Service for the Foreign Trade Industry
01
Leadership and Governance Framework
02
Business Model03
Our Team04
Supplier Management05
Efficient Use of Natural Resources
06
Social Contribution07
Additional Information08
GRI Content Index09
Financial Statements10
SAAM INVERSIONES SPA
Notes to the Financial Statements
The accompanying notes are an integral part of these financial statements.
11
NOTE 2 Presentation Basis of the Financial Statements, continued
Estimates and Judgments
Several critical accounting estimates have been used to prepare these financial statements to quantify certain assets, liabilities, income, expenses and commitments. The areas that involve a greater degree of judgment or complexity, or the areas in which the assumptions and estimates are significant for the financial statements are detailed as follows: 1. The evaluation of potential impairment losses on specific assets. 2. The assumptions used in the actuarial calculation of employee benefits liabilities. 3. Useful lives of property, plant and equipment and intangible assets. 4. The probability that certain liabilities and contingencies will materialize and their
valuations. 5. The fair value of certain financial instruments. 6. The probability of recovery of deferred tax assets.
These estimates are made on the basis of the best available information about the matters being analyzed. In any event, it is possible that future events may require that such estimates are amended in future years. If required, such amendments would be made prospectively, such that the effects of the change would be recognized in future financial statements.
SAAM INVERSIONES SPA
Notes to the Financial Statements
The accompanying notes are an integral part of these financial statements.
12
NOTE 3 Summary of significant accounting policies 3.1 Consolidation basis
a) Investments in associates and joint ventures (equity method)
Associates are those entities where the Company has significant influence, but not control over financial and operating policies. Significant influence is assumed when SAAM Inversiones SPA owns between 20% and 50% of the voting rights of another entity. Joint ventures are those entities where SAAM Inversiones SPA has joint control over their activities, established by contractual agreements and requiring unanimous consent to make financial, operational and strategic decisions. Investments in associates and joint ventures are accounted for using the equity method and are initially recognized at cost. SAAM Inversiones SPA’s investments include goodwill identified in the acquisition, net of accumulated impairment losses. An investment will be accounted for using the equity method from the date on which it becomes an associate or joint venture. When the investment is acquired, any difference between the purchase cost and the entity's share of the net fair value of the identifiable assets and liabilities of the investee shall be accounted for as goodwill and included in the carrying amount of the investment. The requirements of IAS 28 are applied to determine whether an impairment loss must be recognized for the Company's investments in associates or joint ventures. When necessary, the total book value of the investment including goodwill is tested for impairment in accordance with IAS 36 Impairment of Assets, as one single asset by comparing its recoverable amount (the higher of its value in use and its fair value less costs to sell) to its book value; any impairment loss recognized forms part of the investment's book value. Any reversal of that impairment loss recognized in accordance with IAS 36 increases the investment's value based on the recoverable amount of the investment. The Company stops using the equity method on the date on which the investment ceases to be an associate or joint venture, or when the investment is classified as held for sale.
374
2021 Integrated Report
Welcome Message00
SAAM, a Vocation of Service for the Foreign Trade Industry
01
Leadership and Governance Framework
02
Business Model03
Our Team04
Supplier Management05
Efficient Use of Natural Resources
06
Social Contribution07
Additional Information08
GRI Content Index09
Financial Statements10
SAAM INVERSIONES SPA
Notes to the Financial Statements
The accompanying notes are an integral part of these financial statements.
13
Note 3 - Summary of significant accounting policies, continued 3.1 Consolidation basis, continued
a) Investments in associates and joint ventures (equity method), continued The financial statements include its interest in the earnings and equity movements of investments recognized using the equity method, after adjustments to align the accounting criteria of associates with those of SAAM Inversiones SPA, from the date on which significant influence and/or joint control begins. When the share of losses exceeds its interest in the associate, including any long-term investment, the investment is reduced to zero and no more losses are recorded unless SAAM Inversiones SPA has an obligation or has made payments on behalf of the joint venture in which it holds an interest. When the Company reduces its interest in an associate or a joint venture, and continues to use the equity method, any effects previously recognized in other comprehensive income must be reclassified to profit and loss in proportion to the decrease in interest in that associate or joint venture. When a Group company engages in transactions with an associate or joint venture, gains and losses resulting from transactions with the associate or joint venture are recognized in the Company's financial statements only to the extent of the equity interests of third parties of the associate or joint venture.
SAAM INVERSIONES SPA
Notes to the Financial Statements
The accompanying notes are an integral part of these financial statements.
14
Note 3 - Summary of significant accounting policies, continued
3.2 Functional and presentation currency
a) Functional currency The financial statements are presented in United States dollars, which is the functional currency of SAAM Inversiones SPA. Each group entity has determined its functional currency based on the currency of the main economic environment in which it operates. Transactions in a currency other than the functional currency are considered to be in foreign currency and are initially recognized at the exchange rate on the date of the transaction. At the end of each period, monetary assets and liabilities in foreign currency are translated at the closing exchange rate, and non-monetary items in foreign currency remain translated at the exchange rate on the transaction date.
Exchange differences in the statement of comprehensive income by function include the effects of exchange rate changes on the value of assets and liabilities in foreign currencies. b) Presentation currency
As of the reporting date, associated entities with a functional currency other than the currency of SAAM Inversiones SPA must translate their results and statement of financial position to the presentation currency of the parent company by translating their assets and liabilities at the closing exchange rate and their results at the average exchange rate. The main companies presenting their financial statements in US dollars are SAAM Towage Canada Inc. and Subsidiaries, whose functional currency is the Canadian dollar, and Terminal Marítima Mazatlán whose functional currency is the Mexican peso.
Exchange differences arising from the translation into the presentation currency are recognized as a separate component of equity, in other comprehensive income, in the reserve account of exchange differences on translation. 3.3 Translation basis for transactions in foreign currencies and indexed units
The principal foreign currency assets and liabilities are stated at their equivalent value in US dollars, calculated at the following closing exchange rates.
Currency 12-31-2021 12-31-2020 Chilean peso 844.69 710.95
375

2021 Integrated Report
Welcome Message00
SAAM, a Vocation of Service for the Foreign Trade Industry
01
Leadership and Governance Framework
02
Business Model03
Our Team04
Supplier Management05
Efficient Use of Natural Resources
06
Social Contribution07
Additional Information08
GRI Content Index09
Financial Statements10
SAAM INVERSIONES SPA
Notes to the Financial Statements
The accompanying notes are an integral part of these financial statements.
15
Note 3 - Summary of significant accounting policies, continued 3.3 Translation basis for transactions in foreign currencies and indexed units, continued The assets and liabilities indexed in Unidades de Fomento (UF) were presented in US dollars at the following values at the reporting date
Closing date 12-31-2021
ThUS$ 12-31-2020
ThUS$ UF / US$ 36.69 40.89
3.4 Cash and cash equivalents The Company's cash and cash equivalents consist of cash on hand and in bank checking accounts, time deposits and other financial investments that mature within 90 days. They also include cash management investments, such as covenants with repurchase and resale agreements that mature before the same deadline. Bank overdrafts are included in short-term loans under current liabilities. 3.5 Provisions
A provision is recognized when there is a legal or constructive obligation as a result of a past event and it is likely that a resource disbursement, including economic benefits, will be required to settle the obligation, and its value can be reliably estimated. The provision is the best estimate of the amount payable, as of the reporting date. When the estimated payment period is long term and can be estimated with sufficient reliability, the provision is recorded at its present value, discounting the estimated payment flows at a market interest rate that reflects the specific risks of the obligation. Provisions should be reviewed at the end of each reporting period and adjusted accordingly to reflect the best available estimate at any given time.
SAAM INVERSIONES SPA
Notes to the Financial Statements
The accompanying notes are an integral part of these financial statements.
16
Note 3 - Summary of significant accounting policies, continued
3.6 Corporate income tax The Company and its subsidiaries in Chile account for income tax based on net taxable income determined according to the rules established in Income Tax Law. This calculation for foreign subsidiaries complies with the laws in their respective countries. 3.7 Deferred taxes Deferred tax assets and liabilities are recognized using the statement of financial position method. Temporary differences between the book value of the assets and liabilities and their tax base are recorded as established in IAS 12 "Income tax". Deferred taxes are valued at tax rates expected to be applied when temporary differences are reversed, based on laws that have been approved or are about to be approved as of each reporting date. 3.8 Investments and other financial assets a.1) Classification SAAM Inversiones SPA classifies its financial assets into the following categories.
• Those that are subsequently valued at fair value (either through other comprehensive income, or through profit and loss), and
• Those that are valued at amortized cost. This valuation depends on the business model used by the Company to manage the financial assets and the contractual terms of the cash flows. Gains and losses on assets valued at fair value will be recorded in the statement of net income or other comprehensive income. Gains and losses on investments in equity instruments that are not held for trading will depend on whether the Company has made an irrevocable decision at initial recognition to record the investment at fair value through other comprehensive income. The Company only reclassifies debt instruments when it changes its business model for managing those assets.
376

2021 Integrated Report
Welcome Message00
SAAM, a Vocation of Service for the Foreign Trade Industry
01
Leadership and Governance Framework
02
Business Model03
Our Team04
Supplier Management05
Efficient Use of Natural Resources
06
Social Contribution07
Additional Information08
GRI Content Index09
Financial Statements10
SAAM INVERSIONES SPA
Notes to the Financial Statements
The accompanying notes are an integral part of these financial statements.
17
Note 3 - Summary of significant accounting policies, continued 3.8 Investments and other financial assets, continued a.2) Recognition Routine purchases and sales of financial assets are recognized as of the transaction date, which is the date that the Company commits to purchase or sell the asset. Financial assets are de-recognized when the rights to receive cash flows from the financial asset have expired or have been transferred and the Company has transferred substantially all risks and rewards of ownership. a.3) Measurement Financial assets are valued at initial recognition at fair value plus transaction costs directly attributable to the acquisition of the financial asset, in the case of a financial asset that is not recognized at fair value through profit or loss. Transaction costs of financial assets recognized at fair value through profit and loss are recorded in the statement of net income. Financial assets with embedded derivatives are considered in their entirety when determining whether cash flows are only payments of principal and interest. b) Non-derivative financial instruments Financial instruments are classified on initial recognition as a financial asset, financial liability or equity instrument, in accordance with the substance of the contractual arrangement. Also, financial instruments are classified for valuation purposes into four categories, financial assets at fair value through profit or loss, loans and receivables, investments held-to-maturity and financial liabilities. This classification depends on the characteristics of the instrument and the purpose for its acquisition. SAAM Inversiones SPA derecognizes a financial liability when its contractual obligations are settled or expire. After initial recognition, non-derivative financial instruments are valued as follows. b.1) Trade and other payables These include payables for trade purchases and related expenses, plus non-trade payables, such as sundry creditors, retentions from staff remuneration and others.
SAAM INVERSIONES SPA
Notes to the Financial Statements
The accompanying notes are an integral part of these financial statements.
18
Note 3 - Summary of significant accounting policies, continued
3.8 Investments and other financial assets, continued b) Non-derivative financial instruments, continued
b.2) Others
Other non-derivative financial instruments including loans and receivables are valued at amortized cost using the effective interest rate method, less any impairment loss. 3.9 Non-current assets held for sale
Non-current assets, or groups of assets and liabilities, that are expected to be recovered principally through sales rather than through continuous use, are classified as held for sale and are valued at the lower of their book value and fair value less selling costs. Immediately prior to this classification, these assets or disposal groups are valued at the lower of their book value and fair value less selling costs.
Any impairment loss in a disposal group is first allocated to goodwill, and then to the remaining assets and liabilities on a pro rata basis. Impairment losses when initially classified as held for sale and subsequent gains or losses are recognized in the statement of net income. Gains are only recognized when accumulated impairment losses are covered.
3.10 Minimum dividends
The distribution of dividends to the Company’s shareholders is recognized as a liability in SAAM Inversiones SPA’s financial statements in the period when the dividends are approved by the Company’s shareholders. 3.11 Environment
Any environmental liabilities are based on the current interpretation of environmental laws and regulations, when it is probable that an obligation will arise and the amount of such liability can be reliably estimated. Disbursements related to environmental protection are charged to the consolidated income statement when they are incurred.
377

2021 Integrated Report
Welcome Message00
SAAM, a Vocation of Service for the Foreign Trade Industry
01
Leadership and Governance Framework
02
Business Model03
Our Team04
Supplier Management05
Efficient Use of Natural Resources
06
Social Contribution07
Additional Information08
GRI Content Index09
Financial Statements10
SAAM INVERSIONES SPA
Notes to the Financial Statements
The accompanying notes are an integral part of these financial statements.
19
Note 3 - Summary of significant accounting policies, continued
3.12 New Accounting Pronouncements
Standards, interpretations and amendments that are mandatory for the first time for financial periods beginning on January 1, 2021.
Amendments and improvements
Amendment to IFRS 9, IAS 39, IFRS 7, IFRS 4 and IFRS 16 "Reference Rate Reform (IBOR)" - Phase 2 - issued in August 2020. Addresses issues that arise during the reform of benchmark interest rates, including the replacement of one benchmark rate with an alternative.
Amendment to IFRS 16 “Lease concessions” - issued in March 2021. This amendment extends by one year the application period for the practical exemption to IFRS 16 Leases, which was contained in the amendment to that standard issued in May 2020, with the purpose of assisting lessees to account for lease concession reductions related to COVID-19. The amendment coverage was extended from June 30, 2021 to June 30, 2022. The amendment is effective for annual periods beginning on or after April 1, 2021. However, early adoption is permitted even for financial statements not authorized for issue as of March 31, 2021.
Amendment to IFRS4 "Insurance contracts": deferral of IFRS 9 issued on June 25, 2020. This amendment defers the application date of IFRS 17 by two years until January 1, 2023 and changes the date of the temporary exemption in IFRS 4 from applying IFRS 9 "Financial instruments" to January 1, 2023.
Standards and interpretations Mandatory for annual periods beginning
Amendment to IFRS 3, "Business Combinations". Minor amendments were made to IFRS 3 to update the references to the Conceptual Framework for Financial Reporting, without changing the requirements for business combinations.
01/01/2022
Amendment to IAS 16, "Property, plant and equipment" prohibits companies from deducting from the cost of property, plant and equipment the proceeds from the sale of items produced while the company is preparing the asset for its intended use. The Company should recognize such sales revenues and related costs in net income for the year.
01/01/2022
Amendment to IAS 37, "Provisions, contingent liabilities and contingent assets" clarifies which unavoidable costs a company must include under onerous contracts, to assess whether a contract will generate losses.
01/01/2022
SAAM INVERSIONES SPA
Notes to the Financial Statements
The accompanying notes are an integral part of these financial statements.
20
Note 3 - Summary of significant accounting policies, continued
3.12 New accounting pronouncements, continued
Standards and interpretations Mandatory for annual periods beginning
Annual improvements to IFRS standards 2018-2020 cycle. The following improvements were completed in May 2020: -IFRS 9 Financial Instruments: clarifies which fees should be included in the 10% test forderecognition of financial liabilities. -IFRS 16 Leases: amendment of Illustrative Example 13 to remove the lessor payments illustration in relation to leasehold improvements, to eliminate any confusion about the treatment of leaseincentives. -IFRS 1 First-time Adoption of International Financial Reporting Standards: allows companies that have measured their assets and liabilities at their parent company´s book values, to also measure cumulative translation differences using the amounts reported by the parent company. This amendment will also apply to associates and joint ventures that have adopted the same IFRS 1 exemption. -IAS 41 Agriculture: elimination of the requirement for companies to exclude cash flows for taxpurposes when measuring fair value under IAS 41. This amendment is intended to align IAS 41with the requirement in the standard to discount after-tax cash flows
01/01/2022
IFRS 17 “Insurance Contracts" - issued in May 2017, replaces IFRS 4. IFRS 17 will change the accounting for all companies that issue insurance contracts and investment contracts with discretionary participation features. The standard applies to annual periods beginning on or after 1 January 2023, and early application is permitted for companies that apply IFRS 9, "Financial Instruments".
01/01/2023
Amendment to IAS 1 "Presentation of financial statements” regarding the classification of liabilities. This amendment clarifies that liabilities will be classified as current or non-current depending on the rights at the end of the reporting period. Classification is not affected by the company's expectations or events after the reporting date, for example receipt of a waiver or failure to comply with a covenant. The amendment also clarifies what IAS 1 means when it refers to the "settlement" of a liability. The amendment should be applied retrospectively in accordance with IAS 8. The initial application date was January 1, 2022. However, that date was deferred to January 1, 2024.
01/01/2024
Amendments to IAS 1 “Presentation of Financial Statements" and IAS 8 "Accounting Policies, Changes in Accounting Estimates and Errors" - issued in February 2021. The amendments are intended to improve disclosures of accounting policies and to help users of financial statements to distinguish between changes in accounting estimates and changes in accounting policies.
01/01/2023
Amendment to IAS 12 “Deferred Taxes Relating to Assets and Liabilities Arising from a Single Transaction.” These amendments require companies to recognize deferred taxes on transactions that result in equal amounts of taxable and deductible temporary differences upon initial recognition.
01/01/2023
Amendments to IFRS 10 “Consolidated Financial Statements” and IAS 28 “Investments in Associates and Joint Ventures.” - issued in September 2014. This amendment addresses an inconsistency between the requirements of IFRS 10 and IAS 28 in the treatment of the sale or provision of goods between an investor and its associate or joint venture. The main consequence of these amendments is that they recognize a full gain or a loss when the transaction involves a business (whether or not in a subsidiary) and a partial gain or loss when the transaction involves assets that do not constitute a business, even if these assets are in a subsidiary. Early adoption is permitted.
Undetermined
Management believes that the future adoption of these standards, amendments and interpretations will have no significant impact on the Company’s consolidated financial statements when they are first applied.
378

2021 Integrated Report
Welcome Message00
SAAM, a Vocation of Service for the Foreign Trade Industry
01
Leadership and Governance Framework
02
Business Model03
Our Team04
Supplier Management05
Efficient Use of Natural Resources
06
Social Contribution07
Additional Information08
GRI Content Index09
Financial Statements10
SAAM INVERSIONES SPA
Notes to the Financial Statements
The accompanying notes are an integral part of these financial statements.
21
NOTE 4 Accounting Changes
During the year ended December 31, 2021, the Company has uniformly applied its accounting policies compared to 2020.
NOTE 5 Related party balances and transactions
The net balance of receivables from and payable to non-consolidated related parties are detailed as follows.
Current Non-current
Total Current Non-current Total
12-31-2021 12-31-2021 12-31-2021 12-31-2020 12-31-2020 12-31-2020ThUS$ ThUS$ ThUS$ ThUS$ ThUS$ ThUS$
Related party receivables 6 49 55 57 - 57Related party payables - - - - - -
Total 6 49 55 57 - 57
All outstanding current balances with related parties are valued at mutually independent conditions and will be settled within twelve months of the reporting date.
5.1 Related party receivables
Related party receivables are detailed as follows:
Chilean ID Number Chilean companies Relationship Currency Transaction
Current Non-current Current Non-
current 12.31.2021 12.31.2021 12.31.2020 12.31.2020
ThUS$ ThUS$ ThUS$ ThUS$
96,915,330-0 Iquique Terminal Internacional S.A. Indirect US dollar
Total 2 - 3 - Services - - - - Dividend 2 - 3 -
92,048,000-0 SAAM S.A.
Associate and
common parent
US dollar
Total - 49 49 - Dividends - - - Mercantile account - 49 49 -
96,798,520-1 Saam Extraportuarios S.A. Associate US dollar Total - - 5 - Other items - - 5 -
96.720.220-7 Inversiones San Marco Ltda. Associate US dollar
Total 4 - - - Other items 4 - - -
Total related party receivables 6 49 57 -
5.2 Related party payables
As of December 31, 2021 and 2020 there were no related party payables.
SAAM INVERSIONES SPA
Notes to the Financial Statements
The accompanying notes are an integral part of these financial statements.
22
NOTE 5 Related party balances and transactions, continued
5.3 Effects on the statement of net income of transactions with related parties
As of December 31, 2021 and 2020, there were no transactions with related parties with effects on the statement of net income.
5.4 Director’s remuneration
As of December 31, 2021 and 2020 there was no remuneration for Board members.
379
2021 Integrated Report
Welcome Message00
SAAM, a Vocation of Service for the Foreign Trade Industry
01
Leadership and Governance Framework
02
Business Model03
Our Team04
Supplier Management05
Efficient Use of Natural Resources
06
Social Contribution07
Additional Information08
GRI Content Index09
Financial Statements10
380
Statement of Responsibility
380380
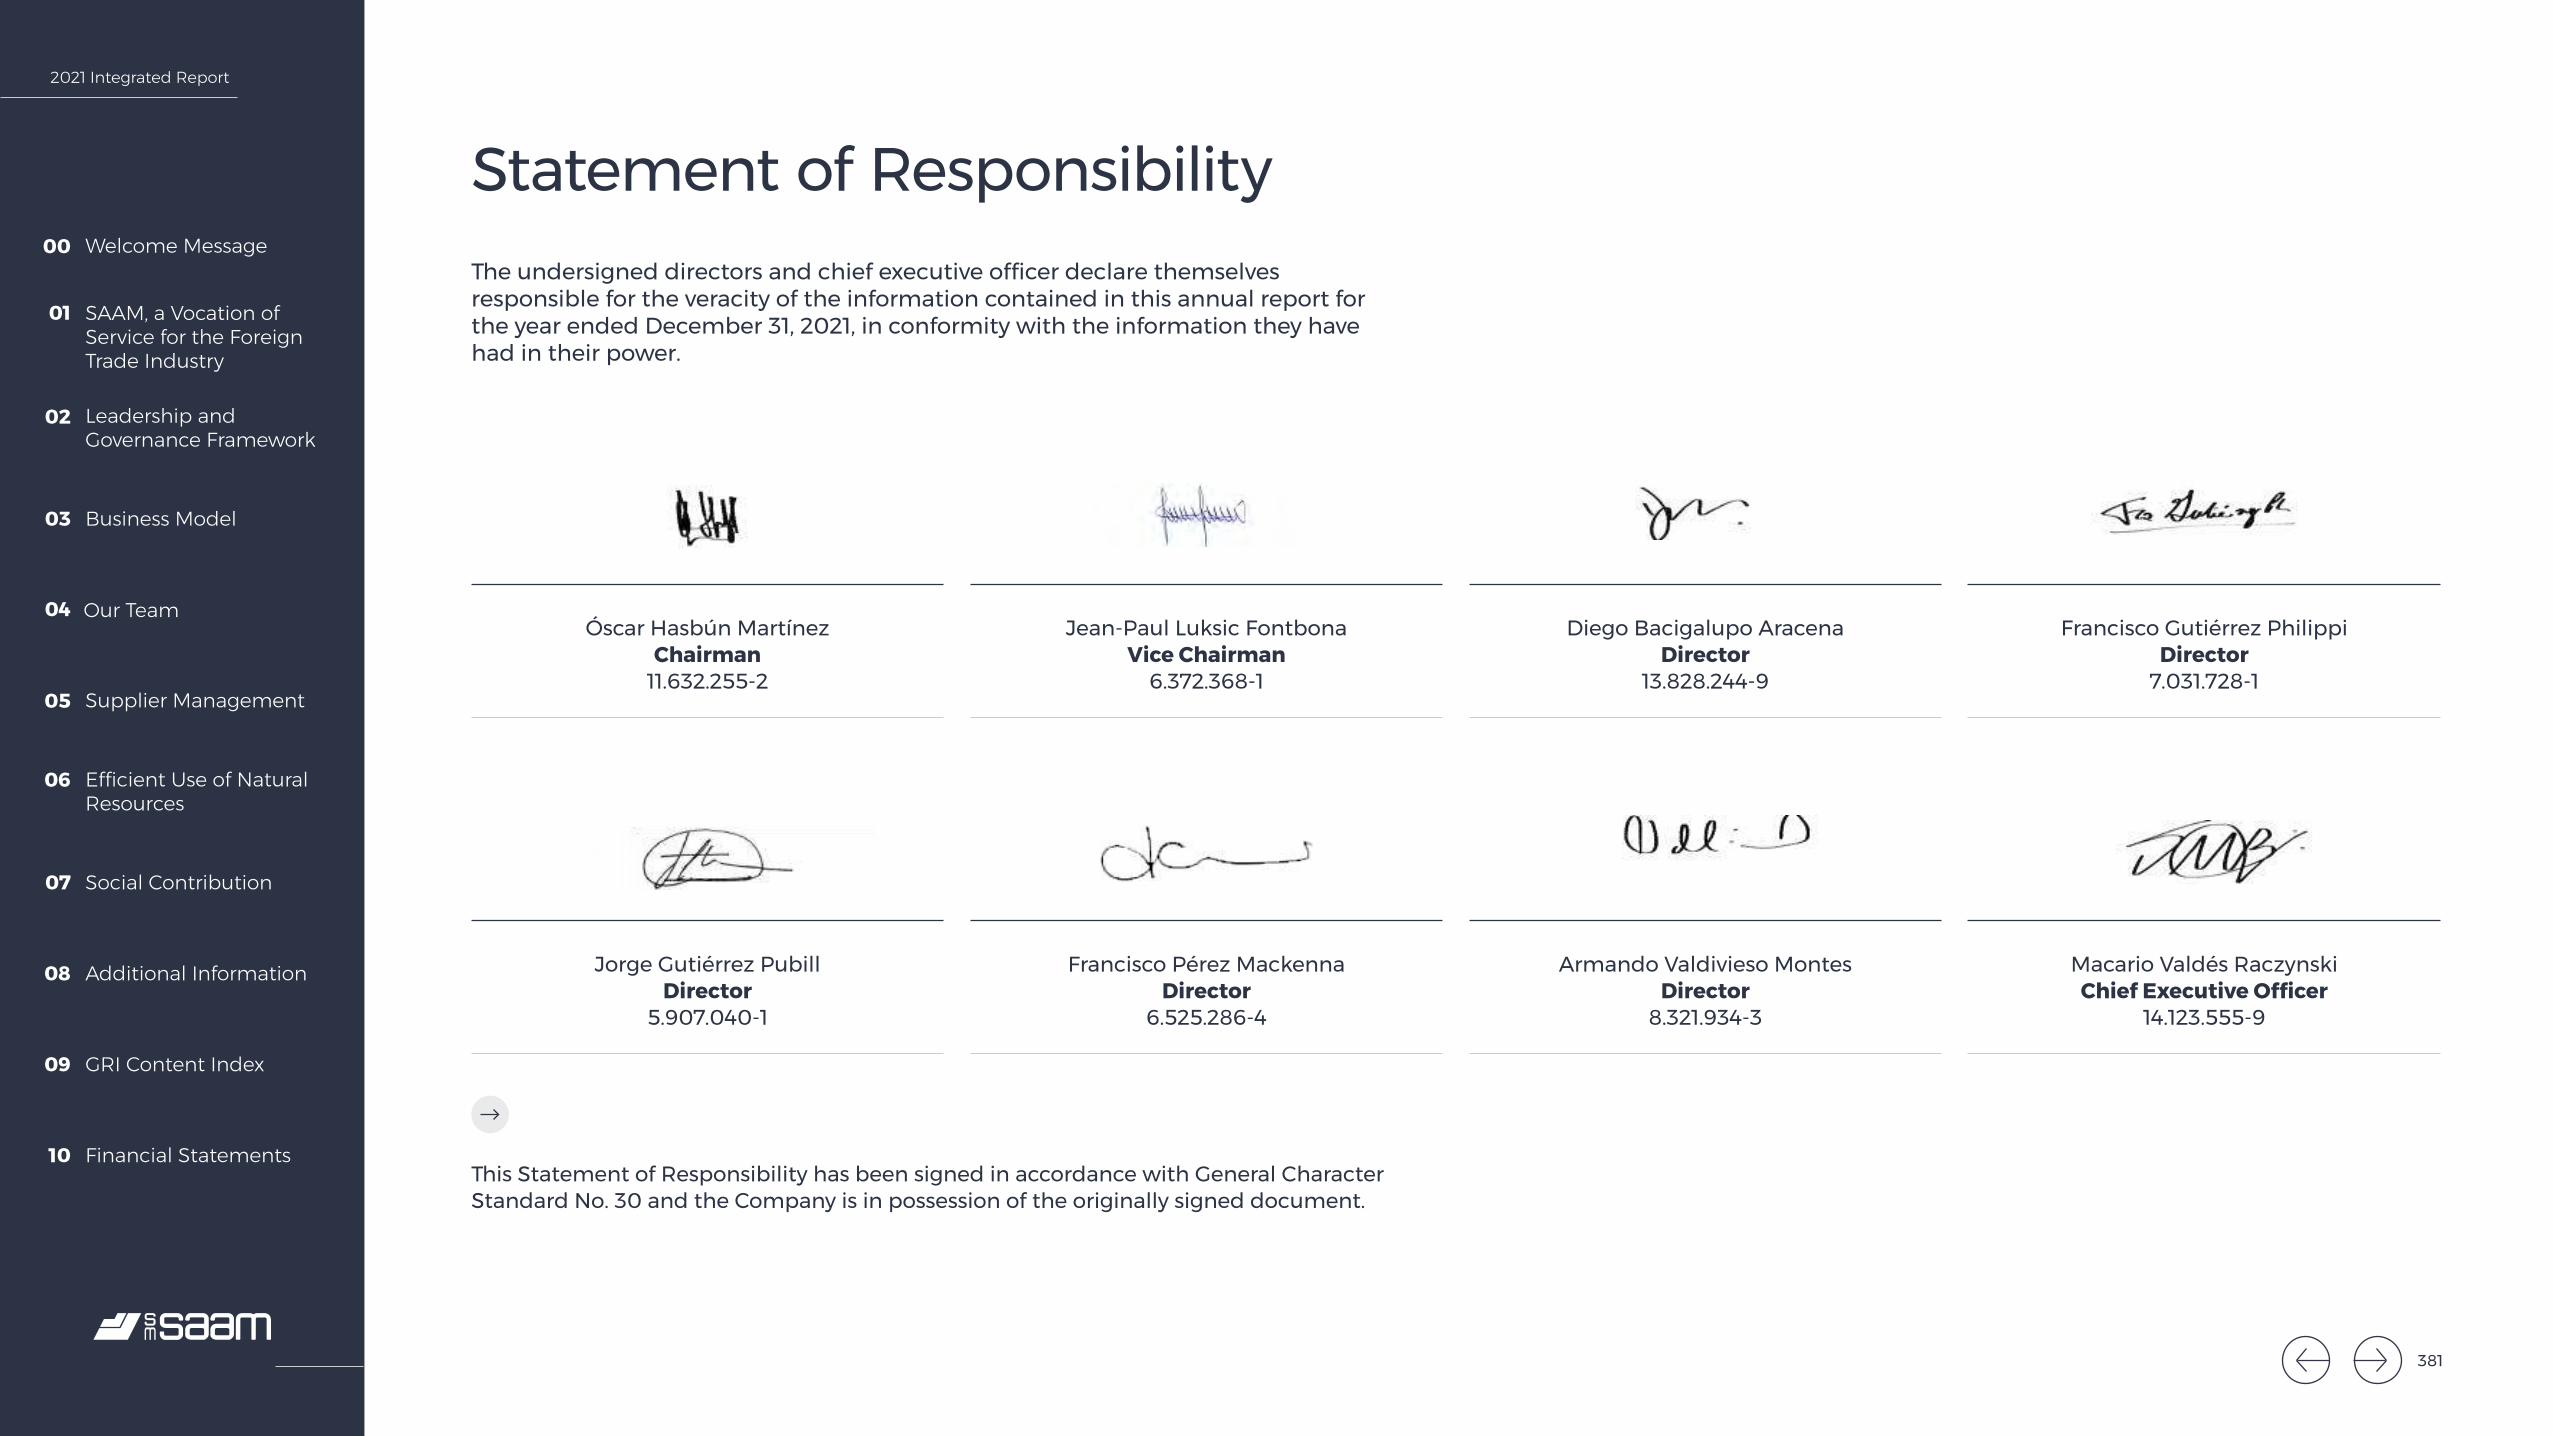
2021 Integrated Report
Welcome Message00
SAAM, a Vocation of Service for the Foreign Trade Industry
01
Leadership and Governance Framework
02
Business Model03
Our Team04
Supplier Management05
Efficient Use of Natural Resources
06
Social Contribution07
Additional Information08
GRI Content Index09
Financial Statements10
Memoria Integrada 2021
Mensaje de bienvenida
SAAM, vocación de servicio al comercio internacional
Modelo de negocios
Liderazgo y marco de gobernanza
Nuestro equipo
Gestión de proveedores
Uso eficiente de los recursos naturales
Contribución social
Información adicional
Índices de contenido
Hechos relevantes
Comentarios de accionistas y Comité de Directores
Informes financieros
Declaración de Responsabilidad
00
01
02
03
04
05
06
07
08
09
10
11
12
13
Declaración de ResponsabilidadLos directores y gerente general que suscriben esta memoria por el ejercicio terminado el 31 de diciembre de 2021, declaran bajo juramento que su contenido es veraz, conforme a la información que han tenido en su poder.
Óscar Hasbún Martínez Presidente 11.632.255-2
Jorge Gutiérrez Pubill Director
5.907.040-1
Diego Bacigalupo Aracena Director
13.828.244-9
Armando Valdivieso Montes Director
8.321.934-3
Jean-Paul Luksic Fontbona Vicepresidente
6.372.368-1
Francisco Pérez Mackenna Director
6.525.286-4
Francisco Gutiérrez Philippi Director
7.031.728-1
Macario Valdés Raczynski Gerente General
14.123.555-9
La presente Declaración de Responsabilidad ha sido suscrita conforme lo dispone la Norma de Carácter General Nº 30, cuyas firmas constan en los ejemplares que se encuentran en poder de la Sociedad
Directorio SM SAAM - Aprobación Memoria
388
Statement of ResponsibilityThe undersigned directors and chief executive officer declare themselves responsible for the veracity of the information contained in this annual report for the year ended December 31, 2021, in conformity with the information they have had in their power.
Óscar Hasbún Martínez Chairman
11.632.255-2
Jorge Gutiérrez Pubill Director
5.907.040-1
Diego Bacigalupo Aracena Director
13.828.244-9
Armando Valdivieso Montes Director
8.321.934-3
Jean-Paul Luksic Fontbona Vice Chairman
6.372.368-1
Francisco Pérez Mackenna Director
6.525.286-4
Francisco Gutiérrez Philippi Director
7.031.728-1
Macario Valdés Raczynski Chief Executive Officer
14.123.555-9
This Statement of Responsibility has been signed in accordance with General Character Standard No. 30 and the Company is in possession of the originally signed document.
381
2021 Integrated Report
Welcome Message00
SAAM, a Vocation of Service for the Foreign Trade Industry
01
Leadership and Governance Framework
02
Business Model03
Our Team04
Supplier Management05
Efficient Use of Natural Resources
06
Social Contribution07
Additional Information08
GRI Content Index09
Financial Statements10
www.saam.cl
Content development and use of standards: Kellun
Design and layout: Baobab
Photography SAAM File
382382