INTEGRATED REPORT 2019 - Marubeni
136
GLOBAL CROSSVALUE PLATFORM INTEGRATED REPORT 2019 Marubeni Corporation Fiscal year ended March 31, 2019
-
Upload
khangminh22 -
Category
Documents
-
view
0 -
download
0
Transcript of INTEGRATED REPORT 2019 - Marubeni
GLOBALCROSSVALUEPLATFORM
INTEGRATEDREPORT2019Marubeni CorporationFiscal year ended March 31, 2019
Editorial PolicyIntegrated Report 2019 is meant to serve as a tool for communicating with stakeholders and gaining the trust of greater society. To provide a systematic explanation of the Marubeni Group’s corporate value, this report is compiled in the form of an integrated report that describes our quest to create both corporate and social value. We hope that this report will give readers an understanding of our business strategies as well as our commitment to helping resolve social issues through our business activities.Furthermore, the notation for the fiscal year covered in this report is FYE 3/2019 (April 1, 2018 to March 31, 2019).
Disclaimer Regarding Forward-Looking StatementsThis material contains forward-looking statements about the future performance, events or management plans of Marubeni Corporation and its Group companies (the Compa-ny) based on the available information, certain assumptions and expectations at the point of disclosure, many of which are beyond the Company’s control. These are subject to a number of risks, uncertainties and factors, including, but not limited to, economic and financial conditions, factors that may affect the level of demand and financial performance of the major industries and customers we serve, interest rates and currency fluctuations, availability and cost of funding, fluctuations in commodity and materials prices, political turmoil in certain countries and regions, litigation claims, changes in laws, regulations and tax rules, and other factors. Actual results, performance and achievements may differ materially from those described explicitly or implicitly in the relevant forward-looking statements.The Company bears no responsibility for any possible damages arising from the use of information in this material, nor does the Company have any obligation to update these statements, information, future events or otherwise.This material is an English language translation of the materials originally written in Japanese. In case of discrepancies, the Japanese version is authoritative and universally valid.
Note Regarding Accounting StandardsThe Company adopted U.S. GAAP up until the fiscal year ended March 31, 2013, and IFRS from the fiscal year ended March 31, 2014.“Profit attributable to owners of the parent” is described as “Consolidated Net Profit”/“Net profit” in this report.
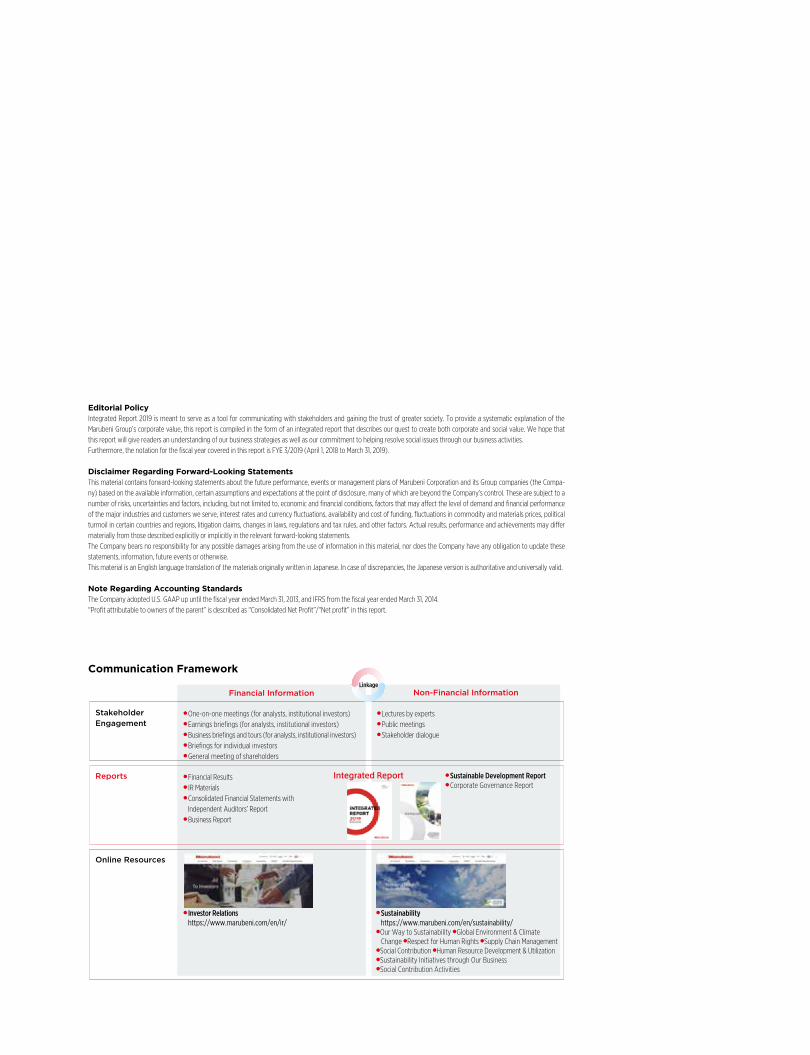
●One-on-one meetings (for analysts, institutional investors)●Earnings briefings (for analysts, institutional investors)●Business briefings and tours (for analysts, institutional investors)●Briefings for individual investors●General meeting of shareholders
●Financial Results● IR Materials●Consolidated Financial Statements with Independent Auditors’ Report●Business Report
● Investor Relations https://www.marubeni.com/en/ir/
●Sustainability https://www.marubeni.com/en/sustainability/
Integrated Report
●Sustainable Development Report ●Corporate Governance Report
●Lectures by experts●Public meetings●Stakeholder dialogue
Communication Framework
Stakeholder Engagement
Financial Information Non-Financial InformationLinkage
Reports
Online Resources
●Our Way to Sustainability ●Global Environment & Climate Change ●Respect for Human Rights ●Supply Chain Management ●Social Contribution ●Human Resource Development & Utilization●Sustainability Initiatives through Our Business ●Social Contribution Activities
002 Marubeni’s History
004 Marubeni’s Performance and Growth Capabilities
008 Marubeni’s Value Creation Process
CHAPTER 1
STRATEGY010 Message from the President & CEO
014 GC2021 Medium-Term Management Strategy in the
President & CEO's Words
Column
021 Chain of Command Flattened to Three Layers
024 Concepts of Horizon 3 and White Space
026 Next Generation Business Development Division:
Business Development Organization for the Creation of
New Business Models Focused on the Next 10 Years
028 Message from the CFO
032 Risk Management
CHAPTER 2
MANAGEMENT FOUNDATION034 Sustainability
034 Our Views on Sustainability
036 Sustainability Dialogue
Dialogue with Stakeholders at Marubeni Sustainability
Information Session
040 Fundamental Materiality
041 Organization
042 Environmental & Social Materiality
052 HR Strategy
056 Corporate Governance
056 Members of the Board
058 Corporate Governance at a Glance
060 Corporate Governance System
070 Corporate Management
CHAPTER 3
OPERATING ACTIVITIES074 Organization
076 Business Divisions
076 Lifestyle Division
078 ICT & Real Estate Business Division
080 Forest Products Division
082 Food Division
084 Agri Business Division
086 Chemicals Division
088 Power Business Division
090 Energy Division
092 Metals & Mineral Resources Division
094 Plant Division
096 Aerospace & Ship Division
098 Finance & Leasing Business Division
100 Construction, Auto & Industrial Machinery Division
CHAPTER 4
CORPORATE INFORMATION102 Performance Highlights
104 Financial Data
105 Non-Financial Data
106 Consolidated Financial Results at a Glance
108 Financial-Related Graph Data
110 Management’s Discussion and Analysis of Financial
Position and Business Results
1 1 3 Business Risks
1 16 Consolidated Financial Statements
124 Global Network
126 Major Subsidiaries and Associates
131 Company Profile
132 Stock Information
133 Independent Assurance of Environmental and
Social Data
INTEGRATED REPORT2019
CONTENTS
001
���������������������
��������������������������������� �� �����
������� ����������
�
Marubeni has been taking on the challenge of creating new value
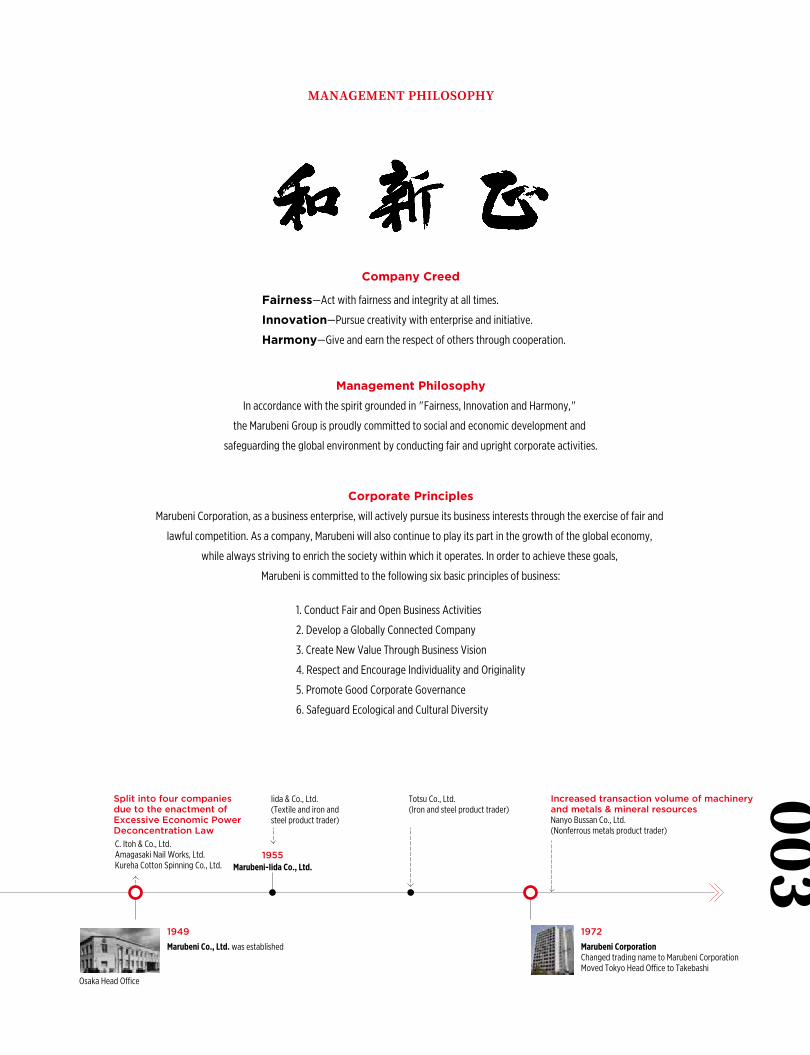
Management Philosophy
In accordance with the spirit grounded in "Fairness, Innovation and Harmony,"
the Marubeni Group is proudly committed to social and economic development and
safeguarding the global environment by conducting fair and upright corporate activities.
Corporate Principles
Marubeni Corporation, as a business enterprise, will actively pursue its business interests through the exercise of fair and
lawful competition. As a company, Marubeni will also continue to play its part in the growth of the global economy,
while always striving to enrich the society within which it operates. In order to achieve these goals,
Marubeni is committed to the following six basic principles of business:
1. Conduct Fair and Open Business Activities
2. Develop a Globally Connected Company
3. Create New Value Through Business Vision
4. Respect and Encourage Individuality and Originality
5. Promote Good Corporate Governance
6. Safeguard Ecological and Cultural Diversity
Company Creed
Fairness—Act with fairness and integrity at all times.
Innovation—Pursue creativity with enterprise and initiative.
Harmony—Give and earn the respect of others through cooperation.
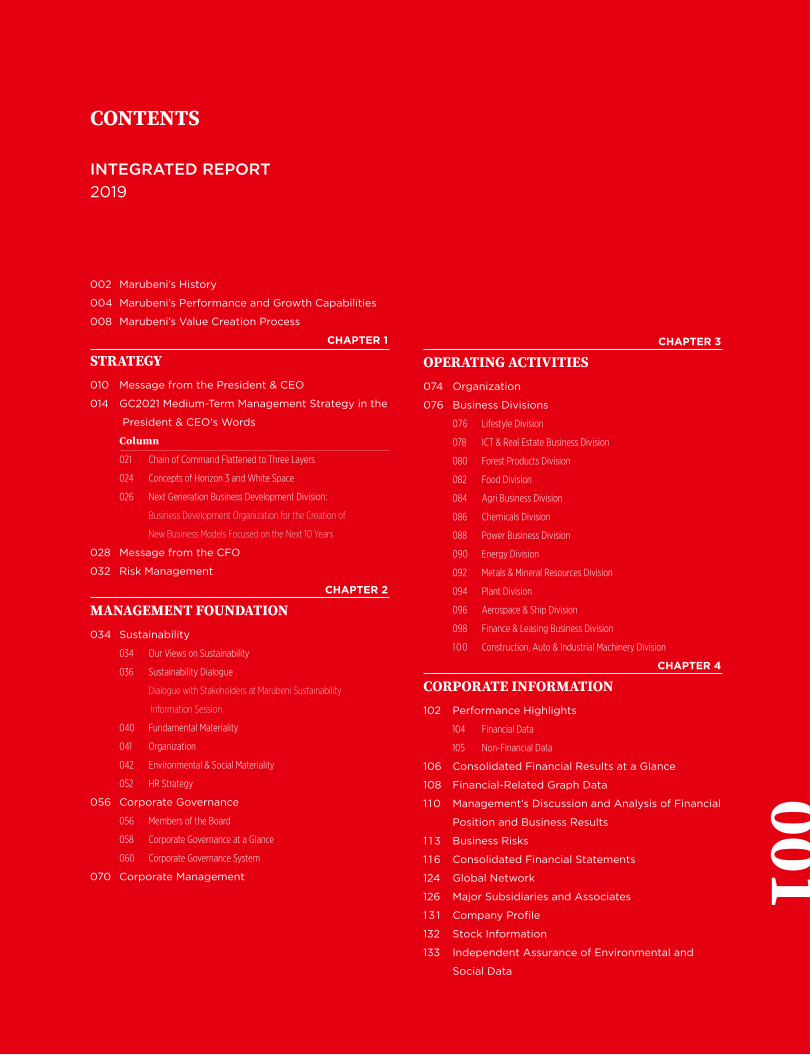
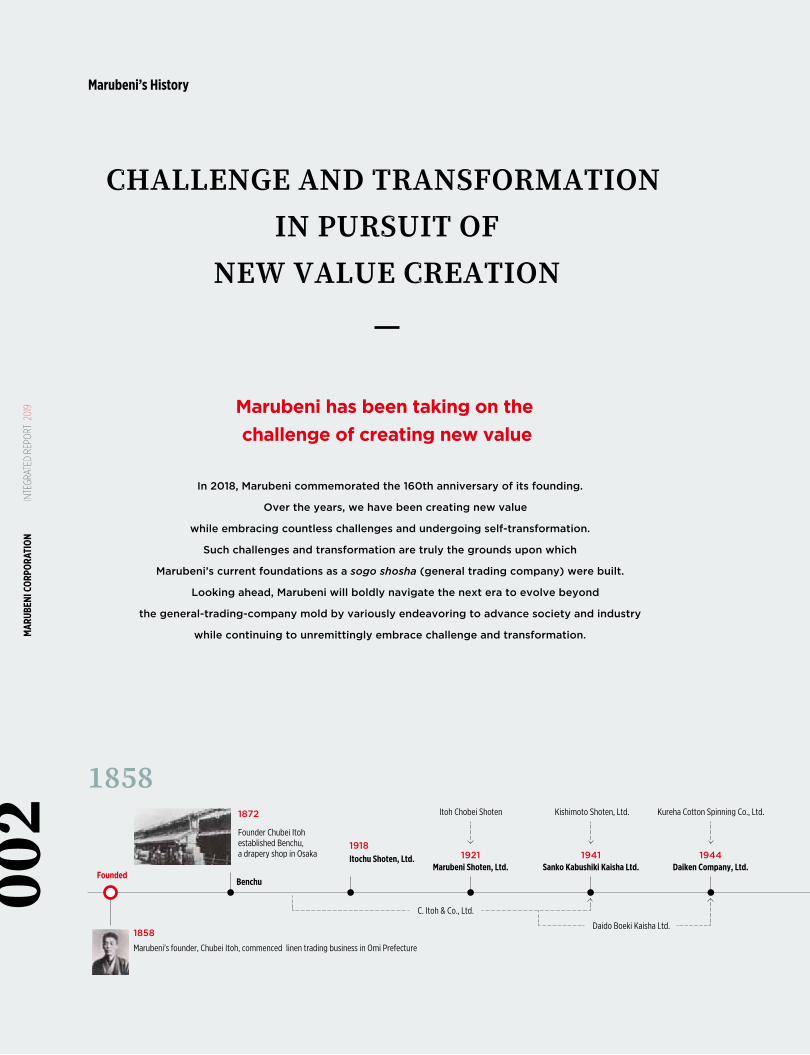
In 2018, Marubeni commemorated the 160th anniversary of its founding.
Over the years, we have been creating new value
while embracing countless challenges and undergoing self-transformation.
Such challenges and transformation are truly the grounds upon which
Marubeni’s current foundations as a sogo shosha (general trading company) were built.
Looking ahead, Marubeni will boldly navigate the next era to evolve beyond
the general-trading-company mold by variously endeavoring to advance society and industry
while continuing to unremittingly embrace challenge and transformation.
1858
Marubeni's founder, Chubei Itoh, commenced linen trading business in Omi Prefecture
1949
Marubeni Co., Ltd. was established
1972
Marubeni CorporationChanged trading name to Marubeni CorporationMoved Tokyo Head O�ce to Takebashi
BenchuFounded
Founder Chubei Itohestablished Benchu,a drapery shop in Osaka
1872
1918Itochu Shoten, Ltd. 1921
Marubeni Shoten, Ltd.
Itoh Chobei Shoten
C. Itoh & Co., Ltd.
Daido Boeki Kaisha Ltd.
Iida & Co., Ltd.(Textile and iron andsteel product trader)
Totsu Co., Ltd.(Iron and steel product trader)
1941Sanko Kabushiki Kaisha Ltd.
1944Daiken Company, Ltd.
1955Marubeni-Iida Co., Ltd.
Increased transaction volume of machinery and metals & mineral resources Nanyo Bussan Co., Ltd.(Nonferrous metals product trader)
Kishimoto Shoten, Ltd. Kureha Cotton Spinning Co., Ltd.
C. Itoh & Co., Ltd.Amagasaki Nail Works, Ltd.Kureha Cotton Spinning Co., Ltd.
Split into four companiesdue to the enactment ofExcessive Economic PowerDeconcentration Law
Osaka Head O�ce
Marubeni’s History
MAR
UBEN
I COR
PORA
TION
IN
TEGR
ATED
REP
ORT
201
900
2
���������������������
��������������������������������� �� �����
������� ����������
�
Marubeni has been taking on the challenge of creating new value
Management Philosophy
In accordance with the spirit grounded in "Fairness, Innovation and Harmony,"
the Marubeni Group is proudly committed to social and economic development and
safeguarding the global environment by conducting fair and upright corporate activities.
Corporate Principles
Marubeni Corporation, as a business enterprise, will actively pursue its business interests through the exercise of fair and
lawful competition. As a company, Marubeni will also continue to play its part in the growth of the global economy,
while always striving to enrich the society within which it operates. In order to achieve these goals,
Marubeni is committed to the following six basic principles of business:
1. Conduct Fair and Open Business Activities
2. Develop a Globally Connected Company
3. Create New Value Through Business Vision
4. Respect and Encourage Individuality and Originality
5. Promote Good Corporate Governance
6. Safeguard Ecological and Cultural Diversity
Company Creed
Fairness—Act with fairness and integrity at all times.
Innovation—Pursue creativity with enterprise and initiative.
Harmony—Give and earn the respect of others through cooperation.
In 2018, Marubeni commemorated the 160th anniversary of its founding.
Over the years, we have been creating new value
while embracing countless challenges and undergoing self-transformation.
Such challenges and transformation are truly the grounds upon which
Marubeni’s current foundations as a sogo shosha (general trading company) were built.
Looking ahead, Marubeni will boldly navigate the next era to evolve beyond
the general-trading-company mold by variously endeavoring to advance society and industry
while continuing to unremittingly embrace challenge and transformation.
1858
Marubeni's founder, Chubei Itoh, commenced linen trading business in Omi Prefecture
1949
Marubeni Co., Ltd. was established
1972
Marubeni CorporationChanged trading name to Marubeni CorporationMoved Tokyo Head O�ce to Takebashi
BenchuFounded
Founder Chubei Itohestablished Benchu,a drapery shop in Osaka
1872
1918Itochu Shoten, Ltd. 1921
Marubeni Shoten, Ltd.
Itoh Chobei Shoten
C. Itoh & Co., Ltd.
Daido Boeki Kaisha Ltd.
Iida & Co., Ltd.(Textile and iron andsteel product trader)
Totsu Co., Ltd.(Iron and steel product trader)
1941Sanko Kabushiki Kaisha Ltd.
1944Daiken Company, Ltd.
1955Marubeni-Iida Co., Ltd.
Increased transaction volume of machinery and metals & mineral resources Nanyo Bussan Co., Ltd.(Nonferrous metals product trader)
Kishimoto Shoten, Ltd. Kureha Cotton Spinning Co., Ltd.
C. Itoh & Co., Ltd.Amagasaki Nail Works, Ltd.Kureha Cotton Spinning Co., Ltd.
Split into four companiesdue to the enactment ofExcessive Economic PowerDeconcentration Law
Osaka Head O�ce
003
FYE 3/2019
FYE 3/2017
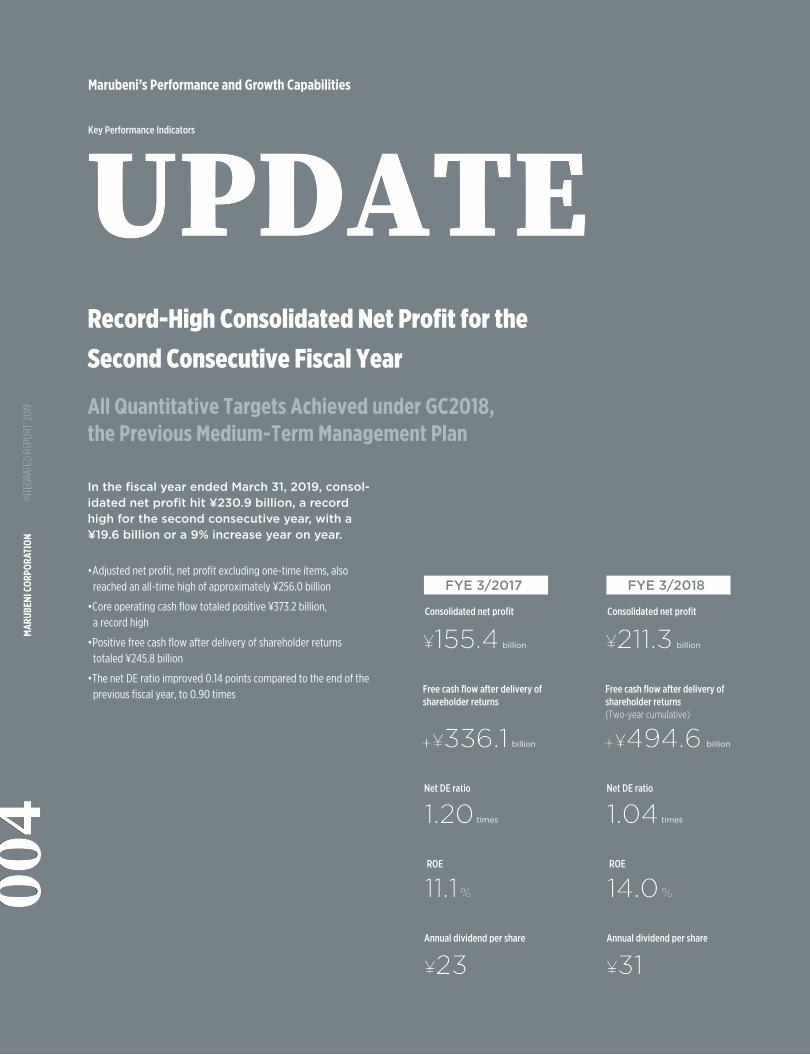
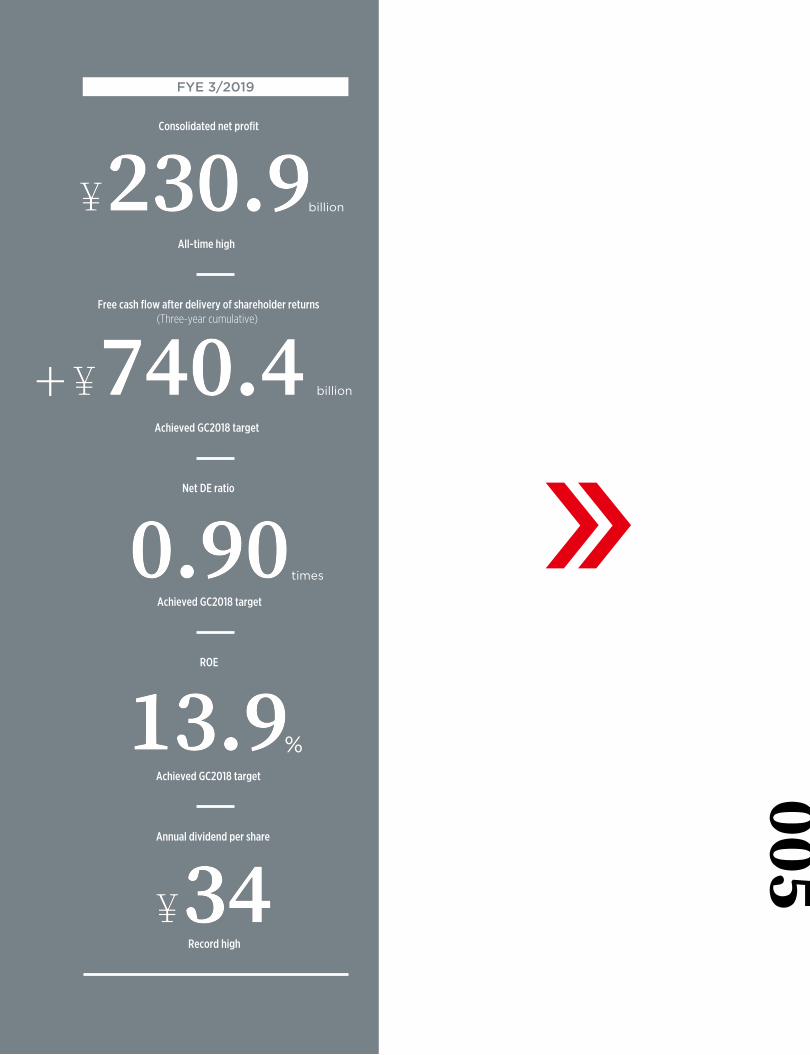
In the fiscal year ended March 31, 2019, consol-idated net profit hit ¥230.9 billion, a record high for the second consecutive year, with a ¥19.6 billion or a 9% increase year on year.
•Adjusted net profit, net profit excluding one-time items, also reached an all-time high of approximately ¥256.0 billion
•Core operating cash flow totaled positive ¥373.2 billion, a record high
•Positive free cash flow after delivery of shareholder returns totaled ¥245.8 billion
•The net DE ratio improved 0.14 points compared to the end of the previous fiscal year, to 0.90 times
Record-High Consolidated Net Profit for theSecond Consecutive Fiscal Year
All Quantitative Targets Achieved under GC2018,the Previous Medium-Term Management Plan
11.1%11.1%
ROE
Consolidated net profit
¥155.4¥155.4 billion
Consolidated net profit
All-time high
billion
1.201.20Net DE ratio
times
¥23¥23Annual dividend per share
Free cash flow after delivery of shareholder returns
+¥336.1+¥336.1 billion
FYE 3/2018
14.0%14.0%
ROE
Consolidated net profit
¥211.3¥211.3 billion
1.041.04Net DE ratio
times
¥31¥31Annual dividend per share
Free cash flow after delivery of shareholder returns (Two-year cumulative)
+¥494.6+¥494.6 billion
times
Net DE ratio
Achieved GC2018 target
Annual dividend per share
Record high
ROE
Achieved GC2018 target
billion
Free cash flow after delivery of shareholder returns(Three-year cumulative)
Achieved GC2018 target
Key Performance Indicators
Marubeni’s Performance and Growth Capabilities
004
MAR
UBEN
I COR
PORA
TION
IN
TEGR
ATED
REP
ORT
201
900
4
FYE 3/2019
FYE 3/2017
In the fiscal year ended March 31, 2019, consol-idated net profit hit ¥230.9 billion, a record high for the second consecutive year, with a ¥19.6 billion or a 9% increase year on year.
•Adjusted net profit, net profit excluding one-time items, also reached an all-time high of approximately ¥256.0 billion
•Core operating cash flow totaled positive ¥373.2 billion, a record high
•Positive free cash flow after delivery of shareholder returns totaled ¥245.8 billion
•The net DE ratio improved 0.14 points compared to the end of the previous fiscal year, to 0.90 times
Record-High Consolidated Net Profit for theSecond Consecutive Fiscal Year
All Quantitative Targets Achieved under GC2018,the Previous Medium-Term Management Plan
11.1%11.1%
ROE
Consolidated net profit
¥155.4¥155.4 billion
Consolidated net profit
All-time high
billion
1.201.20Net DE ratio
times
¥23¥23Annual dividend per share
Free cash flow after delivery of shareholder returns
+¥336.1+¥336.1 billion
FYE 3/2018
14.0%14.0%
ROE
Consolidated net profit
¥211.3¥211.3 billion
1.041.04Net DE ratio
times
¥31¥31Annual dividend per share
Free cash flow after delivery of shareholder returns (Two-year cumulative)
+¥494.6+¥494.6 billion
times
Net DE ratio
Achieved GC2018 target
Annual dividend per share
Record high
ROE
Achieved GC2018 target
billion
Free cash flow after delivery of shareholder returns(Three-year cumulative)
Achieved GC2018 target
Key Performance Indicators
005
Key Performance Indicators
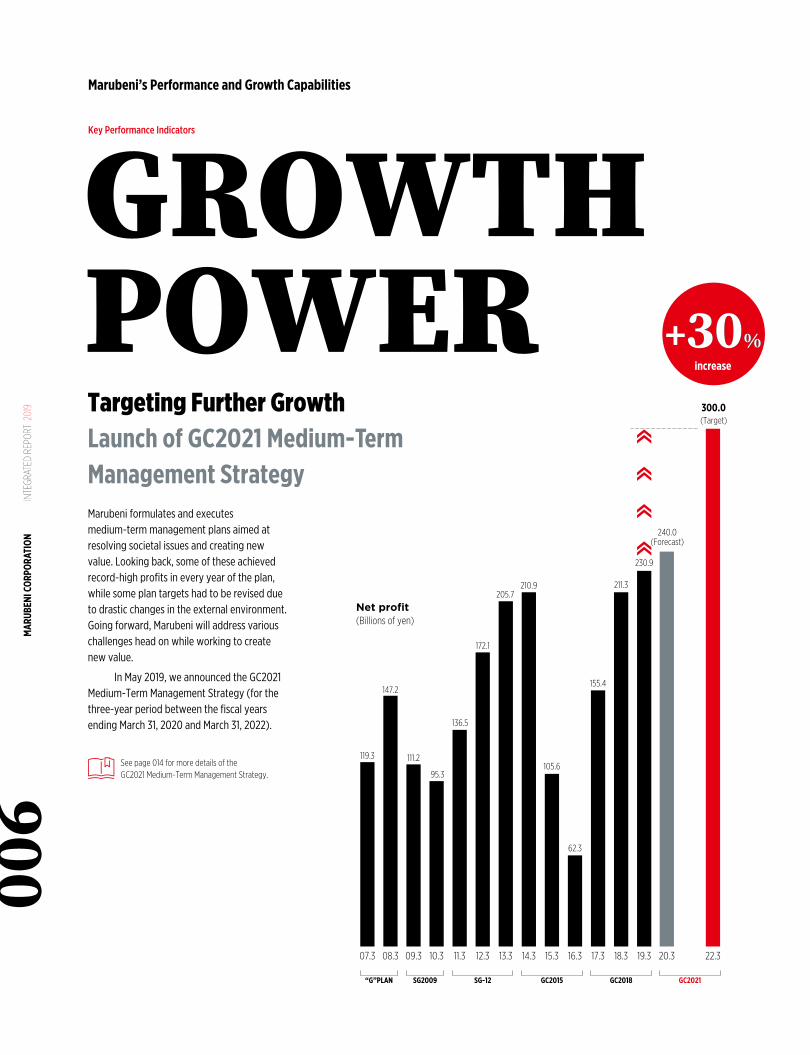
Targeting Further GrowthLaunch of GC2021 Medium-Term Management StrategyMarubeni formulates and executes medium-term management plans aimed at resolving societal issues and creating new value. Looking back, some of these achieved record-high profits in every year of the plan, while some plan targets had to be revised due to drastic changes in the external environment. Going forward, Marubeni will address various challenges head on while working to create new value.
In May 2019, we announced the GC2021 Medium-Term Management Strategy (for the three-year period between the fiscal years ending March 31, 2020 and March 31, 2022).
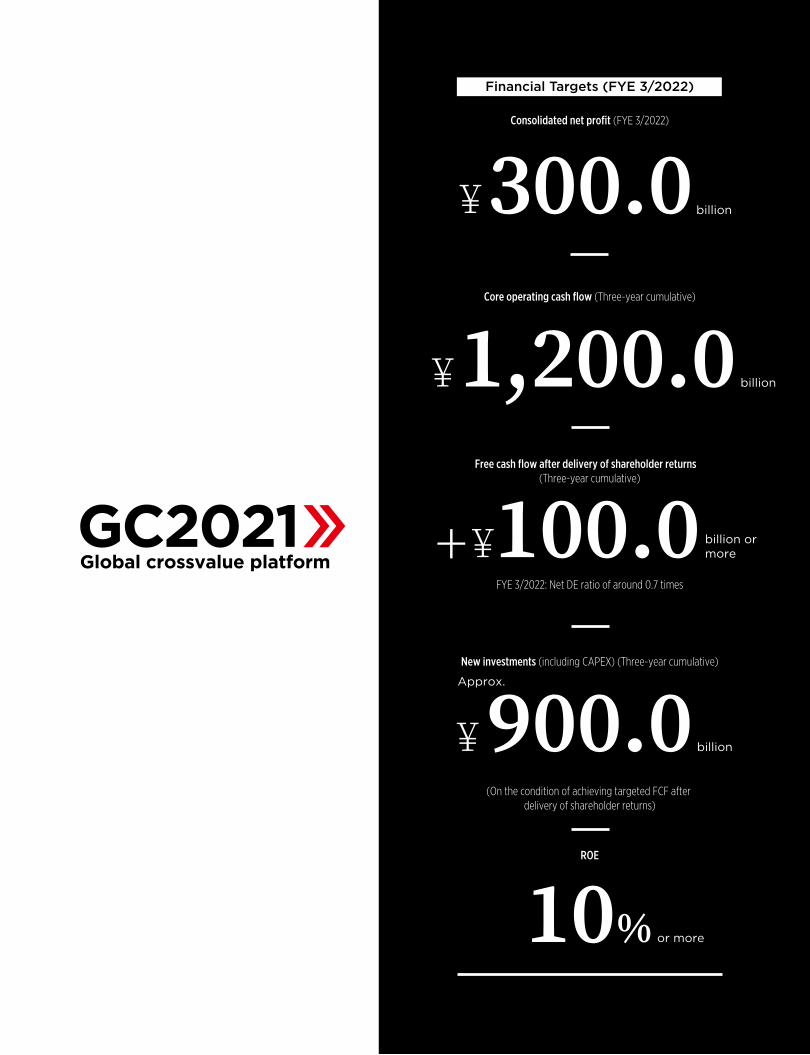
Free cash flow after delivery of shareholder returns (Three-year cumulative)
FYE 3/2022: Net DE ratio of around 0.7 times
New investments (including CAPEX) (Three-year cumulative)
(On the condition of achieving targeted FCF after delivery of shareholder returns)
07.3 08.3 09.3 10.3 11.3 12.3 13.3 14.3 15.3 16.3 17.3 18.3 19.3
“G”PLAN SG2009 SG-12 GC2015 GC2018
20.3 22.3
GC2021
Net profit(Billions of yen)
increase
(Target)
(Forecast)
230.9
62.3
211.3
155.4
105.6
210.9205.7
172.1
136.5
95.3
111.2
147.2
119.3
300.0
240.0
Consolidated net profit (FYE 3/2022)
billion
Financial Targets (FYE 3/2022)
Core operating cash flow (Three-year cumulative)
billion
billion ormore
billion
Approx.
ROE
or more
See page 014 for more details of theGC2021 Medium-Term Management Strategy.
GC2021Global crossvalue platform
丸紅の実行力・成長力丸紅の実行力・成長力
Marubeni’s Performance and Growth Capabilities
MAR
UBEN
I COR
PORA
TION
IN
TEGR
ATED
REP
ORT
201
900
6
Key Performance Indicators
Targeting Further GrowthLaunch of GC2021 Medium-Term Management StrategyMarubeni formulates and executes medium-term management plans aimed at resolving societal issues and creating new value. Looking back, some of these achieved record-high profits in every year of the plan, while some plan targets had to be revised due to drastic changes in the external environment. Going forward, Marubeni will address various challenges head on while working to create new value.
In May 2019, we announced the GC2021 Medium-Term Management Strategy (for the three-year period between the fiscal years ending March 31, 2020 and March 31, 2022).
Free cash flow after delivery of shareholder returns (Three-year cumulative)
FYE 3/2022: Net DE ratio of around 0.7 times
New investments (including CAPEX) (Three-year cumulative)
(On the condition of achieving targeted FCF after delivery of shareholder returns)
07.3 08.3 09.3 10.3 11.3 12.3 13.3 14.3 15.3 16.3 17.3 18.3 19.3
“G”PLAN SG2009 SG-12 GC2015 GC2018
20.3 22.3
GC2021
Net profit(Billions of yen)
increase
(Target)
(Forecast)
230.9
62.3
211.3
155.4
105.6
210.9205.7
172.1
136.5
95.3
111.2
147.2
119.3
300.0
240.0
Consolidated net profit (FYE 3/2022)
billion
Financial Targets (FYE 3/2022)
Core operating cash flow (Three-year cumulative)
billion
billion ormore
billion
Approx.
ROE
or more
See page 014 for more details of theGC2021 Medium-Term Management Strategy.
GC2021Global crossvalue platform
007
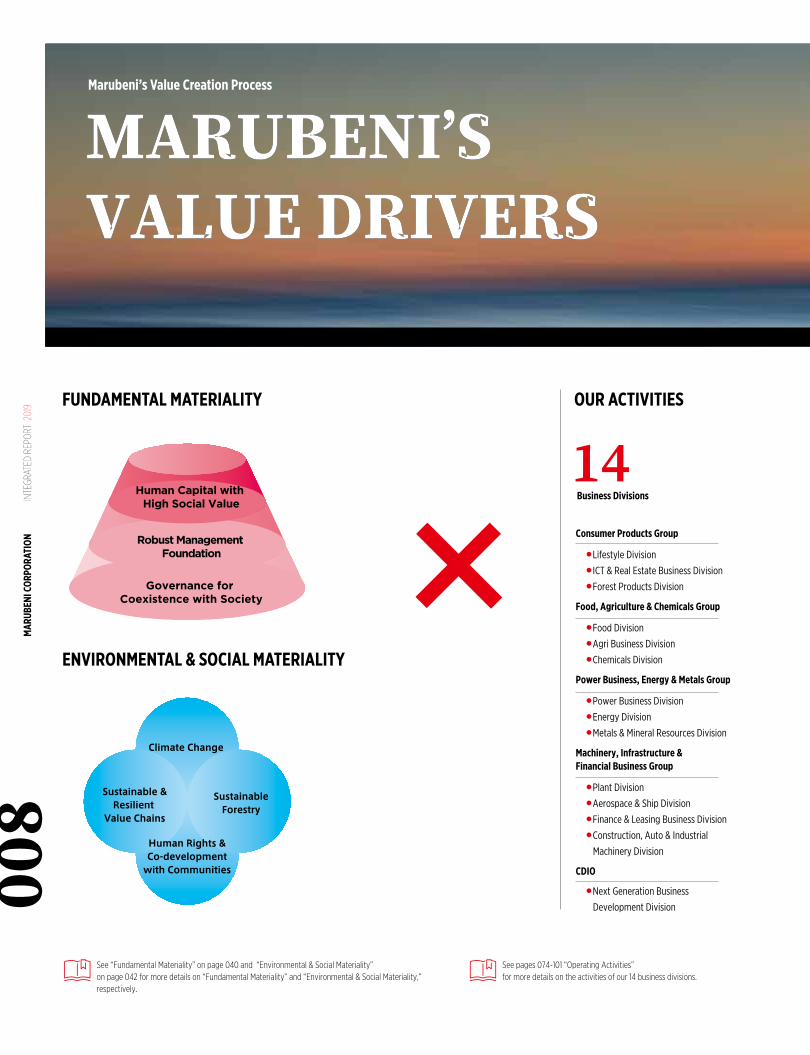
See “Fundamental Materiality” on page 040 and “Environmental & Social Materiality”on page 042 for more details on “Fundamental Materiality” and “Environmental & Social Materiality,” respectively.
See pages 074-101 “Operating Activities”for more details on the activities of our 14 business divisions.
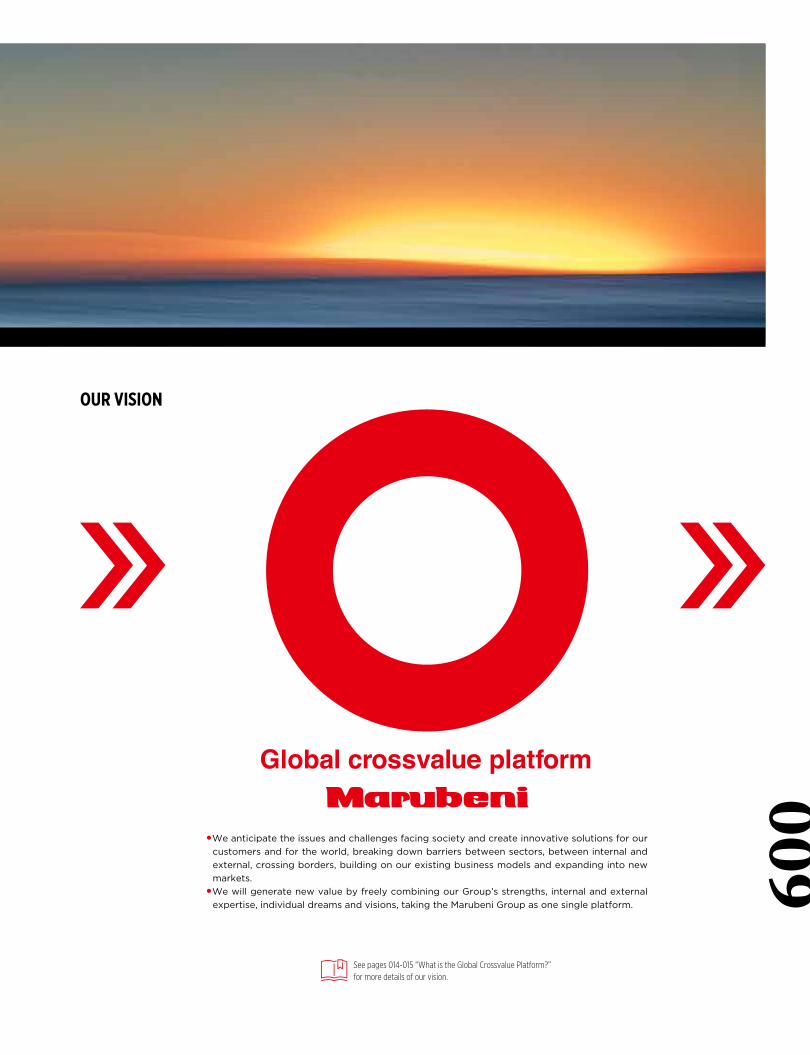
See pages 014-015 “What is the Global Crossvalue Platform?”for more details of our vision.
●We anticipate the issues and challenges facing society and create innovative solutions for our customers and for the world, breaking down barriers between sectors, between internal and external, crossing borders, building on our existing business models and expanding into new markets.
●We will generate new value by freely combining our Group’s strengths, internal and external expertise, individual dreams and visions, taking the Marubeni Group as one single platform.
OUR ACTIVITIES
ENVIRONMENTAL & SOCIAL MATERIALITY
FUNDAMENTAL MATERIALITY OUR VISION
Consumer Products Group
●Lifestyle Division ● ICT & Real Estate Business Division ●Forest Products Division
Food, Agriculture & Chemicals Group
●Food Division ●Agri Business Division ●Chemicals Division
Power Business, Energy & Metals Group
●Power Business Division ●Energy Division ●Metals & Mineral Resources Division
Machinery, Infrastructure & Financial Business Group
●Plant Division ●Aerospace & Ship Division ●Finance & Leasing Business Division ●Construction, Auto & Industrial
Machinery Division
CDIO
●Next Generation Business
Development Division
Business Divisions
����������������������������������������������
Human Capital with High Social Value
Robust Management Foundation
Governance for Coexistence with Society
Climate Change
SustainableForestry
Sustainable &Resilient Value Chains
Human Rights &Co-developmentwith Communities
Marubeni’s Value Creation Process
MAR
UBEN
I COR
PORA
TION
IN
TEGR
ATED
REP
ORT
201
900
8
See “Fundamental Materiality” on page 040 and “Environmental & Social Materiality”on page 042 for more details on “Fundamental Materiality” and “Environmental & Social Materiality,” respectively.
See pages 074-101 “Operating Activities”for more details on the activities of our 14 business divisions.
See pages 014-015 “What is the Global Crossvalue Platform?”for more details of our vision.
●We anticipate the issues and challenges facing society and create innovative solutions for our customers and for the world, breaking down barriers between sectors, between internal and external, crossing borders, building on our existing business models and expanding into new markets.
●We will generate new value by freely combining our Group’s strengths, internal and external expertise, individual dreams and visions, taking the Marubeni Group as one single platform.
OUR ACTIVITIES
��
ENVIRONMENTAL & SOCIAL MATERIALITY
FUNDAMENTAL MATERIALITY OUR VISION
Consumer Products Group
●Lifestyle Division ● ICT & Real Estate Business Division ●Forest Products Division
Food, Agriculture & Chemicals Group
●Food Division ●Agri Business Division ●Chemicals Division
Power Business, Energy & Metals Group
●Power Business Division ●Energy Division ●Metals & Mineral Resources Division
Machinery, Infrastructure & Financial Business Group
●Plant Division ●Aerospace & Ship Division ●Finance & Leasing Business Division ●Construction, Auto & Industrial
Machinery Division
CDIO
●Next Generation Business
Development Division
Business Divisions
����������������������������������������������
Human Capital with High Social Value
Robust Management Foundation
Governance for Coexistence with Society
Climate Change
SustainableForestry
Sustainable &Resilient Value Chains
Human Rights &Co-developmentwith Communities
009
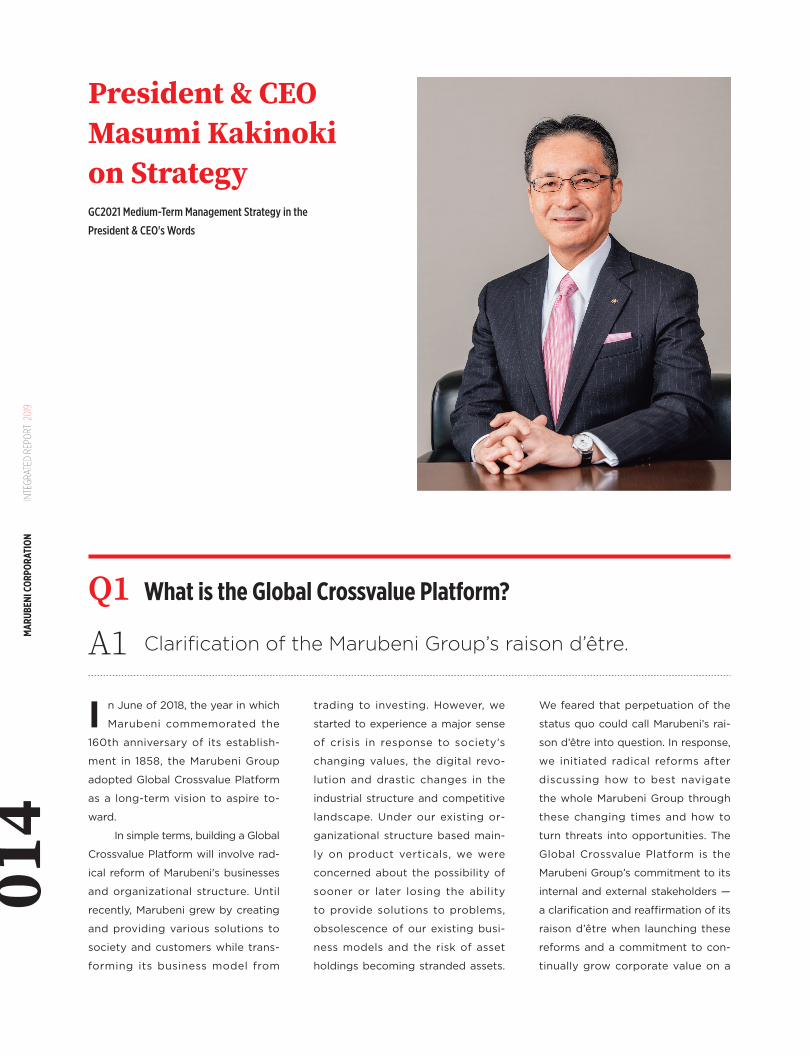
President & CEO
Masumi Kakinoki
Seizing upon changing, uncertain times as growth opportunities, we will forge our own path and elevate Marubeni to new heights.
In addition to anticipating issues and challenges facing society and
providing solutions to society and customers, we will challenge new
growth domains and new business models by transcending the status quo
and conventional wisdom.
Message from the President & CEO
MAR
UBEN
I COR
PORA
TION
IN
TEGR
ATED
REP
ORT
201
901
0
MANAGEMENT FOUNDATION OPERATING ACTIVITIES CORPORATE INFORMATIONSTRATEGY011
CHAPTER 1
I n speaking with people both inside and outside of Marubeni since becom-ing president in April 2019, I keenly feel
the magnitude of the expectations placed on Marubeni.
I believe that meeting such expecta-tions is our raison d’être. I believe a general trading company is an essential partner that continually bridges gaps in society. In the 20th century, we bridged geographic gaps through trade. In the 21st century to date, we have been bridging gaps between current value and future value through investment. Over the past few years, we have entered a new era of rapid economic, technological and political change. Going forward, the Marubeni Group aims to bridge the new gaps (societal issues) that arise between the present and an obscure future. It is difficult to know what form these gaps will take, where they will lie or how big they will be. Additionally, gaps interact with each other, abruptly joining to-gether or splitting apart.
We live in a challenging era. Nonetheless, I believe Marubeni is expected to continue to be a bold leader even amid such an en-vironment. Marubeni will remain a company that propels society forward. The Marubeni Group aims not only to create timely solu-tions by anticipating societal challenges and the emerging needs of customers but also to co-create and realize dreams by antici-pating the dreams of society and customers. The key to doing so is teamwork, as I tell all Marubeni Group personnel. Our teams need to hit the ground running, with everyone playing a valuable role. We cannot afford to have even a single member who lacks commitment or enthusiasm. We must forge ahead no matter what, thinking, acting and
creating as a team. We do not fear failure. We never let failure become an intractable crisis. Additionally, we cultivate human capital by providing opportunities to bounce back from failure. As long as Marubeni workplaces are filled with hard-working young people warmly supported by their seniors, I have absolute confidence that we can meet expectations as a leader that continually bridges gaps.
The Marubeni Group adopted a vision of its future self as a Global Crossvalue Plat-form in June 2018. We did so to reaffirm our commitment to anticipating issues and chal-lenges facing society and creating innovative solutions for society and customers, even in the coming era of uncertainty, through ver-tical evolution and horizontal expansion that break down various barriers, including be-tween sectors, inside and outside the Com-pany and national borders. As a first step toward realizing this vision, we unveiled our GC2021 Medium-Term Management Strategy in May 2019. We aim to be a value-creative group that transcends the general trading company framework. To do so, we will simul-taneously pursue both sustained growth by strengthening existing businesses and explo-sive growth by creating new business mod-els with sights set 10 years ahead.
In the fiscal year ended March 31, 2019, Marubeni earned consolidated net profit in excess of ¥230 billion, a second consecutive record, to achieve our GC2018 medium-term management plan target. Our earnings pow-er and financial foundation are now stronger than ever before in Marubeni’s history of over 160 years. We are heading into an unknown world. I believe uncertain times call for a management approach that places priority on Marubeni’s Creed of “Fairness, Innovation
Message from the President & CEO
MAR
UBEN
I COR
PORA
TION
IN
TEGR
ATED
REP
ORT
201
901
2
and Harmony.” This creed calls on us to act with fairness and integrity at all times, pursue creativity with enterprise and initiative, and give and earn the respect of others through cooperation. There are no words more fitting to the current era or more conducive to sus-tained growth in corporate value. I believe that upholding our Company Creed will in turn gen-erate even greater expectations of Marubeni and further reinforce Marubeni's raison d'être and clarify its path forward. As president, I will make every effort to realize this aim.
Career History
April 1980 Joined Marubeni Corporation
June 2009 Senior Operating Officer, Power Projects & Infrastructure Division; Senior Corporate Officer, Abu Dhabi Trade House Project Department
April 2010 Executive Officer; Chief Operating Officer, Power Projects & Infrastructure Division
April 2013 Managing Executive Officer; Chief Operating Officer, Corporate Planning & Strategy Department, Global Strategy & Coordination Department, and Research Institute; Chairman of Internal Control Committee; Vice Chairman of Investment and Credit Committee
June 2013 Managing Executive Officer, Member of the Board
April 2014 Managing Executive Officer
April 2017 Senior Managing Executive Officer
April 2018 Senior Executive Vice President, Chief Executive Officer, Power Business & Plant Group
June 2018 Senior Executive Vice President, Member of the Board
April 2019 President and CEO, Member of the Board
MANAGEMENT FOUNDATION OPERATING ACTIVITIES CORPORATE INFORMATIONSTRATEGY013
CHAPTER 1
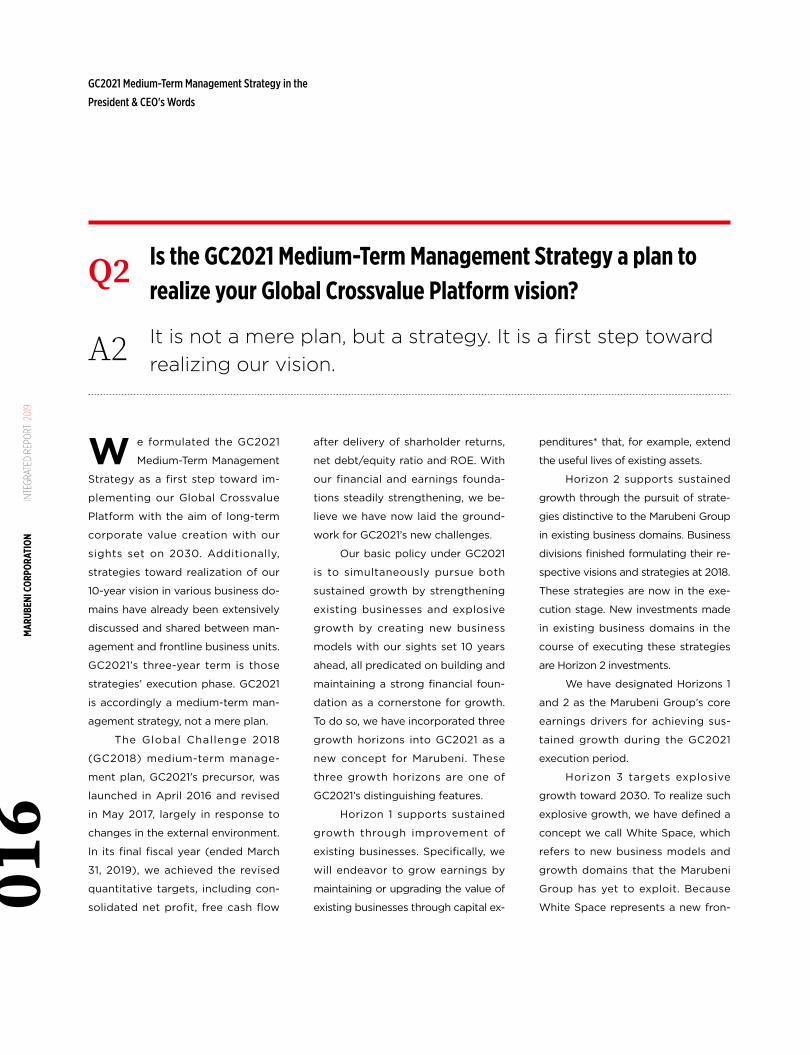
GC2021 Medium-Term Management Strategy in the
President & CEO's Words
I n June of 2018, the year in which
Marubeni commemorated the
160th anniversary of its establish-
ment in 1858, the Marubeni Group
adopted Global Crossvalue Platform
as a long-term vision to aspire to-
ward.
In simple terms, building a Global
Crossvalue Platform will involve rad-
ical reform of Marubeni's businesses
and organizational structure. Until
recently, Marubeni grew by creating
and providing various solutions to
society and customers while trans-
forming its business model from
A1 Clarification of the Marubeni Group’s raison d’être.
We feared that perpetuation of the
status quo could call Marubeni’s rai-
son d’être into question. In response,
we initiated radical reforms after
discussing how to best navigate
the whole Marubeni Group through
these changing times and how to
turn threats into opportunities. The
Global Crossvalue Platform is the
Marubeni Group’s commitment to its
internal and external stakeholders —
a clarification and reaffirmation of its
raison d’être when launching these
reforms and a commitment to con-
tinually grow corporate value on a
What is the Global Crossvalue Platform?Q1
trading to investing. However, we
started to experience a major sense
of crisis in response to society’s
changing values, the digital revo-
lution and drastic changes in the
industrial structure and competitive
landscape. Under our existing or-
ganizational structure based main-
ly on product verticals, we were
concerned about the possibility of
sooner or later losing the ability
to provide solutions to problems,
obsolescence of our existing busi-
ness models and the risk of asset
holdings becoming stranded assets.
President & CEOMasumi Kakinokion Strategy
MAR
UBEN
I COR
PORA
TION
IN
TEGR
ATED
REP
ORT
201
901
4
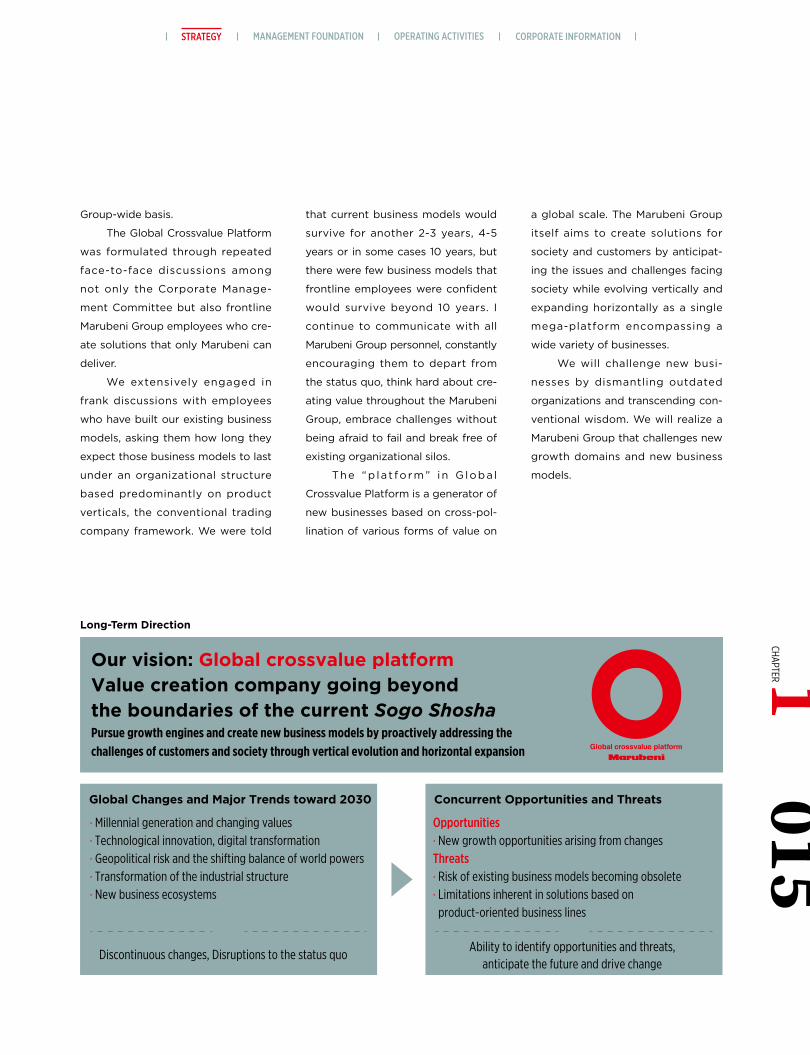
Our vision: Global crossvalue platformValue creation company going beyondthe boundaries of the current Sogo ShoshaPursue growth engines and create new business models by proactively addressing the challenges of customers and society through vertical evolution and horizontal expansion
Global Changes and Major Trends toward 2030 Concurrent Opportunities and Threats
Discontinuous changes, Disruptions to the status quoAbility to identify opportunities and threats,
anticipate the future and drive change
· Millennial generation and changing values· Technological innovation, digital transformation· Geopolitical risk and the shifting balance of world powers· Transformation of the industrial structure· New business ecosystems
Opportunities· New growth opportunities arising from changesThreats· Risk of existing business models becoming obsolete· Limitations inherent in solutions based on product-oriented business lines
Long-Term Direction
Group-wide basis.
The Global Crossvalue Platform
was formulated through repeated
face-to-face discussions among
not only the Corporate Manage-
ment Committee but also frontline
Marubeni Group employees who cre-
ate solutions that only Marubeni can
deliver.
We extensively engaged in
frank discussions with employees
who have built our existing business
models, asking them how long they
expect those business models to last
under an organizational structure
based predominantly on product
verticals, the conventional trading
company framework. We were told
that current business models would
survive for another 2-3 years, 4-5
years or in some cases 10 years, but
there were few business models that
frontline employees were confident
would survive beyond 10 years. I
continue to communicate with all
Marubeni Group personnel, constantly
encouraging them to depart from
the status quo, think hard about cre-
ating value throughout the Marubeni
Group, embrace challenges without
being afraid to fail and break free of
existing organizational silos.
The “p la t fo rm” in G loba l
Crossvalue Platform is a generator of
new businesses based on cross-pol-
lination of various forms of value on
a global scale. The Marubeni Group
itself aims to create solutions for
society and customers by anticipat-
ing the issues and challenges facing
society while evolving vertically and
expanding horizontally as a single
mega-platform encompassing a
wide variety of businesses.
We will challenge new busi-
nesses by dismantling outdated
organizations and transcending con-
ventional wisdom. We will realize a
Marubeni Group that challenges new
growth domains and new business
models.
015CHAPTER 1
MANAGEMENT FOUNDATION OPERATING ACTIVITIES CORPORATE INFORMATIONSTRATEGY
W e formulated the GC2021
Medium-Term Management
Strategy as a first step toward im-
plementing our Global Crossvalue
Platform with the aim of long-term
corporate value creation with our
sights set on 2030. Additionally,
strategies toward realization of our
10-year vision in various business do-
mains have already been extensively
discussed and shared between man-
agement and frontline business units.
GC2021’s three-year term is those
strategies’ execution phase. GC2021
is accordingly a medium-term man-
agement strategy, not a mere plan.
The Global Challenge 2018
(GC2018) medium-term manage-
ment plan, GC2021’s precursor, was
launched in April 2016 and revised
in May 2017, largely in response to
changes in the external environment.
In its final fiscal year (ended March
31, 2019), we achieved the revised
quantitative targets, including con-
solidated net profit, free cash flow
penditures* that, for example, extend
the useful lives of existing assets.
Horizon 2 supports sustained
growth through the pursuit of strate-
gies distinctive to the Marubeni Group
in existing business domains. Business
divisions finished formulating their re-
spective visions and strategies at 2018.
These strategies are now in the exe-
cution stage. New investments made
in existing business domains in the
course of executing these strategies
are Horizon 2 investments.
We have designated Horizons 1
and 2 as the Marubeni Group’s core
earnings drivers for achieving sus-
tained growth during the GC2021
execution period.
Horizon 3 targets explosive
growth toward 2030. To realize such
explosive growth, we have defined a
concept we call White Space, which
refers to new business models and
growth domains that the Marubeni
Group has yet to exploit. Because
White Space represents a new fron-
after delivery of sharholder returns,
net debt/equity ratio and ROE. With
our financial and earnings founda-
tions steadily strengthening, we be-
lieve we have now laid the ground-
work for GC2021’s new challenges.
Our basic policy under GC2021
is to simultaneously pursue both
sustained growth by strengthening
existing businesses and explosive
growth by creating new business
models with our sights set 10 years
ahead, all predicated on building and
maintaining a strong financial foun-
dation as a cornerstone for growth.
To do so, we have incorporated three
growth horizons into GC2021 as a
new concept for Marubeni. These
three growth horizons are one of
GC2021’s distinguishing features.
Horizon 1 supports sustained
growth through improvement of
existing businesses. Specifically, we
will endeavor to grow earnings by
maintaining or upgrading the value of
existing businesses through capital ex-
A2 It is not a mere plan, but a strategy. It is a first step toward realizing our vision.
Is the GC2021 Medium-Term Management Strategy a plan to realize your Global Crossvalue Platform vision?
Q2
GC2021 Medium-Term Management Strategy in the
President & CEO's Words
016
MAR
UBEN
I COR
PORA
TION
IN
TEGR
ATED
REP
ORT
201
9
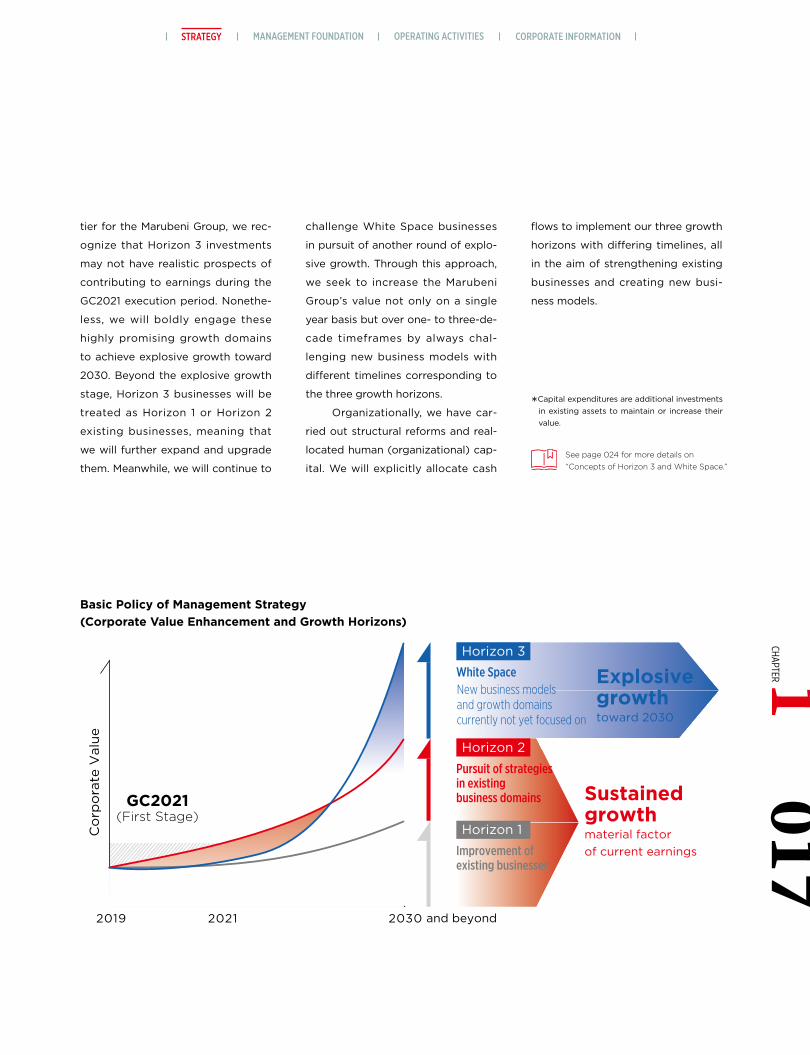
Co
rpo
rate
Val
ue
GC2021(First Stage)
New business models and growth domains currently not yet focused on
Horizon 3
Horizon 2
Horizon 1
White Space
Pursuit of strategies in existing business domains
Improvement of existing businesses
Explosivegrowthtoward 2030
Sustained growthmaterial factorof current earnings
and beyond
Basic Policy of Management Strategy(Corporate Value Enhancement and Growth Horizons)
See page 024 for more details on “Concepts of Horizon 3 and White Space.”
tier for the Marubeni Group, we rec-
ognize that Horizon 3 investments
may not have realistic prospects of
contributing to earnings during the
GC2021 execution period. Nonethe-
less, we will boldly engage these
highly promising growth domains
to achieve explosive growth toward
2030. Beyond the explosive growth
stage, Horizon 3 businesses will be
treated as Horizon 1 or Horizon 2
existing businesses, meaning that
we will further expand and upgrade
them. Meanwhile, we will continue to
challenge White Space businesses
in pursuit of another round of explo-
sive growth. Through this approach,
we seek to increase the Marubeni
Group’s value not only on a single
year basis but over one- to three-de-
cade timeframes by always chal-
lenging new business models with
different timelines corresponding to
the three growth horizons.
Organizationally, we have car-
ried out structural reforms and real-
located human (organizational) cap-
ital. We will explicitly allocate cash
flows to implement our three growth
horizons with differing timelines, all
in the aim of strengthening existing
businesses and creating new busi-
ness models.
*Capital expenditures are additional investments in existing assets to maintain or increase their value.
017CHAPTER 1
MANAGEMENT FOUNDATION OPERATING ACTIVITIES CORPORATE INFORMATIONSTRATEGY
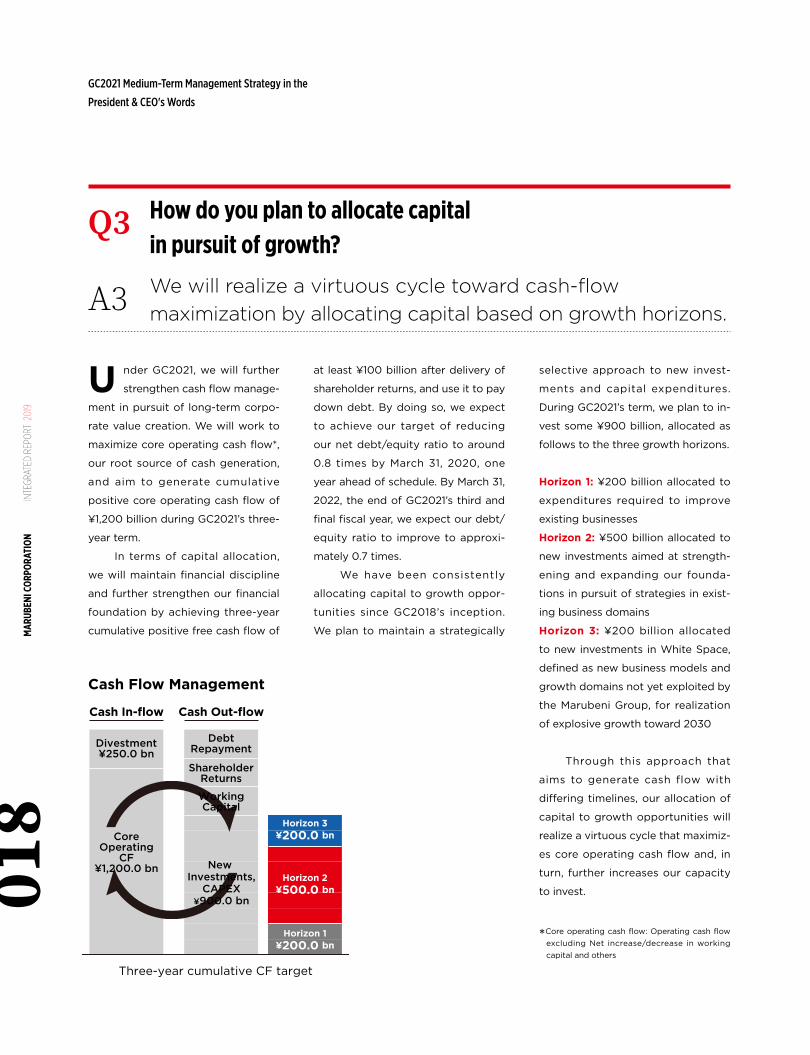
Cash In-flow
Divestment¥250.0 bn
DebtRepayment
ShareholderReturns
WorkingCapital
CoreOperating
CF¥1,200.0 bn New
Investments,CAPEX
¥900.0 bn
Cash Out-flow
Three-year cumulative CF target
Horizon 3¥200.0 bn
Horizon 2¥500.0 bn
Horizon 1¥200.0 bn
Cash Flow Management
U nder GC2021, we will further
strengthen cash flow manage-
ment in pursuit of long-term corpo-
rate value creation. We will work to
maximize core operating cash flow*,
our root source of cash generation,
and aim to generate cumulative
positive core operating cash flow of
¥1,200 billion during GC2021’s three-
year term.
In terms of capital allocation,
we will maintain financial discipline
and further strengthen our financial
foundation by achieving three-year
cumulative positive free cash flow of
at least ¥100 billion after delivery of
shareholder returns, and use it to pay
down debt. By doing so, we expect
to achieve our target of reducing
our net debt/equity ratio to around
0.8 times by March 31, 2020, one
year ahead of schedule. By March 31,
2022, the end of GC2021’s third and
final fiscal year, we expect our debt/
equity ratio to improve to approxi-
mately 0.7 times.
We have been consistently
allocating capital to growth oppor-
tunities since GC2018’s inception.
We plan to maintain a strategically
selective approach to new invest-
ments and capital expenditures.
During GC2021’s term, we plan to in-
vest some ¥900 billion, allocated as
follows to the three growth horizons.
Horizon 1: ¥200 billion allocated to
expenditures required to improve
existing businesses
Horizon 2: ¥500 billion allocated to
new investments aimed at strength-
ening and expanding our founda-
tions in pursuit of strategies in exist-
ing business domains
Horizon 3: ¥200 billion allocated
to new investments in White Space,
defined as new business models and
growth domains not yet exploited by
the Marubeni Group, for realization
of explosive growth toward 2030
Through this approach that
aims to generate cash flow with
differing timelines, our allocation of
capital to growth opportunities will
realize a virtuous cycle that maximiz-
es core operating cash flow and, in
turn, further increases our capacity
to invest.
A3
Q3
We will realize a virtuous cycle toward cash-flow maximization by allocating capital based on growth horizons.
How do you plan to allocate capitalin pursuit of growth?
*Core operating cash flow: Operating cash flow excluding Net increase/decrease in working capital and others
GC2021 Medium-Term Management Strategy in the
President & CEO's Words
018
MAR
UBEN
I COR
PORA
TION
IN
TEGR
ATED
REP
ORT
201
9
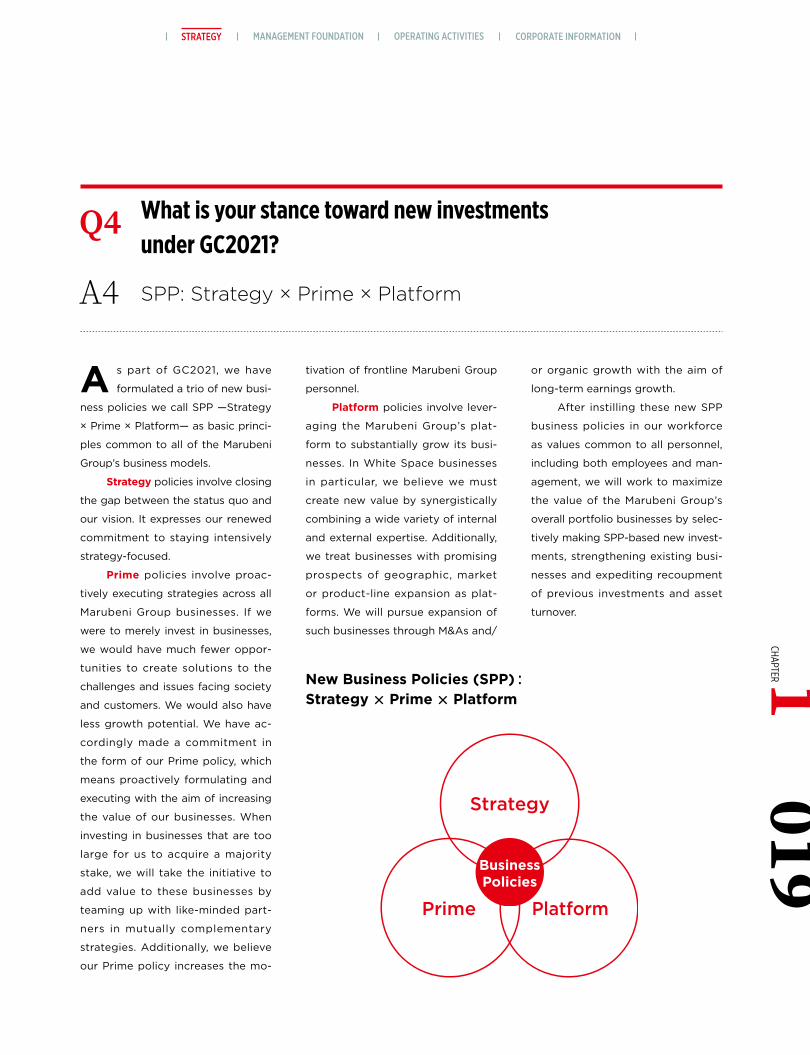
New Business Policies (SPP):Strategy × Prime × Platform
A s part of GC2021, we have
formulated a trio of new busi-
ness policies we call SPP —Strategy
× Prime × Platform— as basic princi-
ples common to all of the Marubeni
Group’s business models.
Strategy policies involve closing
the gap between the status quo and
our vision. It expresses our renewed
commitment to staying intensively
strategy-focused.
Prime policies involve proac-
tively executing strategies across all
Marubeni Group businesses. If we
were to merely invest in businesses,
we would have much fewer oppor-
tunities to create solutions to the
challenges and issues facing society
and customers. We would also have
less growth potential. We have ac-
cordingly made a commitment in
the form of our Prime policy, which
means proactively formulating and
executing with the aim of increasing
the value of our businesses. When
investing in businesses that are too
large for us to acquire a majority
stake, we will take the initiative to
add value to these businesses by
teaming up with like-minded part-
ners in mutually complementary
strategies. Additionally, we believe
our Prime policy increases the mo-
tivation of frontline Marubeni Group
personnel.
Platform policies involve lever-
aging the Marubeni Group’s plat-
form to substantially grow its busi-
nesses. In White Space businesses
in particular, we believe we must
create new value by synergistically
combining a wide variety of internal
and external expertise. Additionally,
we treat businesses with promising
prospects of geographic, market
or product-line expansion as plat-
forms. We will pursue expansion of
such businesses through M&As and/
BusinessPolicies
A4
Q4
or organic growth with the aim of
long-term earnings growth.
After instilling these new SPP
business policies in our workforce
as values common to all personnel,
including both employees and man-
agement, we will work to maximize
the value of the Marubeni Group’s
overall portfolio businesses by selec-
tively making SPP-based new invest-
ments, strengthening existing busi-
nesses and expediting recoupment
of previous investments and asset
turnover.
SPP: Strategy × Prime × Platform
What is your stance toward new investmentsunder GC2021?
MANAGEMENT FOUNDATION OPERATING ACTIVITIES CORPORATE INFORMATIONSTRATEGY019
CHAPTER 1
GC2021 does not designate
any strategic growth sectors
because our business divisions are
pursuing their own respective strat-
egies to create new value. When
formulating GC2021, we placed pri-
ority on strategies devised by our
business divisions based on their
experience addressing the needs
and wants of customers and soci-
ety. The business divisions of course
formulated their respective growth
strategies in accord with GC2021’s
basic policies, namely the growth
horizons and SPP business policies.
Organizational aspects of the
growth strategies’ implementation
were also extensively discussed in
the process of formulating GC2021.
We concluded that for the Marubeni
Group to be able to anticipate diz-
zyingly fast changes in societal val-
ues, digital technologies, industrial
structure and the competitive land-
scape, we must speed up our own
processes and expedite the imple-
ment of growth strategies. GC2021
therefore includes organizational re-
forms. Specifically, we flattened the
chain of command from four layers
to three so that business divisions
are able to implement their strate-
gies more swiftly. The three layers
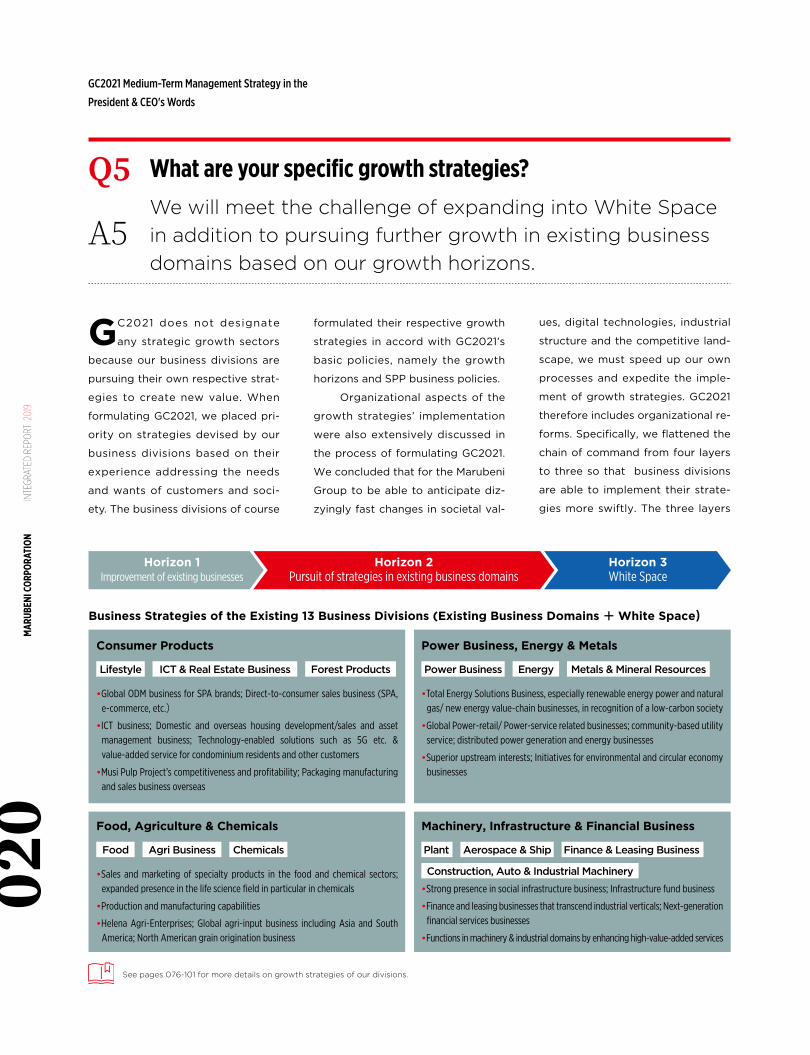
Horizon 2Pursuit of strategies in existing business domains
Horizon 3White Space
Horizon 1Improvement of existing businesses
Business Strategies of the Existing 13 Business Divisions (Existing Business Domains + White Space)
Machinery, Infrastructure & Financial Business
Plant Aerospace & Ship Finance & Leasing Business
Construction, Auto & Industrial Machinery
•Strong presence in social infrastructure business; Infrastructure fund business
•Finance and leasing businesses that transcend industrial verticals; Next-generation financial services businesses
•Functions in machinery & industrial domains by enhancing high-value-added services
Food, Agriculture & Chemicals
Food Agri Business Chemicals
•Sales and marketing of specialty products in the food and chemical sectors; expanded presence in the life science field in particular in chemicals
•Production and manufacturing capabilities
•Helena Agri-Enterprises; Global agri-input business including Asia and South America; North American grain origination business
Power Business, Energy & Metals
Power Business Energy Metals & Mineral Resources
•Total Energy Solutions Business, especially renewable energy power and natural gas/ new energy value-chain businesses, in recognition of a low-carbon society
•Global Power-retail/ Power-service related businesses; community-based utility service; distributed power generation and energy businesses
•Superior upstream interests; Initiatives for environmental and circular economy businesses
Consumer Products
Lifestyle ICT & Real Estate Business Forest Products
•Global ODM business for SPA brands; Direct-to-consumer sales business (SPA, e-commerce, etc.)•ICT business; Domestic and overseas housing development/sales and asset
management business; Technology-enabled solutions such as 5G etc. & value-added service for condominium residents and other customers
•Musi Pulp Project’s competitiveness and profitability; Packaging manufacturing and sales business overseas
See pages 076-101 for more details on growth strategies of our divisions.
A5
Q5We will meet the challenge of expanding into White Space in addition to pursuing further growth in existing business domains based on our growth horizons.
What are your specific growth strategies?
GC2021 Medium-Term Management Strategy in the
President & CEO's Words
MAR
UBEN
I COR
PORA
TION
IN
TEGR
ATED
REP
ORT
201
902
0
consist of Marubeni’s president,
Division COOs and departmental
general managers. Additionally, our
previously product-based business
divisions were reorganized along
business-model lines, centered on
steadily implementing each growth
strategy. Our previous structure of
six groups comprising 16 business
divisions was reorganized into four
groups comprising 13 business divi-
sions. Additionally, we newly estab-
lished the Next Generation Business
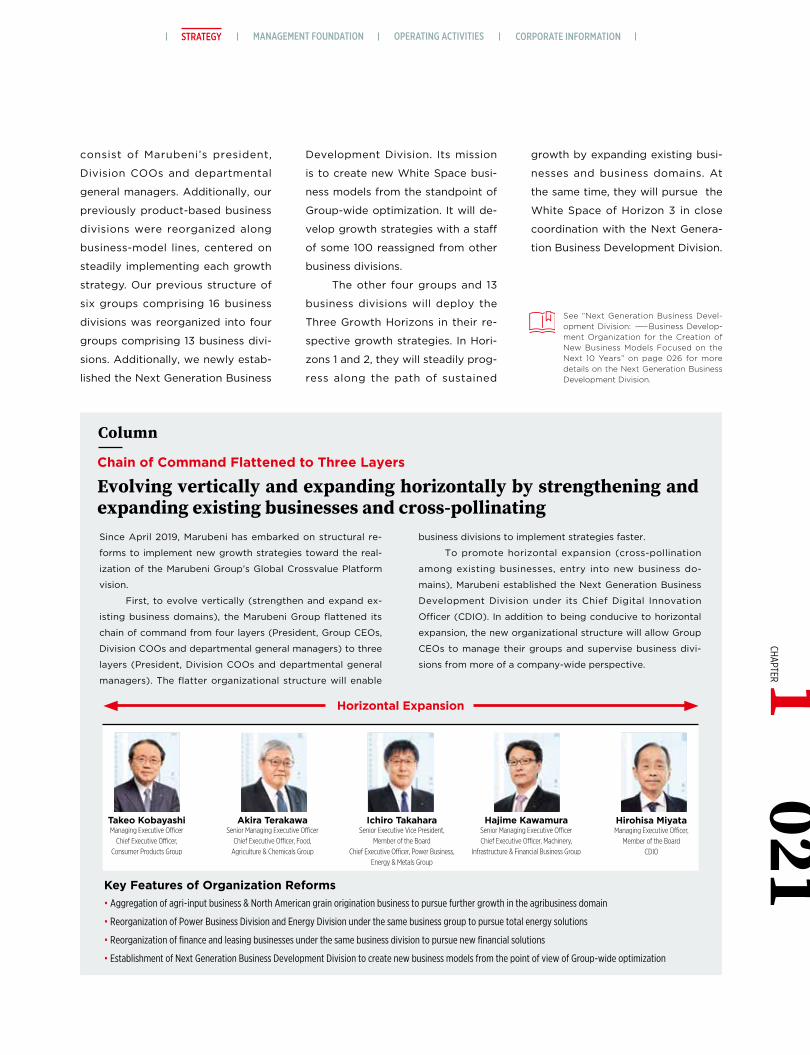
Since April 2019, Marubeni has embarked on structural re-
forms to implement new growth strategies toward the real-
ization of the Marubeni Group’s Global Crossvalue Platform
vision.
First, to evolve vertically (strengthen and expand ex-
isting business domains), the Marubeni Group flattened its
chain of command from four layers (President, Group CEOs,
Division COOs and departmental general managers) to three
layers (President, Division COOs and departmental general
managers). The flatter organizational structure will enable
Key Features of Organization Reforms• Aggregation of agri-input business & North American grain origination business to pursue further growth in the agribusiness domain
• Reorganization of Power Business Division and Energy Division under the same business group to pursue total energy solutions
• Reorganization of finance and leasing businesses under the same business division to pursue new financial solutions
• Establishment of Next Generation Business Development Division to create new business models from the point of view of Group-wide optimization
See “Next Generation Business Devel-opment Division: —Business Develop-ment Organization for the Creation of New Business Models Focused on the Next 10 Years” on page 026 for more details on the Next Generation Business Development Division.
Takeo KobayashiManaging Executive Officer
Chief Executive Officer, Consumer Products Group
Hirohisa MiyataManaging Executive Officer,
Member of the BoardCDIO
Akira TerakawaSenior Managing Executive Officer
Chief Executive Officer, Food, Agriculture & Chemicals Group
Ichiro TakaharaSenior Executive Vice President,
Member of the BoardChief Executive Officer, Power Business,
Energy & Metals Group
Hajime KawamuraSenior Managing Executive OfficerChief Executive Officer, Machinery,
Infrastructure & Financial Business Group
Horizontal Expansion
Chain of Command Flattened to Three Layers
Evolving vertically and expanding horizontally by strengthening and expanding existing businesses and cross-pollinating
Column
Development Division. Its mission
is to create new White Space busi-
ness models from the standpoint of
Group-wide optimization. It will de-
velop growth strategies with a staff
of some 100 reassigned from other
business divisions.
The other four groups and 13
business divisions will deploy the
Three Growth Horizons in their re-
spective growth strategies. In Hori-
zons 1 and 2, they will steadily prog-
ress along the path of sustained
growth by expanding existing busi-
nesses and business domains. At
the same time, they will pursue the
White Space of Horizon 3 in close
coordination with the Next Genera-
tion Business Development Division.
business divisions to implement strategies faster.
To promote horizontal expansion (cross-pollination
among existing businesses, entry into new business do-
mains), Marubeni established the Next Generation Business
Development Division under its Chief Digital Innovation
Officer (CDIO). In addition to being conducive to horizontal
expansion, the new organizational structure will allow Group
CEOs to manage their groups and supervise business divi-
sions from more of a company-wide perspective.
MANAGEMENT FOUNDATION OPERATING ACTIVITIES CORPORATE INFORMATIONSTRATEGY021
CHAPTER 1
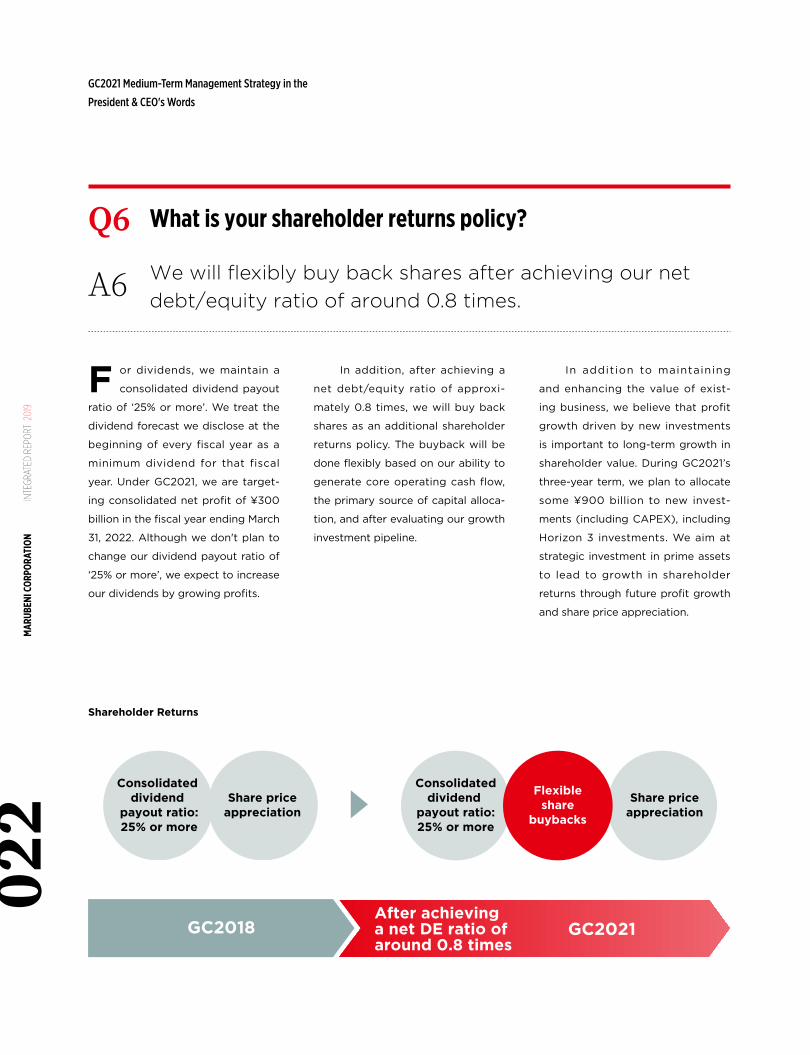
Shareholder Returns
GC2018 GC2021After achievinga net DE ratio ofaround 0.8 times
Consolidated dividend
payout ratio:25% or more
Consolidateddividend
payout ratio:25% or more
Flexibleshare
buybacks
Share priceappreciation
Share priceappreciation
A6
Q6We will flexibly buy back shares after achieving our net debt/equity ratio of around 0.8 times.
What is your shareholder returns policy?
F or dividends, we maintain a
consolidated dividend payout
ratio of ‘25% or more’. We treat the
dividend forecast we disclose at the
beginning of every fiscal year as a
minimum dividend for that fiscal
year. Under GC2021, we are target-
ing consolidated net profit of ¥300
billion in the fiscal year ending March
31, 2022. Although we don't plan to
change our dividend payout ratio of
‘25% or more’, we expect to increase
our dividends by growing profits.
In addition, after achieving a
net debt/equity ratio of approxi-
mately 0.8 times, we will buy back
shares as an additional shareholder
returns policy. The buyback will be
done flexibly based on our ability to
generate core operating cash flow,
the primary source of capital alloca-
tion, and after evaluating our growth
investment pipeline.
In addition to maintaining
and enhancing the value of exist-
ing business, we believe that profit
growth driven by new investments
is important to long-term growth in
shareholder value. During GC2021’s
three-year term, we plan to allocate
some ¥900 billion to new invest-
ments (including CAPEX), including
Horizon 3 investments. We aim at
strategic investment in prime assets
to lead to growth in shareholder
returns through future profit growth
and share price appreciation.
GC2021 Medium-Term Management Strategy in the
President & CEO's Words
MAR
UBEN
I COR
PORA
TION
IN
TEGR
ATED
REP
ORT
201
902
2
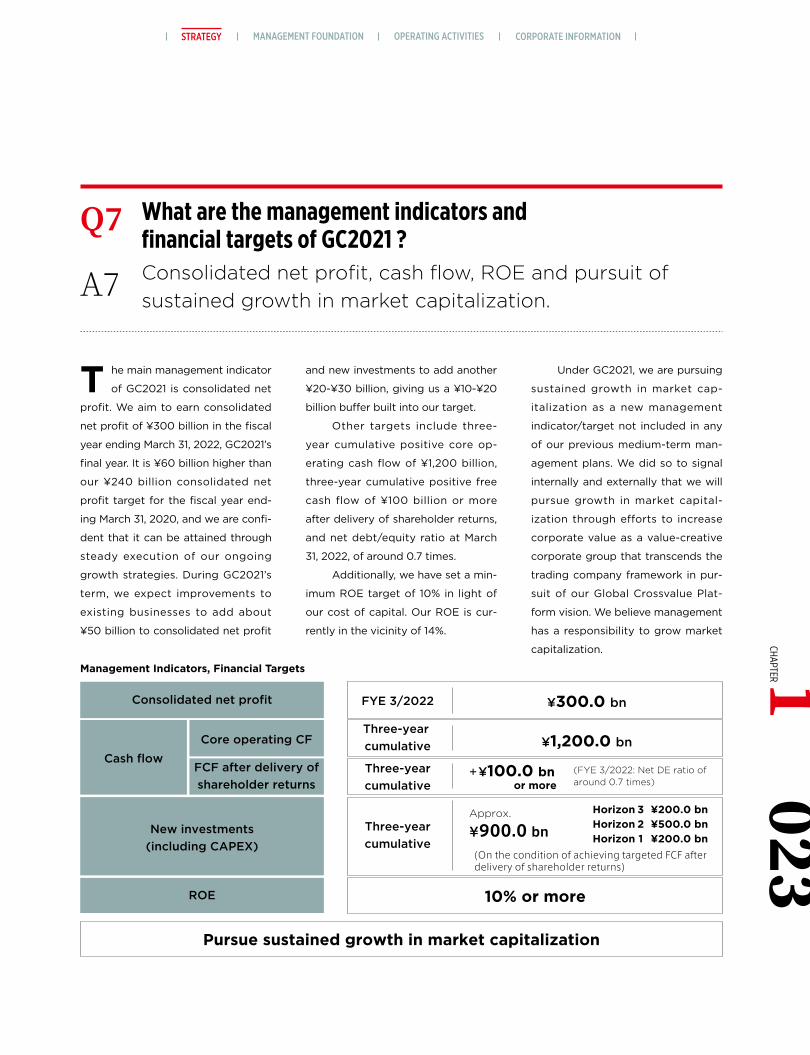
Management Indicators, Financial Targets
Consolidated net profit FYE 3/2022
Three-year cumulative
Three-yearcumulative
Approx.
¥900.0 bn
10% or more
Pursue sustained growth in market capitalization
Three-yearcumulative
+¥100.0 bn or more
(FYE 3/2022: Net DE ratio of around 0.7 times)
Core operating CF
FCF after delivery ofshareholder returns
New investments(including CAPEX)
ROE
Cash flow
Horizon 3 ¥200.0 bnHorizon 2 ¥500.0 bnHorizon 1 ¥200.0 bn
¥300.0 bn
¥1,200.0 bn
(On the condition of achieving targeted FCF after delivery of shareholder returns)
A7
Q7Consolidated net profit, cash flow, ROE and pursuit of sustained growth in market capitalization.
What are the management indicators and financial targets of GC2021 ?
T he main management indicator
of GC2021 is consolidated net
profit. We aim to earn consolidated
net profit of ¥300 billion in the fiscal
year ending March 31, 2022, GC2021’s
final year. It is ¥60 billion higher than
our ¥240 billion consolidated net
profit target for the fiscal year end-
ing March 31, 2020, and we are confi-
dent that it can be attained through
steady execution of our ongoing
growth strategies. During GC2021’s
term, we expect improvements to
existing businesses to add about
¥50 billion to consolidated net profit
and new investments to add another
¥20-¥30 billion, giving us a ¥10-¥20
billion buffer built into our target.
Other targets include three-
year cumulative positive core op-
erating cash flow of ¥1,200 billion,
three-year cumulative positive free
cash flow of ¥100 billion or more
after delivery of shareholder returns,
and net debt/equity ratio at March
31, 2022, of around 0.7 times.
Additionally, we have set a min-
imum ROE target of 10% in light of
our cost of capital. Our ROE is cur-
rently in the vicinity of 14%.
Under GC2021, we are pursuing
sustained growth in market cap-
italization as a new management
indicator/target not included in any
of our previous medium-term man-
agement plans. We did so to signal
internally and externally that we will
pursue growth in market capital-
ization through efforts to increase
corporate value as a value-creative
corporate group that transcends the
trading company framework in pur-
suit of our Global Crossvalue Plat-
form vision. We believe management
has a responsibility to grow market
capitalization.
MANAGEMENT FOUNDATION OPERATING ACTIVITIES CORPORATE INFORMATIONSTRATEGY023
CHAPTER 1
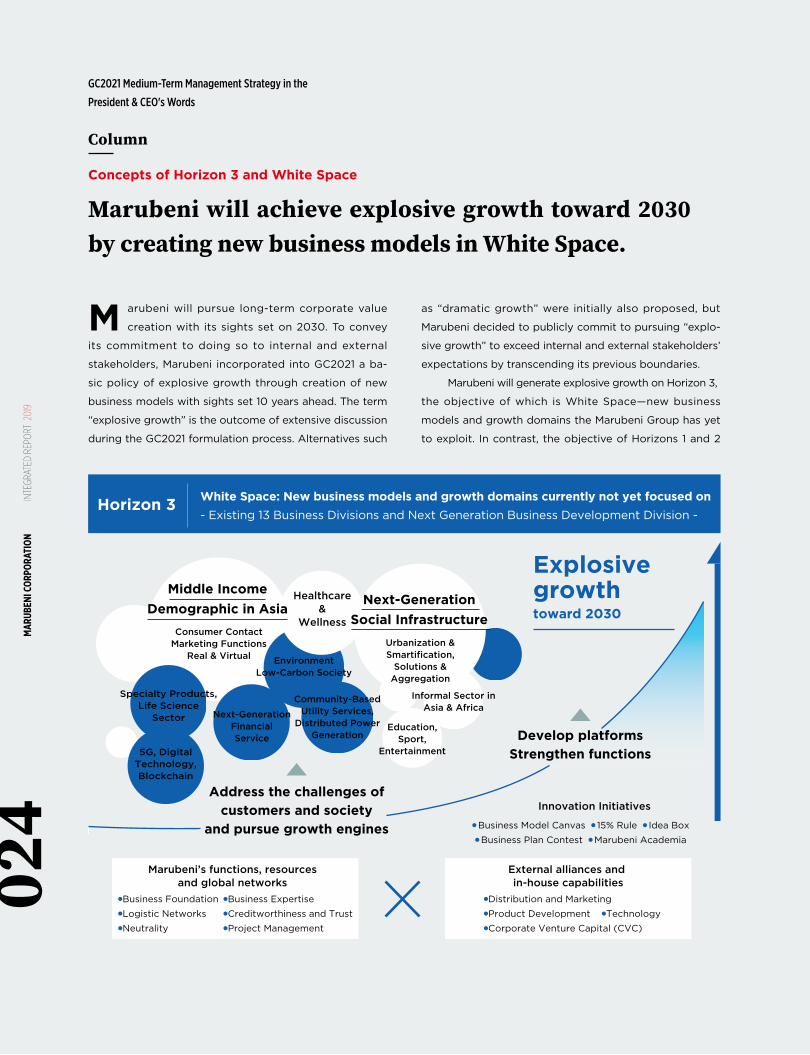
Horizon 3
Address the challenges ofcustomers and society
and pursue growth engines
Develop platformsStrengthen functions
Explosive growthtoward 2030
White Space: New business models and growth domains currently not yet focused on- Existing 13 Business Divisions and Next Generation Business Development Division -
Marubeni’s functions, resourcesand global networks
Healthcare&
Wellness
Middle IncomeDemographic in Asia
Next-GenerationSocial Infrastructure
●Business Foundation●Logistic Networks●Neutrality
Consumer ContactMarketing Functions
Real & VirtualUrbanization &Smartification,
Solutions &Aggregation
Informal Sector inAsia & Africa
Education,Sport,
Entertainment
Community-BasedUtility Services,
Distributed PowerGeneration
EnvironmentLow-Carbon Society
Next-GenerationFinancialService
Specialty Products,Life Science
Sector
5G, DigitalTechnology,Blockchain
●Business Expertise●Creditworthiness and Trust●Project Management
External alliances and in-house capabilities
Innovation Initiatives
●Distribution and Marketing●Product Development ●Technology ●Corporate Venture Capital (CVC)
● Business Model Canvas ● 15% Rule ● Idea Box● Business Plan Contest ● Marubeni Academia
M arubeni will pursue long-term corporate value
creation with its sights set on 2030. To convey
its commitment to doing so to internal and external
stakeholders, Marubeni incorporated into GC2021 a ba-
sic policy of explosive growth through creation of new
business models with sights set 10 years ahead. The term
“explosive growth” is the outcome of extensive discussion
during the GC2021 formulation process. Alternatives such
as “dramatic growth” were initially also proposed, but
Marubeni decided to publicly commit to pursuing “explo-
sive growth” to exceed internal and external stakeholders’
expectations by transcending its previous boundaries.
Marubeni will generate explosive growth on Horizon 3,
the objective of which is White Space—new business
models and growth domains the Marubeni Group has yet
to exploit. In contrast, the objective of Horizons 1 and 2
Column
Marubeni will achieve explosive growth toward 2030 by creating new business models in White Space.
Concepts of Horizon 3 and White Space
GC2021 Medium-Term Management Strategy in the
President & CEO's Words
MAR
UBEN
I COR
PORA
TION
IN
TEGR
ATED
REP
ORT
201
902
4
is sustained growth through efforts to steadily increase
the value of existing businesses by strengthening and
expanding them. Marubeni will ferret out growth engines
from White Space on Horizon 3. While Marubeni defines
“explosive growth” as multifold growth in a business’s
value within a 10-year timeframe, it does not intend to be-
come involved in high-risk/high-return businesses.
A wide range of Horizon 3 growth opportunities ex-
ist one step beyond Horizons 1 and 2, domains in which
the Marubeni Group can fully utilize its strengths. The
key is to identify future growth engines by addressing
and anticipating the challenges and issues of society and
customers and proactively cultivating and growing busi-
nesses from a long-term standpoint. The aim of explosive
growth is to grow businesses into core businesses many
times more valuable within a 10-year timeframe, even if
they do not contribute to earnings in their first years.
The adjacent infographic concretely depicts White
Space to help internal and external stakeholders under-
stand it better.
The white and blue balloons are growth domains
and business models that are new to the Marubeni Group.
They are areas we are targeting under GC2021. The busi-
ness domains represented by blue balloons are ones
already incorporated into the newly formulated GC2021
business strategies. They represent White Space the
Marubeni Group will challenge as an extension of existing
business domains, leveraging its strengths. The white bal-
loons alongside the blue balloons represent domains in
which the Marubeni Group does not yet have a presence,
areas in which the Marubeni Group will strive to develop
businesses from scratch under GC2021. The biggest white
balloons are “rising middle income demographic in Asia”
and “expanding next-generation social infrastructure.”
Marubeni will endeavor to create new business models
in these two domains with major growth prospects by
capitalizing on its platform encompassing its expertise,
know-how, assets and other resources and capabilities.
With respect to the rising middle income demographic in
Asia in particular, Marubeni aims to go beyond its existing
B2B business models by newly developing B2C models.
In other areas as well, including “healthcare & wellness,”
“the informal sector in Asia & Africa,” and “education,
sport and entertainment,” Marubeni will work to develop
various new growth opportunities it has yet to challenge.
In pursuit of its vision of becoming a Global Crossvalue
Platform, Marubeni aims to transform into a company that
transcends the general trading company model to realize
explosive growth through the creation of new business
models instead of clinging to its existing mindset, hesitant
to branch out into new domains.
As already mentioned, Marubeni’s consolidated net
profit in the fiscal year ended March 2019 exceeded ¥230
billion, a second consecutive record-high, achieving the
GC2018 medium-term management plan’s target.
Marubeni’s earnings power and financial foundation
are currently stronger than ever before in its 160-year his-
tory. However, Marubeni has never previously extended its
operations beyond the general trading company model or
its own traditional business lines. Looking at the domains
represented by the white and blue balloons, we keenly
realized during the GC2021 formulation process the vast-
ness of yet-to-be-exploited domains that extend beyond
Marubeni’s existing operations. At the same time, we be-
came convinced that domains in which Marubeni has the
potential to generate explosive growth are expanding.
Marubeni will generate the explosive growth in this White
Space through coordination between its newly estab-
lished Next Generation Business Development Division
and the 13 existing business divisions and cross-pollination of
the Group’s internal resources with external functions in
the aim of creating new business models from the stand-
point of Group-wide optimization.
See “Next Generation Business Development Division:
Business Development Organization for the Creation of New Busi-
ness Models Focused on the Next 10 Years” on page 026 for more
details on the Next Generation Business Development Division.
MANAGEMENT FOUNDATION OPERATING ACTIVITIES CORPORATE INFORMATIONSTRATEGY025
CHAPTER 1
● Asian middle-class● Digital platforms
● Smart cities● New materials
● Healthcare● Medical
Asia Business Dept. Next Generation SocialInfrastructure Dept.
Healthcare & Medical Business Dept.
New Business Development Dept.
● Entertainment● Ag Tech● CVC
Digital Innovation Dept.
● Digital strategies● Innovation strategies
Growth Theme for Next Generation Business Development Division
Business functions Corporate functions
Overseas Bases of Next Generation Business Development Division
Country LocationU.S. New York, Silicon Valley
China Shanghai, Shenzhen
Singapore Singapore
Estonia Tallinn
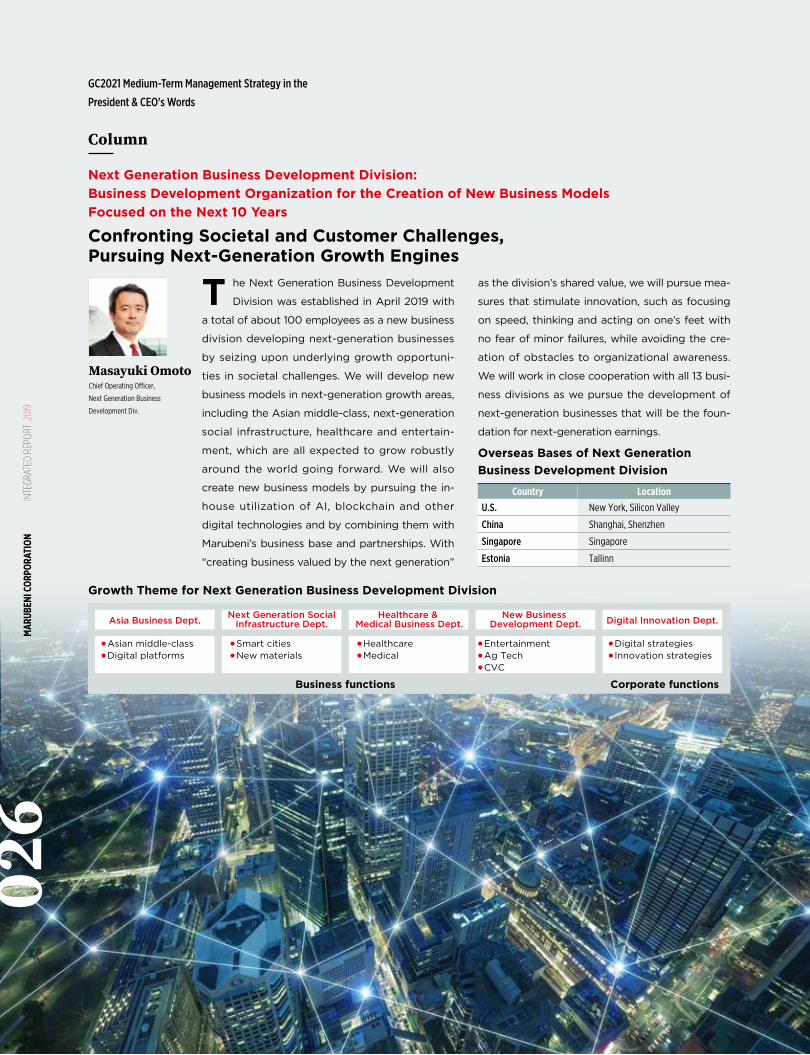
Masayuki OmotoChief Operating Officer,
Next Generation Business
Development Div.
Confronting Societal and Customer Challenges,Pursuing Next-Generation Growth Engines
Next Generation Business Development Division:Business Development Organization for the Creation of New Business ModelsFocused on the Next 10 Years
T he Next Generation Business Development
Division was established in April 2019 with
a total of about 100 employees as a new business
division developing next-generation businesses
by seizing upon underlying growth opportuni-
ties in societal challenges. We will develop new
business models in next-generation growth areas,
including the Asian middle-class, next-generation
social infrastructure, healthcare and entertain-
ment, which are all expected to grow robustly
around the world going forward. We will also
create new business models by pursuing the in-
house utilization of AI, blockchain and other
digital technologies and by combining them with
Marubeni’s business base and partnerships. With
“creating business valued by the next generation”
as the division’s shared value, we will pursue mea-
sures that stimulate innovation, such as focusing
on speed, thinking and acting on one’s feet with
no fear of minor failures, while avoiding the cre-
ation of obstacles to organizational awareness.
We will work in close cooperation with all 13 busi-
ness divisions as we pursue the development of
next-generation businesses that will be the foun-
dation for next-generation earnings.
GC2021 Medium-Term Management Strategy in the
President & CEO's Words
Column
MAR
UBEN
I COR
PORA
TION
IN
TEGR
ATED
REP
ORT
201
902
6
*1. Russian Railways is a railway company wholly owned by the Russian government. Russian Railways has the world's 4th longest railway total extension and also owns the largest hospital group in Russia, which comprises more than 170 medical institutions.
*2. The establishment of the Center is one of the projects of the “cooper-ation to raise medical standards in Russia and help extend healthy life expectancy of the Russian people” portion of the “Eight-Point Coop-eration Plan”, which Japanese Prime Minister Abe presented to Rus-sian President Putin for promoting Japan-Russia economic exchange at the Japan-Russia Summit Meeting in May 2016.
*3. Manages Kameda General Hospital, etc.
* Biosimilars are pharmaceutical products verified to be of the same quality, efficacy, and safety as biopharmaceuticals (pharmaceuticals manufactured using genetic recombination and other biotechnologies) and approved as being similar to biopharmaceuticals.
Marubeni established a Corporate Venture Capital Fund
(CVC) firm called Marubeni Ventures Inc. This firm will
look to invest in start-up companies around the globe.
In using Marubeni Ventures Inc. to invest in start-up
companies that create innovative businesses, Marubeni
will accelerate innovation beyond existing business
models and create new businesses that will become the
revenue base of the next-generation, and achieve explo-
sive growth looking toward 2030 as stated in GC2021
Medium-Term Management Strategy.
This CVC will allow Marubeni to promote collab-
oration and co-creation with start-up companies more
actively and with greater speed. Marubeni believes that
it can support and accelerate the resolution of soci-
etal challenges, and also deliver new value to society
through collaboration with selected start-up companies.
Marubeni will achieve this by combining the disruptive
innovation of start-up companies with its own knowl-
edge, experience and expansive business network.
In addition to the CVC activities, Marubeni will facil-
itate partnerships with start-up companies as a means of
creating innovative business with a global reach.
Establishment of a Corporate Venture Capital Fund
Marubeni and Russian Railways*1 signed a memorandum for
the establishment of a Russian-Japanese health checkup
and prevention center (the Center), with the support of
the Ministry of Health, Labor and Welfare*2 and in coop-
eration with Kameda Medical Center (Kameda*3).
The average life expectancy of Russian people
is below the average for developed countries. One of
the possible causes could be that preventative medical
care, including regular health checkups, are not wide-
spread in the country.
It is under such circumstances that Marubeni and
Russian Railways have agreed to open the Center in
Khabarovsk, Russia in 2021. The Center will provide high-
quality preventative medical services, including health
checkups, with the help of Japanese medical institutions.
Marubeni and Russian Railways plan to have the
Marubeni, in conjunction with Shanghai Fosun Pharma-
ceutical (Group) Co., Ltd. (Fosun Pharma), established
joint venture Fobeni Healthcom Pharmaceutical Jiang-
su Co., Ltd. (Fobeni), targeting pharmaceutical distri-
bution business between Japan and China.
In China, the spread of chronic diseases resulting
from rising living standards and lifestyle changes has
become a societal challenge. As China has recently
been developing a medical insurance system, foreign
pharmaceutical companies including Japanese ones
are increasingly motivated to enter this market.
Fobeni will deliver high-quality Japanese pharma-
ceuticals leveraging Fosun Pharma’s nationwide sales
network in China and promote business aimed at re-
Center act as a flagship facility for the promotion of
health checkups and preventative medical care in Rus-
sia, and are committed to having such medical care
practices take root in the country leveraging the ex-
tensive hospital network of Russian Railways. The two
companies will also work together to help Russian peo-
ple to prevent diseases and lead healthier lives.
solving societal challenges.
Additionally, Marubeni and Fosun Pharma have
entered into a comprehensive strategic alliance to sup-
ply high-quality pharmaceutical resources to overseas
markets in Asia and Africa as well as in Japan and Chi-
na. These resources include the first biosimilars* devel-
oped in China by the Fosun Pharmaceutical Group and
high-quality pharmaceutical raw materials manufac-
tured in China. Marubeni and Fosun Pharma will aim at
further expanding business in the healthcare field.
Establishment of a Russian-Japanese Health Checkup andPrevention Center in Russia
Establishment of a Pharmaceutical Product Wholesaler in China
MANAGEMENT FOUNDATION OPERATING ACTIVITIES CORPORATE INFORMATIONSTRATEGY027
CHAPTER 1
1.20
0.60
0
400
200
300
100
0
264.2
324.0336.1
158.6
245.8
100.0
373.2390.0
Approx.0.8 times
0.901.04
1.20
������
17.3 18.3 19.3 20.3(Forecast)
22.3(Target)
(Times)(Billions of yen)
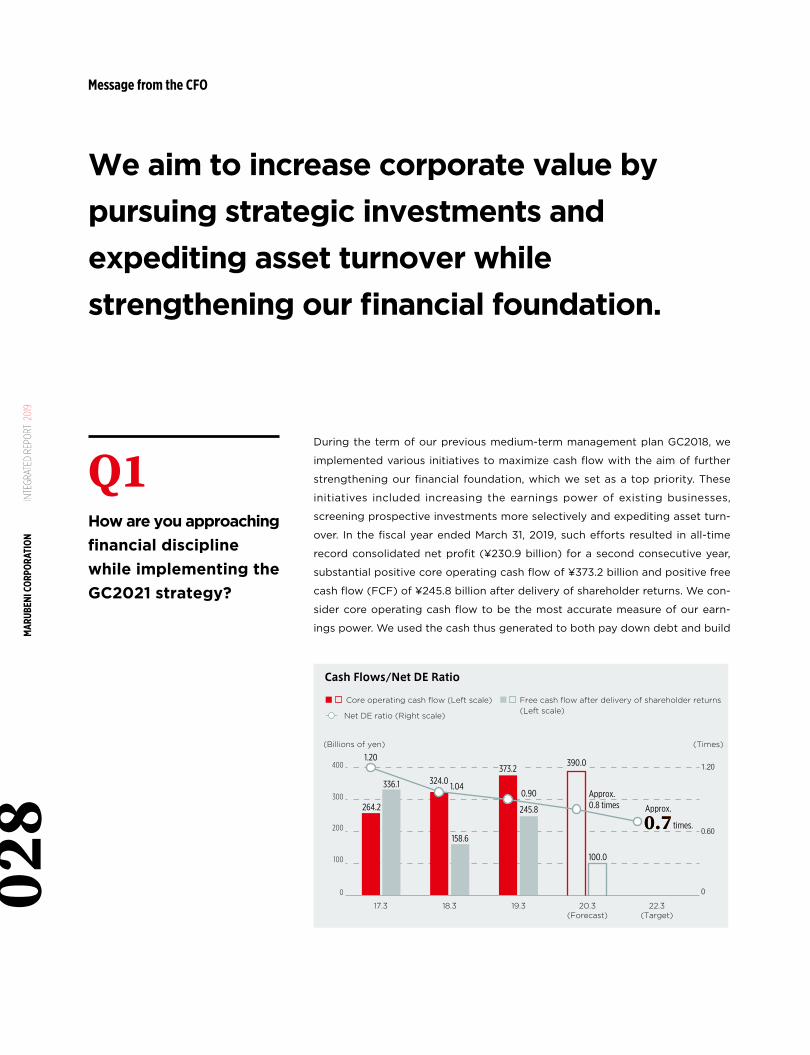
Cash Flows/Net DE Ratio
Net DE ratio (Right scale)
Free cash flow after delivery of shareholder returns (Left scale)
Core operating cash flow (Left scale)
Approx.
times.
Q1How are you approaching financial discipline while implementing the GC2021 strategy?
Message from the CFO
During the term of our previous medium-term management plan GC2018, we
implemented various initiatives to maximize cash flow with the aim of further
strengthening our financial foundation, which we set as a top priority. These
initiatives included increasing the earnings power of existing businesses,
screening prospective investments more selectively and expediting asset turn-
over. In the fiscal year ended March 31, 2019, such efforts resulted in all-time
record consolidated net profit (¥230.9 billion) for a second consecutive year,
substantial positive core operating cash flow of ¥373.2 billion and positive free
cash flow (FCF) of ¥245.8 billion after delivery of shareholder returns. We con-
sider core operating cash flow to be the most accurate measure of our earn-
ings power. We used the cash thus generated to both pay down debt and build
We aim to increase corporate value bypursuing strategic investments andexpediting asset turnover while strengthening our financial foundation.
MAR
UBEN
I COR
PORA
TION
IN
TEGR
ATED
REP
ORT
201
902
8
up equity by accumulating profits, reducing our net debt/equity ratio at March
31, 2019, to 0.90 times, a 0.14-point improvement from a year earlier. We had
set a target of reducing our net debt/equity ratio to around 0.8 times by March
31, 2021 at the latest. We now expect to achieve this target by March 31, 2020,
one year ahead of schedule. We have been strengthening our financial foun-
dation more rapidly than planned. We believe we have solidly laid the ground-
work for our GC2021 Medium-Term Management Strategy.
The quantitative targets of the GC2021 strategy include three-year
cumulative positive core operating cash flow of ¥1,200 billion, positive three-
year cumulative FCF of at least ¥100 billion after delivery of shareholder re-
turns, and reduction of our net debt/equity ratio to around 0.7 times by March
31, 2022, through FCF-funded debt repayments.
With our operating environment changing at an ever-faster pace, we need
to maintain a strong financial foundation with enough risk-bearing capacity to
enable us to continue our investment activities and realize sustained growth.
Deleveraging is crucial to maintaining and upgrading our credit ratings as a
company that borrows globally. We aim to further strengthen our financial
foundation by continuing to rigorously manage our cash flow and interest-bearing
debt no matter how our environment changes going forward.
Senior Managing Executive Officer, Member of the Board CFO; Chief Operating Officer, Investor Relations and Credit Ratings; Chairman of Investment and Credit Committee; Chief Sustainable Development Officer; Chairman of Disclosure Committee
Nobuhiro Yabe
MANAGEMENT FOUNDATION OPERATING ACTIVITIES CORPORATE INFORMATIONSTRATEGY029
CHAPTER 1
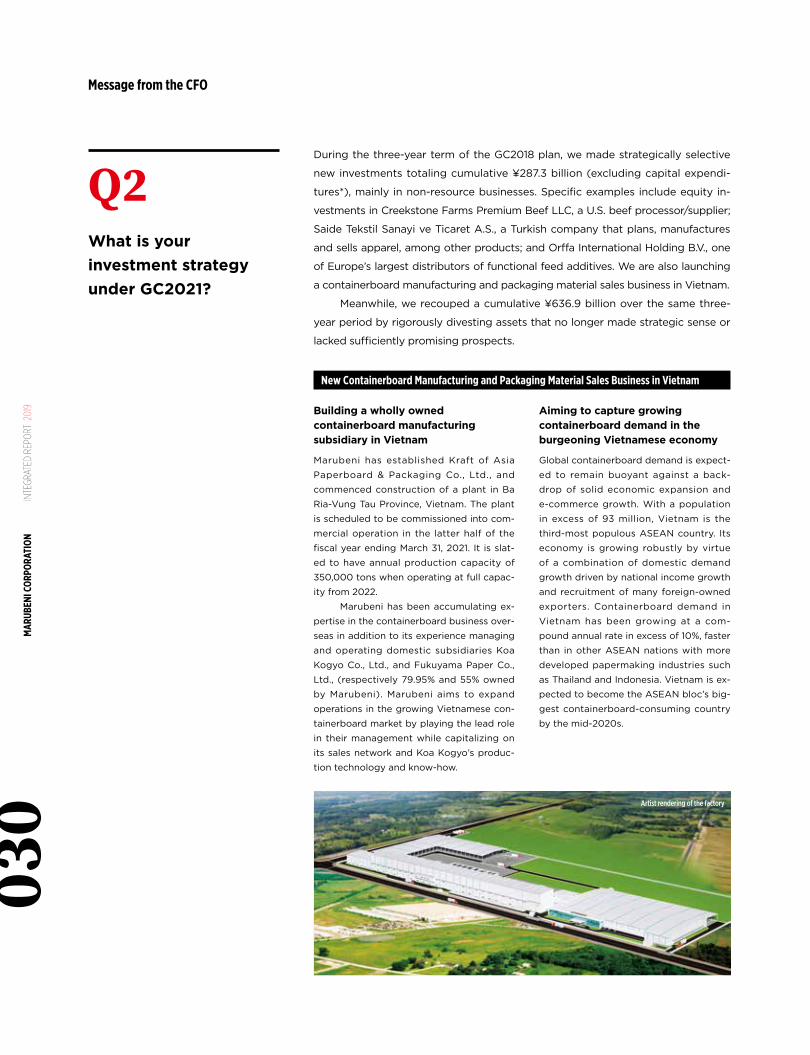
New Containerboard Manufacturing and Packaging Material Sales Business in Vietnam
During the three-year term of the GC2018 plan, we made strategically selective
new investments totaling cumulative ¥287.3 billion (excluding capital expendi-
tures*), mainly in non-resource businesses. Specific examples include equity in-
vestments in Creekstone Farms Premium Beef LLC, a U.S. beef processor/supplier;
Saide Tekstil Sanayi ve Ticaret A.S., a Turkish company that plans, manufactures
and sells apparel, among other products; and Orffa International Holding B.V., one
of Europe’s largest distributors of functional feed additives. We are also launching
a containerboard manufacturing and packaging material sales business in Vietnam.
Meanwhile, we recouped a cumulative ¥636.9 billion over the same three-
year period by rigorously divesting assets that no longer made strategic sense or
lacked sufficiently promising prospects.
Building a wholly owned containerboard manufacturing subsidiary in Vietnam
Marubeni has established Kraft of Asia
Paperboard & Packaging Co., Ltd., and
commenced construction of a plant in Ba
Ria-Vung Tau Province, Vietnam. The plant
is scheduled to be commissioned into com-
mercial operation in the latter half of the
fiscal year ending March 31, 2021. It is slat-
ed to have annual production capacity of
350,000 tons when operating at full capac-
ity from 2022.
Marubeni has been accumulating ex-
pertise in the containerboard business over-
seas in addition to its experience managing
and operating domestic subsidiaries Koa
Kogyo Co., Ltd., and Fukuyama Paper Co.,
Ltd., (respectively 79.95% and 55% owned
by Marubeni). Marubeni aims to expand
operations in the growing Vietnamese con-
tainerboard market by playing the lead role
in their management while capitalizing on
its sales network and Koa Kogyo’s produc-
tion technology and know-how.
Aiming to capture growing containerboard demand in the burgeoning Vietnamese economy
Global containerboard demand is expect-
ed to remain buoyant against a back-
drop of solid economic expansion and
e-commerce growth. With a population
in excess of 93 million, Vietnam is the
third-most populous ASEAN country. Its
economy is growing robustly by virtue
of a combination of domestic demand
growth driven by national income growth
and recruitment of many foreign-owned
exporters. Containerboard demand in
Vietnam has been growing at a com-
pound annual rate in excess of 10%, faster
than in other ASEAN nations with more
developed papermaking industries such
as Thailand and Indonesia. Vietnam is ex-
pected to become the ASEAN bloc’s big-
gest containerboard-consuming country
by the mid-2020s.
Artist rendering of the factory
Q2What is your investment strategy under GC2021?
Message from the CFO
MAR
UBEN
I COR
PORA
TION
IN
TEGR
ATED
REP
ORT
201
903
0
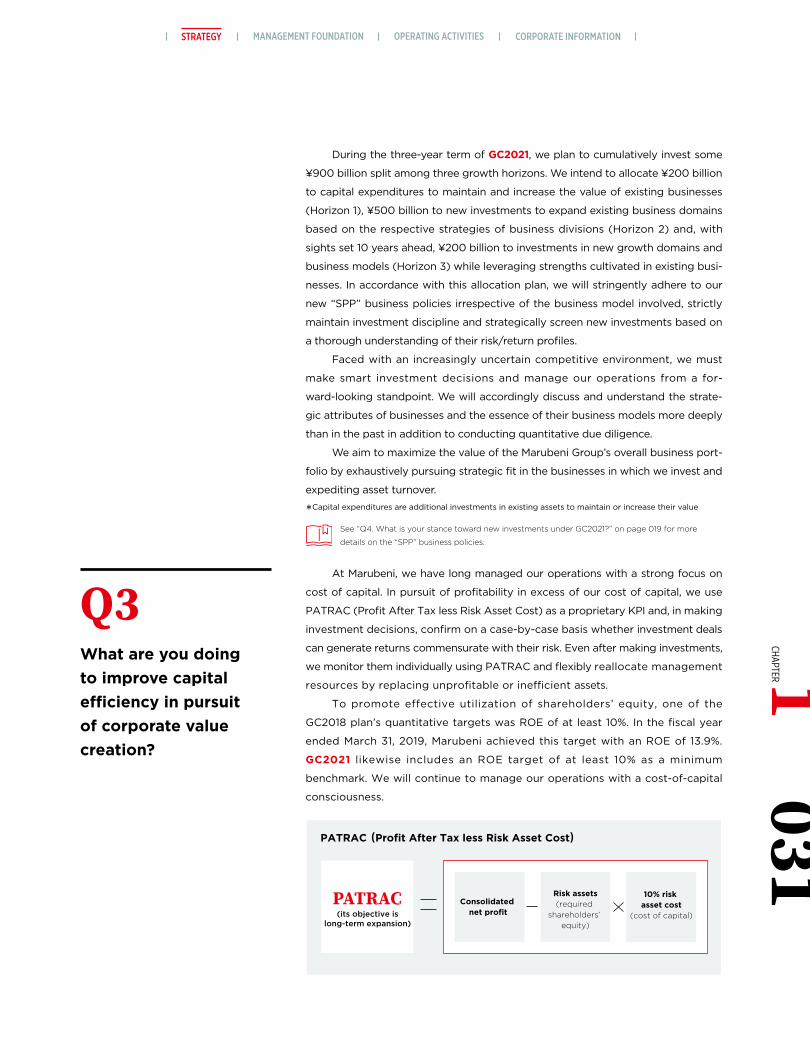
See “Q4. What is your stance toward new investments under GC2021?” on page 019 for more
details on the “SPP” business policies.
PATRAC (Profit After Tax less Risk Asset Cost)
リスク・リターン
リスク・リターン(%)
リスク・リターン
連結純利益
リスクアセット
連結純利益
売上高
売上高
総資産
総資産
リスクアセット
リスク・リターンの改善策
収益率の改善 資産回転率の向上
優良資産への入れ替え
(its objective islong-term expansion)
Consolidated net profit
Risk assets(required
shareholders’ equity)
10% risk asset cost
(cost of capital)
������
���
During the three-year term of GC2021, we plan to cumulatively invest some
¥900 billion split among three growth horizons. We intend to allocate ¥200 billion
to capital expenditures to maintain and increase the value of existing businesses
(Horizon 1), ¥500 billion to new investments to expand existing business domains
based on the respective strategies of business divisions (Horizon 2) and, with
sights set 10 years ahead, ¥200 billion to investments in new growth domains and
business models (Horizon 3) while leveraging strengths cultivated in existing busi-
nesses. In accordance with this allocation plan, we will stringently adhere to our
new “SPP” business policies irrespective of the business model involved, strictly
maintain investment discipline and strategically screen new investments based on
a thorough understanding of their risk/return profiles.
Faced with an increasingly uncertain competitive environment, we must
make smart investment decisions and manage our operations from a for-
ward-looking standpoint. We will accordingly discuss and understand the strate-
gic attributes of businesses and the essence of their business models more deeply
than in the past in addition to conducting quantitative due diligence.
We aim to maximize the value of the Marubeni Group’s overall business port-
folio by exhaustively pursuing strategic fit in the businesses in which we invest and
expediting asset turnover.
*Capital expenditures are additional investments in existing assets to maintain or increase their value
At Marubeni, we have long managed our operations with a strong focus on
cost of capital. In pursuit of profitability in excess of our cost of capital, we use
PATRAC (Profit After Tax less Risk Asset Cost) as a proprietary KPI and, in making
investment decisions, confirm on a case-by-case basis whether investment deals
can generate returns commensurate with their risk. Even after making investments,
we monitor them individually using PATRAC and flexibly reallocate management
resources by replacing unprofitable or inefficient assets.
To promote effective utilization of shareholders’ equity, one of the
GC2018 plan’s quantitative targets was ROE of at least 10%. In the fiscal year
ended March 31, 2019, Marubeni achieved this target with an ROE of 13.9%.
GC2021 likewise includes an ROE target of at least 10% as a minimum
benchmark. We will continue to manage our operations with a cost-of-capital
consciousness.
Q3What are you doing to improve capital efficiency in pursuit of corporate value creation? 031
CHAPTER 1MANAGEMENT FOUNDATION OPERATING ACTIVITIES CORPORATE INFORMATIONSTRATEGY
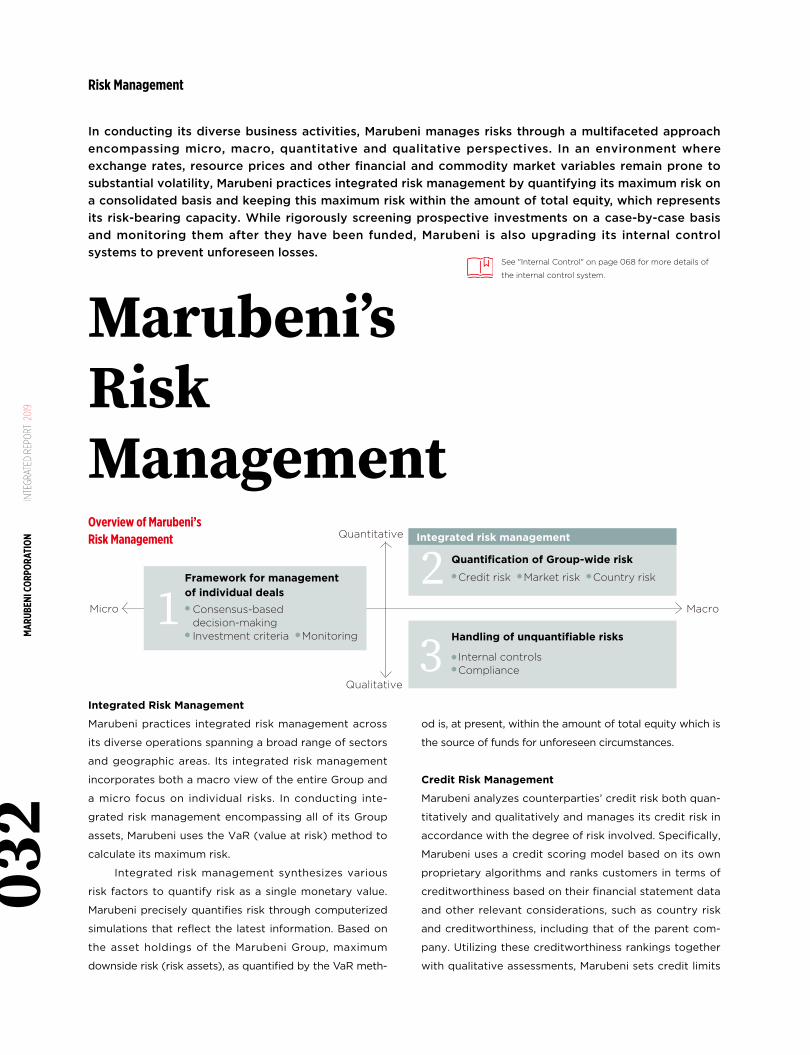
Quantitative
Micro Macro
Qualitative
● Credit risk ● Market risk ● Country risk
● Consensus-based decision-making● Investment criteria ● Monitoring
��
Quantification of Group-wide risk
Framework for management of individual deals
● Internal controls● Compliance� Handling of unquantifiable risks
Integrated risk management
See "Internal Control" on page 068 for more details of
the internal control system.
In conducting its diverse business activities, Marubeni manages risks through a multifaceted approach encompassing micro, macro, quantitative and qualitative perspectives. In an environment where exchange rates, resource prices and other financial and commodity market variables remain prone to substantial volatility, Marubeni practices integrated risk management by quantifying its maximum risk on a consolidated basis and keeping this maximum risk within the amount of total equity, which represents its risk-bearing capacity. While rigorously screening prospective investments on a case-by-case basis and monitoring them after they have been funded, Marubeni is also upgrading its internal control systems to prevent unforeseen losses.
od is, at present, within the amount of total equity which is
the source of funds for unforeseen circumstances.
Credit Risk Management
Marubeni analyzes counterparties’ credit risk both quan-
titatively and qualitatively and manages its credit risk in
accordance with the degree of risk involved. Specifically,
Marubeni uses a credit scoring model based on its own
proprietary algorithms and ranks customers in terms of
creditworthiness based on their financial statement data
and other relevant considerations, such as country risk
and creditworthiness, including that of the parent com-
pany. Utilizing these creditworthiness rankings together
with qualitative assessments, Marubeni sets credit limits
Integrated Risk Management
Marubeni practices integrated risk management across
its diverse operations spanning a broad range of sectors
and geographic areas. Its integrated risk management
incorporates both a macro view of the entire Group and
a micro focus on individual risks. In conducting inte-
grated risk management encompassing all of its Group
assets, Marubeni uses the VaR (value at risk) method to
calculate its maximum risk.
Integrated risk management synthesizes various
risk factors to quantify risk as a single monetary value.
Marubeni precisely quantifies risk through computerized
simulations that reflect the latest information. Based on
the asset holdings of the Marubeni Group, maximum
downside risk (risk assets), as quantified by the VaR meth-
Risk Management
Marubeni’sRiskManagementOverview of Marubeni’s Risk Management
MAR
UBEN
I COR
PORA
TION
IN
TEGR
ATED
REP
ORT
201
903
2
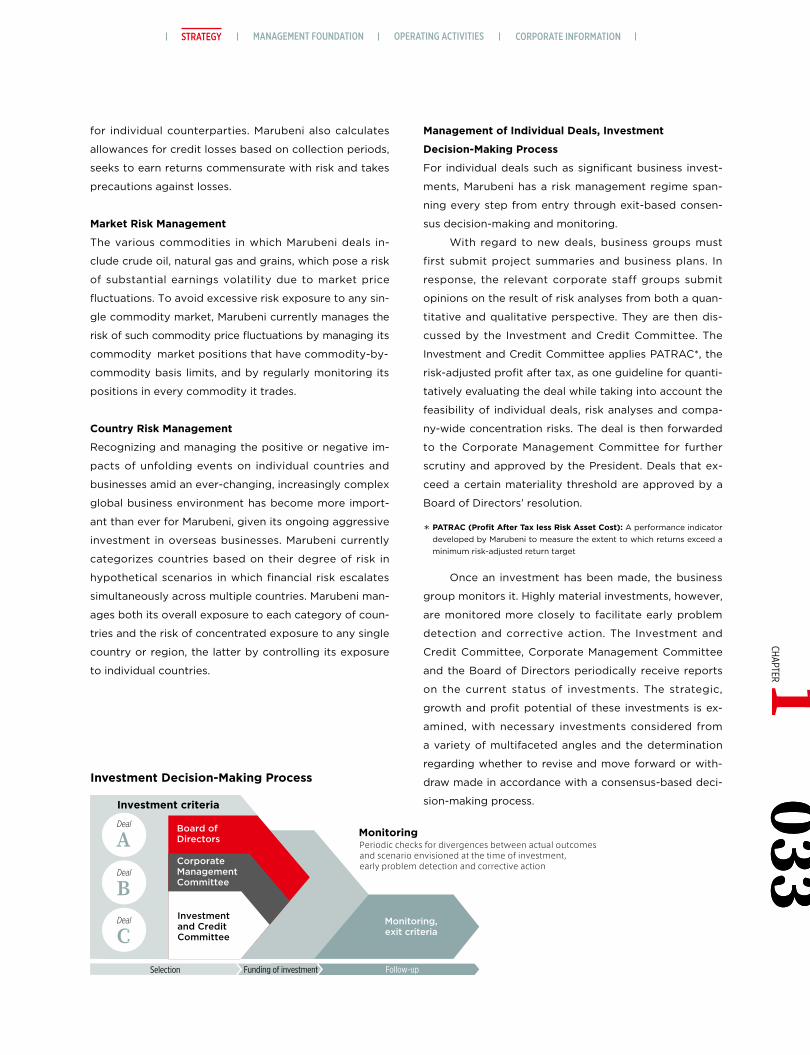
Investment criteria
Board of Directors
Selection Funding of investment Follow-up
Monitoring,exit criteria
Corporate ManagementCommittee
Investment and CreditCommittee
MonitoringPeriodic checks for divergences between actual outcomesand scenario envisioned at the time of investment,early problem detection and corrective action
�Deal
�Deal
�Deal
Investment Decision-Making Process
for individual counterparties. Marubeni also calculates
allowances for credit losses based on collection periods,
seeks to earn returns commensurate with risk and takes
precautions against losses.
Market Risk Management
The various commodities in which Marubeni deals in-
clude crude oil, natural gas and grains, which pose a risk
of substantial earnings volatility due to market price
fluctuations. To avoid excessive risk exposure to any sin-
gle commodity market, Marubeni currently manages the
risk of such commodity price fluctuations by managing its
commodity market positions that have commodity-by-
commodity basis limits, and by regularly monitoring its
positions in every commodity it trades.
Country Risk Management
Recognizing and managing the positive or negative im-
pacts of unfolding events on individual countries and
businesses amid an ever-changing, increasingly complex
global business environment has become more import-
ant than ever for Marubeni, given its ongoing aggressive
investment in overseas businesses. Marubeni currently
categorizes countries based on their degree of risk in
hypothetical scenarios in which financial risk escalates
simultaneously across multiple countries. Marubeni man-
ages both its overall exposure to each category of coun-
tries and the risk of concentrated exposure to any single
country or region, the latter by controlling its exposure
to individual countries.
Management of Individual Deals, Investment
Decision-Making Process
For individual deals such as significant business invest-
ments, Marubeni has a risk management regime span-
ning every step from entry through exit-based consen-
sus decision-making and monitoring.
With regard to new deals, business groups must
first submit project summaries and business plans. In
response, the relevant corporate staff groups submit
opinions on the result of risk analyses from both a quan-
titative and qualitative perspective. They are then dis-
cussed by the Investment and Credit Committee. The
Investment and Credit Committee applies PATRAC*, the
risk-adjusted profit after tax, as one guideline for quanti-
tatively evaluating the deal while taking into account the
feasibility of individual deals, risk analyses and compa-
ny-wide concentration risks. The deal is then forwarded
to the Corporate Management Committee for further
scrutiny and approved by the President. Deals that ex-
ceed a certain materiality threshold are approved by a
Board of Directors’ resolution.
* PATRAC (Profit After Tax less Risk Asset Cost): A performance indicator developed by Marubeni to measure the extent to which returns exceed a minimum risk-adjusted return target
Once an investment has been made, the business
group monitors it. Highly material investments, however,
are monitored more closely to facilitate early problem
detection and corrective action. The Investment and
Credit Committee, Corporate Management Committee
and the Board of Directors periodically receive reports
on the current status of investments. The strategic,
growth and profit potential of these investments is ex-
amined, with necessary investments considered from
a variety of multifaceted angles and the determination
regarding whether to revise and move forward or with-
draw made in accordance with a consensus-based deci-
sion-making process. 033CHAPTER 1
MANAGEMENT FOUNDATION OPERATING ACTIVITIES CORPORATE INFORMATIONSTRATEGY033
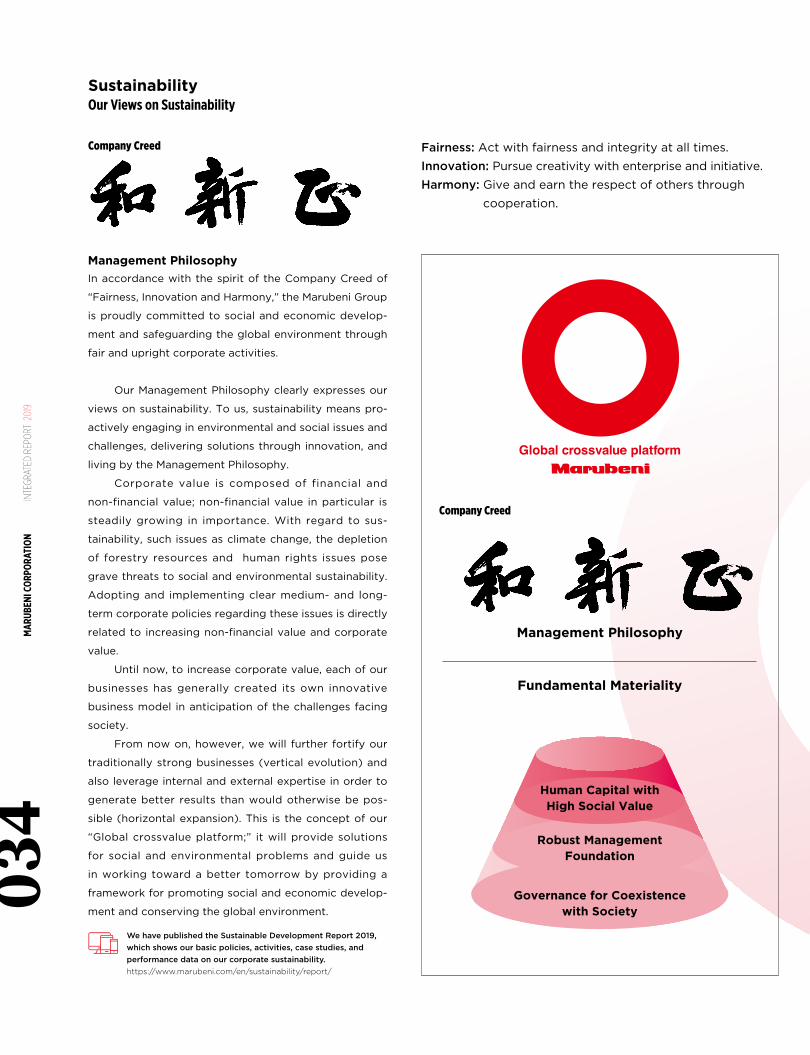
Management PhilosophyIn accordance with the spirit of the Company Creed of
“Fairness, Innovation and Harmony,” the Marubeni Group
is proudly committed to social and economic develop-
ment and safeguarding the global environment through
fair and upright corporate activities.
Our Management Philosophy clearly expresses our
views on sustainability. To us, sustainability means pro-
actively engaging in environmental and social issues and
challenges, delivering solutions through innovation, and
living by the Management Philosophy.
Corporate value is composed of financial and
non-financial value; non-financial value in particular is
steadily growing in importance. With regard to sus-
tainability, such issues as climate change, the depletion
of forestry resources and human rights issues pose
grave threats to social and environmental sustainability.
Adopting and implementing clear medium- and long-
term corporate policies regarding these issues is directly
related to increasing non-financial value and corporate
value.
Until now, to increase corporate value, each of our
businesses has generally created its own innovative
business model in anticipation of the challenges facing
society.
From now on, however, we will further fortify our
traditionally strong businesses (vertical evolution) and
also leverage internal and external expertise in order to
generate better results than would otherwise be pos-
sible (horizontal expansion). This is the concept of our
“Global crossvalue platform;” it will provide solutions
for social and environmental problems and guide us
in working toward a better tomorrow by providing a
framework for promoting social and economic develop-
ment and conserving the global environment.
Fundamental Materiality
BUILDINGA BETTER
TOMORROWManagement Philosophy
Fairness: Act with fairness and integrity at all times.
Innovation: Pursue creativity with enterprise and initiative.
Harmony: Give and earn the respect of others through
cooperation.
Human Capital withHigh Social Value
Robust ManagementFoundation
Governance for Coexistencewith Society
Company Creed
SustainabilityOur Views on Sustainability
Company Creed
We have published the Sustainable Development Report 2019, which shows our basic policies, activities, case studies, and performance data on our corporate sustainability.https://www.marubeni.com/en/sustainability/report/
MAR
UBEN
I COR
PORA
TION
IN
TEGR
ATED
REP
ORT
201
903
4
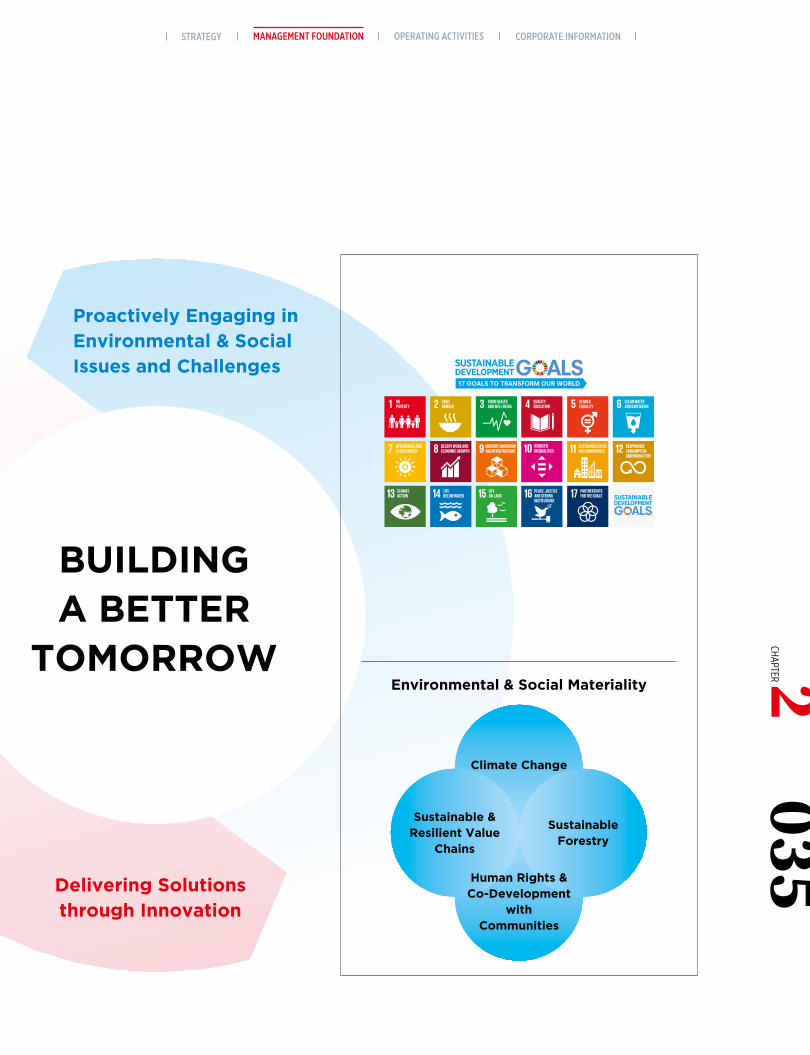
Proactively Engaging inEnvironmental & SocialIssues and Challenges
Delivering Solutionsthrough Innovation
Environmental & Social Materiality
BUILDINGA BETTER
TOMORROW
Climate Change
SustainableForestry
Sustainable &Resilient Value
Chains
Human Rights &Co-Development
with Communities
MANAGEMENT FOUNDATION OPERATING ACTIVITIES CORPORATE INFORMATIONSTRATEGY035
CHAPTER 2
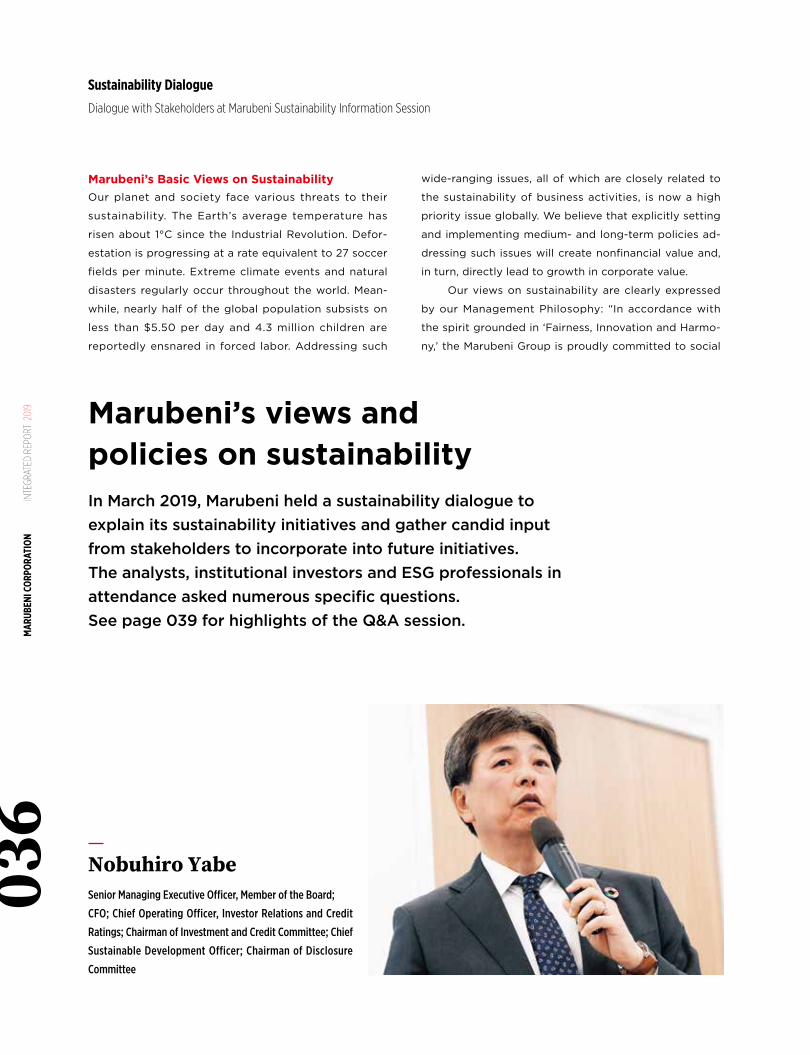
In March 2019, Marubeni held a sustainability dialogue to explain its sustainability initiatives and gather candid input from stakeholders to incorporate into future initiatives.The analysts, institutional investors and ESG professionals in attendance asked numerous specific questions.See page 039 for highlights of the Q&A session.
Sustainability Dialogue
Dialogue with Stakeholders at Marubeni Sustainability Information Session
Marubeni’s Basic Views on SustainabilityOur planet and society face various threats to their
sustainability. The Earth’s average temperature has
risen about 1°C since the Industrial Revolution. Defor-
estation is progressing at a rate equivalent to 27 soccer
fields per minute. Extreme climate events and natural
disasters regularly occur throughout the world. Mean-
while, nearly half of the global population subsists on
less than $5.50 per day and 4.3 million children are
reportedly ensnared in forced labor. Addressing such
Marubeni’s views and policies on sustainability
wide-ranging issues, all of which are closely related to
the sustainability of business activities, is now a high
priority issue globally. We believe that explicitly setting
and implementing medium- and long-term policies ad-
dressing such issues will create nonfinancial value and,
in turn, directly lead to growth in corporate value.
Our views on sustainability are clearly expressed
by our Management Philosophy: “In accordance with
the spirit grounded in ‘Fairness, Innovation and Harmo-
ny,’ the Marubeni Group is proudly committed to social
Senior Managing Executive Officer, Member of the Board;
CFO; Chief Operating Officer, Investor Relations and Credit
Ratings; Chairman of Investment and Credit Committee; Chief
Sustainable Development Officer; Chairman of Disclosure
Committee
Nobuhiro Yabe
MAR
UBEN
I COR
PORA
TION
IN
TEGR
ATED
REP
ORT
201
903
6
and economic development and safeguarding the global
environment by conducting fair and upright corporate
activities.” The very act of practicing our Management
Philosophy through the proactive provision of solutions
to environmental challenges and emerging social needs
constitutes sustainability for the Marubeni Group.
In April 2018, Marubeni formed a Sustainability
Management Committee (the "Committee") that re-
ports directly to the President. The Committee met 23
times over the year through March 2019. Through many
rounds of lively discussion on how to best put our
Management Philosophy into practice, the Committee
reached the conclusion that Marubeni itself must first
become a sustainable entity. The Committee completed
a materiality assessment that identified “human capital
with high social value,” “robust management founda-
tion” and “governance for coexistence with society”
as three categories of Fundamental Materiality for
accomplishing the goal of ensuring sustainable growth
for the Company and “building a better tomorrow.” The
Marubeni Group is now leveraging these three catego-
ries of Fundamental Materiality with a focus on creating
its own innovative business models and highly practical
solutions.
In Pursuit of Solutions to Environmental andSocial DemandAfter setting its three categories of Fundamental Ma-
teriality, Marubeni identified the following four Envi-
ronmental and Social Materiality categories. It needs to
pursue the attainment of the Sustainable Development
Goals (SDGs)*1 adopted by the United Nations General
Assembly in 2015 and resolve sustainability issues of im-
portance to governments, the private sector and civil so-
ciety. Leveraging its Fundamental Materiality will enable
Marubeni to pursue its Environmental and Social Mate-
riality together with innovative solutions that contribute
to the attainment of the SDGs.
*1. Sustainable Development Goals (SDGs): As a first step, in 2001 the UN established the Millennium Development Goals (MDGs) with a target date of 2015. Subsequently, in September 2015 the UN Sustainable Develop-ment Summit established the SDGs under the 2030 Agenda for Sustain-able Development. They are a set of international goals covering the peri-od from 2016 through to 2030, and consist of 17 goals and 169 targets.
1. Climate Change
Marubeni aims to help realize a low-carbon society by
mitigating global warming through its global renewable
energy and related businesses.
In September 2018, the Marubeni Group pledged
to cut its FYE 3/2019 coal-fired power net generation
capacity of approximately 3GW in half by 2030 and
announced we will no longer enter into any new coal-
fired power generation business as a general principle.
We strive to accelerate expansion of our portfolio of
renewable energy generation business. We have adopt-
ed a target of doubling the ratio of power generated by
renewable energy sources in our own net power supply
by 2023. Additionally, we aim to grow our green reve-
nue (revenue from businesses that contribute to climate
change countermeasures) from roughly ¥700 billion at
present to around ¥1.3 trillion by the fiscal year ending
March 31, 2024. As new measures to counter climate
change mitigation initiative, the Marubeni Group af-
firmed the TCFD*2 recommendations in February 2019 in
recognition of the importance of climate-related finan-
cial disclosure. Going forward, we will endeavor to better
understand the financial impacts of risks and opportuni-
ties brought about by climate change, and also engage
in improved climate-related financial disclosure.
*2. TCFD (Task Force on Climate-related Financial Disclosures): Estab-lished by the Financial Stability Board (FSB).
See pages 042-044 for more information on Climate Changeunder Environmental & Social Materiality.
2. Sustainable Forestry
Marubeni owns tree plantations with some 140,000
planted hectares, mostly in Indonesia and Australia. The
total gross project area is equivalent to about 1.5 times
the area of Tokyo Metropolis. Marubeni is contributing to
sustainable forest conservation through its tree planta-
tions around the world.
In February 2019, Marubeni announced a commit-
ment to sustainable forestry in the form of a new Forest
Management Policy and Product Procurement Policy
for forest-derived products. In these policies, Marubeni
pledged both internally and externally: “No conversion
of natural forests in forest plantation developments,”
MANAGEMENT FOUNDATION OPERATING ACTIVITIES CORPORATE INFORMATIONSTRATEGY037
CHAPTER 2
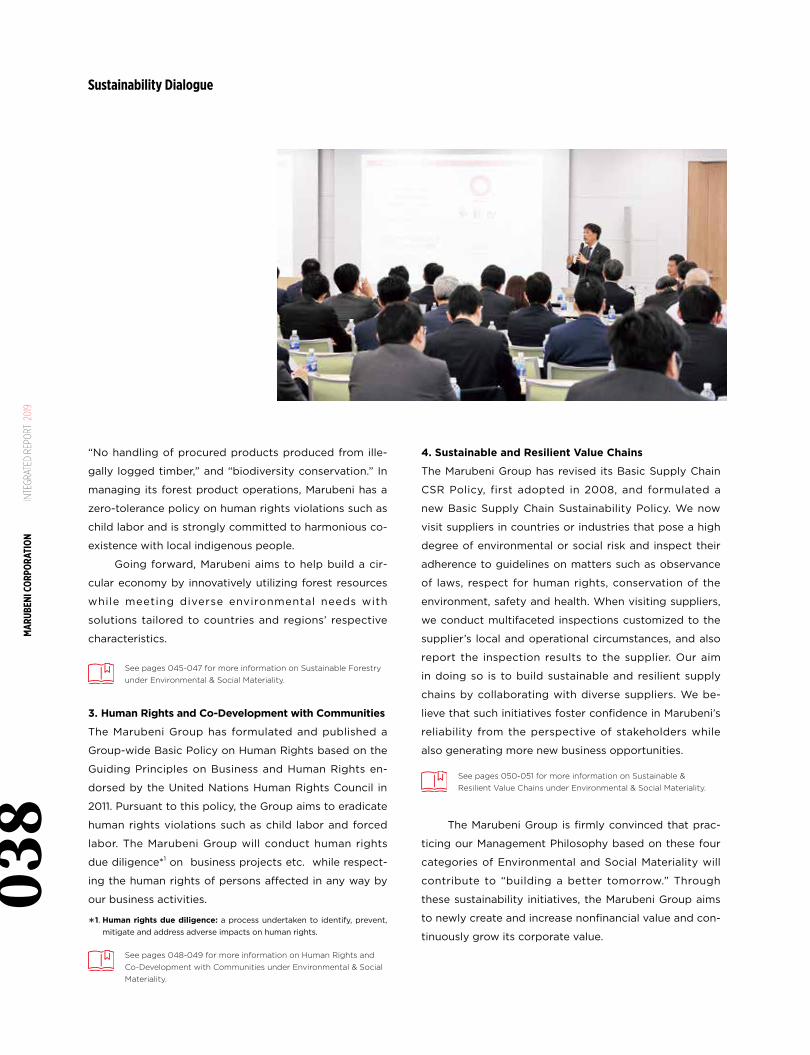
4. Sustainable and Resilient Value Chains
The Marubeni Group has revised its Basic Supply Chain
CSR Policy, first adopted in 2008, and formulated a
new Basic Supply Chain Sustainability Policy. We now
visit suppliers in countries or industries that pose a high
degree of environmental or social risk and inspect their
adherence to guidelines on matters such as observance
of laws, respect for human rights, conservation of the
environment, safety and health. When visiting suppliers,
we conduct multifaceted inspections customized to the
supplier’s local and operational circumstances, and also
report the inspection results to the supplier. Our aim
in doing so is to build sustainable and resilient supply
chains by collaborating with diverse suppliers. We be-
lieve that such initiatives foster confidence in Marubeni’s
reliability from the perspective of stakeholders while
also generating more new business opportunities.
See pages 050-051 for more information on Sustainable & Resilient Value Chains under Environmental & Social Materiality.
The Marubeni Group is firmly convinced that prac-
ticing our Management Philosophy based on these four
categories of Environmental and Social Materiality will
contribute to “building a better tomorrow.” Through
these sustainability initiatives, the Marubeni Group aims
to newly create and increase nonfinancial value and con-
tinuously grow its corporate value.
“No handling of procured products produced from ille-
gally logged timber,” and “biodiversity conservation.” In
managing its forest product operations, Marubeni has a
zero-tolerance policy on human rights violations such as
child labor and is strongly committed to harmonious co-
existence with local indigenous people.
Going forward, Marubeni aims to help build a cir-
cular economy by innovatively utilizing forest resources
while meeting diverse environmental needs with
solutions tailored to countries and regions’ respective
characteristics.
See pages 045-047 for more information on Sustainable Forestry under Environmental & Social Materiality.
3. Human Rights and Co-Development with Communities
The Marubeni Group has formulated and published a
Group-wide Basic Policy on Human Rights based on the
Guiding Principles on Business and Human Rights en-
dorsed by the United Nations Human Rights Council in
2011. Pursuant to this policy, the Group aims to eradicate
human rights violations such as child labor and forced
labor. The Marubeni Group will conduct human rights
due diligence*1 on business projects etc. while respect-
ing the human rights of persons affected in any way by
our business activities.
*1. Human rights due diligence: a process undertaken to identify, prevent, mitigate and address adverse impacts on human rights.
See pages 048-049 for more information on Human Rights and Co-Development with Communities under Environmental & Social Materiality.
Sustainability Dialogue
MAR
UBEN
I COR
PORA
TION
IN
TEGR
ATED
REP
ORT
201
903
8
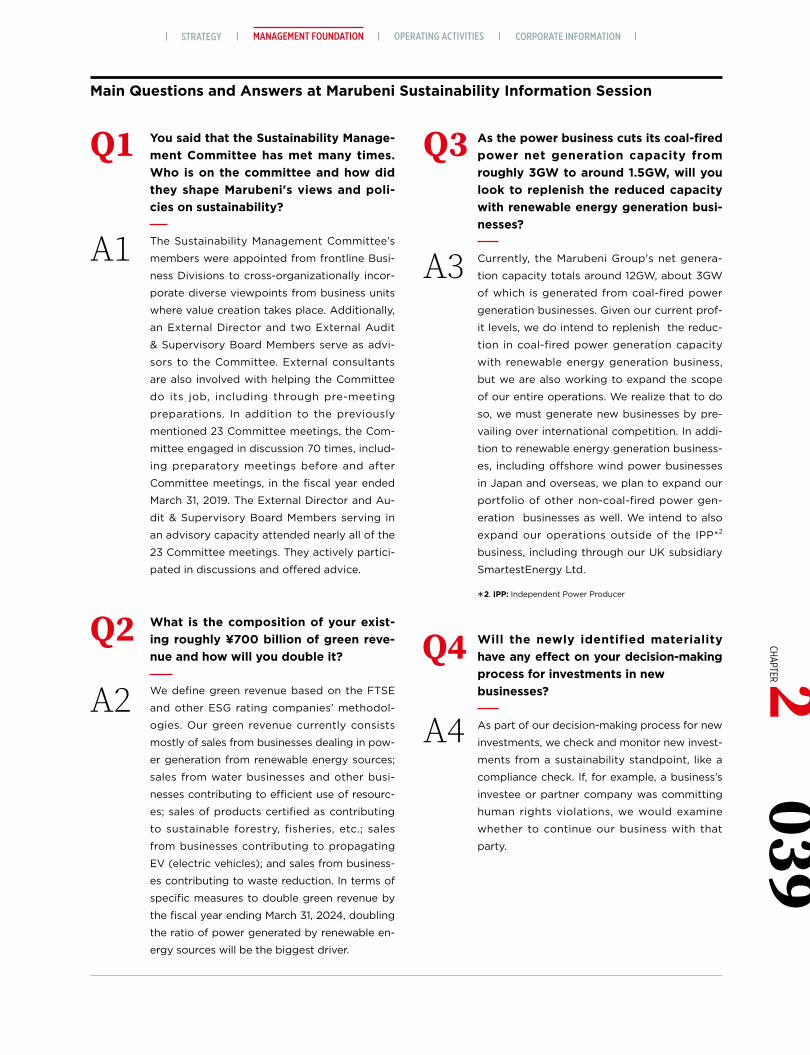
You said that the Sustainability Manage-ment Committee has met many times. Who is on the committee and how did they shape Marubeni's views and poli-cies on sustainability?
The Sustainability Management Committee’s
members were appointed from frontline Busi-
ness Divisions to cross-organizationally incor-
porate diverse viewpoints from business units
where value creation takes place. Additionally,
an External Director and two External Audit
& Supervisory Board Members serve as advi-
sors to the Committee. External consultants
are also involved with helping the Committee
do its job, including through pre-meeting
preparations. In addition to the previously
mentioned 23 Committee meetings, the Com-
mittee engaged in discussion 70 times, includ-
ing preparatory meetings before and after
Committee meetings, in the fiscal year ended
March 31, 2019. The External Director and Au-
dit & Supervisory Board Members serving in
an advisory capacity attended nearly all of the
23 Committee meetings. They actively partici-
pated in discussions and offered advice.
What is the composition of your exist-ing roughly ¥700 billion of green reve-nue and how will you double it?
We define green revenue based on the FTSE
and other ESG rating companies’ methodol-
ogies. Our green revenue currently consists
mostly of sales from businesses dealing in pow-
er generation from renewable energy sources;
sales from water businesses and other busi-
nesses contributing to efficient use of resourc-
es; sales of products certified as contributing
to sustainable forestry, fisheries, etc.; sales
from businesses contributing to propagating
EV (electric vehicles); and sales from business-
es contributing to waste reduction. In terms of
specific measures to double green revenue by
the fiscal year ending March 31, 2024, doubling
the ratio of power generated by renewable en-
ergy sources will be the biggest driver.
Q1 Q3
Q2 Q4
A1 A3
A2A4
As the power business cuts its coal-fired power net generation capacity from roughly 3GW to around 1.5GW, will you look to replenish the reduced capacity with renewable energy generation busi-nesses?
Currently, the Marubeni Group's net genera-
tion capacity totals around 12GW, about 3GW
of which is generated from coal-fired power
generation businesses. Given our current prof-
it levels, we do intend to replenish the reduc-
tion in coal-fired power generation capacity
with renewable energy generation business,
but we are also working to expand the scope
of our entire operations. We realize that to do
so, we must generate new businesses by pre-
vailing over international competition. In addi-
tion to renewable energy generation business-
es, including offshore wind power businesses
in Japan and overseas, we plan to expand our
portfolio of other non-coal-fired power gen-
eration businesses as well. We intend to also
expand our operations outside of the IPP*2
business, including through our UK subsidiary
SmartestEnergy Ltd.
Will the newly identified materiality have any effect on your decision-making process for investments in new businesses?
As part of our decision-making process for new
investments, we check and monitor new invest-
ments from a sustainability standpoint, like a
compliance check. If, for example, a business’s
investee or partner company was committing
human rights violations, we would examine
whether to continue our business with that
party.
Main Questions and Answers at Marubeni Sustainability Information Session
*2. IPP: Independent Power Producer
MANAGEMENT FOUNDATION OPERATING ACTIVITIES CORPORATE INFORMATIONSTRATEGY039
CHAPTER 2
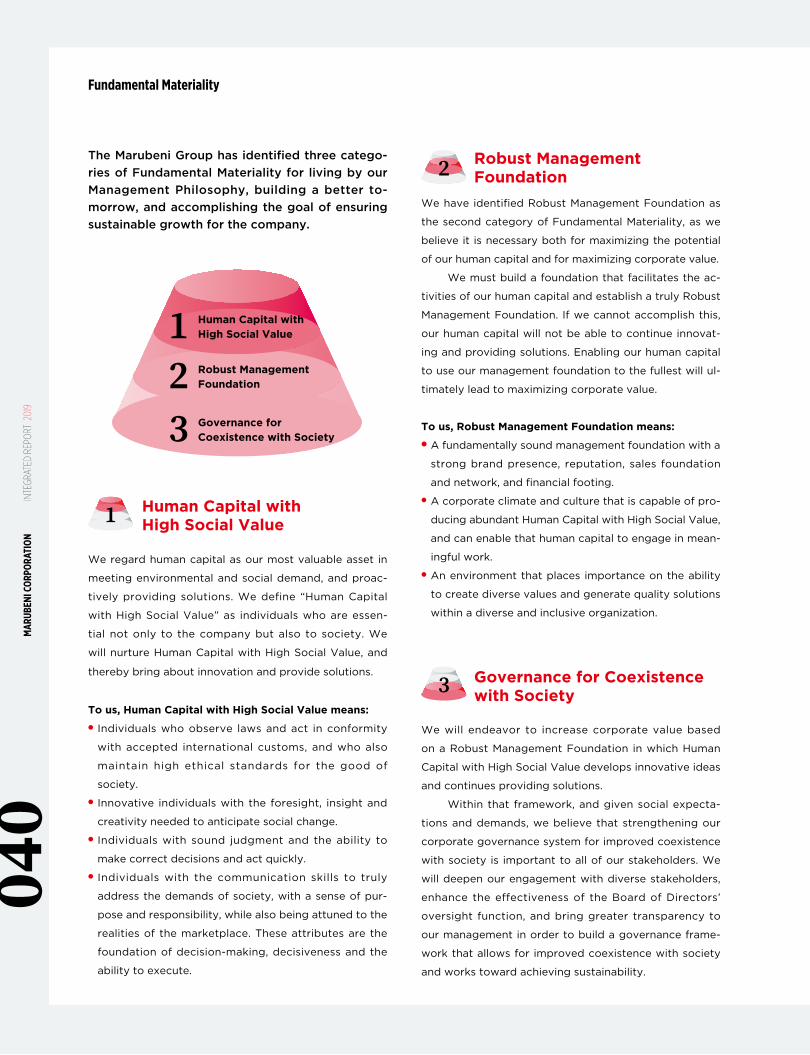
We will endeavor to increase corporate value based
on a Robust Management Foundation in which Human
Capital with High Social Value develops innovative ideas
and continues providing solutions.
Within that framework, and given social expecta-
tions and demands, we believe that strengthening our
corporate governance system for improved coexistence
with society is important to all of our stakeholders. We
will deepen our engagement with diverse stakeholders,
enhance the effectiveness of the Board of Directors’
oversight function, and bring greater transparency to
our management in order to build a governance frame-
work that allows for improved coexistence with society
and works toward achieving sustainability.
Fundamental Materiality
The Marubeni Group has identified three catego-ries of Fundamental Materiality for living by our Management Philosophy, building a better to-morrow, and accomplishing the goal of ensuring sustainable growth for the company.
Human Capital with High Social Value
Robust Management Foundation
Governance for Coexistence with Society
123
We regard human capital as our most valuable asset in
meeting environmental and social demand, and proac-
tively providing solutions. We define “Human Capital
with High Social Value” as individuals who are essen-
tial not only to the company but also to society. We
will nurture Human Capital with High Social Value, and
thereby bring about innovation and provide solutions.
To us, Human Capital with High Social Value means:◉ Individuals who observe laws and act in conformity
with accepted international customs, and who also
maintain high ethical standards for the good of
society.◉ Innovative individuals with the foresight, insight and
creativity needed to anticipate social change.◉ Individuals with sound judgment and the ability to
make correct decisions and act quickly.◉ Individuals with the communication skills to truly
address the demands of society, with a sense of pur-
pose and responsibility, while also being attuned to the
realities of the marketplace. These attributes are the
foundation of decision-making, decisiveness and the
ability to execute.
Human Capital with High Social Value1
We have identified Robust Management Foundation as
the second category of Fundamental Materiality, as we
believe it is necessary both for maximizing the potential
of our human capital and for maximizing corporate value.
We must build a foundation that facilitates the ac-
tivities of our human capital and establish a truly Robust
Management Foundation. If we cannot accomplish this,
our human capital will not be able to continue innovat-
ing and providing solutions. Enabling our human capital
to use our management foundation to the fullest will ul-
timately lead to maximizing corporate value.
To us, Robust Management Foundation means:◉A fundamentally sound management foundation with a
strong brand presence, reputation, sales foundation
and network, and financial footing.◉ A corporate climate and culture that is capable of pro-
ducing abundant Human Capital with High Social Value,
and can enable that human capital to engage in mean-
ingful work.◉ An environment that places importance on the ability
to create diverse values and generate quality solutions
within a diverse and inclusive organization.
Robust Management Foundation2
Governance for Coexistence with Society3
MAR
UBEN
I COR
PORA
TION
IN
TEGR
ATED
REP
ORT
201
904
0
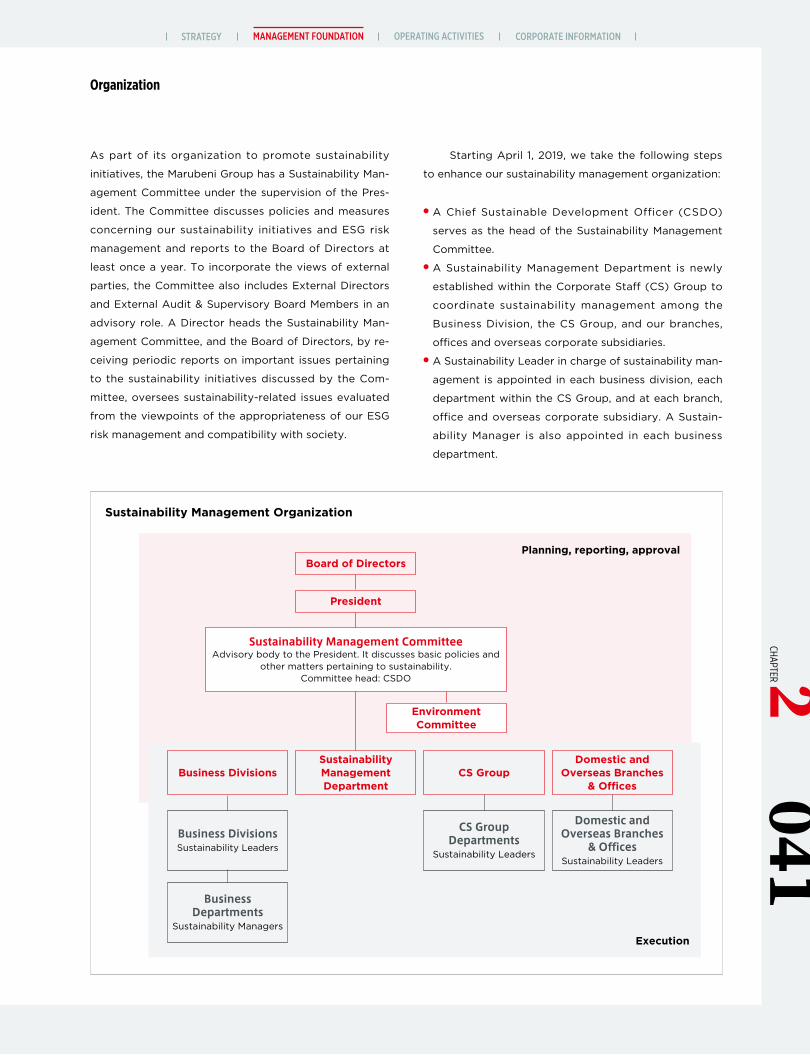
As part of its organization to promote sustainability
initiatives, the Marubeni Group has a Sustainability Man-
agement Committee under the supervision of the Pres-
ident. The Committee discusses policies and measures
concerning our sustainability initiatives and ESG risk
management and reports to the Board of Directors at
least once a year. To incorporate the views of external
parties, the Committee also includes External Directors
and External Audit & Supervisory Board Members in an
advisory role. A Director heads the Sustainability Man-
agement Committee, and the Board of Directors, by re-
ceiving periodic reports on important issues pertaining
to the sustainability initiatives discussed by the Com-
mittee, oversees sustainability-related issues evaluated
from the viewpoints of the appropriateness of our ESG
risk management and compatibility with society.
Starting April 1, 2019, we take the following steps
to enhance our sustainability management organization:
◉A Chief Sustainable Development Officer (CSDO)
serves as the head of the Sustainability Management
Committee.◉A Sustainability Management Department is newly
established within the Corporate Staff (CS) Group to
coordinate sustainability management among the
Business Division, the CS Group, and our branches,
offices and overseas corporate subsidiaries.◉A Sustainability Leader in charge of sustainability man-
agement is appointed in each business division, each
department within the CS Group, and at each branch,
office and overseas corporate subsidiary. A Sustain-
ability Manager is also appointed in each business
department.
Sustainability Management Organization
Planning, reporting, approval
Execution
Environment Committee
Sustainability Management Department
CS Group Departments
Sustainability Leaders
Domestic and Overseas Branches
& OfficesSustainability Leaders
Business Departments
Sustainability Managers
Business Divisions CS GroupDomestic and
Overseas Branches & Offices
Board of Directors
President
Sustainability Management CommitteeAdvisory body to the President. It discusses basic policies and
other matters pertaining to sustainability.Committee head: CSDO
Business DivisionsSustainability Leaders
Organization
MANAGEMENT FOUNDATION OPERATING ACTIVITIES CORPORATE INFORMATIONSTRATEGY041
CHAPTER 2
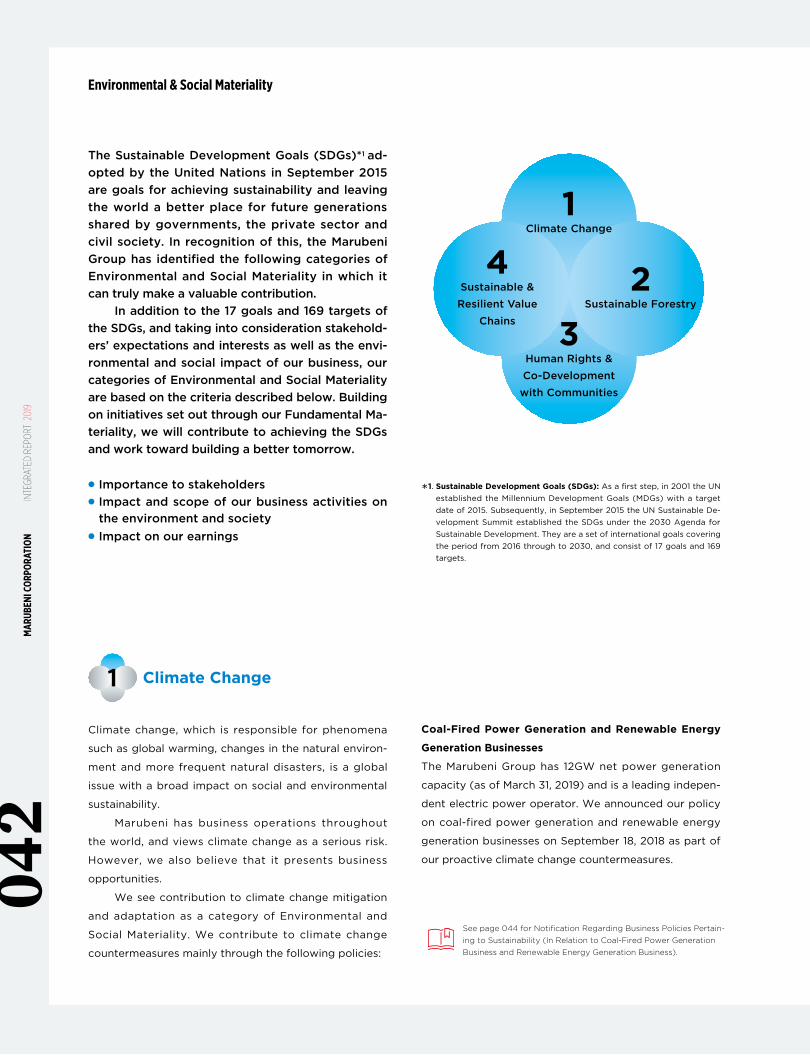
1Climate Change
2Sustainable Forestry
4Sustainable &
Resilient Value Chains 3
Human Rights & Co-Development with Communities
Environmental & Social Materiality
The Sustainable Development Goals (SDGs)*1 ad-opted by the United Nations in September 2015 are goals for achieving sustainability and leaving the world a better place for future generations shared by governments, the private sector and civil society. In recognition of this, the Marubeni Group has identified the following categories of Environmental and Social Materiality in which it can truly make a valuable contribution.
In addition to the 17 goals and 169 targets of the SDGs, and taking into consideration stakehold-ers’ expectations and interests as well as the envi-ronmental and social impact of our business, our categories of Environmental and Social Materiality are based on the criteria described below. Building on initiatives set out through our Fundamental Ma-teriality, we will contribute to achieving the SDGs and work toward building a better tomorrow.
● Importance to stakeholders● Impact and scope of our business activities on
the environment and society● Impact on our earnings
Climate change, which is responsible for phenomena
such as global warming, changes in the natural environ-
ment and more frequent natural disasters, is a global
issue with a broad impact on social and environmental
sustainability.
Marubeni has business operations throughout
the world, and views climate change as a serious risk.
However, we also believe that it presents business
opportunities.
We see contribution to climate change mitigation
and adaptation as a category of Environmental and
Social Materiality. We contribute to climate change
countermeasures mainly through the following policies:
Climate Change1
*1. Sustainable Development Goals (SDGs): As a first step, in 2001 the UN established the Millennium Development Goals (MDGs) with a target date of 2015. Subsequently, in September 2015 the UN Sustainable De-velopment Summit established the SDGs under the 2030 Agenda for Sustainable Development. They are a set of international goals covering the period from 2016 through to 2030, and consist of 17 goals and 169 targets.
Coal-Fired Power Generation and Renewable Energy
Generation Businesses
The Marubeni Group has 12GW net power generation
capacity (as of March 31, 2019) and is a leading indepen-
dent electric power operator. We announced our policy
on coal-fired power generation and renewable energy
generation businesses on September 18, 2018 as part of
our proactive climate change countermeasures.
See page 044 for Notification Regarding Business Policies Pertain-ing to Sustainability (In Relation to Coal-Fired Power Generation Business and Renewable Energy Generation Business).
MAR
UBEN
I COR
PORA
TION
IN
TEGR
ATED
REP
ORT
201
904
2
We view climate change-related transfer risk as a busi-
ness opportunity, and we aim to increase our “Green
Revenue” of ¥700 billion in FYE 3/2018 to ¥1.3 trillion
by FYE 3/2024.
Green Revenue, a part of our business contribution to
climate change countermeasures, includes the following:
●Sales of products certified as contributing to sustain-
able forestry, fisheries, etc.
●Sales from businesses (real estate, etc.) contributing to
lessening environmental impact
●Sales from businesses dealing in power generation
from renewable energy sources
●Sales from businesses contributing to propagating EV
(electric vehicles)
Actual Initiatives Related to TCFDMarubeni endorsed the intent of the TCFD Consortium (“the Consortium”) in which the Ministry of Economy, Trade
and Industry, the Financial Services Agency, and the Ministry of the Environment support as observers, and joined
the Consortium as a member in May 2019. The Consortium is intended to facilitate discussions among corporations
and financial institutions that endorse TCFD recommendations for initiatives aimed at more efficient disclosure of
corporate information as well as information disclosure leading to appropriate investment decisions by financial
and other institutions.
In addition, the Marubeni Group is conducting scenario analysis to analyze the impact that climate change is
likely to have on its businesses and finances. The Marubeni Group will analyze the risks, opportunities and impacts
on its businesses from climate change based on a Current Policies Scenario and the 2.0°C Scenario, and will use the
results in considering business plans and strategies.
TheCaseofourInitiatives• In feed ingredients procurement in the Food Division, taking into account the possibility of increases in product
prices and transportation costs due to a decrease in production volume in the agriculture and livestock industries
resulting from climate change, the Marubeni Group is actively responding to the risks that accompany climate
change by viewing them as opportunities. This response includes geographic diversification of suppliers and cus-
tomers, cultivation of new production regions, research and development of alternative and new products, and
acquisition of new partners.
• In the power generation business of the Power Business Division, in September 2018 Marubeni released the No-
tification Regarding Business Policies Pertaining to Sustainability (In Relation to Coal-Fired Power Generation
Business and Renewable Energy Generation Business) to promote reduction of GHG emissions from its power
generation portfolio, based on transition risks such as changes in the energy mix of each country under the 2.0°C
Scenario, tightening of regulations, changes in systems, and changes in stakeholder awareness. On the other
hand, the increase in renewable energy projects, upgrades and efficiency improvements of existing power plants,
the increase in energy storage and power system stabilization projects, and the increase in distributed power
sources will present business opportunities, and we will therefore take a more active approach in the area of
clean energy generation. Furthermore, Marubeni recognizes the financial impact from changes such as insurance
premium increases as a transition risk based on the Current Policies Scenario, and will use it for reference when
formulating medium- and long-term strategies.
●Sales from businesses (recycling-related, etc.) contrib-
uting to waste reduction
●Sales from businesses (water business, etc.) contribut-
ing to efficient use of resources
The Marubeni Group recognizes the importance of
climate-related financial disclosures. As new measures
to counter climate change, in addition to affirming the
recommendations of the TCFD*2, we will endeavor to
better understand the financial impact of both the risks
and opportunities brought about by climate change, and
also engage in improved climate-related financial
disclosure.
*2. TCFD (Task Force on Climate-related Financial Disclosures): Estab-lished by the Financial Stability Board (FSB).
MANAGEMENT FOUNDATION OPERATING ACTIVITIES CORPORATE INFORMATIONSTRATEGY043
CHAPTER 2
Marubeni Corporation (hereinafter, “Marubeni”) recog-nizes that climate change is a major issue shared by all of humanity. It is a problem that threatens the co-exis-tence of the global environment and society, a problem that has an enormous effect on Marubeni’s business and its shareholders, and a problem that Marubeni believes must be dealt with swiftly. Therefore, as part of Marubeni’s promotion of sustainable management, and in order to contribute fight global climate change, Marubeni has established new business policies (here-inafter, “Policies”) regarding its coal-fired power gen-eration business and its renewable energy generation business.
1. The Process of Pulling Out of Coal-Fired Power GenerationAs a global player in the power business, Marubeni will reduce its greenhouse gas emissions volume from its power generation portfolio. By 2030, Marubeni will cut its FY2018 coal-fired power net generation capacity of approximately 3GW in half. Additionally, Marubeni will deploy innovative technologies to increase the effi-ciency of its portfolio assets, and proactively promote the reduction of its environmental impact.
2. The Policy on New Coal-Fired Power Generation Business
As a general principle, Marubeni will no longer enter into any new coal-fired power generation business. However, Marubeni might consider pursuing projects that adopt BAT (“Best Available Technology”, which at present is USC: “Ultra-supercritical steam generating technology) and are compliant with the policies and measures of the Japanese government and any coun-try in which the project will be executed (e.g. energy supply stability, poverty and employment measures and economic growth policies). Nevertheless, even if Marubeni does make an exception to take on a project like this, Marubeni will make proposals on the creation of a low-carbon society, efficient power generation systems and the diversification of energy sources; Marubeni will make efforts to contribute to the resolu-tion of local issues in the country and/or region in which the project is executed.
September 18, 2018 Notification Regarding Business Policies Pertaining to Sustainability(In Relation to Coal-Fired Power Generation Business and Renewable Energy Generation Business)
3. Proactive Involvement in Renewable Energy Generation BusinessLooking forward to the expansion of the renewable energy generation business, Marubeni will strive to expand the ratio of power generated by renewable energy sources in its own net power supply from approximately 10% to approximately 20% by 2023. Furthermore, Marubeni will contribute to the transition towards a low-carbon society by promoting the expansion of the handled volume of renewable energy sources pertaining to energy trading. An example of this is SmartestEnergy Ltd.*1, a wholly-owned subsidi-ary located in the United Kingdom that manages approximately 3GW of total energy, which is pur-chased from independent generators; about 80% of that 3GW is generated by renewable energy sources.
Moving toward the achievement of these Policies, Marubeni will work to properly communicate and cooperate with its diverse stakeholders, and also pro-actively disclose updates on Marubeni’s progress in reaching these goals. Additionally, given the changes to the external environment, Marubeni will refer to the various international guidelines, beginning with the OECD Export Credits Arrangement, diligently monitor measures taken by different countries in terms of coal-fired and renewable energy generation business, as well as the international state of affairs, and use this information to periodically review and rework its own policies from the standpoint of climate change countermeasures.
In April 2018, Marubeni launched the Sustainabil-ity Management Committee (hereinafter, “the Com-mittee”) under the supervision of the President and CEO, with the aim to strengthen the company’s sus-tainability initiatives. Since its launch, and while solicit-ing the opinions of external parties, the Committee has discussed a number of basic policies and measures pertaining to Marubeni’s sustainability initiatives, beginning with identification and periodic review of the materiality. Policies and measures considered as a result of these discussions will be announced as part of Marubeni’s ESG related data once it has been compiled.
*1. SmartestEnergy Ltd., established by Marubeni in the U.K. in 2001, purchases power from small to medium sized independent generators, and resells on the wholesale market or to retail customers. https://www.smartestenergy.com/
Environmental & Social Materiality
MAR
UBEN
I COR
PORA
TION
IN
TEGR
ATED
REP
ORT
201
904
4
2
*2. HCV forests are forests that have a High Conservation Value in social, cultural and or environmental terms.
Forest Management Policy
1. IntroductionMarubeni Group (hereinafter the “Company”) promotes sustainable forest management by conducting fair and upright corporate activities in accordance with the spirit of the Company Creed of “Fairness, Innovation and Harmony”. We recognize that forests are renewable resources that provide various benefits for sustaining life on earth, and embrace economically viable forest management methods with the aim of ensuring the prosperity of present and future generations.
We strive to contribute to the establishment of a circular economy by creating innovation in the utiliza-tion of forest resources and responding to the society’s environmental needs that are becoming more diverse.
The Forest Management Policy (hereinafter the “Policy”) drives our commitments to sustainable forest management, the protection of forests with high con-servation value (HCV*2) and the elimination of unregu-lated forest logging in our business activities. We, through our focus on on-site operations, are able to create economic benefits and contribute to society by conducting sustainable forest management through coexistence and co-prosperity with local communities, as well as supplying environmentally conscious wood resources that respond to society’s needs.
2. ScopeThe Policy applies to all woodchip and pulp manufac-turing and forest plantation operations by Marubeni and its subsidiaries worldwide.
3. CommitmentsWe go beyond compliance in our commitments to sus-tainable forest management. Through this Policy, we reaffirm our commitment to comply with all applicable laws and regulations relevant to forestry operations and seek to extend this obligation to our contractors and their employees.
1) Natural CapitalIn implementing sustainable forest management, we commit to the following guidelines on the principle of No Deforestation:
•Only handling wood resources managed in a sustain-able and appropriate way.•No conversion of natural forests in forest plantation
developments.•Proactively addressing protection of HCV forests in
our forest management from the viewpoint of biodi-versity conservation.•No forest plantation operations in HCV forests or on
peatland.•Committing to a “No Burn Policy” that restricts the use
of fire in forest plantation operations that can poten-tially cause forest fires in tropical forest areas.•Minimizing the impact of logging and related logging
access roads construction on ecosystems.•Proactively addressing the protection of species at
risk of extinction included in IUCN’s (International Union for Conservation of Nature and Natural Resources) Red List of Threatened Species.•Restricting the usage of alien species only to cases
where impact is manageable.•Following international best practices for soil
management.•Not using any pesticides classified as Class 1A/1B in
the classification scheme of the WHO (World Health Organization), or any substances regulated by the Rotterdam Convention and the Stockholm Convention as pesticides.•Not using genetic modification technology in forest
management.•Effective utilization of trees damaged by natural disas-
ters such as burned trees, fallen trees, drift wood etc.
Sustainable Forestry
Forests are a precious resource and enrich life on Earth in
many ways. The Marubeni Group currently holds 140,000
hectares of tree plantations across the world (total gross
project area is 320,000 hectares). These forests are run
according to management methods for sustainable
forestry.
To build a better tomorrow, we have adopted a Forest
Management Policy and a Procurement Policy (for
Wood-derived Products) to conserve and sustainably use
valuable forest resources. By operating our businesses in
accordance with these policies, we will promote sustainable
forest management and contribute to forest conservation.
MANAGEMENT FOUNDATION OPERATING ACTIVITIES CORPORATE INFORMATIONSTRATEGY045
CHAPTER 2
3) International StandardsWe promote the main principles outlined in interna-tional standards relevant to the forestry industry (forest plantations, woodchips and pulp manufactur-ing) in our own operations as part of our commitment to sustainable forest management.
4) Environmental and Social Risk Assessment We conduct the necessary environmental and social risk assessment prior to the completion of land acqui-sitions or land developments for new operations.
4. Governance1) ImplementationThe Policy is approved by Marubeni’s Board of Direc-tors. Oversight of the Policy is by the Chairperson of Sustainability Management Committee with imple-mentation by the Business Group.
2) Links to Other PoliciesThe Policy complements other sustainability related policies of the Company including the Basic Policy on Human Rights and Basic Supply Chain Sustainability Policy.
3) Policy ManagementWe will review the Policy at least once a year, or as new information and knowledge becomes available, in ways that are consistent with our objectives of sus-tainable forest management.
4) Certification Audit and MonitoringWe hold international certification for sustainable forest management and CoC (Chain of Custody) certi-fication to manage distribution and processing. As a result, accredited bodies conduct regular auditing and monitoring of these certifications.
5) Information DisclosureIn addition to increasing the transparency of our busi-ness activities, we are committed to disclose informa-tion on our approach to sustainable forest management on the Company website etc.
2) Social CapitalWe commit to the social and economic development of the areas where we operate and seek to identify opportunities to create shared values with local com-munities. We recognize the importance of land use rights for local communities and indigenous people and their right to enjoy a fair share of the benefits obtainable from the commercial use of forest resources. Marubeni Group follows the principles regarding human rights described in the Basic Policy on Human Rights, and conducts the following activities as a responsible party:
• Committing to provide a safe and productive work environment, and not tolerating any form for child labor, forced labor, discrimination, harassment or abuse.• Following the principle of Free, Prior and Informed
Consent (FPIC) when starting new forestry opera-tions on the lands where indigenous and local com-munities hold legal or customary rights• Establishing grievance and conflict resolution mech-
anisms compliant with international standards and the regulatory requirements of the host countries of our forestry operations, as well as engaging in good-faith dialogue with stakeholders to resolve any issues.• Actively carrying out stakeholder engagement on
local, national and international scales.• Respecting the rights of every worker.
We are contributing to economic and social development of areas where we operate through the following initiatives:
• Creating employment opportunities for local resi-dents (priority allocation of contracts for forest plantation related work)• Joint programs with local residents (Joint Forestry,
Agriculture and Forest Products Harvesting Pro-grams, etc.)• Support activities for local residents (support for
indigenous people, vocational training, disaster pre-vention drills, voluntary provision of daily necessities, etc.)• Educational support (scholarships, construction or
renovation and extension of schools, dispatching of teachers, operational support, etc.)• Other community support (support for infrastructure
equipment repair, sports events, etc.)
Environmental & Social Materiality
MAR
UBEN
I COR
PORA
TION
IN
TEGR
ATED
REP
ORT
201
904
6
Product Procurement Policy (Forest-derived Products)
1. IntroductionThe Marubeni Group (hereinafter referred to as “we”) conducts fair and upright corporate activities in accor-dance with the spirit of its Company Creed of “Fairness, Innovation and Harmony” and strives to build a sus-tainable society together with its business partners in line with the “Basic Supply Chain Sustainability Policy.”
We have established the Product Procurement Policy (Forest-derived Products) (hereinafter referred to as the “Policy”) to promote the procurement of timber and related products produced from appropri-ately managed forests, thereby realizing the sustain-able use of forest resources.
This Policy has been approved by Marubeni’s Board of Directors. The Chairperson of the Sustainabil-ity Management Committee oversees the Policy, and the Business Group is in charge of its effective imple-mentation. We undertake to review this Policy at least annually and revise it as necessary. 2. ScopeThis Policy applies to the trading of timber and related products by Marubeni and its subsidiaries worldwide. Specifically, it covers raw timber, woodchips (includ-ing fuel woodchips), pulp, and paper and paperboard products (hereinafter referred to as “procured products”). 3. CommitmentIn cooperation with suppliers and customers, we are committed to ensuring the traceability of procured products while conducting our procurement activities in accordance with the Basic Supply Chain Sustainabil-ity Policy and the following principles.
(1) No handling of procured products produced from illegally logged timber.
(2) No handling of products procured from suppliers involved in serious environmental and social con-troversies, such as the destruction of forests with high conservation value.
(3) No handling of procured products produced from genetically modified wood.
(4) Promoting the handling of procured products that have been certified under a reliable international forest certification system.
In order to promote this Policy, we will investigate the environmental and social considerations of suppliers as well as their compliance with laws and regulations. In the event that any non-compliance with this Policy is discovered, consultations and requests for improve-ment measures will be made. If the non-compliant supplier does not improve, we will review our business relationship with the relevant supplier.
We will regularly disclose information on this Policy. We are committed to promoting to society the sustainable use of forest resources through appropri-ate communication with our suppliers and customers and other stakeholders.
047CHAPTER 2
MANAGEMENT FOUNDATION OPERATING ACTIVITIES CORPORATE INFORMATIONSTRATEGY
Human Rights & Co-Development with Communities3
Due to the globalization of economic activity, serious
abuses of human rights against workers and local resi-
dents are taking place in relevant countries and regions.
Many of these abuses can be remedied or improved by
taking human rights into consideration in business activ-
ities, and there are growing expectations that businesses
should play a role in remedying human rights abuses.
The Marubeni Group does business in 136 locations*1
in 67 countries and regions and employs 40,000 people*2
of many different nationalities and ethnicities. We are
active in a wide range of businesses and conduct global,
multi-faceted activities.
To build a better tomorrow, we take a sincere
approach to dealing with human rights issues facing the
international community. As part of our initiatives, we
have included the three basic principles of the United
Nations’ “Guiding Principles on Business and Human
Rights: 1) respect for human rights, 2) due diligence on
human rights, and 3) redress in our Basic Policy on
Human Rights.
*1. As of April 1, 2019 *2. As of March 31, 2019
Basic Policy on Human Rights
In the spirit of the Company Creed of “Fairness, Inno-vation and Harmony,” the Marubeni Group is proudly committed to promoting social and economic devel-opment and safeguarding the global environment through fair and upright corporate activities. We rec-ognize that respecting the human rights of persons affected by our business activities and endeavoring to take responsibility for doing so are of utmost impor-tance, and to this end we have formulated our Basic Policy on Human Rights (“the Policy”), based on the UN’s Guiding Principles on Business and Human Rights.
Our Basic Stance on Human Rights We support and respect all international rules on human rights, including the UN’s International Bill of Human Rights (Universal Declaration of Human Rights and International Covenant on Human Rights), the ILO’s Declaration on Fundamental Principles and Rights at Work and the 10 Principles of the UN Global Compact.
Scope of ApplicationThis Policy applies to all executives and employees of the Marubeni Group. We also ask that stakeholders (vendors, service providers, contractors, third-party manufacturers, joint venture partners, outsourcing partners, customers and other business partners and local communities) and other related parties observe the intent of the Policy and take appropriate action if a negative effect on human rights caused by them is directly related to the business activities of the Marubeni Group.
Responsibility for Human RightsWe will carry out our responsibility to respect human rights by ensuring that we do not violate human rights. If it should come to light that any of our business activ-ities are having a negative impact on human rights, we will take appropriate action to remedy the situation.
●Human Rights Due Diligence: We will create and continue using a system for carry-ing out human rights due diligence.
● Redress:We will create a system (complaint resolution mecha-nism) for reporting when our business activities have a negative effect on human rights or we have been involved in human rights violations. If such reports are received, appropriate procedures for redress will be taken once the facts are sufficiently ascertained.
●Dialogue and Discussion:We will engage in sincere dialogue and discussion with relevant stakeholders in order to promote initiatives in line with this Policy.
● Compliance with Relevant Laws: We will observe the laws and regulations of the coun-tries or regions where we conduct business activities. If national laws are in contradiction with internationally recognized human rights, we will pursue solutions in which we can respect human rights principles.
Environmental & Social Materiality
MAR
UBEN
I COR
PORA
TION
IN
TEGR
ATED
REP
ORT
201
904
8
The above Policy includes the following policies with
regard to those who are especially vulnerable to human
rights abuses:
● Policy Regarding the Rights of Children:
In addition to supporting the Children’s Rights and Busi-
ness Principles*3, which are intended to protect children’s
rights in the course of our business activities, we will
undertake social contribution activities to strengthen
children’s rights and by so doing will contribute to
improving children’s rights.
● Policy Regarding the Rights of Indigenous Peoples:
When conducting our business activities in countries or
regions with indigenous peoples, we will acknowledge
the native culture and history of indigenous peoples, and
we will give due consideration to the laws of the country
or region in question and the rights of indigenous peoples
set out in international rules.
● Policy Regarding Use of Security Services:
We are aware of the inherent risk to human rights related
to the use of weapons for security. With regard to the use
of security services when conducting business activities,
we will observe the laws of the countries or regions where
we operate, support international rules and related prac-
tices and endeavor to respect human rights.
*3. Children’s Rights and Business Principles: A comprehensive set of principles formulated by UNICEF, the UN Global Compact and Save the Children covering various actions that enterprises can take in the work-place, the marketplace and the community in order to promote respect for children’s rights.
● Education and Training:We will conduct appropriate training and skill develop-ment for our executives and employees to ensure that this Policy is understood and effectively put into prac-tice in all our business activities.
●Information Disclosure:We will report on our initiatives, etc. for fulfilling our responsibilities to respect human rights through our official website and other avenues.
049CHAPTER 2
MANAGEMENT FOUNDATION OPERATING ACTIVITIES CORPORATE INFORMATIONSTRATEGY
Sustainable & Resilient Value Chains4
The Marubeni Group deals with thousands of suppliers in
conducting transactions and operating a wide range of
businesses on a global scale. We believe that we make
important contributions to sustainability through environ-
mental conservation and sustainable social development
initiatives throughout our supply chain. To build a better
tomorrow, we have identified Sustainable and Resilient
Value Chains and working together with our business
partners as an essential category of Environmental and
Social Materiality. In addition to managing the supply
chain, we will also involve buyers of our products and
enhance the strength and competitiveness of our entire
value chain, which includes not only the Marubeni group
but also our business partners.
As part of our sustainability initiatives, together with
stakeholders, we, including our business partners,
adopted our Basic Supply Chain CSR Policy in 2008 to
manage our supply chain. Subsequently, to advance
understanding of and cooperation with the spirit of this
Policy, we sent the Policy to suppliers, conducted surveys,
and dispatched personnel to suppliers’ manufacturing or
production sites to conduct direct on-site inspections.
Since we believe that value chain management is import-
ant, we will continue taking initiatives toward both suppli-
ers and buyers of our products to resolve issues in this
area.
In addition, we have revised our Basic Supply Chain
CSR Policy, adopting a new Basic Supply Chain Sustain-
ability Policy to place more importance on climate change
countermeasures and respect for human rights.
Environmental & Social Materiality
MAR
UBEN
I COR
PORA
TION
IN
TEGR
ATED
REP
ORT
201
905
0
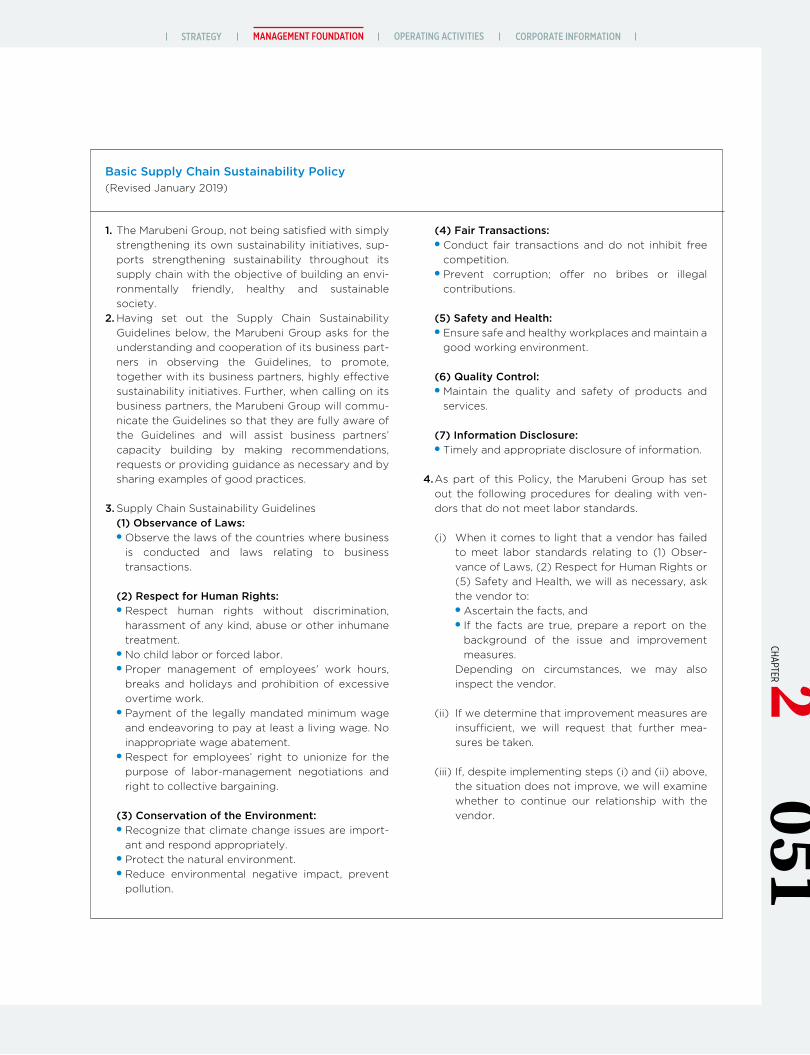
Basic Supply Chain Sustainability Policy(Revised January 2019)
1. The Marubeni Group, not being satisfied with simply strengthening its own sustainability initiatives, sup-ports strengthening sustainability throughout its supply chain with the objective of building an envi-ronmentally friendly, healthy and sustainable society.
2. Having set out the Supply Chain Sustainability Guidelines below, the Marubeni Group asks for the understanding and cooperation of its business part-ners in observing the Guidelines, to promote, together with its business partners, highly effective sustainability initiatives. Further, when calling on its business partners, the Marubeni Group will commu-nicate the Guidelines so that they are fully aware of the Guidelines and will assist business partners’ capacity building by making recommendations, requests or providing guidance as necessary and by sharing examples of good practices.
3. Supply Chain Sustainability Guidelines(1) Observance of Laws: ●Observe the laws of the countries where business
is conducted and laws relating to business transactions.
(2) Respect for Human Rights: ●Respect human rights without discrimination,
harassment of any kind, abuse or other inhumane treatment.
●No child labor or forced labor.●Proper management of employees’ work hours,
breaks and holidays and prohibition of excessive overtime work.
●Payment of the legally mandated minimum wage and endeavoring to pay at least a living wage. No inappropriate wage abatement.
●Respect for employees’ right to unionize for the purpose of labor-management negotiations and right to collective bargaining.
(3) Conservation of the Environment: ●Recognize that climate change issues are import-
ant and respond appropriately.●Protect the natural environment.●Reduce environmental negative impact, prevent
pollution.
(4) Fair Transactions:● Conduct fair transactions and do not inhibit free
competition.● Prevent corruption; offer no bribes or illegal
contributions.
(5) Safety and Health: ● Ensure safe and healthy workplaces and maintain a
good working environment.
(6) Quality Control: ●Maintain the quality and safety of products and
services.
(7) Information Disclosure: ●Timely and appropriate disclosure of information.
4. As part of this Policy, the Marubeni Group has set out the following procedures for dealing with ven-dors that do not meet labor standards.
(i) When it comes to light that a vendor has failed to meet labor standards relating to (1) Obser-vance of Laws, (2) Respect for Human Rights or (5) Safety and Health, we will as necessary, ask the vendor to:
● Ascertain the facts, and ● If the facts are true, prepare a report on the
background of the issue and improvement measures.
Depending on circumstances, we may also inspect the vendor.
(ii) If we determine that improvement measures are insufficient, we will request that further mea-sures be taken.
(iii) If, despite implementing steps (i) and (ii) above, the situation does not improve, we will examine whether to continue our relationship with the vendor.
MANAGEMENT FOUNDATION OPERATING ACTIVITIES CORPORATE INFORMATIONSTRATEGY051
CHAPTER 2
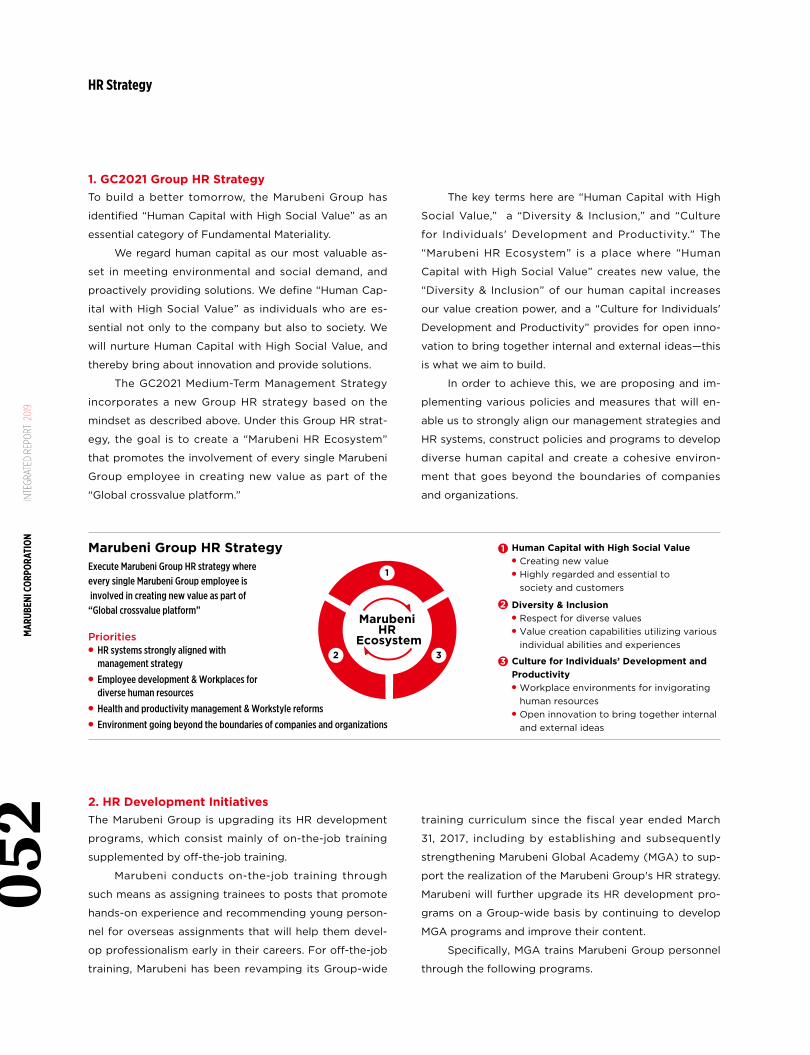
Marubeni Group HR StrategyExecute Marubeni Group HR strategy where every single Marubeni Group employee is involved in creating new value as part of “Global crossvalue platform”
Human Capital with High Social Value● Creating new value● Highly regarded and essential to society and customers
Priorities● HR systems strongly aligned with management strategy● Employee development & Workplaces for diverse human resources● Health and productivity management & Workstyle reforms● Environment going beyond the boundaries of companies and organizations
1
Culture for Individuals’ Development and Productivity● Workplace environments for invigorating human resources● Open innovation to bring together internal and external ideas
2 Diversity & Inclusion● Respect for diverse values● Value creation capabilities utilizing various individual abilities and experiences
3
MarubeniHR
Ecosystem
1
32
HR Strategy
1. GC2021 Group HR StrategyTo build a better tomorrow, the Marubeni Group has
identified “Human Capital with High Social Value” as an
essential category of Fundamental Materiality.
We regard human capital as our most valuable as-
set in meeting environmental and social demand, and
proactively providing solutions. We define “Human Cap-
ital with High Social Value” as individuals who are es-
sential not only to the company but also to society. We
will nurture Human Capital with High Social Value, and
thereby bring about innovation and provide solutions.
The GC2021 Medium-Term Management Strategy
incorporates a new Group HR strategy based on the
mindset as described above. Under this Group HR strat-
egy, the goal is to create a “Marubeni HR Ecosystem”
that promotes the involvement of every single Marubeni
Group employee in creating new value as part of the
“Global crossvalue platform.”
2. HR Development Initiatives The Marubeni Group is upgrading its HR development
programs, which consist mainly of on-the-job training
supplemented by off-the-job training.
Marubeni conducts on-the-job training through
such means as assigning trainees to posts that promote
hands-on experience and recommending young person-
nel for overseas assignments that will help them devel-
op professionalism early in their careers. For off-the-job
training, Marubeni has been revamping its Group-wide
The key terms here are “Human Capital with High
Social Value,” a “Diversity & Inclusion,” and “Culture
for Individuals' Development and Productivity.” The
“Marubeni HR Ecosystem” is a place where “Human
Capital with High Social Value” creates new value, the
“Diversity & Inclusion” of our human capital increases
our value creation power, and a “Culture for Individuals'
Development and Productivity” provides for open inno-
vation to bring together internal and external ideas—this
is what we aim to build.
In order to achieve this, we are proposing and im-
plementing various policies and measures that will en-
able us to strongly align our management strategies and
HR systems, construct policies and programs to develop
diverse human capital and create a cohesive environ-
ment that goes beyond the boundaries of companies
and organizations.
training curriculum since the fiscal year ended March
31, 2017, including by establishing and subsequently
strengthening Marubeni Global Academy (MGA) to sup-
port the realization of the Marubeni Group's HR strategy.
Marubeni will further upgrade its HR development pro-
grams on a Group-wide basis by continuing to develop
MGA programs and improve their content.
Specifically, MGA trains Marubeni Group personnel
through the following programs.
MAR
UBEN
I COR
PORA
TION
IN
TEGR
ATED
REP
ORT
201
905
2
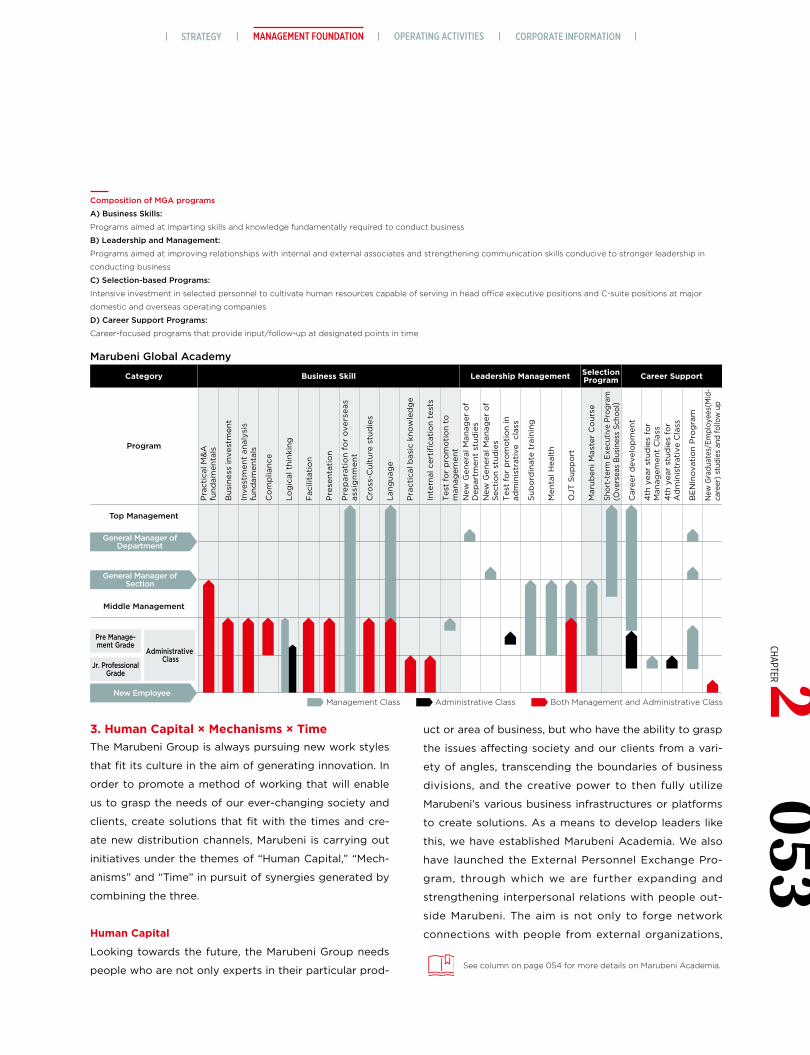
Composition of MGA programs
A) Business Skills:
Programs aimed at imparting skills and knowledge fundamentally required to conduct business
B) Leadership and Management:
Programs aimed at improving relationships with internal and external associates and strengthening communication skills conducive to stronger leadership in
conducting business
C) Selection-based Programs:
Intensive investment in selected personnel to cultivate human resources capable of serving in head office executive positions and C-suite positions at major
domestic and overseas operating companies
D) Career Support Programs:
Career-focused programs that provide input/follow-up at designated points in time
3. Human Capital × Mechanisms × TimeThe Marubeni Group is always pursuing new work styles
that fit its culture in the aim of generating innovation. In
order to promote a method of working that will enable
us to grasp the needs of our ever-changing society and
clients, create solutions that fit with the times and cre-
ate new distribution channels, Marubeni is carrying out
initiatives under the themes of “Human Capital,” “Mech-
anisms” and “Time” in pursuit of synergies generated by
combining the three.
Human Capital
Looking towards the future, the Marubeni Group needs
people who are not only experts in their particular prod-
uct or area of business, but who have the ability to grasp
the issues affecting society and our clients from a vari-
ety of angles, transcending the boundaries of business
divisions, and the creative power to then fully utilize
Marubeni’s various business infrastructures or platforms
to create solutions. As a means to develop leaders like
this, we have established Marubeni Academia. We also
have launched the External Personnel Exchange Pro-
gram, through which we are further expanding and
strengthening interpersonal relations with people out-
side Marubeni. The aim is not only to forge network
connections with people from external organizations,
See column on page 054 for more details on Marubeni Academia.
MANAGEMENT FOUNDATION OPERATING ACTIVITIES CORPORATE INFORMATIONSTRATEGY053
CHAPTER 2
New
Gra
duat
es/E
mpl
oyee
s(M
id-
care
er)
stud
ies
and
follo
w u
p
BE
NIn
ova
tio
n P
rog
ram
4th
yea
r st
udie
s fo
r A
dm
inis
trat
ive
Cla
ss
4th
yea
r st
udie
s fo
r M
anag
emen
t C
lass
Car
eer
dev
elo
pm
ent
Shor
t-te
rm E
xecu
tive
Prog
ram
(Ove
rsea
s B
usin
ess
Scho
ol
)
Mar
uben
i Mas
ter
Co
urse
OJT
Sup
po
rt
Men
tal H
ealt
h
Sub
ord
inat
e tr
aini
ng
Tes
t fo
r p
rom
oti
on
in
adm
inis
trat
ive
cla
ss
New
Gen
eral
Man
ager
of
Sec
tio
n st
udie
s
New
Gen
eral
Man
ager
of
Dep
artm
ent
stud
ies
Tes
t fo
r p
rom
oti
on
to
man
agem
ent
Inte
rnal
cer
tifi
cati
on
test
s
Pra
ctic
al b
asic
kno
wle
dg
e
Lang
uag
e
Cro
ss-C
ultu
re s
tud
ies
Pre
par
atio
n fo
r o
vers
eas
as
sig
nm
en
t
Pre
sent
atio
n
Fac
ilita
tio
n
Log
ical
thi
nkin
g
Co
mp
lianc
e
Inve
stm
ent
anal
ysis
fu
ndam
enta
ls
Bus
ines
s in
vest
men
t
Pra
ctic
al M
&A
fu
ndam
enta
ls
Category Business Skill Leadership Management Selection Program Career Support
Program
Top Management
Middle Management
Marubeni Global Academy
General Manager of Department
General Manager of Section
New Employee Management Class Administrative Class Both Management and Administrative Class
Pre Manage-ment Grade
Jr. Professional Grade
Administrative Class
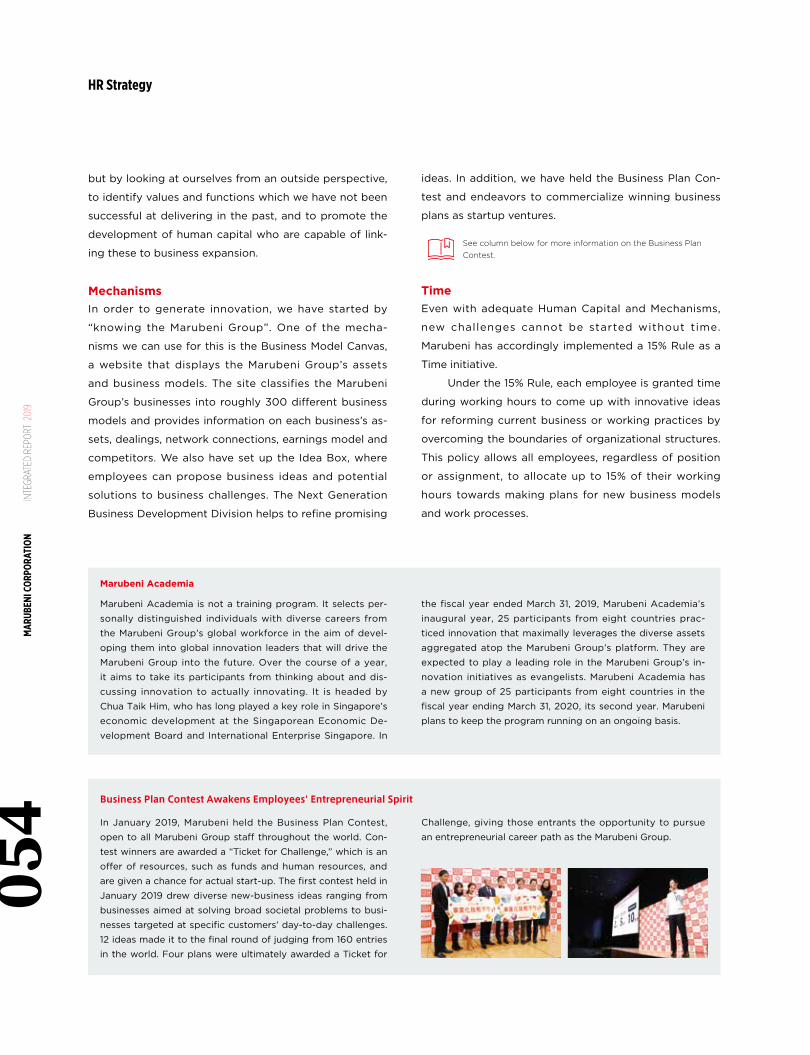
but by looking at ourselves from an outside perspective,
to identify values and functions which we have not been
successful at delivering in the past, and to promote the
development of human capital who are capable of link-
ing these to business expansion.
MechanismsIn order to generate innovation, we have started by
“knowing the Marubeni Group”. One of the mecha-
nisms we can use for this is the Business Model Canvas,
a website that displays the Marubeni Group’s assets
and business models. The site classifies the Marubeni
Group’s businesses into roughly 300 different business
models and provides information on each business’s as-
sets, dealings, network connections, earnings model and
competitors. We also have set up the Idea Box, where
employees can propose business ideas and potential
solutions to business challenges. The Next Generation
Business Development Division helps to refine promising
ideas. In addition, we have held the Business Plan Con-
test and endeavors to commercialize winning business
plans as startup ventures.
TimeEven with adequate Human Capital and Mechanisms,
new challenges cannot be started without time.
Marubeni has accordingly implemented a 15% Rule as a
Time initiative.
Under the 15% Rule, each employee is granted time
during working hours to come up with innovative ideas
for reforming current business or working practices by
overcoming the boundaries of organizational structures.
This policy allows all employees, regardless of position
or assignment, to allocate up to 15% of their working
hours towards making plans for new business models
and work processes.
HR Strategy
Marubeni Academia is not a training program. It selects per-
sonally distinguished individuals with diverse careers from
the Marubeni Group’s global workforce in the aim of devel-
oping them into global innovation leaders that will drive the
Marubeni Group into the future. Over the course of a year,
it aims to take its participants from thinking about and dis-
cussing innovation to actually innovating. It is headed by
Chua Taik Him, who has long played a key role in Singapore’s
economic development at the Singaporean Economic De-
velopment Board and International Enterprise Singapore. In
In January 2019, Marubeni held the Business Plan Contest,
open to all Marubeni Group staff throughout the world. Con-
test winners are awarded a “Ticket for Challenge,” which is an
offer of resources, such as funds and human resources, and
are given a chance for actual start-up. The first contest held in
January 2019 drew diverse new-business ideas ranging from
businesses aimed at solving broad societal problems to busi-
nesses targeted at specific customers’ day-to-day challenges.
12 ideas made it to the final round of judging from 160 entries
in the world. Four plans were ultimately awarded a Ticket for
the fiscal year ended March 31, 2019, Marubeni Academia’s
inaugural year, 25 participants from eight countries prac-
ticed innovation that maximally leverages the diverse assets
aggregated atop the Marubeni Group’s platform. They are
expected to play a leading role in the Marubeni Group’s in-
novation initiatives as evangelists. Marubeni Academia has
a new group of 25 participants from eight countries in the
fiscal year ending March 31, 2020, its second year. Marubeni
plans to keep the program running on an ongoing basis.
Challenge, giving those entrants the opportunity to pursue
an entrepreneurial career path as the Marubeni Group.
Marubeni Academia
Business Plan Contest Awakens Employees' Entrepreneurial Spirit
See column below for more information on the Business PlanContest.
MAR
UBEN
I COR
PORA
TION
IN
TEGR
ATED
REP
ORT
201
905
4
Theme Initiatives
1. Improving health literacy
Walking events, healthy menu options in employee cafeterias, etc.
2. Better prevention of cancer and lifestyle diseases
Increased subsidization of smoking cessation therapies, practical health seminars, physical exams and cerebro-vascular imaging fully paid for by the company, etc.
3. Strengthening mental health measures
Expansion of employee assistance program services, support services for returnees from mental health leave, etc.
4. Strengthening women’s health initiatives
Seminars for improving women’s health literacy, establishment of women’s health consultation desks, etc.
4. Health and Productivity ManagementWith human capital as one of its categories of Funda-
mental Materiality, the Marubeni Group places utmost
priority on its employees’ health and safety to enable
them to fully utilize their capabilities. Toward this end, it
is carrying out various health management initiatives.
External Accolades
●Inclusion in Health & Productivity Stock Selection
Marubeni was chosen for inclusion in the Brand of Com-
panies Enhancing Corporate Value through Health and
Productivity Management Selection (Health & Productiv-
ity Stock Selection). Launched in the year ended March
31, 2015, this joint program by the Ministry of Economy,
Trade and Industry (METI) and the Tokyo Stock Ex-
change (TSE) recognizes TSE-listed companies that
exhibit excellence in strategically practicing health and
productivity management*, thereby making employee
health a management issue. Aiming to help employees
improve their health, Marubeni has been developing
more sophisticated healthcare management systems
while simultaneously supporting employees in living
more fulfilling social and private lives. It was the recog-
nition of these efforts that resulted in the Company’s in-
clusion in the Health & Productivity Stock Selection. Go-
ing forward, we will continue to invest
in employee health to further boost
our global competitiveness.
* The term “health and productivity management” is a registered trademark of the Workshop for the Management of Health on Company and
Employee.
●Marubeni Certified as Health and Productivity
Management Outstanding Organization (White 500)
Marubeni was certified as a 2019 Health and Productiv-
ity Management Outstanding Organization in the large
enterprise category (White 500) by Japan’s Ministry of
Economy, Trade and Industry and Nippon Kenko Kaigi.
The Health and Productivity Management Outstanding
Organization certification is awarded annually to corpo-
rations that practice particularly exemplary health and
productivity management based on initiatives tailored to
local health issues and the Nippon Kenko Kaigi’s health
promotion initiatives. It was awarded to Marubeni in
both 2018 and 2019. Marubeni will continue to support
its employees’ success and expedite
its own growth by creating an envi-
ronment in which all employees can
autonomously and proactively main-
tain or improve their health.
Marubeni Health Promotion StructureMarubeni has established the Marubeni Health Promotion
Structure under the responsibility of the director in charge
of the Human Resources Department. Health management
initiatives are carried out by four groups acting in concert:
occupational physicians (in-company medical clinics), the
Health Insurance Association, the Human Resources
Department and health and productivity management
promotion officers selected by employees.
Marubeni Health ProjectThe Marubeni Health Project carries out various initia-
tives, mainly under the following four themes.
Marubeni Group Health Declaration●Employees are a vital asset for the Marubeni Group, and
their health is of paramount importance. The Group has
therefore positioned maintaining and promoting employ-
ee health as a top management priority.
● The Marubeni Group supports employees’ success by
working to create an environment where each individual
can autonomously and proactively take steps to maintain
and promote his or her health. These efforts will lead to
the growth of the Marubeni Group.
For more details on the Marubeni Health Project, see page 062 of the Sustainable Development Report 2019https://www.marubeni.com/en/sustainability/report/
MANAGEMENT FOUNDATION OPERATING ACTIVITIES CORPORATE INFORMATIONSTRATEGY055
CHAPTER 2CHAPTER
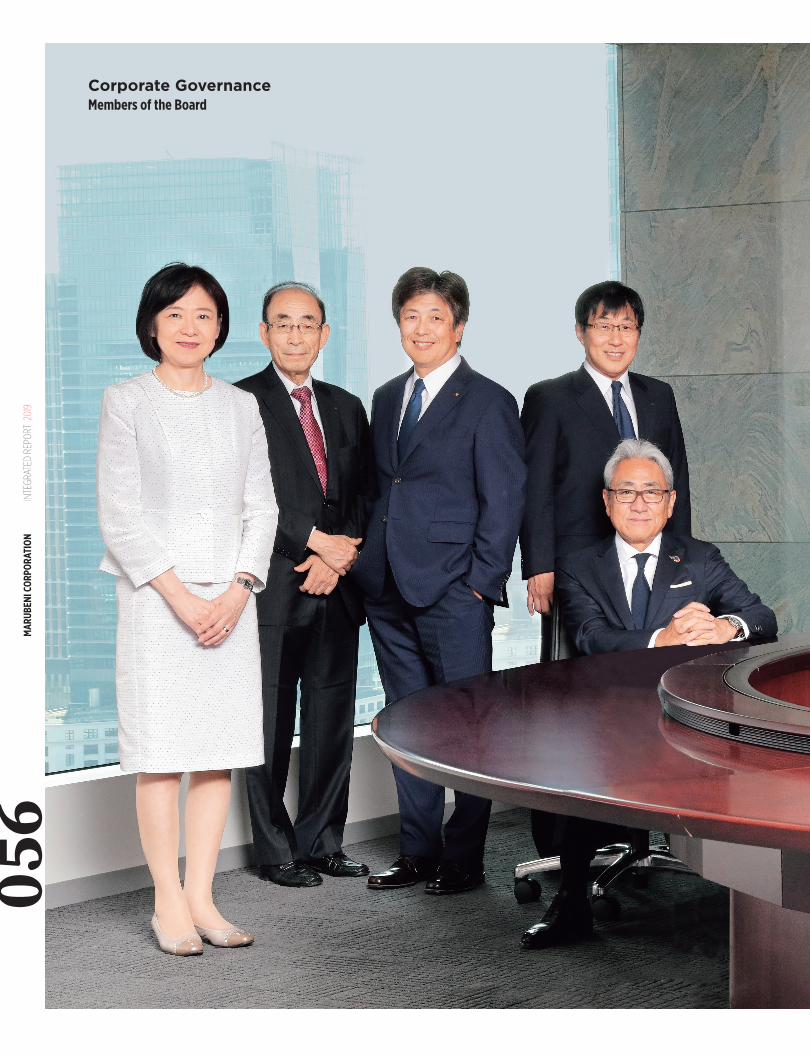
Corporate GovernanceMembers of the Board
MAR
UBEN
I COR
PORA
TION
IN
TEGR
ATED
REP
ORT
201
905
6
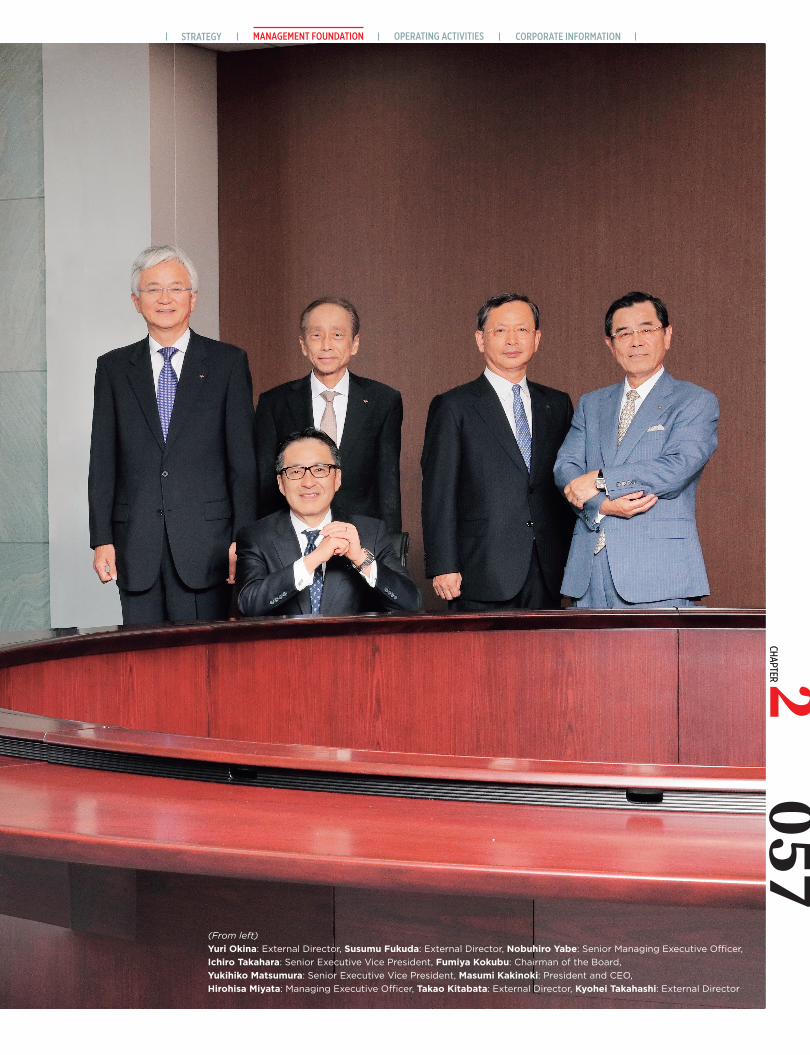
(From left)Yuri Okina: External Director, Susumu Fukuda: External Director, Nobuhiro Yabe: Senior Managing Executive Officer,Ichiro Takahara: Senior Executive Vice President, Fumiya Kokubu: Chairman of the Board,Yukihiko Matsumura: Senior Executive Vice President, Masumi Kakinoki: President and CEO,Hirohisa Miyata: Managing Executive Officer, Takao Kitabata: External Director, Kyohei Takahashi: External Director
MANAGEMENT FOUNDATION OPERATING ACTIVITIES CORPORATE INFORMATIONSTRATEGY057
CHAPTER 2CHAPTER
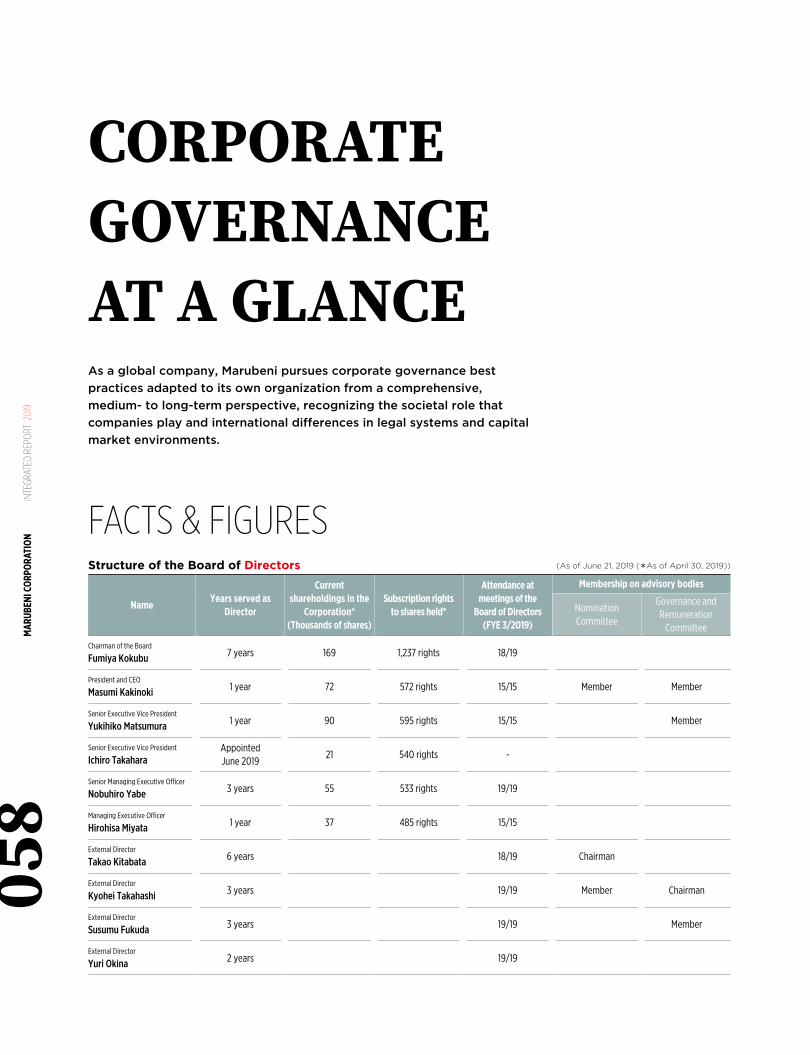
NameYears served as
Director
Currentshareholdings in the
Corporation*(Thousands of shares)
Subscription rightsto shares held*
Attendance atmeetings of the
Board of Directors(FYE 3/2019)
Membership on advisory bodies
NominationCommittee
Governance andRemuneration
Committee
Chairman of the Board
Fumiya Kokubu 7 years 169 1,237 rights 18/19
President and CEO
Masumi Kakinoki 1 year 72 572 rights 15/15 Member Member
Senior Executive Vice President
Yukihiko Matsumura 1 year 90 595 rights 15/15 Member
Senior Executive Vice President
Ichiro TakaharaAppointedJune 2019
21 540 rights -
Senior Managing Executive Officer
Nobuhiro Yabe 3 years 55 533 rights 19/19
Managing Executive Officer
Hirohisa Miyata 1 year 37 485 rights 15/15
External Director
Takao Kitabata 6 years 18/19 Chairman
External Director
Kyohei Takahashi 3 years 19/19 Member Chairman
External Director
Susumu Fukuda 3 years 19/19 Member
External Director
Yuri Okina 2 years 19/19
Structure of the Board of Directors
FACTS & FIGURES
CORPORATEGOVERNANCEAT A GLANCEAs a global company, Marubeni pursues corporate governance best practices adapted to its own organization from a comprehensive, medium- to long-term perspective, recognizing the societal role that companies play and international differences in legal systems and capital market environments.
(As of June 21, 2019 (*As of April 30, 2019))
MAR
UBEN
I COR
PORA
TION
IN
TEGR
ATED
REP
ORT
201
905
8
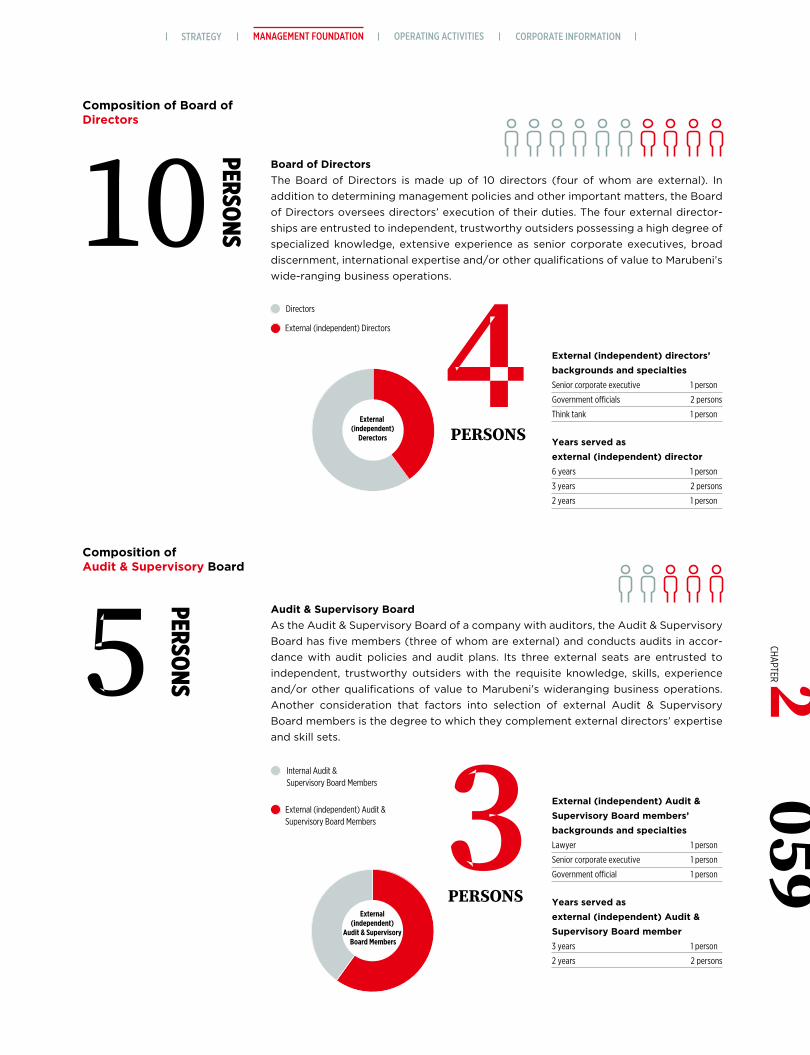
�� PERSONS
��������
External (independent) directors’backgrounds and specialtiesSenior corporate executive 1 person
Government o cials 2 persons
Think tank 1 person
Board of DirectorsThe Board of Directors is made up of 10 directors (four of whom are external). In addition to determining management policies and other important matters, the Board of Directors oversees directors’ execution of their duties. The four external director-ships are entrusted to independent, trustworthy outsiders possessing a high degree of specialized knowledge, extensive experience as senior corporate executives, broad discernment, international expertise and/or other qualifications of value to Marubeni’s wide-ranging business operations.
Years served as external (independent) director6 years 1 person
3 years 2 persons
2 years 1 person
External (independent)
Derectors
� PERSONS
��������
External (independent) Audit &Supervisory Board members’ backgrounds and specialtiesLawyer 1 person
Senior corporate executive 1 person
Government o cial 1 person
Audit & Supervisory BoardAs the Audit & Supervisory Board of a company with auditors, the Audit & Supervisory Board has five members (three of whom are external) and conducts audits in accor-dance with audit policies and audit plans. Its three external seats are entrusted to independent, trustworthy outsiders with the requisite knowledge, skills, experience and/or other qualifications of value to Marubeni’s wideranging business operations. Another consideration that factors into selection of external Audit & Supervisory Board members is the degree to which they complement external directors’ expertise and skill sets.
Years served as external (independent) Audit & Supervisory Board member3 years 1 person
2 years 2 persons
External (independent)
Audit & Supervisory Board Members
Composition of Board ofDirectors
Composition ofAudit & Supervisory Board
Directors
External (independent) Directors
Internal Audit & Supervisory Board Members
External (independent) Audit & Supervisory Board Members
MANAGEMENT FOUNDATION OPERATING ACTIVITIES CORPORATE INFORMATIONSTRATEGY059
CHAPTER 2
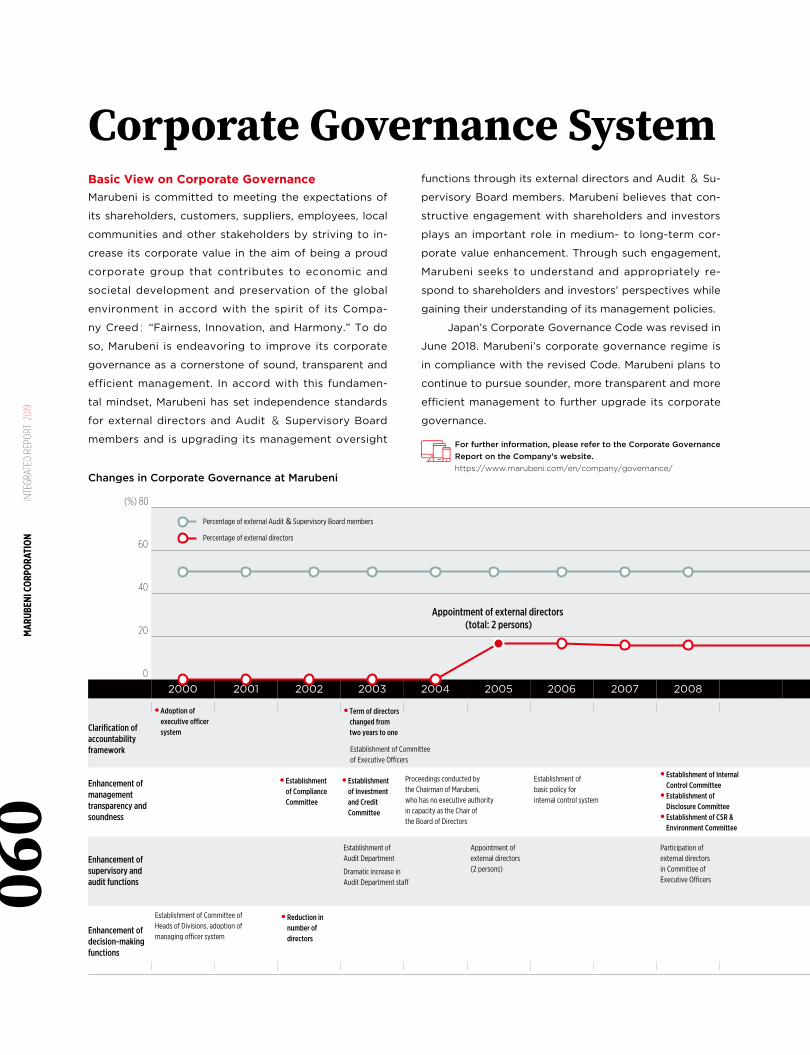
Clarification ofaccountabilityframework
Appointment of external directors (total: 2 persons)
● Adoption of executive o�cer system
● Term of directors changed from two years to one
● Reduction in number of directors
Establishment of Committee of Executive O�cers
Appointment of external directors(2 persons)
Participation ofexternal directorsin Committee ofExecutive O�cers
Establishment of basic policy for internal control system
Proceedings conducted by the Chairman of Marubeni, who has no executive authority in capacity as the Chair ofthe Board of Directors
Establishment of Audit Department
Dramatic increase inAudit Department sta�
Establishment of Committee ofHeads of Divisions, adoption ofmanaging o�cer system
● Establishment of Compliance Committee
● Establishment of Investment and Credit Committee
● Establishment of Internal Control Committee● Establishment of Disclosure Committee● Establishment of CSR & Environment Committee
● Increase in external Audit &
Supervisory Board members
(3 persons)
● Appointment of
female external director
(1 person)
● Increase in external directors (4 persons)
● Change in the Board of Directors
composition, from
12 directors to 10
● Establishment of Nomination Committee● Establishment of Governance and Remuneration Committee● Implementation of performance evaluations for the Board of Directors● Formulation of appointment criteria for Directors and Audit & Supervisory Board members
● Establishment of Sustainability Management Committee
Formulation of standards and methodology regarding independence of external executives
Abolishment of managing o�cer system, adoption of Group CEO system
Flattened the chainof command fromfour layers tothree layers
Increase in external Audit & SupervisoryBoard members (total: 3 persons)
Increase in external directors(total: 4 persons)
Percentage of external Audit & Supervisory Board members
Percentage of external Audit & Supervisory Board members
Percentage of external directors
Enhancement of managementtransparency and soundness
Enhancement of supervisory and audit functions
Enhancement of decision-makingfunctions
20000
20
40
60
(%) 80
2001 2002 2003 2004 2005 2006 2007 2008 2009 2010 2011 2012 2013 2014 2015 2016 2017 2018 2019
60%
40%
Percentage of external directors
● Abolishment of Advisor system
Corporate Governance System
Changes in Corporate Governance at Marubeni
Basic View on Corporate GovernanceMarubeni is committed to meeting the expectations of
its shareholders, customers, suppliers, employees, local
communities and other stakeholders by striving to in-
crease its corporate value in the aim of being a proud
corporate group that contributes to economic and
societal development and preservation of the global
environment in accord with the spirit of its Compa-
ny Creed: “Fairness, Innovation, and Harmony.” To do
so, Marubeni is endeavoring to improve its corporate
governance as a cornerstone of sound, transparent and
efficient management. In accord with this fundamen-
tal mindset, Marubeni has set independence standards
for external directors and Audit & Supervisory Board
members and is upgrading its management oversight
functions through its external directors and Audit & Su-
pervisory Board members. Marubeni believes that con-
structive engagement with shareholders and investors
plays an important role in medium- to long-term cor-
porate value enhancement. Through such engagement,
Marubeni seeks to understand and appropriately re-
spond to shareholders and investors’ perspectives while
gaining their understanding of its management policies.
Japan’s Corporate Governance Code was revised in
June 2018. Marubeni’s corporate governance regime is
in compliance with the revised Code. Marubeni plans to
continue to pursue sounder, more transparent and more
efficient management to further upgrade its corporate
governance.
For further information, please refer to the Corporate Governance Report on the Company’s website.https://www.marubeni.com/en/company/governance/
MAR
UBEN
I COR
PORA
TION
IN
TEGR
ATED
REP
ORT
201
906
0
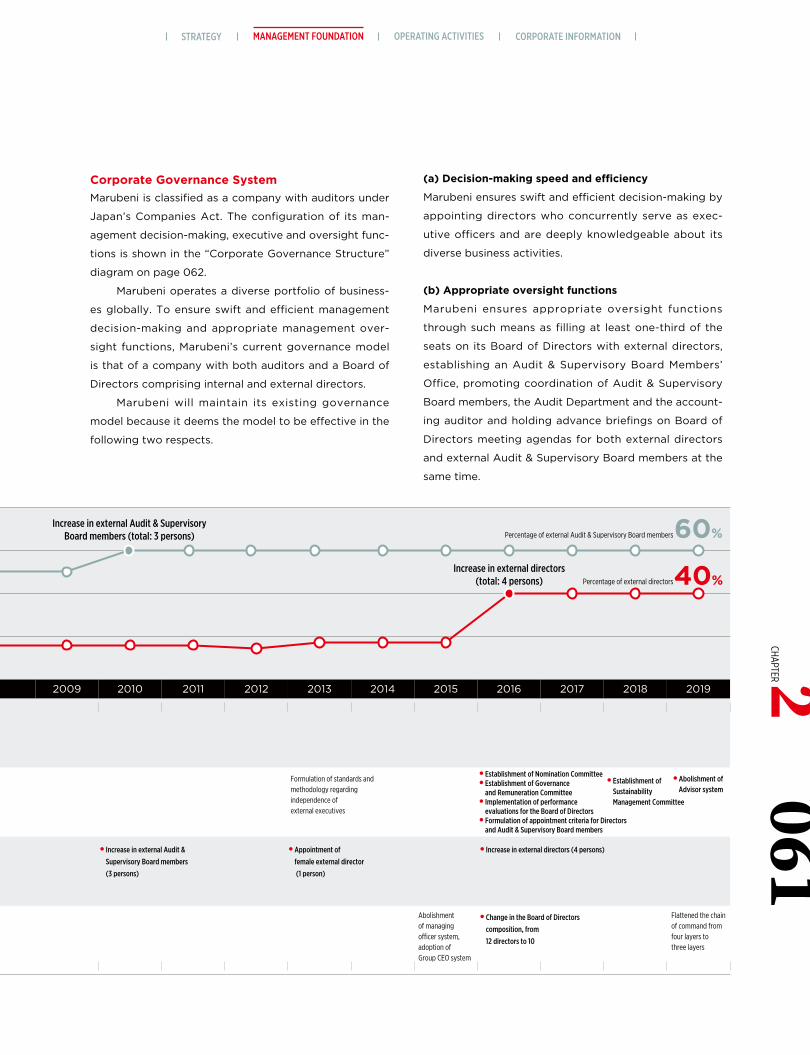
Clarification ofaccountabilityframework
Appointment of external directors (total: 2 persons)
● Adoption of executive o�cer system
● Term of directors changed from two years to one
● Reduction in number of directors
Establishment of Committee of Executive O�cers
Appointment of external directors(2 persons)
Participation ofexternal directorsin Committee ofExecutive O�cers
Establishment of basic policy for internal control system
Proceedings conducted by the Chairman of Marubeni, who has no executive authority in capacity as the Chair ofthe Board of Directors
Establishment of Audit Department
Dramatic increase inAudit Department sta�
Establishment of Committee ofHeads of Divisions, adoption ofmanaging o�cer system
● Establishment of Compliance Committee
● Establishment of Investment and Credit Committee
● Establishment of Internal Control Committee● Establishment of Disclosure Committee● Establishment of CSR & Environment Committee
● Increase in external Audit &
Supervisory Board members
(3 persons)
● Appointment of
female external director
(1 person)
● Increase in external directors (4 persons)
● Change in the Board of Directors
composition, from
12 directors to 10
● Establishment of Nomination Committee● Establishment of Governance and Remuneration Committee● Implementation of performance evaluations for the Board of Directors● Formulation of appointment criteria for Directors and Audit & Supervisory Board members
● Establishment of Sustainability Management Committee
Formulation of standards and methodology regarding independence of external executives
Abolishment of managing o�cer system, adoption of Group CEO system
Flattened the chainof command fromfour layers tothree layers
Increase in external Audit & SupervisoryBoard members (total: 3 persons)
Increase in external directors(total: 4 persons)
Percentage of external Audit & Supervisory Board members
Percentage of external Audit & Supervisory Board members
Percentage of external directors
Enhancement of managementtransparency and soundness
Enhancement of supervisory and audit functions
Enhancement of decision-makingfunctions
20000
20
40
60
(%) 80
2001 2002 2003 2004 2005 2006 2007 2008 2009 2010 2011 2012 2013 2014 2015 2016 2017 2018 2019
60%
40%
Percentage of external directors
● Abolishment of Advisor system
Corporate Governance SystemMarubeni is classified as a company with auditors under
Japan’s Companies Act. The configuration of its man-
agement decision-making, executive and oversight func-
tions is shown in the “Corporate Governance Structure”
diagram on page 062.
Marubeni operates a diverse portfolio of business-
es globally. To ensure swift and efficient management
decision-making and appropriate management over-
sight functions, Marubeni’s current governance model
is that of a company with both auditors and a Board of
Directors comprising internal and external directors.
Marubeni will maintain its existing governance
model because it deems the model to be effective in the
following two respects.
(a) Decision-making speed and efficiency
Marubeni ensures swift and efficient decision-making by
appointing directors who concurrently serve as exec-
utive officers and are deeply knowledgeable about its
diverse business activities.
(b) Appropriate oversight functions
Marubeni ensures appropriate oversight functions
through such means as filling at least one-third of the
seats on its Board of Directors with external directors,
establishing an Audit & Supervisory Board Members’
Office, promoting coordination of Audit & Supervisory
Board members, the Audit Department and the account-
ing auditor and holding advance briefings on Board of
Directors meeting agendas for both external directors
and external Audit & Supervisory Board members at the
same time.
MANAGEMENT FOUNDATION OPERATING ACTIVITIES CORPORATE INFORMATIONSTRATEGY061
CHAPTER 2
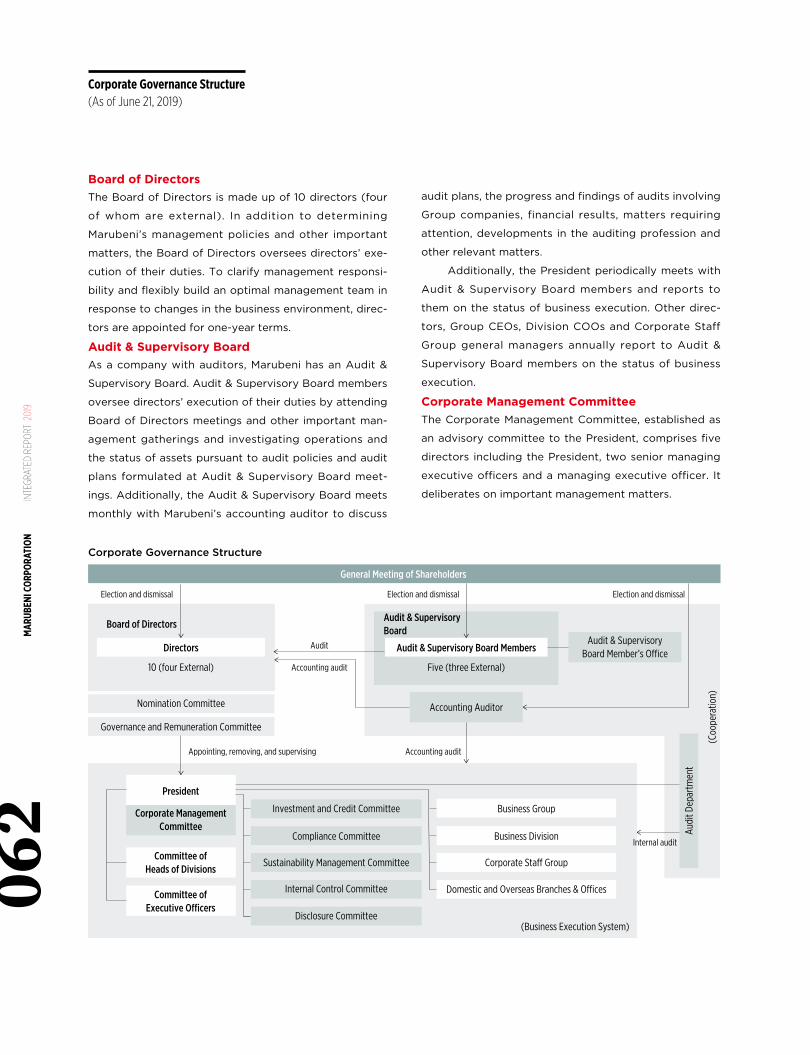
Corporate Governance Structure
Audit & Supervisory Board Members
(Coo
pera
tion)
Election and dismissal
Internal audit
Audit
Accounting audit
Accounting audit
Business GroupInvestment and Credit Committee
Compliance Committee
Sustainability Management Committee
Internal Control Committee
Disclosure Committee
Corporate Sta� Group
Domestic and Overseas Branches & O�ces
Business Division
Accounting Auditor
Audit & SupervisoryBoard Member’s O�ce
Audi
t Dep
artm
ent
President
Corporate ManagementCommittee
Committee ofHeads of Divisions
Committee ofExecutive O�cers
Nomination Committee
Governance and Remuneration Committee
Appointing, removing, and supervising
Election and dismissal Election and dismissal
General Meeting of Shareholders
Audit & Supervisory Board
Directors
10 (four External) Five (three External)
Board of Directors
(Business Execution System)
Corporate Governance Structure(As of June 21, 2019)
Board of DirectorsThe Board of Directors is made up of 10 directors (four
of whom are external). In addition to determining
Marubeni’s management policies and other important
matters, the Board of Directors oversees directors’ exe-
cution of their duties. To clarify management responsi-
bility and flexibly build an optimal management team in
response to changes in the business environment, direc-
tors are appointed for one-year terms.
Audit & Supervisory BoardAs a company with auditors, Marubeni has an Audit &
Supervisory Board. Audit & Supervisory Board members
oversee directors’ execution of their duties by attending
Board of Directors meetings and other important man-
agement gatherings and investigating operations and
the status of assets pursuant to audit policies and audit
plans formulated at Audit & Supervisory Board meet-
ings. Additionally, the Audit & Supervisory Board meets
monthly with Marubeni’s accounting auditor to discuss
audit plans, the progress and findings of audits involving
Group companies, financial results, matters requiring
attention, developments in the auditing profession and
other relevant matters.
Additionally, the President periodically meets with
Audit & Supervisory Board members and reports to
them on the status of business execution. Other direc-
tors, Group CEOs, Division COOs and Corporate Staff
Group general managers annually report to Audit &
Supervisory Board members on the status of business
execution.
Corporate Management CommitteeThe Corporate Management Committee, established as
an advisory committee to the President, comprises five
directors including the President, two senior managing
executive officers and a managing executive officer. It
deliberates on important management matters.
MAR
UBEN
I COR
PORA
TION
IN
TEGR
ATED
REP
ORT
201
906
2
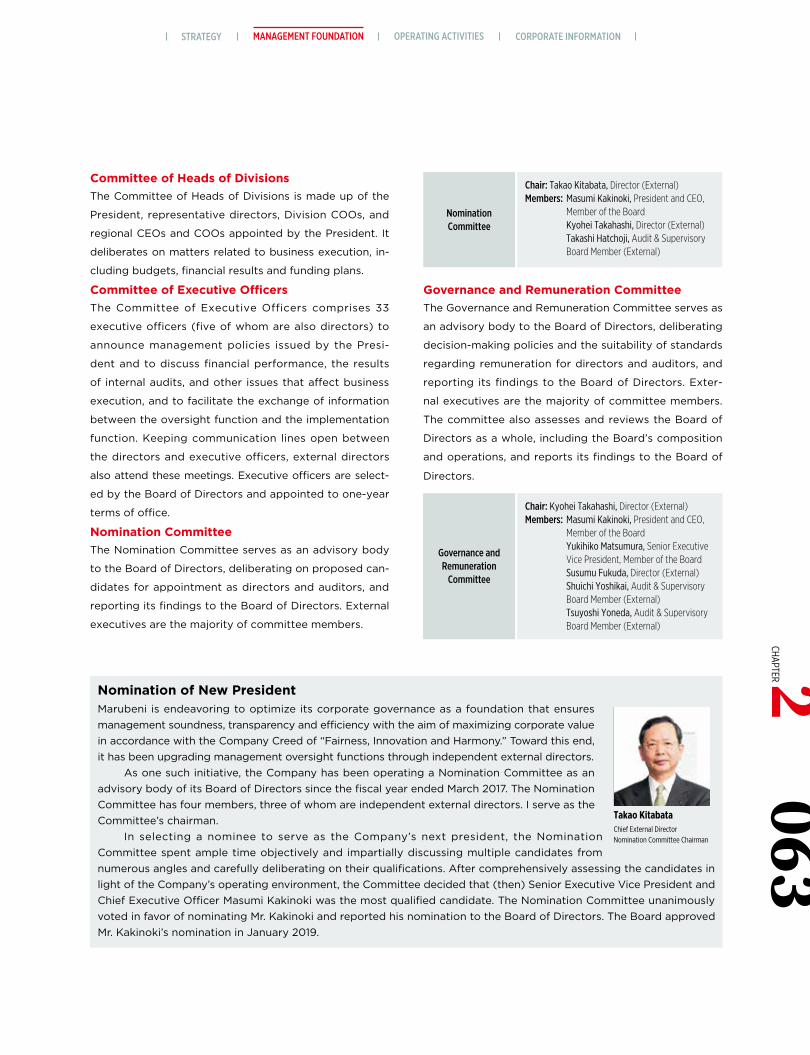
Nomination of New PresidentMarubeni is endeavoring to optimize its corporate governance as a foundation that ensures management soundness, transparency and efficiency with the aim of maximizing corporate value in accordance with the Company Creed of “Fairness, Innovation and Harmony.” Toward this end, it has been upgrading management oversight functions through independent external directors.
As one such initiative, the Company has been operating a Nomination Committee as an advisory body of its Board of Directors since the fiscal year ended March 2017. The Nomination Committee has four members, three of whom are independent external directors. I serve as the Committee’s chairman.
In selecting a nominee to serve as the Company’s next president, the Nomination Committee spent ample time objectively and impartially discussing multiple candidates from numerous angles and carefully deliberating on their qualifications. After comprehensively assessing the candidates in light of the Company’s operating environment, the Committee decided that (then) Senior Executive Vice President and Chief Executive Officer Masumi Kakinoki was the most qualified candidate. The Nomination Committee unanimously voted in favor of nominating Mr. Kakinoki and reported his nomination to the Board of Directors. The Board approved Mr. Kakinoki’s nomination in January 2019.
Chair: Takao Kitabata, Director (External)Members: Masumi Kakinoki, President and CEO, Member of the Board Kyohei Takahashi, Director (External) Takashi Hatchoji, Audit & Supervisory Board Member (External)
Nomination Committee
Committee of Heads of DivisionsThe Committee of Heads of Divisions is made up of the
President, representative directors, Division COOs, and
regional CEOs and COOs appointed by the President. It
deliberates on matters related to business execution, in-
cluding budgets, financial results and funding plans.
Committee of Executive OfficersThe Committee of Executive Officers comprises 33
executive officers (five of whom are also directors) to
announce management policies issued by the Presi-
dent and to discuss financial performance, the results
of internal audits, and other issues that affect business
execution, and to facilitate the exchange of information
between the oversight function and the implementation
function. Keeping communication lines open between
the directors and executive officers, external directors
also attend these meetings. Executive officers are select-
ed by the Board of Directors and appointed to one-year
terms of office.
Nomination CommitteeThe Nomination Committee serves as an advisory body
to the Board of Directors, deliberating on proposed can-
didates for appointment as directors and auditors, and
reporting its findings to the Board of Directors. External
executives are the majority of committee members.
Governance and Remuneration CommitteeThe Governance and Remuneration Committee serves as
an advisory body to the Board of Directors, deliberating
decision-making policies and the suitability of standards
regarding remuneration for directors and auditors, and
reporting its findings to the Board of Directors. Exter-
nal executives are the majority of committee members.
The committee also assesses and reviews the Board of
Directors as a whole, including the Board’s composition
and operations, and reports its findings to the Board of
Directors.
Chair: Kyohei Takahashi, Director (External)Members: Masuimi Kakinoki, President and CEO, Member of the Board Yukihiko Matsumura, Senior Executive Vice President, Member of the Board Susumu Fukuda, Director (External) Shuichi Yoshikai, Audit & Supervisory Board Member (External) Tsuyoshi Yoneda, Audit & Supervisory Board Member (External)
Governance and Remuneration
Committee
Takao KitabataChief External DirectorNomination Committee Chairman
Chair: Kyohei Takahashi, Director (External)Members: Masumi Kakinoki, President and CEO, Member of the Board Yukihiko Matsumura, Senior Executive Vice President, Member of the Board Susumu Fukuda, Director (External) Shuichi Yoshikai, Audit & Supervisory Board Member (External) Tsuyoshi Yoneda, Audit & Supervisory Board Member (External)
Governance and Remuneration
Committee
063CHAPTER 2
MANAGEMENT FOUNDATION OPERATING ACTIVITIES CORPORATE INFORMATIONSTRATEGY
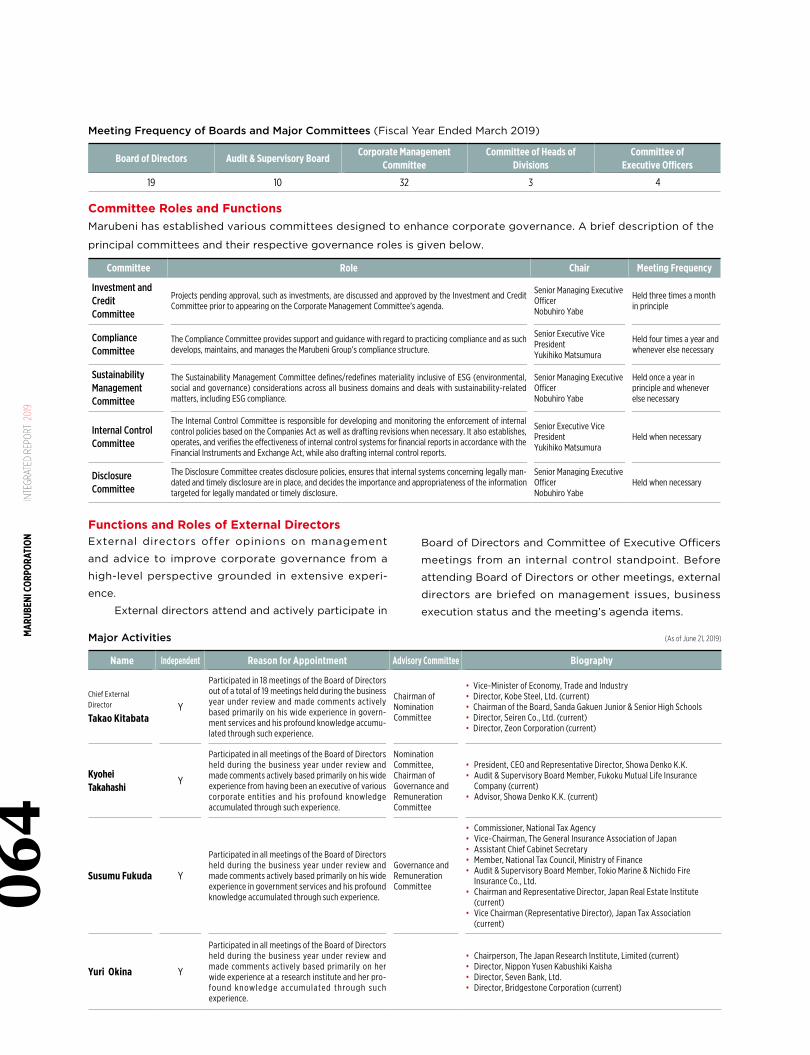
Major Activities (As of June 21, 2019)
Name Independent Reason for Appointment Advisory Committee Biography
Chief ExternalDirector
Takao KitabataY
Participated in 18 meetings of the Board of Directors out of a total of 19 meetings held during the business year under review and made comments actively based primarily on his wide experience in govern-ment services and his profound knowledge accumu-lated through such experience.
Chairman ofNominationCommittee
• Vice-Minister of Economy, Trade and Industry• Director, Kobe Steel, Ltd. (current)• Chairman of the Board, Sanda Gakuen Junior & Senior High Schools• Director, Seiren Co., Ltd. (current)• Director, Zeon Corporation (current)
Kyohei Takahashi
Y
Participated in all meetings of the Board of Directors held during the business year under review and made comments actively based primarily on his wide experience from having been an executive of various corporate entities and his profound knowledge accumulated through such experience.
Nomination Committee, Chairman of Governance and Remuneration Committee
• President, CEO and Representative Director, Showa Denko K.K.• Audit & Supervisory Board Member, Fukoku Mutual Life Insurance
Company (current)• Advisor, Showa Denko K.K. (current)
Susumu Fukuda Y
Participated in all meetings of the Board of Directors held during the business year under review and made comments actively based primarily on his wide experience in government services and his profound knowledge accumulated through such experience.
Governance and Remuneration Committee
• Commissioner, National Tax Agency• Vice-Chairman, The General Insurance Association of Japan• Assistant Chief Cabinet Secretary• Member, National Tax Council, Ministry of Finance• Audit & Supervisory Board Member, Tokio Marine & Nichido Fire
Insurance Co., Ltd.• Chairman and Representative Director, Japan Real Estate Institute
(current)• Vice Chairman (Representative Director), Japan Tax Association
(current)
Yuri Okina Y
Participated in all meetings of the Board of Directors held during the business year under review and made comments actively based primarily on her wide experience at a research institute and her pro-found knowledge accumulated through such experience.
• Chairperson, The Japan Research Institute, Limited (current)• Director, Nippon Yusen Kabushiki Kaisha• Director, Seven Bank, Ltd.• Director, Bridgestone Corporation (current)
Functions and Roles of External DirectorsExternal directors offer opinions on management
and advice to improve corporate governance from a
high-level perspective grounded in extensive experi-
ence.
External directors attend and actively participate in
Board of Directors and Committee of Executive Officers
meetings from an internal control standpoint. Before
attending Board of Directors or other meetings, external
directors are briefed on management issues, business
execution status and the meeting’s agenda items.
Committee Roles and FunctionsMarubeni has established various committees designed to enhance corporate governance. A brief description of the
principal committees and their respective governance roles is given below.
Committee Role Chair Meeting Frequency
Investment and CreditCommittee
Projects pending approval, such as investments, are discussed and approved by the Investment and Credit Committee prior to appearing on the Corporate Management Committee’s agenda.
Senior Managing Executive OfficerNobuhiro Yabe
Held three times a month in principle
Compliance Committee
The Compliance Committee provides support and guidance with regard to practicing compliance and as such develops, maintains, and manages the Marubeni Group’s compliance structure.
Senior Executive Vice PresidentYukihiko Matsumura
Held four times a year and whenever else necessary
Sustainability Management Committee
The Sustainability Management Committee defines/redefines materiality inclusive of ESG (environmental, social and governance) considerations across all business domains and deals with sustainability-related matters, including ESG compliance.
Senior Managing Executive OfficerNobuhiro Yabe
Held once a year in principle and whenever else necessary
Internal Control Committee
The Internal Control Committee is responsible for developing and monitoring the enforcement of internal control policies based on the Companies Act as well as drafting revisions when necessary. It also establishes, operates, and verifies the effectiveness of internal control systems for financial reports in accordance with the Financial Instruments and Exchange Act, while also drafting internal control reports.
Senior Executive Vice PresidentYukihiko Matsumura
Held when necessary
Disclosure Committee
The Disclosure Committee creates disclosure policies, ensures that internal systems concerning legally man-dated and timely disclosure are in place, and decides the importance and appropriateness of the information targeted for legally mandated or timely disclosure.
Senior Managing Executive OfficerNobuhiro Yabe
Held when necessary
Board of Directors Audit & Supervisory BoardCorporate Management
CommitteeCommittee of Heads of
DivisionsCommittee of
Executive Officers
19 10 32 3 4
Meeting Frequency of Boards and Major Committees (Fiscal Year Ended March 2019)
MAR
UBEN
I COR
PORA
TION
IN
TEGR
ATED
REP
ORT
201
906
4
Major Activities (As of June 21, 2019)
Name Independent Reason for Appointment Advisory Committee Biography
Shuichi Yoshikai Y
Participated in all meetings of the Board of Directors and all meetings of the Audit & Supervisory Board held during the business year under review and made comments actively based primarily on his wide experience in legal services and his profound knowl-edge accumulated through such experience.
Governance and Remuneration Committee
• President, Osaka High Court• President, Tokyo High Court• Admitted to Tokyo Bar Association
(current)• Audit & Supervisory Board Member,
Shoko Chukin Bank, Ltd.
Takashi Hatchoji Y
Participated in 18 meetings of the Board of Directors out of a total of 19 meetings and 9 meetings of the Audit & Supervisory Board out of a total of 10 meetings held during the business year under review and made comments actively based primarily on his wide experience from having been an executive of various corporate entities and his profound knowledge accumulated through such experience.
Nomination Committee
• President and Representative Director, Hitachi Research Institute
• Representative Executive Officer, Executive Vice President and Executive Officer, Hitachi, Ltd.
• Director, Nitto Denko Corporation (current)
• Director, Konica Minolta, Inc. (current)
Tsuyoshi Yoneda Y
Participated in all meetings of the Board of Directors and 9 meetings of the Audit & Supervisory Board out of a total of 10 meetings held during the business year under review and made comments actively based primarily on his wide experience in govern-ment services and his profound knowledge accumulated through such experience.
Governance and Remuneration Committee
• Commissioner General, National Police Agency
• Director, Japan Exchange Group, Inc. (current)
Functions and Roles of External Audit & Supervisory Board MembersIn addition to overseeing directors’ execution of their
duties, Audit & Supervisory Board members help to
improve the effectiveness of internal audits by offering
recommendations and advice based on their wealth of
experience.
External Audit & Supervisory Board members peri-
Policy on Cross-Shareholdings* (Listed General Investment Shares) and Reduction Thereof The Company conducts diversified business activities
across a broad range of sectors through domestic and
overseas networks. Cooperative relationships with a
wide variety of companies are essential to its operations.
The Company annually reviews the justification for
owning each of its cross-shareholdings based on a
comprehensive assessment of quantitative metrics (return
on investment (income/loss divided by acquisition cost)
compared against the Company’s weighted-average cost
of capital) and qualitative factors (e.g., maintenance or
strengthening of relationships with investees through
equity ownership). The Board of Directors then decides
odically meet with the President in addition to attending
meetings of the Audit & Supervisory Board, Board of Di-
rectors and Committee of Executive Officers. They also
set up meetings to confer with the Audit Department,
Corporate Accounting Department and the accounting
auditor and utilize audit-related information received
from full-time Audit & Supervisory Board members in
their auditing work.
whether to retain or divest cross-shareholdings based
on the review’s findings. As a general rule, cross-
shareholdings are sold if the Board decides that owning
them is no longer justified. Sales of cross-shareholdings
are reported to the Board of Directors in the fiscal year
following the decision to sell.
* General investment shares are equity investments owned for a purpose other than as a pure investment.
Voting Standard for Cross-Shareholdings (Listed General Investment Shares)When exercising voting rights on listed shares owned
as cross-shareholdings, the Company makes voting
decisions primarily from the standpoint of increasing the
investee’s medium/long-term corporate value.
065CHAPTER 2
MANAGEMENT FOUNDATION OPERATING ACTIVITIES CORPORATE INFORMATIONSTRATEGY
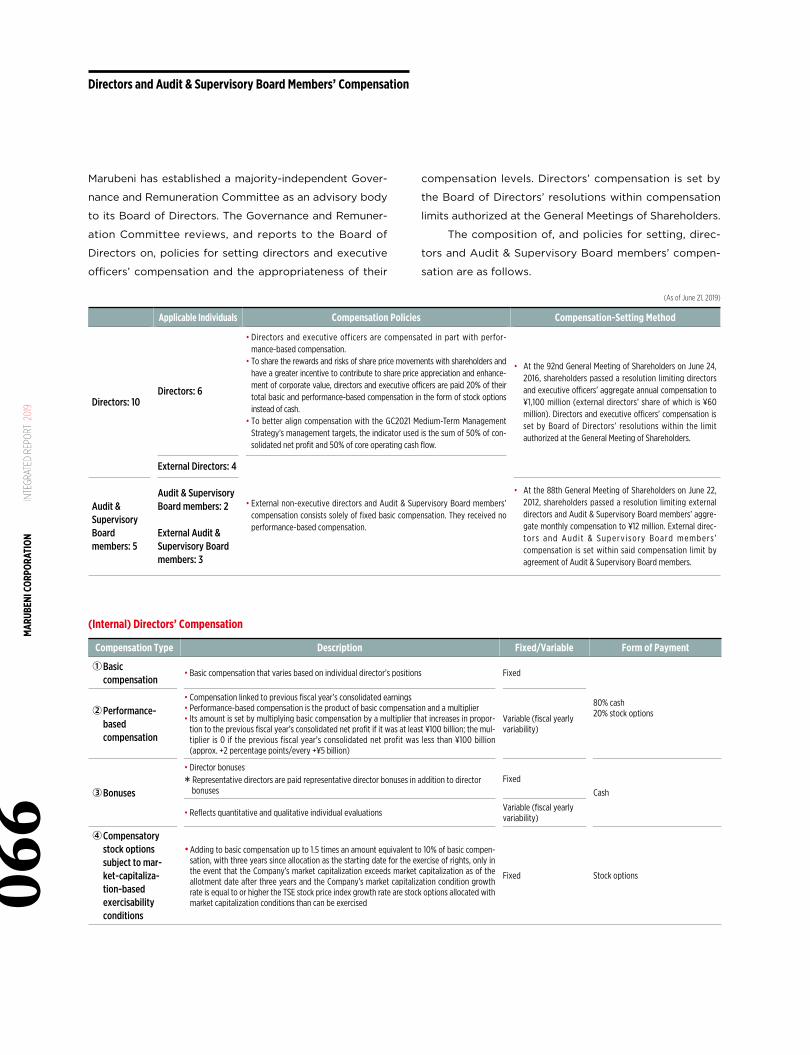
(Internal) Directors’ Compensation
Compensation Type Description Fixed/Variable Form of Payment
①Basic compensation
• Basic compensation that varies based on individual director’s positions Fixed
80% cash20% stock options②Performance-
based compensation
• Compensation linked to previous fiscal year’s consolidated earnings• Performance-based compensation is the product of basic compensation and a multiplier• Its amount is set by multiplying basic compensation by a multiplier that increases in propor-
tion to the previous fiscal year’s consolidated net profit if it was at least ¥100 billion; the mul-tiplier is 0 if the previous fiscal year’s consolidated net profit was less than ¥100 billion (approx. +2 percentage points/every +¥5 billion)
Variable (fiscal yearly variability)
③Bonuses
• Director bonuses
* Representative directors are paid representative director bonuses in addition to director bonuses
Fixed
Cash
• Reflects quantitative and qualitative individual evaluations Variable (fiscal yearly variability)
④Compensatory stock options subject to mar-ket-capitaliza-tion-based exercisability conditions
•Adding to basic compensation up to 1.5 times an amount equivalent to 10% of basic compen-sation, with three years since allocation as the starting date for the exercise of rights, only in the event that the Company’s market capitalization exceeds market capitalization as of the allotment date after three years and the Company’s market capitalization condition growth rate is equal to or higher the TSE stock price index growth rate are stock options allocated with market capitalization conditions than can be exercised
Fixed Stock options
Marubeni has established a majority-independent Gover-
nance and Remuneration Committee as an advisory body
to its Board of Directors. The Governance and Remuner-
ation Committee reviews, and reports to the Board of
Directors on, policies for setting directors and executive
officers’ compensation and the appropriateness of their
Directors and Audit & Supervisory Board Members’ Compensation
compensation levels. Directors’ compensation is set by
the Board of Directors’ resolutions within compensation
limits authorized at the General Meetings of Shareholders.
The composition of, and policies for setting, direc-
tors and Audit & Supervisory Board members’ compen-
sation are as follows.
Applicable Individuals Compensation Policies Compensation-Setting Method
Directors: 10Directors: 6
• Directors and executive officers are compensated in part with perfor-mance-based compensation.
• To share the rewards and risks of share price movements with shareholders and have a greater incentive to contribute to share price appreciation and enhance-ment of corporate value, directors and executive officers are paid 20% of their total basic and performance-based compensation in the form of stock options instead of cash.
• To better align compensation with the GC2021 Medium-Term Management Strategy’s management targets, the indicator used is the sum of 50% of con-solidated net profit and 50% of core operating cash flow.
• At the 92nd General Meeting of Shareholders on June 24, 2016, shareholders passed a resolution limiting directors and executive officers’ aggregate annual compensation to ¥1,100 million (external directors’ share of which is ¥60 million). Directors and executive officers’ compensation is set by Board of Directors’ resolutions within the limit authorized at the General Meeting of Shareholders.
External Directors: 4
• External non-executive directors and Audit & Supervisory Board members’ compensation consists solely of fixed basic compensation. They received no performance-based compensation.
Audit & Supervisory Board members: 5
Audit & Supervisory Board members: 2
External Audit & Supervisory Board members: 3
• At the 88th General Meeting of Shareholders on June 22, 2012, shareholders passed a resolution limiting external directors and Audit & Supervisory Board members’ aggre-gate monthly compensation to ¥12 million. External direc-t o r s a n d A u d i t & S u p e r v i s o r y B o a r d m e m b e r s ’ compensation is set within said compensation limit by agreement of Audit & Supervisory Board members.
(As of June 21, 2019)
MAR
UBEN
I COR
PORA
TION
IN
TEGR
ATED
REP
ORT
201
906
6
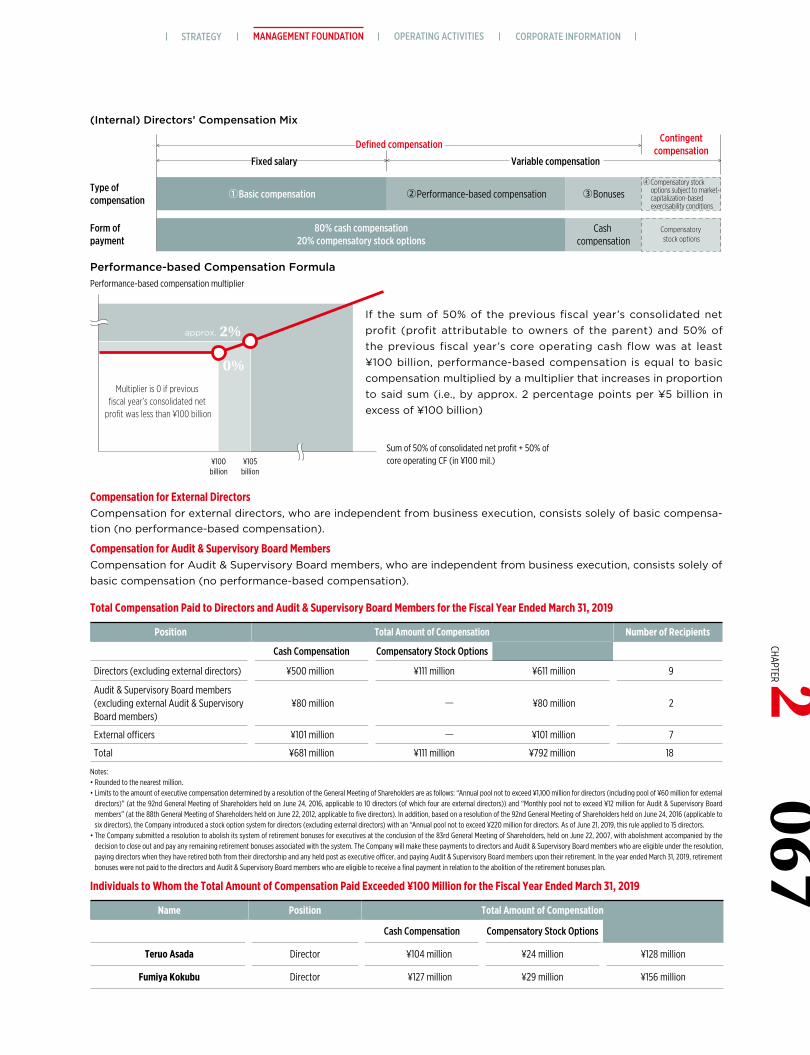
Total Compensation Paid to Directors and Audit & Supervisory Board Members for the Fiscal Year Ended March 31, 2019
Position Total Amount of Compensation Number of Recipients
Cash Compensation Compensatory Stock Options
Directors (excluding external directors) ¥500 million ¥111 million ¥611 million 9
Audit & Supervisory Board members(excluding external Audit & Supervisory Board members)
¥80 million - ¥80 million 2
External officers ¥101 million - ¥101 million 7
Total ¥681 million ¥111 million ¥792 million 18
Notes:• Rounded to the nearest million.• Limits to the amount of executive compensation determined by a resolution of the General Meeting of Shareholders are as follows: “Annual pool not to exceed ¥1,100 million for directors (including pool of ¥60 million for external
directors)” (at the 92nd General Meeting of Shareholders held on June 24, 2016, applicable to 10 directors (of which four are external directors)) and “Monthly pool not to exceed ¥12 million for Audit & Supervisory Board members” (at the 88th General Meeting of Shareholders held on June 22, 2012, applicable to five directors). In addition, based on a resolution of the 92nd General Meeting of Shareholders held on June 24, 2016 (applicable to six directors), the Company introduced a stock option system for directors (excluding external directors) with an “Annual pool not to exceed ¥220 million for directors. As of June 21, 2019, this rule applied to 15 directors.
• The Company submitted a resolution to abolish its system of retirement bonuses for executives at the conclusion of the 83rd General Meeting of Shareholders, held on June 22, 2007, with abolishment accompanied by the decision to close out and pay any remaining retirement bonuses associated with the system. The Company will make these payments to directors and Audit & Supervisory Board members who are eligible under the resolution, paying directors when they have retired both from their directorship and any held post as executive officer, and paying Audit & Supervisory Board members upon their retirement. In the year ended March 31, 2019, retirement bonuses were not paid to the directors and Audit & Supervisory Board members who are eligible to receive a final payment in relation to the abolition of the retirement bonuses plan.
Individuals to Whom the Total Amount of Compensation Paid Exceeded ¥100 Million for the Fiscal Year Ended March 31, 2019
Name Position Total Amount of Compensation
Cash Compensation Compensatory Stock Options
Teruo Asada Director ¥104 million ¥24 million ¥128 million
Fumiya Kokubu Director ¥127 million ¥29 million ¥156 million
④ Compensatory stock options subject to market- capitalization-based exercisability conditions
Defined compensation
Fixed salary
Type of compensation
Form of payment
①Basic compensation
80% cash compensation20% compensatory stock options
②Performance-based compensation ③Bonuses
Cash compensation
Compensatory stock options
Contingentcompensation
Variable compensation
Performance-based compensation multiplier
¥100billion
¥105billion
approx.
Multiplier is 0 if previous fiscal year’s consolidated net
profit was less than ¥100 billion
Performance-based Compensation Formula
Sum of 50% of consolidated net profit + 50% of core operating CF (in ¥100 mil.)
��
��
If the sum of 50% of the previous fiscal year’s consolidated net profit (profit attributable to owners of the parent) and 50% of the previous fiscal year’s core operating cash flow was at least ¥100 billion, performance-based compensation is equal to basic compensation multiplied by a multiplier that increases in proportion to said sum (i.e., by approx. 2 percentage points per ¥5 billion in excess of ¥100 billion)
(Internal) Directors’ Compensation Mix
Compensation for External DirectorsCompensation for external directors, who are independent from business execution, consists solely of basic compensa-tion (no performance-based compensation).
Compensation for Audit & Supervisory Board MembersCompensation for Audit & Supervisory Board members, who are independent from business execution, consists solely of basic compensation (no performance-based compensation).
MANAGEMENT FOUNDATION OPERATING ACTIVITIES CORPORATE INFORMATIONSTRATEGY067
CHAPTER 2
Evaluation of the Effectiveness of the Board of Directors
The evaluation of effectiveness of the Board of Directors
in the fiscal year ended March 31, 2019 was conducted
as described below:
Framework and Method of Evaluation
1. TargetAll Directors (10 people) and Audit and Supervisory Board members (five people)
* As of December 2018
2. Implementation MethodA questionnaire survey was conducted. (Anonymous responses.)
* The Company utilized an external specialized institution for its imple-mentation.
3. Evaluation Items(1) Roles and responsibilities of the Board of Directors(2) Relationship between the Board of Directors and
senior executives(3) Organizational design and composition of the
Board of Directors and other bodies(4) Quality and expertise of Directors and of the
Board of Directors(5) Deliberation by the Board of Directors(6) Relationship and dialogue with shareholders(7) Engagement with stakeholders other than
shareholders(8) Progress of improvement issues from the fiscal
year ended March 31, 2018.
4. Evaluation ProcessThe Board of Directors deliberated in view of the results of the evaluation and review by the Governance and Remuneration Committee concerning the overall Board of Directors, including its composition and operation, based on the responses to the questionnaire.
Overview of the Evaluation Result
The Board of Directors deliberated in view of the results
of the evaluation and review by the Governance and
Remuneration Committee and confirmed that, on the whole,
the Board of Directors is being operated effectively. The
previous fiscal year’s evaluation identified a need for more
thorough deliberation on important matters. Measures
to address this issue that were implemented in the fiscal
year ended March 2019 (e.g., improvement in reporting on
directors’ execution of their duties, revision of materiality
standards for inclusion of individual projects/investments
on Board meeting agendas) were evaluated positively in
the latest evaluation. Meanwhile, some of the participants
expressed expectations of additional initiatives to promote
more substantive discussions of Group management policies.
The Company will continue to endeavor to maintain
and improve its Board of Directors’ effectiveness in light
of the latest evaluation and review.
Internal Control
Basic Internal Control PolicyMarubeni seeks to steadily increase and maximize cor-
porate value through business activities that are in
accordance with its Company Creed and Management
Philosophy, and to steadily and continuously build and
expand the entire Group’s business foundation. To this
end, Marubeni has established internal control systems,
which serve as a rational process to ensure improve-
ment of efficiency of business operations, accurate
financial reporting to stakeholders, compliance with
applicable laws and regulations, safeguarding of assets,
and appropriateness of corporate activities. Marubeni
regularly reviews this internal control system based on
its structure and operation status to respond to changes
in social conditions and the business environment.
In accordance with the Companies Act and its
implementation guidelines, Marubeni has established a
Basic Internal Control Policy, which helps to ensure that
all business activities are conducted appropriately. Each
year, Marubeni confirms the content and implementa-
tion of this policy, and implements improvements when
necessary. With regard to the internal control report
system mandated under the Financial Instruments and
Exchange Act, the Internal Control Committee conducts
evaluations as stipulated in the practical standards. As
in the year ended March 31, 2018, we submitted our in-
ternal control report for the year ended March 31, 2019,
which concluded that, “internal control is effective.”
Basic Internal Control Policy (Key Items)
① System necessary to ensure that the execution of duties by Directors and employees complies with laws and regulations and the Articles of Incorporation
② Systems to preserve and manage information related to the execution of duties by Directors
③ Internal regulations for the risk management of losses and other related systems
④ Systems necessary to ensure the efficient execution of duties by Directors ⑤ Systems necessary to ensure the appropriateness of operations by the
Group⑥ Matters concerning employees assisting the duties of Audit & Supervisory
Board Members, and matters concerning the independence of these em-ployees from Directors
⑦ Systems for Directors and employees to report to Audit & Supervisory Board Members and other systems for reports to Audit & Supervisory Board Mem-bers
⑧ Other systems necessary to ensure effective audits by Audit & Supervisory Board Members
Please refer to the corporate website for information on the Company’s basic internal control policy.https://www.marubeni.com/en/company/governance/measure/internal_control/
MAR
UBEN
I COR
PORA
TION
IN
TEGR
ATED
REP
ORT
201
906
8
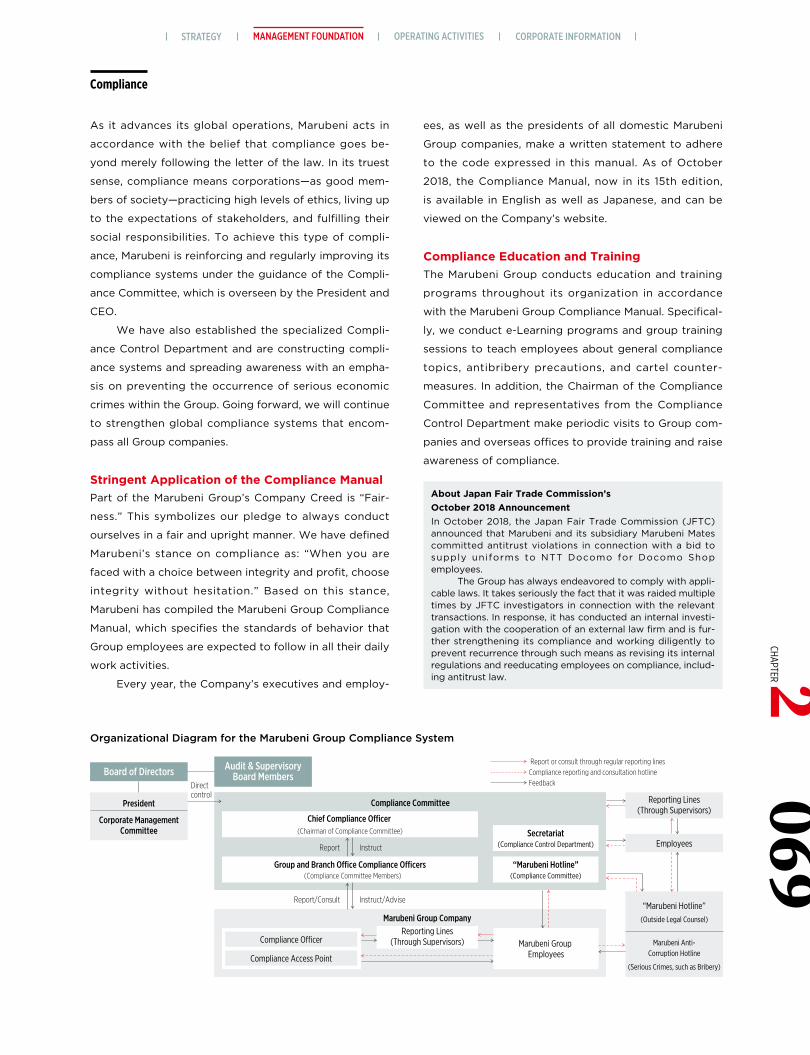
Organizational Diagram for the Marubeni Group Compliance System
About Japan Fair Trade Commission’s October 2018 AnnouncementIn October 2018, the Japan Fair Trade Commission (JFTC) announced that Marubeni and its subsidiary Marubeni Mates committed antitrust violations in connection with a bid to supply uniforms to NTT Docomo for Docomo Shop employees.
The Group has always endeavored to comply with appli-cable laws. It takes seriously the fact that it was raided multiple times by JFTC investigators in connection with the relevant transactions. In response, it has conducted an internal investi-gation with the cooperation of an external law firm and is fur-ther strengthening its compliance and working diligently to prevent recurrence through such means as revising its internal regulations and reeducating employees on compliance, includ-ing antitrust law.
Compliance
As it advances its global operations, Marubeni acts in
accordance with the belief that compliance goes be-
yond merely following the letter of the law. In its truest
sense, compliance means corporations—as good mem-
bers of society—practicing high levels of ethics, living up
to the expectations of stakeholders, and fulfilling their
social responsibilities. To achieve this type of compli-
ance, Marubeni is reinforcing and regularly improving its
compliance systems under the guidance of the Compli-
ance Committee, which is overseen by the President and
CEO.
We have also established the specialized Compli-
ance Control Department and are constructing compli-
ance systems and spreading awareness with an empha-
sis on preventing the occurrence of serious economic
crimes within the Group. Going forward, we will continue
to strengthen global compliance systems that encom-
pass all Group companies.
Stringent Application of the Compliance ManualPart of the Marubeni Group’s Company Creed is “Fair-
ness.” This symbolizes our pledge to always conduct
ourselves in a fair and upright manner. We have defined
Marubeni’s stance on compliance as: “When you are
faced with a choice between integrity and profit, choose
integrity without hesitation.” Based on this stance,
Marubeni has compiled the Marubeni Group Compliance
Manual, which specifies the standards of behavior that
Group employees are expected to follow in all their daily
work activities.
Every year, the Company’s executives and employ-
ees, as well as the presidents of all domestic Marubeni
Group companies, make a written statement to adhere
to the code expressed in this manual. As of October
2018, the Compliance Manual, now in its 15th edition,
is available in English as well as Japanese, and can be
viewed on the Company’s website.
Compliance Education and TrainingThe Marubeni Group conducts education and training
programs throughout its organization in accordance
with the Marubeni Group Compliance Manual. Specifical-
ly, we conduct e-Learning programs and group training
sessions to teach employees about general compliance
topics, antibribery precautions, and cartel counter-
measures. In addition, the Chairman of the Compliance
Committee and representatives from the Compliance
Control Department make periodic visits to Group com-
panies and overseas offices to provide training and raise
awareness of compliance.
Direct control
Chief Compliance O�cer (Chairman of Compliance Committee)
Compliance Committee
Board of Directors
President
Corporate ManagementCommittee
Audit & SupervisoryBoard Members
Report or consult through regular reporting linesCompliance reporting and consultation hotlineFeedback
Reporting Lines(Through Supervisors)
Employees
“Marubeni Hotline”
Marubeni Anti-Corruption Hotline
(Serious Crimes, such as Bribery)
(Outside Legal Counsel)Marubeni Group Company
Marubeni Group Employees
“Marubeni Hotline”(Compliance Committee)
Secretariat(Compliance Control Department)
Group and Branch O�ce Compliance O�cers(Compliance Committee Members)
Compliance O�cer
Compliance Access Point
Report Instruct
Report/Consult Instruct/Advise
Reporting Lines(Through Supervisors)
MANAGEMENT FOUNDATION OPERATING ACTIVITIES CORPORATE INFORMATIONSTRATEGY069
CHAPTER 2
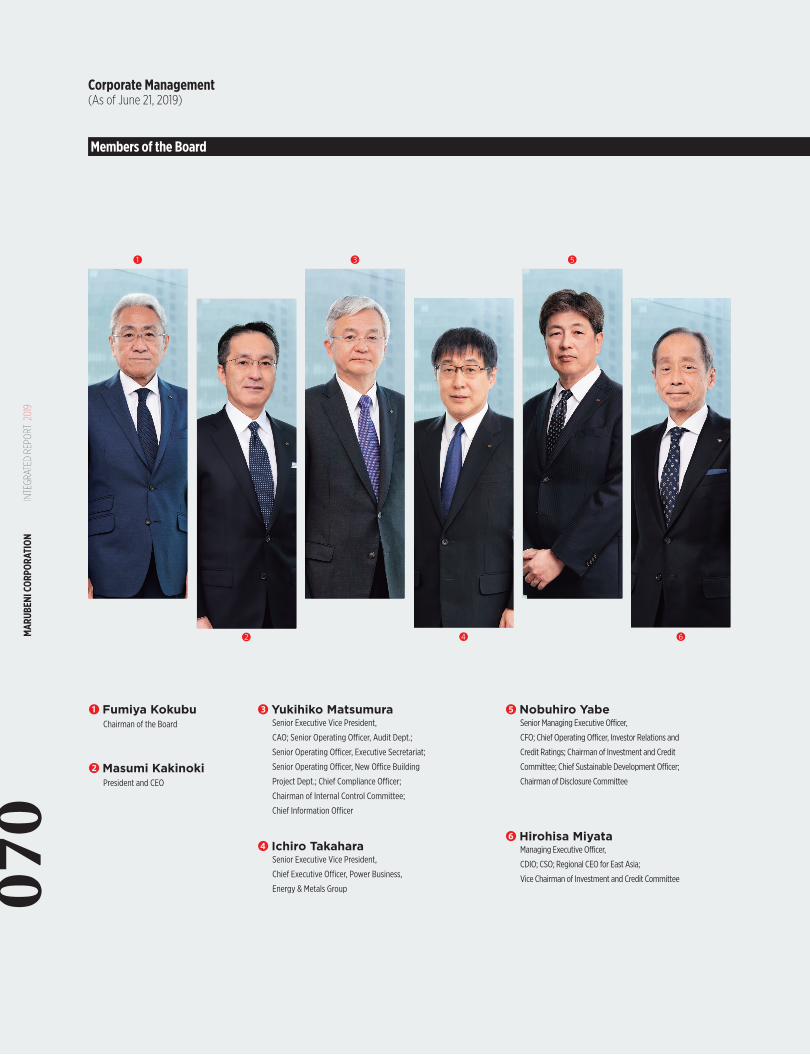
❶ ❸
❻❷
❺
❹
Corporate Management(As of June 21, 2019)
Members of the Board
❶ Fumiya KokubuChairman of the Board
❹ Ichiro TakaharaSenior Executive Vice President,
Chief Executive Officer, Power Business,
Energy & Metals Group
❷Masumi KakinokiPresident and CEO
❺Nobuhiro YabeSenior Managing Executive Officer,
CFO; Chief Operating Officer, Investor Relations and
Credit Ratings; Chairman of Investment and Credit
Committee; Chief Sustainable Development Officer;
Chairman of Disclosure Committee
❸Yukihiko MatsumuraSenior Executive Vice President,
CAO; Senior Operating Officer, Audit Dept.;
Senior Operating Officer, Executive Secretariat;
Senior Operating Officer, New Office Building
Project Dept.; Chief Compliance Officer;
Chairman of Internal Control Committee;
Chief Information Officer
❻Hirohisa MiyataManaging Executive Officer,
CDIO; CSO; Regional CEO for East Asia;
Vice Chairman of Investment and Credit Committee
MAR
UBEN
I COR
PORA
TION
IN
TEGR
ATED
REP
ORT
201
907
0
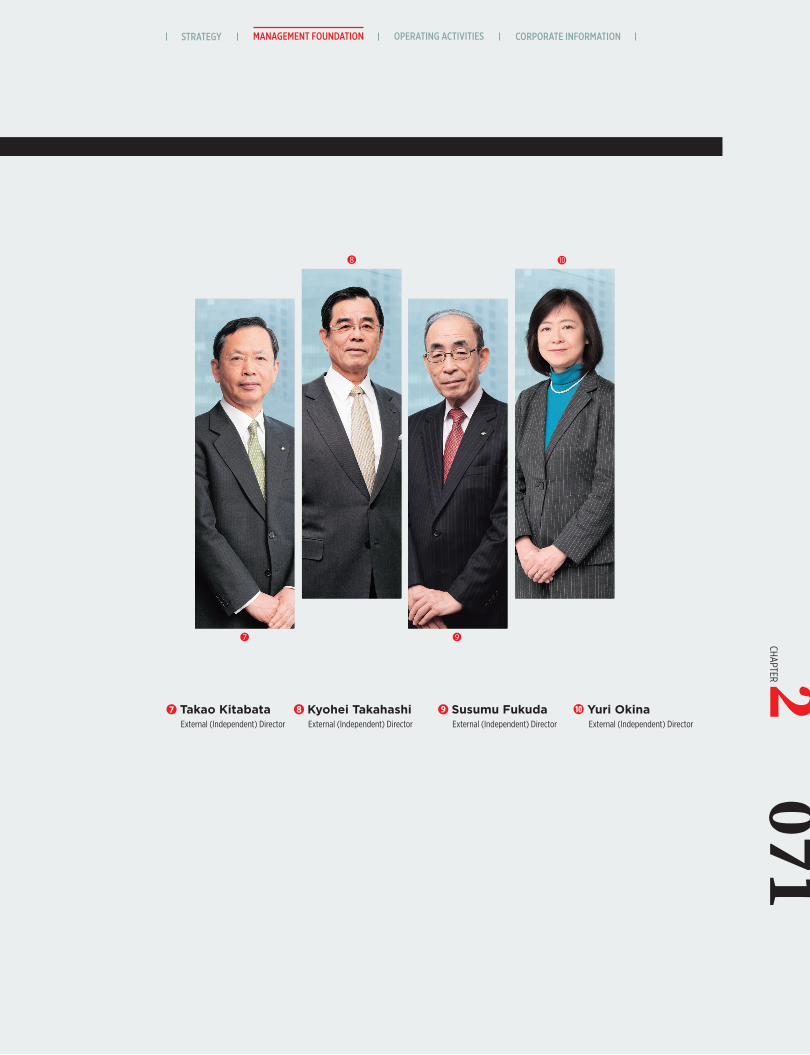
❽
❼ ❾
Members of the Board
❼ Takao KitabataExternal (Independent) Director
Yuri OkinaExternal (Independent) Director
❽Kyohei TakahashiExternal (Independent) Director
❾ Susumu FukudaExternal (Independent) Director
MANAGEMENT FOUNDATION OPERATING ACTIVITIES CORPORATE INFORMATIONSTRATEGY071
CHAPTER 2
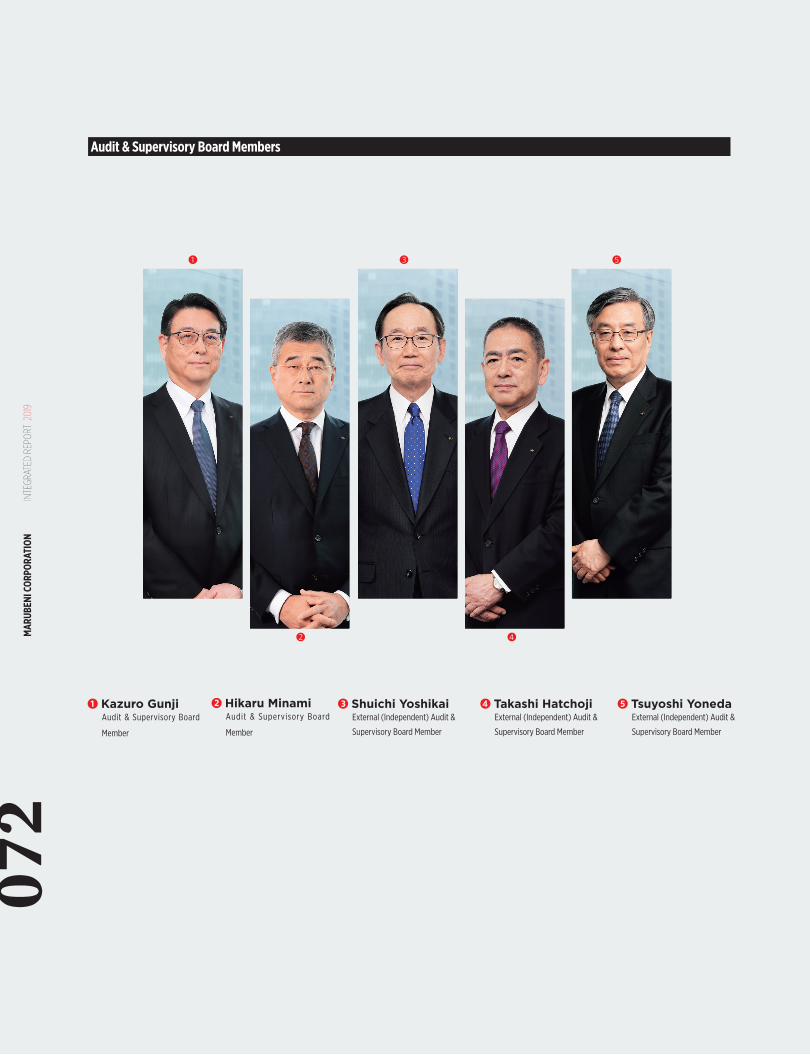
❷
❸ ❺❶
❹
Audit & Supervisory Board Members
❶Kazuro GunjiAudit & Supervisory Board
Member
❹ Takashi HatchojiExternal (Independent) Audit &
Supervisory Board Member
❺ Tsuyoshi YonedaExternal (Independent) Audit &
Supervisory Board Member
❷Hikaru MinamiAudit & Supervisory Board
Member
❸ Shuichi YoshikaiExternal (Independent) Audit &
Supervisory Board Member
MAR
UBEN
I COR
PORA
TION
IN
TEGR
ATED
REP
ORT
201
907
2
Kaoru IwasaRegional CEO for ASEAN & Southwest Asia; Regional COO for
ASEAN; Managing Director, Marubeni ASEAN Pte. Ltd.
Akira TerakawaChief Executive Officer, Food, Agriculture & Chemicals Group;
Vice Chairman of Investment and Credit Committee
Hajime KawamuraChief Executive Officer, Machinery, Infrastructure & Financial
Business Group
Eiji OkadaChief Operating Officer, Plant Div.
Soji SakaiSenior Operating Officer for ASEAN &
Southwest Asia; President, Marubeni Thailand
Co., Ltd.; General Manager, Bangkok Branch
Hisamichi KogaGeneral Manager, Chubu Branch
Yutaka ShimazakiGeneral Manager, Executive Secretariat, and
Corporate Communications Dept.
Minoru TomitaGeneral Manager, Osaka Branch
Hidekazu FutaiSenior Operating Officer, Agri Business Div.
Hidenobu KumadaChief Operating Officer, Food Div.
Jun HirasawaRegional CEO for China;
President, Marubeni (China) Co., Ltd.
Makoto SatoRegional CEO for Middle East
Yuichi OhiraChief Operating Officer, Lifestyle Div.
Mutsumi IshizukiRegional CEO for Europe & CIS; Regional COO for Europe;
Managing Director and CEO, Marubeni Europe plc
Takeo KobayashiChief Executive Officer, Consumer Products Group
Michael McCartyChief Operating Officer, Agri Business Div.;
President & CEO, Helena Agri-Enterprises LLC
Akihiko SagaraChief Operating Officer, Energy Div.
Shinichi KobayashiChief Operating Officer, Metals & Mineral Resources Div.
Jun HorieRegional CEO for the Americas; Regional COO for North & Central
America; President and CEO, Marubeni America Corporation
Kenichiro OikawaChief Operating Officer, Finance & Leasing Business Div.
Takayuki FuruyaGeneral Manager, Corporate
Planning & Strategy Dept.
Yoshiaki YokotaChief Operating Officer,
Power Business Div.
Jiro ItaiChief Operating Officer,
Construction, Auto & Industrial
Machinery Div.
Kosuke TakechiChief Operating Officer,
Aerospace & Ship Div.
Takao AndoGeneral Manager,
Risk Management Dept.
Tsuyoshi TeragakiChief Operating Officer,
Forest Products Div.
Satoru IchinokawaChief Operating Officer,
Chemicals Div.
Takashi ImamuraGeneral Manager, Research Institute
Senior Managing Executive Officers
Managing Executive Officers
Executive Officers
MANAGEMENT FOUNDATION OPERATING ACTIVITIES CORPORATE INFORMATIONSTRATEGY073
CHAPTER 2
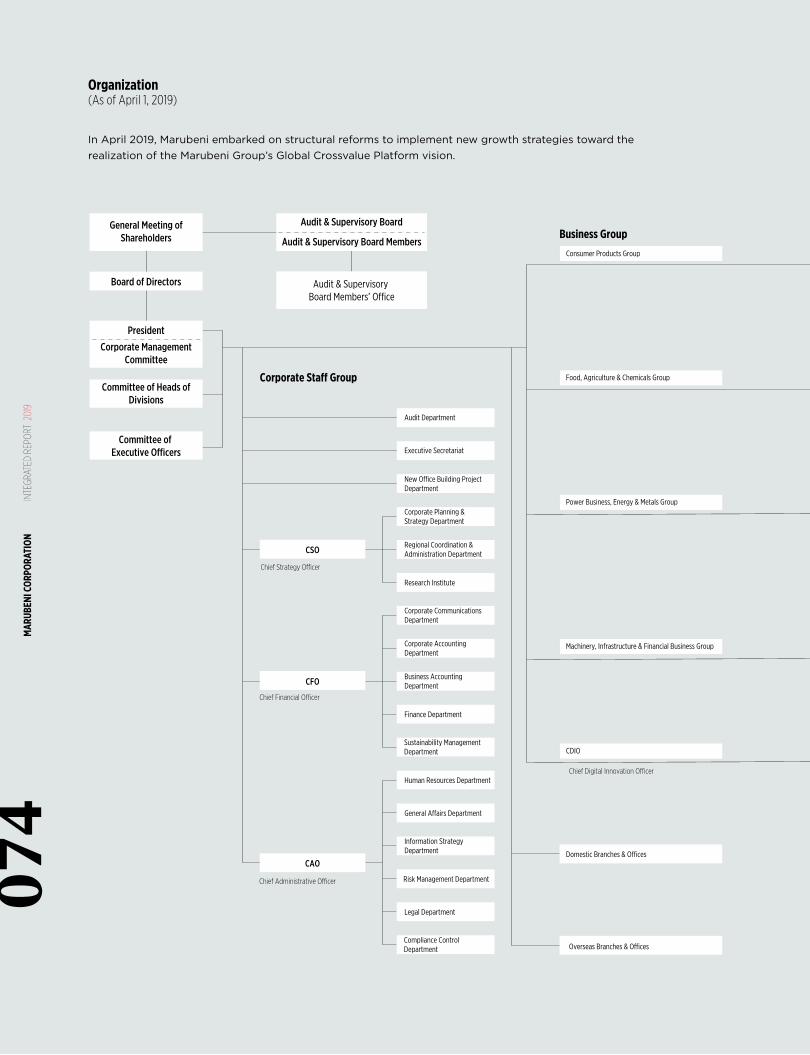
General Meeting ofShareholders
Committee of Heads ofDivisions
Committee of Executive Officers
Board of Directors Audit & Supervisory Board Members’ Office
Audit & Supervisory Board
Audit & Supervisory Board Members
Food, Agriculture & Chemicals Group
Consumer Products Group
Machinery, Infrastructure & Financial Business Group
CSO
Overseas Branches & Offices
Forest Products Division
Lifestyle Division
ICT & Real Estate Business Division
Agri Business Division
Chemicals Division
Next Generation Business Development Division
Energy Division
Food Division
Power Business Division
Construction, Auto & Industrial Machinery Division
Finance & Leasing Business Division
Plant Division
Aerospace & Ship Division
Metals & Mineral Resources Division
Domestic Branches & Offices
Business Division
Chief Digital Innovation Officer
Chief Strategy Officer
Chief Financial Officer
Chief Administrative Officer
Power Business, Energy & Metals Group
CDIO
CAO
Corporate Planning & Strategy Department
Research Institute
Sustainability Management Department
Human Resources Department
Regional Coordination & Administration Department
Audit Department
Executive Secretariat
Corporate Accounting Department
Finance Department
Information Strategy Department
Legal Department
Corporate Communications Department
Business Accounting Department
General Affairs Department
Risk Management Department
Compliance Control Department
New Office Building Project Department
CFO
Corporate ManagementCommittee
President
Aim of Next Generation Business Development Division EstablishmentThe Next Generation Business Development Division will create new business models focused on the next ten years. Specifically, the Asia Business Department, Next Generation Social Infrastructure Depart-ment, Healthcare & Medical Business Department, New Business Devel-opment Department and the Digital Innovation Department were all established under the division's umbrella to pursue “white spaces” (growth areas and business models not currently incorporated into our business), including platform businesses targeting the Asian middle-class, urban development and smart city-related businesses, health and wellness businesses and FinTech businesses with the aim of realizing explosive growth over the next 10 years. In addition to partici-pating in innovation ecosystems located in New York, Silicon Valley, Singapore, and Shenzhen, etc., we will also establish a new European base in Tallinn, Estonia, which is promoting the realization of a digital nation. These efforts are intended to accelerate the incorporation of cutting-edge technologies and business models.
Reorganizing Business Groups and Flattening Chain of Command (From Four Layers to Three)In light of business conditions, we reorganized our business group structure in an attempt to promote optimized and efficient business strategies. We also flattened the chain of command from four layers (President, Group CEOs, Division COOs and departmental general managers) to three (President, Division COOs and general managers), creating a structure enabling each business division to execute strategies more quickly.
Corporate Staff Group
Business Group
Organization(As of April 1, 2019)
In April 2019, Marubeni embarked on structural reforms to implement new growth strategies toward the realization of the Marubeni Group’s Global Crossvalue Platform vision.
MAR
UBEN
I COR
PORA
TION
IN
TEGR
ATED
REP
ORT
201
907
4
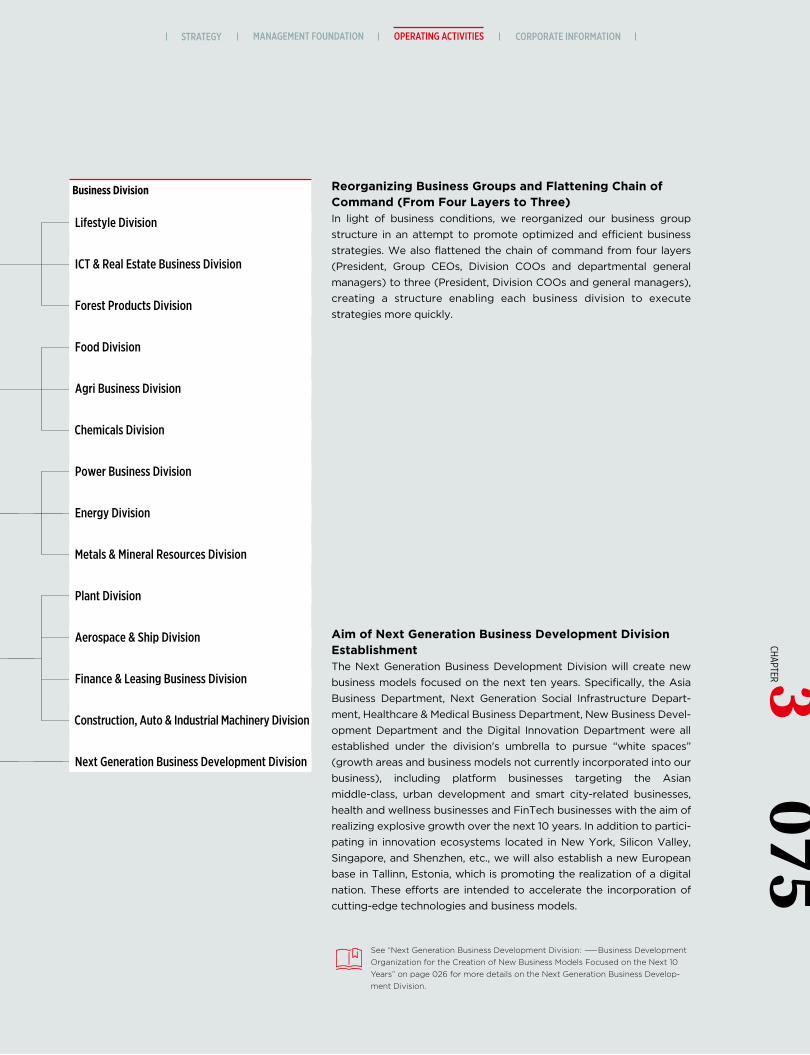
General Meeting ofShareholders
Committee of Heads ofDivisions
Committee of Executive Officers
Board of Directors Audit & Supervisory Board Members’ Office
Audit & Supervisory Board
Audit & Supervisory Board Members
Food, Agriculture & Chemicals Group
Consumer Products Group
Machinery, Infrastructure & Financial Business Group
CSO
Overseas Branches & Offices
Forest Products Division
Lifestyle Division
ICT & Real Estate Business Division
Agri Business Division
Chemicals Division
Next Generation Business Development Division
Energy Division
Food Division
Power Business Division
Construction, Auto & Industrial Machinery Division
Finance & Leasing Business Division
Plant Division
Aerospace & Ship Division
Metals & Mineral Resources Division
Domestic Branches & Offices
Business Division
Chief Digital Innovation Officer
Chief Strategy Officer
Chief Financial Officer
Chief Administrative Officer
Power Business, Energy & Metals Group
CDIO
CAO
Corporate Planning & Strategy Department
Research Institute
Sustainability Management Department
Human Resources Department
Regional Coordination & Administration Department
Audit Department
Executive Secretariat
Corporate Accounting Department
Finance Department
Information Strategy Department
Legal Department
Corporate Communications Department
Business Accounting Department
General Affairs Department
Risk Management Department
Compliance Control Department
New Office Building Project Department
CFO
Corporate ManagementCommittee
President
Aim of Next Generation Business Development Division EstablishmentThe Next Generation Business Development Division will create new business models focused on the next ten years. Specifically, the Asia Business Department, Next Generation Social Infrastructure Depart-ment, Healthcare & Medical Business Department, New Business Devel-opment Department and the Digital Innovation Department were all established under the division's umbrella to pursue “white spaces” (growth areas and business models not currently incorporated into our business), including platform businesses targeting the Asian middle-class, urban development and smart city-related businesses, health and wellness businesses and FinTech businesses with the aim of realizing explosive growth over the next 10 years. In addition to partici-pating in innovation ecosystems located in New York, Silicon Valley, Singapore, and Shenzhen, etc., we will also establish a new European base in Tallinn, Estonia, which is promoting the realization of a digital nation. These efforts are intended to accelerate the incorporation of cutting-edge technologies and business models.
Reorganizing Business Groups and Flattening Chain of Command (From Four Layers to Three)In light of business conditions, we reorganized our business group structure in an attempt to promote optimized and efficient business strategies. We also flattened the chain of command from four layers (President, Group CEOs, Division COOs and departmental general managers) to three (President, Division COOs and general managers), creating a structure enabling each business division to execute strategies more quickly.
Corporate Staff Group
Business Group
See “Next Generation Business Development Division: —Business Development Organization for the Creation of New Business Models Focused on the Next 10 Years” on page 026 for more details on the Next Generation Business Develop-ment Division.
MANAGEMENT FOUNDATION OPERATING ACTIVITIES CORPORATE INFORMATIONSTRATEGY075
CHAPTER 3
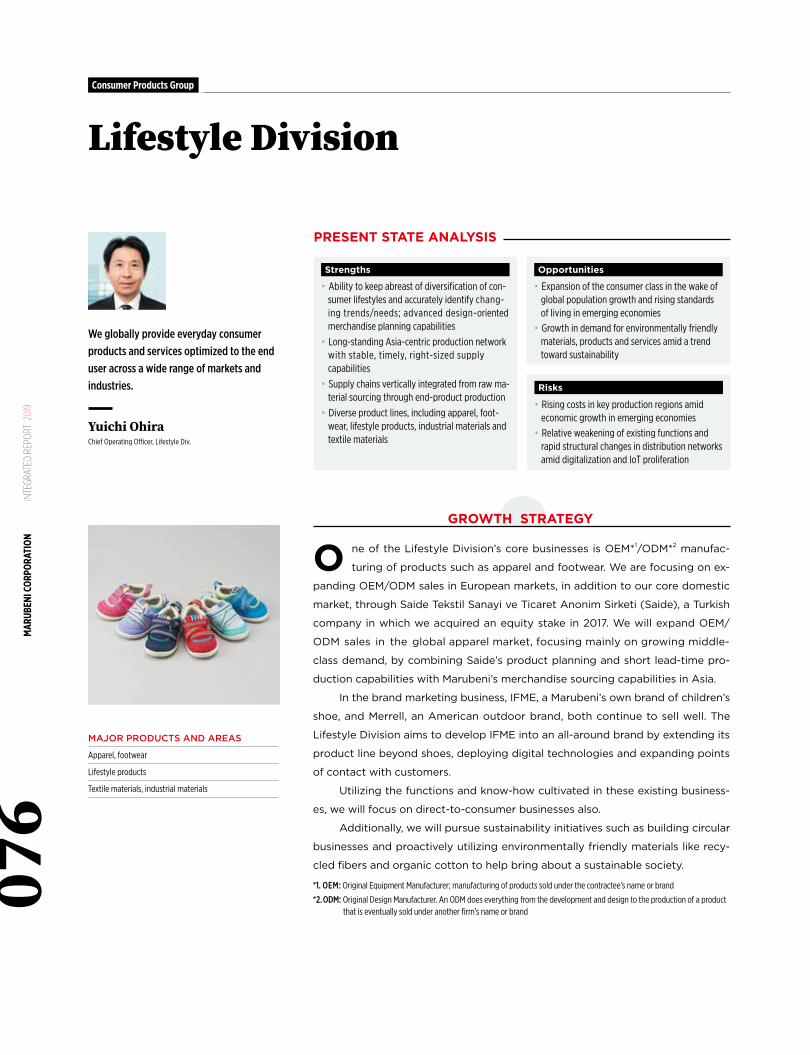
PRESENT STATE ANALYSIS
• Ability to keep abreast of diversification of con-sumer lifestyles and accurately identify chang-ing trends/needs; advanced design-oriented merchandise planning capabilities
• Long-standing Asia-centric production network with stable, timely, right-sized supply capabilities
• Supply chains vertically integrated from raw ma-terial sourcing through end-product production
• Diverse product lines, including apparel, foot-wear, lifestyle products, industrial materials and textile materials
• Expansion of the consumer class in the wake of global population growth and rising standards of living in emerging economies
• Growth in demand for environmentally friendly materials, products and services amid a trend toward sustainability
• Rising costs in key production regions amid economic growth in emerging economies
• Relative weakening of existing functions and rapid structural changes in distribution networks amid digitalization and IoT proliferation
Strengths Opportunities
Risks
Yuichi OhiraChief Operating Officer, Lifestyle Div.
GROWTH STRATEGY
We globally provide everyday consumer products and services optimized to the end user across a wide range of markets and industries.
MAJOR PRODUCTS AND AREAS
Apparel, footwear
Lifestyle products
Textile materials, industrial materials
O ne of the Lifestyle Division’s core businesses is OEM*1/ODM*2 manufac-
turing of products such as apparel and footwear. We are focusing on ex-
panding OEM/ODM sales in European markets, in addition to our core domestic
market, through Saide Tekstil Sanayi ve Ticaret Anonim Sirketi (Saide), a Turkish
company in which we acquired an equity stake in 2017. We will expand OEM/
ODM sales in the global apparel market, focusing mainly on growing middle-
class demand, by combining Saide’s product planning and short lead-time pro-
duction capabilities with Marubeni’s merchandise sourcing capabilities in Asia.
In the brand marketing business, IFME, a Marubeni’s own brand of children’s
shoe, and Merrell, an American outdoor brand, both continue to sell well. The
Lifestyle Division aims to develop IFME into an all-around brand by extending its
product line beyond shoes, deploying digital technologies and expanding points
of contact with customers.
Utilizing the functions and know-how cultivated in these existing business-
es, we will focus on direct-to-consumer businesses also.
Additionally, we will pursue sustainability initiatives such as building circular
businesses and proactively utilizing environmentally friendly materials like recy-
cled fibers and organic cotton to help bring about a sustainable society.
*1. OEM: Original Equipment Manufacturer; manufacturing of products sold under the contractee’s name or brand
*2. ODM: Original Design Manufacturer. An ODM does everything from the development and design to the production of a product that is eventually sold under another firm’s name or brand
Lifestyle DivisionConsumer Products Group
MAR
UBEN
I COR
PORA
TION
IN
TEGR
ATED
REP
ORT
201
907
6
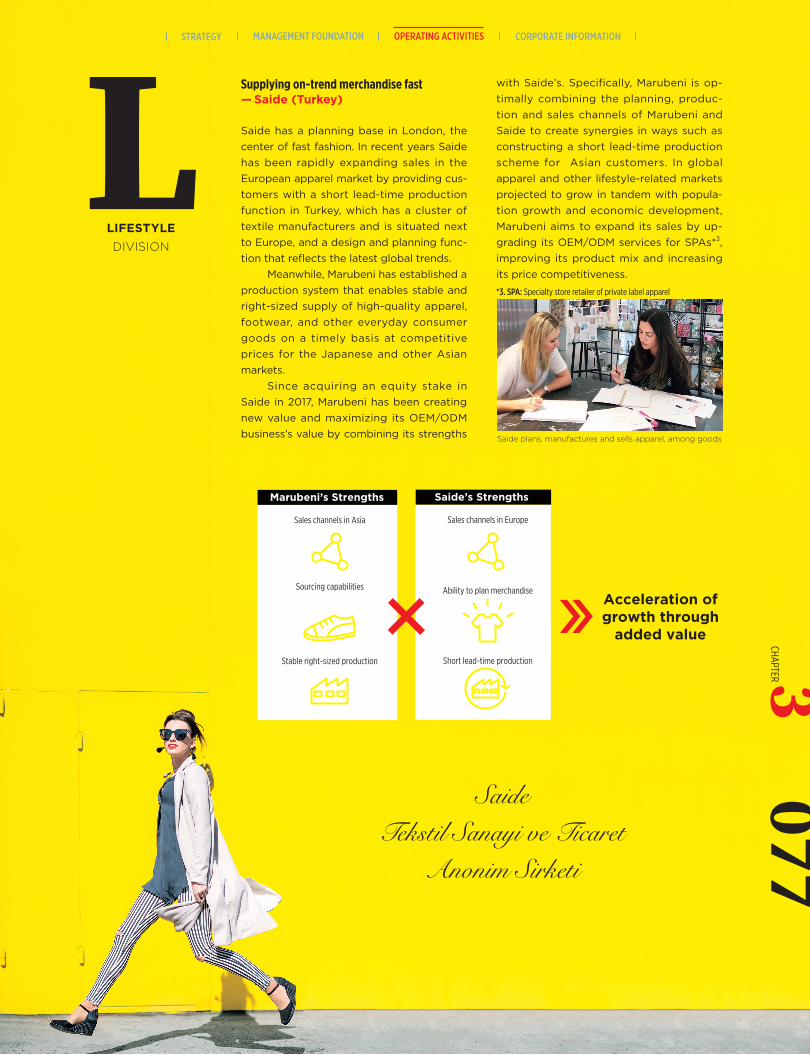
Acceleration ofgrowth through
added value
Sales channels in Asia
Stable right-sized production
Sourcing capabilities
Sales channels in Europe
Short lead-time production
Ability to plan merchandise
Marubeni’s Strengths Saide’s Strengths
with Saide’s. Specifically, Marubeni is op-timally combining the planning, produc-tion and sales channels of Marubeni and Saide to create synergies in ways such as constructing a short lead-time production scheme for Asian customers. In global apparel and other lifestyle-related markets projected to grow in tandem with popula-tion growth and economic development, Marubeni aims to expand its sales by up-grading its OEM/ODM services for SPAs*3, improving its product mix and increasing its price competitiveness.
*3. SPA: Specialty store retailer of private label apparel
Supplying on-trend merchandise fast— Saide (Turkey)
Saide has a planning base in London, the center of fast fashion. In recent years Saide has been rapidly expanding sales in the European apparel market by providing cus-tomers with a short lead-time production function in Turkey, which has a cluster of textile manufacturers and is situated next to Europe, and a design and planning func-tion that reflects the latest global trends.
Meanwhile, Marubeni has established a production system that enables stable and right-sized supply of high-quality apparel, footwear, and other everyday consumer goods on a timely basis at competitive prices for the Japanese and other Asian markets.
Since acquiring an equity stake in Saide in 2017, Marubeni has been creating new value and maximizing its OEM/ODM business’s value by combining its strengths
LLIFESTYLEDIVISION
SaideTekstil Sanayi ve Ticaret
Anonim Sirketi
Saide plans, manufactures and sells apparel, among goods
MANAGEMENT FOUNDATION OPERATING ACTIVITIES CORPORATE INFORMATIONSTRATEGY077
CHAPTER 3
PRESENT STATE ANALYSIS
• Proprietary platform capable of meeting diverse consumer needs; wide range of service offerings (e.g., Internet and property management ser-vices for condo complexes, nationwide mobile phone retail chain)
• Expertise and know-how in accurately iden-tifying increasingly diverse consumer needs; sophisticated deal-structuring and operational capabilities backed by experience
• Growth in opportunities to provide new solu-tions in response to changes in the everyday environment in the wake of advancements in digital and information technologies
• Contraction in domestic demand in the wake of low birthrate and societal aging
• Pending consumption tax hike that may dampen domestic consumer demand
Strengths Opportunities
Risks
Tatsuya AbeChief Operating Officer, ICT & Real Estate Business Div.
GROWTH STRATEGY
We organically integrate specialized know-how in information and communication technologies (ICT), real estate, logistics and insurance to provide high-value-added solutions utilizing new technologies.
MAJOR PRODUCTS AND AREAS
Network
Systems solutions
Mobile sales
Domestic and overseas housing development
J-REIT/Private placement REIT/Private real estate fund management business
Property management
Logistics
Insurance and reinsurance
T he ICT & Real Estate Business Division is involved in a broad range of busi-
ness domains related to consumers’ everyday lives, including telecommu-
nication infrastructure, mobile devices and housing. We provide high-value-add-
ed solutions and services in response to customer needs that are changing as
digital and information technologies evolve.
In the ICT business, the ICT & Real Estate Business Division operates system
solutions and network businesses, mainly through Marubeni Information Sys-
tems Co., Ltd. and ARTERIA Networks Corporation, respectively. They provide
solutions for manufacturers, CRM* solutions and high-speed telecommunication
lines. The mobile phone sales business, operated mainly by MX Mobiling Co.,
Ltd., is focusing on improving the efficiency of its carrier shop operations and
strengthening its custom solutions for corporate customers.
In the real estate business, the ICT & Real Estate Business Division runs a
redevelopment/reconstruction business, demand for which is growing in Japan,
and develops rental properties. In doing so, we are exploiting the track record
and expertise we have amassed in developing housing in Japan and overseas. In
the REIT business, we are enlarging our investment universe with the aim of ac-
cumulating more assets.
In the logistics business, the ICT & Real Estate Business Division is focusing
on digital supply chain management services that optimize supply chains and
improve their visibility. In the insurance business, our main priority is expanding
our domestic and overseas insurance agency operations.
In addition to these initiatives, the ICT & Real Estate Business Division aims
to achieve further growth by developing value-added service businesses such
as smart homes and sharing that cross-pollinate information/communication
technologies and real estate, as well as solutions and services that leverage new
technologies like 5G.
*CRM: Customer Relationship Management
Consumer Products Group
ICT & Real Estate Business Division
MAR
UBEN
I COR
PORA
TION
IN
TEGR
ATED
REP
ORT
201
907
8
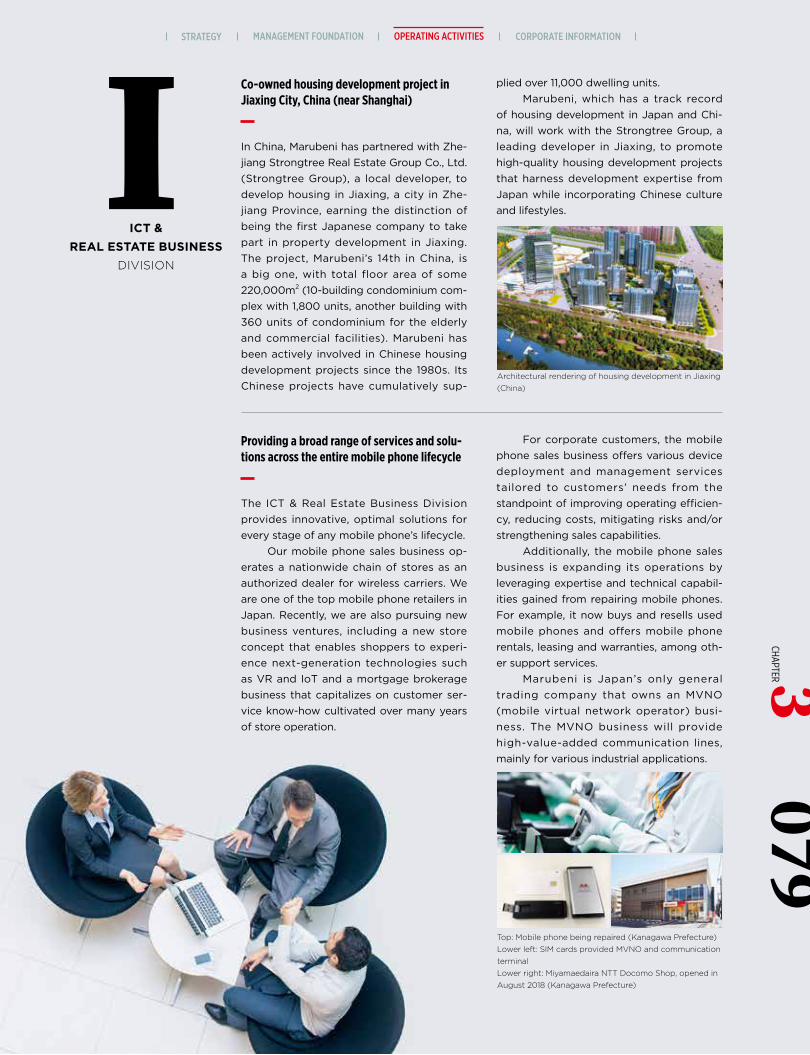
plied over 11,000 dwelling units.Marubeni, which has a track record
of housing development in Japan and Chi-na, will work with the Strongtree Group, a leading developer in Jiaxing, to promote high-quality housing development projects that harness development expertise from Japan while incorporating Chinese culture and lifestyles.
Co-owned housing development project in Jiaxing City, China (near Shanghai)
In China, Marubeni has partnered with Zhe-jiang Strongtree Real Estate Group Co., Ltd. (Strongtree Group), a local developer, to develop housing in Jiaxing, a city in Zhe-jiang Province, earning the distinction of being the first Japanese company to take part in property development in Jiaxing. The project, Marubeni’s 14th in China, is a big one, with total floor area of some 220,000m2 (10-building condominium com-plex with 1,800 units, another building with 360 units of condominium for the elderly and commercial facilities). Marubeni has been actively involved in Chinese housing development projects since the 1980s. Its Chinese projects have cumulatively sup-
Providing a broad range of services and solu-tions across the entire mobile phone lifecycle
The ICT & Real Estate Business Division provides innovative, optimal solutions for every stage of any mobile phone’s lifecycle.
Our mobile phone sales business op-erates a nationwide chain of stores as an authorized dealer for wireless carriers. We are one of the top mobile phone retailers in Japan. Recently, we are also pursuing new business ventures, including a new store concept that enables shoppers to experi-ence next-generation technologies such as VR and IoT and a mortgage brokerage business that capitalizes on customer ser-vice know-how cultivated over many years of store operation.
For corporate customers, the mobile phone sales business offers various device deployment and management services tailored to customers’ needs from the standpoint of improving operating efficien-cy, reducing costs, mitigating risks and/or strengthening sales capabilities.
Additionally, the mobile phone sales business is expanding its operations by leveraging expertise and technical capabil-ities gained from repairing mobile phones. For example, it now buys and resells used mobile phones and offers mobile phone rentals, leasing and warranties, among oth-er support services.
Marubeni is Japan’s only general trading company that owns an MVNO (mobile virtual network operator) busi-ness. The MVNO business will provide high-value-added communication lines, mainly for various industrial applications.
IICT &
REAL ESTATE BUSINESSDIVISION
Architectural rendering of housing development in Jiaxing (China)
Top: Mobile phone being repaired (Kanagawa Prefecture)Lower left: SIM cards provided MVNO and communication terminalLower right: Miyamaedaira NTT Docomo Shop, opened in August 2018 (Kanagawa Prefecture)
079CHAPTER 3
MANAGEMENT FOUNDATION OPERATING ACTIVITIES CORPORATE INFORMATIONSTRATEGY
PRESENT STATE ANALYSIS
• Value chain encompassing everything from tree farming through paper end-product sales
• Massive pulpwood plantation and pulp plant in Sumatra, Indonesia, that is in proximity to Asian markets
• Sales networks in paper, paperboard, pulp and woodchip markets
• Containerboard manufacturing/sales subsidiar-ies’ production technology/know-how
• Feedstock supply network for biomass power plants that help promote the spread of renew-able energy
• Development of business models aligned with trend toward ESG and SDGs, most notably decarbonization and reduction of plastic usage
• Weather/fire risks to tree farming business• Pulp business’s sensitivity to market price
fluctuations
Strengths Opportunities
Risks
Tsuyoshi TeragakiChief Operating Officer, Forest Products Div.
GROWTH STRATEGY
The hallmarks of our forest products are sustainability, renewability and recyclabil-ity. We are expanding our businesses that contribute to the environment and society.
MAJOR PRODUCTS AND AREAS
Wood chips and biomass fuel
Pulp and waste paper
Paper and paperboard
Building & construction materials and wood products
T he Forest Products Division aims to strengthen its earnings foundation,
mainly through stable operation of its Indonesian afforestation business
and pulp manufacturing business (Musi Pulp Project) and improvement in the
profitability of its domestic paper and paperboard manufacturing and sales
operations.
Additionally, we are building business models that involve developing bio-
mass fuels, including internally sourced wood pellets, that contribute to reali-
zation of a low-carbon society; branching into markets for new materials with
promising demand growth prospects, like cellulose nanofiber; and selling plastic-
alternative products in sync with a global trend toward reduction in plastic us-
age. In Vietnam, the Forest Products Division has decided to invest in a contain-
erboard manufacturing and packaging materials sales business with the aim of
building a presence in the rapidly growing Vietnamese packaging market. In ad-
dition to conventional paper and pulp products, we will broadly focus on ligne-
ous materials that embody our products’ hallmarks of sustainability, renewability
and recyclability. In the process, we will also broaden our customer base across
a wider range of industries, thereby expanding our operations that address and
help solve environmental and social problems.
Forest ProductsDivision
Consumer Products Group
080
MAR
UBEN
I COR
PORA
TION
IN
TEGR
ATED
REP
ORT
201
9
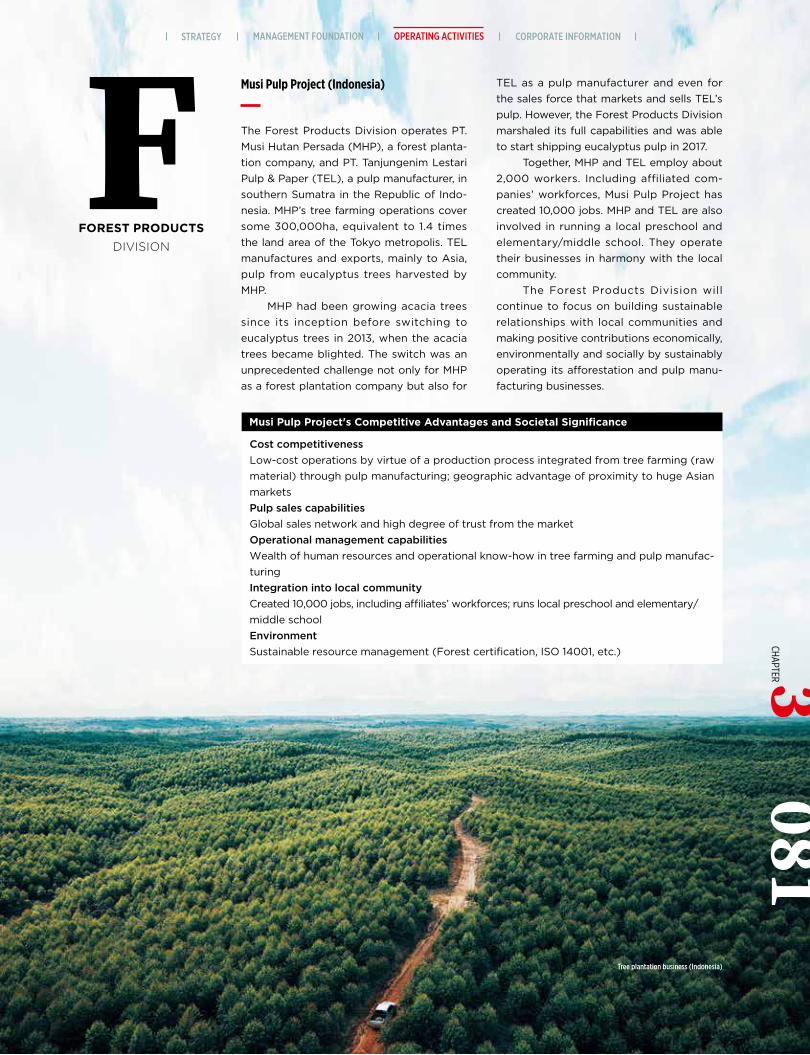
Musi Pulp Project (Indonesia)
The Forest Products Division operates PT. Musi Hutan Persada (MHP), a forest planta-tion company, and PT. Tanjungenim Lestari Pulp & Paper (TEL), a pulp manufacturer, in southern Sumatra in the Republic of Indo-nesia. MHP’s tree farming operations cover some 300,000ha, equivalent to 1.4 times the land area of the Tokyo metropolis. TEL manufactures and exports, mainly to Asia, pulp from eucalyptus trees harvested by MHP.
MHP had been growing acacia trees since its inception before switching to eucalyptus trees in 2013, when the acacia trees became blighted. The switch was an unprecedented challenge not only for MHP as a forest plantation company but also for
TEL as a pulp manufacturer and even for the sales force that markets and sells TEL’s pulp. However, the Forest Products Division marshaled its full capabilities and was able to start shipping eucalyptus pulp in 2017.
Together, MHP and TEL employ about 2,000 workers. Including affiliated com-panies’ workforces, Musi Pulp Project has created 10,000 jobs. MHP and TEL are also involved in running a local preschool and elementary/middle school. They operate their businesses in harmony with the local community.
The Forest Products Division will continue to focus on building sustainable relationships with local communities and making positive contributions economically, environmentally and socially by sustainably operating its afforestation and pulp manu-facturing businesses.
Tree plantation business (Indonesia)
Musi Pulp Project's Competitive Advantages and Societal Significance
FFOREST PRODUCTS
DIVISION
Cost competitivenessLow-cost operations by virtue of a production process integrated from tree farming (raw material) through pulp manufacturing; geographic advantage of proximity to huge Asian marketsPulp sales capabilitiesGlobal sales network and high degree of trust from the marketOperational management capabilitiesWealth of human resources and operational know-how in tree farming and pulp manufac-turingIntegration into local community Created 10,000 jobs, including affiliates’ workforces; runs local preschool and elementary/middle schoolEnvironmentSustainable resource management (Forest certification, ISO 14001, etc.)
CHAPTER 3MANAGEMENT FOUNDATION OPERATING ACTIVITIES CORPORATE INFORMATIONSTRATEGY
081
PRESENT STATE ANALYSIS
• Roughly 30% share of Japan’s coffee bean imports
• Owns Iguaçu de Café Solúvel (Iguaçu), a Bra-zilian instant coffee manufacturer with sales in over 40 countries
• Owns high-quality beef suppliers in the U.S. and Australia, two top beef-producing countries
• Stable worldwide grain supply capacity by virtue of a global network extending from grain origination through sales
• Growth in demand for high-quality food products (e.g., coffee, beef) in emerging market economies (e.g., China, Asia)
• Growth in global demand for grains and other foods
• Changes in political or economic conditions in end-market countries (country risk)
• Risk of natural disasters such as crop failures due to abnormal weather
Strengths Opportunities
Risks
Hidenobu KumadaChief Operating Officer, Food Div.
GROWTH STRATEGY
We pursue further advancement of the value of our businesses by strengthening our value-added sourcing, production and sales of grains and other foods, taking maximal advantage of our global network of subsidiaries and sales channels.
MAJOR PRODUCTS AND AREAS
Grains in general (corn, soybeans, wheat, rapeseed, etc.)
Feed ingredients (soybean meal, rapeseed meal, fish meal, etc.)
Compound feed
Consumer-use food products, commercial-use food materials, dairy products and agricultural resources
Marine products, processed seafood, and fresh and processed meat
Raw ingredients for food (flour, sugar, oils and fats, etc.)
Raw materials for beverages (coffee, tea, fruit juice, etc.)
T he Food Division’s strategic priorities are strengthening specialty prod-
uct marketing, upgrading manufacturing functions, boosting its overseas
share of revenue and maximizing the value of its livestock feed business and the
efficiency of its grain trading operations. We will expand operationally and grow
sustainably by building value-added production and processing businesses and
improving the efficiency of grain origination and trading operations.
In the food products business, we are expanding the scope of our opera-
tions by acquiring high-quality food suppliers throughout the world in addition
to strengthening existing businesses and expanding domestic and overseas
trade. Specific initiatives include expanding the capacity of U.S. beef processor/
supplier Creekstone Farms Premium Beef LLC (Creekstone Farms) and Brazil-
ian instant coffee manufacturer Iguaçu. The latter’s new capacity is slated to be
commissioned into operation in the fiscal year ending March 31, 2021 to meet
globally growing coffee demand.
In the grain sector, we are strengthening our earnings power by functionally
leveraging grain origination, storage and distribution capacity in American grain
belts to expand sales in markets in which Marubeni possesses strong sales infra-
structure. Additionally, the Food Division will move one step closer to helping
achieve the UN’s Sustainable Development Goals (SDGs) for society. Toward this
end, Marubeni entered into a strategic partnership with an agri-tech startup with
proprietary circulatory biomass recycling technology in the fiscal year ended
March 2019.
The Food Division will continue to focus on cultivating diverse human re-
sources and fostering an open organizational culture to create new business
models in response to constant changes in the business environment, including
IT innovation and fragmentation of consumer demand into niche markets.
Food DivisionFood, Agriculture & Chemicals Group
082
MAR
UBEN
I COR
PORA
TION
IN
TEGR
ATED
REP
ORT
201
9
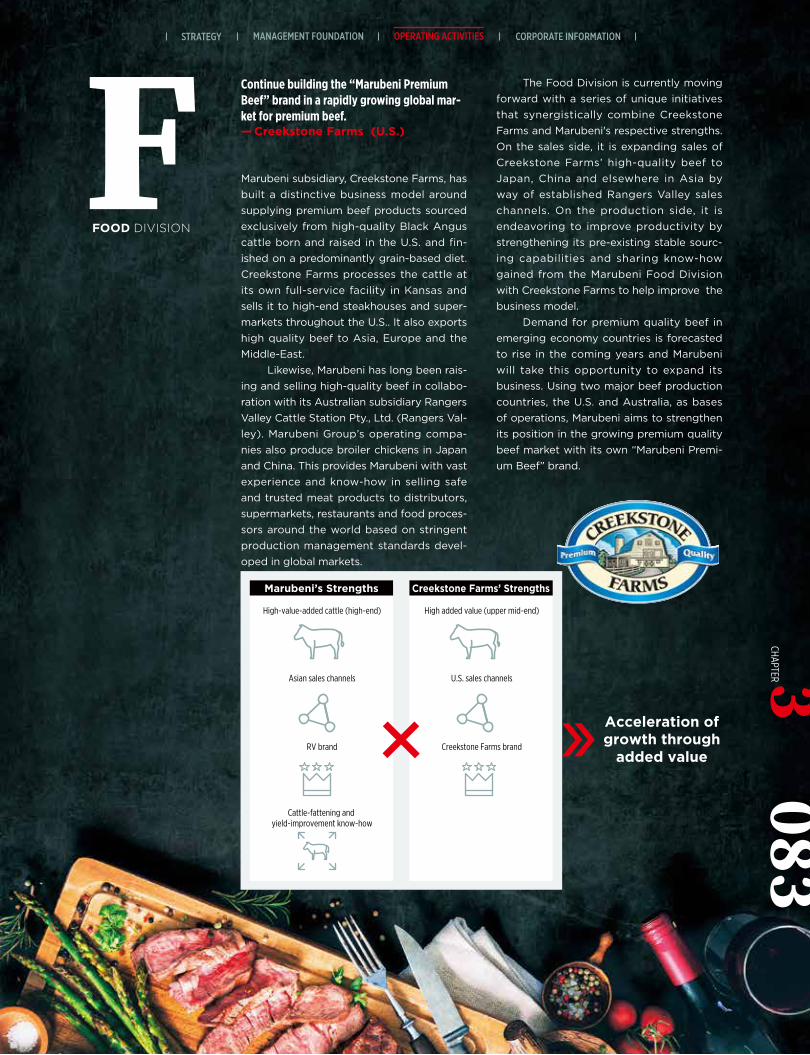
Acceleration ofgrowth through
added value
High-value-added cattle (high-end)
Asian sales channels
RV brand
High added value (upper mid-end)
U.S. sales channels
Creekstone Farms brand
Cattle-fattening and yield-improvement know-how
Marubeni’s Strengths Creekstone Farms’ Strengths
Continue building the “Marubeni Premium Beef” brand in a rapidly growing global mar-ket for premium beef.— Creekstone Farms (U.S.)
Marubeni subsidiary, Creekstone Farms, has built a distinctive business model around supplying premium beef products sourced exclusively from high-quality Black Angus cattle born and raised in the U.S. and fin-ished on a predominantly grain-based diet. Creekstone Farms processes the cattle at its own full-service facility in Kansas and sells it to high-end steakhouses and super-markets throughout the U.S.. It also exports high quality beef to Asia, Europe and the Middle-East.
Likewise, Marubeni has long been rais-ing and selling high-quality beef in collabo-ration with its Australian subsidiary Rangers Valley Cattle Station Pty., Ltd. (Rangers Val-ley). Marubeni Group’s operating compa-nies also produce broiler chickens in Japan and China. This provides Marubeni with vast experience and know-how in selling safe and trusted meat products to distributors, supermarkets, restaurants and food proces-sors around the world based on stringent production management standards devel-oped in global markets.
The Food Division is currently moving forward with a series of unique initiatives that synergistically combine Creekstone Farms and Marubeni's respective strengths. On the sales side, it is expanding sales of Creekstone Farms’ high-quality beef to Japan, China and elsewhere in Asia by way of established Rangers Valley sales channels. On the production side, it is endeavoring to improve productivity by strengthening its pre-existing stable sourc-ing capabilities and sharing know-how gained from the Marubeni Food Division with Creekstone Farms to help improve the business model.
Demand for premium quality beef in emerging economy countries is forecasted to rise in the coming years and Marubeni will take this opportunity to expand its business. Using two major beef production countries, the U.S. and Australia, as bases of operations, Marubeni aims to strengthen its position in the growing premium quality beef market with its own “Marubeni Premi-um Beef” brand.
FFOOD DIVISION
MANAGEMENT FOUNDATION OPERATING ACTIVITIES CORPORATE INFORMATIONSTRATEGY3
083CHAPTER
PRESENT STATE ANALYSIS
• Subsidiary Helena Agri-Enterprises (Helena), an agri-input retailer with close ties to the commu-nities it serves, is ranked second by market share in North America
• Stable worldwide grain supply capacity by virtue of a global network extending from grain collection through sales
• Generation of synergies through integration of agri-input and North American grain businesses
• Agri-input market growth driven by need to increase foodstuff production and limits on expansion of arable acreage
• Risk of changes in farmers income levels or weather events that impact group companies’ sales
• Country risk due to changes in political or economic conditions
Strengths Opportunities
Risks
Michael McCartyChief Operating Officer, Agri Business Div.
GROWTH STRATEGY
With the agri-input and North American grain businesses paired as a single business division, we will strengthen our earnings power by pursuing synergies across both businesses.
MAJOR PRODUCTS AND AREAS
Sales of agri-inputs (crop protection products, fertilizers, seeds, Helena-brand products)
Subcontracting services for fertilization and crop protec-tion products dispersion
Provision of precision agriculture and other technical services
Contract crop protection products formulation
Fertilizer raw materials
Grain & oilseed (corn, wheat, barley, soy, vegetables, edible beans etc.), Procurement and export business in the U.S.
I n the agri-input business, the Agri Business Division offers services to help
farmers increase their profitability and productivity in addition to expanding
existing operations through M&As and capital investment. Such services include
contract farming and consulting aided by sophisticated IT-enabled agri-tech. We
aim to also build new agri-input sales platforms outside of North America. Addi-
tionally, we plan to add value operationally by deploying Helena’s service model
in other operating companies within the Marubeni Group.
In the North American grain business, we aim to strengthen Gavilon and
Columbia Grain International’s earnings power, further improve the efficiency
of their North American grain collection facilities and create crossvalue through
collaboration and affiliation with the agri-input business.
The Agri Business Division is currently expanding businesses in agri-input
product development, contracting and production operations, agri-input retail-
ing operations, grain collection and exporting operations and specialty product
operations in Asia—mainly Japan, Malaysia and Myanmar—and in the West—
mainly the U.S., the U.K., the Netherlands and Brazil. We will offer even more
crossvalue by providing optimal solutions to farmers around the world.
Agri BusinessDivision
Food, Agriculture & Chemicals Group
MAR
UBEN
I COR
PORA
TION
IN
TEGR
ATED
REP
ORT
201
908
4
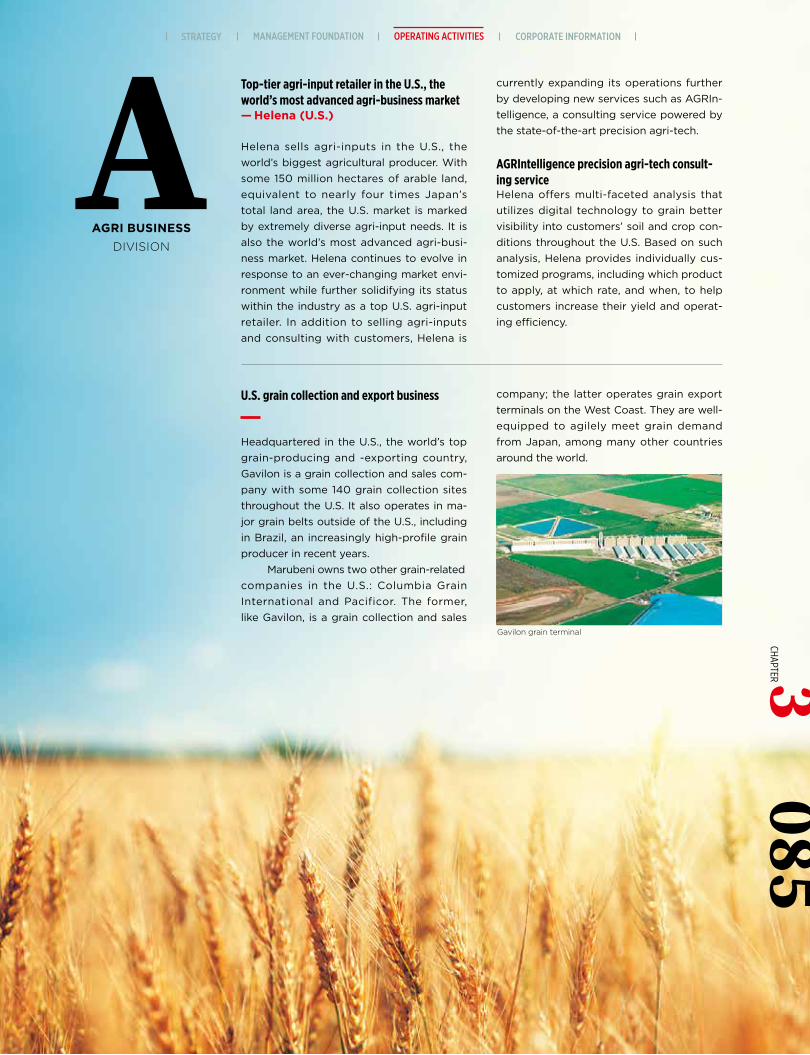
Top-tier agri-input retailer in the U.S., the world’s most advanced agri-business market— Helena (U.S.)
Helena sells agri-inputs in the U.S., the world’s biggest agricultural producer. With some 150 million hectares of arable land, equivalent to nearly four times Japan’s total land area, the U.S. market is marked by extremely diverse agri-input needs. It is also the world’s most advanced agri-busi-ness market. Helena continues to evolve in response to an ever-changing market envi-ronment while further solidifying its status within the industry as a top U.S. agri-input retailer. In addition to selling agri-inputs and consulting with customers, Helena is
U.S. grain collection and export business
Headquartered in the U.S., the world’s top grain-producing and -exporting country, Gavilon is a grain collection and sales com-pany with some 140 grain collection sites throughout the U.S. It also operates in ma-jor grain belts outside of the U.S., including in Brazil, an increasingly high-profile grain producer in recent years.
Marubeni owns two other grain-related companies in the U.S.: Columbia Grain International and Pacificor. The former, like Gavilon, is a grain collection and sales
currently expanding its operations further by developing new services such as AGRIn-telligence, a consulting service powered by the state-of-the-art precision agri-tech.
AGRIntelligence precision agri-tech consult-ing serviceHelena offers multi-faceted analysis that utilizes digital technology to grain better visibility into customers’ soil and crop con-ditions throughout the U.S. Based on such analysis, Helena provides individually cus-tomized programs, including which product to apply, at which rate, and when, to help customers increase their yield and operat-ing efficiency.
company; the latter operates grain export terminals on the West Coast. They are well-equipped to agilely meet grain demand from Japan, among many other countries around the world.
AAGRI BUSINESS
DIVISION
Gavilon grain terminal
MANAGEMENT FOUNDATION OPERATING ACTIVITIES CORPORATE INFORMATIONSTRATEGY085
CHAPTER 3
PRESENT STATE ANALYSIS
• Broad base of customers and suppliers across a wide range of industries
• Roughly 30% share of global ethylene trade
• Dutch subsidiary Orffa International’s promi-nence in European feed additives market
• Electronics value-chain businesses that extend downstream from scarce resources
• Partnerships with top industry players in diverse chemical product trading markets
• Development of life science and related busi-nesses set to grow in tandem with population growth
• Entry into solar-power-related businesses that will promote proliferation of renewable energy
• Trade in petrochemical and other products highly sensitive to market price changes
• Downturn in trade due to political or economic risks in the U.S. and/or China, both of which are major importers of chemicals
Strengths Opportunities
Risks
Satoru IchinokawaChief Operating Officer, Chemicals Div.
GROWTH STRATEGY
We aim to be a group of sales professionals that provide added-value to customers and markets by tapping into our trading platform across a broad range of industries.
MAJOR PRODUCTS AND AREAS
Basic petrochemical products and plastic derivatives
Salt and chlor-alkali products
Life science products like functional feed additives, oleochemicals, multifunctionals for food products
Electronic materials, inorganic mineral resources, fertilizer materials and inorganic chemicals
T he Chemicals Division serves a broad range of industries, reflecting the
nature of the products in which it deals. We operate in an opportunity-rich
environment in which societal problems and market needs are readily identifi-
able amid recurring cycles of drastic structural change.
Capitalizing on such a business environment, the Chemicals Division
aspires to be a group of sales professionals with the ability to conceptualize
products/services and offer solutions while maintaining a strong focus on
creatively adding value.
In the electronic materials business, earnings continue to grow briskly, and
the Innovation Promotion Office has been newly established in April 2019 to cat-
alyze novel “chemical reactions” in new fields that go beyond chemical products.
In the commodity chemical, largely olefin, trading business, an area in which
Marubeni has long been one of the top-ranked players in the industry, the Chem-
icals Division aims to further expand its trading volume by playing a bigger role
in balancing supply and demand and to add maximum value by leveraging lo-
gistics functions and other such services. In the specialty chemicals business, we
will delve more deeply into solution-oriented distribution businesses, capitalizing
on Marubeni Group sales networks and product capabilities that tap into points
of contact with customers. In the life science business, which has particularly
promising prospects of sustainable growth in tandem with population growth,
we will focus on further expanding its operations around Dutch subsidiary Orffa
International Holding B.V., one of Europe’s largest distributors of livestock feed
additives.
●
Chemicals DivisionFood, Agriculture & Chemicals Group
MAR
UBEN
I COR
PORA
TION
IN
TEGR
ATED
REP
ORT
201
908
6

Expanding operations with a focus on life sciences• Operates in multiple life science markets, including
functional food/beverage ingredients and feed additives
Investee: Orffa International (feed additives distributor) Home country: NetherlandsMarubeni Group’s equity stake: 80% • One of Europe’s largest feed additives distributors• Pursuing worldwide distribution of feed additives that
meet European safety and environmental standards through Marubeni’s network
CCHEMICALS DIVISION
●
(From left) LCD plant, one of the largest in the world, owned by China’s BOE Technology Group; Lithium-ion
batteries manufactured by Northvolt of Sweden; Mega solar power plants in Soo City, Kagoshima Prefecture
Marubeni’s Global Chemical BusinessesMarubeni’s Chemicals Division operates businesses worldwide through four business units and a global
network centered on a nucleus of over 20 consolidated subsidiaries and associates.
Commodity chemical trading (olefins, vinyl chloride resin, caustic soda, etc.)
Expanding environmentally attuned businesses, most notably electronic materials and renewable energy• Globally trades LIB materials essential for storage
batteries• Building a nationwide logistics network in China for
hazardous chemicals and refrigerated/frozen chemical materials for LCDs
• Providing full range of solar power solutions, from equipment sales to project organization
Global chlor-alkali trader with integrated supply chain extending upstream to feedstock salt business• World’s top-ranked vinyl chloride resin trader by unit volume • Major player in global caustic soda market
Investee: Dampier Salt (solar salt manufacturer) Home country: AustraliaMarubeni Group’s equity stake: 21.51% • World’s top industrial salt exporter by unit volume• Roughly 30% share of Asian trading volume
Handling the world largest volume of olefin products• Roughly 30% share of global seaborne trade volume• Owns and hires around 30 gas carriers to provide on-time
delivery service
MANAGEMENT FOUNDATION OPERATING ACTIVITIES CORPORATE INFORMATIONSTRATEGY3
087CHAPTER
PRESENT STATE ANALYSIS
• Strong area business & marketing forces, proj-ect development hubs and asset management teams; IPP*1 business of world-class scale
• IPP business’s proven track record, competitive-ness, in-house development and problem-solv-ing know-how/capabilities
• Extensive EPC*2 track record (overseas) and unique EPC management capabilities
• Vast experience in electric power wholesaling/retailing
*1. I PP : Independent Power Producer
*2. EPC : Engineering, Procurement and Construction
• Growing prevalence of De-carbonization, De-centralization and Digitalization (“3Ds”) in the power sector
• Changes of energy mixes and policies in major countries
• Technological innovations in major power gener-ation equipment such as offshore wind and solar power
• Digital technological innovations such as AI, IoT and Big Data
• Policy change in liberalized power market-coun-tries
• High volatility of fuel energy and/or natural resource prices
• Weather variation risks that would affect the power supply-demand balance
Strengths Opportunities
RisksYoshiaki YokotaChief Operating Officer, Power Business Div.
GROWTH STRATEGY
As a global player in IPP as well as power service business, we are committed to con-tribute toward building a sustainable society through delivering safe and stable electric power and services which can preserve the global environment.
MAJOR PRODUCTS AND AREAS
Power generation business
Renewable energy
Power service and retails business
- EPC business and offshore wind turbine installation- Wholesale and retail power sales- Community-based multi utilities service- Power digital and new energy solution business
T he De-carbonization, De-centralization and Digitalization (“3Ds”) are
rapidly gaining prevalence in the power industry. Decarbonization is man-
ifesting as efforts to mitigate climate change in response to a growing commit-
ment to a low-carbon society; decentralization, as dispersion of power sources
to enable local power production for local consumption; and digitalization, as
adoption of digital technologies that would efficiently operate power plants and
deploy renewable energy sources-certification. Seeing such changes in the busi-
ness environment as the opportunities, the Power Business Division is expanding
the portfolio scale of the power generation business as its earnings base. As
announced in September 2018, we strive to double the ratio of power generat-
ed by renewable energy sources in our net power supply by 2023 and increase
energy value chain type business such as fuel to power IPP projects having pro-
curement of LNG or biomass fuel through power generation. In parallel with the
power generation business’s expansion, we are diversifying power service busi-
ness, in which we are expanding retail-power business with various services to
those customers and community based multi-utilities service businesses through
distributed power supply and off-grid power sources. Additionally, we will pro-
actively deploy digital technologies such as AI and IoT to improve the efficiency
of own and major client’ power plants, to operate IT driven power retailing busi-
nesses and to provide various digital services to our customers and the busi-
nesses’ platform usership.
Power BusinessDivision
Power Business, Energy & Metals Group
MAR
UBEN
I COR
PORA
TION
IN
TEGR
ATED
REP
ORT
201
908
8
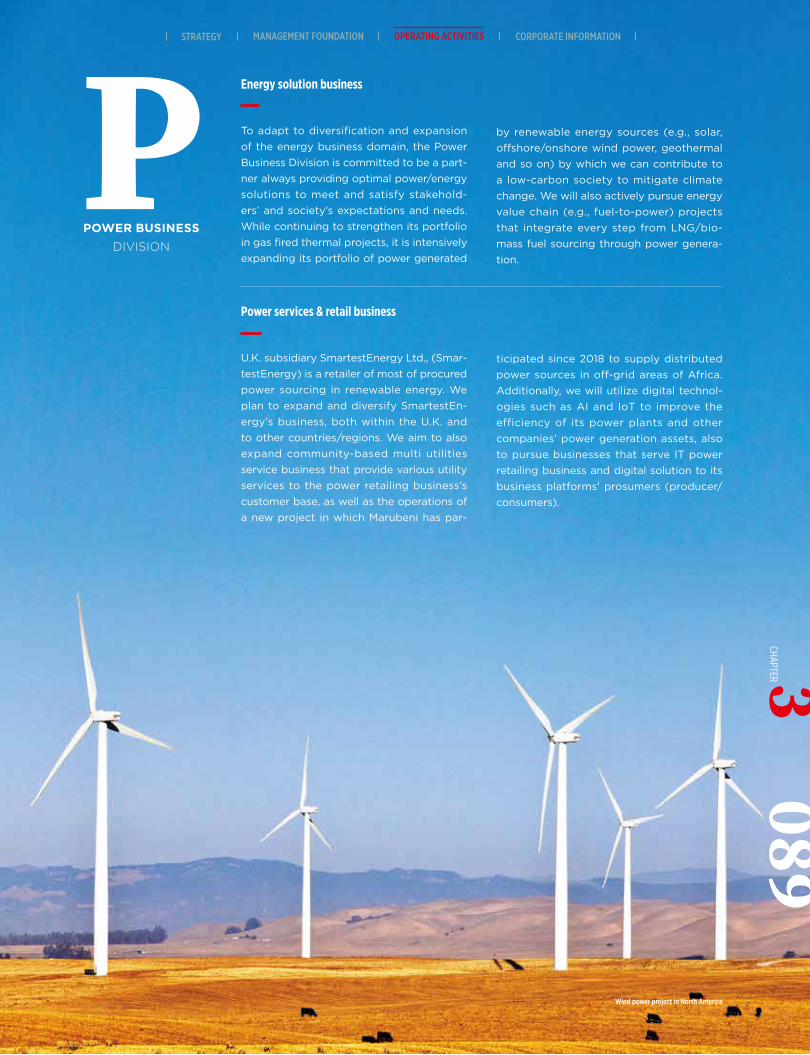
Energy solution business
To adapt to diversification and expansion of the energy business domain, the Power Business Division is committed to be a part-ner always providing optimal power/energy solutions to meet and satisfy stakehold-ers’ and society’s expectations and needs. While continuing to strengthen its portfolio in gas fired thermal projects, it is intensively expanding its portfolio of power generated
Power services & retail business
U.K. subsidiary SmartestEnergy Ltd., (Smar-testEnergy) is a retailer of most of procured power sourcing in renewable energy. We plan to expand and diversify SmartestEn-ergy’s business, both within the U.K. and to other countries/regions. We aim to also expand community-based multi utilities service business that provide various utility services to the power retailing business’s customer base, as well as the operations of a new project in which Marubeni has par-
by renewable energy sources (e.g., solar, offshore/onshore wind power, geothermal and so on) by which we can contribute to a low-carbon society to mitigate climate change. We will also actively pursue energy value chain (e.g., fuel-to-power) projects that integrate every step from LNG/bio-mass fuel sourcing through power genera-tion.
ticipated since 2018 to supply distributed power sources in off-grid areas of Africa. Additionally, we will utilize digital technol-ogies such as AI and IoT to improve the efficiency of its power plants and other companies’ power generation assets, also to pursue businesses that serve IT power retailing business and digital solution to its business platforms’ prosumers (producer/consumers).
Wind power project in North America
PPOWER BUSINESS
DIVISION
MANAGEMENT FOUNDATION OPERATING ACTIVITIES CORPORATE INFORMATIONSTRATEGY3CHAPTER
089
PRESENT STATE ANALYSIS
• Competitive upstream interests such as the Qatar LNG and Sakhalin Projects
• One of Japan’s top energy (e.g., natural gas, LNG, petrochemical feedstock) trading businesses
• New energy businesses conducting demonstra-tion projects in Japan and overseas
• Nuclear energy business that adds value throughout the supply chain
• Growth in natural gas/LNG and new energy (e.g., ammonia, hydrogen) businesses amid transition to low-carbon society
• Changes in sales channels due to shift in LNG demand toward Asia
• Market fluctuations such as resource prices and shifts in geopolitical trends
• Changes in energy demand structure in devel-oped countries
Strengths Opportunities
Risks
Akihiko SagaraChief Operating Officer, Energy Div.
GROWTH STRATEGY
With sights set firmly on the advent of a low-carbon society, we provide compre-hensive energy solutions to address societal challenges and changing customer needs.
MAJOR PRODUCTS AND AREAS
Exploration, development, and production of oil and gas
Natural gas business (production, liquefaction, trade, and infrastructure)
New energy related business (hydrogen, ammonia, municipal solid waste, thermal energy storage)
Petroleum & lpg trade, distribution and marketing business
Nuclear energy business (development of uranium mines, nuclear fuel cycle, related equipment sales & services)
T he Energy Division aims to be a solutions provider capable of addressing
societal challenges and changing customer needs on the path toward a
low-carbon society. In the natural gas/LNG business, we are aggressively ex-
panding our operations across the entire natural gas/LNG value chain from
upstream resource development downward in anticipation of future demand
growth. Specific initiatives include ongoing efforts to improve the operational
stability and efficiency of existing operations and increase the value of projects.
Over the longer term, we will increase the share of natural gas/LNG in our port-
folio of upstream interests. In trading, logistics and marketing businesses, we
are pursuing further earnings growth, mainly through petrochemical feedstock
and natural gas/LNG trading, one of Marubeni’s fortes. Core logistics and mar-
keting subsidiaries, including Marubeni Energy Corporation, Marubeni Ennex
Corporation and ENEOS GLOBE Corporation, are swiftly adapting to changes in
their operating environment while endeavoring to add more value to their asset
holdings. In the new energy business, the Energy Division is working to commer-
cialize CO2-free energy carriers such as hydrogen and ammonia in Japan and
overseas. We have been involved in such CO2-free energy carrier supply chains
since the demonstration stage. In the nuclear energy business, we will provide
total solutions by upgrading the entire supply chain from upstream development
of uranium resources through the back end of the nuclear fuel cycle.
Energy DivisionPower Business, Energy & Metals Group
MAR
UBEN
I COR
PORA
TION
IN
TEGR
ATED
REP
ORT
201
909
0
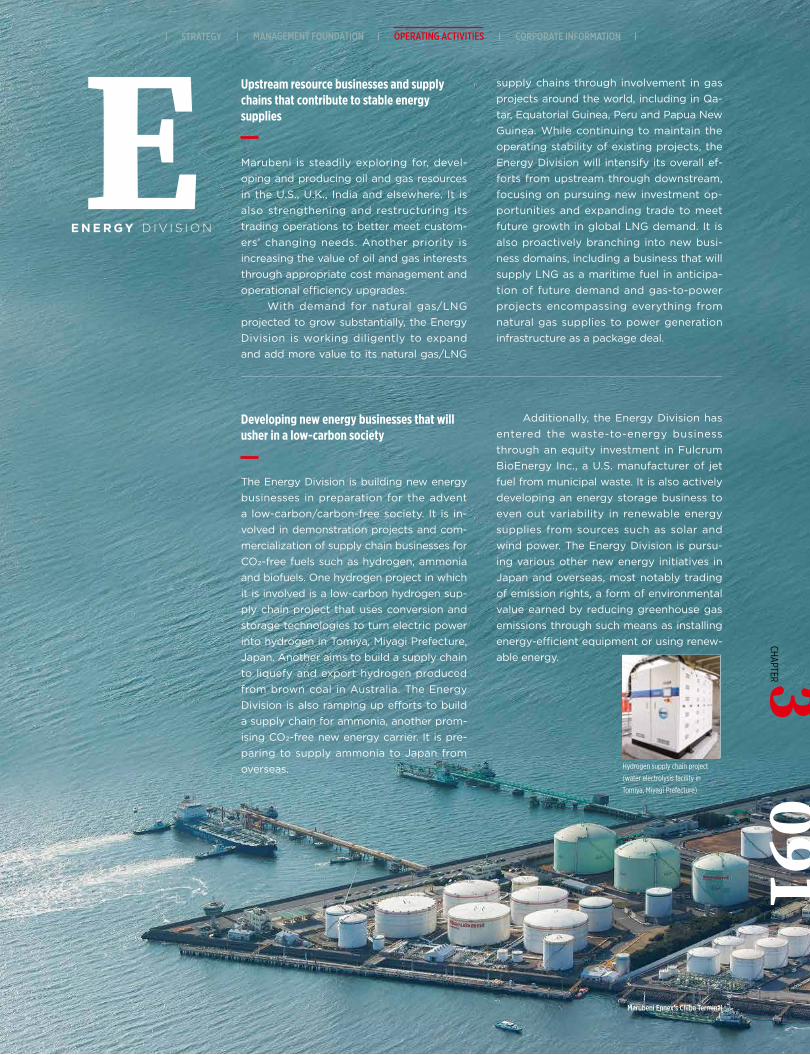
Marubeni Ennex’s Chiba Terminal
Upstream resource businesses and supply chains that contribute to stable energysupplies
Marubeni is steadily exploring for, devel-oping and producing oil and gas resources in the U.S., U.K., India and elsewhere. It is also strengthening and restructuring its trading operations to better meet custom-ers’ changing needs. Another priority is increasing the value of oil and gas interests through appropriate cost management and operational efficiency upgrades.
With demand for natural gas/LNG projected to grow substantially, the Energy Division is working diligently to expand and add more value to its natural gas/LNG
Developing new energy businesses that will usher in a low-carbon society
The Energy Division is building new energy businesses in preparation for the advent a low-carbon/carbon-free society. It is in-volved in demonstration projects and com-mercialization of supply chain businesses for CO2-free fuels such as hydrogen, ammonia and biofuels. One hydrogen project in which it is involved is a low-carbon hydrogen sup-ply chain project that uses conversion and storage technologies to turn electric power into hydrogen in Tomiya, Miyagi Prefecture, Japan. Another aims to build a supply chain to liquefy and export hydrogen produced from brown coal in Australia. The Energy Division is also ramping up efforts to build a supply chain for ammonia, another prom-ising CO2-free new energy carrier. It is pre-paring to supply ammonia to Japan from overseas.
supply chains through involvement in gas projects around the world, including in Qa-tar, Equatorial Guinea, Peru and Papua New Guinea. While continuing to maintain the operating stability of existing projects, the Energy Division will intensify its overall ef-forts from upstream through downstream, focusing on pursuing new investment op-portunities and expanding trade to meet future growth in global LNG demand. It is also proactively branching into new busi-ness domains, including a business that will supply LNG as a maritime fuel in anticipa-tion of future demand and gas-to-power projects encompassing everything from natural gas supplies to power generation infrastructure as a package deal.
Additionally, the Energy Division has entered the waste-to-energy business through an equity investment in Fulcrum BioEnergy Inc., a U.S. manufacturer of jet fuel from municipal waste. It is also actively developing an energy storage business to even out variability in renewable energy supplies from sources such as solar and wind power. The Energy Division is pursu-ing various other new energy initiatives in Japan and overseas, most notably trading of emission rights, a form of environmental value earned by reducing greenhouse gas emissions through such means as installing energy-efficient equipment or using renew-able energy.
EE N E R G Y D I V I S I O N
Hydrogen supply chain project
(water electrolysis facility in
Tomiya, Miyagi Prefecture)
MANAGEMENT FOUNDATION OPERATING ACTIVITIES CORPORATE INFORMATIONSTRATEGYCHAPTER 3
091
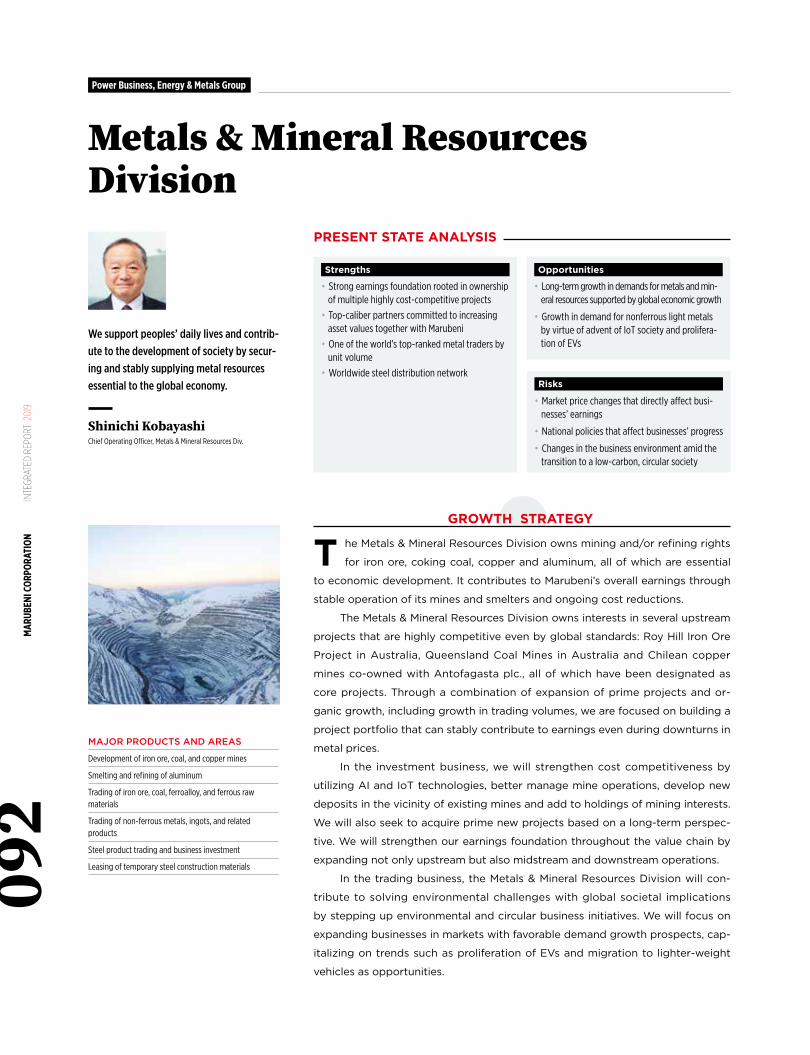
PRESENT STATE ANALYSIS
• Strong earnings foundation rooted in ownership of multiple highly cost-competitive projects
• Top-caliber partners committed to increasing asset values together with Marubeni
• One of the world’s top-ranked metal traders by unit volume
• Worldwide steel distribution network
• Long-term growth in demands for metals and min-eral resources supported by global economic growth
• Growth in demand for nonferrous light metals by virtue of advent of IoT society and prolifera-tion of EVs
• Market price changes that directly affect busi-nesses’ earnings
• National policies that affect businesses’ progress
• Changes in the business environment amid the transition to a low-carbon, circular society
Strengths Opportunities
Risks
Shinichi KobayashiChief Operating Officer, Metals & Mineral Resources Div.
GROWTH STRATEGY
We support peoples’ daily lives and contrib-ute to the development of society by secur-ing and stably supplying metal resources essential to the global economy.
MAJOR PRODUCTS AND AREAS
Development of iron ore, coal, and copper mines
Smelting and refining of aluminum
Trading of iron ore, coal, ferroalloy, and ferrous raw materials
Trading of non-ferrous metals, ingots, and related products
Steel product trading and business investment
Leasing of temporary steel construction materials
T he Metals & Mineral Resources Division owns mining and/or refining rights
for iron ore, coking coal, copper and aluminum, all of which are essential
to economic development. It contributes to Marubeni’s overall earnings through
stable operation of its mines and smelters and ongoing cost reductions.
The Metals & Mineral Resources Division owns interests in several upstream
projects that are highly competitive even by global standards: Roy Hill Iron Ore
Project in Australia, Queensland Coal Mines in Australia and Chilean copper
mines co-owned with Antofagasta plc., all of which have been designated as
core projects. Through a combination of expansion of prime projects and or-
ganic growth, including growth in trading volumes, we are focused on building a
project portfolio that can stably contribute to earnings even during downturns in
metal prices.
In the investment business, we will strengthen cost competitiveness by
utilizing AI and IoT technologies, better manage mine operations, develop new
deposits in the vicinity of existing mines and add to holdings of mining interests.
We will also seek to acquire prime new projects based on a long-term perspec-
tive. We will strengthen our earnings foundation throughout the value chain by
expanding not only upstream but also midstream and downstream operations.
In the trading business, the Metals & Mineral Resources Division will con-
tribute to solving environmental challenges with global societal implications
by stepping up environmental and circular business initiatives. We will focus on
expanding businesses in markets with favorable demand growth prospects, cap-
italizing on trends such as proliferation of EVs and migration to lighter-weight
vehicles as opportunities.
Metals & Mineral Resources Division
Power Business, Energy & Metals Group
MAR
UBEN
I COR
PORA
TION
IN
TEGR
ATED
REP
ORT
201
909
2
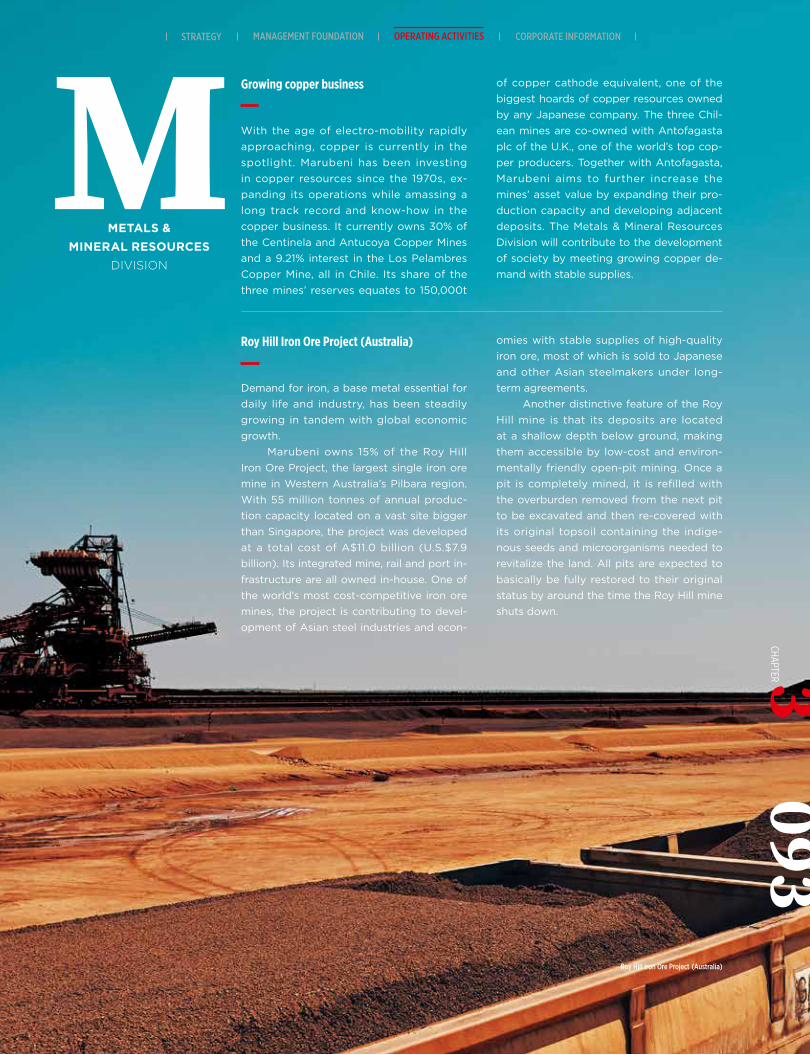
Roy Hill Iron Ore Project (Australia)
Growing copper business
With the age of electro-mobility rapidly approaching, copper is currently in the spotlight. Marubeni has been investing in copper resources since the 1970s, ex-panding its operations while amassing a long track record and know-how in the copper business. It currently owns 30% of the Centinela and Antucoya Copper Mines and a 9.21% interest in the Los Pelambres Copper Mine, all in Chile. Its share of the three mines’ reserves equates to 150,000t
Roy Hill Iron Ore Project (Australia)
Demand for iron, a base metal essential for daily life and industry, has been steadily growing in tandem with global economic growth.
Marubeni owns 15% of the Roy Hill Iron Ore Project, the largest single iron ore mine in Western Australia’s Pilbara region. With 55 million tonnes of annual produc-tion capacity located on a vast site bigger than Singapore, the project was developed at a total cost of A$11.0 billion (U.S.$7.9 billion). Its integrated mine, rail and port in-frastructure are all owned in-house. One of the world’s most cost-competitive iron ore mines, the project is contributing to devel-opment of Asian steel industries and econ-
of copper cathode equivalent, one of the biggest hoards of copper resources owned by any Japanese company. The three Chil-ean mines are co-owned with Antofagasta plc of the U.K., one of the world’s top cop-per producers. Together with Antofagasta, Marubeni aims to further increase the mines’ asset value by expanding their pro-duction capacity and developing adjacent deposits. The Metals & Mineral Resources Division will contribute to the development of society by meeting growing copper de-mand with stable supplies.
omies with stable supplies of high-quality iron ore, most of which is sold to Japanese and other Asian steelmakers under long-term agreements.
Another distinctive feature of the Roy Hill mine is that its deposits are located at a shallow depth below ground, making them accessible by low-cost and environ-mentally friendly open-pit mining. Once a pit is completely mined, it is refilled with the overburden removed from the next pit to be excavated and then re-covered with its original topsoil containing the indige-nous seeds and microorganisms needed to revitalize the land. All pits are expected to basically be fully restored to their original status by around the time the Roy Hill mine shuts down.
MMETALS &
MINERAL RESOURCESDIVISION
MANAGEMENT FOUNDATION OPERATING ACTIVITIES CORPORATE INFORMATIONSTRATEGY3CHAPTER
093
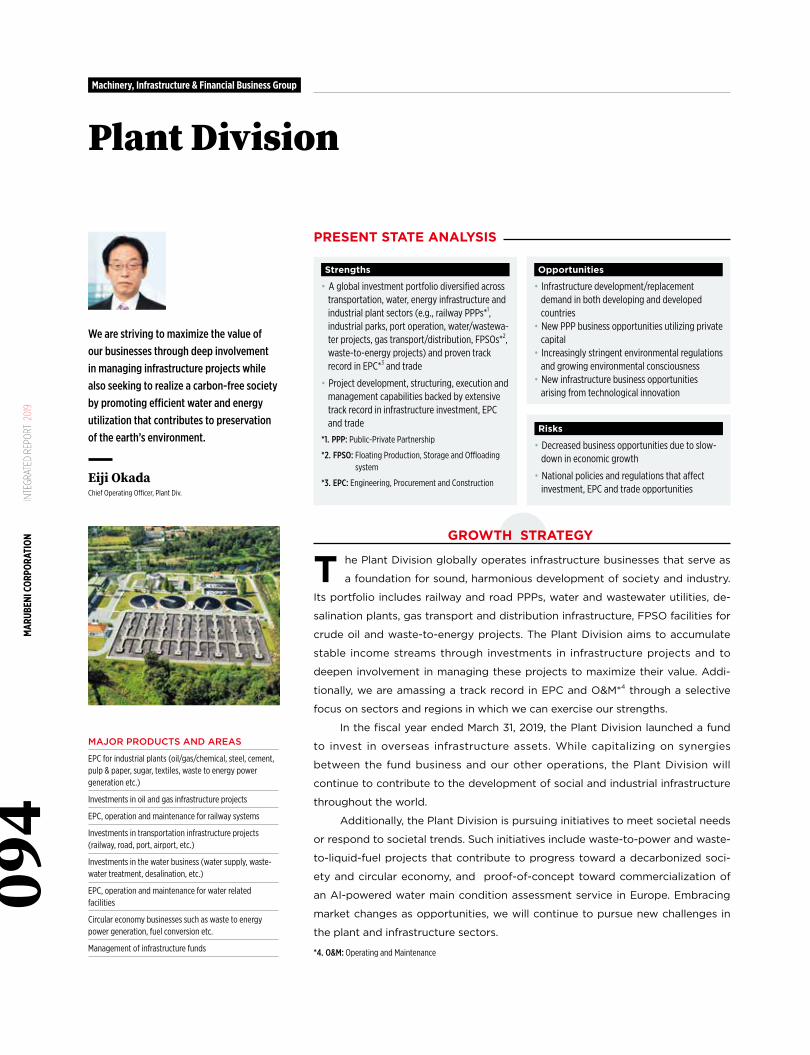
PRESENT STATE ANALYSIS
• A global investment portfolio diversified across transportation, water, energy infrastructure and industrial plant sectors (e.g., railway PPPs*1, industrial parks, port operation, water/wastewa-ter projects, gas transport/distribution, FPSOs*2, waste-to-energy projects) and proven track record in EPC*3 and trade
• Project development, structuring, execution and management capabilities backed by extensive track record in infrastructure investment, EPC and trade
*1. PPP: Public-Private Partnership
*2. FPSO: Floating Production, Storage and Offloading system
*3. EPC: Engineering, Procurement and Construction
• Infrastructure development/replacement demand in both developing and developed countries
• New PPP business opportunities utilizing private capital
• Increasingly stringent environmental regulations and growing environmental consciousness
• New infrastructure business opportunities arising from technological innovation
• Decreased business opportunities due to slow-down in economic growth
• National policies and regulations that affect investment, EPC and trade opportunities
Strengths Opportunities
Risks
Eiji OkadaChief Operating Officer, Plant Div.
GROWTH STRATEGY
We are striving to maximize the value of our businesses through deep involvement in managing infrastructure projects while also seeking to realize a carbon-free society by promoting efficient water and energy utilization that contributes to preservation of the earth’s environment.
MAJOR PRODUCTS AND AREAS
EPC for industrial plants (oil/gas/chemical, steel, cement, pulp & paper, sugar, textiles, waste to energy power generation etc.)
Investments in oil and gas infrastructure projects
EPC, operation and maintenance for railway systems
Investments in transportation infrastructure projects (railway, road, port, airport, etc.)
Investments in the water business (water supply, waste-water treatment, desalination, etc.)
EPC, operation and maintenance for water related facilities
Circular economy businesses such as waste to energy power generation, fuel conversion etc.
Management of infrastructure funds
T he Plant Division globally operates infrastructure businesses that serve as
a foundation for sound, harmonious development of society and industry.
Its portfolio includes railway and road PPPs, water and wastewater utilities, de-
salination plants, gas transport and distribution infrastructure, FPSO facilities for
crude oil and waste-to-energy projects. The Plant Division aims to accumulate
stable income streams through investments in infrastructure projects and to
deepen involvement in managing these projects to maximize their value. Addi-
tionally, we are amassing a track record in EPC and O&M*4 through a selective
focus on sectors and regions in which we can exercise our strengths.
In the fiscal year ended March 31, 2019, the Plant Division launched a fund
to invest in overseas infrastructure assets. While capitalizing on synergies
between the fund business and our other operations, the Plant Division will
continue to contribute to the development of social and industrial infrastructure
throughout the world.
Additionally, the Plant Division is pursuing initiatives to meet societal needs
or respond to societal trends. Such initiatives include waste-to-power and waste-
to-liquid-fuel projects that contribute to progress toward a decarbonized soci-
ety and circular economy, and proof-of-concept toward commercialization of
an AI-powered water main condition assessment service in Europe. Embracing
market changes as opportunities, we will continue to pursue new challenges in
the plant and infrastructure sectors.
*4. O&M: Operating and Maintenance
Plant DivisionMachinery, Infrastructure & Financial Business Group
MAR
UBEN
I COR
PORA
TION
IN
TEGR
ATED
REP
ORT
201
909
4
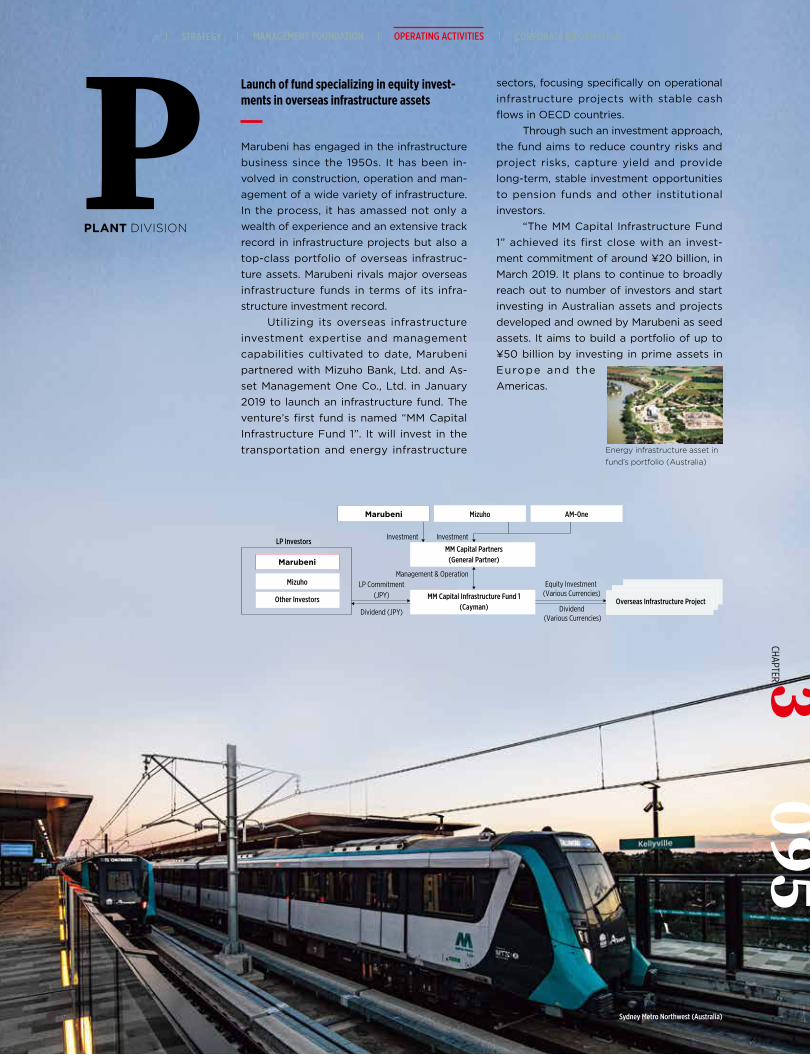
Sydney Metro Northwest (Australia)
Launch of fund specializing in equity invest-ments in overseas infrastructure assets
Marubeni has engaged in the infrastructure business since the 1950s. It has been in-volved in construction, operation and man-agement of a wide variety of infrastructure. In the process, it has amassed not only a wealth of experience and an extensive track record in infrastructure projects but also a top-class portfolio of overseas infrastruc-ture assets. Marubeni rivals major overseas infrastructure funds in terms of its infra-structure investment record.
Utilizing its overseas infrastructure investment expertise and management capabilities cultivated to date, Marubeni partnered with Mizuho Bank, Ltd. and As-set Management One Co., Ltd. in January 2019 to launch an infrastructure fund. The venture’s first fund is named “MM Capital Infrastructure Fund 1”. It will invest in the transportation and energy infrastructure
sectors, focusing specifically on operational infrastructure projects with stable cash flows in OECD countries.
Through such an investment approach, the fund aims to reduce country risks and project risks, capture yield and provide long-term, stable investment opportunities to pension funds and other institutional investors.
“The MM Capital Infrastructure Fund 1” achieved its first close with an invest-ment commitment of around ¥20 billion, in March 2019. It plans to continue to broadly reach out to number of investors and start investing in Australian assets and projects developed and owned by Marubeni as seed assets. It aims to build a portfolio of up to ¥50 billion by investing in prime assets in Europe and the Americas.
Marubeni
MarubeniManagement & Operation
LP Commitment(JPY)
Equity Investment (Various Currencies)
Dividend (Various Currencies)
Dividend (JPY)
Investment Investment
Mizuho
Other Investors
Mizuho
LP InvestorsMM Capital Partners
(General Partner)
MM Capital Infrastructure Fund 1(Cayman)
AM-0ne
Overseas Infrastructure Project
Energy infrastructure asset in fund’s portfolio (Australia)
PPLANT DIVISION
CHAPTER 3MANAGEMENT FOUNDATION OPERATING ACTIVITIES CORPORATE INFORMATIONSTRATEGY
095
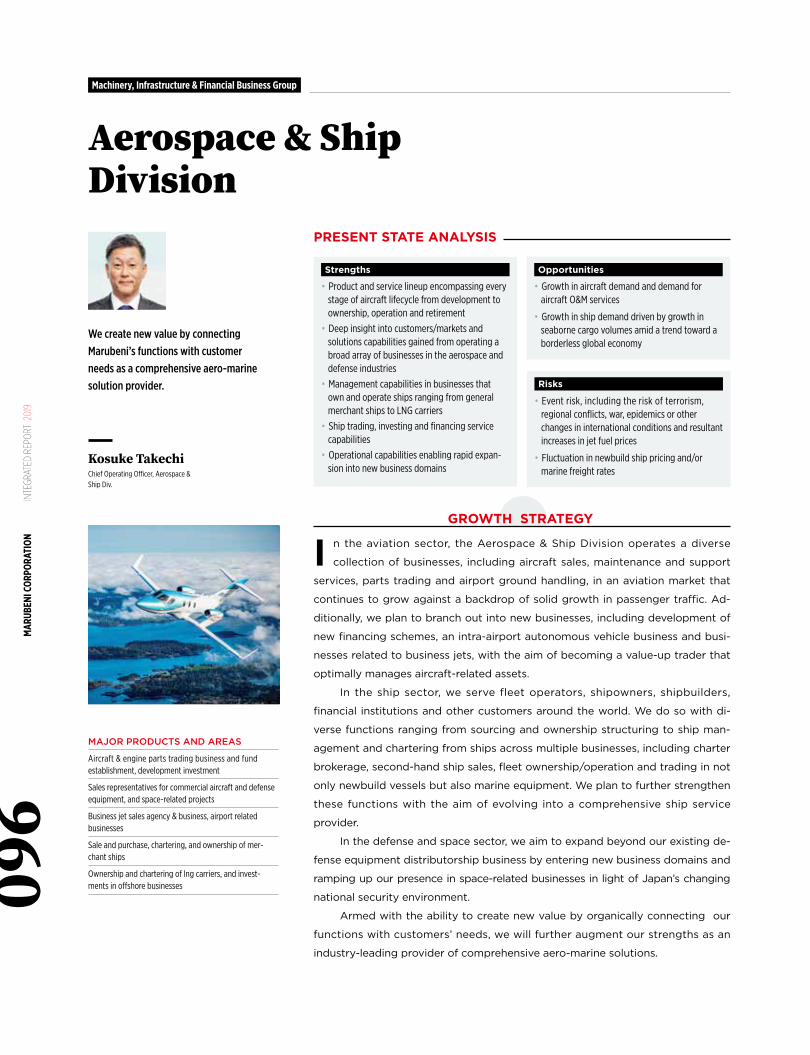
PRESENT STATE ANALYSIS
• Product and service lineup encompassing every stage of aircraft lifecycle from development to ownership, operation and retirement
• Deep insight into customers/markets and solutions capabilities gained from operating a broad array of businesses in the aerospace and defense industries
• Management capabilities in businesses that own and operate ships ranging from general merchant ships to LNG carriers
• Ship trading, investing and financing service capabilities
• Operational capabilities enabling rapid expan-sion into new business domains
• Growth in aircraft demand and demand for aircraft O&M services
• Growth in ship demand driven by growth in seaborne cargo volumes amid a trend toward a borderless global economy
• Event risk, including the risk of terrorism, regional conflicts, war, epidemics or other changes in international conditions and resultant increases in jet fuel prices
• Fluctuation in newbuild ship pricing and/or marine freight rates
Strengths Opportunities
Risks
Kosuke TakechiChief Operating Officer, Aerospace & Ship Div.
GROWTH STRATEGY
We create new value by connecting Marubeni’s functions with customerneeds as a comprehensive aero-marine solution provider.
MAJOR PRODUCTS AND AREAS
Aircraft & engine parts trading business and fund establishment, development investment
Sales representatives for commercial aircraft and defense equipment, and space-related projects
Business jet sales agency & business, airport related businesses
Sale and purchase, chartering, and ownership of mer-chant ships
Ownership and chartering of lng carriers, and invest-ments in offshore businesses
I n the aviation sector, the Aerospace & Ship Division operates a diverse
collection of businesses, including aircraft sales, maintenance and support
services, parts trading and airport ground handling, in an aviation market that
continues to grow against a backdrop of solid growth in passenger traffic. Ad-
ditionally, we plan to branch out into new businesses, including development of
new financing schemes, an intra-airport autonomous vehicle business and busi-
nesses related to business jets, with the aim of becoming a value-up trader that
optimally manages aircraft-related assets.
In the ship sector, we serve fleet operators, shipowners, shipbuilders,
financial institutions and other customers around the world. We do so with di-
verse functions ranging from sourcing and ownership structuring to ship man-
agement and chartering from ships across multiple businesses, including charter
brokerage, second-hand ship sales, fleet ownership/operation and trading in not
only newbuild vessels but also marine equipment. We plan to further strengthen
these functions with the aim of evolving into a comprehensive ship service
provider.
In the defense and space sector, we aim to expand beyond our existing de-
fense equipment distributorship business by entering new business domains and
ramping up our presence in space-related businesses in light of Japan’s changing
national security environment.
Armed with the ability to create new value by organically connecting our
functions with customers’ needs, we will further augment our strengths as an
industry-leading provider of comprehensive aero-marine solutions.
Aerospace & ShipDivision
Machinery, Infrastructure & Financial Business Group
096
MAR
UBEN
I COR
PORA
TION
IN
TEGR
ATED
REP
ORT
201
9
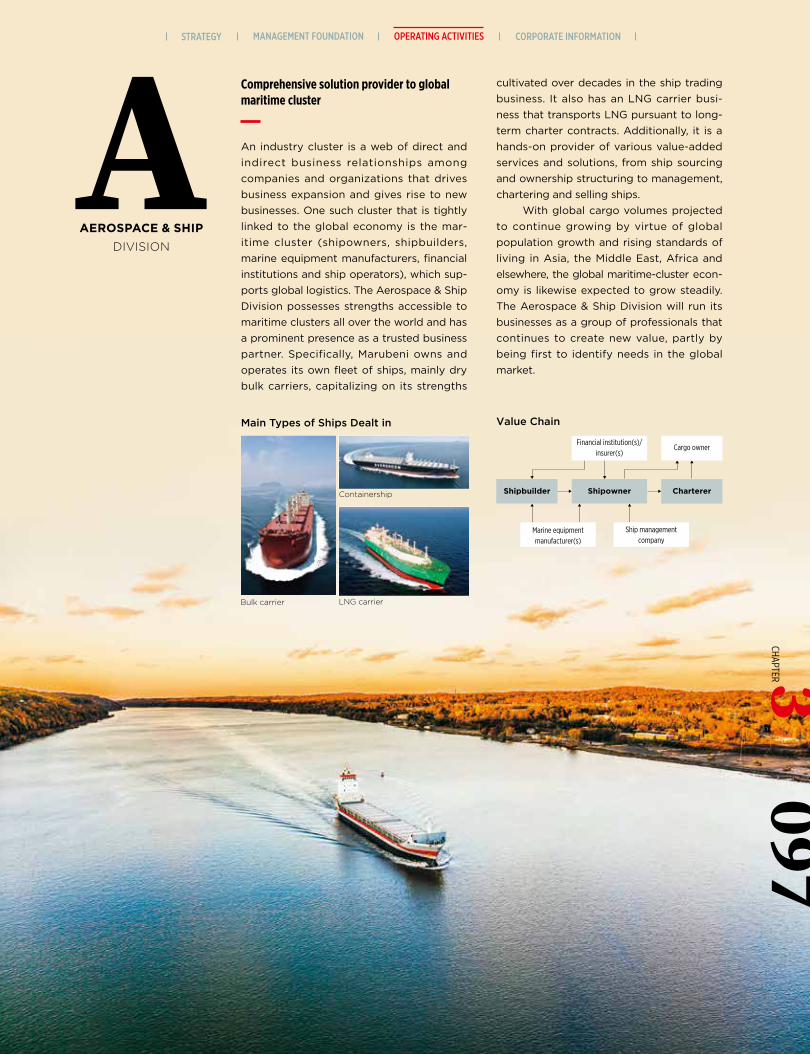
Shipbuilder Shipowner
Marine equipmentmanufacturer(s)
Ship managementcompany
Charterer
Value Chain
Financial institution(s)/insurer(s)
Cargo owner
Main Types of Ships Dealt in
Comprehensive solution provider to global maritime cluster
An industry cluster is a web of direct and indirect business relationships among companies and organizations that drives business expansion and gives rise to new businesses. One such cluster that is tightly linked to the global economy is the mar-itime cluster (shipowners, shipbuilders, marine equipment manufacturers, financial institutions and ship operators), which sup-ports global logistics. The Aerospace & Ship Division possesses strengths accessible to maritime clusters all over the world and has a prominent presence as a trusted business partner. Specifically, Marubeni owns and operates its own fleet of ships, mainly dry bulk carriers, capitalizing on its strengths
cultivated over decades in the ship trading business. It also has an LNG carrier busi-ness that transports LNG pursuant to long-term charter contracts. Additionally, it is a hands-on provider of various value-added services and solutions, from ship sourcing and ownership structuring to management, chartering and selling ships.
With global cargo volumes projected to continue growing by virtue of global population growth and rising standards of living in Asia, the Middle East, Africa and elsewhere, the global maritime-cluster econ-omy is likewise expected to grow steadily. The Aerospace & Ship Division will run its businesses as a group of professionals that continues to create new value, partly by being first to identify needs in the global market.
AAEROSPACE & SHIP
DIVISION
Bulk carrier
Containership
LNG carrier
097CHAPTER 3
MANAGEMENT FOUNDATION OPERATING ACTIVITIES CORPORATE INFORMATIONSTRATEGY
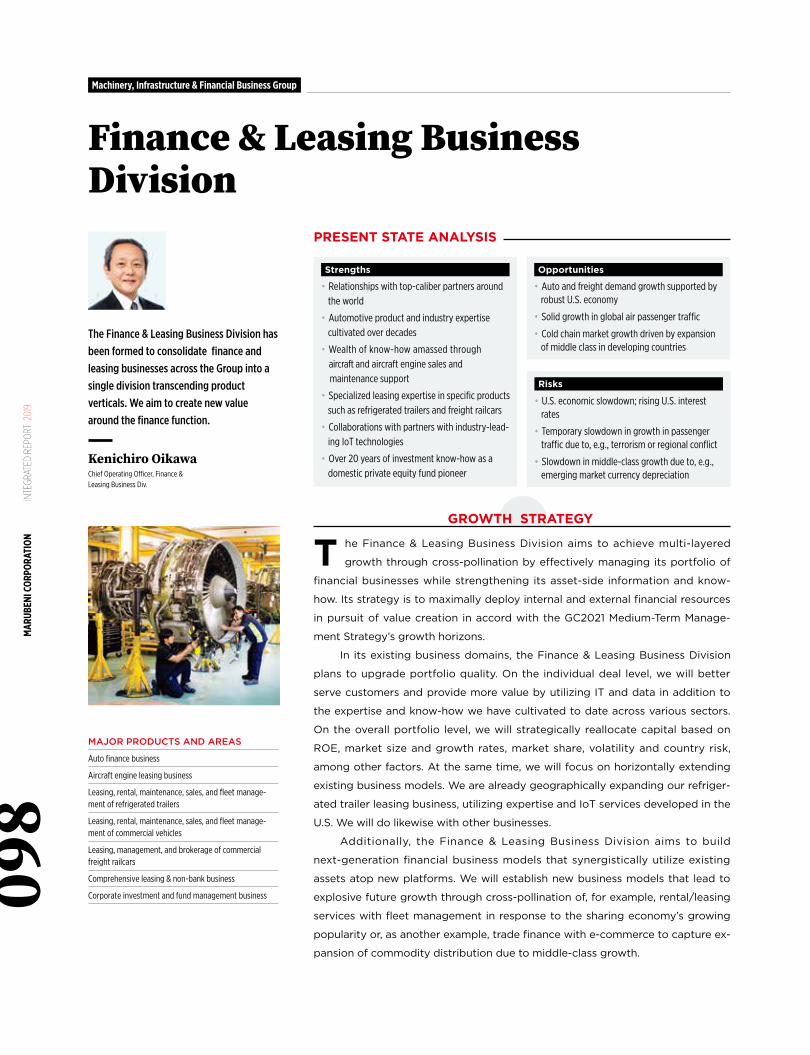
PRESENT STATE ANALYSIS
• Relationships with top-caliber partners around the world
• Automotive product and industry expertise cultivated over decades
• Wealth of know-how amassed through aircraft and aircraft engine sales and maintenance support
• Specialized leasing expertise in specific products such as refrigerated trailers and freight railcars
• Collaborations with partners with industry-lead-ing IoT technologies
• Over 20 years of investment know-how as a domestic private equity fund pioneer
• Auto and freight demand growth supported by robust U.S. economy
• Solid growth in global air passenger traffic
• Cold chain market growth driven by expansion of middle class in developing countries
• U.S. economic slowdown; rising U.S. interest rates
• Temporary slowdown in growth in passenger traffic due to, e.g., terrorism or regional conflict
• Slowdown in middle-class growth due to, e.g., emerging market currency depreciation
Strengths Opportunities
Risks
Kenichiro OikawaChief Operating Officer, Finance & Leasing Business Div.
GROWTH STRATEGY
The Finance & Leasing Business Division has been formed to consolidate finance and leasing businesses across the Group into a single division transcending productverticals. We aim to create new value around the finance function.
MAJOR PRODUCTS AND AREAS
Auto finance business
Aircraft engine leasing business
Leasing, rental, maintenance, sales, and fleet manage-ment of refrigerated trailers
Leasing, rental, maintenance, sales, and fleet manage-ment of commercial vehicles
Leasing, management, and brokerage of commercial freight railcars
Comprehensive leasing & non-bank business
Corporate investment and fund management business
T he Finance & Leasing Business Division aims to achieve multi-layered
growth through cross-pollination by effectively managing its portfolio of
financial businesses while strengthening its asset-side information and know-
how. Its strategy is to maximally deploy internal and external financial resources
in pursuit of value creation in accord with the GC2021 Medium-Term Manage-
ment Strategy’s growth horizons.
In its existing business domains, the Finance & Leasing Business Division
plans to upgrade portfolio quality. On the individual deal level, we will better
serve customers and provide more value by utilizing IT and data in addition to
the expertise and know-how we have cultivated to date across various sectors.
On the overall portfolio level, we will strategically reallocate capital based on
ROE, market size and growth rates, market share, volatility and country risk,
among other factors. At the same time, we will focus on horizontally extending
existing business models. We are already geographically expanding our refriger-
ated trailer leasing business, utilizing expertise and IoT services developed in the
U.S. We will do likewise with other businesses.
Additionally, the Finance & Leasing Business Division aims to build
next-generation financial business models that synergistically utilize existing
assets atop new platforms. We will establish new business models that lead to
explosive future growth through cross-pollination of, for example, rental/leasing
services with fleet management in response to the sharing economy’s growing
popularity or, as another example, trade finance with e-commerce to capture ex-
pansion of commodity distribution due to middle-class growth.
Finance & Leasing Business Division
Machinery, Infrastructure & Financial Business Group
098
MAR
UBEN
I COR
PORA
TION
IN
TEGR
ATED
REP
ORT
201
9
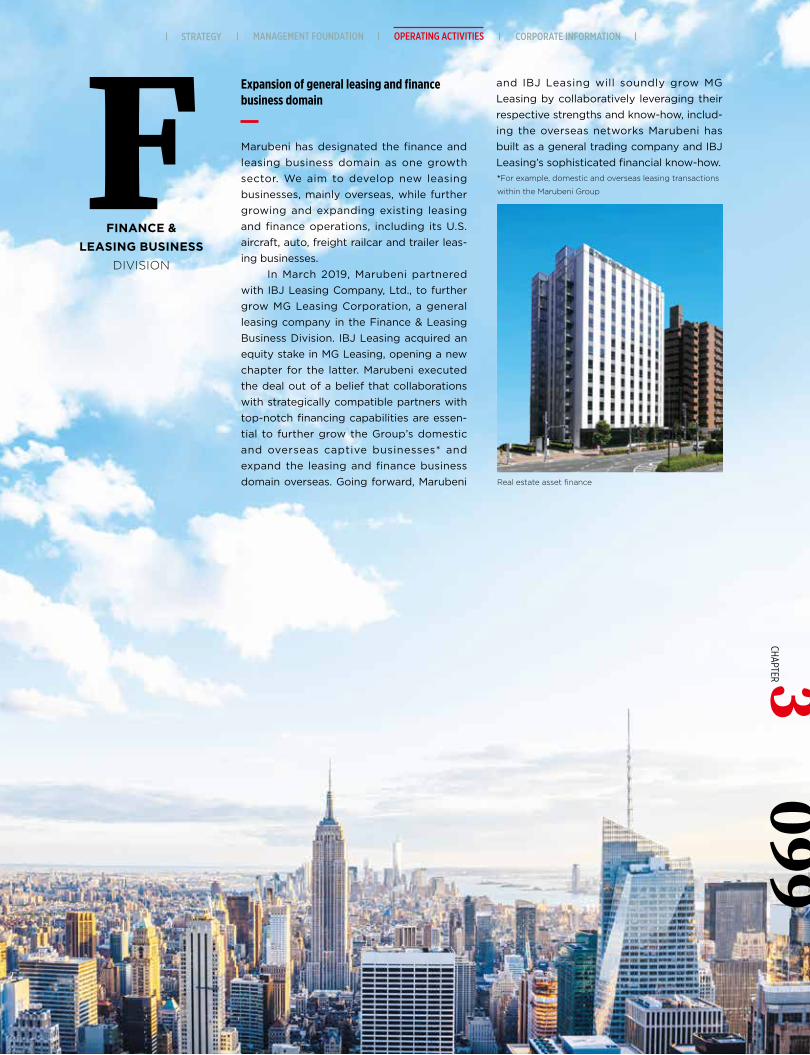
Expansion of general leasing and finance business domain
Marubeni has designated the finance and leasing business domain as one growth sector. We aim to develop new leasing businesses, mainly overseas, while further growing and expanding existing leasing and finance operations, including its U.S. aircraft, auto, freight railcar and trailer leas-ing businesses.
In March 2019, Marubeni partnered with IBJ Leasing Company, Ltd., to further grow MG Leasing Corporation, a general leasing company in the Finance & Leasing Business Division. IBJ Leasing acquired an equity stake in MG Leasing, opening a new chapter for the latter. Marubeni executed the deal out of a belief that collaborations with strategically compatible partners with top-notch financing capabilities are essen-tial to further grow the Group’s domestic and overseas captive businesses* and expand the leasing and finance business domain overseas. Going forward, Marubeni
and IBJ Leasing will soundly grow MG Leasing by collaboratively leveraging their respective strengths and know-how, includ-ing the overseas networks Marubeni has built as a general trading company and IBJ Leasing’s sophisticated financial know-how.F
FINANCE &LEASING BUSINESS
DIVISION
Real estate asset finance
*For example, domestic and overseas leasing transactions
within the Marubeni Group
MANAGEMENT FOUNDATION OPERATING ACTIVITIES CORPORATE INFORMATIONSTRATEGY099
3CHAPTER
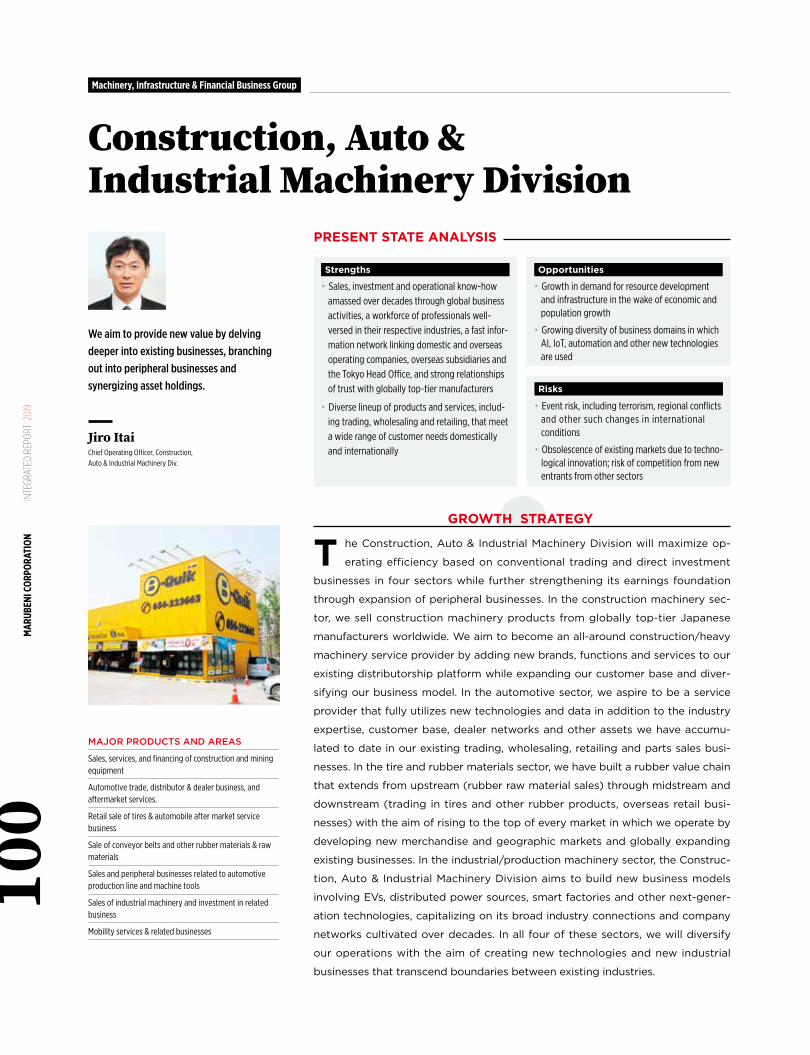
PRESENT STATE ANALYSIS
• Sales, investment and operational know-how amassed over decades through global business activities, a workforce of professionals well-versed in their respective industries, a fast infor-mation network linking domestic and overseas operating companies, overseas subsidiaries and the Tokyo Head Office, and strong relationships of trust with globally top-tier manufacturers
• Diverse lineup of products and services, includ-ing trading, wholesaling and retailing, that meet a wide range of customer needs domestically and internationally
• Growth in demand for resource development and infrastructure in the wake of economic and population growth
• Growing diversity of business domains in which AI, IoT, automation and other new technologies are used
• Event risk, including terrorism, regional conflicts and other such changes in international conditions
• Obsolescence of existing markets due to techno-logical innovation; risk of competition from new entrants from other sectors
Strengths Opportunities
Risks
Jiro ItaiChief Operating Officer, Construction, Auto & Industrial Machinery Div.
GROWTH STRATEGY
T he Construction, Auto & Industrial Machinery Division will maximize op-
erating efficiency based on conventional trading and direct investment
businesses in four sectors while further strengthening its earnings foundation
through expansion of peripheral businesses. In the construction machinery sec-
tor, we sell construction machinery products from globally top-tier Japanese
manufacturers worldwide. We aim to become an all-around construction/heavy
machinery service provider by adding new brands, functions and services to our
existing distributorship platform while expanding our customer base and diver-
sifying our business model. In the automotive sector, we aspire to be a service
provider that fully utilizes new technologies and data in addition to the industry
expertise, customer base, dealer networks and other assets we have accumu-
lated to date in our existing trading, wholesaling, retailing and parts sales busi-
nesses. In the tire and rubber materials sector, we have built a rubber value chain
that extends from upstream (rubber raw material sales) through midstream and
downstream (trading in tires and other rubber products, overseas retail busi-
nesses) with the aim of rising to the top of every market in which we operate by
developing new merchandise and geographic markets and globally expanding
existing businesses. In the industrial/production machinery sector, the Construc-
tion, Auto & Industrial Machinery Division aims to build new business models
involving EVs, distributed power sources, smart factories and other next-gener-
ation technologies, capitalizing on its broad industry connections and company
networks cultivated over decades. In all four of these sectors, we will diversify
our operations with the aim of creating new technologies and new industrial
businesses that transcend boundaries between existing industries.
We aim to provide new value by delving deeper into existing businesses, branching out into peripheral businesses and synergizing asset holdings.
MAJOR PRODUCTS AND AREAS
Sales, services, and financing of construction and mining equipment
Automotive trade, distributor & dealer business, and aftermarket services.
Retail sale of tires & automobile after market service business
Sale of conveyor belts and other rubber materials & raw materials
Sales and peripheral businesses related to automotive production line and machine tools
Sales of industrial machinery and investment in related business
Mobility services & related businesses
Construction, Auto & Industrial Machinery Division
Machinery, Infrastructure & Financial Business Group
MAR
UBEN
I COR
PORA
TION
IN
TEGR
ATED
REP
ORT
201
910
0
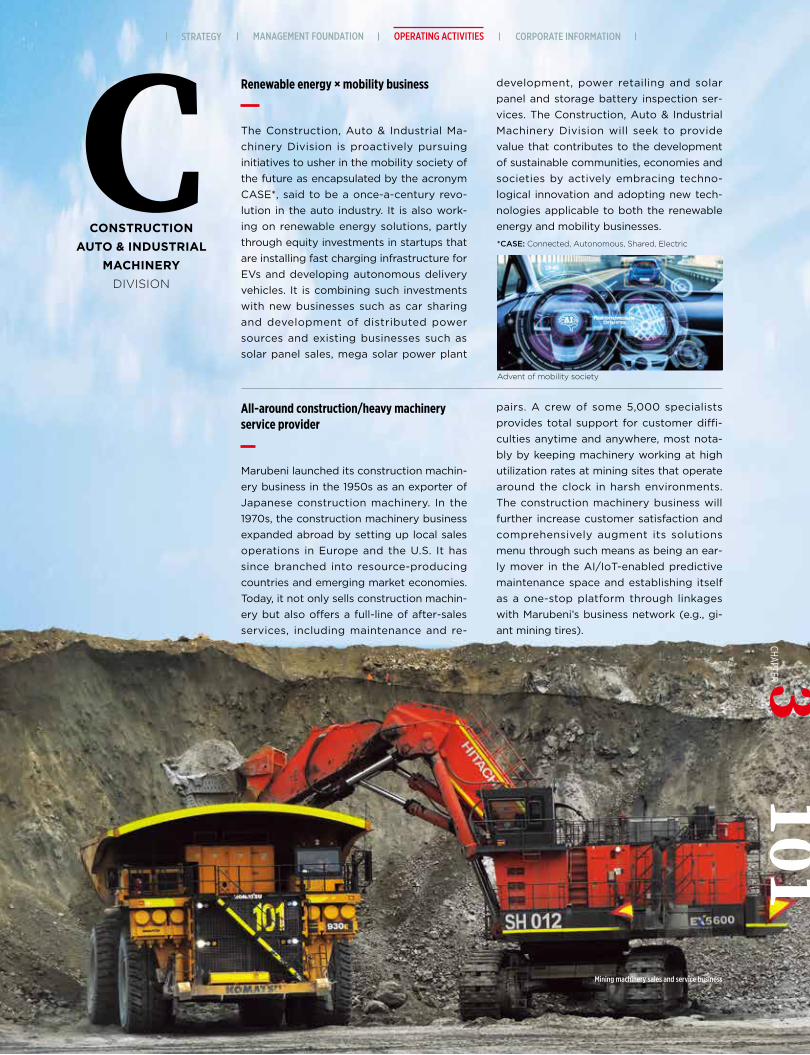
All-around construction/heavy machinery service provider
Marubeni launched its construction machin-ery business in the 1950s as an exporter of Japanese construction machinery. In the 1970s, the construction machinery business expanded abroad by setting up local sales operations in Europe and the U.S. It has since branched into resource-producing countries and emerging market economies. Today, it not only sells construction machin-ery but also offers a full-line of after-sales services, including maintenance and re-
Renewable energy × mobility business
The Construction, Auto & Industrial Ma-chinery Division is proactively pursuing initiatives to usher in the mobility society of the future as encapsulated by the acronym CASE*, said to be a once-a-century revo-lution in the auto industry. It is also work-ing on renewable energy solutions, partly through equity investments in startups that are installing fast charging infrastructure for EVs and developing autonomous delivery vehicles. It is combining such investments with new businesses such as car sharing and development of distributed power sources and existing businesses such as solar panel sales, mega solar power plant
pairs. A crew of some 5,000 specialists provides total support for customer diffi-culties anytime and anywhere, most nota-bly by keeping machinery working at high utilization rates at mining sites that operate around the clock in harsh environments. The construction machinery business will further increase customer satisfaction and comprehensively augment its solutions menu through such means as being an ear-ly mover in the AI/IoT-enabled predictive maintenance space and establishing itself as a one-stop platform through linkages with Marubeni’s business network (e.g., gi-ant mining tires).
development, power retailing and solar panel and storage battery inspection ser-vices. The Construction, Auto & Industrial Machinery Division will seek to provide value that contributes to the development of sustainable communities, economies and societies by actively embracing techno-logical innovation and adopting new tech-nologies applicable to both the renewable energy and mobility businesses.
CCONSTRUCTION
AUTO & INDUSTRIAL MACHINERY
DIVISION
Advent of mobility society
*CASE: Connected, Autonomous, Shared, Electric
Mining machinery sales and service business
MANAGEMENT FOUNDATION OPERATING ACTIVITIES CORPORATE INFORMATIONSTRATEGY3
101CHAPTER
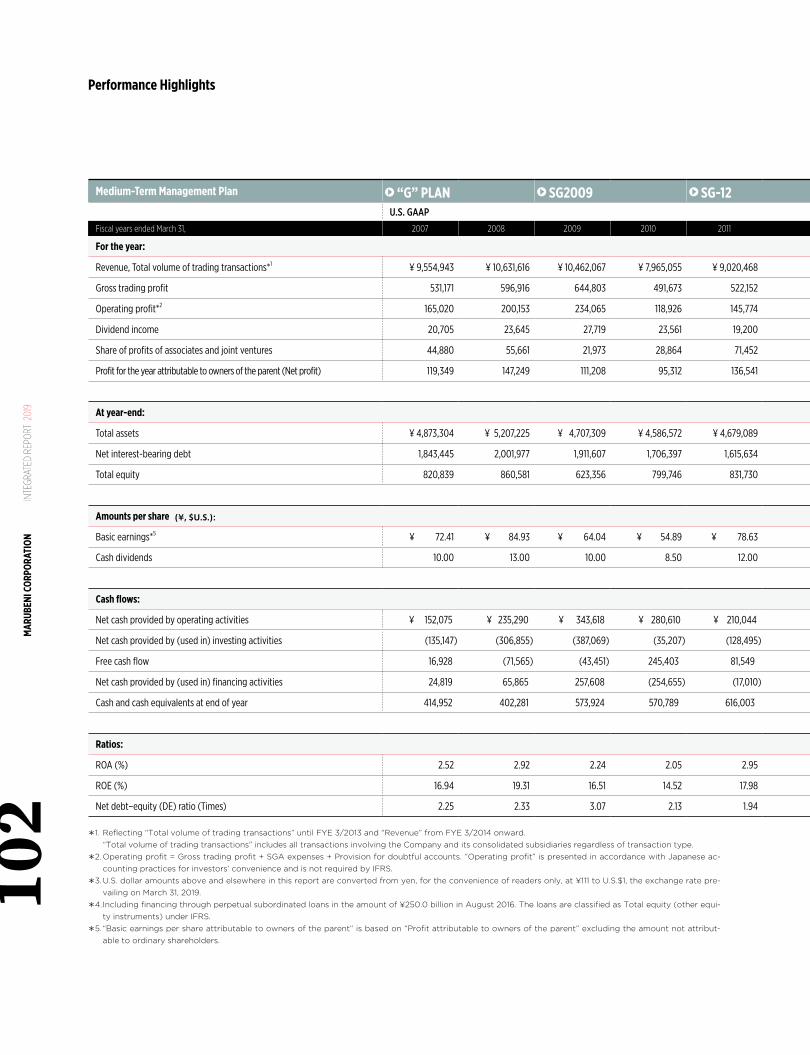
Medium-Term Management Plan “G” PLAN SG2009 SG-12 GC2015 GC2018U.S. GAAP IFRS (Millions of yen) (Millions of U.S. dollers)*3
Fiscal years ended March 31, 2007 2008 2009 2010 2011 2012 2013 2014 2015 2016 2017 2018 2019 2019
For the year:
Revenue, Total volume of trading transactions*1 ¥ 9,554,943 ¥ 10,631,616 ¥ 10,462,067 ¥ 7,965,055 ¥ 9,020,468 ¥ 10,584,393 ¥ 10,509,088 ¥ 7,055,700 ¥ 7,834,295 ¥ 7,300,299 ¥ 7,128,805 ¥ 7,540,337 ¥ 7,401,256 $ 66,678
Gross trading profit 531,171 596,916 644,803 491,673 522,152 541,454 528,194 651,063 707,318 670,086 613,880 677,237 729,675 6,574
Operating profit*2 165,020 200,153 234,065 118,926 145,774 157,315 122,932 157,462 160,688 104,231 91,597 118,054 173,009 1,559
Dividend income 20,705 23,645 27,719 23,561 19,200 27,351 30,112 34,917 34,957 18,555 17,512 21,254 37,336 336
Share of profits of associates and joint ventures 44,880 55,661 21,973 28,864 71,452 81,528 87,790 99,405 89,919 31,824 114,725 148,503 85,278 768
Profit for the year attributable to owners of the parent (Net profit) 119,349 147,249 111,208 95,312 136,541 172,125 205,696 210,945 105,604 62,264 155,350 211,259 230,891 2,080
At year-end:
Total assets ¥ 4,873,304 ¥ 5,207,225 ¥ 4,707,309 ¥ 4,586,572 ¥ 4,679,089 ¥ 5,129,887 ¥ 5,965,086 ¥ 7,256,085 ¥ 7,673,064 ¥ 7,117,686 ¥ 6,896,733 ¥ 6,877,117 ¥ 6,809,077 $ 61,343
Net interest-bearing debt 1,843,445 2,001,977 1,911,607 1,706,397 1,615,634 1,755,705 1,785,247 2,491,043 2,887,608 2,762,453 2,099,939 1,915,824 1,858,839 16,746
Total equity 820,839 860,581 623,356 799,746 831,730 915,770 1,188,379 1,531,231 1,678,713 1,415,202 1,742,758*4 1,835,637*4 2,071,726*4 18,664
Amounts per share (¥, $U.S.):
Basic earnings*5 ¥ 72.41 ¥ 84.93 ¥ 64.04 ¥ 54.89 ¥ 78.63 ¥ 99.13 ¥ 118.48 ¥ 121.52 ¥ 60.85 ¥ 35.88 ¥ 88.08 ¥ 119.43 ¥ 130.74 $ 1.18
Cash dividends 10.00 13.00 10.00 8.50 12.00 20.00 24.00 25.00 26.00 21.00 23.00 31.00 34.00 0.31
Cash flows:
Net cash provided by operating activities ¥ 152,075 ¥ 235,290 ¥ 343,618 ¥ 280,610 ¥ 210,044 ¥ 172,599 ¥ 295,734 ¥ 291,188 ¥ 170,943 ¥ 359,132 ¥ 324,263 ¥ 253,423 ¥ 284,895 $ 2,567
Net cash provided by (used in) investing activities (135,147) (306,855) (387,069) (35,207) (128,495) (273,689) (210,878) (706,585) (331,411) (174,596) 46,504 (49,742) 22,528 203
Free cash flow 16,928 (71,565) (43,451) 245,403 81,549 (101,090) 84,856 (415,397) (160,468) 184,536 370,767 203,681 307,423 2,770
Net cash provided by (used in) financing activities 24,819 65,865 257,608 (254,655) (17,010) 171,913 129,030 196,779 (70,705) (36,268) (258,123) (269,507) (427,420) (3,851)
Cash and cash equivalents at end of year 414,952 402,281 573,924 570,789 616,003 677,312 919,475 665,498 469,106 600,840 704,972 625,834 509,288 4,588
Ratios:
ROA (%) 2.52 2.92 2.24 2.05 2.95 3.51 3.71 3.15 1.41 0.84 2.22 3.07 3.37
ROE (%) 16.94 19.31 16.51 14.52 17.98 21.17 20.74 16.67 7.28 4.39 11.09 13.97 13.92
Net debt–equity (DE) ratio (Times) 2.25 2.33 3.07 2.13 1.94 1.92 1.50 1.63 1.72 1.95 1.20 1.04 0.90
Performance Highlights
*1. Reflecting “Total volume of trading transactions” until FYE 3/2013 and “Revenue” from FYE 3/2014 onward. “Total volume of trading transactions” includes all transactions involving the Company and its consolidated subsidiaries regardless of transaction type.
*2. Operating profit = Gross trading profit + SGA expenses + Provision for doubtful accounts. “Operating profit” is presented in accordance with Japanese ac-counting practices for investors’ convenience and is not required by IFRS.
*3. U.S. dollar amounts above and elsewhere in this report are converted from yen, for the convenience of readers only, at ¥111 to U.S.$1, the exchange rate pre-vailing on March 31, 2019.
*4. Including financing through perpetual subordinated loans in the amount of ¥250.0 billion in August 2016. The loans are classified as Total equity (other equi-ty instruments) under IFRS.
*5. “Basic earnings per share attributable to owners of the parent” is based on “Profit attributable to owners of the parent” excluding the amount not attribut-able to ordinary shareholders.
MAR
UBEN
I COR
PORA
TION
IN
TEGR
ATED
REP
ORT
201
910
2
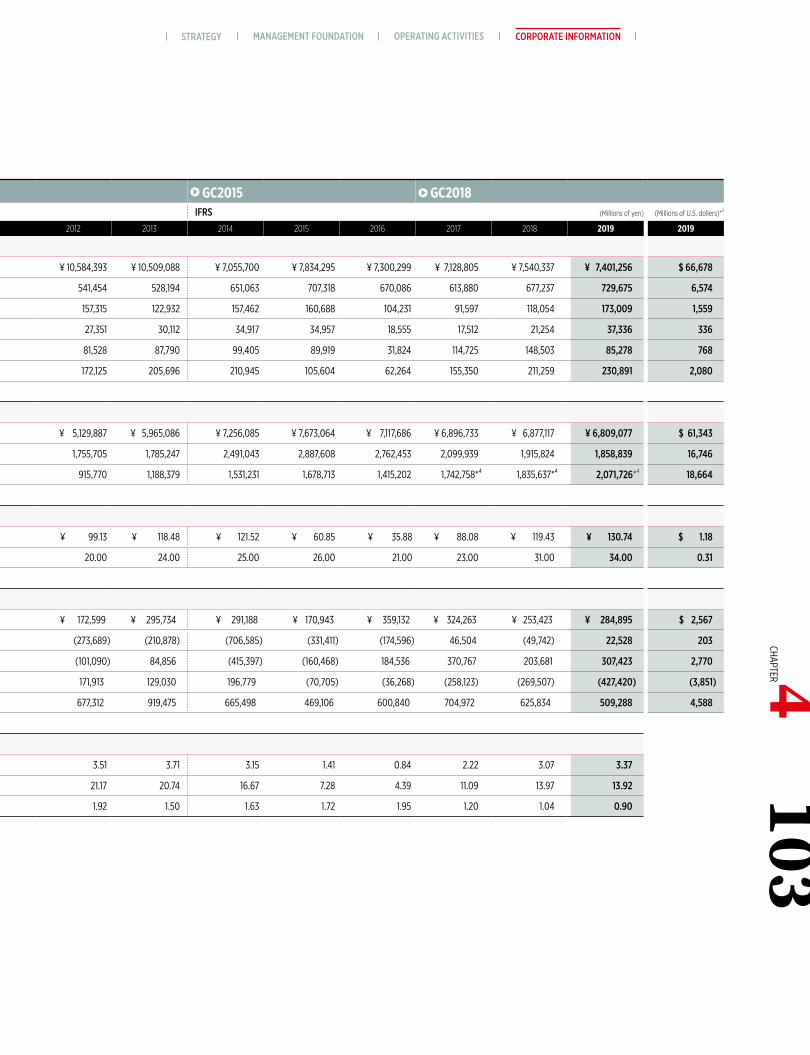
Medium-Term Management Plan “G” PLAN SG2009 SG-12 GC2015 GC2018U.S. GAAP IFRS (Millions of yen) (Millions of U.S. dollers)*3
Fiscal years ended March 31, 2007 2008 2009 2010 2011 2012 2013 2014 2015 2016 2017 2018 2019 2019
For the year:
Revenue, Total volume of trading transactions*1 ¥ 9,554,943 ¥ 10,631,616 ¥ 10,462,067 ¥ 7,965,055 ¥ 9,020,468 ¥ 10,584,393 ¥ 10,509,088 ¥ 7,055,700 ¥ 7,834,295 ¥ 7,300,299 ¥ 7,128,805 ¥ 7,540,337 ¥ 7,401,256 $ 66,678
Gross trading profit 531,171 596,916 644,803 491,673 522,152 541,454 528,194 651,063 707,318 670,086 613,880 677,237 729,675 6,574
Operating profit*2 165,020 200,153 234,065 118,926 145,774 157,315 122,932 157,462 160,688 104,231 91,597 118,054 173,009 1,559
Dividend income 20,705 23,645 27,719 23,561 19,200 27,351 30,112 34,917 34,957 18,555 17,512 21,254 37,336 336
Share of profits of associates and joint ventures 44,880 55,661 21,973 28,864 71,452 81,528 87,790 99,405 89,919 31,824 114,725 148,503 85,278 768
Profit for the year attributable to owners of the parent (Net profit) 119,349 147,249 111,208 95,312 136,541 172,125 205,696 210,945 105,604 62,264 155,350 211,259 230,891 2,080
At year-end:
Total assets ¥ 4,873,304 ¥ 5,207,225 ¥ 4,707,309 ¥ 4,586,572 ¥ 4,679,089 ¥ 5,129,887 ¥ 5,965,086 ¥ 7,256,085 ¥ 7,673,064 ¥ 7,117,686 ¥ 6,896,733 ¥ 6,877,117 ¥ 6,809,077 $ 61,343
Net interest-bearing debt 1,843,445 2,001,977 1,911,607 1,706,397 1,615,634 1,755,705 1,785,247 2,491,043 2,887,608 2,762,453 2,099,939 1,915,824 1,858,839 16,746
Total equity 820,839 860,581 623,356 799,746 831,730 915,770 1,188,379 1,531,231 1,678,713 1,415,202 1,742,758*4 1,835,637*4 2,071,726*4 18,664
Amounts per share (¥, $U.S.):
Basic earnings*5 ¥ 72.41 ¥ 84.93 ¥ 64.04 ¥ 54.89 ¥ 78.63 ¥ 99.13 ¥ 118.48 ¥ 121.52 ¥ 60.85 ¥ 35.88 ¥ 88.08 ¥ 119.43 ¥ 130.74 $ 1.18
Cash dividends 10.00 13.00 10.00 8.50 12.00 20.00 24.00 25.00 26.00 21.00 23.00 31.00 34.00 0.31
Cash flows:
Net cash provided by operating activities ¥ 152,075 ¥ 235,290 ¥ 343,618 ¥ 280,610 ¥ 210,044 ¥ 172,599 ¥ 295,734 ¥ 291,188 ¥ 170,943 ¥ 359,132 ¥ 324,263 ¥ 253,423 ¥ 284,895 $ 2,567
Net cash provided by (used in) investing activities (135,147) (306,855) (387,069) (35,207) (128,495) (273,689) (210,878) (706,585) (331,411) (174,596) 46,504 (49,742) 22,528 203
Free cash flow 16,928 (71,565) (43,451) 245,403 81,549 (101,090) 84,856 (415,397) (160,468) 184,536 370,767 203,681 307,423 2,770
Net cash provided by (used in) financing activities 24,819 65,865 257,608 (254,655) (17,010) 171,913 129,030 196,779 (70,705) (36,268) (258,123) (269,507) (427,420) (3,851)
Cash and cash equivalents at end of year 414,952 402,281 573,924 570,789 616,003 677,312 919,475 665,498 469,106 600,840 704,972 625,834 509,288 4,588
Ratios:
ROA (%) 2.52 2.92 2.24 2.05 2.95 3.51 3.71 3.15 1.41 0.84 2.22 3.07 3.37
ROE (%) 16.94 19.31 16.51 14.52 17.98 21.17 20.74 16.67 7.28 4.39 11.09 13.97 13.92
Net debt–equity (DE) ratio (Times) 2.25 2.33 3.07 2.13 1.94 1.92 1.50 1.63 1.72 1.95 1.20 1.04 0.90
MANAGEMENT FOUNDATION OPERATING ACTIVITIES CORPORATE INFORMATIONSTRATEGY103
CHAPTER 4
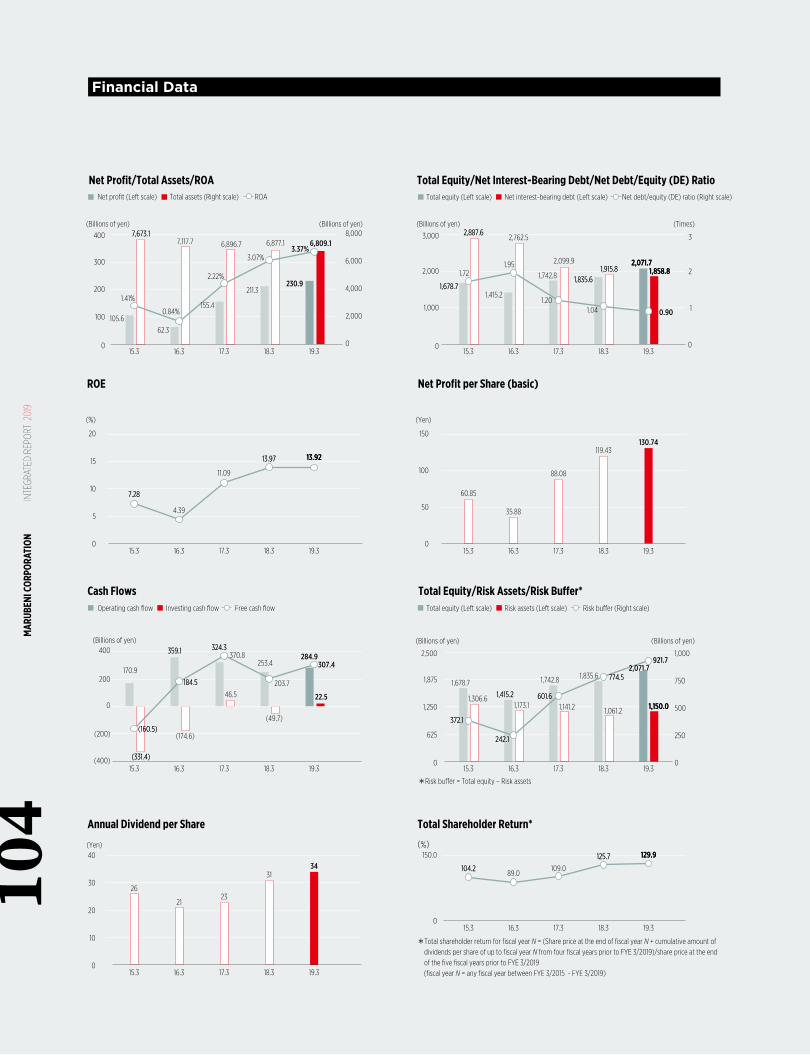
0
625
1,250
1,875
2,500
0
250
500
750
1,000
Net Profit/Total Assets/ROA
Annual Dividend per Share
ROE
(400)
(200)
0
400
200170.9
(160.5)(160.5)
184.5184.5
370.8
(331.4)(331.4)
(174.6)
46.5
284.9
22.5
1,678.7 1,742.8
372.1372.1
242.1242.1
601.6601.61,306.61,173.1 1,141.2
1,835.6 774.5774.5
1,061.2
2,071.7
1,150.01,150.0
921.7
2326
21
3431
10
20
30
40
0
959
20
500
1,000
750
0
5,0215,000
10,000
15,000
5,000
10,000
15,000
0
200
40,000
50,000
60,000
018.317.316.315.3
19.318.317.316.315.3
19.318.317.316.315.3
51,025 100
90
1.0
105
120
0
38,830 39,914 39,952
25.9%25.9% 26.3%26.3% 26.8%26.8%
4,379
2,000
4,000
6,000
15,000
30,000
45,000
0
0
0
74.1%74.1% 73.7%73.7% 73.2%
26.8%26.8%
73.2%
4.665.8 5.9
5555
28
5142 45 47
20
40
80
60
73
43 43 54
0
ENVIRONMENTAL DATA*1
7,673.17,673.1
0 019.318.317.316.315.3
19.318.317.316.315.3
19.318.317.316.315.3
19.318.317.316.315.3
19.318.317.316.315.3
18.3
116
19.317.316.315.3
19.318.317.316.315.3
19.318.30
100
200
300
400
2,000
4,000
6,000
8,000
105.6
62.3
155.41.41%
0.84%
2.22%
7,117.7 6,896.7
211.3
3.07%
6,877.1
230.9
3.37%6,809.1
2,887.62,887.6
2,071.72,071.71,858.8 1,858.8
1,678.71,678.7
1
2
3
0
1,415.2
1,742.81.721.95
1.20
2,762.5
2,099.9
0.90
1,835.61,835.61,915.81,915.8
1.04
0
1,000
2,000
3,000
19.318.317.316.315.3
19.318.317.316.315.3
19.318.317.316.315.3
7.287.28
4.39
11.09
13.9713.97 13.9213.92
0
5
10
15
20
1,0351,035907
17.316.315.3
4.5154.515 4.9784.978
41,353
4,4374,437 4,4584,458 4,4364,436
27.0%27.0%
73.0%
42,882
4,418 4,418
3.73.7
5.45.4
3737
359.1359.1 324.3324.3
307.4
203.7
(49.7)
253.4
1,415.21,415.2
9,4739,473 9,1679,1677,2397,239
12,74012,74012,64512,64513,53213,532
5,180
14,38414,384
9797
50,52950,529
19.3
55,256
0.5310.5310.7910.791
109109
Net profit (Left scale) Total assets (Right scale) ROA
Greenhouse Gas (CO2) Emissions (Energy-Related)Marubeni Corporation’s six principal o�ces·Scope 1 Marubeni Corporation’s six principal o�ces·Scope 2Marubeni Corporation’s other o�ces + consolidated subsidiaries·Scope 1 Marubeni Corporation’s other o�ces + consolidated subsidiaries·Scope 2
(Billions of yen) (Billions of yen)
(%)
Total Shareholder Return*
19.318.317.316.315.3
104.2104.289.0
109.0
125.7125.7 129.9129.9
0
150.0(%)(Yen)
Net Profit per Share (basic)
60.85
35.88
88.08
50
100
150
0
119.43130.74
(Yen)
Cash Flows Total Equity/Risk Assets/Risk Bu�er*
(Billions of yen) (Billions of yen)
(People) (People)
(%)
(People)
(Billions of yen)
(Billions of yen)(kiloton-CO2)
(Thousand m3)(kiloton)
Electricity consumption (MWh) Energy consumption (TJ)(Times)
Operating cash flow Investing cash flow Free cash flow
Total Equity/Net Interest-Bearing Debt/Net Debt/Equity (DE) RatioTotal equity (Left scale) Net interest-bearing debt (Left scale) Net debt/equity (DE) ratio (Right scale)
Water WithdrawalMarubeni Corporation’s six principal o�ces Others of Marubeni Corporation + consolidated subsidiaries
Waste GeneratedMarubeni Corporation’s six principal o�ces Others of Marubeni Corporation + consolidated subsidiaries
Energy ConsumptionElectricity consumption of Marubeni Corporation’s six principal o�ces (Left scale)Energy consumption of Marubeni Corporation + consolidated subsidiaries (Right scale)
Total equity (Left scale) Risk assets (Left scale) Risk bu¢er (Right scale)
*Risk bu¢er = Total equity – Risk assets
No. of Employees (Consolidated)*2/No. of Employees (Non-consolidated)*3/Percentage of Males and Females*4
The Ratio of Females in Managerial Positions*4
No. of Employees Who Took Maternity Leave*5/No. of Employees Who Took Childcare Leave*6
No. of employees (Consolidated) (Left scale) No. of employees (Non-consolidated) (Right scale)Percentage of males Percentage of females
No. of employees who took maternity leave No. of employees who took childcare leave
*1. The boundaries of the environmental data:● For FYE 3/2015 - FYE 3/2016 Marubeni Corporation’s six principal o�ces (Tokyo Head O�ce, plus Hokkaido,
Chubu, Osaka, Kyushu, and Shizuoka Branches). Due to the relocation of the Osaka Branch in July 2015, the energy consumption of the o�ce in July is calculated based on figures at both its previous and current site for FYE 3/2016 data.
● From FYE 3/2017Marubeni Corporation and its domestic and international consolidated subsidiaries, excluding Helena Agri-Enterprises, LLC, and the subsidiaries that are designated to be liquidated or sold. From FYE 3/2019, the grain procurement and export company based in northern U.S., which was not included in FYE 3/2017 and FYE 3/2018, has been included.
Greenhouse gas (CO2) emissions (energy-related):● CO2 emission factors stipulated by the Act on Promotion of Global Warming Countermeasures are used for
fuel and steam.● Emission factors for electricity:
Emission factors for each electric power provider released by the Ministry of the Environment (actual emission factors) are used for Marubeni Corporation. International Energy Agency (IEA) 2016 emission factors by country (CO2 emissions per kWh from electricity generation) are used for the domestic and international consolidated subsidiaries.
● CO2 emission factors for city gas:For FYE 3/2015, emission factors released by the gas companies in each location of the six principal o�ces are used.From FYE 3/2016, the emission factor stipulated by the Act on Promotion of Global Warming Countermea-sures is used.
● For FYE 3/2018, kerosene, diesel oil and gasoline are included. In FYE 3/2018, CO2 emissions associated with consumption of kerosene, diesel and gasoline totaled 25 thousand metric tons of CO2.
Energy Consumption● 3.6 GJ/MWh is used for heat value per unit for electricity.● The heat values per unit described in the Law Concerning the Promotion of Measures to Cope with Global
Warming are used for fuel.● Biomass energy is not included.Waste Generated● Materials with resale or reuse value are not included.
*2. As of March 31.
*3. Total figures include the number of Marubeni employees assigned to other companies and exclude secondees to Marubeni from other companies (as of March 31).
*4. Figures for Marubeni Corporation (non-consolidated basis as of March 31).
*5. Figures for Marubeni Corporation. Indicate the total number of people who used leave in the fiscal year, including those who used the leave continuously from the previous fiscal year.
*6. Figures for Marubeni Corporation. Indicate the total number of people who started using leave in the applicable fiscal year.
SOCIAL DATA
52,375
*Total shareholder return for fiscal year N = (Share price at the end of fiscal year N + cumulative amount of dividends per share of up to fiscal year N from four fiscal years prior to FYE 3/2019)/share price at the end of the five fiscal years prior to FYE 3/2019
(fiscal year N = any fiscal year between FYE 3/2015 - FYE 3/2019)
Financial Data
MAR
UBEN
I COR
PORA
TION
IN
TEGR
ATED
REP
ORT
201
910
4
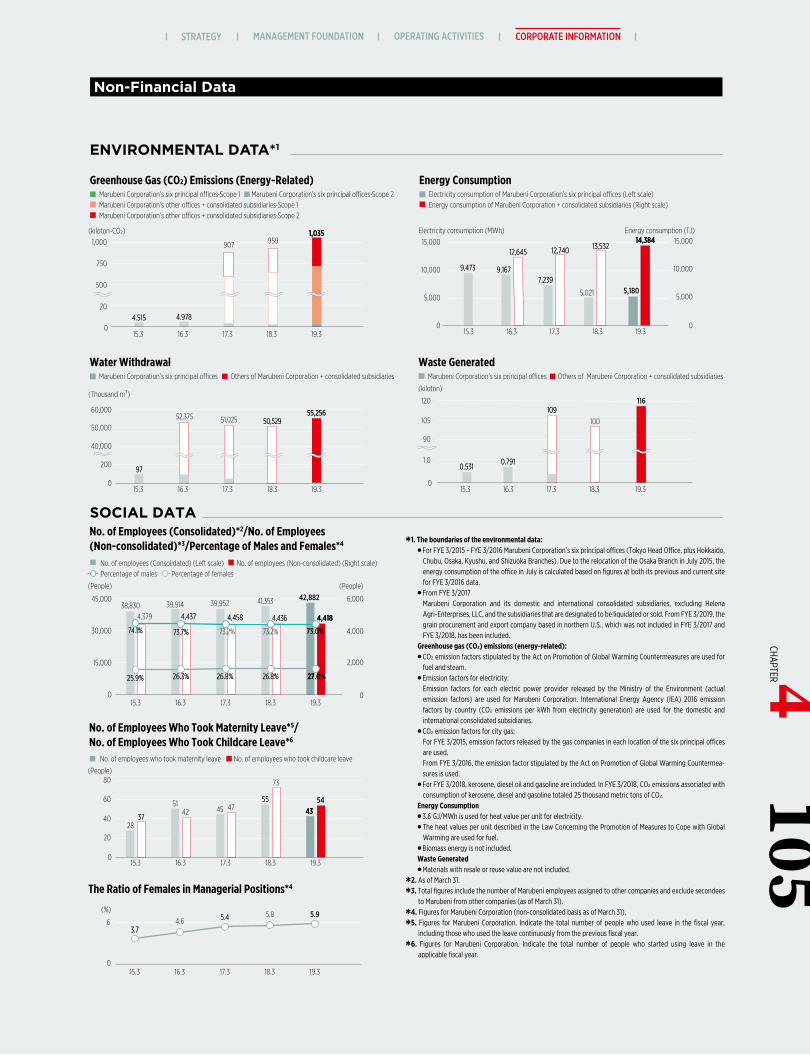
0
625
1,250
1,875
2,500
0
250
500
750
1,000
Net Profit/Total Assets/ROA
Annual Dividend per Share
ROE
(400)
(200)
0
400
200170.9
(160.5)(160.5)
184.5184.5
370.8
(331.4)(331.4)
(174.6)
46.5
284.9
22.5
1,678.7 1,742.8
372.1372.1
242.1242.1
601.6601.61,306.61,173.1 1,141.2
1,835.6 774.5774.5
1,061.2
2,071.7
1,150.01,150.0
921.7
2326
21
3431
10
20
30
40
0
959
20
500
1,000
750
0
5,0215,000
10,000
15,000
5,000
10,000
15,000
0
200
40,000
50,000
60,000
018.317.316.315.3
19.318.317.316.315.3
19.318.317.316.315.3
51,025 100
90
1.0
105
120
0
38,830 39,914 39,952
25.9%25.9% 26.3%26.3% 26.8%26.8%
4,379
2,000
4,000
6,000
15,000
30,000
45,000
0
0
0
74.1%74.1% 73.7%73.7% 73.2%
26.8%26.8%
73.2%
4.665.8 5.9
5555
28
5142 45 47
20
40
80
60
73
43 43 54
0
ENVIRONMENTAL DATA*1
7,673.17,673.1
0 019.318.317.316.315.3
19.318.317.316.315.3
19.318.317.316.315.3
19.318.317.316.315.3
19.318.317.316.315.3
18.3
116
19.317.316.315.3
19.318.317.316.315.3
19.318.30
100
200
300
400
2,000
4,000
6,000
8,000
105.6
62.3
155.41.41%
0.84%
2.22%
7,117.7 6,896.7
211.3
3.07%
6,877.1
230.9
3.37%6,809.1
2,887.62,887.6
2,071.72,071.71,858.8 1,858.8
1,678.71,678.7
1
2
3
0
1,415.2
1,742.81.721.95
1.20
2,762.5
2,099.9
0.90
1,835.61,835.61,915.81,915.8
1.04
0
1,000
2,000
3,000
19.318.317.316.315.3
19.318.317.316.315.3
19.318.317.316.315.3
7.287.28
4.39
11.09
13.9713.97 13.9213.92
0
5
10
15
20
1,0351,035907
17.316.315.3
4.5154.515 4.9784.978
41,353
4,4374,437 4,4584,458 4,4364,436
27.0%27.0%
73.0%
42,882
4,418 4,418
3.73.7
5.45.4
3737
359.1359.1 324.3324.3
307.4
203.7
(49.7)
253.4
1,415.21,415.2
9,4739,473 9,1679,1677,2397,239
12,74012,74012,64512,64513,53213,532
5,180
14,38414,384
9797
50,52950,529
19.3
55,256
0.5310.5310.7910.791
109109
Net profit (Left scale) Total assets (Right scale) ROA
Greenhouse Gas (CO2) Emissions (Energy-Related)Marubeni Corporation’s six principal o�ces·Scope 1 Marubeni Corporation’s six principal o�ces·Scope 2Marubeni Corporation’s other o�ces + consolidated subsidiaries·Scope 1 Marubeni Corporation’s other o�ces + consolidated subsidiaries·Scope 2
(Billions of yen) (Billions of yen)
(%)
Total Shareholder Return*
19.318.317.316.315.3
104.2104.289.0
109.0
125.7125.7 129.9129.9
0
150.0(%)(Yen)
Net Profit per Share (basic)
60.85
35.88
88.08
50
100
150
0
119.43130.74
(Yen)
Cash Flows Total Equity/Risk Assets/Risk Bu�er*
(Billions of yen) (Billions of yen)
(People) (People)
(%)
(People)
(Billions of yen)
(Billions of yen)(kiloton-CO2)
(Thousand m3)(kiloton)
Electricity consumption (MWh) Energy consumption (TJ)(Times)
Operating cash flow Investing cash flow Free cash flow
Total Equity/Net Interest-Bearing Debt/Net Debt/Equity (DE) RatioTotal equity (Left scale) Net interest-bearing debt (Left scale) Net debt/equity (DE) ratio (Right scale)
Water WithdrawalMarubeni Corporation’s six principal o�ces Others of Marubeni Corporation + consolidated subsidiaries
Waste GeneratedMarubeni Corporation’s six principal o�ces Others of Marubeni Corporation + consolidated subsidiaries
Energy ConsumptionElectricity consumption of Marubeni Corporation’s six principal o�ces (Left scale)Energy consumption of Marubeni Corporation + consolidated subsidiaries (Right scale)
Total equity (Left scale) Risk assets (Left scale) Risk bu¢er (Right scale)
*Risk bu¢er = Total equity – Risk assets
No. of Employees (Consolidated)*2/No. of Employees (Non-consolidated)*3/Percentage of Males and Females*4
The Ratio of Females in Managerial Positions*4
No. of Employees Who Took Maternity Leave*5/No. of Employees Who Took Childcare Leave*6
No. of employees (Consolidated) (Left scale) No. of employees (Non-consolidated) (Right scale)Percentage of males Percentage of females
No. of employees who took maternity leave No. of employees who took childcare leave
*1. The boundaries of the environmental data:● For FYE 3/2015 - FYE 3/2016 Marubeni Corporation’s six principal o�ces (Tokyo Head O�ce, plus Hokkaido,
Chubu, Osaka, Kyushu, and Shizuoka Branches). Due to the relocation of the Osaka Branch in July 2015, the energy consumption of the o�ce in July is calculated based on figures at both its previous and current site for FYE 3/2016 data.
● From FYE 3/2017Marubeni Corporation and its domestic and international consolidated subsidiaries, excluding Helena Agri-Enterprises, LLC, and the subsidiaries that are designated to be liquidated or sold. From FYE 3/2019, the grain procurement and export company based in northern U.S., which was not included in FYE 3/2017 and FYE 3/2018, has been included.
Greenhouse gas (CO2) emissions (energy-related):● CO2 emission factors stipulated by the Act on Promotion of Global Warming Countermeasures are used for
fuel and steam.● Emission factors for electricity:
Emission factors for each electric power provider released by the Ministry of the Environment (actual emission factors) are used for Marubeni Corporation. International Energy Agency (IEA) 2016 emission factors by country (CO2 emissions per kWh from electricity generation) are used for the domestic and international consolidated subsidiaries.
● CO2 emission factors for city gas:For FYE 3/2015, emission factors released by the gas companies in each location of the six principal o�ces are used.From FYE 3/2016, the emission factor stipulated by the Act on Promotion of Global Warming Countermea-sures is used.
● For FYE 3/2018, kerosene, diesel oil and gasoline are included. In FYE 3/2018, CO2 emissions associated with consumption of kerosene, diesel and gasoline totaled 25 thousand metric tons of CO2.
Energy Consumption● 3.6 GJ/MWh is used for heat value per unit for electricity.● The heat values per unit described in the Law Concerning the Promotion of Measures to Cope with Global
Warming are used for fuel.● Biomass energy is not included.Waste Generated● Materials with resale or reuse value are not included.
*2. As of March 31.
*3. Total figures include the number of Marubeni employees assigned to other companies and exclude secondees to Marubeni from other companies (as of March 31).
*4. Figures for Marubeni Corporation (non-consolidated basis as of March 31).
*5. Figures for Marubeni Corporation. Indicate the total number of people who used leave in the fiscal year, including those who used the leave continuously from the previous fiscal year.
*6. Figures for Marubeni Corporation. Indicate the total number of people who started using leave in the applicable fiscal year.
SOCIAL DATA
52,375
*Total shareholder return for fiscal year N = (Share price at the end of fiscal year N + cumulative amount of dividends per share of up to fiscal year N from four fiscal years prior to FYE 3/2019)/share price at the end of the five fiscal years prior to FYE 3/2019
(fiscal year N = any fiscal year between FYE 3/2015 - FYE 3/2019)
Non-Financial Data
MANAGEMENT FOUNDATION OPERATING ACTIVITIES CORPORATE INFORMATIONSTRATEGY105
CHAPTER 4
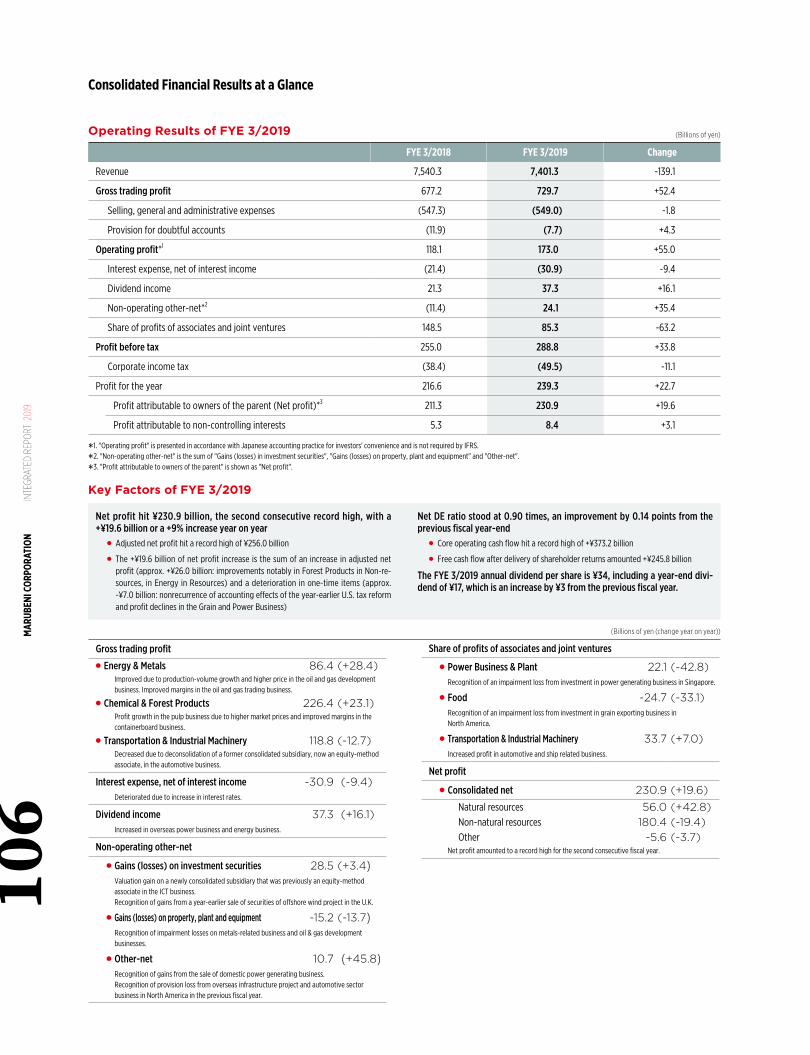
Operating Results of FYE 3/2019� (Billions of yen)
FYE 3/2018 FYE 3/2019 Change
Revenue 7,540.3 7,401.3 -139.1
Gross trading profit 677.2 729.7 +52.4
Selling, general and administrative expenses (547.3) (549.0) -1.8
Provision for doubtful accounts (11.9) (7.7) +4.3
Operating profit*1 118.1 173.0 +55.0
Interest expense, net of interest income (21.4) (30.9) -9.4
Dividend income 21.3 37.3 +16.1
Non-operating other-net*2 (11.4) 24.1 +35.4
Share of profits of associates and joint ventures 148.5 85.3 -63.2
Profit before tax 255.0 288.8 +33.8
Corporate income tax (38.4) (49.5) -11.1
Profit for the year 216.6 239.3 +22.7
Profit attributable to owners of the parent (Net profit)*3 211.3 230.9 +19.6
Profit attributable to non-controlling interests 5.3 8.4 +3.1
Net profit hit ¥230.9 billion, the second consecutive record high, with a +¥19.6 billion or a +9% increase year on year
● Adjusted net profit hit a record high of ¥256.0 billion
● The +¥19.6 billion of net profit increase is the sum of an increase in adjusted net profit (approx. +¥26.0 billion: improvements notably in Forest Products in Non-re-sources, in Energy in Resources) and a deterioration in one-time items (approx. -¥7.0 billion: nonrecurrence of accounting effects of the year-earlier U.S. tax reform and profit declines in the Grain and Power Business)
Net DE ratio stood at 0.90 times, an improvement by 0.14 points from the previous fiscal year-end
● Core operating cash flow hit a record high of +¥373.2 billion
● Free cash flow after delivery of shareholder returns amounted +¥245.8 billion
The FYE 3/2019 annual dividend per share is ¥34, including a year-end divi-dend of ¥17, which is an increase by ¥3 from the previous fiscal year.
Key Factors of FYE 3/2019
*1. "Operating profit" is presented in accordance with Japanese accounting practice for investors' convenience and is not required by IFRS.
*2. "Non-operating other-net" is the sum of "Gains (losses) in investment securities", "Gains (losses) on property, plant and equipment" and "Other-net".
*3. "Profit attributable to owners of the parent" is shown as "Net profit".
Gross trading profit● Energy & Metals 86.4 (+28.4)
Improved due to production-volume growth and higher price in the oil and gas development business. Improved margins in the oil and gas trading business.
● Chemical & Forest Products 226.4 (+23.1)Profit growth in the pulp business due to higher market prices and improved margins in the containerboard business.
● Transportation & Industrial Machinery 118.8 (-12.7)Decreased due to deconsolidation of a former consolidated subsidiary, now an equity-method associate, in the automotive business.
Interest expense, net of interest income -30.9 (-9.4)Deteriorated due to increase in interest rates.
Dividend income 37.3 (+16.1)Increased in overseas power business and energy business.
Non-operating other-net
● Gains (losses) on investment securities 28.5 (+3.4)Valuation gain on a newly consolidated subsidiary that was previously an equity-method associate in the ICT business. Recognition of gains from a year-earlier sale of securities of offshore wind project in the U.K.
● Gains (losses) on property, plant and equipment -15.2 (-13.7)Recognition of impairment losses on metals-related business and oil & gas development businesses.
● Other-net 10.7 (+45.8)Recognition of gains from the sale of domestic power generating business. Recognition of provision loss from overseas infrastructure project and automotive sector business in North America in the previous fiscal year.
Share of profits of associates and joint ventures
● Power Business & Plant 22.1 (-42.8)Recognition of an impairment loss from investment in power generating business in Singapore.
● Food -24.7 (-33.1)Recognition of an impairment loss from investment in grain exporting business in North America.
● Transportation & Industrial Machinery 33.7 (+7.0)Increased profit in automotive and ship related business.
Net profit
● Consolidated net 230.9 (+19.6) Natural resources 56.0 (+42.8) Non-natural resources 180.4 (-19.4) Other -5.6 (-3.7)Net profit amounted to a record high for the second consecutive fiscal year.
(Billions of yen (change year on year))MAR
UBEN
I COR
PORA
TION
IN
TEGR
ATED
REP
ORT
201
910
6Consolidated Financial Results at a Glance
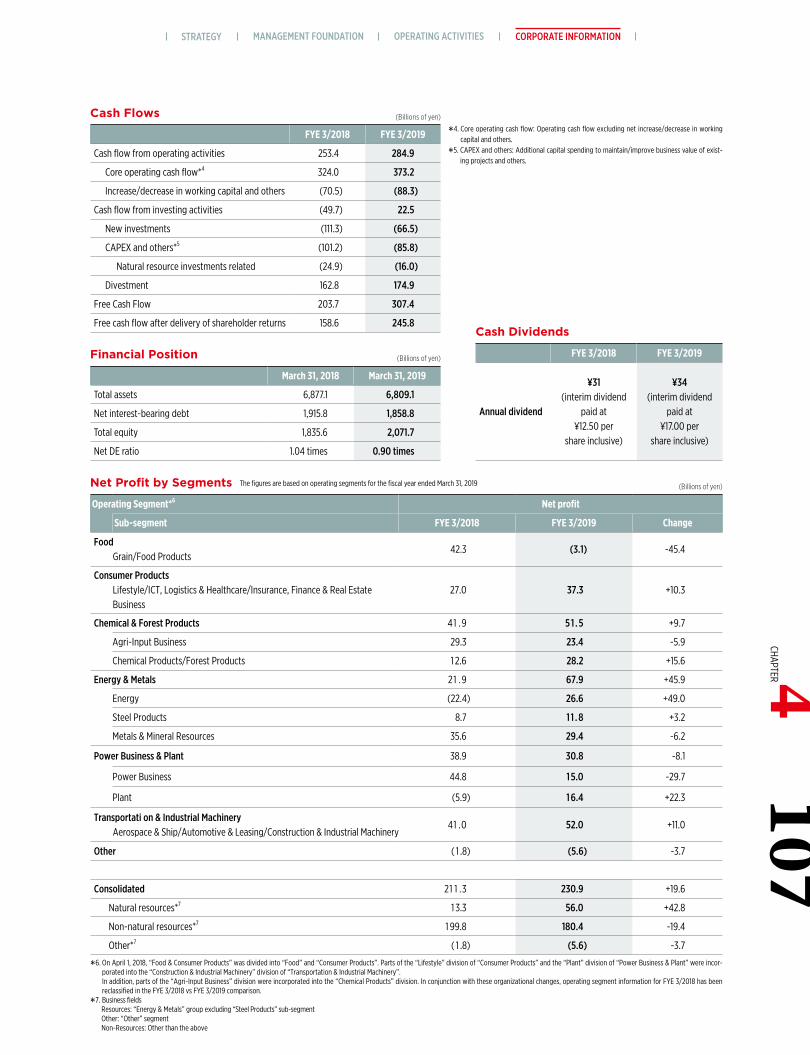
*4. Core operating cash flow: Operating cash flow excluding net increase/decrease in working capital and others.
*5. CAPEX and others: Additional capital spending to maintain/improve business value of exist-ing projects and others.
Financial Position� (Billions of yen)
March 31, 2018 March 31, 2019
Total assets 6,877.1 6,809.1
Net interest-bearing debt 1,915.8 1,858.8
Total equity 1,835.6 2,071.7
Net DE ratio 1.04 times 0.90 times
Cash Flows� (Billions of yen)
FYE 3/2018 FYE 3/2019
Cash flow from operating activities 253.4 284.9
Core operating cash flow*4 324.0 373.2
Increase/decrease in working capital and others (70.5) (88.3)
Cash flow from investing activities (49.7) 22.5
New investments (111.3) (66.5)
CAPEX and others*5 (101.2) (85.8)
Natural resource investments related (24.9) (16.0)
Divestment 162.8 174.9
Free Cash Flow 203.7 307.4
Free cash flow after delivery of shareholder returns 158.6 245.8Cash Dividends
FYE 3/2018 FYE 3/2019
Annual dividend
¥31(interim dividend
paid at¥12.50 per
share inclusive)
¥34(interim dividend
paid at¥17.00 per
share inclusive)
Net Profit by Segments� (Billions of yen)
Operating Segment*6 Net profit
Sub-segment FYE 3/2018 FYE 3/2019 Change
FoodGrain/Food Products
42.3 (3.1) -45.4
Consumer ProductsLifestyle/ICT, Logistics & Healthcare/Insurance, Finance & Real Estate Business
27.0 37.3 +10.3
Chemical & Forest Products 41 .9 5 1 . 5 +9.7
Agri-Input Business 29.3 23.4 -5.9
Chemical Products/Forest Products 1 2.6 28.2 +15.6
Energy & Metals 21 .9 67.9 +45.9
Energy (22.4) 26.6 +49.0
Steel Products 8.7 1 1 . 8 +3.2
Metals & Mineral Resources 35.6 29.4 -6.2
Power Business & Plant 38.9 30.8 -8.1
Power Business 44.8 1 5.0 -29.7
Plant (5.9) 1 6.4 +22.3
Transportati on & Industrial MachineryAerospace & Ship/Automotive & Leasing/Construction & Industrial Machinery
41 .0 52.0 +11.0
Other ( 1 .8) (5.6) -3.7
Consolidated 21 1 .3 230.9 +19.6
Natural resources*7 1 3.3 56.0 +42.8
Non-natural resources*7 1 99.8 180.4 -19.4
Other*7 ( 1 .8) (5.6) -3.7
*6. On April 1, 2018, “Food & Consumer Products” was divided into “Food” and “Consumer Products”. Parts of the “Lifestyle” division of “Consumer Products” and the “Plant” division of “Power Business & Plant” were incor-porated into the “Construction & Industrial Machinery” division of “Transportation & Industrial Machinery”.
In addition, parts of the “Agri-Input Business” division were incorporated into the “Chemical Products” division. In conjunction with these organizational changes, operating segment information for FYE 3/2018 has been reclassified in the FYE 3/2018 vs FYE 3/2019 comparison.
*7. Business fieldsResources: “Energy & Metals” group excluding “Steel Products” sub-segment Other: “Other” segment Non-Resources: Other than the above
The figures are based on operating segments for the fiscal year ended March 31, 2019
MANAGEMENT FOUNDATION OPERATING ACTIVITIES CORPORATE INFORMATIONSTRATEGY107
CHAPTER 4
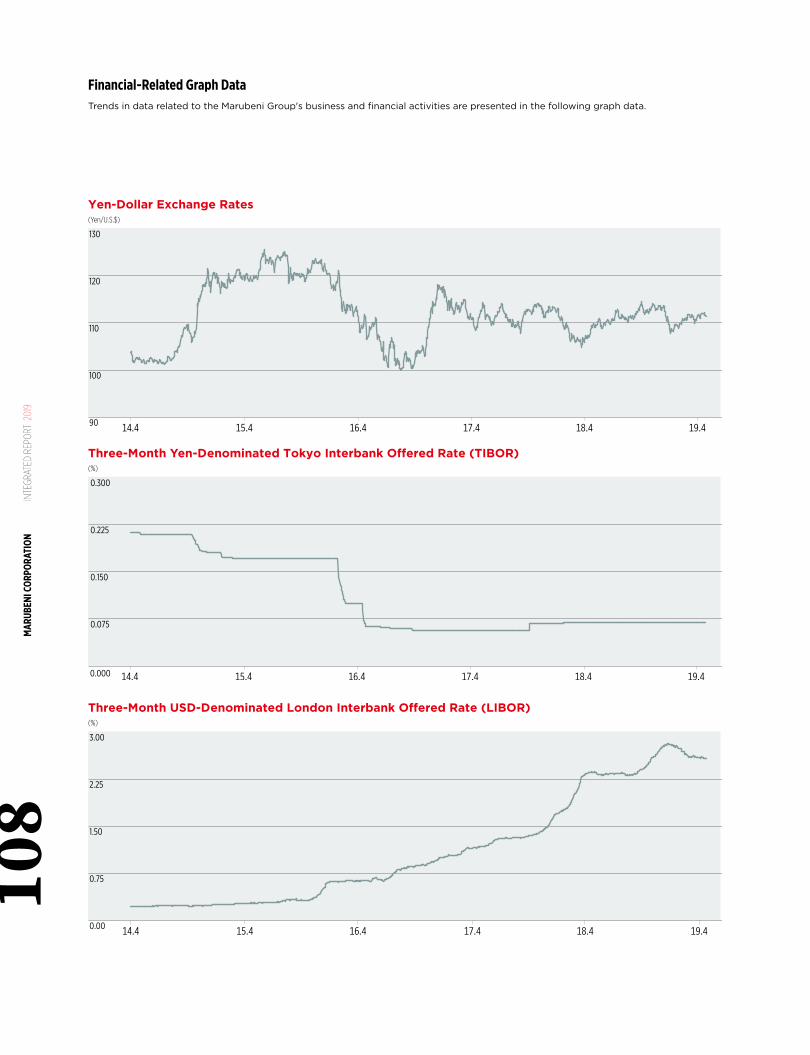
90
100
110
120
130
14.4 15.4 16.4 17.4 18.4 19.4
0.00
0.75
1.50
2.25
3.00
14.4 15.4 16.4 17.4 18.4 19.4
Yen-Dollar Exchange Rates(Yen/U.S.$)
(%)
(%)
Three-Month Yen-Denominated Tokyo Interbank Offered Rate (TIBOR)
Three-Month USD-Denominated London Interbank Offered Rate (LIBOR)
0.000
0.075
0.150
0.225
0.300
14.4 15.4 16.4 17.4 18.4 19.4
MAR
UBEN
I COR
PORA
TION
IN
TEGR
ATED
REP
ORT
201
910
8Financial-Related Graph DataTrends in data related to the Marubeni Group's business and financial activities are presented in the following graph data.
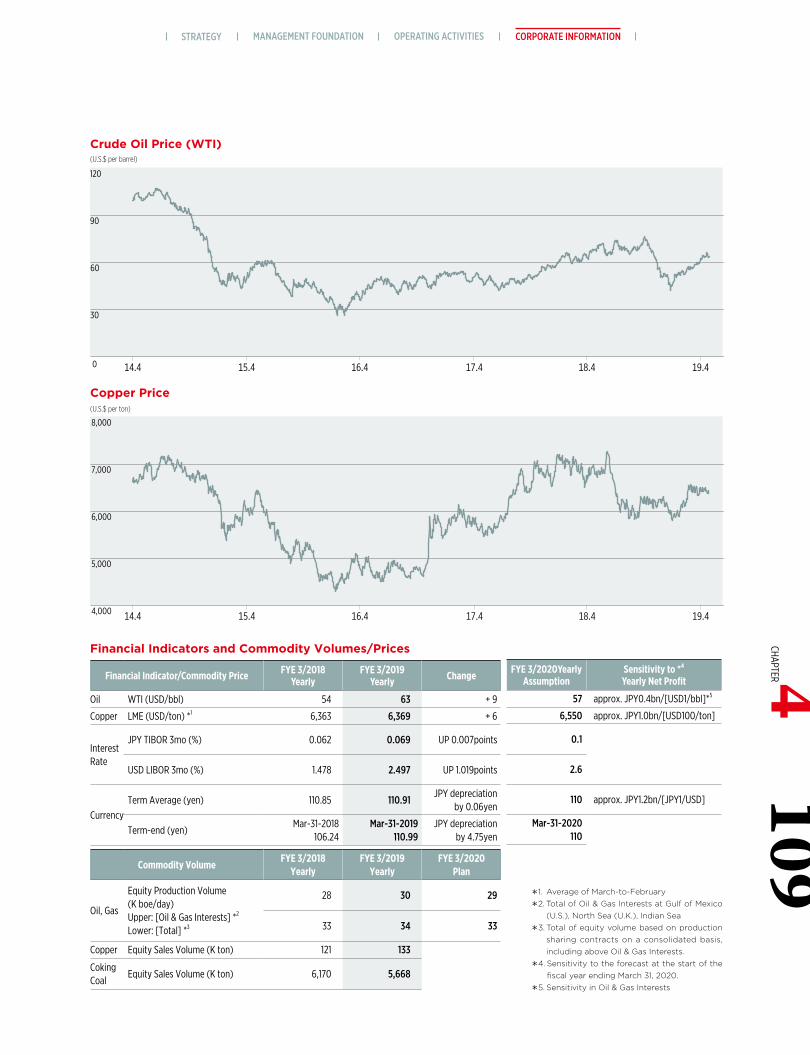
4,000
5,000
6,000
7,000
8,000
14.4 15.4 16.4 17.4 18.4 19.4
Crude Oil Price (WTI)
Copper Price
*1. Average of March-to-February
*2. Total of Oil & Gas Interests at Gulf of Mexico (U.S.), North Sea (U.K.), Indian Sea
*3. Total of equity volume based on production sharing contracts on a consolidated basis, including above Oil & Gas Interests.
*4. Sensitivity to the forecast at the start of the fiscal year ending March 31, 2020.
*5. Sensitivity in Oil & Gas Interests
Financial Indicators and Commodity Volumes/Prices�
Financial Indicator/Commodity Price FYE 3/2018Yearly
FYE 3/2019Yearly Change
Oil WTI (USD/bbl) 54 63 + 9
Copper LME (USD/ton) *1 6,363 6,369 + 6
InterestRate
JPY TIBOR 3mo (%) 0.062 0.069 UP 0.007points
USD LIBOR 3mo (%) 1.478 2.497 UP 1.019points
CurrencyTerm Average (yen) 110.85 110.91
JPY depreciationby 0.06yen
Term-end (yen)Mar-31-2018
106.24Mar-31-2019
110.99JPY depreciation
by 4.75yen
Commodity VolumeFYE 3/2018
YearlyFYE 3/2019
YearlyFYE 3/2020
Plan
Oil, Gas
Equity Production Volume(K boe/day)Upper: [Oil & Gas Interests] *2
Lower: [Total] *3
28 30 29
33 34 33
Copper Equity Sales Volume (K ton) 121 133
CokingCoal
Equity Sales Volume (K ton) 6,170 5,668
��FYE 3/2020Yearly
AssumptionSensitivity to *4
Yearly Net Profit
57 approx. JPY0.4bn/[USD1/bbl]*5
6,550 approx. JPY1.0bn/[USD100/ton]
0.1
2.6
110 approx. JPY1.2bn/[JPY1/USD]
Mar-31-2020110
(U.S.$ per barrel)
(U.S.$ per ton)
0
30
60
90
120
14.4 15.4 16.4 17.4 18.4 19.4
MANAGEMENT FOUNDATION OPERATING ACTIVITIES CORPORATE INFORMATIONSTRATEGY109
CHAPTER 4
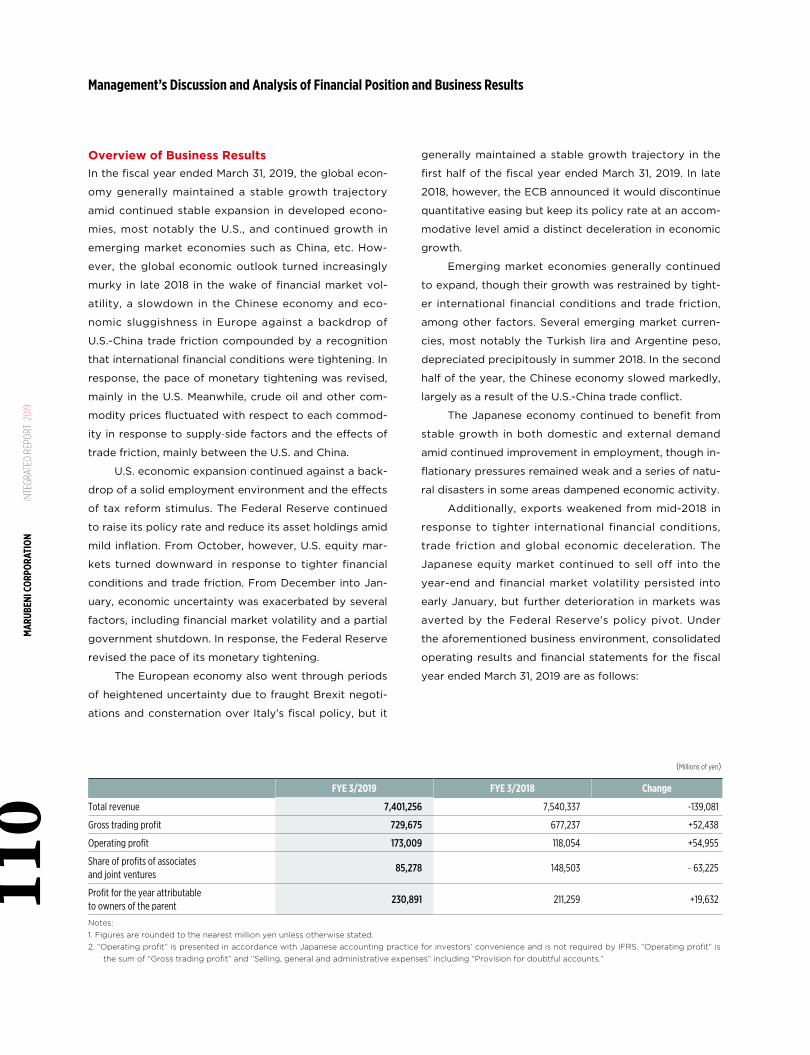
Overview of Business ResultsIn the fiscal year ended March 31, 2019, the global econ-
omy generally maintained a stable growth trajectory
amid continued stable expansion in developed econo-
mies, most notably the U.S., and continued growth in
emerging market economies such as China, etc. How-
ever, the global economic outlook turned increasingly
murky in late 2018 in the wake of financial market vol-
atility, a slowdown in the Chinese economy and eco-
nomic sluggishness in Europe against a backdrop of
U.S.-China trade friction compounded by a recognition
that international financial conditions were tightening. In
response, the pace of monetary tightening was revised,
mainly in the U.S. Meanwhile, crude oil and other com-
modity prices fluctuated with respect to each commod-
ity in response to supply-side factors and the effects of
trade friction, mainly between the U.S. and China.
U.S. economic expansion continued against a back-
drop of a solid employment environment and the effects
of tax reform stimulus. The Federal Reserve continued
to raise its policy rate and reduce its asset holdings amid
mild inflation. From October, however, U.S. equity mar-
kets turned downward in response to tighter financial
conditions and trade friction. From December into Jan-
uary, economic uncertainty was exacerbated by several
factors, including financial market volatility and a partial
government shutdown. In response, the Federal Reserve
revised the pace of its monetary tightening.
The European economy also went through periods
of heightened uncertainty due to fraught Brexit negoti-
ations and consternation over Italy’s fiscal policy, but it
generally maintained a stable growth trajectory in the
first half of the fiscal year ended March 31, 2019. In late
2018, however, the ECB announced it would discontinue
quantitative easing but keep its policy rate at an accom-
modative level amid a distinct deceleration in economic
growth.
Emerging market economies generally continued
to expand, though their growth was restrained by tight-
er international financial conditions and trade friction,
among other factors. Several emerging market curren-
cies, most notably the Turkish lira and Argentine peso,
depreciated precipitously in summer 2018. In the second
half of the year, the Chinese economy slowed markedly,
largely as a result of the U.S.-China trade conflict.
The Japanese economy continued to benefit from
stable growth in both domestic and external demand
amid continued improvement in employment, though in-
flationary pressures remained weak and a series of natu-
ral disasters in some areas dampened economic activity.
Additionally, exports weakened from mid-2018 in
response to tighter international financial conditions,
trade friction and global economic deceleration. The
Japanese equity market continued to sell off into the
year-end and financial market volatility persisted into
early January, but further deterioration in markets was
averted by the Federal Reserve’s policy pivot. Under
the aforementioned business environment, consolidated
operating results and financial statements for the fiscal
year ended March 31, 2019 are as follows:
(Millions of yen)
FYE 3/2019 FYE 3/2018 Change
Total revenue 7,401,256 7,540,337 -139,081
Gross trading profit 729,675 677,237 +52,438
Operating profit 173,009 118,054 +54,955
Share of profits of associatesand joint ventures
85,278 148,503 - 63,225
Profit for the year attributableto owners of the parent
230,891 211,259 +19,632
Notes:1. Figures are rounded to the nearest million yen unless otherwise stated.2. “Operating profit” is presented in accordance with Japanese accounting practice for investors’ convenience and is not required by IFRS. “Operating profit” is
the sum of “Gross trading profit” and “Selling, general and administrative expenses” including “Provision for doubtful accounts.”
MAR
UBEN
I COR
PORA
TION
IN
TEGR
ATED
REP
ORT
201
911
0Management’s Discussion and Analysis of Financial Position and Business Results
RevenueRevenue was down ¥139.1 billion (1.8%) from the fiscal
year ended March 31, 2018 to ¥7,401.3 billion, due mainly
to decreases in Chemical & Forest Products and Trans-
portation & Industrial Machinery.
Gross trading profitGross trading profit increased ¥52.4 billion (7.7%) from
the fiscal year ended March 31, 2018 to ¥729.7 billion.
By operating segment, profits increased mainly at Energy
& Metals and Chemical & Forest Products.
Operating profitOperating profit increased ¥55.0 billion (46.6%) from
the fiscal year ended March 31, 2018 to ¥173.0 billion.
Share of profits of associates and joint venturesShare of profits of associates and joint ventures de-
creased ¥63.2 billion (42.6%) from the fiscal year ended
March 31, 2018 to ¥85.3 billion. By operating segment,
profits decreased mainly in Power Business & Plant and
Food.
Profit attributable to owners of the parentProfit attributable to owners of the parent for the fiscal
year ended March 31, 2019 (also referred to as net profit
for the year under review) increased ¥19.6 billion (9.3%)
to ¥230.9 billion relative to the fiscal year ended March
31, 2018.
Business Outlook by SegmentResults and financial statements for each operating
segment for the fiscal year ended March 31, 2019 are as
follows:
FoodGross trading profit increased ¥3.8 billion (2.8%) year
on year to ¥139.0 billion, driven mainly by consolidation
of a U.S. beef processing/sales subsidiary acquired in
the first half of fiscal year 2019. Net profit for the year
was down ¥45.4 billion ( - %) from the fiscal year end-
ed March 31, 2018 to ¥3.1 billion, due to an impairment
loss from equity-method investment of grain export-
ing business in North America along with the fact that
profit in the previous year was boosted by U.S. tax
reform.
Assets corresponding to this segment amounted
to ¥1,378.6 billion, a decrease of ¥59.2 billion from the
end of the fiscal year ended March 31, 2018, due to a
decrease in trade receivables and impairment of invest-
ments related to the North American grain export
business.
Consumer ProductsGross trading profit increased ¥6.3 billion (5.4%) from
the fiscal year ended March 31, 2018 to ¥123.6 billion, as
a result of new consolidation of a subsidiary that was
previously an equity-method associate in the ICT busi-
ness. Despite non-recurrence of the first half period of
the fiscal year ended March 31, 2018 gain on the sale of
equity-method associate in the ICT business, net prof-
it for the year increased ¥10.3 billion (38.2%) year on
year to ¥37.3 billion, largely because of a valuation gain
on a newly consolidated subsidiary that was previously
an equity-method associate in the ICT business.
Assets corresponding to this segment increased
¥126.2 billion from the end of the fiscal year ended
March 31, 2018, to ¥578.0 billion due to the consolida-
tion of equity-method affiliates in the ICT business.
Chemical & Forest ProductsGross trading profit increased ¥23.1 billion (11.4%) from
the fiscal year ended March 31, 2018 to ¥226.4 billion,
boosted largely by profit growth in the pulp business
due to higher market prices and improved margins in
the containerboard business. Net profit for the year in-
creased ¥9.7 billion (23.1%) from the fiscal year ended
March 31, 2018 to ¥51.5 billion.
Assets corresponding to this segment increased
¥38.2 billion from the end of the fiscal year ended
March 31, 2018, to ¥1,218.2 billion due to an increase in
inventory assets.
Energy & MetalsGross trading profit increased ¥28.4 billion (49.0%)
year on year to ¥86.4 billion, largely as a result of pro-
111CHAPTER 4
MANAGEMENT FOUNDATION OPERATING ACTIVITIES CORPORATE INFORMATIONSTRATEGY
duction volume growth and higher price in the oil and
gas development business and improved margins in
the oil and gas trading business. Net profit for the year
increased ¥45.9 billion (209.3%) from the fiscal year
ended March 31, 2018 to ¥67.9 billion, largely due to
increases in gross trading profit and share of profits of
associates and joint ventures, as well as non-recurrence
of the first half of the fiscal year ended March 31, 2019
decrease in income tax expense due to U.S. tax reform,
which offset the impairment loss of assets on oil and
gas development business and metal related business.
Assets corresponding to this segment increased
¥21.4 billion from the end of the fiscal year ended
March 31, 2018, to ¥1,634.8 billion.
Power Business & PlantGross trading profit increased ¥5.6 billion (14.2%) from
the fiscal year ended March 31, 2018 to ¥45.5 billion,
largely by virtue of growth in profits from overseas
plant business and the UK electricity wholesaling/re-
tailing business. Net profit for the year decreased ¥8.1
billion (20.9%) from the fiscal year ended March 31,
2018 to ¥30.8 billion, largely as a result of impairment
loss in investment of the power generating business in
Singapore which offset gains on the sale of a domestic
power generating business coupled with non-recur-
rence of provision loss from overseas infrastructure
projects of the first half period of fiscal year ended
March 31, 2019.
Assets corresponding to this segment decreased
¥32.6 billion from the end of the fiscal year ended
March 31, 2018, to ¥1,078.4 billion due to impairment of
investments related to the power generating business
in Singapore.
Transportation & Industrial MachineryGross trading profit decreased ¥12.7 billion (9.6%)
from the fiscal year ended March 31, 2018 to ¥118.8
billion, largely as a result of deconsolidation of a for-
mer consolidated subsidiary, now an equity-method
associate, in an automotive business. Net profit for the
year increased ¥11.0 billion (26.8%) from the fiscal year
ended March 31, 2018 to ¥52.0 billion, boosted largely
by a gain on the sale of a domestic power generation
business and growth in profits from equity-method
investments in automotive and ship-related business-
es, as well as non-recurrence of the first half period of
the fiscal year ended March 31, 2019 loss from a North
American automotive business.
Assets corresponding to this segment increased
¥20.5 billion from the end of the fiscal year ended
March 31, 2018, to ¥804.8 billion.
(Note 1)From the fiscal year ended March 31, 2019, "Food & Consumer Products" has been divided into "Food" and "Consumer Products". Parts of "Consumer Products" and "Power Business & Plant" have been incorporated into "Transportation & Industrial Machinery". In conjunction with these revisions, operating segment information for the fiscal year ended March 31, 2018 has been reclassified.
(Note 2)Inter-segment transactions are generally priced in accordance with the prevailing market prices.
112
MAR
UBEN
I COR
PORA
TION
IN
TEGR
ATED
REP
ORT
201
9
Major risks that could have a serious impact on inves-
tor decisions associated with the business operations
and other activities of Marubeni Corporation and its
consolidated subsidiaries are outlined below. The risks
discussed, however, are not inclusive of the full range of
possible risks faced in the broad range of activities en-
gaged in by the Group. Any number of additional risks
other than those discussed below could also impact
business performance. Furthermore, risks considered
to have a low likelihood of materializing have also been
disclosed, from the perspective of ensuring proactive in-
formation disclosure. Forward-looking statements with
respect to the risks discussed below reflect the reason-
able judgment of the Company’s management based on
information available as of March 31, 2019.
Impact of Changes in Global Economy andIndustrial Structure on the Marubeni GroupThe Company is a general trading company engaged in
a wide range of business activities through bases in Ja-
pan and over 60 other countries. Examples include the
production and procurement of natural resources and
other primary commodities, as well as the manufacture
and sale of finished goods and various commercial and
investing activities in Japan and overseas in many in-
dustrial fields. They are consequently affected by global
economic conditions. They also constantly need to de-
velop new business models and revamp existing ones
in response to changes in the industrial structure driven
by forces such as technological innovation and diversi-
fication of values. A global economic downturn or slow-
down or failure to adequately adapt to changes in the
industrial structure could adversely affect the Company
and its subsidiaries’ operating activities, business results
and/or financial condition.
Credit Risks Regarding Business PartnersMarubeni and its consolidated subsidiaries extend credit
to business partners in the form of accounts receivable,
advances, loans, guarantees, and other means. In addi-
tion, as a part of its sales activities, the Group concludes
merchandise supply, subcontracting, operational out-
sourcing, and other types of contracts with business
partners. The incurrence of credit risk due to the inabil-
ity of business partners to fulfill their credit obligations
or a breach of contract by these business partners could
adversely affect the Group’s business results and finan-
cial condition.
To prevent credit risks from materializing, the
Group conducts extensive risk management at the cred-
it screening stage. Nevertheless, the Company is sus-
ceptible to a variety of credit risks.
In preparation for the incurrence of possible losses
when credit risk becomes apparent, the Group estab-
lishes allowances for doubtful accounts based on the
estimated amount of loss, the business partner’s cred-
itworthiness, collateral value, and other set factors. In
the event of such losses, however, the Company cannot
guarantee that actual losses will not exceed these es-
tablished allowances.
Investment RiskMarubeni and its consolidated subsidiaries, both inde-
pendently and in collaboration with other companies, es-
tablish new companies and purchase existing enterprises
in the course of their business operations. Most of these
business investments require sizable amounts of capital.
The Group may be unable to withdraw from such busi-
nesses in an optimal manner or time frame, in which case
it would be obliged to commit additional capital.
In an effort to prevent the occurrence of risks asso-
ciated with investments and other activities, the Group
conducts extensive risk management, including check-
ing new investments to determine whether expected
returns are commensurate with the risks involved. Nev-
ertheless, a decline in the value of these investments or
the necessity of additional expenditures of capital could
adversely affect the Group’s business results and finan-
cial condition.
Concentrated Risk ExposureAs part of their commercial and investment activities,
Marubeni and its consolidated subsidiaries are con-
centrated in specific investment targets, markets, and
regions. In the context of the Group’s country risk man-
agement, the Company classifies countries according to
their level of risk, and has established transaction man-
agement standards and promotes efforts to ensure opti-
mal portfolio management and appropriate risk/reward
ratios. Nevertheless, a deteriorating operating environ-
ment in these markets or regions could adversely affect
the Group’s business results and financial condition.
113CHAPTER 4
MANAGEMENT FOUNDATION OPERATING ACTIVITIES CORPORATE INFORMATIONSTRATEGY
Business Risks
Ability to Procure Funds and Funding CostMarubeni and its consolidated subsidiaries engage in
fund procurement with an emphasis on maintaining an
optimal mix of funding in line with the requirements of
their respective asset portfolios and ensuring liquidity.
However, significant disruptions in major global capital
markets, shortages of cash flows from operating activi-
ties, declining profitability, failure in asset-liability man-
agement, or a sharp downgrade in the credit rating of
the Group by ratings agencies could constrain fund pro-
curement or lead to an increase in funding cost, which
could adversely affect the Group’s business results and
financial condition.
Market Risks❶Fluctuations in the Price of Goods and Merchandise
Marubeni and its consolidated subsidiaries handle a vari-
ety of merchandise. In order to mitigate the risk of fluc-
tuations in market conditions for certain merchandise,
contracts, and scheduled contracts, the Group enters
into commodity futures and forward contracts. Howev-
er, changes in respective market conditions could ad-
versely affect the Group’s business results and financial
condition.
In addition, the Group participates in energy and
natural resource exploration and production (E&P) busi-
nesses and other manufacturing businesses. Fluctua-
tions in the markets of the products sold through these
activities could adversely affect the Group’s business
results and financial condition.
❷Market Liquidity (Liquidity Risk)
Marubeni and its consolidated subsidiaries hold a variety
of assets that are subject to market trading, including
financial instruments. Financial market turmoil and other
factors can cause the market liquidity of held assets to
decline dramatically, a situation that could potentially
trigger a precipitous drop in the value of held assets.
Such an occurrence could adversely affect the Group’s
business results and financial condition.
❸Fluctuations in Foreign Currency Exchange Rates
Marubeni and its consolidated subsidiaries conduct
transactions in a variety of currencies and under a va-
riety of terms. In order to mitigate the risk of exchange
rate fluctuations associated with transactions, receiv-
ables, and liabilities denominated in foreign currencies,
the Group enters into forward exchange contracts and
other derivative transactions. Despite these measures,
fluctuations in exchange rates could adversely affect the
Group’s business results and financial condition.
❹Fluctuations in Interest Rates
Marubeni and its consolidated subsidiaries procure nec-
essary business funds through borrowings from financial
institutions, the issuance of corporate bonds, and other
methods of procuring from capital markets. A large por-
tion of floating rate liabilities is proportionate to operat-
ing assets that can counteract adverse impacts of inter-
est rate fluctuations. However, interest rate fluctuation
risks cannot be completely eliminated, and a certain de-
gree of exposure remains. Among the liabilities procured
for interest insensitive assets, such as investment secu-
rities and property, plant and equipment, the portion
at procured floating rates is categorized as unhedged
through the asset-liability management practices of
Marubeni and its consolidated subsidiaries. Monitoring
market movements in interest rates, the Group utilizes
interest rate swaps and other measures to mitigate the
risk of interest rate fluctuations.
There is no guarantee that the Group will be able
to completely avoid interest rate risk, even after having
implemented these management measures. Therefore,
changes in market interest rates could adversely affect
the Group’s business results and financial condition.
❺Fluctuations in Values of
Marketable Securities Subject to Market Volatility
To strengthen business relationships and for other pur-
poses, Marubeni and its consolidated subsidiaries invest
in marketable securities that are subject to market vola-
tility. Such securities held by the Group carry the risk of
fluctuations in original value due to changes in fair value.
Drops in the fair value of these securities could adverse-
ly affect the Group’s business results and financial con-
dition.
❻Risks Regarding Employees’ Retirement Benefits
As the Group holds domestic and foreign stocks and
bonds as pension assets, sluggish performance in securi-
ties markets could decrease the value of those assets or
could require it to accumulate additional pension assets.
114
MAR
UBEN
I COR
PORA
TION
IN
TEGR
ATED
REP
ORT
201
9
Such an event could adversely affect the Group’s busi-
ness results and financial condition.
Impairment of Real Estate, Machinery and Equipment,and Other Property, Plant and EquipmentMarubeni and its consolidated subsidiaries hold real
estate, machinery and equipment, and other property,
plant and equipment for sale and lease to other par-
ties as well as for their own use. A decline in the value
of these assets could potentially require the Group to
recognize impairment losses. The Group accounts for
impairment of property, plant and equipment in accor-
dance with IFRS. Nevertheless, a dramatic decline in
asset value could adversely affect the Group’s business
results and financial condition.
Laws and RegulationsIn the course of operations, Marubeni and its consoli-
dated subsidiaries are subject to a broad range of laws
and regulations both in Japan and other applicable
countries. Changes in or unanticipated interpretations
of these laws and regulations could increase the obli-
gations pertaining to legal and regulatory compliance
placed on the Group. Accordingly, changes or altered
interpretations of laws and regulations may result in pu-
nitive measures, including the interruption of operations,
lower the Company’s credibility, or cause the occur-
rence of other circumstances that could adversely affect
the Group’s business results and financial condition.
Significant LitigationIn the course of business activities in Japan and over-
seas, Marubeni and its consolidated subsidiaries may
be a party to litigation, disputes, and other legal pro-
ceedings. When party to such litigation, predicting the
outcome is impossible given the inherent uncertainty
of these matters. The Company cannot guarantee that
such litigation will not adversely affect the Group’s busi-
ness results and financial condition.
Environmental RiskMarubeni and its consolidated subsidiaries conduct
business activities globally across a broad range of in-
dustries, and environmental pollution as a result of these
activities could result in business stoppage, pollution
remediation expenses, and legal fees in response to liti-
gation by local residents. In addition, the Group’s social
reputation could be damaged. In the year ended March
31, 2000, an environmental management system was
introduced to cope with such environmental risks, under
which various initiatives have been implemented to as-
sess the potential environmental burden and reduce en-
vironmental risk, including environmental impact evalu-
ations for each new financing and development project.
In the event, however, that some form of environmental
impact occurs, it could adversely affect the Group’s
business results and financial condition.
Natural Disaster RiskEarthquakes and other natural disasters could cause
damage and loss to the Group’s offices and facilities and
inhibit the normal business activities of Marubeni and its
consolidated subsidiaries. While every effort has been
made to implement appropriate countermeasures, such
as the formulation of business continuity plans, earth-
quake countermeasures, and fire prevention drills, the
potential for damage from natural disasters cannot be
completely mitigated. Consequently, there is no guar-
antee that such disasters will not adversely affect the
Group’s business results and financial condition.
Risk Relating to Terrorists and Violent GroupsMarubeni and its consolidated subsidiaries conduct
business operations globally, and these operations are
therefore exposed to risk from unexpected situations re-
lating to terrorists and violent groups, as well as trends
in politics and social factors. The materialization of such
risks could adversely affect the Group’s business results
and financial condition.
Other Risks Inherent and Related to Overall Marubeni OperationsNegligence on the part of employees charged with
executing business operations and malfunctions per-
taining to information leakages from computer systems
supporting business activities are among other risks,
the materialization of which could adversely affect the
Group’s business results and financial condition.
115CHAPTER 4
MANAGEMENT FOUNDATION OPERATING ACTIVITIES CORPORATE INFORMATIONSTRATEGY
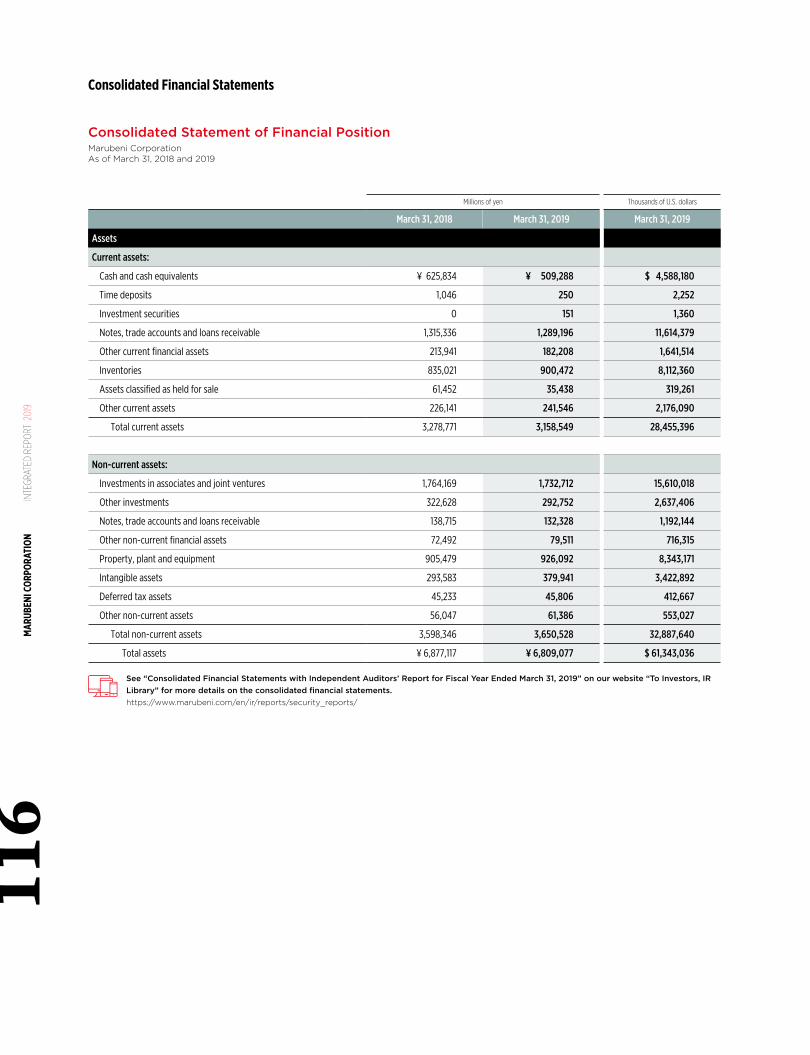
Consolidated Statement of Financial PositionMarubeni Corporation As of March 31, 2018 and 2019
Millions of yen Thousands of U.S. dollars
March 31, 2018 March 31, 2019 March 31, 2019
Assets
Current assets:
Cash and cash equivalents ¥ 625,834 ¥ 509,288 $ 4,588,180
Time deposits 1,046 250 2,252
Investment securities 0 151 1,360
Notes, trade accounts and loans receivable 1,315,336 1,289,196 11,614,379
Other current financial assets 213,941 182,208 1,641,514
Inventories 835,021 900,472 8,112,360
Assets classified as held for sale 61,452 35,438 319,261
Other current assets 226,141 241,546 2,176,090
Total current assets 3,278,771 3,158,549 28,455,396
Non-current assets:
Investments in associates and joint ventures 1,764,169 1,732,712 15,610,018
Other investments 322,628 292,752 2,637,406
Notes, trade accounts and loans receivable 138,715 132,328 1,192,144
Other non-current financial assets 72,492 79,511 716,315
Property, plant and equipment 905,479 926,092 8,343,171
Intangible assets 293,583 379,941 3,422,892
Deferred tax assets 45,233 45,806 412,667
Other non-current assets 56,047 61,386 553,027
Total non-current assets 3,598,346 3,650,528 32,887,640
Total assets ¥ 6,877,117 ¥ 6,809,077 $ 61,343,036
See “Consolidated Financial Statements with Independent Auditors’ Report for Fiscal Year Ended March 31, 2019” on our website “To Investors, IR Library” for more details on the consolidated financial statements.https://www.marubeni.com/en/ir/reports/security_reports/
116
MAR
UBEN
I COR
PORA
TION
IN
TEGR
ATED
REP
ORT
201
9
Consolidated Financial Statements
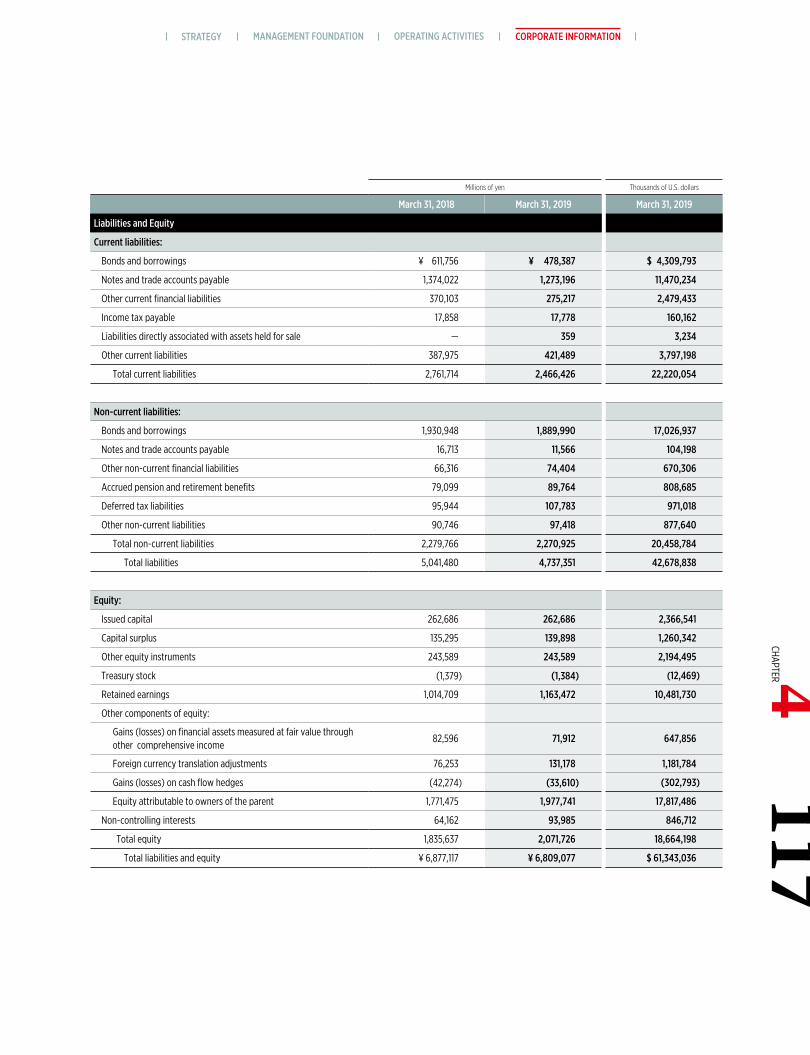
Millions of yen Thousands of U.S. dollars
March 31, 2018 March 31, 2019 March 31, 2019
Liabilities and Equity
Current liabilities:
Bonds and borrowings ¥ 611,756 ¥ 478,387 $ 4,309,793
Notes and trade accounts payable 1,374,022 1,273,196 11,470,234
Other current financial liabilities 370,103 275,217 2,479,433
Income tax payable 17,858 17,778 160,162
Liabilities directly associated with assets held for sale — 359 3,234
Other current liabilities 387,975 421,489 3,797,198
Total current liabilities 2,761,714 2,466,426 22,220,054
Non-current liabilities:
Bonds and borrowings 1,930,948 1,889,990 17,026,937
Notes and trade accounts payable 16,713 11,566 104,198
Other non-current financial liabilities 66,316 74,404 670,306
Accrued pension and retirement benefits 79,099 89,764 808,685
Deferred tax liabilities 95,944 107,783 971,018
Other non-current liabilities 90,746 97,418 877,640
Total non-current liabilities 2,279,766 2,270,925 20,458,784
Total liabilities 5,041,480 4,737,351 42,678,838
Equity:
Issued capital 262,686 262,686 2,366,541
Capital surplus 135,295 139,898 1,260,342
Other equity instruments 243,589 243,589 2,194,495
Treasury stock (1,379) (1,384) (12,469)
Retained earnings 1,014,709 1,163,472 10,481,730
Other components of equity:
Gains (losses) on financial assets measured at fair value through other comprehensive income
82,596 71,912 647,856
Foreign currency translation adjustments 76,253 131,178 1,181,784
Gains (losses) on cash flow hedges (42,274) (33,610) (302,793)
Equity attributable to owners of the parent 1,771,475 1,977,741 17,817,486
Non-controlling interests 64,162 93,985 846,712
Total equity 1,835,637 2,071,726 18,664,198
Total liabilities and equity ¥ 6,877,117 ¥ 6,809,077 $ 61,343,036
117CHAPTER 4
MANAGEMENT FOUNDATION OPERATING ACTIVITIES CORPORATE INFORMATIONSTRATEGY
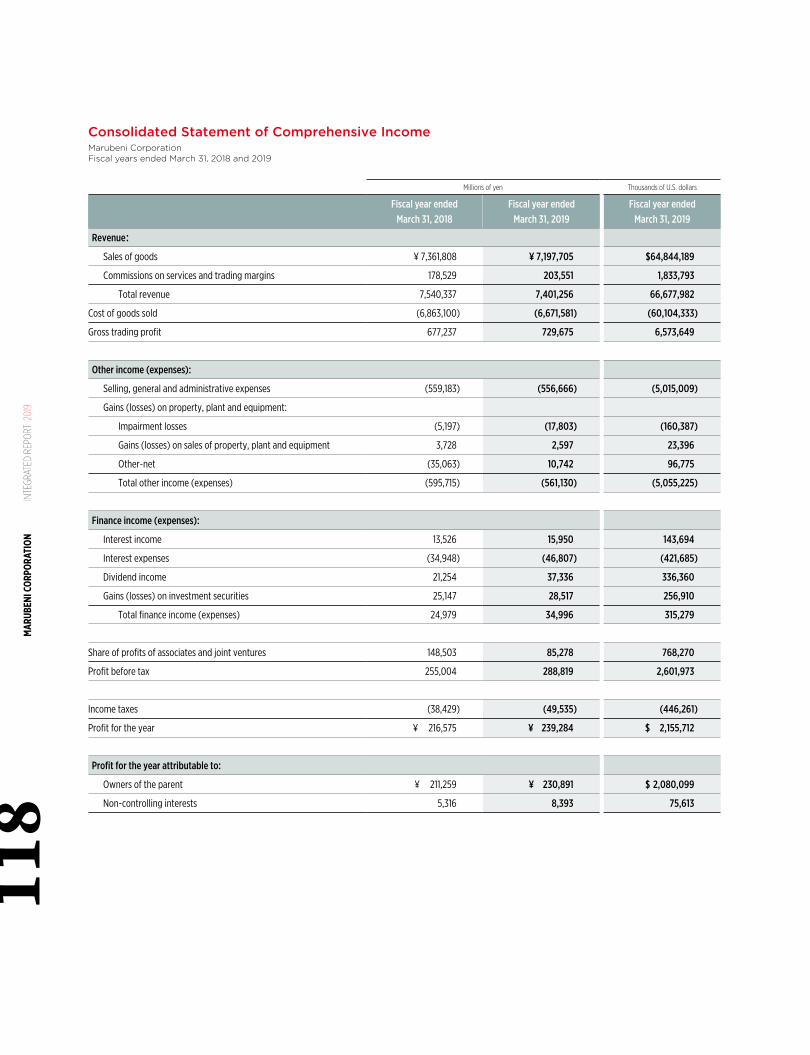
Consolidated Statement of Comprehensive IncomeMarubeni Corporation Fiscal years ended March 31, 2018 and 2019
Millions of yen Thousands of U.S. dollars
Fiscal year endedMarch 31, 2018
Fiscal year endedMarch 31, 2019
Fiscal year endedMarch 31, 2019
Revenue:
Sales of goods ¥ 7,361,808 ¥ 7,197,705 $64,844,189
Commissions on services and trading margins 178,529 203,551 1,833,793
Total revenue 7,540,337 7,401,256 66,677,982
Cost of goods sold (6,863,100) (6,671,581) (60,104,333)
Gross trading profit 677,237 729,675 6,573,649
Other income (expenses):
Selling, general and administrative expenses (559,183) (556,666) (5,015,009)
Gains (losses) on property, plant and equipment:
Impairment losses (5,197) (17,803) (160,387)
Gains (losses) on sales of property, plant and equipment 3,728 2,597 23,396
Other-net (35,063) 10,742 96,775
Total other income (expenses) (595,715) (561,130) (5,055,225)
Finance income (expenses):
Interest income 13,526 15,950 143,694
Interest expenses (34,948) (46,807) (421,685)
Dividend income 21,254 37,336 336,360
Gains (losses) on investment securities 25,147 28,517 256,910
Total finance income (expenses) 24,979 34,996 315,279
Share of profits of associates and joint ventures 148,503 85,278 768,270
Profit before tax 255,004 288,819 2,601,973
Income taxes (38,429) (49,535) (446,261)
Profit for the year ¥ 216,575 ¥ 239,284 $ 2,155,712
Profit for the year attributable to:
Owners of the parent ¥ 211,259 ¥ 230,891 $ 2,080,099
Non-controlling interests 5,316 8,393 75,613
118
MAR
UBEN
I COR
PORA
TION
IN
TEGR
ATED
REP
ORT
201
9
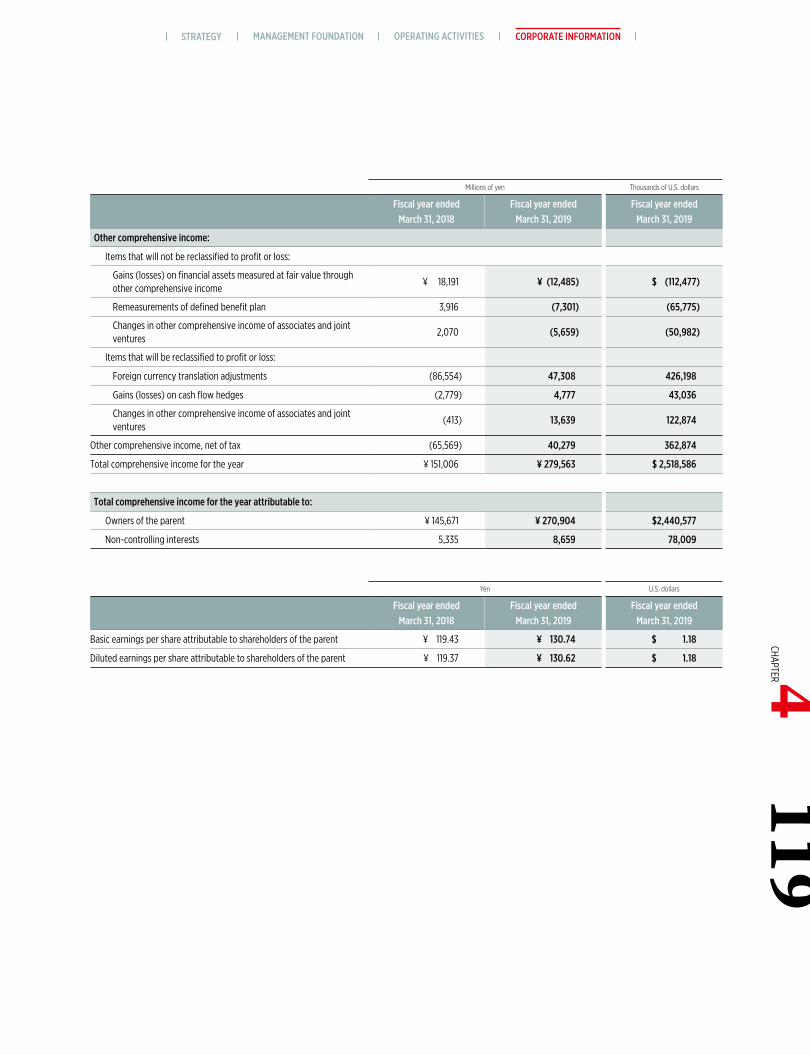
Millions of yen Thousands of U.S. dollars
Fiscal year endedMarch 31, 2018
Fiscal year endedMarch 31, 2019
Fiscal year endedMarch 31, 2019
Other comprehensive income:
Items that will not be reclassified to profit or loss:
Gains (losses) on financial assets measured at fair value through other comprehensive income
¥ 18,191 ¥ (12,485) $ (112,477)
Remeasurements of defined benefit plan 3,916 (7,301) (65,775)
Changes in other comprehensive income of associates and joint ventures
2,070 (5,659) (50,982)
Items that will be reclassified to profit or loss:
Foreign currency translation adjustments (86,554) 47,308 426,198
Gains (losses) on cash flow hedges (2,779) 4,777 43,036
Changes in other comprehensive income of associates and joint ventures
(413) 13,639 122,874
Other comprehensive income, net of tax (65,569) 40,279 362,874
Total comprehensive income for the year ¥ 151,006 ¥ 279,563 $ 2,518,586
Total comprehensive income for the year attributable to:
Owners of the parent ¥ 145,671 ¥ 270,904 $2,440,577
Non-controlling interests 5,335 8,659 78,009
Yen U.S. dollars
Fiscal year endedMarch 31, 2018
Fiscal year endedMarch 31, 2019
Fiscal year endedMarch 31, 2019
Basic earnings per share attributable to shareholders of the parent ¥ 119.43 ¥ 130.74 $ 1.18
Diluted earnings per share attributable to shareholders of the parent ¥ 119.37 ¥ 130.62 $ 1.18
MANAGEMENT FOUNDATION OPERATING ACTIVITIES CORPORATE INFORMATIONSTRATEGY119
CHAPTER 4
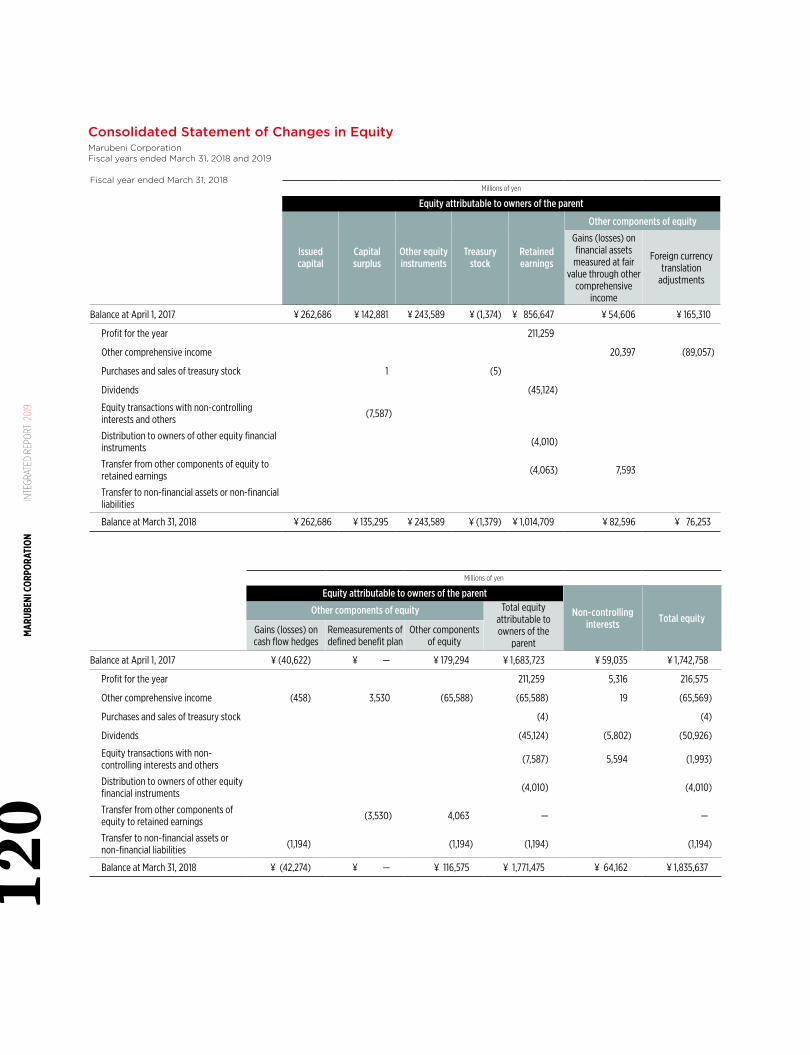
Consolidated Statement of Changes in EquityMarubeni Corporation Fiscal years ended March 31, 2018 and 2019
Millions of yen
Equity attributable to owners of the parent
Issued capital
Capital surplus
Other equity instruments
Treasury stock
Retained earnings
Other components of equity
Gains (losses) on financial assets
measured at fair value through other
comprehensive income
Foreign currency translation
adjustments
Balance at April 1, 2017 ¥ 262,686 ¥ 142,881 ¥ 243,589 ¥ (1,374) ¥ 856,647 ¥ 54,606 ¥ 165,310
Profit for the year 211,259
Other comprehensive income 20,397 (89,057)
Purchases and sales of treasury stock 1 (5)
Dividends (45,124)
Equity transactions with non-controlling interests and others (7,587)
Distribution to owners of other equity financial instruments (4,010)
Transfer from other components of equity to retained earnings (4,063) 7,593
Transfer to non-financial assets or non-financial liabilities
Balance at March 31, 2018 ¥ 262,686 ¥ 135,295 ¥ 243,589 ¥ (1,379) ¥ 1,014,709 ¥ 82,596 ¥ 76,253
Millions of yen
Equity attributable to owners of the parent
Non-controlling interests Total equity
Other components of equity Total equity attributable to owners of the
parentGains (losses) on cash flow hedges
Remeasurements of defined benefit plan
Other components of equity
Balance at April 1, 2017 ¥ (40,622) ¥ — ¥ 179,294 ¥ 1,683,723 ¥ 59,035 ¥ 1,742,758
Profit for the year 211,259 5,316 216,575
Other comprehensive income (458) 3,530 (65,588) (65,588) 19 (65,569)
Purchases and sales of treasury stock (4) (4)
Dividends (45,124) (5,802) (50,926)
Equity transactions with non-controlling interests and others (7,587) 5,594 (1,993)
Distribution to owners of other equity financial instruments (4,010) (4,010)
Transfer from other components of equity to retained earnings (3,530) 4,063 — —
Transfer to non-financial assets or non-financial liabilities (1,194) (1,194) (1,194) (1,194)
Balance at March 31, 2018 ¥ (42,274) ¥ — ¥ 116,575 ¥ 1,771,475 ¥ 64,162 ¥ 1,835,637
Fiscal year ended March 31, 2018
MAR
UBEN
I COR
PORA
TION
IN
TEGR
ATED
REP
ORT
201
912
0
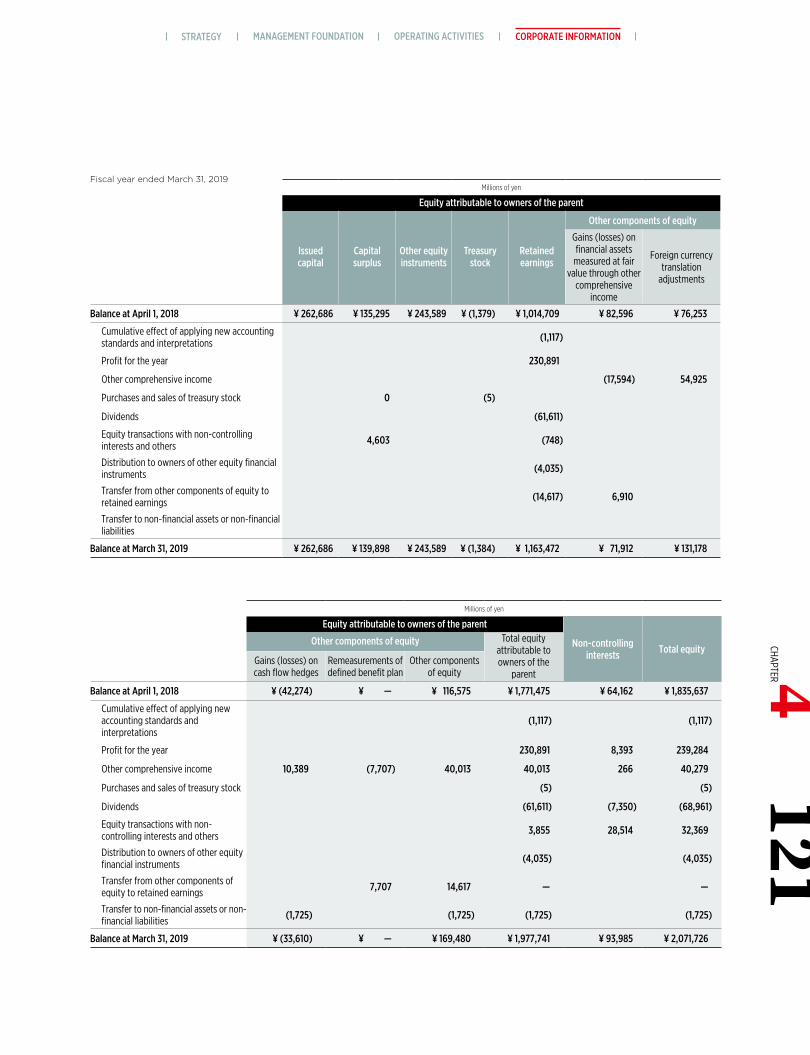
Millions of yen
Equity attributable to owners of the parent
Issued capital
Capital surplus
Other equity instruments
Treasury stock
Retained earnings
Other components of equity
Gains (losses) on financial assets
measured at fair value through other
comprehensive income
Foreign currency translation
adjustments
Balance at April 1, 2018 ¥ 262,686 ¥ 135,295 ¥ 243,589 ¥ (1,379) ¥ 1,014,709 ¥ 82,596 ¥ 76,253
Cumulative effect of applying new accounting standards and interpretations (1,117)
Profit for the year 230,891
Other comprehensive income (17,594) 54,925
Purchases and sales of treasury stock 0 (5)
Dividends (61,611)
Equity transactions with non-controlling interests and others 4,603 (748)
Distribution to owners of other equity financial instruments (4,035)
Transfer from other components of equity to retained earnings (14,617) 6,910
Transfer to non-financial assets or non-financial liabilities
Balance at March 31, 2019 ¥ 262,686 ¥ 139,898 ¥ 243,589 ¥ (1,384) ¥ 1,163,472 ¥ 71,912 ¥ 131,178
Millions of yen
Equity attributable to owners of the parent
Non-controlling interests Total equity
Other components of equity Total equity attributable to owners of the
parentGains (losses) on cash flow hedges
Remeasurements of defined benefit plan
Other components of equity
Balance at April 1, 2018 ¥ (42,274) ¥ — ¥ 116,575 ¥ 1,771,475 ¥ 64,162 ¥ 1,835,637
Cumulative effect of applying new accounting standards and interpretations
(1,117) (1,117)
Profit for the year 230,891 8,393 239,284
Other comprehensive income 10,389 (7,707) 40,013 40,013 266 40,279
Purchases and sales of treasury stock (5) (5)
Dividends (61,611) (7,350) (68,961)
Equity transactions with non-controlling interests and others 3,855 28,514 32,369
Distribution to owners of other equity financial instruments (4,035) (4,035)
Transfer from other components of equity to retained earnings 7,707 14,617 — —
Transfer to non-financial assets or non-financial liabilities (1,725) (1,725) (1,725) (1,725)
Balance at March 31, 2019 ¥ (33,610) ¥ — ¥ 169,480 ¥ 1,977,741 ¥ 93,985 ¥ 2,071,726
Fiscal year ended March 31, 2019
MANAGEMENT FOUNDATION OPERATING ACTIVITIES CORPORATE INFORMATIONSTRATEGY121
CHAPTER 4
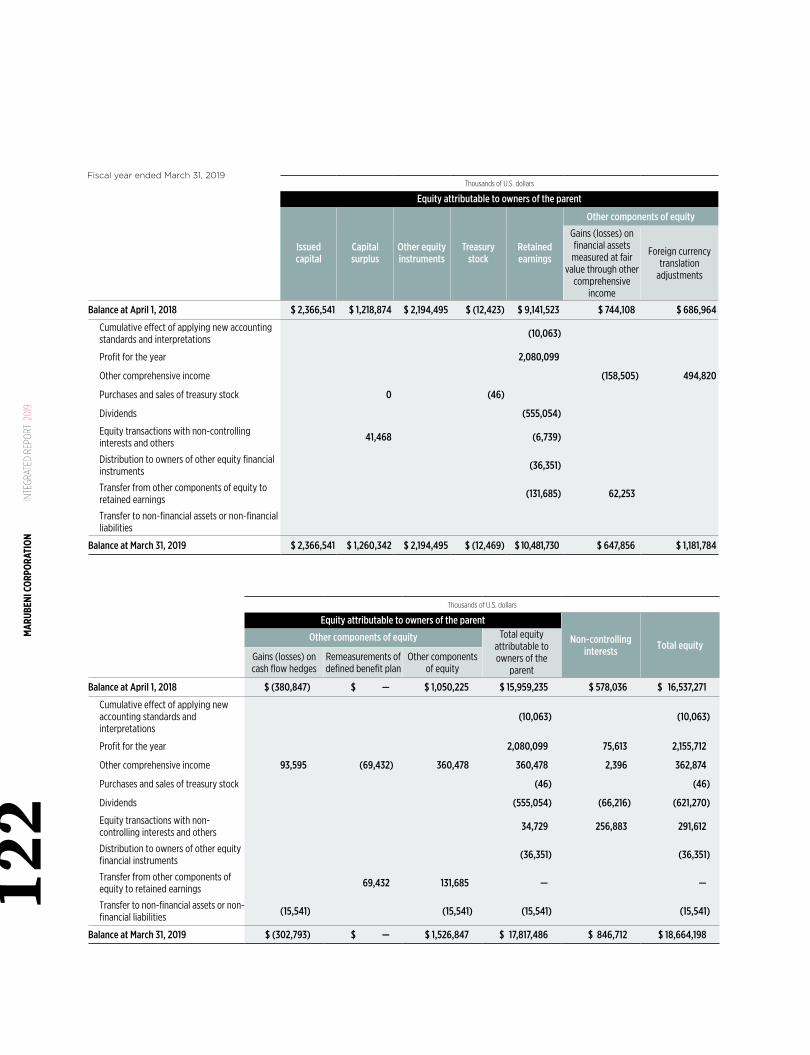
Thousands of U.S. dollars
Equity attributable to owners of the parent
Issued capital
Capital surplus
Other equity instruments
Treasury stock
Retained earnings
Other components of equity
Gains (losses) on financial assets
measured at fair value through other
comprehensive income
Foreign currency translation
adjustments
Balance at April 1, 2018 $ 2,366,541 $ 1,218,874 $ 2,194,495 $ (12,423) $ 9,141,523 $ 744,108 $ 686,964
Cumulative effect of applying new accounting standards and interpretations (10,063)
Profit for the year 2,080,099
Other comprehensive income (158,505) 494,820
Purchases and sales of treasury stock 0 (46)
Dividends (555,054)
Equity transactions with non-controlling interests and others 41,468 (6,739)
Distribution to owners of other equity financial instruments (36,351)
Transfer from other components of equity to retained earnings (131,685) 62,253
Transfer to non-financial assets or non-financial liabilities
Balance at March 31, 2019 $ 2,366,541 $ 1,260,342 $ 2,194,495 $ (12,469) $ 10,481,730 $ 647,856 $ 1,181,784
Thousands of U.S. dollars
Equity attributable to owners of the parent
Non-controlling interests Total equity
Other components of equity Total equity attributable to owners of the
parentGains (losses) on cash flow hedges
Remeasurements of defined benefit plan
Other components of equity
Balance at April 1, 2018 $ (380,847) $ — $ 1,050,225 $ 15,959,235 $ 578,036 $ 16,537,271
Cumulative effect of applying new accounting standards and interpretations
(10,063) (10,063)
Profit for the year 2,080,099 75,613 2,155,712
Other comprehensive income 93,595 (69,432) 360,478 360,478 2,396 362,874
Purchases and sales of treasury stock (46) (46)
Dividends (555,054) (66,216) (621,270)
Equity transactions with non-controlling interests and others 34,729 256,883 291,612
Distribution to owners of other equity financial instruments (36,351) (36,351)
Transfer from other components of equity to retained earnings 69,432 131,685 — —
Transfer to non-financial assets or non-financial liabilities (15,541) (15,541) (15,541) (15,541)
Balance at March 31, 2019 $ (302,793) $ — $ 1,526,847 $ 17,817,486 $ 846,712 $ 18,664,198
Fiscal year ended March 31, 2019
MAR
UBEN
I COR
PORA
TION
IN
TEGR
ATED
REP
ORT
201
912
2
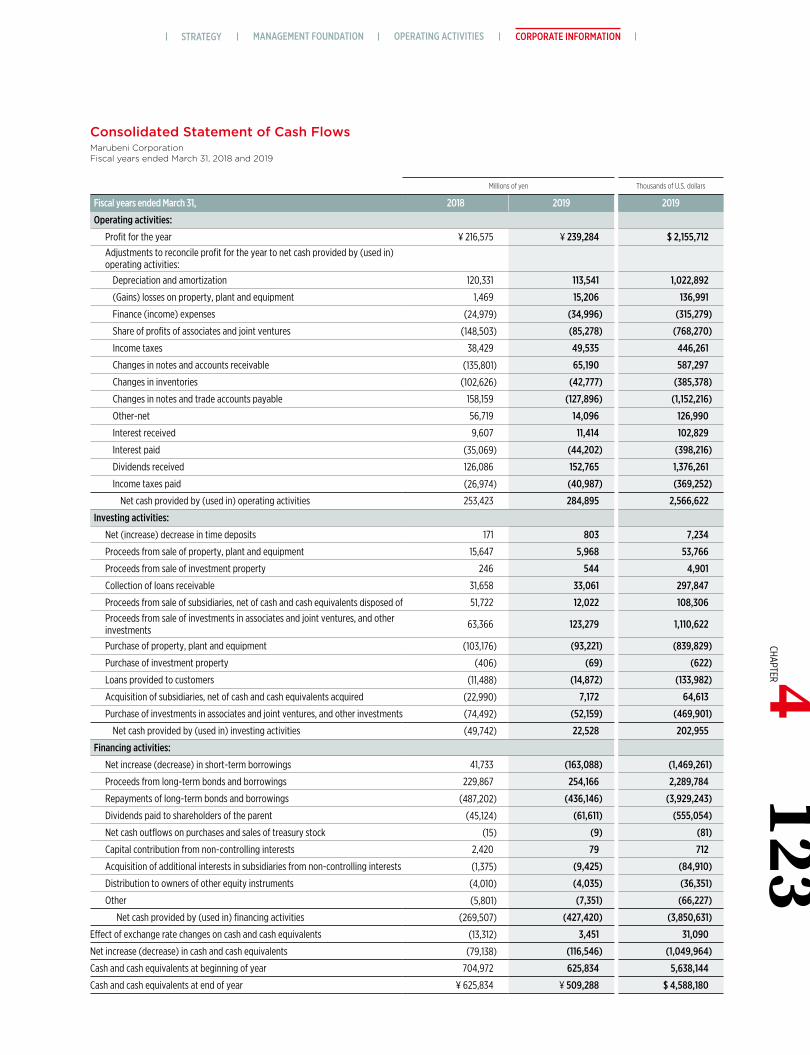
Consolidated Statement of Cash FlowsMarubeni Corporation Fiscal years ended March 31, 2018 and 2019
Millions of yen Thousands of U.S. dollars
Fiscal years ended March 31, 2018 2019 2019
Operating activities:
Profit for the year ¥ 216,575 ¥ 239,284 $ 2,155,712 Adjustments to reconcile profit for the year to net cash provided by (used in) operating activities:
Depreciation and amortization 120,331 113,541 1,022,892
(Gains) losses on property, plant and equipment 1,469 15,206 136,991
Finance (income) expenses (24,979) (34,996) (315,279)
Share of profits of associates and joint ventures (148,503) (85,278) (768,270)
Income taxes 38,429 49,535 446,261
Changes in notes and accounts receivable (135,801) 65,190 587,297
Changes in inventories (102,626) (42,777) (385,378)
Changes in notes and trade accounts payable 158,159 (127,896) (1,152,216)
Other-net 56,719 14,096 126,990
Interest received 9,607 11,414 102,829
Interest paid (35,069) (44,202) (398,216)
Dividends received 126,086 152,765 1,376,261
Income taxes paid (26,974) (40,987) (369,252)
Net cash provided by (used in) operating activities 253,423 284,895 2,566,622
Investing activities:
Net (increase) decrease in time deposits 171 803 7,234
Proceeds from sale of property, plant and equipment 15,647 5,968 53,766
Proceeds from sale of investment property 246 544 4,901
Collection of loans receivable 31,658 33,061 297,847
Proceeds from sale of subsidiaries, net of cash and cash equivalents disposed of 51,722 12,022 108,306 Proceeds from sale of investments in associates and joint ventures, and other investments 63,366 123,279 1,110,622
Purchase of property, plant and equipment (103,176) (93,221) (839,829)
Purchase of investment property (406) (69) (622)
Loans provided to customers (11,488) (14,872) (133,982)
Acquisition of subsidiaries, net of cash and cash equivalents acquired (22,990) 7,172 64,613
Purchase of investments in associates and joint ventures, and other investments (74,492) (52,159) (469,901)
Net cash provided by (used in) investing activities (49,742) 22,528 202,955
Financing activities:
Net increase (decrease) in short-term borrowings 41,733 (163,088) (1,469,261)
Proceeds from long-term bonds and borrowings 229,867 254,166 2,289,784
Repayments of long-term bonds and borrowings (487,202) (436,146) (3,929,243)
Dividends paid to shareholders of the parent (45,124) (61,611) (555,054)
Net cash outflows on purchases and sales of treasury stock (15) (9) (81)
Capital contribution from non-controlling interests 2,420 79 712
Acquisition of additional interests in subsidiaries from non-controlling interests (1,375) (9,425) (84,910)
Distribution to owners of other equity instruments (4,010) (4,035) (36,351)
Other (5,801) (7,351) (66,227)
Net cash provided by (used in) financing activities (269,507) (427,420) (3,850,631)
Effect of exchange rate changes on cash and cash equivalents (13,312) 3,451 31,090
Net increase (decrease) in cash and cash equivalents (79,138) (116,546) (1,049,964)
Cash and cash equivalents at beginning of year 704,972 625,834 5,638,144
Cash and cash equivalents at end of year ¥ 625,834 ¥ 509,288 $ 4,588,180
MANAGEMENT FOUNDATION OPERATING ACTIVITIES CORPORATE INFORMATIONSTRATEGY123
CHAPTER 4
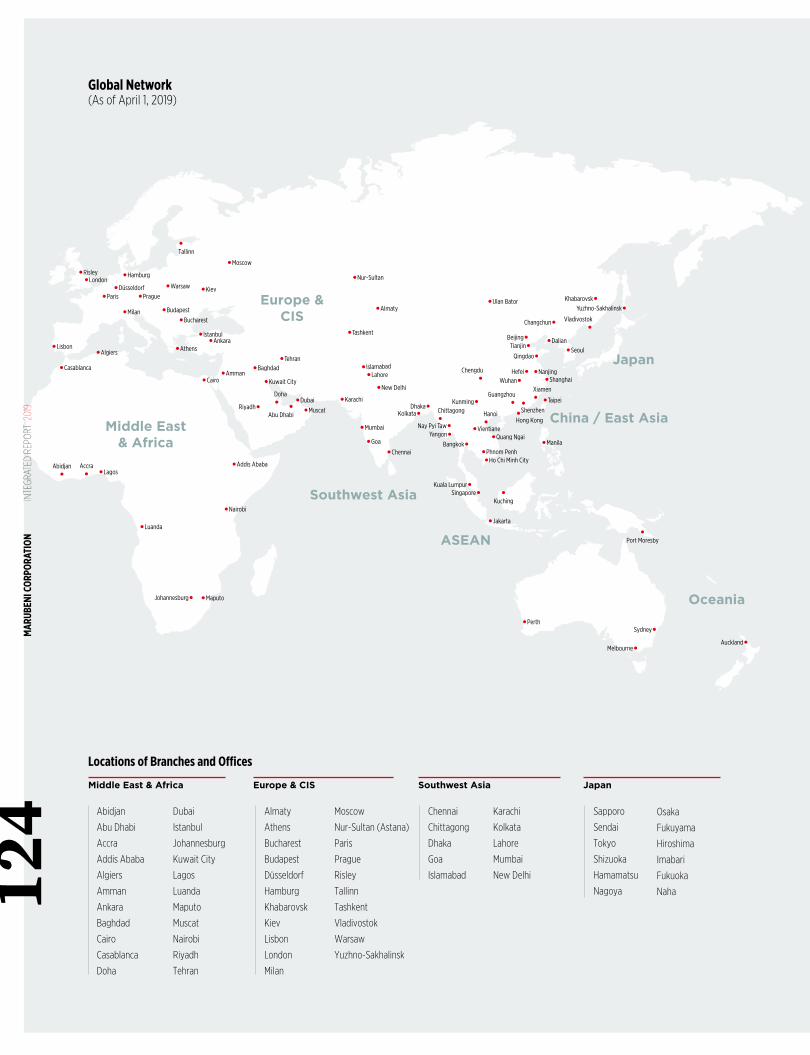
•Risley•London
•Paris
•Milan
•Prague•Warsaw
•Budapest
•Bucharest
•Athens•Ankara
•Istanbul
•Cairo•Amman
Riyadh•Doha• •Dubai
•Abu Dhabi •Muscat
Accra•
Abidjan• •Lagos
•Karachi
•New Delhi
•Lahore•Islamabad
•Tashkent
•Almaty
•Nur-Sultan
•Tehran
•Baghdad
•Kuwait City
•Kiev
•Moscow
•Tallinn
•Lisbon
•Casablanca
Middle East& Africa
Europe &CIS
Southwest Asia
ASEAN
China / East Asia
Japan
Oceania
North & Central America
South America
•Algiers
•Hamburg
•Düsseldorf
•Luanda
Johannesburg• •Maputo
•Nairobi
•Addis Ababa
•Mumbai
•Goa
•Chennai
Nay Pyi Taw•Kolkata•
Bangkok•
Dhaka• Kunming•
Chengdu• Wuhan•
Xiamen• •Taipei•
Shenzhen
•Shanghai•NanjingHefei•
Qingdao•Tianjin• •Dalian
•Seoul
Vladivostok•
Khabarovsk•Yuzhno-Sakhalinsk•
Beijing•Changchun•
•Ulan Bator
Guangzhou•
Chittagong•
Yangon•
Hanoi•
•Vientiane•Quang Ngai
•Hong Kong
•Manila
•Phnom Penh•Ho Chi Minh City
Kuala Lumpur•
•Jakarta
•Perth
Melbourne•
Sydney•Auckland•
•Kuching
•Port Moresby
Singapore•
•Santiago
•Lima
•Bogota
•Guatemala City
•Mexico City
•Queretaro
•Houston
•Los Angeles
•Silicon Valley
•Vancouver
•Omaha
•Toronto
•Washington, D.C.
•Havana
•New York
•Caracas
Salvador•
•Buenos Aires
Rio de Janeiro•
•São Paulo
Locations of Branches and Offices
Global Network (As of April 1, 2019)
Chennai
Chittagong
Dhaka
Goa
Islamabad
Sapporo
Sendai
Tokyo
Shizuoka
Hamamatsu
Nagoya
Almaty
Athens
Bucharest
Budapest
Düsseldorf
Hamburg
Khabarovsk
Kiev
Lisbon
London
Milan
Moscow
Nur-Sultan (Astana)
Paris
Prague
Risley
Tallinn
Tashkent
Vladivostok
Warsaw
Yuzhno-Sakhalinsk
Abidjan
Abu Dhabi
Accra
Addis Ababa
Algiers
Amman
Ankara
Baghdad
Cairo
Casablanca
Doha
Middle East & Africa Europe & CIS Southwest Asia Japan
Dubai
Istanbul
Johannesburg
Kuwait City
Lagos
Luanda
Maputo
Muscat
Nairobi
Riyadh
Tehran
Osaka
Fukuyama
Hiroshima
Imabari
Fukuoka
Naha
Karachi
Kolkata
Lahore
Mumbai
New Delhi
MAR
UBEN
I COR
PORA
TION
IN
TEGR
ATED
REP
ORT
201
912
4
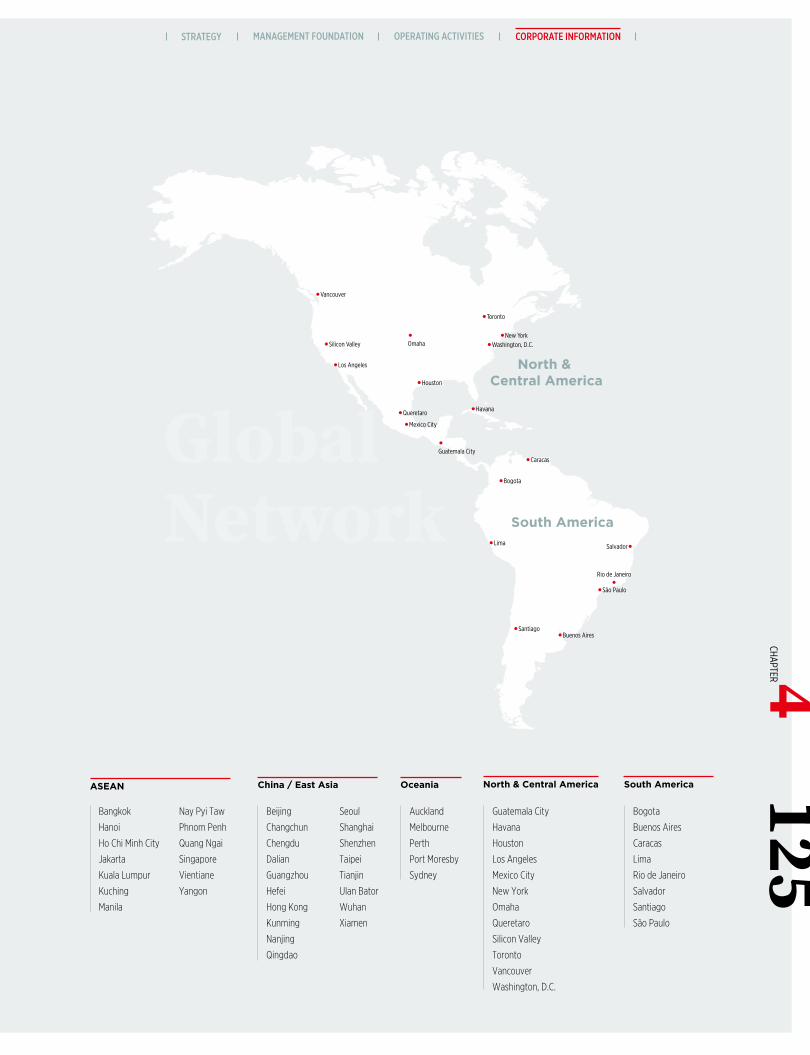
•Risley•London
•Paris
•Milan
•Prague•Warsaw
•Budapest
•Bucharest
•Athens•Ankara
•Istanbul
•Cairo•Amman
Riyadh•Doha• •Dubai
•Abu Dhabi •Muscat
Accra•
Abidjan• •Lagos
•Karachi
•New Delhi
•Lahore•Islamabad
•Tashkent
•Almaty
•Nur-Sultan
•Tehran
•Baghdad
•Kuwait City
•Kiev
•Moscow
•Tallinn
•Lisbon
•Casablanca
Middle East& Africa
Europe &CIS
Southwest Asia
ASEAN
China / East Asia
Japan
Oceania
North & Central America
South America
•Algiers
•Hamburg
•Düsseldorf
•Luanda
Johannesburg• •Maputo
•Nairobi
•Addis Ababa
•Mumbai
•Goa
•Chennai
Nay Pyi Taw•Kolkata•
Bangkok•
Dhaka• Kunming•
Chengdu• Wuhan•
Xiamen• •Taipei•
Shenzhen
•Shanghai•NanjingHefei•
Qingdao•Tianjin• •Dalian
•Seoul
Vladivostok•
Khabarovsk•Yuzhno-Sakhalinsk•
Beijing•Changchun•
•Ulan Bator
Guangzhou•
Chittagong•
Yangon•
Hanoi•
•Vientiane•Quang Ngai
•Hong Kong
•Manila
•Phnom Penh•Ho Chi Minh City
Kuala Lumpur•
•Jakarta
•Perth
Melbourne•
Sydney•Auckland•
•Kuching
•Port Moresby
Singapore•
•Santiago
•Lima
•Bogota
•Guatemala City
•Mexico City
•Queretaro
•Houston
•Los Angeles
•Silicon Valley
•Vancouver
•Omaha
•Toronto
•Washington, D.C.
•Havana
•New York
•Caracas
Salvador•
•Buenos Aires
Rio de Janeiro•
•São Paulo
Auckland
Melbourne
Perth
Port Moresby
Sydney
Oceania
Bogota
Buenos Aires
Caracas
Lima
Rio de Janeiro
Salvador
Santiago
São Paulo
South America
Guatemala City
Havana
Houston
Los Angeles
Mexico City
New York
Omaha
Queretaro
Silicon Valley
Toronto
Vancouver
Washington, D.C.
North & Central AmericaChina / East Asia
Beijing
Changchun
Chengdu
Dalian
Guangzhou
Hefei
Hong Kong
Kunming
Nanjing
Qingdao
Seoul
Shanghai
Shenzhen
Taipei
Tianjin
Ulan Bator
Wuhan
Xiamen
Bangkok
Hanoi
Ho Chi Minh City
Jakarta
Kuala Lumpur
Kuching
Manila
ASEAN
Nay Pyi Taw
Phnom Penh
Quang Ngai
Singapore
Vientiane
Yangon
GlobalNetwork
MANAGEMENT FOUNDATION OPERATING ACTIVITIES CORPORATE INFORMATIONSTRATEGY125
CHAPTER 4
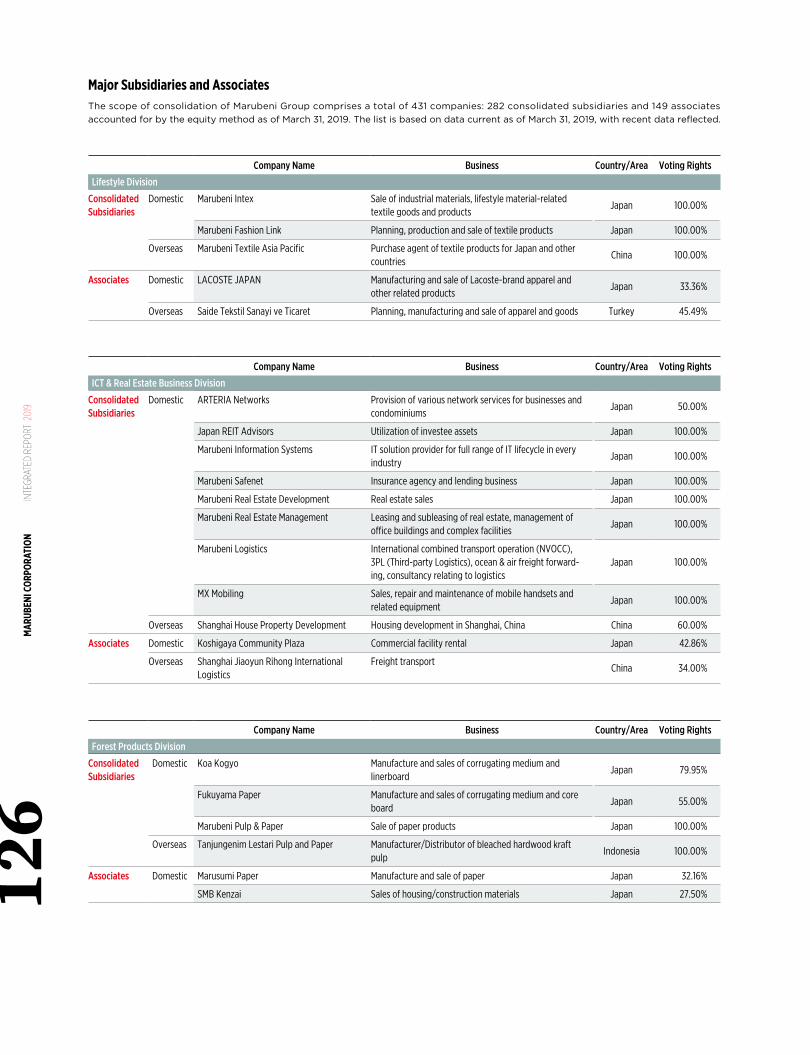
Major Subsidiaries and AssociatesThe scope of consolidation of Marubeni Group comprises a total of 431 companies: 282 consolidated subsidiaries and 149 associates accounted for by the equity method as of March 31, 2019. The list is based on data current as of March 31, 2019, with recent data reflected.
Company Name Business Country/Area Voting Rights
Lifestyle Division
ConsolidatedSubsidiaries
Domestic Marubeni Intex Sale of industrial materials, lifestyle material-related textile goods and products
Japan 100.00%
Marubeni Fashion Link Planning, production and sale of textile products Japan 100.00%
Overseas Marubeni Textile Asia Pacific Purchase agent of textile products for Japan and other countries
China 100.00%
Associates Domestic LACOSTE JAPAN Manufacturing and sale of Lacoste-brand apparel and other related products
Japan 33.36%
Overseas Saide Tekstil Sanayi ve Ticaret Planning, manufacturing and sale of apparel and goods Turkey 45.49%
Company Name Business Country/Area Voting Rights
ICT & Real Estate Business Division
ConsolidatedSubsidiaries
Domestic ARTERIA Networks Provision of various network services for businesses and condominiums
Japan 50.00%
Japan REIT Advisors Utilization of investee assets Japan 100.00%
Marubeni Information Systems IT solution provider for full range of IT lifecycle in every industry
Japan 100.00%
Marubeni Safenet Insurance agency and lending business Japan 100.00%
Marubeni Real Estate Development Real estate sales Japan 100.00%
Marubeni Real Estate Management Leasing and subleasing of real estate, management of office buildings and complex facilities
Japan 100.00%
Marubeni Logistics International combined transport operation (NVOCC), 3PL (Third-party Logistics), ocean & air freight forward-ing, consultancy relating to logistics
Japan 100.00%
MX Mobiling Sales, repair and maintenance of mobile handsets and related equipment
Japan 100.00%
Overseas Shanghai House Property Development Housing development in Shanghai, China China 60.00%
Associates Domestic Koshigaya Community Plaza Commercial facility rental Japan 42.86%
Overseas Shanghai Jiaoyun Rihong International Logistics
Freight transportChina 34.00%
Company Name Business Country/Area Voting Rights
Forest Products Division
ConsolidatedSubsidiaries
Domestic Koa Kogyo Manufacture and sales of corrugating medium and linerboard
Japan 79.95%
Fukuyama Paper Manufacture and sales of corrugating medium and core board
Japan 55.00%
Marubeni Pulp & Paper Sale of paper products Japan 100.00%
Overseas Tanjungenim Lestari Pulp and Paper Manufacturer/Distributor of bleached hardwood kraft pulp
Indonesia 100.00%
Associates Domestic Marusumi Paper Manufacture and sale of paper Japan 32.16%
SMB Kenzai Sales of housing/construction materials Japan 27.50%
MAR
UBEN
I COR
PORA
TION
IN
TEGR
ATED
REP
ORT
201
912
6
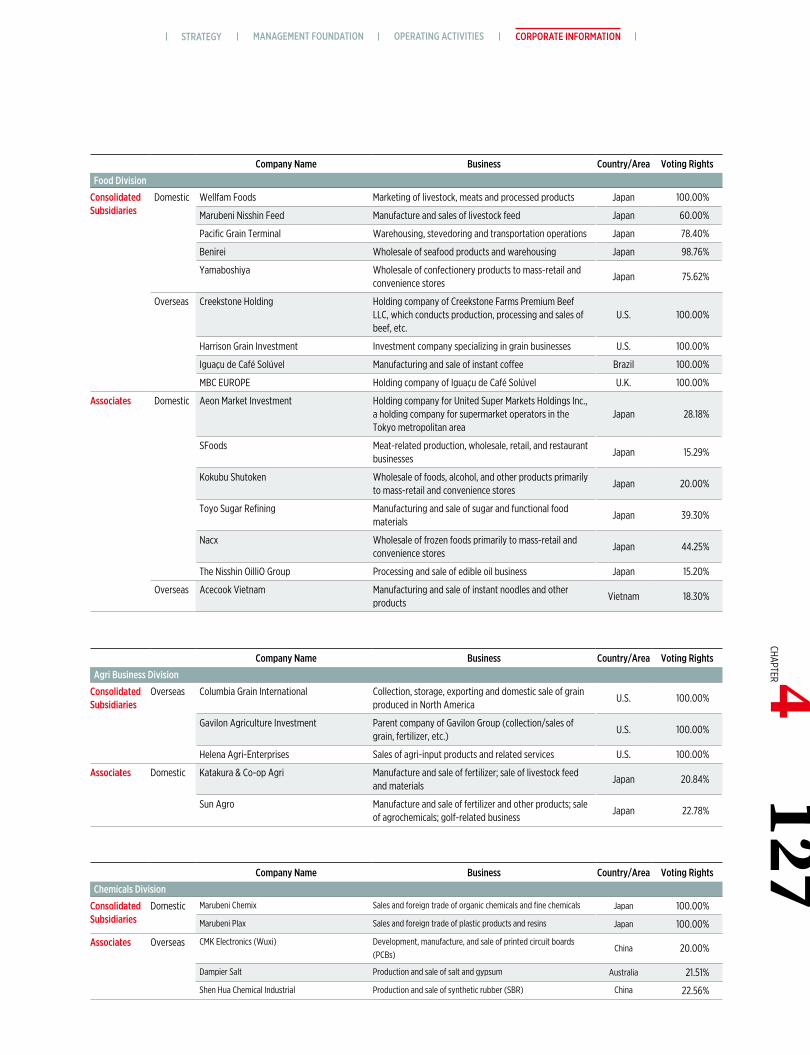
Company Name Business Country/Area Voting Rights
Food Division
ConsolidatedSubsidiaries
Domestic Wellfam Foods Marketing of livestock, meats and processed products Japan 100.00%
Marubeni Nisshin Feed Manufacture and sales of livestock feed Japan 60.00%
Pacific Grain Terminal Warehousing, stevedoring and transportation operations Japan 78.40%
Benirei Wholesale of seafood products and warehousing Japan 98.76%
Yamaboshiya Wholesale of confectionery products to mass-retail and convenience stores
Japan 75.62%
Overseas Creekstone Holding Holding company of Creekstone Farms Premium Beef LLC, which conducts production, processing and sales of beef, etc.
U.S. 100.00%
Harrison Grain Investment Investment company specializing in grain businesses U.S. 100.00%
Iguaçu de Café Solúvel Manufacturing and sale of instant coffee Brazil 100.00%
MBC EUROPE Holding company of Iguaçu de Café Solúvel U.K. 100.00%
Associates Domestic Aeon Market Investment Holding company for United Super Markets Holdings Inc., a holding company for supermarket operators in the Tokyo metropolitan area
Japan 28.18%
SFoods Meat-related production, wholesale, retail, and restaurant businesses
Japan 15.29%
Kokubu Shutoken Wholesale of foods, alcohol, and other products primarily to mass-retail and convenience stores
Japan 20.00%
Toyo Sugar Refining Manufacturing and sale of sugar and functional food materials
Japan 39.30%
Nacx Wholesale of frozen foods primarily to mass-retail and convenience stores
Japan 44.25%
The Nisshin OilliO Group Processing and sale of edible oil business Japan 15.20%
Overseas Acecook Vietnam Manufacturing and sale of instant noodles and other products
Vietnam 18.30%
Company Name Business Country/Area Voting Rights
Agri Business Division
ConsolidatedSubsidiaries
Overseas Columbia Grain International Collection, storage, exporting and domestic sale of grain produced in North America
U.S. 100.00%
Gavilon Agriculture Investment Parent company of Gavilon Group (collection/sales of grain, fertilizer, etc.)
U.S. 100.00%
Helena Agri-Enterprises Sales of agri-input products and related services U.S. 100.00%
Associates Domestic Katakura & Co-op Agri Manufacture and sale of fertilizer; sale of livestock feed and materials
Japan 20.84%
Sun Agro Manufacture and sale of fertilizer and other products; sale of agrochemicals; golf-related business
Japan 22.78%
Company Name Business Country/Area Voting Rights
Chemicals Division
ConsolidatedSubsidiaries
Domestic Marubeni Chemix Sales and foreign trade of organic chemicals and fine chemicals Japan 100.00%
Marubeni Plax Sales and foreign trade of plastic products and resins Japan 100.00%
Associates Overseas CMK Electronics (Wuxi) Development, manufacture, and sale of printed circuit boards (PCBs)
China 20.00%
Dampier Salt Production and sale of salt and gypsum Australia 21.51%
Shen Hua Chemical Industrial Production and sale of synthetic rubber (SBR) China 22.56%
MANAGEMENT FOUNDATION OPERATING ACTIVITIES CORPORATE INFORMATIONSTRATEGY127
CHAPTER 4
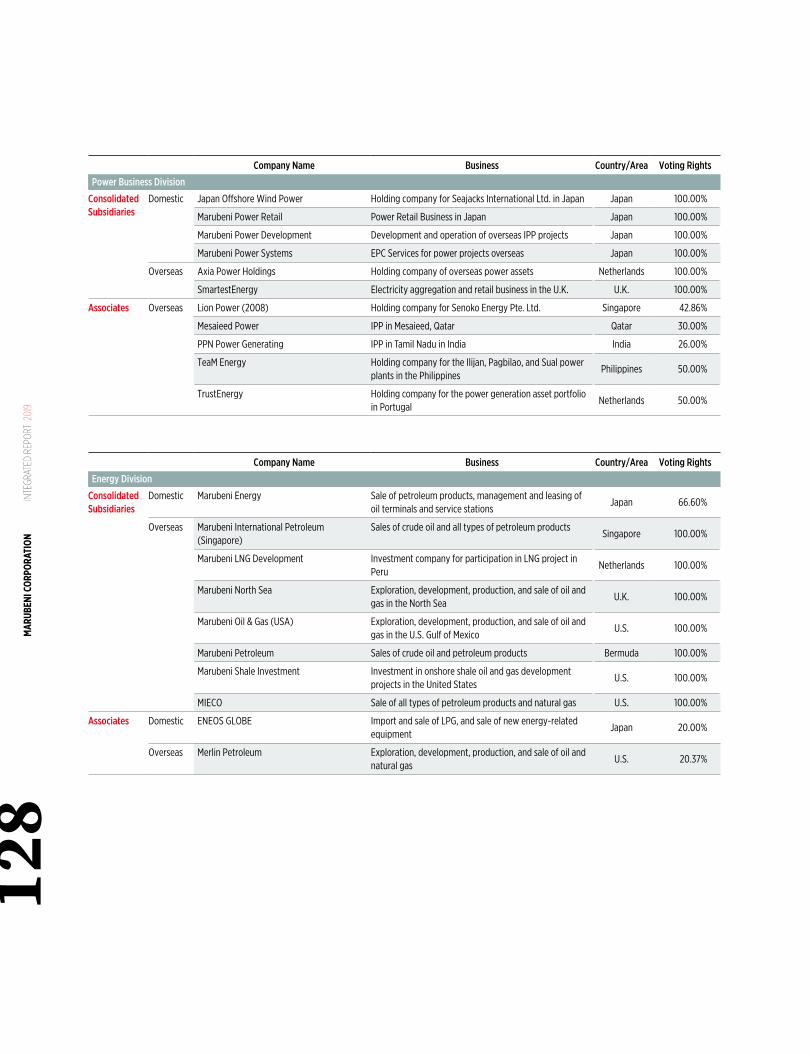
Company Name Business Country/Area Voting Rights
Power Business Division
ConsolidatedSubsidiaries
Domestic Japan Offshore Wind Power Holding company for Seajacks International Ltd. in Japan Japan 100.00%
Marubeni Power Retail Power Retail Business in Japan Japan 100.00%
Marubeni Power Development Development and operation of overseas IPP projects Japan 100.00%
Marubeni Power Systems EPC Services for power projects overseas Japan 100.00%
Overseas Axia Power Holdings Holding company of overseas power assets Netherlands 100.00%
SmartestEnergy Electricity aggregation and retail business in the U.K. U.K. 100.00%
Associates Overseas Lion Power (2008) Holding company for Senoko Energy Pte. Ltd. Singapore 42.86%
Mesaieed Power IPP in Mesaieed, Qatar Qatar 30.00%
PPN Power Generating IPP in Tamil Nadu in India India 26.00%
TeaM Energy Holding company for the Ilijan, Pagbilao, and Sual power plants in the Philippines
Philippines 50.00%
TrustEnergy Holding company for the power generation asset portfolio in Portugal
Netherlands 50.00%
Company Name Business Country/Area Voting Rights
Energy Division
ConsolidatedSubsidiaries
Domestic Marubeni Energy Sale of petroleum products, management and leasing of oil terminals and service stations
Japan 66.60%
Overseas Marubeni International Petroleum (Singapore)
Sales of crude oil and all types of petroleum productsSingapore 100.00%
Marubeni LNG Development Investment company for participation in LNG project in Peru
Netherlands 100.00%
Marubeni North Sea Exploration, development, production, and sale of oil and gas in the North Sea
U.K. 100.00%
Marubeni Oil & Gas (USA) Exploration, development, production, and sale of oil and gas in the U.S. Gulf of Mexico
U.S. 100.00%
Marubeni Petroleum Sales of crude oil and petroleum products Bermuda 100.00%
Marubeni Shale Investment Investment in onshore shale oil and gas development projects in the United States
U.S. 100.00%
MIECO Sale of all types of petroleum products and natural gas U.S. 100.00%
Associates Domestic ENEOS GLOBE Import and sale of LPG, and sale of new energy-related equipment
Japan 20.00%
Overseas Merlin Petroleum Exploration, development, production, and sale of oil and natural gas
U.S. 20.37%
MAR
UBEN
I COR
PORA
TION
IN
TEGR
ATED
REP
ORT
201
912
8
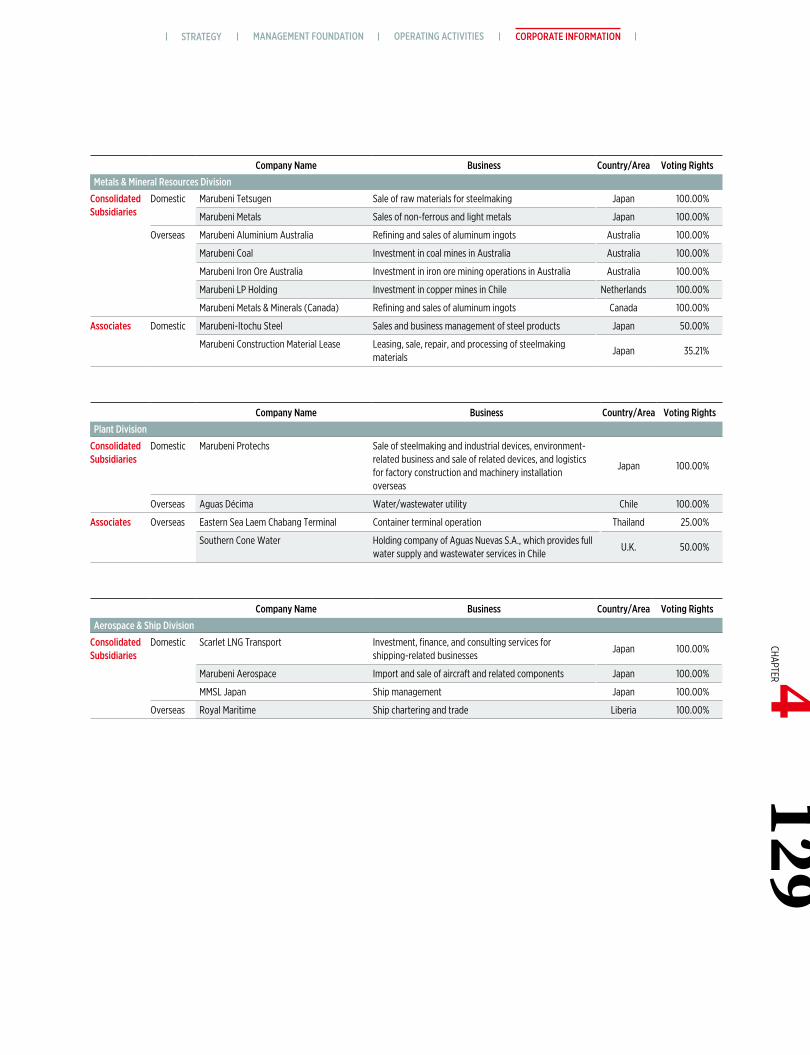
Company Name Business Country/Area Voting Rights
Metals & Mineral Resources Division
ConsolidatedSubsidiaries
Domestic Marubeni Tetsugen Sale of raw materials for steelmaking Japan 100.00%
Marubeni Metals Sales of non-ferrous and light metals Japan 100.00%
Overseas Marubeni Aluminium Australia Refining and sales of aluminum ingots Australia 100.00%
Marubeni Coal Investment in coal mines in Australia Australia 100.00%
Marubeni Iron Ore Australia Investment in iron ore mining operations in Australia Australia 100.00%
Marubeni LP Holding Investment in copper mines in Chile Netherlands 100.00%
Marubeni Metals & Minerals (Canada) Refining and sales of aluminum ingots Canada 100.00%
Associates Domestic Marubeni-Itochu Steel Sales and business management of steel products Japan 50.00%
Marubeni Construction Material Lease Leasing, sale, repair, and processing of steelmaking materials
Japan 35.21%
Company Name Business Country/Area Voting Rights
Plant Division
ConsolidatedSubsidiaries
Domestic Marubeni Protechs Sale of steelmaking and industrial devices, environment-related business and sale of related devices, and logistics for factory construction and machinery installation overseas
Japan 100.00%
Overseas Aguas Décima Water/wastewater utility Chile 100.00%
Associates Overseas Eastern Sea Laem Chabang Terminal Container terminal operation Thailand 25.00%
Southern Cone Water Holding company of Aguas Nuevas S.A., which provides full water supply and wastewater services in Chile
U.K. 50.00%
Company Name Business Country/Area Voting Rights
Aerospace & Ship Division
ConsolidatedSubsidiaries
Domestic Scarlet LNG Transport Investment, finance, and consulting services forshipping-related businesses
Japan 100.00%
Marubeni Aerospace Import and sale of aircraft and related components Japan 100.00%
MMSL Japan Ship management Japan 100.00%
Overseas Royal Maritime Ship chartering and trade Liberia 100.00%
MANAGEMENT FOUNDATION OPERATING ACTIVITIES CORPORATE INFORMATIONSTRATEGY129
CHAPTER 4
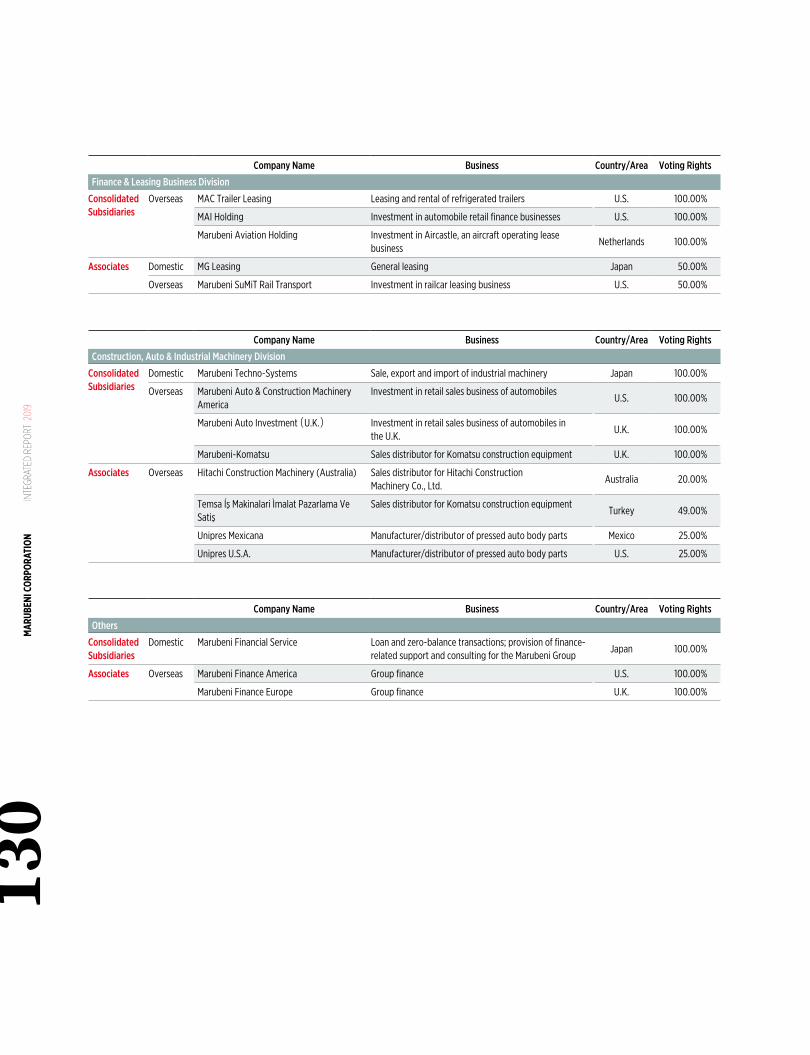
Company Name Business Country/Area Voting Rights
Finance & Leasing Business Division
ConsolidatedSubsidiaries
Overseas MAC Trailer Leasing Leasing and rental of refrigerated trailers U.S. 100.00%
MAI Holding Investment in automobile retail finance businesses U.S. 100.00%
Marubeni Aviation Holding Investment in Aircastle, an aircraft operating lease business
Netherlands 100.00%
Associates Domestic MG Leasing General leasing Japan 50.00%
Overseas Marubeni SuMiT Rail Transport Investment in railcar leasing business U.S. 50.00%
Company Name Business Country/Area Voting Rights
Construction, Auto & Industrial Machinery Division
ConsolidatedSubsidiaries
Domestic Marubeni Techno-Systems Sale, export and import of industrial machinery Japan 100.00%
Overseas Marubeni Auto & Construction Machinery America
Investment in retail sales business of automobilesU.S. 100.00%
Marubeni Auto Investment(U.K.) Investment in retail sales business of automobiles in the U.K.
U.K. 100.00%
Marubeni-Komatsu Sales distributor for Komatsu construction equipment U.K. 100.00%
Associates Overseas Hitachi Construction Machinery (Australia) Sales distributor for Hitachi Construction Machinery Co., Ltd.
Australia 20.00%
Temsa Íş Makinalari Ìmalat Pazarlama Ve Satiş
Sales distributor for Komatsu construction equipmentTurkey 49.00%
Unipres Mexicana Manufacturer/distributor of pressed auto body parts Mexico 25.00%
Unipres U.S.A. Manufacturer/distributor of pressed auto body parts U.S. 25.00%
Company Name Business Country/Area Voting Rights
Others
ConsolidatedSubsidiaries
Domestic Marubeni Financial Service Loan and zero-balance transactions; provision of finance-related support and consulting for the Marubeni Group
Japan 100.00%
Associates Overseas Marubeni Finance America Group finance U.S. 100.00%
Marubeni Finance Europe Group finance U.K. 100.00%
MAR
UBEN
I COR
PORA
TION
IN
TEGR
ATED
REP
ORT
201
913
0
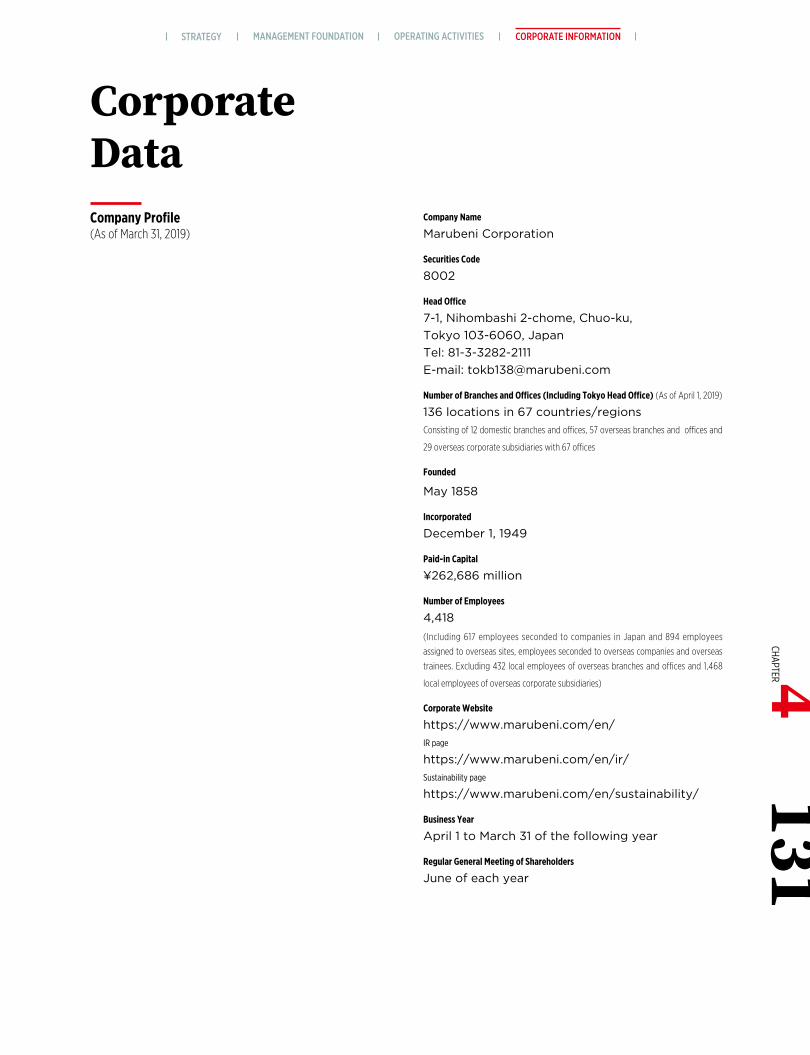
Company Profile(As of March 31, 2019)
Company Name
Marubeni Corporation
Securities Code
8002
Head Office
7-1, Nihombashi 2-chome, Chuo-ku,Tokyo 103-6060, JapanTel: 81-3-3282-2111E-mail: [email protected]
Number of Branches and Offices (Including Tokyo Head Office) (As of April 1, 2019)
136 locations in 67 countries/regionsConsisting of 12 domestic branches and offices, 57 overseas branches and offices and
29 overseas corporate subsidiaries with 67 offices
Founded
May 1858
Incorporated
December 1, 1949
Paid-in Capital
¥262,686 million
Number of Employees
4,418(Including 617 employees seconded to companies in Japan and 894 employees
assigned to overseas sites, employees seconded to overseas companies and overseas
trainees. Excluding 432 local employees of overseas branches and offices and 1,468
local employees of overseas corporate subsidiaries)
Corporate Website
https://www.marubeni.com/en/IR page
https://www.marubeni.com/en/ir/Sustainability page
https://www.marubeni.com/en/sustainability/
Business Year
April 1 to March 31 of the following year
Regular General Meeting of Shareholders
June of each year
CorporateData
131CHAPTER 4
MANAGEMENT FOUNDATION OPERATING ACTIVITIES CORPORATE INFORMATIONSTRATEGY
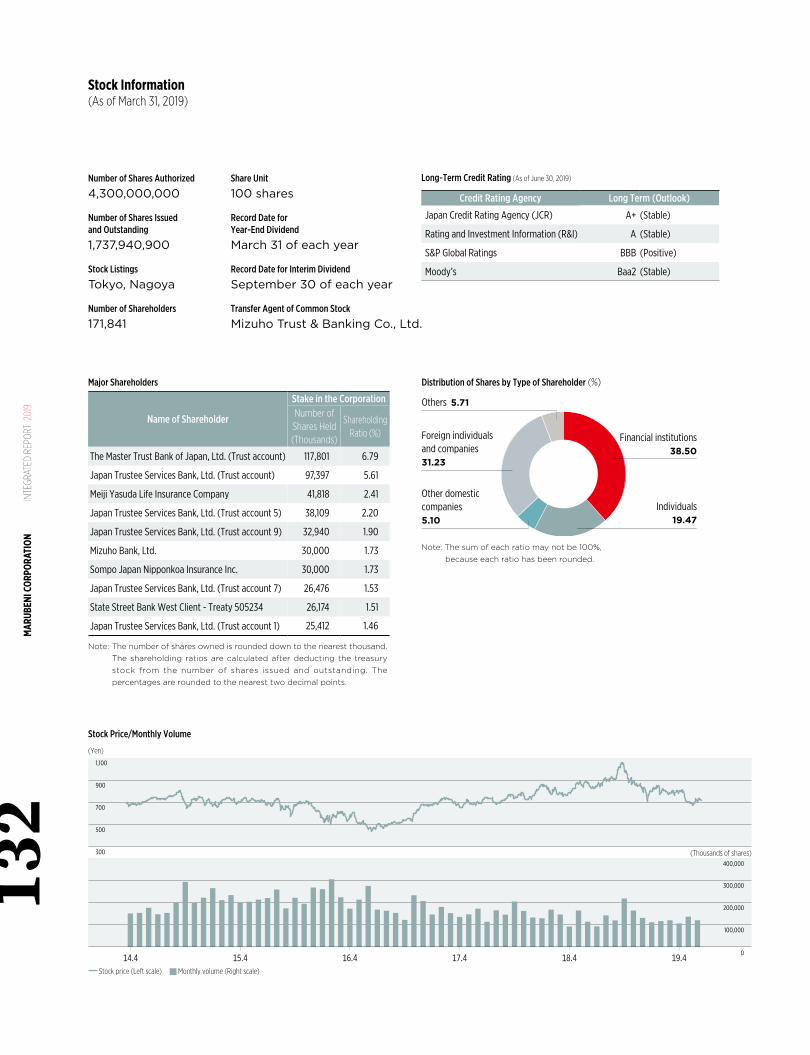
19.40
100,000
400,000
300,000
200,000
300
500
700
900
1,100
14.4 15.4 16.4 17.4 18.4 Stock price (Left scale) Monthly volume (Right scale)
Number of Shares Authorized
4,300,000,000
Number of Shares Issued and Outstanding
1,737,940,900
Stock Listings
Tokyo, Nagoya
Number of Shareholders
171,841
Major Shareholders
Name of Shareholder
Stake in the CorporationNumber ofShares Held(Thousands)
ShareholdingRatio (%)
The Master Trust Bank of Japan, Ltd. (Trust account) 117,801 6.79
Japan Trustee Services Bank, Ltd. (Trust account) 97,397 5.61
Meiji Yasuda Life Insurance Company 41,818 2.41
Japan Trustee Services Bank, Ltd. (Trust account 5) 38,109 2.20
Japan Trustee Services Bank, Ltd. (Trust account 9) 32,940 1.90
Mizuho Bank, Ltd. 30,000 1.73
Sompo Japan Nipponkoa Insurance Inc. 30,000 1.73
Japan Trustee Services Bank, Ltd. (Trust account 7) 26,476 1.53
State Street Bank West Client - Treaty 505234 26,174 1.51
Japan Trustee Services Bank, Ltd. (Trust account 1) 25,412 1.46
Note: The number of shares owned is rounded down to the nearest thousand. The shareholding ratios are calculated after deducting the treasury
stock from the number of shares issued and outstanding. The percentages are rounded to the nearest two decimal points.
Stock Information (As of March 31, 2019)
Stock Price/Monthly Volume
Note: The sum of each ratio may not be 100%, because each ratio has been rounded.
Financial institutions38.50
Individuals19.47
Others 5.71
Foreign individualsand companies31.23
Other domesticcompanies5.10
Distribution of Shares by Type of Shareholder (%)
(Thousands of shares)
(Yen)
Long-Term Credit Rating (As of June 30, 2019)
Credit Rating Agency Long Term (Outlook)
Japan Credit Rating Agency (JCR) A+ (Stable)
Rating and Investment Information (R&I) A (Stable)
S&P Global Ratings BBB (Positive)
Moody’s Baa2 (Stable)
Share Unit
100 shares
Record Date for Year-End Dividend
March 31 of each year
Record Date for Interim Dividend
September 30 of each year
Transfer Agent of Common Stock
Mizuho Trust & Banking Co., Ltd.
MAR
UBEN
I COR
PORA
TION
IN
TEGR
ATED
REP
ORT
201
913
2
Marubeni obtains independent assurance of its environmental and social data to enhance the data’s reliability.
For the fiscal year ended March 31, 2019, KPMG AZSA Sustainability Co., Ltd. provided assurance* on the
following data posted in the Sustainability section of Marubeni’s website.
* The indicators to Third-Party Assurance are assured by KPMG AZSA Sustainability Co., Ltd., through an independent assurance engagement in accordance with ISAE 3000 and 3410.
* KPMG AZSA Sustainability’s Independent Assurance Report is available in the Sustainability section of Marubeni’s website. Environmental Data https://www.marubeni.com/en/sustainability/environment/env_data/ Employee Data https://www.marubeni.com/en/sustainability/human_resources/employee/
Independent Assurance Process
Planning● Ascertain assurance engagement’s scope, indicators subject to independent assurance and
the criteria to be applied in the preparation of the indicators● Determine assurance procedures and schedule
Execution● Conduct interviews and analytical procedures, ask questions based on analytical results and
examine evidence (done mainly on site)● Review content of disclosure media subject to third-party assurance
Submission of Assurance Report● Confirm completion of all required revisions● Conduct internal review (assessment of assurance work’s adequacy by personnel not on the team
that performed the work)● Submit assurance report
Indicators Subject to Independent Assurance
Marubeni Group: Energy consumption, Greenhouse gas (CO2) emissions (energy-related), Waste gen-
erated, Water withdrawal, No. of employees (Consolidated)
Marubeni Corporation: Amount transported (Unit: Thousand ton-km), CO2 emissions during transport, Inten-
sity (kl crude oil eq per thousand ton-km), No. of employees (of which, Domestic and
Overseas), Percentages of male and female, Average age, Average service years, No.
of managerial employees (of which, general managers or above), Ratio of female in
managerial positions, Ratio of female in career-track positions, Turnover rate, Average
total actual working hours per year, Average overtime hours per month, Average use
of vacation time per year, Usage of annual paid leave, No. of employees who took
maternity leave, No. of employees who took childcare leave (of which, male), Return
rate (after childcare leave), No. of employees who took nursing care leave, No. of
employees who took volunteer leave, Lost-time injuries frequency rate, Occupational
illness frequency rate, No. of occupational accidents or incidents leading to injuries or
fatalities, No. of fatal occupational accidents
Marubeni Corporation and certified special-purpose subsidiary Marubeni Office Support Corporation:
Employment rate of persons with disabilities
Independent Assurance of Environmental and Social Data
1
2
3
133CHAPTER 4
MANAGEMENT FOUNDATION OPERATING ACTIVITIES CORPORATE INFORMATIONSTRATEGY
Printed in Japan
https://www.marubeni.com/en/