Integrated Report 2010 - Eskom
328
HI-RES PIC TO BE SUPPLIED On the path to recovery Integrated Report 2010
-
Upload
khangminh22 -
Category
Documents
-
view
2 -
download
0
Transcript of Integrated Report 2010 - Eskom

www.eskom.co.za
Integrated
Rep
ort 2
01
0
Contact information
TelephoneEskom head office:
Eskom Group Communications:
Eskom Development Foundation:
+27 11 800 8111
+27 11 800 2323
+27 11 800 8111
Websites and emailEskom environmental:
Eskom annual report:
Eskom Development Foundation:
www.eskom.co.za/annreport10/
www.eskom.co.za/csi
Eskom website: www.eskom.co.za
Ethics office advisory service: +27 11 800 2791/3187
Company registration number: 2002/015527/06
Confidential fax line: +27 11 507 6358
Physical address:Eskom
Megawatt Park
2 Maxwell Drive
Sunninghill
Sandton
2157
Postal address:Eskom
PO Box 1091
Johannesburg
2000
Eskom Holdings SecretariatBongiwe Mbomvu (Company secretary)
PO Box 1091
Johannesburg
2000
HI-RES PIC TO BE
SUPPLIED
HI RES PIC TO
COME WITH
BLEED
NB:
TO FIT SIZE:
240 X 310
On the path to recovery
Integrated Report 20101970 – 1990Two hydro stations were commissioned for peak load. The decision was taken to build Koeberg, the first nuclear station in Africa. Gas turbine, coal and pumped storage stations were commissioned. Escom was renamed to Eskom in 1987 and an Electricity Council replaced the Commission
1990 – 2010Electrification started on a massive scale and the real price of electricity was reduced to stimulate economic growth. In 2001 Eskom received the Global Power Company of the Year Award. Eskom was converted to a company in 2002. Surplus electricity ran out and power shortages became apparent in 2007
1923Electricity Supply Commission established
1950Vaal and Klip power stations built
1950 – 1970Generation capacity increased by 130%
1984Koeberg, Africa’s first Nuclear PowerStation is built
1970 – 1990Two hydro stations were commissioned for peak load. The decision was taken to build Koeberg, the first nuclear station in Africa. Gas turbine, coal and pumped storage stations were commissioned. Escom was renamed to Eskom in 1987 and an Electricity Council replaced the Commission
1990 – 2010Electrification started on a massive scale and the real price of electricity was reduced to stimulate economic growth. In 2001 Eskom received the Global Power Company of the Year Award. Eskom was converted to a company in 2002. Surplus electricity ran out and power shortages became apparent in 2007
1923 – 1929 1930 – 1950 1950 – 1970
The Electricity Supply Commission (Escom) was established. Dr Hendrik van der Bijl was the first Chairman. Witbank, Colenso and Salt River Power Stations were commissioned
New goldfields on the Witwatersrand and the rise in gold price boosted electricity demand. Vaal and Klip power stations were built and the distribution network was extended
Soaring growth in the Vaal Triangle and Witwatersrand, Eskom’s capacity doubled by extending existing stations and building new ones. R376 million was spent on new plant. Capacity increased by 130%
Research block Information block Education block
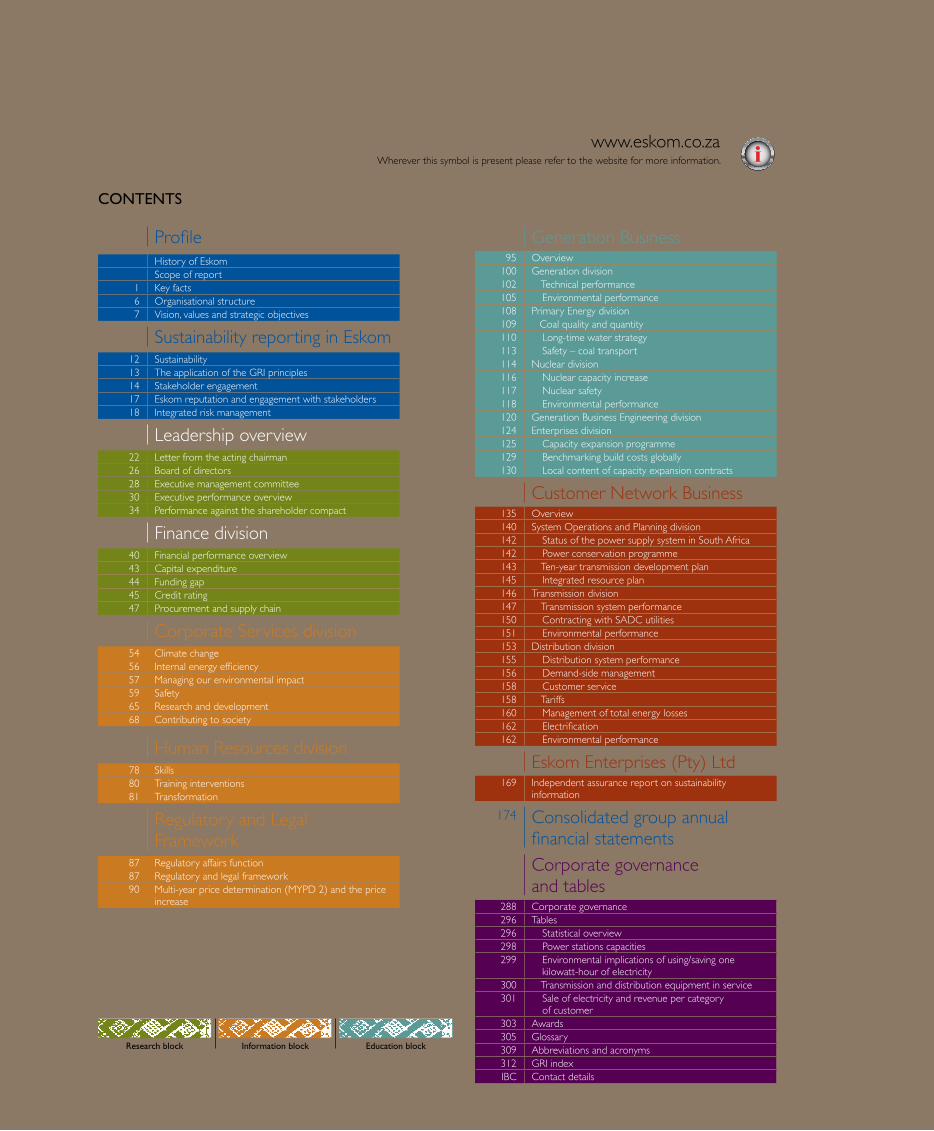
CONTENTS
ProfileHistory of EskomScope of report
1 Key facts6 Organisational structure7 Vision, values and strategic objectives
Sustainability reporting in Eskom12 Sustainability13 The application of the GRI principles14 Stakeholder engagement17 Eskom reputation and engagement with stakeholders18 Integrated risk management
Leadership overview22 Letter from the acting chairman26 Board of directors28 Executive management committee30 Executive performance overview34 Performance against the shareholder compact
Finance division40 Financial performance overview43 Capital expenditure44 Funding gap45 Credit rating47 Procurement and supply chain
Corporate Services division54 Climate change56 Internal energy efficiency57 Managing our environmental impact59 Safety65 Research and development68 Contributing to society
Human Resources division78 Skills 80 Training interventions81 Transformation
Regulatory and Legal Framework
87 Regulatory affairs function87 Regulatory and legal framework90 Multi-year price determination (MYPD 2) and the price
increase
Generation Business95 Overview
100 Generation division102 Technical performance105 Environmental performance108 Primary Energy division109 Coal quality and quantity110 Long-time water strategy113 Safety – coal transport114 Nuclear division116 Nuclear capacity increase117 Nuclear safety118 Environmental performance120 Generation Business Engineering division124 Enterprises division125 Capacity expansion programme129 Benchmarking build costs globally130 Local content of capacity expansion contracts
Customer Network Business135 Overview140 System Operations and Planning division142 Status of the power supply system in South Africa142 Power conservation programme143 Ten-year transmission development plan145 Integrated resource plan146 Transmission division147 Transmission system performance150 Contracting with SADC utilities151 Environmental performance153 Distribution division155 Distribution system performance156 Demand-side management158 Customer service158 Tariffs160 Management of total energy losses162 Electrification162 Environmental performance
Eskom Enterprises (Pty) Ltd169 Independent assurance report on sustainability
information
174 Consolidated group annual financial statementsCorporate governance and tables
288 Corporate governance296 Tables296 Statistical overview298 Power stations capacities299 Environmental implications of using/saving one
kilowatt-hour of electricity300 Transmission and distribution equipment in service301 Sale of electricity and revenue per category
of customer303 Awards305 Glossary309 Abbreviations and acronyms312 GRI indexIBC Contact details
www.eskom.co.zaWherever this symbol is present please refer to the website for more information.
Scope of reportThe annual report for the year ended 31 March 2010 is an
integrated financial, economic, environmental and social
sustainability report. Eskom Holdings Limited (Eskom) and its
subsidiaries aligns itself with international sustainability best
reporting practices, including the Global Reporting Initiative (GRI)
Sustainability Reporting Guideline, and the AA1000APS (2008)
Accountability Principles Standard.
The report considers financial, economic, environmental, social and
technical performance and is available in an internet version on the
Eskom website (www.eskom.co.za/annreport10). Additional
sustainability information is disclosed in the internet version of the
report. The availability of extra web-based information is indicated in
the printed report.
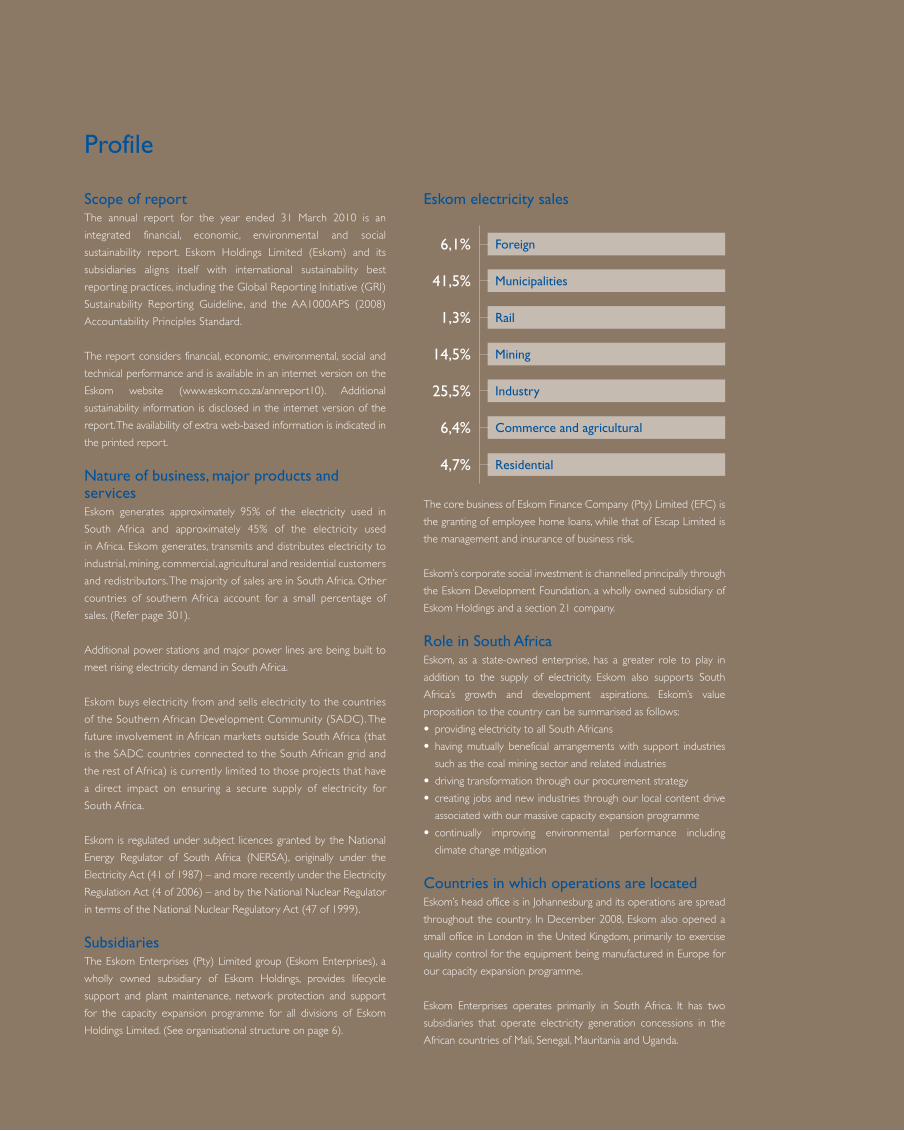
Nature of business, major products and servicesEskom generates approximately 95% of the electricity used in
South Africa and approximately 45% of the electricity used
in Africa. Eskom generates, transmits and distributes electricity to
industrial, mining, commercial, agricultural and residential customers
and redistributors. The majority of sales are in South Africa. Other
countries of southern Africa account for a small percentage of
sales. (Refer page 301).
Additional power stations and major power lines are being built to
meet rising electricity demand in South Africa.
Eskom buys electricity from and sells electricity to the countries
of the Southern African Development Community (SADC). The
future involvement in African markets outside South Africa (that
is the SADC countries connected to the South African grid and
the rest of Africa) is currently limited to those projects that have
a direct impact on ensuring a secure supply of electricity for
South Africa.
Eskom is regulated under subject licences granted by the National
Energy Regulator of South Africa (NERSA), originally under the
Electricity Act (41 of 1987) – and more recently under the Electricity
Regulation Act (4 of 2006) – and by the National Nuclear Regulator
in terms of the National Nuclear Regulatory Act (47 of 1999).
SubsidiariesThe Eskom Enterprises (Pty) Limited group (Eskom Enterprises), a
wholly owned subsidiary of Eskom Holdings, provides lifecycle
support and plant maintenance, network protection and support
for the capacity expansion programme for all divisions of Eskom
Holdings Limited. (See organisational structure on page 6).
Eskom electricity sales
The core business of Eskom Finance Company (Pty) Limited (EFC) is
the granting of employee home loans, while that of Escap Limited is
the management and insurance of business risk.
Eskom’s corporate social investment is channelled principally through
the Eskom Development Foundation, a wholly owned subsidiary of
Eskom Holdings and a section 21 company.
Role in South AfricaEskom, as a state-owned enterprise, has a greater role to play in
addition to the supply of electricity. Eskom also supports South
Africa’s growth and development aspirations. Eskom’s value
proposition to the country can be summarised as follows:
• providing electricity to all South Africans
• having mutually beneficial arrangements with support industries
such as the coal mining sector and related industries
• driving transformation through our procurement strategy
• creating jobs and new industries through our local content drive
associated with our massive capacity expansion programme
• continually improving environmental performance including
climate change mitigation
Countries in which operations are locatedEskom’s head office is in Johannesburg and its operations are spread
throughout the country. In December 2008, Eskom also opened a
small office in London in the United Kingdom, primarily to exercise
quality control for the equipment being manufactured in Europe for
our capacity expansion programme.
Eskom Enterprises operates primarily in South Africa. It has two
subsidiaries that operate electricity generation concessions in the
African countries of Mali, Senegal, Mauritania and Uganda.
Profile
6,1% Foreign
1,3% Rail
41,5% Municipalities
14,5% Mining
25,5% Industry
6,4% Commerce and agricultural
4,7% Residential
Research block Information block Education block
CONTENTS
ProfileHistory of EskomScope of report
1 Key facts6 Organisational structure7 Vision, values and strategic objectives
Sustainability reporting in Eskom12 Sustainability13 The application of the GRI principles14 Stakeholder engagement17 Eskom reputation and engagement with stakeholders18 Integrated risk management
Leadership overview22 Letter from the acting chairman26 Board of directors28 Executive management committee30 Executive performance overview34 Performance against the shareholder compact
Finance division40 Financial performance overview43 Capital expenditure44 Funding gap45 Credit rating47 Procurement and supply chain
Corporate Services division54 Climate change56 Internal energy efficiency57 Managing our environmental impact59 Safety65 Research and development68 Contributing to society
Human Resources division78 Skills 80 Training interventions81 Transformation
Regulatory and Legal Framework
87 Regulatory affairs function87 Regulatory and legal framework90 Multi-year price determination (MYPD 2) and the price
increase
Generation Business95 Overview
100 Generation division102 Technical performance105 Environmental performance108 Primary Energy division109 Coal quality and quantity110 Long-time water strategy113 Safety – coal transport114 Nuclear division116 Nuclear capacity increase117 Nuclear safety118 Environmental performance120 Generation Business Engineering division124 Enterprises division125 Capacity expansion programme129 Benchmarking build costs globally130 Local content of capacity expansion contracts
Customer Network Business135 Overview140 System Operations and Planning division142 Status of the power supply system in South Africa142 Power conservation programme143 Ten-year transmission development plan145 Integrated resource plan146 Transmission division147 Transmission system performance150 Contracting with SADC utilities151 Environmental performance153 Distribution division155 Distribution system performance156 Demand-side management158 Customer service158 Tariffs160 Management of total energy losses162 Electrification162 Environmental performance
Eskom Enterprises (Pty) Ltd169 Independent assurance report on sustainability
information
174 Consolidated group annual financial statementsCorporate governance and tables
288 Corporate governance296 Tables296 Statistical overview298 Power stations capacities299 Environmental implications of using/saving one
kilowatt-hour of electricity300 Transmission and distribution equipment in service301 Sale of electricity and revenue per category
of customer303 Awards305 Glossary309 Abbreviations and acronyms312 GRI indexIBC Contact details
www.eskom.co.zaWherever this symbol is present please refer to the website for more information.
Scope of reportThe annual report for the year ended 31 March 2010 is an
integrated financial, economic, environmental and social
sustainability report. Eskom Holdings Limited (Eskom) and its
subsidiaries aligns itself with international sustainability best
reporting practices, including the Global Reporting Initiative (GRI)
Sustainability Reporting Guideline, and the AA1000APS (2008)
Accountability Principles Standard.
The report considers financial, economic, environmental, social and
technical performance and is available in an internet version on the
Eskom website (www.eskom.co.za/annreport10). Additional
sustainability information is disclosed in the internet version of the
report. The availability of extra web-based information is indicated in
the printed report.
Nature of business, major products and servicesEskom generates approximately 95% of the electricity used in
South Africa and approximately 45% of the electricity used
in Africa. Eskom generates, transmits and distributes electricity to
industrial, mining, commercial, agricultural and residential customers
and redistributors. The majority of sales are in South Africa. Other
countries of southern Africa account for a small percentage of
sales. (Refer page 301).
Additional power stations and major power lines are being built to
meet rising electricity demand in South Africa.
Eskom buys electricity from and sells electricity to the countries
of the Southern African Development Community (SADC). The
future involvement in African markets outside South Africa (that
is the SADC countries connected to the South African grid and
the rest of Africa) is currently limited to those projects that have
a direct impact on ensuring a secure supply of electricity for
South Africa.
Eskom is regulated under subject licences granted by the National
Energy Regulator of South Africa (NERSA), originally under the
Electricity Act (41 of 1987) – and more recently under the Electricity
Regulation Act (4 of 2006) – and by the National Nuclear Regulator
in terms of the National Nuclear Regulatory Act (47 of 1999).
SubsidiariesThe Eskom Enterprises (Pty) Limited group (Eskom Enterprises), a
wholly owned subsidiary of Eskom Holdings, provides lifecycle
support and plant maintenance, network protection and support
for the capacity expansion programme for all divisions of Eskom
Holdings Limited. (See organisational structure on page 6).
Eskom electricity sales
The core business of Eskom Finance Company (Pty) Limited (EFC) is
the granting of employee home loans, while that of Escap Limited is
the management and insurance of business risk.
Eskom’s corporate social investment is channelled principally through
the Eskom Development Foundation, a wholly owned subsidiary of
Eskom Holdings and a section 21 company.
Role in South AfricaEskom, as a state-owned enterprise, has a greater role to play in
addition to the supply of electricity. Eskom also supports South
Africa’s growth and development aspirations. Eskom’s value
proposition to the country can be summarised as follows:
• providing electricity to all South Africans
• having mutually beneficial arrangements with support industries
such as the coal mining sector and related industries
• driving transformation through our procurement strategy
• creating jobs and new industries through our local content drive
associated with our massive capacity expansion programme
• continually improving environmental performance including
climate change mitigation
Countries in which operations are locatedEskom’s head office is in Johannesburg and its operations are spread
throughout the country. In December 2008, Eskom also opened a
small office in London in the United Kingdom, primarily to exercise
quality control for the equipment being manufactured in Europe for
our capacity expansion programme.
Eskom Enterprises operates primarily in South Africa. It has two
subsidiaries that operate electricity generation concessions in the
African countries of Mali, Senegal, Mauritania and Uganda.
Profile
6,1% Foreign
1,3% Rail
41,5% Municipalities
14,5% Mining
25,5% Industry
6,4% Commerce and agricultural
4,7% Residential

1Eskom Holdings Limited
Integrated Repor t 2010
Key facts
RA – Reasonable assurance provided by the independent assurance provider (refer page 169)
LA – Limited assurance provided by the independent assurance provider (refer page 169)
Electricity sales2010 2009 2008 2007 2006
Sales within South Africa (GWh)
International sales (GWh)
Total sales (GWh)
Growth in GWh sales (%)
205 36413 227
218 5911,7
202 202
12 648
214 850
(4,2)
210 458
13 908
224 366
2,9
204 531
13 589
218 120
4,9
194 799
13 122
207 921
(18,9)1
Revenue within South Africa (Rm)
International revenue (Rm)
Total revenue (Rm)2
Growth in revenue (%)
Customers (number)
Peak demand (MW)
66 9702 972
69 94231,7
4 463 30135 850
50 766
2 334
53 100
21,9
4 361 007
35 959
41 585
1 971
43 556
10,6
4 152 312
36 513
37 874
1 515
39 389
11,4
3 963 164
34 807
34 071
1 290
35 361
(14,2)1
3 758 506
33 461
Electricity production by own stations2010 2009 2008 2007 2006
Coal-fired (GWh)
Hydro-electric (GWh)
Pumped storage (GWh)
Gas turbine (GWh)
Nuclear (GWh)
Wind energy (GWh)3
215 9401 2742 742
4912 806
1
211 941
1 082
2 772
143
13 004
2
222 908
751
2 979
1 153
11 317
1
215 211
2 443
2 947
62
11 780
2
206 606
1 141
2 867
78
11 293
3
Total production (GWh) 232 812 228 944 239 109 232 445 221 988
Electricity purchased by Eskom
• Foreign imports (GWh)4
• Local IPP and co-generation, (GWh)
Reserve margin (including imports) (%)
Demand-side management Savings (MW)
10 0470
16,4
372RA
9 162
0
10,6
916RA
10 998
0
5,6
650
10 624
0
7,8
170
9 318
0
12,7
72
Power station net maximum capacity (own)2010 2009 2008 2007 2006
Coal-fired (MW)
Hydro-electric (MW)
Pumped storage (MW)
Gas turbine (MW)
Nuclear (MW)
Wind energy (MW)
34 658600
1 4002 4091 800
3
34 294
600
1 400
2 409
1 800
3
33 566
600
1 400
1 378
1 800
3
33 036
600
1 400
925
1 800
3
32 256
600
1 400
342
1 800
3
Total production (MW) 40 870 40 506 38 747 37 764 36 401
1. Actualsalesgrowthorrevenuegrowthwhencomparedtothe12monthsfrom1April2004to31March2005.2. TotalrevenueincludingtheEDIandenvironmentallevies.3. Windenergyfacilitycommissionedin2008.4. Foreignimportsexcludewheelingofelectricity.
GWh (’000)200150100500 250
2010
2009
2008
2007
2006
Sales within South Africa
MW8006004002000 1 000
2010
2009
2008
2007
2006
Demand-side management savings
MW (’000)403020100 50
2010
2009
2008
2007
2006
Total production

2 Eskom Holdings Limited
Integrated Repor t 2010
Transmission and distribution equipment2010 2009 2008 2007 2006
Transmission lines (km)
Distribution lines (km)
Reticulation lines (km)
Underground cables (km)
Transformer capacity (MVA)
• Transmission
• Distribution
28 48246 018
305 15110 687
123 99099 408
28 243
45 302
297 783
10 379
122 860
96 372
28 164
44 680
293 424
9 921
122 180
93 956
27 619
44 044
288 040
8 622
120 745
90 184
27 406
43 330
282 361
8 031
118 445
87 217
Capacity expansion2010 2009 2008 2007 2006
Generation capacity installed and commissioned (MW)
Transmission lines installed (km)
Transmission transformer capacity installed (MVA)
Distribution lines installed (km)
Distribution transformer capacity installed (MVA)
452RA
600RA
1 630RA
8 392
3 036
1 770RA
418RA
1 255RA
5 439
2 776
1 061
246
1 295
7 319
3 412
1 351
430
1 000
6 984
2 967
170
237
1 090
5 944
1 866
Environmental information2010 2009 2008 2007 2006
Coal burnt in power stations (Mt)
Specific water consumption by power stations (ℓ/kWh sent out)
Net raw water consumption (Mℓ)
Relative particulate emissions (kg/MWh sent out)
Carbon dioxide emissions (CO2) (Mt)
Radiation release (mSv)
122,7
1,34RA
316 202
0,39RA
224,7RA
0,0040
121,2
1,35RA
323 190
0,27RA
221,7RA
0,0045
125,3
1,32
322 666
0,21
223,6
0,0047
119,1
1,35
313 064
0,20
208,9
0,0034
112,1
1,32
291 516
0,21
203,7
0,0049
Safety information2010 2009 2008 2007 2006
Employee fatalities
Contractor fatalities
Lost-time incident rate
2RA
14RA
0,54RA
6RA
21RA
0,50RA
17
12
0,46
8
18
0,35
10
13
0,40
Public fatalities 41 28 42 41 34
Key facts continued
Km (’000)5 10 15 20 25 300
2010
2009
2008
2007
2006
Transmission lines
MW1 5001 0005000 2 000
2010
2009
2008
2007
2006
Generation capacity installed
Ml (’000)200150100500 350250 300
2010
2009
2008
2007
2006
Raw water consumption
10 15 200 5
2010
2009
2008
2007
2006
Employee fatalities
3Eskom Holdings Limited
Integrated Repor t 2010
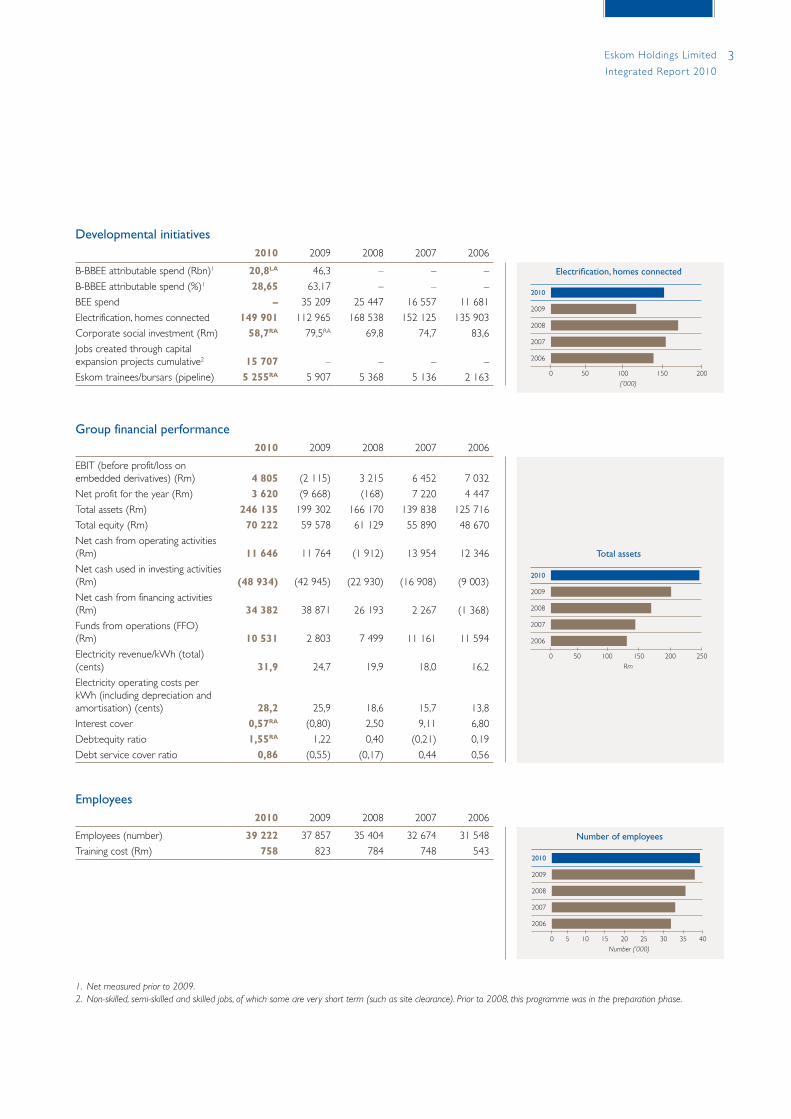
Developmental initiatives2010 2009 2008 2007 2006
B-BBEE attributable spend (Rbn)1
B-BBEE attributable spend (%)1
BEE spend
Electrification, homes connected
Corporate social investment (Rm)
Jobs created through capital expansion projects cumulative2
Eskom trainees/bursars (pipeline)
20,8LA
28,65–
149 90158,7RA
15 707
5 255RA
46,3
63,17
35 209
112 965
79,5RA
–
5 907
–
–
25 447
168 538
69,8
–
5 368
–
–
16 557
152 125
74,7
–
5 136
–
–
11 681
135 903
83,6
–
2 163
Group financial performance2010 2009 2008 2007 2006
EBIT (before profit/loss on embedded derivatives) (Rm)
Net profit for the year (Rm)
Total assets (Rm)
Total equity (Rm)
Net cash from operating activities (Rm)
Net cash used in investing activities (Rm)
Net cash from financing activities (Rm)
Funds from operations (FFO) (Rm)
Electricity revenue/kWh (total) (cents)
Electricity operating costs per kWh (including depreciation and amortisation) (cents)
Interest cover
Debt:equity ratio
Debt service cover ratio
4 8053 620
246 13570 222
11 646
(48 934)
34 382
10 531
31,9
28,20,57RA
1,55RA
0,86
(2 115)
(9 668)
199 302
59 578
11 764
(42 945)
38 871
2 803
24,7
25,9
(0,80)
1,22
(0,55)
3 215
(168)
166 170
61 129
(1 912)
(22 930)
26 193
7 499
19,9
18,6
2,50
0,40
(0,17)
6 452
7 220
139 838
55 890
13 954
(16 908)
2 267
11 161
18,0
15,7
9,11
(0,21)
0,44
7 032
4 447
125 716
48 670
12 346
(9 003)
(1 368)
11 594
16,2
13,8
6,80
0,19
0,56
Employees2010 2009 2008 2007 2006
Employees (number)
Training cost (Rm)
39 222758
37 857
823
35 404
784
32 674
748
31 548
543
1. Netmeasuredpriorto2009.2. Non-skilled,semi-skilledandskilledjobs,ofwhichsomeareveryshortterm(suchassiteclearance).Priorto2008,thisprogrammewasinthepreparationphase.
(’000)200150100500
2010
2009
2008
2007
2006
Electri�cation, homes connected
Rm200150100500 250
2010
2009
2008
2007
2006
Total assets
Number (’000)10 15 20 25 30 35 400 5
2010
2009
2008
2007
2006
Number of employees

Input:Coal1 122,7MtWater 316 202MℓLiquid fuels (diesel and kerosene) 16,1Mℓ
Output:Total electricity produced by Eskom stations – 232 812GWhTotal electricity sold 218 591GWhCarbon dioxide 224,7MtNitrogen oxide 959ktNitrous oxide 2 825t Sulphur dioxide 1 856ktParticulate emissions 88,27ktAsh produced 36,01MtRadiation releases 0,0040mSv
Transmission high-voltage lines (AC– 765, 400, 275, 220kV; DC – 533kV)
Distribution high-voltage lines (132, 88, 66, 44, 33kV)
Reticulation high-voltage lines (22, 11, 6,6, 3,3kV)
The voltage levels of electricity are further transformed to meet distribution requirements
Reticulation low-voltage lines (380, 220V)
1.88%ofelectricitysoldisproducedfromcoal.
Distribution substations
Customers
Municipalities high-voltage lines (132, 88, 66, 44, 33kV)
Transmission substations
Power stations
Electricity: from power station to customer
4 Eskom Holdings Limited
Integrated Repor t 2010

Southern Africa grid map
KEY Future pumped storage station
Existing grid system Coal-fired power station
Possible future grid system Future interconnection substation
Future hydro-electric power station Nuclear power station
Future coal-fired power station Pumped storage station
Hydro-electric power station Gas power station
Interconnection substation Renewable energy
Future gas station Town
The map indicates the South African power network and some interconnections with neighbouring countries.
Luderitz
Temane Gas Fields
Cape Town
Mossel BayPort Elizabeth
Durban
Windhoek
Serule
BulawayoBeira
Pande Gas Fields
Xai-Xai
Inhambane
Kimberley
Maputo
East London
Richards Bay
Polokwane
PretoriaGaborone
Bloemfontein
Lephalale
Johannesburg
400kV
220k
V
400k
V
330k
V
400kV
765k
V
765kV
765kV
132kV13
2kV132kV
220k
V
400k
V
765kV
400k
V
400kV
400k
V
533k
V D
C
765k
V
400kV
Lesotho
Botswana
Namibia
Swaziland
Zimbabwe
Mozambique
South Africa
Walvis Bay Massingir
Corumana
Edvalein II
Kudu
KoebergAcacia
Palmiet
Gariep
Port Rex
Vanderkloof
Arnot
Ankerlig
Grootvlei
Matimba
Kusile
Tubatse
Klipheuwel
Morupule
Drakensberg
Selomo
Gourikwa
WitbankErmelo
Balfour
5Eskom Holdings Limited
Integrated Repor t 2010
6 Eskom Holdings Limited
Integrated Repor t 2010
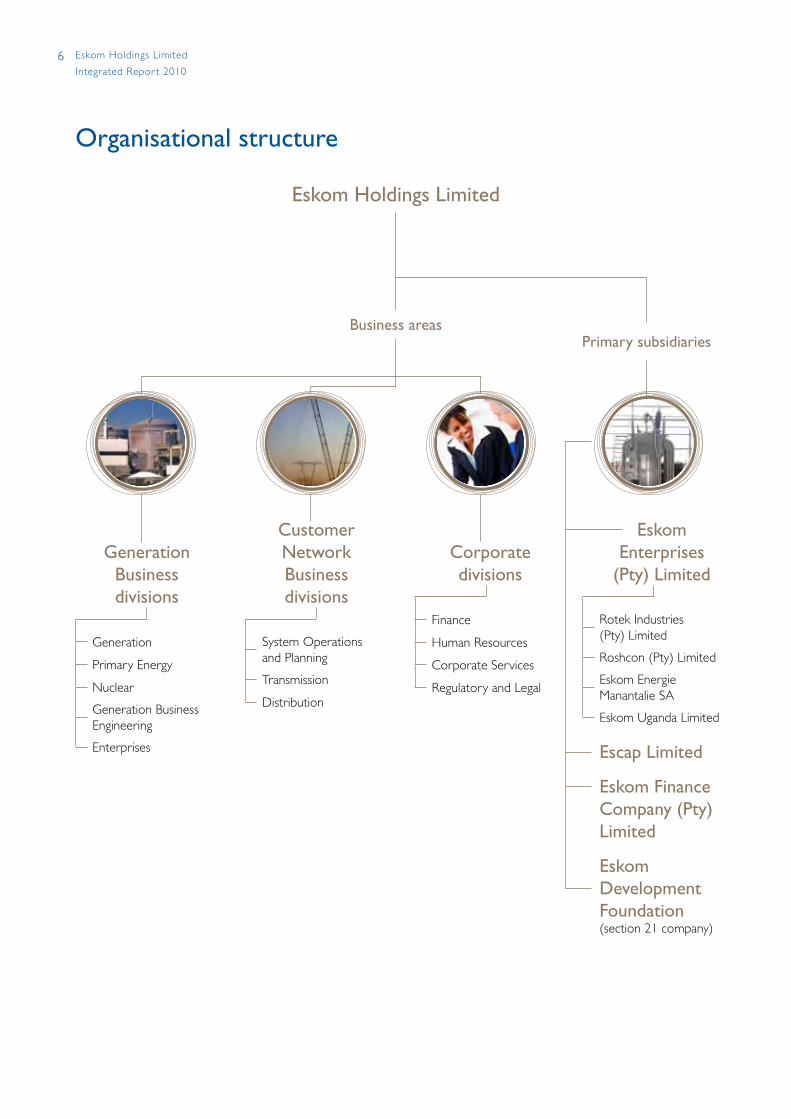
Organisational structure
Business areasPrimary subsidiaries
Eskom Holdings Limited
Generation
Business divisions
Generation
Primary Energy
Nuclear
Generation Business Engineering
Enterprises
Customer Network Business divisions
System Operations and Planning
Transmission
Distribution
Corporate divisions
Finance
Human Resources
Corporate Services
Regulatory and Legal
Eskom Enterprises
(Pty) Limited
Rotek Industries (Pty) Limited
Roshcon (Pty) Limited
Eskom Energie Manantalie SA
Eskom Uganda Limited
Escap Limited
Eskom Finance Company (Pty) Limited
Eskom Development Foundation (section 21 company)
7Eskom Holdings Limited
Integrated Repor t 2010
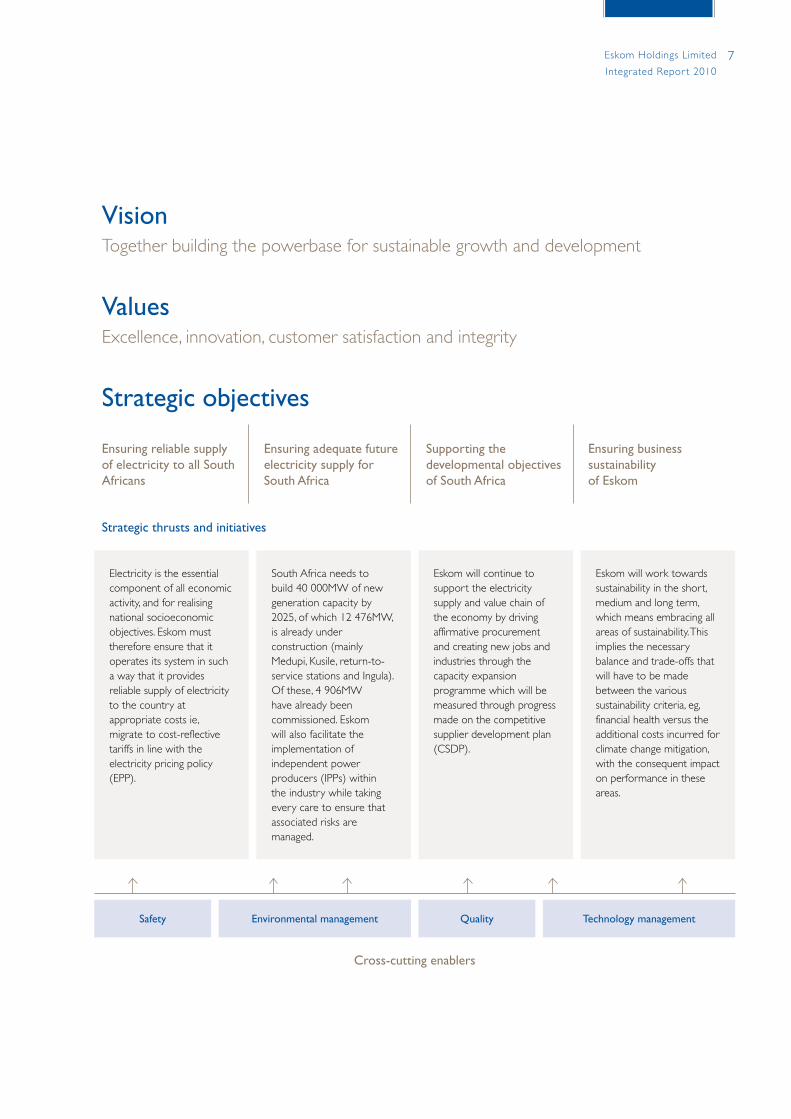
Vision Together building the powerbase for sustainable growth and development
ValuesExcellence, innovation, customer satisfaction and integrity
Strategic objectives
Ensuring reliable supply of electricity to all South Africans
Ensuring adequate future electricity supply for South Africa
Supporting the developmental objectives of South Africa
Ensuring business sustainability of Eskom
Strategic thrusts and initiatives
Electricity is the essential component of all economic activity, and for realising national socioeconomic objectives. Eskom must therefore ensure that it operates its system in such a way that it provides reliable supply of electricity to the country at appropriate costs ie, migrate to cost-reflective tariffs in line with the electricity pricing policy (EPP).
South Africa needs to build 40 000MW of new generation capacity by 2025, of which 12 476MW, is already under construction (mainly Medupi, Kusile, return-to-service stations and Ingula). Of these, 4 906MW have already been commissioned. Eskom will also facilitate the implementation of independent power producers (IPPs) within the industry while taking every care to ensure that associated risks are managed.
Eskom will continue to support the electricity supply and value chain of the economy by driving affirmative procurement and creating new jobs and industries through the capacity expansion programme which will be measured through progress made on the competitive supplier development plan (CSDP).
Eskom will work towards sustainability in the short, medium and long term, which means embracing all areas of sustainability. This implies the necessary balance and trade-offs that will have to be made between the various sustainability criteria, eg, financial health versus the additional costs incurred for climate change mitigation, with the consequent impact on performance in these areas.
Safety Environmental management Quality Technology management
Cross-cutting enablers
8 Eskom Holdings Limited
Integrated Repor t 2010
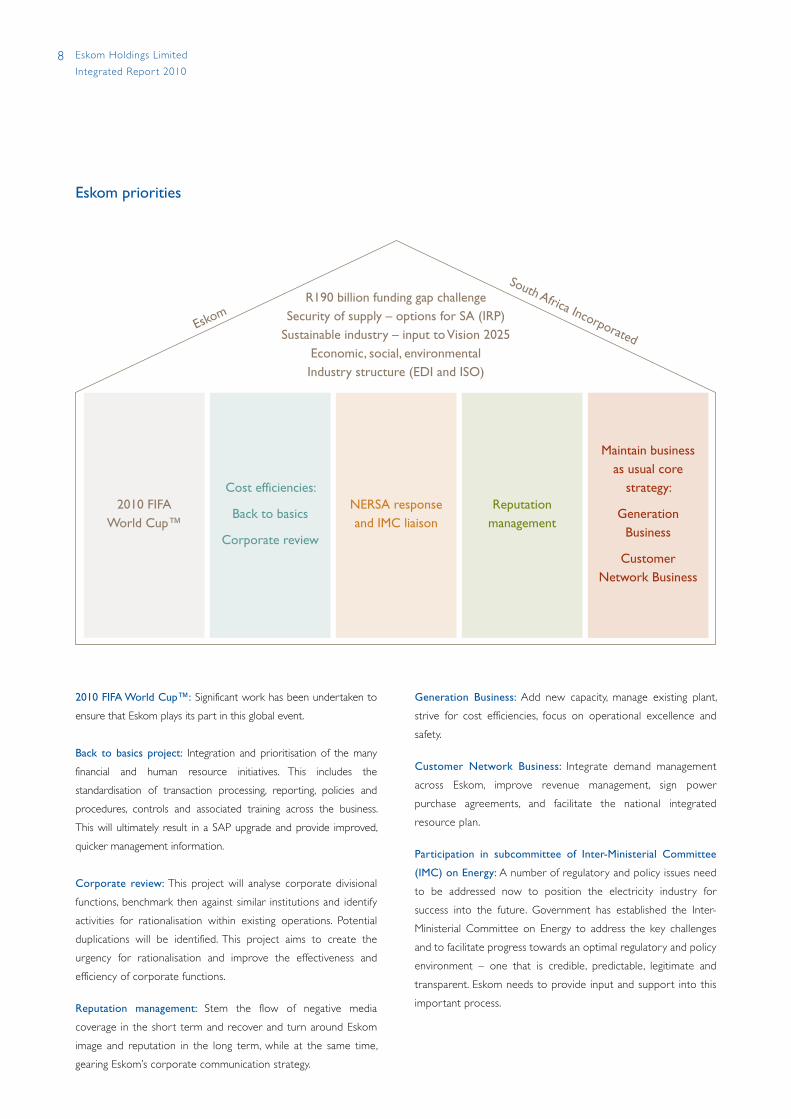
Eskom priorities
2010 FIFA World Cup™: Significant work has been undertaken to
ensure that Eskom plays its part in this global event.
Back to basics project: Integration and prioritisation of the many
financial and human resource initiatives. This includes the
standardisation of transaction processing, reporting, policies and
procedures, controls and associated training across the business.
This will ultimately result in a SAP upgrade and provide improved,
quicker management information.
Corporate review: This project will analyse corporate divisional
functions, benchmark then against similar institutions and identify
activities for rationalisation within existing operations. Potential
duplications will be identified. This project aims to create the
urgency for rationalisation and improve the effectiveness and
efficiency of corporate functions.
Reputation management: Stem the flow of negative media
coverage in the short term and recover and turn around Eskom
image and reputation in the long term, while at the same time,
gearing Eskom’s corporate communication strategy.
Generation Business: Add new capacity, manage existing plant,
strive for cost efficiencies, focus on operational excellence and
safety.
Customer Network Business: Integrate demand management
across Eskom, improve revenue management, sign power
purchase agreements, and facilitate the national integrated
resource plan.
Participation in subcommittee of Inter-Ministerial Committee
(IMC) on Energy: A number of regulatory and policy issues need
to be addressed now to position the electricity industry for
success into the future. Government has established the Inter-
Ministerial Committee on Energy to address the key challenges
and to facilitate progress towards an optimal regulatory and policy
environment – one that is credible, predictable, legitimate and
transparent. Eskom needs to provide input and support into this
important process.
2010 FIFA World Cup™
Cost efficiencies:
Back to basics
Corporate review
NERSA response and IMC liaison
Reputation management
Maintain business as usual core
strategy:
Generation Business
Customer Network Business
R190 billion funding gap challenge Security of supply – options for SA (IRP)
Sustainable industry – input to Vision 2025Economic, social, environmentalIndustry structure (EDI and ISO)
South Africa IncorporatedEsko
m
9Eskom Holdings Limited
Integrated Repor t 2010
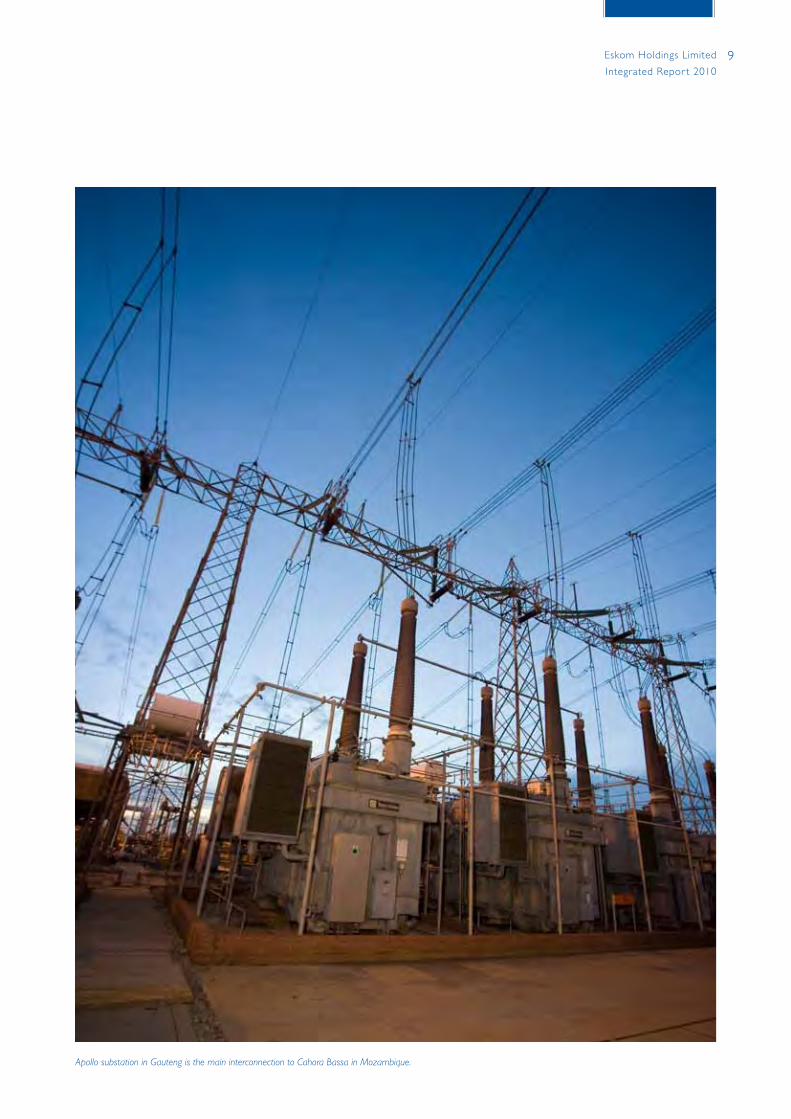
ApollosubstationinGautengisthemaininterconnectiontoCahoraBassainMozambique.
10 Eskom Holdings Limited
Integrated Repor t 2010

11Eskom Holdings Limited
Integrated Repor t 2010
12 Sustainability
13 The application of the GRI principles
14 Stakeholder engagement
17 Eskom reputation and engagement with stakeholders
18 Integrated risk management
Sustainability reporting in Eskom

12 Eskom Holdings Limited
Integrated Repor t 2010
What sustainability means to usOur long-term drive for sustainable development is inherent in the
long-term nature of our business. While we are responding to the
demand for electricity by building new capacity, ensuring financial
stability and driving energy efficiency we understand that the long-
term nature of our business has an impact on environmental
sustainability into the future. Therefore we continue to strive for a
balance between the different legs of sustainability. Bearing this in
mind, our long-term planning processes take into account a lower
carbon future for South Africa, while ensuring that we uphold our
definition of sustainability – providing affordable energy and related
services through the integration and consideration of economic
development, environmental quality and social equity into business
practices in order to continually improve performance and underpin
development. Eskom integrates sustainability criteria into its decision-
making process in order to ensure that this aspiration for sustainable
development is continuously achieved.
An important part of our sustainability drive is increasing consumer
awareness of the implications of electricity generation – the resources
consumed, the cost, and the impacts on the environment – as well as
the benefits of using electricity. Sustainable development requires
that every person in South Africa starts thinking about energy – how
we generate it, what we pay for it, how we use it and how sustainable
it is. Collectively we can make national decisions to ensure a
sustainable electricity system for South Africa.
Sustainability governanceThe directors of Eskom regard corporate governance as vitally
important to the success of the business and are unreservedly
committed to applying the principles necessary to ensure that good
governance is practised, and that the company remains a sustainable
and viable business, of global stature. The board sustainability
committee deals with integrated sustainability issues and approves or
recommends policies, strategies and guidelines, particularly related to
safety, health, environment, quality and nuclear issues.
The executive management sustainability and safety subcommittee
guides Eskom’s strategy on sustainability including environmental
management, development issues and occupational health and safety
matters. Sustainability strategies are reviewed by this committee for
consideration by the sustainability committee of the board.
Sustainability performance indexOur internally developed sustainability performance index has now
been in place for five years and provides a view of our long-term
sustainability status. This is achieved through the use of economic
(including financial), environmental, social and technical indicators for
our operations.
The index has 20 indicators and each indicator is allocated a relative
weighting and further modified with regard to the relative
contribution of each of the four areas of economic, environmental,
technical and social aspects. The overall performance is considered
sustainable if the score is equal to or greater than three on a
five-point scale.
Our overall performance was 2,5 (2009: 2,5) with sector scores as
follows:
After five years of measurement we have seen an initial
three years of decline and a subsequent stabilisation of
sustainability performance during the last two reporting periods.
The performance was the result of improvements in the areas of
staff commitment, electrification connections, HIV/Aids strategy
and return to profitability. Areas contributing to the score being
low, are staff and contractor fatalities, our reserve margin,
productivity, equity and B-BBEE spend.
The index will be re-looked at during the next financial year based
on a revised sustainability strategy.
4,0
3,5
3,0
2,5
2,0
Sustainability performance index
2005/06 2006/07 2007/08 2008/09 2009/10
Technical Social EnvironmentalEconomic Overall score Target
Sustainability

13Eskom Holdings Limited
Integrated Repor t 2010
This report has been structured around the different areas of
our business, namely: Finance, Corporate Services, Human
Resources, Regulatory and Legal Framework, Generation Business,
Customer Network Business and subsidiaries. Each of these areas
has reported on their business performance around the material
issues, highlights, lowlights and forward-looking strategies and
commitments, where relevant.
In Eskom’s previous annual report there were certain shortcomings
relating to our stakeholder engagement process and the way in
which stakeholders influence our reporting of material issues.
The diagram on page 15 depicts the internal governance structure
used during this reporting period to co-ordinate the integrated
report process. This also sets out the process for determining
material issues to be reported on in this report. Stakeholders’ issues
and concerns are integrated into the process through our
stakeholder engagement working group. See section on the next
page for more information on stakeholder engagement for the
annual report. The sustainability reporting process allows for a
“bottom-up” and “top-down” approach in determining the material
issues for reporting.
We make use of the Global Reporting Initiative (GRI) guideline as a
reporting framework for this report and have declared a GRI B+LA
application level. We aim for an A+ application level in the future
using the GRI Electric Utility Sector Supplement.
In terms of providing assurance around the sustainability issues
in this report, our assurance provider was requested to provide
assurance for certain non-financial/sustainability measures against the
International Standard on Assurance Engagements 3000: Assurance
Engagements other than Audits or Reviews of Historical Information
and the AA1000AS (2008) Assurance Standard – Requirements for
independent assurance on disclosed information regarding non-
financial/sustainability and sustainability performance. This report is
presented on page 169.
Our understanding of sustainable development in our specific
context is set out on page 12. The Eskom sustainability performance
index on page 12, together with the performance areas and indicators
in this report, reflect the opportunities and constraints we face in
executing our sustainable development strategy.
The application of the GRI principles
The following AA1000APS principles have been applied in the compilation of this integrated sustainability report:
• Inclusivity: the results of our stakeholder engagement processes, as set out in sections on stakeholder engagement, regulatory framework
and Eskom reputation on pages 14, 17 and 87 of the profile are used to inform the structure and, more importantly, the issues reported
on. This is in addition to our internal process of business planning, setting of objectives and performance targets as well as integrated risk
management. We acknowledge that our existing process around stakeholder engagement is not optimised through a centrally co-ordinated
approach. This is reflected in the corporate risk register relating to “broad reputation damage caused by inconsistent and uncontrollable
communication” – see page 18.
• Materiality: the main areas covered in this report in terms of both current and future issues are based on what our stakeholders have
communicated to us. In addition, our business focus areas and priorities have influenced the material issues reported on as shown on
page 16 covering our vision, values and strategic objectives. This has been strengthened through a group-wide integrated risk management
process. This is disclosed in the risk profiles of the divisional sections within this report. The process of identifying material issues to be
reported on is depicted in the diagram on page 15.
• Responsiveness: our intention is to ensure that we have provided the information our stakeholders have requested relating to sustainable
development. This has been indicated by way of cross-references within the table on page 16. Eskom aims to improve the reporting on the
issues most material to our stakeholders by responding to their specific needs (through the integrated report process as well as our other
stakeholder engagement mechanisms) and provide them with sufficient details.
LA–Limitedassuranceprovidedbytheindependentassuranceprovider(referpage169).
14 Eskom Holdings Limited
Integrated Repor t 2010
Understanding our stakeholdersWe define stakeholders as a person, group, or organisation that has
a direct stake in our business because they can affect or be affected
by our activities, objectives and policies. In this sense, among our key
stakeholders are our shareholder, civil society, the public, and land
owners affected by our operations, customers, Eskom (board of
directors and employees), lending institutions and investors,
government, regulators, industry, suppliers, media, organised business,
organised labour, parliamentary portfolio committees and select
committees and regulators.
How we engage with our stakeholdersAt Eskom we view the participation of internal and external
stakeholders as an essential part of our decision-making process. Our
stakeholder engagement practices are based on the AA1000
Stakeholder Engagement Standard (SES) principles of materiality,
completeness and responsiveness. The process is influenced by our
commitment as a signatory to the United Nations Global Compact
and alignment with King III.
We had a range of stakeholder engagements within the business
driven by different portfolios, divisions and functional areas
throughout the year. The material issues reported on in this
integrated report are based on these engagements.
Our internal Guardian programme (refer to page 17 for more
details) was designed and used as a tool to facilitate continual internal
dialogues with employees to empower them to be ambassadors for
Eskom. Added to this was customer feedback through focus groups,
forums, committees and other methods. Input was also gathered
through stakeholder dialogues, reports from lending institutions and
investors, the shareholder, non-governmental organisations, suppliers,
media and industry.
Stakeholders and materiality issuesTo identify the key material issues to be reported on, we first
compiled information on economic, environmental, governance and
social issues that were relevant to Eskom’s business and stakeholders.
To this end, we reviewed numerous sources, including:
• Eskom shareholder compact
• shareholder resolutions and other feedback received through
ongoing dialogue with shareholders
• Eskom corporate plans, objectives and strategies and performance
• risks
• policies and initiatives related to our business
• employee surveys and other inputs from employees
• customer feedback obtained through focus groups, forums,
committees and other methods
• input gathered through stakeholder dialogues
• input from investors and investor groups committed to sustainable
investing
• partners, non-governmental organisations, suppliers and other
stakeholders
• media coverage
• industry benchmarking
• the Global Reporting Initiative (GRI), the UN Global Compact
principles
Engagements with key internal stakeholders from across all our
portfolios, divisions and functional areas of the business were held to
identify and prioritise material issues for Eskom. The principal
purpose of the engagements was to establish stakeholders’ and the
organisation’s material concerns that Eskom should report on. The
material issues were defined through a number of activities in Eskom:
• feedback from the executive management
• engagement with employees
• internal and independent reviews of Eskom’s 2009 Annual Report
• engagement with external stakeholders
• queries, reviews and assessments from investors and rating
agencies
• trend-spotting of issues of relevance to Eskom’s business
• review of media coverage of Eskom and public agenda issues
The table on page 16 provides a summary (full table available on
internet) of material issues from the stakeholders that were
identified and prioritised for the purposes of the integrated
report. We recognise the importance of issues that may not be
within our mandate but influence the operations of Eskom. In
these areas, we believe that we can, however, influence how
progress is made in addressing these issues, particularly through
public policy and regulation through engagement with those that
have the mandate – see the Regulatory and Legal Framework
section on page 86.
Method for selecting materiality issuesMateriality is determining the relevance and significance of an issue to
Eskom and our stakeholders. An issue or concern is considered
material if it influences or is likely to influence the decisions, actions
and behaviour of stakeholders and/or Eskom. Accountability’s five-
part materiality test was used to help to define the materiality of
issues. Issues were ranked as being of high, medium, or low materiality
in the following:
• the impact on Eskom’s ability to achieve its business strategy
• level of concern to external stakeholders and
• the degree to which Eskom can control and influence the issue
Stakeholder engagement
15Eskom Holdings Limited
Integrated Repor t 2010
Using information obtained from stakeholder engagementsWe have obtained valuable insight from engagements with our
stakeholders and this information has the potential to bring about a
significant shift in the way we do business. Some stakeholder concerns
raised can be addressed fairly easily while others have the potential
to bring about significant process changes within the organisation.
The fundamental issue at present is therefore to prioritise resolution
or incorporation of stakeholder interests of an immediate nature,
while making a sincere attempt to respond to stakeholder concerns
that require longer-term interventions. To build trust, Eskom will
continue to create platforms for meaningful input and discussion with
the broadest spectrum of stakeholders, and to provide meaningful
feedback to stakeholders on the substance and progress made
regarding the issues tabled at these engagements.
Eskom recognises the diverse range of material issues from our
stakeholders. However, it was critical to address specific material
issues they have raised during this reporting period. These have been
addressed through management responses in the form of questions
and answers in those divisional sections mandated to respond to
those material issues. Further insight into those material issues is
addressed in the divisional sections.
Looking forwardEskom will continue to improve on the effectiveness of our existing
stakeholder engagement practices through alignment with the
AA1000 Stakeholder Engagement Standard.
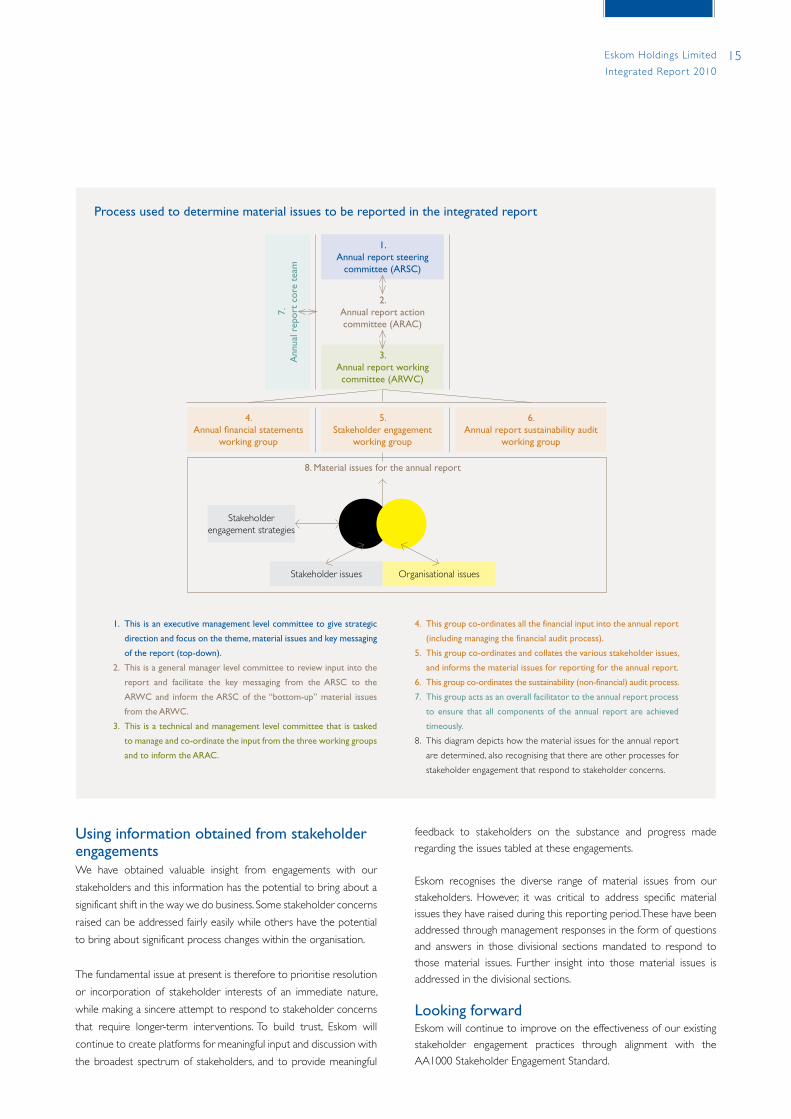
Process used to determine material issues to be reported in the integrated report
1. This is an executive management level committee to give strategic
direction and focus on the theme, material issues and key messaging
of the report (top-down).
2. This is a general manager level committee to review input into the
report and facilitate the key messaging from the ARSC to the
ARWC and inform the ARSC of the “bottom-up” material issues
from the ARWC.
3. This is a technical and management level committee that is tasked
to manage and co-ordinate the input from the three working groups
and to inform the ARAC.
4. This group co-ordinates all the financial input into the annual report
(including managing the financial audit process).
5. This group co-ordinates and collates the various stakeholder issues,
and informs the material issues for reporting for the annual report.
6. This group co-ordinates the sustainability (non-financial) audit process.
7. This group acts as an overall facilitator to the annual report process
to ensure that all components of the annual report are achieved
timeously.
8. This diagram depicts how the material issues for the annual report
are determined, also recognising that there are other processes for
stakeholder engagement that respond to stakeholder concerns.
6.Annual report sustainability audit
working group
4.Annual financial statements
working group
5.Stakeholder engagement
working group
1.Annual report steering
committee (ARSC)7.
A
nnua
l rep
ort
core
tea
m2.
Annual report action committee (ARAC)
3.Annual report working committee (ARWC)
8. Material issues for the annual report
Stakeholder issues
Stakeholder engagement strategies
Organisational issues

16 Eskom Holdings Limited
Integrated Repor t 2010
Key stakeholders and their material issues
Stakeholders
• Civil society (general public, communities land owners and farmers, NGOs)
• Customers
• Employees
• Financial markets and investors
• Industry, including indepen dent power producers; Energy Intensive User Group; Amal gamated Municipal Electricity Undertakers; South African Wind Energy Association, etc
• Government
• Suppliers
• Media
• Organised business
• Organised labour
• Parliamentary portfolio com mittees and select committees
• Regulators
• Previous recipients of our annual report
Engagement methods
• Focus groups
• Forums and committees
• One-on-one meetings
• National Energy Regulator of South Africa’s public hearings on Eskom’s multi-year price determination (MYPD 2)
• Online – emails and internet and intranet
• Public participation as part of environmental impact assessments
• Road shows
• Surveys
Page
Material issues
• Financial sustainability of Eskom including tariff and funding 38 to 46
• Employees: safety, recruiting skills, retaining skills and involving staff in the business (organisational resilience)
76 to 83
• Energy efficiency and demand-side management156 to
157
• Eskom’s operational efficiencies, including the costs and supply of primary energy (coal and water), the collection of bad debt, optimal spending on maintenance for the ageing fleet
102, 109, 203
• Leadership and management commitment 22 to 25
• Managing large capital expansion programme while tightening the anti-corruption and fraud prevention mechanisms
67, 125
• Policy and regulatory environment including:
– Pricing policy – long-term tariff stability and funding of the capacity expansion programme as well as fuel and water policy – adequacy of long-term coal and water supply
– Energy policy – market structure, regulation – enabling the introduction of Independent Power Producers (IPPs)
110, 158
87
• Responding to climate change, renewable energy and nuclear 54
• Restoring public confidence, Eskom’s image and reputation management 17
• Restructuring of the electricity distribution industry 89
• Security of electricity supply – availability of adequate generation capacity to meet customer demand at any time and a secure and reliable transmission system to deliver power to all regions of the country. Including 2010 FIFA World CupTM
135
• Supporting the developmental objectives of South Africa – electrification, eradication of poverty and unemployment and protecting the poor against the impact of a higher electricity tariff, public safety
69
Stakeholder engagement continued
17Eskom Holdings Limited
Integrated Repor t 2010
Eskom’s challenge to satisfy the demand for electricity still remains.
This has taken place within the context of poor financial performance
and leadership challenges. Environmental lobby groups have also
focused worldwide attention on Eskom’s coal-based capacity
expansion programme. These factors, among others, affect the overall
corporate reputation negatively, which makes it difficult for Eskom to
operate and source the required funding.
A number of reputation studies were conducted in partnership with
the Reputation Institute to determine the key drivers of Eskom’s
reputation among employees, stakeholders and the general public.
The insights gained from these studies have been used to inform
communication strategies and plans aimed at creating breathing
space for Eskom in the short term, building credibility in the medium
term and repositioning the organisation into the future.
An integrated communication campaign has been implemented to
educate residential customers about energy efficiency, public safety
and the benefits of the capacity expansion programme. This is
supported by media relations and messaging; as well as branding and
public relations interventions.
An extensive energy efficiency campaign has been implemented to
not only build awareness of saving electricity but also to change the
energy consumption behaviour of South Africans. In partnership with
a number of suppliers, new product offerings were also introduced
to the market such as energy-efficient showerheads, solar water
heating, energy-efficient motors, to name a few.
Eskom’s public safety campaign continues to create awareness in the
market on the safe use of electricity. The campaign culminates in an
annual electricity awareness safety week in August.
Energy losses remain a major concern for the business and a targeted
social marketing campaign was launched in September 2009. This
campaign focuses on non-technical losses such as theft, non-payment
and tampering with electricity installations.
Reputation management has been elevated to be among the key
strategic imperatives of the business. A cross-functional team has
been established to ensure an integrated approach to reputation
management. This consists of members of the executive
committee, as well as specialists from key functions such as
reputation management, corporate strategy and planning, risk
management, human resources, finance, legal and audit
depar tments. This has since culminated in a successful rollout of
the Guardian programme – an internal brand ambassador
campaign, and the MYPD 2 stakeholder engagement roadshows
across the country. The results of these initiatives are leadership
visibility, openness and transparency; and an exciting journey
towards restoring public confidence in Eskom.
Under the auspices of a major reputation restoration campaign for
Eskom, which has been approved for implementation, Eskom will
focus on enhancing our culture, educating employees on their role in
supporting the South Africa Incorporated brand, delivering a
successful 2010 FIFA World Cup™ intensifying stakeholder
engagement on key issues that impact on the corporate reputation,
pro-active media engagement and mobilising the nation towards
power conservation.
Internal programme
The Guardian programme, introduced towards the end of 2009, is
focused on empowering employees to be ambassadors for Eskom.
Central to this objective is instilling pride and passion in the Eskom
brand and helping employees at all levels to work as teams, dedicated
to safeguarding the assets that are vital to the nation’s electricity.
Launched by the Acting Chairman Mpho Makwana, the Guardian
programme is being introduced to all Eskom regions and power
stations in a phased manner. The campaign relies extensively on the
use of elements such as roadshows, industrial theatre, roadmaps,
websites and audio-visual material, to gain the support of employees.
The interactive campaign will continue throughout 2010 and into
2011 to ensure that the Guardian programme becomes an integral
part of the lives of all employees.
Staff who embody the values of the Guardian programme through
their interactions with colleagues and their dedication to their roles
within the company will be used to reinforce the programme with
their peers and families.
Eskom reputation and engagement with stakeholders

18 Eskom Holdings Limited
Integrated Repor t 2010
Eskom values the importance and benefits of having an integrated
risk management (IRM) programme and applies best practices as set
out in ISO 31000, King lll and the Department of Public Enterprises’
risk management framework.
Eskom has established one framework for the management of all
risks across the whole organisation, achieving an appropriate balance
between realising opportunities for gains while minimising adverse
impacts. IRM is an integral part of good management practice and an
essential element of good corporate governance.
Eskom’s approach to IRM looks at risk as exposure to the
consequences of uncertainty, or potential deviations from what is
planned or expected and is applied to the management of both
potential gains and potential losses.
Eskom management is integrating risk management into Eskom’s
management culture. This means that IRM will be embedded in
everything the organisation does – aligning strategy, processes,
people, technology and knowledge. This will enable:
• the Board and senior managers to confidently make informed
decisions about risk and risk treatment
• the pursuit of strategic growth opportunities and projects with
greater speed, robustness and confidence to the benefit of Eskom
and its customers and shareholder
• daily business decisions at the operating level within the context of
Eskom’s capacity to bear risk and the types it prefers
• the organisation to manage the risks to the value of non-tangible
assets – customers, partners, intellectual and knowledge capital,
brand, processes and systems – just as fully as physical and financial
assets
As a result, there will be greater certainty around achieving Eskom’s
strategic objectives.
Integrated risk profile
The Board acknowledges its overall accountability to ensure an
effective results-driven, IRM process. Exco has implemented a risk
control system to enable management to respond appropriately to
significant risks that could impact negatively or positively on business
objectives.
Risk reviews are conducted continually with input from divisional
and functional areas. Risks identified are ranked by divisions and
subsidiaries, reviewed, and then assessed by Exco, the Board risk
management committee, and the board to determine the priority
risks and those risks that may require business continuity plans.
The risk profile is finalised only after executive accountability
has been assigned for each of the risks, backed by continuous
monitoring of the effectiveness of controls and progress against
agreed treatment plans.
Eskom Holdings strategic risks
The current Eskom Holdings high priority risks and initiatives to
address them are listed below:
Financial sustainability
• The impact of funding shortfalls which could affect plant availability
and capacity expansion could lead to load shedding, delayed
commissioning of new plant and further damage to Eskom’s
reputation.
• Increase in bad debts given the impact of the MYPD 2 increases
and the impact on the funding shortfall.
• Increased economic growth (above forecast) and the financial
impact of having to run the more expensive gas turbine stations.
n To address all of the above, a detailed and robust funding plan has
been formulated and is being implemented (see further detail in
Finance division report).
Brand and reputation
• Brand and reputation damage that may be caused by inconsistent
and uncontrolled communication about Eskom both internally and
externally. This could spiral into stakeholder activism and give rise
to security threats.
n Eskom is currently running internal roadshows and external
communication programmes. A review is underway to ensure
integrated reporting across Eskom and that there is consistency in
all communication with the external environment.
Generation and networks
• Overloaded networks leading to Eskom not being able to meet
the nation’s electricity demand, and thus not achieving regulated
service standards. The impact of this can be rolling blackouts and
increased safety related threats.
Integrated risk management
• Risksn Solutions

19Eskom Holdings Limited
Integrated Repor t 2010
n Eskom has embarked on several initiatives to reduce the demand
for electricity such as energy efficiency demand-side management
(EEDSM). This has been executed simultaneously with asset
management and refurbishment programmes that will allow our
existing infrastructure to accommodate the current demand.
Capacity expansion
• Large-scale overruns on capital projects and overruns on key
milestone dates due to uncertainties associated with planning,
design, integration and executability of long-term expansion plans.
n Eskom is continually assessing and improving its controls over
design planning and execution of capital projects.
Regulation and legislation
• Environmental legislation affecting existing and future plant and
investment decisions.
n Eskom is engaging all relevant regulatory bodies and factoring
possible changes into all planning initiatives.
Skills
• Recruitment and retention of skills impacting Eskom’s current and
future needs with regard to day-to-day operations, maintenance
and capacity expansion activities.
n Eskom is reviewing its processes to streamline and optimise
various human resource related functions.
Climate change
• Agreements related to international climate change negotiations
could lead to onerous obligations for the Republic of South Africa
and Eskom.
n Climate change has long been an integral part of Eskom’s business.
We remain committed to the principles and aspirations of our
climate change strategy, developed in 2005 and our six-point plan
on climate change. During this year we will be revising our climate
change strategy taking into account changing international and
national circumstances.
FordetailonEskom’ssix-pointclimatechangestrategygotowww.eskom.co.za/annreport10/001.html
Business continuity management
Business continuity management (BCM) entails risks that may
threaten the continuity of business should they occur. All divisions
and subsidiaries develop, implement, maintain and review appropriate
business continuity plans for their businesses.
Emerging risks
Trends in the local and international domain that might affect
Eskom’s strategic business context and which will be continually
monitored and assessed:
• Widening global governance gaps as a result of international
government decisions taken regarding climate change, international
financial policy, etc.
• Global market recovery and South African financial and growth
recovery resulting in increased demand for electricity.
• Energy inefficiency in South Africa due to the perceived high cost
of energy-saving technology and poor/wasteful behaviour derived
from a long period of low cost electricity.
• Protecting the poor from burdensome increases of electricity
prices while aiming to have electricity tariffs that reflect the
economic cost of electricity production.
• Increasing cost of transporting coal, uncertain long-term supply of
coal and deteriorating quality of coal.
• Decreasing availability and quality of water.
• Security threats against Eskom’s people and assets, energy theft
and vandalism of energy infrastructure.
• Increased non-payment as a way of public protest against the price
of electricity.
• Data fraud/loss due to the hacking of networks.
• Introduction of carbon taxes which may have a negative effect on
Eskom’s financial position.
• Risksn Solutions


22 Letter from the acting chairman
26 Board of directors
28 Executive management committee
30 Executive performance overview
34 Performance against the shareholder compact
On the path to recoveryLeadership overview
22 Eskom Holdings Limited
Integrated Repor t 2010
Letter from the acting chairman
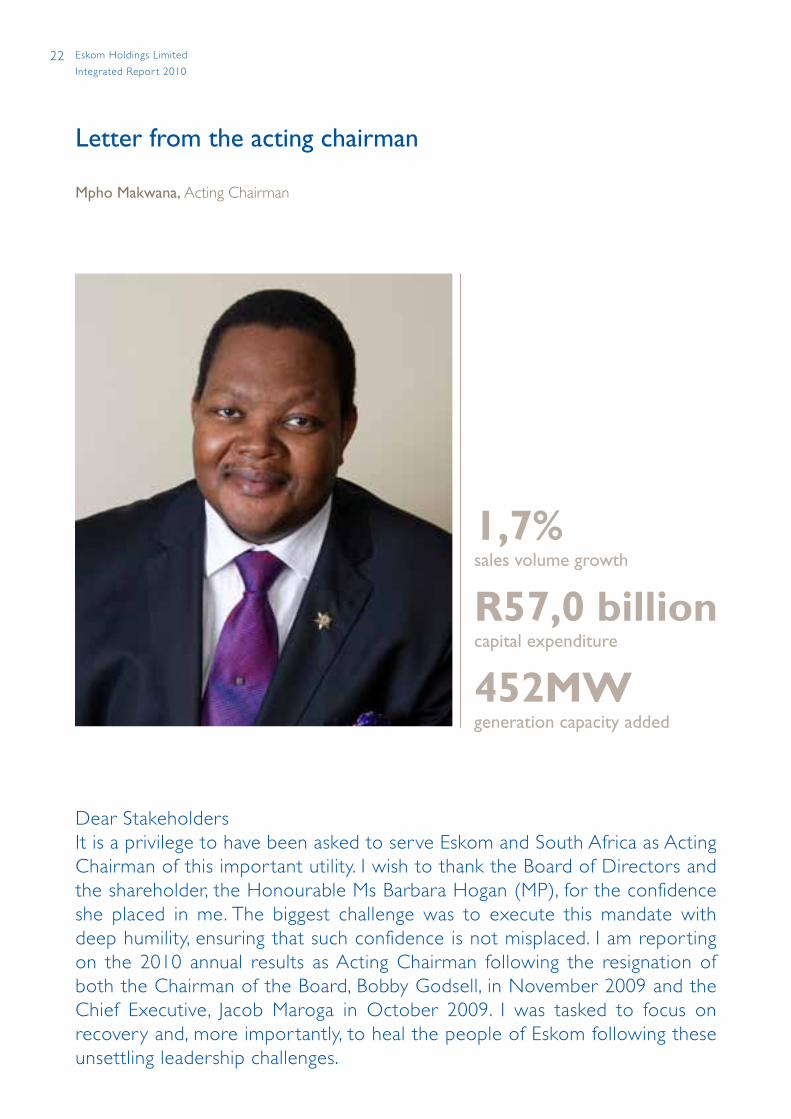
Mpho Makwana, Acting Chairman
Dear StakeholdersIt is a privilege to have been asked to serve Eskom and South Africa as Acting Chairman of this important utility. I wish to thank the Board of Directors and the shareholder, the Honourable Ms Barbara Hogan (MP), for the confidence she placed in me. The biggest challenge was to execute this mandate with deep humility, ensuring that such confidence is not misplaced. I am reporting on the 2010 annual results as Acting Chairman following the resignation of both the Chairman of the Board, Bobby Godsell, in November 2009 and the Chief Executive, Jacob Maroga in October 2009. I was tasked to focus on recovery and, more importantly, to heal the people of Eskom following these unsettling leadership challenges.
1,7%sales volume growth
R57,0 billioncapital expenditure
452MWgeneration capacity added

23Eskom Holdings Limited
Integrated Repor t 2010
Tumultuous as the end of their tenure has been, as we move on and
turn over a new leaf in a new chapter in the history of Eskom, I wish
to thank them on behalf of the Eskom family for the contribution
they made to our journey as a state-owned enterprise.
Last year, when Eskom recorded a loss, we committed to return
Eskom back to financial health and ensure that it will remain a going
concern. I’m pleased to report back on that promise and that we are
posting a profit. We have now removed the majority of the embedded
derivatives from our balance sheet. The vacancies in our executive
management committee, a worry last year for both the board and
the entire community of stakeholders, have all been filled. We will
soon announce the name of the new chief executive.
We believe that we are slowly returning to the status we’ve always
had: a great place to work, a great place to invest for financiers, a
great customer for some of the world’s leading technology suppliers
and a great source of pride for all South Africans. We are pleased to
report back at this point on the progress we’ve made over the past
12 months, and what still needs to be done.
Last year we defined our objective as regaining the trust from our
local and regional markets and customers, the global financial markets,
our regulator and government stakeholders. While this is a work in
progress, I believe we’re well on our way to recovery.
Our past
Since 1923, Eskom has been an integral part of South Africa: Eskom’s
story is South Africa’s story in so many ways. Eskom matters, and it
matters to all of us:
• our 40 870MW net maximum installed capacity makes us one
of the world’s top utilities, when measured in terms of generation
capacity
• we generate 95% of all electricity consumed in South Africa,
indeed, that’s 45% of all electricity consumed in Africa
• we serve more than four million customers, across southern
Africa, every day
• our infrastructure includes 390 000km of power lines: end-to-end,
that’s almost 10 times around the globe
• we employ 39 222 people in the group to serve the nation who
are driven by our central asset – which I believe is our value
system
That’s what makes our recent history so painful, while it makes
our long history a source of pride. We are, I believe, on the way
to recovering that proud status: a par tner and enabler in southern
Africa’s development. I believe that the 2010 FIFA World
CupTM will be one of the steps along that road for us. However,
I fully appreciate that we will have to earn the trust of our
stakeholders again.
We have enough reason to believe that we’ll overcome the
recent challenges – our list of recent achievements stands proud
for all to see:
• In 1994, 30% of all South Africans had access to electricity. That
now stands at 70%, with an addition of 149 901 connections this
year. We have extended electricity to tens of millions of people
since 1994, with 3 901 054 homes electrified since the inception
of the electrification programme in 1991.
• Eskom has been recognised by the Department of Public Works
for creating tens of thousands of jobs under the expanded public
works programme.
• We run a massive skills development programme, training
thousands of people every year, as well as run schools initiatives
such as the Eskom energy and sustainability programme – a long-
standing partnership between Eskom and the Wildlife and
Environment Society of South Africa (WESSA) – and the Eskom
Expo for Young Scientists.
• From the late 1980s until the mid 1990s we allowed the price of
electricity to reduce – too much, as it happens – but in the process,
we released in excess of R40 billion to customers between 1988
and 1999, in a time when the economy needed this kind of
support.
• During that time and, we believe, partly as a result of our efforts,
South Africa won the confidence of investors and foreign
businesses. Our reputation as a world-class utility, confirmed in
2001 when Eskom was chosen as the Global Power Company
of the Year, served us, and served South Africa, during tough times.
• We spend billions of rand in South Africa every year, supporting
local business and industry. Our procurement processes have
been instrumental in the establishment of numerous local
businesses and the empowerment of thousands of previously
disadvantaged South Africans.
Our assets and challenges
We managed to do that with the people that make the Eskom family.
They are South Africans from all walks of life, and without their
special dedication, South Africa would be the poorer. Service tenures
of 30 or 40 years are not uncommon. They are truly representative
24 Eskom Holdings Limited
Integrated Repor t 2010
of our nation, comprising a skills base arguably unmatched anywhere
else in South Africa. With the changes we have seen in our racial
and gender mix since 1994, we now tap the entire skills pool of
South Africa.
They are also the reason I believe we will overcome our current, and
future challenges, significant as these are:
• While the deliberate under-pricing in the early nineties, referred to
above, needed to stimulate the South African economy and
investments as it was coming out of the apartheid era at the time,
it is now clear that it was extended too far, and too long, and that
this needs to be recovered.
• After more than 80 years of delivering the lifeblood of our
economy, we have let the country down through supply shortages
and other operational issues.
• Our capacity expansion programme is enormous: the three projects
currently underway are among the biggest in the world, with a single
project such as Medupi power station being bigger than all the 2010
FIFA World CupTM investments and Gautrain combined.
• We are partnering with the South African government in working
through the challenges of developing a sustainable supply of
electricity, increasing the energy efficiency of the South African
economy, while facing the requirements of climate change
obligations, for instance through large-scale solar and wind
power projects.
• We have to continue our commitment to numerous
programmes that invest in social development. These include
projects run under the auspices of the Eskom Development
Foundation, and focus on the empowerment of women and
children in rural communities.
I believe we are currently staring down the challenges ahead of us,
which I see as supply challenges, associated funding challenges,
managing the large capital investment programme, and regaining the
trust of our customers and other stakeholders. The reason I believe
we will emerge from this challenging phase of our history stronger
and with pride is unambiguous – because of the special people we
have, and the special organisation I have the privilege of stewarding,
and the extraordinary support we have experienced from all our
stakeholders.
We will continue to leverage our investments to the benefit of the
South African economy – our capacity expansion programme has
already created tens of thousands of jobs locally and has catalysed
several new industries which will add value to the economy for years
to come – and all this through a major recession. It is noteworthy
that Eskom’s projects have been major anchors as the economy
weathered the storm of recession.
As a massive business, with the kind of projects we undertake, and
under the kind of pressure we operate, we have to continue to live
our values, and be guided by a clear sense of ethics in all our
endeavours. We believe it is essential that the integrity of our people,
processes and practices are beyond reproach. As founding signatories
to the United Nation’s Global Compact (which includes an anti-
corruption clause) and the World Economic Forum’s Partnership
Against Corruption Initiative, we are proud of our long record of
integrity in this regard.
Our procurement practices are world class – as is evidenced by
the outcomes of numerous third-par ty reviews which are
under taken in parallel with every major order we place. This
includes the controversial placement of the Medupi and Kusile
boiler contract with Hitachi South Africa. The process relating
to this contract has been exhaustively reviewed for any
improper conduct and emerged intact. The outcomes of the
third-par ty review repor t of this process have already been
made public.
Road to recoveryOur recent history, though, is one of several significant crises, such as
the Western Cape crisis of 2006, the nationwide load shedding of
2007 and 2008, the financial crisis of 2009 and most recently the
leadership crisis of 2009.
We have let our customers down – and we have in the process
disappointed and angered South Africa and ourselves. But even in
these crises there is a silver lining. Earlier in this letter, I praised the
people of Eskom and I shall close in the same vein – it is this huge
team that has pulled us through these crises. In particular the
recovery from the load shedding in the first quarter of 2008 – and
the subsequent absence of load shedding – has been nothing short
of commendable.
At the same time we must recognise that the crises are far from
gone. We will be running out of capacity in the near future (as
early as 2011 onwards) and there is therefore a need to urgently
proceed with the current Eskom capacity expansion programme.
This includes the Medupi, Kusile and Ingula projects and to return
the mothballed power stations to service, and introduce
independent power producers in terms of the medium-term
power purchase programme.
Letter from the acting chairman continued
25Eskom Holdings Limited
Integrated Repor t 2010
Eskom and South Africa still have to face emission reduction targets,
water shortages, massive funding requirements and many more
challenges – all of this while recovering from the recession and
investing in new infrastructure at a rate unprecedented in our
country’s history.
I believe that there is a need for a national dialogue on our energy
future, while we focus on the completion of Kusile in 2017. This involves
making choices as a country regarding the capacity needs for the future,
the capacity mix, who will build the required capacity, what it will cost
and how it will be funded. There has been a call for greater engagement
and broader dialogue – we wholeheartedly welcome this in line with
our own call for a national compact on electricity supply. Eskom
welcomes an open and transparent engagement with stakeholders.
SustainabilityEskom is a leader in sustainability reporting – focusing transparently
on reporting our financial, technical, environmental and social impact
performance. We include full disclosure of our compact with our
shareholder as well as against the norms of the Global Reporting
Initiative (GRI) and strive to continually improve our performance in
this regard.
Eskom is also a trend setter in this regard – as reflected in the deep
respect we show for our value of innovation. In 1990 we were
applying the principles of managing our business in terms of the triple
bottom line – committed to maximise the economic, environmental
and social returns of our business.
We acknowledge that 2010 is declared by the United Nations as
the international year of biodiversity and continue to work with
our partners and stakeholders to control our impacts on
ecosystems and seek opportunities to contribute to the South
African biodiversity strategy.
AcknowledgementsI have already made special mention of the women and men of
Eskom who managed to prevent further load shedding over
the past year.
I would also like to thank my fellow board members for their counsel
and am glad that we can continue to rely on their guidance and
assurance for this important national asset. They have spent an
enormous amount of additional time in special board meetings
this year, to address the various challenges and I thank them for
their invaluable time.
We bid farewell to Mr Allen Morgan who resigned as a non-executive
director in March 2010 after serving on the board for nine years.
Ms Sonia Sebotsa, an external committee member, resigned in
February 2010. I thank them for their tangible contribution to the
organisation in terms of strategic guidance.
A word of welcome to our new board members, Dr BL Fanaroff
and Dr B Mehlomakulu. I would like to make special mention of
Mr Paul O’Flaherty who was appointed as the Finance Director in
January 2010. He has in this short space of time already left an
indelible mark on the Eskom business.
A special word of thanks to Ms Barbara Hogan, Minister of Public
Enterprises and Mr Enoch Godongwana, Deputy Minister, for
their active interest in and support of Eskom. I must also
acknowledge the guidance and strategic direction from Ms Dipuo
Peters, Minister of Energy. I would also like to thank Ms Vytjie
Mentor and Ms Elisabeth Thabethe, chairpersons of the portfolio
committees on public enterprises and energy respectively, as well
as Ms Priscilla Themba, chairperson of the select committee on
Labour and Public Enterprises for their continued support.
We may make more mistakes in future – but I hope you share my
belief that, while the threats and challenges are still out there, the
base that makes Eskom special is also still there. Together with the
special partnerships we have throughout the South African society
we can build on the hard lessons we have learnt in recent years and
only go from strength to strength from here on.
Mpho Makwana
Acting Chairman

26 Eskom Holdings Limited
Integrated Repor t 2010
1. Mr PM (Mpho) Makwana (39)Acting Chairman with executive powers
B Admin (Hons) (Pretoria), EDP (North Western)
Mpho was appointed in July 2002
Director: Epitome Investments
Trustee: Lovelife Trust
2. Ms LCZ (Zee) Cele (57)Non-executive director
BCom (Fort Hare), PostGrad Dip Tax, MAcc (Natal) Executive Leadership Development Programme (Cambridge, USA)
Zee was appointed in August 2005
Director: Hulamin Ltd, Combined Motor Holdings, Sports For All Franchising (Pty) Ltd, Three Cities Investments (Pty) Ltd
3. Mr SD (Daniel) Dube (60)Non-executive director
Diploma in Management from the University of Leicester
Daniel was appointed in July 2008.
Chairman: Self-help and Resource Exchange
4. Mr LG (Lars) Josefsson (59) (Swedish)Non-executive director
MSc (Applied Physics) (Chalmers, Sweden)
Professor, Cottbus University, Germany
Lars was appointed in July 2002
Director: Robert Bosch Industrie-Treuhand KG, Robert Bosch GmbH, Dynea Oy
5. Mr HB (Hee-Beom) Lee (61) (Korean)Non-executive director
BA in Electronics Engineering, Seoul National University, Graduate School of Public Administration, Seoul National University, MBA (summa cum laude), George Washington University, Ph.D in Business Management, Kyunghee University, Honorary Doctorate Degree in Public Administration, Hoseo University
Hee-Beom was appointed in July 2008.
Director: National Academy of Engineering of Korea, Korean Air, STX Energy Group
6. Ms WE (Wendy) Lucas-Bull (56)Non-executive director
BSc (Wits)
Wendy was appointed in July 2002
Director: Peotona Group Holdings (Pty) Ltd, Dimension Data Holdings PLC, Development Bank of Southern Africa, Nedbank Group Limited, Anglo Platinum Limited
Board of directors
ZEE
LARS WENDY
HEE-BOEM
DANIELMPHO

27Eskom Holdings Limited
Integrated Repor t 2010
7. Mr J (John) Mirenge (44) (Rwandan)Non-executive director
Bachelor of Law (LLB) from the Makerere University, Kampala and a Post-graduate Diploma in Legal Practice (Law Development Centre, Kampala)
John was appointed in July 2008
Director: Crystal Ventures Ltd, Rwandair Express, RECO/RWASCO (Rwanda)
8. Mr JRD (Jacob) Modise (43)Non-executive director
BCom, BAcc, CA(SA), MBA (Wits), AMP(Harvard), AMP (Samford)
Jacob was appointed in July 2002
Major directorships: Altron, Batsomi Group, Blue IQ Investment Holdings, Electricity Distribution Industry Holdings, Road Accident Fund
9. Mr AJ (Allen) Morgan (62) Non-executive director
BSc, BEng (Electrical) (Stellenbosch)
Allen was appointed in July 2002 and resigned on 31 March 2010
Director: Kumba Iron Ore Ltd, Lomold (Pty) Ltd, Lomotek Polymers (Pty) Ltd, Proplas (Pty) Ltd, South African Sustainability Development Company (Pty) Ltd, Bio Therm Energy (Pty) Ltd
10. Mr PS (Paul) O’Flaherty (47)Executive director responsible for finance
BCom, BAcc, CA (SA)
Paul was appointed in January 2010
Director: Escap (Pty) Ltd
11. Ms U (Uhuru) Zikalala (50)Non-executive director
MSc (Structural Eng) (Patrice Lumumba, Moscow)
Uhuru was appointed in August 2005
Director: Blue Flame Properties, Ulwazi-Bosch Skills Academy.
Changes in board composition:
• Resignation of Jacob Maroga as Chief Executive on 28 October 2009
• Resignation of Bobby Godsell as Chairman on 8 November 2009
• Appointment of Mpho Makwana as Acting Chairman, with executive powers on 12 November 2009
• Appointment of Paul O’Flaherty as Finance Director in January 2010
• Resignation of Allen Morgan on 31 March 2010
PAUL
ALLEN
JOHN
JACOB
UHURU
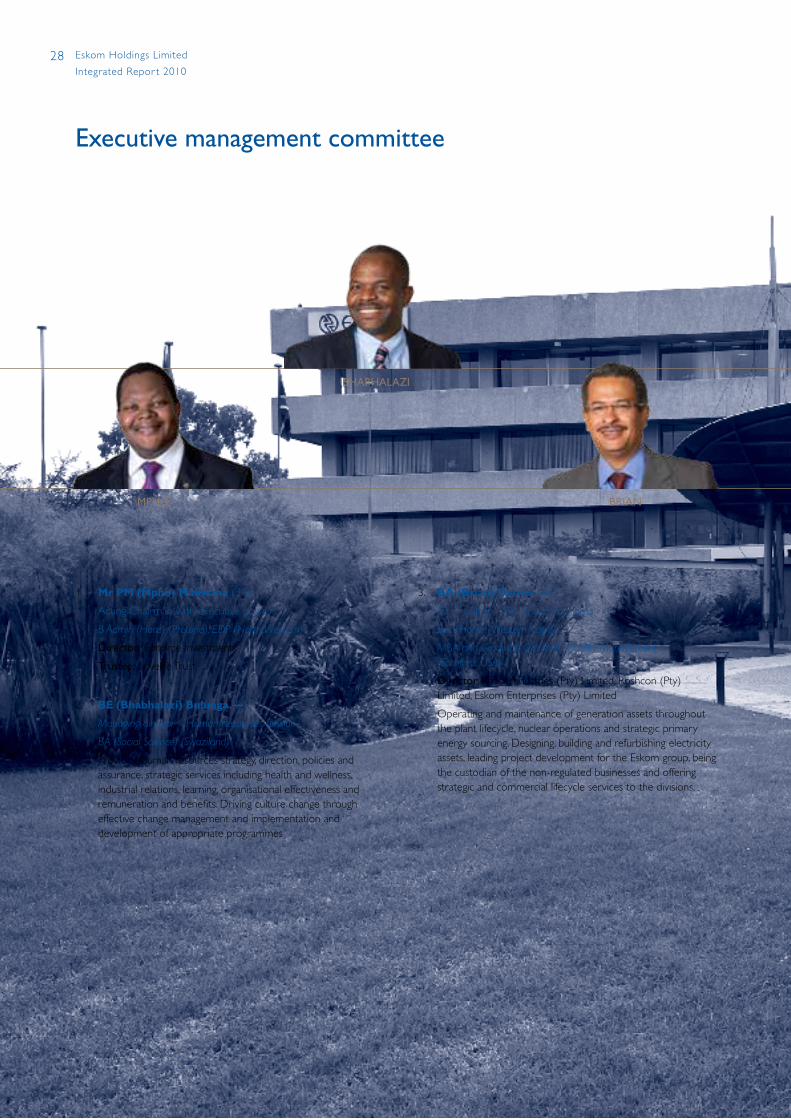
28 Eskom Holdings Limited
Integrated Repor t 2010
1. Mr PM (Mpho) Makwana (39)
Acting Chairman with executive powers
B Admin (Hons) (Pretoria), EDP (North Western)
Director: Epitome Investments
Trustee: Lovelife Trust
2. BE (Bhabhalazi) Bulunga (54)
Managing director – Human Resources division
BA (Social Science) (Swaziland)
Providing human resources strategy, direction, policies and assurance, strategic services including health and wellness, industrial relations, learning, organisational effectiveness and remuneration and benefits. Driving culture change through effective change management and implementation and development of appropriate programmes
3. BA (Brian) Dames (44)
Chief officer – Generation business
BSc (Hons) (Western Cape)
MBA and Graduate Diploma in Utility Management (Samford, USA)
Director: Rotek Industries (Pty) Limited, Roshcon (Pty) Limited, Eskom Enterprises (Pty) Limited
Operating and maintenance of generation assets throughout the plant lifecycle, nuclear operations and strategic primary energy sourcing. Designing, building and refurbishing electricity assets, leading project development for the Eskom group, being the custodian of the non-regulated businesses and offering strategic and commercial lifecycle services to the divisions.
Executive management committee
BRIAN
BHABHALAZI
MPHO
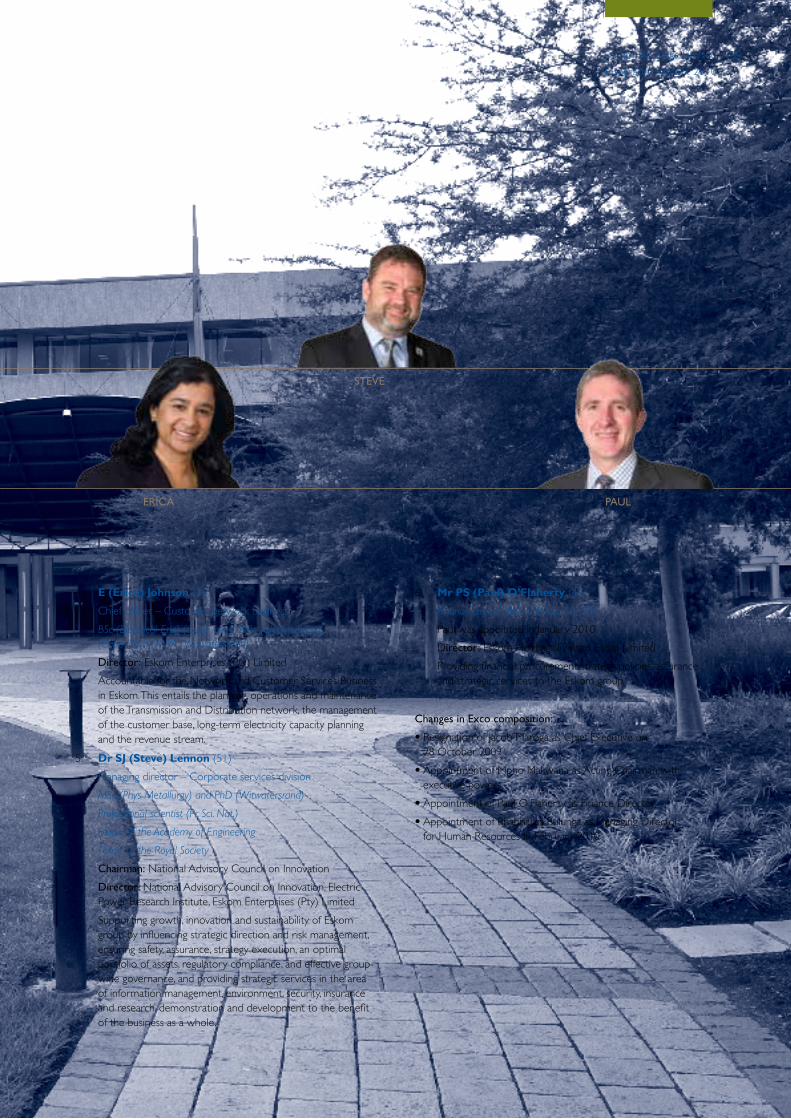
29Eskom Holdings Limited
Integrated Repor t 2010
4. E (Erica) Johnson (41)
Chief officer – Customer network business
BSc (Electrical Eng) (Cape Town), MSc (Electrical Eng) (Cape Town), MBA (Witwatersrand)
Director: Eskom Enterprises (Pty) Limited
Accountable for the Network and Customer Services Business in Eskom. This entails the planning, operations and maintenance of the Transmission and Distribution network, the management of the customer base, long-term electricity capacity planning and the revenue stream.
5. Dr SJ (Steve) Lennon (51)
Managing director – Corporate services division
MSc (Phys Metallurgy) and PhD (Witwatersrand)
Professional scientist (Pr. Sci. Nat.)
Fellow of the Academy of Engineering
Fellow of the Royal Society
Chairman: National Advisory Council on Innovation
Director: National Advisory Council on Innovation, Electric Power Research Institute, Eskom Enterprises (Pty) Limited
Supporting growth, innovation and sustainability of Eskom group by influencing strategic direction and risk management, ensuring safety, assurance, strategy execution, an optimal portfolio of assets, regulatory compliance, and effective group-wide governance, and providing strategic services in the area of information management, environment, security, insurance and research, demonstration and development to the benefit of the business as a whole.
6. Mr PS (Paul) O’Flaherty (47)
Finance director, BCom, BAcc, CA (SA)
Paul was appointed in January 2010
Director: Eskom Holdings Limited, Escap Limited
Providing financial procurement strategy, policies, assurance and strategic services to the Eskom group.
Changes in Exco composition:
• Resignation of Jacob Maroga as Chief Executive on 28 October 2009
• Appointment of Mpho Makwana as Acting Chairman with executive powers
• Appointment of Paul O’Flaherty as Finance Director
• Appointment of Bhabhalazi Bulunga as Managing Director for Human Resources in February 2010
STEVE
PAULERICA
30 Eskom Holdings Limited
Integrated Repor t 2010
Executive performance overview
Economic conditionsThe slowdown in economic performance in the past year led to low
consumer spending, further slowing down growth and putting the
brakes on demand for credit. Spending on retail and wholesale trade
sales plummeted to record lows, with the motor vehicle industry
experiencing one of its worst years in decades. Government
consumption expenditure remained resilient, supported by state-
owned enterprises infrastructure programmes including Eskom’s
capacity expansion programme.
Despite the huge investment drive by state-owned enterprises, real
gross fixed domestic investment decelerated sharply in the 2009
calendar year by 2,3% from a strong 11,7% in 2008. It is worth
mentioning that Eskom’s huge investment drive played a role in
keeping fixed domestic investment in positive territory. Although
headline inflation averaged 7,1% (above the 6% target) in the 2009
calendar year, indications are that consumer prices may decelerate
further in 2010 as a result of the stronger currency and general weak
price pressures. This should steer consumer prices lower and even to
average below 6% in 2010.
Demand for electricity is already on the increase from a negative
4,2% reduction in 2009 to a positive 1,7% growth in 2010 in line with
improving economic conditions.
Business overviewDuring the past year Eskom started laying the foundation for its
recovery in terms of its people, plant, finances, and reputation. Eskom
achieved some notable improvements, the most significant being the
group’s return to profitability. Our promise was to return the group
to financial health and ensure that it remains a sustainable going
concern. As part of this, we have been able to remove a large portion
of the embedded derivatives from our balance sheet and are also
well advanced in finding solutions for our funding gap. The vacancies
in our executive committee, a worry last year for both the Board and
the entire community of stakeholders, have all been filled, except for
the permanent Chief Executive position and the Managing Director
in the Enterprises Division.
The National Energy Regulator of South Africa (NERSA), after
lengthy deliberations including unprecedented stakeholder
engagement announced on 24 February 2010, price increases over
the next three years of 24,8% (FY11), 25,8% (FY12) and 25,9%
(FY13). This ruling is encouraging as it is a positive move along the
path to ensure that electricity tariffs are cost reflective in the medium
term. It has, however, exacerbated the funding challenges we face
as we had requested a 35% annual tariff increase over the next
three years.
We are working hard to ensure that Eskom once more becomes
a reliable supplier of electricity, a great place to work, a great
place to invest for financiers, a great customer for some of the
world’s leading technology suppliers and a great source of pride
for all South Africans.
This recovery would not have been possible without the direct
continued support of the Government of South Africa who have
provided us bridging financial support in terms of a R60 billion
(R40 billion drawn down to date) and a R176 billion guarantee for
borrowings (R117 billion drawn down to date). Our medium-term
goal is to become independently financially stable and the bridging
finance provided to us has set us up favourably to achieve this goal.
Highlights• Return to profitability.
• Capacity expansion achievements – Ambitious agreed targets
for Eskom capacity expansion programme were exceeded.
These achievements include: 452MW installed and commissioned,
600km transmission lines built and 1 630MVA installed. Two units
at Grootvlei power station were commissioned and we upgraded
three units at Arnot power station. The Tabor-Spencer high-
voltage line was commissioned. Since 2005 we have completed
4 905,5MW generating capacity, 2 825,4km transmission lines and
11 730MVA transmission capacity.
• No load shedding has taken place since end April 2008.
• Limited usage of the expensive open cycle gas turbine stations.
• Re-negotiation of aluminium contracts to eliminate embedded
derivative components are at an advanced stage.
• Electrification connections of 149 901 against a target of 145 615
were achieved.
• Eskom ready for the FIFA 2010 World CupTM.
• World Bank (R28 billion) and African Development Bank
(R21 billion) loans granted with drawdowns to commence in the
next financial year.
• A 17-year coal supply agreement for Majuba power station was
signed.
• Very low staff turnover, highlighting our staff commitment and
resilience.
• Solutions to our funding gap well advanced.
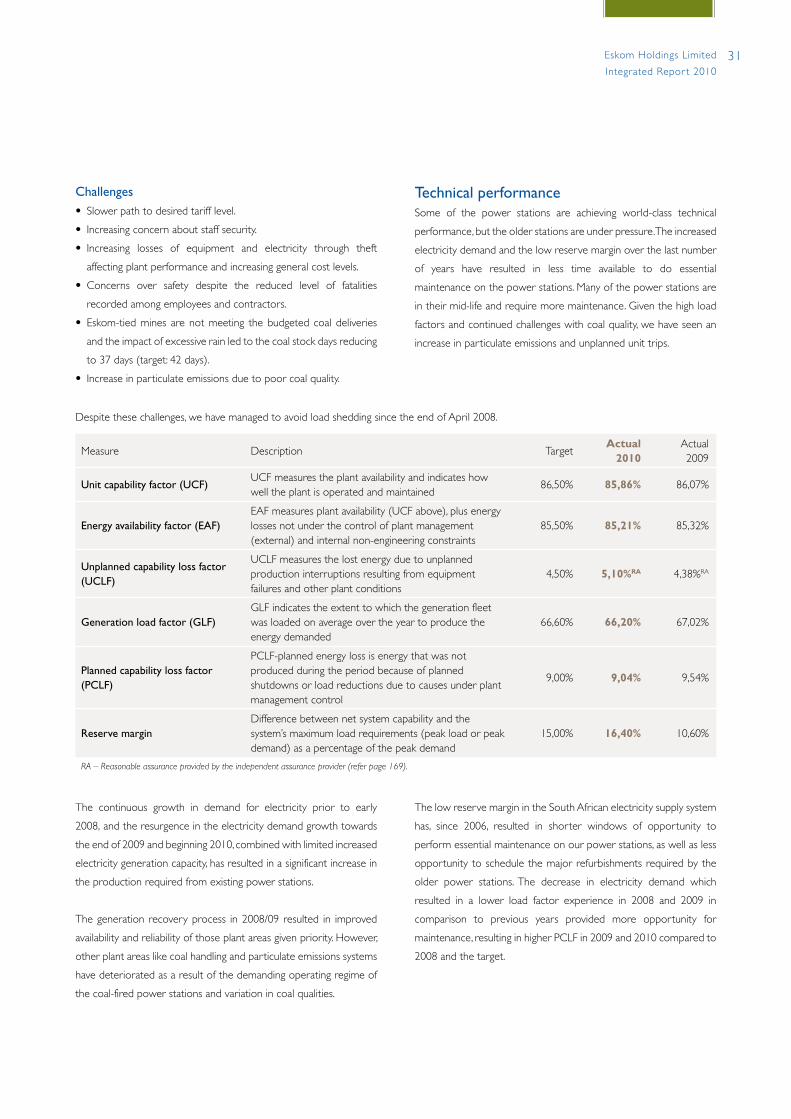
31Eskom Holdings Limited
Integrated Repor t 2010
Challenges• Slower path to desired tariff level.
• Increasing concern about staff security.
• Increasing losses of equipment and electricity through theft
affecting plant performance and increasing general cost levels.
• Concerns over safety despite the reduced level of fatalities
recorded among employees and contractors.
• Eskom-tied mines are not meeting the budgeted coal deliveries
and the impact of excessive rain led to the coal stock days reducing
to 37 days (target: 42 days).
• Increase in particulate emissions due to poor coal quality.
The continuous growth in demand for electricity prior to early
2008, and the resurgence in the electricity demand growth towards
the end of 2009 and beginning 2010, combined with limited increased
electricity generation capacity, has resulted in a significant increase in
the production required from existing power stations.
The generation recovery process in 2008/09 resulted in improved
availability and reliability of those plant areas given priority. However,
other plant areas like coal handling and particulate emissions systems
have deteriorated as a result of the demanding operating regime of
the coal-fired power stations and variation in coal qualities.
Despite these challenges, we have managed to avoid load shedding since the end of April 2008.
Measure Description TargetActual
2010Actual 2009
Unit capability factor (UCF)UCF measures the plant availability and indicates how well the plant is operated and maintained
86,50% 85,86% 86,07%
Energy availability factor (EAF)EAF measures plant availability (UCF above), plus energy losses not under the control of plant management (external) and internal non-engineering constraints
85,50% 85,21% 85,32%
Unplanned capability loss factor (UCLF)
UCLF measures the lost energy due to unplanned production interruptions resulting from equipment failures and other plant conditions
4,50% 5,10%RA 4,38%RA
Generation load factor (GLF)GLF indicates the extent to which the generation fleet was loaded on average over the year to produce the energy demanded
66,60% 66,20% 67,02%
Planned capability loss factor (PCLF)
PCLF-planned energy loss is energy that was not produced during the period because of planned shutdowns or load reductions due to causes under plant management control
9,00% 9,04% 9,54%
Reserve marginDifference between net system capability and the system’s maximum load requirements (peak load or peak demand) as a percentage of the peak demand
15,00% 16,40% 10,60%
RA – Reasonable assurance provided by the independent assurance provider (refer page 169).
Technical performanceSome of the power stations are achieving world-class technical
performance, but the older stations are under pressure. The increased
electricity demand and the low reserve margin over the last number
of years have resulted in less time available to do essential
maintenance on the power stations. Many of the power stations are
in their mid-life and require more maintenance. Given the high load
factors and continued challenges with coal quality, we have seen an
increase in particulate emissions and unplanned unit trips.
The low reserve margin in the South African electricity supply system
has, since 2006, resulted in shorter windows of opportunity to
perform essential maintenance on our power stations, as well as less
opportunity to schedule the major refurbishments required by the
older power stations. The decrease in electricity demand which
resulted in a lower load factor experience in 2008 and 2009 in
comparison to previous years provided more opportunity for
maintenance, resulting in higher PCLF in 2009 and 2010 compared to
2008 and the target.

32 Eskom Holdings Limited
Integrated Repor t 2010
SAIDI and SAIFI performance have deteriorated from the previous
year. Business plan targets have also not been achieved because of
the slower than anticipated benefit realisation for the Distribution
network performance improvement initiatives, resource constraints,
impact of conductor/equipment theft on resources and network
performance and adverse weather conditions during the financial
year. There has been an increased focus during the year on planned
maintenance work.
Energy losses
TargetActual
2010Actual 2009
Total distribution lossTotal transmission loss
≤6,00%≤3,30%
5,87%3,27%
5,46%3,08%
Total Eskom loss ≤8,76% 8,45% 7,94%
Technical performance benchmarks indicate that Transmission is
within the top quartile in terms of performance, but Distribution
needs to improve their performance. Distribution requires different
investment priorities based on mixed urban and rural customer
profiles. Unacceptably high levels of theft of equipment and electricity
are affecting plant performance and increasing cost.
Safety performanceAlthough there has been a reduction in the number of employee and
contractor fatalities for the past year as compared to 2009, we
remain focused on improving safety. Fatalities are unacceptable. Sadly
and regrettably we lost:
• two employees, due to motor vehicle accidents, compared to six
in 2009.
• 14 contractors compared to 21 in 2009. Six of the fatalities were
attributable to vehicle accidents, three to gunshots, three to being
struck by falling objects, one to an electrical contact incident and
one passed away due to a fall from height.
• 41 members of the public in 2010 (compared to 28 in 2009),
with vehicle accidents and electrical contacts remaining the
major causes. An intense public safety campaign is underway
to address this.
In addition our lost-time incident rate (LTIR) worsened to 0,54 per
200 000 manhours worked from 0,50 in 2009 and well above
our target of 0,31. We are disappointed that we did not meet
our target and reaffirm that the safety of our people remains
fundamental to our business, and we will not rest until we have
achieved our safety goals through collective responsibility,
commitment and ongoing focus.
Eskom is working with suppliers, customers and contractors to
integrate safety, health and environmental issues into their operations.
Contractors working under our supervision or on our premises are
expected to comply with Eskom’s safety, health and environment
(SHE) policy, and support the zero tolerance approach to safety
management.
Environmental performanceDue to the nature and extent of our operations, we impact the
environment in terms of our use of resources, the processes required
to generate electricity and the physical footprint we have on the land.
Eskom’s water usage has stabilised to some extent. The volume of
water used as part of the process to generate electricity improved
slightly from 1,35L/kWh in 2009 to 1,34L/kWh in 2010.
There has been a deterioration in our particulate emissions
performance from our coal-fired power stations from 0,27kg/MWh
to 0,39kg/MWh sent out linked to continued poor coal quality
and reduced opportunity for maintenance in prior years due to the
lower reserve margins.
Executive performance overview continued
Transmission and distribution technical performance
Measure (and unit) Description of measureTarget 2010
Actual 2010
Actual 2009
Comments
Number of major incidents
Records number of incidents with a severity greater than one system minute
≤2 1RA 3RA
Incident initiated by a third party and exacerbated by a transmission breaker failure
System average interruption frequency index (SAIFI)
Reliability of supply index (number per annum)
≤23,50 24,65RA 24,16RA
Target not achieved. See comments for SAIFI and SAIDI below
System average interruption duration index (SAIDI)
Availability of supply index (hours per annum)
≤50,00 54,41RA 51,51RA
Target not achieved. See comments for SAIFI and SAIDI below
RA – Reasonable assurance provided by the independent assurance provider (refer page 169).
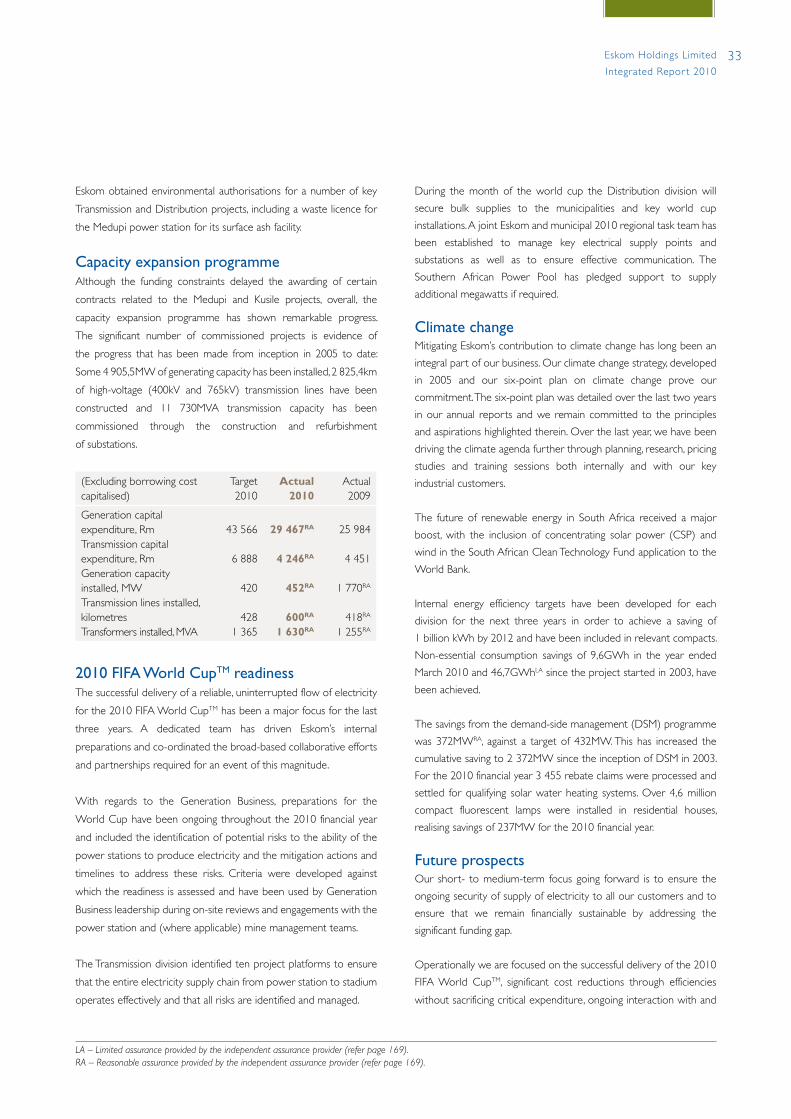
33Eskom Holdings Limited
Integrated Repor t 2010
Eskom obtained environmental authorisations for a number of key
Transmission and Distribution projects, including a waste licence for
the Medupi power station for its surface ash facility.
Capacity expansion programmeAlthough the funding constraints delayed the awarding of certain
contracts related to the Medupi and Kusile projects, overall, the
capacity expansion programme has shown remarkable progress.
The significant number of commissioned projects is evidence of
the progress that has been made from inception in 2005 to date:
Some 4 905,5MW of generating capacity has been installed, 2 825,4km
of high-voltage (400kV and 765kV) transmission lines have been
constructed and 11 730MVA transmission capacity has been
commissioned through the construction and refurbishment
of substations.
(Excluding borrowing cost capitalised)
Target2010
Actual 2010
Actual 2009
Generation capital expenditure, RmTransmission capital expenditure, RmGeneration capacity installed, MWTransmission lines installed, kilometresTransformers installed, MVA
43 566
6 888
420
428
1 365
29 467RA
4 246RA
452RA
600RA
1 630RA
25 984
4 451
1 770RA
418RA
1 255RA
2010 FIFA World CupTM readinessThe successful delivery of a reliable, uninterrupted flow of electricity
for the 2010 FIFA World CupTM has been a major focus for the last
three years. A dedicated team has driven Eskom’s internal
preparations and co-ordinated the broad-based collaborative efforts
and partnerships required for an event of this magnitude.
With regards to the Generation Business, preparations for the
World Cup have been ongoing throughout the 2010 financial year
and included the identification of potential risks to the ability of the
power stations to produce electricity and the mitigation actions and
timelines to address these risks. Criteria were developed against
which the readiness is assessed and have been used by Generation
Business leadership during on-site reviews and engagements with the
power station and (where applicable) mine management teams.
The Transmission division identified ten project platforms to ensure
that the entire electricity supply chain from power station to stadium
operates effectively and that all risks are identified and managed.
During the month of the world cup the Distribution division will
secure bulk supplies to the municipalities and key world cup
installations. A joint Eskom and municipal 2010 regional task team has
been established to manage key electrical supply points and
substations as well as to ensure effective communication. The
Southern African Power Pool has pledged support to supply
additional megawatts if required.
Climate changeMitigating Eskom’s contribution to climate change has long been an
integral part of our business. Our climate change strategy, developed
in 2005 and our six-point plan on climate change prove our
commitment. The six-point plan was detailed over the last two years
in our annual reports and we remain committed to the principles
and aspirations highlighted therein. Over the last year, we have been
driving the climate agenda further through planning, research, pricing
studies and training sessions both internally and with our key
industrial customers.
The future of renewable energy in South Africa received a major
boost, with the inclusion of concentrating solar power (CSP) and
wind in the South African Clean Technology Fund application to the
World Bank.
Internal energy efficiency targets have been developed for each
division for the next three years in order to achieve a saving of
1 billion kWh by 2012 and have been included in relevant compacts.
Non-essential consumption savings of 9,6GWh in the year ended
March 2010 and 46,7GWhLA since the project started in 2003, have
been achieved.
The savings from the demand-side management (DSM) programme
was 372MWRA, against a target of 432MW. This has increased the
cumulative saving to 2 372MW since the inception of DSM in 2003.
For the 2010 financial year 3 455 rebate claims were processed and
settled for qualifying solar water heating systems. Over 4,6 million
compact fluorescent lamps were installed in residential houses,
realising savings of 237MW for the 2010 financial year.
Future prospectsOur short- to medium-term focus going forward is to ensure the
ongoing security of supply of electricity to all our customers and to
ensure that we remain financially sustainable by addressing the
significant funding gap.
Operationally we are focused on the successful delivery of the 2010
FIFA World CupTM, significant cost reductions through efficiencies
without sacrificing critical expenditure, ongoing interaction with and
LA – Limited assurance provided by the independent assurance provider (refer page 169).RA – Reasonable assurance provided by the independent assurance provider (refer page 169).
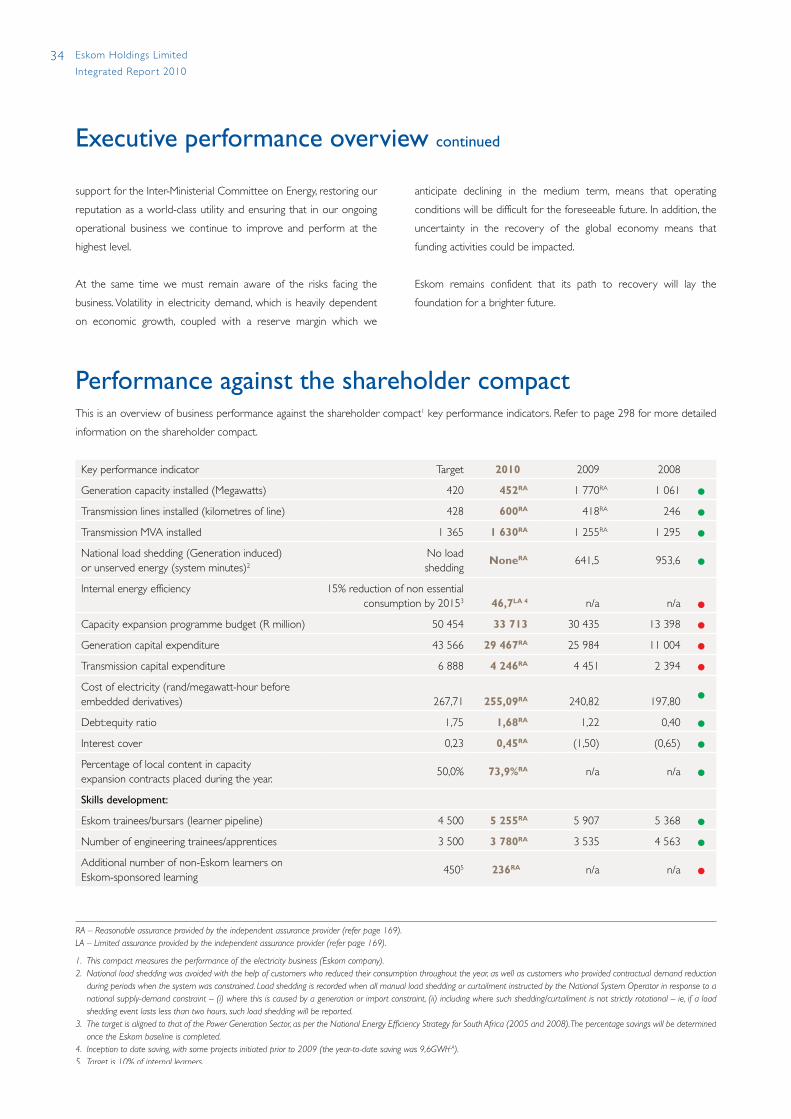
34 Eskom Holdings Limited
Integrated Repor t 2010
Executive performance overview continued
support for the Inter-Ministerial Committee on Energy, restoring our
reputation as a world-class utility and ensuring that in our ongoing
operational business we continue to improve and perform at the
highest level.
At the same time we must remain aware of the risks facing the
business. Volatility in electricity demand, which is heavily dependent
on economic growth, coupled with a reserve margin which we
anticipate declining in the medium term, means that operating
conditions will be difficult for the foreseeable future. In addition, the
uncertainty in the recovery of the global economy means that
funding activities could be impacted.
Eskom remains confident that its path to recovery will lay the
foundation for a brighter future.
Performance against the shareholder compactThis is an overview of business performance against the shareholder compact1 key performance indicators. Refer to page 298 for more detailed
information on the shareholder compact.
Key performance indicator Target 2010 2009 2008
Generation capacity installed (Megawatts) 420 452RA 1 770RA 1 061 l
Transmission lines installed (kilometres of line) 428 600RA 418RA 246 l
Transmission MVA installed 1 365 1 630RA 1 255RA 1 295 l
National load shedding (Generation induced) or unserved energy (system minutes)2
No load shedding
NoneRA 641,5 953,6 l
Internal energy efficiency 15% reduction of non essentialconsumption by 20153 46,7LA 4 n/a n/a l
Capacity expansion programme budget (R million) 50 454 33 713 30 435 13 398 l
Generation capital expenditure 43 566 29 467RA 25 984 11 004 l
Transmission capital expenditure 6 888 4 246RA 4 451 2 394 l
Cost of electricity (rand/megawatt-hour before embedded derivatives) 267,71 255,09RA 240,82 197,80 l
Debt:equity ratio 1,75 1,68RA 1,22 0,40 l
Interest cover 0,23 0,45RA (1,50) (0,65) l
Percentage of local content in capacity expansion contracts placed during the year.
50,0% 73,9%RA n/a n/a l
Skills development:
Eskom trainees/bursars (learner pipeline) 4 500 5 255RA 5 907 5 368 l
Number of engineering trainees/apprentices 3 500 3 780RA 3 535 4 563 l
Additional number of non-Eskom learners on Eskom-sponsored learning
4505 236RA n/a n/a l
RA – Reasonable assurance provided by the independent assurance provider (refer page 169).LA – Limited assurance provided by the independent assurance provider (refer page 169).
1. This compact measures the performance of the electricity business (Eskom company).2. National load shedding was avoided with the help of customers who reduced their consumption throughout the year, as well as customers who provided contractual demand reduction
during periods when the system was constrained. Load shedding is recorded when all manual load shedding or curtailment instructed by the National System Operator in response to a national supply-demand constraint – (i) where this is caused by a generation or import constraint, (ii) including where such shedding/curtailment is not strictly rotational – ie, if a load shedding event lasts less than two hours, such load shedding will be reported.
3. The target is aligned to that of the Power Generation Sector, as per the National Energy Efficiency Strategy for South Africa (2005 and 2008). The percentage savings will be determined once the Eskom baseline is completed.
4. Inception to date saving, with some projects initiated prior to 2009 (the year-to-date saving was 9,6GWhLA).5. Target is 10% of internal learners.
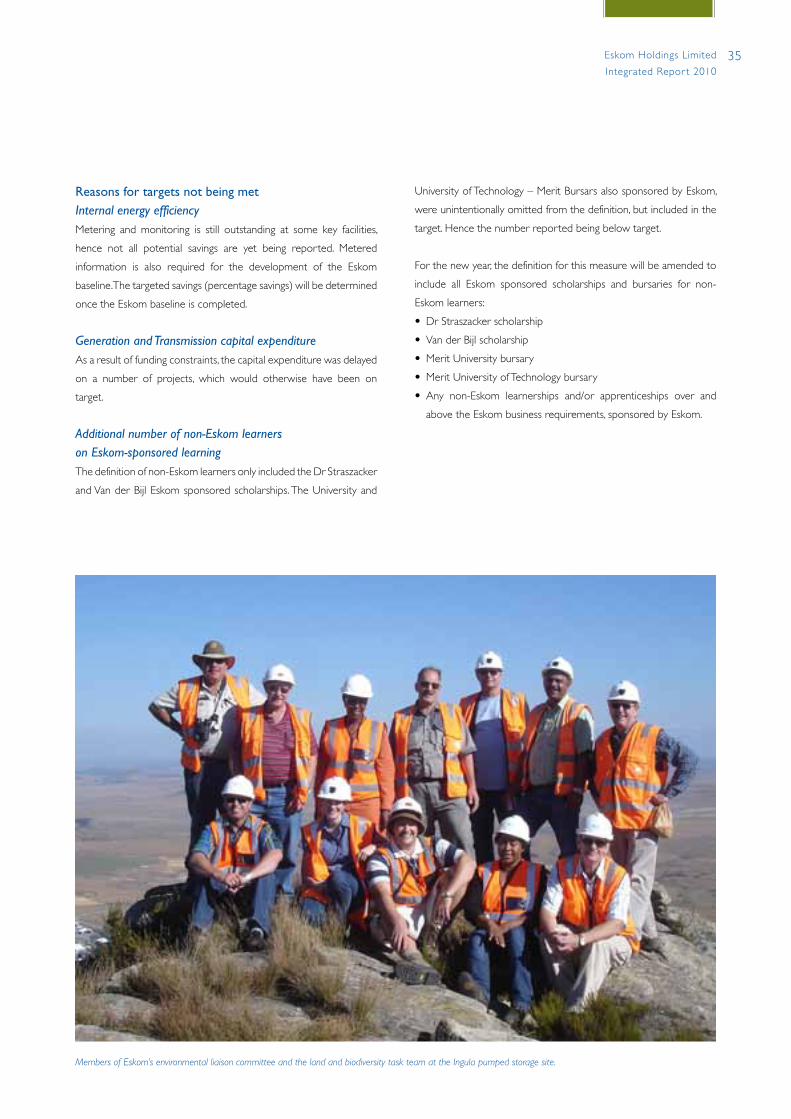
35Eskom Holdings Limited
Integrated Repor t 2010
Reasons for targets not being metInternal energy efficiencyMetering and monitoring is still outstanding at some key facilities,
hence not all potential savings are yet being reported. Metered
information is also required for the development of the Eskom
baseline. The targeted savings (percentage savings) will be determined
once the Eskom baseline is completed.
Generation and Transmission capital expenditureAs a result of funding constraints, the capital expenditure was delayed
on a number of projects, which would otherwise have been on
target.
Additional number of non-Eskom learners on Eskom-sponsored learningThe definition of non-Eskom learners only included the Dr Straszacker
and Van der Bijl Eskom sponsored scholarships. The University and
University of Technology – Merit Bursars also sponsored by Eskom,
were unintentionally omitted from the definition, but included in the
target. Hence the number reported being below target.
For the new year, the definition for this measure will be amended to
include all Eskom sponsored scholarships and bursaries for non-
Eskom learners:
• Dr Straszacker scholarship
• Van der Bijl scholarship
• Merit University bursary
• Merit University of Technology bursary
• Any non-Eskom learnerships and/or apprenticeships over and
above the Eskom business requirements, sponsored by Eskom.
Members of Eskom’s environmental liaison committee and the land and biodiversity task team at the Ingula pumped storage site.
38 Summary
39 Risk profile
40 Financial performance overview40 Results of operations42 Liquidity and capital resources44 Funding gap45 Credit rating46 Understanding Eskom’s funding46 Group value added statement47 Valuation of assets and impairments47 Procurement and supply chain48 Back to basics49 Escap Limited49 Eskom Finance Company Limited
Driving financial sustainabilityFinance division (corporate)
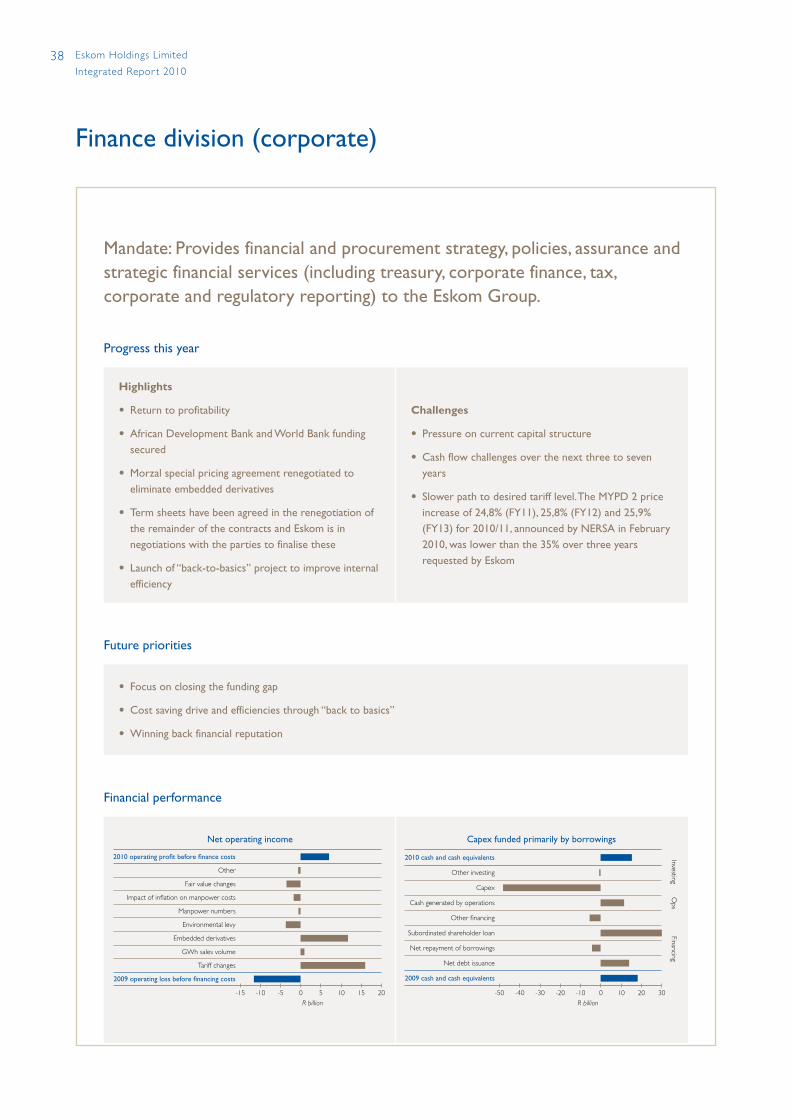
38 Eskom Holdings Limited
Integrated Repor t 2010
Mandate: Provides financial and procurement strategy, policies, assurance and strategic financial services (including treasury, corporate finance, tax, corporate and regulatory reporting) to the Eskom Group.
Progress this year
Highlights
• Return to profitability
• African Development Bank and World Bank funding secured
• Morzal special pricing agreement renegotiated to eliminate embedded derivatives
• Term sheets have been agreed in the renegotiation of the remainder of the contracts and Eskom is in negotiations with the parties to finalise these
• Launch of “back-to-basics” project to improve internal efficiency
Challenges
• Pressure on current capital structure
• Cash flow challenges over the next three to seven years
• Slower path to desired tariff level. The MYPD 2 price increase of 24,8% (FY11), 25,8% (FY12) and 25,9% (FY13) for 2010/11, announced by NERSA in February 2010, was lower than the 35% over three years requested by Eskom
Future priorities
• Focus on closing the funding gap
• Cost saving drive and efficiencies through “back to basics”
• Winning back financial reputation
Financial performance
Net operating income
R billion20151050-5-10-15
Tariff changes
GWh sales volume
Embedded derivatives
Environmental levy
Manpower numbers
Impact of in�ation on manpower costs
Fair value changes
2009 operating loss before �nancing costs
Other
2010 operating pro�t before �nance costs
Capex funded primarily by borrowings
R billion3020100-10-20-30-40-50
2009 cash and cash equivalents
Net debt issuance
Net repayment of borrowings
Subordinated shareholder loan
Other �nancing
Cash generated by operations
Capex
Other investing
2010 cash and cash equivalents InvestingO
psFinancing
Finance division (corporate)
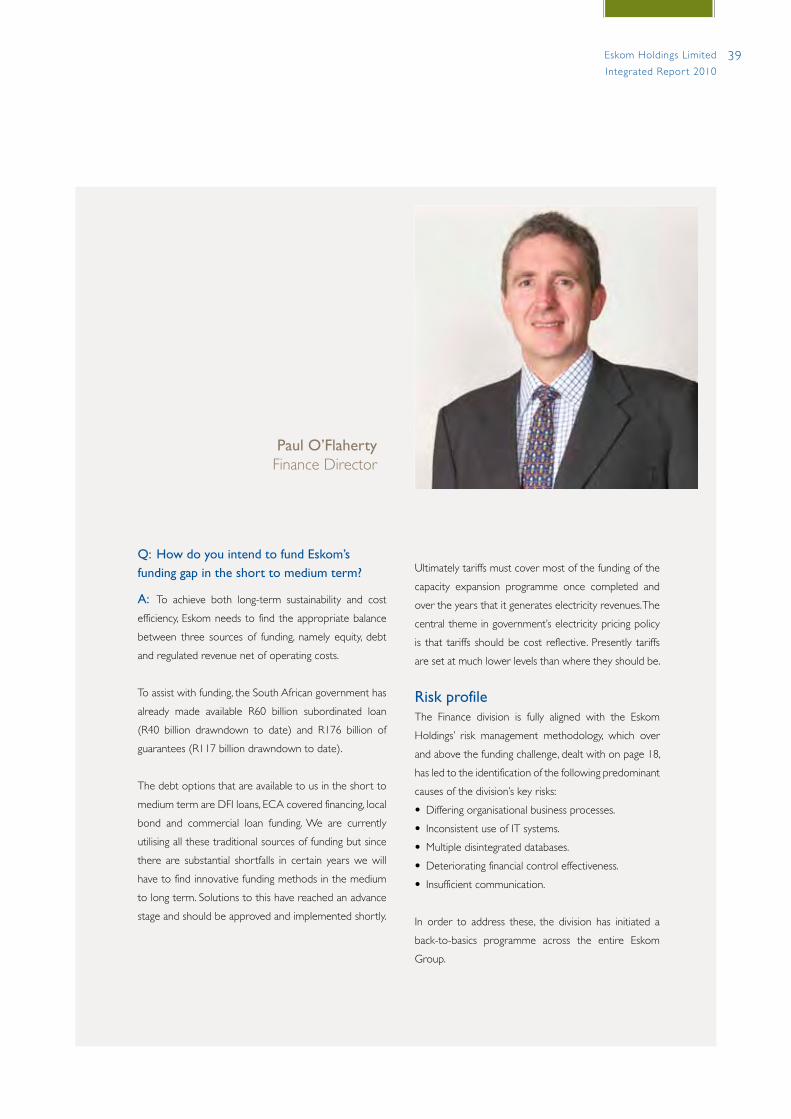
39Eskom Holdings Limited
Integrated Repor t 2010
Paul O’FlahertyFinance Director
Q: How do you intend to fund Eskom’s funding gap in the short to medium term?
A: To achieve both long-term sustainability and cost
efficiency, Eskom needs to find the appropriate balance
between three sources of funding, namely equity, debt
and regulated revenue net of operating costs.
To assist with funding, the South African government has
already made available R60 billion subordinated loan
(R40 billion drawndown to date) and R176 billion of
guarantees (R117 billion drawndown to date).
The debt options that are available to us in the short to
medium term are DFI loans, ECA covered financing, local
bond and commercial loan funding. We are currently
utilising all these traditional sources of funding but since
there are substantial shortfalls in certain years we will
have to find innovative funding methods in the medium
to long term. Solutions to this have reached an advance
stage and should be approved and implemented shortly.
Ultimately tariffs must cover most of the funding of the
capacity expansion programme once completed and
over the years that it generates electricity revenues. The
central theme in government’s electricity pricing policy
is that tariffs should be cost reflective. Presently tariffs
are set at much lower levels than where they should be.
Risk profileThe Finance division is fully aligned with the Eskom
Holdings’ risk management methodology, which over
and above the funding challenge, dealt with on page 18,
has led to the identification of the following predominant
causes of the division’s key risks:
• Differing organisational business processes.
• Inconsistent use of IT systems.
• Multiple disintegrated databases.
• Deteriorating financial control effectiveness.
• Insufficient communication.
In order to address these, the division has initiated a
back-to-basics programme across the entire Eskom
Group.

40 Eskom Holdings Limited
Integrated Repor t 2010
Locally, we experienced the weakest economic performance in the
2009 calendar year since the dawn of the new democracy. Not only
did the country experience a recession, but it suffered major job
losses as a result. The economy contracted by 1,8% as manufacturing
and mining under-performed, costing the economy about 870 000
jobs in the process.
Globally, economic recovery is now underway and the economy is
expected to improve trade activity. In mid-2009 we saw commodity
prices recovering from the lows of 2008. The notable upturn in
commodity prices was largely driven by the increased demand for
commodities by the economies of China and India among others.
This meant that our key industrial customers had to increase their
production of commodities leading to an increase in the demand for
electricity locally.
The upturn in the domestic economy was reflected in the demand
for electricity which grew by 1,7% from 214 850GWh to
218 591GWh compared to a 4,2% decline in the prior year. The
GWh for 2010 is at the levels we achieved in 2007 but not yet near
the high of 224 366GWh achieved during 2008.
During the 2010 financial year our aim was to return the company
to financial stability and we are pleased to announce that we have
achieved a group profit of R3,6 billion (2009: loss of R9,7 billion) and
for the company a profit of R3, 2 billion (2009: loss of R10,1 billion).
Overall, our electricity revenue per kWh sold improved by 29,5%
from 24,7 cents to 31,9 cents and our electricity-related
operational costs per kWh increased by 8,8% to 28,2 cents, from
25,9 cents in 2009, reflecting an overall return to operational
profitability.
This financial turnaround resulted from the 31,3% (including the
environmental levy) interim tariff increase granted by NERSA with
effect from 1 July 2009, improved efficiencies and stringent cost
cutting as well as the re-negotiation of certain of the special pricing
agreements (SPAs) relating to the commodity-linked revenue
contracts. Despite the tariff increase, South African household tariffs
are still among the lowest electricity tariffs in the world.
The operating profit for the year, before fair value gains and losses
and net finance costs for the Eskom Group, was R10,2 billion (2009:
loss of R0,3 billion) and for the company R8,4 billion (2009: loss of
R2,6 billion):
RevenueCompared to the previous year, the sale of electricity increased by
1,7% (2009: decreased by 4,2%) and this coupled with a 29,5%
increase in average sales price resulted in a 31,8% increase in
electricity revenue from R53,0 billion to R69,8 billion. Group revenue,
which includes a small portion of non-electricity revenue, increased
by 31% from R54,2 billion to R71,2 billion.
Finance division (corporate) continued
Financial performance overview | Results of group operations
Key ratios 2010 2009
Current ratio ratio 0,99 1,02
Debt:equity including long-term provisions ratio 1,55 1,22
Interest cover ratio 0,57 (0,80)
Free funds from operations (FFO) Rm 10 531 2 803
Return on average total assets % 2,2 (1,2)
Return on average equity % 5,6 (16,0)
Revenue per kWh (total electricity business) cents/kWh 31,9 24,7
Operating costs per kWh (total electricity business costs including depreciation and amortisation) cents/kWh 28,2 25,9
Bad debts as % of revenue % 0,82 1,54
Average days debtors days 22 21
Average days coal stock days 37RA 41LA
41Eskom Holdings Limited
Integrated Repor t 2010
Primary energy costsThe primary energy costs (group and company – mainly coal)
increased by 16,9% from R24,9 billion in 2009 to R29,1 billion in
2010 inclusive of R3,7 billion for the environmental levy paid in
2010 which was not in effect in the prior financial year. The cost
of primary energy as a percentage of electricity revenue decreased
from 47% in 2009 to 41,7% in 2010. We were able to secure short-
to medium-term coal supplies at lower prices than in the previous
financial year and we also made more use of our fixed cost and cost
plus contracts. In addition, the more expensive gas and liquid fuel
turbine stations were operated at normal levels. However, as noted
this was offset by the negative effects of the 2c/kWh environmental
levy charge (recoverable through revenue), implemented on 1 July
2009, which resulted in a direct 14,9% increase in primary energy
costs from the previous year.
Operating costsGroup and company operating costs consisted of the following
• Employee benefit expenses: the group manpower numbers
increased by a net 1 365 to 39 222 (company by 1 351 to 36 547)
resulting, together with salary increases, in a 14,9% increase
(company 13,3%) in manpower costs from R15,1 billion to
R17,4 billion (company R14,1 billion to R16,0 billion). Eskom’s
manpower needs will continue to grow to bolster core and critical
skills in the context of a capacity expansion programme.
• Group depreciation costs increased to R5,7 billion (2009:
R4,9 billion) due to an increase in the level of capitalised property
plant and equipment. Company depreciation costs increased to
R5,9 billion from R4,7 billion accordingly.
• Other operating expenses, which primarily include repairs and
maintenance, remained constant for both group and company due
to tight controls exercised over the expenditure as a result of the
funding constraints during the year.
• Group bad debt as a percentage of revenue was 0,82% compared
to 1,54% last year (company 0,86% compared to 1,60%). Bad
debts decreased due to the resolution of doubtful debts relating
to some of our large customers.
Net fair value loss on financial instruments, excluding embedded derivativesThe major portion of this cost is the forward cover costs. Group and
company forward cover costs for the year were up by 38% from
R2,5 billion to R3,5 billion due to the ongoing progress of the capital
expansion programme and the associated forward cover taken out
on foreign imports.
Profit on embedded derivativesAt 31 March 2010, the embedded derivative assets (group and
company) amounted to R0,1 billion (2009: R1,4 billion) and the
embedded derivative liabilities (group and company) to
R4,7 billion (2009: R8,3 billion). The net impact on the income
statement of changes in the fair value of the embedded
derivatives for group and company was a fair value gain of
R2,3 billion (2009: loss of R9,5 billion). The net liability has been
significantly reduced as a result of renegotiating cer tain special
pricing agreements (SPAs) relating to commodity-linked revenue
contracts. The negotiations on the balance of the SPAs are
expected to be concluded in the next year.
Net finance costThe net finance cost after the capitalisation of borrowing cost
was R1,2 billion (2009: R1,2 billion) for the group and R1,3 billion
(2009: R1,3 billion) for the company.
The amount of borrowing costs capitalised increased from
R3,4 billion to R8,2 billion (group and company). This was due to the
significant increase in the amount spent on property, plant and
equipment as well as more capital expenditure financed by
borrowings. This also includes the cost of the re-measurement of the
subordinated loan from the shareholder amounting to R4,6 billion.
TaxationThe net effective tax rate of 35,4% (2009: 29,7%) for the group
differs from the statutory rate of 28% (2009: 28%) due primarily to
disallowed expenditure and a prior year adjustment following the
finalisation of the 2009 tax return. The net effective tax rate for the
company was 33,9% (2009: 29,1%) due to the same reasons stated
above.
42 Eskom Holdings Limited
Integrated Repor t 2010
Finance division (corporate) continued
Liquidity and capital resources Group cash and cash equivalents decreased from R18,4 billion
(company: R17,9 billion) to R15,5 billion (company R14,9 billion) at
31 March 2010 for the reasons explained below:
Cash flows from operating activitiesThe group net cash from operations for the year decreased slightly
to R11,6 billion (2009: R11,8 billion) consistent with the decrease in
company net cash from operations to R11,0 billion from R12,4 billion
in 2009.
The group currently carries sufficient funds each month to meet four
months’ operational cash flows and interest and debt repayments.
The intent is to fund all capital expenditure through additional debt
and borrowings over the longer term and also with operational cash
surpluses in the medium term as the tariff starts to become more
cost reflective.
Compared to the previous year’s 41 days, coal stock days were
37 days as at year end. The decline in coal deliveries over the
2009 festive season due to the underperformance of the coal mines
supplying Eskom, and the impact of rain resulted in the system coal
stock days falling to 37 days, below the target 42 days. Plans have
been implemented to facilitate stock day recovery to the targeted
levels.
At the end of March 2010 debtor days remained consistent at
22 (2009: 21 days).
Cash flows used in investing activitiesCash flows used in investing activities increased by 13,9% from
R42,9 billion to R48,9 billion for the group and the company
from R43,3 billion to R47,3 billion.
Group capital expenditure, (excluding capitalised interest) included in
this line item increased by 10,4% (company: 9,4%) from R43,6 billion
(company R43,5 billion) to R48,2 billion (company R47,6 billion) due
to the progress of the capacity expansion programme. However, this
expenditure was still R16,7 billion behind the budget due to a
deferral of expenditure as a result of the tight financial constraints
experienced by the group during the year.
Eskom exceeded the capacity expansion targets set by Government.
Some 452MW of new capacity was added against a target of
420MW. Six hundred kilometres of new transmission lines were built,
against a target of 428km. In the case of new transformers we
installed 1 630MVA (target: 1 365MVA).
Embedded derivativesEskom previously entered into four agreements with electricity-intensive customers to supply electricity to them, where the revenue of these contracts was based on commodity prices, foreign currency rates and/or foreign production price indices the present value of which gave rise to differences when compared to the present value of the forecast revenues if the standard megaflex tariff was charged (an embedded derivative). In terms of IFRS the difference needs to be accounted for on the balance sheet as either an asset or liability with the resultant movement being credited or charged to the income statement.
Original intentIn the early 1990s large electricity contracts with specific pricing arrangements were concluded between Eskom and major clients. A consultative process was followed between government, the customers and Eskom in setting up these contracts. The contracts were approved by the appropriate council governing the industry at the time. The rationale for entering into these contracts was based on the following:
• To stimulate the regional economy.
• To use Eskom’s excess capacity.
• To enable the supply of electricity to energy-intensive industries and align with their pricing requirements.
• To align with the government’s growth objectives for the SADC region.
Contract performance
• Since inception up to recently the contracts have delivered revenues in excess of cost and enabled Eskom to use excess capacity.
• However, due to the decrease in the outlook for the aluminium price during 2009 coupled with the 31% increase in tariffs given by NERSA, the valuation of the embedded derivatives at 31 March 2009 resulted in a fair value loss of R9, 5 billion..
• As a result of the current negotiations and the expected outcomes of such negotiations the net liability of the embedded derivatives has reduced to R4,6 billion as at 31 March 2010 resulting in a gain in the income statement of R2,3 billion.
Going forward
• Eskom is renegotiating the contracts in an attempt to remove the commodity-linked pricing element, which will in turn remove the embedded derivative.
• Eskom will not be entering into contracts of this long-term nature going forward.
The pricing arrangements on the contracts may give rise to profits or losses on the fair valuation of embedded derivatives in the future, depending on the final outcome of the negotiations
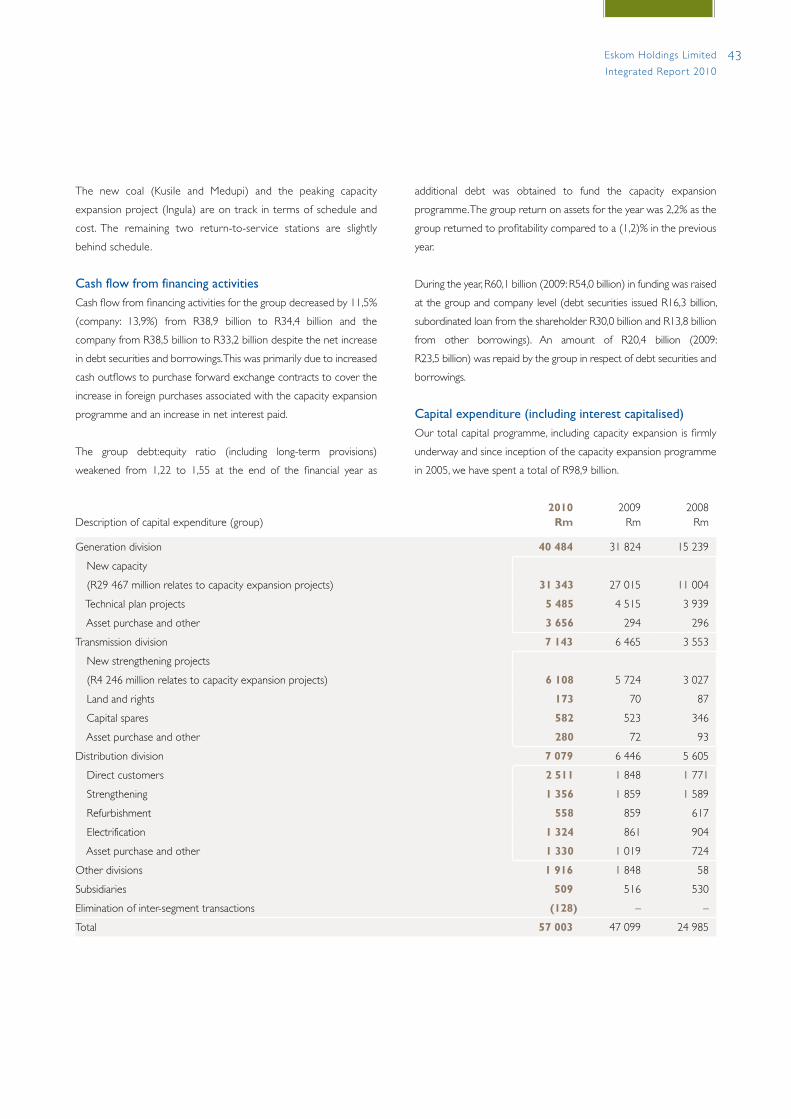
43Eskom Holdings Limited
Integrated Repor t 2010
The new coal (Kusile and Medupi) and the peaking capacity
expansion project (Ingula) are on track in terms of schedule and
cost. The remaining two return-to-service stations are slightly
behind schedule.
Cash flow from financing activitiesCash flow from financing activities for the group decreased by 11,5%
(company: 13,9%) from R38,9 billion to R34,4 billion and the
company from R38,5 billion to R33,2 billion despite the net increase
in debt securities and borrowings. This was primarily due to increased
cash outflows to purchase forward exchange contracts to cover the
increase in foreign purchases associated with the capacity expansion
programme and an increase in net interest paid.
The group debt:equity ratio (including long-term provisions)
weakened from 1,22 to 1,55 at the end of the financial year as
additional debt was obtained to fund the capacity expansion
programme. The group return on assets for the year was 2,2% as the
group returned to profitability compared to a (1,2)% in the previous
year.
During the year, R60,1 billion (2009: R54,0 billion) in funding was raised
at the group and company level (debt securities issued R16,3 billion,
subordinated loan from the shareholder R30,0 billion and R13,8 billion
from other borrowings). An amount of R20,4 billion (2009:
R23,5 billion) was repaid by the group in respect of debt securities and
borrowings.
Capital expenditure (including interest capitalised)Our total capital programme, including capacity expansion is firmly
underway and since inception of the capacity expansion programme
in 2005, we have spent a total of R98,9 billion.
Description of capital expenditure (group)2010
Rm2009
Rm2008
Rm
Generation division 40 484 31 824 15 239
New capacity
(R29 467 million relates to capacity expansion projects) 31 343 27 015 11 004
Technical plan projects 5 485 4 515 3 939
Asset purchase and other 3 656 294 296
Transmission division 7 143 6 465 3 553
New strengthening projects
(R4 246 million relates to capacity expansion projects) 6 108 5 724 3 027
Land and rights 173 70 87
Capital spares 582 523 346
Asset purchase and other 280 72 93
Distribution division 7 079 6 446 5 605
Direct customers 2 511 1 848 1 771
Strengthening 1 356 1 859 1 589
Refurbishment 558 859 617
Electrification 1 324 861 904
Asset purchase and other 1 330 1 019 724
Other divisions 1 916 1 848 58
Subsidiaries 509 516 530
Elimination of inter-segment transactions (128) – –
Total 57 003 47 099 24 985
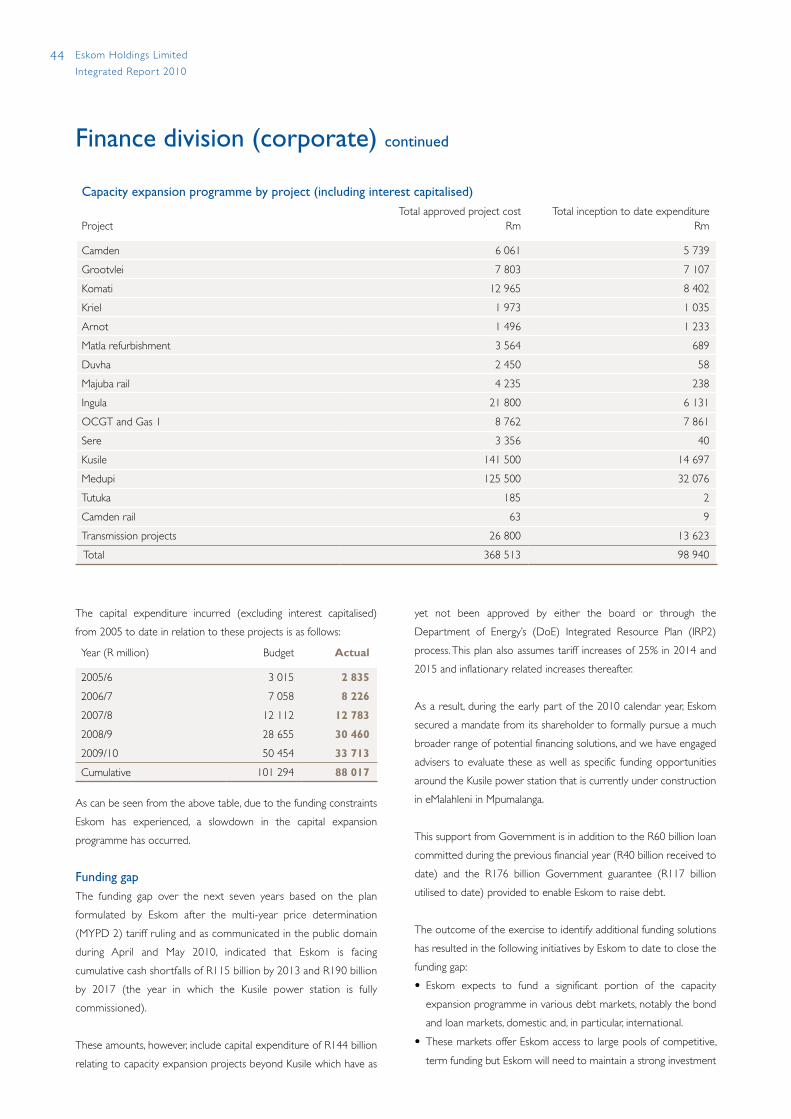
44 Eskom Holdings Limited
Integrated Repor t 2010
Finance division (corporate) continued
The capital expenditure incurred (excluding interest capitalised)
from 2005 to date in relation to these projects is as follows:
Year (R million) Budget Actual
2005/6 3 015 2 835
2006/7 7 058 8 226
2007/8 12 112 12 783
2008/9 28 655 30 460
2009/10 50 454 33 713
Cumulative 101 294 88 017
As can be seen from the above table, due to the funding constraints
Eskom has experienced, a slowdown in the capital expansion
programme has occurred.
Funding gapThe funding gap over the next seven years based on the plan
formulated by Eskom after the multi-year price determination
(MYPD 2) tariff ruling and as communicated in the public domain
during April and May 2010, indicated that Eskom is facing
cumulative cash shortfalls of R115 billion by 2013 and R190 billion
by 2017 (the year in which the Kusile power station is fully
commissioned).
These amounts, however, include capital expenditure of R144 billion
relating to capacity expansion projects beyond Kusile which have as
Capacity expansion programme by project (including interest capitalised)
ProjectTotal approved project cost
Rm Total inception to date expenditure
Rm
Camden 6 061 5 739
Grootvlei 7 803 7 107
Komati 12 965 8 402
Kriel 1 973 1 035
Arnot 1 496 1 233
Matla refurbishment 3 564 689
Duvha 2 450 58
Majuba rail 4 235 238
Ingula 21 800 6 131
OCGT and Gas 1 8 762 7 861
Sere 3 356 40
Kusile 141 500 14 697
Medupi 125 500 32 076
Tutuka 185 2
Camden rail 63 9
Transmission projects 26 800 13 623
Total 368 513 98 940
yet not been approved by either the board or through the
Department of Energy’s (DoE) Integrated Resource Plan (IRP2)
process. This plan also assumes tariff increases of 25% in 2014 and
2015 and inflationary related increases thereafter.
As a result, during the early part of the 2010 calendar year, Eskom
secured a mandate from its shareholder to formally pursue a much
broader range of potential financing solutions, and we have engaged
advisers to evaluate these as well as specific funding opportunities
around the Kusile power station that is currently under construction
in eMalahleni in Mpumalanga.
This support from Government is in addition to the R60 billion loan
committed during the previous financial year (R40 billion received to
date) and the R176 billion Government guarantee (R117 billion
utilised to date) provided to enable Eskom to raise debt.
The outcome of the exercise to identify additional funding solutions
has resulted in the following initiatives by Eskom to date to close the
funding gap:
• Eskom expects to fund a significant portion of the capacity
expansion programme in various debt markets, notably the bond
and loan markets, domestic and, in particular, international.
• These markets offer Eskom access to large pools of competitive,
term funding but Eskom will need to maintain a strong investment
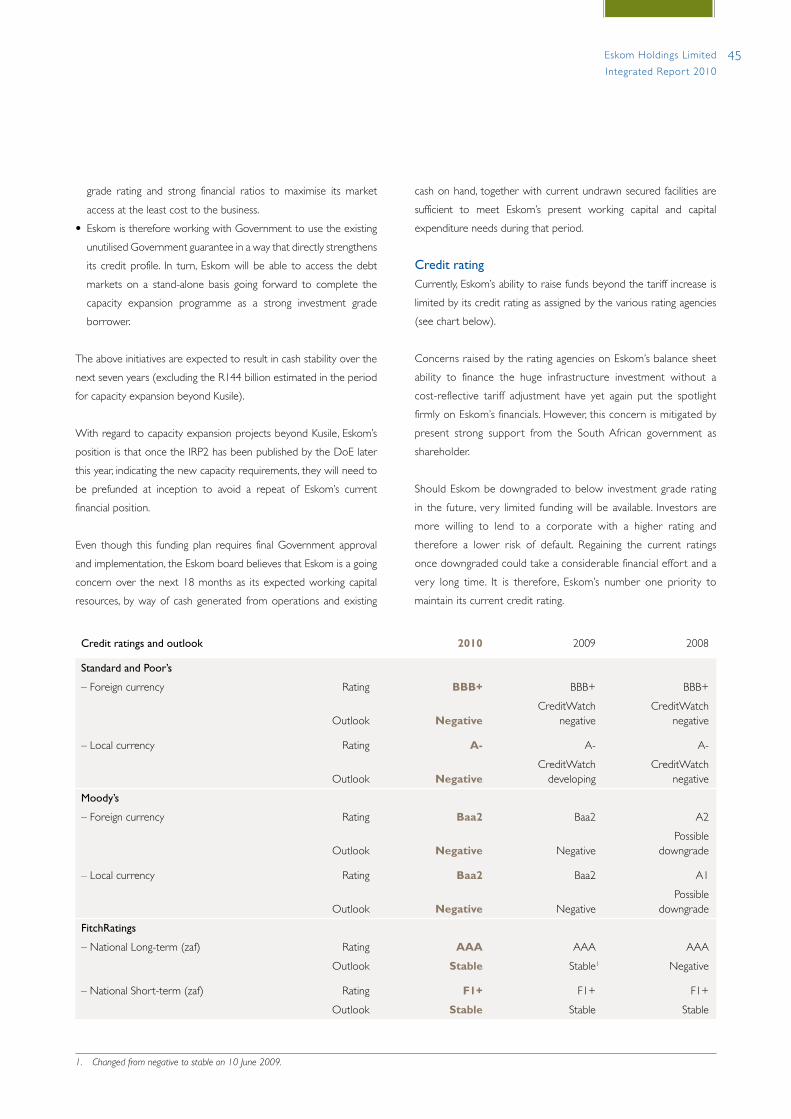
45Eskom Holdings Limited
Integrated Repor t 2010
grade rating and strong financial ratios to maximise its market
access at the least cost to the business.
• Eskom is therefore working with Government to use the existing
unutilised Government guarantee in a way that directly strengthens
its credit profile. In turn, Eskom will be able to access the debt
markets on a stand-alone basis going forward to complete the
capacity expansion programme as a strong investment grade
borrower.
The above initiatives are expected to result in cash stability over the
next seven years (excluding the R144 billion estimated in the period
for capacity expansion beyond Kusile).
With regard to capacity expansion projects beyond Kusile, Eskom’s
position is that once the IRP2 has been published by the DoE later
this year, indicating the new capacity requirements, they will need to
be prefunded at inception to avoid a repeat of Eskom’s current
financial position.
Even though this funding plan requires final Government approval
and implementation, the Eskom board believes that Eskom is a going
concern over the next 18 months as its expected working capital
resources, by way of cash generated from operations and existing
cash on hand, together with current undrawn secured facilities are
sufficient to meet Eskom’s present working capital and capital
expenditure needs during that period.
Credit ratingCurrently, Eskom’s ability to raise funds beyond the tariff increase is
limited by its credit rating as assigned by the various rating agencies
(see chart below).
Concerns raised by the rating agencies on Eskom’s balance sheet
ability to finance the huge infrastructure investment without a
cost-reflective tariff adjustment have yet again put the spotlight
firmly on Eskom’s financials. However, this concern is mitigated by
present strong support from the South African government as
shareholder.
Should Eskom be downgraded to below investment grade rating
in the future, very limited funding will be available. Investors are
more willing to lend to a corporate with a higher rating and
therefore a lower risk of default. Regaining the current ratings
once downgraded could take a considerable financial effort and a
very long time. It is therefore, Eskom’s number one priority to
maintain its current credit rating.
Credit ratings and outlook 2010 2009 2008
Standard and Poor’s
– Foreign currency Rating BBB+ BBB+ BBB+
Outlook NegativeCreditWatch
negativeCreditWatch
negative
– Local currency Rating A- A- A-
Outlook NegativeCreditWatch
developingCreditWatch
negative
Moody’s
– Foreign currency Rating Baa2 Baa2 A2
Outlook Negative NegativePossible
downgrade
– Local currency Rating Baa2 Baa2 A1
Outlook Negative NegativePossible
downgrade
FitchRatings
– National Long-term (zaf) Rating AAA AAA AAA
Outlook Stable Stable1 Negative
– National Short-term (zaf) Rating F1+ F1+ F1+
Outlook Stable Stable Stable
1. Changedfromnegativetostableon10June2009.

46 Eskom Holdings Limited
Integrated Repor t 2010
Understanding Eskom’s funding
New plant is funded from a combination of sources – retained earnings (reserves), new equity, borrowings, and regulated revenue and tariffs.
Borrowings
Eskom has a borrowing target of approximately R90 billion per year over a three-year period. This borrowing programme is supported by Government guarantees of R176 billion of which R117 billion have been committed to date. Funding from various sources namely local and international debt capital markets, development finance institutions (DFIs) such as the EIB, African Development Bank and World Bank are included in the overall borrowing mix. DFIs generally bring concessionary terms and contract with Eskom on the strength of our shareholder. Access to the debt capital markets depends on an organisation’s credit rating.
Regulated revenue
Regulated revenue assists in a move towards achieving sustainable tariffs, it strengthens the organisation’s capacity to borrow and it supports an investment grade credit rating. While borrowings and other various forms of funding can be used to finance the capital expenditure ultimately tariffs must cover the cost of operational expenditure and the interest charge.
Finance division (corporate) continued
Group value added statement 2010Rm
2009Rm
2008Rm
Value createdRevenue Other incomeLess: primary energy and other operating expenses
71 209 571
(41 668)
54 177 647
(46 970)
44 448 445
(28 166)
Value addedFinance income
30 112 1 614
7 854 3 152
16 727 2 933
Wealth created 31 726 11 006 19 660
Value distributed 28 804 23 201 17 072
Benefits to employeesSocial spending to communitiesFinance costs to lendersDividends to shareholderTaxation to government
17 390 59
11 085–
270
15 135 88
7 755–
223
11 353 70
5 448–
201
Value reinvested in the group to maintain and develop operations 2 922 (12 195) 2 588
Depreciation and amortisation Borrowing cost capitalisedDeferred taxNet profit/(loss) after dividend
5 726 (8 234)1 8103 620
4 918 (3 436) (4 009) (9 668)
4 284 (727)(801) (168)
31 726 11 006 19 660
Revenue per employee (Rm)Value added per employee (Rm)Value added per GWh (Rm)Wealth created per employee (Rm)Benefits to employees per employee (Rm)No of employeesGWh
1,82 0,77 0,14 0,810,45
39 222218 591
1,43 0,21 0,04 0,29
0,4137 857
214 850
1,26 0,47 0,07 0,560,33
35 404224 366
Refertowww.eskom.co.za/annreport10/002.html forareviewofEskom’sproductivitymovementoverthepastyear,aswellasagraphofEskom’scompetitivenessover10years.
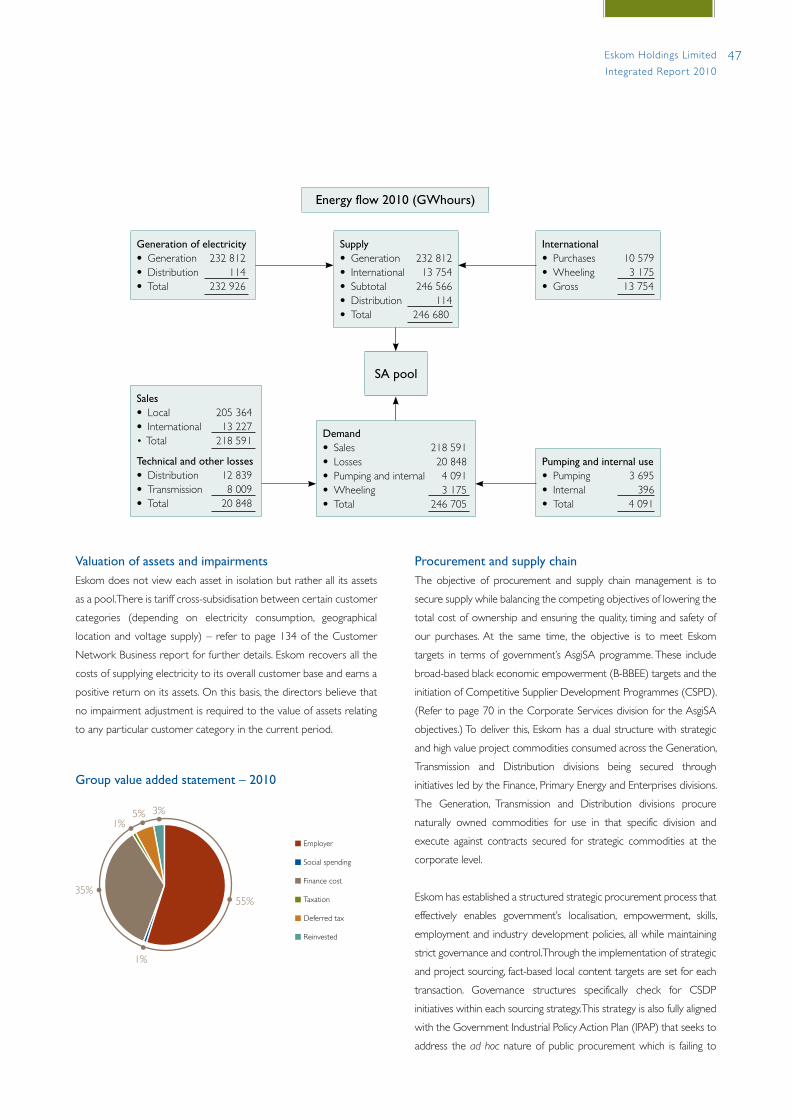
47Eskom Holdings Limited
Integrated Repor t 2010
Valuation of assets and impairmentsEskom does not view each asset in isolation but rather all its assets
as a pool. There is tariff cross-subsidisation between certain customer
categories (depending on electricity consumption, geographical
location and voltage supply) – refer to page 134 of the Customer
Network Business report for further details. Eskom recovers all the
costs of supplying electricity to its overall customer base and earns a
positive return on its assets. On this basis, the directors believe that
no impairment adjustment is required to the value of assets relating
to any particular customer category in the current period.
Group value added statement – 2010
Procurement and supply chainThe objective of procurement and supply chain management is to
secure supply while balancing the competing objectives of lowering the
total cost of ownership and ensuring the quality, timing and safety of
our purchases. At the same time, the objective is to meet Eskom
targets in terms of government’s AsgiSA programme. These include
broad-based black economic empowerment (B-BBEE) targets and the
initiation of Competitive Supplier Development Programmes (CSPD).
(Refer to page 70 in the Corporate Services division for the AsgiSA
objectives.) To deliver this, Eskom has a dual structure with strategic
and high value project commodities consumed across the Generation,
Transmission and Distribution divisions being secured through
initiatives led by the Finance, Primary Energy and Enterprises divisions.
The Generation, Transmission and Distribution divisions procure
naturally owned commodities for use in that specific division and
execute against contracts secured for strategic commodities at the
corporate level.
Eskom has established a structured strategic procurement process that
effectively enables government’s localisation, empowerment, skills,
employment and industry development policies, all while maintaining
strict governance and control. Through the implementation of strategic
and project sourcing, fact-based local content targets are set for each
transaction. Governance structures specifically check for CSDP
initiatives within each sourcing strategy. This strategy is also fully aligned
with the Government Industrial Policy Action Plan (IPAP) that seeks to
address the adhoc nature of public procurement which is failing to
Energy flow 2010 (GWhours)
Generation of electricity• Generation 232 812• Distribution 114• Total 232 926
Supply• Generation 232 812• International 13 754• Subtotal 246 566• Distribution 114• Total 246 680
Demand• Sales 218 591• Losses 20 848• Pumping and internal 4 091• Wheeling 3 175• Total 246 705
Sales• Local 205 364• International 13 227• Total 218 591
Technical and other losses• Distribution 12 839• Transmission 8 009• Total 20 848
Pumping and internal use• Pumping 3 695• Internal 396• Total 4 091
International• Purchases 10 579• Wheeling 3 175• Gross 13 754
SA pool
Social spending
Employer
Taxation
Finance cost
Reinvested
Deferred tax
55%
1%
35%
1%5% 3%
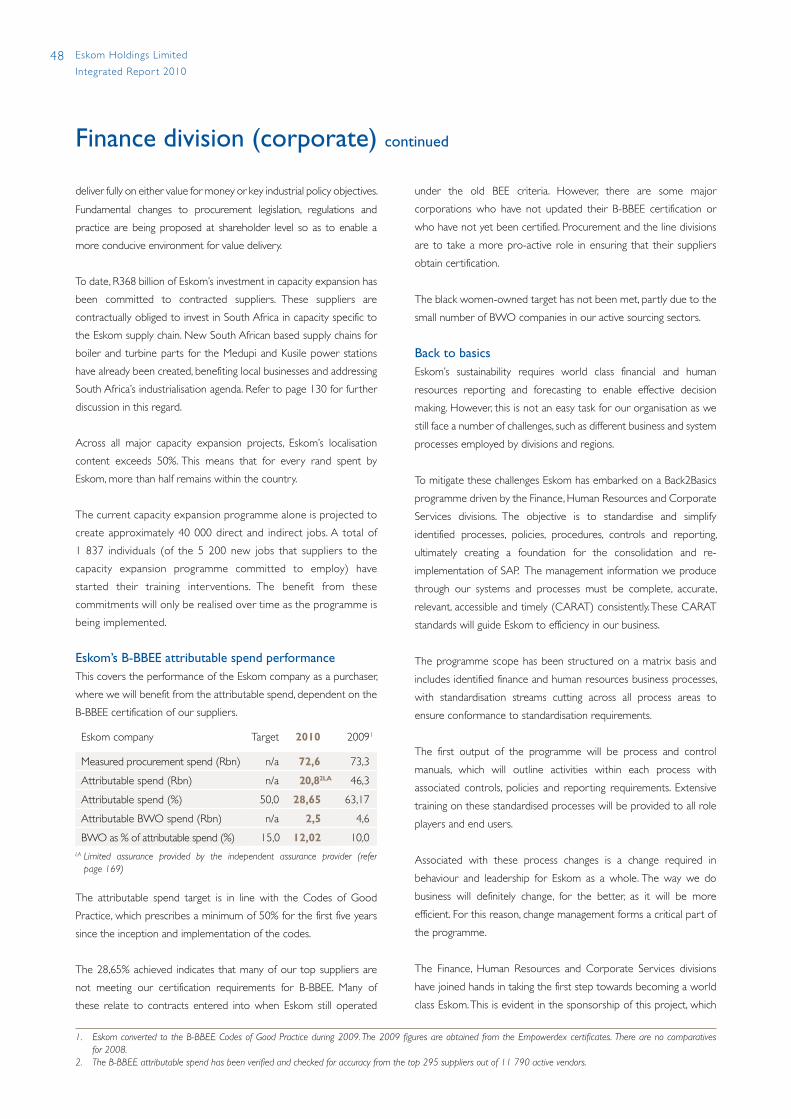
48 Eskom Holdings Limited
Integrated Repor t 2010
deliver fully on either value for money or key industrial policy objectives.
Fundamental changes to procurement legislation, regulations and
practice are being proposed at shareholder level so as to enable a
more conducive environment for value delivery.
To date, R368 billion of Eskom’s investment in capacity expansion has
been committed to contracted suppliers. These suppliers are
contractually obliged to invest in South Africa in capacity specific to
the Eskom supply chain. New South African based supply chains for
boiler and turbine parts for the Medupi and Kusile power stations
have already been created, benefiting local businesses and addressing
South Africa’s industrialisation agenda. Refer to page 130 for further
discussion in this regard.
Across all major capacity expansion projects, Eskom’s localisation
content exceeds 50%. This means that for every rand spent by
Eskom, more than half remains within the country.
The current capacity expansion programme alone is projected to
create approximately 40 000 direct and indirect jobs. A total of
1 837 individuals (of the 5 200 new jobs that suppliers to the
capacity expansion programme committed to employ) have
star ted their training interventions. The benefit from these
commitments will only be realised over time as the programme is
being implemented.
Eskom’s B-BBEE attributable spend performanceThis covers the performance of the Eskom company as a purchaser,
where we will benefit from the attributable spend, dependent on the
B-BBEE certification of our suppliers.
Eskom company Target 2010 20091
Measured procurement spend (Rbn) n/a 72,6 73,3
Attributable spend (Rbn) n/a 20,82LA 46,3
Attributable spend (%) 50,0 28,65 63,17
Attributable BWO spend (Rbn) n/a 2,5 4,6
BWO as % of attributable spend (%) 15,0 12,02 10,0LALimited assurance provided by the independent assurance provider (refer
page169)
The attributable spend target is in line with the Codes of Good
Practice, which prescribes a minimum of 50% for the first five years
since the inception and implementation of the codes.
The 28,65% achieved indicates that many of our top suppliers are
not meeting our certification requirements for B-BBEE. Many of
these relate to contracts entered into when Eskom still operated
under the old BEE criteria. However, there are some major
corporations who have not updated their B-BBEE certification or
who have not yet been certified. Procurement and the line divisions
are to take a more pro-active role in ensuring that their suppliers
obtain certification.
The black women-owned target has not been met, partly due to the
small number of BWO companies in our active sourcing sectors.
Back to basicsEskom’s sustainability requires world class financial and human
resources reporting and forecasting to enable effective decision
making. However, this is not an easy task for our organisation as we
still face a number of challenges, such as different business and system
processes employed by divisions and regions.
To mitigate these challenges Eskom has embarked on a Back2Basics
programme driven by the Finance, Human Resources and Corporate
Services divisions. The objective is to standardise and simplify
identified processes, policies, procedures, controls and reporting,
ultimately creating a foundation for the consolidation and re-
implementation of SAP. The management information we produce
through our systems and processes must be complete, accurate,
relevant, accessible and timely (CARAT) consistently. These CARAT
standards will guide Eskom to efficiency in our business.
The programme scope has been structured on a matrix basis and
includes identified finance and human resources business processes,
with standardisation streams cutting across all process areas to
ensure conformance to standardisation requirements.
The first output of the programme will be process and control
manuals, which will outline activities within each process with
associated controls, policies and reporting requirements. Extensive
training on these standardised processes will be provided to all role
players and end users.
Associated with these process changes is a change required in
behaviour and leadership for Eskom as a whole. The way we do
business will definitely change, for the better, as it will be more
efficient. For this reason, change management forms a critical part of
the programme.
The Finance, Human Resources and Corporate Services divisions
have joined hands in taking the first step towards becoming a world
class Eskom. This is evident in the sponsorship of this project, which
Finance division (corporate) continued
1. EskomconvertedtotheB-BBEECodesofGoodPracticeduring2009.The2009figuresareobtainedfromtheEmpowerdexcertificates.Therearenocomparativesfor 2008.
2. TheB-BBEEattributablespendhasbeenverifiedandcheckedforaccuracyfromthetop295suppliersoutof11790activevendors.

49Eskom Holdings Limited
Integrated Repor t 2010
resides with the Finance director, the Managing director: Human
Resources and the Managing director: Corporate Services.
Escap Limited Eskom’s local captive insurance subsidiary company, Escap, continues
to provide a full range of customised short-term insurance products
to the Eskom Group and manages the insurance needs through a
combination of reinsurance with the external insurance market and
a level of self insurance. This methodology achieves effective cost
solutions for Eskom by balancing risk and the cost of insurance.
Escap’s board of directors has overall responsibility for the
establishment and oversight of Escap’s risk management framework
and has a risk committee that is responsible for developing and
monitoring its risk management policies. The risk committee meets
quarterly to identify and analyse the risks Escap faces, to set
appropriate risk mitigation strategies, and to monitor development of
risks and adherence to the agreed strategies.
Escap is subject to supervisory and regulatory legislation including
the Short-Term Insurance Act, Financial Services Board Regulations,
Companies Act, PFMA, Income Tax Act, VAT Act, SARS regulations,
Reserve Bank regulations, etc. Ultimate responsibility for compliance
resides with Escap’s board of directors.
The need for Gallium, as our offshore captive insurance company,
was reviewed in terms of our risk financing strategy as Escap is able
to cater for the organisation’s self-insurance needs. As a result,
Gallium was effectively closed down in the prior year and paid Eskom
a dividend of R165 million (2009: R30 million).
Eskom Finance Company LimitedThe core business of the Eskom Finance Company (EFC) is the
granting of employee home loans which is a key part of
Eskom’s retention and attraction of key staff strategy. The loan
book is funded both through external securitisation and internal
funding. Note 3 on page 204 of the financial statements provides
further information in this regard.
Palmietpumped-storageschemenearGrabouwintheWesternCape.

52 Summary
54 Climate change
56 Internal energy efficiency
57 Managing our environmental impact
59 Safety
63 Quality
65 Research and development
66 Information management
67 Anti-fraud and anti-corruption programmes
68 Contributing to society
Driving sustainabilityCorporate Services division

52 Eskom Holdings Limited
Integrated Repor t 2010
Corporate Services division
Mandate: Drives research and innovation and ensures sustainability of the Eskom group, by assuring statutory compliance, assuring effective group-wide corporate governance and legal practice and policies, drives environmental, safety and occupational health programmes while developing and ensuring execution of appropriate business strategies, undertakes research and development, develops and executes Eskom’s developmental initiatives, ensures optimal information management, a quality culture, and integrated risk management.
Progress this year
Highlights
• Successful handling of fraud and corruption cases
• Implementation of a new integrated risk management system across divisions
• Integration of climate change considerations in the business and input into various government processes
• Underground coal gasification research project ready for co-firing at Majuba and approvals to continue design of medium-scale power plant
• Utility load manager (ULM) piloted successfully
• Safety cardinal rules rolled out
• Inclusion of solar and wind in the South African Clean Technology Fund application
• Division received ISO 9000 certification
• Received award for practice in promoting openness and setting up systems that promote compliance with the provisions of the Promotion of Access to Information Act (PAIA)
• Completion of full assurance programme
• Execution of security improvement programme
• Award from Department of Public Works for jobs created
• Small Business Expo
• Eskom Expo for Young Scientists
• Record number of entries for eta Awards for excellence in energy efficiency
Challenges
• Overall poor environmental perfor mance related to particulate emissions and environmental legal compliance
• Increasing concern about staff security
• Conductor and lattice theft increasing
• Fraud and corruption still a concern
• Continuing fatalities
Future priorities
• Improve IT efficiencies and reduce costs
• Revise climate change strategy in line with recent national and international developments and integrate with IRP2
• Roll out large-scale renewable energy plant
• Step up internal energy efficiency
• Reduce risk profile
• Roll out phase 2 of underground coal gasification project
• Roll out phase 2 of utility load manager project
• Continue improvement in environmental performance
• Implement the King III Report and new Companies Act
• Tap innovation potential internally
• Roll out quality strategy
• Continue drive for improvement in safety performance
• Revise sustainability performance index for Eskom
• Roll out SAP upgrade and back-to-basics programme together with Finance and Human Resources
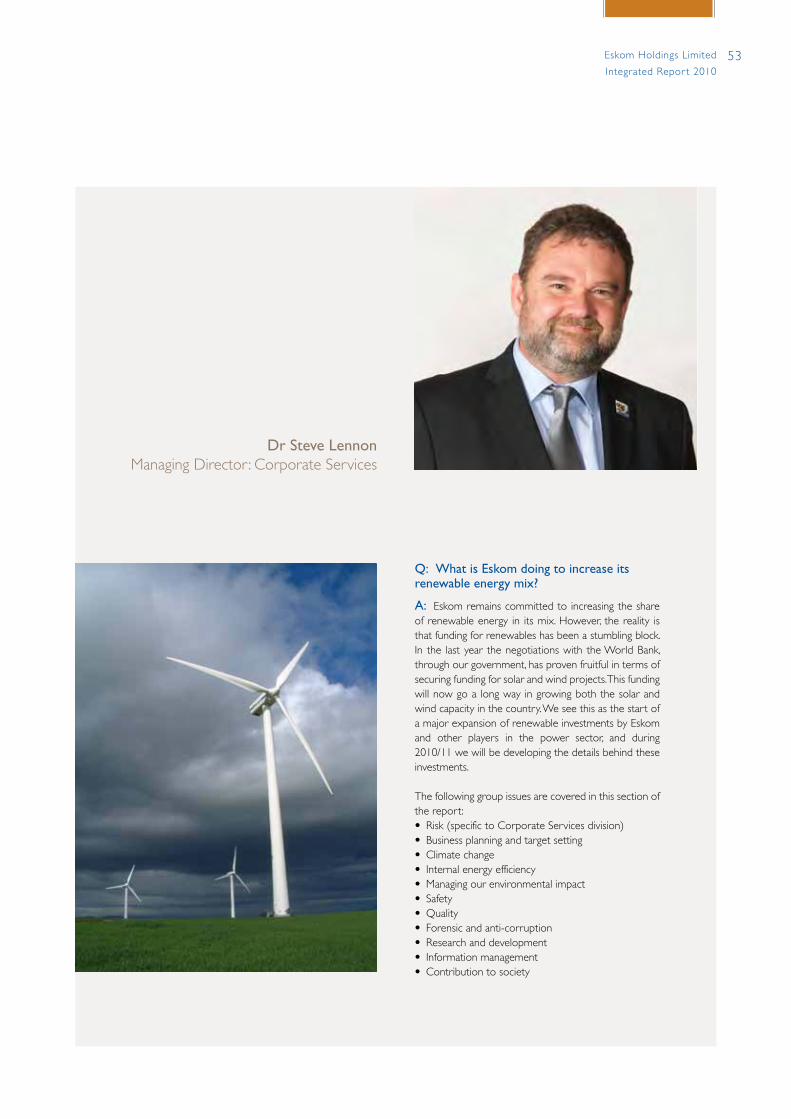
53Eskom Holdings Limited
Integrated Repor t 2010
Dr Steve LennonManaging Director: Corporate Services
Q: What is Eskom doing to increase its renewable energy mix?
A: Eskom remains committed to increasing the share of renewable energy in its mix. However, the reality is that funding for renewables has been a stumbling block. In the last year the negotiations with the World Bank, through our government, has proven fruitful in terms of securing funding for solar and wind projects. This funding will now go a long way in growing both the solar and wind capacity in the country. We see this as the start of a major expansion of renewable investments by Eskom and other players in the power sector, and during 2010/11 we will be developing the details behind these investments.
The following group issues are covered in this section of the report:• Risk (specific to Corporate Services division)• Business planning and target setting• Climate change• Internal energy efficiency• Managing our environmental impact• Safety• Quality• Forensic and anti-corruption• Research and development• Information management• Contribution to society
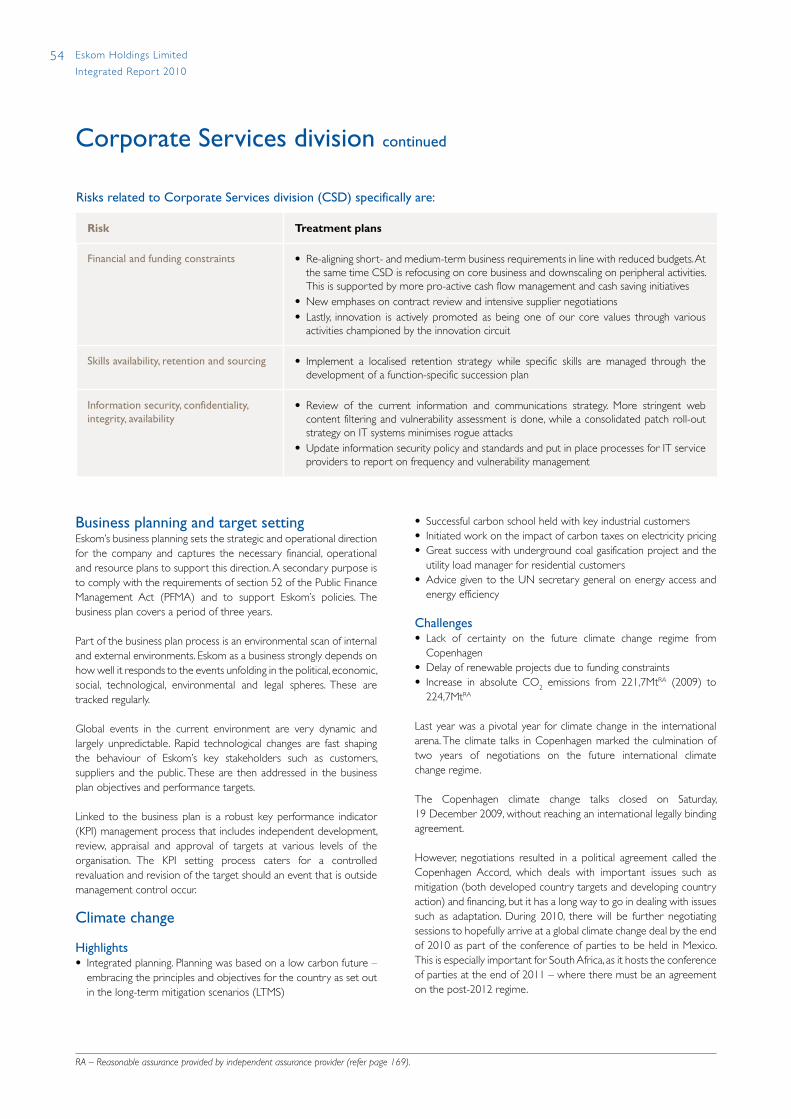
54 Eskom Holdings Limited
Integrated Repor t 2010
Risks related to Corporate Services division (CSD) specifically are:
Risk Treatment plans
Financial and funding constraints • Re-aligning short- and medium-term business requirements in line with reduced budgets. At the same time CSD is refocusing on core business and downscaling on peripheral activities. This is supported by more pro-active cash flow management and cash saving initiatives
• New emphases on contract review and intensive supplier negotiations• Lastly, innovation is actively promoted as being one of our core values through various
activities championed by the innovation circuit
Skills availability, retention and sourcing • Implement a localised retention strategy while specific skills are managed through the development of a function-specific succession plan
Information security, confidentiality, inte grity, availability
• Review of the current information and communications strategy. More stringent web content filtering and vulnerability assessment is done, while a consolidated patch roll-out strategy on IT systems minimises rogue attacks
• Update information security policy and standards and put in place processes for IT service providers to report on frequency and vulnerability management
Corporate Services division continued
Business planning and target settingEskom’s business planning sets the strategic and operational direction for the company and captures the necessary financial, operational and resource plans to support this direction. A secondary purpose is to comply with the requirements of section 52 of the Public Finance Management Act (PFMA) and to support Eskom’s policies. The business plan covers a period of three years.
Part of the business plan process is an environmental scan of internal and external environments. Eskom as a business strongly depends on how well it responds to the events unfolding in the political, economic, social, technological, environmental and legal spheres. These are tracked regularly.
Global events in the current environment are very dynamic and largely unpredictable. Rapid technological changes are fast shaping the behaviour of Eskom’s key stakeholders such as customers, suppliers and the public. These are then addressed in the business plan objectives and performance targets.
Linked to the business plan is a robust key performance indicator (KPI) management process that includes independent development, review, appraisal and approval of targets at various levels of the organisation. The KPI setting process caters for a controlled revaluation and revision of the target should an event that is outside management control occur.
Climate change
Highlights• Integrated planning. Planning was based on a low carbon future –
embracing the principles and objectives for the country as set out in the long-term mitigation scenarios (LTMS)
• Successful carbon school held with key industrial customers• Initiated work on the impact of carbon taxes on electricity pricing• Great success with underground coal gasification project and the
utility load manager for residential customers• Advice given to the UN secretary general on energy access and
energy efficiency
Challenges• Lack of certainty on the future climate change regime from
Copenhagen• Delay of renewable projects due to funding constraints• Increase in absolute CO2 emissions from 221,7MtRA (2009) to
224,7MtRA
Last year was a pivotal year for climate change in the international arena. The climate talks in Copenhagen marked the culmination of two years of negotiations on the future international climate change regime.
The Copenhagen climate change talks closed on Saturday, 19 December 2009, without reaching an international legally binding agreement.
However, negotiations resulted in a political agreement called the Copenhagen Accord, which deals with important issues such as mitigation (both developed country targets and developing country action) and financing, but it has a long way to go in dealing with issues such as adaptation. During 2010, there will be further negotiating sessions to hopefully arrive at a global climate change deal by the end of 2010 as part of the conference of parties to be held in Mexico. This is especially important for South Africa, as it hosts the conference of parties at the end of 2011 – where there must be an agreement on the post-2012 regime.
RA – Reasonable assurance provided by independent assurance provider (refer page 169).
55Eskom Holdings Limited
Integrated Repor t 2010
South Africa’s obligationThe requirements of the accord means that South Africa will need to prepare a report on its mitigation action for formal submission to the (UNFCCC), confirming that South Africa would undertake a range of voluntary nationally appropriate mitigation actions (NAMAs). South Africa’s undertaking ensures that these actions will enable the country’s emissions to deviate below the projected business-as-usual emissions by 34% by 2020 and 42% by 2025. This level of effort would enable emissions to peak between 2020 and 2025, plateau for approximately a decade and decline in absolute terms thereafter.
South Africa’s undertaking to act is distinct from the legally binding quantified emission reduction commitments required from all developed countries. Further, South Africa’s efforts were emphasised as voluntary and conditional on two key elements. Firstly, South Africa requires the UN climate change summit at the end of 2010 in Mexico to conclude with a fair, ambitious, effective and legally binding international agreement. This would be required to ensure legally binding obligations by developed countries on both mitigation and support. Secondly, the extent of the actions to be taken by South Africa, and other developing countries, will depend on the provision of support from the international community, in particular finance, technology and support for capacity building from developed countries, in line with their commitments under both the Framework Convention on Climate Change and the Bali Action Plan. While the Copenhagen Accord makes provision for some of these conditionalities, the requirement for legally binding emission reduction commitments from developed countries remains elusive. The negotiations in 2010 will provide more certainty in this regard.
South Africa is already undertaking significant mitigation actions in relation to: energy efficiency in commerce, energy and industry; mechanisms to support the rollout of renewables and alternative energies; working towards integrated rapid transit systems; and the rollout of solar water heaters.
Eskom’s participation in the climate negotiations is two-pronged. We participate in both the government negotiations and the business meetings. We specifically give input on mitigation issues, including market-related issues and sectoral approaches. We also provide input to the technology negotiations and provide support in general to the South African delegation where necessary. International business has a strong presence at the negotiations through bodies such as the World Business Council for Sustainable Development (WBCSD), International Chamber of Commerce (ICC), International Emissions Trading Association (IETA) and the World Economic Forum (WEF). We are a member of these organisations and we actively participate in their development of position papers for the negotiations on an ongoing basis.
Eskom commitment – pre- and post-CopenhagenClimate change has long been an integral part of our business. Our climate change strategy, developed in 2005 and our six-point plan on climate change are testament to this. The six-point plan was detailed over the last two years in our annual reports and we remain committed to the principles and aspirations highlighted therein. Over the last year, we have been driving the climate agenda further through planning, research, pricing studies and training sessions – both internally and with our key industrial customers.
Eskom has made significant strides in ensuring that the planning process takes into account a low carbon future and prioritises energy efficiency internally and externally. In the past the integrated strategic electricity planning process was based on a least-cost optimisation imperative, while the sustainability indicators were used to do the sensitivity analyses of the plans. The last round of planning used the least cost plan as a reference plan, but several other plans were developed based on achieving a low carbon future as contained in the objectives of the LTMS work and policy objectives at a national level. The process included a robust multi-criteria decision analysis process
The climate change negotiation process This process is governed by the United Nations Framework Convention on Climate Change (UNFCCC). This international treaty has been ratified by all countries and the goal is to consider what can be done to reduce climate change and to cope with whatever temperature increases are inevitable. The UNFCCC does not contain any legally binding commitments for any country. In 1997 the Kyoto Protocol was negotiated and became the legal instrument of the UNFCCC. The major feature of the Kyoto Protocol is that it sets binding targets for 37 industrialised countries and the European community for the reduction of greenhouse gas (GHG) emissions. This amounts to an average of 5% against 1990 levels from 2008 to 2012. The Protocol came in force in 2005, following ratification by the majority of countries. Most famous for not ratifying Kyoto and therefore not bound to any legal obligation, is the USA, which is historically the largest emitter of GHGs. The five-year period for countries to reduce their emissions will end in 2012 and therefore a new regime is required post 2012, which includes additional targets for developed countries. The negotiating session in Copenhagen last year was seen as the watershed for agreeing the post-2012 architecture and emission targets for developed countries and a commitment by developing countries to deviate from business as usual. It is important to note that the Kyoto Protocol contains many other commitments for developed countries, including financing and technology transfer. Countries are still legally bound to deliver on these commitments even post 2012. It is therefore not the Kyoto Protocol that comes to an end in 2012, as is often quoted, but the target period for developed countries to comply with emission reduction targets. Every year in June the governments of the UNFCCC and Kyoto Protocol countries come together to negotiate how these agreements will be met.
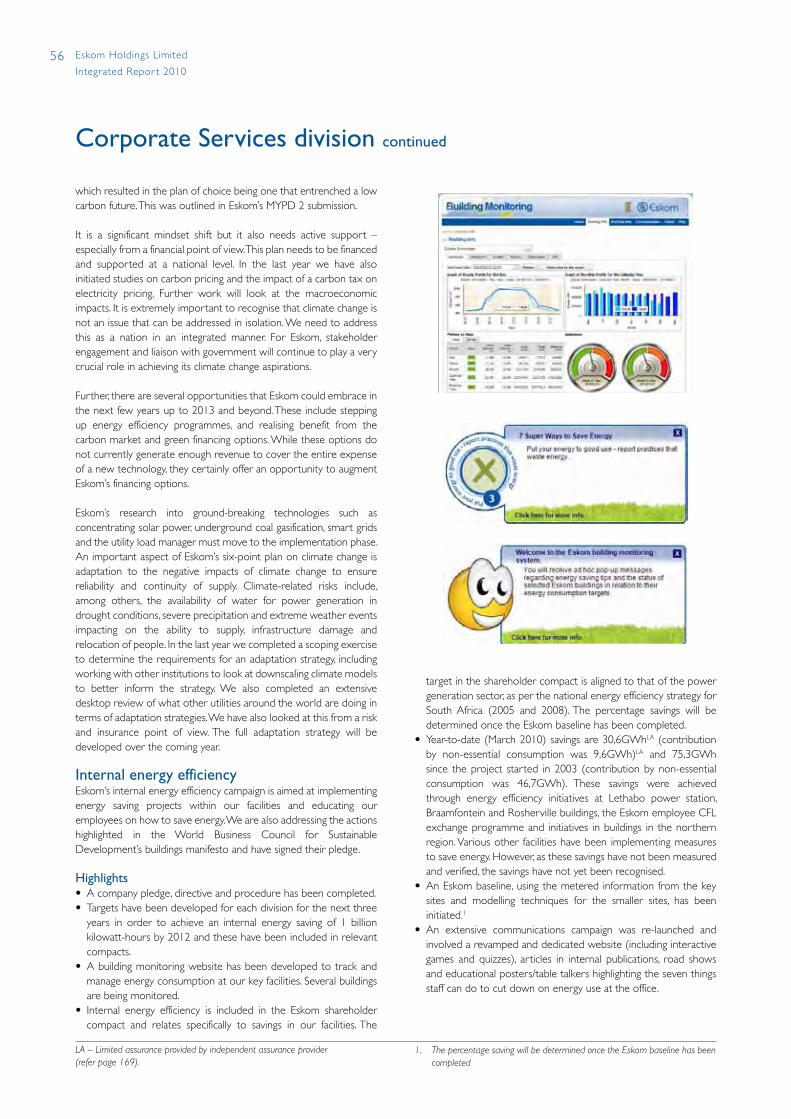
56 Eskom Holdings Limited
Integrated Repor t 2010
which resulted in the plan of choice being one that entrenched a low carbon future. This was outlined in Eskom’s MYPD 2 submission.
It is a significant mindset shift but it also needs active support – especially from a financial point of view. This plan needs to be financed and supported at a national level. In the last year we have also initiated studies on carbon pricing and the impact of a carbon tax on electricity pricing. Further work will look at the macroeconomic impacts. It is extremely important to recognise that climate change is not an issue that can be addressed in isolation. We need to address this as a nation in an integrated manner. For Eskom, stakeholder engagement and liaison with government will continue to play a very crucial role in achieving its climate change aspirations.
Further, there are several opportunities that Eskom could embrace in the next few years up to 2013 and beyond. These include stepping up energy efficiency programmes, and realising benefit from the carbon market and green financing options. While these options do not currently generate enough revenue to cover the entire expense of a new technology, they certainly offer an opportunity to augment Eskom’s financing options.
Eskom’s research into ground-breaking technologies such as concentrating solar power, underground coal gasification, smart grids and the utility load manager must move to the implementation phase.An important aspect of Eskom’s six-point plan on climate change is adaptation to the negative impacts of climate change to ensure reliability and continuity of supply. Climate-related risks include, among others, the availability of water for power generation in drought conditions, severe precipitation and extreme weather events impacting on the ability to supply, infrastructure damage and relocation of people. In the last year we completed a scoping exercise to determine the requirements for an adaptation strategy, including working with other institutions to look at downscaling climate models to better inform the strategy. We also completed an extensive desktop review of what other utilities around the world are doing in terms of adaptation strategies. We have also looked at this from a risk and insurance point of view. The full adaptation strategy will be developed over the coming year.
Internal energy efficiencyEskom’s internal energy efficiency campaign is aimed at implementing energy saving projects within our facilities and educating our employees on how to save energy. We are also addressing the actions highlighted in the World Business Council for Sustainable Development’s buildings manifesto and have signed their pledge.
Highlights• A company pledge, directive and procedure has been completed.• Targets have been developed for each division for the next three
years in order to achieve an internal energy saving of 1 billion kilowatt-hours by 2012 and these have been included in relevant compacts.
• A building monitoring website has been developed to track and manage energy consumption at our key facilities. Several buildings are being monitored.
• Internal energy efficiency is included in the Eskom shareholder compact and relates specifically to savings in our facilities. The
Corporate Services division continued
target in the shareholder compact is aligned to that of the power generation sector, as per the national energy efficiency strategy for South Africa (2005 and 2008). The percentage savings will be determined once the Eskom baseline has been completed.
• Year-to-date (March 2010) savings are 30,6GWhLA (contribution by non-essential consumption was 9,6GWh)LA and 75,3GWh since the project started in 2003 (contribution by non-essential consumption was 46,7GWh). These savings were achieved through energy efficiency initiatives at Lethabo power station, Braamfontein and Rosherville buildings, the Eskom employee CFL exchange programme and initiatives in buildings in the northern region. Various other facilities have been implementing measures to save energy. However, as these savings have not been measured and verified, the savings have not yet been recognised.
• An Eskom baseline, using the metered information from the key sites and modelling techniques for the smaller sites, has been initiated.1
• An extensive communications campaign was re-launched and involved a revamped and dedicated website (including interactive games and quizzes), articles in internal publications, road shows and educational posters/table talkers highlighting the seven things staff can do to cut down on energy use at the office.
LA – Limited assurance provided by independent assurance provider (refer page 169).
1. The percentage saving will be determined once the Eskom baseline has been completed
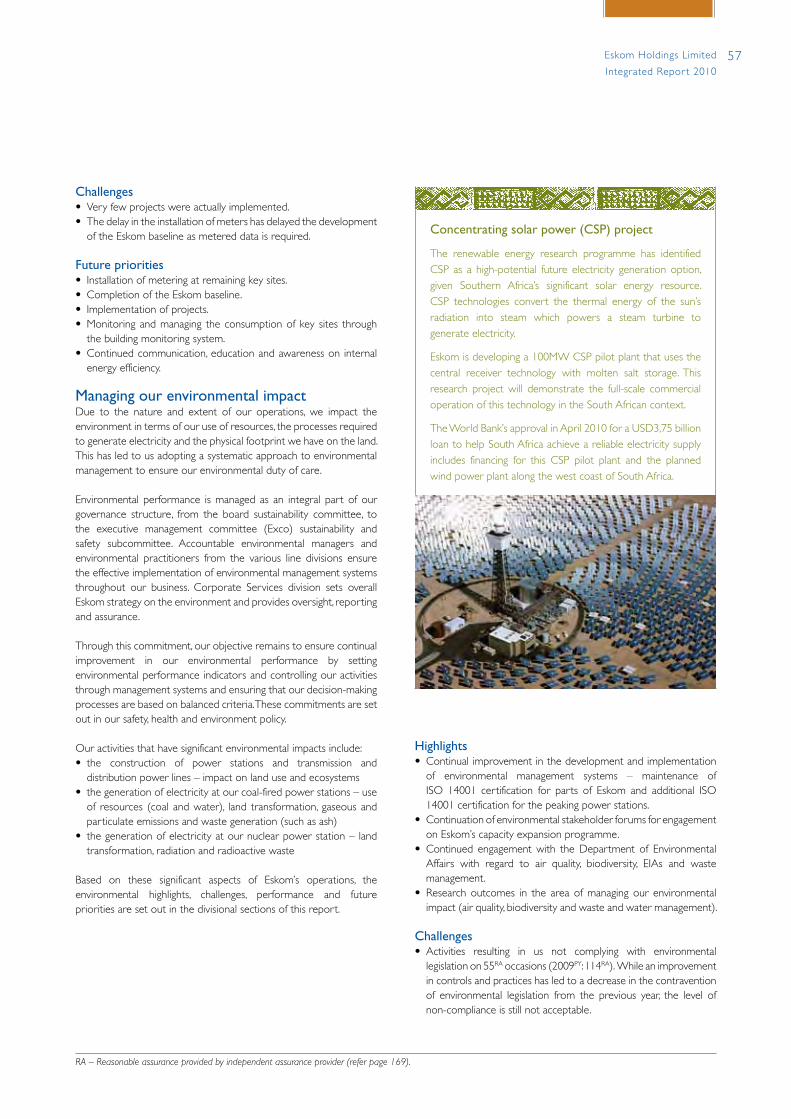
57Eskom Holdings Limited
Integrated Repor t 2010
Concentrating solar power (CSP) project
The renewable energy research programme has identified CSP as a high-potential future electricity generation option, given Southern Africa’s significant solar energy resource. CSP technologies convert the thermal energy of the sun’s radiation into steam which powers a steam turbine to generate electricity.
Eskom is developing a 100MW CSP pilot plant that uses the central receiver technology with molten salt storage. This research project will demonstrate the full-scale commercial operation of this technology in the South African context.
The World Bank’s approval in April 2010 for a USD3,75 billion loan to help South Africa achieve a reliable electricity supply includes financing for this CSP pilot plant and the planned wind power plant along the west coast of South Africa.
Challenges• Very few projects were actually implemented.• The delay in the installation of meters has delayed the development
of the Eskom baseline as metered data is required.
Future priorities• Installation of metering at remaining key sites.• Completion of the Eskom baseline.• Implementation of projects.• Monitoring and managing the consumption of key sites through
the building monitoring system.• Continued communication, education and awareness on internal
energy efficiency.
Managing our environmental impactDue to the nature and extent of our operations, we impact the environment in terms of our use of resources, the processes required to generate electricity and the physical footprint we have on the land. This has led to us adopting a systematic approach to environmental management to ensure our environmental duty of care.
Environmental performance is managed as an integral part of our governance structure, from the board sustainability committee, to the executive management committee (Exco) sustainability and safety subcommittee. Accountable environmental managers and environmental practitioners from the various line divisions ensure the effective implementation of environmental management systems throughout our business. Corporate Services division sets overall Eskom strategy on the environment and provides oversight, reporting and assurance.
Through this commitment, our objective remains to ensure continual improvement in our environmental performance by setting environmental performance indicators and controlling our activities through management systems and ensuring that our decision-making processes are based on balanced criteria. These commitments are set out in our safety, health and environment policy.
Our activities that have significant environmental impacts include:• the construction of power stations and transmission and
distribution power lines – impact on land use and ecosystems• the generation of electricity at our coal-fired power stations – use
of resources (coal and water), land transformation, gaseous and particulate emissions and waste generation (such as ash)
• the generation of electricity at our nuclear power station – land transformation, radiation and radioactive waste
Based on these significant aspects of Eskom’s operations, the environmental highlights, challenges, performance and future priorities are set out in the divisional sections of this report.
Highlights• Continual improvement in the development and implementation
of environmental management systems – maintenance of ISO 14001 certification for parts of Eskom and additional ISO 14001 certification for the peaking power stations.
• Continuation of environmental stakeholder forums for engagement on Eskom’s capacity expansion programme.
• Continued engagement with the Department of Environmental Affairs with regard to air quality, biodiversity, EIAs and waste management.
• Research outcomes in the area of managing our environmental impact (air quality, biodiversity and waste and water management).
Challenges• Activities resulting in us not complying with environmental
legislation on 55RA occasions (2009PY: 114RA). While an improvement in controls and practices has led to a decrease in the contravention of environmental legislation from the previous year, the level of non-compliance is still not acceptable.
RA – Reasonable assurance provided by independent assurance provider (refer page 169).
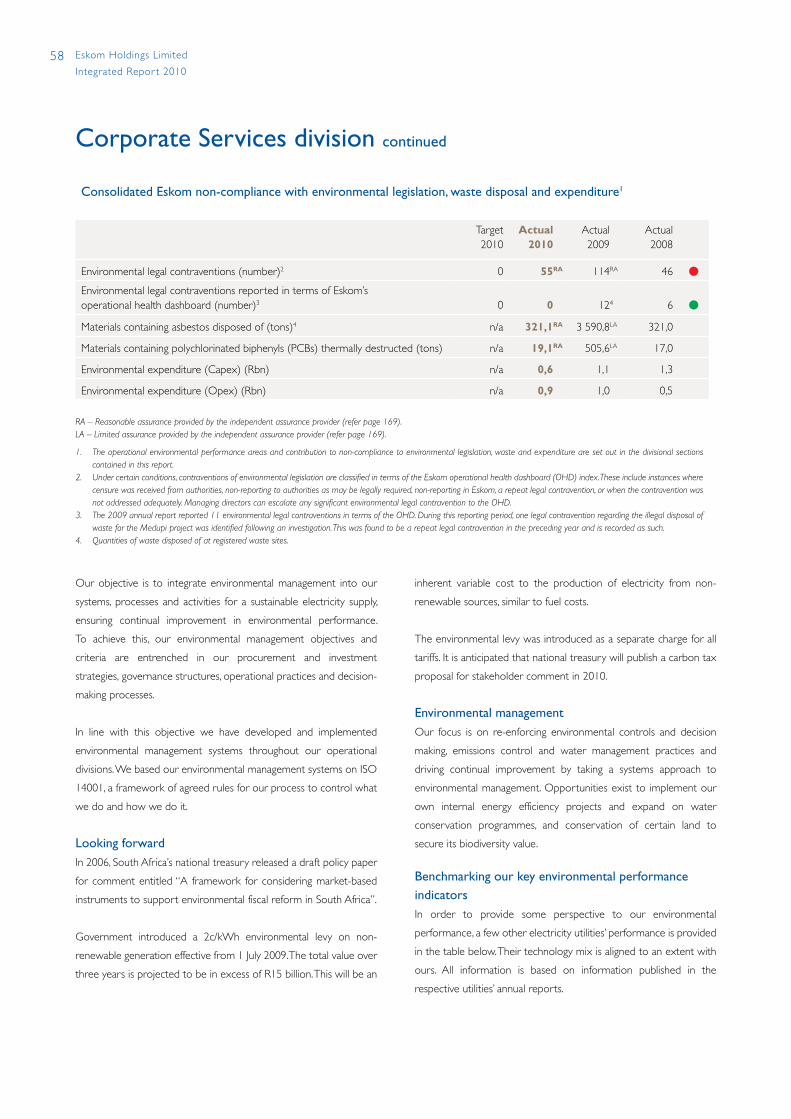
58 Eskom Holdings Limited
Integrated Repor t 2010
Consolidated Eskom non-compliance with environmental legislation, waste disposal and expenditure1
Target2010
Actual2010
Actual2009
Actual2008
Environmental legal contraventions (number)2 0 55RA 114RA 46 lEnvironmental legal contraventions reported in terms of Eskom’s operational health dashboard (number)3 0 0 124 6 lMaterials containing asbestos disposed of (tons)4 n/a 321,1RA 3 590,8LA 321,0
Materials containing polychlorinated biphenyls (PCBs) thermally destructed (tons) n/a 19,1RA 505,6LA 17,0 Environmental expenditure (Capex) (Rbn) n/a 0,6 1,1 1,3 Environmental expenditure (Opex) (Rbn) n/a 0,9 1,0 0,5
RA – Reasonable assurance provided by the independent assurance provider (refer page 169).LA – Limited assurance provided by the independent assurance provider (refer page 169).
1. The operational environmental performance areas and contribution to non-compliance to environmental legislation, waste and expenditure are set out in the divisional sections contained in this report.
2. Under certain conditions, contraventions of environmental legislation are classified in terms of the Eskom operational health dashboard (OHD) index. These include instances where censure was received from authorities, non-reporting to authorities as may be legally required, non-reporting in Eskom, a repeat legal contravention, or when the contravention was not addressed adequately. Managing directors can escalate any significant environmental legal contravention to the OHD.
3. The 2009 annual report reported 11 environmental legal contraventions in terms of the OHD. During this reporting period, one legal contravention regarding the illegal disposal of waste for the Medupi project was identified following an investigation. This was found to be a repeat legal contravention in the preceding year and is recorded as such.
4. Quantities of waste disposed of at registered waste sites.
Corporate Services division continued
inherent variable cost to the production of electricity from non-
renewable sources, similar to fuel costs.
The environmental levy was introduced as a separate charge for all
tariffs. It is anticipated that national treasury will publish a carbon tax
proposal for stakeholder comment in 2010.
Environmental managementOur focus is on re-enforcing environmental controls and decision
making, emissions control and water management practices and
driving continual improvement by taking a systems approach to
environmental management. Opportunities exist to implement our
own internal energy efficiency projects and expand on water
conservation programmes, and conservation of certain land to
secure its biodiversity value.
Benchmarking our key environmental performance indicatorsIn order to provide some perspective to our environmental
performance, a few other electricity utilities’ performance is provided
in the table below. Their technology mix is aligned to an extent with
ours. All information is based on information published in the
respective utilities’ annual reports.
Our objective is to integrate environmental management into our
systems, processes and activities for a sustainable electricity supply,
ensuring continual improvement in environmental performance.
To achieve this, our environmental management objectives and
criteria are entrenched in our procurement and investment
strategies, governance structures, operational practices and decision-
making processes.
In line with this objective we have developed and implemented
environmental management systems throughout our operational
divisions. We based our environmental management systems on ISO
14001, a framework of agreed rules for our process to control what
we do and how we do it.
Looking forwardIn 2006, South Africa’s national treasury released a draft policy paper
for comment entitled “A framework for considering market-based
instruments to support environmental fiscal reform in South Africa”.
Government introduced a 2c/kWh environmental levy on non-
renewable generation effective from 1 July 2009. The total value over
three years is projected to be in excess of R15 billion. This will be an

59Eskom Holdings Limited
Integrated Repor t 2010
Eskom2009/10
Electricityutility inEurope
2009
Electricityutility in
Australia2009
Electricityutility in
USA2009
Electricity utility in Canada/USA
Australia/Mexico2008
Electricityutility in
Australia2009
Total electricity produced (GWh) 232 812 187 200 23 746 53 100 43 105 26 999
Electricity generation mix
Coal-fired power stations (%) 92,8 61,4 88,3 35,0 71,1 99,8
Renewables (%) 0,5 3,5 11,7 8,0 5,3 0,2
Pumped storage and other (%) 1,2 1,1 n/a 2,0 n/a n/a
Gas (%) 0,02 15,9 0,0 37,0 23,6 n/a
Nuclear (%) 5,5 18,1 0,0 18,0 n/a n/a
Environmental performance
Water usage (ℓ/kWhSO) 1,38 1,74 1,73 13,111 5,89 3,18
CO2 (kg/kWhSO) 0,98 0,80 0,91 0,53 0,90 0,94
Particulate emissions (g/kWhSO) 0,39 0,02 0,12 n/a 0,12 0,19
SO2 emissions (g/kWhSO) 8,10 0,32 3,74 4,76 1,08 4,35
1. 90% of water used is returned to the rivers – therefore the high value
remain concerned about this unacceptable performance. To this end,
a number of safety improvement initiatives have been and are in the
process of being implemented, to reduce the number of safety-
related incidents for contractors and employees to zero.
The implementation of a safety improvement programme has led to
enhanced operational discipline among employees and visible felt
leadership in safety. We have identified critical behaviours or
actions that, when performed, have a very high probability of
causing incidents resulting in severe injuries or fatalities. In order
to prevent these unacceptable consequences, we implemented
five safety cardinal rules that apply to Eskom employees and other
persons performing work for Eskom. This initiative has led to zero
fatalities among employees in the high-risk activities covered by
the cardinal rules.
There has also been a greater focus on the health and safety
of Eskom contractors and the public. To this end, Eskom is working
with suppliers, customers and contractors to integrate safety,
health and environmental issues into their operations. Contractors
working under our supervision or on our premises, are expected
to comply with Eskom’s safety, health and environment (SHE) policy,
and support the zero tolerance approach to safety management.
Eskom leadership has taken the initiative to engage with
contractors in the form of quarterly contractor forums to ensure
that the standard of safety management at Eskom sites is in line
with best practice.
BiodiversityThis year is the United Nation’s International Year of Biodiversity.
Globally, there is an increased level of awareness of the importance
of biodiversity and the relevant ecosystem services that we rely on.
We are participating in the World Business Council for Sustainable
Development (WBCSD) ecosystems focus area, which is currently
developing a corporate guide for ecosystem valuations. Furthermore,
we have accepted the challenge of road testing the guide – in parallel
– to better understand our impact on ecosystem services and
subsequently investigate measures to mitigate this impact.
During this reporting year the Eskom land and biodiversity task team
(represented by all the business areas within Eskom) has revised
various biodiversity-related procedures, and drafted a biodiversity
policy and standard within the framework of the ISO 14001
environmental management system.
The Eskom-EWT strategic partnership performed a review of the
effectiveness of the partnership, which highlighted the need to look
at more pro-active and collective mechanisms to manage our impact
on biodiversity. This led to the development of a partnership strategy
with related KPAs and KPIs. It is our intention to test the reporting of
these KPIs within the short term.
Safety Although there has been a reduction in the number of employee and
contractor fatalities for the past year as compared to 2009, we

60 Eskom Holdings Limited
Integrated Repor t 2010
Safety performanceUnit of
measureActual
2010Actual2009
Actual2008
Employee safety
Total fatalities number 2RA 6RA 17 lElectrical contact fatalities number 0 4 5 lVehicle accident fatalities number 2 0 8 lOther fatalities number 0 2 4 lLost-time incident rate, including occupational diseases index 0,54RA 0,50RA 0,46 lElectrical contact injuries number 17 13 25 lContractor safety
Total contractor fatalities number 14RA 21RA 12 lElectrical contact fatalities number 1 1 1 lOther fatalities number 13 20 11 lPublic safety
Total public fatalities number 41 28 42 lElectrical contact fatalities number 27 22 32 lFatalities from other causes number 14 6 10 lRA – Reasonable assurance provided by the independent assurance provider (refer page 169).
Divisional safety performance
LTIREmployee
fatalitiesContractor
fatalities
Generation 0,50 0 0
Transmission 0,80 0 1
Distribution 0,72 2 8
Enterprises 0,29 0 3
Nuclear 0,32 0 1
Corporate Services 0,50 0 0
Primary Energy 0,00 0 1
Generation Business Engineering 0,00 0 0
System Operations and Planning 0,00 0 0
Finance 1,40 0 0
Human Resources 0,97 0 0
Office of the Chief Executive 2,20 0 0
Corporate Services division continued
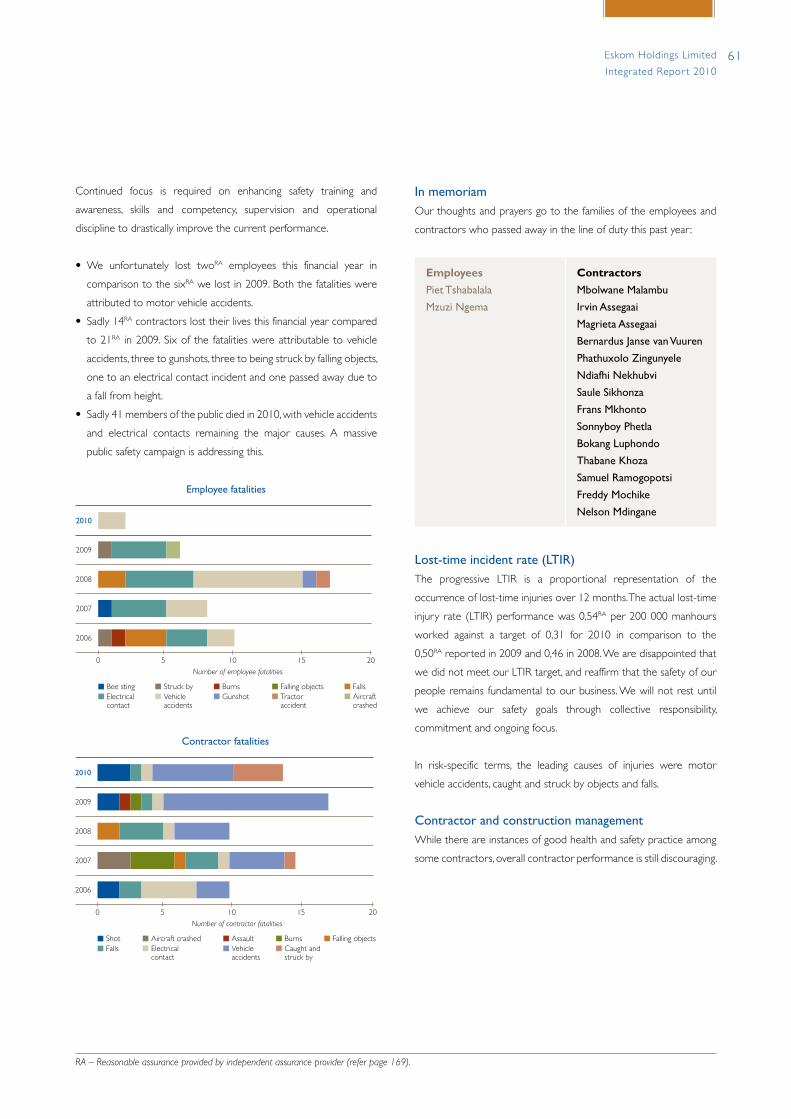
61Eskom Holdings Limited
Integrated Repor t 2010
Continued focus is required on enhancing safety training and
awareness, skills and competency, supervision and operational
discipline to drastically improve the current performance.
• We unfortunately lost twoRA employees this financial year in
comparison to the sixRA we lost in 2009. Both the fatalities were
attributed to motor vehicle accidents.
• Sadly 14RA contractors lost their lives this financial year compared
to 21RA in 2009. Six of the fatalities were attributable to vehicle
accidents, three to gunshots, three to being struck by falling objects,
one to an electrical contact incident and one passed away due to
a fall from height.
• Sadly 41 members of the public died in 2010, with vehicle accidents
and electrical contacts remaining the major causes. A massive
public safety campaign is addressing this.
Employee fatalities
Number of employee fatalities5 10 15 200
2010
2009
2008
2007
2006
Bee stingElectrical contact
Struck byVehicle accidents
BurnsGunshot
Falling objectsTractor accident
FallsAircraft crashed
Contractor fatalities
Number of contractor fatalities5 10 15 200
2010
2009
2008
2007
2006
ShotFalls
Aircraft crashedElectrical contact
AssaultVehicle accidents
BurnsCaught and struck by
Falling objects
In memoriamOur thoughts and prayers go to the families of the employees and
contractors who passed away in the line of duty this past year :
Employees
Piet Tshabalala
Mzuzi Ngema
Contractors
Mbolwane Malambu
Irvin Assegaai
Magrieta Assegaai
Bernardus Janse van Vuuren
Phathuxolo Zingunyele
Ndiafhi Nekhubvi
Saule Sikhonza
Frans Mkhonto
Sonnyboy Phetla
Bokang Luphondo
Thabane Khoza
Samuel Ramogopotsi
Freddy Mochike
Nelson Mdingane
Lost-time incident rate (LTIR)The progressive LTIR is a proportional representation of the
occurrence of lost-time injuries over 12 months. The actual lost-time
injury rate (LTIR) performance was 0,54RA per 200 000 manhours
worked against a target of 0,31 for 2010 in comparison to the
0,50RA reported in 2009 and 0,46 in 2008. We are disappointed that
we did not meet our LTIR target, and reaffirm that the safety of our
people remains fundamental to our business. We will not rest until
we achieve our safety goals through collective responsibility,
commitment and ongoing focus.
In risk-specific terms, the leading causes of injuries were motor
vehicle accidents, caught and struck by objects and falls.
Contractor and construction managementWhile there are instances of good health and safety practice among
some contractors, overall contractor performance is still discouraging.
RA – Reasonable assurance provided by independent assurance provider (refer page 169).
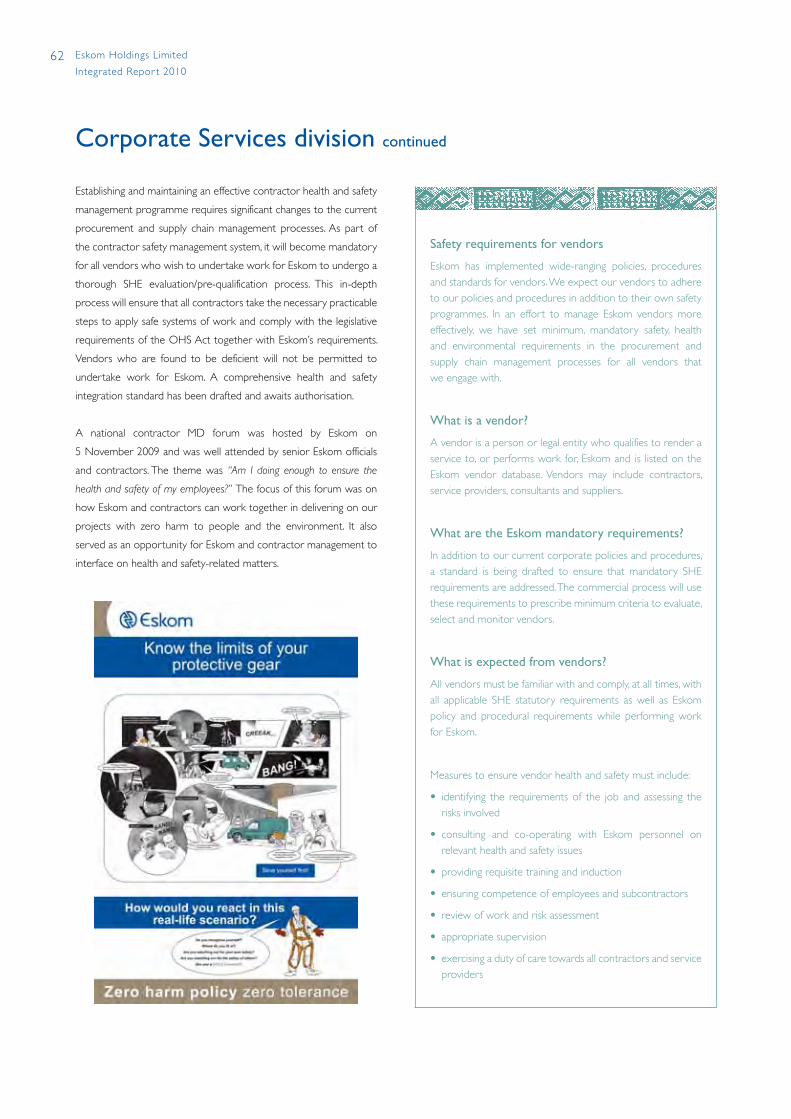
62 Eskom Holdings Limited
Integrated Repor t 2010
Safety requirements for vendors
Eskom has implemented wide-ranging policies, procedures and standards for vendors. We expect our vendors to adhere to our policies and procedures in addition to their own safety programmes. In an effort to manage Eskom vendors more effectively, we have set minimum, mandatory safety, health and environmental requirements in the procurement and supply chain management processes for all vendors that we engage with.
What is a vendor?
A vendor is a person or legal entity who qualifies to render a service to, or performs work for, Eskom and is listed on the Eskom vendor database. Vendors may include contractors, service providers, consultants and suppliers.
What are the Eskom mandatory requirements?
In addition to our current corporate policies and procedures, a standard is being drafted to ensure that mandatory SHE requirements are addressed. The commercial process will use these requirements to prescribe minimum criteria to evaluate, select and monitor vendors.
What is expected from vendors?
All vendors must be familiar with and comply, at all times, with all applicable SHE statutory requirements as well as Eskom policy and procedural requirements while performing work for Eskom.
Measures to ensure vendor health and safety must include:
• identifying the requirements of the job and assessing the risks involved
• consulting and co-operating with Eskom personnel on relevant health and safety issues
• providing requisite training and induction
• ensuring competence of employees and subcontractors
• review of work and risk assessment
• appropriate supervision
• exercising a duty of care towards all contractors and service providers
Corporate Services division continued
Establishing and maintaining an effective contractor health and safety
management programme requires significant changes to the current
procurement and supply chain management processes. As part of
the contractor safety management system, it will become mandatory
for all vendors who wish to undertake work for Eskom to undergo a
thorough SHE evaluation/pre-qualification process. This in-depth
process will ensure that all contractors take the necessary practicable
steps to apply safe systems of work and comply with the legislative
requirements of the OHS Act together with Eskom’s requirements.
Vendors who are found to be deficient will not be permitted to
undertake work for Eskom. A comprehensive health and safety
integration standard has been drafted and awaits authorisation.
A national contractor MD forum was hosted by Eskom on
5 November 2009 and was well attended by senior Eskom officials
and contractors. The theme was “Am I doing enough to ensure the
health and safety of my employees?” The focus of this forum was on
how Eskom and contractors can work together in delivering on our
projects with zero harm to people and the environment. It also
served as an opportunity for Eskom and contractor management to
interface on health and safety-related matters.
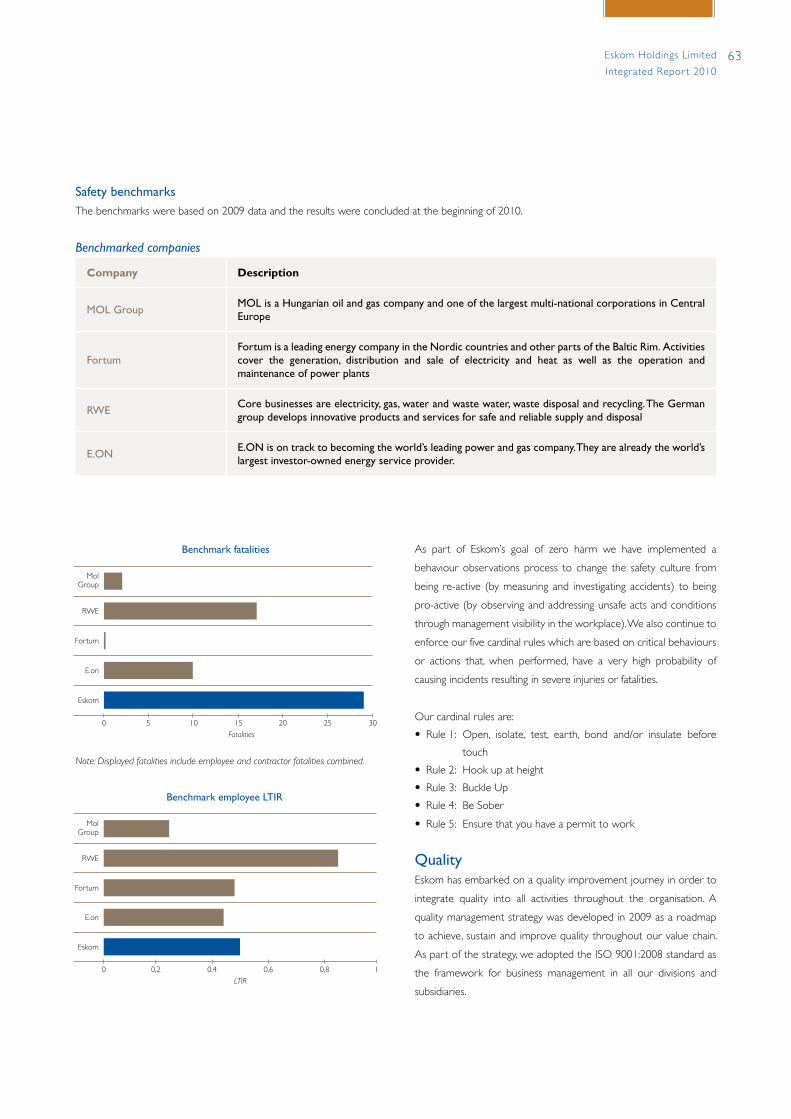
63Eskom Holdings Limited
Integrated Repor t 2010
Safety benchmarksThe benchmarks were based on 2009 data and the results were concluded at the beginning of 2010.
Benchmarked companies
Company Description
MOL GroupMOL is a Hungarian oil and gas company and one of the largest multi-national corporations in Central Europe
FortumFortum is a leading energy company in the Nordic countries and other parts of the Baltic Rim. Activities cover the generation, distribution and sale of electricity and heat as well as the operation and maintenance of power plants
RWECore businesses are electricity, gas, water and waste water, waste disposal and recycling. The German group develops innovative products and services for safe and reliable supply and disposal
E.ONE.ON is on track to becoming the world’s leading power and gas company. They are already the world’s largest investor-owned energy service provider.
As part of Eskom’s goal of zero harm we have implemented a
behaviour observations process to change the safety culture from
being re-active (by measuring and investigating accidents) to being
pro-active (by observing and addressing unsafe acts and conditions
through management visibility in the workplace). We also continue to
enforce our five cardinal rules which are based on critical behaviours
or actions that, when performed, have a very high probability of
causing incidents resulting in severe injuries or fatalities.
Our cardinal rules are:
• Rule 1: Open, isolate, test, earth, bond and/or insulate before
touch
• Rule 2: Hook up at height
• Rule 3: Buckle Up
• Rule 4: Be Sober
• Rule 5: Ensure that you have a permit to work
QualityEskom has embarked on a quality improvement journey in order to
integrate quality into all activities throughout the organisation. A
quality management strategy was developed in 2009 as a roadmap
to achieve, sustain and improve quality throughout our value chain.
As part of the strategy, we adopted the ISO 9001:2008 standard as
the framework for business management in all our divisions and
subsidiaries.
Note: Displayed fatalities include employee and contractor fatalities combined.
Benchmark fatalities
20151050 25 30
MolGroup
RWE
Fortum
E.on
Eskom
Fatalities
Benchmark employee LTIR
0,2 0,4 0,6 0,80 1
MolGroup
RWE
Fortum
E.on
Eskom
LTIR
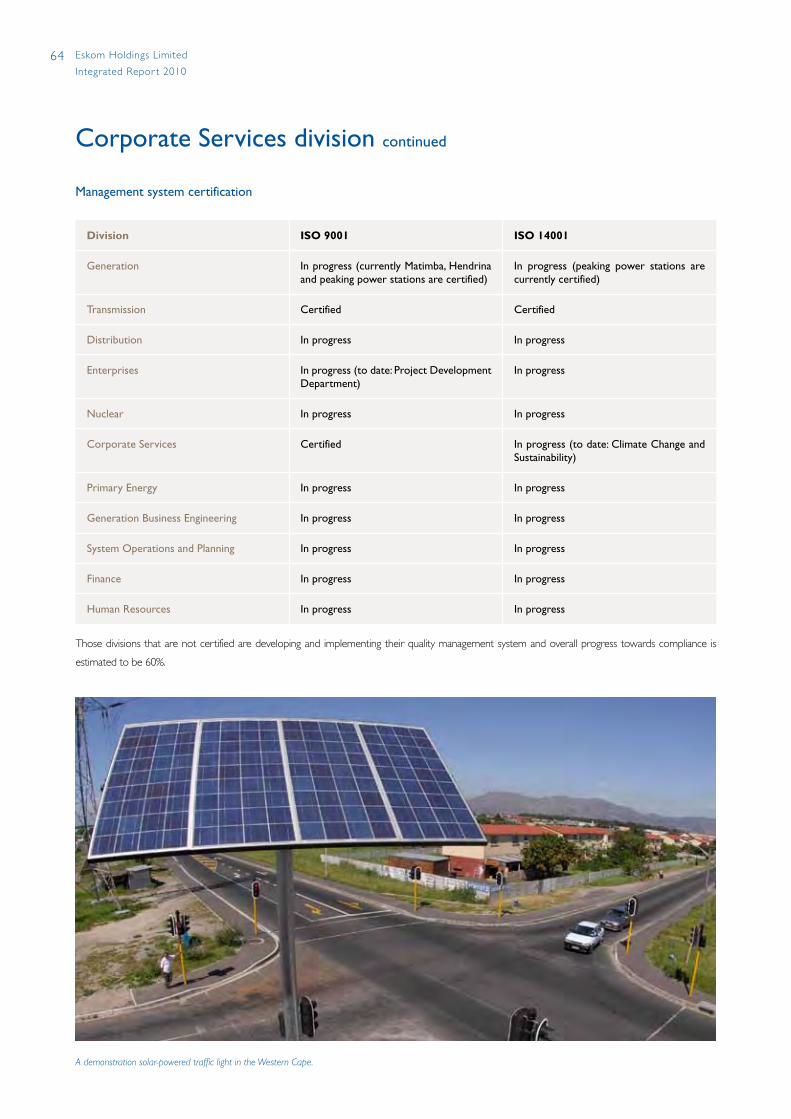
64 Eskom Holdings Limited
Integrated Repor t 2010
Corporate Services division continued
Management system certification
Division ISO 9001 ISO 14001
Generation In progress (currently Matimba, Hendrina and peaking power stations are certified)
In progress (peaking power stations are currently certified)
Transmission Certified Certified
Distribution In progress In progress
Enterprises In progress (to date: Project Development Department)
In progress
Nuclear In progress In progress
Corporate Services Certified In progress (to date: Climate Change and Sustainability)
Primary Energy In progress In progress
Generation Business Engineering In progress In progress
System Operations and Planning In progress In progress
Finance In progress In progress
Human Resources In progress In progress
Those divisions that are not certified are developing and implementing their quality management system and overall progress towards compliance is
estimated to be 60%.
A demonstration solar-powered traffic light in the Western Cape.

65Eskom Holdings Limited
Integrated Repor t 2010
Research and developmentThe Eskom research and development programme is driven by the
Sustainability and Innovation business unit. The department provides
a variety of services such as scientific and technical advice, research
and consulting, analysis, detailed design as well as strategic technical
planning services and direction.
The research is focused on the needs of the line divisions within
Eskom. Thus, the focus is predominantly on applied, not pure
research and the research outputs are linked to the strategic and
operational needs of Eskom. In order to remain relevant, however,
a portion of research resources is allocated to technology innovation
and emerging technology options. Our research expenditure for the
year amounted to R197 million (2009: R207 million).
For further details on the expenditure and research focus areas, go to www.eskom.co.za/annreport10/003.html
Demonstration and pilot projectsAs research matures, it leads to the establishment of demonstration
plants that take the understanding of the technology to the next level. A
demonstration project is a production scale asset that is built to evaluate
and validate prior research findings and recommendations to enable
future business decisions (especially the understanding of risk and
certainty of costs) regarding the applicability of the technology in an
Eskom context. Eskom’s investment in the demonstration and pilot
programme over the last year is shown below.
Project name
Actual expenditure
R000
Solar power for Africa (100MW concentrated solar plant) 2 981
Plant monitor (Online analysis of equipment characteristics) 20 448
Utility load manager (Load management device) 22 914
HVDC (High voltage direct current power transmission) 1 800
Underground coal gasification (Majuba demonstration) 198 945
247 088
Underground coal gasification research
The underground coal gasification (UCG) technology has
been successfully piloted for more than three years, and initial
technical predictions have been confirmed. The next phase of
the demonstration 100 – 140MW open-cycle gas turbine, for
planned commissioning in 2014, has recently been approved.
Stakeholder engagement and a full environmental impact
assessment (EIA) are already underway. The plant will be able
to prove and quantify the technical, environmental and
commercial performance of the technology, and will be able
to predict design and performance of a full-scale, commercial
UCG plant.
The demonstration plant remains under the stewardship
of Corporate Services division, but the project now involves
all Eskom divisions and stakeholders that will be responsible
for ensuring the success of the demonstration plant, and
subsequent uptake of the technology when proven viable.
In parallel to the demonstration plant design, the pilot plant is
presently ramping up gas production, in order to prove the
concept of co-firing the UCG gas with coal in Majuba power
station’s unit 4. The interconnecting pipe work between the
power station and the UCG gas field has been installed, and
will be commissioned as soon as unit 4 is scheduled for an
outage.
The pilot plant is gaining incredible interest locally and globally
given the technology’s potential for clean and lower cost
electricity production.
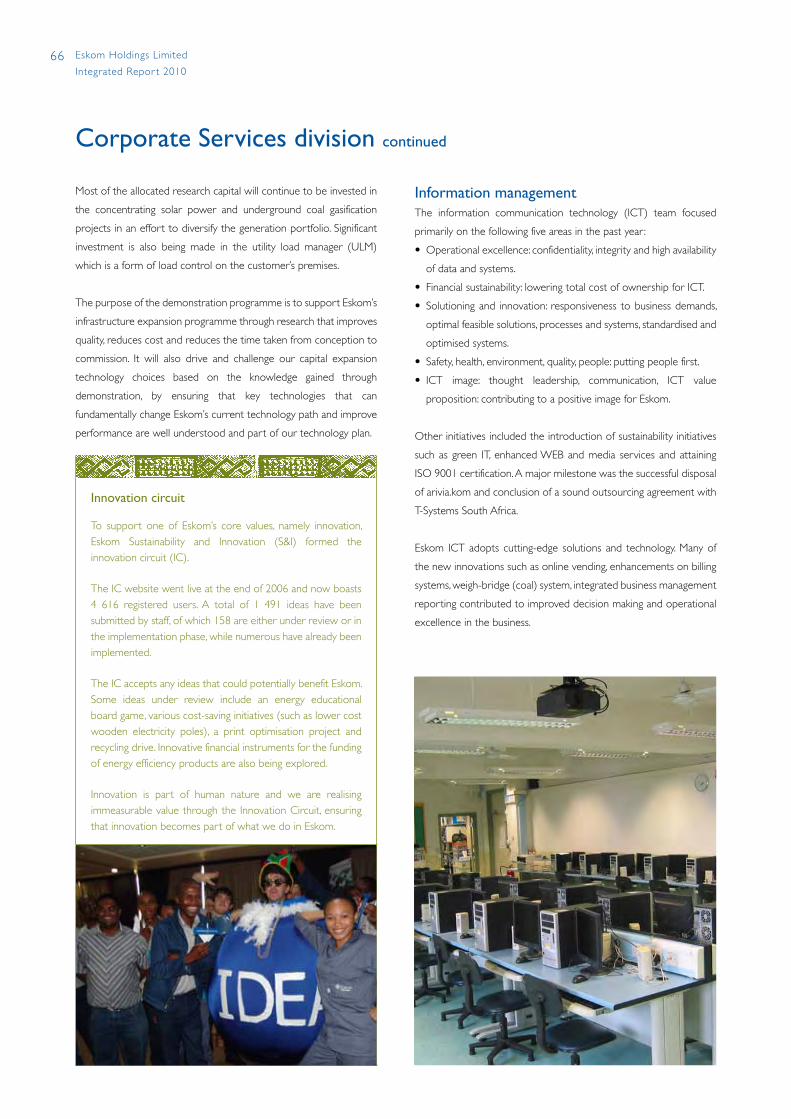
66 Eskom Holdings Limited
Integrated Repor t 2010
Most of the allocated research capital will continue to be invested in
the concentrating solar power and underground coal gasification
projects in an effort to diversify the generation portfolio. Significant
investment is also being made in the utility load manager (ULM)
which is a form of load control on the customer’s premises.
The purpose of the demonstration programme is to support Eskom’s
infrastructure expansion programme through research that improves
quality, reduces cost and reduces the time taken from conception to
commission. It will also drive and challenge our capital expansion
technology choices based on the knowledge gained through
demonstration, by ensuring that key technologies that can
fundamentally change Eskom’s current technology path and improve
performance are well understood and part of our technology plan.
Innovation circuit
To support one of Eskom’s core values, namely innovation, Eskom Sustainability and Innovation (S&I) formed the innovation circuit (IC).
The IC website went live at the end of 2006 and now boasts 4 616 registered users. A total of 1 491 ideas have been submitted by staff, of which 158 are either under review or in the implementation phase, while numerous have already been implemented.
The IC accepts any ideas that could potentially benefit Eskom. Some ideas under review include an energy educational board game, various cost-saving initiatives (such as lower cost wooden electricity poles), a print optimisation project and recycling drive. Innovative financial instruments for the funding of energy efficiency products are also being explored.
Innovation is part of human nature and we are realising immeasurable value through the Innovation Circuit, ensuring that innovation becomes part of what we do in Eskom.
Information managementThe information communication technology (ICT) team focused
primarily on the following five areas in the past year :
• Operational excellence: confidentiality, integrity and high availability
of data and systems.
• Financial sustainability: lowering total cost of ownership for ICT.
• Solutioning and innovation: responsiveness to business demands,
optimal feasible solutions, processes and systems, standardised and
optimised systems.
• Safety, health, environment, quality, people: putting people first.
• ICT image: thought leadership, communication, ICT value
proposition: contributing to a positive image for Eskom.
Other initiatives included the introduction of sustainability initiatives
such as green IT, enhanced WEB and media services and attaining
ISO 9001 certification. A major milestone was the successful disposal
of arivia.kom and conclusion of a sound outsourcing agreement with
T-Systems South Africa.
Eskom ICT adopts cutting-edge solutions and technology. Many of
the new innovations such as online vending, enhancements on billing
systems, weigh-bridge (coal) system, integrated business management
reporting contributed to improved decision making and operational
excellence in the business.
Corporate Services division continued
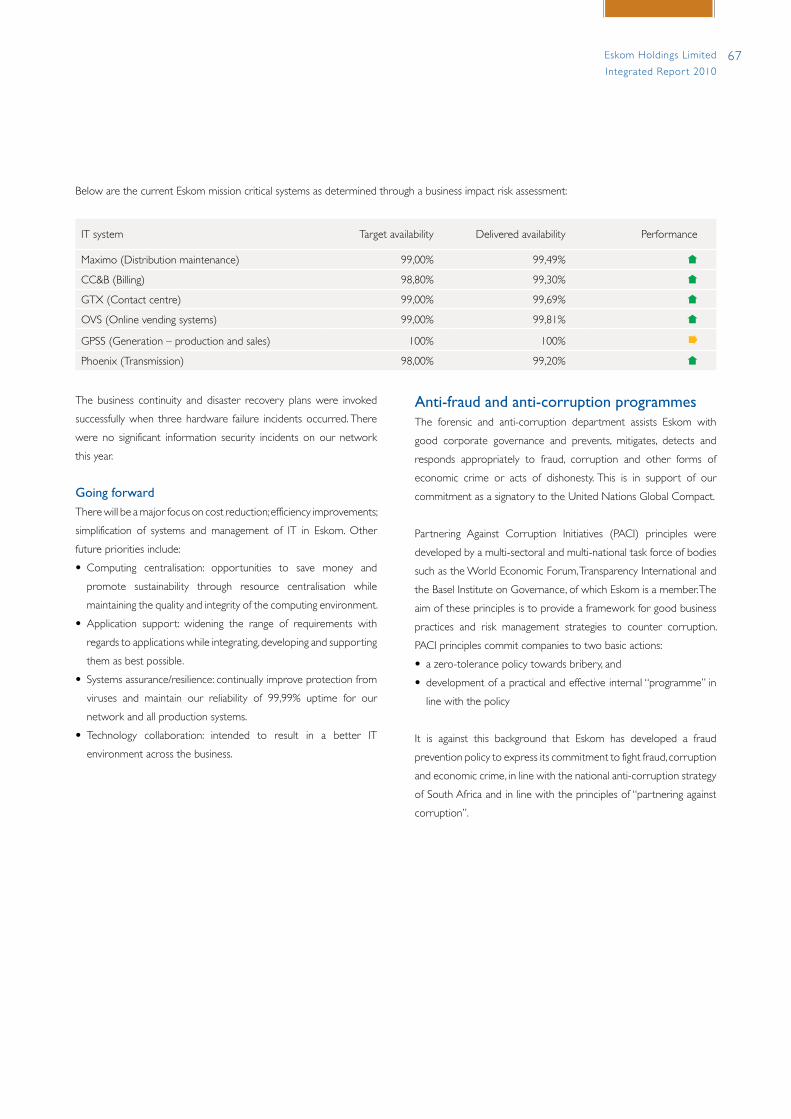
67Eskom Holdings Limited
Integrated Repor t 2010
Below are the current Eskom mission critical systems as determined through a business impact risk assessment:
IT system Target availability Delivered availability Performance
Maximo (Distribution maintenance) 99,00% 99,49%
CC&B (Billing) 98,80% 99,30%
GTX (Contact centre) 99,00% 99,69%
OVS (Online vending systems) 99,00% 99,81%
GPSS (Generation – production and sales) 100% 100%
Phoenix (Transmission) 98,00% 99,20%
The business continuity and disaster recovery plans were invoked
successfully when three hardware failure incidents occurred. There
were no significant information security incidents on our network
this year.
Going forwardThere will be a major focus on cost reduction; efficiency improvements;
simplification of systems and management of IT in Eskom. Other
future priorities include:
• Computing centralisation: opportunities to save money and
promote sustainability through resource centralisation while
maintaining the quality and integrity of the computing environment.
• Application support: widening the range of requirements with
regards to applications while integrating, developing and supporting
them as best possible.
• Systems assurance/resilience: continually improve protection from
viruses and maintain our reliability of 99,99% uptime for our
network and all production systems.
• Technology collaboration: intended to result in a better IT
environment across the business.
Anti-fraud and anti-corruption programmesThe forensic and anti-corruption department assists Eskom with
good corporate governance and prevents, mitigates, detects and
responds appropriately to fraud, corruption and other forms of
economic crime or acts of dishonesty. This is in support of our
commitment as a signatory to the United Nations Global Compact.
Partnering Against Corruption Initiatives (PACI) principles were
developed by a multi-sectoral and multi-national task force of bodies
such as the World Economic Forum, Transparency International and
the Basel Institute on Governance, of which Eskom is a member. The
aim of these principles is to provide a framework for good business
practices and risk management strategies to counter corruption.
PACI principles commit companies to two basic actions:
• a zero-tolerance policy towards bribery, and
• development of a practical and effective internal “programme” in
line with the policy
It is against this background that Eskom has developed a fraud
prevention policy to express its commitment to fight fraud, corruption
and economic crime, in line with the national anti-corruption strategy
of South Africa and in line with the principles of “partnering against
corruption”.
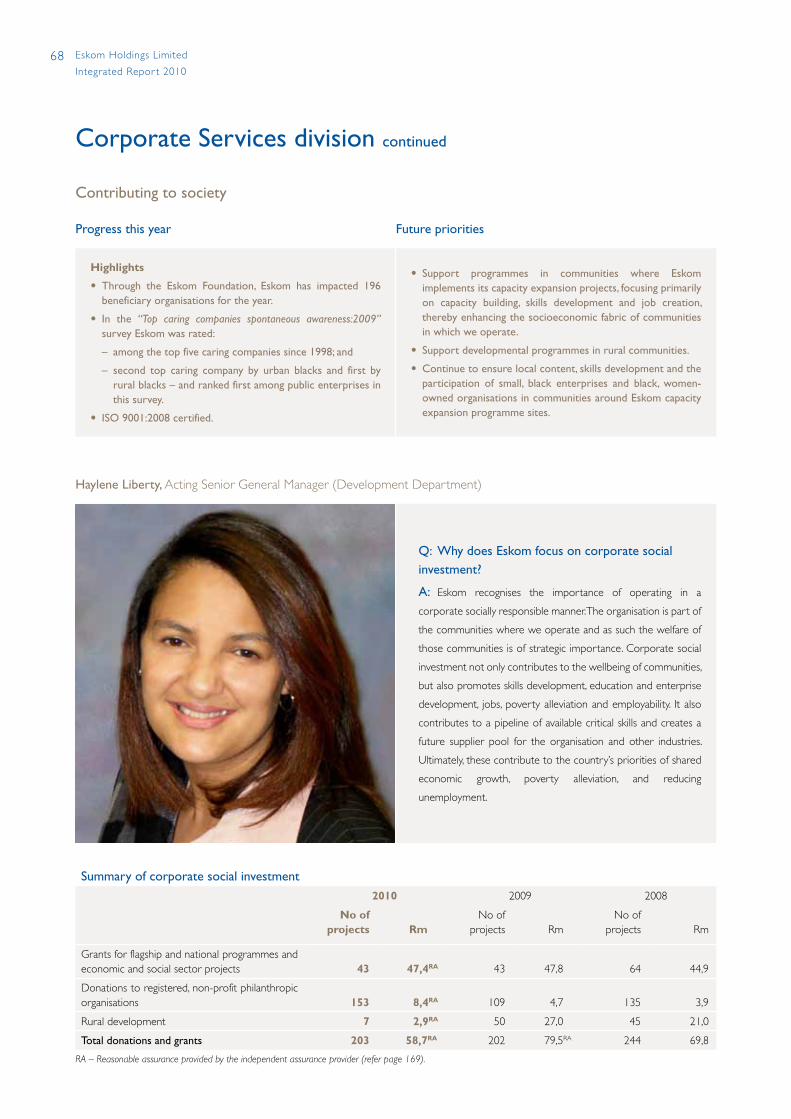
68 Eskom Holdings Limited
Integrated Repor t 2010
Contributing to society
Progress this year Future priorities
Highlights
• Through the Eskom Foundation, Eskom has impacted 196 beneficiary organisations for the year.
• In the “Top caring companies spontaneous awareness:2009” survey Eskom was rated:
– among the top five caring companies since 1998; and
– second top caring company by urban blacks and first by rural blacks – and ranked first among public enterprises in this survey.
• ISO 9001:2008 certified.
• Support programmes in communities where Eskom implements its capacity expansion projects, focusing primarily on capacity building, skills development and job creation, thereby enhancing the socioeconomic fabric of communities in which we operate.
• Support developmental programmes in rural communities.
• Continue to ensure local content, skills development and the participation of small, black enterprises and black, women-owned organisations in communities around Eskom capacity expansion programme sites.
Corporate Services division continued
Haylene Liberty, Acting Senior General Manager (Development Department)
Q: Why does Eskom focus on corporate social investment?
A: Eskom recognises the importance of operating in a
corporate socially responsible manner. The organisation is part of
the communities where we operate and as such the welfare of
those communities is of strategic importance. Corporate social
investment not only contributes to the wellbeing of communities,
but also promotes skills development, education and enterprise
development, jobs, poverty alleviation and employability. It also
contributes to a pipeline of available critical skills and creates a
future supplier pool for the organisation and other industries.
Ultimately, these contribute to the country’s priorities of shared
economic growth, poverty alleviation, and reducing
unemployment.
Summary of corporate social investment2010 2009 2008
No of projects Rm
No of projects Rm
No of projects Rm
Grants for flagship and national programmes and economic and social sector projects 43 47,4RA 43 47,8 64 44,9
Donations to registered, non-profit philanthropic organisations 153 8,4RA 109 4,7 135 3,9
Rural development 7 2,9RA 50 27,0 45 21,0
Total donations and grants 203 58,7RA 202 79,5RA 244 69,8
RA – Reasonable assurance provided by the independent assurance provider (refer page 169).
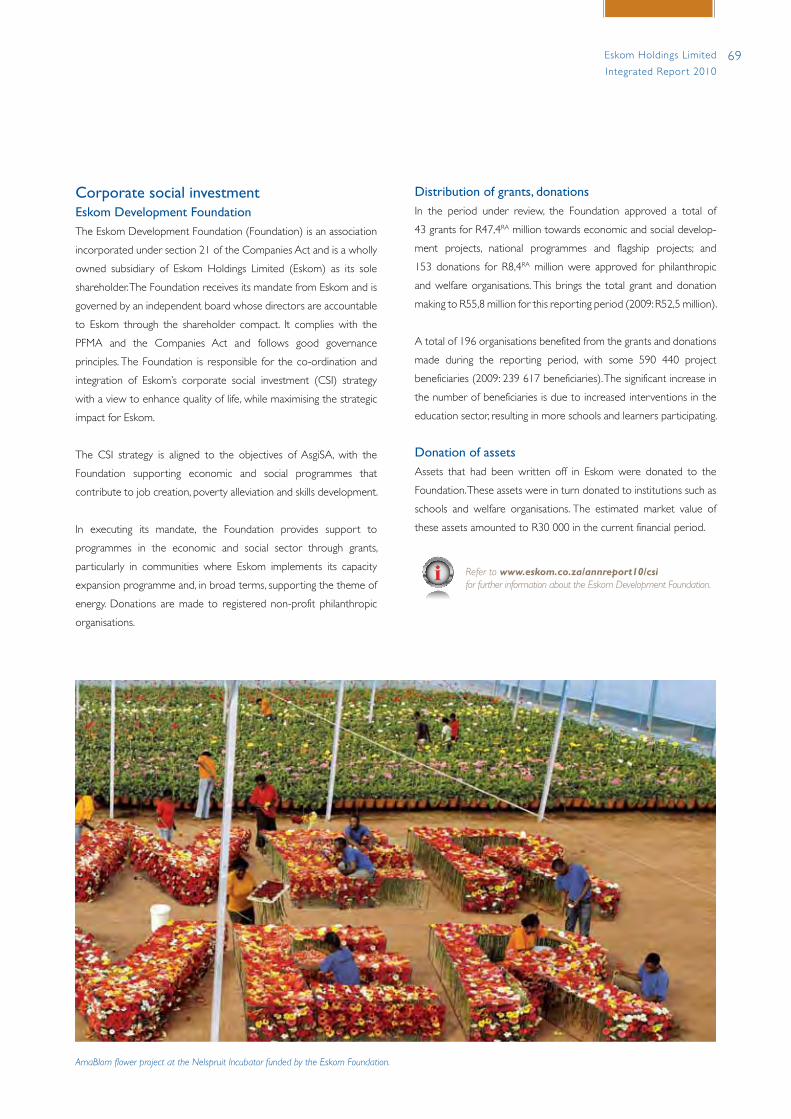
69Eskom Holdings Limited
Integrated Repor t 2010
Corporate social investmentEskom Development FoundationThe Eskom Development Foundation (Foundation) is an association
incorporated under section 21 of the Companies Act and is a wholly
owned subsidiary of Eskom Holdings Limited (Eskom) as its sole
shareholder. The Foundation receives its mandate from Eskom and is
governed by an independent board whose directors are accountable
to Eskom through the shareholder compact. It complies with the
PFMA and the Companies Act and follows good governance
principles. The Foundation is responsible for the co-ordination and
integration of Eskom’s corporate social investment (CSI) strategy
with a view to enhance quality of life, while maximising the strategic
impact for Eskom.
The CSI strategy is aligned to the objectives of AsgiSA, with the
Foundation supporting economic and social programmes that
contribute to job creation, poverty alleviation and skills development.
In executing its mandate, the Foundation provides support to
programmes in the economic and social sector through grants,
particularly in communities where Eskom implements its capacity
expansion programme and, in broad terms, supporting the theme of
energy. Donations are made to registered non-profit philanthropic
organisations.
Distribution of grants, donationsIn the period under review, the Foundation approved a total of
43 grants for R47,4RA million towards economic and social develop-
ment projects, national programmes and flagship projects; and
153 donations for R8,4RA million were approved for philanthropic
and welfare organisations. This brings the total grant and donation
making to R55,8 million for this reporting period (2009: R52,5 million).
A total of 196 organisations benefited from the grants and donations
made during the reporting period, with some 590 440 project
beneficiaries (2009: 239 617 beneficiaries). The significant increase in
the number of beneficiaries is due to increased interventions in the
education sector, resulting in more schools and learners participating.
Donation of assetsAssets that had been written off in Eskom were donated to the
Foundation. These assets were in turn donated to institutions such as
schools and welfare organisations. The estimated market value of
these assets amounted to R30 000 in the current financial period.
Refer to www.eskom.co.za/annreport10/csi for further information about the Eskom Development Foundation.
AmaBlom flower project at the Nelspruit Incubator funded by the Eskom Foundation.
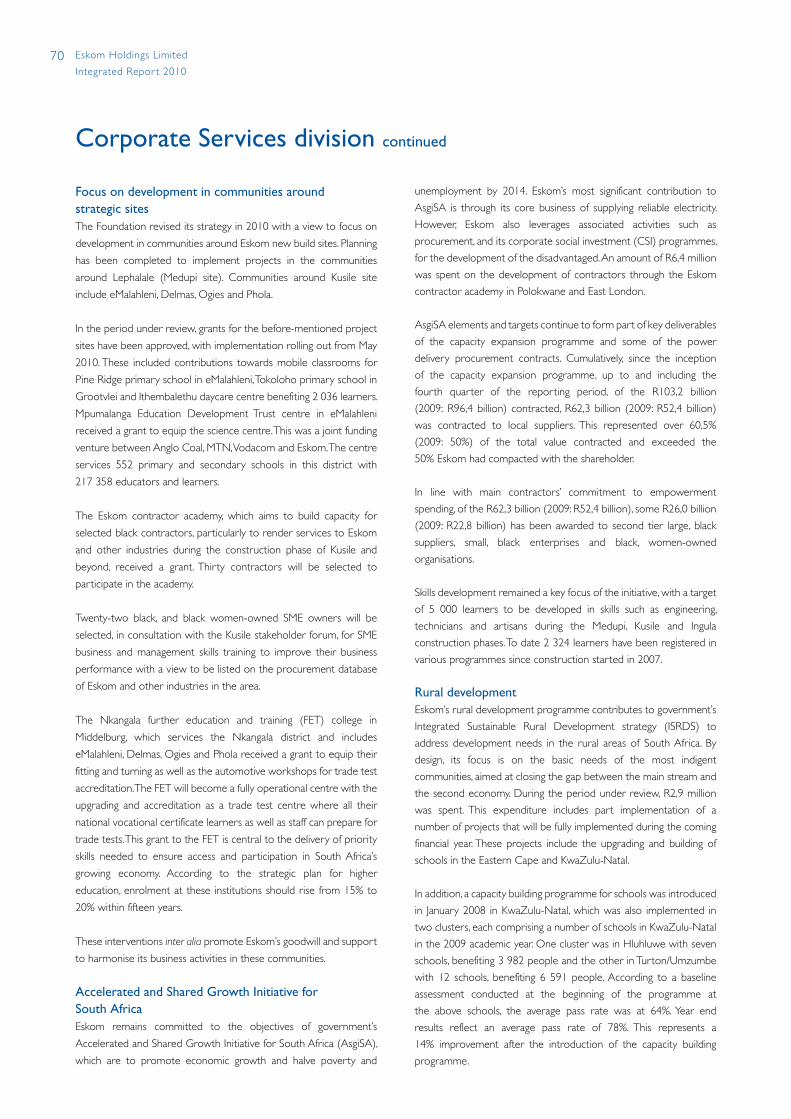
70 Eskom Holdings Limited
Integrated Repor t 2010
Focus on development in communities around strategic sitesThe Foundation revised its strategy in 2010 with a view to focus on
development in communities around Eskom new build sites. Planning
has been completed to implement projects in the communities
around Lephalale (Medupi site). Communities around Kusile site
include eMalahleni, Delmas, Ogies and Phola.
In the period under review, grants for the before-mentioned project
sites have been approved, with implementation rolling out from May
2010. These included contributions towards mobile classrooms for
Pine Ridge primary school in eMalahleni, Tokoloho primary school in
Grootvlei and Ithembalethu daycare centre benefiting 2 036 learners.
Mpumalanga Education Development Trust centre in eMalahleni
received a grant to equip the science centre. This was a joint funding
venture between Anglo Coal, MTN, Vodacom and Eskom. The centre
services 552 primary and secondary schools in this district with
217 358 educators and learners.
The Eskom contractor academy, which aims to build capacity for
selected black contractors, particularly to render services to Eskom
and other industries during the construction phase of Kusile and
beyond, received a grant. Thirty contractors will be selected to
participate in the academy.
Twenty-two black, and black women-owned SME owners will be
selected, in consultation with the Kusile stakeholder forum, for SME
business and management skills training to improve their business
performance with a view to be listed on the procurement database
of Eskom and other industries in the area.
The Nkangala further education and training (FET) college in
Middelburg, which services the Nkangala district and includes
eMalahleni, Delmas, Ogies and Phola received a grant to equip their
fitting and turning as well as the automotive workshops for trade test
accreditation. The FET will become a fully operational centre with the
upgrading and accreditation as a trade test centre where all their
national vocational certificate learners as well as staff can prepare for
trade tests. This grant to the FET is central to the delivery of priority
skills needed to ensure access and participation in South Africa’s
growing economy. According to the strategic plan for higher
education, enrolment at these institutions should rise from 15% to
20% within fifteen years.
These interventions inter alia promote Eskom’s goodwill and support
to harmonise its business activities in these communities.
Accelerated and Shared Growth Initiative for South AfricaEskom remains committed to the objectives of government’s
Accelerated and Shared Growth Initiative for South Africa (AsgiSA),
which are to promote economic growth and halve poverty and
unemployment by 2014. Eskom’s most significant contribution to
AsgiSA is through its core business of supplying reliable electricity.
However, Eskom also leverages associated activities such as
procurement, and its corporate social investment (CSI) programmes,
for the development of the disadvantaged. An amount of R6,4 million
was spent on the development of contractors through the Eskom
contractor academy in Polokwane and East London.
AsgiSA elements and targets continue to form part of key deliverables
of the capacity expansion programme and some of the power
delivery procurement contracts. Cumulatively, since the inception
of the capacity expansion programme, up to and including the
fourth quarter of the reporting period, of the R103,2 billion
(2009: R96,4 billion) contracted, R62,3 billion (2009: R52,4 billion)
was contracted to local suppliers. This represented over 60,5%
(2009: 50%) of the total value contracted and exceeded the
50% Eskom had compacted with the shareholder.
In line with main contractors’ commitment to empowerment
spending, of the R62,3 billion (2009: R52,4 billion), some R26,0 billion
(2009: R22,8 billion) has been awarded to second tier large, black
suppliers, small, black enterprises and black, women-owned
organisations.
Skills development remained a key focus of the initiative, with a target
of 5 000 learners to be developed in skills such as engineering,
technicians and artisans during the Medupi, Kusile and Ingula
construction phases. To date 2 324 learners have been registered in
various programmes since construction started in 2007.
Rural developmentEskom’s rural development programme contributes to government’s
Integrated Sustainable Rural Development strategy (ISRDS) to
address development needs in the rural areas of South Africa. By
design, its focus is on the basic needs of the most indigent
communities, aimed at closing the gap between the main stream and
the second economy. During the period under review, R2,9 million
was spent. This expenditure includes part implementation of a
number of projects that will be fully implemented during the coming
financial year. These projects include the upgrading and building of
schools in the Eastern Cape and KwaZulu-Natal.
In addition, a capacity building programme for schools was introduced
in January 2008 in KwaZulu-Natal, which was also implemented in
two clusters, each comprising a number of schools in KwaZulu-Natal
in the 2009 academic year. One cluster was in Hluhluwe with seven
schools, benefiting 3 982 people and the other in Turton/Umzumbe
with 12 schools, benefiting 6 591 people. According to a baseline
assessment conducted at the beginning of the programme at
the above schools, the average pass rate was at 64%. Year end
results reflect an average pass rate of 78%. This represents a
14% improvement after the introduction of the capacity building
programme.
Corporate Services division continued

71Eskom Holdings Limited
Integrated Repor t 2010
CASE STUDY: Coromandel dairy farm, Lydenburg, Mpumalanga
The Eskom Development Foundation’s grant to Coromandel dairy farm indicates how strategic assistance has helped a fledgling agri-business expand its productivity output and create new jobs.
The farm is an iconic piece of land in Mpumalanga between Dullstroom and Lydenburg. In 2002 Coromandel farm made history when ownership was transferred to 248 farm workers, who succeeded in obtaining a land grant to purchase the 5 800-hectare farm. What made this case unique was that the transfer of ownership was not driven by a land claim, but rather by the workers themselves. When Coromandel came onto the market from a deceased estate, the workers – many of whom had been on the farm from its beginning – approached the Land Reform Office for a purchase grant.
Prior to the Coromandel Farmers Trust taking ownership, farming included cattle (beef and dairy), sheep for their wool and fruit farming. At the time of the sale, only the dairy and some orchards remained. As Coromandel had spiralled into increasing financial difficulty in the years leading up to the sale, vital assets were held by liquidators before an agreement was finally reached.
“This set us back and we had no chance to make improvements or expansions to the farm even though we continued to protect these assets while the estate was being wound up,” explains Brian Phokane, Chairman of the Coromandel Farmers Trust and farm manager. “Eventually the liquidators conceded that the Farmers Trust should have first right of purchase.”
The Eskom Development Foundation assisted Coromandel with a grant for a new milking system and a computerised cooling tank. Since the installation of the system, milking time has been halved to two and a half hours per milking session instead of four and a half hours per milking session. An additional 75 litres of milk is being produced on a daily basis and the dairy’s income has increased to over R6 000 per day. An additional 16 seasonal workers were employed to work at the dairy.

72 Eskom Holdings Limited
Integrated Repor t 2010
More contractor academy students graduate
2009 contractor academy graduates at the awards ceremony.
Eskom’s contractor academy performed well in the 2009 academic year, thanks to the efforts and commitment of its latest group of graduates. At a special awards ceremony, each graduate received certificates of achievement. In addition, the programme’s top students received further accolades in the form of a number of special awards.
The graduates used the occasion to pay a special tribute to Eskom for its support and continual encouragement and, importantly, for taking the time and resources to invest in their skills. Some of the students shared their personal development experiences with the assembled guests; many telling their stories of dedication and sheer hard work in order to improve their personal skills and career prospects by also studying management programmes.
The dedication and commitment of the students at the Eskom contractor academy is testimony to the benefits of Eskom’s contribution to the business world of South Africa. The academy’s graduates emerge richer in terms of self-empowerment, enriched personal lives, and access to a world of new opportunities, while adding to a growing supplier pool of capable small and medium black businesses from which industries can draw.
Corporate Services division continued
Haylene Liberty, CEO of the foundation, presents a cheque to Dr Gareth Edwards, chairman of the Breast Health Foundation at the Eskom Development Foundation’s annual fundraising event – Joy & Jewels.

73Eskom Holdings Limited
Integrated Repor t 2010
Broad-based black economic empowerment (B-BBEE) This year saw Eskom fully engaging the Codes of Good Practice
(the codes) in terms of B-BBEE. The codes, gazetted in February
2007, are a replacement of the narrow-based BEE. The main aim of
the codes is to open more doors for economic emancipation and
participation, with sustainability as the core focus. B-BBEE suppliers
need to be classified according to their level of B-BBEE contribution,
based on certificates from accredited verification agencies, as
required by the codes.
Eskom’s B-BBEE performance is rated from two perspectives:
• Eskom as an empowerment company, where Eskom’s B-BBEE level
2 contributor rating will provide evidence to stakeholders of
Eskom’s performance as an empowerment company.
• Eskom’s performance as a purchaser, where Eskom will benefit
from the attributable spend, dependent on the B-BBEE certification
of its suppliers. For Eskom to benefit, it must ensure that its
suppliers have a current B-BBEE certification document, and to
encourage them to improve their B-BBEE scoring.
For details of Eskom’s B-BBEE scorecard see the Finance Division
report on page 48.
Refer to www.eskom.co.za/annreport10/004.html for details of the B-BBEE process, an explanation of the B-BBEE levels and the link to attributable spend.
Learners enjoy their new classroom at Bester Primary School near the Ingula project.

76 Summary
77 Performance
77 Risk profile
78 Skills
80 Training interventions
80 Focus on leadership
81 Transformation
82 Health and wellness
82 Employee relations
82 Benchmarking
83 Staffing for the expansion phase
Staffing for growthHuman Resources division

76 Eskom Holdings Limited
Integrated Repor t 2010
Human Resources
Mandate: Provides human resources strategy, direction, policies and assurance as well as strategic services to the Eskom Group. Human resources will also drive Eskom-wide culture change through effective change management and implementation of appropriate programmes.
Progress this year
Performance
• Given the economic recession in South Africa, the organisation still attained a steady growth in the performance of its human resources sustainability
Skills
• Magnet Survey: engineering learners voted Eskom – Employer of choice for two consecutive years
• Sustained the skills base and tripled the skills pipeline over the last five years
Future priorities
• Leadership and supervisory development
• Workforce planning and skills management
• Eskom academy of learning (EAL) operationalised
• Maintain employee value proposition (EVP)
• Labour costs and options optimised
• HR@Eskom – back to basics
Q: What is your major challenge in terms of human resources?
A: Ensuring that we maximise our value to the business
through genuine alignment to the line businesses’ needs.
Bhabhalazi BulungaManaging Director: Human Resources
77Eskom Holdings Limited
Integrated Repor t 2010
PerformanceThe mandate of human resources within Eskom remains entrenched
in Eskom’s role within the context of South Africa. The human
resources strategy therefore supports universal principles that reflect
the common needs of all South Africans namely:
• improving the quality of life of all citizens of our country
• maximising the potential of each employee in our organisation
• becoming the embodiment of a united and democratic South
Africa
• enhancing South Africa’s participation in the global economy
The human resources division provides
• direction and assurance on people-related issues
• business partnering in the delivery of the organisational objectives
• a cost-effective transactional service for economies of scale and
skills
An important role is to measure and monitor critical factors
relating to the sustainability of Eskom’s human resources, an internally
developed human resources sustainability index (HRSI) measures
key aspects of human resources sustainability. The HRSI is also
contracted into leadership performance compacts.
The areas of measurement can be summarised into employee
satisfaction, employee competence and employee health and
wellness. The measurements and measurement criteria are reviewed
on an annual basis to ensure applicability.
The HRSI score for the past year was 92,1% (2009: 89,8%) against a
target of 80%. Eskom’s human resources performance was well
maintained and marginally improved in spite of rigorous resource
constraints. This is a satisfactory performance, indicating that our
human resources interventions are relevant and meet the needs of
our people and our organisation.
If we want to meet the needs of this constantly evolving organisation,
we must ensure that we employ the right people for the right job at
the right time. Every effort is being made to ensure that we obtain
and retain the skills needed to ensure a reliable electricity supply for
generations to come.
The human resource development strategy over the past year has
demonstrated remarkable resilience in an environment characterised
by a number of constraints, such as the impact of the global economic
downturn and international demand for scarce skills.
As per the skills development legislation, Eskom has submitted a
workplace skills plan and an annual training report for the period
2009/2010.
Risk profileThe Human Resources division recognises the importance of an
integrated risk management (IRM) system and has implemented a
programme to identify, report and manage the risks in line with
Eskom’s IRM standard and policy. The division started reporting
on the new IRM methodology in October 2009. The Human
Resources executive committee reviews the risk reports and
monitors the status and progress in the treatment of human
resources risks.
The dynamic nature of events, both internal and external to
Eskom, has presented the following distinctive risks to Human
Resources in Eskom.
78 Eskom Holdings Limited
Integrated Repor t 2010
Risk Treatment plansLeadership alignment and development
Implement appropriate governance and operating model to sustain the leadership framework. Implement the leadership framework and associated behaviours throughout Eskom. Measure the impact of “new” leadership behaviours, including LEA (leadership effectiveness assessment) and leadership excellence scorecard
Workforce planning Complete workforce management policy/strategy. Develop workforce planning, organisational design and organisational maintenance procedures. Develop Eskom resourcing framework. Develop and increase the capability to plan and design the organisation
Technical and/or functional competence
Develop an attraction, retention and development strategy. Implement an employee value proposition. Implement and maintain the learning management system. Ensure IDPs are in place. Engage the learner pipeline steering committee
Dynamic changes within the health sector
Perform environmental scanning and impact analysis on staff. Strengthen the collaborative relationship with stakeholders
Human Resources continued
Medium- and long-term skills requirements have been determined in
terms of the critical workforce segments. Likewise, the core and
scarce skills have been identified and translated into a workforce plan
and a medium-term skills plan – aligned to the first integrated
resource plan (IRP).
The recruitment section on the Eskom website
(www.eskom.co.za – “A career at Eskom”) has been streamlined to
make it easy for job seekers to find meaningful work opportunities in
the organisation.
An integral part of retaining current staff and recruiting new people
is developing Eskom as an employer of choice and building a sound
EVP. Key activities in this regard were:
• Incentives: motivating people by looking at reward and recognition
strategies. Where there is a shortage of core, critical or scarce
skills, we will pay competitive salaries and fringe benefits and
review the latest remuneration principles and practices.
• Employee engagement: meaningful engagement and mutual
commitment through effective organisational communication and
ensuring that people are given work that is challenging and
motivating, while having a work/life balance.
• Co-worker quality: employees value co-worker and managerial
quality. Eskom will be able to enhance these qualitative
relationships through the introduction of communities of practice
(CoPs).
SkillsEskom has been fortunate in benefiting from the extremely low
3,5% staff turnover during the year (6,0% in 2009), mainly due to
the restricted job market resulting from the tight economic climate
both locally and internationally. However, we continue to face a
number of skills-related challenges:
• ring-fencing and operationalising the Eskom Academy of Learning
that manages all learning in Eskom
• learner pipeline
• employee value proposition (EVP)
Eskom has sustained its skills base and even managed to triple the
learner pipeline over the last five years (2006 – 2010). During the
recent Magnet survey, 4 892 young professionals rated Eskom as
“Employer of Choice,” out of 60 South African blue-chip companies.
The next planning cycle will be marked by reinforcement of the
shareholder’s vision of being a developmental entity. The higher
levels of growth and development will put the required pressure
on Eskom to maintain and improve its “employer of choice” niche in
the marketplace through high potential (HiPo) talent management
strategies and skills development opportunities for all employees.
A succession management business process and procedure has
been developed to ensure that there is robust talent contingency
planning and that career development opportunities are put in place.
The identification and categorisation of skills, be it non-core or core,
critical and scarce should be aligned with the new legislative
requirements which is the organising framework for occupations
(OFO).

79Eskom Holdings Limited
Integrated Repor t 2010
Cumulative projected additional core, critical and scarce skills requirements
2010 2011 2012 2013 2014
Skills required 1 712 2 054 2 465 2 958 3 300
Eskom staff turnover
CompanyActual
2010Actual2009
Actual2008
Employees at start of period 35 196 32 954 30 746
Add: Recruitment 2 581 4 261 4 385
Less: Resignations (541) (1 312) (1 370)
Deaths (260) (276) (260)
Dismissals (110) (98) (85)
Absconded (12) (11) (13)
Retirements (300) (337) (447)
Voluntary packages (5) (7) (15)
Other (2) 22 13
Total employees at end of period 36 547 35 196 32 954
Employee turnover rate (%) 3,5 6,0 6,9
Eskom staff age distribution
Company
Actual 2010
%
Actual2009
%
Actual2008
%
Age distribution of workforce – end of period
18 – 20 years 0,05 0,04 0,05
20 – 29 21,86 21,62 19,35
30 – 39 28,75 27,25 25,60
40 – 49 22,04 24,59 28,40
50 – 59 23,54 23,20 23,50
Over 60 3,76 3,30 3,10
Additional core, critical and scarce skills must be developed or
recruited annually over the next five years to replace losses and cater
for Eskom’s new build programme. The Eskom learner pipeline has
been increased to 5 255 learners with three- or four-year learning
bursary contracts to accommodate the new skills requirements and
offset normal attrition. This is reflected in the table below:
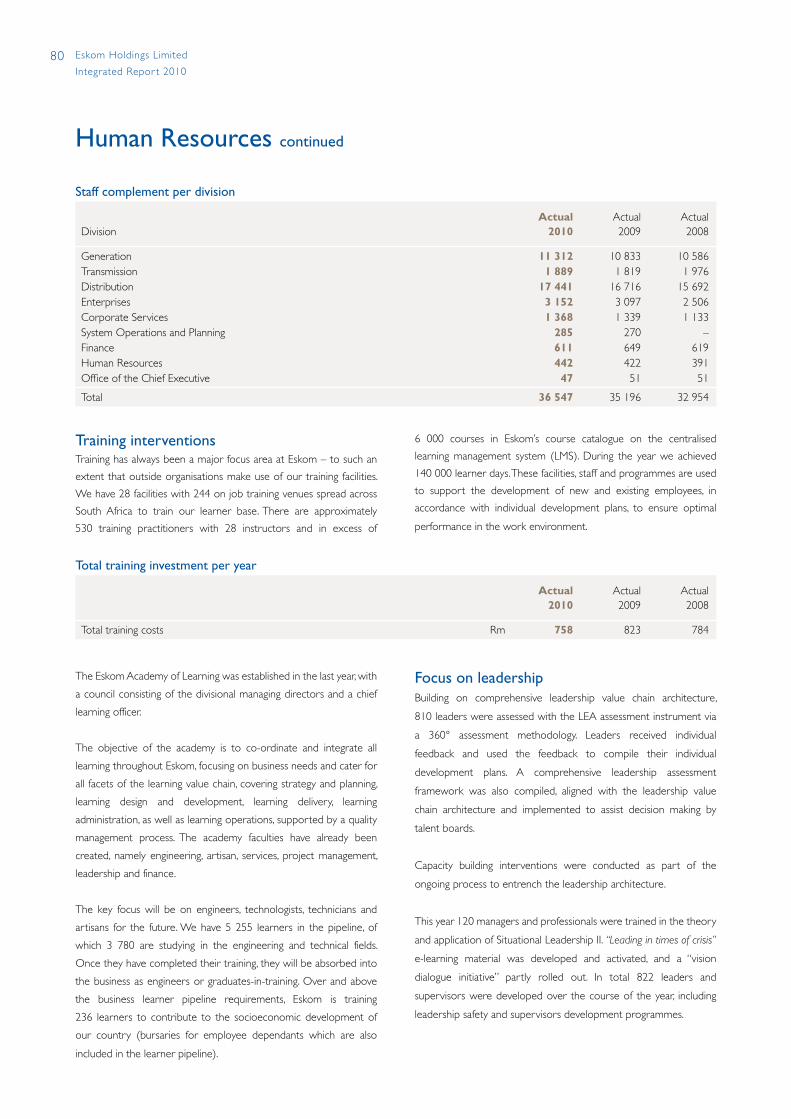
80 Eskom Holdings Limited
Integrated Repor t 2010
Staff complement per division
DivisionActual
2010Actual2009
Actual2008
Generation 11 312 10 833 10 586Transmission 1 889 1 819 1 976Distribution 17 441 16 716 15 692Enterprises 3 152 3 097 2 506Corporate Services 1 368 1 339 1 133System Operations and Planning 285 270 –Finance 611 649 619Human Resources 442 422 391Office of the Chief Executive 47 51 51
Total 36 547 35 196 32 954
Total training investment per year
Actual2010
Actual2009
Actual2008
Total training costs Rm 758 823 784
Human Resources continued
Focus on leadership Building on comprehensive leadership value chain architecture,
810 leaders were assessed with the LEA assessment instrument via
a 360° assessment methodology. Leaders received individual
feedback and used the feedback to compile their individual
development plans. A comprehensive leadership assessment
framework was also compiled, aligned with the leadership value
chain architecture and implemented to assist decision making by
talent boards.
Capacity building interventions were conducted as part of the
ongoing process to entrench the leadership architecture.
This year 120 managers and professionals were trained in the theory
and application of Situational Leadership II. “Leading in times of crisis”
e-learning material was developed and activated, and a “vision
dialogue initiative” partly rolled out. In total 822 leaders and
supervisors were developed over the course of the year, including
leadership safety and supervisors development programmes.
The Eskom Academy of Learning was established in the last year, with
a council consisting of the divisional managing directors and a chief
learning officer.
The objective of the academy is to co-ordinate and integrate all
learning throughout Eskom, focusing on business needs and cater for
all facets of the learning value chain, covering strategy and planning,
learning design and development, learning delivery, learning
administration, as well as learning operations, supported by a quality
management process. The academy faculties have already been
created, namely engineering, artisan, services, project management,
leadership and finance.
The key focus will be on engineers, technologists, technicians and
artisans for the future. We have 5 255 learners in the pipeline, of
which 3 780 are studying in the engineering and technical fields.
Once they have completed their training, they will be absorbed into
the business as engineers or graduates-in-training. Over and above
the business learner pipeline requirements, Eskom is training
236 learners to contribute to the socioeconomic development of
our country (bursaries for employee dependants which are also
included in the learner pipeline).
Training interventions Training has always been a major focus area at Eskom – to such an
extent that outside organisations make use of our training facilities.
We have 28 facilities with 244 on job training venues spread across
South Africa to train our learner base. There are approximately
530 training practitioners with 28 instructors and in excess of
6 000 courses in Eskom’s course catalogue on the centralised
learning management system (LMS). During the year we achieved
140 000 learner days. These facilities, staff and programmes are used
to support the development of new and existing employees, in
accordance with individual development plans, to ensure optimal
performance in the work environment.

81Eskom Holdings Limited
Integrated Repor t 2010
TransformationEskom continues to drive transformation as part of its strategic
objectives. The organisation has over the years set targets to improve
its workforce profile. A 2020 strategy was put in place to set long-
term targets.
The highlight of the transformation process has been the
establishment of consultative structures at all business units, at
divisional and Eskom Holdings level. The challenge is to revise our
long-term strategy for target setting of race, gender and disability to
enable the organisation to change its workforce profile within the
different occupational levels to reflect the demographics of the
country’s economically active population.
As part of our transformation agenda, we will continue with the
affirmative action drive, the promotion of women and the focus on
employment equity for people living with disabilities, not only because
it is required of us by statute, but because we believe that it is the
right thing to do. It is also a business imperative.
Human resources operational measurementsThe table below reflects the performance against internal
transformation guidelines, reflecting employee movements and the
achievement of targets set for gender and race in the managerial
levels only. These guidelines and targets differ from the regulatory
definitions of the Employment Equity Act in the following respects:
• Eskom does not include non-permanent employees who would
otherwise be included in terms of the Employment Equity Act.
• Eskom has excluded foreign nationals when preparing this table.
Although the current Eskom guideline provides for the inclusion of
foreign nationals who would otherwise not be included in terms
of the Employment Equity Act, Eskom intends to modify its
guideline to bring it in line with this Act.
Eskom’s annual report to the Department of Labour in terms of the
Employment Equity Act is being discussed with organised labour
prior to the October 2010 submission requirement.
GroupUnit of
measureTarget
2010Actual
2010Actual2009
Actual2008
Race:Black1 staff at managerial level2 % 66,3 68,7RA 68,6 65,9Black staff at all levels % n/a 76,0 75,8 73,7
Gender:Women at managerial level % 36,4 34,4RA 34,5 34,1Women at all levels % n/a 29,1 28,8 27,5
People with disabilities % 3,7 2,4RA 3,2 3,1
Internal promotions:Black staff at all levels % n/a 83,4 78,7 79,1Women at all levels % n/a 31,8 37,4 36,0
CompanyUnit of
measureTarget
2010Actual
2010Actual2009
Actual2008
Race:Black1 staff at managerial level2 % 66,3 69,3RA 69,3 66,4Black staff at all levels % n/a 76,7 76,5 74,5
Gender:Women at managerial level % 36,4 35,0RA 35,1 34,8Women at all levels % n/a 29,9 29,6 28,2People with disabilities % 3,7 2,6RA 3,4 3,3
Internal promotions:Black staff at all levels % n/a 83,4 78,7 78,6Women at all levels % n/a 31,8 37,4 37,7
1. African, Asian and Coloured Eskom employees.2. Managers, professionals and supervisors – CU to F band on the Patterson grading; TASK grading 11 to 23 plus F bands in Eskom.RA Reasonable assurance provided by the independent assurance provider (refer page 169).
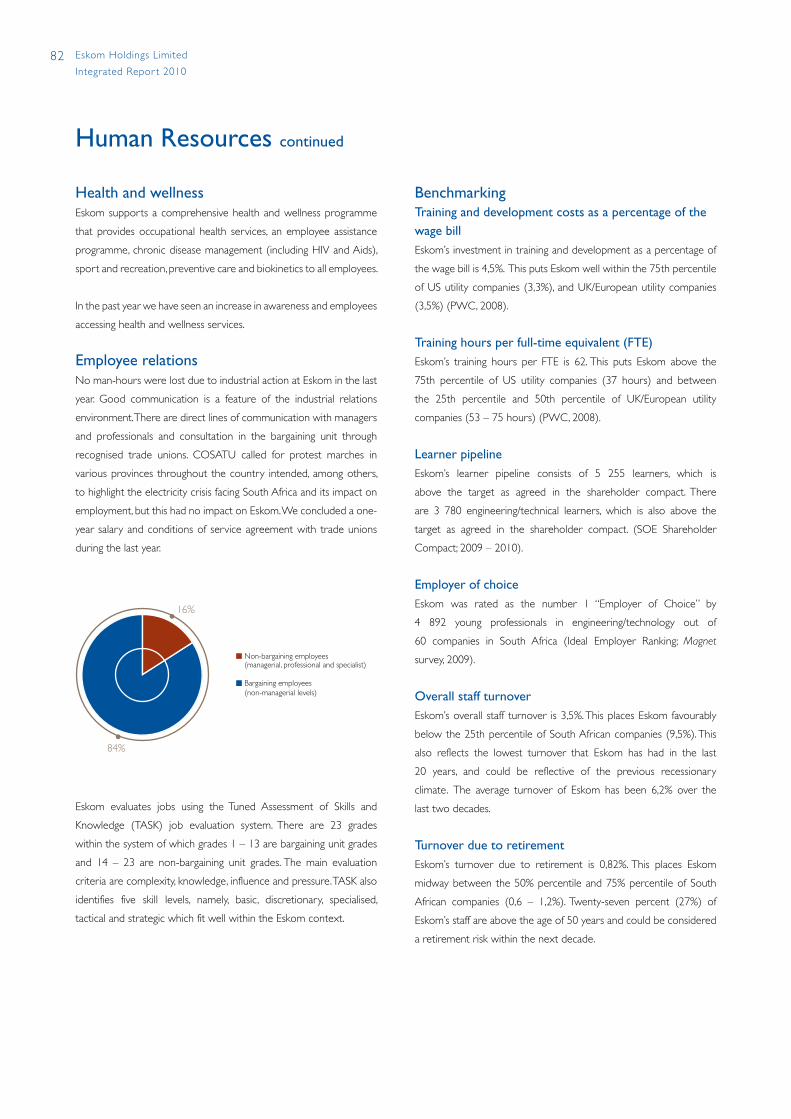
82 Eskom Holdings Limited
Integrated Repor t 2010
Health and wellnessEskom supports a comprehensive health and wellness programme
that provides occupational health services, an employee assistance
programme, chronic disease management (including HIV and Aids),
sport and recreation, preventive care and biokinetics to all employees.
In the past year we have seen an increase in awareness and employees
accessing health and wellness services.
Employee relationsNo man-hours were lost due to industrial action at Eskom in the last
year. Good communication is a feature of the industrial relations
environment. There are direct lines of communication with managers
and professionals and consultation in the bargaining unit through
recognised trade unions. COSATU called for protest marches in
various provinces throughout the country intended, among others,
to highlight the electricity crisis facing South Africa and its impact on
employment, but this had no impact on Eskom. We concluded a one-
year salary and conditions of service agreement with trade unions
during the last year.
Eskom evaluates jobs using the Tuned Assessment of Skills and
Knowledge (TASK) job evaluation system. There are 23 grades
within the system of which grades 1 – 13 are bargaining unit grades
and 14 – 23 are non-bargaining unit grades. The main evaluation
criteria are complexity, knowledge, influence and pressure. TASK also
identifies five skill levels, namely, basic, discretionary, specialised,
tactical and strategic which fit well within the Eskom context.
Bargaining employees(non-managerial levels)
Non-bargaining employees(managerial, professional and specialist)
16%
84%
BenchmarkingTraining and development costs as a percentage of the wage billEskom’s investment in training and development as a percentage of
the wage bill is 4,5%. This puts Eskom well within the 75th percentile
of US utility companies (3,3%), and UK/European utility companies
(3,5%) (PWC, 2008).
Training hours per full-time equivalent (FTE)Eskom’s training hours per FTE is 62. This puts Eskom above the
75th percentile of US utility companies (37 hours) and between
the 25th percentile and 50th percentile of UK/European utility
companies (53 – 75 hours) (PWC, 2008).
Learner pipelineEskom’s learner pipeline consists of 5 255 learners, which is
above the target as agreed in the shareholder compact. There
are 3 780 engineering/technical learners, which is also above the
target as agreed in the shareholder compact. (SOE Shareholder
Compact; 2009 – 2010).
Employer of choiceEskom was rated as the number 1 “Employer of Choice” by
4 892 young professionals in engineering/technology out of
60 companies in South Africa (Ideal Employer Ranking; Magnet
survey, 2009).
Overall staff turnoverEskom’s overall staff turnover is 3,5%. This places Eskom favourably
below the 25th percentile of South African companies (9,5%). This
also reflects the lowest turnover that Eskom has had in the last
20 years, and could be reflective of the previous recessionary
climate. The average turnover of Eskom has been 6,2% over the
last two decades.
Turnover due to retirementEskom’s turnover due to retirement is 0,82%. This places Eskom
midway between the 50% percentile and 75% percentile of South
African companies (0,6 – 1,2%). Twenty-seven percent (27%) of
Eskom’s staff are above the age of 50 years and could be considered
a retirement risk within the next decade.
Human Resources continued
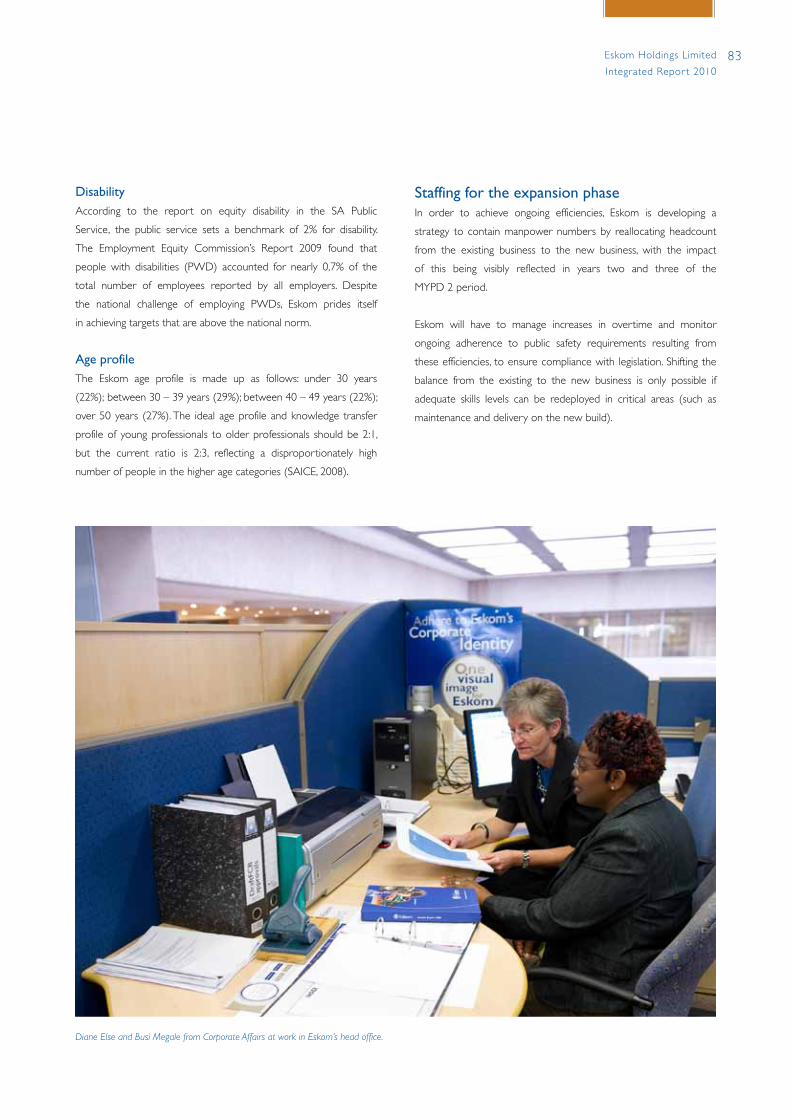
83Eskom Holdings Limited
Integrated Repor t 2010
DisabilityAccording to the report on equity disability in the SA Public
Service, the public service sets a benchmark of 2% for disability.
The Employment Equity Commission’s Report 2009 found that
people with disabilities (PWD) accounted for nearly 0,7% of the
total number of employees reported by all employers. Despite
the national challenge of employing PWDs, Eskom prides itself
in achieving targets that are above the national norm.
Age profileThe Eskom age profile is made up as follows: under 30 years
(22%); between 30 – 39 years (29%); between 40 – 49 years (22%);
over 50 years (27%). The ideal age profile and knowledge transfer
profile of young professionals to older professionals should be 2:1,
but the current ratio is 2:3, reflecting a disproportionately high
number of people in the higher age categories (SAICE, 2008).
Staffing for the expansion phaseIn order to achieve ongoing efficiencies, Eskom is developing a
strategy to contain manpower numbers by reallocating headcount
from the existing business to the new business, with the impact
of this being visibly reflected in years two and three of the
MYPD 2 period.
Eskom will have to manage increases in overtime and monitor
ongoing adherence to public safety requirements resulting from
these efficiencies, to ensure compliance with legislation. Shifting the
balance from the existing to the new business is only possible if
adequate skills levels can be redeployed in critical areas (such as
maintenance and delivery on the new build).
Diane Else and Busi Megale from Corporate Affairs at work in Eskom’s head office.
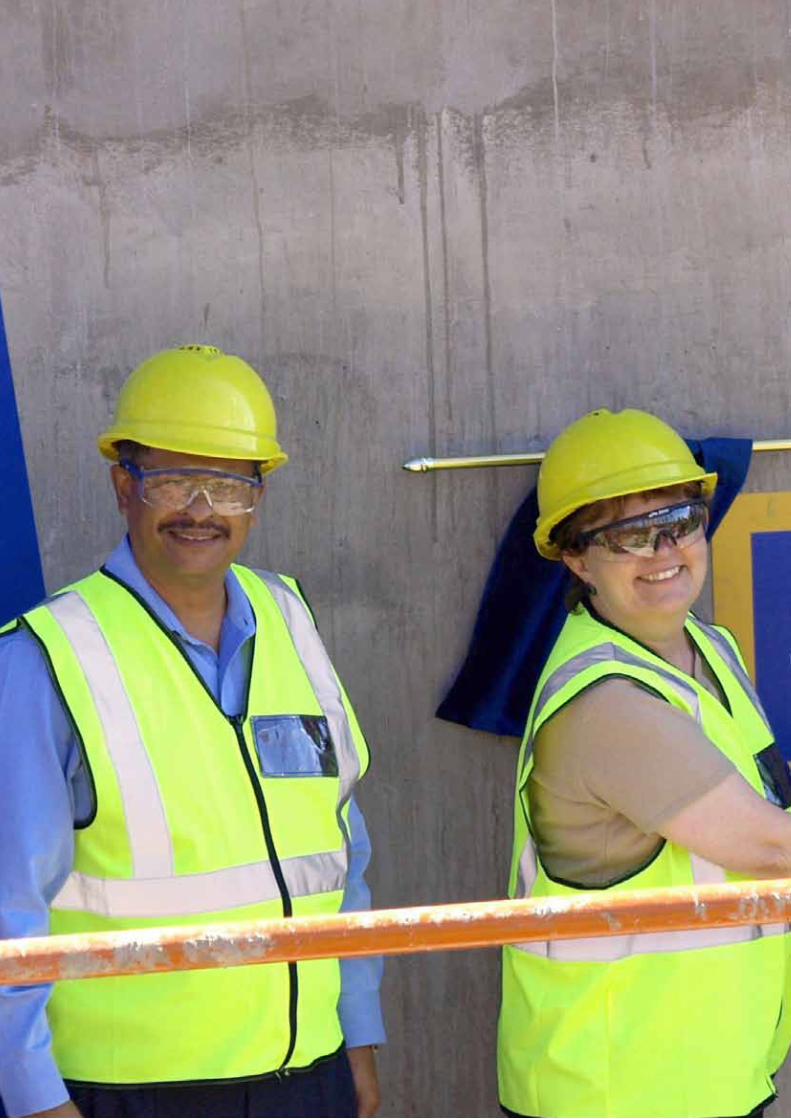
87 Regulatory affairs function
87 Regulatory and legal framework
90 Multi-year price determination (MYPD 2) and the price increase
91 Looking ahead
Engaging on policy and regulationRegulatory and Legal Framework
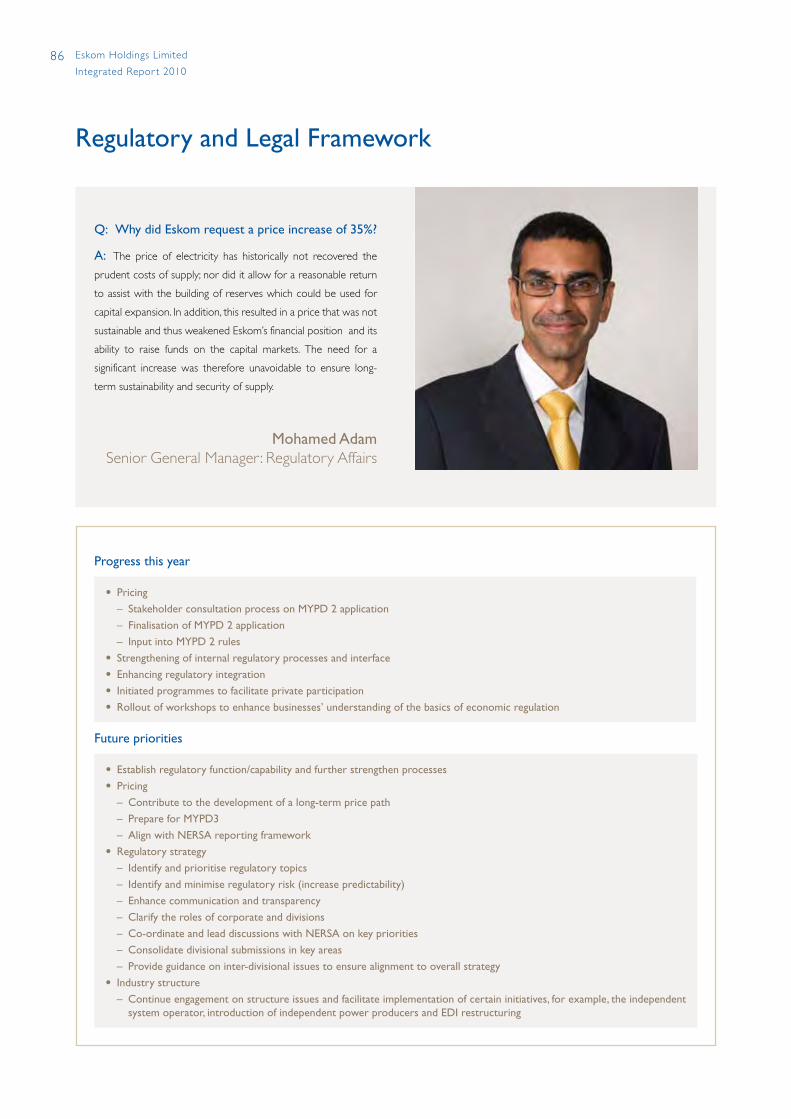
86 Eskom Holdings Limited
Integrated Repor t 2010
Progress this year
• Pricing – Stakeholder consultation process on MYPD 2 application – Finalisation of MYPD 2 application – Input into MYPD 2 rules • Strengthening of internal regulatory processes and interface• Enhancing regulatory integration• Initiated programmes to facilitate private participation• Rollout of workshops to enhance businesses’ understanding of the basics of economic regulation
Future priorities
• Establish regulatory function/capability and further strengthen processes• Pricing – Contribute to the development of a long-term price path – Prepare for MYPD3 – Align with NERSA reporting framework• Regulatory strategy – Identify and prioritise regulatory topics – Identify and minimise regulatory risk (increase predictability) – Enhance communication and transparency – Clarify the roles of corporate and divisions – Co-ordinate and lead discussions with NERSA on key priorities – Consolidate divisional submissions in key areas – Provide guidance on inter-divisional issues to ensure alignment to overall strategy• Industry structure – Continue engagement on structure issues and facilitate implementation of certain initiatives, for example, the independent
system operator, introduction of independent power producers and EDI restructuring
Regulatory and Legal Framework
Mohamed AdamSenior General Manager: Regulatory Affairs
Q: Why did Eskom request a price increase of 35%?
A: The price of electricity has historically not recovered the
prudent costs of supply; nor did it allow for a reasonable return
to assist with the building of reserves which could be used for
capital expansion. In addition, this resulted in a price that was not
sustainable and thus weakened Eskom’s financial position and its
ability to raise funds on the capital markets. The need for a
significant increase was therefore unavoidable to ensure long-
term sustainability and security of supply.
87Eskom Holdings Limited
Integrated Repor t 2010
Africa is applicable to Eskom – for example the Companies Act, the
competition laws, labour laws and tax legislation, to mention a few. In
addition, Eskom is also subject to legislation specifically applicable to
state-owned entities – notably the Public Finance Management Act
and the Promotion of Administrative Justice Act.
During the 2011 financial year, two major pieces of legislation will
become effective. The first is the Companies Act, 71 of 2008 and the
second is the Consumer Protection Act, 68 of 2008. Both Acts may
have a major impact on Eskom and as such Eskom has during the
current financial year focused on preparing for effective
implementation.
Regulatory frameworkEskom is regulated by the National Energy Regulator of South Africa
(NERSA) in accordance with the Electricity Regulation Act, 4 of 2006.
The objectives of the Act include:
• achieving the efficient, effective, sustainable and orderly
development and operation of electricity supply infrastructure in
South Africa
• promoting the long-term sustainability of the industry
• facilitating investment in the industry
• facilitating universal access to electricity
• promoting the use of diverse energy sources and energy efficiency
• promoting competitiveness and customer choice
• facilitating a fair balance between the interests of customers and
end users, licensees, investors and the public
NERSA’s powers include issuing licences for the operation of
generation, distribution and transmission facilities, import, export
and trading of electricity, and determining and approving electricity
prices and tariffs as well as the conditions on which electricity may
be sold.
Eskom has been issued with separate licences for the generation,
transmission and distribution of electricity, including all matters
related or incidental thereto. Eskom also has a nuclear licence that
regulates the operation of its nuclear power station and all aspects of
the nuclear value chain.
In the light of the above it is clear that NERSA has significant influence
and oversight over Eskom’s business. Eskom is also subject to
oversight directly or indirectly through government as shareholder
and policy maker, as well as other regulators.
Eskom needs to interact across all areas of government and has the
benefit of a number of relationships with various ministries and
government departments in so far as the regulatory environment
within which it operates is concerned.
Regulatory affairs functionIn an effort to enhance Eskom’s regulatory capability and its ability to
develop an integrated regulatory strategy that supports its business
objectives in line with best practices, Eskom has established a
regulatory affairs function, under the guidance of Mohamed Adam,
Senior General Manager (Regulatory Affairs) and Corporate Counsel.
The role of the function will be to constructively and effectively
engage with and shape the policy and regulatory environment within
which Eskom operates. Its key focus areas in the immediate future
will include the refinement of the regulatory strategy for the
organisation, co-ordinating the interface with NERSA, assisting with
regulatory compliance and assisting with the integration of regulatory
matters in business decisions across the organisation.
Currently, regulatory matters across the organisation are co-
ordinated through a regulatory interface co-ordinating forum (RICF),
with representation across the divisions in Eskom. As further details
of the Regulatory Affairs function unfolds, it is likely that the workings
of the RICF will be strengthened to assist in fulfilling this mandate.
The Regulatory Affairs function will work closely with all the divisions
as well as other corporate support functions in providing a value-
added input to Eskom’s business. In particular, there is a close
relationship with the company secretary regarding legal, compliance
and governance matters; with the Finance division regarding pricing
and funding matters and with group communications regarding
stakeholder engagement.
A number of issues that are referred to herein are also dealt with
in the divisions. While this section provides an overall context
for some of the major initiatives, further detail is provided in the
divisional reports.
Regulatory and legal frameworkThe absence of sufficient competition in the electricity sector in
South Africa necessitates economic regulation of the industry so
as to ensure that the interests of customers, licensees and other
stakeholders are balanced and to ensure the sustainability of
the industry.
The regulatory, legislative and policy framework in the energy sector
has also been evolving. Some of the significant developments in this
regard are set out later in this section.
Eskom is also regulated in the broader sense beyond electricity
regulation. In 2002 Eskom was converted into a public company
pursuant to the Eskom Conversion Act, 13 of 2001 and as such the
legislative framework applicable to any corporate entity in South
88 Eskom Holdings Limited
Integrated Repor t 2010
Some of the key relationships are outlined below.
Shareholder – Minister of Public Enterprises The Minister of Public Enterprises is the shareholder representative
of the South African government with oversight responsibility for
Eskom. The relationship is governed through a shareholder compact.
The shareholder sets and agrees on the strategic intent, key
performance areas and targets for Eskom. The shareholder compact
includes strategic objectives, policies, financial, technical and other key
performance indicators and reporting requirements. Quarterly and
annual reports on performance against the compact are provided to
the Department of Public Enterprises (DPE). Eskom’s responsibilities,
approvals and reporting in terms of the Public Finance Management
Act (PFMA) are managed through the DPE. The DPE also serves as
a conduit for Eskom’s relationship with other government
departments. Eskom’s compliance with the PFMA is discussed in the
directors’ report on page 179.
Policy – Minister of Energy The Minister of Energy, together with the Department of Energy
(DoE) is the key policy ministry responsible for the energy industry,
including the electricity sector, the activities of which are mainly
governed by the Electricity Regulation Act, 4 of 2006 and its
associated regulations.
Additional financial oversight and reporting – National TreasuryThe Minister of Finance plays a pivotal role in developing South
Africa’s fiscal policy. In certain instances Eskom also needs to obtain
approval from the Minister of Finance and reports to National
Treasury in terms of the PFMA. In addition, National Treasury has
been instrumental in providing the government loan and guarantees
in favour of Eskom. Further information in this regard is set out in the
Finance division section.
Environmental compliance – Minister of Water and Environmental AffairsEskom’s operations have an impact on the environment and Eskom
is committed to managing and mitigating this impact in an effective
manner. It is subject to the current environmental legislation and
policies and strives to fulfil its obligations in a responsible manner.
In terms of environmental control, Eskom is regulated through
environmental authorisations and licences/permits issued by the
Department of Water and Environmental Affairs. These include
licences or permits for commencement of construction of power
stations and major power lines and substations, waste (including ash
dams/dumps), emission licences and integrated water use licences.
Further information in this regard is set out in the Corporate Services
and Generation Business sections.
Economic planning and integration – Minister of Planning (National Planning Commission), Minister of Economic Development and Minister of Trade and IndustryEskom recognises the need to build additional synergies in other
areas of government. The operations of Eskom, and in particular the
capital expansion programme, have a significant macroeconomic
impact beyond just the energy sector. The infrastructure development
needs to be aligned with national planning and economic
development initiatives. In addition, the construction programme
could be leveraged to achieve sustainable benefits for local industry
and manufacturing capability and needs to be aligned with South
Africa’s industrial policy and the industrial policy action plan.
Nuclear operations – National Nuclear RegulatorEskom is also regulated by the National Nuclear Regulator established
by the National Nuclear Regulator Act, 47 of 1999. Its role is to
protect persons, property and the environment against nuclear
damage through the establishment of safety standards and regulatory
practices, to exercise regulatory control related to safety over various
aspects of the nuclear sector, and to issue nuclear licences. The
activities of Eskom’s Koeberg power station are regulated hereunder.
Legal and policy framework Some of the most important recent developments within the
electricity sector are summarised below.
Electricity regulations on new generation capacity1 On 5 August 2009 the Minister of the then Department of Minerals
and Energy (DME) promulgated the electricity regulations on new
generation capacity. These regulations provide guidance on future
investment in generation capacity by both Eskom and independent
power producers (IPPs) in accordance with the integrated resource
plan (IRP).
IPPs have an important role to play in addressing the energy needs
of the country since it is vital to diversify the source and nature of
energy production, introduce new skills and capital in the industry
and enable the benchmarking of related pricing and performance.
Eskom therefore supports the introduction of IPPs.
Regulatory and Legal Framework continued
1. IssuedintermsoftheElectricityRegulationAct,4of2006.

89Eskom Holdings Limited
Integrated Repor t 2010
In order to ensure successful implementation of these regulations, it
is imperative that resolution is reached on a number of critical issues
such as the finalisation of the IRP and designation of the independent
system operator.
Integrated resource plan (IRP)The IRP is the long-term electricity or capacity plan for the country.
It should answer a number of questions: how much capacity is
needed for South Africa in the long term, what mix of energy sources
should be used and who should build the required capacity.
As outlined in the electricity regulations on new generation capacity,
“the system operator, in consultation with the energy planner and
the regulator is responsible for developing the IRP, with the Minister
of Energy ultimately responsible for the approval and gazetting of the
IRP”. Further details on the IRP are reflected in the System Operations
and Planning section on page 145.
Independent system operator (ISO)On 11 February 2010, the President of South Africa during his state
of the nation address announced the establishment of an independent
system operator. The creation of an independent system operator is
seen as a mechanism to support the introduction of independent
power producers (IPPs), by creating a non-conflicted buyer of power.
This restructuring of the electricity supply industry will have a
significant bearing on how the industry is to be regulated into the
future. Eskom has provided input regarding the possible
implementation options in this regard and it is anticipated that a
decision will be finalised by government in due course.
Electricity distribution industry restructuringIn October 2006 Cabinet approved the proposal to create six
regional electricity distributors (REDs). These REDs are to be
established as public entities, accountable to the Department of
Energy. Electricity Distribution Industry Holdings (Pty) Limited is
implementing government’s restructuring policy. The critical next
steps include the finalisation of outstanding policy matters and
enabling legislation.
Eskom completed the ring-fencing of its operating units in prior years,
in preparation for the RED formation. Any further internal preparation
is dependent on the resolution of national policy matters.
Medium-term power purchase programme (MTPPP)Early in 2008, during the load-shedding period, Eskom received
numerous requests from the market claiming that there were new
and refurbished generation projects that could be brought online
fairly quickly to assist Eskom and the country with the medium-term
capacity constraints. In light of the market request and Eskom’s
awareness of potential projects, Eskom initiated the MTPPP to attract
relevant projects. It was Eskom’s intention to procure the maximum
MWs of capacity in the shortest period of time. The MTPPP was
meant to fill a gap between supply and demand in the short to
medium term. One of the key characteristics of this programme was
the publishing of price profiles (ceiling price and maximum
programme price). The programme was run with the necessary
approvals and support of NERSA. Due to funding constraints during
2009, the programme was, however, temporarily delayed.
Eskom is pleased to announce that two power purchase agreements
have been finalised and are awaiting necessary approvals from
NERSA. Discussions with other short-listed bidders are continuing
and we anticipate that further agreements will be finalised shortly.
Electricity regulatory rulesAs the regulatory environment in South Africa continues to mature,
a myriad of regulations, codes, rules, directives and guidelines will be
developed to provide the necessary guidance required in so far as
the regulation of the electricity supply industry is concerned.
Over the past year, a number of developments have taken place on
this front.
NERSA’s multi-year price determination (MYPD) methodologyThe MYPD methodology was published by NERSA on 20 November
2009. NERSA has indicated that the purpose of the methodology is
to consolidate and align the regulatory methodology from various
places into one document. Eskom supports the effective integration
of the regulatory framework.
However, the methodology provides for a substantive change in the
way Eskom’s revenue requirement will be assessed. Significant new
methodological frameworks include:
• the mechanism for the calculation of the cost of capital
• valuation of the regulatory asset base
• the revenue allowance for return on the regulatory asset base
• the revenue allowance for depreciation (based on the valuation of
the regulatory asset base)
• treatment of research and development costs
• service quality incentive/penalty mechanisms
Eskom has commented to NERSA on the proposed methodology
and raised some concerns.
90 Eskom Holdings Limited
Integrated Repor t 2010
The Electricity Pricing Policy of 2008 (EPP)During November 2008 Cabinet approved an electricity pricing
policy (EPP) which was gazetted on 19 December 2008. Among
other issues it also ensures the long-term sustainability of the industry
with the ability to fund future investment in the expansion of
infrastructure capacity without price shocks, by requiring that
electricity tariffs be based on a depreciated replacement valuation
of assets. NERSA’s MYPD 2 decision recognised the requirements of
the EPP and has made some progress towards full implementation
of its requirements within the allowed five-year period.
Regulatory rules for power purchases cost recovery NERSA approved the regulatory rules on power purchases cost
recovery with effect from 26 November 2009. These rules were
developed to facilitate the introduction of IPPs by ensuring that the
costs for IPPs could be recovered through the tariff.
Regulatory rules on selection criteria for renewable energy projects under the REFIT programme In terms of the regulations on new generation capacity, NERSA is
required to issue rules relating to the selection of renewable energy
or co-generation IPPs that qualify for licences. In line with this, NERSA
published regulatory rules on selection criteria for renewable energy
projects under the REFIT (renewable energy feed-in tariff) programme
for public comment during February 2010.
As a stakeholder in this process, Eskom has submitted its comments
on the said selection criteria. It is important that the selection criteria
are finalised timeously, so as to advance progress on renewable
energy projects.
ReportingNERSA is in the process of enhancing reporting and information
requirements. In particular, a regulatory reporting manual has been
developed and the focus is now on implementation. NERSA has also
issued minimum information requirements for tariff applications for
public comment. In principle, Eskom supports these initiatives which,
if correctly implemented, would facilitate greater transparency.
Multi-year price determination (MYPD 2) and the price increaseThe most significant initiative regarding regulatory matters during the
past financial year related to Eskom’s price increase application.
It may be useful to recap Eskom’s rationale regarding its approach. As
was explained in Eskom’s proposed price application, over the last
decade there has been an increasing demand for electricity that has
resulted in a low reserve margin (the capacity available above the
maximum demand), which necessitated Eskom embarking on a
massive capital expansion programme.
In addition, Eskom is also facing significant challenges to meet its
operational costs. This is due partly to the increased costs that have
resulted because of a low reserve margin. More importantly the
price of electricity has historically not recovered all the prudently
incurred costs of supply and thus did not create adequate borrowing
capacity, nor did it allow for the building of reserves which could be
used for the capital expansion.
Eskom highlighted in its MYPD 2 application that:
“…a significant strategic shift was required to achieve a successful
outcomeforEskomandSouthAfrica.Furthermoretheexpectationsand
rolesofEskom,governmentandstakeholdersshouldbeconsistentwith
this shift.This strategic shift isbasedonadeepercommitment to the
following:
• ThecontextualisationoftheMYPD2applicationwithinalong-term
countryvision.Asacountryweneedtohaveaviewoftheoverarching
objectivesandoutcomesthatdefinesuccessandsustainabilityforthe
economyandtheelectricityindustryandensurethatthepricepathis
consistentwiththatobjective.
• Itiscrucialthattherolesofthevariouspartiesinachievingournational
objectives are clear. In particular, there should be clarity of roles
regarding the implementation of key initiatives: aggressive demand-
sidemanagementinitiatives,facilitatingaccesstofunding,introducing
newcapacity,ensuringintegratedinfrastructuredevelopment,reducing
ourcarbon footprint, reducingenergy intensityperGDPoutputand
ensuringsecurityofsupply.
• Eskomcannotprovideforallthefutureenergyneedsofthecountry
onitsownandthereforeanenablingenvironmentisrequiredtoattract
newentrantstothemarket.
• AcollaborativeeffortisrequiredbetweenEskom,government,andall
stakeholders including business, communities, customers and other
role players in the electricity industry. In order to succeed, Eskom
should place its confidence in the ability of other stakeholders to
contributetoasolution.
• Eskom needs to focus on executing its mandate within its own
capabilityandcapacity,whileotherroleplayersinthecountryassigned
withspecificmandatesmustexecutethosemandates.”
Eskom normally applies for a revenue determination, which is then
translated into a price increase. For ease of reference we refer herein
to a price increase application. Eskom submitted a proposed price
increase application of 45% on 30 September 2009, followed by a
revised application of 35% on 30 November 2009. NERSA held
Regulatory and Legal Framework continued
91Eskom Holdings Limited
Integrated Repor t 2010
public hearings on the application in all nine provinces during January
2010, for the first time ever. On 24 February 2010 NERSA awarded
Eskom a price determination of 24, 8% (FY11), 25, 8% (FY12) and
25,9% (FY13), resulting in a revenue shortfall of approximately
R55 billion for the three-year period compared to the 35% increase
applied for. Further information in this regard is set out on page 44 in
the Finance division section.
In its application Eskom also emphasised the following:
“ThisMYPD2 application, and in particular the price path and time
period within which to migrate from the current price level to an
appropriatepricelevel,shouldbeassessedinrelationtotheachievement
oftheoverarchinglong-termcountryobjectives.TheMYPD2istherefore
asteppingstonetowardsachievingtheobjectivesofSouthAfricainthe
longterm. It isasteppingstonethathasbeenforgedthrough intense
stakeholder discussions and relies for its success on an effective
partnershipbetweenEskomandallstakeholders.
Eskomisconcernedabouttheincreasedriskprofilebutiscommittedto
workingwithinthispartnershiptoensurethatweallachievesuccess.
Theprovisionofreliableandaffordableelectricityisacriticalandstrategic
imperative to ensure sustainable economic growth in South Africa.
Eskom’spriceapplicationwillresultinanintegratedsolutionthatisinthe
bestinterestsofEskom,customersandthecountry.Ithasalsomitigated
theadverseimpactontheeconomyandjoblossesbychoosingalonger-
timeperiodtoachievecost-reflectivetariffs.Itisourfirmbeliefthatitis
inthenationalinterestthattheappropriatecountrychoiceshavebeen
madeinacollaborativeandparticipativeprocess.”
In the medium to long term – it is expected that the principles of the
EPP, intended to restore electricity tariffs to cost-reflective levels, in
particular the revaluation of the asset base and the earning of a rate
of return equal to the cost of capital will be phased in. This will ensure
that cost-reflective tariffs are achieved over the medium term in
order to ensure the financial sustainability of Eskom and other
companies who intend entering the local electricity market.
Forahistoryofpricing,see www.eskom.co.za/annreport10/005.html
Looking ahead Eskom continues to be optimistic regarding the continued maturity
of the regulatory environment within South Africa. A consistent and
concerted effort by all stakeholders in the electricity industry will aid
in ensuring the long-term viability and sustainability of the industry as
well as the achievement of our long-term goals as a country.
In the short term Eskom needs to address its funding shortfall and
manage its business within the limits of the price increase allowed by
NERSA. This will present a significant challenge to the organisation,
but we are committed to be as efficient and effective as possible.
There are a number of critical decisions that need to be made during
2010 to ensure security of supply in 2011 and beyond. Not all of
these decisions are within Eskom’s control and there is a need for
government and other stakeholders to prioritise these decisions. The
critical interventions include the implementation of an appropriate
demand management and energy efficiency framework, signing up
IPPs, and the finalisation of certain capacity choices to ensure security
of supply.
In addition, a number of regulatory and policy issues need to be
addressed now to position the electricity industry for success into
the future. A number of government and other stakeholder-led
interventions are already underway to address the key challenges
and to facilitate progress towards an optimal regulatory and policy
environment – one that is credible, predictable, legitimate and
transparent.
The priorities being addressed and which need to be finalised include:
• the IRP, including the assumptions regarding growth, the capacity
need for the country and the fuel choices, and in particular,
renewables and nuclear, and who should build this capacity
• mechanisms to ensure the protection of the poor
• mitigating the impact on climate change
• industry structure, including decisions on the ISO, the electricity
distribution industry and the designation of “buyers” in terms of
the regulations
• an effective demand-management framework (including the
power conservation scheme (PCP) and demand-side management
interventions). Further details on PCP can be found in the System
Operations and Planning section on page 142
• securing coal, water and other resources for power generation
Eskom has and will continue to play an active role in contributing to
the advancement of the regulatory environment so as to ensure that
current, potential and future consumers are protected, that Eskom is
sustainable and that national policy objectives can be realised.


Powering the nationGeneration Business
95 Overview
100 Generation division101 Key focus areas101 Risk profile102 Plans for 2010 – 2013102 Technical performance104 Benchmarking105 Environmental performance107 Environmental impact assessments
108 Primary Energy division109 Primary energy update109 Risk profile109 Coal quality and quantity110 Long-term coal supply strategy110 Long-term water strategy111 Liquid fuels (diesel and kerosene) strategy111 Impact of primary energy costs on the business112 Road repairs112 Environmental performance113 Safety – coal transport
114 Nuclear division115 Key focus areas115 Risk profile116 Key performance indicators116 Nuclear capacity increase116 Pebble-bed modular reactor (PBMR) update117 Nuclear fuel117 Nuclear safety118 Environmental performance119 Nuclear waste management
120 Generation Business Engineering division
121 Key strategy121 The engineering excellence programme122 Plans for 2010 – 2013122 The GEDI project123 Risk profile123 Challenges
124 Enterprises division125 Capacity expansion programme125 Risk profile129 Future of renewable projects129 Benchmarking build costs globally130 Environmental performance130 Local content of capacity expansion contracts131 Stimulating economies around capacity expansion
projects131 Training and development

94 Eskom Holdings Limited
Integrated Repor t 2010
Mandate: The Generation Business is a dynamic portfolio that efficiently operates the existing generating capacity, provides primary energy and water resources, delivers on the massive capacity expansion programme and ensures world-class engineering solutions.
Progress this year
Highlights
• Improved financial performance
• No load shedding in the past 12 months
• Negotiations for new coal supply agreement for Majuba power station successfully completed
• Improved performance of Koeberg nuclear power station as measured by the INPO index
• Generation capacity and transmission infrastructure installed and commissioned exceeded targets
• Safety performance on capacity expansion construction sites
• Staff commitment
Challenges
• Increased particulate emissions
• Number of trips at power stations
• Undersupply of coal by coal companies and the poor quality of coal supplied to Eskom power stations impacting station performance and output
• Funding constraints on new build projects
Future priorities
• Delivery of Eskom expansion programme
• Implementation of the Eskom long-term coal supply strategy
• An improvement of 4% in the energy availability factor (EAF) of the power stations within three years (“4 in 3” programme)
• Energy efficiency – reduce power plant consumption
• Reduce carbon footprint – investigate co-firing coal-fired power stations with biomass, thereby reducing coal usage by 10%
• Operational excellence – back to basics in the operation and maintenance of power plants
• Financial excellence – 10% reduction in operating and primary energy costs
Generation Business
Financial results – Generation Business
R millions 2010 2009
Total revenue 49 732 33 790
Profit (loss) for the year 192 (6 537)
Total assets 131 039 93 671
Capital expenditure 40 484 31 864

95Eskom Holdings Limited
Integrated Repor t 2010
– Camden, Grootvlei and Komati) and the new power
stations as well as new transmission network infrastructure.
The Generation Business portfolio operates, maintains
and engineers are of the world’s largest fleet of electricity
generating power stations, and is implementing the fifth
largest utility capacity expansion programme internationally.
The portfolio procures more than half of the coal produced
in South Africa, while the logistics supporting the coal
movements are one of the largest undertakings in the
country. Through these new build activities Eskom will be
investing around R485 billion in the South African economy
over a seven-year period from 2005 to 2012. Annually
Eskom procures about approximately R20 billion in coal and
water and spends approximately R6 billion on operating and
maintenance activities. Collectively, these activities provide
direct and indirect employment for more than 60 000
people throughout South Africa across the electricity, mining,
transport and construction industries.
Power station performanceIn early 2008 the country experienced significant shortages
of electricity (rolling blackouts) due partly to technical
problems and unexpectedly high unplanned shutdowns for
repairs and maintenance at some of the power stations,
exacerbated by the continuous growth in the demand for
electricity. Since then significant progress has been and
Q: What impact has the funding challenge had on the capacity expansion programme?
A: The funding challenge has resulted in delays in placing
contracts, for example for certain parts of the Kusile power
station project, and the suspension of other new capacity
projects, such as Nuclear-1. The consequence is a delay in a
return of the reserve margin (the margin between the
demand for, and the capacity to supply electricity) to
internationally acceptable levels.
Q: What are the key challenges in generating electricity for the future?
A: Our priority is always to ensure the safety of our staff
and contractors. This will be an increasing challenge,
particularly on our construction sites. We are also running
our existing power stations much harder to meet the
demand for electricity. Until the reserve margin improves,
the scheduling for planned maintenance activities will be
challenging, but is critical to ensure and improve the technical
and environmental performance of the stations. A reliable
supply of good quality coal and water to our coal-fired
power stations at a reasonable price is a further challenge.
And of course completing the return-to-service programme
and keeping to the schedule, maintaining high quality and
containing costs for the power stations and transmission
infrastructure under construction remains one of our
priorities.
OverviewThe Generation Business portfolio was established in 2008.
It is a diverse portfolio encompassing the operations and
engineering of the existing power stations, the supply of
primary energy (coal, liquid fuels and nuclear fuel), the supply
of water and the project development, project management,
construction and commissioning associated with the return-
to-service project (of the three mothballed power stations
Brian DamesChief Officer : Generation Business
96 Eskom Holdings Limited
Integrated Repor t 2010
the mines were never designed to meet the current station burn
levels) and a need for new coal supplies to meet the needs of the
return to service (RTS) and new build power stations. Importantly,
the bulk of this coal has to be transported from more distant mines,
requiring road transportation in the short and medium term, and
investment in a longer-term logistics infrastructure.
This “temporary” coal demand/supply imbalance has been
accompanied by several other important adverse dynamics in the
South African coal industry:
• Ongoing deregulation of the coal mining industry, with a
corresponding shift in the power balance away from the national
interest to that of the shareholders of the mining companies. This
has directly impacted the quantity, quality and cost of coal supplied
to Eskom as some miners have deliberately optimised their total
business at Eskom’s expense (even to the extent of receiving
ongoing volume and quality penalties).
• Exports of lower quality coal to India, creating direct competition
for new coal sources that were previously only suitable for
domestic use, and a marked deterioration in the coal offered to
Eskom from existing multi-product mines.
• Extensions of the lives of most of Eskom’s coal-fired stations from
40 to 60 years, beyond the contracted duration of the tied
collieries, which were originally set up to supply only for 40 years.
These contracts start to expire as early as 2013, and in many cases
coal reserves have not yet been dedicated to meet the full life
extensions.
• Ageing of Eskom’s existing tied collieries, resulting in deterioration
of coal qualities and reliability of supply from these mines.
• Depletion of the higher grade coal reserves in Mpumalanga,
resulting in increased competition for the remaining reserves
suitable for supplying Eskom’s older power stations.
• Dramatic escalation in costs, partly driven by “real” factors (the
commodities boom, resource depletion and more stringent
environmental and safety standards), but also by a diversion of
scarce resources (skills, capital, management focus) away from the
Eskom mines to the higher margin export businesses.
Eskom has implemented a widely syndicated coal sourcing strategy
based on the following eight principles:
1. Optimal portfolio of long-, short- and medium-term sources, in
order to achieve the best balance between cost, capital investment,
volume flexibility and security of supply, while creating sufficient
certainty to permit investment in long-term logistics infrastructure.
2. Prices based on efficient costs and fair returns on invested capital.
This implies a new level of cost transparency between Eskom and
the industry, and an equitable sharing of risk and reward.
continues to be made in improving the performance of the power
stations.
A number of recovery teams were established to improve the plant
reliability and availability. These have brought about excellent results,
with the consequence that there has been no load shedding since
late April 2008. Eskom has over many years benchmarked its
performance against international counterparts. It is evident from
recent benchmarks that the performance of Eskom’s power stations
is in line with or better than many of its international peers.
Environmental performanceUnfortunately the quality of the coal that is being supplied to some
of the power stations is at the low end of the contractual specification,
which sets out a broad range of quality parameters. This, together
with the very demanding operational regime that is being placed on
the power stations as a consequence of the high demand for
electricity and the low reserve margin, has led to an increase in the
emission of particulates from the coal-fired power stations. An
improvement in this environmental performance indicator is one of
the top priorities for the Generation division. The division will also
improve its monitoring of gaseous emissions, such as sulphur dioxide
and oxides of nitrogen. Although the relative consumption of water
improved slightly in the past year, this will remain one of the major
focus areas for continued improvement.
Coal supplyLow coal stock levels at some power stations in early 2008 resulted
in these stocks being vulnerable to excessive rain, the coal being too
wet to feed into the power stations and contributing to the shortages
of electricity supply. This situation has been turned around over the
past two years. The average coal stock levels improved from
approximately 12 days in early 2008 to 37 days at the end of March
2010. As a result of the stock build up, the coal supply is not as
vulnerable to wet coal, although excessive rain will always have a
negative impact on the supply of coal to the power stations. To
mitigate the effect of rain, “coarse coal” stock piles treated with
special chemicals to prevent water ingress have been created at
stations vulnerable to wet coal supply.
Long-term coal strategyThe growth in electricity demand over the past several years has
resulted in an increasing erosion of Eskom’s generation reserve
margin with the result that the existing power stations have had to
be operated at much higher load factors. The direct consequence of
this has been a shortfall in coal supplied from the tied collieries (since
Generation Business continued

97Eskom Holdings Limited
Integrated Repor t 2010
can hold out for prices equivalent to Eskom’s next alternative,
which in most cases involves a lower quality coal and substantial
transport costs.
• Limited means for Eskom to drive negotiations to conclusion in
the necessary timeframes, since the miners are almost always
better off delaying until Eskom has no option but to agree to
their terms.
Coal qualityA marked deterioration in the quality of the total coal deliveries to
Eskom has been the trend since 2006. A step change occurred from
19,5MJ/kg to 19,0MJ/kg. The stations which suffered significant
deteriorations were Duvha, Matla and Arnot. Hendrina and Kendal
were affected to a lesser extent while the quality at the remainder of
the stations remained either relatively constant or showed
improvement over time.
These trends, together with higher load factors, have resulted in
significant coal-related load losses and the equivalent financial loss to
Eskom is approximately R1 billion, based on replacement power
assuming 5% OCGT at R2 800/MWh and mid-merit stations at
R118/MWh.
Total system lossesThe loss per station is as follows:
Duvha 1 601 214MWh 40%
Matla 1 506 086MWh 37,6%
Tutuka 334 234MWh 8,3%
Camden 204 507MWh 5,1%
Kriel 166 593MWh 4%
As can be seen from the above table, Duvha, Matla and Tutuka
power stations accounted for 86% of the total system losses.
2010 FIFA World CupTM readinessThe reliable performance of the power stations is a critical component
of the successful delivery of a dependable, uninterrupted flow of
electricity for the 2010 FIFA World CupTM. Preparations for the
world cup have been ongoing throughout the 2009/10 financial
year and included the identification of potential risks to the ability
of the power stations to produce electricity and the mitigation
actions and timelines to address these risks. Criteria were
developed against which the readiness can be assessed and have
been used by Generation business leadership during on-site reviews
and engagements with the power station and (where applicable)
mine management teams.
3. Investment in low cost, flexible coal transport infrastructure, with
the primary focus being conveyers and rail capacity, with a
corresponding reduction in road transportation.
4. Quality management and coal beneficiation to reduce the total
cost of ownership (TCO), aimed at reducing the load losses
attributed to poor coal quality.
5. Risk-based stock management to align stock levels with the
dramatically changed (and constantly changing) risk profile of coal
supplies.
6. Strengthening the primary energy division to deliver on the
strategy, through a combination of increasing skills in critical areas
and putting in the systems and processes required to operate in
this more challenging environment.
7. Improved co-operation with major stakeholders, including
authorities, regulators, suppliers and local communities.
8. Investment in long-term infrastructure, the benefits of which will
not accrue in the immediate future. These include underground
coal gasification (UCG), water infrastructure (through contracts
with the Department of Water and Environmental Affairs) and the
Waterberg rail link.
Eskom has made extensive progress in implementing this strategy.
This has included the conclusion of multiple new coal supply
contracts (of varying durations), the renegotiation of the Medupi coal
supply agreement and several unfavourable short-term agreements,
the thorough evaluation of several initiatives to improve coal quality
(now under implementation), securing funds for rail infrastructure
investments and road repairs, and the implementation of the first set
of rail projects (Camden rail container solution scheduled to go live
in June 2010).
However, despite these successes, Eskom has continued to face
substantial challenges in securing coal for the full lives of its power
stations at efficient costs. These challenges result from several
structural shortcomings in the industry and associated legislation
as follows:
• Insufficient mechanisms for the country to optimise the total
South African coal resource and to “reserve” coal for future use,
coupled with the incentive implicit in the “use it or lose it” principle
for miners to seek ways to exploit deposits before their
prospecting rights expire. Similarly, miners tend to optimise the
resource within their boundaries and can occasionally be exploited
by players owning small adjacent deposits.
• Limited means for Eskom to drive consistent pricing and contract
terms in negotiations – in securing a mining right the miner has
only to indicate that the coal is intended for Eskom, but thereafter
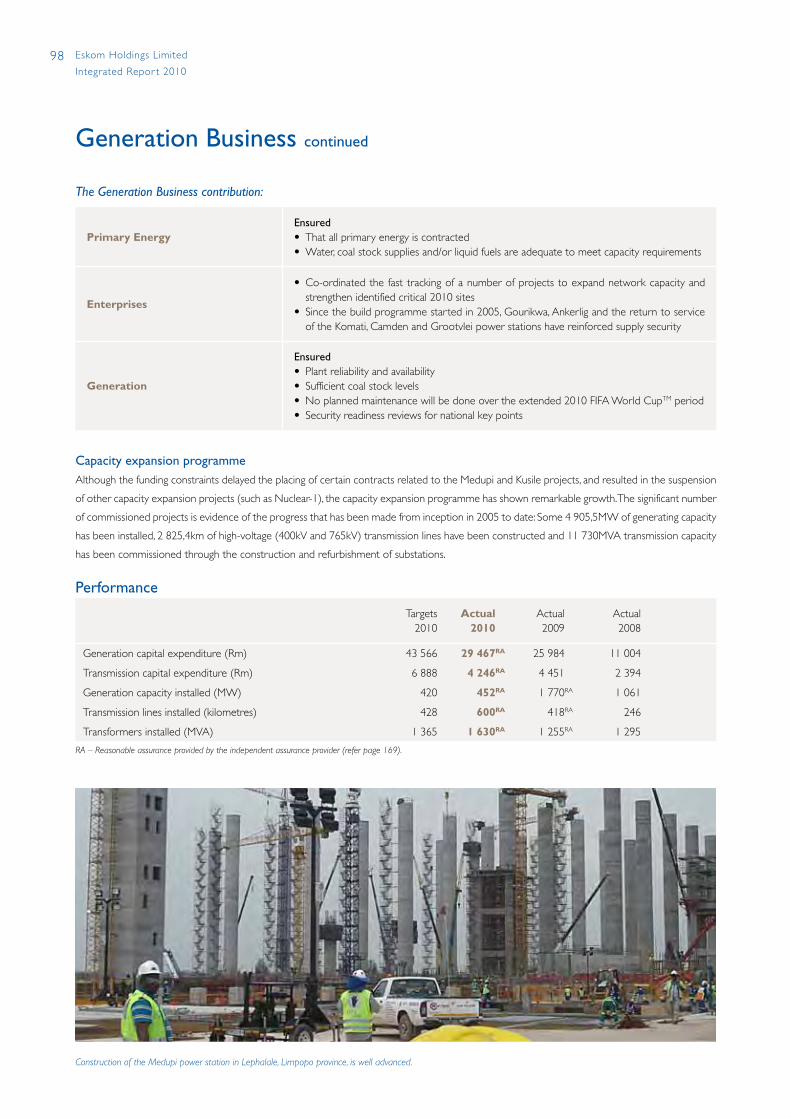
98 Eskom Holdings Limited
Integrated Repor t 2010
The Generation Business contribution:
Primary EnergyEnsured• That all primary energy is contracted• Water, coal stock supplies and/or liquid fuels are adequate to meet capacity requirements
Enterprises
• Co-ordinated the fast tracking of a number of projects to expand network capacity and strengthen identified critical 2010 sites
• Since the build programme started in 2005, Gourikwa, Ankerlig and the return to service of the Komati, Camden and Grootvlei power stations have reinforced supply security
Generation
Ensured• Plant reliability and availability• Sufficient coal stock levels• No planned maintenance will be done over the extended 2010 FIFA World CupTM period• Security readiness reviews for national key points
Capacity expansion programmeAlthough the funding constraints delayed the placing of certain contracts related to the Medupi and Kusile projects, and resulted in the suspension
of other capacity expansion projects (such as Nuclear-1), the capacity expansion programme has shown remarkable growth. The significant number
of commissioned projects is evidence of the progress that has been made from inception in 2005 to date: Some 4 905,5MW of generating capacity
has been installed, 2 825,4km of high-voltage (400kV and 765kV) transmission lines have been constructed and 11 730MVA transmission capacity
has been commissioned through the construction and refurbishment of substations.
Performance
Targets 2010
Actual 2010
Actual 2009
Actual 2008
Generation capital expenditure (Rm) 43 566 29 467RA 25 984 11 004
Transmission capital expenditure (Rm) 6 888 4 246RA 4 451 2 394
Generation capacity installed (MW) 420 452RA 1 770RA 1 061
Transmission lines installed (kilometres) 428 600RA 418RA 246
Transformers installed (MVA) 1 365 1 630RA 1 255RA 1 295
RA – Reasonable assurance provided by the independent assurance provider (refer page 169).
Generation Business continued
Construction of the Medupi power station in Lephalale, Limpopo province, is well advanced.
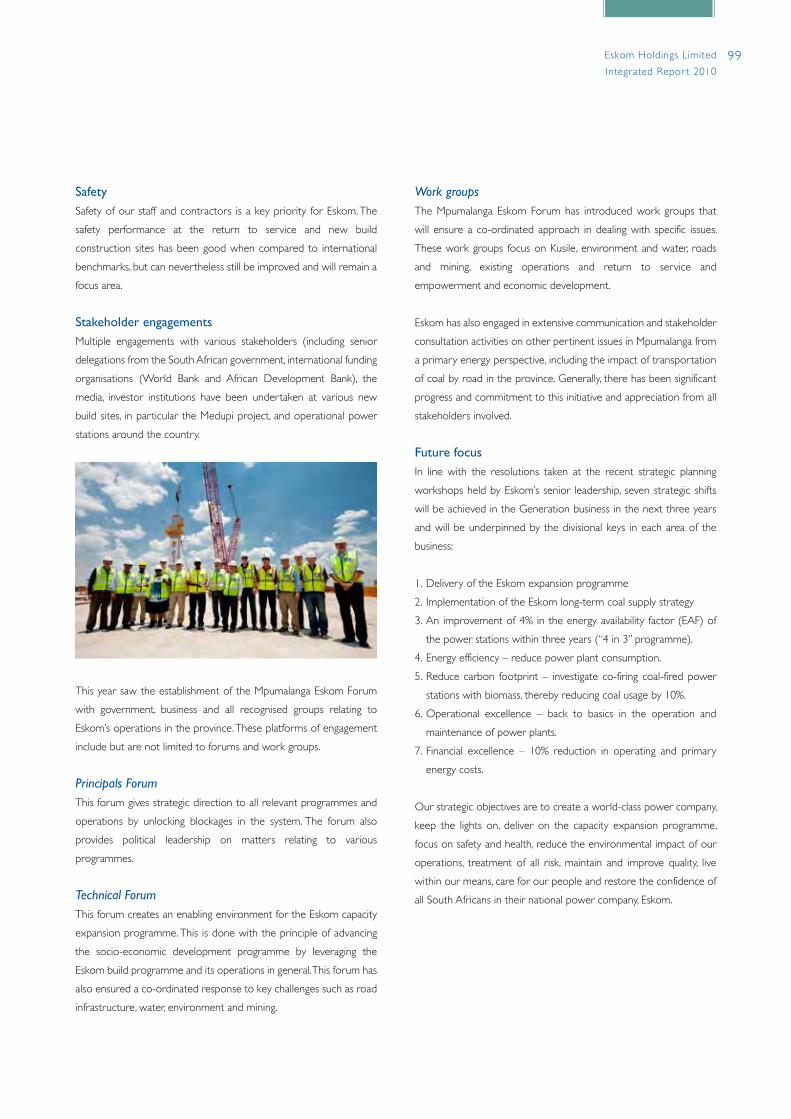
99Eskom Holdings Limited
Integrated Repor t 2010
Work groupsThe Mpumalanga Eskom Forum has introduced work groups that
will ensure a co-ordinated approach in dealing with specific issues.
These work groups focus on Kusile, environment and water, roads
and mining, existing operations and return to service and
empowerment and economic development.
Eskom has also engaged in extensive communication and stakeholder
consultation activities on other pertinent issues in Mpumalanga from
a primary energy perspective, including the impact of transportation
of coal by road in the province. Generally, there has been significant
progress and commitment to this initiative and appreciation from all
stakeholders involved.
Future focusIn line with the resolutions taken at the recent strategic planning
workshops held by Eskom’s senior leadership, seven strategic shifts
will be achieved in the Generation business in the next three years
and will be underpinned by the divisional keys in each area of the
business:
1. Delivery of the Eskom expansion programme
2. Implementation of the Eskom long-term coal supply strategy
3. An improvement of 4% in the energy availability factor (EAF) of
the power stations within three years (“4 in 3” programme).
4. Energy efficiency – reduce power plant consumption.
5. Reduce carbon footprint – investigate co-firing coal-fired power
stations with biomass, thereby reducing coal usage by 10%.
6. Operational excellence – back to basics in the operation and
maintenance of power plants.
7. Financial excellence – 10% reduction in operating and primary
energy costs.
Our strategic objectives are to create a world-class power company,
keep the lights on, deliver on the capacity expansion programme,
focus on safety and health, reduce the environmental impact of our
operations, treatment of all risk, maintain and improve quality, live
within our means, care for our people and restore the confidence of
all South Africans in their national power company, Eskom.
SafetySafety of our staff and contractors is a key priority for Eskom. The
safety performance at the return to service and new build
construction sites has been good when compared to international
benchmarks, but can nevertheless still be improved and will remain a
focus area.
Stakeholder engagementsMultiple engagements with various stakeholders (including senior
delegations from the South African government, international funding
organisations (World Bank and African Development Bank), the
media, investor institutions have been undertaken at various new
build sites, in particular the Medupi project, and operational power
stations around the country.
This year saw the establishment of the Mpumalanga Eskom Forum
with government, business and all recognised groups relating to
Eskom’s operations in the province. These platforms of engagement
include but are not limited to forums and work groups.
Principals ForumThis forum gives strategic direction to all relevant programmes and
operations by unlocking blockages in the system. The forum also
provides political leadership on matters relating to various
programmes.
Technical ForumThis forum creates an enabling environment for the Eskom capacity
expansion programme. This is done with the principle of advancing
the socio-economic development programme by leveraging the
Eskom build programme and its operations in general. This forum has
also ensured a co-ordinated response to key challenges such as road
infrastructure, water, environment and mining.
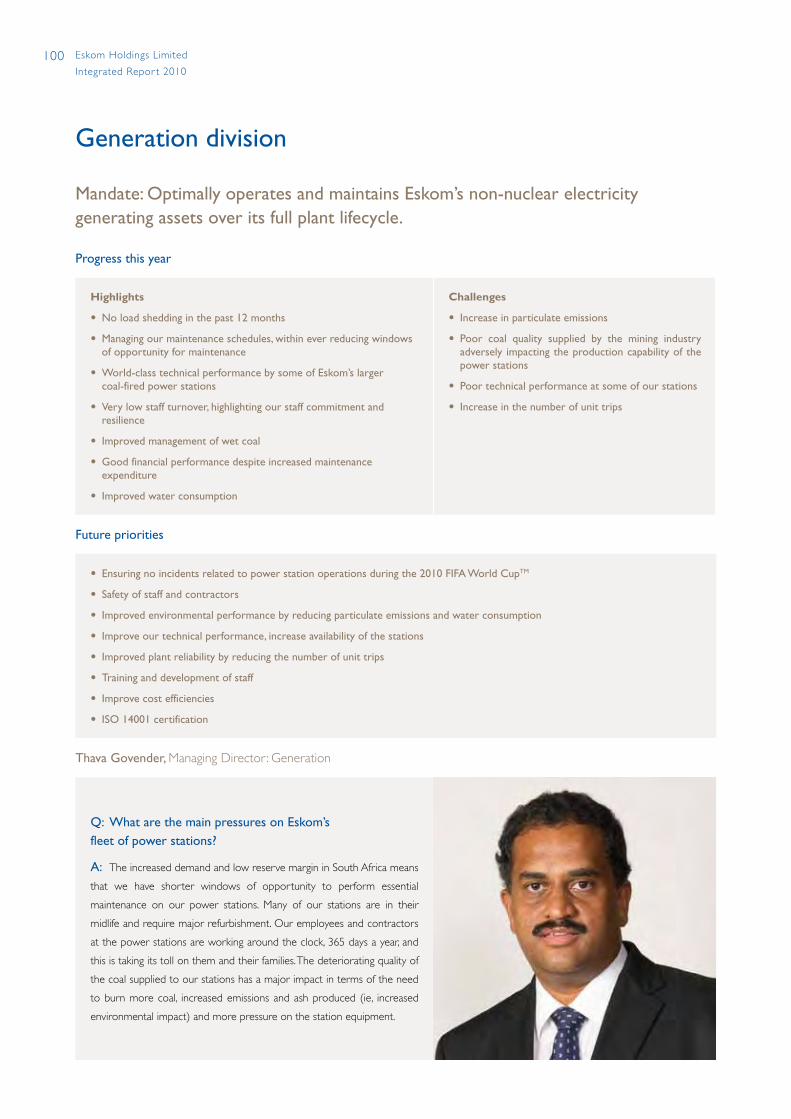
100 Eskom Holdings Limited
Integrated Repor t 2010
Mandate: Optimally operates and maintains Eskom’s non-nuclear electricity generating assets over its full plant lifecycle.
Progress this year
Highlights
• No load shedding in the past 12 months
• Managing our maintenance schedules, within ever reducing windows of opportunity for maintenance
• World-class technical performance by some of Eskom’s larger coal-fired power stations
• Very low staff turnover, highlighting our staff commitment and resilience
• Improved management of wet coal
• Good financial performance despite increased maintenance expenditure
• Improved water consumption
Challenges
• Increase in particulate emissions
• Poor coal quality supplied by the mining industry adversely impacting the production capability of the power stations
• Poor technical performance at some of our stations
• Increase in the number of unit trips
Future priorities
• Ensuring no incidents related to power station operations during the 2010 FIFA World CupTM
• Safety of staff and contractors
• Improved environmental performance by reducing particulate emissions and water consumption
• Improve our technical performance, increase availability of the stations
• Improved plant reliability by reducing the number of unit trips
• Training and development of staff
• Improve cost efficiencies
• ISO 14001 certification
Thava Govender, Managing Director: Generation
Q: What are the main pressures on Eskom’s fleet of power stations?
A: The increased demand and low reserve margin in South Africa means
that we have shorter windows of opportunity to perform essential
maintenance on our power stations. Many of our stations are in their
midlife and require major refurbishment. Our employees and contractors
at the power stations are working around the clock, 365 days a year, and
this is taking its toll on them and their families. The deteriorating quality of
the coal supplied to our stations has a major impact in terms of the need
to burn more coal, increased emissions and ash produced (ie, increased
environmental impact) and more pressure on the station equipment.
Generation division
101Eskom Holdings Limited
Integrated Repor t 2010
Ensuring financial sustainability as the generating licenseeWe will maintain operating and capital expenditure within ±5% of
budget for the next five years.
Reduce the carbon footprint by investigating the feasibility of co-firing with biomassThe intent is to expedite the introduction of renewables into Eskom,
in support of Eskom’s response to mitigate CO2 production.
Ensure energy efficiency by pursuing• the reduction of power station auxiliary power consumption per
unit sent out
• optimising boiler and turbine cycle efficiency
• reducing specific fuel consumption per unit output
Ensure operational excellence through a back-to-basics focus in plant operations
Risk profileThe division implemented the new Eskom integrated risk management
(IRM) process, built on the ISO 31000 standard. All business unit
managers are responsible for managing risk within their respective
areas. All business and operational risks are captured and managed
thorough a newly adopted IRM system. The following generation
division risks were identified at Generation executive level.
Key focus areas for the coming yearBased on the challenges identified in both the internal and external
contexts, the Generation division will focus on supporting the
following strategic thrusts of the Generation business:
Ensuring no supply interruptions due to plant unavailabilityGeneration division will ensure that there will be no load shedding
due to poor plant performance over the next five years. An average
of daily MW lost to forced outages (OCLF + UCLF) must not
exceed 2 500MW. This will be achieved by ensuring that an
adequate pool of core, critical and scarce skills are available to
operate and maintain current and future power stations. The daily
supply and demand will be balanced by optimising long- and short-
term maintenance requirements within the real-time status of
unplanned plant unavailability. The integrated Generation control
centre (IGCC) will enable us to better identify and co-ordinate
responses to operation challenges and crises.
In support of Eskom’s strategic shift, Generation embarked on a
programme to improve the energy availability factor (EAF) of the
power stations by 4% within three years (“4 in 3” programme). The
focus is on the factors that will enhance the performance of the
existing power stations to provide reliable and sustainable supply of
electricity within the tight operating environment that prevails.
Risk Treatment plans
Security of supply is breached (demand and reserves)
• Requested NERSA authorisation for inclusion of gas turbines capacity as additional maintenance space
• Generation and NERSA interaction on a quarterly basis as a platform for engagement on Generation issues
• Maintain required system reserve requirement namely 1 700MW of real time reserve, 2 500 MW of unplanned which equals 4 200MW in planning mode
• Achieve least cost dispatch (coal driven) and more emphasis on demand-side interventions• Outages continually monitored through short-term energy risk forum which is held weekly
Further deterioration of safety performance
• Visible felt leadership (behavioural safety observation, senior leadership inspections)• Cardinal rule enforcement
Compliance to environmental requirements
• Implement air quality strategy• A long-term plan to change to bag filters• Improve coal quality

102 Eskom Holdings Limited
Integrated Repor t 2010
• sustain a motivated, high performing workforce to give effect to
the Eskom strategic objectives
• have processes, systems and technology that enable superior
performance
• drive to achieve its medium-term objectives, underpinned by the
following strategic thrusts:
– pursuing various strategies to enhance energy efficiency
– seeking to reduce its carbon footprint (for example, co-firing
with biomass)
– ensure operational excellence through a focus on back-to-
basics in plant operations.
– financial excellence
Plans for 2010 – 2013The division will:
• ensure zero harm to its employees, contractors, the public and the
natural environment
• meet the balanced expectations of major stakeholders, weighing
up the benefits and risks to all involved eg, meeting our obligation
to supply while managing a reduced tariff increase
• ensure no supply interruptions due to plant unavailability during
the 2010 FIFA World CupTM, and respond quickly and effectively
to restore continuity of supply in the event of a unforeseen
supply interruption
• ensure its financial sustainability as the generating licensee
Technical performance
Measure Description TargetActual
2010Actual 2009
Actual 2008
Unit capability factor (UCF) (%)
UCF measures the plant availability and provides an indication of how well the plant is operated and maintained
86,5 85,86 86,07 86,24 l
Energy availability factor (EAF) (%)
EAF measures plant availability (UCF above), plus energy losses not under the control of plant management (external) and internal non-engineering constraints
85,5 85,21 85,32 84,85 l
Unplanned automatic grid separations (UAGS/7 000 hours)
UAGS measures the reliability of service provided to the electrical grid and the number of supply interruptions per operating period (7 000 hours on average)
2,40 2,80 2,93 2,80 l
Unplanned capability loss factor (UCLF) (%)
UCLF measures the lost energy due to unplanned production interruptions resulting from equipment failures and other plant conditions
4,50 5,10RA 4,38RA 5,13 l
Planned capability loss factor (PCLF) (%)
PCLF-planned energy loss is energy that was not produced during the period because of planned shutdowns or load reductions due to causes under plant management control
9,0 9,04 9,54 8,63 l
Reserve margin (including imports) (%)
Difference between net system capability and the system’s maximum load requirements (peak load or peak demand)
15 – 19 16,4 10,6 5,6 l
Generation load factor (GLF) (%)
GLF generation load factor (net) indicates the extent to which the generation fleet was loaded on average over the year to produce the energy demanded from the power stations
66,6 66,2 67,02 72,29 l
RA – Reasonable assurance provided by the independent assurance provider (refer page 169).
Generation division continued
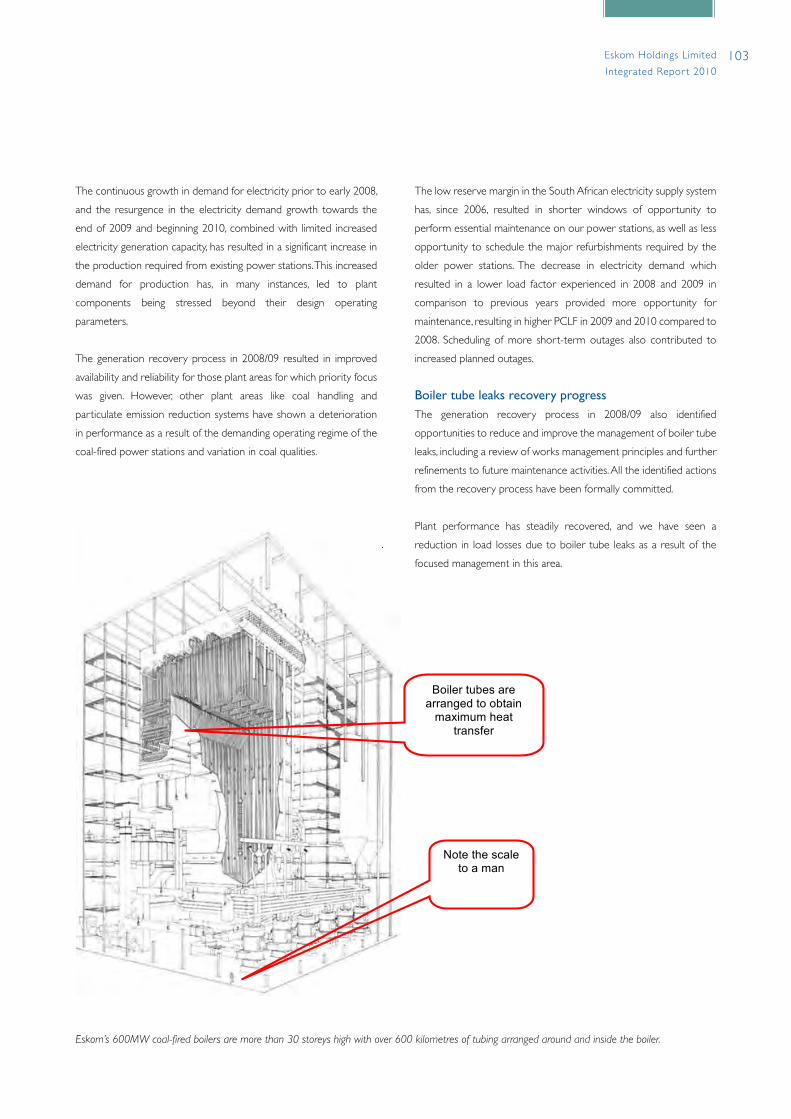
103Eskom Holdings Limited
Integrated Repor t 2010
Eskom’s 600MW coal-fired boilers are more than 30 storeys high with over 600 kilometres of tubing arranged around and inside the boiler.
2010 Eskom Integrated Annual Report Generation Business
Page 23 of 52 12:29 PM 2010/05/23
For further details on our environmental performance improvement initiatives go to www.eskom.co.za/annreport10xxx
Eskom’s 600MW coal-fired boilers are more than 30 stories high with over 600 kilometres of tubing arranged around and inside the boiler
Boiler tubes are arranged to obtain
maximum heat transfer
Note the scale to a man
The low reserve margin in the South African electricity supply system
has, since 2006, resulted in shorter windows of opportunity to
perform essential maintenance on our power stations, as well as less
opportunity to schedule the major refurbishments required by the
older power stations. The decrease in electricity demand which
resulted in a lower load factor experienced in 2008 and 2009 in
comparison to previous years provided more opportunity for
maintenance, resulting in higher PCLF in 2009 and 2010 compared to
2008. Scheduling of more short-term outages also contributed to
increased planned outages.
Boiler tube leaks recovery progressThe generation recovery process in 2008/09 also identified
opportunities to reduce and improve the management of boiler tube
leaks, including a review of works management principles and further
refinements to future maintenance activities. All the identified actions
from the recovery process have been formally committed.
Plant performance has steadily recovered, and we have seen a
reduction in load losses due to boiler tube leaks as a result of the
focused management in this area.
The continuous growth in demand for electricity prior to early 2008,
and the resurgence in the electricity demand growth towards the
end of 2009 and beginning 2010, combined with limited increased
electricity generation capacity, has resulted in a significant increase in
the production required from existing power stations. This increased
demand for production has, in many instances, led to plant
components being stressed beyond their design operating
parameters.
The generation recovery process in 2008/09 resulted in improved
availability and reliability for those plant areas for which priority focus
was given. However, other plant areas like coal handling and
particulate emission reduction systems have shown a deterioration
in performance as a result of the demanding operating regime of the
coal-fired power stations and variation in coal qualities.

104 Eskom Holdings Limited
Integrated Repor t 2010
Plant monitor for generators
Eskom has developed a unique generator monitoring system that includes partial discharge, stray flux, electromagnetic interference, shaft monitoring and fault diagnostic modules, all combined into a host system.
We have applied for patents for the design of some of the modules and 44 partial discharge monitors have already been sold to a South American utility.
Monitors are currently in operation at two Eskom power stations with the rollout to other power stations scheduled for upcoming planned maintenance shutdowns.
Some major successes of the application of these monitors are:• integration of the system as part of a programme where it is
applied to every generator being returned to service;• Duvha and Koeberg power station rotor interventions in
2007, where data from the modules allowed slightly damaged rotors to be operational for a longer time than expected; and
• detection of a failing Koeberg rotor bearing in 2009. If this had not been detected, the machine could have failed catastrophically. Koeberg nuclear stations’ performance is discussed in more detail in the nuclear division section on page 114.
Generation division continued
High load factors
In order to deliver on its obligation to meet the ever-increasing demand for electricity in South Africa with limited system capacity expansion, Eskom has been forced to operate its existing power stations up to and often beyond their design limits. In some instances this has resulted in increased degradation rates and introduced new failure mechanisms, which necessitated the re-evaluation of current maintenance strategies. For example, the scope of inspections for phenomena such as fly ash erosion of boiler tubes has had to be increased since wear is no longer occurring in the same areas where previous history would have predicted.
For further information on maintenance activities, go to www.eskom.co.za/annreport10/006.html
BenchmarkingTechnical performance indicatorsGeneration has over many years benchmarked its performance against international counterparts. It is evident from recent benchmarks that Eskom’s plant performance aligns closely with that of VGB (the European technical association for the electricity and heat generation industries with 427 member organisations from 32 countries, representing a collective capacity of 500 000MW).
The availability performance of Eskom’s generating plant in comparison to aggregate VGB member performance (excluding Eskom) compares as follows:
From the above it is clear that Eskom’s plant generally performs better than the comparative VGB plant sets, but is showing a declining trend emanating from increased operating pressure on the electricity production infrastructure.
When comparing the load factor of Eskom’s assets with that of the VGB members, the following graph indicates that Eskom has generally experienced a more severe increase in operating conditions, thus implying that we have done slightly better than international counterparts in maintaining plant availability under adverse operating conditions. Eskom has a higher load factor compared to VGB plants, which is indicative of the lower reserve margin in South Africa.
EAF
(%)
100
90
80
70
60
Benchmarking EAF all coal all sizes 1999 – 200896 VGB units (excluding Eskom)
1999
2000
2001
2002
2003
2004
2005
2006
2007
2008
2009
VGB median VGB best quarter VGB worst quarterEskom median Eskom best quarter Eskom worst quarter
LF (
%)
100
90
80
70
60
50
40
30
Benchmarking LF all coal all sizes 1999 – 200896 VGB units (excluding Eskom)
1999
2000
2001
2002
2003
2004
2005
2006
2007
2008
2009
VGB median VGB best quarter VGB worst quarterEskom median Eskom best quarter Eskom worst quarter
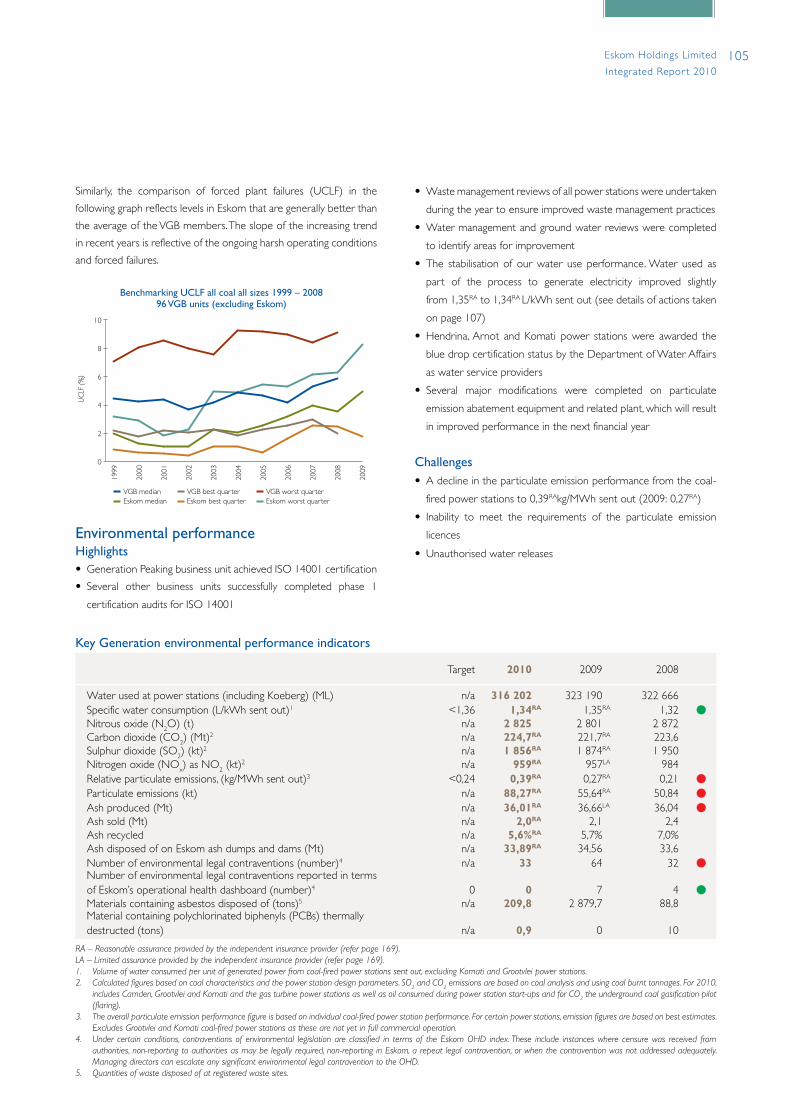
105Eskom Holdings Limited
Integrated Repor t 2010
Key Generation environmental performance indicators
Target 2010 2009 2008
Water used at power stations (including Koeberg) (ML) n/a 316 202 323 190 322 666Specific water consumption (L/kWh sent out)1 <1,36 1,34RA 1,35RA 1,32 lNitrous oxide (N2O) (t) n/a 2 825 2 801 2 872Carbon dioxide (CO2) (Mt)2 n/a 224,7RA 221,7RA 223,6Sulphur dioxide (SO2) (kt)2 n/a 1 856RA 1 874RA 1 950Nitrogen oxide (NOx) as NO2 (kt)2 n/a 959RA 957LA 984Relative particulate emissions, (kg/MWh sent out)3 <0,24 0,39RA 0,27RA 0,21 lParticulate emissions (kt) n/a 88,27RA 55,64RA 50,84 lAsh produced (Mt) n/a 36,01RA 36,66LA 36,04 lAsh sold (Mt) n/a 2,0RA 2,1 2,4Ash recycled n/a 5,6%RA 5,7% 7,0%Ash disposed of on Eskom ash dumps and dams (Mt) n/a 33,89RA 34,56 33,6Number of environmental legal contraventions (number)4 n/a 33 64 32 lNumber of environmental legal contraventions reported in terms of Eskom’s operational health dashboard (number)4 0 0 7 4 lMaterials containing asbestos disposed of (tons)5 n/a 209,8 2 879,7 88,8Material containing polychlorinated biphenyls (PCBs) thermally destructed (tons) n/a 0,9 0 10
RA – Reasonable assurance provided by the independent insurance provider (refer page 169).LA – Limited assurance provided by the independent insurance provider (refer page 169).1. Volume of water consumed per unit of generated power from coal-fired power stations sent out, excluding Komati and Grootvlei power stations.2. Calculated figures based on coal characteristics and the power station design parameters. SO
2 and CO2 emissions are based on coal analysis and using coal burnt tonnages. For 2010, includes Camden, Grootvlei and Komati and the gas turbine power stations as well as oil consumed during power station start-ups and for CO2 the underground coal gasification pilot (flaring).
3. The overall particulate emission performance figure is based on individual coal-fired power station performance. For certain power stations, emission figures are based on best estimates. Excludes Grootvlei and Komati coal-fired power stations as these are not yet in full commercial operation.
4. Under certain conditions, contraventions of environmental legislation are classified in terms of the Eskom OHD index. These include instances where censure was received from authorities, non-reporting to authorities as may be legally required, non-reporting in Eskom, a repeat legal contravention, or when the contravention was not addressed adequately. Managing directors can escalate any significant environmental legal contravention to the OHD.
5. Quantities of waste disposed of at registered waste sites.
Similarly, the comparison of forced plant failures (UCLF) in the
following graph reflects levels in Eskom that are generally better than
the average of the VGB members. The slope of the increasing trend
in recent years is reflective of the ongoing harsh operating conditions
and forced failures.
Environmental performanceHighlights• Generation Peaking business unit achieved ISO 14001 certification
• Several other business units successfully completed phase 1
certification audits for ISO 14001
UCL
F (%
)
10
8
6
4
2
0
Benchmarking UCLF all coal all sizes 1999 – 200896 VGB units (excluding Eskom)
1999
2000
2001
2002
2003
2004
2005
2006
2007
2008
2009
VGB median VGB best quarter VGB worst quarterEskom median Eskom best quarter Eskom worst quarter
• Waste management reviews of all power stations were undertaken
during the year to ensure improved waste management practices
• Water management and ground water reviews were completed
to identify areas for improvement
• The stabilisation of our water use performance. Water used as
part of the process to generate electricity improved slightly
from 1,35RA to 1,34RA L/kWh sent out (see details of actions taken
on page 107)
• Hendrina, Arnot and Komati power stations were awarded the
blue drop certification status by the Department of Water Affairs
as water service providers
• Several major modifications were completed on particulate
emission abatement equipment and related plant, which will result
in improved performance in the next financial year
Challenges• A decline in the particulate emission performance from the coal-
fired power stations to 0,39RAkg/MWh sent out (2009: 0,27RA)
• Inability to meet the requirements of the particulate emission
licences
• Unauthorised water releases

106 Eskom Holdings Limited
Integrated Repor t 2010
• replacement of secondary air heater packs on four of the six units at Kendal power station
• refurbishment of the SO3 plants for all units at Kriel power station• refurbishment of common SO3 plant at Matla power station• completion of most of the short-term ESP improvement plan at
Tutuka power station, which included repairing the defective ESP fields, modifying the rapping system, air-heater and ESP washing and ESP controller optimisation
• replacement of pulse jet fabric filters at Majuba and Hendrina power stations
The nature of these actions is such that they do not result in an immediate reduction in particulate emissions, but rather a reduction over a number of years. Thus positive improvements are expected to become evident during the next financial year (2010/11). There was however a reduction in the number of exemptions requested from emission licence conditions from 160 in 2008/09 to 135 in 2009/10.
Ambient air quality monitoringThis year saw the finalisation and gazetting of ambient air quality standards for major pollutants including sulphur dioxide, nitrogen dioxide and particulate matter. Emissions from Eskom do not result in non-compliance with ambient air quality standards in any populated areas in the vicinity of power stations.
Eskom has carried out ambient air quality monitoring for more than 20 years. Ambient monitoring is conducted to measure the impact of Eskom’s emissions on people residing in the vicinity of power stations; to measure the change in air quality as a result of commissioning new power stations; to measure long-term trends in air quality; and to gain a greater understanding of atmospheric chemistry and Eskom’s influence on the environment.
WaterEskom, as a strategic water user, has a responsibility to play a leading role in the management of this precious resource. Eskom continues to implement water management improvement measures and monitoring and improvement of water consumption at our power stations.
The specific water consumption of 1,34RA L/kWhSO (2009: 1,35RA) (for the power stations excluding the Grootvlei and Komati return to service power stations) was better than the target of 1,36L/kWhSO.
Speci�c water consumption
l/kWh sent out
12 m
mi
0,3 0,6 0,9 1,2 1,50
Dec ’00
Dec ’01
Dec ’02
Dec ’03
Dec ’04
Mar ’05
Mar ’06
Mar ’07
Mar ’08
Mar ’09
Mar ’10
Actual Annual target
Atmospheric emissionsThe generation of electricity at Eskom coal and liquid fuel-fired power stations results, inter alia, in the release of combustion gases and particulate matter. These gases and particulates have the potential to adversely impact local and regional air quality.
The reduction of particulate emissions from coal-fired power station stacks has been a focus since the early 1980s. Significant reductions in the quantity of particulates emitted have been achieved through the use of various particulate abatement technologies, such as electrostatic precipitators (ESPs), whose efficiency has been further enhanced through sulphur trioxide (SO3) flue gas conditioning, skew flow technology and modern control systems. Some power stations have been retrofitted with pulse jet fabric filters.
Although the relative quantity of particulates emitted from the coal-fired power stations compared to the amount of electricity generated is significantly less than the 1980s, there has been an increasing trend over the most recent years, resulting in relative particulate emissions being the highest in the past decade.
The poor particulate emissions performance from the coal-fired power stations in 2009/10 is the result of:• deteriorating coal qualities at some power stations• continued reduced opportunity for maintenance owing to the
lower reserve margin• continued running of power stations at higher load factors• refurbishment work on critical pollution abatement equipment
(sulphur trioxide injection plants) at Kriel and Matla power stations. During such a refurbishment the emissions increase due to the absence of the sulphur trioxide injection. This refurbishment takes place approximately once in 20 years. Successful refurbishment results in long-term emission reductions
The deteriorating emission performance has been identified as an area of significant concern, resulting in Eskom developing a comprehensive particulate emission reduction plan. This plan focuses on specific plant maintenance regimes, upgrades and technology retrofits.
Over the past two years the actions that have been implemented included the following:• installation and optimisation of SO3 plants to improve the
performance of the electrostatic precipitators (ESPs) at Matimba power station
Particle emissions
kg/MWh sent out
12 m
mi
0,05 0,1 0,15 0,2 0,25 0,3 0,35 0,4 0,450
Dec ’01
Dec ’00
Dec ’02
Dec ’03
Dec ’04
Mar ’05
Mar ’06
Mar ’07
Mar ’08
Mar ’09
Mar ’10
Actual Annual target
Generation division continued
RA – Reasonable assurance provided by independent assurance provider (refer page 169).
107Eskom Holdings Limited
Integrated Repor t 2010
was the first in the division to achieve ISO 14001 certification, during this financial year. The remaining stations are all at various stages of the certification process and are on track to meeting their respective target dates.
Partnering with non-government organisationsThe Ingula Partnership, between Eskom, Birdlife South Africa and Middelpunt Wetland Trust, was formed six years ago to provide a forum for discussion and management decision taking related to environmental issues on 8 000 hectares of land purchased for conservation around the Ingula pumped-storage scheme.
Participation by other organisations interested in environmental aspects of the pumped-storage scheme was enabled by creating a working committee – the Ingula Advisory Committee: Conservation. This facilitates transparency, further discussion and input of advice to the partnership. Meetings of the working committee are held regularly, the participants of which include representatives from the national Department of Agriculture, the KwaZulu-Natal and Free State environmental departments and the Ekangala Grassland Trust. A comprehensive conservation plan is being implemented, which includes the possible declaration of the area as a nature reserve and the wetland as a Ramsar site. Significant achievements have been made this year, including the initiation of the alien vegetation eradication programme, the development of an erosion rehabilitation plan and the completion of most of the baseline studies.
The positive performance was the result of• above normal rainfall during the year which resulted in improved
recovery of dirty water• a power station dispatching programme that favoured water
efficient stations• maintenance and repair of water leaks• improved recovery as a result of reuse and recycle
Water management and sewage plant reviews were conducted at all coal-fired power stations to assess the status and effectiveness of water management practices, and to promote water conservation and water demand management. The management reviews revealed various deficiencies such as unaccounted water losses, water leaks, ageing plant, poor coal quality leading to load losses and higher demineralised water consumption and opportunities to reduce water consumption.
WasteAll waste, general and hazardous, produced at the power stations is disposed of at licensed landfill sites. Of particular relevance is the commitment to phase out polychlorinated biphenyls (PCBs) and asbestos-containing materials. Generation division disposed of 0,9 tons of PCB contaminated material (2009: 0) and 209,8 tons of asbestos (2009: 2 879,7 tons).
AshOf the approximately 36,01RA million tons (2009: 36,7LA million tons) of ash produced at the coal-fired power stations 5,6%RA (2009: 5,7%) was reused.
Some of the ash from Lethabo, Majuba, Matla, Kriel, and Kendal is used for the production of cement. The remaining ash is safely disposed of and managed at ash dams and dumps adjacent to the power station. These ash disposal sites are continually rehabilitated to ensure the mitigation of any fugitive dust that may arise.
Environmental impact assessmentsThe undertaking of environmental impact assessments (EIAs) plays a critical role in ensuring informed decision making regarding Eskom’s capacity expansion programme and modifications on existing plant such as waste disposal sites and the extension of ash dams. Environmental authorisations are issued by the national Department of Environmental Affairs (DEA).
EIAs were initiated for two future coal-fired power stations and one nuclear power station in 2008 and 2007, respectively. This year Generation received approval of scoping for these projects which are now well advanced in the EIA phase. Several smaller EIAs were completed during 2009/10 for a landfill site, extension to existing ash dams as well as infrastructure associated with new build projects, such as the Kusile rail project, the Medupi landfill site and the cemetery at Ingula.
Environmental management systemsGeneration division has committed to achieving ISO 14001 certification by March 2011. The Generation peaking business unit
For further details on our environmental performance improvement initiatives go to www.eskom.co.za/annreport10/007.html
Air quality monitoring
Eskom’s research team has been undertaking investigative air
quality monitoring on a regional scale since the late 1970s using
state-of-the-art equipment. Currently there are 13 sites,
including a “super-site” at Elandsfontein, measuring most of the
criteria pollutants as stipulated by the Department of
Environmental Affairs under the Air Quality Act.
The air quality monitoring network is accredited by the South
African National Accreditation Service (SANAS). By identifying
long-term pollution trends and atmospheric chemistry
processes, Eskom is able to assess compliance with ambient air
quality standards and also predict long-term environmental
impacts. By enhancing our knowledge and understanding of the
effects of power station emissions on atmospheric chemistry at
a regional and global scale, Eskom will be able to minimise our
industry’s impact on the environment.
RA – Reasonable assurance provided by the independent assurance provider (refer page 169).LA – Limited assurance provided by the independent assurance provider (refer page 169).
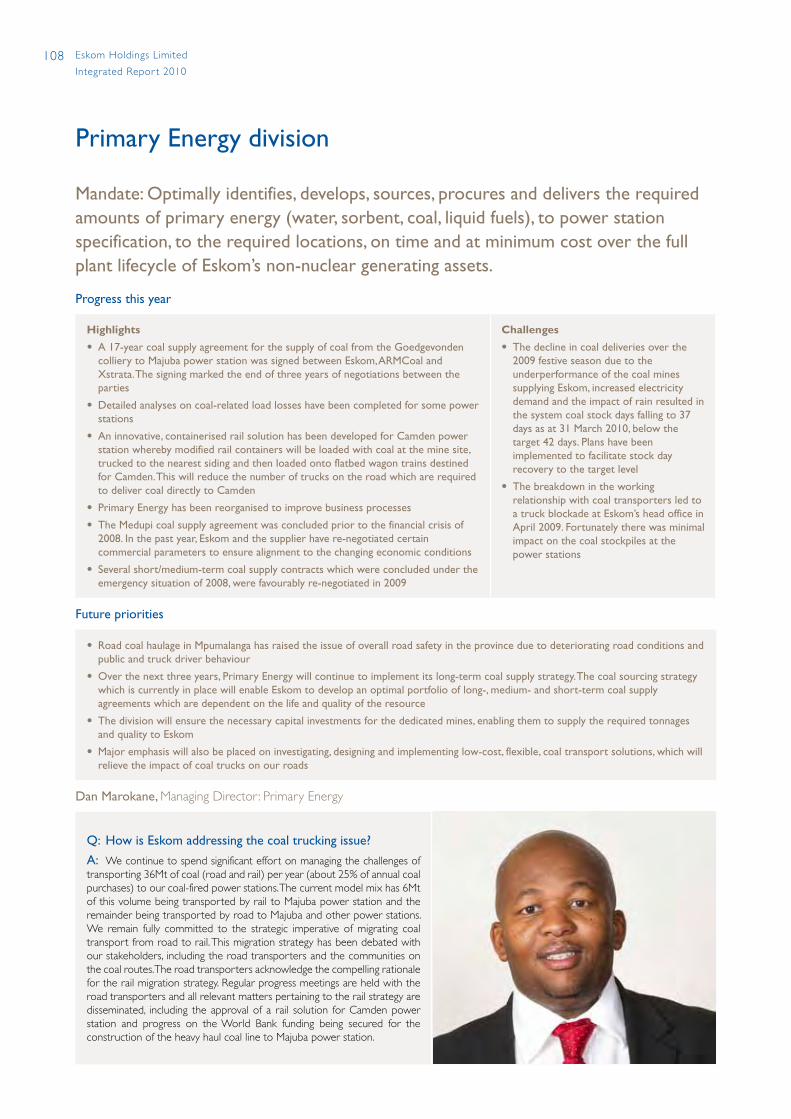
108 Eskom Holdings Limited
Integrated Repor t 2010
Mandate: Optimally identifies, develops, sources, procures and delivers the required amounts of primary energy (water, sorbent, coal, liquid fuels), to power station specification, to the required locations, on time and at minimum cost over the full plant lifecycle of Eskom’s non-nuclear generating assets.
Progress this year
Highlights
• A 17-year coal supply agreement for the supply of coal from the Goedgevonden colliery to Majuba power station was signed between Eskom, ARMCoal and Xstrata. The signing marked the end of three years of negotiations between the parties
• Detailed analyses on coal-related load losses have been completed for some power stations
• An innovative, containerised rail solution has been developed for Camden power station whereby modified rail containers will be loaded with coal at the mine site, trucked to the nearest siding and then loaded onto flatbed wagon trains destined for Camden. This will reduce the number of trucks on the road which are required to deliver coal directly to Camden
• Primary Energy has been reorganised to improve business processes
• The Medupi coal supply agreement was concluded prior to the financial crisis of 2008. In the past year, Eskom and the supplier have re-negotiated certain commercial parameters to ensure alignment to the changing economic conditions
• Several short/medium-term coal supply contracts which were concluded under the emergency situation of 2008, were favourably re-negotiated in 2009
Challenges
• The decline in coal deliveries over the 2009 festive season due to the underperformance of the coal mines supplying Eskom, increased electricity demand and the impact of rain resulted in the system coal stock days falling to 37 days as at 31 March 2010, below the target 42 days. Plans have been implemented to facilitate stock day recovery to the target level
• The breakdown in the working relationship with coal transporters led to a truck blockade at Eskom’s head office in April 2009. Fortunately there was minimal impact on the coal stockpiles at the power stations
Future priorities
• Road coal haulage in Mpumalanga has raised the issue of overall road safety in the province due to deteriorating road conditions and public and truck driver behaviour
• Over the next three years, Primary Energy will continue to implement its long-term coal supply strategy. The coal sourcing strategy which is currently in place will enable Eskom to develop an optimal portfolio of long-, medium- and short-term coal supply agreements which are dependent on the life and quality of the resource
• The division will ensure the necessary capital investments for the dedicated mines, enabling them to supply the required tonnages and quality to Eskom
• Major emphasis will also be placed on investigating, designing and implementing low-cost, flexible, coal transport solutions, which will relieve the impact of coal trucks on our roads
Dan Marokane, Managing Director: Primary Energy
Q: How is Eskom addressing the coal trucking issue?
A: We continue to spend significant effort on managing the challenges of transporting 36Mt of coal (road and rail) per year (about 25% of annual coal purchases) to our coal-fired power stations. The current model mix has 6Mt of this volume being transported by rail to Majuba power station and the remainder being transported by road to Majuba and other power stations. We remain fully committed to the strategic imperative of migrating coal transport from road to rail. This migration strategy has been debated with our stakeholders, including the road transporters and the communities on the coal routes. The road transporters acknowledge the compelling rationale for the rail migration strategy. Regular progress meetings are held with the road transporters and all relevant matters pertaining to the rail strategy are disseminated, including the approval of a rail solution for Camden power station and progress on the World Bank funding being secured for the construction of the heavy haul coal line to Majuba power station.
Primary Energy division
109Eskom Holdings Limited
Integrated Repor t 2010
Primary Energy updateOver the past year, Primary Energy has undergone an extensive
exercise focusing on its organisational structure. The structure was
developed based on an international benchmarking exercise and on
the principles of organisational design. The structure was approved
and is currently being implemented in the division. This exercise also
Risk profile
RiskReduced coal purchases and inadequate coal qualities caused by non-performance of the coal mines
Treatment plansEngage and manage the coal suppliers and the coal supply agreements to ensure maximum efficiency and performance
Deterioration of road infrastructure caused by heavy rains and lack of road maintenance by the relevant authorities
• Continual engagement with the relevant authorities to improve and maintain the road network
• Optimisation of the rail network, thus decreasing the need for coal to be transported by road
Reduced rail performance caused by inefficiencies across the coal value chain leading to coal being transported by road at extra cost
Embark on various initiatives to ensure that the rail network is optimised
Eskom is in the process of establishing rail off-loading facilities at power stations which will be supplied by mine loading sites in the central basin of Mpumalanga
Short-term containerised coal solutions will be implemented at some stations because these solutions are cost effective and relatively quick to implement
Eskom aims to move over 18Mtpa of coal from road to rail in the foreseeable future
Delays in implementation of new water supply infrastructure leading to late delivery of water to new power stations
• Prioritise and fast track off-take agreements• Trigger specialist studies on water resource availability and impact• Support strategic environmental studies around impact of water use for future power
generation developments• Obtain explicit or implicit guarantees from government for water infrastructure funding
Coal quality and quantityCoal quantity procured has been below the business requirements in the current year due to underperformance of the tied mines operated
by the major mining companies supplying Eskom. Stockpiles at all the stations have been kept at above their minimum levels and total system
stock is within the expected range.
Eskom has also embarked on several initiatives to ensure that the correct quality of coal reaches each power station. These initiatives will continue
over the next few years.
Performance – coal purchased and burnt
Target 2010
Actual 2010
Actual 2009
Actual 2008
Coal burnt (M tons) 122,50 122,70 121,16 125,30Coal purchased (M tons) 123,94 121,82 132,66 119,63Coal stock days 42 37RA 41LA 13
RA – Reasonable assurance provided by the independent assurance provider (refer page 169).LA – Limited assurance provided by the independent assurance provider (refer page 169).
For the year under review, the largest impacts on coal costs were lower volumes than planned (4,1Mt) from the long-term coal supply agreements
with tied mines resulting in a higher level of short/medium-term coal being procured (with its associated transport costs) to fill Eskom’s coal
demand gap.
identified the key positions in the division and vacant positions have
been advertised. Primary Energy will acquire the requisite skills and
experience from the market. Extensive focus is currently on
implementing processes and systems that will improve contract
management while strengthening governance practices. A number of
legacy issues in different contracts will also receive attention.
110 Eskom Holdings Limited
Integrated Repor t 2010
requirements of Medupi power station and the associated
developments but excluding water for flue gas desulphurisation
(FGD). In the interim, Medupi power station will have adequate
water supply, using the existing surplus from Matimba power
station, to cater for Medupi’s first three units fully commissioned
without FGD.
MCWAP phase 2 involves the abstraction and transfer of water
from the Crocodile West River to the Lephalale area. Phase 2 will
support future water requirements beyond Eskom’s needs in the
region and Medupi’s FGD and is planned to be completed by
October 2015.
In addition, the Vaal River eastern subsystem augmentation
project (VRESAP) was declared operational by DWA in June 2009.
Eskom has requested the DWA to investigate potential
infrastructure bottlenecks in their water supply systems and this
study is expected to be completed by end April 2011. Eskom is
also working closely with the DWA to mitigate potential water
deficits in the Vaal River system. This water feeds all the power
stations in the Mpumalanga province.
Eskom has engaged with the DWA’s national water resources
planning directorate to ensure water resources and infrastructure
planning needs are factored into the integrated resources plan. The
DWA has also initiated and completed various water resources
studies and strategies to ensure plans are implemented timeously to
meet the electricity generation and related development needs
of the country.
Further, pronounced water scarcity and deteriorating quality in key
catchments, along with heightened expectations among important
stakeholders including consumers and investors, has created a
compelling business case for our overall water management strategy,
including a water demand management strategy. This strategy takes
into account the scenarios related to the future cost of water.
The key elements of the water strategy are:
• to meet the water quality objectives of the various catchments
• to efficiently manage water cost increases into the future
• to actively influence policy, strategy, planning, legislative and
regulatory environment related to water
• to meet the water requirements for existing and new
power stations
Long-term coal supply strategyEskom has developed a long-term coal supply strategy in order to
meet the requirements of the current and future power stations. The
key elements of this strategy are:
• to develop an optimal portfolio of long-, medium- and short-term
coal supply agreements
• to invest in low-cost, flexible, coal transport infrastructure
• to improve the consistency and quality of coal supplied to the
power stations
• to intensively engage with all major stakeholders
Long-term water strategyThe concerns of growing water scarcity; lack of access to water to
meet basic human needs; depleted environmental flows; growing
pollution from land use activities; human health concerns and the
implications of climate change on the hydrological cycle and yields
have brought water to the forefront as a strategic area for us. This has
resulted in us understanding that we will no longer be able to easily
access relatively cheap and clean water and that we must consider
limited supplies and the implications of our water use and discharge
on watersheds, ecosystems, and communities. The increase in
demand for water together with deterioration in water quality will
result in increases in the cost of water, requiring recovery from the
electricity tariff.
Eskom, as a strategic water user, has an added responsibility to play a
leading role in the management of this precious resource, while
leveraging its role of setting a foundation for growth and development
as well as creating a sustainable economy, not harmful to the
environment.
The key water supply infrastructure projects that have been identified
to deliver water to Medupi, Kusile and the return-to-service stations
are the Mokolo and Crocodile Water Augmentation Project
(MCWAP) and the Komati Water Scheme Augmentation Project
(KWSAP), respectively.
The KWSAP is awaiting Public Finance Management Act approval
before the water supply agreements between Eskom and the
Department of Water Affairs (DWA) can be signed. The
environmental authorisation is expected by end May 2010 and water
delivery planned by end May 2012.
The MCWAP phase 1 water supply agreements are planned to be
concluded by end June 2010 with water delivery planned for end
April 2013. This will provide sufficient capacity for all the water
Primary Energy division continued
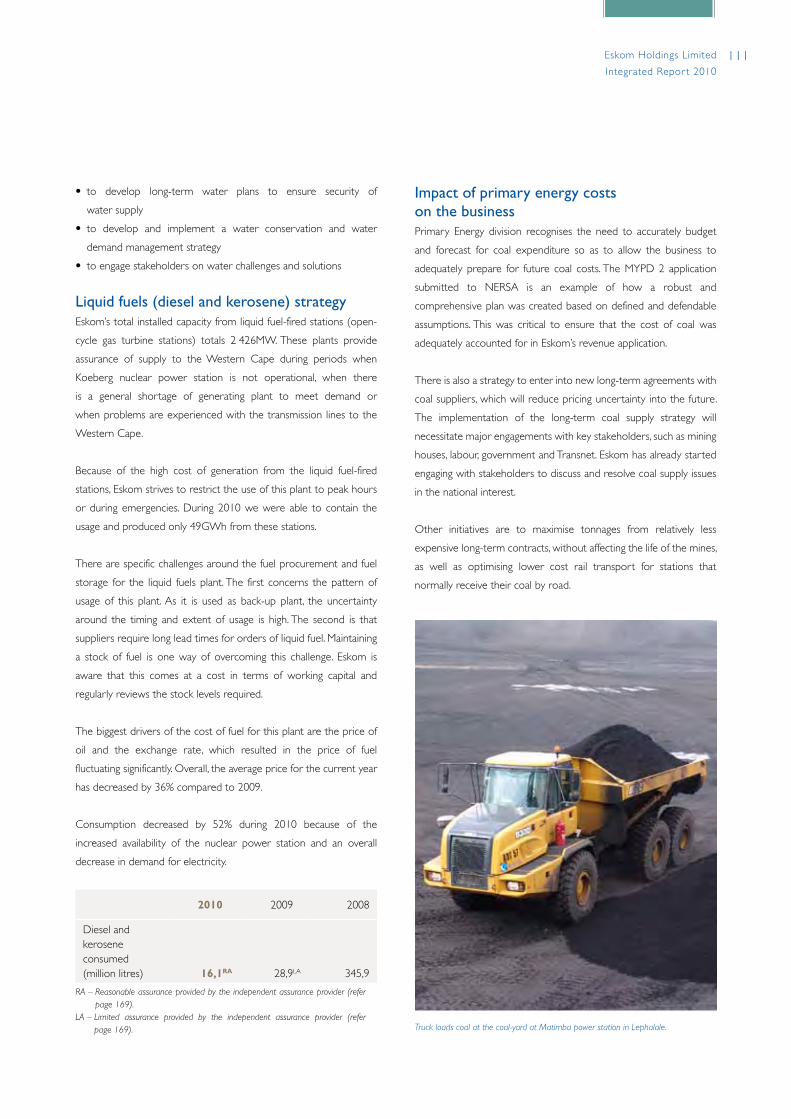
111Eskom Holdings Limited
Integrated Repor t 2010
• to develop long-term water plans to ensure security of
water supply
• to develop and implement a water conservation and water
demand management strategy
• to engage stakeholders on water challenges and solutions
Liquid fuels (diesel and kerosene) strategyEskom’s total installed capacity from liquid fuel-fired stations (open-
cycle gas turbine stations) totals 2 426MW. These plants provide
assurance of supply to the Western Cape during periods when
Koeberg nuclear power station is not operational, when there
is a general shortage of generating plant to meet demand or
when problems are experienced with the transmission lines to the
Western Cape.
Because of the high cost of generation from the liquid fuel-fired
stations, Eskom strives to restrict the use of this plant to peak hours
or during emergencies. During 2010 we were able to contain the
usage and produced only 49GWh from these stations.
There are specific challenges around the fuel procurement and fuel
storage for the liquid fuels plant. The first concerns the pattern of
usage of this plant. As it is used as back-up plant, the uncertainty
around the timing and extent of usage is high. The second is that
suppliers require long lead times for orders of liquid fuel. Maintaining
a stock of fuel is one way of overcoming this challenge. Eskom is
aware that this comes at a cost in terms of working capital and
regularly reviews the stock levels required.
The biggest drivers of the cost of fuel for this plant are the price of
oil and the exchange rate, which resulted in the price of fuel
fluctuating significantly. Overall, the average price for the current year
has decreased by 36% compared to 2009.
Consumption decreased by 52% during 2010 because of the
increased availability of the nuclear power station and an overall
decrease in demand for electricity.
2010 2009 2008
Diesel and kerosene consumed (million litres) 16,1RA 28,9LA 345,9
RA – Reasonable assurance provided by the independent assurance provider (refer page 169).
LA – Limited assurance provided by the independent assurance provider (refer page 169).
Impact of primary energy costs on the businessPrimary Energy division recognises the need to accurately budget
and forecast for coal expenditure so as to allow the business to
adequately prepare for future coal costs. The MYPD 2 application
submitted to NERSA is an example of how a robust and
comprehensive plan was created based on defined and defendable
assumptions. This was critical to ensure that the cost of coal was
adequately accounted for in Eskom’s revenue application.
There is also a strategy to enter into new long-term agreements with
coal suppliers, which will reduce pricing uncertainty into the future.
The implementation of the long-term coal supply strategy will
necessitate major engagements with key stakeholders, such as mining
houses, labour, government and Transnet. Eskom has already started
engaging with stakeholders to discuss and resolve coal supply issues
in the national interest.
Other initiatives are to maximise tonnages from relatively less
expensive long-term contracts, without affecting the life of the mines,
as well as optimising lower cost rail transport for stations that
normally receive their coal by road.
Truck loads coal at the coal-yard at Matimba power station in Lephalale.
112 Eskom Holdings Limited
Integrated Repor t 2010
Primary Energy division continued
Road repairsWhile Eskom does not have an obligation to repair roads, the
organisation has spent R161 million in the last financial year on
repairs to the roads used to transport coal to the power stations. For
the coming financial year, a total amount of R950 million will be spent
on repairing and maintaining this network of roads. Part of Eskom’s
long-term strategy is to maximise the use of rail to transport coal.
However, in the short term, it is imperative that these roads are
repaired and maintained in order to provide an adequate supply of
coal to the power stations and ensure safe driving for the communities.
In 2009, the government and the South African National Roads
Agency Limited (SANRAL) agreed that SANRAL will be responsible
for road maintenance. However, for the coming financial year, Eskom,
in its MYPD 2 application to NERSA, requested an amount for road
repairs to allow for time for the new arrangements to be finalised.
This was granted by NERSA. Beyond the next financial year, SANRAL
Key primary energy environmental performance indicators
Target 2010 2009 2008
Number of environmental legal contraventions 0 1 1 n/a lNumber of environmental legal contraventions reported in terms of Eskom’s operational health dashboard1 0 0 0 n/a l
1. Under certain conditions, contraventions of environmental legislation are classified in terms of the Eskom operational health dashboard (OHD) index. These include instances where censure was received from authorities, non-reporting to authorities as may be legally required, non-reporting in Eskom, a repeat legal contravention, or when the contravention was not addressed adequately.
Looking forward
• Eskom aims to implement its water demand management strategy to reduce its water losses (evaporative, seepage and spillages) and continuously achieve improvement in its water use performance (litres per kWh sent out) by setting stretch targets
• Investigating mine water treatment and reuse at power stations
• Conducting activities in a self-regulatory manner, complying with legal and regulatory requirements and reducing long-term environmental liabilities
will conduct all road repairs and Eskom will pay a shadow toll
to SANRAL based on Eskom’s beneficial use of the roads for
coal haulage.
Environmental performanceHighlights• Environmental and water strategies are in place and plans are
being implemented
• Inclusion of environmental conditions in new coal suppliers
contracts
• Completion of the water and waste water management reviews
at all coal-fired power stations
• Water use licence authorisations and permits issued for Eskom
operations
Challenges• Repair of roads required to improve coal transport was started
before obtaining the required environmental authorisation
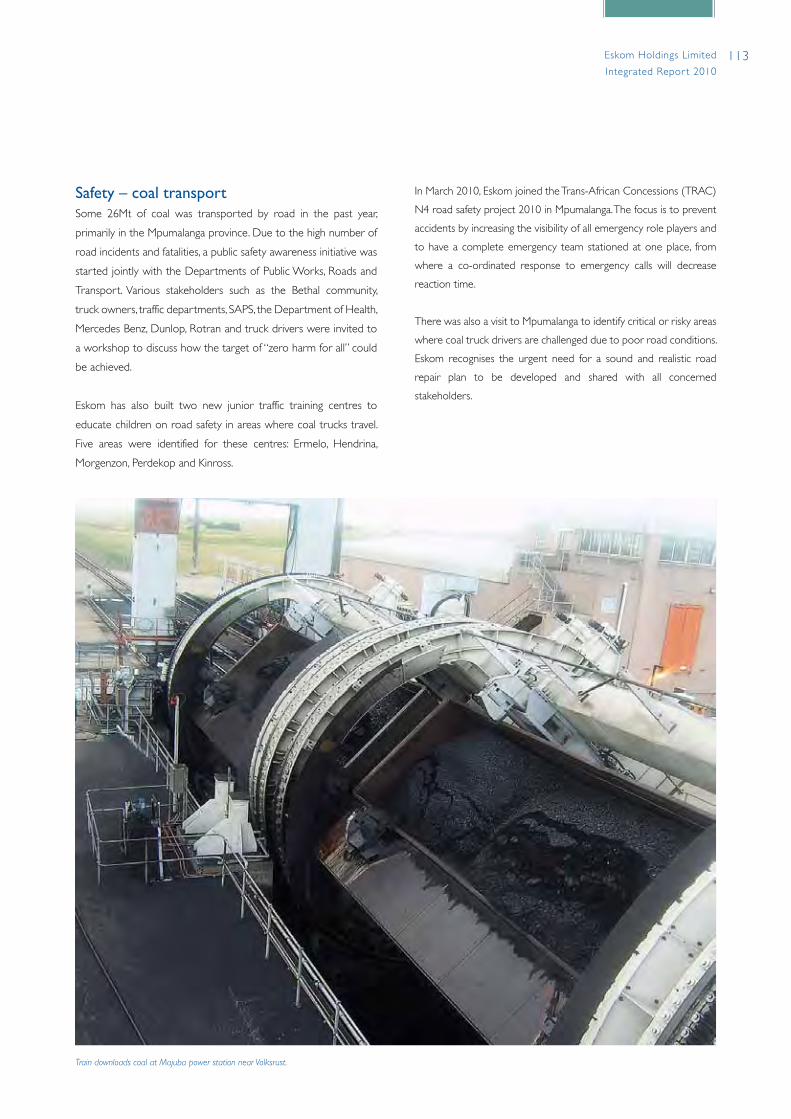
113Eskom Holdings Limited
Integrated Repor t 2010
In March 2010, Eskom joined the Trans-African Concessions (TRAC)
N4 road safety project 2010 in Mpumalanga. The focus is to prevent
accidents by increasing the visibility of all emergency role players and
to have a complete emergency team stationed at one place, from
where a co-ordinated response to emergency calls will decrease
reaction time.
There was also a visit to Mpumalanga to identify critical or risky areas
where coal truck drivers are challenged due to poor road conditions.
Eskom recognises the urgent need for a sound and realistic road
repair plan to be developed and shared with all concerned
stakeholders.
Safety – coal transportSome 26Mt of coal was transported by road in the past year,
primarily in the Mpumalanga province. Due to the high number of
road incidents and fatalities, a public safety awareness initiative was
started jointly with the Departments of Public Works, Roads and
Transport. Various stakeholders such as the Bethal community,
truck owners, traffic departments, SAPS, the Department of Health,
Mercedes Benz, Dunlop, Rotran and truck drivers were invited to
a workshop to discuss how the target of “zero harm for all” could
be achieved.
Eskom has also built two new junior traffic training centres to
educate children on road safety in areas where coal trucks travel.
Five areas were identified for these centres: Ermelo, Hendrina,
Morgenzon, Perdekop and Kinross.
Train downloads coal at Majuba power station near Volksrust.
114 Eskom Holdings Limited
Integrated Repor t 2010
Mandate: Performs activities relating to the optimal operation and maintenance of Eskom’s nuclear generation assets over their full plant lifecycle.
Progress this year
Highlights
• Significant worker radiation dose reduction
• Reduced staff turnover
Challenges
• Decision for new nuclear capacity (Nuclear-1 project) not finalised (awaiting IRP2)
Future priorities
• Formalisation of Koeberg lifespan at 60 years
• Koeberg steam generator replacement project
• EIA process for new nuclear sites
• DRA for future nuclear capacity
Clive le Roux, Senior General Manager: Nuclear
Q: What is Eskom’s view on the future nuclear expansion programme?
A: Other than coal-fired power stations, the only feasible alternative for
base load electricity in South Africa is nuclear power stations. Because the
existing nuclear power station at Koeberg is a pressurised water reactor,
this remains the preferred nuclear technology for a new fleet of reactors.
The South African government is currently considering the way forward in
terms of the expansion of South Africa’s nuclear power generation capacity.
Nuclear division

115Eskom Holdings Limited
Integrated Repor t 2010
Key focus areas in 2010During the year under review, the Nuclear division concentrated on
providing nuclear energy in accordance with world-class nuclear
safety and technical performance requirements. This was achieved
through the development of supportive nuclear safety values and
beliefs, continuous effort to ensure operational excellence and
adherence to the fundamentals of sound financial management.
New techniques, and a concerted drive to change behaviours,
resulted in the total radiation dose emitted to the Koeberg workforce
in the execution of work in radiological controlled zones, being
reduced significantly. This achievement was maintained during the
year, even though considerable work was conducted within narrowly
defined timeframes during the outage period.
A suite of technical modifications was completed on both units.
These safety modifications have further reduced the probability of
accidents and public risk, which remains below limits prescribed by
regulation.
Eskom continues to actively participate in the international nuclear
domain through its affiliation to the World Association of Nuclear
Operators (WANO), the International Atomic Energy Agency
(IAEA) and the Institute of Nuclear Power Operators (INPO).This
facilitates benchmarking of performance, periodic safety reviews,
definition of standards, dissemination of best practices and training of
industry personnel.
Risk Treatment plans
Threats to production To improve the availability of the Koeberg units, future planned upgrades are part of the ongoing asset management strategy, and are planned in a prioritised manner for future outages
The extent of the reliance of Koeberg and the Western Cape on the transmission network
This is addressed through continuous dialogue between the Koeberg operators and the network operators, to ensure that risks on the transmission network and at Koeberg are understood and appropriate contingencies plans are devised
Delays in the establishment of National Radioactive Waste Disposal Management Agency
The agency has many responsibilities that directly influence the operations of nuclear installations. Eskom is actively involved with the Department of Energy and its consultants in the establishment of the agency. Eskom has evaluated the different strategies for managing used fuel and is ready to make proposals to the agency when established
Eskom remains a member of the European Mutual Association for
Nuclear Insurance and uses this membership to reduce the cost of
insurance for the business and to network with other nuclear utilities
on common risk and insurance issues.
During 2009 Koeberg celebrated its 25th consecutive year of safe
operation of unit 1 with unit 2 about to reach that milestone during
2010. This remarkable feat, combined with the current condition of
the plant, makes it feasible to consider a plant operational lifespan of
60 years in line with international trends. A formal decision in this
regard is anticipated in the coming year.
In an effort to ensure public participation, the division undertook
awareness activities through various media, community forum
initiatives and effective communication strategies. In addition,
continuous support was provided to the South African government
with regards to initiatives aimed at the development of a future
nuclear power industry.
Risk profileThe nuclear division has implemented an integrated risk management
practice that is aligned to that of Eskom. Pursuant to this policy, the
nuclear division has identified risks and appropriate risk mitigation
techniques. The more important risks are listed hereunder.
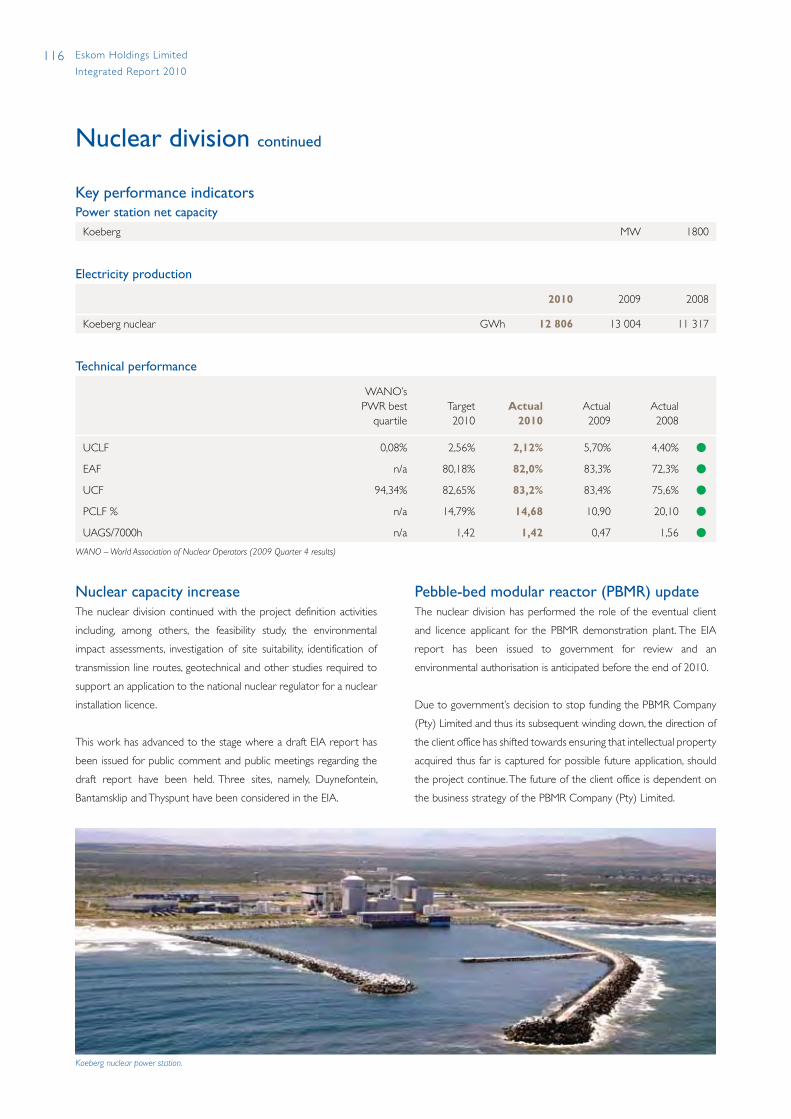
116 Eskom Holdings Limited
Integrated Repor t 2010
Key performance indicatorsPower station net capacity
Koeberg MW 1800
Electricity production
2010 2009 2008
Koeberg nuclear GWh 12 806 13 004 11 317
Technical performance
WANO’s PWR best
quartileTarget 2010
Actual 2010
Actual 2009
Actual 2008
UCLF 0,08% 2,56% 2,12% 5,70% 4,40% lEAF n/a 80,18% 82,0% 83,3% 72,3% lUCF 94,34% 82,65% 83,2% 83,4% 75,6% lPCLF % n/a 14,79% 14,68 10,90 20,10 lUAGS/7000h n/a 1,42 1,42 0,47 1,56 l
WANO – World Association of Nuclear Operators (2009 Quarter 4 results)
Pebble-bed modular reactor (PBMR) updateThe nuclear division has performed the role of the eventual client
and licence applicant for the PBMR demonstration plant. The EIA
report has been issued to government for review and an
environmental authorisation is anticipated before the end of 2010.
Due to government’s decision to stop funding the PBMR Company
(Pty) Limited and thus its subsequent winding down, the direction of
the client office has shifted towards ensuring that intellectual property
acquired thus far is captured for possible future application, should
the project continue. The future of the client office is dependent on
the business strategy of the PBMR Company (Pty) Limited.
Nuclear capacity increaseThe nuclear division continued with the project definition activities
including, among others, the feasibility study, the environmental
impact assessments, investigation of site suitability, identification of
transmission line routes, geotechnical and other studies required to
support an application to the national nuclear regulator for a nuclear
installation licence.
This work has advanced to the stage where a draft EIA report has
been issued for public comment and public meetings regarding the
draft report have been held. Three sites, namely, Duynefontein,
Bantamsklip and Thyspunt have been considered in the EIA.
Nuclear division continued
Koeberg nuclear power station.

117Eskom Holdings Limited
Integrated Repor t 2010
Nuclear fuelNuclear fuel is procured and delivered to Koeberg nuclear power
station in accordance with government-authorised contracts for the
supply of enriched uranium and for the supply of nuclear fuel
fabrication services for the nuclear fuel assemblies. A second fuel
fabrication vendor was established during the year to ensure flexibility
and competition in the fuel market. These contracts are sufficient to
provide the fuel demand for Koeberg for the next eight years.
Nuclear safetyEskom’s nuclear safety performance as measured by the INPO index
has shown cumulative improvement since the beginning of 2009.
%100959085807570656055504540
Station score monthly average INPO US all units median 2010 index
Jul ’09
INPO index two-yearly trend
Apr ’08
May ’08
Jun ’08
Jul ’08
Aug ’08
Sep ’08
Oct ’08
Nov ’08
Aug ’09
Sep ’09
Oct ’09
Nov ’09
Dec ’09
Jan ’10
Feb ’10
Mar ’10
Dec ’08
Jan ’09
Feb ’09
Mar ’09
Apr ’09
May ’09
Jun ’09
The safety performance of Koeberg for 2009 has been above the
WANO median performance indicators relative to pressurised
water reactors of similar design.
Nuclear Safety and Assurance, a separate department within the
Generation business with its own technical experts and resources,
provides independent assurance on nuclear safety and compliance
with licence requirements. In line with international best practice,
Eskom has a three-tier system of nuclear safety governance.
The sustainability committee of the board (the top tier), dedicates
several meetings a year to nuclear matters. The meetings are
attended by international nuclear experts who bring a broad
perspective to the deliberations. The Nuclear Management
Committee (middle tier), presided over by the chief officer
(Generation business), monitors, reviews and makes
recommendations on issues such as nuclear policy, standards,
benchmarks and rules, and Eskom’s overall business requirements.
The safety review committees (third tier), bring together experts
from various parts of Eskom to evaluate nuclear safety issues and
make recommendations to senior management and the other tiers.
A significant reduction in core damage frequency (CDF) has been
achieved, primarily due to hardware modifications implemented
during recent outages. This large reduction in the baseline core
damage frequency has significantly reduced the potential impact of
human fallibility and equipment failure on safety. A total of R720 million
has been spent to date on upgrades to ensure the overall plant safety
of Koeberg.
The overall inherent level of safety reflected in the graph below is at
world standard compared to the IAEA guidance for existing plants.
The Koeberg design and technical practice is aligned to that of the
Electricité de France (EdF) CP1 reference plant, while the
management processes and training philosophy are aligned to that of
the US nuclear industry.
Core
dam
age
frequ
ency
(pe
r uni
t per
yea
r)
1,00E-04
1,00E-05
1,00E-06
7,61E-05
3,57E-05
1,93E-05
8,74E-06
Koeberg core damage frequency (CDF)
Jan
’05
Jul ’
05
Jan
’06
Jul ’
06
Jan
’07
Jul ’
07
Jan
’08
Jul ’
08
Jan
’09
Jan
’10
Jul ’
09
IAEA limit for existing plants IAEA limit for new plants
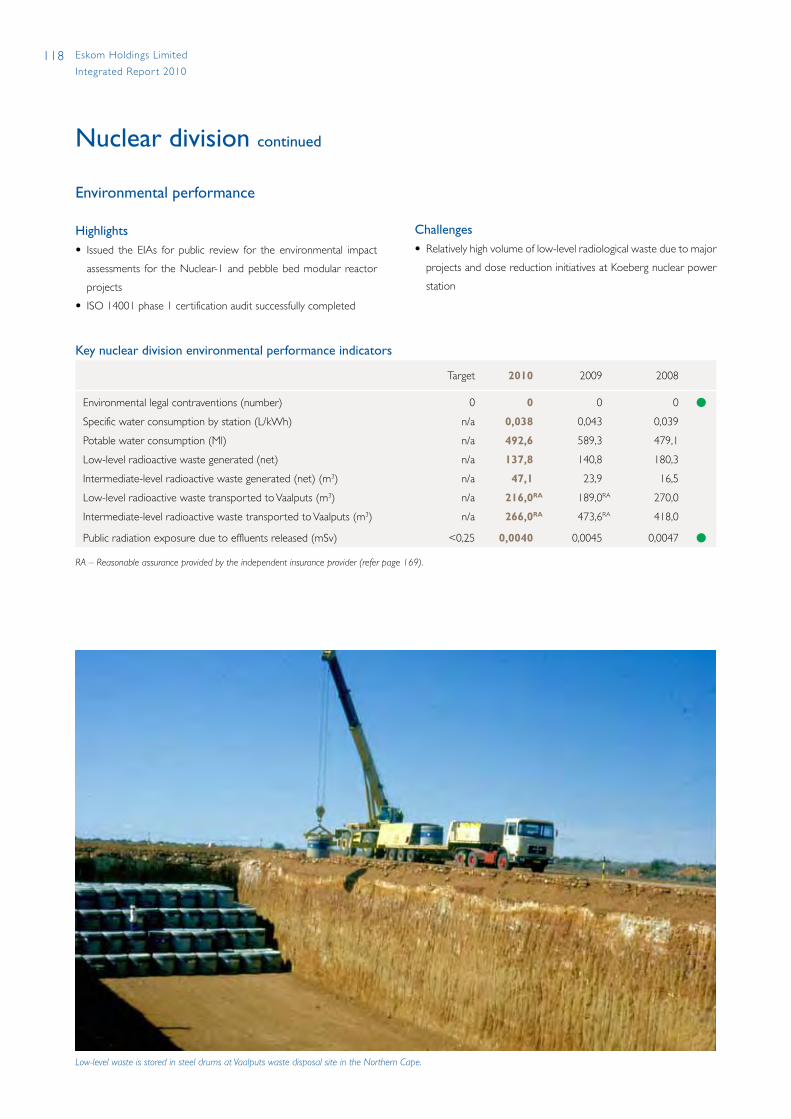
118 Eskom Holdings Limited
Integrated Repor t 2010
Nuclear division continued
Environmental performance
Highlights• Issued the EIAs for public review for the environmental impact
assessments for the Nuclear-1 and pebble bed modular reactor
projects
• ISO 14001 phase 1 certification audit successfully completed
Challenges• Relatively high volume of low-level radiological waste due to major
projects and dose reduction initiatives at Koeberg nuclear power
station
Key nuclear division environmental performance indicators
Target 2010 2009 2008
Environmental legal contraventions (number) 0 0 0 0 lSpecific water consumption by station (L/kWh) n/a 0,038 0,043 0,039
Potable water consumption (Ml) n/a 492,6 589,3 479,1
Low-level radioactive waste generated (net) n/a 137,8 140,8 180,3
Intermediate-level radioactive waste generated (net) (m3) n/a 47,1 23,9 16,5
Low-level radioactive waste transported to Vaalputs (m3) n/a 216,0RA 189,0RA 270,0
Intermediate-level radioactive waste transported to Vaalputs (m3) n/a 266,0RA 473,6RA 418,0
Public radiation exposure due to effluents released (mSv) <0,25 0,0040 0,0045 0,0047 lRA – Reasonable assurance provided by the independent insurance provider (refer page 169).
Low-level waste is stored in steel drums at Vaalputs waste disposal site in the Northern Cape.
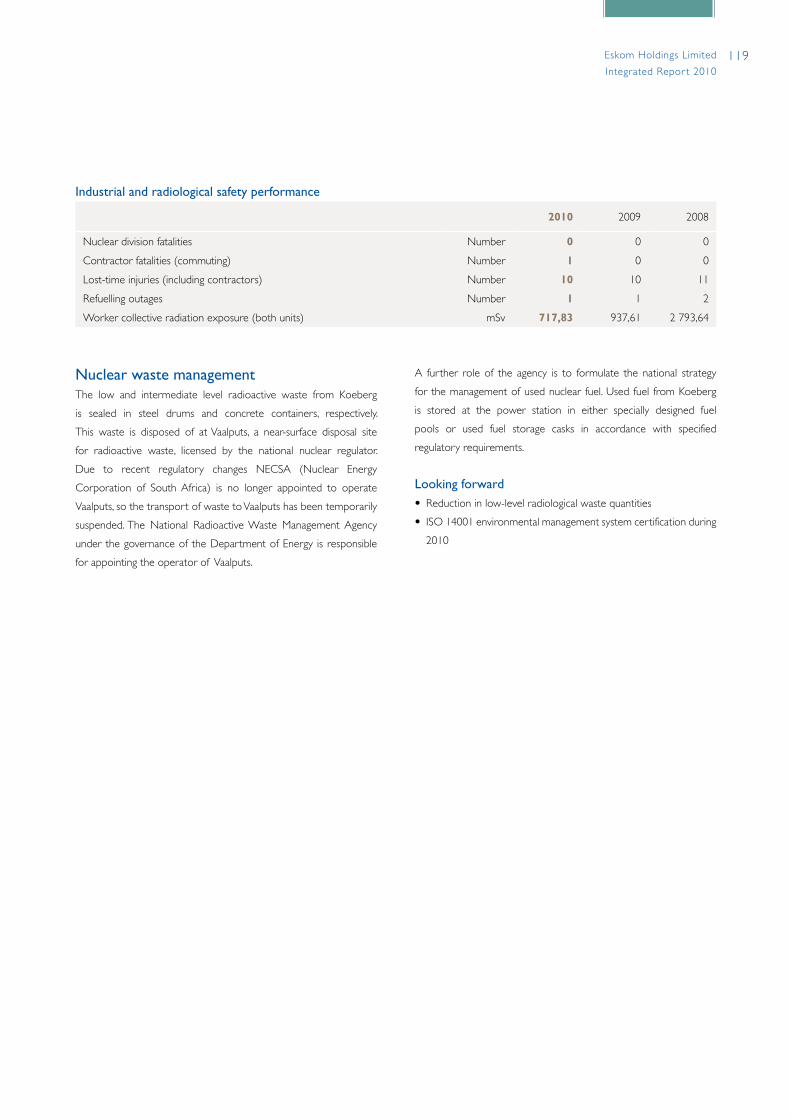
119Eskom Holdings Limited
Integrated Repor t 2010
Nuclear waste managementThe low and intermediate level radioactive waste from Koeberg
is sealed in steel drums and concrete containers, respectively.
This waste is disposed of at Vaalputs, a near-surface disposal site
for radioactive waste, licensed by the national nuclear regulator.
Due to recent regulatory changes NECSA (Nuclear Energy
Corporation of South Africa) is no longer appointed to operate
Vaalputs, so the transport of waste to Vaalputs has been temporarily
suspended. The National Radioactive Waste Management Agency
under the governance of the Department of Energy is responsible
for appointing the operator of Vaalputs.
A further role of the agency is to formulate the national strategy
for the management of used nuclear fuel. Used fuel from Koeberg
is stored at the power station in either specially designed fuel
pools or used fuel storage casks in accordance with specified
regulatory requirements.
Looking forward• Reduction in low-level radiological waste quantities
• ISO 14001 environmental management system certification during
2010
Industrial and radiological safety performance
2010 2009 2008
Nuclear division fatalities Number 0 0 0
Contractor fatalities (commuting) Number 1 0 0
Lost-time injuries (including contractors) Number 10 10 11
Refuelling outages Number 1 1 2
Worker collective radiation exposure (both units) mSv 717,83 937,61 2 793,64
120 Eskom Holdings Limited
Integrated Repor t 2010
Mandate: Provides specialist engineering services to ensure the continued operation of existing power stations and to design new power generation assets.
Progress this year
Highlights
• Establishment of engineering competence to deliver design requirements for Eskom
• Completion of phase 1 of the engineering framework development
• Generation engineering design infrastructure (GEDI) project progress
• Safety performance
• Modern Power Systems Power Plant Innovation Award for Medupi plant
Challenges
• Increased pressure to run ageing plant beyond design life
• Skills and competency gaps in critical input areas
Future priorities
• Rollout of the engineering framework
• Provide engineering support to Generation to ensure sustainable long-term plant health in current high-demand conditions
• Engineering enhancements to reduce our environmental impact
• Establish and embed use of a common engineering system platform across entire Generation business
Matshela Koko, Senior General Manager: Generation Business Engineering
Q: What are the main challenges facing engineering in Eskom?
A: Eskom is in the middle of a capacity expansion programme while simultaneously operating and maintaining a large fleet of power stations supplying power to South Africa. These dual programmes have put tremendous pressure on Eskom’s ability to provide effective and efficient engineering services and support. Furthermore, the large number of interfaces that engineering is required to manage makes the total Eskom design integration a great challenge.
Our engineering capability is fully engaged in assisting the generation division to operate the current generating fleet assets at optimal levels without undue risks. On the other hand, Eskom’s engineering capability in design is gaining international recognition – the Modern Power Systems Innovation Design Award for the Medupi plant is evidence of this.
Generation Business Engineering division
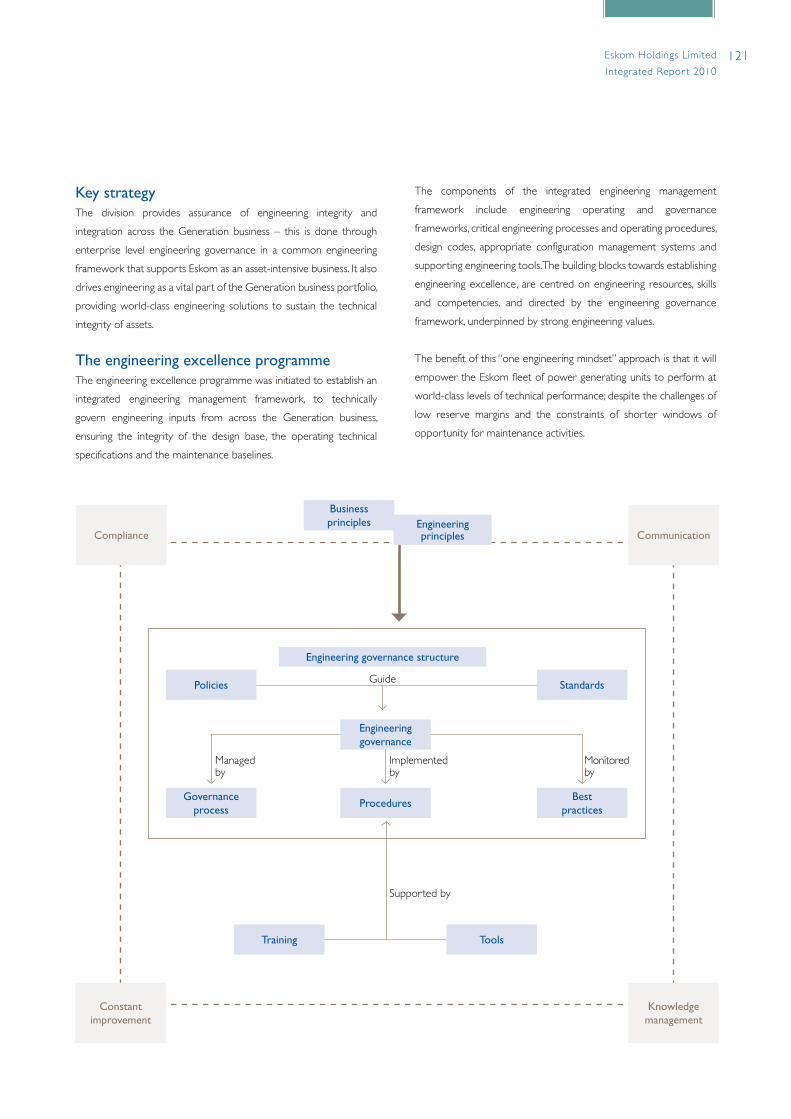
121Eskom Holdings Limited
Integrated Repor t 2010
The components of the integrated engineering management
framework include engineering operating and governance
frameworks, critical engineering processes and operating procedures,
design codes, appropriate configuration management systems and
supporting engineering tools. The building blocks towards establishing
engineering excellence, are centred on engineering resources, skills
and competencies, and directed by the engineering governance
framework, underpinned by strong engineering values.
The benefit of this “one engineering mindset” approach is that it will
empower the Eskom fleet of power generating units to perform at
world-class levels of technical performance; despite the challenges of
low reserve margins and the constraints of shorter windows of
opportunity for maintenance activities.
Key strategyThe division provides assurance of engineering integrity and
integration across the Generation business – this is done through
enterprise level engineering governance in a common engineering
framework that supports Eskom as an asset-intensive business. It also
drives engineering as a vital part of the Generation business portfolio,
providing world-class engineering solutions to sustain the technical
integrity of assets.
The engineering excellence programmeThe engineering excellence programme was initiated to establish an
integrated engineering management framework, to technically
govern engineering inputs from across the Generation business,
ensuring the integrity of the design base, the operating technical
specifications and the maintenance baselines.
Communication
Knowledge management
Compliance
Business principles Engineering
principles
Engineering governance structure
Standards
Engineering governance
Procedures
Training Tools
Governance process
Best practices
Guide
Managed by
Implemented by
Monitoredby
Supported by
Policies
Constant improvement

122 Eskom Holdings Limited
Integrated Repor t 2010
Plans for 2010 – 2013A number of activities were initiated in 2009 to establish a sound
foundation for Generation business engineering. An engineering
six-point plan was developed, centred on the Eskom vision.
The period 2010 to 2013 will be used to fully establish, rollout
and implement the integrated engineering management framework
across the Generation business. To complete the framework, an
engineering toolbox will be defined and established that will enable
the Eskom engineer to deliver the services accurately and efficiently,
with the confidence of world-class approaches and applications.
Engineering Framework Process driven engineering
• Do not duplicate efforts
• Effectively use smart plant enterprise tools to ensure design integrations
• Engineering intensive nature of asset creation activities
• Design work in Eskom must have the same process methodology
• Processes should ensure re-use across plants and business areas
• Consistent application of Engineering processes, standards and systems throughout Generation Business
The structured approach has led to the development of an
engineering framework, which has as key elements, the following
• The required engineering governance and practices needed to
sustain a world-class engineering organisation
• Standardised, repeatable and audit-able engineering and design
processes
• Standards, procedures and design codes to enable and support all
engineering activities throughout all phases of projects and plant
asset lifecycles.
• The required systems, technology and design tools to support
engineering and design activities throughout all phases of projects
and plant asset lifecycles.
The Generation engineering design infrastructure (GEDI) projectIn late 2008, the Generation engineering design infrastructure (GEDI)
project was launched. The GEDI project builds on previous
investments made by Eskom in technology such as a common
engineering system platform (SmartPlant Enterprise), by using such
technology on build projects to fast-track optimisation of the
configuration and align the technology with Eskom-specific needs. To
this end, the GEDI project is partnering with the Kusile project to
create an Eskom coal technology reference plant in collaboration
with the implementation partner (Black & Veatch). In the process,
fully intelligent piping and instrumentation diagrams (P&IDs) will
be created, as well as a full 3D plant model and a boiler internal
3D model for Kusile. This has the additional benefit in that Medupi
and Kusile are of similar design as far as the boilers and turbines
are concerned, so this information will also be re-usable at Medupi
power station.
Black & Veatch has also provided assistance in the development
of the engineering framework, by providing access to their work
processes and methodology. In addition to this, the division has
access to the RWE framework for O&M processes. This dual
approach ensures that the division will develop an engineering
business process framework that suppor ts the entire plant
lifecycle from conceptual design right through to
decommissioning.
In phase 1 of the GEDI project, extensive work was completed to
create inter-operability between the SmartPlant Enterprise
engineering platform and plant process and performance simulation
software like Flownex. This creates an extremely powerful tool to
analyse the impact of plant operational changes, and the ability to
simulate occurrence events when tied up with the Generation Plant
Data Store (PDS).
Generation Business Engineering division continued
Engineering Governance Framework
Standardsprocedures
designcodes
Engineering and designprocesses
Engineering and designprocesses
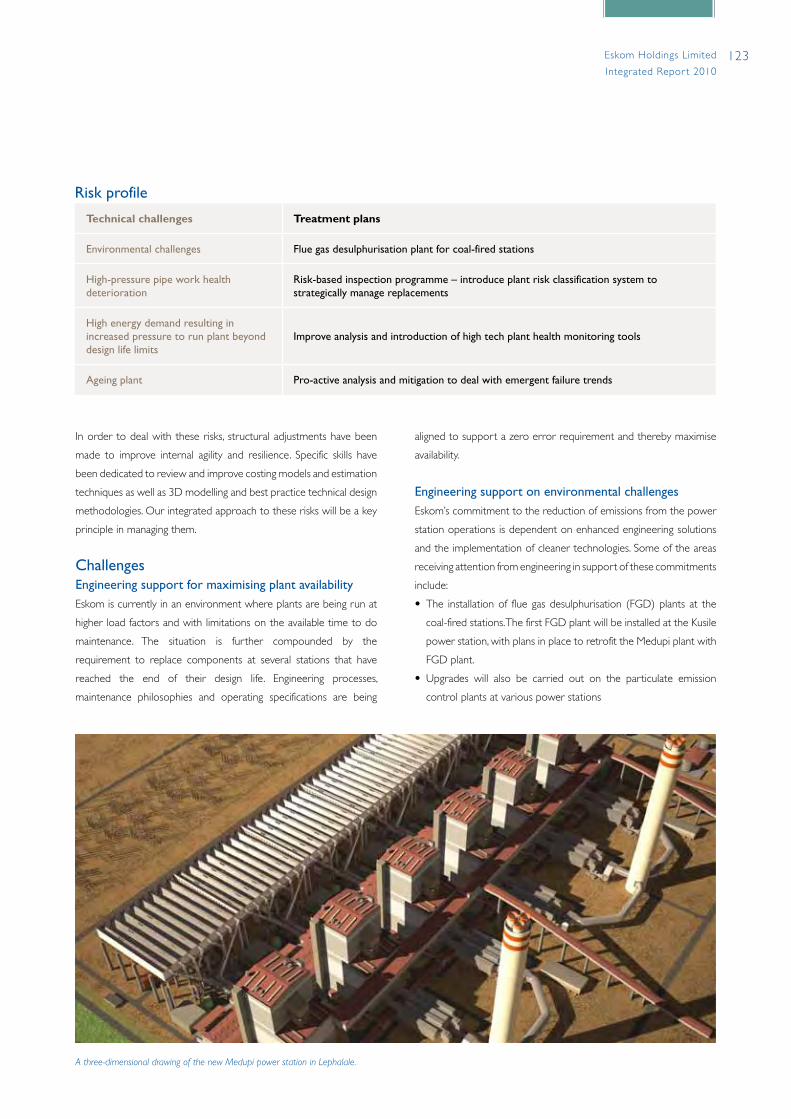
123Eskom Holdings Limited
Integrated Repor t 2010
Risk profile
Technical challenges Treatment plans
Environmental challenges Flue gas desulphurisation plant for coal-fired stations
High-pressure pipe work health deterioration
Risk-based inspection programme – introduce plant risk classification system to strategically manage replacements
High energy demand resulting in increased pressure to run plant beyond design life limits
Improve analysis and introduction of high tech plant health monitoring tools
Ageing plant Pro-active analysis and mitigation to deal with emergent failure trends
In order to deal with these risks, structural adjustments have been
made to improve internal agility and resilience. Specific skills have
been dedicated to review and improve costing models and estimation
techniques as well as 3D modelling and best practice technical design
methodologies. Our integrated approach to these risks will be a key
principle in managing them.
ChallengesEngineering support for maximising plant availabilityEskom is currently in an environment where plants are being run at
higher load factors and with limitations on the available time to do
maintenance. The situation is further compounded by the
requirement to replace components at several stations that have
reached the end of their design life. Engineering processes,
maintenance philosophies and operating specifications are being
aligned to support a zero error requirement and thereby maximise
availability.
Engineering support on environmental challengesEskom’s commitment to the reduction of emissions from the power
station operations is dependent on enhanced engineering solutions
and the implementation of cleaner technologies. Some of the areas
receiving attention from engineering in support of these commitments
include:
• The installation of flue gas desulphurisation (FGD) plants at the
coal-fired stations. The first FGD plant will be installed at the Kusile
power station, with plans in place to retrofit the Medupi plant with
FGD plant.
• Upgrades will also be carried out on the particulate emission
control plants at various power stations
A three-dimensional drawing of the new Medupi power station in Lephalale.
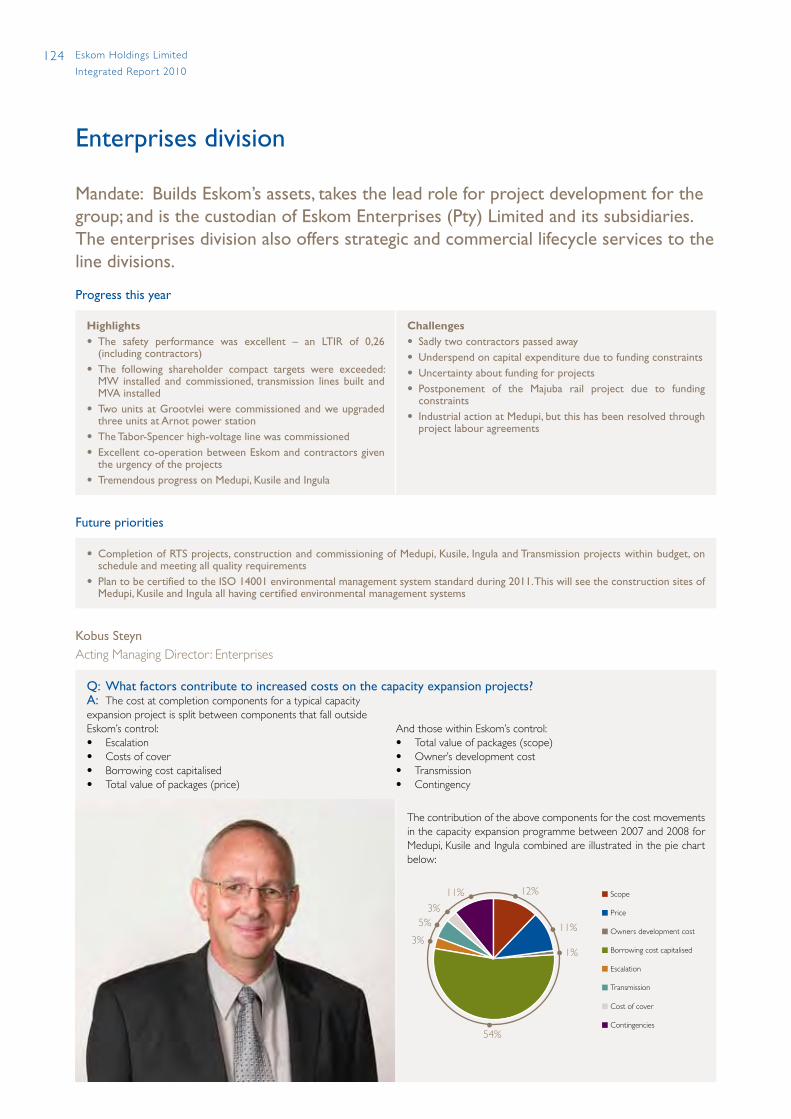
124 Eskom Holdings Limited
Integrated Repor t 2010
Enterprises division
Mandate: Builds Eskom’s assets, takes the lead role for project development for the group; and is the custodian of Eskom Enterprises (Pty) Limited and its subsidiaries. The enterprises division also offers strategic and commercial lifecycle services to the line divisions.
Progress this year
Highlights• The safety performance was excellent – an LTIR of 0,26
(including contractors)• The following shareholder compact targets were exceeded:
MW installed and commissioned, transmission lines built and MVA installed
• Two units at Grootvlei were commissioned and we upgraded three units at Arnot power station
• The Tabor-Spencer high-voltage line was commissioned• Excellent co-operation between Eskom and contractors given
the urgency of the projects• Tremendous progress on Medupi, Kusile and Ingula
Challenges• Sadly two contractors passed away• Underspend on capital expenditure due to funding constraints• Uncertainty about funding for projects• Postponement of the Majuba rail project due to funding
constraints• Industrial action at Medupi, but this has been resolved through
project labour agreements
Future priorities
• Completion of RTS projects, construction and commissioning of Medupi, Kusile, Ingula and Transmission projects within budget, on schedule and meeting all quality requirements
• Plan to be certified to the ISO 14001 environmental management system standard during 2011. This will see the construction sites of Medupi, Kusile and Ingula all having certified environmental management systems
Kobus Steyn Acting Managing Director: Enterprises
Q: What factors contribute to increased costs on the capacity expansion projects?A: The cost at completion components for a typical capacity expansion project is split between components that fall outside Eskom’s control: And those within Eskom’s control:• Escalation • Total value of packages (scope)• Costs of cover • Owner’s development cost• Borrowing cost capitalised • Transmission• Total value of packages (price) • Contingency
The contribution of the above components for the cost movements in the capacity expansion programme between 2007 and 2008 for Medupi, Kusile and Ingula combined are illustrated in the pie chart below:
Price
Scope
Borrowing cost capitalised
Owners development cost
Transmission
Escalation
Contingencies
Cost of cover
12%
11%
1%
54%
3%
5%3%
11%

125Eskom Holdings Limited
Integrated Repor t 2010
Capacity expansion programmeThe capacity expansion programme has shown remarkable growth.
The significant number of commissioned projects is evidence of the
progress that has been made so far. In an effort to meet the expected
quality standards and deadlines, formal project assurance is used to
track project schedules, cost and safety risks.
Despite the global recession, Eskom has successfully managed to
negotiate and secure most of the fundamental contracts. Building a
coal-fired power station is a mammoth task which takes approximately
eight years (not including project development which typically takes
five to seven years to produce a bankable document). As such,
keeping the construction costs fixed to a specific amount is a
challenge which Eskom will continue to grapple with.
So far, the following portfolios of the Eskom capacity expansion
programme are on track in terms of schedule and capital expenditure:
new coal (Kusile and Medupi) and the peaking projects (Ingula and
Gas 1 projects). The return-to-service stations are not doing so well
in terms of schedule but one of the RTS stations (Camden) has been
completed and all units fully commissioned. Undoubtedly, the
“breather” for Eskom as it walks the tightrope between supply and
demand will be further enhanced when Ingula, Medupi and Kusile
power stations come on line. Once completed, the Ingula pumped-
storage scheme will generate electricity during peak periods
specifically. The team that is building and refurbishing transmission
Risk Treatment plans
Insufficient funding has resulted in selected work-packages being delayed and may further result in the projects not being delivered as required by the integrated resource plan
Closely monitoring the deployment of available funds, so as to optimise the execution programme, and is actively supporting the group finance division in its efforts to source additional funding
Delays to critical approvals (including investment decisions, regulatory approvals and granting of servitudes)
The processes for up-front environmental approval have been reviewed and project development efforts are continuing in order to prepare robust business cases for future projects
The non-placement of selected work packages (as a result of funding constraints) has created a risk that some components and equipment may be delivered ahead of their revised installation date without adequate storage facilities
Existing Eskom storage facilities will be used where possible but additional facilities may need to be constructed in order to prevent damage. Continual review of project schedules will include such scenarios in order to allow for pro-active management
The integrated risk management process has also identified aspects of financial, commercial, safety, environment, quality, information and human
resource management where opportunities for business process improvements have been identified.
lines and substations is making significant inroads in strengthening the
transmission network.
Risk profileEnterprises division has adopted the corporate risk management
policy and standard as developed by group risk management and will
be incorporating these principles into its business planning process.
Although the CURA risk management information system will only
be rolled out in the division during the 2010/2011 financial year, risks
from departments and business units have been captured in this
system for inclusion in the group risk management reports.
Total system capacity added per �ve-year period
MW20 00015 00010 0005 0000
2021 – 20282016 – 20202011 – 20152006 – 2010
2001 – 20051996 – 20001991 – 19951986 – 19901981 – 1985
1976 – 19801969 – 1975

126 Eskom Holdings Limited
Integrated Repor t 2010
Enterprises division continued
Build project update
Project: Medupi power station
Technology: Coal, dry cooling, flue gas desulphurisation (FGD) – commissioning of FGD plant planned for 2018
Output: 4 764MW (6 x 794MW units)
Location: Lephalale
Completion date: First unit in 2012 and completion in 2015
Progress:
Eskom contracted PB Power, an international engineering consulting firm, to provide support with the execution of the Medupi power station project. A multi-package procurement strategy was selected for the project. The boiler package was awarded to Hitachi Power, the turbine package to Alstom and the generator transformer package to Siemens. The main civil works package was awarded to a joint venture company comprised of Murray & Roberts, Grinaker LTA and Concor.
The site on which Medupi is being constructed was first accessed in May 2007 to commence the site preparation activities.
As of 28 February 2010, the progress against the schedule for the procurement and commercial processes was as follows:
• Number of package contracts placed – 19
• Number of package contracts not yet placed – 13
• Percentage of contracts placed (by value) – 92%
• Progress has been made on the air cool condensers – the first phase has been completed and handed over
• The structure of the turbine hall has been completed
• Transmission integration is well underway with major focus on phase 1 for the substation and lines
May 2007 February 2010
Project: Grootvlei power station
Technology: Coal (return to service)
Output: 1 200MW (6 x 200MW units)
Location: Balfour
Completion date: End of August 2010
Progress
• Unit 1 went into commercial operation on 31 March 2008
• Unit 2 went into commercial operation on 27 March 2009
• Unit 4 went into commercial operation on 21 October 2009
• Unit 3 went into commercial operation on 9 March 2010
• Work is in progress on units 5 and 6
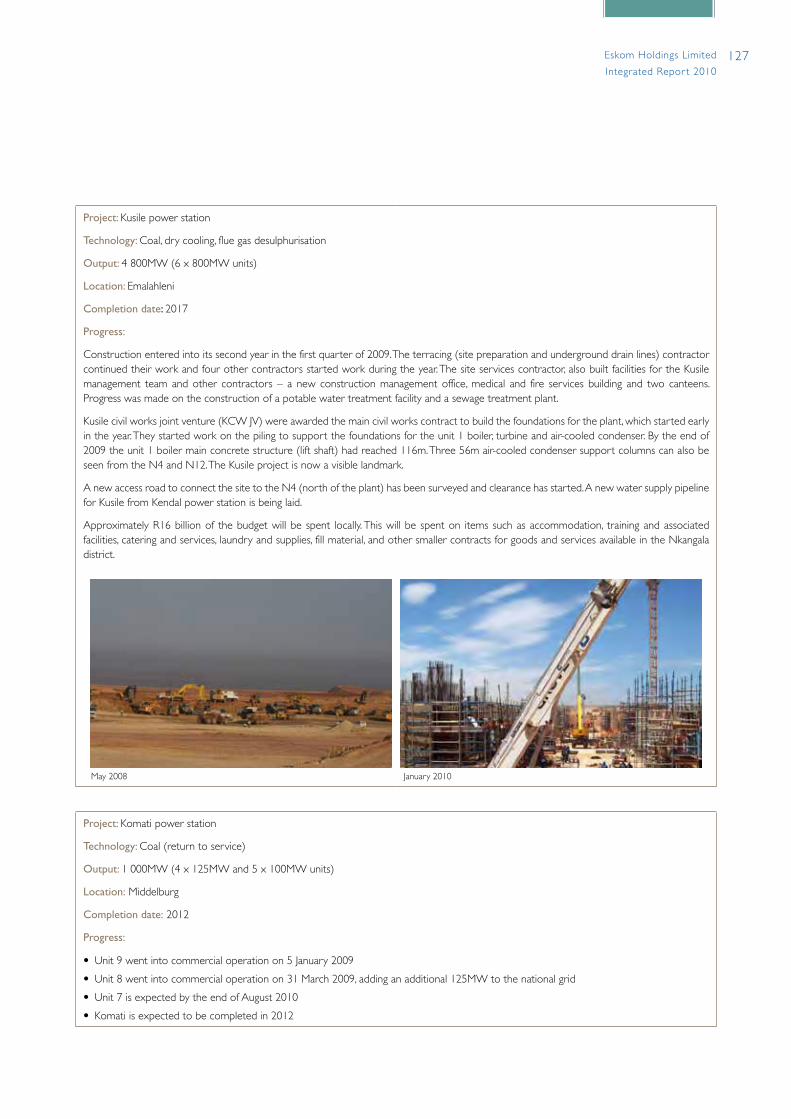
127Eskom Holdings Limited
Integrated Repor t 2010
Project: Kusile power station
Technology: Coal, dry cooling, flue gas desulphurisation
Output: 4 800MW (6 x 800MW units)
Location: Emalahleni
Completion date: 2017
Progress:
Construction entered into its second year in the first quarter of 2009. The terracing (site preparation and underground drain lines) contractor continued their work and four other contractors started work during the year. The site services contractor, also built facilities for the Kusile management team and other contractors – a new construction management office, medical and fire services building and two canteens. Progress was made on the construction of a potable water treatment facility and a sewage treatment plant.
Kusile civil works joint venture (KCW JV) were awarded the main civil works contract to build the foundations for the plant, which started early in the year. They started work on the piling to support the foundations for the unit 1 boiler, turbine and air-cooled condenser. By the end of 2009 the unit 1 boiler main concrete structure (lift shaft) had reached 116m. Three 56m air-cooled condenser support columns can also be seen from the N4 and N12. The Kusile project is now a visible landmark.
A new access road to connect the site to the N4 (north of the plant) has been surveyed and clearance has started. A new water supply pipeline for Kusile from Kendal power station is being laid.
Approximately R16 billion of the budget will be spent locally. This will be spent on items such as accommodation, training and associated facilities, catering and services, laundry and supplies, fill material, and other smaller contracts for goods and services available in the Nkangala district.
May 2008 January 2010
Project: Komati power station
Technology: Coal (return to service)
Output: 1 000MW (4 x 125MW and 5 x 100MW units)
Location: Middelburg
Completion date: 2012
Progress:
• Unit 9 went into commercial operation on 5 January 2009
• Unit 8 went into commercial operation on 31 March 2009, adding an additional 125MW to the national grid
• Unit 7 is expected by the end of August 2010
• Komati is expected to be completed in 2012
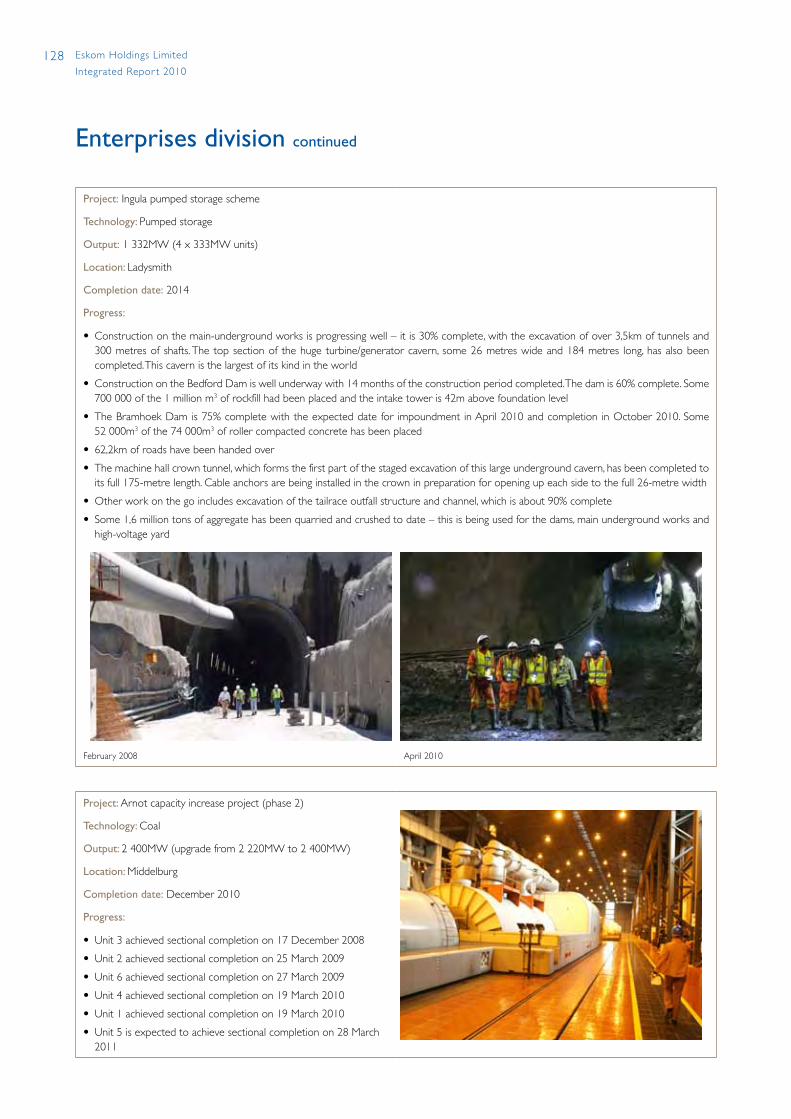
128 Eskom Holdings Limited
Integrated Repor t 2010
Project: Ingula pumped storage scheme
Technology: Pumped storage
Output: 1 332MW (4 x 333MW units)
Location: Ladysmith
Completion date: 2014
Progress:
• Construction on the main-underground works is progressing well – it is 30% complete, with the excavation of over 3,5km of tunnels and 300 metres of shafts. The top section of the huge turbine/generator cavern, some 26 metres wide and 184 metres long, has also been completed. This cavern is the largest of its kind in the world
• Construction on the Bedford Dam is well underway with 14 months of the construction period completed. The dam is 60% complete. Some 700 000 of the 1 million m3 of rockfill had been placed and the intake tower is 42m above foundation level
• The Bramhoek Dam is 75% complete with the expected date for impoundment in April 2010 and completion in October 2010. Some 52 000m3 of the 74 000m3 of roller compacted concrete has been placed
• 62,2km of roads have been handed over
• The machine hall crown tunnel, which forms the first part of the staged excavation of this large underground cavern, has been completed to its full 175-metre length. Cable anchors are being installed in the crown in preparation for opening up each side to the full 26-metre width
• Other work on the go includes excavation of the tailrace outfall structure and channel, which is about 90% complete
• Some 1,6 million tons of aggregate has been quarried and crushed to date – this is being used for the dams, main underground works and high-voltage yard
February 2008 April 2010
Project: Arnot capacity increase project (phase 2)
Technology: Coal
Output: 2 400MW (upgrade from 2 220MW to 2 400MW)
Location: Middelburg
Completion date: December 2010
Progress:
• Unit 3 achieved sectional completion on 17 December 2008
• Unit 2 achieved sectional completion on 25 March 2009
• Unit 6 achieved sectional completion on 27 March 2009
• Unit 4 achieved sectional completion on 19 March 2010
• Unit 1 achieved sectional completion on 19 March 2010
• Unit 5 is expected to achieve sectional completion on 28 March 2011
Enterprises division continued

129Eskom Holdings Limited
Integrated Repor t 2010
Project: Sere
Technology: Wind energy
Output: 100MW (50 x 2MW units)
Location: Koekenaap, West Coast
Progress:
Development work, including viable funding plan nearing completion and construction expected early in 2011.
Transmission expansion projects
Line construction progress:
The completion dates for the transmission projects are as follows:
• 765kV: strengthening projects March 2012
• Northern Grid: November 2016
• Central Grid: September 2012
• Cape Grid: December 2012
By the end of 2010 the power delivery team will have completed the 400kV strengthening of the Nelson Mandela Bay area, as well as the 275kV and 400kV strengthening in the Polokwane area in Limpopo. The network strengthening in Johannesburg North should be complete by end 2010 and the first phase of the Vaal strengthening by end 2011, and phase 2 by end 2012.
The 765kV strengthening (operated at 400kV) of the Empangeni area will be finalised by the end of 2011, and the 765kV project from Zeus to Omega to strengthen supply to the Western Cape region by mid-2012.
The Ingula and Medupi 400kV integration into the national grid is planned for the end of 2013.
Future of renewable projectsProject Sere (100MW wind power project on the West Coast) is
progressing, with funding approved by the World Bank and other
multilateral development banks. Construction is expected early in 2011.
Eskom has a portfolio of wind projects and other renewable energy
projects (including wind, and concentrating solar power) at various
stages of development in line with national renewable objectives and
Eskom’s own renewable energy strategy.
The work undertaken by the South African government to determine
the potential and options for the country to reduce its greenhouse
gas emissions, the long-term mitigation scenarios (LTMS), was clear
about the need for renewables – together with nuclear and clean
coal as options to reduce emissions from electricity generation. For
renewables, the challenge is to scale up in the next few years, so that
implementation at a larger scale is feasible and more affordable in
future. The central problem is cost – and much depends on what
technology learning happens in South Africa and in other countries.
Benchmarking build costs globallyFor comparison purposes, the costs of a power station can be
measured in a number of ways, two of which are the “cost to
completion” and the “levelised cost of electricity” 1 measures.
Capital or overnight cost (USD/kW) is defined as the cost to
completion if the station was built overnight. Because of this, overnight
costs exclude escalation on equipment, labour and commodity prices
that could occur during construction. It also excludes the financing
charges (like interest during construction) incurred while the plant is
being built.
Benchmarking capital costs for the purposes of comparison is usually
quoted as a USD/kW overnight cost.
Comparisons are difficult due to site-specific conditions, differing
plant design specifications and the variability in market conditions
from year to year. Notwithstanding this, benchmarking is a useful
indication of how the cost of a plant compares to other plants.
1. Levelised costs include all costs over lifetime on plant, ie, initial investments, operation and maintenance, fuel and cost of capital.
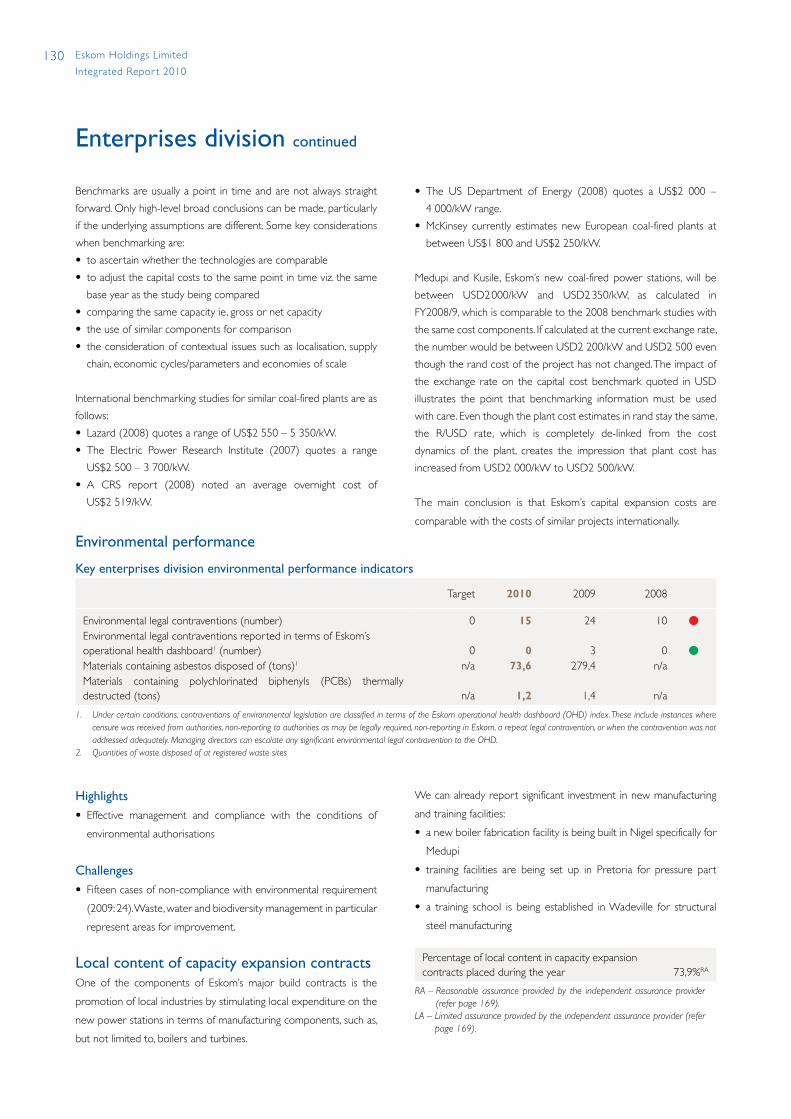
130 Eskom Holdings Limited
Integrated Repor t 2010
Benchmarks are usually a point in time and are not always straight
forward. Only high-level broad conclusions can be made, particularly
if the underlying assumptions are different. Some key considerations
when benchmarking are:
• to ascertain whether the technologies are comparable
• to adjust the capital costs to the same point in time viz. the same
base year as the study being compared
• comparing the same capacity ie, gross or net capacity
• the use of similar components for comparison
• the consideration of contextual issues such as localisation, supply
chain, economic cycles/parameters and economies of scale
International benchmarking studies for similar coal-fired plants are as
follows:
• Lazard (2008) quotes a range of US$2 550 – 5 350/kW.
• The Electric Power Research Institute (2007) quotes a range
US$2 500 – 3 700/kW.
• A CRS report (2008) noted an average overnight cost of
US$2 519/kW.
Highlights• Effective management and compliance with the conditions of
environmental authorisations
Challenges• Fifteen cases of non-compliance with environmental requirement
(2009: 24). Waste, water and biodiversity management in particular
represent areas for improvement.
Local content of capacity expansion contractsOne of the components of Eskom’s major build contracts is the
promotion of local industries by stimulating local expenditure on the
new power stations in terms of manufacturing components, such as,
but not limited to, boilers and turbines.
• The US Department of Energy (2008) quotes a US$2 000 –
4 000/kW range.
• McKinsey currently estimates new European coal-fired plants at
between US$1 800 and US$2 250/kW.
Medupi and Kusile, Eskom’s new coal-fired power stations, will be
between USD2 000/kW and USD2 350/kW, as calculated in
FY2008/9, which is comparable to the 2008 benchmark studies with
the same cost components. If calculated at the current exchange rate,
the number would be between USD2 200/kW and USD2 500 even
though the rand cost of the project has not changed. The impact of
the exchange rate on the capital cost benchmark quoted in USD
illustrates the point that benchmarking information must be used
with care. Even though the plant cost estimates in rand stay the same,
the R/USD rate, which is completely de-linked from the cost
dynamics of the plant, creates the impression that plant cost has
increased from USD2 000/kW to USD2 500/kW.
The main conclusion is that Eskom’s capital expansion costs are
comparable with the costs of similar projects internationally.
We can already report significant investment in new manufacturing
and training facilities:
• a new boiler fabrication facility is being built in Nigel specifically for
Medupi
• training facilities are being set up in Pretoria for pressure part
manufacturing
• a training school is being established in Wadeville for structural
steel manufacturing
Percentage of local content in capacity expansion contracts placed during the year 73,9%RA
RA – Reasonable assurance provided by the independent assurance provider (refer page 169).
LA – Limited assurance provided by the independent assurance provider (refer page 169).
Enterprises division continued
Environmental performance
Key enterprises division environmental performance indicators
Target 2010 2009 2008
Environmental legal contraventions (number) 0 15 24 10 lEnvironmental legal contraventions reported in terms of Eskom’s operational health dashboard1 (number) 0 0 3 0 lMaterials containing asbestos disposed of (tons)1 n/a 73,6 279,4 n/aMaterials containing polychlorinated biphenyls (PCBs) thermally destructed (tons) n/a 1,2 1,4 n/a
1. Under certain conditions, contraventions of environmental legislation are classified in terms of the Eskom operational health dashboard (OHD) index. These include instances where censure was received from authorities, non-reporting to authorities as may be legally required, non-reporting in Eskom, a repeat legal contravention, or when the contravention was not addressed adequately. Managing directors can escalate any significant environmental legal contravention to the OHD.
2. Quantities of waste disposed of at registered waste sites

131Eskom Holdings Limited
Integrated Repor t 2010
The following components are already being manufactured locally:
air-cooled condensers, major pumps, heaters, main cranes, LP outer
casings and feed water tanks.
Our main contractors, in line with their CSDP commitments, have
cumulatively subcontracted from the inception of the build
programme some R51,12 billion locally – R12,7 billion with local
suppliers; R5,81 billion with black women-owned businesses and
R4,6 billion with small and medium enterprises. This translates to
over 52% of the build programme spend awarded to local contractors
and over 45% of the local portion being shared with empowerment
contractors.
Stimulating economies around capacity expansion projectsConsidering that an average six-unit coal-fired power station takes up
to eight years to build, the impact on the communities around these
projects is massive. The Medupi, Kusile and Ingula projects have
already shown the following positive spin-offs for the adjacent
communities:
• it is expected that the Medupi project will impact the Lephalale
GDP by about 95%. Kusile will impact the Delmas town GDP by
around 25%. The Ingula projects will impact the Ladysmith town
GDP by about 1%
• more than 3 000 skills will be developed through partnerships
with suppliers and educational institutions
• there are about 7 500 people currently on site at Medupi – of
which around 4 500 are from Lephalale
• at Kusile we have employed some 1 625 people from the local
area
• some 1 300 local people are working on the Ingula project
• at Medupi the MPS joint venture plans to invest R10 million in a
brick-making plant to be owned by local black women
• the build projects are impacting all the following sectors in the
communities around them: catering, laundry, housing, house
maintenance, hotels, entertainment, training facilities, security,
schools, policing, churches, medical care, banks and financial
services, shops and transport
Training and developmentEnterprises division competes with utilities in major industrial
countries for rare skills, therefore constant focus is being directed
towards resource planning to ensure that resources across projects
are optimally leveraged and that the appropriate skills are acquired,
developed and nurtured.
Active focus is directed towards the following in order to ensure
effective skills management:
• the development of young professionals through structured
mentoring and coaching programmes
• enhancing learnerships and establishing learnership programmes
in skills areas that have been identified as core and critical to the
business
• involvement in community development and upliftment through
youth programmes, Eskom mathematics and science school
projects and the awarding of bursary schemes
• enhancement and development of existing skills base within the
division through structured training curricula and programmes
such as the Eskom learning faculty with a wide variety of training
programmes
• tertiary education support programmes
• development of a strategy to maximise the use of South African
resources for welding on-site
• ensure skills transfer from contractors and consultants to Eskom
employees
There are currently 220 engineers-in-training, of which 190 graduated
in January 2010. About 400 Eskom bursaries have been allocated, of
which 99% are technically oriented – engineering, civil, quantity
surveyors and control and instrumentation.
Definite plans are in place to liaise with secondary schools and
tertiary institutions to ensure identification of the required talent and
skills and to ensure that training programmes are aligned and relevant.
The cumulative learners recruited since inception of the capacity
expansion programme up to and including the first quarter of the
2009/10 financial year is 1 502 against a target of 4 992.
Did you know?
• Medupi will require enough concrete to build four Greenpoint stadiums
• 71 tons of steel was used to reinforce the foundation for the lift shaft
• It took 575 tons of steel to build the lift shaft• Parts and cement weighing the same as seven super tankers
will be transported over land• The total height of the lift shaft is 119,55m• The lift shaft was completed on 4 August 2009, three days
ahead of schedule despite stoppages caused by the strike action that lasted eight days
• The Ingula pumped-storage scheme consists of an upper and lower dam, both having approximately 22 million m3 water supply. The dams, 6,6km apart, are connected by underground waterways, through an underground powerhouse, which will house 4 x 333MW pump turbines


Customer Network Business
135 Overview
140 System Operations and Planning division
141 Key focus areas in 2010 141 Risk profile142 Status of the power supply system in South Africa142 Power conservation programme143 Ten-year Transmission development plan (TDP)144 Demand and energy forecasting145 Integrated resource plan
146 Transmission division147 Risk profile147 Transmission system performance148 Benchmarking Transmission’s performance148 Maintenance and refurbishment149 Environmental impact assessments and land
acquisitions150 Copper and pylon theft150 Contracting with SADC utilities151 Westcor151 Key customer update151 Environmental performance
153 Distribution division153 Future priorities154 Risk profile154 Distribution system performance156 Demand-side management (DSM) 2010158 Customer service158 Tariffs 160 Management of total energy losses161 Free basic electricity (FBE)162 Electrification162 Environmental performance
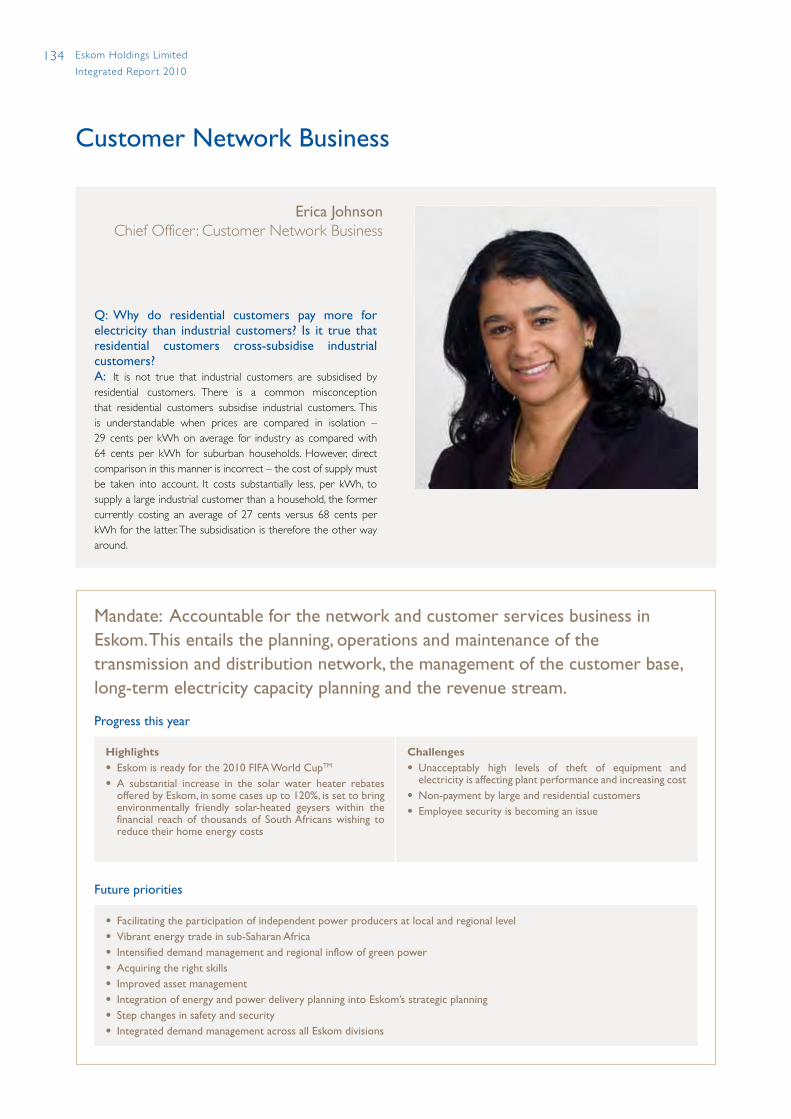
134 Eskom Holdings Limited
Integrated Repor t 2010
Customer Network Business
Erica Johnson Chief officer : Customer Network Business
Mandate: Accountable for the network and customer services business in Eskom. This entails the planning, operations and maintenance of the transmission and distribution network, the management of the customer base, long-term electricity capacity planning and the revenue stream.
Progress this year
Highlights• Eskom is ready for the 2010 FIFA World CupTM
• A substantial increase in the solar water heater rebates offered by Eskom, in some cases up to 120%, is set to bring environmentally friendly solar-heated geysers within the financial reach of thousands of South Africans wishing to reduce their home energy costs
Challenges• Unacceptably high levels of theft of equipment and
electricity is affecting plant performance and increasing cost• Non-payment by large and residential customers• Employee security is becoming an issue
Future priorities
• Facilitating the participation of independent power producers at local and regional level• Vibrant energy trade in sub-Saharan Africa• Intensified demand management and regional inflow of green power • Acquiring the right skills• Improved asset management• Integration of energy and power delivery planning into Eskom’s strategic planning • Step changes in safety and security• Integrated demand management across all Eskom divisions
Q: Why do residential customers pay more for electricity than industrial customers? Is it true that residential customers cross-subsidise industrial customers? A: It is not true that industrial customers are subsidised by residential customers. There is a common misconception that residential customers subsidise industrial customers. This is understandable when prices are compared in isolation – 29 cents per kWh on average for industry as compared with 64 cents per kWh for suburban households. However, direct comparison in this manner is incorrect – the cost of supply must be taken into account. It costs substantially less, per kWh, to supply a large industrial customer than a household, the former currently costing an average of 27 cents versus 68 cents per kWh for the latter. The subsidisation is therefore the other way around.

135Eskom Holdings Limited
Integrated Repor t 2010
Financial results
R millions
Trans-mission
and Systemoperations
and Planning
Distri-bution
CustomerNetworkBusiness
2010
• Total revenue 29 492 43 577 73 069
• Profit for the year 2 080 290 2 370
• Total assets 28 438 43 995 72 433
• Capital expenditure 7 143 7 079 14 222
2009
• Total revenue 20 548 32 542 53 090
• Profit/(loss) for the year (6 596) 1 288 (5 308)
• Total assets 22 504 38 372 60 876
• Capital expenditure 6 665 6 615 13 280
OverviewThe Customer Network Business (CNB) was established in February
2008, as a result of the need to sharpen our operational focus on
security of supply.
CNB’s 19 615 employees ensure that 390 338km of power lines,
3 500 substations, and 344 369 transformers deliver electricity
optimally to our approximately 4,5 million direct customers. The
business comprises Eskom’s customer services, network asset
management, system operations and capacity planning functions
organised into three main divisions, namely, System operations and
Planning, Transmission and Distribution. A dedicated project office
was also established to oversee Eskom’s preparations for the 2010
FIFA World Cup™ from a security of supply perspective up to and
including our areas of responsibility.
The CNB footprint spans the country and requires appropriate
levels of resources and indicators to manage risk in an effective
manner.
Technical system performance International performance benchmarks indicate that Transmission
and System operations and Planning are within top quartile
performance, but Distribution system performance requires
improvement. In this regard, urgent attention is being given to
reducing the number and duration of customer interruptions,
particularly in rural areas where huge distances covered by technical
staff to repair faults lead to long restoration times.
System securityThe country’s electricity system is under pressure. We have a low
reserve margin, and as long as this situation prevails, we will always be
at risk of supply interruptions.
However, the power system has performed well over the past year,
and there has not been an incident of load shedding. Indeed, more
than two years have passed since the devastating load-shedding
incidents of 2008. We are committed to ensuring that the national
electricity supply situation remains stable and that the electricity
necessary for the country’s growth and advancement is provided.
The reduced electricity demand levels in 2009, mainly due to the
economic downturn, have since been returning to normal activity
levels. In fact, the demand for electricity is averaging about 9%
higher in March 2010 than it was in March 2009 and is in line with
2007 levels.
The tight system conditions are expected to continue during the
remaining maintenance months, but will improve as all power stations
come back into operation during the winter season. This winter will
also coincide with a special event, the 2010 FIFA World Cup™. There
is a very low likelihood of load shedding prior to and during the 2010
FIFA World Cup™, but we need to be vigilant as South Africans
throughout this period. Thereafter, the system will be extremely tight,
as the power station maintenance season starts again.
Eskom workers maintain around 390 000km of power lines across the country.

136 Eskom Holdings Limited
Integrated Repor t 2010
Integrated demand management projectEskom will aggressively pursue demand management as a key
solution to manage the projected shortfall in the next few years until
the next new baseload power stations start coming online from
2012. This includes the reorganisation of all demand management
activities into a single business division.
Eskom is in the process of developing and implementing a number
of demand management initiatives. Firstly, an extensive demand-
side management (DSM) programme drives energy efficiency by
rolling out new technologies and encouraging customer behaviour
change through communications and awareness campaigns.
Secondly, initiatives such as demand market participation, the utility
load management, and advanced metering infrastructure are
targeted at managing load − with secondary energy efficiency
benefits. Inherent in the Eskom suite of demand management
solutions is the power conservation programme − a risk mitigation
solution that could be implemented in a short space of time
should the need arise.
System resilienceThe electricity crisis of 2008 and the fact that it will take several years
to regain a healthy reserve margin have highlighted the need to
target a range of measures to increase the resilience of the system
and society as a whole.
Some of the key areas on which Eskom is focusing to build resilience
are defined as the ability to:
• Identify, anticipate and adapt rapidly to vulnerabilities arising
from changes in the internal and external environment.
• operate at elevated levels of stress without failure for extended
periods of time.
• Respond to a shock by containing the impact (severity/duration)
of the event.
• Recover quickly in a co-ordinated manner.
• Implement learning from near misses and recovery experiences.
Significantly increasing situational awareness and the ability of the
organisation to visualise operational trends and emerging risks at the
frontlines of the organisation are critical.
The system challenges we face until the new capacity comes into
commission will be that of meeting the demand while creating
maximum opportunities to undertake generation plant maintenance.
This will require a tight trade-off in terms of controlling costs with
respect to usage of the expensive open-cycle gas turbine (oCGT)
stations. The indications are that more oCGT usage will be required
over the forthcoming years.
System adequacyEnsuring that the system adequately meets the future electricity
needs of the country for economic growth and prosperity has shifted
from only increasing supply-side resources to including intensive
demand management in the process. Ensuring delivery on increasing
supply-side resources and managing demand requires an integrated
approach to planning with focused interventions.
Integrated resource planningThe Department of Energy (DoE) is accountable for the country’s
energy plan and the related electricity generation capacity plan − the
integrated resource plan (IRP). The system operator within the
Customer Network Business provides the resources to develop the
plan under the policy guidance of the DoE. Decisions on how much
capacity is needed, who should build it, the technology to be adopted
and the publication of the plan lie within the Energy Ministry. The first
IRP was published at the end of 2009. The second IRP is currently
under development and is expected to be published during the
second half of 2010. This is an opportunity for active engagement for
South Africa on economic growth projections, electricity demand
projections and technology choices balanced against affordability.
Energy efficiencyEnergy efficiency and conservation are essential. In all our stakeholder
interactions, we are stressing the importance of saving electricity
wherever possible. This will assist with the constraints on the power
system and help customers run their businesses and homes more
efficiently and at a lower cost. Eskom will play its role in assisting
South Africa to migrate to an energy conserving culture. In the short
to medium term energy efficiency and conservation are essential for
power system stability. This conservation drive presents a good
opportunity for long-term climate change support by reducing the
carbon footprint from electricity production and delivery.
Customer Network Business continued
137Eskom Holdings Limited
Integrated Repor t 2010
Eskom has embarked on an intense resilience building initiative and
has implemented the following:
• The establishment of regional reliability teams, which are aimed at
developing a consolidated view of supply risks and societal
resilience in each of the Eskom supply regions. This focused risk
management (across all Eskom divisions operating in the region)
significantly increases the ability to identify and respond to current
and emerging vulnerabilities.
• The development of a national code of practice, which addresses
load shedding and curtailment under system emergencies,
restoration of supply after a regional or national blackout, the
identification and treatment of critical loads and essential load
requirements of customers.
• Undertaking emergency simulations and exercises – both at a
technical level and multi-stakeholder exercises (for example,
communication and interaction with stakeholders) to deal with
power outages.
The system resilience drive within Eskom is ultimately aimed at
ensuring that there is a high degree of emergency preparedness to
be in a position to respond to events while managing a constrained
power system.
2010 FIFA World Cup™ readinessThe successful delivery of a reliable, uninterrupted flow of electricity
for the FIFA 2010 World Cup™ has been a major focus for the last
three years. A dedicated team has driven Eskom’s internal
preparations and co-ordinated the broad-based collaborative efforts
and partnerships required for an event of this magnitude. Potential
risks to supply continuity were identified and addressed by the team.
Ten “project platforms” ensured that the entire electricity supply-
chain from power station to stadium would operate effectively and
that all risks were identified and managed. The project platforms are
as follows:
1. Technical and Capacity National, which co-ordinates efforts across
Generation, including Nuclear, Primary Energy, System
operations and Transmission.
2. Technical and Capacity SAPP, which co-ordinates efforts between
Eskom and our partners in the Southern African Power Pool.
3. Technical and Capacity Regional, which co-ordinates efforts across
Transmission, Distribution, the municipalities and host cities.
4. 2010 Marketing and Communication, which co-ordinates and
leads the internal and external Eskom 2010 marketing and
communication initiatives.
5. 2010 DSM, which links into the overall Eskom DSM programme
and seeks to fast-track specific DSM initiatives for the event.
6. 2010 Greening, which co-ordinates the overall Eskom greening
contributions in support of the Department of Environmental
Affairs Greening 2010 initiatives.
7. 2010 Security, which co-ordinates the overall Eskom 2010
security-related initiatives and efforts with the various security
structures and agencies, such as SAPS.
8. 2010 IT, which co-ordinates the overall Eskom 2010 IT support-
related initiatives.
9. 2010 Telecommunications, which co-ordinates the overall Eskom
2010 telecommunications-related initiatives.
10. 2010 HR, which co-ordinates the overall Eskom 2010 HR-
related initiatives.
Stakeholder collaborationEskom, through the Association of Municipal Electricity Undertakings
(AMEU), was a founding partner and catalyst for the establishment
of the 2010 Electricity Supply Industry (ESI) forum, which consisted
of Eskom, 2010 FIFA World Cup™ host municipalities, the
Department of Energy, the FIFA Local organising Committee,
the National Energy Regulator of South Africa (NERSA), and
National Treasury. The forum assesses the total electricity
requirements of the 2010 FIFA World Cup™, addresses challenges
and monitors the status of preparations.
SAPP members will undertake all necessary maintenance on their
generators prior to the event, so ensuring that maximum plant
capacity is available in southern Africa during the event.
Simultaneously, considerable effort has been put into ensuring that all
members of the public are aware of the need to conserve energy
and promote energy efficiency for the duration of the event.
See www.eskom.co.za/annreport10/008.html for detail on the divisional contributions to the project.
138 Eskom Holdings Limited
Integrated Repor t 2010
Energy loss management Due to the nature of the network, technical losses are an inherent
feature of power systems. There is continued focus to keep technical
losses to a minimum. For the financial year, the overall energy losses
were 8,45% against a budget of 8,76% of generation supplied and
imported energy. The total energy losses for the Distribution network
and Transmission network are 5,87% and 3,27%, respectively. This
distribution figure compares favourably with the international
benchmark. Continued efforts are made, as far as possible, to manage
losses to minimum levels.
Theft has regrettably broadened from cables to transmission tower
components and other equipment. Municipalities are experiencing a
similar challenge, which points to the need for a country-wide
security initiative to reverse the current trends. We estimate non-
technical losses to be between 1,3% and 2,1% of total energy
losses and 1,5% to 2,4% of distribution energy losses.
Renegotiating long-term price agreementsEskom entered into long-term negotiated pricing agreements (NPAs)
with large industrial customers during the period of excess capacity
and low-cost electricity in South Africa in the nineties, with a view to
stimulating economic development in the country and the SADC
region. These agreements were designed on a risk-sharing basis over
the contract term. The current environment within South Africa has
made it necessary for Eskom to reflect on its experiences with
NPAs and to review the overall expected contribution from the
existing NPAs.
of concern to Eskom was the considerable deviation of the contract
price of these NPAs from the standard tariff going forward, resulting
in significant under-recovery. In addition to the sustainability of these
contracts, the embedded derivative volatility arising from most of
these agreements also prompted a re-examination of these
agreements.
The key challenge in addressing these concerns was to engage the
counter-parties to amend the agreements, as the counter-parties had
no contractual obligation to renegotiate the current price levels. The
counter-parties willingly engaged Eskom to find a solution. We are
pleased to confirm that a new pricing addendum has been
concluded for one of the negotiated pricing agreements which is
effective from 1 March 2010, while terms sheet have been agreed for
the other contracts.
Eskom is in negotiations with the parties to finalise these contracts
during 2011.
The Finance division report contains further details on the results of
the negotiations on page 41.
Customer service levelsKey Sales and Customer Services (KSACS) customers are largely
serviced through customer executives allocated per region.
Interaction via face-to-face and telephonic means is important to
ensure that Eskom is continually made aware of the key industrial
customer issues so that they are dealt with timeously. Regular surveys
are conducted with KSACS customers to assess issues ranging from
communication to service quality. For this financial year, the KSACS
customer service level was 98% against a target of 103%. This
performance is currently under review, and new strategies are being
developed to improve this figure.
Distribution customers are serviced through call centres, walk-in
centres, customer executives and electronic channels such as internet
and cellphone SMS. once again, this interface is important for
understanding and resolving customer challenges in a timeous
manner. Customer service in the Distribution environment is
measured through the customer service index, and for this financial
year, 85,05% was achieved against a target of 82,65%. However, the
Customer Network Business is currently looking at new strategies to
further enhance the current customer service levels. A project to
look at integrated customer strategies that are comparable to best
practice has been initiated.
Customer service performance levels are in line with historical
performance, but the results also show that much work is needed to
rebuild Eskom’s reputation following the load-shedding incidents in
2008 and the recent electricity price increase announcements.
Improved communication with customers and the public regarding
the outlook for security of electricity and electricity prices in the
country is essential.
Security of our staffWe have staff that experience varied challenges from a security
point of view, specifically when dealing with situations of illegal
connections. Staff members are required to travel to remote sites,
during periods of outages and other technical problems. This
operational requirement places them in danger of armed robbery,
vehicle hijacking and violent attacks. The number of incidents in
this area is not acceptable. Interventions by security forces
are required to mitigate this situation.
Future focus areasour resolve is to manage the power system to ensure no load
shedding despite the current constraints. The acceleration of demand
Customer Network Business continued
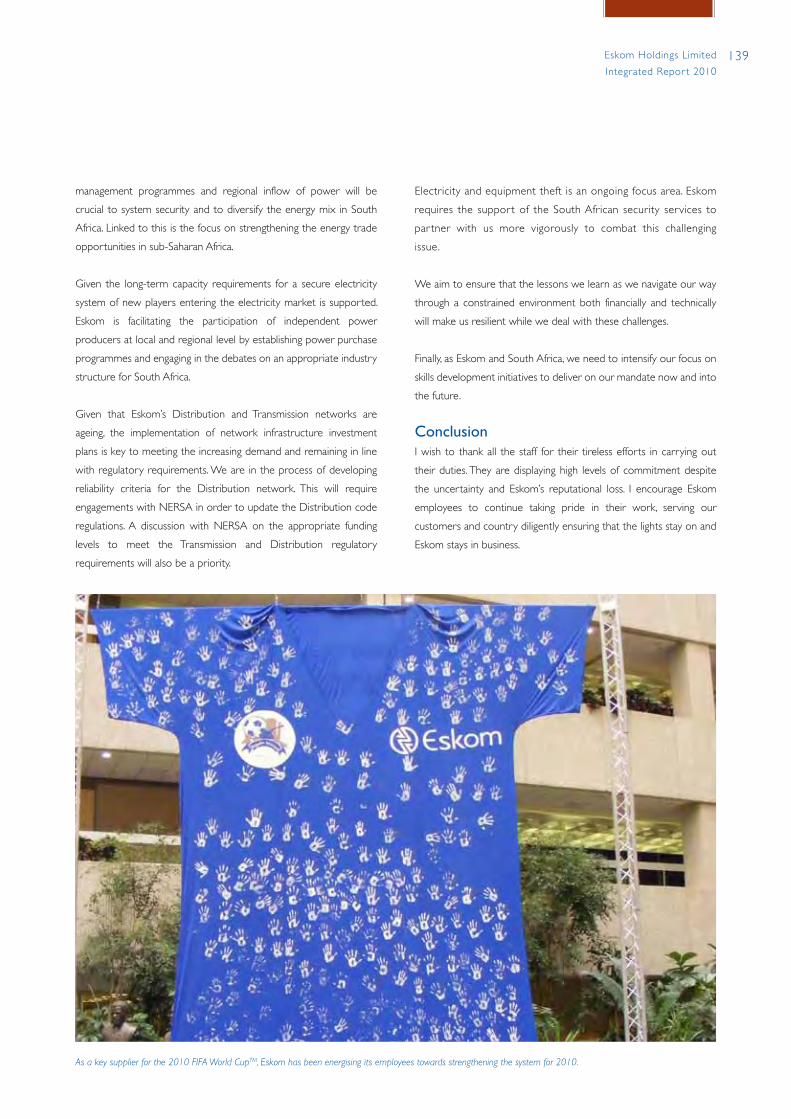
139Eskom Holdings Limited
Integrated Repor t 2010
management programmes and regional inflow of power will be
crucial to system security and to diversify the energy mix in South
Africa. Linked to this is the focus on strengthening the energy trade
opportunities in sub-Saharan Africa.
Given the long-term capacity requirements for a secure electricity
system of new players entering the electricity market is supported.
Eskom is facilitating the participation of independent power
producers at local and regional level by establishing power purchase
programmes and engaging in the debates on an appropriate industry
structure for South Africa.
Given that Eskom’s Distribution and Transmission networks are
ageing, the implementation of network infrastructure investment
plans is key to meeting the increasing demand and remaining in line
with regulatory requirements. We are in the process of developing
reliability criteria for the Distribution network. This will require
engagements with NERSA in order to update the Distribution code
regulations. A discussion with NERSA on the appropriate funding
levels to meet the Transmission and Distribution regulatory
requirements will also be a priority.
Electricity and equipment theft is an ongoing focus area. Eskom
requires the suppor t of the South African security services to
par tner with us more vigorously to combat this challenging
issue.
We aim to ensure that the lessons we learn as we navigate our way
through a constrained environment both financially and technically
will make us resilient while we deal with these challenges.
Finally, as Eskom and South Africa, we need to intensify our focus on
skills development initiatives to deliver on our mandate now and into
the future.
ConclusionI wish to thank all the staff for their tireless efforts in carrying out
their duties. They are displaying high levels of commitment despite
the uncertainty and Eskom’s reputational loss. I encourage Eskom
employees to continue taking pride in their work, serving our
customers and country diligently ensuring that the lights stay on and
Eskom stays in business.
As a key supplier for the 2010 FIFA World CupTM, Eskom has been energising its employees towards strengthening the system for 2010.
140 Eskom Holdings Limited
Integrated Repor t 2010
System Operations and Planning division
Mandate: Provides an integrative function for the reliable development, operation and risk management of the interconnected power system.
Progress this year
Highlights
• We have not had load shedding since late April 2008, which has required continual co-ordination between System Operations and Generation
• Completion of a detailed capital investment plan, integrating all aspects of the business and indicating the key decisions that have to be made in 2010 to ensure security of supply through to 2028
• The successful integration of several units from the return-to-service programme
• The enhancement of the resilience teams in the regions and the emergency preparedness protocols in Eskom, greatly improving Eskom’s ability to anticipate, respond and recover from technical system shocks
• Power purchase agreements signed with independent power producers
Challenges
• Funding constraints delaying investment required to achieve an adequate power system
Future priorities
• Reframing the energy efficiency drive to create a positive message of sustainability, affordability and enhancing security of supply
• Creating an enabling environment to introduce new players and technologies into the electricity market
• No load shedding until 2012
• Ensure that our planning processes provide a coherent and clear decision framework to meet reliability standards and strategic priorities
• Sustainable skills development
• Financial sustainability
• Invest in the Transmission network to ensure compliance with the NERSA approved reliability standards progressively
Kannan LakmeeharanManaging Director: System operations and Planning
Q: How are you preparing for an independent system operator (ISO)?A: We are ensuring that all stakeholders have information and a
common fact base on the enablers for an ISo and what form and
shape such an ISo could take. Position papers have been prepared
for Eskom and external stakeholders on a possible transition path to
a desired end state. A project team has also been set up to deal with
change management and process management once decisions on
the transition path have been made. Internally we are focusing on
regulatory, financial and governance ring-fencing of the
system operator.
As the current system operator we are positioned to operate as the
single buyer of electricity from IPPs, and now that funds are being
made available we will be signing up more IPPs in future.
141Eskom Holdings Limited
Integrated Repor t 2010
Key focus areas in 2010 • Ensuring a fault-free 2010 FIFA World CupTM and ensuring that the requirements for a secure power system to 2012 are understood and
implemented
• A 10-year transmission development plan that is made available for public engagement
• Supporting the Department of Energy in developing the IRP
• Supporting the implementation of an energy conservation scheme
• Increasing the resilience of our technical systems and processes
• Developing the requirements for Eskom’s technical investment plan to support the direction of the integrated resource plan
Risk profile
Risk Treatment plans
Execute a robust IRP planning process to ensure an adequate expansion programme
• Together with Department of Energy engage with stakeholders to resolve governance framework, verification of assumptions and agreement on process
• Develop an integrated decision-making framework that allows us to be flexible and nimble• Develop an open database to provide energy planning data for consistency in independent
studies and for verification• Develop a related investment plan to support the flexibility and robustness of the IRP
process
Sufficient integration and executability of long-term expansion plans combined with investment leading to an ability to meet customer needs
• oEM and construction capability assessment through integrated supply chain management: through supply chain management most of the long lead time equipment requirements have been communicated to suppliers and agreements are being put into place. This still has to be done in terms of communicating Transmission’s construction requirements
• Asset creation process enhancement, monitoring and reporting• Sustainable funding model for Transmission investment • Alignment of new Transmission planning process with the new IRP process• Align Distribution master plans
Maintain coal quality, coal stockpile days and coal handling as a result of logistical constraints leading to reduced plant availability
• So&P is in constant contact with Generation production and sales regarding outages on generation units and liquid fuel usages. Studies are constantly being done as new situations arise
• Assist with the change in operating regime to allow recovery of fuel supply• So&P to engage with Primary Energy and Generation to raise the profile of control
measures and treatment plans
Manage the reserve margin to respond to the real-time demands of the power system to have the ability to respond to customer demands
• Development of an alternate Eskom PCP strategy to develop internal capability• Continuation with the voluntary PCP• Sign up MTPPP power purchase agreements• Integration with the integrated demand-management programme• Project to ensure/resolve to do no load shedding
Avoid the loss of supply capability at Transmission substations due to equipment loss or failure and/or operating errors leading to load shedding and brown out in the worst case
• Work towards ensuring the reliability and security of supply at all Transmission substations• Adequate spares levels maintained
142 Eskom Holdings Limited
Integrated Repor t 2010
System Operations and Planning division continued
Status of the power supply system in South AfricaDemand has returned to 2007 levels in March 2010. If energy
efficiency measures are not put in place by the winter of 2010, the
power system will be tight beyond winter 2010 and in 2011 as we go
back into our generation maintenance season. The risk of
interruptions increases.
While the peak demand during the winter of 2009 was 35 850MW,
the current forecast peak for 2010 is 37 240MW.
Medium-term outlook – up to 2017/18Medupi and Kusile power stations must be completed. A third base-
load power station will possibly be needed by 2017. Decisions have
to be made in the next year to ensure that water and transmission
network infrastructure is planned for such a station.
Continued focus on energy efficiency to maintain a healthy reserve
margin and to slow the rate of increase in the demand for electricity,
could enable us to delay the need for the third baseload station and
allow the development of other technologies to be used. The role of
nuclear and renewable energy to fulfil the energy needs of the
country in the future will have to be concluded in the coming
two years.
Under most scenarios, the adequacy of supply in 2012/13 is a serious
concern. DSM and energy efficiency are essential over the next three
years to ensure system adequacy. It is estimated that there is an
opportunity of an 8% to 15% reduction in energy usage in the next
five to 10 years through energy efficiency initiatives.
If worse than planned generation performance occurs (from 86% to
84% availability) this would result in higher risk and reduced system
adequacy especially between 2011 and 2013. Relatively high load
factor supply-side options are needed in this timeframe (such as co-
generation).
Long-term outlookCurrent net installed generation capacity in South Africa and
contracted imported generation amounts to around 43,5GW.
Current expansion plans are based on the moderate growth
scenario (averaging 3% electricity consumption growth rate over a
20-year period). This may change as part of the IRP development
process.
In order to power the South African economy and ensure an
adequate reserve margin, 20GW of additional generation capacity is
required by 2020 and up to 40GW by 2030. Eskom’s current capacity
expansion programme is well advanced and together with IPP
projects could contribute at least 14GW by 2017 to this requirement.
Eskom’s older coal-fired power stations will probably start to be de-
commissioned from 2023 onwards. It is possible that up to 50GW of
capacity up to 2030 will have to be built or sourced from demand-
side options to cater for the increase in demand and to replace the
decommissioned plant.
Power conservation programmeIn January 2008, Eskom was requested by the then Department of
Minerals and Energy (DME) to develop the power conservation
programme (PCP) on behalf of national government to assist in
addressing the energy challenge by creating space to do essential
generation plant maintenance and allow space for growth.
The key components of PCP include the energy conservation
scheme (ECS) to reduce energy consumption by approximately
10% and electricity growth management to manage new electrical
connections in line with available supply capacity. While the global
economic downturn of the past two years created some breathing
space, national consumption has returned to the “pre-economic
crisis” levels and the security of supply is once again threatened
unless specific strategies, such as PCP, are implemented to create
additional space.
PCP can be implemented in a relatively short space of time
(9-12 months from finalisation of the rules) to provide the bulk of the
required demand reduction. In addition, PCP will provide the pricing
signal to ensure the uptake on other solutions such as demand-side
management, particularly among larger consumers. Most of the large
consumers in the target market of the proposed first phase are
preparing themselves for the implementation of PCP, and prefer this
route in order to ensure security of supply. Specific discussions have
been held with the Energy-intensive User Group in this regard.
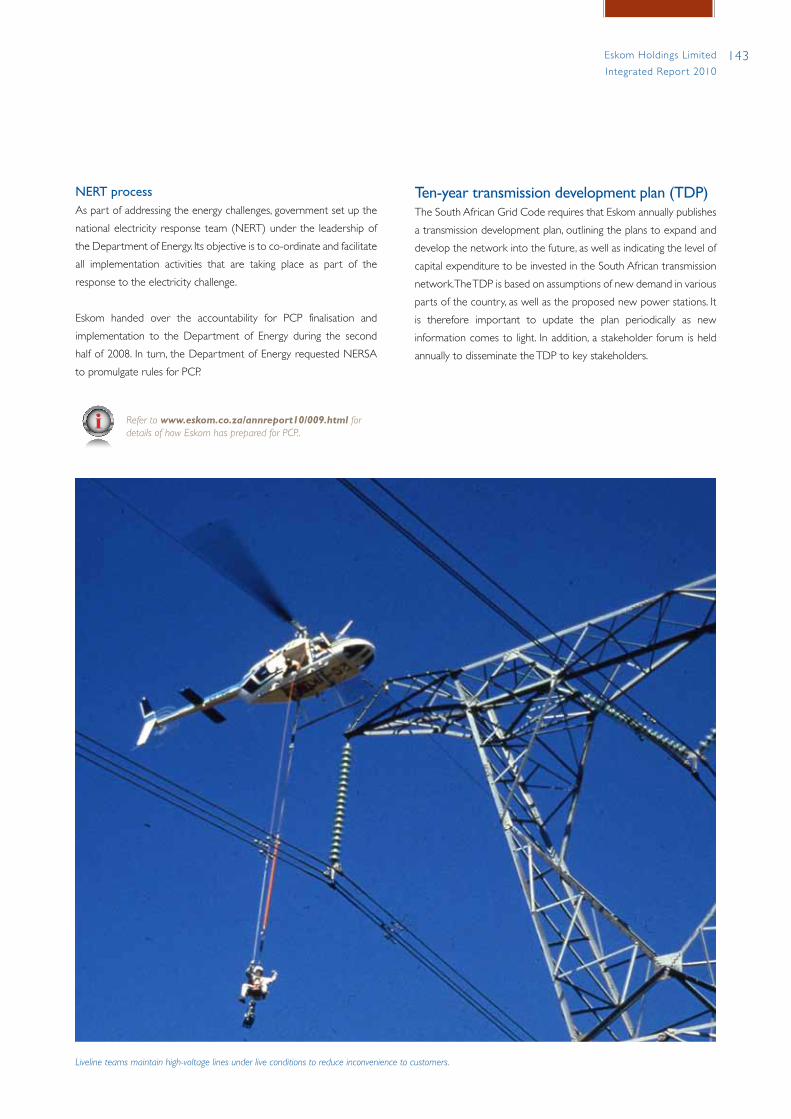
143Eskom Holdings Limited
Integrated Repor t 2010
NERT processAs part of addressing the energy challenges, government set up the
national electricity response team (NERT) under the leadership of
the Department of Energy. Its objective is to co-ordinate and facilitate
all implementation activities that are taking place as part of the
response to the electricity challenge.
Eskom handed over the accountability for PCP finalisation and
implementation to the Department of Energy during the second
half of 2008. In turn, the Department of Energy requested NERSA
to promulgate rules for PCP.
Refer to www.eskom.co.za/annreport10/009.html for details of how Eskom has prepared for PCP..
Ten-year transmission development plan (TDP)The South African Grid Code requires that Eskom annually publishes
a transmission development plan, outlining the plans to expand and
develop the network into the future, as well as indicating the level of
capital expenditure to be invested in the South African transmission
network. The TDP is based on assumptions of new demand in various
parts of the country, as well as the proposed new power stations. It
is therefore important to update the plan periodically as new
information comes to light. In addition, a stakeholder forum is held
annually to disseminate the TDP to key stakeholders.
Liveline teams maintain high-voltage lines under live conditions to reduce inconvenience to customers.
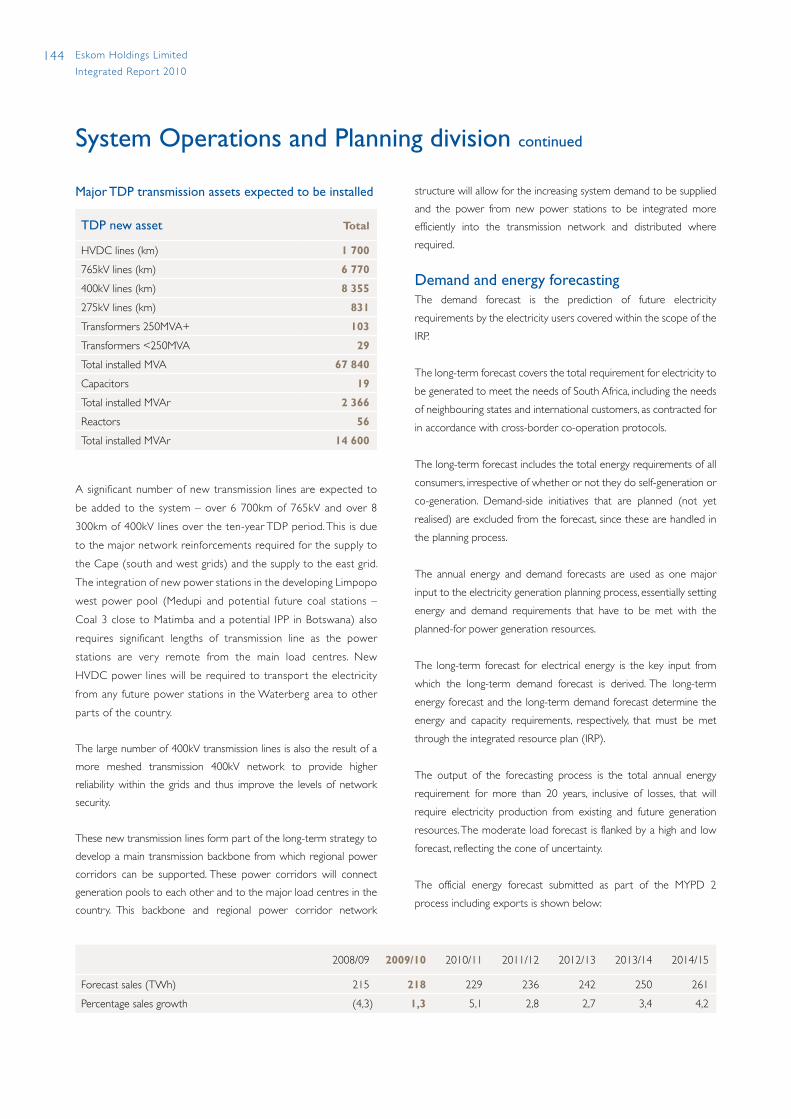
144 Eskom Holdings Limited
Integrated Repor t 2010
Major TDP transmission assets expected to be installed
TDP new asset Total
HVDC lines (km) 1 700
765kV lines (km) 6 770
400kV lines (km) 8 355
275kV lines (km) 831
Transformers 250MVA+ 103
Transformers <250MVA 29
Total installed MVA 67 840
Capacitors 19
Total installed MVAr 2 366
Reactors 56
Total installed MVAr 14 600
A significant number of new transmission lines are expected to
be added to the system – over 6 700km of 765kV and over 8
300km of 400kV lines over the ten-year TDP period. This is due
to the major network reinforcements required for the supply to
the Cape (south and west grids) and the supply to the east grid.
The integration of new power stations in the developing Limpopo
west power pool (Medupi and potential future coal stations –
Coal 3 close to Matimba and a potential IPP in Botswana) also
requires significant lengths of transmission line as the power
stations are very remote from the main load centres. New
HVDC power lines will be required to transport the electricity
from any future power stations in the Waterberg area to other
par ts of the country.
The large number of 400kV transmission lines is also the result of a
more meshed transmission 400kV network to provide higher
reliability within the grids and thus improve the levels of network
security.
These new transmission lines form part of the long-term strategy to
develop a main transmission backbone from which regional power
corridors can be supported. These power corridors will connect
generation pools to each other and to the major load centres in the
country. This backbone and regional power corridor network
structure will allow for the increasing system demand to be supplied
and the power from new power stations to be integrated more
efficiently into the transmission network and distributed where
required.
Demand and energy forecastingThe demand forecast is the prediction of future electricity
requirements by the electricity users covered within the scope of the
IRP.
The long-term forecast covers the total requirement for electricity to
be generated to meet the needs of South Africa, including the needs
of neighbouring states and international customers, as contracted for
in accordance with cross-border co-operation protocols.
The long-term forecast includes the total energy requirements of all
consumers, irrespective of whether or not they do self-generation or
co-generation. Demand-side initiatives that are planned (not yet
realised) are excluded from the forecast, since these are handled in
the planning process.
The annual energy and demand forecasts are used as one major
input to the electricity generation planning process, essentially setting
energy and demand requirements that have to be met with the
planned-for power generation resources.
The long-term forecast for electrical energy is the key input from
which the long-term demand forecast is derived. The long-term
energy forecast and the long-term demand forecast determine the
energy and capacity requirements, respectively, that must be met
through the integrated resource plan (IRP).
The output of the forecasting process is the total annual energy
requirement for more than 20 years, inclusive of losses, that will
require electricity production from existing and future generation
resources. The moderate load forecast is flanked by a high and low
forecast, reflecting the cone of uncertainty.
The official energy forecast submitted as part of the MYPD 2
process including exports is shown below:
2008/09 2009/10 2010/11 2011/12 2012/13 2013/14 2014/15
Forecast sales (TWh) 215 218 229 236 242 250 261
Percentage sales growth (4,3) 1,3 5,1 2,8 2,7 3,4 4,2
System Operations and Planning division continued

145Eskom Holdings Limited
Integrated Repor t 2010
The official energy forecast is used as one of the major inputs into the hourly maximum demand forecast model to generate annual maximum (peak) demand forecast.
The other major inputs to the hourly maximum demand forecast model are the electricity demand profiles. These are developed using the historical customer electricity usage and modelled to determine the expected demand profiles per sector using load research models and expertise.
Integrated resource planon 5 August 2009 the Department of Energy promulgated, in terms of the Electricity Regulation Act, the electricity regulations
on new generation capacity. The regulations clarify the role of the Department of Energy as the energy planner who is therefore accountable for electricity generation planning in South Africa. The Department of Energy gazetted the first integrated resource plan (IRP) on 29 January 2010.
The IRP requires the completion of the current Eskom generation build programme and the introduction of independent power producers (IPPs). It needs to meet the needs of a growing economy and be consistent with government’s energy policy (such as emission targets, the use of renewable energy, nuclear energy and the promotion of an energy efficiency culture in
South Africa).
The IRP reflects capacity and DSM requirements for 2009 to 2013 in MW:
Return toservice Medupi Kusile Ingula
DoEIPP
MTPPPREFIT
Wind, solar other
Totalcapacity DSM
2009 772 – – – – – – – 772 432
2010 683 – – – – 343 150 30 1 206 923
2011 404 – – – 1 020 518 – 55 1 997 1 343
2012 – 738 – – – 284 – – 1 022 2 118
2013 – 738 723 666 – 300 – – 2 427 3 056
Total 1 859 1 476 723 666 1 020 1 445 150 85 7 424
The options for IPPs and co-generation included in Eskom’s MYPD 2 application and the subsequent approval by NERSA of the allowed expenditure for IPPs is shown in the tables below:
Capacity (MW) 2011 2012 2013
MTPPP 417 417 417
REFIT 100 445 725
Total 517 862 1 142
Allowed expenditure (R million) 2011 2012 2013
MTPPP 2 246 2 416 2 480
REFIT 58 1 883 3 339
Total 2 304 4 299 5 819
The IRP 1 also includes the Department of Energy oCGT IPP (1 020MW) in 2011 and 300MW of MTPPP/REFIT in 2013. The costs associated with these options were not included as part of the allowed expenditure for IPPs and co-generation in the MYPD 2 and therefore do not feature in the tables above.
Eskom has publicly stated that the electricity needs of the country can only be met if IPPs are introduced. At the end of 2009 the regulator approved the mechanism in terms of which Eskom may recover the cost arising from purchases from IPPs and, on 24 February 2010, the regulator furthermore approved, as part of the multi-year price determination 2 (MYPD 2), the funds that Eskom may employ during the next three financial years to purchase power from IPPs.
Eskom is awaiting finalisation of the enabling environment, which includes inter alia: an appropriate government support package, determination of the “buyer” in terms of the new generation regulations, a guideline on the targets for each of the renewable technologies set out under the IRP and the NERSA rules for evaluation.
once a fully supportive, enabling environment is in place, Eskom will be in a position to run a procurement process for the REFIT programme including all other IPP programmes as prescribed in the IRP by the Minister of Energy (in accordance with the new generation regulations). The first MTPPP contracts are currently close to being signed.
Further details on the IRP are reflected in the regulatory and legal framework section on page 89.

146 Eskom Holdings Limited
Integrated Repor t 2010
Transmission division
Mandate: Optimally operates and maintains the lifecycle of the South African transmission network, while managing key customer relationships and trading energy internationally.
Progress this year
Highlights• Safety record• Improved stakeholder engagement through forums with key
customers • Environmental legal compliance• Continued co-operation with SADC countries• Apollo DC/AC converter upgraded – now world class• Progress was made with the implementation of the voluntary
power conservation programme (PCP) with our key industrial customers
• Term sheets have been agreed for the majority of the national pricing agreement contracts and Eskom is negotiating with the parties to finalise the contracts
• Term sheets have been agreed for the majority of the national pricing agreement contracts and Eskom is negotiating with the parties to finalise the contracts
• Mozal pricing agreement successfully renegotiated
Challenges• The theft of steel structures is on the increase• A number of incidents took place where network failures were
directly coupled to asset theft, and where our staff were threatened
• Problems with gaining access to land are slowing down our efforts to strengthen the national grid
• The lower than budgeted sales to the key industrial customers, which was mainly caused by the global economic problems
Future priorities
• Promote projects in the SADC region, particularly those that connect South Africa to renewable energy sources and new power pools• Pay special attention to payment of accounts and general revenue management, including guarantees • Honouring the regulator’s licence conditions as required by the grid code• Ensure availability of the transmission network, especially during the 2010 FIFA World CupTM • Improved transmission asset management practices and processes as part of continual operational improvement• Conclude remaining negotiations with key industrial customers with negotiated pricing agreements which expose Eskom to embedded
derivatives
Mongezi NtsokoloManaging Director: Transmission
Q: What are the key challenges in maintaining a secure power grid in South Africa?A: Given the age of many of our main networks, maintenance and other asset management practices are crucial, with the added challenge of maintaining assets with constrained budgets. other than maintaining the existing infrastructure, we also need timeous and efficient expansion of the transmission network to improve security of supply. This requires in-depth planning, approval processes such as EIAs and stakeholder engagement before buying land and starting tender processes for the actual construction work.
The transmission network is spread all over South Africa – covering nearly 29 000km – and our personnel have to travel long distances on deteriorating roads. operating safety is and will remain a challenge.
An unfortunate issue that seems to be escalating is threats to the physical security of our people and assets. In response we are developing a security improvement plan that deals with securing our people and addressing cable and lattice theft.

147Eskom Holdings Limited
Integrated Repor t 2010
Risk profileManagement throughout Transmission is responsible for the
integrated risk management (IRM) capability. Transmission has
implemented IRM structures which are aligned to the new Eskom
Risk Treatment plans
Legacy agreements which are not cost reflective
There is an engagement strategy in place regarding these agreements and the agreements are recognised in the regulatory environment. An energy-intensive user strategy is also being developed. Any future negotiated pricing agreements will continue to be recognised and approved by NERSA
Dissatisfied customers Efforts will continue to expand customer engagement and analyse survey feedback through the KeyCare tool. There are ongoing strategies to improve service levels. Customer forums are held on a regular basis, led by the Chief Executive, Chief operating officer (Customer Network Business), Managing Director (Transmission) and General Manager (Key Sales and Customer Service)
Unavailability of the Transmission network The implementation of the asset management project will assist in improving the life-cycle management of plant, review of policies, procedures and processes. There is also a continual review of emergency preparedness plans and testing of the plant to look into multiple failures and response strategies
Funding constraints Treatments include cash-saving initiatives, analysis of monthly cash flow projections, prioritisation of capital projects, short- and long-term cost efficiencies. A capital review committee has been constituted and will monitor project progress on a quarterly basis. A stakeholder engagement plan has been compiled and audits are performed to measure adherence to the grid code criteria
Customers defaulting on payment Eskom has implemented a credit management policy that guides the process of when to cut off the electricity supply of defaulting customers and criteria to be complied with before payment extensions may be granted. Security guarantees are analysed on a regular basis to ensure that adequate securities are in place and that the “good payer” principle is adhered to and managed
Transmission system performance
Measure (and unit)
Description of measure
Target2010
Actual 2010
Actual 2009
Actual2008
(includes load
shedding) Comments
Number of interruptions
Interruptions affecting the continuity of supply
≤35 31 31 49 Target achievedl
Number of system minutes lost
Total number of system minutes lost (for incidents of less than one system minute)
≤3,40 4,09RA 4,21RA 3,56 Not achieved, poor performance primarily due to the loss of large loads and the inflexibility of the network during contingencies
l
Number of major incidents
Records number of incidents with a severity greater than one system minute.
Achieved l
– severity degree one (≥ 1 but less than 10)
≤2 11 RA 3RA 5 Incident initiated by a third party and exacerbated by a transmission breaker failure
– severity degree two (≥ 10 but less than 100)
0 0 0 0
– severity degree three (≥ 100) 0 0 1 1
Number of line faults
Number of transmission line faults per 100km
≤2,45 2,54 2,46 2,31 Not achieved, due to tower design limitations for extreme wind conditions and high unseasonable rainfall impacts
l
RA – Reasonable assurance provided by the independent assurance provider (refer page 169).1. A major incident (degree 1) took place on 19 February 2010, at Ararat substation in the Northern grid. The Minpro number one and number two 88kV (distribution) lines
tripped due to a construction vehicle colliding with the number two line. The Ararat-Minpro number one 88kV breaker (transmission breaker) failed to close, resulting in an interruption of supply. On investigation, a defective latch was found on the breaker and this was cleaned. There was an interruption of supply with a total of 1,16 system minutes lost.
IRM standard and policy. Risks are included in every business area’s
operational plan as well as the divisional business plan to ensure
integration and that risks are identified against Eskom and the
division’s functional objectives.
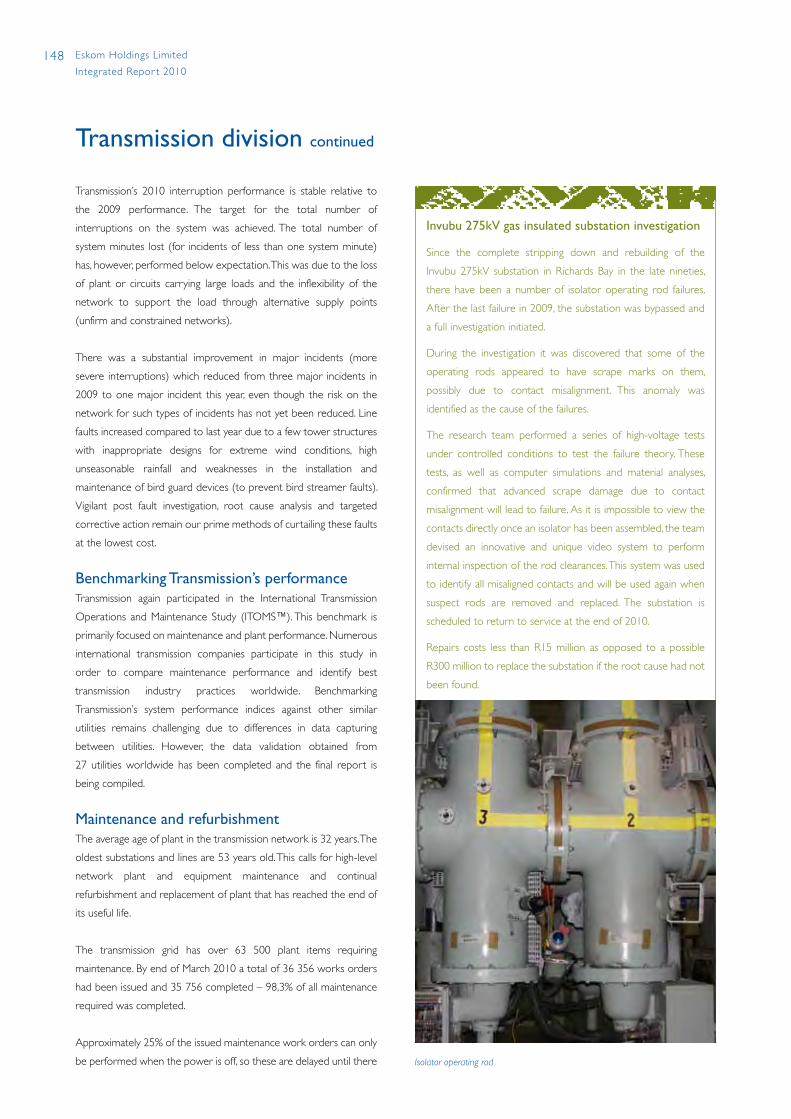
148 Eskom Holdings Limited
Integrated Repor t 2010
Invubu 275kV gas insulated substation investigation
Since the complete stripping down and rebuilding of the
Invubu 275kV substation in Richards Bay in the late nineties,
there have been a number of isolator operating rod failures.
After the last failure in 2009, the substation was bypassed and
a full investigation initiated.
During the investigation it was discovered that some of the
operating rods appeared to have scrape marks on them,
possibly due to contact misalignment. This anomaly was
identified as the cause of the failures.
The research team performed a series of high-voltage tests
under controlled conditions to test the failure theory. These
tests, as well as computer simulations and material analyses,
confirmed that advanced scrape damage due to contact
misalignment will lead to failure. As it is impossible to view the
contacts directly once an isolator has been assembled, the team
devised an innovative and unique video system to perform
internal inspection of the rod clearances. This system was used
to identify all misaligned contacts and will be used again when
suspect rods are removed and replaced. The substation is
scheduled to return to service at the end of 2010.
Repairs costs less than R15 million as opposed to a possible
R300 million to replace the substation if the root cause had not
been found.
Transmission division continued
Transmission’s 2010 interruption performance is stable relative to
the 2009 performance. The target for the total number of
interruptions on the system was achieved. The total number of
system minutes lost (for incidents of less than one system minute)
has, however, performed below expectation. This was due to the loss
of plant or circuits carrying large loads and the inflexibility of the
network to support the load through alternative supply points
(unfirm and constrained networks).
There was a substantial improvement in major incidents (more
severe interruptions) which reduced from three major incidents in
2009 to one major incident this year, even though the risk on the
network for such types of incidents has not yet been reduced. Line
faults increased compared to last year due to a few tower structures
with inappropriate designs for extreme wind conditions, high
unseasonable rainfall and weaknesses in the installation and
maintenance of bird guard devices (to prevent bird streamer faults).
Vigilant post fault investigation, root cause analysis and targeted
corrective action remain our prime methods of curtailing these faults
at the lowest cost.
Benchmarking Transmission’s performanceTransmission again participated in the International Transmission
operations and Maintenance Study (IToMS™). This benchmark is
primarily focused on maintenance and plant performance. Numerous
international transmission companies participate in this study in
order to compare maintenance performance and identify best
transmission industry practices worldwide. Benchmarking
Transmission’s system performance indices against other similar
utilities remains challenging due to differences in data capturing
between utilities. However, the data validation obtained from
27 utilities worldwide has been completed and the final report is
being compiled.
Maintenance and refurbishmentThe average age of plant in the transmission network is 32 years. The
oldest substations and lines are 53 years old. This calls for high-level
network plant and equipment maintenance and continual
refurbishment and replacement of plant that has reached the end of
its useful life.
The transmission grid has over 63 500 plant items requiring
maintenance. By end of March 2010 a total of 36 356 works orders
had been issued and 35 756 completed – 98,3% of all maintenance
required was completed.
Approximately 25% of the issued maintenance work orders can only
be performed when the power is off, so these are delayed until there Isolator operating rod
149Eskom Holdings Limited
Integrated Repor t 2010
is a planned outage, so as not to inconvenience customers. The
commissioning of new substations and lines also demanded more
time from grid staff, resulting in further delays in the performance of
maintenance.
Transmission is in the process of implementing a revised organisational
structure and business processes based on asset management
principles in line with the PAS551 standard. To this end, Transmission
is in the process of performing plant health, criticality and risk
assessments to help determine plant end-of-life and optimise
maintenance and refurbishment strategies.
During 2010 the following major refurbishment projects were
completed:
• Arnot high-voltage yard
• Batteries and chargers nationally (done on a rolling two-year basis)
• Remote terminal units at seven substations
• 500MVA Hermes transformer and 315MVA transformer from
Bighorn
Note that the timing of some refurbishment projects were re-phased
in line with Eskom’s cash flow savings initiative.
Environmental impact assessments and land acquisitionsThe process of acquiring land, land rights and environmental
authorisation to build electricity infrastructure has become
increasingly challenging. over the years we have learnt that we
should initiate this process at least three to four years before the
construction process can begin. However, even these timeframes
seem insufficient given the urgency of most projects and the
demanding nature of the consultation process during the EIA process.
The detailed participation process experienced in recent years is a
positive indication that the public are exercising their democratic
right to be heard and play an active role in making our process
robust and credible. Despite this challenge Eskom is still committed
to ensuring an inclusive and informed participation process to ensure
maximum participation by all interested and affected parties. This in
turn increases the success rate of our projects.
For details on activities to enhance stakeholder relationships go to www.eskom.co.za/annreport10/010.html
705A compact cross-rope 765kV tower
Research is currently involved in the verification and testing of
a new generation of compact towers to make optimal use of
limited servitudes, and to review the aesthetical characteristics
of transmission lines and towers.
The 705A is a new compact cross-rope 765kV suspension
tower. The tower offers a strategic advantage as opposed to its
conventional lattice type predecessors in that it offers a
reduction in steel and foundation costs. The compact structure
should not compromise the technical performance of the
tower, hence an exercise was undertaken to determine the
electrical, mechanical and liveline operability and maintainability
of the tower.
Although this structure is not cheaper on a per-pylon basis,
significant operational cost savings can be achieved on long-
distance links (typically over 200km), due to favourable
capacitance and inductance characteristics of the delta phase
configuration. The verification aspects currently being
conducted include the reliability, liveline, cost savings and
electrical characteristics.
1. International specification and guideline for the optimised management of physical assets

150 Eskom Holdings Limited
Integrated Repor t 2010
ExpropriationThe biggest challenge experienced with land and servitude acquisition
is the inability to match the landowners’ expectation of their land
values. Eskom is prepared to acquire land and servitudes at market
values as determined by professional valuators. However, landowner
expectations are normally above the market value, sometimes
resulting in a deadlock during negotiations.
As a last resort, Eskom would resort to expropriation. This is not the
best approach since it:
• affects the long-term relationship between Eskom and the
landowner
• is a long process that normally affects the project delivery times
• is a process controlled by the state and therefore the decision
made by the responsible minister becomes binding on all parties
involved, leaving little room for negotiation.
Due to difficulty in acquiring servitudes on the following projects,
Eskom has in 2010 initiated the process of expropriating six servitudes
on the Mercury-Zeus 765kV line, the Spitskop-Dinaledi 400kV line
and the Mercury-Ferrum 499kV line.
Eskom’s relationship with landowners who have our infrastructure
on their properties requires attention. Disputes regarding claims by
property owners against Eskom, often result in a deadlock during
negotiations for new servitude rights. These claims involve “act of
God” incidents, and often involve fire claims. Eskom’s insurance cover
does not cover every claim forwarded by property owners, especially
losses as a result of an “act of God”. Eskom’s insurance only covers
cases where Eskom is legally liable. Property owners express extreme
frustration and dissatisfaction with the manner in which these claims
are assessed and adjudicated. This is affecting the success of
many projects.
Eskom insurance management services (EIMS) settles all claims
speedily in cases where there is legal liability on the part of Eskom.
However, where no legal liability exists, the affected business units
within Eskom normally take a business decision as the case may
no longer be an insurance matter. It is also noted that this is a
reactive solution as it happens long after relationships with the
landowner have been tarnished. A more pro-active solution is
still required.
Copper and pylon theftIn the year under review the Transmission division suffered losses
amounting to R5,3 million due to conductor theft and R5,5 million
due to theft of steel tower lattices (pylon theft). These incidents
continue to be a concern and various initiatives are in place to
combat them.
In the high prevalence areas aggressive awareness campaigns have
been successfully launched with the view to informing the public of
the negative effects of conductor and tower-member theft to the
security and cost of electrical supply. Moreover, we continue with
deployment of new technologies as well as the expansion of our
intelligence activities to combat these incidents.
Contracting with SADC utilitiesEskom is a founding member of the Southern African Power Pool
(SAPP) which facilitates the relationship and contracting with the
utilities and end-use customers in the SADC region. This provides the
platform for a regional energy market, where Eskom is able to pursue
additional import options from potential regional power sources.
The bulk of the exports into SADC are made as firm supply in terms
of bilateral agreements. In addition Eskom participates in the SAPP
day-ahead market which trades electricity on a day-ahead basis when
short-term surplus energy is available.
Eskom is a net exporter (exports exceed imports) of electricity to
the region:
• Exports = 6,30% of the total electricity available in South Africa
• Imports = 5,39% of the total electricity available in South Africa
• Net exports = 0,93%
Most of Eskom’s current exports are to the national utilities of
Botswana (BPC), Namibia (NamPower), Swaziland (SEC) and
Lesotho (LEC). Eskom also has trading relationships with Zimbabwe
(ZESA) and Zambia (ZESCo), but these agreements are for non-
firm power when surplus capacity exists and during emergency
situations. In addition Eskom exports to three end-use customers,
one in Mozambique and two in Namibia.
The bulk of the imports are currently received from the Cahora
Bassa hydro scheme in Mozambique, with non-firm imports received
on occasion from other regional utilities. Eskom has been purchasing
approximately 1 250MW from Cahora Bassa for a number of years
Transmission division continued
151Eskom Holdings Limited
Integrated Repor t 2010
and this agreement is effective until 2030. We also have an agreement
for an additional 250MW and this agreement is valid until 2014. The
original and additional agreements are concluded at different prices.
The SADC region has considerable potential primary energy capacity,
specifically hydro and natural gas, and these primary energy sources
offer a future supply option into South Africa. These will not only
assist with the growing capacity requirements in South Africa, but
will also assist in reducing the country’s dependence on coal with
its associated carbon emissions. Eskom is currently engaging in a
number of such potential projects in the region. one such project is
noted below:
WestcorThe aim of the Westcor project was to build a 3 500MW hydro
station (Inga 3) on the Congo river in the Democratic Republic of
Congo (DRC) as well as a transmission system through Angola,
Namibia, Botswana and into South Africa. The national utilities of
these five countries had formed the Westcor joint venture to develop
this project.
At the SADC energy ministers’ meeting regarding Westcor held in
Kinshasa in February 2010, the President of the DRC announced that
the Inga 3 capacity should be opened up to all members of SADC.
As a result of a changing mandate it was decided to close the
Westcor company and the project. It is possible that this move will
provide the impetus to develop the Grand Inga concept on the
Congo river.
Key customer updateThe key sales and customer services team is the interface with major
key customers (those customers using a minimum of 100GWh of
energy a year). The KeyCare total quality index measures the
satisfaction of about 120 key customers. An independent research
house conducts interviews with senior managers in the companies
to measure our performance and produces a 12-month moving
average KPI of these segments (the KeyCare index).
The KeyCare index performance was 98% against a target of 103%
(2009: 101%). The main reasons for not meeting target were the
capacity constraints and the price increases.
Environmental performanceTransmission’s environmental policy commits to:
• comply with applicable legislation and other requirements
• establish an environmental management system, including
prevention of pollution that is economically viable and sustainable
• educate, train and motivate our employees about environmental
issues
• promote open communication on environmental issues among
employees and stakeholders
Highlights• reduction in number of cases of non-compliance with
environmental legislation. This was attributed to the controls and
oversight mechanisms implemented at all the Transmission
business units
• development and implementation of biodiversity and land
management environmental management plans for 330 existing
power lines based on a phase-in approach: the proposed target of
90% for 2010 was achieved (2009: 80%)
• all Transmission business units were recommended for ISo 14001
and re-certification was achieved in August 2009
Challenges• an increase in the number of environmental complaints related to
power line construction projects
• increase in the number of oil spills
• higher collision rate of Ludwig’s Bustards with high-voltage
transmission power lines in the De Aar area of the Karoo region
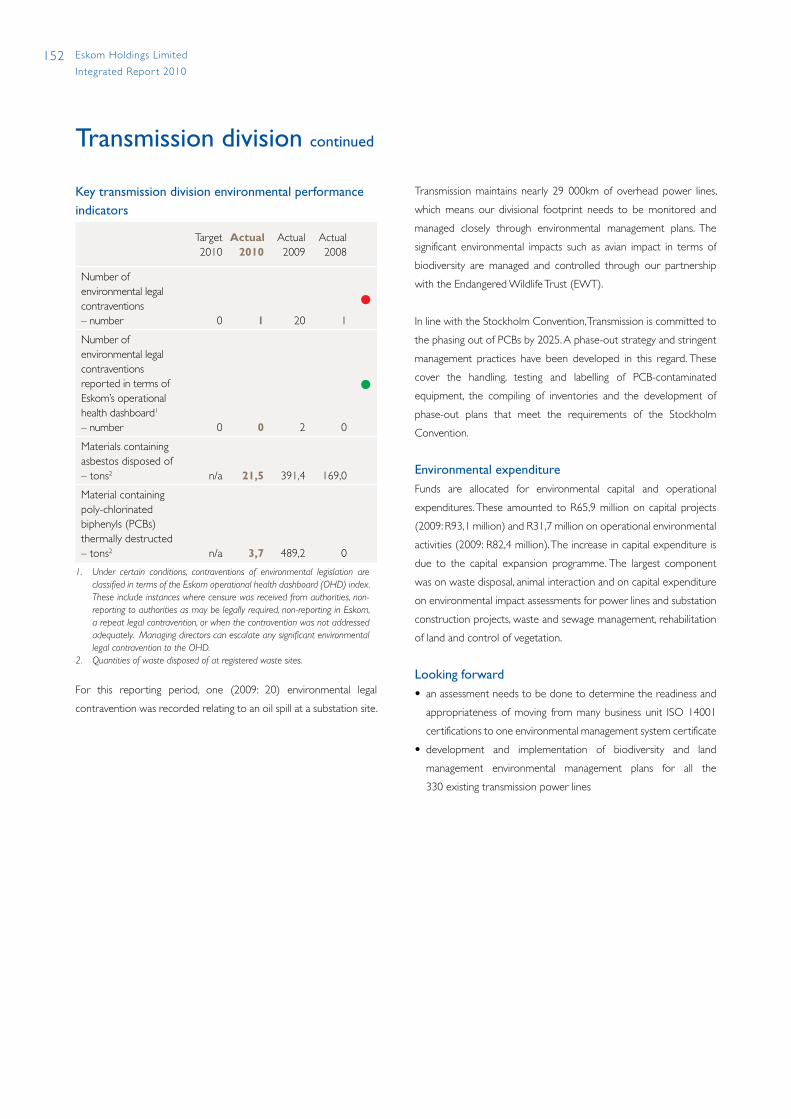
152 Eskom Holdings Limited
Integrated Repor t 2010
Transmission maintains nearly 29 000km of overhead power lines,
which means our divisional footprint needs to be monitored and
managed closely through environmental management plans. The
significant environmental impacts such as avian impact in terms of
biodiversity are managed and controlled through our partnership
with the Endangered Wildlife Trust (EWT).
In line with the Stockholm Convention, Transmission is committed to
the phasing out of PCBs by 2025. A phase-out strategy and stringent
management practices have been developed in this regard. These
cover the handling, testing and labelling of PCB-contaminated
equipment, the compiling of inventories and the development of
phase-out plans that meet the requirements of the Stockholm
Convention.
Environmental expenditureFunds are allocated for environmental capital and operational
expenditures. These amounted to R65,9 million on capital projects
(2009: R93,1 million) and R31,7 million on operational environmental
activities (2009: R82,4 million). The increase in capital expenditure is
due to the capital expansion programme. The largest component
was on waste disposal, animal interaction and on capital expenditure
on environmental impact assessments for power lines and substation
construction projects, waste and sewage management, rehabilitation
of land and control of vegetation.
Looking forward• an assessment needs to be done to determine the readiness and
appropriateness of moving from many business unit ISo 14001
certifications to one environmental management system certificate
• development and implementation of biodiversity and land
management environmental management plans for all the
330 existing transmission power lines
Key transmission division environmental performance indicators
Target2010
Actual2010
Actual2009
Actual2008
Number of environmental legal contraventions – number 0 1 20 1
l
Number of environmental legal contraventions reported in terms of Eskom’s operational health dashboard1 – number 0 0 2 0
l
Materials containing asbestos disposed of – tons2 n/a 21,5 391,4 169,0
Material containing poly-chlorinated biphenyls (PCBs) thermally destructed – tons2 n/a 3,7 489,2 0
1. Under certain conditions, contraventions of environmental legislation are classified in terms of the Eskom operational health dashboard (OHD) index. These include instances where censure was received from authorities, non-reporting to authorities as may be legally required, non-reporting in Eskom, a repeat legal contravention, or when the contravention was not addressed adequately. Managing directors can escalate any significant environmental legal contravention to the OHD.
2. Quantities of waste disposed of at registered waste sites.
For this reporting period, one (2009: 20) environmental legal
contravention was recorded relating to an oil spill at a substation site.
Transmission division continued

153Eskom Holdings Limited
Integrated Repor t 2010
Mandate: Manage the retail business and optimally operate and maintain the Eskom distribution network, while playing an active role in the restructuring of the electricity distribution industry (EDI).
Progress this year
Highlights• Customer service index score of 85,05% against a target
of 82,65%• Environmental index (compliance) score of 105,5 against a
target of 100• Small power user debtor days of 40,53 days against a target
of 45 days• Electrification connections of 149 901 against a target of
145 615• Implementation of on-line vending resulting in improved
customer accessibility
Challenges• Collisions and electrocutions of birds on distribution power
lines• Large power debtor days of 18,88 days against a target of
16 days• Demand-side management savings of 372MW against a target
of 432MW• SAIDI technical performance of 54,41 interruption hours per
annum against a target of ≤50,00 hours per annum• SAIFI technical performance of 24,65 interruption events per
annum against a target of ≤23,50 events per annum• Sadly two Distribution employees and eight contract workers
passed away during the financial year
Future priorities
• Continue with appropriate network maintenance and investment levels• Continue with the business optimisation plan to drive service and financial efficiency• Enhancing skills • Enhanced focus on our revenue management and non-technical loss management• Continue development of initiatives to protect the poor and improve payment affordability • Support government initiatives such as the universal access plan and solar water heating
Ayanda NoahManaging Director: Distribution division
Q: How is Eskom driving energy efficiency nationally?A: During the past 10 years, the Eskom DSM initiative has grown into a concerted national electricity saving effort, which has been driven and managed by Eskom with the joint participation and buy-in from government, NERSA, municipal, residential, commercial, and industrial sectors.
The key objective of DSM is to implement measurable and sustainable demand reduction interventions, using energy efficiency and load reduction technologies that “hardwire” energy savings via customer purchasing patterns (technology choices) and behavioural changes (usage patterns).
From a business perspective, DSM is extremely beneficial to South Africa because the measures have been proven internationally and locally for the short, medium, and long term to:• be the most cost-effective mechanism for demand reduction;• have the least economic impact;• have the quickest time to implement;• be one of the most effective climate change mitigation strategies;• be a strong resource to improve overall energy productivity; and• create sustainable jobs in terms of installation and maintenance of
systems
Distribution division
154 Eskom Holdings Limited
Integrated Repor t 2010
Key focus areas• Anticipate, understand, provide for and respond to our current
and future customer needs
• Work towards a seamless working relationship with all our key
stakeholders
• Continue to make sustainable contributions to social delivery
through initiatives such as
– reducing public safety incidents through awareness
– demonstrated climate change deliverables
– delivering on the universal electrification access expectations
– providing viable electricity solutions to informal settlements, and
– contributing to B-BBEE and small business development in a
sustainable manner
• Continue to play an active role in the EDI restructuring process
• Continue to focus on energy efficiency and demand management
• Continue to enhance our internal business processes and business
enablers
• Grow our human capital through retention of core, critical and
scarce skills, complemented by effective skills and talent
management
Risk profile
Risk Treatment plans
Networks becoming overloaded • Identify, develop and enhance the skills required for the optimal running of the technical business
• Refurbishment prioritisation for ageing networks• Enhance our approach to illegal connections and energy theft• Encourage energy efficiency among our customers• Enhance and implement sound asset management principles• Develop an effective supply chain for equipment
Energy theft escalating • ongoing execution of the enhanced energy losses programme• Launch a public and social awareness campaign to counter the culture of non-payment and
energy theft• Meter audits on all customer categories• Engage with law enforcement authorities to improve litigation success• Successful prosecution of offenders
Equipment theft and vandalism escalates • Proactive patrol of installations and lines in high-risk areas• ongoing awareness initiatives • Engage Eskom contractors in controlling materials and implementation of security measures• Use new technology to monitor and track equipment theft• Interact and co-operate with government departments and other industry stakeholders• Increased capacity for the specialised conductor theft teams in high-risk areas• Successful prosecution of offenders
Inability to reduce or contain demand growth through demand-side manage-ment (DSM), energy efficiency and power conservation programme (PCP) implementation
• Develop and implement demand-side solutions to support security of supply• Create a culture of energy efficiency • Integrate demand initiatives across the organisation• Develop funding and investment solutions for energy efficiency, DSM and customers
initiatives• Influence and contribute to the policy and regulatory environment
Inadequate skills and capacity to effectively and efficiently operate the Distribution business
• Strengthen the organisational capacity to manage the evolving skills challenge• Co-ordinate all functional skills development and capacity creation • Standardise the approach to training, training materials and training curriculum • Strengthen coaching and mentoring• Capture and transfer specialised knowledge across the organisation
Inability to collect all the revenue due to increased tariffs
• Use advanced technology to curb energy theft and reduce revenue losses• Normalisation of credit management practices (disconnections)• Removal of illegal connections• Launch a public social awareness campaign to counter the culture of non-payment• Provide infrastructure in informal settlements to improve revenue collection• Improve meter reading practices
Distribution division continued

155Eskom Holdings Limited
Integrated Repor t 2010
Distribution system performance
Measure Description of measure (and unit)
Target2010
Actual 2010
Actual 2009
Actual2008 Comments
Distribution supply loss index (DSLI)
Distribution network unavailability index (minutes per month)
≤8,70 12,30 9,17 10,36 Target not achieved. See comments for DSLI and RSLI below. l
Reticulation supply loss index (RSLI)
Total reticulation network unavailability index(hours per annum)
≤2,20 2,43 2,16 2,24 Target not achieved. See comments for DSLI and RSLI below.
l
Reticulation supply loss index (RSLI)
Unplanned reticulation network unavailability index (hours per annum)
≤1,60 1,84 1,70 1,68 Target not achieved. See comments for DSLI and RSLI below.
l
System average interruption frequency index (SAIFI)
Reliability of supply index(number per annum)
≤23,50 24,65RA
24,16RA
25,36 Target not achieved. See comments for SAIFI and SAIDI below.
l
System average interruption duration index (SAIDI)
Availability of supply index (hours per annum)
≤50,00 54,41RA
51,51RA
55,51 Target not achieved. See comments for SAIFI and SAIDI below.
l
RA – Reasonable assurance provided by the independent assurance provider (refer page 169).
Comments regarding DSLI and RSLI performanceDistribution has started with various initiatives to improve the
accuracy of the reporting of DSLI and RSLI due to process and data
integrity challenges. These initiatives were not completed by the end
of the 2010 financial year and will continue into the next financial
year. The reported performance for DSLI and RSLI is therefore a best
estimate of our performance, and this needs to be taken into
consideration for year-on-year evaluation and comparative analysis.
Comments regarding SAIFI and SAIDI performanceSAIDI and SAIFI performance have marginally deteriorated since the
previous year. Business plan targets have also not been achieved
because of the slower than anticipated benefit realisation for
Distribution’s network performance improvement initiatives,
resource constraints, impact of conductor/equipment theft on
resources and network performance and adverse weather conditions
during the financial year. There has been an increased focus during the
year on planned work.
Distribution continues to focus on the following key initiatives to
improve SAIFI and SAIDI performance and to reduce the impact of
planned/unplanned outages on customers:
• increased use of live-line techniques
• increased network visibility and remote control of switching
devices
• improved outage management and co-ordination
• implementation of enhanced asset management processes
(PAS55 standard)
• increased maintenance and refurbishment expenditure
• focus on improvement plans for worst performing networks
Refer to www.eskom.co.za/annreport10/011.htmlfor detail on distribution performance and benchmarks.
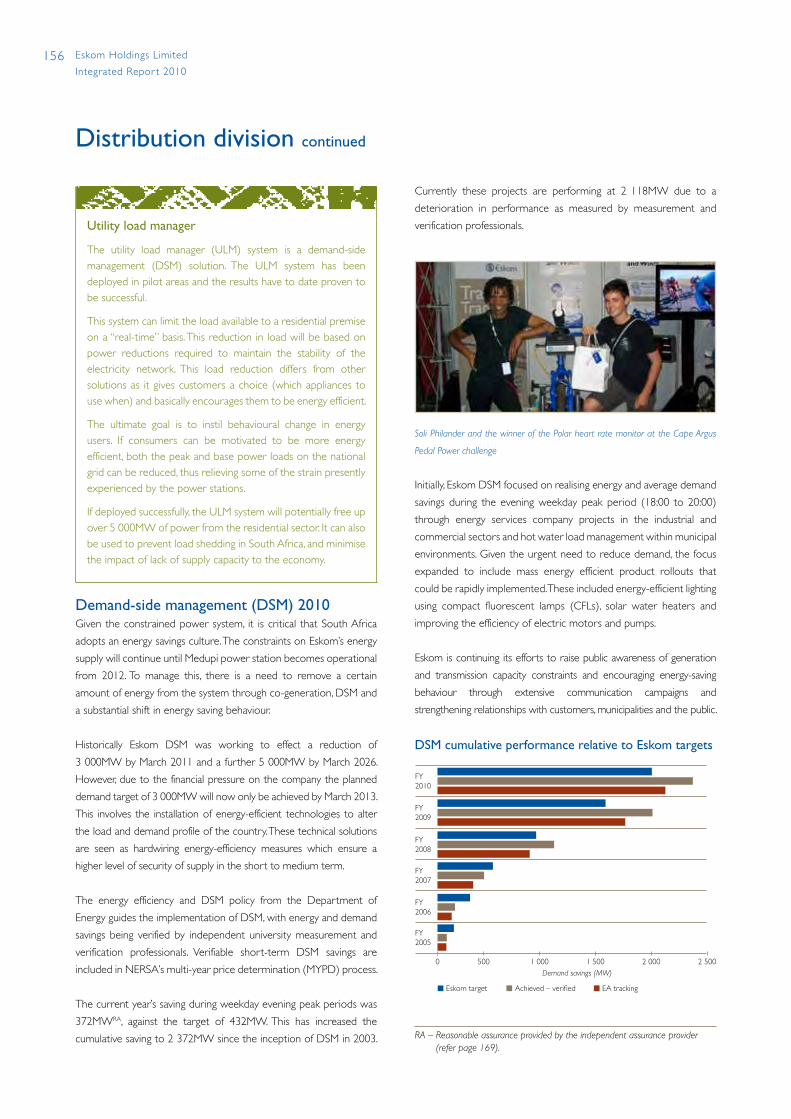
156 Eskom Holdings Limited
Integrated Repor t 2010
Distribution division continued
Utility load manager
The utility load manager (ULM) system is a demand-side management (DSM) solution. The ULM system has been deployed in pilot areas and the results have to date proven to be successful.
This system can limit the load available to a residential premise on a “real-time” basis. This reduction in load will be based on power reductions required to maintain the stability of the electricity network. This load reduction differs from other solutions as it gives customers a choice (which appliances to use when) and basically encourages them to be energy efficient.
The ultimate goal is to instil behavioural change in energy users. If consumers can be motivated to be more energy efficient, both the peak and base power loads on the national grid can be reduced, thus relieving some of the strain presently experienced by the power stations.
If deployed successfully, the ULM system will potentially free up over 5 000MW of power from the residential sector. It can also be used to prevent load shedding in South Africa, and minimise the impact of lack of supply capacity to the economy.
Demand-side management (DSM) 2010Given the constrained power system, it is critical that South Africa
adopts an energy savings culture. The constraints on Eskom’s energy
supply will continue until Medupi power station becomes operational
from 2012. To manage this, there is a need to remove a certain
amount of energy from the system through co-generation, DSM and
a substantial shift in energy saving behaviour.
Historically Eskom DSM was working to effect a reduction of
3 000MW by March 2011 and a further 5 000MW by March 2026.
However, due to the financial pressure on the company the planned
demand target of 3 000MW will now only be achieved by March 2013.
This involves the installation of energy-efficient technologies to alter
the load and demand profile of the country. These technical solutions
are seen as hardwiring energy-efficiency measures which ensure a
higher level of security of supply in the short to medium term.
The energy efficiency and DSM policy from the Department of
Energy guides the implementation of DSM, with energy and demand
savings being verified by independent university measurement and
verification professionals. Verifiable short-term DSM savings are
included in NERSA’s multi-year price determination (MYPD) process.
The current year’s saving during weekday evening peak periods was
372MWRA, against the target of 432MW. This has increased the
cumulative saving to 2 372MW since the inception of DSM in 2003.
Currently these projects are performing at 2 118MW due to a
deterioration in performance as measured by measurement and
verification professionals.
Soli Philander and the winner of the Polar heart rate monitor at the Cape Argus
Pedal Power challenge
Initially, Eskom DSM focused on realising energy and average demand
savings during the evening weekday peak period (18:00 to 20:00)
through energy services company projects in the industrial and
commercial sectors and hot water load management within municipal
environments. Given the urgent need to reduce demand, the focus
expanded to include mass energy efficient product rollouts that
could be rapidly implemented. These included energy-efficient lighting
using compact fluorescent lamps (CFLs), solar water heaters and
improving the efficiency of electric motors and pumps.
Eskom is continuing its efforts to raise public awareness of generation
and transmission capacity constraints and encouraging energy-saving
behaviour through extensive communication campaigns and
strengthening relationships with customers, municipalities and the public.
DSM cumulative performance relative to Eskom targets
Demand savings (MW)2 5002 0001 5001 0005000
FY2008
FY2007
FY2006
FY2005
FY2009
FY2010
Eskom target Achieved – veri�ed EA tracking
RA – Reasonable assurance provided by the independent assurance provider (refer page 169).
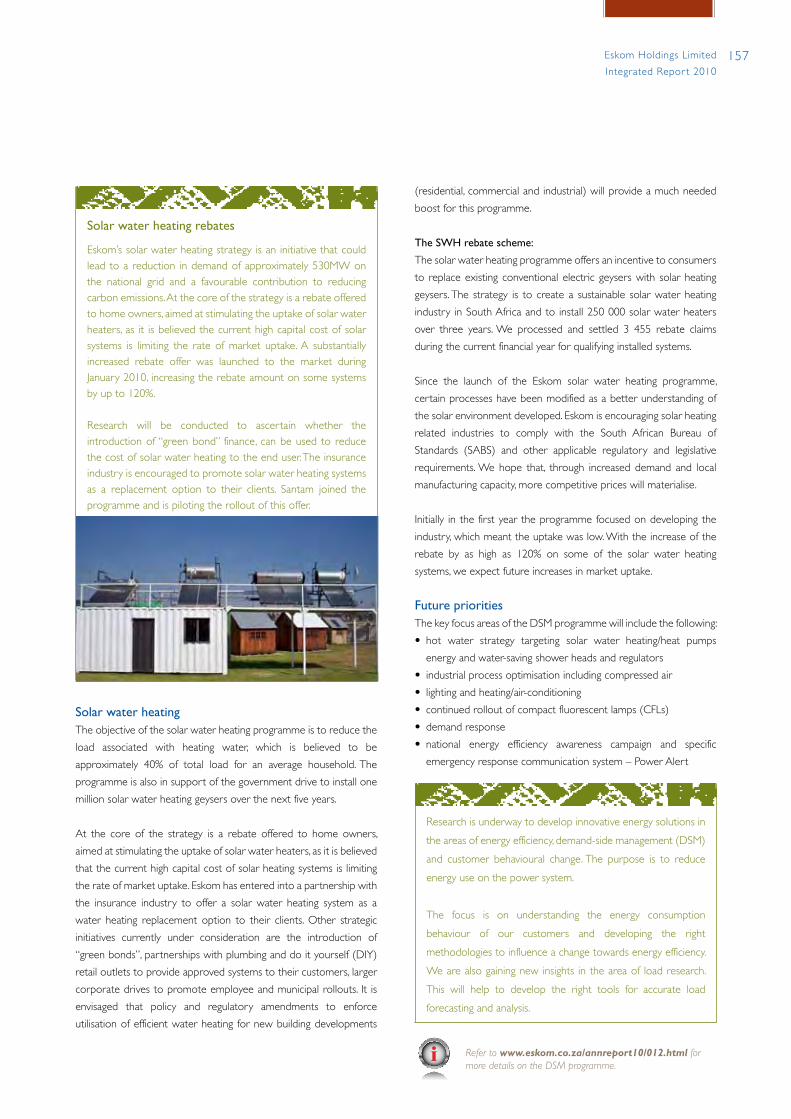
157Eskom Holdings Limited
Integrated Repor t 2010
Solar water heating rebates
Eskom’s solar water heating strategy is an initiative that could lead to a reduction in demand of approximately 530MW on the national grid and a favourable contribution to reducing carbon emissions. At the core of the strategy is a rebate offered to home owners, aimed at stimulating the uptake of solar water heaters, as it is believed the current high capital cost of solar systems is limiting the rate of market uptake. A substantially increased rebate offer was launched to the market during January 2010, increasing the rebate amount on some systems by up to 120%.
Research will be conducted to ascertain whether the introduction of “green bond” finance, can be used to reduce the cost of solar water heating to the end user. The insurance industry is encouraged to promote solar water heating systems as a replacement option to their clients. Santam joined the programme and is piloting the rollout of this offer.
Solar water heatingThe objective of the solar water heating programme is to reduce the
load associated with heating water, which is believed to be
approximately 40% of total load for an average household. The
programme is also in support of the government drive to install one
million solar water heating geysers over the next five years.
At the core of the strategy is a rebate offered to home owners,
aimed at stimulating the uptake of solar water heaters, as it is believed
that the current high capital cost of solar heating systems is limiting
the rate of market uptake. Eskom has entered into a partnership with
the insurance industry to offer a solar water heating system as a
water heating replacement option to their clients. other strategic
initiatives currently under consideration are the introduction of
“green bonds”, partnerships with plumbing and do it yourself (DIY)
retail outlets to provide approved systems to their customers, larger
corporate drives to promote employee and municipal rollouts. It is
envisaged that policy and regulatory amendments to enforce
utilisation of efficient water heating for new building developments
(residential, commercial and industrial) will provide a much needed
boost for this programme.
The SWH rebate scheme:
The solar water heating programme offers an incentive to consumers
to replace existing conventional electric geysers with solar heating
geysers. The strategy is to create a sustainable solar water heating
industry in South Africa and to install 250 000 solar water heaters
over three years. We processed and settled 3 455 rebate claims
during the current financial year for qualifying installed systems.
Since the launch of the Eskom solar water heating programme,
certain processes have been modified as a better understanding of
the solar environment developed. Eskom is encouraging solar heating
related industries to comply with the South African Bureau of
Standards (SABS) and other applicable regulatory and legislative
requirements. We hope that, through increased demand and local
manufacturing capacity, more competitive prices will materialise.
Initially in the first year the programme focused on developing the
industry, which meant the uptake was low. With the increase of the
rebate by as high as 120% on some of the solar water heating
systems, we expect future increases in market uptake.
Future prioritiesThe key focus areas of the DSM programme will include the following:
• hot water strategy targeting solar water heating/heat pumps
energy and water-saving shower heads and regulators
• industrial process optimisation including compressed air
• lighting and heating/air-conditioning
• continued rollout of compact fluorescent lamps (CFLs)
• demand response
• national energy efficiency awareness campaign and specific
emergency response communication system – Power Alert
Research is underway to develop innovative energy solutions in
the areas of energy efficiency, demand-side management (DSM)
and customer behavioural change. The purpose is to reduce
energy use on the power system.
The focus is on understanding the energy consumption
behaviour of our customers and developing the right
methodologies to influence a change towards energy efficiency.
We are also gaining new insights in the area of load research.
This will help to develop the right tools for accurate load
forecasting and analysis.
Refer to www.eskom.co.za/annreport10/012.html for more details on the DSM programme.
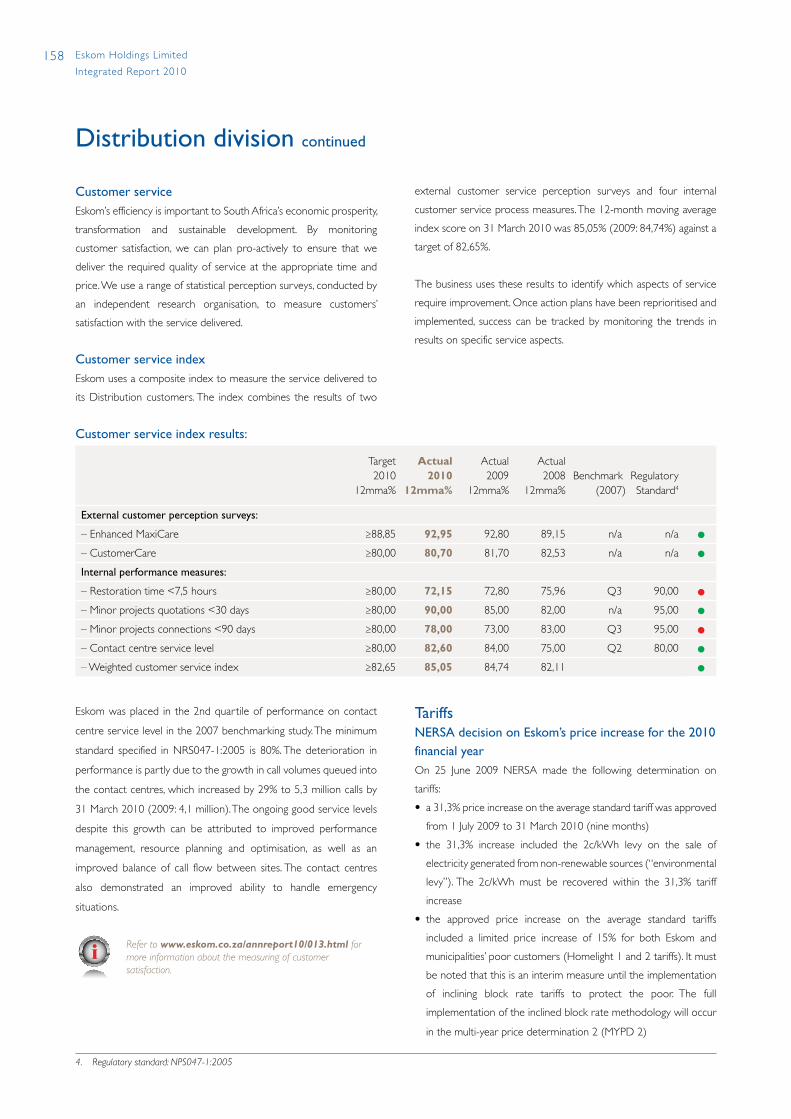
158 Eskom Holdings Limited
Integrated Repor t 2010
Distribution division continued
Customer service index results:
Target2010
12mma%
Actual2010
12mma%
Actual2009
12mma%
Actual2008
12mma%Benchmark
(2007)RegulatoryStandard4
External customer perception surveys:
– Enhanced MaxiCare ≥88,85 92,95 92,80 89,15 n/a n/a l
– CustomerCare ≥80,00 80,70 81,70 82,53 n/a n/a l
Internal performance measures:
– Restoration time <7,5 hours ≥80,00 72,15 72,80 75,96 Q3 90,00 l
– Minor projects quotations <30 days ≥80,00 90,00 85,00 82,00 n/a 95,00 l
– Minor projects connections <90 days ≥80,00 78,00 73,00 83,00 Q3 95,00 l
– Contact centre service level ≥80,00 82,60 84,00 75,00 Q2 80,00 l
– Weighted customer service index ≥82,65 85,05 84,74 82,11 l
Eskom was placed in the 2nd quartile of performance on contact
centre service level in the 2007 benchmarking study. The minimum
standard specified in NRS047-1:2005 is 80%. The deterioration in
performance is partly due to the growth in call volumes queued into
the contact centres, which increased by 29% to 5,3 million calls by
31 March 2010 (2009: 4,1 million). The ongoing good service levels
despite this growth can be attributed to improved performance
management, resource planning and optimisation, as well as an
improved balance of call flow between sites. The contact centres
also demonstrated an improved ability to handle emergency
situations.
Refer to www.eskom.co.za/annreport10/013.html for more information about the measuring of customer satisfaction.
Tariffs NERSA decision on Eskom’s price increase for the 2010 financial yearon 25 June 2009 NERSA made the following determination on
tariffs:
• a 31,3% price increase on the average standard tariff was approved
from 1 July 2009 to 31 March 2010 (nine months)
• the 31,3% increase included the 2c/kWh levy on the sale of
electricity generated from non-renewable sources (“environmental
levy”). The 2c/kWh must be recovered within the 31,3% tariff
increase
• the approved price increase on the average standard tariffs
included a limited price increase of 15% for both Eskom and
municipalities’ poor customers (Homelight 1 and 2 tariffs). It must
be noted that this is an interim measure until the implementation
of inclining block rate tariffs to protect the poor. The full
implementation of the inclined block rate methodology will occur
in the multi-year price determination 2 (MYPD 2)
Customer serviceEskom’s efficiency is important to South Africa’s economic prosperity,
transformation and sustainable development. By monitoring
customer satisfaction, we can plan pro-actively to ensure that we
deliver the required quality of service at the appropriate time and
price. We use a range of statistical perception surveys, conducted by
an independent research organisation, to measure customers’
satisfaction with the service delivered.
Customer service indexEskom uses a composite index to measure the service delivered to
its Distribution customers. The index combines the results of two
external customer service perception surveys and four internal
customer service process measures. The 12-month moving average
index score on 31 March 2010 was 85,05% (2009: 84,74%) against a
target of 82,65%.
The business uses these results to identify which aspects of service
require improvement. once action plans have been reprioritised and
implemented, success can be tracked by monitoring the trends in
results on specific service aspects.
4. Regulatory standard: NPS047-1:2005
159Eskom Holdings Limited
Integrated Repor t 2010
The Eskom tariffs implemented on 1 July 2009 were the restructured
tariffs that incorporate stronger energy price signals, especially
impacting more energy-intensive users. Together with the
environmental levy charge, these tariffs recover the NERSA-approved
annual revenue requirements. As in the past, all the charges and
components of the tariffs were adjusted with annual average price
increases for standard tariffs, differentiated by local authority and
non-local authority tariffs.
Eskom also recognises the importance of the protection for the poor
at a time of increasing prices and that this requires a sustainable
solution. Currently, we have with the guidance of NERSA implemented
different types of subsidies to address the affordability of mainly our
residential and rural consumers. As Eskom only directly supplies 40%
of these affected consumers, addressing the affordability of electricity
requires a national approach. National policy on protection for the
poor needs to deal not only with electricity, but also with the
provision of other basic services and grants. Any changes to this
national policy remain the accountability of the relevant government
departments.
NERSA decision on Eskom’s price increase for the 2011
financial year
Eskom requested a nominal increase of 35% for 2010/11. NERSA in
its determination allowed for an annual average price increase of
24,8%. The average price increase was then applied to Eskom’s tariffs
after taking into account NERSA’s decision regarding protection of
poor, which resulted in different tariff categories having different
increases applied to the tariffs. NERSA also decided on the
introduction of an inclining block rate tariff for residential customers,
thereby replacing Eskom’s existing residential tariff structures. This has
only been implemented for conventional residential customers, while
implementation for prepayment residential customers remains a
challenge and is under discussion with NERSA.
Refer to MYPD 2 on page 90
For detail on Eskom’s price increases over the past 17 years go to www.eskom.co.za/annreport10/014.html
Changes to retail tariffs in 2009/10
In addition to the price increase Eskom also implemented the
following in 2009:
Retail tariff restructuring plan
The price of any product influences the way in which customers use
the product. our electricity tariffs are therefore designed to send out
signals that resemble the cost to supply the electricity. Customers are
guided, through price signals, to use electricity in an economic and
efficient way. Eskom’s tariffs are designed to support both energy and
capacity efficiency. Energy efficiency is supported through energy
rates that are time-of-day and seasonally differentiated, while cost-
reflective network charges ensure that the networks are used in an
optimal way as customers pay for what they use and for what they
reserve on the network for their own requirement.
The tariffs are designed to be as non-discriminatory as possible by
taking into account the needs of all customers on a fair and equitable
basis. our tariff options are based on consumers’ demand sizes, with
charges differentiated in terms of location and voltage for the larger
supply points.
Effective 1 July 2009, NERSA approved the retail tariff structural
changes designed to recover the Eskom revenue requirement and to
contain cost-reflective signals for economic efficiency and sustainability.
The restructuring plan updated the tariffs with the latest cost
associated with energy, network and customer service.
This restructuring of the tariffs saw energy rates increasing and
network charges and most service charges proportionally reducing:
• for higher load factor customers the tariff restructuring resulted in
higher increases than the average price increase as they are more
energy intensive users of electricity
• for small power users, the impact of the restructuring was minimal.
The price increase implemented to the retail tariffs on
1 July 2009
The price increase determined by NERSA was based on the average
price paid for electricity. Individual tariffs saw increases that differed
from the average increase due to the following:
• in an effort to protect the poor, the NERSA decision included a
lower increase for Eskom’s Homelight tariff customers. The capping
of the Homelight tariffs to a 15% increase meant a shortfall in
revenue, which was applied to non-local authority tariffs, resulting
in these tariffs seeing increases higher than the average increase.
This resulted in the increase in subsidies for the Homelight tariffs.
Local authority tariffs were not impacted as NERSA expected
them to provide a similar subsidy to their customers
160 Eskom Holdings Limited
Integrated Repor t 2010
Distribution division continued
• because the environmental levy was introduced as a separate
charge, the price increase applied to all individual tariff rates had to
be adjusted accordingly
Increase on tariff rates excluding the environmental levy
Increase applied to tariff rates
%
Total Eskom average excluding the environmental levy: 24,08
Local-authority tariffs 23,23
Non local-authority tariffs (excluding Homelight) 26,18
Non local-authority Eskom Homelight tariff (billed and prepaid) 11,30
Average increase including the environmental levy
Average price
increase%
Total Eskom average including the environmental levy: 31,30
Local-authority tariffs 31,30
Non local-authority tariffs (excluding Homelight) 33,601
Non local-authority Eskom Homelight tariff (billed and prepaid) 15,00
Management of total energy lossesEnergy losses reflect the difference between the quantity of energy
sent out from the power stations and the quantity sold to the various
customers at the end of the value chain. Losses are categorised as
technical or non-technical in nature.
• Technical energy losses naturally occur when electrical energy is
transferred from one point to another. The medium through which
electrical energy is transferred imposes a resistance to the flow
and thereby some of the energy is dissipated as heat.
• Non-technical energy losses can be calculated as the difference
between total energy losses and technical losses. These are
typically caused by electricity theft (illegal connections, meter
tampering), data and billing errors, etc.
In the current 2010 financial year the total Distribution energy losses
were 5,87%, of which non-technical losses is estimated to be between
1,5% and 2,4%. Compared to other utilities globally, Eskom continues
to perform well with regards to energy loss management. The
international benchmark exercise carried out in 2007 puts Eskom in
the first quartile of the top performing distribution utilities in terms
of total energy losses. The Eskom result is within the benchmark
parameters of 5,60% to 12,07%.
Even though we compare favourably with other utilities globally, this
continues to be a key focus area in our business. We are currently
preparing to launch a public and social campaign to augment the
work done under the energy loss management programme (ELP).
The level of energy losses has improved due to increased
interventions in the management thereof. These actual results
achieved are better than the target energy losses allowed for
by NERSA.
1. The Homelight tariff was capped by NERSA to a 15% increase. This meant that the 31,3% for other non-local authorities was increased to 33,6% to cater for the Homelight subsidy.
Pole-top fires
Pole-top fires on distribution and transmission wooden pole
structures cause power trips and cost money and time to
repair. Far more importantly, in some cases, people and animals
make contact with energised low-hanging conductors resulting
from pole-top fires. The mitigation of pole-top fires is therefore
receiving significant attention within Eskom.
Results from extensive outdoor laboratory tests and field
investigations assist us in updating applicable standards and
procedures, in order to provide a high-quality product that is
able to better withstand the impact on the network and
thereby reduce safety risks.
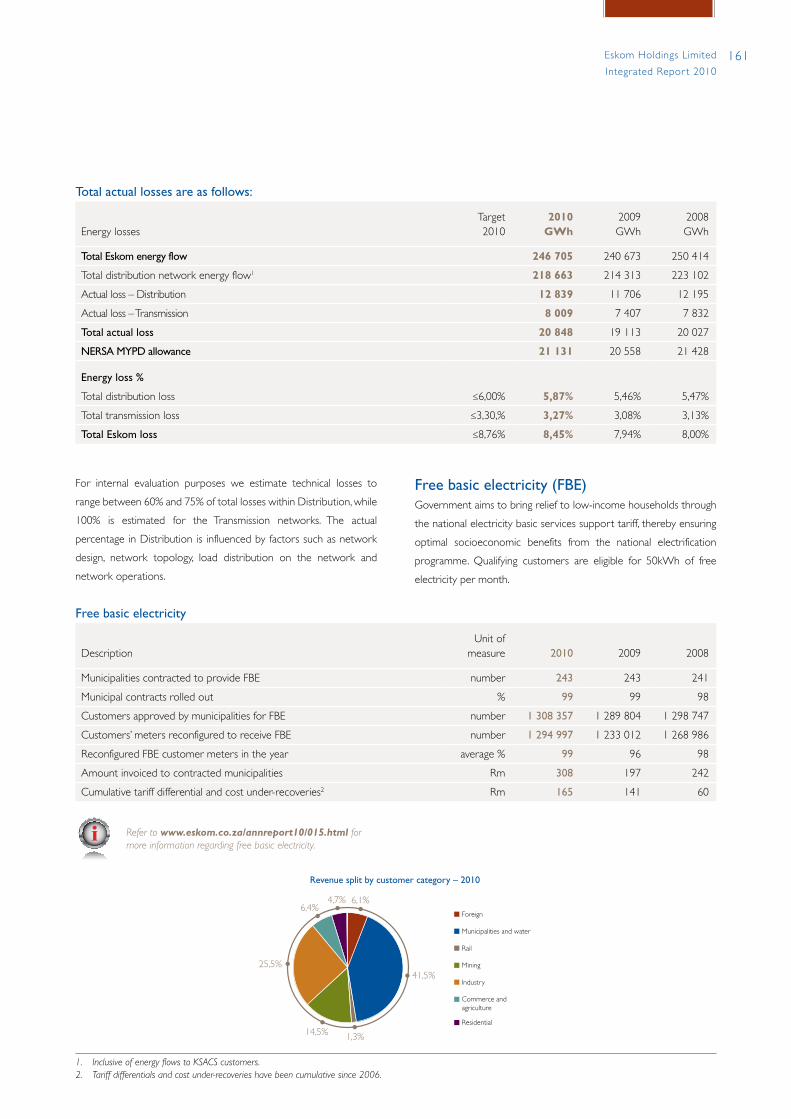
161Eskom Holdings Limited
Integrated Repor t 2010
Total actual losses are as follows:
Energy lossesTarget2010
2010GWh
2009GWh
2008GWh
Total Eskom energy flow 246 705 240 673 250 414
Total distribution network energy flow1 218 663 214 313 223 102
Actual loss – Distribution 12 839 11 706 12 195
Actual loss – Transmission 8 009 7 407 7 832
Total actual loss 20 848 19 113 20 027
NERSA MYPD allowance 21 131 20 558 21 428
Energy loss %
Total distribution loss ≤6,00% 5,87% 5,46% 5,47%
Total transmission loss ≤3,30,% 3,27% 3,08% 3,13%
Total Eskom loss ≤8,76% 8,45% 7,94% 8,00%
Free basic electricity
DescriptionUnit of
measure 2010 2009 2008
Municipalities contracted to provide FBE number 243 243 241
Municipal contracts rolled out % 99 99 98
Customers approved by municipalities for FBE number 1 308 357 1 289 804 1 298 747
Customers’ meters reconfigured to receive FBE number 1 294 997 1 233 012 1 268 986
Reconfigured FBE customer meters in the year average % 99 96 98
Amount invoiced to contracted municipalities Rm 308 197 242
Cumulative tariff differential and cost under-recoveries2 Rm 165 141 60
Refer to www.eskom.co.za/annreport10/015.html for more information regarding free basic electricity.
For internal evaluation purposes we estimate technical losses to
range between 60% and 75% of total losses within Distribution, while
100% is estimated for the Transmission networks. The actual
percentage in Distribution is influenced by factors such as network
design, network topology, load distribution on the network and
network operations.
Free basic electricity (FBE)Government aims to bring relief to low-income households through
the national electricity basic services support tariff, thereby ensuring
optimal socioeconomic benefits from the national electrification
programme. Qualifying customers are eligible for 50kWh of free
electricity per month.
1. Inclusive of energy flows to KSACS customers.2. Tariff differentials and cost under-recoveries have been cumulative since 2006.
Municipalities and water
Foreign
Mining
Rail
Commerce and agriculture
Residential
Industry41,5%
1,3%14,5%
25,5%
6,4%4,7% 6,1%
Revenue split by customer category – 2010
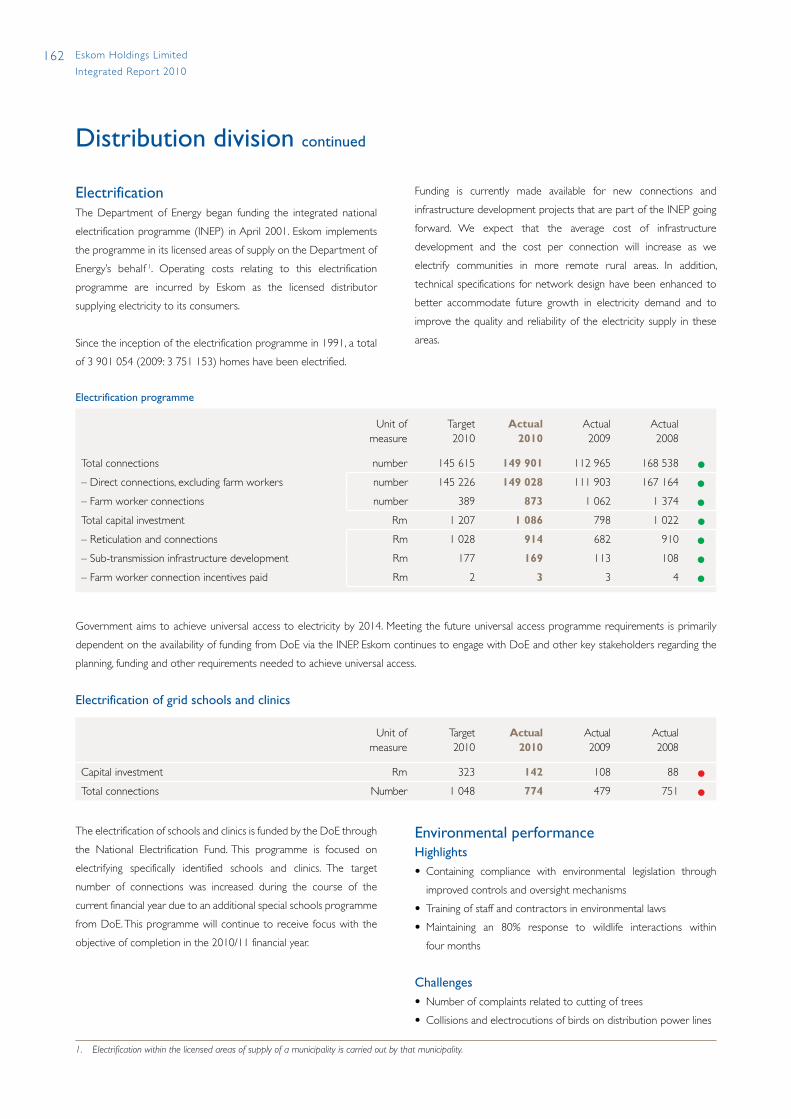
162 Eskom Holdings Limited
Integrated Repor t 2010
Distribution division continued
ElectrificationThe Department of Energy began funding the integrated national
electrification programme (INEP) in April 2001. Eskom implements
the programme in its licensed areas of supply on the Department of
Energy’s behalf 1. operating costs relating to this electrification
programme are incurred by Eskom as the licensed distributor
supplying electricity to its consumers.
Since the inception of the electrification programme in 1991, a total
of 3 901 054 (2009: 3 751 153) homes have been electrified.
Electrification programme
Unit of measure
Target2010
Actual 2010
Actual 2009
Actual 2008
Total connections number 145 615 149 901 112 965 168 538 l
– Direct connections, excluding farm workers number 145 226 149 028 111 903 167 164 l
– Farm worker connections number 389 873 1 062 1 374 l
Total capital investment Rm 1 207 1 086 798 1 022 l
– Reticulation and connections Rm 1 028 914 682 910 l
– Sub-transmission infrastructure development Rm 177 169 113 108 l
– Farm worker connection incentives paid Rm 2 3 3 4 l
Government aims to achieve universal access to electricity by 2014. Meeting the future universal access programme requirements is primarily
dependent on the availability of funding from DoE via the INEP. Eskom continues to engage with DoE and other key stakeholders regarding the
planning, funding and other requirements needed to achieve universal access.
Electrification of grid schools and clinics
Unit ofmeasure
Target2010
Actual2010
Actual2009
Actual2008
Capital investment Rm 323 142 108 88 l
Total connections Number 1 048 774 479 751 l
Funding is currently made available for new connections and
infrastructure development projects that are part of the INEP going
forward. We expect that the average cost of infrastructure
development and the cost per connection will increase as we
electrify communities in more remote rural areas. In addition,
technical specifications for network design have been enhanced to
better accommodate future growth in electricity demand and to
improve the quality and reliability of the electricity supply in these
areas.
The electrification of schools and clinics is funded by the DoE through
the National Electrification Fund. This programme is focused on
electrifying specifically identified schools and clinics. The target
number of connections was increased during the course of the
current financial year due to an additional special schools programme
from DoE. This programme will continue to receive focus with the
objective of completion in the 2010/11 financial year.
Environmental performanceHighlights• Containing compliance with environmental legislation through
improved controls and oversight mechanisms
• Training of staff and contractors in environmental laws
• Maintaining an 80% response to wildlife interactions within
four months
Challenges• Number of complaints related to cutting of trees
• Collisions and electrocutions of birds on distribution power lines
1. Electrification within the licensed areas of supply of a municipality is carried out by that municipality.

163Eskom Holdings Limited
Integrated Repor t 2010
Key distribution division environmental performance indicators
Target2010
Actual2010
Actual2009
Actual2008
Number of environmental legal contraventions 0 4 5 3 l
Number of environmental legal contraventions reported in terms of Eskom’s operational health dashboard1 0 0 0 2 l
Materials containing asbestos disposed of – tons2 n/a 16,2 40,2 49,2
Material containing polychlorinated biphenyls (PCBs) thermally destructed – tons2 n/a 13,3 15,0 7,4
over and above the legal requirement of obtaining an environmental
authorisation through the undertaking of EIAs, many of the
Distribution powerline projects do not require authorisation. These
projects are, however, subjected to internal environmental screening
so as to ensure environmental duty of care and informed decision
making.
Through formal environmental management systems with allocated
environmental roles and responsibilities, the division ensures the
provision of electricity to Eskom’s customers while reducing its
environmental impact.
During this year the division had four cases (2009: five) of
activities that resulted in environmental legal contraventions as a
result of not fully complying with the conditions of environmental
authorisations.
The thousands of kilometres of power lines impact wildlife and in
particular birds. This has resulted in a long-standing partnership with
the Endangered Wildlife Trust (EWT) which assists in mitigation of
these environmental impacts.
Distribution, and the rest of Eskom, continues to maintain a register
of all PCB-contaminated equipment so as to ensure the long-term
commitment to the phasing out of PCBs by 2025.
Environmental expenditureFunds are allocated for environmental capital and operational
expenditures. These amounted to R84 million on capital projects
(2009: R79,2 million). on the other hand R32,4 million was generated
through recycling efforts.
Looking forward• Ensuring continual improvement in the effective implementation
of conditions of environmental authorisations, including
environmental management plans.
• Focus on the quality of and use of geographical information
systems used to complete the Distribution environmental
screening studies for those projects not required to obtain an
environmental authorisation.
• Review of the environmental questions raised in the internal risk
audit system.
• Finalisation of the Distribution climate change strategy.
Urban distribution automation
Eskom has more than 280 000km of medium voltage (MV)
lines to provide power to its customers. Distribution
automation (DA) can improve power network reliability by
making the grid “smart” by integrating protection and control
technologies. Such “smart” networks can automatically detect
the occurrence and location of faults, and automatically switch
circuit breakers and switches to restore supply as quickly as
possible; all without any human intervention.
DA systems therefore ensure that “healthy” parts of the
network are restored as quickly as possible through intelligent,
automatic switching. The result is improved network reliability
and customer satisfaction.
Eskom’s urban DA project is investigating the technical and
financial benefits of DA technology through a number of pilot
systems. The study also includes a cost-benefit analysis. This will
help to make electricity delivery more reliable into the future.
1. Under certain conditions, contraventions of environmental legislation are classified in terms of the Eskom operational health dashboard (OHD) index. These include instances where censure was received from authorities, non-reporting to authorities as may be legally required, non-reporting in Eskom, a repeat legal contravention, or when the contravention was not addressed adequately. Managing directors can escalate any significant environmental legal contravention to the OHD.
2. Quantities of waste disposed of at registered waste sites.

166 Financial results
166 Structure
168 Key focus areas in 2010
168 Performance indicators
168 Disposals
Supporting the Eskom businessEskom Enterprises (Pty) Limited
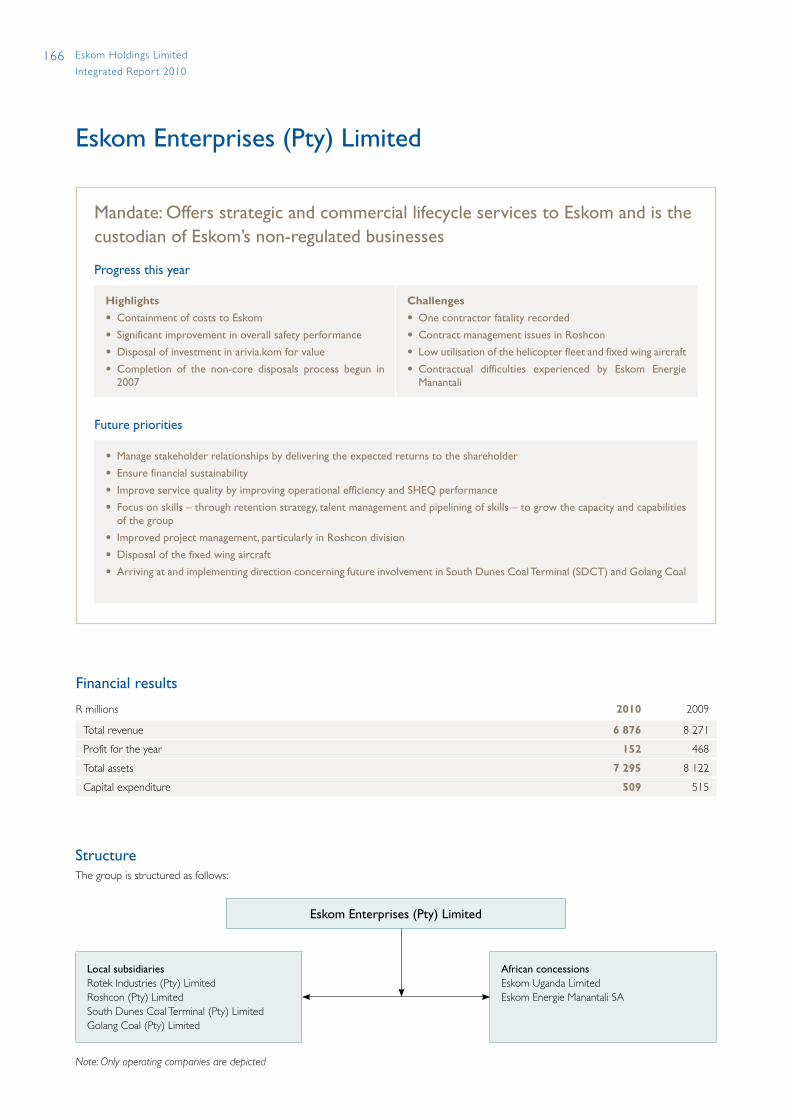
166 Eskom Holdings Limited
Integrated Repor t 2010
Mandate: Offers strategic and commercial lifecycle services to Eskom and is the custodian of Eskom’s non-regulated businesses
Progress this year
Highlights
• Containment of costs to Eskom
• Significant improvement in overall safety performance
• Disposal of investment in arivia.kom for value
• Completion of the non-core disposals process begun in 2007
Challenges
• One contractor fatality recorded
• Contract management issues in Roshcon
• Low utilisation of the helicopter fleet and fixed wing aircraft
• Contractual difficulties experienced by Eskom Energie Manantali
Future priorities
• Manage stakeholder relationships by delivering the expected returns to the shareholder
• Ensure financial sustainability
• Improve service quality by improving operational efficiency and SHEQ performance
• Focus on skills – through retention strategy, talent management and pipelining of skills – to grow the capacity and capabilities of the group
• Improved project management, particularly in Roshcon division
• Disposal of the fixed wing aircraft
• Arriving at and implementing direction concerning future involvement in South Dunes Coal Terminal (SDCT) and Golang Coal
Eskom Enterprises (Pty) Limited
StructureThe group is structured as follows:
Note: Only operating companies are depicted
Financial results
R millions 2010 2009
Total revenue 6 876 8 271
Profit for the year 152 468
Total assets 7 295 8 122
Capital expenditure 509 515
Eskom Enterprises (Pty) Limited
Local subsidiariesRotek Industries (Pty) LimitedRoshcon (Pty) LimitedSouth Dunes Coal Terminal (Pty) LimitedGolang Coal (Pty) Limited
African concessionsEskom Uganda LimitedEskom Energie Manantali SA

167Eskom Holdings Limited
Integrated Repor t 2010
Q: What is Eskom’s longer-term strategy in the rest of Africa?A: At the moment, the focus of the Eskom Enterprises group is
on servicing the needs of its main customer, being Eskom
Holdings Limited. However, should the group have surplus
capacity, it will source external work, firstly in South Africa, then
in the SADC countries. At the moment there is no drive to
expand into Africa.
Q: Which of the subsidiaries have performed well this past year?A: On a financial level, the Eskom Enterprises group did not
perform well against budget during the 2010 financial year, since
the group was badly affected by a reduction in work for Eskom
Holdings Limited, due to the widely publicised financial pressures
in Eskom. However, Eskom Enterprises (Pty) Limited did perform
better than budget, mainly due to cost savings measures
implemented in Telecomms, the main operating division.
Brian Dames Chief Executive Officer : Eskom Enterprises
Les Carlo Chief Operating Officer : Eskom Enterprises

168 Eskom Holdings Limited
Integrated Repor t 2010
Eskom Enterprises continued
The Eskom Enterprises group supports the Eskom business by
providing plant lifecycle support and plant maintenance, including
return-to-service work, network protection and measurement, and
supporting the build programme for all the main Eskom line divisions.
The group operates and maintains the Eskom group private
telephone network, and provided the IT function to the Eskom
group, until the sale of its investment in arivia.kom. Various other
support services are provided.
Key focus areas in 2010 • Effective cash management
• Safety improvement initiatives
• Extraction of value from assets
• Disposal of arivia.kom
• Eskom Energie Manantali arbitration
During the year ended 31 March 2010, 56 lost-time incidents (2009:
86) were reported, covering employees and contractors. Regrettably,
there was one fatal incident during the year (2009: five), being a
contractor, as a result of a vehicle accident. The employee lost-time
incidence rate declined significantly from 0,50 in 2009 to 0,34 during
the current financial year, while the contractor lost-time incident rate
declined from 0,43 in 2009 to 0,24 at year end.
Risk profileRisk Treatment plans
Low forward order book
Identify areas within Eskom to add value
DisposalsEskom Enterprises disposed of its 58,5% shareholding in arivia.kom
for a consideration of R235 million, which resulted in a reversal of
R34 million of the impairment loss of R195 million incurred in the
previous year. A five-year IT service outsourcing contract was signed
on behalf of Eskom with the new owners of arivia.kom – T-Systems
South Africa.
Performance indicators
Performance measureTarget2010
Actual 2010
Actual 2009
Actual 2008
Socio-economic measures
LTIR – employees 0,20 0,34 0,50 0,39 lLTIR – contractors 0,40 0,24 0,43 Not measured lFatalities – employees Nil Nil 3 1 lFatalities – contractors Nil 1 2 2 l
169Eskom Holdings Limited
Integrated Repor t 2010
Independent assurance report on sustainability information
To the directors of Eskom Holdings Limited
We have undertaken an assurance engagement on selected
performance information presented in the 2010 Eskom Integrated
Annual Report (the report) of Eskom Holdings Limited (Eskom).
The directors are responsible for the preparation and presentation
of the selected performance information presented in the report,
the identification of stakeholders and stakeholder reporting
requirements, material issues, for commitments with respect to
sustainability performance, establishing and maintaining appropriate
performance management and internal control systems, and the
selection of the performance information which forms the subject
of our engagement. The directors are also responsible for the
selection and application of the following criteria in the evaluation
of the subject matter :
• The AA1000APS (2008)1 for the three principles of inclusivity,
materiality and responsiveness (the AA1000APS (2008) principles);
• The Global Reporting Initiative (GRI) G3 Guidelines, supported
by Eskom’s internally developed reporting guidelines, which are
available on request from Eskom, for the selected performance
data; and
• The GRI G3 Guidelines for the B+ application level.
Our responsibility is to express assurance conclusions on the selected
information based on our work performed. We believe that the
evidence obtained from our work performed provides an appropriate
basis for conclusions expressed in this report.
We comply with the appropriate requirements of the International
Federation of Accountants (IFAC) Code of Ethics for Professional
Accountants and have systems and processes in place to monitor
compliance with the code and to prevent conflicts regarding
independence. Our work was carried out by a multi-disciplinary
team of health, safety, social, environmental and assurance specialists
with extensive experience in sustainability reporting.
Our work has been undertaken to enable us to express the
conclusions contained in this report solely to the directors of Eskom
in accordance with the terms of our engagement, and for no other
purpose. We do not accept or assume liability to any party other
than Eskom, for our work, for this report, or for the conclusions we
have reached.
Assurance standards usedWe conducted our engagement in accordance with the ISAE 30002
and AA1000AS (2008)3.
The scope of an AA1000AS (2008) engagement conforms to the
requirements of a Type 2 assurance engagement which covers not
only the nature and extent of the organisation’s adherence to the
AA1000APS (2008) principles of inclusivity, materiality and
responsiveness, but also evaluates the reliability of the selected
performance information. Reasonable and limited assurance are
terms used in an ISAE 3000 engagement to distinguish between the
two types of assurance and are consistent with a high and moderate
level of assurance respectively which are the terms used in an
AA1000AS (2008) engagement.
The scope of our engagementThe scope of our engagement included the provision of:
1. Limited assurance on Eskom’s alignment with AA1000APS
(2008) principles as described on page 13 of the report.
2. Assurance, as described below, on the ‘selected performance
information’.
(a) Reasonable assurance on the following performance data,
marked with an ‘RA’ on the relevant pages of the report:
• Technical performance parameters – Unplanned capability
loss factor, system minutes lost, major incidents, system
average interruption frequency index (SAIFI) and system
average interruption duration index (SAIDI) and National
Load Shedding (Generation induced) OR unserved energy
1. AA1000 AccountAbility Principles Standard (2008), issued by AccountAbility2. International Standard on Assurance Engagements 3000: Assurance engagements other than audits or reviews of historical information, issued by the International
Auditing and Accounting Standards Board3. AA1000 Assurance Standard (2008) issued by AccountAbility
170 Eskom Holdings Limited
Integrated Repor t 2010
Independent assurance report on sustainability information continued
• Environmental performance parameters – Coal
purchased – stock days, specific water consumption, liquid
fuel usage at the Open Cycle Gas Turbines, demand side
management monitoring and verification, particulate
emissions, carbon dioxide emissions, sulphur dioxide
emissions, nitrogen oxides emissions, low level radioactive
waste disposed, intermediate level radioactive waste
disposed, polychlorinated biphenyls (PCBs) thermally
destructed, asbestos disposed, ash disposed and
environmental legal contraventions
• Social performance parameters – Skills and development
(Eskom trainees/bursars-learner pipeline, number of
engineering trainees/apprentices, additional number of
non-Eskom learners on Eskom-sponsored learning), human
resource operational measurements (race, gender,
disabilities), corporate social investment spend, employee
and contractor work related fatalities, employee lost time
injury rate (LTIR)
• Economic parameters – Generation capacity installed and
commissioned, transmission lines installed, transmission
Mega Volt Amperes (MVA) installed, generation capital
expenditure, transmission capital expenditure, percentage of
local content in new-build contracts, cost of electricity, ratio of
debt to equity (the debt: equity ratio) and interest cover.
(b) Limited assurance on the following performance data,
marked with an ‘LA’ on the relevant pages of the report:
• Environmental performance parameters – Internal
energy efficiency (non-essential energy consumption)
• Social performance parameters – Broad-Based Black
Employment Equity (B-BBEE) Expenditure-Company
(top 295 suppliers)
3. Limited assurance on Eskom’s self-declaration of the GRI B+
Application Level (page 169).
The above is collectively referred to as the ‘selected information’.
Summary of work performedOur work was performed to obtain the evidence that we considered
necessary for our engagement. The procedures selected depend on
our judgement including the risks of material misstatement of the
selected information in the report, whether due to fraud or error. In
making those risk assessments we considered internal control
relevant to the preparation of the report. Our evidence-gathering
procedures are more limited than where reasonable assurance is
expressed.
Our work included the following evidence-gathering procedures:
• Interviews with management and senior executives at corporate,
operational divisions and site level to evaluate the application of
the GRI G3 Guidelines and the AA1000APS (2008) principles
and to obtain an understanding of the general control
environment, taking into account the maturity of the application
of AA1000APS (2008) in South Africa and at Eskom.
• Evaluating evidence provided by management and senior
executives at corporate level to substantiate the accuracy of
statements made during the interviews as well as systems in
place at corporate, divisional and site level.
• Evaluating and testing of process and systems and inspecting
documentation at corporate, operational divisions and site level
to generate, collate, aggregate, monitor and report the selected
sustainability performance information for the year.
• Visiting business units including Koeberg (nuclear power station),
Arnot (coal power station), Tutuka (coal power station), Matimba
(coal power station), Lethabo (coal power station), Matla (coal
power station), Kendal (coal power station), Kriel (coal power
station), Hendrina (coal power station), Transmission division, the
North West Distribution region, Northern Distribution Region,
Central Distribution Region, Capital Expansion (Enterprises),
Roshcon (Enterprises) and Rotek (Enterprises).
• Conducting an application level check on the report to ensure
all disclosure requirements of the GRI B+ application level have
been adhered to.

171Eskom Holdings Limited
Integrated Repor t 2010
• Evaluating whether the information presented in the report is
consistent with our overall knowledge and experience of
sustainability management and performance at Eskom and is not
inconsistent with information contained in the annual financial
statements that are included in the Annual Report.
Conclusions1. On the AA1000APS (2008) principles of
inclusiveness, materiality and responsiveness
Based on our work performed, nothing has come to our
attention that causes us to believe that Eskom’s assertions
relating to their alignment with the AA1000APS (2008)
principles of inclusivity, materiality and responsiveness,
described on page 13, is not fairly stated.
2. On the selected performance information
In our opinion, the selected 2009/2010 performance information
set out in 2(a) above for the year ended 31 March 2010, is fairly
stated in all material respects in accordance with the GRI G3
Guidelines, supported by Eskom’s internally developed reporting
guidelines.
Based on our work performed, nothing has come to our
attention that causes us to believe that the selected 2009/2010
performance information set out in 2(b) above for the year
ended 31 March 2010, is not fairly stated in all material respects
in accordance with the GRI G3 Guidelines, supported by Eskom’s
internally developed reporting guidelines.
3. On Eskom’s self-declaration on the GRI G3 B+
Application Level
Based on our work performed, nothing has come to our
attention that causes us to believe that Eskom’s self-declaration
of a B+ Application Level, is not fairly stated in all material
respects in accordance with the GRI G3 Guidelines.
ObservationsThe key observations below do not affect our conclusions.
On the AA1000APS principles of inclusiveness,
materiality and responsiveness
In relation to the principle of inclusiveness, Eskom has an extensive
stakeholder engagement process in place and has identified a broad
range of relevant stakeholders. However, as discussed on page 14, the
process is currently not centrally co-ordinated and integrated. Eskom
have taken several steps to improve the effectiveness of their
stakeholder engagement processes.
In relation to the principle of materiality, as discussed on page 13,
Eskom has implemented a group-wide risk management framework
for the identification and analysis of risks. This process will benefit
from a more effective stakeholder engagement process. The process
of determining which material issues to report on and meaningfully
analysing the chosen material issues within the report in proportion
to the magnitude of the risk to Eskom and to stakeholders is an area
for future focused sustainability reporting.
In relation to the principle of responsiveness, as the improvements
described in the preceding paragraphs are addressed, the issue of
responsiveness to stakeholder concerns is expected to improve.
KPMG Services (Pty) Limited
Per PD Naidoo AH Jaffer
Director Director
Johannesburg Johannesburg
10 June 2010 10 June 2010


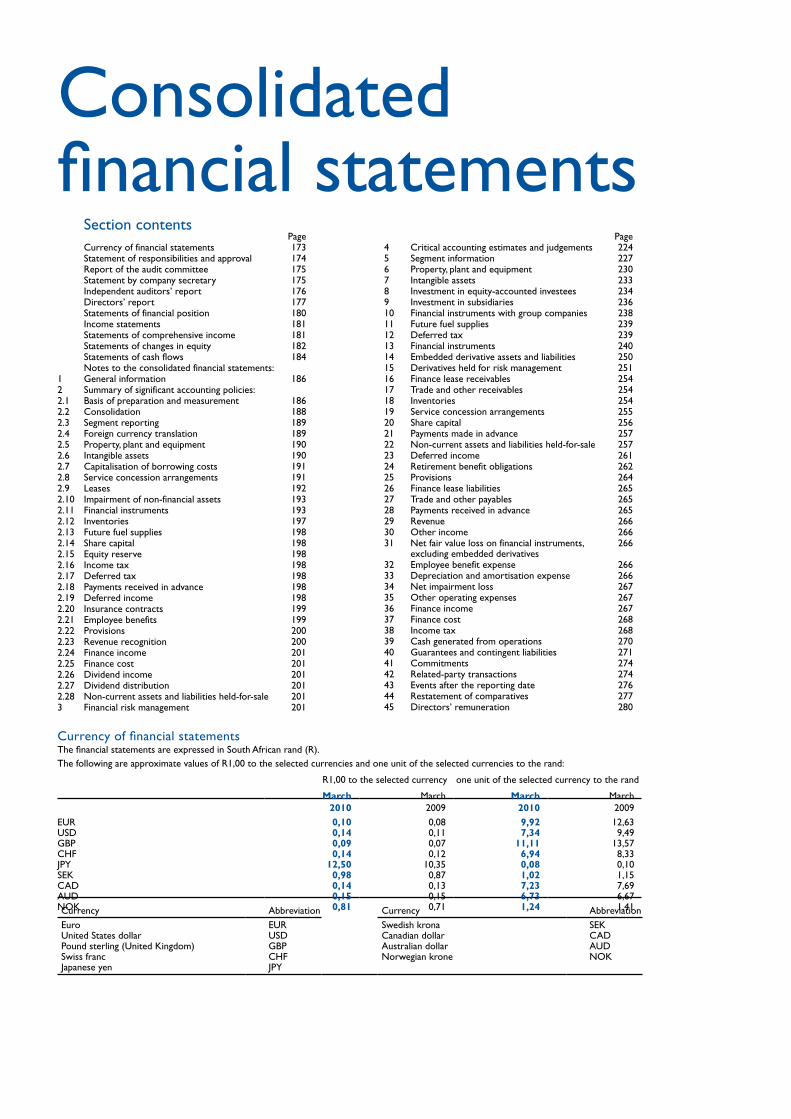
Consolidated financial statements
Section contentsPage
Currency of financial statements 173Statement of responsibilities and approval 174Report of the audit committee 175Statement by company secretary 175Independent auditors’ report 176Directors’ report 177Statements of financial position 180Income statements 181Statements of comprehensive income 181Statements of changes in equity 182Statements of cash flows 184Notes to the consolidated financial statements:
1 General information 1862 Summary of significant accounting policies: 2.1 Basis of preparation and measurement 1862.2 Consolidation 1882.3 Segment reporting 1892.4 Foreign currency translation 1892.5 Property, plant and equipment 1902.6 Intangible assets 1902.7 Capitalisation of borrowing costs 1912.8 Service concession arrangements 1912.9 Leases 1922.10 Impairment of non-financial assets 1932.11 Financial instruments 1932.12 Inventories 1972.13 Future fuel supplies 1982.14 Share capital 1982.15 Equity reserve 1982.16 Income tax 1982.17 Deferred tax 1982.18 Payments received in advance 1982.19 Deferred income 1982.20 Insurance contracts 1992.21 Employee benefits 1992.22 Provisions 2002.23 Revenue recognition 2002.24 Finance income 2012.25 Finance cost 2012.26 Dividend income 2012.27 Dividend distribution 2012.28 Non-current assets and liabilities held-for-sale 2013 Financial risk management 201
Page4 Critical accounting estimates and judgements 2245 Segment information 2276 Property, plant and equipment 2307 Intangible assets 2338 Investment in equity-accounted investees 2349 Investment in subsidiaries 23610 Financial instruments with group companies 23811 Future fuel supplies 23912 Deferred tax 23913 Financial instruments 24014 Embedded derivative assets and liabilities 25015 Derivatives held for risk management 25116 Finance lease receivables 25417 Trade and other receivables 25418 Inventories 25419 Service concession arrangements 25520 Share capital 25621 Payments made in advance 25722 Non-current assets and liabilities held-for-sale 25723 Deferred income 26124 Retirement benefit obligations 26225 Provisions 26426 Finance lease liabilities 26527 Trade and other payables 26528 Payments received in advance 26529 Revenue 26630 Other income 26631 Net fair value loss on financial instruments,
excluding embedded derivatives266
32 Employee benefit expense 26633 Depreciation and amortisation expense 26634 Net impairment loss 26735 Other operating expenses 26736 Finance income 26737 Finance cost 26838 Income tax 26839 Cash generated from operations 27040 Guarantees and contingent liabilities 27141 Commitments 27442 Related-party transactions 27443 Events after the reporting date 27644 Restatement of comparatives 27745 Directors’ remuneration 280
Currency of financial statementsThe financial statements are expressed in South African rand (R).The following are approximate values of R1,00 to the selected currencies and one unit of the selected currencies to the rand:
R1,00 to the selected currency one unit of the selected currency to the rand
March2010
March2009
March2010
March2009
EUR 0,10 0,08 9,92 12,63USD 0,14 0,11 7,34 9,49GBP 0,09 0,07 11,11 13,57CHF 0,14 0,12 6,94 8,33JPY 12,50 10,35 0,08 0,10SEK 0,98 0,87 1,02 1,15CAD 0,14 0,13 7,23 7,69AUD 0,15 0,15 6,73 6,67NOK 0,81 0,71 1,24 1,41Currency Abbreviation Currency AbbreviationEuro EUR Swedish krona SEKUnited States dollar USD Canadian dollar CADPound sterling (United Kingdom) GBP Australian dollar AUDSwiss franc CHF Norwegian krone NOKJapanese yen JPY
174 Eskom Holdings Limited
Integrated Repor t 2010
Statement of responsibilities and approval
The Public Finance Management Act requires the directors to ensure
that Eskom Holdings Limited (Eskom) and its subsidiaries (the group)
keep full and proper records of their financial affairs. The financial
statements should fairly present the state of affairs of Eskom and the
group, its financial results, its performance against predetermined
objectives for the year and its financial position at the end of the year
in terms of International Financial Reporting Standards.
To enable the directors to meet the above mentioned responsibilities,
the Eskom board of directors sets standards and management
implements systems of internal control. The controls are designed
to provide cost-effective assurance that assets are safeguarded, and
that liabilities and working capital are efficiently managed. Policies,
procedures, structures and approval frameworks provide direction,
accountability and division of responsibilities, and contain self-
monitoring mechanisms. The controls throughout Eskom focus on
those critical risk areas identified by operational risk management
and confirmed by executive management. Both management and the
internal audit department closely monitor the controls, and actions
taken to correct deficiencies as they are identified.
The financial statements are the responsibility of the directors. The
external auditors are responsible for independently auditing the
financial statements in accordance with International Standards of
Auditing and the Public Audit Act.
Nothing significant has come to the attention of the directors to
indicate that any material breakdown has occurred in the functioning
of these controls, procedures and systems during the year under
review.
The financial statements of Eskom and the group have been prepared
in terms of International Financial Reporting Standards, the
Companies Act of South Africa, 61 of 1973, as amended and
the Public Finance Management Act, 1 of 1999. These financial
statements are based on appropriate accounting policies, supported
by reasonable and prudent judgements and estimates and are
prepared on the going-concern basis. Refer to the directors’ report
on page 177 for further information.
Should Eskom not receive adequate funding for its planned activities,
the board undertakes to curtail its activities in order to balance its
cash flow requirements.
Based on the information and explanations given by management,
the internal audit function and discussions held with the independent
external auditors, the directors are of the opinion that the internal
accounting controls are adequate to ensure that the financial records
may be relied upon for preparing the financial statements, and that
accountability for assets and liabilities is maintained.
In the opinion of the directors, based on the information available to
date, the financial statements fairly present the financial position of
Eskom and the group at 31 March 2010 and the results of its
operations and cash flows for the year.
The financial statements of Eskom and the group for the year ended
31 March 2010 have been approved by the board of directors and
signed on its behalf on 10 June 2010 by
MP Makwana PS O’Flaherty
Acting chairman Finance director
10 June 2010 10 June 2010

175Eskom Holdings Limited
Integrated Repor t 2010
Report of the audit committee
Statement by company secretary
preparing the financial statements, and accountability for assets and
liabilities is maintained.
Nothing significant has come to the attention of the audit committee
to indicate that any material breakdown in the functioning of these
controls, procedures and systems has occurred during the year under
review.
Having considered the matters set out in section 270A(5) of the
Companies Act of South Africa as amended by the Corporate Laws
Amendment Act, the audit committee is satisfied with the
independence and objectivity of the external auditors.
The audit committee has evaluated the financial statements of Eskom
Holdings Limited and the group for the year ended 31 March 2010
and, based on the information provided to the audit committee,
considers that they comply, in all material respects, with the
requirements of the Companies Act of South Africa, 61 of 1973, as
amended, the Public Finance Management Act, 1 of 1999, as amended,
and International Financial Reporting Standards. The audit committee
concurs with the adoption of the going-concern premise in the
preparation of the financial statements. The audit committee has
therefore, at their meeting held on 3 June 2010, recommended the
adoption of the financial statements by the board of directors.
JRD Modise
Chairman
10 June 2010
Report of the audit committee in terms of the Public Finance Management Act, 1 of 1999
The audit committee reports that it has adopted appropriate formal
terms of reference as its audit committee charter, has regulated its
affairs in compliance with this charter, and has discharged all of its
responsibilities contained therein.
In the conduct of its duties, the audit committee has, inter alia,
reviewed the following:
• the effectiveness of the internal control systems
• the risk areas of the entity’s operations covered in the scope of
internal and external audits
• the adequacy, reliability and accuracy of financial information
provided by management
• accounting and auditing concerns identified as a result of internal
and external audits
• the entity’s compliance with legal and regulatory provisions
• the effectiveness of the assurance and forensic department
• the activities of the assurance and forensic department, including
its annual work programme, co-ordination with the external
auditors, the reports of significant investigations and the responses
of management to specific recommendations
• preparation of the annual financial statements on the going-
concern basis and related cash flow projections
• the independence of and objectivity of the external auditors
The audit committee is of the opinion, based on the information and
explanations given by management and the assurance and forensic
department and discussions with the independent external auditors
on the result of their audits, that the internal accounting controls are
adequate to ensure that the financial records may be relied upon for
In terms of section 268G(d) of the Companies Act, 61 of 1973, as amended, I certify that the company has lodged with the Registrar of Companies all
such returns as are required of a public company in terms of the Act, and that all such returns are true, correct and up to date.
B Mbomvu
Company secretary
10 June 2010
176 Eskom Holdings Limited
Integrated Repor t 2010
Independent auditors’ report to the shareholder – Minister of Public Enterprises
Report on the annual financial statementsWe have audited the group annual financial statements and annual financial statements of Eskom Holdings Limited (Eskom) which comprise the directors’ report, the consolidated and separate statements of financial position at 31 March 2010, the consolidated and separate income statements and statements of comprehensive income, statement of changes in equity and cash flows for the year then ended, and the notes to the financial statements which contain a summary of significant accounting policies and other explanatory notes as set out on pages 177 to 285.
Directors’ responsibility for the annual financial statements The company’s directors, who constitute the accounting authority for Eskom Holdings Limited, are responsible for the preparation and fair presentation of these financial statements in accordance with International Financial Reporting Standards, and in the manner required by the Public Finance Management Act and the Companies Act of South Africa. This responsibility includes: designing, implementing and maintaining internal control relevant to the preparation and fair presentation of financial statements that are free from material misstatement, whether due to fraud or error; selecting and applying appropriate accounting policies; and making accounting estimates that are reasonable in the circumstances.
Auditors’ responsibility concerning the annual financial statementsOur responsibility is to express an opinion on these financial statements based on our audit. We conducted our audit in accordance with International Standards on Auditing. Those standards require that we comply with ethical requirements and plan and perform the audit to obtain reasonable assurance whether the financial statements are free from material misstatement.
An audit involves performing procedures to obtain audit evidence about the amounts and disclosures in the financial statements. The procedures selected depend on the auditor’s judgement, including the assessment of the risks of material misstatement of the financial statements, whether due to fraud or error. In making those risk assessments, the auditor considers internal control relevant to the entity’s preparation and fair presentation of the financial statements in order to design audit procedures that are appropriate in the circumstances, but not for the purpose of expressing an opinion on the effectiveness of the entity’s internal control. An audit also includes evaluating the appropriateness of accounting policies used and the reasonableness of accounting estimates made by management, as well as evaluating the overall presentation of the financial statements.
We believe that the audit evidence we have obtained is sufficient and appropriate to provide a basis for our audit opinion.
OpinionIn our opinion, the financial statements present fairly, in all material respects, the consolidated and separate financial position of Eskom Holdings Limited at 31 March 2010 and its consolidated and separate statements of financial performance and consolidated and separate cash flows for the year then ended in accordance with International Financial Reporting Standards, and in the manner required by the Public Finance Management Act of South Africa and the Companies Act of South Africa.
Report on other legal and regulatory requirementsIn terms of the Public Audit Act of South Africa and General Notice 1570 of 2009, issued in Government Gazette No 32758 of 27 November 2009, we include below our findings on the report on performance against predetermined objectives, compliance with laws and regulations and internal control.
Report on performance against predetermined objectivesWe are required by the Auditor-General to undertake a limited assurance engagement on the performance against the shareholder compact as set out on pages 34 and 35 of the Integrated report, in which the actual performance of the company for the year ended 31 March 2010 is compared with target key performance indicators (predetermined objectives) and report thereon to those charged with governance. In this report we are required to report our findings coming from our engagement relating to non-compliance with regulatory requirements, where the reported information was inadequately presented or not received timeously, and where we have evaluated reported information to be useful or reliable. We report that we have no significant findings.
Compliance with laws and regulationsOur audit of the annual financial statements, described in our report on the financial statements, did not reveal any material non-compliance with applicable laws and regulations relating to financial matters, financial management and related matters as required by the Public Finance Management Act of South Africa (which includes the relevant National Treasury Regulations) and the Companies Act of South Africa.
Internal control We considered internal control relevant to our audit of the financial statements, and the report on performance against predetermined objectives and compliance with laws and regulations, but not for the purpose of expressing an opinion on the effectiveness of internal control. The matters reported in this report are limited to the deficiencies identified during our audit. Our opinion on the financial statements, as expressed in our report on the financial statements, is unmodified.
KPMG Inc SizweNtsaluba vsp
Director: AH Jaffer Director: SY LockhatRegistered auditor Registered auditor
10 June 2010 10 June 2010
85 Empire Road 20A Morris Street EastParktown Woodmead2193 2191
177Eskom Holdings Limited
Integrated Repor t 2010
The directors are pleased to present their report for the year ended 31 March 2010.
Principal activities, state of affairs and business review
The principal activities of the Eskom group are described on the inside front cover in the Profile section.
State of affairs and business overviewThe operating profit for the year for the Eskom group, before fair value gains and losses and net finance costs, was R10 193 million (2009: loss of R333 million) and for the company a profit of R8 351 million (2009: loss of R2 636 million).
The profit for the year for the Eskom group was R3 620 million (2009: loss of R9 668 million) after taking into account the net fair value profit on embedded derivatives of R2 284 million (2009: loss of R9 514 million).
The profit for the year for the company was R3 187 million (2009: loss of R10 137 million) after taking into account the net fair value profit on embedded derivatives of R2 283 million (2009: loss of R9 506 million).
Eskom applied for a 34% price increase for the 2009/10 period and received a 31,3% increase. For the period 2010/11 to 2012/13 Eskom submitted a proposed price increase application of 45% on 30 September 2009, followed by a revised application of 35% on 30 November 2009. Nersa held public hearings on the application in all nine provinces during January 2010, for the first time ever. On 24 February 2010 Nersa awarded Eskom a price determination of 24,8% (2010/11), 25,8% (2011/12) and 25,9% (2012/13). Further information in this regard is set out on page 90 in the Regulatory and Legal Framework section.
The forward electricity price curve used to value embedded derivatives at 31 March 2010 was the applicable tariff determined by Nersa as referred to above. The curve assumes two additional annual increases of 25% and CPI thereafter. A sensitivity analysis for the embedded derivatives appears in note 4 to the annual financial statements on page 224.
The special pricing agreements link the price of electricity to commodity prices which resulted in embedded derivatives in our financial statements. The large changes in commodity prices and other variables used to fair value them resulted in volatility in our results. It therefore became a priority to renegotiate these contracts to eliminate the embedded derivatives. By year end the contract with Mozal had been successfully renegotiated, while the others were at an advanced stage in the negotiation, which we estimate will be concluded by the end of the 2011 financial year. These negotiations had a significant impact in reducing the carrying value of the net embedded derivative exposure.
Eskom succeeded in removing the link of its power price to the market price of aluminium. Eskom now sells electricity to Mozal at a rand price and have taken off any derivatives.
Capital expenditure including borrowing cost capitalised is disclosed in notes 6 and 7 to the annual financial statements. An amount of R57 003 million (2009: R47 099 million) was spent during the year. The future funding of the capital expansion programme is discussed in the Finance division section on page 44.
For more detailed information on the performance for the year, refer to the annual financial statements on pages 173 to 285 and Sustainability reporting in Eskom on pages 11 to 171.
Share capital and shareholderThe Government of the Republic of South Africa is the sole shareholder of Eskom Holdings Limited. The shareholder’s representative is the Minister of Public Enterprises.
DividendsNo dividend was declared during the current and prior year, after taking into account the resource impact of the future build programme, the current capital structure, and the dividend policy.
Going concernThe funding gap over the next seven years based on the plan formulated by Eskom after the multi-year price determination tariff ruling and as communicated in the public domain during April and May 2010, indicated that Eskom is facing cumulative cash shortfalls of R115 billion by 2013 and R190 billion by 2017 (the year in which the Kusile power station is fully commissioned).
These amounts, however, include capital expenditure of R144 billion relating to capacity expansion projects beyond Kusile which have as yet not been approved by either the board or by the Department of Energy’s (DoE) Integrated Resource Plan (IRP2) process.
With regard to capacity expansion projects beyond Kusile, Eskom’s position is that once this IRP2 has been published by DoE later this year, indicating the new capacity requirements, they will need to be pre-funded at inception to avoid a repeat of Eskom’s current financial position.
As a result, during the early part of calendar year 2010, Eskom secured a mandate from its shareholder to formally pursue a much broader range of potential financing solutions, and it has engaged advisors to evaluate these as well as specific funding opportunities around the Kusile power station that is currently under construction in eMalahleni in Mpumalanga.
This support from government is in addition to the R60 billion loan committed during the previous financial year (R40 billion received to date) and the R176 billion government guarantee (R117 billion used to date) provided to enable Eskom to raise debt.
The World Bank has approved Eskom’s request for a R28 billion loan to co-finance the Medupi power plant in Lephalale, Limpopo province. These funds combine favourable financing rates with a structured repayment profile. This approval clears the way for the full construction of Medupi power station and is catalytic for South Africa’s commitment to renewable energy and lower carbon technologies such as large-scale solar thermal and wind power.
Directors’ report

178 Eskom Holdings Limited
Integrated Repor t 2010
Directors’ report
The above initiatives are expected to result in cash stability over the next seven years (excluding the R144 billion estimated in the period for capacity expansion beyond Kusile).
Even though this funding plan requires final government approval and implementation, the Eskom board believes that Eskom is a going concern over the next 18 months as its expected working capital resources, by way of cash generated from operations and existing cash on hand, together with current undrawn secured facilities are sufficient to meet Eskom’s present working capital and capital expenditure needs during that period.
DirectorsCurrently the board consists of nine non-executive directors, the acting chairman and the finance director. Mr RM Godsell resigned as chairman on 9 November 2009 and Mr PJ Maroga resigned as chief executive on 28 October 2009. Mr PM Makwana was appointed as acting chairman with executive powers on 12 November 2009. Mr PS O’Flaherty was appointed as finance director from 1 January 2010. Mr AJ Morgan resigned on 31March 2010.
The board of directors and their details are discussed on page 26 and on page 288 in the Corporate governance report.
Remuneration of directors and members of Exco The remuneration of the directors and the executives who were members of Exco during the financial year, is disclosed in note 45 to the annual financial statements, on page 280.
Company secretaryThe details of the company secretary and her declaration in terms of section 268G(d) of the Companies Act are disclosed in her statement on page 175.
AuditorsThe statutory auditors for the forthcoming financial year will be appointed at the annual general meeting scheduled for 28 June 2010.
Eskom’s policy is, where possible, not to use the external auditors for non-audit services. In cases where the external auditors are to be used for non-audit services, the prior approval of the board’s audit committee must be obtained.
Internal controlAn effective internal control framework is the responsibility of the board. The control framework provides cost-effective assurance that the assets of the organisation are safe guarded and that the liabilities and working capital are efficiently managed.
These controls are monitored and evaluated through the audit committee. Refer to the Governance section on page 293 and the statement of responsibilities and approval on page 174 for further detail on internal control and integrated risk management.
Subsidiaries, associated and joint venture companiesThe investment of Eskom in subsidiaries, associate and joint venture companies is disclosed in notes 8 and 9 in the annual financial statements. Refer also to the organisational structure on page 6.
Interests of directors and officersDetails of directors’ and officers’ interests in the Eskom incentive scheme is disclosed in note 45 to the annual financial statements. Refer to page 293 for Eskom’s ethics policies and their application regarding interests in contracts.
Research and development activitiesResearch is driven by the sustainability and innovation business unit. It focuses predominantly on applied, rather than pure research, and outputs are linked to the strategic and operational needs of Eskom. In order to remain relevant, a portion of research resources are allocated to technology innovation and emerging technology options. Our research expenditure for the year amounted to R197 million (2009: R207 million). Research and development activities are discussed in greater detail within the research blocks within the Corporate Services section on pages 51 to 163 and in other divisional reports.
Employee informationThe Eskom group had a staff complement of 39 222 men and women at the end of the financial year. Training has always been a major focus area and this past year R758 million (2009: R823 million) was spent on training and developing our staff. The staff turnover during the year was a low 3,5%, but with the build programme underway, we face a number of skills-related challenges. The management of human resources is discussed in the Human Resources section on page 76.
SafetySafety remains a major area of concern for Eskom as we have to report the death of two employees and 14 contract workers in the past year. Sadly 41 members of the public died in 2010, with vehicle accidents and electrical contacts remaining the major causes. Much work and effort continues to be put into safety awareness.
Environmental issuesWhile we are responding to the demand of electricity by building new capacity, ensuring financial stability and driving energy efficiency, we understand that the long-term nature of our business has an impact on environmental sustainability into the future. We therefore continue to strive for a balance between the different legs of sustainability. Bearing this in mind, our long-term planning processes take into account a lower carbon future for South Africa. Eskom’s response to climate change and limiting the impact on the environment is discussed on page 52 in the Corporate Services section and divisional reports.
Corporate social investmentEskom is committed to good corporate citizenship through its corporate social investment (CSI) initiatives. Eskom does not consider donations and grants to political party activities, trade union activities and religious organisations unless it is a non-profit organisation and has an outreach programme that directly benefits the community, for example, Aids hospice. Refer also to page 68 in the Corporate Services section.

179Eskom Holdings Limited
Integrated Repor t 2010
Information required by the Public Finance Management ActPerformance in terms of the shareholder compactThe performance of Eskom against the shareholder compact key performance indicators is shown in the table on page 34 in the Profile section.
Reasons for not meeting the targets on the shareholder compact:• Internal energy efficiency Metering and monitoring is still outstanding at some key facilities,
hence not all potential savings are as yet being reported. Metered information is also required for the development of the Eskom baseline. The targeted savings (percentage savings) will be determined once the Eskom baseline is completed
• Generation and transmission capital expenditure As a result of funding constraints, the capital expenditure was
delayed on a number of projects, which would otherwise have been on target
• Additional number of non-Eskom learners on Eskom-sponsored
learning The definition of non-Eskom learners only included the
Dr Straszacker and Van der Bijl Eskom-sponsored scholarships. The University of Technology merit bursars also sponsored by Eskom, were unintentionally omitted from the definition, but included in the target. Hence the number reported being below target
Losses through criminal conduct and irregular or fruitless and wasteful expenditureIn terms of the materiality framework agreed with the shareholder, any losses due to criminal conduct or irregular or fruitless and wasteful expenditure, that individually (or collectively where items are closely related) exceed R10 million must be reported.
Irregular or fruitless and wasteful expenditureDuring the year the company underpaid value-added tax to the South African Revenue Service as a result of compilation errors. Due to the late payment, an additional amount of R47 million was paid as interest and penalties. Certain internal control enhancements relating to the preparation of returns have since been implemented. Disciplinary action was instituted, which resulted in a dismissal.
Losses due to criminal conduct Conductor theftLosses due to conductor theft (including copper, cable, trans- formers and tower-related structures) totalled R45,6 million (2009: R38 million), and involved 2 580 incidents (2009: 2 343 incidents).
Actions to combat conductor theft are managed by the Eskom Conductor Theft Committee in collaboration with other affected state-owned enterprises and the South African Police Services. The combined effort resulted in 367 arrests (2009: 480 arrests). R6,3 million worth of stolen material was recovered (2009: R4,7 million).
FraudDuring the financial year investigations into incidents of fraud suffered by the group, amounting to R13,4 million (2009: R3,1 million), were finalised. Of this amount, R7,3 million (2009: Rnil) was recovered. The existing internal control measures in the affected areas as well as similar areas have been reviewed and enhanced. Disciplinary, criminal as well as civil proceedings have been instituted against those involved.
Promotion of Access to Information Act
Management of energy lossesEnergy losses reflect the difference between the quantity of energy sent out from the power stations and the quantity sold to the various customers at the end of the value chain. Losses are categorised as technical or non-technical in nature. Refer to page 160 for more details regarding energy losses.
The energy losses are as follows:
2010 2009 2008Energy losses Target
%Actual
%Actual
%Actual
%
Total distribution loss ≤6,00 5,87 5,46 5,47
Total transmission loss ≤3,30 3,25 3,08 3,13
Total Eskom loss ≤8,76 8,45 7,94 8,00
Refer to www.eskom.co.za/annreport10/016.html for statistics relating to requests received during the year in terms of the Promotion of Access to Information Act.
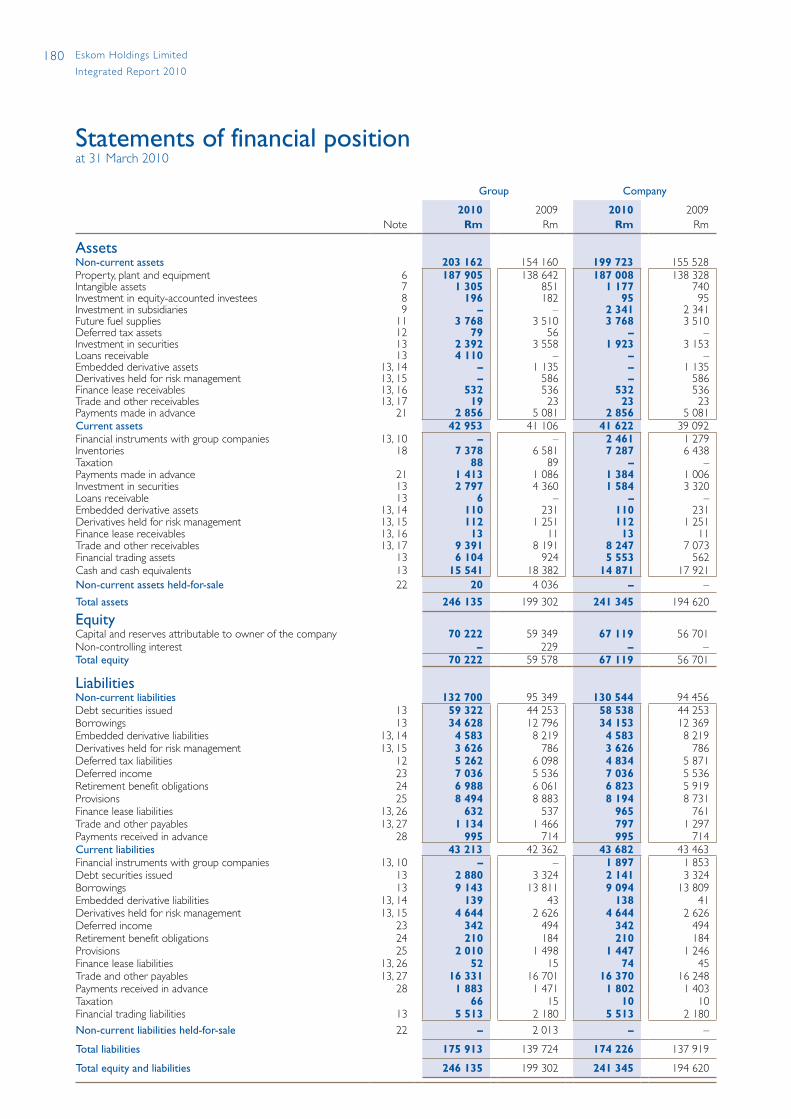
180 Eskom Holdings Limited
Integrated Repor t 2010
Statements of financial position at 31 March 2010
Group Company
Note2010
Rm 2009
Rm 2010
Rm 2009
Rm
AssetsNon-current assets 203 162 154 160 199 723 155 528 Property, plant and equipment 6 187 905 138 642 187 008 138 328 Intangible assets 7 1 305 851 1 177 740 Investment in equity-accounted investees 8 196 182 95 95 Investment in subsidiaries 9 – – 2 341 2 341Future fuel supplies 11 3 768 3 510 3 768 3 510Deferred tax assets 12 79 56 – –Investment in securities 13 2 392 3 558 1 923 3 153Loans receivable 13 4 110 – – –Embedded derivative assets 13, 14 – 1 135 – 1 135 Derivatives held for risk management 13, 15 – 586 – 586 Finance lease receivables 13, 16 532 536 532 536 Trade and other receivables 13, 17 19 23 23 23 Payments made in advance 21 2 856 5 081 2 856 5 081 Current assets 42 953 41 106 41 622 39 092 Financial instruments with group companies 13, 10 – – 2 461 1 279 Inventories 18 7 378 6 581 7 287 6 438 Taxation 88 89 – –Payments made in advance 21 1 413 1 086 1 384 1 006 Investment in securities 13 2 797 4 360 1 584 3 320 Loans receivable 13 6 – – –Embedded derivative assets 13, 14 110 231 110 231 Derivatives held for risk management 13, 15 112 1 251 112 1 251 Finance lease receivables 13, 16 13 11 13 11 Trade and other receivables 13, 17 9 391 8 191 8 247 7 073 Financial trading assets 13 6 104 924 5 553 562 Cash and cash equivalents 13 15 541 18 382 14 871 17 921 Non-current assets held-for-sale 22 20 4 036 – –
Total assets 246 135 199 302 241 345 194 620
EquityCapital and reserves attributable to owner of the company 70 222 59 349 67 119 56 701 Non-controlling interest – 229 – –Total equity 70 222 59 578 67 119 56 701
LiabilitiesNon-current liabilities 132 700 95 349 130 544 94 456 Debt securities issued 13 59 322 44 253 58 538 44 253 Borrowings 13 34 628 12 796 34 153 12 369 Embedded derivative liabilities 13, 14 4 583 8 219 4 583 8 219 Derivatives held for risk management 13, 15 3 626 786 3 626 786 Deferred tax liabilities 12 5 262 6 098 4 834 5 871 Deferred income 23 7 036 5 536 7 036 5 536 Retirement benefit obligations 24 6 988 6 061 6 823 5 919 Provisions 25 8 494 8 883 8 194 8 731 Finance lease liabilities 13, 26 632 537 965 761 Trade and other payables 13, 27 1 134 1 466 797 1 297 Payments received in advance 28 995 714 995 714 Current liabilities 43 213 42 362 43 682 43 463 Financial instruments with group companies 13, 10 – – 1 897 1 853 Debt securities issued 13 2 880 3 324 2 141 3 324 Borrowings 13 9 143 13 811 9 094 13 809 Embedded derivative liabilities 13, 14 139 43 138 41 Derivatives held for risk management 13, 15 4 644 2 626 4 644 2 626 Deferred income 23 342 494 342 494 Retirement benefit obligations 24 210 184 210 184 Provisions 25 2 010 1 498 1 447 1 246 Finance lease liabilities 13, 26 52 15 74 45 Trade and other payables 13, 27 16 331 16 701 16 370 16 248 Payments received in advance 28 1 883 1 471 1 802 1 403 Taxation 66 15 10 10 Financial trading liabilities 13 5 513 2 180 5 513 2 180 Non-current liabilities held-for-sale 22 – 2 013 – –
Total liabilities 175 913 139 724 174 226 137 919
Total equity and liabilities 246 135 199 302 241 345 194 620
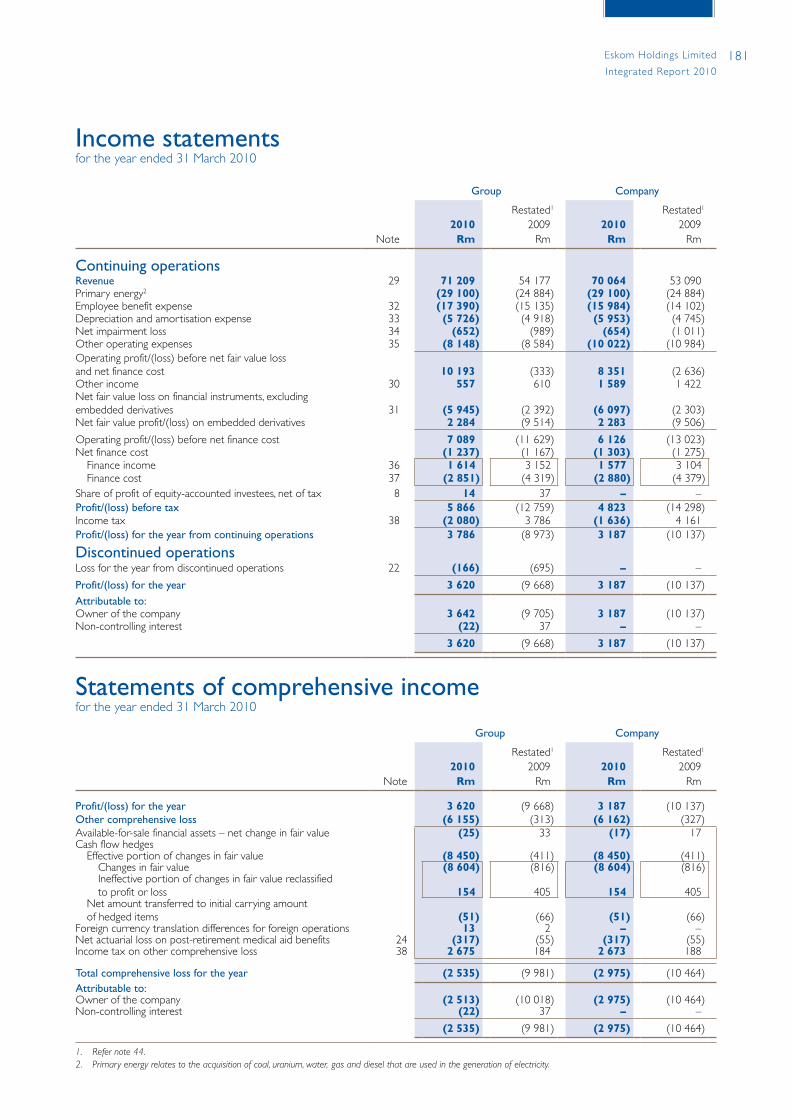
181Eskom Holdings Limited
Integrated Repor t 2010
Income statements for the year ended 31 March 2010
Statements of comprehensive income for the year ended 31 March 2010
Group Company
Note2010
Rm
Restated1 2009
Rm 2010
Rm
Restated1 2009
Rm
Profit/(loss) for the year 3 620 (9 668) 3 187 (10 137)Other comprehensive loss (6 155) (313) (6 162) (327)Available-for-sale financial assets – net change in fair value (25) 33 (17) 17 Cash flow hedges Effective portion of changes in fair value (8 450) (411) (8 450) (411) Changes in fair value (8 604) (816) (8 604) (816) Ineffective portion of changes in fair value reclassified
to profit or loss 154 405 154 405 Net amount transferred to initial carrying amount
of hedged items (51) (66) (51) (66)Foreign currency translation differences for foreign operations 13 2 – –Net actuarial loss on post-retirement medical aid benefits 24 (317) (55) (317) (55)Income tax on other comprehensive loss 38 2 675 184 2 673 188
Total comprehensive loss for the year (2 535) (9 981) (2 975) (10 464)Attributable to:Owner of the company (2 513) (10 018) (2 975) (10 464)Non-controlling interest (22) 37 – –
(2 535) (9 981) (2 975) (10 464)
1. Refer note 44.2. Primary energy relates to the acquisition of coal, uranium, water, gas and diesel that are used in the generation of electricity.
Group Company
Note2010
Rm
Restated1 2009
Rm 2010
Rm
Restated1 2009
Rm
Continuing operationsRevenue 29 71 209 54 177 70 064 53 090 Primary energy2 (29 100) (24 884) (29 100) (24 884)Employee benefit expense 32 (17 390) (15 135) (15 984) (14 102)Depreciation and amortisation expense 33 (5 726) (4 918) (5 953) (4 745)Net impairment loss 34 (652) (989) (654) (1 011)Other operating expenses 35 (8 148) (8 584) (10 022) (10 984)Operating profit/(loss) before net fair value loss and net finance cost 10 193 (333) 8 351 (2 636)Other income 30 557 610 1 589 1 422 Net fair value loss on financial instruments, excluding embedded derivatives 31 (5 945) (2 392) (6 097) (2 303)Net fair value profit/(loss) on embedded derivatives 2 284 (9 514) 2 283 (9 506)
Operating profit/(loss) before net finance cost 7 089 (11 629) 6 126 (13 023)Net finance cost (1 237) (1 167) (1 303) (1 275) Finance income 36 1 614 3 152 1 577 3 104 Finance cost 37 (2 851) (4 319) (2 880) (4 379)Share of profit of equity-accounted investees, net of tax 8 14 37 – –Profit/(loss) before tax 5 866 (12 759) 4 823 (14 298)Income tax 38 (2 080) 3 786 (1 636) 4 161 Profit/(loss) for the year from continuing operations 3 786 (8 973) 3 187 (10 137)
Discontinued operationsLoss for the year from discontinued operations 22 (166) (695) – –
Profit/(loss) for the year 3 620 (9 668) 3 187 (10 137)Attributable to:Owner of the company 3 642 (9 705) 3 187 (10 137)Non-controlling interest (22) 37 – –
3 620 (9 668) 3 187 (10 137)
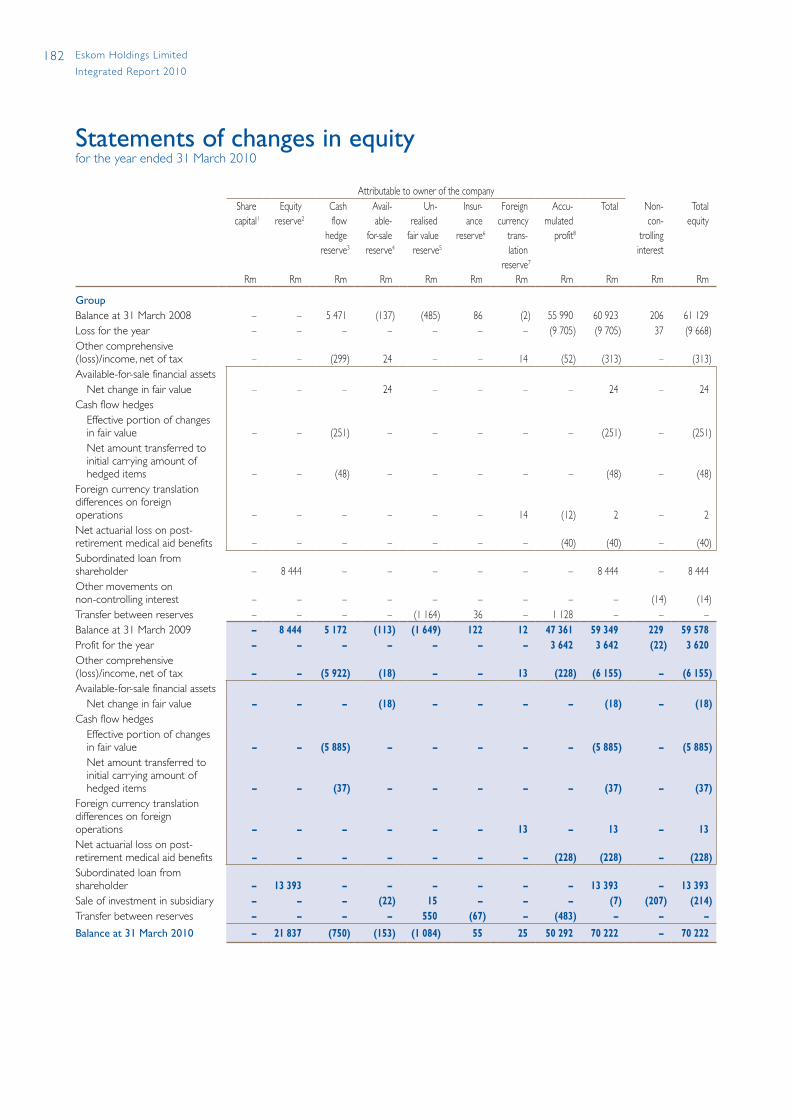
182 Eskom Holdings Limited
Integrated Repor t 2010
Statements of changes in equity for the year ended 31 March 2010
Attributable to owner of the companySharecapital1
Rm
Equityreserve2
Rm
Cash flow
hedgereserve3
Rm
Avail-able-
for-salereserve4
Rm
Un-realised
fair valuereserve5
Rm
Insur-ance
reserve6
Rm
Foreigncurrency
trans-lation
reserve7
Rm
Accu-mulated
profit8
Rm
Total
Rm
Non-con-
trollinginterest
Rm
Total equity
Rm
GroupBalance at 31 March 2008 – – 5 471 (137) (485) 86 (2) 55 990 60 923 206 61 129 Loss for the year – – – – – – – (9 705) (9 705) 37 (9 668)Other comprehensive (loss)/income, net of tax – – (299) 24 – – 14 (52) (313) – (313) Available-for-sale financial assets Net change in fair value – – – 24 – – – – 24 – 24 Cash flow hedges Effective portion of changes
in fair value – – (251) – – – – – (251) – (251) Net amount transferred to
initial carrying amount of hedged items – – (48) – – – – – (48) – (48)
Foreign currency translation differences on foreign operations – – – – – – 14 (12) 2 – 2 Net actuarial loss on post-retirement medical aid benefits – – – – – – – (40) (40) – (40)Subordinated loan from shareholder – 8 444 – – – – – – 8 444 – 8 444 Other movements on non-controlling interest – – – – – – – – – (14) (14)Transfer between reserves – – – – (1 164) 36 – 1 128 – – –Balance at 31 March 2009 – 8 444 5 172 (113) (1 649) 122 12 47 361 59 349 229 59 578 Profit for the year – – – – – – – 3 642 3 642 (22) 3 620 Other comprehensive (loss)/income, net of tax – – (5 922) (18) – – 13 (228) (6 155) – (6 155)Available-for-sale financial assets Net change in fair value – – – (18) – – – – (18) – (18)Cash flow hedges Effective portion of changes
in fair value – – (5 885) – – – – – (5 885) – (5 885) Net amount transferred to
initial carrying amount of hedged items – – (37) – – – – – (37) – (37)
Foreign currency translation differences on foreign operations – – – – – – 13 – 13 – 13 Net actuarial loss on post-retirement medical aid benefits – – – – – – – (228) (228) – (228)Subordinated loan from shareholder – 13 393 – – – – – – 13 393 – 13 393 Sale of investment in subsidiary – – – (22) 15 – – – (7) (207) (214)Transfer between reserves – – – – 550 (67) – (483) – – –
Balance at 31 March 2010 – 21 837 (750) (153) (1 084) 55 25 50 292 70 222 – 70 222

183Eskom Holdings Limited
Integrated Repor t 2010
Attributable to owner of the companySharecapital1
Rm
Equityreserve2
Rm
Cash flow
hedgereserve3
Rm
Avail-able-
for-salereserve4
Rm
Un-realised
fair valuereserve5
Rm
Accu-mulated
profit8
Rm
Total
Rm
CompanyBalance at 31 March 2008 – – 5 473 (159) (497) 53 904 58 721 Loss for the year – – – – – (10 137) (10 137)Other comprehensive (loss)/income, net of tax – – (299) 12 – (40) (327)Available-for-sale financial assets Net change in fair value – – – 12 – – 12 Cash flow hedges Effective portion of changes in fair value – – (251) – – – (251) Net amount transferred to initial carrying amount of hedged items – – (48) – – – (48)Net actuarial loss on post-retirement medical aid benefits – – – – – (40) (40)Subordinated loan from shareholder – 8 444 – – – – 8 444Transfer between reserves – – – – (1 136) 1 136 –Balance at 31 March 2009 – 8 444 5 174 (147) (1 633) 44 863 56 701 Profit for the year – – – – – 3 187 3 187 Other comprehensive loss, net of tax – – (5 922) (12) – (228) (6 162)Available-for-sale financial assets Net change in fair value – – – (12) – – (12)Cash flow hedges Effective portion of changes in fair value – – (5 885) – – – (5 885) Net amount transferred to initial carrying amount of hedged items – – (37) – – – (37)Net actuarial loss on post-retirement medical aid benefits – – – – – (228) (228)Subordinated loan from shareholder – 13 393 – – – – 13 393 Transfer between reserves – – – – 550 (550) –Balance at 31 March 2010 – 21 837 (748) (159) (1 083) 47 272 67 119
Dividends proposedNo dividend has been proposed in the current or prior year.
1. Nominal amount.2. The equity reserve comprises the day-one gain on initial recognition of the subordinated loan from the shareholder (refer note 13.5).3. The cash flow hedge reserve comprises the effective portion of the cumulative net change in the fair value of cash flow hedging instruments (comprising forward exchange
contracts, interest rate swaps and cross-currency swaps) related to hedged transactions that have not yet occurred. The cross-currency swap hedges foreign exchange rate risk of the future interest payments and the principal repayment on a euro-denominated loan.
4. The available-for-sale reserve comprises the cumulative net change in the fair value of available-for-sale financial assets until the investments are derecognised.5. The cumulative net change in the fair value of derivatives that have not been designated as cash flow hedging instruments is recognised in profit or loss. The unrealised
portion of the net change in fair value is not distributable and has been reallocated from a distributable reserve (accumulated profit) to a non-distributable reserve.6. The insurance reserve is a contingency reserve created in terms of the Short-term Insurance Act, 1998.7. The foreign currency translation reserve comprises exchange differences resulting from the translation of the results and financial position of foreign operations. 8. Accumulated profit is the amount of cumulative profit retained in the business after tax.
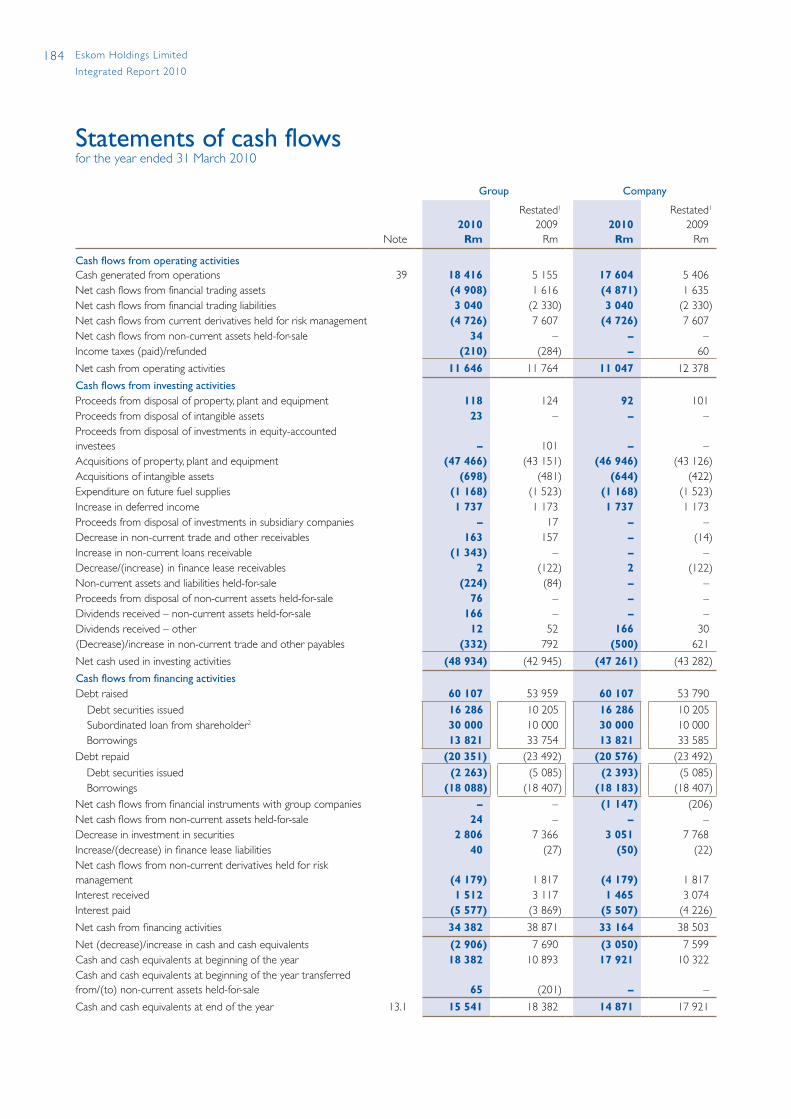
184 Eskom Holdings Limited
Integrated Repor t 2010
Statements of cash flows for the year ended 31 March 2010
Group Company
Note2010
Rm
Restated1 2009
Rm 2010
Rm
Restated1 2009
Rm
Cash flows from operating activitiesCash generated from operations 39 18 416 5 155 17 604 5 406 Net cash flows from financial trading assets (4 908) 1 616 (4 871) 1 635 Net cash flows from financial trading liabilities 3 040 (2 330) 3 040 (2 330)Net cash flows from current derivatives held for risk management (4 726) 7 607 (4 726) 7 607 Net cash flows from non-current assets held-for-sale 34 – – –Income taxes (paid)/refunded (210) (284) – 60
Net cash from operating activities 11 646 11 764 11 047 12 378
Cash flows from investing activitiesProceeds from disposal of property, plant and equipment 118 124 92 101 Proceeds from disposal of intangible assets 23 – – –Proceeds from disposal of investments in equity-accounted investees – 101 – –Acquisitions of property, plant and equipment (47 466) (43 151) (46 946) (43 126)Acquisitions of intangible assets (698) (481) (644) (422)Expenditure on future fuel supplies (1 168) (1 523) (1 168) (1 523)Increase in deferred income 1 737 1 173 1 737 1 173 Proceeds from disposal of investments in subsidiary companies – 17 – –Decrease in non-current trade and other receivables 163 157 – (14)Increase in non-current loans receivable (1 343) – – –Decrease/(increase) in finance lease receivables 2 (122) 2 (122)Non-current assets and liabilities held-for-sale (224) (84) – –Proceeds from disposal of non-current assets held-for-sale 76 – – –Dividends received – non-current assets held-for-sale 166 – – –Dividends received – other 12 52 166 30 (Decrease)/increase in non-current trade and other payables (332) 792 (500) 621
Net cash used in investing activities (48 934) (42 945) (47 261) (43 282)
Cash flows from financing activitiesDebt raised 60 107 53 959 60 107 53 790 Debt securities issued 16 286 10 205 16 286 10 205 Subordinated loan from shareholder2 30 000 10 000 30 000 10 000 Borrowings 13 821 33 754 13 821 33 585 Debt repaid (20 351) (23 492) (20 576) (23 492) Debt securities issued (2 263) (5 085) (2 393) (5 085) Borrowings (18 088) (18 407) (18 183) (18 407)Net cash flows from financial instruments with group companies – – (1 147) (206)Net cash flows from non-current assets held-for-sale 24 – – –Decrease in investment in securities 2 806 7 366 3 051 7 768 Increase/(decrease) in finance lease liabilities 40 (27) (50) (22)Net cash flows from non-current derivatives held for risk management (4 179) 1 817 (4 179) 1 817 Interest received 1 512 3 117 1 465 3 074 Interest paid (5 577) (3 869) (5 507) (4 226)
Net cash from financing activities 34 382 38 871 33 164 38 503
Net (decrease)/increase in cash and cash equivalents (2 906) 7 690 (3 050) 7 599 Cash and cash equivalents at beginning of the year 18 382 10 893 17 921 10 322 Cash and cash equivalents at beginning of the year transferred from/(to) non-current assets held-for-sale 65 (201) – –
Cash and cash equivalents at end of the year 13.1 15 541 18 382 14 871 17 921

185Eskom Holdings Limited
Integrated Repor t 2010
Group Company
Note2010
Rm
Restated1 2009
Rm 2010
Rm
Restated1 2009
Rm
Reconciliation of net cash flow to movement in net debtNet increase in debt securities issued 14 023 5 120 13 893 5 120 Net increase in borrowings 25 733 25 347 25 638 25 178 Net cash flows from financial instruments with group companies – – (1 147) (206)Decrease in investment in securities 2 806 7 366 3 051 7 768 Increase/(decrease) in finance lease liabilities 40 (27) (50) (22)Net cash flows from derivatives held for risk management (8 905) 9 424 (8 905) 9 424 Net debt raised 33 697 47 230 32 480 47 262 Portion on subordinated loan from shareholder allocated to equity (13 393) (8 444) (13 393) (8 444)Non-cash flow movements 20 929 3 647 19 728 3 730 Cash and cash equivalents at beginning of the year transferred (from)/to non-current assets held-for-sale (65) 201 – –Net increase/(decrease) in cash and cash equivalents for the year 2 906 (7 690) 3 050 (7 599)Movement in net debt for the year 44 074 34 944 41 865 34 949 Net debt at beginning of the year 50 011 15 067 52 316 17 367
Net debt at end of the year 94 085 50 011 94 181 52 316
Analysis of net debtDebt securities issued 13 62 202 47 577 60 679 47 577 Borrowings 13 43 771 26 607 43 247 26 178 Finance lease liabilities 13, 26 684 552 1 039 806 Financial instruments with group companies 13, 10 – – (564) 574 Derivatives held for risk management 13, 15 8 158 1 575 8 158 1 575
114 815 76 311 112 559 76 710 Cash and cash equivalents 13 (15 541) (18 382) (14 871) (17 921)Investment in securities 13 (5 189) (7 918) (3 507) (6 473)
Net debt at end of the year 94 085 50 011 94 181 52 316
1. Refer note 44. 2. Includes R23 445 million (2009: R1 575 million) which is included in borrowings (refer note 13.5). The remainder of the balance is recognised in equity.
186 Eskom Holdings Limited
Integrated Repor t 2010
Notes to the consolidated financial statementsfor the year ended 31 March 2010
1. General information Eskom Holdings Limited (Eskom), a public company and
holding company of the group, is incorporated and domiciled in the Republic of South Africa. Eskom is a vertically integrated operation that generates, transmits and distributes electricity to industrial, mining, commercial, agricultural, redistributors, and residential customers and to international customers in southern Africa. The nature of the businesses of the significant operating subsidiaries is set out in note 9.
2. Summary of significant accounting policies The principal accounting policies applied in the preparation
of these separate and consolidated financial statements are set out below. These policies have been consistently applied to all years presented, unless otherwise stated.
2.1 Basis of preparation and measurement Statement of compliance The consolidated financial statements of Eskom at and for
the year ended 31 March 2010 comprise the company and its subsidiaries (together referred to as the group) and the group’s interest in associates and joint ventures. The separate and consolidated financial statements have been prepared in accordance with International Financial Reporting Standards (IFRS) and in the manner required by the Public Finance Management Act, I of 1999, and the Companies Act of South Africa, 61 of 1973, as amended.
Basis of measurement The separate and consolidated financial statements are
prepared on the historical basis except for the following financial instruments which are measured at fair value:
• embedded derivative assets and liabilities • financial instruments classified under held-for-trading • financial instruments classified under available-for-sale
The preparation of financial statements in conformity with IFRS requires management to make judgements, estimates and assumptions that affect the application of accounting policies and the reported amounts of assets, liabilities, income and expenses. Actual results may differ from these estimates. The estimates and underlying assumptions are reviewed on an ongoing basis. Revisions to accounting estimates are recognised in the period in which the estimates are revised. The areas involving a higher degree of judgement or complexity, or areas where assumptions and estimates are significant to the consolidated financial statements, are disclosed in note 4.
Functional and presentation currency Items included in the financial statements of each of the
group’s entities are measured using the currency of the primary economic environment in which the entity operates (functional currency). The consolidated financial statements are presented in rand (rounded to the nearest million unless otherwise stated), which is the company’s functional and presentation currency.
Changes in accounting policies and comparability The group has adopted certain new standards, amendments
and interpretations to existing standards which were effective for the group for the financial year beginning on or after 1 April 2009. The effects of adopting these standards are discussed in note 44.
Standards, interpretations and amendments to published standards that are not yet effective
The following new standards, amendments and interpretations to existing standards have been published that are applicable for future accounting periods but have not been adopted early by the group:
IAS 24 Related party disclosures (effective 1 January 2011) (revised)
The revised IAS 24 provides a partial exemption for government-related entities. The revised standard still requires disclosures that are important to users of financial statements but eliminates requirements to disclose information that is costly to gather and of less value to users. It achieves this balance by requiring disclosure about these transactions only if they are individually or collectively significant. The revised standard also amends the definition of a related party. The standard is applicable retrospectively. The group is still determining the impact of the revised standard on the financial statements.
IAS 27 Consolidated and separate financial statements (effective 1 July 2009) (revised)
In accordance with the amended IAS 27, acquisitions of additional non-controlling equity interests in subsidiaries have to be accounted for as equity transactions. Disposals of equity interests while retaining control are also accounted for as equity transactions. When control of an investee is lost, the resulting gain or loss relating to the transaction will be recognised in profit or loss.
It has always been the group’s accounting policy to treat all acquisitions of additional interests in subsidiaries, as well as disposals of interests in subsidiaries, as equity transactions. The

187Eskom Holdings Limited
Integrated Repor t 2010
group will, however, change its accounting policy relating to the loss of control when an equity interest is retained. In future, when control is lost through sale or otherwise, the resulting gain or loss recognised in profit or loss will include any remeasurement to fair value of the retained equity interest.
The amendments to IAS 27 also require that losses (including negative other comprehensive income as detailed in the revised IAS 1) have to be allocated to the non-controlling interest even if doing so causes the non-controlling interest to be in a deficit position. The group will in future change its accounting policies on the allocation of losses to non-controlling interests. In the past, losses were allocated only until the non-controlling interests had a zero balance. The amendments to IAS 27 have resulted in consequential amendments being made to IAS 28 Investment in associates and IAS 31 Interest in joint ventures.
IAS 32 Financial instruments: Presentation (effective 1 February 2010) The amendment to IAS 32 in respect of the classification of
rights issues states that rights issues offered pro rata to all of an entity’s existing shareholders in the same class for a fixed amount of currency, should be classified as equity regardless of the currency in which the exercise price is denominated. The amendment is not expected to have an impact on the group’s financial statements.
IAS 39 Financial instruments: Recognition and measurement (effective 1 July 2009) IAS 39 provides additional guidance on the designation of a
hedged item. The amendment clarifies the designation of a one-sided risk in a hedged item and inflation in a financial hedged item. The group is still determining the impact of the amendment on the financial statements.
IAS 39 Financial instruments: Recognition and measurement and IFRIC 9: Reassessment of embedded derivatives (effective 1 July 2009)
The amendments to IAS 39 and IFRIC 9 clarify that on reclassification of a financial asset out of the fair value through profit or loss category, all embedded derivatives have to be assessed and, if necessary, separately accounted for in the financial statements.
The amendments will not have an impact on the group’s financial statements as the group does not intend to reclassify any of its financial assets out of the fair value through profit or loss category.
IFRS 1 First-time adoption of International Financial Reporting Standards (effective 1 July 2010)
The amendment to IFRS 1 relieves first-time adopters of IFRS from providing the additional disclosures included in
Amendments to IFRS 7 Financial instruments: Disclosures which require enhanced disclosures about fair value measurements and liquidity risk of financial instruments. The amendment will not have an impact on the group’s financial statements.
IFRS 2 Share-based payment (effective 1 January 2010) (amended)
IFRS 2 provides that an entity receiving goods or services in a share-based payment transaction, that is settled by any other entity in the group or any shareholder of such an entity in cash or other assets, is now required to recognise the goods or services received in its financial statements. This amendment is not expected to have a significant impact on the group’s financial statements.
IFRS 3 Business combinations (effective 1 July 2009)
(revised) IFRS 3 applies to all new business combinations that occur
after 1 April 2010. The statement requires that all transaction costs be expensed and the contingent purchase consideration be recognised at fair value on acquisition date. For successive share purchases, any gain or loss, on the difference between the fair value and the carrying amount of the previously held equity interest in the acquiree, will have to be recognised in profit or loss. For future business combinations, the group will change its accounting policy to be in line with the revised IFRS 3.
IFRS 5 Non-current assets held-for-sale and discontinued
operations (effective 1 January 2010) The amendment to IFRS 5 specifies the disclosures required
in respect of non-current assets (or disposal groups) classified as held-for-sale or discontinued operations. Disclosures in other IFRS do not apply to such assets (or disposal groups) unless those IFRS require specific disclosures in respect of non-current assets (or disposal groups) classified as held-for-sale or discontinued operations; or disclosures about measurement of assets and liabilities within a disposal group that are not within the scope of the measurement requirement of IFRS 5 and such disclosures are not already provided in the other notes to the financial statements.
IFRS 9 Financial instruments (effective 1 January 2013) IFRS 9 addresses the initial measurement and classification of
financial assets and replaces the relevant sections of IAS 39 Financial instruments: Recognition and measurement. IFRS 9 retains but simplifies the mixed measurement model and establishes two primary measurement categories for financial assets: amortised cost and fair value. The basis of classification depends on the entity’s business model and the contractual cash flow characteristics of the financial asset. The group is still determining the impact of the standard on the financial statements.
188 Eskom Holdings Limited
Integrated Repor t 2010
Notes to the consolidated financial statements continuedfor the year ended 31 March 2010
2. Summary of significant accounting policies (continued)
2.1 Basis of preparation and measurement (continued) Standards, interpretations and amendments to published
standards that are not yet effective (continued) IFRIC 14 IAS 19 – The limit on a defined benefit asset,
minimum funding requirements and their interaction (effective 1 January 2011) (amended)
The amendment applies in the limited circumstances when an entity is subject to minimum funding requirements and makes an early payment of contributions to cover those requirements. The amendment permits such an entity to treat the benefit of such an early payment as an asset on the basis that the entity has a future economic benefit. The amendment is not expected to have an impact on the group’s financial statements.
IFRIC 17 Distribution of non-cash assets to owners (effective 1 July 2009)
IFRIC 17 provides guidance on when and how a liability for certain distributions of non-cash assets is recognised and measured, and how to account for settlement of that liability. The interpretation is currently expected to have no impact on the financial statements.
IFRIC 19 Extinguishing financial liabilities with equity
instruments (effective 1 July 2010) IFRIC 19 provides guidance on how to account for the
extinguishment of a financial liability by the issue of equity instruments. The interpretation clarifies the requirements of IFRS when an entity renegotiates the terms of a financial liability with its creditor and the creditor agrees to accept the entity’s shares or other equity instruments to settle the financial liability fully or partially. The interpretation is not expected to have an impact on the group’s financial statements.
Standards, interpretations and amendments to published standards that are effective and applicable to the group
The following standards, interpretations and amendments were effective and applicable to the group for the year ended 31 March 2010, but had no impact on the financial statements:
• IAS 23 Borrowing costs • IAS 32 Financial instruments: Presentation • IFRS 1 First-time adoption of International Financial Reporting
Standards and IAS 27 Consolidated and separate financial statements
• IFRS 2 Share-based payment • IFRIC 13 Customer loyalty programmes • IFRIC 15 Agreements for the construction of real estate • IFRIC 16 Hedges of a net investment in a foreign operation
The following standards, interpretations and amendments were effective and applicable to the group for the year
ended 31 March 2010 and had an impact on the financial statements:
• IFRIC 18 Transfers of assets from customers • IFRS 7 Financial instruments: Disclosures • IFRS 8 Operating segments • IAS 1 Presentation of financial statements
Various improvements to IFRS A number of standards have been amended as part of the
International Accounting Standards Board’s (IASB) annual improvement project. Management is in the process of considering the relevant amendments to the standards and determining the financial implications and impact on the group.
2.2 Consolidation Investment in subsidiaries Subsidiaries are all entities (including special-purpose
entities) over which the group has the power to govern the financial and operating policies to obtain benefits from the activities of the entity. The existence and effect of potential voting rights that are currently exercisable or convertible are considered when assessing whether the group controls another entity. Subsidiaries are consolidated from the date on which control is transferred to the group. They are de-consolidated from the date that control ceases.
Investments in subsidiaries are accounted for at cost less impairment losses in the separate financial statements of the company.
Business combinations The purchase method of accounting is used to account for
the acquisition of subsidiaries by the group. The cost of an acquisition is measured as the fair value of the assets given, equity instruments issued and liabilities incurred or assumed at the date of exchange, plus costs directly attributable to the acquisition. Identifiable assets acquired and liabilities and contingent liabilities assumed in a business combination are measured initially at their fair values at the acquisition date, irrespective of the extent of any non-controlling interest. The excess of the cost of acquisition over the fair value of the group’s share of the identifiable net assets acquired is recorded as goodwill. If the cost of acquisition is less than the fair value of the net assets of the subsidiary acquired, the difference is recognised directly in profit or loss.
Inter-company transactions, balances and unrealised gains on transactions between group companies are eliminated. Unrealised losses are also eliminated, but are considered an impairment indicator of the asset transferred. Accounting policies of subsidiaries have been changed where necessary, to ensure consistency with the policies adopted by the group.

189Eskom Holdings Limited
Integrated Repor t 2010
Transactions with non-controlling interests The group applies a policy of accounting for transactions
with non-controlling interests as transactions with parties external to the group. Disposals to non-controlling interests result in gains or losses for the group that are recorded in profit or loss. Purchases from non-controlling interests result in goodwill, being the difference between any consideration paid and the relevant share acquired of the carrying value of net assets of the subsidiary.
Investment in equity-accounted investees Associates are all entities over which the group has significant
influence but no control over the financial and operating policies, generally linked to a shareholding of between 20% and 50% of the voting rights.
Joint ventures are contractual arrangements whereby two or more parties undertake an economic activity that is subject to joint control.
Investments in associates and joint ventures are accounted for at cost less impairment losses in the separate financial statements of the company. These investments are accounted for using the equity method of accounting and are initially recognised at cost in the financial statements of the group. The group’s investment in associates and joint ventures includes goodwill (net of any accumulated impairment loss) identified on acquisition.
The group’s share of its associates’ and joint ventures’ post-acquisition profits or losses is recognised in profit or loss within share of profit of equity-accounted investees, and its share of post-acquisition movement in reserves is recognised in reserves. The cumulative post-acquisition movements are adjusted against the carrying amount of the investment. When the group’s share of losses in an associate or joint venture equals or exceeds its interest in the associate or joint venture, including any other unsecurable receivables, the group does not recognise further losses, unless it has incurred obligations or made payments on behalf of the associate or joint venture.
Unrealised gains on transactions between the group and its associates or joint ventures are eliminated to the extent of the group’s interest in the associates or joint ventures. Unrealised losses are also eliminated, unless the transaction provides evidence of an impairment of the asset transferred. Accounting policies of associates or joint ventures have been changed where necessary to ensure consistency with the policies adopted by the group.
2.3 Segment reporting Operating segments are reported in a manner consistent
with the internal reporting provided to the chief operating
decision-maker. The chief operating decision-maker, who is responsible for allocating resources and assessing performance of the operating segments, has been identified as the group executive committee (Exco).
An operating segment is a component of the group that engages in business activities from which it may earn revenues and incur expenses, including revenues and expenses that relate to transactions with any of the group’s other components. An operating segment’s results are reviewed regularly by Exco to make decisions about resources to be allocated to the segment and assess performance, and for which discrete financial information is available.
2.4 Foreign currency translation Transactions and balances Foreign currency transactions are translated into the
functional currency using the exchange rates prevailing at the dates of the transactions. Foreign exchange gains or losses resulting from the settlement of such transactions and from the translation at year end exchange rates of monetary assets and liabilities denominated in foreign currencies are recognised in profit or loss, except when recognised in other comprehensive income for qualifying cash flow hedges.
Changes in the fair value of monetary securities denominated in foreign currency classified as available-for-sale are analysed between translation differences resulting from changes in the amortised cost of the security, and other changes in the carrying amount of the security. Translation differences relating to changes in the amortised cost are recognised in profit or loss and other changes in the carrying amount are recognised in other comprehensive income within available-for-sale financial assets.
Translation differences on non-monetary financial assets are reported as part of the fair value gain or loss. Translation differences on non-monetary financial assets and liabilities, such as equities held at fair value through profit or loss, are recognised in profit or loss as part of the fair value gain or loss. Translation differences on non-monetary financial assets, such as equities classified as available-for-sale, are recognised in other comprehensive income within available-for-sale financial assets.
Foreign loans are initially recognised at the exchange rate prevailing at transaction date and are translated at spot at every reporting date. The exchange differences resulting from the mark to spot on foreign loans, except foreign loans accounted for in terms of cash flow hedge accounting, are recognised in profit or loss within finance income or finance cost.

190 Eskom Holdings Limited
Integrated Repor t 2010
Notes to the consolidated financial statements continuedfor the year ended 31 March 2010
2. Summary of significant accounting policies (continued)
2.4 Foreign currency translation (continued) Foreign operations The assets and liabilities of foreign operations, including
goodwill and fair value adjustments arising on acquisition, are translated to rand at exchange rates at the reporting date. The income and expenses of foreign operations, excluding foreign operations in hyperinflationary economies, are translated to rand at the average exchange rate. The group does not have any foreign operations in hyperinflationary economies.
Foreign currency differences arising as a result of the above are recognised in other comprehensive income within foreign currency translation reserve.
2.5 Property, plant and equipment Land and buildings comprise mainly office, power station,
substation, workshop and related buildings.
Property, plant and equipment is stated at cost less accumulated depreciation and impairment losses. Cost includes:
• any costs directly attributable to bringing the asset to the location and condition necessary for it to be capable of operating in the manner intended by management
• the initial estimate of the costs of dismantling and removing the item and restoring the site on which it is located, the obligation for which an entity incurs either when the item is acquired or as a consequence of having used the item during a particular period for purposes other than to produce inventories during that period
• borrowing costs (refer note 2.7)
Costs may also include transfers from equity of any gains or losses on qualifying cash flow hedges of foreign currency purchases of property, plant and equipment.
Subsequent costs are included in the asset’s carrying amount or recognised as a separate asset, as appropriate, only when it is probable that future economic benefits associated with the item will flow to the group and the cost of the item can be measured reliably. The carrying amount of the replaced part is derecognised. All other repairs and maintenance are charged to profit or loss during the financial period in which they are incurred.
Works under construction are stated at cost which includes cost of materials and direct labour and any costs incurred in bringing it to its present location and condition. Materials used in the construction of property, plant and equipment are stated at weighted average cost.
Land is not depreciated. Depreciation on other assets is calculated using the straight-line method to allocate their cost to their residual values over their estimated useful lives, as follows:
Years
Buildings and facilities 10 to 40Plant – Generation 6 to 80
– Transmission 5 to 40– Distribution 10 to 35– Test, telecommunication and other plant 3 to 20
Equipment and vehicles 1 to 10
The depreciation method, residual values and useful lives of assets are reviewed, and adjusted if appropriate, at each reporting date.
Where parts of an item of property, plant and equipment have different useful lives, they are accounted for as separate items (major components) of property, plant and equipment.
Gains or losses on disposals are determined by comparing proceeds with the carrying amount. These gains or losses are included in profit or loss within other income or other operating expenses.
2.6 Intangible assets Goodwill Goodwill represents the excess of the cost of an acquisition
over the fair value of the group’s share of the net identifiable assets of the acquired subsidiary/associate/joint venture at the date of acquisition. Goodwill on acquisition of subsidiaries is included in intangible assets. Goodwill on acquisition of associates and joint ventures is included in investments in equity-accounted investees and is tested for impairment as part of the overall balance. Separately recognised goodwill is tested annually for impairment and carried at cost less accumulated impairment losses. Impairment losses on goodwill are not reversed. Gains or losses on the disposal of an entity include the carrying amount of goodwill relating to the entity sold.
Goodwill is allocated to cash-generating units for the purpose of impairment testing. The allocation is made to those cash-generating units or groups of cash-generating units that are expected to benefit from the business combination in which the goodwill arose. The group allocates goodwill to each business segment in each country in which it operates.
Licences Licences are shown at historical cost. Licences have a finite
useful life and are carried at cost less accumulated amortisation and impairment losses. Amortisation is calculated using the straight-line method to allocate the cost of licences over their estimated useful life.
191Eskom Holdings Limited
Integrated Repor t 2010
Computer software Acquired computer software licences are capitalised on
the basis of the costs incurred to acquire and bring to use the specific software. These costs are amortised over their estimated useful lives. If software is integral to the functionality of related equipment, then it is capitalised as part of the equipment.
Costs associated with developing or maintaining computer software programmes are recognised as an expense as incurred. Costs that are directly associated with the development of identifiable and unique software products controlled by the group, and that will probably generate economic benefits exceeding costs beyond one year, are recognised as intangible assets and amortised as above. Costs include employee costs incurred as a result of developing software and an appropriate portion of relevant overheads.
Rights Rights consist mainly of servitudes and rights of way under
power lines. Rights are not amortised as they have an indefinite useful life. A servitude right is granted to Eskom for an indefinite period. The life of the servitude will remain in force as long as the transmission or distribution line is used to transmit electricity.
A servitude will only become impaired if the line to which the servitude is linked is derecognised. In practice a derecognised line will be refurbished or replaced by a new line. The likelihood of the impairment of a servitude right is remote.
Concession assets Concession assets consist of rights to charge for the usage
of the infrastructure under service concession arrangements (refer note 19). Concession assets are capitalised on the basis of the cost of capital expenditure incurred in respect of service concession arrangements (which is the fair value at initial recognition), including borrowing costs on qualifying capital expenditures. Subsequent to initial recognition, the concession assets are measured at cost less accumulated amortisation and impairment losses. Concession assets are amortised over their estimated useful life, which is the concession period during which they are available for use.
Research and development Research expenditure is recognised as an expense as
incurred. Costs incurred on development projects (relating to the design and testing of new or improved products) are recognised as intangible assets when the following criteria are fulfilled:
• it is technically feasible to complete the intangible asset so that it will be available for use or sale
• management intends to complete the intangible asset and use or sell it
• there is an ability to use or sell the intangible asset • it can be demonstrated how the intangible asset will
generate probable future economic benefits • adequate technical, financial and other resources to
complete the development and to use or sell the intangible asset are available
• the expenditure attributable to the intangible asset during its development can be measured reliably
Research and other development expenditure that do not meet these criteria is recognised in profit or loss within other operating expenses. Development costs previously recognised as an expense are not recognised as an asset in a subsequent period. Capitalised development costs are recorded as intangible assets and amortised from the point at which the asset is ready for use on a straight-line basis over its useful life.
2.7 Capitalisation of borrowing costs Borrowing costs attributable to the construction of qualifying
assets are capitalised as part of the cost of these assets over the period of construction to the extent that the assets are financed by borrowings. The capitalisation rate applied is the weighted average of the borrowing costs applicable to the borrowings of the entities in the group unless an asset is financed by a specific loan, in which case the specific rate is used.
2.8 Service concession arrangements A service concession arrangement is an arrangement
involving an operator constructing and/or upgrading, operating and maintaining infrastructure used to provide a public service for a specified period of time. The operator is paid for its services over the period of the arrangement. The arrangement is governed by a contract that sets out performance standards, mechanisms for adjusting prices and arrangements for arbitrating disputes. The grantor (the party that grants the service arrangement) controls the infrastructure, and the operator is required to return to the grantor the infrastructure at the end of the arrangement.
Intangible asset The group recognises an intangible asset arising from a
service concession arrangement to the extent that it receives a right to charge for the usage of the concession infrastructure. Intangible assets received as consideration for providing construction services in a service concession arrangement are measured at fair value upon initial recognition. Subsequent to initial recognition, the intangible asset is measured at cost less accumulated amortisation and impairment losses.
192 Eskom Holdings Limited
Integrated Repor t 2010
Notes to the consolidated financial statements continuedfor the year ended 31 March 2010
2. Summary of significant accounting policies (continued)
2.8 Service concession arrangements (continued) Intangible asset (continued) Intangible assets arising from a service concession
arrangement are included within intangible assets under concession assets.
Financial asset The group recognises a financial asset arising from a service
concession arrangement to the extent that it has an unconditional right to receive cash or another financial asset from or at the direction of the grantor, for the construction, upgrade or operation services of concession assets. Financial assets recognised as a result of the service concession arrangement are measured at fair value upon initial recognition. Subsequent to initial recognition, the financial asset is accounted for in accordance with IAS 39 Financial Instruments: Recognition and measurement (refer note 2.11, non-derivative financial instruments).
Financial assets arising from a service concession arrangement are included within trade and other receivables under other receivables (refer note 17).
Construction or upgrade services The group accounts for revenue and costs relating to
construction or upgrade services in accordance with IAS 11 Construction contracts.
Operation services The group accounts for revenue relating to operation
services in accordance with IAS 18 Revenue.
Contractual obligations to maintain and restore the infrastructure
The group accounts for the contractual obligations to maintain or restore the infrastructure in accordance with IAS 37 Provisions, contingent liabilities and contingent assets. The provision to restore the infrastructure is included within provisions.
2.9 Leases A lease is an agreement whereby the lessor conveys to the
lessee, in return for a payment, or series of payments, the right to use an asset for an agreed period of time.
Finance leases – where the group is the lessee The group leases certain property, plant and equipment.
Leases of property, plant and equipment where the group has substantially all the risks and rewards of ownership are classified as finance leases. Finance leases are capitalised at the lease’s commencement at the lower of the fair value of the leased asset and the present value of the minimum lease payments.
Each lease payment is allocated between the liability and finance charges so as to achieve a constant rate on the finance balance outstanding. The corresponding rental obligations, net of finance charges, are included in other short-term and other long-term payables. The interest element of the finance cost is charged to profit or loss within finance cost over the lease period so as to produce a constant periodic rate of interest on the remaining balance of the liability for each period. The property, plant and equipment acquired under finance leases are depreciated or amortised over the shorter of the useful life of the asset and the lease term.
Finance lease liabilities are derecognised in accordance with the derecognition requirements for financial liabilities (refer note 2.11). Derivatives embedded in leases are accounted for in accordance with the requirements for embedded derivatives (refer note 2.11).
Cost plus coal contracts are treated as finance leases where the group is the lessee.
Finance leases – where the group is the lessor When property, plant and equipment are leased out under
a finance lease, the present value of the lease payments is recognised as a receivable. The difference between the gross receivable and the present value of the receivable is disclosed as unearned finance income within finance lease receivables.
Lease income is recognised over the term of the lease using the net investment method, which reflects a constant periodic rate of return.
Finance lease receivables are assessed for impairment and derecognised in accordance with the requirements for financial assets (refer note 2.11). Derivatives embedded in leases are accounted for in accordance with the requirements for embedded derivatives (refer note 2.11).
Premium power supplies are treated as finance leases where the group is the lessor.
Fair value The fair value of finance lease receivables and finance lease
liabilities is determined by discounting the future cash flows with respect to the finance lease at the interest rate implicit in the lease.
Operating leases Leases where substantially all of the risks and rewards of
ownership are not transferred to the group are classified as operating leases. Payments made under operating leases (net of any incentives received from the lessor) are charged
193Eskom Holdings Limited
Integrated Repor t 2010
to profit or loss within other operating expenses on a straight-line basis over the period of the lease.
Leases where substantially all of the risks and rewards of ownership are not transferred to the lessee (ie the group is the lessor) are classified as operating leases. Payments received under operating leases are recognised in profit or loss within other income on a straight-line basis over the period of the lease.
2.10 Impairment of non-financial assets Assets that have an indefinite useful life, for example land, are
not subject to amortisation or depreciation and are tested annually for impairment. Assets that are subject to amortisation or depreciation are reviewed for impairment whenever events or changes in circumstances indicate that the carrying amount may not be recoverable. An impairment loss is recognised for the amount by which the asset’s carrying amount exceeds its recoverable amount. The recoverable amount is the higher of an asset’s fair value less costs to sell and value in use. For the purposes of assessing impairment, assets are grouped at the lowest levels for which there are separately identifiable cash flows (cash-generating units). Non-financial assets other than goodwill that were subject to impairment are reviewed for possible reversal of the impairment at each reporting date. Impairment (loss)/reversal is recognised in profit or loss within net impairment (loss)/reversal.
2.11 Financial instruments2.11.1 Non-derivative financial instruments Recognition, measurement and derecognition of financial
assets Non-derivative financial assets comprise investment in
securities, financial instruments with group companies, financial trading assets, loans receivable, trade and other receivables, finance lease receivables and cash and cash equivalents.
Cash and cash equivalents comprise balances with local and international banks, monies in call accounts, short-term assets and money market assets with an original maturity of less than 90 days. Bank overdrafts are shown within borrowings in current liabilities on the statement of financial position.
All non-derivative financial assets are recognised on the date of commitment to purchase (trade date). Non-derivative financial assets are derecognised when the rights to receive cash flows from the investments have expired or the group has transferred substantially all the risks and rewards of ownership. Realised gains or losses on derecognition are determined using the FIFO (first in first out) method.
Non-derivative financial assets plus any directly attributable transaction costs are recognised initially at fair value. Directly
attributable transaction costs related to financial assets at fair value through profit or loss are recognised in profit or loss on initial recognition when incurred. Subsequent to initial recognition, non-derivative financial assets are measured per asset category (as stated below). The appropriate classification of the financial asset is determined at the time of commitment to acquire the financial asset.
When entering into a transaction, the financial instrument is recognised initially at the transaction price which is the best indicator of fair value. Where fair value of the financial instrument is different from the transaction price a day-one gain or loss may arise. The day-one gain or loss is immediately recognised in profit or loss (except for embedded derivatives and the subordinated loan from shareholder) within net fair value gain/(loss) on financial instruments, excluding embedded derivatives, provided that the fair value has been determined based on market-observable data.
Held-to-maturity investments Held-to-maturity investments are non-derivative financial
assets with fixed or determinable payments and fixed maturity that management has both the ability and intent to hold to maturity.
Subsequent to initial recognition, held-to-maturity invest-ments are measured at amortised cost using the effective interest method, less any accumulated impairment losses.
The amortised cost of a financial asset is the amount at which the financial asset is measured at initial recognition minus principal payments, plus or minus the cumulative amortisation using the effective interest method and minus any reduction for impairment or uncollectibility.
The effective interest rate is the rate that discounts the estimated future cash receipts of the financial asset exactly to its net carrying amount.
Financial assets at fair value through profit or loss An instrument is classified at fair value through profit or loss
if it is held-for-trading or is designated as such upon initial recognition. An instrument may only be designated at fair value through profit or loss when certain criteria are met. The group has elected not to designate financial assets at fair value through profit or loss.
A financial asset is classified as held-for-trading if it is: • acquired for the purpose of selling it in the short term • part of a portfolio of identified financial instruments that
is managed together and for which there is evidence of a recent pattern of short-term profit taking
• a derivative instrument

194 Eskom Holdings Limited
Integrated Repor t 2010
Notes to the consolidated financial statements continuedfor the year ended 31 March 2010
2. Summary of significant accounting policies (continued)
2.11 Financial instruments (continued)2.11.1 Non-derivative financial instruments (continued) Financial assets at fair value through profit or loss (continued) Subsequent to initial recognition, changes in the fair value of
these financial assets are recognised in profit or loss within net fair value gain/(loss) on financial instruments, excluding embedded derivatives.
Loans and receivables The trade and other receivables of the group are classified
as loans and receivables. Loans and receivables are non-derivative financial assets with fixed or determinable payments that are not quoted in an active market, other than:
• those that management intends to sell immediately or in the short term, which are classified as held-for-trading
• those that upon initial recognition are designated as available-for-sale
• those for which the group may not recover substantially all of its initial investment, other than because of credit deterioration, which shall be classified as available-for-sale
Subsequent to initial recognition, loans and receivables are measured at amortised cost using the effective interest method, less any accumulated impairment losses.
Available-for-sale assets Available-for-sale financial assets are those assets that are
designated as such or do not qualify to be classified as fair value through profit or loss, held-to-maturity or loans and receivables.
Subsequent to initial recognition, available-for-sale financial assets are measured at fair value and changes therein, other than impairment losses and foreign exchange gains and losses (for monetary items), are recognised in other comprehensive income within available-for-sale financial assets. When the asset is derecognised, the cumulative gain or loss in equity is transferred to profit or loss.
Fair value The fair values of trading assets, available-for-sale assets and
assets carried at amortised cost are based on quoted bid prices. For assets that are not quoted in an active market, valuation techniques are used. Where pricing models are used, inputs are based on market-related measures at the reporting date. Where discounted cash flow techniques are used, estimated future cash flows are based on management’s best estimates and the discount rate is a market-related rate for a financial asset with similar terms and conditions at the reporting date.
The fair value of trade and other receivables is estimated as the present value of future cash flows, discounted at the market rate of interest at the reporting date.
Impairment (held-to-maturity investments, loans and receivables)
A review for impairment indicators is carried out at each financial year end to determine whether there is any objective evidence that a financial asset not carried at fair value through profit or loss is impaired. A financial asset is considered to be impaired if objective evidence indicates that one or more events have had a negative effect on the estimated future cash flows of that asset. In the case of equity securities classified as available-for-sale, a significant or prolonged decline in the fair value of the security below its cost is considered to be an indicator that the securities are impaired.
An impairment loss in respect of a financial asset measured at amortised cost is calculated as the difference between its carrying amount and the present value of the estimated future cash flows discounted at the original effective interest rate. An impairment loss in respect of an available-for-sale financial asset is calculated by reference to its fair value.
Individually significant financial assets are tested for impairment on an individual basis. The remaining financial assets are assessed collectively in groups that share similar credit risk characteristics.
All impairment losses are recognised in profit or loss within net impairment loss. In the case of available-for-sale financial assets, the cumulative loss – measured as the difference between the acquisition cost and the current fair value, less any impairment loss on that financial asset previously recognised in profit or loss – is removed from other comprehensive income and recognised in profit or loss.
An impairment loss is reversed if the reversal can be related objectively to an event occurring after the impairment loss was recognised. For financial assets carried at amortised cost and available-for-sale financial assets that are debt securities, the reversal is recognised in profit or loss within net impairment loss. For available-for-sale financial assets that are equity securities, a subsequent increase in fair value is recognised directly in other comprehensive income.
Where an asset has been impaired, the carrying amount of the asset is reduced through an allowance account.
195Eskom Holdings Limited
Integrated Repor t 2010
Recognition, measurement and derecognition of financial liabilities
Non-derivative financial liabilities comprise debt securities issued, borrowings, financial instruments with group companies, financial trading liabilities, finance lease liabilities and trade and other payables.
Non-derivative financial liabilities are recognised initially at fair value plus any directly attributable transaction costs except for financial liabilities at fair value through profit or loss. Directly attributable transaction costs related to liabilities recognised at fair value through profit or loss are recognised in profit or loss on initial recognition when incurred. Subsequent to initial recognition, non-derivative financial liabilities are measured at amortised cost or fair value as per the relevant liability category (as described below).
All non-derivative financial liabilities are recognised on the date of commitment (trade date) and are derecognised when the obligation expires, is discharged or cancelled. Realised gains and losses are determined using the FIFO method.
Financial liabilities at fair value through profit or loss (held-for-trading)
An instrument is classified at fair value through profit or loss if it is held-for-trading or is designated as such upon initial recognition. An instrument may only be designated at fair value through profit or loss when certain criteria are met. The group has not elected to designate financial liabilities at fair value through profit or loss.
A financial liability is classified as held-for-trading if it is: • incurred principally for the purpose of selling or
repurchasing it in the near term • part of a portfolio of identified financial instruments that
is managed together and for which there is evidence of a recent pattern of short-term profit taking, or
• a derivative instrument
Subsequent to initial recognition, financial liabilities at fair value through profit or loss continue to be measured at fair value.
Financial liabilities at amortised cost Financial liabilities that are not held-for-trading are classified
as financial liabilities at amortised cost. Debt securities issued, including foreign loans, that are not held-for-trading are classified as held at amortised cost. Subsequent to initial recognition, these liabilities are measured at amortised cost using the effective interest method. The trade and other payables of the group are classified as financial liabilities at amortised cost.
Fair value The fair value of financial trading liabilities is based on quoted
offer prices. For liabilities that are not quoted in an active market, valuation techniques are used. Where pricing models are used, inputs are based on market-related measures at the reporting date. Where discounted cash flow techniques are used, estimated future cash flows are based on management’s best estimates and the discount rate is a market-related rate for a financial liability with similar terms and conditions at the reporting date.
2.11.2 Financial guarantees Recognition
Financial guarantees are contracts that require the group to make specified payments to reimburse the holder for a loss that may occur because a specified receivable fails to make payment when due in accordance with the terms of a debt instrument.
Financial guarantee liabilities are initially recognised at fair value, and the initial fair value is amortised over the life of the financial guarantee. The guarantee liability is subsequently carried at the higher of this amortised cost and the present value of any expected payment (when a payment under the guarantee has become probable). Financial guarantees are included within other liabilities.
Fair value Financial guarantees are valued initially by taking into account
discounted future cash flows adjusted according to the probability of occurrence of the trigger event. The resultant guarantee is raised as a liability, with the costs being charged to profit or loss. The unprovided portion is disclosed as a contingent liability. As a result of using discounted cash flows, interest rate risk may arise due to the possibility of the actual yields on assets being different from the rates assumed in the discounting process.
2.11.3 Derivative financial instruments and hedging activities
Recognition A derivative is a financial instrument whose value changes in
response to an underlying variable, requires little or no initial investment and is settled at a future date. All derivatives are classified as held-for-trading instruments, unless they meet the criteria for hedge accounting and have been designated for purposes of applying hedge accounting. Derivatives are initially recognised at fair value and re-measured subsequently at fair value. Fair values are obtained from quoted market prices, discounted cash flow models and options pricing models which consider current market and contractual prices for the underlying instruments as well as the time value of money.

196 Eskom Holdings Limited
Integrated Repor t 2010
Notes to the consolidated financial statements continuedfor the year ended 31 March 2010
2. Summary of significant accounting policies (continued)
2.11 Financial instruments (continued)2.11.3 Derivative financial instruments and hedging activities
(continued) Recognition (continued) All derivative instruments of the group are included in the
statement of financial position as derivatives held for risk management. Realised and unrealised gains or losses for derivatives used for economic hedging are recognised in profit or loss within net fair value gain/(loss) on financial instruments, excluding embedded derivatives. Realised and unrealised gains or losses for derivatives used for cash flow hedging are recognised in other comprehensive income within cash flow hedges.
Hedge accounting The method of recognising the resulting gain or loss on the
derivative depends on whether the derivative is designated as a hedging instrument, and if so, the nature of the item being hedged. Derivatives can be designated as:
• hedges of the fair value of recognised liabilities and assets (fair value hedge)
• hedges of a particular risk associated with a recognised liability, asset or a highly probable forecast transaction (cash flow hedge)
• hedges of a net investment in a foreign operation (net investment hedge)
The group applies only cash flow hedge accounting. The group documents, at the inception of the transaction,
the relationship between hedging instruments and hedged items, as well as its risk management objectives and strategy for undertaking various hedging transactions. The group also documents its assessment, both at hedge inception and on an ongoing basis, of whether the derivatives that are used in hedging transactions are highly effective in offsetting changes in fair values or cash flows of hedged items.
Movements on the hedging reserve are shown in other comprehensive income within cash flow hedges. The full fair value of a hedging derivative is classified as a non-current asset or liability when the remaining period of the hedged item is more than 12 months; it is classified as a current asset or liability when the remaining period of the hedged item is less than 12 months. Trading derivatives are classified as current assets or liabilities.
Cash flow hedges The effective portion of changes in the fair value of
derivatives that are designated and qualify as cash flow hedges is recognised in other comprehensive income within cash flow hedges. The gain or loss relating to the ineffective
portion and the forward points portion which is not designated (as part of the hedge) is recognised immediately in profit or loss within net fair value gain/(loss) on financial instruments, excluding embedded derivatives.
When the forecast transaction occurs, any cumulative gain or loss existing in equity at that time is included in the initial cost or other carrying amount of the asset or liability.
When a hedging instrument expires, is sold or a hedge no longer meets the criteria for hedge accounting, any cumulative gain or loss existing in equity at that time remains in other comprehensive income until the forecast transaction occurs. When a forecast transaction is no longer expected to occur, the cumulative gain or loss that was reported in equity is immediately transferred to profit or loss within the relevant expense category.
Economic hedging Certain derivative instruments do not qualify for hedge
accounting and are used for economic hedging. Changes in the fair value of these derivative instruments are recognised in profit or loss within net fair value gain or loss on financial instruments, excluding embedded derivatives.
2.11.4 Repurchase and resale agreements Securities sold subject to repurchase agreements are
disclosed in the financial statements as financial assets. The liability to the counterparty is recorded as repurchase agreements and is included in financial trading liabilities.
Securities purchased under agreements to resell are recorded as repurchase agreements and are included in financial trading assets.
The difference between the sale and repurchase price or purchase and resale price is treated as interest accrued over the life of the repurchase or resale agreement using the effective-yield method.
2.11.5 Embedded derivatives Recognition An embedded derivative is a component of a hybrid
(combined) instrument that also includes a non-derivative host contract, with the effect that some of the cash flows of the combined instrument vary in a way similar to those of a standalone derivative. An embedded derivative causes some or all of the cash flows that otherwise would be required by the contract to be modified according to a specified interest rate, financial instrument price, commodity price, foreign exchange rate, index of prices or rates, or other variable. The hybrid contract is the entire contract and the host contract is the main body of the contract excluding the embedded derivative.

197Eskom Holdings Limited
Integrated Repor t 2010
An embedded derivative is separated from the host contract and accounted for as a derivative if:
• the economic characteristics and risks of the embedded derivative are not closely related to the economic characteristics and risks of the host contract
• a separate instrument with the same terms as the embedded derivative would meet the definition of a derivative and
• the combined instrument is not measured at fair value with changes in fair value recognised in profit or loss
The determination of the host contract of an electricity contract (which includes an embedded derivative) is based on the standard electricity tariff specified in the contract and where no standard tariff is specified, the tariff that would normally apply to such a customer.
Fair value
Embedded derivatives are disclosed separately from derivatives held for risk management. The changes in fair value are included in net fair value gain/(loss) on embedded derivatives in profit or loss. The impact of the fair value gains or losses is taken into account in the calculation of current and deferred taxation.
Embedded derivatives that are not separated are effectively accounted for as part of the hybrid instrument.
Non-option based derivatives are separated on terms that result in a fair value at the date of inception of zero. Option-based derivatives are separated on the terms stated in the contracts and will not necessarily have a fair value equal to zero at the initial recognition of the embedded derivative resulting in day-one gains. These day-one gains or losses are spread equally over the period of the agreement. The fair value will depend on the strike price at inception.
The valuation at initial recognition is adjusted for cash flows since inception. The value of the embedded derivatives which involve a foreign currency is first determined by calculating the future cash flows and then discounting the cash flows by using the relevant interest rate curve and only then is the net present value of the cash flows converted at the relevant rand/foreign currency spot rate to the reporting currency.
The determination of the host contract of an electricity contract is based on the standard electricity tariff specified in the contract and where no standard tariff is specified, the tariff that would normally apply to such a customer.
The fair value of the embedded derivative is determined on the basis of its terms and conditions. If this is not possible, then the value of the embedded derivative is determined by
fair valuing the whole contract and deducting from it the fair value of the host contract.
Where there is no active market for the embedded derivatives, valuation techniques are used to ascertain their fair values. Financial models are developed incorporating valuation methods, formulae and assumptions. The valuation methods include the following:
• swaps: electricity tariff is swapped for a commodity in a foreign currency
• forwards: electricity tariff or other revenue or expenditure is based on a foreign currency
• options: electricity tariff or other revenue is based on an embedded derivative floor or cap on foreign consumer or production price indices or interest rates. The Monte Carlo simulation technique is used to produce various cap and floor strike prices
The fair value of embedded derivatives is adjusted, where applicable, to take into account the inherent uncertainty relating to the future cash flows of embedded derivatives such as liquidity, model risk and other economic factors.
The more important assumptions, which include the following, are obtained either with reference to the contractual provisions of the relevant contracts or from independent market sources where appropriate:
• spot and forward commodity prices • spot and forward foreign currency exchange rates • spot and forward interest rates • forecast sales volumes • spot and forward consumer and foreign production price
indices • spot and forward electricity prices • liquidity, model risk and other economic factors
2.12 Inventories Coal, maintenance spares and consumables Inventories are stated at the lower of cost and net realisable
value. Cost is determined on the weighted average basis and includes expenditure incurred in acquiring inventories, production and conversion costs and other costs incurred in bringing inventory to present location and condition.
Nuclear fuel Nuclear fuel is stated at the lower of cost and net realisable
value. Cost is determined on the FIFO basis. Nuclear fuel consists of raw materials, fabricated fuel assemblies and fuel in reactors.
Net realisable value is the estimated selling price in the ordinary course of business, less applicable variable selling expenses. Costs of inventories include the transfer from equity of any gains/losses on qualifying cash flow hedges relating to purchases of raw materials.

198 Eskom Holdings Limited
Integrated Repor t 2010
Notes to the consolidated financial statements continuedfor the year ended 31 March 2010
2. Summary of significant accounting policies (continued)
2.13 Future fuel supplies Coal Non-refundable advances to suppliers, together with related
borrowing costs thereon, are deferred in the statement of financial position within future fuel supplies and amortised against the cost of coal supplied on the basis of the estimated life of the asset procured by the suppliers.
Repayable advances to suppliers are capitalised, and the related interest earned is credited to profit or loss within finance income and the refunds are repaid in terms of the agreements.
Nuclear Fuel assemblies in the process of fabrication are stated at
cost within future fuel supplies, which includes the non-refundable advance payments made in terms of the agreement. Hedge accounting is applied to foreign exchange contracts entered into with respect to the purchase of nuclear fuel, with the effective portion being capitalised during the fabrication period. Advance payments in terms of agreements are capitalised.
2.14 Share capital Ordinary shares are classified as equity.
2.15 Equity reserve The subordinated loan from the shareholder is held at
amortised cost. The market value of the loan at inception is calculated for each tranche utilising the expected cash flows which are discounted at market rates to determine the effective interest rates. The effective interest rates for each tranche remain constant over the life of the loan tranche. The future cash flows are re-assessed annually and the loans are remeasured at each reporting period. Although the loan is interest bearing, the interest payment terms could potentially be favourable and are dependent on the liquidity and gearing of Eskom. The change in the loan value with respect to interest amortised and the remeasurement is reflected in the profit or loss in finance cost and is eligible for capitalisation as borrowing costs.
2.16 Income tax Income tax expense comprises current and deferred tax.
Income tax expense is recognised in profit or loss except to the extent that it relates to items recognised in other comprehensive income, in which case it is recognised in other comprehensive income.
Current tax is expected tax payable on taxable income for the year, using tax rates enacted or substantively enacted at the reporting date, and any adjustment to tax payable in respect of previous years.
2.17 Deferred tax Deferred tax is recognised, using the statement of financial
position method, on temporary differences arising between the tax bases of assets and liabilities and their carrying amounts in the financial statements. Deferred tax is not accounted for if it arises from initial recognition of an asset or liability in a transaction other than a business combination that at the time of the transaction, affects neither accounting nor taxable profit or loss. However, deferred tax is provided in respect of the temporary differences arising on the assets and provisions created in respect of decommissioning and nuclear waste management and closure, pollution control and rehabilitation. Deferred tax is determined using tax rates (and laws) enacted or substantively enacted at the reporting date and that are expected to apply when the related deferred tax asset is realised or the deferred tax liability is settled.
Deferred tax assets are recognised to the extent that it is probable that future taxable profit will be available against which the temporary differences can be utilised. Deferred tax assets are reviewed at each reporting date and reversed if it is no longer probable that the related tax benefits will be realised.
Deferred tax is provided on temporary differences arising on investments in subsidiaries and associates, except where the timing of the reversal of the temporary difference is controlled by the group and it is probable that the temporary difference will not reverse in the foreseeable future.
2.18 Payments received in advance Payments received in advance consist mainly of upfront
capital contributions for the construction of assets and funding for electrification. From 1 July 2009, upfront capital contributions are recognised in profit or loss within other revenue, excluding electricity revenue when the customer is connected to the electricity network.
2.19 Deferred income Cross-border leases Income realised on cross-border lease transactions is
deferred. This income is recognised over the period that Eskom is exposed to the risk of a cancellation event on the contract and is allocated to profit or loss on the same basis as the risk exposure profile.
Grants Government grants received relating to the creation of
electrification assets are included in non-current liabilities as deferred income and are credited to profit or loss within depreciation and amortisation expense on a straight-line basis over the expected useful lives of the related assets when these assets have been placed in commercial operation.
199Eskom Holdings Limited
Integrated Repor t 2010
Government grants which become receivable as compensation for expenses or losses already incurred, or for the purpose of giving immediate financial support to the entity with no future related costs are recognised in profit or loss within other income for the period in which they become receivable.
Capital contributions received from customers Contributions paid in advance by electricity customers
relating to the construction of regular distribution and transmission assets (with a standard supply) are credited to profit or loss within other revenue, excluding electricity revenue on a straight-line basis over the expected useful lives of the related assets when these assets have been placed in commercial operation up to 30 June 2009. From 1 July 2009 the contributions paid in advance are credited to profit or loss within other revenue, excluding electricity revenue when the customer is connected to the electricity network (refer note 2.18).
2.20 Insurance contracts The group, through its subsidiary – Escap Limited (Escap),
issues contracts that transfer insurance risk. An insurance contract is one under which one party (the insurer) accepts significant insurance risk from another party (the policyholder) by agreeing to compensate the policyholder or other beneficiary, if a specified uncertain future event (the insured event) adversely affects the policyholder or other beneficiary. The group insures accident and health, engineering, guarantee, liability, motor, property, transportation and miscellaneous classes of short-term insurance business.
At each reporting date, liability adequacy tests are performed to ensure the adequacy of the claims liabilities. In performing these tests, current best estimates of future contractual cash flows and claims handling and administration expenses are used. Where a shortfall is identified an additional provision is made and the company recognises the deficiency in profit or loss.
Contracts are entered into with reinsurers, under which the group is compensated for losses on one or more contracts issued by it and that meet the classification requirements for insurance contracts. The benefits to which Escap is entitled under its reinsurance contracts held are recognised as reinsurance assets in the statement of financial position. Amounts recoverable are dependent on the expected claims and benefits arising under the related reinsured insurance contracts. Amounts due from or due to reinsurers are measured consistently with the amounts associated with the reinsured insurance contracts and in accordance with the terms of each reinsurance contract. Reinsurance liabilities are primarily premiums payable for reinsurance contracts and are recognised as an expense when due. Reinsurance
assets and liabilities are recognised initially at fair value and subsequently measured at amortised cost using the effective interest method, less provision for impairment.
A full contingency reserve of 10% of net premium income is maintained in Escap Limited in terms of the Short-term Insurance Act, 53 of 1998.
2.21 Employee benefits Annual and performance bonus The group recognises a liability for annual and performance
bonuses. A liability for annual bonuses is accrued on a proportionate basis as services are rendered. A provision for performance bonus is raised on the estimated amount payable in terms of the incentive scheme which is based on the employee’s performance in the applicable year.
Occasional and service leave The group recognises a liability for occasional and service
leave as the leave is of a long-term nature. An actuarial valuation is performed on an annual basis for occasional and service leave. The accrued liabilities are determined by valuing all future leave expected to be taken and payments expected to be made in respect of benefits up to the valuation date. Allowance has been made in the calculations for the assumed benefit options employees will exercise, as well as salary increases and investment returns up to the date the benefit is received. All actuarial gains or losses and past service costs are recognised immediately in profit or loss within employee benefit expense. The present values of the benefit are determined by using the yield of long-dated corporate bonds (or government bonds where high-quality corporate bonds are not available).
Pension obligations Retirement benefits are provided for employees through the
Eskom Pension and Provident Fund. Contributions to the fund are based on a percentage of pensionable emoluments and are expensed in the period in which they are incurred.
Post-retirement medical aid obligations The liability for post-retirement medical aid is the present
value of the obligation by using long-dated corporate bonds (or government bonds where high-quality corporate bonds are not available) which have maturities similar to the liability. Provision is made by accounting, through profit or loss, for the estimated cost over the expected period to retirement of the employees. The cost to the employer, in the form of employer contributions, is determined by using the projected unit credit method, with actuarial valuations being carried out at reporting date. Actuarial gains or losses are recognised in other comprehensive income within net actuarial gain or loss on post-retirement medical aid benefits immediately. No deferred recognition mechanism is applied.

200 Eskom Holdings Limited
Integrated Repor t 2010
Notes to the consolidated financial statements continuedfor the year ended 31 March 2010
2. Summary of significant accounting policies (continued)
2.21 Employee benefits (continued) Post-retirement medical aid obligations (continued) The entitlement to these benefits is usually conditional on
the employee remaining in service up to retirement. All employees qualify for post-retirement medical aid, except for new employees appointed on or after 1 June 2003 at a managerial level.
2.22 Provisions Provisions are recognised when the group has a present
legal or constructive obligation as a result of a past event, when it is probable that an outflow of resources will be required to settle the obligation and when the amount can be reliably estimated. Provisions are not recognised for future operating losses.
Provisions are determined by discounting the expected future cash flows using a pre-tax discount rate that reflects current market assessments of the time value of money and, where appropriate, the risks specific to the liability. The increase in the provision due to the passage of time is recognised as finance cost.
The provisions below are restated on an annual basis to
reflect changes in measurement that result from changes in the estimated timing or amount of the outflow of resources embodying economic benefits required to settle the obligation, or a change in discount rate, which shall be accounted for as follows:
• changes in the liability shall be added to, or deducted from, the cost of the related asset in the current period
• the amount deducted from the cost of the asset shall not exceed its carrying amount. The excess shall be recognised in profit or loss
• any additions to the cost of an asset shall be reviewed in terms of the normal impairment principles
Decommissioning and nuclear waste management Nuclear and other generation plant A provision is raised for the estimated decommissioning
cost of nuclear and other generation plant and capitalised to the cost of nuclear or other generation plant when it is commissioned. The estimated cost of decommissioning at the end of the productive life of plant is based on engineering estimates and reports from independent experts. Decommissioning costs capitalised to the cost of nuclear or other generation plant is written off on a straight-line basis over the estimated useful life of the plant.
Spent nuclear fuel A provision is raised, over the life of the plant, for the
management of spent nuclear fuel assemblies and radioactive
waste. The charge to profit or loss is based on the latest available cost information and is included in primary energy.
Closure, pollution control and rehabilitation Expenditure on property, plant and equipment for pollution
control is capitalised and depreciated over the useful lives of the assets. The cost of current ongoing programmes to prevent and control pollution and to rehabilitate the environment is charged to profit or loss within primary energy as incurred, unless a present legal or constructive obligation exists to recognise such expenditure, in which case a provision is created based on the best estimates available.
A provision is raised for the estimated cost of closure, pollution control and rehabilitation during and at the end of the life of the mines where a legal or constructive obligation exists to pay coal suppliers. Closure, pollution control and rehabilitation costs capitalised are written off over the estimated useful life of the power station.
Service concession arrangements A provision is raised for contractual obligations to maintain
and restore the infrastructure (refer note 2.8). These contractual obligations to maintain or restore infrastructure, except for any upgrade element, are recognised and measured at the best estimate of the expenditure that would be required to settle the present obligation at the end of the reporting period.
2.23 Revenue recognition Revenue comprises the fair value of the consideration
received or receivable for the sale of goods and services in the ordinary course of the group’s activities. Revenue is shown, net of value added tax, estimated returns, rebates and discounts, but includes the 2c/kWh environmental levy introduced from 1 July 2009.
The group recognises revenue when the amount of revenue can be reliably measured, it is probable that future economic benefits will flow to the entity and specific criteria have been met for each of the group’s activities as described below. The amount of revenue is not considered to be reliably measured until all contingencies relating to the sale have been resolved. The group bases its estimates on historical results, taking into consideration the type of customer, the type of transaction and the specifics of each arrangement.
Revenue is recognised as follows: Sale of goods Sale of goods is recognised when significant risks and
rewards of ownership have passed and the collectibility of the related receivable is reasonably assured.
Electricity revenue is recognised when electricity is consumed by the customer.
201Eskom Holdings Limited
Integrated Repor t 2010
Sale of services Sale of services is recognised in the reporting period in
which the services are rendered, by reference to the stage of completion of the specific transaction assessed on the basis of the actual service provided as a proportion of the total services to be provided.
Other revenue Other revenue is recognised when the significant risks and
rewards of ownership are transferred to the buyer and the amount of revenue can be measured reliably.
Construction contracts Contract revenue includes the initial amount agreed in the
contract plus any variations in contract work to the extent that it is probable that they will result in revenue and can be measured reliably. As soon as the outcome of a construction contract can be estimated reliably, contract revenue is recognised in profit or loss within other revenue, excluding electricity revenue in proportion to the stage of completion of the contract.
The stage of completion is assessed by reference to the
contract costs incurred to the reporting date as a percentage of total estimated costs for each contract. When an outcome of a construction contract cannot be estimated reliably, contract revenue is recognised only to the extent of contract costs incurred that are likely to be recoverable. An expected loss on a contract is recognised immediately in profit or loss.
Service concession arrangements Revenue relating to construction or upgrade services under
a service concession arrangement (refer note 2.8) is recognised based on the stage of completion of the work performed, consistent with the group’s accounting policy on recognising revenue on construction contracts.
Operation or service revenue is recognised in the period in
which the services are provided by the group. When the group provides more than one service in a service concession arrangement the consideration received is allocated by reference to the relative fair values of the services delivered.
2.24 Finance income Finance income comprises interest receivable on loans,
advances, trade receivables, finance lease receivables and income from financial market investments. Interest income is recognised as it accrues in profit or loss, using the effective interest method.
2.25 Finance cost Finance cost comprises interest payable on borrowings and
interest resulting from the unwinding of discount on liabilities. Borrowing costs which are not capitalised (refer note 2.7) are recognised in profit or loss using the effective interest method.
2.26 Dividend income Dividend income is recognised when the right to receive
payment is established.
2.27 Dividend distribution Dividend distribution to the shareholder is recognised as a
liability in the financial statements of the group in the period in which the dividends are approved by the shareholder.
2.28 Non-current assets and liabilities held-for-sale Assets and liabilities which meet the definition of held-for-
sale under IFRS 5 Non-current assets held-for-sale and discontinued operations, except for assets excluded from the scope of IFRS 5 for measurement purposes, are stated at the lower of their carrying amount and fair value less costs to sell if their carrying amount is recovered principally through a sale transaction rather than through continuing use.
3. Financial risk management The group has an integrated risk management framework.
The group’s approach to risk management is based on risk governance structures, risk management policies, risk identification, measurement and reporting. Three types of risks are reported as part of the risk profile, namely operational, strategic and business continuity risks. Operational risks are events, hazards, variances or opportunities which could influence the achievement of Eskom’s compliance and operational objectives. For Eskom, a strategic risk is a significant unexpected or unpredictable change or outcome beyond what was factored into the organisation’s strategy and business model which could have an impact on the group’s performance. Business continuity risks are those events, hazards, variances and opportunities which could influence the continuity of Eskom. One of the key risks for Eskom, identified both under the operational and strategic risk categories, is the financial sustainability of Eskom. The financial risks, as defined by IFRS 7 Financial instruments: Disclosures, and the management thereof, form part of this key risk area. For more information on risk, refer to page 292 in the Corporate governance report and page 18 in the Sustainability reporting in Eskom section.
202 Eskom Holdings Limited
Integrated Repor t 2010
Notes to the consolidated financial statements continuedfor the year ended 31 March 2010
3. Financial risk management (continued) The board of directors (the board) has delegated the
management of enterprise-wide risk to the risk management committee which operates through various subcommittees. One of the committee’s objectives is to ensure that the group is not unduly exposed to financial risks. Most of the financial risks arising from financial instruments are managed in the centralised treasury function of the group, except for instruments such as trade and finance lease receivables and trade and finance lease payables which are managed by the other divisions and subsidiaries.
The group’s exposure to risk, its objectives, policies and processes for managing the risk and the methods used to measure it have been consistently applied in the years presented, unless otherwise stated.
The exposure of the centralised treasury function to the major financial risks is unique to its activities and therefore different to those of the divisions and subsidiaries within the Eskom group. A distinction is therefore made between the treasury department and other divisions and subsidiaries in the group in respect of financial risk management where relevant.
The group has exposure to the following risks as a result of its financial instruments:
• credit risk (refer note 3.1) • market risk (refer note 3.2) • liquidity risk (refer note 3.3)
3.1 Credit risk Credit risk is the risk of financial loss to the group if a
customer or other counterparty (including government and financial institutions) to a financial instrument fails to meet its contractual obligations. Credit risk arises primarily from the sale of goods and services in the ordinary course of business and the centralised treasury activities. Credit risk includes counterparty risk and delivery or settlement risk.
Counterparty risk is the risk that a counterparty is unable to meet its financial and/or contractual obligations during the period of a transaction. Delivery or settlement risk is the risk that a counterparty does not deliver on its contractual commitment on maturity date (including the settlement of money and delivery of securities).
3.1.1 Management of credit risk Financial instruments managed by the treasury function Credit risk arises from cash and cash equivalents, investment
in securities, derivatives held for risk management, financial trading assets and deposits made with counterparties. Processes are in place to identify, measure, monitor, control and report credit risk. The objective of Eskom’s credit risk management framework is firstly to protect cash and
investments and, secondly to project and maximise the rate of return of financial market investments.
Responsibility and governance The treasury credit risk committee, a subcommittee of the
risk management committee, manages counterparty credit risk which arises from the treasury activities in the financial markets. This committee is chaired by the finance director and reports on a quarterly basis to the risk management committee. The activities of the committee are guided by the terms of reference that are updated and approved by the risk management committee.
The terms of reference set out the minimum acceptable
standards to be adhered to by those responsible for credit-related transactions within the treasury department. The terms of reference are aligned to the Exco credit risk governance standards and are supplemented by appropriate policies and procedures.
The committee: • assesses the credit quality of counterparties and types of
instruments used • approves credit limits • facilitates and manages the issuing of financial guarantees
by the group • ensures that transactions with counterparties are
supported by trading agreements, where applicable • approves methodologies used for the management of
counterparty exposure The senior credit risk adviser in the risk assessment division
provides feedback on all treasury credit risk-related matters to the treasury management, finance director, treasury credit risk committee and risk management committee.
The management of credit risk is governed by the following policies:
• trading in financial instruments is conducted and entered into with selected counterparties after credit limits have been authorised. Individual risk limits are set based on internal and external ratings in line with limits set by the board. All credit limits are approved by the treasury credit risk committee. The use of credit limits is regularly monitored
• only banks and financial institutions with an independent minimum rating of A1 are accepted. If there are no independent ratings, the credit quality of the counterparty is assessed, taking into account its financial position, past experience and other factors
• all exposures are mark-to-market. Transaction or close-out netting takes place in accordance with the terms and conditions of the underlying trading agreements
• minimum credit-rating requirements for financial institutions are maintained to assess the risk categories by

203Eskom Holdings Limited
Integrated Repor t 2010
rating class and to ascertain the probability of default inherent in each rating class
• approved concentration risk parameters and collateral management procedures are in place
Concentration of credit risk is managed by setting credit risk limits at a counterparty-specific level. Concentration credit risk limits are used as second tier limits in relation to counterparty credit limits. Counterparty-specific exposure is monitored against a set concentration of credit risk limits in relation to the total credit risk exposure to all counterparties.
Credit risk measurement, monitoring and reporting Risk is measured by determining a default probability per
counterparty (expressed through an internal risk rating) which is then applied to the market value of the investment placed to determine the capital at risk.
The treasury department’s policies and practices are designed to preserve the independence and integrity of decision making and ensure credit risks are accurately assessed, properly approved, continually monitored and actively managed.
Aggregate credit exposure, hold-limit exceptions and risk profile changes are reported to Exco and the risk management committee on a quarterly basis. There is regular detailed reporting of limit utilisation, limit breaches and customer concentrations to ensure these are appropriately managed and monitored.
Impairment assessments are performed to evaluate the credit risk exposure. The assessments focus on the following areas:
• significant financial difficulty of the issuer or counterparty • high probability of bankruptcy • breach of contract
Financial instruments managed by other divisions and subsidiaries
(a) Electricity receivables Eskom supplies electricity to customers in its licensed
areas of supply. A large proportion of the residential customers are on a prepaid basis.
Eskom’s exposure to credit risk is influenced by the individual characteristics of each customer. In monitoring credit risk, customers are grouped according to their credit characteristics, including whether they are large or small power users, geographic location, ageing profile, security (deposits and guarantees) held and payment history.
The main classes of electricity receivables are international, local large and local small power users.
Electricity supply agreements are entered into with key international customers who comprise utility companies and governments of neighbouring countries. These customers are not required to provide any security unless they default on their payment terms.
Key large power users comprise mainly South African commercial, industrial and mining customers. Some key large power users are not required to provide any security if they have an acceptable credit rating from an approved rating agency. New customers are required to provide security equivalent to the value of three months’ estimated consumption. Existing customers are required to provide security to the value of three months’ consumption if they default on their payment terms.
Non-key customers (other than large power users and small power users) are required to provide security equivalent to between one to three months’ consumption at the commencement of the supply agreement. The level of security is reviewed when a customer defaults on their payment obligation or requires additional electricity supply capacity in which case they are required to either provide security or increase their existing security to an amount equivalent to between one to three months’ of recent consumption before supply will commence. Redistributors are not required to provide any security and are currently re-evaluated based on their payment history to determine if any security is necessary. Eskom is currently developing a municipal model to manage any associated risk exposure.
Payment terms vary between customer classes as follows:
• key international customers: 10 to 45 days • key and other large power users:
individually negotiated up to a maximum of 15 days • small power users: 30 days
Interest is charged at market-related rates on balances in arrears.
The group has well-established credit control procedures that monitor activity on customer accounts and allow for remedial action should the customer not comply with payment terms. These procedures include an internal collection process, follow up with the customer either telephonically or in person, negotiations of mutually acceptable payment arrangements and the issue of a notice of disconnection of supply and letters of demand. Non-payment will result in disconnection of supply and the customer’s account being closed. The legal collection process is pursued thereafter.
204 Eskom Holdings Limited
Integrated Repor t 2010
Notes to the consolidated financial statements continuedfor the year ended 31 March 2010
3. Financial risk management (continued)3.1 Credit risk (continued)3.1.1 Management of credit risk (continued) Financial instruments managed by other divisions and
subsidiaries (continued) (a) Electricity receivables (continued) The decision to impair overdue amounts is assessed on
the probability of recovery based on the customer’s credit risk profile.
Progress on the collection process is reviewed on a regular basis and if it is evident that the amount will not be recovered, it is recommended for write-off in terms of the Eskom policy and delegation of authority. The process of recovery continues unless it is confirmed that there is no prospect of recovery or the costs of such action will exceed the benefits to be derived. Amounts written off are determined after taking into account the value of the security held.
The total cumulative allowance for impairment for electricity receivables at 31 March 2010 was R2,15 billion (2009: R2,69 billion) (refer note 3.1.2(a)). A substantial portion relates to outstanding debt in problematic areas. The collection of revenue from small power users in Soweto remains a challenge. The enhancement of credit control strategies and monitoring of payment levels in this area continue to receive management attention. The payment levels from these customers, expressed as a percentage of billed revenue, was 32% (2009: 33%).
Eskom is currently testing the strategy of secured split metering and debt recovery via prepayment as a key approach to minimise the risk of non-collection. Significant stakeholder and political support at local and national government level is required to ensure the successful rollout of this new strategy going forward.
In addition, the following strategies are currently in operation and are largely successful in other high-risk areas of non-paying customers. These include:
• disconnections • conversion to prepayment • increased internal debt management capacity • use of debt collectors • payment arrangements • focus on early identification and letters of demand • increased securities • efficient internal process, for example system
automation of credit and collections such as automated notices and letters of demand
(b) Other trade receivables Eskom Enterprises (Pty) Limited provides plant life-
cycle support, plant maintenance work, network protection and measurement mainly to Eskom. Credit exposure is managed, among others, by setting credit limits which are reviewed and approved by management on a regular basis. Ongoing credit evaluations are performed on the financial position of debtors. Interest is charged on balances in arrears. In the event of default, a collection process is initiated. Impairment is considered on an individual account basis. Debtors are considered to be impaired when alternative collection methods to recover outstanding debt has failed.
(c) Other receivables Other receivables include recoverable work, employee
debtors, inter-group balances (company only) and sundry debtors.
Recoverable work is mainly project work carried out by Eskom on behalf of external parties. The projects include repairing damaged power lines, moving of power lines or underground cables and engineering-related work.
(d) Finance lease receivables Finance lease receivables mainly comprise premium
power supply contracts. The supply of electricity to customers may be either in the form of standard or premium power supply.
A standard supply is the least-cost technically acceptable solution as defined in the Distribution Network Code whereas the premium power supply is where the customer’s requirement exceeds the specifications of a standard supply. Premium supply customers may already have a standard supply from Eskom but wish to reserve dedicated additional equipment to provide a backup supply. This is achieved through the installation of dedicated premium supply equipment for which the customer is required to pay the full capital costs.
Connection charges for premium supply contracts can be repayable on a monthly basis over a maximum period of 25 years.
The credit risk exposure resulting from premium supply contracts is managed in a similar manner as for the standard supply contracts. Security is required from customers for premium supply assets which covers irrecoverable costs in the event of the early termination of the supply contract. Premium supply customers

205Eskom Holdings Limited
Integrated Repor t 2010
have maintained a good payment history with Eskom over the years. The standard payment terms are also applicable to the connection charge relating to the premium supply equipment which is billed monthly to the customer.
(e) Insurance activities Escap Limited (Escap), a 100% subsidiary of Eskom,
acts as the primary insurer for the group. It insures the accident and health, engineering liability, motor, property, transportation and miscellaneous classes of the short-term insurance business. It also insures motor vehicles in terms of Eskom’s employee vehicle allowance scheme.
Escap self-insures the group up to agreed limits by risk category whereafter the risks are covered by the reinsurance market.
Reinsurers The creditworthiness of reinsurers is regularly assessed
by the Escap risk management committee, especially prior to finalisation of any contract. Minimum credit ratings and credit limits per counterparty are set. The major reinsurers used during the financial year had market security ratings of A- or higher (based on Standard and Poor’s ratings). Although there was a write-off of R6,7 million in the prior year, Escap has not experienced any other write-offs in the past three years, and management is confident that the group’s exposure in respect of the possibility of default by its reinsurers remains minimal.
(f) Loans receivable Home and personal loans are made available to
employees in the group via Eskom Finance Company (Pty) Limited (EFC). Credit risk policies are in place which require various criteria to be met prior to the approval of a loan. These criteria include the valuation of property, affordability and credit history of the employee.
The amounts advanced are secured by first mortgages over the property purchased and are repayable over an average period of up to 26 years. The risk of default by the employee is reduced as the monthly instalments are deducted from the employee’s salary. Employees who are no longer in the employ of the group are required to arrange for a monthly debit order to settle the monthly instalment. Loans are not extended where the purchase price of the property exceeds its open market value. The weighted average
individual loan amount as a percentage of the total home loan book at 31 March 2010 was 0,01% (2009: 0,01%).
In the event of default, the debtor is notified verbally and in writing. If payment has not been received for a period exceeding three months, a process to foreclose on the loan is initiated and the property is sold by public auction or repossessed. Should the property be sold by public auction, a reserve value is set that takes into account the value of the property, arrear rates and taxes, legal costs and commissions payable. If the reserve value is not achieved, the property is repossessed and is held for resale.
EFC entered into a securitisation arrangement with
Nqaba Finance 1 (Pty) Limited (Nqaba), a special-purpose entity. The securitising of the home loan book converted the loan assets into marketable securities traded on the South African Bond Exchange. The special purpose entity is consolidated in the annual financial statements of the EFC group. EFC is the preferential shareholder of Nqaba which entitles it to all the residual profits (residual cash after priority payments).
EFC provides a first-loss credit enhancement loan equal to 2% of the notes in issue which bears interest at 30% per annum. At 31 March 2010 the loan was R63 million (2009: R39 million). As servicer of Nqaba, EFC earns a servicing fee equal to 0,35% of the quarterly outstanding loan book balance. At the end of the financial year, the net asset value of Nqaba was R16 million (2009: R26 million).

206 Eskom Holdings Limited
Integrated Repor t 2010
Notes to the consolidated financial statements continuedfor the year ended 31 March 2010
3. Financial risk management (continued)
3.1 Credit risk (continued)
3.1.2 Credit exposure
The carrying amount of financial assets represents the maximum credit exposure at the reporting date (refer note 13). The following table represents an analysis per credit rating level (as determined by rating agencies) of the credit risk of financial assets, except for embedded derivatives, trade and other receivables and financial instruments with group companies.
Investment in securities Financialtrading assets
Rm
Cash andcash
equivalents
Rm
Derivativesheld for risk
management
Rm
Finance lease
receivables
Rm
Held-to-maturity
Rm
Loans andreceivables
Rm
Available-for-sale
Rm
2010GroupAAA – – 1 934 5 022 – – –AA – – – – 1 – –A1+ – – 2 137 1 078 7 915 104 –A1 – 549 – – 7 267 8 –A2 – – – – – – 4 Unrated – 569 – 4 358 – 541
– 1 118 4 071 6 104 15 541 112 545
CompanyAAA – – 1 934 5 022 – – –AA – – – – 1 – –A1+ – – 1 024 527 7 857 104 –A1 – 549 – – 6 783 8 –A2 – – – – – – 4 Unrated – – – 4 230 – 541
– 549 2 958 5 553 14 871 112 545
2009GroupAAA – – 1 873 – 394 – –AA+ – – – – – – 4 AA – – – – 1 – –AA- – – – – – – 3 A+ – – – – 381 – –A1+ – – 3 109 517 12 216 1 555 –A1 104 2 427 – 407 5 378 282 –BBB- – – – – – – 9 Unrated – 405 – – 12 – 531
104 2 832 4 982 924 18 382 1 837 547
CompanyAAA – – 1 873 – 394 – –AA+ – – – – – – 4 AA – – – – 1 – –AA- – – – – – – 3 A+ – – – – – – –A1+ – – 2 069 155 12 144 1 555 –A1 104 2 427 – 407 5 378 282 –BBB- – – – – – – 9 Unrated – – – – 4 – 531
104 2 427 3 942 562 17 921 1 837 547
No credit limits were exceeded during the reporting period, nor does management expect any losses from non-performance by these counterparties.
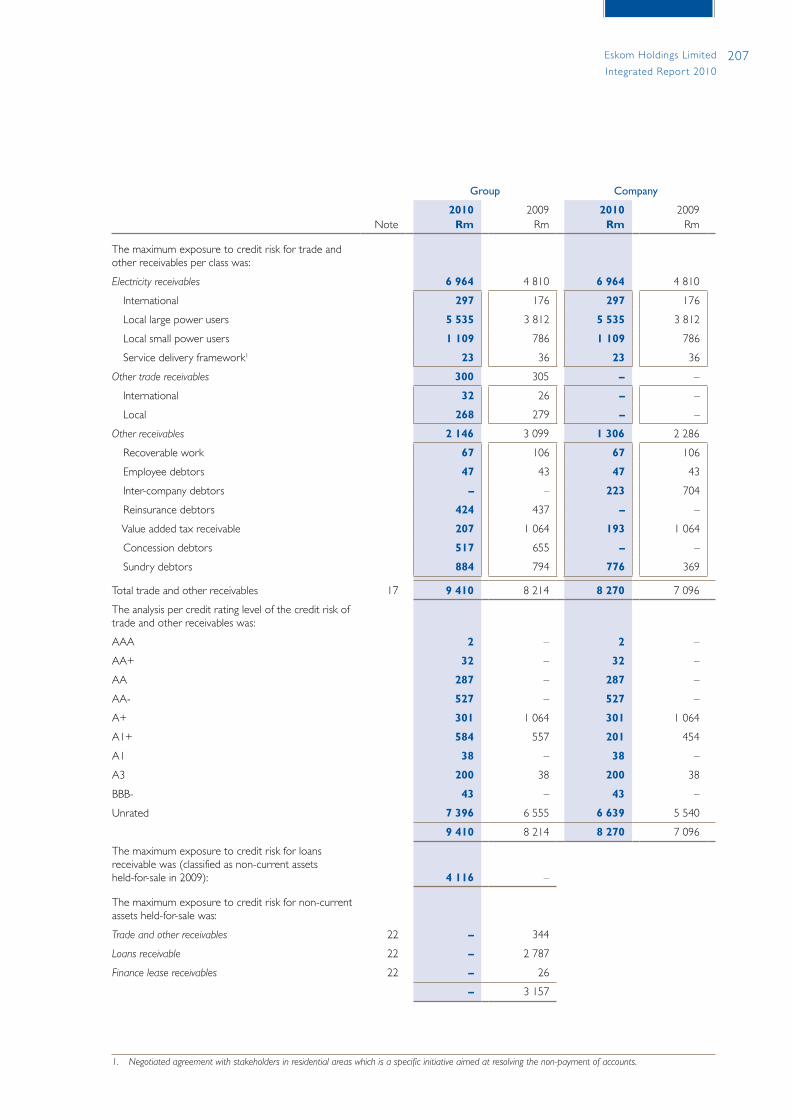
207Eskom Holdings Limited
Integrated Repor t 2010
Group Company
Note2010
Rm 2009
Rm 2010
Rm 2009
Rm
The maximum exposure to credit risk for trade and other receivables per class was:
Electricity receivables 6 964 4 810 6 964 4 810
International 297 176 297 176
Local large power users 5 535 3 812 5 535 3 812
Local small power users 1 109 786 1 109 786
Service delivery framework1 23 36 23 36
Other trade receivables 300 305 – –
International 32 26 – –
Local 268 279 – –
Other receivables 2 146 3 099 1 306 2 286
Recoverable work 67 106 67 106
Employee debtors 47 43 47 43
Inter-company debtors – – 223 704
Reinsurance debtors 424 437 – –
Value added tax receivable 207 1 064 193 1 064
Concession debtors 517 655 – –
Sundry debtors 884 794 776 369
Total trade and other receivables 17 9 410 8 214 8 270 7 096
The analysis per credit rating level of the credit risk of trade and other receivables was:
AAA 2 – 2 –
AA+ 32 – 32 –
AA 287 – 287 –
AA- 527 – 527 –
A+ 301 1 064 301 1 064
A1+ 584 557 201 454
A1 38 – 38 –
A3 200 38 200 38
BBB- 43 – 43 –
Unrated 7 396 6 555 6 639 5 540
9 410 8 214 8 270 7 096
The maximum exposure to credit risk for loans receivable was (classified as non-current assets held-for-sale in 2009): 4 116 –
The maximum exposure to credit risk for non-current assets held-for-sale was:
Trade and other receivables 22 – 344
Loans receivable 22 – 2 787
Finance lease receivables 22 – 26
– 3 157
1. Negotiated agreement with stakeholders in residential areas which is a specific initiative aimed at resolving the non-payment of accounts.
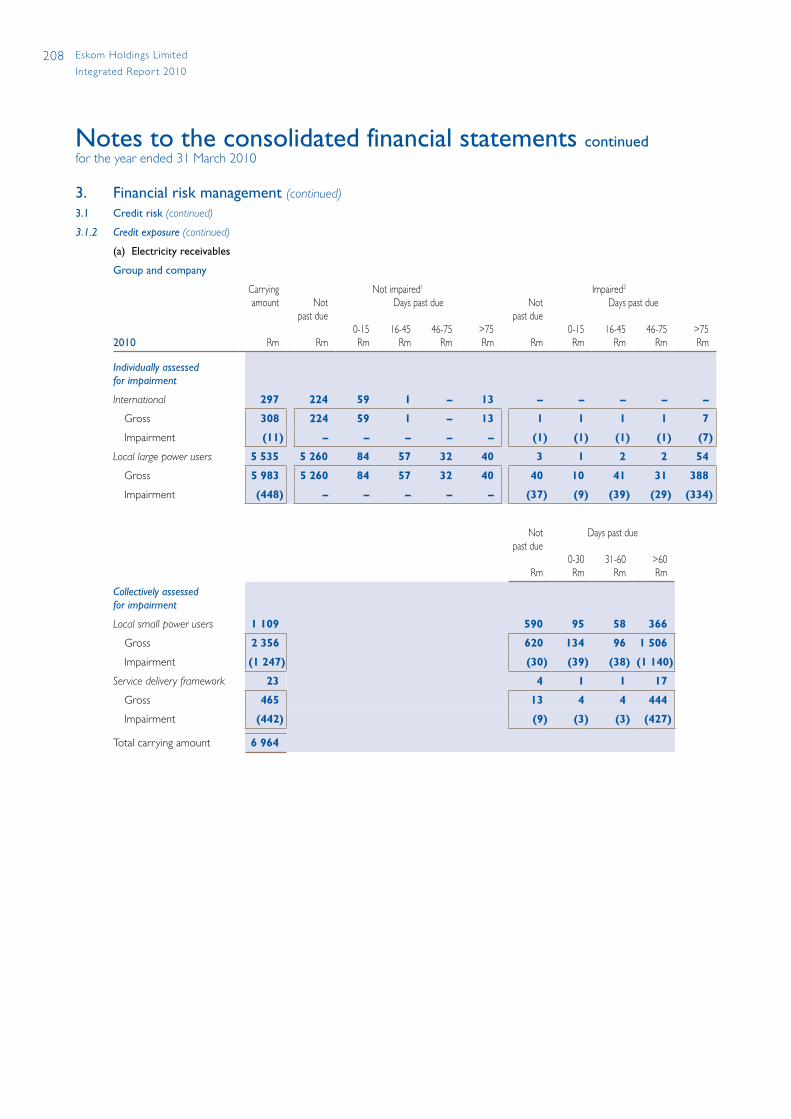
208 Eskom Holdings Limited
Integrated Repor t 2010
Notes to the consolidated financial statements continuedfor the year ended 31 March 2010
3. Financial risk management (continued)
3.1 Credit risk (continued)
3.1.2 Credit exposure (continued)
(a) Electricity receivables
Group and company
Carrying Not impaired1 Impaired2
amount Not past due
Days past due Not past due
Days past due
2010 Rm Rm0-15 Rm
16-45 Rm
46-75 Rm
>75 Rm Rm
0-15 Rm
16-45 Rm
46-75 Rm
>75 Rm
Individually assessed for impairment
International 297 224 59 1 – 13 – – – – –
Gross 308 224 59 1 – 13 1 1 1 1 7
Impairment (11) – – – – – (1) (1) (1) (1) (7)
Local large power users 5 535 5 260 84 57 32 40 3 1 2 2 54
Gross 5 983 5 260 84 57 32 40 40 10 41 31 388
Impairment (448) – – – – – (37) (9) (39) (29) (334)
Not past due
Days past due
Rm0-30 Rm
31-60 Rm
>60 Rm
Collectively assessed for impairment
Local small power users 1 109 590 95 58 366
Gross 2 356 620 134 96 1 506
Impairment (1 247) (30) (39) (38) (1 140)
Service delivery framework 23 4 1 1 17
Gross 465 13 4 4 444
Impairment (442) (9) (3) (3) (427)
Total carrying amount 6 964

209Eskom Holdings Limited
Integrated Repor t 2010
Group and company Carrying Not impaired1 Impaired2
amount Not past due
Days past due Not past due
Days past due
2009 Rm Rm0-15 Rm
16-45 Rm
46-75 Rm
>75 Rm Rm
0-15 Rm
16-45 Rm
46-75 Rm
>75 Rm
Individually assessed for impairment
International 176 35 – 1 – – 119 – 15 4 2
Gross 552 35 – 1 – – 150 – 15 10 341
Impairment (376) – – – – – (31) – – (6) (339)
Local large power users 3 812 3 576 190 24 8 2 5 1 1 – 5
Gross 4 010 3 576 190 24 8 2 26 22 27 26 109
Impairment (198) – – – – – (21) (21) (26) (26) (104)
Not past due
Days past due
Rm0-30 Rm
31-60 Rm
>60 Rm
Collectively assessed for impairment
Local small power users 786 377 40 29 340
Gross 1 694 415 95 90 1 094
Impairment (908) (38) (55) (61) (754)
Service delivery framework 36 7 3 2 24
Gross 518 14 5 4 495
Impairment (482) (7) (2) (2) (471)
Total carrying amount 4 810
Electricity receivables include an amount of R75 million (2009: R34 million) relating to receivables that were renegotiated3. These electricity receivables would have been past due had their terms not been renegotiated.
Interest is accrued on all arrear debts and R216 million (2009: R401 million) was credited to profit or loss within finance income.
1. Receivables past due but not impaired are receivables where contractual payment terms are past due but the group believes that impairment is not required on the basis of the level of security or collateral available and the stage of collection of amounts owed to the group.
2. Impaired receivables are receivables for which the group determines that it is probable that it will be unable to collect all amounts due in accordance with the contractual payment terms.
3. Receivables with renegotiated terms are receivables that have been restructured due to the deterioration in the customer’s financial position and where the group has made concessions that it would not otherwise consider.
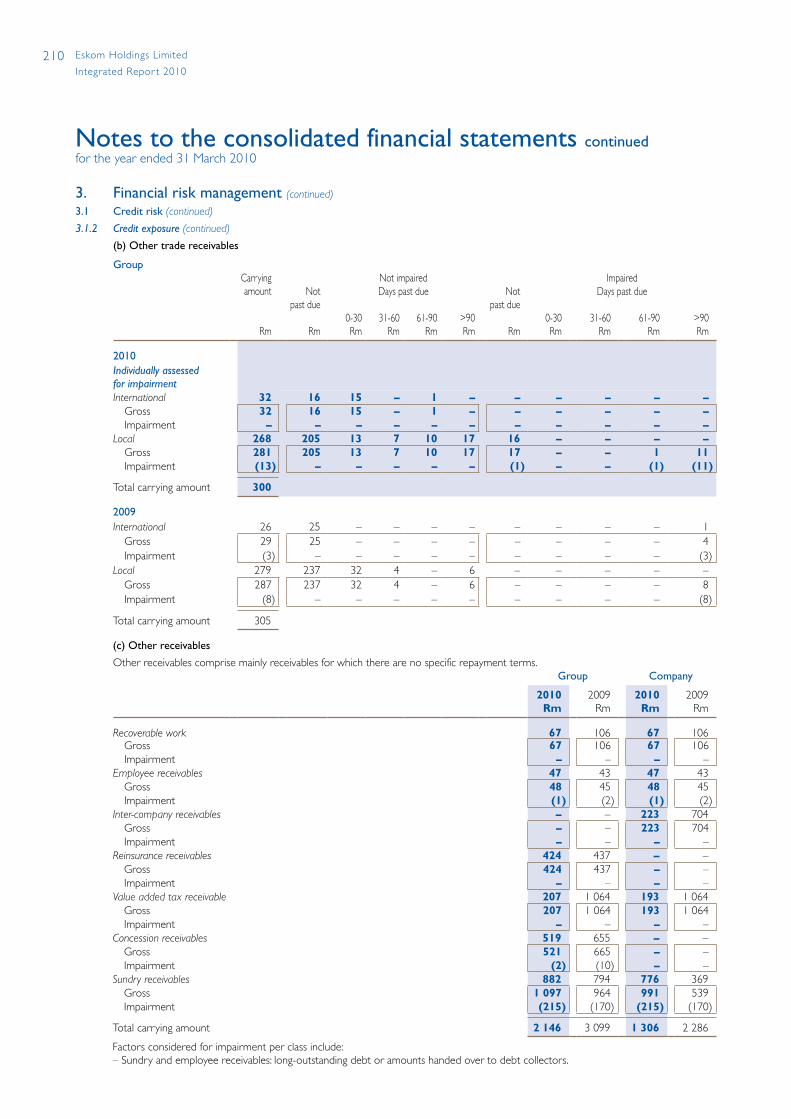
210 Eskom Holdings Limited
Integrated Repor t 2010
Notes to the consolidated financial statements continuedfor the year ended 31 March 2010
3. Financial risk management (continued)
3.1 Credit risk (continued)
3.1.2 Credit exposure (continued)
(b) Other trade receivables
GroupCarryingamount
Not impaired ImpairedNot
past dueDays past due Not
past dueDays past due
Rm Rm0-30Rm
31-60Rm
61-90Rm
>90Rm Rm
0-30Rm
31-60Rm
61-90Rm
>90Rm
2010Individually assessed for impairmentInternational 32 16 15 – 1 – – – – – –
Gross 32 16 15 – 1 – – – – – –Impairment – – – – – – – – – – –
Local 268 205 13 7 10 17 16 – – – –Gross 281 205 13 7 10 17 17 – – 1 11 Impairment (13) – – – – – (1) – – (1) (11)
Total carrying amount 300
2009International 26 25 – – – – – – – – 1
Gross 29 25 – – – – – – – – 4 Impairment (3) – – – – – – – – – (3)
Local 279 237 32 4 – 6 – – – – –Gross 287 237 32 4 – 6 – – – – 8 Impairment (8) – – – – – – – – – (8)
Total carrying amount 305
(c) Other receivables
Other receivables comprise mainly receivables for which there are no specific repayment terms. Group Company
2010Rm
2009Rm
2010Rm
2009Rm
Recoverable work 67 106 67 106 Gross 67 106 67 106 Impairment – – – –
Employee receivables 47 43 47 43 Gross 48 45 48 45 Impairment (1) (2) (1) (2)
Inter-company receivables – – 223 704 Gross – – 223 704 Impairment – – – –
Reinsurance receivables 424 437 – –Gross 424 437 – –Impairment – – – –
Value added tax receivable 207 1 064 193 1 064 Gross 207 1 064 193 1 064 Impairment – – – –
Concession receivables 519 655 – –Gross 521 665 – –Impairment (2) (10) – –
Sundry receivables 882 794 776 369 Gross 1 097 964 991 539 Impairment (215) (170) (215) (170)
Total carrying amount 2 146 3 099 1 306 2 286
Factors considered for impairment per class include: – Sundry and employee receivables: long-outstanding debt or amounts handed over to debt collectors.
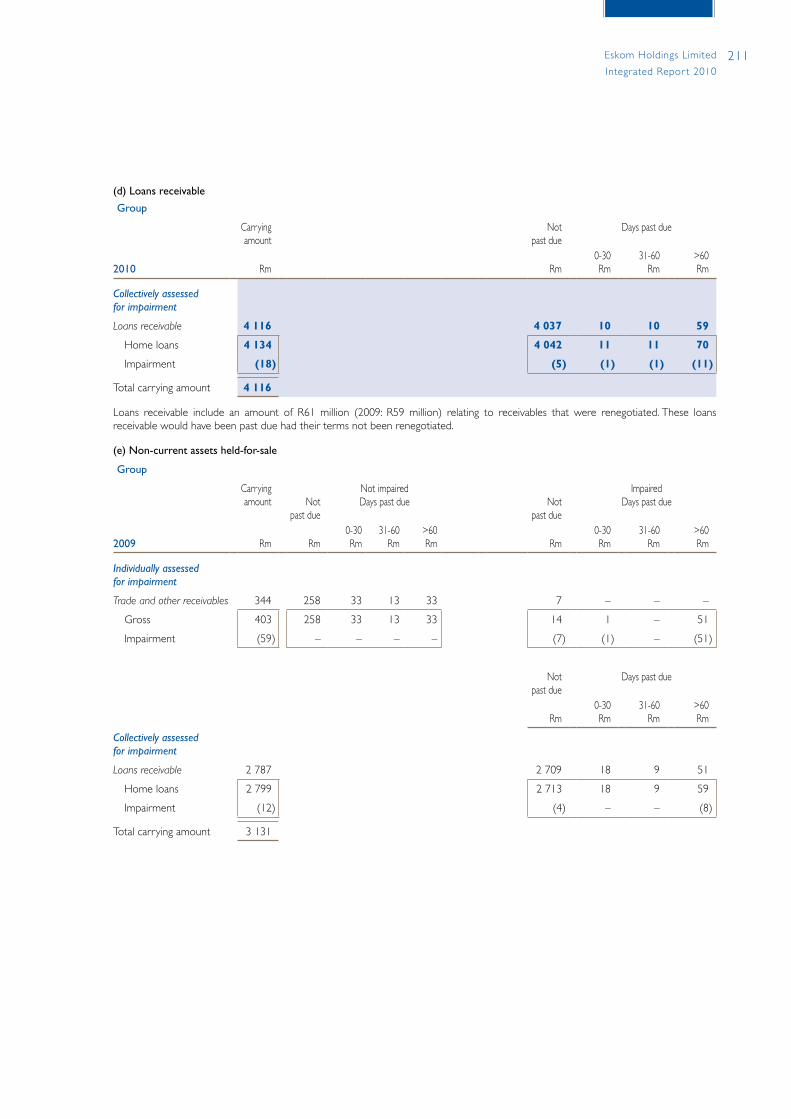
211Eskom Holdings Limited
Integrated Repor t 2010
(d) Loans receivable
Group
Carryingamount
Not past due
Days past due
2010 Rm Rm0-30Rm
31-60Rm
>60Rm
Collectively assessed for impairment
Loans receivable 4 116 4 037 10 10 59
Home loans 4 134 4 042 11 11 70
Impairment (18) (5) (1) (1) (11)
Total carrying amount 4 116
Loans receivable include an amount of R61 million (2009: R59 million) relating to receivables that were renegotiated. These loans receivable would have been past due had their terms not been renegotiated.
(e) Non-current assets held-for-sale
Group
Carrying amount
Not impaired ImpairedNot
past dueDays past due Not
past dueDays past due
2009 Rm Rm0-30Rm
31-60Rm
>60Rm Rm
0-30Rm
31-60Rm
>60Rm
Individually assessed for impairment
Trade and other receivables 344 258 33 13 33 7 – – –
Gross 403 258 33 13 33 14 1 – 51
Impairment (59) – – – – (7) (1) – (51)
Not past due
Days past due
Rm0-30Rm
31-60Rm
>60Rm
Collectively assessed for impairment
Loans receivable 2 787 2 709 18 9 51
Home loans 2 799 2 713 18 9 59
Impairment (12) (4) – – (8)
Total carrying amount 3 131
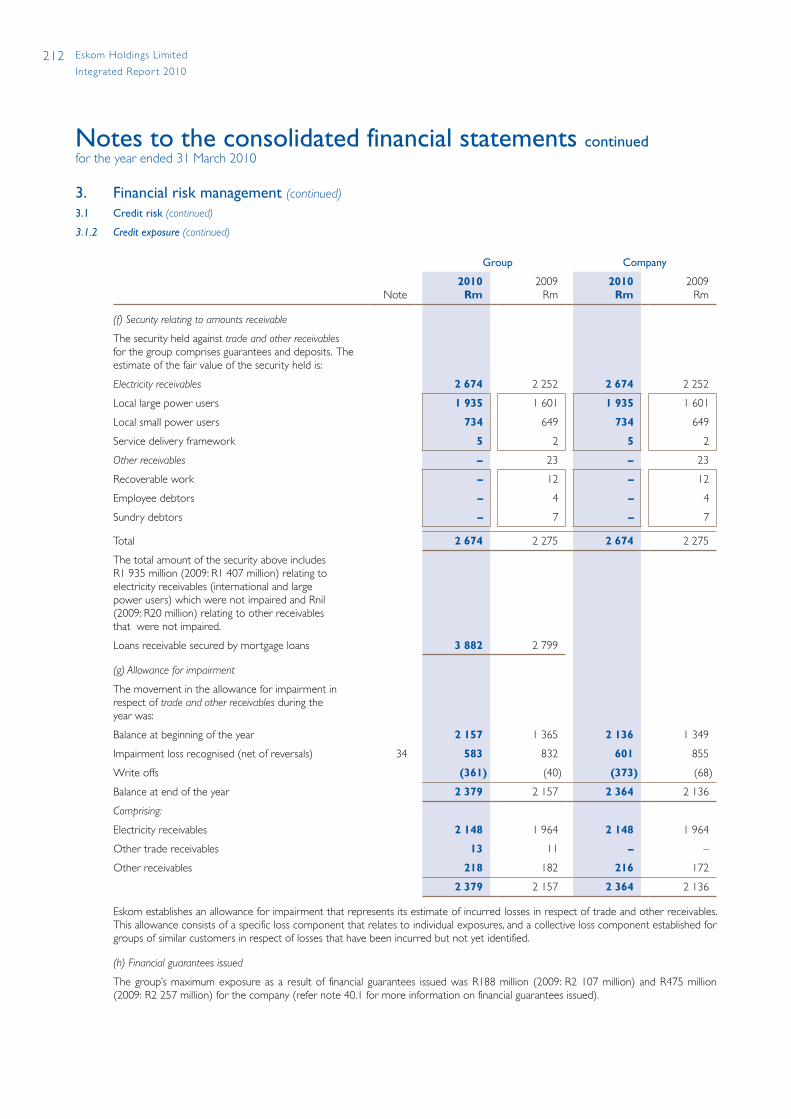
212 Eskom Holdings Limited
Integrated Repor t 2010
Notes to the consolidated financial statements continuedfor the year ended 31 March 2010
3. Financial risk management (continued)
3.1 Credit risk (continued)
3.1.2 Credit exposure (continued)
Group Company
Note2010
Rm2009
Rm2010
Rm2009
Rm
(f) Security relating to amounts receivable
The security held against trade and other receivables for the group comprises guarantees and deposits. The estimate of the fair value of the security held is:
Electricity receivables 2 674 2 252 2 674 2 252
Local large power users 1 935 1 601 1 935 1 601
Local small power users 734 649 734 649
Service delivery framework 5 2 5 2
Other receivables – 23 – 23
Recoverable work – 12 – 12
Employee debtors – 4 – 4
Sundry debtors – 7 – 7
Total 2 674 2 275 2 674 2 275
The total amount of the security above includes R1 935 million (2009: R1 407 million) relating to electricity receivables (international and large power users) which were not impaired and Rnil (2009: R20 million) relating to other receivables that were not impaired.
Loans receivable secured by mortgage loans 3 882 2 799
(g) Allowance for impairment
The movement in the allowance for impairment in respect of trade and other receivables during theyear was:
Balance at beginning of the year 2 157 1 365 2 136 1 349
Impairment loss recognised (net of reversals) 34 583 832 601 855
Write offs (361) (40) (373) (68)
Balance at end of the year 2 379 2 157 2 364 2 136
Comprising:
Electricity receivables 2 148 1 964 2 148 1 964
Other trade receivables 13 11 – –
Other receivables 218 182 216 172
2 379 2 157 2 364 2 136
Eskom establishes an allowance for impairment that represents its estimate of incurred losses in respect of trade and other receivables. This allowance consists of a specific loss component that relates to individual exposures, and a collective loss component established for groups of similar customers in respect of losses that have been incurred but not yet identified.
(h) Financial guarantees issued
The group’s maximum exposure as a result of financial guarantees issued was R188 million (2009: R2 107 million) and R475 million (2009: R2 257 million) for the company (refer note 40.1 for more information on financial guarantees issued).

213Eskom Holdings Limited
Integrated Repor t 2010
3.2 Market risk
Market risk is the risk that the fair value or future cash flows of financial instruments will fluctuate because of changes in foreign exchange rates, commodity prices, interest rates and equity prices.
A significant part of the market risk encountered arises from financial instruments that are managed centrally within the treasury function of the group or from contracts containing embedded derivatives.
The objective of the group’s market risk management policy is to protect and enhance the statement of financial position and profit or loss by managing and controlling market risk exposures and to optimise the funding of business operations and facilitate capital expansion.
Financial instruments managed by the treasury function The treasury department is responsible for managing market risk within the risk management framework approved by Exco and the board. The overall authority for the management of market risks within the treasury department is vested in the asset and liability committee (Alco) and the credit risk committee. Measurement and reporting occurs on a daily and/or monthly basis and is performed by an independent section within the treasury department. Financial derivatives are used to manage market risk.
Financial instruments managed by other divisions and subsidiaries Market risk arises mainly from changes in foreign exchange rates and to a limited extent from changes in commodity prices and equity prices. The divisions and subsidiaries are responsible for identifying the exposure arising from these risks. They liaise with the centralised treasury function to hedge (economic and cash flow hedges) these exposures appropriately on their behalf.
Embedded derivatives Eskom entered into a number of agreements to supply electricity to electricity-intensive industries where the revenue from these contracts is based on commodity prices and foreign currency rates (mainly USD) or foreign production price indices. This gives rise to embedded derivatives that require separation as a result of the different characteristics of the embedded derivative and the host contract. The contractual periods vary from one year up to a maximum of 18 years. Certain of these contracts are currently being renegotiated.
The net impact on profit or loss of changes in the fair value of the embedded derivatives for the group is a fair value gain of R2 284 million (2009: R9 514 million loss) and a fair value gain of R2 283 million (2009: R9 506 million loss) for the company. At 31 March 2010, the embedded derivative assets amounted to R110 million (2009: R1 366 million) for the group and R110 million (2009: R1 366 million) for the company. The embedded derivative liabilities at 31 March 2010 were R4 722 million (2009: R8 262 million) for the group and R4 721 million (2009: R8 260 million) for the company.
The valuation methods and inputs are discussed in the accounting policies (refer note 2.11.5, page 196) and the valuation assumptions are disclosed under critical accounting estimates and judgements (refer note 4, page 224). Risks arising from these contracts are discussed under the relevant risk areas as follows:• currency risk (refer note 3.2.1, page 216)• commodity risk (refer note 3.2.2, page 216)• interest rate risk (refer note 3.2.3, page 218)• other price risk (refer note 3.2.5, page 219)
Electricity contracts that contain embedded derivatives are considered for economic hedging. Hedging in respect of commodity risk and foreign currency exposure resulting from these embedded derivatives takes place on a short-term basis up to a maximum of five years. The South African Reserve Bank currently allows Eskom to hedge commodity price risk up to a maximum of five years with a foreign or local party.
Loans receivable Market risks in respect of loans receivable, arise from changes in interest rates and market prices. Market risk is monitored and analysed through the treasury department and reported to the EFC finance committee. A strategy aimed at protecting the EFC group from changes in market risk that may have a negative impact on earnings has been implemented. Funds to finance operations are raised over the short term, usually for periods of three to six months, but not exceeding one year. This enables the pricing of assets to be matched with changes in the pricing of liabilities. The cost of funding is based on prevailing conditions in the South African money market. Rates charged on outstanding loans receivable are based on movements in the South African Reserve Bank repurchase rate.
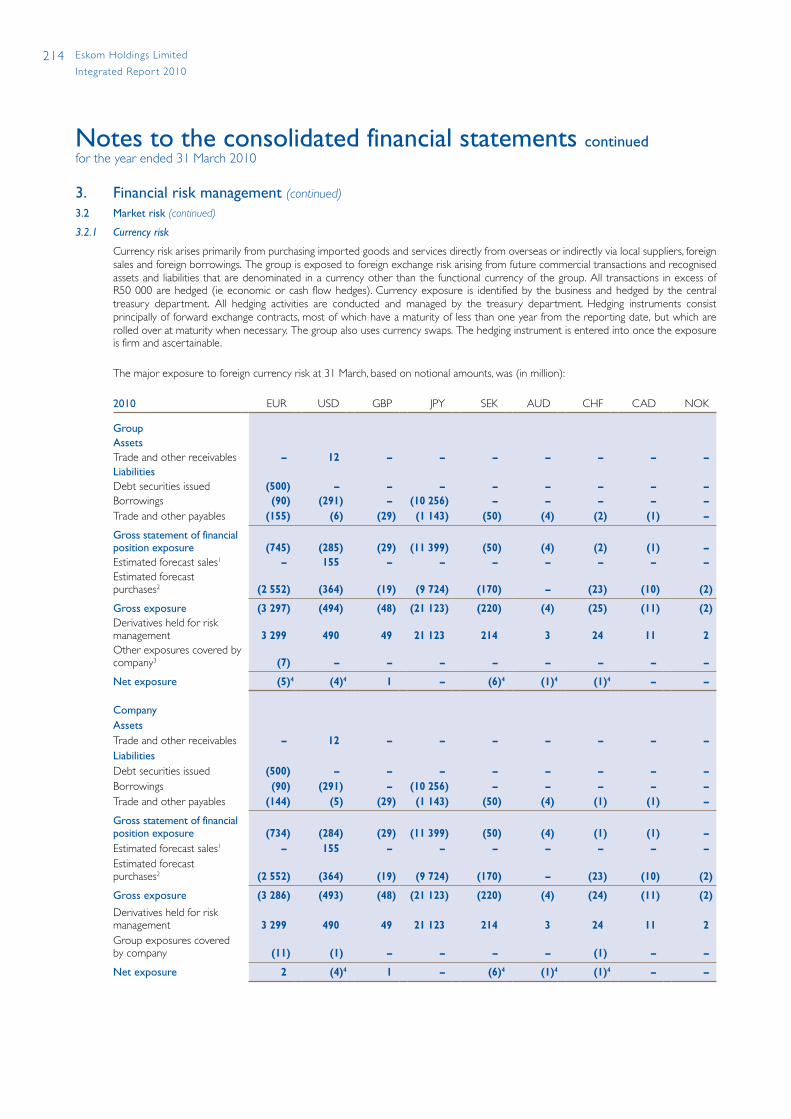
214 Eskom Holdings Limited
Integrated Repor t 2010
Notes to the consolidated financial statements continuedfor the year ended 31 March 2010
3. Financial risk management (continued)
3.2 Market risk (continued)
3.2.1 Currency risk
Currency risk arises primarily from purchasing imported goods and services directly from overseas or indirectly via local suppliers, foreign sales and foreign borrowings. The group is exposed to foreign exchange risk arising from future commercial transactions and recognised assets and liabilities that are denominated in a currency other than the functional currency of the group. All transactions in excess of R50 000 are hedged (ie economic or cash flow hedges). Currency exposure is identified by the business and hedged by the central treasury department. All hedging activities are conducted and managed by the treasury department. Hedging instruments consist principally of forward exchange contracts, most of which have a maturity of less than one year from the reporting date, but which are rolled over at maturity when necessary. The group also uses currency swaps. The hedging instrument is entered into once the exposure is firm and ascertainable.
The major exposure to foreign currency risk at 31 March, based on notional amounts, was (in million):
2010 EUR USD GBP JPY SEK AUD CHF CAD NOK
Group AssetsTrade and other receivables – 12 – – – – – – –LiabilitiesDebt securities issued (500) – – – – – – – –Borrowings (90) (291) – (10 256) – – – – –Trade and other payables (155) (6) (29) (1 143) (50) (4) (2) (1) –
Gross statement of financial position exposure (745) (285) (29) (11 399) (50) (4) (2) (1) –Estimated forecast sales1 – 155 – – – – – – –Estimated forecast purchases2 (2 552) (364) (19) (9 724) (170) – (23) (10) (2)
Gross exposure (3 297) (494) (48) (21 123) (220) (4) (25) (11) (2)Derivatives held for risk management 3 299 490 49 21 123 214 3 24 11 2 Other exposures covered by company3 (7) – – – – – – – –
Net exposure (5)4 (4)4 1 – (6)4 (1)4 (1)4 – –
Company AssetsTrade and other receivables – 12 – – – – – – –LiabilitiesDebt securities issued (500) – – – – – – – –Borrowings (90) (291) – (10 256) – – – – –Trade and other payables (144) (5) (29) (1 143) (50) (4) (1) (1) –
Gross statement of financial position exposure (734) (284) (29) (11 399) (50) (4) (1) (1) –Estimated forecast sales1 – 155 – – – – – – –Estimated forecast purchases2 (2 552) (364) (19) (9 724) (170) – (23) (10) (2)
Gross exposure (3 286) (493) (48) (21 123) (220) (4) (24) (11) (2)
Derivatives held for risk management 3 299 490 49 21 123 214 3 24 11 2 Group exposures covered by company (11) (1) – – – – (1) – –
Net exposure 2 (4)4 1 – (6)4 (1)4 (1)4 – –
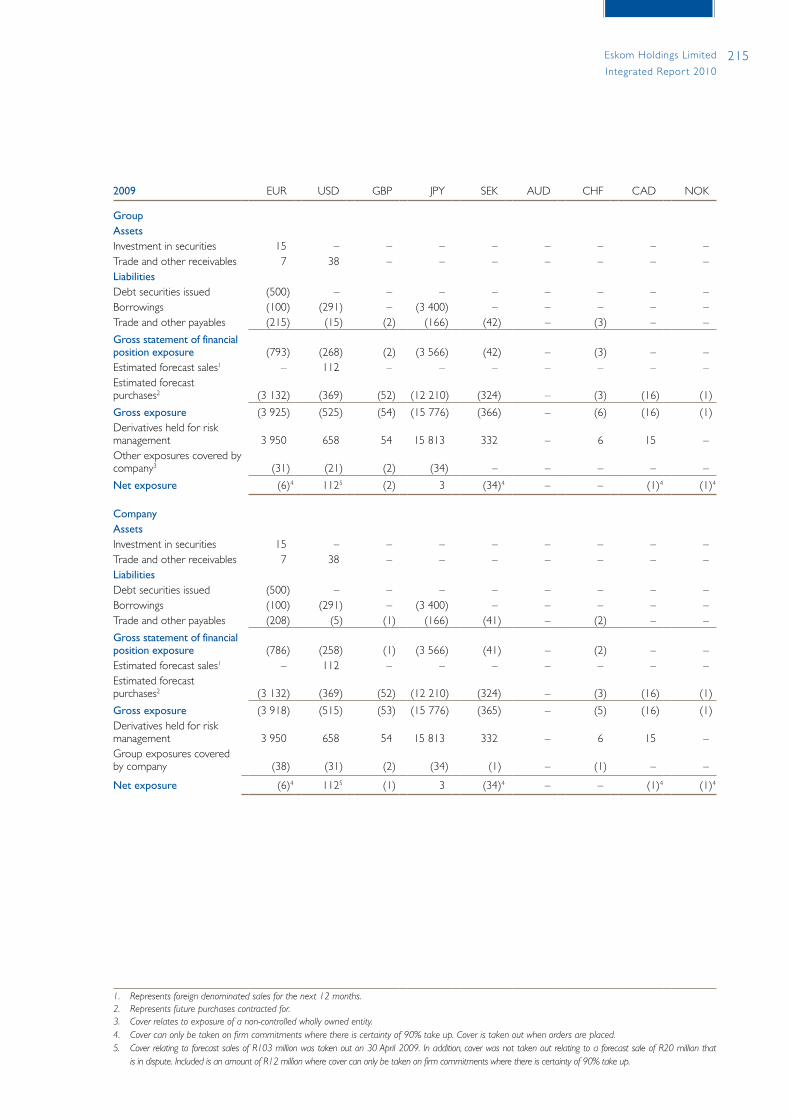
215Eskom Holdings Limited
Integrated Repor t 2010
2009 EUR USD GBP JPY SEK AUD CHF CAD NOK
Group AssetsInvestment in securities 15 – – – – – – – –Trade and other receivables 7 38 – – – – – – –LiabilitiesDebt securities issued (500) – – – – – – – –Borrowings (100) (291) – (3 400) – – – – –Trade and other payables (215) (15) (2) (166) (42) – (3) – –
Gross statement of financial position exposure (793) (268) (2) (3 566) (42) – (3) – –Estimated forecast sales1 – 112 – – – – – – –Estimated forecast purchases2 (3 132) (369) (52) (12 210) (324) – (3) (16) (1)
Gross exposure (3 925) (525) (54) (15 776) (366) – (6) (16) (1)Derivatives held for risk management 3 950 658 54 15 813 332 – 6 15 –Other exposures covered by company3 (31) (21) (2) (34) – – – – –
Net exposure (6)4 1125 (2) 3 (34)4 – – (1)4 (1)4
Company AssetsInvestment in securities 15 – – – – – – – –Trade and other receivables 7 38 – – – – – – –LiabilitiesDebt securities issued (500) – – – – – – – –Borrowings (100) (291) – (3 400) – – – – –Trade and other payables (208) (5) (1) (166) (41) – (2) – –
Gross statement of financial position exposure (786) (258) (1) (3 566) (41) – (2) – –Estimated forecast sales1 – 112 – – – – – – –Estimated forecast purchases2 (3 132) (369) (52) (12 210) (324) – (3) (16) (1)
Gross exposure (3 918) (515) (53) (15 776) (365) – (5) (16) (1)Derivatives held for risk management 3 950 658 54 15 813 332 – 6 15 –Group exposures covered by company (38) (31) (2) (34) (1) – (1) – –
Net exposure (6)4 1125 (1) 3 (34)4 – – (1)4 (1)4
1. Represents foreign denominated sales for the next 12 months.2. Represents future purchases contracted for.3. Cover relates to exposure of a non-controlled wholly owned entity.4. Cover can only be taken on firm commitments where there is certainty of 90% take up. Cover is taken out when orders are placed.5. Cover relating to forecast sales of R103 million was taken out on 30 April 2009. In addition, cover was not taken out relating to a forecast sale of R20 million that
is in dispute. Included is an amount of R12 million where cover can only be taken on firm commitments where there is certainty of 90% take up.
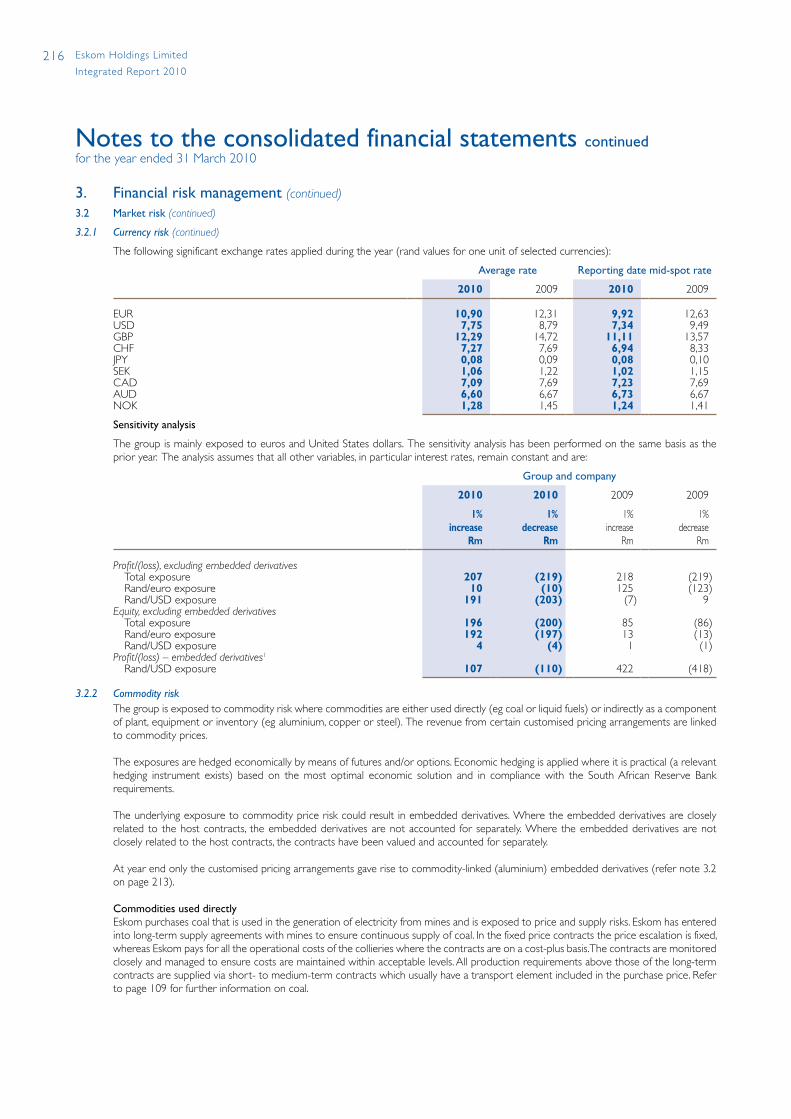
216 Eskom Holdings Limited
Integrated Repor t 2010
Notes to the consolidated financial statements continuedfor the year ended 31 March 2010
3. Financial risk management (continued)
3.2 Market risk (continued)
3.2.1 Currency risk (continued)
The following significant exchange rates applied during the year (rand values for one unit of selected currencies):
Average rate Reporting date mid-spot rate
2010 2009 2010 2009
EUR 10,90 12,31 9,92 12,63USD 7,75 8,79 7,34 9,49GBP 12,29 14,72 11,11 13,57CHF 7,27 7,69 6,94 8,33JPY 0,08 0,09 0,08 0,10SEK 1,06 1,22 1,02 1,15CAD 7,09 7,69 7,23 7,69AUD 6,60 6,67 6,73 6,67NOK 1,28 1,45 1,24 1,41
Sensitivity analysis
The group is mainly exposed to euros and United States dollars. The sensitivity analysis has been performed on the same basis as the prior year. The analysis assumes that all other variables, in particular interest rates, remain constant and are:
Group and company
2010 2010 2009 2009
1%increase
Rm
1%decrease
Rm
1%increase
Rm
1%decrease
Rm
Profit/(loss), excluding embedded derivativesTotal exposure 207 (219) 218 (219)Rand/euro exposure 10 (10) 125 (123)Rand/USD exposure 191 (203) (7) 9
Equity, excluding embedded derivativesTotal exposure 196 (200) 85 (86)Rand/euro exposure 192 (197) 13 (13)Rand/USD exposure 4 (4) 1 (1)
Profit/(loss) – embedded derivatives1
Rand/USD exposure 107 (110) 422 (418)
3.2.2 Commodity riskThe group is exposed to commodity risk where commodities are either used directly (eg coal or liquid fuels) or indirectly as a component of plant, equipment or inventory (eg aluminium, copper or steel). The revenue from certain customised pricing arrangements are linked to commodity prices.
The exposures are hedged economically by means of futures and/or options. Economic hedging is applied where it is practical (a relevant hedging instrument exists) based on the most optimal economic solution and in compliance with the South African Reserve Bank requirements.
The underlying exposure to commodity price risk could result in embedded derivatives. Where the embedded derivatives are closely related to the host contracts, the embedded derivatives are not accounted for separately. Where the embedded derivatives are not closely related to the host contracts, the contracts have been valued and accounted for separately.
At year end only the customised pricing arrangements gave rise to commodity-linked (aluminium) embedded derivatives (refer note 3.2 on page 213).
Commodities used directly Eskom purchases coal that is used in the generation of electricity from mines and is exposed to price and supply risks. Eskom has entered into long-term supply agreements with mines to ensure continuous supply of coal. In the fixed price contracts the price escalation is fixed, whereas Eskom pays for all the operational costs of the collieries where the contracts are on a cost-plus basis. The contracts are monitored closely and managed to ensure costs are maintained within acceptable levels. All production requirements above those of the long-term contracts are supplied via short- to medium-term contracts which usually have a transport element included in the purchase price. Refer to page 109 for further information on coal.
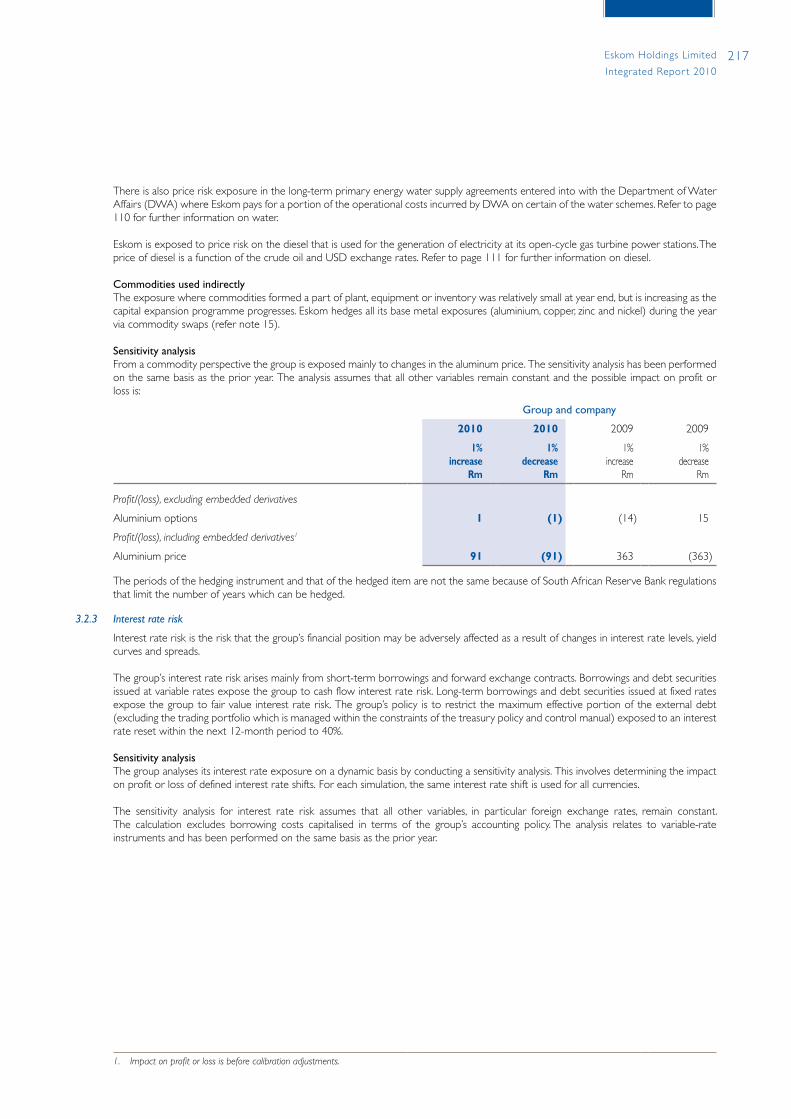
217Eskom Holdings Limited
Integrated Repor t 2010
There is also price risk exposure in the long-term primary energy water supply agreements entered into with the Department of Water Affairs (DWA) where Eskom pays for a portion of the operational costs incurred by DWA on certain of the water schemes. Refer to page 110 for further information on water.
Eskom is exposed to price risk on the diesel that is used for the generation of electricity at its open-cycle gas turbine power stations. The price of diesel is a function of the crude oil and USD exchange rates. Refer to page 111 for further information on diesel.
Commodities used indirectly The exposure where commodities formed a part of plant, equipment or inventory was relatively small at year end, but is increasing as the capital expansion programme progresses. Eskom hedges all its base metal exposures (aluminium, copper, zinc and nickel) during the year via commodity swaps (refer note 15).
Sensitivity analysis From a commodity perspective the group is exposed mainly to changes in the aluminum price. The sensitivity analysis has been performed on the same basis as the prior year. The analysis assumes that all other variables remain constant and the possible impact on profit or loss is:
Group and company
2010 2010 2009 2009
1%increase
Rm
1%decrease
Rm
1%increase
Rm
1%decrease
Rm
Profit/(loss), excluding embedded derivatives
Aluminium options 1 (1) (14) 15
Profit/(loss), including embedded derivatives1
Aluminium price 91 (91) 363 (363)
The periods of the hedging instrument and that of the hedged item are not the same because of South African Reserve Bank regulations that limit the number of years which can be hedged.
3.2.3 Interest rate risk
Interest rate risk is the risk that the group’s financial position may be adversely affected as a result of changes in interest rate levels, yield curves and spreads.
The group’s interest rate risk arises mainly from short-term borrowings and forward exchange contracts. Borrowings and debt securities issued at variable rates expose the group to cash flow interest rate risk. Long-term borrowings and debt securities issued at fixed rates expose the group to fair value interest rate risk. The group’s policy is to restrict the maximum effective portion of the external debt (excluding the trading portfolio which is managed within the constraints of the treasury policy and control manual) exposed to an interest rate reset within the next 12-month period to 40%.
Sensitivity analysis The group analyses its interest rate exposure on a dynamic basis by conducting a sensitivity analysis. This involves determining the impact on profit or loss of defined interest rate shifts. For each simulation, the same interest rate shift is used for all currencies.
The sensitivity analysis for interest rate risk assumes that all other variables, in particular foreign exchange rates, remain constant. The calculation excludes borrowing costs capitalised in terms of the group’s accounting policy. The analysis relates to variable-rate instruments and has been performed on the same basis as the prior year.
1. Impact on profit or loss is before calibration adjustments.
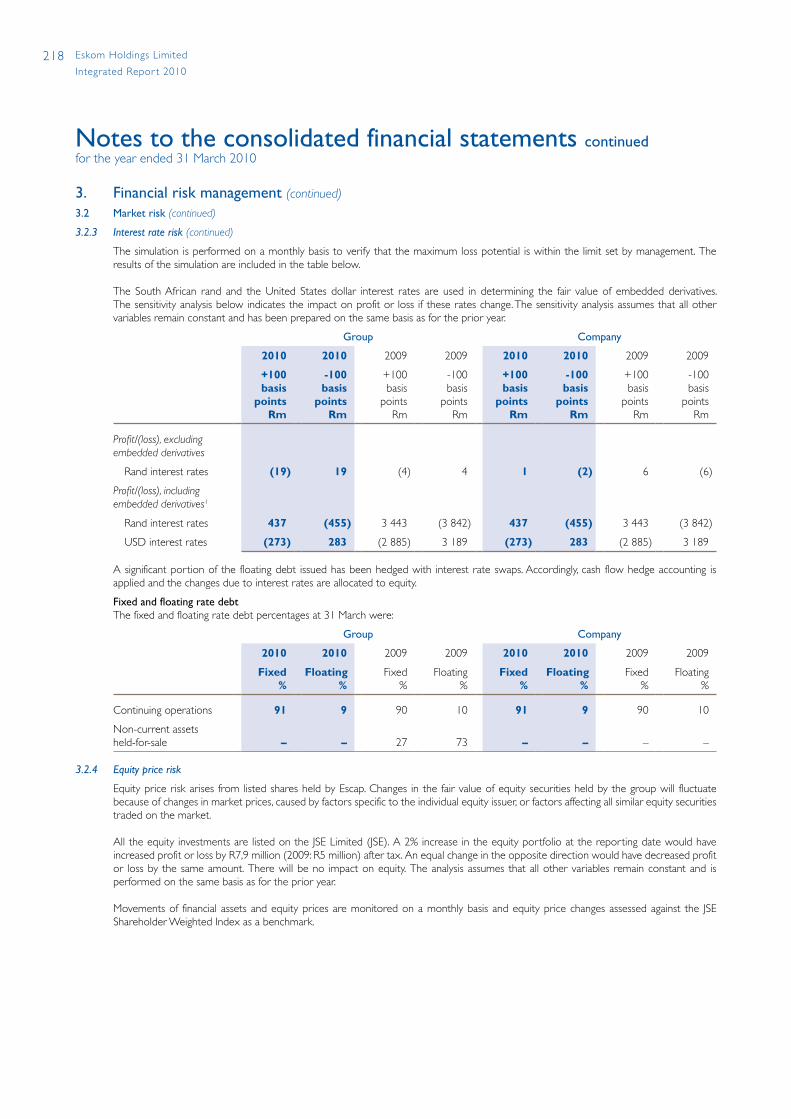
218 Eskom Holdings Limited
Integrated Repor t 2010
Notes to the consolidated financial statements continuedfor the year ended 31 March 2010
3. Financial risk management (continued)
3.2 Market risk (continued)
3.2.3 Interest rate risk (continued)
The simulation is performed on a monthly basis to verify that the maximum loss potential is within the limit set by management. The results of the simulation are included in the table below.
The South African rand and the United States dollar interest rates are used in determining the fair value of embedded derivatives. The sensitivity analysis below indicates the impact on profit or loss if these rates change. The sensitivity analysis assumes that all other variables remain constant and has been prepared on the same basis as for the prior year.
Group Company
2010 2010 2009 2009 2010 2010 2009 2009
+100basis
points Rm
-100basis
points Rm
+100basis
points Rm
-100basis
points Rm
+100basis
points Rm
-100basis
points Rm
+100basis
points Rm
-100basis
points Rm
Profit/(loss), excluding embedded derivatives
Rand interest rates (19) 19 (4) 4 1 (2) 6 (6)
Profit/(loss), including embedded derivatives1
Rand interest rates 437 (455) 3 443 (3 842) 437 (455) 3 443 (3 842)
USD interest rates (273) 283 (2 885) 3 189 (273) 283 (2 885) 3 189
A significant portion of the floating debt issued has been hedged with interest rate swaps. Accordingly, cash flow hedge accounting is applied and the changes due to interest rates are allocated to equity.
Fixed and floating rate debt The fixed and floating rate debt percentages at 31 March were:
Group Company
2010 2010 2009 2009 2010 2010 2009 2009
Fixed %
Floating%
Fixed%
Floating %
Fixed %
Floating%
Fixed%
Floating %
Continuing operations 91 9 90 10 91 9 90 10
Non-current assets held-for-sale – – 27 73 – – – –
3.2.4 Equity price risk
Equity price risk arises from listed shares held by Escap. Changes in the fair value of equity securities held by the group will fluctuate because of changes in market prices, caused by factors specific to the individual equity issuer, or factors affecting all similar equity securities traded on the market.
All the equity investments are listed on the JSE Limited (JSE). A 2% increase in the equity portfolio at the reporting date would have increased profit or loss by R7,9 million (2009: R5 million) after tax. An equal change in the opposite direction would have decreased profit or loss by the same amount. There will be no impact on equity. The analysis assumes that all other variables remain constant and is performed on the same basis as for the prior year.
Movements of financial assets and equity prices are monitored on a monthly basis and equity price changes assessed against the JSE Shareholder Weighted Index as a benchmark.

219Eskom Holdings Limited
Integrated Repor t 2010
3.2.5 Other price risk
Inflation price risk arises from embedded derivatives as discussed under note 3.2 on page 213. The risk arises from movements in the electricity tariffs, the United States production price index (PPI) and the South African consumer price index (CPI).
The following is the sensitivity analysis of the change in the value of the embedded derivatives (relating to customised pricing agreements) as a result of changes in electricity tariffs, the South African CPI or the United States PPI. This analysis has been performed on the same basis as the prior year. The analysis assumes that all other variables remain constant and the possible impact on profit or loss is:
Group and company
2010 2010 2009 2009
1%increase
Rm
1%decrease
Rm
1%increase
Rm
1%decrease
Rm
Profit/(loss), including embedded derivatives1
Electricity tariffs (95) 95 (3 085) 2 852
South African CPI (316) 309 (3 489) 3 193
United States PPI 39 (39) 129 (134)
3.3 Liquidity risk
Liquidity risk is the risk that the group will not have sufficient financial resources to meet its obligations when they fall due, or will have to do so at excessive cost. This risk can arise from mismatches in the timing of cash flows from revenue and capital and operational outflows. Funding risk arises when the necessary liquidity to fund illiquid asset positions, such as building new electricity capacity, cannot be obtained at the expected terms and when required.
The objective of the group’s liquidity and funding management is to ensure that all foreseeable operational, capital expansion and loan commitment expenditure can be met under both normal and stressed conditions. The group has adopted an overall statement of financial position approach, which consolidates all sources and uses of liquidity, while aiming to maintain a balance between liquidity, profitability and interest rate considerations.
The management of consolidated liquidity and funding risk is centralised in the treasury department in accordance with practices and limits set by the Exco and the board. The group’s liquidity and funding management process includes:• projecting cash flows and considering the cash required by the group and optimising the short-term liquidity requirements as well as
the long-term funding• monitoring financial position liquidity ratios• maintaining a diverse range of funding sources with adequate back-up facilities• managing the concentration and profile of debt maturities• actively managing the funding risk by evaluating optimal entry points into the various markets per the official funding plan• maintaining liquidity and funding contingency plans
Eskom has an established corporate governance structure and process for managing the risks regarding guarantees and contingent liabilities (refer note 40). All significant guarantees issued by Eskom are approved by the board, and are managed on an ongoing basis through the quarterly meetings of the treasury credit committee, and by the risk management committee of the board.
The guarantees are administratively managed by the treasury department. Updated guarantee schedules are compiled every month, taking cognisance of any changed risk factors, and are submitted to each of the committees for consideration and action, if necessary. Risk factors and assumptions affecting probability calculations are reassessed twice a year and presented to the above committees.
Eskom's guarantees are diverse and unlinked, such that a trigger event for any one guarantee is unlikely to precipitate a trigger event in respect of other guarantees.
Given that there would be forewarning of payments required in terms of the other guarantees, and considering the amounts of the guarantees, it is expected that Eskom will be able to raise the required liquidity to effect any required payments.
1. Impact on profit or loss is before calibration adjustments.
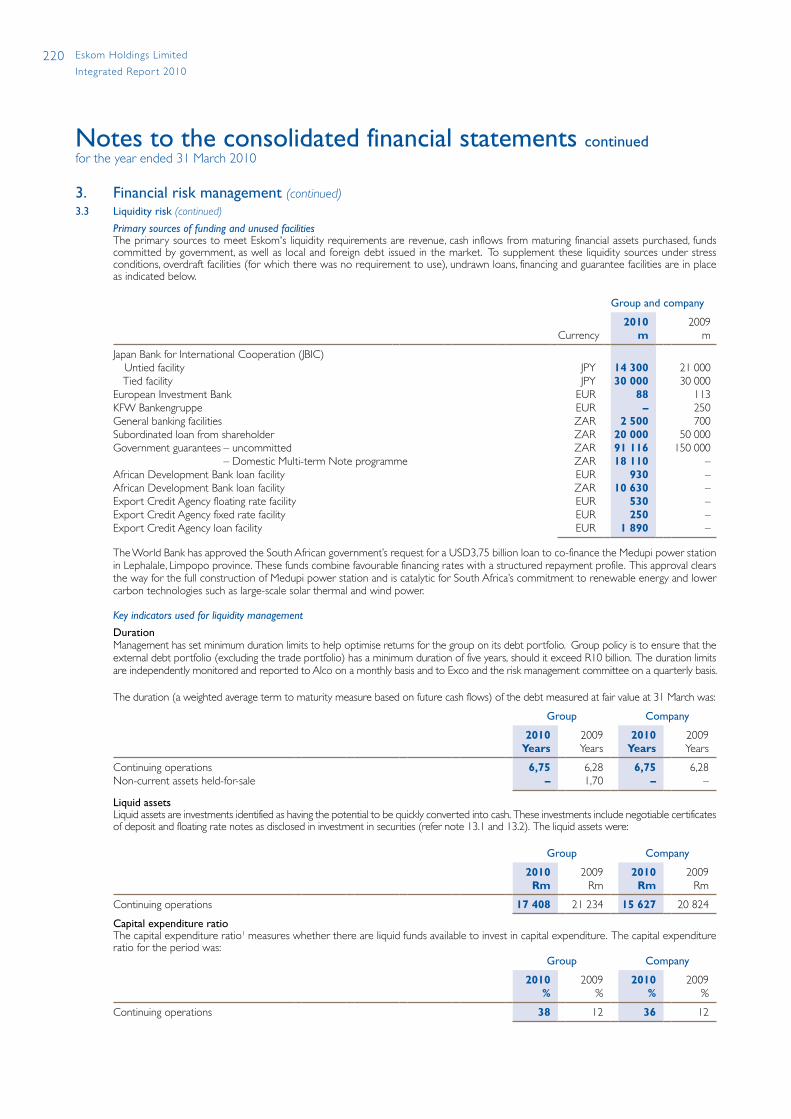
220 Eskom Holdings Limited
Integrated Repor t 2010
Notes to the consolidated financial statements continuedfor the year ended 31 March 2010
3. Financial risk management (continued)3.3 Liquidity risk (continued)
Primary sources of funding and unused facilities The primary sources to meet Eskom's liquidity requirements are revenue, cash inflows from maturing financial assets purchased, funds committed by government, as well as local and foreign debt issued in the market. To supplement these liquidity sources under stress conditions, overdraft facilities (for which there was no requirement to use), undrawn loans, financing and guarantee facilities are in place as indicated below.
Group and company
Currency2010
m2009
m
Japan Bank for International Cooperation (JBIC) Untied facility JPY 14 300 21 000 Tied facility JPY 30 000 30 000 European Investment Bank EUR 88 113 KFW Bankengruppe EUR – 250 General banking facilities ZAR 2 500 700 Subordinated loan from shareholder ZAR 20 000 50 000 Government guarantees – uncommitted ZAR 91 116 150 000 – Domestic Multi-term Note programme ZAR 18 110 –African Development Bank loan facility EUR 930 –African Development Bank loan facility ZAR 10 630 –Export Credit Agency floating rate facility EUR 530 –Export Credit Agency fixed rate facility EUR 250 –Export Credit Agency loan facility EUR 1 890 –
The World Bank has approved the South African government’s request for a USD3,75 billion loan to co-finance the Medupi power station in Lephalale, Limpopo province. These funds combine favourable financing rates with a structured repayment profile. This approval clears the way for the full construction of Medupi power station and is catalytic for South Africa’s commitment to renewable energy and lower carbon technologies such as large-scale solar thermal and wind power.
Key indicators used for liquidity management
Duration Management has set minimum duration limits to help optimise returns for the group on its debt portfolio. Group policy is to ensure that the external debt portfolio (excluding the trade portfolio) has a minimum duration of five years, should it exceed R10 billion. The duration limits are independently monitored and reported to Alco on a monthly basis and to Exco and the risk management committee on a quarterly basis.
The duration (a weighted average term to maturity measure based on future cash flows) of the debt measured at fair value at 31 March was:
Group Company
2010Years
2009Years
2010Years
2009Years
Continuing operations 6,75 6,28 6,75 6,28 Non-current assets held-for-sale – 1,70 – –
Liquid assets Liquid assets are investments identified as having the potential to be quickly converted into cash. These investments include negotiable certificates of deposit and floating rate notes as disclosed in investment in securities (refer note 13.1 and 13.2). The liquid assets were:
Group Company
2010Rm
2009Rm
2010Rm
2009Rm
Continuing operations 17 408 21 234 15 627 20 824
Capital expenditure ratio The capital expenditure ratio1 measures whether there are liquid funds available to invest in capital expenditure. The capital expenditure ratio for the period was:
Group Company
2010%
2009%
2010%
2009%
Continuing operations 38 12 36 12
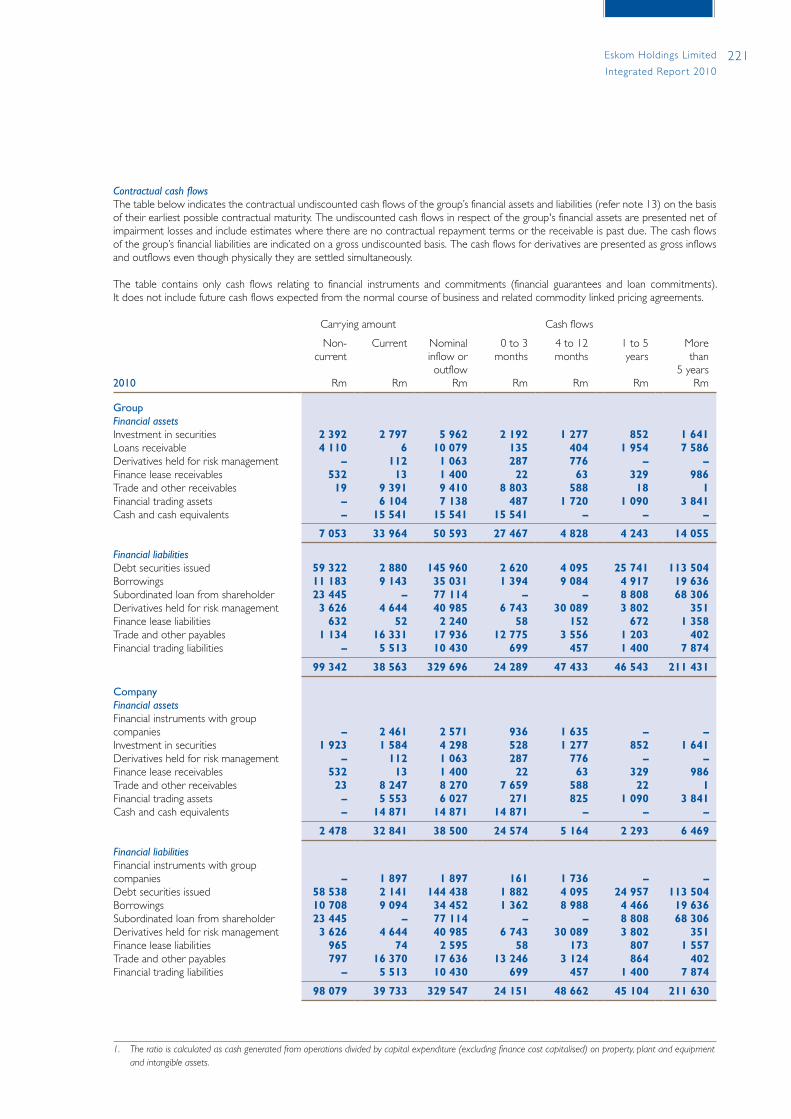
221Eskom Holdings Limited
Integrated Repor t 2010
Contractual cash flows The table below indicates the contractual undiscounted cash flows of the group’s financial assets and liabilities (refer note 13) on the basis of their earliest possible contractual maturity. The undiscounted cash flows in respect of the group's financial assets are presented net of impairment losses and include estimates where there are no contractual repayment terms or the receivable is past due. The cash flows of the group’s financial liabilities are indicated on a gross undiscounted basis. The cash flows for derivatives are presented as gross inflows and outflows even though physically they are settled simultaneously.
The table contains only cash flows relating to financial instruments and commitments (financial guarantees and loan commitments). It does not include future cash flows expected from the normal course of business and related commodity linked pricing agreements.
Carrying amount Cash flows
2010
Non-current
Rm
Current
Rm
Nominalinflow or outflow
Rm
0 to 3months
Rm
4 to 12months
Rm
1 to 5 years
Rm
Morethan
5 yearsRm
GroupFinancial assetsInvestment in securities 2 392 2 797 5 962 2 192 1 277 852 1 641 Loans receivable 4 110 6 10 079 135 404 1 954 7 586Derivatives held for risk management – 112 1 063 287 776 – –Finance lease receivables 532 13 1 400 22 63 329 986 Trade and other receivables 19 9 391 9 410 8 803 588 18 1 Financial trading assets – 6 104 7 138 487 1 720 1 090 3 841 Cash and cash equivalents – 15 541 15 541 15 541 – – –
7 053 33 964 50 593 27 467 4 828 4 243 14 055
Financial liabilitiesDebt securities issued 59 322 2 880 145 960 2 620 4 095 25 741 113 504 Borrowings 11 183 9 143 35 031 1 394 9 084 4 917 19 636 Subordinated loan from shareholder 23 445 – 77 114 – – 8 808 68 306 Derivatives held for risk management 3 626 4 644 40 985 6 743 30 089 3 802 351 Finance lease liabilities 632 52 2 240 58 152 672 1 358 Trade and other payables 1 134 16 331 17 936 12 775 3 556 1 203 402 Financial trading liabilities – 5 513 10 430 699 457 1 400 7 874
99 342 38 563 329 696 24 289 47 433 46 543 211 431
CompanyFinancial assetsFinancial instruments with group companies – 2 461 2 571 936 1 635 – –Investment in securities 1 923 1 584 4 298 528 1 277 852 1 641 Derivatives held for risk management – 112 1 063 287 776 – –Finance lease receivables 532 13 1 400 22 63 329 986 Trade and other receivables 23 8 247 8 270 7 659 588 22 1 Financial trading assets – 5 553 6 027 271 825 1 090 3 841 Cash and cash equivalents – 14 871 14 871 14 871 – – –
2 478 32 841 38 500 24 574 5 164 2 293 6 469
Financial liabilitiesFinancial instruments with group companies – 1 897 1 897 161 1 736 – –Debt securities issued 58 538 2 141 144 438 1 882 4 095 24 957 113 504 Borrowings 10 708 9 094 34 452 1 362 8 988 4 466 19 636 Subordinated loan from shareholder 23 445 – 77 114 – – 8 808 68 306 Derivatives held for risk management 3 626 4 644 40 985 6 743 30 089 3 802 351 Finance lease liabilities 965 74 2 595 58 173 807 1 557 Trade and other payables 797 16 370 17 636 13 246 3 124 864 402 Financial trading liabilities – 5 513 10 430 699 457 1 400 7 874
98 079 39 733 329 547 24 151 48 662 45 104 211 630
1. The ratio is calculated as cash generated from operations divided by capital expenditure (excluding finance cost capitalised) on property, plant and equipment and intangible assets.

222 Eskom Holdings Limited
Integrated Repor t 2010
Notes to the consolidated financial statements continuedfor the year ended 31 March 2010
3. Financial risk management (continued)3.3 Liquidity risk (continued)
Carrying amount Cash flows
2009
Non-current
Rm
Current
Rm
Nominalinflow oroutflow
Rm
0 to 3months
Rm
4 to 12months
Rm
1 to 5 years
Rm
Morethan
5 yearsRm
GroupFinancial assetsInvestment in securities 3 558 4 360 9 830 4 262 133 2 086 3 349 Derivatives held for risk management 586 1 251 6 128 1 843 3 166 710 409 Finance lease receivables 536 11 1 516 20 62 348 1 086 Trade and other receivables 23 8 191 8 214 7 486 705 21 2 Financial trading assets – 924 927 815 112 – –Cash and cash equivalents – 18 382 18 693 18 693 – – –
4 703 33 119 45 308 33 119 4 178 3 165 4 846
Financial liabilitiesDebt securities issued 44 253 3 324 134 777 3 017 3 299 20 560 107 901 Borrowings 11 221 13 811 27 636 4 491 10 235 618 12 292 Subordinated loan from shareholder 1 575 – 10 000 – – – 10 000 Derivatives held for risk management 786 2 626 63 041 8 090 48 229 5 542 1 180 Finance lease liabilities 537 15 1 880 27 82 405 1 366 Trade and other payables 1 466 16 701 18 726 13 570 3 131 1 686 339 Financial trading liabilities – 2 180 2 069 44 101 241 1 683
59 838 38 657 258 129 29 239 65 077 29 052 134 761
CompanyFinancial assetsFinancial instruments with group companies – 1 279 1 292 1 127 165 – –Investment in securities 3 153 3 320 8 385 2 788 567 1 681 3 349 Derivatives held for risk management 586 1 251 6 128 1 843 3 166 710 409 Finance lease receivables 536 11 1 516 20 62 348 1 086 Trade and other receivables 23 7 073 7 096 6 394 679 21 2 Financial trading assets – 562 565 453 112 – –Cash and cash equivalents – 17 921 18 235 18 235 – – –
4 298 31 417 43 217 30 860 4 751 2 760 4 846
Financial liabilitiesFinancial instruments with group companies – 1 853 1 915 643 1 272 – –Debt securities issued 44 253 3 324 134 777 3 017 3 299 20 560 107 901 Borrowings 10 794 13 809 27 164 4 491 10 235 146 12 292 Subordinated loan from shareholder 1 575 – 10 000 – – – 10 000 Derivatives held for risk management 786 2 626 63 041 8 090 48 229 5 542 1 180 Finance lease liabilities 761 45 2 311 44 131 619 1 517 Trade and other payables 1 297 16 248 18 104 15 836 412 1 401 455 Financial trading liabilities – 2 180 2 069 44 101 241 1 683
59 466 40 085 259 381 32 165 63 679 28 509 135 028
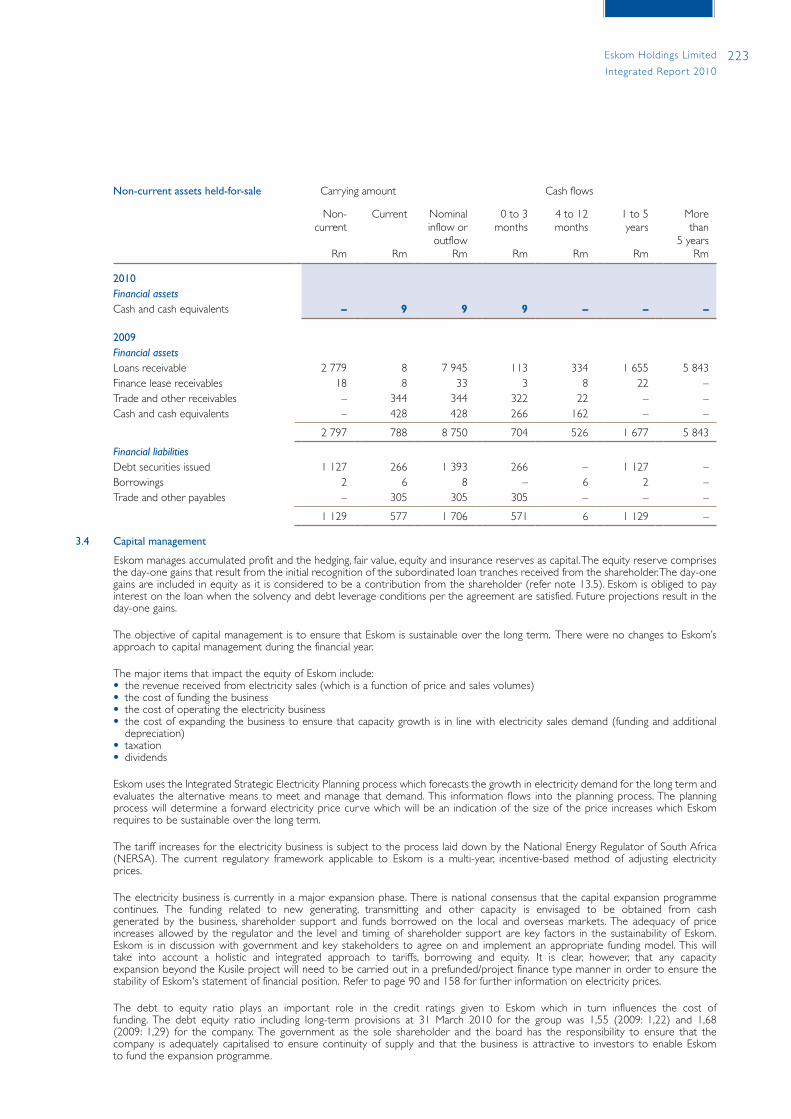
223Eskom Holdings Limited
Integrated Repor t 2010
Non-current assets held-for-sale Carrying amount Cash flows
Non-current
Rm
Current
Rm
Nominalinflow oroutflow
Rm
0 to 3months
Rm
4 to 12months
Rm
1 to 5 years
Rm
Morethan
5 yearsRm
2010Financial assetsCash and cash equivalents – 9 9 9 – – –
2009Financial assetsLoans receivable 2 779 8 7 945 113 334 1 655 5 843Finance lease receivables 18 8 33 3 8 22 –Trade and other receivables – 344 344 322 22 – –Cash and cash equivalents – 428 428 266 162 – –
2 797 788 8 750 704 526 1 677 5 843
Financial liabilitiesDebt securities issued 1 127 266 1 393 266 – 1 127 –Borrowings 2 6 8 – 6 2 –Trade and other payables – 305 305 305 – – –
1 129 577 1 706 571 6 1 129 –
3.4 Capital management
Eskom manages accumulated profit and the hedging, fair value, equity and insurance reserves as capital. The equity reserve comprises the day-one gains that result from the initial recognition of the subordinated loan tranches received from the shareholder. The day-one gains are included in equity as it is considered to be a contribution from the shareholder (refer note 13.5). Eskom is obliged to pay interest on the loan when the solvency and debt leverage conditions per the agreement are satisfied. Future projections result in the day-one gains.
The objective of capital management is to ensure that Eskom is sustainable over the long term. There were no changes to Eskom’s approach to capital management during the financial year.
The major items that impact the equity of Eskom include:• the revenue received from electricity sales (which is a function of price and sales volumes)• the cost of funding the business• the cost of operating the electricity business• the cost of expanding the business to ensure that capacity growth is in line with electricity sales demand (funding and additional
depreciation)• taxation• dividends
Eskom uses the Integrated Strategic Electricity Planning process which forecasts the growth in electricity demand for the long term and evaluates the alternative means to meet and manage that demand. This information flows into the planning process. The planning process will determine a forward electricity price curve which will be an indication of the size of the price increases which Eskom requires to be sustainable over the long term.
The tariff increases for the electricity business is subject to the process laid down by the National Energy Regulator of South Africa (NERSA). The current regulatory framework applicable to Eskom is a multi-year, incentive-based method of adjusting electricity prices.
The electricity business is currently in a major expansion phase. There is national consensus that the capital expansion programme continues. The funding related to new generating, transmitting and other capacity is envisaged to be obtained from cash generated by the business, shareholder support and funds borrowed on the local and overseas markets. The adequacy of price increases allowed by the regulator and the level and timing of shareholder support are key factors in the sustainability of Eskom. Eskom is in discussion with government and key stakeholders to agree on and implement an appropriate funding model. This will take into account a holistic and integrated approach to tariffs, borrowing and equity. It is clear, however, that any capacity expansion beyond the Kusile project will need to be carried out in a prefunded/project finance type manner in order to ensure the stability of Eskom's statement of financial position. Refer to page 90 and 158 for further information on electricity prices.
The debt to equity ratio plays an important role in the credit ratings given to Eskom which in turn influences the cost of funding. The debt equity ratio including long-term provisions at 31 March 2010 for the group was 1,55 (2009: 1,22) and 1,68 (2009: 1,29) for the company. The government as the sole shareholder and the board has the responsibility to ensure that the company is adequately capitalised to ensure continuity of supply and that the business is attractive to investors to enable Eskom to fund the expansion programme.

224 Eskom Holdings Limited
Integrated Repor t 2010
Notes to the consolidated financial statements continuedfor the year ended 31 March 2010
4. Critical accounting estimates and judgementsEstimates and judgements are evaluated continually and are based on historical experience and other factors, including expectations of future events that are believed to be reasonable under the circumstances.
The group makes estimates and assumptions concerning the future. The resulting accounting estimates will, by definition, seldom equal the related actual results. The estimates and assumptions that have a significant risk of causing a material adjustment to the carrying amounts of assets and liabilities within the next financial year are discussed below.
(a) Embedded derivatives Eskom has entered into a number of agreements to supply electricity to electricity-intensive industries where the revenue from these contracts is linked to commodity prices and foreign currency rates (mainly USD) or foreign production price indices that give rise to embedded derivatives. Subsidiaries of Eskom Enterprises also entered into sales contracts where the revenue is based on the USD, foreign production price indices and foreign interest rates that give rise to embedded derivatives.
The embedded derivatives have been divided into three categories:• commodity and/or foreign currency derivatives• foreign currency or interest rate derivatives• production price and foreign currency derivatives
Valuation The fair value of embedded derivatives is determined by using a forward electricity price curve.
Valuation assumptions The forward electricity price curve used to value embedded derivatives at 31 March 2010 was the applicable tariff determined by NERSa on 24 February 2010. This forward curve is based on the average electricity price increase indicated by NERSa in the price applications for the 2010/11, 2011/12 and 2012/13 financial years. These rates are 24,8%, 25,8% and 25,9% and assumes two additional annual increases of 25% and CPI thereafter. The forward electricity price curve used to value embedded derivatives at 31 March 2009 was 26,2% for the 2010 financial year, 25% plus CPI for the next two years and CPI thereafter.
The contracted electricity price used to value embedded derivatives is based on a combination of the factors in the table below over the contracted period.
Forecast sales volumes are based on the most likely future sales volumes which have been back-tested against historic volumes.
The fair value of embedded derivatives takes into account the inherent uncertainty relating to the future cash flows of embedded derivatives, such as liquidity, model risk and other economic factors.
The renegotiation of the Mozal contract has significantly reduced the value of embedded derivatives. The negotiations regarding the other commodity-linked contracts are continuing.
The following valuation assumptions for the future electricity price curve discussed above for the valuation of embedded derivatives were used and are regarded as the best estimates by the board:
2010 Year ended 31 March
Input Unit 2010 20111 20121 20131 20141 20151
aluminium USD per ton 2 262 2 408 2 495 2 568 2 633 2 688
Rand/USD USD per rand 0,14 – – – – –
Rand interest rates Continuous actual/365 days (%) 6,44 7,21 6,92 7,30 7,65 7,92
Dollar interest rates annual actual/360 days (%) 0,23 1,10 1,20 1,82 2,35 2,78
United States PPI Year-on-year (%) (1,63) 4,89 1,85 3,00 1,28 2,28
South african CPI Year-on-year (%) (2,02) 7,85 6,70 6,21 6,79 6,59

225Eskom Holdings Limited
Integrated Repor t 2010
2009 Year ended 31 March
Input Unit 2009 20101 20111 20121 20131 20141
aluminium USD per ton 1 357 1 498 1 642 1 769 1 875 1 970
Rand/USD USD per rand 0,11 – – – – –
Rand interest rates Continuous actual/365 days (%) 9,31 7,44 7,53 7,84 8,08 8,24
Dollar interest rates annual actual/360 days (%) 0,43 1,29 1,46 1,75 2,04 2,30
United States PPI Year-on-year (%) (0,84) (3,62) 2,36 2,17 0,41 2,59
South african CPI Year-on-year (%) 10,30 6,38 5,70 5,50 5,46 6,95
Sensitivity analysis
The approximate change in the value of embedded derivatives if one of the inputs is changed is disclosed in note 3.2 Financial risk management – market risk on page 213.
The carrying amount of the embedded derivative assets for the group and company is R110 million (2009: R1 366 million). The carrying amount of the embedded derivative liabilities for group is R4 722 million (2009: R8 262 million) and R4 721 million (2009: R8 260 million) for company.
(b) Post-retirement medical benefitsThe group provides post-retirement medical benefits to its retirees. The post-retirement medical benefits plan is unfunded.
Valuation The estimated present value of the anticipated expenditure for both in-service and retired members is actuarially valued using the projected unit method. This method treats the accrued service liability separately from the current cost liability. The accrued service liability (on the valuation assumptions) is based on the completed service to the valuation date. The current cost is the cost of providing the benefit over the next year.
Valuation assumptions The principal actuarial assumptions used were:
Group and company
2010%
2009%
Long-term interest rate before tax 8,90 8,75 Long-term medical aid inflation 7,40 7,25
Sensitivity analysisThe carrying amount of the provision would be an estimated R689 million (2009: R847 million) lower had the medical inflation rate used in the valuation decreased by 1% and R794 million (2009: R1 057 million) higher had the medical inflation rate increased by 1%.
The carrying amount of the post-retirement medical benefits liability for group is R7 190 million (2009: R6 238 million) and R7 033 million (2009: R6 103 million) for company.
1. Forwardcurvebasedonfinancialyears.
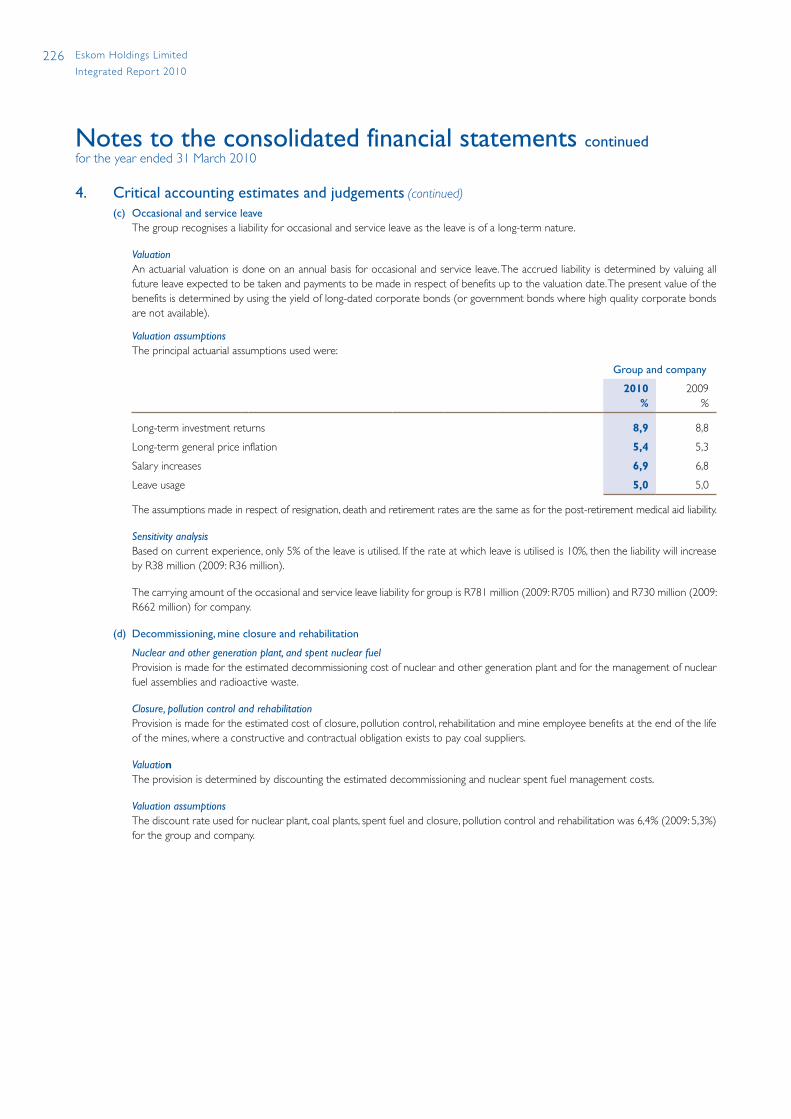
226 Eskom Holdings Limited
Integrated Repor t 2010
Notes to the consolidated financial statements continuedfor the year ended 31 March 2010
4. Critical accounting estimates and judgements (continued)
(c) Occasional and service leaveThe group recognises a liability for occasional and service leave as the leave is of a long-term nature.
Valuationan actuarial valuation is done on an annual basis for occasional and service leave. The accrued liability is determined by valuing all future leave expected to be taken and payments to be made in respect of benefits up to the valuation date. The present value of the benefits is determined by using the yield of long-dated corporate bonds (or government bonds where high quality corporate bonds are not available).
Valuation assumptionsThe principal actuarial assumptions used were:
Group and company
2010%
2009%
Long-term investment returns 8,9 8,8
Long-term general price inflation 5,4 5,3
Salary increases 6,9 6,8
Leave usage 5,0 5,0
The assumptions made in respect of resignation, death and retirement rates are the same as for the post-retirement medical aid liability.
Sensitivity analysisBased on current experience, only 5% of the leave is utilised. If the rate at which leave is utilised is 10%, then the liability will increase by R38 million (2009: R36 million).
The carrying amount of the occasional and service leave liability for group is R781 million (2009: R705 million) and R730 million (2009: R662 million) for company.
(d) Decommissioning, mine closure and rehabilitation
Nuclear and other generation plant, and spent nuclear fuelProvision is made for the estimated decommissioning cost of nuclear and other generation plant and for the management of nuclear fuel assemblies and radioactive waste.
Closure, pollution control and rehabilitationProvision is made for the estimated cost of closure, pollution control, rehabilitation and mine employee benefits at the end of the life of the mines, where a constructive and contractual obligation exists to pay coal suppliers.
ValuationThe provision is determined by discounting the estimated decommissioning and nuclear spent fuel management costs.
Valuation assumptionsThe discount rate used for nuclear plant, coal plants, spent fuel and closure, pollution control and rehabilitation was 6,4% (2009: 5,3%) for the group and company.
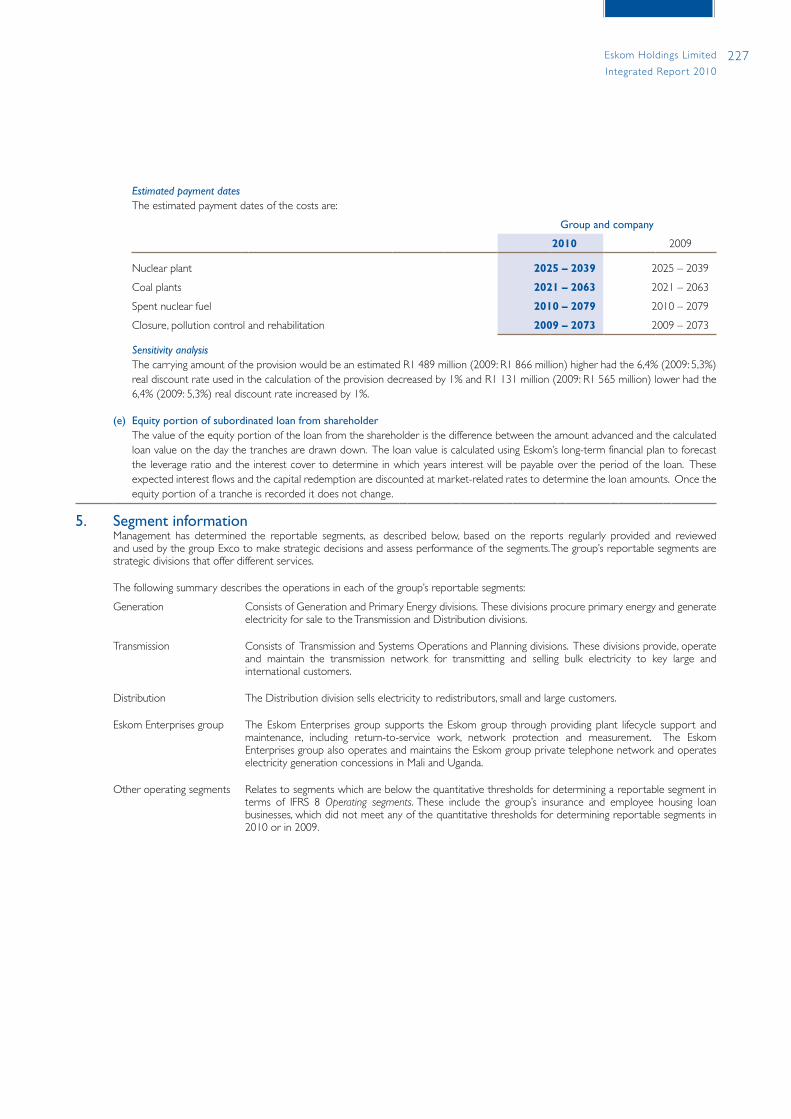
227Eskom Holdings Limited
Integrated Repor t 2010
Estimated payment datesThe estimated payment dates of the costs are:
Group and company
2010 2009
Nuclear plant 2025 – 2039 2025 – 2039
Coal plants 2021 – 2063 2021 – 2063
Spent nuclear fuel 2010 – 2079 2010 – 2079
Closure, pollution control and rehabilitation 2009 – 2073 2009 – 2073
Sensitivity analysisThe carrying amount of the provision would be an estimated R1 489 million (2009: R1 866 million) higher had the 6,4% (2009: 5,3%) real discount rate used in the calculation of the provision decreased by 1% and R1 131 million (2009: R1 565 million) lower had the 6,4% (2009: 5,3%) real discount rate increased by 1%.
(e) Equity portion of subordinated loan from shareholderThe value of the equity portion of the loan from the shareholder is the difference between the amount advanced and the calculated loan value on the day the tranches are drawn down. The loan value is calculated using Eskom’s long-term financial plan to forecast the leverage ratio and the interest cover to determine in which years interest will be payable over the period of the loan. These expected interest flows and the capital redemption are discounted at market-related rates to determine the loan amounts. Once the equity portion of a tranche is recorded it does not change.
5. Segment informationManagement has determined the reportable segments, as described below, based on the reports regularly provided and reviewed and used by the group Exco to make strategic decisions and assess performance of the segments. The group’s reportable segments are strategic divisions that offer different services.
The following summary describes the operations in each of the group’s reportable segments:
Generation Consists of Generation and Primary Energy divisions. These divisions procure primary energy and generate electricity for sale to the Transmission and Distribution divisions.
Transmission Consists of Transmission and Systems Operations and Planning divisions. These divisions provide, operate and maintain the transmission network for transmitting and selling bulk electricity to key large and international customers.
Distribution The Distribution division sells electricity to redistributors, small and large customers.
Eskom Enterprises group The Eskom Enterprises group supports the Eskom group through providing plant lifecycle support and maintenance, including return-to-service work, network protection and measurement. The Eskom Enterprises group also operates and maintains the Eskom group private telephone network and operates electricity generation concessions in Mali and Uganda.
Other operating segments Relates to segments which are below the quantitative thresholds for determining a reportable segment in terms of IFRS 8 Operating segments. These include the group’s insurance and employee housing loan businesses, which did not meet any of the quantitative thresholds for determining reportable segments in 2010 or in 2009.
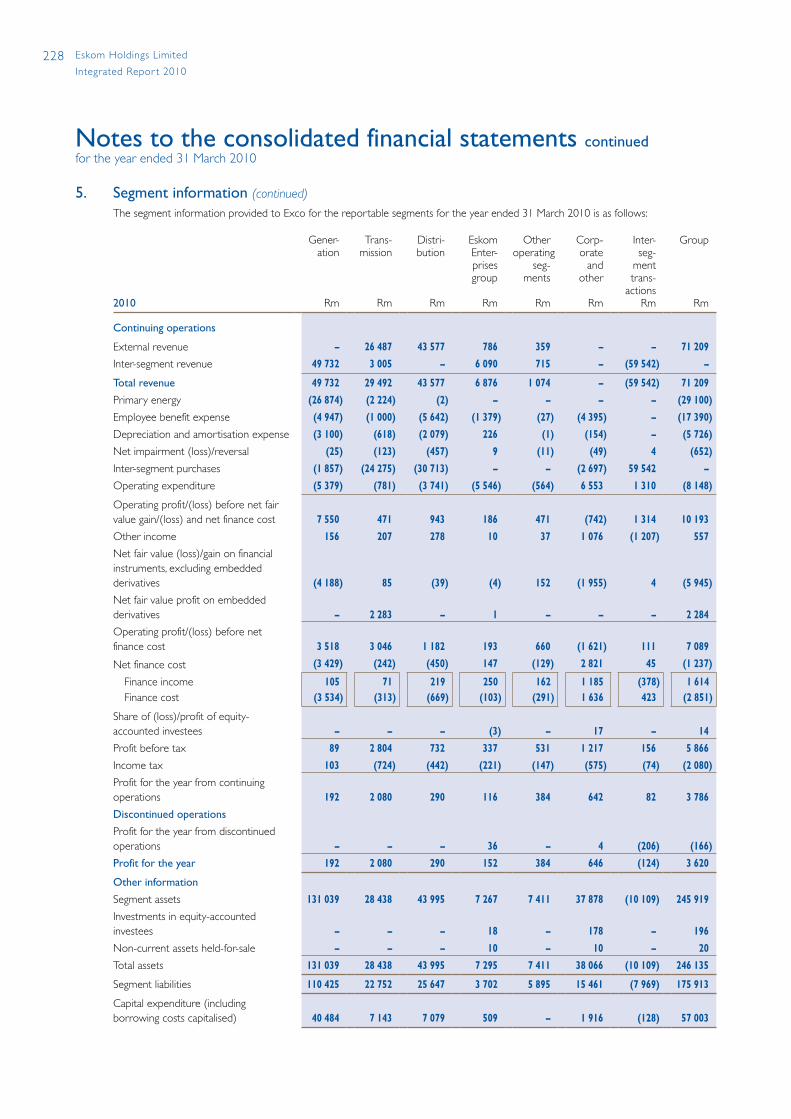
228 Eskom Holdings Limited
Integrated Repor t 2010
Notes to the consolidated financial statements continuedfor the year ended 31 March 2010
5. Segment information (continued)
The segment information provided to Exco for the reportable segments for the year ended 31 March 2010 is as follows:
2010
Gener-ation
Rm
Trans-mission
Rm
Distri-bution
Rm
EskomEnter-prises group
Rm
Otheroperating
seg-ments
Rm
Corp-orate
andother
Rm
Inter-seg-
menttrans-
actionsRm
Group
Rm
Continuing operations
External revenue – 26 487 43 577 786 359 – – 71 209
Inter-segment revenue 49 732 3 005 – 6 090 715 – (59 542) –
Total revenue 49 732 29 492 43 577 6 876 1 074 – (59 542) 71 209
Primary energy (26 874) (2 224) (2) – – – – (29 100)
Employee benefit expense (4 947) (1 000) (5 642) (1 379) (27) (4 395) – (17 390)
Depreciation and amortisation expense (3 100) (618) (2 079) 226 (1) (154) – (5 726)
Net impairment (loss)/reversal (25) (123) (457) 9 (11) (49) 4 (652)
Inter-segment purchases (1 857) (24 275) (30 713) – – (2 697) 59 542 –
Operating expenditure (5 379) (781) (3 741) (5 546) (564) 6 553 1 310 (8 148)
Operating profit/(loss) before net fair value gain/(loss) and net finance cost 7 550 471 943 186 471 (742) 1 314 10 193
Other income 156 207 278 10 37 1 076 (1 207) 557
Net fair value (loss)/gain on financial instruments, excluding embedded derivatives (4 188) 85 (39) (4) 152 (1 955) 4 (5 945)
Net fair value profit on embedded derivatives – 2 283 – 1 – – – 2 284
Operating profit/(loss) before net finance cost 3 518 3 046 1 182 193 660 (1 621) 111 7 089
Net finance cost (3 429) (242) (450) 147 (129) 2 821 45 (1 237)
Finance income 105 71 219 250 162 1 185 (378) 1 614 Finance cost (3 534) (313) (669) (103) (291) 1 636 423 (2 851)
Share of (loss)/profit of equity-accounted investees – – – (3) – 17 – 14
Profit before tax 89 2 804 732 337 531 1 217 156 5 866
Income tax 103 (724) (442) (221) (147) (575) (74) (2 080)
Profit for the year from continuing operations 192 2 080 290 116 384 642 82 3 786
Discontinued operations
Profit for the year from discontinued operations – – – 36 – 4 (206) (166)
Profit for the year 192 2 080 290 152 384 646 (124) 3 620
Other information
Segment assets 131 039 28 438 43 995 7 267 7 411 37 878 (10 109) 245 919
Investments in equity-accounted investees – – – 18 – 178 – 196
Non-current assets held-for-sale – – – 10 – 10 – 20
Total assets 131 039 28 438 43 995 7 295 7 411 38 066 (10 109) 246 135
Segment liabilities 110 425 22 752 25 647 3 702 5 895 15 461 (7 969) 175 913
Capital expenditure (including borrowing costs capitalised) 40 484 7 143 7 079 509 – 1 916 (128) 57 003
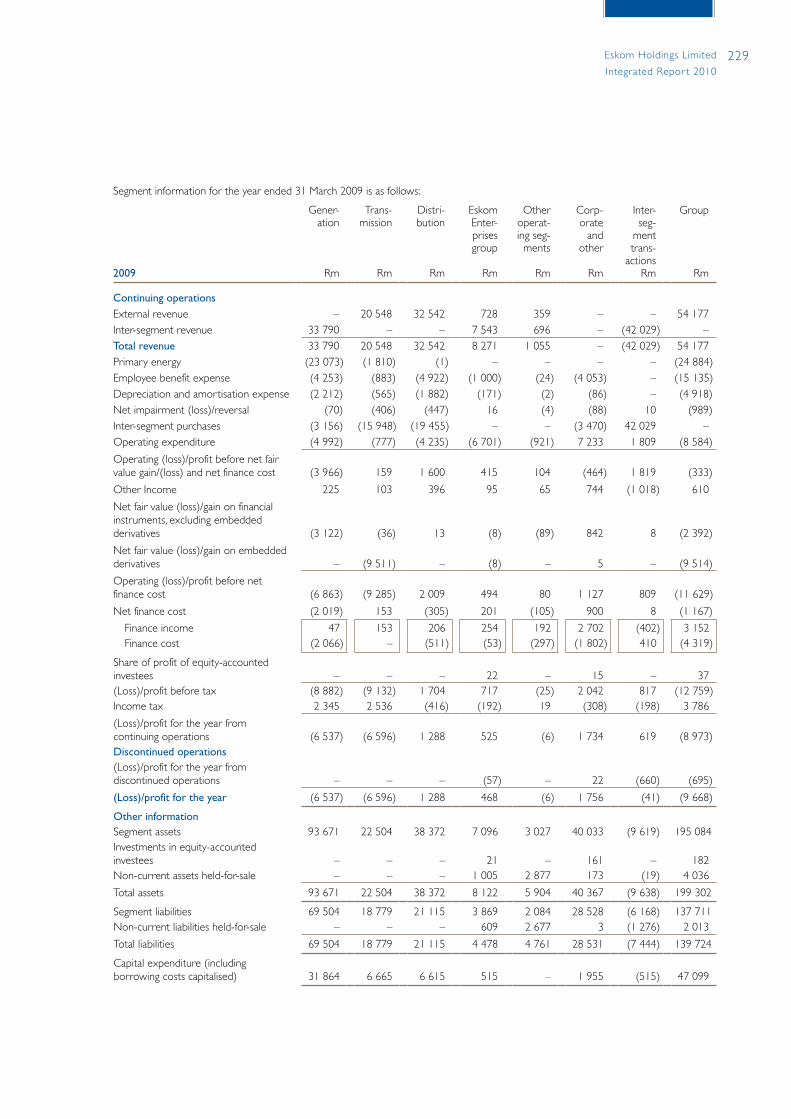
229Eskom Holdings Limited
Integrated Repor t 2010
Segment information for the year ended 31 March 2009 is as follows:
2009
Gener-ation
Rm
Trans-mission
Rm
Distri-bution
Rm
EskomEnter-prises group
Rm
Otheroperat-ing seg-
ments
Rm
Corp-orate
and other
Rm
Inter-seg-
menttrans-
actionsRm
Group
Rm
Continuing operationsExternal revenue – 20 548 32 542 728 359 – – 54 177 Inter-segment revenue 33 790 – – 7 543 696 – (42 029) –Total revenue 33 790 20 548 32 542 8 271 1 055 – (42 029) 54 177 Primary energy (23 073) (1 810) (1) – – – – (24 884)Employee benefit expense (4 253) (883) (4 922) (1 000) (24) (4 053) – (15 135)Depreciation and amortisation expense (2 212) (565) (1 882) (171) (2) (86) – (4 918)Net impairment (loss)/reversal (70) (406) (447) 16 (4) (88) 10 (989)Inter-segment purchases (3 156) (15 948) (19 455) – – (3 470) 42 029 –Operating expenditure (4 992) (777) (4 235) (6 701) (921) 7 233 1 809 (8 584)
Operating (loss)/profit before net fair value gain/(loss) and net finance cost (3 966) 159 1 600 415 104 (464) 1 819 (333)
Other Income 225 103 396 95 65 744 (1 018) 610
Net fair value (loss)/gain on financial instruments, excluding embedded derivatives (3 122) (36) 13 (8) (89) 842 8 (2 392)
Net fair value (loss)/gain on embedded derivatives – (9 511) – (8) – 5 – (9 514)
Operating (loss)/profit before net finance cost (6 863) (9 285) 2 009 494 80 1 127 809 (11 629)
Net finance cost (2 019) 153 (305) 201 (105) 900 8 (1 167)
Finance income 47 153 206 254 192 2 702 (402) 3 152 Finance cost (2 066) – (511) (53) (297) (1 802) 410 (4 319)
Share of profit of equity-accounted investees – – – 22 – 15 – 37 (Loss)/profit before tax (8 882) (9 132) 1 704 717 (25) 2 042 817 (12 759)Income tax 2 345 2 536 (416) (192) 19 (308) (198) 3 786
(Loss)/profit for the year from continuing operations (6 537) (6 596) 1 288 525 (6) 1 734 619 (8 973)Discontinued operations(Loss)/profit for the year from discontinued operations – – – (57) – 22 (660) (695)
(Loss)/profit for the year (6 537) (6 596) 1 288 468 (6) 1 756 (41) (9 668)
Other informationSegment assets 93 671 22 504 38 372 7 096 3 027 40 033 (9 619) 195 084 Investments in equity-accounted investees – – – 21 – 161 – 182 Non-current assets held-for-sale – – – 1 005 2 877 173 (19) 4 036
Total assets 93 671 22 504 38 372 8 122 5 904 40 367 (9 638) 199 302
Segment liabilities 69 504 18 779 21 115 3 869 2 084 28 528 (6 168) 137 711 Non-current liabilities held-for-sale – – – 609 2 677 3 (1 276) 2 013
Total liabilities 69 504 18 779 21 115 4 478 4 761 28 531 (7 444) 139 724
Capital expenditure (including borrowing costs capitalised) 31 864 6 665 6 615 515 – 1 955 (515) 47 099
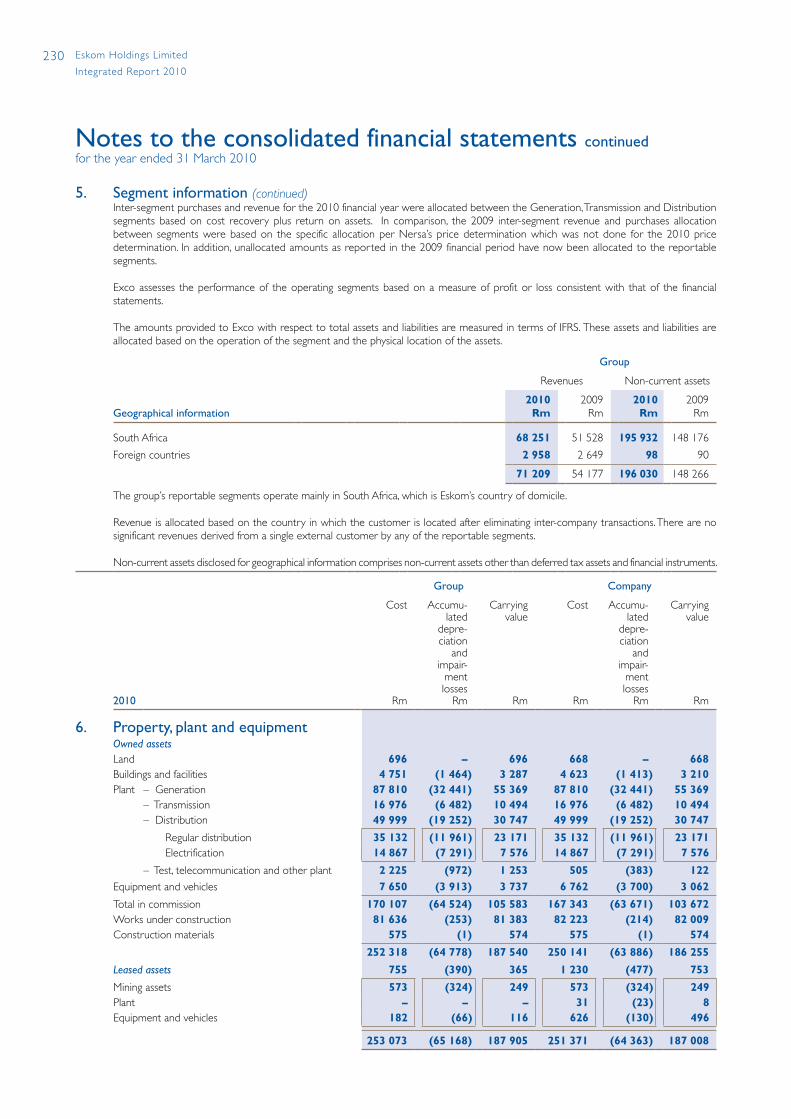
230 Eskom Holdings Limited
Integrated Repor t 2010
Notes to the consolidated financial statements continuedfor the year ended 31 March 2010
5. Segment information (continued)Inter-segment purchases and revenue for the 2010 financial year were allocated between the Generation, Transmission and Distribution segments based on cost recovery plus return on assets. In comparison, the 2009 inter-segment revenue and purchases allocation between segments were based on the specific allocation per Nersa’s price determination which was not done for the 2010 price determination. In addition, unallocated amounts as reported in the 2009 financial period have now been allocated to the reportable segments.
Exco assesses the performance of the operating segments based on a measure of profit or loss consistent with that of the financial statements.
The amounts provided to Exco with respect to total assets and liabilities are measured in terms of IFRS. These assets and liabilities are allocated based on the operation of the segment and the physical location of the assets.
Group
Revenues Non-current assets
Geographical information2010
Rm2009
Rm2010
Rm2009
Rm
South africa 68 251 51 528 195 932 148 176
Foreign countries 2 958 2 649 98 90
71 209 54 177 196 030 148 266
The group’s reportable segments operate mainly in South africa, which is Eskom’s country of domicile.
Revenue is allocated based on the country in which the customer is located after eliminating inter-company transactions. There are no significant revenues derived from a single external customer by any of the reportable segments.
Non-current assets disclosed for geographical information comprises non-current assets other than deferred tax assets and financial instruments.
Group Company
2010
Cost
Rm
accumu-lated
depre-ciation
andimpair-
ment losses
Rm
Carrying value
Rm
Cost
Rm
accumu-lated
depre-ciation
andimpair-
ment losses
Rm
Carrying value
Rm
6. Property, plant and equipmentOwned assetsLand 696 – 696 668 – 668 Buildings and facilities 4 751 (1 464) 3 287 4 623 (1 413) 3 210 Plant – Generation 87 810 (32 441) 55 369 87 810 (32 441) 55 369
– Transmission 16 976 (6 482) 10 494 16 976 (6 482) 10 494 – Distribution 49 999 (19 252) 30 747 49 999 (19 252) 30 747
Regular distribution 35 132 (11 961) 23 171 35 132 (11 961) 23 171 Electrification 14 867 (7 291) 7 576 14 867 (7 291) 7 576
– Test, telecommunication and other plant 2 225 (972) 1 253 505 (383) 122 Equipment and vehicles 7 650 (3 913) 3 737 6 762 (3 700) 3 062
Total in commission 170 107 (64 524) 105 583 167 343 (63 671) 103 672 Works under construction 81 636 (253) 81 383 82 223 (214) 82 009 Construction materials 575 (1) 574 575 (1) 574
252 318 (64 778) 187 540 250 141 (63 886) 186 255
Leased assets 755 (390) 365 1 230 (477) 753
Mining assets 573 (324) 249 573 (324) 249 Plant – – – 31 (23) 8 Equipment and vehicles 182 (66) 116 626 (130) 496
253 073 (65 168) 187 905 251 371 (64 363) 187 008

231Eskom Holdings Limited
Integrated Repor t 2010
Group Company
2009
Cost
Rm
accumu-lated
depre-ciation
andimpair-
ment losses
Rm
Carrying value
Rm
Cost
Rm
accumu-lated
depre-ciation
andimpair-
ment losses
Rm
Carrying value
Rm
Owned assetsLand 572 – 572 544 – 544 Buildings and facilities 3 449 (1 372) 2 077 3 358 (1 329) 2 029 Plant – Generation 80 083 (29 766) 50 317 80 083 (29 766) 50 317
– Transmission 15 139 (6 076) 9 063 15 139 (6 076) 9 063 – Distribution 43 151 (17 482) 25 669 43 151 (17 482) 25 669
Regular distribution 29 604 (10 735) 18 869 29 604 (10 735) 18 869 Electrification 13 547 (6 747) 6 800 13 547 (6 747) 6 800
– Test, telecommunication and other plant 2 270 (1 496) 774 461 (324) 137
Equipment and vehicles 6 543 (3 585) 2 958 5 926 (3 363) 2 563
Total in commission 151 207 (59 777) 91 430 148 662 (58 340) 90 322 Works under construction 46 406 (154) 46 252 46 955 (154) 46 801 Construction materials 691 – 691 691 – 691
198 304 (59 931) 138 373 196 308 (58 494) 137 814
Leased assets 621 (352) 269 965 (451) 514
Mining assets 573 (310) 263 573 (310) 263 Plant 23 (18) 5 31 (23) 8 Equipment and vehicles 25 (24) 1 361 (118) 243
198 925 (60 283) 138 642 197 273 (58 945) 138 328
Reconciliation of movements
2010
Carry-ing
value begin-
ning of year
Rm
additions and
transfers1
Rm
Transfer (to)/from
non-current
assetsheld-for-
sale
Rm
Change in rate
of decom-mission-
ing provisionand costestimate
Rm
Dis-posals
Rm
Impair-ment losses
Rm
Reversal of impair-
ment losses
Rm
Depre-ciation
Rm
Carry-ing
value end of
year
Rm
GroupOwned assetsLand 572 126 – – (2) – – – 696 Buildings and facilities 2 077 1 306 – – (3) – – (93) 3 287 Plant 85 823 18 196 – (1 117) (51) (11) 3 (4 980) 97 863 Equipment and vehicles 2 958 1 523 (11) – (56) – – (677) 3 737 Works under construction 46 252 35 178 – – (7) (40)2 – – 81 383 Construction materials 691 (116) – – – – – (1) 574
138 373 56 213 (11) (1 117) (119) (51) 3 (5 751) 187 540
Leased assets 269 92 50 – – – – (46) 365
Mining assets 263 – – – – – – (14) 249 Plant 5 (5) – – – – – – –Equipment and vehicles 1 97 50 – – – – (32) 116
Total property, plant and equipment 138 642 56 305 39 (1 117) (119) (51) 3 (5 797) 187 905
1. IncludedinadditionsandtransfersareborrowingcostscapitalisedofR8234million(2009:R3436million)forthegroupandcompany.2. Impairmentrecognisedbecauseoftheuncertaintysurroundingthecompletionofidentifiedprojects.

232 Eskom Holdings Limited
Integrated Repor t 2010
Notes to the consolidated financial statements continuedfor the year ended 31 March 2010
Carry-ing
value begin-
ning of year
Rm
additionsand
transfers1
Rm
Transfer (to)/from
non-current
assetsheld-for-
sale
Rm
Change in rate
of decom-mission-
ing provisionand costestimate
Rm
Dis-posals
Rm
Impair-ment losses
Rm
Reversal of impair-
ment losses
Rm
Depre-ciation
Rm
Carry-ing
value end of
year
Rm
6. Property, plant and equipment (continued)Reconciliation of movements (continued)2010CompanyOwned assetsLand 544 126 – – (2) – – – 668 Buildings and facilities 2 029 1 271 – – (2) – – (88) 3 210 Plant 85 186 17 976 – (1 117) (37) (11) 3 (5 268) 96 732 Equipment and vehicles 2 563 1 180 – – (45) – – (636) 3 062 Works under construction 46 801 35 255 – – (7) (40)1 – – 82 009 Construction materials 691 (116) – – – – – (1) 574
137 814 55 692 – (1 117) (93) (51) 3 (5 993) 186 255
Leased assets 514 285 – – – – – (46) 753
Mining assets 263 – – – – – – (14) 249 Plant 8 – – – – – – – 8 Equipment and vehicles 243 285 – – – – – (32) 496
Total property, plant and equipment 138 328 55 977 – (1 117) (93) (51) 3 (6 039) 187 008
Group Company
Note2010
Rm2009
Rm2010
Rm2009
Rm
Borrowing costs on general borrowings are capitalised at an average rate of 10,03% (2009: 9,60%). Borrowing costs on funds borrowed specifically for the purpose of obtaining a qualifying asset are capitalised at the actual rate obtained for the specific funds borrowed. The average specific rate for the year was 19,70% (2009: 11,08%). This rate includes the capitalisation of the remeasurement of the subordinated loan from the shareholder. The amounts capitalised during the year were 37 8 234 3 436 8 234 3 436
Details of land and buildings are available for examination at the registered offices of the respective businesses.
Included in generation plant are assets leased to an international party and leased back under cross-border lease agreements with a carrying value of – 3 456 – 3 456
The cross-border lease transaction was terminated on 15 april 2009. Eskom has thereby been released from all the financial and operating obligations which arose due to this agreement.
The total depreciation charge for property, plant and equipment is disclosed in profit or loss in the following categories: 5 797 5 023 6 039 4 861
Depreciationandamortisationexpense 33 5 783 5 009 6 025 4 847
Primaryenergy 14 14 14 14
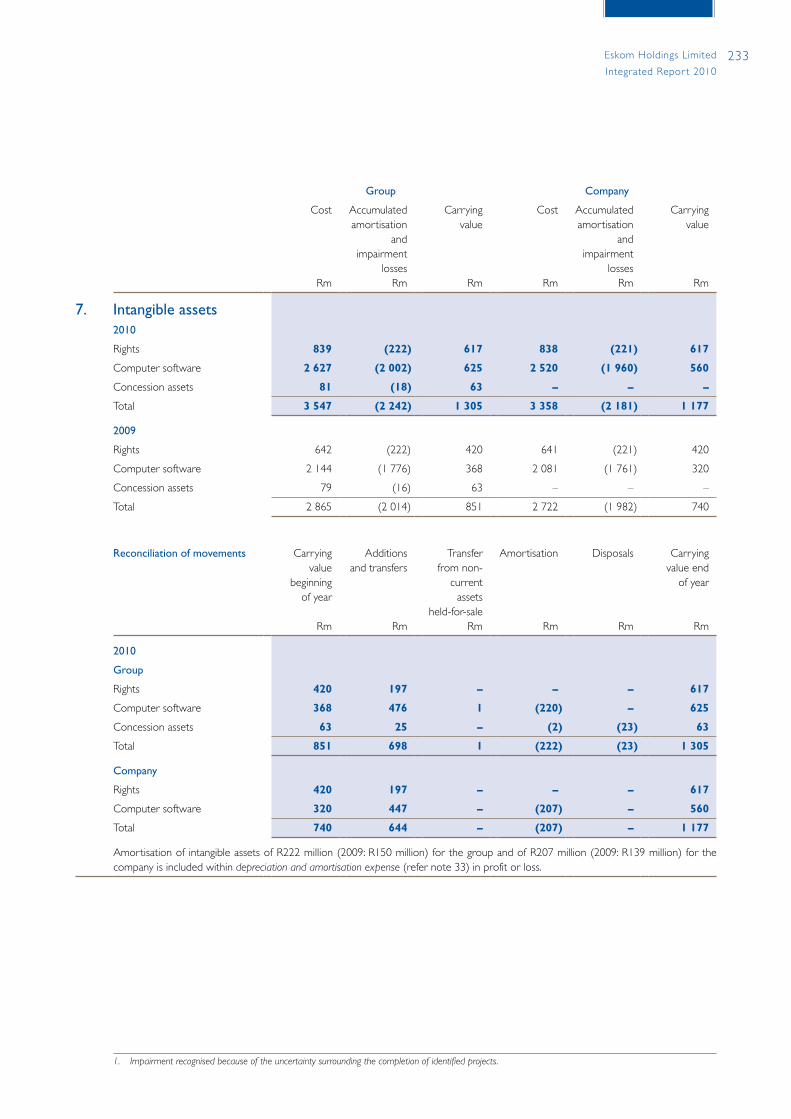
233Eskom Holdings Limited
Integrated Repor t 2010
Group Company
Cost
Rm
accumulatedamortisation
andimpairment
lossesRm
Carrying value
Rm
Cost
Rm
accumulatedamortisation
andimpairment
lossesRm
Carrying value
Rm
7. Intangible assets2010
Rights 839 (222) 617 838 (221) 617
Computer software 2 627 (2 002) 625 2 520 (1 960) 560
Concession assets 81 (18) 63 – – –
Total 3 547 (2 242) 1 305 3 358 (2 181) 1 177
2009
Rights 642 (222) 420 641 (221) 420
Computer software 2 144 (1 776) 368 2 081 (1 761) 320
Concession assets 79 (16) 63 – – –
Total 2 865 (2 014) 851 2 722 (1 982) 740
Reconciliation of movements Carrying value
beginning of year
Rm
additions and transfers
Rm
Transfer from non-
current assets
held-for-saleRm
amortisation
Rm
Disposals
Rm
Carrying value end
of year
Rm
2010
Group
Rights 420 197 – – – 617
Computer software 368 476 1 (220) – 625
Concession assets 63 25 – (2) (23) 63
Total 851 698 1 (222) (23) 1 305
Company
Rights 420 197 – – – 617
Computer software 320 447 – (207) – 560
Total 740 644 – (207) – 1 177
amortisation of intangible assets of R222 million (2009: R150 million) for the group and of R207 million (2009: R139 million) for the company is included within depreciationandamortisationexpense (refer note 33) in profit or loss.
1. Impairmentrecognisedbecauseoftheuncertaintysurroundingthecompletionofidentifiedprojects.
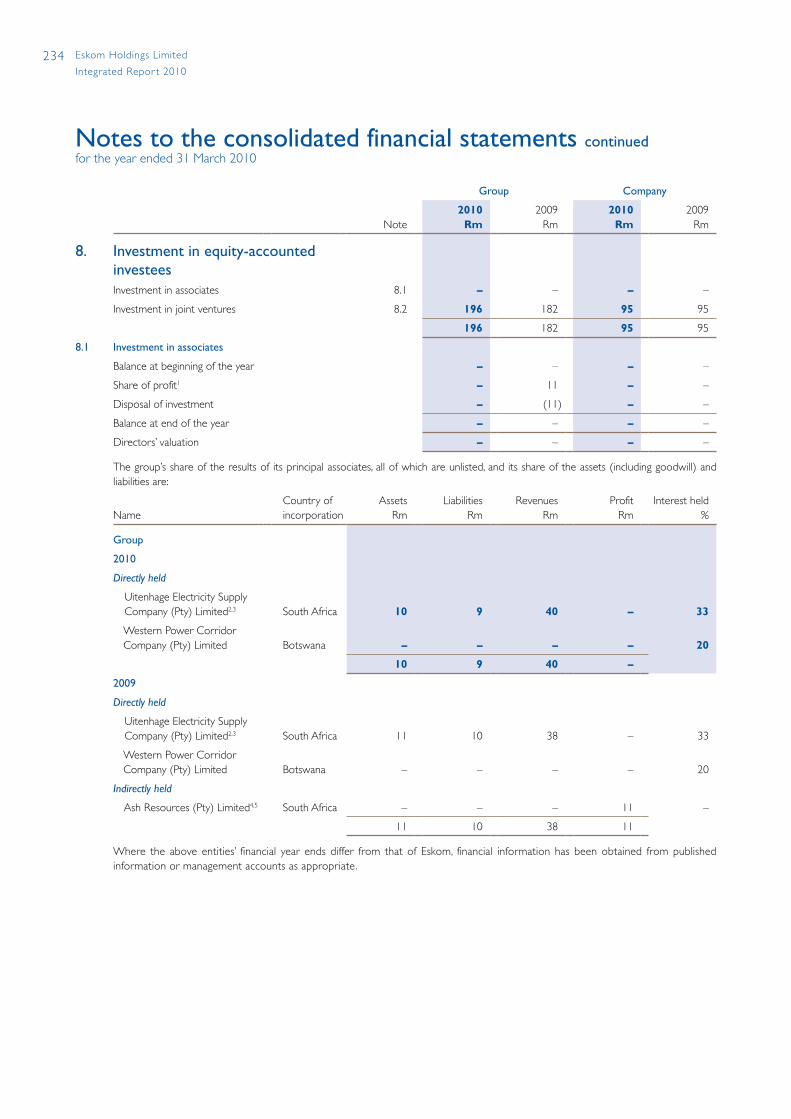
234 Eskom Holdings Limited
Integrated Repor t 2010
Notes to the consolidated financial statements continuedfor the year ended 31 March 2010
Group Company
Note2010
Rm2009
Rm2010
Rm2009
Rm
8. Investment in equity-accounted investeesInvestment in associates 8.1 – – – –
Investment in joint ventures 8.2 196 182 95 95
196 182 95 95
8.1 Investment in associates
Balance at beginning of the year – – – –
Share of profit1 – 11 – –
Disposal of investment – (11) – –
Balance at end of the year – – – –
Directors’ valuation – – – –
The group’s share of the results of its principal associates, all of which are unlisted, and its share of the assets (including goodwill) and liabilities are:
NameCountry ofincorporation
assetsRm
Liabilities Rm
Revenues Rm
Profit Rm
Interest held %
Group
2010
Directly held
Uitenhage Electricity Supply Company (Pty) Limited2,3 South africa 10 9 40 – 33
Western Power Corridor Company (Pty) Limited Botswana – – – – 20
10 9 40 –
2009
Directly held
Uitenhage Electricity Supply Company (Pty) Limited2,3 South africa 11 10 38 – 33
Western Power Corridor Company (Pty) Limited Botswana – – – – 20
Indirectly held
ash Resources (Pty) Limited4,5 South africa – – – 11 –
11 10 38 11
Where the above entities’ financial year ends differ from that of Eskom, financial information has been obtained from published information or management accounts as appropriate.
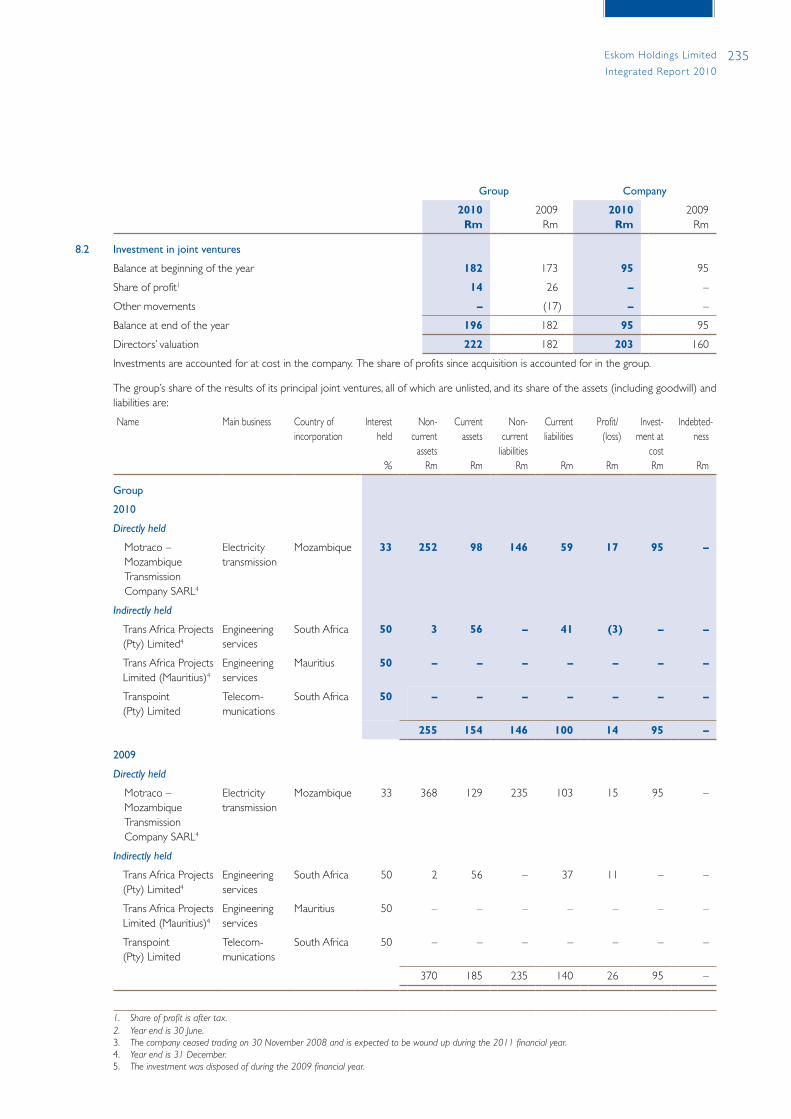
235Eskom Holdings Limited
Integrated Repor t 2010
Group Company
2010Rm
2009Rm
2010Rm
2009Rm
8.2 Investment in joint ventures
Balance at beginning of the year 182 173 95 95
Share of profit1 14 26 – –
Other movements – (17) – –
Balance at end of the year 196 182 95 95
Directors’ valuation 222 182 203 160
Investments are accounted for at cost in the company. The share of profits since acquisition is accounted for in the group.
The group’s share of the results of its principal joint ventures, all of which are unlisted, and its share of the assets (including goodwill) and liabilities are:
Name Main business Country of incorporation
Interest held
%
Non-current
assetsRm
Currentassets
Rm
Non-current
liabilitiesRm
Current liabilities
Rm
Profit/(loss)
Rm
Invest-ment at
costRm
Indebted-ness
Rm
Group
2010
Directly held
Motraco – Mozambique Transmission Company SaRL4
Electricity transmission
Mozambique 33 252 98 146 59 17 95 –
Indirectly held
Trans africa Projects (Pty) Limited4
Engineering services
South africa 50 3 56 – 41 (3) – –
Trans africa Projects Limited (Mauritius)4
Engineering services
Mauritius 50 – – – – – – –
Transpoint (Pty) Limited
Telecom-munications
South africa 50 – – – – – – –
255 154 146 100 14 95 –
2009
Directly held
Motraco – Mozambique Transmission Company SaRL4
Electricity transmission
Mozambique 33 368 129 235 103 15 95 –
Indirectly held
Trans africa Projects (Pty) Limited4
Engineering services
South africa 50 2 56 – 37 11 – –
Trans africa Projects Limited (Mauritius)4
Engineering services
Mauritius 50 – – – – – – –
Transpoint (Pty) Limited
Telecom-munications
South africa 50 – – – – – – –
370 185 235 140 26 95 –
1. Shareofprofitisaftertax.2. Yearendis30June.3. Thecompanyceasedtradingon30November2008andisexpectedtobewoundupduringthe2011financialyear.4. Yearendis31December.5. Theinvestmentwasdisposedofduringthe2009financialyear.
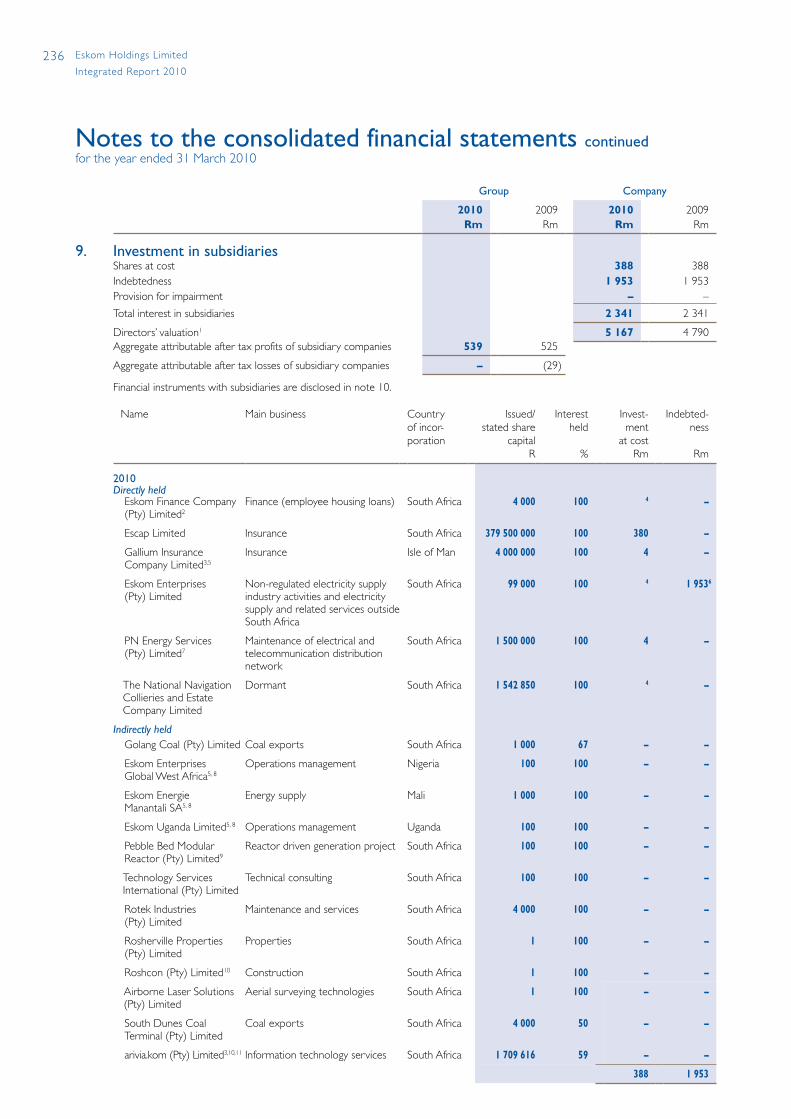
236 Eskom Holdings Limited
Integrated Repor t 2010
Notes to the consolidated financial statements continuedfor the year ended 31 March 2010
Group Company
2010Rm
2009Rm
2010Rm
2009Rm
9. Investment in subsidiariesShares at cost 388 388 Indebtedness 1 953 1 953 Provision for impairment – –
Total interest in subsidiaries 2 341 2 341
Directors’ valuation1 5 167 4 790 aggregate attributable after tax profits of subsidiary companies 539 525
aggregate attributable after tax losses of subsidiary companies – (29)
Financial instruments with subsidiaries are disclosed in note 10.
Name Main business Country of incor-poration
Issued/stated share
capitalR
Interest held
%
Invest-ment
at costRm
Indebted-ness
Rm
2010Directly held Eskom Finance Company
(Pty) Limited2Finance (employee housing loans) South africa 4 000 100 4 –
Escap Limited Insurance South africa 379 500 000 100 380 –
Gallium Insurance Company Limited3,5
Insurance Isle of Man 4 000 000 100 4 –
Eskom Enterprises (Pty) Limited
Non-regulated electricity supply industry activities and electricity supply and related services outside South africa
South africa 99 000 100 4 1 9536
PN Energy Services (Pty) Limited7
Maintenance of electrical and telecommunication distribution network
South africa 1 500 000 100 4 –
The National Navigation Collieries and Estate Company Limited
Dormant South africa 1 542 850 100 4 –
Indirectly held Golang Coal (Pty) Limited Coal exports South africa 1 000 67 – –
Eskom Enterprises Global West africa5, 8
Operations management Nigeria 100 100 – –
Eskom Energie Manantali Sa5, 8
Energy supply Mali 1 000 100 – –
Eskom Uganda Limited5, 8 Operations management Uganda 100 100 – –
Pebble Bed Modular Reactor (Pty) Limited9
Reactor driven generation project South africa 100 100 – –
Technology Services International (Pty) Limited
Technical consulting South africa 100 100 – –
Rotek Industries (Pty) Limited
Maintenance and services South africa 4 000 100 – –
Rosherville Properties (Pty) Limited
Properties South africa 1 100 – –
Roshcon (Pty) Limited10 Construction South africa 1 100 – –
airborne Laser Solutions (Pty) Limited
aerial surveying technologies South africa 1 100 – –
South Dunes Coal Terminal (Pty) Limited
Coal exports South africa 4 000 50 – –
arivia.kom (Pty) Limited3,10,11 Information technology services South africa 1 709 616 59 – –
388 1 953

237Eskom Holdings Limited
Integrated Repor t 2010
Name Main business Country of incor- poration
Issued/stated share
capitalR
Interestheld
%
Invest-ment
at cost
Rm
Indebtedness
Rm
2009
Directly held
Eskom Finance Company (Pty) Limited3
Finance (employee housing loans)
South africa 4 000 100 4 –
Escap Limited Insurance South africa 379 500 000 100 380 –
Gallium Insurance Company Limited3,5
Insurance Isle of Man 4 000 000 100 4 –
Eskom Enterprises (Pty) Limited
Non-regulated electricity supply industry activities and electricity supply and related services outside South africa
South africa 99 000 100 4 1 9536
PN Energy Services (Pty) Limited7
Maintenance of electrical and telecommunication distribution network
South africa 1 500 000 100 4 –
The Natal Navigation Collieries and Estate Company Limited
Dormant South africa 1 542 850 100 4 –
Indirectly held
Golang Coal (Pty) Limited Coal exports South africa 1 000 67 – –
Eskom Enterprises Global West africa5,8
Operations management Nigeria 100 100 – –
Eskom Energie Manantali Sa5,8 Energy supply Mali 1 000 100 – –
Eskom Uganda Limited5,8 Operations management Uganda 100 100 – –
Pebble Bed Modular Reactor (Pty) Limited9
Reactor driven generation project
South africa 100 100 – –
Technology Services International (Pty) Limited
Technical consulting South africa 100 100 – –
Rotek Industries (Pty) Limited Maintenance and services South africa 4 000 100 – –
Rosherville Properties (Pty) Limited
Properties South africa 1 100 – –
Roshcon (Pty) Limited10 Construction South africa 1 100 – –
airborne Laser Solutions (Pty) Limited
aerial surveying technologies South africa 1 100 – –
Lunsemfwa Hydro Power Company5,8,12
Operations and maintenance services
Zambia 1 825 51 – –
South Dunes Coal Terminal (Pty) Limited
Coal exports South africa 4 000 50 – –
arivia.kom (Pty) Limited3,10 Information technology services
South africa 1 709 616 59 – –
388 1 953
1. Includesinvestmentsclassifiedasnon-currentassetsheld-for-sale. 2. EskomFinanceCompany(Pty)Limitedwasreclassifiedaspartofcontinuingoperationsduringthe2010financialyear. 3. Classifiedasnon-currentassetsandliabilitiesheld-for-sale(refernote22). 4. Nominal. 5. Issued/statedcapitalinforeigncurrency. 6. TheequityloantoEskomEnterprises(Pty)Limitedisinterestfree. 7. TheactivitiesofPNEnergyServices(Pty)LimitedisbeingintegratedintoEskom. 8. Yearendis31December. 9. PebbleBedModularReactor(Pty)LimitedisnotconsolidatedasitisnotconsideredtobecontrolledbyEskomEnterprises.10. Thesubsidiariesofarivia.kom(Pty)LimitedandRoshcon(Pty)Limitedhavenotbeendisclosed.11. Theinvestmentinarivia.kom(Pty)Limitedwasdisposedofduringthe2010financialyear.12. TheinvestmentinLunsemfwaHydroPowerCompanywasdisposedofduringthe2009financialyear.
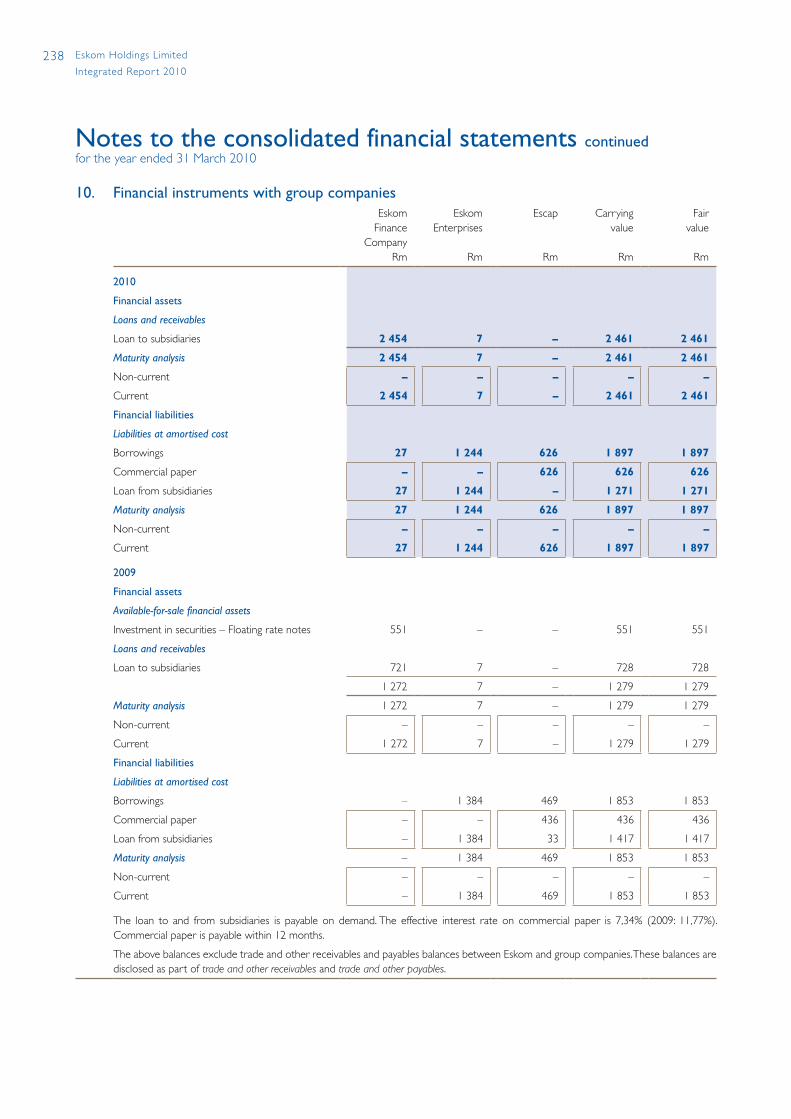
238 Eskom Holdings Limited
Integrated Repor t 2010
Notes to the consolidated financial statements continuedfor the year ended 31 March 2010
10. Financial instruments with group companiesEskom
FinanceCompany
Rm
EskomEnterprises
Rm
Escap
Rm
Carrying value
Rm
Fair value
Rm
2010
Financial assets
Loans and receivables
Loan to subsidiaries 2 454 7 – 2 461 2 461
Maturity analysis 2 454 7 – 2 461 2 461
Non-current – – – – –
Current 2 454 7 – 2 461 2 461
Financial liabilities
Liabilities at amortised cost
Borrowings 27 1 244 626 1 897 1 897
Commercial paper – – 626 626 626
Loan from subsidiaries 27 1 244 – 1 271 1 271
Maturity analysis 27 1 244 626 1 897 1 897
Non-current – – – – –
Current 27 1 244 626 1 897 1 897
2009
Financial assets
Available-for-sale financial assets
Investment in securities – Floating rate notes 551 – – 551 551
Loans and receivables
Loan to subsidiaries 721 7 – 728 728
1 272 7 – 1 279 1 279
Maturity analysis 1 272 7 – 1 279 1 279
Non-current – – – – –
Current 1 272 7 – 1 279 1 279
Financial liabilities
Liabilities at amortised cost
Borrowings – 1 384 469 1 853 1 853
Commercial paper – – 436 436 436
Loan from subsidiaries – 1 384 33 1 417 1 417
Maturity analysis – 1 384 469 1 853 1 853
Non-current – – – – –
Current – 1 384 469 1 853 1 853
The loan to and from subsidiaries is payable on demand. The effective interest rate on commercial paper is 7,34% (2009: 11,77%). Commercial paper is payable within 12 months.
The above balances exclude trade and other receivables and payables balances between Eskom and group companies. These balances are disclosed as part of tradeandotherreceivables and tradeandotherpayables.

239Eskom Holdings Limited
Integrated Repor t 2010
Group Company
Note2010
Rm2009
Rm2010
Rm2009
Rm
11. Future fuel suppliesCoal 3 397 3 132 3 397 3 132
Balance at beginning of the year 3 132 2 543 3 132 2 543
additions 656 856 656 856
amortised during the year1 (293) (233) (293) (233)
Transfer to inventories (98) (34) (98) (34)
Nuclear 371 378 371 378
Balance at beginning of the year 378 42 378 42
additions 368 667 368 667
amortised during the year1 (3) (3) (3) (3)
Transfer from equity (51) (66) (51) (66)
Transfer to inventories (321) (262) (321) (262)
3 768 3 510 3 768 3 510
12. Deferred taxDeferred tax assets
Balance at beginning of the year 56 8 – –
Transfer from profit or loss 38 23 70 – –
Transfer to deferred tax liabilities – (22) – –
79 56 – –
Comprising 79 56 – –
Property, plant and equipment (22) (15) – –
Provisions 90 68 – –
Other 11 3 – –
Deferred tax liabilities
Balance at beginning of the year 6 098 10 229 5 871 10 220
Transfer from/(to) profit or loss 38 1 839 (3 924) 1 636 (4 161)
Transfer to statement of comprehensive income (2 675) (184) (2 673) (188)
Transfer from deferred tax assets – (22) – –
Other – (1) – –
5 262 6 098 4 834 5 871
Comprising 5 262 6 098 4 834 5 871
Property, plant and equipment 17 296 14 619 17 102 14 557
Inventories 654 406 654 406
Provisions (5 181) (5 205) (5 180) (5 168)
Tax losses (3 974) (2 814) (3 969) (2 809)
Embedded derivative assets and liabilities (1 291) (1 930) (1 291) (1 930)
available-for-sale financial assets 57 62 57 62
Cash flow hedges 134 2 714 134 2 714
Post-retirement medical aid benefits (104) (15) (104) (15)
Payments received in advance (2 816) (1 853) (2 816) (1 853)
Other 487 114 247 (93)
Unused tax losses available for offset against future taxable income 14 513 10 050 14 175 10 032
1. Amortisationoffuturefuelisincludedinprofitorlosswithinprimaryenergy.
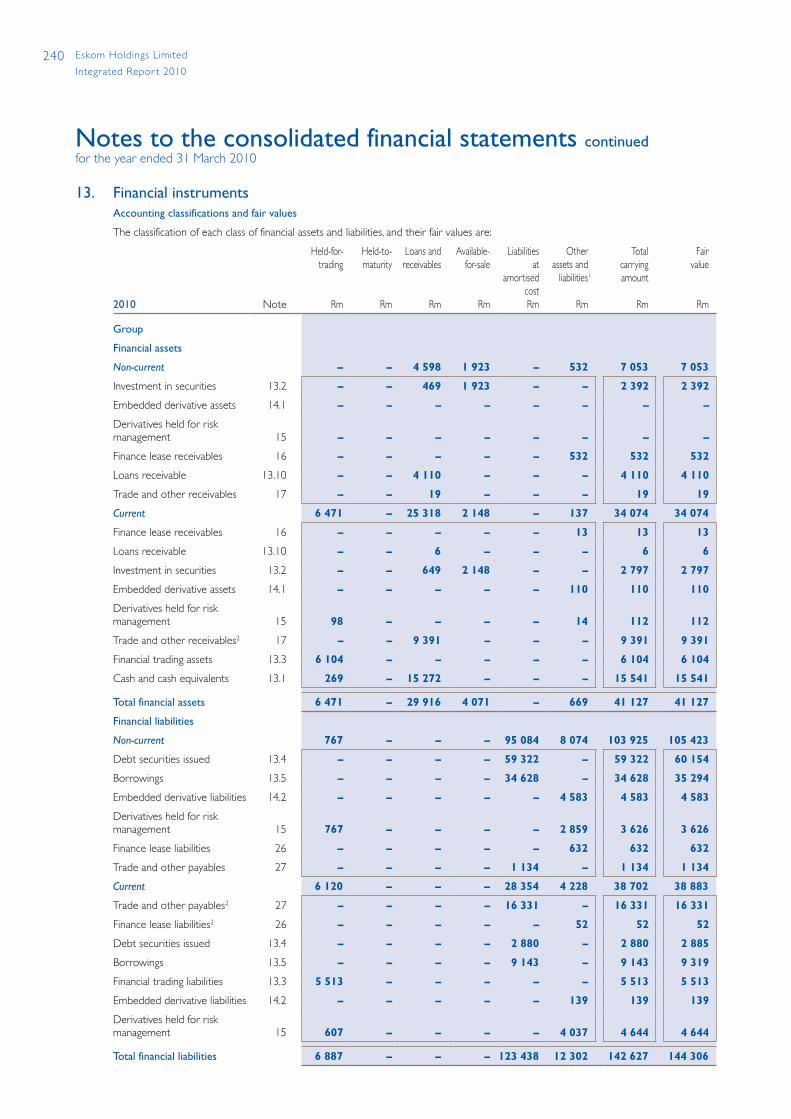
240 Eskom Holdings Limited
Integrated Repor t 2010
Notes to the consolidated financial statements continuedfor the year ended 31 March 2010
13. Financial instruments Accounting classifications and fair values
The classification of each class of financial assets and liabilities, and their fair values are:
2010 Note
Held-for-trading
Rm
Held-to-maturity
Rm
Loans andreceivables
Rm
Available-for-sale
Rm
Liabilities at
amortisedcostRm
Other assets and
liabilities1
Rm
Totalcarryingamount
Rm
Fair value
Rm
Group
Financial assets
Non-current – – 4 598 1 923 – 532 7 053 7 053
Investment in securities 13.2 – – 469 1 923 – – 2 392 2 392
Embedded derivative assets 14.1 – – – – – – – –
Derivatives held for risk management 15 – – – – – – – –
Finance lease receivables 16 – – – – – 532 532 532
Loans receivable 13.10 – – 4 110 – – – 4 110 4 110
Trade and other receivables 17 – – 19 – – – 19 19
Current 6 471 – 25 318 2 148 – 137 34 074 34 074
Finance lease receivables 16 – – – – – 13 13 13
Loans receivable 13.10 – – 6 – – – 6 6
Investment in securities 13.2 – – 649 2 148 – – 2 797 2 797
Embedded derivative assets 14.1 – – – – – 110 110 110
Derivatives held for risk management 15 98 – – – – 14 112 112
Trade and other receivables2 17 – – 9 391 – – – 9 391 9 391
Financial trading assets 13.3 6 104 – – – – – 6 104 6 104
Cash and cash equivalents 13.1 269 – 15 272 – – – 15 541 15 541
Total financial assets 6 471 – 29 916 4 071 – 669 41 127 41 127
Financial liabilities
Non-current 767 – – – 95 084 8 074 103 925 105 423
Debt securities issued 13.4 – – – – 59 322 – 59 322 60 154
Borrowings 13.5 – – – – 34 628 – 34 628 35 294
Embedded derivative liabilities 14.2 – – – – – 4 583 4 583 4 583
Derivatives held for risk management 15 767 – – – – 2 859 3 626 3 626
Finance lease liabilities 26 – – – – – 632 632 632
Trade and other payables 27 – – – – 1 134 – 1 134 1 134
Current 6 120 – – – 28 354 4 228 38 702 38 883
Trade and other payables2 27 – – – – 16 331 – 16 331 16 331
Finance lease liabilities2 26 – – – – – 52 52 52
Debt securities issued 13.4 – – – – 2 880 – 2 880 2 885
Borrowings 13.5 – – – – 9 143 – 9 143 9 319
Financial trading liabilities 13.3 5 513 – – – – – 5 513 5 513
Embedded derivative liabilities 14.2 – – – – – 139 139 139
Derivatives held for risk management 15 607 – – – – 4 037 4 644 4 644
Total financial liabilities 6 887 – – – 123 438 12 302 142 627 144 306
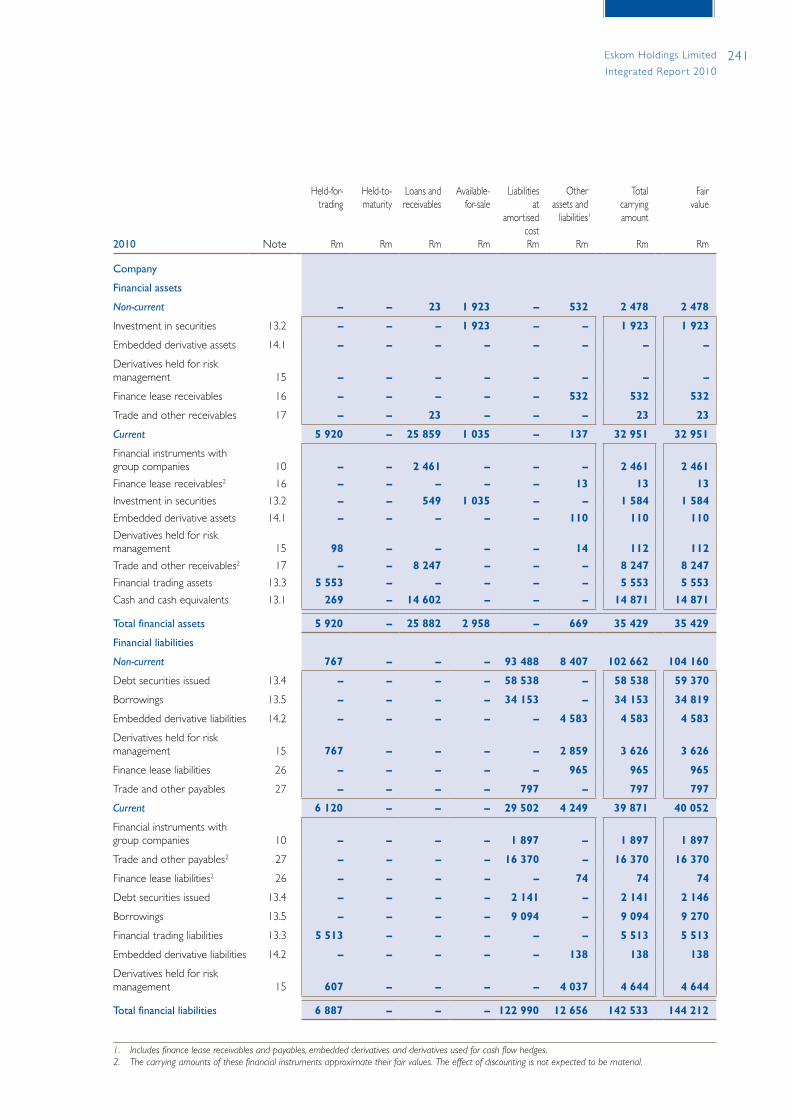
241Eskom Holdings Limited
Integrated Repor t 2010
2010 Note
Held-for-trading
Rm
Held-to-maturity
Rm
Loans andreceivables
Rm
Available-for-sale
Rm
Liabilities at
amortisedcostRm
Other assets and
liabilities1
Rm
Totalcarryingamount
Rm
Fair value
Rm
Company
Financial assets
Non-current – – 23 1 923 – 532 2 478 2 478
Investment in securities 13.2 – – – 1 923 – – 1 923 1 923
Embedded derivative assets 14.1 – – – – – – – –
Derivatives held for risk management 15 – – – – – – – –
Finance lease receivables 16 – – – – – 532 532 532
Trade and other receivables 17 – – 23 – – – 23 23
Current 5 920 – 25 859 1 035 – 137 32 951 32 951
Financial instruments with group companies 10 – – 2 461 – – – 2 461 2 461
Finance lease receivables2 16 – – – – – 13 13 13
Investment in securities 13.2 – – 549 1 035 – – 1 584 1 584
Embedded derivative assets 14.1 – – – – – 110 110 110
Derivatives held for risk management 15 98 – – – – 14 112 112
Trade and other receivables2 17 – – 8 247 – – – 8 247 8 247
Financial trading assets 13.3 5 553 – – – – – 5 553 5 553
Cash and cash equivalents 13.1 269 – 14 602 – – – 14 871 14 871
Total financial assets 5 920 – 25 882 2 958 – 669 35 429 35 429
Financial liabilities
Non-current 767 – – – 93 488 8 407 102 662 104 160
Debt securities issued 13.4 – – – – 58 538 – 58 538 59 370
Borrowings 13.5 – – – – 34 153 – 34 153 34 819
Embedded derivative liabilities 14.2 – – – – – 4 583 4 583 4 583
Derivatives held for risk management 15 767 – – – – 2 859 3 626 3 626
Finance lease liabilities 26 – – – – – 965 965 965
Trade and other payables 27 – – – – 797 – 797 797
Current 6 120 – – – 29 502 4 249 39 871 40 052
Financial instruments with group companies 10 – – – – 1 897 – 1 897 1 897
Trade and other payables2 27 – – – – 16 370 – 16 370 16 370
Finance lease liabilities2 26 – – – – – 74 74 74
Debt securities issued 13.4 – – – – 2 141 – 2 141 2 146
Borrowings 13.5 – – – – 9 094 – 9 094 9 270
Financial trading liabilities 13.3 5 513 – – – – – 5 513 5 513
Embedded derivative liabilities 14.2 – – – – – 138 138 138
Derivatives held for risk management 15 607 – – – – 4 037 4 644 4 644
Total financial liabilities 6 887 – – – 122 990 12 656 142 533 144 212
1. Includesfinanceleasereceivablesandpayables,embeddedderivativesandderivativesusedforcashflowhedges.2. Thecarryingamountsofthesefinancialinstrumentsapproximatetheirfairvalues.Theeffectofdiscountingisnotexpectedtobematerial.

242 Eskom Holdings Limited
Integrated Repor t 2010
Notes to the consolidated financial statements continuedfor the year ended 31 March 2010
13. Financial instruments (continued)
Accounting classifications and fair values (continued)
2009 Note
Held-for-trading
Rm
Held-to-maturity
Rm
Loans andreceivables
Rm
Available-for-sale
Rm
Liabilities at
amortisedcostRm
Other assets andliabilities1
Rm
Totalcarryingamount
Rm
Fair value
Rm
Group
Financial assets
Non-current 586 100 1 620 1 861 – 1 671 5 838 5 835
Investment in securities 13.2 – 100 1 597 1 861 – – 3 558 3 555
Embedded derivative assets 14.1 – – – – – 1 135 1 135 1 135
Derivatives held for risk management 15 586 – – – – – 586 586
Finance lease receivables 16 – – – – – 536 536 536
Trade and other receivables 17 – – 23 – – – 23 23
Current 1 451 4 27 808 3 121 – 966 33 350 33 365
Finance lease receivables 16 – – – – – 11 11 11
Investment in securities 13.2 – 4 1 235 3 121 – – 4 360 4 375
Embedded derivative assets 14.1 – – – – – 231 231 231
Derivatives held for risk management 15 527 – – – – 724 1 251 1 251
Trade and other receivables2 17 – – 8 191 – – – 8 191 8 191
Financial trading assets 13.3 924 – – – – – 924 924
Cash and cash equivalents 13.1 – – 18 382 – – – 18 382 18 382
Total financial assets 2 037 104 29 428 4 982 – 2 637 39 188 39 200
Financial liabilities
Non-current 123 – – – 58 515 9 419 68 057 68 040
Debt securities issued 13.4 – – – – 44 253 – 44 253 43 701
Borrowings 13.5 – – – – 12 796 – 12 796 13 331
Embedded derivative liabilities 14.2 – – – – – 8 219 8 219 8 219
Derivatives held for risk management 15 123 – – – – 663 786 786
Finance lease liabilities 26 – – – – – 537 537 537
Trade and other payables 27 – – – – 1 466 – 1 466 1 466
Current 2 900 – – – 33 836 1 964 38 700 38 655
Trade and other payables2 27 – – – – 16 701 – 16 701 16 701
Finance lease liabilities2 26 – – – – – 15 15 15
Debt securities issued 13.4 – – – – 3 324 – 3 324 3 154
Borrowings 13.5 – – – – 13 811 – 13 811 13 936
Financial trading liabilities 13.3 2 180 – – – – – 2 180 2 180
Embedded derivative liabilities 14.2 – – – – – 43 43 43
Derivatives held for risk management 15 720 – – – – 1 906 2 626 2 626
Total financial liabilities 3 023 – – – 92 351 11 383 106 757 106 695
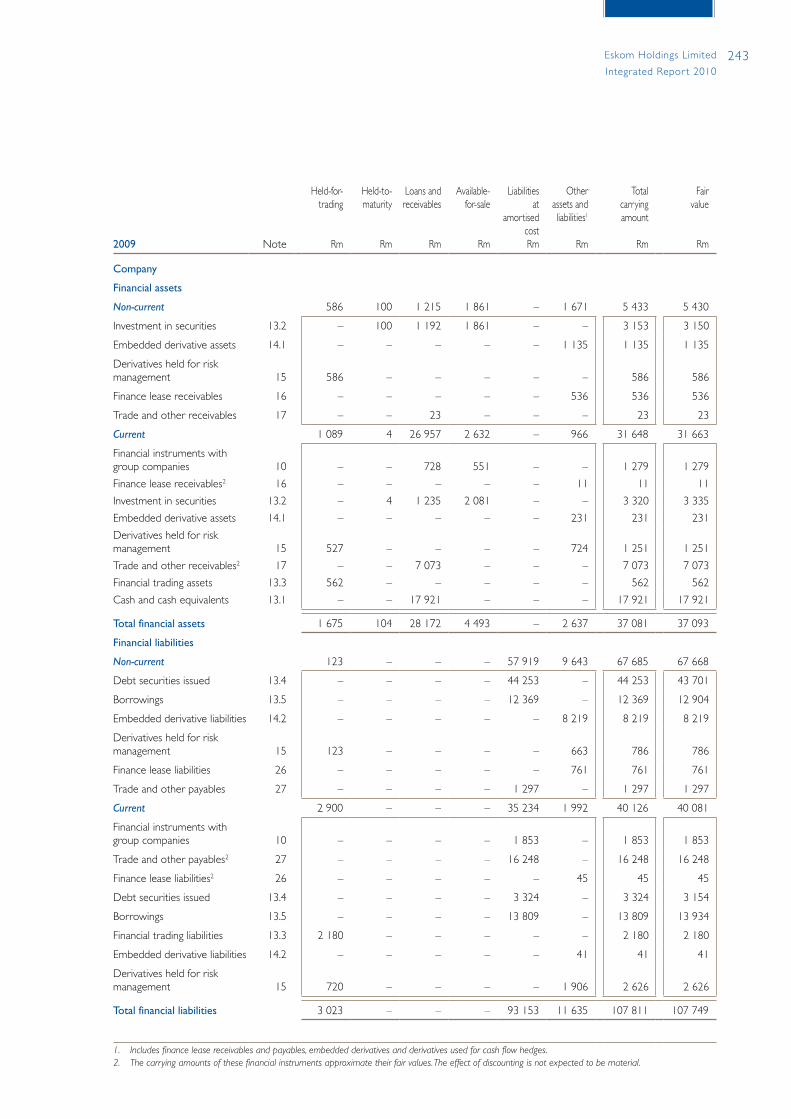
243Eskom Holdings Limited
Integrated Repor t 2010
2009 Note
Held-for-trading
Rm
Held-to-maturity
Rm
Loans andreceivables
Rm
Available-for-sale
Rm
Liabilities at
amortisedcostRm
Other assets andliabilities1
Rm
Totalcarryingamount
Rm
Fair value
Rm
Company
Financial assets
Non-current 586 100 1 215 1 861 – 1 671 5 433 5 430
Investment in securities 13.2 – 100 1 192 1 861 – – 3 153 3 150
Embedded derivative assets 14.1 – – – – – 1 135 1 135 1 135
Derivatives held for risk management 15 586 – – – – – 586 586
Finance lease receivables 16 – – – – – 536 536 536
Trade and other receivables 17 – – 23 – – – 23 23
Current 1 089 4 26 957 2 632 – 966 31 648 31 663
Financial instruments with group companies 10 – – 728 551 – – 1 279 1 279
Finance lease receivables2 16 – – – – – 11 11 11
Investment in securities 13.2 – 4 1 235 2 081 – – 3 320 3 335
Embedded derivative assets 14.1 – – – – – 231 231 231
Derivatives held for risk management 15 527 – – – – 724 1 251 1 251
Trade and other receivables2 17 – – 7 073 – – – 7 073 7 073
Financial trading assets 13.3 562 – – – – – 562 562
Cash and cash equivalents 13.1 – – 17 921 – – – 17 921 17 921
Total financial assets 1 675 104 28 172 4 493 – 2 637 37 081 37 093
Financial liabilities
Non-current 123 – – – 57 919 9 643 67 685 67 668
Debt securities issued 13.4 – – – – 44 253 – 44 253 43 701
Borrowings 13.5 – – – – 12 369 – 12 369 12 904
Embedded derivative liabilities 14.2 – – – – – 8 219 8 219 8 219
Derivatives held for risk management 15 123 – – – – 663 786 786
Finance lease liabilities 26 – – – – – 761 761 761
Trade and other payables 27 – – – – 1 297 – 1 297 1 297
Current 2 900 – – – 35 234 1 992 40 126 40 081
Financial instruments with group companies 10 – – – – 1 853 – 1 853 1 853
Trade and other payables2 27 – – – – 16 248 – 16 248 16 248
Finance lease liabilities2 26 – – – – – 45 45 45
Debt securities issued 13.4 – – – – 3 324 – 3 324 3 154
Borrowings 13.5 – – – – 13 809 – 13 809 13 934
Financial trading liabilities 13.3 2 180 – – – – – 2 180 2 180
Embedded derivative liabilities 14.2 – – – – – 41 41 41
Derivatives held for risk management 15 720 – – – – 1 906 2 626 2 626
Total financial liabilities 3 023 – – – 93 153 11 635 107 811 107 749
1. Includesfinanceleasereceivablesandpayables,embeddedderivativesandderivativesusedforcashflowhedges.2. Thecarryingamountsofthesefinancialinstrumentsapproximatetheirfairvalues.Theeffectofdiscountingisnotexpectedtobematerial.
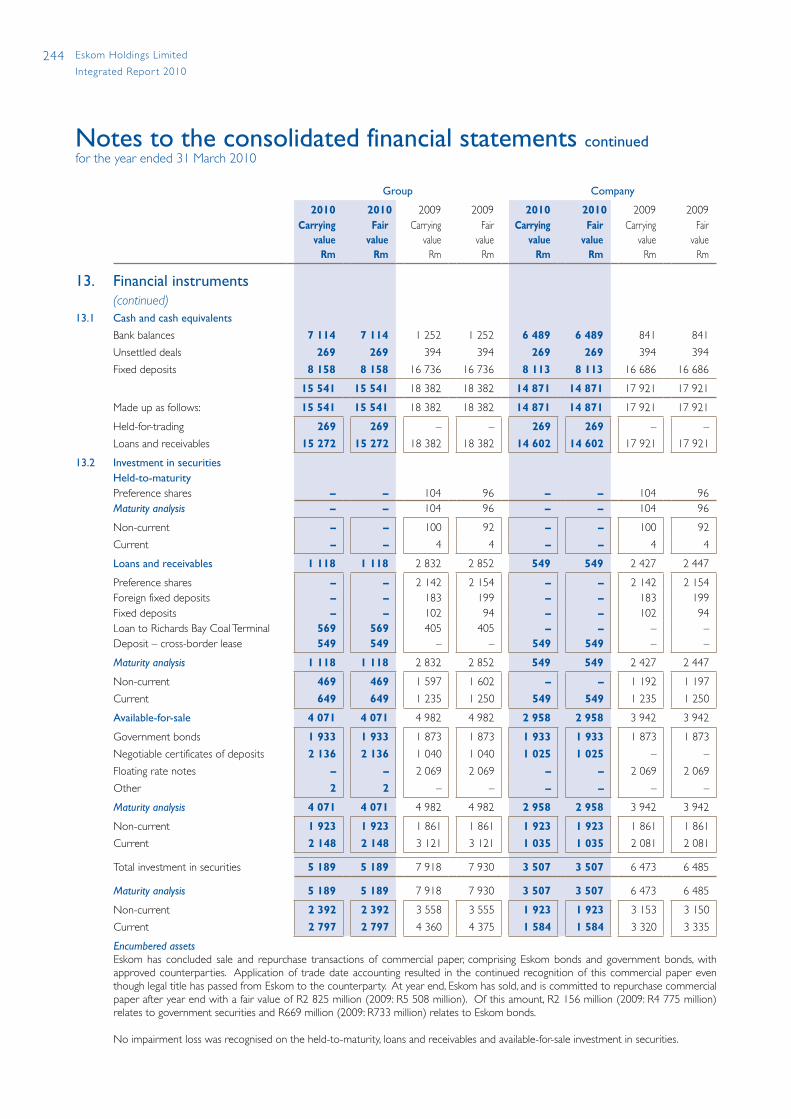
244 Eskom Holdings Limited
Integrated Repor t 2010
Notes to the consolidated financial statements continuedfor the year ended 31 March 2010
Group Company
2010 2010 2009 2009 2010 2010 2009 2009Carrying
valueRm
Fair value
Rm
Carryingvalue
Rm
Fair value
Rm
Carrying value
Rm
Fair value
Rm
Carryingvalue
Rm
Fair value
Rm
13. Financial instruments (continued)
13.1 Cash and cash equivalents
Bank balances 7 114 7 114 1 252 1 252 6 489 6 489 841 841
Unsettled deals 269 269 394 394 269 269 394 394
Fixed deposits 8 158 8 158 16 736 16 736 8 113 8 113 16 686 16 686
15 541 15 541 18 382 18 382 14 871 14 871 17 921 17 921
Made up as follows: 15 541 15 541 18 382 18 382 14 871 14 871 17 921 17 921
Held-for-trading 269 269 – – 269 269 – –
Loans and receivables 15 272 15 272 18 382 18 382 14 602 14 602 17 921 17 921
13.2 Investment in securitiesHeld-to-maturityPreference shares – – 104 96 – – 104 96 Maturity analysis – – 104 96 – – 104 96
Non-current – – 100 92 – – 100 92
Current – – 4 4 – – 4 4
Loans and receivables 1 118 1 118 2 832 2 852 549 549 2 427 2 447
Preference shares – – 2 142 2 154 – – 2 142 2 154 Foreign fixed deposits – – 183 199 – – 183 199 Fixed deposits – – 102 94 – – 102 94 Loan to Richards Bay Coal Terminal 569 569 405 405 – – – –Deposit – cross-border lease 549 549 – – 549 549 – –
Maturity analysis 1 118 1 118 2 832 2 852 549 549 2 427 2 447
Non-current 469 469 1 597 1 602 – – 1 192 1 197
Current 649 649 1 235 1 250 549 549 1 235 1 250
Available-for-sale 4 071 4 071 4 982 4 982 2 958 2 958 3 942 3 942
Government bonds 1 933 1 933 1 873 1 873 1 933 1 933 1 873 1 873
Negotiable certificates of deposits 2 136 2 136 1 040 1 040 1 025 1 025 – –
Floating rate notes – – 2 069 2 069 – – 2 069 2 069
Other 2 2 – – – – – –
Maturity analysis 4 071 4 071 4 982 4 982 2 958 2 958 3 942 3 942
Non-current 1 923 1 923 1 861 1 861 1 923 1 923 1 861 1 861
Current 2 148 2 148 3 121 3 121 1 035 1 035 2 081 2 081
Total investment in securities 5 189 5 189 7 918 7 930 3 507 3 507 6 473 6 485
Maturity analysis 5 189 5 189 7 918 7 930 3 507 3 507 6 473 6 485
Non-current 2 392 2 392 3 558 3 555 1 923 1 923 3 153 3 150
Current 2 797 2 797 4 360 4 375 1 584 1 584 3 320 3 335
Encumbered assets Eskom has concluded sale and repurchase transactions of commercial paper, comprising Eskom bonds and government bonds, with approved counterparties. Application of trade date accounting resulted in the continued recognition of this commercial paper even though legal title has passed from Eskom to the counterparty. At year end, Eskom has sold, and is committed to repurchase commercial paper after year end with a fair value of R2 825 million (2009: R5 508 million). Of this amount, R2 156 million (2009: R4 775 million) relates to government securities and R669 million (2009: R733 million) relates to Eskom bonds.
No impairment loss was recognised on the held-to-maturity, loans and receivables and available-for-sale investment in securities.
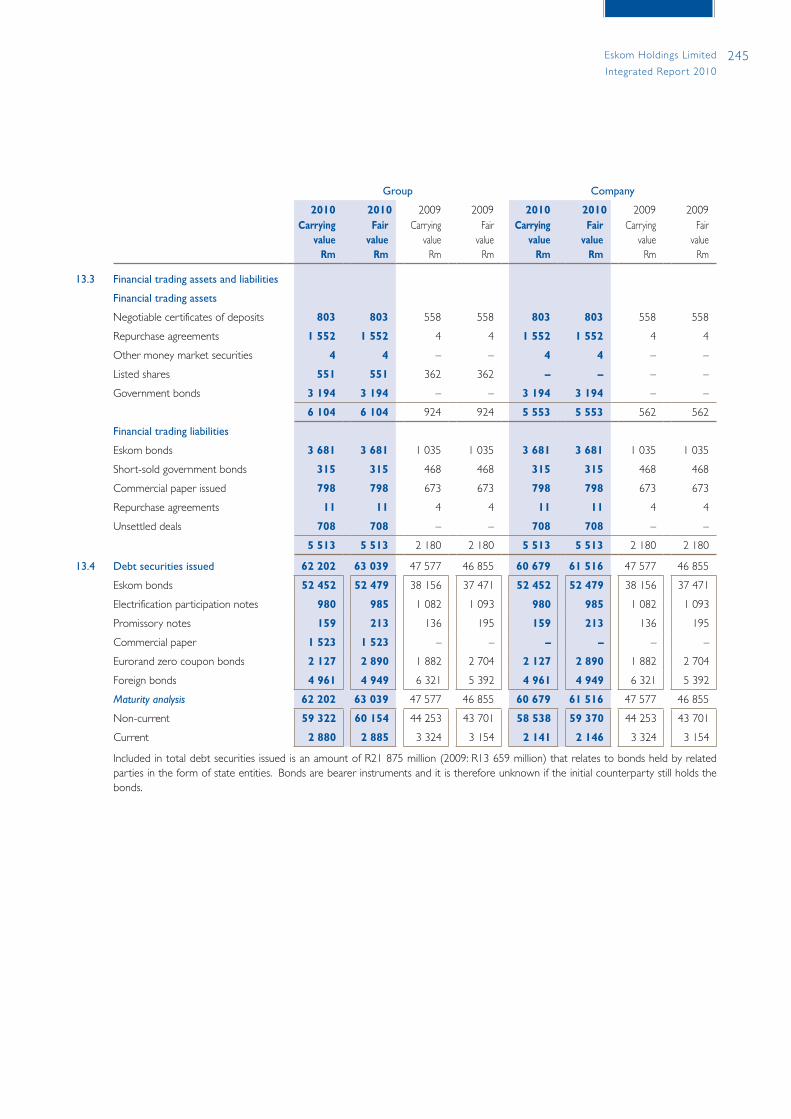
245Eskom Holdings Limited
Integrated Repor t 2010
Group Company
2010 2010 2009 2009 2010 2010 2009 2009Carrying
valueRm
Fair value
Rm
Carryingvalue
Rm
Fair value
Rm
Carrying value
Rm
Fair value
Rm
Carryingvalue
Rm
Fair value
Rm
13.3 Financial trading assets and liabilities
Financial trading assets
Negotiable certificates of deposits 803 803 558 558 803 803 558 558
Repurchase agreements 1 552 1 552 4 4 1 552 1 552 4 4
Other money market securities 4 4 – – 4 4 – –
Listed shares 551 551 362 362 – – – –
Government bonds 3 194 3 194 – – 3 194 3 194 – –
6 104 6 104 924 924 5 553 5 553 562 562
Financial trading liabilities
Eskom bonds 3 681 3 681 1 035 1 035 3 681 3 681 1 035 1 035
Short-sold government bonds 315 315 468 468 315 315 468 468
Commercial paper issued 798 798 673 673 798 798 673 673
Repurchase agreements 11 11 4 4 11 11 4 4
Unsettled deals 708 708 – – 708 708 – –
5 513 5 513 2 180 2 180 5 513 5 513 2 180 2 180
13.4 Debt securities issued 62 202 63 039 47 577 46 855 60 679 61 516 47 577 46 855
Eskom bonds 52 452 52 479 38 156 37 471 52 452 52 479 38 156 37 471
Electrification participation notes 980 985 1 082 1 093 980 985 1 082 1 093
Promissory notes 159 213 136 195 159 213 136 195
Commercial paper 1 523 1 523 – – – – – –
Eurorand zero coupon bonds 2 127 2 890 1 882 2 704 2 127 2 890 1 882 2 704
Foreign bonds 4 961 4 949 6 321 5 392 4 961 4 949 6 321 5 392
Maturity analysis 62 202 63 039 47 577 46 855 60 679 61 516 47 577 46 855
Non-current 59 322 60 154 44 253 43 701 58 538 59 370 44 253 43 701
Current 2 880 2 885 3 324 3 154 2 141 2 146 3 324 3 154
Included in total debt securities issued is an amount of R21 875 million (2009: R13 659 million) that relates to bonds held by related parties in the form of state entities. Bonds are bearer instruments and it is therefore unknown if the initial counterparty still holds the bonds.
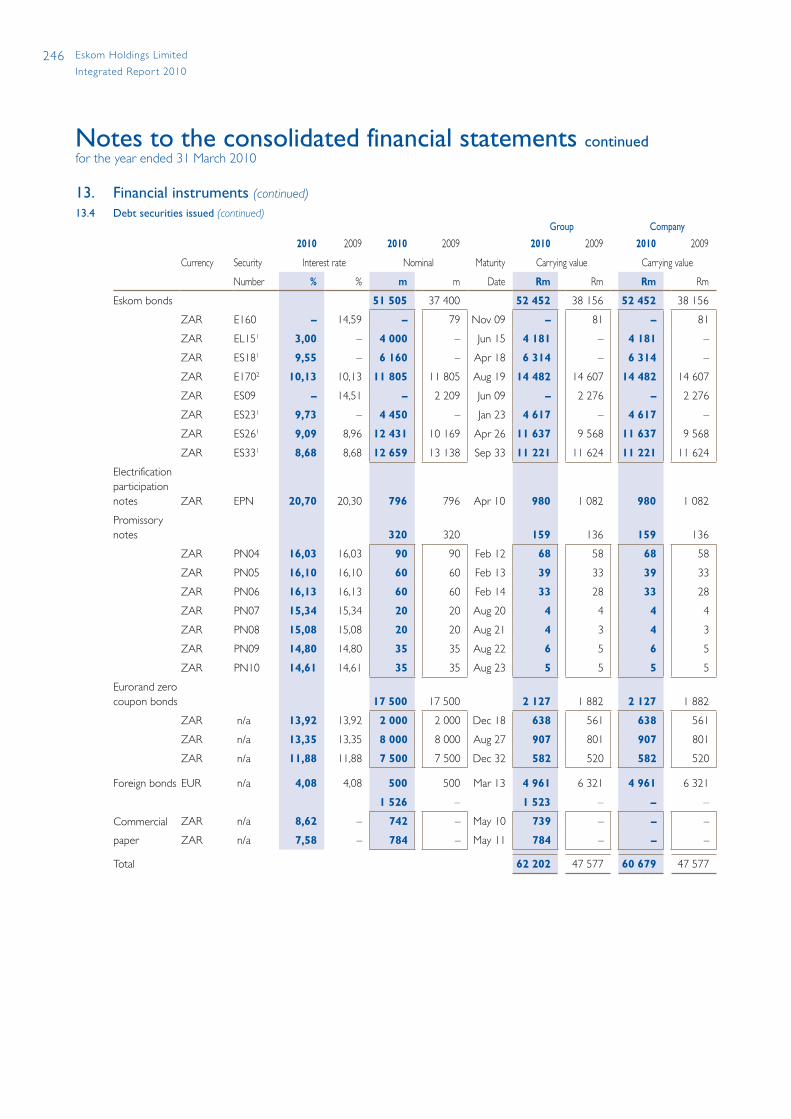
246 Eskom Holdings Limited
Integrated Repor t 2010
Notes to the consolidated financial statements continuedfor the year ended 31 March 2010
13. Financial instruments (continued)
13.4 Debt securities issued (continued)Group Company
2010 2009 2010 2009 2010 2009 2010 2009
Currency Security Interest rate Nominal Maturity Carrying value Carrying value
Number % % m m Date Rm Rm Rm Rm
Eskom bonds 51 505 37 400 52 452 38 156 52 452 38 156
ZAR E160 – 14,59 – 79 Nov 09 – 81 – 81
ZAR EL151 3,00 – 4 000 – Jun 15 4 181 – 4 181 –
ZAR ES181 9,55 – 6 160 – Apr 18 6 314 – 6 314 –
ZAR E1702 10,13 10,13 11 805 11 805 Aug 19 14 482 14 607 14 482 14 607
ZAR ES09 – 14,51 – 2 209 Jun 09 – 2 276 – 2 276
ZAR ES231 9,73 – 4 450 – Jan 23 4 617 – 4 617 –
ZAR ES261 9,09 8,96 12 431 10 169 Apr 26 11 637 9 568 11 637 9 568
ZAR ES331 8,68 8,68 12 659 13 138 Sep 33 11 221 11 624 11 221 11 624
Electrification participation notes ZAR EPN 20,70 20,30 796 796 Apr 10 980 1 082 980 1 082
Promissory notes 320 320 159 136 159 136
ZAR PN04 16,03 16,03 90 90 Feb 12 68 58 68 58
ZAR PN05 16,10 16,10 60 60 Feb 13 39 33 39 33
ZAR PN06 16,13 16,13 60 60 Feb 14 33 28 33 28
ZAR PN07 15,34 15,34 20 20 Aug 20 4 4 4 4
ZAR PN08 15,08 15,08 20 20 Aug 21 4 3 4 3
ZAR PN09 14,80 14,80 35 35 Aug 22 6 5 6 5
ZAR PN10 14,61 14,61 35 35 Aug 23 5 5 5 5
Eurorand zero coupon bonds 17 500 17 500 2 127 1 882 2 127 1 882
ZAR n/a 13,92 13,92 2 000 2 000 Dec 18 638 561 638 561
ZAR n/a 13,35 13,35 8 000 8 000 Aug 27 907 801 907 801
ZAR n/a 11,88 11,88 7 500 7 500 Dec 32 582 520 582 520
Foreign bonds EUR n/a 4,08 4,08 500 500 Mar 13 4 961 6 321 4 961 6 321
Commercial
paper
1 526 – 1 523 – – –
ZAR n/a 8,62 – 742 – May 10 739 – – –
ZAR n/a 7,58 – 784 – May 11 784 – – –
Total 62 202 47 577 60 679 47 577
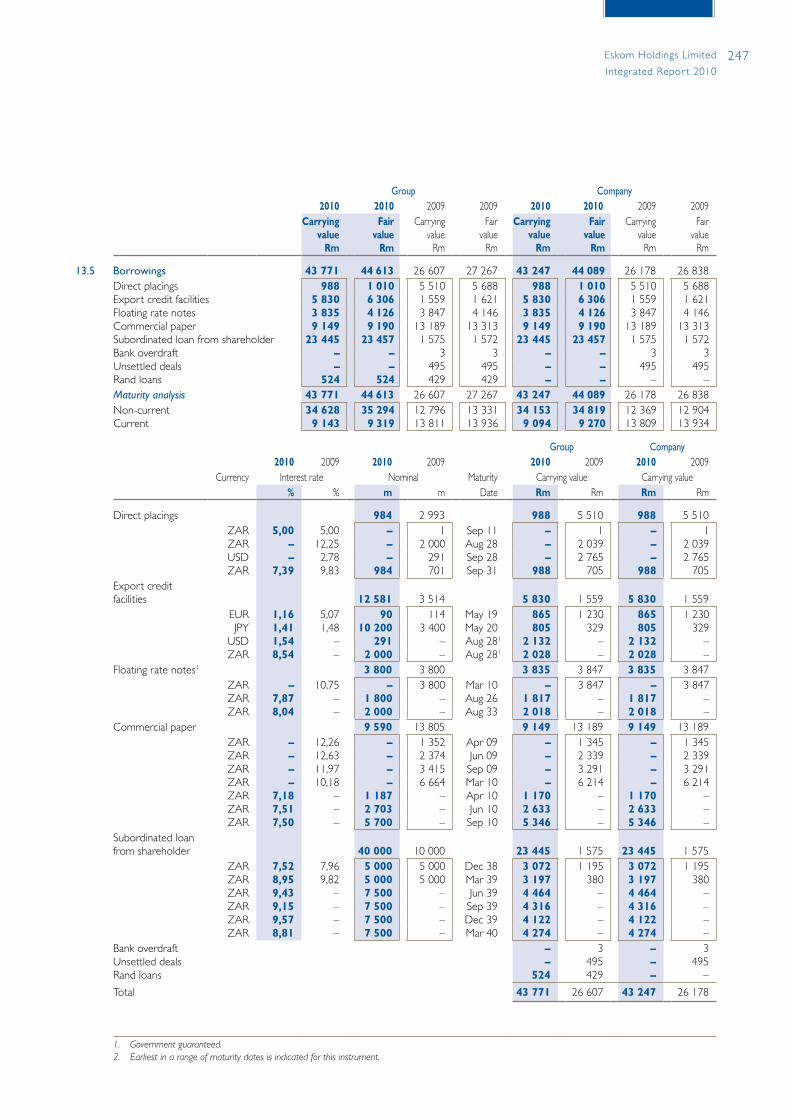
247Eskom Holdings Limited
Integrated Repor t 2010
Group Company2010 2010 2009 2009 2010 2010 2009 2009
Carryingvalue
Rm
Fair value
Rm
Carryingvalue
Rm
Fair value
Rm
Carryingvalue
Rm
Fair value
Rm
Carryingvalue
Rm
Fair value
Rm
13.5 Borrowings 43 771 44 613 26 607 27 267 43 247 44 089 26 178 26 838 Direct placings 988 1 010 5 510 5 688 988 1 010 5 510 5 688 Export credit facilities 5 830 6 306 1 559 1 621 5 830 6 306 1 559 1 621 Floating rate notes 3 835 4 126 3 847 4 146 3 835 4 126 3 847 4 146 Commercial paper 9 149 9 190 13 189 13 313 9 149 9 190 13 189 13 313 Subordinated loan from shareholder 23 445 23 457 1 575 1 572 23 445 23 457 1 575 1 572 Bank overdraft – – 3 3 – – 3 3 Unsettled deals – – 495 495 – – 495 495 Rand loans 524 524 429 429 – – – –Maturity analysis 43 771 44 613 26 607 27 267 43 247 44 089 26 178 26 838 Non-current 34 628 35 294 12 796 13 331 34 153 34 819 12 369 12 904 Current 9 143 9 319 13 811 13 936 9 094 9 270 13 809 13 934
Group Company2010 2009 2010 2009 2010 2009 2010 2009
Currency Interest rate Nominal Maturity Carrying value Carrying value% % m m Date Rm Rm Rm Rm
Direct placings 984 2 993 988 5 510 988 5 510ZAR 5,00 5,00 – 1 Sep 11 – 1 – 1 ZAR – 12,25 – 2 000 Aug 28 – 2 039 – 2 039 USD – 2,78 – 291 Sep 28 – 2 765 – 2 765 ZAR 7,39 9,83 984 701 Sep 31 988 705 988 705
Export credit facilities 12 581 3 514 5 830 1 559 5 830 1 559
EUR 1,16 5,07 90 114 May 19 865 1 230 865 1 230 JPY 1,41 1,48 10 200 3 400 May 20 805 329 805 329
USD 1,54 – 291 – Aug 281 2 132 – 2 132 –ZAR 8,54 – 2 000 – Aug 281 2 028 – 2 028 –
Floating rate notes1 3 800 3 800 3 835 3 847 3 835 3 847 ZAR – 10,75 – 3 800 Mar 10 – 3 847 – 3 847 ZAR 7,87 – 1 800 – Aug 26 1 817 – 1 817 –ZAR 8,04 – 2 000 – Aug 33 2 018 – 2 018 –
Commercial paper 9 590 13 805 9 149 13 189 9 149 13 189 ZAR – 12,26 – 1 352 Apr 09 – 1 345 – 1 345 ZAR – 12,63 – 2 374 Jun 09 – 2 339 – 2 339 ZAR – 11,97 – 3 415 Sep 09 – 3 291 – 3 291 ZAR – 10,18 – 6 664 Mar 10 – 6 214 – 6 214 ZAR 7,18 – 1 187 – Apr 10 1 170 – 1 170 –ZAR 7,51 – 2 703 – Jun 10 2 633 – 2 633 –ZAR 7,50 – 5 700 – Sep 10 5 346 – 5 346 –
Subordinated loan from shareholder 40 000 10 000 23 445 1 575 23 445 1 575
ZAR 7,52 7,96 5 000 5 000 Dec 38 3 072 1 195 3 072 1 195 ZAR 8,95 9,82 5 000 5 000 Mar 39 3 197 380 3 197 380 ZAR 9,43 – 7 500 – Jun 39 4 464 – 4 464 –ZAR 9,15 – 7 500 – Sep 39 4 316 – 4 316 –ZAR 9,57 – 7 500 – Dec 39 4 122 – 4 122 –ZAR 8,81 – 7 500 – Mar 40 4 274 – 4 274 –
Bank overdraft – 3 – 3 Unsettled deals – 495 – 495 Rand loans 524 429 – –
Total 43 771 26 607 43 247 26 178
1. Governmentguaranteed.2. Earliestinarangeofmaturitydatesisindicatedforthisinstrument.
248 Eskom Holdings Limited
Integrated Repor t 2010
Notes to the consolidated financial statements continuedfor the year ended 31 March 2010
13. Financial instruments (continued)13.5 Borrowings (continued)
Subordinated loan from shareholderThe group negotiated a subordinated loan of R60 billion (2009: R60 billion) from the shareholder. The draw down for the year was R30 billion (2009: R10 billion). Eskom is obliged to pay interest on the loan when Eskom is solvent and the debt leverage conditions per the agreement are satisfied. The interest on the subordinated loan is not cumulative.
The loan has been classified as a financial liability in accordance with IAS 32 Financialinstruments: Presentation and has been measured at amortised cost. The loan was initially measured at fair value and the difference between the fair valued amount and the advanced amount accounted for under borrowings gave rise to a day-one gain. This day-one gain is disclosed in equity, under equityreserve (refer page 182). The amounts drawn down in the previous year were remeasured at their initial effective rate due to expected changes in cash flows based on Eskom’s current long-term financial view.
13.6 Collateral obtainedEskom has called upon security deposits and guarantees from customers who have defaulted on their accounts. The carrying amount of the security deposits and guarantees which were called upon is R81 million (2009: R30 million).
13.7 Collateral held Eskom has bought commercial paper from approved counterparties and has committed to sell this commercial paper back to the counterparties in the following financial year. Although Eskom has legal title to the commercial paper at year end, it has not been recognised as such on the statement of financial position due to the application of trade date accounting. This has also resulted in the recognition of a loan receivable with a fair value of R2 824 million (2009: R5 425 million) at year end. Of this amount, R2 155 million (2009: R1 035 million) relates to government securities and R669 million (2009: R4 386 million) to Eskom bonds. The total loan receivable is secured by commercial paper of an equivalent fair value.
13.8 Collateral placedEskom has provided collateral security in the form of letters of credit from banks in respect of the cross-border lease transactions. Assets to the value of Rnil (2009: R2 144 million), included under loans and receivables, Rnil (2009: R100 million), included under held-to-maturity and Rnil (2009: R530 million), included under derivatives held for risk management, have been pledged to the letter of credit providers. The collateral has been provided to hedge the beneficiary against its exposure to the loss of its remaining investment in the cross-border leases and the cost of replacing the transaction in the event of cancellation or default. The calculation of the beneficiary’s exposure is influenced by pledged securities in the form of US treasury notes which are marked-to-market semi-annually. The exposure amount was adjusted accordingly.
The cross-border lease transaction was terminated on 15 April 2009 (refer note 6). Pursuant to the termination of the cross-border lease transaction, the letters of credit mentioned above are being negotiated for termination in stages with the issuing banks, depending on the maturity of the underlying structures. The carrying amount of the collateral placed of Rnil (2009: R905 million) matured and was returned to Eskom. The unwinding of the remaining assets linked to the letters of credit is being negotiated.
In terms of the credit support annexure of the International Swaps and Derivatives Association/International Securities Market Association agreements, Eskom placed R459 million (2009: Rnil) reflected in available-for-sale assets as collateral as a result of changes in the market value of the financial instruments traded in the market.
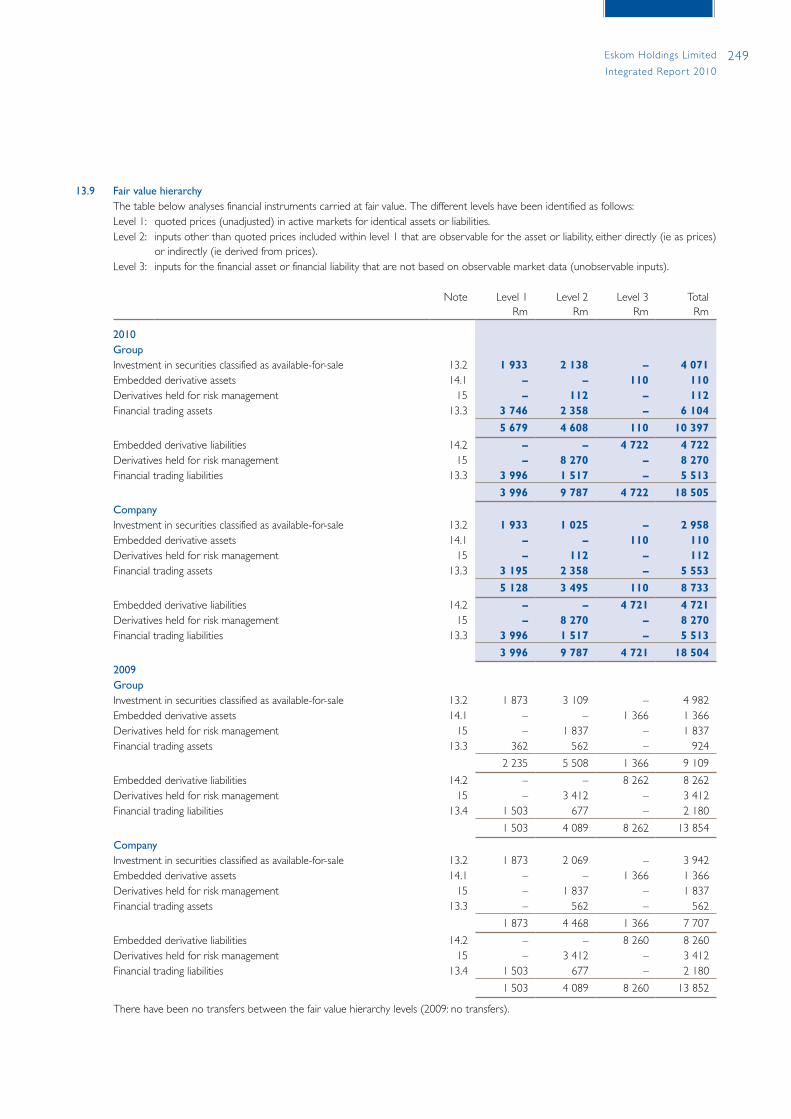
249Eskom Holdings Limited
Integrated Repor t 2010
13.9 Fair value hierarchyThe table below analyses financial instruments carried at fair value. The different levels have been identified as follows:Level 1: quoted prices (unadjusted) in active markets for identical assets or liabilities.Level 2: inputs other than quoted prices included within level 1 that are observable for the asset or liability, either directly (ie as prices)
or indirectly (ie derived from prices).Level 3: inputs for the financial asset or financial liability that are not based on observable market data (unobservable inputs).
Note Level 1 Rm
Level 2 Rm
Level 3 Rm
Total Rm
2010GroupInvestment in securities classified as available-for-sale 13.2 1 933 2 138 – 4 071 Embedded derivative assets 14.1 – – 110 110 Derivatives held for risk management 15 – 112 – 112 Financial trading assets 13.3 3 746 2 358 – 6 104
5 679 4 608 110 10 397
Embedded derivative liabilities 14.2 – – 4 722 4 722 Derivatives held for risk management 15 – 8 270 – 8 270 Financial trading liabilities 13.3 3 996 1 517 – 5 513
3 996 9 787 4 722 18 505
CompanyInvestment in securities classified as available-for-sale 13.2 1 933 1 025 – 2 958 Embedded derivative assets 14.1 – – 110 110 Derivatives held for risk management 15 – 112 – 112 Financial trading assets 13.3 3 195 2 358 – 5 553
5 128 3 495 110 8 733
Embedded derivative liabilities 14.2 – – 4 721 4 721 Derivatives held for risk management 15 – 8 270 – 8 270 Financial trading liabilities 13.3 3 996 1 517 – 5 513
3 996 9 787 4 721 18 504
2009GroupInvestment in securities classified as available-for-sale 13.2 1 873 3 109 – 4 982 Embedded derivative assets 14.1 – – 1 366 1 366 Derivatives held for risk management 15 – 1 837 – 1 837 Financial trading assets 13.3 362 562 – 924
2 235 5 508 1 366 9 109
Embedded derivative liabilities 14.2 – – 8 262 8 262 Derivatives held for risk management 15 – 3 412 – 3 412 Financial trading liabilities 13.4 1 503 677 – 2 180
1 503 4 089 8 262 13 854
CompanyInvestment in securities classified as available-for-sale 13.2 1 873 2 069 – 3 942 Embedded derivative assets 14.1 – – 1 366 1 366 Derivatives held for risk management 15 – 1 837 – 1 837 Financial trading assets 13.3 – 562 – 562
1 873 4 468 1 366 7 707
Embedded derivative liabilities 14.2 – – 8 260 8 260 Derivatives held for risk management 15 – 3 412 – 3 412 Financial trading liabilities 13.4 1 503 677 – 2 180
1 503 4 089 8 260 13 852
There have been no transfers between the fair value hierarchy levels (2009: no transfers).

250 Eskom Holdings Limited
Integrated Repor t 2010
Notes to the consolidated financial statements continuedfor the year ended 31 March 2010
13. Financial instruments (continued)13.9 Fair value hierarchy (continued)
A reconciliation has been performed for fair value measurements in level 3 of the fair value hierarchy as follows:
Group Company2010
Rm2009
Rm2010
Rm2009
Rm
Embedded derivative assetsCarrying value beginning of year 1 366 7 702 1 366 7 696
Net fair value loss on embedded derivatives1 (1 256) (6 336) (1 256) (6 330)
Carrying value at end of year 110 1 366 110 1 366
Embedded derivative liabilities
Carrying value beginning of year 8 262 5 084 8 260 5 084
Net fair value (loss)/gain on embedded derivatives1 (3 540) 3 178 (3 539) 3 176
Carrying value at end of year 4 722 8 262 4 721 8 260
Refer note 3.2 for a sensitivity analysis disclosing the effect of fair value changes that would result if one or more of the inputs were to be changed.
Group
2010Rm
2009Rm
13.10 Loans receivable
Secured by mortgages 3 893 –
Other 241 –
4 134 –
Allowance for impairment (18) –
4 116 –
Maturity analysis 4 116 –
Non-current 4 110 –
Current 6 –
In prior years the loans receivable advanced by EFC were included under non-currentassetsheld-for-sale. Refer to note 22.
Current Non-current Total non-current
Total
1 yearRm
1 – 5 yearsRm
After 5 years
Rm Rm Rm
14. Embedded derivative assets and liabilities14.1 Embedded derivative assets
2010GroupCommodity and/or foreign currency 110 – – – 110
CompanyCommodity and/or foreign currency 110 – – – 110
2009GroupCommodity and/or foreign currency 231 235 900 1 135 1 366
CompanyCommodity and/or foreign currency 231 235 900 1 135 1 366
1. Includedwithinnetfairvaluelossonembeddedderivativesinprofitorloss.

251Eskom Holdings Limited
Integrated Repor t 2010
Current Non-current Total non-current
Total
1 yearRm
1 – 5 yearsRm
After 5 years
Rm Rm Rm
14.2 Embedded derivative liabilities2010GroupCommodity and/or foreign currency – 3 291 1 3 292 3 292Foreign currency or interest rate 1 – – – 1PPI and foreign currency 138 965 326 1 291 1 429
139 4 256 327 4 583 4 722CompanyCommodity and/or foreign currency – 3 291 1 3 292 3 292PPI and foreign currency 138 965 326 1 291 1 429
138 4 256 327 4 583 4 7212009GroupCommodity and/or foreign currency 27 2 353 4 463 6 816 6 843Foreign currency or interest rate 2 – – – 2PPI and foreign currency 14 336 1 067 1 403 1 417
43 2 689 5 530 8 219 8 262
CompanyCommodity and/or foreign currency 27 2 353 4 463 6 816 6 843PPI and foreign currency 14 336 1 067 1 403 1 417
41 2 689 5 530 8 219 8 260
The embedded derivative instruments comprise a combination of swaps, forwards and options.
The liability has been significantly reduced as a result of renegotiating certain special pricing agreements relating to commodity linked revenue contracts.
Assets
Rm
Liabilities
Rm
Notional amount
Rm
15. Derivatives held for risk management2010 Group and companyDerivatives held for economic hedging 98 1 374 10 451 Foreign exchange derivatives 38 1 090 7 208 Swaps – 767 2 790 Foreign exchange contracts 38 299 3 899 Cross-border lease – 24 519 Interest rate derivatives – 1 637 Forward rate agreements – 1 637 Commodity derivatives 60 283 2 606 Aluminium options – 184 337 Swaps 60 99 2 269
Derivatives held for cash flow hedging 14 6 896 43 979 Foreign exchange contracts 14 4 037 31 323 Interest rate swap – 355 3 800 Cross-currency swap – 2 504 8 856
Total derivatives held for risk management 112 8 270
Maturity analysis 112 8 270Derivatives held for economic hedging 98 1 374 Non-current – 767 Current 98 607 Derivatives held for cash flow hedging 14 6 896 Non-current – 2 859 Current 14 4 037

252 Eskom Holdings Limited
Integrated Repor t 2010
Notes to the consolidated financial statements continuedfor the year ended 31 March 2010
Assets
Rm
Liabilities
Rm
Notional amount
Rm
15. Derivatives held for risk management (continued)2009 Group and companyDerivatives held for economic hedging 1 113 843 17 232 Foreign exchange derivatives 615 559 10 477 Swaps 530 36 519 Foreign exchange contracts 85 523 9 958 Interest rate derivatives 57 4 3 726 Forward rate agreements – 4 936 Swaps 57 – 2 790 Commodity derivatives 441 280 3 029 Aluminium options 437 66 2 570 Swaps 4 214 459
Derivatives held for cash flow hedging 724 2 569 52 217 Foreign exchange contracts 724 1 415 41 492 Interest rate swap – 463 3 800 Cross-currency swap – 691 6 925
Total derivatives held for risk management 1 837 3 412
Maturity analysis 1 837 3 412 Derivatives held for economic hedging 1 113 843 Non-current 586 123 Current 527 720 Derivatives held for cash flow hedging 724 2 569Non-current – 663Current 724 1 906
The hedging practices and accounting treatment are disclosed in note 2.11.3 in the accounting policies (refer page 195).
The group uses forward exchange contracts, cross-currency swaps and interest rate swaps for cash flow hedging. Only the changes in cash flows attributable to movements in the spot exchange rates are hedged.
• Foreign exchange contracts: used to hedge the changes in the cash flows resulting from the purchase of services and goods denominated mainly in US dollars, euro and yen.
• Cross-currency swap: used to hedge the currency risk arising from the fixed rate bonds (denominated in euro and yen) issued by the group.
• Interest rate swaps: used to hedge the interest expense variability of the issued floating rate notes.
During the year R154 million (2009: R405 million) was recognised in profit or loss as ineffectiveness arising from cash flow hedges. In 2009 a spot adjustment from the implied spot rate of R13,85 to the actual spot rate of R13,04 on the day that the euro cross-currency swap was re-couponed resulted in a R405 million loss recycled out of equity to profit or loss. There were no transactions for which cash flow hedge accounting had to be ceased in the current or comparative financial years as a result of highly probable cash flows no longer being expected to occur.
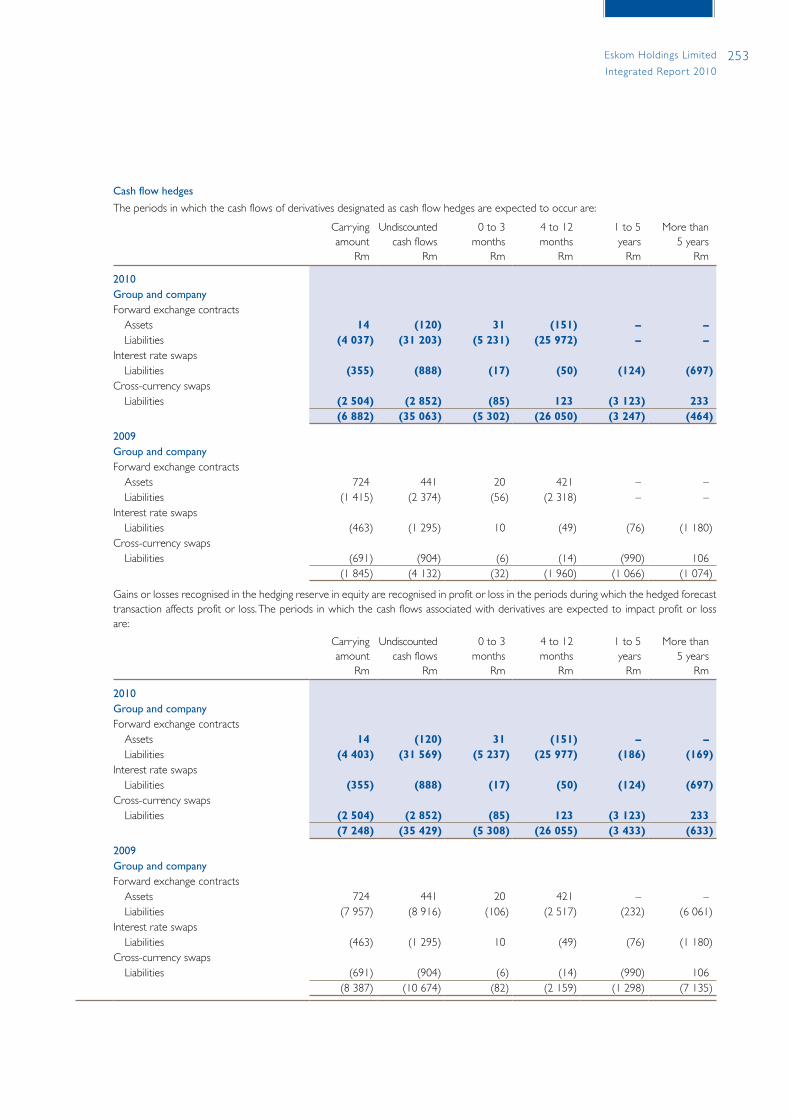
253Eskom Holdings Limited
Integrated Repor t 2010
Cash flow hedges
The periods in which the cash flows of derivatives designated as cash flow hedges are expected to occur are:
Carryingamount
Rm
Undiscountedcash flows
Rm
0 to 3 months
Rm
4 to 12 months
Rm
1 to 5 years
Rm
More than5 years
Rm
2010Group and companyForward exchange contracts
Assets 14 (120) 31 (151) – –Liabilities (4 037) (31 203) (5 231) (25 972) – –
Interest rate swapsLiabilities (355) (888) (17) (50) (124) (697)
Cross-currency swapsLiabilities (2 504) (2 852) (85) 123 (3 123) 233
(6 882) (35 063) (5 302) (26 050) (3 247) (464)
2009Group and companyForward exchange contracts
Assets 724 441 20 421 – –Liabilities (1 415) (2 374) (56) (2 318) – –
Interest rate swapsLiabilities (463) (1 295) 10 (49) (76) (1 180)
Cross-currency swapsLiabilities (691) (904) (6) (14) (990) 106
(1 845) (4 132) (32) (1 960) (1 066) (1 074)
Gains or losses recognised in the hedging reserve in equity are recognised in profit or loss in the periods during which the hedged forecast transaction affects profit or loss. The periods in which the cash flows associated with derivatives are expected to impact profit or loss are:
Carryingamount
Rm
Undiscountedcash flows
Rm
0 to 3 months
Rm
4 to 12 months
Rm
1 to 5 years
Rm
More than5 years
Rm
2010Group and companyForward exchange contracts
Assets 14 (120) 31 (151) – –Liabilities (4 403) (31 569) (5 237) (25 977) (186) (169)
Interest rate swapsLiabilities (355) (888) (17) (50) (124) (697)
Cross-currency swapsLiabilities (2 504) (2 852) (85) 123 (3 123) 233
(7 248) (35 429) (5 308) (26 055) (3 433) (633)
2009Group and companyForward exchange contracts
Assets 724 441 20 421 – –Liabilities (7 957) (8 916) (106) (2 517) (232) (6 061)
Interest rate swapsLiabilities (463) (1 295) 10 (49) (76) (1 180)
Cross-currency swapsLiabilities (691) (904) (6) (14) (990) 106
(8 387) (10 674) (82) (2 159) (1 298) (7 135)
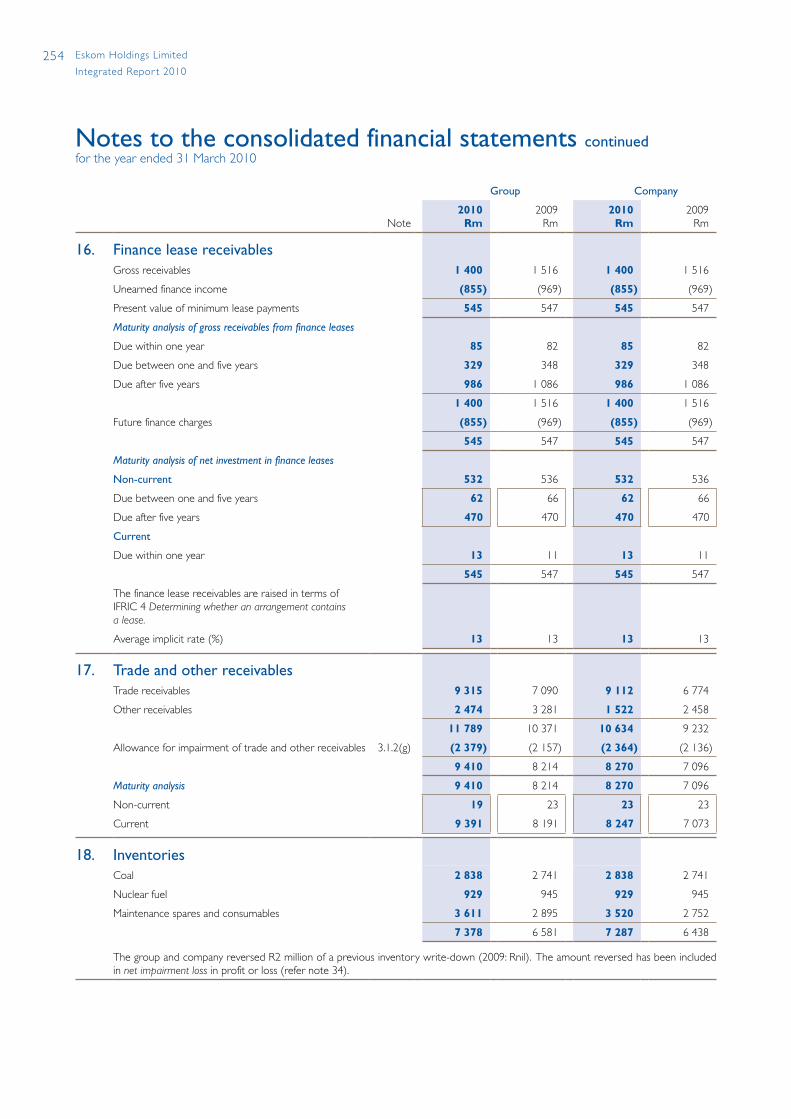
254 Eskom Holdings Limited
Integrated Repor t 2010
Notes to the consolidated financial statements continuedfor the year ended 31 March 2010
Group Company
Note2010
Rm2009
Rm2010
Rm2009
Rm
16. Finance lease receivablesGross receivables 1 400 1 516 1 400 1 516
Unearned finance income (855) (969) (855) (969)
Present value of minimum lease payments 545 547 545 547
Maturity analysis of gross receivables from finance leases
Due within one year 85 82 85 82
Due between one and five years 329 348 329 348
Due after five years 986 1 086 986 1 086
1 400 1 516 1 400 1 516
Future finance charges (855) (969) (855) (969)
545 547 545 547
Maturity analysis of net investment in finance leases
Non-current 532 536 532 536
Due between one and five years 62 66 62 66
Due after five years 470 470 470 470
Current
Due within one year 13 11 13 11
545 547 545 547
The finance lease receivables are raised in terms of IFRIC 4 Determiningwhetheranarrangementcontainsa lease.
Average implicit rate (%) 13 13 13 13
17. Trade and other receivablesTrade receivables 9 315 7 090 9 112 6 774
Other receivables 2 474 3 281 1 522 2 458
11 789 10 371 10 634 9 232
Allowance for impairment of trade and other receivables 3.1.2(g) (2 379) (2 157) (2 364) (2 136)
9 410 8 214 8 270 7 096
Maturity analysis 9 410 8 214 8 270 7 096
Non-current 19 23 23 23
Current 9 391 8 191 8 247 7 073
18. InventoriesCoal 2 838 2 741 2 838 2 741
Nuclear fuel 929 945 929 945
Maintenance spares and consumables 3 611 2 895 3 520 2 752
7 378 6 581 7 287 6 438
The group and company reversed R2 million of a previous inventory write-down (2009: Rnil). The amount reversed has been included in netimpairmentloss in profit or loss (refer note 34).
255Eskom Holdings Limited
Integrated Repor t 2010
19. Service concession arrangementsThe Eskom Group operates two service concessions for the generation and/or transmission of electricity, through its operations in Mali and Uganda.
Mali Eskom Energie Manantali (EEM) entered into an operation and maintenance agreement with La Société de Gestion de L’Energie de Manantali (SOGEM) in 2001 to operate and maintain a 200MW hydro-electricity facility in Mali and supply power to the national electrical companies in Mali, Senegal and Mauritania. The dam, hydro-electric generating plant and eastern and western transmission networks together constitute the “energy assets” in terms of the agreement. The concession period is 15 years (ends December 2017).
EEM is entitled to a fixed annual fee to operate the concession. Although EEM is responsible for the billing of electricity supplied, it merely collects and distributes the proceeds from the sale of electricity. The annual fee does not cover additional expenditure to be incurred on the energy assets.
EEM is responsible for the day-to-day maintenance, repairs and replacement of the energy assets. In terms of this requirement, a fund is to be set up by SOGEM, to which EEM is to contribute 10% of annual revenues to cover the cost of major overhauls. This fund has not yet been set up. EEM has, however, made provisions amounting to 10% of revenues.
The assets remain the property of SOGEM and will revert to them at the end of the concession period. At that point EEM will have no further obligations in respect of the energy assets. The agreement does not contain a renewal option.
A provision of R198 million (2009: R101 million) has been raised in the group as an onerous contract as the expected future operating costs exceed the expected future revenue. A claim was recently lodged with SOGEM for the reimbursement of expenditure on the energy assets. Given the uncertainty of the outcome of the claim, it is not considered prudent to recognise an asset.
Uganda Eskom Uganda Limited (Eskom Uganda) entered into an operation and maintenance agreement with Uganda Electricity Generation Company Limited (UEGCL) in 2002, which is linked to a power purchase agreement concluded with Uganda Electricity Transmission Company Limited (UETCL). In terms of the agreements, Eskom Uganda operates and maintains two hydro-electric power stations in Uganda, from which it supplies electricity to UETCL. The dams, powerhouses, related switchyard facilities, high voltage substation, land and movable property together constitute the “energy assets” in terms of the agreement. The concession period is 20 years (ends in December 2023).
Eskom Uganda is entitled to receive revenue from UETCL, based on electricity supplied at tariffs regulated by the Electricity Regulatory Authority of Uganda. It also receives a fee to cover it for investment in additional energy assets where required. This has been recognised as an intangible asset.
The plant remains the property of UEGCL and will revert to UEGCL at the end of the concession period. At that point Eskom Uganda will have no further obligations in respect of the plant.

256 Eskom Holdings Limited
Integrated Repor t 2010
Notes to the consolidated financial statements continuedfor the year ended 31 March 2010
19. Service concession arrangements (continued)
EskomManantali
Rm
Eskom Uganda
Rm
2010Total
Rm
2009Total
Rm
Income statements
Revenue 79 144 223 266
(Loss)/profit for the year before tax (118) 22 (96) (110)
Taxation – (7) (7) (5)
(Loss)/profit for the year after tax (118) 15 (103) (115)
Statements of financial position
Property, plant and equipment 35 – 35 27
Intangible assets – 63 63 63
Inventory 23 19 42 32
Trade and other receivables1 614 38 652 1 002
Cash and cash equivalents 44 37 81 74
Total assets 716 157 873 1 198
Provisions 253 13 266 154
Borrowings 26 19 45 65
Trade and other payables1 649 36 685 1 003
Other liabilities – 9 9 13
Total liabilities 928 77 1 005 1 235
Group Company
2010R
2009R
2010R
2009R
20. Share capitalAuthorised
1 000 ordinary shares of R1 each 1 000 1 000 1 000 1 000
Issued
1 ordinary share of R1 1 1 1 1
In terms of the memorandum and articles of association, the unissued share capital is under the control of the Government of the Republic of South Africa, represented by the Department of Public Enterprises, as the sole shareholder.
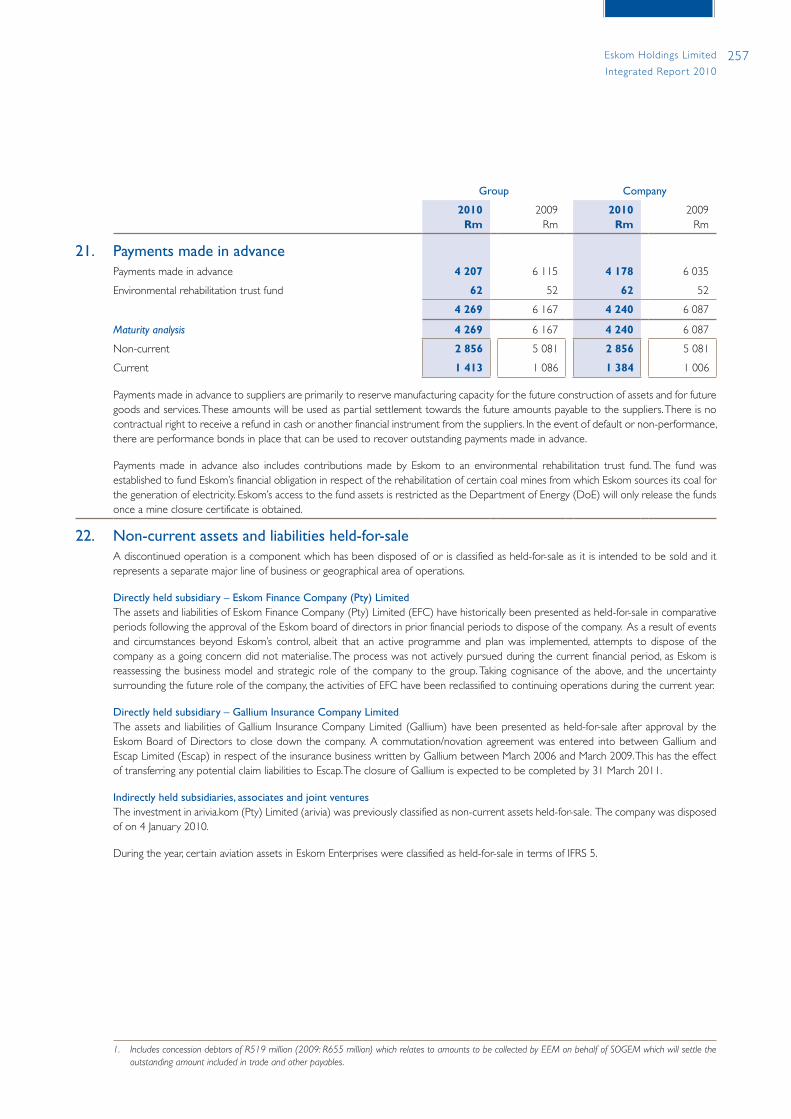
257Eskom Holdings Limited
Integrated Repor t 2010
Group Company
2010Rm
2009Rm
2010Rm
2009Rm
21. Payments made in advancePayments made in advance 4 207 6 115 4 178 6 035
Environmental rehabilitation trust fund 62 52 62 52
4 269 6 167 4 240 6 087
Maturity analysis 4 269 6 167 4 240 6 087
Non-current 2 856 5 081 2 856 5 081
Current 1 413 1 086 1 384 1 006
Payments made in advance to suppliers are primarily to reserve manufacturing capacity for the future construction of assets and for future goods and services. These amounts will be used as partial settlement towards the future amounts payable to the suppliers. There is no contractual right to receive a refund in cash or another financial instrument from the suppliers. In the event of default or non-performance, there are performance bonds in place that can be used to recover outstanding payments made in advance.
Payments made in advance also includes contributions made by Eskom to an environmental rehabilitation trust fund. The fund was established to fund Eskom’s financial obligation in respect of the rehabilitation of certain coal mines from which Eskom sources its coal for the generation of electricity. Eskom’s access to the fund assets is restricted as the Department of Energy (DoE) will only release the funds once a mine closure certificate is obtained.
22. Non-current assets and liabilities held-for-saleA discontinued operation is a component which has been disposed of or is classified as held-for-sale as it is intended to be sold and it represents a separate major line of business or geographical area of operations.
Directly held subsidiary – Eskom Finance Company (Pty) Limited The assets and liabilities of Eskom Finance Company (Pty) Limited (EFC) have historically been presented as held-for-sale in comparative periods following the approval of the Eskom board of directors in prior financial periods to dispose of the company. As a result of events and circumstances beyond Eskom’s control, albeit that an active programme and plan was implemented, attempts to dispose of the company as a going concern did not materialise. The process was not actively pursued during the current financial period, as Eskom is reassessing the business model and strategic role of the company to the group. Taking cognisance of the above, and the uncertainty surrounding the future role of the company, the activities of EFC have been reclassified to continuing operations during the current year.
Directly held subsidiary – Gallium Insurance Company Limited The assets and liabilities of Gallium Insurance Company Limited (Gallium) have been presented as held-for-sale after approval by the Eskom Board of Directors to close down the company. A commutation/novation agreement was entered into between Gallium and Escap Limited (Escap) in respect of the insurance business written by Gallium between March 2006 and March 2009. This has the effect of transferring any potential claim liabilities to Escap. The closure of Gallium is expected to be completed by 31 March 2011.
Indirectly held subsidiaries, associates and joint venturesThe investment in arivia.kom (Pty) Limited (arivia) was previously classified as non-current assets held-for-sale. The company was disposed of on 4 January 2010.
During the year, certain aviation assets in Eskom Enterprises were classified as held-for-sale in terms of IFRS 5.
1. IncludesconcessiondebtorsofR519million(2009:R655million)whichrelatestoamountstobecollectedbyEEMonbehalfofSOGEMwhichwillsettletheoutstandingamountincludedintradeandotherpayables.

258 Eskom Holdings Limited
Integrated Repor t 2010
Notes to the consolidated financial statements continuedfor the year ended 31 March 2010
22. Non-current assets and liabilities held-for-sale (continued)
A consolidated analysis of the results of these discontinued operations, and the result recognised on the remeasurement of assets is:
arivia.kom
Rm
Gallium
Rm
Total beforeinter-
companyelimina-
tionsRm
Inter-companyelimina-
tions
Rm
2010 Total
Rm
2009 Total
Rm
Income statements
Revenue 1 174 – 1 174 (566) 608 557
Other income 2 – 2 – 2 1
Employee benefit expense (335) – (335) – (335) (797)
Net impairment reversal/(loss) 34 – 34 – 34 (195)
Depreciation and amortisation expense (24) – (24) – (24) (28)
Loss on disposal of investment (8) – (8) – (8) –
Other operating expenses (812) (1) (813) 566 (247) (447)
Operating profit/(loss) before net finance income 31 (1) 30 – 30 (909)
Finance income 19 5 24 (7) 17 44
Finance cost (4) – (4) – (4) (2)
Profit/(loss) before tax 46 4 50 (7) 43 (867)
Income tax (10) – (10) (199) (209) 172
Profit/(loss) for the year from discontinued operations 36 4 40 (206) (166) (695)
The loss from discontinued operations includes operating expenditure which will still be incurred by the continuing operations after these entities have been disposed of.
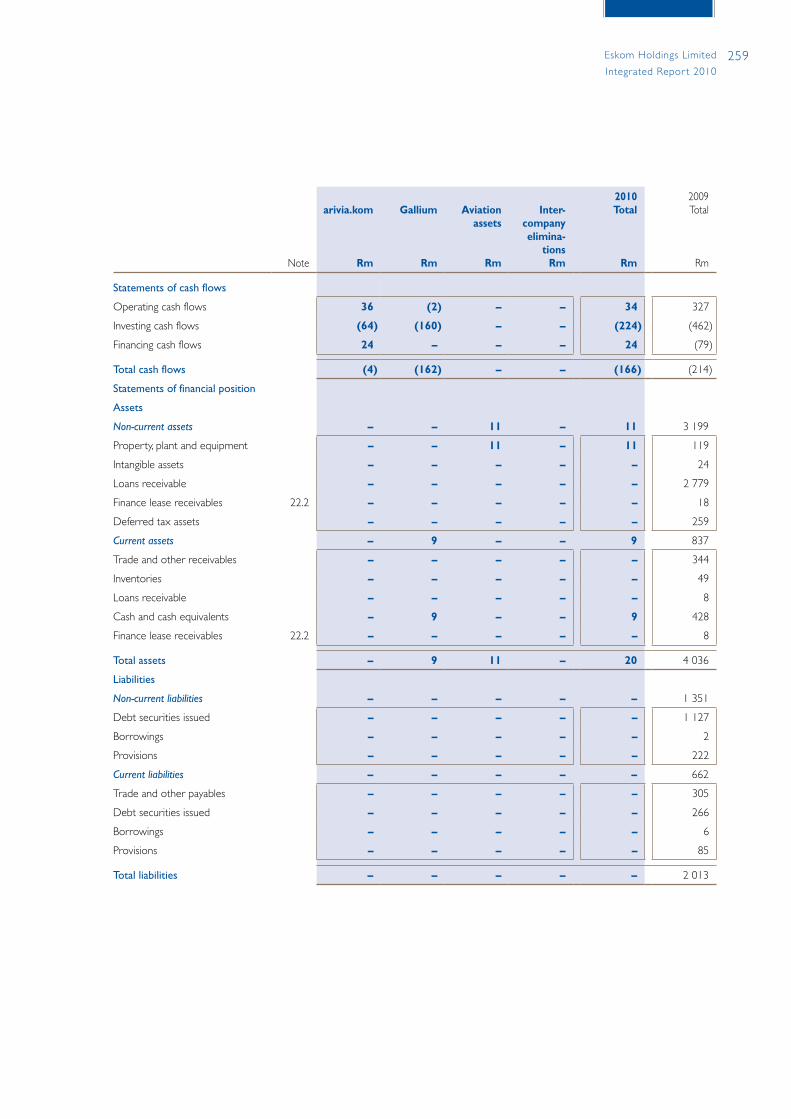
259Eskom Holdings Limited
Integrated Repor t 2010
Note
arivia.kom
Rm
Gallium
Rm
Aviationassets
Rm
Inter-companyelimina-
tionsRm
2010 Total
Rm
2009 Total
Rm
Statements of cash flows
Operating cash flows 36 (2) – – 34 327
Investing cash flows (64) (160) – – (224) (462)
Financing cash flows 24 – – – 24 (79)
Total cash flows (4) (162) – – (166) (214)
Statements of financial position
Assets
Non-current assets – – 11 – 11 3 199
Property, plant and equipment – – 11 – 11 119
Intangible assets – – – – – 24
Loans receivable – – – – – 2 779
Finance lease receivables 22.2 – – – – – 18
Deferred tax assets – – – – – 259
Current assets – 9 – – 9 837
Trade and other receivables – – – – – 344
Inventories – – – – – 49
Loans receivable – – – – – 8
Cash and cash equivalents – 9 – – 9 428
Finance lease receivables 22.2 – – – – – 8
Total assets – 9 11 – 20 4 036
Liabilities
Non-current liabilities – – – – – 1 351
Debt securities issued – – – – – 1 127
Borrowings – – – – – 2
Provisions – – – – – 222
Current liabilities – – – – – 662
Trade and other payables – – – – – 305
Debt securities issued – – – – – 266
Borrowings – – – – – 6
Provisions – – – – – 85
Total liabilities – – – – – 2 013
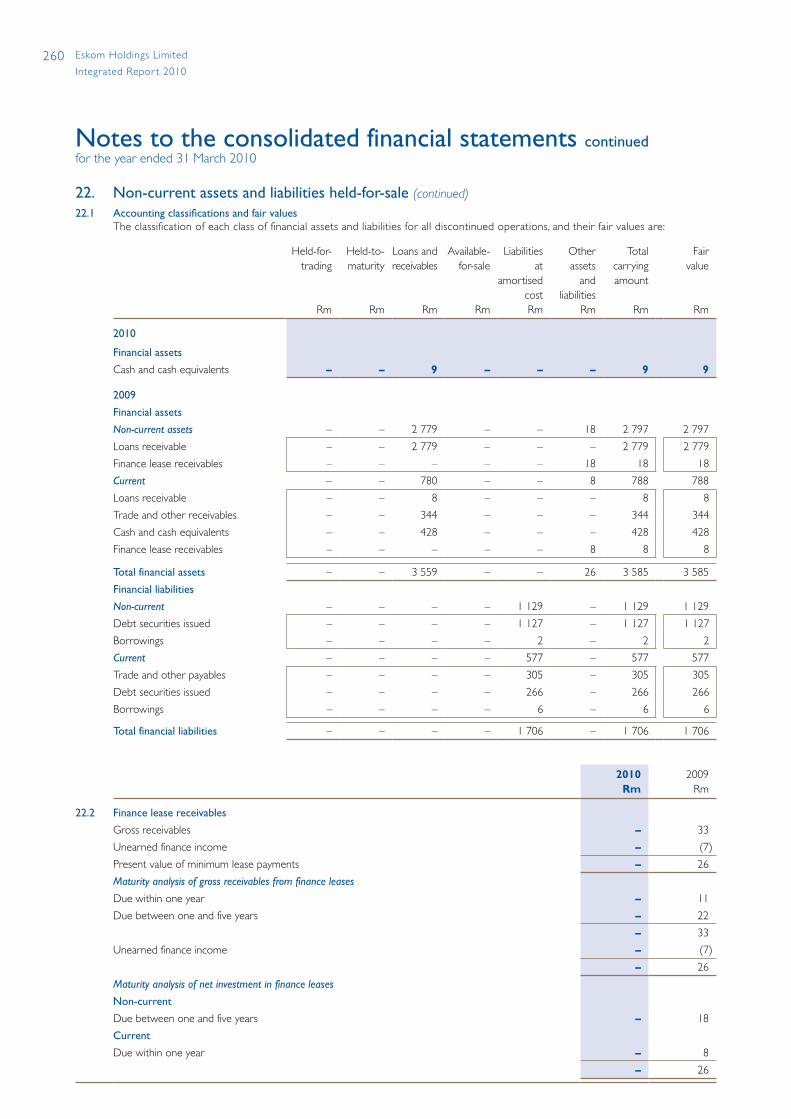
260 Eskom Holdings Limited
Integrated Repor t 2010
Notes to the consolidated financial statements continuedfor the year ended 31 March 2010
22. Non-current assets and liabilities held-for-sale (continued)
22.1 Accounting classifications and fair values The classification of each class of financial assets and liabilities for all discontinued operations, and their fair values are:
Held-for-trading
Rm
Held-to-maturity
Rm
Loans and receivables
Rm
Available-for-sale
Rm
Liabilitiesat
amortisedcostRm
Other assets
andliabilities
Rm
Totalcarrying amount
Rm
Fairvalue
Rm
2010
Financial assets
Cash and cash equivalents – – 9 – – – 9 9
2009
Financial assets
Non-current assets – – 2 779 – – 18 2 797 2 797
Loans receivable – – 2 779 – – – 2 779 2 779
Finance lease receivables – – – – – 18 18 18
Current – – 780 – – 8 788 788
Loans receivable – – 8 – – – 8 8
Trade and other receivables – – 344 – – – 344 344
Cash and cash equivalents – – 428 – – – 428 428
Finance lease receivables – – – – – 8 8 8
Total financial assets – – 3 559 – – 26 3 585 3 585
Financial liabilities
Non-current – – – – 1 129 – 1 129 1 129
Debt securities issued – – – – 1 127 – 1 127 1 127
Borrowings – – – – 2 – 2 2
Current – – – – 577 – 577 577
Trade and other payables – – – – 305 – 305 305
Debt securities issued – – – – 266 – 266 266
Borrowings – – – – 6 – 6 6
Total financial liabilities – – – – 1 706 – 1 706 1 706
2010Rm
2009Rm
22.2 Finance lease receivables
Gross receivables – 33
Unearned finance income – (7)
Present value of minimum lease payments – 26
Maturity analysis of gross receivables from finance leases
Due within one year – 11
Due between one and five years – 22
– 33
Unearned finance income – (7)
– 26
Maturity analysis of net investment in finance leases
Non-current
Due between one and five years – 18
Current
Due within one year – 8
– 26
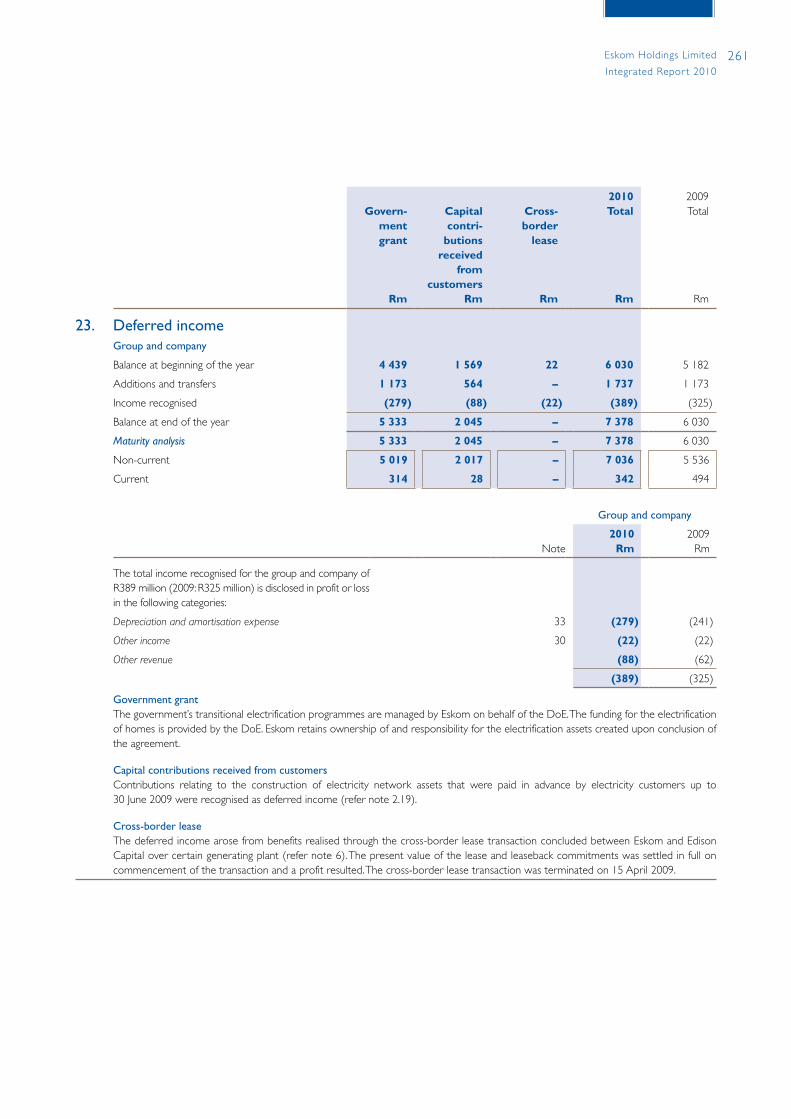
261Eskom Holdings Limited
Integrated Repor t 2010
Govern-mentgrant
Rm
Capital contri-
butionsreceived
from customers
Rm
Cross-border
lease
Rm
2010Total
Rm
2009Total
Rm
23. Deferred incomeGroup and company
Balance at beginning of the year 4 439 1 569 22 6 030 5 182
Additions and transfers 1 173 564 – 1 737 1 173
Income recognised (279) (88) (22) (389) (325)
Balance at end of the year 5 333 2 045 – 7 378 6 030
Maturity analysis 5 333 2 045 – 7 378 6 030
Non-current 5 019 2 017 – 7 036 5 536
Current 314 28 – 342 494
Group and company
Note2010
Rm 2009
Rm
The total income recognised for the group and company of R389 million (2009: R325 million) is disclosed in profit or loss in the following categories:
Depreciationandamortisationexpense 33 (279) (241)
Otherincome 30 (22) (22)
Otherrevenue (88) (62)
(389) (325)
Government grantThe government’s transitional electrification programmes are managed by Eskom on behalf of the DoE. The funding for the electrification of homes is provided by the DoE. Eskom retains ownership of and responsibility for the electrification assets created upon conclusion of the agreement.
Capital contributions received from customersContributions relating to the construction of electricity network assets that were paid in advance by electricity customers up to 30 June 2009 were recognised as deferred income (refer note 2.19).
Cross-border leaseThe deferred income arose from benefits realised through the cross-border lease transaction concluded between Eskom and Edison Capital over certain generating plant (refer note 6). The present value of the lease and leaseback commitments was settled in full on commencement of the transaction and a profit resulted. The cross-border lease transaction was terminated on 15 April 2009.
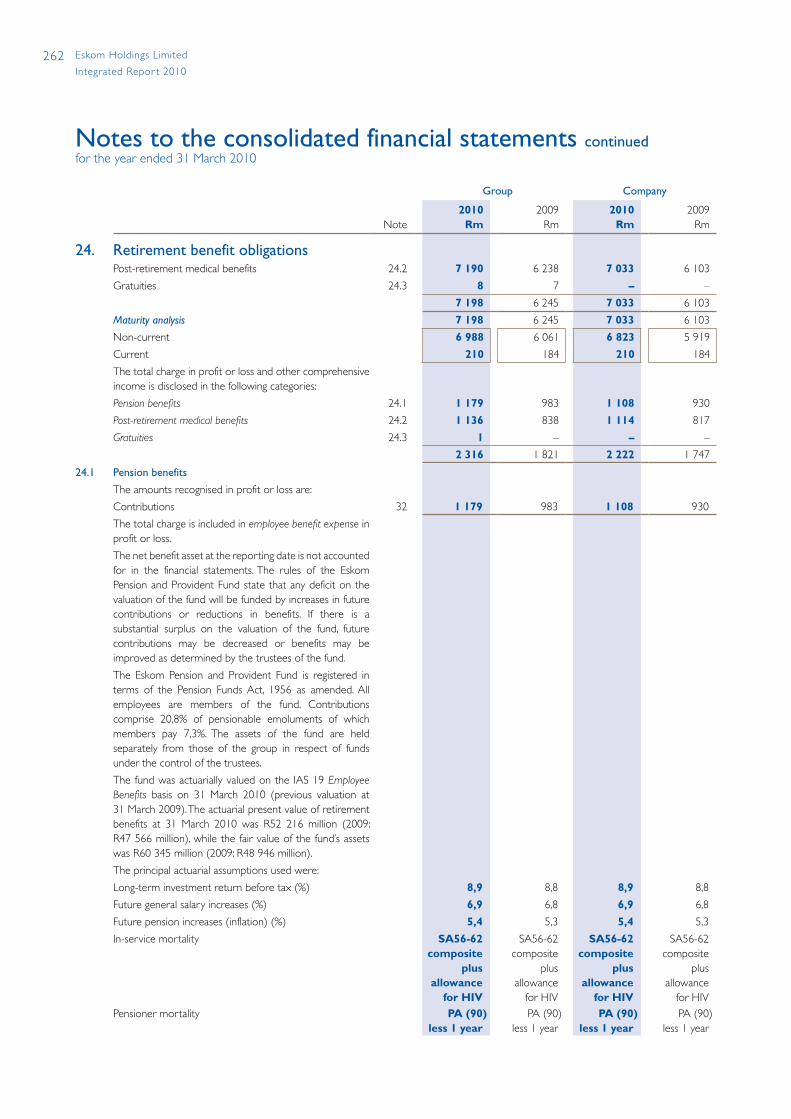
262 Eskom Holdings Limited
Integrated Repor t 2010
Notes to the consolidated financial statements continuedfor the year ended 31 March 2010
Group Company
Note2010
Rm 2009
Rm2010
Rm 2009
Rm
24. Retirement benefit obligationsPost-retirement medical benefits 24.2 7 190 6 238 7 033 6 103
Gratuities 24.3 8 7 – –
7 198 6 245 7 033 6 103
Maturity analysis 7 198 6 245 7 033 6 103
Non-current 6 988 6 061 6 823 5 919
Current 210 184 210 184
The total charge in profit or loss and other comprehensive income is disclosed in the following categories:
Pensionbenefits 24.1 1 179 983 1 108 930
Post-retirementmedicalbenefits 24.2 1 136 838 1 114 817
Gratuities 24.3 1 – – –
2 316 1 821 2 222 1 747
24.1 Pension benefits
The amounts recognised in profit or loss are:
Contributions 32 1 179 983 1 108 930
The total charge is included in employeebenefitexpensein profit or loss.
The net benefit asset at the reporting date is not accounted for in the financial statements. The rules of the Eskom Pension and Provident Fund state that any deficit on the valuation of the fund will be funded by increases in future contributions or reductions in benefits. If there is a substantial surplus on the valuation of the fund, future contributions may be decreased or benefits may be improved as determined by the trustees of the fund.
The Eskom Pension and Provident Fund is registered in terms of the Pension Funds Act, 1956 as amended. All employees are members of the fund. Contributions comprise 20,8% of pensionable emoluments of which members pay 7,3%. The assets of the fund are held separately from those of the group in respect of funds under the control of the trustees.
The fund was actuarially valued on the IAS 19 EmployeeBenefits basis on 31 March 2010 (previous valuation at 31 March 2009). The actuarial present value of retirement benefits at 31 March 2010 was R52 216 million (2009: R47 566 million), while the fair value of the fund’s assets was R60 345 million (2009: R48 946 million).
The principal actuarial assumptions used were:
Long-term investment return before tax (%) 8,9 8,8 8,9 8,8
Future general salary increases (%) 6,9 6,8 6,9 6,8
Future pension increases (inflation) (%) 5,4 5,3 5,4 5,3
In-service mortality SA56-62composite
plus allowance
for HIV
SA56-62composite
plus allowance
for HIV
SA56-62composite
plus allowance
for HIV
SA56-62composite
plus allowance
for HIV Pensioner mortality PA (90)
less 1 year PA (90)
less 1 year PA (90)
less 1 year PA (90)
less 1 year
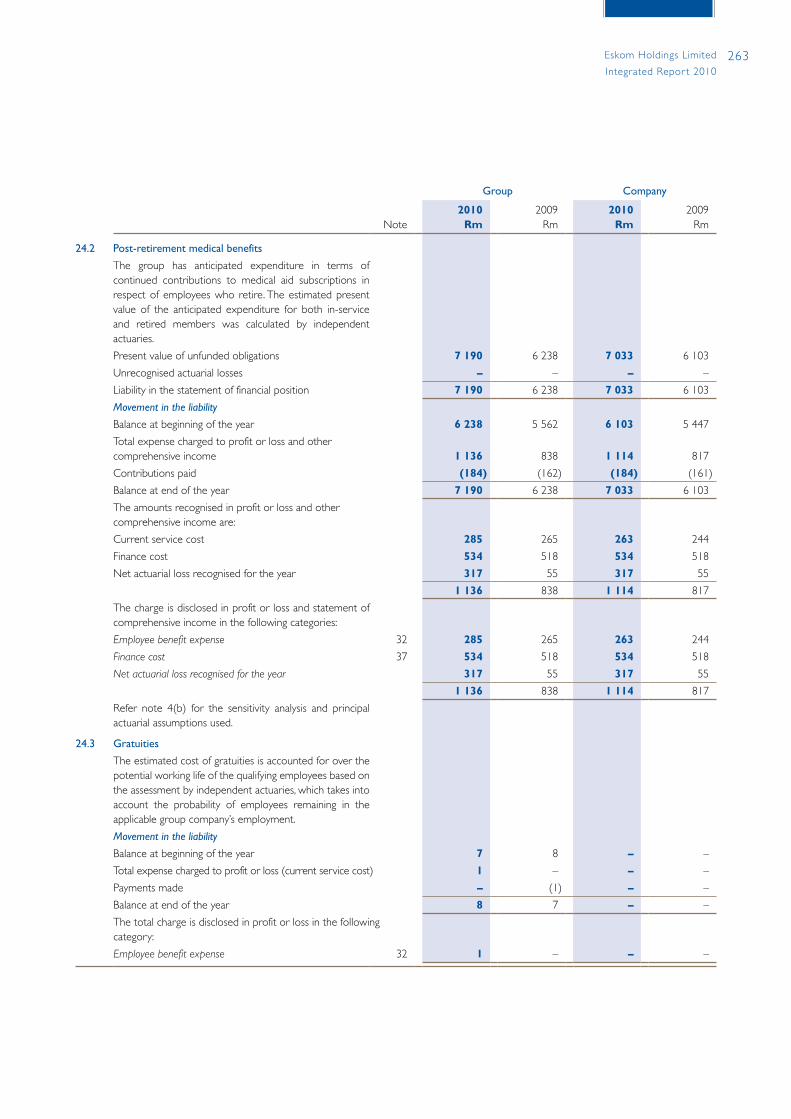
263Eskom Holdings Limited
Integrated Repor t 2010
Group Company
Note2010
Rm 2009
Rm2010
Rm 2009
Rm
24.2 Post-retirement medical benefits
The group has anticipated expenditure in terms of continued contributions to medical aid subscriptions in respect of employees who retire. The estimated present value of the anticipated expenditure for both in-service and retired members was calculated by independent actuaries.
Present value of unfunded obligations 7 190 6 238 7 033 6 103
Unrecognised actuarial losses – – – –
Liability in the statement of financial position 7 190 6 238 7 033 6 103
Movement in the liability
Balance at beginning of the year 6 238 5 562 6 103 5 447
Total expense charged to profit or loss and other comprehensive income 1 136 838 1 114 817
Contributions paid (184) (162) (184) (161)
Balance at end of the year 7 190 6 238 7 033 6 103
The amounts recognised in profit or loss and other comprehensive income are:
Current service cost 285 265 263 244
Finance cost 534 518 534 518
Net actuarial loss recognised for the year 317 55 317 55
1 136 838 1 114 817
The charge is disclosed in profit or loss and statement of comprehensive income in the following categories:
Employeebenefitexpense 32 285 265 263 244
Financecost 37 534 518 534 518
Netactuariallossrecognisedfortheyear 317 55 317 55
1 136 838 1 114 817
Refer note 4(b) for the sensitivity analysis and principal actuarial assumptions used.
24.3 Gratuities
The estimated cost of gratuities is accounted for over the potential working life of the qualifying employees based on the assessment by independent actuaries, which takes into account the probability of employees remaining in the applicable group company’s employment.
Movement in the liability
Balance at beginning of the year 7 8 – –
Total expense charged to profit or loss (current service cost) 1 – – –
Payments made – (1) – –
Balance at end of the year 8 7 – –
The total charge is disclosed in profit or loss in the following category:
Employeebenefitexpense 32 1 – – –

264 Eskom Holdings Limited
Integrated Repor t 2010
Notes to the consolidated financial statements continuedfor the year ended 31 March 2010
Powerstation-related
environ-mental
restora-tion1
Rm
Mine-relatedclosure,
pollutioncontrol
andrehabili-
tation2
Rm
Leave3
Rm
Annual and
perform-ance
bonus4
Rm
Other5
Rm
2010 Total
Rm
2009 Total
Rm
25. Provisions
Group
Balance at beginning of the year 6 578 1 563 705 1 123 412 10 381 7 124
Provision raised/(reversed) for the year (1 016) (112) 265 1 736 499 1 372 3 048
Raised/(reversed) to the income statement (442) – 265 1 736 499 2 058 2 177
Capitalised to property, plant and equipment, inventory and future fuel (574) (112) – – – (686) 871
Finance cost 280 168 – – – 448 1 431
Unwinding of discount 844 171 – – – 1 015 964
Change in discount rate applied to provision (564) (3) – – – (567) 467
Provisions used – – (189) (1 479) (29) (1 697) (1 222)
Balance at end of the year 5 842 1 619 781 1 380 882 10 504 10 381
Maturity analysis 5 842 1 619 781 1 380 882 10 504 10 381
Non-current 5 842 1 619 734 – 299 8 494 8 883
Current – – 47 1 380 583 2 010 1 498
Company
Balance at beginning of the year 6 578 1 563 662 1 041 133 9 977 6 716
Provision raised/(reversed) for the year (1 016) (112) 256 1 705 13 846 3 030
Raised/(reversed) to the income statement (442) – 256 1 705 13 1 532 2 159
Capitalised to property, plant and equipment, inventory and future fuel (574) (112) – – – (686) 871
Finance cost 280 168 – – – 448 1 431
Unwinding of discount 844 171 – – – 1 015 964
Change in discount rate applied to provision (564) (3) – – – (567) 467
Provisions used – – (188) (1 425) (17) (1 630) (1 200)
Balance at end of the year 5 842 1 619 730 1 321 129 9 641 9 977
Maturity analysis 5 842 1 619 730 1 321 129 9 641 9 977
Non-current 5 842 1 619 730 – 3 8 194 8 731
Current – – – 1 321 126 1 447 1 246
1. Provision ismade for theestimateddecommissioningcostofnuclearandothergenerationplantand for themanagementofnuclear fuelassembliesandradioactivewaste(refernote4d).
2. Provisionismadefortheestimatedcostofclosure,pollutioncontrol,rehabilitationandmineemployeebenefitsattheendofthelifeofthemines,whereaconstructiveandcontractualobligationexiststopaycoalsuppliers(refernote4d).
3. Thegrouprecognisesaliabilityforoccasionalandserviceleaveastheleaveisofalong-termnature(refernote4c). 4. Theannualbonusequalsonemonth’ssalaryforemployeesonTunedAssessmentofSkillsandKnowledge(TASK)gradinglevels1to13.EmployeesonTASK
gradinglevels14to26canchoosetospreadtheirbonusamountovertheyearortakeitasa13thcheque.Theperformancebonusisbasedontheperformanceofthecompanyandemployees.
5. Includesprovisionmadeforcontractualobligationstomaintainandrestoretheinfrastructureunderserviceconcessionarrangements,onerouscontractsandguarantees.
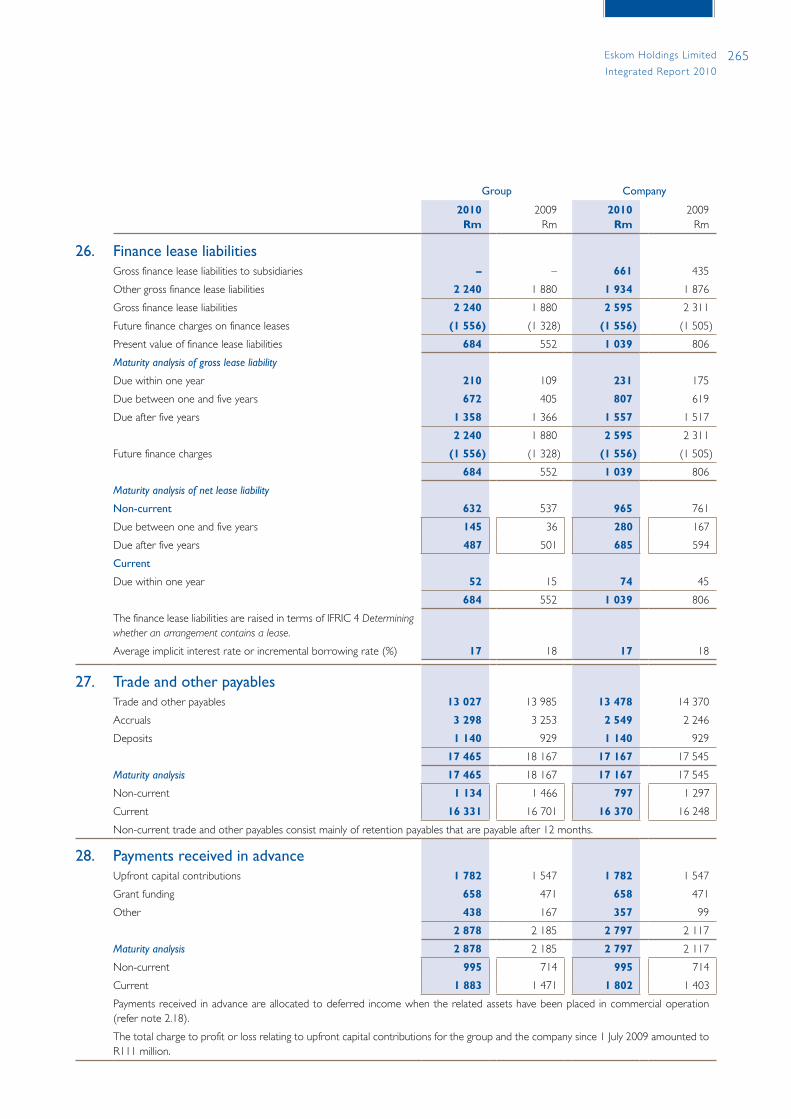
265Eskom Holdings Limited
Integrated Repor t 2010
Group Company
2010Rm
2009Rm
2010Rm
2009Rm
26. Finance lease liabilitiesGross finance lease liabilities to subsidiaries – – 661 435
Other gross finance lease liabilities 2 240 1 880 1 934 1 876
Gross finance lease liabilities 2 240 1 880 2 595 2 311
Future finance charges on finance leases (1 556) (1 328) (1 556) (1 505)
Present value of finance lease liabilities 684 552 1 039 806
Maturity analysis of gross lease liability
Due within one year 210 109 231 175
Due between one and five years 672 405 807 619
Due after five years 1 358 1 366 1 557 1 517
2 240 1 880 2 595 2 311
Future finance charges (1 556) (1 328) (1 556) (1 505)
684 552 1 039 806
Maturity analysis of net lease liability
Non-current 632 537 965 761
Due between one and five years 145 36 280 167
Due after five years 487 501 685 594
Current
Due within one year 52 15 74 45
684 552 1 039 806
The finance lease liabilities are raised in terms of IFRIC 4 Determiningwhetheranarrangementcontainsalease.
Average implicit interest rate or incremental borrowing rate (%) 17 18 17 18
27. Trade and other payablesTrade and other payables 13 027 13 985 13 478 14 370
Accruals 3 298 3 253 2 549 2 246
Deposits 1 140 929 1 140 929
17 465 18 167 17 167 17 545
Maturity analysis 17 465 18 167 17 167 17 545
Non-current 1 134 1 466 797 1 297
Current 16 331 16 701 16 370 16 248
Non-current trade and other payables consist mainly of retention payables that are payable after 12 months.
28. Payments received in advanceUpfront capital contributions 1 782 1 547 1 782 1 547
Grant funding 658 471 658 471
Other 438 167 357 99
2 878 2 185 2 797 2 117
Maturity analysis 2 878 2 185 2 797 2 117
Non-current 995 714 995 714
Current 1 883 1 471 1 802 1 403
Payments received in advance are allocated to deferred income when the related assets have been placed in commercial operation (refer note 2.18).
The total charge to profit or loss relating to upfront capital contributions for the group and the company since 1 July 2009 amounted to R111 million.
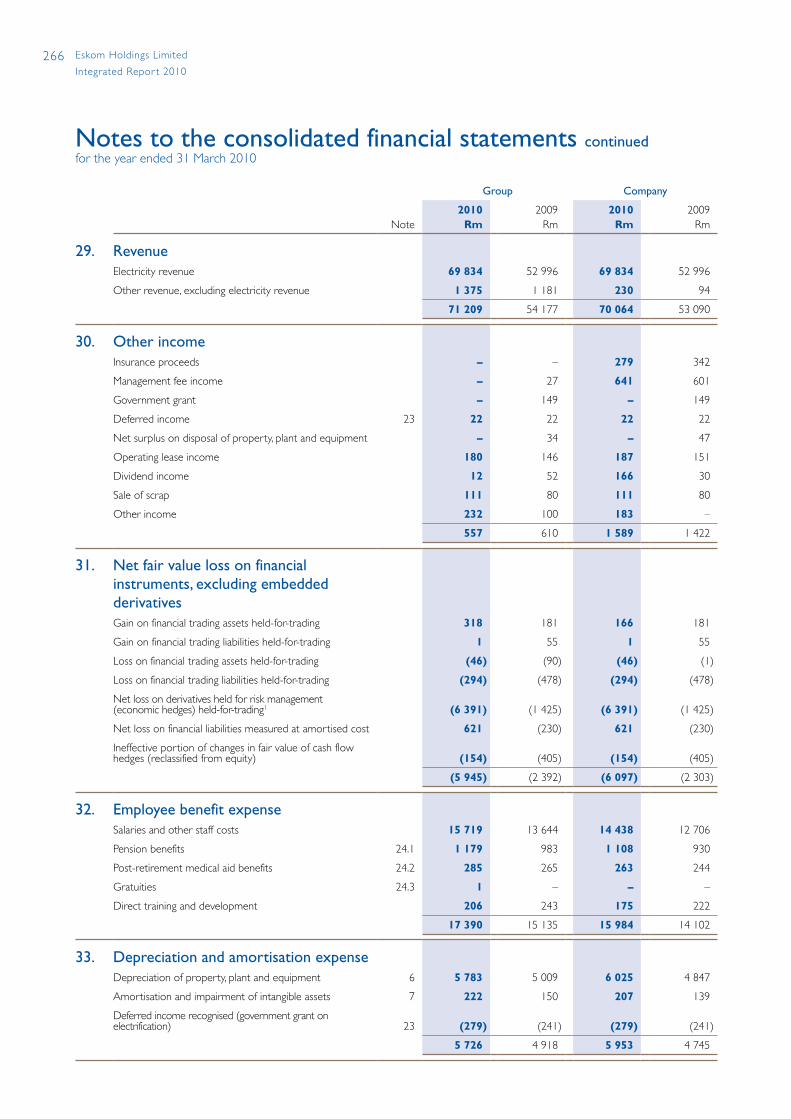
266 Eskom Holdings Limited
Integrated Repor t 2010
Notes to the consolidated financial statements continuedfor the year ended 31 March 2010
Group Company
Note2010
Rm 2009
Rm2010
Rm 2009
Rm
29. RevenueElectricity revenue 69 834 52 996 69 834 52 996
Other revenue, excluding electricity revenue 1 375 1 181 230 94
71 209 54 177 70 064 53 090
30. Other incomeInsurance proceeds – – 279 342
Management fee income – 27 641 601
Government grant – 149 – 149
Deferred income 23 22 22 22 22
Net surplus on disposal of property, plant and equipment – 34 – 47
Operating lease income 180 146 187 151
Dividend income 12 52 166 30
Sale of scrap 111 80 111 80
Other income 232 100 183 –
557 610 1 589 1 422
31. Net fair value loss on financial instruments, excluding embedded derivativesGain on financial trading assets held-for-trading 318 181 166 181
Gain on financial trading liabilities held-for-trading 1 55 1 55
Loss on financial trading assets held-for-trading (46) (90) (46) (1)
Loss on financial trading liabilities held-for-trading (294) (478) (294) (478)
Net loss on derivatives held for risk management (economic hedges) held-for-trading1 (6 391) (1 425) (6 391) (1 425)
Net loss on financial liabilities measured at amortised cost 621 (230) 621 (230)
Ineffective portion of changes in fair value of cash flow hedges (reclassified from equity) (154) (405) (154) (405)
(5 945) (2 392) (6 097) (2 303)
32. Employee benefit expenseSalaries and other staff costs 15 719 13 644 14 438 12 706
Pension benefits 24.1 1 179 983 1 108 930
Post-retirement medical aid benefits 24.2 285 265 263 244
Gratuities 24.3 1 – – –
Direct training and development 206 243 175 222
17 390 15 135 15 984 14 102
33. Depreciation and amortisation expenseDepreciation of property, plant and equipment 6 5 783 5 009 6 025 4 847
Amortisation and impairment of intangible assets 7 222 150 207 139
Deferred income recognised (government grant on electrification) 23 (279) (241) (279) (241)
5 726 4 918 5 953 4 745
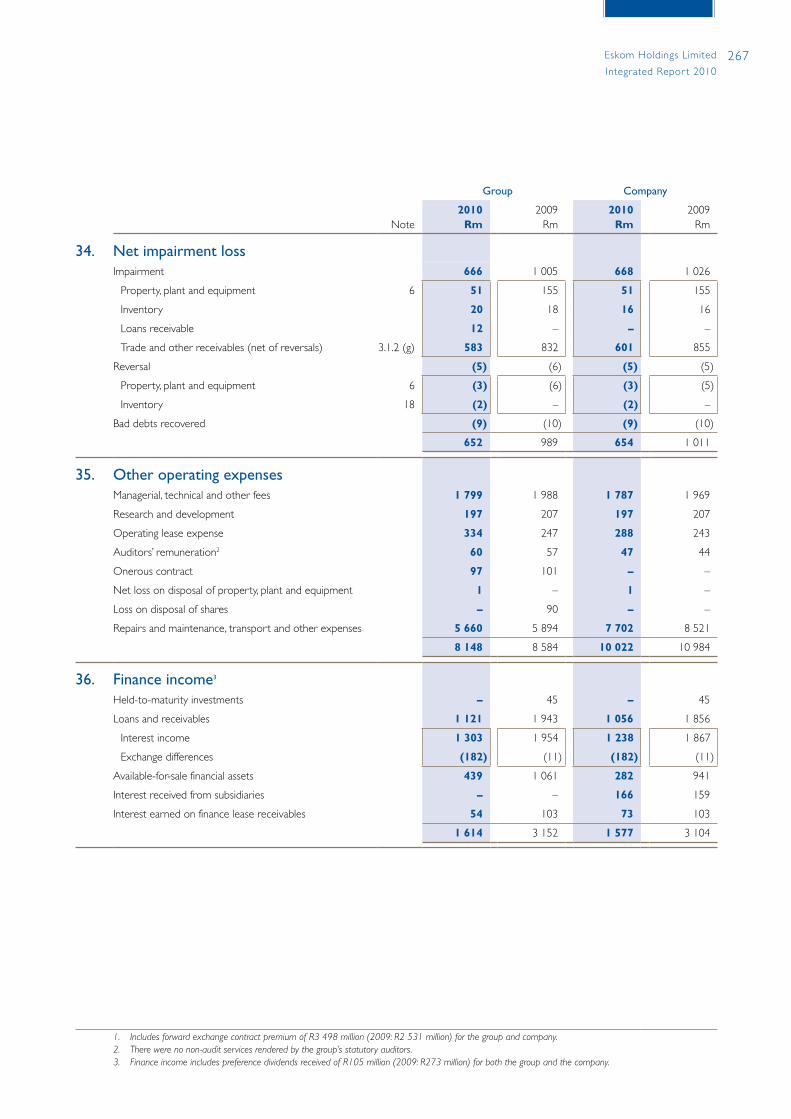
267Eskom Holdings Limited
Integrated Repor t 2010
Group Company
Note2010
Rm 2009
Rm2010
Rm 2009
Rm
34. Net impairment lossImpairment 666 1 005 668 1 026
Property, plant and equipment 6 51 155 51 155
Inventory 20 18 16 16
Loans receivable 12 – – –
Trade and other receivables (net of reversals) 3.1.2 (g) 583 832 601 855
Reversal (5) (6) (5) (5)
Property, plant and equipment 6 (3) (6) (3) (5)
Inventory 18 (2) – (2) –
Bad debts recovered (9) (10) (9) (10)
652 989 654 1 011
35. Other operating expensesManagerial, technical and other fees 1 799 1 988 1 787 1 969
Research and development 197 207 197 207
Operating lease expense 334 247 288 243
Auditors’ remuneration2 60 57 47 44
Onerous contract 97 101 – –
Net loss on disposal of property, plant and equipment 1 – 1 –
Loss on disposal of shares – 90 – –
Repairs and maintenance, transport and other expenses 5 660 5 894 7 702 8 521
8 148 8 584 10 022 10 984
36. Finance income3
Held-to-maturity investments – 45 – 45
Loans and receivables 1 121 1 943 1 056 1 856
Interest income 1 303 1 954 1 238 1 867
Exchange differences (182) (11) (182) (11)
Available-for-sale financial assets 439 1 061 282 941
Interest received from subsidiaries – – 166 159
Interest earned on finance lease receivables 54 103 73 103
1 614 3 152 1 577 3 104
1. IncludesforwardexchangecontractpremiumofR3498million(2009:R2531million)forthegroupandcompany. 2. Therewerenonon-auditservicesrenderedbythegroup’sstatutoryauditors. 3. FinanceincomeincludespreferencedividendsreceivedofR105million(2009:R273million)forboththegroupandthecompany.
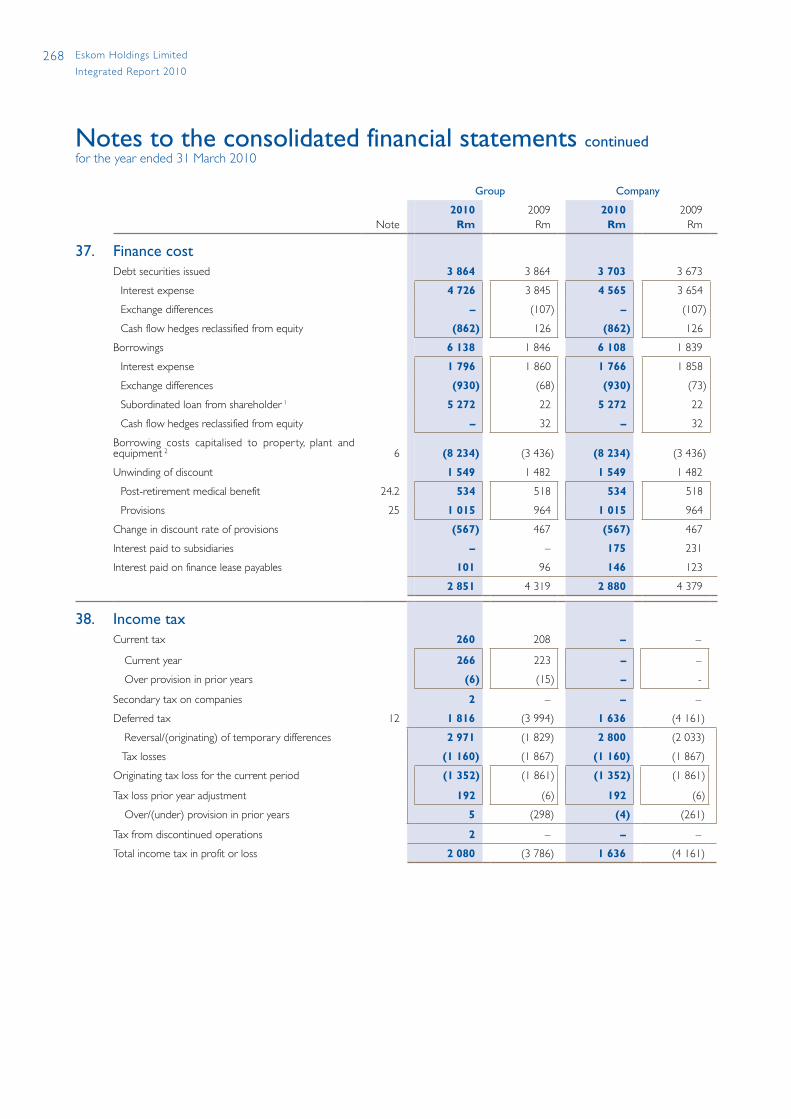
268 Eskom Holdings Limited
Integrated Repor t 2010
Notes to the consolidated financial statements continuedfor the year ended 31 March 2010
Group Company
Note2010
Rm 2009
Rm2010
Rm 2009
Rm
37. Finance costDebt securities issued 3 864 3 864 3 703 3 673
Interest expense 4 726 3 845 4 565 3 654
Exchange differences – (107) – (107)
Cash flow hedges reclassified from equity (862) 126 (862) 126
Borrowings 6 138 1 846 6 108 1 839
Interest expense 1 796 1 860 1 766 1 858
Exchange differences (930) (68) (930) (73)
Subordinated loan from shareholder 1 5 272 22 5 272 22
Cash flow hedges reclassified from equity – 32 – 32
Borrowing costs capitalised to property, plant and equipment 2 6 (8 234) (3 436) (8 234) (3 436)
Unwinding of discount 1 549 1 482 1 549 1 482
Post-retirement medical benefit 24.2 534 518 534 518
Provisions 25 1 015 964 1 015 964
Change in discount rate of provisions (567) 467 (567) 467
Interest paid to subsidiaries – – 175 231
Interest paid on finance lease payables 101 96 146 123
2 851 4 319 2 880 4 379
38. Income taxCurrent tax 260 208 – –
Current year 266 223 – –
Over provision in prior years (6) (15) – -
Secondary tax on companies 2 – – –
Deferred tax 12 1 816 (3 994) 1 636 (4 161)
Reversal/(originating) of temporary differences 2 971 (1 829) 2 800 (2 033)
Tax losses (1 160) (1 867) (1 160) (1 867)
Originating tax loss for the current period (1 352) (1 861) (1 352) (1 861)
Tax loss prior year adjustment 192 (6) 192 (6)
Over/(under) provision in prior years 5 (298) (4) (261)
Tax from discontinued operations 2 – – –
Total income tax in profit or loss 2 080 (3 786) 1 636 (4 161)

269Eskom Holdings Limited
Integrated Repor t 2010
2010 2009
Before tax
Rm
Taxbenefit
Rm
Net of tax
Rm
Before tax
Rm
Tax(expense)/
benefitRm
Net of tax
Rm
Income tax recognised in other comprehensive income
Group
Available-for-sale financial assets (25) 7 (18) 33 (9) 24
Cash flow hedges – effective portion of changes in fair value (8 501) 2 579 (5 922) (477) 178 (299)
Effective portion of changes in fair value (8 450) 2 565 (5 885) (411) 160 (251)
Net amount transferred to initial carrying amount of hedged items (51) 14 (37) (66) 18 (48)
Foreign currency translation differences 13 – 13 2 – 2
Net actuarial loss on post-retirement medical aid benefits (317) 89 (228) (55) 15 (40)
(8 830) 2 675 (6 155) (497) 184 (313)
Company
Available-for-sale financial assets (17) 5 (12) 17 (5) 12
Cash flow hedges (8 501) 2 579 (5 922) (477) 178 (299)
Effective portion of changes in fair value (8 450) 2 565 (5 885) (411) 160 (251)
Net amount transferred to initial carrying amount of hedged items (51) 14 (37) (66) 18 (48)
Foreign currency translation differences – – – – – –
Net actuarial loss on post-retirement medical aid benefits (317) 89 (228) (55) 15 (40)
(8 835) 2 673 (6 162) (515) 188 (327)
Group Company
2010%
2009%
2010%
2009%
Reconciliation of effective tax rate
Taxation as a percentage of profit before tax 35,44 29,67 33,92 29,09
Taxation effect of:
Exempt income 0,48 (0,94) 0,87 (0,63)
Expenses not deductible for tax purposes (2,94) 1,99 (2,81) 1,44
Controlled foreign operations income (0,03) 0,05 (0,02) 0,04
Prior year adjustment (3,35) (2,38) (3,89) (1,86)
Secondary tax on companies (0,03) – – –
Deferred tax asset not raised (1,52) – – –
Other (0,05) (0,39) (0,07) (0,08)
Standard tax rate 28 28 28 28
1. FinancecostonthesubordinatedloanfromshareholderincludesR4570million(2009:Rnil)relatingtotheremeasurementoftheloan. 2. BorrowingcostcapitalisedincludesR4570million(2009:Rnil)relatingtotheremeasurementofthesubordinatedloanfromtheshareholder.
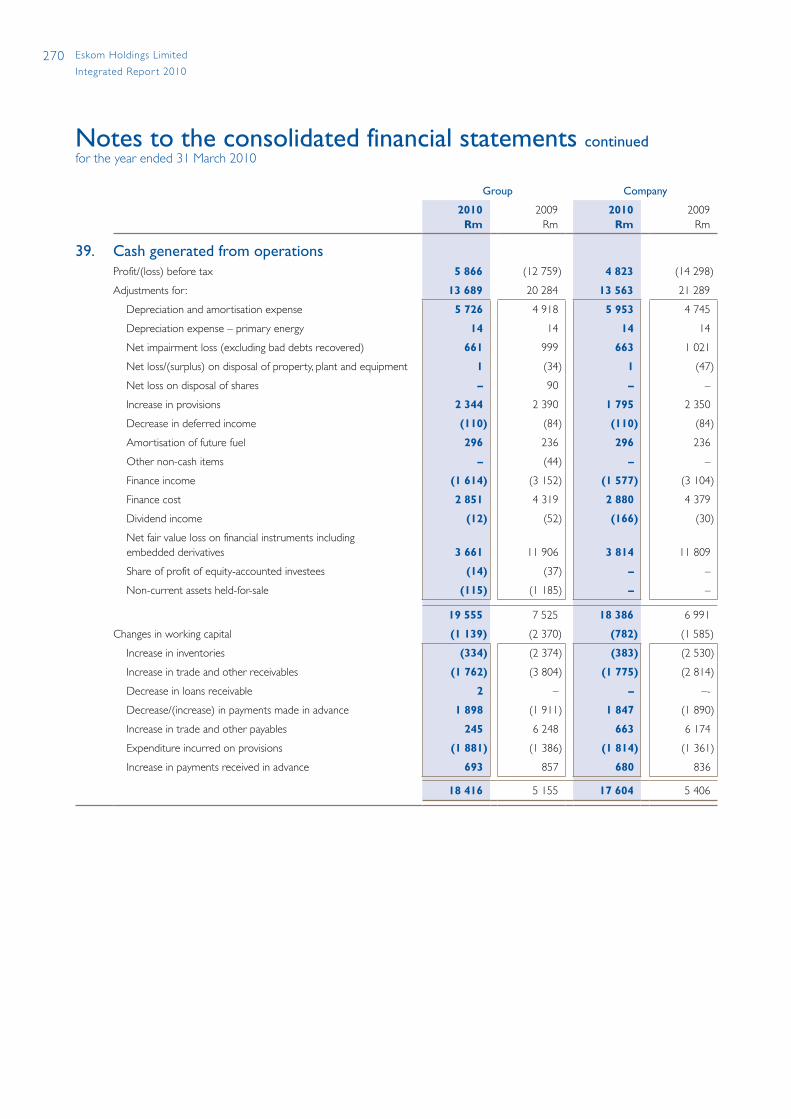
270 Eskom Holdings Limited
Integrated Repor t 2010
Notes to the consolidated financial statements continuedfor the year ended 31 March 2010
Group Company
2010Rm
2009Rm
2010Rm
2009Rm
39. Cash generated from operationsProfit/(loss) before tax 5 866 (12 759) 4 823 (14 298)
Adjustments for : 13 689 20 284 13 563 21 289
Depreciation and amortisation expense 5 726 4 918 5 953 4 745
Depreciation expense – primary energy 14 14 14 14
Net impairment loss (excluding bad debts recovered) 661 999 663 1 021
Net loss/(surplus) on disposal of property, plant and equipment 1 (34) 1 (47)
Net loss on disposal of shares – 90 – –
Increase in provisions 2 344 2 390 1 795 2 350
Decrease in deferred income (110) (84) (110) (84)
Amortisation of future fuel 296 236 296 236
Other non-cash items – (44) – –
Finance income (1 614) (3 152) (1 577) (3 104)
Finance cost 2 851 4 319 2 880 4 379
Dividend income (12) (52) (166) (30)
Net fair value loss on financial instruments including embedded derivatives 3 661 11 906 3 814 11 809
Share of profit of equity-accounted investees (14) (37) – –
Non-current assets held-for-sale (115) (1 185) – –
19 555 7 525 18 386 6 991
Changes in working capital (1 139) (2 370) (782) (1 585)
Increase in inventories (334) (2 374) (383) (2 530)
Increase in trade and other receivables (1 762) (3 804) (1 775) (2 814)
Decrease in loans receivable 2 – – –-
Decrease/(increase) in payments made in advance 1 898 (1 911) 1 847 (1 890)
Increase in trade and other payables 245 6 248 663 6 174
Expenditure incurred on provisions (1 881) (1 386) (1 814) (1 361)
Increase in payments received in advance 693 857 680 836
18 416 5 155 17 604 5 406
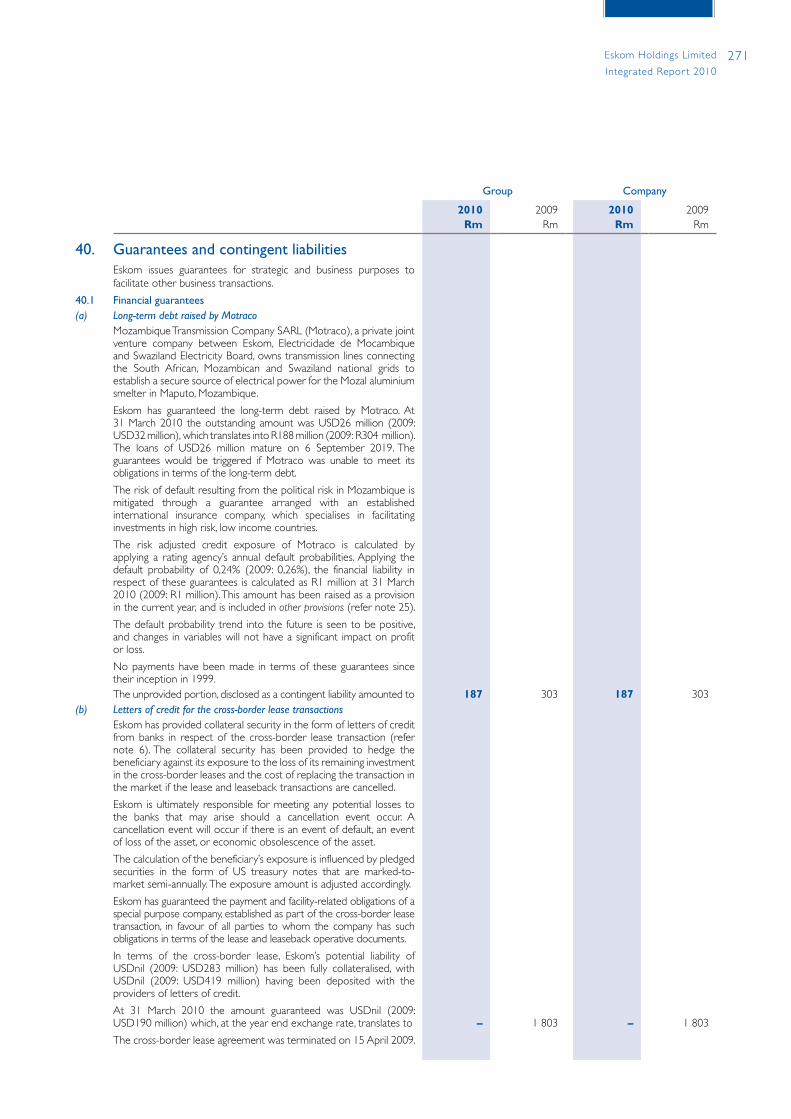
271Eskom Holdings Limited
Integrated Repor t 2010
Group Company
2010Rm
2009Rm
2010Rm
2009Rm
40. Guarantees and contingent liabilitiesEskom issues guarantees for strategic and business purposes to facilitate other business transactions.
40.1 Financial guarantees(a) Long-term debt raised by Motraco
Mozambique Transmission Company SARL (Motraco), a private joint venture company between Eskom, Electricidade de Mocambique and Swaziland Electricity Board, owns transmission lines connecting the South African, Mozambican and Swaziland national grids to establish a secure source of electrical power for the Mozal aluminium smelter in Maputo, Mozambique.
Eskom has guaranteed the long-term debt raised by Motraco. At 31 March 2010 the outstanding amount was USD26 million (2009: USD32 million), which translates into R188 million (2009: R304 million). The loans of USD26 million mature on 6 September 2019. The guarantees would be triggered if Motraco was unable to meet its obligations in terms of the long-term debt.
The risk of default resulting from the political risk in Mozambique is mitigated through a guarantee arranged with an established international insurance company, which specialises in facilitating investments in high risk, low income countries.
The risk adjusted credit exposure of Motraco is calculated by applying a rating agency’s annual default probabilities. Applying the default probability of 0,24% (2009: 0,26%), the financial liability in respect of these guarantees is calculated as R1 million at 31 March 2010 (2009: R1 million). This amount has been raised as a provision in the current year, and is included in otherprovisions (refer note 25).
The default probability trend into the future is seen to be positive, and changes in variables will not have a significant impact on profit or loss.
No payments have been made in terms of these guarantees since their inception in 1999.The unprovided portion, disclosed as a contingent liability amounted to 187 303 187 303
(b) Letters of credit for the cross-border lease transactionsEskom has provided collateral security in the form of letters of credit from banks in respect of the cross-border lease transaction (refer note 6). The collateral security has been provided to hedge the beneficiary against its exposure to the loss of its remaining investment in the cross-border leases and the cost of replacing the transaction in the market if the lease and leaseback transactions are cancelled.
Eskom is ultimately responsible for meeting any potential losses to the banks that may arise should a cancellation event occur. A cancellation event will occur if there is an event of default, an event of loss of the asset, or economic obsolescence of the asset.
The calculation of the beneficiary’s exposure is influenced by pledged securities in the form of US treasury notes that are marked-to-market semi-annually. The exposure amount is adjusted accordingly.
Eskom has guaranteed the payment and facility-related obligations of a special purpose company, established as part of the cross-border lease transaction, in favour of all parties to whom the company has such obligations in terms of the lease and leaseback operative documents.
In terms of the cross-border lease, Eskom’s potential liability of USDnil (2009: USD283 million) has been fully collateralised, with USDnil (2009: USD419 million) having been deposited with the providers of letters of credit.
At 31 March 2010 the amount guaranteed was USDnil (2009: USD190 million) which, at the year end exchange rate, translates to – 1 803 – 1 803
The cross-border lease agreement was terminated on 15 April 2009.
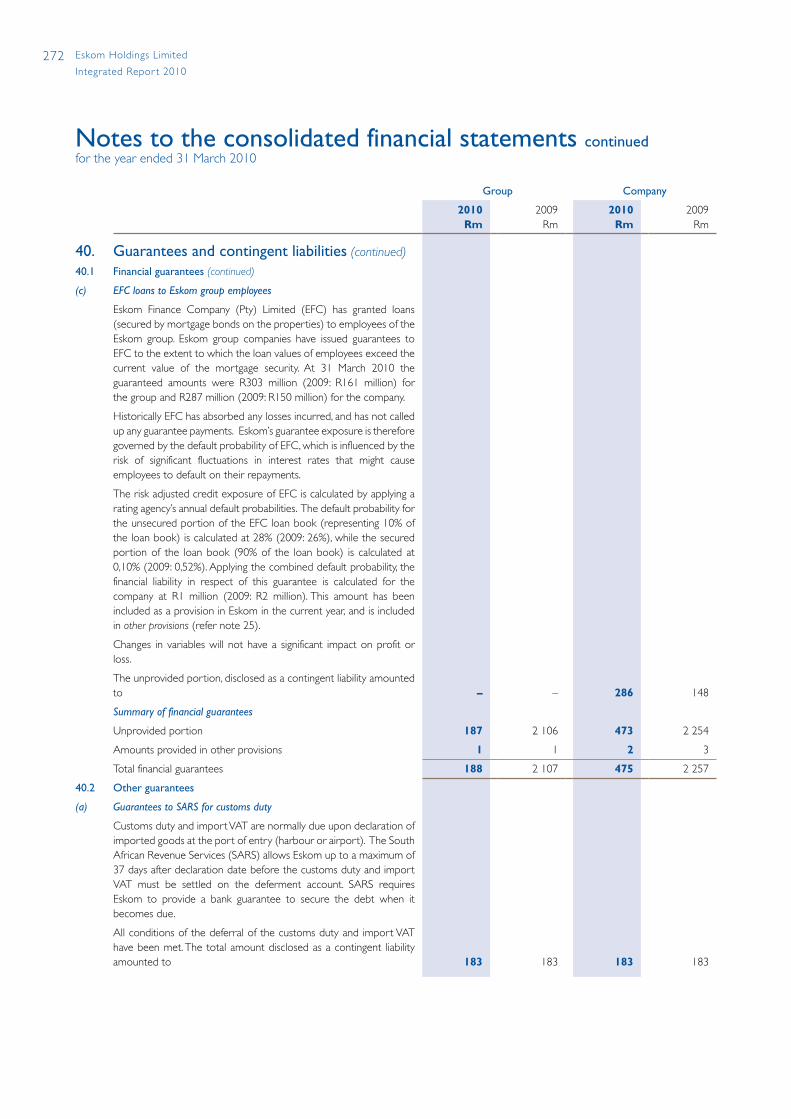
272 Eskom Holdings Limited
Integrated Repor t 2010
Notes to the consolidated financial statements continuedfor the year ended 31 March 2010
Group Company
2010Rm
2009Rm
2010Rm
2009Rm
40. Guarantees and contingent liabilities (continued)
40.1 Financial guarantees (continued)
(c) EFC loans to Eskom group employees
Eskom Finance Company (Pty) Limited (EFC) has granted loans (secured by mortgage bonds on the properties) to employees of the Eskom group. Eskom group companies have issued guarantees to EFC to the extent to which the loan values of employees exceed the current value of the mortgage security. At 31 March 2010 the guaranteed amounts were R303 million (2009: R161 million) for the group and R287 million (2009: R150 million) for the company.
Historically EFC has absorbed any losses incurred, and has not called up any guarantee payments. Eskom’s guarantee exposure is therefore governed by the default probability of EFC, which is influenced by the risk of significant fluctuations in interest rates that might cause employees to default on their repayments.
The risk adjusted credit exposure of EFC is calculated by applying a rating agency’s annual default probabilities. The default probability for the unsecured portion of the EFC loan book (representing 10% of the loan book) is calculated at 28% (2009: 26%), while the secured portion of the loan book (90% of the loan book) is calculated at 0,10% (2009: 0,52%). Applying the combined default probability, the financial liability in respect of this guarantee is calculated for the company at R1 million (2009: R2 million). This amount has been included as a provision in Eskom in the current year, and is included in otherprovisions (refer note 25).
Changes in variables will not have a significant impact on profit or loss.
The unprovided portion, disclosed as a contingent liability amounted to – – 286 148
Summary of financial guarantees
Unprovided portion 187 2 106 473 2 254
Amounts provided in other provisions 1 1 2 3
Total financial guarantees 188 2 107 475 2 257
40.2 Other guarantees
(a) Guarantees to SARS for customs duty
Customs duty and import VAT are normally due upon declaration of imported goods at the port of entry (harbour or airport). The South African Revenue Services (SARS) allows Eskom up to a maximum of 37 days after declaration date before the customs duty and import VAT must be settled on the deferment account. SARS requires Eskom to provide a bank guarantee to secure the debt when it becomes due.
All conditions of the deferral of the customs duty and import VAT have been met. The total amount disclosed as a contingent liability amounted to 183 183 183 183

273Eskom Holdings Limited
Integrated Repor t 2010
Group Company
2010Rm
2009Rm
2010Rm
2009Rm
(b) Eskom Pension and Provident Fund
Eskom has indemnified the Eskom Pension and Provident Fund against any loss resulting from negligence, dishonesty or fraud by the fund’s officers or trustees.
(c) Eskom Enterprises performance bonds
Eskom Enterprises (Pty) Limited has performance bonds totalling R43 million (2009: R54 million) with respect to various contracts. The probability of having to pay out in terms of the performance bonds is calculated after assessing the likelihood of meeting the contract deliverables. Probable future payments are then discounted and the amount raised as a liability.
The project management processes in place confirm that all but one of the contracts should meet the project deliverables. As a result of this contractual dispute, the R27 million (2009: R35 million) performance bond for this contract has a high probability of being called up. The full amount has been raised as a provision in the current year and is included in otherprovisions (refer note 25).
Eskom Enterprises (Pty) Limited has not been required to make any previous performance bond payments.
The total amount disclosed as a contingent liability amounted to 16 19 – –
(d) Conflict of interest guarantee
A subsidiary of Eskom Enterprises (Pty) Limited issued a conflict of interest guarantee to a customer, that restricts Eskom Enterprises from trading outside a specific area in Mali. There is currently no possibility of Eskom Enterprises trading outside the specified area. The total contingent liability amounts to 51 65 – –
(e) Rental guarantees
Some Eskom Enterprises group companies issued rental guarantees to various property owners to guarantee the rental on the properties they occupy. The guarantees have various dates of expiry. The total amount disclosed as a contingent liability amounted to 15 10 – –
40.3 Other contingent liabilities
(a) Legal claims
Legal claims are in process against Eskom as a result of contractual disputes with various parties. On the basis of the evidence available it appears that no obligation is present. The claims are disclosed as a contingent liability and amounted to 71 434 152 434
(b) Pledges
South Dunes Coal Terminal (Pty) Limited signed a loan agreement with Investec Bank for the funding of the Richards Bay Coal Terminal Phase V expansion project. All rights, title and interest in and to the loan to Richards Bay Coal Terminal, the South Dunes Coal Terminal (Pty) Limited Throughput Agreement Rights and Entitlement and certain other accounts are pledged as security for the loan. The unused loan facility, disclosed as a contingent liability, amounts to – 50 – –

274 Eskom Holdings Limited
Integrated Repor t 2010
Notes to the consolidated financial statements continuedfor the year ended 31 March 2010
Group Company
2010Rm
2009Rm
2010Rm
2009Rm
41. Commitments41.1 Capital expenditure
Estimated capital expenditure 227 206 213 805 224 995 211 181
Contracted 113 061 99 446 112 520 98 990
Approved, not yet contracted for 114 145 114 359 112 475 112 191
The expenditure is expected to be incurred as follows: 227 206 213 805 224 995 211 181
Due within one year 65 594 76 101 64 489 75 404
Due between two and five years 159 005 135 324 157 899 133 397
Due after five years 2 607 2 380 2 607 2 380
This expenditure will be financed through shareholder support, debt (refer to funding strategy on page 44 for further information) and internally generated funds.
41.2 Operating leases
Group as lessee
The future minimum lease payments payable under non-cancellable operating leases are: 199 127 182 111
Due within one year 95 70 87 60
Due between two and five years 103 57 94 51
Due after five years 1 – 1 –
Group as lessor
The future minimum lease payments receivable under non-cancellable operating leases are: 589 1 004 589 1 004
Due within one year 59 88 59 88
Due between two and five years 261 317 261 317
Due after five years 269 599 269 599
41.3 Supply of waterEskom has entered into long-term agreements with the Department of Water Affairs to reimburse the department for the cost incurred in supplying water to Eskom. This cost is regarded as part of primaryenergy in profit or loss.
41.4 CoalEskom has entered into long-term agreements with suppliers for coal purchases. The annual cost of coal is regarded as part of primaryenergy in profit or loss.
42. Related-party transactionsThe group is 100% controlled by its shareholder, the government, represented by the Minister of Public Enterprises.
Eskom (and its subsidiaries) constitute a Schedule 2 public entity in terms of the Public Finance Management Act. The related party disclosure is required in terms of IAS 24 Related PartyDisclosures and the specific guidance given by the South African Institute of Chartered Accountants.
The related parties of Eskom consist mainly of government departments, state-owned enterprises, subsidiaries of Eskom and other public entities in the national sphere of government, as well as key management personnel of Eskom or its shareholder and close family members of these related parties. The list of public entities in the national sphere of government was provided by National Treasury on its website www.treasury.gov.za. It also provided the names of subsidiaries of public entities.
The comparative information has been based on the list of public entities and their subsidiaries effective at 31 March 2009.
In addition, related parties comprise associates and joint ventures of the group and post-retirement benefit plans for the benefit of employees.
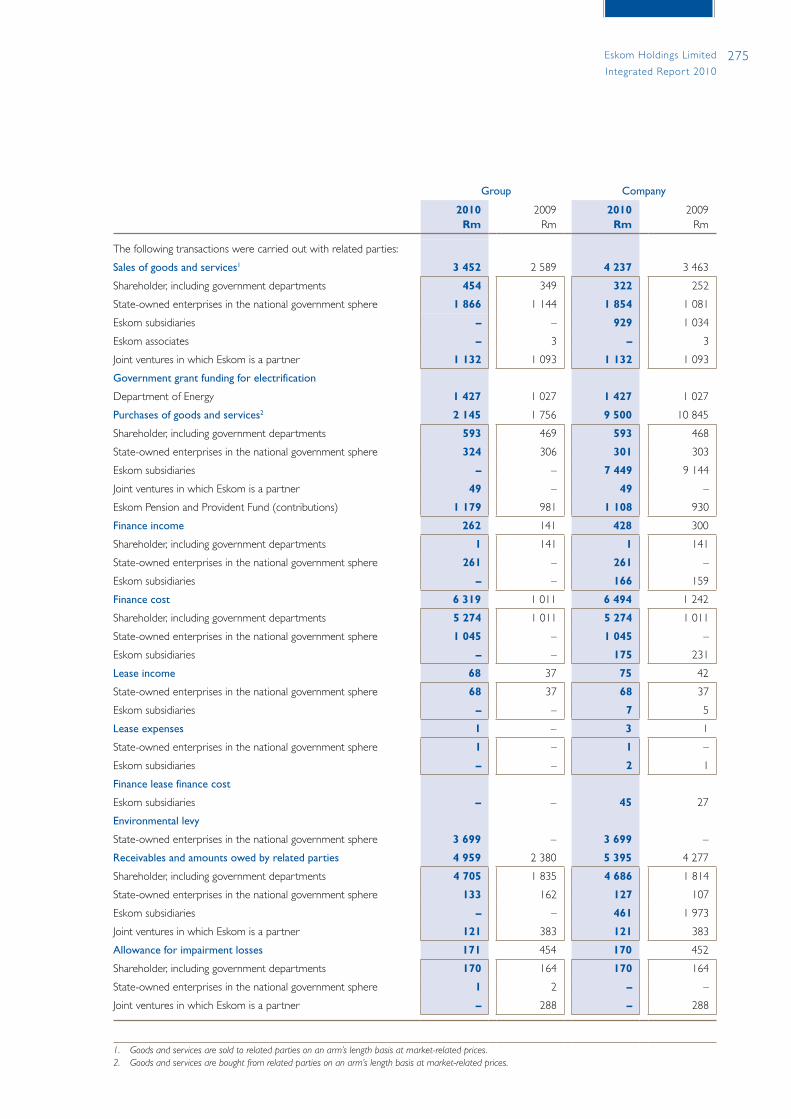
275Eskom Holdings Limited
Integrated Repor t 2010
Group Company
2010Rm
2009Rm
2010Rm
2009Rm
The following transactions were carried out with related parties:
Sales of goods and services1 3 452 2 589 4 237 3 463
Shareholder, including government departments 454 349 322 252
State-owned enterprises in the national government sphere 1 866 1 144 1 854 1 081
Eskom subsidiaries – – 929 1 034
Eskom associates – 3 – 3
Joint ventures in which Eskom is a partner 1 132 1 093 1 132 1 093
Government grant funding for electrification
Department of Energy 1 427 1 027 1 427 1 027
Purchases of goods and services2 2 145 1 756 9 500 10 845
Shareholder, including government departments 593 469 593 468
State-owned enterprises in the national government sphere 324 306 301 303
Eskom subsidiaries – – 7 449 9 144
Joint ventures in which Eskom is a partner 49 – 49 –
Eskom Pension and Provident Fund (contributions) 1 179 981 1 108 930
Finance income 262 141 428 300
Shareholder, including government departments 1 141 1 141
State-owned enterprises in the national government sphere 261 – 261 –
Eskom subsidiaries – – 166 159
Finance cost 6 319 1 011 6 494 1 242
Shareholder, including government departments 5 274 1 011 5 274 1 011
State-owned enterprises in the national government sphere 1 045 – 1 045 –
Eskom subsidiaries – – 175 231
Lease income 68 37 75 42
State-owned enterprises in the national government sphere 68 37 68 37
Eskom subsidiaries – – 7 5
Lease expenses 1 – 3 1
State-owned enterprises in the national government sphere 1 – 1 –
Eskom subsidiaries – – 2 1
Finance lease finance cost
Eskom subsidiaries – – 45 27
Environmental levy
State-owned enterprises in the national government sphere 3 699 – 3 699 –
Receivables and amounts owed by related parties 4 959 2 380 5 395 4 277
Shareholder, including government departments 4 705 1 835 4 686 1 814
State-owned enterprises in the national government sphere 133 162 127 107
Eskom subsidiaries – – 461 1 973
Joint ventures in which Eskom is a partner 121 383 121 383
Allowance for impairment losses 171 454 170 452
Shareholder, including government departments 170 164 170 164
State-owned enterprises in the national government sphere 1 2 – –
Joint ventures in which Eskom is a partner – 288 – 288
1. Goodsandservicesaresoldtorelatedpartiesonanarm’slengthbasisatmarket-relatedprices.2. Goodsandservicesareboughtfromrelatedpartiesonanarm’slengthbasisatmarket-relatedprices.
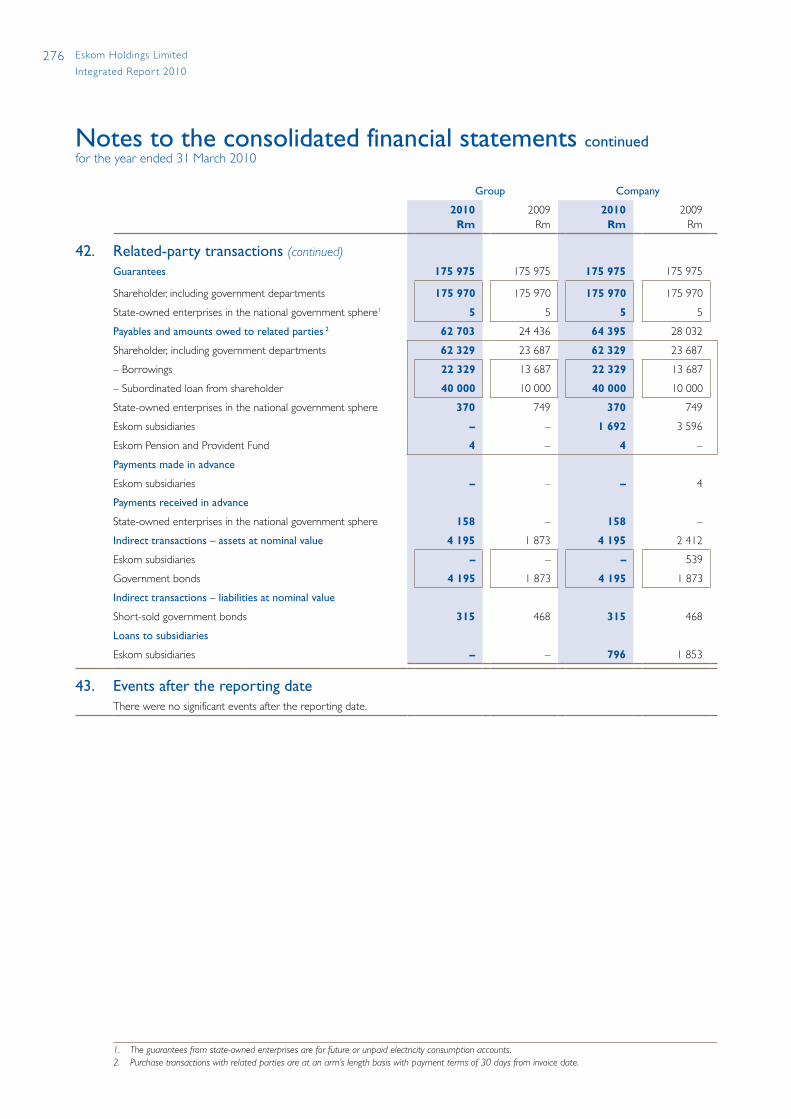
276 Eskom Holdings Limited
Integrated Repor t 2010
Notes to the consolidated financial statements continuedfor the year ended 31 March 2010
Group Company
2010Rm
2009Rm
2010Rm
2009Rm
42. Related-party transactions (continued)
Guarantees 175 975 175 975 175 975 175 975
Shareholder, including government departments 175 970 175 970 175 970 175 970
State-owned enterprises in the national government sphere1 5 5 5 5
Payables and amounts owed to related parties 2 62 703 24 436 64 395 28 032
Shareholder, including government departments 62 329 23 687 62 329 23 687
– Borrowings 22 329 13 687 22 329 13 687
– Subordinated loan from shareholder 40 000 10 000 40 000 10 000
State-owned enterprises in the national government sphere 370 749 370 749
Eskom subsidiaries – – 1 692 3 596
Eskom Pension and Provident Fund 4 – 4 –
Payments made in advance
Eskom subsidiaries – – – 4
Payments received in advance
State-owned enterprises in the national government sphere 158 – 158 –
Indirect transactions – assets at nominal value 4 195 1 873 4 195 2 412
Eskom subsidiaries – – – 539
Government bonds 4 195 1 873 4 195 1 873
Indirect transactions – liabilities at nominal value
Short-sold government bonds 315 468 315 468
Loans to subsidiaries
Eskom subsidiaries – – 796 1 853
43. Events after the reporting dateThere were no significant events after the reporting date.
1. Theguaranteesfromstate-ownedenterprisesareforfutureorunpaidelectricityconsumptionaccounts. 2. Purchasetransactionswithrelatedpartiesareatanarm’slengthbasiswithpaymenttermsof30daysfrominvoicedate.

277Eskom Holdings Limited
Integrated Repor t 2010
44. Restatement of comparativesNew and revised standards and interpretationsThe following new, revised and amended standards and interpretations were implemented during the financial year, but had no significant impact on the financial statements:– IAS 23 Borrowingcosts– IAS 32 Financialinstruments: Presentation– IFRS 1 First-timeadoptionofInternationalFinancialReportingStandardsand IAS 27 Consolidatedandseparatefinancialstatements– IFRS 2 Share-basedpayment– IFRIC 13 Customerloyaltyprogrammes– IFRIC 15 Agreementsfortheconstructionofrealestate– IFRIC 16 Hedgesofanetinvestmentinaforeignoperation
The following new and revised standards and interpretations, which had an impact on the financial statements, were implemented during the financial year :– IFRS 7Financialinstruments:Disclosures– IFRS 8 Operatingsegments– IAS 1 Presentationoffinancialstatements– IFRIC 18 Transfersofassetsfromcustomers
IFRS 7 Financial instruments: DisclosuresThe implementation of the amendment to IFRS 7 Financialinstruments:Disclosures did not result in a restatement of comparative figures as the amendment is in respect of disclosure requirements. The amendment introduces a three-tier hierarchy disclosure for fair value measurement based on the significant inputs (refer note 13.9) and also clarifies and enhances existing disclosure about the nature and extent of liquidity risk arising from financial instruments.
IFRS 8 Operating segmentsAs of 1 April 2009, the group determines and presents its operating segments based on the information that is internally provided to the group executive committee (Exco), which is the group's chief operating decision maker. This change in accounting policy is due to the adoption of IFRS 8 Operating segments. Previously, operating segments were determined and presented in accordance with IAS 14 Segment reporting. Comparative segment information has been represented in conformity with the transitional requirements of such standard. The change in accounting policy did not result in a financial impact on the financial statements as the change is in respect of disclosure requirements. Refer note 5.
IAS 1 Presentation of financial statementsThe effect of the restatement of comparative figures to comply with the new IAS 1Presentationoffinancialstatementsand the reclassification of other line items on the statements of financial position, statements of comprehensive income, statements of changes in equity and statements of cash flows is indicated below.
IFRIC 18 Transfers of assets from customersThe group also implemented IFRIC 18 Transfersofassetsfromcustomers which is prospectively effective for the transfer of assets from customers received on or after 1 July 2009. The group has previously (up to 30 June 2009) credited the contribution paid in advance by electricity customers relating to the construction of regular distribution and transmission assets to profit or loss on a straight-line basis over the expected useful lives of the related assets when these assets were placed into commercial operation. From 1 July 2009, the contributions paid in advance are credited to profit or loss within otherrevenue when the customer is connected to the electricity network.
Eskom Finance Company (Pty) Limited (EFC)The results of Eskom Finance Company (Pty) Limited (EFC), a 100% held subsidiary, was classified as a non-current asset held-for-sale in the previous financial years. The results of EFC was treated as continuing operations for the 2010 financial year. The comparative information for the group in the consolidated income statement has been restated in line with IFRS 5 Non-currentassetsheld-for-saleanddiscontinuedoperations to reflect the results of EFC as a continuing operation (refer note 22). This is presented below:
Statement of financial position at 31 March 2009There have been no restatements made to the statement of financial position at 31 March 2009.

278 Eskom Holdings Limited
Integrated Repor t 2010
Notes to the consolidated financial statements continuedfor the year ended 31 March 2010
44. Restatement of comparatives (continued)
Group Company
Previouslyreported
Rm
Adjust-ments
Rm
Restated
Rm
Previouslyreported
Rm
Adjust-ments
Rm
Restated
Rm
Income statement for the year ended 31 March 2009
Continuing operations
Revenue 53 826 351 54 177 53 090 – 53 090
Primary energy (25 351) 467 (24 884) (25 351) 467 (24 884)
Employee benefit expense (15 166) 31 (15 135) (14 157) 55 (14 102)
Depreciation and amortisation (4 916) (2) (4 918) (4 745) – (4 745)
Net impairment loss (1 213) 224 (989) (1 239) 228 (1 011)
Other operating expenses (8 591) 7 (8 584) (10 996) 12 (10 984)
Operating (loss)/profit before net fair value loss and net finance cost (1 411) 1 078 (333) (3 398) 762 (2 636)
Other income 586 24 610 1 422 – 1 422
Net fair value loss on financial instruments, excluding embedded derivatives (2 370) (22) (2 392) (2 281) (22) (2 303)
Net fair value loss on embedded derivatives (9 514) – (9 514) (9 506) – (9 506)
Operating (loss)/profit before net finance cost (12 709) 1 080 (11 629) (13 763) 740 (13 023)
Net finance cost (314) (853) (1 167) (590) (685) (1 275)
Finance income 3 370 (218) 3 152 3 322 (218) 3 104
Finance cost (3 684) (635) (4 319) (3 912) (467) (4 379)
Share of profit of equity-accounted investees 37 – 37 – – –
Loss before tax (12 986) 227 (12 759) (14 353) 55 (14 298)
Income tax 3 805 (19) 3 786 4 176 (15) 4 161
Loss for the year from continuing operations (9 181) 208 (8 973) (10 177) 40 (10 137)
Discontinued operations
Loss for the year from discontinued operations (527) (168) (695) – – –
Loss for the year (9 708) 40 (9 668) (10 177) 40 (10 137)
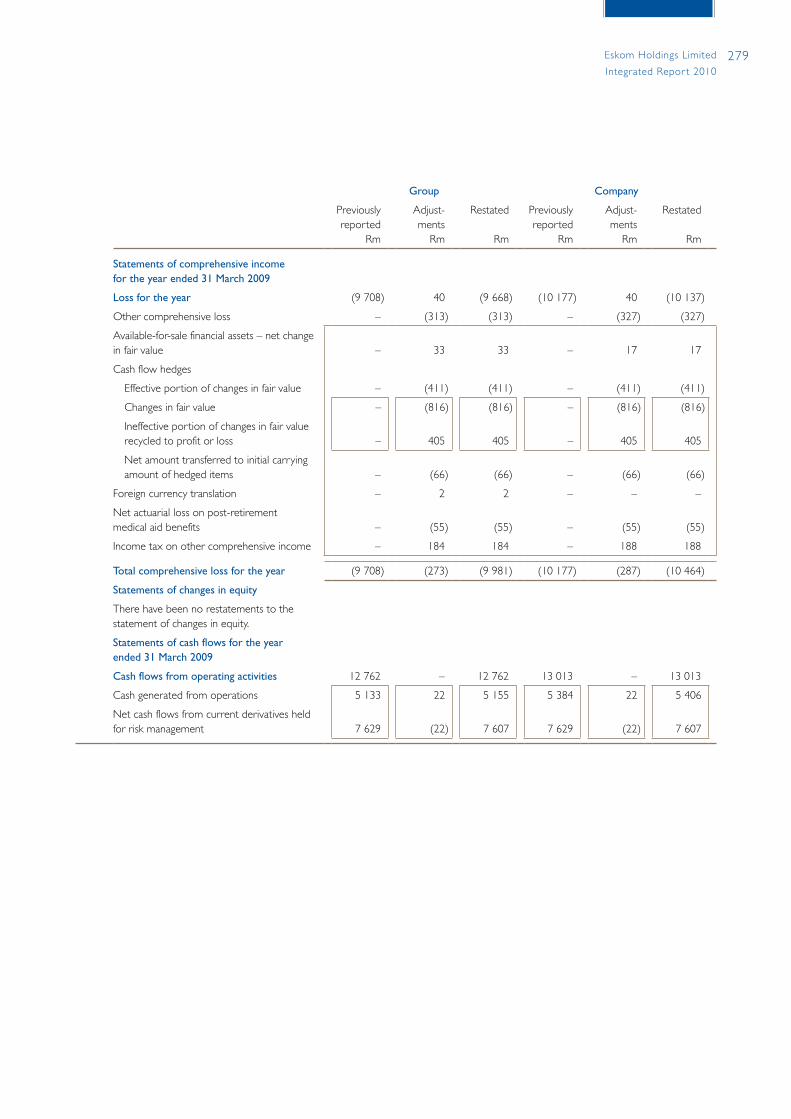
279Eskom Holdings Limited
Integrated Repor t 2010
Group Company
Previouslyreported
Rm
Adjust-ments
Rm
Restated
Rm
Previouslyreported
Rm
Adjust-ments
Rm
Restated
Rm
Statements of comprehensive income for the year ended 31 March 2009
Loss for the year (9 708) 40 (9 668) (10 177) 40 (10 137)
Other comprehensive loss – (313) (313) – (327) (327)
Available-for-sale financial assets – net change in fair value – 33 33 – 17 17
Cash flow hedges
Effective portion of changes in fair value – (411) (411) – (411) (411)
Changes in fair value – (816) (816) – (816) (816)
Ineffective portion of changes in fair value recycled to profit or loss – 405 405 – 405 405
Net amount transferred to initial carrying amount of hedged items – (66) (66) – (66) (66)
Foreign currency translation – 2 2 – – –
Net actuarial loss on post-retirement medical aid benefits – (55) (55) – (55) (55)
Income tax on other comprehensive income – 184 184 – 188 188
Total comprehensive loss for the year (9 708) (273) (9 981) (10 177) (287) (10 464)
Statements of changes in equity
There have been no restatements to the statement of changes in equity.
Statements of cash flows for the year ended 31 March 2009
Cash flows from operating activities 12 762 – 12 762 13 013 – 13 013
Cash generated from operations 5 133 22 5 155 5 384 22 5 406
Net cash flows from current derivatives held for risk management 7 629 (22) 7 607 7 629 (22) 7 607
280 Eskom Holdings Limited
Integrated Repor t 2010
Notes to the consolidated financial statements continuedfor the year ended 31 March 2010
45. Directors’ remuneration1 Remuneration philosophyEskom links management remuneration to the performance of the organisation and an individual’s contribution. Market factors are also crucial as rewards and remuneration must be kept at levels that will assist us in retaining key leadership skills. Basic salary is augmented by short- and long-term incentives.
International and local benchmarks are considered to ensure executive packages are aligned with those offered by companies of similar stature to Eskom. We aim to remunerate in line with the median of the market to recruit and retain the best management team to lead our business.
The executive remuneration strategy is constantly reviewed to stay aligned with the Department of Public Enterprises remuneration guidelines and abreast with best practices.
Remuneration committeeThe human resources and remuneration committee helps the board to apply policy relating to the remuneration of directors and executives as set by our shareholder. The policy also covers the nomination of executives for senior positions and conditions of service. Refer page 292.
The committee enhances business performance by:• approving, guiding and influencing key human resources policies and strategies• monitoring compliance with the Employment Equity Act• guiding strategies to achieve equity in Eskom• approving the principles governing reward and incentive schemes
Non-executive directorsRemuneration of non-executive directors is benchmarked against the norms for companies of similar size and is in line with guidelines issued by the shareholder. Remuneration proposals from the human resources and remuneration committee are forwarded to the board. The board then makes recommendations to the shareholder.
Non-executive directors receive a fixed monthly fee and are reimbursed for out-of-pocket expenses incurred in fulfilling their duties.
Executive management committee (Exco) membersThe committee makes recommendations to the board concerning the remuneration of the chief executive, and approves the remuneration of the other Exco members. The remuneration is considered in accordance with a framework approved by the shareholder. The board recommendation on the remuneration of the chief executive has to be approved by the shareholder.
Factors influencing the remuneration of the Exco members include level of skill, experience, contribution to organisational performance and success of the group. Remuneration includes a basic package and short and long-term incentives.
Every year, the human resources and remuneration committee reviews the structure of these packages to ensure an appropriate balance between fixed and variable remuneration and short and long-term incentives and rewards.
The finance director, chief operating officers and managing directors have permanent employment contracts based on Eskom’s standard conditions of service. Six months’ notice is required.
281Eskom Holdings Limited
Integrated Repor t 2010
Remuneration structureThe remuneration of the Exco members includes the following components:
Guaranteed amountThey receive a guaranteed pay package with remuneration based on cost to company. This comprises a fixed cash portion and compulsory benefits (medical aid, life cover and pension). The guaranteed amount is reviewed annually to keep remuneration in line with the market.
Short-term incentivesThese reward the achievement of individual predetermined performance objectives and targets as set by the chief executive in performance contracts with each Exco member. The human resources and remuneration committee approves the targets set for the chief executive.
The short-term incentive scheme is calculated as a percentage of pensionable earnings.
Long-term incentivesThese are designed to attract, retain and reward the Exco members for meeting the organisational objectives set by the shareholder. A market-benchmarked long-term incentive and deferred bonus scheme have been approved effective from 1 April 2005.
Long-term incentive schemeA number of performance shares (award performance shares) were awarded to the Exco members on 1 April 2005, 2006, 2007 and 2008. Award performance shares and deferred bonus shares to be awarded as at 1 April 2009 are deferred pending the outcome of an investigation into the remuneration policy of state-owned enterprises.
The value of the performance shares is deemed to be R1 at grant date, and is escalated at a money-market rate to determine the value at reporting date.
The board has set performance conditions in line with the Eskom business plan and shareholder compact over a three-year performance period. Performance covers financial and non-financial targets in areas such as ensuring business sustainability of Eskom, ensuring reliability of supply to all South Africans, ensuring that future power needs for South Africa are adequately provided for and supporting the developmental objectives of South Africa, with an agreed weighting in each category.
Awards only vest if, and to the extent that, these targets are met. Potential vesting percentages range from 0% to 100%. A threshold and a stretch target are set for each measure, with an expected (on target) vesting of 50%.
Performance parameters are complemented by a set of gatekeeper conditions. If gatekeeper requirements are not met, the board at its discretion may adjust the vesting percentages even though targets have been met.
The following gatekeeper conditions trigger a review of vesting percentages:• if the lost-time incident rate is greater than 0,31• if the sustainability committee gives an unfavourable safety report • if Eskom’s audited annual financial statements show a financial loss • if the auditors qualify Eskom’s annual financial statements• if a significant PFMA contravention occurs• enhancement of Eskom’s reputation
The vesting period for award performance shares is three years from the date of grant. At the end of that period, the human resources and remuneration committee decides the amounts to be paid in line with:• the percentage of award performance shares that vest, based on the performance conditions achieved• the value of the award performance shares based on the grant value, escalated at a money market rate
In addition to the performance conditions, vesting of award performance shares is dependent on the scheme participant remaining in Eskom's employment throughout the vesting period. The award lapses if employment ceases during the vesting period (other than for permitted reasons).
1. IncludesremunerationofExcomembers(chiefexecutive,financedirector,chiefoperatingofficersandmanagingdirectors)whoareseniorexecutivesandnotdirectorsofEskom.
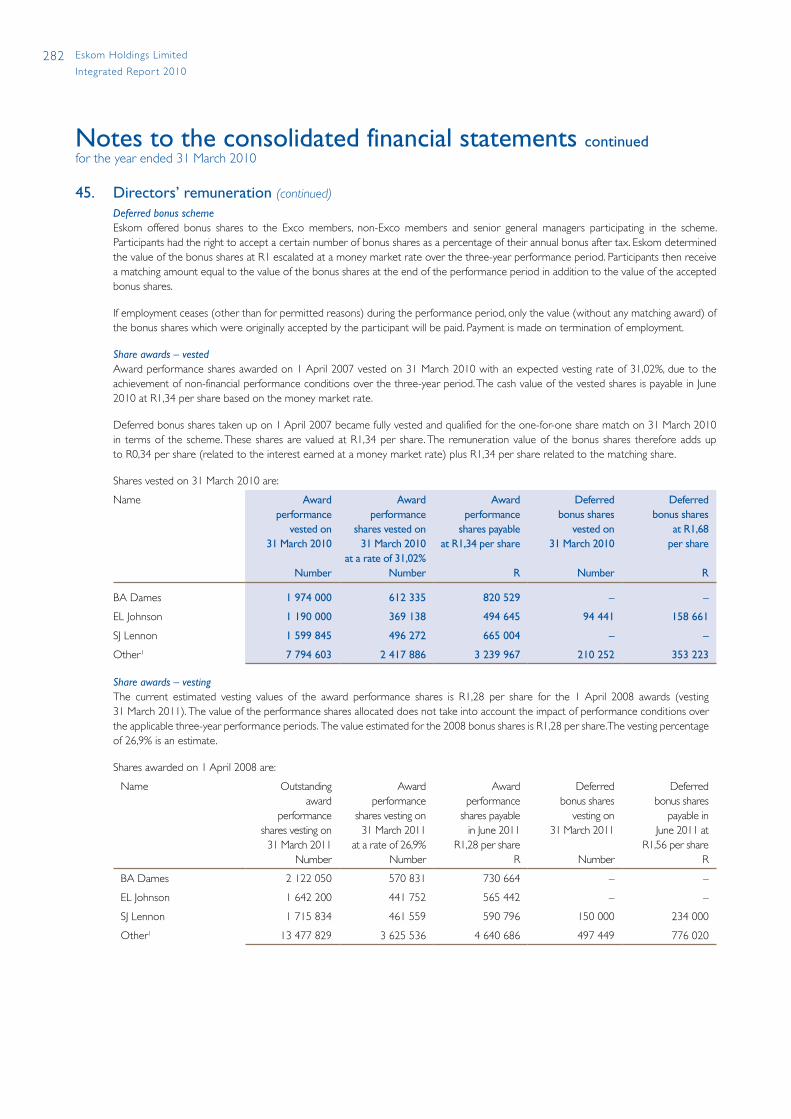
282 Eskom Holdings Limited
Integrated Repor t 2010
Notes to the consolidated financial statements continuedfor the year ended 31 March 2010
45. Directors’ remuneration (continued)
Deferred bonus schemeEskom offered bonus shares to the Exco members, non-Exco members and senior general managers participating in the scheme. Participants had the right to accept a certain number of bonus shares as a percentage of their annual bonus after tax. Eskom determined the value of the bonus shares at R1 escalated at a money market rate over the three-year performance period. Participants then receive a matching amount equal to the value of the bonus shares at the end of the performance period in addition to the value of the accepted bonus shares.
If employment ceases (other than for permitted reasons) during the performance period, only the value (without any matching award) of the bonus shares which were originally accepted by the participant will be paid. Payment is made on termination of employment.
Share awards – vestedAward performance shares awarded on 1 April 2007 vested on 31 March 2010 with an expected vesting rate of 31,02%, due to the achievement of non-financial performance conditions over the three-year period. The cash value of the vested shares is payable in June 2010 at R1,34 per share based on the money market rate.
Deferred bonus shares taken up on 1 April 2007 became fully vested and qualified for the one-for-one share match on 31 March 2010 in terms of the scheme. These shares are valued at R1,34 per share. The remuneration value of the bonus shares therefore adds up to R0,34 per share (related to the interest earned at a money market rate) plus R1,34 per share related to the matching share.
Shares vested on 31 March 2010 are:
Name Awardperformance
vested on 31 March 2010
Number
Awardperformance
shares vested on 31 March 2010
at a rate of 31,02%Number
Awardperformance
shares payable at R1,34 per share
R
Deferred bonus shares
vested on 31 March 2010
Number
Deferredbonus shares
at R1,68per share
R
BA Dames 1 974 000 612 335 820 529 – –
EL Johnson 1 190 000 369 138 494 645 94 441 158 661
SJ Lennon 1 599 845 496 272 665 004 – –
Other1 7 794 603 2 417 886 3 239 967 210 252 353 223
Share awards – vestingThe current estimated vesting values of the award performance shares is R1,28 per share for the 1 April 2008 awards (vesting 31 March 2011). The value of the performance shares allocated does not take into account the impact of performance conditions over the applicable three-year performance periods. The value estimated for the 2008 bonus shares is R1,28 per share. The vesting percentage of 26,9% is an estimate.
Shares awarded on 1 April 2008 are:
Name Outstandingaward
performanceshares vesting on
31 March 2011Number
Awardperformance
shares vesting on 31 March 2011
at a rate of 26,9%Number
Awardperformance
shares payable in June 2011
R1,28 per shareR
Deferred bonus shares
vesting on 31 March 2011
Number
Deferredbonus shares
payable in June 2011 at
R1,56 per shareR
BA Dames 2 122 050 570 831 730 664 – –
EL Johnson 1 642 200 441 752 565 442 – –
SJ Lennon 1 715 834 461 559 590 796 150 000 234 000
Other1 13 477 829 3 625 536 4 640 686 497 449 776 020

283Eskom Holdings Limited
Integrated Repor t 2010
Scheme detailsThe details of the scheme are:
Long-term incentive plan2
Deferred bonus plan2
Long-term incentive plan
Deferred bonus plan
Date of grant 1 April 2009 1 April 2009 1 April 2008 1 April 2008
Number granted – – 25 649 031 647 449
Contractual life 3 yearsVariable vesting
depending on theachievement
of performanceconditions
3 yearsThree-year
service period
3 yearsVariable vesting
depending on theachievement
of performanceconditions
3 yearsThree-year
service period
Vesting conditions
Method of settlement Cash Cash Cash Cash
Expected attrition of employee (%) – – – –
Expected outcome of performance conditions (%) – – 26,90 Not applicable
Reconciliation of performance share movements
2010Number
2010Number
2009Number
2009Number
Number of performance shares
Outstanding at beginning of year 56 260 002 1 192 508 74 345 360 2 441 158
Granted during the year – 647 449 25 649 031 –
Forfeited during the year (12 264 771) – (12 956 274) (162 067)
Settled during the year (12 478 871) (887 815) (15 298 866) (1 020 259)
Adjustment in performance share value – – (15 479 249) (681 004)
Adjustment to deferred bonus plan – – – 614 680
Outstanding at end of year 31 516 360 952 142 56 260 002 1 192 508
Carrying amount of liability (R’000) 9 307 1 144 16 979 1 816
Intrinsic value of liabilities relating to vested rights (R’000) 9 307 1 144 16 979 1 816
1. Non-ExcoF-Bandemployees.2. Awardperformancesharesanddeferredbonussharestobeawardedeffective1April2009weredeferredpendingtheoutcomeofaninvestigationintothe
remunerationpolicyofstate-ownedenterprises.
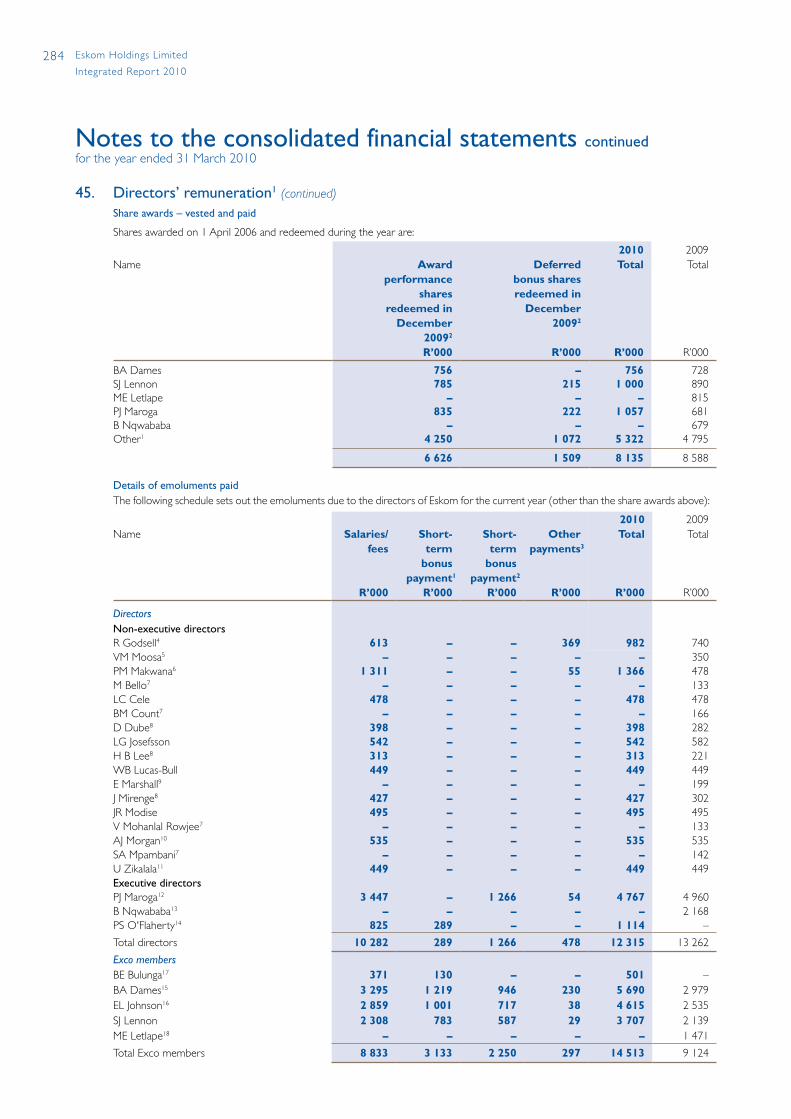
284 Eskom Holdings Limited
Integrated Repor t 2010
Notes to the consolidated financial statements continuedfor the year ended 31 March 2010
45. Directors’ remuneration1 (continued)
Share awards – vested and paid
Shares awarded on 1 April 2006 and redeemed during the year are:
Name Awardperformance
shares redeemed in
December 20092
R’000
Deferred bonus sharesredeemed in
December 20092
R’000
2010Total
R’000
2009Total
R’000
BA Dames 756 – 756 728SJ Lennon 785 215 1 000 890ME Letlape – – – 815PJ Maroga 835 222 1 057 681B Nqwababa – – – 679Other1 4 250 1 072 5 322 4 795
6 626 1 509 8 135 8 588
Details of emoluments paidThe following schedule sets out the emoluments due to the directors of Eskom for the current year (other than the share awards above):
Name Salaries/fees
R’000
Short-term
bonuspayment1
R’000
Short-term
bonuspayment2
R’000
Otherpayments3
R’000
2010Total
R’000
2009Total
R’000
DirectorsNon-executive directorsR Godsell4 613 – – 369 982 740VM Moosa5 – – – – – 350 PM Makwana6 1 311 – – 55 1 366 478M Bello7 – – – – – 133 LC Cele 478 – – – 478 478 BM Count7 – – – – – 166 D Dube8 398 – – – 398 282 LG Josefsson 542 – – – 542 582 H B Lee8 313 – – – 313 221 WB Lucas-Bull 449 – – – 449 449 E Marshall9 – – – – – 199 J Mirenge8 427 – – – 427 302JR Modise 495 – – – 495 495 V Mohanlal Rowjee7 – – – – – 133 AJ Morgan10 535 – – – 535 535 SA Mpambani7 – – – – – 142 U Zikalala11 449 – – – 449 449 Executive directorsPJ Maroga12 3 447 – 1 266 54 4 767 4 960 B Nqwababa13 – – – – – 2 168 PS O'Flaherty14 825 289 – – 1 114 –
Total directors 10 282 289 1 266 478 12 315 13 262
Exco membersBE Bulunga17 371 130 – – 501 –BA Dames15 3 295 1 219 946 230 5 690 2 979EL Johnson16 2 859 1 001 717 38 4 615 2 535SJ Lennon 2 308 783 587 29 3 707 2 139ME Letlape18 – – – – – 1 471
Total Exco members 8 833 3 133 2 250 297 14 513 9 124
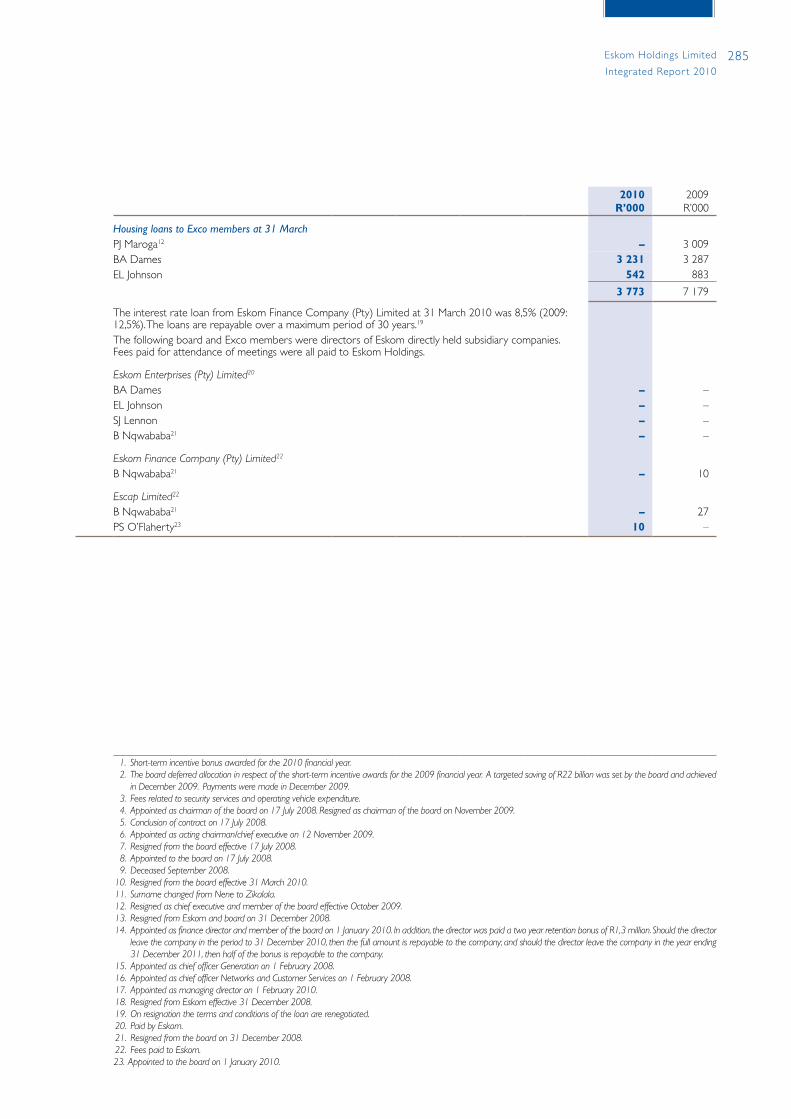
285Eskom Holdings Limited
Integrated Repor t 2010
2010R’000
2009R’000
Housing loans to Exco members at 31 MarchPJ Maroga12 – 3 009BA Dames 3 231 3 287EL Johnson 542 883
3 773 7 179
The interest rate loan from Eskom Finance Company (Pty) Limited at 31 March 2010 was 8,5% (2009: 12,5%). The loans are repayable over a maximum period of 30 years.19
The following board and Exco members were directors of Eskom directly held subsidiary companies. Fees paid for attendance of meetings were all paid to Eskom Holdings.
EskomEnterprises(Pty)Limited20
BA Dames – –EL Johnson – –SJ Lennon – –B Nqwababa21 – –
EskomFinanceCompany(Pty)Limited22
B Nqwababa21 – 10
EscapLimited22
B Nqwababa21 – 27PS O’Flaherty23 10 –
1. Short-termincentivebonusawardedforthe2010financialyear. 2. Theboarddeferredallocationinrespectoftheshort-termincentiveawardsforthe2009financialyear.AtargetedsavingofR22billionwassetbytheboardandachieved
inDecember2009.PaymentsweremadeinDecember2009. 3. Feesrelatedtosecurityservicesandoperatingvehicleexpenditure. 4. Appointedaschairmanoftheboardon17July2008.ResignedaschairmanoftheboardonNovember2009. 5. Conclusionofcontracton17July2008. 6. Appointedasactingchairman/chiefexecutiveon12November2009. 7. Resignedfromtheboardeffective17July2008. 8. Appointedtotheboardon17July2008. 9. DeceasedSeptember2008.10. Resignedfromtheboardeffective31 March2010.11. SurnamechangedfromNenetoZikalala.12. ResignedaschiefexecutiveandmemberoftheboardeffectiveOctober2009.13. ResignedfromEskomandboardon31 December2008.14. Appointedasfinancedirectorandmemberoftheboardon 1 January2010.Inaddition,thedirectorwaspaidatwoyearretentionbonusofR1,3million.Shouldthedirector
leavethecompanyintheperiodto31December2010,thenthefullamountisrepayabletothecompany;andshouldthedirectorleavethecompanyintheyearending31December2011,thenhalfofthebonusisrepayabletothecompany.
15. AppointedaschiefofficerGenerationon1February2008.16. AppointedaschiefofficerNetworksandCustomerServiceson 1 February2008.17. Appointedasmanagingdirectoron1February2010.18. ResignedfromEskomeffective31 December2008.19. Onresignationthetermsandconditionsoftheloanare renegotiated.20. PaidbyEskom.21. Resignedfromtheboardon31 December2008.22. FeespaidtoEskom.23. Appointedtotheboardon1 January 2010.

288 Introduction
288 Companies Act and King III Report
288 Shareholding and shareholder compact
288 Governing bodies
292 Compliance with Public Finance Management Act (PFMA)
292 Integrated risk management
293 Ethical business conduct
293 Internal control
293 Assurance and forensics
294 Security risk management
294 Nuclear safety
294 Corporate citizenship and sustainability
295 Subsidiaries
Ensuring best practiceCorporate governance
288 Eskom Holdings Limited
Integrated Repor t 2010
IntroductionAs a state-owned enterprise (SOE), it is critical for Eskom to fulfil its
mandate in a manner that is in keeping with governance best
practices and, in particular, with regard to accountability, transparency,
fairness and responsibility.
The year under review remained demanding for Eskom. It was
marked by interaction with various stakeholders and more
importantly with NERSA and customers regarding the company’s
application for a multi-year price determination (MYPD). Also
notable is the interaction between Eskom and its shareholder on
issues affecting the organisation, including the leadership of the
company. It was necessary for the governance processes, systems and
structures (governance framework) to deal with a number of issues
in a coherent and effective manner.
The leadership is well aware of the challenges regarding funding for
the capital expansion programme and this remains a priority. At the
same time Eskom had to focus on the operations of the business and
there was a need for in-depth consideration of a number of issues.
The increased engagements have been beneficial to Eskom’s
governance processes, and the company has committed to improve
its communication with stakeholders.
More frequent meetings of the board of directors and the executive
management committee were required. These challenges demand
astute governance practices that will ensure that the business remains
sustainable in the long term.
Companies Act and King III reportThe company has adhered to the statutory duties and responsibilities
imposed by the Companies Act as augmented by the Public Finance
Management Act (PFMA). Eskom’s systems and processes are
reviewed to ensure that compliance is monitored in this regard. In
addition, Eskom is also guided on best practices by international
developments as well as the King reports on Corporate Governance
for South Africa (King II – 2002 until King III came into effect
in 2009) and the Protocol on Corporate Governance in the
Public Sector – 2002.
To ensure that Eskom’s governance framework continues to be of a
superior standard and is aligned with statutory and governance best
practice developments, a Companies Act task team and a King III task
team were established in 2009. The objectives of the teams are to
ensure compliance with the new Companies Act, 2008, which comes
into effect later in 2010, and application of King III principles and
practices, which came into effect in March 2010, respectively. Eskom
welcomes these developments and are using them as an opportunity
for the organisation to review its entire governance framework
(2010 Governance Review). To this end provisions impacting Eskom’s
operations are being identified, assessed and addressed; gaps, if any,
are filled through action plans and regular monitoring and reporting
to the various governance structures. Eskom is at an advanced stage
of readiness for the implementation of the new Companies Act and
King III.
Shareholding and shareholder compactThe government of the Republic of South Africa is Eskom’s sole
shareholder. The shareholder representative is the Minister of Public
Enterprises.
Each year, Eskom, in consultation with the Minister of Public
Enterprises, agrees on its performance objectives, measures and
indicators in line with government treasury regulations under the
PFMA. The annual targets are annexed to a list of principles agreed
between Eskom and its shareholder (the shareholder compact)
and regular reports are provided. The performance of the
organisation against the performance objectives is indicated in the
shareholder compact on page 34.
The compact does not interfere with the normal principles of
company law. The relationship between the shareholder and board is
preserved. The board ensures that proper internal controls are in
place and that Eskom is effectively managed. The compact promotes
good governance by helping to clarify the board and shareholder
roles and responsibilities and ensures consensus on Eskom’s mandate
and key objectives.
A special and an annual general meeting were held during the year.
Governing bodiesComposition of the boardEskom has a unitary board structure with a majority of independent
non-executive directors. The directors, appointed by the shareholder,
are drawn from diverse backgrounds (local and international). Their
contributions to the board, consisting of a wide range of experience
and professional skills, are invaluable. These skills are supplemented at
committee level by external committee members. Ms S Sebotsa, an
external committee member, resigned in February 2010.
The chairman of the board, Mr RM Godsell, and the chief executive,
Mr PJ Maroga resigned in November and October 2009, respectively.
Mr Makwana was appointed as the acting chairman and granted the
executive powers of a chief executive to fill the vacated position on
Corporate governance
289Eskom Holdings Limited
Integrated Repor t 2010
the board of directors as an interim measure. In effect, Mr Makwana
became an acting chairman with executive powers. Eskom is cognisant
of the governance risk of having an executive chairman, although it
strives to adhere to best governance principles and practices. The
unusual circumstances that Eskom faced necessitated that, as an
interim measure, a suitably experienced, skilled and available person
be appointed to lead Eskom through a difficult period.
Mr AJ Morgan resigned as a non-executive director at the
end of March 2010 after serving on the board for nine years.
Mr PS O’Flaherty was appointed as the executive director responsible
for the finance function in January 2010. At the end of the period
under review, the board comprised eight non-executive directors,
one executive director and the executive chairman.
Eskom’s articles of association stipulate that the shareholder will, after
consulting the board, appoint a chairman, chief executive and non-
executive directors. The remaining executive directors are appointed
by the board after obtaining shareholder approval. The shareholder
is in the process of filling the vacancies on the Eskom board.
Good corporate governance requires that the composition of the
board be reviewed on a regular basis. The rotation of directors at
regular intervals is accepted as standard practice since it ensures
that the board remains dynamic and does not become stagnant in
terms of its thinking and abilities. However, it is important that the
process is managed in such a way that the rotation of directors does
not lead to a disruption in the operations of the business and that the
board is well-balanced in terms of skills, expertise and demographics
(race, gender and people with disabilities).
The term of office of non-executive directors is a maximum of three
years; this will be subject to review at the next annual general
meeting. Retiring directors are eligible for re-appointment.
Executive directors are full-time employees and as such are subject
to Eskom’s conditions of service.
Board meetings are scheduled annually in advance. Special meetings
are convened as necessary to address specific issues. Directors or
external committee members unable to attend meetings may use
electronic communication facilities. The attendance of the 14 board
meetings during the reporting period is reflected below.
Delegation of authorityThe board has the authority to lead, control, manage and conduct
the business of Eskom, including the authority to delegate its powers.
Its aim is to ensure that Eskom remains a sustainable and viable
business of global stature. Its responsibilities are facilitated by a well-
developed governance structure through board committees,
including the executive management committee (Exco), as well as
subcommittees of Exco and a comprehensive delegation-of-authority
framework. This framework assists decision making without diluting
director accountability and responsibility.
Integral to the 2010 Governance Review is an analysis of the
mandates, composition and level of authority delegated to the
governing structures within Eskom to ensure that its governance
system continues to support the company’s strategic objectives and
is adaptable to the changing Eskom environment. It is anticipated that
this review will lead to a rationalisation of committees, speedier
decision making and cost efficiencies, thereby enhancing corporate
governance in Eskom.
Board evaluation and performanceA performance evaluation of the board and individual directors is
conducted at the end of the financial year. Any shortcomings are
addressed and areas of strength consolidated. The performance of
board committees is evaluated against their terms of reference. The
human resources and remuneration committee facilitates the
evaluation of senior management.
Director induction and orientationNew directors and external committee members have to complete
an induction programme to improve their understanding of Eskom’s
legislative framework, governance processes, delegation of authority
and business operations. Continual training programme that
addresses the needs of each director or group of directors is in place.
Directors are briefed on new legislation and regulations. The
induction and training include visits to certain business sites.
Awareness and training on the new Companies Act and King III has
been conducted and will continue.
Board and board committee meeting attendance As a result of the challenges facing the company, additional board
meetings were held during the year and these are reflected in the
meeting attendance table below. The purpose of the additional
briefing sessions was to keep directors informed of key developments
as they unfolded and to allow directors an opportunity to express
their views on the developments and strategies on an ongoing basis.
Eskom directors were called on to commit significant additional time
to the business of Eskom during this critical period.
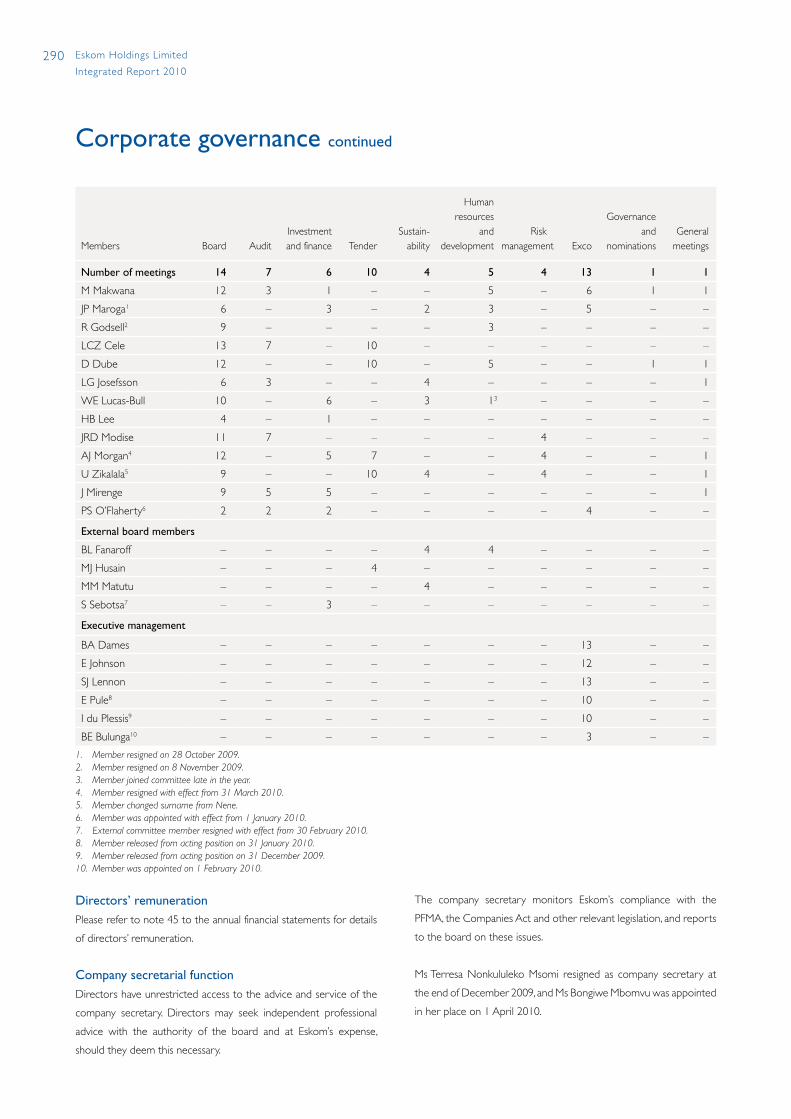
290 Eskom Holdings Limited
Integrated Repor t 2010
Directors’ remunerationPlease refer to note 45 to the annual financial statements for details
of directors’ remuneration.
Company secretarial functionDirectors have unrestricted access to the advice and service of the
company secretary. Directors may seek independent professional
advice with the authority of the board and at Eskom’s expense,
should they deem this necessary.
Members Board AuditInvestmentand finance Tender
Sustain-ability
Humanresources
and development
Risk management Exco
Governance and
nominationsGeneral
meetings
Number of meetings 14 7 6 10 4 5 4 13 1 1
M Makwana 12 3 1 – – 5 – 6 1 1
JP Maroga1 6 – 3 – 2 3 – 5 – –
R Godsell2 9 – – – – 3 – – – –
LCZ Cele 13 7 – 10 – – – – – –
D Dube 12 – – 10 – 5 – – 1 1
LG Josefsson 6 3 – – 4 – – – – 1
WE Lucas-Bull 10 – 6 – 3 13 – – – –
HB Lee 4 – 1 – – – – – – –
JRD Modise 11 7 – – – – 4 – – –
AJ Morgan4 12 – 5 7 – – 4 – – 1
U Zikalala5 9 – – 10 4 – 4 – – 1
J Mirenge 9 5 5 – – – – – – 1
PS O’Flaherty6 2 2 2 – – – – 4 – –
External board members
BL Fanaroff – – – – 4 4 – – – –
MJ Husain – – – 4 – – – – – –
MM Matutu – – – – 4 – – – – –
S Sebotsa7 – – 3 – – – – – – –
Executive management
BA Dames – – – – – – – 13 – –
E Johnson – – – – – – – 12 – –
SJ Lennon – – – – – – – 13 – –
E Pule8 – – – – – – – 10 – –
I du Plessis9 – – – – – – – 10 – –
BE Bulunga10 – – – – – – – 3 – –
1. Memberresignedon28October2009.2. Memberresignedon8November2009.3. Memberjoinedcommitteelateintheyear.4. Memberresignedwitheffectfrom31March2010.5. MemberchangedsurnamefromNene.6. Memberwasappointedwitheffectfrom1January2010.7. Externalcommitteememberresignedwitheffectfrom30February2010.8. Memberreleasedfromactingpositionon31January2010.9. Memberreleasedfromactingpositionon31December2009.10. Memberwasappointedon1February2010.
The company secretary monitors Eskom’s compliance with the
PFMA, the Companies Act and other relevant legislation, and reports
to the board on these issues.
Ms Terresa Nonkululeko Msomi resigned as company secretary at
the end of December 2009, and Ms Bongiwe Mbomvu was appointed
in her place on 1 April 2010.
Corporate governance continued

291Eskom Holdings Limited
Integrated Repor t 2010
Board committeesSeveral committees assist the board in carrying out its responsibilities.
Their recommendations and reports to the board ensure
transparency and full disclosure of committee activities. Each
committee operates within terms of reference that define the
composition, role, responsibilities and delegated authority of the
committee. The board from time to time sets up committees for
specific (adhoc) purposes. All committees, except Exco, comprise a
majority of independent non-executive directors. An independent
non-executive director serves as chairman in each case. Committee
meeting attendance is reflected above.
In addition to the terms of reference, a board committee exercises
its delegated authority in accordance with specific policies approved
by the board from time to time.
Audit committee The committee comprised four independent non-executive directors
until November 2009, when Mr Makwana was appointed as acting
chairman and stopped being a member. The committee monitors
the internal control system to protect Eskom’s interests and assets.
The committee also reviews any accounting and auditing concerns
raised by internal and external audit, the annual financial statements
and the interim reports, the accompanying reports to shareholders,
the preliminary announcement of results and any other
announcement regarding the company’s results or other financial
information to be made public. Refer to page 175 for the report of
the audit committee detailing how it carried out its functions.
The committee ensures that an effective internal audit function is in
place and that the roles and functions of external audit and internal
audit are sufficiently clarified and co-ordinated to provide an objective
overview of the operational effectiveness of the company’s systems
of internal control, risk management, governance and reporting. The
committee also has to assess the performance of the internal audit
function, and the adequacy of available internal audit resources.
In addition, the committee considers and appropriately deals with
any complaints received relating to the financial statements,
accounting practices or internal audit, whether from within or outside
of Eskom.
The committee considers and makes recommendations on the
appointment and retention of the external auditors and ensures that
such appointments comply with legislation, the fees paid and the
terms of engagement, pre-approves the nature and extent of any
non-audit services and evaluates their independence, objectivity and
effectiveness.
The assurance and forensic general manager and the external
auditors have unrestricted access to the chairman of the committee
and the chairman of the board. The committee reviews the accuracy,
reliability and credibility of statutory financial reporting. It also reviews
the annual financial statements and the Eskom group annual report,
as presented by management prior to board approval.
Seven committee meetings were held during the review period. They
were also attended by the external auditors, the finance director and
relevant company officials.
Investment and finance committee The committee currently comprises four independent non-executive
directors, the acting chairman and finance director. Ms S Sebotsa, an
external committee member, resigned as a member of the committee.
The committee reviews the investment strategy and makes
recommendations to the board. It evaluates and approves business
cases for new ventures or projects, approves criteria and guidelines
for investments and approves investments within its delegated
authority. Investment decisions are made within a framework of
policies that guide such decisions and which are approved by
the board.
Six committee meetings were held during the period under review.
Tender committee The committee comprises four independent non-executive directors,
and Mr MJ Husain, an external committee member. The tender
committee assists the board decisions, tenders and contracts within
its delegated authority and approves procurement policies. It ensures
that Eskom’s procurement system, which drives its approved
investments, is equitable, transparent, competitive and cost effective.
Ten committee meetings were held.

292 Eskom Holdings Limited
Integrated Repor t 2010
Sustainability committee The committee comprises three independent non-executive
directors, the acting chief executive and Messrs BL Fanaroff and
MM Matutu, external committee members. This committee deals
with integrated sustainability issues and makes recommendations on
policies, strategies and guidelines, particularly related to safety, health,
environment, quality and nuclear issues.
The committee also scrutinises nuclear safety at Eskom facilities to
ensure that standards exceed all regulatory and internal requirements
and remain consistent with international best practice.
Four committee meetings were held.
Human resources and remuneration committee This committee comprises two independent non-executive directors,
the acting chairman of the board and Mr BL Fanaroff, an external
committee member.
The committee, interalia, makes recommendations on remuneration
and other human resources-related policies.
Five committee meetings were held.
Nomination and governance committee The committee comprises two independent non-executive directors
and the acting chief executive. It deals with board and committee
composition, succession planning, board and committee training
and evaluation and exercises oversight of governance matters,
including ethics.
One meeting was held.
Risk management committee The committee comprises three independent non-executive
directors and the finance director. Synergy between the risk
management committee and the audit committee is achieved by
having the chairman of the audit committee as a member of the
risk management committee. The committee ensures that the
company’s risk management strategies and processes are aligned
with best practice.
Four committee meetings were held during the year, covering the
integrated risk management strategy and processes, risk tolerance
and appetite, risk accountabilities, major risk exposures and emerging
risks. Further information on the risk management processes is set
out on page 18.
Executive management committee (Exco) The Exco comprises the chief executive, the finance director and
three divisional managing directors. Mr Makwana has chaired the
Exco since November 2009. The committee assists the chief
executive in guiding the overall direction of the business and in
exercising executive control. Its task is to assist with the effective
management of the day-to-day operations of the business.
Thirteen Exco meetings were held. Attendance is reflected above.
Exco is assisted by its procurement, operations, investment and
capital assurance, nuclear management and sustainability and safety
subcommittees.
Compliance with the Public Finance Management Act (PFMA)The board is the accounting authority in terms of the PFMA and
Eskom is listed as a Schedule 2 public entity. This Act also applies to
subsidiaries and entities owned or controlled by Eskom. They are also
classified as Schedule 2 entities.
The PFMA regulates financial management and governance. Eskom
ensures that all directors and employees are aware of the provisions
of the PFMA through regular training programmes. Directors comply
with their fiduciary duties as set out in the PFMA. Board responsibilities
are also specified in the PFMA.
Integrated risk management The effective management of risk is central to the achievement of
Eskom’s vision of together, building the power-base for sustainable
growth and development in South Africa. By understanding and
managing risk, we can provide greater certainty and security for our
employees, our customers and all our stakeholders.
The Eskom board, through the risk management committee,
acknowledges its overall accountability for ensuring an effective
results-driven, IRM process. Exco has implemented a risk monitoring
system that enables management to respond appropriately to all
significant risks that could impact on business objectives.
Responsibility for the management of risk resides with line
management in all divisions and projects. Those accountable for the
management of risks also ensure that the necessary controls remain
in place and are effective at all times. Control effectiveness focuses on
Corporate governance continued
293Eskom Holdings Limited
Integrated Repor t 2010
improving our ability to manage risk effectively, so that we can quickly
and confidently act on opportunities to improve and sustain the
quality and continuity of supply, create value and achieve sustained
growth.
Risk management in Eskom is performed at departmental, regional,
divisional and subsidiary level and is reported upward to corporate
(bottom-up). After consolidation of these integrated risk reports,
Exco and the board risk management committee review and evaluate
the risk profile to determine the major operational, strategic and
business continuity risks (top-down).
Ethical business conductGood corporate governance is about effective ethical leadership,
which requires leadership that demonstrates ethics in decision
making, leads by example and oversees the management of ethics
within the organisation.
Eskom’s board is accountable for Eskom’s ethics management
programme and the operational responsibilities lie with Exco
assisted by the ethics office, which is located within the corporate
governance department.
The ethics office assists the chief executive in setting the framework,
rules, standards and boundaries for ethical behaviour, and provides
ethics training and an advisory service to employees, assisting
them in dealing effectively with ethics issues and ethical dilemmas
in the workplace.
Following the implementation of Eskom’s code of ethics, TheWay, in
2009, the supplementary code procedure was developed through
stakeholder engagement. The latter provides assistance to directors
and employees in applying the code of ethics in their daily activities
and decision making, in dealing with specific ethics issues in the
workplace, and providing information regarding other ethics-related
policies that have to be complied with.
Eskom’s conflict of interest policy, the declaration of interest
procedure, the electronic declaration form, and declaration
monitoring procedure have all been revised in line with the proposed
new Companies Act and King III. A separate electronic declaration
system and procedure for board members has also been developed,
which replaces the manual declaration process. Eskom is also a
signatory to the UN Global Compact that includes an anti-corruption
clause, as well as the World Economic Forum’s Partnership Against
Corruption Initiative.
Besides these developments, Eskom provided ongoing ethics
awareness, training, and an ethics advisory service, which are essential
to maintaining an ethical culture within the workplace. The board and
Exco are kept informed of the ethical culture and issues of concern
through quarterly ethics status reports.
Internal controlManagement is responsible for establishing an effective internal
control environment, which is developed and maintained on an
ongoing basis to provide reasonable assurance to the board regarding:
• the integrity and reliability of the financial statements
• the safeguarding of Eskom’s assets
• economic and efficient use of resources
• compliance with applicable legislation and regulations
• the verification of the accomplishment of established goals and
objectives
• the detection and minimisation of fraud, potential liability, loss and
material misstatement
These controls are contained in organisational policies and
procedures, structures and approval frameworks, and they provide
direction, establish accountability and ensure adequate segregation of
duties. They each contain self-monitoring mechanisms.
The board ensures that an effective internal control framework is
established and maintained. The internal audit function within the
assurance and forensic department monitors the operation of the
internal control systems and reports findings and recommendations
for improvement to management and the audit committee.
The audit committee monitors and evaluates the duties and
responsibilities of management, and of internal and external audit to
ensure that all major issues reported have been satisfactorily resolved.
Finally, the audit committee reports all important matters considered
necessary to the board.
Assurance and forensicsDuring the period under review the corporate departments of audit,
technical audit, technical investigations as well as forensic and anti-
corruption were integrated into the assurance and forensic
department (AFD).
294 Eskom Holdings Limited
Integrated Repor t 2010
In line with the requirements of the PFMA and good governance,
AFD provides the audit committee and management with
independent, objective assurance, consulting and forensic services
designed to add value to and improve Eskom’s operations. The
department brings a systematic, disciplined approach to the
evaluation and improvement of the effectiveness of risk management,
control and governance processes.
AFD is governed by international standards and best practices,
published by recognised professional institutes.
A risk-based audit approach is followed by assurance and forensic.
The audit plan is based on the risk assessment and other
considerations, such as the achievement of organisational business
objectives. The audit plan is updated as required (minimum quarterly)
to reflect significant changes in the risk profile resulting from changes
in the business operations, changes in customer needs or regulatory
requirements.
AFD is supported by the board and audit committee and is
authorised to have unrestricted access to all functions, records,
property and personnel. External auditors independently audit
and report on the financial statements and the sustainability
indicators reflected in this report. These reports are included on
pages 169 and 176.
Security risk managementThe board ensures that an integrated crime prevention plan is
implemented to minimise exposure to criminal acts, particularly
fraud. The security risk management department addresses these
threats. Its work covers crime prevention, detection, response and
investigation.
Where serious fraud, corruption and irregularities are suspected,
forensic investigations (a department of assurance and forensic)
establish the facts to enable management to deal appropriately with
the matter and prevent a recurrence.
Nuclear safetyThe nuclear safety assurance function is kept independent from the
electricity production function by dividing Eskom’s nuclear
infrastructure into two. The nuclear business area is directly
accountable to the chief officer (generation business) for all aspects
of electricity production at Koeberg power station, including safety.
The nuclear safety and assurance section, a separate department in
generation business, with its own technical experts and resources,
provides independent assurance on nuclear safety and compliance
with licence requirements.
In line with international best practice, Eskom has a three-tier
system of nuclear safety governance. The sustainability committee
of the board (the top tier) dedicates several meetings a year
to nuclear matters. The meetings are attended by international
nuclear experts who bring a broad perspective to the deliberations.
The middle tier, the nuclear management subcommittee presided
over by the chief officer of the generation business, monitors, reviews
and makes recommendations on issues such as nuclear policy,
standards, benchmarks and rules and Eskom’s overall business
requirements. The third tier, the safety review committees, brings
together experts from various parts of Eskom to evaluate nuclear
safety issues and make recommendations to senior management
and other tiers.
Corporate citizenship and sustainabilityIn Eskom’s view, being a good corporate citizen means that its
business must be run in an ethical manner, taking into account
its impact on all stakeholders. In addition, it means that Eskom needs
to contribute to the realisation of the hopes and aspirations of
South Africa.
This includes contributing to a safe working environment,
environmental responsibility, promoting the Accelerated and shared
growth initiative for South Africa (AsgiSA) and corporate social
responsibility and improving the life of all South Africans.
The chief executive, as chief safety officer and chairman of Exco’s
sustainability and safety subcommittee, is accountable for overall
sustainability and safety performance.
The sustainability and safety subcommittee guides our strategy and
sets performance targets on sustainability, occupational health and
safety and environmental matters, in line with Eskom’s safety health
and environment policy, the National Environmental Management
Act, 107 of 1998, as amended, and the Occupational Health and
Safety Act, 85 of 1993, as amended. Strategies are reviewed by the
sustainability committee of the board.
Exco’s operations subcommittee assesses occupational health, safety
and environmental performance and reviews major incidents to
ensure that corrective action is taken.
Corporate governance continued

295Eskom Holdings Limited
Integrated Repor t 2010
The objective of government’s AsgiSA programme is to promote
economic growth and halve poverty and unemployment by 2014.
Eskom’s contribution to this initiative as well as rural development is
centrally co-ordinated and facilitated through the corporate services
division. Eskom’s most significant contribution to AsgiSA is through its
core business of supplying reliable electricity. Eskom also leverages
associated activities, including its corporate social investment (CSI)
programmes, for the development of the disadvantaged.
Eskom’s CSI contributes to the development of the disadvantaged
and promotes, interalia, skills development, job creation, education
and health. Many CSI initiatives are executed by the Eskom
Development Foundation.
Subsidiaries Eskom Enterprises (Pty) Limited and its subsidiaries, a wholly owned
subsidiary of Eskom Holdings, provides lifecycle support and plant
maintenance, network protection and support for the build
programme for all Eskom divisions. It also has subsidiaries in South
Africa, Mali and Uganda.
Eskom’s other wholly owned operating subsidiaries include Eskom
Finance Company (Pty) Limited, Eskom Development Foundation
and Escap Limited.
All Eskom’s subsidiaries are subject to Eskom group policies,
governance and financial control. They comply with the PFMA and
Companies Act, or their equivalent legislation where they are foreign-
registered, and follow good governance principles and practices.
While each subsidiary remains accountable to Eskom through a
formal shareholder compact, Eskom is also developing a subsidiary
governance framework in accordance with principle 2.24 of King III
to facilitate the flow of information between the holding company
and its subsidiary companies.
EskomstaffatKoebergvolunteeroverweekendstotutorhighschoollearnersinmathsandscience.

296 Eskom Holdings Limited
Integrated Repor t 2010
Tables
1 Statistical overview
2010 2009 2008 2007 20062005
(15 months) 2004 2003 2002 2001 2000
SalesTotal sold (GWh)1, 2 218 591 214 850 224 366 218 120 207 921 256 453 206 799 196 980 187 957 181 511 178 193
Growth/(reduction) in GWh sales (%) 1,7 (4,2) 2,9 4,9 (18,9)3 30,5 5,0 4,8 3,5 1,8 2,8
Electricity output Total produced by Eskom stations (GWh (net)) 232 812 228 944 239 109 232 445 221 988 273 404 220 152 210 218 197 737 189 590 189 307
Coal-fired stations (GWh (net)) 215 940 211 941 222 908 215 211 206 606 251 914 202 171 194 046 181 651 175 223 172 362
Hydro-electric stations (GWh (net)) 1 274 1 082 751 2 443 1 141 903 720 777 2 357 2 061 1 343
Pumped storage stations (GWh (net)) 2 742 2 772 2 979 2 947 2 867 3 675 2 981 2 732 1 738 1 587 2 591
Gas turbine stations (GWh (net)) 49 143 1 153 62 78 – – – – – 1
Wind energy (GWh (net)) 1 2 1 2 3 – – – – – –
Nuclear power station (GWh (net)) 12 806 13 004 11 317 11 780 11 293 16 912 14 280 12 663 11 991 10 719 13 010
Total purchased for Eskom system (GWh) 13 754 12 189 11 510 11 483 10 310 12 197 9 818 8 194 9 496 9 200 5 294
Total electricity for Eskom system (Eskom stations and purchased) (GWh)4
246 566 241 133 250 619 243 928 232 298 285 601 229 970 218 412 207 233 198 790 194 601
Total consumed by Eskom (GWh)5 3 695 3 816 4 136 3 937 3 814 5 043 4 040 3 664 2 354 2 177 3 478
Total available for distribution (GWh)2 242 871 237 317 246 483 239 991 228 484 280 558 225 930 214 748 204 879 196 613 191 123
Plant performance indicators Total power station nominal capacity (MW) 44 175 44 193 43 037 42 618 42 011 42 011 42 011 42 011 42 011 42 011 41 298
Total power station net maximum capacity (MW) 40 870 40 506 38 747 37 761 36 398 36 208 36 208 36 208 36 208 36 208 35 584
Peak demand on integrated Eskom system (MW) 35 850 35 959 36 513 34 807 33 461 34 195 34 195 31 928 31 621 30 599 29 188
Average energy availability – EAF (UCF) (%)6 85,2 (85,9) 85,3 (86,1) 84,8 (86,2) 87,5 (88,6) 87,4 (88,7) 89,5 (89,9)7 89,5 (90,0) 87,5 (88,7) 89,3 (91,7) 92,0 (92,5) 92,1 (92,8)
Generation load factor (%)8 66,2 67,0 72,3 72,4 69,7 69,0 69,2 66,3 62,3 59,8 60,6
Integrated Eskom system load factor (EUF) (%) 77,7 78,6 85,2 82,7 79,8 78,0 77,4 76,8 74,0 73,4 74,7
Environmental indicators Specific water consumption (ℓ/kWh sent out)9 1,34RA 1,35RA 1,32 1,35 1,32 1,277 1,26 1,29 1,27 1,26 1,21
Significant legal contraventions reported (number)10 0 1211 6 0 1 37 2 2 3 2 3
Customer satisfaction (Enhanced PreCare/MaxiCare) (ratio)12 99,65 99,84 97,21 100,80 101,06 93,10 8,31 8,47 8,57 8,43 8,82
Net raw water consumption (Mℓ) 316 202 323 190 322 666 313 064 291 516 347 135 277 557 271 940 251 611 239 233 228 759
Liquid fuels (diesel and kerosene) (Mℓ) 16,1RA 28,9LA 345,9 11,3 – – – – – – –
Coal burnt (Mt) 122,7 121,2 125,3 119,1 112,1 136,4 109,6 104,4 96,5 94,1 92,5
Average calorific value (MJ/kg) 19,22 19,10 18,51 19,06 19,58 19,36 19,42 19,41 19,54 19,42 19,50
Average ash content (%) 29,56 29,70 29,09 29,70 29,10 29,60 29,60 28,90 28,40 28,80 28,60
Average sulphur content (%) 0,81 0,83 0,87 0,86 0,88 0,87 0,87 0,92 0,92 0,93 0,90
Overall thermal efficiency (%) 33,1 33,4 33,4 33,9 33,8 34,0 34,0 34,2 34,1 34,1 34,4
Line losses (%) 8,5 7,9 8,0 8,4 8,2 8,27 7,8 8,3 8,2 7,2 7,4
Nitrous oxide (N2O) (t)13 2 825 2 801 2 872 2 730 3 134 3 552 2 924 2 580 2 246 2 154 2 093
Carbon dioxide (CO2) (Mt)13 224,7RA 221,7RA 223,6 208,9 203,7 247,0 197,7 190,1 175,2 169,3 161,2
Sulphur dioxide (SO2) (kt)13 1 856RA 1 874RA 1 950 1 876 1 763 2 236 1 779 1 728 1 494 1 500 1 505
Nitrogen oxide (NOx) as NO2 (kt)13 959RA 957LA 984 930 877 994 797 760 702 684 674
Relative particulate emissions (kg/MWh sent out)14 0,39RA 0,27RA 0,21 0,20 0,21 0,267 0,27 0,28 0,29 0,31 0,35
Particulate emissions (kt)14 88,27RA 55,64RA 50,84 46,08 45,76 72,83 59,17 58,65 57,53 59,64 66,08
Ash produced (Mt) 36,01RA 36,66LA 36,04 34,16 33,40 40,80 33,10 29,80 26,20 26,50 24,60
Ash sold (Mt) 2,0RA 2,1 2,4 2,2 1,8 2,0 1,6 1,2 1,3 1,2 1,1
Asbestos disposed (tons)18 321,4RA 3 590,8LA 321 6 060 – – – – – – –
PCB thermally destructed (tons)18 19,1RA 505,6LA 17 10 – – – – – – –
Radiation release (mSv)15 0,0040 0,0045 0,0047 0,0034 0,0049 0,00797 0,0087 0,0123 0,0060 0,0192 0,0059
Low-level radioactive waste generated (cubic metres)16 137,8 140,8 180,3 94,5 90,2 80,3 81,4 100,5 111,9 82,6 61,6
Intermediate-level radioactive waste generated (cubic metres)16 47,1 23,9 16,5 49,8 52,7 47,2 36,8 30,1 45,8 22,1 41,2
Low-level radioactive waste disposed of (cubic metres)18 216,0RA 189,0RA 270,0 135 91,0 – – – – – –
Intermediate-level radioactive waste disposed of (cubic metres)18 266,0RA 473,6RA 418,0 436 52,0 – – – – – –
Low-level nuclear waste – fuel racks (cubic metres) (cumulative)17 0 (697) 0 (697) 0 (697) 0 (697) 0 (697) 0 (697) 697 – – – –
Spent nuclear fuel, number of elements (cumulative figure) 56 (1 785) 56 (1 729) 112 (1 673) 56 (1 561) 52 (1 505) 104 (1 453) 56 (1 405) 104 (1 349) 48 (1 245) 104 (1 197) 52 (1 093)
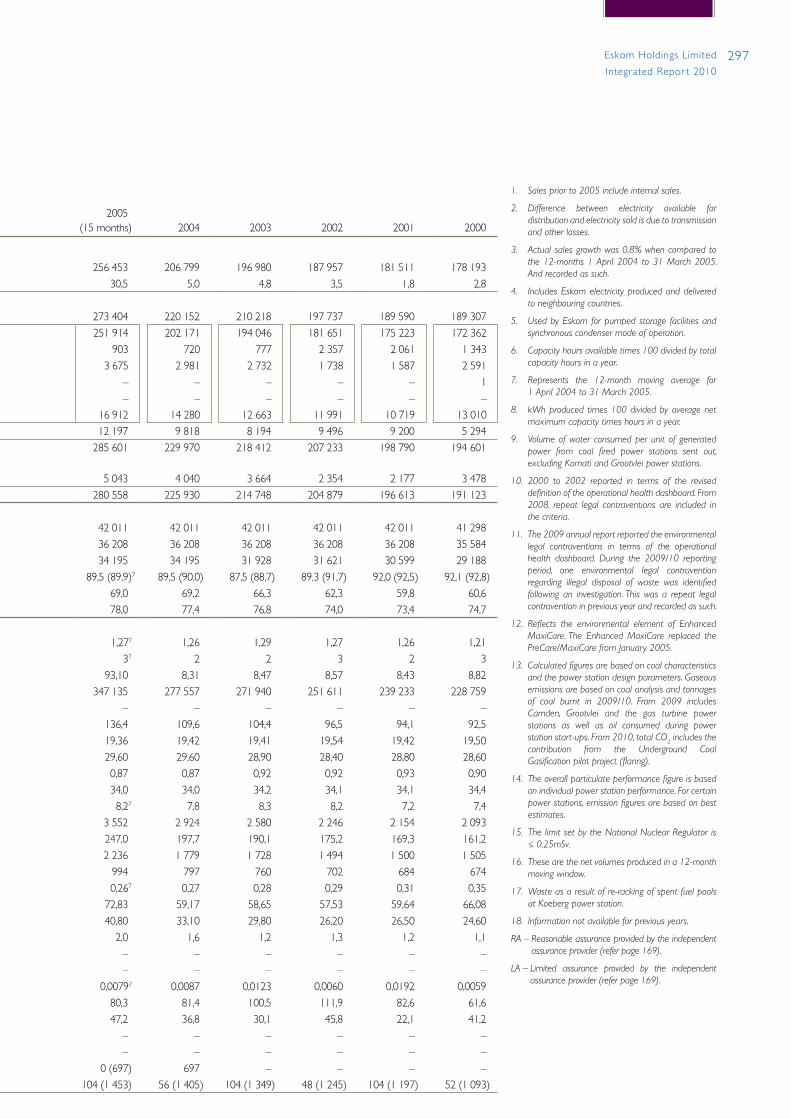
297Eskom Holdings Limited
Integrated Repor t 2010
1 Statistical overview
2010 2009 2008 2007 20062005
(15 months) 2004 2003 2002 2001 2000
SalesTotal sold (GWh)1, 2 218 591 214 850 224 366 218 120 207 921 256 453 206 799 196 980 187 957 181 511 178 193
Growth/(reduction) in GWh sales (%) 1,7 (4,2) 2,9 4,9 (18,9)3 30,5 5,0 4,8 3,5 1,8 2,8
Electricity output Total produced by Eskom stations (GWh (net)) 232 812 228 944 239 109 232 445 221 988 273 404 220 152 210 218 197 737 189 590 189 307
Coal-fired stations (GWh (net)) 215 940 211 941 222 908 215 211 206 606 251 914 202 171 194 046 181 651 175 223 172 362
Hydro-electric stations (GWh (net)) 1 274 1 082 751 2 443 1 141 903 720 777 2 357 2 061 1 343
Pumped storage stations (GWh (net)) 2 742 2 772 2 979 2 947 2 867 3 675 2 981 2 732 1 738 1 587 2 591
Gas turbine stations (GWh (net)) 49 143 1 153 62 78 – – – – – 1
Wind energy (GWh (net)) 1 2 1 2 3 – – – – – –
Nuclear power station (GWh (net)) 12 806 13 004 11 317 11 780 11 293 16 912 14 280 12 663 11 991 10 719 13 010
Total purchased for Eskom system (GWh) 13 754 12 189 11 510 11 483 10 310 12 197 9 818 8 194 9 496 9 200 5 294
Total electricity for Eskom system (Eskom stations and purchased) (GWh)4
246 566 241 133 250 619 243 928 232 298 285 601 229 970 218 412 207 233 198 790 194 601
Total consumed by Eskom (GWh)5 3 695 3 816 4 136 3 937 3 814 5 043 4 040 3 664 2 354 2 177 3 478
Total available for distribution (GWh)2 242 871 237 317 246 483 239 991 228 484 280 558 225 930 214 748 204 879 196 613 191 123
Plant performance indicators Total power station nominal capacity (MW) 44 175 44 193 43 037 42 618 42 011 42 011 42 011 42 011 42 011 42 011 41 298
Total power station net maximum capacity (MW) 40 870 40 506 38 747 37 761 36 398 36 208 36 208 36 208 36 208 36 208 35 584
Peak demand on integrated Eskom system (MW) 35 850 35 959 36 513 34 807 33 461 34 195 34 195 31 928 31 621 30 599 29 188
Average energy availability – EAF (UCF) (%)6 85,2 (85,9) 85,3 (86,1) 84,8 (86,2) 87,5 (88,6) 87,4 (88,7) 89,5 (89,9)7 89,5 (90,0) 87,5 (88,7) 89,3 (91,7) 92,0 (92,5) 92,1 (92,8)
Generation load factor (%)8 66,2 67,0 72,3 72,4 69,7 69,0 69,2 66,3 62,3 59,8 60,6
Integrated Eskom system load factor (EUF) (%) 77,7 78,6 85,2 82,7 79,8 78,0 77,4 76,8 74,0 73,4 74,7
Environmental indicators Specific water consumption (ℓ/kWh sent out)9 1,34RA 1,35RA 1,32 1,35 1,32 1,277 1,26 1,29 1,27 1,26 1,21
Significant legal contraventions reported (number)10 0 1211 6 0 1 37 2 2 3 2 3
Customer satisfaction (Enhanced PreCare/MaxiCare) (ratio)12 99,65 99,84 97,21 100,80 101,06 93,10 8,31 8,47 8,57 8,43 8,82
Net raw water consumption (Mℓ) 316 202 323 190 322 666 313 064 291 516 347 135 277 557 271 940 251 611 239 233 228 759
Liquid fuels (diesel and kerosene) (Mℓ) 16,1RA 28,9LA 345,9 11,3 – – – – – – –
Coal burnt (Mt) 122,7 121,2 125,3 119,1 112,1 136,4 109,6 104,4 96,5 94,1 92,5
Average calorific value (MJ/kg) 19,22 19,10 18,51 19,06 19,58 19,36 19,42 19,41 19,54 19,42 19,50
Average ash content (%) 29,56 29,70 29,09 29,70 29,10 29,60 29,60 28,90 28,40 28,80 28,60
Average sulphur content (%) 0,81 0,83 0,87 0,86 0,88 0,87 0,87 0,92 0,92 0,93 0,90
Overall thermal efficiency (%) 33,1 33,4 33,4 33,9 33,8 34,0 34,0 34,2 34,1 34,1 34,4
Line losses (%) 8,5 7,9 8,0 8,4 8,2 8,27 7,8 8,3 8,2 7,2 7,4
Nitrous oxide (N2O) (t)13 2 825 2 801 2 872 2 730 3 134 3 552 2 924 2 580 2 246 2 154 2 093
Carbon dioxide (CO2) (Mt)13 224,7RA 221,7RA 223,6 208,9 203,7 247,0 197,7 190,1 175,2 169,3 161,2
Sulphur dioxide (SO2) (kt)13 1 856RA 1 874RA 1 950 1 876 1 763 2 236 1 779 1 728 1 494 1 500 1 505
Nitrogen oxide (NOx) as NO2 (kt)13 959RA 957LA 984 930 877 994 797 760 702 684 674
Relative particulate emissions (kg/MWh sent out)14 0,39RA 0,27RA 0,21 0,20 0,21 0,267 0,27 0,28 0,29 0,31 0,35
Particulate emissions (kt)14 88,27RA 55,64RA 50,84 46,08 45,76 72,83 59,17 58,65 57,53 59,64 66,08
Ash produced (Mt) 36,01RA 36,66LA 36,04 34,16 33,40 40,80 33,10 29,80 26,20 26,50 24,60
Ash sold (Mt) 2,0RA 2,1 2,4 2,2 1,8 2,0 1,6 1,2 1,3 1,2 1,1
Asbestos disposed (tons)18 321,4RA 3 590,8LA 321 6 060 – – – – – – –
PCB thermally destructed (tons)18 19,1RA 505,6LA 17 10 – – – – – – –
Radiation release (mSv)15 0,0040 0,0045 0,0047 0,0034 0,0049 0,00797 0,0087 0,0123 0,0060 0,0192 0,0059
Low-level radioactive waste generated (cubic metres)16 137,8 140,8 180,3 94,5 90,2 80,3 81,4 100,5 111,9 82,6 61,6
Intermediate-level radioactive waste generated (cubic metres)16 47,1 23,9 16,5 49,8 52,7 47,2 36,8 30,1 45,8 22,1 41,2
Low-level radioactive waste disposed of (cubic metres)18 216,0RA 189,0RA 270,0 135 91,0 – – – – – –
Intermediate-level radioactive waste disposed of (cubic metres)18 266,0RA 473,6RA 418,0 436 52,0 – – – – – –
Low-level nuclear waste – fuel racks (cubic metres) (cumulative)17 0 (697) 0 (697) 0 (697) 0 (697) 0 (697) 0 (697) 697 – – – –
Spent nuclear fuel, number of elements (cumulative figure) 56 (1 785) 56 (1 729) 112 (1 673) 56 (1 561) 52 (1 505) 104 (1 453) 56 (1 405) 104 (1 349) 48 (1 245) 104 (1 197) 52 (1 093)
1. Salespriorto2005includeinternalsales.
2. Difference between electricity available fordistributionandelectricitysoldisduetotransmissionandotherlosses.
3. Actualsalesgrowthwas0,8%whencomparedtothe12-months1 April2004to31March2005.Andrecordedassuch.
4. IncludesEskomelectricityproducedanddeliveredtoneighbouringcountries.
5. UsedbyEskomforpumpedstorage facilitiesandsynchronouscondensermodeofoperation.
6. Capacityhoursavailabletimes100dividedbytotalcapacityhoursinayear.
7. Represents the 12-month moving average for1 April2004to31 March2005.
8. kWhproducedtimes100dividedbyaveragenetmaximumcapacitytimeshoursinayear.
9. Volumeofwaterconsumedperunitofgeneratedpower from coal fired power stations sent out,excludingKomatiandGrootvleipowerstations.
10. 2000 to 2002 reported in terms of the reviseddefinitionoftheoperationalhealthdashboard.From2008, repeat legal contraventions are included inthecriteria.
11. The2009annualreportreportedtheenvironmentallegal contraventions in terms of the operationalhealth dashboard. During the 2009/10 reportingperiod, one environmental legal contraventionregarding illegal disposal of waste was identifiedfollowing an investigation.Thiswas a repeat legalcontraventioninpreviousyearandrecordedassuch.
12. Reflects the environmental element of EnhancedMaxiCare.The Enhanced MaxiCare replaced thePreCare/MaxiCarefromJanuary 2005.
13. Calculatedfiguresarebasedoncoalcharacteristicsandthepowerstationdesignparameters.Gaseousemissionsarebasedoncoalanalysisandtonnagesof coal burnt in 2009/10. From 2009 includesCamden, Grootvlei and the gas turbine powerstations as well as oil consumed during powerstationstart-ups.From2010,totalCO2includesthecontribution from the Underground CoalGasificationpilotproject(flaring).
14.Theoverallparticulateperformancefigureisbasedonindividualpowerstationperformance.Forcertainpowerstations,emissionfiguresarebasedonbestestimates.
15.ThelimitsetbytheNationalNuclearRegulatoris≤ 0,25mSv.
16. Thesearethenetvolumesproducedina12-monthmovingwindow.
17. Wasteasaresultofre-rackingofspentfuelpoolsatKoebergpowerstation.
18. Informationnotavailableforpreviousyears.
RA–Reasonableassuranceprovidedbytheindependentassuranceprovider(referpage169).
LA–Limited assurance provided by the independentassuranceprovider(referpage169).
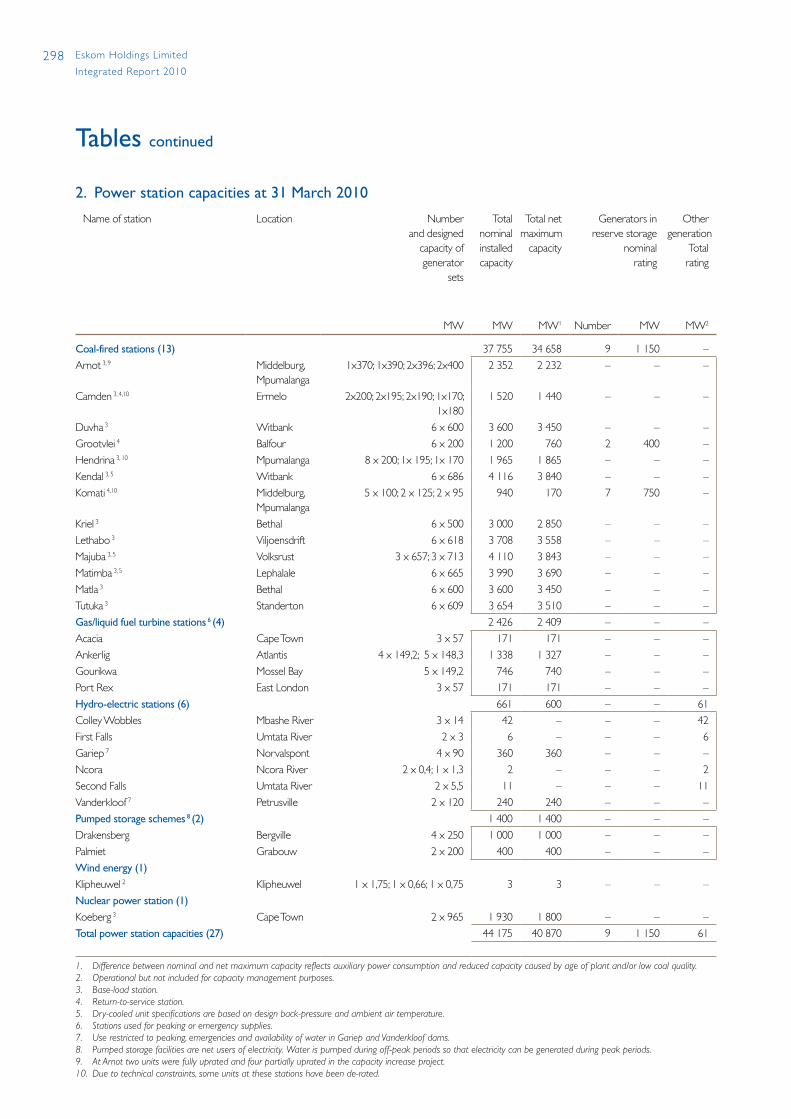
298 Eskom Holdings Limited
Integrated Repor t 2010
2. Power station capacities at 31 March 2010
Name of station Location Numberand designed
capacity ofgenerator
sets
Totalnominalinstalledcapacity
Total netmaximum
capacity
Generators in reserve storage
nominalrating
Othergeneration
Totalrating
MW MW MW1 Number MW MW2
Coal-fired stations (13) 37 755 34 658 9 1 150 –
Arnot 3, 9 Middelburg, Mpumalanga
1x370; 1x390; 2x396; 2x400 2 352 2 232 – – –
Camden 3, 4,10 Ermelo 2x200; 2x195; 2x190; 1x170; 1x180
1 520 1 440 – – –
Duvha 3 Witbank 6 x 600 3 600 3 450 – – –
Grootvlei 4 Balfour 6 x 200 1 200 760 2 400 –
Hendrina 3, 10 Mpumalanga 8 x 200; 1x 195; 1x 170 1 965 1 865 – – –
Kendal 3, 5 Witbank 6 x 686 4 116 3 840 – – –
Komati 4,10 Middelburg, Mpumalanga
5 x 100; 2 x 125; 2 x 95 940 170 7 750 –
Kriel 3 Bethal 6 x 500 3 000 2 850 – – –
Lethabo 3 Viljoensdrift 6 x 618 3 708 3 558 – – –
Majuba 3, 5 Volksrust 3 x 657; 3 x 713 4 110 3 843 – – –
Matimba 3, 5 Lephalale 6 x 665 3 990 3 690 – – –
Matla 3 Bethal 6 x 600 3 600 3 450 – – –
Tutuka 3 Standerton 6 x 609 3 654 3 510 – – –
Gas/liquid fuel turbine stations 6 (4) 2 426 2 409 – – –
Acacia Cape Town 3 x 57 171 171 – – –
Ankerlig Atlantis 4 x 149,2; 5 x 148,3 1 338 1 327 – – –
Gourikwa Mossel Bay 5 x 149,2 746 740 – – –
Port Rex East London 3 x 57 171 171 – – –
Hydro-electric stations (6) 661 600 – – 61
Colley Wobbles Mbashe River 3 x 14 42 – – – 42
First Falls Umtata River 2 x 3 6 – – – 6
Gariep 7 Norvalspont 4 x 90 360 360 – – –
Ncora Ncora River 2 x 0,4; 1 x 1,3 2 – – – 2
Second Falls Umtata River 2 x 5,5 11 – – – 11
Vanderkloof 7 Petrusville 2 x 120 240 240 – – –
Pumped storage schemes 8 (2) 1 400 1 400 – – –
Drakensberg Bergville 4 x 250 1 000 1 000 – – –
Palmiet Grabouw 2 x 200 400 400 – – –
Wind energy (1)
Klipheuwel 2 Klipheuwel 1 x 1,75; 1 x 0,66; 1 x 0,75 3 3 – – –
Nuclear power station (1)Koeberg 3 Cape Town 2 x 965 1 930 1 800 – – –
Total power station capacities (27) 44 175 40 870 9 1 150 61
1. Differencebetweennominalandnetmaximumcapacityreflectsauxiliarypowerconsumptionandreducedcapacitycausedbyageofplantand/orlowcoalquality.2. Operationalbutnotincludedforcapacitymanagementpurposes.3. Base-loadstation.4. Return-to-servicestation.5. Dry-cooledunitspecificationsarebasedondesignback-pressureandambientairtemperature.6. Stationsusedforpeakingoremergencysupplies.7. Userestrictedtopeaking,emergenciesandavailabilityofwaterinGariepandVanderkloofdams.8. Pumpedstoragefacilitiesarenetusersofelectricity. Waterispumpedduringoff-peakperiodssothatelectricitycanbegeneratedduringpeakperiods.9. AtArnottwounitswerefullyupratedandfourpartiallyupratedinthecapacityincreaseproject.10.Duetotechnicalconstraints,someunitsatthesestationshavebeende-rated.
Tables continued
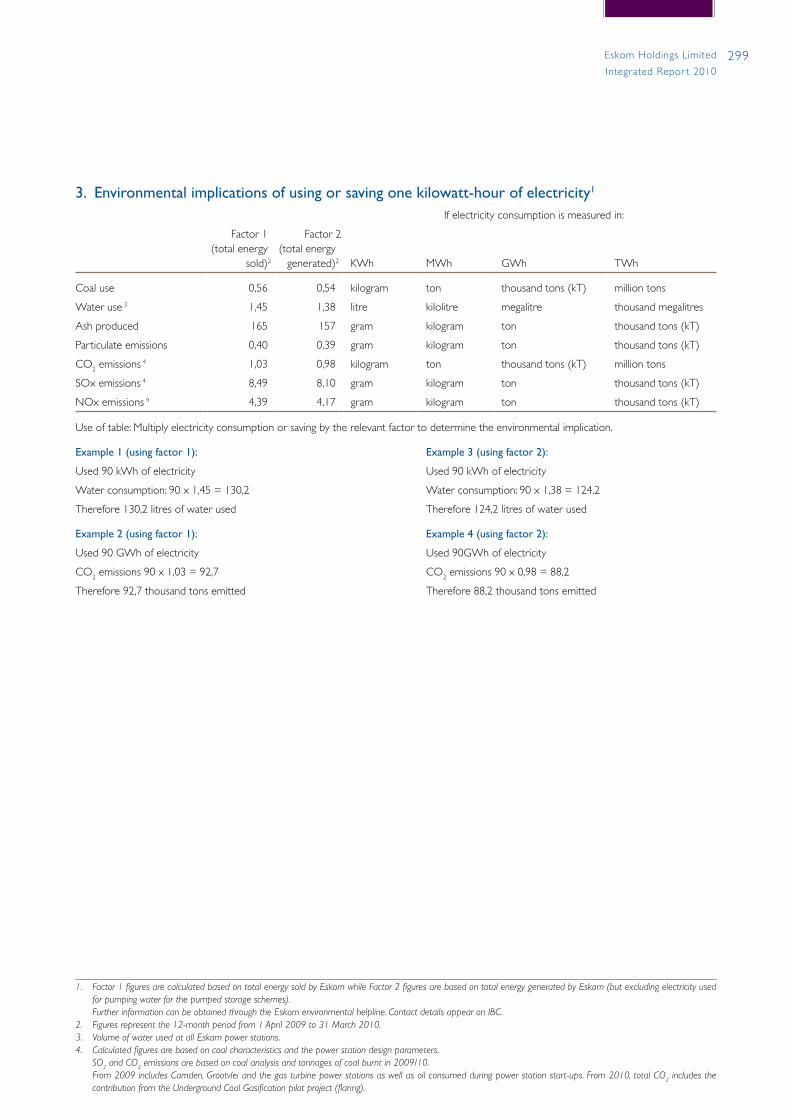
299Eskom Holdings Limited
Integrated Repor t 2010
3. Environmental implications of using or saving one kilowatt-hour of electricity1
If electricity consumption is measured in:
Factor 1(total energy
sold)2
Factor 2(total energy
generated)2 KWh MWh GWh TWh
Coal use 0,56 0,54 kilogram ton thousand tons (kT) million tons
Water use 3 1,45 1,38 litre kilolitre megalitre thousand megalitres
Ash produced 165 157 gram kilogram ton thousand tons (kT)
Particulate emissions 0,40 0,39 gram kilogram ton thousand tons (kT)
CO2 emissions 4 1,03 0,98 kilogram ton thousand tons (kT) million tons
SOx emissions 4 8,49 8,10 gram kilogram ton thousand tons (kT)
NOx emissions 4 4,39 4,17 gram kilogram ton thousand tons (kT)
Use of table: Multiply electricity consumption or saving by the relevant factor to determine the environmental implication.
Example 1 (using factor 1): Example 3 (using factor 2):
Used 90 kWh of electricity Used 90 kWh of electricity
Water consumption: 90 x 1,45 = 130,2 Water consumption: 90 x 1,38 = 124,2
Therefore 130,2 litres of water used Therefore 124,2 litres of water used
Example 2 (using factor 1): Example 4 (using factor 2):
Used 90 GWh of electricity Used 90GWh of electricity
CO2 emissions 90 x 1,03 = 92,7 CO2 emissions 90 x 0,98 = 88,2
Therefore 92,7 thousand tons emitted Therefore 88,2 thousand tons emitted
1. Factor1figuresarecalculatedbasedontotalenergysoldbyEskomwhileFactor2figuresarebasedontotalenergygeneratedbyEskom(butexcludingelectricityusedforpumpingwaterforthepumpedstorageschemes).
FurtherinformationcanbeobtainedthroughtheEskomenvironmentalhelpline.ContactdetailsappearonIBC.2. Figuresrepresentthe12-monthperiodfrom1April2009to31March2010.3. VolumeofwaterusedatallEskompowerstations.4. Calculatedfiguresarebasedoncoalcharacteristicsandthepowerstationdesignparameters. SO2andCO2emissionsarebasedoncoalanalysisandtonnagesofcoalburntin2009/10. From2009includesCamden,Grootvleiandthegasturbinepowerstationsaswellasoilconsumedduringpowerstationstart-ups.From2010,totalCO2includesthe
contributionfromtheUndergroundCoalGasificationpilotproject(flaring).

300 Eskom Holdings Limited
Integrated Repor t 2010
Tables continued
4. Transmission and distribution equipment in service at 31 March 2010
2010 2009 2008
Power lines
Transmission power lines (km)1 28 482 28 243 28 164
765kV 1 153 1 153 1 153
533kV DC (monopolar) 1 035 1 035 1 035
400kV 16 582 16 343 16 1902
275kV 7 390 7 390 7 3482
220kV 1 333 1 333 1 3332
132kV 989 989 1 1052
Distribution power lines (km) 46 018 45 302 44 680
165-132kV 24 514 23 856 23 296
88-33kV 21 504 21 446 21 384
Reticulation power lines (km)22kV and lower 305 151 297 783 293 424
Total all power lines (km) 379 651 371 328 366 268
Underground cables (km) 10 687 10 379 9 921
165 – 132kV 197 179 170
22kV and lower 10 490 10 200 9 751
Total transformer capacity (MVA) 223 398 219 232 215 776
Transmission (MVA)3 123 990 122 860 122 180
Distribution and reticulation (MVA) 99 408 96 372 93 596
Total transformers (number) 344 369 333 945 324 437
Transmission (number) 399 394 387
Distribution and reticulation (number) 343 970 333 551 324 050
1. TransmissionpowerlinelengthsasperGeographicInformationSystem(GIS)distances.2. Baseofdefinition:transformersrated≥30MVAandprimaryvoltage≥132kV.3. Transformerpowerlinelengthsfor2009havebeenrestatedtocorrectforonepowerlinenotreportedbefore.

301Eskom Holdings Limited
Integrated Repor t 2010
5. Sale of electricity and revenue per category of customerCustomers
Category2010
number 2009
number2008
number
Local 4 463 291 4 360 997 4 152 302
Redistributors 773 769 766
Residential1 4 325 550 4 223 708 4 016 689
Commercial 47 984 47 603 46 496
Industrial 2 925 2 935 2 966
Mining 1 134 1 144 1 153
Agricultural 84 415 84 329 83 722
Traction 510 509 510
International 10 10 10
Utilities 7 7 7
End users across the border 3 3 3
4 463 301 4 361 007 4 152 312
Sold
Category2010
GWh 2009GWh
2008GWh
Local 205 364 202 202 210 458
Redistributors 90 712 88 345 89 941
Residential1 10 350 10 392 10 423
Commercial 8 889 8 642 8 373
Industrial 55 816 54 815 61 510
Mining 31 733 32 177 32 373
Agricultural 5 010 4 913 4 848
Traction 2 854 2 918 2 990
International 13 227 12 648 13 908
Utilities 4 109 3 525 4 553
End users across the border 9 118 9 123 9 355
218 591 214 850 224 366
Sales to countries in southern Africa, GWh 13 227 12 648 13 908
Botswana 2 684 1 959 2 181
Mozambique 8 326 8 243 8 491
Namibia 1 459 1 573 2 087
Zimbabwe 6 – 107
Lesotho 121 107 50
Swaziland 597 756 770
Zambia 33 10 222
Short-term energy market2 1 – –

302 Eskom Holdings Limited
Integrated Repor t 2010
Tables continued
5. Sale of electricity and revenue per category of customer (continued)
Revenue
Category2010
Rm2009
Rm2008
Rm
Local 66 970 50 766 41 585
Redistributors 27 973 20 362 16 220
Residential1 6 622 5 493 4 599
Commercial 3 642 2 704 2 061
Industrial 15 089 11 762 10 524
Mining 9 599 7 360 5 768
Agricultural 2 954 2 225 1 723
Traction 1 091 860 690
International 2 972 2 334 1 971
Utilities 1 561 978 860
End users across the border 1 411 1 356 1 111
Gross electricity revenue 69 942 53 100 43 556
Less: Revenue capitalised3 (108) (104) (35)
Electricity revenue per note 29 69 834 52 996 43 521
Levies included in revenue:
The EDI restructuring levy4 n/a 594 416
The environmental levy5 3 263 n/a n/a
1. Prepaymentsandpubliclightingareincludedunderresidential.2. Theshort-termenergymarketconsistsofalltheutilitiesinthesouthernAfricancountriesthatformpartoftheSouthernAfricanPowerPool.Energyistradedonadaily,
weeklyandmonthlybasisasthereisnolong-termbilateralcontract.3. Revenuefromthesaleofproductionwhiletestinggenerationplantcapitalisedtoplant.4. TheEDIrestructuringlevywaspaidovertoEDIHoldings(Pty)Ltdin2008and2009intermsofMYPD1.5. The environmental levy is a 2c/kWh tax, effective from 1 July 2009, payable for electricity produced from non-renewable sources (coal, nuclear and petroleum).
Thelevyisraisedonthetotalelectricityproductionvolumesandisrecoveredthroughsales.
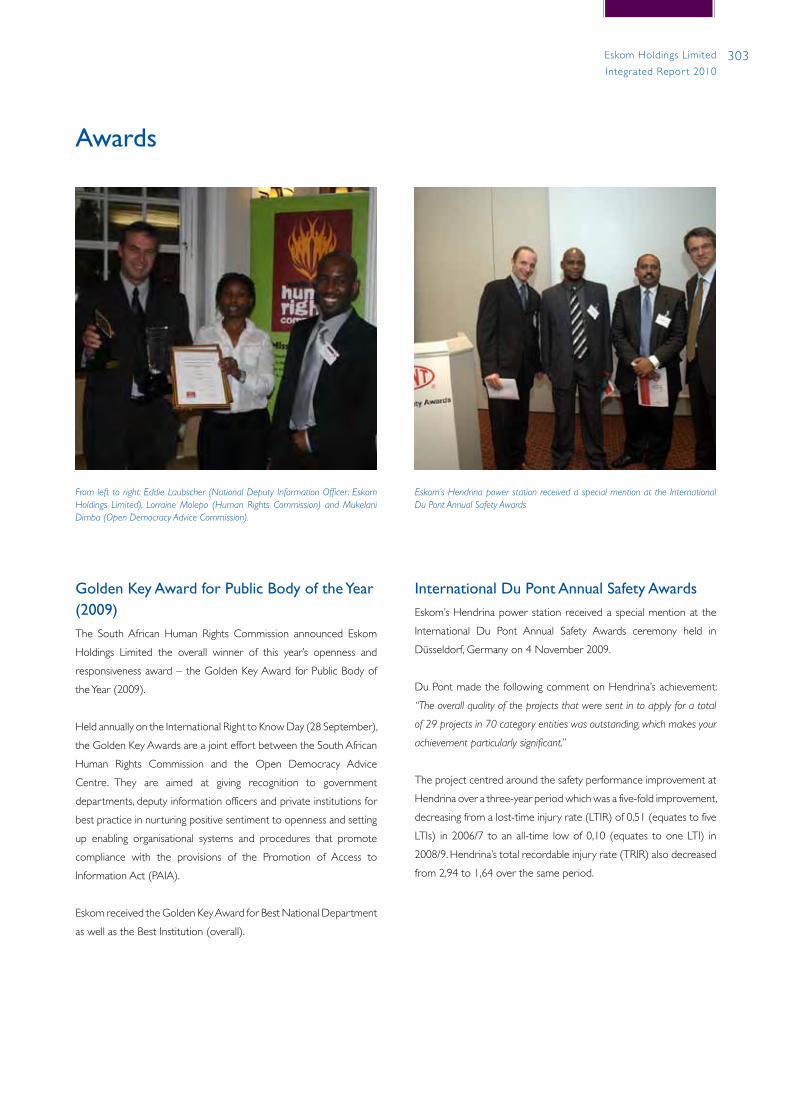
303Eskom Holdings Limited
Integrated Repor t 2010
Golden Key Award for Public Body of the Year (2009)The South African Human Rights Commission announced Eskom
Holdings Limited the overall winner of this year’s openness and
responsiveness award – the Golden Key Award for Public Body of
the Year (2009).
Held annually on the International Right to Know Day (28 September),
the Golden Key Awards are a joint effort between the South African
Human Rights Commission and the Open Democracy Advice
Centre. They are aimed at giving recognition to government
departments, deputy information officers and private institutions for
best practice in nurturing positive sentiment to openness and setting
up enabling organisational systems and procedures that promote
compliance with the provisions of the Promotion of Access to
Information Act (PAIA).
Eskom received the Golden Key Award for Best National Department
as well as the Best Institution (overall).
International Du Pont Annual Safety AwardsEskom’s Hendrina power station received a special mention at the
International Du Pont Annual Safety Awards ceremony held in
Düsseldorf, Germany on 4 November 2009.
Du Pont made the following comment on Hendrina’s achievement:
“The overall quality of the projects that were sent in to apply for a total
of 29 projects in 70 category entities was outstanding, which makes your
achievement particularly significant.”
The project centred around the safety performance improvement at
Hendrina over a three-year period which was a five-fold improvement,
decreasing from a lost-time injury rate (LTIR) of 0,51 (equates to five
LTIs) in 2006/7 to an all-time low of 0,10 (equates to one LTI) in
2008/9. Hendrina’s total recordable injury rate (TRIR) also decreased
from 2,94 to 1,64 over the same period.
Awards
Eskom’s Hendrina power station received a special mention at the International Du Pont Annual Safety Awards
From left to right: Eddie Laubscher (National Deputy Information Officer : Eskom Holdings Limited), Lorraine Molepo (Human Rights Commission) and Mukelani Dimba (Open Democracy Advice Commission).
304 Eskom Holdings Limited
Integrated Repor t 2010
This loan will be used to fund part of the eligible foreign content of
Eskom’s Medupi and Kusile power station turbine contracts with
French supplier Alstom S & E Africa (Pty) Limited. The facility
agreements were signed between Eskom as borrower and five
French banks as lenders; BNP Paribas, Calyon, Société Générale,
Natixis and CIC.
Eskom received another Best Deal of 2009 Award for the
€705 million (USD979 million) loan concluded on 11 December
2009. The loans, covered by Germany’s Euler Hermes, will be used to
fund part of the foreign content of the Kusile boiler contract with
Hitachi Power Europe. A total of four international lenders (KfW
Ipex-Bank, HSBC, Bank of Tokyo-Mitsubishi UFJ and Deutsche Bank)
and three South African lenders (Standard Bank of South Africa
Limited, Nedbank Capital and Rand Merchant Bank – a division of
FirstRand Bank Limited) participated in the transaction.
Most Ideal Employer in Engineering awardEskom was voted the Most Ideal Employer in Engineering by South
Africa’s engineering students on 18 December 2009.
The announcement was made at the annual Magnet Communications’
Ideal Employer Awards. The awards are a culmination of the Magnet
Student Survey, an independent research report conducted at
23 South African universities.
More than 26 000 students took part in the survey and once again
Eskom was hailed the most desirable company to work for in South
Africa.
Eskom has a holistic approach of developing engineering skills and
this proved popular among the younger generation once again. The
organisation has achieved this through its programmes that
encourage female learners to study mathematics and science and
other programmes that develop female engineers within the
organisation.
Komosa AwardOn 6 November 2009 Eskom was the recipient of the Komosa
Award (Komosa is the Sotho word for raise up).
This award is presented by the Department of Public Works to
companies in the public sector who facilitate the creation of work
opportunities for poor and unemployed people in South Africa. The
objective of this programme is to create 4,5 million job opportunities
during the next five years.
The Development department from the Corporate Services division
took up the challenge and for the 2008 financial year reported that
in the Distribution division, 19 895 job opportunities were created
from 2 482 projects.
In 2009, the Development department continued supporting the
Expanded Public Works Programme (EPWP) initiative and reported
the creation of 36 308 job opportunities. This represents 6,37% of
the total of 570 019 job opportunities created in the country during
this period.
The Distribution business is currently the main focus but Eskom’s
other divisions are in the process of being incorporated.
Fossil Fuel Foundation AwardThe Council of the Fossil Fuel Foundation of Africa recognised the
outstanding achievement by the Eskom underground coal gasification
project team for the development of underground coal gasification.
The implementation of this technology is considered a major
achievement and will contribute to national and international
efforts to use coal optimally and protect the environment. The
council congratulated Eskom for the insight and courage to
undertake such an ambitious project which has demonstrated the
skills and expertise of South African scientists and engineers.
Best Deal of 2009 awardsThe (Global Trade Review Magazine) has honoured Eskom with a
Best Deal of 2009 Award for the €1,185 billion fixed interest rate
loan, covered by Coface, the French export credit agency (ECA).
Awards continued
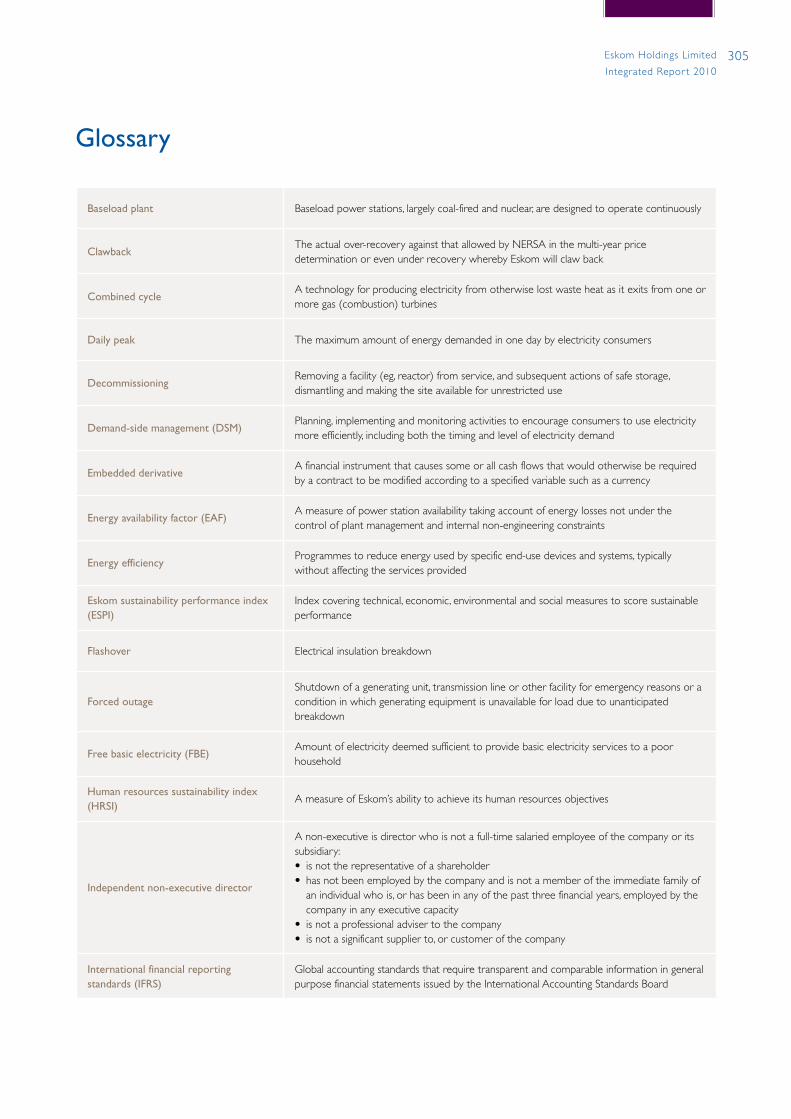
305Eskom Holdings Limited
Integrated Repor t 2010
Baseload plant Baseload power stations, largely coal-fired and nuclear, are designed to operate continuously
ClawbackThe actual over-recovery against that allowed by NERSA in the multi-year price determination or even under recovery whereby Eskom will claw back
Combined cycleA technology for producing electricity from otherwise lost waste heat as it exits from one or more gas (combustion) turbines
Daily peak The maximum amount of energy demanded in one day by electricity consumers
DecommissioningRemoving a facility (eg, reactor) from service, and subsequent actions of safe storage, dismantling and making the site available for unrestricted use
Demand-side management (DSM)Planning, implementing and monitoring activities to encourage consumers to use electricity more efficiently, including both the timing and level of electricity demand
Embedded derivativeA financial instrument that causes some or all cash flows that would otherwise be required by a contract to be modified according to a specified variable such as a currency
Energy availability factor (EAF)A measure of power station availability taking account of energy losses not under the control of plant management and internal non-engineering constraints
Energy efficiencyProgrammes to reduce energy used by specific end-use devices and systems, typically without affecting the services provided
Eskom sustainability performance index (ESPI)
Index covering technical, economic, environmental and social measures to score sustainable performance
Flashover Electrical insulation breakdown
Forced outageShutdown of a generating unit, transmission line or other facility for emergency reasons or a condition in which generating equipment is unavailable for load due to unanticipated breakdown
Free basic electricity (FBE)Amount of electricity deemed sufficient to provide basic electricity services to a poor household
Human resources sustainability index (HRSI)
A measure of Eskom’s ability to achieve its human resources objectives
Independent non-executive director
A non-executive is director who is not a full-time salaried employee of the company or its subsidiary:• is not the representative of a shareholder • has not been employed by the company and is not a member of the immediate family of
an individual who is, or has been in any of the past three financial years, employed by the company in any executive capacity
• is not a professional adviser to the company• is not a significant supplier to, or customer of the company
International financial reporting standards (IFRS)
Global accounting standards that require transparent and comparable information in general purpose financial statements issued by the International Accounting Standards Board
Glossary
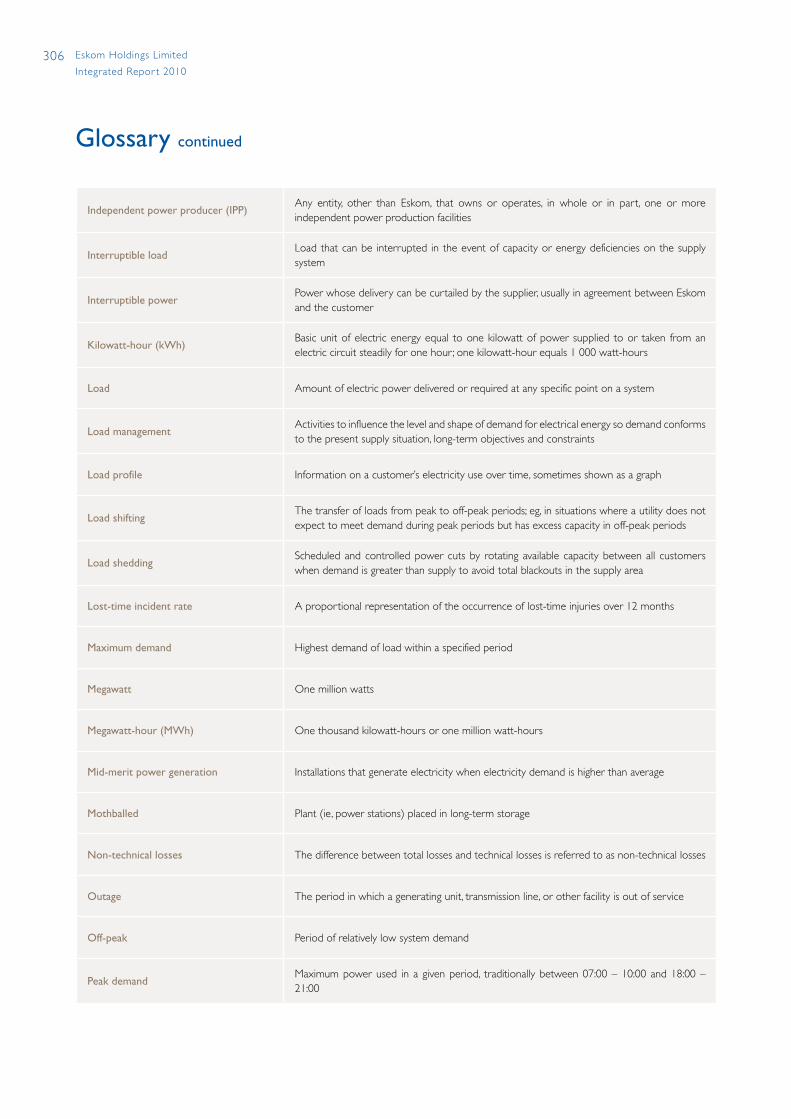
306 Eskom Holdings Limited
Integrated Repor t 2010
Glossary continued
Independent power producer (IPP)Any entity, other than Eskom, that owns or operates, in whole or in part, one or more independent power production facilities
Interruptible loadLoad that can be interrupted in the event of capacity or energy deficiencies on the supply system
Interruptible powerPower whose delivery can be curtailed by the supplier, usually in agreement between Eskom and the customer
Kilowatt-hour (kWh)Basic unit of electric energy equal to one kilowatt of power supplied to or taken from an electric circuit steadily for one hour; one kilowatt-hour equals 1 000 watt-hours
Load Amount of electric power delivered or required at any specific point on a system
Load managementActivities to influence the level and shape of demand for electrical energy so demand conforms to the present supply situation, long-term objectives and constraints
Load profile Information on a customer’s electricity use over time, sometimes shown as a graph
Load shiftingThe transfer of loads from peak to off-peak periods; eg, in situations where a utility does not expect to meet demand during peak periods but has excess capacity in off-peak periods
Load sheddingScheduled and controlled power cuts by rotating available capacity between all customers when demand is greater than supply to avoid total blackouts in the supply area
Lost-time incident rate A proportional representation of the occurrence of lost-time injuries over 12 months
Maximum demand Highest demand of load within a specified period
Megawatt One million watts
Megawatt-hour (MWh) One thousand kilowatt-hours or one million watt-hours
Mid-merit power generation Installations that generate electricity when electricity demand is higher than average
Mothballed Plant (ie, power stations) placed in long-term storage
Non-technical losses The difference between total losses and technical losses is referred to as non-technical losses
Outage The period in which a generating unit, transmission line, or other facility is out of service
Off-peak Period of relatively low system demand
Peak demandMaximum power used in a given period, traditionally between 07:00 – 10:00 and 18:00 – 21:00
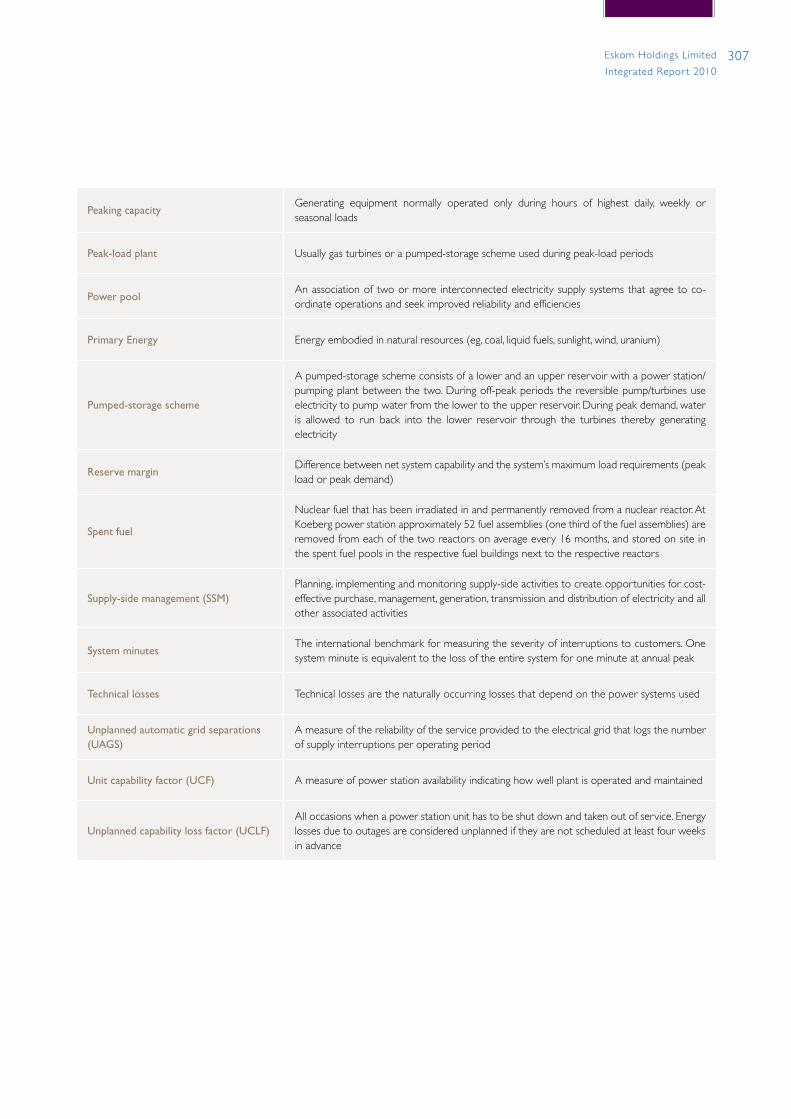
307Eskom Holdings Limited
Integrated Repor t 2010
Peaking capacityGenerating equipment normally operated only during hours of highest daily, weekly or seasonal loads
Peak-load plant Usually gas turbines or a pumped-storage scheme used during peak-load periods
Power poolAn association of two or more interconnected electricity supply systems that agree to co-ordinate operations and seek improved reliability and efficiencies
Primary Energy Energy embodied in natural resources (eg, coal, liquid fuels, sunlight, wind, uranium)
Pumped-storage scheme
A pumped-storage scheme consists of a lower and an upper reservoir with a power station/pumping plant between the two. During off-peak periods the reversible pump/turbines use electricity to pump water from the lower to the upper reservoir. During peak demand, water is allowed to run back into the lower reservoir through the turbines thereby generating electricity
Reserve marginDifference between net system capability and the system’s maximum load requirements (peak load or peak demand)
Spent fuel
Nuclear fuel that has been irradiated in and permanently removed from a nuclear reactor. At Koeberg power station approximately 52 fuel assemblies (one third of the fuel assemblies) are removed from each of the two reactors on average every 16 months, and stored on site in the spent fuel pools in the respective fuel buildings next to the respective reactors
Supply-side management (SSM)Planning, implementing and monitoring supply-side activities to create opportunities for cost-effective purchase, management, generation, transmission and distribution of electricity and all other associated activities
System minutesThe international benchmark for measuring the severity of interruptions to customers. One system minute is equivalent to the loss of the entire system for one minute at annual peak
Technical losses Technical losses are the naturally occurring losses that depend on the power systems used
Unplanned automatic grid separations (UAGS)
A measure of the reliability of the service provided to the electrical grid that logs the number of supply interruptions per operating period
Unit capability factor (UCF) A measure of power station availability indicating how well plant is operated and maintained
Unplanned capability loss factor (UCLF)All occasions when a power station unit has to be shut down and taken out of service. Energy losses due to outages are considered unplanned if they are not scheduled at least four weeks in advance
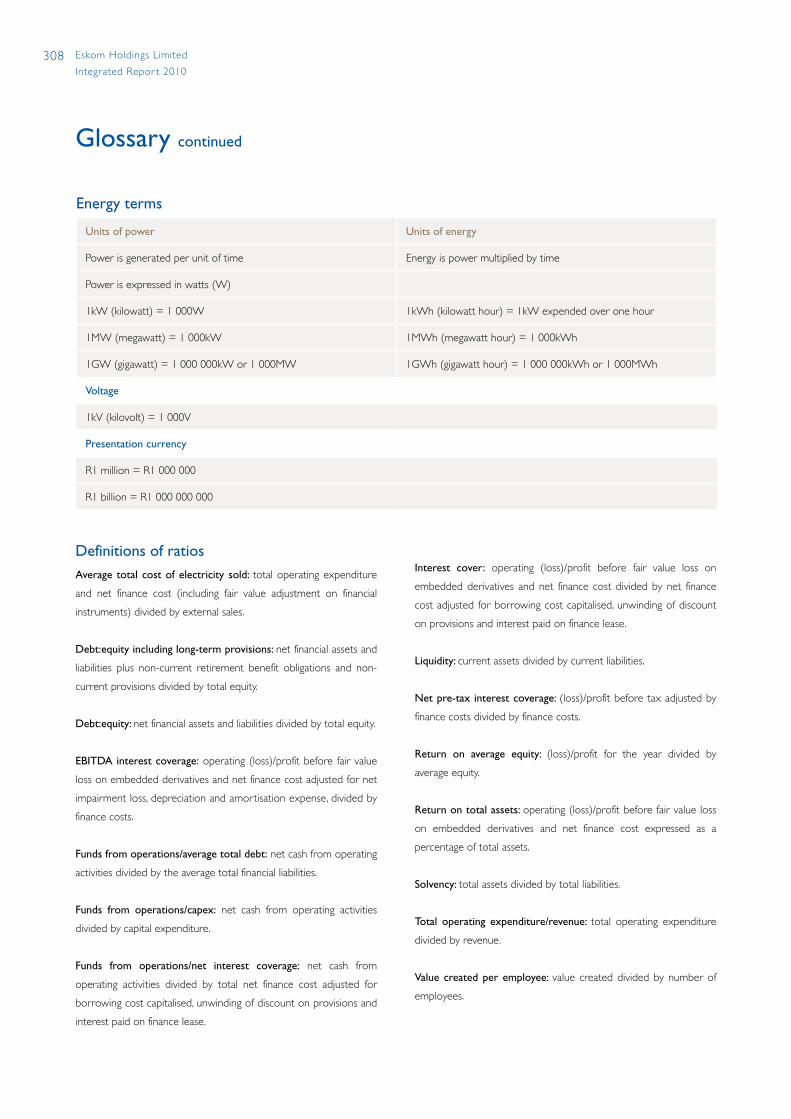
308 Eskom Holdings Limited
Integrated Repor t 2010
Interest cover: operating (loss)/profit before fair value loss on
embedded derivatives and net finance cost divided by net finance
cost adjusted for borrowing cost capitalised, unwinding of discount
on provisions and interest paid on finance lease.
Liquidity: current assets divided by current liabilities.
Net pre-tax interest coverage: (loss)/profit before tax adjusted by
finance costs divided by finance costs.
Return on average equity: (loss)/profit for the year divided by
average equity.
Return on total assets: operating (loss)/profit before fair value loss
on embedded derivatives and net finance cost expressed as a
percentage of total assets.
Solvency: total assets divided by total liabilities.
Total operating expenditure/revenue: total operating expenditure
divided by revenue.
Value created per employee: value created divided by number of
employees.
Definitions of ratiosAverage total cost of electricity sold: total operating expenditure
and net finance cost (including fair value adjustment on financial
instruments) divided by external sales.
Debt:equity including long-term provisions: net financial assets and
liabilities plus non-current retirement benefit obligations and non-
current provisions divided by total equity.
Debt:equity: net financial assets and liabilities divided by total equity.
EBITDA interest coverage: operating (loss)/profit before fair value
loss on embedded derivatives and net finance cost adjusted for net
impairment loss, depreciation and amortisation expense, divided by
finance costs.
Funds from operations/average total debt: net cash from operating
activities divided by the average total financial liabilities.
Funds from operations/capex: net cash from operating activities
divided by capital expenditure.
Funds from operations/net interest coverage: net cash from
operating activities divided by total net finance cost adjusted for
borrowing cost capitalised, unwinding of discount on provisions and
interest paid on finance lease.
Energy terms
Units of power Units of energy
Power is generated per unit of time Energy is power multiplied by time
Power is expressed in watts (W)
1kW (kilowatt) = 1 000W 1kWh (kilowatt hour) = 1kW expended over one hour
1MW (megawatt) = 1 000kW 1MWh (megawatt hour) = 1 000kWh
1GW (gigawatt) = 1 000 000kW or 1 000MW 1GWh (gigawatt hour) = 1 000 000kWh or 1 000MWh
Voltage
1kV (kilovolt) = 1 000V
Presentation currency
R1 million = R1 000 000
R1 billion = R1 000 000 000
Glossary continued
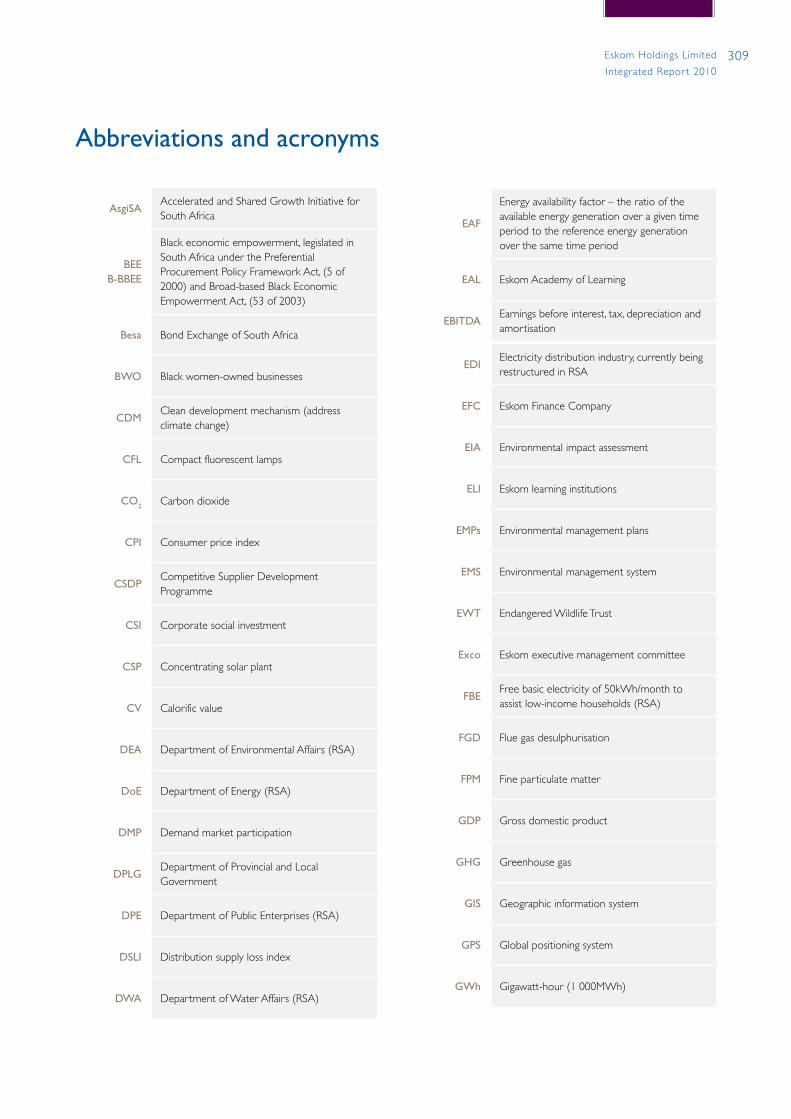
309Eskom Holdings Limited
Integrated Repor t 2010
AsgiSAAccelerated and Shared Growth Initiative for South Africa
BEEB-BBEE
Black economic empowerment, legislated in South Africa under the Preferential Procurement Policy Framework Act, (5 of 2000) and Broad-based Black Economic Empowerment Act, (53 of 2003)
Besa Bond Exchange of South Africa
BWO Black women-owned businesses
CDMClean development mechanism (address climate change)
CFL Compact fluorescent lamps
CO2 Carbon dioxide
CPI Consumer price index
CSDPCompetitive Supplier Development Programme
CSI Corporate social investment
CSP Concentrating solar plant
CV Calorific value
DEA Department of Environmental Affairs (RSA)
DoE Department of Energy (RSA)
DMP Demand market participation
DPLGDepartment of Provincial and Local Government
DPE Department of Public Enterprises (RSA)
DSLI Distribution supply loss index
DWA Department of Water Affairs (RSA)
Abbreviations and acronyms
EAF
Energy availability factor – the ratio of the available energy generation over a given time period to the reference energy generation over the same time period
EAL Eskom Academy of Learning
EBITDAEarnings before interest, tax, depreciation and amortisation
EDIElectricity distribution industry, currently being restructured in RSA
EFC Eskom Finance Company
EIA Environmental impact assessment
ELI Eskom learning institutions
EMPs Environmental management plans
EMS Environmental management system
EWT Endangered Wildlife Trust
Exco Eskom executive management committee
FBEFree basic electricity of 50kWh/month to assist low-income households (RSA)
FGD Flue gas desulphurisation
FPM Fine particulate matter
GDP Gross domestic product
GHG Greenhouse gas
GIS Geographic information system
GPS Global positioning system
GWh Gigawatt-hour (1 000MWh)
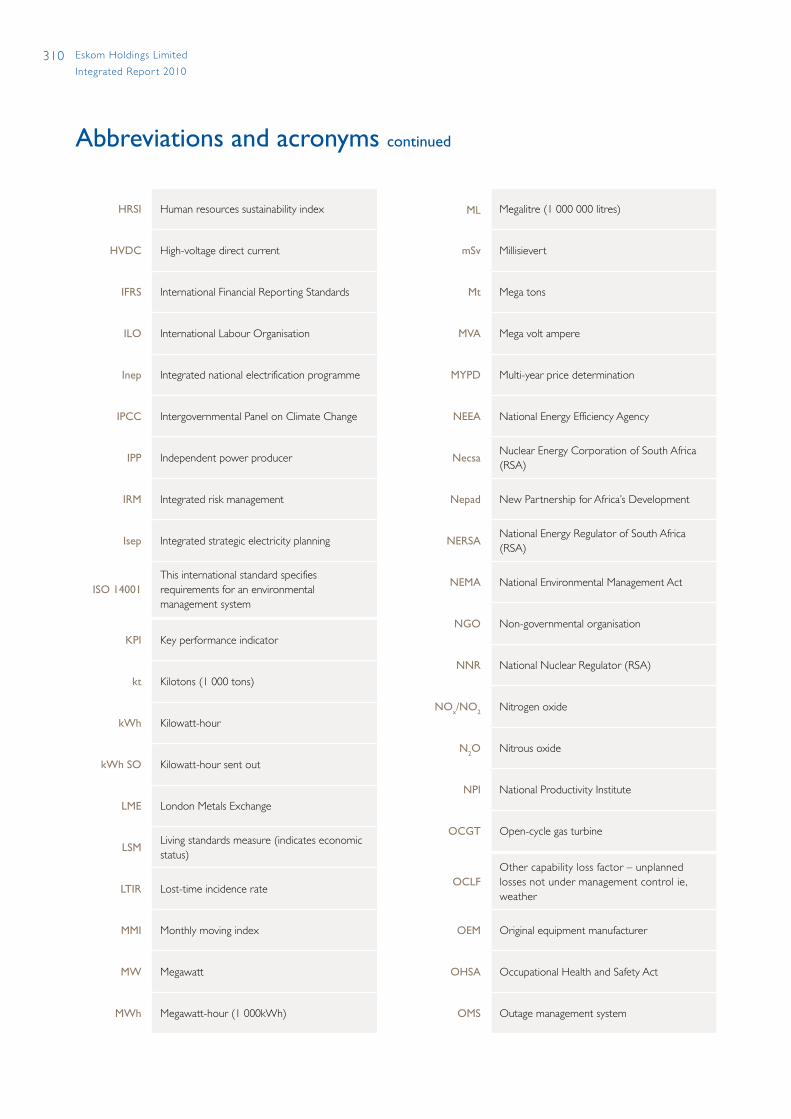
310 Eskom Holdings Limited
Integrated Repor t 2010
Abbreviations and acronyms continued
HRSI Human resources sustainability index
HVDC High-voltage direct current
IFRS International Financial Reporting Standards
ILO International Labour Organisation
Inep Integrated national electrification programme
IPCC Intergovernmental Panel on Climate Change
IPP Independent power producer
IRM Integrated risk management
Isep Integrated strategic electricity planning
ISO 14001This international standard specifies requirements for an environmental management system
KPI Key performance indicator
kt Kilotons (1 000 tons)
kWh Kilowatt-hour
kWh SO Kilowatt-hour sent out
LME London Metals Exchange
LSMLiving standards measure (indicates economic status)
LTIR Lost-time incidence rate
MMI Monthly moving index
MW Megawatt
MWh Megawatt-hour (1 000kWh)
ML Megalitre (1 000 000 litres)
mSv Millisievert
Mt Mega tons
MVA Mega volt ampere
MYPD Multi-year price determination
NEEA National Energy Efficiency Agency
NecsaNuclear Energy Corporation of South Africa (RSA)
Nepad New Partnership for Africa’s Development
NERSANational Energy Regulator of South Africa (RSA)
NEMA National Environmental Management Act
NGO Non-governmental organisation
NNR National Nuclear Regulator (RSA)
NOx/NO2 Nitrogen oxide
N2O Nitrous oxide
NPI National Productivity Institute
OCGT Open-cycle gas turbine
OCLFOther capability loss factor – unplanned losses not under management control ie, weather
OEM Original equipment manufacturer
OHSA Occupational Health and Safety Act
OMS Outage management system

311Eskom Holdings Limited
Integrated Repor t 2010
PCB Polychlorinated biphenyls
PBMR Pebble-bed modular reactor
PCP Power conservation programme
PCLF
Planned capability loss factor – ratio of the energy not produced over a given time period, due to planned shutdowns, to the maximum amount of energy which could be produced over the same time period
PFMA Public Finance Management Act (RSA)
RED Regional electricity distributor
RSLI Reticulation supply loss index
Saavi South African Aids Vaccine Initiative
SACECSSouth African Centre for Essential Community Services
SADC Southern African Development Community
SAIDI System average interruption duration index
SAIFI System average interruption frequency index
Sapp Southern African Power Pool
SHE Safety, health and environment
SMME Small, medium and micro enterprises
SME Small and medium enterprises
SOE State-owned enterprise
SO2 Sulphur dioxide
SO3 Sulphur trioxide
Sm3 Standard cubic metre
TOU Time-of-use (tariff)
TQI Total quality index
UCF Unit capability factor
UCG Underground coal gasification
UCLF
Unplanned capability loss factor – ratio of the unplanned energy losses over a given time period to the maximum amount of energy which could be produced over the same time period
ULM Utility load manager
UN United Nations
UNFCCCUnited Nations Framework Convention on Climate Change
VAT Value added tax (RSA)
VCTVoluntary counselling and testing (HIV/Aids RSA)
Wano World Association of Nuclear Operators
WESSAWildlife and Environment Society of South Africa
WBCSDWorld Business Council for Sustainable Development
ZLED Zero liquid effluent discharge

312 Eskom Holdings Limited
Integrated Repor t 2010
GRI index
An index to the 2010 integrated report based on the Global Reporting Initiative (GRI) sustainability reporting guideline criteria is provided in the table.
Strategy and analysis
GRI reference Description Reference(s) in integrated report Page
1.1 – 1.2 Statement from senior decision makers, on sustainability including description of impacts, risk and opportunities
Letter from the acting chairman 24 – 25
Integrated risk management 22 – 25
Divisional and business area overviews 38, 52, 76, 86, 94, 134, 166
Organisational profile
GRI reference Description Reference(s) in integrated report Page
2.1 – 2.10 Organisational profile: details and scale of organisation, ownership, changes and awards received
Scope of report IFC
Key facts 1 – 3
Southern African grid map 5
Organisational structure 6
Leadership overview – letter from the acting chairman 24 – 25
Tables 296
Awards 303 – 304
Corporate governance 288
Report parameters
GRI reference Description Reference(s) in integrated report Page
3.1 – 3.13 Report profile, scope and boundaries.GRI content indexAssurance
Scope of report IFC
Countries in which we operate IFC
Electricity: from power station to customer 4
Application of the GRI principles 13
Materiality 13
Stakeholder engagement 14
Executive performance overview 30
Performance against the shareholder compact 34
Management approach 38, 52, 76, 86, 94, 134, 166
Contact information IBC
Independent assurance report to the directors of Eskom Holdings Limited
169
Statement of responsibilities and approval 174
Independent auditors’ report to the Minister of Public Enterprises
176
GRI Index 312
IFC – Inside front cover.IBC – Inside back cover.
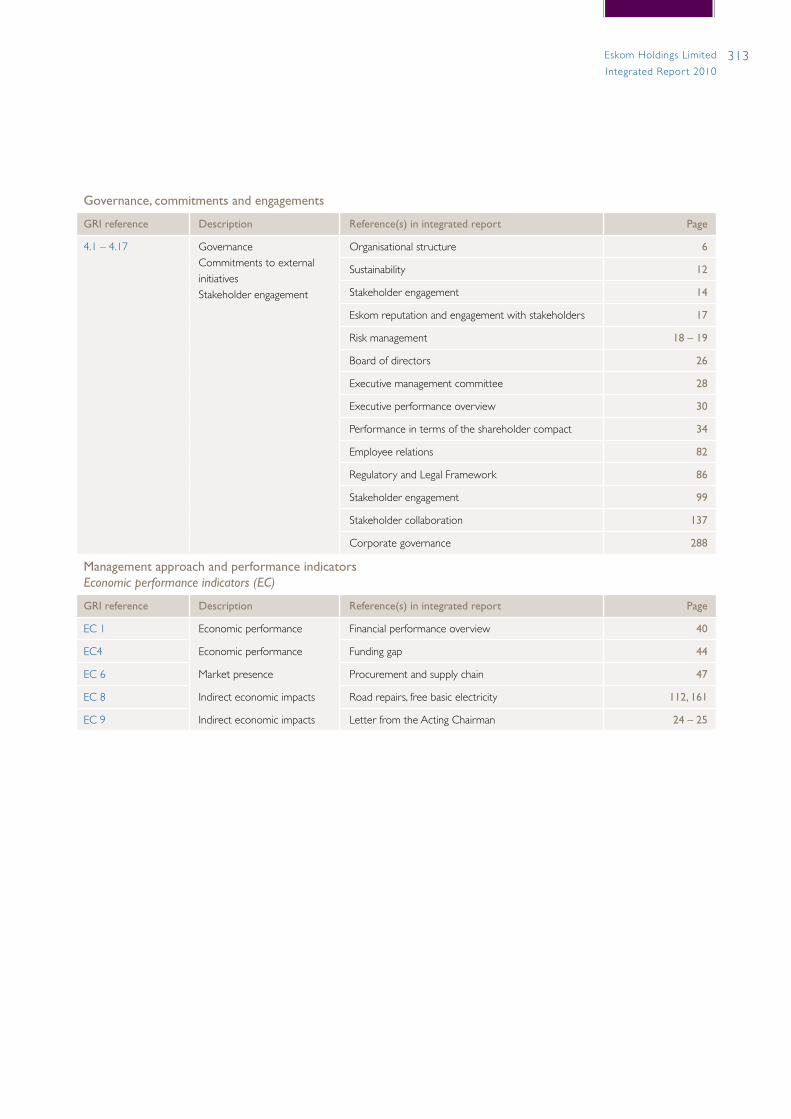
313Eskom Holdings Limited
Integrated Repor t 2010
Governance, commitments and engagements
GRI reference Description Reference(s) in integrated report Page
4.1 – 4.17 GovernanceCommitments to external initiativesStakeholder engagement
Organisational structure 6
Sustainability 12
Stakeholder engagement 14
Eskom reputation and engagement with stakeholders 17
Risk management 18 – 19
Board of directors 26
Executive management committee 28
Executive performance overview 30
Performance in terms of the shareholder compact 34
Employee relations 82
Regulatory and Legal Framework 86
Stakeholder engagement 99
Stakeholder collaboration 137
Corporate governance 288
Management approach and performance indicatorsEconomic performance indicators (EC)
GRI reference Description Reference(s) in integrated report Page
EC 1 Economic performance Financial performance overview 40
EC4 Economic performance Funding gap 44
EC 6 Market presence Procurement and supply chain 47
EC 8 Indirect economic impacts Road repairs, free basic electricity 112, 161
EC 9 Indirect economic impacts Letter from the Acting Chairman 24 – 25
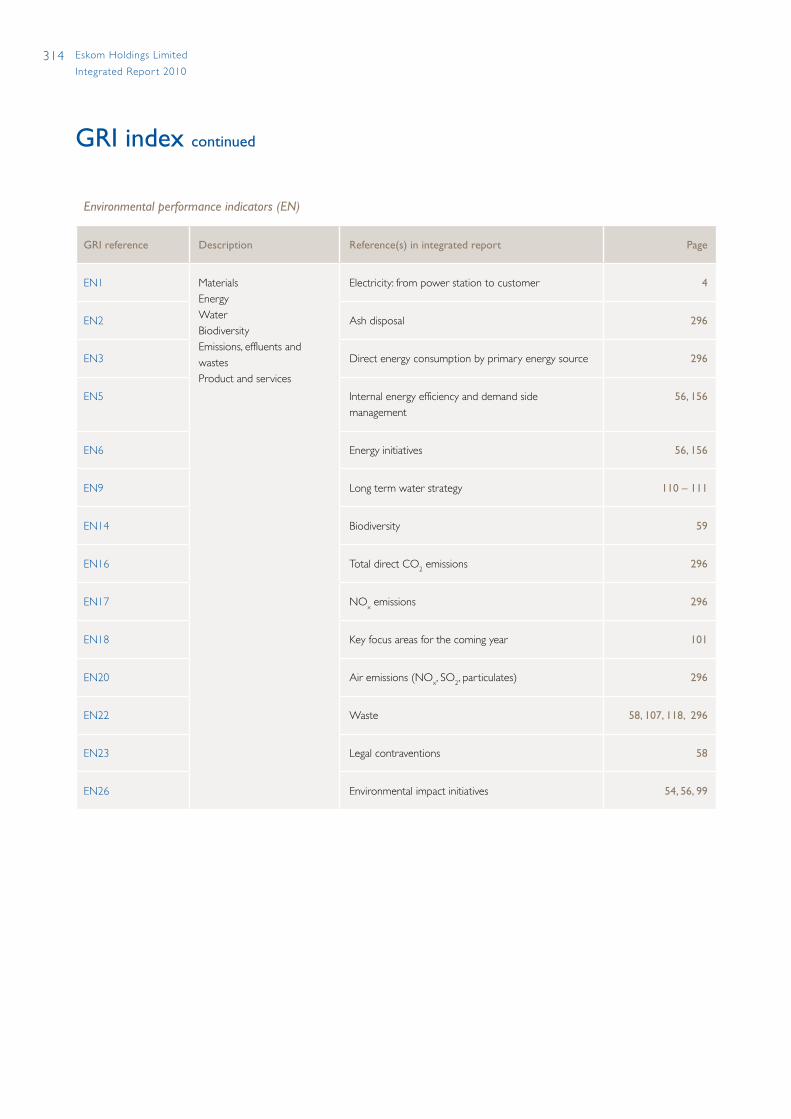
314 Eskom Holdings Limited
Integrated Repor t 2010
GRI index continued
Environmental performance indicators (EN)
GRI reference Description Reference(s) in integrated report Page
EN1 MaterialsEnergyWaterBiodiversityEmissions, effluents and wastesProduct and services
Electricity: from power station to customer 4
EN2 Ash disposal 296
EN3 Direct energy consumption by primary energy source 296
EN5 Internal energy efficiency and demand side management
56, 156
EN6 Energy initiatives 56, 156
EN9 Long term water strategy 110 – 111
EN14 Biodiversity 59
EN16 Total direct CO2 emissions 296
EN17 NOx emissions 296
EN18 Key focus areas for the coming year 101
EN20 Air emissions (NOx, SO2, particulates) 296
EN22 Waste 58, 107, 118, 296
EN23 Legal contraventions 58
EN26 Environmental impact initiatives 54, 56, 99
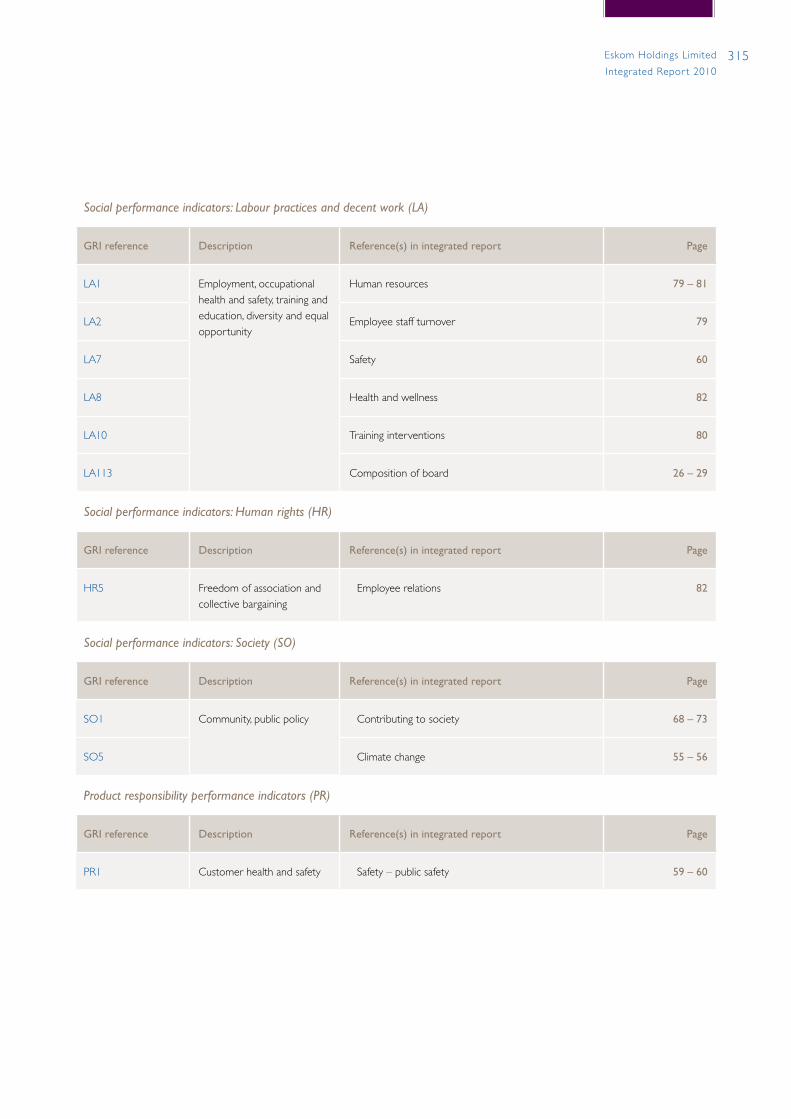
315Eskom Holdings Limited
Integrated Repor t 2010
Social performance indicators: Labour practices and decent work (LA)
GRI reference Description Reference(s) in integrated report Page
LA1 Employment, occupational health and safety, training and education, diversity and equal opportunity
Human resources 79 – 81
LA2 Employee staff turnover 79
LA7 Safety 60
LA8 Health and wellness 82
LA10 Training interventions 80
LA113 Composition of board 26 – 29
Social performance indicators: Human rights (HR)
GRI reference Description Reference(s) in integrated report Page
HR5 Freedom of association and collective bargaining
Employee relations 82
Social performance indicators: Society (SO)
GRI reference Description Reference(s) in integrated report Page
SO1 Community, public policy Contributing to society 68 – 73
SO5 Climate change 55 – 56
Product responsibility performance indicators (PR)
GRI reference Description Reference(s) in integrated report Page
PR1 Customer health and safety Safety – public safety 59 – 60
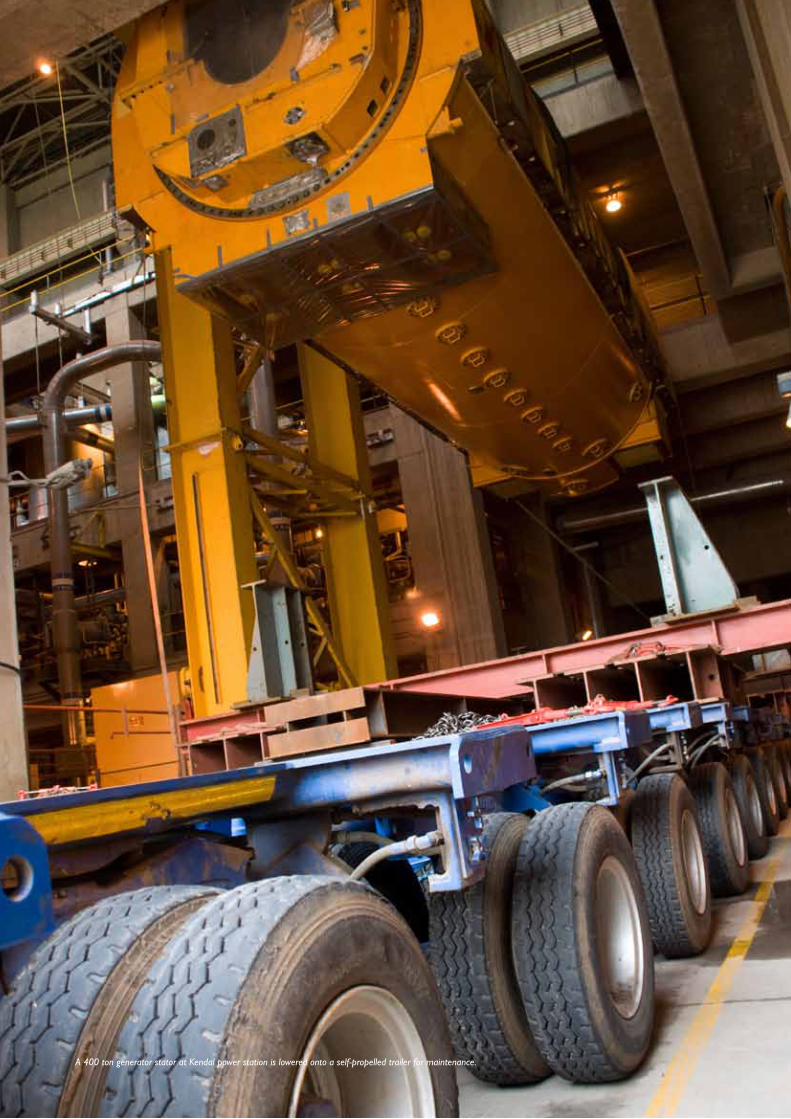
316 Eskom Holdings Limited
Integrated Repor t 2010
GRI index continued
A 400 ton generator stator at Kendal power station is lowered onto a self-propelled trailer for maintenance.
www.eskom.co.za
Integrated
Rep
ort 2
01
0
Contact information
TelephoneEskom head office:
Eskom Group Communications:
Eskom Development Foundation:
+27 11 800 8111
+27 11 800 2323
+27 11 800 8111
Websites and emailEskom environmental:
Eskom annual report:
Eskom Development Foundation:
www.eskom.co.za/annreport10/
www.eskom.co.za/csi
Eskom website: www.eskom.co.za
Ethics office advisory service: +27 11 800 2791/3187
Company registration number: 2002/015527/06
Confidential fax line: +27 11 507 6358
Physical address:Eskom
Megawatt Park
2 Maxwell Drive
Sunninghill
Sandton
2157
Postal address:Eskom
PO Box 1091
Johannesburg
2000
Eskom Holdings SecretariatBongiwe Mbomvu (Company secretary)
PO Box 1091
Johannesburg
2000
HI-RES PIC TO BE
SUPPLIED
HI RES PIC TO
COME WITH
BLEED
NB:
TO FIT SIZE:
240 X 310
On the path to recovery
Integrated Report 20101970 – 1990Two hydro stations were commissioned for peak load. The decision was taken to build Koeberg, the first nuclear station in Africa. Gas turbine, coal and pumped storage stations were commissioned. Escom was renamed to Eskom in 1987 and an Electricity Council replaced the Commission
1990 – 2010Electrification started on a massive scale and the real price of electricity was reduced to stimulate economic growth. In 2001 Eskom received the Global Power Company of the Year Award. Eskom was converted to a company in 2002. Surplus electricity ran out and power shortages became apparent in 2007
1923Electricity Supply Commission established
1950Vaal and Klip power stations built
1950 – 1970Generation capacity increased by 130%
1984Koeberg, Africa’s first Nuclear PowerStation is built
1970 – 1990Two hydro stations were commissioned for peak load. The decision was taken to build Koeberg, the first nuclear station in Africa. Gas turbine, coal and pumped storage stations were commissioned. Escom was renamed to Eskom in 1987 and an Electricity Council replaced the Commission
1990 – 2010Electrification started on a massive scale and the real price of electricity was reduced to stimulate economic growth. In 2001 Eskom received the Global Power Company of the Year Award. Eskom was converted to a company in 2002. Surplus electricity ran out and power shortages became apparent in 2007
1923 – 1929 1930 – 1950 1950 – 1970
The Electricity Supply Commission (Escom) was established. Dr Hendrik van der Bijl was the first Chairman. Witbank, Colenso and Salt River Power Stations were commissioned
New goldfields on the Witwatersrand and the rise in gold price boosted electricity demand. Vaal and Klip power stations were built and the distribution network was extended
Soaring growth in the Vaal Triangle and Witwatersrand, Eskom’s capacity doubled by extending existing stations and building new ones. R376 million was spent on new plant. Capacity increased by 130%