(PDF:) Clariant Integrated Report 2018
206
Integrated Report 2018
-
Upload
khangminh22 -
Category
Documents
-
view
0 -
download
0
Transcript of (PDF:) Clariant Integrated Report 2018

Integrated Report2018

AVAILABLE REPORTS
The Clariant Integrated Report 2018 provides an in-depth overview of the company’s holistic approach to multidimensional value creation, covering both tangible and intangible, and financial and non-financial aspects of the business.
Comprehensive information on financial results can be found in the online Financial Report. Details on governance and com-pensation are available in the online Corporate Governance Report and the Compen sation Report. Additional information on the com-pany's engagement regarding sustainable value creation can be found in the online GRI Report.
Integrated Report
reports.clariant.com
Corporate Governance Report
reports.clariant.com/ 2018/corporategovernance
Compensation Report
reports.clariant.com/ 2018/ compensation
GRI Report
reports.clariant.com/ 2018/gri
Financial Report
reports.clariant.com/ 2018/ financialreport
THE FOLLOWING REPORTS ARE AVAILABLE ONLINE AND AS A PDF FOR DOWNLOAD:

The core ideas of Clariant’s integrated reporting are based on the framework devel-oped by the International Integrated Reporting Council (IIRC), which fosters sustainable change by promoting a holistic approach to corporate reporting that focuses on financial and non-financial value creation.
INTEGRATED REPORTING
Integrated Reporting extends traditional formats of corporate disclosure in order to communicate the full range of factors that significantly affect a company’s ability to create value through its business model. In this third annual report published in the form of an Integrated Report, Clariant provides a comprehensive overview of its value creation process. The resources Clariant uses and affects are categorized into the following six »capitals«: financial, intellectual, manufactured, human, relationship, and natural.
Intellectual Capital
Knowledge-based in-tangibles used and created by the company, often in collaboration with partners. This can include intellectual property, such as pa-tents, trademarks, copy-rights, software, rights, and licenses, and »organizational capital«, such as tacit knowledge, systems, procedures, and protocols.
Human Capital
The company’s staff and its composition, competencies, capabil-ities, experience, and motivation to innovate. This can include em-ployees’ alignment with corporate values and their ability to under-stand and implement the company’s strategy.
Relationship Capital
Key relationships, in-cluding those with significant groups of stakeholders and other networks. This can include shared values, the trust and willingness to engage, and related intan-gibles associated with the company’s brand and reputation.
Manufactured Capital
Manufactured physical objects, such as build-ings, equipment, and products. These can in-clude objects that are available to the com-pany for use in the pro-duction of goods or the provision of services, or that the company produces for sale to customers or for its own use.
Natural Capital
Renewable and nonre-newable environmental resources and process-es that support the past, current, or future prosperity of the company or are affect-ed by it. Examples can include resources relat-ed to air, water, and land that are utilized or impacted by emissions.
Financial Capital
The pool of funds avail-able to the company for use in the production of goods or the provi-sion of services. This can include funds obtained through financing, such as debt, equity, or grants, and funds gen-erated by the company, for example, through sales or investments.

MANUFACTURED CAPITAL
2018 2017
Research & Development Centers 8 8
Technical Centers > 50 > 50
Production sites 125 125
Countries with production facilities 39 39
Raw materials procured (in m t) 3.57 3.14
Production (in m t) 4.34 1 4.60
1 For 2018, the production volume is based on a reduced reporting scope, which includes sites that are responsible for 95 % of total production.
FINANCIAL CAPITAL in CHF m
2018 2017
Sales 6 623 6 377
EBITDA before exceptional items 1 018 974
EBITDA margin before exceptional items (%) 15.4 15.3
EBIT before exceptional items 693 673
Net income 356 302
Basic earnings per share (in CHF) 1.02 0.84
Adjusted earnings per share (in CHF) 1.50 1.47
Operating cash flow 530 428
Investment in property, plant, and equipment 237 248
Research & Development expenditures 209 211
Growth through innovation (%) 1 > 3.0 2.5
Personnel expenditures 2 1 518 1 516
Raw material procurement 2 948 2 674
Total assets 7 981 8 299
Equity 2 970 2 939
Equity ratio (%) 37.2 35.7
Net debt 1 374 1 539
Gearing ratio (%) 46 52
1 Contains the contribution to growth from both Top Line Innovation as well as Life Cycle Innovation. Potential cannibalization of existing sales caused by Life Cycle Innovation in certain cases has not been excluded from the calculation.
2 Including own employees and external staff
INTELLECTUAL CAPITAL
2018 2017
Patents (year end) 6 700 6 600
Active innovation projects > 375 > 370
Of which Class 1 Projects with double-digit million sales potential or of strategic relevance > 70 > 65
Scientific collaborations > 125 > 125
Performance
HUMAN CAPITAL in FTE (Full Time Equivalents)
2018 2017
Total staff 17 901 18 135
Employees 10 405 10 482
Of which male 7 115 (68 %) 7 264 (69 %)
Of which female 3 290 (32 %) 3 218 (31 %)
Workers 7 496 7 653
Of which male 6 890 (92 %) 7 066 (92 %)
Of which female 606 (8 %) 587 (8 %)
Total training hours 234 240 192 000
Training hours (Ø per participant) 15 20
Staff in Research & Development > 1 100 > 1 100
Lost Time Accident Rate (LTAR: accidents with at least 1 day lost/200 000 work hours) 0.15 0.20
RELATIONSHIP CAPITAL
2018 2017
Employee participation in engagement survey 2 466 n.a. 1
Raw material suppliers 7 000 7 000
Raw material supply base by spend covered by sustainability evaluations (%) 74 65
Survey responses obtained from customer contacts 2 791 n.a. 1
Customers who want to continue doing business with Clariant (%) 90 n.a. 1
1 Surveys are conducted every two years.
People
NATURAL CAPITAL
2018 1 2017
Total energy consumption (in m kWh) 3 209 3 245
Energy consumption (in kWh/t production) 739 706
Total water consumption (in m m3) 49 49
Total wastewater generation (in m m3) 13 13
Total greenhouse gas emissions (Scope 1 & 2 CO2 equivalents) (in m t) 0.93 0.97
Total indirect greenhouse gas emissions (Scope 3 CO2 equivalents) (in m t) 5.69 5.21
Greenhouse gas emissions (Scope 1 & 2 CO2 equivalents) (in kg/t production) 215 211
Total quantity of waste (in thousand t) 232 198
Planet
SUMMARY ON PERFORMANCE, PEOPLE, PLANET
1 Every three years, Clariant validates environmental data from all production sites. The last full reporting campaign was in 2017. In interim years, including 2018, the reduced reporting scope comprises the larger sites responsible for 95 % of production.

006 The Foundation
of Success
054 Value Creation
in the Four Business Areas
104Multicapital
Review
002 Letter to Shareholders
004 Introduction – Two Perspectives Interviews
008 Operating an Integrated Business Model012 Thriving in the External Environment 014 Building on Vision, Mission, and Values016 Internal and External Stakeholder
Engagement 018 Materiality Assessment020 Updated Strategy to Strengthen
Clariant022 Interview with CEO Ernesto Occhiello026 Two Perspectives: What Will Help Us
Succeed in China? 032 Overview on Corporate Governance 036 Empowerment through Leadership038 Two Perspectives: What Helps People
Reach Their Full Potential? 044 Overview on Compensation Policy 046 Core Processes for Value Creation
056 How Care Chemicals Creates Value 062 Two Perspectives: Where Can We Help
Accelerate Innovation?068 How Catalysis Creates Value 074 Two Perspectives: When Can We
Advance the Shift to Renewable Energy?
080 How Natural Resources Creates Value086 Two Perspectives: Where Can We
Improve Safety Even Further? 092 How Plastics & Coatings Creates Value098 Two Perspectives: Why Does It Pay to
Focus on Sustainability?
106 Performance128 Two Perspectives: Who Shapes New
Digital Business Models?134 People 152 Two Perspectives: What Will Our
Customers Expect from Us Tomorrow?158 Planet 166 Two Perspectives: Where Can Chemistry
Help Close the Plastics Loop?
172 Independent Assurance Report (PwC)
Table of Contents
1CLARIANT INTEGRATED REPORT 2018

Consistent Execution of the Group StrategyConsistent Execution of the Group Strategy
Clariant continued its success story in the 2018 financial year. This means that we were able to seamlessly build on the previous years, in which we significantly increased the attractiveness and earnings power of Clariant through the consistent implementation of our long-term strategy, in particular through the continuous development of the portfolio. Over the last few years, our shareholders have thus received a significantly higher total shareholder return than the peer-group average.
The 2018 results speak for themselves: We increased our sales in local currencies by 5 % to around 6.6 billion Swiss francs. The EBITDA before exceptional items also improved by 5 % to over 1 billion Swiss francs, which is the highest level since 2004. This operational per-formance improvement prompts us to propose a dividend increase of 10 % to 0.55 Swiss francs for you at the next Annual General Meeting.
We have always stressed that we need to continuously and consistently develop the Clariant portfolio towards specialty chemicals to fur-ther enhance the value of the company for you as shareholders. The size of the company is one aspect of this development. However, we cannot rely on organic growth alone. For this reason, one of our strategic priorities since the acquisition of Süd-Chemie in 2011 has been portfolio management, which has been further intensified over the past three years. The planned merger with the US company Huntsman was part of it − it would have led to an increase in value of over 3 billion Swiss francs. This merger was, however, thwarted by an activist investor.
Since our management feels obligated to actually realize the potential increase in value held out to the shareholders, we will now do so in cooperation with SABIC. We intend to form the new High Perfor-mance Materials Business Area from SABIC’s specialty chemicals business and Clariant’s Additives and high-value Masterbatches businesses. At the same time, we will sell more mature businesses
such as Pigments and Standard Masterbatches. In this way, Clariant’s portfolio will have a much more pronounced profile for high-quality specialty chemical products, which in turn will visibly improve the value of the company as a whole. At the same time, we will continue to develop our Care Chemicals, Catalysis, and Natural Resources Business Areas. Our focus remains on innovation, sustainability, highly qualified employees and the fast and reliable fulfillment of our customers’ needs as the basis for future success. This will be reflected in a significant increase in the profitability of these businesses.
Keyword sustainability: It has long been an integral part of our business strategy. For us, this means constantly orienting our activities and shaping our product portfolio in such a way that they make a positive contribution to sustainability, based on a holistic approach whether in environmental protection, in the supply chain, in the minimization of risks, or in employee engagement. That is why we also support all sustainability targets of the United Nations and, especially in our industry, the Responsible Care™ Charter. In addition, we are proud to report that we have achieved top rankings in the Dow Jones Sustain-ability Index in recent years.
Our agenda for 2019 and 2020 is clear: The management, headed by the new CEO Ernesto Occhiello, is currently working hard to develop the new High Performance Materials Business Area, which will be one of the core activities of the new Clariant from 2020 onward. This means that Clariant, in contrast to today, will be significantly larger, considerably more profitable and − thanks to an increased cash flow − will also have potential for further growth. In principle, our medium-term objective must be to focus Clariant’s portfolio even more on high-value, future-oriented and high-yield specialty chemical businesses.
2 LETTER TO SHAREHOLDERS

HARIOLF KOTTMANNChairman of the Board of Directors
HARIOLF KOTTMANNChairman of the Board of Directors
I would like to thank everyone who supported us in 2018 and the years before. I thank our employees for their loyalty and the high level of commitment we see within the company. Thank you, dear share-holders, for your continued confidence in Clariant. We will do our best to uphold this trust in the coming years. Sincerely,
Hariolf KottmannChairman of the Board of Directors
This is all the more important because the performance of the macro-economic environment is already weakening today. According to the International Monetary Fund (IMF), the risk of a greater decline in global economic growth has increased. Global gross domestic product is expected to increase by only 3.5 % in 2019, compared to 3.7 % in 2018. The geopolitical risks such as the trade conflict between the USA and China or the impending Brexit continue to be significant.
Nevertheless, we at Clariant are positive and confident about the future. The Board of Directors and Group management will continue to follow the current course in order to realize the potential increase in value held out to our shareholders and the desired attractiveness for customers and employees.
3CLARIANT INTEGRATED REPORT 2018

PAUL LIECKCorporate Safety Director North America, Clariant
PAGE 88
CHRISTIAN KOHLPAINTNERMember of the Executive Committee, Clariant
PAGE 28
CAMILLA LANGSite Manager Business Unit Functional Minerals & Country ESHA Nordics, Clariant PAGE 76
SIBYLLE MUTSCHLERHead of Digital4Clariant, Clariant
PAGE 130
KLEMENTINA PEJICHead of Group Human Resources, Clariant
PAGE 40
JUDITH VAN VLIET Designer ColorWorks®, Clariant
PAGE 154
LUCIUS KEMPHead of High Throughput Experimentation, Clariant
PAGE 64
LYNETTE CHUNGHead of Sustainability Strategy & Advocacy, Clariant
PAGE 100
RICHARD HALDIMANN Head of New Business Development, Clariant
PAGE 168
INTRODUCTION — TWO PERSPECTIVES INTERVIEWS4

Asking Questions Is What Makes Us Better
Driving Questions
Curiosity sparks progress. We ask how things work and how we can improve them. At Clariant, we don’t have all the answers. But we ask the right questions and take different perspectives. That’s why, for this Integrated Report, we spoke to our own experts and to our stakeholders about the most material topics of the Materiality Matrix. PAGE 19

Growth and Profitability
026 What Will Help Us Succeed in China?
Talent Attraction and Development
038 What Helps People Reach Their Full Potential?
Innovation and Technological Advances
062 Where Can We Help Accelerate Innovation?
Environmental Protection and Resources
074 When Can We Advance the Shift to Renewable Energy?
Occupational Health, Safety, and Well-being
086 Where Can We Improve Safety Even Further?
Product Stewardship/Sustainable Chemistry
098 Why Does It Pay to Focus on Sustainability?
Digitalization
128 Who Shapes New Digital Business Models?
Customer Relationships
152 What Will Our Customers Expect from Us Tomorrow?
Circular Economy
166 Where Can Chemistry Help Close the Plastics Loop?

JANIS AMBROSE SHARD Senior Manager Product Planning &
Strategy, Toyota North America PAGE 156
MARTIN CLAUSEN Senior Risk Engineer,
Zurich Insurance PAGE 90
EDWARD TSE CEO & Founder,
Gao Feng Advisory Company PAGE 30
DANIEL TEICHMANN CEO,
Hydrogenious Technologies PAGE 78
JIAN MIN SIM CEO & Co-founder,
SourceSage PAGE 132
ANKE WOLFFreelance Consultant
Human Resources PAGE 42
TIAGO MERCKEL HAUGG Marketing Manager,
Cooperativa Piá PAGE 66
ISOLDE BACHERT Director Research & Development,
Follmann PAGE 102
ALEXANDER SCHAU Packaging Developer,
Werner & Mertz PAGE 170
JANIS AMBROSE SHARD Senior Manager Product Planning &
Strategy, Toyota North America PAGE 156
5CLARIANT INTEGRATED REPORT 2018

The Foundation of Success
The Foundation of Success
FOUNDATION6

The »Foundation of Success« provides an in-depth view of Clariant’s holistic approach to creating added value. It presents an overview of Clariant’s integrated business model and details how each layer of the model, from the external business environ-ment to the discussion of three corpo-rate-wide value creation phases, supports the Business Areas in achieving valuable outcomes for the company and its stake-holders.

008 Operating an Integrated Business Model012 Thriving in the External Environment 014 Building on Vision, Mission, and Values016 Internal and External Stakeholder
Engagement 018 Materiality Assessment020 Updated Strategy to Strengthen
Clariant022 Interview with CEO Ernesto Occhiello026 Two Perspectives: What Will Help Us
Succeed in China? 032 Overview on Corporate Governance 036 Empowerment through Leadership038 Two Perspectives: What Helps People
Reach Their Full Potential? 044 Overview on Compensation Policy 046 Core Processes for Value Creation

Value creation from the short to the long term depends on a combination of financial and non-financial, tangible and intangible assets. The value a company creates for its customers, shareholders, and other stakeholders has to be attuned to their needs and provide valuable differentiation compared to the competition.
Clariant’s success is measured by its ability to provide innovative and sustainable solutions that support its customers’ goals, and to operate with efficiency and integrity. The discussion of Clariant’s business model illustrates how Clariant transforms financial and non- financial inputs into valuable outputs by applying three main value creation phases throughout its corporate activities and in its four Business Areas.
Clariant’s ambition to create sustainable value is guided by its vision, mission, and corporate values, which are underpinned by its corporate objectives, targets, and strategy. Its corporate governance principles, strong leadership culture, and compensation principles also support sustainable value creation.
By considering trends and market drivers in the business environment and engaging in ongoing dialog with its stakeholders, Clariant stays attuned to the needs of its customers, employees, shareholders, and society, and embraces their feedback to improve its business.
7CLARIANT INTEGRATED REPORT 2018

Operating an Integrated Business Model
1. Building on a strong foundationClariant’s business model is based on a focused vision and mission, and strong corporate values, all of which are operationalized through its five-pillar strategy and overall corporate objectives and financial targets.
Clariant recognizes global challenges as business oppor-tunities and relies on an entrepreneurial leadership culture and dedicated employees who contribute their knowledge and skills to make Clariant a high-perform-ing organization.
2. Transforming capitals to create value for all stakeholdersClariant draws on six kinds of capital to fuel the value creation process: financial, intellectual, manufactured, human, relationship, and natural. Clariant converts these capitals into valuable outputs, such as products and services, which benefit customers, employees, shareholders, and the environment.
— Financial Capital refers to the pool of funds available to the company for use in the production of goods or the provision of services. This can include funds obtained through financing, such as debt, equity, or grants, and funds generated by the company, for example through sales or investments. In Clariant’s business model, presented overleaf, these are, for example, R&D spend as an input and sales as an output.
— Intellectual Capital is the knowledge-based intangibles used and created by the company, often in collabora-tion with partners. This can include intellectual prop-erty, such as patents, trademarks, copyrights, soft-ware, rights, and licenses, and »organizational capital« such as tacit knowledge, systems, procedures, and protocols. For Clariant, examples include scientific collaborations as an input and patents at year end as an output.
— Manufactured Capital includes manufactured physical objects such as buildings, equipment, and products. These can include objects that are available to the com-pany for use in the production of goods or the provi-
Clariant’s business model illustrates how the company transforms various resources into innovative, sustainable solutions. As expressed by Clariant’s brand values – Performance, People, and Planet – the achieved outcomes benefit all stakeholders, and their feedback helps Clariant continuously improve value creation.
8 FOUNDATION — BUSINESS MODEL

sion of services, or that the company produces for sale to customers or for its own use. In Clariant’s business model, examples are raw material procured as an input and production volume as an output.
— Human Capital is the company’s staff and its compo-sition, competencies, capabilities, experience, and motivation to innovate. This can include employees’ alignment with corporate values and their ability to understand and implement the company’s strategy. In the case of Clariant, inputs include training hours and outputs are, for example, employee health and safety.
— Relationship Capital refers to key relationships, including those with significant groups of stakeholders and other networks. This can include shared values, the trust and willingness to engage, and related intan-gibles associated with its brand and reputation. For Clariant, examples are client interviews as an input and customer satisfaction as an output.
— Natural Capital includes the renewable and nonre-newable environmental resources and processes that support the past, current, or future prosperity of the company or are affected by it. Examples can include resources related to air, water, and land that are uti-lized or impacted by emissions. In the Clariant business model, energy consumption is one input and green-house gas emissions are an output.
Clariant categorizes these six capitals under its brand values Performance (encompassing financial, intellec-tual and manufactured capital), People (encompassing human and relationship capital), and Planet (encom-passing natural capital).
3. Fueling growth and profitability with three value creation phasesClariant’s Business Areas are guided by three value creation phases that ensure excellence in execution throughout the company’s activities: — Idea to Market— Market to Customer and — Customer to Cash.
Idea to Market encompasses all processes that contribute to a well-filled and high-performing innovation pipe-line. Market to Customer includes all steps of a truly cus-tomer-experience-centered marketing and sales pro-cess. Customer to Cash covers Clariant’s efforts to ensure safe, efficient production and reliable delivery.
9CLARIANT INTEGRATED REPORT 2018

FOUNDATION — BUSINESS MODEL
001 BUSINESS MODEL
External EnvironmentSocietal Trends and Market Drivers
CLARIANTVision, Mission, Corporate Values
StakeholdersClariant constantly engages with its stakeholders to stay attuned to their needs and gain feedback on how to best create value for them.
FEEDBACK
OU
TCO
ME
A
CH
IEV
ED
FO
R
New employees hired
2 142
Client interviews
538
Production facilities
125
Raw material procurement in CHF m
2 948
Training hours
234 240
Scientific collaborations
> 125
Raw material supply base by spend covered by sustainability evaluation
74 %
Raw material procured in m t
3.57
Energy consumption in m kWh
3 209 3
Water consumption in m m3
49 3
PERFORMANCE
PEOPLE
PLANET
InputResources and relationships that Clariant draws upon for its business activities.
Catalysis
NaturalResources
Plastics & Coatings
CareChemicals
Idea to
Market Market to
Custom
er
Leadership
Five Pillar Strategy
Overall Objectives and Financial Targets
Custom
er to Cash
1 Contains the contribution to growth from both Top Line Innovation as well as Life Cycle Innovation. Potential cannibalization of existing sales caused by Life Cycle Innovation in certain cases has not been excluded from calculation.
2 For 2018, the production volume is based on a reduced reporting scope, which includes sites that are responsible for 95 % of total production.
R&D spend in CHF m
209
> 375Active innovation projects
Natural capital
Financial capital Intellectual capital
Relationship capitalHuman capital
Manufactured capital
10

The Integrated Report 2018 can be explored not only through the subsequent layers of Clariant’s business model, but also along three thematic »focus routes«. They shed light on value creation from the perspective of the Group as well as the Business Areas along the main threads of innovation, customer experience, and operational excellence, providing shortcuts between the respective parts of the report. For simple orientation and guidance, the content of each focus route is high-lighted with a colored icon and vertical line.
IDEA TO MARKET
The Idea to Market focus route covers the innovation- related parts of the Integrated Report. After the over-view in the »Idea to Market« chapter, this focus route elaborates on the Business Areas’ innovation endeavors and discusses the results achieved with respect to the innovation-related material topics. PAGE 46
MARKET TO CUSTOMER
The Market to Customer focus route includes report sections that illustrate Clariant’s approach to customer- centricity. Starting with the »Market to Customer« chapter, this focus route sheds light on the Business Areas’ efforts to develop their marketing and sales processes toward true customer-centricity, and reveals the results regarding the customer-related material topics. PAGE 49
CUSTOMER TO CASH
The Customer to Cash focus route encompasses the parts of the Integrated Report that center around Clariant’s efforts to ensure safe, reliable, and efficient operations. Beginning with the »Customer to Cash« chapter, this focus route illustrates the Business Areas’ actions to optimize procurement, planning, produc-tion, and delivery, and presents the results achieved for the operations-related material topics. PAGE 51
PERFORMANCE
PEOPLE
PLANET
OutputResults from Clariant’s business activities.
Sales in CHF m
6 623
Staff in FTE at year end
17 901
Growth through innovation
> 3 % 1
Production volume in m t
4.34 2
Products awarded the EcoTain® label
24
EBITDA margin before exceptional items
15.4 %
Lost time accident rate (LTAR)
0.15
Patents at year end
6 700
Wastewater in m m3
13 3
Greenhouse gas emissions (scope 1 & 2) in m t
0.93 3
3 Every three years, Clariant validates environmental data from all production sites. The last full reporting campaign was in 2017. In interim years, including 2018, the reduced reporting scope comprises the larger sites responsible for 95 % of production.
11CLARIANT INTEGRATED REPORT 2018

Thriving in the External Environment
1. Current regional trends shape the opportunity spaceRegional developments relevant for the specialty chem-icals sector, and for Clariant in particular, include:— Renewed investment interest in the European chemi-
cal industry for the first time in over a decade. As an importer of most base chemical products, Europe has an opportunity to increasingly meet demand with local production, and reduce reliance on imports to only key inputs, such as feedstock from the United States. In addition, by maintaining the competitiveness of the base chemical industry, the raw materials required for specialty chemical production will con-tinue to be available locally.
— An overall shift in China from export-related growth to growth based on local consumption. This would lead to slower, more sustainable growth but could also reduce the import demand for certain chemicals. Chinese companies aim to move into higher-specifi-cation products.
— Conflicting trends in the investment climate for the chemical industry in North America. High availability of feedstock in the US makes chemical investments potentially attractive, while changes to trade policy entail higher risks for future investments as North America is an exporter of many base chemicals and polymers.
— Growth in local currency rather than product volume in Latin America due to depreciating currencies. The current outlook indicates increased volume growth at potentially more stable currencies, with more opti-mism in Brazil than there has been in the last several years. The business environment is improving.
2. Innovative, sustainable solutions and trusted relationships are neededBeyond these regional developments, a number of over-arching trends are currently emerging. For example, demand for oil-based fuels is forecast to decrease globally in the longer term. This is motivating oil and refining companies to increasingly enter the chemicals business, where growth is still healthy. Regarding trends in market needs, customers are seeking innovative specialty products for differentiated, high-performance applica-tions to avoid commoditization. In addition, customers are expecting shorter lead times from suppliers such as Clariant as they strive to become more agile, making digitalization an essential topic. Lastly, large customers are setting goals for supply chain sustainability that Clariant must meet as a supplier.
Concerning revenue developments, global Clariant sales were supported in 2018 by strong end-market growth during most of the year. Revenue growth in the oil, basic chemical, and refinery areas led to a continued recovery in the Catalysis and Natural Resources Business Areas following a dip in 2016. Growing revenues in the specialty chemical, healthcare, and agrochemical markets and steady growth in surfactants supported Care Chemicals’ growth. Slower, but still positive, growth was experi-enced in the Plastics & Coatings end markets.
How specialty chemicals companies and their customers innovate, collaborate, and operate does not change overnight. To develop the required know-how, relationships, and infrastructure in a timely manner, Clariant carefully tracks relevant external drivers, from current economic developments to megatrends with long-term impact.
FOUNDATION — EXTERNAL ENVIRONMENT12

With regard to cost, after rising approximately 7 % in 2018 partly due to increasing commodity and oil prices, overall raw materials costs are expected to rise in the range of 2.5 to 4 % in 2019. Mitigating this will require collaborations with partners based on mutual apprecia-tion, understanding, and cooperation. Clariant recognizes that trusted relationships with suppliers increase access to competitively priced raw materials, while proximity to customers supports value-based pricing by quantifying product and service benefits that allow customers to enhance their own offerings.
3. Long-term megatrends impact innovation and market perspectivesMegatrends, whose impacts will be felt beyond Clariant’s strategic planning horizon, are relevant for the company’s innovation programs and future-oriented marketing and business development. Considered megatrends are:— Future of Oil— Future of Plastics— Future of Transportation— Circular Economy
Concerning the Future of Oil, peak oil – the maximum petroleum extraction rate that will be achieved before decline begins – is forecast to occur in the 2030s. Over the next three years, forecasts project the oil price around USD 70 – 80/barrel (bbl), which is likely to moti-vate continued investment in shale oil in the US and in deep-water projects in Brazil – markets where Clariant has a strong presence – to meet demand growth while other sources mature.
With regard to the Future of Plastic, current demand for plastic products is expected to grow, especially in devel-oping economies. In the longer term, however, growth may be slower than previously predicted due to plas-tic-saving product redesign and increased recycling. Both of these trends could create innovation opportunities for Clariant, as could the emerging need for substitutions between plastic types in order to reduce environmental impact.
Concerning the Future of Transportation, major shifts in automotive markets are expected over the next 15 years regarding powertrains, vehicle use, and design. Although Clariant currently has limited exposure to the automotive market, announced changes in the Clariant portfolio make Clariant well placed to benefit from the trends in this transition. PAGE 20
Finally, with regard to the Circular Economy, 130 trends that could impact parts of Clariant’s portfolio were assessed. While there is a business risk of decreasing demand growth from factors such as design for longer product life for consumer durables, this also presents opportunities to sell value-added products. The oppor-tunities identified largely compensate for areas of poten-tial risk to Clariant’s business. Furthermore, the risk can be further mitigated by innovating and investing in the most promising opportunities. PAGE 168
13CLARIANT INTEGRATED REPORT 2018

Building on Vision, Mission, and Values
1. Vision and mission focused on value creationClariant aspires to be the globally leading company for specialty chemicals, and to stand out through above- average value creation for all stakeholders. To bring this vision to fruition in the context of the drivers of Clariant’s external environment, the company builds and maintains leading positions in its businesses and strives for functional excellence in innovation, commercializa-tion, and operations as part of its corporate culture. Clariant’s vision is underpinned by its mission to create value by appreciating the needs of:— customers – by providing competitive and
innovative solutions— employees – by adhering to corporate values— shareholders – by achieving above-average returns— the environment – by acting sustainably
2. Appreciation, culture, and reputation as drivers for successClariant believes strongly that its brand essence »appre-ciation« is a key driver for successful value creation.
FIGURE 001 For Clariant, appreciation means putting values at the center of everything the company does in each area where it is active or has an influence: per-formance, people, and the planet.
Clariant relies on its guiding vision, a well-defined mission, and a culture that encourages every employee to explore new ways to create value for all stakeholders.
001 BRAND VALUES WITH A FOCUS ON PERFORMANCE, PEOPLE, AND PLANET
Sustainable &
lead
ing-
edg
e te
chn
olo
gy
Perso
nal respect & dedication
Plan
et
People
Innovative & customized solutions
Performance
Appre ciation
FOUNDATION — VISION, MISSION, AND VALUES14

002 CORPORATE VALUES FOR SUSTAINABLE VALUE CREATION
Sustainable Value Creation
Values
Drive for Excellence
Co
rpo
rate
R
esp
ons
ibili
ty
Lived
Appreciation
Courageous and Decisive Leadership
Del
iver
to
Prom
ise
Discip
lined
Perform
ance
Manag
ement
— Performance: Clariant appreciates its customers by striving for exceptional performance and offering innovative, customized, high-quality solutions.
— People: Clariant expresses appreciation toward its stakeholders and employees with its unflagging commitment to transparency and integrity, and by fostering a culture of dialog and mutual respect.
— Planet: Clariant embodies appreciation of the planet by protecting the environment and safeguarding natural resources. By using sustainable, cutting-edge technologies, Clariant meets the most stringent standards and sets new benchmarks in the industry.
Cultivating a corporate culture that balances business performance, social commitments, and environmental targets, while also upholding the goals of all stakeholders, is essential for generating value and sustainable growth. Therefore, appreciation is embedded throughout the company’s culture and its six corporate values,
FIGURE 002 which define expectations of employee behaviors and build the company’s reputation and brand: 1. Drive for Excellence: Clariant goes for the highest
standards to profitably meet customer needs and challenges its achievement for more.
2. Disciplined Performance Management: People at Clariant set – and ask for – clear direction and challenging but achievable targets. They give – and ask for – open feedback on measured progress.
3. Deliver to Promise: Clariant counts on self-driven employees, who fully leverage their true capabilities and do not over-promise or under-deliver.
4. Courageous and Decisive Leadership: Clariant supports risk taking and acceptance of failure while learning from results and chooses the best people for the right places.
5. Lived Appreciation: People at Clariant acknowledge strength and advise on areas for improvement. They acknowledge outstanding contributions and celebrate success.
6. Corporate Responsibility: People at Clariant care for the welfare of all stakeholders, protect the environ-ment and respect communities. They never shortcut a safety procedure and live Clariant’s Code of Conduct.
15CLARIANT INTEGRATED REPORT 2018

Internal and External Stakeholder Engagement
1. Appreciation lies at the core of Clariant’s stakeholder engagementClariant expresses appreciation to its stakeholders through a variety of channels: in its unflagging commit-ment to transparency and integrity; in fostering a cul-ture of dialog and mutual respect; and by committing to sustainable, innovative technologies. A continuous dialog allows Clariant to understand all stakeholders’ needs and develop corresponding solutions that meet the most stringent standards and set new industry benchmarks.
2. Ongoing engagement with stakeholders creates valuable insightsClariant uses various channels to engage with its stake-holders. In addition to feedback received from daily interactions with customers, Clariant runs a biennial sur-vey to monitor customer satisfaction, which is critical to learn about customers’ perception of Clariant as a sup-plier and business partner. PAGE 143 In addition, Clariant regularly conducts customer interviews in the context of the Marketing Excellence Initiative and Innovation Excellence Initiative. In 2018, these engage-ments included 538 customer interviews and 150 industry expert interviews. PAGE 49
Clariant pays close attention to engaging with its employ-ees on all levels, focusing on its core value of appreciation. Appreciation means providing the support and resources that employees need to achieve their goals, and giving credit for extra effort. Development goals and performance are discussed during annual Performance Dialogs as well as 360-Degree Feedbacks. In 2018, Clariant conducted a company-wide survey to assess employee engagement and gain valuable insights for future organizational development. PAGE 139 In order to foster an ongoing dialog within the company, Clariant uses several channels to communicate with its employees, e.g., intranet, newsletters, townhalls.
For Clariant, ensuring transparency to all of its investors is a matter of course. The Integrated Report, the annual general meeting, investor updates, and an investor rela-tions iPad application, as well as presentations at ana-lyst conferences and roadshows, underpin this engage-ment. PAGE 106 In 2018, Clariant’s shareholder structure changed: The Saudi Basic Industries Corpora-tion (SABIC) acquired a stake of almost 25 %. SABIC, one of the world’s largest petrochemical manufacturers, aims to act as strategic shareholder. The resulting stability will allow Clariant to develop as a strong spe-cialty chemicals company.
To minimize the company’s impacts on the environment and safeguard natural resources, Clariant uses compre-hensive management tools and programs that combine technology, data, and behavioral guidelines, and fosters a corporate culture that prioritizes environmental stew-ardship. PAGE 158 Clariant consistently steers its product portfolio toward safer and more sustainable solu-tions in order to protect customers, consumers, and the environment. PAGE 122
Clariant constantly engages with its stakeholders to stay attuned to their needs and gain feedback on how to best create value for them. Clariant’s key stakeholders are its customers, employees, and share-holders, as well as the environment.
FOUNDATION — STAKEHOLDER ENGAGEMENT16

3. A shared language communicates sustainabilityClariant has welcomed the adoption of the 2030 Agenda for Sustainable Development by the United Nations member states in September 2015. The Agenda, including its 17 Sustainable Development Goals (SDGs), marks a milestone on the global path to a more sustainable future.
Clariant recognizes the opportunity offered by the SDGs to share a common framework of action and language when communicating with stakeholders and reporting on sustainability objectives, impact, and performance. Clariant thus plans to further increase transparency on the alignment of its strategy with the SDGs and to regularly report on the progress made toward achieving them.
These universally accepted goals are highly relevant for the chemical industry and Clariant is committed to contributing to their realization. The SDGs are in many ways congruent with Clariant’s own sustainability objectives, strategy, and values. Sustainability for Clariant is a journey – a continuous effort to steer the company’s activities and product portfolio to contribute positively to global sustainable development.
Examples of Clariant’s contributions to the SDGs are the 2025 environmental targets PAGE 158, the extensive work done through the Portfolio Value Program (PVP) to screen the product portfolio for sustainability and bring forward more sustainable products and Eco-Tain® products PAGE 122, and the company’s efforts to promote health and safety in the workplace. PAGE 140
Clariant’s various initiatives have wide sustainability impacts on value chains, communities, and society, and thus contribute to several of the SDGs, including SDG 12 »Responsible Consumption and Production«, SDG 8 »Decent Work and Economic Growth«, and SDG 6 »Clean Water and Sanitation«.
4. Stakeholder perspectives inform Clariant’s materiality assessmentIn-depth engagement with internal and external stake-holders lies at the heart of Clariant’s process of deter-mining the economic, social, and environmental topics that offer the highest potential for value creation for stakeholders and for the company. This prioritization of topics related to performance, people, and planet helps Clariant further develop its integrated management approach. PAGE 18
001 CLARIANT SUPPORTS THE SUSTAINABLE DEVELOPMENT GOALS
Source: United Nations Department of Public Information
17CLARIANT INTEGRATED REPORT 2018

International Integrated Reporting Council (IIRC)
integratedreporting.org
Global Reporting Initiative (GRI)
globalreporting.org
Materiality Assessment
1. Based on recognized standards and proceduresThe latest materiality assessment, performed in 2017, identified and prioritized the issues that matter most to Clariant and its stakeholders. It was based on two internationally recognized frameworks: the Integrated Reporting <IR> framework issued by the International Integrated Reporting Council (IIRC) and the sustain-ability reporting standards of the Global Reporting Initiative (GRI). As a first step, Clariant compiled eco-nomic, environmental, and social topics that are included in frameworks such as GRI, <IR>, SASB, UN Global Compact, and UN Sustainable Development Goals, as well as Clariant’s previously determined mate-rial topics and topics defined by peers. The resulting initial list of more than 400 topics was then consolidated to a list of less than 50 topics.
Then, Materiality was evaluated in two dimensions: stakeholders provided feedback on the relevance of each topic for Clariant from their perspective, and senior managers across the company assessed the importance of each topic for value creation by Clariant. The latter assessment included the potential influence of each issue on strategy development and achievement, market positioning and growth opportunities, risk management, compliance, and reputation management. Through con-
sidering the risks and opportunities linked to Clariant’s external impacts, the process indirectly took Clariant’s potential effect on various aspects of sustainable devel-opment into account.
2. Broad stakeholder inclusionBoth external and internal stakeholders were invited to express which topics they deemed most relevant for future value creation, with carefully defined selection criteria ensuring a balanced representation of interests among invited participants. Management and stake-holder surveys were conducted worldwide, with the lat-ter offered in English, German, Spanish, Portuguese, and Mandarin.
Overall, 131 external stakeholders, 69 employees, and 36 managers gave feedback. Seventy-four customers included in the external stakeholder group responded to the survey, in addition to non-governmental organi-zation representatives, sustainability experts, scientists, and suppliers. The outcome was evaluated and vali-dated by senior management in a workshop that was part of the 2017 assessment.
In 2018, the materiality assessment was reviewed to look for topics that had become more or less relevant during the year. In particular, recent stakeholder interactions and management discussions indicated that two topics – circular economy and digitalization – had become more relevant both to stakeholders and to value creation. The materiality matrix was refreshed accordingly.
To determine which levers offer the highest potential for value creation in the long run, Clariant conducts comprehensive materiality assess-ments at regular intervals. The prioritization of material topics related to performance, people, and planet is well aligned with Clariant’s strategic pillars.
FOUNDATION — MATERIALITY18

For Focus topics as well as for Advance topics, Clariant has established management approaches. REPORTS.CLARIANT.COM/2018/GRI Current developments, activities, and achievements for each topic can be found throughout the Integrated Report, especially in the Multicapital Review. PAGE 104
Focus topics are further illustrated by dedicated interviews with internal and external experts:Growth and Profitability PAGE 26, Talent Attraction and Development PAGE 38, Innovation and Technological Advances PAGE 62, Environmental Protection and Resources PAGE 74, Occupational Health, Safety, and Well-being PAGE 86, Product Stewardship/Sustainable Chemistry PAGE 98, Digitalization PAGE 128, Customer Relationships PAGE 152, Circular Economy PAGE 166
001 CLARIANT MATERIALITY MATRIX
RE
LE
VA
NC
E F
OR
STA
KE
HO
LD
ER
M
OD
ER
AT
E
MODERATERELEVANCE FOR COMPANY VALUE CREATION
HIGH VERY HIGH
HIG
HV
ER
Y H
IGH
CULTIVATE FOCUSADVANCE
Talent Attraction and Development
Growth and Profitability
Product Stewardship / Sustainable Chemistry
Customer Relationships
Innovation and Technological Advances
Occupational Health, Safety, and Well-being
Environmental Protection and Resources
Circular Economy
Digitalization
Community Engagement
Transparency
Diversity
Bio-based Economy
Employee Engagement
Corporate Governance
Climate Change
HumanRights
Sustainability Performance in the Supply chain
Policy and Stakeholder Relations
Value Chain Collaboration for Sustainability
Ethics and Compliance
3. Materiality MatrixThe results of the comprehensive materiality assess-ment are summarized in the Clariant Materiality Matrix
FIGURE 001, which shows topics considered moder-ately to highly relevant. The matrix depicts the relevance of the topics from the stakeholder point of view on the vertical axis and relevance for value creation by Clariant on the horizontal axis.
The topics are categorized in three areas: Cultivate, Advance, and Focus. Focus topics are at the core of Clariant’s ability to create long-term value; further improvements regarding Advance topics allow Clariant to better meet company and stakeholder expectations; Cultivate topics support successful value creation in the future.
19CLARIANT INTEGRATED REPORT 2018

Updated Strategy to Strengthen Clariant
1. Overall objectives underpin Clariant’s vision and missionTo advance into the top tier in specialty chemicals, Clariant focuses on overall objectives related to its dif-ferent stakeholder groups. The company strives:— to be a publicly listed company with a broad share-
holder base, reliable long-term anchor shareholders, and a high reputation for above industry-average profitability, growth, and Total Return to Shareholders (TRS);
— to be known as a powerhouse for R&D and Innovation and to increase value by applying a forward-looking sustainability lens to operations and market offerings;
— to serve markets with future perspectives and strong growth rates and focus on businesses with competitive position, and
— to be a preferred employer.
In addition, Clariant has increased its financial targets based on the expected implementation of an updated strategy and significant portfolio upgrade, as summa-rized in FIGURE 004.
2. A five-pillar strategy provides guidanceAgainst the background of its qualitative objectives and financial targets, Clariant articulates its approach to long-term value creation for its stakeholders through its Group strategy, which has been further developed along five pillars: focusing on innovation and R&D; adding value with sustainability; repositioning the portfolio;
intensifying growth; and increasing profitability. In 2018, a strategy update featured a major portfolio upgrade designed to capture a significant collaboration opportu-nity with SABIC in the area of high-performance materials. FIGURE 001
The strategic pillars are well aligned with the material topics deemed most relevant for Clariant and its stakeholders. PAGE 18 From the topics determined to be most material in the comprehensive materiality assessment conducted in 2017, Innovation and Technological Advances lies at the heart of the first strategic pillar; Product Stewardship and Sustainable Chemistry, as well as Environmental Protection and Resources, are essen-tial aspects of the second strategic pillar, as is Occupa-tional Health, Safety, and Well-being as part of the mitigation of risk; and Customer Relationships are an important foundation of the fourth and fifth strategic pillars, which together correspond to the most material topic of Growth and Profitability. All five strategic pillars are underpinned by Clariant’s People Excellence initiative, for which the most material topic of Talent Attraction and Development is an important aspect.
In 2018, the materiality matrix was reviewed and slightly refreshed with two new topics elevated into the group of most material topics: Digitalization and Circular Economy. Digitalization is now represented in the first strategic pillar by highlighting digital business model opportunities and in the fifth pillar by including digitally enabled operating models. Circular Economy is addressed in the second pillar, emphasizing the focus on products and partnerships.
Clariant’s holistic approach to creating value for all stakeholders is underpinned by its overall objectives, financial targets, and five-pillar strategy. In 2018, Clariant announced a portfolio upgrade that enables the Group to realize a significant step change into higher value specialties.
FOUNDATION — STRATEGY20
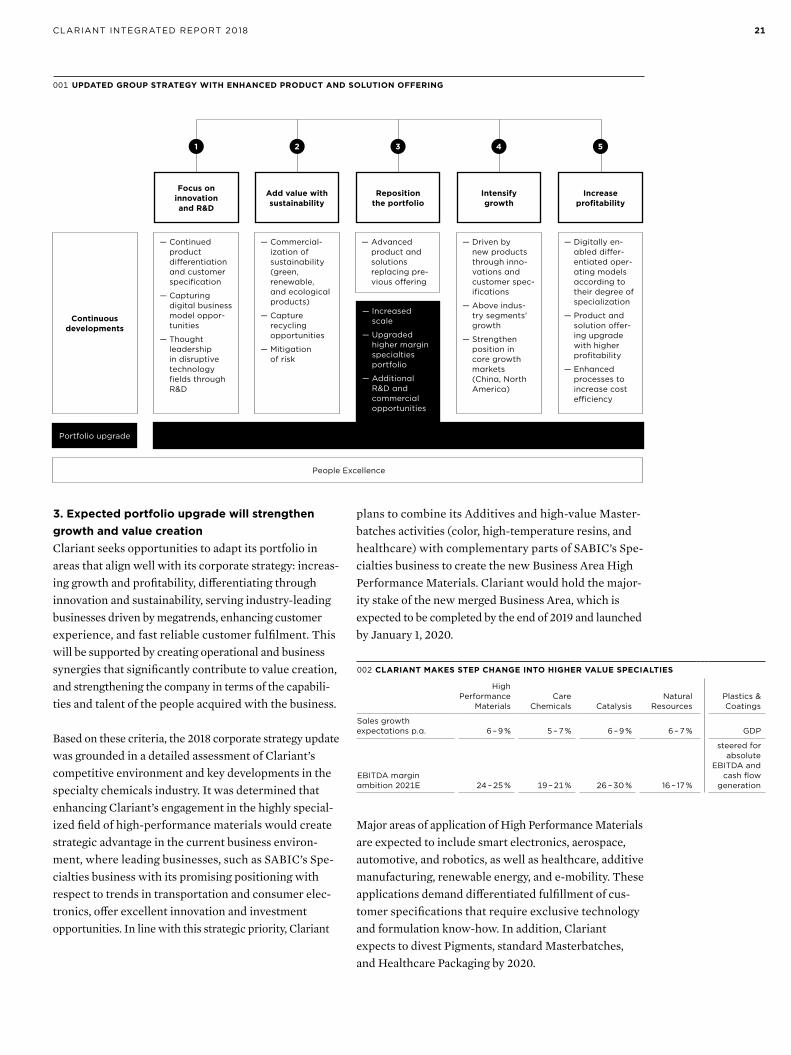
001 UPDATED GROUP STRATEGY WITH ENHANCED PRODUCT AND SOLUTION OFFERING
Continuous developments
— Continued product differentiation and customer specification
— Capturing digital business model oppor-tunities
— Thought leadership in disruptive technology fields through R&D
— Commercial-ization of sustainability (green, renewable, and ecological products)
— Capture recycling opportunities
— Mitigation of risk
— Advanced product and solutions replac ing pre-vious offering
— Driven by new products through inno-vations and customer spec-ifications
— Above indus-try segments' growth
— Strengthen position in core growth markets (China, North America)
— Digitally en-abled differ-entiated oper-ating models according to their degree of specialization
— Product and solution offer-ing upgrade with higher profitability
— Enhanced processes to increase cost efficiency
People Excellence
Portfolio upgrade
21 3 4 5
Focus on innovation and R&D
Add value with sustainability
Reposition the portfolio
Intensify growth
Increase profitability
— Increased scale
— Upgraded higher margin specialties portfolio
— Additional R&D and commercial opportunities
3. Expected portfolio upgrade will strengthen growth and value creationClariant seeks opportunities to adapt its portfolio in areas that align well with its corporate strategy: increas-ing growth and profitability, differentiating through innovation and sustainability, serving industry-leading businesses driven by megatrends, enhancing customer experience, and fast reliable customer fulfilment. This will be supported by creating operational and business synergies that significantly contribute to value creation, and strengthening the company in terms of the capabili-ties and talent of the people acquired with the business.
Based on these criteria, the 2018 corporate strategy update was grounded in a detailed assessment of Clariant’s competitive environment and key developments in the specialty chemicals industry. It was determined that enhancing Clariant’s engagement in the highly special-ized field of high-performance materials would create strategic advantage in the current business environ-ment, where leading businesses, such as SABIC’s Spe-cialties business with its promising positioning with respect to trends in transportation and consumer elec-tronics, offer excellent innovation and investment opportunities. In line with this strategic priority, Clariant
plans to combine its Additives and high-value Master-batches activities (color, high-temperature resins, and healthcare) with complementary parts of SABIC’s Spe-cialties business to create the new Business Area High Performance Materials. Clariant would hold the major-ity stake of the new merged Business Area, which is expected to be completed by the end of 2019 and launched by January 1, 2020.
002 CLARIANT MAKES STEP CHANGE INTO HIGHER VALUE SPECIALTIES
High Performance
MaterialsCare
Chemicals CatalysisNatural
ResourcesPlastics & Coatings
Sales growth expectations p.a. 6 – 9 % 5 – 7 % 6 – 9 % 6 – 7 % GDP
EBITDA margin ambition 2021E 24 – 25 % 19 – 21 % 26 – 30 % 16 – 17 %
steered for absolute
EBITDA and cash flow
generation
Major areas of application of High Performance Materials are expected to include smart electronics, aerospace, automotive, and robotics, as well as healthcare, additive manufacturing, renewable energy, and e-mobility. These applications demand differentiated fulfillment of cus-tomer specifications that require exclusive technology and formulation know-how. In addition, Clariant expects to divest Pigments, standard Masterbatches, and Healthcare Packaging by 2020.
21CLARIANT INTEGRATED REPORT 2018

Focusing on Best-In-Class Customer Experience and Excellence in Execution
INTERVIEW WITH CEO ERNESTO OCCHIELLO
Focusing on Best-In-Class Customer Experience and Excellence in Execution
Ernesto, you’ve been the CEO of Clariant for a few months now. What are some of your first impressions?Clariant is an excellent company with great people. The company is run well and has some exceptional technologies. It has a lot of potential in creating value for our customers. And I think we’re on the right path to become one of the fastest and most reliable suppliers in our field and a true world leader in high-value specialty chemicals.
2018 was another intense year for Clariant with the entry of a new shareholder and the announcement of a strategy update. What is your view on this?First of all, we delivered on our promise. Business was good with sales increasing 5 % and an improved absolute EBITDA before excep-tional items of more than one billion Swiss francs. Considering the state of the global economy, which softened towards the end of the year, that alone is a positive sign. Some of our businesses that are closer to the consumer have shown significant increases of sales and profitability, which is a remarkably good outcome. But the clearest evidence of what a good job the people at Clariant are doing is the operating cash flow. Its increase of 24 % is a real step change from previous years. However, we mustn’t rest on our laurels. We aim high: We want to position ourselves in the top quartile of the high-value specialty chemical industry. And we want to be the best in what we do. To that end, with SABIC’s entry as a new anchor share-holder and our announcement of the creation of a new Business Area High Performance Materials, 2018 saw two strategic milestones on this journey.
What are the next steps in terms of divestments?We have already started to carve out Pigments, Standard Master-batches, and Healthcare Packaging from the former Plastics & Coatings Business Area. I am very confident about their sale, which we hope to complete by 2020.
What will change with Clariant’s trans formation?Everybody likes to see a new CEO put a different spin on how things are done. But Clariant is in good shape. That’s why we will continue to execute our proven five-pillar strategy and to focus on innovation and R&D, which is key for our continued product differentiation and customer specification. We will also keep creating value by com-mercializing the sustainability needs of our customers, for example, by delivering more renewable and eco-friendly products. However, we’ll remain open to bolt-on acquisitions in order to reposition our portfolio and open to taking additional transformative steps when-ever appropriate. Part of our transformation is to further strengthen our profitability and improve our cash generation. Good cash man-agement is a prerequisite for us to invest in growth. Another thing we’ll continue is our Clariant Excellence initiative with an even stronger focus on operational efficiency and excellence in execution.
You seem to focus very much on customer needs...Yes, we need to better align our application development and our products with the needs of our customers. Our customers should rely on us to get the fastest and most reliable customer fullfilment in the industry. In other words: we want to create the best possible customer experience and we want to maximize their success. This will help in both retaining existing customers and attracting new ones.
Where do you see potential for further growth?The most successful companies rely on their core strengths. We have to make sure that our portfolio addresses the upcoming challenges, technology opportunities, and consumer demands – including their appetite for more convenience, safety, health, and resource effi-ciency. Our new Business Area High Performance Materials can deliver solutions for the increasing digitalization in many industries, like the fast-growing market for smart electronics and appliances. And our other businesses, like Care Chemicals, Catalysis, and Natural Re sources, serve rising customer needs in safety and health – with anything from halogen-free flame retardants to natural, ethical, and sustainable ingredients for personal care products.
22

ERNESTO OCCHIELLOChief Executive OfficerERNESTO OCCHIELLOChief Executive Officer
Clariant is known as a leader in sustainability. How important is it to you?Sustainability is the core of our strategy. We need to ensure that we address environmental, economic, and societal needs in order to compete. If you can run your business using fewer resources than others or if you find ways to reduce your environmental impact, you’re very likely to be rewarded – by your customers, your share-holders, and society in general. Our catalysts are a great example. As the International Council of Chemical Associations put it, catalysts are the best way to significantly improve the energy efficiency of chemical processes.
What are your personal expectations for Clariant and the way forward?Everybody knows that I don’t talk too much. I prefer to let results speak for themselves. We have an experienced and dedicated leader-ship team, a lot of great talent and hardworking people in the com-pany. I am convinced that with the support of our Board and Chairman, Hariolf Kottmann, we will continue on our successful path. We have certain goals: By 2021, we want to achieve sales of around 9 bil-lion Swiss francs, an EBITDA margin after exceptional items in the order of 20 %, an operational cash flow of more than 1.2 billion Swiss francs, and an ROIC after exceptional items of more than 10 %. If we stay focused on our customers, on operational efficiency, and on excellence in execution, I’m sure we can realize the full potential of this great company – to the benefit of everyone: to our customers, who value fast and reliable service, to our employees, who appreciate a safe and motivating working environment, to our shareholders, who delight in increased dividends and shareholder value, and to society as a whole, which pushes for sustainable development.
23CLARIANT INTEGRATED REPORT 2018

Combined with attractive prospects in Care Chemicals, Catalysis, and Natural Resources, this portfolio upgrade will allow Clariant to focus even more on customer- specific, technologically advanced applications with high growth and high value-creation potential.
4. Strategic Management Process ensures Corporate and Business Unit involvementClariant’s Strategic Management Process (SMP) ensures that the overall strategy development is conducted as an iterative process at the Group level as well as for each of the individual Business Units.
In the SMP process conducted during the course of 2018, each Business Unit in close cooperation with Cor-porate Planning & Strategy reviewed Cross-Business Unit topics both in regard to external trends (Future of Oil, Future of Transportation, Future of Plastics, Circu-lar Economy) as well as regarding the five pillars of the Group strategy. For example, cross-Business Unit workshops regarding digital impact, innovation through
R&D, and sustainability were conducted to identify priority areas. Each Business Unit selected specific topics for deep dives, and then substantiated these as core elements in their Business Plan, including must-win battles.
Depending on the Business Unit in question, must-win battles can include specific regional growth targets, sup-ply chain or marketing opportunities, or innovation areas that are especially relevant in further differentiat-ing the Business Units’ product portfolio.
This process ensures that Business Unit strategies are developed with corporate guidance on aspects such as external trends or priorities of the five-pillar Group strategy, while also focusing on the specific opportunities and risks in the particular businesses. On the basis of these deliberations, the scope of the SMP discussions with each Business Unit included: — marketing, innovation, sustainability, and operations
strategy/roadmap, and growth and profitability targets at the segment level, and
— innovation focus fields, innovation growth targets, and core growth and profitability targets for the whole Business Unit.
The corresponding implementation plans feed into financial plans for each Business Unit that are developed and refined alongside the Group financial objectives. In the context of the enhanced growth profile of the Group related to the portfolio upgrade, Clariant expects to be able to reach sales growth of 5 – 6 % annually and to
FOUNDATION — STRATEGY
003 CONTENT DEEP DIVES TO THE BUSINESS UNIT STRATEGIES
Overarching topics
Specific deep dives
SMP 2018 – 21 Business Plan
Cross-Business Unit Mega-trends
Digital End- Market-Back implications
Innovation
Sustainability
Deep dive 1
Deep dive 2
Deep dive 3
…
Must-win battle 1
Must-win battle 2
Must-win battle 3
Other segments
24

In 2018, Clariant’s Excellence Initiatives achieved a net benefit of CHF 194 m.
194
increase EBITDA margin after exceptional items to approximately 20 % by 2021. The combination of Clariant’s and SABIC’s offerings within Clariant is expected to result in significant synergies, with an anticipated annual run rate of CHF 100 million realized over three years from closing.
The mid-term financial objectives are discussed in the context of the »multicapital review«. PAGE 114
5. Clariant Excellence supports value creationClariant Excellence (CLNX), the company’s Business Excellence program, supports the Business Units in their strategy execution. Along with People Excellence, the program comprises Innovation Excellence (CIX), Commercial Excellence (CCE), and Operational Excel-lence (COX). These linked initiatives for excellence in execution drive value from EBIT improvements and cash flow from additional growth.
In total, CLNX improvement projects delivered esti-mated net benefits of CHF 194 m in 2018, of which CHF 112 m were cost savings. CLNX supports systematic value creation along the entire value chain: from ide-ation for new products, services, or business models to defining commercial strategy to ultimately ensuring effective and efficient production and delivery of finished goods to Clariant’s customers. PAGE 46
Note: combines business foreign exchange rate assumption of 1.0 USD = 1.0 CHF; 2021E at stable 2018 FX rates
004 OBJECTIVES FOR FUTURE FINANCIAL GROWTH
6.4
12.7
428
> 10
Salesin CHF bn
EBITDA marginafter exceptional items (%)
Operating cash flowin CHF bn
ROICafter exceptional items(%)
~ 9
~ 20
> 1 200
Above peer group
average
2017
2017
2017
2017
2021E
2021E
2021E
2021E
005 NET BENEFIT BY CLARIANT EXCELLENCE in CHF m
141
2015
162
2017
131
20162014
127
194
2018
25CLARIANT INTEGRATED REPORT 2018

TWO PERSPECTIVES — GROWTH AND PROFITABILITY26

What Will Help Us Succeed in China?
Growth and Profitability
Like so many others, Clariant has identified China as the driver for global business growth and innovation. But unlike many other Western companies Clariant has put China at the heart of its global strategy to explore new opportunities and fully adapt to the country’s unique business environment.

ChristianKohlpaintner
As a Member of Clariant’s Executive Committee, Christian spent more than two years
in Shanghai, implementing the company’s unique China strategy.

Edward Tse
As one of China's leading Global Strategy Consul tants, Edward and his unique perspective on the country’s development were instrumental in developing Clariant’s China strategy.
Edward Tse
As one of China’s leading Global Strategy Consul tants, Edward and his unique perspective on the country’s development were instrumental in developing Clariant’s China strategy.
27CLARIANT INTEGRATED REPORT 2018

What’s the goal for Clariant in China?In 2016 we set out to double our revenue by 2021.And we’re on track to doing so. In the last twelve months we have been growing faster than any other competitor, be it multinational or domestic.
You mentioned sustainability as a trend. What role does that play in China?Sustainability is a top priority in China’s current Five-Year Plan. And rightfully so! People long to see blue skies again. They view pollution as a risk to their newly found prosperity. The Chinese government is fully aware of this and takes measures unlike anything you see elsewhere. Imagine your local supplier being shut down literally overnight for not complying with new regulations. Some of these regulations, by the way, are even much stricter than in Europe.
Tell us a bit about Clariant’s new governance model in China.It’s essentially about giving China a voice at the table whenever and wherever global business decisions are made. Each of our seven Business Units is run by a global management team and the five most relevant ones in China have a member solely responsible for the China business. That way, China is always on the global agenda. And we’ve gone one step further by establishing China as a sort of eighth Business Unit. Its head, our new regional president, Fu Cai Wang, reports directly to the Executive Committee, just like the heads of all our global Business Units, with whom he is on peer level.
Why did Clariant fill these new positions almost exclusively with native Chinese? It reduces cultural and language barriers, which is crucial in China – no matter if you’re dealing with small local heroes or multi-billion dollar companies.
Was it hard finding the necessary talent?We looked for seasoned business experts who not only know the Chinese market very well but also have ample experience with multinationals. The fact that we won over almost everyone we reached out to tells us that our China story is very compelling and thus has attracted top talents to Clariant.
Christian, you’ve recently spent the better part of two years in Shanghai. What were you there for?I had been responsible for Asia, and thus for China at the Executive Committee for some time, but we weren’t seeing the kind of progress we were hoping for. So my move there in 2016 was to show our commitment to putting China from »Fringe to Core« of our global strategy. And it’s been instrumental in building a China- focused governance structure that now reports straight to the top. We’re the first multinational to have based an Executive Committee member in Shanghai, mainland China.
What makes China so essential to Clariant?It’s the largest single chemicals market in the world – twice the size of the US or Europe. China is also by far the fastest growing market. That makes for boundless opportunities and I’m more than ever convinced the future of Clariant will be decided in China.
How has the experience affected you personally?I like to joke that China made me ten years younger. The speed and agility of doing business there, the pace at which you move and the way you use technology – it all »modernizes« you in a way that I really hadn’t expected.
Is it important for an executive to gain that kind of insight? Let’s put it this way. I don’t need anybody to tell me any-thing about megatrends anymore. Clariant wants to tap into trends like urbanization, shifting demographics, mobility, and sustainability. But there’s only so much you can learn about these things from a cozy office in Switzerland. Living in Shanghai, I’ve experienced life in an exploding megacity of 24 million people first-hand – population density, traffic gridlock, the constant construc-tion work and pollution. But I’ve also witnessed the unique Chinese entrepreneurial spirit.
What’s different about Chinese entrepreneurs? They’re eager and open to innovate in a way that you rarely see in Western Europe. They’re optimistic. They’re ambitious, but also forgiving. Trying new things, failing, and then trying again tomorrow – that’s deeply embed-ded in their business culture. It’s also why I believe China should be our first market whenever we try to commercialize anything new.
TWO PERSPECTIVES — GROWTH AND PROFITABILITY28

CHRISTIAN KOHLPAINTNERMember of the Executive Committee, Clariant
How can we harness China’s
potential?
How can we harness China’s
potential?
29CLARIANT INTEGRATED REPORT 2018

EDWARD TSECEO & Founder, Gao Feng Advisory CompanyEDWARD TSECEO & Founder, Gao Feng Advisory Company
TWO PERSPECTIVES — GROWTH AND PROFITABILITY
What drives business and innovation in China?
What drives business and innovation in China?
30

What chapters would you like to add to this book today?What’s special today is the fact that entrepreneurship is not just for the privileged. It has become the fabric of Chinese culture today. State-Owned Enterprises (SOEs) still play an important role, but many young people have realized that starting a business or working for a start-up rather than an SOE is a path for them to get where they want to be. If I were to write a new book about Chinese innovation today, it would be about the new era we’re entering with technologies like artificial intelligence, the internet of things, blockchain technology, and 5G. Those will have a profound impact on China’s innovation and business. The Chinese entrepreneurs will be at the fore-front of that.
Are Western executives in China less open to innovation?Western executives are very keen – I would even say in-doctrinated – to base their strategy on the doctrine of core competencies: »Focus on what you are good at and don’t divert your attention to anything else«.
Why is that bad for innovation?Because it limits what the company is willing to consider. Chinese entrepreneurs don’t necessarily have that ideological baggage. Many of them are happy to develop multiple business ecosystems even if they don’t have all the capabilities in place themselves. When they feel a new opportunity is worth pursuing, often they would rather jump before anybody else does and then fill the capability gaps along the way.
Are the gold rush days over for Western companies in China?China continues to evolve and to open up. China today is very different from China ten years ago, and it will again look very different ten years from now. There is major potential for more growth. But if you want to make the most out of that, you need to put China at the core of your global strategy and organization, which means making China a part of your corporate brain. Including the ability to evaluate opportunities and to design, innovate, and execute new ideas. It’s impossible for a corporate headquarter that is thousands of miles away to fully appreciate what’s going on on the ground in China.
Edward, what’s the biggest misconception Western companies have about China?It’s the presumption that China’s development will fol-low the path of the West, and that they can simply copy and paste their strategy and business model to China. The typical Western stance is, »If this cookie-cutter approach results in success, that’s great and we know what we are doing! However, if it doesn’t, then the problem has got to be with China, and not our strategy«.
What makes China so different?It’s an ancient civilization going back 5 000 years, but its modern business development is exceptionally young. Only since the reforms and opening of the late 1970s has China started to reconnect with the rest of the world. That development is far from perfect, but it has lifted 700 million people out of poverty. The China that you’re seeing now comes from a rather unique background and makes for a very different context compared to that of the West.
Is the role of the government as big as we think?Going from a Soviet-style planned economy to a market economy takes time, and China is not entirely there yet. But today, relative to the state sector, China’s private sector is by far the bigger job creator and contributor to the country’s GDP. It’s also the primary source of busi-ness innovation. The reemergence of the Chinese entre-preneurial spirit is probably the most profound devel-opment in China’s recent history.
It led you to write a book in 2015 about »China’s Disruptors«. What contributed to their success?What certainly helped was the size and growth of the China market, which allowed for rapid scaling of their business models. The prevalence of digital technology, specifically the wireless internet through smart devices, was the critical enabler.
31CLARIANT INTEGRATED REPORT 2018

Overview on Corporate Governance
1. Principles of Corporate GovernanceThe Group commits to Swiss and international standards of corporate governance by following the respective statutory provisions and the rules issued by the SIX Swiss Exchange, and by implementing the principles of the Swiss Code of Best Practices for Corporate Governance.
2. Organizational overviewClariant is headquartered in Muttenz, Switzerland. While Clariant reports in the four Business Areas Care Chemicals (Business Unit Industrial & Consumer Specialties), Catalysis (Business Unit Catalysts), Natural Resources (Business Unit Oil & Mining Services, Busi-ness Unit Functional Minerals), and Plastics & Coatings (Business Unit Additives, Business Unit Masterbatches, Business Unit Pigments), the seven Business Units are the highest-level operating units within the Group.
Clariant is committed to international compliance standards, ensuring checks and balances between the Board and Management, as well as a sustainable approach to value creation.
FOUNDATION — CORPORATE GOVERNANCE
Additives
Catalysts
Functional Minerals
Industrial & Consumer Specialties
Masterbatches
Pigments
Oil & Mining Services
Group HR Services
Group Communica tion Services
Group Legal Services
Group Excellence Services
Group Finance Services
Group Procurement Services
Group Sustain. & Reg. Affairs Services
Senior Mgmt. Development Services
Group IT Services
Middle East & Africa
Japan
Greater ChinaSouth East Asia
North America
India
Latin America
Europe
001 CLARIANT ORGANIZATIONAL STRUCTURE AS OF 31 DECEMBER 2018
Business Units RegionsGroup Technology & Innovation
Global Business Services
Corporate Center
Board of Directors
Executive Committee
Business Services
32

The Board of Directors is comprised of 12 members, of which three are women.
12The organizational structure FIGURE 001 is further comprised of nine Business Services, Group Technology & Innovation (GTI), Global Business Services, Regional Service Centers, and the Corporate Center, which centralizes key corporate functions. The Executive Com-mittee is responsible for the management of the Group.
3. The Board of DirectorsThe Board of Directors stands for election or re-election for one-year terms. The Chairman of the Board of Directors of Clariant Ltd, as well as the members of the Compensation Committee, are elected individually for a term of one year by the Annual General Meeting.
At the end of 2018, the Board of Directors of Clariant Ltd was comprised of 12 members: Hariolf Kottmann (Chairman), Dr. Khaled Homza A. Nahas (Vice-Chairman), Abdullah Mohammed Alissa, Günter von Au, Calum MacLean, Geoffery Merszei, Eveline Saupper, Carlo G. Soave, Peter Steiner, Claudia Suessmuth Dyckerhoff, Susanne Wamsler, and Konstantin Winterstein. All mem-bers of the Board of Directors (except for Hariolf Kottmann, who held the position of CEO until 15 October 2018) are considered to be independent in accordance with international best-practice standards.
Of the nine male and three female members of the Board of Directors, five have German citizenship, two Saudi Arabian, two British, one Swiss, one Canadian, and one US citizenship. Concerning education, Board members hold PhDs or other degrees in the following fields: four in economics, political economy, languages
and economics, or law; three in chemistry; three in industrial engineering, production engineering, engineer-ing management, mining and engineering, or engineer-ing and economic systems; and two in business adminis-tration. With regard to age, one member of the Board is 50 years or younger, two are 51 – 55 years, four are 56 – 60 years, two are 61 – 65 years, and three are 65 – 70 years of age. Concerning the first year of election to the Board, two Board members were first elected in 2008, two in 2011, one in 2015, three in 2016, and four in 2018.
4. The Board of Directors’ responsibilities and committeesThe Board of Directors is the ultimate decision-making authority for Clariant Ltd in all matters except those decisions reserved by law or the Articles of Association for the shareholders. The Board provides the strategic direction for the Group and reviews and further devel-ops the company’s strategy annually during a two-day Board of Directors’ meeting.
Further duties of the Board include establishing a man-agement and corporate culture that is appropriate for the company’s objectives and ensuring an internal control system and adequate risk and compliance management, particularly regarding financial, corporate governance and citizenship, personnel, and environmental protec-tion matters.
Corporate Governance Report
This short overview summarizes some aspects of corporate governance that are particularly relevant for integrated value creation at Clariant. For more detailed information, see the separate Corporate Governance Report on reports.clariant.com/2018/ corporategovernance
33CLARIANT INTEGRATED REPORT 2018

The members of the Board of Directors constitute the following committees: the Nomination Committee, whose duties include drawing up principles for the selec-tion of candidates for election and re-election to the Board of Directors and the office of CEO, and preparing the corresponding recommendations; the Compensa-tion Committee reviews and proposes to the Board of Directors Compensation and Benefits Policies and Programs, reviews performance criteria relevant to com-pensation and determines individual executive compen-sation, and benefits and the compensation paid to the Members of the Board of Directors, including the com-pensation of the Chairman and the CEO; the Audit Committee, whose duties include reviewing the activities of the external auditors, their collaboration with the internal auditors, and their organizational adequacy; and, until 31 December 2018, the Technology and Innovation
Committee, which was discontinued as of 1 January 2019. Instead, reports on innovation performance will be directly presented to the Board of Directors on a regular basis.
5. Management of the GroupThe Board of Directors has delegated the executive management of the Clariant Group to the CEO and the other members of the Executive Committee. The mem-bers of the Executive Committee are appointed by the Board of Directors on the recommendation of the Nomination Committee.
At the end of 2018, the Executive Committee consisted of CEO Ernesto Occhiello, CFO Patrick Jany, Hans Bohnen, and Christian Kohlpaintner.
ERNESTO OCCHIELLOChief Executive Officer (CEO)
HANS BOHNENMember of the Executive Committee
PATRICK JANYChief Financial Officer (CFO)
CHRISTIAN KOHLPAINTNERMember of the Executive Committee
34 FOUNDATION — CORPORATE GOVERNANCE

» The Board of Directors has reviewed the 2018 Integrated Report and proposes its approval to the Annual General Meeting.«HARIOLF KOTTMANNChairman of the Board of Directors
Of the four male members of the Executive Committee, three have German citizenship and one is an Italian citizen. Concerning education, Executive Committee members hold PhDs or other degrees in the following fields: two in Chemistry, one in Business Administration, and one in Chemistry and Business Administration. With regard to age, one member of the Executive Com-mittee is 50 years or younger, two are 51 – 55 years, and one is 56 – 60 years. The first year of membership in the Executive Committee was 2006 for one member, 2009 for another, and 2018 for two members.
The Executive Committee is primarily responsible for implementing and monitoring the Group strategy, the financial and operational management of the Group, and the efficiency of the Group’s structure and organi-zation.
6. Enterprise risk management Under the Enterprise Risk Management Policy, based on the standard of »The Institute of Risk Management«, each year a tool is used to prepare risk assessments by Business Units, Service Units, and Regions to assess threats that could impact the achievement of Clariant’s objec-tives. These objectives stem from the overall strategy of the Group as set by the Board of Directors and imple-mented by the Executive Committee. The Executive Com-mittee is responsible for monitoring the risk assess-ments for relevance and consistency.
A consolidated risk assessment is submitted annually to the Executive Committee, Audit Committee, and Board of Directors for review. In the case of new or changed risks, reporting is accelerated. To support functional responsibility, certain functions have access to risk assess-ments to assist them in their roles. Examples of such functions are Environmental Safety & Health Affairs (ESHA), to identify key sites for their property risk survey program, Corporate Auditing, and Group Pro-curement.
7. Significant shareholdings and shareholders’ participation rightsAt 31 December 2018, the following shareholders held 3 % or more of voting rights in Clariant Ltd: SABIC International Holdings B.V., 25.67 %, Blue Beteiligungs-gesellschaft mbH, 3.49 %, APG Asset Management N.V., 5.01 %.
Subject to certain limitations on voting by nominees, each registered share entitles the holder to one vote at the Annual General Meeting. Shareholders have the right to receive dividends and such other rights as are granted by the Swiss Code of Obligations. However, only shareholders entered in the Clariant share register may exercise their voting rights.
Shareholders representing shares with a total par value of CHF 1 million have the right to submit written requests that an item be included on the agenda, at least 45 days prior to the 25th Annual General Meeting on 30 March 2020.
35CLARIANT INTEGRATED REPORT 2018

Empowerment through Leadership
1. Evolving requirements for leadershipFast-evolving markets, digitalization, and Clariant’s strategic redirection are among the biggest challenges for people working at Clariant. The effects of these developments are manifold: skill requirements are rapidly changing; agile project management is increasing uncertainty in daily working life; people are more geo-graphically scattered and change jobs more frequently; and employees are increasingly seeking jobs with a purpose.
These developments impact the ways people work together and require adjusted forms of leadership. For example, as employee location loses importance, remote leader-ship skills become more crucial; as digitalization increases the availability of information, organizations must promote collaboration and skill-building. Above all, change management skills and end-to-end thinking are becoming a prerequisite for motivating and inspir-ing people in these transformative times.
2. People Excellence provides the basis for high-performanceClariant fosters a culture of learning and development throughout the organization to ensure outstanding per-formance in times of fundamental change. In 2017, it developed the People Excellence Strategy Initiative, which was rolled out systematically in 2018 in all Business Units and will be cascaded down to the regional level in 2019. Updated people strategies were defined in a process that involved the leadership teams in the global units. First, the business landscape was analyzed and major success factors for successful strategy execution were defined. Subsequently, key opportunities and challenges, as well as their root causes, were identified, allowing Clariant to derive improvement measures and define requirements for peoples’ capabilities, mindsets, and behaviors. Major strategic themes were thus trans-lated into organizational change and customized support measures, from recruiting to skills development.
The People Excellence Strategy Initiative has three main components: it provides clarity on the major require-ments and development needs for Clariant’s leaders, including communication skills and strategic thinking; it identifies solutions such as training programs and moderated workshops that address those systemic chal-lenges and development needs; and lastly, it translates these solutions into concrete human resource measures, such as training in communication or recruitment strategy to target missing competencies. At Clariant,
Strong leadership is at the core of Clariant’s high-performance culture. Through fair and authentic behavior, Clariant’s leaders underscore the value of trust and collaboration, creating a work environment that motivates employees to continuously learn and achieve ambitious personal and organizational goals.
FOUNDATION — LEADERSHIP36

Pioneer Program
The Pioneer Program enhances organizational understanding as well as leadership and com-munication skills of as-piring leaders by expos-ing them to short-term assignments outside of their area of responsi-bility.
strong leadership and sophisticated human resources processes go hand in hand. Different human resource functions thus play a key role in implementing the iden-tified measures, which could be a new talent manage-ment initiative, an innovative recruitment campaign, or improvements to the performance management system.
3. Promoting continuous development and managing talentClariant pays close attention to continuous learning and development. This is not only crucial to stay competitive in rapidly evolving markets, but also central to motivate and advance employees on their career path. Clariant focuses on developing the interpersonal and technical skills of all employees, regardless of their employment level and experience. To ensure continuity and enhance organizational knowledge, developing internal talent and shaping new leaders is critical. In this regard, the global talent management program is a success story. The program includes structured talent identification and review processes, diverse talent development measures, such as internal mentoring or the Pioneer Program, and career management. In 2018, Clariant was able to fill 84 % of open management positions with internal candidates. PAGE 135
4. Strengthening Clariant’s position as a preferred employerGiven the global hunt for talent and the rapidly evolving skill requirements driven primarily by globalization and digitalization, retaining people is a business imperative. Employees are at the core of Clariant’s sustainable value creation and constitute the company’s most valuable asset. By providing challenging positions across functions, promoting the individual development of every employee, and showing appreciation for efforts made, Clariant strengthens its position as a preferred employer. PAGE 139
For Clariant, being a preferred employer means offering a healthy working environment that is fair and consist-ent, encourages learning and evolution, and promotes team collaboration. As a preferred employer, Clariant encourages and values diversity of thinking and acting. By hiring and promoting people with different genders, ages, cultural backgrounds, and career paths into key positions, Clariant lays the foundation for addressing the key challenges created by globalization and digitalization.
» We empower our employees by supporting their development and by encouraging them to take risks.«KLEMENTINA PEJICHead of Group Human Resources
37CLARIANT INTEGRATED REPORT 2018

TWO PERSPECTIVES — TALENT ATTRACTION AND DEVELOPMENT38

What Helps People Reach Their Full Potential?
Talent Attraction and Development
In the digital age, work is evolving and so are the expectations of professionals. New tools and work environments, uncon-ventional career paths, and different forms of leadership are taking hold. How Clariant adapts to these changes will shape its future and that of its employees.

Klementina Pejic
As Head of Group Human Resources at Clariant, Klementina wants to foster an inspiring work
environment that lets people thrive and develop their individual talents.

Anke Wolf Anke Wolf
As a Freelance Consultant for human resources, Anke helps companies adapt their culture to new ways of collaboration and leadership.
As a Freelance Consultant for human resources, Anke helps companies adapt their culture to new ways of collaboration and leadership.
39CLARIANT INTEGRATED REPORT 2018

Are you talking from personal experience?Absolutely! I was quite young when I joined Clariant in a global position. It was only my second job. But I walked into management committee meetings and spoke up about things I wanted to change, about new ideas I wanted to introduce. And of course I got a lot of pushback. For me, that wasn’t the end of the world though. What mat-tered was that the people in charge never stopped listening. So I would typically offer to do a pilot. If the results showed I was right, we could go for it!
That surely took guts. Yes, you need courage to speak up, to challenge established patterns, and to drive change.
Has that gotten easier over the past 15 years?I’m sure it has. All of us at Clariant have gone through many changes over those years, and we’ve come to learn that change isn’t a bad thing.
How does Clariant help people make their next career move?We closely follow people’s progress and assess their capa-bilities. And then we try and match those to what we look for in a certain role. In 2018, we filled more than 84 % of open management positions with internal talent.
Why is that important to you?It shows that we’re rewarding people based on merit rather than hiring leadership from outside. And we’re developing the skills and people we need.
Who benefits from such development tools?We offer programs on every level – from blue-collar workers to global managers and everyone in between. One thing I strongly believe though is that you need to put people in the driver’s seat. They have to be motivated and somewhat self-reliant when it comes to developing and building their career.
You don’t believe in nudging people?Not too much. People are motivated to different degrees. They have different preferences and ambitions. I encourage everyone to talk openly about career goals. Those don’t have to be about climbing a corporate ladder. Development can also mean taking on new and interesting project work or new functional experiences.
Klementina, you’ve been with Clariant for 15 years now and recently took over as Head of Human Resources. What is your overall goal in this role?The overarching goal I’ve always worked for in any of my roles at Clariant is to contribute to a healthy organi-zation, one that’s motivating and inspiring to people.
What is a healthy environment to you?To me, it’s a work environment where people trust one another, where they can be authentic and open. And that has a lot to do with principled leadership.
How do you achieve that?Through many things. First and foremost, probably through consistency in terms of decisions and actions. Also by involving people in the decision-making process in order to foster a sense of participation and fairness.
What makes that motivating and inspiring?People need to know that their leaders act with consis-tency and congruency. Only a merit-based system ensures fairness and a certain predictability. Employees want to know what you expect from them and what they can expect in return. They must be able to partici-pate and be part of the game. I believe we all want to do something meaningful that makes a difference. And we want to learn and grow.
How does Clariant empower people to grow?For one thing, by allowing them to not be perfect and to make mistakes. And by helping them learn from those mistakes. Reliability and accountability are very impor-tant to us as a company. That might make us more risk-averse than others. But if you want people to come up with new ideas and to collaborate, you need to encour-age some form of risk-taking. And you need employees who are both willing to take those risks and able to endure some pushback. Not everything you come up with is going to be brilliant right away.
TWO PERSPECTIVES — TALENT ATTRACTION AND DEVELOPMENT40

KLEMENTINA PEJICHead of Group Human Resources, Clariant
How do we inspire people to reach their
goals?
How do we inspire people to reach their
goals?
41CLARIANT INTEGRATED REPORT 2018

ANKE WOLFFreelance Consultant Human ResourcesANKE WOLFFreelance Consultant Human Resources
TWO PERSPECTIVES — TALENT ATTRACTION AND DEVELOPMENT
How are careers and leadership evolving?
How are careers and leadership evolving?
42

especially want to work in an environment that embraces the digital technologies they’ve grown up with. Under-standably so! Everything from Google to Amazon to Snapchat has taught them that information is always available and mostly free, that feedback is immediate and personal. It’s hard to allow it to be any different in the workplace.
How is leadership changing?There may have been a time when you could expect your boss to know everything there was to know about your business. Those times are long gone. Today, leadership is about connecting the right experts. It’s about asking the right questions and letting people come up with creative answers.
What will careers look like in the future?Job tenure is shorter today and employees are more flex-ible. That doesn’t mean that professionals don’t want to see a clear career path or opportunities to grow. How-ever, they might not be swayed as much by job titles or power. Fulfilling careers may involve ever more interest-ing or ambitious projects, more responsibility, more creative freedom. So we should reconsider how we approach talent management.
How so?Rather than nominating a pool of outperforming employees that we then groom to take on leadership positions, we may want to develop individual talents and skills within all of our employees. Especially if lead-ership becomes less of a measure of career advance-ment. And if collaboration is key, you have to take a hard look at the incentives you’re giving. For instance, do individual objectives and bonuses really compel people to collaborate and share knowledge freely?
Anke, you advise big companies in matters of talent management, leadership, and digital trans-formation. How do these things go together?Digital transformation stands for a lot more than just clever ways of using and connecting data. It changes the way people work and how they collaborate. So immedi-ately, we’re talking about new skill sets, new forms of leadership, and a different type of organization altogether.
What’s so different about this new work environment?It gives us more flexibility, more transparency, and new ways of collaborating. But it also brings with it a certain degree of complexity and uncertainty. Take agile project management. It used to be that you’d run a development project for, say, three years and knew more or less exactly what your team had to deliver. Today’s approach is radically different. It has to be, because innovation cycles are so much shorter. Projects are typically meas-ured in months not years with decision points every other week. We focus on a specific problem our custom-ers may have, narrow it down step by step, and then, very gradually, circle in on a possible solution. Upfront, neither the customer nor we will know what that solu-tion might look like. That’s a lot harder to manage. You need people who can handle this uncertainty and a culture that lets them thrive.
Where do you find these people?First and foremost, companies will have to find them in their current workforce. You don’t necessarily need new talent.
How are employees’ expectations changing?Probably the biggest change is that their expectations are more specific these days. That still catches some recruiters off-guard. Especially since the discussions go well beyond salary. Applicants today are more enticed by a package that may involve things like flexible working hours, training, and so on to fit their per-sonal needs and ambitions. And then there are many other things applicants want to talk to you about. They look for a sense of purpose and they’re interested in what your company contributes to society, its eco-logical impact, and how it treats people. Millennials
43CLARIANT INTEGRATED REPORT 2018

Overview on the Compensation Policy
Clariant’s compensation philosophy supports its ambition to be an employer of choice. It is designed to attract, motivate, and retain committed employees.
1. Board oversight on compensationThe Compensation Committee of the Board of Directors establishes principles for the compensation of members of the Board of Directors and the Executive Committee, and submits these to the Board of Directors for approval. The Committee also takes note of employment contracts for the Heads of Global Functions, Global Business Units, and Region Heads, including their respective compensation.
2. Compensation conceptTo attract, motivate, and retain qualified and committed employees throughout the world, Clariant’s compensa-tion policy is based on the following main principles:
Remuneration components are aligned with the Clariant Business Strategy and designed to support it. To be competitive, Clariant conducts regular bench-
marking studies to ensure compensation levels are adequate and in line with market practices. With a focus on compliance, Clariant’s compensation practices always follow local regulations, such as laws and collec-tive union agreements. Compensation guidelines and work instructions are in place to ensure consistently fair treatment of employees working for Clariant. In regard to performance-based pay, Clariant’s remuneration ele-ments incentivize business and individual performance. Furthermore, remuneration elements must be clear and transparent in order to be understood and appreciated.
The structure of total remuneration is highly performance- and success-oriented to ensure that shareholder and management interests are aligned.
While long-term and short-term incentives are based on Group Performance only, individual performance – measured through a consistent, Global Performance Man-agement system – is a determining factor in career development and annual salary reviews. Within the Global Performance Management System, each manager’s or employee’s performance is assessed and discussed on a yearly basis. This process includes regular 360-degree feedback for all management levels.
FOUNDATION — COMPENSATION POLICY
Remuneration Components
Clariant considers six remuneration components:— Business strategy— Competitiveness— Compliance— Internal fairness— Performance-based
pay— Transparency
Group Employee Bonus Plan
Global Sales Incentive Plan
16 997 Positions ¹
Group Management Bonus Plan Performance Share Unit (PSU) Plan
Long-Term IncentivesShort-Term Incentives
1 Number of positions as at 31 December 2018 2 ML: Management Level
Local Managers, Professionals, Employees
108 Positions ¹ GSM-LTIP
144 Positions ¹
652 Positions ¹ML ² 5
ML ² 4
EC
ML ² 1 – 3
001 CLARIANT INCENTIVE SCHEME LANDSCAPE
44

3. Linking compensation to sustainable value creationShort-term incentive plans (cash bonus) include the Group Management Bonus Plan, the Group Employee Bonus Plan, and the Global Sales Incentive Plan. Long-Term Incentive Plans offer equity-based compensation for approximately 250 senior managers worldwide (Executive Committee and Management Level 1 – 4).
FIGURE 001
The Group Management Bonus Plan is anchored in the overall Performance Cycle at Clariant, which ensures a challenging business-specific target agreement for each Business Unit and Service Unit (BU/SU). The individual amount of each bonus payment generated in a year is determined by the achieved result of the Clariant Group measured against clear objectives. The achievement is calculated based on three elements: 1. financial result of the Group;2. financial results of Business and Service Units; and3. defined top priorities (Group Performance Indicators
and strategic projects).
In addition to financial indicators, the Group Performance Indicators include, for example, inventory excellence, Clariant Excellence (CLNX) benefits, innovation sales, and Occupational Health and Safety (Lost Time Accident Rate).
The Group Employee Bonus Plan is an aligned and stan-dardized bonus plan for non-management levels for all legal entities around the world that apply (where legally compliant and possible) the global Group Achievement or a combination of Group results and local Top Priorities as the basis for bonus payouts. For the sales force, the
Global Sales Incentive Plan incentivizes premier sales performance and growth by focusing on the individual sales performance in the areas of sales, margin, and trade receivables.
Participation in the Performance Share Unit (PSU) Plan is limited to the Executive Committee and selected senior managers of Management Level 1 – 4, i.e., approxi-mately 1.4 % of the workforce. The vesting is conditional on the achievement of the performance target (after three years). The relevant underlying key performance indi-cator is EBITDA (before exceptional items) in percentage of sales and the performance target to be at or above the median of a defined peer group.
The Compensation Committee has decided to amend the PSU Plan for senior management starting in 2019 to more closely align key performance indicators relevant for PSU vesting with the market perspective, and to pre-sent an attractive and competitive incentive for senior management. In addition, the committee has decided to discontinue another element of long-term incentives, the Matching Share Plan, and integrate its volume into the new PSU Plan.
4. Compensation of members of the Executive CommitteeThe Executive Committee participates in the same compensation elements as Clariant’s senior managers, receiving a fixed annual base salary, an annual cash bonus, and long-term incentives. The annual bonus is based on achieved results for the particular financial year, according to the criteria mentioned above with respect to the Group Management Bonus Plan.
Compensation Report
This short overview summarizes some aspects of compensation that are particularly relevant for integrated value creation at Clariant. For more detailed information, see the sepa-rate Compensation Report on reports.clariant.com/ 2018/compensation
REMUNERATION STRUCTURE OF THE CLARIANT EXECUTIVE COMMITTEE 1 in CHF
CEO Compensation EC Compensation
2018 2 2017 2018 2017
Total target 3 900 000 4 560 000 2 250 000 2 400 000
Performance Share Unit 3 500 000 500 000 350 000 350 000
Matching Shares 4 – 460 000 – 200 000
Target Cash Bonus, thereof Investment Share 5 (20 % Invest)
2 200 000 (–)
2 300 000 (460 000)
1 000 000 (–)
1 000 000 (200 000)
Base salary 1 200 000 1 300 000 900 000 850 000
1 Without other benefits2 New 2018 annual CEO remuneration structure for Ernesto Occhiello; annual total target remuneration for Hariolf Kottmann would have been
4 175 000 CHF3 3 years vesting period with defined performance hurdle (Value at Grant)4 2017: 1:1 Match of Investment Shares after 3 years vesting period (Value at Grant); 2018: no grant due to planned change in Long-Term Incentive Plan5 2017: Investment of 20 % from Actual Cash Bonus into 3 years blocked shares (Value at Grant); 2018: no deduction for Investment Shares due to
planned change in Long-Term Incentive Plan
45CLARIANT INTEGRATED REPORT 2018

IDEA TO MARKET
1. Idea to MarketTranslating unmet customer needs into market-ready solutions requires a strong focus on innovation and technology. With its extensive Research & Development resources and its commitment to breaking new ground beyond its core business, Clariant is well-equipped to tackle emerging trends and stay ahead of competition.
1.1. Addressing global trends and harnessing the potential of digitalizationSocietal needs and the regulatory environment are evolving quickly, creating new challenges and oppor-tunities for the chemical industry. Sustainability dominated the innovation agenda in 2018, fueled not only by stricter regulatory requirements but also consumers’ increasing ecological sensitivity, which has a particularly strong effect on Clariant’s consumer goods business. PAGE 122
The current trend toward a circular economy requires chemical companies to create products that are recyclable or support recycling objectives. Clariant has responded by helping brand owners increase recy-clability of their products, especially relating to plastic waste. In addition, Clariant is evaluating how differ-ent raw material qualities impact the characteristics of products, and how production processes can be adapted to fluctuations in energy availability.
PAGE 116
Core Processes for Value Creation
The Idea to Market phase encompasses scouting global trends and ideas, scoping business opportunities and exploring unmet customer needs, executing product development, and commercializing and monitoring product performance. This phase is aimed at developing a product and service pipeline that is well-filled and delivers marketable innovations.
The Market to Customer phase includes identifying market attractiveness, developing and articulating clear value propositions, and capturing the value created through relationship-building and sales process. To reach a seamless customer experience, these steps are well-connected and centered around customer needs.
The Customer to Cash phase encompasses balancing demand and supply, optimizing sourcing for spend effectiveness, monitoring production for high efficiency, and delivering finished goods on time and in full to customers in order to achieve safe, reliable, and efficient operations that support profitable growth.
The three value creation phases »Idea to Market«, »Market to Customer«, and »Customer to Cash« represent key processes at the core of Clariant’s business model. Underpinned by Clariant’s Innovation Excel-lence, Commercial Excellence, and Operational Excellence initiatives, the company’s business activities are aligned with these three phases to turn customer needs into innovative and sustainable solutions that create value for all stakeholders.
FOUNDATION — VALUE CREATION46

Generating, analyzing, and utilizing data, and then combining it with chemical know-how to generate added value, is critical in the digital age. Approaches such as High Throughput Experimentation (HTE) accelerate innovation, enabling Clariant to synthesize a vast variety of new molecules and test large num-bers of formulations in parallel, thus discovering and delivering value-adding solutions to its customers at an unprecedented speed. By developing new data- driven business models, some of Clariant’s Business Units look into becoming fully integrated solution pro-viders. PAGE 120
1.2. Providing a comprehensive toolbox to drive innovationClariant Innovation Excellence (CIX) supports the company’s profitable growth strategy by ensuring that innovation portfolios are stringently steered and projects are managed according to the Clariant Idea-to-Market process. This iterative process allows project teams to discover attractive business opportunities and translate global trends and unmet customer needs into compelling value propositions. By systematically scouting emerging trends and ideas, scoping out cus-tomer needs, evaluating sustainability opportunities, executing product development, and commercializing products with agility and speed, project teams are able to launch differentiated innovations and decrease time to market. To ensure the quality of new products and solutions, the stage-gate process scrutinizes innovation projects at each gate according to five dimensions of attractiveness and feasibility. This allows Clariant to drive innovations from ideation to busi-ness opportunity, and efficiently execute more than 375 innovation projects (Class 1 and Class 2) in 2018.
1.3. Building on a strong innovation networkClariant’s elaborate Research & Development network comprises eight Research & Development Centers, more than 50 technical centers, and over 1 100 employees. Research & Development activities are bundled in the department Group Technology and Innovation (GTI) and structured along four tech-nology platforms: Chemistry & Materials, Biotech-nology, Catalysis, and Process Technology. GTI col-laborates closely with the Business Units to ensure that technology push and market pull go hand in hand.
FIGURE 001
This setup is complemented by New Business Devel-opment PAGE 56, which explores business opportu-nities beyond the current scope of Clariant’s Business Units with sustainability aspects being an essential driver, Group Engineering, which is responsible for management and execution of capital investment proj-ects, and Group Intellectual Property Management, which secures the generated value through intellectual property protection.
In 2018, Clariant adjusted its innovation governance to enhance innovation management and further increase the innovation rate and profitability. As of January 2019, the newly established Innovation Committee, chaired by the Chief Technology Officer, will review and shape Clariant’s innovation strategy, maximizing the value and delivery of the innovation pipeline. Further, the Innovation Committee will play an active role in driving cross-business and open innovation, in securing public funding, and forging win-win col-laborations with academia and industry peers to fos-ter Clariant’s position as a leader in innovation. It will
Innovation Project Classes
Class 1 projects have an estimated annual mar-ket value of CHF 10 mil-lion or more and are managed by 18 fully dedicated Innovation Black Belts. Class 2 and Class 3 projects are led by over 270 Innovation Green Belts or trained Class 3 project leaders.
» The Innovation Committee will create strong and colla borative ownership to deliver innovation across the organization. This will enable Clariant to leverage its technical and commercial capabilities to their full extent and create room for strategic innovation, resulting in breakthrough solutions and cross-business innovations.«MARTIN VOLLMERChief Technology Officer and Head of Group Technology & Innovation
47CLARIANT INTEGRATED REPORT 2018

discovery and early incubation stages by applying agile design thinking and lean start-up methodologies, yielding validated new business and technology con-cepts for identified, attractive opportunities.
PAGE 57, PAGE 116
The Lab Excellence (LabX) program was initiated in 2017 to increase the speed and impact of innovation. The goal of the initiative is to streamline workflows within and across laboratories to gain efficiency in order to transform the entire R&D system into a lean organization, increase the quality of the research, and reduce time to market. In 2019 and beyond, the identified measures from the first pilot projects will be rolled out within Clariant’s R&D community and the initiative will be expanded throughout the organi-zation to strengthen the lean innovation culture and the consequent innovation performance management. Moreover, the implementation of an Electronic Lab Notebook across the company will significantly enhance efficiency by digitizing work flows.
PAGE 116
also steer innovation talent development programs to attract and develop talents and to foster expert as well as cross-functional and general management career paths.
1.4. Fostering incremental and disruptive innovation through collaborationClariant has several initiatives to strengthen collabo-ration across functions and businesses, as well as with external partners. The Open Innovation initiative, managed by New Business Development, identifies collaboration partners ranging from large corpora-tions to start-ups, universities, and other research insti-tutions. In 2018, it launched the program »Chinese Innovation for China Market«, which encourages Clariant’s Business Units in China to explore technol-ogies that help meet local market needs. PAGE 116
In 2018, Clariant also launched new formats to capitalize on the innovation potential within its work-force. For example, iEngine (Innovation Engine) crowdsources expertise across the firm to tackle key challenges within adjacent applications. Clariant also started the iGarage (Innovation Garage), a platform to develop strategic innovation opportunities at the
FOUNDATION — VALUE CREATION
001 CLARIANT INNOVATION CHAIN
Chemistry & Materials
Biotechnology
Catalysis
Process Technology
Group Engineering designs and constructs production plants
Intellectual Property Management manages patents and trademarks
Business Areas
New Business Development
Performance
People
Planet
are influenced by solutions
Technology Platforms
Support to the Technology Platforms, New Business Development and to Business Areas.
technology push
market pull
Market & Customers
48

MARKET TO CUSTOMER
2. Market to CustomerUnderstanding customer needs along the entire value chain, developing solutions to address those needs, and capturing the value created for profitable growth are fundamental to Clariant’s success. Clariant focuses on building customer relationships and increas-ing its marketing and sales capabilities in order to achieve these goals.
2.1. Responding to market developments and evolving customer needs Due to overcapacity in Asian markets in recent years, competitive and pricing pressure has developed in the specialty chemicals industry. In 2018, the market situation began to improve in China when older and less environmentally friendly chemical production plants were shut down due to the enforcement of regulations.
Also in 2018, customer demand for sustainable prod-ucts and solutions further increased. To meet this demand, Clariant is continuously bringing forward solu-tions that are more sustainable while not compromis-ing on performance and particular customer needs. Using 36 sustainability criteria to screen products across their entire life cycle, as part of its Portfolio Value Program (PVP), Clariant awarded 24 new products the EcoTain® label in 2018, given their outstanding sustainability profile. PAGE 98, PAGE 122
The continuing commoditization trend in the chemical markets has required Clariant to increasingly provide innovative products and services and maintain cost- efficient operations in order to meet customer-specific
needs and stay competitive. Clariant addresses these challenges by leveraging digitalization capabilities in operations and innovative services to improve pro-duction efficiency and customer service. PAGE 51
In 2016, Clariant launched Digital4Clariant, a dedicated cross-functional digital program to integrate opportu-nities presented by digitalization. By developing digi-tal business models, Clariant explores new ways to spur growth, easily adjusts how it interacts with cus-tomers, and thereby meets customers’ ever-changing needs. Customers increasingly prefer self-service when searching for an ingredient for their formula-tions. By offering comprehensive commercial and technical information about products and services digitally, for example through the new platform Chemberry™, customers are more informed and can make quicker decisions when they speak with sales professionals. PAGE 120, PAGE 128
2.2. Enabling active and consistent customer engagement Looking through a »customer lens« allows Clariant to understand changing product and service needs, as well as discern how the customer perceives the com-pany. Clariant manifests its customer-centricity through the Commercial Excellence Initiative estab-lished in 2011, which underlines its commitment to facilitating dialog with customers, partners, and pros-pects to evaluate and improve commercial strategies, customer engagement, and sales and marketing opera-tions. In 2018, Commercial Excellence continued to implement the Marketing Excellence Find & Win process in order to increase sales in select market seg-ments. Find & Win maps a market’s value chain and
In 2018, 24 products were awarded the EcoTain® label.
2449CLARIANT INTEGRATED REPORT 2018

2.3. Developing compelling value propositions The volatility of raw material prices over the last sev-eral years has created pressure on the profit margins of Clariant’s Business Units, requiring close monitor-ing of costs and supply chain competitiveness while also staying focused on sales growth. Since the insti-tution of the Pricing Excellence initiative in 2017, Clariant has used Value Stream Design to analyze the transactional pricing process and has drafted a road-map of improvements to create a transparent, fast, and effective way of pricing execution in the market. Clariant is now developing a tool that transparently shows how the forecasted price changes of basic raw materials impact the costs and margins of finished goods, which helps determine where and when pric-ing actions are required to maintain value creation.
In 2018, Clariant initiated holistic pricing projects that analyze a portfolio of products and services to deter-mine whether value-based or transactional pricing is better suited to maximize value in the long run. If the product or service offering is identified as adding more value than the next best alternative, Clariant uses value-based pricing. If a product or service offering is found to be nearly equivalent to the competitive offer-ing, transactional pricing is employed. In 2018, Clariant also revisited the models that govern service offerings to support the focus on value-based selling. Additionally, it plans to further incorporate customer needs into the definition of customer segments to refine value propositions and focus marketing and sales activities.
Clariant’s strategic marketing experts work with the Sales and Innovation teams to develop solutions that create value for both the customer and Clariant. By carving out the savings or revenue upside in terms of total costs of ownership at a mutually beneficial price
customer needs by interviewing customers and indus-try experts, allowing Clariant to develop tailored value propositions and go-to-market strategies to achieve targeted profitable growth rates.
As part of all Commercial Excellence marketing and strategy projects, Clariant conducted 538 customer interviews and 150 interviews with industry experts in 2018. Driven by the new roles filled as part of the Leading Marketing Organization, over half of the inter-views were conducted by the Marketing & Sales Departments of the Business Units. In addition, cus-tomers completed scorecards to evaluate Clariant’s performance compared to its competitors’ product and service offerings. The resulting insights provide direction for Clariant’s commercial and innovation pursuits.
To leverage customer feedback, Clariant conducts biennial customer satisfaction surveys, which provide insights into how Clariant’s operational, commercial, and innovation performance is perceived. In 2018, customers of all Business Units in all regions were sur-veyed. The results show that more than three-quar-ters of the survey participants considered Clariant a reliable business partner and solution provider. Over-all customer satisfaction and loyalty remained stable at a high level. »Products and Packaging«, which showed improved satisfaction and competitive perfor-mance compared to 2016, was ranked as one of the most important buying criteria, along with »Technical Service«. Sustainability, a new assessment criterion, also showed a strong competitive performance and was rated as important for their operations and/or markets by 92 % of the survey respondents. PAGE 143
FOUNDATION — VALUE CREATION50

CUSTOMER TO CASH
3. Customer to Cash With its holistic, cross-functional approach, Clariant continually optimizes planning, procurement, produc-tion, and delivery. By balancing supply and demand, Operational Excellence improves product availability, supplier cost, and risk. This results in ever-shorter lead times and increased On-Time, In-Full deliveries, enhancing both customer satisfaction and Clariant’s profitability.
3.1. Agility is keyAs customers across all markets are becoming more agile, they expect the same from Clariant. While long lead times for high product volumes were the norm in the past, short lead times and small volumes are now more typical. This is particularly pronounced in Asia, where production time is often more decisive than price, requiring Clariant to enhance its focus on optimizing lead times. For example, in one of the Shanghai produc-tion facilities for Business Unit Masterbatches, lead times in 2018 decreased from about two weeks to five days, with a future goal of only three days. This was achieved by implementing a value stream design approach developed in Kaizen workshops. Although Clariant’s products are well-known for their high qual-ity, the company is striving to also be known as a fast, reliable supplier.
3.2. Optimizing procurement and delivery with digitalizationDigitalization offers many new opportunities, and Clariant is in a leading position to seize them. Clariant aims to further integrate the operational with the commercial value chain to make comprehensive infor-mation more accessible to all departments. By con-necting all steps from planning to delivery, Clariant will be able to integrate sales volumes in production planning in realtime and quickly react to changes in customer requirements. With a smartphone app, sales representatives will obtain immediate information about raw material availability and production capacity, allowing them to inform customers about delivery dates within minutes.
Clariant’s spend on raw materials amounted to CHF 2.9 billion.
2.9point, Clariant’s commercial organization transforms value created for customers into profitable growth. Clariant’s value calculators are a helpful tool to demon-strate a product’s value to customers, as they quantify and visualize the financial benefits of using Clariant’s products as compared to the next best competing alternative.
2.4. Establishing Leading Marketing OrganizationIn 2017, Clariant launched Leading Marketing Organi-zation, an initiative that further integrates marketing within the Business Units. In 2018, all key positions of the redefined marketing organizations were filled and a training program that reinforces marketing skills was piloted. A »Marketing Essentials« training program was successfully launched and an advanced strategic marketing training program is being devel-oped and will launch in 2019. Clariant also established a Marketing Advisory Board for the Marketing Heads of each Business Unit and Commercial Excellence to share best practices and drive further development of marketing processes, tools, and capabilities.
51CLARIANT INTEGRATED REPORT 2018

Digitalization is also influencing Clariant’s procurement. Opportunities to purchase raw materials via electronic interfaces such as e-auctions are constantly growing, speeding up purchasing and enabling instant cost comparisons between various suppliers. In addition, artificial intelligence applied in production will identify machine outages, allowing for predictive main-tenance and impeding production bottlenecks.
3.3. Continuous cost saving and risk reductionAs a global player with a comprehensive product portfolio, Clariant is embedded in an extensive supply chain. In 2018, approximately 7 000 vendors deliv-ered raw materials worth CHF 2.9 billion to Clariant, and Clariant purchased about CHF 1.3 billion of other products and services from roughly another 27 000 suppliers. Careful procurement is therefore vital in overall cost savings. In 2018, Clariant achieved sav-ings greater than the cost of inflation thanks in large part to Clariant Procurement Excellence (CPX). CPX takes a broad perspective on procurement to profit from countries with favorable sourcing conditions and bundles purchasing power, reducing supply risks and costs as well as improving free cash flow.
Clariant also continued de-specification in 2018. By widening specifications and available sources, the company reduced supply chain complexity and broad-ened the supplier base, leading to lower purchasing prices, a minimized need for high safety stocks, and more efficient inventories. A thorough analysis of Clariant’s supply chain led to the implementation of a customized tool that improved estimations of upcom-ing efforts and trainings. This helped optimize external contractor management, which further reduced costs in 2018.
3.4. Steady advance of the Integrated Planning LandscapeThe Integrated Planning Landscape (IPL), launched in 2015, enhances organization, aligns best-practice planning, and optimizes capabilities and IT tools. One key element is the Inventory Health Check, which continuously improves inventory performance by determining optimum levels, defining targets, and optimizing cash flow based on market research and data analysis. Inventory Health Checks are now regularly applied across all Business Units. In 2017, Clariant began rolling out the Manufacturing Execution System (MES), a powerful tool used in pro-duction. It provides a real-time view of the produc-tion status and online information that is essential for continuous improvement. By the end of 2018, 50 plants with about 20 % of total production volume were integrated.
In addition, Clariant Production System methods (CPS) employ lean methodologies within the Customer-to- Cash Process, such as door-to-door material and infor-mation flows along value chains of shared facilities. This fosters collaboration between Business Units and is a key lever for increased productivity. Overall, IPL contributes substantially to On-Time, In-Full (OTIF) orders, ensuring profitable operations.
3.5. Toward integrated value chainsIn 2018, Clariant thoroughly assessed all its supply chains to establish high-performing supply chain man-agement across all Business Units and regions. The assessment was used to prioritize gaps to close and develop detailed roadmaps that will help different Business Units attain cross-functional processes and end-to-end effectiveness. These new priorities will lead to optimized costs, inventories, and on-time deliveries.
FOUNDATION — VALUE CREATION
The Lost Time Accident Rate (LTAR) decreased to 0.15 days lost per 200 000 hours of work.
0.1552

3.6. Operational efficiency through sustainabilitySustainability topics are gaining in importance, not only for Clariant’s customers but also for its opera-tions. CPS embraces sustainable production as a driver for cost savings by optimizing chemical yield and reducing emissions, while simultaneously saving energy. The Production System Yield, Energy, Environ-ment (YEE) contributes to these efforts, as does the eWATCH™ program. Within YEE, specific production processes or production units are analyzed to gain a comprehensive picture of energy optimization, while eWATCH™ identifies savings potential by carefully analyzing energy consumption across Clariant’s entire operations. PAGE 160
3.7. Safe and healthy operationsRunning a safe operational chain is not only a stipulation of a responsible employer, it also minimizes disrup-tions in production. Clariant’s ambitious health and safety target of zero accidents reflects both of these factors. In 2018, Safety Moments – brief documents containing safety messages – were rolled out inter-nally and used at the beginning of meetings to raise safety awareness. Safety Moments helped slightly decrease the lost time accident rate (LTAR) from 0.2 to 0.15 days lost per 200 000 hours of work in 2018. PAGE 140
» With Operational Excellence, we aim to achieve world-class performance in supply chain, procurement and production for all our operations.«AXEL SCHOENFELDHead of Operational Excellence
53CLARIANT INTEGRATED REPORT 2018

Value Creation in the Four Business Areas
Value Creation in the Four Business Areas
BUSINESS AREAS54

»Value Creation in the Four Business Areas« outlines how each Business Area contributes to Clariant’s overall growth and profitability. To contribute to value creation, the Business Areas transform key societal trends, market drivers, and stakeholder needs into valuable products and solutions. They succeed in the market by relying on Clariant’s three value cre-ation phases: »Idea to Market«, »Market to Customer«, and »Customer to Cash«.

056 How Care Chemicals Creates Value 062 Two Perspectives: Where Can We Help
Accelerate Innovation?068 How Catalysis Creates Value 074 Two Perspectives: When Can We
Advance the Shift to Renewable Energy?
080 How Natural Resources Creates Value086 Two Perspectives: Where Can We
Improve Safety Even Further? 092 How Plastics & Coatings Creates Value098 Two Perspectives: Why Does It Pay to
Focus on Sustainability?
FOUNDATION –

With a vast product portfolio and countless applications, Clariant’s Business Areas serve multiple industries and continuously translate customer needs into innovative and sustainable solutions.
In 2018, the overall economic conditions led to increased sales throughout Clariant’s Business Areas. In addition, increased environmental awareness in the markets pre-sented business opportunities that fueled growth.
The Business Areas accelerated their innovation pro-cesses, for example, by applying High Throughput Experimentation. Strategic partnerships led to innovation breakthroughs, such as the development of a liquid organic hydrogen carrier.
Implementation of the Leading Marketing Organization initiative in the Business Areas strengthened marketing capabilities, helped better identify customer insights along value chains, and refined customer segmentation.
In order to guarantee shorter lead times, the Business Areas adapted production processes and implemented smart delivery systems. Multiple supplier strategies and increasing de-specification secured availability of raw materials. By increasing the share of direct spend on suppliers covered by sustainability assessments, the Business Areas solidified their reputations as sustain-ability leaders.
Business Area Care Chemicalscomprises the Business Unit Industrial & Consumer Specialties (ICS) and New Business Development (NBD). It focuses on attractive, high-margin, and low- cyclicality segments. Care Chemicals follows life-style-driven megatrends and strengthens Clariant’s position as a supplier of sustainable products.
Business Area Catalysiscomprises the Business Unit Catalysts and the Business Line Biofuels & Derivatives. It develops, manufactures, and sells a wide range of catalysts for the chemical and fuel industries, which contribute significantly to value creation in customers’ operations, ensuring finite raw materials and energy are used efficiently. In addition, Catalysis is at the forefront of developments for bio- ethanol.
Business Area Natural Resourcescomprises the Business Units Oil & Mining Services and Functional Minerals. It is characterized by high growth as well as a strong megatrend orientation. Main drivers are the rising demand for high value-added specialty chemicals used in the oil, mining, food, and packaging industries and the increased consumption of oil, gas, and base metals driven by fast-growing economies.
Business Area Plastics & Coatingscomprises the Business Units Additives, Pigments, and Masterbatches. The Business Area is typically subject to GDP growth and economic cycles due to its highly diversified end applications. Main drivers are the increas-ing use of plastic applications, as well as the growing demand for more sustainable coating solutions.
55CLARIANT INTEGRATED REPORT 2018

1. Responding agilely to market developments in each businessAs overall economic conditions improve, and the mega-trends of convenience, well-being, sustainability, and urbanization continue to drive demand, Care Chemicals has risen to the challenge with its high-performing, sustainable products.
In the personal care market, Asia is a center of gravity as new regulatory requirements are generating opportu-nities for developing market-specific molecules, while Latin America continues to set the trends in hair care and cosmetics. In Europe, the new ISO standard 16128-1 for organic products provides further pull for natural solu-
tions, and new brands in the North American market are spurring growth in eco-friendly and responsibly sourced products.
In the home care market, Clariant offers a comprehen-sive portfolio of highly concentrated and easy-to-handle solutions that address new customer needs, such as quick-drying formulations. With stringent regulations for sustainability driving the industry toward ingredi-ents that perform well at low temperature and low water consumption, Clariant constantly scouts new ingredients in order to benefit from first-mover advan-tages.
Clariant’s paints and coatings business achieved market growth of more than 5 % in 2018. With an extensive portfolio of neutralizing additives, watering and dispers-ing agents, and emulsifiers, Clariant capitalizes on the demand for more ecological and less harmful ingredi-ents in waterborne paints, which represent more than 80 % of the architectural coatings market.
The Business Area Care Chemicals, comprised of Industrial & Con sumer Specialties (ICS) and New Business Development (NBD), concentrates on markets with high margins and low cyclicality. By responding to con-sumer-driven trends, generating cutting-edge innovation, and operat-ing agile, integrated value chains, Care Chemicals has created a foundation for success in highly dynamic markets.
How Care Chemicals Creates Value
BUSINESS AREAS — CARE CHEMICALS
001 CARE CHEMICALS
APPLICATIONS
OVERVIEW
The Business Area Care Chemicals is comprised of Industrial & Consumer Specialties (ICS), which serves customers in the personal care, home care, paints and coatings, and crop solutions markets, and New
Business Development (NBD), which scouts and develops solutions with high growth potential for all Business Areas.
Industrial & Consumer Specialties
— Automotive fluids— Aviation— Construction— Crop solutions— Gas treatment— Heat transfer fluids
— Industrial and home care— Industrial lubricants— Paints and coatings— Personal care— Special solvents
New Business Development
— Food ingredients— Silver-based inks for the
electronic and graphic industries
— 3D printing materials— Encapsulation technology
56

By 2025 Care Chemicals aims to increase the use of renewable raw materials by 30 %.
30While the crop solutions business has been affected by shrinking farm incomes, new regulations and increasing demand for bio-based solutions are disrupting the crop market. In Europe, the ban on additives for agrochemi-cals and the discontinuation of endocrine disruptors has unlocked opportunities for substitute products. With its previous investment in a modern crop greenhouse, Clariant is now in a leadership position to benefit from the continuing global trend toward bio-based pesticides, foliar fertilizers, and plant growth regulators.
IDEA TO MARKET
2. Innovating ahead of the curveCreating disruptive innovation requires a diversified toolset. In 2018, Care Chemicals broke new ground by piloting the Innovation Garage. PAGE 116 The iGarage combines aspects of agile innovation and design thinking by bringing together various parties (e.g., deter-gent customers, washing machine manufacturers, and academic researchers) to enhance Clariant’s under-standing of different needs along the value chain. Such collaborations help formalize product and service offerings for the benefit of all parties in the value chain.
To keep up with increasing requirements for agility and speed, Care Chemicals is also exploiting the pos-sibilities of digitalization. By synergistically combin-ing advanced electronics laboratory documentation with data from High Throughput Experimentation (HTE), PAGE 116 Clariant is able to develop predic-tive tools that can increase the speed and quality of innovation and enhance the capability to find disrup-tive solutions.
To minimize products’ ecological impacts during pro-duction and use, Clariant is improving the traceability of raw materials so customers can distinguish a sus-tainably produced ingredient from a chemically iden-tical product. New Business Development addresses this challenge by scouting partnerships with compa-nies offering suitable technologies. For example, a minority stake in Haelixa, a spin-off from the Swiss Federal Institute of Technology Zurich, was acquired. Haelixa provides expertise in a unique tagging and tracing technology based on encapsulated DNA. This technology may be applied to ensure product authen-ticity in the value chain and is evaluated for several fields of application with the support of New Business Development. Areas of focus for future innovation activities include recycling plastic waste for chemical building blocks and developing biodegradable poly-mers to address the microplastic problem.
Care Chemicals is striving to create a portfolio based on renewable resources coming from agricultural waste streams, which do not compete with food pro-duction. By 2025, Care Chemicals aims to increase the use of renewable raw materials by 30 % and achieve an innovation pipeline that is entirely based on renewable feedstocks. Regarding the use of palm oil, Industrial & Consumer Specialties already offers almost all personal and home care products in RSPO Mass Balance quality. PAGE 160 Since a key enabler of this transition is the combination of chemistry and biotechnology, Industrial & Consumer Specialties teamed up with Group Biotechnology in 2018 to drive future innovation in this field.
57CLARIANT INTEGRATED REPORT 2018

One example of how Care Chemicals addresses the sustainability megatrend is with its high-performing hair conditioner line Genadvance®, which was launched globally in 2018. The conditioning agents outperform classical technologies and show a signifi-cantly improved sustainability profile, mainly due to the use of natural raw materials and a silicone-free formulation. Genadvance® Hydra is certified by the independent organic certification organization ECOCERT™ and is one of nine new product launches that have been awarded the EcoTain® label in 2018.
PAGE 122
Another 2018 highlight was the global launch of AristocareTM Smart, a versatile polymer that reduces the filming, spotting, and drying time of cleaning detergents. This considerably lowers the cleaning effort for consumers and responds to the growing demand for high-performance, easy-to-use home care products.
MARKET TO CUSTOMER
3. Addressing emerging customer needs with new products and solutionsGiven the sharp increase in demand for plant-based ingredients, Care Chemicals strengthened its integra-tion of sustainability into key marketing segments. As a first step, a business development role was estab-lished to fully capture the natural ingredients trend and further develop the portfolio. Mutually beneficial partnerships play a key role in this regard, such as a partnership announced in October 2018 with the Indonesian company PT Martina Berto, which will add Southeast Asian biodiversity ingredients to Clariant’s expanding personal care portfolio.
The personal and home care businesses leverage their respective trend-monitoring platforms, BeautyForward® and CleanForward™, to identify market trends at an early stage and pinpoint customers’ evolving needs. For example, in 2018, products that protect consum-
» Our ambition is to become the number one supplier for natural and sustainable solutions for consumer care.«VINCENT GASSHead of Global Marketing, Business Unit Industrial & Consumer Specialties
BUSINESS AREAS — CARE CHEMICALS
ECOCERT™
ECOCERT™ is active in over 80 countries and one of the largest organic inspection and certification organiza-tions in the world. ecocert.com
58

4. Increasing marketing and digital capabilities to enhance customer relationships Industrial & Consumer Specialties has further devel-oped its marketing organization in 2018 based on a blueprint developed in 2017. It created five centers of excellence for strategy execution, innovation manage-ment, market intelligence, launch management, and portfolio value management. All functions were repli-cated at a global and regional level and new key positions were filled, adding valuable competencies to detect, qualify, segment, and serve local market opportunities. To translate improved market penetra-tion into profitable growth, Care Chemicals success-fully ran a transactional pricing campaign in 2018 and implemented value-based pricing methods for all new product launches.
Customer relationships were simplified through a series of digital initiatives. In Europe, an e-commerce platform was deployed for industrial applications and a chatbot was added on the Industrial & Consumer Specialties website to address basic customer requests. Further-more, Clariant launched Chemberry™, a chemical ingredients search engine to enhance the connection between suppliers and buyers. PAGE 120
CUSTOMER TO CASH
5. Streamlining production and delivery processesTo upgrade the portfolio to higher-value products, Care Chemicals is working to adapt production processes to smaller batch sizes and shift from bulk shipping to transporting smaller packages. This shift will benefit customers who demand more agility and shorter lead times for their orders. To improve production plan-ning and securing of raw material supplies, a web
ers from blue light and pollution were identified as a trending customer demand. In response, Clariant launched Eosidin®, an active ingredient that protects skin from indoor pollution. Eosidin® won the silver ITEHPEC Innovation Award at InCosmetics in Brazil in 2018 and the gold medal for »Sustainable Innova-tion of the Year« at Cosmetics Design Europe.
New Business Development focused on the rapidly growing 3D printing market. At the end of 2017, it bun-dled Clariant’s materials capabilities to create a port-folio of high-quality 3D printing filaments that meet the evolving requirements of end-part production. In 2018, Clariant collaborated with Original Equipment Manufacturers (OEMs) to tailor filaments that meet their specific material requirements and comply with the relevant regulations in their respective end mar-kets. In addition, Clariant continually increased the printability of the materials. To make the printing as reliable and simple as possible, a collaboration was entered with the printer manufacturer Ultimaker, which provides optimized printing parameters for Clariant’s filaments. Its high-quality materials, ability to rapidly adapt to industry requirements, and its print optimization support have made Clariant an attractive partner for OEMs who significantly support the expanding market of 3D printed products.
According to the customer satisfaction survey con-ducted in 2018, the customers of Business Area Care Chemicals particularly value its products. »Products and Packaging« was ranked as the most important buying criteria by survey respondents and showed an outstanding competitive performance. Overall cus-tomer satisfaction improved to 79 points (2016: 77) and the Net Promoter Score jumped to 43 % (2016: 28 %).
Net Promoter Score (NPS)
The NPS gauges the loyalty of a company’s customers on a scale from – 100 (no loyalty) to + 100 (high loyalty). An NPS of > 50 % is felt to be excellent.
59CLARIANT INTEGRATED REPORT 2018

Care Chemicals established relationships with 360 new suppliers.
360shop for distributor self-service was introduced, enabling fast and flexible offer placement and man-agement, and facilitating the coordination between the commercial and the operational chain.
As a result of the continued rollout of the Manufac-turing Execution System, which provides a real-time view of the status of production, and the implementa-tion of the Integrated Planning Landscape (IPL) in Latin America, North America, and Europe, operational reliability was strengthened. PAGE 52 Additionally, relationships with 360 new suppliers were estab-lished to reduce dependence on single-sourced mate-rials, leading to improved flexibility and relia bility.
6. Increasing efficiency while reducing environmental impacts In 2018, Care Chemicals reduced the consumption of energy and water and the emission of waste, wastewa-ter, and greenhouse gases, in accordance with Clariant’s 2025 environmental targets. By analyzing end-to-end processes with a focus on increasing yield through initiatives such as the Production System Yield, Energy, Environment (YEE) PAGE 53, emissions and resource consumption were reduced, helping Indus-trial & Consumer Specialties achieve ISO 50001 certification for all of its sites in Europe. To further reduce pollution and protect ecosystems, a chiller at the Gendorf, Germany, site was replaced, eliminat-ing the emission of Frigen, a halogenated hydrocar-bon. At the Bonthapally, India, site, the wastewater treatment was upgraded to achieve zero liquid dis-charge. PAGE 160
In 2018, Industrial & Consumer Specialties started Project Olive II, which will upgrade the site in Tarragona, Spain, to a fully integrated production plant for Squalane and Squalene and the respective down-stream products. Integrating several value creation steps in one location will allow Clariant to produce high-er-value products while effectively reducing negative impacts on the environment by decreasing transport requirements.
7. Achieving safe operationsIn 2018, Care Chemicals undertook important steps toward Clariant’s goal of zero accidents. The Avoiding Accidents program was implemented at all sites while refresher trainings were conducted at four sites that had already implemented the program. PAGE 140 Additionally, individual safety training sessions for managers were rolled out, covering modules such as electrical safety and personal protective equip-ment. At its Gendorf, Germany, site, Industrial & Con-sumer Specialties conducted a pilot of the Global Operational Discipline initiative, which is based on an approach developed by DuPont and consists of safety trainings and an awareness-raising campaign. The global rollout of the initiative began in 2018 with the initial implementation at Clariant’s Suzano, Brazil, site. Other sites will follow over the course of 2019 and 2020. Finally, frequent audits at all plants contributed to rigorous improvements in product quality, environ-mental protections, and health and safety precautions.
BUSINESS AREAS — CARE CHEMICALS60

Production sites
13Production volume in m t
0.98 1
Number of raw materials procured
2 988
Greenhouse gas emissions in kg/t production
217 2
Energy consumption in m kWh
806 2
Waste in thousand t
60 2
Targets 2021
Growth potential per year EBITDA target margin
5 – 7 % 19 – 21 %
PerformanceINPUT OUTPUT
Training hours
32 019Staff in FTE at year end (2017: 2 582)
2 541Raw material suppliers
1 710
PeopleINPUT OUTPUT
PlanetINPUT OUTPUT
R&D spend of sales
2.8 %Sales in CHF m
1 665Raw material procured in CHF m
965
Active innovation projects
> 70Growth in local currencies
7 %
EBITDA margin before exceptional items
19 %
Natural capital
Financial capital Intellectual capital
Relationship capitalHuman capital
Manufactured capital 1 For 2018, the production volume is based on a reduced reporting scope, which includes sites that are responsible for 95 % of total production.
2 Every three years, Clariant validates environmental data from all production sites. The last full reporting campaign was in 2017. In interim years, including 2018, the reduced reporting scope comprises the larger sites responsible for 95 % of production.
61CLARIANT INTEGRATED REPORT 2018

TWO PERSPECTIVES — INNOVATION AND TECHNOLOGICAL ADVANCES62

Speed was always crucial in innovation. Whether in solving a problem or bringing a new solution to market, being first can make all the difference. Ever shorter inno-vation cycles and lower entry barriers for competitors make it harder to stay ahead of the curve. At Clariant, new ways of doing research and a unique approach to joint product development help bringing new ideas to life faster and more reliably.
Where Can We Help Accelerate Innovation?
Innovation and Technological Advances

Lucius Kemp
Via High Throughput Experimentation (HTE), Lucius and his global team help Clariant to
efficiently explore new research areas while boosting innovation output.

Tiago worked with Clariant to develop three different dairy-alternative beverages in record time for Piá, a leading Brazilian dairy cooperative.
Tiago Merckel Haugg
Tiago worked with Clariant to develop three different dairy-alternative beverages in record time for Piá, a leading Brazilian dairy cooperative.
Tiago Merckel Haugg
63CLARIANT INTEGRATED REPORT 2018

How do you design experiments differently?By initially focusing on the most important aspects required for screening, we can streamline efforts that will deliver results with the greatest impact. We employ software tools and statistical analysis to better understand the process and point us to the most promising areas for testing. This often yields solutions that can easily be over-looked with classical approaches.
How do you physically set up the experiments? This was actually the biggest challenge when designing the first HTE lab. As a central research group we serve all Clariant Business Units. One day we synthesize mol-ecules for personal care applications, the next day we optimize formulations for a refinery and the next, we model the stability of chocolate milk. So our lab is designed to allow quick transitions from one workflow to another.
Does HTE increase sustainability?Yes, one way is by miniaturizing experiments. We can run experiments on much smaller scales compared to a stan-dard chemical lab, thus using less raw materials and gener-ating less waste. This both decreases costs and supports the progress towards Clariant’s environmental targets.
Will this type of automation replace people?No, not at all. Often when brainstorming on a new research area, a great deal of ideas are generated and dis-cussed. But time and resources are finite, which in turn limits the number of ideas that can realistically be explored. Automation allows for more. We use automa-tion at Clariant to enable broad screening and exploration of the solution space. The information gained is then fed into the application labs of each Business Unit to help them determine where to focus their efforts and ulti-mately increase their chances of success in the market.
Lucius, what is the HTE lab you’re building in Houston, Texas, right now?The High Throughput Experimentation (HTE) lab in Houston is a satellite facility to the HTE lab we have established in Frankfurt, Germany. The instrumentation, infrastructure, and operational model are a direct clone of the facility in Frankfurt. This ensures that our efforts in extending these capabilities to the Americas region deliver the same successes as those experienced in Europe. The same concept will be applied in the HTE expansion to Asia.
How does HTE speed up research?HTE approaches are a collection of research practices that are designed to deliver more information, hopefully with less effort. The more we understand about our processes and products, the better we can design solutions that deliver the required performance. Enhanced experi-mental design, automation-assisted execution, big data evaluation, and modeling are concepts that enable this in-depth knowledge.
Automation is nothing new to the industry. What sets the Clariant HTE group apart from the rest?In most environments, automation is deployed for a particular process. At Clariant, for example, we success-fully use high throughput screening for the develop-ment and optimization of catalysts at the Business Unit Catalysts or for the screening of enzymes and microor-ganisms in our Technology Platform Biotechnology. We have designed a laboratory that truly automates research from end to end with a broader scope of applications.
How does that increase efficiency?The efficiency gained from automation comes from numbers, reproducibility, and times of operation. Many of our instruments work in parallel, and many reactions are being conducted simultaneously. Having operations run continuously, overnight and weekends, greatly increases the throughput when compared to classical laboratory approaches. This allows us to explore the full solution space. The efficiency is realized by gaining more knowledge in a shorter amount of time, thus providing answers and ultimately solutions faster.
TWO PERSPECTIVES — INNOVATION AND TECHNOLOGICAL ADVANCES64

LUCIUS KEMPHead of High Throughput Experimentation, Clariant
What helps us test more ideas
faster?
What helps us test more ideas
faster?
65CLARIANT INTEGRATED REPORT 2018

TIAGO MERCKEL HAUGGMarketing Manager, Cooperativa PiáTIAGO MERCKEL HAUGGMarketing Manager, Cooperativa Piá
TWO PERSPECTIVES — INNOVATION AND TECHNOLOGICAL ADVANCES
How can we help customers accelerate innovation?
How can we help customers accelerate innovation?
66

Why was that so important?It’s the difference between introducing your product to the whole sector within two days or having to go door-to-door to about 15 000 customers.
How long would a project like this usually take?There is no general answer to this question. Complex projects like this can take up to two years.
How did Piá and Clariant work together?Clariant presented some concepts and market opportu-nities. Then we started the development phase with the R&D team, prototyping and negotiating. They set up pilot plant tests and then we moved on to industrial testing.
How would you describe that collaboration?What stood out for me was the interest and effort in speeding up the process to meet our deadline. That was really exceptional! It went very smoothly, which is amazing, considering we were developing a new prod-uct and a new process with new ingredients and even a new supplier.
What was particularly important in this project?I think the most important aspect was trust. Both com-panies had to share some very valuable information. We worked very closely on a technical level but also shared ideas on things like marketing, regulation, and packaging.
How’s the new product doing with consumers?We’re still developing the market, and we have some work to do in increasing volumes. But the feedback we’ve gotten so far is positive, especially regarding the product’s sensory properties and its packaging.
What are you working on now? Has the collaboration spawned any new ideas?We started working on some important new projects with Clariant. We’re testing new flavors and new pack-aging sizes. And we’re also developing vegetable-based yogurt products.
Tiago, Piá was first established over 50 years ago as a milk farmers’ cooperative and now is one of southern Brazil’s leading dairy companies. Why did you decide to also offer non-dairy substitutes?Piá is about healthy food, regardless of whether that is milk or any other product. We see a growing trend for plant-based products. That’s why we launched a com-plete new line not only of vegetable-based beverages, but also other vegetable-based dairy substitutes. We see it as a way to retain consumers who’ve stopped consuming milk for different reasons, be it health issues or personal beliefs about animal welfare.
How is that trend manifesting itself?We witnessed a strong trend in Europe and the United States, with dairy brands buying out vegetable-based companies. Brazil’s market is in an emerging stage, but we made the strategic decision to be the first to build up such a portfolio and use our well-established distri-bution system here in Brazil.
You partnered with Clariant to develop the product. What were your requirements?We wanted a good level of quality at a fair cost, but the product also had to work within our existing assets and manufacturing processes.
What made that challenging?Apart from the technical challenge, there was also a very close deadline. We had only six or seven months because we wanted to launch the new product line at our region’s leading trade fair for supermarkets.
67CLARIANT INTEGRATED REPORT 2018

How Catalysis Creates Value
1. Benefiting from economic growth and future-oriented regulationBusiness Area Catalysis is embedded in a highly global-ized business environment, with production sites around the world and a product portfolio that serves a multitude of industries. Thus, the global economic growth in 2018 supported strong sales in Business Unit Catalysts. In addition, promising business opportunities emerged from the regulatory environment, which is continually adapting to increased awareness of environ-mental issues, such as climate change. In China’s fast-growing market, for example, stricter emission leg-islation led to an increase in demand for catalysts, enabling more sustainable production processes and products. In the European Union, the Renewable Energy Directive foresees a 3.5 % usage of advanced bio-
fuels by 2030, and China is aiming to achieve a 10 % renewable ethanol content in transportation fuels in the next few years. These commitments offer substantial growth potential for Business Line Biofuels & Derivatives by spurring demand for sustainably produced biofuels.
IDEA TO MARKET
2. Innovating for a fossil-free futureFor Business Area Catalysis, innovation is the corner-stone of all activities to develop outstanding, multi- purposed products. Due to the negative environmen-tal effects of burning fossil fuels, harvesting renewable energies is becoming increasingly import-ant. As wind and solar power are dependent on weather fluctuations, storage is paramount in order to ensure steady energy supply.
In 2018, Clariant partnered with Hydrogenious Tech-nologies to revolutionize the hydrogen economy. The innovative Liquid Organic Hydrogen Carrier (LOHC) technology significantly improves safety, scalability, and convenience in hydrogen storage and transporta-
Business Area Catalysis helps customers increase yield while simulta-neously decreasing energy consumption and emissions. After developing an innovative process to produce biofuels using biologic catalysts, Catalysis entered a new, promising market. With its impressive innova-tion activities and long-standing expertise, Catalysis contributes to Clariant’s growth and profitability.
BUSINESS AREAS — CATALYSIS
001 CATALYSIS
APPLICATIONS
OVERVIEW
Business Area Catalysis comprises Business Unit Catalysts, which runs 14 production sites globally, and Business Line Biofuels & Derivatives. The applications for its product portfolio include chemicals and feedstock production, fuel processing, as well as custom catalysts.
Business Line Biofuels & Derivatives complements the offering with sunliquid®, a groundbreaking technology to produce biofuels and renewable raw materials from agricultural residues.
Business Unit Catalysts
— Ammonia— Custom catalysts— Ethylene and -derivatives— Fischer-Tropsch— Fuel cell— Fuel upgrading— Gasoline desulfurization— Gas processing
— Hydrogenation— Methanol— Off-gas treatment for
chemical plants and stationary engines
— Oxidation— Polypropylene and
on-purpose propylene, MTP
— Hydrogen— Refinery stream purification— Sour gas shift— Steam cracker and
Olefin purification— Styrene and BTX— Synthetic natural gas— Zeolite powders
Business Line Biofuels & Derivatives
— Biocatalysis— Cellulosic ethanol— Fermentation— Low carbon advanced biofuels— Residue derived biomaterials
68

tion. Clariant’s EleMax™ catalysts chemically bind and release hydrogen to and from an organic carrier, permitting storage without notable energy losses and enabling optimized life cycle efficiency of the LOHC. The carrier is non-toxic and of low flammability, thus classifying it as non-hazardous. In addition, the com-pound remains liquid through a broad temperature range at ambient pressure and can be transported in the existing infrastructure for fossil fuels. This enables a ready supply of industrial locations and fueling sites. In Tennessee, USA, the first commercial-scale units are in operation, confirming the technical and economic attractiveness of the technology. Clariant is proud of its role in facilitating this major leap forward to making hydrogen a safe, efficient, and scalable energy carrier.
sunliquid® is an innovative process to produce biofuels and bio-materials from agricultural residues. First, an agricultural residue, such as wheat straw, is treated with steam, followed by a subse-quent sudden drop in pressure, which leads the straw to break down. Second, the straw remnants enter a series of reactors in which they are liquefied and specific enzymes are grown. These enzymes break down the straw into simple sugars. Then, the sugars are fermented to create an ethanol-water mixture. In the last step, the ethanol is purified, so it can serve as biofuel or as a feedstock for biomaterials. By using lignin, the insoluble part of the straw, as fuel, the sunliquid® process is energy self-sufficient.
Clariant completed a report on the carbon footprint of sunliquid®, which revealed that the carbon intensity of ethanol produced with sunliquid® is up to six times lower compared to conventional fuels.
SUNLIQUID® – A FULLY INTEGRATED PROCESS DESIGN
Saccharification Carbohydrates
Enzyme Production
Purification
Mechanical/Thermal
Pre-Treatment
Agricultural Residues
Ethanol Water
FermentationSUNLIQUID®
PRODUCTION CYCLE
For Business Line Biofuels & Derivatives, the innovation focus remains on sunliquid®. In 2018, the sunliquid® technology was granted the Meyer-Galow Award for business chemistry, which is bestowed on innovations with outstanding sustainability. Clariant was honored for its achievements and contributions to the success-ful development and commercialization of this ground- breaking technology. In collaboration with Exxon and the Renewable Energy Group (REG) the technology was diversified to produce cellulosic diesel from sec-ond-generation sugars. Further Research & Develop-ment activities are aimed at optimizing sunliquid® with regard to further optimizing the platform in itself and in further diversifying the suit of derivatives products from sunliquid® platform.
69CLARIANT INTEGRATED REPORT 2018

Clariant’s Business Unit Catalysts also organizes a biennial customer event, the »Defining the Future« conference, to gather the global industry community for networking, insight, and critical analysis. In 2018, over 50 presentations by experts on global chemical markets were given to more than 600 participants during the eighth »Defining the Future« conference in Hangzhou, China. Clariant detailed several cus-tomer challenges and how the company addressed them by designing products with outstanding performance and sustainability properties.
Business Line Biofuels & Derivatives continued rela-tionship-building with political stakeholders in 2018. In addition, the sunliquid® sales and marketing team participated in various international conferences, particularly in the biomarkets and renewable energy sector, to further promote sunliquid® and its applica-tions.
4. Launching products with enhanced sustainability profilesProducts of Business Unit Catalysts enhance sustain-ability and safety performance of customer produc-tion sites and processes. In 2018, Clariant expanded its EnviCat® portfolio with a high-performance solu-tion that significantly reduces nitrogen oxides, which contribute to a range of negative environmental impacts, such as acid rain, smog, and ground-level ozone. The honeycomb-structured catalyst uses ammonia as a reducing agent for the conversion of the nitrogen oxides into harmless nitrogen gas and water. The catalyst effectively lowers nitrogen oxide emis-sions from gas-fired exhaust streams and is well suited for use in a multitude of chemical and industrial applications, such as power generation or petrochem-ical refining.
MARKET TO CUSTOMER
3. Engaging with customersUnderstanding and anticipating customer needs is crucial for business success. Thus, Business Area Catalysis focuses on spotting and identifying customer insights along the value chain. Clariant’s Leading Marketing Organization initiative is addressing these goals by constantly analyzing the company’s existing marketing capabilities.
A central source of customer insights is the biennial customer satisfaction survey. The results of the 2018 survey emphasize the importance of innovation for the customers of Business Area Catalysis. After »Tech-nical Services«, it is the second most important buy-ing criteria and the customers see a clear competitive edge over Clariant’s competitors. The Customer Sat-isfaction Index reached 77 points (2016: 79) and the Customer Loyalty Index remained at a high level, reaching 81 points (2016: 83).
The Customer Loyalty Index of the Business Area Catalysis remained at a high level of 81 points.
81
BUSINESS AREAS — CATALYSIS70

Clariant prides itself on consistently innovating catalysts that achieve optimal performance. The OleMax™ 260 catalyst, launched in 2018, for example, provides close to 100 % selectivity to ethylene. Not only does OleMax™ 260 produce higher yields, it also fosters a sustainable process with a simplified operation that reduces start-up-related hydrocarbon flaring, as well as time to on-specification ethylene production. The first commercial start-up in the new ethylene produc-tion plant of The Dow Chemical Company in Free-port, Texas, USA, proved the potential of the catalyst.
With every product launch, Business Unit Catalysts further strengthens its product capabilities. In 2018, HYDEX™ E, the latest diesel dewaxing catalyst in the HYDEX™ series, was launched. The catalyst improves the cold flow properties of the fuel, facilitating its handling during cold conditions. HYDEX™ E is a new catalyst that can even operate under full sour service conditions, increasing diesel yield and reducing by-prod-uct formation. Due to improved desulfurization, additional product swelling, and an increased share of combustion-benign substances in the final product, HYDEX™ E prepares customers for new, more strin-gent fuel regulations regarding particulate formation.
In 2018, the MegaMax® 800 methanol synthesis catalyst was successfully implemented at one of China National Offshore Oil Corporation’s (CNOOC) plants in Hainan Province. Methanol is used as a feedstock for a variety of chemicals, as well as a fuel, solvent, and antifreeze. MegaMax® 800 increases yield and effi-ciency while being compatible across a range of meth-anol process technology platforms. Furthermore, it maintains high selectivity over its lifetime and there-fore considerably reduces by-product formation. The installation of MegaMax® 800 improves profit-
ability and carbon efficiency of the CNOOC site, owing to the catalyst’s high productivity and due to its high activity and performance in lower operating temperatures.
CUSTOMER TO CASH
5. Securing profitable partnershipsEngaging with partners along the value chain is vital for Business Area Catalysis to drive business and access new markets. In 2018, Business Unit Catalysts signed two key agreements with Sinopec, China’s largest petroleum and chemical company. One of the agreements allows Clariant to license S-Zorb, a sorbent used to desulfurize naphtha for gasoline production. The sorbent is ideal for upgrading gasoline in existing refineries in order to comply with the China National V standards for fuel quality. The other agreement posi-tions Clariant as representative for Sinopec’s fluid cata-lytic-cracking catalysts to oil refineries in Qatar.
Another example showcasing that partnerships can lead to outstanding results is the contract to work with McDermott, formerly CB&I, to design the world’s largest single-train propane dehydrogenation unit for Jinneng Science & Technology Company in China. The partnership combines Clariant’s CATOFIN™ cat-alysts and Heat Generating Material with McDermott’s Lummus CATOFIN™ propane dehydrogenation technology. Clariant’s catalysts enable maximum con-version of raw materials, while the patented Heat Generating Material increases the catalysts’ selectivity, both producing higher yields at lower operating costs.
Desulfurization
Crude oil, the base of diesel, always contains a fraction of sulfur, which is responsible for acid rain. The latest Clariant diesel catalyst shows improved desul-furization and thus helps reduce harmful emissions.
» The successful development of dedicated catalysts for the LOHC technology is not only a testament to Clariant’s pioneering capabilities, but also reflects the importance of sustain ability to our culture, operations, and as a driver for growth and innovation.«MARVIN ESTENFELDERHead of R&D at Business Unit Catalysts
71CLARIANT INTEGRATED REPORT 2018

6. Advancing procurement, production, and operational safetyBusiness Area Catalysis continued to advance Clariant’s global procurement initiative in order to increase reli-ability and sustainability of its vast, global supply chain. In addition, Business Unit Catalysts managed to reach the goals set for third-party sustainability assessments.
For the sunliquid® production plant in Romania, a dedicated team worked on establishing a long-term stable supply base and relationship with local farmers to ensure feedstock supply in the operational phase of the plant. Business Line Biofuels & Derivatives is developing a digital solution to support a transparent and efficient operation of the straw supply chain.
Within Business Line Biofuels & Derivatives, ongoing safety trainings are used to increase safety awareness in day-to-day operations. In addition, by conducting health days, awareness on working ergonomics and a healthy lifestyle was raised.
7. Improving environmental performance of production sitesBusiness Area Catalysis is determined to improve environmental sustainability of its production sites. At the Severodonetsk, Ukraine, facility, for example, upgrades with new technologies are planned in order
to enhance energy and water management. By 2020, a modern evaporation unit will decrease overall energy consumption, and the installation of a reverse osmosis plant for wastewater treatment will introduce water circulation, reducing consumption and releasing cleaner runoff.
Business Line Biofuels & Derivatives initiated several projects as part of Clariant’s eWATCH™ program and the Production System Yield, Energy, Environment (YEE) to reduce resource consumption. In its precom-mercial plant in Straubing, Germany, a smart cooling tower decreased overall electricity consumption by 9 %. In addition, thanks to optimized production protocols, fresh water use and wastewater production are reduced continuously and the costs of wastewater discharge were reduced significantly by first feeding the wastewater to a biogas plant.
sunliquid®
The sunliquid® produc-tion facility in Romania is expected to produce 50 000 tons of ethanol from straw every year.
BUSINESS AREAS — CATALYSIS
A smart cooling tower helped decrease overall electricity consump-tion of the precommercial plant in Straubing, Germany, by 9 %.
972

Targets 2021
Growth potential per year EBITDA target margin
6 – 9 % 26 – 30 %
Training hours
27 726Staff in FTE at year end (2017: 1 970)
2 061
Production sites (50:50 or minority joint ventures not included)
14Production volume in m t
0.06 1
Raw material suppliers
538
Number of raw materials procured
968
Greenhouse gas emissions in kg/t production
2 709 2
Energy consumption in m kWh
588 2
Waste in thousand t
15 2
PerformanceINPUT OUTPUT
PeopleINPUT OUTPUT
PlanetINPUT OUTPUT
R&D spend of sales
6.6 %Sales in CHF m
861Raw material procured in CHF m
263
Active innovation projects
> 110Growth in local currencies
11 %
EBITDA margin before exceptional items
23.1 %
Natural capital
Financial capital Intellectual capital
Relationship capitalHuman capital
Manufactured capital 1 For 2018, the production volume is based on a reduced reporting scope, which includes sites that are responsible for 95 % of total production.
2 Every three years, Clariant validates environmental data from all production sites. The last full reporting campaign was in 2017. In interim years, including 2018, the reduced reporting scope comprises the larger sites responsible for 95 % of production.
73CLARIANT INTEGRATED REPORT 2018

TWO PERSPECTIVES — ENVIRONMENTAL PROTECTION AND RESOURCES74

When Can We Advance the Shift to Renewable Energy?
Environmental Protection and Resources
Renewable energy sources are the future. Their use is taking hold across the globe but also poses new challenges with energy storage and distribution. The chemical industry has an important role to play both as a big energy consumer and by enabling new ways of using and storing electricity.
Camilla Lang
As Site Manager and Country ESHA for the Nordics region, Camilla helped Clariant's Swedish
sites make the switch to renewable energy.

Daniel Teichmann
As CEO of Hydrogenious Technologies, Daniel has set out to finally make using hydrogen for storing and transporting energy easy and safe.
Daniel Teichmann
As CEO of Hydrogenious Technologies, Daniel has set out to finally make using hydrogen for storing and transporting energy easy and safe.
75CLARIANT INTEGRATED REPORT 2018

What about energy costs?Because of our newly combined purchasing power, we now actually spend less on electricity than we did before.
Is the supply as stable and secure as, say, nuclear power?We’re connected to the power grid the same way as before, so there are no concerns about stability. We just pay for hydroelectric power. It’s basically the same as when you switch at home. In any case, hydroelectric power is among the most stable renewable sources anyway.
What are some of the other things you’re doing to reduce emissions?We’re in the process of reducing diesel in our produc-tion processes. We still use it mainly in the drying process for bentonite clay here in Hällekis. We’re also looking at our fleet of cars and considering more sustainable options. But, admittedly, we still have quite a way to go in that regard. Still, little things have an impact. Some years ago, we replaced an old engine in our mill here in Hällekis, which now uses only half as much energy as it did before.
Do you think your experience with the switch to renewable energy is applicable elsewhere?Certainly. There obviously needs to be enough supply and a working market for renewable energy. Then it’s just a matter of, well, just doing it. For us, the timing was right because we wanted to renegotiate our contracts anyway, and I had just taken over my new role for the region. I think that’s a lesson you can take away from it: get different sites and Business Units together under one roof to increase your purchasing power and keep costs down. That may be more difficult in other regions where they operate, let’s say, more independently. And then you need someone or even a small team to take this idea and just run with it.
Clariant’s three production sites in Sweden recently switched to renewable energy. Why?Because it makes a lot of sense. Clariant has set itself global environmental targets, such as to reduce green-house gas emissions by 35 percent per ton of produced goods by 2025. Our switch to renewables is a step towards that. The time was right too. We had different contracts with our electricity providers for each of our three sites, and they were all up for renewal. So we decided, first of all, to combine the three agreements and to look for renewable options.
What type of energy were you using and what do you use now?We switched from mostly nuclear, which still makes up the largest share of Sweden’s electricity mix, to 100 percent hydroelectric power.
How much electricity do the three sites use?We use around three million kilowatt-hours, and we’ve calculated that we now avoid about 300 tons of CO₂ per year.
What was your role in all this?I’ve been the site manager for our site in Hällekis since 2011. In 2016, I also took on the responsibility for Envi-ronmental, Safety and Health Affairs, or ESHA, in the Nordics region. In this role, I could negotiate a single agreement for all of our three Swedish sites across the business units. I talked to my fellow site managers and management. They were all immediately on board.
Did you face any problems or concerns?No. It was fairly easy to convince people. We are very conscious of environmental issues in Sweden. And we have a well-working market for renewables. So it was actually very easy to switch.
TWO PERSPECTIVES — ENVIRONMENTAL PROTECTION AND RESOURCES76

CAMILLA LANG Site Manager Business Unit Functional Minerals & Country ESHA Nordics, Clariant
Can we fill our energy needs sustainably?
Can we fill our energy needs sustainably?
77CLARIANT INTEGRATED REPORT 2018

DANIEL TEICHMANNCEO, Hydrogenious TechnologiesDANIEL TEICHMANNCEO, Hydrogenious Technologies
TWO PERSPECTIVES — ENVIRONMENTAL PROTECTION AND RESOURCES
Can catalysis shape the future energy storage?
Can catalysis shape the future energy storage?
78

What role does catalysis play and what kind of catalyst do you use?Catalysis is the key to getting hydrogen into the molecule. We use precious metal catalysts from Clariant’s EleMax™ range tailored specifically to our needs.
How is your partnership with Clariant helping?Efficiency is crucial. That’s why we work with Clariant to further tweak the catalysts and the process. One of the challenges was that we designed our system to extract hydrogen from mixed streams from industry exhausts. That makes it compatible with real-life hydro-gen sources but it demands a lot from the catalyst.
How much hydrogen can the LOHC hold?A cubic meter of LOHC can carry about 57 kilograms of hydrogen. To give you a better sense, a regular fuel tank with 80 liters of LOHC would carry enough hydrogen to travel about 500 kilometers in a fuel cell car.
Could you fill your fuel tank with LOHC to drive your fuel cell car?That’s certainly the long term goal. It will require, how-ever, a miniaturized version of our technology. At the moment, we’re focussing on large-scale applications, like providing hydrogen to industrial users and large-scale hydrogen refueling stations. Our current technol-ogy comfortably fits a 20-foot shipping container. The beauty is that LOHC lets us use existing infrastructure! Our system can work basically anywhere a truck can go. And the resulting LOHC is easy to transport using conventional fuel trucks.
What would a complete LOHC ecosystem for hydrogen cars look like?A gas station could store loaded LOHC in their conven-tional underground fuel tanks and de-hydrogenate it on demand. Our home city of Erlangen is the first to open such a refueling station. But we’re also working towards solutions that could de-hydrogenate LOHC right in your car so that refueling would involve simply exchang-ing unloaded for loaded oil. Heavy-duty vehicles, such as trucks, trains and even ships, are obvious first contend-ers on the path to an ever more compact system. One of the pilot projects, coordinated by our partner Helmholtz-Institute of Renewable Energy Erlangen- Nuremberg, involves a train running on LOHC.
Daniel, hydrogen is often touted as the fuel of the future. Why isn’t our world running on hydrogen? Hydrogen is a powerful and fully renewable energy carrier. The only emission from using it as fuel is water. That’s why we believe it will play a significant role as fuel for cars and as a way to store energy from renew-able sources like wind and solar power. The problem lies with storing and transporting hydrogen, which at normal temperatures has a low density and is extremely volatile. The conventional fix was to either compress it or cool it to very low temperatures. Both methods require elaborate equipment and additional energy.
What is your solution?We store hydrogen in a liquid by chemically binding it in an oil – our Liquid Organic Hydrogen Carrier, or LOHC.
How do you get the hydrogen into the oil?We hydrogenate the oil using a catalyst. Basically, we build our hydrogen atoms into the molecule.
What’s the oil in question?Dibenzyl-toluene, a readily available commodity mostly used to transfer heat in commercial applications.
How safe is LOHC once it’s full of hydrogen?A demonstration I often perform for TV crews involves dipping a burning torch into a bucket of loaded LOHC. The torch just dies. The oil doesn’t react at all.
You can literally carry your hydrogen around in an open bucket?Yes. It is non-toxic and not classified as a dangerous good. It is safer than diesel fuel.
79CLARIANT INTEGRATED REPORT 2018

1. Capitalizing on economic upturn and growth in key industries to drive businessIn 2018, Functional Minerals continued on its growth path supported by the positive dynamics of the global economy, which increased demand for processed bentonite. Global trends such as urbanization, renew-able energy, and changing food consumption supported growth opportunities for purification products. Although purification sales were initially weak due to an unfavor-able quality of soybean and palm oil crops, the market saw some recovery in the second half of the year. In addi-tion, the growing demand for purification solutions in the field of renewable energy compensated for the weaker edible-oil purification sales in early 2018. Functional Minerals is very well positioned to grow in this segment as it demonstrated its ability to develop tailor-
made and innovative solutions for the purification of second-generation biofuels through strong collabora-tions with key customers.
Continued growth in the global automotive industry and an increasing trend toward reducing harmful emis-sions in the iron-casting process created favorable con ditions for Clariant’s foundry additives business. Functional Minerals capitalized on this trend by expanding the sales of low-emission foundry additives, such as Geko™ LE. The electrification trend in the passenger car industry is a disrupting challenge where Mining Services has refocused activities in the industrial minerals field toward solutions for lithium extraction, a key raw mate-rial for the batteries.
In 2018, the price of oil continued to recover while key commodity markets stabilized. This allowed many of Clariant’s Oil & Mining customers to reevaluate their operations to look for ways to grow and gain efficiencies alongside of opening strategic growth opportunities. However, regional differences persisted. With the trade
Business Area Natural Resources combines businesses that extract minerals, oil, and gas with those that use these materials to develop high-performing and sustainable solutions. Driven by growing oil, metals, and food consumption around the globe, the Business Area addresses emerging trends in multiple industries.
How Natural Resources Creates Value
BUSINESS AREAS — NATURAL RESOURCES
001 NATURAL RESOURCES
APPLICATIONS
OVERVIEW
The Business Area Natural Resources is comprised of Functional Minerals and Oil & Mining Services. Functional Minerals operates a fully integrated value chain, from the exploration and mining of bentonites to the processing of finished products to the application of technical
know-how at the customer’s operations. Oil & Mining Services provides innovative chemistry, technology, and service solutions for the oil, mining, and refinery industries
Functional Minerals
— Oil purification— Foundry additives— Desiccants, oxygen absorber,
humidity indicator solutions— Sediment management— Civil engineering— Wastewater treatment
— Clay specialties— Paper additives— Detergent additives— PVC stabilizers— BTX catalysts— Kerosene and jet fuel
purification
Oil & Mining Services
— Pour point depressants— Explosive emulsifiers— Froth flotation chemistries— Well service additives— Oil and water separation— Asphaltene control
technologies— Scale management
— Corrosion management— Chemical delivery and data
management systems— Gas well deliquification— Near wellbore remidation
technologies— Hydrate management and
control
80

dispute between the United States and China creating uncertainty in the market and hampering growth in China, Chinese-sourced raw material prices might increase due to the growing costs of regulatory compliance and tariffs.
IDEA TO MARKET
2. Innovating for food safety and environmental protectionThe innovation agenda at Functional Minerals was dominated by three main themes in 2018. First, Func-tional Minerals addressed the need for improved food safety with, for example, the launch of new Tonsil® grades that reduce the risk of harmful substance formation, such as 3-monochloropropane-1,2-diol (3-MCDP), during purification processes.
Second, Functional Minerals developed products that help customers reduce their overall costs. For exam-ple, Clariant supports the edible-oil processing indus-try and the growing renewable fuel industry by inno-vating in the field of dry-soap removal. Dry soaps are generated during production processes and present a considerable cost factor for Clariant’s customers.
Third, the Business Unit further developed Invoque®, an innovative solution that helps customers in the dredging and mining industries manage disturbed sediments suspended in water. Invoque® allows users to separate solid and liquid components faster and more efficiently while also reducing water usage, envi-ronmental impacts, and overall costs.
Addressing these three challenges contributed to a well-filled innovation pipeline at Functional Miner-als, with about 35 active Class 1 and Class 2 projects and about the same number of smaller Class 3 proj-ects in the stage gate process at the end of 2018. In order to accelerate innovation processes and improve the pipeline output, Functional Minerals improved the stringent evaluation, prioritization, and tracking of innovation projects.
3. Increasing speed to exploit opportunities from unconventional oil production and electrificationThe growing global oil demand and rapidly changing characteristics of produced oils increase the complex-ity of oil production and require shorter innovation cycles. Oil Services is tackling this challenge by work-ing with Group Technology & Innovation on High Throughput Experimentation (HTE) and advanced analytics. PAGE 116 The collaboration led to five successful applications in identified growth fields, such as pour point depressants, and will continue into 2019. To support the commercialization of the inno-vative pour point depressants used in oil production, the iGarage concept was adopted. PAGE 116
Functional Minerals ran about 35 active innovation projects (Class 1 and 2) in 2018.
3581CLARIANT INTEGRATED REPORT 2018

Intensive customer interaction around sustainability challenges revealed an unmet customer need to elimi-nate hazardous compounds from copper and molyb-denum collectors. In response, Clariant developed non- hazardous collectors for enhanced copper and molybdenum recovery, which customers in Chile and North America embraced for their improved perfor-mance and sustainability benefits.
The progress in sustainable product development is further exemplified by the successful commercializa-tion of Flotigam™ 7500, an EcoTain®-awarded col-lector to recuperate iron ore by flotation.
As shown by the results of the 2018 customer satisfac-tion survey, the customers of Natural Resources place high value on the »Technical Services« offering, which they ranked as the most important buying cri-teria ahead of »Products and Packaging«. Since the last customer survey in 2016, Natural Resources increased their competitive performance as well as overall customer satisfaction and loyalty, which improved to 80 points (2016: 79) and 85 points (2016: 82), respectively. The Net Promoter Score leaped to 45 % (2016: 37 %).
5. Building on Leading Marketing Organizations to turn value propositions into profitable growth In 2018, the Leading Marketing Organizations (LMO) initiative was implemented within Natural Resources. By the end of the year, most of the new key functions were filled. In addition, the businesses aligned inno-vation strategies with Clariant’s overall growth strat-egy and refined customer segmentation, exploring synergies across regions, coupling offerings with digi-tal support and improving pricing excellence. To sup-port the latter, Functional Minerals launched a value- based pricing initiative to ensure that products are priced according to the value they create for custom-ers. Oil & Mining Services established a Pricing Coun-cil, which focuses on developing regional strategies to improve procurement negotiations and position the right value of Clariant’s products in the market.
Flotigam™ 7500
The EcoTain®-awarded iron ore collector Flotigam™ 7500 de-creases the amount of fine material discarded to tailing ponds by up to 70 %.
BUSINESS AREAS — NATURAL RESOURCES
In 2018, Mining Solutions focused its innovation activities on copper and iron ore benefication by flota-tion in efforts to improve customers’ operational efficiency. To improve sustainability in the mining industry, Mining Solutions has been working on replacement technology for the current use of the hazardous material xanthate. Clariant Hostaflot™ products were developed to overcome the hazardous xanthate properties. The current use of hazardous xanthate as a flotation additive to recover fine parti-cles of the desired mineral is both dangerous and cost-intensive since storage involves controlled con-ditions, specific handling requirements, and constant monitoring.
Lastly, as increasing amounts of lithium are needed to support the growing sales of electric passenger cars and other battery-powered devices, Clariant is devel-oping innovative flotation collectors that improve the separation of lithium-bearing minerals from other rock-forming minerals, enabling lithium extraction from new sources.
MARKET TO CUSTOMER
4. Addressing customer challenges sustainablyIn 2018, Functional Minerals helped solve some spe-cific customer challenges and launched, for example, the innovative solution Opazil™ FFR. Opazil™ FFR is an active adsorbent that avoids the penetration of mineral oils from recycled paper into packaged food. Due to the specific absorption properties of the active adsorbent, this product enables food-packaging manu-facturers to reduce potential health risks by adjusting and streamlining their production process without jeopardizing food safety standards. Another product example is Toxisorb™ Premium, an additive that binds toxins and neutralizes harmful substances in animal feed. Both products were awarded Clariant’s EcoTain® label in 2018. PAGE 122
Oil & Mining Services successfully launched a series of products in 2018, including newly developed paraf-fin inhibitors: WAXTREAT DF, which prevent block-ages of flow lines in deepwater oil production opera-tions; a water-based paraffin dispersant LIBERATE®, which remediates existing paraffin deposits where inhibitors cannot be applied; and Hostaflot™ xanthate replacement products, which facilitate the efficient and sustainable collection of sulfide minerals.
82

7. Enhancing research and production capacities through global investmentsIn 2018, Natural Resources expanded its research and production capacity in several locations. For Functional Minerals, the most important expansion took place in Indonesia, where the Business Unit eliminated spe-cific bottlenecks in the bleaching earth production at different production sites that serve the Southeastern Asian market, thereby supporting Clariant’s strategic growth and profitability targets in that region. Another expansion occurred in South China, where Clariant increased its production of bentonite desiccant clay to meet increasing demand.
Together with Business Unit Industrial & Consumer Specialties, Oil & Mining Services benefited from the completed expansion of the industrial facility in Coatzacoalcos, Mexico, increasing the production capacity of ethoxylates, particularly demulsifiers, by several thousand tons per annum. In addition, it opened a cutting-edge laboratory facility in Clinton, Oklahoma, and announced the inauguration of a simi-lar technical laboratory in its facility in Midland, Texas. In 2018, Oil & Mining Services terminated pro-duction activities of the Business Lines Mining and Emulsions in Morocco and started servicing custom-ers in the region with supplies from Europe.
CUSTOMER TO CASH
6. Balancing cost efficiency, risks, and sustainability standards in the supply chainNatural Resources relies on strong relationships with suppliers to create sustainable value for Clariant, customers, and suppliers. Functional Minerals imple-mented a series of initiatives in 2018 to increase reliability in the supply chain. For example, it initiated preferred partnerships with logistics providers to ensure access to transport capacities and reformulated certain product recipes to reduce supply chain-re-lated risks. To mitigate the impact of rising energy and transportation costs, Functional Minerals also opti-mized its value stream from mine to market by sourc-ing the clays closer to operations and intensifying the sun-drying of bentonite (for example, in Sardinia and Spain) to reduce energy and logistics costs.
Oil & Mining Services uses an individualized review process to assess the performance of its suppliers. To evaluate additional factors specifically related to the product line of Oil & Mining Services that are not cov-ered in the standard performance review or the Together for Sustainability initiative (TfS), PAGE 148 a lean questionnaire is distributed. As Oil & Mining Services prioritizes active supplier communication, it shares an updated standard information package regularly and participates in Clariant’s yearly procure-ment events, which are attended by more than 300 suppliers and offer an excellent opportunity to raise awareness for Clariant’s safety and sustainability requirements.
» Sustainability has become a part of the diagnostic conversations our sales professionals hold with customers. As a result, large copper producers have embraced Clariant’s sustainable xanthate replacement products, aiming to eliminate xanthate use in all their operations.«JORGE ARIASGlobal Head of Mining Solutions
83CLARIANT INTEGRATED REPORT 2018

8. Improving profitability through optimized operationsContinually optimizing the operational chain is criti-cal to ensure customer satisfaction and profitability. In 2018, Functional Minerals began implementing a system for web-based slot management with trucking companies to ensure just-in-time arrival of trucks to retrieve finished goods at Clariant’s production sites. Furthermore, it took steps to better integrate the commercial and the operational chain by testing a system for linking customers’ silo levels to Clariant’s planning system.
Oil & Mining Services was able to transition from bulk deliveries to intermodal deliveries across the United States, resulting in net savings of approximately CHF 37 000 per year and a reduction of 36.75 t CO₂ equivalents (– 65 %).
9. Ensuring safety at the workplace and on the roadTo increase the occupational health, safety, and well- being of employees, Functional Minerals started the Safety Teams initiative in 2018 to involve workers in continuously improving safety at the workplace. Oil & Mining Services focused its efforts on increasing road safety, as employees drive over 36 000 000 kilometers each year to deliver products or provide services to customers. In 2018, it introduced a driver training program for all employees in North America and installed camera systems with an incorporated event recorder in over 200 vehicles in the United States. The training will be rolled out in Latin America in 2019 and will be available as an e-learning course as well.
Shifting from bulk to intermodal deliveries reduces the yearly green-house gas emissions of BU OMS by 36.75 t CO₂ equivalents.
36.75
» Under the new motto ›Customers are our passion, excellence is our way,‹ Functional Minerals engages in a close dialog with its customers. Starting with the question ›what is precious to you?‹ we co-develop new products or solutions with and for our customers.«SVEN SCHULTHEISHead of Business Unit Functional Minerals
BUSINESS AREAS — NATURAL RESOURCES84

Targets 2021
Growth potential per year EBITDA target margin
6 – 7 % 16 – 17 %
Training hours
30 232Staff in FTE at year end (2016: 3 235)
3 276
Production sites
36Production volume in m t
2.9 1
Raw material suppliers
1 680
Number of raw materials procured
2 713
Greenhouse gas emissions in kg/t production
94 2
Energy consumption in m kWh
857 2
Waste in thousand t
109 2
PerformanceINPUT OUTPUT
PeopleINPUT OUTPUT
Planet
INPUT OUTPUT
R&D spend of sales
2.1 %Sales in CHF m
1 394Raw material procured in CHF m
463
Active innovation projects
> 90Growth in local currencies
8 %
EBITDA margin before exceptional items
12.8 %
Natural capital
Financial capital Intellectual capital
Relationship capitalHuman capital
Manufactured capital 1 For 2018, the production volume is based on a reduced reporting scope, which includes sites that are responsible for 95 % of total production.
2 Every three years, Clariant validates environmental data from all production sites. The last full reporting campaign was in 2017. In interim years, including 2018, the reduced reporting scope comprises the larger sites responsible for 95 % of production.
85CLARIANT INTEGRATED REPORT 2018

TWO PERSPECTIVES — OCCUPATIONAL HEALTH, SAFETY, AND WELL-BEING86

Where Can We Improve Safety Even Further?
Occupational Health, Safety, and Well-being
Accidents in the chemical industry are few and far between. That’s undoubtedly a good thing. But it also means that there is less left to learn from mistakes. Managing ever more complex systems and further increasing safety will require a new way of thinking about risks.
CLARIANT INTEGRATED REPORT 2018

Paul Lieck
As Corporate Safety Director North America at Clariant, Paul works to highlight and control
everyday risks in the workplace and uphold safety as a core company value.

Martin Clausen
As Senior Risk Engineer at Zurich Insurance, Martin visits Clariant's chemical sites all over the world to assess risks and further improve safety.
Martin Clausen
As Senior Risk Engineer at Zurich Insurance, Martin visits Clariant's chemical sites all over the world to assess risks and further improve safety.
87CLARIANT INTEGRATED REPORT 2018

implemented a program called »SmartDrive« where driving habits are continually evaluated and improved. Additionally, they’ve introduced an effort called »Check 6« to focus attention on checking the condition of each vehicle before use.
Let’s talk numbers! How many accidents have you seen in 2018?In 2018, the Lost Time Accident Rate or LTAR is 0.16 for Clariant North America.
What does that mean in absolute numbers?It means that, with over 2 300 employees working well over 5 million hours annually, we’ve so far seen a total of four accidents where people had to miss at least a day at work. LTAR is a common indicator by which the indus-try measures work safety.
Are there others?We track so-called OSHA reportable incidents where a person might need to get treatment but won’t have to miss work. Then there are first-aid incidents – starting with even just a band-aid. And we track near misses or »safety deviations« as we call them, where employees report a potentially hazardous situation they’ve wit-nessed. All this gives us data to work with.
What are the data telling you?What we see is that we’ve come a very long way in pro-cess and work safety. But we have to stay aware of everyday risks. As an example, in 2017, a third of our more significant injuries in North America resulted from slips, trips, and falls. That’s nothing specific to the kind of work we do. But it led us to take action, and already we’ve seen a significant drop in those types of accidents in 2018. Numbers aren’t everything, but they help us focus our attention and raise awareness.
What are some of the more creative ways you’ve seen used to raise awareness?Our site in Chicago has a great program providing mate-rials that people can take home and even use with their kids. That encourages you to think about safety more broadly. At our site in Phoenix, Arizona, they’ve named the aisle ways in the plant using street signs like »Safety Way«, »Proper Lifting Lane«, or »No-Lost-Time Boule-vard«. That’s a new and really innovative way to focus on safety. Awareness is extremely important. Combin-ing this with the other elements of safety is what we have to do to ensure our success in keeping our work-places safe.
Paul, you’re coming up on 37 years of working in environmental safety and health. What’s your recipe for safety?There’s not one simple answer to that. I always talk about all the different things that go into it – what we call the elements of safety. You have policies and guidelines at a Group level and then specific procedures at the sites. You need proper training and the appropriate resources. Of course it’s about designing our plants so they can be operated safely. But safety also involves ensuring people have the right skills and attitude towards safety, as well as focusing on safe behaviors. All of these elements are critical to our success.
How important is the right attitude in general?Awareness among employees and commitment from management are crucial elements of safety. I see that with Clariant. And the commitment goes to the very top. Our former CEO has clearly supported safety, and our incoming CEO made it a key part of his message when he introduced himself to us. To me, that’s fantastic!
So it’s about making safety a priority throughout the company?I’d go further than that. I see safety as one of our core values. It’s okay to talk about safety being a priority, but it has to go beyond being a priority. A rush order that comes in or other factors may momentarily shift your priorities, but not your core values.
What about you personally?If you asked my wife and my daughters, they would tell you that safety has been a constant theme around our house for many years. Safety at home was already important to me, but became even more important as our daughters grew, especially when they started driving.
Is driver safety an issue for Clariant too?Absolutely. Our Business Unit Oil & Mining Services (OMS), for instance, places special emphasis on driver safety. OMS employs a significant number of trucks and drivers to deliver our products to customers, even in very remote places. It not only puts our drivers on the road but often on our customers’ property. So OMS has
88 TWO PERSPECTIVES — OCCUPATIONAL HEALTH, SAFETY, AND WELL-BEING

PAUL LIECKCorporate Safety Director North America, Clariant
What helps us keep employees healthy
and safe?
What helps us keep employees healthy
and safe?
89CLARIANT INTEGRATED REPORT 2018

MARTIN CLAUSENSenior Risk Engineer, Zurich InsuranceMARTIN CLAUSENSenior Risk Engineer, Zurich Insurance
Where should we look to improve safety even further?
Where should we look to improve safety even further?
90 TWO PERSPECTIVES — OCCUPATIONAL HEALTH, SAFETY, AND WELL-BEING

Speaking of goals, the industry as a whole has a record of reducing accident rates further and further. Clariant works towards »zero accidents«. What do you make of that?Personally, I’m skeptical. A world without accidents is a nice goal to have. A strong focus on ever lower accident rates does help to improve, and we have to learn from what went wrong. But things are more complex from my point of view.
You’ll have to explain.Think of it this way: Do we really understand new risks we’re dealing with if we mainly learn from past failures? Systems are becoming ever more complex and intercon-nected. We need to understand and work on what I call »system resilience«. Rather than focussing on what went wrong, we should be asking why things go right. What makes the system in question stable and safe? I believe in looking at the bigger picture rather than chas-ing numbers.
Are different aspects of safety connected?Absolutely. A lapse in process safety can have immedi-ate and drastic consequences on all aspects of safety. A healthy safety culture can’t have any blind spots, and laxness in one area usually seeps into others.
What are warning signs when visiting a site?It literally starts right at the gate. If security is lax, for example, I’m already alert. If the people I’m talking to aren’t prepared, I know there’s trouble.
You say safety is becoming more complex, but is there still a simple golden rule to safety?I think there are a few life-saving rules in the working environment that we need to enforce with zero toler-ance. I’m thinking also about those little shortcuts we’re all attempted to take: Walking a red light, using the phone while driving. That’s the kind of unnecessary risk-taking we need to eliminate. I know of cases where people have been fired on the spot because they called into meetings from their phone while driving.
Martin, you’ve just come back from Asia. What were you doing there?I visited two of Clariant’s large production sites for a risk assessment, one in China and one in Indonesia. Zurich Insurance Group is Clariant’s main global insurer for property and supply chain risks. As a risk engineer for Zurich, I personally visit about ten Clariant sites every year. It’s important to us that we understand the specific risks our client deals with and help find ways to reduce them.
What kind of risks do you assess and how?I focus on risks to Clariant’s assets as well as their plants and facilities. Risks may involve accidents, fires, natural hazards, and so on that could spell massive losses and potentially interrupt Clariant’s supply chain for days or even months. That’s why my visits are usually to larger sites that play a critical role in Clariant’s supply chain. But occasionally Clariant might specifically ask us to analyze smaller sites, say, if they’re taking on assets from someone else.
Is the chemical industry a risky business?The industry handles substances that can be very dan-gerous to humans and the environment. And chemical processes can involve large amounts of energy. All this combined can pose huge risks. It’s paramount that those risks are mitigated effectively and the industry as a whole does this very well. Tight regulation and over-sight also do their part.
Are there regional differences?Not so much. Particularly with a global company like Clariant, which has very high safety standards and a working safety culture, because they establish the same policies and expectations all over the world. That being said, in my job, I find it especially interesting to see how different cultures go about meeting the same goal. And I think it’s important to give teams a certain degree of freedom to do so.
91CLARIANT INTEGRATED REPORT 2018

To proactively adapt or develop solutions, Clariant closely monitors legislative developments that could ban or impact the use of critical substances.
Fueled by increasing awareness of the persistence of plastics in the environment, particularly in the oceans, the circular economy is poised to have the largest impact on the plastics industry in recent history. PAGE 164 In response, bio-based and bio-compostable products are gaining in popularity as potential solutions. Clariant is addressing the persistence of plastics by promoting improved recyclability and usage of biomaterials in its product development cycle. In 2018, Clariant also joined the Plastics Recyclers Europe Association (PRE) as well as the Responsible Packaging Coalition in South East Asia.
Together, increased environmental awareness and the trending circular economy are driving demand for sus-tainable products and creating opportunities to acceler-ate product-related innovation and sustainable growth.
1. Creating promising business opportunities from demand for sustainable products and stricter regulations Plastics & Coatings is increasingly challenged by rising environmental awareness. Customers ask for products that are free of hazardous substances or feature renew-able raw materials. In addition, new regulations and toxicological reclassifications regarding ingredients such as biocides and impurities such as heavy metals, amines, and polychlorinated biphenyls (PCBs) are necessitating the development of alternative products. In food packaging, products free of allergens or geneti-cally modified organisms (GMOs) are also being requested.
Through continuous innovation, Plastics & Coatings satisfies the in-creasing demand for sustainable products while also meeting stricter regulations. By tracking megatrends and engaging with customers, the Business Area develops solutions tailored to each market. Contin-uous improvements to the supply chain ensure a reliable, steady supply of raw materials, which support the On-Time, In-Full deliveries of finished products that are critical to Clariant’s profitability.
How Plastics & Coatings Creates Value
001 PLASTICS & COATINGS
MAIN APPLICATIONS
OVERVIEW
Business Area Plastics & Coatings is comprised of Business Units Additives, Masterbatches, and Pigments. Plastics & Coatings serves markets ranging from packaging, electrical and electronics, consumer
goods, medical, textile, transportation, building and construction, as well as agriculture. It delivers to local and regional customers as well as multinationals.
Business Unit Additives
— Flame Retardants: Patented halogen-free flame retardants provide environmentally com-patible protection and pass or comply with demanding fire safety standards
— Performance Additives: Performance additive solutions prevent oxidation, dissipate electric charge accumulation and improve heat, light and weather resistance
— Advanced Surface Solutions: Protect and enhance surfaces in Plastics, Coatings and Inks, Adhesives, Agro and Care sector
Business Unit Masterbatches
— Color and additive concen-trate solutions for plastics processing
— Concentrates for functional packaging, medical devices and pharma packaging
— Protection against moisture and oxygen in drug packaging
— Small lot color plastic com-pounds for the use in automo-tive, electrical and electronics markets
Business Unit Pigments
— Decorative, industrial, and automotive coatings
— Coloration of plastic applications
— Applications for conventional printing inks, inkjet inks, and electrophotographic toners
— Special applications for e.g., home and personal care, alu-minum, seed coatings, statio-nery, viscose, latex and leather
92 BUSINESS AREAS — PLASTICS & COATINGS

In addition, a globally growing middle class and the advance of the Internet of Things further support sales growth. For example, as demand for electronic devices for smarter homes and smarter cars rises, so does demand for safe flame retardants.
IDEA TO MARKET
2. Innovating for a sustainable futureIn 2018, Business Unit Additives made strong progress in transforming to a more market-driven organization by advancing innovation and sustainability collabora-tions with its customers. This was supported by intense technical consultation and development to address new technical requirements in markets affected by digitalization, such as solutions for smarter homes, smarter cars, and mobility. Additives increased its offering of EcoTain® products to 32 PAGE 122 and expanded partnerships for more sustainable value chains. One example is the introduction of Licocare® RBW, a high-performing lubricant, which is based on a renewable and non-food-competing by-product of the rice oil production. Another example is the part-nership with Neste, which will result in further possi-bilities to produce additives based on renewable materials. The Business Unit also engaged in the devel-opment of new additives to substitute for persistent, bio-accumulating, and toxic substances (PBT). Clariant’s flame retardant product portfolio, already known for being halogen-free, was further strengthened by improving processability, durability, and electrical properties. Future developments will enable highly efficient recycling processes that align with goals of the circular economy.
In 2018, Business Unit Masterbatches placed sustain-ability at the core of its innovation activities and entered a collaboration with »We are Spindye«, a com-pany that colors textiles by dyeing yarn prior to weav-ing rather than bathing finished products in color dye. Its innovative process greatly reduces water usage, water contamination, and energy consumption, mak-ing it an effective alternative to conventional dyeing and a promising pathway for the textile industry to reduce its environmental footprint. Another major innovation project for this Business Unit was the development of oxygen barrier technologies for poly-ethylene terephthalate (PET) and polyolefins, both of which are used in food packaging. The technology is expected to prolong shelf life of packaged products and reduce food waste.
Business Unit Pigments focused its innovation activi-ties on increasing product safety and adapting to reg-ulatory changes. In addition, to improve the cost structure of the product portfolio, the Business Unit investigated process innovation and examined tech-nologies such as micro reactors and process automa-tion. This supports growth targets, while simultane-ously increasing sustainability of products and production processes.
MARKET TO CUSTOMER
3. Launching products successfully In 2018, Business Unit Additives launched the flame retardant Exolit® OP 945, a micronized version suited for adhesive layers used, for example, in the electron-ics sector. Due to miniaturization of electronic equip-ment, these layers have become ever thinner requir-ing that flame retardants adapt in size as well. Another launch was the 100 % polymer adhesive Licocene® PP
93CLARIANT INTEGRATED REPORT 2018

Near-infrared (NIR)
NIR spectroscopy is used in plastics recycling. Typically, black colored plastic blocks NIR and thus hinders the recy-cling process. Clariant developed a NIR-trans-parent black color to avoid this problem.
2502 for mattress construction, which enabled the production of the first EcoTain®-labeled mattresses. Licocene® PP 2502 is purer, less energy-consuming, and can be based on renewable monomers – clear advantages when comparing the product with con-ventional alternatives. Several new solutions were launched under the AddWorks® brand, for example, AddWorks® PKG 906, which enhances post-manufac-turing waste recycling in polyolefin films for packaging.
In order to increase and simplify plastics recycling, Business Unit Masterbatches successfully developed a near-infrared (NIR) transparent black color, which enhances sorting of black plastic articles in recycling plants. Black-colored articles typically blind the NIR detectors, potentially contaminating waste streams. This breakthrough solution helps to solve this problem.
Business Unit Pigments worked on reformulating pig-ment preparation ranges. Tangible outcomes include future-oriented formulations of Colanyl® 500, Hostatint™ 500, and Hostafine® pigment preparations for decorative and wood coatings, meeting the latest and upcoming environmental and application requirements. In Latin America, new tailor-made Agrocer preparations for seed coloration were launched to fulfill the unmet customer need regarding technical performance and batch-to-batch quality consistency.
4. Engaging with customers Gaining insights into customer demands and expecta-tions is paramount to business success. To acknowl-edge the importance of marketing and customer rela-tions, the new Leading Marketing Organization (LMO) has been implemented within Business Area Plastics & Coatings. The LMO strengthens business segment focus with commercial and technical mar-keting. PAGE 49
In 2018, Business Unit Additives further strengthened its go-to-market organization by widening its portfo-lio as well as its technical and marketing capabilities. This resulted in several customer collaborations for joint innovation or sustainability projects. Particularly through collaborations with specifiers along distinc-tive value chains, new insights were shared and initia-tives started in order to find answers to future challenges.
In 2018, Business Unit Masterbatches attended sev-eral industry-specific fairs in order to strengthen cus-tomer relationships and enable experience of new products, and hosted customer days in various coun-tries. Customer feedback solicited through the Clariant 2018 customer survey will also help to con-tinuously improve and tailor solutions to customer needs.
Business Unit Pigments focused on the introduction of the LMO and strategic key account management process in 2018. Both will lead to a better understand-ing of market trends and demands, resulting in more collaborative projects with customers. In addition, Business Unit Pigments offered technical training to its customers’ new staff, for which demand was high.
The 2018 customer satisfaction survey underscored the importance of »Technical Services«, which were rated as the second most important buying criterion, right after »Products and Packaging«. For the latter, Plastics & Coatings maintained its high satisfaction score of 83 points (2016: 83), while the score for »Technical Services« decreased slightly to 75 points (2016: 77). Overall customer satisfaction reached 76 points (2016: 78), while the Customer Loyalty Index scored 80 points (2016: 84).
CUSTOMER TO CASH
5. Securing raw material availabilityHaving a safe and reliable supply chain is crucial for a seamless Customer to Cash process. PAGE 51 In 2018, a supplier dashboard that collects and updates relevant information was introduced, enabling rapid screening of factors such as price, lead time, environ-mental performance indicators, and, if existing, possible connections to indicators of child labor and conflict minerals.
94 BUSINESS AREAS — PLASTICS & COATINGS

Business Unit Masterbatches started a project to eval-uate the possibility for customers to place and track orders online, which will enable customers to receive regular, real-time updates on the order status.
Business Unit Pigments initiated project »Clockwork« in order to improve effectiveness and efficiency of the end-to-end supply chain, which will lead to opti-mized transparency, reliability, and predictability as well as improved inventory levels and lead times.
7. Ensuring safe operationsPlastics & Coatings is committed to protecting employee safety, health, and well-being and aspires to the company-wide goal of zero accidents. Within the Avoiding Accidents program, managers and employ-ees are trained to optimize safety behavior and cul-ture to reduce accidents that cannot be eliminated technically. PAGE 140
Availability of raw materials and intermediate prod-ucts posed a challenge to Plastics & Coatings in 2018. Stricter environmental regulations in producing countries, such as China and India, as well as several forces majeures led to supply shortages, impacting Clariant’s ability to ensure supply security to custom-ers. In order to increase flexibility, Plastics & Coatings implemented several countermeasures. For example, sourcing strategies were expanded to include multi-ple suppliers for the most important raw materials and de-specification of raw materials was advanced, enabling Plastics & Coatings to use alternative feed-stock for some products and reduce dependence on other raw materials.
6. Increasing reliability of the operational chainMarket dynamics require continuous improvement of the operational chain as well as reductions in delivery time. Plastics & Coatings worked on several measures in 2018 to advance these topics.
Business Unit Additives invested in expansions of exist-ing plants as well as the commissioning of two new plants in China. Supply chain upgrades included capa-bility building and process enhancements regarding planning, logistics, and communication. In addition, new digital tools were evaluated to improve process-ing and information flow.
» We increased our market insight and customer intimacy with strong value propositions along sustainability and innovation as well as intense value chain collaborations.«WOLFGANG WANZKESustainability Manager Business Unit Additives
Plastics & Coatings maintained a high satisfaction score of 83 points in the category »Products and Packaging« of the customer satisfaction survey 2018.
83
95CLARIANT INTEGRATED REPORT 2018

Business Unit Additives has intensified its awareness program with behavioral training, safety checks, and accident avoidance projects. By implementing and providing management support for a stringent safety focus in all plants, Business Unit Masterbatches significantly improved safety performance in recent years, which shows in the stark decline of the Lost Time Accident Rate (LTAR) of 4.6 in 2008 to 0.11 in 2018. In the future, local, regional, and global stan-dards will be harmonized in order to apply the strict-est safety regulations across all operations. Business Unit Pigments implemented site-specific programs to improve overall accident and incident rates, e.g., physical exercises to improve overall fitness and body awareness in Suzano, Brazil, and Shizuoka, Japan, or awareness trainings regarding walking, ascending and descending stairs, stumbling in Höchst, Germany, near miss recording, analysis and deduction of spe-cific measures in all sites. Additional refresher train-ing such as the Clariant Safe Behavior Training (CSBT) as well as Safety Moments at the beginning of each meeting and the Avoiding Accidents at Clariant Program further raise awareness among employees.
8. Improving environmental performancePlastics & Coatings is focused on achieving Clariant’s Environmental, Safety and Health (ESH) targets.
PAGE 160 Production processes and workflows are constantly reviewed and optimized for improved environmental performance.
All European facilities of Business Unit Additives are certified with the Energy Management system ISO 50001. Plants to be commissioned and built outside of Europe will be certified in due course. Specially trained energy managers drive energy efficiency enhancement projects, waste avoidance, closed-loop manufacturing, and carbon footprint reduction.
Business Unit Masterbatches applies three layers of environmental protection. First, strict compliance with all local regulations, laws, and permits of the production sites is ensured. Second, Clariant’s ESHA guidelines, which typically go beyond local regula-tions, are followed at all sites. Third, all production sites operate along ISO 9001/14001 standards.
Within Business Unit Pigments, numerous projects to save energy, reduce waste, and use chemicals in a more efficient and sustainable way are being conducted. These projects are part of Clariant’s long-term oriented excellence programs such as the Production System Yield, Energy, Environment (YEE) and Clariant Production System (CPS).
» The key challenge is that the industry needs to connect along the value chain to develop tangible solutions adressing various circular economy topics.«JOCHEN AHRENSHead of Global Marketing & Innovation Business Unit Masterbatches
96 BUSINESS AREAS — PLASTICS & COATINGS

Targets 2021
Growth potential per year
=̂ global GDP
steered for absolute EBITDA and cash flow generation
Training hours
28 459Staff in FTE at year end (2017: 6 759)
6 793
Production sites
62Production volume in m t
0.36 1
Raw material suppliers
4 746
Number of raw materials procured
15 305
Greenhouse gas emissions in kg/t production
774 2
Energy consumption in m kWh
952 2
Waste in thousand t
48 2
PerformanceINPUT OUTPUT
People
INPUT OUTPUT
Planet
INPUT OUTPUT
R&D spend of sales
1.4 %Sales in CHF m
2 703Raw material procured in CHF m
1 149
Active innovation projects
> 105Growth in local currencies
1 %
EBITDA margin before exceptional items
15.2 %
Natural capital
Financial capital Intellectual capital
Relationship capitalHuman capital
Manufactured capital 1 For 2018, the production volume is based on a reduced reporting scope, which includes sites that are responsible for 95 % of total production.
2 Every three years, Clariant validates environmental data from all production sites. The last full reporting campaign was in 2017. In interim years, including 2018, the reduced reporting scope comprises the larger sites responsible for 95 % of production.
97CLARIANT INTEGRATED REPORT 2018

TWO PERSPECTIVES — PRODUCT STEWARDSHIP/SUSTAINABLE CHEMISTRY98

Why Does It Pay to Focus on Sustain ability?
Product Stewardship/Sustainable Chemistry
Sustainability is a pillar of Clariant's busi-ness strategy. Substantiating and quantify-ing claims about how a certain product helps customers perform more sustainably is a key. It's not always straighforward, however. With EcoTain®, Clariant has taken out the guess work. Not only about the environmental and social benefits of prod-ucts, but also their economic impact and the shift in customer demand.

LynetteChung
As Head of Corporate Sustainability Strategy & Advocacy at Clariant, Lynette helps businesses
better promote and market sustainable products.

Isolde Bachert
As Head of Research & Development at Follmann, Isolde works on ways to measure and promote sustainability benefits across Follmann’s portfolio.
Isolde Bachert
As Head of Research & Development at Follmann, Isolde works on ways to measure and promote sustainability benefits across Follmann’s portfolio.
99CLARIANT INTEGRATED REPORT 2018

How many products carry the EcoTain® label?As we speak, we have 193 EcoTain® products. EcoTain® products exist in all of our Business Units.
Do you track how well EcoTain® products are doing economically?Absolutely! That’s one of the big questions. What kind of value are they adding – apart from, of course, the environmental and societal contribution?
And what are you seeing?Sales in our EcoTain® products overall are growing significantly faster than the rest of our portfolio, at a double-digit growth rate, which is excellent. In addi-tion, margins for EcoTain® products are typically stron-ger. The higher growth rates and profitability clearly demonstrate the business case for sustainability.
What does that tell you?It tells us that markets really are shifting towards more sustainable solutions. And we have an opportunity to use sustainability as a driver for innovation and in mar-keting.
Were there doubts about that?Maybe not doubts. We all believe that markets are shift-ing and are increasingly sensitive to sustainability, but having done this exercise and having actual proof of how it’s affecting our bottom line is very rewarding and convincing.
Have you seen other kinds of recognition?We’ve received a few awards and great feedback on our approach from stakeholders, such as NGOs, policy- makers, and peers. The greatest and most recent recog-nition comes from some customers that have asked to highlight the EcoTain® ingredients in their own prod-ucts with the EcoTain® label. This is tremendous! But I think we’re still not quite where we want to be. There’s still some way to go in promoting EcoTain®, advocating change, policy and market shifts to bring more customers and markets with us on our sustainability journey.
Lynette, how would you describe EcoTain® to the uninitiated?The short answer: It’s Clariant’s brand for products and solutions that have outstanding sustainability advan-tages, don’t compromise on performance, and benefit customers, the value chain, and society as a whole.
What’s the long answer?EcoTain® is a way to distinguish our sustainability offering from the mainstream. It sets an ambitious bench-mark for our aspirations. Each product carrying the EcoTain® label has undergone a systematic, in-depth screening process using 36 criteria, which consider the overall product life cycle and value chain. The criteria are forward looking, developed and tested with custom-ers, NGOs and other stakeholder groups, establishing a solid approach. Only exceptional products that signifi-cantly exceed market standards, with a best-in-class performance in one or several of the 36 criteria, are awarded the EcoTain® label by the corporate EcoTain® panel that scrutinizes each application.
EcoTain® as a company-wide label was born in 2015. Why does it make sense to have a universal set of criteria across so many different products and markets? It helps to have a common understanding of what sus-tainability really means at the product level in the com-pany. There are always broad claims in every market about what is a sustainable solution and what isn’t. Using the same criteria across the board lets us validate and quantify our claims. This is very important in order to have a strong, credible brand that customers but also we ourselves can relate to. That’s something our Business Units appreciate.
Has this common understanding changed the dis-cussion about sustainability within the company?It has. Our Business Units and their markets face differ-ent requirements and challenges. But lately, we’ve seen an overall shift that’s not just due to our corporate focus on sustainability – it is more business- and market- driven. Having a sustainability brand, ensures visibility of our efforts in the market place. Internally, it drives progress as it also creates internal competition. Our Business Units take pride in having an EcoTain® portfo-lio and growing it. We now also systematically use our sustainability criteria in screening major Research & Development projects.
TWO PERSPECTIVES — PRODUCT STEWARDSHIP/SUSTAINABLE CHEMISTRY100

LYNETTE CHUNGHead of Sustainability Strategy & Advocacy, Clariant
Who benefits from labeling sustainable
products?
Who benefits from labeling sustainable
products?
101CLARIANT INTEGRATED REPORT 2018
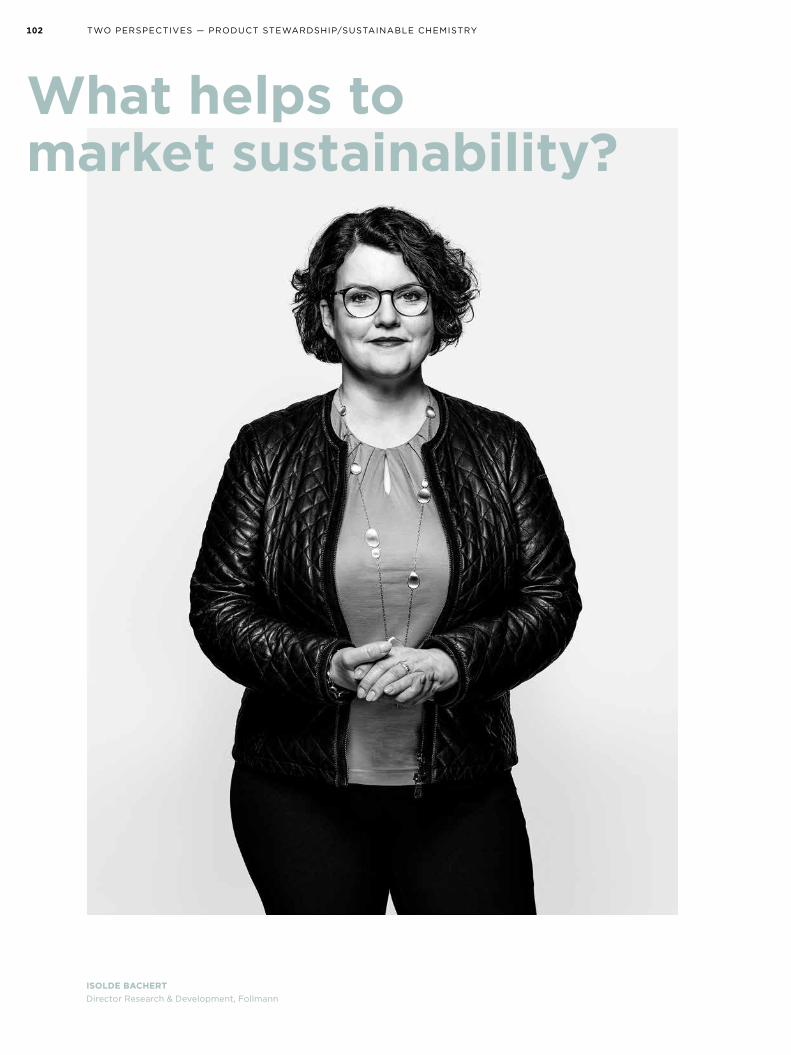
ISOLDE BACHERTDirector Research & Development, FollmannISOLDE BACHERTDirector Research & Development, Follmann
TWO PERSPECTIVES — PRODUCT STEWARDSHIP/SUSTAINABLE CHEMISTRY
What helps to market sustainability?What helps to market sustainability?
102
compounds that you’d have to collect and burn off. There were times when nobody cared too much whether that added a little to the overall carbon footprint. Those times are over.
EcoTain® uses a methodology to quantify these kinds of benefits. What’s special about that? Clariant was the first supplier to come to us with the idea. I like that they use a wide range of criteria that are near and dear to our customers. Also, EcoTain® doesn’t just look at a product by itself. Instead, it analyzes the specific application and how that measures up to com-mon alternatives. That helps make a convincing argu-ment for our solution. Additionally, applying that same methodology across our whole portfolio helps us see which products are set to do well and which might face problems when regulations or customer demands intensify.
What are some of your products that carry the EcoTain® label?One is a glue that’s used in book binding. Its main ingre-dient is an EcoTain® product that’s based on renewable materials. Another product like this goes into glues for cardboard packaging.
And does Follmann plan to further apply the EcoTain® methodology?The first step is to look for products that rely or could rely on EcoTain® materials. But then we expand this view and look to apply the same criteria to other prod-ucts and ingredients. In the end, we’ll want to quantify how well our products address what is most important to our customers – be it renewable materials, CO₂ reduction, energy savings, water use, or whatever. That goes for our current portfolio as well as innovation, whenever we’re evaluating if an R&D project is worth pursuing.
Will you be making use of the EcoTain® methodology with other suppliers?Absolutely. But that’s along the lines of what we’re see-ing already. Our customers ask more and more detailed questions about what goes into our products. A supplier that can’t or won’t help us answer those questions won’t be a supplier for long.
Isolde, you manage Research & Development at Follmann. What’s your relationship to Clariant as a supplier?They supply some of our most essential materials, but not only that. We’ve come to value them for their inno-vative products and the way we work together on a technical level. It’s a great partnership – one that we’re expanding.
You’re talking about plans to jointly promote the Clariant EcoTain® label. What’s the idea behind that? Sustainability has been a defining trend for us and our industry for some time. But recently, what our custom-ers ask from us has become a lot more specific. Deliver-ing quantifiable benefits in terms of sustainability now is a big selling point for us. That’s something the EcoTain® label helps us with.
Who is driving this trend?Consumers are the driving force. Follmann specializes in printing inks, coatings, and adhesives. So while con-sumers aren’t our direct customers, we deal with con-sumer goods companies, the packaging industry, and furniture manufacturers. Printing and bookbinding are also big markets for our inks and adhesives. All these industries face a certain amount of consumer pressure in terms of sustainability. Initially, that was all about energy consumption and CO₂ emissions, but companies are increasingly taking other factors into account. Many companies made big commitments to using only renew-able materials.
How big is that impact though, when there’s just so little ink on a piece of packaging?It might be small in comparison, but it adds up. Take our water-based inks. They replace the need for organic solvents. That way the drying process doesn’t emit organic
103CLARIANT INTEGRATED REPORT 2018
Multicapital ReviewMulticapital Review
104 REVIEW
Organized along Clariant’s brand values Performance, People, and Planet, the »Multicapital review« presents Clariant’s progress during the reporting year on the topics deemed material for the company’s longterm business success. Key performance indicators covering economic, social, and environmental topics are explained and discussed.

106 Performance128 Two Perspectives: Who Shapes New
Digital Business Models?134 People 152 Two Perspectives: What Will Our
Customers Expect from Us Tomorrow?158 Planet 166 Two Perspectives: Where Can Chemistry
Help Close the Plastics Loop?

By drawing on a multitude of tangible and intangible, financial and nonfinancial resources, Clariant creates value for all its stakeholders. Six different capitals – financial, intellectual, manufactured, human, relationship, and natural – are all considered in balancing business performance, social interests, and environmental stewardship. Clariant categorizes the six capitals under the brand values Performance, People, and Planet.
PerformanceWithin Performance, Clariant combines financial, intel-lectual, and manufactured capital. In addition to finan-cial performance, progress is outlined on the topics of innovation and technological advances, digitalization, product stewardship and sustainable chemistry, pro-curement, and production.
PeopleWithin People, Clariant combines human and relation-ship capital. Employee-related topics such as talent at-traction and development, employee engagement, and occupational health, safety, and well-being are grouped under human capital. The topics regarding customers, policy-makers, suppliers, and society at large are dis-cussed within relationship capital.
PlanetWithin Planet, Clariant reports on natural capital. This includes the progress Clariant made on its ambitious environmental targets and on topics related to environ-mental stewardship, such as safeguarding resources, mitigating climate change, and promoting the transition to a circular economy.
105CLARIANT INTEGRATED REPORT 2018
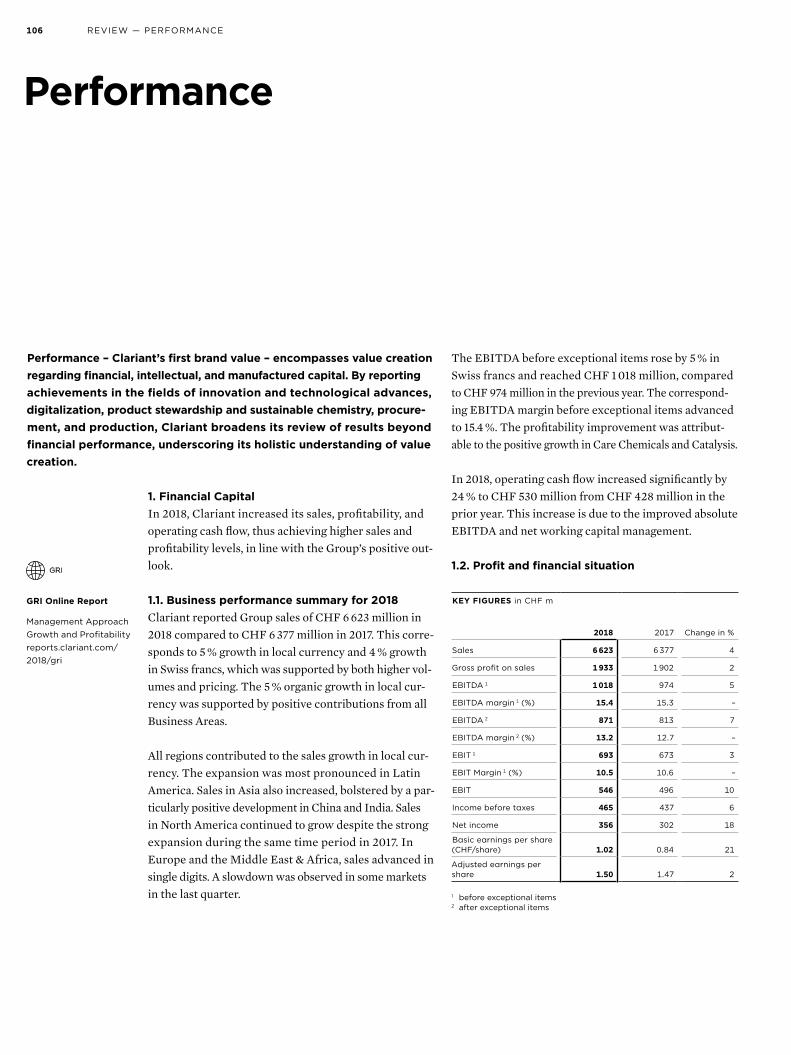
1. Financial CapitalIn 2018, Clariant increased its sales, profitability, and operating cash flow, thus achieving higher sales and profitability levels, in line with the Group’s positive out-look.
1.1. Business performance summary for 2018Clariant reported Group sales of CHF 6 623 million in 2018 compared to CHF 6 377 million in 2017. This corre-sponds to 5 % growth in local currency and 4 % growth in Swiss francs, which was supported by both higher vol-umes and pricing. The 5 % organic growth in local cur-rency was supported by positive contributions from all Business Areas.
All regions contributed to the sales growth in local cur-rency. The expansion was most pronounced in Latin America. Sales in Asia also increased, bolstered by a par-ticularly positive development in China and India. Sales in North America continued to grow despite the strong expansion during the same time period in 2017. In Europe and the Middle East & Africa, sales advanced in single digits. A slowdown was observed in some markets in the last quarter.
The EBITDA before exceptional items rose by 5 % in Swiss francs and reached CHF 1 018 million, compared to CHF 974 million in the previous year. The correspond-ing EBITDA margin before exceptional items advanced to 15.4 %. The profitability improvement was attribut-able to the positive growth in Care Chemicals and Catalysis.
In 2018, operating cash flow increased significantly by 24 % to CHF 530 million from CHF 428 million in the prior year. This increase is due to the improved absolute EBITDA and net working capital management.
1.2. Profit and financial situation
KEY FIGURES in CHF m
2018
2017 Change in %
Sales 6 623 6 377 4
Gross profit on sales 1 933 1 902 2
EBITDA 1 1 018 974 5
EBITDA margin 1 (%) 15.4 15.3 –
EBITDA 2 871 813 7
EBITDA margin 2 (%) 13.2 12.7 –
EBIT 1 693 673 3
EBIT Margin 1 (%) 10.5 10.6 –
EBIT 546 496 10
Income before taxes 465 437 6
Net income 356 302 18
Basic earnings per share (CHF/share) 1.02 0.84 21
Adjusted earnings per share 1.50 1.47 2
1 before exceptional items 2 after exceptional items
Performance – Clariant’s first brand value – encompasses value creation regarding financial, intellectual, and manufactured capital. By reporting achievements in the fields of innovation and technological advances, digitalization, product stewardship and sustainable chemistry, procurement, and production, Clariant broadens its review of results beyond financial performance, underscoring its holistic understanding of value creation.
Performance
REVIEW — PERFORMANCE106
GRI
GRI Online Report
Management Approach Growth and Profitabilityreports.clariant.com/ 2018/gri

1.2.1. Continued sales growth attributable to all Business AreasIn 2018, Group sales rose by 5 % in local currency and 4 % in Swiss francs against the previous year to CHF 6 623 million (2017: CHF 6 377 million). The impact of the full consolidation of the joint venture in India as of 1 April 2017 only had an impact in the first quarter of 2018. The organic sales growth persisted at a high level throughout the entire year driven by increases in all Business Areas. Sales were driven by 2 % volume growth and by a 3 % price increase. Organic sales increased by a strong 5 % in local currency for the year.
SALES BY BUSINESS AREA in CHF m
2018
2017Change
in %Change in
LC 1 in %
Care Chemicals 1 665 1 575 6 7
Catalysis 861 767 12 11
Natural Resources 1 394 1 357 3 8
Plastics & Coatings 2 703 2 678 1 1
Group Total 6 623 6 377 4 5
1 LC = Local currency
1.2.1.1. Sales progression driven by all Business AreasSales in the Business Area Care Chemicals improved by 7 % in local currency (6 % in Swiss francs). The notable sales development was supported by both the Consumer Care and the Industrial Applications businesses. In Catalysis, sales grew by 11 % in local currency (12 % in Swiss francs), with an excellent organic sales expansion of 8 % in local currency. This improvement was driven, in par-ticular, by higher Syngas demand. Natural Resources sales advanced by 8 % in local currency (3 % in Swiss francs). The Oil & Mining Services business exhibited double-digit sales growth in local currency, despite the continuingly challenging market trend in the oil busi-ness. Sales in Functional Minerals continued to grow solidly at a single-digit rate in local currency. In Plastics & Coatings, sales expanded by 1 % in local currency (1 % in Swiss francs), against a very strong comparable base.
2 322 (+ 2 %) Europe
1 295 (+ 5 %) North America
775 (+ 12 %) Latin America
481 (+ 2 %) MEA 1
1 750 (+ 7 %) Asia- Pacific
001 SALES BY REGION in CHF m
1 Middle East & Africa
6 623
39 (Euro)
16 (LC 1 Emerging markets)
3 (Japanese yen)
42 (US dollar)
002 COST STRUCTURE BY CURRENCIES 2018 in %
1 LC = Local currency
0 (Swiss franc)
107CLARIANT INTEGRATED REPORT 2018

Clariant’s EBITDA margin before exceptional items rose to 15.4 %.
15.41.2.1.2. Positive absolute EBITDA momentum continues in 2018Clariant’s gross margin softened slightly from 29.8 % in 2017 to 29.2 % in 2018. This development is largely the result of a less favorable product mix.
The EBITDA before exceptional items rose by 5 % in Swiss francs and reached CHF 1 018 million compared to CHF 974 million in the previous year. The corre-sponding EBITDA margin before exceptional items rose by 10 basis points from 15.3 % to 15.4 %.
The increase in absolute EBITDA before exceptional items reflects the enhanced profitability in most Business Areas, with the most pronounced improvement in Care Chemicals at 9 % in Swiss francs and 6 % in Plastics & Coatings. In Catalysis, EBITDA before exceptional items increased by 1 % in Swiss francs while in Natural Resources the absolute profitability was 14 % lower.
EBITDA1 BY BUSINESS AREA in CHF m
2018 2017 Change in %
Care Chemicals 316 290 9
Catalysis 199 198 1
Natural Resources 179 207 – 14
Plastics & Coatings 412 388 6
Group Total 2 1 018 974 5
1 before exceptional items 2 includes corporate costs of CHF 88 m in 2018 and CHF 109 m in 2017
The improvement in the EBITDA margin before excep-tional items was primarily attributable to higher profit-ability in Care Chemicals, reflecting the top-line sales improvement, operating leverage, and an improved product mix. In Plastics & Coatings, the favorable progression was mainly attributable to Additives and Masterbatches and some income from Stahl. As antici-pated, the slightly lower EBITDA margin before excep-tional items in Catalysis was due to the change in product mix. The EBITDA margin decline in Natural Resources largely resulted from the unabated price consciousness of the oil market throughout the year as well as a lower contribution from Functional Minerals’ Purification business compared to the previous year.
EBITDA1 MARGIN BY BUSINESS AREA in %
2018
2017
Care Chemicals 19.0 18.4
Catalysis 23.1 25.8
Natural Resources 12.8 15.3
Plastics & Coatings 15.2 14.5
Group Total 15.4 15.3
1 before exceptional items
Clariant’s exceptional items in 2018 amounted to CHF 147 million (2017: CHF 161 million). Restructuring, impair-ment, and transaction related costs (CHF 93 million) include costs for efficiency programs that were initiated to further streamline business processes (CHF 14 mil-lion), and transaction related costs (CHF 79 million). Exceptional items also include a loss from the disposal of activities (CHF 54 million).
REVIEW — PERFORMANCE108

Operating cash flow
Cash flow from operat-ing activities increased to CHF 530 million.
In 2018, the operating income (EBIT) increased to CHF 546 million (2017: CHF 496 million) as a result of the Group’s improved profitability but also due to lower exceptional items.
Income before taxes increased to CHF 465 million (2017: CHF 437 million) and the net income after taxes rose by 18 % to CHF 356 million (2017: CHF 302 mil-lion), supported by the continued expansion in absolute EBITDA as well as lower one-off costs and a lower effective tax rate.
With regard to the performance in 2018, Clariant’s Board of Directors has decided to propose an increased distribution of CHF 0.55 per share for 2018 to the gen-eral assembly. The corresponding proposal will be pre-sented at the 24th Annual General Meeting on 1 April 2019.
1.2.1.3. Continued solid balance sheetAs of 31 December 2018, total assets decreased to CHF 7 981 million from CHF 8 229 million at the end of 2017 mainly due to the decrease in current assets driven by lower trade receivables.
Net debt decreased to CHF 1 374 million at the end of December 2018, compared to CHF 1 539 million at the end of 2017. This figure includes current and non-cur-rent financial debts, cash and cash equivalents, short-term deposits, and financial instruments with positive fair values reported under other current assets.
1.2.1.4. Longterm structured maturity profile secures solid liquidity structureIn the year 2018, Clariant’s financing structure persisted at a very sound level. The Group maintains a broadly diversified maturity structure of financial liabilities with a long-term focus reaching until 2028. This funding has been secured at favorable terms.
Current financial debts decreased to CHF 529 million at the end of December 2018 from CHF 567 million at the end of December 2017.
On 25 September 2018, four certificates of indebtedness were issued with a total amount of EUR 265 million (CHF 300 million).
1.2.1.5. Operating cash flow boosted by working capital development and lower oneoff costsCash flow before changes in net working capital rose to CHF 802 million from CHF 759 million in the previous year.
Changes in net working capital, including provisions, amounted to CHF – 55 million in 2018 (2017: CHF – 230 million). The ratio of net working capital to sales decreased from 20.1 % to 17.3 %.
Cash flow from operating activities increased to CHF 530 million compared to CHF 428 million in the previous year due to the improved absolute EBITDA and net working capital management.
109CLARIANT INTEGRATED REPORT 2018

REVIEW — PERFORMANCE
410
344
174
529
298
265
175
29
866
285 CHF Bond
408 Certifi-cates of Indebt-edness EUR
2 Loans & other liabilities
859 Cash and short-term deposits
63 Certificates of indebtedness EUR
19 Certificates
of indebted- ness EUR
10 Loans & other liabilities
243 Short-term loans & other liabilities
9 Loans & other liabilities
CHF Bond
1 Loans & other liabilities
160 CHF Bond
1 Derivatives
Certificates of indebtedness EUR
Cash 2019 2020 2021 2022 2023 2024 2025 2026 2028
Liquidity Headroom Maturities of Financial Debt
1 Financial instruments with positive fair values reported under other current assets
7 Derivatives 1
003 DEBT MATURITY PROFILE PER 31 DECEMBER 2018 in CHF m
1 Derivatives
16
Certifi- cates of indebt- edness
EUR
272 Certificates of indebtedness USD
297 Certifi-cates of indebt-edness EUR
104 Certificates of indebted-ness EUR
110

Cash flow from investing activities declined to CHF – 132 million (2017: CHF 65 million). There were no notable acquisitions in 2018 or 2017 and capital expenditures decreased to CHF 237 million (2017: CHF 248 million). Free cash flow, which equates to operating cash flow after capital expenditures and investments in intangible assets, increased to CHF 273 million (2017: CHF 149 million).
Net cash flow after investing and financing activities was positive by CHF 132 million (2017: CHF – 342 million). This allowed to further reduce the net debt of the Group.
004 CASH FLOW 2018 in CHF m
900
800
700
600
500
400
300
200
100
EBITDA Other cash items
(taxes, etc.)
Change in
working capital,
incl. provisions
Cash flow
from operat ing
activities
871 – 286
– 55530
EXTRACT OF CASH FLOW STATEMENT in CHF m
31.12.2018 31.12.2017
Net Income 356 302
Reversals of non-cash items 438 452
Cash flow before changes in net working capital and provisions 802 759
Operating cash flow 530 428
Cash flow from investing activities – 132 65
Cash flow from financing activities – 246 – 826
Net change in cash and cash equivalents 132 – 342
Cash and cash equivalents at the beginning of the period 701 1 043
Cash and cash equivalents at the end of the period 833 701
111CLARIANT INTEGRATED REPORT 2018

1.2.2. Business Areas
1.2.2.1. Care Chemicals
CARE CHEMICALS KEY FIGURES in CHF m
2018 2017
Sales 1 665 1 575
EBITDA before exceptional items 316 290
Margin (%) 19.0 18.4
EBIT before exceptional items 253 230
Margin (%) 15.2 14.6
Full time equivalent (FTE) 2 541 2 582
Care Chemicals sales grew by 7 % in local currency and 6 % in Swiss francs. Both Consumer Care and Industrial Applications delivered solid growth, which was sup-ported by positive contributions from all three Consumer Care Business Lines and most Industrial Applications businesses.
Most regions achieved good sales growth in local currency with North America and Asia advancing at double-digit rates, Latin America and Europe in single digits. Sales in the Middle East & Africa, the smallest region, reflected a negative growth.
The EBITDA margin before exceptional items increased to 19.0 % from 18.4 % in 2017 primarily as a result of the good top-line growth, operational leverage, and an improved favorable product mix.
Consumers are increasingly looking for personalized products based on natural ingredients. Clariant’s Genadvance® range of forward-looking hair care technol-ogies consists of three silicon-free hair conditioning
REVIEW — PERFORMANCE
ingredients each targeting different hair issues: Genadvance® Life – for thin hair, Genadvance® Repair – for damaged hair, and Genadvance® Hydra – for dry hair. Genadvance® Hydra, e.g., is based on an entirely naturally derived, ethically sourced ingredient, that is biodegradable 2 – 3 times faster than traditional prod-ucts. This product thus not only meets the market’s rising focus on naturality as well as safety and health, but also the demand for more recyclable, sustainable application formats and products made from renewable sources, while not compromising, and in some cases even improving, the performance.
1.2.2.2. Catalysis
CATALYSIS KEY FIGURES in CHF m
2018 2017
Sales 861 767
EBITDA before exceptional items 199 198
Margin (%) 23.1 25.8
EBIT before exceptional items 125 135
Margin (%) 14.5 17.6
Full time equivalent (FTE) 2 061 1 970
In 2018, sales in Catalysis rose by 11 % in local currency and 12 % in Swiss francs. The strong organic sales expansion of 8 % in local currency was primarily attrib-utable to Syngas but also due to good progression in Specialty Catalysts.
112

The solid sales development benefited from good demand in Asia, the Middle East & Africa, and Latin America while sales in Europe and North America remained comparatively volatile throughout the year.
The EBITDA margin before exceptional items decreased to 23.1 % from 25.8 % in 2017 mainly as a reflection of the product mix, which remained largely unchanged throughout the year. The proportionally higher sales from Syngas compared to last year and the ramp-up in Biofuels & Derivatives had a dampening effect on the margin.
Clariant offers a process to remove high levels of NOx from the air with its EnviCat® NOx SCR catalyst. NOx is the product of fossil fuel combustion and industrial processes. It also contributes to the formation of smog, ground level ozone, acid rain, and other hazards. Air purification catalysts such as EnviCat® therefore meet the market’s rising focus on safety and health. Further-more, Clariant’s emphasis on resource efficiency and sustainability in tandem with future regulations is reflected in the progress made on the construction of the first large-scale commercial sunliquid® plant in Romania for the production of cellulosic ethanol.
1.2.2.3. Natural Resources
NATURAL RESOURCES KEY FIGURES in CHF m
2018 2017
Sales 1 394 1 357
EBITDA before exceptional items 179 207
Margin (%) 12.8 15.3
EBIT before exceptional items 118 148
Margin (%) 8.5 10.9
Full time equivalent (FTE) 3 276 3 454
Sales in Natural Resources increased by 8 % in local currency and by 3 % in Swiss francs.
The Oil & Mining Services business exhibited double- digit sales growth in local currency in a slowly improving environment. Sales in Functional Minerals grew at a single-digit rate in local currency, primarily driven by the Foundry business.
In 2018, the EBITDA margin before exceptional items declined to 12.8 % year-on-year. This largely resulted from the persistent price consciousness of the oil mar-ket as well as a lower contribution from Functional Minerals’ Purification business compared to the previ-ous year.
The Oil & Mining Services activities address the increasing requirement for intelligent electronics with the VERITRAX™ real-time chemical management system. VERITRAX™ turns data into actionable infor-mation that is key to maintaining production and improving operational efficiency and reliability. Functional Minerals’ Purification business for edible oils addresses the nutritional demand linked to the growing population and higher standards of living, while the low emissions technology for the foundry industry focuses on and anticipates the intensification of regulations and sustainability.
1.2.2.4. Plastics & Coatings
PLASTICS & COATINGS KEY FIGURES in CHF m
2018 2017
Sales 2 703 2 678
EBITDA before exceptional items 412 388
Margin (%) 15.2 14.5
EBIT before exceptional items 332 310
Margin (%) 12.3 11.6
Full time equivalent (FTE) 6 793 6 759
The Plastics & Coatings Business Area increased sales by 1 % in local currency and in Swiss francs in 2018.
In Masterbatches, the sales growth in local currency was underpinned by increased demand in Latin America and Asia. Sales increased mainly in Consumer Goods and Automotive. Moreover, Healthcare Packaging also reported an attractive sales development in 2018. Sales in Pigments remained flat, but still grew in Latin Amer-ica and Asia driven by China and Japan. On a Business Line level, Coatings and Plastics reported continued sales growth. Additives sales remained very strong, sup-ported by all Business Lines and also by solid demand in almost all regions, North America, China, and Europe in particular.
113CLARIANT INTEGRATED REPORT 2018

EBITDA before exceptional items in the Business Area Plastics & Coatings rose by 6 % to CHF 412 million.
412The EBITDA before exceptional items in absolute value rose by 6 % in Swiss francs to CHF 412 million despite a strong previous year. The profitability improvement was primarily attributable to Additives and Masterbatches and some income from Stahl.
Additives develops products such as halogen-free flame retardants, which are patented and provide environmen-tally compatible protection compliant with the demand-ing fire safety standards. In addition, Healthcare Packag-ing offerings include desiccant canisters that contain sorbent components that help maintain drug stability and prolong shelf life inside Healthcare Packaging containers.
1.3. Outlook 2021
1.3.1. Above market growth, higher profitability, and stronger cash generationClariant is a focused and innovative specialty chemical company. We aim to provide more than just customer- oriented products. We strive to provide the best customer experience and fast, reliable customer fulfillment in the industry by setting the right priorities.
Our aim is to make our customers more successful. We therefore constantly focus on timely and rewarding innovations, products that are difficult to imitate, sus-tainability, agility, and ethical practices. We will only be satisfied with the highest level of excellence in every function within the Group. Our success will be realized through the execution of our strategy.
By 2021, Clariant intends to achieve above market growth, higher profitability, and stronger cash generation.
1.4. Stock market 2018
1.4.1. Clariant share price development 2018After a strong increase in 2017, the share price develop-ment in 2018 generally followed the market trends and was impacted by corporate announcements and changes in the shareholder structure.
At the beginning of January 2018, the share price traded in the range of CHF 26.07 to CHF 29.38 amid break-up speculations along with White Tale’s request for a stra-tegic review of Clariant. On 25 January 2018, SABIC purchased the 24.99 % stake from White Tale, which prompted some analysts to adjust their valuation to a stand-alone basis (no M&A or break-up premium) and to reflect the fact that White Tale considerations were no longer relevant. On the announcement day of the change in main shareholder, the share price dropped from CHF 28.38 to CHF 26.07.
On 13 February 2019, Clariant released the full year 2018 results and the guidance for 2021. The results were in line with market expectations and analyst recommen-dations remained largely unchanged, so that the Clariant share price remained largely stable.
REVIEW — PERFORMANCE114

In March and at the beginning of April 2018, the global stock markets vacillated between gains and losses based upon the debate between the U.S. and China on the potential introduction of tariffs. The Clariant share price decreased during this period to a low point of CHF 22.33, in line with the chemical sector. The price recov-ered amid an improved market sentiment as investors focused on the start of the first quarter reporting sea-son. Some analysts reduced their target prices based on expectations of a slower EBITDA development in 2018. The Clariant share price declined due to the slight EBITDA margin miss (20 bps versus consensus) in the first quarter results. This weakness was in line with global stock markets and the chemical sector, which was impacted by the oil price trend and the continued trade tensions between China and U.S.
On 25 July 2018, the first half year 2018 results came in slightly below consensus, which was somewhat disap-pointed by the further margin decline in the Natural Resources Business Area and lower than expected cash flow generation. The share price declined from CHF 23.82 to CHF 23.10 on the reporting day; however, it began to recover again the following day.
The Clariant share price, along with the market in gen-eral, was weighed down by the dampened market senti-ment amid concerns over a Turkish currency crisis in August.
On 18 September 2018, the financial market initially reacted positively to the announcement of Clariant’s strategy update and the Governance Agreement, with the share price increasing from CHF 24.04 to CHF 25.93.
During October 2018, the Clariant share price dropped due to general market concerns on the global economy, tar-iffs, supply chain issues, and raw material prices, which lead to a sell-off in the market.
The overall perception of Clariant remained positive despite slightly lower than anticipated third quarter sales and a somewhat softer economic outlook for 2018, published on 31 October 2018. The share price increased from CHF 21.09 to CHF 21.71 on the reporting day. Clariant’s results were broadly in line with the trend seen in the chemical sector.
In November 2018, the disappointing earnings season and other geopolitical risks put pressure on markets, which also had a negative impact on the Clariant share price development.
005 CLARIANT SHARE PRICE DEVELOPMENT 1 JANUARY – 31 DECEMBER 2018 in CHF
30
28
26
24
22
20
18
16
27.25
18.09
Jan Feb Mar Apr May Jun Jul Aug Sep Oct Nov Dec
115CLARIANT INTEGRATED REPORT 2018

The Clariant share price came under pressure in Decem-ber 2018 in tandem with the chemical market and the Swiss stock indexes and closed the year at CHF 18.09.
Clariant has also been included in a number of notable indexes such as the MSCI Equity Switzerland Index. Clariant has also been part of the Swiss Performance Index Select Dividend 20 Index basket since 2017. This basket consists of the top dividend delivering Swiss stocks. Both these achievements are confirmation of the success of Clariant’s strategy and its positive perfor-mance result.
The inclusion of Clariant in the Dow Jones Sustainability Index, SXI Switzerland Sustainability 25®, FTSE-4Good Index Series, Euronext Vigeo Eiris Indices, and Ethibel Sustainability Indices (ESI) also reflects the continued progress made in various fields of sustain-ability as well as the outstanding, solid performance that has been achieved in economic, environmental, and social dimensions.
1.4.2. Dividend paymentClariant aims to increase or at least maintain dividends. Since 2013, Clariant increased the dividend by an aver-age of 9 % per annum. The continued improvement in performance allows the Board of Directors of Clariant Ltd to propose a dividend distribution of CHF 0.55 per share for the 2018 financial year at the Annual General Meeting on 1 April 2019. This proposal reflects an increase of 10 % compared to the previous year. The distribution is proposed to be made from the capital contribution reserve that is exempt from Swiss withholding tax.
IDEA TO MARKET
2. Intellectual CapitalWith a strong focus on innovation and digital trans-formation, Clariant successfully expanded its intellec-tual capital in 2018. While managing its patents and trademarks, active innovation projects, and promising scientific collaborations, Clariant developed new digital products and services and implemented projects to improve operational efficiency via digitalization.
OVERVIEW INTELLECTUAL CAPITAL
2018 2017 Change in %
Patents (year end) 6 700 6 600 1.5
Trademarks (year end) 8 900 8 300 7.2
Active innovation projects > 375 > 370 –
Of which Class 1 Pro-jects with double-digit million sales potential or of strategic relevance > 70 > 65 –
Scientific collaborations > 125 > 125 –
2.1. Innovation and Technological AdvancesClariant achieves its growth targets by developing innovative and sustainable products based on state- of-the-art technologies. In 2018, Clariant grew over 3 % through innovation projects, surpassing its 2 – 3 % target and realizing 1 – 2 % sales growth from Top Line Innovation alone. This increase can mainly be attributed to a heightened focus on innovations with high value propositions.
Research & Development spending in 2018 was CHF 209 million, compared to CHF 211 million in 2017. As a share of sales, R&D spending was 3.2 %, a decrease from 3.3 % in 2017. The higher growth through innovation at slightly reduced R&D expenditures was likely a result of a more efficient and focused R&D organization, which was launched in 2017.
The number of active projects in the innovation pipe-line increased from over 370 in 2017 to more than 375 in 2018. This was mainly due to the newly intro-duced innovation formats iEngine and iGarage, and continuous and stringent innovation portfolio man-agement.
REVIEW — PERFORMANCE
GRI
GRI Online Report
Management Approach Innovation and Technological Advancesreports.clariant.com/ 2018/gri
Dow Jones Sustainability Index
For the sixth consecu-tive year, Clariant was included in the renowned Dow Jones Sustainability Index. The company also received a Silver distinction in the RobecoSAM yearbook.
116

INNOVATION AND TECHNOLOGICAL ADVANCES
2018 2017 Change in %
Growth through innovation (%) 1 > 3.0 2.5 > 20
Research & Develop-ment expenditures (CHF m) 209 211 – 0.9
Research & Develop-ment expenditures as share of sales (%) 3.2 3.3 –
1 Includes Top Line Innovation and Life Cycle Innovation. Potential cannibalization of existing sales caused by Life Cycle Innovation is not excluded from the calculation.
State-of-the-art equipment and infrastructure in eight R&D centers and over fifty Technical Centers formed the basis for successful innovation. In addi-tion, Clariant increased the number of trained innova-tion belts from 272 in 2017 to over 290 in 2018 – a key factor in improving the project pipeline and increas-ing the number of Class 1 projects (those with a double- digit million sales potential) from more than 65 in 2017 to over 70 in 2018.
After Clariant revised its Intellectual Property strat-egy in 2015 and 2016, it abandoned patents that were no longer of strategic relevance, leading to an overall drop in the number of patents. After this strategy adjustment, the number of patents started growing again in 2017. In 2018, Clariant registered another 100 patents, leading to a total number of 6 700 patents at year end. The number of trademarks increased from 8 300 in 2017 to 8 900 in 2018. This was mainly due to the strong portfolio growth of Business Unit Industrial & Consumer Specialties as well as the enhancement of existing trademarks with non-Latin transcript trademarks to improve trademark protection in Asia.
2.1.1. Accelerate innovation by using High Throughput Experimentation (HTE)In 2018, Clariant mainly aimed to accelerate the inno-vation process by exploiting the potential of digitali-zation. By applying the High Throughput Experimen-tation (HTE) method, which uses automation, miniaturization, and parallelization for intelligent planning and execution of experiments, the time needed to plan, prepare, and screen large numbers of formulations is reduced significantly compared to traditional methods. Since the experimental sequences are operated on small scales, the approach also helps increase resource efficiency. By using intelligent design tactics, the HTE team can maximize analytical data through proper planning and execution in line with the Business Units’ needs and project requests. The analyzed data allows Clariant to find correlations that would not have been detectable with traditional methods. It can also help develop prediction tools that find new digital business models beyond chemi-cal products and thus enable Clariant to become a fully integrated solutions provider. Given the effec-tiveness of the method, project requests from Busi-ness Units to the existing HTE laboratory in Frankfurt, Germany, increased beyond available capacity. To meet demand, Clariant is further expanding its capac-ity by opening an additional laboratory in the United States, which will be operational in early 2019. Further expansion to Asia is planned for 2020.
Clariant achieved more than 3 % growth through innovation.
3117CLARIANT INTEGRATED REPORT 2018

2.1.2. Lab Excellence ProgramTo increase the speed and impact of innovation and decrease time to market, Clariant initiated the Lab Excellence (LabX) program in 2017, which focuses on Clariant’s entire R&D community. The goal of the initiative is to streamline work flows within and across laboratories along the entire Idea to Market value chain, in order to transform the entire R&D system into a lean and agile organization, increase the quality of the research, and boost innovation for Clariant’s customers. In 2018, the first pilots in the Technology Platforms were completed, leading to an acceleration of the examined processes by up to 50 %. The identi-fied improvement measures will be rolled out within the R&D community. Together with the consequent introduction of lean principles in the R&D system, this will lead to increased speed in innovation, as sample cycles are synchronized across application and analytical laboratories, and administrative tasks are reduced. Moreover, the implementation of an Electronic Lab Notebook across the company will sig-nificantly enhance efficiency by digitizing work flows. In 2019 and beyond, Clariant plans to further expand LabX throughout the organization in order to strengthen the lean innovation culture and the conse-quent innovation performance management. The achieved efficiency improvements are expected to materialize in reduced time to market, higher innova-tion contribution margins (COMA), and hence a higher overall contribution to Clariant’s EBIT.
2.1.3. New innovation formats spur disruptive innovationFinding solutions to unresolved challenges in the industry and exploring strategic growth fields beyond the core business also require collaboration and lever-aging the potential of Clariant’s workforce. Therefore, the company launched two new innovation formats in 2018, the iEngine and the iGarage.
iEngine brings together a cross-functional, cross- business team in a series of virtual and face-to-face workshops to collect, prioritize, and refine potential high-quality technology solutions for unmet cus-tomer needs. The most promising ideas are selected and pursued in an innovation project. After a 2017 pilot, four additional iEngines were launched in 2018, running on topics across four Business Units and resulting in new Class 1 projects and first feasibility trials at production scale.
iGarage develops strategic innovation growth options at the discovery and early incubation stages by apply-ing agile, design thinking, and lean start-up methodol-ogies to manage uncertainty and drive the development of customer-centric, macro-trend-derived break-through innovations outside the current solution space. On behalf of Business Units, a team consisting of dedi-cated cross-functional talent and supported by exter-nal experts and coaches convenes off-site over three to six months to explore an opportunity domain and develop business concepts through constant interac-tion with prospective customers and other partners. With agility and speed, the teams aim to design corre-
REVIEW — PERFORMANCE
Clariant launched four iEngine innovation workshop series in 2018.
4118

sponding business models, differentiating value prop-ositions, viable technical concepts, and build a compelling financial plan. The ultimate objective is to develop a validated innovation to the point where continuous staffing and funding from the sponsoring Business Unit is secured. In 2018, two pilots of the iGarage were conducted, one with Business Unit Industrial & Consumer Specialties PAGE 57 and one on plastics recycling. Moreover, Business Unit Oil & Mining Services conducted the iGarage to develop new business concepts for their innovative pour point depressants used in oil production.
PAGE 81, PAGE 116
2.1.4. Scientific collaborationsIn addition to internal collaboration, partnerships with external parties are vital to stimulate innovation. In 2018, Clariant engaged in more than 125 scientific partnerships, which is comparable to the number in the previous year.
An example of such a partnership is the collaboration with the Excellence Cluster of the Friedrich-Alexander- University in Erlangen-Nuremberg. The goal of the collaboration is to explore new ways to achieve highly tolerant and flexible production processes that can deal with various internal and external impacts on plant operation, such as variations in feedstock com-position or energy fluctuations over the asset life cycle. Modular plants, multifunctional equipment,
and unit operations with enlarged operational win-dows are examples of technical solutions that can be systematically designed and optimized with the toler-ant processes approach. To drive the development of tolerant processes further, the research partners are also initiating a public funding platform via Pro-cessNet, the German platform for process technology, chemical engineering, and technical chemistry.
In collaboration with the China Petroleum Chemical Industry Federation (CPCIF), Clariant organized the first Clariant Chemistry Day in China in 2018. It facil-itated in-depth discussions on innovation and sus-tainability and fostered the exchange between the industrial and academic research sectors. During the event, five young researchers were awarded the CPCIF-Clariant CleanTech Award, recognizing their achievements in the field of sustainable chemical technologies.
2.1.5. Open Innovation initiativeThe Open Innovation initiative, managed by New Business Development, identifies collaboration partners ranging from large corporations to start- ups, universities, and other research institutions, thus supporting the Business Units in connecting with external partners around the world. Open Innovation is increasingly focusing on Asia, as local technologies present attractive market-specific growth opportunities with sustainability as a dominant theme. In 2018, more than 300 technology proposals were introduced to the Business Units for consideration.
119CLARIANT INTEGRATED REPORT 2018

To further build on regional needs regarding sustain-ability, the 2018 Sustainability Trend Meeting was held in Shanghai. Multiple Business Units, as well as New Business Development and Corporate Sustain-ability and Regulatory Affairs (CSRA), gathered to identify innovative business opportunities that address significant sustainability challenges through innova-tion. The technology challenges relating to these new opportunities will be sourced via the Open Innova-tion initiative.
In 2018, Open Innovation launched the »Chinese Innovation for China Market« program, encouraging Clariant’s Business Units to explore technologies that help meet local market needs in China. The Busi-ness Units are supported by external technology scouts, which use big data analytics and artificial intel-ligence to find the most promising local innovations.
Under the umbrella of the Open Innovation initiative, Clariant also introduced a »Pitch Day« to provide selected technology providers an opportunity to pitch their technology directly to Business Units. Business Unit Industrial & Consumer Specialties was Clariant’s first business to embrace this new format and con-ducted a two-day pitching program for the Personal Care and the Industrial & Home Care segments. More than 15 startups participated in the »Pitch Day« and seven of them were selected for further evaluation.
2.1.6. Sustainability screeningsSustainability is an integral part of the innovation process and a fundamental prerequisite for all new major product developments. Corporate Sustainabil-ity Assessments, as defined under Clariant’s Portfolio Value Program (PVP), known as PVP screenings, are thus systematically carried out not only for the entire product portfolio but also for Clariant’s innovation project pipeline PAGE 122
2.2. Digitalization
2.2.1. A two-way approachClariant considers digitalization an opportunity that is best tackled in two ways. First, Clariant includes all existing Business and Services Units – including IT – in a continuous effort to transition its business into the digital age. In 2018, all organizational units assessed and realized opportunities to digitally upgrade pro-cesses and products in their area of expertise and, where necessary, recruited digitally skilled talents. In addition, the implementation of the »Leading Mar-keting Organizations« initiative supported the com-mercialization of products and services with well- designed marketing strategies that covered digital aspects. The use of data-driven predictive tools in procurement for risk management and the use of automated e-auctions are also important steps to speed up purchasing and allow Clariant to buy in a more competitive way, since offers from a large number of suppliers can be easily compared.
REVIEW — PERFORMANCE
GRI
GRI Online Report
Management Approach Digitalizationreports.clariant.com/ 2018/gri
120

006 DIGITAL INNOVATION CYCLE
Exploration
Validation through customer interviews
Incubation
Validation through test phases with customers
Commercialization
Validation through market success
Ideas
Concepts
Solutions
Co
ncr
eten
ess
Time
No Business Model Validated Business Model Revenue-generating Business Model
Second, Clariant runs a dedicated cross-functional digi-tal program, Digital4Clariant. In 2018, Digital4Clariant further evolved along its three core workstreams »New Business Models«, »Digital@Operations«, and »Big Data and Advanced Analytics«.
2.2.2. Generating new business modelsThe workstream »New Business Models« incubated several minimally viable products and soft-launched new services in the market for testing. One notable example is Chemberry™, an internet platform that enables customers to easily find chemical ingredients using intelligent search engines. Chemberry™ includes products from all relevant chemical suppli-ers free of charge, automatically extracting and organizing product information from supplier web-
sites. This platform, which is operated independently to ensure confidentiality and neutrality, currently features ingredients for the personal care industry, but is positioned to be the most comprehensive tool for ingredient-sourcing across all sectors.
2.2.3. Optimizing operations through six clustersThe workstream »Digital@Operations« ran several projects along six digital clusters identified as partic-ularly relevant for Clariant. Clusters deemed to have the biggest impact in terms of cost saving and effi-ciency improvements are predictive process and qual-ity control, predictive maintenance, digital material flow, connected workforce, retrofitting, and robotics. Clariant also strengthened its collaborations, for
Chemberry™
The platform simplifies the interaction between chemical buyers and suppliers by providing a comprehensive and up-to-date directory of chemical ingredients.chemberry.com/ ourSolution
121CLARIANT INTEGRATED REPORT 2018

example, with universities and technology providers, to better understand and make use of relevant digital process technology developments.
2.2.4. Increasing speed and quality of innovation with big data analyticsThe workstream »Big Data and Advanced Analytics« identified data science as a method that comple-ments Clariant’s chemical competencies and bears great process improvement potential. As a result, Clariant’s demand for data scientists grew consider-ably. To meet this growing demand, a new Compe-tence Center for Data Science focusing on data intelli-gence and process simulations was established at Group Technology and Innovation. While the data intelligence team will primarily support the Digi-tal4Clariant initiatives by focusing on data analytics projects and automated analytics platforms, the process simulations team will focus on process devel-opment. Together with Clariant’s high throughput experimentation team, this new organizational set-up is expected to increase the speed and quality of both digital and non-digital products and services develop-ment, as well as the improvement of processes.
2.2.5. Attracting and developing digital talentsLastly, Clariant emphasizes attracting and recruiting candidates with the capabilities relevant in a digital context. It has reviewed hiring processes and edu-cated specific groups in the company with new skills. Examples include training and education measures such as design thinking training for IT, data science training, and events like digital law days.
MARKET TO CUSTOMER
3. Manufactured capitalIn 2018, Clariant took further steps to improve the sustainability of the product portfolio. It awarded 24 products the EcoTain® label, increasing the total number of products with proven sustainability excel-lence to 193. By piloting the first EcoTain® Partner-ships, the company also underscored its commitment to solving sustainability challenges along the value chain in a collaborative way. In addition, production and research capacities were expanded considerably in 2018, with significant investments in high-growth regions, such as China and North America.
OVERVIEW OF MANUFACTURED CAPITAL
2018 2017Change
in %
EcoTain®-awarded products 24 18 33.3
Research & Development Centers 8 8 0
Technical Centers > 50 > 50 0
Countries with production facilities 39 39 0
Production sites 125 125 0
Raw materials procured (in m t) 3.57 3.14 13.7
Production (in m t) 4.34 1 4.60 –
1 For 2018, the production volume is based on a reduced reporting scope, which includes sites that are responsible for 95 % of total production.
3.1. Product Stewardship/Sustainable ChemistryProtecting customers, consumers, and the environment by providing safer and more sustainable solutions is one of Clariant’s top priorities. In 2018, it took further steps to comply with the EU REACH regulation and promote the EcoTain® label, which designates prod-ucts with outstanding sustainability properties.
REVIEW — PERFORMANCE
GRI
GRI Online Report
Management Approach Product Stewardship/Sustainable Chemistryreports.clariant.com/ 2018/gri
122

3.1.1. EU REACHIn 2018, Clariant successfully completed Phase 3 of EU REACH by submitting 100 % of the necessary dos-siers to the European Chemicals Agency (ECHA). Clariant continues to register newly manufactured or imported chemicals in accordance with the REACH regulation.
Since the adoption of EU REACH regulation ten years ago, Clariant has submitted more than 1 200 dossiers for chemical substances that need to be kept up to date. Currently, the focus under the EU REACH regulation is shifting toward assessing the safe handling of substances, which requires Clariant to respond to requests for additional information and react to assessments of the registered substances. This also includes demonstrating efforts taken to communicate information on safe handling of products throughout their entire life cycle along Clariant’s value chain. In 2018, Clariant launched its REACH 2018+ project, which fosters awareness for the REACH require-ments in all relevant Business and Service Units to ensure future compliance.
Clariant is also active in promoting the safe use and management of chemicals across the entire value chain and ensuring compliance with REACH obliga-tions. In addition, Clariant is represented in various trade associations, such as the European Chemical Industry Council (Cefic) and the German Chemicals
Industry Association (VCI), and has taken leadership roles in workstreams relating to chemical manage-ment. As an example, the memorandum of understand-ing between Cefic and the European Chemical Agency (ECHA) was signed in 2018 during the tenure of Hariolf Kottmann as Cefic president.
3.1.2. Portfolio Value ProgramIn 2018, Clariant continued to screen innovative prod-ucts before commercialization and revise existing product screenings to ensure high screening coverage.
PRODUCT STEWARDSHIP/SUSTAINABLE CHEMISTRY 1
2018 2017 Change in %
EcoTain®-awarded products 24 18 33.3
Cumulative number of EcoTain® products 193 169 14.2
Sales-based share of product port folio scree-ned for sustain ability performance (since 2012) (%) 80 80 0
Sales-based share of screened products not meeting internal sustain-ability definition (%) 9.0 9.4 – 4.3
1 The displayed data excludes Business Unit Masterbatches.
In 2018, the screening coverage of the portfolio was maintained at 80 %, reflecting Clariant’s efforts to assess new products. Likewise, the increase in total number of EcoTain® products showcased how inno-vation fuels sustainability excellence and vice versa. Innovation also helps to capture the sustainability improvement opportunities uncovered in the portfo-lio screening.
EU REACH
REACH (Registration, Evaluation, Authorisa-tion and Restriction of Chemicals) is a regula-tion of the European Union, adopted in 2007 to protect human health and the environment from potential risks posed by chemicals, while enhancing the competi-tiveness of the European chemicals industry.echa.europa.eu/ regulations/reach/ understanding-reach
Clariant awarded a total number of 193 products with the EcoTain® label.
193123CLARIANT INTEGRATED REPORT 2018

Among other objectives, roadmaps for these improve-ment opportunities focus on reducing the use of cer-tain hazardous substances in Clariant’s product port-folio. The roadmaps typically promote alternatives that go beyond relevant regulations, which is particu-larly important in regions where regulatory action is lagging.
As part of such a roadmap, Clariant supports the sub-stitution of heavy metal pigments and, given the strong portfolio and expertise of Business Unit Pigments, is in an excellent position to promote alternatives. As a result of these roadmap activities, the share of prod-ucts that do not meet Clariant’s internal sustainability definition further declined in 2018.
Clariant also strengthened its reporting capabilities to link the financial performance of products with their sustainability performance. The results of the PVP Financial Reporting complement the traditional finan-cial reporting and support decision-making toward increased sustainability and financial performance.
3.1.3. EcoTain®During 2018, the EcoTain® label was further pro-moted through additional EcoTain® licensing discus-sions, a concept that had been launched in 2017. In a joint effort to bring more sustainable products to the market, customers purchasing EcoTain® products piloted the use of an EcoTain® label on their own products. For example, an Indonesian mattress pro-ducer used Clariant’s EcoTain®-awarded hot melt adhesive Licocene® to reduce volatile hydrocarbons and odor emissions in their mattress core. As these emissions occur during the production and use phases, the new solution benefits the health of employees and consumers alike. Additionally, using Licocene® reduced the carbon footprint of the mat-tress production. Given this strong sustainability per-formance, after a strict evaluation process, this cus-tomer received the license to use the EcoTain® label on its own products and in its marketing materials. By highlighting EcoTain® as a sustainable ingredient in their offerings, Clariant’s customers not only promote the safety of their own products, but also support the recognition of the EcoTain® brand as a safer and more sustainable product.
REVIEW — PERFORMANCE
In 2012, Clariant developed the Portfolio Value Program (PVP) in cooperation with the Collaborating Centre on Sustainable Consumption and Production (CSCP), founded by the United Nations Environment Program (UNEP) and the Wuppertal Institute. The program is based on a thorough analysis of sustainability trends and needs, as well as on the input and views of external stakeholders. The PVP provides the overarching framework to develop Clariant’s product and innovation project portfolio toward more innovative and sustainable products. At the heart of the PVP lies Clariant’s ambition to steer the product portfolio toward solutions that add value through sustainability for customers and society, while also ensuring long-term profitable growth. Clariant continues to be inspired by the opportunities to raise the bar in sustainability that are brought about by societal changes, market trends, existing and future regulations, customer preferences, and stakeholder expectations.
Clariant uses the comprehensive screening of the PVP to further clarify the sustainability performance of its product portfolio with its distinguishing EcoTain® label. Products awarded the EcoTain® label must have best-in-class sustainability performance in at least one of the 36 criteria, offer benefits in several product life cycle phases, and not have any significant adverse environmental or social impacts. A corporate panel of experts reviews all products in Clariant’s portfolio and awards flagship products with the EcoTain® label. At the end of 2018, 80 % of the product portfolio was screened for its sustainability portfolio and 193 products were awarded the distinguishing label.
THE PORTFOLIO VALUE PROGRAM (PVP) AND THE ECOTAIN® LABEL
SUSTAINABILITY CRITERIA
36 criteria grouped into six categories are considered in the Portfolio Value Program (PVP) to screen the product portfolio for sustainability.
People
Safe use, transparency, and information
Addressing megatrends and societal needs
Planet
Resource efficiency and environmental protection
Raw materials and sustainable sourcing
Integrated sustainable business
Performance
Performance
124

To further rollout its initiative to promote sustain-ability in the market and society in general, Clariant is also piloting EcoTain® Partnerships—a standard for establishing value chain collaborations on sustainabil-ity that highlights the importance of partnerships to solve sustainability challenges. It also draws attention to outstanding collaborations on sustainability and shows appreciation to the employees who go the extra mile to deliver sustainable value. In 2018, Clariant advanced the development of possible EcoTain® Partnerships across its markets and value chains and further refined the concept. For an example of model elements, please see the SPOTS project.
CUSTOMER TO CASH
3.2. Production volumeClariant’s production volume is comprised of finished goods that leave production sites and are sold to customers. In 2018, the reported production volume decreased to 4.34 million t. This is mainly due to a different reporting scope, in 2018 only the 79 largest sites of a total of 125 sites were considered. Business Area Natural Resources continues to provide the larg-est share, with 2.9 million t of produced goods, repre-senting a decrease of 0.2 million t over 2017. Business Area Care Chemicals increased production volume by 0.02 million t to 0.98 million t. Business Area Plastics & Coatings reduced its production volume by 0.1 mil-lion t to 0.36 million t, while the volume of Business Area Catalysis remained stable at 0.06 million t. Overall, more than 40 % of the production volume is manufac-tured in plants with a certified ISO 50001 energy management system.
Clariant spent CHF 4.3 billion on goods and services.
4.33.3. Raw material procurementDue to growing demand from customers and consum-ers, an evolving regulatory environment, and increas-ing interest in the circular economy, renewable raw materials are gaining importance. Clariant prioritizes responsible procurement of raw materials and pro-motes innovation using biofuels and bio-based chemi-cals and feedstock to solidify its role as a sustainabil-ity leader in the chemical industry. PAGE 68
Clariant spent about CHF 4.3 billion on goods and services in 2018. Roughly CHF 3 billion were dis-bursed for raw materials from approximately 7 000 suppliers. Across all Business Areas, more than 34 000 different raw materials were procured, although 92 % of the purchase volume was made up of around 200 raw materials. In 2018, around 23 % of purchased raw materials stemmed directly or indirectly from crude oil, about 19 % were derived from natural raw materi-als such as bentonite, and 5 % were made of renew-able raw materials. The remaining materials were either base or specialty chemicals or non-chemicals.
In addition to promoting renewable raw materials, Clariant prefers to procure goods and services from local suppliers in order to support the economic development of the respective regions. That said, in order to opt for local raw materials, impeccable q uality as well as technical and economic feasibility must be guaranteed.
SPOTS
The Sustainable Palm Oil and Traceability in Sabah (SPOTS) aims to support small Malaysian palm oil producers on sustainability, certifica-tion, and supply chain traceability, and to increase productivity by 20 % until 2020. clariant.com/en/ Sustainability/ Value-Chain- Collaboration/The-SPOTS-Initiative
125CLARIANT INTEGRATED REPORT 2018

RAW MATERIAL PROCUREMENT ACCORDING TO REGION in CHF m
2018 2017
AsiaPacific 672 627
Of which with local suppliers 1 641 591
Number of local suppliers 2 2 527 2 800
Europe 1 340 1 237
Of which with local suppliers 1 1 228 1 122
Number of local suppliers 2 1 514 1 690
Latin America 320 307
Of which with local suppliers 1 213 209
Number of local suppliers 2 1 085 1 092
Middle East & Africa 106 109
Of which with local suppliers 1 57 56
Number of local suppliers 2 378 407
North America 510 395
Of which with local suppliers 1 464 359
Number of local suppliers 2 930 1 002
Grand Total 2 948 2 674
Of which with local suppliers 1 2 603 2 337
Number of suppliers 2 6 434 6 991
1 Raw material spending of Clariant production sites in this region2 Regional suppliers that supplied Clariant (production) sites
3.4. Production sites and innovation facilities
3.4.1. Developments in the production site networkBy the end of 2018, Clariant operated 125 production sites in 39 countries around the world.
— Care Chemicals: Business Unit Industrial & Consumer Specialties integrated a new production plant for squalene and associated downstream products in Tarragona, Spain, which became oper-ative in the last quarter of 2018. In addition, the
REVIEW — PERFORMANCE
Business Unit expanded several production facili-ties: in Coatzacoalcos, Mexico, ethylene oxide and propylene oxide (EO/PO) derivatives production was initiated; in Gendorf, Germany, an additional ethoxylation reactor began operating and a new polyethylene glycol (PEG) flake milling line was built; and capacity of the PEG-producing Clear Lake site in the United States was expanded. In Gebze, Turkey, production was halted and Clariant began selling the site’s land and equipment.
— Natural Resources: In Cileungsi and Cimapag, Indonesia, Business Unit Functional Minerals reduced bottlenecks of existing bleaching earth production. In Casablanca, Morocco, Business Unit Oil & Mining Services closed its production facility, without affecting other Clariant businesses operating in Morocco.
— Plastics & Coatings: Business Unit Additives suc-cessfully began operating the newly built produc-tion line of Hostavin® NOW in Muttenz, Switzer-land. In Germany, debottlenecking projects focused on the expansion of plants for Exolit® halogen-free flame retardants and Licocene® high-performance polymers. Business Unit Masterbatches opened a new production facility for white masterbatches in Yanbu, Saudi Arabia. Additionally, a compounding line serving the medical industry was installed in Lewiston in the United States.
126

3.4.2. Continued investments in ChinaClariant has remained committed to its China strat-egy and harvested further growth opportunities in 2018. In Zhenjiang, Business Unit Industrial & Con-sumer Specialties expanded production capacity. Business Unit Functional Minerals increased desic-cant production capacity, upholding China’s status as one of the largest desiccant markets in the world. Business Unit Additives invested in three new pro-duction facilities: In Zhenjiang, two plants were com-missioned in the second half of 2018. The new facili-ties are dedicated to the production of AddWorks® synergistic additive solutions and Ceridust® micron-ized waxes, both of which are used in various applica-tions across the plastics, coatings, and ink industries. Within the joint venture between Clariant and Tiangang Auxiliary Co. Ltd., construction of a plant for high-end process and light stabilizers, including the state-of-the-art Nylostab® S-EED® chemistry, began in the Cangzhou National Coastal-Port Economy and Tech-nology Development Zone. Located about 200 km south of Beijing, the plant will eventually serve various industries, but will initially focus on the textile and automotive markets.
IDEA TO MARKET
3.4.3. Research & Development and Technical CentersClariant’s strong innovation infrastructure consists of eight Research & Development Centers and more than fifty Technical Centers. The centers are distributed around the world, with locations in Europe, North and Latin America, China, and India.
In 2018, Business Unit Oil & Mining Services opened a state-of-the-art laboratory in Midland, Texas, in the United States, with unique capabilities to support its customers in the oil and gas industry. The latest instrumentation enables the laboratory specialists to rapidly analyze samples and assess them for risk factors such as flow assurance, asset integrity, and oil/water quality. This strongly supports customers in lowering their operational costs for shale oil and gas extraction. Combined with other facilities in Mid-land, the laboratory augments Clariant’s service offer-ings to customers in the fastest-growing oil basin in the United States.
Prior to the opening in Midland, Business Unit Oil & Mining Services inaugurated another state-of-the-art laboratory in Clinton, Oklahoma, in the United States. This strategic investment will enable oil production companies to increase production efficiency and reduce operating expenses. Situated in proximity to custom-ers, fast turnaround times of laboratory analyses and new solutions to be developed are ensured. Clariant is the fastest growing specialty oilfield production chemical supplier in North America, and its investments in technical facilities demonstrate its commitment to remain a key contributor in the production of oil and gas.
127CLARIANT INTEGRATED REPORT 2018

TWO PERSPECTIVES — DIGITALIZATION128

Who Shapes New Digital Business Models?
Digitalization
The digital transformation is changing our daily lives and reshaping entire industries. Its impact on the chemical industry so far might have seemed limited. But that's rapidly changing. Both start-ups and corporations are trying out new ways of reaching out to customers. New platforms and disruptive business models are taking hold. By moving early, Clariant is staking its territory and shaping its future.

Sibylle Mutschler
As Head of Digital4Clariant, Sibylle works on Clariant’s digital transformation
and rethinks business models for the chemical industry.

As CEO and Co-founder of SourceSage, Jian uses market data and modern communication technology to revolutionize the global trade in specialty chemicals.
Jian Min SimJian Min Sim
As CEO and Co-founder of SourceSage, Jian uses market data and modern communication technology to revolutionize the global trade in specialty chemicals.
129CLARIANT INTEGRATED REPORT 2018

What could that look like?One of the ways we’re exploring is to develop special-ized software-based services that our customers can use to leverage our vast chemical know-how.
On the other hand, Clariant recently started sell-ing products via Alibaba in China. Doesn’t that detract from your customer relationships?Alibaba is a way to reach customers. But it’s only one way. And Clariant is actively looking for other ways to reach its customers.
Is that the reason you started Chemberry™? Very much so, yes.
What is Chemberry™?It’s essentially a search engine to look up suppliers of specialty chemicals, today in the area of personal care. It lets you conveniently browse information you wouldn’t easily find using Google.
Why on earth would you set up a platform that makes it easier for buyers to find Clariant’s competitors?That’s exactly what some of our detractors said. My response is that we believe in fair competition and we are not afraid to compete. Isn’t it a lot better then to help customers to find what they want and thereby learn a lot about how they want to interact with us?
What role does big data play for your business?We’re looking at a future where more and more jobs will deal with at least certain aspects of data science. Chemberry™ is only the latest data source we added. We are by nature a »data-rich« company and there will be more data in the future. We expect a new generation of sensors to track almost every single aspect of our pro-duction processes. The actual technical maturity of sensors is still a challenge, however. We also learn from data in Research & Development, in logistics, in cus-tomer relationships management, and in human resources. The list goes on and on. The key is to find ever more ways of using data and the digital transformation to our advantage.
Sibylle, is it true that the chemical industry is a bit of a latecomer in the digital transformation?That’s certainly a prevailing stereotype. But it’s wrong. If you’re comparing our industry with, say, banking, publishing or music, then obviously our way of dealing with customers hasn’t changed as much. But if you look at the underlying processes, the picture is quite different. Here it’s banks and publishers that struggle to trans-form, while we’ve been dealing with automation, sensors, data, and digital tools for decades. To use some software terminology, their front end looks modern, but our back end is a lot more digitally advanced.
So the chemical industry primarily needs to digitalize how it deals with customers?Don’t get me wrong! There’s a lot to benefit from new hardware and data science in our operations, too. Things like predictive maintenance, digital material flows, and robotics will help us improve efficiency, and we’re very much looking into these things. But when we at Clariant talk about digitalization, we make sure it’s not just about the next software or hardware update. We want to see what actual transformation looks like.
Who’s looking?My team has six workstreams reflecting major digital opportunities we see – from big data to digital operations to new digital business models. And Clariant as a whole is building knowledge and infrastructure. One example is the new Data Science Center we recently set up in Frankfurt, Germany.
What is it you do there?We’re combining our unique chemistry know-how with new ways of using data. Mind you, we’ve been hiring data scientists for years. We just never called them that. But these people have been improving processes and building knowledge that’s extremely valuable. What we’re now doing is applying new tools and new ideas under one roof. All to add more value and sell new services.
Speaking of selling, Clariant deals in physical materials, not ones and zeros like the music or banking industry you mentioned. Will that change? Every Clariant product comes with information, and lots of it. Selling specialty chemicals means providing solutions to very specific problems. So our business was never only about materials. Our customers rely on our know-how. I’m sure our business models will include ones and zeros in the future as well.
TWO PERSPECTIVES — DIGITALIZATION130

SIBYLLE MUTSCHLERHead of Digital4Clariant, Clariant
How can we shape the digital future of our
industry?
How can we shape the digital future of our
industry?
131CLARIANT INTEGRATED REPORT 2018

JIAN MIN SIMCEO & Co-founder, SourceSageJIAN MIN SIMCEO & Co-founder, SourceSage
TWO PERSPECTIVES — DIGITALIZATION
What makes chemicals trading more efficient?
What makes chemicals trading more efficient?
132

market intelligence firms. And on top of that, we have a growing range of customers that use our platform as a white-label solution to set up their own marketplace.
How many subscribers do you have?Right now we have 1 057 individual subscribers from a few hundred companies. Over 10 000 users use the basic features, and we learn a lot from them.
It’s said that inefficient markets make for higher prices. Do you make it harder for middlemen to make a profit?First of all, especially with niche chemical products, buyers tend to value familiarity and reliability. So price isn’t everything. You need to provide customized ser-vices for customers. And I believe we offer opportunities to all stakeholders, including middlemen. These middlemen add value, for example by providing trade financing and logistical support.
How open are companies about their prices?Initially, we saw that companies were very reluctant to share specific prices. What we could provide, however, was aggregated market reference prices as well as his-torical prices. Both help determine when to buy or sell. Today you’ll find product offers by companies that state, for example, their price range, available packaging, and treatment options as well as the port they ship from. Once you then click on the »buy« button, you’ll enter a private inquiry mode. That way both buyers and sellers can feel comfortable dealing via our platform.
Why don’t chemical companies just sell their commodities via a site like Alibaba?Some do. But the types of transactions in this market aren’t really compatible with the payment mode of Alibaba. We’re dealing with transactions worth millions of dollars, where companies almost never pay 100 per-cent in advance and may even pay 30 to 45 days after receiving the goods at their port. That’s where middle-men, and especially banks, come in.
What’s the next step for SourceSage?We have recently partnered with a bank in Singapore to build a B2B payments gateway for transactions via escrow accounts and even complete with trade financ-ing solutions. That’s something that’s becoming more relevant in 2019.
Jian Min, around 2014 you and your father started an app called SourceSage that has gotten a lot of attention. What is the idea behind it?In short, SourceSage provides real-time market intelli-gence for chemical commodities and connects buyers and sellers. I like to call us the Amazon for market infor-mation.
What kind of products would I find on SourceSage?We have about 400 products on our platform. Most of them are niche chemicals, downstream commodities, and specialties you wouldn’t find with Google, for instance.
How did you come up with the idea?My parents were running a chemicals trading company when I came back from studying at Oxford. As a com-puter scientist, I realized that there was a lot of ineffi-ciency in this market. Gathering market intelligence and prices was all about getting people on the phone. What we set out to do was to digitize this whole process. In a way, I wanted to digitize my father’s brain and his decades of experience. So initially, we set up a platform that provides market data and combined it with a chat functionality.
What’s so great about looking up suppliers on your smartphone?We bring our data to the devices that people use anyway, be they smartphones, tablets, or desktop computers. That lowers the barrier. Also, this business is global, but most people in it aren’t native English speakers. So having a way to browse for information and then text someone rather than talk on the phone helps people become more comfortable. We see customers becoming more ambitious in venturing beyond their established network of suppliers, especially with global uncertainties like the trade wars that disrupt existing supply chains.
What’s your business model?Registration to SourceSage is free, and you’re free to browse general market information and offers. For long-term access to individual pricing data you need to sub-scribe. We also offer official channels to suppliers who want to promote their products and to third-party
133CLARIANT INTEGRATED REPORT 2018

People
1. Human CapitalIn 2018, the number of full time equivalents declined by 1.3 % to 17 901. Through targeted employer branding activities and training programs, Clariant continued to secure the skills and capabilities it needs to remain a high-performing organization over the long run. Its efforts to create an inspiring and motivating work envi-ronment for a diverse workforce resulted in very positive feedback from employees, as captured by the company-wide engagement survey. The continuous focus on ensuring the health, safety, and well-being of its employees is reflected in the lowest Lost Time Accident Rate since the beginning of the monitoring.
Compared to 2017, the distribution of the workforce between regions remained almost unchanged, with slight increases in Asia-Pacific (+ 0.8 percentage points) and Europe (+ 0.2 percentage points) and decreases of the same magnitude in North America (– 0.3 percentage points), Latin America (– 0.5 percentage points), and Middle East & Africa (– 0.2 percentage points).
The age and gender structure of Clariant employees also remained constant. In 2018, 14 % of employees were younger than 30 years, 60 % were 30 – 50 years old, and 26 % were older than 50 years. The total workforce consisted of 78 % men and 22 % women.
60 % (30 – 50 years)
14 % (< 30 years)
26 % (> 50 years)
002 AGE DIVERSITY
7 589 Europe
793 MEA 1
2 344 Latin America
2 294 North America
4 882 Asia-Pacific
001 FTE BY REGION
17 901
1 Middle East & Africa
People – Clariant’s second brand value – represents value creation that stems from human and relationship capital. Human capital encompasses all employee-related value creation processes, from talent attraction and development to employee engagement and occupational health, safety, and well-being programs. Achievements regarding value created for customers, policy-makers, suppliers, and society at large are reported in the relationship capital chapter.
REVIEW — PEOPLE134

KEY FIGURES WORKFORCE
2018 2017 Change in %
Total staff (in FTE) 17 901 18 135 – 1.3
Employees (in FTE) 10 405 10 482 – 0.7
Male 7 115 7 264 – 2.1
Female 3 290 3 218 2.2
Workers (in FTE) 7 496 7 653 – 2.1
Male 6 890 7 066 – 2.5
Female 606 587 3.2
Number of people hired 2 142 1 983 8
Male 1 453 1 412 2.9
Female 689 571 20.7
Number of people who left the company 2 047 1 991 2.8
Male 1 515 1 448 4.6
Female 532 543 – 2
Turnover rate (%) 11.1 10.7 –
Number of employees in the local, regional, and global talent pools > 1 000 > 1 000 –
Global management positions (ML 1 – 5) filled with internal candidates (%) 84 80 –
Total training hours 234 240 192 435 21.7
Number of training participants 15 791 9 720 62.5
Training hours (Ø per participant) 15 20 – 25
Number of employees with standardized per-formance management process 10 350 10 300 0.5
Staff in Research & Development > 1 100 > 1 100 –
Lost Time Accident Rate (LTAR; accidents with at least 1 day lost/200 000 work hours) 0.15 0.20 – 25
1.1. Talent attraction and developmentFor Clariant and its stakeholders, talent attraction and development is a central factor for future business success, as shown by the comprehensive materiality assessment conducted in 2017. Clariant follows an inte-grated approach to talent management, aligning all related processes through its MySuccess platform. This fully integrated tool covers all people processes from recruitment and onboarding to learning, talent, and per-formance management. In 2018, Clariant implemented a broad range of projects along the entire employee journey to realize the full potential of its workforce.
GRI
GRI Online Report
Management Approach Talent Attraction and Developmentreports.clariant.com/ 2018/gri
135CLARIANT INTEGRATED REPORT 2018

The Chinese messaging, social media, and mobile payment app has more than 1 billion active users per month.
TALENT ATTRACTION AND DEVELOPMENT
2018 2017 Change in %
Number of people hired 2 142 1 983 8
Male 1 453 1 412 2.9
Female 689 571 20.7
Number of people who left the company 2 047 1 991 2.8
Male 1 515 1 448 4.6
Female 532 543 – 2
Number of employees in the local, regional, and global talent pools > 1 000 > 1 000 –
Global management po-sitions (ML 1-5) filled with internal candidates (%) 84 80 –
Total training hours 234 240 192 435 21.7
Number of training participants 15 791 9 720 62.5
Average training hours per participant 15 20 – 25
Number of employees with standardized performance manage-ment process 10 350 10 300 0.5
Clariant aims to attract people who fit with its values and meet the defined role requirements. In 2018, Clariant hired 2 142 new employees (689 women and 1 453 men) to support its profitable growth strategy. With 35.1 % of new hires, Europe accounted for the largest share of new employees, followed by the Asia-Pacific region, which accounted for 23.5 % of new hires.
Clariant’s performance management process ensures that strategic business objectives are translated into the employee’s day-to-day activities. In 2018, 10 350 employees followed a standardized performance man-agement process.
Overall, 15 791 employees participated in a training recorded in the central learning management system, for a total of 234 240 training hours. The sharp increase of training participants compared to 2017 is due to the global data privacy training conducted in 2018 and the increased usage of e-learning by the Business Units. The average hours per employee that engaged in training decreased by 25 % to 15 hours per employee.
More than 1 500 talents were discussed in 60 talent reviews across the organization and concrete develop-ment steps and career measures were defined and will be implemented in 2019. The reward for Clariant’s systematic talent management activities is a very high talent retention rate of 95 % in 2018, which is only 3 per-centage points lower than in 2017. Clariant promoted internal candidates into 84 % of senior management positions, and filled 77 % of openings overall with the internal population.
1.1.1. Employer branding and recruitingIn 2018, a core focus of Clariant’s employer branding and recruiting activities was to recruit highly skilled people that can support Clariant on its way into the digi-tal future. It rolled out a targeted digital campaign via the Asian social network WeChat, developing specific brand content to attract digitally skilled candidates in China. The follower base of Clariant’s profile grew con-sistently over 2018 and the first results of the campaign will be measured in 2019. Clariant also hired a Digital and IT Talent Acquisition Specialist, whose primary mission is to support the company in the business- critical hunt for digital talents. This focus underscores Clariant’s commitment to exploit the full potential of digitalization as a growth lever. PAGE 120
REVIEW — PEOPLE136

In 60 talent review sessions more than 1 500 talents were discussed.
60Another important development was the launch of a digital interviewing platform, making it easier for can-didates from around the world to apply to open posi-tions. They can record and upload their video interview anytime and from anywhere, saving time and travel expenses. For Clariant, the new process facilitates an improved assessment of body language and communica-tion skills, while increasing flexibility and saving costs.
In order to set up the Leading Marketing Organization, 320 marketing and sales positions were filled in 2018.
PAGE 51 Clariant supported recruiting with a targeted digital campaign running on social media and its own corporate channels. The campaign further positioned Clariant as a preferred employer and enabled the creation of new talent pools, which were a valuable source in filling open marketing positions across regions.
1.1.2. Strengthening commercial competenciesAdding to the broad range of in-person trainings and e-learning modules that are accessible via the MySuccess platform, Clariant developed several new learning pro-grams in 2018 to strengthen commercial competencies within the organization. As part of the implementation of the Leading Marketing Organization, an advanced marketing e-learning module was developed that will be launched in 2019. This was complemented by the roll-out of »Manage for Growth«, a three-day program tar-geted at senior sales managers and that aims to strengthen their competencies for driving growth within their teams. In 2018, several sessions were conducted in Europe, Latin America, and North America.
1.1.3. Key position placement and succession planningClariant maintains a resilient talent pipeline and has a robust succession planning system in order to fill key roles according to a transparent set of criteria. In 2018, Clariant conducted 60 talent review sessions across all countries, regions, and global units and discussed more than 1 500 talents. As part of these reviews, individual development measures and career steps were defined. The results are translated into the global succession plans.
Clariant’s assessment center and capability develop-ment program provide aspiring leaders with clarity on competence requirements for various job levels and offer an assessment to identify development opportunities at organizational and individual levels. Every year, around 50 employees participate in this development program. In 2018, around 80 employees from innovation functions, Global Business Services, and procurement attended a competency assessment.
With Innovation and Research & Development as the first pillar of its Group strategy, Clariant launched the Innovation Talent Management Review (ITMR) initia-tive, which ensures succession for core roles within innovation job families. As part of the implementation of ITMR, career paths in the innovation field were defined, candidates were identified, and a learning cur-riculum focusing on innovation-specific topics was developed.
137CLARIANT INTEGRATED REPORT 2018

Leadership skills
There are a variety of internal and external of-ferings available for ex-ecutive training.
1.1.4. Training and development programsTo support key position placement and succession plan-ning, Clariant offers a range of formal and informal pro-grams for younger high-potential employees. The Pio-neer Program enhances organizational understanding as well as leadership and communication skills of aspir-ing leaders by exposing them to short-term assignments outside of their area of responsibility. In 2018, the sec-ond group of participants completed the program. One key achievement of all participants was the successful launch of a business project, which will be executed in 2019.
In the Mentoring Program, younger professionals get the opportunity to team up with experienced leaders to strengthen leadership skills and to encourage knowl-edge transfer across functions and age-groups. In 2018, more than 40 new mentees started their internal men-torship program.
These informal development initiatives are comple-mented by formal learning programs delivered by busi-ness schools, specialized training companies, and Clariant’s internal experts. These efforts contribute to the continuous development of Clariant’s leadership population.
Clariant also offers various leadership trainings. These include, for example, the »License to Hire« trainings, which provide a toolkit for efficient recruiting and sup-port line managers in making the right hiring decisions. The program is offered to all hiring managers. In 2018, more than 200 employees involved in the recruitment
process participated in one of the ten »License to Hire« trainings offered. After the training, participants receive online materials that summarize the main learnings and best practices. Clariant plans to make the training man-datory for all hiring managers across all levels in 2019.
Launched in 2017, the »Frontline Leadership Training« – designed for Production Managers and Shift Leaders – covers basic leadership instruments that enable manag-ers to effectively lead and motivate teams and manage change. The interactive training is facilitated by a dedi-cated Learning Manager and repeatedly receives out-standing reviews from participants. In 2018, the learn-ing content was refined to better fit the needs of the target group. More practical exercises, for example on how to provide effective feedback, were included in order to allow participants to apply learnings in prac-tice. Over the course of the year, 105 shift leaders participated in this training across all regions.
With the »Authentic Leadership Training«, Clariant offers a new intensive course that focuses on pivotal communication skills necessary to be perceived as a successful and inspiring leader. The participants either attend the Executive Performance Training, which is designed for cross-functional groups of six people, or the Inspirational Leadership Creative Communication Program, which is open to larger groups. In 2018, 31 senior leaders participated in the two-month training.
In addition, Clariant continued the implementation of the team effectiveness program across leadership teams in various locations and management levels. As part of the program, teams apply measures to enhance trust within the team, improve the quality of decision-mak-
REVIEW — PEOPLE138

ing, and strengthen the execution of commitments. The program was specifically designed to help leaders build high-performing teams. More than 80 % of Clariant’s global and regional leadership teams attended the pro-gram during the past two years.
1.2. Employee engagementClariant’s people are its most valuable asset to stay ahead of the curve in contested markets. By developing, improving, protecting, and delivering Clariant’s prod-ucts and services, they are the core of Clariant’s sustain-able value creation. Therefore, Clariant pays close attention to engaging with its employees on all levels, focusing on its core value of appreciation.
Clariant is driven by the belief that diverse perspectives enable the company to capture market opportunities faster and foster a corporate culture that is conducive to innovation and growth. Thus, cultivating an inclusive work environment that values differences in experience, culture, nationality, ethnicity, age, gender, sexual orien-tation, and physical ability is vital for Clariant’s business success. It also contributes to keeping the turnover rate at a stable level.
EMPLOYEE ENGAGEMENT
2018 2017 Change in %
Turnover rate (%) 11.1 10.7 –
Employee engagement score 85 1 n.a. 2 –
1 Due to a change in the methodology, the engagement index 2018 cannot be compared with previous engagement scores.
2 Surveys are conducted every two years
1.2.1. Engaging with a diverse workforce in times of changeIn times of change, providing the support and resources that employees need to achieve their goals, and showing appreciation for their efforts, is particularly important. Following the updated corporate strategy and business port folio upgrade announced in 2018, Clariant’s global workforce will adapt and encompass even more diversity. To facilitate the ongoing change process, Clariant’s Group Human Resources ensures that the company stays open to new ways of working, offers a global workplace based on common values, and creates a sense of purpose for all employees across regions and age clusters.
The development of a more global, diverse, and flexible workforce requires adherence to standards that uphold Clariant’s approach to equal treatment and diversity. Clariant thus adopted a new globally applicable Employ-ment Policy in 2018. The policy, which is accessible to all employees and is part of the onboarding curriculum, describes what fair working conditions mean in daily practice, underlining the importance of employee col-laboration. It clearly commits to equal development and promotion of all people across every organizational level and age group.
1.2.2. The »Pulse Survey« as a strategic instrumentIn 2018, Clariant broke new ground in assessing employee engagement. By implementing the »Pulse Sur-vey«, which is considered the starting point for using a company-wide survey as a strategic instrument to drive organizational development, more Clariant-specific, strategic, and timely issues were covered than with pre-vious surveys. A representative and randomly selected sample group of almost 2 500 employees was surveyed
GRI
GRI Online Report
Management Approach Employee Engagementreports.clariant.com/ 2018/gri
139CLARIANT INTEGRATED REPORT 2018

on topics such as change, strategy, and vision. The survey results showed a positive perception of the work environment. With an engagement index of 85, Clariant ranked above the industry benchmark and achieved high scores on strategy endorsement, innovation culture, and collaboration within and across teams. In future years, customized Pulse Surveys will be carried out upon Business and Service Units’ requirements. A global survey will be conducted biennially.
1.2.3. Recognizing extra efforts and leveraging employee recommendations in recruitmentIn 2018, Clariant further developed its »Recognition Program« to enhance employee engagement through appreciation. As part of the program, special recogni-tion awards were further promoted. These monetary awards honor outstanding contributions and motivate employees to »go the extra mile«. Beyond financial rewards, Clariant also started the rollout of local appre-ciation awards that acknowledge great achievements of peers or supervisors in form of presents or vouchers.
In addition, Clariant further developed its referral pro-gram, which encourages employees to recruit new candidates. Employees are invited to refer people from their professional networks for advertised jobs and are granted a cash reward if their referred candidate is suc-cessfully hired. In 2018, the referral program was rolled out to Clariant’s Shared Services Center in Poland, focused on recruiting external candidates, and in India, where the objective was to refer internal candidates for open positions.
1.2.4. Streamlining global benefitsFurthermore, in 2018, Clariant conducted a global benefit survey to establish consistent benefit programs across the organization. Building on the results of the survey, the Global Benefits Policy was developed. The policy does not stipulate a one-size-fits-all benefit program, but acknowledges country-specific circumstances. It sets binding key elements regarding flexible work arrangements, healthcare, travel, well-being, retire-ment, accidents and death. These elements will be reflected within each local benefit program to foster consistency and create an attractive workplace for everyone.
CUSTOMER TO CASH
1.3. Occupational Health, Safety, and Well-beingClariant’s zero-accidents goal underscores its com-mitment to protect and promote the health, safety, and well-being of all employees. In addition to multi-faceted health and safety programs, such as Avoidin-gAccidents@Clariant, Clariant took further steps in 2018 to maintain a safety-oriented leadership culture, enhance health and safety precautions at its sites, and learn from past incidents through improved reporting.
REVIEW — PEOPLE
GRI
GRI Online Report
Management Approach Occupational Health, Safety, and Well-beingreports.clariant.com/ 2018/gri
140

The number of lost-time accidents decreased by 26 %.
26OCCUPATIONAL HEALTH, SAFETY, AND WELL-BEING
2018 2017 Change in %
Lost time accidents 1 28 38 – 26.3
Lost time accident rate (LTAR) 2 0.15 0.2 – 25
Number of recognized occupational diseases 1 0 –
Number of work-related fatal accidents 0 2 3 –
Lost workdays (LWD) caused by occupational accidents 988 1 135 4 – 13
Lost workday rate (LWDR) 5 5.23 5.95 4 – 12.1
Process safety event rate 6 0.46 0.35 31.4
1 Number of occupational accidents with at least one day’s work lost2 Lost Time Accident Rate = ratio of the number of occupational
accidents where at least one day’s work was lost in relation to 200 000 hours of work
3 Fatalities disclosure includes employees and contractors.4 Including 221 LWDs carried over from 20165 Lost Workday Rate = loss of workdays caused by occupational
accidents in relation to 200 000 hours of work6 Process Safety Event = Number of Process Safety Events in relation
to 200 000 hours of work. In 2018, Clariant changed the reporting criteria from Cefic to ICCA. If Clariant had used the Cefic criteria for 2018, the process safety event rate would have been 0.35.
In 2018, the overall health and safety performance at Clariant’s sites further improved, as illustrated by the key performance indicators. The number of lost time accidents decreased by 26 %, from 38 in 2017 to 28 in 2018, with six cases concerning supervised (non-Clariant) workers. In addition, ten lost time accidents involved contractors, which is a slight increase of two cases compared to 2017. 83 % of all recorded injuries required first aid measures, 12 % needed medi-cal treatment, and 5 % of recorded injuries were restricted work cases. The most frequent injury types in 2018 were bone fractures (29 %), sprains, bruises and contusions (25 %), and open wounds (14 %).
Occupational Health, Safety, and Well-being at Clariant means much more than wearing necessary safety gear. It is a commit-ment to tackle safety in a comprehensive way and ensure that every employee returns home after work as healthy as they arrived. The most effective way to prevent occupational accidents and achieve the goal of zero accidents is by implementing a set of cohesive management programs and leadership measures. AvoidingAccidents@Clariant is a global program that creates safe working environments, raises awareness of safety, and illustrates Clariant's focus on prevention. Since the start of the program in 2007, the lost time accident rate (LTAR) has declined from 0.92 to 0.15. Clariant’s »Safety Counts!« cards also play an important role in ensuring health and safety, helping employees record critical safety situations and the circumstances that led to them. Improvement measures taken are shared locally, enabling the production teams to build best practices and promote a preventive mindset throughout the entire company.
AVOIDINGACCIDENTS@CLARIANT
Employee
Plant/ Department
Manager
Safety Counts! Contact
Safety Counts! Contact
SAFETY COUNTS!
Consults the info board for the
follow-up status
Receives measures list and posts status
on info board
Updates measures list and controls implementation
Evaluates the hazard potential and initiates further action for risk elimination
Collects and forwards »Safety Counts!« cards to Plant or Depart-ment manager (daily)
Fills in the »Safety Counts!« card and places it into the »Safety Counts!« box
141CLARIANT INTEGRATED REPORT 2018

Chemical burns, and internal injuries each accounted for 11 %. In 7 % of the cases, a limb was lost, and in 4 % of the cases the injury was due to a foreign body. No work-related fatal accident was recorded in 2018. The number of recognized occupational illnesses increased to 1, compared to 0 in 2018.
Clariant managed to further reduce the lost time acci-dent rate (LTAR) to 0.15 accidents per 200 000 hours of work, as compared to 0.2 in 2017, representing the lowest level since the beginning of the monitoring. The total number of lost workdays decreased significantly from 1 135 in 2017 to 988 in 2018, representing an improvement of 13 %. This reduction indicates that job-related injuries were less severe in 2018. Clariant also managed to reduce the lost workday rate to 5.23 workdays lost per 200 000 hours of work. Compared to 2017, this is a 12 % reduction. One key factor that contributed to the good results was the Leadership Improvement Initiative. This includes measures such as site tours conducted by members of the Business Units’ management com-mittees to respond to safety-related questions and deepen awareness, »Safety Moments« discussed at the beginning of meetings, and the mandatory involvement of site managers and their next level managers in Incident Investigation Reviews.
1.3.1. Raising awareness of safety challengesThe »Safety Moments« initiative, launched in 2017 to strengthen Clariant’s safety-oriented leadership culture, was further developed in 2018. Held at the beginning of each meeting, »Safety Moments« raise awareness of safety-related challenges at the work-place and offer ideas for how to avoid or resolve these issues. To support managers with implementation across regions, an internal platform was launched to share customized handouts with relevant information for each employee group.
1.3.2. Improving safety reportingAnother priority area in 2018 was improving occupa-tional health and safety-related reporting, building on steps first taken in 2017. Clariant refined reporting of restricted work cases – incidents that keep the affected employees from performing routine functions of their job or from working at least one full workday – by requiring all sites to issue a report immediately after an incident occurs and to make investigation reports mandatory for all cases. The number of cases decreased from 95 in 2017 to 61 in 2018.
In addition, Clariant started reporting Process Safety Events (PSEs) according to the criteria of the Interna-tional Council of Chemical Associations (ICCA). Given the improved reporting culture, the number of reported Process Safety Events increased to 86 in 2018, compared to 66 cases in 2017. The Process Safety Event rate increased from 0.35 in 2017 to 0.46 in 2018. However, if Clariant had still used the Cefic reporting criteria, the rate for 2018 would have been 0.35. In order to comply with the reporting requirements of the European Chemical Industry Council (Cefic),
REVIEW — PEOPLE142

Clariant will also record process safety events accord-ing to Cefic criteria until 2020. From 2021 onward, only ICCA criteria will be applicable.
1.3.3. Enhancing employee well-beingThe promotion of workplace health and well-being is a local responsibility that each Clariant region addresses with tailored programs. In many countries, Clariant offers free psychological counseling and stress management trainings, and runs employee assistance programs that analyze and evaluate mental strain, educate employees on mental health risks, and develop relief strategies with affected employees.
To protect its employees from work-related hazards, every workplace at Clariant is subject to a systematic, multi-step assessment that includes workplace ergo-nomics, illumination, noise, indoor air quality, humid-ity, and temperature. Clear minimum requirements are defined for each factor and measures to redesign the workplace are taken if these requirements are not met. In addition, Clariant offers a range of bene-fits designed to enhance the work-life balance of its employees. These include the provision of fitness facilities and contributions to external fitness pro-grams, flexible working hours and working from home arrangements, childcare facilities and contribu-tions to external childcare, as well as support for employees who care for elderly family members.
2. Relationship capitalIn 2018, Clariant successfully expanded its relationship capital. It increased the number of interactions along the customer journey and received positive feedback through its biennial global customer satisfaction survey, deepening its understanding of value chains and unmet customer needs. It also maintained strong contacts with chemical industry trade associations and policy makers.
OVERVIEW OF RELATIONSHIP CAPITAL
2018 2017 Change in %
Survey responses ob-tained from customer contacts 2 791 n.a. 1 –
Customer interviews 538 515 4.5
Net Promoter Score (NPS) (%) 29 n.a. 1 –
Raw material suppliers 7 000 7 000 0
Raw material supply base by spend covered by sustainability evaluations (%) 74 65 –
1 Surveys are conducted every two years.
MARKET TO CUSTOMER
2.1. Customer RelationshipsCustomer engagement, a key to profitable growth, lies at the core of Clariant’s commercial strategy. After taking significant steps in recent years to turn Clariant from a product-driven to a customer-centric organization, in 2018 Clariant refocused on streng-thening the customer experience – a crucial shift to gain a better understanding of the customers’ needs and develop tailor-made value propositions.
GRI
GRI Online Report
Management Approach Customer Relationshipsreports.clariant.com/ 2018/gri
Customer satisfaction survey
Clariant’s global customer satisfaction survey 2018 was made available to customers in nine languages.
143CLARIANT INTEGRATED REPORT 2018

CUSTOMER RELATIONSHIPS
2018 2017 Change in %
Survey responses ob-tained from customer contacts 2 791 n.a. 1 –
Net Promoter Score (NPS) (%) 29 n.a. 1 –
Customers who want to continue doing business with Clariant (%) 90 n.a. 1 –
Customers who plan to intensify the business relationship (%) 77 n.a. 1 –
Customer interviews as part of marketing and strategy initiatives 538 515 4.5
Interviews with indus-try experts as part of marketing and strategy initiatives 150 59 154.2
Number of Marketing Excellence projects 37 34 8.8
Commercial margin (CHF m) 12.8 12.3 6.2
1 Surveys are conducted every two years.
2.1.1. Leveraging customer feedback for continuous developmentThe large number of customer interactions through-out the year reflects the increased focus on customers. In 2018, Clariant conducted 538 customer interviews (2017: 515) and 150 industry-expert interviews (2017: 59) as part of marketing and strategy projects, yield-ing valuable feedback on how to further improve its product and solutions offerings and the entire cus-tomer journey.
The most important source of customer feedback in 2018 was the biennial comprehensive customer satis-faction survey. Customers of all Business Units in all regions were surveyed, with the total number of respondents increasing to 2 791, almost 100 more than in 2016. Compared to the previous survey, the participants were also more diverse, with a growing share of responding stakeholders from R&D and pro-duction functions.
The overall results show that the high level of customer satisfaction remained stable, with the Customer Satisfaction Index at 77 points (2016: 78). In total, more than three-quarters of participants stated that Clariant is a reliable business partner and solutions provider and 73 % highlighted Clariant’s excellent customer-oriented approach. Respondents ranked »Technical Service« and »Products and Packaging« as the two most important buying criteria. In »Products and Packaging«, Clariant increased its competitive edge, with a larger share of respondents rating Clariant’s products higher than those of the competitors. The competitive performance of the »Technical Service« decreased slightly compared to 2016 but remained at a high level. Sustainability was introduced as a new assessment criterion in the 2018 survey and showed a strong competitive performance. Sustainability was ranked as the 7th highest buying criteria, with 92 % of the respondents stating sustainability was important for their operations and/or markets.
Customer loyalty was also found to be very high in 2018. The Customer Loyalty Index reached 81 points (2016: 84), while the Net Promoter Score (NPS) decreased from 37 % to 29 %. In the chemicals indus-
REVIEW — PEOPLE144

try, an NPS of 30 % is considered the benchmark. 90 % of respondents are likely to continue doing business with Clariant in the future (2016: 91 %) and 77 % stated they are likely to increase business with Clariant (2016: 81 %). The results also revealed several areas with room for improvement, including complaint management and logistics. Since survey results differ considerably between regions and Business Units, future improvement efforts will target business-spe-cific and regional challenges in order to further increase customer satisfaction and loyalty. PAGE 54
2.1.2. Advancing the Leading Marketing OrganizationsGood customer and market research creates transpar-ency at all touchpoints along the customer journey, delivers customer insights that create unique value propositions, and identifies market opportunities that can be addressed with innovative solutions. In 2017, Clariant launched the Leading Marketing Organiza-tion to rethink its approach to marketing and further integrate marketing within the Business Units. Set-ting up dedicated marketing functions within each Business Unit was a first step. In 2018, Clariant filled all key positions and established a Marketing Advi-sory Board that serves as a platform to share best prac-tices between the Business Units’ Marketing Heads and the Head of Marketing Excellence. The Market-ing Advisory Board plays a key role in the continuous development and delivery of the marketing programs within and across the Business Units. Other key aspects of implementing the Leading Marketing Orga-nization were the launch of marketing essentials training and the development of an advanced strategic
marketing training program. The latter is being co-devel-oped by the Business Units’ marketing departments and an industry-leading partner. In 2019, the Marketing Excellence team will work with the Marketing and Innovation Heads to develop additional programs that satisfy the evolving needs of Clariant’s marketing community and customers. PAGE 135
In 2018, Clariant carried out 37 Marketing Excellence projects, with the additional commercial margin from these efforts increasing from CHF 12.3 million to CHF 12.8 million in 2018. FIGURE 003
003 COMMERCIAL MARGIN in CHF m
9
2016
12.8
2018
12
20172015
4
145CLARIANT INTEGRATED REPORT 2018

2.2. Ethics and complianceIn 2018, Clariant continued implementing the measures outlined in its Strategic Integrity Roadmap. Structured around the company’s five pillars of leadership engage-ment, communication and training, risk assessment, standards and controls, and monitoring, this roadmap anchors an ethical mindset and behavior in the work-force and continues the ongoing process of transform-ing Clariant from a rules- and principles-based organi-zation to a value-based organization.
ETHICS AND COMPLIANCE
2018 2017 Change in %
Questions and allegations issued via the anonymous Integrity Line 104 80 30
Fully or partially substantiated 29 16 81.3
Closed during the year 72 46 56.5
Percentage of Board members that received training on anti- corruption (in %) 50 45 11
Percentage of employees that received training on anti-corruption (in %) 30 60 – 50
Clariant uses a comprehensive set of key performance indicators to measure effective progress toward the objectives of the roadmap.
2.2.1. Excellence through IntegrityIn 2018, Clariant continued the rollout of its »Excel-lence through Integrity« campaign, which was launched in 2017. As part of the campaign, members of the Executive Committee and regional heads articulated what ethics and integrity mean to them personally in order to further raise awareness for ethical behavior. These statements were printed on posters and displayed at all sites to increase the visibility of the campaign.
2.2.2. Improving compliance through leadership and trainingTo underscore its commitment to ethical business practice, Clariant launched »Leader-led Compliance Sessions«, which were held by roughly 1 000 leaders with their direct reports in 2018. These sessions provided a forum to discuss ethical dilemmas that emerge in daily business practices and share lessons learned and best practices. The dilemmas were all build around the commitments of the Code of Conduct related to the Anti-Bribery, Antitrust, Data Privacy, Conflict of Interest and absence of discrimination and harassment. With this effort, roughly 5 000 employees received Code of Conduct training. The »Leader-led Compliance Sessions« resulted in more request for guidance from the Ethics & Integrity functions and an increase of reports through the Integrity Line by 30 %.
Clariant continued to conduct its mandatory compliance trainings for all employees, via e-learning and in-per-son, to prevent violations of the Code of Conduct. 50 % of the Board members and 30 % of employees received training on anti-corruption, while approximately 5 000 employees successfully completed the relaunched e-learning on antitrust law. Furthermore, an anti-brib-
Through the anonymous Integrity Line, 104 questions and allegations were issued.
1 04REVIEW — PEOPLE
GRI
GRI Online Report
Management Approach Ethics and Compliancereports.clariant.com/ 2018/gri
146

ery e-learning program was rolled out in 2018 that spe-cifically targeted sales, marketing, and procurement professionals. In 2019, the anti-bribery e-learning will be rolled out to the remaining units of the organization.
2.2.3. Internal communication increases sensitivity for compliance issuesClariant also strengthened communication regarding ethics and compliance by publishing regularly articles around business ethics and shared results from internal investigations in its ethics journal. Each example illustrated a real case from Clariant’s businesses and dis-cussed how it was resolved. The articles caught consid-erable attention from employees, as indicated by above-average click rates.
2.2.4. Reducing risk exposure across regionsAs Clariant’s businesses operate in a large number of countries with diverging risk profiles, an ongoing risk assessment is conducted to identify gaps in the ethics and compliance framework in different markets. In 2018, a compliance risk assessment was initiated for the most exposed Business Units. This process revealed gaps, which were closed by taking steps to reduce the risk exposure.
2.2.5. Launch of the Data Privacy ProgramIn response to the new General Data Protection Regula-tion (GDPR) of the European Union, Clariant started a Data Privacy Program in 2018. The program consists of a policy framework, consisting of a Data Privacy Policy, a general Directive on how to process personal data and SOP’s on the subject of Data Breach and execution of privacy rights and a basic Data Privacy e-learning course, to familiarize all employees with the principles of the data privacy policy as well as dedicated deep dive sessions for the more exposed functions like Human Resources, Marketing, Sales. In addition, a Data Privacy Organization
was set up and internally certified after extensive train-ing, covering the main topics for a certified Privacy Pro-fessionals from the International Association of Privacy Professionals (iapp.org). The members of the Data Privacy Organization are responsible for creating awareness and build up the relevant knowledge throughout the organi-zation with the »train the trainer« approach.
2.2.6. Providing clear grievance mechanismsA key instrument to track Clariant’s performance on ethics and compliance is the Integrity Line, which is used to report workplace-related issues. To strengthen this channel, Clariant rolled out the »Speak-up« cam-paign. As part of this campaign the Integrity Line, was promoted on Clariant’s website and made accessible to external stakeholders to anonymously report any alleged violations of the Code of Conduct. In 2018, 104 questions and allegations were issued via the Integ-rity Line (2017: 80), of which 29 were fully or partially substantiated (2017: 16). The substantiation rate is low, and we will focus in the coming year on more transpar-ency related to the process and what should be reported.
2.3. Policy and stakeholder relationsClariant believes that maintaining an open and trust-worthy dialogue with all stakeholders and participating in relevant public policy developments are important aspects of its corporate responsibility. As a responsible corporate actor that values transparency, Clariant publicly discloses its contributions to trade and business associations. CLARIANT.COM/EN/COMPANY/
CORPORATE-GOVERNANCE/PUBLIC-POLICY-DIALOG
GRI
GRI Online Report
Management Approach Policy and Stakeholder Relationsreports.clariant.com/ 2018/gri
147CLARIANT INTEGRATED REPORT 2018

In 2018, Clariant decided to step up its support of the transition to a circular economy in the European Union. It joined associations such as the «Plastics Recyclers Europe» and «Petcore», the association representing the complete Polyethylene terephthalate (PET) value chain in Europe.
Active engagement in these bodies helps Clariant main-tain a continuous stakeholder dialogue in strategically important fields. In 2018, dossiers related to sustainable chemistry, circular economy, bio-economy, and innova-tion policy frameworks were a particular focus.
CUSTOMER TO CASH
2.4. Sustainability performance in the supply chainClariant sources over 34 000 types of raw materials from approximately 7 000 suppliers. In 2018, CHF 2.9 billion was spent on raw materials, representing the largest portion of Clariant’s total expenditure. Suppliers are critically important to Clariant’s value creation and substantially impact the company’s over-all sustainability performance. Clariant uses a com-prehensive set of criteria to select and manage suppli-ers, outsourcing partners, and service providers. Apart from economic and product-specific perfor-mance, these criteria include sustainability consid-erations such as environmental and safety standards, social and governance aspects, complaint manage-ment, working conditions, and respect for human rights.
The engagement of Clariant representatives in trade associations and other platforms supports strategic alignment across the industry, provides an opportunity for exchange on industry perspectives and best prac-tices, and brings forward Clariant’s views and positions on various policy areas.
Clariant is a member of numerous interest groups and trade associations. At the international and regional level, these include, among others, the International Council of Chemical Associations (ICCA) and the Euro-pean Chemical Industry Council (Cefic). At the local level, Clariant is part of national business federations and chemical industry associations, such as ABIQUIM in Brazil, CPCIF in China, the Verband der Chemischen Industrie (VCI) in Germany, and the American Chemis-try Council (ACC) in the United States.
Clariant is also active in sectorial associations, for exam-ple in the bio-economy field, and supports scientific and research associations, such as SusChem, the European Technology Platform for Sustainable Chemistry.
The top three contributions in 2018 were all made to Europe-based associations. Together, they represented more than 50 % of Clariant’s total membership costs:1. Verband der Chemischen Industrie e.V. – VCI, the
German national association of chemical producers;2. Handelskammer beider Basel, the Basel Chamber of
Commerce; and3. Scienceindustries, the Swiss business association for
the chemical, pharmaceutical, and biotech indutries.
REVIEW — PEOPLE
GRI
GRI Online Report
Management Approach Sustainability Performance in the Supply Chainreports.clariant.com/ 2018/gri
148

SUSTAINABLE VALUE CHAIN
2018 2017
Number of new Sustainability Assessments shared 1 1 491 2 309
Percentage of direct spend (raw materials) on suppliers covered by shared Sustainability Assessments 74 65
Number of new Sustain ability Audits shared 2 358 441
1 »Together for Sustainability« Supplier assessments2 »Together for Sustainability« Supplier audits
2.4.1. Supplier Code of ConductIn its Supplier Code of Conduct, Clariant outlines the strategy, scope, and expectations regarding the sus-tainability engagement and performance of suppliers. The Code is part of Clariant’s General Terms and Conditions of Purchase, which are incorporated into every purchase order issued by procurement. Suppli-ers and their subsidiaries are required to agree and fully comply with the Code. CLARIANT.COM/EN/
COMPANY/CORPORATE-GOVERNANCE/
CODES-OF-CONDUCT
2.4.2. Assessing and steering sustainability in the supply chainIn order to ensure compliance with the Supplier Code of Conduct, Clariant relies on assessments and audits conducted by »Together for Sustainability« (TfS). In 2018, TfS members assessed 1 491 suppliers for the first time, compared to 2 309 assessments in 2017. In total, more than 10 000 suppliers have been assessed since the inception of TfS. To identify which portion
TfS was founded in 2012 and currently lists 21 major chemical companies as members, representing a combined yearly spend of more than CHF 230 billion. Clariant joined TfS in 2014 in order to assess and steer sustainability in its supply chain, along-side other members. As an active member, Clariant contributes to the initiative by providing sustainability performance assess-ments and audits of its own suppliers. In turn, it gains access to assessments generated and shared by other TfS members.
To ensure independence and consistency of results, TfS supplier assessments are conducted according to a standard approach by best-in-class service providers. The sustainability assessments consist of scorecards providing an overall score as well as a sub-score for performance in Environment, Labor Practices, Fair Business Practices, and Sustainable Procurement. The on-site sustainability audits are carried out by globally renowned and specialized service providers.
TOGETHER FOR SUSTAINABILITY (TFS)
In 2018, the members of the »Together for Sustainability« initiative have assessed 1 491 suppliers.
1 491149CLARIANT INTEGRATED REPORT 2018

of its total spend is covered by TfS assessments, Clariant maps completed assessments against its sup-plier base. In 2018, coverage was 74 %, an increase of 9 % compared to 2017. With this, Clariant managed to reach its goal of a direct spend coverage of 70 % by 2019 one year early. The number of new audits amounted to 358 in 2018, compared with 441 in 2017, adding up to a total of more than 1 500 audits con-ducted since 2012. As such, TfS achieved its goal of 1 400 audits one year early.
Based on TfS sustainability assessments, Clariant initi-ates Corrective Action Plans (CAPs) to reduce identi-fied sustainability risks. About 200 supplier CAPs were completed in 2017. The reassessment of these suppliers in 2018 showed positive results: 75 % improved their score and the average score improved by 6 %.
In 2018, Clariant formalized TfS assessments in order to use them for screening customer eligibility for EcoTain® licensing. Suppliers need to have a solid sus-tainability performance and reach a minimum score of 45 points in the online assessment conducted by third-party service provider EcoVadis to become eligible for the use of the EcoTain® label on their own products and marketing material. The assessment tool thus not only helps Clariant evaluate the sustain-ability performance of its suppliers but also contrib-utes to the growth of the EcoTain® brand. PAGE 122
2.4.3. Goals and challenges in sustainable supply chain managementIn 2018, Clariant established supply chain sustainabil-ity targets for each Business Unit individually. The targets address increasing customer requests and pro-actively support Clariant’s reputation as a sustain-ability leader. Clariant also organizes internal train-ings every year to increase awareness and enhance its capability to evaluate sustainability performance in the supply chain. The trainings mainly target employees in Global Procurement Services (GPS) and associates in the Business Units. A particular focus of the trainings provided to GPS is put on the toolbox Clariant uses to further deploy sustainability with the company’s suppliers. The trainings for the Business Units serve to provide updates on GPS’ activities and inform them about sustainable procurement initia-tives in other businesses.
While Clariant is committed to motivating its suppliers to participate in the »Together for Sustainability« program, a major remaining challenge is the systematic extension of Clariant’s supply chain management to tier 2 suppliers and beyond. As Clariant does not have a direct business relationship with these companies and in many cases does not know them, the company launches pilot projects that will facilitate an exchange with tier 2 suppliers on the issue of sustainability.
REVIEW — PEOPLE150
GRI
GRI Online Report
Management Approach Human Rightsreports.clariant.com/ 2018/gri
2.4.4. Strong engagement leads to outside recognitionOver the last few years, Clariant’s supply chain sus-tainability performance has consistently received external recognition. In December 2017, the Euro-pean Institute for Purchasing Management (EIPM) honored Clariant with its prestigious »Sustainability Leadership in the Supply Chain« award. With a score of 80 points, it also received one of the highest Eco-Vadis assessment scores of more than 30 000 assessed companies in 2018. The assessment focuses on 21 sustainability criteria grouped into the four categories »Environment«, »Social«, »Ethics«, and »Supply Chain«. In 2018, Clariant reached 80 points in all four categories. In the supply chain category, this rep-resents an improvement by 23 points since 2011.
2.5. Human rightsClariant is firmly committed to protecting human rights during all phases of value creation within all business units. This obligation applies not only to Clariant’s own business operations, but also to its entire supply chain and contracted workers. As a prerequisite for sound business governance and license-to-operate, Clariant expects its business partners to uphold the same high standards regarding human rights.
Clariant crafted a comprehensive framework of policies, guidelines, and processes to ensure the implementation of its human rights commitments. Over the last two years, deep-dive investigations were performed in areas
that were identified as high-risk during our 2016 human rights due diligence review. A specific focus was on contracted labor in order to assess that all corporate poli-cies were well implemented and that the same require-ments were applied to Clariant’s own employees as to temporary workers and contractors. These efforts con-centrated particularly in high-risk geographies, such as India.
In order to reinforce its commitment to workplace rights and globally ensure the same high standards regarding working conditions, Clariant developed a new employ-ment policy in 2018. The policy fosters sustainable employee relations and addresses fair working condi-tions, discrimination, freedom of association, occupa-tional health and safety, as well as child and forced labor. The policy applies equally to permanent and tem-porary employees and workers, and is applicable to all employment agencies and contractors that collaborate with or engage on behalf of Clariant. The new policy was communicated to all employees across all countries.
Finally, via the Together for Sustainability (TfS) plat-form and in cooperation with other companies, Clariant assesses its suppliers in relation to child and forced labor, among other social, governance, and environmen-tal topics. PAGE 148
151CLARIANT INTEGRATED REPORT 2018

TWO PERSPECTIVES — CUSTOMER RELATIONSHIPS152

What Will Our Custom-ers Expect from Us Tomorrow?
Customer Relationships
Trends and tastes shape what consumers buy. Knowing what people want is hard. Knowing what they'll want tomorrow or next year is even harder. With innovation cycles shortening and global trends moving faster than ever, it's crucial for consumer goods companies and their suppliers to know which way to innovate. That's why Clariant helps its customers predict trends and keeps its finger on the pulse.
CLARIANT INTEGRATED REPORT 2018

Judith van Vliet
As Designer for ColorWorks™ at Clariant, Judith helps companies figure out which colors
consumers will favor in coming years.

Janis Ambrose Shard
As Senior Manager for Cross Car Line at Toyota, Janis works on trends that may change what cars will look like and how we use them.
Janis Ambrose Shard
As Senior Manager for Cross Car Line at Toyota, Janis works on trends that may change what cars will look like and how we use them.
153CLARIANT INTEGRATED REPORT 2018

What’s in it for Clariant?It’s to positively distinguish ourselves from the compe-tition. Clariant sells masterbatches that give plastics their unique visual appearance and functionality. The masterbatches market is a crowded one, with many dozens of competitors in Europe alone – from small family businesses to other multinationals. Customers understand, though, that we know their markets better than anybody else. We know societal trends that will shape consumer decisions and we speak the language of their designers.
Why is that important?Designers don’t talk in color codes. They try to evoke feelings or replicate things they’ve seen in the world. Translating that into something a chemist or an engi-neer can work with is a big and beautiful part of what we do. And vice versa, we inspire designers by introduc-ing them to things our chemists come up with.
Don’t your customers have people for that?It depends. Some multinationals have entire buildings populated by color, material, and finish designers – basically people like myself. Yet the most creative com-panies will always invite different perspectives. Beiersdorf is a good example. The makers of NIVEA™ certainly aren’t looking for new shades of blue and white for their flagship product. Still, they’re usually the first to invite us each year to talk about trends.
How accurate are your predictions?You never get it completely right. We compile four stories and usually 20 directional colors. Each year, 15 to 17 of those are confirmed, making us 75 to 85 percent accu-rate. What is most important is that the overarching sto-ries are almost always confirmed.
Have there been forecasts you were particularly fond of?I was personally very touched by a story we dubbed »Umswenko«. That’s a Zulu word describing the style and attitude of African millennials. It’s part of ColorForward® 2019 and tells the story of the creative and confident startup culture we see flourishing across the African continent, which is inspiring on so many levels. Not surprising, considering Africa is the next big thing
Judith, what’s the color for 2020?There’s not one color. That’s a misconception people have, that a single color will work in every context. With ColorForward®, we outline trends and a range of colors that interpret and translate those trends. For 2020, we see consumers gravitating to cooler blues and greens – away from the warmer tones of recent years.
Okay, I feel we’ve jumped right into your work, which is rather unique. Yes, we are one of a kind within the company – and the industry. I’m a conceptual designer at ColorWorks™, which is the global network of Design & Technology Centers within the Business Unit Masterbatches.In short, ColorWorks™ helps Clariant customers choose the right aesthetic for their product.
Who are those customers?They come from a wide range of industries – from pack-aging and automotive, to consumer goods and textiles, to food and interiors. We work directly with these cus-tomers. So I would work mostly with a designer or marketeer at a brand to pick the color and finish for a new product.
What goes into these decisions and how can you help?There’s a lot that comes into play. Obviously their brand and their demographic target, but also societal trends and regional tastes. Clariant has developed its own fore-casting guide called ColorForward®. We’ve just finished working on its 14th edition for trends, their respective colors, and associated aesthetics in 2020.
How do you forecast trends?Our team goes to shows, conferences, and exhibitions all over the world. We talk to other trend watchers, to designers, artists, and customers. And even when we’re just walking down the street, we always have our anten-nas out. We try to see what is happening and what is dif-ferent. It’s about all the small signs that might signal change.
Where are those teams you mentioned?Our teams are located in Italy, Singapore, Chicago, and São Paolo.
TWO PERSPECTIVES — CUSTOMER RELATIONSHIPS154

JUDITH VAN VLIETDesigner ColorWorks®, Clariant
Why do we predict trends for our
customers?
Why do we predict trends for our
customers?
155CLARIANT INTEGRATED REPORT 2018

JANIS AMBROSE SHARDSenior Manager Product Planning & Strategy, Toyota North AmericaJANIS AMBROSE SHARDSenior Manager Product Planning & Strategy, Toyota North America
TWO PERSPECTIVES — CUSTOMER RELATIONSHIPS
What shapes consumer tastes and trends in cars?
What shapes consumer tastes and trends in cars?
156

Speaking of appearance, how might autonomous driving change the way cars look?We’re starting to see how the interior can be packaged differently, because suddenly you’ll have all this free time on your hands as the vehicle whizzes you from A to B.
You’ve been with Toyota for twenty years now. How have tastes changed?With things like Pinterest and Instagram, everyone’s a designer now. Tastes and expectations are a lot more sophisticated.
How are materials changing?We’re seeing a lot more natural materials for interiors – organic fabrics for example or bamboo. The European market is leading the way here.
What role do suppliers play in addressing or even setting new trends?Our reliance on suppliers is huge. They’re the ones bringing in, say, a new technology for a seat material. I’m not the expert in leather or paint technology. So we rely on suppliers competing on new technologies. And they come with some pretty wild ideas.
Are trends the same for every car company?They can affect our buyers differently than those of other brands. You buy a Toyota for specific reasons and those might be different than the ones for choosing a Honda or a Mercedes.
How important is it that a supplier understands your industry?It’s one thing if they’ve got a beautiful product. But it has to meet our standards, which are a lot higher than for other industries, not least from a regulatory stand-point. I’ve had suppliers come to me with seat materials they’ve developed for boats. But what might look amaz-ing on a yacht won’t necessarily hold up as a car seat in Louisiana humidity or in Texas heat. Another thing is how you deal with suppliers. For mass production, you want to make sure that it’s a smooth process, whether it’s purchasing or the engineering side. So when we try out a new material, for a concept car for example, we’re also testing what it’s like dealing with that particular supplier.
Janis, Henry Ford famously said that his custom-ers could have their cars any color they wanted as long as it was black. Why are we still buying mostly black cars a century later?Well, we’re not. Actually pearl white has overtaken black, especially in Asian markets. And more to the point, when Henry Ford said that, black was the easiest color to paint. Today’s colors and today’s blacks are not easy to paint. But it is true that black, white, gray, and silver cars tend to hold their resale value a little better. So people play it safe. You don’t just throw out your old car the way you do with a carpet or an iPod. If it weren’t for that, I think consumers would be more open. My team and I are always trying to infuse more colors.
You help set the global color palette for Toyota and Lexus. Was there ever a favorite for you?I remember a bright orange called »Inferno« that we eventually chose for the launch of our TRD Pro trucks in 2015. I had to fight tooth and nail to get that color. Orange is technically challenging and parts were being painted at different locations so I had to make sure that each factory was able to get it right. But the color made a huge splash at the Chicago Motor Show.
Do societal trends affect which color people buy?Yes, definitely! In my experience, when the economy is booming, colors go a little bit darker, people turn to black and dark grey. When there is a downturn, we start seeing fluorescence and bright colors because people need optimism.
Besides colors, your team oversees technologies to be rolled out across the entire model range. What are you seeing and how far ahead of the curve are you?The next big thing will be electrification and the neces-sary infrastructure – along with, eventually, autono-mous driving. Toyota is not always at the forefront of everything, even though we brought hybrids to the mainstream long before anybody else. We tend to be later to the party, but better dressed.
157CLARIANT INTEGRATED REPORT 2018

1. Natural CapitalClariant remains committed to continuously improve operational efficiency by tackling environmental chal-lenges. Stewardship of natural resources is paramount, as Clariant’s production depends on reliable access to a multitude of raw materials. To monitor environmen-tal impacts from its production sites in a meaningful and efficient manner, Clariant regularly validates and reports environmental data from its largest production sites. Collectively, these cover around 95 % of produc-tion volume. To keep track of the smaller sites as well, Clariant collects environmental data for all production sites every three years. Due to this schedule, 125 pro-duction sites were included in the 2017 reporting and 79 in the 2018 reporting. In addition, five administrative sites are included in the reporting as well. This promotes
comparisons of relative numbers (per ton of produc-tion), rather than absolute ones. Thus, in the following tables and discussions, year-on-year comparisons of relative numbers are highlighted.
In 2018, total sales increased, while production volume decreased – a finding that also remains valid when con-sidering the effect of the reduced reporting scope. Over-all, the lower production volume led to increased rela-tive figures, since resource consumption, emissions, and waste can only partially be related to production vol-ume. Despite these challenges, Clariant remains commit-ted to its 2025 environmental targets and is well on track to achieve them. FIGURE 002
CUSTOMER TO CASH
1.1. Progress toward environmental targets 2025Clariant has set goals to achieve significant impact reductions in six crucial areas by 2025, as compared to 2013. In relation to produced goods (per ton), Clariant aims to reduce energy consumption and direct CO₂ emissions by 30 %, greenhouse gas emissions, water con-sumption, and waste volume by 35 %, and wastewater volume by 40 %.
In 2018, energy consumption per ton of produced goods rose by 4.6 %, from 706 kWh to 739 kWh. Direct CO₂ emissions (Scope 1) and greenhouse gas emissions, including from the production of electricity (Scope 1 & 2), followed this development, with increases from 95 to 97.5 kg (2.7 %), and 211 to 215 kg (1.9 %) per ton of production, respectively. The lower increase in emissions indicates Clariant’s shift to cleaner energy sources, such as natural gas.
Planet – Clariant’s third brand value – encompasses the value creation processes that benefit the environment. To meet its ambitious environ-mental targets, Clariant takes measures to ensure the responsible use of natural capital. This includes programs to protect the environment, safeguard natural resources, mitigate climate change, and promote the transition to a circular economy.
001 ENVIRONMENTAL TARGETS 2025 in % (per t produced goods)
Reduction of Energy
Consumption
Reduction of Water
Consumption
– 30
– 35
Reduction of
Direct CO₂ Emissions
Reduction of Volume
of Wastewater
– 30
– 40
Reduction of Emissions
from Greenhouse Gases
Reduction of Volume
of Waste
– 35
– 35
Planet
REVIEW — PLANET158

eWATCH™ oversees all forms and usages of energy at Clariant – electrici-ty, heating and cooling, steam, natural gas, nitrogen, and the production of deionized water – by taking into account the design and setup of equipment and processes across Clariant's facilities. It also records and analyzes Clariant's energy consumption, including information on energy flows, prices, and usage optimization. It maintains information on total energy usage patterns and requirements and will increasingly consider maintenance activities, change-overs, cleaning, and production planning and scheduling in the future.
eWATCH™
002 PROGRESS TOWARDS 2025 TARGETS
218
2016
3.2
2016
11.7
2016
35.8
2016
Target 2025
195
Target 2025
2.75
Target 2025
Target 2025
10.6
Target 2025
33.5
Target 2025
215
2018
211
2017
2.9
2018
2.75
2017
11.3
2018
10.6
2017
53.3
2018
43.2
2017
2016
0.72
2016
1010.64 83
2018
0.74
2017
0.71
2018
98
2017
95
Energy Consumption in MWh per t produced goods, corresponding to – 20 % since 2013
Greenhouse Gas Emissions in kg per t produced goods, corresponding to – 28 % since 2013
Wastewater Generation in m3 per t produced goods, corresponding to – 37 % since 2013
Direct CO₂ Emissions in kg per t produced goods, corresponding to – 18 % since 2013
Water Consumption in m3 per t produced goods, corresponding to – 31 % since 2013
Waste Generation in kg per t produced goods, corresponding to + 4 % since 2013
(Waste performance mainly affected by reclassification of
non-hazardous waste from gypsum waste)
159CLARIANT INTEGRATED REPORT 2018

GRI
GRI Online Report
Management Approach Environmental Protection and Resourcesreports.clariant.com/ 2018/gri
Water consumption per ton of produced goods increased by 6.5 %, from 10.6 m3 to 11.3 m3. This was mainly due to an extremely warm summer and, consequently, increased cooling demand. Wastewater generation per ton of pro-duction increased by 5.6 %, from 2.8 m3 to 2.9 m3.
Waste generation increased by 23 % in 2018, rising from 43.2 kg to 53.3 kg per ton of production. This significant increase is mainly due to different accounting, resulting from internal and regulatory changes. PAGE 159
1.2. Environmental protection and resourcesFor Clariant, environmental protection and resources encompasses consumption of resources, such as energy and water, on one hand and preventing pollu-tion and ecosystem effects on the other. To minimize the company’s impacts on the environment and safe-guard natural resources, high-level management attention and a corporate culture that prioritizes environmental stewardship throughout the company is essential. To ensure this focus, Clariant uses comprehensive management tools and programs that combine technology, data, and behavioral guidelines.
ENVIRONMENTAL PROTECTION AND RESOURCES
2018 1 2017
Total energy consumption (in m kWh) 3 209 3 245
Energy consumption (in kWh/t production) 739 706
Total water consumption (in m m3) 49 49
Total wastewater generation (in m m3) 13 13
Total quantity of waste (in thousand t) 232 198
1 Every three years, Clariant validates environmental data from all production sites. The last full reporting campaign was in 2017. In interim years, including 2018, the reduced reporting scope comprises the larger sites responsible for 95 % of production.
1.2.1. EnergyClariant recognizes the critical role companies must play to reduce energy consumption and minimize energy-related greenhouse gas emissions. In 2018, energy consumption per ton of produced goods rose by 4.6 %. The increase is mainly due to a reduction of the production volume. Clariant will continue to work toward its energy consumption reductions targeted for 2025 by further investing in and developing programs such as eWATCH™, Clariant Operational Excellence, and the Clariant Production System Yield, Energy, Environment (YEE) initiative.
Through eWATCH™, Clariant crafted a comprehensive energy efficiency program that analyzes energy consumption across operations and identifies potential cost-saving opportunities. Since 2013, a total of CHF 26.7 million was saved by implementing energy efficiency measures and energy-purchasing optimiza-tions. In 2018, Clariant managed to save CHF 3.85 mil-lion.
eWATCH™ focuses on three pillars: operations and technology; awareness, mindset, and behavior; and energy management. In 2018, the eWATCH™ program was rolled out in Greater China, at two Business Unit Catalysts sites in South Africa and at all Clariant sites in Indonesia. Clariant globally passed the recertification of the energy management system according to ISO 50001. More than 40 % of Clariant’s production volume was produced at ISO 50001-certified sites. Clariant also continued performing energy benchmarks of utility generation systems internally as well as against state-of-the-art installations. A guideline of best practice for utility engineering is in preparation and will be further developed in 2019.
REVIEW — PLANET160

With the »eWATCH™ goes digital« initiative, Clariant will identify additional energy saving and emission reduction opportunities by increasing transparency at the different levels of production and organization, and by exploiting suitable tools for data monitoring, analysis and interpretation. For example, real-time energy consumption data at equipment, plant, produc-tion, and product level is key to realizing further operational energy efficiency. The focus will be on iden-tifying equipment that is mainly responsible for energy consumption in the utility and production areas.
The Production System Yield, Energy, Environment (YEE) initiative analyzes Clariant’s production processes and units to discover even more opportuni-ties to increase yields, improve energy efficiency, and reduce waste streams. Since its inception in 2012, Clariant achieved savings with the YEE of more than CHF 50 million. In 2018 alone, savings amounted to CHF 6 million.
1.2.2. Water consumption and wastewater generationWater is one of the most important auxiliary materials for the chemical industry. Clariant considers the entire volume of water withdrawn and used as its total water consumption. Cooling water returned to the source after being used in cooling cycles is not excluded from total consumption. Clariant uses about 70 % of purchased water for cooling production plants, 20 % for production processes, and 10 % as a product component or for sanitary purposes. Conser-vation of water is mandated by local communities, customers, and regulators.
In 2018, water consumption per ton of produced goods increased by 6.5 %, mainly caused by an extremely warm summer that led to a higher demand for cooling water. The reduced reporting scope also contributed to the increased water intensity, as the omitted sites are only responsible for a very small fraction of total water consumption. Similarly, wastewater generation per ton of produced goods increased by 5.6 %.
Wastewater is closely managed at all Clariant produc-tion sites and local regulatory requirements regarding discharge limits are strictly followed. The company assesses wastewater quality by measuring heavy met-als concentration, nitrogen and phosphorus com-pounds, as well as biological and chemical oxygen demands. Wastewater is often pretreated at Clariant’s sites before being transferred to dedicated industrial or municipal wastewater treatment plants for further treatment. The pretreatment mostly consists of a multi-stage chemical and physical treatment to ensure effluents do not impair the receiving water bodies. With this multistep treatment approach and constant monitoring, Clariant guarantees that discharged wastewater does not negatively impact ecosystems.
In 2017, Clariant undertook a Group-wide water risk assessment to understand which production sites are located in water-risk areas. First, the World Re-sources Institute’s (WRI) global risk assessment tool was utilized to prepare a short list of sites located in areas with water risks. Second, the short-listed sites were analyzed in an internal survey aiming to under-stand site-specific water risks and impacts. To further develop an in-depth understanding of risks, a pilot water risk management project was completed in Santa Clara, Mexico, in 2018. While at-risk sites com-prise only a small percentage of Clariant’s total sites,
With the Yield, Energy, Environment (YEE) initiative, Clariant saved more than CHF 50 million since 2012.
50161CLARIANT INTEGRATED REPORT 2018

REVIEW — PLANET
the results of the pilot study will be used to develop goals to ensure all sites are equipped to responsibly manage water risks. Due to its engagement to reduce water-related risks, Clariant was recognized as the sector leader in the Dow Jones Sustainability Index (DJSI) for the second consecutive year.
Clariant is one of eleven partners in the European INSPIREWater project, which is exploring innovative solutions for industrial water management. The proj-ect includes developing a pilot wastewater treatment plant in the water-limited region of Tarragona, Spain, with the aim of achieving zero liquid discharge. Knowledge obtained from this project can be trans-ferred to other Clariant sites, particularly those located in water-stressed areas.
1.2.3. WasteClariant is aware of the environmental harm associ-ated with waste production and consequently follows a strict waste-management protocol. Clariant priori-tizes waste prevention over recycling waste, as this approach minimizes resource consumption in addi-tion to costs. During product development and manu-facturing, Clariant aims to generate as little waste as possible, and any unavoidable waste is recycled or dis-posed of properly. Accumulated waste is documented in detail in order to enable proper classification and handling.
Per ton of production, generation of waste increased by 23 % in 2018. The increase can only be observed in non-hazardous waste, which is 76 % of Clariant’s total waste. Gypsum is a by-product of bentonite process-ing and represents 40 % of the total non-hazardous waste. In 2018, two sites accumulated large amounts of gypsum. The sites are exploring different commer-cial avenues to convert gypsum into a viable product.
In addition, changes in regulations and definitions led to changes in reporting and a further increase of non-hazardous waste.
1.2.4. Air pollutionIn order to maintain healthy ecosystems, Clariant not only focuses on wastewater treatment, but also judi-ciously monitors and contains air emissions from oper-ations. Clariant adheres to local regulations regarding air emission limits in all the countries in which it oper-ates. Air pollutants tracked include volatile organic compounds (VOCs), sulfur oxides (SOx’s), and nitrogen oxides (NOx’s).
1.2.5. Ecosystem protectionEcosystem services are vital for businesses and soci-ety. They include provision of fresh water, air purifica-tion, energy production, and protection against natu-ral disasters, among many other critical benefits. Clariant strives to ensure its activities do not impede or degrade such services. Thus, Clariant does not operate production sites in biological reserves or areas with high biodiversity value. In addition, Clariant carefully addresses the environmental impacts of sourcing palm oil and mining bentonite, both of which are important raw materials for the company.
To protect rainforests and peatland and combat eco-logical degradation caused by clearing land for palm oil plantations, Clariant pursues certification of its palm oil derivatives supply. As member of the Round-table on Sustainable Palm Oil (RSPO), Clariant achieved mass-balance certification for all of its sites in 2016 and has more than 250 products certified specifically. Clariant will continue to extend the certi-fied product portfolio in order to help its customers meet demand for certified-palm ingredients.
INSPIREWater
The eleven partners of the EU-funded project span eight industries, including steel, paper, and chemicals. Clariant joined the project in 2016.
162

GRI
GRI Online Report
Management Approach Climate Changereports.clariant.com/ 2018/gri
When mining bentonite, Clariant follows several steps to exceed societal and community expectations regarding the conservation of the surrounding eco-system. Before drilling begins, Clariant’s geologists craft a plan to minimize associated environmental impacts. This includes removing the topsoil and over-burden to preserve the land for restoration, as well as reduce operating costs and fuel consumption. During mining, Clariant ensures that resident animals may easily move to adjacent areas. Before being trans-ported, the bentonite is sun-dried, reducing its weight and thus emissions produced in shipping. Quarry closure is undertaken with local experts in order to restore the land for profitable use in forestry or agri-culture. These efforts are crucial to maintain healthy relationships with local communities and protect local ecosystems.
1.3. Climate changeMitigating and adapting to human-induced climate change is one of the world’s most pertinent challenges. The expectations and pressure for corporations to address climate change have risen considerably in recent years. Financial investors, customers, poli-cy-makers, rating programs, and NGOs have set clear expectations regarding the need to properly identify and evaluate climate risks and opportunities, and to develop mitigation strategies.
Clariant’s overall objective is to address and promote the transition to a low-carbon economy and ulti-mately achieve climate resilience. Clariant also wants to capitalize on business opportunities such as reduc-ing energy costs and developing low-carbon products, for which customer demand is rising.
In order to contribute to a sustainable economy, Clariant adopted environmental targets to be achieved by 2025. Clariant committed to reduce Scope 1 and 2 greenhouse gas emissions by 35 %, and to reduce direct carbon dioxide emissions by 30 %, both per met-ric ton of production, compared to the base year 2013. Clariant is well on track to reach these targets.
PAGE 159
GREENHOUSE GAS EMISSIONS
2018 1 2017
Total greenhouse gas emissions (Scope 1 & 2 CO₂ equivalents) (in m t) 0.93 0.97
Total indirect greenhouse gas emissions (Scope 3 CO₂ equivalents) (in m t) 5.69 5.21
Greenhouse gas emissions (Scope 1 & 2 CO₂ equivalents) (in kg/t production) 215 211
1 Every three years, Clariant validates environmental data from all production sites. The last full reporting campaign was in 2017. In interim years, including 2018, the reduced reporting scope comprises the larger sites responsible for 95 % of production.
In 2018, direct CO₂ emissions (Scope 1) per ton of pro-duction rose by 2.7 % and greenhouse gas emissions, including from the production of electricity (Scope 1 & 2), increased by 1.9 %. The increase per ton is mainly due to the lower production volume.
To increase transparency about its carbon footprint, Clariant is moving beyond Scope 1 and 2 and reports further emissions that occur along its value chain, so-called Scope 3 emissions. The most relevant Scope 3 emission activities for Clariant are: purchase of raw materials, energy-related emissions, transportation and distribution of supplied materials and sold prod-ucts, and the end-of-life treatment of its products.
Emission scopes
»Scope 1« covers direct emissions from opera-tions, including from the combustion of fuels in vehicles, boilers, and furnaces. »Scope 2« includes indirect emis-sions from the genera-tion of purchased energy, such as electric-ity and district heat. »Scope 3« comprises emissions occurring in the value chain, which are not included in Scope 1 or 2.
163CLARIANT INTEGRATED REPORT 2018

GRI
GRI Online Report
Management Approach Circular Economyreports.clariant.com/ 2018/gri
REVIEW — PLANET
Scope 3 emissions are typically much larger than Scope 1 and 2 emissions, given the broader value chain and activity coverage. The increase of Scope 3 emissions between 2017 and 2018 was primarily driven by increased purchases of raw materials. A detailed breakdown of Clariant’s greenhouse gas emissions is available in the GRI report.
To support the agenda on climate change mitigation, Clariant focuses on low-carbon products that are also a promising growth market. Based on Clariant’s Port folio Value Program, already more than 20 % of sales are associated with products that help reduce carbon emissions. In the future, an increasing share of bio-based raw materials will replace fossil-based re sources, leading to a reduced product carbon foot-print. Examples of products contributing to emissions reduction are lightweight solutions for automotive applications, such as the foaming agent Hydrocerol® or the catalyst EnviCat®, which significantly reduces nitrogen oxide emissions.
Increasing pressure on natural resources, concerns on climate change, rising expectations about corporate performance, and higher availability and affordability of renewable energy are factors leading to their grow-ing uptake. To increase the share of clean energy in the consumed energy mix, Clariant started develop-ing a global renewable energy procurement strategy. More specifically, it investigates drivers, sourcing options, contractual instruments, and the feasibility of green energy solutions at the country level. The increase in renewable energy use will have a positive, direct effect on greenhouse gas emissions. PAGE 76
In addition, Clariant is currently assessing how to further integrate a dedicated climate risks and oppor-tunities management process at the Group level. This process would support the company to better identify mid- to long-term developments, address and enable the transition to a low-carbon economy, and ultimately secure climate resilience.
IDEA TO MARKET
1.4. Circular economy
1.4.1 The circular model gains tractionIncreasing awareness of limited natural resources has generated support for the circular economy as a necessary alternative to the current linear economic model. In a circular economy, materials are kept in use for as long as possible, and are fully reused or recycled at a product’s end-of-life. Ideally, materials originate from renewable sources, where feasible, and are sus-tainably sourced. The circular economy eliminates currently prevalent and wasteful take-make-dispose material flows and requires a strong focus on product design that favors durability, reparability, and recy-clability.
Due to increasing customer and policy attention, intensified by media coverage of plastic waste, the cir-cular economy has gained importance as a topic across all Business Units. In addition, two recent poli-cies are further creating momentum: In 2018, the European Union Plastic Strategy was adopted and the waste ban in China came into force. As a supplier to value chains in various industries, Clariant and other chemical companies play an important role in transi-
164

tioning from a linear to a circular economy. Clariant also supports the development of public policies pro-moting the circular economy and sustainable chemis-try. PAGE 122, PAGE 147
1.4.2 Embracing opportunities with chemical expertise and sustainability innovationsClariant is ideally positioned to seize new market opportunities arising from the transition to a circular economy. Being a specialty chemical company with strong connections and customers in the plastic value chain, e.g., through its catalysts, additives, or master-batches, Clariant’s understanding of product-related recycling efforts and deep chemical knowledge not yet represented in the recycling value chain are clear advantages. Further, as a company with a strong focus on innovation and sustainability leadership, the topic has already been embraced in its early stage.
Clariant contributes in several ways to the prolifera-tion of the circular economy, for example, by increas-ing eco-efficiency of production processes by using waste and renewable resources instead of virgin or fossil ones. For instance, waste streams from food production are used to source esters, and rice bran wax serves as feedstock for esterquats. Clariant also redesigns processes and promotes closed-loop recy-cling on-site, such as solvent recycling in wax production and comprehensive concepts on de-icing fluids for aircraft, as well as water recycling within the INSPIREWater project. In addition, Clariant engages in industrial symbiosis and value chain clusters, such as the Carbon2Chem project, which aims to convert process gases from steel production into base chemi-cals. Furthermore, circular economy principles are integrated in product and technology development.
1.4.3 A comprehensive approach yields tangible resultsA highlight in 2018 was the Cradle-to-Cradle™ certi-fication for Business Unit Masterbatches’ CESA® solu-tion for colored bottle caps made of 100 % recycled polypropylene. The solution avoids the use of adverse substances, such as halogenated pigments, while still enabling customers to obtain the requested color match and meeting the stringent Cradle-to-Cradle™ certification. The Cradle-to-Cradle™ certification considers the complete life cycle of a product, assess-ing it along five dimensions: material health, material reutilization, renewable energy and carbon manage-ment, water stewardship, and social fairness. The solu-tion was awarded with the 2017 German Packaging Award and was tailor-made for Werner & Mertz, a German company offering cleaning agents and deter-gents. PAGE 171
In addition, an iGarage focusing on plastic recycling has been set up. The iGarage is a platform to develop strategic innovation opportunities by applying agile and design thinking methods. PAGE 116 The objec-tive of this iGarage is to evaluate challenges and opportunities in plastic recycling and explore how Clariant can address these in collaboration with customers and other value chain partners. PAGE 168
165CLARIANT INTEGRATED REPORT 2018

TWO PERSPECTIVES — CIRCULAR ECONOMY166

Where Can Chemistry Help Close the Plastics Loop?
Circular Economy
Plastic is everywhere. Our modern lives depend on it. But the miracle material is becoming a global problem as single-use plastics waste resources and choke ecosystems. A circular economy for post- consumer plastic could change that. Modern chemistry might hold the key.
Richard Haldimann
As Head of New Business Development at Clariant, Richard works with a unique team
that is rethinking how we design and formulate plastics for a circular economy.

Alexander Schau
As Packaging Developer for Werner & Mertz, Alexander designs recyclable packaging that's easy to separate and reuse, and works to incorporate more and more recycled materials in his designs.
Alexander Schau
As Packaging Developer for Werner & Mertz, Alexander designs recyclable packaging that's easy to separate and reuse, and works to incorporate more and more recycled materials in his designs.
167CLARIANT INTEGRATED REPORT 2018

more durable reduces waste. And that’s something we are already doing a lot today. Our second contribution would be to help design plastic products for improved recyclability. That can mean designing materials to make them easier to separate, recover, and reuse them for new products. It can also mean designing materials that make mixing different materials obsolete in the first place. Imagine a single recyclable material that does the job usually reserved for several layers of different plastics.
What’s driving the push for a circular plastics economy?Consumer awareness is very high, which drives brand owners and consumer-facing industries to make strong commitments. I know of big companies that want to use 100 percent recycled materials by 2025. As things are going, they won’t even find those materials. Addi-tionally, legislation is being introduced around the world that increases the pressure on industries to reduce plastic waste.
What are the next steps for Clariant?We’ve prioritized five specific concepts that we're fleshing out right now, again working with external experts and scouting for technologies.
What are you looking for? New products, new services, or even new business models? All of the above. We want to apply our products, but we also think about new business models. Is there, for example, an opportunity to co-develop recyclable and high-performing post-consumer solutions in particular? Those are things the individual Business Unit could do, but there may be opportunities for an overarching busi-ness model addressing the whole plastics-recycling value chain.
How is the industry reacting to your efforts?They haven’t gone unnoticed. We’re now being invited to join various consortia like the Circular Economy Initiative Deutschland.
Richard, Clariant is exploring new approaches to plastics recycling. Why?As a company we are driven by sustainability. In a sense, it’s become the lens through which we look at any new business opportunity. And plastics are an interesting case here. Their strength, light weight, and versatility have made them ubiquitous. Which, in and of itself, isn’t a bad thing. Better plastic packaging has dramatically reduced food waste. Light weight plastics help save fuel. And plastics have increased the durability of products in many aspects of modern life. That’s why demand for plastic has reached 322 million tons in 2015. Unfortu-nately, much of the produced plastic is lost after a single use. Every year, about 200 million tons are disposed of in landfills and about eight million tons leak into the oceans uncontrolled. We desperately need to find a solution for this waste problem. Having decades of experience in improving plastics, we consider Clariant to be well positioned to do just that. This also drove our decision to become a founding member of the Alli-ance to End Plastic Waste.
In your search, you’ve applied a new concept called iGarage. What is that and how does it help?The problem is very complex and involves many differ-ent industries. We applied the iGarage, a new concept developed by Clariant Excellence to drive customer- centric innovation. It’s a space where we bring together different experts from across the company as well as from the outside. By leveraging methods like design thinking and lean startup tools, they come up with new insights and approaches for a business. The main point is to gain speed and to focus on a singular challenge together. The iGarage allows us to tackle opportunities that are more complex and uncertain but also more rewarding.
What could Clariant’s contribution look like?We can contribute in two important ways. First, we can help increase the lifespan and use of plastic products. Reusing a plastic product several times because it’s
TWO PERSPECTIVES — CIRCULAR ECONOMY168

RICHARD HALDIMANNHead of New Business Development, Clariant
How can we help improve plastics
recycling?
How can we help improve plastics
recycling?
169CLARIANT INTEGRATED REPORT 2018

ALEXANDER SCHAUPackaging Developer, Werner & MertzALEXANDER SCHAUPackaging Developer, Werner & Mertz
TWO PERSPECTIVES — CIRCULAR ECONOMY
How are design and recycling interlinked?How are design and recycling interlinked?
170

You mentioned joint Research & Development. Who are you working with?No one company can solve this problem alone. We need to work with partners along the entire packaging value chain. That's why, in 2012, we started our recyclate ini-tiative. It involves »Der Grüne Punkt™«, Germany’s larg-est industry-funded waste collection scheme, a super-market chain, a big manufacturer of plastic bottles and caps, as well as an environmental group and the makers of sensors used to sort waste. But it’s an open collabora-tion that invites any company to get involved, including our competitors.
Don’t recyclers work with plastics manufacturers anyway?A lot less than you’d think. We made an effort to actually visit recycling facilities and bottle-production sites together. That was a first for some. To better understand the needs and constraints along the value chain is part of our drive to rethink packaging.
Where does a supplier like Clariant come in?We recently introduced a new bottle cap made entirely of recycled polypropylene extracted from household waste. Together with Clariant, we’ve developed a new type of color masterbatch for our trademark green that is tailored to this specific post-consumer plastic. Not only that, we were able to substitute certain chemicals in this masterbatch, making it particularly sustainable and recyclable. It follows the Cradle-to-Cradle™ guide-lines, and the certification process has started.
What’s the key in designing for recyclability?We need to rethink certain paradigms in packaging. For example, for years the industry has designed for packag-ing to be lightweight. That often meant using ever thin-ner layers but adding different materials, additives, and functions. This causes problems in recycling up to no recyclability at all. »Healthy materials«, meaning mono-materials without additives, would actually be a huge boon to recyclability.
Are you following this route to simplicity?Yes. Last year, we patented a 100-percent recyclable pouch made of a polyethylene mono-material that will hit the shelves this year for a laundry detergent and a host of other products. The spout and cap are also made of polyethylene, and, instead of printing or gluing on any labels, we dress the pack in a decorative layer of low-density polyethylene that comes off easily and cleanly after use.
Alexander, your company prides itself on being a pioneer in eco-friendly products. Does that apply to their packaging as well?Back in 1986, with environmental awareness on the rise, Werner & Mertz established Frosch as a brand for eco-friendly cleaning products. It led the way back then and we’re leading the way again by working to close the loop for our packaging materials.
What’s the current share of recycled material in your bottles and what’s the target?Roughly 70 percent of our bottles currently incorporate recycled materials. We’ve committed ourselves to using 100 percent recycled material by the year 2025 for all of our packaging. So we’re well underway, but there’s work left to be done.
What’s holding you back?There are both economic and technical hurdles. The use of recycled materials still lacks economies of scale. Today, recycled plastics are in many cases more expen-sive than virgin plastics. But we’re confident that this will change with growth in demand and supply. In the meantime, we´re working with different shareholders on solutions for recyclable packaging and working to open new fields for the use of recycled materials.
Impurities in recycled materials are a problem. Where do they come from?Some stem from labels for example. We’re dealing with inks, adhesives, and paper fibers that end up in the recy-clates. Here we need to call both on recycling firms to improve treatment processes and on packaging manu-facturers to use more recycling-friendly solutions. But there’s also the issue of complex plastic mixes. What to a consumer might seem like a simple enough plastic pack, say for cheese or meats, is in fact made up of sev-eral functional layers, each from a different plastic with any number of additives in the mix. Here we need uni-fication in materials.
171CLARIANT INTEGRATED REPORT 2018

Independent Assurance Report on the Clariant Non-Financial Performance Reporting 2018
To the Board of Directors of Clariant Ltd, MuttenzWe have been engaged to perform assurance procedures to provide limited assurance on the non-financial performance reporting of Clariant Ltd and its consolidated subsidiaries (›Clariant‹) for the year ended 31 December 2018.
Scope and Subject matterOur limited assurance engagement focused on the 2018 non-financial performance indicators published in the Integrated Report 2018 of Clariant:a) The »Intellectual Capital« indicators on page 116, the »Manufactured Capital« indicators on page 122, the »Product Stewardship/
Sustainable Chemistry« indicators on page 123, the« Raw Material Procurement according to Region« indicators on page 126, the »Key Figures Workforce« on page 135, the »Talent Attraction and Development« indicators« on page 138, the »Employee Engagement« indica-tors on page 139, the »Occupational Health, Safety and Well-being« indicators on page 141, the »Relationship Capital« indicators on page 143, the »Customer Relationships« indicators on page 144, the »Ethics and Compliance« indicators on page 146, the »Sustainable Value Chain« indicators on page 149, the »Environmental Protection and Resources« indicators on page 160 and the »Greenhouse Gas Emissions« indicators on page 163; and
b) The management and reporting processes to collect and aggregate the data as well as the control environment in relation to the data aggregation of these data.
CriteriaThe reporting criteria used by Clariant are described in the internal reporting guidelines and define those procedures, by which the non- financial performance indicators are internally gathered, collated and aggregated. The internal guidelines are based on the GRI Sustainability Reporting Standards (GRI Standards) published by the Global Reporting Initiative (GRI).
Inherent limitationsThe accuracy and completeness of non-financial performance indicators are subject to inherent limitations given their nature and methods for determining, calculating and estimating such data. Our assurance report should therefore be read in connection with Clariant’s internal guidelines, definitions and procedures on non-financial performance reporting. Further, the greenhouse gas quantification is subject to inherent uncertainty because of incomplete scientific knowledge used to determine emissions factors and the values needed to combine emissions of different gases.
Clariant ResponsibilitiesThe Board of Directors of Clariant Ltd is responsible for both the subject matter and the criteria as well as for selection, preparation and presentation of the information in accordance with the criteria. This responsibility includes the design, implementation and maintenance of related internal control relevant to this reporting process that is free from material misstatement, whether due to fraud or error.
Our ResponsibilitiesOur responsibility is to form an independent conclusion, based on our limited assurance procedures, on whether anything has come to our attention to indicate that the non-financial performance indicators are not stated, in all material respects, in accordance with the reporting criteria.
INDEPENDENT ASSURANCE REPORT172

We planned and performed our procedures in accordance with the International Standard on Assurance Engagements (ISAE) 3000 (revised) ›Assurance engagements other than audits or reviews of historical financial information‹ and with ISAE 3410 ›Assurance Engage-ments on Greenhouse Gas Statements‹. These standards require that we plan and perform the assurance engagement to obtain limited assurance the identified non-financial indicators.
A limited assurance engagement is substantially less in scope than a reasonable assurance engagement in relation to both the risk assess-ment procedures, including an understanding of internal control, and the procedures performed in response to the assessed risks. Conse-quently, the nature, timing and extent of procedures for gathering sufficient appropriate evidence are deliberately limited relative to a reasonable assurance engagement and therefore less assurance is obtained with a limited assurance engagement than for a reasonable assurance engagement is obtained with a limited assurance engagement than for a reasonable assurance.
Our Independence and Quality ControlWe have complied with the independence and other ethical requirements of the Code of Ethics for Professional Accountants issued by the International Ethics Standards Board for Accountants, which is founded on fundamental principles of integrity, objectivity, professional competence and due care, confidentiality and professional behavior.
Our firm applies International Standard on Quality Control 1 and accordingly maintains a comprehensive system of quality control includ-ing documented policies and procedures regarding compliance with ethical requirements, professional standards and applicable legal and regulatory requirements.
Summary of work performedOur limited assurance procedures included, but were not limited to the following work:— Reviewing the application of Clariant’s internal guidelines— Interviewing Clariant representatives at Group level responsible for the data collection and reporting— Interviewing Clariant representatives in South Africa, Mexico and USA responsible for the data collection and reporting by phone— Performing tests on a sample basis of evidence supporting the non-financial performance indicators as outlined in the scope and subject
matter section concerning completeness, accuracy, adequacy and consistency — Inspecting the relevant documentation on a sample basis— Reviewing and assessing the management reporting processes for non-financial performance reporting and consolidation and their
related controls
We have not carried out any work on data other than outlined in the scope and subject matter section as defined above. We believe that the evidence we have obtained is sufficient and appropriate to provide a basis for our assurance conclusions.
Limited assurance conclusionBased on the procedures we performed, nothing has come to our attention that causes us to believe thata) The 2018 non-financial performance indicators of Clariant as described in the scope and subject matter section are not prepared and
disclosed in all material respects in accordance with Clariant’s internal guidelines and procedures; andb) The management and reporting processes to collect and aggregate the data as well as the control environment in relation to the data
aggregation are not functioning as design
PricewaterhouseCoopers AG
Dr. Marc Schmidli Raphael Rutishauser
Basel, 6 March 2019
173CLARIANT INTEGRATED REPORT 2018

Publication DetailsPublisherClariant International Ltd, Muttenz
ContactInvestor Relations
Anja Pomrehn
Phone +41 61 469 67 45
Fax +41 61 469 67 67
Group Communications
Kai Rolker
Phone +41 61 469 63 63
Fax +41 61 469 75 49
Editorial office, project managementClaudia Kamensky
Joana-Isabel Kelp
Financial Editor
Philipp Baberschke
Websitewww.clariant.com
® Trademarks of Clariant, registered in many countries
™ Trademarks of Clariant
Hostafine and Hostavin are registered trademarks. Hostaflot, and Hostatint are trademarks.
ECOCERT, DER GRÜNE PUNKT, Responsible Care, Cradle-to-Cradle, and NIVEA are trademarks of their respective owners.
© 2019 Clariant International Ltd, Rothausstrasse 61, 4132 Muttenz,
Switzerland
Editor and integrated reporting consultantSustainserv, Zurich and Boston
ConceptMutabor Design GmbH, Hamburg
Design, graphics, layout, and editorial interviewsKammann Rossi GmbH, Cologne
CreditsMedia Central: p. 89, 156
PixelMusica: p. 132
Ricardo Funari: p. 66
Scanderbeg Sauer Photography: p. 3, 23 – 29, 34 – 65, 77 – 78,
90 – 131, 155, 169 – 170
Shanghai Saygo Culture Media: p. 30
PrintingNeidhart + Schön Print AG, Zurich
Note about forward-looking statementsThis report contains forward-looking statements based on current
assumptions and projections made by management. Such statements
are subject to known and unknown risks, uncertainties and other
factors which may cause the actual results and performance of Clariant
International Ltd to differ from those expressed in, implied or projected
by the forward-looking information and statements. The information
published in this report is provided by Clariant International Ltd and
corresponds to the status as of the date of publication of this report.
DisclaimerClariant International Ltd published the Integrated Report in English
and German. The English version is legally binding.
Financial Calendar 2019
25 July
First Half 2019 Results
30 October
Nine Months 2019 Results
13 February
Full Year 2018 Results
1 April
Annual General Meeting
30 April
First Quarter 2019 Results
DECNOVSEPAUG
JUNMAYJAN
JUL OCT
FEB MAR APR
174 FINANCIAL CALENDAR 2019/PUBLICATION DETAILS

Five-Year Group Overview2014 – 2018
CHF m 2018 2017 2016 2015 2014
Group sales 6 623 6 377 5 847 5 807 6 116
Change relative to preceding year
in Swiss francs (%) 4 9 1 – 5 1
in local currencies (%) 5 9 2 3 5
Operating income before exceptionals 693 673 622 596 585
Operating income 546 496 512 496 525
EBITDA before exceptionals 1 018 974 887 853 867
EBITDA 871 813 785 767 923
Net income 356 302 263 227 1 235 1
Basic earnings per share (in CHF) 1.02 0.84 0.78 0.67 0.55
Distribution per share (in CHF) 0.55 0.50 0.45 0.40 0.40
EBITDA margin before exceptionals (%) 15.4 15.3 15.2 14.7 14.2
Return on invested capital (ROIC) (%) 10.1 10.2 10.2 9.7 9.4
Operating cash flow 530 428 646 502 334
Investment in property, plant, and equipment 237 248 297 374 310
Research & Development expenditures 209 211 206 206 213
Depreciation and amortization 325 301 265 257 282
Net working capital 1 145 1 281 1 087 1 027 1 169
in % of sales 17.3 20.1 18.6 17.7 19.1
Total assets 7 981 8 229 8365 7 461 7 915
Equity (including non-controlling interests) 2 970 2 939 2 546 2 494 2 733
Equity ratio (%) 37.2 35.7 30.4 33.4 34.5
Net financial debt 1 374 1 539 1540 1 312 1 263
Gearing ratio (%) 46 52 60 53 46
Employees (in FTE) 17 901 18 135 17 442 17 213 17 003
1 Continuing operations
CLARIANT INTERNATIONAL LTDRothausstrasse 61 · 4132 Muttenz · Switzerland© Clariant International Ltd, 2019
CLARIANT.COM
Curiosity sparks progress
SA
P-N
r. 1
39
28
32