2020 Recreational Boating Statistics
83
2020 Recreational Boating Statistics COMDTPUB P16754.34 U.S. Department of Homeland Security U.S. Coast Guard Office of Auxiliary and Boating Safety
-
Upload
khangminh22 -
Category
Documents
-
view
6 -
download
0
Transcript of 2020 Recreational Boating Statistics

2020 Recreational Boating Statistics
COMDTPUB P16754.34 U.S. Department of Homeland Security U.S. Coast Guard Office of Auxiliary and Boating Safety
Introduction & Executive Summary
Commandant 2703 Martin Luther King Jr Ave SE United States Coast Guard Washington, DC 20593-7501
Staff Symbol: CG-BSX-21Phone: (202) 372-1062Email: [email protected]
COMDTPUB P16754.34
COMMANDANT PUBLICATION P16754.34
FOREWORD
Under the authority of Title 46, United States Code, the Inspections & Compliance Directorate has been delegated the responsibility to collect, analyze, and annually publish statistical information obtained from recreational boat numbering and casualty reporting systems. Within the Directorate, the Office of Auxiliary and Boating Safety, Boating Safety Division has National Recreational Boating Safety Program responsibility.
Recreational Boating Statistics 2020, the 62nd annual report, contains statistics on recreational boating accidents and state vessel registration. This publication is a result of the coordinated effort of the Coast Guard and those states and territories that have Federally-approved boat numbering and casualty reporting systems. These include all states, the District of Columbia, Puerto Rico, Guam, the Virgin Islands, American Samoa, and the Commonwealth of the Northern Mariana Islands.
Recreational Boating Statistics 2020 may be copied and distributed freely in the interest of boating safety. For questions and suggestions regarding content, use the address, telephone number, or email address at the top of this page. For an electronic copy, visit the Boating Safety Division website at www.uscgboating.org.
WAYN RE AR. GUIN / s /Captain U.S, C to. as GuardDirecto Ir nof spections & Compliance
DISTRIBUTION --– SDL No. 170
a b c d e f g h i j k l m n o p q r s t u v w x y z
A
B X X X
C X X X X
D X X
E X X X X
F
G
H
NON-STANDARD DISTRIBUTION:
Recreational Boating Statistics 2020 2
29 June 2021

Introduction & Executive Summary
Table of Contents Introduction 2020 Executive Summary 6-7 Mission and Strategic Plan of the National Recreational Boating Safety Program 8 Overview of Statistics 8 Major Changes to the Publication 9 Accident Reporting as Required by Federal Law 9-10 Casualty and Accident Reporting Guidelines 10 “Reportable” Boating Accidents 10 “Non-Reportable” Boating Accidents 10-12 Use of Statistics 13-14
Accident Causes and Conditions Section with Explanation 16-17 Figure 1 Percent of Accidents that are Fatal by Month (graph) 18 Table 4 Percent of Accidents that are Fatal by Month 18 Figure 2 Percent of Accidents that are Fatal by Time Period 19 Table 4a Percent of Accidents that are Fatal by Time Period 19 Table 5 Primary Contributing Factor of Accidents & Casualties 20 Table 6 Machinery & Equipment Primary Contributing Factor of Accidents & Casualties 21 Figure 3 Primary Contributing Factor of Accidents 22 Figure 4 Primary Contributing Factor of Deaths 23 Figure 5 Primary Contributing Factor of Injuries 24 Table 7 Number of Vessels in Accidents by Vessel Type & Primary Contributing Factor 25 Table 8 Alcohol Use as a Contributing Factor in Accidents & Casualties by State 16-20 26 Table 9 Vessel Operation at the Time of Accident 27 Table 10 Vessel Activity at the Time of Accident 27 Table 11 Weather & Water Conditions 28 Table 12 Time Related Data 29 Table 13 Vessel Information 30 Table 14 Rental Status of Vessels Involved in Accidents 31 Figure 6 Number of Deaths by Vessel Length 32 Table 15 Number & Percent of Deaths by Vessel Length 32
Accident Types Section with Explanation 34-35 Table 16 Accident, Vessel & Casualty Numbers by Primary Accident Type 36 Table 17 Frequency of Accident Types in Accidents & Casualties Nationwide 37-40 Table 18 Number of Vessels in Accidents by Vessel Length & Primary Accident Type 41 Table 19 Number of Vessels in Accidents by Vessel Type & Primary Accident Type 42 Table 20 Number of Vessels in Accidents by Primary Accident Type & Propulsion Type 43 Table 21 Number of Vessels with Propellers by Primary Accident Type & Engine Type 43
Operator/Passenger Information Section with Explanation 45 Table 22 Operator Information 46 Table 23 Number of Deaths by Type of Operator Boating Instruction 47 Figure 7 Percent of Deaths by Known Operator Instruction 47 Table 24 Number of Deaths by Vessel Type 48 Figure 8 Number of Deaths by Vessel Type (graph) 48 Figure 9 Percent of Deaths by Vessel Type, 2006-2020 (graph) 49 Table 25 Percent of Deaths by Vessel Type, 2006-2020 49 Table 26 Number of Deceased Victims by Age & Vessel Type 50 Figure 9a Percent of Deceased Victims by Age and Vessel Type 51 Figure 9b Percent of Injured Victims by Age and Vessel Type 51 Table 27 Number of Injured Victims by Age & Vessel Type 52 Table 28 Nature of Primary Injury Type by Area of Injury 53 Figure 10 Number of Injured Victims under Age 18 by Age Group & Injury Type on PWCs 53
Casualty Summary Data Section with Explanation 55 Figure 11 Deaths, Injuries & Accidents by Year, 2001-2020 (graph) 56 Table 29 Deaths, Injuries, & Accidents by Year, 2001-2020 56
Recreational Boating Statistics 2020 3

Introduction & Executive Summary
Table 30 Accident, Casualty & Damage Data by State 57 Figure 12 Distribution of 2020 Deaths by State 58 Figure 12a Fatal Accidents by Location– Continental U.S. and U.S. Virgin Islands 59 Figure 12b Fatal Accidents by Location– Alaska 60 Figure 12c Fatal Accidents by Location– Hawaii 60 Figure 13 Annual Recreational Boating Fatality Rates 2001-2020 (graph) 61 Table 31 Annual Recreational Boating Fatality Rates 2001-2020 61 Figure 14 States Coded by their 2020 Fatality Rate 62 Table 32 Five-year Summary of Selected Accident Data by State 63 Table 33 Number of Accidents by Primary Accident Type & State 64-65 Table 34 Number of Injured Victims by Primary Injury & Vessel Type 66 Table 35 Number of Fatal Victims by Life Jacket Wear, Cause of Death, & Vessel Type 66
Registration Data Section with Explanation 68 Table 36 Recreational Vessels Registered by Year, 1986-2020 69 Figure 15 Recreational Vessels Registered by Year, 1986-2020 (graph) 69 Table 37 Recreational Vessel Registration by Length & Means of Propulsion 70 Table 38 Recreational Vessel Registration Data by State 71 Figure 16 Distribution of 2020 Recreational Vessel Registration by State 72
Boating Accident Report Form 73-78 Glossary of Terms 79-82 Glossary of State Codes 83
Recreational Boating Statistics 2020 4

Introduction & Executive Summary
List of Tables Table 1 2020 Executive Summary 7 Table 2 News Media and Federally-sourced Accidents and Casualties 8 Table 3 Non-Reportable Scenarios with their Casualty Count 12 Table 4 Percent of Accidents that are Fatal by Month 18 Table 4a Percent of Accidents that are Fatal by Time Period 19 Table 5 Primary Contributing Factor of Accidents & Casualties 20 Table 6 Machinery & Equipment Primary Contributing Factor of Accidents & Casualties 21 Table 7 Number of Vessels in Accidents by Vessel Type & Primary Contributing Factor 25 Table 8 Alcohol Use as a Contributing Factor in Accidents & Casualties by State 16-20 26 Table 9 Vessel Operation at the Time of Accident 27 Table 10 Vessel Activity at the Time of Accident 27 Table 11 Weather & Water Conditions 28 Table 12 Time Related Data 29 Table 13 Vessel Information 30 Table 14 Rental Status of Vessels Involved in Accidents 31 Table 15 Number and Percent of Deaths by Vessel Length 32 Table 16 Accident, Vessel & Casualty Numbers by Primary Accident Type 36 Table 17 Frequency of Accident Types in Accidents & Casualties Nationwide 37-40 Table 18 Number of Vessels in Accidents by Vessel Length & Primary Accident Type 41 Table 19 Number of Vessels in Accidents by Vessel Type & Primary Accident Type 42 Table 20 Number of Vessels in Accidents by Primary Accident Type & Propulsion Type 43 Table 21 Number of Vessels with Propellers by Primary Accident Type & Engine Type 43 Table 22 Operator Information 46 Table 23 Number of Deaths by Type of Operator Boating Instruction 47 Table 24 Number of Deaths by Vessel Type 48 Table 25 Percent of Deaths by Vessel Type, 2006-2020 49 Table 26 Number of Deceased Victims by Age & Vessel Type 50 Table 27 Number of Injured Victims by Age & Vessel Type 52 Table 28 Nature of Primary Injury Type by Area of Injury 53 Table 29 Deaths, Injuries, & Accidents by Year, 2001-2020 56 Table 30 Accident, Casualty & Damage Data by State 57 Table 31 Annual Recreational Boating Fatality Rates 2001-2020 61 Table 32 Five-year Summary of Selected Accident Data by State 63 Table 33 Number of Accidents by Primary Accident Type & State 64-65 Table 34 Number of Injured Victims by Primary Injury & Vessel Type 66 Table 35 Number of Fatal Victims by Life Jacket Wear, Cause of Death & Vessel Type 66 Table 36 Recreational Vessels Registered by Year, 1986-2020 69 Table 37 Recreational Vessel Registration by Length & Means of Propulsion 70 Table 38 Recreational Vessel Registration Data by State 71
List of Figures Figure 1 Percent of Accidents that are Fatal by Month 18 Figure 2 Percent of Accidents that are Fatal by Time Period 19 Figure 3 Primary Contributing Factor of Accidents 22 Figure 4 Primary Contributing Factor of Deaths 23 Figure 5 Primary Contributing Factor of Injuries 24 Figure 6 Number of Deaths by Vessel Length 32 Figure 7 Percent of Deaths by Known Operator Instruction 47 Figure 8 Number of Deaths by Vessel Type 48 Figure 9 Percent of Deaths by Vessel Type, 2006-2020 49 Figure 9a Percent of Deceased Victims by Age and Vessel Type 51 Figure 9b Percent of Injured Victims by Age and Vessel Type 51 Figure 10 Number of Injured Victims under Age 18 by Age Group & Injury Type on PWCs 53 Figure 11 Deaths, Injuries & Accidents by Year, 2001-2020 56 Figure 12 Distribution of 2020 Deaths by State 58 Figure 12a Fatal Accidents by Location– Continental U.S. and U.S. Virgin Islands 59 Figure 12b Fatal Accidents by Location– Alaska 60 Figure 12c Fatal Accidents by Location– Hawaii 60 Figure 13 Annual Recreational Boating Fatality Rates 2001-2020 61 Figure 14 States Coded by their 2020 Fatality Rate 62 Figure 15 Recreational Vessels Registered by Year, 1986-2020 69 Figure 16 Distribution of 2020 Recreational Vessel Registration by State 72
Recreational Boating Statistics 2020 5
Introduction & Executive Summary
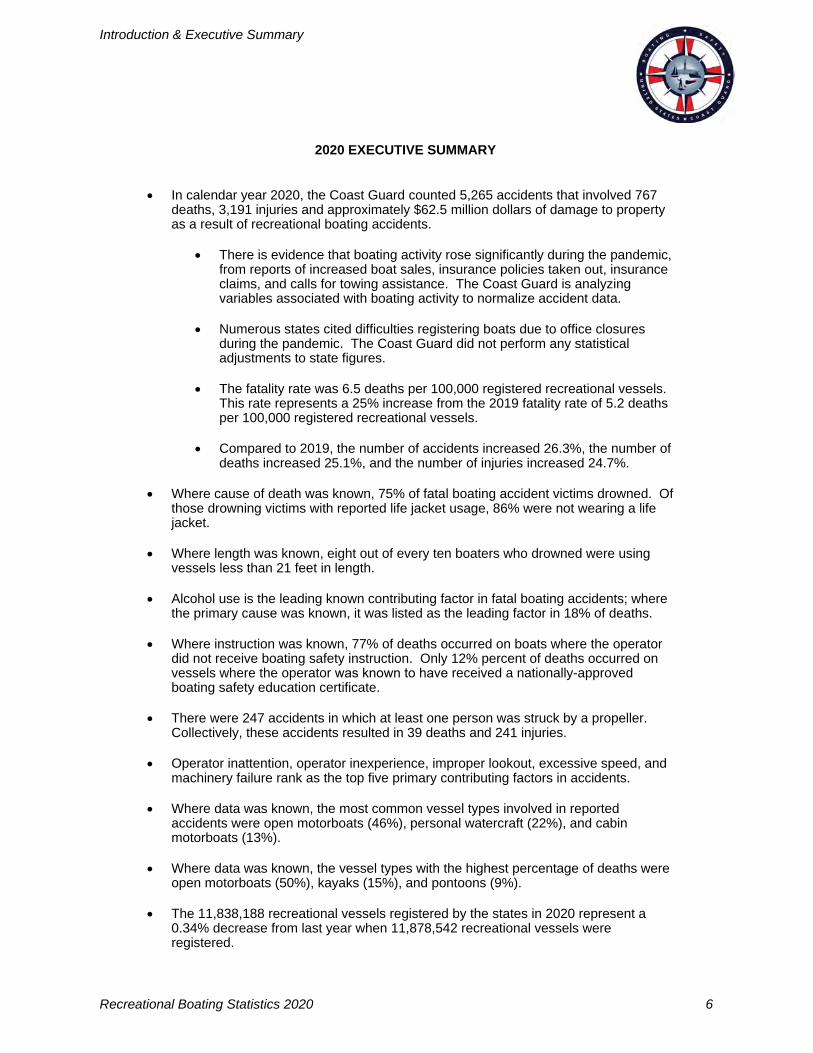
2020 EXECUTIVE SUMMARY
In calendar year 2020, the Coast Guard counted 5,265 accidents that involved 767deaths, 3,191 injuries and approximately $62.5 million dollars of damage to propertyas a result of recreational boating accidents.
There is evidence that boating activity rose significantly during the pandemic,from reports of increased boat sales, insurance policies taken out, insuranceclaims, and calls for towing assistance. The Coast Guard is analyzing variables associated with boating activity to normalize accident data.
Numerous states cited difficulties registering boats due to office closuresduring the pandemic. The Coast Guard did not perform any statisticaladjustments to state figures.
The fatality rate was 6.5 deaths per 100,000 registered recreational vessels.This rate represents a 25% increase from the 2019 fatality rate of 5.2 deathsper 100,000 registered recreational vessels.
Compared to 2019, the number of accidents increased 26.3%, the number ofdeaths increased 25.1%, and the number of injuries increased 24.7%.
Where cause of death was known, 75% of fatal boating accident victims drowned. Of those drowning victims with reported life jacket usage, 86% were not wearing a lifejacket.
Where length was known, eight out of every ten boaters who drowned were usingvessels less than 21 feet in length.
Alcohol use is the leading known contributing factor in fatal boating accidents; wherethe primary cause was known, it was listed as the leading factor in 18% of deaths.
Where instruction was known, 77% of deaths occurred on boats where the operator did not receive boating safety instruction. Only 12% percent of deaths occurred on vessels where the operator was known to have received a nationally-approved boating safety education certificate.
There were 247 accidents in which at least one person was struck by a propeller.Collectively, these accidents resulted in 39 deaths and 241 injuries.
Operator inattention, operator inexperience, improper lookout, excessive speed, andmachinery failure rank as the top five primary contributing factors in accidents.
Where data was known, the most common vessel types involved in reportedaccidents were open motorboats (46%), personal watercraft (22%), and cabinmotorboats (13%).
Where data was known, the vessel types with the highest percentage of deaths wereopen motorboats (50%), kayaks (15%), and pontoons (9%).
The 11,838,188 recreational vessels registered by the states in 2020 represent a0.34% decrease from last year when 11,878,542 recreational vessels wereregistered.
Recreational Boating Statistics 2020 6

Introduction & Executive Summary
Table 1 ▪ 2020 EXECUTIVE SUMMARY
TOP FIVE PRIMARY ACCIDENT TYPES
Accident Rank Accident Type Number of Accidents Number of Deaths
Number of Injuries
1 Collision with recreational vessel 1379 66 831
2 Flooding/swamping 589 84 128
3 Collision with fixed object 542 62 389
4 Grounding 484 14 255
5 Falls overboard 335 181 161
VESSEL TYPES WITH THE TOP CASUALTY NUMBERS
Casualty Rank Type of Boat Drownings Other Deaths
Total Deaths Total Injuries Total Casualties
1 Open motorboat 260 116 376 1520 1896
2 Personal watercraft 19 47 66 896 962
3 Cabin motorboat 16 17 33 298 331
4 Pontoon 53 14 67 232 299
5 Canoe/kayak 131 23 154 117 271
LIFE JACKET WEAR BY TOP FIVE KNOWN CAUSES OF DEATH
Known Cause of Death Rank Cause of Death Number of
Deaths
Life Jacket
Worn Not Worn Unknown if worn
1 Drowning 534 74 450 10
2 Trauma 152 57 88 7
3 Cardiac arrest 11 4 6 1
4 Hypothermia 6 5 1 0
5 Carbon monoxide poisoning 3 0 3 0
TOP TEN KNOWN PRIMARY CONTRIBUTING FACTORS OF ACCIDENTS
Accident Rank Contributing Factor Number of Accidents Number of Deaths
Number of Injuries
1 Operator inattention 664 55 383
2 Operator inexperience 612 56 343
3 Improper lookout 578 28 409
4 Excessive speed 418 32 345
5 Machinery failure 373 19 151
6 Navigation rules violation 316 26 220
7 Alcohol use 296 115 260
8 Weather 244 42 81
9 Hazardous waters 232 62 95
10 Force of wave/wake 215 14 182
Recreational Boating Statistics 2020 7

Introduction & Executive Summary
Mission and Strategic Plan of the National Recreational Boating Safety Program The mission of the National Recreational Boating Safety (RBS) Program is “to ensure the public has a safe, secure, and enjoyable recreational boating experience by implementing programs that minimize the loss of life, personal injury, and property damage while cooperating with environmental and national security efforts.”
The Coast Guard has released the Strategic Plan of the National Recreational Boating Safety Program for 2017-2021 to address the following initiatives: 1) Improve and expand recreational boating education, training, and outreach; 2) Update, leverage, and enforce policies, regulations, and standards; and 3) Improve upon and expand recreational boating data collection and research. To view the Strategic Plan of the Program, please visit the Division’s website at http://www.uscgboating.org/content/strategic-plan.php.
Overview of Statistics This report contains statistics on registered recreational vessels and boating accidents during calendar year 2020. Data used to compile the recreational boating accident statistics come from four main sources: State marine agencies; Federal agencies, including the Coast Guard, National Park Service, Army Corps of Engineers, and Forest Service; the public, on a CG-3865 Recreational Boating Accident Report (BAR) form; and the news media. The Coast Guard collects data from multiple sources in an attempt to document all incidents that meet reporting requirements.
The data in this publication reflects a collaboration of state and Coast Guard efforts. After reports are submitted, the Coast Guard reviews them and standardizes the data so that it can be used for national comparison. The data in this publication reflects Coast Guard standardized values, which may be differ-ent from the state’s original submission.
The following table reflects the number of accidents, deaths, injuries, and losses of vessels that were captured from federal and news media sources that met reporting requirements and are included in this report.
Table 2 ▪ NEWS MEDIA AND FEDERALLY-SOURCED ACCIDENTS AND CASUALTIES Accidents Deaths Injuries Vessel losses Damages Notes
AL 1 8 9 35 $489,300.00 1 accident the Coast Guard investigated
AT 7 0 2 5 $178,085.00 7 accidents offshore in the Atlantic Ocean
FL 12 0 8 6 $320,200.00
GA 5 2 7 0 $134,000.00
GM 5 1 0 4 $223,775.00 5 accidents offshore in the Gulf of Mexico
MA 1 0 0 0 $17,475.00
MI 1 1 0 0 $0.00
NC 4 4 2 0 $20,000.00 1 accident on private waters; 2 accidents the Coast Guard investigated
OR 1 0 2 1 $0.00
PC 4 1 0 4 $618,435.00 4 accidents offshore in the Pacific Ocean
SC 1 0 0 1 $130,175.00
TX 2 3 0 0 $0.00 2 accidents on private waters
Nation 44 20 30 56 $2,131,445.00
Recreational Boating Statistics 2020 8

Introduction & Executive Summary
Major Changes to the PublicationAs a result of changes in 33 CFR 174.19 that took effect 1 January 2017, a new term “paddlecraft” was introduced and defined as “a vessel powered only by its occupants, using a single or double bladed pad-dle as a lever without the aid of a fulcrum provided by oarlocks, thole pins, crutches, or similar arrange-ments”. As such, the definition limits the use of the term “paddlecraft” to non-motorized vessels. Conse-quently, any canoe or kayak with a motor has been classified as an “open motorboat” for accident re-porting and registration purposes. Though the term “paddlecraft” exists in regulation, for the purposes of this publication, the subcategories of canoe, kayak, and standup paddleboard have been retained; these represent non-motorized vessels, and data can be combined to represent paddlecraft.
Table 10 has been amended to provide a breakdown of the victim’s role (operator, occupant, other/unknown). Examples of “other” include tuber, wakeboarder, water skier, kneeboarder, bystander, and swimmer.
Table 4a has been added to provide detail related to Figure 2. Figures 9a and 9b have been added to provide a graphical depiction of information in Tables 26 and 27. Figures 12 and 16 have been color-coded.
The glossary has been updated to reflect new definitions in the Code of Federal Regulations (CFR).
Table 37 has been rearranged due to a change in data collection. On 1 January 2017, changes in regu-lation (33 CFR 174.19) necessitated revision to the Coast Guard’s data collection on registration, which took place in early 2017. Due to delays in transitioning to a new form, the Coast Guard accepted regis-tration data on the previous registration collection form used and the proposed form. Since the forms did not cover the same information, the publication table was amended.
Four of the statistics in the Executive Summary were changed to remove the records where values were unknown. To find information on the number of “unknown” cases excluded, please reference Tables 35(on page 66), 22 (on page 46), 5 (on page 20), and 7 (on page 25).
Accident Reporting as Required by Federal LawUnder federal regulations (33 CFR Part 173; Subpart C – Casualty and Accident Reporting) the operator of any numbered vessel that was not required to be inspected or a vessel that was operated for recreational purposes is required to file a BAR when, as a result of an occurrence that involves the vessel or its equipment:
1. A person dies; or 2. A person disappears from the vessel under circumstances that indicate death or injury; or 3. A person is injured and requires medical treatment beyond first aid; or 4. Damage to vessels and other property totals $2,000 or more; or 5. There is a complete loss of any vessel.
If the above conditions are met, the federal regulations state that the operator or owner must report their accident to a state reporting authority, abbreviated in this publication as “state.” The reporting authority can be either the state where the accident occurred, the state in which the vessel was numbered, or, if the vessel does not have a number, the state where the vessel was principally used. The owner must submit the report if the operator is deceased or unable to make the report.
The regulations also state the acceptable length of time in which the accident report must be submitted to the reporting authority. Boat operators or owners must submit:
1. Accident reports within 48 hours of an occurrence if: a. A person dies within 24 hours of the occurrence; or b. A person requires medical treatment beyond first aid; or c. A person disappears from the vessel.
2. Accident reports within 10 days of an occurrence if there is damage to the vessel/property only.
The minimum reporting requirements are set by Federal regulation, but states are allowed to have more stringent requirements. For example, some states have a lower threshold for reporting damage to
Recreational Boating Statistics 2020 9
Introduction & Executive Summary
vessels and other property.
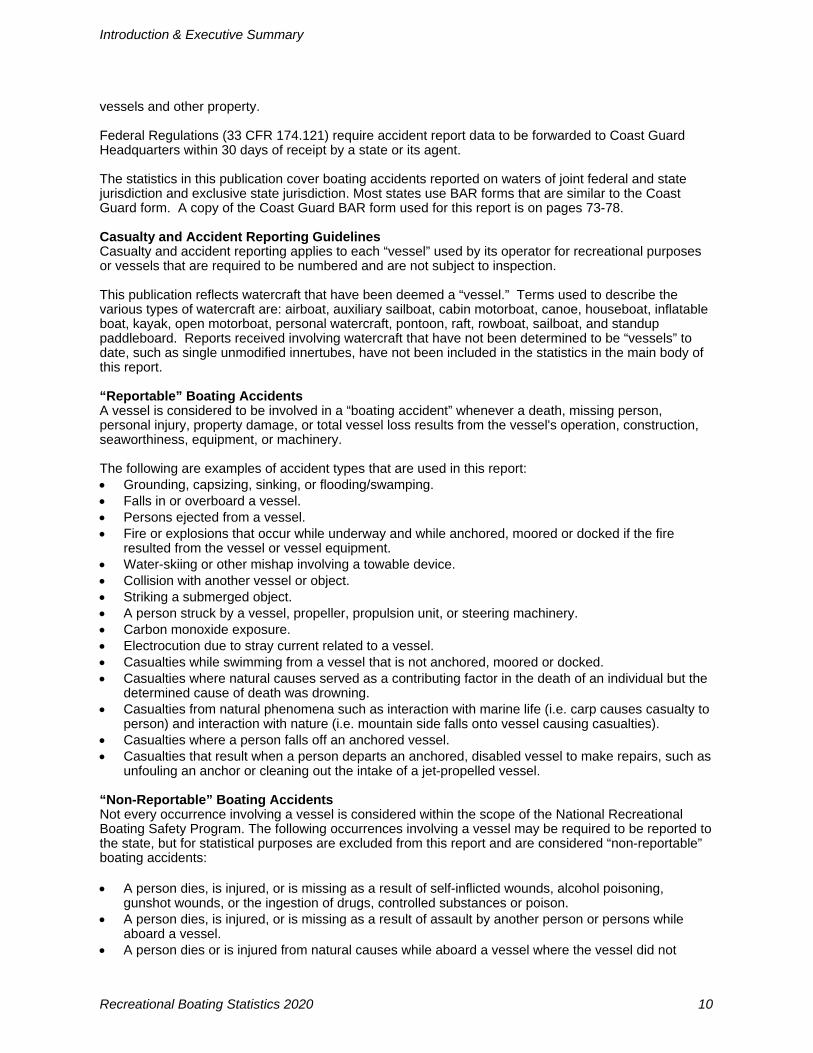
Federal Regulations (33 CFR 174.121) require accident report data to be forwarded to Coast Guard Headquarters within 30 days of receipt by a state or its agent.
The statistics in this publication cover boating accidents reported on waters of joint federal and state jurisdiction and exclusive state jurisdiction. Most states use BAR forms that are similar to the Coast Guard form. A copy of the Coast Guard BAR form used for this report is on pages 73-78.
Casualty and Accident Reporting Guidelines Casualty and accident reporting applies to each “vessel” used by its operator for recreational purposes or vessels that are required to be numbered and are not subject to inspection.
This publication reflects watercraft that have been deemed a “vessel.” Terms used to describe the various types of watercraft are: airboat, auxiliary sailboat, cabin motorboat, canoe, houseboat, inflatable boat, kayak, open motorboat, personal watercraft, pontoon, raft, rowboat, sailboat, and standup paddleboard. Reports received involving watercraft that have not been determined to be “vessels” to date, such as single unmodified innertubes, have not been included in the statistics in the main body of this report.
“Reportable” Boating Accidents A vessel is considered to be involved in a “boating accident” whenever a death, missing person, personal injury, property damage, or total vessel loss results from the vessel's operation, construction, seaworthiness, equipment, or machinery.
The following are examples of accident types that are used in this report: Grounding, capsizing, sinking, or flooding/swamping. Falls in or overboard a vessel. Persons ejected from a vessel. Fire or explosions that occur while underway and while anchored, moored or docked if the fire
resulted from the vessel or vessel equipment. Water-skiing or other mishap involving a towable device. Collision with another vessel or object. Striking a submerged object. A person struck by a vessel, propeller, propulsion unit, or steering machinery. Carbon monoxide exposure. Electrocution due to stray current related to a vessel. Casualties while swimming from a vessel that is not anchored, moored or docked. Casualties where natural causes served as a contributing factor in the death of an individual but the
determined cause of death was drowning. Casualties from natural phenomena such as interaction with marine life (i.e. carp causes casualty to
person) and interaction with nature (i.e. mountain side falls onto vessel causing casualties). Casualties where a person falls off an anchored vessel. Casualties that result when a person departs an anchored, disabled vessel to make repairs, such as
unfouling an anchor or cleaning out the intake of a jet-propelled vessel.
“Non-Reportable” Boating Accidents Not every occurrence involving a vessel is considered within the scope of the National Recreational Boating Safety Program. The following occurrences involving a vessel may be required to be reported to the state, but for statistical purposes are excluded from this report and are considered “non-reportable” boating accidents:
A person dies, is injured, or is missing as a result of self-inflicted wounds, alcohol poisoning, gunshot wounds, or the ingestion of drugs, controlled substances or poison.
A person dies, is injured, or is missing as a result of assault by another person or persons while aboard a vessel.
A person dies or is injured from natural causes while aboard a vessel where the vessel did not
Recreational Boating Statistics 2020 10

Introduction & Executive Summary
contribute to the casualty. A person dies, is injured, or is missing as a result of jumping, diving, or swimming for pleasure from
an anchored, moored or docked vessel. A person dies, is injured, or is missing as a result of swimming to retrieve an object or a vessel that
is adrift from its mooring or dock, having departed from a place of inherent safety, such as the shore or pier.
Property damage occurs or a person dies, is injured, or is missing while preparing a vessel for launching or retrieving and the vessel is not on the water and capable / ready for its intended use.
Property damage occurs or a person dies, is injured, or is missing as a result of a fire on shore or a pier that spreads to a vessel or vessels.
Property damage occurs to a docked or moored vessel or a person dies, is injured, or is missing from such a vessel as a result of storms, or unusual tidal or sea conditions; or when a vessel gets underway in those conditions in an attempt to rescue persons or vessels.
Property damage occurs to a docked or moored vessel due to lack of maintenance on the vessel or the structure to which it was moored.
Property damage occurs to a docked or moored vessel due to theft or vandalism. Property damage occurs to, a person dies or is injured on, or a person is missing from a
non-propelled residential platform or other watercraft used primarily as a residence that is not underway.
Casualties that result from falls from or on docked vessels or vessels that are moored to a permanent structure.
Casualties that result from a person climbing aboard an anchored vessel from the water orswimming near an anchored vessel (unless the casualty was related to carbon monoxide exposure or stray electric current).
Fire or explosions on anchored, docked or moored boats where the cause of the fire was not attributed to the vessel or vessel equipment.
Casualty or damage that results when the vehicle used for trailering the vessel fails. Casualties or damage that occur during accidents that only involve watercraft that have not been
deemed a vessel. Casualties or damage that occur when the only vessel(s) involved are being used solely for
governmental, commercial or criminal activity. Casualties or damage that occur when the only vessel(s) involved are not required to be numbered
and are being used exclusively for racing (exclusion in 33 CFR 173.13(a)). Casualties or damage that occur when the only vessel(s) involved are foreign vessels and thus not
subject to U.S. federal reporting requirements.
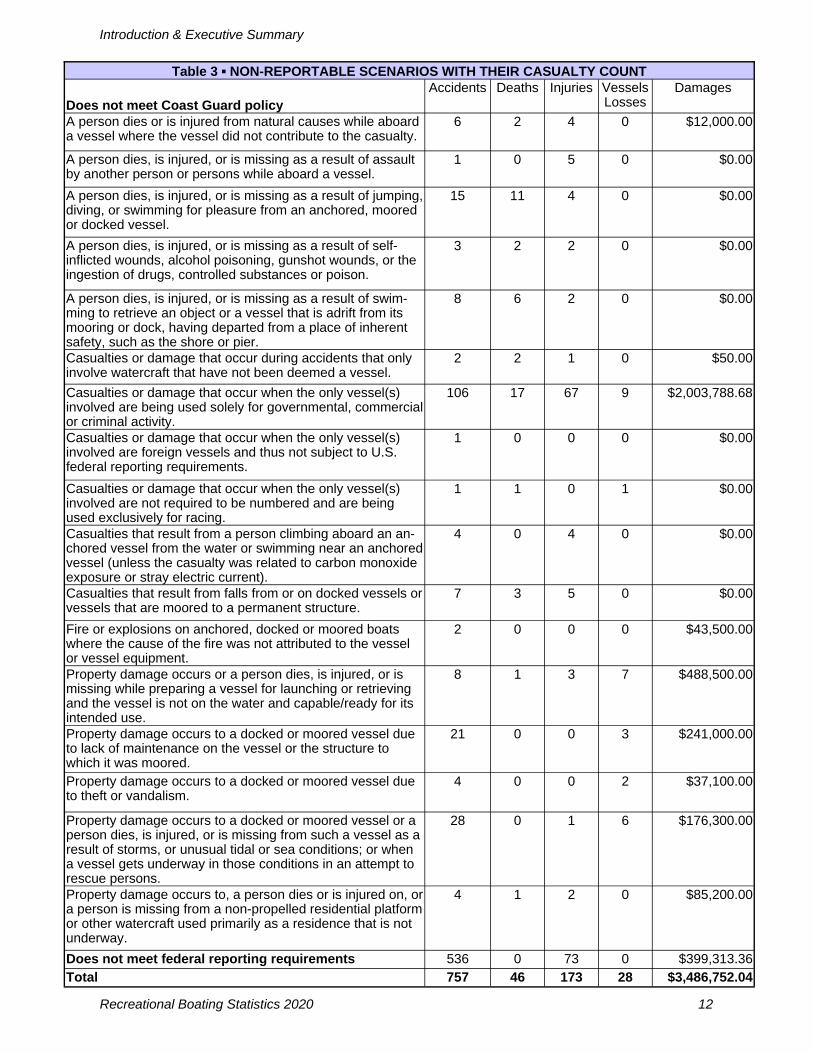
A list of “non-reportable” scenarios and their associated casualty counts can be found in Table 3.
Recreational Boating Statistics 2020 11
Introduction & Executive Summary
Table 3 ▪ NON-REPORTABLE SCENARIOS WITH THEIR CASUALTY COUNT
Does not meet Coast Guard policy Accidents Deaths Injuries Vessels
Losses Damages
A person dies or is injured from natural causes while aboard a vessel where the vessel did not contribute to the casualty.
6 2 4 0 $12,000.00
A person dies, is injured, or is missing as a result of assault by another person or persons while aboard a vessel.
1 0 5 0 $0.00
A person dies, is injured, or is missing as a result of jumping, diving, or swimming for pleasure from an anchored, moored or docked vessel.
15 11 4 0 $0.00
A person dies, is injured, or is missing as a result of self-inflicted wounds, alcohol poisoning, gunshot wounds, or the ingestion of drugs, controlled substances or poison.
3 2 2 0 $0.00
A person dies, is injured, or is missing as a result of swim-ming to retrieve an object or a vessel that is adrift from itsmooring or dock, having departed from a place of inherent safety, such as the shore or pier.
8 6 2 0 $0.00
Casualties or damage that occur during accidents that only involve watercraft that have not been deemed a vessel.
2 2 1 0 $50.00
Casualties or damage that occur when the only vessel(s) involved are being used solely for governmental, commercial or criminal activity.
106 17 67 9 $2,003,788.68
Casualties or damage that occur when the only vessel(s) involved are foreign vessels and thus not subject to U.S. federal reporting requirements.
1 0 0 0 $0.00
Casualties or damage that occur when the only vessel(s) involved are not required to be numbered and are being used exclusively for racing.
1 1 0 1 $0.00
Casualties that result from a person climbing aboard an an-chored vessel from the water or swimming near an anchored vessel (unless the casualty was related to carbon monoxide exposure or stray electric current).
4 0 4 0 $0.00
Casualties that result from falls from or on docked vessels or vessels that are moored to a permanent structure.
7 3 5 0 $0.00
Fire or explosions on anchored, docked or moored boats where the cause of the fire was not attributed to the vessel or vessel equipment.
2 0 0 0 $43,500.00
Property damage occurs or a person dies, is injured, or is missing while preparing a vessel for launching or retrieving and the vessel is not on the water and capable/ready for its intended use.
8 1 3 7 $488,500.00
Property damage occurs to a docked or moored vessel due to lack of maintenance on the vessel or the structure to which it was moored.
21 0 0 3 $241,000.00
Property damage occurs to a docked or moored vessel due to theft or vandalism.
4 0 0 2 $37,100.00
Property damage occurs to a docked or moored vessel or a person dies, is injured, or is missing from such a vessel as a result of storms, or unusual tidal or sea conditions; or when a vessel gets underway in those conditions in an attempt to rescue persons.
28 0 1 6 $176,300.00
Property damage occurs to, a person dies or is injured on, or a person is missing from a non-propelled residential platform or other watercraft used primarily as a residence that is not underway.
4 1 2 0 $85,200.00
Does not meet federal reporting requirements 536 0 73 0 $399,313.36 Total 757 46 173 28 $3,486,752.04
Recreational Boating Statistics 2020 12

Introduction & Executive Summary
Use of Statistics The following are notes on using data on recreational boating accidents.
1) Normalizing data. When analyzing recreational boating accident data, it is recommended that any researcher nor-malize it with a denominator.
The Coast Guard frequently uses recreational vessel registration as a denominator because ofthe availability of the data. The Coast Guard calculates a fatality rate expressed as the number of deaths per 100,000 registered recreational vessels. This measure is representative of the entire program (motorized and non-motorized activity) but necessitates a caveat that not all states register the same types of vessels (many do not register non-motorized vessels, whichare represented in fatal accident data) and some states have longer boating seasons than oth-ers. Further, when examining a state fatality rate, it is important to note that the state fatality rate may include deaths from vessels that were registered by another state.
The Coast Guard also calculates a motorized fatality rate expressed as the number of deaths on motorized vessels per 100,000 registered motorized recreational vessels. While this measure is sound, it doesn’t reflect all of recreational boating because it does not represent non-motorizedactivity.
It is worthwhile to note that the Coast Guard is pursuing a denominator on exposure, which would reflect the level of boating activity. The proposed measure would be a fatality rate ex-pressed as the number of deaths per 100,000,000 exposure hours. The Coast Guard most re-cently published exposure data from a 2018 survey. The two resulting reports can be found onthe Coast Guard’s website at https://uscgboating.org/statistics/national-recreational-boating-safety-survey.php
The number of deaths and fatality rate rose significantly in 2020 from the prior year. Anecdotal-ly, the agency has received notice of numerous indicators of increased boating activity, including increased boat sales, calls for towing assistance, new insurance policies taken out,insurance claims issued, and number of people on the water.
2) Limitations on collection.It is recommended that any researcher focus on fatal data since the confidence of this data is very high. The Coast Guard works with state marine agencies, other federal agencies, and news media aggregating services to identify boating incidents. Despite best efforts to document incidents, the Coast Guard is only confident in its capture of deceased victims since fatal acci-dents undoubtedly involve state or government oversight, and garner more attention in the news media.
Data on non-fatal accidents have a much lower confidence level. Non-fatal accidents are se-verely under-reported because boaters are unaware of reporting requirements or are unwilling to report. A 2006 study, “Recent Research on Recreational Boating Accidents and the Contribu-tion of Boating Under the Influence,” suggest that 20% of hospital-admitted injuries were not captured, and upwards of 93% of non-fatal, non-hospital admitted injuries were not captured inthe data collection on boating accidents. The study is posted on the Coast Guard’s website at http://www.uscgboating.org/library/bui-study/BUI_Study_Final.pdf.
There has been discussion about adjusting numbers to account for non-reporting, but results have not been published yet. The Coast Guard is studying alternate data sources including in-surance claims to better gauge the gap between reported and unreported accidents.
In 2020, numerous states cited difficulties registering boats due to office closures during the pandemic. In particular, West Virginia demonstrated a nearly 45% decrease in recreational reg-istration. The Coast Guard did not perform any statistical adjustments to state figures.
Recreational Boating Statistics 2020 13

Introduction & Executive Summary
3) Comparisons with other sources.The data in this publication may differ from other sources due to a number of factors, including:
a. Time period. The statistics in this publication are based on calendar year 2020 accident data submitted by states as of 5 April 2021 with subsequent updates as information is reviewed and standardized. This publication covers only accidents meeting the afore-mentioned reporting requirements.
b. Geographic location. This publication reflects accidents that occurred on waters subject to the jurisdiction of the United States and on the high seas.
Although the reporting of accidents that occur on private waters (such as a pond on a private property) are not required to be reported since states do not have jurisdiction, the Coast Guard includes data on private waters if the accidents satisfy the other re-quirements for inclusion. The rationale for doing so is that the National Recreational Boating Safety program could still impact individuals who boat on private waters. For those accidents that occur on private waters, the Coast Guard attributes the data to a state. For instance, if an accident occurred on a private pond in Texas, the Coast Guard attributes the accident to Texas.
Similarly, although the reporting of accidents that occur on federal waters within the boundaries of a state (for instance, Aberdeen Proving Grounds in Maryland), are not required to be reported by the states since state officials do not have jurisdiction, the Coast Guard includes data on federal waters if the accidents satisfy the other require-ments for inclusion. The rationale for doing so is the same; the National Recreational Boating Safety program could still impact individuals who boat on federal waters. For those accidents that occur on federal waters, the Coast Guard attributes the data to a state. For instance, if an accident occurred on Aberdeen Proving Grounds, the Coast Guard attributes the accident to Maryland.
c. Different reporting requirements. Some states have more stringent reporting require-ments than the federal government. For instance, some states may require a person to report an accident that involved at least $500 damage, whereas the federal threshold for reporting damage is $2,000 or more.
4) Fatal accidents are accidents that involve at least one death. For example, a fatal accident could be a capsizing that resulted in three deaths. It was an accident that had at least one death.
5) Disappearances. Victims who have disappeared and are presumed dead are represented in the tallies of deaths.
Recreational Boating Statistics 2020 14

Accident causes & conditions

Accident Causes & Conditions
Explanation of Accident Causes and Conditions Section
The following eighteen tables and figures focus on the causes of accidents with a special focus on alcohol use, the operation and activity at the time of accident, weather and water conditions, vessel information, and the time of accidents.
Percent of Accidents that are Fatal by Month (Figure 1 & Table 4, Page 18) This table provides information about total accidents, fatal accidents, non-fatal accidents, and deaths. The figure focuses on the percent of fatal accidents by month.
Percent of Accidents that are Fatal by Time Period (Figure 2 & Table 4a, Page 19) This table and figure reflect the percent of accidents that are fatal by time period. The category in which accidents are more frequently fatal span the hours between 12:00am and 2:30am.
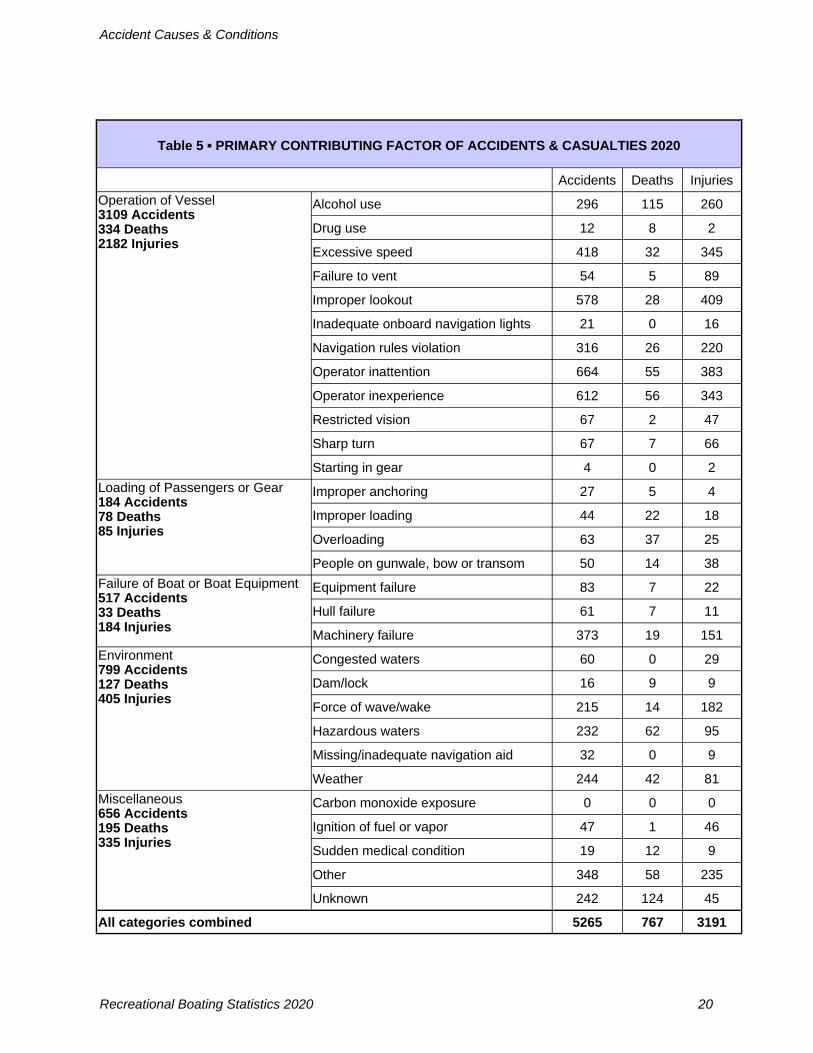
Primary Contributing Factor of Accidents & Casualties (Table 5, Page 20) The "contributing factors" of an accident are the causes of the accident. In the Coast Guard's national accident reporting database, there are allowances for up to four causes. This table reflects the first cause listed for all accidents, deaths, and injuries nationwide.
For the purposes of displaying information in a simplified manner, the Coast Guard divided the contributing factor categories into five larger categories: operation of vessel, loading of passengers orgear, failure of vessel or vessel equipment, environment, and miscellaneous. These five categories are situated in the leftmost column of the table and have the total number of accidents, deaths, and injuries associated with each category under the category name.
Machinery & Equipment Primary Contributing Factor of Accidents & Casualties (Table 6, Page 21)This table reflects the number of accidents, deaths, and injuries where machinery or equipment failure was listed as a first cause of the accident. The table also delineates the different types of failure that were listed.
Primary Contributing Factor of Accidents (Figure 3, Page 22) This figure reflects the first cause of accidents for all accidents nationwide.
Primary Contributing Factor of Deaths (Figure 4, Page 23) This figure reflects the first cause listed for all deaths.
Primary Contributing Factor of Injuries (Figure 5, Page 24) This figure reflects the first cause listed for all injuries.
Number of Vessels in Accidents by Vessel Type & Primary Contributing Factor (Table 7, Page 25) This table looks at the number of vessels involved in accidents by vessel type and the primary cause of the accident.
Alcohol Use as a Contributing Factor in Accidents & Casualties by State 2016-2020 (Table 8, Page 26)This table reflects a tally of all four causes of accidents listed for all national accidents, deaths, and injuries.
This table lists accidents where alcohol use by the vessel’s occupants was listed as a direct or indirect cause of the accident. There are other cases in the national database where alcohol use is listed as being involved in the accident but it was not determined to be a cause of the accident.
Recreational Boating Statistics 2020 16

Accident Causes & Conditions
Vessel Operation at the Time of Accident (Table 9, Page 27) This table focuses on the vessel operation at the time of the accident. The table lists information about the number of vessels involved, the resulting number of deaths, and the resulting number of injuries.
Vessel Activity at the Time of Accident (Table 10, Page 27) This table examines the vessel and victim activity at the time of the accident. The table provides information about the number of vessels involved, the resulting number of deaths, and the resulting number of injuries.
Please note that vessels used for commercial or government activity were included in this recreational boating statistics publication if they were involved in a multi-vessel accident that involved at least one recreational vessel.
Also note that racing was included as an activity because either the vessels involved in racing were not exempted from reporting requirements, or the vessels were involved in a multi-vessel accident that involved at least one recreational vessel.
Weather & Water Conditions (Table 11, Page 28) This table documents some of the environmental characteristics of accidents. It focuses on accidents, deaths, and injuries by type of body of water, water conditions, wind level, visibility, and water temperature.
Time Related Data (Table 12, Page 29)These three sections independently examine time-related information for accidents, deaths, and injuries. The top section documents the number of accidents, deaths, and injuries that occurred during a time frame. The middle section documents the number of accidents, deaths, and injuries that occurred during a given month. Finally, the bottom section documents the number of accidents, deaths, and injuries that occurred during a given day of the week.
Each section examines the national data separately and should not be combined to draw conclusions. For instance, one cannot use them to deduce that the majority of accidents occur from 2:31 pm-4:30 pm in July on the weekends. However, you could deduce that 2:31 pm-4:30 pm was the time frame during which the highest number of accidents occurred in calendar year 2020. Furthermore, the month with the highest number of accidents was July. Finally, the two days of the week with the greatest number of accidents were Saturday and Sunday.
Vessel Information (Table 13, Page 30) This table documents some of the characteristics of vessels involved in accidents. It providesinformation about the number of accidents, deaths, and injuries by horsepower, year built, length, and hull material.
Rental Status of Vessels Involved in Accidents (Table 14, Page 31) This table examines whether a vessel involved in an accident was rented. It also provides information on whether deaths and injuries occurred on rented vessels. Please note that some states only docu-ment if a vessel was rented; they do not indicate whether a vessel was “not rented”. As a result, the rental status of many vessels is “unknown”.
Number & Percent of Deaths by Vessel Length (Figure 6 & Table 15, Page 32) This table focuses on the number of deaths by vessel length. Deaths are categorized into drownings and non-drownings. The table also provides a percentage of all deaths that were caused by drowning.
Recreational Boating Statistics 2020 17

Accident Causes & Conditions
Table 4 ▪ PERCENT OF ACCIDENTS THAT ARE FATAL BY MONTH
Month Fatal
Accidents Non-Fatal Accidents
Total Accidents
Accidents Resulting in
Deaths Total Deaths
January 20 83 103 19% 28
February 12 74 86 14% 16
March 35 146 181 19% 39
April 46 179 225 20% 51
May 83 639 722 11% 88
June 118 803 921 13% 126
July 126 989 1115 11% 137
August 112 808 920 12% 123
September 60 442 502 12% 64
October 37 205 242 15% 46
November 30 122 152 20% 33
December 13 83 96 14% 16
Total 692 4573 5265 13% 767
Recreational Boating Statistics 2020 18

Accident Causes & Conditions
Table 4a ▪ PERCENT OF ACCIDENTS THAT ARE FATAL BY TIME PERIOD
Time period Fatal
Accidents Non-Fatal Accidents
Total Accidents
Accidents Resulting in
Deaths Total Deaths 12:00 AM to 2:30 AM 25 78 103 24% 34
2:31 AM to 4:30 AM 5 46 51 10% 6
4:31 AM to 6:30 AM 1 39 40 3% 1
6:31 AM to 8:30 AM 23 125 148 16% 27
8:31 AM to 10:30 AM 48 227 275 17% 51
10:31 AM 12:30 PM 75 490 565 13% 82
12:31 PM to 2:30 PM 89 743 832 11% 95
2:31 PM to 4:30 PM 121 965 1086 11% 124
4:31 PM to 6:30 PM 139 919 1058 13% 151
6:31 PM to 8:30 PM 82 568 650 13% 94
8:31 PM to 10:30 PM 50 248 298 17% 56
10:31 PM to 11:59 PM 16 73 89 18% 19
Unknown 18 52 70 26% 27
All time periods 692 4573 5265 13% 767
Recreational Boating Statistics 2020 19
Accident Causes & Conditions
Table 5 ▪ PRIMARY CONTRIBUTING FACTOR OF ACCIDENTS & CASUALTIES 2020
Accidents Deaths Injuries
Operation of Vessel3109 Accidents 334 Deaths 2182 Injuries
Alcohol use 296 115 260
Drug use 12 8 2
Excessive speed 418 32 345
Failure to vent 54 5 89
Improper lookout 578 28 409
Inadequate onboard navigation lights 21 0 16
Navigation rules violation 316 26 220
Operator inattention 664 55 383
Operator inexperience 612 56 343
Restricted vision 67 2 47
Sharp turn 67 7 66
Starting in gear 4 0 2
Loading of Passengers or Gear 184 Accidents 78 Deaths 85 Injuries
Improper anchoring 27 5 4
Improper loading 44 22 18
Overloading 63 37 25
People on gunwale, bow or transom 50 14 38
Failure of Boat or Boat Equipment517 Accidents 33 Deaths 184 Injuries
Equipment failure 83 7 22
Hull failure 61 7 11
Machinery failure 373 19 151
Environment 799 Accidents 127 Deaths 405 Injuries
Congested waters 60 0 29
Dam/lock 16 9 9
Force of wave/wake 215 14 182
Hazardous waters 232 62 95
Missing/inadequate navigation aid 32 0 9
Weather 244 42 81
Miscellaneous 656 Accidents 195 Deaths 335 Injuries
Carbon monoxide exposure 0 0 0
Ignition of fuel or vapor 47 1 46
Sudden medical condition 19 12 9
Other 348 58 235
Unknown 242 124 45
All categories combined 5265 767 3191
Recreational Boating Statistics 2020 20

Accident Causes & Conditions
Table 6 ▪ MACHINERY & EQUIPMENT PRIMARY CONTRIBUTING FACTOR OF ACCIDENTS & CASUALTIES 2020
Accidents Deaths Injuries
Machinery Failure
Electrical system failure 48 8 19
Engine failure 199 8 52
Exhaust system failure 3 0 9
Fuel system failure 28 0 18
Shift failure 18 0 0
Steering system failure 31 1 25
Throttle failure 17 1 8
Ventilation system failure 4 0 17
Not specified 25 1 3
Equipment Failure
Auxiliary equipment failure 71 4 15
Onboard navigation aid 0 0 0
Sail dismasting 1 0 0
Seat broke loose 5 3 3
Other 5 0 4
Not specified 1 0 0
Recreational Boating Statistics 2020 21

Accident Causes & Conditions
Number of Accidents
Recreational Boating Statistics 2020 22

Accident Causes & Conditions
Number of Deaths
Recreational Boating Statistics 2020 23

Accident Causes & Conditions
Number of Injuries
Recreational Boating Statistics 2020 24

Accident Causes & Conditions
Tab
le 7
▪ N
UM
BE
R O
F V
ES
SE
LS
IN A
CC
IDE
NT
S B
Y V
ES
SE
L T
YP
E &
PR
IMA
RY
CO
NT
RIB
UT
ING
FA
CT
OR
202
0
Unknown 305
1 11 66 9 13 1 33 117
18 11 6 2 0 3 0 14
Other 356 2 4 28 0 3 0 3
232
22 57 1 2 0 0 0 2
Weather 313 0 23 67 6 5 1 17 154
13 16 1 5 1 1 1 2
Sudden medical condition 20 0 0 2 0 0 1 4 9 2 1 1 0 0 0 0 0
Starting in gear 5 0 1 2 0 0 0 0 2 0 0 0 0 0 0 0 0
Sharp turn 76 4 0 0 0 0 0 0 33 35 4 0 0 0 0 0 0
Restricted vision 99 0 2 12 0 0 0 1 61 16 7 0 0 0 0 0 0
People on gunwale, bow or transom 52 0 1 4 1 0 0 1 22 0 20 3 0 0 0 0 0
Overloading 65 0 0 0 0 0 0 3 52 2 5 1 1 0 0 1 0
Operator inexperience 910 2 22 92 10 11 1 38 283
320
103
7 4 0 3 1 13
Operator inattention 934 1 37 126 1 4 4 11 418
221
85 6 6 0 0 7 7
Navigation rules violation 553 1 21 34 2 2 1 2
187
216
49 0 2 1 1 1 33
Missing/inadequate navigation aid 33 0 2 9 0 0 0 0 20 1 1 0 0 0 0 0 0
Machinery failure 537
5 29 177
0 13 0 0
212
31 30 0 0 1 0 0 39
Inadequate onboard navigation lights 40 0 2 6 0 0 0 1 24 3 3 0 0 0 0 1 0
Improper lookout 947
4 42 98 1 0 0 3
465
250
60 3 3 0 2 3 13
Improper loading 44 0 0 3 6 1 0 1 25 0 3 4 0 0 1 0 0
Improper anchoring 31 0 5 6 0 0 0 0 17 0 2 1 0 0 0 0 0
Ignition of fuel or vapor 59 0 1 16 0 2 0 0 29 3 2 0 0 0 0 0 6
Hull failure 67 3 2 6 0 1 0 4 41 7 1 2 0 0 0 0 0
Hazardous waters 256
1 9 15 11 1 12 54 120
13 9 5 2 0 3 0 1
Force of wave/wake 245 0 2 13 2 4 0 7
142
46 20 1 1 0 1 1 5
Failure to vent 62 0 0 20 0 0 0 0 36 4 1 0 0 0 0 0 1
Excessive speed 626
7 5 63 0 2 0 5
231
264
31 0 0 0 0 3 15
Equipment failure 91 0 7 14 0 3 0 0 61 0 4 0 2 0 0 0 0 Drug use 14 0 0 2 2 0 1 3 5 0 0 0 0 0 1 0 0 Dam/lock 16 0 0 0 1 0 1 6 8 0 0 0 0 0 0 0 0
Congested waters 88 1 0 13 0 0 0 0 44 19 9 0 0 0 0 0 2
Carbon monoxide exposure 0 0 0 0 0 0 0 0 0 0 0 0 0 0 0 0 0
Alcohol use 404
0 6 43 7 2 3 16 207
58 54 0 1 0 1 0 6
All contributing factors 7248
32 234
937
59 67 26 213
3257
1564
588
42 31 3 17 19 159
All
vess
els
Airb
oat
Aux
iliar
y sa
ilboa
t
Cab
in m
otor
boat
Can
oe
Hou
sebo
at
Infla
tabl
e
Kay
ak
Ope
n m
otor
boat
Per
sona
l wat
ercr
aft
Pon
toon
Row
boat
Sai
l (on
ly)
Sai
l (un
know
n)
Sta
ndup
pad
dleb
oard
Oth
er
Unk
now
n
Recreational Boating Statistics 2020 25

Accident Causes & Conditions
Table 8 ▪ ALCOHOL USE AS A CONTRIBUTING FACTORCASUALTIES BY STATE 2016-2020
IN ACCIDENTS &
Accidents Deaths Injuries
2016 2017 2018 2019 2020 2016 2017 2018 2019 2020 2016 2017 2018 2019 2020 USA 350 323 309 330 353 133 118 119 128 130 335 255 275 279 315 AK 1 1 7 1 5 1 1 10 1 6 0 0 5 0 0 AL 7 8 9 12 11 6 2 7 8 2 5 10 7 12 4 AR 2 4 1 3 4 2 1 0 1 2 0 7 1 0 2 AZ 11 2 9 8 7 3 2 4 0 0 12 0 17 6 5 CA 11 14 11 16 21 3 4 5 6 10 20 17 13 18 24 CO 3 5 2 1 4 1 1 1 0 3 1 3 1 1 2 CT 3 4 2 6 0 1 5 0 1 0 5 1 2 1 0 DE 1 3 1 0 1 0 1 0 0 0 0 2 0 0 1 DC 0 0 0 0 0 0 0 0 0 0 0 0 0 0 0 FL 31 39 29 40 36 14 14 6 18 13 25 35 20 26 27 GA 12 11 8 7 11 7 2 2 3 0 7 9 8 2 27 HI 0 0 0 0 0 0 0 0 0 0 0 0 0 0 0 IA 7 4 6 4 8 2 1 2 1 2 4 3 6 6 4 ID 3 5 3 4 6 3 1 1 1 0 5 4 3 3 9 IL 10 7 7 9 6 1 3 4 8 4 4 1 2 6 2 IN 4 6 7 5 4 2 2 2 4 2 3 7 10 2 1 KS 6 4 1 2 0 2 0 0 1 0 5 5 4 3 0 KY 6 7 5 8 9 2 5 4 1 1 6 2 1 6 7 LA 7 11 12 8 10 3 3 3 3 2 6 11 11 8 21 MA 7 3 6 6 6 2 3 1 0 2 2 1 6 8 3 MD 12 16 10 14 17 3 3 5 9 3 13 17 5 10 21 ME 6 6 4 3 3 2 4 1 2 1 7 2 1 0 1 MI 10 9 8 17 14 7 4 3 5 4 6 3 4 13 12 MN 18 14 8 10 12 8 4 2 2 5 11 12 10 4 5 MO 14 13 19 14 13 3 1 3 4 2 15 8 33 18 20 MS 8 1 5 0 4 3 1 1 0 1 6 0 7 0 4 MT 3 1 4 1 1 1 0 4 1 0 6 0 4 0 1 NC 12 13 18 11 22 1 1 4 4 10 13 13 18 9 18 ND 0 4 1 0 2 0 3 1 0 0 0 1 1 0 3 NE 1 3 2 3 1 0 1 0 0 0 0 2 0 3 2 NH 2 3 3 1 1 0 0 1 0 0 2 1 0 1 1 NJ 4 1 4 2 1 0 0 0 2 0 6 1 2 0 0 NM 0 0 2 0 2 0 0 1 0 1 0 0 1 0 1 NV 3 2 3 1 1 0 1 1 0 1 3 1 4 0 0 NY 18 12 15 11 9 6 1 3 2 3 24 16 13 17 7 OH 9 10 6 11 12 4 4 2 2 9 11 8 3 11 9 OK 4 5 7 4 4 0 3 3 2 2 6 6 7 2 3 OR 3 1 4 5 4 1 1 2 4 2 6 0 7 3 1 PA 7 5 1 3 3 5 3 1 1 2 8 4 0 4 0 RI 3 2 0 0 2 0 2 0 0 0 1 1 0 0 3 SC 9 12 4 9 6 4 2 1 2 3 9 8 3 9 4 SD 3 0 4 1 1 2 0 1 0 1 1 0 3 4 0 TN 11 9 8 9 7 5 2 3 1 6 10 3 6 7 8 TX 21 10 12 27 29 6 7 6 11 8 28 5 6 33 35 UT 5 1 4 5 6 1 0 3 2 5 10 1 3 6 1 VA 5 3 6 6 7 4 2 2 4 4 2 0 1 1 4 VT 0 1 0 0 0 0 1 0 0 0 0 0 0 0 0 WA 10 9 8 17 6 3 5 5 9 3 8 3 4 14 6 WI 9 16 10 4 12 8 9 6 1 4 7 20 10 2 6 WV 6 2 2 1 2 0 1 2 1 1 5 1 1 0 0 WY 1 1 1 0 0 1 1 0 0 0 0 0 1 0 0 AS 0 0 0 0 0 0 0 0 0 0 0 0 0 0 0
CNMI 0 0 0 0 0 0 0 0 0 0 0 0 0 0 0 GU 0 0 0 0 0 0 0 0 0 0 0 0 0 0 0 PR 1 0 0 0 0 0 0 0 0 0 1 0 0 0 0 VI 0 0 0 0 0 0 0 0 0 0 0 0 0 0 0 AT 0 0 0 0 0 0 0 0 0 0 0 0 0 0 0 GM 0 0 0 0 0 0 0 0 0 0 0 0 0 0 0 PC 0 0 0 0 0 0 0 0 0 0 0 0 0 0 0
Recreational Boating Statistics 2020 26

Accident Causes & Conditions
Table 9 ▪ VESSEL OPERATION AT THE TIME OF ACCIDENT 2020
Vessels Involved Deaths Injuries
Totals 7248 767 3191
At anchor 253 28 63
Being towed 53 0 10
Changing direction 1021 58 491
Changing speed 823 39 409
Cruising 2870 217 1540
Docking/undocking 59 7 10
Drifting 708 186 353
Idling 65 7 45
Launching/loading 30 1 12
Rowing/paddling 257 150 108
Sailing 59 4 17
Tied to dock/moored 775 8 73
Towing 49 1 3
Trolling 30 8 10
Other 39 2 11
Unknown 157 51 36
Table 10 ▪ VESSEL ACTIVITY AT THE TIME OF ACCIDENT 2020
Deaths Injuries
Vessels Involved Total Operator Occupant
Other/unknown
role Total Operator Occupant
Other/unknown
role Totals 7248 767 448 285 34 3191 1222 1496 473
Boating/relaxation 4683 425 260 155 10 2186 972 1146 68
Commercial 37 0 0 0 0 1 1 0 0 Fishing 772 226 145 76 5 271 132 135 4
Fueling 24 0 0 0 0 26 7 18 1
Government 21 0 0 0 0 1 0 1 0
Hunting 37 13 5 8 0 24 14 10 0
Racing 36 2 1 1 0 16 8 8 0
Repairs 65 3 3 0 0 41 18 21 2
Starting engine 71 2 0 2 0 70 23 44 3
Swimming/snorkeling 129 58 21 37 0 67 5 50 12
Towed watersports 496 23 1 3 19 439 16 45 378
Towing 89 1 1 0 0 12 3 8 1
Whitewater 33 11 9 2 0 15 12 3 0
Other 27 3 2 1 0 16 11 5 0
None; not in operation 661 0 0 0 0 3 0 0 3
Unknown 67 0 0 0 0 3 0 2 1
Recreational Boating Statistics 2020 27

Accident Causes & Conditions
Table 11 ▪ WEATHER AND WATER CONDITIONS 2020
Accidents Deaths Injuries 5265 767 3191
TYPE OF BODY OF WATER
Lakes, Ponds, Reservoirs, Dams, Gravel Pits 2474 396 1486
Rivers, Streams, Creeks, Swamps, Bayous 1161 219 792 Bays, Inlets, Marinas, Sounds, Harbors,Channels, Canals, Sloughs, Coves 1071 108 626
Ocean/Gulf 432 32 229
Great Lakes (not tributaries) 127 12 58
Unknown 0 0 0
WATER CONDITIONS
Calm (waves less than 6") 2946 409 1862 Choppy (waves >6" to 2') 1519 179 950
Rough (waves >2' to 6') 462 81 190 Very Rough (waves larger than 6') 86 14 39 Unknown 252 84 150
WIND
None 393 54 271 Light (0 - 6 mph) 3064 434 2003 Moderate (7 - 14 mph) 1258 159 664 Strong (15 - 25 mph) 330 61 135 Storm (over 25 mph) 63 19 27 Unknown 157 40 91
VISIBILITY
Poor - Day 82 23 31 Poor - Night 140 27 128 Poor - Unknown if day or night 0 0 0 Fair - Day 209 31 104 Fair - Night 130 27 68 Fair– Unknown if day or night 2 1 0 Good - Day 3971 515 2346 Good - Night 458 85 366 Good- Unknown if day or night 6 0 3 Unknown - Day 197 42 113 Unknown - Night 60 12 29 Unknown - Unknown if day or night 10 4 3
WATER TEMPERATURE
39 degrees F and below 46 22 28 40 - 49 degrees F 127 46 70 50 - 59 degrees F 371 84 191 60 - 69 degrees F 876 121 469 70 - 79 degrees F 1634 184 1015
80 - 89 degrees F 1312 148 881 90 degrees F and above 41 5 25 Unknown 858 157 512
Recreational Boating Statistics 2020 28

Accident Causes & Conditions
Table 12 ▪ TIME RELATED DATA 2020 Accidents Deaths Injuries
5265 767 3191
Time of Day
12:00 am to 2:30 am 103 34 70 2:31 am to 4:30 am 51 6 18 4:31 am to 6:30 am 40 1 24 6:31 am to 8:30 am 148 27 66 8:31 am to 10:30 am 275 51 136 10:31 am 12:30 pm 565 82 293 12:31 pm to 2:30 pm 832 95 501 2:31 pm to 4:30 pm 1086 124 662 4:31 pm to 6:30 pm 1058 151 619 6:31 pm to 8:30 pm 650 94 452 8:31 pm to 10:30 pm 298 56 221 10:31 pm to 11:59 pm 89 19 115 Unknown 70 27 14
Month of Year
January 103 28 57 February 86 16 38 March 181 39 105 April 225 51 116 May 722 88 462 June 921 126 558 July 1115 137 715 August 920 123 576 September 502 64 287 October 242 46 142 November 152 33 86 December 96 16 49
Day of Week
Sunday 1290 167 828 Monday 455 77 266 Tuesday 360 73 192 Wednesday 385 73 197 Thursday 479 89 249 Friday 683 98 374 Saturday 1613 190 1085
Recreational Boating Statistics 2020 29

Accident Causes & Conditions
Table 13 ▪ VESSEL INFORMATION 2020
Vessels Involved Deaths Injuries
7248 767 3191
Hull Material
Aluminum 1197 232 511 Fiberglass 5344 337 2458 Plastic 292 112 128 Rubber/Vinyl/Canvas 61 35 28 Steel 35 4 3 Wood 63 10 15 Other 31 4 9 Unknown 225 33 39
Horsepower
No Engine 390 209 164 10 hp or less 107 35 36 11 - 25 hp 138 32 63
26 - 75 hp 518 82 238 76 - 150 hp 1488 109 772 151 - 250 hp 1015 72 490 Over 250 hp 1417 50 541 Unknown 2175 178 887
Year Built
2020 540 33 273 2019 553 49 264 2017 - 2018 622 58 295 2015 - 2016 413 35 196 2013 - 2014 265 25 118 2007 - 2012 706 51 299 Prior to 2007 3312 319 1464 Unknown 837 197 282
Length
Less than 16 feet 2091 342 1118 16 feet to <26 feet 3333 329 1594 26 feet to <40 feet 902 34 290 40 feet to 65 feet 391 3 51 More than 65 feet 51 1 2 Unknown 480 58 136
Recreational Boating Statistics 2020 30

Accident Causes & Conditions
Tab
le 1
4 ▪
RE
NT
AL
ST
AT
US
OF
VE
SS
EL
S I
NV
OL
VE
D I
N A
CC
IDE
NT
S
Ves
sels
D
eath
s In
juri
es
# of
Ves
sels
R
ente
d N
otR
ente
d U
nkno
wn
if re
nted
#
ofD
eath
s R
ente
d N
otre
nted
U
nkno
wn
if re
nted
#
ofIn
jurie
s R
ente
d N
otre
nted
U
nkno
wn
if re
nted
All
Ves
sels
72
48
995
4600
16
53
767
81
515
171
3191
48
9 21
23
579
Airb
oat
32
0 30
2
1 0
1 0
15
0 15
0
Aux
iliar
y sa
ilboa
t 23
4 11
17
6 47
2
0 2
0 33
2
21
10
Cab
in m
otor
boat
93
7 11
75
8 16
8 33
0
28
5 29
8 3
254
41
Can
oe
59
6 42
11
42
3
28
11
28
4 21
3
Hou
sebo
at
67
11
25
31
2 1
1 0
6 3
3 0
Infla
tabl
e 26
4
15
7 18
2
12
4 14
4
5 5
Kay
ak
213
19
139
55
112
10
80
22
89
7 51
31
O
pen
mot
orbo
at
3257
17
5 23
32
750
376
19
269
88
1520
82
11
65
273
Per
sona
l wat
ercr
aft
1564
55
3 71
0 30
1 66
16
40
10
89
6 28
7 45
0 15
9 P
onto
on
588
196
267
125
67
27
27
13
232
92
102
38
Row
boat
42
1
36
5 20
0
16
4 17
1
16
0 S
ailb
oat (
only
) 31
2
23
6 5
0 5
0 8
1 6
1
Sai
lboa
t (un
know
n)
3 0
2 1
0 0
0 0
0 0
0 0
Sta
ndup
pad
dleb
oard
17
3
10
4 10
1
6 3
7 2
4 1
Oth
er
19
2 9
8 2
2 0
0 1
0 0
1
Unk
now
n 15
9 1
26
132
11
0 0
11
27
1 10
16
Recreational Boating Statistics 2020 31

Accident Causes & Conditions
Table 15 ▪ NUMBER & PERCENT OF DEATHS BY VESSEL LENGTH
Length Drownings Deaths by Causes
other than Drowning Total Deaths Percent of Deaths
from Drowning <16' 257 85 342 75% 16-<26' 221 108 329 67% 26-<40' 18 16 34 53%
40-65' 2 1 3 67% >65' 0 1 1 0%
Unknown 36 22 58 62% Total 534 233 767 70%
Recreational Boating Statistics 2020 32

Accident types

Accident Types
Explanation of Accident Types Section
The following section contains six tables that examine data related to the events in accidents (termed “accident types”). The tables focus on these events and break down information by state, vessel type, vessel length, engine type, and propulsion.
In the Coast Guard's national database, there are four fields that can be used to define the series of events in an accident. By events, we mean the series of occurrences during an accident. If a wave broke over a vessel causing it to take on water, capsize, and eject its occupant, the Coast Guard would categorize this accident by three events. First, there was a flooding/swamping. Second, there was a capsizing. Third, there was an ejection.
With the exception of one table, the tables and figures in this report focus only on the first event in the sequence. The rationale for providing only the first accident type is to keep the tables simplistic; if we added the second, third, and fourth events in the boating sequence, our accident, casualty, and damage totals would not match up because they would be double-counting the accidents, casualties, and damages for cases that had more than one event.
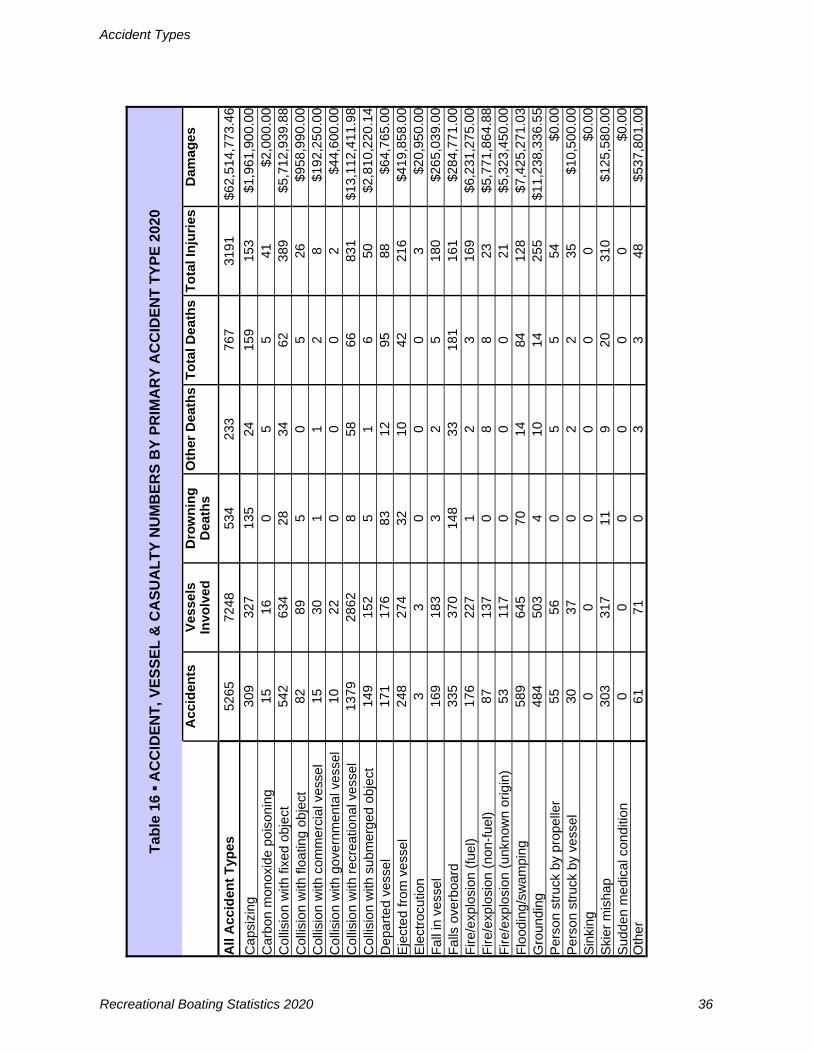
Accident, Vessel & Casualty Numbers by Primary Accident Type (Table 16, Page 36) This table focuses on the first event in a boating accident and provides information on the number of accidents, vessels, and casualties attributed to that first event. The deaths section is also separated by the categories drownings and non-drownings.
Five-year Summary of Frequency of Events in Accidents & Casualties Nationwide (Table 17, Pages 37-40) As mentioned in the second paragraph, there are four fields that can be used to define the series of events in an accident. This table focuses on the first three events in an accident and the number of cas-ualties associated with each event. The Coast Guard leaves out the fourth because it is not a standardized field.
Using the example in the opening paragraphs, the flooding/swamping would fall under the intersection of the column "First Event in an Accident" and the row "Flooding/swamping”. The capsizing would be marked under the column "Second Event in an Accident" and the row "Capsizing". Finally, the ejectionwould be marked under the column "Third Event in an Accident" and the row "Ejected from Vessel”.
This table focuses on the frequency that these events occurred nationally and the total number of deaths that were associated with each accident type. If we turn back to our example and focus on deaths as a result of flooding/swamping, we see that there were 589 accidents where flooding/swamping was the first event in the boating accident. There were 84 deaths associated with this first event type. However, there were other accidents that involved a flooding/swamping as a second or third occurrence. There were 343 accidents and 25 deaths associated with flooding/swamping as a second event and 75 accidents and 8 deaths associated with flooding/swamping as a third event. All combined, you get the sixth column of the table that looks at how many deaths were associated with an event that occurredeither as the first, second, or third occurrence in an accident. Please note that in this table deaths are not separated by first, second and third event. In the example, there were 1,007 accidents and 117 deaths associated with flooding/swamping as a first, second, or third event.
This table can be difficult to understand, especially when the reader is under the expectation that the tallies of the casualty columns will equal the numbers published at the front of this report that reference the number of reportable accidents and deaths.
Number of Vessels in Accidents by Vessel Length & Primary Accident Type (Table 18, Page 41) This table displays the types of accidents by the length of vessel. The table lists vessel length by foot for vessels of lengths 4 ft-39 ft. After 39 ft, information is categorized in ranges. This table also provides information about the number of casualties and vessels associated by length of vessel.
Recreational Boating Statistics 2020 34

Accident Types
Number of Vessels in Accidents by Vessel Type & Primary Accident Type (Table 19, Page 42) This table examines the first event of a boating accident for all vessels involved in an accident. It also provides information about the casualties associated with each vessel type.
Number of Vessels in Accidents by Primary Accident Type & Propulsion Type (Table 20, Page 43) This table provides information about the number of vessels involved in accidents by primary accident type and propulsion type.
Number of Vessels with Propellers by Primary Accident Type & Engine Type (Table 21, Page 43) This table provides information about the number of casualties and vessels associated by primary acci-dent type and engine type. This table is a subset of information from Table 20 and represents all ves-sels propelled by a propeller.
Recreational Boating Statistics 2020 35
Accident Types
Tab
le 1
6 ▪
AC
CID
EN
T,
VE
SS
EL
& C
AS
UA
LT
Y N
UM
BE
RS
BY
PR
IMA
RY
AC
CID
EN
T T
YP
E 2
020
Acc
iden
ts
Ves
sels
Invo
lved
D
row
nin
g
Dea
ths
Oth
er D
eath
s T
ota
l Dea
ths
To
tal I
nju
ries
D
amag
es
All
Acc
iden
t T
ypes
52
65
7248
53
4 23
3 76
7 31
91
$62,
514,
773.
46
Cap
sizi
ng
309
327
135
24
159
153
$1,9
61,9
00.0
0 C
arbo
n m
onox
ide
pois
onin
g 15
16
0
5 5
41
$2,0
00.0
0 C
ollis
ion
with
fixe
d ob
ject
54
2 63
4 28
34
62
38
9 $5
,712
,939
.88
Col
lisio
n w
ith fl
oatin
g ob
ject
82
89
5
0 5
26
$958
,990
.00
Col
lisio
n w
ith c
omm
erci
al v
esse
l 15
30
1
1 2
8 $1
92,2
50.0
0C
ollis
ion
with
gov
ernm
enta
l ves
sel
10
22
0 0
0 2
$44,
600.
00
Col
lisio
n w
ith r
ecre
atio
nal v
esse
l 13
79
2862
8
58
66
831
$13,
112,
411.
98C
ollis
ion
with
sub
mer
ged
obje
ct
149
152
5 1
6 50
$2
,810
,220
.14
Dep
arte
d ve
ssel
17
1 17
6 83
12
95
88
$6
4,76
5.00
E
ject
ed fr
om v
esse
l 24
8 27
4 32
10
42
21
6 $4
19,8
58.0
0E
lect
rocu
tion
3 3
0 0
0 3
$20,
950.
00
Fal
l in
vess
el
169
183
3 2
5 18
0 $2
65,0
39.0
0F
alls
ove
rboa
rd
335
370
148
33
181
161
$284
,771
.00
Fire
/exp
losi
on (
fuel
) 17
6 22
7 1
2 3
169
$6,2
31,2
75.0
0 F
ire/e
xplo
sion
(no
n-fu
el)
87
137
0 8
8 23
$5
,771
,864
.88
Fire
/exp
losi
on (
unkn
own
orig
in)
53
117
0 0
0 21
$5
,323
,450
.00
Flo
odin
g/sw
ampi
ng
589
645
70
14
84
128
$7,4
25,2
71.0
3 G
roun
ding
48
4 50
3 4
10
14
255
$11,
238,
336.
55P
erso
n st
ruck
by
prop
elle
r 55
56
0
5 5
54
$0.0
0 P
erso
n st
ruck
by
vess
el
30
37
0 2
2 35
$1
0,50
0.00
S
inki
ng
0 0
0 0
0 0
$0.0
0 S
kier
mis
hap
30
3 31
7 11
9
20
310
$125
,580
.00
Sud
den
med
ical
con
ditio
n 0
0 0
0 0
0 $0
.00
Oth
er
61
71
0 3
3 48
$5
37,8
01.0
0
Recreational Boating Statistics 2020 36

Accident Types
Table 17 ▪ FREQUENCY OF EVENTS IN ACCIDENTS & CASUALTIES NATIONWIDE
2020
First E
vent in an Accident
Second E
vent in an Accident
Third E
vent in an Accident
Total T
imes E
vent O
ccurred in all Accidents
Deaths A
ssociated with E
vent in all A
ccidents
Injuries Associated w
ith Event
in all Accidents
Dam
ages Associated w
ithE
vent in all Accidents
Capsizing 309 315 72 696 226 284 $6,195,036.34 Carbon monoxide poisoning 15 0 0 15 5 41 $2,000.00 Collision with fixed object 542 93 19 654 69 445 $7,027,142.79 Collision with floating object 82 4 0 86 5 28 $966,005.00 Collision with commercial vessel 15 1 1 17 2 10 $195,005.00 Collision with governmental vessel 10 2 0 12 0 3 $92,600.00 Collision with recreational vessel 1379 89 10 1478 68 854 $14,437,120.93 Collision with submerged object 149 1 0 150 6 51 $2,810,220.14 Departed vessel 171 97 19 287 119 130 $2,153,967.00 Ejected from vessel 248 717 475 1440 351 1186 $9,893,195.46 Electrocution 3 1 0 4 2 5 $20,950.00 Fall in vessel 169 259 54 482 22 691 $4,360,490.00 Falls overboard 335 49 5 389 200 189 $408,911.00 Fire/explosion (fuel) 176 1 2 179 3 171 $7,505,475.00 Fire/explosion (non-fuel) 87 3 1 91 8 24 $6,350,364.88 Fire/explosion (unknown origin) 53 0 0 53 0 21 $5,323,450.00 Flooding/swamping 589 343 75 1007 117 284 $24,329,920.03 Grounding 484 80 34 598 34 319 $12,528,222.55 Person struck by propeller 55 148 44 247 39 241 $511,850.00 Person struck by vessel 30 314 26 370 54 442 $1,717,942.00 Sinking 0 112 99 211 40 62 $7,737,499.00 Skier mishap 303 28 2 333 22 353 $142,285.00 Sudden medical condition 0 0 0 0 0 0 $0.00 Other 61 12 1 74 4 60 $557,601.00 Unknown 0 0 0 0 0 0 $0.00
2019 Capsizing 242 240 50 532 185 234 $6,672,595.09 Carbon monoxide poisoning 12 1 0 13 5 32 $650.00 Collision with fixed object 493 101 13 607 53 380 $11,611,781.57 Collision with floating object 68 7 3 78 14 30 $1,124,094.75 Collision with commercial vessel 21 3 2 26 2 19 $381,306.78 Collision with governmental vessel 8 0 0 8 0 4 $56,200.00 Collision with recreational vessel 1071 83 15 1169 47 690 $12,097,263.60
Collision with submerged object 134 1 0 135 9 59 $1,675,134.20
Recreational Boating Statistics 2020 37

Accident Types
Table 17 Con nued ▪ FREQUENCY OF EVENTS IN ACCIDENTS & CASUALTIES NATIONWIDE
2019 continued
First E
vent in an Accident
Second E
vent in an Accident
Third E
vent in an Accident
Total T
imes E
vent O
ccurred in all Accidents
Deaths A
ssociated with E
vent in all A
ccidents
Injuries Associated w
ith Event
in all Accidents
Dam
ages Associated w
ith E
vent in all Accidents
Departed vessel 97 41 7 145 73 69 $333,423.01 Ejected from vessel 181 555 347 1083 277 910 $10,425,432.09 Electrocution 0 2 0 2 0 5 $30,000.00 Fall in vessel 131 252 43 426 26 637 $7,903,634.68 Falls overboard 299 27 7 333 194 151 $143,451.19 Fire/explosion (fuel) 134 5 0 139 0 107 $4,123,621.71 Fire/explosion (non-fuel) 59 3 2 64 2 16 $6,496,195.00 Fire/explosion (unknown origin) 46 0 0 46 3 9 $6,499,679.00 Flooding/swamping 399 246 58 703 76 206 $16,930,794.83 Grounding 413 56 20 489 25 294 $6,792,155.24 Person struck by propeller 39 101 31 171 35 155 $100,402.19 Person struck by vessel 19 225 25 269 34 338 $956,315.00 Sinking 0 86 70 156 18 37 $7,901,198.44 Skier mishap 259 13 0 272 13 301 $33,833.01 Sudden medical condition 0 2 0 2 1 1 $0.00 Other 43 11 3 57 5 55 $68,550.00 Unknown 0 0 0 0 0 0 $0.00
2018 Capsizing 266 223 62 551 214 269 $4,245,361.27 Carbon monoxide poisoning 8 2 0 10 8 8 $0.00 Collision with fixed object 470 84 17 571 71 348 $8,793,679.73 Collision with floating object 59 5 0 64 11 26 $499,957.49 Collision with commercial vessel 25 0 1 26 1 18 $753,995.00 Collision with governmental vessel 6 3 0 9 1 4 $71,501.00 Collision with recreational vessel 1028 65 10 1103 45 689 $11,044,445.18 Collision with submerged object 151 1 0 152 10 45 $1,274,500.69 Departed vessel 119 69 20 208 86 100 $857,197.37 Ejected from vessel 197 585 276 1058 305 983 $7,858,064.03 Electrocution 0 0 0 0 0 0 $0.00 Fall in vessel 128 191 57 376 39 535 $4,205,491.69 Falls overboard 274 49 6 329 171 158 $455,847.70 Fire/explosion (fuel) 145 2 1 148 4 99 $3,906,954.54 Fire/explosion (non-fuel) 70 3 0 73 0 11 $6,235,940.37 Fire/explosion (unknown origin) 41 0 0 41 0 7 $3,291,006.75 Flooding/swamping 443 244 78 765 105 227 $13,031,049.80
Recreational Boating Statistics 2020 38

Accident Types
Table 17 Con nued ▪ FREQUENCY OF EVENTS IN ACCIDENTS & CASUALTIES NATIONWIDE
2018 continued
First E
vent in an Accident
Second E
vent in an Accident
Third E
vent in an Accident
Total T
imes E
vent O
ccurred in all Accidents
Deaths A
ssociated with E
vent in all A
ccidents
Injuries Associated w
ith Event
in all Accidents
Dam
ages Associated w
ith E
vent in all Accidents
Grounding 367 64 33 464 26 298 $6,901,793.84
Person struck by propeller 45 107 25 177 25 177 $80,388.70
Person struck by vessel 31 204 34 269 23 348 $837,487.82
Sinking 0 144 87 231 20 45 $6,343,604.00
Skier mishap 230 8 1 239 10 264 $2,600.00
Sudden medical condition 0 0 0 0 0 0 $0.00
Other 42 17 1 60 2 53 $498,108.00
Unknown 0 0 0 0 0 0 $0.00
2017 Capsizing 286 244 72 602 222 324 $5,472,159.63 Carbon monoxide poisoning 9 1 1 11 4 14 $100.00 Collision with fixed object 470 103 11 584 68 384 $7,133,312.41 Collision with floating object 55 5 0 60 5 29 $665,200.00 Collision with commercial vessel 19 2 2 23 2 15 $543,700.00 Collision with governmental vessel 6 0 0 6 0 5 $56,200.00 Collision with recreational vessel 1145 65 2 1212 52 753 $10,007,231.45 Collision with submerged object 141 1 0 142 3 47 $1,236,846.31 Departed vessel 93 56 14 163 66 82 $1,146,500.00 Ejected from vessel 173 610 348 1131 330 968 $7,569,723.77 Electrocution 1 2 0 3 5 0 $7,000.00 Fall in vessel 154 272 58 484 23 743 $5,109,056.87 Falls overboard 306 39 4 349 190 158 $135,458.00 Fire/explosion (fuel) 157 5 2 164 2 103 $5,532,049.00 Fire/explosion (non-fuel) 81 2 1 84 0 12 $6,793,581.68 Fire/explosion (unknown origin) 33 0 1 34 1 5 $2,758,227.00 Flooding/swamping 435 269 74 778 98 251 $17,383,750.97
Grounding 368 50 15 433 24 262 $5,773,401.27 Person struck by propeller 30 118 24 172 31 162 $170,980.00 Person struck by vessel 23 253 31 307 38 403 $1,087,437.00 Sinking 0 113 100 213 19 50 $10,377,829.59 Skier mishap 259 18 1 278 16 290 $14,134.00 Sudden medical condition 2 1 0 3 3 0 $0.00 Other 45 9 3 57 1 54 $392,437.00 Unknown 0 0 0 0 0 0 $0.00
Recreational Boating Statistics 2020 39

Accident Types
Table 17 Con nued ▪ FREQUENCY OF EVENTS IN ACCIDENTS & CASUALTIES NATIONWIDE
2016
First E
vent in an Accident
Second E
vent in an Accident
Third E
vent in an Accident
Total T
imes E
vent O
ccurred in all Accidents
Deaths A
ssociated with E
vent in all A
ccidents
Injuries Associated w
ith Event in
all Accidents
Dam
ages Associated w
ith Event
in all Accidents
Capsizing 305 262 60 627 263 356 $4,262,346.53
Carbon monoxide poisoning 8 2 1 11 6 13 $5,000.00
Collision with fixed object 565 82 9 656 74 475 $8,189,699.35
Collision with floating object 53 4 0 57 5 19 $489,063.83
Collision with commercial vessel 31 3 0 34 5 23 $696,484.58
Collision with governmental vessel 4 0 1 5 0 3 $15,100.00
Collision with recreational vessel 1051 67 9 1127 42 747 $9,587,374.22
Collision with submerged object 143 5 0 148 9 56 $2,772,112.20
Departed vessel 121 58 16 195 96 88 $1,018,112.00
Ejected from vessel 160 609 311 1080 319 969 $7,122,482.55
Electrocution 2 0 0 2 2 1 $0.00
Fall in vessel 170 284 52 506 25 693 $3,956,127.78
Falls overboard 284 58 9 351 183 177 $227,195.00
Fire/explosion (fuel) 158 10 2 170 2 138 $3,054,056.00
Fire/explosion (non-fuel) 81 2 1 84 0 8 $7,265,495.00
Fire/explosion (unknown origin) 34 0 0 34 1 10 $5,198,480.00
Flooding/swamping 470 258 82 810 111 285 $15,154,400.50
Grounding 413 55 23 491 16 299 $7,128,476.37
Person struck by propeller 42 101 28 171 24 175 $124,740.00
Person struck by vessel 32 220 31 283 24 367 $889,104.49
Sinking 0 119 83 202 23 46 $8,122,022.00
Skier mishap 278 19 3 300 11 316 $47,490.00
Sudden medical condition 10 1 0 11 9 2 $700.00
Other 48 28 5 81 6 66 $759,150.09
Unknown 0 0 0 0 0 0 $0.00
Recreational Boating Statistics 2020 40

Accident Types
Table 18 ▪ NUMBER OF VESSELS IN ACCIDENTS BY VESSELACCIDENT TYPE
LENGTH & PRIMARY
Total vessels involved
Capsizing
Carbon m
onoxide poisoning
Collision w
ith fixed object
Collision w
ith floating object
Collision w
ith comm
ercial vessel
Collision w
ith governmental vessel
Collision w
ith recreational vessel
Collision w
ith submerged o
bject
Departed
vessel
Ejected from
vessel
Electrocution
Fall in
vesse
l
Falls overboard
Fire/e
xplo
sion
(fue
l)
Fire/explosion (n
on-fuel)
Fire/explosion (u
nknown)
Flooding/ sw
amp
ing
Grou
nding
Person struck b
y propeller
Pe
rson
struck by ve
ssel
Sin
king
Skier m
ishap
Sudden m
edical condition
Other
Unkno
wn
Dro
wnings
Other D
eaths
Total D
eaths
Injuries
All lengths 7248 327 16 634 89 30 22 2862 152 176 274 3 183 370 227 137 117 645 503 56 37 0 317 0 71 0 534 233 767 3191
3 feet 1 0 0 0 0 0 0 0 0 0 0 0 0 0 0 0 0 0 1 0 0 0 0 0 0 0 0 0 0 1
4 feet 2 1 0 0 0 0 0 0 0 0 0 0 0 1 0 0 0 0 0 0 0 0 0 0 0 0 1 0 1 1
5 feet 2 0 0 0 0 0 0 1 0 0 1 0 0 0 0 0 0 0 0 0 0 0 0 0 0 0 0 0 0 0
6 feet 11 3 1 0 0 0 0 2 2 0 0 0 0 1 0 0 0 1 1 0 0 0 0 0 0 0 2 1 3 7
7 feet 23 1 0 0 0 2 0 10 0 1 3 0 3 2 0 0 0 1 0 0 0 0 0 0 0 0 4 0 4 10
8 feet 79 20 0 3 3 0 0 24 0 1 5 0 1 12 2 1 0 3 1 0 1 0 1 0 1 0 27 3 30 41
9 feet 135 14 0 9 3 0 0 61 1 1 12 0 5 12 3 0 0 5 3 0 2 0 4 0 0 0 15 5 20 70
10 feet 739 46 0 47 4 0 0 418 7 9 62 0 16 59 7 2 4 16 18 0 4 0 17 0 3 0 60 22 82 410
11 feet 575 18 0 46 4 2 2 342 5 1 70 1 20 27 1 2 0 10 12 0 5 0 5 0 2 0 18 23 41 332
12 feet 191 30 0 12 2 0 0 67 3 2 17 0 3 26 0 0 3 15 8 0 0 0 3 0 0 0 39 7 46 102
13 feet 57 10 0 10 0 0 0 12 2 1 3 0 1 4 0 0 2 7 4 0 0 0 1 0 0 0 12 5 17 28
14 feet 138 23 0 14 3 1 0 17 5 4 6 0 2 19 1 0 0 36 3 1 1 0 0 0 2 0 43 7 50 67
15 feet 138 13 0 15 1 0 0 29 4 1 13 0 4 6 2 1 0 42 7 0 0 0 0 0 0 0 36 12 48 49
Under 16 ft 2091 179 1 156 20 5 2 983 29 21 192 1 55 169 16 6 9 136 58 1 13 0 31 0 8 0 257 85 342 1118
16 feet 253 28 0 26 2 1 0 63 9 6 11 0 5 18 6 0 0 56 13 0 1 0 7 0 1 0 44 11 55 131
17 feet 286 16 0 21 4 1 0 86 18 7 6 0 3 14 8 3 0 63 19 2 1 0 11 0 3 0 26 5 31 150
18 feet 401 11 0 37 7 2 1 120 8 16 4 0 12 23 13 3 3 64 33 4 3 0 34 0 3 0 39 13 52 189
19 feet 311 5 1 20 5 0 3 96 8 10 7 0 13 13 19 7 1 31 28 3 4 0 33 0 4 0 14 17 31 173
20 feet 448 10 1 31 10 1 0 153 12 17 14 1 14 24 18 1 1 57 35 5 1 0 37 0 5 0 30 14 44 229
21 feet 417 3 3 26 4 4 0 134 10 14 7 0 14 14 15 6 1 51 46 11 1 0 49 0 4 0 17 18 35 201
22 feet 376 4 3 33 5 1 0 138 8 19 2 0 9 16 17 0 3 32 42 7 1 0 29 0 7 0 19 15 34 144
23 feet 289 1 0 35 4 0 2 106 5 13 5 0 8 7 8 7 2 19 27 8 0 0 27 0 5 0 8 7 15 150
24 feet 339 3 1 40 3 1 1 127 9 19 3 0 12 17 15 5 6 22 20 3 4 0 24 0 4 0 15 5 20 138
25 feet 213 2 1 24 3 2 3 73 5 9 2 0 7 5 8 3 4 14 28 3 1 0 14 0 2 0 9 3 12 89
16 ft to less than 26 ft
3333 83 10 293 47 13 10 1096 92 130 61 1 97 151 127 35 21 409 291 46 17 0 265 0 38 0 221 108 329 1594
26 feet 138 4 1 13 2 2 2 51 5 3 0 0 2 5 9 1 4 9 15 3 1 0 3 0 3 0 2 4 6 38
27 feet 101 1 0 16 1 0 1 32 5 3 0 0 2 0 5 1 5 10 7 2 1 0 5 0 4 0 1 3 4 44 28 feet 95 0 0 9 2 0 1 45 0 3 2 0 4 0 5 3 2 7 10 1 0 0 0 0 1 0 5 0 5 20
29 feet 51 1 0 6 0 1 0 24 2 1 1 0 0 0 3 2 2 3 5 0 0 0 0 0 0 0 0 1 1 8
30 feet 76 5 0 6 3 1 0 27 1 3 1 0 3 1 3 2 3 2 11 0 0 0 1 0 3 0 2 0 2 28
31 feet 51 0 1 5 2 0 0 17 0 0 0 0 4 0 8 1 2 4 6 0 0 0 1 0 0 0 0 0 0 32
32 feet 70 0 1 2 1 1 0 31 1 0 1 0 3 3 5 3 2 3 7 1 2 0 1 0 2 0 3 1 4 24
33 feet 64 1 0 7 2 1 1 28 2 1 0 0 3 1 5 3 2 1 6 0 0 0 0 0 0 0 1 2 3 21
34 feet 58 0 0 5 1 1 0 30 0 0 2 0 0 2 3 7 1 1 4 0 0 0 0 0 1 0 2 1 3 11
35 feet 44 1 1 4 1 0 0 25 1 0 0 0 0 0 2 2 2 0 5 0 0 0 0 0 0 0 0 2 2 27
36 feet 47 1 0 4 0 1 0 24 0 1 1 0 0 1 2 4 2 2 4 0 0 0 0 0 0 0 1 0 1 9
37 feet 41 0 0 8 1 0 0 16 2 0 0 0 0 1 2 1 3 1 5 1 0 0 0 0 0 0 1 0 1 11
38 feet 39 1 0 5 1 0 0 17 1 0 0 0 0 0 0 2 2 2 8 0 0 0 0 0 0 0 0 2 2 13
39 feet 27 1 0 0 0 0 0 16 0 0 0 0 0 1 1 3 2 1 2 0 0 0 0 0 0 0 0 0 0 4
26 ft to less than 40 ft
902 16 4 90 17 8 5 383 20 15 8 0 21 15 53 35 34 46 95 8 4 0 11 0 14 0 18 16 34 290
40 ft to 65 ft 391 1 1 62 3 2 1 166 6 1 0 0 1 7 16 22 39 15 41 0 1 0 0 0 6 0 2 1 3 51
Over 65 ft 51 1 0 10 0 2 0 28 1 0 0 0 0 2 1 0 2 2 2 0 0 0 0 0 0 0 0 1 1 2
Unknown 480 47 0 23 2 0 4 206 4 9 13 1 9 26 14 39 12 37 16 1 2 0 10 0 5 0 36 22 58 136
Recreational Boating Statistics 2020 41

Accident Types
Tab
le 1
9 ▪
NU
MB
ER
OF
VE
SS
EL
S IN
AC
CID
EN
TS
BY
VE
SS
EL
TY
PE
& P
RIM
AR
Y A
CC
IDE
NT
TY
PE
WIT
H
NU
MB
ER
OF
CA
SU
AL
TIE
S B
Y C
AS
UA
LT
Y T
YP
E &
VE
SS
EL
TY
PE
202
0
Injuries
3191 15 33 298
28 6 14 8915
2089
623
217 8 0 7 1 27
Total deaths
767 1 2 33 42 2 18 112
376
66 67 20 5 0 10 2 11
Deaths by causes other than drowning
233 0 1 17 6 2 0 17 116
47 14 1 2 0 0 0 10
Drownings
534 1 1 16 36 0 18 95 260
19 53 19 3 0 10 2 1
Unknown 0 0 0 0 0 0 0 0 0 0 0 0 0 0 0 0 0
Other 71 1 1 10 0 0 0 2 35 4 15 0 0 1 0 0 2
Sudden medical condition 0 0 0 0 0 0 0 0 0 0 0 0 0 0 0 0 0
Skier mishap
317 0 0 4 0 0 0 0
250
31 30 0 0 0 0 0 2
Sinking 0 0 0 0 0 0 0 0 0 0 0 0 0 0 0 0 0
Person struck by vessel
37 0 0 1 0 0 0 0 17 13 6 0 0 0 0 0 0
Person struck by propeller
56 0 0 7 0 0 0 0 33 0 15 0 0 0 0 0 1
Grounding
503 5 36 103
0 1 0 2 274
38 30 2 4 0 0 1 7
Flooding/swamping
645 8 9 54 4 9 2 15 491
20 17 4 2 0 0 1 9
Fire/explosion (unknown origin) 11
7 0 8 56 0 11 0 0 21 10 7 0 0 0 0 0 4
Fire/explosion (non-fuel) 13
7
0 6 47 0 4 0 0 32 5 6 0 1 0 0 0 36
Fire/explosion (fuel)
227 0 4 80 0 5 0 0 112
14 5 0 0 0 0 0 7
Falls overboard
370
0 3 14 6 4 6 31 139
81 57 12 7 0 9 1 0
Fall in vessel
183
0 3 14 0 2 0 1 92 50 14 1 0 0 1 1 4
Electrocution 3 0 0 0 0 0 0 1 1 1 0 0 0 0 0 0 0
Ejected from vessel
274
1 4 1 0 1 3 6 79 169
8 0 0 0 0 0 2
Departed vessel
176
0 1 7 2 0 1 5 89 7 60 3 0 0 0 1 0
Collision with submerged object
152 0 2 23 1 0 1 5 99 12 8 0 0 0 0 0 1
Collision with recreational vessel
2862 3 125
366 0 24 1 14 1047
969
223 1 9 1 3 7 69
Collision with governmental vessel
22 0 1 7 0 0 0 0 8 2 1 0 0 0 0 0 3 Collision with commercial vessel 30 1 0 6 0 0 0 0 14 4 1 1 0 0 0 3 0 Collision with floating object
89 1 5 16 0 0 1 3 44 9 7 1 0 0 0 0 2
Collision with fixed object
634
9 19 107
8 5 7 9 278
100
72 6 1 1 2 3 7
Carbon monoxide exposure
16 0 0 5 0 1 0 0 9 1 0 0 0 0 0 0 0
Capsizing
327
3 7 9 38 0 4 119
93 24 6 11 7 0 2 1 3
All accident types
7248 32 234
937
59 67 26 213
3257
1564
588
42 31 3 17 19 159
All
vess
els
Airb
oat
Aux
iliar
y sa
ilboa
tC
abin
mot
orbo
at
Can
oe
Hou
sebo
at
Infla
tabl
eK
ayak
Ope
n m
otor
boat
P
erso
nal w
ater
craf
t P
onto
onR
owbo
at
Sai
lboa
t (on
ly)
Sai
lboa
t (un
know
n)
Sta
ndup
pad
dleb
oard
O
ther
Unk
now
n
Recreational Boating Statistics 2020 42

Accident Types
Tab
le 2
0 ▪
NU
MB
ER
OF
VE
SS
EL
S IN
AC
CID
EN
TS
BY
PR
IMA
RY
AC
CID
EN
T T
YP
E &
PR
OP
UL
SIO
N T
YP
E
Injuries
3191 15 156
2018 8
965
29
Total deaths
767 1 204
472
5 75 10
Other deaths
233 0 24 146 2 52 9
Drownings
534 1
180
326 3 23 1
Unknown 0 0 0 0 0 0 0
Other 71 1 2 58 0 7 3
Sudden medical condition 0 0 0 0 0 0 0
Skier mishap
317 0 0 275
0 37 5
Sinking 0 0 0 0 0 0 0
Person struck by vessel 37 0 0 23 0 14 0
Person struck by propeller
56 0 0 56 0 0 0
Grounding
503 5 4 426 4 52 12
Flooding/swamping
645 8 25 550
2 35 25
Fire/explosion (unknown origin)
117 0 0 98 0 10 9
Fire/explosion (non-fuel)
137 0 0 93 1 7 36
Fire/explosion (fuel)
227
0 0 199
0 20 8
Falls overboard
370 0 65 212 7 86 0
Fall in vessel
183 0 3 122 0 54 4
Electrocution 3 0 1 1 0 1 0
Ejected from vessel
274
1 9 89 017
23
Departed vessel
176 0 12 156 0 8 0
Collision with submerged object
152
0 7 127
0 16 2
Collision with recreational vessel
2862 3 20 1715 9
1020 95
Collision with governmental vessel
22 0 0 18 0 3 1
Collision with commercial vessel
30 1 1 23 0 5 0
Collision with floating object
89 1 5 70 0 11 2
Collision with fixed object
634
9 31 463 1
123
7
Carbon monoxide 16 0 0 12 0 4 0
Capsizing
327
3 174
111
7 27 5
Total vessels involved
7248
32 359
4897 31
1712
217
All
Typ
es
Air
Thr
ust
Man
ual
Pro
pelle
r S
ail
Wat
er J
etU
nkno
wn
Tab
le 2
1 ▪
NU
MB
ER
OF
VE
SS
EL
S W
ITH
PR
OP
EL
LE
RS
BY
PR
IMA
RY
AC
CID
EN
T T
YP
E &
EN
GIN
E T
YP
E
Injuries
458
1176 0 355
29
Total deaths
44 370 0 47 11
Other deaths 17 102 0 22 5
Drownings
27 268 0 25 6
Unknown 0 0 0 0 0
Other 12 32 1 11 2
Sudden medical condition 0 0 0 0 0
Skier mishap
110
85 0 72 8
Sinking 0 0 0 0 0
Person struck by vessel
5 13 0 4 1
Person struck by propeller 9 33 0 11 3
Grounding
153
177 0 85 11
Flooding/swamping
101
395 0 48 6
Fire/explosion (unknown origin)
53 20 0 15 10
Fire/explosion (non-fuel)
46 22 0 22 3
Fire/explosion (fuel)
90 48 0 61 0
Falls overboard
24 170 0 15 3
Fall in vessel
23 73 0 24 2
Electrocution 0 1 0 0 0
Ejected from vessel
10 70 0 8 1
Departed vessel
14 107 0 32 3
Collision with submerged object
31 72 0 23 1
Collision with recreational vessel 47
895
0 0 254
33
Collision with governmental vessel 2 11 0 4 1
Collision with commercial vessel 7 16 0 0 0 Collision with floating object
13 43 0 14 0
Collision with fixed object
129
275 0 50 9
Carbon monoxide 8 0 0 2 2
Capsizing 510
2 0 4 0
Total vessels involved
1323
2715 1 759
99
Eng
ine
Typ
e
Inbo
ard
Out
boar
d P
od d
rive
Ste
rndr
ive
Unk
now
n
Recreational Boating Statistics 2020 43

Operator & passenger
information

Operator/Passenger Information
Explanation of Operator/Passenger Information Section
The following section contains eleven tables and figures that examine data relating to the operators and passengers in accidents. Information is displayed by age, boating safety instruction, type of injury, and cause of death.
Operator Information (Table 22, Page 46) This table provides information about the operator. Information covers a variety of topics including age, operator’s experience, number of people onboard the vessel, and the boating safety instruction level of the operator.
Examples of “other” boating safety instruction include licenses issued by the Coast Guard, military train-ing, police academy training, rental operator training, commercially-available courses, and camp train-ing. Informal training signifies that the operator did not receive formal instruction, but rather learned from experience.
Number of Deaths by Type of Operator Boating Instruction (Table 23 & Figure 7, Page 47) This table and accompanying figure focus on boating safety instruction for those operators who had a person die on their vessel. The table and figure both focus on instruction provided by the U.S. Coast Guard Auxiliary, U.S. Power Squadrons, American Red Cross, and state sources. The figure examines only deaths where the operator instruction was known.
Number of Deaths by Vessel Type (Table 24 & Figure 8, Page 48) This table documents deaths by vessel type with a focus on drownings. It also provides the percentage of deaths by drowning by type of vessel.
Percentage of Deaths by Vessel Type, 2006-2020 (Figure 9 & Table 25, Page 49) This table and accompanying figure focus on the percentage of deaths that occurred on each vessel type for the past ten years. The figure may be interpreted by measuring the upper and lower bounds of the color-coded vessel type to obtain the percentage of deaths attributed to that vessel type within the year.
Please note that the percentages in the table have been rounded up, and that the vessel types in the figure are displayed alphabetically from the bottom up.
Number of Deceased Victims by Age & Vessel Type (Table 26 and Figure 9a, Pages 50 and 51) This table documents the age of fatal accident victims by vessel type, and delineates the number of drownings, non-drownings, and total deaths by age. The accompanying figure charts the percent of de-ceased victims by age group and vessel type.
Percent of Injured Victims by Age & Vessel Type (Figure 9b and Table 27, Pages 51 and 52) This figure charts the percent of injured victims by age group and vessel type, and the accompanying table documents the age of injured victims by vessel type.
Nature of Primary Injury Type by Area of Injury 2020 (Table 28, Page 53) This table focuses on the nature and area of the primary injury of injured victims.
Number of Injured Victims under Age 18 by Age Group and Injury Type on Personal Watercraft, 2020 (Figure 10, Page 53) This figure focuses on the number of injured victims from personal watercraft for specific age groups and by type of injury.
Recreational Boating Statistics 2020 45

Operator/Passenger Information
Table 22 ▪ OPERATOR INFORMATION 2020
Vessels Involved Deaths Injuries
7248 767 3191
Age of Operator
12 years and under 29 2 21 13 to 18 years 448 21 286 19 to 25 years 773 76 440 26 to 35 years 1021 129 542 36 to 55 years 2165 243 1196 Over 55 years 1375 252 502 Unknown 478 21 125 No operator 959 23 79
Operator's Experience
No Experience 77 8 42 Under 10 hours 790 86 454 10 to 100 hours 1316 100 737 101 to 500 hours 1876 158 900 Over 500 Hours 627 53 282 Unknown 1603 339 697 No Operator 959 23 79
Number of Persons on Board
None 580 0 5 One 2171 283 732 Two 1829 227 877 Three 677 79 377 Four 569 49 316 Five 361 23 254 Six 274 35 179 Seven 155 18 120 Eight 125 9 111 Nine 83 10 87 Ten 62 8 29 More than 10 81 24 81 Unknown 281 2 23
Education of Operator
American Red Cross 2 0 2 Informal 271 15 142 Internet Course 258 18 148 State Course 1107 46 561 US Power Squadrons 37 0 9 USCG Auxiliary 121 5 49 Other 161 10 65 No Education 2567 317 1336 Unknown 1765 333 800 No Operator 959 23 79
Recreational Boating Statistics 2020 46

Operator/Passenger Information
BOATING SAFETY INSTRUCTION
Table 23 ▪ NUMBER OF DEATHS BY TYPE OF OPERATOR BOATING INSTRUCTION 2020
Type of Boating Instruction Deaths
American Red Cross 0
Informal 15
Internet Course 18
State Course 46
US Power Squadrons 0
USCG Auxiliary 5
Other 10
No Education 317
Total Deaths - Known Operator Instruction 411
Total Deaths - Unknown Operator Instruction 333
Total Deaths - No Operator 23
Total Deaths - Known & Unknown Operator Instruction 767
Recreational Boating Statistics 2020 47

Operator/Passenger Information
Table 24 ▪ NUMBER OF DEATHS BY VESSEL TYPE 2020
Vessel type Drownings Deaths by Causes
other than Drowning Total Deaths
Percentage ofDeaths from
Drowning
Airboat 1 0 1 100%
Auxiliary Sailboat 1 1 2 50%
Cabin Motorboat 16 17 33 48%
Canoe 36 6 42 86%
Houseboat 0 2 2 0%
Inflatable 18 0 18 100%
Kayak 95 17 112 85%
Open Motorboat 260 116 376 69%
Personal Watercraft 19 47 66 29%
Pontoon 53 14 67 79%
Rowboat 19 1 20 95%
Sailboat (only) 3 2 5 60%
Sailboat (unknown) 0 0 0 0%
Standup paddleboard 10 0 10 100%
Other 2 0 2 100% Unknown 1 10 11 9% Total 534 233 767 70%
Recreational Boating Statistics 2020 48
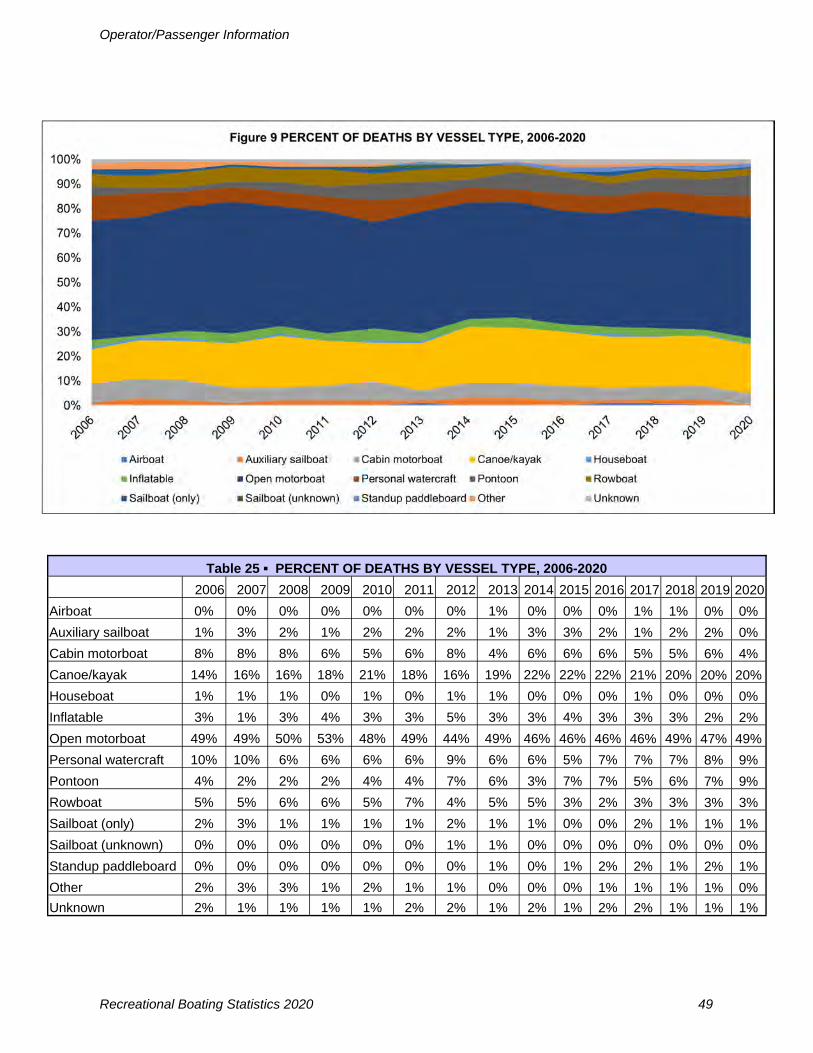
Operator/Passenger Information
Table 25 ▪ PERCENT OF DEATHS BY VESSEL TYPE, 2006-2020
2006 2007 2008 2009 2010 2011 2012 2013 2014 2015 2016 2017 2018 2019 2020
Airboat 0% 0% 0% 0% 0% 0% 0% 1% 0% 0% 0% 1% 1% 0% 0%
Auxiliary sailboat 1% 3% 2% 1% 2% 2% 2% 1% 3% 3% 2% 1% 2% 2% 0%
Cabin motorboat 8% 8% 8% 6% 5% 6% 8% 4% 6% 6% 6% 5% 5% 6% 4%
Canoe/kayak 14% 16% 16% 18% 21% 18% 16% 19% 22% 22% 22% 21% 20% 20% 20%
Houseboat 1% 1% 1% 0% 1% 0% 1% 1% 0% 0% 0% 1% 0% 0% 0%
Inflatable 3% 1% 3% 4% 3% 3% 5% 3% 3% 4% 3% 3% 3% 2% 2%
Open motorboat 49% 49% 50% 53% 48% 49% 44% 49% 46% 46% 46% 46% 49% 47% 49%
Personal watercraft 10% 10% 6% 6% 6% 6% 9% 6% 6% 5% 7% 7% 7% 8% 9%
Pontoon 4% 2% 2% 2% 4% 4% 7% 6% 3% 7% 7% 5% 6% 7% 9%
Rowboat 5% 5% 6% 6% 5% 7% 4% 5% 5% 3% 2% 3% 3% 3% 3%
Sailboat (only) 2% 3% 1% 1% 1% 1% 2% 1% 1% 0% 0% 2% 1% 1% 1%
Sailboat (unknown) 0% 0% 0% 0% 0% 0% 1% 1% 0% 0% 0% 0% 0% 0% 0%
Standup paddleboard 0% 0% 0% 0% 0% 0% 0% 1% 0% 1% 2% 2% 1% 2% 1%
Other 2% 3% 3% 1% 2% 1% 1% 0% 0% 0% 1% 1% 1% 1% 0%
Unknown 2% 1% 1% 1% 1% 2% 2% 1% 2% 1% 2% 2% 1% 1% 1%
Recreational Boating Statistics 2020 49

Operator/Passenger Information
Table 26 ▪ NUMBER OF DECEASED VICTIMS BY AGE AND VESSEL TYPE 2020
Age ofDeceased
Victim
Type of Vessel D
rownings
Other deaths
Total deaths
Airboat
Auxiliary sailboat
Cabin m
otorboat
Canoe
Houseboat
Inflatable
Kayak
Open m
otorboat
Personal w
atercraft
Pontoon
Row
boat
Sailboat (only)
Sailboat (unknow
n)
Standup paddelboard
Other
Unknow
n
Total 1 2 33 42 2 18 112 376 66 67 20 5 0 10 2 11 534 233 767
1 0 0 0 0 0 0 1 0 0 0 0 0 0 0 0 0 1 0 1
2 0 0 0 0 0 0 0 0 0 0 0 0 0 0 0 0 0 0 0
3 0 0 0 0 0 0 0 0 0 0 0 0 0 0 0 0 0 0 0
4 0 0 0 0 1 0 0 0 0 0 0 0 0 0 0 0 0 1 1
5 0 0 0 0 0 0 0 2 0 0 0 0 0 0 0 0 1 1 2
6 0 0 0 0 0 0 0 1 2 0 0 0 0 0 0 0 1 2 3
7 0 0 0 0 0 0 0 2 0 0 0 0 0 0 0 1 1 2 3
8 0 0 0 1 0 0 0 0 0 0 0 0 0 0 0 0 1 0 1
9 0 0 0 0 0 0 0 1 0 0 0 0 0 0 0 1 0 2 2
10 0 0 0 0 0 0 1 0 0 0 0 1 0 0 0 1 1 2 3
11 0 0 0 0 0 0 1 1 1 0 0 0 0 0 0 0 1 2 3
12 0 0 1 0 0 0 0 0 0 0 0 0 0 0 0 0 0 1 1
0-12 0 0 1 1 1 0 3 7 3 0 0 1 0 0 0 3 7 13 20
13 - 19 0 0 1 6 0 2 6 20 7 3 0 0 0 1 0 3 27 22 49
20 - 29 0 0 7 12 0 0 26 51 17 17 3 1 0 0 2 0 94 42 136
30 - 39 0 1 5 5 0 3 21 36 10 9 2 0 0 2 0 2 67 29 96
40 - 49 1 0 2 5 0 3 16 55 16 13 1 0 0 2 0 1 80 35 115
50 - 59 0 0 11 6 1 2 16 71 10 4 4 0 0 1 0 1 88 39 127
60 - 69 0 1 5 3 0 6 17 76 3 7 4 1 0 3 0 1 95 32 127
70 - 79 0 0 1 3 0 2 7 43 0 10 4 2 0 1 0 0 59 14 73
80 and Over 0 0 0 0 0 0 0 13 0 3 2 0 0 0 0 0 14 4 18
Unknown 0 0 0 1 0 0 0 4 0 1 0 0 0 0 0 0 3 3 6
Recreational Boating Statistics 2020 50

Operator/Passenger Information
Recreational Boating Statistics 2020 51

Operator/Passenger Information
Table 27 ▪ NUMBER OF INJURED VICTIMS BY AGE AND VESSEL TYPE 2020
Age ofInjured Victim
Total injuries
Airboat
Auxiliary sailboat
Cabin m
otorboat
Canoe
Houseboat
Inflatable
Kayak
Open m
otorboat
Personal w
atercraft
Pontoon
Row
boat
Sailboat (only)
Sailboat (unknow
n)
Standup paddleboard
Other
Unknow
n
Total 3191 15 33 298 28 6 14 89 1520 896 232 17 8 0 7 1 27
0 1 0 0 0 0 0 0 0 1 0 0 0 0 0 0 0 0 1 0 0 0 0 0 0 0 0 0 0 0 0 0 0 0 0 0 2 7 0 0 1 0 0 0 0 3 2 1 0 0 0 0 0 0 3 17 0 0 4 1 0 0 1 8 2 1 0 0 0 0 0 0 4 11 0 0 1 0 0 0 0 4 4 2 0 0 0 0 0 0 5 17 0 0 1 1 0 0 0 8 4 3 0 0 0 0 0 0 6 20 0 0 3 0 0 0 0 11 3 3 0 0 0 0 0 0 7 12 0 0 1 0 0 1 0 5 4 1 0 0 0 0 0 0 8 25 0 0 3 0 0 0 1 8 7 6 0 0 0 0 0 0 9 16 0 0 3 1 1 1 1 5 2 1 0 0 0 0 0 1 10 26 0 1 4 0 0 0 1 12 4 3 0 1 0 0 0 0 11 33 0 0 1 0 0 0 1 21 5 4 0 1 0 0 0 0 12 41 0 0 5 0 0 1 1 20 12 2 0 0 0 0 0 0
0 - 12 226 0 1 27 3 1 3 6 106 49 27 0 2 0 0 0 1 13 - 19 515 1 1 23 4 0 1 8 218 227 30 0 0 0 0 1 1 20 - 29 694 1 1 41 11 0 2 20 311 255 50 1 0 0 1 0 0 30 - 39 458 5 4 45 2 0 2 14 208 132 41 3 0 0 1 0 1 40 - 49 459 4 6 47 3 0 4 9 244 108 26 6 1 0 1 0 0 50 - 59 340 0 3 42 1 2 1 13 188 62 21 1 2 0 4 0 0 60 - 69 202 2 7 30 1 2 0 9 104 23 21 2 1 0 0 0 0 70 - 79 72 1 2 12 0 0 0 1 48 1 3 3 1 0 0 0 0
80 and Over 9 0 0 3 0 0 0 2 3 0 1 0 0 0 0 0 0 Unknown 216 1 8 28 3 1 1 7 90 39 12 1 1 0 0 0 24
Recreational Boating Statistics 2020 52

Operator/Passenger Information
Table 28 ▪ NATURE OF PRIMARY INJURY TYPE BY AREA OF INJURY 2020
All Areas Arm Body Foot Hand Head Leg Neck Trunk Unknown
All primary injury types 3191 273 303 148 120 754 728 72 545 248
Amputation 36 1 0 6 21 0 8 0 0 0
Broken bone 610 50 0 54 33 77 225 10 149 12
Burn 147 23 14 12 5 14 37 0 11 31 Carbon monoxide 42 0 42 0 0 0 0 0 0 0 Concussion 313 0 0 0 0 313 0 0 0 0 Dislocation 60 34 0 3 1 1 16 0 2 3 Electric shock 4 0 4 0 0 0 0 0 0 0 Hypothermia 199 0 199 0 0 0 0 0 0 0 Internal organ injury 160 0 0 0 0 14 0 0 126 20 Laceration 762 71 3 51 38 247 265 7 39 41 Scrape/bruise 394 57 12 4 12 62 114 7 61 65 Shock 19 0 19 0 0 0 0 0 0 0 Spinal cord Injury 42 0 0 0 0 0 0 6 36 0 Sprain/strain 150 19 7 17 8 2 35 23 30 9 Other 2 0 0 0 0 0 1 0 1 0 Unknown 251 18 3 1 2 24 27 19 90 67
Recreational Boating Statistics 2020 53

Casualty data
Casualty Data
Explanation of Casualty Data Section
This section contains fifteen tables and figures that examine data relating to the victims in boating accidents. The following pages focus on historical casualty information, casualty-vessel information, and state-specific casualty information.
Deaths, Injuries & Accidents by Year, 2001-2020 (Figure 11 & Table 29, Page 56) This figure and table document the number of accidents and casualties from 2001-2020.
Accident, Casualty & Damage Data by State (Table 30, Page 57) This table provides accident, casualty, and damage information by state for the year 2020. Accidents are broken down into three levels of severity– fatal accidents, non-fatal injury accidents, and property damage only accidents. Please note that under this categorization, accidents are represented by their greatest severity. If an accident resulted in one death, two injured victims, and $5,000 damages, the accident would be represented under the fatal accident column under the greater “Number of Accidents” heading. The death, injured victims, and damages would be represented in the totals under the “Persons Involved” and “Damages” headings.
Distribution of Recreational Boating Deaths by State (Figure 12, Page 58) This figure provides the percentage that each state contributed to the national death count. So, for instance, Michigan had 31 deaths. Out of the total national death count of 767, Michigan contributed 4.0% ((31/767) × 100) of deaths to the national count. Please note that percentages have been round-ed.
Fatal Accidents by Location (Figures 12a-c, Pages 59-60) These figures plot the location of fatal accidents in four different regions. 12a represents the continental United States and the U.S. Virgin Islands. 12b represents Alaska. 12c represents Hawaii. In many cas-es, the location was plotted using coordinates. When coordinates were not available, other fields such as the name of body of water, nearest city or town, county, and the narrative were used to approximate the location. The size of the plot correlates to the number of deaths in the fatal accident.
Annual Recreational Boating Fatality Rates, 2001-2020 (Figure 13 & Table 31, Page 61) This table and accompanying figure provide two fatality rates for years 2001-2020. The fatality rate iscalculated by dividing the number of fatalities by the total national vessel registration. The Coast Guard then multiplied by a factor of 100,000 to arrive at the number of deaths per 100,000 registered vessels. The fatality rate takes into account all fatalities and all recreational registration data collected. The motorized fatality rate takes into account only fatalities that occurred on motorized vessels and only motorized recreational vessels registered.
States Coded by their 2020 Fatality Rate (Figure 14, Page 62) This figure displays states that are color-coded depending on their fatality rate which is expressed as the number of deaths that occurred in that state per 100,000 vessels that the state registered. It is important to note that not all states register the same types of vessels which could skew the fatality rates provided. Please see Table 38, Recreational Registration Data by State 2019-2020 to view the Scope of each state’s registration system. Further, when examining a state fatality rate, it is important to note that the state fatality rate may include deaths from vessels that were registered in another state.
Five-year Summary of Selected Accident Data by State, 2016-2020 (Table 32, Page 63) This table examines the number of accidents, fatal accidents, and fatalities by state for years 2016-2020.
Number of Accidents by Primary Accident Type & State (Table 33, Page 64-65) This table documents the first accident event by state. It also provides information about the total number of accidents and casualties by state.
Number of Injured Victims by Primary Injury & Vessel Type (Table 34, Page 66) This table displays the number of injured victims by primary injury and vessel type.
Number of Fatal Victims by Life Jacket Wear, Cause of Death, & Vessel Type (Table 35, Page 66) This table displays the number of fatal victims by vessel type and cause of death. The table also provides information on whether the deceased victim was wearing a life jacket.
Recreational Boating Statistics 2020 55

Casualty Data
Table 29 ▪ DEATHS, INJURIES, & ACCIDENTS BY YEAR, 2001-2020
Year Deaths Injuries Accidents 2001* 681 4274 6419
2002 750 4062 5705
2003 703 3888 5438
2004 676 3363 4904
2005 697 3451 4969
2006 710 3474 4967
2007 685 3673 5191
2008 709 3331 4789
2009 736 3358 4730
2010 672 3153 4604
2011 758 3081 4588
2012 651 3000 4515
2013 560 2620 4062
2014 610 2678 4064
2015 626 2613 4158
2016 701 2903 4463
2017 658 2629 4291
2018 633 2511 4145
2019 613 2559 4168
2020 767 3191 5265
* On July 2, 2001, the Federal threshold of property damage for reports of accidents involving recreational vessels changed from $500 to $2000.
Recreational Boating Statistics 2020 56
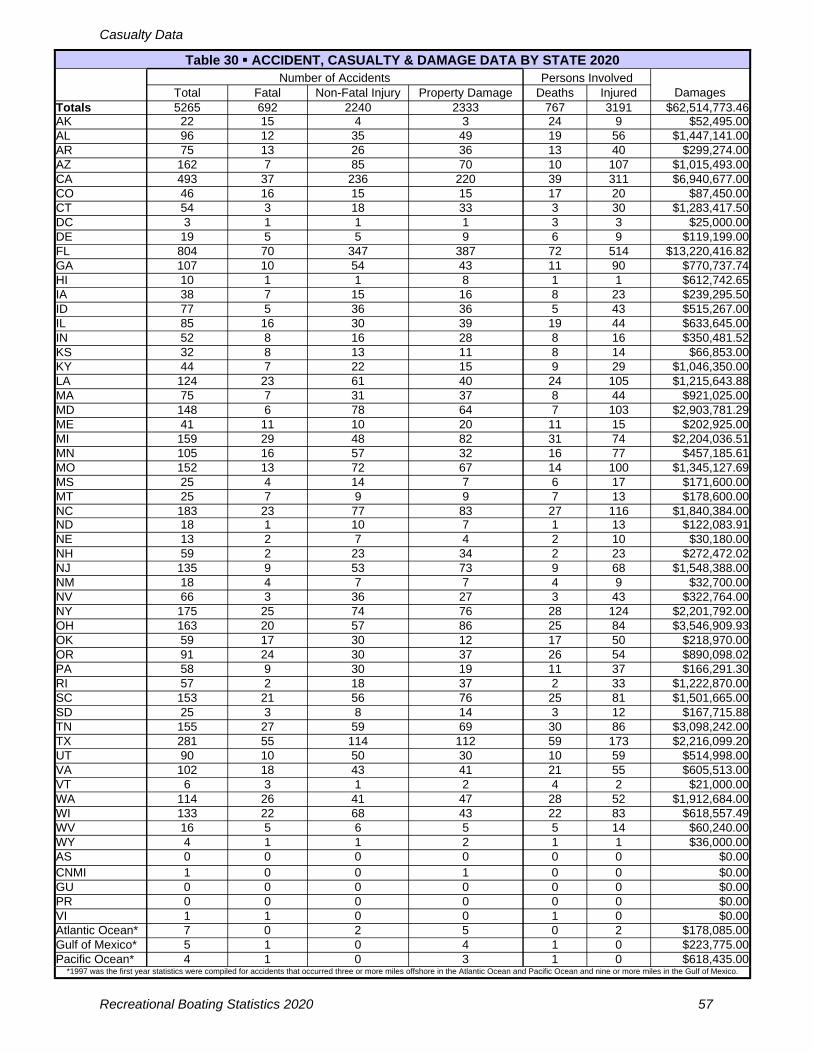
Casualty Data
Table 30 ▪ ACCIDENT, CASUALTY & DAMAGE DATA BY STATE 2020 Number of Accidents Persons Involved
Damages Total Fatal Non-Fatal Injury Property Damage Deaths Injured Totals 5265 692 2240 2333 767 3191 $62,514,773.46 AK 22 15 4 3 24 9 $52,495.00 AL 96 12 35 49 19 56 $1,447,141.00 AR 75 13 26 36 13 40 $299,274.00 AZ 162 7 85 70 10 107 $1,015,493.00 CA 493 37 236 220 39 311 $6,940,677.00 CO 46 16 15 15 17 20 $87,450.00 CT 54 3 18 33 3 30 $1,283,417.50 DC 3 1 1 1 3 3 $25,000.00 DE 19 5 5 9 6 9 $119,199.00 FL 804 70 347 387 72 514 $13,220,416.82 GA 107 10 54 43 11 90 $770,737.74 HI 10 1 1 8 1 1 $612,742.65 IA 38 7 15 16 8 23 $239,295.50 ID 77 5 36 36 5 43 $515,267.00 IL 85 16 30 39 19 44 $633,645.00 IN 52 8 16 28 8 16 $350,481.52 KS 32 8 13 11 8 14 $66,853.00 KY 44 7 22 15 9 29 $1,046,350.00 LA 124 23 61 40 24 105 $1,215,643.88 MA 75 7 31 37 8 44 $921,025.00 MD 148 6 78 64 7 103 $2,903,781.29 ME 41 11 10 20 11 15 $202,925.00 MI 159 29 48 82 31 74 $2,204,036.51 MN 105 16 57 32 16 77 $457,185.61 MO 152 13 72 67 14 100 $1,345,127.69 MS 25 4 14 7 6 17 $171,600.00 MT 25 7 9 9 7 13 $178,600.00 NC 183 23 77 83 27 116 $1,840,384.00 ND 18 1 10 7 1 13 $122,083.91 NE 13 2 7 4 2 10 $30,180.00 NH 59 2 23 34 2 23 $272,472.02 NJ 135 9 53 73 9 68 $1,548,388.00 NM 18 4 7 7 4 9 $32,700.00 NV 66 3 36 27 3 43 $322,764.00 NY 175 25 74 76 28 124 $2,201,792.00 OH 163 20 57 86 25 84 $3,546,909.93 OK 59 17 30 12 17 50 $218,970.00 OR 91 24 30 37 26 54 $890,098.02 PA 58 9 30 19 11 37 $166,291.30 RI 57 2 18 37 2 33 $1,222,870.00 SC 153 21 56 76 25 81 $1,501,665.00 SD 25 3 8 14 3 12 $167,715.88 TN 155 27 59 69 30 86 $3,098,242.00 TX 281 55 114 112 59 173 $2,216,099.20 UT 90 10 50 30 10 59 $514,998.00 VA 102 18 43 41 21 55 $605,513.00 VT 6 3 1 2 4 2 $21,000.00 WA 114 26 41 47 28 52 $1,912,684.00 WI 133 22 68 43 22 83 $618,557.49 WV 16 5 6 5 5 14 $60,240.00 WY 4 1 1 2 1 1 $36,000.00 AS 0 0 0 0 0 0 $0.00 CNMI 1 0 0 1 0 0 $0.00 GU 0 0 0 0 0 0 $0.00 PR 0 0 0 0 0 0 $0.00 VI 1 1 0 0 1 0 $0.00 Atlantic Ocean* 7 0 2 5 0 2 $178,085.00 Gulf of Mexico* 5 1 0 4 1 0 $223,775.00 Pacific Ocean* 4 1 0 3 1 0 $618,435.00
*1997 was the first year statistics were compiled for accidents that occurred three or more miles offshore in the Atlantic Ocean and Pacific Ocean and nine or more miles in the Gulf of Mexico.
Recreational Boating Statistics 2020 57

Casualty Data
Recreational Boating Statistics 2020 58

Casualty Data
Fig
ure
12a
▪ F
AT
AL
AC
CID
EN
TS
BY
LO
CA
TIO
N–
CO
NT
INE
NT
AL
U.S
. AN
D U
.S. V
IRG
IN IS
LA
ND
S
Plo
ts r
epre
sent
fata
l acc
iden
ts; t
he s
ize
of th
e pl
ot c
orre
late
s to
the
num
ber
of d
eath
s in
a fa
tal a
ccid
ent.
The
larg
est
plot
rep
rese
nts
eigh
t dea
ths.
Recreational Boating Statistics 2020 59

Casualty Data
Figure 12b ▪ FATAL ACCIDENTS BY LOCATION– ALASKA
Plots represent fatal accidents; the size of the plot correlates to the number of deaths in a fatal accident. The largest plot represents seven deaths.
Figure 12c ▪ FATAL ACCIDENTS BY LOCATION– HAWAII
Plots represent fatal accidents; the size of the plot correlates to the number of deaths in a fatal accident. The largest plot represents one death.
Recreational Boating Statistics 2020 60

Casualty Data
Table 31 ▪ ANNUAL RECREATIONAL BOATING FATALITY RATES 2001-2020
All Deaths All RegisteredVessels
FatalityRate
Motorized Vessel Deaths
Registered Motorized Vessels
Motorized Vessel FatalityRate
2001 681 12,876,346 5.3 484 12,100,439 4.0
2002 750 12,854,054 5.8 612 11,918,688 5.1
2003 703 12,794,616 5.5 536 11,946,576 4.5
2004 676 12,781,476 5.3 515 11,878,783 4.3
2005 697 12,942,414 5.4 528 11,998,728 4.4
2006 710 12,746,126 5.6 535 11,802,419 4.5
2007 685 12,875,568 5.3 515 11,966,627 4.3
2008 709 12,692,892 5.6 518 11,841,281 4.4
2009 736 12,721,541 5.8 522 11,834,872 4.4
2010 672 12,438,926 5.4 469 11,597,326 4.0
2011 758 12,173,935 6.2 527 11,326,848 4.7
2012 651 12,101,936 5.4 476 11,226,268 4.2
2013 560 12,013,496 4.7 391 11,128,052 3.5
2014 610 11,804,002 5.2 411 10,960,861 3.7
2015 626 11,867,049 5.3 434 11,034,479 3.9
2016 701 11,861,811 5.9 481 11,005,841 4.4
2017 658 11,961,568 5.5 440 11,090,600 4.0
2018 633 11,852,969 5.3 441 10,994,900 4.0
2019 613 11,878,542 5.2 426 11,052,684 3.9
2020 767 11,838,188 6.5 493 10,987,619 4.5
Recreational Boating Statistics 2020 61

Casualty Data
Recreational Boating Statistics 2020 62

Casualty Data
Table 32 ▪ FIVE YEAR SUMMARY OF SELECTED ACCIDENT DATA BY STATE 2016-2020
Total Number of Accidents Fatal Accidents Deaths 2016 2017 2018 2019 2020 2016 2017 2018 2019 2020 2016 2017 2018 2019 2020
Totals 4463 4291 4145 4168 5265 624 599 565 556 692 701 658 633 613 767 Alabama 46 70 66 101 96 12 18 13 25 12 14 21 17 28 19 Alaska 26 15 22 14 22 14 13 17 8 15 19 20 22 11 24 Arizona 90 123 129 96 162 5 11 6 7 7 5 13 11 7 10 Arkansas 47 64 60 37 75 9 11 7 10 13 10 11 7 10 13 California 386 350 322 324 493 43 49 33 37 37 47 50 34 39 39 Colorado 43 32 28 44 46 11 6 6 12 16 12 6 6 12 17 Connecticut 47 49 39 40 54 3 8 4 2 3 3 9 5 2 3 Delaware 23 23 23 13 19 1 3 2 1 5 1 3 2 1 6 DC 2 1 2 2 3 0 0 0 1 0 0 0 0 3 Florida 684 723 607 679 804 59 60 54 55 70 70 66 57 62 72 Georgia 112 102 104 109 107 15 12 9 22 10 22 14 11 23 11 Hawaii 14 15 8 15 10 6 3 1 3 1 8 3 1 4 1 Idaho 50 46 44 50 77 8 13 9 7 5 10 16 10 8 5 Illinois 74 84 67 75 85 9 15 16 13 16 9 15 17 18 19 Indiana 40 57 43 40 52 6 7 8 11 8 7 8 8 16 8 Iowa 37 40 31 21 38 7 4 8 5 7 7 4 8 5 8 Kansas 32 29 22 13 32 7 2 2 2 8 7 2 2 2 8 Kentucky 46 41 41 39 44 8 12 13 9 7 8 13 13 9 9 Louisiana 112 106 95 105 124 23 19 17 18 23 24 19 19 20 24 Maine 49 49 43 35 41 9 11 4 4 11 9 13 4 4 11 Maryland 150 147 122 130 148 11 6 13 12 6 16 6 16 16 7 Massachusetts 92 66 77 79 75 13 10 10 4 7 15 10 10 5 8 Michigan 125 116 119 128 159 33 19 20 21 29 38 20 22 22 31 Minnesota 96 105 77 100 105 17 13 13 10 16 17 14 14 10 16 Mississippi 43 34 31 20 25 10 6 9 4 4 11 6 11 5 6 Missouri 137 124 122 145 152 14 10 12 18 13 16 10 14 18 14 Montana 23 9 19 13 25 5 2 9 4 7 5 2 13 5 7 Nebraska 22 27 20 19 13 2 4 4 2 2 2 4 4 2 2 Nevada 48 35 53 44 66 4 4 5 4 3 4 4 5 5 3 New Hampshire 76 49 39 37 59 8 5 4 3 2 9 5 5 4 2 New Jersey 109 106 116 110 135 4 4 5 4 9 5 4 5 4 9 New Mexico 16 18 24 13 18 2 5 2 2 4 2 5 2 2 4 New York 188 167 143 165 175 20 19 17 17 25 22 22 20 17 28 North Carolina 143 117 182 128 183 22 15 27 15 23 23 15 30 16 27 North Dakota 15 15 13 16 18 1 4 2 2 1 1 4 2 2 1 Ohio 113 117 126 128 163 12 20 15 12 20 12 20 17 13 25 Oklahoma 44 38 36 24 59 5 7 5 8 17 5 10 7 8 17 Oregon 82 60 65 62 91 17 11 16 16 24 19 12 17 18 26 Pennsylvania 55 69 63 58 58 9 15 13 8 9 11 15 14 8 11 Rhode Island 36 31 26 42 57 0 3 1 1 2 0 4 1 1 2 South Carolina 136 151 130 141 153 20 12 15 15 21 23 13 16 15 25 South Dakota 20 17 12 23 25 4 0 1 4 3 5 0 1 5 3 Tennessee 116 93 109 107 155 17 14 22 9 27 18 16 22 9 30 Texas 176 170 204 184 281 48 51 35 38 55 53 63 38 43 59 Utah 94 58 81 86 90 5 3 8 6 10 5 3 9 7 10 Vermont 4 3 6 4 6 1 3 3 3 3 1 3 3 4 4 Virginia 83 72 80 84 102 19 10 9 18 18 21 10 11 20 21 Washington 98 109 94 106 114 18 15 19 26 26 18 15 21 27 28 West Virginia 24 12 16 9 16 5 3 3 2 5 5 3 4 2 5 Wisconsin 103 105 106 82 133 16 22 15 9 22 20 25 21 9 22 Wyoming 8 10 8 11 4 3 5 1 3 1 3 5 1 3 1 AS 0 0 0 0 0 0 0 0 0 0 0 0 0 0 0 CNMI 0 0 0 0 1 0 0 0 0 0 0 0 0 0 0 Guam 0 2 4 2 0 0 0 0 0 0 0 0 0 0 0 Puerto Rico 6 3 4 4 0 1 1 1 1 0 1 3 1 2 0 Virgin Islands 0 0 0 0 1 0 0 0 0 1 0 0 0 0 1 *AT 8 8 10 5 7 2 1 1 2 0 2 1 1 2 0
*GM 8 2 7 3 5 1 0 1 0 1 1 0 1 0 1 *PC 6 7 5 4 4 0 0 0 2 1 0 0 0 3 1
*1997 was the first year statistics were compiled for accidents that occurred three or more miles offshore in the Atlantic Ocean and Pacific Ocean and nine or more miles in the Gulf of Mexico.
Recreational Boating Statistics 2020 63

Casualty Data
Tab
le 3
3 ▪
NU
MB
ER
OF
AC
CID
EN
TS
BY
PR
IMA
RY
AC
CID
EN
T T
YP
E &
ST
AT
E 2
020
Injuries
319
1 9 56 40 107
311
20 30 3 9
514
90 1 23 43 44 16 14 29 105
44 103
15 74 77 100
17 13 116
13
Total deaths
767
24 19 13 10 39 17 3 3 6 72 11 1 8 5 19 8 8 9 24 8 7 11 31 16 14 6 7 27 1
Other deaths
233
11 13 1 5 14 0 2 0 1 38 7 0 3 1 3 3 1 1 4 1 1 4 11 2 5 4 0 11 0
Drownings
534
13 6 12 5 25 17 1 3 5 34 4 1 5 4 16 5 7 8 20 7 6 7 20 14 9 2 7 16 1
Other
61 1 1 0 2 0 2 0 0 0 11 2 0 0 2 1 1 0 0 1 0 0 0 2 0 1 0 1 4 0
Sudden medical condition 0 0 0 0 0 0 0 0 0 0 0 0 0 0 0 0 0 0 0 0 0 0 0 0 0 0 0 0 0 0
Skier mishap
303 0 2 6 12 37 4 1 0 1 16 11 0 1 13 2 3 4 2 4 2 12 5 9 10 16 2 0 9 1
Sinking 0 0 0 0 0 0 0 0 0 0 0 0 0 0 0 0 0 0 0 0 0 0 0 0 0 0 0 0 0 0
Person struck by vessel
30 0 1 0 2 1 0 0 0 0 4 0 0 0 0 0 0 0 1 0 1 0 0 1 1 1 1 0 1 0
Person struck by propeller
55 0 0 2 2 3 0 0 0 0 10 0 0 0 1 1 0 0 2 0 1 1 0 0 1 2 0 1 1 0
Grounding
484 1 4 9 10 65 3 8 0 4 70 13 5 5 12 7 0 1 2 11 8 4 5 7 1 13 1 1 11 1
Flooding/swamping
589 2 11 7 16 46 4 7 0 3 91 9 0 3 13 4 7 5 4 17 7 13 6 22 9 12 2 5 17 1
Fire/explosion (unknown origin)
53 0 1 0 1 14 0 1 0 0 11 0 0 0 0 1 0 0 2 0 0 4 0 3 2 2 0 0 0 0
Fire/explosion (non-fuel)
87 0 2 0 3 9 1 0 1 0 9 0 0 0 0 1 5 0 0 1 4 9 0 2 1 2 0 0 1 0
Fire/explosion (fuel)
176 0 7 4 3 15 2 4 0 0 26 6 0 1 3 4 1 1 4 0 3 2 0 4 6 8 0 0 2 1
Falls overboard
335 3 4 4 4 37 4 2 1 2 45 7 1 1 3 10 9 1 4 10 3 2 4 12 10 5 1 2 15 0
Fall in vessel
169 0 2 2 2 15 3 3 0 0 22 6 0 3 2 0 2 2 1 1 4 12 0 2 8 18 1 0 3 0
Electrocution 3 0 0 0 0 0 0 0 0 0 2 0 0 0 0 0 0 0 0 0 0 0 0 0 0 1 0 0 0 0
Ejected from vessel
248 0 5 2 7 22 4 5 0 2 47 1 0 1 3 4 3 1 2 5 4 8 0 5 4 5 1 0 9 2
Departed vessel
171 1 2 1 7 19 2 1 0 0 20 3 0 2 1 6 0 1 0 1 3 6 0 7 6 2 0 0 5 0
Collision with submerged object 14
9 1 2 3 0 10 0 0 0 0 8 4 0 6 2 1 4 0 2 16 2 6 2 1 2 7 0 0 12 0
Collision with recreational vessel
137
9 1 31 12 81 143
11 17 0 1
209
25 3 11 13 26 12 5 9 27 21 37 7 51 25 36 5 7 64 9
Collision with governmentalvessel 10 0 0 0 0 1 0 0 0 0 1 0 0 0 0 0 0 0 0 0 0 0 0 2 1 0 0 0 0 0 Collision with commercial vessel 15 0 1 0 0 0 0 0 0 0 5 0 0 0 0 1 0 0 0 0 2 2 1 0 0 0 0 0 0 0
Collision with floating object
82 0 0 3 0 8 0 0 0 2 15 1 0 0 1 3 1 0 3 4 0 5 1 1 0 1 2 0 1 0
Collision with fixed object
542 1 18 16 9 31 0 2 1 4
151
16 0 3 3 7 3 4 3 21 6 21 1 15 7 13 6 5 24 1
Carbon monoxide
15 0 0 0 1 0 0 0 0 0 1 1 0 0 0 0 0 0 0 0 0 0 0 1 1 0 0 0 0 0
Capsizing
309
11 2 4 0 17 6 3 0 0 30 2 1 1 5 6 1 7 3 5 4 4 9 12 10 7 3 3 4 2
Total accidents
526
5 22 96 75 16
249
3
46 54 3 19 804
107
10 38 77 85 52 32 44 124
75 148
41 159
105
152
25 25 183
18
To
tals
AK
AL
AR
AZ
CA
CO
CT
DC
DE
FL
GA
HI
IA ID IL IN KS
KY
LA MA
MD
ME
MI
MN
MO
MS
MT
NC
ND
Recreational Boating Statistics 2020 64

Casualty Data
Tab
le 3
3 C
on
tin
ued
▪ N
UM
BE
R O
F A
CC
IDE
NT
S B
Y P
RIM
AR
Y A
CC
IDE
NT
TY
PE
& S
TA
TE
202
0
Injuries
10 23 68 9 43 124
84 50 54 37 33 81 12 86 173
59 55 2 52 83 14 1 0 0 0 0 0 2 0 0
Total deaths 2 2 9 4 3 28 25 17 26 11 2 25 3 30 59 10 21 4 28 22 5 1 0 0 0 0 1 0 1 1
Other deaths 0 0 1 0 1 12 7 5 4 1 0 13 0 5 18 1 4 0 8 4 0 0 0 0 0 0 1 0 0 1
Drownings 2 2 8 4 2 16 18 12 22 10 2 12 3 25 41 9 17 4 20 18 5 1 0 0 0 0 0 0 1 0
Other 0 1 3 0 1 4 3 1 2 0 1 2 0 3 1 1 3 0 0 1 0 0 0 0 0 0 0 0 0 2
Sudden medical condition 0 0 0 0 0 0 0 0 0 0 0 0 0 0 0 0 0 0 0 0 0 0 0 0 0 0 0 0 0 0
Skier mishap 2 11 0 0 4 9 5 4 4 4 0 5 0 5 16 17 9 0 8 14 0 1 0 0 0 0 0 0 0 0
Sinking 0 0 0 0 0 0 0 0 0 0 0 0 0 0 0 0 0 0 0 0 0 0 0 0 0 0 0 0 0 0
Person struck by vessel 0 0 0 1 0 0 1 1 0 0 0 1 0 0 5 3 1 0 1 0 1 0 0 0 0 0 0 0 0 0
Person struck by propeller 0 0 0 1 0 1 2 1 1 0 1 1 1 1 6 5 2 0 0 3 0 0 0 0 0 0 1 0 0 0
Grounding 0 22 11 3 10 26 20 2 15 3 5 13 2 11 17 11 11 2 9 7 1 1 0 0 0 0 0 0 0 0
Flooding/swamping 3 3 19 2 7 13 23 10 10 6 10 15 4 19 52 12 11 0 11 6 2 2 0 1 0 0 0 2 2 1
Fire/explosion (unknown origin) 0 0 2 0 0 0 0 0 1 0 0 0 0 2 0 1 2 0 2 0 0 0 0 0 0 0 0 0 1 0
Fire/explosion (non-fuel) 0 0 5 0 1 3 5 0 0 0 3 2 2 4 4 2 1 0 0 3 0 0 0 0 0 0 0 1 0 0
Fire/explosion (fuel) 1 0 2 0 3 11 8 5 3 1 0 4 0 6 8 4 3 0 5 3 2 0 0 0 0 0 0 0 0 0
Falls overboard 0 4 3 1 1 6 4 7 6 10 1 9 4 8 27 8 10 1 11 8 0 0 0 0 0 0 0 0 0 0
Fall in vessel 0 1 3 0 2 4 5 1 2 1 0 5 0 7 14 2 1 0 3 2 0 0 0 0 0 0 0 2 0 0
Electrocution 0 0 0 0 0 0 0 0 0 0 0 0 0 0 0 0 0 0 0 0 0 0 0 0 0 0 0 0 0 0
Ejected from vessel 1 0 12 1 2 9 7 3 6 4 2 4 2 11 19 2 2 0 1 8 0 0 0 0 0 0 0 0 0 0
Departed vessel 0 1 3 4 6 3 6 6 1 1 0 4 0 5 10 6 0 2 6 10 0 0 0 0 0 0 0 0 0 1
Collision with submerged object 2 2 5 0 1 2 5 1 3 2 1 3 0 6 11 0 3 0 3 6 2 0 0 0 0 0 0 0 0 0
Collision with recreational vessel
3 9 53 4 23 49 37 10 15 8 20 52 7 41 54 8 20 1 28 34 4 0 0 0 0 0 0 0 0 0
Collision with governmentalvessel
0 0 1 0 0 2 0 0 1 0 0 0 0 0 1 0 0 0 0 0 0 0 0 0 0 0 0 0 0 0 Collision with commercial vessel
0 0 0 0 0 0 0 0 0 1 1 0 0 1 0 0 0 0 0 0 0 0 0 0 0 0 0 0 0 0
Collision with floating object 0 0 1 0 0 2 6 0 1 3 1 3 0 5 1 2 0 0 4 1 0 0 0 0 0 0 0 0 0 0
Collision with fixed object 1 0 8 1 3 12 16 2 8 4 5 21 2 15 21 1 9 0 10 11 0 0 0 0 0 0 0 0 0 0
Carbon monoxide 0 0 0 0 0 2 0 2 0 0 0 0 0 1 0 3 1 0 1 0 0 0 0 0 0 0 0 0 0 0
Capsizing
0 5 4 0 2 17 10 3 12 10 6 9 1 4 14 2 13 0 11 16 4 0 0 0 0 0 0 2 2 0
Total accidents
13 59 135
18 66 175
163
59 91 58 57 153
25 155
281
90 102 6 114
133
16 4 0 1 0 0 1 7 5 4
NE
NH
NJ
NM
NV
NY
OH
OK
OR
PA
RI
SC
SD
TN
TX
UT
VA
VT
WA
WI
WV
WY
AS
CN
MI
GU
PR
VI
AT
GM
PC
Recreational Boating Statistics 2020 65

Casualty Data
Table 34 ▪ NUMBER OF INJURED VICTIMS BY PRIMARY INJURY & VESSEL TYPE
Primary Injury
Num
ber of injuries
Airboat
Auxiliary
sailboat
Cabin
motorboat
Canoe
Houseboat
Inflatable
Kayak
Open
motorboat
Personal
watercraft
Pontoon
Row
boat
Sailboat (only)
Sailboat
Standup
Other
Unknow
n
Amputation 36 0 0 1 0 0 0 0 21 8 6 0 0 0 0 0 0 Broken bone 610 5 4 41 0 1 0 4 240 278 36 0 0 0 0 0 1 Burns 147 0 5 61 0 2 0 0 64 12 0 0 0 0 0 0 3 Carbon monoxide 42 0 0 29 0 0 0 0 12 1 0 0 0 0 0 0 0 Concussion 313 0 3 17 1 0 2 10 153 100 17 0 1 0 0 0 9 Dislocation 60 0 2 3 2 0 2 1 30 16 3 1 0 0 0 0 0 Electric shock 4 0 0 2 0 0 0 1 1 0 0 0 0 0 0 0 0 Hypothermia 199 1 5 10 18 0 6 45 92 4 3 10 3 0 2 0 0 Internal organ injury 160 1 3 8 1 0 0 11 61 58 14 0 1 0 1 0 1 Laceration 762 2 3 56 2 3 0 4 422 161 101 3 1 0 2 1 1 Scrape/bruise 394 3 3 24 2 0 0 8 189 137 23 2 2 0 1 0 0 Shock 19 0 0 0 0 0 0 0 6 7 5 0 0 0 0 0 1 Spinal cord injury 42 1 1 1 0 0 0 0 24 10 5 0 0 0 0 0 0 Sprain/strain 150 1 0 6 2 0 4 2 91 37 5 0 0 0 1 0 1 Other 2 0 0 0 0 0 0 0 2 0 0 0 0 0 0 0 0 Unknown 251 1 4 39 0 0 0 3 112 67 14 1 0 0 0 0 10 All Injuries 3191 15 33 298 28 6 14 89 1520 896 232 17 8 0 7 1 27
Table 35 ▪ NUMBER OF FATAL VICTIMS BY LIFE JACKCAUSE OF DEATH & VESSEL TYPE 2020
ET WEAR,
Cause of Death
Life jacket w
orn
?
Num
ber
of deaths
Airboat
Auxiliary
sailboat
Cabin
motorboat
Can
oe
Housebo
at
Inflatable
Kayak
Open
motorboat
Person
al w
atercraft
Pontoo
n
Ro
wb
oat
Sailboat (o
nly)
Sailboat
(unkno
wn)
Standu
p pad
dlebo
ard
Other
Unkn
ow
n
Carbon monoxide
Yes 0 0 0 0 0 0 0 0 0 0 0 0 0 0 0 0 0
No 3 0 0 2 0 0 0 0 1 0 0 0 0 0 0 0 0
Unknown 0 0 0 0 0 0 0 0 0 0 0 0 0 0 0 0 0
Cardiac arrest
Yes 4 0 0 0 0 0 0 2 1 1 0 0 0 0 0 0 0
No 6 0 0 0 0 0 0 1 3 0 2 0 0 0 0 0 0
Unknown 1 0 0 0 0 0 0 0 1 0 0 0 0 0 0 0 0
Drowning
Yes 74 0 1 3 3 0 6 22 25 8 0 1 1 0 4 0 0
No 450 1 0 13 33 0 12 70 231 11 52 16 2 0 6 2 1 Unknown 10 0 0 0 0 0 0 3 4 0 1 2 0 0 0 0 0
Hypothermia
Yes 5 0 0 2 1 0 0 1 0 1 0 0 0 0 0 0 0 No 1 0 0 0 0 0 0 0 1 0 0 0 0 0 0 0 0 Unknown 0 0 0 0 0 0 0 0 0 0 0 0 0 0 0 0 0
Other
Yes 1 0 0 0 0 0 0 0 0 1 0 0 0 0 0 0 0
No 2 0 0 0 0 0 0 1 1 0 0 0 0 0 0 0 0
Unknown 0 0 0 0 0 0 0 0 0 0 0 0 0 0 0 0 0
Trauma
Yes 57 0 0 1 0 0 0 0 18 36 1 0 1 0 0 0 0
No 88 0 0 6 0 2 0 0 61 5 6 0 0 0 0 0 8
Unknown 7 0 0 3 0 0 0 0 2 1 1 0 0 0 0 0 0
Unknown
Yes 9 0 1 0 0 0 0 4 1 2 0 0 1 0 0 0 0
No 40 0 0 3 3 0 0 8 23 0 3 0 0 0 0 0 0
Unknown 9 0 0 0 2 0 0 0 3 0 1 1 0 0 0 0 2
All Causes 767 1 2 33 42 2 18 112 376 66 67 20 5 0 10 2 11 Recreational Boating Statistics 2020 66

Registration data

Registration Data
Explanation of Registration Data Section
The following section contains fives tables and figures that examine boat registration information. Registered vessels are those vessels that are required to be recorded by a state, which includes numbered vessels and other forms of registration. Not all states have the same registration requirements. While some states may only register vessels with a motor, others may register sailboats, canoes, kayaks, and rowboats in addition to those vessels with a motor.
Recreational Vessel Registration by Year, 1986-2020 (Table 36 & Figure 15, Page 69) This table provides information about recreational vessel registration for each year from 1986-2020. The accompanying figure displays a trend line from 1986-2020.
Recreational Vessel Registration by Length & Means of Propulsion (Table 37, Page 70)The top section of the table provides tallies for the number of mechanically-propelled vessels, the number of manually-propelled vessels, and a summation of these two categories. The middle section of the table documents mechanically-propelled vessel registration by length category. The bottom section of the table focuses on manually-propelled vessels.
Registration Data by State (Table 38, Page 71) This table examines recreational vessel registration, deaths, and fatality rates by state for years 2019 and 2020. The fatality rate is calculated by dividing the number of fatalities by the total vessel registration. The Coast Guard then multiplied by a factor of 100,000 to arrive at the number of deaths per 100,000 registered vessels. When examining a state fatality rate, it is important to note that the state fatality rate may include deaths from vessels that were registered in another state. This table also specifies the scope of the state’s registration program.
Distribution of 2020 Recreational Vessel Registration by State (Figure 16, Page 72) This figure provides the percentage that each state contributed to national registration figures. So, for instance, California registered 645,951 vessels. Out of the total national registration of 11,838,188California contributed 5.5% ((645,951/11,838,188) × 100) of registered vessels. Please note that percentages have been rounded.
Recreational Boating Statistics 2020 68

Registration Data
Tab
le 3
6 ▪
RE
CR
EA
TIO
NA
L
VE
SS
EL
S R
EG
IST
ER
ED
BY
Y
EA
R, 1
986-
2020
Yea
r R
egis
tere
d V
esse
ls
1986
9,
876,
197
1987
9,
963,
696
1988
10
,362
,613
19
89
10,7
77,3
70
1990
10
,996
,253
19
91
11,0
68,4
40
1992
11
,132
,386
19
93
11,2
82,7
36
1994
11
,429
,585
19
95
11,7
34,7
10
1996
11
,877
,938
19
97
12,3
12,9
82
1998
12
,565
,930
19
99
12,7
38,2
71
2000
12
,782
,143
20
01
12,8
76,3
46
2002
12
,854
,054
20
03
12,7
94,6
16
2004
12
,781
,476
20
05
12,9
42,4
14
2006
12
,746
,126
20
07
12,8
75,5
68
2008
12
,692
,892
20
09
12,7
21,5
41
2010
12
,438
,926
20
11
12,1
73,9
35
2012
12
,101
,936
20
13
12,0
13,4
96
2014
11
,804
,002
20
15
11,8
67,0
49
2016
11
,861
,811
20
17
11,9
61,5
68
2018
11
,852
,969
20
19
11,8
78,5
42
2020
11
,838
,188
Recreational Boating Statistics 2020 69

Registration Data
Table 37 ▪ RECREATIONAL VESSEL REGISTRATION BY LENGTH AND MEANS OF PROPULSION 2020
MECHANICALLY PROPELLED 10,987,619 Under 16 feet 3,947,119 16 to less than 26 feet 6,452,583 26 to less than 40 feet 505,104 40 to 65 feet 71,610
Over 65 feet 11,203
NOT MECHANICALLY PROPELLED 850,569 Rowboats 69,348 Sailboats 94,500 Paddlecraft 568,466
Other 118,255
TOTAL 11,838,188
Recreational Boating Statistics 2020 70

Registration Data
Table 38 ▪ RECREATIONAL VESSEL REGISTRATION DATA BY STATE 2019-2020 2020 2019
Registration Deaths Fatality Rate Registration Deaths Fatality Rate Scope of Current Boat Registration System
11,838,188 767 6.5 11,878,542 613 5.2 AK 48,011 24 50 50,788 11 21.7 All motorboats; non-motorized is voluntary AL 248,260 19 7.7 245,636 28 11.4 All motorboats, sailboats and rental boats AR 185,378 13 7 160,932 10 6.2 All watercraft AZ 129,276 10 7.7 124,055 7 5.6 All motorized watercraft CA 645,951 39 6 711,173 39 5.5 All motorboats; sailboats over 8 feet in length CO 94,385 17 18 85,001 12 14.1 All watercraft powered by motor or sail; sailboards exempt CT 86,816 3 3.5 91,791 2 2.2 All motorboats; sailboats 19.5 feet or more in length DC 1,780 3 168.5 2,048 0 0.0 All watercraft DE 52,711 6 11.4 52,740 1 1.9 All motorboats; non-motorized is voluntary FL 959,816 72 7.5 935,742 62 6.6 All motorboats; all non-motorized vessels over 16 feet in length GA 330,270 11 3.3 331,481 23 6.9 All motorboats; sailboats 10 feet or more in length HI 12,355 1 8.1 12,100 4 33.1 All motorboats IA 215,321 8 3.7 196,965 5 2.5 All watercraft with exceptions (a) ID 90,290 5 5.5 88,450 8 9.0 All motorboats and sailboats IL 216,175 19 8.8 233,788 18 7.7 All motorboats on public waterways IN 202,093 8 4 208,599 16 7.7 All motorboats on public waterways KS 84,468 8 9.5 80,356 2 2.5 All motorboats and sailboats KY 156,800 9 5.7 166,760 9 5.4 All motorboats, except electric motors 1 hp or less LA 317,711 24 7.6 316,439 20 6.3 All motorboats; sailboats more than 12 feet in length MA 131,030 8 6.1 132,106 5 3.8 All motorboats MD 169,902 7 4.1 169,891 16 9.4 All motorboats ME 108,721 11 10.1 112,396 4 3.6 All motorboats MI 785,993 31 3.9 806,296 22 2.7 All watercraft with exceptions (b) MN 819,377 16 2 813,955 10 1.2 All watercraft with exceptions (c) MO 287,820 14 4.9 289,416 18 6.2 All motorboats; sailboats over 12 feet in length MS 128,076 6 4.7 125,252 5 4.0 All motorboats and sailboats MT 51,207 7 13.7 72,480 5 6.9 All motorboats NC 370,780 27 7.3 361,970 16 4.4 All motorboats; sailboats more than 14 feet in length ND 57,806 1 1.7 66,961 2 3.0 All motorboats; non-motorized is voluntary NE 79,034 2 2.5 78,212 2 2.6 All motorboats NH 101,312 2 2 96,006 4 4.2 All motorboats; sailboats 12 feet or more in length NJ 133,463 9 6.7 147,618 4 2.7 All watercraft with exceptions (d) NM 30,918 4 12.9 32,005 2 6.2 All motorboats and sailboats NV 41,627 3 7.2 41,522 5 12.0 All motorboats; non-motorized is voluntary NY 433,457 28 6.5 440,381 17 3.9 All motorboats OH 593,422 25 4.2 586,159 13 2.2 All watercraft OK 199,129 17 8.5 194,966 8 4.1 All watercraft with exceptions (e) OR 164,838 26 15.8 165,253 18 10.9 All motorboats; sailboats 12 feet or more in length PA 301,450 11 3.6 301,287 8 2.7 All motorboats and certain non-powered craft (f) RI 38,406 2 5.2 38,836 1 2.6 All motorboats and rowboats over 12 feet SC 556,226 25 4.5 567,443 15 2.6 All watercraft SD 60,557 3 5 57,825 5 8.6 All motorboats; all other boats over 12 feet in length TN 246,190 30 12.2 245,991 9 3.7 All motorboats and sailboats TX 577,144 59 10.2 563,820 43 7.6 All motorboats and sailboats 14 feet or more in length UT 68,559 10 14.6 64,949 7 10.8 All motorboats and sailboats VA 230,195 21 9.1 221,629 20 9.0 All motorboats VT 26,641 4 15 28,333 4 14.1 All motorboats WA 254,280 28 11 241,760 27 11.2 All motorboats with exceptions (g); sailboats >16 ft in length WI 620,812 22 3.5 607,211 9 1.5 All motorboats & sailboats over 12 feet in length WV 31,018 5 16.1 56,297 2 3.6 All motorboats WY 26,022 1 3.8 25,659 3 11.7 All motorboats AS 108 0 0 75 0 0.0 All watercraft CNMI 307 0 0 402 0 0.0 All motorboats GU 853 0 0 911 0 0.0 All motorboats PR 29,624 0 0 25,352 2 7.9 All motorboats; vessels adapted to hold a motor VI 4,017 1 24.9 3,073 0 0.0 All watercraft
Offshore 2 5 (a) IA excludes inflatables under 7 feet in length and canoes/kayaks under 13 feet in length. (b) MI excludes manually propelled boats 16 feet or less in length, and privately-owned non-motorized rafts, ca-noes, and kayaks. (c) MN excludes non-motorized boats 10 feet or less in length, duckboats during duckhunting season, riceboats during harvest season, and seaplanes. (d) NJ excludes non-motorized boats less than 12 feet in length and canoes and kayaks. (e) OK excludes canoes, kayaks, and pedal boats. (f) PA registers non-powered craft using lakes or access areas owned by the State Fish & Boat Commis-sion. (g) WA excludes motorboats < 16 feet with motors 10 horsepower or less used solely on exclusive state waters.
Recreational Boating Statistics 2020 71

Registration Data
Recreational Boating Statistics 2020 72

□ □
□
□
□
□ □ I □
□ □
I
RECREATIONAL BOATING ACCIDENT REPORT 7 22
INSTRUCTIONS
Privacy Act Notice
Authority: Purpose:
Routine Uses:
REPORT SUBMISSION
Report required because (select all that apply):
died
required or was in need of treatment beyond first aid
disappeared
All damage (e.g., fishing/hunting gear) totaled (or likely totaled)
your $
your $
boat (or likely was) total loss
Report submitted by (select all that apply)(required if possible)
(if operator unable, or same as operator)(describe)
ACCIDENT SUMMARY
WHEN ACCIDENT DESCRIPTION Briefly
(attach extra pages if necessary) (mm/dd/yyyy) (select one)
WHERE
(on water) DAMAGE TO YOUR BOAT Briefly
YOUR BOAT – PEOPLE DAMAGE TO YOUR OTHER PROPERTY: (NOT BOAT) Briefly (not boat) on board (including operator)
being towed (e.g., on tubes, skis)
wearing lifejackets (on board or towed)
OTHER BOATS INVOLVED IN ACCIDENT
other
To be submitted within: (if injury, disappearance or death)
(if boat/property damage only)
(Local State Reporting Authority)
For State Agency Use Only First Name Last Name
Phone
Primary Cause of Accident
9/18)
20

I I I I I I □ □
I
I I I I I I
I I I I I I
□ □ □ □
I
I I
- I
For each question below, please provide answers IF APPLICABLE AND IF KNOWN, otherwise leave blank.
YOUR BOAT
BOAT IDENTIFICATION
Your Boat Name: Manufacturer:
Model Name: Model Year:
Registration #: Documentation #:
Hull Identification # Rented: Yes No
SIZE ESTIMATES
Length: ft. Depth from transom to keel : ft. in. Beam width at widest point: ft.
HULL MATERIAL Type of Hull Material
Fiberglass Wood Rubber/vinyl/canvas Other
Aluminum Steel Plastic BOAT TYPE Boat Type Available Propulsion
Cabin motorboat Inflatable Canoe Personal watercraft TM
TM TM
Propeller Air thrust
Open motorboat Houseboat Rowboat Sail Other
Auxiliary sail Sail Air boat Other Manual Pontoon boat Kayak Water jet
ENGINE # Engines Engine type and horsepower Fuel type Manufacturer Outboard Sterndrive Inboard None Gasoline Diesel Electric
Total horsepower: hp
SAFETY MEASURES Organizations that have conducted a vessel safety check on board your boat within the past year
US Coast Guard Auxiliary: VSC Decal? Yes No
US Power Squadrons: VSC Decal? Yes No
Federal Agency
State Agency (
Other Agency
# Life jackets on board: # Fire extinguishers on board: Type of fire extinguishers :
# Fire extinguishers used: Amount of fire extinguishers used:
ACCIDENT DETAILS – EXTERNAL CONDITIONS
WEATHER Overall weather was It was Visibility was Wind was
Clear Raining Day Good 0 mph Cloudy Snowing Night Fair Over 0, up to 12 mph Foggy Hazy Poor Over 12, up to 25 mph Other Over 25, up to 55 mph
Approximate air temperature: ºF Over 55 mph (stormy)
WATER Overall water conditions : Other water conditions:
Up to 6 in. waves Approximate water temperature: ºF
Over 6 in., up to 2 ft. waves Strong current? Yes No
Over 2 ft., up to 6 ft. waves Hazardous waters? Yes No
Over 6 ft. waves Congested waters? Yes No
CG-3865 (9/18) Page 2 of 6
20

For each question below, please provide answers IF APPLICABLE AND IF KNOWN, otherwise leave blank.
ACCIDENT DETAILS – ACTIVITIES AND OPERATIONS ON YOUR BOAT OPERATOR/PASSENGER ACTIVITIES Operator/passenger activities on your boat at time of accident:
Activities were Operator/Passenger activities Recreational Fishing Tubing Starting engine Commercial Hunting Water Skiing Making repairs
White water activity Relaxing Other
BOAT OPERATIONS Your boat operations at time of accident
Cruising Drifting Racing Towing another vessel Changing direction At anchor Rowing/paddling Launching Changing speed Being towed Docking/undocking Tied to dock/mooring Sailing Other
ACCIDENT DETAILS – CONTRIBUTING FACTORS ON YOUR BOAT
CONTRIBUTING FACTORS Indicate factors on your boat which may have contributed to this accident
Alcohol use Improper lookout Dam/lock Starting in gear Drug use Operator inattention Force of wake/wave Sharp turn Excessive speed Operator inexperience Hazardous waters Restricted vision
Improper anchoring Language barrier Heavy weather Mission/inadequate aids to navigation
Improper loading Navigation rules violation Ignition of fuel or vapor
Inadequate on-board navigation lights
Overloading Failure to vent Hull failure People on gunwale, bow or transom Other :
ACCIDENT DETAILS –YOUR BOAT
MACHINERY/EQUIPMENT FAILURE Failure of the following machinery/equipment on your boat contributed to this accident
Engine Onboard lights Shift Sound equipment
Electrical system Seats Radio Auxiliary equipment Fuel system Steering Fire extinguisher Other ( ): Sail/mast Throttle Ventilation Onboard navigation aids
ACCIDENT DETAILS – EVENTS ON YOUR BOAT ACCIDENT EVENTS Types of events occurring to/on your boat during accident
Collision with recreational boat Flooding/swamping Person fell overboard
Collision with commercial boat Fire/explosion fuel Person fell on/within boat
Collision with fixed object Fire/explosion non-fuel Sudden medical condition
Collision with submerged object
Carbon monoxide exposure Person struck by boat
Collision with floating object Mishap of skier, tuber, wake boarder, etc.
Person struck by propeller or propulsion unit
Capsizing Person left boat voluntarily Person electrocuted
Grounding Person ejected from boat
Sinking Other
CG-3865 (9/18) Page 3 of 6
20

For each question below, please provide answers IF APPLICABLE AND IF KNOWN, otherwise leave blank.
ACCIDENT DETAILS –YOUR BOAT-INJURED PEOPLE RECEIVING OR IN NEED OF TREATMENT BEYOND FIRST AID
injured people on, struck by, or being towed by , receiving treatment beyond first aid. injured people on, struck by, or being towed by (e.g., swimmers, people on a dock). injured person to report, attach additional copies of this page. , SKIP INJURED PEOPLE section.
INJURED PERSON
First Name MI Last Name
Street
City State Zip
Phone Date of Birth
Age
INJURY DETAILS
Injury caused when person Nature of most serious injury
Struck the Scrape/bruise Dislocation
Was struck by a Cut Internal organ injury
Was exposed to carbon monoxide poisoning Sprain/strain Amputation
Received an electric shock Concussion/brain injury Burn
Other Spinal cord injury Other
Person was wearing lifejacket? Yes No Broken/fractured bone Person received treatment beyond first aid? Yes No Body part of injury
Person was admitted to a hospital? Yes No
ACCIDENT DETAILS – YOUR BOAT – DEATHS/DISAPPEARANCES
report deaths/disappearances of people on, struck by, or being towed by . If more than one death/disappearance to report, attach additional copies of this page.
, SKIP DEATHS/DISAPPEARANCES section.
PERSON WHO DIED/DISAPPEARED
First Name MI Last Name
Street
City State Zip
Phone Date of Birth
Age
DETAILS OF DEATH/DISAPPEARANCE
Injury caused when person Nature of death/disappearance
Struck the Death by drowning
Was struck by a
Death other likely cause
Was exposed to carbon monoxide poisoning
Received an electric shock Disappeared and not yet recovered Other
Person was wearing lifejacket? Yes No
I
I
I I I I CG-3865 (9/18) Page 4 of 6
20

I I I I I I
□ □ □ □ □ I
I I
□ □ □ □ □ I
I I
For each question below, please provide answers IF APPLICABLE AND IF KNOWN, otherwise leave blank.
ACCIDENT DETAILS – YOUR BOAT OPERATOR
OPERATOR INSTRUCTION OPERATOR SAFETY MEASURES
Boating safety instruction completed On board, prior to accident, was operator wearing:
None A lifejacket? Yes No
State course An engine cut-off switch if equipped? Yes No
USCG Auxiliary course On board, prior to accident, was operator using:
Alcohol? Yes NoUS Power Squadrons course
Internet Drugs? Yes No
Other Operator arrested for Boating Under the Influence? Yes No
Weather reports consulted prior to accident? Yes No
OPERATOR EXPERIENCE
Experience operating this type of boat
0 to 10 hours Over 10, up to 100 hours Over 100, up to 500 hours Over 500 hours
ACCIDENT DETAILS – OTHER KEY PEOPLE other key people as injured, died, disappeared or operator/owner of boat.
If more than two other key people to report, attach additional copies of this page.
NAME/ADDRESS This other key person was a(n)
boat operator boat owner Owner of damaged property Passenger on boat Witness
First Name MI Last Name
Street
City State Zip Phone
boat name boat registration #
NAME/ADDRESS
This other key person was a(n)
boat operator boat owner Owner of damaged property Passenger on boat Witness
First Name MI Last Name
Street
City State Zip Phone
boat name boat registration #
CG-3865 (9/18) Page 5 of 6
20

I I
I I
I I I I I I
I I
I I
I I
I I
For each question below, please provide answers IF APPLICABLE AND IF KNOWN, otherwise leave blank.
YOUR BOAT OPERATOR
NAME/ADDRESS
First Name MI Last Name
Street
City State Zip
AGE/GENDER/PHONE
Date of Birth
Age Gender Male Female Phone
YOUR BOAT OWNER
If same as boat SKIP rest of YOUR BOAT OWNER section.
NAME/ADDRESS/PHONE
First Name MI Last Name
Street
City State Zip Phone
PERSON SUBMITTING THIS REPORT
If same as boat OR , SKIP rest of PERSON SUBMITTING THIS REPORT section.
NAME/ADDRESS/PHONE/ROLE
First Name MI Last Name
Street
City State Zip Phone
I was a(n)
Other person on board boat
Accident witness on board boat Other
SIGNATURE OF PERSON SUBMITTING THIS REPORT Your signature Date
An Agency may not conduct or sponsor and a person is not required to respond to an information collection, unless it displays a currently valid OMB Control Number.
The Coast Guard estimates that the average burden for this report form is 30 minutes. You may submit any comments concerning the accuracy of this burden estimate or any suggestions for reducing the burden to: Commandant (CG-
2 ), U.S. Coast Guard, Washington, DC 20593-0001 or Office of Management and Budget, Paperwork Reduction Project (1625-0003), Washington, DC 20503.
CG-3865 (9/18) Page 6 of 6
7820

Glossaries
Glossary
Airboat - A vessel that is typically flat-bottomed and propelled by an aircraft-type propeller powered by an engine.
At Anchor - Held in place in the water by an anchor; includes “moored” to a buoy or anchored vessel and “dragging anchor”.
Auxiliary Sail - A vessel with sail as its primary method of propulsion and mechanical propulsion as its secondary method.
Cabin Motorboat - A vessel propelled by propulsion machinery and providing enclosed spaces inside its structure.
Canoe - A small narrow boat, propelled by paddles. Canoes usually are pointed at both bow and stern and are normally open on top, but can be covered.
Capsizing - Overturning of a vessel.
Carbon Monoxide Poisoning - Death or injury resulting from an odorless, colorless gas generated from auxiliary boat equipment (stoves, heaters, refrigerators, generators, hot water heaters, etc.), another boat’s exhaust, or the exhaust of the vessel on which persons were either aboard or in close proximity.
Collision with Fixed Object - The striking of any fixed object, above or below the surface of the water.
Collision with Floating Object - Collision with any waterborne object above or below the surface that is free to move with the tide, current, or wind, except another vessel.
Collision with Commercial/Governmental/Recreational Vessel - Any striking together of two or more vessels, regardless of operation at the time of the accident, is a collision.
Collision with Submerged Object - A boat’s collision with any waterborne or fixed object that is below the surface of the water.
Congested Waters - Where the body of water is either too small or narrow to safely accommodate the number of boats on it.
Cruising - Proceeding normally, unrestricted, with an absence of drastic rudder or engine changes.
Departed Vessel - An accident where a person voluntarily disembarks a vessel by his/her own will (i.e. by diving off, jumping in), as opposed to a case where the person is forcefully ejected by a change in the vessel speed and/or direction.
Documented Vessel - A vessel of five or more net tons owned by a citizen of the UnitedStates and used exclusively for pleasure with a valid marine document issued by the Coast Guard. Doc-umented vessels are not numbered.
Drifting - Underway, but proceeding over the bottom without use of engines, oars or sails; being carried along only by the tide, current, or wind.
Electrocution - Death or injury resulting from an electrical current that comes in contact with water causing electrocution of the victim.
Excessive Speed - Speed above that which a reasonable and prudent person would have operated under the conditions that existed. It is not necessarily a speed in excess of a posted limit.
Failure to Vent - Prior to starting the engine, failure to turn on the powered ventilation system that
Recreational Boating Statistics 2020 79

Glossaries
brings in “fresh air” and expels gasoline vapors from the engine compartment.
Fall in Vessel - Any operator or passenger who slips, trips, or falls on board or within the vessel.
Falls Overboard - Any operator or passenger who falls off of the vessel.
Fiberglass hull - Hulls of fiber-reinforced plastic. The laminate consists of two basic components, the reinforcing material (glass filaments) and the plastic or resin in which it is embedded.
Fire/Explosion (fuel) - Accidental combustion of vessel fuel, liquids, including their vapors, or other substances such as wood.
Fire/Explosion (other) - Accidental burning or explosion of any material onboard except vessel fuels or their vapors.
Flooding/Swamping - Filling with water, regardless of method of ingress, but retaining sufficient buoyancy to remain on the surface.
Force of Wave/Wake - The track in the water of a moving boat; commonly used for the disturbance of the water (waves) resulting from the passage of the boat’s hull.
Fueling - Any stage of the fueling operation; primarily concerned with introduction of explosive or combustible vapors or liquids on board.
Grounding - Running aground of a vessel, striking or pounding on rocks, reefs, or shoals; stranding.
Hazardous Waters - Rapid tidal flows (the vertical movement of water) and/or currents (the horizontal flow of water) resulting in hazardous conditions in which to operate a boat.
Houseboat - A motorized vessel that is usually non-planing and designed primarily for multi-purpose accommodation spaces with low freeboard and little or no foredeck or cockpit.
Hull Failure - Defect or failure of the structural body of a vessel (i.e., hull material, design, or construction) not including superstructure, masts, or rigging.
Ignition of Spilled Fuel or Vapor - Accidental combustion of vessel fuel, liquids, and/or their vapors.
Improper Anchoring - Where a boat is either in the process of being anchored incorrectly or incorrectly held in place in the water by an anchor.
Improper Loading - Loading, including weight shifting, of the vessel causing instability, limited maneuverability, or dangerously reduced freeboard.
Improper Lookout - No proper watch; the failure of the operator to perceive danger because no one was serving as lookout, or the person so serving failed in that regard. Every vessel shall at all times maintain a proper look-out by sight and hearing as well as by all available means appropriate in the prevailing circumstances and conditions so as to make a full appraisal of the situation and of the risk of collision.
Inboard– An engine mounted inside the confines of a vessel which powers a drive shaft that turns a wa-ter jet impeller or that runs through the bottom of the hull and is attached to a propeller at the other end.
Inflatable - A vessel that uses air-filled flexible fabric for buoyancy.
Kayak - A small boat with a cockpit that is propelled by a double-bladed paddle by a sitting paddler.
Inadequate On-board Navigation Lights - Insufficient and/or improper lights shown by a boat that indicate course, position, and occupation, such as fishing or towing.
Recreational Boating Statistics 2020 80

Glossaries
Machinery Failure - Defect and/or failure in the machinery or material, design or construction, or components installed by the manufacturer involved in the mechanical propulsion of the boat (e.g., engine, transmission, fuel system, electric system, and steering system).
Missing or Inadequate Navigation Aids - The absence of or ineffective presence of navigation aids.
Motorboat - Any vessel equipped with propulsion machinery.
Navigation Rules Violation - Violation of the statutory and regulatory rules governing the navigation of vessels.
Numbered vessel - An undocumented vessel numbered by a state with an approvednumbering system under Chapter 123 of title 46, U.S.C.
Open Motorboat - A vessel equipped with propulsion machinery and having an open load carrying areathat does not have a continuous deck to protect it from the entry of water.
Operator Inattention - Failure on the part of the operator to pay attention to the vessel, its occupants, or the environment in which the vessel is operating.
Operator Inexperience - Lack of practical experience or knowledge in operating a vessel or, more particularly, the vessel involved in the accident.
Outboard - An engine with propeller or water jet integrally attached, which is usually mounted at the stern of a vessel.
Overloading - Excessive loading of the vessel causing instability, limited maneuverability, dangerously reduced freeboard, etc.
Paddlecraft - A vessel powered only by its occupants, using a single or double- bladed paddle as a lev-er without the aid of a fulcrum provided by oarlocks, thole pins, crutches, or similar arrangements.
People on Gunwale, Bow or Transom - Standing/Sitting on the upper edge of the side of a boat, usually on a small projection above the deck; and/or standing/sitting on the most forward part of the boat; and/or standing/sitting on the back of the boat.
Person Struck by Vessel - A person is struck by a boat.
Person Struck by Propeller - A person is struck by the propeller, propulsion unit, or steering machinery.
Personal Watercraft - A vessel propelled by a water-jet pump or other machinery as its primary source of motive power and designed to be operated by a person sitting, standing, or kneeling on the vessel, rather than sitting or standing within the vessel's hull.
Pod drive- An engine mounted in front of the transom of a vessel and attached through the bottom of the hull to a steerable propulsion unit.
Pontoon Boat - A vessel with a broad, flat deck that is affixed on top of closed cylinders which are used for buoyancy, the basic design of which is usually implemented with two rows of floats as a catamaran or with three rows of floats as a trimaran.
Restricted Vision - A vessel operator's vision is said to be restricted when it is limited by a vessel's bow high trim, or by glare, sunlight, bright lights, a dirty windshield, spray, a canopy top, etc.
Rowboat - An open vessel manually propelled by oars.
Sail (only) - A vessel propelled only by sails.
Recreational Boating Statistics 2020 81

Glossaries
Sharp Turn - An immediate or abrupt change in the boat’s course of direction.
Sinking - Losing enough buoyancy to settle below the surface of the water.
Skier Mishap - Skier mishap is defined by persons (1) falling off their water-skis, (2) striking a fixed or submerged object, or by (3) becoming entangled or struck by the tow line. Also includes mishaps involving inner-tubes and other devices on which a person can be towed behind a boat.
Standup Paddleboard - A vessel, typically 7’ – 15’ in length with enough width and flotation to stay afloat without momentum while boarded, that is propelled by a standing operator with the use of a single or double-bladed paddle.
Starting in Gear - The boat’s engine is started with the transmission in forward or reverse.
Steel hull - Hulls of sheet steel or steel alloy, not those with steel ribs and wood, canvas, or plastic hull coverings.
Sterndrive - An engine, powering a propeller through a series of shafts and gears, mounted in front of the transom of a vessel and attached through the transom to a drive unit that is similar to the lower unit of an outboard; and may also be known as an inboard-outdrive or an inboard-outboard.
Sudden Medical Condition - An incident where a person on a vessel experiences an unexpected medical condition.
Towing - Engaged in towing any vessel or object, other than a person.
Weather - As a contributing factor of an accident, “Weather” is supposed to signify a stormy or windy condition, usually connoting rough or high seas and dangerous operating conditions.
Wood Hull - Hulls of plywood, molded plywood, wood planking, or any other wood fiber in its natural consistency, including those of wooden construction that have been “sheathed” with fiberglass or sheet metal.
Recreational Boating Statistics 2020 82

Glossaries
Glossary of State Codes
AL Alabama NJ New Jersey AK Alaska NM New Mexico AZ Arizona NY New York AR Arkansas NC North Carolina CA California ND North Dakota CO Colorado OH Ohio CT Connecticut OK Oklahoma DE Delaware OR Oregon DC District of Columbia PA Pennsylvania FL Florida RI Rhode Island GA Georgia SC South Carolina HI Hawaii SD South Dakota ID Idaho TN Tennessee IL Illinois TX Texas IN Indiana UT Utah IA Iowa VT Vermont KS Kansas VA Virginia KY Kentucky WA Washington LA Louisiana WV West Virginia ME Maine WI Wisconsin MD Maryland WY Wyoming MA Massachusetts GU Guam MI Michigan PR Puerto Rico MN Minnesota VI Virgin Islands MS Mississippi AS American Samoa MO Missouri CNMI Northern Mariana Islands MT Montana AT Atlantic Ocean NE Nebraska GM Gulf of Mexico NV Nevada PC Pacific Ocean NH New Hampshire
Recreational Boating Statistics 2020 83