Beaver Lake Boating Carrying Capacity Study - USACE Little ...
98
Beaver Lake Boating Carrying Capacity Study Prepared for: U.S. Army Corps of Engineers Little Rock District P.O. Box 867 Little Rock, AR 72203 Prepared by: CDM Federal Programs Corp. 1050 North Reed Station Road, Suite D Carbondale, IL 62902 Under Contract with: U.S. Army Corps of Engineers Institute for Water Resources Contract W912HQ-16-D-0003, DO #04 February 2017
-
Upload
khangminh22 -
Category
Documents
-
view
1 -
download
0
Transcript of Beaver Lake Boating Carrying Capacity Study - USACE Little ...

Beaver Lake Boating Carrying
Capacity Study
Prepared for: U.S. Army Corps of Engineers Little Rock District P.O. Box 867 Little Rock, AR 72203 Prepared by: CDM Federal Programs Corp. 1050 North Reed Station Road, Suite D Carbondale, IL 62902
Under Contract with: U.S. Army Corps of Engineers Institute for Water Resources Contract W912HQ-16-D-0003, DO #04
February 2017

Views, opinions, and/or findings contained in this report are those of the authors and should not be
construed as an official Department of the Army position, policy, or decision unless so designated by
other official documentation.

Page iii
Table of Contents
Executive Summary .................................................................................................................. ES-1
ES.1 Setting the Carrying Capacity Benchmarks ........................................................................ ES-3
ES.2 User Perceptions on Safety and Crowding ......................................................................... ES-4
ES.3 Current Boat Use and Origination ...................................................................................... ES-6
ES.4 Analysis of Current to Potential Capacity ........................................................................... ES-7
ES.5 Discussion ........................................................................................................................... ES-9
Section 1 Introduction ........................................................................................................... 1-1
1.1 Study Purpose ....................................................................................................................... 1-2
1.2 Carrying Capacity Definitions ............................................................................................... 1-2
1.3 Beaver Lake Study Approach ................................................................................................ 1-5
1.4 Document Organization ....................................................................................................... 1-6
Section 2 Study Area Description .......................................................................................... 2-1
2.1 Study Zones .......................................................................................................................... 2-1
2.2 Lake Features ........................................................................................................................ 2-1
2.3 Useable Surface Area ........................................................................................................... 2-3
2.4 Existing Infrastructure .......................................................................................................... 2-5
2.4.1 Private and Community Boat Docks .............................................................................. 2-5
2.4.2 Marinas/Resorts ............................................................................................................ 2-8
2.4.3 Public Boat Launches .................................................................................................. 2-11
2.4.4 Recreation Areas/Campgrounds ................................................................................. 2-11
2.5 Demographic Characteristics .............................................................................................. 2-14
2.6 User Characteristics ............................................................................................................ 2-17
2.7 Visitation ............................................................................................................................. 2-19
Section 3 Existing Data and Studies Related to Boat Crowding and Safety ............................ 3-1
3.1 MP/SMP Comments ............................................................................................................. 3-1
3.2 Boating Incident Summary ................................................................................................... 3-1
3.2.1 Bodily Harm and Fatalities ............................................................................................ 3-2
3.2.2 Crowding-Related Boating Incidents ............................................................................. 3-4
3.2.3 Comparison to Other Lakes ........................................................................................... 3-7
Section 4 Current Boat Use Study and Results ....................................................................... 4-1
4.1 Field Survey Methodology .................................................................................................... 4-1
4.1.1 Aerial Boat Survey ......................................................................................................... 4-1
4.1.2 Marina and Boat Ramp Survey...................................................................................... 4-3
4.1.3 Marina Slip Vacancy Adjustment .................................................................................. 4-6
4.2 Boat Type and Distribution Results ...................................................................................... 4-7
4.3 Observed Peak Boat Density .............................................................................................. 4-12
4.4 Boat Origination Results ..................................................................................................... 4-13
4.4.1 Public Access Ramp Results ........................................................................................ 4-13
4.4.2 Marina Slip Survey Results .......................................................................................... 4-14

Beaver Lake Boating Carrying Capacity Study Table of Contents
Page iv
4.4.3 Resort Results ..................................................................................................................... 4-16
4.4.4 Public and Community Dock Origination............................................................................ 4-16
4.4.5 Boat Origination Summary ................................................................................................. 4-17
4.5 Peak Holiday Use ................................................................................................................ 4-18
4.6 Field Survey Limitations ...................................................................................................... 4-18
Section 5 Boater Perceptions on Crowding and Safety .......................................................... 5-1
5.1 Safety .................................................................................................................................... 5-1
5.2 Crowding .............................................................................................................................. 5-3
5.3 Response to Crowding .......................................................................................................... 5-5
5.4 Boater Survey Limitations .................................................................................................... 5-5
Section 6 Carrying Capacity Benchmarks ............................................................................... 6-1
6.1 WALROS Calculation ............................................................................................................. 6-1
6.2 Spatial Carrying Capacity ...................................................................................................... 6-6
6.3 Social Carrying Capacity........................................................................................................ 6-7
Section 7 Carrying Capacity Utilization and Facility Use ......................................................... 7-1
7.1 Boating Density Analysis ....................................................................................................... 7-1
7.2 Total Boat Capacity and Boating Lake Use Rates ................................................................. 7-3
7.3 Analysis Discussion ............................................................................................................... 7-5
Section 8 References ............................................................................................................. 8-1

Beaver Lake Boating Carrying Capacity Study Table of Contents
Page v
List of Figures
Figure ES-1. Lake Study Zones and Useable Surface Area ........................................................................ ES-2 Figure ES-2. Beaver Lake Recreational Carrying Capacity Process Overview ........................................... ES-3 Figure ES-3. Survey Respondent Optimal Social Boat Density ................................................................. ES-4 Figure ES-4. Top Boating Safety Concerns ................................................................................................ ES-5 Figure ES-5. Seriousness of a Safety Problem from the Number of Boats ............................................... ES-5 Figure ES-6. Average Boat Origination by Facility Type ........................................................................... ES-7 Figure ES-7. Beaver Lake Carrying Capacity Utilization ............................................................................ ES-8 Figure 1-1. Beaver Lake, September 4, 2016.............................................................................................. 1-1 Figure 2-1. Lake Study Zones ...................................................................................................................... 2-2 Figure 2-2. Unusable Water near Prairie Creek Marina ............................................................................. 2-3 Figure 2-3. Useable Water .......................................................................................................................... 2-4 Figure 2-4. Useable and Unusable Lake Surface Area ................................................................................ 2-6 Figure 2-5. Private, Community, and Resort Boat Dock Locations............................................................. 2-7 Figure 2-6. Concentrations of Private, Community, and Resort Slips on Beaver Lake ............................... 2-9 Figure 2-7. Beaver Lake Marinas .............................................................................................................. 2-10 Figure 2-8. Public Boat Launches ............................................................................................................. 2-12 Figure 2-9. Public Use Recreational Areas ................................................................................................ 2-13 Figure 2-10. Fayetteville-Springdale-Rogers Metropolitan Statistical Area ............................................. 2-14 Figure 2-11. Resident Population in Fayetteville-Springdale-Rogers MSA............................................... 2-15 Figure 2-12. Per Capita Personal Income in Fayetteville-Springdale-Rogers MSA ................................... 2-16 Figure 2-13. Northwest Arkansas Population Projections ....................................................................... 2-16 Figure 2-14. Projected Population Growth in Northwest Arkansas from 2015 to 2035 .......................... 2-17 Figure 2-15. Average Number of Times Users Engage in Boating Activities at Beaver Lake .................... 2-18 Figure 2-16. Primary Study Zone Used during a Typical Recreational Boating Trip ................................. 2-18 Figure 3-1. Fatalities at Beaver Lake by Type (2011–2016) ........................................................................ 3-2 Figure 3-2. All Fatalities for All Types at Beaver Lake by Gender ............................................................... 3-2 Figure 3-3. Boating-Related Fatality and Bodily Injury Incident Locations (2011–2016) ........................... 3-3 Figure 3-4. Crowding vs. Non-Crowding Incidents on Beaver Lake............................................................ 3-4 Figure 3-5. Boating Incidents by Study Zone (2011–2016) ........................................................................ 3-5 Figure 3-6. Map of Boating Incidents by Study Zone (2011–2016) ............................................................ 3-6 Figure 3-7. Boating Incidents by Day and Time .......................................................................................... 3-7 Figure 3-8. Boating Incidents by Month ..................................................................................................... 3-7 Figure 3-9. Incidents on Beaver Lake in Comparison to the Arkansas Statewide Total ............................. 3-8 Figure 3-10. Comparison of Arkansas Lakes with Consistently High Numbers of Incidents ...................... 3-8 Figure 4-1. Congested Area of Beaver Lake, July 23 p.m. Flyover .............................................................. 4-3 Figure 4-2. Boat Launches Surveyed .......................................................................................................... 4-4 Figure 4-3. Number of Boats by Type ......................................................................................................... 4-8 Figure 4-4. Count and Percent of Total Boats Surveyed by Study Zone ..................................................... 4-9 Figure 4-5. Boat Type by Morning and Afternoon Field Survey Periods .................................................. 4-10 Figure 4-6. Boat Type by Study Zone ........................................................................................................ 4-11 Figure 4-7. Boat Type Distribution across Study Zones Weighted for Zone Area .................................... 4-12 Figure 4-8. Empty Boat Trailers by Study Zone ........................................................................................ 4-13 Figure 4-9. Average Boat Origination by Facility Type ............................................................................. 4-18 Figure 5-1. Top 15 Safety Concerns ............................................................................................................ 5-2 Figure 5-2. Seriousness of a Safety Problem from the Number of Boats ................................................... 5-2 Figure 5-3. Boating Condition Safety by Primary Study Zone Used ........................................................... 5-3 Figure 5-4. Respondents Indicating a Problem with too Many Boats by Primary Zone Used ................... 5-4 Figure 5-5. Boater Response to Crowding .................................................................................................. 5-5

Beaver Lake Boating Carrying Capacity Study Table of Contents
Page vi
Figure 6-1. WALROS Physical Inventory Expert Results ............................................................................. 6-3 Figure 6-2. WALROS Social Inventory Expert Results ................................................................................. 6-3 Figure 6-3. WALROS Management Inventory Expert Results .................................................................... 6-4 Figure 6-4. WALROS Inventory Classifications by Study Zone .................................................................... 6-4 Figure 6-5. WALROS Boating Capacity Range Decision Tool ...................................................................... 6-5 Figure 6-6. Boater Survey Photo Simulations Used to Determine Social Carrying Capacity ...................... 6-8 Figure 6-7. Boater Survey Respondent Optimal Social Boat Density ......................................................... 6-9 Figure 6-8. Boater Survey Respondent Optimal Social Boat Density by Study Zone ................................. 6-9 Figure 7-1. Beaver Lake Carrying Capacity Utilization ................................................................................ 7-2

Beaver Lake Boating Carrying Capacity Study Table of Contents
Page vii
List of Tables
Table ES-1. Recommended Carrying Capacity Range for Beaver Lake by Study Zone ............................. ES-3 Table ES-2. Observed Boat Density by Study Zone .................................................................................. ES-7 Table ES-3. Summary of Beaver Lake Carrying Capacity Utilization by Study Zone ................................. ES-8 Table 2-1. Useable Surface Water Acres by Study Zone ............................................................................ 2-5 Table 2-2. Count of Private, Community, and Resort Boat Docks and Slips by Study Zone ....................... 2-5 Table 2-3. Characteristics of Beaver Lake Marinas .................................................................................... 2-8 Table 2-4. Characteristics of Beaver Lake Recreation Areas and Facilities .............................................. 2-11 Table 2-5. Historical and Projected Population in Northwest Arkansas Region ...................................... 2-17 Table 2-6. Beaver Lake Visitation Data ..................................................................................................... 2-19 Table 3-1. Crowding Incidents by Zone per 10,000 Useable Acres (2011–2016) ....................................... 3-5 Table 4-1. Primary and Alternate Field Survey Dates ................................................................................. 4-1 Table 4-2. Planned Flyover Direction by Study Zone.................................................................................. 4-2 Table 4-3. Beaver Lake Recreation Facilities Included in Field Survey ....................................................... 4-5 Table 4-4. Marina Slip Vacancy Adjustment Factors .................................................................................. 4-7 Table 4-5. Number of Boats by Survey Period and Study Zone ................................................................. 4-8 Table 4-6. Distribution of Boat Type within Each Study Zone .................................................................. 4-10 Table 4-7. Distribution of Each Boat Type by Study Zone, Weighted for Zone Area ............................... 4-11 Table 4-8. Observed Peak Boat Density by Study Zone............................................................................ 4-12 Table 4-9. Available Trailer Parking Spaces by Study Zone ...................................................................... 4-13 Table 4-10. Empty Boat Trailers by Survey Period and Study Zone ......................................................... 4-14 Table 4-11. Marina Slip Information ........................................................................................................ 4-15 Table 4-12. Marina Slip Information Summarized by Study Zone ............................................................ 4-15 Table 4-13. Boats Originating from Marinas by Survey Period ................................................................ 4-16 Table 4-14. Boats Originating from All Facilities for Afternoon Survey Periods ...................................... 4-17 Table 6-1. Attributes Used to Differentiate WALROS Classes .................................................................... 6-1 Table 6-2. WALROS Recommended Carrying Capacity Range for Beaver Lake by Study Zone .................. 6-6 Table 7-1. Observed to Recommended Boat Densities by Study Zone ...................................................... 7-2 Table 7-2. Recommended BOATS by Study Zone and Overall ................................................................... 7-3

Beaver Lake Boating Carrying Capacity Study Table of Contents
Page viii
Appendices
Appendix A Boating Carrying Capacity Studies: A Literature Review
Appendix B Boater Survey Report
Appendix C WALROS Classification of Beaver Lake
Appendix D Field Survey Methodology

Page ix
Acronyms
ANS Aquatic Nuisance Species
BOATS Total boats actively operating on the available water surface at any given point in time
FY fiscal year
GIS geographic information system
MP Master Plan
MSA Metropolitan Statistical Area
NWARPC Northwest Arkansas Regional Planning Commission
OMB U.S. Office of Management and Budget
OMBIL Operations and Maintenance Business Information Link
Reclamation U.S. Bureau of Reclamation
SMP Shoreline Management Plan
USACE U.S. Army Corps of Engineers
WALROS Water and Land Recreation Opportunity Spectrum

Page x
This page intentionally left blank.

Page ES-1
Executive Summary
During the summer of 2016, a recreational boating carrying capacity study was completed on Beaver
Lake, Arkansas for the Little Rock District of the U.S. Army Corps of Engineers (USACE). This study
characterizes current boating lake use during peak boating periods and boaters’ perspectives on safety
and crowding at the lake. The primary focus of the study is to evaluate existing recreational use and
users’ perspectives against carrying capacity ranges researched and developed specifically for the
Beaver Lake setting. Additional information regarding facility carrying capacity was collected and is also
presented to assist in future lake management decisions.
For study purposes, Beaver Lake was delineated into five study zones. Data were collected, analyzed and
are reported according to study zone and the lake as a whole, as appropriate. The surface area of the
lake useable for boating was calculated by study zone, providing the basis for estimating current boat
density (useable acres per boat) (Figure ES-1).
Field data were collected on recreational boating lake use during four high-use summer weekends. Data
were collected through aerial boat counts and simultaneous ground counts of empty boat trailers and
empty marina slips. This information was utilized to determine the number and types of boats using the
lake at any given time. The collected information also provides insights into boat origin and existing
utilization levels of lake access facilities and infrastructure during peak times.
A survey of boaters at Beaver Lake was conducted following the summer boating period in 2016 and
provides information on user characteristics, on-water activities, and perceptions of safety, crowding,
and preferred boat density. This information was used to develop an acceptable range of social boating
carrying capacity at Beaver Lake and to assess the impact of existing boating density on the quality of
the recreational experience and boating safety. According to federal guidelines and requirements, the
survey questionnaire was approved by the U.S. Office of Management and Budget (OMB) prior to its
administration. The survey had a response rate of 45 percent and provided a statistically valid sample
for the analysis.
To provide the context and setting for interpretation of the results, the lake and surrounding area were
characterized with input from the USACE Beaver Lake Project Office management staff and Chief
Rangers as well as data collected from various sources. A literature review was completed to identify
nationwide studies of similar nature with established carrying capacity benchmarks. Data collected for
the study included existing Beaver Lake reports, boating incident and fatality data for Beaver Lake and
other recreational lakes in Arkansas, visitation data, area demographics, an assessment of existing
infrastructure, and a lake characterization following the Water and Land Recreation Opportunity
Spectrum (WALROS) developed by the U.S. Bureau of Reclamation (Reclamation).
An overview of the study process is shown in Figure ES-2.

Beaver Lake Boating Carrying Capacity Study Executive Summary
Page ES-2
Figure ES-1. Lake Study Zones and Useable Surface Area
Zone 1 5,104
Zone 2 5,473
Zone 3 7,493
Zone 4 4,051
Zone 5 2,280
Useable Acres All Zones
24,401

Beaver Lake Boating Carrying Capacity Study Executive Summary
Page ES-3
Figure ES-2. Beaver Lake Recreational Carrying Capacity Process Overview
ES.1 Setting the Carrying Capacity Benchmarks An essential component of the carrying capacity study is the calculation of benchmark ranges of
appropriate boating carrying capacity specific to each study zone of Beaver Lake. Shoreline
configuration, lake setting and context, visitors’ perceptions, number of accidents involving other boats,
boat type and speed, and dominant boating activities were factors specific to Beaver Lake that were
taken into consideration in determining a range of appropriate boat densities.
WALROS was used to incorporate lake managers’ and experts’ perceptions of the physical, social, and
managerial attributes of each study zone to develop an appropriate range of recreational boating
capacities or densities. The WALROS methodology allows users to classify a specific lake into a spectrum
that ranges from urban, suburban, rural developed, rural natural, semi-primitive, and primitive
recreation opportunities. The lake was classified overall as “Suburban” with an associated broad boating
capacity range of 10 to 20 useable water surface acres per boat.
To arrive at a more precise boating capacity range by study zone, the WALROS Range Decision Tool was
utilized to incorporate additional information for each study zone and to narrow down the
recommended range of densities. This additional analysis resulted in the recommended carrying
capacity range of approximately 14 to 17 useable acres per boat in Zones 1, 2, and 4; 18 to 20 useable
acres per boat in Zone 3; and 10 to 13 useable acres per boat in Zone 5 (Table ES-1).
Table ES-1. Recommended Carrying Capacity Range for Beaver Lake by Study Zone
Study Zone Capacity Range
(useable acres per boat)
Entire Lake
Zone 1
Zone 2
Zone 3
Zone 4
Zone 5
10–20
14–17
14–17
18–20
14–17
10–13
STUDY INPUTS
Data on Facilities, Incidents, and Demographics
2016 Boat and Facility Field Survey
2016 Boater Perception Survey
STUDY RESULTS
Benchmark Carrying Capacity Ranges
Current Summer Boating Use Profile, Including Boating Density
Current Social Perceptions on Crowding and Safety

Beaver Lake Boating Carrying Capacity Study Executive Summary
Page ES-4
To validate and confirm the carrying capacity ranges from the WALROS method, a literature review was
conducted to develop capacity ranges considering only the spatial carrying capacity for Beaver Lake.
Shoreline configuration, useable lake area, dominant boat types and speed, and historical crowding-
related accident records were considered in conjunction with past studies. Based on these
considerations, a conservative spatial boating carrying capacity for Beaver Lake was determined to be 10
to 20 acres per boat. The range of carrying capacity is dependent on boat type and study zone, thereby
confirming the WALROS range.
Similarly, social carrying capacity benchmarks were developed to validate the WALROS range based on
users’ perceptions of crowding from the boater perception survey. Using photo simulations, survey
respondents were asked to indicate which photograph represents the maximum number of boaters one
could see at a time without thinking it was too crowded. Based on calculated boat densities associated
with each photo, 88 percent of boaters indicated a preference for boating densities that do not exceed
10 acres per boat. Furthermore, density that reaches 14 acres per boat exceeds the preference of 55
percent of boaters. The reported optimal boating preferences of the survey respondents are provided in
Figure ES-3.
Figure ES-3. Survey Respondent Optimal Social Boat Density
ES.2 User Perceptions on Safety and Crowding Most respondents to the boater survey indicated that they feel boating conditions on Beaver Lake are
very to extremely safe (64 percent) while the remaining 36 percent noted some concern for boating
safety. The top boating safety concerns are summarized in Figure ES-4. Six out of 10 respondents
0
2
4
6
8
10
12
14
16
18
20
1 4 7
10
13
16
19
22
25
28
31
34
37
40
43
46
49
52
55
58
61
64
67
70
73
76
79
82
85
88
91
94
97
10
0
Bo
ats
per
10
0 A
cres
Percent of Survey Respondents
Number of Boats Per 100 Acres Before Users Indicate
Conditions Are Too Crowded
9% of users prefer seeing fewer than
5 boats per 100 acres
55% of users prefer seeing fewer than
7 boats per 100 acres
88% of users prefer seeing fewer than
10 boats per 100 acres
94% of users prefer seeing less than 12 boats per 100 acres

Beaver Lake Boating Carrying Capacity Study Executive Summary
Page ES-5
indicated that the number of boats on Beaver Lake is creating some degree of a safety problem (Figure
ES-5). Results indicate that boaters who primarily recreate in Zones 3 or 4 are slightly more likely to note
safety issues than those that use Zones 1, 2, or 5.
Figure ES-4. Top Boating Safety Concerns
Figure ES-5. Seriousness of a Safety Problem from the Number of Boats
42.4
36.1
18.4
2.4 0.7
Not at all serious
Slightly serious
Moderately serious
Very serious
Extremely serious
0
20
40
60
80
100
120
140
160U
ned
uca
ted
/In
exp
erie
nce
dB
oat
ers
Cau
se S
afet
y I
ssu
es
Hig
hsp
eed
/Cig
aret
te/W
ake
Bo
ats
Cau
se S
afet
y I
ssu
es
Cro
wd
ed o
n H
oli
day
s
Pas
sin
g to
o C
lose
to
Bo
ats/
Skie
rs/D
ock
s C
ause
s…
Spee
din
g C
ause
s Sa
fety
Co
nce
rns
PW
C/J
et S
kis
Cre
ate
Safe
tyC
on
cern
s
Un
mar
ked
Haz
ard
s/Sh
allo
ws
Deb
ris
in W
ater
is
Dan
gero
us
Wak
e B
oar
ds/
Tu
bes
/Sk
iers
Cre
ate
Safe
ty C
on
cern
s
Dri
nk
ing
on
th
e L
ake
is a
Pro
ble
m
Cro
wd
ed o
n W
eek
end
s
Lo
w W
ater
Lev
el C
asu
ses
Safe
ty I
ssu
es
Nee
d M
ore
No
Wak
e Z
on
es
Pra
irie
Cre
ek A
rea
is C
row
ded
No
ise
is a
Pro
ble
m
Co
un
t o
f R
esp
on
se
Safety Concern

Beaver Lake Boating Carrying Capacity Study Executive Summary
Page ES-6
One out of 4 respondents indicated that they feel there is a problem with too many boats on Beaver
Lake. Those that use rowboats, kayaks, or canoes were more likely to see a problem of too many boats,
followed by boaters using fishing or bass boats. Only slight variations exist in users’ perceptions of
crowding based on the zone primarily used during an average boating trip. Boaters indicated that they
are responsive to crowding and will change their behavior if the social carrying capacity at Beaver Lake is
exceeded.
ES.3 Current Boat Use and Origination
To establish the current (2016) summer recreational boating use profile for Beaver Lake, a field survey
was conducted consisting of coordinated aerial and ground surveys. During aerial flyovers, observers
recorded the number and type of boat and recreational activity while noting approximate locations of
each boat on map sheets. Boats were tallied by type and activity, according to the list below.
Power Boats and Activities
Fishing/Bass
Pontoon/Houseboat
Skiing/Wake
Speedboat
Personal Watercraft
Non-Power Boats and Activities
Sailboat
Canoe/Kayak
Simultaneously, ground crews surveyed the number of empty boat trailers at public boat ramps and
campgrounds. Similarly, the number of rented but empty boat slips at each marina was tallied. Counts
were conducted in the morning and the afternoon on both Saturday and Sunday of four summer
weekends (including the Fourth of July and Labor Day holiday weekends) during the 2016 recreation
season. Two survey periods were called off due to weather and crew safety concerns thus field data
were collected for a total of 14 observations.
The greatest number of boats counted during any survey period was during the Labor Day weekend on
the afternoon of September 4, 2016 when 1,450 boats were observed on the lake at one time
(“BOATS”). The observed peak boating density for Beaver Lake is calculated by dividing the usable water
surface acres by the boat count from the survey period that tallied the most number of boats:
Observed Peak Boat Density = 24,401 useable acres ÷ 1,450 boats = 16.8 acres/boat
The analysis of boat density was completed for each of five study zones. Table ES-2 provides the
observed maximum boat density for each study zone. Higher density values are reflective of fewer boats

Beaver Lake Boating Carrying Capacity Study Executive Summary
Page ES-7
on the lake. Zone 2 was found to have the greatest density of boats at 12 acres per boat followed by
Zone 4 at 15.5 acres per boat.
Table ES-2. Observed Boat Density by Study Zone
Zone 1 Zone 2 Zone 3 Zone 4 Zone 5 Total
Useable Acres 5,104 5,473 7,493 4,051 2,280 24,401
Maximum Number Observed Boats 297 455 394 261 68 1,450
Useable Acres per Boat 17.2 12.0 19.0 15.5 33.5 16.8
There are notable differences in use patterns across lake zones and by time of day. Consistently fewer
boats were observed on the water in the morning survey periods, and the areas where boaters
concentrate also varied considerably between the morning and afternoon counts. Boat type/activity
varied by lake zone and between the morning and afternoon counts, with fishing boats more frequently
encountered in the mornings in Zones 4 and 5 and waterski boats more common in the afternoons in
Zones 2 and 3.
Field data are also used to estimate the origination facility for boats on the water. Counts of empty boat
trailers and empty marina slips are used to derive the percentage of boats originating from public boat
ramps, marinas, and private, community, and resort boat docks. The field data indicate that
approximately 42 percent of the boats on the water originate from public boat ramps, 43 percent from
marina slips, and 15 percent from private, community docks, and resort docks (Figure ES-6).
Figure ES-6. Average Boat Origination by Facility Type
ES.4 Analysis of Current to Potential Capacity Given the recommended lake-wide range of 10 to 20 acres per boat developed using the WALROS
methodology and the Observed Peak Boat Density of 16.8 useable acres per boat, Beaver Lake has
42%
43%
15%
Boat Ramps
Marina Slips
Private, Community, and ResortDocks

Beaver Lake Boating Carrying Capacity Study Executive Summary
Page ES-8
currently reached but not exceeded the recommended carrying capacity during peak use times (Figure
ES-7). The density of 20 and 10 useable acres per boat translates to approximately 1,410 and 1,689
BOATS, respectively. This translates to a capacity utilization ranging from 86 to 103 percent.
Figure ES-7. Beaver Lake Carrying Capacity Utilization
The analysis of capacity utilization can be further assessed by study zone. As shown in Table ES-3, Zones
1, 3, and 4 peak boating densities indicate boating activities have reached but not exceeded the
recommended ranges of carrying capacity. Zone 2 exceeds the suggested benchmark carrying capacity
range, with an estimated peak density of 12 acres per boat compared to a suggested carrying capacity
range of 14 to 17 acres per boat. Zone 5 was found to be underutilized, with an estimated peak summer
density of 34 acres per boat.
Table ES-3. Summary of Beaver Lake Carrying Capacity Utilization by Study Zone
Study Zone
Dominant Boat Type
Crowding Concerns
(% indicating too many
boats)
Safety Concerns
(% indicating less than very
safe)
Observed Maximum
Boat Density (acres per
boat)
WALROS Carrying Capacity
(acres per boat)
Analysis of Capacity Utilized
Zone 1 Ski/Wake 20 26 17 14 to 17 Reached
Zone 2 Ski/Wake 27 36 12 14 to 17 Exceeded
Zone 3 Ski/Wake 25 40 19 18 to 20 Reached
Zone 4 Pontoon 21 40 16 14 to 17 Reached
Zone 5 Fish/Bass 31 36 34 10 to 13 Not Reached
Additional analyses were conducted to determine the relationship between BOATS, existing facilities,
and boat origination. Total Access Opportunities is a measure of the total number of boats that can be

Beaver Lake Boating Carrying Capacity Study Executive Summary
Page ES-9
moored or stored at an approved moorage facility, such as a marina or boat dock, plus the total number
of boats that can be placed on the water surface using an approved boat ramp or launch facility.
Currently, the Total Access Opportunities for Beaver Lake is 7,843 boats.
Facility Use Rate is a measure of the estimated number of boats on the lake at any given time from the
access points. Facility Use Rate is calculated by dividing the Total Access Opportunities by BOATS.
Currently, the Facility Use Rate for Beaver Lake is 19 percent. The Facility Impact Rate furthers this
calculation and indicates a 5:1 ratio of access opportunities to BOATS. In other words, at Beaver Lake,
adding 5 access opportunities results in 1 additional boat on the water during peak times.
It is possible to estimate the Facility Use Rate and thus the Facility Impact Rate by facility type:
Marina Facility Impact Rate = 4:1
Boat Ramp Facility Impact Rate = 1:1
Private, Community, and Resort Dock Slips Facility Impact Rate = 14:1
ES.5 Discussion The recommended boat density from WALROS and other studies is similar to the densities the majority
of survey respondents selected as the point beyond which the lake would be too crowded. Because
Beaver Lake is currently within the recommended boating density, and only exceeds it in limited areas or
for limited periods of time, it is not surprising that more survey respondents did not rank current
crowding as a significant issue. However, there is evidence that boaters are beginning to experience
negative consequences. One in 3 survey respondents did note at least some level of concern regarding
boating safety, and 58 percent indicated that they feel that the number of boats on Beaver Lake is
creating a safety problem. Comments received during the 2015 and 2016 Master Plan (MP) and
Shoreline Management Plan (SMP) scoping processes for Beaver Lake indicated a desire for greater
boater safety through the regulation of boat size/type and speed, increased enforcement of rules, or
increased patrols. Zone 2 exceeded recommended capacity during the study period and has seen 5
times more crowding-related incidents over the past 6 years than Zones 1 or 4. Zone 2 is known to lake
management as having several “party cove” areas in which several boats will tie together in a cove.
These areas were verified during helicopter flyovers and contribute to the high BOATS estimates
observed within this zone. While a gathering of stationary boats in coves generally does not contribute
to a lake-wide crowding issue or an increase in the frequency of accidents, it can contribute to crowding
and accidents as boats return to their point of origin.
Given that the Northwest Arkansas Regional Planning Commission (NWARPC) projects the population of
Springdale, Bentonville, Bella Vista, Lowell, and Centerton will more than double from 2015 to 2035, the
demand for recreational boating opportunities at Beaver Lake is likely to increase. The public boat ramp
facilities are currently experiencing a 1:1 Facility Impact Rate. However, only 7 percent of the existing
private, community, and resort boat dock slip owners are currently boating at one time. Given the large
number of these boat slips on Beaver Lake, even minor changes to this use pattern can impact the
number of boats on the water at any given point in time. From this information, lake managers can
better plan for the future of Beaver Lake and strive for a healthy, balanced level of recreational boating.

Page ES-10
This page intentionally left blank.
Page 1-1
Section 1
Introduction
Located in the Ozark Mountains of northwest Arkansas, Beaver Lake is a popular attraction for nature
lovers and water enthusiasts during all seasons but especially so in the summer. Its recreational
amenities, scenery, and clear water coupled with its location near one of the fastest growing
metropolitan areas in the United States makes it a prime destination for a multitude of recreational
boating activities. Increases in lake visitation along with regional population growth have raised
crowding-related concerns among lake managers and visitors. As a result, lake managers have been
tasked with identifying a range of recreational boating use levels at Beaver Lake that address
environmental protection goals while also preserving users’ recreational experiences. The purpose of
this study was to collect data on boating use of Beaver Lake and to develop a range of recommended
boating carrying capacities to assist lake managers with meeting demands on lake resources.
The Little Rock District of the U.S. Army Corps of Engineers (USACE) is the steward of the lands and
waters around Beaver Lake and is responsible for providing the public with quality outdoor recreation
experiences that serve the needs of present and future generations. Beaver Lake is formed from the
headwaters of the White River and is popular with boaters, campers, fishermen, and scuba divers. The
lake is a manmade reservoir authorized by the Flood Control Act of 1954. Construction of Beaver Dam,
on the northeastern side of the lake, was completed in 1966. The lake has 490 miles of natural shoreline
and 28,299 acres of surface water. Not only is it a great source of outdoor recreation, but it is also the
largest supplier of water to northwest Arkansas, serving over 400,000 customers. Figure 1-1 shows an
aerial view of a portion of the lake on a busy Sunday afternoon (Labor Day weekend 2016).
Figure 1-1. Beaver Lake, September 4, 2016

Section 1 Introduction
Page 1-2
1.1 Study Purpose The purpose of this Beaver Lake boating carrying capacity study was to gather information, using
statistical methods, about recreational boating use on Beaver Lake and the perceptions/preferences of
boaters concerning management of the lake. USACE is currently in the process of updating Beaver Lake’s
Master Plan (MP) and Shoreline Management Plan (SMP). This carrying capacity study is intended to
provide data to support these plan revisions by:
Evaluating the impact current lake usage has on the quality of recreation and public safety
Evaluating the effect that marinas, boat ramps, private boat docks, and commercial activities have
on the carrying capacity and distribution of users on the lake
Evaluating boater's perceptions of resource, social, and management conditions at the lake
Estimating the carrying capacity of Beaver Lake, expressed as a benchmark range of
recommended boat densities specific to Beaver Lake and for differing geographic areas of the lake
(as appropriate), and assessing how much of that capacity has been reached under existing
conditions
A level of use that balances environmental protection and user enjoyment may be considered an
optimal recreational carrying capacity (U.S. Bureau of Outdoor Recreation 1977). Boating carrying
capacity is defined to include consideration of both the number and types of watercraft on the lake.
1.2 Carrying Capacity Definitions The overall goals and objectives of a carrying capacity study are specific to the lake being studied. Some
carrying capacity studies are focused solely on one aspect of carrying capacity, such as recreational
safety, while others provide a comprehensive view of the elements that may affect boating carrying
capacity. Studies are typically designed with the aim of informing management strategies to balance the
recreational uses of the lake while protecting the boating environment. The resulting overall
recommended carrying capacity is specific to the lake being studied and may be derived using one or a
combination of several methodologies.
In reviewing past studies, it was determined that there are four main types of recreational carrying
capacity (ERM, Inc. 2004, Olvany and Pitchford 2010, Colorado State Parks 2011). Recreational boating
carrying capacity can be identified using any combination of these four indicators, depending on the
overall goals and management objectives of the project. The four components are ecological, facility,
spatial, and social carrying capacity. See Appendix A for the complete literature review.
Ecological carrying capacity refers to the ability of the ecosystem to cope with human impacts
associated with recreational activities. These would include impacts on wetlands and riparian
communities, trash accumulation and pollution, soil erosion and shoreline damages, and loss of
groundcover. Ecological carrying capacity may also include impacts on cultural resources at developed
and dispersed recreation areas.
Ecological carrying capacity can be one of the most difficult indicators to quantify. For some ecological
indicators, the presence of a single boat can be as disturbing as many boats, depending on the activity

Section 1 Introduction
Page 1-3
(Colorado State Parks 2011). Impacts on the natural environment from major disturbances can be
measured and may be either short- or long-term. Impacts may include shoreline erosion or damage, a
significant drop in waterfowl rafting, damage to vegetation, loss of fish and wildlife habitat, destruction
of fish spawning and rearing areas, deterioration of water quality, increased trash or pollution, and/or
dispersal of invasive plant species (Olvany and Pitchford 2010, Rajan et al. 2011). Water quality related
impacts, including pollution and increases in turbidity, can be measured through establishment of a
long-term surface water sampling plan. Other impacts, such as shoreline erosion and vegetative
damage, may take several years of field observations to document trends. Ecological impacts can also be
qualitatively measured through user survey questions aimed at perceptions of water clarity and quality
and/or shoreline property owners’ perceptions of shoreline damage and erosion.
Facility carrying capacity refers to the ability of the recreational facilities to accommodate the number
of users. Facilities may include parking lots (boat trailer and vehicle parking), marina slips, boat launches,
and other day use sites. Analysis of this component may include metrics such as wait times to use
facilities or parking space vacancy rates.
Facility carrying capacity is dependent on the size of available facilities and metrics such as boat launch
procedures for each lake. In a study at Stagecoach State Park in Colorado, estimates of facility capacity
included an evaluation of wait times to complete Aquatic Nuisance Species (ANS) inspections prior to
boat launch (Colorado State Parks 2011). Reservoirs that do not require inspections could derive launch
wait time estimates from monitoring and recording boat launch waits during several peak times.
Estimates of facility capacity may also include field counts of available boat trailer and vehicle parking
spaces and/or available marina slip rentals during peak boating periods (CDM Smith 2012).
Facility carrying capacity can be used as a limiting factor to manage recreational access and achieve
boating carrying capacity goals (Colorado State Parks 2011). For example, it may be possible to influence
actual boat density by managing the facility capacity and thus meet spatial carrying capacity goals.
Spatial carrying capacity refers to physical constraints of the lake related to its size and the useable
surface water area for various types of boating activities. Spatial carrying capacity is the number of boats
that can comfortably engage in their chosen recreational activity within a specific area of the lake.
Spatial boating carrying capacity considers the useable acres of the lake, the boat types, peak use levels,
and how the lake is being used.
Techniques used to estimate the total number of boats in use during peak and non-peak times may
include on-the-water surveying, aerial fly-overs, and/or parking lot vehicle counts (Bosley 2005). Field
data collection of boat density on smaller lakes may include scanning the water with binoculars from
various vantage points along the shoreline (Lake Ripley Management District 2003) or boat surveys of
open water and shorelines (Cherokee CRC 2010, JFNEW 2007). Larger lakes may require fixed wing or
helicopter flyovers (JFNew 2007, Pinecrest Lake 2012, CDM Smith 2012) or the use of aerial photography
(ERM, Inc. 2004). In some cases, aerial photography can be used to validate the findings of on-water or
aerial observations. Boat count and boat type data can also be collected during field surveys of launch or
ANS inspection points. Additionally, maximum boating density may be estimated via collection of
watercraft registration within townships and counties with little out-of-area visitation (JFNew 2007).

Section 1 Introduction
Page 1-4
Counts of vehicles and/or boat trailers at marinas and boat launches can provide estimates of watercraft
origin (CDM Smith 2012).
Surveys of boats on the water provide a point in time depiction of boat use and allow collection of data
on boat number, location, type, speed, and activity. Boat speed may be relevant dependent on overall
project goals and management objectives and can be recorded generally as fast-moving (i.e., wake
producing) or stationary and slow-moving (Lake Ripley Management District 2003). Additionally,
moored, docked, or beached watercraft may be recorded (Warren and Rea 1989). Launch and ANS
inspection point data can provide insight into the number and types of watercraft on a lake during a
particular time and general information on the point of origin. Watercraft are generally classified as
speed boats, pontoon boats, fishing boats, personal watercraft, sailboats, or paddle craft (canoes,
kayaks, and inflatables).
A watercraft census provides either a snapshot of the number of boats on the lake or reservoir during a
specific point in time or an estimate of potential maximum watercraft density. In order to provide the
most accurate picture of actual usage, the census should capture activity at several points in time (Doshi
2006). While an estimate of the number of boats on the water during peak use periods is essential to
any carrying capacity study, additional information, including boat type, boat speed, shoreline counts,
and/or off-peak counts, offer insights on different aspects of overall use and management. For example,
it may not make sense to base management protocols solely on the number of boats on the water but
instead to factor in changes in the number of motor or speed boats, which typically need greater surface
acreage for safe operation (Warren and Rea 1989). Analyses of spatial carrying capacity may also include
indicators of boating safety such as analyses of historical and current boating accident data. These data
can be viewed for the entire lake or by lake zones to indicate any areas of concern.
Social carrying capacity refers to visitors’ perceptions of crowding as defined by the lake’s users. This
capacity is reached when conflict arises or when the user chooses to no longer use the lake (Colorado
State Parks 2011).
Users’ perceptions of preferred boating density are measured via survey instruments. These may include
onsite field surveys at ramps and marinas, telephone surveys, and/or mail surveys. Generally, responses
to onsite surveys are aimed at perceptions of crowding on a specific day, whereas users’ responding to
mail-back or telephone surveys report their overall perceptions of crowding. Social carrying capacity
surveys most commonly utilize a 5- or 9-point Likert-type scale or digital enhanced photographic
simulations to gage users’ perceptions of crowding (Bosley 2005).
Onsite contact surveys can be administered on shore at boat ramps and/or marinas or on the lake by
boat. Mail-back surveys are often distributed randomly to groups likely to have utilized the lake,
including adjacent property owners, dock permit holders, marina slip renters, and campers. It is
important to develop a sampling plan, which results in a representative sample of the user groups of
interest (ERM, Inc. 2004). For example, many studies have found that, especially in rural areas, crowding
thresholds of residents are significantly lower than those of visitors coming from metropolitan areas.

Section 1 Introduction
Page 1-5
1.3 Beaver Lake Study Approach The overall goal of this study was to summarize current recreational boating lake use during peak
boating periods and to gather recreational boating users’ perspectives to assist in the development of
future lake management objectives. The primary focus is the identification of recommended spatial and
social carrying capacity ranges specific to Beaver Lake and to characterize the extent to which boating
falls within, under, or beyond the recommended capacity. Additional information on existing facilities
was collected to inform lake managers about how facility capacity may affect spatial carrying capacity
goals. Limited information was collected on the ecological carrying capacity.
The field activities, conducted during the summer of 2016, gathered data on boating activities during
four survey weekends, including the Fourth of July and Labor Day holiday weekends and two additional
weekends in July. Data about boat use on the water were collected via aerial flyovers. Simultaneously,
ground crews conducted counts of empty boat trailers at public boat launch parking lots and
campgrounds. The teams also counted empty marina slips. These field estimates provide primary data
on volume of boat traffic and origination of boats on the lake.
A user survey targeting boaters at Beaver Lake was administered following the summer boating period
in the fall of 2016. The survey follows the requirements and guidelines for federally sponsored data
collections and was approved by the U.S. Office of Management and Budget (OMB). This survey provides
critical information on user characteristics, on-water activities, and perceptions of safety, crowding, and
user preferences. The survey was offered both online and via mail-out/mail-back format. The survey had
a response rate of 45 percent and provided a statistically valid sample for the analysis. Results collected
provide a wide variety of information and key results of the survey are provided throughout the main
report. Details on the development, administration, and resulting responses from the survey are
provided in full in Appendix B.
A recommended carrying capacity benchmark range, expressed as acres per boat, was developed based
on the Water and Land Recreation Opportunity Spectrum (WALROS) methodology developed by the U.S.
Department of the Interior, Bureau of Reclamation (Reclamation) (U.S. Bureau of Reclamation 2011).
WALROS is a widely accepted method used to systematically classify recreational opportunities.
WALROS considers the physical, social, and managerial attributes of a lake to classify it along a spectrum
of urban, suburban, rural-developed, rural-natural, semi-primitive, and primitive recreation
opportunities. Each WALROS classification has an associated recommended range of boating densities to
achieve an appropriate carrying capacity for that lake’s setting. from several sources. The WALROS
analysis for Beaver Lake was conducted using the expertise of the Beaver Lake Project Office lake
management staff (see Appendix C for the complete WALROS analysis). A literature review was
conducted to develop spatial benchmark ranges for boating density based on the setting, typical
activities, and types of boats used at Beaver Lake (Appendix A). Additionally, a survey question asked
respondents to identify their preferences for boating density to characterize the social boating capacity.
Both the spatial and social capacities were used to validate the WALROS range.
The recommended carrying capacity benchmark range from WALROS and the literature review was
compared to observed boat densities as derived from the 2016 summer field study. The data and
analyses provide a foundation for analyzing critical questions for lake management. Estimates can be
made about the available capacity for growth in lake boating use and how existing facilities are

Section 1 Introduction
Page 1-6
contributing to lake uses. From this information, lake managers can better plan for the future of Beaver
Lake and strive for a healthy, balanced level of recreational boating.
1.4 Document Organization This report documents the methods and results of the Beaver Lake boating carrying capacity study. The
report is organized as follows:
Section 2 describes the study area, including study zones, lake features, useable surface area,
existing infrastructure, demographic characteristics, user characteristics (from the survey results),
and visitation levels.
Section 3 describes previously collected data on boating safety and crowding at Beaver Lake and
incident data to describe the current safety conditions at the lake.
Section 4 describes the methodology and results of the field studies to characterize the existing
boat density at Beaver Lake, including data on boat origin and facility capacity.
Section 5 presents the results of the user survey and perceptions related to safety and crowding
to derive the social carrying capacity.
Section 6 details results of the literature review and WALROS analysis used to develop the
recommended ranges for boat density for Beaver Lake.
Section 7 provides a summary of the analysis and conclusions about recommended carrying
capacities for boating recreation at Beaver Lake.
Section 8 lists the sources cited in the preparation of this report.

Page 2-1
Section 2
Study Area Description
This section provides the context and setting for the lake against which the results of the study are
interpreted. The context and setting of the lake includes its physical features and the social and
economic characteristics of the surrounding area and the users of the lake.
2.1 Study Zones For purposes of this study, data were collected, analyzed, and reported on by study zones. Based on
discussions with Beaver Lake managers, the lake was divided into five study zones (Figure 2-1). The
study zones were identified as areas that have different physical characteristics that may relate to
different patterns of boat use or management strategies. For example, the southern end of the lake
(Zones 4 and 5) is very narrow and can be shallow, making this area more attractive to fishermen, while
the middle section of the lake (Zones 2 and 3) contains wide spaces that allow for sailboats and attract
water skiers.
Data were collected by specific location to the maximum extent possible, i.e., by specific boat launch or
marina location. The results are presented both in aggregate for the entire lake and by the lake study
zones. Delineation of the lake into study zones not only allows analysis of individual portions of the lake
but may also assist in future development of zone-specific management criteria based on the results of
this study.
2.2 Lake Features The Beaver Lake watershed is 1,192 square miles in size, with the lake itself estimated to be
approximately 44 square miles. At the top of the conservation pool (at an elevation of 1,120 feet above
sea level), Beaver Lake has approximately 28,299 surface acres. The water levels in the lake vary year to
year, depending on local weather, particularly rainfall. Because Beaver Lake is a reservoir and its water
level fluctuates by design, the surface area and depth will also vary. For the purposes of shoreline
planning and management, USACE uses the top of the conservation pool at an elevation of 1,120 feet
above sea level as the standard lake position. Average depth of the lake is 60 feet. Other published
estimates of the size of Beaver Lake may use a different lake surface elevation or a different
interpretation of the lake boundaries such as the boundary between the river and the lake.
USACE indicated that three management zones are present at Beaver Lake and are used as the basis for
patrols: North, Middle, and South. These management zones roughly correspond to the zones as
follows:
North: Zone 1
Middle: Zones 2 and 3
South: Zones 4 and 5

Section 2 Study Area Description
Page 2-2
Figure 2-1. Lake Study Zones

Section 2 Study Area Description
Page 2-3
2.3 Useable Surface Area The calculation of boating density (acres per boat) relies on useable acres. Unusable water is defined as
water that is only safe for operating non-motorized watercraft. Areas around marinas, boat docks, swim
areas and shallow areas close to shore are typically excluded from the useable water area. Figure 2-2
shows a portion of the lake considered an unusable area. Figure 2-3 shows a useable water portion of
the lake.
To identify the useable areas of Beaver Lake, the shoreline when the lake is at elevation 1,110 (10 feet
lower than the top of the conservation pool) was digitized as a geographic information system (GIS)
shapefile (polygon). This shoreline that is based on a lower lake elevation excludes low water areas and
very narrow portions of the lake such as the southern end of the lake where it transitions into the White
River. This means that from the edge of the useable lake area shapefile boundary to the edge of the lake
when it is at an elevation of 1,120 feet above sea level, the water would be at least 10 feet deep at all
locations. By using this lower elevation as a starting point, it was not necessary to buffer the entire
shoreline to account for areas close to shore that might be too shallow for active boat use.
Figure 2-2. Unusable Water near Prairie Creek Marina

Section 2 Study Area Description
Page 2-4
Figure 2-3. Useable Water
A 150-foot buffer zone was applied around all private, community, and resort docks. This 150-foot
distance was based on the estimated average depth of docks plus a distance of 100 feet. Arkansas law
requires that boats remain at idle within 100 feet of any structure [Arkansas Code 27-101-202(3)]. A GIS
polygon layer of the marina docks was buffered with that 100-foot buffer zone based on the law.
Designated swim areas were classified as unusable for boating, as no boats are allowed in those areas.
Areas around known no-wake buoys were given a 100-foot buffer as well. A buffer zone of 100 feet was
applied to areas near bridges in accordance with state law. Restricted areas around the four water
supply intakes and the restricted area near the dam were also removed from the total useable surface
area.
The total unusable area is the difference in area between the lake surface at the top of the conservation
pool (28,299 acres at elevation 1,120) and the useable lake area shapefile boundary (elevation 1,110)
minus the areas deemed unusable by the above factors. This analysis identified a total of 3,898 acres of
unusable area. Table 2-1 shows the number of useable acres by lake zone, and Figure 2-4 shows the
useable areas on a map of the lake. Total useable acres are estimated to be 24,401 acres, or 86 percent
of the total surface water acres at the top of the conservation pool. Zone 3 has the largest total useable
acres while Zone 5 has the smallest (Table 2-1).
Section 2 Study Area Description
Page 2-5
Table 2-1. Useable Surface Water Acres by Study Zone
Study Zone Total Surface Water Acres
at Top of Conservation Pool Useable Water Surface
Acres Percent of Total Lake Area that is Useable
Zone 1 5,732 5,104 89%
Zone 2 6,245 5,473 88%
Zone 3 8,524 7,493 88%
Zone 4 4,599 4,051 88%
Zone 5 3,199 2,280 71%
Total 28,299 24,401 86%
2.4 Existing Infrastructure Water-based recreational activities are critically linked with infrastructure such as boat ramps, marinas,
swim beaches, and private docks. At Beaver Lake, there are 12 developed parks, 2,008 acres of
campgrounds, and over 650 individual campsites. Other amenities include picnic sites, group picnic
shelters, swimming beaches, hiking trails, boat launch ramps, sanitary dump stations, and restroom and
shower facilities. This section focuses on the land and water infrastructure that provides access to the
lake, including private and community boat docks, marinas, resorts, public boat launches, and camping
and recreation areas.
2.4.1 Private and Community Boat Docks Boat docks, or private floating facilities, are only permitted on USACE lakes in areas allocated as Limited
Development Areas through the lake’s SMP in accordance with 36 Code of Federal Regulations 327.30,
Shoreline Management of Civil Works Projects. Applicants for boat docks must have ready access to the
shoreline either by ownership of adjoining property (within 200 lateral feet of the government property
line) or deeded perpetual lake access. Each individual household can have a maximum of two slips and
are not permitted ownership of more than one boat dock.
There are currently 1,813 private, community, and resort/club boat docks on Beaver Lake, with 5,175
associated slips. Private boat dock locations are shown in Figure 2-5. A summary of the number of docks
and slips by study zone is shown in Table 2-2. The highest concentrations of docks are found in the
middle and northern sections of the lake. The greatest number of docks and slips is found in Zone 3, and
the lowest number of docks is found in Zone 5.
Table 2-2. Count of Private, Community, and Resort Boat Docks and Slips by Study Zone
Study Zone
Private Docks
Private Slips Resorts
Resort Docks
Resort Slips
Sailing Club Docks
Sailing Club Slips
Total Docks
Total Slips
Zone 1 424 1,138 1 1 8 5 72 430 1,218
Zone 2 405 1,115 3 3 26 408 1,141
Zone 3 541 1,527 2 3 52 544 1,579
Zone 4 299 850 0 0 0 299 850
Zone 5 131 375 1 1 12 132 387
Total 1,800 5,005 7 8 98 5 72 1,813 5,175

Section 2 Study Area Description
Page 2-6
Figure 2-4. Useable and Unusable Lake Surface Area

Section 2 Study Area Description
Page 2-7
Figure 2-5. Private, Community, and Resort Boat Dock Locations

Section 2 Study Area Description
Page 2-8
Figure 2-6 shows the distribution and concentrations of boat slips across the lake. For this analysis, the
lake was broken up into a grid approximately 330 feet by 330 feet. Then the number of slips within a
half mile of each gridded point is shown on the figure. The darker areas of shading shows areas with the
greatest concentration of boat slips.
2.4.2 Marinas/Resorts There are seven marinas at Beaver Lake, as shown on Figure 2-7 and described in Table 2-3. These
privately owned and operated marinas are within public campgrounds and day use areas managed by
USACE. Marinas on Beaver Lake are all full service and provide gasoline, slip rentals, food service, and
watercraft rentals.
At Beaver Lake, only wet storage slips are available (boats docked on the water and ready for use). For
comparison, dry slip storage involves removing the boat from the water, generally via a crane or lift. The
seven marinas on Beaver Lake offer a total of 1,976 wet slips available for rent to the public; none of the
marinas offer dry storage. Prairie Creek Marina accounts for 37 percent of the total slips.
There are seven resorts that have docks and provide boats and lake access for guests. These resorts
include Camp War Eagle, Ventris Trail’s End, Lake Shore Cabins, Coppermine Lodge, Twin Coves, Beaver
Lakefront, and Hide-A-Way.
Table 2-3. Characteristics of Beaver Lake Marinas
Marina Wet Storage
Slips* Boat
Rentals Restaurant
Hickory Creek Marina 180 Y Y
Horseshoe Bend Marina 160 Y N
Lost Bridge Marina 232 Y N
Prairie Creek Marina 733 Y Y
Rocky Branch Marina 307 Y N
Starkey Marina 156 Y N
War Eagle Marina 189 N N
Total 1,957
*Number is based on field counts and may differ from other sources of information such as the USACE Operations and
Maintenance Business Information Link (OMBIL). For example, Lost Bridge has a dock that is not currently being used and is not
included in this count.

Section 2 Study Area Description
Page 2-9
Figure 2-6. Concentrations of Private, Community, and Resort Slips on Beaver Lake

Section 2 Study Area Description
Page 2-10
Figure 2-7. Beaver Lake Marinas

Section 2 Study Area Description
Page 2-11
2.4.3 Public Boat Launches There are 76 public boat launches geographically dispersed throughout Beaver Lake, as shown in Figure
2-8. Of these, 16 are in public recreation areas and 26 are out-granted to a non-USACE entity via license,
easement, or other appropriate authorization. The remaining 34 are informal, end-of-road, launch
areas. In total, there are 483 trailer and car spaces available at the boat launch sites.
2.4.4 Recreation Areas/Campgrounds There are 21 public use areas and campgrounds either operated by USACE or out-granted around
Beaver Lake, as shown in Figure 2-9. Day use and overnight use is permitted in some areas with an
applicable fee. In total, these areas provide 1,645 car parking spaces and 493 boat trailer parking spaces.
The characteristics of the recreation areas around the lake are summarized in Table 2-4.
Table 2-4. Characteristics of Beaver Lake Recreation Areas and Facilities
Facility USACE or Outgrant
Car Parking Spaces
Trailer Parking Spaces
Total Parking Spaces
Blackburn Creek USACE 5 0 5
Blue Springs USACE 13 16 29
Clifty Park Outgrant 20 10 30
Dam Site USACE 69 30 99
Dam Site - North Bluffs USACE 74 6 80
Dam Site - Parker Bottoms USACE 18 0 18
Dam Site - Peninsula USACE 224 0 224
Dam Site - River USACE 86 18 104
Dam Site - White Bass Cove USACE 4 0 4
Dam Site Overlook USACE 21 0 21
Hickory Creek USACE 243 81 324
Horseshoe Bend USACE 196 30 226
Indian Creek USACE 56 10 66
Lost Bridge North USACE 52 21 73
Lost Bridge South USACE 31 15 46
Monte Ne USACE 11 15 26
Prairie Creek USACE 372 177 549
Rocky Branch USACE 58 41 99
Starkey USACE 41 10 51
Ventris USACE 2 10 12
War Eagle USACE 49 18 67
Total 1,645 509 2,153
Source: Provided by USACE Beaver Lake Project Office
Bold values indicate estimations of trailer parking spaces.

Section 2 Study Area Description
Page 2-12
Figure 2-8. Public Boat Launches

Section 2 Study Area Description
Page 2-13
Figure 2-9. Public Use Recreational Areas

Section 2 Study Area Description
Page 2-14
2.5 Demographic Characteristics The Fayetteville-Springdale-Rogers Metropolitan Statistical Area (MSA) that surrounds Beaver Lake
covers Benton, Madison, and Washington counties in Arkansas and McDonald County in Missouri
(Figure 2-10). Unlike most MSAs that are centered on one urban core, a number of large distinct cities
make up the MSA, and several are in close proximity to the Beaver Lake public access points: Rogers (5
miles from the Prairie Creek Marina), Bentonville (12 miles from the Prairie Creek Marina), Springdale (8
miles from the Hickory Creek Marina), and Fayetteville (20 miles from both the War Eagle and the
Hickory Creek Marinas).
Figure 2-10. Fayetteville-Springdale-Rogers Metropolitan Statistical Area Source: U.S. Census Bureau 2014
The Fayetteville-Springdale-Rogers MSA is the seventh fastest-growing economy among large
metropolitan areas in the nation (IHS Global Insight 2014). The proximity to the lake and unique
characteristics of each city in the MSA suggest that the observed growth in demand for recreation at
Beaver Lake is likely to continue. Fayetteville, home of the University of Arkansas, is a major source of
skilled labor in the region, with 44.8 percent of residents aged over 25 holding a bachelor’s degree or
graduate degree. Springdale and Rogers are home to Tyson Foods, a multinational food corporation, and
J.B. Hunt, a trucking and transportation company. Thirty-four percent of Springdale residents are
employed in one of the two sectors, while in Rogers, 22 percent of the population is employed in one of
these sectors. Bentonville, the corporate headquarters of Walmart, is the smallest but fastest growing

Section 2 Study Area Description
Page 2-15
city in the region. From April 2010 to July 2013, the city grew by 14 percent. Bentonville is also the
wealthiest of the cities, with a median household income exceeding $60,000 in 2015 (Gascon and Varley
2015).
The MSA has seen exponential growth in the past 50 years (Figure 2-11). All four counties have grown
faster than national averages since 1971, with Benton and Washington counties growing the fastest (2.4
percent on average). This population growth has been accompanied by increases in economic prosperity
as per capita income in the region has also grown faster than average. In northwest Arkansas, per capita
income has grown 2.3 percent annually compared to 1.4 percent nationally (Figure 2-12) (Federal
Reserve Bank of St. Louis 2015; Gascon and Varley 2015). While income and population growth both
slowed slightly during the recession of 2008, both have recovered and returned to pre-recession growth
rates. By 2011, the per capita personal income in the MSA had, for the first time, surpassed that of the
United States ($43,199 and $42,459, respectively). In 2014, the per capita personal income in the MSA
was 34 percent higher than the rest of Arkansas and 12 percent higher than the average per capita
personal income in the United States.
Figure 2-11. Resident Population in Fayetteville-Springdale-Rogers MSA Source: https://fred.stlouisfed.org/series/FASPOP
0
100
200
300
400
500
600
1970 1975 1980 1985 1990 1995 2000 2005 2010
Po
pu
lati
on
in
Th
ou
san
ds

Section 2 Study Area Description
Page 2-16
Figure 2-12. Per Capita Personal Income in Fayetteville-Springdale-Rogers MSA Source: Federal Reserve Bank of St. Louis 2015
The Northwest Arkansas Regional Planning Commission (NWARPC) projects that the regional population
will be well over half a million by 2035 (Figure 2-13 and Table 2-5). In the period from 2015 to 2035,
NWARPC projects that the population of Springdale, Bentonville, Bella Vista, Lowell, and Centerton will
more than double (Figure 2-14). Historical and future projected growth of the area suggests that
demand for recreational activities at Beaver Lake will continue to increase.
Figure 2-13. Northwest Arkansas Population Projections Source: Parsons Brinckerhoff 2011
0
10000
20000
30000
40000
50000
60000
1970 1975 1980 1985 1990 1995 2000 2005 2010
Do
llar
s, N
ot
Seas
on
ally
Ad
just
ed
Northwest Arkansas United States Arkansas
0
100,000
200,000
300,000
400,000
500,000
600,000
700,000
800,000
1990 1995 2000 2005 2010 2015 2020 2025 2030 2035
Po
pu
lati
on

Section 2 Study Area Description
Page 2-17
Table 2-5. Historical and Projected Population in Northwest Arkansas Region
City/County 1990* 2000* 2010 2020 2030 2035
Fayetteville 42,099 58,047 73,580 89,321 105,061 112,931
Springdale 29,941 45,798 69,797 89,725 109,653 119,617
Rogers 24,692 38,829 55,964 71,600 87,236 95,054
Bentonville 11,257 19,730 35,301 47,323 59,345 65,356
Bella Vista 9,083 16,582 26,461 35,150 43,839 48,184
Siloam Springs 8,151 10,843 15,039 18,483 21,927 23,649
Lowell 1,224 5,013 7,327 10,379 13,430 14,956
Centerton 491 2,146 9,515 14,027 18,539 20,795
Benton County 97,499 153,406 221,339 283,259 345,179 376,139
Washington County 113,409 157,715 203,065 247,893 292,721 315,135
Region 210,908 311,121 424,404 531,152 637,900 691,274
*Data are actual counts from the U.S. Census; projections based on Census figures and building permit trends compiled by NWARPC.
Figure 2-14. Projected Population Growth in Northwest Arkansas from 2015 to 2035
2.6 User Characteristics This section presents characteristics of lake users according to results of the user perception survey. Full
details on the survey administration and results are provided in Appendix B. Seventy percent of the
respondents live within 0.25 miles of the Beaver Lake shoreline. Of these respondents who reside along
the shoreline, 26 percent report living in Zone 1, 18 percent in Zone 2, 32 percent in Zone 3, 17 percent
in Zone 4, and 7 percent in Zone 5. Most survey respondents permanently reside in Arkansas (79
39%
50% 49%
58% 56%
41%
69%
77%
49%
40%

Section 2 Study Area Description
Page 2-18
percent). The other frequently mentioned states of permanent residency include Kansas (6 percent),
Missouri (3 percent), and Oklahoma (3 percent).
Most respondents regularly boat at Beaver Lake, as shown in Figure 2-15. Most boaters have experience
boating (80 percent boating for 11 years or more) but less experience on Beaver Lake (37 percent have
been boating on Beaver Lake for 10 years or less).
Figure 2-15. Average Number of Times Users Engage in Boating Activities at Beaver Lake
When asked which zone is primarily used during an average recreational boating trip, Beaver Lake
boaters indicated that Zone 3 is used most often, followed by Zone 1 and Zone 2 (see Figure 2-16). Five
percent of respondents did not indicate a zone, possibly because they were not able to choose one
primary zone, they did not understand the question, or they do not know which zone they recreate in.
Figure 2-16. Primary Study Zone Used during a Typical Recreational Boating Trip
Zone 1, 21%
Zone 2, 17%
Zone 3, 35%
Zone 4, 16%
Zone 5, 5%No Response, 5%
1%
10%
15%
16%
14%
41%
Less than once per year
1-5 times per year
6-10 times per year
11-15 times per year
16-20 times per year
21 times or more per year

Section 2 Study Area Description
Page 2-19
Respondents engage in a variety of activities such as cruising (32 percent), relaxing (26 percent), fishing
(24 percent), and swimming (23 percent). Additional frequent activities include water skiing, tubing,
kayaking, and sailing.
The majority of the boats used on the lake are between 21 and 28 feet in length (60 percent), with 16 to
20 feet in length making up an additional 33 percent of the boats. The most commonly used boat types
are pontoon (30 percent), ski or wake boats (24 percent), runabout/speedboats (20 percent), and
fishing/bass boats (14 percent).
Of all survey respondents, 58 percent indicate that the boat they use most often is kept at their private
or community boat dock. Twenty-nine percent indicate that the boat is kept at a marina while 13
percent transport their boat to the lake via trailer (or some other method).
Eighty percent of the survey respondents are male and 88 percent are 45 years of age or older. Sixty-five
percent of respondents hold either a bachelor’s or post-graduate degree. A large proportion of
respondents elected not to disclose their household income (21 percent). Of those that did, 79 percent
report a household income exceeding $75,000 per year.
2.7 Visitation Visitation data, shown in Table 2-6, were provided by USACE for fiscal years (FY) 2009 through 2012.
During this time period, there has been a consistent annual visitation of approximately 2.5 million
visitors. In addition to fishing and boating activities on the lake, visitors also participate in camping,
hunting, hiking, swimming, scuba diving, spelunking, and sightseeing.
Beaver Lake is home to eight national bass tournaments per year and multiple local fishing tournaments
as well as other boating recreational events for power boaters.
Table 2-6. Beaver Lake Visitation Data
Year (FY) Visitor Hours Visits Dispersed
Visitor Hours
2009 18,365,184 2,628,560 3,262,040
2010 18,983,532 2,643,229 3,132,346
2011 17,497,453 2,439,917 2,904,190
2012 19,167,010 2,457,662 2,820,528

Page 2-20
This page intentionally left blank.
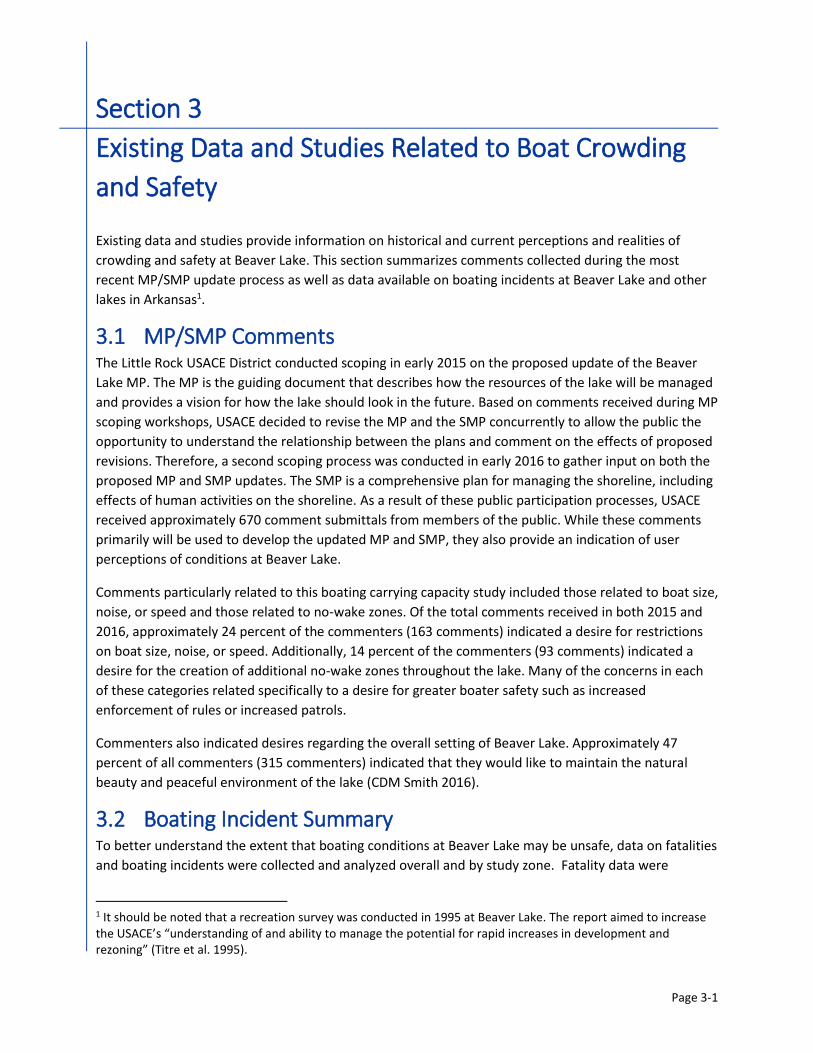
Page 3-1
Section 3
Existing Data and Studies Related to Boat Crowding
and Safety
Existing data and studies provide information on historical and current perceptions and realities of
crowding and safety at Beaver Lake. This section summarizes comments collected during the most
recent MP/SMP update process as well as data available on boating incidents at Beaver Lake and other
lakes in Arkansas1.
3.1 MP/SMP Comments The Little Rock USACE District conducted scoping in early 2015 on the proposed update of the Beaver
Lake MP. The MP is the guiding document that describes how the resources of the lake will be managed
and provides a vision for how the lake should look in the future. Based on comments received during MP
scoping workshops, USACE decided to revise the MP and the SMP concurrently to allow the public the
opportunity to understand the relationship between the plans and comment on the effects of proposed
revisions. Therefore, a second scoping process was conducted in early 2016 to gather input on both the
proposed MP and SMP updates. The SMP is a comprehensive plan for managing the shoreline, including
effects of human activities on the shoreline. As a result of these public participation processes, USACE
received approximately 670 comment submittals from members of the public. While these comments
primarily will be used to develop the updated MP and SMP, they also provide an indication of user
perceptions of conditions at Beaver Lake.
Comments particularly related to this boating carrying capacity study included those related to boat size,
noise, or speed and those related to no-wake zones. Of the total comments received in both 2015 and
2016, approximately 24 percent of the commenters (163 comments) indicated a desire for restrictions
on boat size, noise, or speed. Additionally, 14 percent of the commenters (93 comments) indicated a
desire for the creation of additional no-wake zones throughout the lake. Many of the concerns in each
of these categories related specifically to a desire for greater boater safety such as increased
enforcement of rules or increased patrols.
Commenters also indicated desires regarding the overall setting of Beaver Lake. Approximately 47
percent of all commenters (315 commenters) indicated that they would like to maintain the natural
beauty and peaceful environment of the lake (CDM Smith 2016).
3.2 Boating Incident Summary To better understand the extent that boating conditions at Beaver Lake may be unsafe, data on fatalities
and boating incidents were collected and analyzed overall and by study zone. Fatality data were
1 It should be noted that a recreation survey was conducted in 1995 at Beaver Lake. The report aimed to increase the USACE’s “understanding of and ability to manage the potential for rapid increases in development and rezoning” (Titre et al. 1995).

Section 3 Existing Data and Studies Related to Boat Crowding and Safety
Page 3-2
provided by the Beaver Lake USACE Project Office. Additional data on fatalities as well as boating
incidents were provided by the Arkansas Game and Fish Commission.
3.2.1 Bodily Harm and Fatalities At Beaver Lake, 74 percent of all fatalities in the past 5 years were due to drowning (Figure 3-1), and 82
percent of the victims were male (Figure 3-2). During this time, 4 of the 19 fatalities occurred while the
victim was engaged in boating activities. In addition to fatalities, incidents that result in bodily harm
were collected from data provided by Arkansas Game and Fish Commission. There were 17 boating
incidents that occurred resulting in bodily injury (Figure 3-3). Boating-related fatalities were relatively
evenly dispersed geographically across the lake; however, incidents that resulted in injury occurred
more frequently in Zones 1, 2, and 3 than in Zones 4 and 5. Of the boating-related fatalities, two
occurred in early spring and two occurred during the summer. All 17 incidents that resulted in bodily
injury occurred during the summer boating season.
Figure 3-1. Fatalities at Beaver Lake by Type (2011–2016) Source: Beaver Lake USACE Project Office
Figure 3-2. All Fatalities for All Types at Beaver Lake by Gender Source: Beaver Lake USACE Project Office
5%5%
5%
5%
5%
74%
Boat Capsized
Free Diving
Kayaking
Lightning Strike While Boating
Personal Watercraft Accident
Swimming
2
54 4
21
1
2
1
0
1
2
3
4
5
6
7
2011 2012 2013 2014 2015 2016
Co
un
t o
f Fa
talit
ies
Male Female

Section 3 Existing Data and Studies Related to Boat Crowding and Safety
Page 3-3
Figure 3-3. Boating-Related Fatality and Bodily Injury Incident Locations (2011–2016) Source: Arkansas Game and Fish Commission 2016

Section 3 Existing Data and Studies Related to Boat Crowding and Safety
Page 3-4
3.2.2 Crowding-Related Boating Incidents The Arkansas Game and Fish Commission reported 56 known boating incidents on Beaver Lake from
2011 to 2016 that had geographic location information associated with the report (Arkansas Game and
Fish Commission 2016). Please note that 2016 incident reports are only through August. These 56
incidents include the 21 boating-related incidents that involved bodily harm or fatalities as described
above.
Of these 56 reports, 16 were deemed to be caused by crowding-related issues on the lake, and 40 were
not caused by any form of crowding (Figure 3-4). For the purposes of this study, “crowding incidents”
are defined as any incident that could have been avoided if another occupied boat was not present in
the direct vicinity. Crowding incidents require two or more boats to be in close proximity to each other
for the incident to occur. Crowding incidents include boat-on-boat incidents (except if one of the boats
was docked at a marina), boat-on-wake incidents, and boat-on-tube incidents. Non-crowding incidents
are defined as any incident that did not involve the presence of another occupied boat in the direct
vicinity. Non-crowding incidents included boat fires and explosions, boat-on-dock incidents, capsized
boats, boats that were sinking due to malfunction, boating incidents caused by large waves, boats
hitting submerged and non-submerged objects, boats running ashore (grounding), passengers falling
overboard, as well as swimming, skiing, and tubing incidents not involving a second boat.
The greatest number of incidents occurred in 2012, with 38 percent of those incidents determined to be
crowding-related. Note: The 2015 and 2016 data indicate a noticeable decrease in incidents. However,
recent legislative changes on reportable incidents increased the reporting amount from $500 to $2,000.
Therefore, incidents where damage is less than $2,000 are no longer reported (Arkansas Game and Fish
Commission 2015), which may account for much of the reported decrease in 2015 and 2016.
Figure 3-4. Crowding vs. Non-Crowding Incidents on Beaver Lake Source: Arkansas Game and Fish Commission 2016
3
8
41
10
13
6
9
20
5
10
15
20
25
2011 2012 2013 2014 2015 2016
Co
un
t o
f In
cid
ents
Crowding Non-Crowding
Incidents where Damage is LESS than $2,000 No
Longer Reported
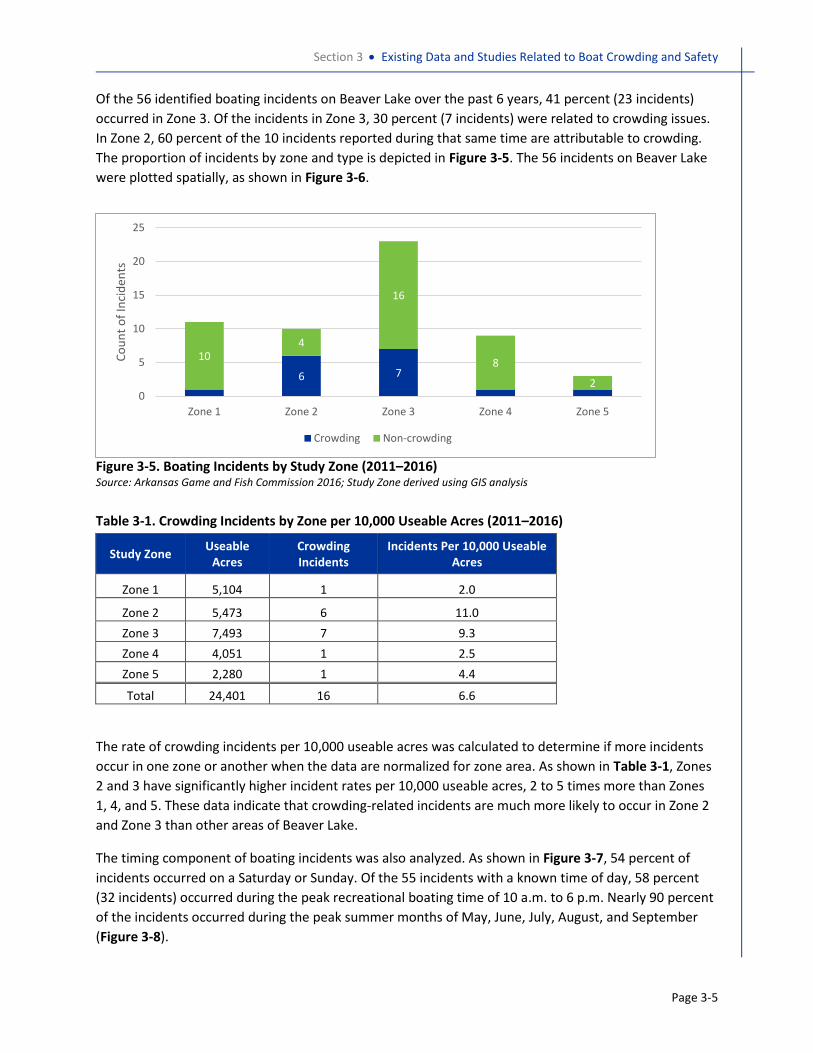
Section 3 Existing Data and Studies Related to Boat Crowding and Safety
Page 3-5
Of the 56 identified boating incidents on Beaver Lake over the past 6 years, 41 percent (23 incidents)
occurred in Zone 3. Of the incidents in Zone 3, 30 percent (7 incidents) were related to crowding issues.
In Zone 2, 60 percent of the 10 incidents reported during that same time are attributable to crowding.
The proportion of incidents by zone and type is depicted in Figure 3-5. The 56 incidents on Beaver Lake
were plotted spatially, as shown in Figure 3-6.
Figure 3-5. Boating Incidents by Study Zone (2011–2016) Source: Arkansas Game and Fish Commission 2016; Study Zone derived using GIS analysis
Table 3-1. Crowding Incidents by Zone per 10,000 Useable Acres (2011–2016)
Study Zone Useable
Acres Crowding Incidents
Incidents Per 10,000 Useable Acres
Zone 1 5,104 1 2.0
Zone 2 5,473 6 11.0
Zone 3 7,493 7 9.3
Zone 4 4,051 1 2.5
Zone 5 2,280 1 4.4
Total 24,401 16 6.6
The rate of crowding incidents per 10,000 useable acres was calculated to determine if more incidents
occur in one zone or another when the data are normalized for zone area. As shown in Table 3-1, Zones
2 and 3 have significantly higher incident rates per 10,000 useable acres, 2 to 5 times more than Zones
1, 4, and 5. These data indicate that crowding-related incidents are much more likely to occur in Zone 2
and Zone 3 than other areas of Beaver Lake.
The timing component of boating incidents was also analyzed. As shown in Figure 3-7, 54 percent of
incidents occurred on a Saturday or Sunday. Of the 55 incidents with a known time of day, 58 percent
(32 incidents) occurred during the peak recreational boating time of 10 a.m. to 6 p.m. Nearly 90 percent
of the incidents occurred during the peak summer months of May, June, July, August, and September
(Figure 3-8).
6 7
104
16
8
20
5
10
15
20
25
Zone 1 Zone 2 Zone 3 Zone 4 Zone 5
Co
un
t o
f In
cid
ents
Crowding Non-crowding

Section 3 Existing Data and Studies Related to Boat Crowding and Safety
Page 3-6
Figure 3-6. Map of Boating Incidents by Study Zone (2011–2016) Source: GIS analysis of Arkansas Game and Fish Commission 2016 data

Section 3 Existing Data and Studies Related to Boat Crowding and Safety
Page 3-7
Figure 3-7. Boating Incidents by Day and Time Source: Arkansas Game and Fish Commission 2016
Figure 3-8. Boating Incidents by Month Source: Arkansas Game and Fish Commission 2016
3.2.3 Comparison to Other Lakes From 2011 to 2015, there were 350 boating incidents statewide across Arkansas (Arkansas Game and
Fish Commission 2011–2015). Of these, 17 percent (59 incidents) occurred on Beaver Lake. The number
of reported incidents on Beaver Lake as compared to the total reported lake incidents in Arkansas is
shown in Figure 3-9. The most incidents occurred in 2012, with Beaver Lake accounting for 32 percent of
all boating incidents in Arkansas that year. Compared to other lakes in Arkansas with high numbers of
boating incidents, Beaver Lake had the highest number of boating incidents in 2011 and 2012, as shown
in Figure 3-10 (this comparison only included lakes with consistently high numbers of incidents over the
0
5
10
15
20
25
Sunday Monday Tuesday Wednesday Thursday Friday Saturday
Co
un
t o
f In
cid
ents
12 am - 10 am 10 am - 6 pm 6 pm - 12 am Unknown time
45 5
1 12 2
5
108
66
1
0
2
4
6
8
10
12
14
16
March April May June July August September October
Co
un
t o
f In
cid
ents
Crowding Non-crowding

Section 3 Existing Data and Studies Related to Boat Crowding and Safety
Page 3-8
time period). The main causes of these incidents were operator inattention, followed by fault of
machinery, reckless/negligent operation, and hazardous waters. Note: The 2015 data indicate a
noticeable decrease in incidents. However, recent legislative changes on reportable incidents increased
the reporting amount from $500 to $2,000. Therefore, incidents where damage is less than $2,000 are
no longer reported (Arkansas Game and Fish Commission 2015), which may account for much of the
reported decrease in 2015.
Figure 3-9. Incidents on Beaver Lake in Comparison to the Arkansas Statewide Total Source: Arkansas Game and Fish Commission 2011–2015
Figure 3-10. Comparison of Arkansas Lakes with Consistently High Numbers of Incidents Source: Arkansas Game and Fish Commission 2011–2015
5865
59 6051
15
21
612
3
0
10
20
30
40
50
60
70
80
90
100
2011 2012 2013 2014 2015
Co
un
t o
f In
cid
ents
Other Arkansas Accidents Beaver Lake Reported Accidents
15
21
6
12
3
10
6
9
6
87
6 65 5
4
9
5
18
7
0
5
10
15
20
25
2011 2012 2013 2014 2015
Co
un
t o
f In
cid
ents
Beaver Lake Lake Ouachita Lake Hamilton Greers Ferry

Page 4-1
Section 4
Current Boat Use Study and Results
A field survey was conducted to collect data on recreational boating lake use during four high-use
summer weekends. Data were collected through aerial boat counts and simultaneous ground counts of
empty boat trailers and empty marina slips. This information is utilized to determine the number and
types of boats using the lake at any given time. The collected information also provides insights into
boat origin and existing utilization levels of lake access facilities and infrastructure. This section
describes the field survey methodology and resulting collected data and analysis.
4.1 Field Survey Methodology The boat use and access study was conducted via field surveys that consisted of coordinated aerial and
ground surveys boats on the water and access area use counts. The aerial team counted boats that were
on the water at the same time that ground-based teams counted empty boat trailers at public boat
launches and rented-but-empty marina slips. Counts were conducted in the morning and the afternoon
on both Saturday and Sunday of four summer weekends during the 2016 recreation season. The field
survey methodology is described in detail in Appendix D.
4.1.1 Aerial Boat Survey Surveys were conducted over four weekends, including the Fourth of July weekend (July 2/3), two
additional weekends in July (July 16/17 and July 23/24), and Labor Day weekend (September 3/4).
Weather conditions prohibited helicopter operations during some survey periods over Fourth of July
weekend and likely depressed boater turnout during other periods of that weekend. During the
preparations, an alternate survey weekend was allotted for in the instance that an entire weekend was
forecasted for rain. Table 4-1 shows the planned survey dates and the alternate survey dates.
The weekend of July 9/10 was cancelled due to predicted rain, and the alternate survey schedule was
implemented at USACE’ direction. In addition, thunderstorms prevented a flyover from occurring the
morning of July 3, and crew safety concerns resulted in a partial count on the morning of July 2.
Table 4-1. Primary and Alternate Field Survey Dates
Primary Survey Dates Alternate Survey Dates
Flyover #1 July 2–3
Flyover #2 July 9–10 July 16–17
Flyover #3 July 16–17 July 23–24
Flyover #4 Sept 2–3
Two flyovers were attempted on each date as shown in Table 4-2, once in the morning (9 a.m. to noon)
and once in the afternoon (1 to 4 p.m.). These flyovers were scheduled to coincide with the peak
recreational use periods for the morning and the afternoons, respectively. Actual starting and ending

Section 4 Current Boat Use Study and Results
Page 4-2
times are noted in the data tables found in Appendix D. The direction of travel (north to south or south
to north) was varied (Table 4-2) so that the morning and afternoon counts were sampled equally in both
directions.
Table 4-2. Planned Flyover Direction by Study Zone
Day A.M./P.M. Flyover Sequence by Study Zone
Weekend 1
Saturday a.m. 1 2 3 4 5
p.m. 5 4 3 2 1
Sunday a.m. 5 4 3 2 1
p.m. 1 2 3 4 5
Weekend 2
Saturday a.m. 5 4 3 2 1
p.m. 1 2 3 4 5
Sunday a.m. 1 2 3 4 5
p.m. 5 4 3 2 1
Weekend 3
Saturday a.m. 1 2 3 4 5
p.m. 5 4 3 2 1
Sunday a.m. 5 4 3 2 1
p.m. 1 2 3 4 5
Weekend 4
Saturday a.m. 5 4 3 2 1
p.m. 1 2 3 4 5
Sunday a.m. 1 2 3 4 5
p.m. 5 4 3 2 1
During each flyover, two observers in the helicopter recorded the number, type of vessel, and
recreational activity. The approximate location of each boat was noted on map sheets provided to
record the data. In highly congested areas, the observers outlined the congested area and noted
photograph numbers to allow for a tally to be made later. Another observer took photographs to assist
in documenting the usage, density, and type of recreational activities observed (Figure 4-1).
The boating activity/boat types to be recorded were determined in coordination with USACE staff. Boats
were tallied and recorded as falling into one of the following seven categories:
Fishing/Bass
Pontoon/Houseboat
Skiing/Wake
Speedboat
Personal Watercraft
Sailboat
Canoe/Kayak

Section 4 Current Boat Use Study and Results
Page 4-3
Figure 4-1. Congested Area of Beaver Lake, July 23 p.m. Flyover
Eight boat launch locations that are somewhat remote were identified to be surveyed from the air
(shown on Figure 4-2). The helicopter crew flew over these locations during each aerial survey and took
photographs of the parking areas so that the number of empty boat trailers could be counted. After the
first two weekends, it was determined that the ground crews could more easily survey three of these
launch sites, and Old Prairie Creek Road, Black Oak Drive, and Dam Site North Bluffs were eliminated
from the helicopter flyover responsibilities.
4.1.2 Marina and Boat Ramp Survey Ground-based field teams surveyed the boat ramps, marinas, and campgrounds around Beaver Lake at
the same time periods as the helicopter flyovers. In coordination with USACE, the public boat launch
access points to be surveyed were determined (Figure 2-8 shows all boat launch locations at Beaver
Lake, and Figure 4-2 shows those that were surveyed for this study). All major public recreation areas
and the primary public access points to the lake were surveyed, including all public boat ramps at
campgrounds and marinas as well as several of the more popular public road ends. The recreation areas
and access points included in the surveys are listed in Table 4-3. The number of empty boat trailers were
counted at each boat launch area. All marinas (Figure 2-7) were visited during each survey period and
the number of empty slips tallied.

Section 4 Current Boat Use Study and Results
Page 4-4
Figure 4-2. Boat Launches Surveyed

Section 4 Current Boat Use Study and Results
Page 4-5
The areas to be surveyed were grouped and pre-set routes mapped to allow four two-person ground
teams to cover the survey areas within the same time period as each helicopter flyover. The direction of
travel for the ground teams (approximately north to south or south to north) mirrored the direction of
helicopter travel for each survey period.
Table 4-3. Beaver Lake Recreation Facilities Included in Field Survey
Location 1 Study Zone Total Slips2 Trailer Parking Spaces3
Beaver Lakefront Resort (R) 2 6 N/A
Beaver Shores (PR & RA) 4 N/A 40
Black Oak Drive (PR & RA) 1 N/A 9
Blue Springs (PR) 5 N/A 16
Camp War Eagle (R) 5 12 N/A
Clifty Park (PR) 2 N/A 10
Coppermine Lodge (R) 3 28 N/A
Dam Site Park (PR & C) 1 N/A 30
Dam Site North Park (PR) 1 N/A 6
Don Rouf/Hwy 412 (PR & RA) 5 N/A 10
Hickory Creek Park (PR & C) 4 N/A 81
Hickory Creek Marina (M) 4 180 39
Hide-A-Way Campground (R) 2 6 N/A
Horseshoe Bend Park (PR & C) 4 N/A 30
Horseshoe Bend Marina (M) 4 160 N/A
HWY 12 Ramp (PR & RA) 4 N/A 48
HWY 264 (RA) 4 N/A 12
Indian Creek Park (PR & C) 1 N/A 10
Jet Ski Beach (RA) 4 N/A 15
Lake Shore Cabins (R) 1 8 N/A
Lost Bridge North Park (PR & C) 1 N/A 21
Lost Bridge Marina (M) 1 232 N/A
Lost Bridge South Park (PR & C) 1 N/A 15
Monte Ne (PR & RA) 4 N/A 15
Natural Walk (PR & RA) 5 N/A 15
Old Prairie Creek Road (RA) 3 N/A 10
Prairie Creek Marina (M) 3 733 N/A
Prairie Creek Park (PR & C) 3 N/A 177
Rocky Branch Park (PR & C) 3 N/A 41
Rocky Branch Marina (M) 3 307 N/A
Starkey Park (PR & C) 1 N/A 10
Starkey Marina (M) 1 156 N/A

Section 4 Current Boat Use Study and Results
Page 4-6
Location 1 Study Zone Total Slips2 Trailer Parking Spaces3
Twin Coves (PR & RA) 2 N/A 15
Twin Coves Resort (R) 2 10 N/A
Ventris Park (PR) 3 N/A 10
Ventris Trails End Resort (R) 3 24 N/A
War Eagle Park (PR & C) 5 N/A 18
War Eagle Marina (M) 5 189 N/A
White River Marine (RA) 5 0 8
1. RA – Road Access Point; R – Resort; M – Marina; C – Campground; PR – Public Ramp
2. Marina and resort slip counts are based on field surveys and may not match other data sources.
3. Bold values indicate an estimated number of trailer parking spaces as provided by the Beaver Lake USACE Project Office staff.
Note: There are additional minor boat ramp areas that were not included in the field survey.
To determine the number of boats on the water from each marina location, the number of rented but
empty boat slips at each marina was tallied. At marinas where there is a public boat ramp, the number
of empty boat trailers in boat ramp parking lots was also counted. For each marina, the following
information was collected:
Number of slips currently rented
Number of slips available for rent
Number of empty but rented slips
Number of vehicles with empty boat trailers
In addition to commercial marinas, resort operators were requested to self-report the number of boats
departing from their docks during each of the survey periods. USACE coordinated with the resort owners
who were provided with data sheets to record the information. Not all resort owners were able to
participate, and one participated but the data were not in the requested format and could not be used.
In total, four resorts provided useable data.
4.1.3 Marina Slip Vacancy Adjustment As part of the process, the field team obtained the number of slips and the number of rented slips from
each marina operator. During each survey period, the team counted the number of slips that were
empty during each count and subtracted the number that were not rented (from the marina operator)
to arrive at the number of boats on the lake from that marina.
During the initial survey periods, the teams noted that there were slips that were not only empty but
which also appeared to have been unused for an extended period. For example, ground crews noted
empty lifts covered with dust and cobwebs that might indicate that a rented slip is unoccupied and that
the slip renter has pulled the boat off the lake for some reason. Boats may be used on a different lake
during a specific weekend or for the summer or they may be removed from Beaver Lake for
maintenance.

Section 4 Current Boat Use Study and Results
Page 4-7
To arrive at an adjustment index to account for rented marina slips that are not occupied by a boat at
Beaver Lake, the study team tracked empty slips by location on the last survey weekend of the field
season (Labor Day weekend). A data form was developed where each slip along each dock in a marina
was assigned a number. Slips that were empty were noted with an “X,” and slips that appeared to be
unoccupied or unused for an extended period were noted with a “U.” These observations were tracked
over the course of the entire weekend. Where the same slips were unoccupied for all four counts during
a weekend, the likelihood increases that these slips are unused.
This information was considered in the analysis and the development of the point of access conclusions.
The high end of the range assumes that all rented but empty slips represent a boat on the lake from a
marina while the low end uses a value adjusted to account for slips that were unoccupied for an entire
weekend. Table 4-4 shows the data collected over the Labor Day weekend. These results indicate that
approximately 6 percent of the rented marina slips could be vacant at any given time because a boat has
been taken out for use at another lake or removed for maintenance.
Table 4-4. Marina Slip Vacancy Adjustment Factors
Marina
Slips Marked
“U” All
Periods
Slips Marked
“X” All
Periods
Unrented
slips
Rented and
Vacant 1
Total
rented
slips
Percentage
“off lake” 2
Hickory Creek Marina 4 9 0 13 180 7%
Horseshoe Bend
Marina 3 5 12 0 148 0%
Lost Bridge Marina 7 14 0 21 232 9%
Prairie Creek Marina 37 30 13 54 720 8%
Rocky Branch Marina 27 12 27 12 280 4%
Starkey Marina 1 10 0 11 156 7%
War Eagle Marina 6 22 19 9 170 5%
Total 85 102 71 120 1,886 6%
1 – “Vacant slips” are the number of rented slips that were unoccupied for all four survey periods over the Labor Day weekend. All
empty slips that were occupied for at least one of the survey periods are counted as a boat on Beaver Lake and are not included in
this table.
2 – Percentage of unoccupied rented slips that may not represent a boat on the lake. This adjustment factor is applied to all survey
weekends to calculate a lower end of boat activity from marinas on Beaver Lake.
4.2 Boat Type and Distribution Results A total of 10,793 boats were tallied during the completed 14 aerial boat count survey periods. Of all the
boats counted, 87 percent were power boats, and 13 percent were non‐powered vessels. The most
popular type of boat was skiing/wake boarding boat (40 percent), followed by pontoon/houseboat (26
percent), fishing/bass (12 percent), kayak/canoe (11 percent), personal watercraft (8 percent), sailboat
(2 percent), and speedboat (1 percent). Figure 4-3 shows the number of observed boats by type.

Section 4 Current Boat Use Study and Results
Page 4-8
Figure 4-3. Number of Boats by Type
Boat counts ranged from 398 to 1,450, with afternoon counts consistently higher than morning counts.
The greatest overall number of boats counted during any survey period was on the afternoon of
September 4, 2016 when 1,450 boats were observed on the lake. Zone 3 was observed as having the
highest boat count during the July 2 p.m. flyover. The boat counts by survey period and study zone are
included in Table 4-5.
Table 4-5. Number of Boats by Survey Period and Study Zone
Date Time Zone 1 Zone 2 Zone 3 Zone 4 Zone 5 Total
2-Jul 1 a.m. 71 49 65 N/A N/A N/A
2-Jul3 p.m. 284 345 394 237 39 1,299
3-Jul 2 a.m. N/A N/A N/A N/A N/A N/A
3-Jul3 p.m. 102 118 163 145 66 592
16-Jul a.m. 175 85 143 152 56 611
16-Jul p.m. 197 274 296 233 22 1,022
17-Jul a.m. 101 43 93 117 35 389
17-Jul p.m. 153 171 295 183 46 848
23-Jul a.m. 72 48 157 135 41 453
23-Jul p.m. 213 331 301 204 47 1,096
24-Jul a.m. 145 62 94 77 20 398
24-Jul p.m. 146 152 212 172 52 734
3-Sep a.m. 120 47 89 95 36 387
3-Sep p.m. 164 210 187 187 51 799
4-Sep a.m. 123 63 116 131 43 476
4-Sep p.m. 297 455 369 261 68 1,450
1 – Due to safety considerations, aerial survey was aborted. Zones 1 and 2 were completed, Zone 3 was partially completed, and
Zones 4 and 5 were not surveyed.
2 – Due to thunderstorms, the aerial survey was cancelled.
3 – 4th of July weekend experienced rainy conditions, and survey times may have underestimated boating.
Values in BOLD represent the maximum number of boats observed for the study zone and lake overall.
1325
2763
4265
185 134
1170895
0500
1,0001,5002,0002,5003,0003,5004,0004,500
Fishing/ Bass Pontoon/Houseboat
Skiing/ Wake Sailboat Speedboat Canoe/ Kayak JetskiPersonal Watercraft

Section 4 Current Boat Use Study and Results
Page 4-9
Overall, for the 14 survey periods, Zone 3 tallied the most number of boats, with 2,935 (excluding counts
on the morning of July 2), followed by Zone 4 with 2,294. Zones 1 through 4 each totaled between 21
and 28 percent of the total number of boats. A significantly fewer number of boats was observed in
Zone 5 (6 percent). Total boat counts and the percent of total boats by study zone are shown in Figure
4-4.
Figure 4-4. Count and Percent of Total Boats Surveyed by Study Zone
More boats were observed on the lake in the afternoon survey periods than in the morning periods
(Figure 4-5). However, boat type was not consistently distributed between the morning and afternoon
periods. Fishing/bass boats were more common in the mornings than in the afternoon while sailboats
and speedboats were almost never encountered in the mornings. Ski boats were five times more likely
to be out on the lake in the afternoon than in the mornings.
22%
23%28%
22%
6%Zone 1
Zone 2
Zone 3
Zone 4
Zone 5
2,3762,903
2,351
599
2,325

Section 4 Current Boat Use Study and Results
Page 4-10
Figure 4-5. Boat Type by Morning and Afternoon Field Survey Periods
The type of vessel and associated recreational activity varied between study zone. Skiing/wake boats
were the most common type of boat observed in Zones 1, 2, and 3. In Zone 4, 36 percent of the boats
were pontoon/houseboats, and in Zone 5, fishing/bass boats were the most common at 41 percent of all
boats observed within that zone (Table 4-6). Figure 4-6 displays boat type by study zone.
Table 4-6. Distribution of Boat Type within Each Study Zone
Study Zone
Fishing/ Bass
Pontoon/ Houseboat
Skiing/ Wake
Sailboat Speedboat Canoe/ Kayak
Personal Watercraft
Zone 1 8% 28% 33% 5% 1% 13% 12%
Zone 2 6% 20% 52% 1% 4% 10% 6%
Zone 3 10% 22% 49% 1% 1% 10% 7%
Zone 4 18% 36% 28% 0% 0% 10% 8%
Zone 5 41% 18% 17% 0% 0% 14% 9%
779
726
649
60
18
432
235
2899
546
2037
3616
125
116
738
660
7840
0 1,000 2,000 3,000 4,000 5,000 6,000 7,000 8,000 9,000
Fishing/ Bass
Pontoon/ Houseboat
Skiing/ Wake
Sailboat
Speedboat
Canoe/ Kayak
Jetski
Total
PM AM
Personal Watercraft

Section 4 Current Boat Use Study and Results
Page 4-11
Figure 4-6. Boat Type by Study Zone
An alternative way to view the data is to consider how each boat type is distributed across the lake.
However, because each study zone is a different size, this distribution is adjusted to account for the
relative size of the study zone, which provides a uniform basis for comparison of percent use by study
zone. Table 4-7 shows that of all the fishing boats, 12 percent were found in Zone 1, 9 percent were
found in Zone 2, and so on.
Table 4-7. Distribution of Each Boat Type by Study Zone, Weighted for Zone Area
Zone 1 Zone 2 Zone 3 Zone 4 Zone 5
Fishing/Bass 12% 9% 13% 33% 33%
Pontoon/Houseboat 23% 18% 24% 31% 4%
Skiing/Wake 18% 30% 34% 16% 2%
Sailboat 62% 19% 18% 1% 0%
Speedboat 10% 72% 16% 2% 0%
Canoe/Kayak 27% 21% 25% 20% 7%
Personal Watercraft 31% 17% 25% 21% 6%
All Boats 22% 23% 28% 22% 6%
0%
10%
20%
30%
40%
50%
60%
Zone 1 Zone 2 Zone 3 Zone 4 Zone 5
Fishing/Bass
Pontoon/Houseboat
Skiing/Wake
Sailboat
Speedboat
Canoe/Kayak
JetskiPersonal Watercraft

Section 4 Current Boat Use Study and Results
Page 4-12
Figure 4-7. Boat Type Distribution across Study Zones Weighted for Zone Area
Figure 4-7 shows the distribution of each boat type across the five study zones. The chart more clearly
shows where boat types occur preferentially in one or two lake zones. The difference in occurrence in
Zone 5 as compared to other study zones for all boat types is statistically significant. The differences in
the distribution of ski boats and fishing boats is particularly striking. Skiing boats are significantly more
likely to be found in Zones 2 and 3 than in other lake zones. Fishing boats are more likely to be found in
Zones 4 and 5.
4.3 Observed Peak Boat Density The observed peak boating density for Beaver Lake is calculated by dividing the useable water surface
acres by the boat count from the survey period that tallied the most number of boats:
Observed Peak Density = 24,401 ÷ 1,450 = 16.8 useable acres per boat
Table 4-8 shows the Observed Peak Density by Zone from the collected field data. For Zones 1, 2, 4, and
5, the greatest number of boats were observed during the September 4 p.m. flyover of Labor Day
weekend. For Zone 3, the greatest number of boats was observed during the July 2 p.m. flyover of the
Fourth of July holiday weekend. Zone 2 was observed as having the greatest density of boats at 12
useable acres per boat followed Zone 4 at 15.5 useable acres per boat.
Table 4-8. Observed Peak Boat Density by Study Zone
Zone 1 Zone 2 Zone 3 Zone 4 Zone 5 Total
Useable Acres 5,104 5,473 7,493 4,051 2,280 24,401
Maximum Number Observed Boats 297 455 394 261 68 1,450
Useable Acres per Boat 17.2 12.0 19.0 15.5 33.5 16.8
0%
10%
20%
30%
40%
50%
60%
70%
80%
Zone 1
Zone 2
Zone 3
Zone 4
Zone 5

Section 4 Current Boat Use Study and Results
Page 4-13
4.4 Boat Origination Results Boaters can access Beaver Lake from various infrastructure and facilities: public boat ramps, marina
slips, or private, community, and resort docks. The presumption was that one empty boat trailer equals
one boat on the lake originating from the public access point where the trailer was observed. Similarly,
an empty but rented marina slip represents one boat on the lake and the marina location provides the
origination location for those boats. From this information, the number of boats on the water from
private, community, and resort docks can be derived.
4.4.1 Public Access Ramp Results According to data provided by USACE, there are a total of 711 trailer parking spaces located in
recreation areas where empty boat trailer counts were conducted (Table 4-9). This represents officially
designated parking spaces at facilities where trailer parking spaces are marked and estimated values at
areas where trailer parking spaces are not marked (i.e., end of the road access points). A total of 4,795
empty boat trailers were tallied during all survey periods. The percentage of empty boat trailers by
study zone are shown in Figure 4-8. These percentages represent the origination location for the boats
on the water from each study zone for all survey periods.
Table 4-9. Available Trailer Parking Spaces by Study Zone
Study Zone Trailer Parking Spaces
Zone 1 101
Zone 2 25
Zone 3 238
Zone 4 280
Zone 5 67
Total 711
Figure 4-8. Empty Boat Trailers by Study Zone
25%
0.50%
31%
38%
6%
Zone 1
Zone 2
Zone 3
Zone 4
Zone5

Section 4 Current Boat Use Study and Results
Page 4-14
Empty boat trailer counts for each lake area and survey period are included in Table 4-10. Overall, boat
ramps at Beaver Lake operated at 48 percent of total capacity on average during the field survey.
Maximum usage of 90 percent of total capacity was recorded on July 2 during the afternoon survey. For
some facilities, however, capacity exceed 100 percent at times as boat trailers were observed in non-
designated parking areas or in car parking spaces. Peak capacity use rate varied by study zone. Zone 1
experienced a peak of 151 percent of capacity. Zone 3 experienced 93 percent of capacity, followed by
Zone 4 at 85 percent, Zone 5 at 49 percent, and Zone 2 at 32 percent. The geographic proximity of Zone
2 likely accounts for its low use rate, as it is the furthest distance from the Fayetteville-Springdale-
Rogers MSA.
Table 4-10. Empty Boat Trailers by Survey Period and Study Zone
Date Time
Period Zone 1 Zone 2 Zone 3 Zone 4 Zone 5 Total
Percent
Capacity2
2-Jul a.m. 75 0 55 116 10 256 36%
2-Jul p.m. 153 8 221 238 18 638 90%
3-Jul p.m. 45 1 33 76 13 168 24%
16-Jul a.m. 51 1 90 102 19 263 37%
16-Jul p.m. 98 2 155 142 22 419 59%
17-Jul a.m. 51 2 38 76 15 182 26%
17-Jul p.m. 79 0 114 161 13 367 52%
23-Jul a.m. 54 0 66 73 18 211 30%
23-Jul p.m. 122 2 167 153 19 463 65%
24-Jul a.m. 42 2 49 70 14 177 25%
24-Jul p.m. 76 1 89 92 20 278 39%
3-Sep a.m. 54 0 59 85 20 218 31%
3-Sep p.m. 102 2 100 126 19 349 49%
4-Sep a.m. 54 1 52 100 17 224 32%
4-Sep p.m. 148 3 200 198 33 582 82%
Total 1,204 25 1,488 1,808 270 4,795 48%
Percent Capacity by
Study Zone3 151% 32% 93% 85% 49%
Notes: The number of empty boat trailers tallied during each survey period includes empty boat trailers located in designated trailer spaces, empty boat trailers located in undesignated locations, and empty boat trailers located within campgrounds adjacent to the boat ramps where surveys were conducted. One empty boat trailer equals one boat on the lake from a public access point. 2. Percent of Capacity is the percent of the total available trailer parking spaces for boat trailers (711) against the number of spaces that were occupied during the survey period. 3. Available trailer parking spaces by study zone is found in Table 4-9.
4.4.2 Marina Slip Survey Results There are seven commercial concession marinas located on Beaver Lake that contain a total of 1,957
slips as counted during the field surveys. The overall occupancy rate for all marinas at the time the
marina surveys were conducted was 96 percent. Table 4-11 identifies usage information for each marina
at the time of the survey. Table 4-12 identifies the total number of slips and rental rates by study zone.
Slip rental information was obtained from each marina operator at the time of the field surveys. There
are no marinas located in Zone 2.
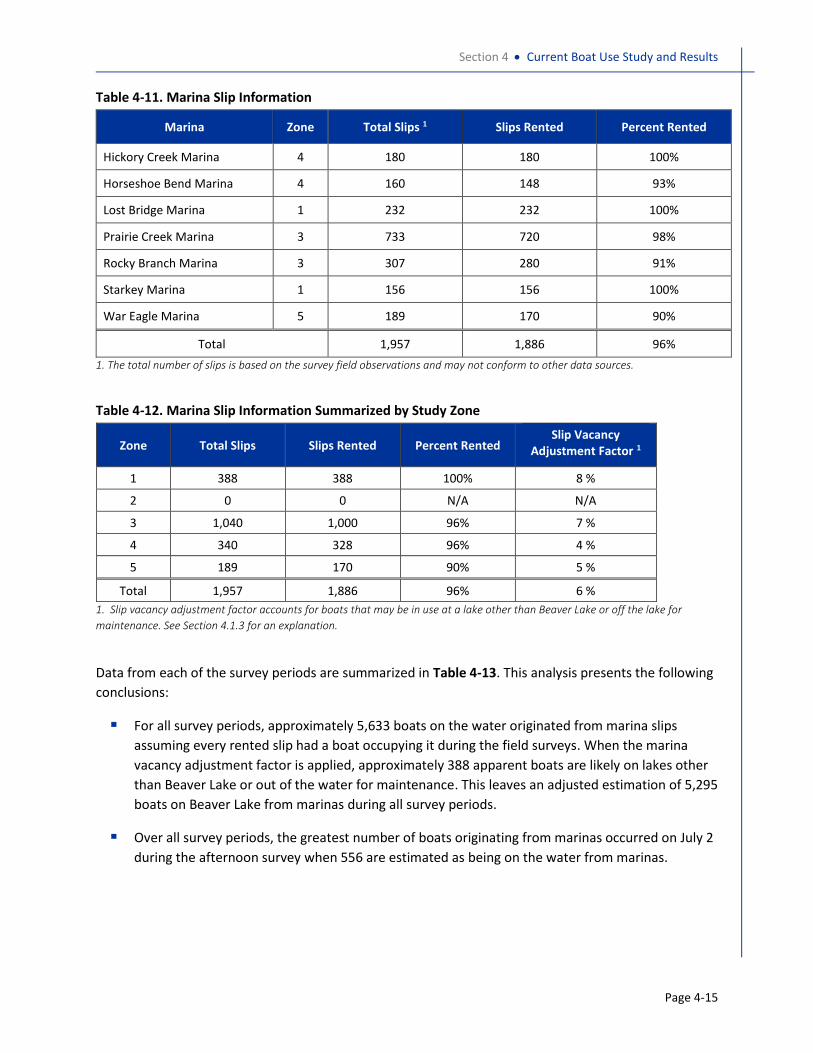
Section 4 Current Boat Use Study and Results
Page 4-15
Table 4-11. Marina Slip Information
Marina Zone Total Slips 1 Slips Rented Percent Rented
Hickory Creek Marina 4 180 180 100%
Horseshoe Bend Marina 4 160 148 93%
Lost Bridge Marina 1 232 232 100%
Prairie Creek Marina 3 733 720 98%
Rocky Branch Marina 3 307 280 91%
Starkey Marina 1 156 156 100%
War Eagle Marina 5 189 170 90%
Total 1,957 1,886 96%
1. The total number of slips is based on the survey field observations and may not conform to other data sources.
Table 4-12. Marina Slip Information Summarized by Study Zone
Zone Total Slips Slips Rented Percent Rented Slip Vacancy
Adjustment Factor 1
1 388 388 100% 8 %
2 0 0 N/A N/A
3 1,040 1,000 96% 7 %
4 340 328 96% 4 %
5 189 170 90% 5 %
Total 1,957 1,886 96% 6 %
1. Slip vacancy adjustment factor accounts for boats that may be in use at a lake other than Beaver Lake or off the lake for
maintenance. See Section 4.1.3 for an explanation.
Data from each of the survey periods are summarized in Table 4-13. This analysis presents the following
conclusions:
For all survey periods, approximately 5,633 boats on the water originated from marina slips
assuming every rented slip had a boat occupying it during the field surveys. When the marina
vacancy adjustment factor is applied, approximately 388 apparent boats are likely on lakes other
than Beaver Lake or out of the water for maintenance. This leaves an adjusted estimation of 5,295
boats on Beaver Lake from marinas during all survey periods.
Over all survey periods, the greatest number of boats originating from marinas occurred on July 2
during the afternoon survey when 556 are estimated as being on the water from marinas.

Section 4 Current Boat Use Study and Results
Page 4-16
Table 4-13. Boats Originating from Marinas by Survey Period
Date Time Period Boats on the Water from
Marina Slips (high) 1 Slip Vacancy
Adjustment Factor Boats on the Water from
Marina Slips (low) 2
2-Jul a.m. 309 19 290
2-Jul p.m. 591 35 556
3-Jul p.m. 304 18 286
16-Jul a.m. 319 19 300
16-Jul p.m. 461 28 433
17-Jul a.m. 280 17 263
17-Jul p.m. 465 28 437
23-Jul a.m. 308 18 290
23-Jul p.m. 444 27 417
24-Jul a.m. 269 16 253
24-Jul p.m. 403 24 379
3-Sep a.m. 273 16 257
3-Sep p.m. 396 24 372
4-Sep a.m. 279 17 262
4-Sep p.m. 532 32 500
Total 5,633 338 5,295
1. The higher tally of boats on the water from marina slips is from the actual count of empty slips before adjusting for vacancies
(vacant rented slips that do not represent a boat on Beaver Lake during the survey).
2. The lower tally of boats on the water from marinas is adjusted by the slip vacancy adjustment factor of 6 percent.
4.4.3 Resort Results Resort owners/operators were requested to self-report the number of boats departing from their docks
during each of the survey periods. The resorts were asked to report the number of rented or occupied
boat slips that were currently empty, which assumes that boat was on the water at the given survey
period. Not all resort owners were able to participate, and one participated but the data were not in the
requested format and could not be used. In total, four resorts provided useable data.
Analysis of the data provided by the four resorts reveals that the use rate of resort boat slips ranged
from a low of 10 percent on the morning of July 23 to a high of 38 percent on both the afternoons of
July 2 and July 17. Average over the survey period was a 27 percent use rate. The lake use rate indicates
that every 100 resort slips would generate, on average, approximately 27 boats on the water at one
time and up to 38 boats at one time during peak use periods.
4.4.4 Public and Community Dock Origination The origination source for boating activity on Beaver Lake was estimated by combining and analyzing
data from the various field survey data collections. The number of empty boat trailers from boat ramp
and campground parking lots was added together with the number of rented but empty marina slips
from the marina survey to determine the origination location for boats on the water during the survey
periods. When the sum of this data is subtracted from the boat counts from the aerial boat counts, the
number of boats on the water that originated from private, community, and resort docks can be

Section 4 Current Boat Use Study and Results
Page 4-17
estimated. This calculation was executed for the afternoon surveys only, as shown in Table 4-14, as early
morning survey periods experienced a high level of boaters in transit and are not useful in providing
accurate estimates of private and community dock boat origination. Note: Actual self-report resort
counts were not considered in this calculation since the data were partial. Rather, the estimated value
represents private, community, and resort docks. This assumption is carried forth in the remainder of
the document.
On average, 15 percent of boats on the water during the afternoon counts can be attributed to private,
community, and resort boat docks. The 8 percent estimated value for the July 2 afternoon flyover may
be representative of the actual count but may be underestimated for the peak of that day. Fireworks
started that evening after dark, and the peak may have occurred later in the afternoon, and a high
number of boaters may have been in transit during the time of the count. The greatest number of boats
from private, community, and resort boat docks is from the September 4 afternoon flyover where a
total of 368 boats, or 25 percent of the total, are estimated to have originated from this source.
Table 4-14. Boats Originating from All Facilities for Afternoon Survey Periods
Date Time
Period
Total Boats Counted by Aerial Team
a.
Empty Trailers
b.
Marina Slips
(adjusted) c.
Boats from Private, Community, and Resort
Docks (Derived)1 d.
Percent from Private,
Community, and Resort Docks
2-Jul p.m. 1,299 638 556 105 8%
3-Jul p.m. 592 168 286 138 23%
16-Jul p.m. 1,022 419 433 170 17%
17-Jul p.m. 848 367 437 44 5%
23-Jul p.m. 1,096 463 417 216 20%
24-Jul p.m. 734 278 379 77 10%
3-Sep p.m. 799 349 372 78 10%
4-Sep p.m. 1,450 582 500 368 25%
1. Boats from private, community, and resort boat docks calculated as: d = a – b – c.
4.4.5 Boat Origination Summary Data from Table 4-14 are used to summarize the average boat origination percent for boat ramps,
marina slips, and private, community, and resort docks. On average, for the afternoon flyovers,
approximately 42 percent of the boats on the water during the survey periods came from boat ramps
and 43 percent from marina slips. An estimate 15 percent of the boats on the lake can be attributed to
private, community, and resort docks. Figure 4-9 displays boat origination summary by facility type.
Note: Slips associated with sailing clubs are included with the private, community, and resort dock slips.

Section 4 Current Boat Use Study and Results
Page 4-18
Figure 4-9. Average Boat Origination by Facility Type
4.5 Peak Holiday Use Memorial Day weekend, the traditional start of the summer season, is an especially busy weekend at
Beaver Lake. This contract to initiate this survey was not in place until mid-June 2016; thus this survey
did not capture the boating use patterns over Memorial Day weekend. However, USACE rangers did
count the number of empty boat trailers at seven locations during the early afternoon at seven of the
busier boat launches over the Memorial Day weekend and through the initiation of the study. USACE
conducted the trailer counts during the July 23/24 weekend as well. This allowed USACE counts to be
compared to the number of trailers counted during study weekends, assuring a reasonable comparison.
Data were pulled for those seven locations for all study weekends to determine if missing the Memorial
Day weekend or earlier summer weekends in June could have resulted in underestimating peak use at
Beaver Lake.
Comparing the number of empty trailers observed by USACE and by the survey teams in the afternoons
revealed that the Fourth of July weekend (July 2 afternoon count) had the greatest numbers of empty
trailers at the seven locations than any other survey period. Thus, the peak holiday weekend was likely
surveyed during this study.
4.6 Field Survey Limitations The survey method was designed to capture a range of boating conditions and activities. By conducting
two surveys each day, the survey gathered data about users who may be more interested in fishing or a
quieter or perhaps cooler experience as well as those interested in more active water sports or using the
lake during the hotter part of the day. The survey times were selected in consultation with lake
managers to capture the peak times for users across the spectrum of user types.
It is possible that the 9 a.m. start time under estimated use by fishermen who may go out very early in
the day or even with first light. At several locations, surveyors encountered boaters coming off the
water at 9 a.m. just as the survey was starting. Similarly, in the summer when the days are long, it is
42%
43%
15%
Boat Ramps
Marina Slips
Private, Community, andResort Docks

Section 4 Current Boat Use Study and Results
Page 4-19
possible that many afternoon boaters may not get out onto the water until after 3 or 4 p.m. when most
surveys were completed and thus would not be counted. This may have been especially true on July 2
when many boaters went out onto the water late in the day to watch an evening fireworks display near
Prairie Creek.
Although each survey period is intended to be a point in time snapshot of activity on the lake, it is not
truly instantaneous. During the 2- to 3-hour period for each survey, boats would enter and exit the lake
and boats would move around the lake from place to place. The lake was sampled each time within a
relatively short window (2 to 3 hours), which minimizes the effect of this potential source of variation in
the counts, but this error cannot be eliminated. Times when many boaters were in transit bring
uncertainty in estimating boat origination. The use of a helicopter allowed for much faster recording of
boats on each segment of the lake than would be possible from another location such as from another
boat. The helicopter crew learned to note the speed and direction of boats that were close to a survey
zone boundary. Then as the helicopter circled over a zone or went down an arm and returned to the
boundary vicinity, they could avoid double counting boats that would have moved in the intervening
few minutes. The use of the helicopter also allowed for complete coverage of the lake. The helicopter
team was able to efficiently fly over the ends of narrow coves where boats would tie up for a quiet
retreat or where rafts of boats would link up for a summertime party. These remote corners of the lake
were included in these survey results, thus, making the results more robust.

Page 4-20
This page intentionally left blank.

Page 5-1
Section 5
Boater Perceptions on Crowding and Safety
The existing social carrying capacity was assessed through administration and analysis of a survey to a
sample of boaters who participate in on-water recreation activities at Beaver Lake. The purpose of the
survey was to gather information on user experiences, perceptions, and preferences in regards to
crowding and boating safety. The goals of the survey were to:
Determine the general characteristics of lake users
Determine the impact of current lake usage on the quality of the recreational experience, public
safety, and the natural ecology of the lake
Determine boaters’ perspectives on the social conditions of the lake and on current resource
management of the lake
This section provides key results from the survey on social perceptions of safety and crowding. Appendix
B provides details on the development, administration, and full results of the boater survey.
5.1 Safety The majority of respondents indicated that they feel that boating conditions are very to extremely safe
(64 percent), with the remaining 36 percent noting some concern for boating safety. The top 15 safety
issues noted are summarized in Figure 5-1. The top issue was uneducated/inexperienced boaters, with
10 percent of the respondents writing in a response such as this. High-speed cigarette and wake boats
were noted as a safety concern by 9 percent of the respondents. Crowding on holidays and weekends as
well as crowding at Prairie Creek were among the other top responses.
When asked a different way, 58 percent of respondents indicated they feel that the number of boats on
Beaver Lake is creating a safety problem (Figure 5-2). Thirty-six percent indicated that the problem is
slightly serious, and 18 percent indicated the problem is moderately serious.
A difference was noted in responses by residency. Those residents who indicated their home is located
along the shoreline of Zone 1 were much more likely to say boating conditions are very or extremely
safe (73 percent), and residents located in Zone 4 were less likely to say boating conditions are very or
extremely safe (55 percent). Residents of Zone 4 were also least likely to say that safety was “not at all”
a problem.
There are also significant differences in perceptions of safety by the primary type of boat used at the
lake. Those that use personal watercrafts, cabin cruisers, or houseboats are most likely to say that
boating at the lake is very or extremely safe (78, 74, and 73 percent, respectively). Those that use
rowboats, sailboats, or fishing boats are least likely to say that conditions are very or extremely safe (50,
55, and 54 percent, respectively).

Section 5 Boater Perceptions on Crowding and Safety
Page 5-2
Figure 5-1. Top 15 Safety Concerns
Figure 5-2. Seriousness of a Safety Problem from the Number of Boats
When asked how safe boating conditions are on Beaver Lake, boaters who primarily recreate in Zone 3
and Zone 4 are more likely to indicate safety issues (Figure 5-3). Those who primarily use Zone 1 are less
likely to perceive safety issues. When asked how serious of a safety problem is the number of boats on
0
20
40
60
80
100
120
140
160
Un
edu
cate
d/I
nex
per
ien
ced
Bo
ater
s C
ause
Saf
ety
Iss
ues
Hig
hsp
eed
/Cig
aret
te/W
ake
Bo
ats
Cau
se S
afet
y I
ssu
es
Cro
wd
ed o
n H
oli
day
s
Pas
sin
g to
o C
lose
to
Bo
ats/
Skie
rs/D
ock
s C
ause
s…
Spee
din
g C
ause
s Sa
fety
Co
nce
rns
PW
C/J
et S
kis
Cre
ate
Safe
tyC
on
cern
s
Un
mar
ked
Haz
ard
s/Sh
allo
ws
Deb
ris
in W
ater
is D
ange
rou
s
Wak
e B
oar
ds/
Tu
bes
/Sk
iers
Cre
ate
Safe
ty C
on
cern
s
Dri
nk
ing
on
th
e L
ake
is a
Pro
ble
m
Cro
wd
ed o
n W
eek
end
s
Lo
w W
ater
Lev
el C
asu
ses
Safe
tyIs
sues
Nee
d M
ore
No
Wak
e Z
on
es
Pra
irie
Cre
ek A
rea
is C
row
ded
No
ise
is a
Pro
ble
m
Co
un
t o
f R
esp
on
se
Safety Concern
Not at all serious
42%
Slightly serious
36%
Moderately serious
18%
Very serious3%
Extremely serious1%

Section 5 Boater Perceptions on Crowding and Safety
Page 5-3
the lake, users who recreate in Zones 2, 3, and 4 were more likely to indicate a problem from the
number of boats.
Figure 5-3. Boating Condition Safety by Primary Study Zone Used
5.2 Crowding One out of four respondents indicated that they feel there is a problem from too many boats on Beaver
Lake. Of those who indicated there is a problem, 54 percent said it is a moderate problem, and 14
percent noted it as a serious problem. Those who use rowboats, kayaks, or canoes were most likely to
see a problem from too many boats (38 percent), followed by boaters using fishing or bass boats (30
percent). Those using speedboats, sailboats, ski boats, and pontoon boats all identified too many boats
as a problem in about equal proportions (25, 23, 23, and 19 percent, respectively). Those using
houseboats, cabin cruisers, and personal watercrafts were least likely to see a problem from too many
boats (13, 14, and 16 percent, respectively).
Slight variations exist on user’s perceptions of crowding based on the primary zone used for recreation
activities. Respondents who use Zones 2 and 3 are more likely to indicate that a problem does exist from
too many boats although the number remains close to that of Zones 1 and 4 (Figure 5-4). Residents are
slightly more likely to indicate a problem from the number of boats on Beaver Lake when compared to
non-residents.
25.835.7 40.2 40.2 35.9
74.264.3 59.8 59.8 64.1
0
10
20
30
40
50
60
70
80
90
100
Zone 1 Zone 2 Zone 3 Zone 4 Zone 5
Per
cen
t o
f R
esp
on
den
ts
Primary Study Zone Used
Not at All, Slightly, or Somewhat Safe Very or Extremely Safe

Section 5 Boater Perceptions on Crowding and Safety
Page 5-4
Figure 5-4. Respondents Indicating a Problem with too Many Boats by Primary Zone Used
Noise was said to reduce boating enjoyment for approximately half of all respondents, with 9 percent
indicating that it has significantly reduced enjoyment. As with crowding, there are significant differences
in perceptions of the amount that noise has decreased their enjoyment of the lake depending on the
type of boat primarily used. Nearly 30 percent of rowboat/kayak/canoe users and 23 percent of sailboat
users said that noise had decreased their enjoyment of the lake quite a bit or extremely. Residents of
the lake (those living within 0.25 miles of the shoreline) tended to claim that noise from other boats was
more likely to reduce their enjoyment of the lake. While 58 percent of non-residents said that their
enjoyment of the lake was “not at all” reduced by noise from other boats, only 46 percent of residents
said the same.
When asked to recall their last boating outing, respondents generally indicated that they saw as many
boats as they expected to see (67 percent) and about as many boats as they wanted to see (73 percent).
However, respondents who recalled a holiday weekend as their last outing (defined as Friday through
Monday on Labor Day, Memorial Day, or Fourth of July) were much more likely to say that they saw
more boats than they expected to see when compared to those who indicated their last outing as a day
other than a holiday weekend day (25 percent compared to 8 percent). At about equal levels, those who
reported their last outing was during a holiday weekend were also much more likely to say that they saw
more boats than they wanted to see (28 percent compared to 8 percent).
In summary, the survey results indicate that crowding is not an issue for the majority of recreational
boaters at Beaver Lake although some users reported that crowding has become a problem for them.
Users who prefer non-motorized watercraft are more likely to see crowding and noise as an issue.
While most boaters’ expectations for the number of boats on the lake were met and preferences were
not exceeded, those visiting on holiday weekends were more likely to indicate that there was more
crowding than they expected or preferred.
19.926.6 25.2 21
12.7
80.173.4 74.8 79
87.3
0
10
20
30
40
50
60
70
80
90
100
Zone 1 Zone 2 Zone 3 Zone 4 Zone 5
Per
cen
t o
f R
esp
on
den
ts
Primary Study Zone Used
Yes No
Section 5 Boater Perceptions on Crowding and Safety
Page 5-5
5.3 Response to Crowding Most respondents (72 percent) did indicate that the presence of too many boats is likely to cause them
to avoid their favorite places on Beaver Lake, as shown in Figure 5-5. One in four indicated that the
presence of too many boats is quite or extremely likely to cause them to avoid a part of the lake. This
indicates that boaters are responsive to the level of lake use and will experience negative consequences
and change their behavior if the social carrying capacity at Beaver Lake is exceeded.
Figure 5-5. Boater Response to Crowding
5.4 Boater Survey Limitations The survey was administered in October of 2016, following the summer boating period. Given the time
lapse between the peak boating activities and the administration of the survey, it is possible that
respondent perceptions of safety and crowding could have been dampened. That is, people may not
have felt as strongly about concerns over safety and/or crowding after being so far removed in time
from the boating experience.
Non-response was under 5 percent for any given question, with a few notable exceptions that should be
considered. The question asking for the primary zone where boating activities occurred had a non-
response rate of 5.2 percent. No difference was measurable between those completing the survey
online or via paper mail back. The slightly higher non-response rate is likely due to respondents simply
not knowing which zone they primarily recreate in or possibly that they perceived their use as equally
distributed between two or more zones. The question asking for respondents to indicate the date of
their last outing had a non-response response rate of 8.9 percent. This is likely because the survey was
administered in October and the respondents simply could not identify the date.
Not at all likely28%
Slightly likely27%
Somewhat likely20%
Quite likely18%
Extremely likely7%
Likelihood that the Presence of too Many
Boats Would Cause Boaters to Avoid their
Favorite Parts of Beaver Lake

Page 5-6
This page intentionally left blank.

Page 6-1
Section 6
Carrying Capacity Benchmarks
In a carrying capacity study, an essential component is the calculation of an appropriate boating carrying
capacity range that is specific to the lake under study. The appropriate boating carrying capacity is
dependent on site-specific attributes, the lake setting, and users’ preferences. Lake-specific factors to
consider in calculating a range of boating capacities include water depth, shoreline configuration, lake
setting and context, visitors’ perceptions, number of accidents involving other boats, boat type and
speed, and dominant boating activities.
The WALROS methodology developed by Reclamation has been utilized in several national carrying
capacity studies as a means of developing an appropriate range of recreational boating capacities or
densities. WALROS considers the physical, social, and managerial attributes of a lake and, based on user
inputs, provides a range of densities appropriate for the lake. The WALROS calculation was used as the
primary method for developing the carrying capacity benchmark ranges for Beaver Lake (Section 6.1).
Additionally, a literature review was conducted to determine if the resulting WALROS range should be
adjusted to account for the purely spatial constraints that exist at Beaver Lake (Section 6.2). Similarly,
results of the boating survey were used to validate the resulting WALROS range (Section 6.3).
6.1 WALROS Calculation WALROS is a methodology used to systematically classify recreational opportunities to determine
appropriate management strategies. Application of the WALROS methodology allows users to classify a
specific lake into a spectrum that ranges across urban, suburban, rural developed, rural natural, semi-
primitive, and primitive recreation opportunities. The combination of lake-specific (or lake zone-specific)
recreation activities, settings, experiences, and benefits define each of these classes. Physical, social,
and management attributes are used to differentiate each of these six classes. Table 6-1 provides an
overview of the physical, social, and management attributes used to differentiate the six WALROS
classes.
Table 6-1. Attributes Used to Differentiate WALROS Classes
Physical Attributes Social Attributes Managerial Attributes
Degree of major development
Distance from major development
Degree of natural resource modification
Sense of closeness to a community
Degree that natural ambiance dominates the area
Degree of visitor presence
Degree of visitor concentration
Degree of recreation diversity
Degree of solitude and remoteness
Degree of non-recreational activity
Degree of management structures
Distance to developed recreation facilities and services
Distance to developed public access facilities
Frequency of seeing management personnel
WALROS classifications can be used to help managers make better and more defensible boating capacity
decisions. To assist managers in this process, Reclamation developed a set of boating capacity
coefficients based on collaborative expert opinion, professional experience, published articles and plans,

Section 6 Carrying Capacity Benchmarks
Page 6-2
sound professional judgment, and the rule of reasonableness. The exercise of evaluating a lake or lake
zones by the WALROS classifications helps managers understand the context in which users experience
the lake. The classification system helps to explain differences in user perceptions between lakes and
may indicate how lake zones on large lakes vary from each other.
In the WALROS inventory stage, a team of experts is asked to select and inventory a series of sites on the
waterbody. For this study, the selected inventory sites are defined as the Beaver Lake study zones
shown in Figure 2-1 of Section 2. The team of experts used to inventory these sites consisted of the
Beaver Lake Project Office operations management team and the Chief Rangers at Beaver Lake (herein
referred to as “USACE experts”). For each inventory site, the USACE experts were asked to complete
three inventory assessments of the lake.
Physical Inventory – Physical attributes are features that are relatively permanent or fixed and not
likely to change. The protocol worksheet for this inventory is provided in Appendix C.
Social Inventory – Social attributes include the type of current recreation uses, nearby land and
water activities, and special values and meanings associated with the area. The protocol
worksheet for this inventory is provided in Appendix C.
Management Inventory – Management attributes are those features that are provided for,
managed, and may be changed by the managing agency or its partners. The protocol worksheet
for this inventory is provided in Appendix C.
Using these worksheets, the USACE experts were asked to indicate the degree, extent, or magnitude
that each attribute is present within each study zone.
To facilitate completion of the questionnaire, a desktop analysis of each study zone was completed to
provide minimum, maximum, and average distances to facilities and services specifically mentioned
within the questionnaire. This information was provided to and utilized by the USACE experts to answer
questions specific to distance. Questionnaire results were compiled and analyzed.
The results of the WALROS questionnaire are illustrated in Figure 6-1, Figure 6-2, and Figure 6-3. As
shown, there is some variation in the inventory for each study zone. Classifications generally range
between “Urban” and “Rural Developed”, depending on specific questions and attribute class.

Section 6 Carrying Capacity Benchmarks
Page 6-3
Figure 6-1. WALROS Physical Inventory Expert Results
Figure 6-2. WALROS Social Inventory Expert Results
Degree of visitorpreference
Degree of visitorconcentration
Degree ofrecreationdiversity
Distance tovisitor's services,security, safety,comforts, andconveniences
Degree ofsolitude andremoteness
Degree non-recreational
activity
Overall
Social Inventory
Zone 1 Zone 2 Zone 3 Zone 4 Zone 5
Primitive
Semi-Primitive
Rural Natural
Rural Developed
Suburban
Urban
Degree ofdevelopment
Sense ofcloseness to a
community
Degree ofnatural resource
modification
Distance fromdevelopment on
or adjacent tothe waterresource
Degree thatnatural
ambiancedominates the
area
Overall
Physical Inventory
Zone 1 Zone 2 Zone 3 Zone 4 Zone 5
Primitive
Semi-Primitive
Rural Natural
Rural Developed
Suburban
Urban

Section 6 Carrying Capacity Benchmarks
Page 6-4
Figure 6-3. WALROS Management Inventory Expert Results
Figure 6-4. WALROS Inventory Classifications by Study Zone
Average values from the WALROS results provided by the team of USACE experts were used to indicate
an appropriate WALROS classification for each study zone (Figure 6-4). The classifications for each study
zone fall within the range of the “Suburban” classification. Zone 3 is classified as having the most
development, visitor presence and concentration, and recreational diversity. This is most likely due to its
location near the cities of Bentonville and Rogers as well as the larger marinas located within this zone.
Zone 2 is classified as being closest to the “Rural Developed” classification, although still falling within
the spectrum of the “Suburban” classification, due to an absence of management structures and greater
distances to recreation facilities, visitors’ services, and community settings within this portion of the
lake. Zones 1, 4, and 5 all fall between Zones 2 and 3 on the range of suburban classification. Overall, an
Degree ofmanagement
structures
Distance to onsitedeveloped
recreation facilitiesand services
Distance fromdeveloped publicaccess facilities
Frequency of seeingmanagement
personnel
Overall
Management Inventory
Zone 1 Zone 2 Zone 3 Zone 4 Zone 5
Primitive
Semi-Primitive
Rural Natural
Rural Developed
Suburban
Urban
Zone 1 Zone 2 Zone 3 Zone 4 Zone 5
Urban
Suburban
Rural Developed

Section 6 Carrying Capacity Benchmarks
Page 6-5
appropriate WALROS classification for all study zones at Beaver Lake is “Suburban”, which has an
associated broad boating capacity range of 10 to 20 useable surface acres per boat.
To arrive at a more precise boating capacity by study zone, the WALROS Range Decision Tool was
utilized (Figure 6-5). To assign the more precise recommended capacity ranges to each of the five study
zones, information was utilized from the USACE experts, data outlined in Sections 2 and 3, data
collected through the field survey, and results of the boater survey. Based on assessment of the data,
Zones 1, 2, and 4 were determined to fall in the middle of the range, Zone 3 in the lower end of the
range, and Zone 5 in the higher end of the range. Thus, the refined WALROS boat density ranges
recommended for Beaver Lake are estimated at 14 to 17 acres per boat in Zones 1, 2, and 4; 18 to 20
acres per boat in Zone 3; and 10 to 13 acres per boat in Zone 5 (Table 6-2).
Figure 6-5. WALROS Boating Capacity Range Decision Tool

Section 6 Carrying Capacity Benchmarks
Page 6-6
Table 6-2. WALROS Recommended Carrying Capacity Range for Beaver Lake by Study Zone
Study Zone Classification and Range
Decision Capacity Range
(useable acres per boat)
Entire Lake
Zone 1
Zone 2
Zone 3
Zone 4
Zone 5
Suburban
Suburban – Mid-range
Suburban – Mid-range
Suburban – Higher End
Suburban – Mid-range
Suburban – Lower End
10–20
14–17
14–17
18–20
14–17
10–13
6.2 Spatial Carrying Capacity Spatial capacity refers specifically and solely to the physical recreation activity constraints at the lake.
Spatial capacity was estimated for Beaver Lake as a validation of the WALROS recommendation. An
extensive literature review revealed many suggested spatial capacities or densities specific to individual
lakes, boat types, and recreational boating activities. To determine an appropriate range of spatial
carrying capacity specific to Beaver Lake based on the literature, the characteristics of Beaver Lake
discussed in Sections 2 and 3 were reviewed and compared with existing studies. Additionally, boat type
and speed as well as primary recreational activities during peak boating use periods were evaluated
based on the field survey results discussed in Section 4 and the user perception survey discussed in
Section 5.
Similar to the WALROS analysis, the majority of the literature reviewed encourages analysis of useable
boating surface area, lake use characteristics, shoreline configuration, and a combination of boat type,
size, speed, and activity when determining the spatial capacity. While Beaver Lake has a large useable
surface area, as described in Section 2.3, the irregularity of the shoreline of Beaver Lake, especially in
coves and the meandering portions of Zones 4 and 5 are important to take into consideration in
determining a benchmark or appropriate spatial carrying capacity.
Additionally, boating incident data, as discussed in Section 3.2, are important in determining the overall
safety record of the lake. While Beaver Lake ranks high in accidents compared to other recreational
lakes in Arkansas, it was found that most of these accidents were not related to crowding. However,
analysis of the data indicate that crowding-related incidents are much more likely to occur in Zones 2
and 3 than other areas of Beaver Lake (Section 3.2.2).
Dominant boat type used is also an important component in the determination of recommended spatial
carrying capacities, as boat type is often indicative of boat speed and recreational activity. Based on
both field survey results and user survey results, approximately 40 percent of recreational boaters utilize
speed/ski/wake-style boats, 30 percent utilize pontoon-style boats, and 14 percent utilize fishing boats.
Field survey results show that during peak boating periods, speed/ski and pontoon boats are far more
Section 6 Carrying Capacity Benchmarks
Page 6-7
common than fishing boats. These types of boats are commonly used to pull skiers, wake boarders, and
tubers, all of which require additional acreage to maintain safe conditions for all users. The field survey
also indicates that these activities are distributed throughout the lake, except for Zone 5 where the lake
narrows and is not ideal for these types of activities.
Based on these considerations and past studies, a conservative spatial boating carrying capacity for
Beaver Lake would be 10 to 20 acres per boat. The range of carrying capacity is dependent on boat type
and study zone. In the most crowded study zone, Zone 3, where high speed ski and speed boats
dominate, the recommended density is the upper end of the range at approximately 20 acres per boat.
Slower moving pontoon and fishing boats common in Zone 5 are assumed to be able to operate safely at
a density of approximately 10 acres per boat based on study zone use patterns and historical incident
data. This range of recommended spatial density or carrying capacity was derived specifically for Beaver
Lake and may change as the boating use characteristics change over time.
The recommended ranges for study zones based solely on spatial requirements for a safe boating
environment align with the WALROS estimation of carrying capacity by zone for Beaver Lake and do not
warrant adjustments to the range provided in Table 6-2.
6.3 Social Carrying Capacity An appropriate social carrying capacity is based on users’ perceptions of crowding. The social carrying
capacity is considered to be exceeded when conflicts arise, users no longer feel safe on the lake, or
when the user chooses to no longer use the lake. As with the spatial capacity, social capacity was
analyzed separately as a verification of the resulting WALROS range.
In developing the boater survey (Appendix B), question 18, which provided simulated photos of boating
conditions on Beaver Lake, was intended to gage users’ optimal social carrying capacity. Given a series of
five photos, the question asked which photo shows the maximum number of boats a respondent could
see at one time on Beaver Lake without thinking it was too crowded. The photos provided within the
survey are shown in Figure 6-6. The total acreage depicted within the photo is approximately 100 acres,
which allows boat densities to be calculated for each photo.

Section 6 Carrying Capacity Benchmarks
Page 6-8
Figure 6-6. Boater Survey Photo Simulations Used to Determine Social Carrying Capacity
The survey results are shown in Figure 6-7. Based on calculated boat densities associated with each
simulation, 88 percent of boaters indicated a preference for boating densities that do not exceed 10
acres per boat. Furthermore, density that reaches 14 acres per boat exceeds the preference of 55
percent of boaters. These results indicate a socially acceptable boating carrying capacity range of
between 10 and 20 acres per boat, according to the majority of the boater survey respondents.
There was a slight difference in the maximum number of boats that would be tolerated depending on
which zone a respondent frequented. Most notably, Zone 3 users perceived Photo C as the maximum
number of boaters before appearing crowded at greater levels than users of Zone 2 (36 and 27 percent,

Section 6 Carrying Capacity Benchmarks
Page 6-9
respectively) (see Figure 6-8). There were no significant differences in responses to this photo array
between residents of the lake and visitors to the lake nor by how the lake is accessed.
Figure 6-7. Boater Survey Respondent Optimal Social Boat Density
Figure 6-8. Boater Survey Respondent Optimal Social Boat Density by Study Zone
8% 12%7% 9% 5%
46%47%
44%46%
44%
36% 27%36%
32%33%
0%
10%
20%
30%
40%
50%
60%
70%
80%
90%
100%
Zone 1 Zone 2 Zone 3 Zone 4 Zone 5
Per
cen
t o
f R
esp
on
den
ts
Primary Zone Used
No photo toocrowded
E
D
C
B
A
0
2
4
6
8
10
12
14
16
18
201 4 7
10
13
16
19
22
25
28
31
34
37
40
43
46
49
52
55
58
61
64
67
70
73
76
79
82
85
88
91
94
97
10
0
Bo
ats
per
10
0 A
cres
Percent of Survey Respondents
Number of Boats Per 100 Acres Before Users Indicate
Conditions Are Too Crowded
9% of users prefer seeing fewer than
5 boats per 100 acres
55% of users prefer seeing fewer than
7 boats per 100 acres
88% of users prefer seeing fewer than
10 boats per 100 acres
94% of users prefer seeing less than 12 boats per 100 acres

Section 6 Carrying Capacity Benchmarks
Page 6-10
By primary zone used, there is not a significant amount of difference between the thresholds for
preferred boating density before perceiving conditions as too crowded (Figure 6-8). Those who primarily
recreate in Zone 2 have a slightly stronger preference to see fewer boats. For users of Zones 1, 3, 4, and
5, 77 to 82 percent of users selected either Photo B or Photo C while only about 74 percent of users in
Zone 2 selected either of those photos.
Based on review of the optimal social boating density by study zone from the boater survey, the
recommended range of boat density by zone derived from the WALROS method (Table 6-2) aligns with
the social preferences for crowding specific to Beaver Lake boaters.

Page 7-1
Section 7
Carrying Capacity Utilization and Facility Use
Boating activity was measured during four summer weekends in 2016, including two holiday weekends
(Fourth of July and Labor Day) and two July weekends. In addition, survey was conducted to solicit
boaters’ perceptions of safety and crowding on Beaver Lake during the summer of 2016. From these
data, existing boat densities and facility use rates were calculated. Using the Reclamation WALROS tool,
recommended boating densities by study zone were calculated and verified through spatial and social
density analysis. This section furthers the analysis of the information and data complied to assess the
recommended capacity that is currently utilized at Beaver Lake, overall and by study zone, and the
impact that increases in facilities and private/public infrastructure may have on the boat density.
7.1 Boating Density Analysis The estimate of maximum boats using the lake at one time is useful for calculating the existing boating
density and other metrics of lake use. This measurement, herein referred to as “BOATS”, is the total
number of boats actively operating on the available water surface at any given point in time. This
number is derived from the actual boat count from the aerial surveys. The greatest number of boats
counted during any survey period was 1,450 for the overall lake. From this value, the current boat
density can be calculated:
BOATS Beaver Lake = 1,450
Current Boat Density Beaver Lake Overall
= Total Useable Acres ÷ BOATS
= 24,401 ÷ 1,450
= 17 useable acres per boat
Given the recommended lake-wide range of 10 to 20 acres per boat developed using the WALROS
analysis (see Section 6.1), during peak use times, Beaver Lake has currently reached the recommended
boat density, as shown in Figure 7-1. This means that Beaver Lake, overall, currently has reached but not
exceeded its carrying capacity.

Section 7 Carrying Capacity Utilization and Facility Use
Page 7-2
Figure 7-1. Beaver Lake Carrying Capacity Utilization
This calculation can be further evaluated by study zone to determine if the overall lake capacity metric
varies by zone. Table 7-1 shows the calculations of BOATS, Current Boat Density by study zone, and the
recommended density. Comparing the Current Boat Density and recommended range of densities, the
following conclusions are drawn:
Zones 1, 3, and 4 have reached but not exceeded recommended carrying capacity.
Zone 5 has not yet reached carrying capacity, as the data collected indicate that Zone 5 is
underutilized and has a much lower boat density than it could accommodate given the typical
boating activities that occur in Zone 5.
Zone 2 has an observed BOATS of 455, resulting in a density of 12 useable acres per boat. Given
the recommended density of between 14 and 17 acres per boat, Zone 2 has exceeded
recommended carrying capacity.
Table 7-1. Observed to Recommended Boat Densities by Study Zone
Study Zone
Useable Acres
Max Observed
BOATS Current Boat Density (useable acres/boat)
Recommended Range
(useable acres/boat)
Analysis of Capacity Utilized
Zone 1 5,104 297 17 14–17 Reached
Zone 2 5,473 455 12 14–17 Exceeded
Zone 3 7,493 394 19 18–20 Reached
Zone 4 4,051 261 16 14–17 Reached
Zone 5 2,280 68 34 10–13 Not Reached

Section 7 Carrying Capacity Utilization and Facility Use
Page 7-3
The range of boat density can be used to estimate the BOATS that can safely use the reservoir without exceeding capacity. The calculation is:
BOATS Capacity = Useable Acres ÷ Recommended Boat Density Table 7-2 presents this information by study zone and for the lake overall. Given the recommended range of boat density by zone, the recommended number of BOATS to remain within capacity is between 1,410 and 1,689. Given the peak BOATS observed for the lake overall, Beaver Lake’s current utilization is between 86 and 103 percent of the recommended capacity. This utilization percent varies by study zone, with Zone 2 beyond the recommended utilization; Zones 2, 3, and 4 within or exceeding the lower-end of the range; and Zone 5 underutilized. Table 7-2. Recommended BOATS by Study Zone and Overall
Study Zone
Recommended Boat Density
(Range) Useable
Acres
BOATS Capacity Current Percent Utilized of
Recommend Capacity
Low-end High-end Low-end High-end
Zone 1 14–17 5,104 300 365 99% 81%
Zone 2 14–17 5,473 322 391 141% 116%
Zone 3 18–20 7,493 375 416 105% 95%
Zone 4 14–17 4,051 238 289 110% 90%
Zone 5 10–13 2,280 175 228 39% 30%
Total 10–20 24,401 1,410 1,689 103% 86%
7.2 Total Boat Capacity and Boating Lake Use Rates Boaters can access Beaver Lake from various infrastructure and facilities: public boat ramps, marina
slips, or private, community, and resort docks. These can be referred to as access points or
opportunities, wherein one access point is equal to an opportunity for one boat to engage in boating
activities on Beaver Lake. The Total Access Opportunities, then, is the total number of boats that can be
moored or stored at an approved moorage facility, such as a marina or boat dock, plus the total number
of boats that can be placed on the water surface using an approved boat ramp or launch facility. The
number of boats that can be placed on the water surface from public boat ramps is calculated as the
number of boat trailer parking spaces available. Currently, the Total Access Opportunities for Beaver
Lake is 7,843 boats and was calculated as follows:
711 Boat trailer parking spaces at boat ramps (Table 4-9)
+ 1,957 Marina wet slips (Table 2-3)
+ 5,175 Slips at private, community, and resort boat docks (Table 2-2)
= 7,843 Total Access Opportunities

Section 7 Carrying Capacity Utilization and Facility Use
Page 7-4
Facility Use Rate is a measure of the estimated number of boats on the lake at any given time from the
access points. Facility Use Rate is calculated by dividing the Total Access Opportunities by BOATS.
Currently the Facility Use Rate for Beaver Lake is 19 percent and is calculated as follows:
Facility Use Rate = [Total Access Opportunities ÷ BOATS] * 100
= [1,450 ÷ 7,843] * 100 = 19 percent
Therefore, during peak use periods, one can reasonably expect that 19 percent of all available access
opportunities will result in a boat on the water. Facility Impact Rate furthers this calculation to express
the impact that adding “X” number of access opportunities has on BOATS:
Facility Impact Rate = 100 ÷ Facility Use Rate = 5:1
The Facility Impact Rate can be interpreted as follows: At Beaver Lake, adding 5 access opportunities
results in 1 additional boat on the water during peak times. The Facility Impact Rate is a measure of the
proportion of available access infrastructure to BOATS. It can be a useful tool to estimate the effects of
changes in Total Access Opportunities on BOATS. That is, if the available infrastructure for accessing the
lake were to change, the lake use rate provides a way to estimate how those changes would affect the
number of boats on the lake at one time and thus the boating density should the observed use rate
remain constant in the future.
It is possible to break the Facility Use Rate and Facility Impact Rate down by facility type, as shown
below. The boat ramp facilities have the highest impact on BOATS, with an impact ratio of 1:1, followed
by marinas with a ratio of 4:1. Private, community, and resort dock slips have the lowest impact on
BOATS with an impact ratio of 14:1. Note: Slips associated with sailing clubs are included with the
private, community, and resort dock slips.
Marinas
Marina Facility Use Rate = [556 ÷ 1,957] * 100 = 28 percent
Marina Facility Impact Rate = 100 ÷ 28 = 4:1
Boat Ramps in Public Recreation Areas
Boat Ramp Facility Use Rate = [638 ÷ 711] * 100 = 90 percent
Boat Ramp Facility Impact Rate = 100 ÷ 90 = 1:1
Private, Community, and Resort Dock Slips
Private, Community, and Resort Dock Slips Facility Use Rate = [368 ÷ 5,175] * 100 = 7 percent
Private, Community, and Resort Dock Slips Facility Impact Rate = 100 ÷ 7 = 14:1

Section 7 Carrying Capacity Utilization and Facility Use
Page 7-5
7.3 Analysis Discussion The recommended boat density from WALROS and other studies is similar to the densities the majority
of survey respondents selected as the point beyond which the lake would be too considered crowded.
Because Beaver Lake is currently within the recommended boating density, and only exceeds it in
limited areas or for limited periods of time, it is not surprising that more survey respondents did not
rank current crowding as a significant issue. However, there is evidence that boaters are beginning to
experience negative consequences. One in 3 survey respondents did note at least some level of concern
regarding boating safety, and 58 percent indicated that they feel that the number of boats on Beaver
Lake is creating a safety problem. Comments received during the 2015 and 2016 MP and SMP scoping
processes for Beaver Lake indicated a desire for greater boater safety through the regulation of boat
size/type and speed, increased enforcement of rules, or increased patrols. Zone 2 exceeded
recommended capacity during the study period and has seen 5 times more crowding-related incidents
over the past 6 years than Zones 1 or 4. Zone 2 is also known to lake management as having several
“party cove” areas in which several boats will tie together in a cove. These areas were verified during
helicopter flyovers and contribute to the high BOATS estimates observed within this zone. While a
gathering of stationary boats in coves generally does not contribute to a lake-wide crowding issue or an
increase in the frequency of accidents, it can contribute to crowding and accidents as boats return to
their point of origin.
Given that the NWARPC projects the population of Springdale, Bentonville, Bella Vista, Lowell, and
Centerton will more than double from 2015 to 2035, the demand for recreational boating opportunities
at Beaver Lake is likely to increase. The public boat ramp facilities are currently experiencing a 1:1
Facility Impact Rate. However, only 7 percent of the existing private, community, and resort boat dock
slip owners are currently boating at one time. Given the large number of these boat slips on Beaver
Lake, even minor changes to this use pattern can impact the number of boats on the water at any given
point in time. From this information, lake managers can better plan for the future of Beaver Lake and
strive for a healthy, balanced level of recreational boating.

Page 7-6
This page intentionally left blank.

Page 8-1
Section 8
References
Arkansas Game and Fish Commission. 2011. Boating Accident Year-End Report. Prepared by Captain S.
Weathernington, Boating Law Administrator.
_____. 2012. Boating Accident Year-End Report. Prepared by Captain S. Weathernington, Boating Law
Administrator.
_____. 2013. Boating Accident Year-End Report. Prepared by Captain S. Weathernington, Boating Law
Administrator.
_____. 2014. Boating Accident Year-End Report. Prepared by Captain S. Weathernington, Boating Law
Administrator.
_____. 2015. Boating Accident Year-End Report. Prepared by Captain S. Weathernington, Boating Law
Administrator.
_____. 2016. Accident data specific to Beaver Lake provided by Captain S. Weathernington, Boating Law
Administrator, via email communications, September 2016.
Bosley, Holly. 2005. Techniques for Estimating Boating Carrying Capacity: A Literature Review. North
Carolina State University. Department of Parks, Recreation, and Tourism.
CDM Smith. 2012. Beaver Lake Shoreline Management Plan Revision and Master Plan Supplement
Environmental Impact Statement: Recreation Study Report. Prepared for Prepared for USACE
Tulsa District.
_____. 2016. Beaver Lake Master Plan and Shoreline Management Plan Revision Scoping Report.
Prepared for USACE Little Rock District.
Cherokee CRC. 2010. Recreational Boating Use Study: Table Rock Lake, Missouri. Prepared for USACE
Little Rock District, W9127S-07-D-0017.
Colorado State Parks. 2011. Stagecoach State Park Management Plan 2011-2021; Appendix G: Boating
Capacity Study.
Doshi, Sheela. 2006. Recreational Carrying Capacity in Lakes: How Much is Too Much? Water Column,
Indiana Clean Lakes Program (18) 2: 1-3.
ERM, Inc. 2004. Deep Creek Lake Boating and Commercial Use Carrying Capacity Study, Proposal No.
KOOR2200624.
Federal Reserve Bank of St. Louis, Economic Research Division. 2015. “FRED Graph Observations:
FASPCPI; A792RCOA052NBEA; ARPCPI.” Federal Reserve Economic Data.
http://fred.stlouisfed.org.

Section 8 References
Page 8-2
Gascon, Charles S., and Michael A. Varley. 2015. “A Tale of Four Cities: Widespread Growth in Northwest
Arkansas.” The Regional Economist, January.
IHS Global Insight. 2014. U.S. Metro Economies: GMP and Employment 2013 -2015.
https://usmayors.org/metroeconomies/2014/06/report.pdf
JFNew. 2007. Wawasee Carrying Capacity Report: Elkhart, Kosciusko, and Noble Counties, Indiana.
Prepared for Wawasee Area Conservancy Foundation. October 2007.
Lake Ripley Management District. 2003. Lake Ripley Watercraft Census & Recreational Carrying Capacity
Analysis. December 2003.
Olvany, Kevin, and Jonathan Pitchford. 2010. Final Canandaigua Lake: Peak Use Boat Inventory and
Carrying Capacity Analysis. Canandaigua Lake Watershed Council, June 1.
Parsons Brinkerhoff in cooperation with Garver and Stantec. 2011. Northwest Arkansas Western
Beltway Feasibility Study – Final Report. Prepared for Northwest Arkansas Regional Planning
Commission.
Pinecrest Lake. 2012. Boating Carrying Capacity Review. April 3, 2012.
Rajan, B., V.M. Varghese, and A.P. Pradeepkumar. 2011. Recreational Boat Carrying Capacity of
Vembanad Lake Ecosystem, Kerala, South India. Environmental Research, Engineering and
Management 2(56): 11-19.
Titre, J. P., Vogel J., Dunk, W.M., Chilman, K., Killelea, J. 1995. A Study of Boater Recreation on Beaver
Lake, Arkansas. Final Report. USACE, Little Rock, Arkansas.
U.S. Bureau of Outdoor Recreation. 1977. Guidelines for Understanding and Determining Optimum
Recreation Carrying Capacity. Bethlehem, Pa.: Urban Research and Development Corporation.
U.S. Bureau of Reclamation. 2011. Water and Land Recreation Opportunity Spectrum (WALROS). Users’
Handbook, Second Edition. September 2011.
U.S. Census Bureau. 2014. TIGER/Line Shapefiles (machine-readable data files).
Warren, R., and P. Rea. 1989. Management of Aquatic Recreation Resources. Columbus, Ohio:
Publishing Horizons Inc.