2020 Ecological PRofile - Olongapo City
88
2020 ECOLOGICAL PROFILE Olongapo City A basic reference about all possible aspects of the locality socioeconomic and biophysical profiles. This year’s edition includes the CORONA VIRUS DISEASE 2019 Pandemic local impact, response, and interventions. Research Section City Planning and Development Office
-
Upload
khangminh22 -
Category
Documents
-
view
0 -
download
0
Transcript of 2020 Ecological PRofile - Olongapo City
2020 ECOLOGICAL
PROFILE Olongapo City
A basic reference about all possible aspects of the locality
socioeconomic and biophysical profiles.
This year’s edition includes the CORONA VIRUS DISEASE 2019
Pandemic local impact, response, and interventions.
Research Section City Planning and Development Office
Page 1 of 85
Table of Contents FOREWORD ........................................................................................................................................................................................................................................... 2 Acknowledgment ..................................................................................................................................................................................................................................... 4 List of Tables ........................................................................................................................................................................................................................................... 5 List of Charts ........................................................................................................................................................................................................................................... 6 CHAPTER 1. BRIEF HISTORY .............................................................................................................................................................................................................. 7 CHAPTER 2. GEOPHYSICAL ENVIRONMENT ................................................................................................................................................................................... 9
2.1 Geographical Location ................................................................................................................................................................................................................ 9 2.2 Political Boundaries .................................................................................................................................................................................................................... 9 2.3 Topography ................................................................................................................................................................................................................................. 9
2.4 Geology ....................................................................................................................................................................................................................................... 8
2.5 Land Resources .......................................................................................................................................................................................................................... 9
2.6 Freshwater Resources .............................................................................................................................................................................................................. 10 2.7 Water supply ............................................................................................................................................................................................................................. 11
2.8 Climate ...................................................................................................................................................................................................................................... 11
2.9 Natural Hazards / Constraints................................................................................................................................................................................................... 12
CHAPTER 3. POPULATION ................................................................................................................................................................................................................ 15 3.1 Social Composition and Characteristics ................................................................................................................................................................................... 15 3.2 Population Size and Growth Rate ............................................................................................................................................................................................ 15 3.3 Growth of Barangay Population ............................................................................................................................................................................................... 15 3.4 Migration Patterns ..................................................................................................................................................................................................................... 15 3.5 Population Density .................................................................................................................................................................................................................... 16 3.6 Household Distribution .............................................................................................................................................................................................................. 16 3.7 Urban – Rural Distribution ........................................................................................................................................................................................................ 16 3.8 Age–Sex Distribution ................................................................................................................................................................................................................ 16 3.9 Dependency Ratio .................................................................................................................................................................................................................... 16
CHAPTER 4. HEALTH ......................................................................................................................................................................................................................... 17 4.1 COVID 19 Pandemic situation as of December 31, 2020 ........................................................................................................................................................ 17 4.3 Health Facilities, Public and Private ......................................................................................................................................................................................... 18 4.4. Top leading cases of emergency consultation ........................................................................................................................................................................ 19 4.5 Top 3 Leading Causes of mortality ........................................................................................................................................................................................... 19 4.6 JLGMH’s inpatient and outpatient census ................................................................................................................................................................................ 19 4.7 Nutritional Status....................................................................................................................................................................................................................... 19 4.8 Total number of births ............................................................................................................................................................................................................... 19 4.9Total number of deaths .............................................................................................................................................................................................................. 19 4.10 Family Planning Services ....................................................................................................................................................................................................... 19
CHAPTER 5. SOCIAL WELFARE ....................................................................................................................................................................................................... 20 Social Welfare Service Provision during Corona Virus Disease 2019 Pandemic .......................................................................................................................... 20 5.1 Social welfare programs and services available ...................................................................................................................................................................... 20
CHAPTER 6. EDUCATION .................................................................................................................................................................................................................. 23 6.1 Educational Attainment ............................................................................................................................................................................................................. 23 6.2. Literacy Rate ............................................................................................................................................................................................................................ 23 6.3. Projected School-age population, by level .............................................................................................................................................................................. 23 6.4. Number of public and private schools, by level ....................................................................................................................................................................... 23 6.5 Other Educational Statistics...................................................................................................................................................................................................... 23
6.6 Tertiary Enrolment and Graduates ........................................................................................................................................................................................... 25 CHAPTER 7. HOUSING ....................................................................................................................................................................................................................... 26
7.1 Housing units, by type and construction materials ................................................................................................................................................................... 26 7.2 Tenure on the house and home lot ........................................................................................................................................................................................... 26
2.3.1 Elevation ............................................................................................................................................................................................................................ 8 2.3.2 Slopes ................................................................................................................................................................................................................................ 8
2.4.1 Soil Types .......................................................................................................................................................................................................................... 8
2.5.1 Land Classification............................................................................................................................................................................................................. 9 2.5.2 2016 Existing General Land Classification ........................................................................................................................................................................ 9 2.5.3 Land Use Development Trend ........................................................................................................................................................................................ 10
2.7.1 Surface runoff .................................................................................................................................................................................................................. 11 2.7.2 Groundwater Resources.................................................................................................................................................................................................. 11
2.8.1 Atmospheric Temperature ............................................................................................................................................................................................... 11 2.8.2 Rainfall ............................................................................................................................................................................................................................. 12
2.9.a Drought ............................................................................................................................................................................................................................ 12 2.9.b Flood and landslide ......................................................................................................................................................................................................... 12 2.9.c Erosion and Siltation ........................................................................................................................................................................................................ 14
5.1.1 Social Development Center (SDC).................................................................................................................................................................................. 20 5.1.3 Center for Women ........................................................................................................................................................................................................... 21 5.1.4 Center for Youth .............................................................................................................................................................................................................. 21 5.1.5 Community-Based services ............................................................................................................................................................................................. 22 5.2.4 Number and location of Day Care Centers .................................................................................................................................................................... 22
6.5.1 Total Enrolment (past 3 school years)............................................................................................................................................................................. 23
Page 2 of 85
7.3 Sources of drinking water ......................................................................................................................................................................................................... 26
CHAPTER 8. PUBLIC UTILITIES ........................................................................................................................................................................................................ 27 8.1 Solid Waste Management ......................................................................................................................................................................................................... 27 8.2 Monthly volume of garbage collection ...................................................................................................................................................................................... 27
CHAPTER 9. EMPLOYMENT AND INCOME ...................................................................................................................................................................................... 28 9.1 Working Age Population ........................................................................................................................................................................................................... 28 9.2 Labor Force Participation Rate (LFPR) .................................................................................................................................................................................... 28 9.3 Employment rate, by sector ...................................................................................................................................................................................................... 28 9.4 Number of overseas Filipino workers (OFWs) ......................................................................................................................................................................... 28 9.5 Poverty ...................................................................................................................................................................................................................................... 28 9.6 Annual Mean Per Capita Income .............................................................................................................................................................................................. 29 9.7 Subic Bay Freeport Zone (SBFZ) Olongapo City-based Employed Members of the Labor Force ......................................................................................... 29
CHAPTER 10. PROTECTIVE SERVICES ........................................................................................................................................................................................... 30 10.1 Total number of police personnel ........................................................................................................................................................................................... 30 10.2 Police – population ratio. ........................................................................................................................................................................................................ 30 10.3 Types and volume of crime..................................................................................................................................................................................................... 30 10.4 Fire-fighting personnel and facilities ....................................................................................................................................................................................... 31 10.5 2020 Fire Incidents ................................................................................................................................................................................................................. 31
CHAPTER 11. LOCAL ECONOMY AMIDST THE COVID 19 PANDEMIC ........................................................................................................................................ 32 11.1 Business Establishments/Activities Allowed to Operate during Quarantine .......................................................................................................................... 32 11.2 Timeline of Events, Economic Impact and Responses .......................................................................................................................................................... 33 11.3 Decreased number of Registered Business ........................................................................................................................................................................... 35 11.4 Decreased Volume of Business ............................................................................................................................................................................................. 35 11.5 Decreased New Capital Investment ....................................................................................................................................................................................... 36 11.6 Agriculture informal economy ................................................................................................................................................................................................. 36 11.7 Decreased slaughtered and traded livestock ......................................................................................................................................................................... 36 11.8 Decreased Gross Value of Livestock Trading ........................................................................................................................................................................ 36
CHAPTER 12. INFRASTRUCTURE AND TRANSPORTATION ........................................................................................................................................................ 37 12.1 Roads by classification ........................................................................................................................................................................................................... 37 12.2 2019-2020 Current Infrastructures ......................................................................................................................................................................................... 37
12.3 Transportation ......................................................................................................................................................................................................................... 41
CHAPTER 13. COMMUNICATION AND INFORMATION TECHNOLOGY ....................................................................................................................................... 43 13.1 Communication Services Facilities ......................................................................................................................................................................................... 43
CHAPTER 14. INSTITUTIONAL DEVELOPMENT ............................................................................................................................................................................. 44 14.1 Creation and Classification ..................................................................................................................................................................................................... 44 14.2 Planning Function ................................................................................................................................................................................................................... 44 14.3 Existing Information Systems of the City ................................................................................................................................................................................ 44 14.4 Legislation ............................................................................................................................................................................................................................... 45 14.5 Fiscal Management................................................................................................................................................................................................................. 46 14.6 Powers and Functions of the City Government of Olongapo ................................................................................................................................................. 48
ENDNOTES .......................................................................................................................................................................................................................................... 62 FOREWORD
Barangay Sta Rita Infrastructure Projects ................................................................................................................................................................................ 37 Barangay New Cabalan Infrastructure Projects ....................................................................................................................................................................... 37 Barangay West Bajac Bajac Infrastructure Projects ................................................................................................................................................................ 38 Barangay New Asinan Infrastructure Projects ......................................................................................................................................................................... 38 Barangay Gordon Heights Infrastructure Projects ................................................................................................................................................................... 38 Barangay Kalaklan Infrastructure Projects ............................................................................................................................................................................... 38 Barangay Barretto Infrastructure Projects ................................................................................................................................................................................ 39 Barangay East Tapinac Infrastructure Projects ........................................................................................................................................................................ 39 Barangay West Tapinac Infrastructure Projects ....................................................................................................................................................................... 39 Barangay New Ilalim Infrastructure Projects ............................................................................................................................................................................ 39 Barangay Pag-asa Infrastructure Projects ............................................................................................................................................................................... 39 Barangay East Bajac Bajac Infrastructure Projects ................................................................................................................................................................. 40 Barangay New Kababae and New Banicain Infrastructure Projects ........................................................................................................................................ 40 Barangay Mabayuan Infrastructure Projects ............................................................................................................................................................................ 40 Barangay Old Cabalan Infrastructure Projects ......................................................................................................................................................................... 40 Barangay New Kalalake Infrastructure Projects ....................................................................................................................................................................... 40
Public Utility Vehicles................................................................................................................................................................................................................ 41 Road and Vehicle Safety .......................................................................................................................................................................................................... 41 Accidents usual places of occurrence ...................................................................................................................................................................................... 42 Traffic Citation Ticket ................................................................................................................................................................................................................ 42 Documented time of accidents ................................................................................................................................................................................................. 42
13.1.1 Postal and Courier Services .......................................................................................................................................................................................... 43 13.1.2 Internet Providers .......................................................................................................................................................................................................... 43 13.1.3 Telecommunication Service Provider ............................................................................................................................................................................ 43 13.1.5 Broadcast Media ............................................................................................................................................................................................................ 43

Page 3 of 85
Foreword
The year 2020 was marked and envisioned by many countries and cities of the world as their pivotal year of development surge. The weaknesses and vulnerabilities of these visions were unmasked by a microbial organism, the Corona Virus Disease 2019, fast and lethal. The COVID – 19 Pandemic brought an unprecedented global crisis and unforgiving impact in all facets of our contemporary lives, as the infection and death toll grows. The pandemic happened while the world is strengthening its capabilities to address susceptibilities and exposures to contemporary disasters and Climate Change. COVID 19 reminded humanity that epidemiology is an additional field and frontier to focus on. With the rollout of inoculation, humanity is racing with the virus. Steadfast to our tradition and foundation on public safety, Olongapo City treated Corona Virus Disease 2019 seriously. As early as January 28, 2020, we have appealed to the SBMA leadership to temporarily halt receiving Cruise Ships. Before the national declaration of the State of Calamity, we have imposed a mandatory self-quarantine on individuals who are with symptoms of the virus. After which, a series of policy development and executive interventions to suppress the spread of the virus ensued for the rest of the year 2020. With all the uncertainties, struggles, and distress, the outcome is worth mentioning that as of the end of the assessment period, Olongapo City has a high recovery rate (94.3%) on COVID 19 confirmed cases. Fifty-three percent (53%) of the tested individuals are negative and forty-seven percent (47%) are positive. The percentage of mortality is lower (2%) than the national figure of 5.3%.
The Ecological Profile is an essential document of a local government unit, developed and updated periodically, that provides the general characteristics of a certain locality; its demographics, social, cultural, and economic dimensions. The Ecological Profile emphasizes the biophysical and ecological component of the City and attempts to provide a geographical dimension of various attributes of the data, which is particularly important in planning activities at the local level. This record is a good source of information for academic practitioners and promising scholars. Moreover, potential investors and budding entrepreneurs may utilize this as a basis of major decisions relative to marketing, finance, and other organizational aspects of their businesses. The Corona Virus Disease 2019 (COVID 19) Pandemic, its local situation, impact, and interventions became the major focus of this Ecological Profile 2020 edition. This is aside from the usual economic development, ecology, climate, and demographic dimensions which emphasized the crucial factor they play in development. Planners must consider people at the core of development for human capital is the most important asset to achieve a better quality of life.
I commend the efforts of everyone who contributed to the development of this Ecological Profile and I wish to extend my sincerest gratitude to all Office Heads of the City Government and National Agencies for their continued support and commitment to dedicated and honest public service.
HON.ROLEN C. PAULINO, JR. City Mayor
Page 4 of 85
Acknowledgment
Foremost, acknowledgment goes to the following City officials for the support, production, and publication of this document:
Honorable Rolen C. Paulino, Jr. City Mayor Honorable Aquilino Y. Jong Cortez, Jr.
Preparing, writing, and publishing this document is not a one-man task and not of men working in silos. Thus, acknowledgment goes to the cooperation of concerned City Government Offices / Departments and National Government agencies for their inputs in the formulation of this development plan. They greatly substantiate the data and information needed in this document. They are as follows:
INSTITUTIONAL DEVELOPMENT SECTOR 1. City Mayor’s Office 2. City Administrator’s Office 3. City Personnel Office 4. City Legal Office 5. Public Affairs Office 6. General Service Office 7. Management Information System 8. Barangay Affairs 9. City Tourism Office 10. Department of Interior and Local Government
SOCIAL SECTOR 1. City Social Welfare and Development Office 2. Persons with Disability Office 3. Office of Senior Citizen 4. City Health Office 5. City Population Office 6. Phil Health Indigent Office 7. JLG Memorial Hospital 8. Sports and Youth Development Office 9. Gordon College 10. Department of Education Division Office
ECONOMIC SECTOR 1. Treasury Department 2. City Assessor’s Office 3. City Accounting Office
Finally, worth acknowledging is the men and women of the City Planning and Development Office who patiently toiled for several months in the preparation of this publication, they are as follows:
1. Land Use Section, for the land information, maps, and technical inputs; 2. Technical and GIS Section, for digitally generating thematic maps; 3. Administrative Section, for the support services needed; 4. Research Section, for the data collection, processing, analysis, write-ups, editing, layout, and design.
4. City Budget Office 5. Business Permit and Licensing Office 6. Public Employment Service Office 7. Olongapo City Public Market 8. JLG Memorial Public Market 9. West Bajac Bajac Public Market 10. City Veterinarian Office 11. Livelihood and Cooperative Development Office 12. Department of Trade and Industry 13. Department of Labor and Employment PROTECTIVE SERVICE SECTOR 1. Disaster Risk Reduction and Management Office 2. Office of Transportation Management and Public Safety 3. Philippine National Police 4. Bureau of Fire Protection 5. Bureau of Jail Management and Penology
ENVIRONMENT SECTOR 1. Environment and Sanitation Management Office 2. Community Environment and Natural Resources Office 3. Parks and Plaza Management Office 4. Phil. Atmospheric, Geophysical and Astronomical Services Administration - Subic Bay Weather Complex
INFRASTRUCTURE SECTOR 1. City Engineer’s Office 2. Department of Public Works and Highways
Editing, Layout and Design
Research Section, City Planning and Development Office Eric M. Sanchez, Head Lino Mañago, Planning Officer Dolor Milanio, Economic Researcher Beverly Jane R. Salgado, Economic Researcher Maria Khristina E. Mundo, Economic Researcher Maridanne P. Manglicmot, Economic Researcher
Published 2021 by Olongapo City Planning and Development Office, 2/f City Hall Complex, Rizal Avenue, West Bajac Bajac,Olongapo City
Tel. No, (047) 611●4826 local 242 Email address: [email protected] Website: https://www.olongapocity.gov.ph/
ALL RIGHTS RESERVED.
No part of this publication may be reproduced, stored in retrieval system or electronic, mechanical, photocopying, recording or otherwise without the prior
permission of the publisher.
The Official Seal of the Olongapo City Government illustrates the upland, low land, and coastal marine ecosystem of the City, emphasizing the sensitivity and need to care for its ecology. In the middle of the seal is the old Naval Spanish Gate, which represents the historical and economic lifeline of the City, the port area in Subic Bay. Designed in 1966 by a former City Government employee and an Architect of the City Engineering Department, Arch. Benjamin Hayag (Cabatit, The Making of Olongapo).
The illustration, created at the Centers for Disease Control and Prevention (CDC), reveals ultrastrustural morphology exhibited by coronaviruses. Note the spikes that adorn the outer surface of the virus, which impart the look of a corona surrounding the virion, when viewed electron microscopically. A novel coronavirus, named Severe Acute Respiratory Syndrome coronavirus 2 (SARS-CoV-2), was identified as the cause of an outbreak of respiratory illness first detected in Wuhan, China in 2019. The illness caused by this virus has been named coronavirus disease 2019
(https://www.cdc.gov/media/subtopic/images.htm)
About the Cover
Page 5 of 85
List of Tables Table 1. Olongapo City, Magnitude of Disputed Areas, 1999 …………………………………………………………… 8 Table 2. Land Classification (in has); 1961 – 2013 …………………………………………………………… 9 Table 3. 2016 Existing Land Use; 2016 …………………………………………………………… 10 Table 4. Volume of SWSCI Water Production (in cum); 2015-2020 …………………………………………………………… 11 Table 5. Average Temperature; 2016-2020 …………………………………………………………… 11 Table 6. Dredging Frequency and Volume; 2013- 2014 …………………………………………………………… 14 Table 7. Barangay Population Growth; 2010-2015 …………………………………………………………… 15 Table 8. Dependency ratio; 2015 mid-censal …………………………………………………………… 16 Table 9. Total Population 10 Years Old & Over, Marital Status: 2020 …………………………………………………………… 16 Table 10. COVID 19 Situation Matrix; Dec. 31, 2020 …………………………………………………………… 17 Table 11. Reclassification of Barangay Health Services; 2020 …………………………………………………………… 18 Table 12. Medical Health Facilities by Capacity and Condition; as of 2020 …………………………………………………………… 18 Table 13. Malnutrition Status, Children ages 0-5 YO; 2018-2020 …………………………………………………………… 19 Table 14. Births and Deaths; 2020 …………………………………………………………… 19 Table 15. Family Planning Products Users; 2020 …………………………………………………………… 19 Table 16. Social Development Center Residents, by cases; 2018-2020 …………………………………………………………… 20 Table 17. Center for Women Residents, by cases; 2018-2020 …………………………………………………………… 21 Table 18. Center for 2020 Youth Residents; 2018-2020 …………………………………………………………… 21 Table 19. Day Care Centers, by barangay and Day Care Worker; 2020 …………………………………………………………… 22 Table 20. 2020 Projected School Age Going Population …………………………………………………………… 23 Table 21. Olongapo City Primary and Secondary Schools; SY 2019-2020 …………………………………………………………… 23 Table 22. Enrolment by year, by level; 2015-2017 …………………………………………………………… 23 Table 23. Performance Indicators; 2018-2020 …………………………………………………………… 25 Table 24.Tertiary Education Institution’s Enrolment; SY 2017 – 2020 …………………………………………………………… 25 Table 25.Tertiary Education Institution’s Graduates; SY 2017 – 2019 …………………………………………………………… 25 Table 26. Housing by type of building; PSA 2015 Censal survey …………………………………………………………… 26 Table 27. Housing Units by Construction Materials - Walls / Roof; 2015 …………………………………………………………… 26 Table 28. Tenure status of housing units and lots, Olongapo City; 2015 …………………………………………………………… 26 Table 29. Source of drinking water, Olongapo City; 2015 …………………………………………………………… 26 Table 30. Toilet Facility; Olongapo City; 2016 …………………………………………………………… 26 Table 31. Monthly Volume of Garbage Collected, in tons; 2016-2020 …………………………………………………………… 27 Table 32. OEDC Power service connections & consumption; 2020 …………………………………………………………… 27 Table 33. Projected Working-Age Population; 2020 …………………………………………………………… 28 Table 34. Projected 57.3% Labor Force Participation Rate; 2020 …………………………………………………………… 28 Table 35. Projected Employed members of the labor force …………………………………………………………… 28 Table 36. Filipino Overseas Working and Non-working, Olongapo City; 2016 …………………………………………………………… 28 Table 37. Poverty Incidence, Olongapo City; 2016 …………………………………………………………… 28 Table 38. Poverty Incidence, by barangay; CBMS 2016 …………………………………………………………… 29 Table 39. Mean Per Capita Income; CBMS 2016 …………………………………………………………… 29 Table 40. Police sub stations’ area of jurisdiction: 2020 …………………………………………………………… 30 Table 41. Index Crime; 2015-2020 …………………………………………………………… 33 Table 42. Business Classification; 2015-2020 …………………………………………………………… 35 Table 43. Declared Annual Gross Sales, (in millions); 2015-2020 …………………………………………………………… 36 Table 44. Declared Capital Investments of New Businesses (in millions); 2015-2020 …………………………………………………………… 36 Table 45. Gross value of inspected, slaughtered livestock trading (in millions) …………………………………………………………… 36 Table 46. Barangay Sta Rita Infrastructure Projects; 2019-2020 …………………………………………………………… 37 Table 47. Barangay New Cabalan Infrastructure Projects; 2019-2020 …………………………………………………………… 37 Table 48. Barangay West Bajac Bajac Infrastructure Projects; 2019-2020 …………………………………………………………… 38 Table 49. Barangay New Asinan Infrastructure Projects; 2019-2020 …………………………………………………………… 38 Table 50. Barangay Gordon Heights Infrastructure Projects; 2019-2020 …………………………………………………………… 38 Table 51. Barangay Kalaklan Infrastructure Projects; 2019-2020 …………………………………………………………… 38 Table 52. Barangay Barretto Infrastructure Projects; 2019-2020 …………………………………………………………… 39 Table 53. Barangay East Tapinac Infrastructure Projects; 2019-2020 …………………………………………………………… 39 Table 54. Barangay West Tapinac Infrastructure Projects; 2019-2020 …………………………………………………………… 39 Table 55. Barangay Pag-asa Infrastructure Projects; 2019-2020 …………………………………………………………… 39 Table 56. Barangay East Bajac Bajac Infrastructure Projects; 2019-2020 …………………………………………………………… 40 Table 57. Barangay New Kababae and New Banicain Infrastructure Projects; 2019-2020 …………………………………………………………… 40 Table 58. Barangay Mabayuan List of Infrastructure Projects; 2019 …………………………………………………………… 40 Table 59. Brgy Old Cabalan List of Infrastructure Projects; 2019-2020 …………………………………………………………… 40 Table 60. Barangay New Kalalake List of Infrastructure Projects; 2019-2020 …………………………………………………………… 40 Table 61. Type of vehicles involved in accidents; 2020 …………………………………………………………… 42 Table 62. Places of Accidents; 2020 …………………………………………………………… 42 Table 63. Registered Courier Service; 2020 …………………………………………………………… 43 Table 64. Registered Broadcasting Businesses; 2020 …………………………………………………………… 43 Table 65. Register Print Media Business; 2020 …………………………………………………………… 43
Page 6 of 85
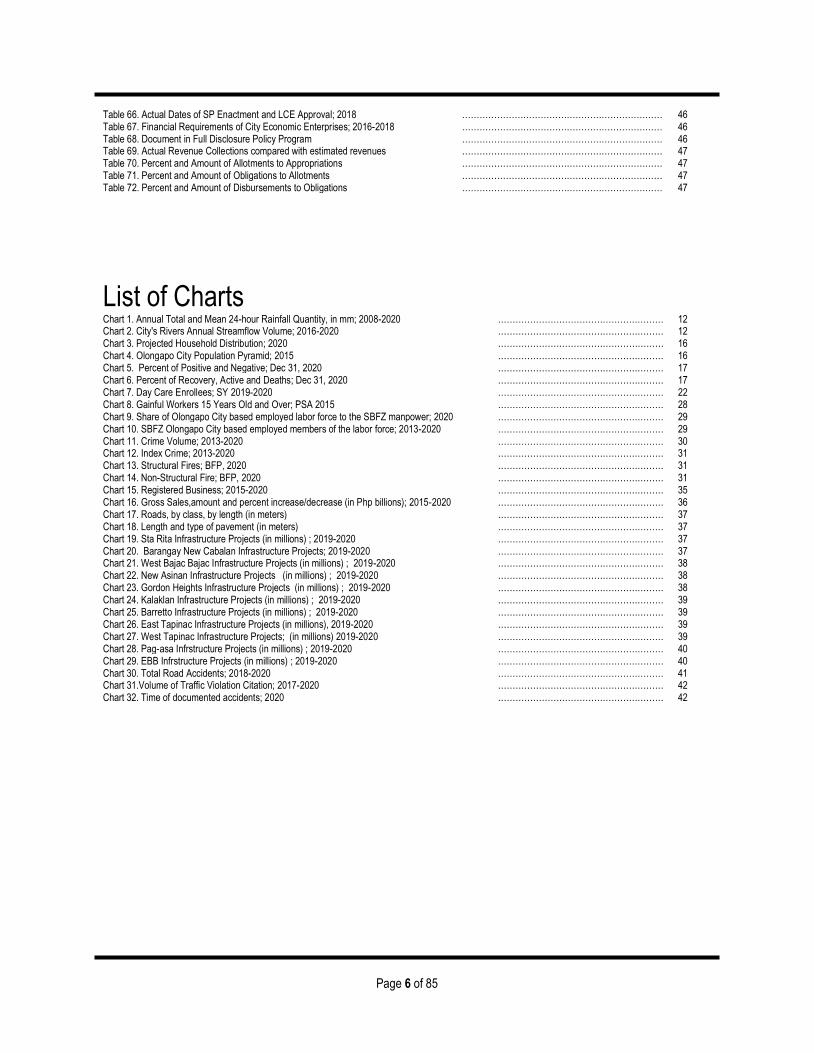
Table 66. Actual Dates of SP Enactment and LCE Approval; 2018 …………………………………………………………… 46 Table 67. Financial Requirements of City Economic Enterprises; 2016-2018 …………………………………………………………… 46 Table 68. Document in Full Disclosure Policy Program …………………………………………………………… 46 Table 69. Actual Revenue Collections compared with estimated revenues …………………………………………………………… 47 Table 70. Percent and Amount of Allotments to Appropriations …………………………………………………………… 47 Table 71. Percent and Amount of Obligations to Allotments …………………………………………………………… 47 Table 72. Percent and Amount of Disbursements to Obligations …………………………………………………………… 47
List of Charts Chart 1. Annual Total and Mean 24-hour Rainfall Quantity, in mm; 2008-2020 ………………………………………………… 12 Chart 2. City's Rivers Annual Streamflow Volume; 2016-2020 ………………………………………………… 12 Chart 3. Projected Household Distribution; 2020 ………………………………………………… 16 Chart 4. Olongapo City Population Pyramid; 2015 ………………………………………………… 16 Chart 5. Percent of Positive and Negative; Dec 31, 2020 ………………………………………………… 17 Chart 6. Percent of Recovery, Active and Deaths; Dec 31, 2020 ………………………………………………… 17 Chart 7. Day Care Enrollees; SY 2019-2020 ………………………………………………… 22 Chart 8. Gainful Workers 15 Years Old and Over; PSA 2015 ………………………………………………… 28 Chart 9. Share of Olongapo City based employed labor force to the SBFZ manpower; 2020 ………………………………………………… 29 Chart 10. SBFZ Olongapo City based employed members of the labor force; 2013-2020 ………………………………………………… 29 Chart 11. Crime Volume; 2013-2020 ………………………………………………… 30 Chart 12. Index Crime; 2013-2020 ………………………………………………… 31 Chart 13. Structural Fires; BFP, 2020 ………………………………………………… 31 Chart 14. Non-Structural Fire; BFP, 2020 ………………………………………………… 31 Chart 15. Registered Business; 2015-2020 ………………………………………………… 35 Chart 16. Gross Sales,amount and percent increase/decrease (in Php billions); 2015-2020 ………………………………………………… 36 Chart 17. Roads, by class, by length (in meters) ………………………………………………… 37 Chart 18. Length and type of pavement (in meters) ………………………………………………… 37 Chart 19. Sta Rita Infrastructure Projects (in millions) ; 2019-2020 ………………………………………………… 37 Chart 20. Barangay New Cabalan Infrastructure Projects; 2019-2020 ………………………………………………… 37 Chart 21. West Bajac Bajac Infrastructure Projects (in millions) ; 2019-2020 ………………………………………………… 38 Chart 22. New Asinan Infrastructure Projects (in millions) ; 2019-2020 ………………………………………………… 38 Chart 23. Gordon Heights Infrastructure Projects (in millions) ; 2019-2020 ………………………………………………… 38 Chart 24. Kalaklan Infrastructure Projects (in millions) ; 2019-2020 ………………………………………………… 39 Chart 25. Barretto Infrastructure Projects (in millions) ; 2019-2020 ………………………………………………… 39 Chart 26. East Tapinac Infrastructure Projects (in millions), 2019-2020 ………………………………………………… 39 Chart 27. West Tapinac Infrastructure Projects; (in millions) 2019-2020 ………………………………………………… 39 Chart 28. Pag-asa Infrstructure Projects (in millions) ; 2019-2020 ………………………………………………… 40 Chart 29. EBB Infrstructure Projects (in millions) ; 2019-2020 ………………………………………………… 40 Chart 30. Total Road Accidents; 2018-2020 ………………………………………………… 41 Chart 31.Volume of Traffic Violation Citation; 2017-2020 ………………………………………………… 42 Chart 32. Time of documented accidents; 2020 ………………………………………………… 42
Page 7 of 85
The earliest recorded known chronicle of Olongapo and Subic
Bay was during the expeditionary and exploration feats of the
Spanish Empire, the world’s colonial power during the 15th to
17th century. It was called by historians the Age of
Exploration. This period was seen as the bridge between the
Middle Age and the Modern era. Europeans, prominently the
Portuguese and Spaniards pioneered long-distance maritime
travels in search of trading opportunities to sustain their
respective monarchial societies and economies. Before the
colonization of the Philippines, Olongapo was believed to be
part of the vast habitat of nomadic bands of aboriginal
hunters, the Aetas.
Nodes of History
I. 1569 - Juan de Salcedo, known as “The Last Conquistadores” and grandson of the 1st Governor and Captain-General of the Philippines, Miguel Lopez de Legaspi succeeded in conquering Manila from its Muslim rulers.
II. 1571 - The conquest continued north of Luzon Island which paved the way to the discovery of Subic Bay and later on the Ilocos Region.
III. 1868 - 297 years later, a Spanish military expedition was dispatched to study the possibility of relocating the Cavite Naval Station in Subic Bay due to its unhealthy condition.
IV. 1884 - 16 years later King Alfonso XII issued a Royal
Decree officially declaring Subic Bay as a Spanish Naval Port.
V. 1898 - The Spanish-American War broke and a single detachment from the fleet of Admiral George Dewey easily took over Olongapo and Subic Bay.
VI. December 10, 1989 - Signing of the Treaty of Paris. Spain ceded to the United States all its colonies including the Philippine Islands.
VI. In 1904, US President Theodore Roosevelt issued an Executive Order designating Subic Bay and 70,000 acres of adjacent land, including Olongapo as an American military reservation.
VII. 1904 - Major Lincoln Karmany, the Governor-in-Charge of the US Naval Reservation, issued a notice to the attention of the Acting Governor, Don Gabriel Alba of Zambales, placing Olongapo under the Reservation territory.
VIII. 1941 to 1945 - The period of World War 2. With the US Naval Station, Subic Bay and Olongapo area played an important and pivotal value in the outcome of the war.
IX. January 29, 1945 - The arrival of the American Liberation Forces arrived and the untiring struggle of the Filipino guerillas ended the Japanese rule in Olongapo through a fiery battle at the Zig-Zag Pass.
X. 1946 - The United States granted independence to the Philippines under the Republic of the Philippines - United States Military Bases Agreement of 1947 provided the retention of the US Military Bases which included Subic Bay and the existing Naval Reservation of Olongapo.
XI. The Early 1950s - The conversion of the Subic Naval Station into a homeport of the US Navy’s 7th Fleet, which was known to be the largest US installation in Asia.
XII. December 07, 1959 - The United States Military Administration decided to turn over Olongapo to the Philippine government and was converted into a municipality under Executive Order No. 366 issued by then-President Carlos P. Garcia.
XIII. November 11, 1963 - The first local election of municipal officials resulted in the election of James Leonard Gordon as the 1st elected Mayor at beginning of the year 1964.
XIV. June 1, 1966 - President Ferdinand E. Marcos signed Republic Act No. 4645, converting Olongapo into a chartered City.
XV. February 20, 1967 - Mayor Gordon, Sr. succumbed to an assassin’s bullet but his commitment for peace and development has been an adage for the generations to come.
XVI. November 14, 1967 - The people of Olongapo City elected Amelia Juico Gordon, wife of Mayor James L. Gordon to administer the City, under her winning platform, “Blueprint for Tomorrow.”
XVII. 1971 - Republic Act 6199 was enacted and a new barrio, Gordon Heights was established, formerly Purok 7 of Barangay Sta. Rita.
XVIII. April 24, 1971 - New Cabalan was recognized as a Barangay through a City Council Resolution upon the recommendation of several Barangay Officials.
CHAPTER 1. BRIEF HISTORY
Page 8 of 85
XIX. October 12, 1988 - Sangguniang Panlungsod enacted and approved City Ordinance No. 30-A (Series of 1988) creating Barangay Old Cabalan.
XX. September 21, 1972 - President Ferdinand E.Marcos issued Proclamation No. 1081, placing the entire country under Martial Law, suspending national and local elections.
XXI. March 2, 1980 - Richard J. Gordon, son of the late Mayor James L. Gordon, was elected as City Mayor in the 1979 Mayoralty Elections under Martial Law. He was inducted into office and administered Olongapo City. His passion for a developmental brand of governance made Olongapo City known to the world.
XXII. December 7, 1983 - Olongapo City passed the criteria required by the Ministry of Local Government (MLG) and was declared as a Highly Urbanized City under MLG Memorandum Circular # 83-49.
XXIII. June 15, 1991 - Mt. Pinatubo, a volcano 20 miles away from Olongapo City, erupted causing unprecedented destruction of lives and properties.
XXIV. September 16, 1991 - The 1991 Senate of the Philippines did not grant an extension of the existing Republic of the Philippines and the United States of America Military Bases Agreement thereby terminating the stay of U.S. Military Bases in the Philippines.
XXV. Mayor Dick Gordon boldly led a strong corps of 8,000 City volunteers to protect and preserve the abandoned US Naval Base facilities from poachers. He complemented this with aggressive national advocacy to convert the area into a protected area and industrial zone.
XXVI. March 13, 1992 - Republic Act 7227 or The Bases
Conversion and Development Act of 1992 was enacted and paved the way for the creation of the Subic Bay Metropolitan Authority.
XXVII. November 24, 1992 - US Facility including Naval
Station and the Naval Air Station was turned over formally to the Philippine Government.
XXVIII. July 1, 1993 - Olongapo City Mayor Richard Gordon
was formally appointed as the first Chairman and Chief Executive Officer of Subic Bay Metropolitan Authority (SBMA).
XXIX. November 24, 1996 - Subic‘s transformation was completed when it hosted the leaders of 18 economies during the 4th APEC Leaders‘ Summit.
XXX. September 2, 1998 - After reviving the economy of Central Luzon and the City of Olongapo, Chairman Gordon stepped down from his SBMA post.
XXXI. December 05, 2001– Former SBMA Chairman Richard
J. Gordon was appointed as Secretary of Tourism and was confirmed by the Commission on Appointments.
XXXII. March 31, 1998 - The only lady Mayor, Mayor Kate H. Gordon won the United Nations Educational Scientific Cultural Organization (UNESCO) Peace Price Award and was among five awardees from different regions of the world.
XXXIII. On December 1, 1999, Mayor Kate H. Gordon was awarded the Konrad Adenauer Local Government Award (KALGA) for initiating reforms in the city bureaucracy to achieve efficiency and productivity in governance.
XXXIV. In May 2004, the former Congressman of Zambales, James Gordon, Jr., won the mayoralty election of Olongapo City.
XXXV. May 10, 2013, local election was a historical event for Olongapo City. Rolen C. Paulino, the three-termer Vice Mayor (from 2004 to 2007 and June 2010 to July 2013) broke the decade-long choice of affiliation on the Mayoralty seat and emerged as the newly elected Local Chief Executive of Olongapo City.
Mayor Rolen C. Paulino rose from the ranks of government employees and had been a City Councilor for 6 years from July 1998 to June 2004 before being the City’s Legislative Presiding Officer.
XXXVI. On July 1, 2019, the son of Mayor Rolen C. Paulino,
Atty. Rolen C. Paulino, Jr., succeeded in winning the mayoralty seat in the May 2019 local election.
Rolen C. Paulino Jr. is a successful examinee of the 2015 Bar Examinations. He completed his Bachelor of Laws in San Beda in 2015 ranking 29th out of 220 graduates. He obtained his pre-law degree from Ateneo De Manila University in 2011. He has been exposed to various legal internships and employment, giving him invaluable hands-on experience and practical know-how on appearing in court as counsel in various courts and tribunals, dealing with clients, conducting legal researches, and drafting pleadings, orders, and court decisions during his internships. In May of 2019, he was elected as City Mayor of Olongapo City, Zambales. (https://www.olongapocity.gov.ph/mayor)
Page 9 of 85
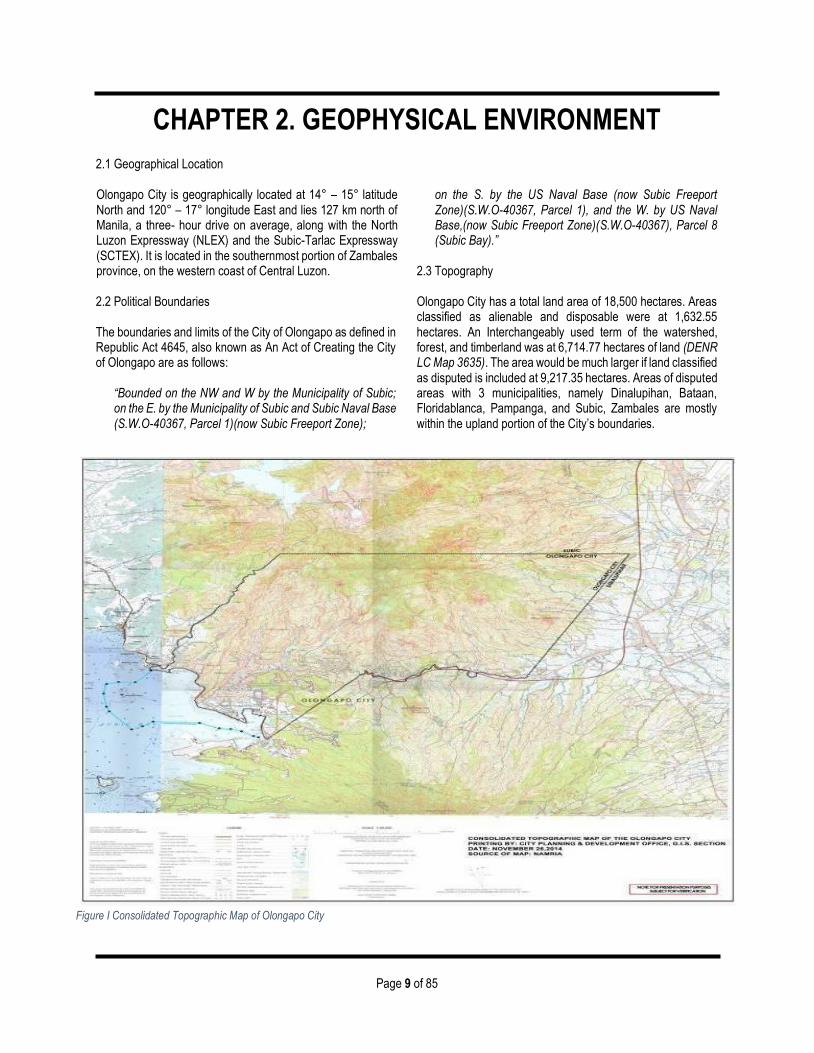
Figure I Consolidated Topographic Map of Olongapo City
CHAPTER 2. GEOPHYSICAL ENVIRONMENT 2.1 Geographical Location Olongapo City is geographically located at 14° – 15° latitude North and 120° – 17° longitude East and lies 127 km north of Manila, a three- hour drive on average, along with the North Luzon Expressway (NLEX) and the Subic-Tarlac Expressway (SCTEX). It is located in the southernmost portion of Zambales province, on the western coast of Central Luzon. 2.2 Political Boundaries The boundaries and limits of the City of Olongapo as defined in Republic Act 4645, also known as An Act of Creating the City of Olongapo are as follows:
“Bounded on the NW and W by the Municipality of Subic; on the E. by the Municipality of Subic and Subic Naval Base (S.W.O-40367, Parcel 1)(now Subic Freeport Zone);
on the S. by the US Naval Base (now Subic Freeport Zone)(S.W.O-40367, Parcel 1), and the W. by US Naval Base,(now Subic Freeport Zone)(S.W.O-40367), Parcel 8 (Subic Bay).”
2.3 Topography Olongapo City has a total land area of 18,500 hectares. Areas classified as alienable and disposable were at 1,632.55 hectares. An Interchangeably used term of the watershed, forest, and timberland was at 6,714.77 hectares of land (DENR LC Map 3635). The area would be much larger if land classified as disputed is included at 9,217.35 hectares. Areas of disputed areas with 3 municipalities, namely Dinalupihan, Bataan, Floridablanca, Pampanga, and Subic, Zambales are mostly within the upland portion of the City’s boundaries.
Page 8 of 85
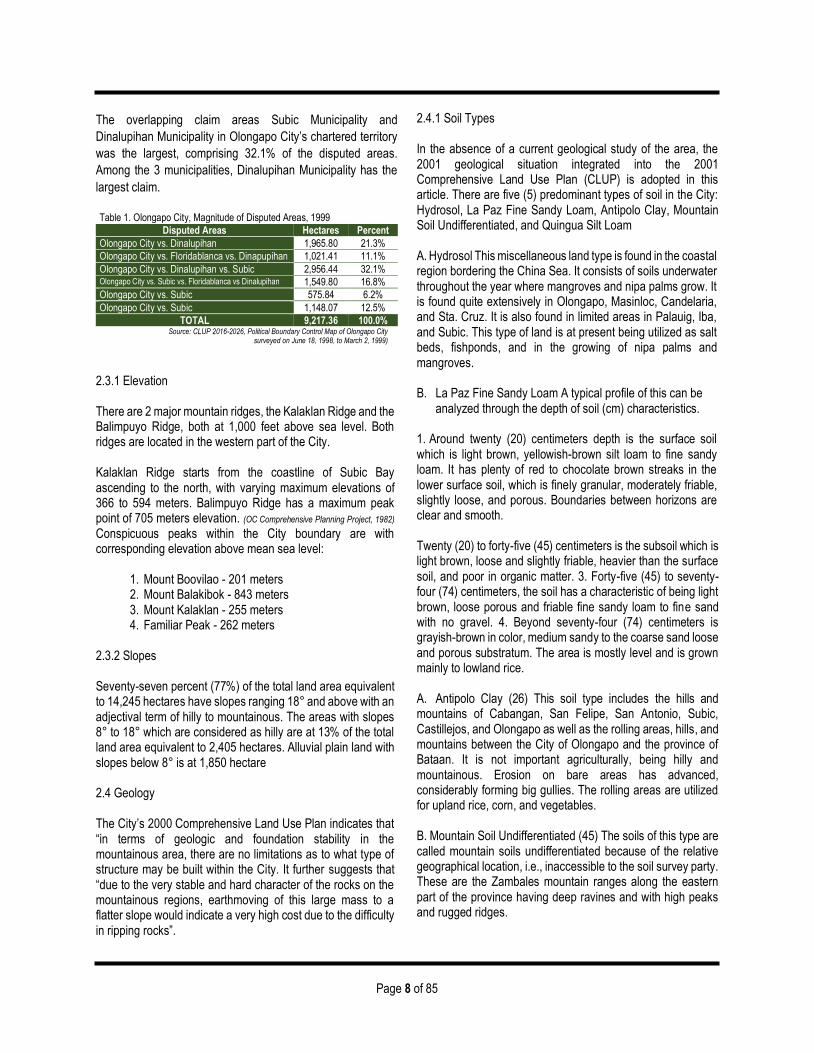
The overlapping claim areas Subic Municipality and
Dinalupihan Municipality in Olongapo City’s chartered territory
was the largest, comprising 32.1% of the disputed areas.
Among the 3 municipalities, Dinalupihan Municipality has the
largest claim.
Table 1. Olongapo City, Magnitude of Disputed Areas, 1999
Disputed Areas Hectares Percent
Olongapo City vs. Dinalupihan 1,965.80 21.3%
Olongapo City vs. Floridablanca vs. Dinapupihan 1,021.41 11.1%
Olongapo City vs. Dinalupihan vs. Subic 2,956.44 32.1% Olongapo City vs. Subic vs. Floridablanca vs Dinalupihan 1,549.80 16.8%
Olongapo City vs. Subic 575.84 6.2%
Olongapo City vs. Subic 1,148.07 12.5%
TOTAL 9,217.36 100.0% Source: CLUP 2016-2026, Political Boundary Control Map of Olongapo City
surveyed on June 18, 1998, to March 2, 1999)
2.3.1 Elevation
There are 2 major mountain ridges, the Kalaklan Ridge and the Balimpuyo Ridge, both at 1,000 feet above sea level. Both ridges are located in the western part of the City.
Kalaklan Ridge starts from the coastline of Subic Bay ascending to the north, with varying maximum elevations of 366 to 594 meters. Balimpuyo Ridge has a maximum peak point of 705 meters elevation. (OC Comprehensive Planning Project, 1982) Conspicuous peaks within the City boundary are with corresponding elevation above mean sea level:
1. Mount Boovilao - 201 meters 2. Mount Balakibok - 843 meters 3. Mount Kalaklan - 255 meters 4. Familiar Peak - 262 meters
2.3.2 Slopes
Seventy-seven percent (77%) of the total land area equivalent to 14,245 hectares have slopes ranging 18° and above with an adjectival term of hilly to mountainous. The areas with slopes 8° to 18° which are considered as hilly are at 13% of the total land area equivalent to 2,405 hectares. Alluvial plain land with slopes below 8° is at 1,850 hectare 2.4 Geology The City’s 2000 Comprehensive Land Use Plan indicates that “in terms of geologic and foundation stability in the mountainous area, there are no limitations as to what type of structure may be built within the City. It further suggests that “due to the very stable and hard character of the rocks on the mountainous regions, earthmoving of this large mass to a flatter slope would indicate a very high cost due to the difficulty in ripping rocks”.
2.4.1 Soil Types
In the absence of a current geological study of the area, the 2001 geological situation integrated into the 2001 Comprehensive Land Use Plan (CLUP) is adopted in this article. There are five (5) predominant types of soil in the City: Hydrosol, La Paz Fine Sandy Loam, Antipolo Clay, Mountain Soil Undifferentiated, and Quingua Silt Loam
A. Hydrosol This miscellaneous land type is found in the coastal region bordering the China Sea. It consists of soils underwater throughout the year where mangroves and nipa palms grow. It is found quite extensively in Olongapo, Masinloc, Candelaria, and Sta. Cruz. It is also found in limited areas in Palauig, Iba, and Subic. This type of land is at present being utilized as salt beds, fishponds, and in the growing of nipa palms and mangroves. B. La Paz Fine Sandy Loam A typical profile of this can be
analyzed through the depth of soil (cm) characteristics. 1. Around twenty (20) centimeters depth is the surface soil which is light brown, yellowish-brown silt loam to fine sandy loam. It has plenty of red to chocolate brown streaks in the lower surface soil, which is finely granular, moderately friable, slightly loose, and porous. Boundaries between horizons are clear and smooth. Twenty (20) to forty-five (45) centimeters is the subsoil which is light brown, loose and slightly friable, heavier than the surface soil, and poor in organic matter. 3. Forty-five (45) to seventy-four (74) centimeters, the soil has a characteristic of being light brown, loose porous and friable fine sandy loam to fine sand with no gravel. 4. Beyond seventy-four (74) centimeters is grayish-brown in color, medium sandy to the coarse sand loose and porous substratum. The area is mostly level and is grown mainly to lowland rice. A. Antipolo Clay (26) This soil type includes the hills and mountains of Cabangan, San Felipe, San Antonio, Subic, Castillejos, and Olongapo as well as the rolling areas, hills, and mountains between the City of Olongapo and the province of Bataan. It is not important agriculturally, being hilly and mountainous. Erosion on bare areas has advanced, considerably forming big gullies. The rolling areas are utilized for upland rice, corn, and vegetables. B. Mountain Soil Undifferentiated (45) The soils of this type are called mountain soils undifferentiated because of the relative geographical location, i.e., inaccessible to the soil survey party. These are the Zambales mountain ranges along the eastern part of the province having deep ravines and with high peaks and rugged ridges.
Page 9 of 85
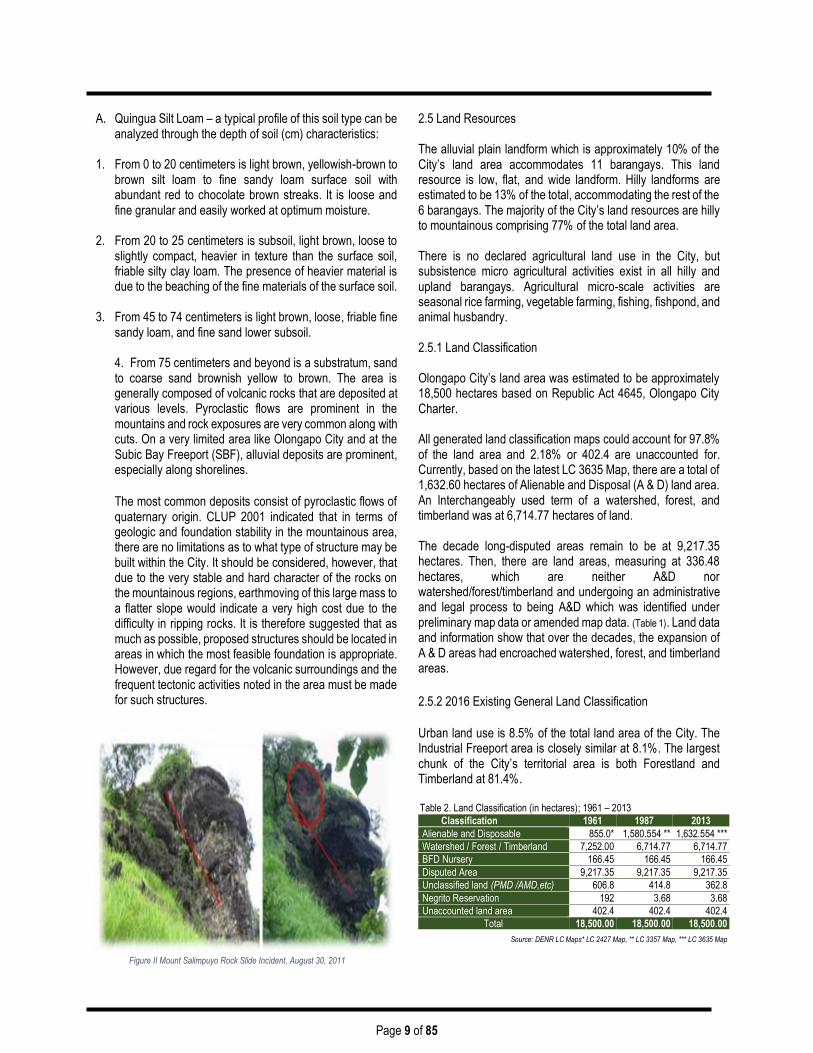
Figure II Mount Salimpuyo Rock Slide Incident, August 30, 2011
A. Quingua Silt Loam – a typical profile of this soil type can be
analyzed through the depth of soil (cm) characteristics:
1. From 0 to 20 centimeters is light brown, yellowish-brown to brown silt loam to fine sandy loam surface soil with abundant red to chocolate brown streaks. It is loose and fine granular and easily worked at optimum moisture.
2. From 20 to 25 centimeters is subsoil, light brown, loose to
slightly compact, heavier in texture than the surface soil, friable silty clay loam. The presence of heavier material is due to the beaching of the fine materials of the surface soil.
3. From 45 to 74 centimeters is light brown, loose, friable fine sandy loam, and fine sand lower subsoil.
4. From 75 centimeters and beyond is a substratum, sand to coarse sand brownish yellow to brown. The area is generally composed of volcanic rocks that are deposited at various levels. Pyroclastic flows are prominent in the mountains and rock exposures are very common along with cuts. On a very limited area like Olongapo City and at the Subic Bay Freeport (SBF), alluvial deposits are prominent, especially along shorelines.
The most common deposits consist of pyroclastic flows of quaternary origin. CLUP 2001 indicated that in terms of geologic and foundation stability in the mountainous area, there are no limitations as to what type of structure may be built within the City. It should be considered, however, that due to the very stable and hard character of the rocks on the mountainous regions, earthmoving of this large mass to a flatter slope would indicate a very high cost due to the difficulty in ripping rocks. It is therefore suggested that as much as possible, proposed structures should be located in areas in which the most feasible foundation is appropriate. However, due regard for the volcanic surroundings and the frequent tectonic activities noted in the area must be made for such structures.
2.5 Land Resources
The alluvial plain landform which is approximately 10% of the City’s land area accommodates 11 barangays. This land resource is low, flat, and wide landform. Hilly landforms are estimated to be 13% of the total, accommodating the rest of the 6 barangays. The majority of the City’s land resources are hilly to mountainous comprising 77% of the total land area. There is no declared agricultural land use in the City, but subsistence micro agricultural activities exist in all hilly and upland barangays. Agricultural micro-scale activities are seasonal rice farming, vegetable farming, fishing, fishpond, and animal husbandry. 2.5.1 Land Classification Olongapo City’s land area was estimated to be approximately 18,500 hectares based on Republic Act 4645, Olongapo City Charter. All generated land classification maps could account for 97.8% of the land area and 2.18% or 402.4 are unaccounted for. Currently, based on the latest LC 3635 Map, there are a total of 1,632.60 hectares of Alienable and Disposal (A & D) land area. An Interchangeably used term of a watershed, forest, and timberland was at 6,714.77 hectares of land. The decade long-disputed areas remain to be at 9,217.35 hectares. Then, there are land areas, measuring at 336.48 hectares, which are neither A&D nor watershed/forest/timberland and undergoing an administrative and legal process to being A&D which was identified under preliminary map data or amended map data. (Table 1). Land data and information show that over the decades, the expansion of A & D areas had encroached watershed, forest, and timberland areas.
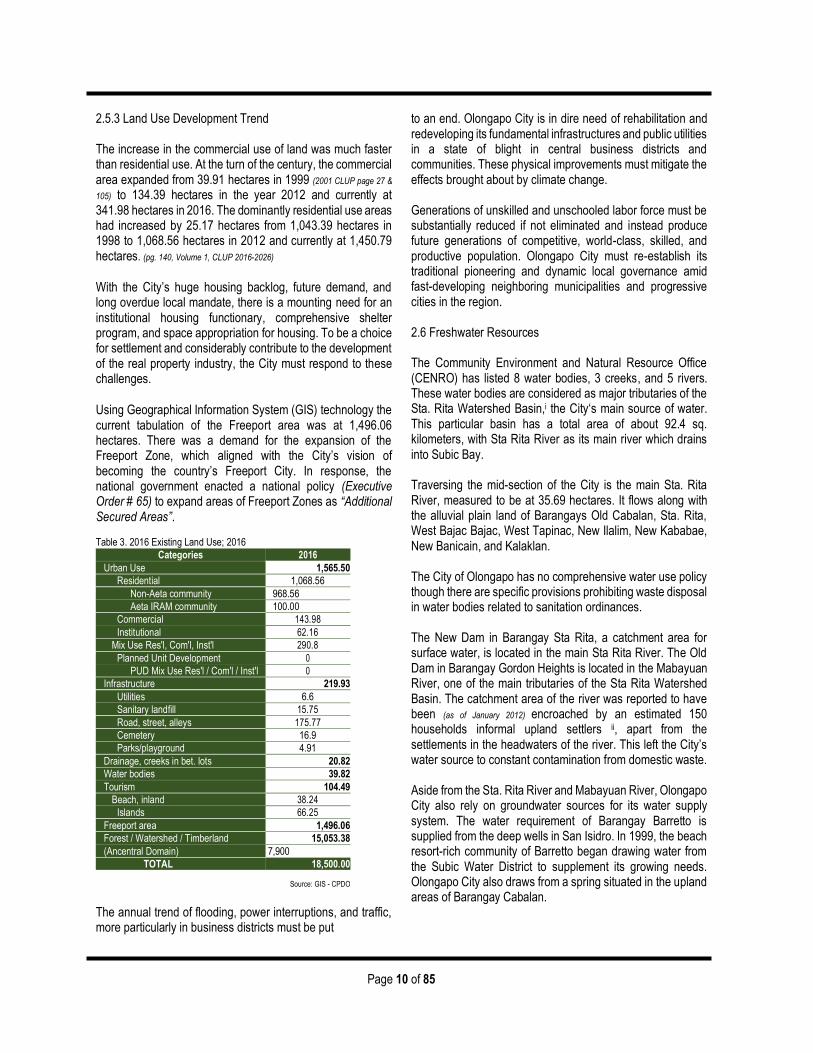
2.5.2 2016 Existing General Land Classification
Urban land use is 8.5% of the total land area of the City. The Industrial Freeport area is closely similar at 8.1%. The largest chunk of the City’s territorial area is both Forestland and Timberland at 81.4%. Table 2. Land Classification (in hectares); 1961 – 2013
Classification 1961 1987 2013
1. Alienable and Disposable 855.0* 1,580.554 ** 1,632.554 ***
2. Watershed / Forest / Timberland 7,252.00 6,714.77 6,714.77
3. BFD Nursery 166.45 166.45 166.45
4. Disputed Area 9,217.35 9,217.35 9,217.35
5. Unclassified land (PMD /AMD,etc) 606.8 414.8 362.8
6. Negrito Reservation 192 3.68 3.68
7. Unaccounted land area 402.4 402.4 402.4
Total 18,500.00 18,500.00 18,500.00
Source: DENR LC Maps* LC 2427 Map, ** LC 3357 Map, *** LC 3635 Map
Page 10 of 85
2.5.3 Land Use Development Trend
The increase in the commercial use of land was much faster than residential use. At the turn of the century, the commercial area expanded from 39.91 hectares in 1999 (2001 CLUP page 27 &
105) to 134.39 hectares in the year 2012 and currently at 341.98 hectares in 2016. The dominantly residential use areas had increased by 25.17 hectares from 1,043.39 hectares in 1998 to 1,068.56 hectares in 2012 and currently at 1,450.79 hectares. (pg. 140, Volume 1, CLUP 2016-2026)
With the City’s huge housing backlog, future demand, and long overdue local mandate, there is a mounting need for an institutional housing functionary, comprehensive shelter program, and space appropriation for housing. To be a choice for settlement and considerably contribute to the development of the real property industry, the City must respond to these challenges.
Using Geographical Information System (GIS) technology the current tabulation of the Freeport area was at 1,496.06 hectares. There was a demand for the expansion of the Freeport Zone, which aligned with the City’s vision of becoming the country’s Freeport City. In response, the national government enacted a national policy (Executive Order # 65) to expand areas of Freeport Zones as “Additional Secured Areas”.
The annual trend of flooding, power interruptions, and traffic, more particularly in business districts must be put
to an end. Olongapo City is in dire need of rehabilitation and redeveloping its fundamental infrastructures and public utilities in a state of blight in central business districts and communities. These physical improvements must mitigate the effects brought about by climate change.
Generations of unskilled and unschooled labor force must be substantially reduced if not eliminated and instead produce future generations of competitive, world-class, skilled, and productive population. Olongapo City must re-establish its traditional pioneering and dynamic local governance amid fast-developing neighboring municipalities and progressive cities in the region. 2.6 Freshwater Resources The Community Environment and Natural Resource Office (CENRO) has listed 8 water bodies, 3 creeks, and 5 rivers. These water bodies are considered as major tributaries of the Sta. Rita Watershed Basin,i the City‘s main source of water. This particular basin has a total area of about 92.4 sq. kilometers, with Sta Rita River as its main river which drains into Subic Bay. Traversing the mid-section of the City is the main Sta. Rita River, measured to be at 35.69 hectares. It flows along with the alluvial plain land of Barangays Old Cabalan, Sta. Rita, West Bajac Bajac, West Tapinac, New Ilalim, New Kababae, New Banicain, and Kalaklan.
The City of Olongapo has no comprehensive water use policy though there are specific provisions prohibiting waste disposal in water bodies related to sanitation ordinances. The New Dam in Barangay Sta Rita, a catchment area for surface water, is located in the main Sta Rita River. The Old Dam in Barangay Gordon Heights is located in the Mabayuan River, one of the main tributaries of the Sta Rita Watershed Basin. The catchment area of the river was reported to have been (as of January 2012) encroached by an estimated 150 households informal upland settlers ii, apart from the settlements in the headwaters of the river. This left the City’s water source to constant contamination from domestic waste. Aside from the Sta. Rita River and Mabayuan River, Olongapo City also rely on groundwater sources for its water supply system. The water requirement of Barangay Barretto is supplied from the deep wells in San Isidro. In 1999, the beach resort-rich community of Barretto began drawing water from the Subic Water District to supplement its growing needs. Olongapo City also draws from a spring situated in the upland areas of Barangay Cabalan.
Table 3. 2016 Existing Land Use; 2016
Categories 2016
Urban Use 1,565.50
Residential 1,068.56
Non-Aeta community 968.56
Aeta IRAM community 100.00
Commercial 143.98
Institutional 62.16
Mix Use Res'l, Com'l, Inst'l 290.8
Planned Unit Development 0
PUD Mix Use Res'l / Com'l / Inst'l 0
Infrastructure 219.93
Utilities 6.6
Sanitary landfill 15.75
Road, street, alleys 175.77
Cemetery 16.9
Parks/playground 4.91
Drainage, creeks in bet. lots 20.82
Water bodies 39.82
Tourism 104.49
Beach, inland 38.24
Islands 66.25
Freeport area 1,496.06
Forest / Watershed / Timberland 15,053.38
(Ancentral Domain) 7,900
TOTAL 18,500.00
Source: GIS - CPDO
Page 11 of 85
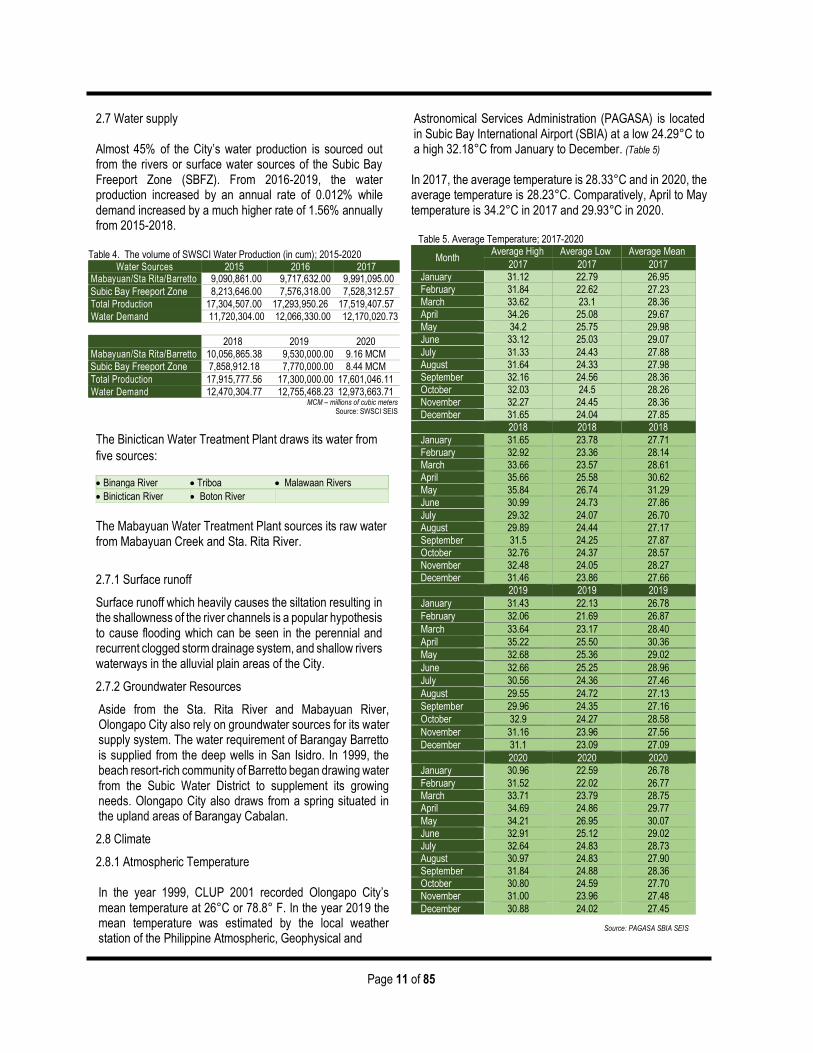
2.7 Water supply Almost 45% of the City’s water production is sourced out from the rivers or surface water sources of the Subic Bay Freeport Zone (SBFZ). From 2016-2019, the water production increased by an annual rate of 0.012% while demand increased by a much higher rate of 1.56% annually from 2015-2018.
Table 4. The volume of SWSCI Water Production (in cum); 2015-2020 Water Sources 2015 2016 2017
Mabayuan/Sta Rita/Barretto 9,090,861.00 9,717,632.00 9,991,095.00
Subic Bay Freeport Zone 8,213,646.00 7,576,318.00 7,528,312.57
Total Production 17,304,507.00 17,293,950.26 17,519,407.57
Water Demand 11,720,304.00 12,066,330.00 12,170,020.73
2018 2019 2020
Mabayuan/Sta Rita/Barretto 10,056,865.38 9,530,000.00 9.16 MCM
Subic Bay Freeport Zone 7,858,912.18 7,770,000.00 8.44 MCM
Total Production 17,915,777.56 17,300,000.00 17,601,046.11
Water Demand 12,470,304.77 12,755,468.23 12,973,663.71 MCM – millions of cubic meters
Source: SWSCI SEIS
The Binictican Water Treatment Plant draws its water from
five sources:
Binanga River Triboa Malawaan Rivers
Binictican River Boton River
The Mabayuan Water Treatment Plant sources its raw water from Mabayuan Creek and Sta. Rita River.
2.7.1 Surface runoff
Surface runoff which heavily causes the siltation resulting in the shallowness of the river channels is a popular hypothesis to cause flooding which can be seen in the perennial and recurrent clogged storm drainage system, and shallow rivers waterways in the alluvial plain areas of the City.
2.7.2 Groundwater Resources
Aside from the Sta. Rita River and Mabayuan River, Olongapo City also rely on groundwater sources for its water supply system. The water requirement of Barangay Barretto is supplied from the deep wells in San Isidro. In 1999, the beach resort-rich community of Barretto began drawing water from the Subic Water District to supplement its growing needs. Olongapo City also draws from a spring situated in the upland areas of Barangay Cabalan.
2.8 Climate
2.8.1 Atmospheric Temperature
In the year 1999, CLUP 2001 recorded Olongapo City’s mean temperature at 26°C or 78.8° F. In the year 2019 the mean temperature was estimated by the local weather station of the Philippine Atmospheric, Geophysical and
Astronomical Services Administration (PAGASA) is located in Subic Bay International Airport (SBIA) at a low 24.29°C to a high 32.18°C from January to December. (Table 5)
In 2017, the average temperature is 28.33°C and in 2020, the average temperature is 28.23°C. Comparatively, April to May temperature is 34.2°C in 2017 and 29.93°C in 2020.
Table 5. Average Temperature; 2017-2020
Month Average High Average Low Average Mean
2017 2017 2017
January 31.12 22.79 26.95
February 31.84 22.62 27.23
March 33.62 23.1 28.36
April 34.26 25.08 29.67
May 34.2 25.75 29.98
June 33.12 25.03 29.07
July 31.33 24.43 27.88
August 31.64 24.33 27.98
September 32.16 24.56 28.36
October 32.03 24.5 28.26
November 32.27 24.45 28.36
December 31.65 24.04 27.85
2018 2018 2018
January 31.65 23.78 27.71
February 32.92 23.36 28.14
March 33.66 23.57 28.61
April 35.66 25.58 30.62
May 35.84 26.74 31.29
June 30.99 24.73 27.86
July 29.32 24.07 26.70
August 29.89 24.44 27.17
September 31.5 24.25 27.87
October 32.76 24.37 28.57
November 32.48 24.05 28.27
December 31.46 23.86 27.66
2019 2019 2019
January 31.43 22.13 26.78
February 32.06 21.69 26.87
March 33.64 23.17 28.40
April 35.22 25.50 30.36
May 32.68 25.36 29.02
June 32.66 25.25 28.96
July 30.56 24.36 27.46
August 29.55 24.72 27.13
September 29.96 24.35 27.16
October 32.9 24.27 28.58
November 31.16 23.96 27.56
December 31.1 23.09 27.09
2020 2020 2020
January 30.96 22.59 26.78
February 31.52 22.02 26.77
March 33.71 23.79 28.75
April 34.69 24.86 29.77
May 34.21 26.95 30.07
June 32.91 25.12 29.02
July 32.64 24.83 28.73
August 30.97 24.83 27.90
September 31.84 24.88 28.36
October 30.80 24.59 27.70
November 31.00 23.96 27.48
December 30.88 24.02 27.45
Source: PAGASA SBIA SEIS
Page 12 of 85
2013 2014 2015 2016 2017 2018 2019 2020
TOTAL 3542.5 3160.8 2162.1 4073.8 2344.8 4866.3 4436.3 2149.8
MEAN 295.2 263.4 180.18 339.48 195.4 405.53 369.69 179.15
0.0
50.0
100.0
150.0
200.0
250.0
300.0
350.0
400.0
450.0
0
1000
2000
3000
4000
5000
6000
Chart 1. Annual Total and Mean 24-hour Rainfall Quantity; in mm; 2013-2020
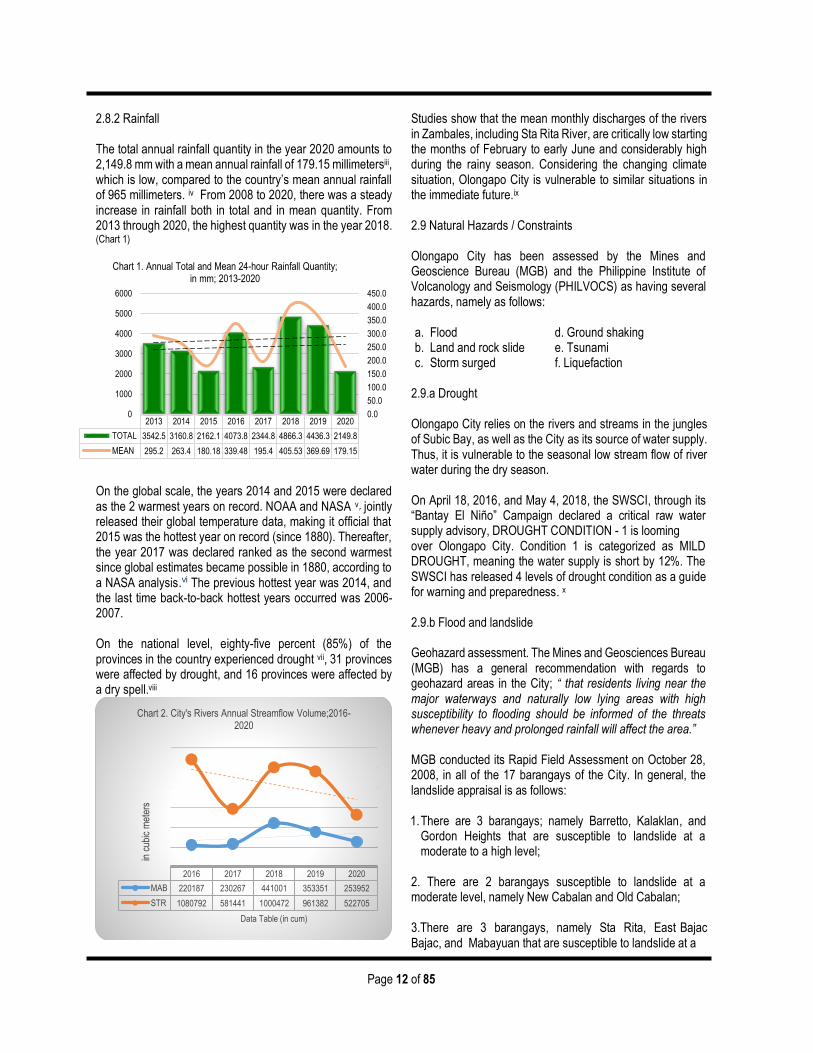
2.8.2 Rainfall The total annual rainfall quantity in the year 2020 amounts to 2,149.8 mm with a mean annual rainfall of 179.15 millimetersiii, which is low, compared to the country’s mean annual rainfall of 965 millimeters. iv From 2008 to 2020, there was a steady increase in rainfall both in total and in mean quantity. From 2013 through 2020, the highest quantity was in the year 2018. (Chart 1)
On the global scale, the years 2014 and 2015 were declared as the 2 warmest years on record. NOAA and NASA v
7 jointly released their global temperature data, making it official that 2015 was the hottest year on record (since 1880). Thereafter, the year 2017 was declared ranked as the second warmest since global estimates became possible in 1880, according to a NASA analysis.vi The previous hottest year was 2014, and the last time back-to-back hottest years occurred was 2006-2007. On the national level, eighty-five percent (85%) of the provinces in the country experienced drought vii, 31 provinces were affected by drought, and 16 provinces were affected by a dry spell.viii
Studies show that the mean monthly discharges of the rivers in Zambales, including Sta Rita River, are critically low starting the months of February to early June and considerably high during the rainy season. Considering the changing climate situation, Olongapo City is vulnerable to similar situations in the immediate future.ix
2.9 Natural Hazards / Constraints
Olongapo City has been assessed by the Mines and Geoscience Bureau (MGB) and the Philippine Institute of Volcanology and Seismology (PHILVOCS) as having several hazards, namely as follows:
a. Flood d. Ground shaking b. Land and rock slide e. Tsunami c. Storm surged f. Liquefaction
2.9.a Drought
Olongapo City relies on the rivers and streams in the jungles of Subic Bay, as well as the City as its source of water supply. Thus, it is vulnerable to the seasonal low stream flow of river water during the dry season. On April 18, 2016, and May 4, 2018, the SWSCI, through its “Bantay El Niño” Campaign declared a critical raw water supply advisory, DROUGHT CONDITION - 1 is looming over Olongapo City. Condition 1 is categorized as MILD DROUGHT, meaning the water supply is short by 12%. The SWSCI has released 4 levels of drought condition as a guide for warning and preparedness. x 2.9.b Flood and landslide Geohazard assessment. The Mines and Geosciences Bureau (MGB) has a general recommendation with regards to geohazard areas in the City; “ that residents living near the major waterways and naturally low lying areas with high susceptibility to flooding should be informed of the threats whenever heavy and prolonged rainfall will affect the area.” MGB conducted its Rapid Field Assessment on October 28, 2008, in all of the 17 barangays of the City. In general, the landslide appraisal is as follows: 1. There are 3 barangays; namely Barretto, Kalaklan, and
Gordon Heights that are susceptible to landslide at a moderate to a high level;
2. There are 2 barangays susceptible to landslide at a moderate level, namely New Cabalan and Old Cabalan; 3.There are 3 barangays, namely Sta Rita, East Bajac Bajac, and Mabayuan that are susceptible to landslide at a
2016 2017 2018 2019 2020
MAB 220187 230267 441001 353351 253952
STR 1080792 581441 1000472 961382 522705
in c
ubic
met
ers
Data Table (in cum)
Chart 2. City's Rivers Annual Streamflow Volume;2016-2020
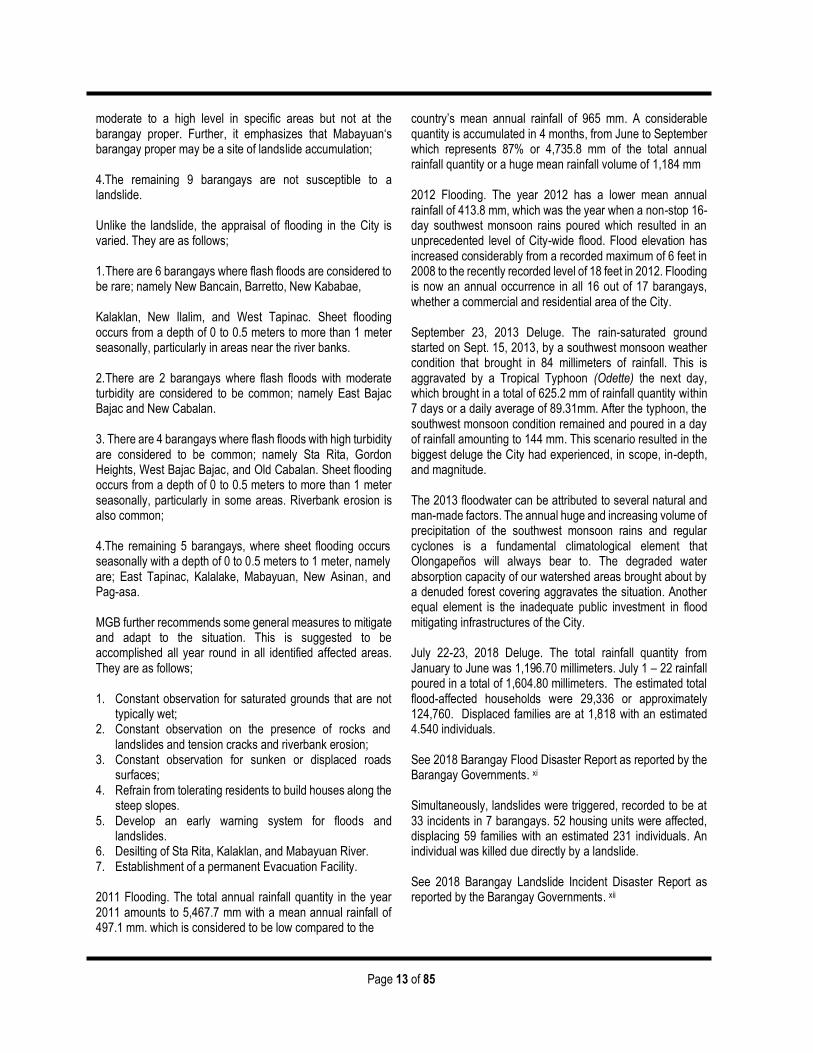
Page 13 of 85
moderate to a high level in specific areas but not at the barangay proper. Further, it emphasizes that Mabayuan‘s barangay proper may be a site of landslide accumulation;
4.The remaining 9 barangays are not susceptible to a landslide. Unlike the landslide, the appraisal of flooding in the City is varied. They are as follows; 1. There are 6 barangays where flash floods are considered to be rare; namely New Bancain, Barretto, New Kababae, Kalaklan, New Ilalim, and West Tapinac. Sheet flooding occurs from a depth of 0 to 0.5 meters to more than 1 meter seasonally, particularly in areas near the river banks. 2. There are 2 barangays where flash floods with moderate turbidity are considered to be common; namely East Bajac Bajac and New Cabalan. 3. There are 4 barangays where flash floods with high turbidity are considered to be common; namely Sta Rita, Gordon Heights, West Bajac Bajac, and Old Cabalan. Sheet flooding occurs from a depth of 0 to 0.5 meters to more than 1 meter seasonally, particularly in some areas. Riverbank erosion is also common; 4.The remaining 5 barangays, where sheet flooding occurs seasonally with a depth of 0 to 0.5 meters to 1 meter, namely are; East Tapinac, Kalalake, Mabayuan, New Asinan, and Pag-asa. MGB further recommends some general measures to mitigate and adapt to the situation. This is suggested to be accomplished all year round in all identified affected areas. They are as follows; 1. Constant observation for saturated grounds that are not
typically wet; 2. Constant observation on the presence of rocks and
landslides and tension cracks and riverbank erosion; 3. Constant observation for sunken or displaced roads
surfaces; 4. Refrain from tolerating residents to build houses along the
steep slopes. 5. Develop an early warning system for floods and
landslides. 6. Desilting of Sta Rita, Kalaklan, and Mabayuan River. 7. Establishment of a permanent Evacuation Facility. 2011 Flooding. The total annual rainfall quantity in the year 2011 amounts to 5,467.7 mm with a mean annual rainfall of 497.1 mm. which is considered to be low compared to the
country’s mean annual rainfall of 965 mm. A considerable quantity is accumulated in 4 months, from June to September which represents 87% or 4,735.8 mm of the total annual rainfall quantity or a huge mean rainfall volume of 1,184 mm 2012 Flooding. The year 2012 has a lower mean annual rainfall of 413.8 mm, which was the year when a non-stop 16-day southwest monsoon rains poured which resulted in an unprecedented level of City-wide flood. Flood elevation has increased considerably from a recorded maximum of 6 feet in 2008 to the recently recorded level of 18 feet in 2012. Flooding is now an annual occurrence in all 16 out of 17 barangays, whether a commercial and residential area of the City. September 23, 2013 Deluge. The rain-saturated ground started on Sept. 15, 2013, by a southwest monsoon weather condition that brought in 84 millimeters of rainfall. This is aggravated by a Tropical Typhoon (Odette) the next day, which brought in a total of 625.2 mm of rainfall quantity within 7 days or a daily average of 89.31mm. After the typhoon, the southwest monsoon condition remained and poured in a day of rainfall amounting to 144 mm. This scenario resulted in the biggest deluge the City had experienced, in scope, in-depth, and magnitude. The 2013 floodwater can be attributed to several natural and man-made factors. The annual huge and increasing volume of precipitation of the southwest monsoon rains and regular cyclones is a fundamental climatological element that Olongapeños will always bear to. The degraded water absorption capacity of our watershed areas brought about by a denuded forest covering aggravates the situation. Another equal element is the inadequate public investment in flood mitigating infrastructures of the City. July 22-23, 2018 Deluge. The total rainfall quantity from January to June was 1,196.70 millimeters. July 1 – 22 rainfall poured in a total of 1,604.80 millimeters. The estimated total flood-affected households were 29,336 or approximately 124,760. Displaced families are at 1,818 with an estimated 4.540 individuals. See 2018 Barangay Flood Disaster Report as reported by the Barangay Governments. xi Simultaneously, landslides were triggered, recorded to be at 33 incidents in 7 barangays. 52 housing units were affected, displacing 59 families with an estimated 231 individuals. An individual was killed due directly by a landslide. See 2018 Barangay Landslide Incident Disaster Report as reported by the Barangay Governments. xii
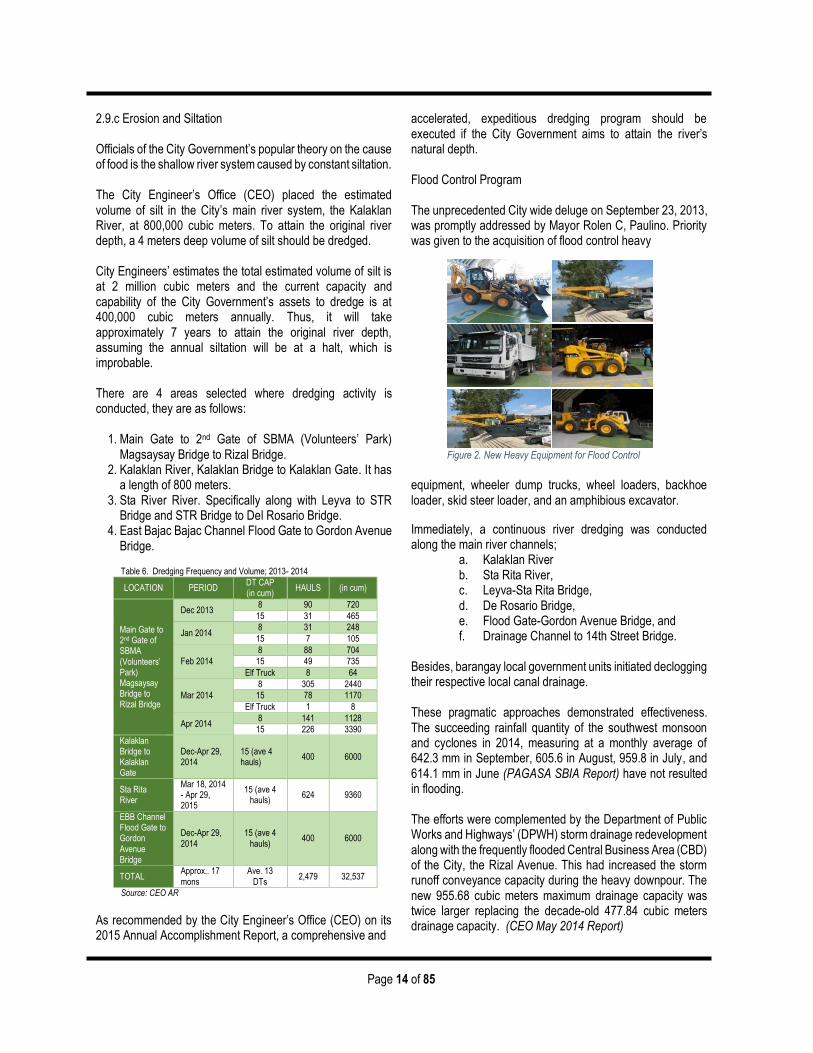
Page 14 of 85
2.9.c Erosion and Siltation Officials of the City Government’s popular theory on the cause of food is the shallow river system caused by constant siltation. The City Engineer’s Office (CEO) placed the estimated volume of silt in the City’s main river system, the Kalaklan River, at 800,000 cubic meters. To attain the original river depth, a 4 meters deep volume of silt should be dredged. City Engineers’ estimates the total estimated volume of silt is at 2 million cubic meters and the current capacity and capability of the City Government’s assets to dredge is at 400,000 cubic meters annually. Thus, it will take approximately 7 years to attain the original river depth, assuming the annual siltation will be at a halt, which is improbable. There are 4 areas selected where dredging activity is conducted, they are as follows:
1. Main Gate to 2nd Gate of SBMA (Volunteers’ Park) Magsaysay Bridge to Rizal Bridge.
2. Kalaklan River, Kalaklan Bridge to Kalaklan Gate. It has a length of 800 meters.
3. Sta River River. Specifically along with Leyva to STR Bridge and STR Bridge to Del Rosario Bridge.
4. East Bajac Bajac Channel Flood Gate to Gordon Avenue Bridge.
As recommended by the City Engineer’s Office (CEO) on its 2015 Annual Accomplishment Report, a comprehensive and
accelerated, expeditious dredging program should be executed if the City Government aims to attain the river’s natural depth. Flood Control Program The unprecedented City wide deluge on September 23, 2013, was promptly addressed by Mayor Rolen C, Paulino. Priority was given to the acquisition of flood control heavy equipment, wheeler dump trucks, wheel loaders, backhoe loader, skid steer loader, and an amphibious excavator.
Immediately, a continuous river dredging was conducted along the main river channels;
a. Kalaklan River b. Sta Rita River, c. Leyva-Sta Rita Bridge, d. De Rosario Bridge, e. Flood Gate-Gordon Avenue Bridge, and f. Drainage Channel to 14th Street Bridge.
Besides, barangay local government units initiated declogging their respective local canal drainage. These pragmatic approaches demonstrated effectiveness. The succeeding rainfall quantity of the southwest monsoon and cyclones in 2014, measuring at a monthly average of 642.3 mm in September, 605.6 in August, 959.8 in July, and 614.1 mm in June (PAGASA SBIA Report) have not resulted in flooding. The efforts were complemented by the Department of Public Works and Highways’ (DPWH) storm drainage redevelopment along with the frequently flooded Central Business Area (CBD) of the City, the Rizal Avenue. This had increased the storm runoff conveyance capacity during the heavy downpour. The new 955.68 cubic meters maximum drainage capacity was twice larger replacing the decade-old 477.84 cubic meters drainage capacity. (CEO May 2014 Report)
Table 6. Dredging Frequency and Volume; 2013- 2014
LOCATION PERIOD DT CAP (in cum)
HAULS (in cum)
Main Gate to 2nd Gate of SBMA (Volunteers’ Park) Magsaysay Bridge to Rizal Bridge
Dec 2013 8 90 720
15 31 465
Jan 2014 8 31 248
15 7 105
Feb 2014
8 88 704
15 49 735
Elf Truck 8 64
Mar 2014
8 305 2440
15 78 1170
Elf Truck 1 8
Apr 2014 8 141 1128
15 226 3390
Kalaklan Bridge to Kalaklan Gate
Dec-Apr 29, 2014
15 (ave 4 hauls)
400 6000
Sta Rita River
Mar 18, 2014 - Apr 29, 2015
15 (ave 4 hauls)
624 9360
EBB Channel Flood Gate to Gordon Avenue Bridge
Dec-Apr 29, 2014
15 (ave 4 hauls)
400 6000
TOTAL Approx.. 17 mons
Ave. 13 DTs
2,479 32,537
Source: CEO AR
Figure 2. New Heavy Equipment for Flood Control
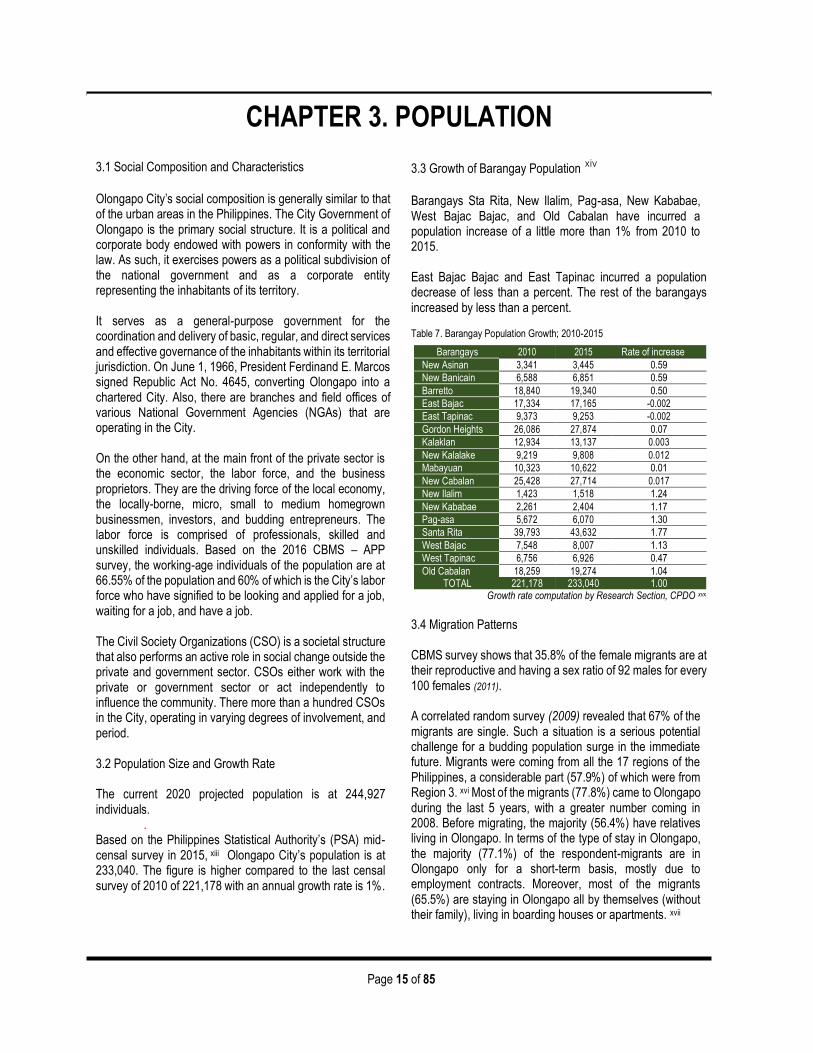
Page 15 of 85
CHAPTER 3. POPULATION LATION
3.1 Social Composition and Characteristics
Olongapo City’s social composition is generally similar to that of the urban areas in the Philippines. The City Government of Olongapo is the primary social structure. It is a political and corporate body endowed with powers in conformity with the law. As such, it exercises powers as a political subdivision of the national government and as a corporate entity representing the inhabitants of its territory.
It serves as a general-purpose government for the coordination and delivery of basic, regular, and direct services and effective governance of the inhabitants within its territorial jurisdiction. On June 1, 1966, President Ferdinand E. Marcos signed Republic Act No. 4645, converting Olongapo into a chartered City. Also, there are branches and field offices of various National Government Agencies (NGAs) that are operating in the City. On the other hand, at the main front of the private sector is the economic sector, the labor force, and the business proprietors. They are the driving force of the local economy, the locally-borne, micro, small to medium homegrown businessmen, investors, and budding entrepreneurs. The labor force is comprised of professionals, skilled and unskilled individuals. Based on the 2016 CBMS – APP survey, the working-age individuals of the population are at 66.55% of the population and 60% of which is the City’s labor force who have signified to be looking and applied for a job, waiting for a job, and have a job. The Civil Society Organizations (CSO) is a societal structure that also performs an active role in social change outside the private and government sector. CSOs either work with the private or government sector or act independently to influence the community. There more than a hundred CSOs in the City, operating in varying degrees of involvement, and period. 3.2 Population Size and Growth Rate The current 2020 projected population is at 244,927 individuals.
. Based on the Philippines Statistical Authority’s (PSA) mid-censal survey in 2015, xiii Olongapo City’s population is at 233,040. The figure is higher compared to the last censal survey of 2010 of 221,178 with an annual growth rate is 1%.
3.3 Growth of Barangay Population xiv Barangays Sta Rita, New Ilalim, Pag-asa, New Kababae, West Bajac Bajac, and Old Cabalan have incurred a population increase of a little more than 1% from 2010 to 2015. East Bajac Bajac and East Tapinac incurred a population decrease of less than a percent. The rest of the barangays increased by less than a percent. Table 7. Barangay Population Growth; 2010-2015
3.4 Migration Patterns CBMS survey shows that 35.8% of the female migrants are at their reproductive and having a sex ratio of 92 males for every 100 females (2011). A correlated random survey (2009) revealed that 67% of the migrants are single. Such a situation is a serious potential challenge for a budding population surge in the immediate future. Migrants were coming from all the 17 regions of the Philippines, a considerable part (57.9%) of which were from Region 3. xvi Most of the migrants (77.8%) came to Olongapo during the last 5 years, with a greater number coming in 2008. Before migrating, the majority (56.4%) have relatives living in Olongapo. In terms of the type of stay in Olongapo, the majority (77.1%) of the respondent-migrants are in Olongapo only for a short-term basis, mostly due to employment contracts. Moreover, most of the migrants (65.5%) are staying in Olongapo all by themselves (without their family), living in boarding houses or apartments. xvii
Barangays 2010 2015 Rate of increase
New Asinan 3,341 3,445 0.59
New Banicain 6,588 6,851 0.59
Barretto 18,840 19,340 0.50
East Bajac 17,334 17,165 -0.002
East Tapinac 9,373 9,253 -0.002
Gordon Heights 26,086 27,874 0.07
Kalaklan 12,934 13,137 0.003
New Kalalake 9,219 9,808 0.012
Mabayuan 10,323 10,622 0.01
New Cabalan 25,428 27,714 0.017
New Ilalim 1,423 1,518 1.24
New Kababae 2,261 2,404 1.17
Pag-asa 5,672 6,070 1.30
Santa Rita 39,793 43,632 1.77
West Bajac 7,548 8,007 1.13
West Tapinac 6,756 6,926 0.47
Old Cabalan 18,259 19,274 1.04 TOTAL 221,178 233,040 1.00
Growth rate computation by Research Section, CPDO xvx

Page 16 of 85
11464
7324
7282
5082
5064
4510
3452
2791
2577
2431
2104
1820
1800
1595
905
632
399
0 2000 4000 6000 8000 10000 12000 14000
Santa Rita
Gordon Heights
New Cabalan
Barreto
Old Cabalan
East Bajac-bajac
Kalaklan
Mabayuan
New Kalalake
East Tapinac
West Bajac-bajac
West Tapinac
New Banicain
Pag-asa
New Asinan
New Kababae
New Ilalim
Chart 3. Projected Household Distribution;2020
The Philippine Statistics Authority (PSA) 2015 mid-censal survey shows that the dominant religious affiliation (85.6%) is the Roman Catholic. Thirty (30) religious affiliations are at 4.45% of the population. Affiliated with Iglesia ni Kristo is at 5.4% of the population and 4.6% have not indicated their affiliation. xviii 3.5 Population Density
At a projected population of 244,927 in the year 2020, population density is at 12 persons per hectare factoring in the vast open space forest land. A more sensible and pragmatic representation of population density is by using the urban space area which accounts for 1,565.50 hectares in 2016 which results in a density of 153 individuals per hectare. 3.6 Household Distribution The projected households in the year 2020 are at 61,231 households, utilizing the 2015 mid-censal survey at 56,482 households recorded with an annual growth rate of 1% since the last censal survey of 2010. 3.7 Urban – Rural Distribution For every square kilometer of the chartered land of the City, there are 1,260 persons. This is way above the 1,000 persons per square kilometer for urban classification in the country.
3.8 Age–Sex Distribution
Persons with ages 0 to 17 years old, categorized as children
comprised 35.4% (82,120) xix 17 of the population, at a sex
ratio of 96 females for every 100 males. Young dependents,
ages 0-14 years old are at almost 30% of the total population.
The working-age population (15-64 years old) comprised
66.3% of the population at a sex ratio of 98 males for every
100 females. Senior citizens (ages 60 years old and above)
are at 7.4% of the population (at a count of 17,223). Old
dependents, on the other hand, are at 5% of the population
(10,648). xx
3.9 Dependency Ratio
The young dependent ratio is at 45 dependents for every 100 working-age individuals. The old dependency ratio, on the other hand, is at 11:100. The population’s overall dependency ratio is at 56:100 lower than 7 years ago at 57:100.
3.10 Marital Status
Thirty-four and two percent (32.4%) of the 10 yrs. old and
above population are married, forty-seven percent (47%) are
single, and six percent (6%) are either widowed or
separated. Almost 13% are in a live-in relationship.
Table 9. Total Population 10 Yrs Old & Over, Marital Status: 2015
Total Single Married Widowed
186,575
87,666 63,716 7,982
Separated Live in Unknown
3,387 23,788 36 Source: PSA mid censal survey 2015
5% 4% 3% 2% 1% 0% 1% 2% 3% 4% 5%
0-45-9
10-1415-1920-2425-2930-3435-3940-4445-4950-5455-5960-6465-6970-7475-79
80 +
Percent to Population
Age
Gro
up
Chart 4.Olongapo City Population Pyramid; 2015
female
male
Table 8. Dependency ratio; 2015 mid censal
Dependents Age Total Male Female
Young 0 - 14 68,812 34,961 33,851
Old 60 over 17,223 7,428 9,795
Working age 15 - 64 153,580 76,369 77,211
Source: PSA mid censal survey 2015
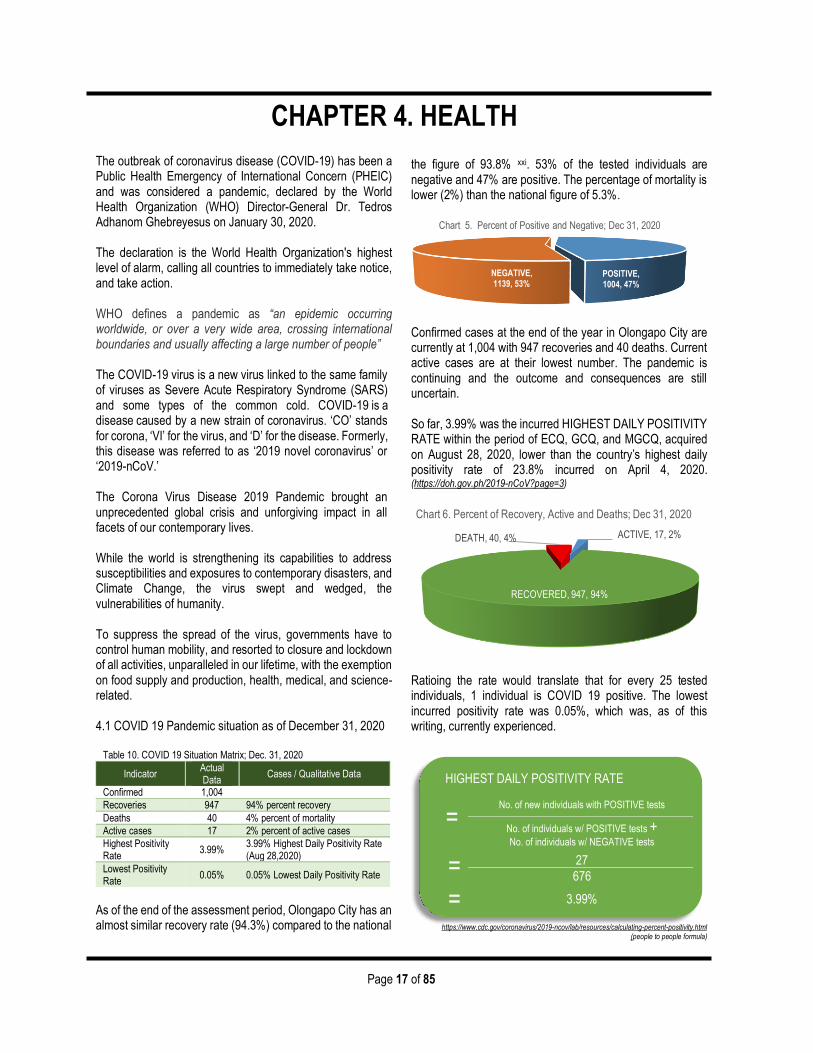
Page 17 of 85
CHAPTER 4. HEALTH
POSITIVE, 1004, 47%
NEGATIVE, 1139, 53%
Chart 5. Percent of Positive and Negative; Dec 31, 2020
RECOVERED, 947, 94%
DEATH, 40, 4% ACTIVE, 17, 2%
Chart 6. Percent of Recovery, Active and Deaths; Dec 31, 2020
The outbreak of coronavirus disease (COVID-19) has been a Public Health Emergency of International Concern (PHEIC) and was considered a pandemic, declared by the World Health Organization (WHO) Director-General Dr. Tedros Adhanom Ghebreyesus on January 30, 2020. The declaration is the World Health Organization's highest level of alarm, calling all countries to immediately take notice, and take action. WHO defines a pandemic as “an epidemic occurring worldwide, or over a very wide area, crossing international boundaries and usually affecting a large number of people”
The COVID-19 virus is a new virus linked to the same family of viruses as Severe Acute Respiratory Syndrome (SARS) and some types of the common cold. COVID-19 is a disease caused by a new strain of coronavirus. ‘CO’ stands for corona, ‘VI’ for the virus, and ‘D’ for the disease. Formerly, this disease was referred to as ‘2019 novel coronavirus’ or ‘2019-nCoV.’ The Corona Virus Disease 2019 Pandemic brought an unprecedented global crisis and unforgiving impact in all facets of our contemporary lives. While the world is strengthening its capabilities to address susceptibilities and exposures to contemporary disasters, and Climate Change, the virus swept and wedged, the vulnerabilities of humanity.
To suppress the spread of the virus, governments have to control human mobility, and resorted to closure and lockdown of all activities, unparalleled in our lifetime, with the exemption on food supply and production, health, medical, and science-related. 4.1 COVID 19 Pandemic situation as of December 31, 2020
Table 10. COVID 19 Situation Matrix; Dec. 31, 2020
Indicator Actual Data
Cases / Qualitative Data
Confirmed 1,004
Recoveries 947 94% percent recovery
Deaths 40 4% percent of mortality
Active cases 17 2% percent of active cases
Highest Positivity Rate
3.99% 3.99% Highest Daily Positivity Rate (Aug 28,2020)
Lowest Positivity Rate
0.05% 0.05% Lowest Daily Positivity Rate
As of the end of the assessment period, Olongapo City has an almost similar recovery rate (94.3%) compared to the national
the figure of 93.8% xxi. 53% of the tested individuals are negative and 47% are positive. The percentage of mortality is lower (2%) than the national figure of 5.3%. Confirmed cases at the end of the year in Olongapo City are currently at 1,004 with 947 recoveries and 40 deaths. Current active cases are at their lowest number. The pandemic is continuing and the outcome and consequences are still uncertain.
So far, 3.99% was the incurred HIGHEST DAILY POSITIVITY RATE within the period of ECQ, GCQ, and MGCQ, acquired on August 28, 2020, lower than the country’s highest daily positivity rate of 23.8% incurred on April 4, 2020. (https://doh.gov.ph/2019-nCoV?page=3) Ratioing the rate would translate that for every 25 tested individuals, 1 individual is COVID 19 positive. The lowest incurred positivity rate was 0.05%, which was, as of this writing, currently experienced.
HIGHEST DAILY POSITIVITY RATE
=
No. of new individuals with POSITIVE tests
No. of individuals w/ POSITIVE tests +
No. of individuals w/ NEGATIVE tests
=
27
676
= 3.99%
https://www.cdc.gov/coronavirus/2019-ncov/lab/resources/calculating-percent-positivity.html (people to people formula)
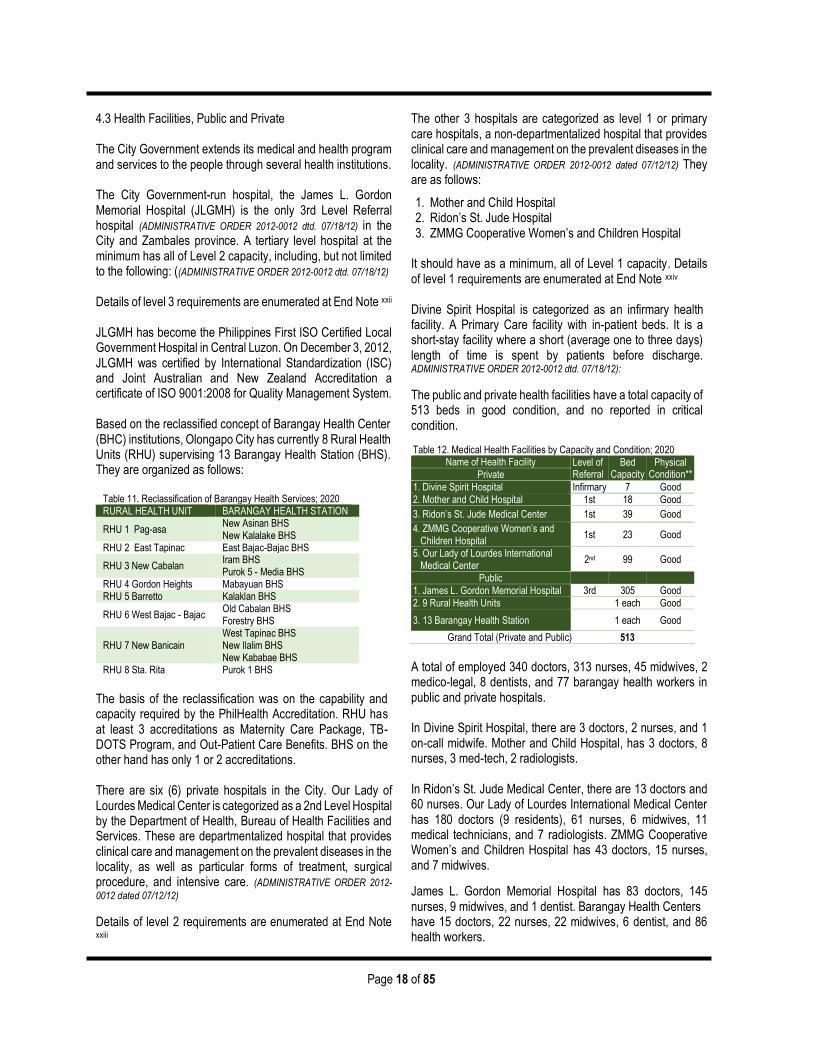
Page 18 of 85
4.3 Health Facilities, Public and Private The City Government extends its medical and health program and services to the people through several health institutions. The City Government-run hospital, the James L. Gordon Memorial Hospital (JLGMH) is the only 3rd Level Referral hospital (ADMINISTRATIVE ORDER 2012-0012 dtd. 07/18/12) in the City and Zambales province. A tertiary level hospital at the minimum has all of Level 2 capacity, including, but not limited to the following: ((ADMINISTRATIVE ORDER 2012-0012 dtd. 07/18/12) Details of level 3 requirements are enumerated at End Note xxii
JLGMH has become the Philippines First ISO Certified Local Government Hospital in Central Luzon. On December 3, 2012, JLGMH was certified by International Standardization (ISC) and Joint Australian and New Zealand Accreditation a certificate of ISO 9001:2008 for Quality Management System.
Based on the reclassified concept of Barangay Health Center (BHC) institutions, Olongapo City has currently 8 Rural Health Units (RHU) supervising 13 Barangay Health Station (BHS). They are organized as follows:
Table 11. Reclassification of Barangay Health Services; 2020 RURAL HEALTH UNIT BARANGAY HEALTH STATION
RHU 1 Pag-asa New Asinan BHS New Kalalake BHS
RHU 2 East Tapinac East Bajac-Bajac BHS
RHU 3 New Cabalan Iram BHS Purok 5 - Media BHS
RHU 4 Gordon Heights Mabayuan BHS RHU 5 Barretto Kalaklan BHS
RHU 6 West Bajac - Bajac Old Cabalan BHS Forestry BHS
RHU 7 New Banicain West Tapinac BHS New Ilalim BHS New Kababae BHS
RHU 8 Sta. Rita Purok 1 BHS
The basis of the reclassification was on the capability and capacity required by the PhilHealth Accreditation. RHU has at least 3 accreditations as Maternity Care Package, TB-DOTS Program, and Out-Patient Care Benefits. BHS on the other hand has only 1 or 2 accreditations. There are six (6) private hospitals in the City. Our Lady of Lourdes Medical Center is categorized as a 2nd Level Hospital by the Department of Health, Bureau of Health Facilities and Services. These are departmentalized hospital that provides clinical care and management on the prevalent diseases in the locality, as well as particular forms of treatment, surgical procedure, and intensive care. (ADMINISTRATIVE ORDER 2012-
0012 dated 07/12/12)
Details of level 2 requirements are enumerated at End Note xxiii
The other 3 hospitals are categorized as level 1 or primary care hospitals, a non-departmentalized hospital that provides clinical care and management on the prevalent diseases in the locality. (ADMINISTRATIVE ORDER 2012-0012 dated 07/12/12) They are as follows:
1. Mother and Child Hospital 2. Ridon’s St. Jude Hospital 3. ZMMG Cooperative Women’s and Children Hospital
It should have as a minimum, all of Level 1 capacity. Details of level 1 requirements are enumerated at End Note xxiv Divine Spirit Hospital is categorized as an infirmary health facility. A Primary Care facility with in-patient beds. It is a short-stay facility where a short (average one to three days) length of time is spent by patients before discharge. ADMINISTRATIVE ORDER 2012-0012 dtd. 07/18/12):
The public and private health facilities have a total capacity of 513 beds in good condition, and no reported in critical condition.
Table 12. Medical Health Facilities by Capacity and Condition; 2020 Name of Health Facility Level of
Referral Bed
Capacity Physical
Condition** Private
1. Divine Spirit Hospital Infirmary 7 Good
2. Mother and Child Hospital 1st 18 Good
3. Ridon’s St. Jude Medical Center 1st 39 Good
4. ZMMG Cooperative Women’s and Children Hospital
1st 23 Good
5. Our Lady of Lourdes International Medical Center
2nd 99 Good
Public
1. James L. Gordon Memorial Hospital 3rd 305 Good
2. 9 Rural Health Units 1 each Good
3. 13 Barangay Health Station 1 each Good
Grand Total (Private and Public) 513
A total of employed 340 doctors, 313 nurses, 45 midwives, 2 medico-legal, 8 dentists, and 77 barangay health workers in public and private hospitals. In Divine Spirit Hospital, there are 3 doctors, 2 nurses, and 1 on-call midwife. Mother and Child Hospital, has 3 doctors, 8 nurses, 3 med-tech, 2 radiologists. In Ridon’s St. Jude Medical Center, there are 13 doctors and 60 nurses. Our Lady of Lourdes International Medical Center has 180 doctors (9 residents), 61 nurses, 6 midwives, 11 medical technicians, and 7 radiologists. ZMMG Cooperative Women’s and Children Hospital has 43 doctors, 15 nurses, and 7 midwives.
James L. Gordon Memorial Hospital has 83 doctors, 145 nurses, 9 midwives, and 1 dentist. Barangay Health Centers have 15 doctors, 22 nurses, 22 midwives, 6 dentist, and 86 health workers.
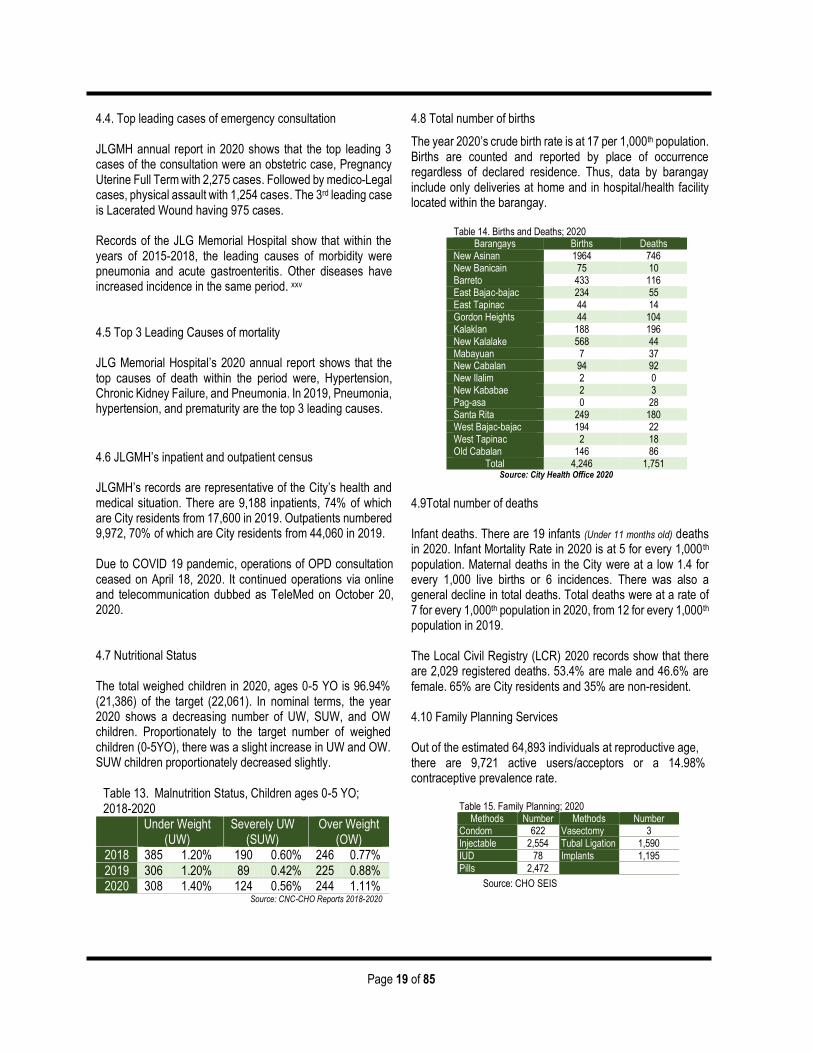
Page 19 of 85
4.4. Top leading cases of emergency consultation
JLGMH annual report in 2020 shows that the top leading 3 cases of the consultation were an obstetric case, Pregnancy Uterine Full Term with 2,275 cases. Followed by medico-Legal cases, physical assault with 1,254 cases. The 3rd leading case is Lacerated Wound having 975 cases. Records of the JLG Memorial Hospital show that within the years of 2015-2018, the leading causes of morbidity were pneumonia and acute gastroenteritis. Other diseases have increased incidence in the same period. xxv 4.5 Top 3 Leading Causes of mortality JLG Memorial Hospital’s 2020 annual report shows that the top causes of death within the period were, Hypertension, Chronic Kidney Failure, and Pneumonia. In 2019, Pneumonia, hypertension, and prematurity are the top 3 leading causes.
4.6 JLGMH’s inpatient and outpatient census JLGMH’s records are representative of the City’s health and medical situation. There are 9,188 inpatients, 74% of which are City residents from 17,600 in 2019. Outpatients numbered 9,972, 70% of which are City residents from 44,060 in 2019. Due to COVID 19 pandemic, operations of OPD consultation ceased on April 18, 2020. It continued operations via online and telecommunication dubbed as TeleMed on October 20, 2020. 4.7 Nutritional Status
The total weighed children in 2020, ages 0-5 YO is 96.94% (21,386) of the target (22,061). In nominal terms, the year 2020 shows a decreasing number of UW, SUW, and OW children. Proportionately to the target number of weighed children (0-5YO), there was a slight increase in UW and OW. SUW children proportionately decreased slightly.
Table 13. Malnutrition Status, Children ages 0-5 YO; 2018-2020
Under Weight (UW)
Severely UW (SUW)
Over Weight (OW)
2018 385 1.20% 190 0.60% 246 0.77%
2019 306 1.20% 89 0.42% 225 0.88% 2020 308 1.40% 124 0.56% 244 1.11%
Source: CNC-CHO Reports 2018-2020
4.8 Total number of births
The year 2020’s crude birth rate is at 17 per 1,000th population. Births are counted and reported by place of occurrence regardless of declared residence. Thus, data by barangay include only deliveries at home and in hospital/health facility located within the barangay.
Table 14. Births and Deaths; 2020 Barangays Births Deaths
New Asinan 1964 746 New Banicain 75 10 Barreto 433 116 East Bajac-bajac 234 55 East Tapinac 44 14 Gordon Heights 44 104 Kalaklan 188 196 New Kalalake 568 44 Mabayuan 7 37 New Cabalan 94 92 New Ilalim 2 0 New Kababae 2 3 Pag-asa 0 28 Santa Rita 249 180 West Bajac-bajac 194 22 West Tapinac 2 18 Old Cabalan 146 86
Total 4,246 1,751 Source: City Health Office 2020
4.9Total number of deaths Infant deaths. There are 19 infants (Under 11 months old) deaths in 2020. Infant Mortality Rate in 2020 is at 5 for every 1,000 th population. Maternal deaths in the City were at a low 1.4 for every 1,000 live births or 6 incidences. There was also a general decline in total deaths. Total deaths were at a rate of 7 for every 1,000th population in 2020, from 12 for every 1,000th population in 2019. The Local Civil Registry (LCR) 2020 records show that there are 2,029 registered deaths. 53.4% are male and 46.6% are female. 65% are City residents and 35% are non-resident. 4.10 Family Planning Services Out of the estimated 64,893 individuals at reproductive age, there are 9,721 active users/acceptors or a 14.98% contraceptive prevalence rate.
Table 15. Family Planning; 2020 Methods Number Methods Number
Condom 622 Vasectomy 3
Injectable 2,554 Tubal Ligation 1,590
IUD 78 Implants 1,195
Pills 2,472
Source: CHO SEIS
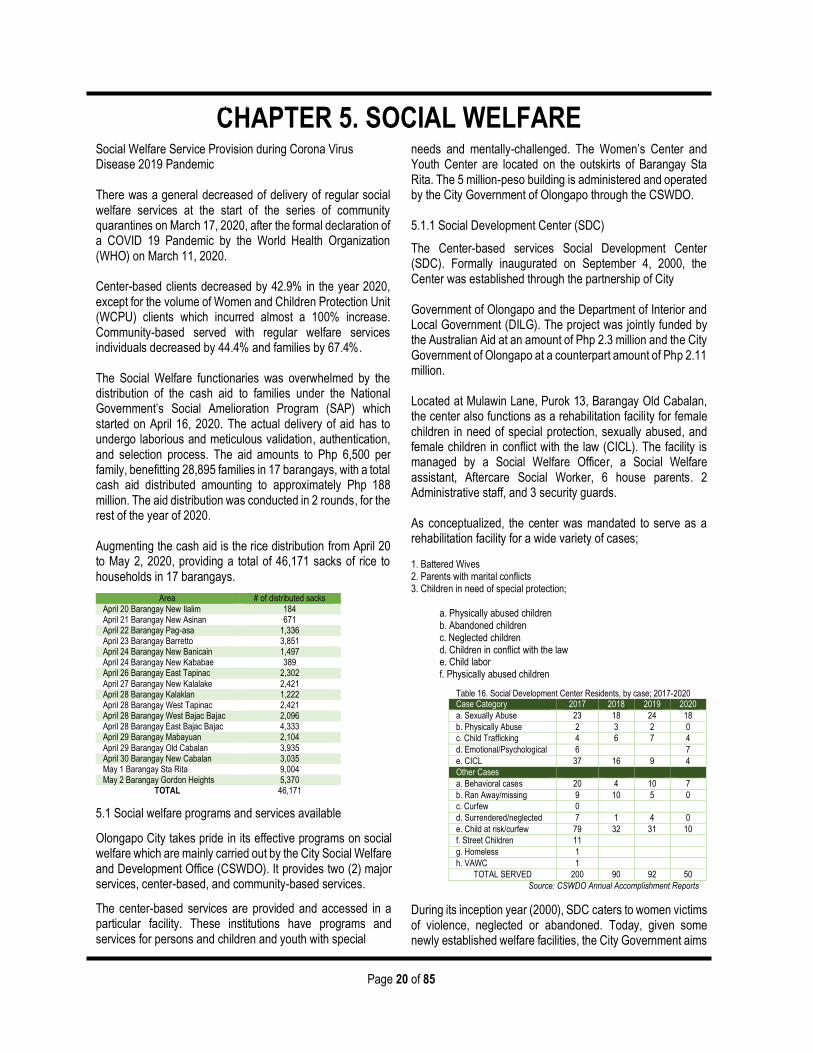
Page 20 of 85
CHAPTER 5. SOCIAL WELFARE
CHAPTER 5. SOCIAL WELFARE Social Welfare Service Provision during Corona Virus Disease 2019 Pandemic There was a general decreased of delivery of regular social welfare services at the start of the series of community quarantines on March 17, 2020, after the formal declaration of a COVID 19 Pandemic by the World Health Organization (WHO) on March 11, 2020. Center-based clients decreased by 42.9% in the year 2020, except for the volume of Women and Children Protection Unit (WCPU) clients which incurred almost a 100% increase. Community-based served with regular welfare services individuals decreased by 44.4% and families by 67.4%. The Social Welfare functionaries was overwhelmed by the distribution of the cash aid to families under the National Government’s Social Amelioration Program (SAP) which started on April 16, 2020. The actual delivery of aid has to undergo laborious and meticulous validation, authentication, and selection process. The aid amounts to Php 6,500 per family, benefitting 28,895 families in 17 barangays, with a total cash aid distributed amounting to approximately Php 188 million. The aid distribution was conducted in 2 rounds, for the rest of the year of 2020. Augmenting the cash aid is the rice distribution from April 20 to May 2, 2020, providing a total of 46,171 sacks of rice to households in 17 barangays.
Area # of distributed sacks April 20 Barangay New Ilalim 184 April 21 Barangay New Asinan 671 April 22 Barangay Pag-asa 1,336 April 23 Barangay Barretto 3,851 April 24 Barangay New Banicain 1,497 April 24 Barangay New Kababae 389 April 26 Barangay East Tapinac 2,302 April 27 Barangay New Kalalake 2,421 April 28 Barangay Kalaklan 1,222 April 28 Barangay West Tapinac 2,421 April 28 Barangay West Bajac Bajac 2,096 April 28 Barangay East Bajac Bajac 4,333 April 29 Barangay Mabayuan 2,104 April 29 Barangay Old Cabalan 3,935 April 30 Barangay New Cabalan 3,035 May 1 Barangay Sta Rita 9,004 May 2 Barangay Gordon Heights 5,370
TOTAL 46,171
5.1 Social welfare programs and services available
Olongapo City takes pride in its effective programs on social welfare which are mainly carried out by the City Social Welfare and Development Office (CSWDO). It provides two (2) major services, center-based, and community-based services.
The center-based services are provided and accessed in a particular facility. These institutions have programs and services for persons and children and youth with special
needs and mentally-challenged. The Women’s Center and Youth Center are located on the outskirts of Barangay Sta Rita. The 5 million-peso building is administered and operated by the City Government of Olongapo through the CSWDO. 5.1.1 Social Development Center (SDC)
The Center-based services Social Development Center (SDC). Formally inaugurated on September 4, 2000, the Center was established through the partnership of City Government of Olongapo and the Department of Interior and Local Government (DILG). The project was jointly funded by the Australian Aid at an amount of Php 2.3 million and the City Government of Olongapo at a counterpart amount of Php 2.11 million. Located at Mulawin Lane, Purok 13, Barangay Old Cabalan, the center also functions as a rehabilitation facility for female children in need of special protection, sexually abused, and female children in conflict with the law (CICL). The facility is managed by a Social Welfare Officer, a Social Welfare assistant, Aftercare Social Worker, 6 house parents. 2 Administrative staff, and 3 security guards. As conceptualized, the center was mandated to serve as a rehabilitation facility for a wide variety of cases; 1. Battered Wives 2. Parents with marital conflicts 3. Children in need of special protection;
a. Physically abused children b. Abandoned children c. Neglected children d. Children in conflict with the law e. Child labor f. Physically abused children
During its inception year (2000), SDC caters to women victims of violence, neglected or abandoned. Today, given some newly established welfare facilities, the City Government aims
Table 16. Social Development Center Residents, by case; 2017-2020 Case Category 2017 2018 2019 2020
a. Sexually Abuse 23 18 24 18
b. Physically Abuse 2 3 2 0
c. Child Trafficking 4 6 7 4
d. Emotional/Psychological 6 7
e. CICL 37 16 9 4
Other Cases
a. Behavioral cases 20 4 10 7
b. Ran Away/missing 9 10 5 0
c. Curfew 0
d. Surrendered/neglected 7 1 4 0
e. Child at risk/curfew 79 32 31 10
f. Street Children 11
g. Homeless 1
h. VAWC 1
TOTAL SERVED 200 90 92 50
Source: CSWDO Annual Accomplishment Reports
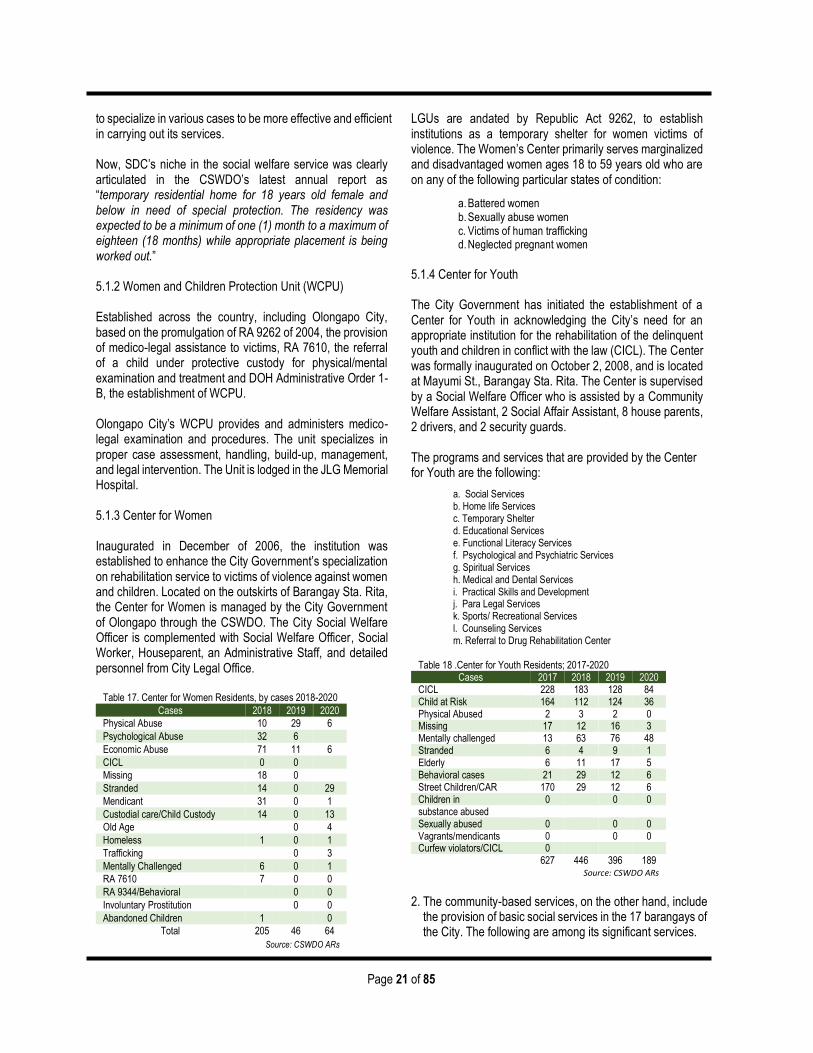
Page 21 of 85
to specialize in various cases to be more effective and efficient in carrying out its services. Now, SDC’s niche in the social welfare service was clearly articulated in the CSWDO’s latest annual report as “temporary residential home for 18 years old female and below in need of special protection. The residency was expected to be a minimum of one (1) month to a maximum of eighteen (18 months) while appropriate placement is being worked out.” 5.1.2 Women and Children Protection Unit (WCPU) Established across the country, including Olongapo City, based on the promulgation of RA 9262 of 2004, the provision of medico-legal assistance to victims, RA 7610, the referral of a child under protective custody for physical/mental examination and treatment and DOH Administrative Order 1-B, the establishment of WCPU. Olongapo City’s WCPU provides and administers medico-legal examination and procedures. The unit specializes in proper case assessment, handling, build-up, management, and legal intervention. The Unit is lodged in the JLG Memorial Hospital. 5.1.3 Center for Women Inaugurated in December of 2006, the institution was established to enhance the City Government’s specialization on rehabilitation service to victims of violence against women and children. Located on the outskirts of Barangay Sta. Rita, the Center for Women is managed by the City Government of Olongapo through the CSWDO. The City Social Welfare Officer is complemented with Social Welfare Officer, Social Worker, Houseparent, an Administrative Staff, and detailed personnel from City Legal Office.
Table 17. Center for Women Residents, by cases 2018-2020
Cases 2018 2019 2020
Physical Abuse 10 29 6
Psychological Abuse 32 6
Economic Abuse 71 11 6
CICL 0 0
Missing 18 0
Stranded 14 0 29
Mendicant 31 0 1
Custodial care/Child Custody 14 0 13
Old Age 0 4
Homeless 1 0 1
Trafficking 0 3
Mentally Challenged 6 0 1
RA 7610 7 0 0
RA 9344/Behavioral 0 0
Involuntary Prostitution 0 0
Abandoned Children 1 0
Total 205 46 64
Source: CSWDO ARs
LGUs are andated by Republic Act 9262, to establish institutions as a temporary shelter for women victims of violence. The Women’s Center primarily serves marginalized and disadvantaged women ages 18 to 59 years old who are on any of the following particular states of condition:
a. Battered women b. Sexually abuse women c. Victims of human trafficking d. Neglected pregnant women
5.1.4 Center for Youth The City Government has initiated the establishment of a Center for Youth in acknowledging the City’s need for an appropriate institution for the rehabilitation of the delinquent youth and children in conflict with the law (CICL). The Center was formally inaugurated on October 2, 2008, and is located at Mayumi St., Barangay Sta. Rita. The Center is supervised by a Social Welfare Officer who is assisted by a Community Welfare Assistant, 2 Social Affair Assistant, 8 house parents, 2 drivers, and 2 security guards. The programs and services that are provided by the Center for Youth are the following:
a. Social Services b. Home life Services c. Temporary Shelter d. Educational Services e. Functional Literacy Services f. Psychological and Psychiatric Services g. Spiritual Services h. Medical and Dental Services i. Practical Skills and Development j. Para Legal Services k. Sports/ Recreational Services l. Counseling Services m. Referral to Drug Rehabilitation Center
Table 18 .Center for Youth Residents; 2017-2020 Cases 2017 2018 2019 2020
CICL 228 183 128 84 Child at Risk 164 112 124 36 Physical Abused 2 3 2 0 Missing 17 12 16 3 Mentally challenged 13 63 76 48 Stranded 6 4 9 1 Elderly 6 11 17 5 Behavioral cases 21 29 12 6 Street Children/CAR 170 29 12 6 Children in 0 0 0 substance abused
Sexually abused 0 0 0 Vagrants/mendicants 0 0 0 Curfew violators/CICL 0
627 446 396 189 Source: CSWDO ARs
2. The community-based services, on the other hand, include
the provision of basic social services in the 17 barangays of the City. The following are among its significant services.

Page 22 of 85
a. Family and Community Welfare; b. Child and Youth Welfare; c. Disabled and Senior Citizen’s Welfare; d. Self -Employment Assistance; e. Practical Skills Dev’t and Emergency Relief Assistance; f. Day Care Services Program.
Service interventions of the City’s social welfare office in the communities were being conducted based primarily on three (3) methodological approaches;
a. Walk-in clients. These are people in need of a particular or
numerous social welfare assistance who voluntarily submit itself to the main office of the City Social Welfare and Development Office located in the City Hall Complex;
b. Referrals or reported cases. These are cases endorsed or
cases reported to the main CSWD Office, upon the initiative of a concerned citizen, a government agency, a business organization, or an NGO. The particular reported individual may voluntary or involuntary submit itself for assistance;
c. Based on previous clients served. Annual plans are based
on the volume of clients served in the previous year, the volume of walk-ins, and referrals.
5.1.5 Community-Based services Community-Based services which are provided under a facility are the Day Care Service under the Child Welfare Program and the services provided in the Day Center for the Elderly under the Senior Citizen’s Welfare Program and the Emergency Welfare Program process in the auspices of CSWDO. In the field service is the Community and Family Welfare Program.
5.2.4 Number and location of Day Care Centers xxvi
There are a total of 53 Day Centers and 1 Child Minding Center, manned by 54 Day Care Workers under the
supervision of the CSWDO. The remote upland barangay, New Cabalan, has the highest number of Day Care enrollees. The barangay has 10 Day Care Centers, followed by Barangay Sta Rita with 6 Centers.
Parents and guardians of the Day Care enrolees are organized into a Day Care Parent Committee on every 54 Centers having a total of 810 officers and federated into city-wide Parent Committee.
Table 19. Day Care Centers #, by barangay and Day Care Worker; 2020 Name of DCC Barangay Name of DCW 1 Asinan New Asinan Jenalyn M. Arenga 2 Banicain I New Banican Maria Cristina V. Belleza 3 Banicain II New Banicain Julie Ann C. San Antonio 4 Barretto I Barretto Maricel D. Ammay 5 Barretto II Barretto Christian D. Carizal 6 Gabaya Barretto Rowena M. Sarmiento 7 Purok 13 Barretto Jenny Fe T. Araña 8 Mountain View Barretto Shaina Sumaway 9 Johnson EastBajacBajac Edelyn C. Rivera 10 Little Baguio I EastBajacBajac Mildred A. Escano 11 Little Baguio II EastBajacBajac Leonelyn C. Legaspi 12 Upper Sibul EastBajacBajac Melanie R. Asuncion 13 East Tapinac I EastTapinac Adora C. Ramos 14 Acacia Gordon Heights Mary Rojean P. Laban 15 Long Road Gordon Heights Marilou L. Merced 16 Blk. 12 A Gordon Heights Ainalyn S. Egaran 17 Blk. 12 B Gordon Heights Jocelyn F. Apostol 18 Greenhills Gordon Heights Amalia A. Sleanares 19 Cell I Gordon Heights Shirly T. Macapagal 20 Upper Kalaklan Kalaklan Joan M. Fuentebella 21 Lower Kalaklan Kalaklan Maria Gliceria C. Morandante 22 Kalalake I NewKalalake Edina Mary Grace I. Cabriga 23 Kalalake II NewKalalake Grace Ann C. Calimlim 24 Mabayuan I Mabayuan Shaina S. Sumaway 25 Mabayuan II Mabayuan mary Karen M. Dela Cruz 26 Mercurio Mabayuan Decenia M. Dela Paz 27 Child Minding Mabayuan Rodjeane E. Peralta 28 Libas NewCabalan Almira D. Salinas 29 Purok 2 NewCabafan Nova F. Ferrer 30 Purok 3 NewCabalan Marlene M. Khederian 31 Purok 4 NewCabalan Ada Dagitab Merza 32 Purok 5 NewCabalan Airish C. Abraham 33 Purok 6 NewCabalan Jedah Joy Sunguad 34 Maliwakat NewCabalan Lewelyn P. Ramos 35 Highland NewCabalan Ada Dagitab Merza 36 Upper View NewCabalan Teresita M. Carpio 37 Greenland NewCabalan Rosemarie C. Tagulao 38 New llalim Newllalim Mariamel C. Morante 39 Kababae NewKababae Tahirih A. Cordero 40 Mactan OldCabalan Nadsmah S. Zainal 41 Forestry OldCabalan Bernadette B. Valdez 42 Mampueng OldCabalan Jocelyn R. Apacible 43 Mulawin OldCabalan Shermen T. Tenerife 44 Pag-asa Pag-asa Marisa G. Lozano 45 Purok 1-A Sta.Rita Anna Liza A. Escaño 46 Purok 1-B Sta.Rita Nanette B Mamon 47 Sampaguita Sta.Rita Nadja Alleluia E. Baquiran 48 Julo Tabacuhan Sta.Rita Georgia M. Sumala 49 Cristobal Sta. Rita Mary Fe M. Peñaflor 50 Purok 5-C Sta.Rita Ermalyn A. Monterey 51 WBB I WestBajacBajac Edeliza V. Labrador 52 WBB 11 WestBajacBajac Ruth V, Dela Peña 53 In-House WestBajacBajac Lizel V. Roaring 54 West Tapinac WestTapinac Junabel S. Dasing
0 50 100 150 200 250 300 350 400 450 500 550
New AsinanNew Banicain
BarrettoEast Bajac-Bajac
East TapinacGordon Heights
KalaklanNew Kalalake
MabayuanNew CabalanOld Cabalan
Pag-asaSta. Rita
West Bajac-BajacWest Tapinac
New IlalimNew Kababae
Chart 8. Day Care Enrollees; SY 2019-2020
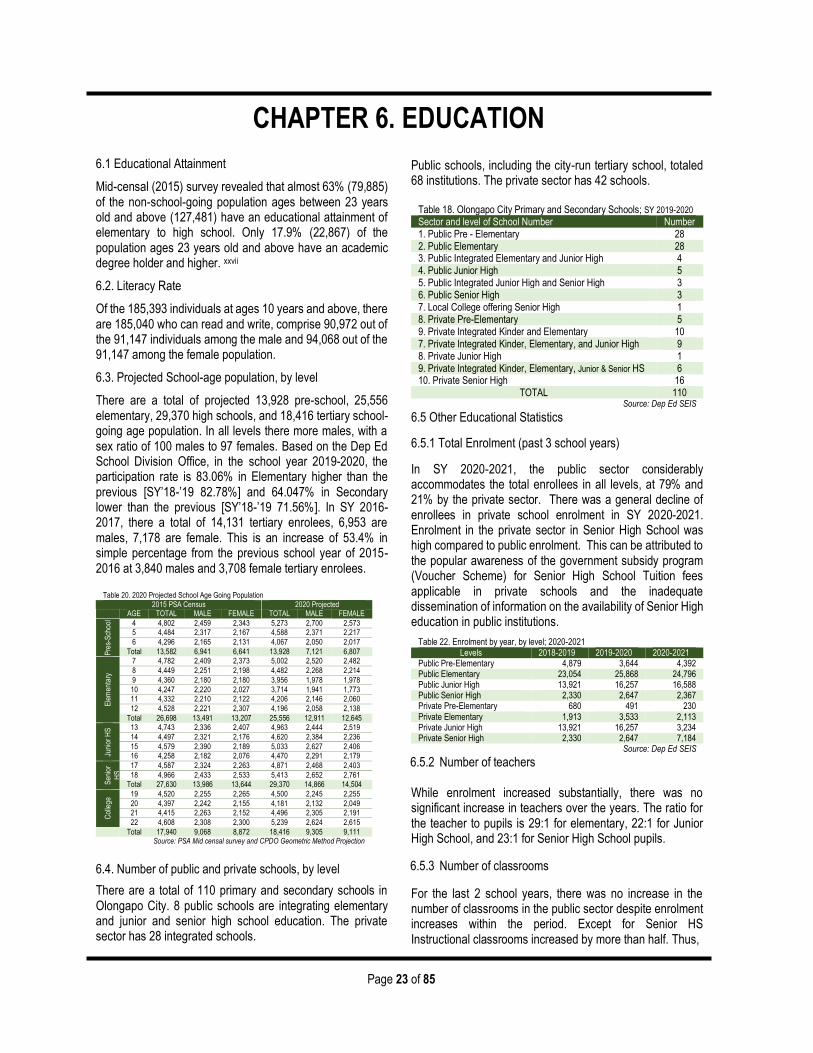
Page 23 of 85
6.1 Educational Attainment
Mid-censal (2015) survey revealed that almost 63% (79,885) of the non-school-going population ages between 23 years old and above (127,481) have an educational attainment of elementary to high school. Only 17.9% (22,867) of the population ages 23 years old and above have an academic degree holder and higher. xxvii
6.2. Literacy Rate
Of the 185,393 individuals at ages 10 years and above, there are 185,040 who can read and write, comprise 90,972 out of the 91,147 individuals among the male and 94,068 out of the 91,147 among the female population.
6.3. Projected School-age population, by level
There are a total of projected 13,928 pre-school, 25,556 elementary, 29,370 high schools, and 18,416 tertiary school-going age population. In all levels there more males, with a sex ratio of 100 males to 97 females. Based on the Dep Ed School Division Office, in the school year 2019-2020, the participation rate is 83.06% in Elementary higher than the previous [SY’18-’19 82.78%] and 64.047% in Secondary lower than the previous [SY’18-’19 71.56%]. In SY 2016-2017, there a total of 14,131 tertiary enrolees, 6,953 are males, 7,178 are female. This is an increase of 53.4% in simple percentage from the previous school year of 2015-2016 at 3,840 males and 3,708 female tertiary enrolees.
Table 20. 2020 Projected School Age Going Population
2015 PSA Census 2020 Projected AGE TOTAL MALE FEMALE TOTAL MALE FEMALE
Pre
s-S
choo
l
4 4,802 2,459 2,343 5,273 2,700 2,573 5 4,484 2,317 2,167 4,588 2,371 2,217
6 4,296 2,165 2,131 4,067 2,050 2,017
Total 13,582 6,941 6,641 13,928 7,121 6,807
Ele
men
tary
7 4,782 2,409 2,373 5,002 2,520 2,482
8 4,449 2,251 2,198 4,482 2,268 2,214
9 4,360 2,180 2,180 3,956 1,978 1,978
10 4,247 2,220 2,027 3,714 1,941 1,773 11 4,332 2,210 2,122 4,206 2,146 2,060
12 4,528 2,221 2,307 4,196 2,058 2,138
Total 26,698 13,491 13,207 25,556 12,911 12,645
Juni
or H
S 13 4,743 2,336 2,407 4,963 2,444 2,519
14 4,497 2,321 2,176 4,620 2,384 2,236
15 4,579 2,390 2,189 5,033 2,627 2,406 16 4,258 2,182 2,076 4,470 2,291 2,179
Sen
ior
HS
17 4,587 2,324 2,263 4,871 2,468 2,403
18 4,966 2,433 2,533 5,413 2,652 2,761 Total 27,630 13,986 13,644 29,370 14,866 14,504
Col
lege
19 4,520 2,255 2,265 4,500 2,245 2,255
20 4,397 2,242 2,155 4,181 2,132 2,049 21 4,415 2,263 2,152 4,496 2,305 2,191
22 4,608 2,308 2,300 5,239 2,624 2,615 Total 17,940 9,068 8,872 18,416 9,305 9,111
Source: PSA Mid censal survey and CPDO Geometric Method Projection
6.4. Number of public and private schools, by level
There are a total of 110 primary and secondary schools in Olongapo City. 8 public schools are integrating elementary and junior and senior high school education. The private sector has 28 integrated schools.
Public schools, including the city-run tertiary school, totaled 68 institutions. The private sector has 42 schools.
Table 18. Olongapo City Primary and Secondary Schools; SY 2019-2020 Sector and level of School Number Number 1. Public Pre - Elementary 28 2. Public Elementary 28 3. Public Integrated Elementary and Junior High 4 4. Public Junior High 5 5. Public Integrated Junior High and Senior High 3 6. Public Senior High 3 7. Local College offering Senior High 1 8. Private Pre-Elementary 5 9. Private Integrated Kinder and Elementary 10 7. Private Integrated Kinder, Elementary, and Junior High 9 8. Private Junior High 1 9. Private Integrated Kinder, Elementary, Junior & Senior HS 6 10. Private Senior High 16
TOTAL 110 Source: Dep Ed SEIS
6.5 Other Educational Statistics
6.5.1 Total Enrolment (past 3 school years)
In SY 2020-2021, the public sector considerably accommodates the total enrollees in all levels, at 79% and 21% by the private sector. There was a general decline of enrollees in private school enrolment in SY 2020-2021. Enrolment in the private sector in Senior High School was high compared to public enrolment. This can be attributed to the popular awareness of the government subsidy program (Voucher Scheme) for Senior High School Tuition fees applicable in private schools and the inadequate dissemination of information on the availability of Senior High education in public institutions.
Table 22. Enrolment by year, by level; 2020-2021 Levels 2018-2019 2019-2020 2020-2021
Public Pre-Elementary 4,879 3,644 4,392 Public Elementary 23,054 25,868 24,796 Public Junior High 13,921 16,257 16,588 Public Senior High 2,330 2,647 2,367 Private Pre-Elementary 680 491 230 Private Elementary 1,913 3,533 2,113 Private Junior High 13,921 16,257 3,234 Private Senior High 2,330 2,647 7,184
Source: Dep Ed SEIS
6.5.2 Number of teachers While enrolment increased substantially, there was no significant increase in teachers over the years. The ratio for the teacher to pupils is 29:1 for elementary, 22:1 for Junior High School, and 23:1 for Senior High School pupils.
6.5.3 Number of classrooms
For the last 2 school years, there was no increase in the number of classrooms in the public sector despite enrolment increases within the period. Except for Senior HS Instructional classrooms increased by more than half. Thus,
CHAPTER 6. EDUCATION

Page 24 of 85
the classroom to pupil ratio is 39:1 for elementary students, 42:1 for Junior HS, and 26:1 for senior secondary students.
6.5.4 Performance indicators xxviii a. Gross Enrolment Rate (GER) Gross enrolment rate is the ratio of the total enrolment in a given education level as a percentage of the population, which according to national regulations should be enrolled at this level. DepEd Schools Division Office reported a decreasing gross enrolment rate from SY 2018-2019 to SY 2019-2020, at 88.19% to 87.61% respectively on Elementary level and 87.03% to 71.7% on the secondary level. b. Net Enrolment Ratio or Participation Rate (NER) xxix The ratio of the enrolment for the age group corresponding to the official school age in the elementary/secondary level to the population of the same age group in a given year. Also known as Participation Rate. xxx
SY 2018-2019 to SY 2019-2020 shows a slight increase in elementary PR, from 82.78% to 83.06%, and a significant decrease on the secondary level from 71.56% to 64.47%. Compare to Region III’s NER in 2015, at 93.85%, Olongapo City has a higher net enrolment rate in the primary level and a lower rate at the secondary level. xxxi
c. Completion Rate The percentage of first grade/year entrants in a level of education who complete/finish the level following the required number of years of study. xxxii For the SY 2018-2019 to SY 2019-2020, the city’s primary education completion rate decreased from 98.35% to 91.3%. The secondary education completion rate has significantly decreased from 92.92% to 73.09%. The secondary level has a lower completion rate compared to the primary level. d. Graduation rate
For the SY 2018-2019 to SY 2019-2020, there was a slight decrease on the primary level from 98.35% to 97.50% and a slight increase on the secondary level from 92.92% to 93.04%. The graduation rate is high in Olongapo City. Graduates are students or trainees who are enrolled in a particular course/program and have completed the requirements set for that course/program. The graduation rate is the percentage of pupils/students who completed the academic requirements for elementary, secondary, or tertiary levels in the current school year to the number of pupils/students enrolled in the terminal year of the level during the same school year. xxxiii
e. Dropouts
As reported by the Dep Ed SDO, in SY 2018-2019, the dropout rate is at 1.19% for the primary level and 3.89% for the secondary level. Dropouts are pupils/students who leave school during the year for any reason as well as those who complete the previous grade/year level but fail to enroll in the next grade/year level the following school year. The dropout rate is the percentage of pupils/students who leave school during the year for any reason as well as those who complete the previous grade/year level but fail to enroll in the next grade/year level the following school year to the total number of pupils/students enrolled during the previous school year.
f. Promotees
Pupils/students who complete/finish the grade/year. Promotion Rate is the percentage of pupils/students promoted to the next grade/year level in the following school year. The promotion rate in Olongapo City decreased from SY 2018-2019 to SY 2019-2020 from 101.08% to 97.61% respectively, on the primary level, and from 104.55% to 92.43% in the secondary level.
g. Cohort Survival Rate (CSR)
A cohort is a group of pupils/students who join the first grade/year of a given cycle in the same school year, and subsequently experience the events of promotion, repetition, dropout, or successful completion of the final grade, each in his/her way. Cohort Survival Rate (CSR) is the percentage of enrollees at the beginning grade or year in a given school year who reached the final grade or year of the elementary/secondary level. The city’s cohort survival rate from SY 2018-2019 to SY 2019-2020 for primary education is 98.83% to 96.47%, respectively, and 93.37to 88.72% for secondary education. Comparably, the primary level has a high cohort survival rate.
h. Repeaters
Pupils/students who failed or left a particular grade/year level during a given school year, or pupils/students who are enrolled in the same grade/year for a second (or more) time. Repetition Rate is the percentage of pupils/students enrolled in a given grade/year in a given school year who study in the same grade/year the following school year. In SY 2019-2020, primary level repeaters in Olongapo City are at 1.22% and 2.62% on the secondary level.
i. Retention Rate The retention rate (RR) is the proportion of the enrolment in any school of students or pupils that continue to be in school the following year. Olongapo City has a decreasing retention rate. At the primary level, the rate is at 98.77% in SY 2019-2020 from 101.8% in SY 2018-2019. The secondary level is at 96.58% in SY 2018-2019 to 94.02% in SY 2019-2020.
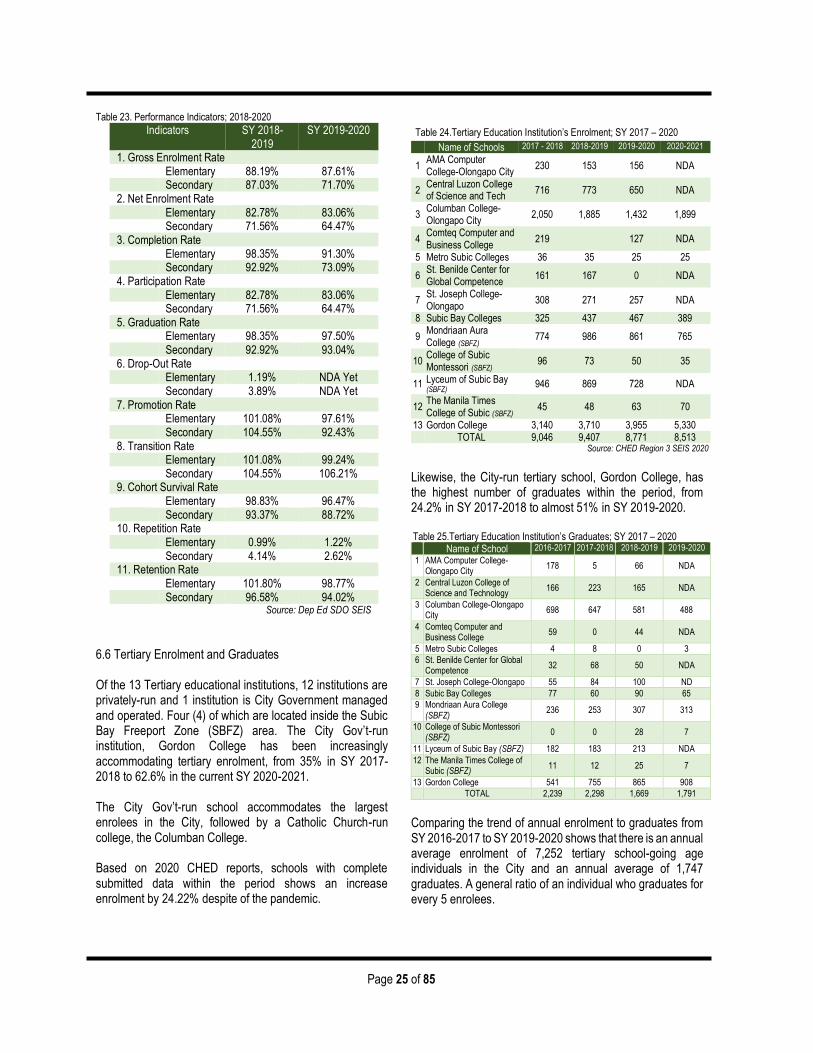
Page 25 of 85
Table 23. Performance Indicators; 2018-2020
Indicators SY 2018-2019
SY 2019-2020
1. Gross Enrolment Rate Elementary 88.19% 87.61% Secondary 87.03% 71.70% 2. Net Enrolment Rate Elementary 82.78% 83.06% Secondary 71.56% 64.47% 3. Completion Rate Elementary 98.35% 91.30% Secondary 92.92% 73.09% 4. Participation Rate Elementary 82.78% 83.06% Secondary 71.56% 64.47% 5. Graduation Rate Elementary 98.35% 97.50% Secondary 92.92% 93.04% 6. Drop-Out Rate Elementary 1.19% NDA Yet Secondary 3.89% NDA Yet 7. Promotion Rate Elementary 101.08% 97.61% Secondary 104.55% 92.43% 8. Transition Rate Elementary 101.08% 99.24% Secondary 104.55% 106.21% 9. Cohort Survival Rate Elementary 98.83% 96.47% Secondary 93.37% 88.72% 10. Repetition Rate Elementary 0.99% 1.22% Secondary 4.14% 2.62% 11. Retention Rate Elementary 101.80% 98.77% Secondary 96.58% 94.02%
Source: Dep Ed SDO SEIS
6.6 Tertiary Enrolment and Graduates Of the 13 Tertiary educational institutions, 12 institutions are privately-run and 1 institution is City Government managed and operated. Four (4) of which are located inside the Subic Bay Freeport Zone (SBFZ) area. The City Gov’t-run institution, Gordon College has been increasingly accommodating tertiary enrolment, from 35% in SY 2017-2018 to 62.6% in the current SY 2020-2021. The City Gov’t-run school accommodates the largest enrolees in the City, followed by a Catholic Church-run college, the Columban College. Based on 2020 CHED reports, schools with complete submitted data within the period shows an increase enrolment by 24.22% despite of the pandemic.
Table 24.Tertiary Education Institution’s Enrolment; SY 2017 – 2020
Name of Schools 2017 - 2018 2018-2019 2019-2020 2020-2021
1 AMA Computer College-Olongapo City
230 153 156 NDA
2 Central Luzon College of Science and Tech
716 773 650 NDA
3 Columban College-Olongapo City
2,050 1,885 1,432 1,899
4 Comteq Computer and Business College
219 127 NDA
5 Metro Subic Colleges 36 35 25 25
6 St. Benilde Center for Global Competence
161 167 0 NDA
7 St. Joseph College-Olongapo
308 271 257 NDA
8 Subic Bay Colleges 325 437 467 389
9 Mondriaan Aura College (SBFZ)
774 986 861 765
10 College of Subic Montessori (SBFZ)
96 73 50 35
11 Lyceum of Subic Bay (SBFZ) 946 869 728 NDA
12 The Manila Times College of Subic (SBFZ)
45 48 63 70
13 Gordon College 3,140 3,710 3,955 5,330 TOTAL 9,046 9,407 8,771 8,513
Source: CHED Region 3 SEIS 2020
Likewise, the City-run tertiary school, Gordon College, has the highest number of graduates within the period, from 24.2% in SY 2017-2018 to almost 51% in SY 2019-2020. Table 25.Tertiary Education Institution’s Graduates; SY 2017 – 2020 Name of School 2016-2017 2017-2018 2018-2019 2019-2020
1 AMA Computer College-Olongapo City
178 5 66 NDA
2 Central Luzon College of Science and Technology
166 223 165 NDA
3 Columban College-Olongapo City
698 647 581 488
4 Comteq Computer and Business College
59 0 44 NDA
5 Metro Subic Colleges 4 8 0 3
6 St. Benilde Center for Global Competence
32 68 50 NDA
7 St. Joseph College-Olongapo 55 84 100 ND
8 Subic Bay Colleges 77 60 90 65
9 Mondriaan Aura College (SBFZ)
236 253 307 313
10 College of Subic Montessori (SBFZ)
0 0 28 7
11 Lyceum of Subic Bay (SBFZ) 182 183 213 NDA
12 The Manila Times College of Subic (SBFZ)
11 12 25 7
13 Gordon College 541 755 865 908
TOTAL 2,239 2,298 1,669 1,791
Comparing the trend of annual enrolment to graduates from SY 2016-2017 to SY 2019-2020 shows that there is an annual average enrolment of 7,252 tertiary school-going age individuals in the City and an annual average of 1,747 graduates. A general ratio of an individual who graduates for every 5 enrolees.
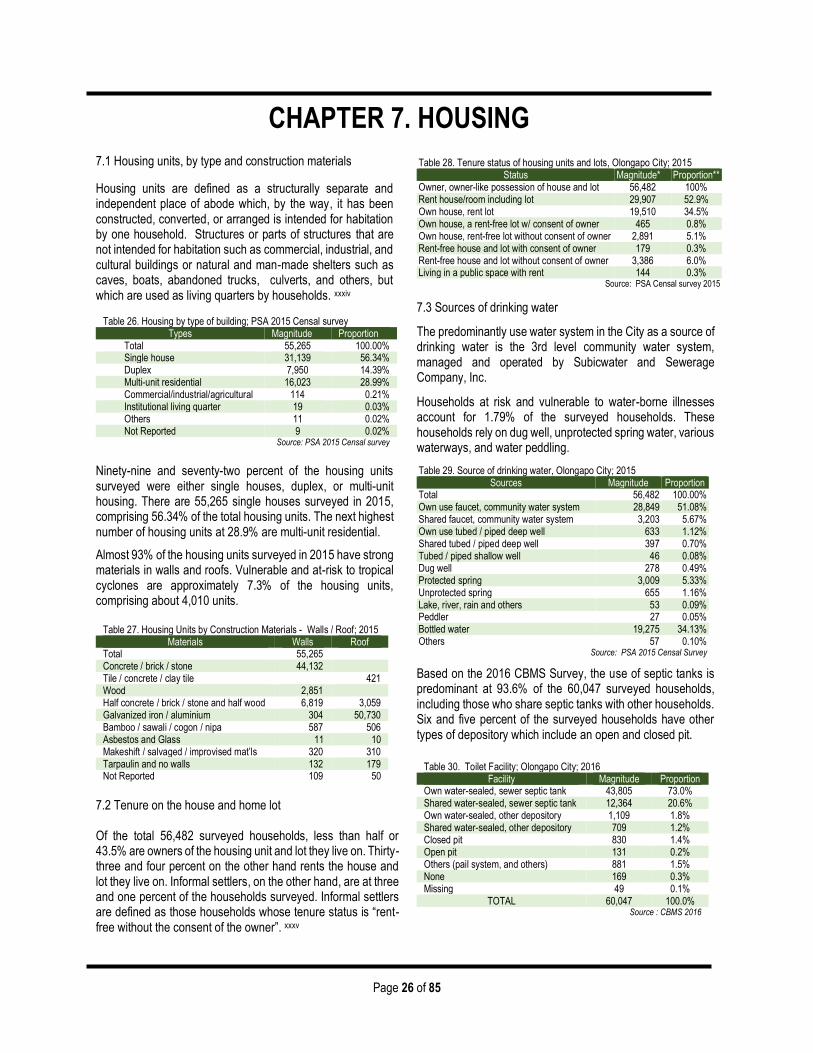
Page 26 of 85
CHAPTER 7. HOUSING
7.1 Housing units, by type and construction materials
Housing units are defined as a structurally separate and independent place of abode which, by the way, it has been constructed, converted, or arranged is intended for habitation by one household. Structures or parts of structures that are not intended for habitation such as commercial, industrial, and cultural buildings or natural and man-made shelters such as caves, boats, abandoned trucks, culverts, and others, but which are used as living quarters by households. xxxiv
Table 26. Housing by type of building; PSA 2015 Censal survey Types Magnitude Proportion
Total 55,265 100.00% Single house 31,139 56.34% Duplex 7,950 14.39% Multi-unit residential 16,023 28.99% Commercial/industrial/agricultural 114 0.21% Institutional living quarter 19 0.03% Others 11 0.02% Not Reported 9 0.02%
Source: PSA 2015 Censal survey
Ninety-nine and seventy-two percent of the housing units surveyed were either single houses, duplex, or multi-unit housing. There are 55,265 single houses surveyed in 2015, comprising 56.34% of the total housing units. The next highest number of housing units at 28.9% are multi-unit residential.
Almost 93% of the housing units surveyed in 2015 have strong materials in walls and roofs. Vulnerable and at-risk to tropical cyclones are approximately 7.3% of the housing units, comprising about 4,010 units.
Table 27. Housing Units by Construction Materials - Walls / Roof; 2015 Materials Walls Roof
Total 55,265 Concrete / brick / stone 44,132 Tile / concrete / clay tile 421 Wood 2,851 Half concrete / brick / stone and half wood 6,819 3,059 Galvanized iron / aluminium 304 50,730 Bamboo / sawali / cogon / nipa 587 506 Asbestos and Glass 11 10 Makeshift / salvaged / improvised mat’ls 320 310 Tarpaulin and no walls 132 179 Not Reported 109 50
7.2 Tenure on the house and home lot Of the total 56,482 surveyed households, less than half or 43.5% are owners of the housing unit and lot they live on. Thirty-three and four percent on the other hand rents the house and lot they live on. Informal settlers, on the other hand, are at three and one percent of the households surveyed. Informal settlers are defined as those households whose tenure status is “rent-free without the consent of the owner”. xxxv
Table 28. Tenure status of housing units and lots, Olongapo City; 2015
Status Magnitude* Proportion** Owner, owner-like possession of house and lot 56,482 100% Rent house/room including lot 29,907 52.9% Own house, rent lot 19,510 34.5% Own house, a rent-free lot w/ consent of owner 465 0.8% Own house, rent-free lot without consent of owner 2,891 5.1% Rent-free house and lot with consent of owner 179 0.3% Rent-free house and lot without consent of owner 3,386 6.0% Living in a public space with rent 144 0.3%
Source: PSA Censal survey 2015
7.3 Sources of drinking water
The predominantly use water system in the City as a source of drinking water is the 3rd level community water system, managed and operated by Subicwater and Sewerage Company, Inc.
Households at risk and vulnerable to water-borne illnesses account for 1.79% of the surveyed households. These households rely on dug well, unprotected spring water, various waterways, and water peddling.
Table 29. Source of drinking water, Olongapo City; 2015 Sources Magnitude Proportion
Total 56,482 100.00% Own use faucet, community water system 28,849 51.08% Shared faucet, community water system 3,203 5.67% Own use tubed / piped deep well 633 1.12% Shared tubed / piped deep well 397 0.70% Tubed / piped shallow well 46 0.08% Dug well 278 0.49% Protected spring 3,009 5.33% Unprotected spring 655 1.16% Lake, river, rain and others 53 0.09% Peddler 27 0.05% Bottled water 19,275 34.13% Others 57 0.10%
Source: PSA 2015 Censal Survey
Based on the 2016 CBMS Survey, the use of septic tanks is predominant at 93.6% of the 60,047 surveyed households, including those who share septic tanks with other households. Six and five percent of the surveyed households have other types of depository which include an open and closed pit.
Table 30. Toilet Facility; Olongapo City; 2016 Facility Magnitude Proportion
Own water-sealed, sewer septic tank 43,805 73.0% Shared water-sealed, sewer septic tank 12,364 20.6% Own water-sealed, other depository 1,109 1.8% Shared water-sealed, other depository 709 1.2% Closed pit 830 1.4% Open pit 131 0.2% Others (pail system, and others) 881 1.5% None 169 0.3% Missing 49 0.1%
TOTAL 60,047 100.0% Source : CBMS 2016

Page 27 of 85
CHAPTER 8. PUBLIC UTILITIES
8.1 Solid Waste Management
The Environmental Sanitation and Management Office (ESMO) of the City Government is responsible for the collection and disposal of the City’s solid waste. To complement the advocacy and augment efforts in Compost, Reduce, Reuse and Recycle CR3, the Waste Containerization Program was introduced. The City Government distributed 7,460 waste bins with a capacity of 240 and 660 liters and an additional 6,500 waste bins with a capacity of 360 liters. At the core of solid waste management are the newly established Sanitary Landfill (SLF) and the fleet of garbage trucks, compactors, bulldozer trucks, and different sorts of vehicles.
Because of the perseverance and consistency of the City Government’s campaign on solid waste management, currently, there are a total of 10,257 households surveyed, or 17.1% of the total 60,047 households surveyed in 2016, who practiced composting, segregation, and recycling. There are three (3) work shifts for collection:
a. Dayshift starts the collection at 5:30 am for residential areas, b. Swing shift starts a collection at 3:00 pm for public markets; c. The graveyard shift starts at 9:00 pm for commercial areas.
There are three (3) inspectors and twenty-nine (29) river maintenance workers assigned in river surface garbage collection in three (3) areas: Kalaklan, Pag-asa, and Marikit – Gordon Avenue. They utilized six (6) bancas for garbage collection: one (1) motorized and five (5) non-motorized.
8.2 Monthly volume of garbage collection The average daily garbage disposal was 270 tons. SBMA garbage shares an average of 10.5% of the total. SBMA Contract was terminated in 2020.
Table 31. Monthly Volume of Garbage Collected, in tons; 2016-2020 2016 2017 2018 2019 2020 JANUARY 3,855.69 5,937.19 7,911.20 7,625.28 6,799.48 FEBRUARY 3,437.66 5,293.47 7,008.40 8,653.80 7,657.28 MARCH 3,915.59 6,029.41 7,945.30 8,618.78 7,690.28 APRIL 3,665.91 5,644.95 7,566.00 8,550.27 7,538.27 MAY 3,634.94 5,597.25 7,785.96 8,938.28 8,082.78 JUNE 4,023.60 5,663.74 7,794.00 9,039.48 8,105.80 JULY 4,157.72 6,216.76 9,457.85 10,518.21 9,522.11 AUGUST 4,348.37 6,402.37 8,987.60 9,927.14 8,993.24 SEPTEMBER 3,970.80 6,695.90 8,625.70 9,768.23 8,840.23 OCTOBER 4,573.43 7,042.37 8,463.84 8,611.11 7,599.14 NOVEMBER 3,965.40 6,309.57 7,864.90 8,653.24 7,827.55 DECEMBER 4,284.51 6,755.96 7,981.30 9,498.55 8,642.21 TOTAL 44,167.71 73,588.94 97,392.05 108,402.37 97,298.37 SBMA Volume
3,846 7,526 9,530 5,998 Contract
terminated Source: ESMO Annual Reports 2016-2020
A caused for serious attention is the increasing trend of the volume of garbage collected, which is an indicator of inadequate segregation, recycling, and composting. This poses a considerable challenge for the City to reduce its garbage volume.
8.3 Electric Power Utility
Olongapo City’s power distribution infrastructure was currently privatized through Republic Act (RA) No. 10373xxxvi which was approved by President Benigno Aquino on March 1, 2013. Through this act, the President gave a 25-year franchise to Olongapo Electricity Distribution Company, Inc. (OEDC), a privately owned electric distribution utility which started operations in the City on June 1, 2013. OEDC is a subsidiary of Cagayan Electric Power and Light Company. Inc. (CEPALCO), the fourth largest privately owned electric distribution utility in the Philippines, under joint venture with San Miguel Energy Corporation (SMEC).xxxvii OEDC sources its power requirements from the National Grid Corporation of the Philippines (NGCP) through its Metering Facility at NGCP – Halfmoon Substation. In the year 2020, there are 53,684 connections disaggregated by sector as follows:
8.4 Subic Water and Sewerage, Inc (SWSCI)
Subic Water and Sewerage, Inc (SWSCI) manage and operate the City’s Level 3 water supply or piped water system. It is the first and only ISO 9001:2000 certified water utility company in the country today. Subicwater has 2 water treatment plants: the Binictican Water Treatment Plant which serves the need of the Subic Bay Freeport Zone and the southern part of the City and Cabalan, and the Mabayuan Water Treatment Plant which supplies the northern part of the City. The Binictican Water Treatment Plant draws its water from five sources: Binanga, Binictican, Boton, Triboa and Malawaan Rivers. The Mabayuan Water Treatment Plant sources its raw water from the Mabayuan Creek and Sta. Rita River. The two water treatment plants have a combined capacity of 66,500 cum/day (CMD) or 66.5 million liters per day (MLD)xxxviii.
In 2020, the volume of water production is at 17,601,046.11 cubic meters. Locally sourced-out water production (MWTP and City Wells) is at 9,158,916.13 cubic meters and the volume of water access in the Subic Freeport Zone is at 8,442,129.98 cubic meters. Water demand is at 12,973,663.71 cubic meters annually.
Table 32. OEDC Power service connections & consumption; 2020 Connections Consumption (kwh)
1. Residential 47,992 134,411,510 2. Industrial 2 900,060 3. Commercial 5,273 60,223,765 4. Institutional 1 752 5. Government 302 3,154,485
City Gov’t 196 2,330,114 Barangay Gov’t 106 824,371
6. Others 114 4,937,276 TOTAL 53,684 203,627,848
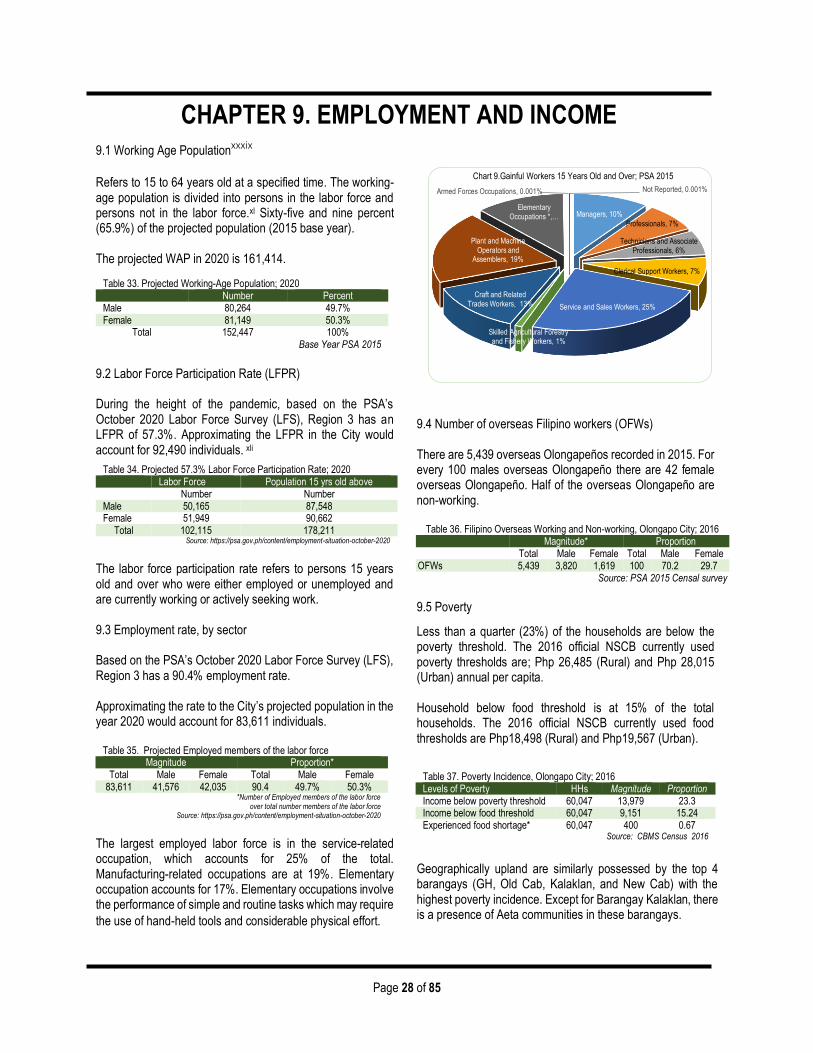
Page 28 of 85
Managers, 10%
Professionals, 7%
Technicians and Associate Professionals, 6%
Clerical Support Workers, 7%
Service and Sales Workers, 25%
Skilled Agricultural Forestry and Fishery Workers, 1%
Craft and Related Trades Workers, 13%
Plant and Machine Operators and
Assemblers, 19%
Elementary Occupations *, …
Armed Forces Occupations, 0.001% Not Reported, 0.001%
Chart 9.Gainful Workers 15 Years Old and Over; PSA 2015
CHAPTER 8. EMPLOYMENT AND INCOME
9.1 Working Age Populationxxxix Refers to 15 to 64 years old at a specified time. The working-age population is divided into persons in the labor force and persons not in the labor force.xl Sixty-five and nine percent (65.9%) of the projected population (2015 base year). The projected WAP in 2020 is 161,414.
9.2 Labor Force Participation Rate (LFPR)
During the height of the pandemic, based on the PSA’s October 2020 Labor Force Survey (LFS), Region 3 has an LFPR of 57.3%. Approximating the LFPR in the City would account for 92,490 individuals. xli
The labor force participation rate refers to persons 15 years old and over who were either employed or unemployed and are currently working or actively seeking work. 9.3 Employment rate, by sector Based on the PSA’s October 2020 Labor Force Survey (LFS), Region 3 has a 90.4% employment rate. Approximating the rate to the City’s projected population in the year 2020 would account for 83,611 individuals.
Table 35. Projected Employed members of the labor force
Magnitude Proportion* Total Male Female Total Male Female
83,611 41,576 42,035 90.4 49.7% 50.3% *Number of Employed members of the labor force
over total number members of the labor force Source: https://psa.gov.ph/content/employment-situation-october-2020
The largest employed labor force is in the service-related occupation, which accounts for 25% of the total. Manufacturing-related occupations are at 19%. Elementary occupation accounts for 17%. Elementary occupations involve the performance of simple and routine tasks which may require
the use of hand-held tools and considerable physical effort.
9.4 Number of overseas Filipino workers (OFWs) There are 5,439 overseas Olongapeños recorded in 2015. For every 100 males overseas Olongapeño there are 42 female overseas Olongapeño. Half of the overseas Olongapeño are non-working.
Table 36. Filipino Overseas Working and Non-working, Olongapo City; 2016 Magnitude* Proportion
Total Male Female Total Male Female OFWs 5,439 3,820 1,619 100 70.2 29.7
Source: PSA 2015 Censal survey
9.5 Poverty
Less than a quarter (23%) of the households are below the poverty threshold. The 2016 official NSCB currently used poverty thresholds are; Php 26,485 (Rural) and Php 28,015 (Urban) annual per capita. Household below food threshold is at 15% of the total households. The 2016 official NSCB currently used food thresholds are Php18,498 (Rural) and Php19,567 (Urban).
Table 37. Poverty Incidence, Olongapo City; 2016 Levels of Poverty HHs Magnitude Proportion Income below poverty threshold 60,047 13,979 23.3 Income below food threshold 60,047 9,151 15.24 Experienced food shortage* 60,047 400 0.67
Source: CBMS Census 2016
Geographically upland are similarly possessed by the top 4 barangays (GH, Old Cab, Kalaklan, and New Cab) with the highest poverty incidence. Except for Barangay Kalaklan, there is a presence of Aeta communities in these barangays.
Table 33. Projected Working-Age Population; 2020 Number Percent Male 80,264 49.7% Female 81,149 50.3%
Total 152,447 100% Base Year PSA 2015
Table 34. Projected 57.3% Labor Force Participation Rate; 2020 Labor Force Population 15 yrs old above Number Number Male 50,165 87,548 Female 51,949 90,662
Total 102,115 178,211 Source: https://psa.gov.ph/content/employment-situation-october-2020
CHAPTER 9. EMPLOYMENT AND INCOME
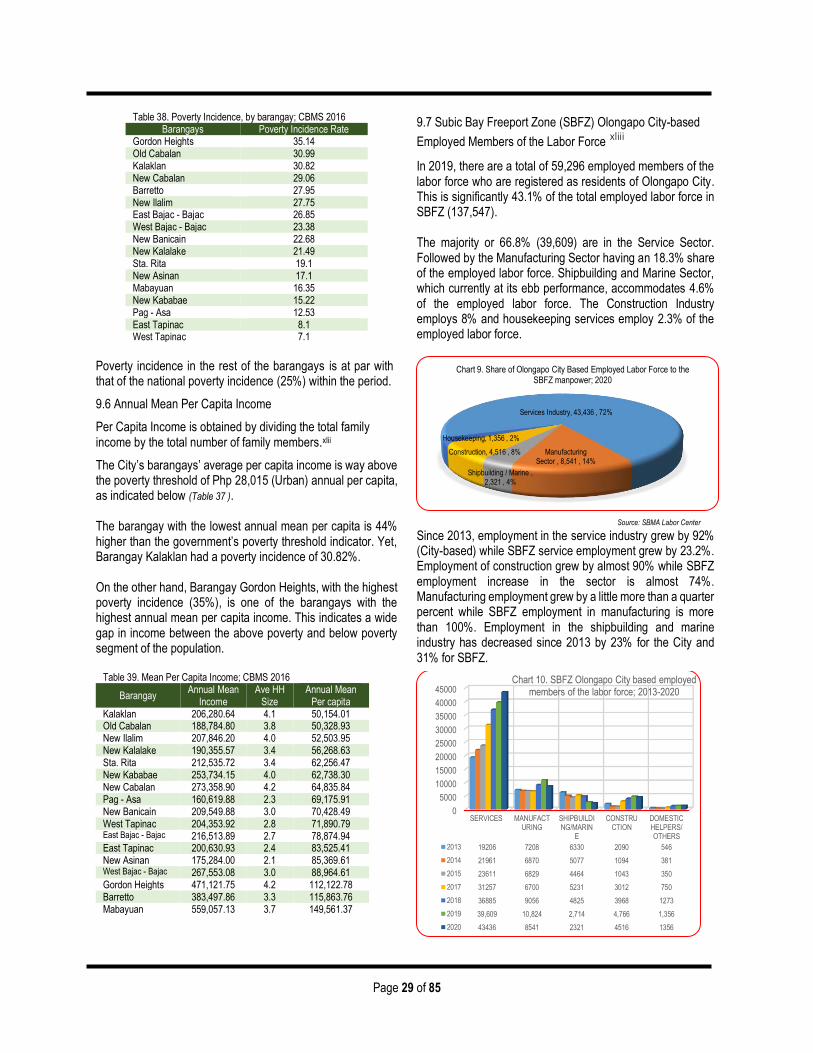
Page 29 of 85
Source: SBMA Labor Center
Table 38. Poverty Incidence, by barangay; CBMS 2016
Barangays Poverty Incidence Rate Gordon Heights 35.14 Old Cabalan 30.99 Kalaklan 30.82 New Cabalan 29.06 Barretto 27.95 New Ilalim 27.75 East Bajac - Bajac 26.85 West Bajac - Bajac 23.38 New Banicain 22.68 New Kalalake 21.49 Sta. Rita 19.1 New Asinan 17.1 Mabayuan 16.35 New Kababae 15.22 Pag - Asa 12.53 East Tapinac 8.1 West Tapinac 7.1
Poverty incidence in the rest of the barangays is at par with that of the national poverty incidence (25%) within the period.
9.6 Annual Mean Per Capita Income
Per Capita Income is obtained by dividing the total family income by the total number of family members.xlii
The City’s barangays’ average per capita income is way above the poverty threshold of Php 28,015 (Urban) annual per capita, as indicated below (Table 37 ). The barangay with the lowest annual mean per capita is 44% higher than the government’s poverty threshold indicator. Yet, Barangay Kalaklan had a poverty incidence of 30.82%.
On the other hand, Barangay Gordon Heights, with the highest poverty incidence (35%), is one of the barangays with the highest annual mean per capita income. This indicates a wide gap in income between the above poverty and below poverty segment of the population.
Table 39. Mean Per Capita Income; CBMS 2016
Barangay Annual Mean
Income Ave HH
Size Annual Mean
Per capita Kalaklan 206,280.64 4.1 50,154.01 Old Cabalan 188,784.80 3.8 50,328.93 New Ilalim 207,846.20 4.0 52,503.95 New Kalalake 190,355.57 3.4 56,268.63 Sta. Rita 212,535.72 3.4 62,256.47 New Kababae 253,734.15 4.0 62,738.30 New Cabalan 273,358.90 4.2 64,835.84 Pag - Asa 160,619.88 2.3 69,175.91 New Banicain 209,549.88 3.0 70,428.49 West Tapinac 204,353.92 2.8 71,890.79 East Bajac - Bajac 216,513.89 2.7 78,874.94 East Tapinac 200,630.93 2.4 83,525.41 New Asinan 175,284.00 2.1 85,369.61 West Bajac - Bajac 267,553.08 3.0 88,964.61 Gordon Heights 471,121.75 4.2 112,122.78 Barretto 383,497.86 3.3 115,863.76 Mabayuan 559,057.13 3.7 149,561.37
9.7 Subic Bay Freeport Zone (SBFZ) Olongapo City-based
Employed Members of the Labor Force xliii
In 2019, there are a total of 59,296 employed members of the labor force who are registered as residents of Olongapo City. This is significantly 43.1% of the total employed labor force in SBFZ (137,547).
The majority or 66.8% (39,609) are in the Service Sector. Followed by the Manufacturing Sector having an 18.3% share of the employed labor force. Shipbuilding and Marine Sector, which currently at its ebb performance, accommodates 4.6% of the employed labor force. The Construction Industry employs 8% and housekeeping services employ 2.3% of the employed labor force.
Since 2013, employment in the service industry grew by 92% (City-based) while SBFZ service employment grew by 23.2%. Employment of construction grew by almost 90% while SBFZ employment increase in the sector is almost 74%. Manufacturing employment grew by a little more than a quarter percent while SBFZ employment in manufacturing is more than 100%. Employment in the shipbuilding and marine industry has decreased since 2013 by 23% for the City and 31% for SBFZ.
Services Industry, 43,436 , 72%
Manufacturing Sector , 8,541 , 14%
Shipbuilding / Marine , 2,321 , 4%
Construction, 4,516 , 8%
Housekeeping, 1,356 , 2%
Chart 9. Share of Olongapo City Based Employed Labor Force to the SBFZ manpower; 2020
0
5000
10000
15000
20000
25000
30000
35000
40000
45000
SERVICES MANUFACTURING
SHIPBUILDING/MARIN
E
CONSTRUCTION
DOMESTICHELPERS/OTHERS
2013 19206 7208 6330 2090 546
2014 21961 6870 5077 1094 381
2015 23611 6829 4464 1043 350
2017 31257 6700 5231 3012 750
2018 36885 9056 4825 3968 1273
2019 39,609 10,824 2,714 4,766 1,356
2020 43436 8541 2321 4516 1356
Chart 10. SBFZ Olongapo City based employed members of the labor force; 2013-2020
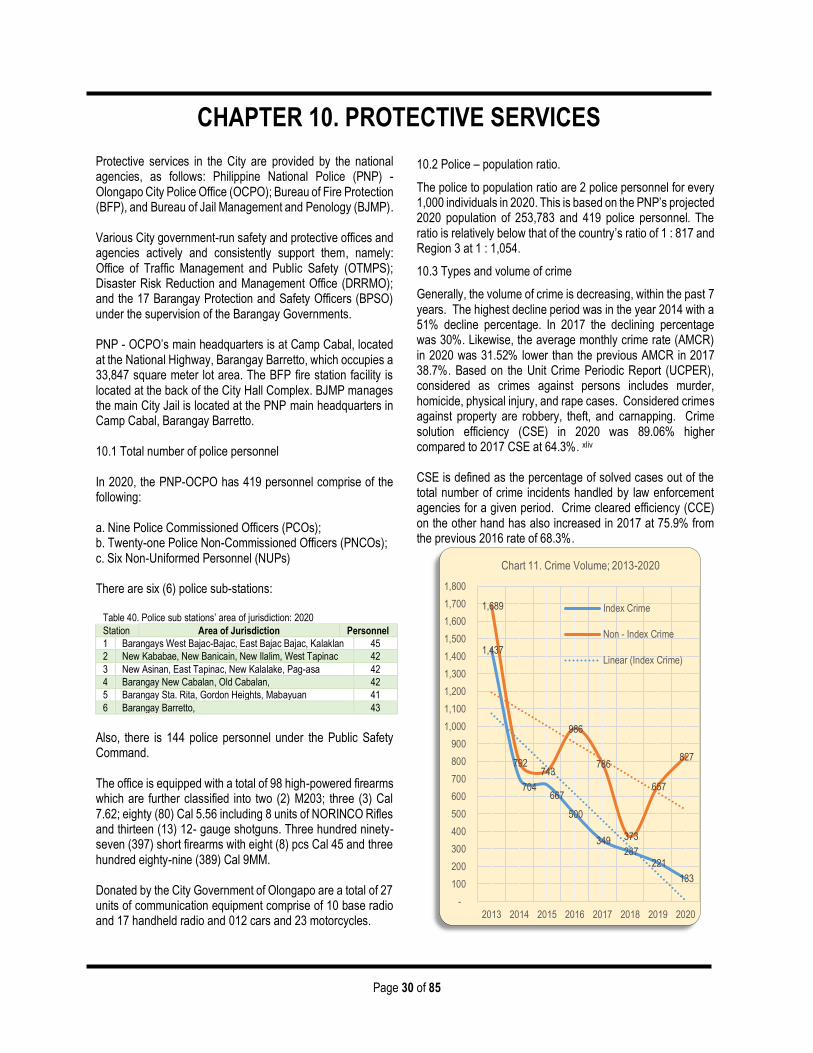
Page 30 of 85
CHAPTER 10. PROTECTIVE SERVICES
Protective services in the City are provided by the national agencies, as follows: Philippine National Police (PNP) - Olongapo City Police Office (OCPO); Bureau of Fire Protection (BFP), and Bureau of Jail Management and Penology (BJMP). Various City government-run safety and protective offices and agencies actively and consistently support them, namely: Office of Traffic Management and Public Safety (OTMPS); Disaster Risk Reduction and Management Office (DRRMO); and the 17 Barangay Protection and Safety Officers (BPSO) under the supervision of the Barangay Governments. PNP - OCPO’s main headquarters is at Camp Cabal, located at the National Highway, Barangay Barretto, which occupies a 33,847 square meter lot area. The BFP fire station facility is located at the back of the City Hall Complex. BJMP manages the main City Jail is located at the PNP main headquarters in Camp Cabal, Barangay Barretto. 10.1 Total number of police personnel In 2020, the PNP-OCPO has 419 personnel comprise of the following:
a. Nine Police Commissioned Officers (PCOs); b. Twenty-one Police Non-Commissioned Officers (PNCOs); c. Six Non-Uniformed Personnel (NUPs) There are six (6) police sub-stations:
Table 40. Police sub stations’ area of jurisdiction: 2020
Station Area of Jurisdiction Personnel
1 Barangays West Bajac-Bajac, East Bajac Bajac, Kalaklan 45
2 New Kababae, New Banicain, New Ilalim, West Tapinac 42
3 New Asinan, East Tapinac, New Kalalake, Pag-asa 42
4 Barangay New Cabalan, Old Cabalan, 42
5 Barangay Sta. Rita, Gordon Heights, Mabayuan 41
6 Barangay Barretto, 43
Also, there is 144 police personnel under the Public Safety Command. The office is equipped with a total of 98 high-powered firearms which are further classified into two (2) M203; three (3) Cal 7.62; eighty (80) Cal 5.56 including 8 units of NORINCO Rifles and thirteen (13) 12- gauge shotguns. Three hundred ninety-seven (397) short firearms with eight (8) pcs Cal 45 and three hundred eighty-nine (389) Cal 9MM. Donated by the City Government of Olongapo are a total of 27 units of communication equipment comprise of 10 base radio and 17 handheld radio and 012 cars and 23 motorcycles.
10.2 Police – population ratio.
The police to population ratio are 2 police personnel for every 1,000 individuals in 2020. This is based on the PNP’s projected 2020 population of 253,783 and 419 police personnel. The ratio is relatively below that of the country’s ratio of 1 : 817 and Region 3 at 1 : 1,054.
10.3 Types and volume of crime
Generally, the volume of crime is decreasing, within the past 7 years. The highest decline period was in the year 2014 with a 51% decline percentage. In 2017 the declining percentage was 30%. Likewise, the average monthly crime rate (AMCR) in 2020 was 31.52% lower than the previous AMCR in 2017 38.7%. Based on the Unit Crime Periodic Report (UCPER), considered as crimes against persons includes murder, homicide, physical injury, and rape cases. Considered crimes against property are robbery, theft, and carnapping. Crime solution efficiency (CSE) in 2020 was 89.06% higher compared to 2017 CSE at 64.3%. xliv
CSE is defined as the percentage of solved cases out of the total number of crime incidents handled by law enforcement agencies for a given period. Crime cleared efficiency (CCE) on the other hand has also increased in 2017 at 75.9% from the previous 2016 rate of 68.3%.
1,437
704 667
500
349 287
221
133
1,689
792 743
986
786
373
657
827
-
100
200
300
400
500
600
700
800
900
1,000
1,100
1,200
1,300
1,400
1,500
1,600
1,700
1,800
2013 2014 2015 2016 2017 2018 2019 2020
Chart 11. Crime Volume; 2013-2020
Index Crime
Non - Index Crime
Linear (Index Crime)
CHAPTER 10. PROTECTIVE SERVICES
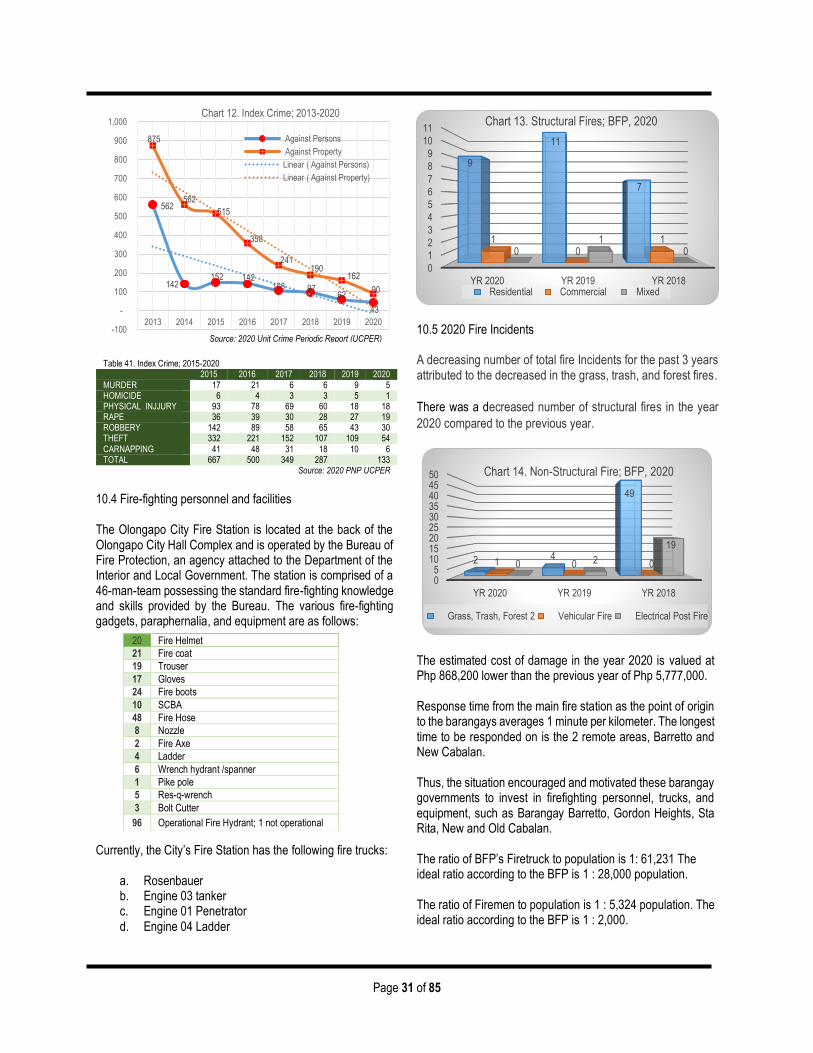
Page 31 of 85
Source: 2020 Unit Crime Periodic Report (UCPER)
Table 41. Index Crime; 2015-2020
2015 2016 2017 2018 2019 2020
MURDER 17 21 6 6 9 5 HOMICIDE 6 4 3 3 5 1 PHYSICAL INJJURY 93 78 69 60 18 18 RAPE 36 39 30 28 27 19 ROBBERY 142 89 58 65 43 30 THEFT 332 221 152 107 109 54
CARNAPPING 41 48 31 18 10 6 TOTAL 667 500 349 287 133
Source: 2020 PNP UCPER
10.4 Fire-fighting personnel and facilities The Olongapo City Fire Station is located at the back of the Olongapo City Hall Complex and is operated by the Bureau of Fire Protection, an agency attached to the Department of the Interior and Local Government. The station is comprised of a 46-man-team possessing the standard fire-fighting knowledge and skills provided by the Bureau. The various fire-fighting gadgets, paraphernalia, and equipment are as follows:
Currently, the City’s Fire Station has the following fire trucks:
a. Rosenbauer b. Engine 03 tanker c. Engine 01 Penetrator d. Engine 04 Ladder
10.5 2020 Fire Incidents A decreasing number of total fire Incidents for the past 3 years attributed to the decreased in the grass, trash, and forest fires.
There was a decreased number of structural fires in the year
2020 compared to the previous year.
The estimated cost of damage in the year 2020 is valued at Php 868,200 lower than the previous year of Php 5,777,000. Response time from the main fire station as the point of origin to the barangays averages 1 minute per kilometer. The longest time to be responded on is the 2 remote areas, Barretto and New Cabalan. Thus, the situation encouraged and motivated these barangay governments to invest in firefighting personnel, trucks, and equipment, such as Barangay Barretto, Gordon Heights, Sta Rita, New and Old Cabalan.
The ratio of BFP’s Firetruck to population is 1: 61,231 The ideal ratio according to the BFP is 1 : 28,000 population. The ratio of Firemen to population is 1 : 5,324 population. The ideal ratio according to the BFP is 1 : 2,000.
562
142 152 142
108 97 62
43
875
562
515
358
241 190
162
90
-100
-
100
200
300
400
500
600
700
800
900
1,000
2013 2014 2015 2016 2017 2018 2019 2020
Chart 12. Index Crime; 2013-2020
Against Persons
Against Property
Linear ( Against Persons)
Linear ( Against Property)
0
1
2
3
4
5
6
7
8
9
10
11
YR 2020 YR 2019 YR 2018
9
11
7
10
10
10
Chart 13. Structural Fires; BFP, 2020
Residential Commercial Mixed
05
101520253035404550
YR 2020 YR 2019 YR 2018
2 4
49
1 0 00 2
19
Chart 14. Non-Structural Fire; BFP, 2020
Grass, Trash, Forest 2 Vehicular Fire Electrical Post Fire
20 Fire Helmet
21 Fire coat
19 Trouser
17 Gloves
24 Fire boots
10 SCBA
48 Fire Hose
8 Nozzle
2 Fire Axe
4 Ladder
6 Wrench hydrant /spanner
1 Pike pole
5 Res-q-wrench
3 Bolt Cutter
96 Operational Fire Hydrant; 1 not operational
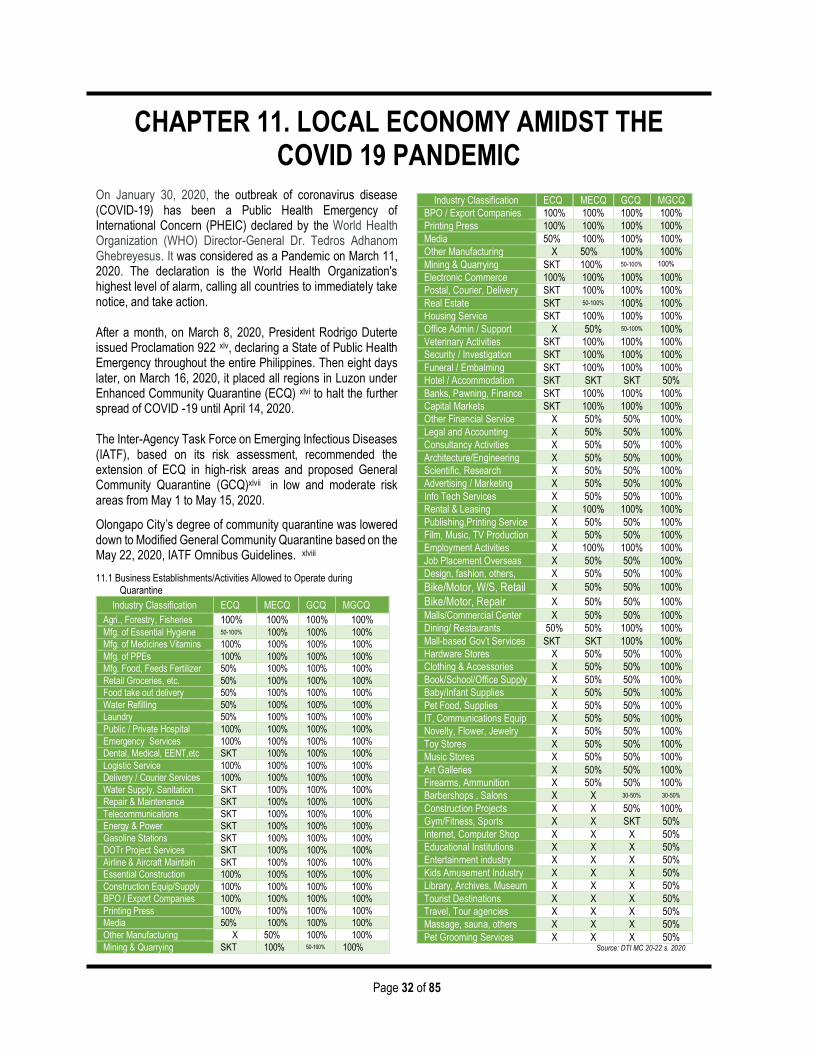
Page 32 of 85
On January 30, 2020, the outbreak of coronavirus disease (COVID-19) has been a Public Health Emergency of International Concern (PHEIC) declared by the World Health Organization (WHO) Director-General Dr. Tedros Adhanom Ghebreyesus. It was considered as a Pandemic on March 11, 2020. The declaration is the World Health Organization's highest level of alarm, calling all countries to immediately take notice, and take action. After a month, on March 8, 2020, President Rodrigo Duterte issued Proclamation 922 xlv, declaring a State of Public Health Emergency throughout the entire Philippines. Then eight days later, on March 16, 2020, it placed all regions in Luzon under Enhanced Community Quarantine (ECQ) xlvi to halt the further spread of COVID -19 until April 14, 2020. The Inter-Agency Task Force on Emerging Infectious Diseases (IATF), based on its risk assessment, recommended the extension of ECQ in high-risk areas and proposed General Community Quarantine (GCQ)xlvii in low and moderate risk areas from May 1 to May 15, 2020.
Olongapo City’s degree of community quarantine was lowered down to Modified General Community Quarantine based on the May 22, 2020, IATF Omnibus Guidelines. xlviii
11.1 Business Establishments/Activities Allowed to Operate during Quarantine
Industry Classification ECQ MECQ GCQ MGCQ
Agri., Forestry, Fisheries 100% 100% 100% 100% Mfg. of Essential Hygiene 50-100% 100% 100% 100% Mfg. of Medicines Vitamins 100% 100% 100% 100% Mfg. of PPEs 100% 100% 100% 100% Mfg. Food, Feeds Fertilizer 50% 100% 100% 100% Retail Groceries, etc. 50% 100% 100% 100% Food take out delivery 50% 100% 100% 100% Water Refilling 50% 100% 100% 100% Laundry 50% 100% 100% 100% Public / Private Hospital 100% 100% 100% 100% Emergency Services 100% 100% 100% 100% Dental, Medical, EENT,etc SKT 100% 100% 100% Logistic Service 100% 100% 100% 100% Delivery / Courier Services 100% 100% 100% 100% Water Supply, Sanitation SKT 100% 100% 100% Repair & Maintenance SKT 100% 100% 100% Telecommunications SKT 100% 100% 100% Energy & Power SKT 100% 100% 100% Gasoline Stations SKT 100% 100% 100% DOTr Project Services SKT 100% 100% 100% Airline & Aircraft Maintain SKT 100% 100% 100% Essential Construction 100% 100% 100% 100% Construction Equip/Supply 100% 100% 100% 100% BPO / Export Companies 100% 100% 100% 100% Printing Press 100% 100% 100% 100% Media 50% 100% 100% 100% Other Manufacturing X 50% 100% 100% Mining & Quarrying SKT 100% 50-100% 100%
Industry Classification ECQ MECQ GCQ MGCQ
BPO / Export Companies 100% 100% 100% 100% Printing Press 100% 100% 100% 100% Media 50% 100% 100% 100% Other Manufacturing X 50% 100% 100% Mining & Quarrying SKT 100% 50-100% 100%
Electronic Commerce 100% 100% 100% 100% Postal, Courier, Delivery SKT 100% 100% 100% Real Estate SKT 50-100% 100% 100% Housing Service SKT 100% 100% 100% Office Admin / Support X 50% 50-100% 100%
Veterinary Activities SKT 100% 100% 100% Security / Investigation SKT 100% 100% 100% Funeral / Embalming SKT 100% 100% 100% Hotel / Accommodation SKT SKT SKT 50%
Banks, Pawning, Finance SKT 100% 100% 100% Capital Markets SKT 100% 100% 100% Other Financial Service X 50% 50% 100%
Legal and Accounting X 50% 50% 100%
Consultancy Activities X 50% 50% 100%
Architecture/Engineering X 50% 50% 100%
Scientific, Research X 50% 50% 100%
Advertising / Marketing X 50% 50% 100%
Info Tech Services X 50% 50% 100%
Rental & Leasing X 100% 100% 100%
Publishing,Printing Service X 50% 50% 100%
Film, Music, TV Production X 50% 50% 100%
Employment Activities X 100% 100% 100%
Job Placement Overseas X 50% 50% 100%
Design, fashion, others, X 50% 50% 100%
Bike/Motor, W/S, Retail X 50% 50% 100%
Bike/Motor, Repair X 50% 50% 100%
Malls/Commercial Center X 50% 50% 100%
Dining/ Restaurants 50% 50% 100% 100%
Mall-based Gov’t Services SKT SKT 100% 100%
Hardware Stores X 50% 50% 100%
Clothing & Accessories X 50% 50% 100%
Book/School/Office Supply X 50% 50% 100%
Baby/Infant Supplies X 50% 50% 100%
Pet Food, Supplies X 50% 50% 100%
IT, Communications Equip X 50% 50% 100%
Novelty, Flower, Jewelry X 50% 50% 100%
Toy Stores X 50% 50% 100%
Music Stores X 50% 50% 100%
Art Galleries X 50% 50% 100%
Firearms, Ammunition X 50% 50% 100%
Barbershops , Salons X X 30-50% 30-50%
Construction Projects X X 50% 100%
Gym/Fitness, Sports X X SKT 50%
Internet, Computer Shop X X X 50%
Educational Institutions X X X 50%
Entertainment industry X X X 50%
Kids Amusement Industry X X X 50%
Library, Archives, Museum X X X 50%
Tourist Destinations X X X 50%
Travel, Tour agencies X X X 50%
Massage, sauna, others X X X 50%
Pet Grooming Services X X X 50% Source: DTI MC 20-22 s. 2020
CHAPTER 11. LOCAL ECONOMY AMIDST THE COVID 19 PANDEMIC
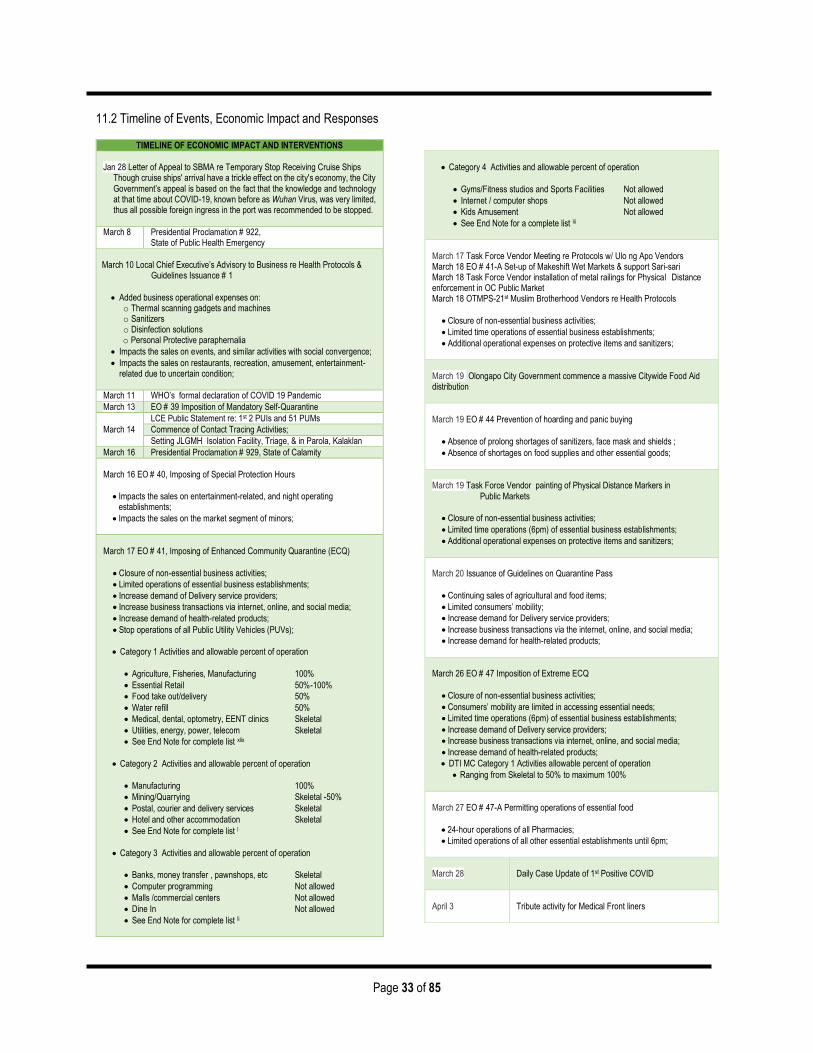
Page 33 of 85
11.2 Timeline of Events, Economic Impact and Responses
TIMELINE OF ECONOMIC IMPACT AND INTERVENTIONS
Jan 28 Letter of Appeal to SBMA re Temporary Stop Receiving Cruise Ships
Though cruise ships' arrival have a trickle effect on the city's economy, the City Government’s appeal is based on the fact that the knowledge and technology at that time about COVID-19, known before as Wuhan Virus, was very limited, thus all possible foreign ingress in the port was recommended to be stopped.
March 8 Presidential Proclamation # 922, State of Public Health Emergency
March 10 Local Chief Executive’s Advisory to Business re Health Protocols & Guidelines Issuance # 1
Added business operational expenses on: o Thermal scanning gadgets and machines o Sanitizers o Disinfection solutions o Personal Protective paraphernalia
Impacts the sales on events, and similar activities with social convergence;
Impacts the sales on restaurants, recreation, amusement, entertainment-related due to uncertain condition;
March 11 WHO’s formal declaration of COVID 19 Pandemic
March 13 EO # 39 Imposition of Mandatory Self-Quarantine
March 14
LCE Public Statement re: 1st 2 PUIs and 51 PUMs
Commence of Contact Tracing Activities;
Setting JLGMH Isolation Facility, Triage, & in Parola, Kalaklan
March 16 Presidential Proclamation # 929, State of Calamity
March 16 EO # 40, Imposing of Special Protection Hours
Impacts the sales on entertainment-related, and night operating establishments;
Impacts the sales on the market segment of minors;
March 17 EO # 41, Imposing of Enhanced Community Quarantine (ECQ)
Closure of non-essential business activities;
Limited operations of essential business establishments;
Increase demand of Delivery service providers;
Increase business transactions via internet, online, and social media;
Increase demand of health-related products;
Stop operations of all Public Utility Vehicles (PUVs);
Category 1 Activities and allowable percent of operation
Agriculture, Fisheries, Manufacturing 100%
Essential Retail 50%-100%
Food take out/delivery 50%
Water refill 50%
Medical, dental, optometry, EENT clinics Skeletal
Utilities, energy, power, telecom Skeletal
See End Note for complete list xlix
Category 2 Activities and allowable percent of operation
Manufacturing 100%
Mining/Quarrying Skeletal -50%
Postal, courier and delivery services Skeletal
Hotel and other accommodation Skeletal
See End Note for complete list l
Category 3 Activities and allowable percent of operation
Banks, money transfer , pawnshops, etc Skeletal
Computer programming Not allowed
Malls /commercial centers Not allowed
Dine In Not allowed
See End Note for complete list li
Category 4 Activities and allowable percent of operation
Gyms/Fitness studios and Sports Facilities Not allowed
Internet / computer shops Not allowed
Kids Amusement Not allowed
See End Note for a complete list lii
March 17 Task Force Vendor Meeting re Protocols w/ Ulo ng Apo Vendors March 18 EO # 41-A Set-up of Makeshift Wet Markets & support Sari-sari March 18 Task Force Vendor installation of metal railings for Physical Distance enforcement in OC Public Market March 18 OTMPS-21st Muslim Brotherhood Vendors re Health Protocols
Closure of non-essential business activities;
Limited time operations of essential business establishments;
Additional operational expenses on protective items and sanitizers;
March 19 Olongapo City Government commence a massive Citywide Food Aid distribution
March 19 EO # 44 Prevention of hoarding and panic buying
Absence of prolong shortages of sanitizers, face mask and shields ;
Absence of shortages on food supplies and other essential goods;
March 19 Task Force Vendor painting of Physical Distance Markers in Public Markets
Closure of non-essential business activities;
Limited time operations (6pm) of essential business establishments;
Additional operational expenses on protective items and sanitizers;
March 20 Issuance of Guidelines on Quarantine Pass
Continuing sales of agricultural and food items;
Limited consumers’ mobility;
Increase demand for Delivery service providers;
Increase business transactions via the internet, online, and social media;
Increase demand for health-related products;
March 26 EO # 47 Imposition of Extreme ECQ
Closure of non-essential business activities;
Consumers’ mobility are limited in accessing essential needs;
Limited time operations (6pm) of essential business establishments;
Increase demand of Delivery service providers;
Increase business transactions via internet, online, and social media;
Increase demand of health-related products;
DTI MC Category 1 Activities allowable percent of operation
Ranging from Skeletal to 50% to maximum 100%
March 27 EO # 47-A Permitting operations of essential food
24-hour operations of all Pharmacies;
Limited operations of all other essential establishments until 6pm;
March 28
Daily Case Update of 1st Positive COVID
April 3
Tribute activity for Medical Front liners
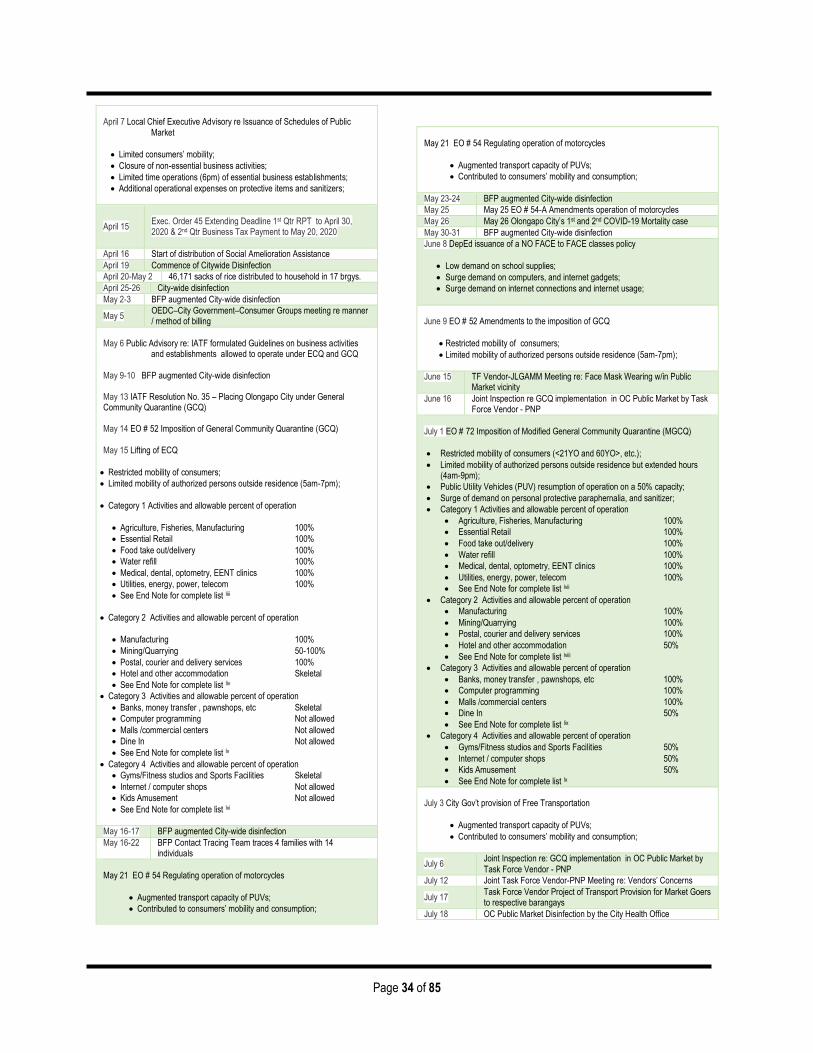
Page 34 of 85
April 7 Local Chief Executive Advisory re Issuance of Schedules of Public Market
Limited consumers’ mobility;
Closure of non-essential business activities;
Limited time operations (6pm) of essential business establishments;
Additional operational expenses on protective items and sanitizers;
April 15
Exec. Order 45 Extending Deadline 1st Qtr RPT to April 30, 2020 & 2nd Qtr Business Tax Payment to May 20, 2020
April 16 Start of distribution of Social Amelioration Assistance
April 19 Commence of Citywide Disinfection
April 20-May 2 46,171 sacks of rice distributed to household in 17 brgys.
April 25-26 City-wide disinfection
May 2-3 BFP augmented City-wide disinfection
May 5 OEDC–City Government–Consumer Groups meeting re manner / method of billing
May 6 Public Advisory re: IATF formulated Guidelines on business activities and establishments allowed to operate under ECQ and GCQ May 9-10 BFP augmented City-wide disinfection May 13 IATF Resolution No. 35 – Placing Olongapo City under General Community Quarantine (GCQ) May 14 EO # 52 Imposition of General Community Quarantine (GCQ)
May 15 Lifting of ECQ
Restricted mobility of consumers;
Limited mobility of authorized persons outside residence (5am-7pm);
Category 1 Activities and allowable percent of operation
Agriculture, Fisheries, Manufacturing 100%
Essential Retail 100%
Food take out/delivery 100%
Water refill 100%
Medical, dental, optometry, EENT clinics 100%
Utilities, energy, power, telecom 100%
See End Note for complete list liii
Category 2 Activities and allowable percent of operation
Manufacturing 100%
Mining/Quarrying 50-100%
Postal, courier and delivery services 100%
Hotel and other accommodation Skeletal
See End Note for complete list liv
Category 3 Activities and allowable percent of operation
Banks, money transfer , pawnshops, etc Skeletal
Computer programming Not allowed
Malls /commercial centers Not allowed
Dine In Not allowed
See End Note for complete list lv
Category 4 Activities and allowable percent of operation
Gyms/Fitness studios and Sports Facilities Skeletal
Internet / computer shops Not allowed
Kids Amusement Not allowed
See End Note for complete list lvi
May 16-17 BFP augmented City-wide disinfection
May 16-22 BFP Contact Tracing Team traces 4 families with 14 individuals
May 21 EO # 54 Regulating operation of motorcycles
Augmented transport capacity of PUVs;
Contributed to consumers’ mobility and consumption;
May 21 EO # 54 Regulating operation of motorcycles
Augmented transport capacity of PUVs;
Contributed to consumers’ mobility and consumption;
May 23-24 BFP augmented City-wide disinfection
May 25 May 25 EO # 54-A Amendments operation of motorcycles
May 26 May 26 Olongapo City’s 1st and 2nd COVID-19 Mortality case
May 30-31 BFP augmented City-wide disinfection
June 8 DepEd issuance of a NO FACE to FACE classes policy
Low demand on school supplies;
Surge demand on computers, and internet gadgets;
Surge demand on internet connections and internet usage;
June 9 EO # 52 Amendments to the imposition of GCQ
Restricted mobility of consumers;
Limited mobility of authorized persons outside residence (5am-7pm);
June 15 TF Vendor-JLGAMM Meeting re: Face Mask Wearing w/in Public Market vicinity
June 16 Joint Inspection re GCQ implementation in OC Public Market by Task Force Vendor - PNP
July 1 EO # 72 Imposition of Modified General Community Quarantine (MGCQ)
Restricted mobility of consumers (<21YO and 60YO>, etc.);
Limited mobility of authorized persons outside residence but extended hours (4am-9pm);
Public Utility Vehicles (PUV) resumption of operation on a 50% capacity;
Surge of demand on personal protective paraphernalia, and sanitizer;
Category 1 Activities and allowable percent of operation
Agriculture, Fisheries, Manufacturing 100%
Essential Retail 100%
Food take out/delivery 100%
Water refill 100%
Medical, dental, optometry, EENT clinics 100%
Utilities, energy, power, telecom 100%
See End Note for complete list lvii
Category 2 Activities and allowable percent of operation
Manufacturing 100%
Mining/Quarrying 100%
Postal, courier and delivery services 100%
Hotel and other accommodation 50%
See End Note for complete list lviii
Category 3 Activities and allowable percent of operation
Banks, money transfer , pawnshops, etc 100%
Computer programming 100%
Malls /commercial centers 100%
Dine In 50%
See End Note for complete list lix
Category 4 Activities and allowable percent of operation
Gyms/Fitness studios and Sports Facilities 50%
Internet / computer shops 50%
Kids Amusement 50%
See End Note for complete list lx
July 3 City Gov’t provision of Free Transportation
Augmented transport capacity of PUVs;
Contributed to consumers’ mobility and consumption;
July 6 Joint Inspection re: GCQ implementation in OC Public Market by Task Force Vendor - PNP
July 12 Joint Task Force Vendor-PNP Meeting re: Vendors’ Concerns
July 17 Task Force Vendor Project of Transport Provision for Market Goers to respective barangays
July 18 OC Public Market Disinfection by the City Health Office
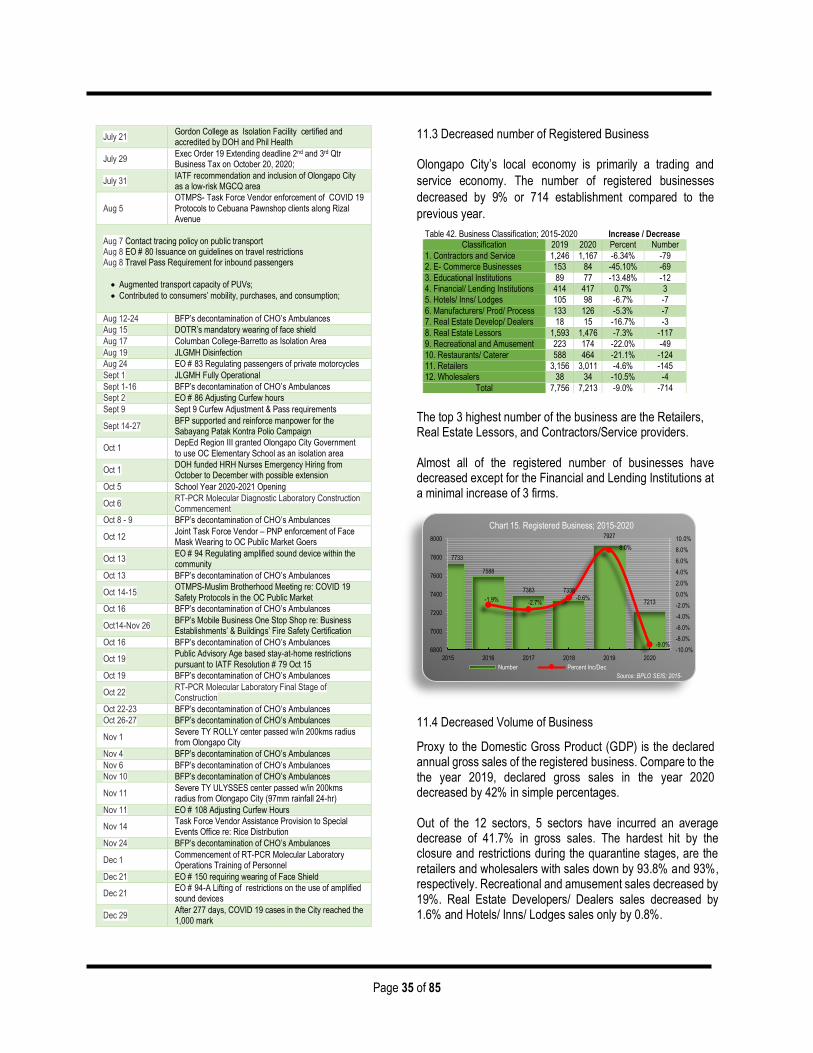
Page 35 of 85
11.3 Decreased number of Registered Business Olongapo City’s local economy is primarily a trading and
service economy. The number of registered businesses
decreased by 9% or 714 establishment compared to the
previous year.
The top 3 highest number of the business are the Retailers, Real Estate Lessors, and Contractors/Service providers. Almost all of the registered number of businesses have decreased except for the Financial and Lending Institutions at a minimal increase of 3 firms. 11.4 Decreased Volume of Business
Proxy to the Domestic Gross Product (GDP) is the declared annual gross sales of the registered business. Compare to the the year 2019, declared gross sales in the year 2020 decreased by 42% in simple percentages. Out of the 12 sectors, 5 sectors have incurred an average decrease of 41.7% in gross sales. The hardest hit by the closure and restrictions during the quarantine stages, are the retailers and wholesalers with sales down by 93.8% and 93%, respectively. Recreational and amusement sales decreased by 19%. Real Estate Developers/ Dealers sales decreased by 1.6% and Hotels/ Inns/ Lodges sales only by 0.8%.
July 21 Gordon College as Isolation Facility certified and accredited by DOH and Phil Health
July 29 Exec Order 19 Extending deadline 2nd and 3rd Qtr Business Tax on October 20, 2020;
July 31 IATF recommendation and inclusion of Olongapo City as a low-risk MGCQ area
Aug 5
OTMPS- Task Force Vendor enforcement of COVID 19
Protocols to Cebuana Pawnshop clients along Rizal Avenue
Aug 7 Contact tracing policy on public transport Aug 8 EO # 80 Issuance on guidelines on travel restrictions Aug 8 Travel Pass Requirement for inbound passengers
Augmented transport capacity of PUVs;
Contributed to consumers’ mobility, purchases, and consumption; Aug 12-24 BFP’s decontamination of CHO’s Ambulances
Aug 15 DOTR’s mandatory wearing of face shield
Aug 17 Columban College-Barretto as Isolation Area
Aug 19 JLGMH Disinfection
Aug 24 EO # 83 Regulating passengers of private motorcycles
Sept 1 JLGMH Fully Operational
Sept 1-16 BFP’s decontamination of CHO’s Ambulances
Sept 2 EO # 86 Adjusting Curfew hours
Sept 9 Sept 9 Curfew Adjustment & Pass requirements
Sept 14-27 BFP supported and reinforce manpower for the Sabayang Patak Kontra Polio Campaign
Oct 1 DepEd Region III granted Olongapo City Government to use OC Elementary School as an isolation area
Oct 1 DOH funded HRH Nurses Emergency Hiring from October to December with possible extension
Oct 5 School Year 2020-2021 Opening
Oct 6 RT-PCR Molecular Diagnostic Laboratory Construction Commencement
Oct 8 - 9 BFP’s decontamination of CHO’s Ambulances
Oct 12 Joint Task Force Vendor – PNP enforcement of Face Mask Wearing to OC Public Market Goers
Oct 13 EO # 94 Regulating amplified sound device within the community
Oct 13 BFP’s decontamination of CHO’s Ambulances
Oct 14-15 OTMPS-Muslim Brotherhood Meeting re: COVID 19 Safety Protocols in the OC Public Market
Oct 16 BFP’s decontamination of CHO’s Ambulances
Oct14-Nov 26 BFP’s Mobile Business One Stop Shop re: Business Establishments’ & Buildings’ Fire Safety Certification
Oct 16 BFP’s decontamination of CHO’s Ambulances
Oct 19 Public Advisory Age based stay-at-home restrictions pursuant to IATF Resolution # 79 Oct 15
Oct 19 BFP’s decontamination of CHO’s Ambulances
Oct 22 RT-PCR Molecular Laboratory Final Stage of Construction
Oct 22-23 BFP’s decontamination of CHO’s Ambulances
Oct 26-27 BFP’s decontamination of CHO’s Ambulances
Nov 1 Severe TY ROLLY center passed w/in 200kms radius from Olongapo City
Nov 4 BFP’s decontamination of CHO’s Ambulances
Nov 6 BFP’s decontamination of CHO’s Ambulances
Nov 10 BFP’s decontamination of CHO’s Ambulances
Nov 11 Severe TY ULYSSES center passed w/in 200kms radius from Olongapo City (97mm rainfall 24-hr)
Nov 11 EO # 108 Adjusting Curfew Hours
Nov 14 Task Force Vendor Assistance Provision to Special Events Office re: Rice Distribution
Nov 24 BFP’s decontamination of CHO’s Ambulances
Dec 1 Commencement of RT-PCR Molecular Laboratory Operations Training of Personnel
Dec 21 EO # 150 requiring wearing of Face Shield
Dec 21 EO # 94-A Lifting of restrictions on the use of amplified sound devices
Dec 29 After 277 days, COVID 19 cases in the City reached the 1,000 mark
Table 42. Business Classification; 2015-2020 Increase / Decrease Classification 2019 2020 Percent Number
1. Contractors and Service 1,246 1,167 -6.34% -79 2. E- Commerce Businesses 153 84 -45.10% -69
3. Educational Institutions 89 77 -13.48% -12 4. Financial/ Lending Institutions 414 417 0.7% 3 5. Hotels/ Inns/ Lodges 105 98 -6.7% -7
6. Manufacturers/ Prod/ Process 133 126 -5.3% -7 7. Real Estate Develop/ Dealers 18 15 -16.7% -3
8. Real Estate Lessors 1,593 1,476 -7.3% -117
9. Recreational and Amusement 223 174 -22.0% -49
10. Restaurants/ Caterer 588 464 -21.1% -124 11. Retailers 3,156 3,011 -4.6% -145 12. Wholesalers 38 34 -10.5% -4
Total 7,756 7,213 -9.0% -714
7733
7588
7383 7338
7927
7213-1.9% -2.7%-0.6%
8.0%
-9.0%-10.0%
-8.0%
-6.0%
-4.0%
-2.0%
0.0%
2.0%
4.0%
6.0%
8.0%
10.0%
6800
7000
7200
7400
7600
7800
8000
2015 2016 2017 2018 2019 2020
Chart 15. Registered Business; 2015-2020
Number Percent Inc/Dec
Source: BPLO SEIS; 2015-
2020
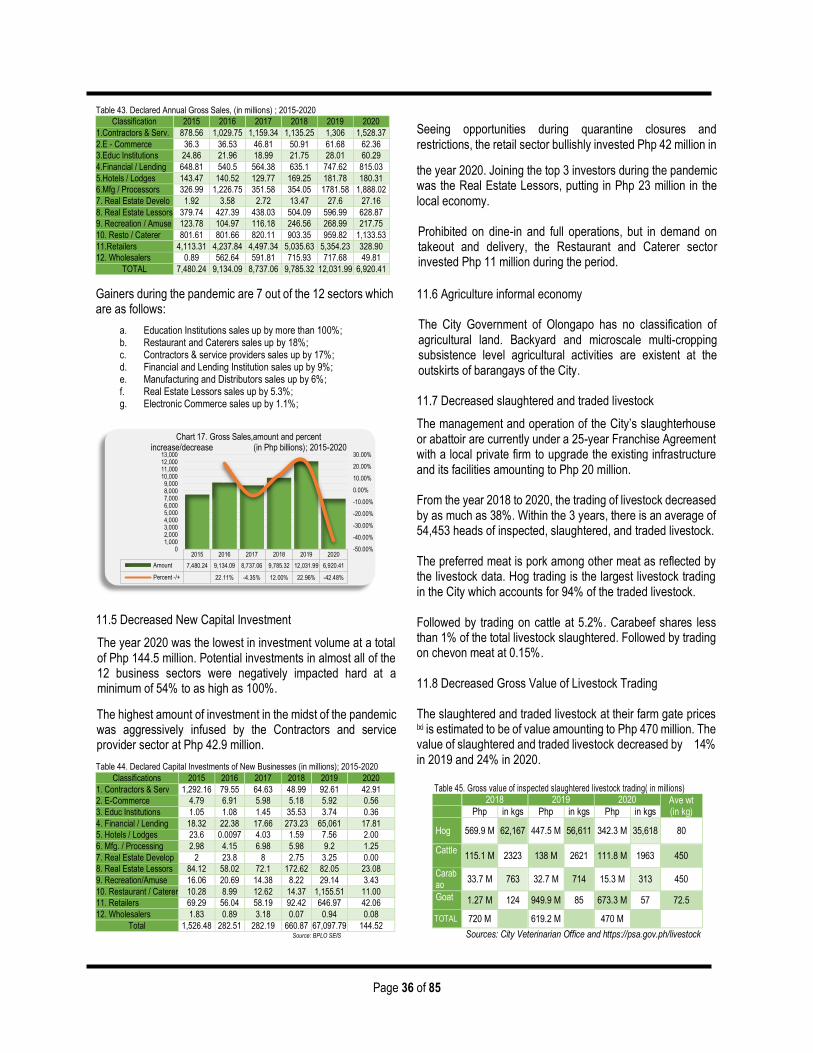
Page 36 of 85
Gainers during the pandemic are 7 out of the 12 sectors which are as follows:
a. Education Institutions sales up by more than 100%; b. Restaurant and Caterers sales up by 18%; c. Contractors & service providers sales up by 17%; d. Financial and Lending Institution sales up by 9%; e. Manufacturing and Distributors sales up by 6%; f. Real Estate Lessors sales up by 5.3%; g. Electronic Commerce sales up by 1.1%;
11.5 Decreased New Capital Investment
The year 2020 was the lowest in investment volume at a total of Php 144.5 million. Potential investments in almost all of the 12 business sectors were negatively impacted hard at a minimum of 54% to as high as 100%.
The highest amount of investment in the midst of the pandemic was aggressively infused by the Contractors and service provider sector at Php 42.9 million.
Table 44. Declared Capital Investments of New Businesses (in millions); 2015-2020
Classifications 2015 2016 2017 2018 2019 2020
1. Contractors & Serv 1,292.16 79.55 64.63 48.99 92.61 42.91
2. E-Commerce 4.79 6.91 5.98 5.18 5.92 0.56
3. Educ Institutions 1.05 1.08 1.45 35.53 3.74 0.36
4. Financial / Lending 18.32 22.38 17.66 273.23 65,061 17.81
5. Hotels / Lodges 23.6 0.0097 4.03 1.59 7.56 2.00
6. Mfg. / Processing 2.98 4.15 6.98 5.98 9.2 1.25
7. Real Estate Develop 2 23.8 8 2.75 3.25 0.00
8. Real Estate Lessors 84.12 58.02 72.1 172.62 82.05 23.08
9. Recreation/Amuse 16.06 20.69 14.38 8.22 29.14 3.43
10. Restaurant / Caterer 10.28 8.99 12.62 14.37 1,155.51 11.00
11. Retailers 69.29 56.04 58.19 92.42 646.97 42.06
12. Wholesalers 1.83 0.89 3.18 0.07 0.94 0.08
Total 1,526.48 282.51 282.19 660.87 67,097.79 144.52 Source: BPLO SEIS
Seeing opportunities during quarantine closures and restrictions, the retail sector bullishly invested Php 42 million in
the year 2020. Joining the top 3 investors during the pandemic was the Real Estate Lessors, putting in Php 23 million in the local economy. Prohibited on dine-in and full operations, but in demand on takeout and delivery, the Restaurant and Caterer sector invested Php 11 million during the period.
11.6 Agriculture informal economy The City Government of Olongapo has no classification of agricultural land. Backyard and microscale multi-cropping subsistence level agricultural activities are existent at the outskirts of barangays of the City. 11.7 Decreased slaughtered and traded livestock
The management and operation of the City’s slaughterhouse or abattoir are currently under a 25-year Franchise Agreement with a local private firm to upgrade the existing infrastructure and its facilities amounting to Php 20 million.
From the year 2018 to 2020, the trading of livestock decreased by as much as 38%. Within the 3 years, there is an average of 54,453 heads of inspected, slaughtered, and traded livestock.
The preferred meat is pork among other meat as reflected by the livestock data. Hog trading is the largest livestock trading in the City which accounts for 94% of the traded livestock. Followed by trading on cattle at 5.2%. Carabeef shares less than 1% of the total livestock slaughtered. Followed by trading on chevon meat at 0.15%. 11.8 Decreased Gross Value of Livestock Trading The slaughtered and traded livestock at their farm gate prices lxi is estimated to be of value amounting to Php 470 million. The value of slaughtered and traded livestock decreased by 14% in 2019 and 24% in 2020.
Table 45. Gross value of inspected slaughtered livestock trading( in millions) 2018 2019 2020 Ave wt
(in kg) Php in kgs Php in kgs Php in kgs
Hog 569.9 M 62,167 447.5 M 56,611 342.3 M 35,618 80
Cattle 115.1 M 2323 138 M 2621 111.8 M 1963 450
Carabao
33.7 M 763 32.7 M 714 15.3 M 313 450
Goat 1.27 M 124 949.9 M 85 673.3 M 57 72.5
TOTAL 720 M 619.2 M 470 M
Sources: City Veterinarian Office and https://psa.gov.ph/livestock
Table 43. Declared Annual Gross Sales, (in millions) ; 2015-2020
Classification 2015 2016 2017 2018 2019 2020
1.Contractors & Serv. 878.56 1,029.75 1,159.34 1,135.25 1,306 1,528.37
2.E - Commerce 36.3 36.53 46.81 50.91 61.68 62.36
3.Educ Institutions 24.86 21.96 18.99 21.75 28.01 60.29
4.Financial / Lending 648.81 540.5 564.38 635.1 747.62 815.03
5.Hotels / Lodges 143.47 140.52 129.77 169.25 181.78 180.31
6.Mfg / Processors 326.99 1,226.75 351.58 354.05 1781.58 1,888.02
7. Real Estate Develo 1.92 3.58 2.72 13.47 27.6 27.16
8. Real Estate Lessors 379.74 427.39 438.03 504.09 596.99 628.87
9. Recreation / Amuse 123.78 104.97 116.18 246.56 268.99 217.75
10. Resto / Caterer 801.61 801.66 820.11 903.35 959.82 1,133.53
11.Retailers 4,113.31 4,237.84 4,497.34 5,035.63 5,354.23 328.90
12. Wholesalers 0.89 562.64 591.81 715.93 717.68 49.81
TOTAL 7,480.24 9,134.09 8,737.06 9,785.32 12,031.99 6,920.41
2015 2016 2017 2018 2019 2020
Amount 7,480.24 9,134.09 8,737.06 9,785.32 12,031.99 6,920.41
Percent -/+ 22.11% -4.35% 12.00% 22.96% -42.48%
-50.00%
-40.00%
-30.00%
-20.00%
-10.00%
0.00%
10.00%
20.00%
30.00%
01,0002,0003,0004,0005,0006,0007,0008,0009,000
10,00011,00012,00013,000
Chart 17. Gross Sales,amount and percent increase/decrease (in Php billions); 2015-2020
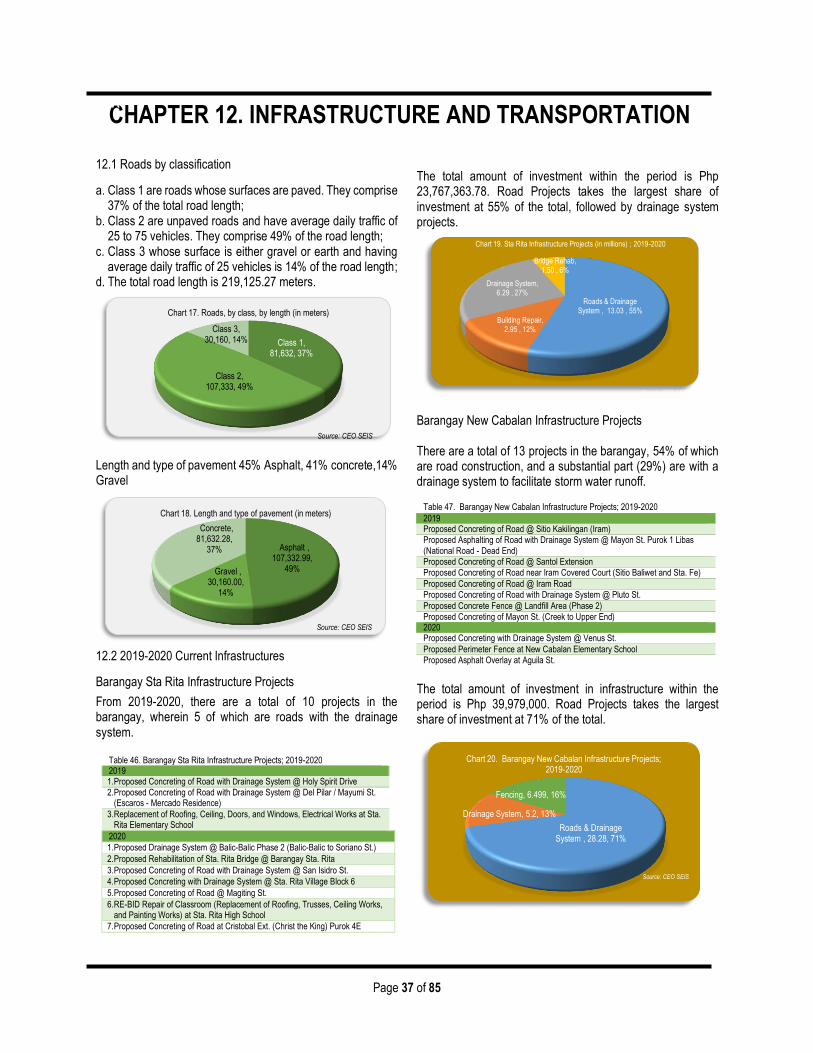
Page 37 of 85
Class 1, 81,632, 37%
Class 2, 107,333, 49%
Class 3, 30,160, 14%
Chart 17. Roads, by class, by length (in meters)
Asphalt , 107,332.99,
49%Gravel , 30,160.00,
14%
Concrete, 81,632.28,
37%
Chart 18. Length and type of pavement (in meters)
Source: CEO SEIS
Roads & Drainage System , 13.03 , 55%
Building Repair, 2.95 , 12%
Drainage System, 6.29 , 27%
Bridge Rehab, 1.50 , 6%
Chart 19. Sta Rita Infrastructure Projects (in millions) ; 2019-2020
Roads & Drainage System , 28.28, 71%
Drainage System, 5.2, 13%
Fencing, 6.499, 16%
Chart 20. Barangay New Cabalan Infrastructure Projects; 2019-2020
CHAPTER 12. INFRASTRUCTURE AND TRANSPORTATION
CHA 12.1 Roads by classification
a. Class 1 are roads whose surfaces are paved. They comprise 37% of the total road length;
b. Class 2 are unpaved roads and have average daily traffic of 25 to 75 vehicles. They comprise 49% of the road length;
c. Class 3 whose surface is either gravel or earth and having average daily traffic of 25 vehicles is 14% of the road length;
d. The total road length is 219,125.27 meters. Length and type of pavement 45% Asphalt, 41% concrete,14% Gravel
12.2 2019-2020 Current Infrastructures
Barangay Sta Rita Infrastructure Projects
From 2019-2020, there are a total of 10 projects in the barangay, wherein 5 of which are roads with the drainage system.
Table 46. Barangay Sta Rita Infrastructure Projects; 2019-2020 2019 1. Proposed Concreting of Road with Drainage System @ Holy Spirit Drive 2. Proposed Concreting of Road with Drainage System @ Del Pilar / Mayumi St.
(Escaros - Mercado Residence)
3. Replacement of Roofing, Ceiling, Doors, and Windows, Electrical Works at Sta. Rita Elementary School
2020
1. Proposed Drainage System @ Balic-Balic Phase 2 (Balic-Balic to Soriano St.)
2. Proposed Rehabilitation of Sta. Rita Bridge @ Barangay Sta. Rita
3. Proposed Concreting of Road with Drainage System @ San Isidro St.
4. Proposed Concreting with Drainage System @ Sta. Rita Village Block 6
5. Proposed Concreting of Road @ Magiting St.
6. RE-BID Repair of Classroom (Replacement of Roofing, Trusses, Ceiling Works, and Painting Works) at Sta. Rita High School
7. Proposed Concreting of Road at Cristobal Ext. (Christ the King) Purok 4E
The total amount of investment within the period is Php 23,767,363.78. Road Projects takes the largest share of investment at 55% of the total, followed by drainage system projects. Barangay New Cabalan Infrastructure Projects
There are a total of 13 projects in the barangay, 54% of which are road construction, and a substantial part (29%) are with a drainage system to facilitate storm water runoff.
Table 47. Barangay New Cabalan Infrastructure Projects; 2019-2020
2019 Proposed Concreting of Road @ Sitio Kakilingan (Iram) Proposed Asphalting of Road with Drainage System @ Mayon St. Purok 1 Libas (National Road - Dead End) Proposed Concreting of Road @ Santol Extension Proposed Concreting of Road near Iram Covered Court (Sitio Baliwet and Sta. Fe)
Proposed Concreting of Road @ Iram Road Proposed Concreting of Road with Drainage System @ Pluto St.
Proposed Concrete Fence @ Landfill Area (Phase 2) Proposed Concreting of Mayon St. (Creek to Upper End) 2020 Proposed Concreting with Drainage System @ Venus St.
Proposed Perimeter Fence at New Cabalan Elementary School Proposed Asphalt Overlay at Aguila St.
The total amount of investment in infrastructure within the period is Php 39,979,000. Road Projects takes the largest share of investment at 71% of the total.
Source: CEO SEIS
Source: CEO SEIS
Source: CEO SEIS
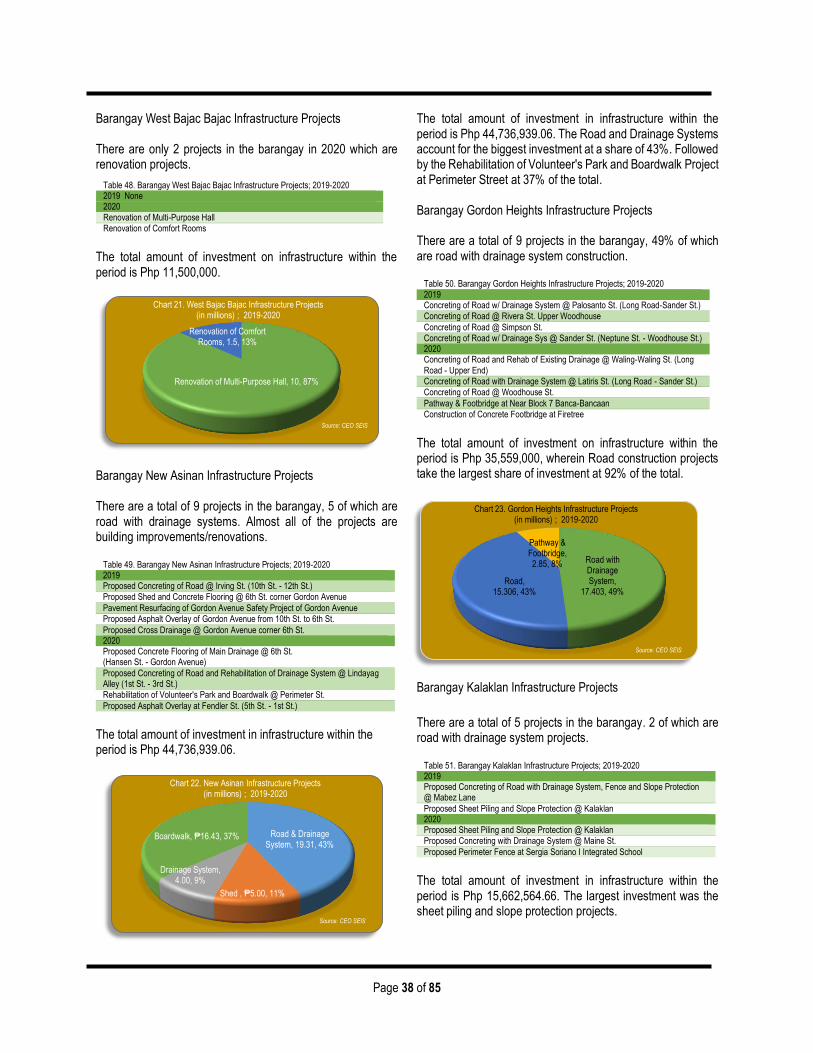
Page 38 of 85
Road & Drainage System, 19.31, 43%
Shed , ₱5.00, 11%
Drainage System, 4.00, 9%
Boardwalk, ₱16.43, 37%
Chart 22. New Asinan Infrastructure Projects (in millions) ; 2019-2020
Road with Drainage System,
17.403, 49%Road,
15.306, 43%
Pathway & Footbridge, 2.85, 8%
Chart 23. Gordon Heights Infrastructure Projects (in millions) ; 2019-2020
Barangay West Bajac Bajac Infrastructure Projects
There are only 2 projects in the barangay in 2020 which are renovation projects.
Table 48. Barangay West Bajac Bajac Infrastructure Projects; 2019-2020 2019 None 2020 Renovation of Multi-Purpose Hall Renovation of Comfort Rooms
The total amount of investment on infrastructure within the period is Php 11,500,000.
Barangay New Asinan Infrastructure Projects There are a total of 9 projects in the barangay, 5 of which are road with drainage systems. Almost all of the projects are building improvements/renovations.
Table 49. Barangay New Asinan Infrastructure Projects; 2019-2020 2019 Proposed Concreting of Road @ Irving St. (10th St. - 12th St.) Proposed Shed and Concrete Flooring @ 6th St. corner Gordon Avenue
Pavement Resurfacing of Gordon Avenue Safety Project of Gordon Avenue Proposed Asphalt Overlay of Gordon Avenue from 10th St. to 6th St.
Proposed Cross Drainage @ Gordon Avenue corner 6th St. 2020 Proposed Concrete Flooring of Main Drainage @ 6th St. (Hansen St. - Gordon Avenue)
Proposed Concreting of Road and Rehabilitation of Drainage System @ Lindayag Alley (1st St. - 3rd St.) Rehabilitation of Volunteer's Park and Boardwalk @ Perimeter St.
Proposed Asphalt Overlay at Fendler St. (5th St. - 1st St.)
The total amount of investment in infrastructure within the period is Php 44,736,939.06.
The total amount of investment in infrastructure within the period is Php 44,736,939.06. The Road and Drainage Systems account for the biggest investment at a share of 43%. Followed by the Rehabilitation of Volunteer's Park and Boardwalk Project at Perimeter Street at 37% of the total. Barangay Gordon Heights Infrastructure Projects There are a total of 9 projects in the barangay, 49% of which are road with drainage system construction.
Table 50. Barangay Gordon Heights Infrastructure Projects; 2019-2020 2019 Concreting of Road w/ Drainage System @ Palosanto St. (Long Road-Sander St.) Concreting of Road @ Rivera St. Upper Woodhouse
Concreting of Road @ Simpson St. Concreting of Road w/ Drainage Sys @ Sander St. (Neptune St. - Woodhouse St.) 2020 Concreting of Road and Rehab of Existing Drainage @ Waling-Waling St. (Long
Road - Upper End) Concreting of Road with Drainage System @ Latiris St. (Long Road - Sander St.) Concreting of Road @ Woodhouse St.
Pathway & Footbridge at Near Block 7 Banca-Bancaan Construction of Concrete Footbridge at Firetree
The total amount of investment on infrastructure within the period is Php 35,559,000, wherein Road construction projects take the largest share of investment at 92% of the total. Barangay Kalaklan Infrastructure Projects
There are a total of 5 projects in the barangay. 2 of which are road with drainage system projects.
Table 51. Barangay Kalaklan Infrastructure Projects; 2019-2020 2019 Proposed Concreting of Road with Drainage System, Fence and Slope Protection @ Mabez Lane
Proposed Sheet Piling and Slope Protection @ Kalaklan 2020 Proposed Sheet Piling and Slope Protection @ Kalaklan Proposed Concreting with Drainage System @ Maine St.
Proposed Perimeter Fence at Sergia Soriano I Integrated School
The total amount of investment in infrastructure within the period is Php 15,662,564.66. The largest investment was the sheet piling and slope protection projects.
Renovation of Multi-Purpose Hall, 10, 87%
Renovation of Comfort Rooms, 1.5, 13%
Chart 21. West Bajac Bajac Infrastructure Projects (in millions) ; 2019-2020
Source: CEO SEIS
Source: CEO SEIS
Source: CEO SEIS
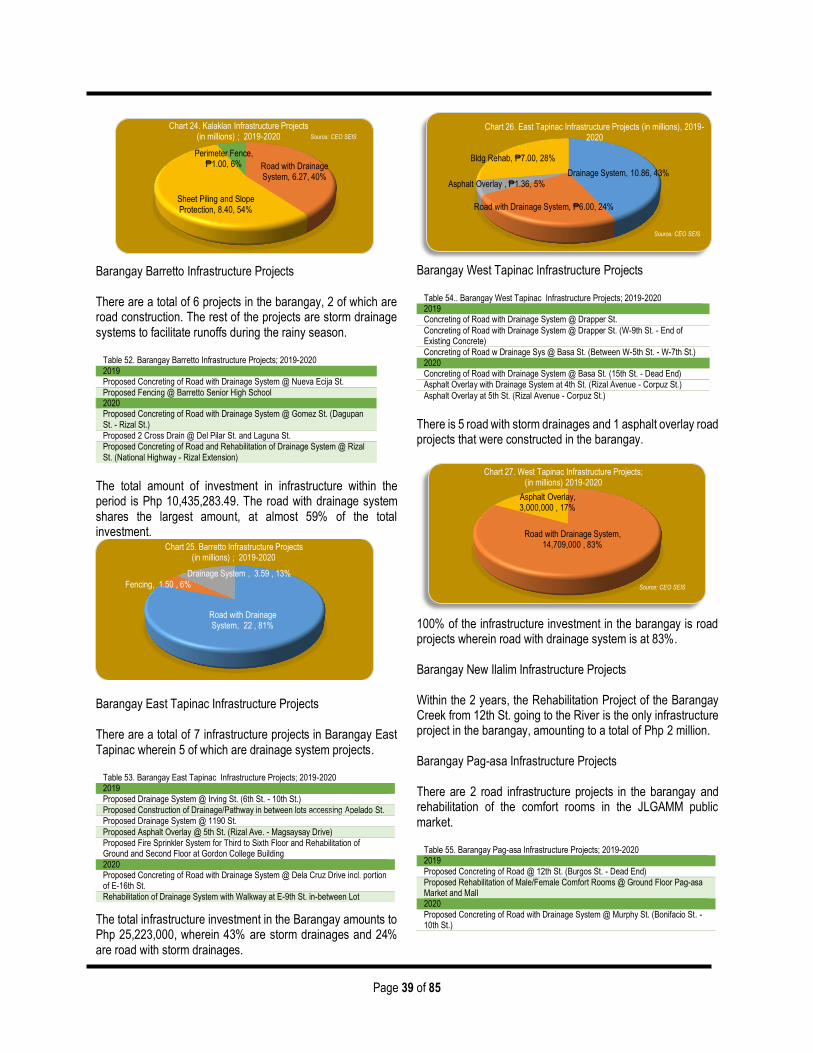
Page 39 of 85
Road with Drainage System, 6.27, 40%
Sheet Piling and Slope Protection, 8.40, 54%
Perimeter Fence, ₱1.00, 6%
Chart 24. Kalaklan Infrastructure Projects (in millions) ; 2019-2020
Barangay Barretto Infrastructure Projects There are a total of 6 projects in the barangay, 2 of which are road construction. The rest of the projects are storm drainage systems to facilitate runoffs during the rainy season.
Table 52. Barangay Barretto Infrastructure Projects; 2019-2020 2019 Proposed Concreting of Road with Drainage System @ Nueva Ecija St.
Proposed Fencing @ Barretto Senior High School 2020 Proposed Concreting of Road with Drainage System @ Gomez St. (Dagupan St. - Rizal St.) Proposed 2 Cross Drain @ Del Pilar St. and Laguna St.
Proposed Concreting of Road and Rehabilitation of Drainage System @ Rizal St. (National Highway - Rizal Extension)
The total amount of investment in infrastructure within the period is Php 10,435,283.49. The road with drainage system shares the largest amount, at almost 59% of the total investment.
Barangay East Tapinac Infrastructure Projects There are a total of 7 infrastructure projects in Barangay East Tapinac wherein 5 of which are drainage system projects.
Table 53. Barangay East Tapinac Infrastructure Projects; 2019-2020 2019 Proposed Drainage System @ Irving St. (6th St. - 10th St.) Proposed Construction of Drainage/Pathway in between lots accessing Apelado St. Proposed Drainage System @ 1190 St.
Proposed Asphalt Overlay @ 5th St. (Rizal Ave. - Magsaysay Drive) Proposed Fire Sprinkler System for Third to Sixth Floor and Rehabilitation of Ground and Second Floor at Gordon College Building 2020 Proposed Concreting of Road with Drainage System @ Dela Cruz Drive incl. portion of E-16th St. Rehabilitation of Drainage System with Walkway at E-9th St. in-between Lot
The total infrastructure investment in the Barangay amounts to Php 25,223,000, wherein 43% are storm drainages and 24% are road with storm drainages.
Barangay West Tapinac Infrastructure Projects
Table 54.. Barangay West Tapinac Infrastructure Projects; 2019-2020 2019 Concreting of Road with Drainage System @ Drapper St.
Concreting of Road with Drainage System @ Drapper St. (W-9th St. - End of Existing Concrete)
Concreting of Road w Drainage Sys @ Basa St. (Between W-5th St. - W-7th St.) 2020 Concreting of Road with Drainage System @ Basa St. (15th St. - Dead End) Asphalt Overlay with Drainage System at 4th St. (Rizal Avenue - Corpuz St.)
Asphalt Overlay at 5th St. (Rizal Avenue - Corpuz St.)
There is 5 road with storm drainages and 1 asphalt overlay road projects that were constructed in the barangay.
100% of the infrastructure investment in the barangay is road projects wherein road with drainage system is at 83%. Barangay New Ilalim Infrastructure Projects Within the 2 years, the Rehabilitation Project of the Barangay Creek from 12th St. going to the River is the only infrastructure project in the barangay, amounting to a total of Php 2 million. Barangay Pag-asa Infrastructure Projects There are 2 road infrastructure projects in the barangay and rehabilitation of the comfort rooms in the JLGAMM public market.
Table 55. Barangay Pag-asa Infrastructure Projects; 2019-2020 2019 Proposed Concreting of Road @ 12th St. (Burgos St. - Dead End) Proposed Rehabilitation of Male/Female Comfort Rooms @ Ground Floor Pag-asa Market and Mall 2020 Proposed Concreting of Road with Drainage System @ Murphy St. (Bonifacio St. - 10th St.)
Road with Drainage System, 22 , 81%
Fencing, 1.50 , 6%
Drainage System , 3.59 , 13%
Chart 25. Barretto Infrastructure Projects (in millions) ; 2019-2020
Drainage System, 10.86, 43%
Road with Drainage System, ₱6.00, 24%
Asphalt Overlay , ₱1.36, 5%
Bldg Rehab, ₱7.00, 28%
Chart 26. East Tapinac Infrastructure Projects (in millions), 2019-2020
Road with Drainage System, 14,709,000 , 83%
Asphalt Overlay, 3,000,000 , 17%
Chart 27. West Tapinac Infrastructure Projects; (in millions) 2019-2020
Source: CEO SEIS
Source: CEO SEIS
Source: CEO SEIS
Source: CEO SEIS
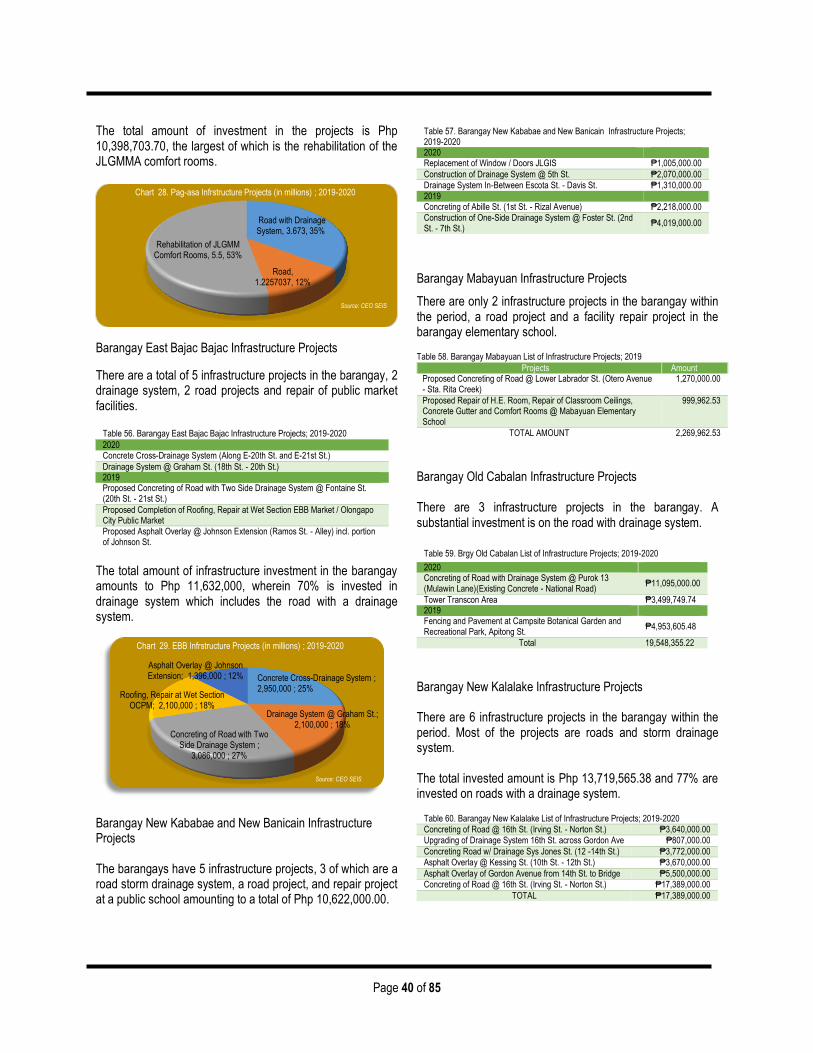
Page 40 of 85
The total amount of investment in the projects is Php 10,398,703.70, the largest of which is the rehabilitation of the JLGMMA comfort rooms.
Barangay East Bajac Bajac Infrastructure Projects
There are a total of 5 infrastructure projects in the barangay, 2 drainage system, 2 road projects and repair of public market facilities.
Table 56. Barangay East Bajac Bajac Infrastructure Projects; 2019-2020
2020 Concrete Cross-Drainage System (Along E-20th St. and E-21st St.)
Drainage System @ Graham St. (18th St. - 20th St.) 2019 Proposed Concreting of Road with Two Side Drainage System @ Fontaine St. (20th St. - 21st St.)
Proposed Completion of Roofing, Repair at Wet Section EBB Market / Olongapo City Public Market Proposed Asphalt Overlay @ Johnson Extension (Ramos St. - Alley) incl. portion of Johnson St.
The total amount of infrastructure investment in the barangay amounts to Php 11,632,000, wherein 70% is invested in drainage system which includes the road with a drainage system.
Barangay New Kababae and New Banicain Infrastructure Projects The barangays have 5 infrastructure projects, 3 of which are a road storm drainage system, a road project, and repair project at a public school amounting to a total of Php 10,622,000.00.
Table 57. Barangay New Kababae and New Banicain Infrastructure Projects; 2019-2020 2020 Replacement of Window / Doors JLGIS ₱1,005,000.00
Construction of Drainage System @ 5th St. ₱2,070,000.00
Drainage System In-Between Escota St. - Davis St. ₱1,310,000.00 2019 Concreting of Abille St. (1st St. - Rizal Avenue) ₱2,218,000.00 Construction of One-Side Drainage System @ Foster St. (2nd St. - 7th St.)
₱4,019,000.00
Barangay Mabayuan Infrastructure Projects
There are only 2 infrastructure projects in the barangay within the period, a road project and a facility repair project in the barangay elementary school. Table 58. Barangay Mabayuan List of Infrastructure Projects; 2019
Projects Amount Proposed Concreting of Road @ Lower Labrador St. (Otero Avenue - Sta. Rita Creek)
1,270,000.00
Proposed Repair of H.E. Room, Repair of Classroom Ceilings, Concrete Gutter and Comfort Rooms @ Mabayuan Elementary School
999,962.53
TOTAL AMOUNT 2,269,962.53
Barangay Old Cabalan Infrastructure Projects There are 3 infrastructure projects in the barangay. A substantial investment is on the road with drainage system.
Table 59. Brgy Old Cabalan List of Infrastructure Projects; 2019-2020
2020 Concreting of Road with Drainage System @ Purok 13 (Mulawin Lane)(Existing Concrete - National Road)
₱11,095,000.00
Tower Transcon Area ₱3,499,749.74 2019 Fencing and Pavement at Campsite Botanical Garden and Recreational Park, Apitong St.
₱4,953,605.48
Total 19,548,355.22
Barangay New Kalalake Infrastructure Projects There are 6 infrastructure projects in the barangay within the period. Most of the projects are roads and storm drainage system. The total invested amount is Php 13,719,565.38 and 77% are invested on roads with a drainage system.
Table 60. Barangay New Kalalake List of Infrastructure Projects; 2019-2020 Concreting of Road @ 16th St. (Irving St. - Norton St.) ₱3,640,000.00 Upgrading of Drainage System 16th St. across Gordon Ave ₱807,000.00
Concreting Road w/ Drainage Sys Jones St. (12 -14th St.) ₱3,772,000.00 Asphalt Overlay @ Kessing St. (10th St. - 12th St.) ₱3,670,000.00
Asphalt Overlay of Gordon Avenue from 14th St. to Bridge ₱5,500,000.00 Concreting of Road @ 16th St. (Irving St. - Norton St.) ₱17,389,000.00
TOTAL ₱17,389,000.00
Road with Drainage System, 3.673, 35%
Road, 1.2257037, 12%
Rehabilitation of JLGMM Comfort Rooms, 5.5, 53%
Chart 28. Pag-asa Infrstructure Projects (in millions) ; 2019-2020
Concrete Cross-Drainage System ; 2,950,000 ; 25%
Drainage System @ Graham St.; 2,100,000 ; 18%
Concreting of Road with Two Side Drainage System ;
3,086,000 ; 27%
Roofing, Repair at Wet Section OCPM; 2,100,000 ; 18%
Asphalt Overlay @ Johnson Extension; 1,396,000 ; 12%
Chart 29. EBB Infrstructure Projects (in millions) ; 2019-2020
Source: CEO SEIS
Source: CEO SEIS
Source: CEO SEIS
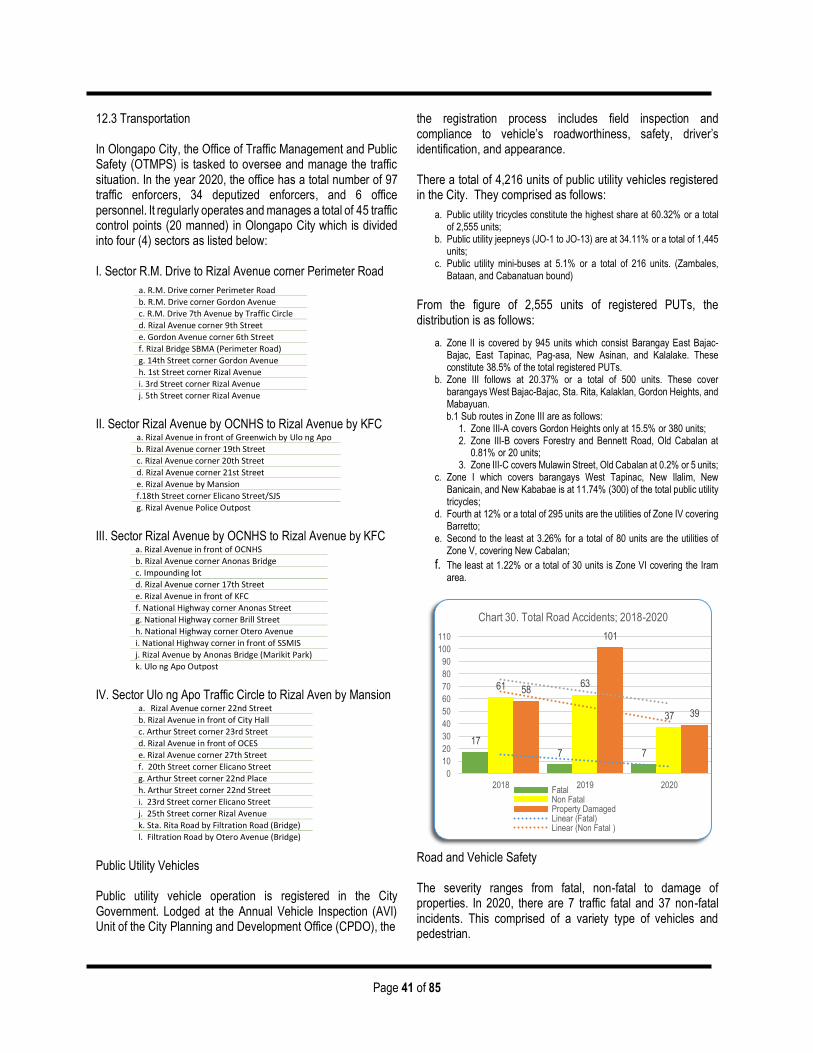
Page 41 of 85
12.3 Transportation In Olongapo City, the Office of Traffic Management and Public Safety (OTMPS) is tasked to oversee and manage the traffic situation. In the year 2020, the office has a total number of 97 traffic enforcers, 34 deputized enforcers, and 6 office personnel. It regularly operates and manages a total of 45 traffic control points (20 manned) in Olongapo City which is divided into four (4) sectors as listed below: I. Sector R.M. Drive to Rizal Avenue corner Perimeter Road
II. Sector Rizal Avenue by OCNHS to Rizal Avenue by KFC
a. Rizal Avenue in front of Greenwich by Ulo ng Apo
b. Rizal Avenue corner 19th Street
c. Rizal Avenue corner 20th Street
d. Rizal Avenue corner 21st Street
e. Rizal Avenue by Mansion
f.18th Street corner Elicano Street/SJS
g. Rizal Avenue Police Outpost
III. Sector Rizal Avenue by OCNHS to Rizal Avenue by KFC
a. Rizal Avenue in front of OCNHS
b. Rizal Avenue corner Anonas Bridge
c. Impounding lot
d. Rizal Avenue corner 17th Street
e. Rizal Avenue in front of KFC
f. National Highway corner Anonas Street
g. National Highway corner Brill Street
h. National Highway corner Otero Avenue
i. National Highway corner in front of SSMIS
j. Rizal Avenue by Anonas Bridge (Marikit Park)
k. Ulo ng Apo Outpost
IV. Sector Ulo ng Apo Traffic Circle to Rizal Aven by Mansion
a. Rizal Avenue corner 22nd Street
b. Rizal Avenue in front of City Hall
c. Arthur Street corner 23rd Street
d. Rizal Avenue in front of OCES
e. Rizal Avenue corner 27th Street
f. 20th Street corner Elicano Street
g. Arthur Street corner 22nd Place
h. Arthur Street corner 22nd Street
i. 23rd Street corner Elicano Street
j. 25th Street corner Rizal Avenue
k. Sta. Rita Road by Filtration Road (Bridge)
l. Filtration Road by Otero Avenue (Bridge)
Public Utility Vehicles Public utility vehicle operation is registered in the City Government. Lodged at the Annual Vehicle Inspection (AVI) Unit of the City Planning and Development Office (CPDO), the
the registration process includes field inspection and compliance to vehicle’s roadworthiness, safety, driver’s identification, and appearance.
There a total of 4,216 units of public utility vehicles registered in the City. They comprised as follows:
a. Public utility tricycles constitute the highest share at 60.32% or a total of 2,555 units;
b. Public utility jeepneys (JO-1 to JO-13) are at 34.11% or a total of 1,445 units;
c. Public utility mini-buses at 5.1% or a total of 216 units. (Zambales, Bataan, and Cabanatuan bound)
From the figure of 2,555 units of registered PUTs, the distribution is as follows:
a. Zone II is covered by 945 units which consist Barangay East Bajac-Bajac, East Tapinac, Pag-asa, New Asinan, and Kalalake. These constitute 38.5% of the total registered PUTs.
b. Zone III follows at 20.37% or a total of 500 units. These cover barangays West Bajac-Bajac, Sta. Rita, Kalaklan, Gordon Heights, and Mabayuan.
b.1 Sub routes in Zone III are as follows: 1. Zone III-A covers Gordon Heights only at 15.5% or 380 units; 2. Zone III-B covers Forestry and Bennett Road, Old Cabalan at
0.81% or 20 units; 3. Zone III-C covers Mulawin Street, Old Cabalan at 0.2% or 5 units;
c. Zone I which covers barangays West Tapinac, New Ilalim, New Banicain, and New Kababae is at 11.74% (300) of the total public utility tricycles;
d. Fourth at 12% or a total of 295 units are the utilities of Zone IV covering Barretto;
e. Second to the least at 3.26% for a total of 80 units are the utilities of Zone V, covering New Cabalan;
f. The least at 1.22% or a total of 30 units is Zone VI covering the Iram area.
Road and Vehicle Safety The severity ranges from fatal, non-fatal to damage of properties. In 2020, there are 7 traffic fatal and 37 non-fatal incidents. This comprised of a variety type of vehicles and pedestrian.
a. R.M. Drive corner Perimeter Road
b. R.M. Drive corner Gordon Avenue
c. R.M. Drive 7th Avenue by Traffic Circle
d. Rizal Avenue corner 9th Street
e. Gordon Avenue corner 6th Street
f. Rizal Bridge SBMA (Perimeter Road)
g. 14th Street corner Gordon Avenue
h. 1st Street corner Rizal Avenue
i. 3rd Street corner Rizal Avenue
j. 5th Street corner Rizal Avenue
177 7
61 63
37
58
101
39
0
10
20
30
40
50
60
70
80
90
100
110
2018 2019 2020
Chart 30. Total Road Accidents; 2018-2020
FatalNon FatalProperty DamagedLinear (Fatal)Linear (Non Fatal )
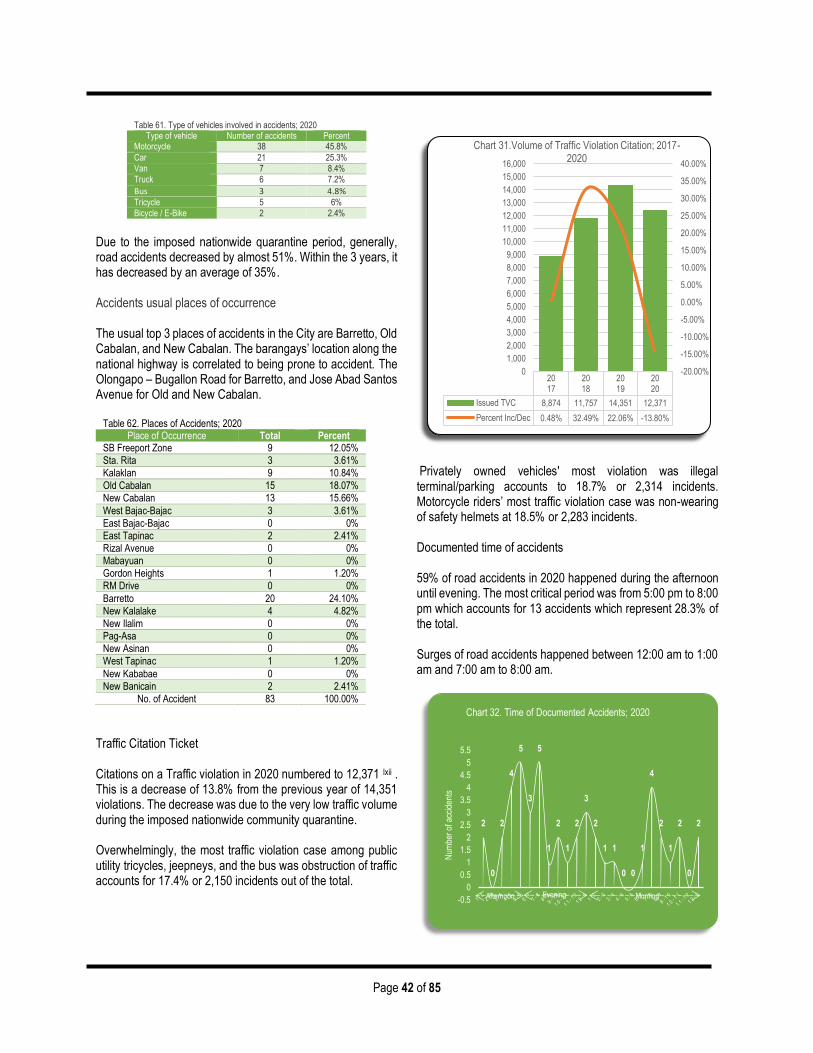
Page 42 of 85
Table 61. Type of vehicles involved in accidents; 2020 Type of vehicle Number of accidents Percent
Motorcycle 38 45.8%
Car 21 25.3% Van 7 8.4% Truck 6 7.2%
Bus 3 4.8% Tricycle 5 6% Bicycle / E-Bike 2 2.4%
Due to the imposed nationwide quarantine period, generally, road accidents decreased by almost 51%. Within the 3 years, it has decreased by an average of 35%. Accidents usual places of occurrence The usual top 3 places of accidents in the City are Barretto, Old Cabalan, and New Cabalan. The barangays’ location along the national highway is correlated to being prone to accident. The Olongapo – Bugallon Road for Barretto, and Jose Abad Santos Avenue for Old and New Cabalan.
Table 62. Places of Accidents; 2020 Place of Occurrence Total Percent
SB Freeport Zone 9 12.05%
Sta. Rita 3 3.61%
Kalaklan 9 10.84%
Old Cabalan 15 18.07%
New Cabalan 13 15.66%
West Bajac-Bajac 3 3.61%
East Bajac-Bajac 0 0%
East Tapinac 2 2.41%
Rizal Avenue 0 0%
Mabayuan 0 0%
Gordon Heights 1 1.20%
RM Drive 0 0%
Barretto 20 24.10%
New Kalalake 4 4.82%
New Ilalim 0 0%
Pag-Asa 0 0%
New Asinan 0 0%
West Tapinac 1 1.20%
New Kababae 0 0%
New Banicain 2 2.41%
No. of Accident 83 100.00%
Traffic Citation Ticket Citations on a Traffic violation in 2020 numbered to 12,371 lxii . This is a decrease of 13.8% from the previous year of 14,351 violations. The decrease was due to the very low traffic volume during the imposed nationwide community quarantine. Overwhelmingly, the most traffic violation case among public utility tricycles, jeepneys, and the bus was obstruction of traffic accounts for 17.4% or 2,150 incidents out of the total.
Privately owned vehicles' most violation was illegal terminal/parking accounts to 18.7% or 2,314 incidents. Motorcycle riders’ most traffic violation case was non-wearing of safety helmets at 18.5% or 2,283 incidents. Documented time of accidents 59% of road accidents in 2020 happened during the afternoon until evening. The most critical period was from 5:00 pm to 8:00 pm which accounts for 13 accidents which represent 28.3% of the total. Surges of road accidents happened between 12:00 am to 1:00 am and 7:00 am to 8:00 am.
2
0
2
4
5
3
5
1
2
1
2
3
2
1 1
0 0
1
4
2
1
2
0
2
-0.5
0
0.5
1
1.5
2
2.5
3
3.5
4
4.5
5
5.5
Num
ber
of a
ccid
ents
Chart 32. Time of Documented Accidents; 2020
MorningAfternoon
2017
2018
2019
2020
Issued TVC 8,874 11,757 14,351 12,371
Percent Inc/Dec 0.48% 32.49% 22.06% -13.80%
-20.00%
-15.00%
-10.00%
-5.00%
0.00%
5.00%
10.00%
15.00%
20.00%
25.00%
30.00%
35.00%
40.00%
0
1,000
2,000
3,000
4,000
5,000
6,000
7,000
8,000
9,000
10,000
11,000
12,000
13,000
14,000
15,000
16,000
Chart 31.Volume of Traffic Violation Citation; 2017-2020
Evening
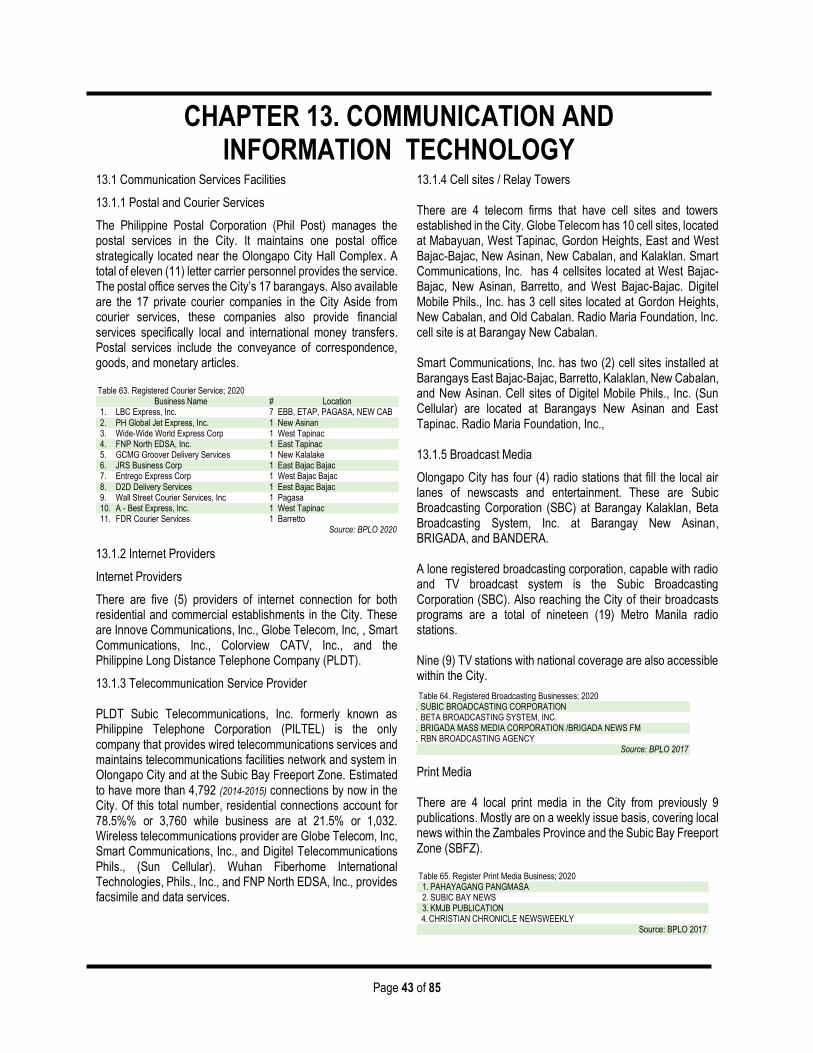
Page 43 of 85
CHAPTER 13. COMMUNICATION AND INFORMATION TECHNOLOGY
13.1 Communication Services Facilities
13.1.1 Postal and Courier Services
The Philippine Postal Corporation (Phil Post) manages the postal services in the City. It maintains one postal office strategically located near the Olongapo City Hall Complex. A total of eleven (11) letter carrier personnel provides the service. The postal office serves the City’s 17 barangays. Also available are the 17 private courier companies in the City Aside from courier services, these companies also provide financial services specifically local and international money transfers. Postal services include the conveyance of correspondence, goods, and monetary articles. Table 63. Registered Courier Service; 2020
Business Name # Location 1. LBC Express, Inc. 7 EBB, ETAP, PAGASA, NEW CAB 2. PH Global Jet Express, Inc. 1 New Asinan 3. Wide-Wide World Express Corp 1 West Tapinac 4. FNP North EDSA, Inc. 1 East Tapinac 5. GCMG Groover Delivery Services 1 New Kalalake 6. JRS Business Corp 1 East Bajac Bajac 7. Entrego Express Corp 1 West Bajac Bajac
8. D2D Delivery Services 1 Eest Bajac Bajac 9. Wall Street Courier Services, Inc 1 Pagasa 10. A - Best Express, Inc. 1 West Tapinac 11. FDR Courier Services 1 Barretto
Source: BPLO 2020
13.1.2 Internet Providers
Internet Providers
There are five (5) providers of internet connection for both residential and commercial establishments in the City. These are Innove Communications, Inc., Globe Telecom, Inc, , Smart Communications, Inc., Colorview CATV, Inc., and the Philippine Long Distance Telephone Company (PLDT).
13.1.3 Telecommunication Service Provider PLDT Subic Telecommunications, Inc. formerly known as Philippine Telephone Corporation (PILTEL) is the only company that provides wired telecommunications services and maintains telecommunications facilities network and system in Olongapo City and at the Subic Bay Freeport Zone. Estimated to have more than 4,792 (2014-2015) connections by now in the City. Of this total number, residential connections account for 78.5%% or 3,760 while business are at 21.5% or 1,032. Wireless telecommunications provider are Globe Telecom, Inc, Smart Communications, Inc., and Digitel Telecommunications Phils., (Sun Cellular). Wuhan Fiberhome International Technologies, Phils., Inc., and FNP North EDSA, Inc., provides facsimile and data services.
13.1.4 Cell sites / Relay Towers There are 4 telecom firms that have cell sites and towers established in the City. Globe Telecom has 10 cell sites, located at Mabayuan, West Tapinac, Gordon Heights, East and West Bajac-Bajac, New Asinan, New Cabalan, and Kalaklan. Smart Communications, Inc. has 4 cellsites located at West Bajac-Bajac, New Asinan, Barretto, and West Bajac-Bajac. Digitel Mobile Phils., Inc. has 3 cell sites located at Gordon Heights, New Cabalan, and Old Cabalan. Radio Maria Foundation, Inc. cell site is at Barangay New Cabalan. Smart Communications, Inc. has two (2) cell sites installed at Barangays East Bajac-Bajac, Barretto, Kalaklan, New Cabalan, and New Asinan. Cell sites of Digitel Mobile Phils., Inc. (Sun Cellular) are located at Barangays New Asinan and East Tapinac. Radio Maria Foundation, Inc., 13.1.5 Broadcast Media
Olongapo City has four (4) radio stations that fill the local air lanes of newscasts and entertainment. These are Subic Broadcasting Corporation (SBC) at Barangay Kalaklan, Beta Broadcasting System, Inc. at Barangay New Asinan, BRIGADA, and BANDERA. A lone registered broadcasting corporation, capable with radio and TV broadcast system is the Subic Broadcasting Corporation (SBC). Also reaching the City of their broadcasts programs are a total of nineteen (19) Metro Manila radio stations. Nine (9) TV stations with national coverage are also accessible within the City.
Table 64. Registered Broadcasting Businesses; 2020 1. SUBIC BROADCASTING CORPORATION 2. BETA BROADCASTING SYSTEM, INC. 3. BRIGADA MASS MEDIA CORPORATION /BRIGADA NEWS FM 4. RBN BROADCASTING AGENCY
Source: BPLO 2017
Print Media There are 4 local print media in the City from previously 9 publications. Mostly are on a weekly issue basis, covering local news within the Zambales Province and the Subic Bay Freeport Zone (SBFZ). Table 65. Register Print Media Business; 2020 1. PAHAYAGANG PANGMASA 2. SUBIC BAY NEWS 3. KMJB PUBLICATION 4. CHRISTIAN CHRONICLE NEWSWEEKLY
Source: BPLO 2017
Page 44 of 85
CHAPTER 14. INSTITUTIONAL DEVELOPMENT 14.1 Creation and Classification
June 1, 1966 - The City Government of Olongapo was created by virtue of Republic Act No. 4645; Classified as Highly Urbanized City December 7, 1983 – The City was classified as a highly urbanized city according to the provisions of Section 166 and 168 of the Local Government Code The City’s power and authority was later modified by Republic Act 7160 or the Local Government Code of 1991
This is vested in the Office of the City Mayor and through its various departments, divisions, branches, sections, and sub-sections, performing its primary and subsidiary functions following the rules and regulations governing the local government 14.2 Planning Function The City Government through the City Planning and Development Office (CPDO) maintains databases for planning, namely as follows:
1. The Socio-Economic Information System (SEIS) 2. The Community Based Information System (CBMS) 3. The Unified Land Information System (ULIS) 4. The Geographical Information System (GIS)
It has an approved Comprehensive Land Use Plan (CLUP) and Comprehensive Development Plan (CDP) which are due for updating. It likewise maintains a Local Development Investment Plan (LDIP) for the period of 2008-2013 formulated under a different administration from that of a period of conception of the CLUP and CDP. There are a total 226 programs, projects, and activities (PPAs) in the LDIP. Similarly, 226 projects and activities can be linked with the City’s Comprehensive Development Plan (CDP). This illustrates a connected LDIP to the general thrust of the City and vice versa, owing to the city’s continued compliance with mandated plans. Meanwhile, the operational linkage of the LDIP document to the Annual Investment Plan (AIP), which includes Supplemental AIPs was at a high 100%. Annual Investment Plans (AIP) PPAs are derived and are an annual slice of the LDIP.
The mandated Plans of the City area as follows:
1. Comprehensive Development Plan 2. Local Development Investment Program 3. Annual Investment Program 4. Comprehensive Land Use Plan 5. Revenue Generation Plan 6. Emergency Response Plan 7. Solid Waste Management Plan 8. Health Investment Plan 9. Barangay Development Plans 10. Gender and Development Plan 11. Executive-Legislative Agenda 12. Local Investment Plan for the Children
14.3 Existing Information Systems of the City 1. Socio-Economic Information System (SEIS) Set of designated statistics deemed vital and essential on
the city’s social and economic planning; City government offices and departments delegate the
task of managing the related designated statistics.
2. Unified Land Information System (ULIS) Consolidate all land-related information of all parcels of
land in the City; In digital form, all land data and information can be publicly
accessed in a virtual One-Stop workstation at the lobby of the City Hall and its component offices;
Unified information eliminates delays and red tape in processing land titling and resolving land disputes;
It accelerates decision-making, documentation processes on land titling, adjudication, property valuation, and access to other geographical information.
3. Geographic Information System (GIS) At the core of the city’s Unified Land Information System
is the installation of the Geographic Information System (GIS) which aims to integrate information related to land, economic activity, and even social activities geographically;
The program intended to diagnose and solve future land-related, real property, economic, and other relevant issues through GIS technology.
4. Business Permit & Licensing System (BPLS)
BPLD has started the implementation of the new Business Permit and Licensing System (BPLS Version 4i) in 2008;
The system computerizes and expedites the processing of Mayor’s permits and licenses;
CHAPTER 14. INSTITUTIONAL DEVELOPMENT
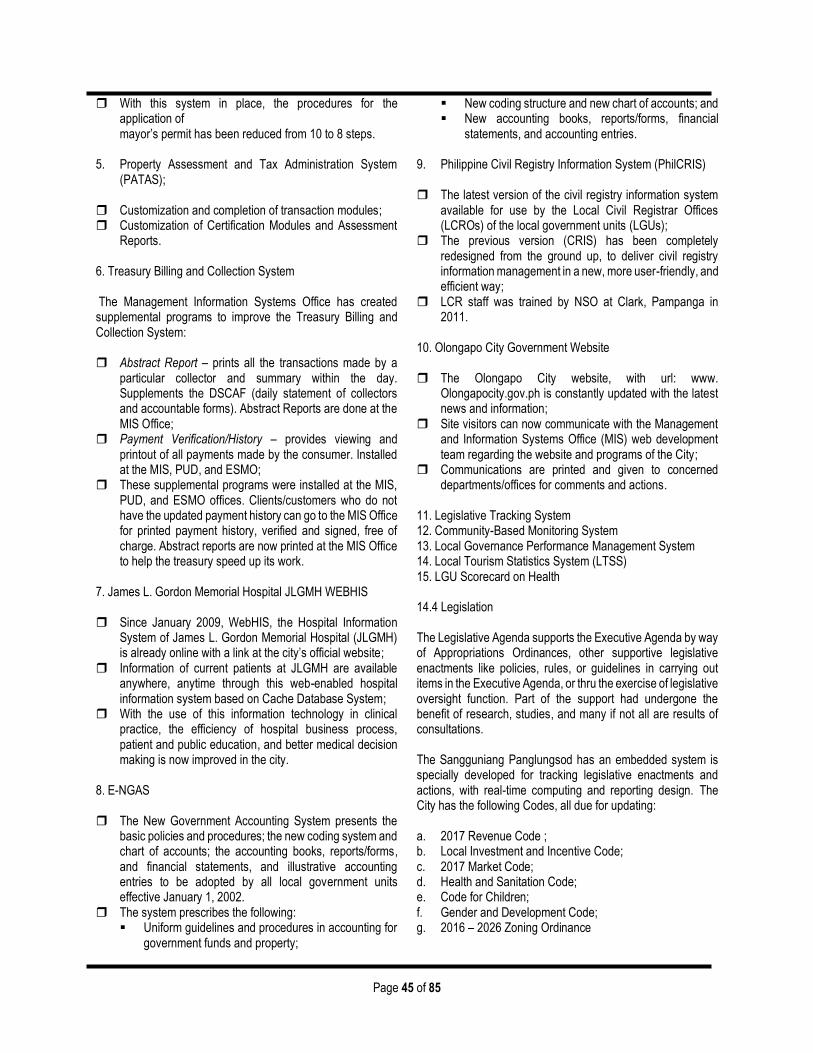
Page 45 of 85
With this system in place, the procedures for the application of mayor’s permit has been reduced from 10 to 8 steps.
5. Property Assessment and Tax Administration System (PATAS);
Customization and completion of transaction modules; Customization of Certification Modules and Assessment
Reports.
6. Treasury Billing and Collection System The Management Information Systems Office has created supplemental programs to improve the Treasury Billing and Collection System: Abstract Report – prints all the transactions made by a
particular collector and summary within the day. Supplements the DSCAF (daily statement of collectors and accountable forms). Abstract Reports are done at the MIS Office;
Payment Verification/History – provides viewing and printout of all payments made by the consumer. Installed at the MIS, PUD, and ESMO;
These supplemental programs were installed at the MIS, PUD, and ESMO offices. Clients/customers who do not have the updated payment history can go to the MIS Office for printed payment history, verified and signed, free of charge. Abstract reports are now printed at the MIS Office to help the treasury speed up its work.
7. James L. Gordon Memorial Hospital JLGMH WEBHIS
Since January 2009, WebHIS, the Hospital Information
System of James L. Gordon Memorial Hospital (JLGMH) is already online with a link at the city’s official website;
Information of current patients at JLGMH are available anywhere, anytime through this web-enabled hospital information system based on Cache Database System;
With the use of this information technology in clinical practice, the efficiency of hospital business process, patient and public education, and better medical decision making is now improved in the city.
8. E-NGAS The New Government Accounting System presents the
basic policies and procedures; the new coding system and chart of accounts; the accounting books, reports/forms, and financial statements, and illustrative accounting entries to be adopted by all local government units effective January 1, 2002.
The system prescribes the following: Uniform guidelines and procedures in accounting for
government funds and property;
New coding structure and new chart of accounts; and New accounting books, reports/forms, financial
statements, and accounting entries. 9. Philippine Civil Registry Information System (PhilCRIS)
The latest version of the civil registry information system
available for use by the Local Civil Registrar Offices (LCROs) of the local government units (LGUs);
The previous version (CRIS) has been completely redesigned from the ground up, to deliver civil registry information management in a new, more user-friendly, and efficient way;
LCR staff was trained by NSO at Clark, Pampanga in 2011.
10. Olongapo City Government Website The Olongapo City website, with url: www.
Olongapocity.gov.ph is constantly updated with the latest news and information;
Site visitors can now communicate with the Management and Information Systems Office (MIS) web development team regarding the website and programs of the City;
Communications are printed and given to concerned departments/offices for comments and actions.
11. Legislative Tracking System 12. Community-Based Monitoring System 13. Local Governance Performance Management System 14. Local Tourism Statistics System (LTSS) 15. LGU Scorecard on Health 14.4 Legislation The Legislative Agenda supports the Executive Agenda by way of Appropriations Ordinances, other supportive legislative enactments like policies, rules, or guidelines in carrying out items in the Executive Agenda, or thru the exercise of legislative oversight function. Part of the support had undergone the benefit of research, studies, and many if not all are results of consultations. The Sangguniang Panglungsod has an embedded system is specially developed for tracking legislative enactments and actions, with real-time computing and reporting design. The City has the following Codes, all due for updating: a. 2017 Revenue Code ; b. Local Investment and Incentive Code; c. 2017 Market Code; d. Health and Sanitation Code; e. Code for Children; f. Gender and Development Code; g. 2016 – 2026 Zoning Ordinance
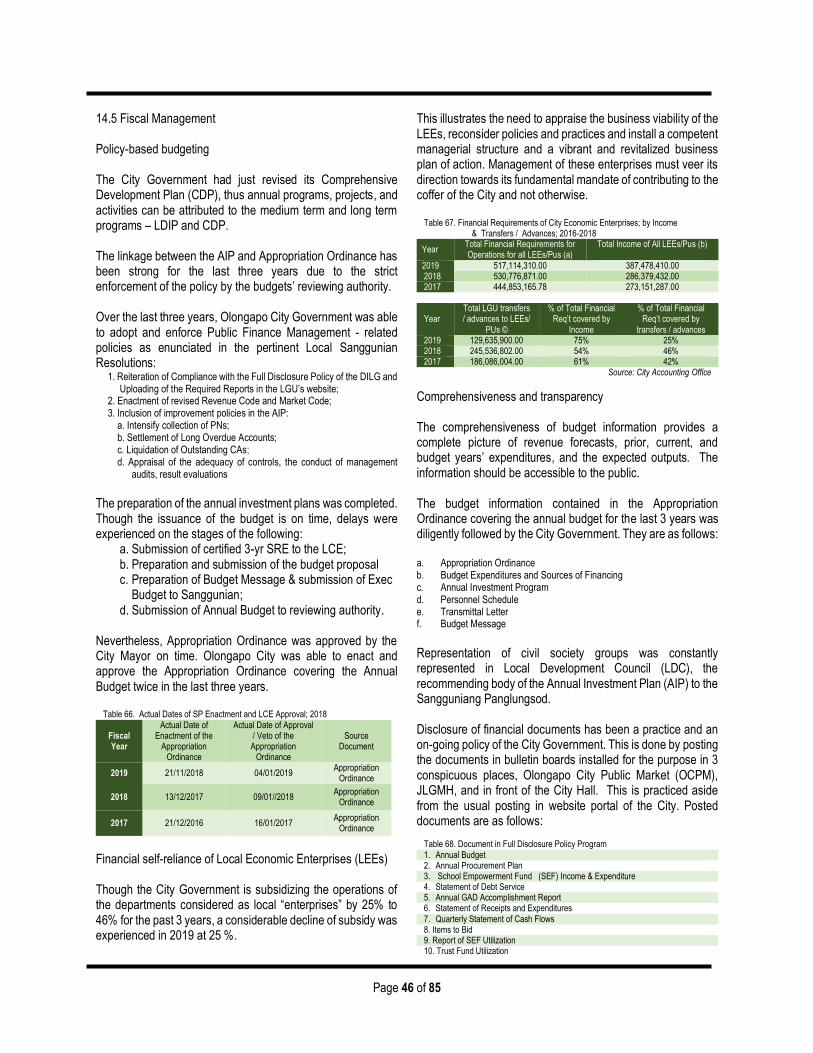
Page 46 of 85
14.5 Fiscal Management Policy-based budgeting The City Government had just revised its Comprehensive Development Plan (CDP), thus annual programs, projects, and activities can be attributed to the medium term and long term programs – LDIP and CDP.
The linkage between the AIP and Appropriation Ordinance has been strong for the last three years due to the strict enforcement of the policy by the budgets’ reviewing authority. Over the last three years, Olongapo City Government was able to adopt and enforce Public Finance Management - related policies as enunciated in the pertinent Local Sanggunian Resolutions:
1. Reiteration of Compliance with the Full Disclosure Policy of the DILG and Uploading of the Required Reports in the LGU’s website;
2. Enactment of revised Revenue Code and Market Code; 3. Inclusion of improvement policies in the AIP: a. Intensify collection of PNs; b. Settlement of Long Overdue Accounts; c. Liquidation of Outstanding CAs; d. Appraisal of the adequacy of controls, the conduct of management
audits, result evaluations
The preparation of the annual investment plans was completed. Though the issuance of the budget is on time, delays were experienced on the stages of the following:
a. Submission of certified 3-yr SRE to the LCE; b. Preparation and submission of the budget proposal c. Preparation of Budget Message & submission of Exec
Budget to Sanggunian; d. Submission of Annual Budget to reviewing authority.
Nevertheless, Appropriation Ordinance was approved by the City Mayor on time. Olongapo City was able to enact and approve the Appropriation Ordinance covering the Annual Budget twice in the last three years.
Table 66. Actual Dates of SP Enactment and LCE Approval; 2018
Fiscal Year
Actual Date of Enactment of the
Appropriation Ordinance
Actual Date of Approval / Veto of the
Appropriation Ordinance
Source Document
2019 21/11/2018 04/01/2019 Appropriation
Ordinance
2018 13/12/2017 09/01//2018 Appropriation
Ordinance
2017 21/12/2016 16/01/2017 Appropriation
Ordinance
Financial self-reliance of Local Economic Enterprises (LEEs) Though the City Government is subsidizing the operations of the departments considered as local “enterprises” by 25% to 46% for the past 3 years, a considerable decline of subsidy was experienced in 2019 at 25 %.
This illustrates the need to appraise the business viability of the LEEs, reconsider policies and practices and install a competent managerial structure and a vibrant and revitalized business plan of action. Management of these enterprises must veer its direction towards its fundamental mandate of contributing to the coffer of the City and not otherwise.
Table 67. Financial Requirements of City Economic Enterprises; by Income & Transfers / Advances; 2016-2018
Year Total Financial Requirements for Operations for all LEEs/Pus (a)
Total Income of All LEEs/Pus (b)
2019 517,114,310.00 387,478,410.00 2018 530,776,871.00 286,379,432.00 2017 444,853,165.78 273,151,287.00
Year Total LGU transfers / advances to LEEs/
PUs ©
% of Total Financial Req’t covered by
Income
% of Total Financial Req’t covered by
transfers / advances 2019 129,635,900.00 75% 25% 2018 245,536,802.00 54% 46% 2017 186,086,004.00 61% 42%
Source: City Accounting Office
Comprehensiveness and transparency The comprehensiveness of budget information provides a complete picture of revenue forecasts, prior, current, and budget years’ expenditures, and the expected outputs. The information should be accessible to the public. The budget information contained in the Appropriation Ordinance covering the annual budget for the last 3 years was diligently followed by the City Government. They are as follows: a. Appropriation Ordinance b. Budget Expenditures and Sources of Financing c. Annual Investment Program d. Personnel Schedule e. Transmittal Letter f. Budget Message
Representation of civil society groups was constantly represented in Local Development Council (LDC), the recommending body of the Annual Investment Plan (AIP) to the Sangguniang Panglungsod. Disclosure of financial documents has been a practice and an on-going policy of the City Government. This is done by posting the documents in bulletin boards installed for the purpose in 3 conspicuous places, Olongapo City Public Market (OCPM), JLGMH, and in front of the City Hall. This is practiced aside from the usual posting in website portal of the City. Posted documents are as follows:
Table 68. Document in Full Disclosure Policy Program 1. Annual Budget 2. Annual Procurement Plan 3. School Empowerment Fund (SEF) Income & Expenditure 4. Statement of Debt Service 5. Annual GAD Accomplishment Report 6. Statement of Receipts and Expenditures 7. Quarterly Statement of Cash Flows 8. Items to Bid 9. Report of SEF Utilization 10. Trust Fund Utilization
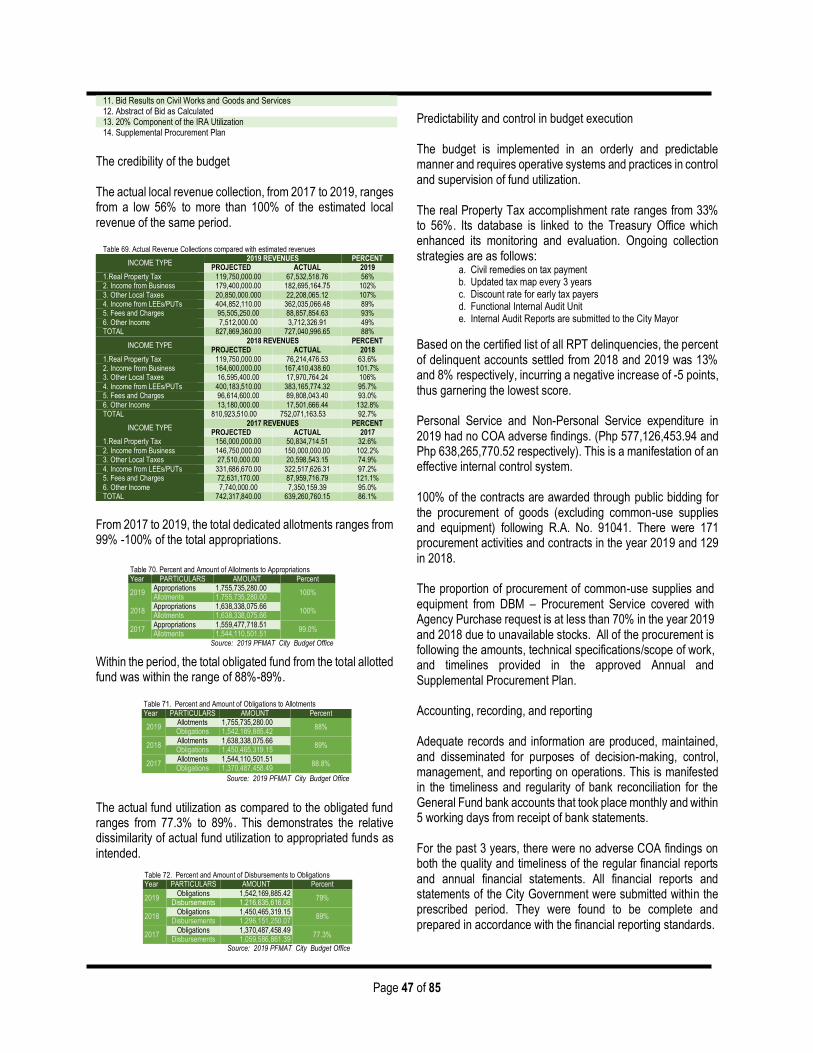
Page 47 of 85
11. Bid Results on Civil Works and Goods and Services 12. Abstract of Bid as Calculated 13. 20% Component of the IRA Utilization 14. Supplemental Procurement Plan
The credibility of the budget The actual local revenue collection, from 2017 to 2019, ranges from a low 56% to more than 100% of the estimated local revenue of the same period.
From 2017 to 2019, the total dedicated allotments ranges from 99% -100% of the total appropriations.
Within the period, the total obligated fund from the total allotted fund was within the range of 88%-89%.
Table 71. Percent and Amount of Obligations to Allotments Year PARTICULARS AMOUNT Percent
2019 Allotments 1,755,735,280.00
88% Obligations 1,542,169,885.42
2018 Allotments 1,638,338,075.66
89% Obligations 1,450,465,319.15
2017 Allotments 1,544,110,501.51
88.8% Obligations 1,370,487,458.49
Source: 2019 PFMAT City Budget Office
The actual fund utilization as compared to the obligated fund ranges from 77.3% to 89%. This demonstrates the relative dissimilarity of actual fund utilization to appropriated funds as intended.
Predictability and control in budget execution The budget is implemented in an orderly and predictable manner and requires operative systems and practices in control and supervision of fund utilization. The real Property Tax accomplishment rate ranges from 33% to 56%. Its database is linked to the Treasury Office which enhanced its monitoring and evaluation. Ongoing collection strategies are as follows:
a. Civil remedies on tax payment b. Updated tax map every 3 years c. Discount rate for early tax payers d. Functional Internal Audit Unit e. Internal Audit Reports are submitted to the City Mayor
Based on the certified list of all RPT delinquencies, the percent of delinquent accounts settled from 2018 and 2019 was 13% and 8% respectively, incurring a negative increase of -5 points, thus garnering the lowest score. Personal Service and Non-Personal Service expenditure in 2019 had no COA adverse findings. (Php 577,126,453.94 and Php 638,265,770.52 respectively). This is a manifestation of an effective internal control system. 100% of the contracts are awarded through public bidding for the procurement of goods (excluding common-use supplies and equipment) following R.A. No. 91041. There were 171 procurement activities and contracts in the year 2019 and 129 in 2018. The proportion of procurement of common-use supplies and equipment from DBM – Procurement Service covered with Agency Purchase request is at less than 70% in the year 2019 and 2018 due to unavailable stocks. All of the procurement is following the amounts, technical specifications/scope of work, and timelines provided in the approved Annual and Supplemental Procurement Plan. Accounting, recording, and reporting Adequate records and information are produced, maintained, and disseminated for purposes of decision-making, control, management, and reporting on operations. This is manifested in the timeliness and regularity of bank reconciliation for the General Fund bank accounts that took place monthly and within 5 working days from receipt of bank statements. For the past 3 years, there were no adverse COA findings on both the quality and timeliness of the regular financial reports and annual financial statements. All financial reports and statements of the City Government were submitted within the prescribed period. They were found to be complete and prepared in accordance with the financial reporting standards.
Table 69. Actual Revenue Collections compared with estimated revenues
INCOME TYPE 2019 REVENUES PERCENT
PROJECTED ACTUAL 2019 1.Real Property Tax 119,750,000.00 67,532,518.76 56% 2. Income from Business 179,400,000.00 182,695,164.75 102% 3. Other Local Taxes 20,850,000.000 22,208,065.12 107% 4. Income from LEEs/PUTs 404,852,110.00 362,035,066.48 89% 5. Fees and Charges 95,505,250.00 88,857,854.63 93% 6. Other Income 7,512,000.00 3,712,326.91 49% TOTAL 827,869,360.00 727,040,996.65 88%
INCOME TYPE 2018 REVENUES PERCENT
PROJECTED ACTUAL 2018 1.Real Property Tax 119,750,000.00 76,214,476.53 63.6% 2. Income from Business 164,600,000.00 167,410,438.60 101.7% 3. Other Local Taxes 16,595,400.00 17,970,764.24 106% 4. Income from LEEs/PUTs 400,183,510.00 383,165,774.32 95.7% 5. Fees and Charges 96,614,600.00 89,808,043.40 93.0% 6. Other Income 13,180,000.00 17,501,666.44 132.8% TOTAL 810,923,510.00 752,071,163.53 92.7%
INCOME TYPE 2017 REVENUES PERCENT
PROJECTED ACTUAL 2017 1.Real Property Tax 156,000,000.00 50,834,714.51 32.6% 2. Income from Business 146,750,000.00 150,000,000.00 102.2% 3. Other Local Taxes 27,510,000.00 20,598,543.15 74.9% 4. Income from LEEs/PUTs 331,686,670.00 322,517,626.31 97.2% 5. Fees and Charges 72,631,170.00 87,959,716.79 121.1% 6. Other Income 7,740,000.00 7,350,159.39 95.0% TOTAL 742,317,840.00 639,260,760.15 86.1%
Table 70. Percent and Amount of Allotments to Appropriations Year PARTICULARS AMOUNT Percent
2019 Appropriations 1,755,735,280.00
100% Allotments 1,755,735,280.00
2018 Appropriations 1,638,338,075.66
100% Allotments 1,638,338,075.66
2017 Appropriations 1,559,477,718.51
99.0% Allotments 1,544,110,501.51
Source: 2019 PFMAT City Budget Office
Table 72. Percent and Amount of Disbursements to Obligations Year PARTICULARS AMOUNT Percent
2019 Obligations 1,542,169,885.42
79% Disbursements 1,216,635,616.08
2018 Obligations 1,450,465,319.15
89% Disbursements 1,296,151,250.07
2017 Obligations 1,370,487,458.49
77.3% Disbursements 1,059,586,861.39
Source: 2019 PFMAT City Budget Office
Page 48 of 85
THE OFFICIAL SEAL OF OLONGAPO CITY Designed in 1966 by a former city government employee and architect of the City
Engineering Department, Benjamin Hayag (Cabatit, The Making of Olongapo)
14.6 Powers and Functions of the City Government of
Olongapo Pursuant to the provisions of Chapter 2, General Powers and Attributes of the Local Government Unit of the Republic Act 7160, also known as the Local Government Code of the Philippines, the City Government of Olongapo possesses both the governmental and proprietary powers and functions, Section 18, states that “Local government units shall have the power and authority to establish an organization that shall be responsible for the efficient and effective implementation of their development plans, program objectives, and priorities…” It further empowers LGUs to have corporate powers having full autonomy in the exercise of its proprietary functions and management of its economic enterprises. 14.6 Departments and Offices Institutional Sector…………………………………………………. City Mayor’s Office..................................................................... Exercise general supervision and control over all programs,
projects, services, and activities of the city government;
Enforce all laws and ordinances relative to the governance of the city and in the exercise of the appropriate corporate
powers provided for under Section 22 of the Local Government Code and implement all approved policies, programs, projects, services, and activities of the City;
Initiate and maximize the generation of resources and
revenues, and apply the same to the implementation of development plans, program objectives, and priorities as provided for under Section 18 of the Local Government Code and particularly those resources and revenues programmed for agro-industrial development and countryside growth and progress;
Ensure the delivery of basic services and the provision of adequate facilities;
Exercise such other powers and perform such other duties and functions as may be prescribed by law or ordinance and issuances issued by the national agency from time to time;

Page 49 of 85
City Administrator’s Office…………………………………………
Conduct a continuing organizational development of the local government unit with the end of instituting effective administrative reforms;
Recommend to the Sanggunian and advise the city mayor, on all other matters relative to the management and administration of the local government unit;
Assists in the cooperative organization and rehabilitation of existing cooperatives to make them workable as an economic enterprise and social organization;
Exercise such other powers and perform such other functions and duties as may be prescribed by law or ordinance;
Formulate measures for the consideration of the Sanggunian and provide administrative assistance to the city mayor in carrying out the delivery of basic services and provisions of adequate facilities as provided for under the Local Government Code;
Develop plans and strategies and upon approval thereof by the city mayor implement the same particularly those which have to do with the management and administration-related programs and projects which the city mayor is empowered to implement and which the Sanggunian is empowered to provide for under RA 7160;
Assist in the coordination of the work of all officials of the
local government unit, under the supervision, direction, and control of the city mayor, and for this purpose, he may convene the chiefs of offices and other officials of the local government unit;
Human Resources Management Office…………………………. Exercise such other powers and perform such other
functions and duties as may be prescribed by law or ordinance;
Formulate measures for the consideration of the
Sanggunian and provide human resource management assistance and support to the City Mayor in carrying out the delivery of basic services and provisions adequate facilities as provided for under the Local Government Code;
Develop plans and strategies and upon approval by the
city mayor implement the same particularly those which
have to do with programs and projects related to human resource developments;
Establish and maintain a sound personnel program for the
city government designed to promote career development and uphold the merit principle in the government service;
Responsible for planning, development, and
implementation of a comprehensive human resource management and development program;
Advise the city mayor and all other city officials on the formulation and execution of personnel policies, rules, and regulations;
Enforce Civil Service laws/programs, rules, and
regulations on personnel administration including but not limited to the performance evaluation system, employee suggestions and incentive awards, training and skills development, employee welfare and benefits, grievance machinery, and discipline;
Establish a city-wide skills inventory through job fairs in
coordination with various departments and establishments within the city;
Maintain liaison with CSC, DILG, DBM, DOLE, DTI, and
other government agencies as regards human resource management and development matters;
Provides active support and participation in activities of
CSC and DOLE; Exercise such other powers and perform such other
functions and duties as may be prescribed by law or ordinance;
Sangguniang Panglungsod........................................................ Enact ordinances; approve resolutions and appropriate
funds for the general welfare of the city and its inhabitants;
Approve ordinances and pass resolutions necessary for an efficient and effective city government;
Generate and maximize the use of resources and
revenues for the development plans, program objectives, and priorities of the city as provided for under Section 18 of RA 7160, with particular attention to agro-industrial development and citywide growth and progress;
Enact ordinances granting franchises and authorizing the
issuance of permits or licenses, upon such conditions and
Page 50 of 85
for such purposes intended to promote the general welfare of the inhabitants of the city;
Regulate activities relative to the use of land, buildings,
and structures within the city to promote the general welfare;
Approve ordinances, which shall ensure the efficient and
effective delivery of the basic services and facilities as provided for under Section 17 of RA 7160;
Enact ordinances for the generation of revenues and
approve the proper use of such revenues; Exercise such other powers and perform such other duties
and functions as may be prescribed by law or ordinance; City Budget Office………………………………………………….. Prepare forms, orders, and circulars embodying
instructions on budgetary and appropriation matters for the signature of the City Mayor;
Review and consolidate the budget proposals of different departments and offices of the City Government;
Review barangay annual/supplemental budget proposals and provide technical assistance;
Assist the City Mayor in the preparation of the budget and during budget hearings;
Study and evaluate budgetary implications of proposed
legislation and submit comments and recommendations thereon;
Submit periodic budgetary reports to the Department of
Budget and Management; Coordinate with the Treasurer, Accountant, and the
Planning and Development Coordinator for budgeting;
Assist the Sanggunian concerned in reviewing the approved budgets;
Coordinate with the planning and development
coordinator in the formulation of the City Government development plan;
Exercise such other powers and perform such other duties
and functions as may be prescribed by law or ordinance; City Accountant’s Office……………………………………………
Prepare and submit financial statements to the city mayor
and the Sanggunian concerned;
Appraise the Sanggunian and other local government
officials on the financial condition and operations of the local government unit concerned;
Certify to the availability of budgetary allotment to which
expenditures and obligations may be properly charged; Review supporting documents before preparation of
vouchers to determine the completeness of requirements; Prepare statements of cash advances, liquidation,
salaries, allowances, reimbursements, and remittances about the local government unit;
Prepare statements of journal vouchers and liquidation of
the same and other adjustments related thereto; Post individual disbursements to the subsidiary ledger and
index cards; Maintain individual ledgers for officials and employees of
the local government unit about payrolls and deductions; Record and post in index cards details of purchased
furniture, fixtures, and equipment, including disposal thereof, if any;
Account for all issued requests for obligations and maintain and keep all records and reports related thereto;
Prepare journals and the analysis of obligations and
maintain and keep all records and reports related thereto; Exercise such other powers and perform such other duties
and functions as may be prescribed by law or ordinance; City Internal Audit Unit…………………………………………….. Determine the effectiveness and adequacy of security
and management controls over information systems and databases;
Appraise existing procedures and related matters as to
efficiency and adequacy; Verify and analyze financial operations to ascertain if
attendant management information systems generate reports that are complete, accurate, and valid;
Verify the extent of compliance to ensure that proper
accounting procedures or other policies are being followed, operating procedures are properly implemented, governmental regulations are being complied with, performance targets are being achieved and other contractual obligations are met;
Page 51 of 85
Review cases involving misuse of city government
property and check transactions with outside parties to prevent and/or detect fraud or dishonesty;
Perform other services including special investigations
and assistance to outside contacts such as COA;
Exercise such other powers and perform such other duties and functions as may be prescribed by law or ordinance;
City Treasurer’s Office…………………………………………….. Advise the city mayor, the Sanggunian, and other local
government and national officials concerned regarding disposition of local government funds, and on such other matters relative to public finance;
Take custody of and exercise proper management of the
funds of the local government unit;
Take charge of the disbursement of all local government funds and such other funds the custody of which may be entrusted by law or other competent authority;
Inspect private commercial and industrial establishments
within the jurisdiction of the local government unit concerning the implementation of tax ordinances, under the provisions under Book II of the Local Government Code;
Maintain and update the tax information system of the
local government unit; Exercise such other powers and perform such other duties
and functions as may be prescribed by law or ordinance; Management Information Systems Office………………………. Formulate measures and provide managerial and
maintenance functions on different computer systems installed and providing information technology-related assistance and support to the City Mayor in carrying out the delivery of basic services and provision of adequate facilities as provided for under the Local Government Code;
Develop plans and strategies which have to do with
information technology management related activities within the city government jurisdiction;
Provide the following core Information Technology
services to the City Government of Olongapo;
a. System Analysis and Design
b. Software Development c. Systems Administration d. Technical Support
Maintain the different computerized systems that are
currently being used by the Office of the City Assessor, Business Permit and Licensing Office, and the City Treasury;
Provide relevant, adequate, and timely information/reports
as may be required by concerned offices; Analyze the current manual system of the City, design,
and recommendations for improvements. Research innovations in Information and Communication Technology that could be feasibly adopted by the City;
Study computerization programs being offered by the
National Government and various private software companies and recommend the same;
Provide technical support to various departments of the
City, like installation of appropriate software and basic troubleshooting and repair of the computers;
Maintain the current Network System of the City Hall
Building;
Exercise such other powers and perform such other duties and functions as may be prescribed by law or ordinance;
General Services Office…………………………………………… Formulate measures for the consideration of the
Sanggunian and provide technical assistance and support to the city mayor in carrying out measures to ensure the delivery of basic services and provision of adequate facilities pursuant to the Local Government Code and which require general services expertise and technical support services;
Develop plans and strategies and upon approval thereof
by the city mayor and implement the same, particularly those which have to do with the general services supportive of the welfare of the inhabitants which the city mayor is empowered to implement and which the Sanggunian is empowered to provide for under the Local Government Code;
Take custody and be accountable for all properties, real,
or personal, owned by the city government and those granted to it in the form of donation, reparation, assistance, and counterpart of joint projects;
Page 52 of 85
With the approval of the City Mayor, as the case may be, assign building or land space to city officials or other public officials, who by law, are entitled to such space;
Recommend to the City Mayor reasonable rental rates for
local government properties, whether real or personal, which will be leased to public or private entities by the city government;
Recommend to the City Mayor reasonable rental rates of private properties which may be leased for the official use of the City Government;
Maintain and supervise janitorial and security of
government public buildings and other real property, whether owned or leased by the City Government;
Collate and disseminate information regarding prices,
shipping, and other costs of supplies and other items commonly used by the City Government;
Perform archives and record management concerning
records of offices and departments of the City Government;
Perform all other functions about supply and property
management heretofore performed by the city government treasurer; enforce policies on records creation, maintenance, and disposal;
Be in the frontline of general services-related activities, such as the possible or imminent destruction or damage of records, supplies, properties, and structures and the orderly and sanitary cleaning up of waste materials or debris, particularly during and in the aftermath of man-made and natural calamities and disasters;
Recommend to the Sanggunian and advise the city mayor
on all other matters relative to general services; Exercise such other powers and perform such other duties
and functions as may be prescribed by law or ordinance; City Legal Office…………………………………………………….
Formulate measures for the consideration of the Sanggunian and provide legal assistance and support to the city mayor in carrying out the delivery of basic services and provisions of adequate facilities as provided for under the Local Government Code;
Develop plans and strategies and upon approval thereof
by the city mayor implement the same, particularly those which have to do with programs and projects related to
legal services which the city mayor is empowered to implement and which the Sanggunian is empowered to provide for under the Local Government Code;
Represent the local government unit in all civil actions and
special proceedings wherein the city government or any official thereof, in his official capacity, is a party: Provided, That, in actions or proceedings where a component city or municipality is a party adverse to the provincial government or another component city or municipality, a special legal officer may be employed to represent the adverse party;
When required by the City Mayor or Sanggunian, draft, ordinances, contracts, bonds, leases, and their instruments, involving any interest of the city government and provide comments and recommendations on any instruments already drawn;
Render his opinion in writing on any question of law when
requested to do so by the city mayor or Sanggunian; Investigate or cause to be investigated any local official or
employee for administrative neglect or misconduct in office, and recommend appropriate action to the City Mayor or Sanggunian;
Investigate or cause to be investigated any person, firm or
corporation holding any franchise or exercising any public privilege for failure to comply with any term or condition in the grant of such franchise or privilege, and recommending appropriate action to the City Mayor or Sanggunian;
When directed by the City Mayor, or Sanggunian, initiate
and prosecute in the interest of the City Government any civil action on any bond, lease, or other contracts upon any breach or violation thereof;
Recommend measures to the Sanggunian and advise the
City Mayor as the case may be on all other matters related to upholding the rule of law;
Be in the frontline of protecting human rights and
prosecuting any violations thereof, particularly those which occur during and in the aftermath of man-made or natural disasters or calamities.
Public Affairs Office………………………………………………... Formulate measures for the consideration of the
Sanggunian and provide technical assistance and support to the city mayor, in providing the information and research data required for the delivery of basic services and
Page 53 of 85
provision of adequate facilities so that the public becomes aware of said services and may fully avail of the same;
Develop plans and strategies and, upon approval thereof
by the city mayor implement the same, particularly those which have to do with public information and research data to support programs and projects which the city mayor is empowered to implement and which the Sanggunian is empowered to provide for under the Local Government Code;
Provide relevant, adequate, and timely information to the City Government and its residents;
Furnish information and data on City Government to
governmental agencies or offices as may be required by law or ordinances and non-governmental organizations to be furnished to said agencies and organizations;
Maintain effective liaison with the various sectors of the
community on matters and issues that affect the livelihood and the quality of life of the inhabitants and encourage support for programs of the city and national government;
Be on the frontline in providing information during and in
the aftermath of man-made and natural calamities and disasters with special attention to the victims thereof, to help minimize injuries and casualties during and after the emergency, and to accelerate relief and rehabilitation;
Recommend to the Sanggunian and advise the City Mayor
on all other matters relative to public information and research data as it relates to the total socioeconomic development of the local government;
Establish/maintain and formulate plans and programs for
an efficient and effective operation of a City Public Library;
Exercise such other powers and perform such other duties and functions as may be prescribed by law or ordinance;
Social Sector……………………………………………………….. City Social Welfare and Development Office…………………… Formulate measures for the approval of the Sanggunian
and provide technical assistance and support to the City Mayor in carrying out measures to ensure the delivery of basic services and provision of adequate facilities relative to social welfare and development services as provided for under the Local Government Code;
Develop plans and strategies and upon approval thereof by the City Mayor, implement the same particularly those which have to do with social welfare programs and
projects which the City Mayor is empowered to implement and which the Sanggunian is empowered to provide for under the Local Government Code;
Identify the basic needs of the needy, the disadvantaged,
and the impoverished and develop and implement appropriate measures to alleviate their problems and improve their living conditions;
Provide relief and appropriate crisis intervention for victims
of abuse and exploitation and recommend appropriate measures to defer further abuse and exploitation;
Assist the City Mayor in implementing the barangay level
program for the total development and protection of children up to six (6) years of age;
Facilitate the implementation of welfare programs for the
disabled, elderly, and victims of drug addiction, the rehabilitation of prisoners and parolees, the prevention of juvenile delinquency, and such other activities which would eliminate or minimize the ill-effects of poverty;
Initiate and support youth welfare programs that will
enhance the role of the youth in nation-building;
Coordinate with government agencies and non-governmental organizations which have for their purpose the promotion and the protection of all needy, disadvantaged, underprivileged, or impoverished groups or individuals, particularly those identified as vulnerable and high-risk to exploitation, abuse, and neglect;
Be in the frontline of service delivery, particularly those
which have to do with immediate relief and assistance during and in the aftermath of man-made and natural disaster and natural calamities;
Recommend to the Sanggunian and advise the city mayor
on all other matters related to social welfare and development services which will improve the livelihood and living conditions of the inhabitants;
Exercise such other powers and perform such other duties
and functions as may be prescribed by law or ordinance; City Health Office…………………………………………………… Formulate measures for the consideration of the
Sanggunian and provide technical assistance and support to the City Mayor in carrying out activities to ensure the delivery of basic services and provision of adequate facilities relative to health services and interpretation of the
Page 54 of 85
population development principle provided under the Local Government Code;
Develop plans and strategies and upon approval thereof
by the City Mayor implement the same, particularly those which have to do with health programs and projects as well as the integration of population development principles which the City Mayor, is empowered to implement and which the Sanggunian is empowered to provide for under the Local Government Code;
Take charge of the office on health services, supervise the
personnel and staff of said office, formulate program implementation guidelines and rules and regulations for the operation of the said office for the approval of the City Mayor to assist him in the efficient, effective, and economical implementation of a health services program geared to implementation of health-related projects and activities;
Formulate and implement policies, plans, programs, and
projects to promote the health of the people in the City Government;
Advise the City Mayor and the Sanggunian on matters
about health;
Execute and enforce all laws, ordinances, and regulations relating to public health.
Recommend to the Sanggunian, through the local health
board, the passage of such ordinances as he may deem necessary for the preservation of public health;
Recommend the prosecution of any violation of sanitary laws, ordinances, or regulations;
Direct the sanitary inspection of all business
establishments selling food items or providing accommodations such as hotels, motels, lodging houses, pension houses, and the like, following the Sanitation Code;
Conduct health information campaigns and render health
intelligence services; Coordinate with other government agencies and non-
governmental organizations involved in the promotion and delivery of health services;
Be in the frontline of health services delivery, particularly
during and in the aftermath of man-made and natural disaster and calamities;
Assist the City Mayor in the implementation of the Constitutional provisions relative to population development and the promotion of responsible parenthood;
Establish and maintain an updated data bank for
population program operations, development planning, and an educational program to ensure the people‘s participation in and understanding of population development;
Implement appropriate training programs responsive to
the cultural heritage of the inhabitants; Exercise such other powers and perform such other duties
and functions as may be prescribed by law or ordinance. James L. Gordon Memorial Hospital…………………………….. Formulate measures and provide technical medical-
related assistance and support to the City Mayor in carrying out the delivery of basic services and provision of adequate facilities as provided for under the Local Government Code;
Develop plans and strategies which have to do with programs and projects related to medical and alleviate afflictions and maladies of the hospital services within the City Government jurisdiction;
Extend medical services to the general public to help
prevent, relieve, or people especially the poor and the less fortunate in life without regard to race, creed, or political belief;
Facilitate, encourage, or undertake the training of medical
staff for specialized cases; Promote and develop a medical center that will deliver
efficiently, quality, and affordable medical and surgical care to the people of Olongapo;
Exercise such other powers and perform such other
duties and functions as may be prescribed by law or ordinance.
City Population Office……………………………………………… Formulate measures for the consideration of the
Sanggunian and provide technical assistance and support to the city mayor in carrying out measures to ensure the delivery of basic services and provision of adequate facilities relative to the integration of the population development principles and in providing access to said services and facilities;
Page 55 of 85
Develop plans and strategies and upon approval thereof
by the governor or mayor, as the case may be, implement the same, particularly those which have to do with the integration of population development principles and methods in programs and projects which the governor or mayor is empowered to implement and which the Sanggunian is empowered to provide for under this Code;
Assist the City Mayor in the implementation of the
Constitutional provisions relative to population
development and the promotion of responsible parenthood;
Establish and maintain an updated data bank for program
operations, development planning, and an educational program to ensure the people's participation in and understanding of population development;
Implement appropriate training programs responsive to
the cultural heritage of the inhabitants; and
Exercise such other powers and perform such other duties and functions as may be prescribed by law or ordinance.
City Civil Registry Office…………………………………………… Formulate measures and provide assistance and support
to the City Mayor in carrying out the delivery of basic services and provision of adequate facilities as provided for under Local Government Code;
Develop plans and strategies and upon approval thereof by the City Mayor implement the same, particularly those which have to do with civil registry programs and projects which the mayor is empowered to implement and which the Sanggunian is empowered to provide for under the Local Government Code.
The Civil Registrar shall be responsible for the civil
registration program in the City Government, pursuant to the Civil Registry Law, the Civil Code, and other pertinent laws, rules, and regulations issued to implement them;
Accept all registrable documents and judicial decrees
affecting the civil status of persons; File, keep, and preserve in a secure place the books
required by law;
Transcribe and enter immediately upon receipt all registrable documents and judicial decrees affecting the civil status of persons in the appropriate civil registry books;
Transmit to the Office of the Civil Registrar-General, within
the prescribed period, duplicate copies of registered documents required by law;
Issue certified transcripts or copies of any certificate or
registered documents upon payment of the prescribed fees to the Treasurer;
Receive applications for the issuance of a marriage license and, after determining that the requirements and supporting certificates and publication thereof for the
prescribed period have been complied with, issue the license upon payment of the authorized fee to the Treasurer;
Coordinate with the Philippine Statistics Authority (PSA) in
conducting educational campaigns for vital registration and assist in the preparation of demographic and other statistics for the local government unit concerned;
Exercise such other powers and perform such other duties
and functions as may be prescribed by law or ordinance. Gordon College…………………………………………………….. Formulate measures and provide assistance and support
to the city mayor in carrying out the delivery of basic services and provision of adequate facilities as provided for under the Local Government Code;
Develop plans and strategies which have to do with
programs and projects related to the educational needs of the community;
Manage and operate the college academic and
administrative activities to ensure quality education is accessible to the community;
Continually evaluate and develop programs and strategies
to improve effectiveness and efficiency in meeting the educational needs of the community;
Full development of individual skills, knowledge, abilities,
and moral values through formal and informal instructions; Ensure a safe, secure, and healthy teaching/learning
condition in the college premises; Plan and program activities for the total personal and
professional development of the individual;
Continually conduct research and study on the latest trends, innovations, and technology towards quality education;
Page 56 of 85
Exercise such other powers and perform such other duties
and functions as may be prescribed by law or ordinance. Office of Senior Citizens Affairs…………………………………… Plans, implements, and monitors yearly work programs in
pursuance of the objectives of the Expanded Senior Citizens Act of 2010;
Draws up a list of available and required services which can be provided by the senior citizens;
Maintains and regularly updates every quarter the list of
senior citizens and issues national individual identification cards, free of charge, which shall be valid anywhere in the country;
Serves as a general information and liaison center for
senior citizens; Monitors compliance with the provisions of this Act
particularly the grant of special discounts and privileges to senior citizens;
Reports to the mayor, any individual, establishments,
business entity, institutions, or agency found violating any provision of the Expanded Senior Citizens Act of 2010;
Assists the senior citizens in filing complaints or charges
against any individual, establishments, business entity, institution, or agency refusing to comply with the privileges under the Expanded Senior Citizens Act of 2010 before the Department of Justice (DOJ), the Provincial Prosecutor's Office, the regional or the municipal trial court, the municipal trial court in cities, or the municipal circuit trial court.
Phil Health Indigent Program Unit…………………………………
Submits applications of new applicants to the Phil Health Insurance Corporation;
Attends meetings with the Phil Health Insurance Corporation relative to the update and benefits of the program;
Assists indigent beneficiaries with their hospitalization benefit claims and refund with the Phil Health Insurance Corporation;
Reports to the City Mayor regarding the status of Phil Health Indigent Program;
Consults other barangay residents and officials regarding the update of Phil Health Indigent programs and implementation;
Assists in the accreditation of rural health units to Phil Health Benefits Program;
Attends to radio and TV interviews as part of the Advocacy to show the public the importance of health insurance and its benefits.
Urban Basic Services Programme……………………………….
Takes charge of community organizing in the city and cuts across all components namely, health and nutrition, education, water and sanitation, community livelihood, and special protection services for children in need.
Economic Sector…………………………………………………… Business Permit and Licensing Office…………………………… Formulate measures and provide technical assistance to
the City Mayor on all issues relevant to issuances of business permits and licenses;
Develop plans and strategies that will support programs
and projects of the City Mayor which affects business and community;
Provide efficient service in processing all applications for
business permits and licenses; Recommend issuance of licenses and permits as well as
revocation of the same for any violation of the conditions upon which said permits or license had been issued pursuant to laws or ordinances;
Inspect private, commercial, and industrial establishments
within the jurisdiction of the city government concerning the issuance of business licenses and permits;
Coordinate with other servicing offices to facilitate
immediate issuance of business licenses and permits;
Exercise such other powers and perform such other duties and functions as may be prescribed by law or ordinance.
Livelihood and Cooperative Development Office……………….. Formulate measures for the approval of the Sanggunian
and provide technical assistance and support to the City Mayor in carrying out measures to ensure the delivery of
Page 57 of 85
basic services and provision of adequate facilities relative to livelihood and cooperative development services as provided for under the Local Government Code;
Develop plans and strategies and upon approval thereof
by the City Mayor, implement the same particularity those which have to do with livelihood programs and projects which the City Mayor is empowered to implement and which the Sanggunian is empowered to provide for under the Local Government Code;
Identify the basic needs of the needy, the disadvantaged,
and the impoverished and develop and implement appropriate measures to alleviate their problems and improve their living conditions;
Assist the City Mayor in implementing the barangay level
program for the lively hood and total development;
Facilitate the implementation of livelihood programs, cooperative development, fish port and such other activities which would eliminate or minimize the ill – effect of poverty;
Recommend to the Sanggunian and advise the City Mayor
on all matters related to livelihood and cooperative development services which will improve the livelihood and living conditions of the inhabitants;
Exercise such other powers and perform such other duties
and functions as may be prescribed by law ordinance. City Agriculture Office……………………………………………… Formulate measures for the approval of the Sanggunian
and provide technical assistance and support to the City Mayor in carrying out said measures to ensure the delivery of basic services and provision of adequate facilities relative to agricultural services as provided for under Section 17 of the Local Government Code;
Develop plans and strategies and upon approval thereof
by the City Mayor, implement the same, particularly those which have to do with agricultural programs and projects which the city mayor is empowered to implement and which the Sanggunian is empowered to provide for under Local Government Code;
Ensure that maximum assistance and access to resources
in the production, processing, and marketing of agricultural and aquaculture and marine products are extended to farmers, fishermen, and local entrepreneurs;
Conduct or cause to be conducted location-specific
agricultural researches and assist in making available the appropriate technology arising out of and disseminating information on basic research on crops, preventive and control of plant diseases and pests, and other agricultural matters which will maximize productivity;
Assist the city mayor in the establishment and extension
services of demonstration farms or aquaculture and marine products;
Enforce rules and regulations relating to agriculture and
aquaculture; Coordinate with government agencies and non-governmental organizations which promote agricultural productivity through appropriate technology compatible with environmental integrity.
City Assessor’s Office……………………………………………... Formulate measures and provide assistance and support
to the city mayor in carrying out the delivery of basic services and provision of adequate facilities as provided for under the Local Government Code.
Develop plans and strategies which have to do with
programs and projects related to appraisal and assistance of all real properties within the city government jurisdiction.
Ensure that all laws and policies governing the appraisal
and assessment of real properties for taxation purposes are properly executed.
Initiate, review, and recommend changes in policies and
objectives, plans and programs, techniques, procedures, and practices in the valuation and assessment of real properties for taxation purposes.
Establish a systematic method of real property
assessment. Install and maintain a real property identification and
accounting system. Prepare, install and maintain a system of tax mapping,
showing graphically all property subject to assessment and gather all data concerning the same;
Exercise the functions of appraisal and assessment
primarily for taxation purposes of all real properties in the local government unit concerned;
Prepare a schedule of the fair market value for the different
classes of real properties, in accordance with the Local Government Code;
Page 58 of 85
Issue, upon request of any interested party, certified
copies of assessment records of real property and all other records relative to its assessment, upon payment of service charge or fee to the Treasurer;
Submit every semester a report of all assessments, as well
as cancellations and modifications of assessments to the City Mayor and the Sanggunian;
Exercise such other powers and perform such other duties
and functions as may be prescribed by law or ordinance. City Tourism Office…………………………………………………. Formulate measures and provide tourism-related
assistance and support to the City Mayor in carrying out the delivery of basic services and provision of adequate facilities as provided for under the Local Government Code;
Develop plans and strategies which have to do with
programs and projects related to tourism-related activities within the City Government jurisdiction;
Initiate programs to develop the tourism and industrial
potentials of the city to the fullest extent;
Implement policies and programs that will promote tourism activities within the city of Olongapo;
Formulate developmental plans and programs as well as
marketing strategies to enhance the city‘s economic activities;
Inspects and evaluates tourism-related establishment
within the city for registration and accreditation purposes;
Develop tourism packages to promote tourism spots as well as tourism-related establishments within the city;
Organize and coordinate conventions, conferences, and
other activities/events with various agencies thereby promoting the maximum use of the Olongapo City Convention Center, the City Museum, and other city government buildings;
Embark on promotional and marketing programs to attract
investors and businesses in the area; Exercise such other powers and perform such other duties
and functions as may be prescribed by law or ordinance.
Olongapo City Public Market……………………………………… Formulate measures and provide technical assistance and
support to the city mayor in carrying out the delivery of basic services and provision of adequate facilities as provided for under the Local Government Code;
Develop plans and strategies which have to do with programs and projects related to management and operation of the public market within the City Government jurisdiction;
Enforce all rules and ordinances in the public market
operated by the City Government;
Ensure a safe, secure, and healthy condition within the premises of the public market;
Plan and program activities as well as marketing
promotions, and strategies to attract investors and businesses;
Exercise such other powers and perform such other duties
and functions as may be prescribed by law or ordinance. Public Employment Service Office (PESO)……………………… Facilitates the exchange of labor market information on
local and overseas employment through the cooperation of the business sector;
Develops and administers testing and evaluation instruments for effective job selection, training, and counseling;
Provides access to various self-employment programs by
undertaking referrals and undertakes employability enhancement training;
Provides pre-employment & counseling career guidance,
mass motivation & values development activities; Provides reintegration assistance services to returning
OFW;
Exercises such other powers and perform such other duties and functions as may be prescribed by law and ordinance.
City Veterinarian’s Office………………………………………….. Formulate measures for the consideration of the
Sanggunian and provide technical assistance and support to the city mayor in carrying out measures to ensure the

Page 59 of 85
delivery of basic services and provision of adequate facilities;
Develop plans and strategies and upon approval thereof by the City Mayor implement the same, particularly those which have to do with the veterinary-related activities and aquacultural programs which the city mayor is empowered to provide for under the Local Government Code;
Advise the City Mayor on all matters about the slaughter
of animals for human consumption and the regulation of slaughterhouses;
Advise the City Mayor on all matters about agricultural and aqua-cultural and marine products;
Regulate the keeping of domestic animals; Regulate and inspect agricultural and aqua-cultural and
marine products for public consumption; Regulate and inspect poultry, milk, and dairy products for
public consumption; Enforce all laws and regulations for the prevention of
cruelty to animals;
Take the necessary measures to eradicate, prevent, or cure all forms of animal diseases;
Be in the frontline of veterinary-related activities, such as
in the outbreak of highly contagious and deadly diseases, and in situations resulting in the depletion of animals for work and consumption, particularly those arising from and in the aftermath of man-made and natural calamities and disasters;
Exercise such other powers and perform such other duties
and functions as may be prescribed by law or ordinance.
Infrastructure / Physical and Planning Sector………………….. City Engineer’s Office……………………………………………… Formulate measures for the consideration of the
Sanggunian and provide technical assistance and support to the City Mayor in carrying out measures to ensure the delivery of basic services and provisions of adequate facilities relative to engineering and architectural planning and design as provided for under the Local Government Code;
Develop plans and strategies and upon approval thereof by the City Mayor implement the same, particularly those
which have to do with engineering and architectural planning and design programs and projects which the city mayor is empowered to implement and which the Sanggunian is empowered to provide for under the Local Government Code;
Prepare and recommend for consideration of the
Sanggunian the engineering and architectural plan and design for the city government establishments or a part thereof, including the renewal of slums and blighted areas, land reclamation activities, the greening of the land, and appropriate planning of marine and foreshore areas;
Review and recommend for appropriate action of the
Sanggunian, City Mayor, the engineering and architectural plans and design submitted by governmental and non-governmental entities or individuals, particularly those for
undeveloped, underdeveloped, and poorly designed areas;
Be in the frontline of the delivery of services involving
engineering and architectural planning and design, particularly those related to redesigning of the spatial distribution of basic facilities and physical structures during and in the aftermath of man-made and natural calamities and disasters;
Recommend to the Sanggunian and advise the City Mayor
on all other matters relative to the engineering and architectural planning and design as it relates to the total socioeconomic development of the local government unit;
Responsible for the enforcement of the National Building
Code of the Philippines within the City Government; Initiate, review, and recommend changes in policies and
objectives, plans and programs, techniques, procedures and practices in infrastructure development and public works in general of the City Government;
Advise the City Mayor on infrastructure, public works, and
other engineering matters; Administer, coordinate, supervise, and control the
construction, maintenance, improvement, and repair of roads, bridges, and other engineering and public works projects of the City Government;
Provide engineering services to the City Government
including investigation and survey, engineering designs, feasibility studies, and project management;
Exercise such other powers and perform such other duties and functions as may be prescribed by law or ordinance.
Page 60 of 85
City Planning and Development Office…………………………… Initiate the formulation and oversee the implementation of
a comprehensive development plan/land use plan for the city that will maximize citizen participation to achieve an improved quality of life;
Formulate integrated economic, social, physical, and other development plans and policies for consideration of the local government development council;
Conduct continuing studies, researches, and training
programs necessary to evolve plans and programs for implementation;
Integrate and coordinate all sectoral plans and studies
undertaken by the different functions groups or agencies; Monitor and evaluate the implementations of the different
development programs, projects, and activities in the City Government following the approved development plan;
Prepare comprehensive plans and other development
planning documents for the consideration of the Local Development Council;
Analyze the income and expenditure patterns, and
formulate and recommend fiscal plans and policies for consideration of the finance committee of the city government as provided under title five, Book II of the Local Government Code;
Promote people participation in development planning
within the City Government; Exercise supervision and control over the secretariat of the
Local Development Council; Exercise such other powers and perform such other
functions and duties as may be prescribed by law or ordinance.
Environment Sector…………………..……………………………. Environmental Sanitation and Management Office…………….. Formulate measures for the consideration of the
Sanggunian and provide technical assistance and support to the City Mayor in carrying out measures to ensure the delivery of basic services and provision of adequate facilities relative to environment and natural resources services as provided for under the Local Government Code;
Develop plans and strategies and upon approval thereof
by the City Mayor, implement the same, particularly those which have to do with the environment and natural resources programs and projects which the City Mayor is empowered to implement and which the Sanggunian is empowered to provide for under the Local Government Code;
Establish, maintain, protect, and preserve communal
forests, watersheds, tree parks, mangroves, greenbelts, and similar forest projects and commercial forests like industrial tree farm and agro-forestry projects;
Establish and maintain efficient solid waste disposal and
environmental management system; Enhance and support the cleanliness drive of the City
Government; Provide extension services to beneficiaries of forest
development projects and technical, financial, and infrastructure assistance;
Manage and maintain seed banks and produce seedlings
for forests and tree parks; Provide extension services to beneficiaries of forest
development projects and render assistance for natural resources-related conservation and utilization activities consistent with ecological balance;
Coordinate with government agencies and non-
governmental organizations in the implementation of measures to prevent and control land, air and water pollution with the assistance of the Department of Environment and Natural Resources;
Be in the frontline of the delivery of services concerning
the environment and natural resources, particularly in the renewal and rehabilitation of the environment during and in the aftermath of man-made and natural calamities and disasters;
Recommend to the Sanggunian and advise the city mayor
on all matters relative to the protection, conservation, maximum utilization, application of appropriate technology, and other matters related to the environment and natural resources;
Exercise such other powers and perform such other duties
and functions as may be prescribed by law or ordinance.

Page 61 of 85
Protective Service Sector…………………………………………. Office of Traffic Management and Public Safety……………….. Formulate measures and provide public security-related
assistance and support to the City Mayor in carrying out the delivery of basic services and provision of adequate facilities as provided for under the Local Government Code;
Develop plans and strategies which have to do with public
safety and traffic management programs and projects related activities within the city government jurisdiction that improves public safety;
Augment auxiliary services on traffic management of the
City;
Educate road users in the comprehension, observance, and use of traffic signs, signal devices, and controls;
Enforce traffic laws and ordinances to maintain road user
discipline in the City;
Exercise such other powers and perform such other duties and functions as may be prescribed by law or ordinance.
Disaster Risk Reduction and Management Office……………… Formulate measures for the protection of government
property and the interest of the people of Olongapo within the city‘s jurisdiction;
Develop plans and strategies for effective and swift emergency response and assistance at the height of any disaster (natural or man-made);
Ensure the effective implementation of the City Disaster
Risk Reduction and Management Office functions in accordance with the PD 1566 and other related laws and issuances;
Implement programs for the protection and preservation of
lives and property to ensure that effective emergency response in terms of disasters/calamities and other emergencies is provided to the local populace;
Develop programs on information campaign education
and training and coordinate the same to all barangay units Disaster Coordinating Council (DCC) and other local government units and NGO‘s;
Provide immediate service to the victims and would-be
victims of calamity areas;
Implement laws, policies, and programs relative to disaster
prevention, preparedness, mitigation, response, and reconstruction rehabilitation;
Coordinate with PNP in connection with the city‘s peace
and order;
Exercise such other powers and perform such other duties and functions as may be prescribed by law or ordinance.

Page 62 of 85
ENDNOTES
i They are as follows: Sta Rita River, Mabayuan River, Pamo River, Nagunao River, Tawirang Balite River, Jadjad River, Iram River and Licab Creek.
ii Subicwater News, Volume 11.2, A quarterly publication of the SWSCI July-December 2012 iii Total and Mean Rainfall quantity (PAG-ASA – DOST SBIA Station)
2008 2009 2010 2011 2012 2013 2014 2015 2016 2017 2018 2019
TOTAL 3386.7 4162.4 1918.2 5467.7 4965.44 3542.5 3160.8 2162.1 4073.8 2344.8 4866.3 4436.3
MEAN 307.9 378.4 174.4 497.1 413.8 295.21 263.4 180.2 339.48 195.4 405.5 369.69
iv http://kidlat.pagasa.dost.gov.ph/cab/climate.htm
v The National Oceanic and Atmospheric Administration is an American scientific agency within the United States Department of Commerce that focuses on the conditions of the oceans and the atmosphere. The National Aeronautics and Space Administration is an independent agency of the executive branch of the United States federal government responsible for the civilian space program, as well as aeronautics and aerospace research.
vi NASA’s Goddard Institute for Space Studies (GISS) vii WATERMARK, Sept 2016 issue Subicwater publication viii Drought is defined as 3-consecutive months of way below rainfall condition (>80% reduction from average rainfall)
Dry Spell is defined as 3 consecutive months of below normal rainfall condition (21-60% reduction from average rainfall). ix Sta Rita River and Mabayuan River Monthly Streamflow; Source Subicwater Report
MAB Jan Feb Mar Apr May Jun Jul Aug Sep Oct Nov Dec Total
2015 9500 7636 7344 6360 6264 9600 76566 75534 56280 54748 22750 13100 345682
2016 8969 7720 6624 5256 6353 17288 25297 36000 36000 36000 21960 12720 220187
2017 10487 8028 6670 6132 7356 7416 24000 63678 33000 16200 36200 11100 230267
2018 8544 7560 6600 5892 5580 67384 104635 80521 76228 42375 18446 17236 441001
2019 No submission disaggregated data 353351
2020 No submission disaggregated data
STR
2016 37835 31526 21253 17684 18660 56735 97174 165000 255000 289618 60206 30101 1080792
2017 33140 20848 18690 19522 19700 19900 49677 124540 138073 64444 46274 26633 581441
2018 26610 24894 22693 21212 20136 98456 243752 187579 172245 92833 52712 37350 1000472
2019 No submission disaggregated data 961382
2020 No submission disaggregated data
x DROUGHT CONDITION 1
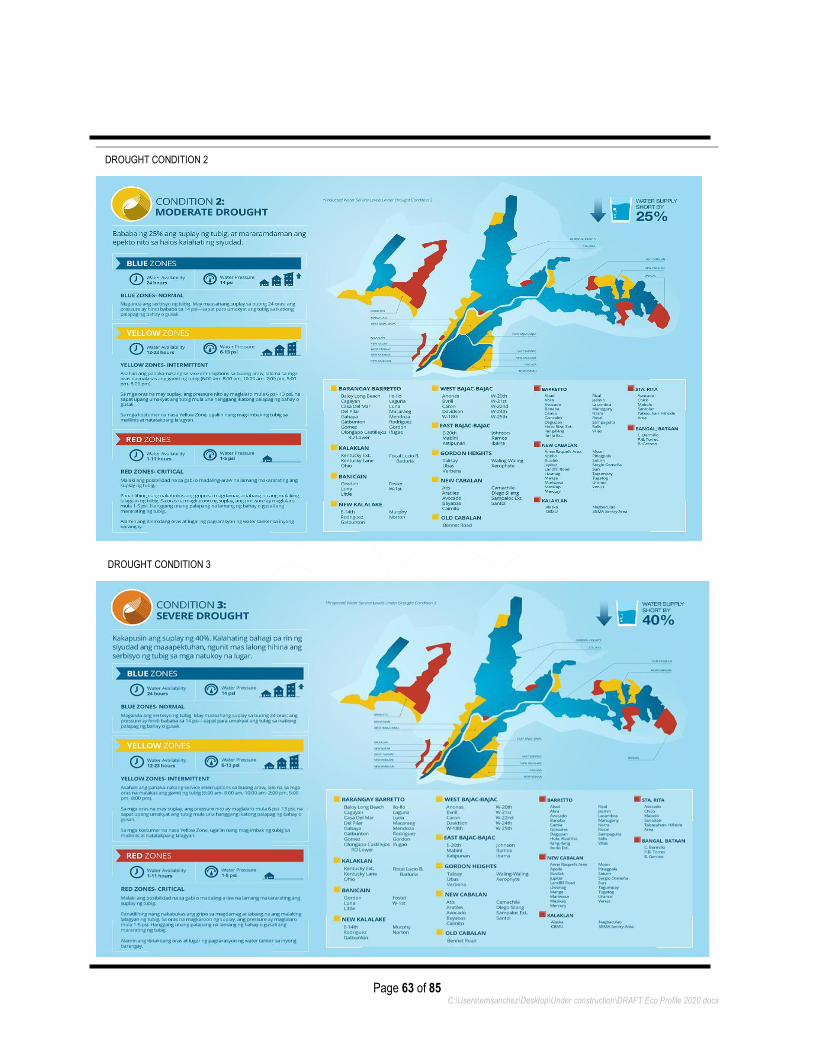
Page 63 of 85 C:\Users\emsanchez\Desktop\Under construction\DRAFT Eco Profile 2020.docx
DROUGHT CONDITION 2
DROUGHT CONDITION 3
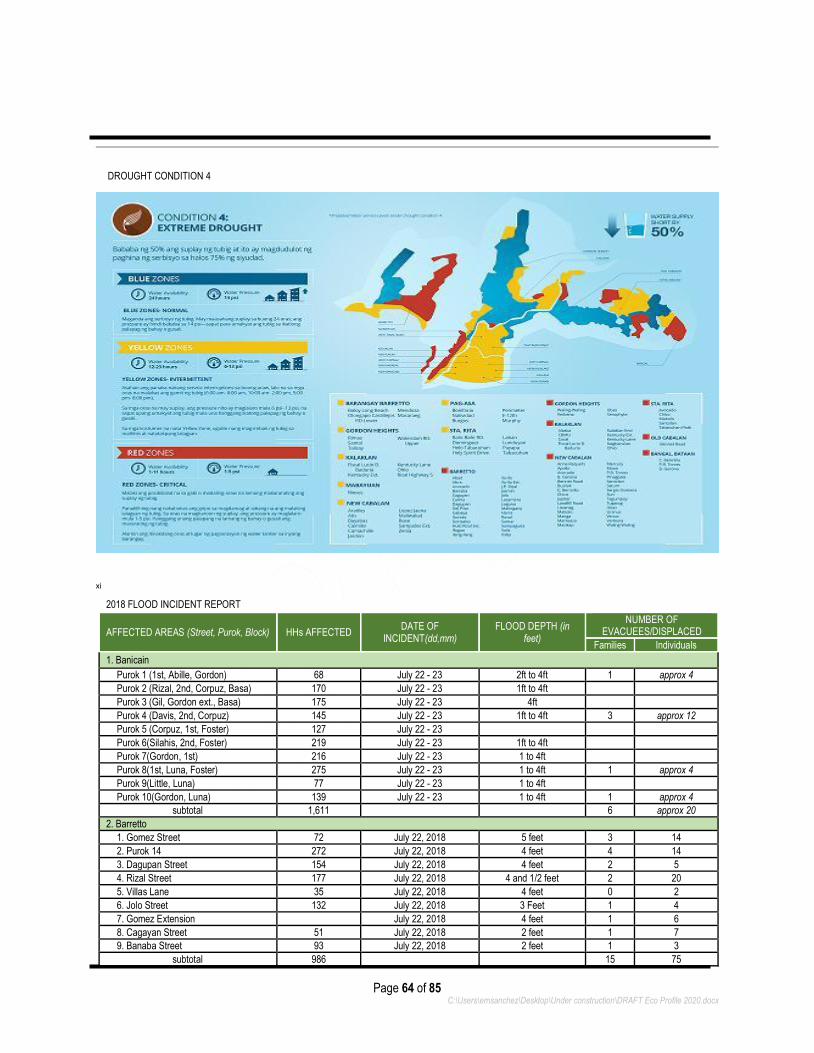
Page 64 of 85 C:\Users\emsanchez\Desktop\Under construction\DRAFT Eco Profile 2020.docx
DROUGHT CONDITION 4
xi
2018 FLOOD INCIDENT REPORT
AFFECTED AREAS (Street, Purok, Block) HHs AFFECTED DATE OF
INCIDENT(dd,mm) FLOOD DEPTH (in
feet)
NUMBER OF EVACUEES/DISPLACED
Families Individuals
1. Banicain
Purok 1 (1st, Abille, Gordon) 68 July 22 - 23 2ft to 4ft 1 approx 4
Purok 2 (Rizal, 2nd, Corpuz, Basa) 170 July 22 - 23 1ft to 4ft
Purok 3 (Gil, Gordon ext., Basa) 175 July 22 - 23 4ft
Purok 4 (Davis, 2nd, Corpuz) 145 July 22 - 23 1ft to 4ft 3 approx 12
Purok 5 (Corpuz, 1st, Foster) 127 July 22 - 23
Purok 6(Silahis, 2nd, Foster) 219 July 22 - 23 1ft to 4ft
Purok 7(Gordon, 1st) 216 July 22 - 23 1 to 4ft
Purok 8(1st, Luna, Foster) 275 July 22 - 23 1 to 4ft 1 approx 4
Purok 9(Little, Luna) 77 July 22 - 23 1 to 4ft
Purok 10(Gordon, Luna) 139 July 22 - 23 1 to 4ft 1 approx 4
subtotal 1,611 6 approx 20
2. Barretto
1. Gomez Street 72 July 22, 2018 5 feet 3 14
2. Purok 14 272 July 22, 2018 4 feet 4 14
3. Dagupan Street 154 July 22, 2018 4 feet 2 5
4. Rizal Street 177 July 22, 2018 4 and 1/2 feet 2 20
5. Villas Lane 35 July 22, 2018 4 feet 0 2
6. Jolo Street 132 July 22, 2018 3 Feet 1 4
7. Gomez Extension July 22, 2018 4 feet 1 6
8. Cagayan Street 51 July 22, 2018 2 feet 1 7
9. Banaba Street 93 July 22, 2018 2 feet 1 3
subtotal 986 15 75
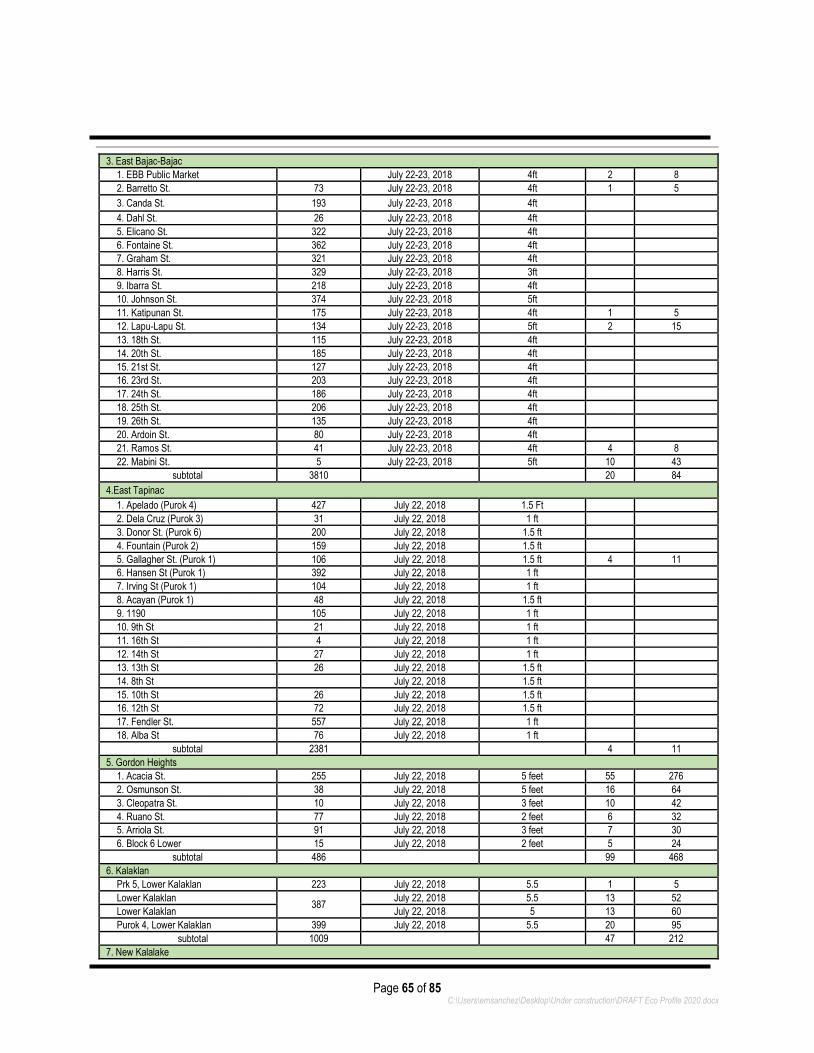
Page 65 of 85 C:\Users\emsanchez\Desktop\Under construction\DRAFT Eco Profile 2020.docx
3. East Bajac-Bajac
1. EBB Public Market July 22-23, 2018 4ft 2 8
2. Barretto St. 73 July 22-23, 2018 4ft 1 5
3. Canda St. 193 July 22-23, 2018 4ft
4. Dahl St. 26 July 22-23, 2018 4ft
5. Elicano St. 322 July 22-23, 2018 4ft
6. Fontaine St. 362 July 22-23, 2018 4ft
7. Graham St. 321 July 22-23, 2018 4ft
8. Harris St. 329 July 22-23, 2018 3ft
9. Ibarra St. 218 July 22-23, 2018 4ft
10. Johnson St. 374 July 22-23, 2018 5ft
11. Katipunan St. 175 July 22-23, 2018 4ft 1 5
12. Lapu-Lapu St. 134 July 22-23, 2018 5ft 2 15
13. 18th St. 115 July 22-23, 2018 4ft
14. 20th St. 185 July 22-23, 2018 4ft
15. 21st St. 127 July 22-23, 2018 4ft
16. 23rd St. 203 July 22-23, 2018 4ft
17. 24th St. 186 July 22-23, 2018 4ft
18. 25th St. 206 July 22-23, 2018 4ft
19. 26th St. 135 July 22-23, 2018 4ft
20. Ardoin St. 80 July 22-23, 2018 4ft
21. Ramos St. 41 July 22-23, 2018 4ft 4 8
22. Mabini St. 5 July 22-23, 2018 5ft 10 43
subtotal 3810 20 84
4.East Tapinac
1. Apelado (Purok 4) 427 July 22, 2018 1.5 Ft
2. Dela Cruz (Purok 3) 31 July 22, 2018 1 ft
3. Donor St. (Purok 6) 200 July 22, 2018 1.5 ft
4. Fountain (Purok 2) 159 July 22, 2018 1.5 ft
5. Gallagher St. (Purok 1) 106 July 22, 2018 1.5 ft 4 11
6. Hansen St (Purok 1) 392 July 22, 2018 1 ft
7. Irving St (Purok 1) 104 July 22, 2018 1 ft
8. Acayan (Purok 1) 48 July 22, 2018 1.5 ft
9. 1190 105 July 22, 2018 1 ft
10. 9th St 21 July 22, 2018 1 ft
11. 16th St 4 July 22, 2018 1 ft
12. 14th St 27 July 22, 2018 1 ft
13. 13th St 26 July 22, 2018 1.5 ft
14. 8th St July 22, 2018 1.5 ft
15. 10th St 26 July 22, 2018 1.5 ft
16. 12th St 72 July 22, 2018 1.5 ft
17. Fendler St. 557 July 22, 2018 1 ft
18. Alba St 76 July 22, 2018 1 ft
subtotal 2381 4 11
5. Gordon Heights
1. Acacia St. 255 July 22, 2018 5 feet 55 276
2. Osmunson St. 38 July 22, 2018 5 feet 16 64
3. Cleopatra St. 10 July 22, 2018 3 feet 10 42
4. Ruano St. 77 July 22, 2018 2 feet 6 32
5. Arriola St. 91 July 22, 2018 3 feet 7 30
6. Block 6 Lower 15 July 22, 2018 2 feet 5 24
subtotal 486 99 468
6. Kalaklan
Prk 5, Lower Kalaklan 223 July 22, 2018 5.5 1 5
Lower Kalaklan 387
July 22, 2018 5.5 13 52
Lower Kalaklan July 22, 2018 5 13 60
Purok 4, Lower Kalaklan 399 July 22, 2018 5.5 20 95
subtotal 1009 47 212
7. New Kalalake
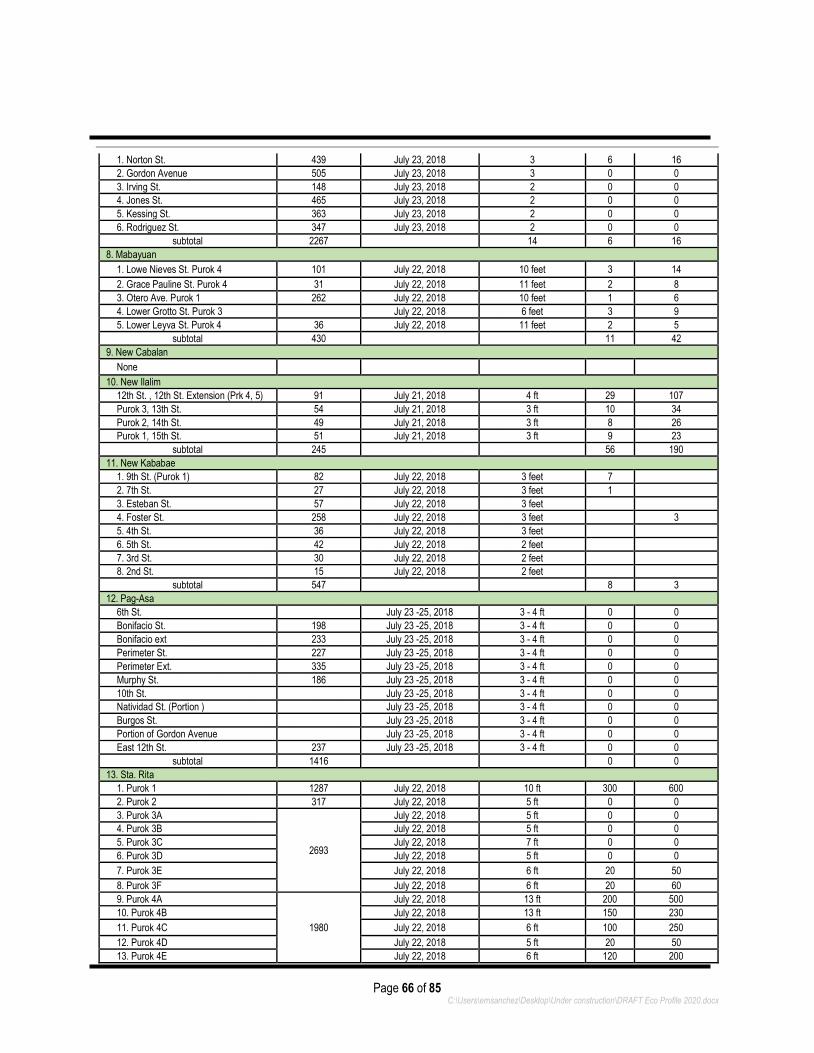
Page 66 of 85 C:\Users\emsanchez\Desktop\Under construction\DRAFT Eco Profile 2020.docx
1. Norton St. 439 July 23, 2018 3 6 16
2. Gordon Avenue 505 July 23, 2018 3 0 0
3. Irving St. 148 July 23, 2018 2 0 0
4. Jones St. 465 July 23, 2018 2 0 0
5. Kessing St. 363 July 23, 2018 2 0 0
6. Rodriguez St. 347 July 23, 2018 2 0 0
subtotal 2267 14 6 16
8. Mabayuan
1. Lowe Nieves St. Purok 4 101 July 22, 2018 10 feet 3 14
2. Grace Pauline St. Purok 4 31 July 22, 2018 11 feet 2 8
3. Otero Ave. Purok 1 262 July 22, 2018 10 feet 1 6
4. Lower Grotto St. Purok 3 July 22, 2018 6 feet 3 9
5. Lower Leyva St. Purok 4 36 July 22, 2018 11 feet 2 5
subtotal 430 11 42
9. New Cabalan
None
10. New Ilalim
12th St. , 12th St. Extension (Prk 4, 5) 91 July 21, 2018 4 ft 29 107
Purok 3, 13th St. 54 July 21, 2018 3 ft 10 34
Purok 2, 14th St. 49 July 21, 2018 3 ft 8 26
Purok 1, 15th St. 51 July 21, 2018 3 ft 9 23
subtotal 245 56 190
11. New Kababae
1. 9th St. (Purok 1) 82 July 22, 2018 3 feet 7
2. 7th St. 27 July 22, 2018 3 feet 1
3. Esteban St. 57 July 22, 2018 3 feet
4. Foster St. 258 July 22, 2018 3 feet 3
5. 4th St. 36 July 22, 2018 3 feet
6. 5th St. 42 July 22, 2018 2 feet
7. 3rd St. 30 July 22, 2018 2 feet
8. 2nd St. 15 July 22, 2018 2 feet
subtotal 547 8 3
12. Pag-Asa
6th St. July 23 -25, 2018 3 - 4 ft 0 0
Bonifacio St. 198 July 23 -25, 2018 3 - 4 ft 0 0
Bonifacio ext 233 July 23 -25, 2018 3 - 4 ft 0 0
Perimeter St. 227 July 23 -25, 2018 3 - 4 ft 0 0
Perimeter Ext. 335 July 23 -25, 2018 3 - 4 ft 0 0
Murphy St. 186 July 23 -25, 2018 3 - 4 ft 0 0
10th St. July 23 -25, 2018 3 - 4 ft 0 0
Natividad St. (Portion ) July 23 -25, 2018 3 - 4 ft 0 0
Burgos St. July 23 -25, 2018 3 - 4 ft 0 0
Portion of Gordon Avenue July 23 -25, 2018 3 - 4 ft 0 0
East 12th St. 237 July 23 -25, 2018 3 - 4 ft 0 0
subtotal 1416 0 0
13. Sta. Rita
1. Purok 1 1287 July 22, 2018 10 ft 300 600
2. Purok 2 317 July 22, 2018 5 ft 0 0
3. Purok 3A
2693
July 22, 2018 5 ft 0 0
4. Purok 3B July 22, 2018 5 ft 0 0
5. Purok 3C July 22, 2018 7 ft 0 0
6. Purok 3D July 22, 2018 5 ft 0 0
7. Purok 3E July 22, 2018 6 ft 20 50
8. Purok 3F July 22, 2018 6 ft 20 60
9. Purok 4A
1980
July 22, 2018 13 ft 200 500
10. Purok 4B July 22, 2018 13 ft 150 230
11. Purok 4C July 22, 2018 6 ft 100 250
12. Purok 4D July 22, 2018 5 ft 20 50
13. Purok 4E July 22, 2018 6 ft 120 200
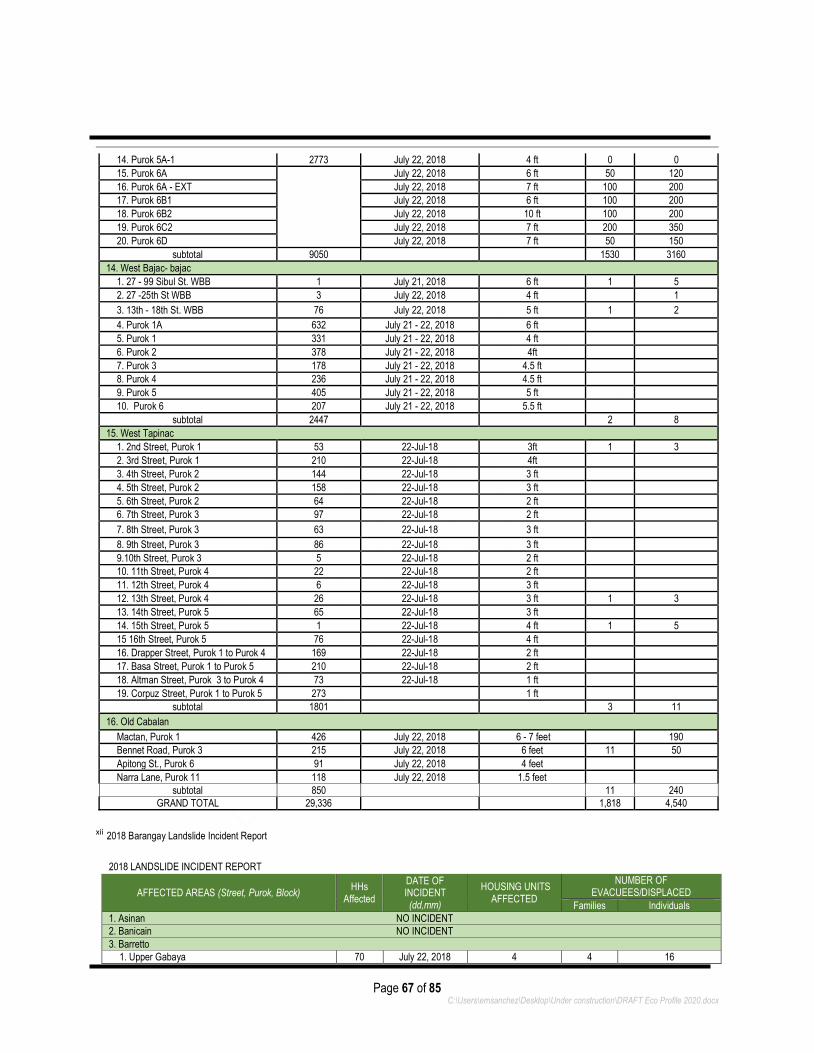
Page 67 of 85 C:\Users\emsanchez\Desktop\Under construction\DRAFT Eco Profile 2020.docx
14. Purok 5A-1 2773 July 22, 2018 4 ft 0 0
15. Purok 6A
July 22, 2018 6 ft 50 120
16. Purok 6A - EXT July 22, 2018 7 ft 100 200
17. Purok 6B1 July 22, 2018 6 ft 100 200
18. Purok 6B2 July 22, 2018 10 ft 100 200
19. Purok 6C2 July 22, 2018 7 ft 200 350
20. Purok 6D July 22, 2018 7 ft 50 150
subtotal 9050 1530 3160
14. West Bajac- bajac
1. 27 - 99 Sibul St. WBB 1 July 21, 2018 6 ft 1 5
2. 27 -25th St WBB 3 July 22, 2018 4 ft 1
3. 13th - 18th St. WBB 76 July 22, 2018 5 ft 1 2
4. Purok 1A 632 July 21 - 22, 2018 6 ft
5. Purok 1 331 July 21 - 22, 2018 4 ft
6. Purok 2 378 July 21 - 22, 2018 4ft
7. Purok 3 178 July 21 - 22, 2018 4.5 ft
8. Purok 4 236 July 21 - 22, 2018 4.5 ft
9. Purok 5 405 July 21 - 22, 2018 5 ft
10. Purok 6 207 July 21 - 22, 2018 5.5 ft
subtotal 2447 2 8
15. West Tapinac
1. 2nd Street, Purok 1 53 22-Jul-18 3ft 1 3
2. 3rd Street, Purok 1 210 22-Jul-18 4ft
3. 4th Street, Purok 2 144 22-Jul-18 3 ft
4. 5th Street, Purok 2 158 22-Jul-18 3 ft
5. 6th Street, Purok 2 64 22-Jul-18 2 ft
6. 7th Street, Purok 3 97 22-Jul-18 2 ft
7. 8th Street, Purok 3 63 22-Jul-18 3 ft
8. 9th Street, Purok 3 86 22-Jul-18 3 ft
9.10th Street, Purok 3 5 22-Jul-18 2 ft
10. 11th Street, Purok 4 22 22-Jul-18 2 ft
11. 12th Street, Purok 4 6 22-Jul-18 3 ft
12. 13th Street, Purok 4 26 22-Jul-18 3 ft 1 3
13. 14th Street, Purok 5 65 22-Jul-18 3 ft
14. 15th Street, Purok 5 1 22-Jul-18 4 ft 1 5
15 16th Street, Purok 5 76 22-Jul-18 4 ft
16. Drapper Street, Purok 1 to Purok 4 169 22-Jul-18 2 ft
17. Basa Street, Purok 1 to Purok 5 210 22-Jul-18 2 ft
18. Altman Street, Purok 3 to Purok 4 73 22-Jul-18 1 ft
19. Corpuz Street, Purok 1 to Purok 5 273 1 ft
subtotal 1801 3 11
16. Old Cabalan
Mactan, Purok 1 426 July 22, 2018 6 - 7 feet 190
Bennet Road, Purok 3 215 July 22, 2018 6 feet 11 50
Apitong St., Purok 6 91 July 22, 2018 4 feet
Narra Lane, Purok 11 118 July 22, 2018 1.5 feet
subtotal 850 11 240
GRAND TOTAL 29,336 1,818 4,540
xii 2018 Barangay Landslide Incident Report
2018 LANDSLIDE INCIDENT REPORT
AFFECTED AREAS (Street, Purok, Block) HHs
Affected
DATE OF INCIDENT (dd,mm)
HOUSING UNITS AFFECTED
NUMBER OF EVACUEES/DISPLACED
Families Individuals
1. Asinan NO INCIDENT
2. Banicain NO INCIDENT
3. Barretto
1. Upper Gabaya 70 July 22, 2018 4 4 16
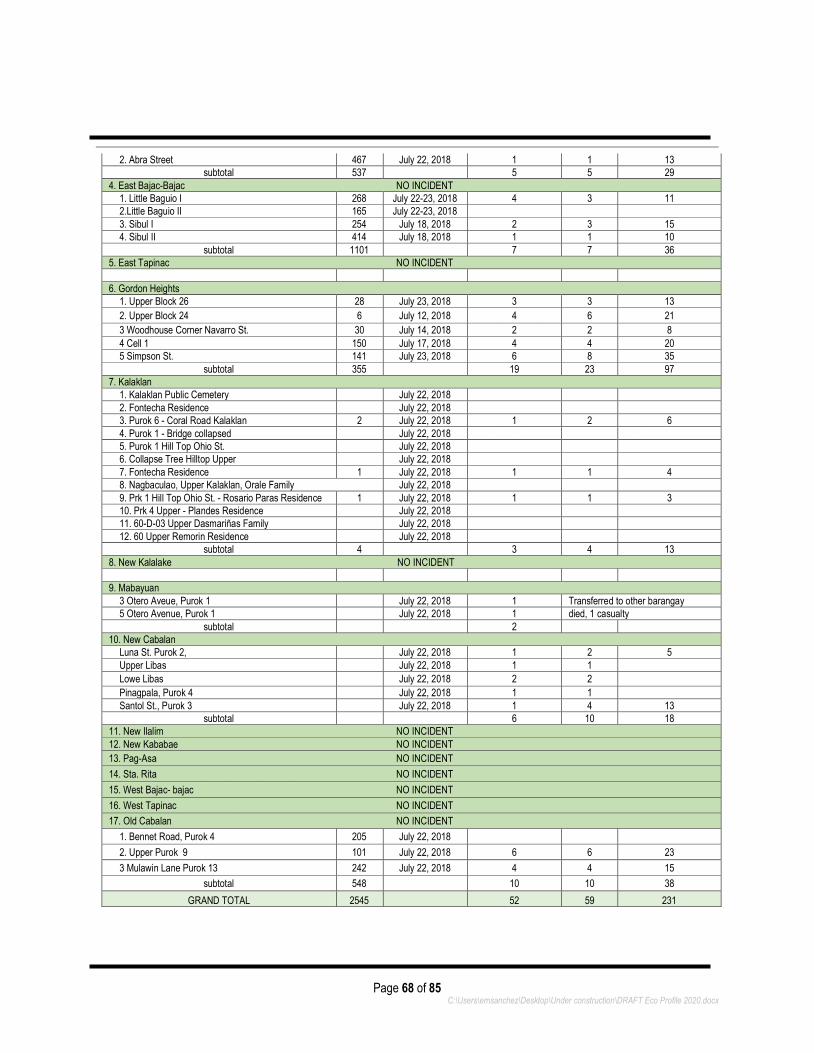
Page 68 of 85 C:\Users\emsanchez\Desktop\Under construction\DRAFT Eco Profile 2020.docx
2. Abra Street 467 July 22, 2018 1 1 13
subtotal 537 5 5 29
4. East Bajac-Bajac NO INCIDENT
1. Little Baguio I 268 July 22-23, 2018 4 3 11
2.Little Baguio II 165 July 22-23, 2018
3. Sibul I 254 July 18, 2018 2 3 15
4. Sibul II 414 July 18, 2018 1 1 10
subtotal 1101 7 7 36
5. East Tapinac NO INCIDENT
6. Gordon Heights
1. Upper Block 26 28 July 23, 2018 3 3 13
2. Upper Block 24 6 July 12, 2018 4 6 21
3 Woodhouse Corner Navarro St. 30 July 14, 2018 2 2 8
4 Cell 1 150 July 17, 2018 4 4 20
5 Simpson St. 141 July 23, 2018 6 8 35
subtotal 355 19 23 97
7. Kalaklan
1. Kalaklan Public Cemetery July 22, 2018
2. Fontecha Residence July 22, 2018
3. Purok 6 - Coral Road Kalaklan 2 July 22, 2018 1 2 6
4. Purok 1 - Bridge collapsed July 22, 2018
5. Purok 1 Hill Top Ohio St. July 22, 2018
6. Collapse Tree Hilltop Upper July 22, 2018
7. Fontecha Residence 1 July 22, 2018 1 1 4
8. Nagbaculao, Upper Kalaklan, Orale Family July 22, 2018
9. Prk 1 Hill Top Ohio St. - Rosario Paras Residence 1 July 22, 2018 1 1 3
10. Prk 4 Upper - Plandes Residence July 22, 2018
11. 60-D-03 Upper Dasmariñas Family July 22, 2018
12. 60 Upper Remorin Residence July 22, 2018
subtotal 4 3 4 13
8. New Kalalake NO INCIDENT
9. Mabayuan
3 Otero Aveue, Purok 1 July 22, 2018 1 Transferred to other barangay
5 Otero Avenue, Purok 1 July 22, 2018 1 died, 1 casualty
subtotal 2
10. New Cabalan
Luna St. Purok 2, July 22, 2018 1 2 5
Upper Libas July 22, 2018 1 1
Lowe Libas July 22, 2018 2 2
Pinagpala, Purok 4 July 22, 2018 1 1
Santol St., Purok 3 July 22, 2018 1 4 13
subtotal 6 10 18
11. New Ilalim NO INCIDENT
12. New Kababae NO INCIDENT
13. Pag-Asa NO INCIDENT
14. Sta. Rita NO INCIDENT
15. West Bajac- bajac NO INCIDENT
16. West Tapinac NO INCIDENT
17. Old Cabalan NO INCIDENT
1. Bennet Road, Purok 4 205 July 22, 2018
2. Upper Purok 9 101 July 22, 2018 6 6 23
3 Mulawin Lane Purok 13 242 July 22, 2018 4 4 15
subtotal 548 10 10 38
GRAND TOTAL 2545 52 59 231
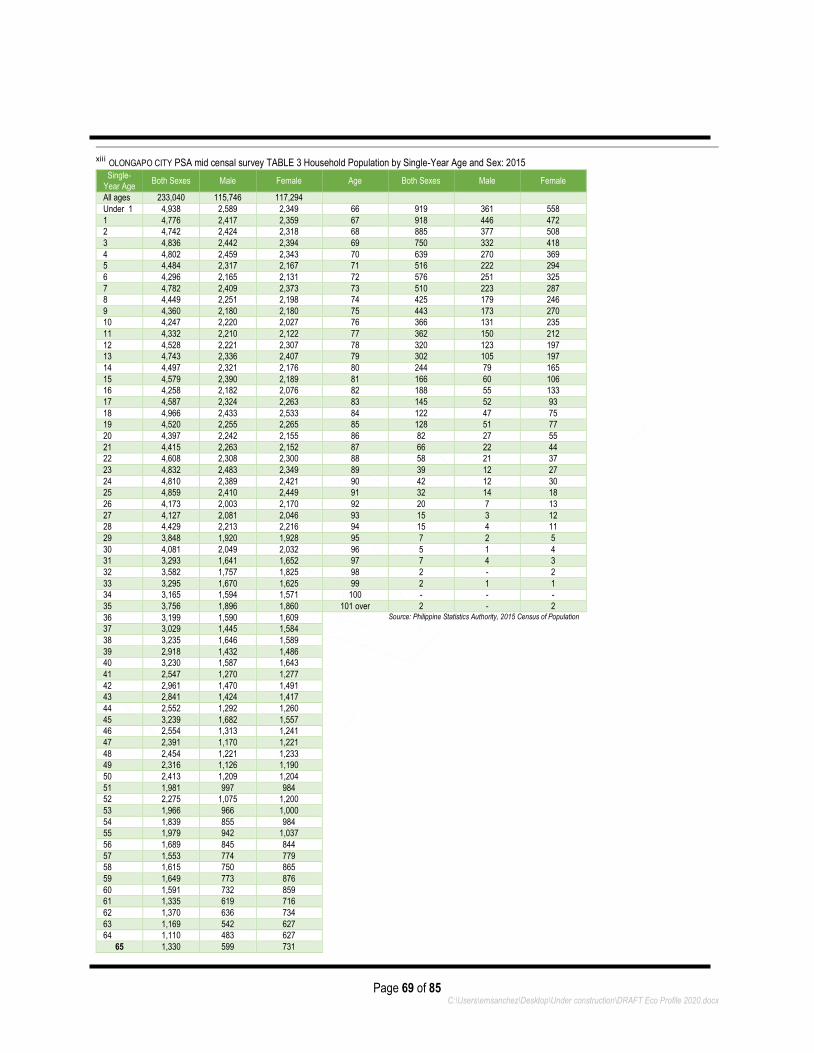
Page 69 of 85 C:\Users\emsanchez\Desktop\Under construction\DRAFT Eco Profile 2020.docx
xiii OLONGAPO CITY PSA mid censal survey TABLE 3 Household Population by Single-Year Age and Sex: 2015
Single-Year Age
Both Sexes Male Female Age Both Sexes Male Female
All ages 233,040 115,746 117,294
Under 1 4,938 2,589 2,349 66 919 361 558
1 4,776 2,417 2,359 67 918 446 472
2 4,742 2,424 2,318 68 885 377 508
3 4,836 2,442 2,394 69 750 332 418
4 4,802 2,459 2,343 70 639 270 369
5 4,484 2,317 2,167 71 516 222 294
6 4,296 2,165 2,131 72 576 251 325
7 4,782 2,409 2,373 73 510 223 287
8 4,449 2,251 2,198 74 425 179 246
9 4,360 2,180 2,180 75 443 173 270
10 4,247 2,220 2,027 76 366 131 235
11 4,332 2,210 2,122 77 362 150 212
12 4,528 2,221 2,307 78 320 123 197
13 4,743 2,336 2,407 79 302 105 197
14 4,497 2,321 2,176 80 244 79 165
15 4,579 2,390 2,189 81 166 60 106
16 4,258 2,182 2,076 82 188 55 133
17 4,587 2,324 2,263 83 145 52 93
18 4,966 2,433 2,533 84 122 47 75
19 4,520 2,255 2,265 85 128 51 77
20 4,397 2,242 2,155 86 82 27 55
21 4,415 2,263 2,152 87 66 22 44
22 4,608 2,308 2,300 88 58 21 37
23 4,832 2,483 2,349 89 39 12 27
24 4,810 2,389 2,421 90 42 12 30
25 4,859 2,410 2,449 91 32 14 18
26 4,173 2,003 2,170 92 20 7 13
27 4,127 2,081 2,046 93 15 3 12
28 4,429 2,213 2,216 94 15 4 11
29 3,848 1,920 1,928 95 7 2 5
30 4,081 2,049 2,032 96 5 1 4
31 3,293 1,641 1,652 97 7 4 3
32 3,582 1,757 1,825 98 2 - 2
33 3,295 1,670 1,625 99 2 1 1
34 3,165 1,594 1,571 100 - - -
35 3,756 1,896 1,860 101 over 2 - 2
36 3,199 1,590 1,609 Source: Philippine Statistics Authority, 2015 Census of Population
37 3,029 1,445 1,584
38 3,235 1,646 1,589
39 2,918 1,432 1,486
40 3,230 1,587 1,643
41 2,547 1,270 1,277
42 2,961 1,470 1,491
43 2,841 1,424 1,417
44 2,552 1,292 1,260
45 3,239 1,682 1,557
46 2,554 1,313 1,241
47 2,391 1,170 1,221
48 2,454 1,221 1,233
49 2,316 1,126 1,190
50 2,413 1,209 1,204
51 1,981 997 984
52 2,275 1,075 1,200
53 1,966 966 1,000
54 1,839 855 984
55 1,979 942 1,037
56 1,689 845 844
57 1,553 774 779
58 1,615 750 865
59 1,649 773 876
60 1,591 732 859
61 1,335 619 716
62 1,370 636 734
63 1,169 542 627
64 1,110 483 627
65 1,330 599 731
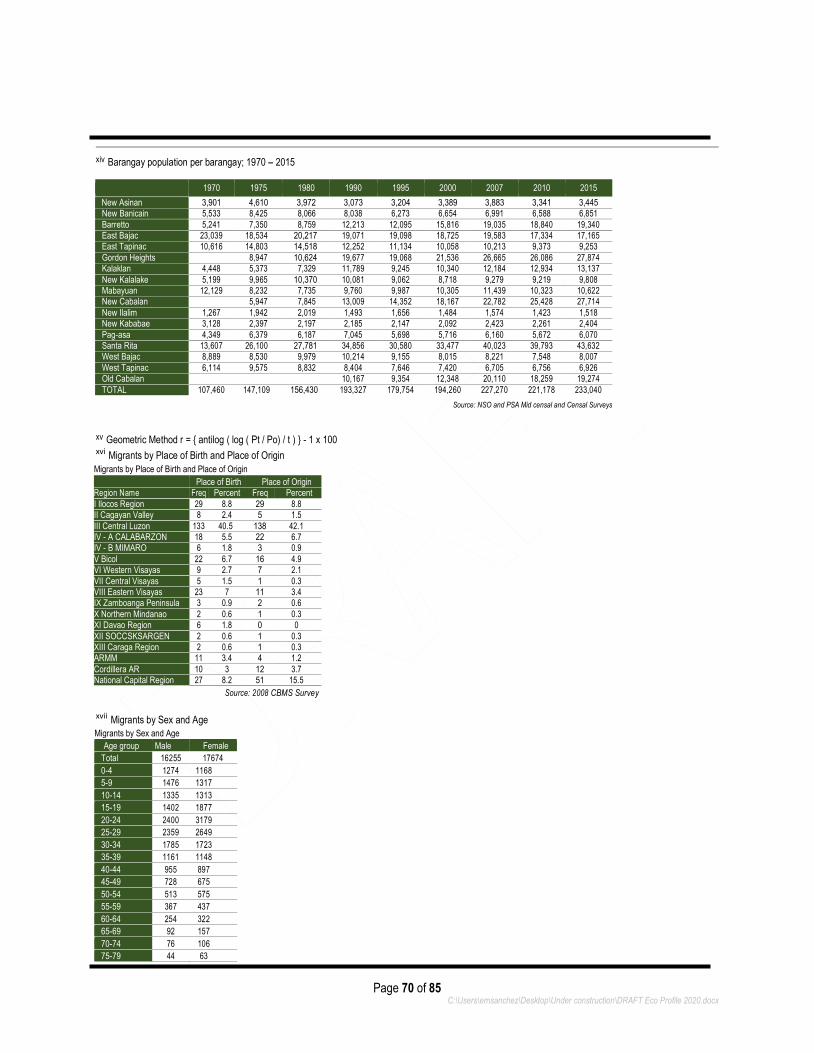
Page 70 of 85 C:\Users\emsanchez\Desktop\Under construction\DRAFT Eco Profile 2020.docx
xiv Barangay population per barangay; 1970 – 2015
1970 1975 1980 1990 1995 2000 2007 2010 2015
New Asinan 3,901 4,610 3,972 3,073 3,204 3,389 3,883 3,341 3,445 New Banicain 5,533 8,425 8,066 8,038 6,273 6,654 6,991 6,588 6,851
Barretto 5,241 7,350 8,759 12,213 12,095 15,816 19,035 18,840 19,340 East Bajac 23,039 18,534 20,217 19,071 19,098 18,725 19,583 17,334 17,165 East Tapinac 10,616 14,803 14,518 12,252 11,134 10,058 10,213 9,373 9,253
Gordon Heights 8,947 10,624 19,677 19,068 21,536 26,665 26,086 27,874 Kalaklan 4,448 5,373 7,329 11,789 9,245 10,340 12,184 12,934 13,137
New Kalalake 5,199 9,965 10,370 10,081 9,062 8,718 9,279 9,219 9,808 Mabayuan 12,129 8,232 7,735 9,760 9,987 10,305 11,439 10,323 10,622 New Cabalan 5,947 7,845 13,009 14,352 18,167 22,782 25,428 27,714
New Ilalim 1,267 1,942 2,019 1,493 1,656 1,484 1,574 1,423 1,518 New Kababae 3,128 2,397 2,197 2,185 2,147 2,092 2,423 2,261 2,404
Pag-asa 4,349 6,379 6,187 7,045 5,698 5,716 6,160 5,672 6,070
Santa Rita 13,607 26,100 27,781 34,856 30,580 33,477 40,023 39,793 43,632 West Bajac 8,889 8,530 9,979 10,214 9,155 8,015 8,221 7,548 8,007
West Tapinac 6,114 9,575 8,832 8,404 7,646 7,420 6,705 6,756 6,926 Old Cabalan 10,167 9,354 12,348 20,110 18,259 19,274
TOTAL 107,460 147,109 156,430 193,327 179,754 194,260 227,270 221,178 233,040
Source: NSO and PSA Mid censal and Censal Surveys
xv Geometric Method r = { antilog ( log ( Pt / Po) / t ) } - 1 x 100 xvi Migrants by Place of Birth and Place of Origin Migrants by Place of Birth and Place of Origin
Place of Birth Place of Origin Region Name Freq Percent Freq Percent
I Ilocos Region 29 8.8 29 8.8 II Cagayan Valley 8 2.4 5 1.5
III Central Luzon 133 40.5 138 42.1 IV - A CALABARZON 18 5.5 22 6.7 IV - B MIMARO 6 1.8 3 0.9
V Bicol 22 6.7 16 4.9 VI Western Visayas 9 2.7 7 2.1
VII Central Visayas 5 1.5 1 0.3 VIII Eastern Visayas 23 7 11 3.4 IX Zamboanga Peninsula 3 0.9 2 0.6
X Northern Mindanao 2 0.6 1 0.3
XI Davao Region 6 1.8 0 0
XII SOCCSKSARGEN 2 0.6 1 0.3 XIII Caraga Region 2 0.6 1 0.3 ARMM 11 3.4 4 1.2
Cordillera AR 10 3 12 3.7 National Capital Region 27 8.2 51 15.5
Source: 2008 CBMS Survey
xvii Migrants by Sex and Age Migrants by Sex and Age
Age group Male Female
Total 16255 17674
0-4 1274 1168
5-9 1476 1317
10-14 1335 1313
15-19 1402 1877
20-24 2400 3179
25-29 2359 2649
30-34 1785 1723
35-39 1161 1148
40-44 955 897
45-49 728 675
50-54 513 575
55-59 367 437
60-64 254 322
65-69 92 157
70-74 76 106
75-79 44 63

Page 71 of 85 C:\Users\emsanchez\Desktop\Under construction\DRAFT Eco Profile 2020.docx
80-84 22 35
85-89 8 23
90-94 2 7
95-above 2 3
Source: 2008 CBMS Survey
xviii PSA mid censal
TABLE 8 Total Population by Religious Affiliation and Sex: 2015
Religious Affiliation Both Sexes Male Female
OLONGAPO CITY
Total 233,040 115,746 117,294
Aglipay 451 236 215
Association of Baptist Churches in Luzon, Visayas, and Mindanao 5 2 3
Bible Baptist Church 33 18 15
Bread of Life Ministries 1 0 1
Buddhist 165 94 71
Church of Christ 702 356 346
Church of Jesus Christ of the Latter Day Saints 994 481 513
Crusaders of the Divine Church of Christ , Incorporated 17 7 10
Evangelical Christian Outreach Foundation 3 2 1
Evangelicals (Philippine Council of Evangelical Churches) 1,201 647 554
Iglesia ni Cristo 12,522 6,232 6,290
Iglesia sa Dios Espiritu Santo , Incorporated 8 4 4
International One Way Outreach 5 3 2
Islam 1,797 935 862
Jehovah’s Witness 813 373 440
Jesus is Alive Community , Incorporated 2 1 1
Jesus is Lord Church 539 272 267
Love of Christ International Ministries 1 1 0
Lutheran Church of the Philippines 22 12 10
National Council of Churches in the Philippines 371 189 182
Philippine Ecumenical Christian Church 6 2 4
Philippine Grace Gospel 21 11 10
Philippine Independent Catholic Church 25 12 13
Roman Catholic, including Catholic Charismatic 199,503 99,060 100,443
Seventh Day Adventist 566 281 285
United Church of Christ in the Philippines 4 2 2
United Pentecostal Church (Philippines) , Incorporated 18 5 13
Victory Chapel Christian Fellowship 8 4 4
Way of Salvation Church , Incorporated 1 1 0
Other Baptists 2,131 1,037 1,094
Other Protestants 356 178 178
Other Religious Affiliations 10,656 5,256 5,400
Tribal Religions 69 20 49
None 24 12 12
Source: Philippine Statistics Authority, 2015 Census of Population
xix PSA mid censal TABLE 3 Household Population by Single-Year Age and Sex: 2015
Single-Year Age Both Sexes Male Female
OLONGAPO CITY
All ages 231,823 114,785 117,038
Under 1 4,935 2,588 2,347
1 4,774 2,417 2,357
2 4,741 2,424 2,317
3 4,831 2,440 2,391
4 4,799 2,459 2,340
5 4,482 2,316 2,166
6 4,293 2,162 2,131
7 4,777 2,406 2,371
8 4,444 2,249 2,195
9 4,354 2,177 2,177
10 4,241 2,215 2,026
11 4,329 2,207 2,122
12 4,521 2,215 2,306
13 4,736 2,330 2,406
14 4,485 2,313 2,172
15 4,562 2,379 2,183
16 4,249 2,176 2,073
17 4,567 2,311 2,256
18 4,942 2,416 2,526
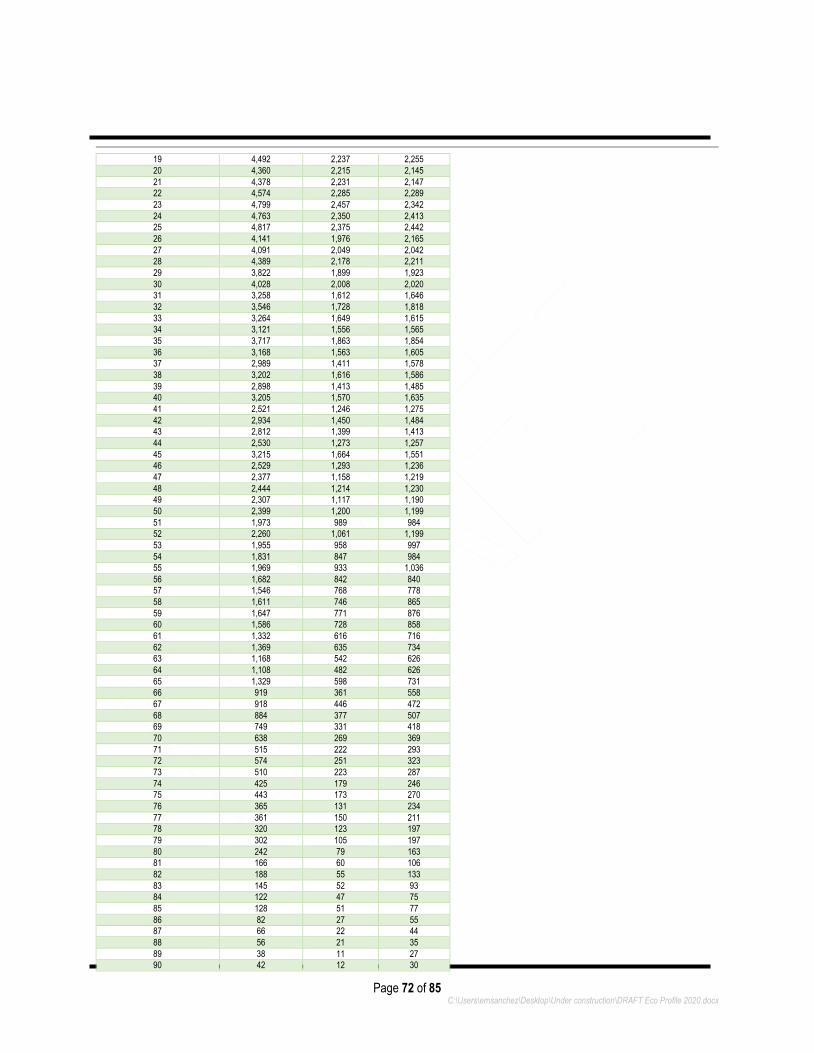
Page 72 of 85 C:\Users\emsanchez\Desktop\Under construction\DRAFT Eco Profile 2020.docx
19 4,492 2,237 2,255
20 4,360 2,215 2,145
21 4,378 2,231 2,147
22 4,574 2,285 2,289
23 4,799 2,457 2,342
24 4,763 2,350 2,413
25 4,817 2,375 2,442
26 4,141 1,976 2,165
27 4,091 2,049 2,042
28 4,389 2,178 2,211
29 3,822 1,899 1,923
30 4,028 2,008 2,020
31 3,258 1,612 1,646
32 3,546 1,728 1,818
33 3,264 1,649 1,615
34 3,121 1,556 1,565
35 3,717 1,863 1,854
36 3,168 1,563 1,605
37 2,989 1,411 1,578
38 3,202 1,616 1,586
39 2,898 1,413 1,485
40 3,205 1,570 1,635
41 2,521 1,246 1,275
42 2,934 1,450 1,484
43 2,812 1,399 1,413
44 2,530 1,273 1,257
45 3,215 1,664 1,551
46 2,529 1,293 1,236
47 2,377 1,158 1,219
48 2,444 1,214 1,230
49 2,307 1,117 1,190
50 2,399 1,200 1,199
51 1,973 989 984
52 2,260 1,061 1,199
53 1,955 958 997
54 1,831 847 984
55 1,969 933 1,036
56 1,682 842 840
57 1,546 768 778
58 1,611 746 865
59 1,647 771 876
60 1,586 728 858
61 1,332 616 716
62 1,369 635 734
63 1,168 542 626
64 1,108 482 626
65 1,329 598 731
66 919 361 558
67 918 446 472
68 884 377 507
69 749 331 418
70 638 269 369
71 515 222 293
72 574 251 323
73 510 223 287
74 425 179 246
75 443 173 270
76 365 131 234
77 361 150 211
78 320 123 197
79 302 105 197
80 242 79 163
81 166 60 106
82 188 55 133
83 145 52 93
84 122 47 75
85 128 51 77
86 82 27 55
87 66 22 44
88 56 21 35
89 38 11 27
90 42 12 30
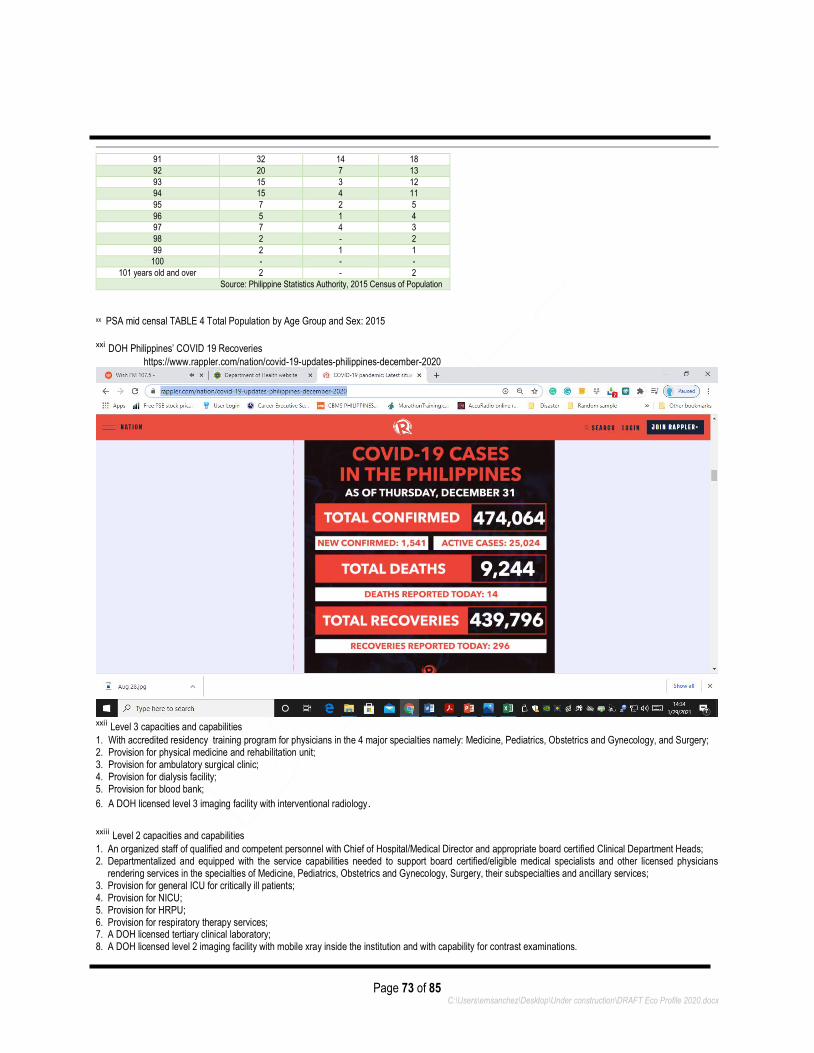
Page 73 of 85 C:\Users\emsanchez\Desktop\Under construction\DRAFT Eco Profile 2020.docx
91 32 14 18
92 20 7 13
93 15 3 12
94 15 4 11
95 7 2 5
96 5 1 4
97 7 4 3
98 2 - 2
99 2 1 1
100 - - -
101 years old and over 2 - 2
Source: Philippine Statistics Authority, 2015 Census of Population
xx PSA mid censal TABLE 4 Total Population by Age Group and Sex: 2015 xxi DOH Philippines’ COVID 19 Recoveries https://www.rappler.com/nation/covid-19-updates-philippines-december-2020
xxii Level 3 capacities and capabilities 1. With accredited residency training program for physicians in the 4 major specialties namely: Medicine, Pediatrics, Obstetrics and Gynecology, and Surgery; 2. Provision for physical medicine and rehabilitation unit; 3. Provision for ambulatory surgical clinic; 4. Provision for dialysis facility; 5. Provision for blood bank;
6. A DOH licensed level 3 imaging facility with interventional radiology.
xxiii Level 2 capacities and capabilities 1. An organized staff of qualified and competent personnel with Chief of Hospital/Medical Director and appropriate board certified Clinical Department Heads; 2. Departmentalized and equipped with the service capabilities needed to support board certified/eligible medical specialists and other licensed physicians
rendering services in the specialties of Medicine, Pediatrics, Obstetrics and Gynecology, Surgery, their subspecialties and ancillary services; 3. Provision for general ICU for critically ill patients; 4. Provision for NICU; 5. Provision for HRPU; 6. Provision for respiratory therapy services; 7. A DOH licensed tertiary clinical laboratory; 8. A DOH licensed level 2 imaging facility with mobile xray inside the institution and with capability for contrast examinations.
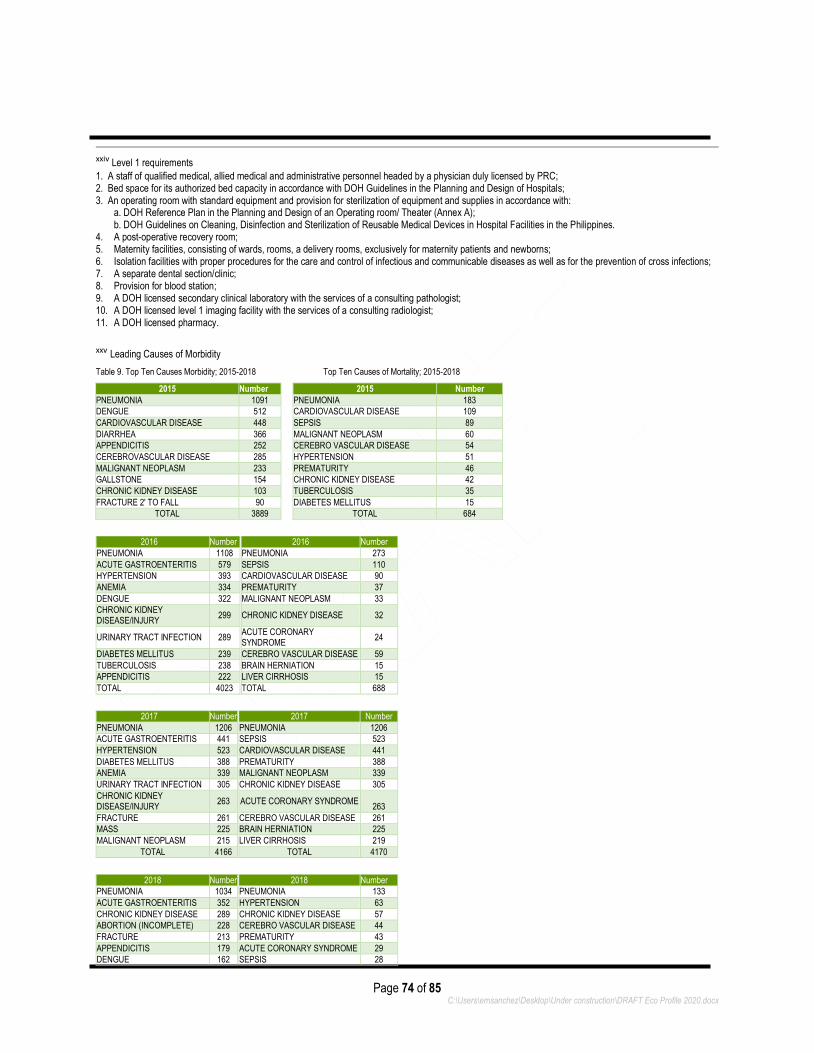
Page 74 of 85 C:\Users\emsanchez\Desktop\Under construction\DRAFT Eco Profile 2020.docx
xxiv Level 1 requirements
1. A staff of qualified medical, allied medical and administrative personnel headed by a physician duly licensed by PRC; 2. Bed space for its authorized bed capacity in accordance with DOH Guidelines in the Planning and Design of Hospitals; 3. An operating room with standard equipment and provision for sterilization of equipment and supplies in accordance with:
a. DOH Reference Plan in the Planning and Design of an Operating room/ Theater (Annex A); b. DOH Guidelines on Cleaning, Disinfection and Sterilization of Reusable Medical Devices in Hospital Facilities in the Philippines.
4. A post-operative recovery room; 5. Maternity facilities, consisting of wards, rooms, a delivery rooms, exclusively for maternity patients and newborns; 6. Isolation facilities with proper procedures for the care and control of infectious and communicable diseases as well as for the prevention of cross infections; 7. A separate dental section/clinic; 8. Provision for blood station; 9. A DOH licensed secondary clinical laboratory with the services of a consulting pathologist; 10. A DOH licensed level 1 imaging facility with the services of a consulting radiologist; 11. A DOH licensed pharmacy.
xxv Leading Causes of Morbidity
Table 9. Top Ten Causes Morbidity; 2015-2018 Top Ten Causes of Mortality; 2015-2018
2015 Number 2015 Number
PNEUMONIA 1091 PNEUMONIA 183
DENGUE 512 CARDIOVASCULAR DISEASE 109
CARDIOVASCULAR DISEASE 448 SEPSIS 89
DIARRHEA 366 MALIGNANT NEOPLASM 60
APPENDICITIS 252 CEREBRO VASCULAR DISEASE 54
CEREBROVASCULAR DISEASE 285 HYPERTENSION 51
MALIGNANT NEOPLASM 233 PREMATURITY 46
GALLSTONE 154 CHRONIC KIDNEY DISEASE 42
CHRONIC KIDNEY DISEASE 103 TUBERCULOSIS 35
FRACTURE 2' TO FALL 90 DIABETES MELLITUS 15
TOTAL 3889 TOTAL 684
2016 Number 2016 Number
PNEUMONIA 1108 PNEUMONIA 273
ACUTE GASTROENTERITIS 579 SEPSIS 110
HYPERTENSION 393 CARDIOVASCULAR DISEASE 90
ANEMIA 334 PREMATURITY 37
DENGUE 322 MALIGNANT NEOPLASM 33
CHRONIC KIDNEY DISEASE/INJURY
299 CHRONIC KIDNEY DISEASE 32
URINARY TRACT INFECTION 289 ACUTE CORONARY SYNDROME
24
DIABETES MELLITUS 239 CEREBRO VASCULAR DISEASE 59
TUBERCULOSIS 238 BRAIN HERNIATION 15
APPENDICITIS 222 LIVER CIRRHOSIS 15
TOTAL 4023 TOTAL 688
2017 Number 2017 Number
PNEUMONIA 1206 PNEUMONIA 1206
ACUTE GASTROENTERITIS 441 SEPSIS 523
HYPERTENSION 523 CARDIOVASCULAR DISEASE 441
DIABETES MELLITUS 388 PREMATURITY 388
ANEMIA 339 MALIGNANT NEOPLASM 339
URINARY TRACT INFECTION 305 CHRONIC KIDNEY DISEASE 305
CHRONIC KIDNEY DISEASE/INJURY
263 ACUTE CORONARY SYNDROME 263
FRACTURE 261 CEREBRO VASCULAR DISEASE 261
MASS 225 BRAIN HERNIATION 225
MALIGNANT NEOPLASM 215 LIVER CIRRHOSIS 219
TOTAL 4166 TOTAL 4170
2018 Number 2018 Number
PNEUMONIA 1034 PNEUMONIA 133
ACUTE GASTROENTERITIS 352 HYPERTENSION 63
CHRONIC KIDNEY DISEASE 289 CHRONIC KIDNEY DISEASE 57
ABORTION (INCOMPLETE) 228 CEREBRO VASCULAR DISEASE 44
FRACTURE 213 PREMATURITY 43
APPENDICITIS 179 ACUTE CORONARY SYNDROME 29
DENGUE 162 SEPSIS 28
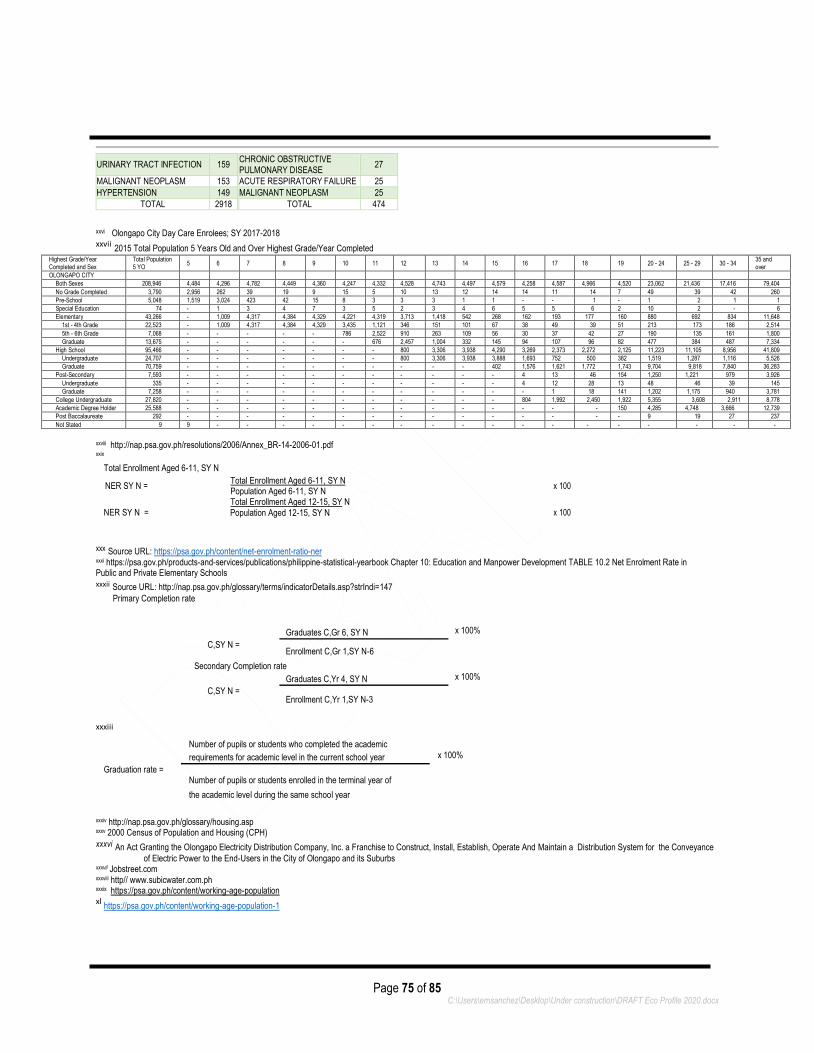
Page 75 of 85 C:\Users\emsanchez\Desktop\Under construction\DRAFT Eco Profile 2020.docx
URINARY TRACT INFECTION 159 CHRONIC OBSTRUCTIVE PULMONARY DISEASE
27
MALIGNANT NEOPLASM 153 ACUTE RESPIRATORY FAILURE 25
HYPERTENSION 149 MALIGNANT NEOPLASM 25
TOTAL 2918 TOTAL 474
xxvi Olongapo City Day Care Enrolees; SY 2017-2018 xxvii 2015 Total Population 5 Years Old and Over Highest Grade/Year Completed
Highest Grade/Year Completed and Sex
Total Population 5 YO
5 6 7 8 9 10 11 12 13 14 15 16 17 18 19 20 - 24 25 - 29 30 - 34 35 and over
OLONGAPO CITY
Both Sexes 208,946 4,484 4,296 4,782 4,449 4,360 4,247 4,332 4,528 4,743 4,497 4,579 4,258 4,587 4,966 4,520 23,062 21,436 17,416 79,404
No Grade Completed 3,790 2,956 262 39 19 9 15 5 10 13 12 14 14 11 14 7 49 39 42 260
Pre-School 5,048 1,519 3,024 423 42 15 8 3 3 3 1 1 - - 1 - 1 2 1 1
Special Education 74 - 1 3 4 7 3 5 2 3 4 6 5 5 6 2 10 2 - 6
Elementary 43,266 - 1,009 4,317 4,384 4,329 4,221 4,319 3,713 1,418 542 268 162 193 177 160 880 692 834 11,648
1st - 4th Grade 22,523 - 1,009 4,317 4,384 4,329 3,435 1,121 346 151 101 67 38 49 39 51 213 173 186 2,514
5th - 6th Grade 7,068 - - - - - 786 2,522 910 263 109 56 30 37 42 27 190 135 161 1,800
Graduate 13,675 - - - - - - 676 2,457 1,004 332 145 94 107 96 82 477 384 487 7,334
High School 95,466 - - - - - - - 800 3,306 3,938 4,290 3,269 2,373 2,272 2,125 11,223 11,105 8,956 41,809
Undergraduate 24,707 - - - - - - - 800 3,306 3,938 3,888 1,693 752 500 382 1,519 1,287 1,116 5,526
Graduate 70,759 - - - - - - - - - - 402 1,576 1,621 1,772 1,743 9,704 9,818 7,840 36,283
Post-Secondary 7,593 - - - - - - - - - - - 4 13 46 154 1,250 1,221 979 3,926
Undergraduate 335 - - - - - - - - - - - 4 12 28 13 48 46 39 145
Graduate 7,258 - - - - - - - - - - - - 1 18 141 1,202 1,175 940 3,781
College Undergraduate 27,820 - - - - - - - - - - - 804 1,992 2,450 1,922 5,355 3,608 2,911 8,778
Academic Degree Holder 25,588 - - - - - - - - - - - - - - 150 4,285 4,748 3,666 12,739
Post Baccalaureate 292 - - - - - - - - - - - - - - - 9 19 27 237
Not Stated 9 9 - - - - - - - - - - - - - - - - - -
xxviii http://nap.psa.gov.ph/resolutions/2006/Annex_BR-14-2006-01.pdf xxix
Total Enrollment Aged 6-11, SY N
NER SY N = Total Enrollment Aged 6-11, SY N
x 100 Population Aged 6-11, SY N
NER SY N = Total Enrollment Aged 12-15, SY N
Population Aged 12-15, SY N x 100
xxx Source URL: https://psa.gov.ph/content/net-enrolment-ratio-ner xxxi https://psa.gov.ph/products-and-services/publications/philippine-statistical-yearbook Chapter 10: Education and Manpower Development TABLE 10.2 Net Enrolment Rate in Public and Private Elementary Schools xxxii Source URL: http://nap.psa.gov.ph/glossary/terms/indicatorDetails.asp?strIndi=147
Primary Completion rate
C,SY N =
Graduates C,Gr 6, SY N x 100%
Enrollment C,Gr 1,SY N-6
Secondary Completion rate
C,SY N =
Graduates C,Yr 4, SY N x 100%
Enrollment C,Yr 1,SY N-3
xxxiii
Number of pupils or students who completed the academic
Graduation rate =
requirements for academic level in the current school year x 100%
Number of pupils or students enrolled in the terminal year of
the academic level during the same school year
xxxiv http://nap.psa.gov.ph/glossary/housing.asp xxxv 2000 Census of Population and Housing (CPH)
xxxvi An Act Granting the Olongapo Electricity Distribution Company, Inc. a Franchise to Construct, Install, Establish, Operate And Maintain a Distribution System for the Conveyance
of Electric Power to the End-Users in the City of Olongapo and its Suburbs xxxvii Jobstreet.com xxxviii http// www.subicwater.com.ph xxxix https://psa.gov.ph/content/working-age-population xl
https://psa.gov.ph/content/working-age-population-1
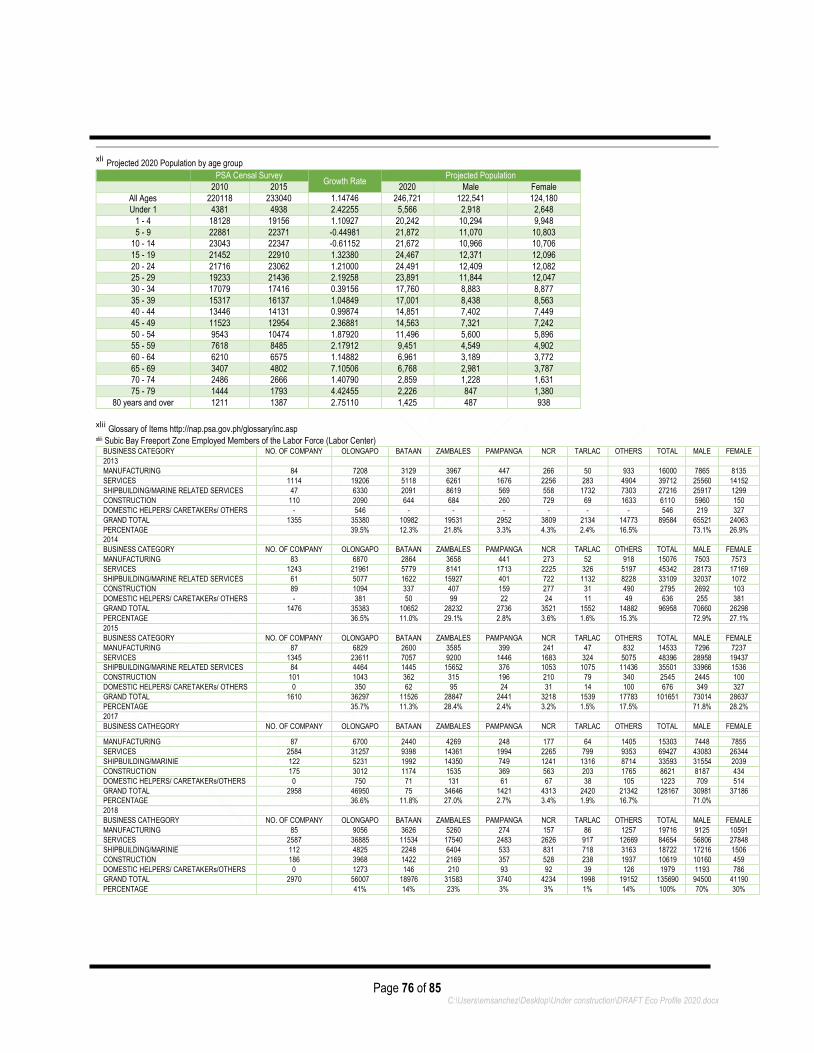
Page 76 of 85 C:\Users\emsanchez\Desktop\Under construction\DRAFT Eco Profile 2020.docx
xli Projected 2020 Population by age group
PSA Censal Survey Growth Rate
Projected Population 2010 2015 2020 Male Female
All Ages 220118 233040 1.14746 246,721 122,541 124,180
Under 1 4381 4938 2.42255 5,566 2,918 2,648
1 - 4 18128 19156 1.10927 20,242 10,294 9,948
5 - 9 22881 22371 -0.44981 21,872 11,070 10,803
10 - 14 23043 22347 -0.61152 21,672 10,966 10,706
15 - 19 21452 22910 1.32380 24,467 12,371 12,096
20 - 24 21716 23062 1.21000 24,491 12,409 12,082
25 - 29 19233 21436 2.19258 23,891 11,844 12,047
30 - 34 17079 17416 0.39156 17,760 8,883 8,877
35 - 39 15317 16137 1.04849 17,001 8,438 8,563
40 - 44 13446 14131 0.99874 14,851 7,402 7,449
45 - 49 11523 12954 2.36881 14,563 7,321 7,242
50 - 54 9543 10474 1.87920 11,496 5,600 5,896
55 - 59 7618 8485 2.17912 9,451 4,549 4,902
60 - 64 6210 6575 1.14882 6,961 3,189 3,772
65 - 69 3407 4802 7.10506 6,768 2,981 3,787
70 - 74 2486 2666 1.40790 2,859 1,228 1,631
75 - 79 1444 1793 4.42455 2,226 847 1,380
80 years and over 1211 1387 2.75110 1,425 487 938
xlii Glossary of Items http://nap.psa.gov.ph/glossary/inc.asp xliii Subic Bay Freeport Zone Employed Members of the Labor Force (Labor Center)
BUSINESS CATEGORY NO. OF COMPANY OLONGAPO BATAAN ZAMBALES PAMPANGA NCR TARLAC OTHERS TOTAL MALE FEMALE
2013
MANUFACTURING 84 7208 3129 3967 447 266 50 933 16000 7865 8135
SERVICES 1114 19206 5118 6261 1676 2256 283 4904 39712 25560 14152
SHIPBUILDING/MARINE RELATED SERVICES 47 6330 2091 8619 569 558 1732 7303 27216 25917 1299
CONSTRUCTION 110 2090 644 684 260 729 69 1633 6110 5960 150
DOMESTIC HELPERS/ CARETAKERs/ OTHERS - 546 - - - - - - 546 219 327
GRAND TOTAL 1355 35380 10982 19531 2952 3809 2134 14773 89584 65521 24063
PERCENTAGE 39.5% 12.3% 21.8% 3.3% 4.3% 2.4% 16.5% 73.1% 26.9%
2014 BUSINESS CATEGORY NO. OF COMPANY OLONGAPO BATAAN ZAMBALES PAMPANGA NCR TARLAC OTHERS TOTAL MALE FEMALE
MANUFACTURING 83 6870 2864 3658 441 273 52 918 15076 7503 7573
SERVICES 1243 21961 5779 8141 1713 2225 326 5197 45342 28173 17169
SHIPBUILDING/MARINE RELATED SERVICES 61 5077 1622 15927 401 722 1132 8228 33109 32037 1072
CONSTRUCTION 89 1094 337 407 159 277 31 490 2795 2692 103
DOMESTIC HELPERS/ CARETAKERs/ OTHERS - 381 50 99 22 24 11 49 636 255 381
GRAND TOTAL 1476 35383 10652 28232 2736 3521 1552 14882 96958 70660 26298
PERCENTAGE 36.5% 11.0% 29.1% 2.8% 3.6% 1.6% 15.3% 72.9% 27.1%
2015 BUSINESS CATEGORY NO. OF COMPANY OLONGAPO BATAAN ZAMBALES PAMPANGA NCR TARLAC OTHERS TOTAL MALE FEMALE
MANUFACTURING 87 6829 2600 3585 399 241 47 832 14533 7296 7237
SERVICES 1345 23611 7057 9200 1446 1683 324 5075 48396 28958 19437
SHIPBUILDING/MARINE RELATED SERVICES 84 4464 1445 15652 376 1053 1075 11436 35501 33966 1536
CONSTRUCTION 101 1043 362 315 196 210 79 340 2545 2445 100
DOMESTIC HELPERS/ CARETAKERs/ OTHERS 0 350 62 95 24 31 14 100 676 349 327
GRAND TOTAL 1610 36297 11526 28847 2441 3218 1539 17783 101651 73014 28637
PERCENTAGE 35.7% 11.3% 28.4% 2.4% 3.2% 1.5% 17.5% 71.8% 28.2%
2017 BUSINESS CATHEGORY NO. OF COMPANY OLONGAPO BATAAN ZAMBALES PAMPANGA NCR TARLAC OTHERS TOTAL MALE FEMALE
MANUFACTURING 87 6700 2440 4269 248 177 64 1405 15303 7448 7855
SERVICES 2584 31257 9398 14361 1994 2265 799 9353 69427 43083 26344
SHIPBUILDING/MARINIE 122 5231 1992 14350 749 1241 1316 8714 33593 31554 2039
CONSTRUCTION 175 3012 1174 1535 369 563 203 1765 8621 8187 434
DOMESTIC HELPERS/ CARETAKERs/OTHERS 0 750 71 131 61 67 38 105 1223 709 514
GRAND TOTAL 2958 46950 75 34646 1421 4313 2420 21342 128167 30981 37186
PERCENTAGE 36.6% 11.8% 27.0% 2.7% 3.4% 1.9% 16.7% 71.0% 2018 BUSINESS CATHEGORY NO. OF COMPANY OLONGAPO BATAAN ZAMBALES PAMPANGA NCR TARLAC OTHERS TOTAL MALE FEMALE
MANUFACTURING 85 9056 3626 5260 274 157 86 1257 19716 9125 10591
SERVICES 2587 36885 11534 17540 2483 2626 917 12669 84654 56806 27848
SHIPBUILDING/MARINIE 112 4825 2248 6404 533 831 718 3163 18722 17216 1506
CONSTRUCTION 186 3968 1422 2169 357 528 238 1937 10619 10160 459
DOMESTIC HELPERS/ CARETAKERs/OTHERS 0 1273 146 210 93 92 39 126 1979 1193 786
GRAND TOTAL 2970 56007 18976 31583 3740 4234 1998 19152 135690 94500 41190
PERCENTAGE 41% 14% 23% 3% 3% 1% 14% 100% 70% 30%
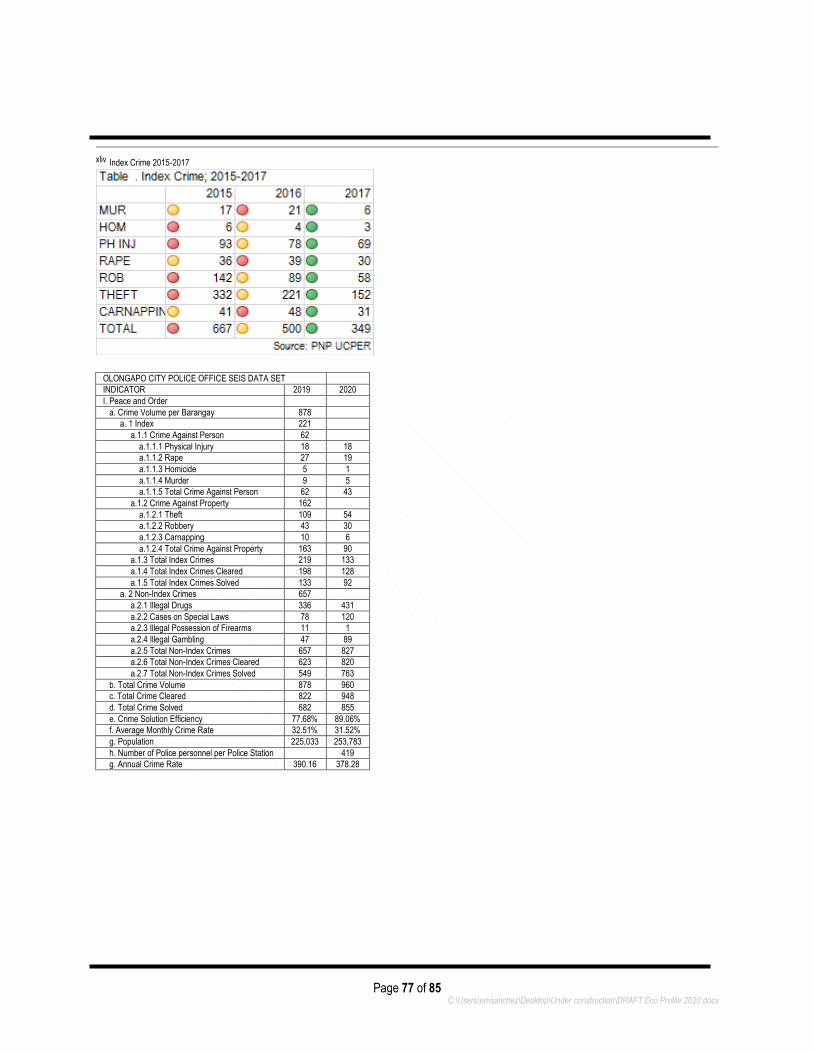
Page 77 of 85 C:\Users\emsanchez\Desktop\Under construction\DRAFT Eco Profile 2020.docx
xliv Index Crime 2015-2017
OLONGAPO CITY POLICE OFFICE SEIS DATA SET
INDICATOR 2019 2020
I. Peace and Order
a. Crime Volume per Barangay 878
a. 1 Index 221
a.1.1 Crime Against Person 62
a.1.1.1 Physical Injury 18 18
a.1.1.2 Rape 27 19
a.1.1.3 Homicide 5 1
a.1.1.4 Murder 9 5
a.1.1.5 Total Crime Against Person 62 43
a.1.2 Crime Against Property 162
a.1.2.1 Theft 109 54
a.1.2.2 Robbery 43 30
a.1.2.3 Carnapping 10 6
a.1.2.4 Total Crime Against Property 163 90
a.1.3 Total Index Crimes 219 133
a.1.4 Total Index Crimes Cleared 198 128
a.1.5 Total Index Crimes Solved 133 92
a. 2 Non-Index Crimes 657
a.2.1 Illegal Drugs 336 431
a.2.2 Cases on Special Laws 78 120
a.2.3 Illegal Possession of Firearms 11 1
a.2.4 Illegal Gambling 47 89
a.2.5 Total Non-Index Crimes 657 827
a.2.6 Total Non-Index Crimes Cleared 623 820
a.2.7 Total Non-Index Crimes Solved 549 763
b. Total Crime Volume 878 960
c. Total Crime Cleared 822 948
d. Total Crime Solved 682 855
e. Crime Solution Efficiency 77.68% 89.06%
f. Average Monthly Crime Rate 32.51% 31.52%
g. Population 225,033 253,783
h. Number of Police personnel per Police Station 419
g. Annual Crime Rate 390.16 378.28
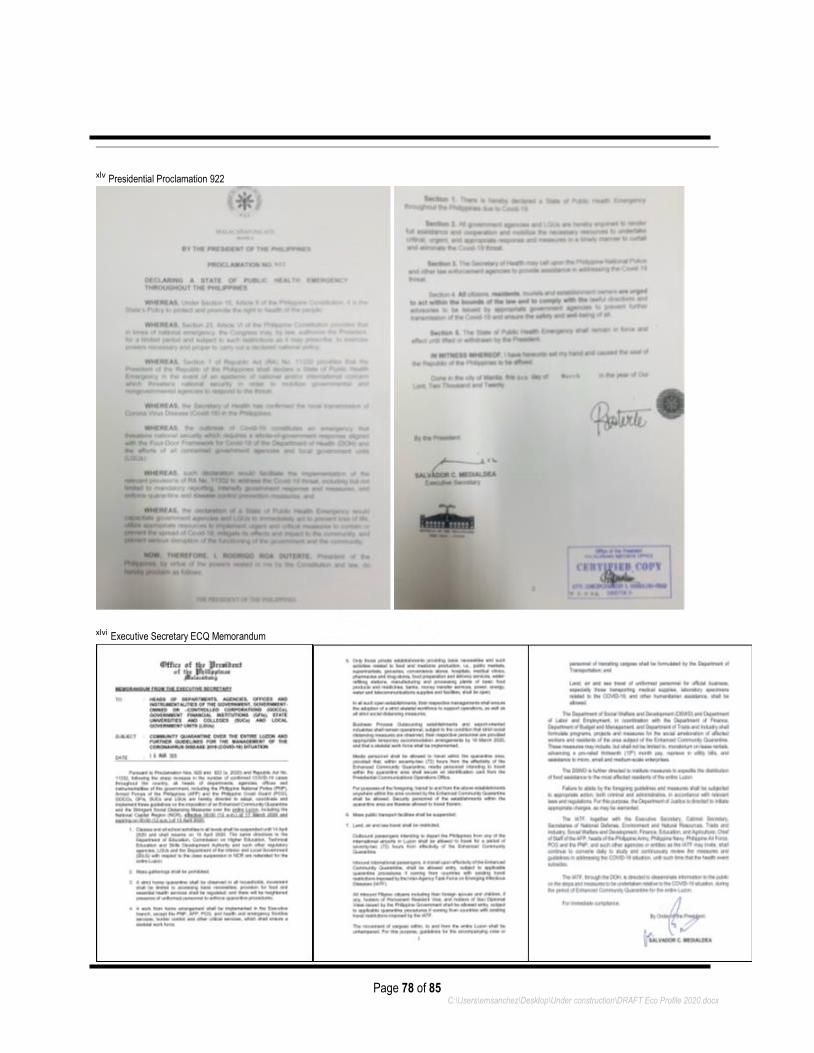
Page 78 of 85 C:\Users\emsanchez\Desktop\Under construction\DRAFT Eco Profile 2020.docx
xlv Presidential Proclamation 922
xlvi Executive Secretary ECQ Memorandum

Page 79 of 85 C:\Users\emsanchez\Desktop\Under construction\DRAFT Eco Profile 2020.docx
xlvii 30 April 2020, Executive Order (E.O.) No. 112, s. 2020
xlviii May 22, 2020 IATF Omnibus Guidelines on Community Quarantine
Section 1. Item 13. Modified General Community Quarantine - refers to the transition phase between GCQ and the New Normal, when the following temporary measures are relaxed and become less necessary: limiting movement and transportation, the regulation of operating industries, and the presence of uniformed personnel to enforce community quarantine protocols.
xlix Department of Trade and Industry (DTI) Memo Circular 20-33 Revised List of Business Allowed to Operate during ECQ, MECQ, GCQ, MGCQ
CATEGORY I Percentage of Operation
Agriculture, Forestry, and Fisheries 100%
Manufacturing of essential goods: 100%
* Food and Beverages (non-alcoholic) 50- 100%
* Essential and Hygiene Products 50- 100%
* Medicines and Vitamins 100%
* Medical Products, PPEs, Masks, etc. 100%
* Pet food, Feeds, Fertilizer 50%
Essential Retail (markets, drug stores) 50%
Food preparation take-out /delivery 50%
Water-Refilling Stores 50%
Laundry Services (including self-service) 50%
Public and private hospitals 100%
Health, emergency and frontline services 100%
Other medical, dental, optometry EENT SKN
Logistics Service Providers 100%
Delivery and courier services, 100%
Water supply, sanitation, waste disposal SKN
Repair & maintenance HH fixtures/ equip SKN
Household fixtures and equipment SKN
Telecom ( ISPs, cable TV, telco ) SKN
Energy and power companies SKN
Gasoline Stations SKN
Workers accredited by the DOTr SKN
Aviation industry SKN
Maritime industry SKN
DPWH Public / private construction projs 100%
Construction equip mfg/suppliers 100%
Business Process Outsourcing (BPO) 100%
Export- oriented companies 100%
Printing presses authorized by the BIR 100%
Media Establishments 50%
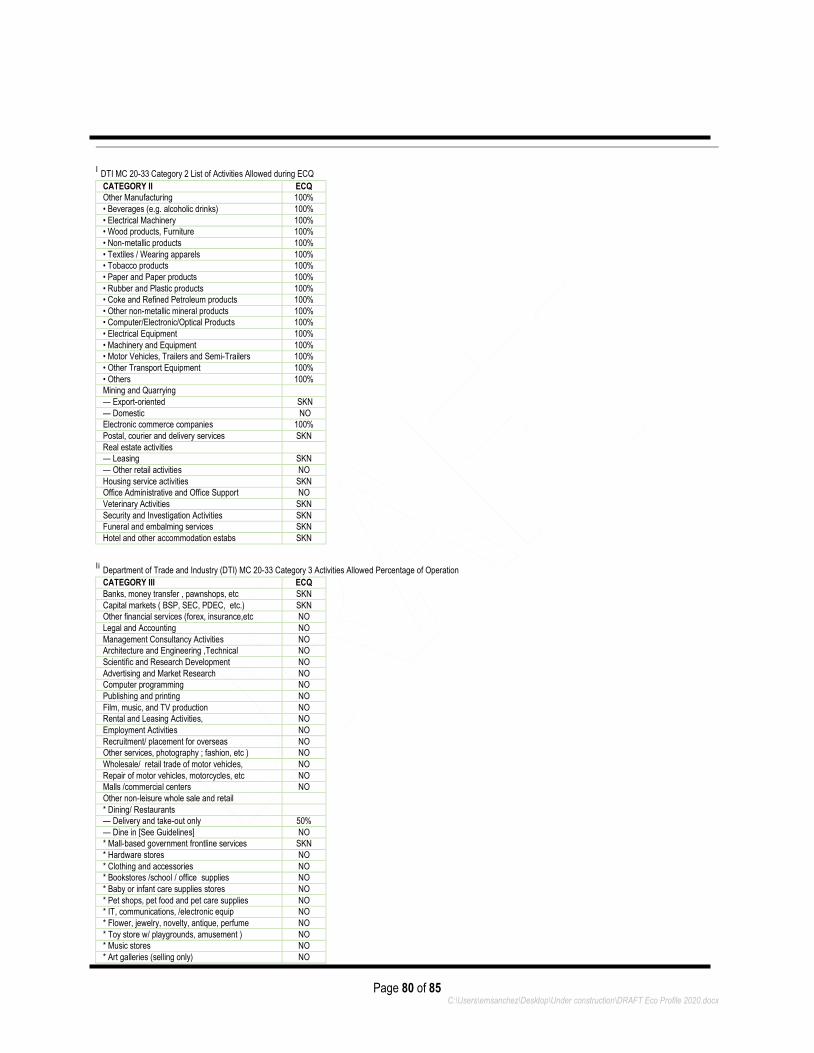
Page 80 of 85 C:\Users\emsanchez\Desktop\Under construction\DRAFT Eco Profile 2020.docx
l DTI MC 20-33 Category 2 List of Activities Allowed during ECQ
CATEGORY II ECQ
Other Manufacturing 100%
• Beverages (e.g. alcoholic drinks) 100%
• Electrical Machinery 100%
• Wood products, Furniture 100%
• Non-metallic products 100%
• Textiles / Wearing apparels 100%
• Tobacco products 100%
• Paper and Paper products 100%
• Rubber and Plastic products 100%
• Coke and Refined Petroleum products 100%
• Other non-metallic mineral products 100%
• Computer/Electronic/Optical Products 100%
• Electrical Equipment 100%
• Machinery and Equipment 100%
• Motor Vehicles, Trailers and Semi-Trailers 100%
• Other Transport Equipment 100%
• Others 100%
Mining and Quarrying
— Export-oriented SKN
— Domestic NO
Electronic commerce companies 100%
Postal, courier and delivery services SKN
Real estate activities
— Leasing SKN
— Other retail activities NO
Housing service activities SKN
Office Administrative and Office Support NO
Veterinary Activities SKN
Security and Investigation Activities SKN
Funeral and embalming services SKN
Hotel and other accommodation estabs SKN
li Department of Trade and Industry (DTI) MC 20-33 Category 3 Activities Allowed Percentage of Operation
CATEGORY III ECQ
Banks, money transfer , pawnshops, etc SKN
Capital markets ( BSP, SEC, PDEC, etc.) SKN
Other financial services (forex, insurance,etc NO
Legal and Accounting NO
Management Consultancy Activities NO
Architecture and Engineering ,Technical NO
Scientific and Research Development NO
Advertising and Market Research NO
Computer programming NO
Publishing and printing NO
Film, music, and TV production NO
Rental and Leasing Activities, NO
Employment Activities NO
Recruitment/ placement for overseas NO
Other services, photography ; fashion, etc ) NO
Wholesale/ retail trade of motor vehicles, NO
Repair of motor vehicles, motorcycles, etc NO
Malls /commercial centers NO
Other non-leisure whole sale and retail
* Dining/ Restaurants
— Delivery and take-out only 50%
— Dine in [See Guidelines] NO
* Mall-based government frontline services SKN
* Hardware stores NO
* Clothing and accessories NO
* Bookstores /school / office supplies NO
* Baby or infant care supplies stores NO
* Pet shops, pet food and pet care supplies NO
* IT, communications, /electronic equip NO
* Flower, jewelry, novelty, antique, perfume NO
* Toy store w/ playgrounds, amusement ) NO
* Music stores NO
* Art galleries (selling only) NO
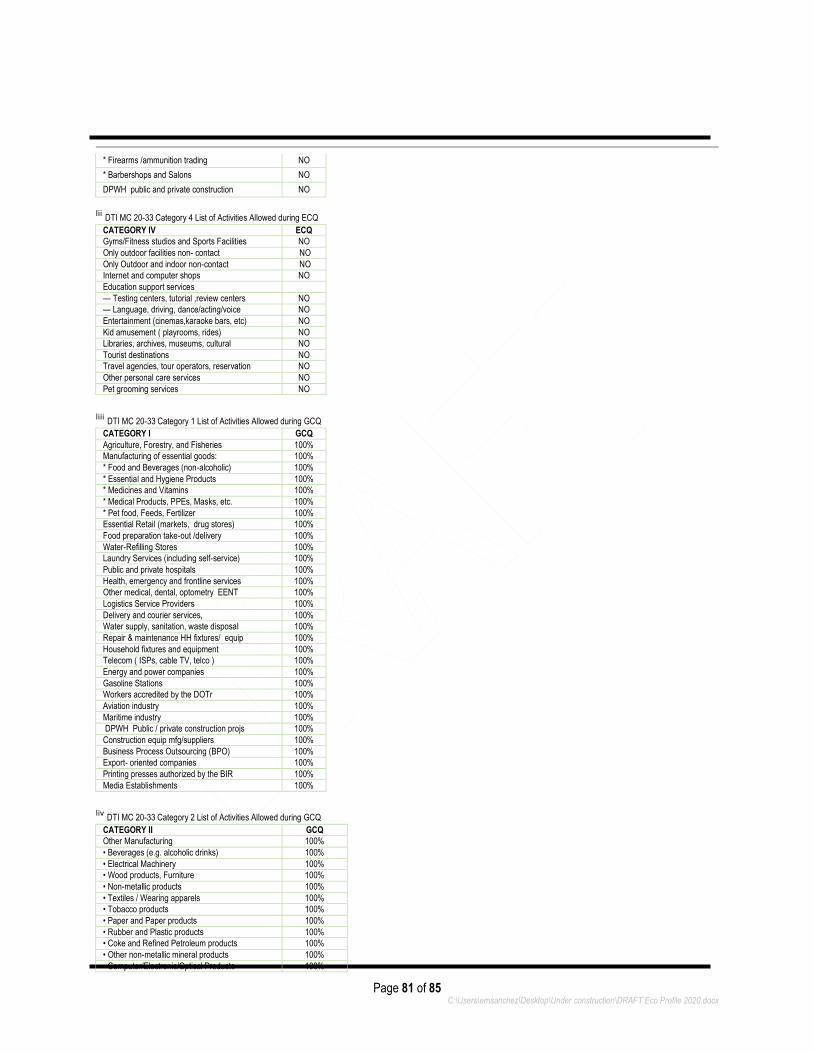
Page 81 of 85 C:\Users\emsanchez\Desktop\Under construction\DRAFT Eco Profile 2020.docx
* Firearms /ammunition trading NO
* Barbershops and Salons NO
DPWH public and private construction NO
lii DTI MC 20-33 Category 4 List of Activities Allowed during ECQ
CATEGORY IV ECQ
Gyms/Fitness studios and Sports Facilities NO
Only outdoor facilities non- contact NO
Only Outdoor and indoor non-contact NO
Internet and computer shops NO
Education support services
— Testing centers, tutorial ,review centers NO
— Language, driving, dance/acting/voice NO
Entertainment (cinemas,karaoke bars, etc) NO
Kid amusement ( playrooms, rides) NO
Libraries, archives, museums, cultural NO
Tourist destinations NO
Travel agencies, tour operators, reservation NO
Other personal care services NO
Pet grooming services NO
liii DTI MC 20-33 Category 1 List of Activities Allowed during GCQ
CATEGORY I GCQ
Agriculture, Forestry, and Fisheries 100%
Manufacturing of essential goods: 100%
* Food and Beverages (non-alcoholic) 100%
* Essential and Hygiene Products 100%
* Medicines and Vitamins 100%
* Medical Products, PPEs, Masks, etc. 100%
* Pet food, Feeds, Fertilizer 100%
Essential Retail (markets, drug stores) 100%
Food preparation take-out /delivery 100%
Water-Refilling Stores 100%
Laundry Services (including self-service) 100%
Public and private hospitals 100%
Health, emergency and frontline services 100%
Other medical, dental, optometry EENT 100%
Logistics Service Providers 100%
Delivery and courier services, 100%
Water supply, sanitation, waste disposal 100%
Repair & maintenance HH fixtures/ equip 100%
Household fixtures and equipment 100%
Telecom ( ISPs, cable TV, telco ) 100%
Energy and power companies 100%
Gasoline Stations 100%
Workers accredited by the DOTr 100%
Aviation industry 100%
Maritime industry 100%
DPWH Public / private construction projs 100%
Construction equip mfg/suppliers 100%
Business Process Outsourcing (BPO) 100%
Export- oriented companies 100%
Printing presses authorized by the BIR 100%
Media Establishments 100%
liv DTI MC 20-33 Category 2 List of Activities Allowed during GCQ
CATEGORY II GCQ
Other Manufacturing 100%
• Beverages (e.g. alcoholic drinks) 100%
• Electrical Machinery 100%
• Wood products, Furniture 100%
• Non-metallic products 100%
• Textiles / Wearing apparels 100%
• Tobacco products 100%
• Paper and Paper products 100%
• Rubber and Plastic products 100%
• Coke and Refined Petroleum products 100%
• Other non-metallic mineral products 100%
• Computer/Electronic/Optical Products 100%

Page 82 of 85 C:\Users\emsanchez\Desktop\Under construction\DRAFT Eco Profile 2020.docx
• Electrical Equipment 100%
• Machinery and Equipment 100%
• Motor Vehicles, Trailers and Semi-Trailers 100%
• Other Transport Equipment 100%
• Others 100%
Mining and Quarrying
— Export-oriented 100%
— Domestic 50- 100%
Electronic commerce companies 100%
Postal, courier and delivery services 100%
Real estate activities
— Leasing 100%
— Other retail activities 100%
Housing service activities 100%
Office Administrative and Office Support 50- 100%
Veterinary Activities 100%
Security and Investigation Activities 100%
Funeral and embalming services 100%
Hotel and other accommodation estabs SKN
lv DTI MC 20-33 Category 3 List of Activities Allowed during GCQ
CATEGORY III GCQ
Banks, money transfer , pawnshops, etc 100%
Capital markets ( BSP, SEC, PDEC, etc.) 100%
Other financial services (forex, insurance,etc 50%
Legal and Accounting 50%
Management Consultancy Activities 50%
Architecture and Engineering ,Technical 50%
Scientific and Research Development 50%
Advertising and Market Research 50%
Computer programming 50%
Publishing and printing 50%
Film, music, and TV production 50%
Rental and Leasing Activities, 100%
Employment Activities 100%
Recruitment/ placement for overseas 50%
Other services, photography ; fashion, etc ) 50%
Wholesale/ retail trade of motor vehicles, 50%
Repair of motor vehicles, motorcycles, etc 50%
Malls /commercial centers 50%
Other non-leisure whole sale and retail
* Dining/ Restaurants
— Delivery and take-out only 50%
— Dine in [See Guidelines] NO
* Mall-based government frontline services 100%
* Hardware stores 50%
* Clothing and accessories 50%
* Bookstores /school / office supplies 50%
* Baby or infant care supplies stores 50%
* Pet shops, pet food and pet care supplies 50%
* IT, communications, /electronic equip 50%
* Flower, jewelry, novelty, antique, perfume 50%
* Toy store w/ playgrounds, amusement ) 50%
* Music stores 50%
* Art galleries (selling only) 50%
* Firearms /ammunition trading 50%
* Barbershops and Salons 30- 50%
DPWH public and private construction 50%
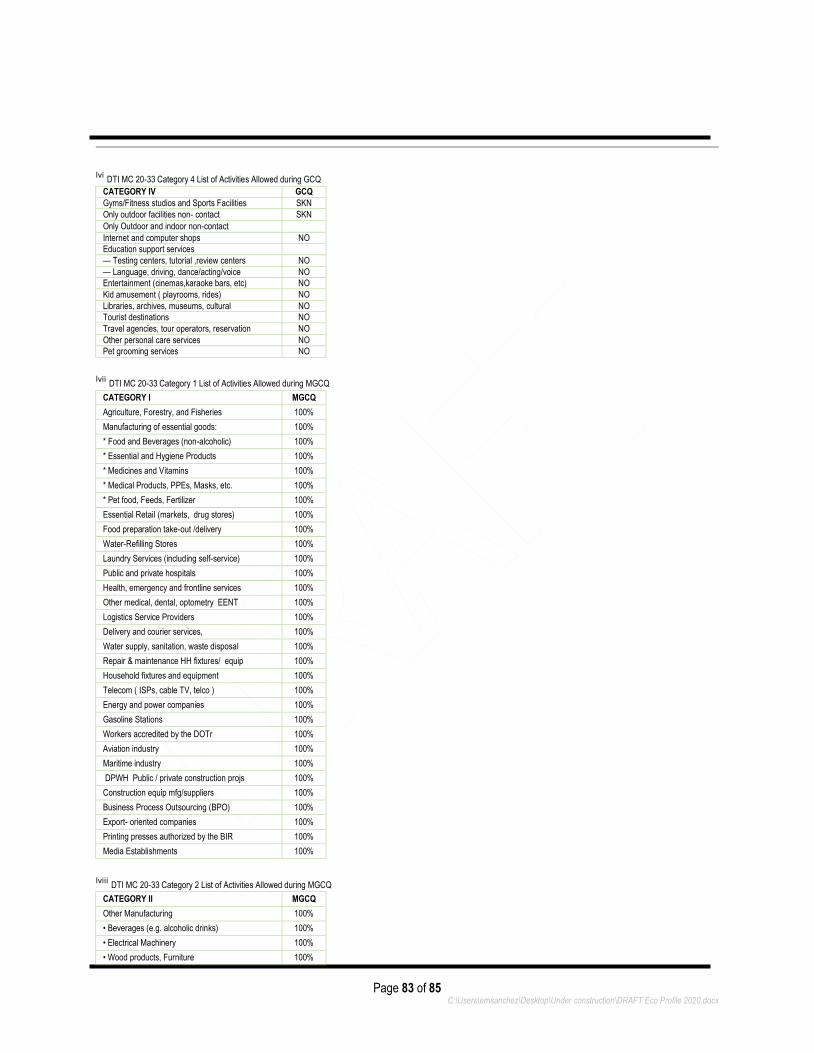
Page 83 of 85 C:\Users\emsanchez\Desktop\Under construction\DRAFT Eco Profile 2020.docx
lvi DTI MC 20-33 Category 4 List of Activities Allowed during GCQ
CATEGORY IV GCQ
Gyms/Fitness studios and Sports Facilities SKN
Only outdoor facilities non- contact SKN
Only Outdoor and indoor non-contact Internet and computer shops NO
Education support services
— Testing centers, tutorial ,review centers NO
— Language, driving, dance/acting/voice NO
Entertainment (cinemas,karaoke bars, etc) NO
Kid amusement ( playrooms, rides) NO
Libraries, archives, museums, cultural NO
Tourist destinations NO
Travel agencies, tour operators, reservation NO
Other personal care services NO
Pet grooming services NO
lvii DTI MC 20-33 Category 1 List of Activities Allowed during MGCQ
CATEGORY I MGCQ
Agriculture, Forestry, and Fisheries 100%
Manufacturing of essential goods: 100%
* Food and Beverages (non-alcoholic) 100%
* Essential and Hygiene Products 100%
* Medicines and Vitamins 100%
* Medical Products, PPEs, Masks, etc. 100%
* Pet food, Feeds, Fertilizer 100%
Essential Retail (markets, drug stores) 100%
Food preparation take-out /delivery 100%
Water-Refilling Stores 100%
Laundry Services (including self-service) 100%
Public and private hospitals 100%
Health, emergency and frontline services 100%
Other medical, dental, optometry EENT 100%
Logistics Service Providers 100%
Delivery and courier services, 100%
Water supply, sanitation, waste disposal 100%
Repair & maintenance HH fixtures/ equip 100%
Household fixtures and equipment 100%
Telecom ( ISPs, cable TV, telco ) 100%
Energy and power companies 100%
Gasoline Stations 100%
Workers accredited by the DOTr 100%
Aviation industry 100%
Maritime industry 100%
DPWH Public / private construction projs 100%
Construction equip mfg/suppliers 100%
Business Process Outsourcing (BPO) 100%
Export- oriented companies 100%
Printing presses authorized by the BIR 100%
Media Establishments 100%
lviii DTI MC 20-33 Category 2 List of Activities Allowed during MGCQ
CATEGORY II MGCQ
Other Manufacturing 100%
• Beverages (e.g. alcoholic drinks) 100%
• Electrical Machinery 100%
• Wood products, Furniture 100%

Page 84 of 85 C:\Users\emsanchez\Desktop\Under construction\DRAFT Eco Profile 2020.docx
• Non-metallic products 100%
• Textiles / Wearing apparels 100%
• Tobacco products 100%
• Paper and Paper products 100%
• Rubber and Plastic products 100%
• Coke and Refined Petroleum products 100%
• Other non-metallic mineral products 100%
• Computer/Electronic/Optical Products 100%
• Electrical Equipment 100%
• Machinery and Equipment 100%
• Motor Vehicles, Trailers and Semi-Trailers 100%
• Other Transport Equipment 100%
• Others 100%
Mining and Quarrying
— Export-oriented 100%
— Domestic 100%
Electronic commerce companies 100%
Postal, courier and delivery services 100%
Real estate activities
— Leasing 100%
— Other retail activities 100%
Housing service activities 100%
Office Administrative and Office Support 100%
Veterinary Activities 100%
Security and Investigation Activities 100%
Funeral and embalming services 100%
Hotel and other accommodation estabs 50%
lix DTI MC 20-33 Category 3 List of Activities Allowed during MGCQ
CATEGORY III MGCQ
Banks, money transfer , pawnshops, etc 100%
Capital markets ( BSP, SEC, PDEC, etc.) 100%
Other financial services (forex, insurance,etc 100%
Legal and Accounting 100%
Management Consultancy Activities 100%
Architecture and Engineering ,Technical 100%
Scientific and Research Development 100%
Advertising and Market Research 100%
Computer programming 100%
Publishing and printing 100%
Film, music, and TV production 100%
Rental and Leasing Activities, 100%
Employment Activities 100%
Recruitment/ placement for overseas 100%
Other services, photography ; fashion, etc ) 100%
Wholesale/ retail trade of motor vehicles, 100%
Repair of motor vehicles, motorcycles, etc 100%
Malls /commercial centers 100%
Other non-leisure whole sale and retail
* Dining/ Restaurants
— Delivery and take-out only 100%
— Dine in [See Guidelines] 50%
* Mall-based government frontline services 100%
* Hardware stores 100%
* Clothing and accessories 100%
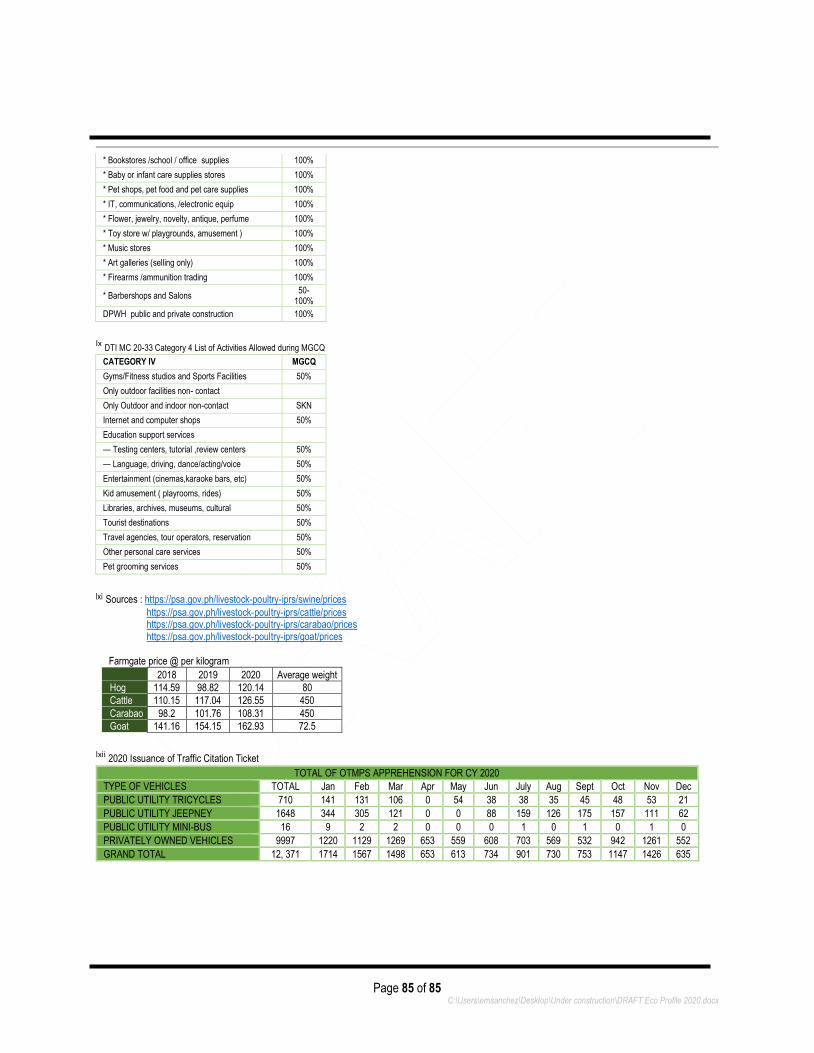
Page 85 of 85 C:\Users\emsanchez\Desktop\Under construction\DRAFT Eco Profile 2020.docx
* Bookstores /school / office supplies 100%
* Baby or infant care supplies stores 100%
* Pet shops, pet food and pet care supplies 100%
* IT, communications, /electronic equip 100%
* Flower, jewelry, novelty, antique, perfume 100%
* Toy store w/ playgrounds, amusement ) 100%
* Music stores 100%
* Art galleries (selling only) 100%
* Firearms /ammunition trading 100%
* Barbershops and Salons
50- 100%
DPWH public and private construction 100%
lx DTI MC 20-33 Category 4 List of Activities Allowed during MGCQ
CATEGORY IV MGCQ
Gyms/Fitness studios and Sports Facilities 50%
Only outdoor facilities non- contact
Only Outdoor and indoor non-contact SKN
Internet and computer shops 50%
Education support services
— Testing centers, tutorial ,review centers 50%
— Language, driving, dance/acting/voice 50%
Entertainment (cinemas,karaoke bars, etc) 50%
Kid amusement ( playrooms, rides) 50%
Libraries, archives, museums, cultural 50%
Tourist destinations 50%
Travel agencies, tour operators, reservation 50%
Other personal care services 50%
Pet grooming services 50%
lxi Sources : https://psa.gov.ph/livestock-poultry-iprs/swine/prices
https://psa.gov.ph/livestock-poultry-iprs/cattle/prices https://psa.gov.ph/livestock-poultry-iprs/carabao/prices https://psa.gov.ph/livestock-poultry-iprs/goat/prices
Farmgate price @ per kilogram
2018 2019 2020 Average weight
Hog 114.59 98.82 120.14 80
Cattle 110.15 117.04 126.55 450
Carabao 98.2 101.76 108.31 450
Goat 141.16 154.15 162.93 72.5
lxii 2020 Issuance of Traffic Citation Ticket
TOTAL OF OTMPS APPREHENSION FOR CY 2020
TYPE OF VEHICLES TOTAL Jan Feb Mar Apr May Jun July Aug Sept Oct Nov Dec
PUBLIC UTILITY TRICYCLES 710 141 131 106 0 54 38 38 35 45 48 53 21
PUBLIC UTILITY JEEPNEY 1648 344 305 121 0 0 88 159 126 175 157 111 62
PUBLIC UTILITY MINI-BUS 16 9 2 2 0 0 0 1 0 1 0 1 0
PRIVATELY OWNED VEHICLES 9997 1220 1129 1269 653 559 608 703 569 532 942 1261 552
GRAND TOTAL 12, 371 1714 1567 1498 653 613 734 901 730 753 1147 1426 635