The ecological impact of city lighting scenarios: exploring gap crossing thresholds for urban bats
12
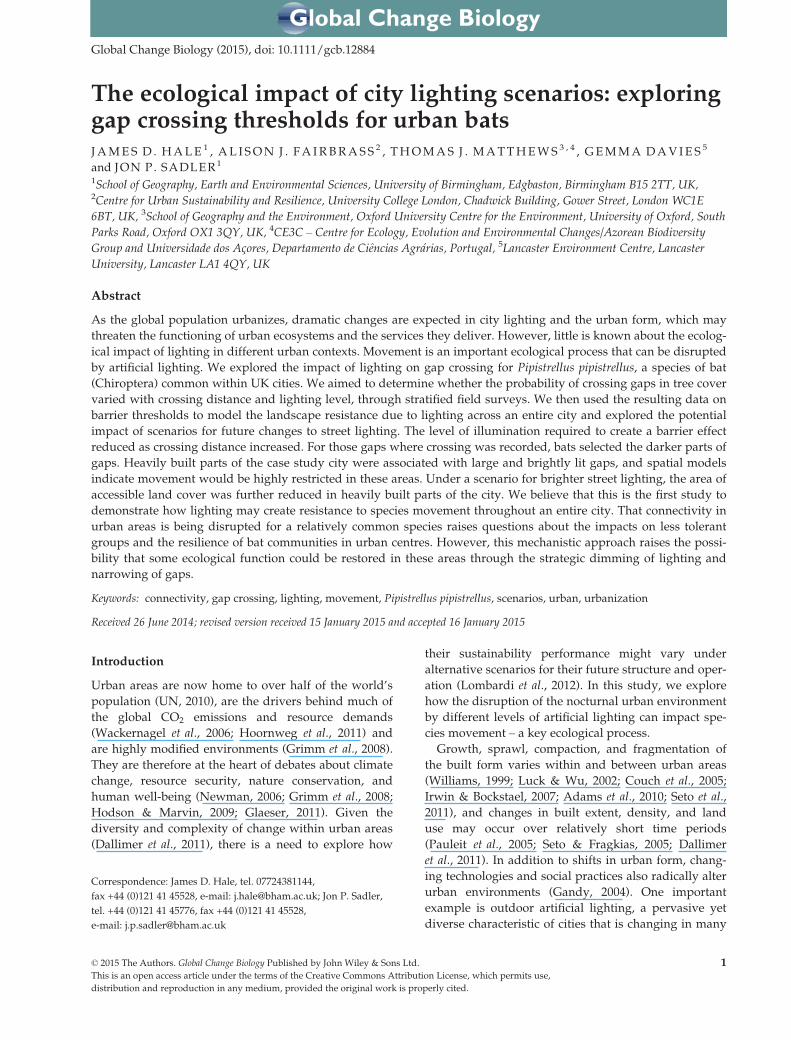
The ecological impact of city lighting scenarios: exploring gap crossing thresholds for urban bats JAMES D. HALE 1 , ALISON J. FAIRBRASS 2 , THOMAS J. MATTHEWS 3,4 , GEMMA DAVIES 5 andJON P. SADLER 1 1 School of Geography, Earth and Environmental Sciences, University of Birmingham, Edgbaston, Birmingham B15 2TT, UK, 2 Centre for Urban Sustainability and Resilience, University College London, Chadwick Building, Gower Street, London WC1E 6BT, UK, 3 School of Geography and the Environment, Oxford University Centre for the Environment, University of Oxford, South Parks Road, Oxford OX1 3QY, UK, 4 CE3C – Centre for Ecology, Evolution and Environmental Changes/Azorean Biodiversity Group and Universidade dos Ac ßores, Departamento de Ci ^ encias Agr arias, Portugal, 5 Lancaster Environment Centre, Lancaster University, Lancaster LA1 4QY, UK Abstract As the global population urbanizes, dramatic changes are expected in city lighting and the urban form, which may threaten the functioning of urban ecosystems and the services they deliver. However, little is known about the ecolog- ical impact of lighting in different urban contexts. Movement is an important ecological process that can be disrupted by artificial lighting. We explored the impact of lighting on gap crossing for Pipistrellus pipistrellus, a species of bat (Chiroptera) common within UK cities. We aimed to determine whether the probability of crossing gaps in tree cover varied with crossing distance and lighting level, through stratified field surveys. We then used the resulting data on barrier thresholds to model the landscape resistance due to lighting across an entire city and explored the potential impact of scenarios for future changes to street lighting. The level of illumination required to create a barrier effect reduced as crossing distance increased. For those gaps where crossing was recorded, bats selected the darker parts of gaps. Heavily built parts of the case study city were associated with large and brightly lit gaps, and spatial models indicate movement would be highly restricted in these areas. Under a scenario for brighter street lighting, the area of accessible land cover was further reduced in heavily built parts of the city. We believe that this is the first study to demonstrate how lighting may create resistance to species movement throughout an entire city. That connectivity in urban areas is being disrupted for a relatively common species raises questions about the impacts on less tolerant groups and the resilience of bat communities in urban centres. However, this mechanistic approach raises the possi- bility that some ecological function could be restored in these areas through the strategic dimming of lighting and narrowing of gaps. Keywords: connectivity, gap crossing, lighting, movement, Pipistrellus pipistrellus, scenarios, urban, urbanization Received 26 June 2014; revised version received 15 January 2015 and accepted 16 January 2015 Introduction Urban areas are now home to over half of the world’s population (UN, 2010), are the drivers behind much of the global CO 2 emissions and resource demands (Wackernagel et al., 2006; Hoornweg et al., 2011) and are highly modified environments (Grimm et al., 2008). They are therefore at the heart of debates about climate change, resource security, nature conservation, and human well-being (Newman, 2006; Grimm et al., 2008; Hodson & Marvin, 2009; Glaeser, 2011). Given the diversity and complexity of change within urban areas (Dallimer et al., 2011), there is a need to explore how their sustainability performance might vary under alternative scenarios for their future structure and oper- ation (Lombardi et al., 2012). In this study, we explore how the disruption of the nocturnal urban environment by different levels of artificial lighting can impact spe- cies movement – a key ecological process. Growth, sprawl, compaction, and fragmentation of the built form varies within and between urban areas (Williams, 1999; Luck & Wu, 2002; Couch et al., 2005; Irwin & Bockstael, 2007; Adams et al., 2010; Seto et al., 2011), and changes in built extent, density, and land use may occur over relatively short time periods (Pauleit et al., 2005; Seto & Fragkias, 2005; Dallimer et al., 2011). In addition to shifts in urban form, chang- ing technologies and social practices also radically alter urban environments (Gandy, 2004). One important example is outdoor artificial lighting, a pervasive yet diverse characteristic of cities that is changing in many Correspondence: James D. Hale, tel. 07724381144, fax +44 (0)121 41 45528, e-mail: [email protected]; Jon P. Sadler, tel. +44 (0)121 41 45776, fax +44 (0)121 41 45528, e-mail: [email protected] 1 © 2015 The Authors. Global Change Biology Published by John Wiley & Sons Ltd. This is an open access article under the terms of the Creative Commons Attribution License, which permits use, distribution and reproduction in any medium, provided the original work is properly cited. Global Change Biology (2015), doi: 10.1111/gcb.12884
Transcript of The ecological impact of city lighting scenarios: exploring gap crossing thresholds for urban bats
The ecological impact of city lighting scenarios: exploringgap crossing thresholds for urban batsJAMES D . HALE 1 , AL I SON J . FA IRBRASS 2 , THOMAS J . MATTHEWS 3 , 4 , GEMMA DAV IE S 5
and JON P. SADLER1
1School of Geography, Earth and Environmental Sciences, University of Birmingham, Edgbaston, Birmingham B15 2TT, UK,2Centre for Urban Sustainability and Resilience, University College London, Chadwick Building, Gower Street, London WC1E
6BT, UK, 3School of Geography and the Environment, Oxford University Centre for the Environment, University of Oxford, South
Parks Road, Oxford OX1 3QY, UK, 4CE3C – Centre for Ecology, Evolution and Environmental Changes/Azorean Biodiversity
Group and Universidade dos Ac�ores, Departamento de Ciencias Agr�arias, Portugal, 5Lancaster Environment Centre, Lancaster
University, Lancaster LA1 4QY, UK
Abstract
As the global population urbanizes, dramatic changes are expected in city lighting and the urban form, which may
threaten the functioning of urban ecosystems and the services they deliver. However, little is known about the ecolog-
ical impact of lighting in different urban contexts. Movement is an important ecological process that can be disrupted
by artificial lighting. We explored the impact of lighting on gap crossing for Pipistrellus pipistrellus, a species of bat
(Chiroptera) common within UK cities. We aimed to determine whether the probability of crossing gaps in tree cover
varied with crossing distance and lighting level, through stratified field surveys. We then used the resulting data on
barrier thresholds to model the landscape resistance due to lighting across an entire city and explored the potential
impact of scenarios for future changes to street lighting. The level of illumination required to create a barrier effect
reduced as crossing distance increased. For those gaps where crossing was recorded, bats selected the darker parts of
gaps. Heavily built parts of the case study city were associated with large and brightly lit gaps, and spatial models
indicate movement would be highly restricted in these areas. Under a scenario for brighter street lighting, the area of
accessible land cover was further reduced in heavily built parts of the city. We believe that this is the first study to
demonstrate how lighting may create resistance to species movement throughout an entire city. That connectivity in
urban areas is being disrupted for a relatively common species raises questions about the impacts on less tolerant
groups and the resilience of bat communities in urban centres. However, this mechanistic approach raises the possi-
bility that some ecological function could be restored in these areas through the strategic dimming of lighting and
narrowing of gaps.
Keywords: connectivity, gap crossing, lighting, movement, Pipistrellus pipistrellus, scenarios, urban, urbanization
Received 26 June 2014; revised version received 15 January 2015 and accepted 16 January 2015
Introduction
Urban areas are now home to over half of the world’s
population (UN, 2010), are the drivers behind much of
the global CO2 emissions and resource demands
(Wackernagel et al., 2006; Hoornweg et al., 2011) and
are highly modified environments (Grimm et al., 2008).
They are therefore at the heart of debates about climate
change, resource security, nature conservation, and
human well-being (Newman, 2006; Grimm et al., 2008;
Hodson & Marvin, 2009; Glaeser, 2011). Given the
diversity and complexity of change within urban areas
(Dallimer et al., 2011), there is a need to explore how
their sustainability performance might vary under
alternative scenarios for their future structure and oper-
ation (Lombardi et al., 2012). In this study, we explore
how the disruption of the nocturnal urban environment
by different levels of artificial lighting can impact spe-
cies movement – a key ecological process.
Growth, sprawl, compaction, and fragmentation of
the built form varies within and between urban areas
(Williams, 1999; Luck & Wu, 2002; Couch et al., 2005;
Irwin & Bockstael, 2007; Adams et al., 2010; Seto et al.,
2011), and changes in built extent, density, and land
use may occur over relatively short time periods
(Pauleit et al., 2005; Seto & Fragkias, 2005; Dallimer
et al., 2011). In addition to shifts in urban form, chang-
ing technologies and social practices also radically alter
urban environments (Gandy, 2004). One important
example is outdoor artificial lighting, a pervasive yet
diverse characteristic of cities that is changing in many
Correspondence: James D. Hale, tel. 07724381144,
fax +44 (0)121 41 45528, e-mail: [email protected]; Jon P. Sadler,
tel. +44 (0)121 41 45776, fax +44 (0)121 41 45528,
e-mail: [email protected]
1© 2015 The Authors. Global Change Biology Published by John Wiley & Sons Ltd.
This is an open access article under the terms of the Creative Commons Attribution License, which permits use,
distribution and reproduction in any medium, provided the original work is properly cited.
Global Change Biology (2015), doi: 10.1111/gcb.12884

regions (Bennie et al., 2014a; Kyba et al., 2014). Remo-
tely sensed measures of light emissions from the earth’s
surface have been found to correlate with built land
cover (Hale et al., 2013), population density (Sutton
et al., 1997), electric power consumption (Elvidge et al.,
1997), and per capita income (Ebener et al., 2005). Out-
door artificial lighting also varies considerably within
cities depending on land cover and land use (Lug-
inbuhl et al., 2009; Kuechly et al., 2012; Hale et al., 2013;
Levin et al., 2014). Intensification and expansion of
lighting is evident at both local and global scales
(H€olker et al., 2010a; Bennie et al., 2014a), a process
fuelled by the emergence of cheaper and more efficient
lighting technologies (Tsao et al., 2010; Kyba et al.,
2014). The large-scale introduction of such technologies
would also be expected to result in changes to the dom-
inant spectral composition of outdoor lighting (Stone
et al., 2012). However, despite a broad trend of growth
in artificial lighting, some locations are becoming dar-
ker (Bennie et al., 2014a) as lamps are shielded,
dimmed, or even removed to reduce light pollution,
running costs, and carbon emissions (RCEP, 2009; Fal-
chi et al., 2011; Gaston et al., 2012). Changes in artificial
lighting can impact city performance in a variety of
ways (Smith, 2009; Falchi et al., 2011), yet many of the
potential sustainability impacts remain unexplored
(H€olker et al., 2010a; Lyytimaki et al., 2012). The nature
of lighting infrastructure and its operation has obvious
implications for energy demands and costs (Gallaway
et al., 2010; Tsao et al., 2010). However, artificial light-
ing also has numerous positive and negative impacts
on social practices and human health; lighting has
enabled greater flexibility in the timing of work and lei-
sure activities, although at the cost of disruption to cir-
cadian rhythms, behaviours, and physiological
processes (e.g. Navara & Nelson, 2007; Falchi et al.,
2011; Cho et al., 2013). Less is known, however, about
how natural systems are disturbed and the resulting
effects on ecological function and service provision
(Rich & Longcore, 2006; H€olker et al., 2010b; Gaston
et al., 2012).
In this study, we focus on ecological impacts of artifi-
cial lighting in urban areas and explore how these may
vary with different levels of illumination and configu-
rations of the built form.
The value of the semi-natural components of cities is
increasingly recognized, particularly from the perspec-
tive of those ecosystem functions with strong links to
human well-being (Carpenter et al., 2006; Sadler et al.,
2010; Haase et al., 2014). Given the known effects of
artificial lighting on a variety of species and habitats
(Longcore & Rich, 2004; H€olker et al., 2010b; Gaston
et al., 2012) and the rapid changes to urban street light-
ing already underway, research is needed that explores
the potential disruption of ecological processes at the
city scale. Individuals of most species are sensitive to
natural cycles of day and night (H€olker et al., 2010b),
with light acting both as information and a resource
(Gaston et al., 2013). For some species, the disruption of
these cycles by artificial lighting can impair particular
parts of their life history, for example feeding and
growth (Boldogh et al., 2007), commuting to foraging
sites (Stone et al., 2009) or the timing of reproduction
(Kempenaers et al., 2010). Conversely, lighting can
bring direct advantages such as concentrating prey
(Blake et al., 1994; Jung & Kalko, 2010) or for diurnal
and crepuscular species, it may extend the hours of
activity (Negro et al., 2000). A further complication is
that lighting may deliver both costs and benefits to a
single individual, making the net impact challenging to
estimate. For example, artificial lighting has been found
to delay roost emergence in the bat Pipistrellus pygmaeus
(Downs et al., 2003), but also to provide foraging loca-
tions for the same species (Bartonička et al., 2008).
Impacts on individual fitness may be sufficient to alter
populations and even community composition (Perkin
et al., 2011; Davies et al., 2012), with the potential to
affect important ecosystem functions and services such
as pollination (Eisenbeis, 2006) or seed dispersal (Lew-
anzik & Voigt, 2014). However, population or ecosys-
tem-scale research related to artificial lighting is rare
(Gaston et al., 2013; Lyytim€aki, 2013). One further nota-
ble research gap relates to lighting thresholds for eco-
logical impacts and their spatial extent (Gaston et al.,
2013).
Here, we examine the impact of lighting on animal
movement within urban areas as movement is a pro-
cess relevant to individual fitness, to population resil-
ience and to broader ecosystem structure and function
(Nathan et al., 2008). Despite the importance of move-
ment for enabling organisms to forage, disperse, and
ensure gene flow between populations, the direct mea-
surement of functional connectivity is not always prac-
tical (Nathan et al., 2008; Zeller et al., 2012). Tracking
and genetic studies may provide evidence that some
patches within a landscape are functionally connected,
but on their own, these approaches fail to explain why
movement may have been recorded in some contexts
but not in others. Understanding the factors that affect
movement between habitat patches is therefore impor-
tant for conservation practice (Rayfield et al., 2010;
Watts et al., 2010), particularly in landscapes undergo-
ing rapid environmental change (Zeller et al., 2012).
This can be highly complicated as movement may not
only depend on patterns of land cover and land use
within a landscape, but also on the motivation and abil-
ity of individuals to move (Tischendorf & Fahrig, 2000;
Nathan et al., 2008; Pe’er et al., 2011).
© 2015 The Authors. Global Change Biology Published by John Wiley & Sons Ltd., doi: 10.1111/gcb.12884
2 J . D. HALE et al.

The flight behaviour of several bat species may be
influenced by artificial lighting (Kuijper et al., 2008;
Stone et al., 2009, 2012; Polak et al., 2011) which can
cause deviation of the flight path to avoid the most
heavily lit area (Kuijper et al., 2008; Stone et al., 2009),
or barrier effects where approaching bats turn and fly
in the opposite direction (Stone et al., 2009). Barrier
effects on commuting bats have also been demonstrated
for structures such as motorways that bisect habitat net-
works (Kerth & Melber, 2009). Several European bat
species are known to fly along woodland edges and
tree lines when commuting between their roost and
feeding locations (Racey & Entwistle, 2003), and the
activity of some species is higher with increasing prox-
imity to these corridor features (Verboom & Spoelstra,
1999; Downs & Racey, 2006). This suggests that move-
ment for nocturnal bat species might be simultaneously
impacted by the structural fragmentation of habitat net-
works and by the artificial lighting of commuting
routes, both of which are common within urban areas,
potentially increasing levels of landscape resistance.
Here, we modelled the effect of both crossing dis-
tance and illumination level on the crossing behaviour
of a common urban bat (Pipistrellus pipistrellus) at gaps
in urban tree networks. The resulting model was then
used to explore the landscape-scale implications of dif-
ferent urban lighting scenarios for movement.
The study objectives were to:
1. determine whether the probability of bats crossing
gaps in tree lines varies with crossing distance and
illumination, and to model any barrier effects;
2. develop spatial models for landscape resistance due
to artificial lighting; and
3. explore the implications of these resistance models
for habitat accessibility along an urban gradient.
Materials and methods
These methods are divided into five distinct sections (Fig. 1):
(1) the selection of survey gaps within networks of urban tree
cover, (2) surveys of gap crossing events by bats, (3) the devel-
opment of statistical models for gap crossing probability that
identify distance-dependant lighting thresholds for barriers to
movement, (4) the translation of this barrier lux model into
spatial GIS models for landscape resistance under contrasting
lighting scenarios for a case study city, and (5) an analysis of
how these scenarios for landscape resistance may impact habi-
tat accessibility along an urban gradient.
Selection of survey gaps
For P. pipistrellus, movement between resource patches is
facilitated by linear features such as tree lines (Verboom &
Spoelstra, 1999) and therefore, the patch-matrix-corridor
model (Forman, 1995) would appear to be an appropriate
starting point for exploring some of the mechanisms that deli-
ver functional connectivity for this species. A key assumption
within this model is that the matrix creates resistance to the
movement of individuals between habitat patches and that
this resistance is reduced by the presence of linear habitat fea-
tures that form structural connections between patches. To
directly measure functional connectivity between bat roosts
and feeding areas within an urban area would be extremely
challenging, particularly as both feeding areas and roosts may
be difficult to identify or gain access to, given their frequent
association with private built infrastructure (Blake et al., 1994;
Altringham, 2003). This therefore led us to focus on corridor
features known to facilitate movement and to explore the
degree to which structural gaps in these features and lighting
within the intervening matrix could influence crossing behav-
iour.
Field observations were undertaken in the summer of 2010
within the West Midlands of the United Kingdom (UK), a
highly urbanized metropolitan county covering 902 km2 with
a population of ~2.3 million (S1). P. pipistrellus is a species of
bat that is broadly distributed over Europe and the Near East
(Altringham, 2003), is commonly found within UK cities and
can be found throughout the UK West Midlands (Hale et al.,
2012). It is nocturnal and easily surveyed and was therefore
chosen as a model species for exploring the impacts of lighting
on bat movement in urban areas. Bats were surveyed at gaps
in networks of tree cover, as this species is known to follow
the edges of tree lines when commuting between roosts and
feeding areas (Downs & Racey, 2006). Tree cover is ubiquitous
within the West Midlands, with the exception of the most den-
sely built areas. Trees are typically located along road edges,
railway embankments and waterways, in gardens and recrea-
tional green spaces, and within the broader amenity planting
of commercial areas. Such trees are rarely isolated, but tend to
form linear features that follow existing or historic land use
boundaries such as the perimeter of a park or residential
development. These lines of trees are readily identifiable from
aerial photography, and their canopy typically forms a struc-
tural network that connects a variety of urban land covers.
Despite this high structural connectivity, gaps within this net-
work are evident. Tree lines were selected that were at least
20 m wide and composed of trees >4 m in height, which we
consider ideal commuting features for P. pipistrellus (c.f. Ver-
boom & Spoelstra, 1999). Gaps in tree lines were defined as
locations where a tree line terminated, but where after a break
of at least 20 m, a second tree line continued along approxi-
mately the same direction. In some cases, it is likely that such
tree lines had originally formed a single boundary feature,
which was subsequently bisected by the building of a road.
Gaps were illuminated to varying levels (S1) by sodium-
vapour street lamps [the dominant source of outdoor artificial
lighting within the city (Hale et al., 2013)].
Our aim was to explore the impact of different gap widths
and lighting conditions on crossing behaviour. Rather than
experimentally manipulating gap characteristics, we identified
a selection of gaps within which to undertake surveys, strati-
fied by width and illumination level. To support this stratifica-
© 2015 The Authors. Global Change Biology Published by John Wiley & Sons Ltd., doi: 10.1111/gcb.12884
THE ECOLOGICAL IMPACT OF CITY LIGHTING 3

tion process, gaps were each assigned single values for width
and illumination as follows: (1) a variety of gaps in tree lines
were identified in ARCGIS 9.2 (ESRI, Redlands, CA, USA)
using a raster layer representing tree cover >4 m in height
derived from remotely sensed 1 m resolution colour and near-
infrared photography (2007) (Bluesky International Limited,
Coalville, Leicestershire, UK) and LiDAR data (2006) (The
GeoInformation Group, Linton, Cambridge, UK). Gaps where
the built land cover within a 350 m radius exceeded 60% were
excluded, as activity for P. pipistrellus tends to be lower in
these areas (Hale et al., 2012). (2) Measurements of surface illu-
mination within each gap were collected in the field following
a 2-m interval grid of survey points, using a USB2000+RAD
spectroradiometer (Ocean Optics, Dunedin, FL, USA). (3)
These point measurements were subsequently digitized
within the GIS, and spline interpolation was used to generate
a 1-m resolution raster layer representing surface lux within
each gap (Fig. 2). (4) Five transect lines crossing each gap were
created in the GIS at 5-m intervals parallel to the main axis of
the tree line (Fig. 2), and the length of each transect line was
recorded. (5) Each transect line was then intersected with the
lux raster to identify the maximum lux encountered, using
Hawth’s Analysis Tools (Beyer 2004). The result of this process
was the calculation of five width and five lux values for each
gap (S1). From these, the median width and median lux value
were used to characterize each gap, in order to provide typical
values to inform the final stratified selection of survey gaps.
(6) 27 survey gaps were then chosen to ensure strong coverage
across three width and three illumination categories (S1).
Gap crossing surveys
To record crossing behaviour of P. pipistrellus, surveys were
undertaken at each gap for a 1.5-h period following dusk (c.f.
Berthinussen & Altringham, 2012). Surveyors were positioned
at either end of the gap and used Batbox Duet detectors (Bat-
box Ltd., Steyning, West Sussex, UK) to be alerted to
approaching bats. As directionality of bat detectors is gener-
ally poor, it was necessary for surveyors to identify and record
the crossing route of each bat, which was later digitized onto
the GIS. This species typically commutes at a height of 2.5–10 m (Russ, 1999; Verboom & Spoelstra, 1999; Berthinussen &
Altringham, 2012), and individuals were visible when cross-
ing lit gaps. However, when bats crossed in groups or when
dark gaps were surveyed, the crossing routes were confirmed
using video recordings. Two cameras were used: a Thermovi-
Fig. 1 A flow diagram representing key steps within the methods.
Fig. 2 A gap in an urban tree line caused by a road, as repre-
sented in the GIS. Dark green areas represent tree cover >4 m
high, and the variation in road surface lux is indicated by the
yellow gradient. Parallel transects (blue lines) were used to pro-
vide an indication of potential crossing routes, the distance of
these routes, and the maximum lux that they encounter (indi-
cated by numbered circles). Actual bat crossing routes (red
arrow) were mapped based on surveyor (black circle) observa-
tions and confirmed based on camera (blue rectangle) record-
ings.
© 2015 The Authors. Global Change Biology Published by John Wiley & Sons Ltd., doi: 10.1111/gcb.12884
4 J . D. HALE et al.

sion A20M thermal camera (FLIR Systems, Boston, MA, USA)
and a DCR-HC19E digital video camera (Sony Corporation,
Konan Minato, Tokyo, Japan) in NightShot mode, with addi-
tional near-infrared (NIR) lighting provided by a 70° angle
850 nm IR LED flood lamp (Camsecure, Bristol, UK). Such
lighting is routinely used in bat surveys (Berthinussen & Altr-
ingham, 2012), and we found no research to indicate NIR sen-
sitivity for any bat species. The potential for mammals to
sense NIR wavelengths has been raised by Newbold & King
(2009) and the possibility of NIR lighting impacting bat behav-
iour should therefore not be excluded, although we emphasize
that our research design was systematic across all sites. Bat
calls were recorded using a pair of AnaBat SD1 frequency
division bat detectors (Titley Scientific, Lawnton, Queensland,
Australia) positioned at either end of the gap, allowing each
crossing event to be attributed to a species or species group.
Calls were identified in ANALOOKW (Corben, 2009) using
bespoke filters (Hale et al., 2012).
Models for crossing behaviour
Two analyses were undertaken to explore the response of bats
to potential crossing routes that differed in their width and
illumination level, using data from the gap crossing surveys.
The primary analysis sought to identify barrier thresholds for
gap crossing, using logistic regression to estimate the proba-
bility of a barrier effect (c.f. Awade et al., 2012). First, we cre-
ated a single data set of distance and lux values (referred to as
the ‘crossing distance’ and ‘crossing lux’, respectively) for
crossing events and failures. For crossing events, these values
were extracted from the GIS using the digitized crossing
routes. For survey gaps where no crossings were recorded,
distance and lux data were extracted from the GIS using the
gap transect lines. As lux levels could be highly variable
within a gap, we extracted the maximum lux value encoun-
tered along each crossing route or gap transect. These data
were then used to generate a series of binary logistic regres-
sion models in R 2.11.1 (R Core Team, 2014) as follows, using
the MASS library (Venables & Ripley, 2002). To explore
whether the level of illumination required for a barrier effect
(the ‘barrier lux’) varied with crossing distance, subsets of
data were selected for modelling using a 20-m moving win-
dow (see Fig. 3 for examples). The barrier lux was defined as
the lux level required for a crossing probability of 5% or less.
The barrier lux and mid-range distance from each logistic
regression model were then used to model barrier lux as a lin-
ear function of crossing distance (henceforth referred to as the
‘barrier lux model’) (Fig. 4).
The second analysis aimed to explore whether the routes
taken by bats crossing survey gaps differed from the typical
values for the corresponding gaps, in terms of lighting and
distance. To highlight potential biases in crossing behaviour,
values for the distance of each digitized crossing route were
plotted against the median width of the gap being crossed,
calculated using distance data from the 5 gap transects. Simi-
larly, the lux of each crossing route was plotted against the
median lux value of the gap being crossed.
Spatial models for the impact of artificial lighting onlandscape resistance
Generating resistance surfaces is an increasingly popular
way to provide quantitative estimates of how different
environmental parameters such as land cover type or
human population density may impede animal movement
(Zeller et al., 2012). Spatial environmental data are typically
combined with biological data from surveys to generate
cost surfaces that can be interpreted as maps of resis-
tance/barriers to movement. In this case, we created a
resistance surface to represent the combined effect of dis-
tance from tree cover and illumination by artificial lighting
on bat movement. We generated this resistance surface for
the city of Birmingham, as it is within the broader West
Midlands metropolitan county where our gap surveys
were undertaken, and high-resolution lighting and tree
cover data are available for the full extent of the city (Hale
et al., 2012, 2013). Our aim was to use the barrier lux
model to generate a resistance surface using rasters repre-
senting distance to tree cover and incident lux as input
values for the model variables, from which we could clas-
sify the landscape into either accessible or inaccessible
patches of land cover. A key assumption within this model
was that lighting would have no barrier effect on individ-
uals of P. pipistrellus commuting along contiguous tree
(a) (b)
Fig. 3 Examples of binary logistic regression models for the probability of gap crossing by Pipistrellus pipistrellus at different lux levels.
Models are given for crossing distances of (a) 20–40 m and (b) 60–80 m. The dashed lines indicates where the probability of cross-
ing = 0.05.
© 2015 The Authors. Global Change Biology Published by John Wiley & Sons Ltd., doi: 10.1111/gcb.12884
THE ECOLOGICAL IMPACT OF CITY LIGHTING 5

lines and woodland edges (c.f. Stone et al., 2012), but that
lighting had the potential to act as a barrier to the cross-
ing of open areas between tree cover.
First, the ARCGIS Cost Distance tool was used to generate a
1-m resolution raster layer for the entire city representing dis-
tance to the nearest tree cover >4 m high. In most cases, the
output raster values represented linear distance to tree cover.
However, nonlinear distance calculations were also permitted
to recognize that euclidian distance measures would be inap-
propriate for locations where tall buildings would create a
barrier to straight line flight at typical commuting height. To
achieve this, parts of buildings >30 m in height were selected
from the 2008 Ordnance Survey MasterMap (OSMM) land use
data set and saved as NoData values within a 1-m resolution
raster layer. All other raster cells were assigned a value of 1,
and this layer was then used as an input cost raster as part of
the cost distance calculations. Next, the distance value attrib-
uted to each pixel was doubled to represent the minimal pos-
sible flight distance for a bat leaving and returning to tree
cover via that pixel location. This distance layer was then used
to calculate the lux level that would be required for a barrier
effect at each pixel location, using the Raster Calculator tool to
apply the regression equation from the barrier lux model to
the distance value of each pixel value. The resulting barrier
lux layer was compared to a second layer representing inci-
dent lux (2009) for the entire city at 1 m resolution, estimated
from aerial night photography (Hale et al., 2013). When the
lux value for a pixel from the 2009 lighting data set was equal
to or greater than the corresponding pixel value within the
barrier lux layer, the pixel was classified as inaccessible to our
study species. The resulting resistance surface was converted
to a polygon layer representing zones surrounding urban tree
cover that would be expected to be accessible to bats, based
upon the lighting levels in 2009 (Fig. 5). This process was
repeated to generate resistance surfaces for two contrasting
urban lighting scenarios. The first scenario was for a city with-
out any lighting (the Dark City) and was intended to serve as
a baseline model for the independent effect of the structural
connectivity of tree cover on landscape resistance. The second
was for a heavily lit scenario (the Bright City). This Bright City
scenario used the 2009 lighting layer as a starting point, but
the surface lighting values of all roads were increased to a
minimum of 20 lux, representing a plausible but extreme sce-
nario for future urban road lighting.
Habitat accessibility along an urban gradient
Urban gradient analyses have been extensively used as a
means for exploring the impact of ‘intensification’ on species
presence or abundance. Such approaches are a practical
response to concerns about the increasing density and extent
of urban areas; yet as many ecologically relevant variables
covary along such gradients (Hahs & Mcdonnell, 2006), it is
rarely clear how these variables combine to drive the ecologi-
cal patterns observed. The aim of this analysis was to use GIS
analyses to explore how the landscape resistance resulting
from variations in urban tree cover and lighting could impact
habitat accessibility along a gradient of built land cover. Sam-
pling was centred on small ponds (maximum area 2000 m2),
as these are potential foraging sites for P. pipistrellus and are
distributed throughout the city. The underlying assumption of
this analysis was that ponds would have greater value as for-
aging habitats if the surrounding landscape had low resistance
to bat movement. All ponds within Birmingham were identi-
Fig. 5 Zones surrounding urban tree cover where the lighting
levels are predicted to be insufficient to act as a barrier to move-
ment for Pipistrellus pipistrellus. This was derived from a resis-
tance surface generated within the GIS at 1 m resolution, by
applying the barrier lux model to a raster representing distance
to tree cover (2006/7) and by comparing the output to a map of
incident lux (2009). Key: green = trees >4 m, blue net-
work = areas surrounding tree cover where lighting has no bar-
rier effect, blue gradient indicates distance from tree cover,
yellow = surface illuminance >20 lx, grey = buildings, and red
dot = an urban pond used by bats for foraging. Building out-
lines derived from OS MasterMap land cover and land use par-
cels reprinted from original mapping with permission from the
Ordnance Survey (2008).
Fig. 4 Gap crossing successes and failures for Pipistrellus pipi-
strellus. For crossing events, the distance and maximum lux for
each crossing route are plotted (blue diamonds). For gaps where
no crossing events were recorded, the distance and maximum
lux for gap transects are plotted (red squares). The dashed line
represents an estimate of the barrier lux for any given crossing
distance, generated using the linear regression equation from
the barrier lux model.
© 2015 The Authors. Global Change Biology Published by John Wiley & Sons Ltd., doi: 10.1111/gcb.12884
6 J . D. HALE et al.

fied from OSMM land use polygons using the GIS and each
pond centre was buffered by 350 m, a key spatial scale for pre-
dictive models of P. pipistrellus activity identified in an earlier
study (Hale et al., 2012). The percentage built land cover
within 350 m of each pond was then estimated using OSMM
polygon data, and each pond was assigned to one of seven
‘density classes’ ranging from a low density class of 10–20%
built land cover, to a class of ponds surrounded by between
70% and 80% built land cover. Thirty-five of these ponds were
then selected for use in the gradient analysis, 5 from each den-
sity class. A greater number of ponds could not be selected
without causing uneven sampling, because few ponds were
present in heavily built areas.
The polygon layer representing patches of land cover pre-
dicted to be accessible under 2009 lighting levels was then
clipped by a 350-m buffer zone surrounding each pond, and
those patches that intersected the pond were retained (Fig. 6).
The total area of accessible land cover connected to each pond
was then recorded as a percentage of the total surface area
within 350 m of the pond. This was modelled against the per-
centage built land cover within the 350-m buffer zone using a
generalized additive model (GAM) in R 2.11.1, using the
MGCV library (Wood, 2006). This process was then repeated
for the accessible land cover models generated for the Dark
City and Bright City scenarios.
Results
Crossing behaviour
The majority of the bats that were recorded crossing
gaps were P. pipistrellus, and therefore, all results pre-
sented here relate to this species. Individuals of P. pipi-
strellus were recorded in the vicinity of all survey gaps,
but were only observed crossing 19 of the 27 gaps. The
lighting threshold for a barrier effect reduced with
increasing crossing distance (Fig. 4), following the
linear model: barrier lux = �0.46*crossing distance +46.2, where the barrier lux is the lux value at which the
probability of crossing is 5%. The majority of bats
(95.6%) selected crossing routes that were darker than
the median gap lux value (Fig. 7a), indicating that bats
were choosing to cross in the darker parts of gaps,
whereas the length of crossing routes was not consis-
tently larger or smaller than the median gap width
(Fig. 7b).
Landscape connectivity analysis
Landscape resistance for P. pipistrellus varied within
the City of Birmingham (Fig. 8a) along a gradient of
built density (Fig. 8b), as a result of the fine grained
arrangement of trees and lighting (S2). When modelled
using 2009 lighting data, accessible land cover was
highest in areas where built surfaces account for <25%of the landscape, but dropped markedly when built
land cover was >65%. Much of this effect is due to the
abundance and arrangement of tree cover, although the
impact of lighting is clear at higher built densities
(Fig. 9). Compared to a Dark City model, lighting levels
in 2009 further reduce the percentage of accessible land
cover surrounding ponds by up to 5% in heavily built
areas, and by up to 7% under a Bright City scenario
(Fig. 9).
Discussion
Outdoor artificial lighting is one of many urban charac-
teristics that are changing rapidly across the globe, yet
relatively little is known about its unintended conse-
quences for environmental well-being. There is a need
for research to identify these potential impacts and to
contextualize the results in a way that allows mitigation
to be targeted effectively. Our analysis demonstrates
that lighting can affect landscape resistance in cities,
even for a species of bat (P. pipistrellus) that that has
been recorded in many urban land cover types (Gaisler
et al., 1998; Hale et al., 2012). The greatest impacts on
this species are likely to be in brightly lit areas where
structural connectivity of tree cover is already low,
characteristics typical of heavily built areas such as
urban centres.
Bats, connectivity, and lighting
There is a need to better understand those factors that
influence the ability of organisms to move between
resource patches and for tools that can predict the
impacts of changes at a landscape scale (Adriaensen
Fig. 6 Two spatial models for areas of accessible land cover
within 350 m (red circle) of an urban pond (red dot), under a
Dark City scenario (blue) and a Bright City scenario (yellow). In
this example, when no lighting is present, 44% of the local land-
scape is predicted to be accessible from the pond, shrinking to
36% in the brightly lit scenario.
© 2015 The Authors. Global Change Biology Published by John Wiley & Sons Ltd., doi: 10.1111/gcb.12884
THE ECOLOGICAL IMPACT OF CITY LIGHTING 7

et al., 2003). Central to this is the recognition that func-
tional connectivity of habitats is dependent on both
landscape structure and individual behaviour (Tischen-
dorf & Fahrig, 2000). To our knowledge, this is the first
study to quantify the effect of lighting on gap crossing
in bats and to explore how barrier effects may
accumulate across a landscape. Distance thresholds for
gap crossing have been identified in the field for groups
such as birds (Creegan & Osborne, 2005; Awade &
Metzger, 2008) and mammals (van der Ree et al., 2004)
and then translated into maps of accessible habitat
(Awade & Metzger, 2008). However, few attempts have
been made to model landscape resistance for bats (but
see Frey-Ehrenbold et al., 2013), or to integrate lighting
into gap crossing models.
Measures of tree/hedge connectivity have been used
to model bat activity in both rural and urban land-
scapes. A connectivity index for rural trees and hedge-
rows was developed by Frey-Ehrenbold et al. (2013),
and used to identify a positive association between con-
nectivity and activity patterns for three bat guilds.
Their results indicate that the distance between patches
impacts their likelihood of use. In addition, a connectiv-
ity measure used by Hale et al. (2012) found a signifi-
cant effect of connected urban tree cover on bat activity,
based upon the assumption that bats could cross gaps
in tree cover of <40 m. In both cases, the connectivity
model was developed using weightings or distance
thresholds chosen to broadly reflect what was known
of the species movement ecology, although the results
of this study suggests that the inclusion of lighting in
such connectivity models could be beneficial.
Researchers have also experimentally tested the effect
of lighting on bat movement (e.g. Stone et al., 2009) and
(a) (b)
Fig. 7 (a) Maximum lux for bat crossing routes vs. maximum lux of the median gap transect. The line indicates where the crossing
route lux and gap lux values are equal. (b) Distance of each crossing route vs. the median gap width (based upon gap transects). The
line indicates where the crossing route distance and gap width are equal.
(a) (b)
Fig. 8 (a) A spatial model of areas within the City of Birmingham where accessibility for Pipistrellus pipistrellus is not restricted (indi-
cated by green networks) by artificial lighting levels present in 2009. Accessible land cover is poor in the urban centre and other highly
built up areas, as well as at the rural fringe. (b) Estimates of habitat accessibility along a gradient of built surface cover, based on mea-
surements for 35 typical ‘foraging ponds’. Habitat accessibility is defined as the percentage of surface area within a 350 m radius of
each pond that the model predicts to be available to bats under a given lighting scenario and that also intersects the pond. Shaded areas
represent 95% confidence intervals.
© 2015 The Authors. Global Change Biology Published by John Wiley & Sons Ltd., doi: 10.1111/gcb.12884
8 J . D. HALE et al.

others have modelled the effect of lighting on the move-
ment of nocturnal species using street lamp locations to
create spatially explicit lightscapes (Bennie et al.,
2014b); however, no studies have considered lighting
thresholds for gap crossing. Stone et al. (2009) used
experimental lighting of rural hedge lines to disrupt
movement for the relatively slow flying lesser horse-
shoe bat (Rhinolophus hipposideros), demonstrating a sig-
nificant barrier effect. In a later study (Stone et al.,
2012), they found no effect of lighting on P. pipistrellus
despite using similar illumination ranges to our study.
The study by Stone et al. (2012) differs to this study in
two important ways: firstly in terms of the structural
connectivity of the hedges/tree lines (continuous vs.
fragmented), and secondly the landscape context (rural
vs. urban). It is possible that illuminating a tree line to
50 lux is insufficient to disrupt the commuting behav-
iour of P. pipistrellus, but that the creation of a similarly
lit gap may be enough to deter crossing. Moreover, it is
possible that a small section of lit hedge in an otherwise
dark rural landscape may be of little concern to the fast
flying P. pipistrellus, whereas the perceived predation
risk from crossing a lit gap in an already extensively lit
urban area may be high enough to deter crossing.
Habitat accessibility and urban context
Ecological studies along urbanization gradients are rel-
atively common and typically indicate a reduction in
species richness or abundance at high levels of built
density (Mckinney, 2008). However, given that many
variables such as land cover and disturbance covary
(Hahs & Mcdonnell, 2006; Hale et al., 2013), it is often
unclear which underlying mechanisms are responsible
for the ecological patterns observed (Threlfall et al.,
2011). Here, we found that along a gradient of increas-
ing built land cover, the area of tree canopy cover
reduces whilst brightly lit surfaces increase (S2) and
that these combine to increase the resistance to move-
ment within heavily built areas.
Implications for conservation
Relating movement patterns to measures of land-
scape structure is desirable (Kindlmann & Burel,
2008), particularly as habitat features are often easily
mapped. However, it is clear that simple maps of
contiguous habitat do not necessarily correspond to
functionally connected areas (Tischendorf & Fahrig,
2000) as individuals may move between habitat
patches for a wide variety of reasons (Nathan et al.,
2008), crossing a potentially hostile matrix in the
process. Networks of tree cover along with broader
elements of ‘green infrastructure’ are commonly rec-
ognized in urban planning policy as ‘wildlife corri-
dors’, although the evidence base for their efficacy
is mixed (Angold et al., 2006; Gilbert-Norton et al.,
2010). Whether such structural features actually
function to reduce landscape resistance has been a
much debated question in landscape ecology (Beier
& Noss, 1998). Awareness of the potential impacts
of habitat fragmentation (Kerth & Melber, 2009) and
lighting (Stone et al., 2009) on bat movement has led
to a range of mitigation practices, yet in some cases,
they appear ineffective (Berthinussen & Altringham,
2012). The ability to commute from roost to feeding
areas is crucial to the survival of P. pipistrellus, and
commuting distances >1 km are not uncommon
(Davidson-Watts & Jones, 2006). It is therefore plau-
sible that restrictions on movement in parts of a city
could have fitness impacts at the individual level, as
well as limiting the size and extent of urban popu-
lations. This highlights the need for a stronger evi-
dence base to support work to protect and improve
landscape permeability for urban bats. Whilst bat
roosts within the European Union are legally pro-
tected under the EU Habitats Directive (1992/43/
EEC), the level of protection afforded to commuting
routes is less clear (Garland & Markham, 2007).
Analyses such as those presented here could sup-
port the development of related policy, by clarifying
the likely location of commuting routes and the
thresholds for their disturbance. These results
suggest that networks of urban trees support the
movement of P. pipistrellus, even when they contain
gaps of up to 80 m. However, it is clear that access
to feeding habitats may be undermined by lighting
within the surrounding landscape, even if the
Fig. 9 The impact of lighting on the area of accessible land
cover connected to urban ponds under Bright (Red) and 2009
(Blue) city lighting scenarios, compared to the levels found
under a Dark City scenario.
© 2015 The Authors. Global Change Biology Published by John Wiley & Sons Ltd., doi: 10.1111/gcb.12884
THE ECOLOGICAL IMPACT OF CITY LIGHTING 9

structural elements of the tree network remain
unchanged. Although the impacts of lighting
demonstrated here are subtle, the approach used to
characterize barriers was conservative and lower
thresholds for identifying impacts on movement
may be more appropriate for conservation purposes.
This is supported by the finding that individuals
consistently crossed in the darker parts of the gap,
even when those gaps were poorly lit, suggesting
that all crossing events may be associated with costs
(e.g. greater predation risks) that commuting indi-
viduals attempt to minimize. The strategic dimming
of lights in the vicinity of gaps, combined with the
narrowing of gaps through tree planting, might
therefore be reasonable conservation measures for
this species in urban areas. Such an approach may
also have benefits for other bat species that are even
less tolerant of lighting such as Myotis spp (Stone
et al., 2012). However, the impacts on P. pipistrellus
of a broader scale reduction in urban lighting may
be more complex, given that this species is able to
exploit concentrations of its insect prey surrounding
individual lamps (Blake et al., 1994). Species of bats
may respond to gaps (Kerth & Melber, 2009) and
also lighting (Stone et al., 2012) very differently;
therefore, whilst this approach could be used to
model the impact of lighting on landscape resistance
for other species, further research is needed to iden-
tify appropriate threshold values. Similarly, it is
unknown whether the barrier lux model developed
here is suitable for all individuals of P. pipistrellus,
or for different times of the night. Movement is a
key component of functional connectivity, and it is
important to recognize that a range of factors may
influence movement events. Whilst patterns of tree
cover and lighting appear to be important, further
work is needed to identify how resistance may vary
with different land covers or the impact of habitat
quality and social structure on movement decisions.
The use of contrasting lighting scenarios to explore
potential impacts on landscape resistance could be
incorporated into practical conservation measures at a
variety of scales. Scenarios are commonly used in sus-
tainability research and practice to test the resilience of
infrastructure, communities, resources, and natural sys-
tems to a variety of stressors (Nakicenovic & Swart,
2000; Carpenter et al., 2006; Hunt et al., 2012). The eco-
logical impacts of different scenarios for land cover
have been explored by other authors (Adriaensen et al.,
2003; Kong et al., 2010; Sushinsky et al., 2013), but we
believe this is the first study that has explored the
impacts of different urban lighting scenarios at the city
scale. This approach may be useful for exploring the
impact of specific proposals for changes to urban light-
ing (Gaston et al., 2012) or tree cover (Pincetl, 2010).
However, the limited knowledge of how these charac-
teristics can change over time (Gaston et al., 2012;
Gillespie et al., 2012) means that a broader sensitivity
analysis may be required to identify network connec-
tions that are particularly vulnerable or resilient.
Given the rapid changes underway in cities, urban
biodiversity is often faced with multiple ecological dis-
ruptors that may be changing simultaneously; disen-
tangling the impacts of these disruptors presents a
major challenge. For conservation to shift from a largely
reactive to a more proactive approach, it must move on
from detecting broad patterns in urban biodiversity to
a more mechanistic understanding of the processes that
drive them (Mcdonnell & Hahs, 2013). The results of
this study indicate that the structural connectivity of
tree cover and the levels of lighting within the interven-
ing matrix combine to affect gap crossing behaviour for
a common urban bat. In the case study city, this model
predicts that as a result, habitat accessibility may
reduce with increasing built density, although the
potential exists for decoupling this relationship in the
future. This has implications for conserving urban bio-
diversity in cities that are becoming brighter and more
densely developed.
Acknowledgements
We would like to thank the following people and organizationsthat have helped support this research. This work was sup-ported by the UK Engineering and Physical Sciences ResearchCouncil through the Urban Futures project, Mapping ArtificialLightscapes project and the Liveable Cities programme [grantnumbers EP/F007426/1, EP/J017698/1 and EP/I035129/1].Volunteers from the Birmingham and Black Country Bat Group.Dr Lee Chapman from the University of Birmingham for pro-viding access to the thermal camera. Staff from the Joint Infor-mation Systems Committee (JISC) funded Landmap service forproviding access to geospatial data. Staff from Birmingham CityCouncil and the Environment Agency Geomatics Group –www.geomaticsgroup.co.uk (collection and licensing of aerialnight photography). Geospatial data were also provided by theOrdnance Survey (GB) and comprised OS MasterMap Topogra-phy Layer [GML geospatial data]; coverage – Birmingham,Black Country and Solihull; updated – November 2008, Ord-nance Survey (GB); and using – EDINA Digimap Ordnance Sur-vey Service, http://edina.ac.uk/digimap. Accessed 1stDecember 2008. The authors have no conflict of interest inregard to this manuscript.
References
Adams D, De Sousa C, Tiesdell S (2010) Brownfield development: a comparison of
North American and British approaches. The Urban Studies, 47, 75–104.
Adriaensen F, Chardon J, De Blust G, Swinnen E, Villalba S, Gulinck H, Matthysen E
(2003) The application of ‘least-cost’modelling as a functional landscape model.
Landscape and Urban Planning, 64, 233–247.
Altringham JD (2003) British Bats. HarperCollins, London.
© 2015 The Authors. Global Change Biology Published by John Wiley & Sons Ltd., doi: 10.1111/gcb.12884
10 J . D. HALE et al.

Angold PG, Sadler JP, Hill MO et al. (2006) Biodiversity in urban habitat patches. Sci-
ence of the Total Environment, 360, 196–204.
Awade M, Metzger JP (2008) Using gap-crossing capacity to evaluate functional con-
nectivity of two Atlantic rainforest birds and their response to fragmentation. Aus-
tral Ecology, 33, 863–871.
Awade M, Boscolo D, Metzger JP (2012) Using binary and probabilistic habitat avail-
ability indices derived from graph theory to model bird occurrence in fragmented
forests. Landscape Ecology, 27, 185–198.
Bartonicka T, Bielik A, Reh�ak Z (2008) Roost switching and activity patterns in the
soprano pipistrelle, pipistrellus pygmaeus, during lactation. Annales Zoologici Fen-
nici, 45, 503–512.
Beier P, Noss RF (1998) Do habitat corridors provide connectivity? Conservation Biol-
ogy, 12, 1241–1252.
Bennie J, Davies TW, Duffy JP, Inger R, Gaston KJ (2014a) Contrasting trends in light
pollution across Europe based on satellite observed night time lights. Scientific
reports, 4, 4789.
Bennie J, Davies TW, Inger R, Gaston KJ (2014b) Mapping artificial lightscapes for
ecological studies. Methods in Ecology and Evolution, 5, 534–540.
Berthinussen A, Altringham J (2012) Do bat gantries and underpasses help bats cross
roads safely? PLoS One, 7, e38775.
Beyer HL (2004) Hawth’s Analysis Tools for ArcGIS. Available at: http://www.spatiale
cology.com/htools (accessed 1 March 2009).
Blake D, Hutson AM, Racey PA, Rydell J, Speakman JR (1994) Use of Lamplit roads
by foraging bats in Southern England. Journal of Zoology, 234, 453–462.
Boldogh S, Dobrosi D, Samu P (2007) The effects of the illumination of buildings on
house-dwelling bats and its conservation consequences. Acta Chiropterologica, 9,
527–534.
Carpenter SR, Bennett EM, Peterson GD (2006) Scenarios for ecosystem services: an
overview. Ecology and Society, 11, 29.
Cho JR, Joo EY, Koo DL, Hong SB (2013) Let there be no light: the effect of bedside
light on sleep quality and background electroencephalographic rhythms. Sleep
Medicine, 14, 1422–1425.
Corben C (2009) AnalookW bat call analysis software. Version 3.7u, Available at:
http://www.hoarybat.com (accessed 1 August 2009).
Couch C, Karecha J, Nuissl H, Rink D (2005) Decline and sprawl: an evolving type of
urban development – observed in Liverpool and Leipzig. European Planning Stud-
ies, 13, 117–136.
Creegan HP, Osborne PE (2005) Gap-crossing decisions of woodland songbirds in
Scotland: an experimental approach. Journal of Applied Ecology, 42, 678–687.
Dallimer M, Tang Z, Bibby PR, Brindley P, Gaston KJ, Davies ZG (2011) Temporal
changes in greenspace in a highly urbanized region. Biology Letters, 7, 763–766.
Davidson-Watts I, Jones G (2006) Differences in foraging behaviour between Pipistrel-
lus pipistrellus (Schreber, 1774) and Pipistrellus pygmaeus (Leach, 1825). Journal of
Zoology, 268, 55–62.
Davies TW, Bennie J, Gaston KJ (2012) Street lighting changes the composition of
invertebrate communities. Biology Letters, 8, 764–767.
Downs NC, Racey PA (2006) The use by bats of habitat features in mixed farmland in
Scotland. Acta Chiropterologica, 8, 169–185.
Downs NC, Beaton V, Guest J, Polanski J, Robinson SL, Racey PA (2003) The effects
of illuminating the roost entrance on the emergence behaviour of Pipistrellus pyg-
maeus. Biological Conservation, 111, 247–252.
Ebener S, Murray C, Tandon A, Elvidge CC (2005) From wealth to health: modelling
the distribution of income per capita at the sub-national level using night-time
light imagery. International Journal of Health Geographics, 4, 5.
Eisenbeis G (2006) Artificial night lighting and insects: attraction of insects to street-
lamps in a rural setting in Germany. In: Ecological Consequences of Artificial Night
Lighting (eds Rich C, Longcore T), pp. 281–304. Island Press, Washington.
Elvidge CD, Baugh KE, Kihn EA, Kroehl HW, Davis ER, Davis CW (1997) Relation
between satellite observed visible-near infrared emissions, population, economic
activity and electric power consumption. International Journal of Remote Sensing, 18,
1373–1379.
Falchi F, Cinzano P, Elvidge CD, Keith DM, Haim A (2011) Limiting the impact of
light pollution on human health, environment and stellar visibility. Journal of envi-
ronmental management, 92, 2714–2722.
Forman RT (1995) Land Mosaics: The Ecology of Landscapes and Regions. Cambridge Uni-
versity Press, UK.
Frey-Ehrenbold A, Bontadina F, Arlettaz R, Obrist MK (2013) Landscape connectivity,
habitat structure and activity of bat guilds in farmland-dominated matrices. Jour-
nal of Applied Ecology, 50, 252–261.
Gaisler J, Zukal J, Rehak Z, Homolka M (1998) Habitat preference and flight activity
of bats in a city. Journal of Zoology, 244, 439–445.
Gallaway T, Olsen RN, Mitchell DM (2010) The economics of global light pollution.
Ecological Economics, 69, 658–665.
Gandy M (2004) Rethinking urban metabolism: water, space and the modern city.
City, 8, 363–379.
Garland L, Markham S (2007) Is Important Bat Foraging and Commuting Habitat Legally
Protected? Bat Conservation Trust, London.
Gaston KJ, Davies TW, Bennie J, Hopkins J (2012) REVIEW: reducing the ecological
consequences of night-time light pollution: options and developments. Journal of
Applied Ecology, 49, 1256–1266.
Gaston KJ, Bennie J, Davies TW, Hopkins J (2013) The ecological impacts of nighttime
light pollution: a mechanistic appraisal. Biological Reviews, 88, 912–927.
Gilbert-Norton L, Wilson R, Stevens JR, Beard KH (2010) A meta-analytic review of
corridor effectiveness. Conservation Biology, 24, 660–668.
Gillespie TW, Pincetl S, Brossard S, Smith J, Saatchi S, Pataki D, Saphores J-D (2012)
A time series of urban forestry in Los Angeles. Urban Ecosystems, 15, 233–246.
Glaeser E (2011) Cities, productivity, and quality of life. Science, 333, 592–594.
Grimm NB, Faeth SH, Golubiewski NE, Redman CL, Wu J, Bai X, Briggs JM (2008)
Global change and the ecology of cities. Science, 319, 756–760.
Haase D, Larondelle N, Andersson E et al. (2014) A quantitative review of urban eco-
system service assessments: concepts, models, and implementation. Ambio, 43,
413–433.
Hahs AK, Mcdonnell MJ (2006) Selecting independent measures to quantify Mel-
bourne’s urban-rural gradient. Landscape and Urban Planning, 78, 435–448.
Hale JD, Fairbrass AJ, Matthews TJ, Sadler JP (2012) Habitat composition and connec-
tivity predicts bat presence and activity at foraging sites in a large UK conurba-
tion. PLoS One, 7, e33300.
Hale JD, Davies G, Fairbrass AJ, Matthews TJ, Rogers CD, Sadler JP (2013) Mapping
lightscapes: spatial patterning of artificial lighting in an urban landscape. PLoS
One, 8, e61460.
Hodson M, Marvin S (2009) ‘Urban ecological security’: a new urban paradigm? Inter-
national Journal of Urban and Regional Research, 33, 193–215.
H€olker F, Moss T, Griefahn B et al. (2010a) The dark side of light: a transdisciplinary
research agenda for light pollution policy. Ecology & Society, 15, 13.
H€olker F, Wolter C, Perkin EK, Tockner K (2010b) Light pollution as a biodiversity
threat. Trends in Ecology & Evolution, 25, 681–682.
Hoornweg D, Sugar L, Gomez CLT (2011) Cities and greenhouse gas emissions: mov-
ing forward. Environment and Urbanization, 23, 207–227.
Hunt DV, Lombardi DR, Atkinson S et al. (2012) Scenario archetypes: converging
rather than diverging themes. Sustainability, 4, 740–772.
Irwin EG, Bockstael NE (2007) The evolution of urban sprawl: evidence of spatial het-
erogeneity and increasing land fragmentation. Proceedings of the National Academy
of Sciences of the USA, 104, 20672–20677.
Jung K, Kalko EK (2010) Where forest meets urbanization: foraging plasticity of aerial
insectivorous bats in an anthropogenically altered environment. Journal of Mam-
malogy, 91, 144–153.
Kempenaers B, Borgstr€om P, Lo€es P, Schlicht E, Valcu M (2010) Artificial night light-
ing affects dawn song, extra-pair siring success, and lay date in songbirds. Current
Biology, 20, 1735–1739.
Kerth G, Melber M (2009) Species-specific barrier effects of a motorway on the habitat
use of two threatened forest-living bat species. Biological Conservation, 142, 270–
279.
Kindlmann P, Burel F (2008) Connectivity measures: a review. Landscape Ecology, 23,
879–890.
Kong F, Yin H, Nakagoshi N, Zong Y (2010) Urban green space network development
for biodiversity conservation: identification based on graph theory and gravity
modeling. Landscape and Urban Planning, 95, 16–27.
Kuechly HU, Kyba C, Ruhtz T, Lindemann C, Wolter C, Fischer J, H€olker F (2012)
Aerial survey and spatial analysis of sources of light pollution in Berlin, Germany.
Remote Sensing of Environment, 126, 39–50.
Kuijper DP, Schut J, Van Dullemen D, Toorman H, Goossens N, Ouwehand J, Lim-
pens H (2008) Experimental evidence of light disturbance along the commuting
routes of pond bats (Myotis dasycneme). Lutra, 51, 37–49.
Kyba CCM, Hanel A, Holker F (2014) Redefining efficiency for outdoor lighting.
Energy & Environmental Science, 7, 1806–1809.
Levin N, Johansen K, Hacker JM, Phinn S (2014) A new source for high spatial resolu-
tion night time images—the EROS-B commercial satellite. Remote Sensing of Envi-
ronment, 149, 1–12.
Lewanzik D, Voigt CC (2014) Artificial light puts ecosystem services of frugivorous
bats at risk. Journal of Applied Ecology, 51, 388–394.
Lombardi DR, Leach JM, Rogers CD et al. (2012) Designing Resilient Cities: A Guide to
Good Practice. IHS BRE Press, Watford, UK.
© 2015 The Authors. Global Change Biology Published by John Wiley & Sons Ltd., doi: 10.1111/gcb.12884
THE ECOLOGICAL IMPACT OF CITY LIGHTING 11

Longcore T, Rich C (2004) Ecological light pollution. Frontiers in Ecology and the Envi-
ronment, 2, 191–198.
Luck M, Wu J (2002) A gradient analysis of urban landscape pattern: a case study
from the Phoenix metropolitan region, Arizona, USA. Landscape Ecology, 17, 327–
339.
Luginbuhl CB, Lockwood GW, Davis DR, Pick K, Selders J (2009) From the ground
up I: light pollution sources in Flagstaff, Arizona. Publications of the Astronomical
Society of the Pacific, 121, 185–203.
Lyytim€aki J (2013) Nature’s nocturnal services: light pollution as a non-recognised
challenge for ecosystem services research and management. Ecosystem Services, 3,
e44–e48.
Lyytimaki J, Tapio P, Assmuth T (2012) Unawareness in environmental protection:
the case of light pollution from traffic. Land Use Policy, 29, 598–604.
Mcdonnell MJ, Hahs AK (2013) The future of urban biodiversity research: moving
beyond the ‘low-hanging fruit’. Urban Ecosystems, 16, 397–409.
Mckinney ML (2008) Effects of urbanization on species richness: a review of plants
and animals. Urban Ecosystems, 11, 161–176.
Nakicenovic N, Swart R (2000) Special Report on Emissions Scenarios. Cambridge Uni-
versity Press, Cambridge, UK.
Nathan R, Getz WM, Revilla E, Holyoak M, Kadmon R, Saltz D, Smouse PE (2008) A
movement ecology paradigm for unifying organismal movement research. Pro-
ceedings of the National Academy of Sciences of the USA, 105, 19052–19059.
Navara KJ, Nelson RJ (2007) The dark side of light at night: physiological, epidemio-
logical, and ecological consequences. Journal of pineal research, 43, 215–224.
Negro JJ, Bustamante J, Melguizo C, Ruiz JL, Grande JM (2000) Nocturnal activity of
lesser kestrels under artificial lighting conditions in Seville, Spain. Journal of Raptor
Research, 34, 327–329.
Newbold HG, King CM (2009) Can a predator see ‘invisible’ light? Infrared vision in
ferrets (Mustelo furo). Wildlife Research, 36, 309–318.
Newman P (2006) The environmental impact of cities. Environment and Urbanization,
18, 275–295.
Pauleit S, Ennos R, Golding Y (2005) Modeling the environmental impacts of urban
land use and land cover change—a study in Merseyside, UK. Landscape and Urban
Planning, 71, 295–310.
Pe’er G, Henle K, Dislich C, Frank K (2011) Breaking functional connectivity into
components: a novel approach using an individual-based model, and first out-
comes. PLoS One, 6, e22355.
Perkin EK, H€olker F, Richardson JS, Sadler JP, Wolter C, Tockner K (2011) The influ-
ence of artificial light on stream and riparian ecosystems: questions, challenges,
and perspectives. Ecosphere, 2, art122.
Pincetl S (2010) Implementing municipal tree planting: Los Angeles million-tree ini-
tiative. Environmental management, 45, 227–238.
Polak T, Korine C, Yair S, Holderied M (2011) Differential effects of artificial lighting
on flight and foraging behaviour of two sympatric bat species in a desert. Journal
of Zoology, 285, 21–27.
R Core Team (2014) R: A language and environment for statistical computing. R Founda-
tion for Statistical Computing, Vienna, Austria. Available at: http://www.R-pro
ject.org (accessed 1 March 2014).
Racey P, Entwistle A (2003) Conservation ecology of bats. In: Bat Ecology (eds Kunz T,
Fenton M), pp. 680–743. The University of Chicago Press, Chicago.
Rayfield B, Fortin M-J, Fall A (2010) The sensitivity of least-cost habitat graphs to rela-
tive cost surface values. Landscape Ecology, 25, 519–532.
RCEP (2009) Artificial Light in the Environment. RCEP, London.
van der Ree R, Bennett AF, Gilmore D (2004) Gap-crossing by gliding marsupials:
thresholds for use of isolated woodland patches in an agricultural landscape. Bio-
logical Conservation, 115, 241–249.
Rich C, Longcore T (eds.) (2006) Ecological Consequences of Artificial Night Lighting.
Island Press, Washington, DC.
Russ J (1999) The Bats of Britain and Ireland – Echolocation Calls, Sound Analysis, and Spe-
cies Identification. Alana Ecology, Powys.
Sadler J, Bates A, Hale JD, James P (2010) Bringing cities alive: the importance of
urban green spaces for people and biodiversity. In: Urban Ecology (ed. Gaston KJ),
pp. 230–260. Cambridge University Press, Cambridge.
Seto KC, Fragkias M (2005) Quantifying spatiotemporal patterns of urban land-use
change in four cities of China with time series landscape metrics. Landscape Ecol-
ogy, 20, 871–888.
Seto KC, Fragkias M, Guneralp B, Reilly MK (2011) A meta-analysis of global urban
land expansion. PLoS One, 6, e23777.
Smith M (2009) Time to turn off the lights. Nature, 457, 27.
Stone EL, Jones G, Harris S (2009) Street lighting disturbs commuting bats. Current
Biology, 19, 1123–1127.
Stone EL, Jones G, Harris S (2012) Conserving energy at a cost to biodiversity?
Impacts of LED lighting on bats. Global Change Biology, 18, 2458–2465.
Sushinsky JR, Rhodes JR, Possingham HP, Gill TK, Fuller RA (2013) How should we
grow cities to minimize their biodiversity impacts? Global Change Biology, 19, 401–
410.
Sutton P, Roberts D, Elvidge C, Meij H (1997) A comparison of nighttime satellite
imagery and population density for the continental United States. Photogrammetric
Engineering and Remote Sensing, 63, 1303–1313.
Threlfall C, Law B, Penman T, Banks PB (2011) Ecological processes in urban land-
scapes: mechanisms influencing the distribution and activity of insectivorous bats.
Ecography, 34, 814–826.
Tischendorf L, Fahrig L (2000) On the usage and measurement of landscape connec-
tivity. Oikos, 90, 7–19.
Tsao JY, Saunders HD, Creighton JR, Coltrin ME, Simmons JA (2010) Solid-state light-
ing: an energy-economics perspective. Journal of Physics D: Applied Physics, 43,
354001.
UN (2010) World Urbanization Prospects: The 2009 Revision. United Nations, New York.
Venables WN, Ripley BD (2002) Modern Applied Statistics with S. Springer, New York.
Verboom B, Spoelstra K (1999) Effects of food abundance and wind on the use of tree
lines by an insectivorous bat, Pipistrellus pipistrellus. Canadian Journal of Zoology, 77,
1393–1401.
Wackernagel M, Kitzes J, Moran D, Goldfinger S, Thomas M (2006) The ecological
footprint of cities and regions: comparing resource availability with resource
demand. Environment and Urbanization, 18, 103–112.
Watts K, Eycott AE, Handley P, Ray D, Humphrey JW, Quine CP (2010) Targeting
and evaluating biodiversity conservation action within fragmented landscapes: an
approach based on generic focal species and least-cost networks. Landscape Ecol-
ogy, 25, 1305–1318.
Williams K (1999) Urban intensification policies in England: problems and contradic-
tions. Land Use Policy, 16, 167–178.
Wood S (2006) Generalized Additive Models: An Introduction with R. Chapman and
Hall/CRC, London.
Zeller KA, Mcgarigal K, Whiteley AR (2012) Estimating landscape resistance to move-
ment: a review. Landscape Ecology, 27, 777–797.
Supporting Information
Additional Supporting Information may be found in theonline version of this article:
Figure S1. Information on survey gap locations and charac-teristics.Figure S2. Changes in tree cover and lighting along a builtdensity gradient.
© 2015 The Authors. Global Change Biology Published by John Wiley & Sons Ltd., doi: 10.1111/gcb.12884
12 J . D. HALE et al.