2019-bopu-annual-financial-report.pdf - Cheyenne Board of ...
107
BOARD OF PUBLIC UTILITIES W ATERWORKS AND SEWER ENTERPRISE FUNDS OF THE CITY OF CHEYENNE, WYOMING COMPREHENSIVE ANNUAL FINANCIAL REPORT FOR THE FISCAL YEAR ENDED JUNE 30, 2019 Prepared by: Administration Division Board of Public Utilities City of Cheyenne, Wyoming
-
Upload
khangminh22 -
Category
Documents
-
view
3 -
download
0
Transcript of 2019-bopu-annual-financial-report.pdf - Cheyenne Board of ...

BOARD OF PUBLIC UTILITIES
WATERWORKS AND SEWER ENTERPRISE FUNDS OF THE
CITY OF CHEYENNE, WYOMING
COMPREHENSIVE ANNUAL FINANCIAL REPORT FOR THE
FISCAL YEAR ENDED JUNE 30, 2019
Prepared by: Administration Division Board of Public Utilities City of Cheyenne, Wyoming
CONTENTS
INTRODUCTORY SECTION
Letter of Transmittal i Certificate of Achievement for Excellence in Financial Reporting xii Board Members xiii List of Principal Officials xiv Water Development xv Organizational Chart of the Board of Public Utilities xxiii
FINANCIAL SECTION
INDEPENDENT AUDITOR’S REPORT 1 - 3 MANAGEMENT’S DISCUSSION AND ANALYSIS (REQUIRED SUPPLEMENTARY INFORMATION) 4 - 15 BASIC FINANCIAL STATEMENTS Statement of Net Position 16 and 17 Statement of Revenues, Expenses, and Changes in Fund Net Position 18 Statement of Cash Flows 19 and 20 Notes to Financial Statements 21 - 40 REQUIRED SUPPLEMENTARY INFORMATION Schedule of the Board’s Proportionate Share of the Net Pension Liability 41 Schedule of the Board’s Contributions 42 Notes to Required Supplementary Information 43 SUPPLEMENTARY INFORMATION Budgetary Comparison Schedule 44 and 45 Notes to Budgetary Comparison Schedule 46
CONTINUED
CONTENTS, CONTINUED
STATISTICAL SECTION (UNAUDITED)
INTRODUCTION TO STATISTICAL SECTION (UNAUDITED) 47 FINANCIAL TRENDS Net Position by Component 48 and 49 Combined Changes in Net Position 50 Combined Operating Revenues by Source 51 Combined Operating Expenses 52 and 53 Combined Nonoperating Revenues and Expenses 54 REVENUE CAPACITY Water and Sewer Rates 55 and 56 Ten Largest Water Customers 57 Ten Largest Sewer Customers 58 DEBT CAPACITY Ratios of Outstanding Debt by Type 59 Sewer Fund Legal Debt Margin Information 60 Pledged Revenue Coverage – Waterworks Fund 61 Pledged Revenue Coverage – Sewer Fund 62 DEMOGRAPHIC AND ECONOMIC INFORMATION Demographic and Economic Statistics 63 Principal Employers 64 Number of Employees by Identifiable Activity 65 and 66 OPERATING INFORMATION Operating and Capital Indicators 67 and 68 Water Delivered and Sold and Wastewater Treated 69 Annual Tap Sales 70 Number of Water and Sewer Users by Type 71 and 72 Gallons per Capita per Day 73 Metered Water Sales by Customer Class and Operating and Debt Service Cost per 1,000 Gallons Sold 74 and 75
COMPLIANCE SECTION
INDEPENDENT AUDITOR’S REPORT ON INTERNAL CONTROL OVER FINANCIAL REPORTING AND ON COMPLIANCE AND OTHER MATTERS BASED ON AN AUDIT OF FINANCIAL STATEMENTS PERFORMED IN ACCORDANCE WITH GOVERNMENT AUDITING STANDARDS 76 and 77
i
Board of Public Utilities Cheyenne Water and Sewer Department
P.O. Box 1469
● Cheyenne, Wyoming 82003 ● Phone: (307) 637-6460
2416 Snyder Avenue Fax: (307) 637-7672 The Honorable Mayor Marian J. Orr, City Council Members, and Members of the Board of Public Utilities City of Cheyenne, Wyoming
Monday, October 21, 2019
The Board of Public Utilities of the City of Cheyenne, Wyoming (the “Board”) Comprehensive Annual Financial Report (CAFR) for the fiscal year ended June 30, 2019 is hereby submitted. The Board’s Administration Division prepared this report and is responsible for the accuracy of the data and the completeness and fairness of the presentation, including all disclosures. To the best of our knowledge and belief, the enclosed data is accurate in all material respects, and is reported in a manner intended to present fairly the financial position and results of operations of the City of Cheyenne’s Waterworks and Sewer Enterprise Funds. All disclosures necessary to enable the reader to gain an understanding of the Board’s financial activities have been included. WYO. STAT. § 16-4-121 (1977) requires that an annual audit be conducted by an independent auditor and be in accordance with generally accepted auditing standards as promulgated by the American Institute of Certified Public Accountants in their guidelines for audits of state and local governments. The audits shall be financial and legal compliance audits. The independent audit shall be completed and a copy sent to the Wyoming Department of Audit within six months of the end of the fiscal year. McGee Hearne & Paiz LLP, a firm of licensed certified public accountants, has audited the Board’s financial statements. The goal of the independent audit is to provide reasonable assurance that the Board’s financial statements for the fiscal year ended June 30, 2019 are free of material misstatement. The independent auditor concluded, based upon the audit, that there was a reasonable basis for rendering an unmodified opinion that the Board’s financial statements for the fiscal year ended June 30, 2019 are fairly presented in conformity with accounting principles generally accepted in the United States (U.S. GAAP). The independent auditor’s opinion is presented as the first component of the financial section. U.S. GAAP requires that management provide a narrative introduction, overview, and analysis to accompany the basic financial statements in the form of Management’s Discussion and Analysis (MD&A). This letter of transmittal is designed to complement the MD&A and should be read in conjunction with it. The Board’s MD&A can be found immediately following the report of the independent auditor in the financial section.
ii
THE REPORTING ENTITY AND SERVICES PROVIDED
Any city or town in the State of Wyoming which owns and operates a municipal waterworks, a sanitary sewer system, a sewage disposal plant, or an electric utility distribution system may establish a board of commissioners, to be known as a Board of Public Utilities. On April 27, 1943, the City of Cheyenne established such a board. This year marks the Board’s 76th anniversary. The Board manages, operates, maintains, and controls the water treatment plants, water mains, sanitary sewer systems, and water reclamation plants, and makes all procedures and regulations necessary for their safe, economical, and efficient operation and management.
The Board has exclusive control of all water and sewer utility systems owned by the City of Cheyenne, Wyoming. The Board is charged with developing and supplying the City and its residents with water for domestic and industrial purposes and for public use. Sanitary sewer facilities are provided for this same group of users.
The City of Cheyenne Governing Body, operating under the Mayor/Council form of government, reviews and approves changes to the water and sewer rates and the water and sewer enterprise fund budgets as recommended by the Board. The Board consists of five members appointed to staggered six-year terms by the Mayor with the advice and consent of the City Council.
The Board is considered a proprietary fund of the City of Cheyenne, Wyoming, which publishes a separate financial report and is subject to separate accountability.
The Board provides water and sewer services for the City of Cheyenne, F. E. Warren Air Force Base, and South Cheyenne Water and Sewer District, as well as several residential and commercial customers and ranchers located outside of the City. These services include operation and maintenance of water supplies (ground water, well fields, surface water, dams, recycled water, and reservoirs), water purification facilities, water distribution mains and meters, wastewater collection mains, and water reclamation facilities.
GENERAL INFORMATION
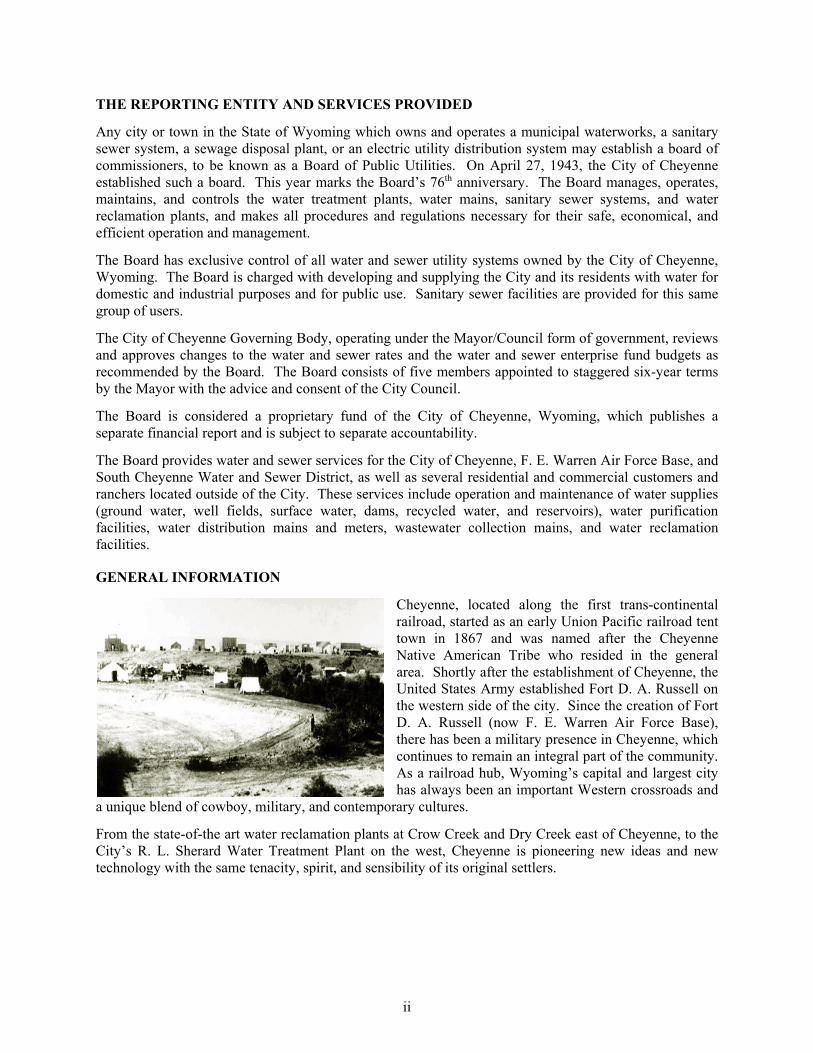
Cheyenne, located along the first trans-continental railroad, started as an early Union Pacific railroad tent town in 1867 and was named after the Cheyenne Native American Tribe who resided in the general area. Shortly after the establishment of Cheyenne, the United States Army established Fort D. A. Russell on the western side of the city. Since the creation of Fort D. A. Russell (now F. E. Warren Air Force Base), there has been a military presence in Cheyenne, which continues to remain an integral part of the community. As a railroad hub, Wyoming’s capital and largest city has always been an important Western crossroads and
a unique blend of cowboy, military, and contemporary cultures.
From the state-of-the art water reclamation plants at Crow Creek and Dry Creek east of Cheyenne, to the City’s R. L. Sherard Water Treatment Plant on the west, Cheyenne is pioneering new ideas and new technology with the same tenacity, spirit, and sensibility of its original settlers.
iii
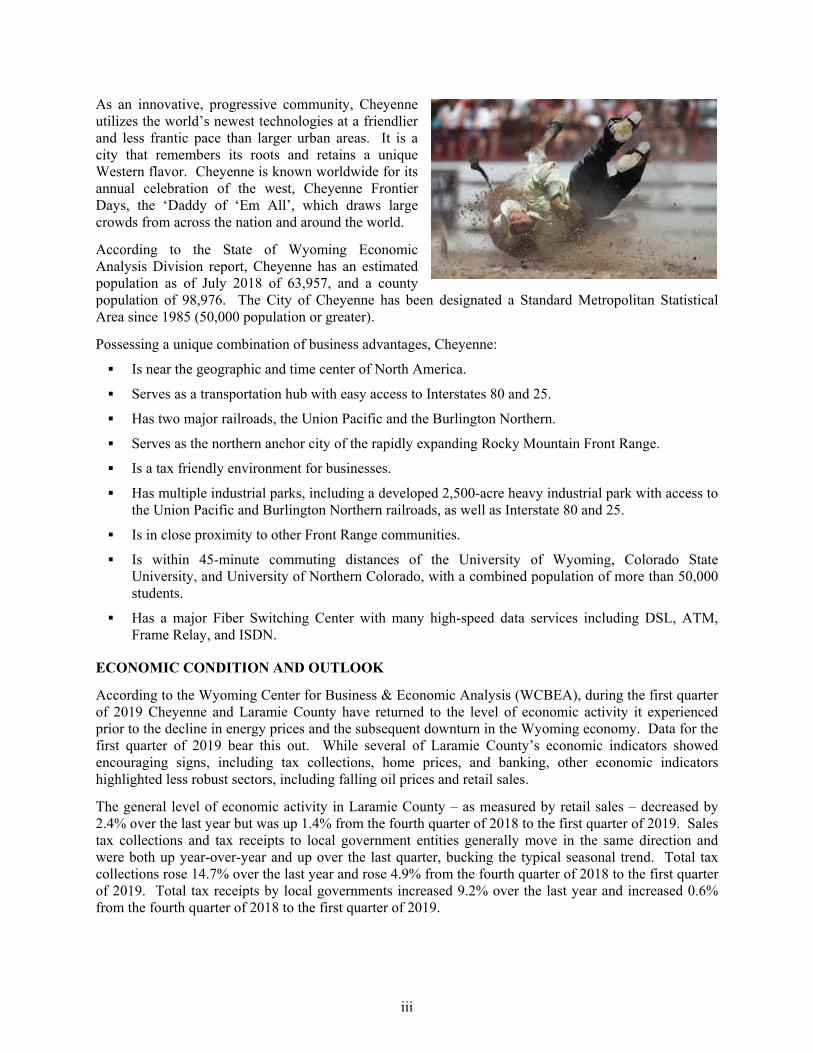
As an innovative, progressive community, Cheyenne utilizes the world’s newest technologies at a friendlier and less frantic pace than larger urban areas. It is a city that remembers its roots and retains a unique Western flavor. Cheyenne is known worldwide for its annual celebration of the west, Cheyenne Frontier Days, the ‘Daddy of ‘Em All’, which draws large crowds from across the nation and around the world.
According to the State of Wyoming Economic Analysis Division report, Cheyenne has an estimated population as of July 2018 of 63,957, and a county population of 98,976. The City of Cheyenne has been designated a Standard Metropolitan Statistical Area since 1985 (50,000 population or greater).
Possessing a unique combination of business advantages, Cheyenne:
Is near the geographic and time center of North America.
Serves as a transportation hub with easy access to Interstates 80 and 25.
Has two major railroads, the Union Pacific and the Burlington Northern.
Serves as the northern anchor city of the rapidly expanding Rocky Mountain Front Range.
Is a tax friendly environment for businesses.
Has multiple industrial parks, including a developed 2,500-acre heavy industrial park with access to the Union Pacific and Burlington Northern railroads, as well as Interstate 80 and 25.
Is in close proximity to other Front Range communities.
Is within 45-minute commuting distances of the University of Wyoming, Colorado State University, and University of Northern Colorado, with a combined population of more than 50,000 students.
Has a major Fiber Switching Center with many high-speed data services including DSL, ATM, Frame Relay, and ISDN.
ECONOMIC CONDITION AND OUTLOOK
According to the Wyoming Center for Business & Economic Analysis (WCBEA), during the first quarter of 2019 Cheyenne and Laramie County have returned to the level of economic activity it experienced prior to the decline in energy prices and the subsequent downturn in the Wyoming economy. Data for the first quarter of 2019 bear this out. While several of Laramie County’s economic indicators showed encouraging signs, including tax collections, home prices, and banking, other economic indicators highlighted less robust sectors, including falling oil prices and retail sales.
The general level of economic activity in Laramie County – as measured by retail sales – decreased by 2.4% over the last year but was up 1.4% from the fourth quarter of 2018 to the first quarter of 2019. Sales tax collections and tax receipts to local government entities generally move in the same direction and were both up year-over-year and up over the last quarter, bucking the typical seasonal trend. Total tax collections rose 14.7% over the last year and rose 4.9% from the fourth quarter of 2018 to the first quarter of 2019. Total tax receipts by local governments increased 9.2% over the last year and increased 0.6% from the fourth quarter of 2018 to the first quarter of 2019.
iv
Residential construction was down over the last year in the city of Cheyenne but rose in the rural part of Laramie County. In the city of Cheyenne, the number of single-family building permits decreased from 67 in the first quarter of 2018 to 33 in the first quarter of 2019 (-41%). Outside of Cheyenne, single-family building permits rose from 38 in the first quarter of 2018 to 48 in the first quarter of 2019 (26.3%). The average monthly value of authorized commercial construction in the city rose 25.9% over the last year from the first quarter of 2018 to the first quarter of 2019.
Annual real estate sales prices continued to climb in the first quarter of 2019. In the city of Cheyenne, the average sales price rose from $237,017 in the first quarter of 2018 to $256,962 in the first quarter of 2019 (8.4%). In Laramie County year-over-year, the average sales price for homes in rural Laramie County rose by 15%, from $365,060 in the first quarter of 2018 to $413,223 in the first quarter of 2019.
The number of unemployed workers fell over the last year, from 1,930 in the first quarter of 2018 to 1,819 in the first quarter of 2018 (-5.8%). The number of unemployed workers rose over the last quarter, from 1,698 in the fourth quarter of 2018 to 1,819 in the first quarter of 2019 (7.1%).
The average monthly unemployment rate fell over the last year, from 4.1% in the first quarter of 2018 to 3.8% in the first quarter of 2019. The unemployment rate rose slightly over the last quarter, from an average monthly rate of 3.6$ in the fourth quarter of 2018 to 3.8% in the first quarter of 2019.
The continuing threat to the local government’s economy is the impact of sustained low energy prices and the corresponding decrease in severance tax revenue to the State government. As the State’s budget becomes more problematic, the allocation of funds received by the local governments from the State could see significant decreases. Additionally, grant monies from the Wyoming Water Development Commission might see significant reductions. These reductions will force water utilities to increase debt loads, in future years.
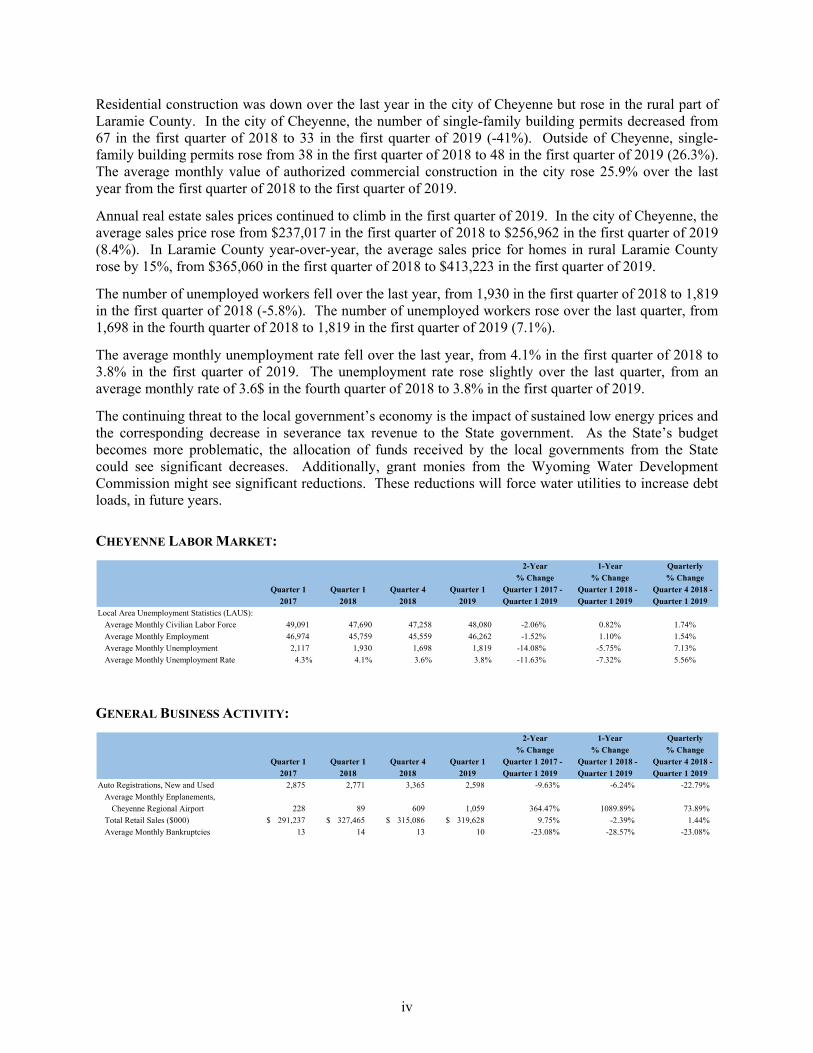
CHEYENNE LABOR MARKET:
2-Year 1-Year Quarterly
% Change % Change % Change
Quarter 1 Quarter 1 Quarter 4 Quarter 1 Quarter 1 2017 - Quarter 1 2018 - Quarter 4 2018 -
2017 2018 2018 2019 Quarter 1 2019 Quarter 1 2019 Quarter 1 2019
Local Area Unemployment Statistics (LAUS):
Average Monthly Civilian Labor Force 49,091 47,690 47,258 48,080 -2.06% 0.82% 1.74%
Average Monthly Employment 46,974 45,759 45,559 46,262 -1.52% 1.10% 1.54%
Average Monthly Unemployment 2,117 1,930 1,698 1,819 -14.08% -5.75% 7.13%
Average Monthly Unemployment Rate 4.3% 4.1% 3.6% 3.8% -11.63% -7.32% 5.56%
GENERAL BUSINESS ACTIVITY:
2-Year 1-Year Quarterly
% Change % Change % Change
Quarter 1 Quarter 1 Quarter 4 Quarter 1 Quarter 1 2017 - Quarter 1 2018 - Quarter 4 2018 -
2017 2018 2018 2019 Quarter 1 2019 Quarter 1 2019 Quarter 1 2019
Auto Registrations, New and Used 2,875 2,771 3,365 2,598 -9.63% -6.24% -22.79%
Average Monthly Enplanements,
Cheyenne Regional Airport 228 89 609 1,059 364.47% 1089.89% 73.89%
Total Retail Sales ($000) 291,237 $ 327,465 $ 315,086 $ 319,628 $ 9.75% -2.39% 1.44%
Average Monthly Bankruptcies 13 14 13 10 -23.08% -28.57% -23.08%

v
OTHER SIGNIFICANT ECONOMIC NEWS AND EVENTS DURING RECENT FISCAL YEARS:
Precious Cat, Inc. relocating to Cheyenne. An effort through the Cheyenne-Laramie County Corporation for Economic Development (LEADS) has resulted in Precious Cat, Inc. relocating their Dr. Elsey’s Precious Cat Products manufacturing and distribution facility to Cheyenne.
The move is being driven by the need for rail service and more space than is available at the company’s current location in Englewood, Colorado. According to Dr. Bruce Elsey, President of Precious Cat, Inc., “We chose Cheyenne because, in addition to the availability of rail and rail-served land, we appreciate the work ethic and values present in a town the size of Cheyenne.”
The availability of high-quality bentonite, the main ingredient used in cat litter, was also a factor, says Elsey. “There is nothing better than Wyoming bentonite.”
Cheyenne LEADS began working with Precious Cat in October 2016. The company will employ 20-30 employees and plans to build a 150,000 square foot building located on 33 acres in the in the Swan Ranch Business Park, owned by Granite Peak Development. Construction is planned to begin by the end of 2019.
“We are thrilled that Dr. Elsey’s Precious Cat Products will relocate to Cheyenne,” said Randy Bruns, Chief Executive Officer of Cheyenne LEADS. “Precious Cat, Inc. produces a high-quality product from Wyoming materials and has a reputation as a top employer.”
Wyoming Microsoft expansion. After an 18-month delay, Microsoft has begun work to complete a promised expansion of its data center operations west of Cheyenne. The Redmond, Washington based technology giant originally announced the expansion at a 2015 news conference with Wyoming’s
Governor at the time, Matt Mead, where officials said the company planned to spend more than $200 million and double the 25 permanent jobs at the center within one to two years.
Cheyenne LEADS Chief Executive Officer, Randy Bruns, said the company delayed physical expansion after upgrades made existing servers more efficient, pushing back the need for more. That development led the company to review its data center strategy and
put all projects on hold, Bruns said. But now, expansion work is back on. Black Hills Energy began preparing for a new center in mid-summer, and Microsoft began preparatory and foundation work in the fall. “Now they’re well under construction,” Bruns said, “and it will increase as the weather improves.”
In 2015, the expansion was expected to bring the company’s total investment in the data center to $750 million and employment to 50 full-time jobs. But Bruns said Microsoft was “already well beyond what they promised,” adding that he anticipated more jobs would accompany the growth.
Cheyenne is a perfect environment for data centers. Its cold winters reduce the cost of cooling servers, and the remoteness and low population density helps with security. The state’s cheap energy also helps with power-hungry servers. That compatibility gives Wyoming a foothold in the booming information economy that is only going to keep growing.
vi
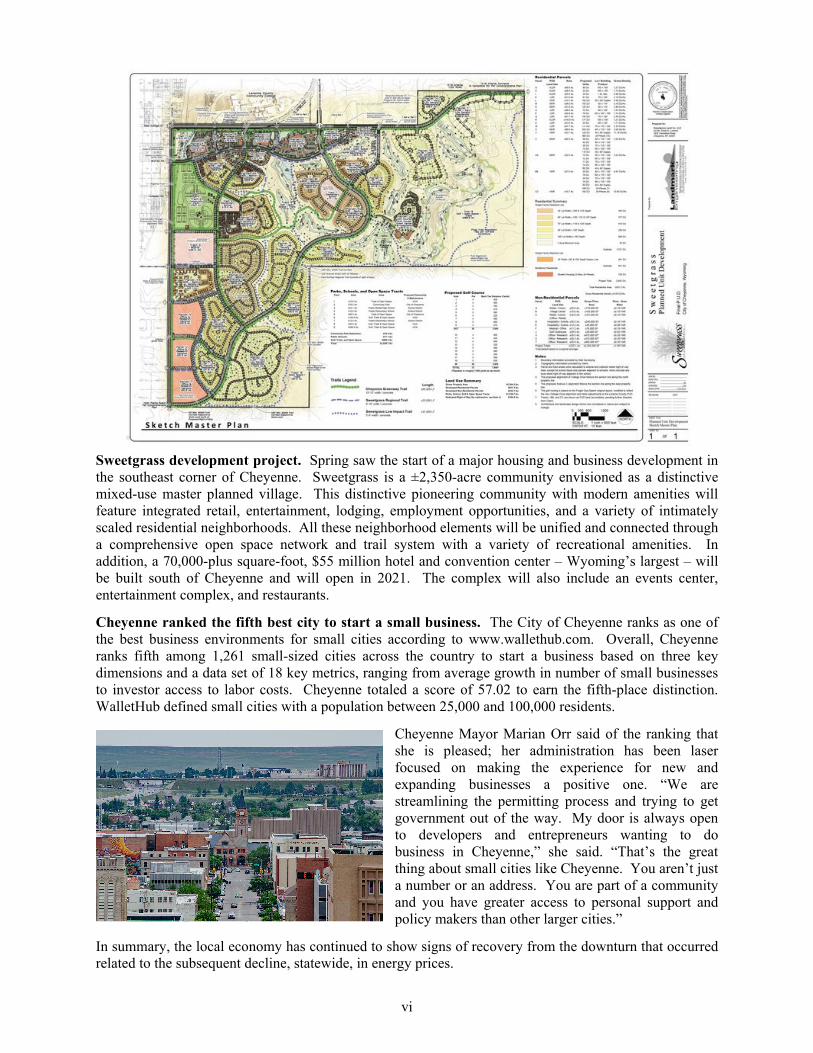
Sweetgrass development project. Spring saw the start of a major housing and business development in the southeast corner of Cheyenne. Sweetgrass is a ±2,350-acre community envisioned as a distinctive mixed-use master planned village. This distinctive pioneering community with modern amenities will feature integrated retail, entertainment, lodging, employment opportunities, and a variety of intimately scaled residential neighborhoods. All these neighborhood elements will be unified and connected through a comprehensive open space network and trail system with a variety of recreational amenities. In addition, a 70,000-plus square-foot, $55 million hotel and convention center – Wyoming’s largest – will be built south of Cheyenne and will open in 2021. The complex will also include an events center, entertainment complex, and restaurants.
Cheyenne ranked the fifth best city to start a small business. The City of Cheyenne ranks as one of the best business environments for small cities according to www.wallethub.com. Overall, Cheyenne ranks fifth among 1,261 small-sized cities across the country to start a business based on three key dimensions and a data set of 18 key metrics, ranging from average growth in number of small businesses to investor access to labor costs. Cheyenne totaled a score of 57.02 to earn the fifth-place distinction. WalletHub defined small cities with a population between 25,000 and 100,000 residents.
Cheyenne Mayor Marian Orr said of the ranking that she is pleased; her administration has been laser focused on making the experience for new and expanding businesses a positive one. “We are streamlining the permitting process and trying to get government out of the way. My door is always open to developers and entrepreneurs wanting to do business in Cheyenne,” she said. “That’s the great thing about small cities like Cheyenne. You aren’t just a number or an address. You are part of a community and you have greater access to personal support and policy makers than other larger cities.”
In summary, the local economy has continued to show signs of recovery from the downturn that occurred related to the subsequent decline, statewide, in energy prices.
vii
MAJOR INITIATIVES
For the year, the Board continued to take steps forward to ensure continuing quality and quantity of water and wastewater services.
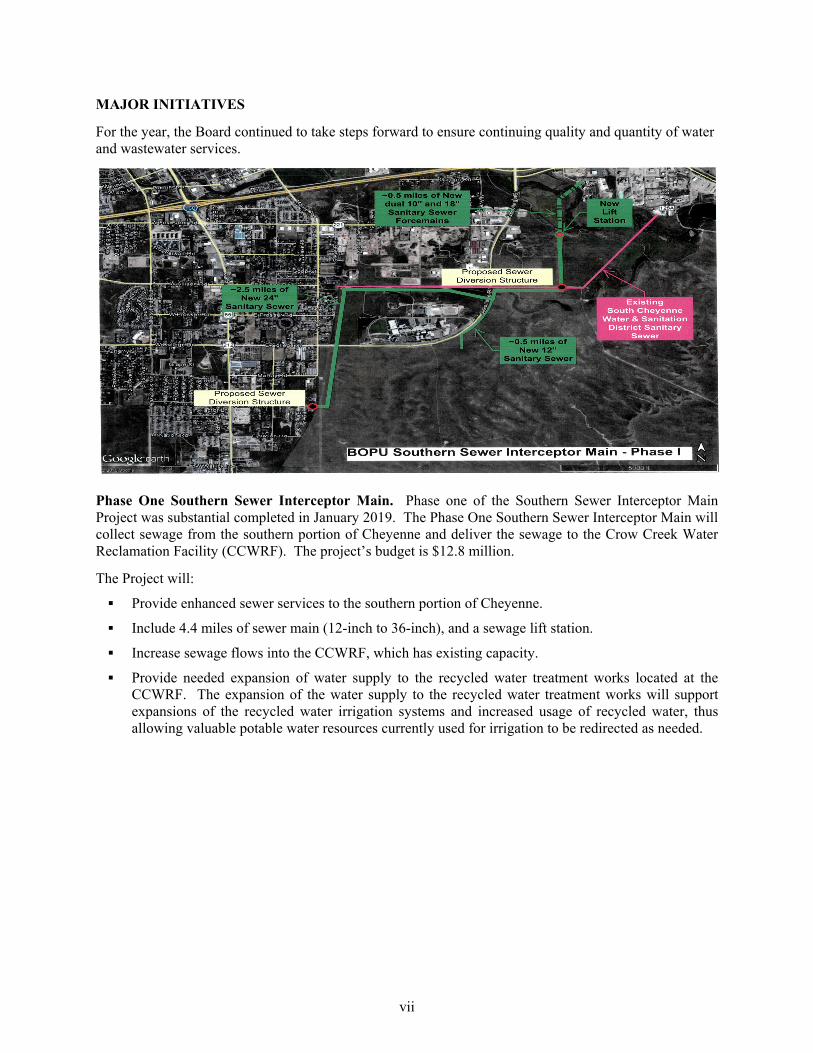
Phase One Southern Sewer Interceptor Main. Phase one of the Southern Sewer Interceptor Main Project was substantial completed in January 2019. The Phase One Southern Sewer Interceptor Main will collect sewage from the southern portion of Cheyenne and deliver the sewage to the Crow Creek Water Reclamation Facility (CCWRF). The project’s budget is $12.8 million.
The Project will:
Provide enhanced sewer services to the southern portion of Cheyenne.
Include 4.4 miles of sewer main (12-inch to 36-inch), and a sewage lift station.
Increase sewage flows into the CCWRF, which has existing capacity.
Provide needed expansion of water supply to the recycled water treatment works located at the CCWRF. The expansion of the water supply to the recycled water treatment works will support expansions of the recycled water irrigation systems and increased usage of recycled water, thus allowing valuable potable water resources currently used for irrigation to be redirected as needed.
viii
OTHER INITIATIVES
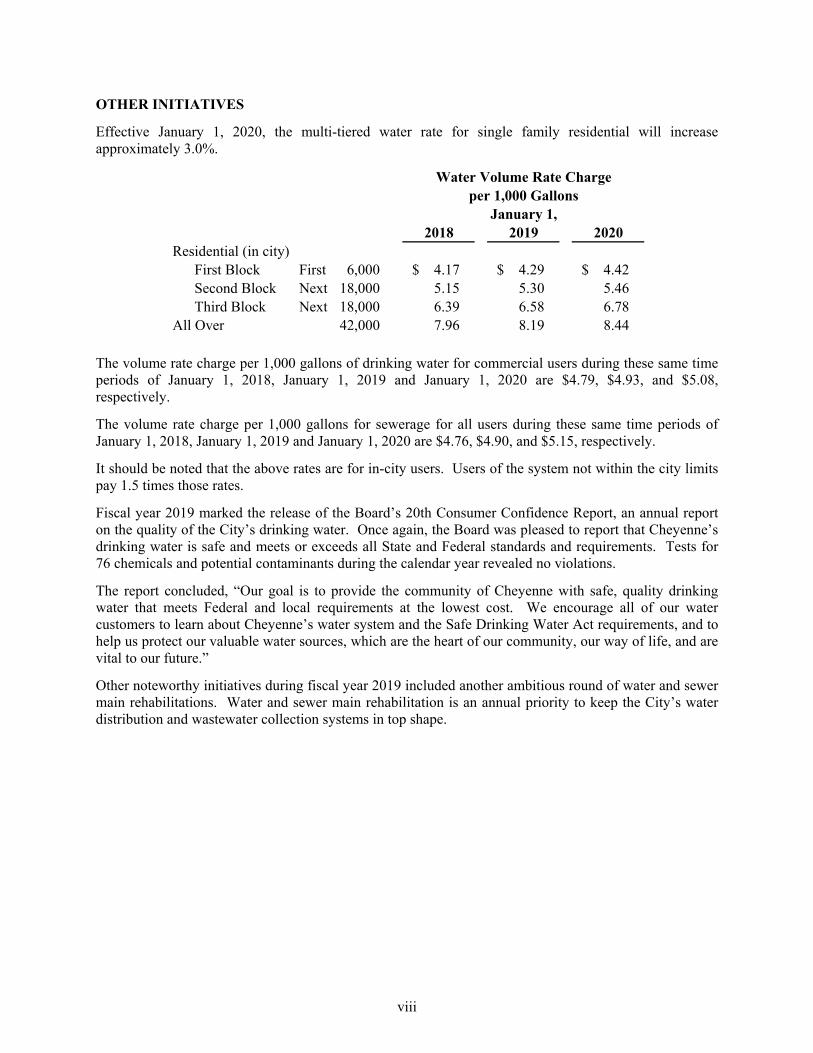
Effective January 1, 2020, the multi-tiered water rate for single family residential will increase approximately 3.0%.
2018 2019 2020
First Block First 6,000 4.17 $ 4.29 $ 4.42 $ Second Block Next 18,000 5.15 5.30 5.46 Third Block Next 18,000 6.39 6.58 6.78
All Over 42,000 7.96 8.19 8.44
Water Volume Rate Chargeper 1,000 Gallons
January 1,
Residential (in city)
The volume rate charge per 1,000 gallons of drinking water for commercial users during these same time periods of January 1, 2018, January 1, 2019 and January 1, 2020 are $4.79, $4.93, and $5.08, respectively.
The volume rate charge per 1,000 gallons for sewerage for all users during these same time periods of January 1, 2018, January 1, 2019 and January 1, 2020 are $4.76, $4.90, and $5.15, respectively.
It should be noted that the above rates are for in-city users. Users of the system not within the city limits pay 1.5 times those rates.
Fiscal year 2019 marked the release of the Board’s 20th Consumer Confidence Report, an annual report on the quality of the City’s drinking water. Once again, the Board was pleased to report that Cheyenne’s drinking water is safe and meets or exceeds all State and Federal standards and requirements. Tests for 76 chemicals and potential contaminants during the calendar year revealed no violations.
The report concluded, “Our goal is to provide the community of Cheyenne with safe, quality drinking water that meets Federal and local requirements at the lowest cost. We encourage all of our water customers to learn about Cheyenne’s water system and the Safe Drinking Water Act requirements, and to help us protect our valuable water sources, which are the heart of our community, our way of life, and are vital to our future.”
Other noteworthy initiatives during fiscal year 2019 included another ambitious round of water and sewer main rehabilitations. Water and sewer main rehabilitation is an annual priority to keep the City’s water distribution and wastewater collection systems in top shape.
ix
FOR THE FUTURE
Looking ahead, the Board is committed to maintaining a high-quality water and wastewater system that will meet the needs of a growing community in the 21st century. As the Board moves forward, there will be major emphasis on expanding the available water supplied to Cheyenne in order to facilitate future expansion of the city for both residential and commercial/industrial needs.
MAJOR FISCAL YEAR 2020 BUDGETED PROJECTS:
Fiscal year 2020 rate study. During the 2020 fiscal year, the Board will be imitating a comprehensive rate study for both water and sewer user rates, system development fees, and other types of revenue related to the ongoing operation of the Board. The Board has several key objectives in developing the comprehensive water rate study:
Develop the study in a manner that is consistent with the principles and methodologies established by the American Water Works Association (AWWA) M1 Manual, Principles of Water Rates, Fees, and Charges.
Review and utilize the Board’s current financial/rate setting policies and practices.
Develop the Board’s revenue requirement analysis to provide prudent and adequate funding levels for operations and maintenance (O&M), capital infrastructure (asset management plan, and debt service).
Develop a cost allocation methodology that equitably allocates the cost of providing water service to the Board’s various types of customers.
Review the Board’s current water rate designs/structures, and provide rate designs that are contemporary, cost based, and defensible and meet the specific rate design objectives of the Board.
Develop the proposed water rates and fees to meet the legal and statutory requirements.
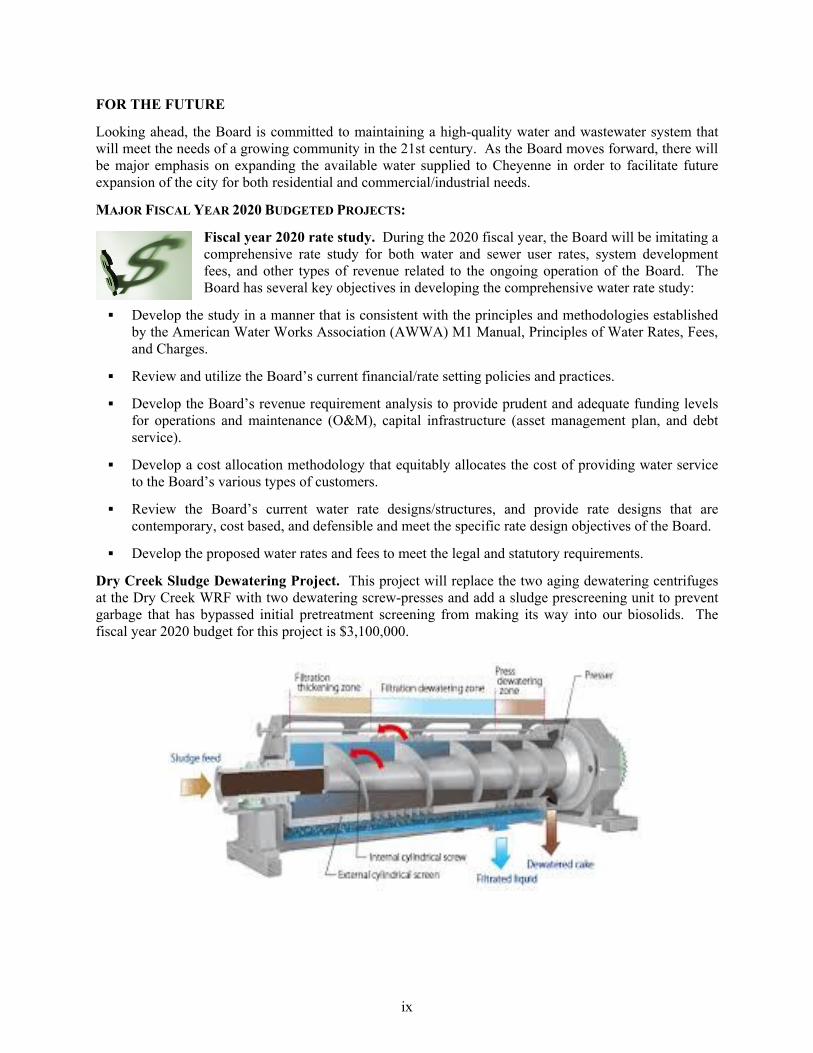
Dry Creek Sludge Dewatering Project. This project will replace the two aging dewatering centrifuges at the Dry Creek WRF with two dewatering screw-presses and add a sludge prescreening unit to prevent garbage that has bypassed initial pretreatment screening from making its way into our biosolids. The fiscal year 2020 budget for this project is $3,100,000.
x
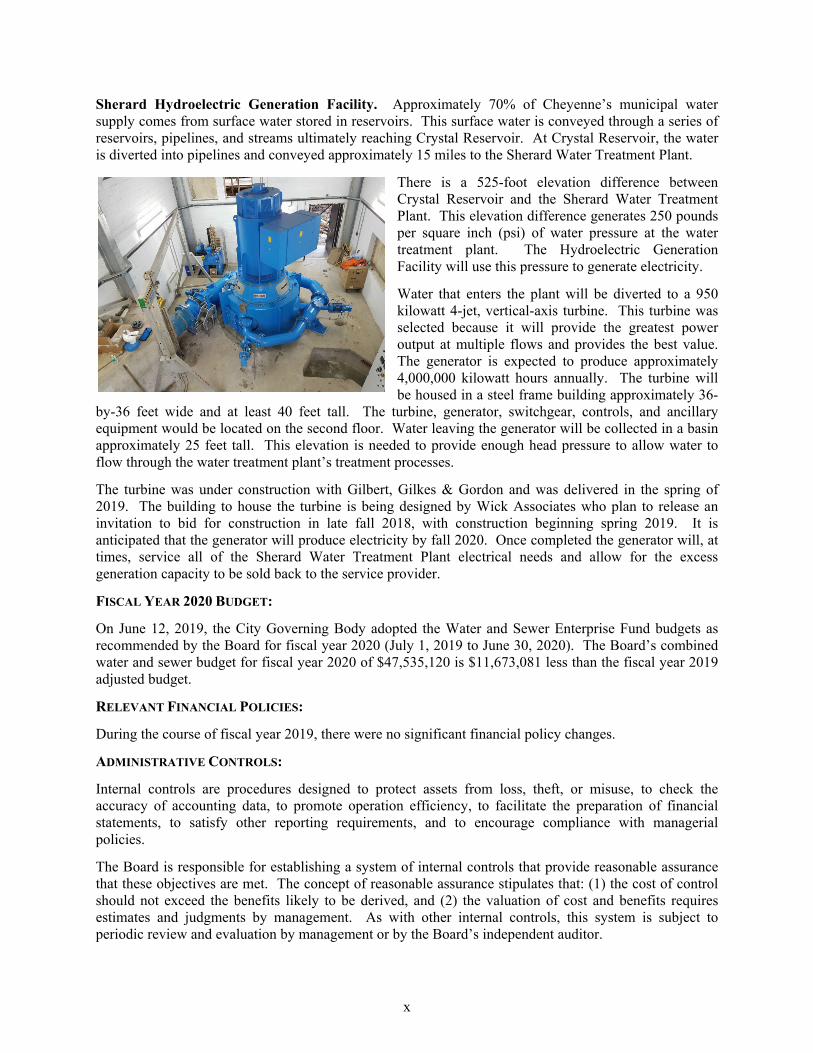
Sherard Hydroelectric Generation Facility. Approximately 70% of Cheyenne’s municipal water supply comes from surface water stored in reservoirs. This surface water is conveyed through a series of reservoirs, pipelines, and streams ultimately reaching Crystal Reservoir. At Crystal Reservoir, the water is diverted into pipelines and conveyed approximately 15 miles to the Sherard Water Treatment Plant.
There is a 525-foot elevation difference between Crystal Reservoir and the Sherard Water Treatment Plant. This elevation difference generates 250 pounds per square inch (psi) of water pressure at the water treatment plant. The Hydroelectric Generation Facility will use this pressure to generate electricity.
Water that enters the plant will be diverted to a 950 kilowatt 4-jet, vertical-axis turbine. This turbine was selected because it will provide the greatest power output at multiple flows and provides the best value. The generator is expected to produce approximately 4,000,000 kilowatt hours annually. The turbine will be housed in a steel frame building approximately 36-
by-36 feet wide and at least 40 feet tall. The turbine, generator, switchgear, controls, and ancillary equipment would be located on the second floor. Water leaving the generator will be collected in a basin approximately 25 feet tall. This elevation is needed to provide enough head pressure to allow water to flow through the water treatment plant’s treatment processes.
The turbine was under construction with Gilbert, Gilkes & Gordon and was delivered in the spring of 2019. The building to house the turbine is being designed by Wick Associates who plan to release an invitation to bid for construction in late fall 2018, with construction beginning spring 2019. It is anticipated that the generator will produce electricity by fall 2020. Once completed the generator will, at times, service all of the Sherard Water Treatment Plant electrical needs and allow for the excess generation capacity to be sold back to the service provider.
FISCAL YEAR 2020 BUDGET:
On June 12, 2019, the City Governing Body adopted the Water and Sewer Enterprise Fund budgets as recommended by the Board for fiscal year 2020 (July 1, 2019 to June 30, 2020). The Board’s combined water and sewer budget for fiscal year 2020 of $47,535,120 is $11,673,081 less than the fiscal year 2019 adjusted budget.
RELEVANT FINANCIAL POLICIES:
During the course of fiscal year 2019, there were no significant financial policy changes.
ADMINISTRATIVE CONTROLS:
Internal controls are procedures designed to protect assets from loss, theft, or misuse, to check the accuracy of accounting data, to promote operation efficiency, to facilitate the preparation of financial statements, to satisfy other reporting requirements, and to encourage compliance with managerial policies.
The Board is responsible for establishing a system of internal controls that provide reasonable assurance that these objectives are met. The concept of reasonable assurance stipulates that: (1) the cost of control should not exceed the benefits likely to be derived, and (2) the valuation of cost and benefits requires estimates and judgments by management. As with other internal controls, this system is subject to periodic review and evaluation by management or by the Board’s independent auditor.
xi
AWARDS:
The Government Finance Officers Association of the United States and Canada (GFOA) awarded a Certificate of Achievement of Excellence in Financial Reporting to the Board for its Comprehensive Annual Financial Report for the fiscal year ended June 30, 2018. This was the 41st consecutive year that the Board has received this prestigious award.
IN CONCLUSION
The preparation of the annual financial report on a timely basis was made possible by the dedication of the Administration Division staff. Each member of the Division has our sincere appreciation for the contributions made in the preparation of this report.
In closing, the Board Members and Management continue to provide valuable leadership, planning, and direction for Cheyenne’s water and wastewater systems. Serving nearly 76,000 residents, these systems will continue to play a vital role in the development and growth of our City for many years to come.
The Board, its management, and employees are all dedicated to the goal of providing the Cheyenne area with the highest quality of water and wastewater services at the most economical cost.
Respectfully submitted, Randy K. Hays Manager, Administration Division and Assistant City Treasurer

xii

xiii
BOARD OF PUBLIC UTILITIES CITY OF CHEYENNE, WYOMING
BOARD MEMBERS JUNE 30, 2019
MARY B. GUTHRIE BOARD PRESIDENT
Board Member since June 18, 2015
MATTHEW L. POPE BOARD SECRETARY
Board Member since September 9, 2013
ALLAN CUNNINGHAM BOARD MEMBER
Board Member since February 19, 2019
JOHN EDWARDS BOARD MEMBER
Board Member since June 8, 2018
JAMES MURPHY BOARD MEMBER
Board Member since June 1, 2013
xiv
BOARD OF PUBLIC UTILITIES CITY OF CHEYENNE, WYOMING
LIST OF PRINCIPAL OFFICIALS JUNE 30, 2019
ELECTED AND APPOINTED OFFICIALS: POSITION: CURRENT TERM EXPIRES:
Marian J. Orr Mayor January 4, 2021
Mary B. Guthrie Board President June 1, 2021
Matthew L. Pope Board Secretary June 1, 2021
Allan Cunningham Board Member June 1, 2025
John Edwards Board Member June 1, 2023
James Murphy Board Member June 1, 2025
MANAGEMENT: POSITION:
Bradley A. Brooks Director
Kathy Kellner Manager, Human Resources
Randy Hays Manager, Administration Division
Clint Bassett Manager, Water Treatment Division
Frank Strong Manager, Operations and Maintenance Division
Bruce Hattig Manager, Engineering and Water Resource Division
Matthew Buelow Manager, Water Reclamation Division
xv
WATER AND WATER RECLAMATION, AND WASTEWATER SYSTEMS – PAST, PRESENT, AND FUTURE
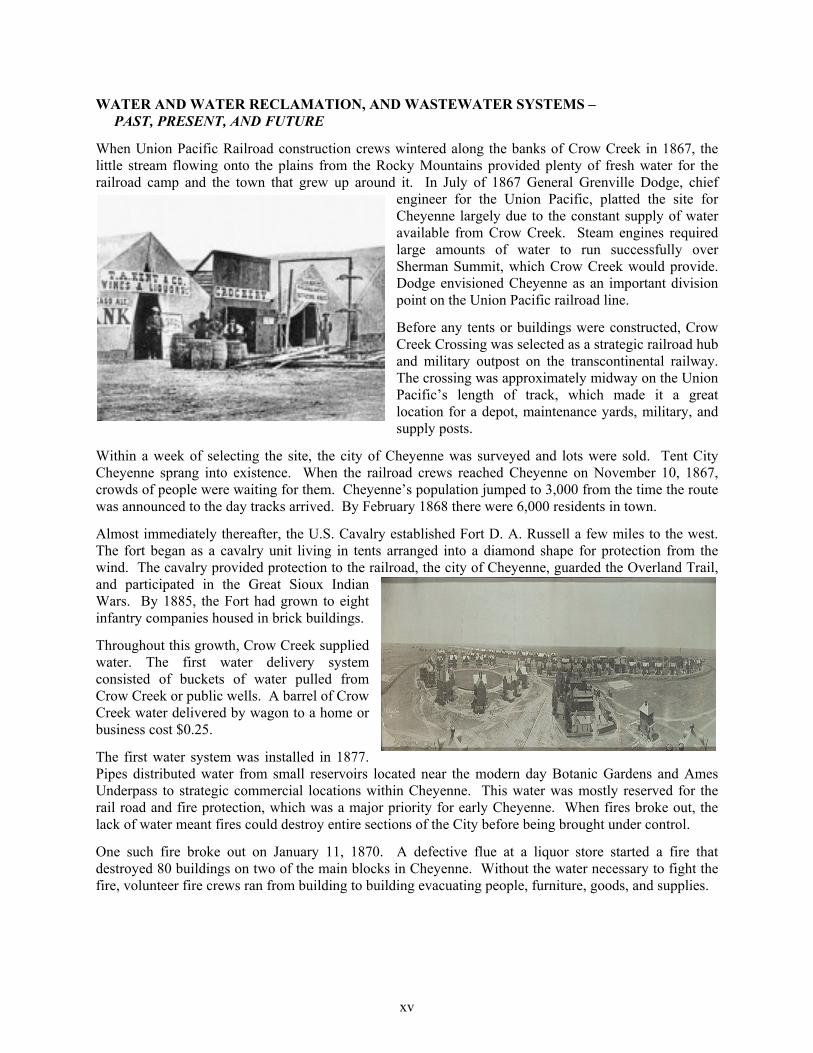
When Union Pacific Railroad construction crews wintered along the banks of Crow Creek in 1867, the little stream flowing onto the plains from the Rocky Mountains provided plenty of fresh water for the railroad camp and the town that grew up around it. In July of 1867 General Grenville Dodge, chief
engineer for the Union Pacific, platted the site for Cheyenne largely due to the constant supply of water available from Crow Creek. Steam engines required large amounts of water to run successfully over Sherman Summit, which Crow Creek would provide. Dodge envisioned Cheyenne as an important division point on the Union Pacific railroad line.
Before any tents or buildings were constructed, Crow Creek Crossing was selected as a strategic railroad hub and military outpost on the transcontinental railway. The crossing was approximately midway on the Union Pacific’s length of track, which made it a great location for a depot, maintenance yards, military, and supply posts.
Within a week of selecting the site, the city of Cheyenne was surveyed and lots were sold. Tent City Cheyenne sprang into existence. When the railroad crews reached Cheyenne on November 10, 1867, crowds of people were waiting for them. Cheyenne’s population jumped to 3,000 from the time the route was announced to the day tracks arrived. By February 1868 there were 6,000 residents in town.
Almost immediately thereafter, the U.S. Cavalry established Fort D. A. Russell a few miles to the west. The fort began as a cavalry unit living in tents arranged into a diamond shape for protection from the wind. The cavalry provided protection to the railroad, the city of Cheyenne, guarded the Overland Trail, and participated in the Great Sioux Indian Wars. By 1885, the Fort had grown to eight infantry companies housed in brick buildings.
Throughout this growth, Crow Creek supplied water. The first water delivery system consisted of buckets of water pulled from Crow Creek or public wells. A barrel of Crow Creek water delivered by wagon to a home or business cost $0.25.
The first water system was installed in 1877. Pipes distributed water from small reservoirs located near the modern day Botanic Gardens and Ames Underpass to strategic commercial locations within Cheyenne. This water was mostly reserved for the rail road and fire protection, which was a major priority for early Cheyenne. When fires broke out, the lack of water meant fires could destroy entire sections of the City before being brought under control.
One such fire broke out on January 11, 1870. A defective flue at a liquor store started a fire that destroyed 80 buildings on two of the main blocks in Cheyenne. Without the water necessary to fight the fire, volunteer fire crews ran from building to building evacuating people, furniture, goods, and supplies.
xvi
The early residents and businesses within Cheyenne recognized the economic and lifestyle enhancements that access to water provided. In 1882, these citizens petitioned City Council to allow homes and businesses to tap into the water system. Water use was not metered. Instead, customers were charged based on the number of bathrooms and types of water uses at the location. For example, an eight-room home with one bathroom and a stable paid $17 per year in 1883.i
While an improvement over scooping water from Crow Creek, this early water system wasn’t without challenges. The water was described as tasting terrible and many of the residents of Cheyenne considered the reservoirs in Cheyenne to be a source of disease.ii
A second challenge was water pressure. Water pressure was produced using steam engines. The engines required constant attention by Cheyenne employees. By 1897, the city operated and maintained three pump stations.
A third challenge was the limited supply of water. As with all natural streams, Crow Creek flooded in the spring and produced trickles of water in the fall and winter.
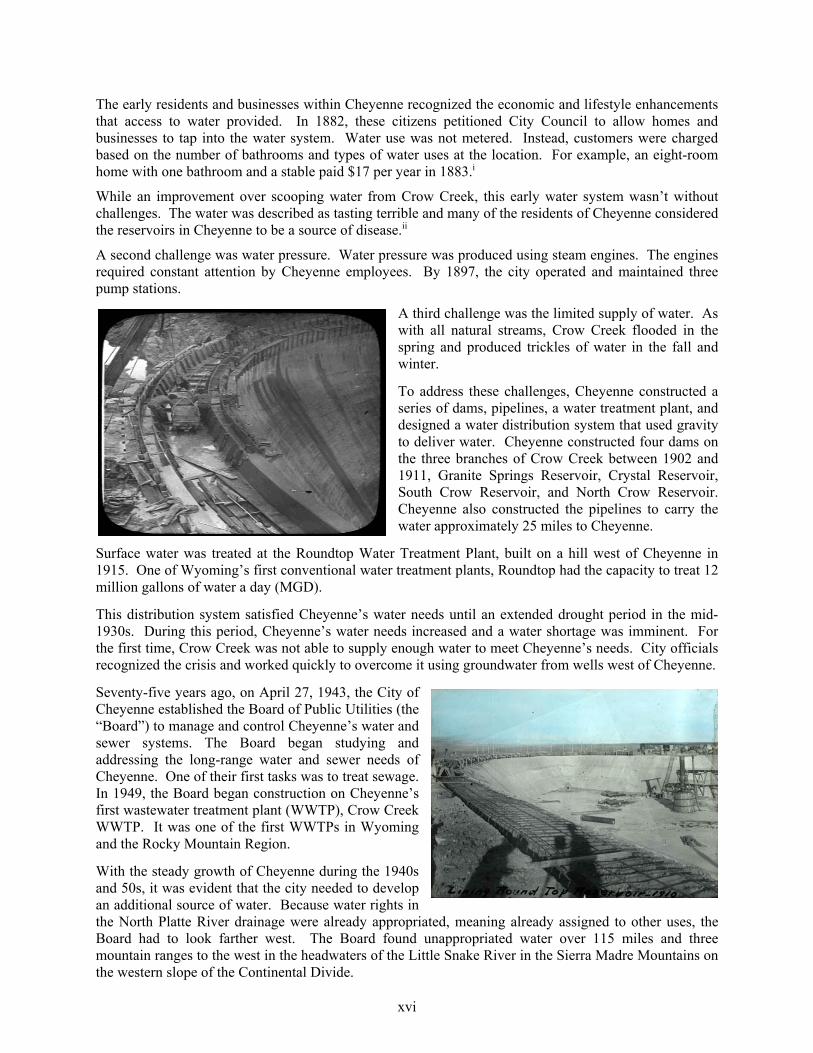
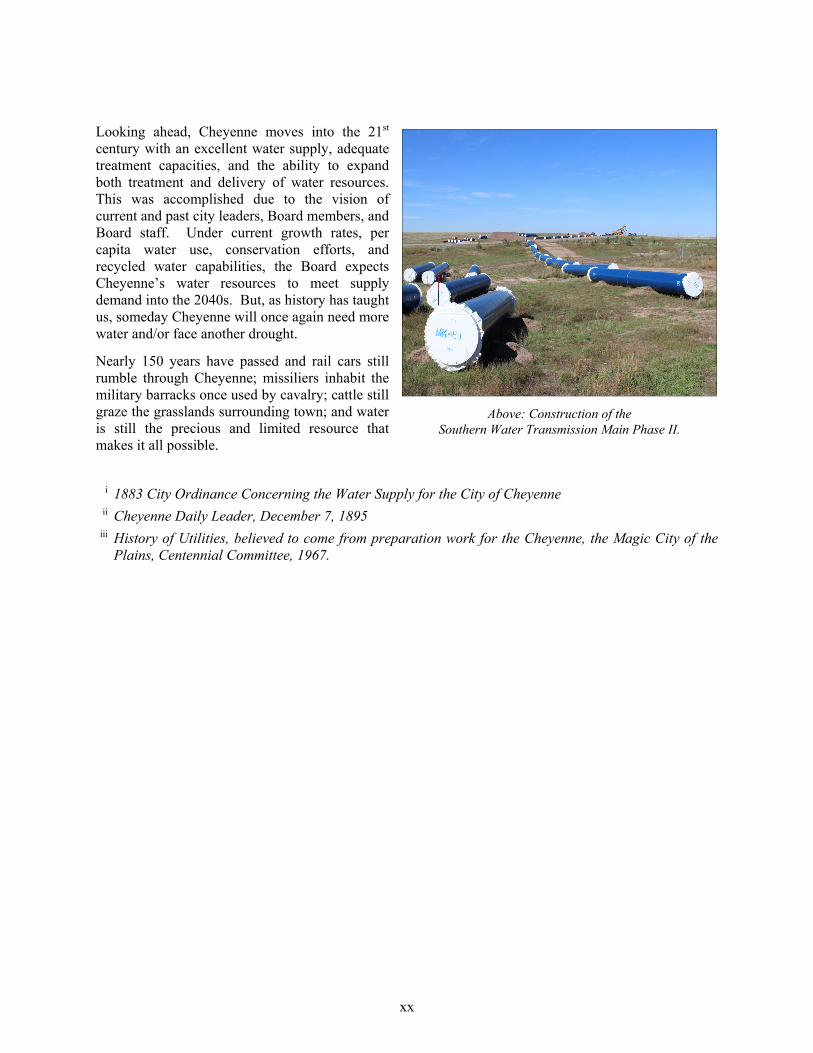
To address these challenges, Cheyenne constructed a series of dams, pipelines, a water treatment plant, and designed a water distribution system that used gravity to deliver water. Cheyenne constructed four dams on the three branches of Crow Creek between 1902 and 1911, Granite Springs Reservoir, Crystal Reservoir, South Crow Reservoir, and North Crow Reservoir. Cheyenne also constructed the pipelines to carry the water approximately 25 miles to Cheyenne.
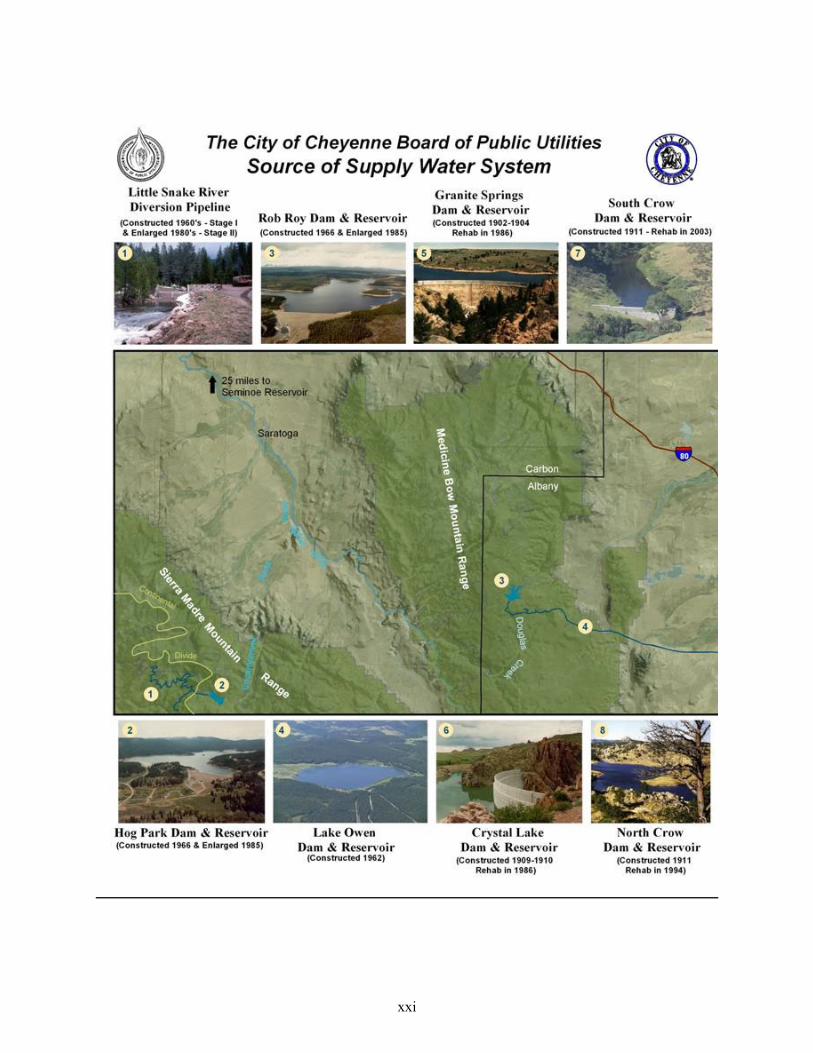
Surface water was treated at the Roundtop Water Treatment Plant, built on a hill west of Cheyenne in 1915. One of Wyoming’s first conventional water treatment plants, Roundtop had the capacity to treat 12 million gallons of water a day (MGD).
This distribution system satisfied Cheyenne’s water needs until an extended drought period in the mid- 1930s. During this period, Cheyenne’s water needs increased and a water shortage was imminent. For the first time, Crow Creek was not able to supply enough water to meet Cheyenne’s needs. City officials recognized the crisis and worked quickly to overcome it using groundwater from wells west of Cheyenne.
Seventy-five years ago, on April 27, 1943, the City of Cheyenne established the Board of Public Utilities (the “Board”) to manage and control Cheyenne’s water and sewer systems. The Board began studying and addressing the long-range water and sewer needs of Cheyenne. One of their first tasks was to treat sewage. In 1949, the Board began construction on Cheyenne’s first wastewater treatment plant (WWTP), Crow Creek WWTP. It was one of the first WWTPs in Wyoming and the Rocky Mountain Region.
With the steady growth of Cheyenne during the 1940s and 50s, it was evident that the city needed to develop an additional source of water. Because water rights in the North Platte River drainage were already appropriated, meaning already assigned to other uses, the Board had to look farther west. The Board found unappropriated water over 115 miles and three mountain ranges to the west in the headwaters of the Little Snake River in the Sierra Madre Mountains on the western slope of the Continental Divide.
xvii
The presence of the mountains between the Sierra Madres and Cheyenne made the actual delivery of this water to Cheyenne cost prohibitive. In order to use the water, city leaders developed an intricate trans-basin system whereby water collected from the Little Snake River drainage could be traded for water from the closer and more deliverable Douglas Creek drainage located in the Snowy Range about 75 miles west of Cheyenne.
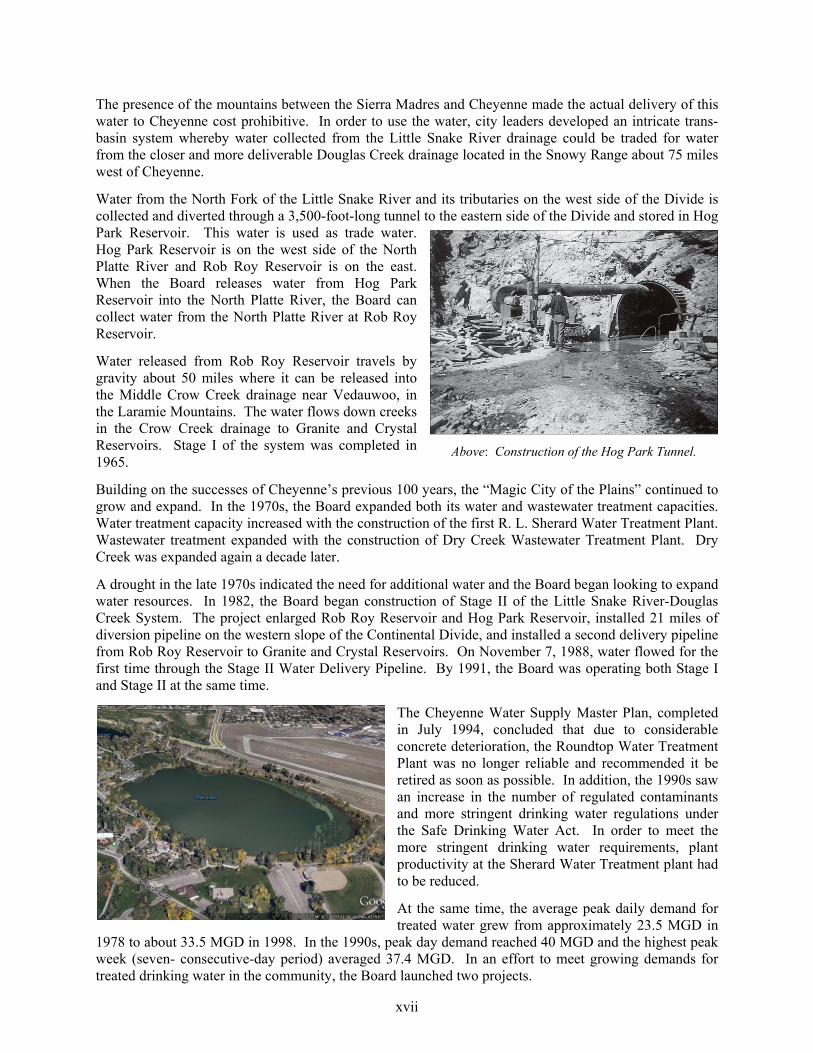
Water from the North Fork of the Little Snake River and its tributaries on the west side of the Divide is collected and diverted through a 3,500-foot-long tunnel to the eastern side of the Divide and stored in Hog Park Reservoir. This water is used as trade water. Hog Park Reservoir is on the west side of the North Platte River and Rob Roy Reservoir is on the east. When the Board releases water from Hog Park Reservoir into the North Platte River, the Board can collect water from the North Platte River at Rob Roy Reservoir.
Water released from Rob Roy Reservoir travels by gravity about 50 miles where it can be released into the Middle Crow Creek drainage near Vedauwoo, in the Laramie Mountains. The water flows down creeks in the Crow Creek drainage to Granite and Crystal Reservoirs. Stage I of the system was completed in 1965.
Building on the successes of Cheyenne’s previous 100 years, the “Magic City of the Plains” continued to grow and expand. In the 1970s, the Board expanded both its water and wastewater treatment capacities. Water treatment capacity increased with the construction of the first R. L. Sherard Water Treatment Plant. Wastewater treatment expanded with the construction of Dry Creek Wastewater Treatment Plant. Dry Creek was expanded again a decade later.
A drought in the late 1970s indicated the need for additional water and the Board began looking to expand water resources. In 1982, the Board began construction of Stage II of the Little Snake River-Douglas Creek System. The project enlarged Rob Roy Reservoir and Hog Park Reservoir, installed 21 miles of diversion pipeline on the western slope of the Continental Divide, and installed a second delivery pipeline from Rob Roy Reservoir to Granite and Crystal Reservoirs. On November 7, 1988, water flowed for the first time through the Stage II Water Delivery Pipeline. By 1991, the Board was operating both Stage I and Stage II at the same time.
The Cheyenne Water Supply Master Plan, completed in July 1994, concluded that due to considerable concrete deterioration, the Roundtop Water Treatment Plant was no longer reliable and recommended it be retired as soon as possible. In addition, the 1990s saw an increase in the number of regulated contaminants and more stringent drinking water regulations under the Safe Drinking Water Act. In order to meet the more stringent drinking water requirements, plant productivity at the Sherard Water Treatment plant had to be reduced.
At the same time, the average peak daily demand for treated water grew from approximately 23.5 MGD in
1978 to about 33.5 MGD in 1998. In the 1990s, peak day demand reached 40 MGD and the highest peak week (seven- consecutive-day period) averaged 37.4 MGD. In an effort to meet growing demands for treated drinking water in the community, the Board launched two projects.
Above: Construction of the Hog Park Tunnel.
xviii
The first was the Northwest Area Raw Water Irrigation Project. This project switched irrigation of two golf courses and a City park to raw, untreated water instead of treated city drinking water. The project freed up as much as three MGD of treated water during peak summer day demands.
The second was the design and construction of a new 32 MGD R. L. Sherard Water Treatment Plant. The new plant replaced the 1915 Roundtop Water Treatment Plant and the original Sherard Water Plant. The new plant was designed to meet or exceed current and future drinking water requirements. It was also designed to be expanded, at some future date, to 50 MGD. The water treatment plant began serving the community in the spring of 2002, just as a multiple-year drought peaked and another water shortage loomed.
At about the same time, the Wyoming Department of Environmental Quality reclassified Crow Creek below the discharges of Cheyenne’s wastewater treatment plants. Historically, the Crow Creek was classified for uses such as agriculture, industry, recreation, wildlife, and scenic value. Under the new classification, designated uses were expanded to also include nongame fisheries, fish consumption, aquatic life other than fish, and primary contact recreation.
As a result, ammonia and chlorine could no longer be discharged to Crow Creek. This created the need to upgrade both of Cheyenne’s wastewater treatment plants.
Upgrades included biological treatment and disinfection. Biologic treatment was enhanced by improving contact with the water. At Crow Creek WWTP, the previous biological treatment consisted of clarified wastewater sprayed across a rock media upon which beneficial bacteria grew. The beneficial bacteria consumed contaminants in the water. Contact with the water was limited by how long it took the water to flow down the rock and freezing temperatures could prevent water from contacting the rock. With the upgrades, beneficial bacteria float freely and attach to pasta-shaped plastic media while being mixed through the water in a series of basins. This increases contact with the water and increases contaminant removal. Both plants implemented the more efficient biological treatment. Disinfection was upgraded from chlorine to ultra-violet light. The treated wastewater flows through a series of intense ultra-violet lights that sterilizes bacteria.
These upgraded treatment methods meant that Cheyenne had the ability to restore usefulness and value to wastewater. As a result, the Board changed the names of the wastewater treatment plants to water reclamation facilities (WRF). The construction also presented the Board with an opportunity to expand treatment capacity and provide an additional source of water, recycled water.
Like the droughts in the 1880s, 1930s, and 1970s, the drought in the early 2000s resulted in increased water use when less water was available. Treated water use peaked at 39.5 MGD. With the combination of water demand, wastewater projects, and drought, the Board seized upon an opportunity to realize an observation made by a Board president fifty years earlier.
“The story of the long struggle for water in Cheyenne is typical of the general situation of the arid West, and leads to the conclusion that in order to meet the demands of the future, the existing sources of water must be conserved, and that the residents of this area must learn to use water so that one gallon of the supply provided by nature will perform the duty of two gallons as it is now used.” He continued saying, “Probably the most promising source of additional water at Cheyenne is the reclamation of sewage effluent for industrial use.” – W. J. Dinneen, circa 1951.iii
In the spirit of this observation, the Board added additional water treatment capabilities to the Crow Creek Water Reclamation Facility. These additional treatment methods produced Class A reuse water, affectionately termed recycled water. Class A reuse water is the most stringent classification of reuse water in Wyoming and has the least restrictions on its use. Recycled water is a drought resistant source of water which will be available even during severe droughts.

xix
The Board installed the first large-scale recycled water system in Wyoming and used the water to irrigate parks, athletic fields, and green spaces. This reduced peak summer treated water demand by as much as 3 MGD.
During the last decade, the Board continued to prepare for future water demands. In 2003, the Board adopted a water conservation program. The water conservation program has successfully reduced water demand. Since implementing the program, peak water use dropped.
In 2003, the Board participated in the purchase of the Belvoir Ranch to expand ground water resources. Since the purchase, the Board and the Wyoming Water Development Commission have studied the water resources on the ranch and ways to deliver the water to Cheyenne. Building a pipeline to the ranch is part of the Board’s plans.
In 2007, the Board completed construction of a second delivery pipeline from Crystal Reservoir to the new Sherard Water Treatment Plant. The second pipeline added redundancy and increased supply capabilities in preparation for a future expansion of the plant.
In 2013, the Board completed Phase II of the Southern Water Transmission Main. This main was needed to supply water to Cheyenne, provide redundancy, and provide relief to the transmission mains that supply water to the northern parts of the City.
Also, in 2013, the Board conducted a water and wastewater master plan. This plan identifies and prioritizes the projects the Board needs to accomplish to be able to supply water into the future.
Phase III of the Southern Water Transmission Main continued to the east and to the north and will eventually tie into the existing water system near the Holly-Frontier Refinery. Phase III will complete the loop around the southern section of the city. Phase III was completed in fiscal year 2019.
Phase I of the Southern Sewer Interceptor Main will start construction in near future.
Phase I will run from the Crow Creek Water Reclamation Facility to the south and west eventually, ending in the vicinity of Artesian Road south of Cheyenne. Phase I will reach completion in fiscal year 2019.
Above: Purple pipe. The recycled water system includes a separate distribution system for recycled water. To differentiate this system from the potable system, purple pipe was used.
xx
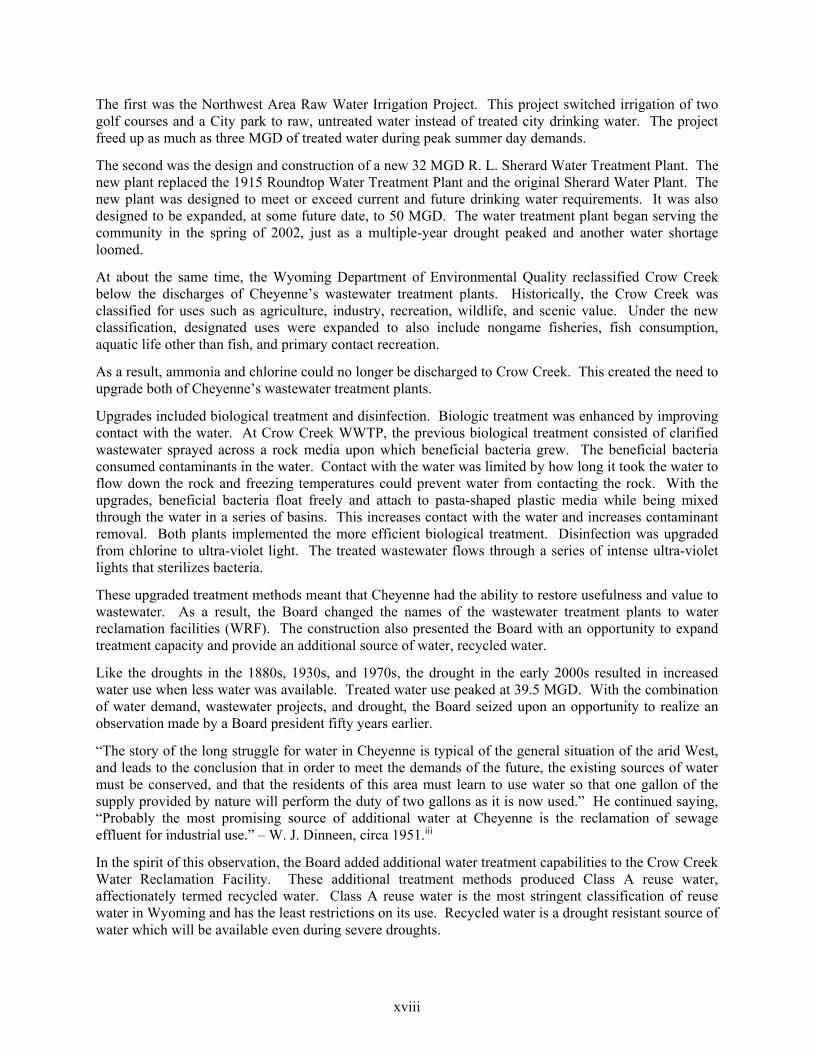
Looking ahead, Cheyenne moves into the 21st century with an excellent water supply, adequate treatment capacities, and the ability to expand both treatment and delivery of water resources. This was accomplished due to the vision of current and past city leaders, Board members, and Board staff. Under current growth rates, per capita water use, conservation efforts, and recycled water capabilities, the Board expects Cheyenne’s water resources to meet supply demand into the 2040s. But, as history has taught us, someday Cheyenne will once again need more water and/or face another drought.
Nearly 150 years have passed and rail cars still rumble through Cheyenne; missiliers inhabit the military barracks once used by cavalry; cattle still graze the grasslands surrounding town; and water is still the precious and limited resource that makes it all possible.
i 1883 City Ordinance Concerning the Water Supply for the City of Cheyenne ii Cheyenne Daily Leader, December 7, 1895 iii History of Utilities, believed to come from preparation work for the Cheyenne, the Magic City of the
Plains, Centennial Committee, 1967.
Above: Construction of the Southern Water Transmission Main Phase II.
xxi
xxii
xxiii
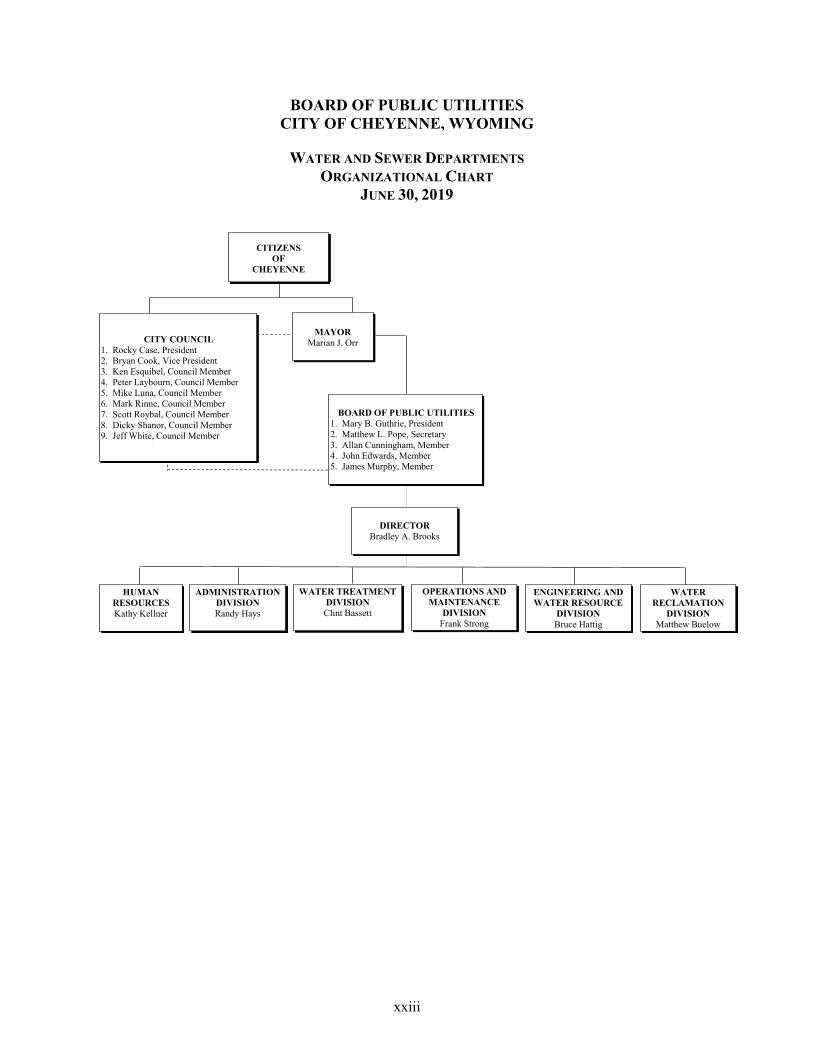
BOARD OF PUBLIC UTILITIES CITY OF CHEYENNE, WYOMING
WATER AND SEWER DEPARTMENTS ORGANIZATIONAL CHART
JUNE 30, 2019
MAYORMarian J. OrrCITY COUNCIL
1. Rocky Case, President2. Bryan Cook, Vice President3. Ken Esquibel, Council Member4. Peter Laybourn, Council Member5. Mike Luna, Council Member6. Mark Rinne, Council Member7. Scott Roybal, Council Member8. Dicky Shanor, Council Member9. Jeff White, Council Member
CITIZENSOF
CHEYENNE
BOARD OF PUBLIC UTILITIES1. Mary B. Guthrie, President2. Matthew L. Pope, Secretary3. Allan Cunningham, Member4. John Edwards, Member5. James Murphy, Member
DIRECTORBradley A. Brooks
WATER TREATMENTDIVISIONClint Bassett
ADMINISTRATIONDIVISIONRandy Hays
ENGINEERING AND WATER RESOURCE
DIVISIONBruce Hattig
OPERATIONS AND MAINTENANCE
DIVISIONFrank Strong
HUMAN RESOURCESKathy Kellner
WATERRECLAMATION
DIVISIONMatthew Buelow
1
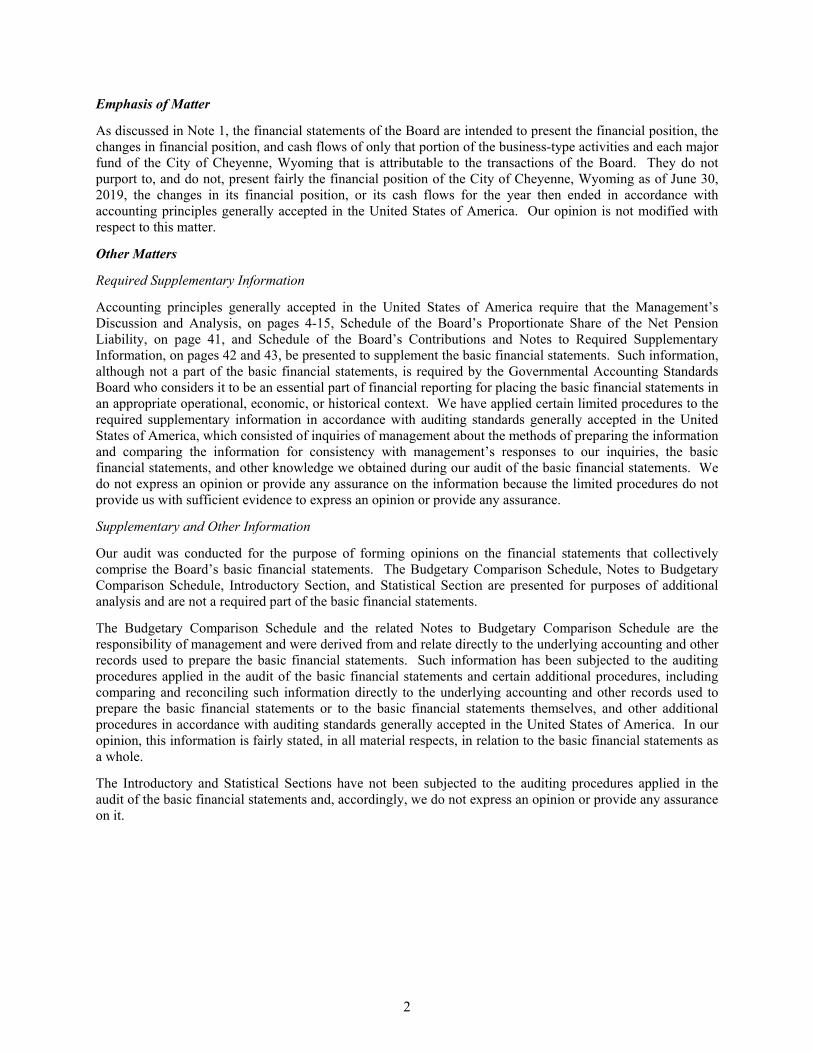
INDEPENDENT AUDITOR’S REPORT To the Honorable Mayor, Members of the City Council, and Members of the Board of Public Utilities City of Cheyenne, Wyoming Board of Public Utilities Cheyenne, Wyoming
Report on the Financial Statements
We have audited the accompanying financial statements of the business-type activities and each major fund of the City of Cheyenne, Wyoming Board of Public Utilities (the “Board”), as of and for the year ended June 30, 2019, and the related notes to the financial statements, which collectively comprise the Board’s basic financial statements as listed in the table of contents.
Management’s Responsibility for the Financial Statements
Management is responsible for the preparation and fair presentation of these financial statements in accordance with accounting principles generally accepted in the United States of America; this includes the design, implementation, and maintenance of internal control relevant to the preparation and fair presentation of financial statements that are free from material misstatement, whether due to fraud or error.
Auditor’s Responsibility
Our responsibility is to express opinions on these financial statements based on our audit. We conducted our audit in accordance with auditing standards generally accepted in the United States of America and the standards applicable to financial audits contained in Government Auditing Standards, issued by the Comptroller General of the United States. Those standards require that we plan and perform the audit to obtain reasonable assurance about whether the financial statements are free from material misstatement.
An audit involves performing procedures to obtain audit evidence about the amounts and disclosures in the financial statements. The procedures selected depend on the auditor’s judgment, including the assessment of the risks of material misstatement of the financial statements, whether due to fraud or error. In making those risk assessments, the auditor considers internal control relevant to the Board’s preparation and fair presentation of the financial statements in order to design audit procedures that are appropriate in the circumstances, but not for the purpose of expressing an opinion on the effectiveness of the Board’s internal control. Accordingly, we express no such opinion. An audit also includes evaluating the appropriateness of accounting policies used and the reasonableness of significant accounting estimates made by management, as well as evaluating the overall presentation of the financial statements.
We believe that the audit evidence we have obtained is sufficient and appropriate to provide a basis for our audit opinions.
Opinions
In our opinion, the financial statements referred to above present fairly, in all material respects, the respective financial position of the business-type activities and each major fund of the Board as of June 30, 2019, and the respective changes in financial position and cash flows thereof for the year then ended in accordance with accounting principles generally accepted in the United States of America.
2
Emphasis of Matter
As discussed in Note 1, the financial statements of the Board are intended to present the financial position, the changes in financial position, and cash flows of only that portion of the business-type activities and each major fund of the City of Cheyenne, Wyoming that is attributable to the transactions of the Board. They do not purport to, and do not, present fairly the financial position of the City of Cheyenne, Wyoming as of June 30, 2019, the changes in its financial position, or its cash flows for the year then ended in accordance with accounting principles generally accepted in the United States of America. Our opinion is not modified with respect to this matter.
Other Matters
Required Supplementary Information
Accounting principles generally accepted in the United States of America require that the Management’s Discussion and Analysis, on pages 4-15, Schedule of the Board’s Proportionate Share of the Net Pension Liability, on page 41, and Schedule of the Board’s Contributions and Notes to Required Supplementary Information, on pages 42 and 43, be presented to supplement the basic financial statements. Such information, although not a part of the basic financial statements, is required by the Governmental Accounting Standards Board who considers it to be an essential part of financial reporting for placing the basic financial statements in an appropriate operational, economic, or historical context. We have applied certain limited procedures to the required supplementary information in accordance with auditing standards generally accepted in the United States of America, which consisted of inquiries of management about the methods of preparing the information and comparing the information for consistency with management’s responses to our inquiries, the basic financial statements, and other knowledge we obtained during our audit of the basic financial statements. We do not express an opinion or provide any assurance on the information because the limited procedures do not provide us with sufficient evidence to express an opinion or provide any assurance.
Supplementary and Other Information
Our audit was conducted for the purpose of forming opinions on the financial statements that collectively comprise the Board’s basic financial statements. The Budgetary Comparison Schedule, Notes to Budgetary Comparison Schedule, Introductory Section, and Statistical Section are presented for purposes of additional analysis and are not a required part of the basic financial statements.
The Budgetary Comparison Schedule and the related Notes to Budgetary Comparison Schedule are the responsibility of management and were derived from and relate directly to the underlying accounting and other records used to prepare the basic financial statements. Such information has been subjected to the auditing procedures applied in the audit of the basic financial statements and certain additional procedures, including comparing and reconciling such information directly to the underlying accounting and other records used to prepare the basic financial statements or to the basic financial statements themselves, and other additional procedures in accordance with auditing standards generally accepted in the United States of America. In our opinion, this information is fairly stated, in all material respects, in relation to the basic financial statements as a whole.
The Introductory and Statistical Sections have not been subjected to the auditing procedures applied in the audit of the basic financial statements and, accordingly, we do not express an opinion or provide any assurance on it.
3
Other Reporting Required by Government Auditing Standards
In accordance with Government Auditing Standards, we have also issued our report, dated October 21, 2019, on our consideration of the Board’s internal control over financial reporting and on our tests of its compliance with certain provisions of laws, regulations, contracts, and grant agreements and other matters. The purpose of that report is solely to describe the scope of our testing of internal control over financial reporting and compliance and the results of that testing, and not to provide an opinion on the effectiveness of the Board’s internal control over financial reporting or on compliance. That report is an integral part of an audit performed in accordance with Government Auditing Standards in considering the Board’s internal control over financial reporting and compliance. Cheyenne, Wyoming October 21, 2019
4
CITY OF CHEYENNE, WYOMING BOARD OF PUBLIC UTILITIES
MANAGEMENT’S DISCUSSION AND ANALYSIS
Management of the Board of Public Utilities (the “Board”) offers readers of the Board’s financial statements this narrative overview and analysis of the financial activities of the Board for the fiscal year ended June 30, 2019.
Readers are encouraged to consider the information presented here along with additional information presented in our letter of transmittal.
FINANCIAL HIGHLIGHTS
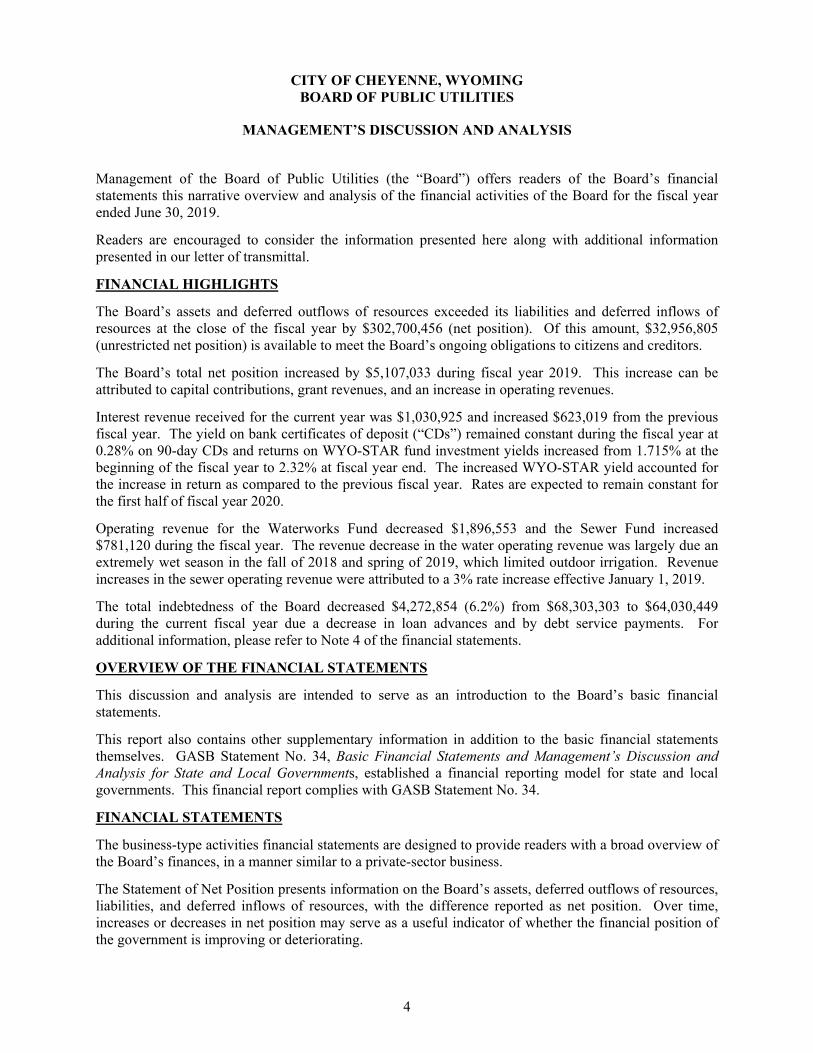
The Board’s assets and deferred outflows of resources exceeded its liabilities and deferred inflows of resources at the close of the fiscal year by $302,700,456 (net position). Of this amount, $32,956,805 (unrestricted net position) is available to meet the Board’s ongoing obligations to citizens and creditors.
The Board’s total net position increased by $5,107,033 during fiscal year 2019. This increase can be attributed to capital contributions, grant revenues, and an increase in operating revenues.
Interest revenue received for the current year was $1,030,925 and increased $623,019 from the previous fiscal year. The yield on bank certificates of deposit (“CDs”) remained constant during the fiscal year at 0.28% on 90-day CDs and returns on WYO-STAR fund investment yields increased from 1.715% at the beginning of the fiscal year to 2.32% at fiscal year end. The increased WYO-STAR yield accounted for the increase in return as compared to the previous fiscal year. Rates are expected to remain constant for the first half of fiscal year 2020.
Operating revenue for the Waterworks Fund decreased $1,896,553 and the Sewer Fund increased $781,120 during the fiscal year. The revenue decrease in the water operating revenue was largely due an extremely wet season in the fall of 2018 and spring of 2019, which limited outdoor irrigation. Revenue increases in the sewer operating revenue were attributed to a 3% rate increase effective January 1, 2019.
The total indebtedness of the Board decreased $4,272,854 (6.2%) from $68,303,303 to $64,030,449 during the current fiscal year due a decrease in loan advances and by debt service payments. For additional information, please refer to Note 4 of the financial statements.
OVERVIEW OF THE FINANCIAL STATEMENTS
This discussion and analysis are intended to serve as an introduction to the Board’s basic financial statements.
This report also contains other supplementary information in addition to the basic financial statements themselves. GASB Statement No. 34, Basic Financial Statements and Management’s Discussion and Analysis for State and Local Governments, established a financial reporting model for state and local governments. This financial report complies with GASB Statement No. 34.
FINANCIAL STATEMENTS
The business-type activities financial statements are designed to provide readers with a broad overview of the Board’s finances, in a manner similar to a private-sector business.
The Statement of Net Position presents information on the Board’s assets, deferred outflows of resources, liabilities, and deferred inflows of resources, with the difference reported as net position. Over time, increases or decreases in net position may serve as a useful indicator of whether the financial position of the government is improving or deteriorating.

5
The Statement of Revenues, Expenses, and Changes in Fund Net Position presents information showing how the Board’s net position changed during the most recent fiscal year.
Both financial statements distinguish functions of the Board that are principally intended to recover all or a significant portion of their costs through user fees and charges (business-type activities). The business-type activities of the Board include Waterworks and Sewer Enterprise Fund activities.
The basic financial statements of the Board presented as business-type activities of the enterprise funds are found on pages 16-20 of this report.
The Statement of Cash Flows presents cash receipts and payments of the Board during a period of time. Its purpose is to assess the Board’s ability to generate future net cash flows and meet its obligations as they come due.
Fund Financial Statements
A fund is a grouping of related accounts that is used to maintain control over resources that have been segregated for specific activities or objectives. The Board, like other state and local governments, uses fund accounting to ensure and demonstrate compliance with finance-related legal requirements. The funds of the Board are categorized as proprietary funds.
Proprietary Funds
The Board maintains a single type of proprietary fund called enterprise funds. Enterprise funds are used to report the same functions presented as business-type activities in the government-wide financial statements. Enterprise funds are used to account for the waterworks and sewer activities.
Proprietary funds provide the same type of information, as do government-wide financial statements, only in more detail. The proprietary fund financial statements provide separate information for the Waterworks and Sewer Departments, which are the only funds of the Board.
The basic proprietary fund financial statements are represented by individual fund columns and also can be found on pages 16-20 of this report.
Notes to the Financial Statements
The notes provide additional information that is essential to a full understanding of the data provided in the government-wide and fund financial statements. The notes to the financial statements can be found on pages 21-40 of this report.
OTHER INFORMATION
Required supplementary information regarding the Net Pension Liability is included in this report on pages 41-43. In addition to the basic financial statements and accompanying notes, this report also presents certain supplementary information concerning the Board’s budget comparison – budget versus actual. This supplementary information can be found on pages 44-46 of this report.
Financial Analysis
Since the Board has only business-type activities, accounted for as two enterprise funds (Waterworks and Sewer), the following discussion will be related to the combining of those two funds as expressed by the business-type activities total of the financial statements.

6
Invested In Capital Assets, Net of Related Debt
88.9%
Restricted0.2%
Unrestricted10.9%
Business-Type Activities Net Position
As noted earlier, net position may serve over time as a useful indicator of a government’s financial position. In the case of the Board, total net position increased by $5,107,031 during fiscal year 2019.
The largest portion of the Board’s net position, $269,243,649 (88.9%) reflects its net investment in capital assets (e.g., dams, reservoirs, water and sewer treatment plants, miles and miles of water and sewer mains, land, buildings, machinery and equipment), less any related outstanding debt used to acquire those assets.
The Board uses these capital assets to provide services to citizens; consequently, these assets are not available for future spending. Although the Board’s investment in its capital assets is reported net of related debt, it should be noted that the resources needed to repay this debt must be provided from other sources, since the capital assets themselves cannot be used to liquidate these liabilities.
Net Position Categories as of June 30, 2019:
Net Position:
2019 2018 2019 2018 2019 2018
Current and other assets 35,632 $ 32,305 $ 18,290 $ 17,243 $ 53,922 $ 49,548 $ Capital assets 241,208 244,036 91,763 90,689 332,971 334,725
Total assets 276,840 276,341 110,053 107,932 386,893 384,273
Deferred outflows of resources 2,715 2,398 804 684 3,519 3,082
Total assets and deferredoutflows of resources 279,555 278,739 110,857 108,616 390,412 387,355
Long-term liabilities outstanding 38,227 39,377 33,869 33,798 72,096 73,175 Other liabilities 9,990 8,568 5,310 6,186 15,300 14,754
Total liabilities 48,217 47,945 39,179 39,984 87,396 87,929
Deferred inflows of resources 236 1,375 78 458 314 1,833
Total liabilities and deferredinflows of resources 48,453 49,320 39,257 40,442 87,710 89,762
Net investment in capital assets 210,187 209,489 59,057 57,278 269,244 266,767 Restricted 500 500 - 500 500 Unrestricted 20,415 19,430 12,542 10,896 32,957 30,326
Total net position 231,102 $ 229,419 $ 71,599 $ 68,174 $ 302,701 $ 297,593 $
Sewer FundTotal
Waterworks Fund Business-Type Activities($1,000s) ($1,000s) ($1,000s)
7
The remaining balance of unrestricted net position $32,956,805 may be used to meet the government’s ongoing obligations to citizens and creditors.
At the end of the current fiscal year, the Board reports positive balances in all categories of net positions. The same situation held true for the prior fiscal year.
Changes in Net Position Over the Last Ten Years:
Total IncomeOperating Nonoperating (Loss) before Change
Fiscal Operating Operating Income Revenue/ Capital Capital in NetYear Revenue Expenses (Loss) (Expenses) Contribution Contribution Position
2010 24,281,960 $ 24,220,188 $ 61,772 $ (149,067) $ (87,295) $ 1,498,273 $ 1,410,978 $ 2011 26,575,116 25,151,232 1,423,884 (685,814) 738,070 5,958,598 6,696,668 2012 28,594,129 26,005,418 2,588,711 (179,719) 2,408,992 4,381,020 6,790,012 2013 28,417,091 26,474,263 1,942,828 (543,390) 1,399,438 3,765,449 5,164,887 2014 28,030,122 27,483,943 546,179 2,855,489 3,401,668 19,083,507 22,485,175 2015 28,223,658 27,605,751 617,907 2,906,969 3,524,876 2,554,040 6,078,916 2016 31,243,040 29,990,481 1,252,559 2,380,668 3,633,227 4,051,165 7,684,392 2017 32,881,259 30,735,969 2,145,290 2,176,250 4,321,540 4,131,540 8,453,080 2018 34,518,439 31,800,359 2,718,080 2,228,947 4,947,027 8,634,681 13,581,708 2019 33,403,006 33,329,702 73,304 2,259,035 2,332,339 2,774,694 5,107,033
Net position increased by $5,107,033 during fiscal year 2019 to $302,700,456 from $297,593,423 at the end of fiscal year 2018. This is attributed to donated utilities, grant revenues, and increased operating revenues.
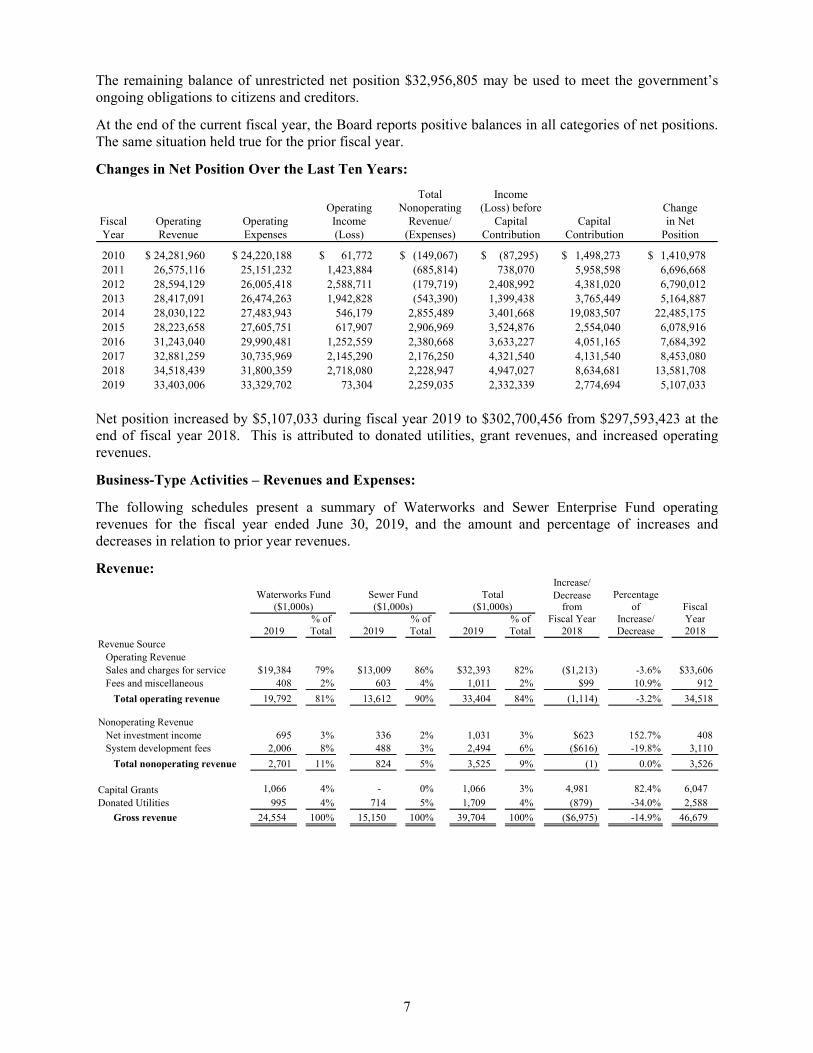
Business-Type Activities – Revenues and Expenses:
The following schedules present a summary of Waterworks and Sewer Enterprise Fund operating revenues for the fiscal year ended June 30, 2019, and the amount and percentage of increases and decreases in relation to prior year revenues.
Revenue: Increase/Decrease Percentage
from of Fiscal% of % of % of Fiscal Year Increase/ Year
2019 Total 2019 Total 2019 Total 2018 Decrease 2018Revenue Source
Operating RevenueSales and charges for service $19,384 79% $13,009 86% $32,393 82% ($1,213) -3.6% $33,606Fees and miscellaneous 408 2% 603 4% 1,011 2% $99 10.9% 912
Total operating revenue 19,792 81% 13,612 90% 33,404 84% (1,114) -3.2% 34,518
Nonoperating Revenue Net investment income 695 3% 336 2% 1,031 3% $623 152.7% 408System development fees 2,006 8% 488 3% 2,494 6% ($616) -19.8% 3,110
Total nonoperating revenue 2,701 11% 824 5% 3,525 9% (1) 0.0% 3,526
Capital Grants 1,066 4% - 0% 1,066 3% 4,981 82.4% 6,047 Donated Utilities 995 4% 714 5% 1,709 4% (879) -34.0% 2,588
Gross revenue 24,554 100% 15,150 100% 39,704 100% ($6,975) -14.9% 46,679
Total($1,000s)
Waterworks Fund($1,000s)($1,000s)
Sewer Fund
8
Charges For Service86%
Fees and Miscellaneous
4%
System Development Fees
3%
Net Investment Income
2%
Donated utilities5%
Charges for Service79%
Fees and Miscellaneous
2%Net Investment
Income3%
System Development Fees
8%
Capital grants4%
Donated Utilities4%
Water Revenue by Source:
Sewer Revenue by Source:
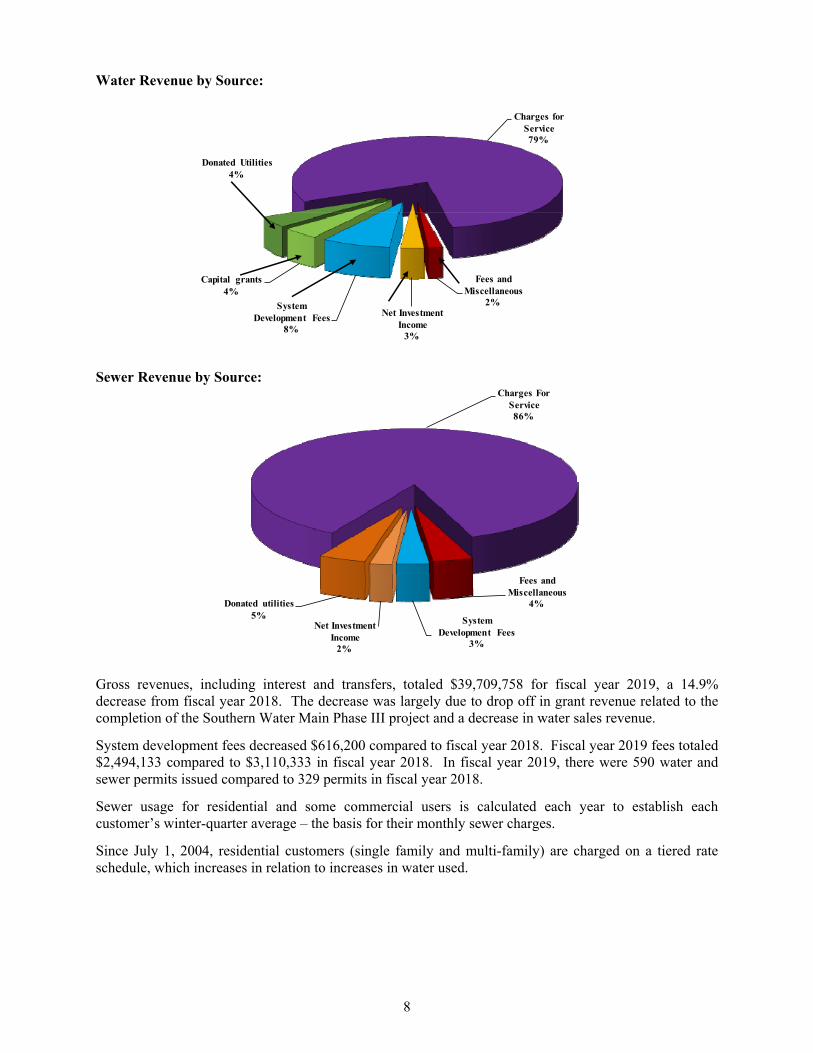
Gross revenues, including interest and transfers, totaled $39,709,758 for fiscal year 2019, a 14.9% decrease from fiscal year 2018. The decrease was largely due to drop off in grant revenue related to the completion of the Southern Water Main Phase III project and a decrease in water sales revenue.
System development fees decreased $616,200 compared to fiscal year 2018. Fiscal year 2019 fees totaled $2,494,133 compared to $3,110,333 in fiscal year 2018. In fiscal year 2019, there were 590 water and sewer permits issued compared to 329 permits in fiscal year 2018.
Sewer usage for residential and some commercial users is calculated each year to establish each customer’s winter-quarter average – the basis for their monthly sewer charges.
Since July 1, 2004, residential customers (single family and multi-family) are charged on a tiered rate schedule, which increases in relation to increases in water used.
9
$-
$5,000
$10,000
$15,000
$20,000
$25,000
$30,000
$35,000
2010
2011
2012
2013
2014
2015
2016
2017
2018
2019
Dol
lars
( i
n 1,
000'
s)
Fiscal year
Water Expenses Sewer Expenses Total Expenses
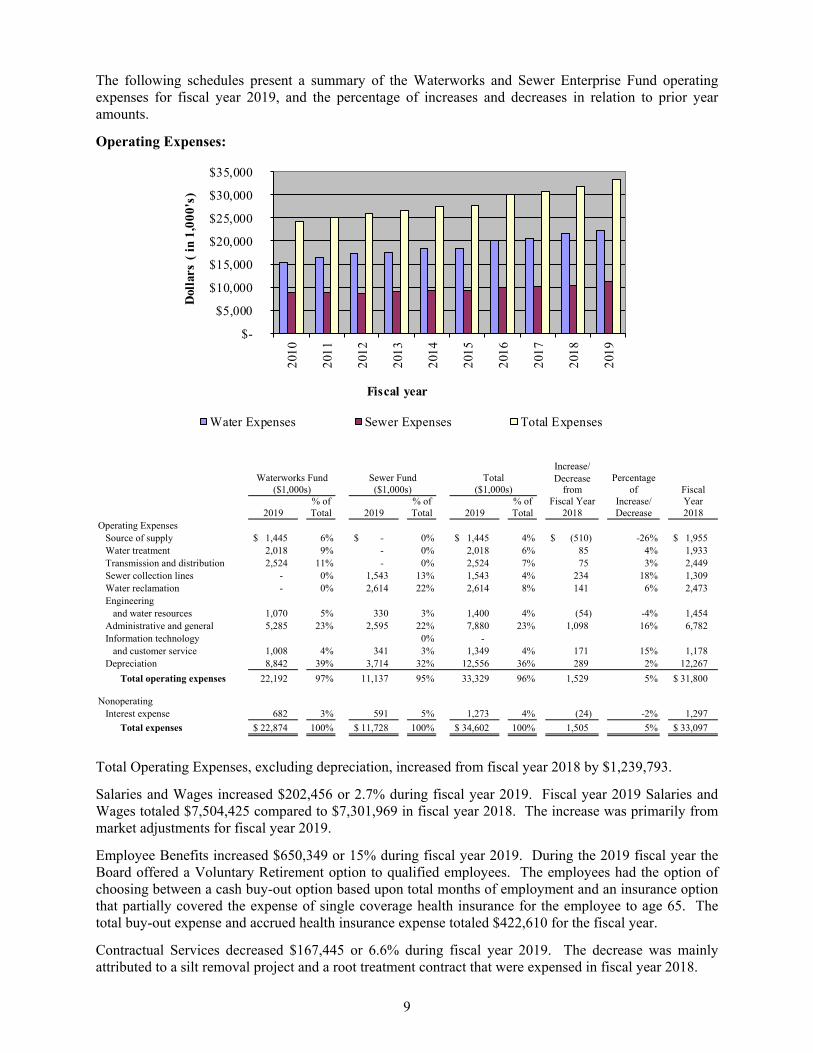
The following schedules present a summary of the Waterworks and Sewer Enterprise Fund operating expenses for fiscal year 2019, and the percentage of increases and decreases in relation to prior year amounts.
Operating Expenses:
Increase/Decrease Percentage
from of Fiscal% of % of % of Fiscal Year Increase/ Year
2019 Total 2019 Total 2019 Total 2018 Decrease 2018Operating Expenses
Source of supply 1,445 $ 6% -$ 0% 1,445 $ 4% (510) $ -26% 1,955 $ Water treatment 2,018 9% - 0% 2,018 6% 85 4% 1,933 Transmission and distribution 2,524 11% - 0% 2,524 7% 75 3% 2,449 Sewer collection lines - 0% 1,543 13% 1,543 4% 234 18% 1,309 Water reclamation - 0% 2,614 22% 2,614 8% 141 6% 2,473 Engineering
and water resources 1,070 5% 330 3% 1,400 4% (54) -4% 1,454 Administrative and general 5,285 23% 2,595 22% 7,880 23% 1,098 16% 6,782 Information technology 0% -
and customer service 1,008 4% 341 3% 1,349 4% 171 15% 1,178 Depreciation 8,842 39% 3,714 32% 12,556 36% 289 2% 12,267
Total operating expenses 22,192 97% 11,137 95% 33,329 96% 1,529 5% 31,800 $
Nonoperating Interest expense 682 3% 591 5% 1,273 4% (24) -2% 1,297
Total expenses 22,874 $ 100% 11,728 $ 100% 34,602 $ 100% 1,505 5% 33,097 $
Waterworks Fund Sewer Fund Total($1,000s) ($1,000s) ($1,000s)
Total Operating Expenses, excluding depreciation, increased from fiscal year 2018 by $1,239,793.
Salaries and Wages increased $202,456 or 2.7% during fiscal year 2019. Fiscal year 2019 Salaries and Wages totaled $7,504,425 compared to $7,301,969 in fiscal year 2018. The increase was primarily from market adjustments for fiscal year 2019.
Employee Benefits increased $650,349 or 15% during fiscal year 2019. During the 2019 fiscal year the Board offered a Voluntary Retirement option to qualified employees. The employees had the option of choosing between a cash buy-out option based upon total months of employment and an insurance option that partially covered the expense of single coverage health insurance for the employee to age 65. The total buy-out expense and accrued health insurance expense totaled $422,610 for the fiscal year.
Contractual Services decreased $167,445 or 6.6% during fiscal year 2019. The decrease was mainly attributed to a silt removal project and a root treatment contract that were expensed in fiscal year 2018.
10
Materials and Supplies increased $126,954 or 5.9% during fiscal year 2019. The increase was from the rehab and remodeling expenses at the water treatment plant and for GIS projects.
Supportive service expenses (electricity, gas, telephone, postage, etc.) totaled $2,187,709 for fiscal year 2019 which was a $58,558 decrease from fiscal year 2018.
Interest expense on bonds and loans totaled $1,273,023 for fiscal year 2019 and was included in the above schedule of operating expenses. This was a 1.9% decrease from fiscal year 2018.
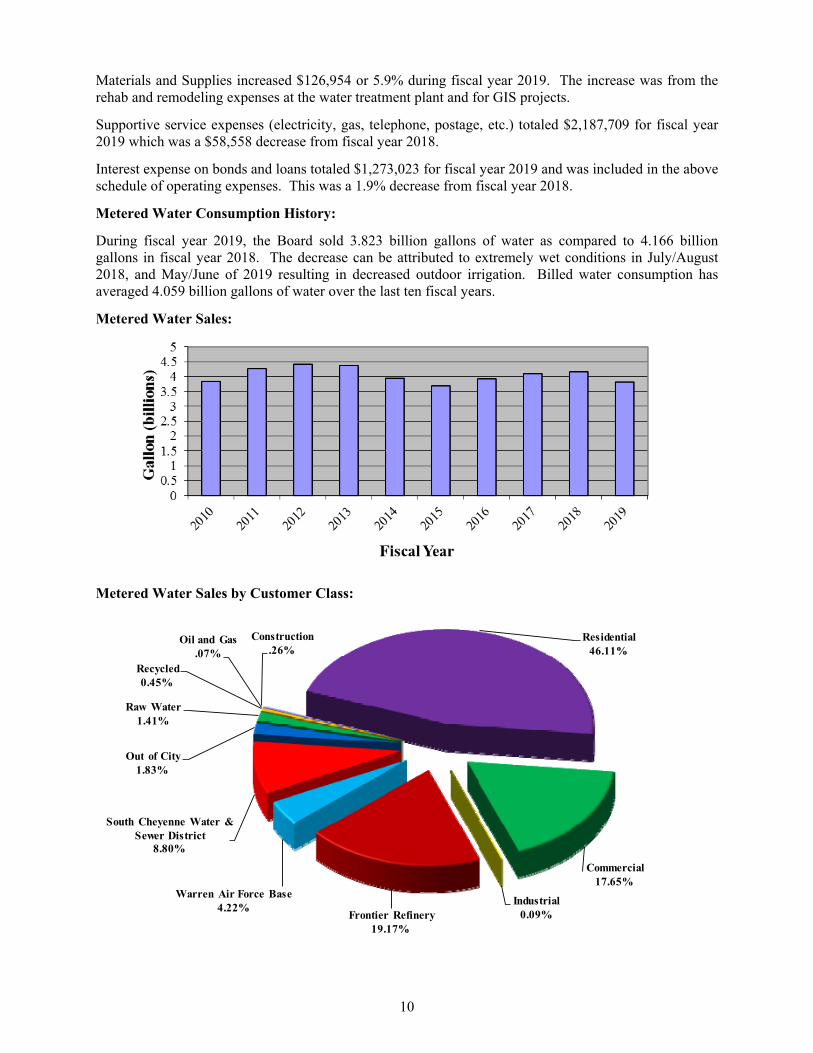
Metered Water Consumption History:
During fiscal year 2019, the Board sold 3.823 billion gallons of water as compared to 4.166 billion gallons in fiscal year 2018. The decrease can be attributed to extremely wet conditions in July/August 2018, and May/June of 2019 resulting in decreased outdoor irrigation. Billed water consumption has averaged 4.059 billion gallons of water over the last ten fiscal years.
Metered Water Sales:
Metered Water Sales by Customer Class:
Residential46.11%
Commercial17.65%
Industrial0.09%Frontier Refinery
19.17%
Warren Air Force Base4.22%
South Cheyenne Water & Sewer District
8.80%
Out of City1.83%
Raw Water1.41%
Recycled0.45%
Oil and Gas.07%
Construction.26%
11
54,000
55,000
56,000
57,000
58,000
59,000
60,000
61,000
62,000
63,000
64,000
65,000
- 200 400 600 800
1,000 1,200 1,400 1,600 1,800 2,000 2,200 2,400
2010 2011 2012 2013 2014 2015 2016 2017 2018 2019
Residential Gallons
Population
Fiscal Years 2010-2019
Mill
ions
of
Gal
lons
Estim
ated Population
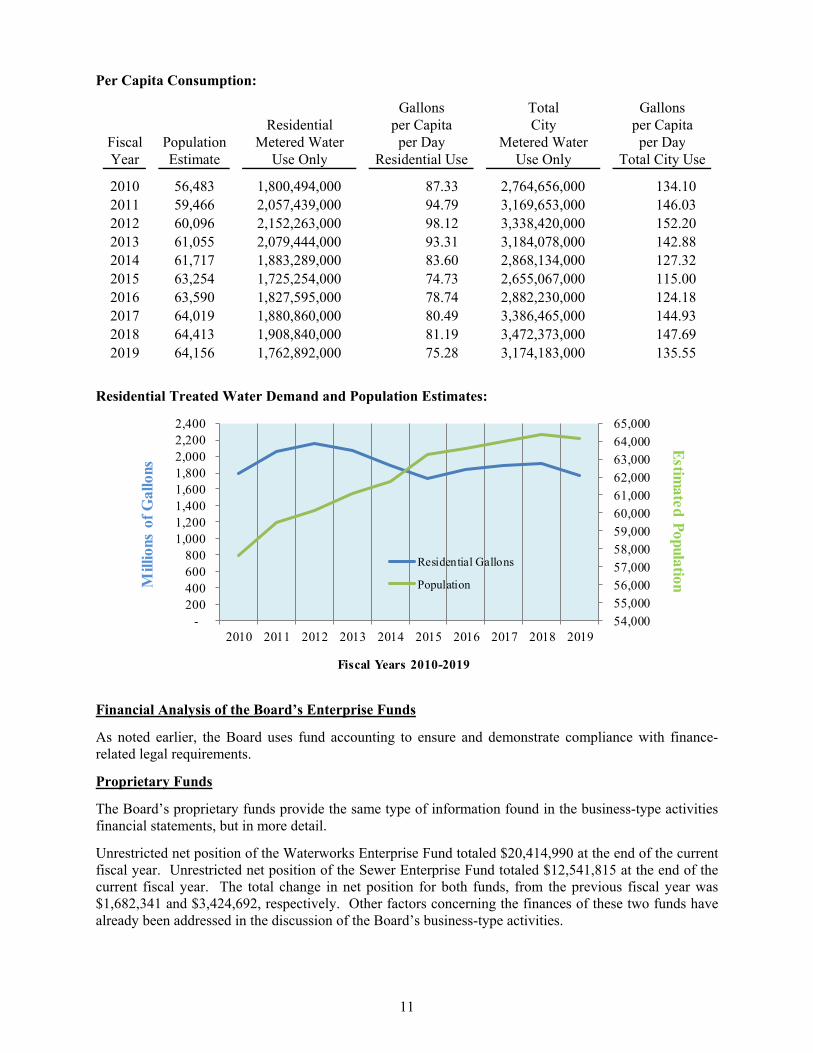
Per Capita Consumption:
Gallons Total GallonsResidential per Capita City per Capita
Fiscal Population Metered Water per Day Metered Water per DayYear Estimate Use Only Residential Use Use Only Total City Use
2010 56,483 1,800,494,000 87.33 2,764,656,000 134.10 2011 59,466 2,057,439,000 94.79 3,169,653,000 146.03 2012 60,096 2,152,263,000 98.12 3,338,420,000 152.20 2013 61,055 2,079,444,000 93.31 3,184,078,000 142.88 2014 61,717 1,883,289,000 83.60 2,868,134,000 127.32 2015 63,254 1,725,254,000 74.73 2,655,067,000 115.00 2016 63,590 1,827,595,000 78.74 2,882,230,000 124.18 2017 64,019 1,880,860,000 80.49 3,386,465,000 144.93 2018 64,413 1,908,840,000 81.19 3,472,373,000 147.69 2019 64,156 1,762,892,000 75.28 3,174,183,000 135.55
Residential Treated Water Demand and Population Estimates:
Financial Analysis of the Board’s Enterprise Funds
As noted earlier, the Board uses fund accounting to ensure and demonstrate compliance with finance-related legal requirements.
Proprietary Funds
The Board’s proprietary funds provide the same type of information found in the business-type activities financial statements, but in more detail.
Unrestricted net position of the Waterworks Enterprise Fund totaled $20,414,990 at the end of the current fiscal year. Unrestricted net position of the Sewer Enterprise Fund totaled $12,541,815 at the end of the current fiscal year. The total change in net position for both funds, from the previous fiscal year was $1,682,341 and $3,424,692, respectively. Other factors concerning the finances of these two funds have already been addressed in the discussion of the Board’s business-type activities.
12
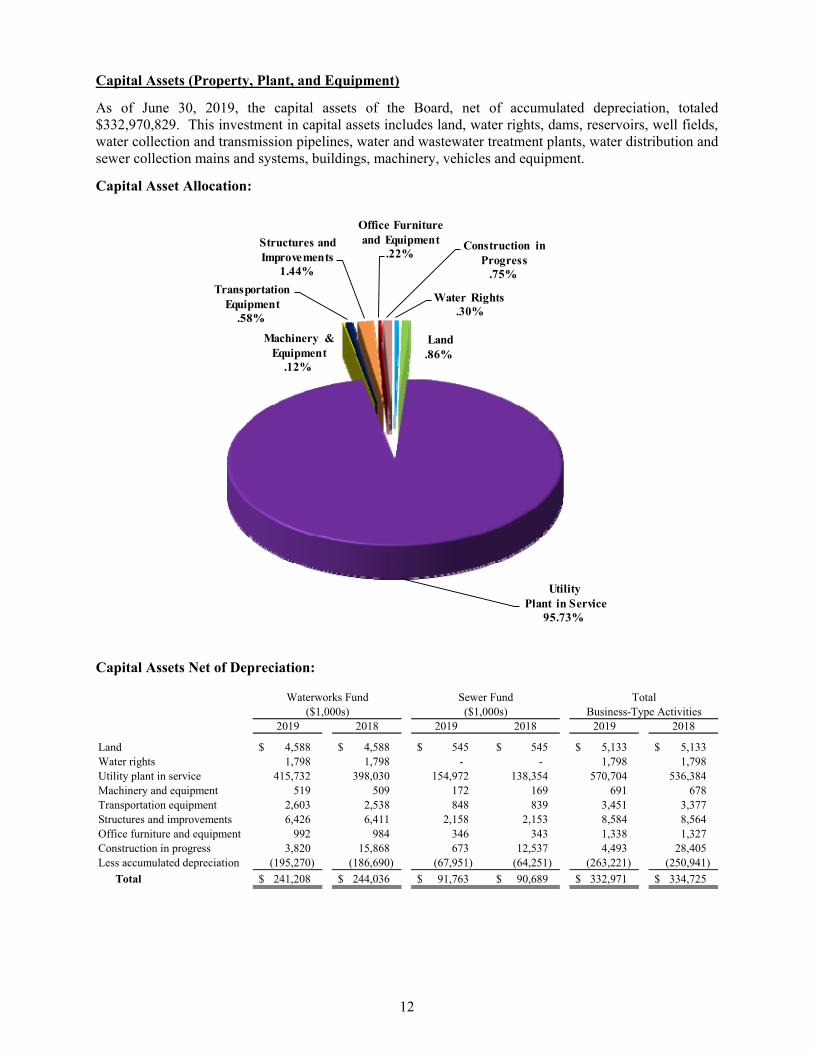
Water Rights.30%
Land.86%
Utility Plant in Service
95.73%
Machinery & Equipment
.12%
Transportation Equipment
.58%
Structures and Improvements
1.44%
Office Furniture and Equipment
.22%Construction in
Progress.75%
Capital Assets (Property, Plant, and Equipment)
As of June 30, 2019, the capital assets of the Board, net of accumulated depreciation, totaled $332,970,829. This investment in capital assets includes land, water rights, dams, reservoirs, well fields, water collection and transmission pipelines, water and wastewater treatment plants, water distribution and sewer collection mains and systems, buildings, machinery, vehicles and equipment.
Capital Asset Allocation:
Capital Assets Net of Depreciation:
2019 2018 2019 2018 2019 2018
Land 4,588 $ 4,588 $ 545 $ 545 $ 5,133 $ 5,133 $ Water rights 1,798 1,798 - - 1,798 1,798 Utility plant in service 415,732 398,030 154,972 138,354 570,704 536,384 Machinery and equipment 519 509 172 169 691 678 Transportation equipment 2,603 2,538 848 839 3,451 3,377 Structures and improvements 6,426 6,411 2,158 2,153 8,584 8,564 Office furniture and equipment 992 984 346 343 1,338 1,327 Construction in progress 3,820 15,868 673 12,537 4,493 28,405 Less accumulated depreciation (195,270) (186,690) (67,951) (64,251) (263,221) (250,941)
Total 241,208 $ 244,036 $ 91,763 $ 90,689 $ 332,971 $ 334,725 $
($1,000s)($1,000s)Sewer Fund
Business-Type ActivitiesTotalWaterworks Fund
13
Major capital asset events during the current fiscal year included the following:
Completion of Southern Water Transmission Phase III Project.
Completion of 19th Street Project.
Completion of the Phase I Southern Sewer Interceptor Main Project.
Contributed capital (water distribution mains, hydrants, sewer collection mains, and manholes) from development projects.
Improvements and upgrades to water distribution and sewer collection mains.
At the close of fiscal year 2019, the Board had transferred the following projects from construction work in progress to Capital Assets:
Water ProjectsFiscal year 2016 PRV Vault 35,577 $ Sloan Lake Pipeline Rehab 51,125 Fiscal year 2018 Wellfield Projects 105,974 Water Main Projects 4,195,567 Southern Transm Main Phase III 11,802,502 Administration Building/CIS remodel 14,879
Total Water Projects 16,205,624 $
Sewer ProjectsSewer Collection Main Projects 2,720,936 $ UV Modules Project 93,978 Phase One Southern Sewer Interceptor Project 12,540,099 Administration Building/CIS remodel 4,962
Total Sewer Projects 15,359,975 $
BOARD OF PUBLIC UTILITIES - CWIPTransferred to Capital Assets
Additional information on the Board’s capital assets can be found in Note 3 on page 27 of this report.
Long-Term Debt
At the end of the current fiscal year, the Board had total bonded debt outstanding of $64,030,449. Of this amount, $5,880,000 is the 2013 Water Revenue Note and the remainder of $58,150,449 are loans from the State of Wyoming for various water and sewer projects.
The total indebtedness of the Board decreased by $4,272,854 (6.3%) from $68,303,303 to $64,030,449 during the current fiscal year.
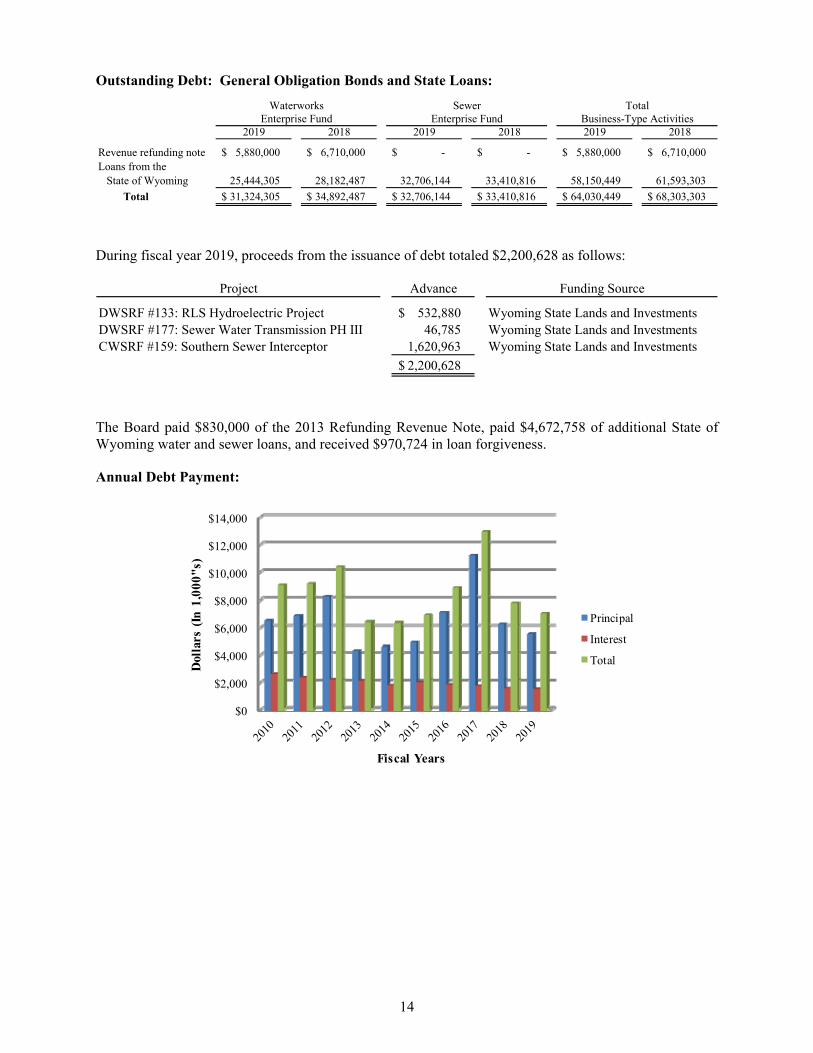
14
Outstanding Debt: General Obligation Bonds and State Loans:
2019 2018 2019 2018 2019 2018
Revenue refunding note 5,880,000 $ 6,710,000 $ -$ -$ 5,880,000 $ 6,710,000 $ Loans from the
State of Wyoming 25,444,305 28,182,487 32,706,144 33,410,816 58,150,449 61,593,303
Total 31,324,305 $ 34,892,487 $ 32,706,144 $ 33,410,816 $ 64,030,449 $ 68,303,303 $
Enterprise Fund Enterprise Fund Business-Type ActivitiesWaterworks Sewer Total
During fiscal year 2019, proceeds from the issuance of debt totaled $2,200,628 as follows:
Project Advance Funding Source
DWSRF #133: RLS Hydroelectric Project 532,880 $ Wyoming State Lands and InvestmentsDWSRF #177: Sewer Water Transmission PH III 46,785 Wyoming State Lands and InvestmentsCWSRF #159: Southern Sewer Interceptor 1,620,963 Wyoming State Lands and Investments
2,200,628 $
The Board paid $830,000 of the 2013 Refunding Revenue Note, paid $4,672,758 of additional State of Wyoming water and sewer loans, and received $970,724 in loan forgiveness.
Annual Debt Payment:
$0
$2,000
$4,000
$6,000
$8,000
$10,000
$12,000
$14,000
Dol
lars
(In
1,0
00"s
)
Fiscal Years
Principal
Interest
Total
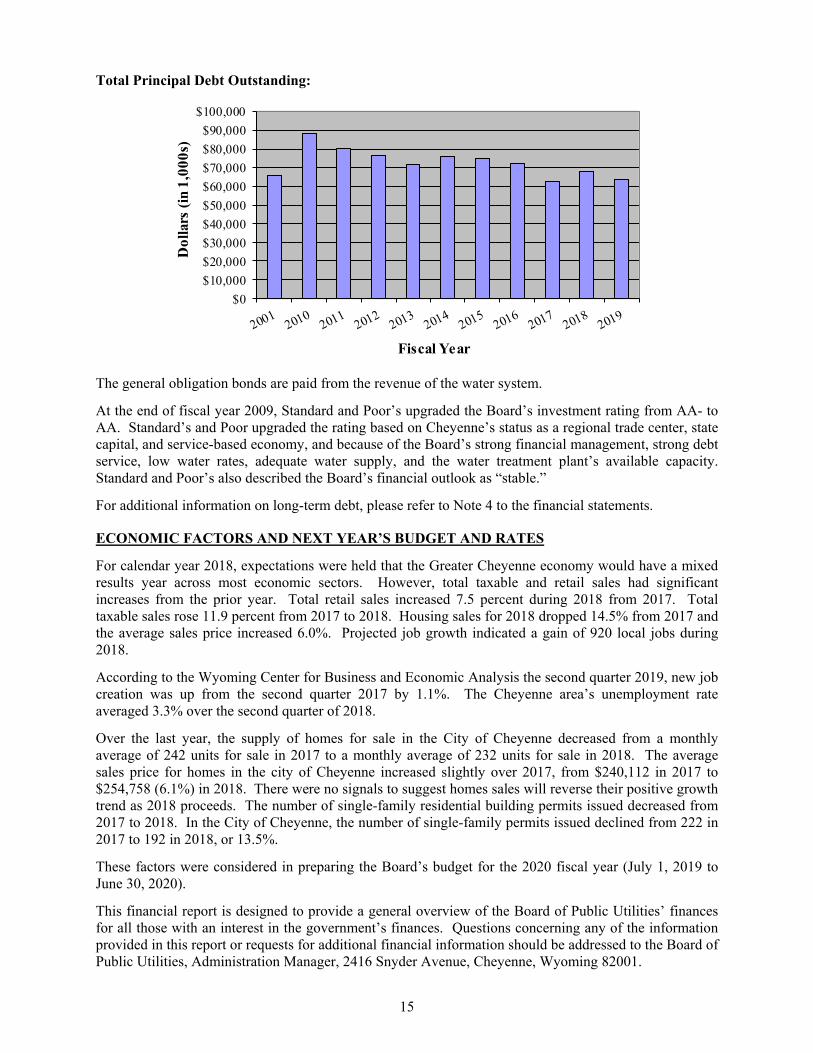
15
$0
$10,000
$20,000
$30,000
$40,000
$50,000
$60,000
$70,000
$80,000
$90,000
$100,000
Dol
lars
(in
1,00
0s)
Fiscal Year
Total Principal Debt Outstanding: The general obligation bonds are paid from the revenue of the water system.
At the end of fiscal year 2009, Standard and Poor’s upgraded the Board’s investment rating from AA- to AA. Standard’s and Poor upgraded the rating based on Cheyenne’s status as a regional trade center, state capital, and service-based economy, and because of the Board’s strong financial management, strong debt service, low water rates, adequate water supply, and the water treatment plant’s available capacity. Standard and Poor’s also described the Board’s financial outlook as “stable.”
For additional information on long-term debt, please refer to Note 4 to the financial statements.
ECONOMIC FACTORS AND NEXT YEAR’S BUDGET AND RATES
For calendar year 2018, expectations were held that the Greater Cheyenne economy would have a mixed results year across most economic sectors. However, total taxable and retail sales had significant increases from the prior year. Total retail sales increased 7.5 percent during 2018 from 2017. Total taxable sales rose 11.9 percent from 2017 to 2018. Housing sales for 2018 dropped 14.5% from 2017 and the average sales price increased 6.0%. Projected job growth indicated a gain of 920 local jobs during 2018.
According to the Wyoming Center for Business and Economic Analysis the second quarter 2019, new job creation was up from the second quarter 2017 by 1.1%. The Cheyenne area’s unemployment rate averaged 3.3% over the second quarter of 2018.
Over the last year, the supply of homes for sale in the City of Cheyenne decreased from a monthly average of 242 units for sale in 2017 to a monthly average of 232 units for sale in 2018. The average sales price for homes in the city of Cheyenne increased slightly over 2017, from $240,112 in 2017 to $254,758 (6.1%) in 2018. There were no signals to suggest homes sales will reverse their positive growth trend as 2018 proceeds. The number of single-family residential building permits issued decreased from 2017 to 2018. In the City of Cheyenne, the number of single-family permits issued declined from 222 in 2017 to 192 in 2018, or 13.5%.
These factors were considered in preparing the Board’s budget for the 2020 fiscal year (July 1, 2019 to June 30, 2020).
This financial report is designed to provide a general overview of the Board of Public Utilities’ finances for all those with an interest in the government’s finances. Questions concerning any of the information provided in this report or requests for additional financial information should be addressed to the Board of Public Utilities, Administration Manager, 2416 Snyder Avenue, Cheyenne, Wyoming 82001.
BASIC FINANCIAL STATEMENTS
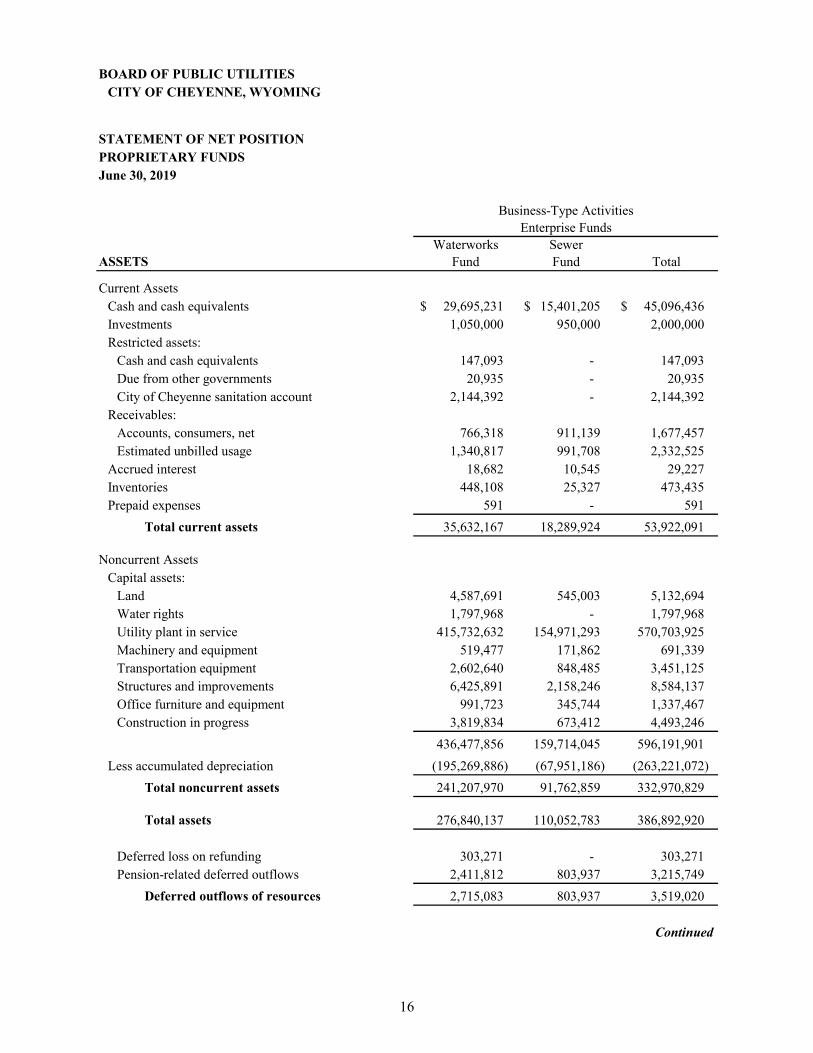
16
BOARD OF PUBLIC UTILITIESCITY OF CHEYENNE, WYOMING
STATEMENT OF NET POSITIONPROPRIETARY FUNDSJune 30, 2019
Waterworks SewerASSETS Fund Fund Total
Current AssetsCash and cash equivalents 29,695,231 $ 15,401,205 $ 45,096,436 $ Investments 1,050,000 950,000 2,000,000 Restricted assets:
Cash and cash equivalents 147,093 - 147,093 Due from other governments 20,935 - 20,935 City of Cheyenne sanitation account 2,144,392 - 2,144,392
Receivables:Accounts, consumers, net 766,318 911,139 1,677,457 Estimated unbilled usage 1,340,817 991,708 2,332,525
Accrued interest 18,682 10,545 29,227 Inventories 448,108 25,327 473,435 Prepaid expenses 591 - 591
Total current assets 35,632,167 18,289,924 53,922,091
Noncurrent AssetsCapital assets:
Land 4,587,691 545,003 5,132,694 Water rights 1,797,968 - 1,797,968 Utility plant in service 415,732,632 154,971,293 570,703,925 Machinery and equipment 519,477 171,862 691,339 Transportation equipment 2,602,640 848,485 3,451,125 Structures and improvements 6,425,891 2,158,246 8,584,137 Office furniture and equipment 991,723 345,744 1,337,467 Construction in progress 3,819,834 673,412 4,493,246
436,477,856 159,714,045 596,191,901
Less accumulated depreciation (195,269,886) (67,951,186) (263,221,072)
Total noncurrent assets 241,207,970 91,762,859 332,970,829
Total assets 276,840,137 110,052,783 386,892,920
Deferred loss on refunding 303,271 - 303,271 Pension-related deferred outflows 2,411,812 803,937 3,215,749
Deferred outflows of resources 2,715,083 803,937 3,519,020
Continued
Enterprise FundsBusiness-Type Activities

17
BOARD OF PUBLIC UTILITIESCITY OF CHEYENNE, WYOMING
STATEMENT OF NET POSITIONPROPRIETARY FUNDS, Continued
June 30, 2019
Waterworks SewerLIABILITIES Fund Fund Total
Current LiabilitiesVouchers payable 1,299,683 $ 1,367,877 $ 2,667,560 $ Accrued compensated absences
and early retirement 441,676 295,528 737,204 Accrued interest on general obligation
bonds and loans 288,430 471,675 760,105 Current portion of general obligation
bonds and loans 3,256,717 2,433,550 5,690,267 Unearned fees and deposits 2,106,389 415,300 2,521,689 Due to other City of Cheyenne funds 2,597,400 326,401 2,923,801
Total current liabilities 9,990,295 5,310,331 15,300,626
Noncurrent LiabilitiesAccrued compensated absences
and early retirement 617,454 415,946 1,033,400 Net pension liability 9,542,137 3,180,713 12,722,850 General obligation bonds and loans,
net of current position, current position,deferred amount on refunding, andunamortized bond premium 28,067,588 30,272,594 58,340,182
Total noncurrent liabilities 38,227,179 33,869,253 72,096,432
Total liabilities 48,217,474 39,179,584 87,397,058
Deferred inflows of resources 235,820 78,606 314,426
NET POSITIONNet Investment in Capital Assets 209,022,833 57,620,703 266,643,536 Restricted for Debt Service
and Capital Improvements 500,000 - 500,000 Unrestricted 21,579,093 13,977,827 35,556,920
Total net position 231,101,926 $ 71,598,530 $ 302,700,456 $
See Notes to Financial Statements.
Business-Type ActivitiesEnterprise Funds
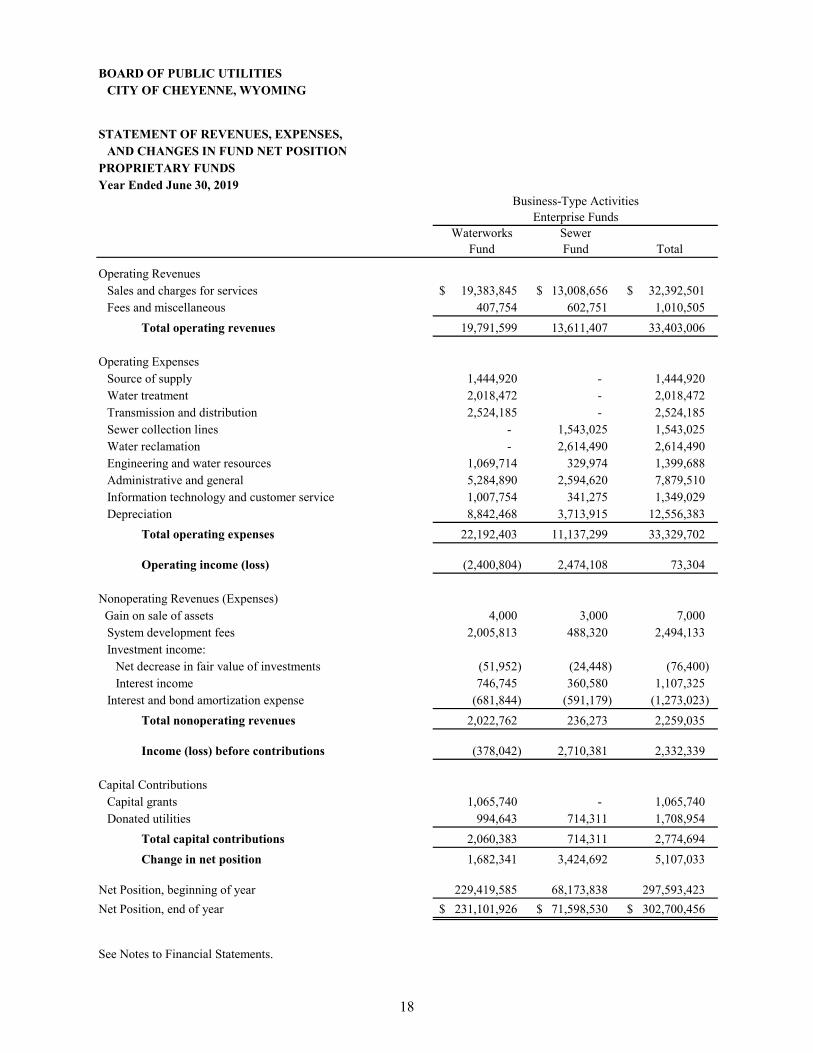
18
BOARD OF PUBLIC UTILITIESCITY OF CHEYENNE, WYOMING
STATEMENT OF REVENUES, EXPENSES,AND CHANGES IN FUND NET POSITION
PROPRIETARY FUNDSYear Ended June 30, 2019
Waterworks SewerFund Fund Total
Operating RevenuesSales and charges for services 19,383,845 $ 13,008,656 $ 32,392,501 $ Fees and miscellaneous 407,754 602,751 1,010,505
Total operating revenues 19,791,599 13,611,407 33,403,006
Operating ExpensesSource of supply 1,444,920 - 1,444,920 Water treatment 2,018,472 - 2,018,472 Transmission and distribution 2,524,185 - 2,524,185 Sewer collection lines - 1,543,025 1,543,025 Water reclamation - 2,614,490 2,614,490 Engineering and water resources 1,069,714 329,974 1,399,688 Administrative and general 5,284,890 2,594,620 7,879,510 Information technology and customer service 1,007,754 341,275 1,349,029 Depreciation 8,842,468 3,713,915 12,556,383
Total operating expenses 22,192,403 11,137,299 33,329,702
Operating income (loss) (2,400,804) 2,474,108 73,304
Nonoperating Revenues (Expenses) Gain on sale of assets 4,000 3,000 7,000
System development fees 2,005,813 488,320 2,494,133 Investment income:
Net decrease in fair value of investments (51,952) (24,448) (76,400) Interest income 746,745 360,580 1,107,325
Interest and bond amortization expense (681,844) (591,179) (1,273,023)
Total nonoperating revenues 2,022,762 236,273 2,259,035
Income (loss) before contributions (378,042) 2,710,381 2,332,339
Capital ContributionsCapital grants 1,065,740 - 1,065,740 Donated utilities 994,643 714,311 1,708,954
Total capital contributions 2,060,383 714,311 2,774,694
Change in net position 1,682,341 3,424,692 5,107,033
Net Position, beginning of year 229,419,585 68,173,838 297,593,423
Net Position, end of year 231,101,926 $ 71,598,530 $ 302,700,456 $
See Notes to Financial Statements.
Enterprise FundsBusiness-Type Activities

19
BOARD OF PUBLIC UTILITIESCITY OF CHEYENNE, WYOMING
STATEMENT OF CASH FLOWSPROPRIETARY FUNDSYear Ended June 30, 2019
Waterworks SewerFund Fund Total
Cash Flows from Operating ActivitiesCash received from customers 20,951,397 $ 13,489,903 $ 34,441,300 $ Cash payments to suppliers (4,293,129) (2,455,272) (6,748,401) Cash payments to employees (7,612,204) (4,392,098) (12,004,302) Change in City sanitation account (25,500) - (25,500)
Net cash provided by operating activities 9,020,564 6,642,533 15,663,097
Cash Flows fromCapital and Related Financing Activities
System development fees 2,932,540 676,640 3,609,180 Capital grants 95,016 - 95,016 Proceeds from issuance of debt 819,326 3,199,685 4,019,011 Principal paid on general obligation/revenue bonds
and loan debt maturities (3,177,126) (2,325,635) (5,502,761) Interest paid on debt (877,455) (593,705) (1,471,160) Proceeds from sale of capital assets 4,000 3,000 7,000 Acquisition and construction of capital assets (4,975,463) (5,402,186) (10,377,649)
Net cash (used in)capital and related financing activities (5,179,162) (4,442,201) (9,621,363)
Cash Flows from Investing ActivitiesInterest on cash and investments 690,966 295,761 986,727 Redemption of investments - 37,231 37,231
Net cash provided byinvesting activities 690,966 332,992 1,023,958
Net increase incash and cash equivalents 4,532,368 2,533,324 7,065,692
Cash and Cash EquivalentsBeginning 25,309,956 12,867,881 38,177,837
Ending 29,842,324 $ 15,401,205 $ 45,243,529 $
Continued
Enterprise FundsBusiness-Type Activities
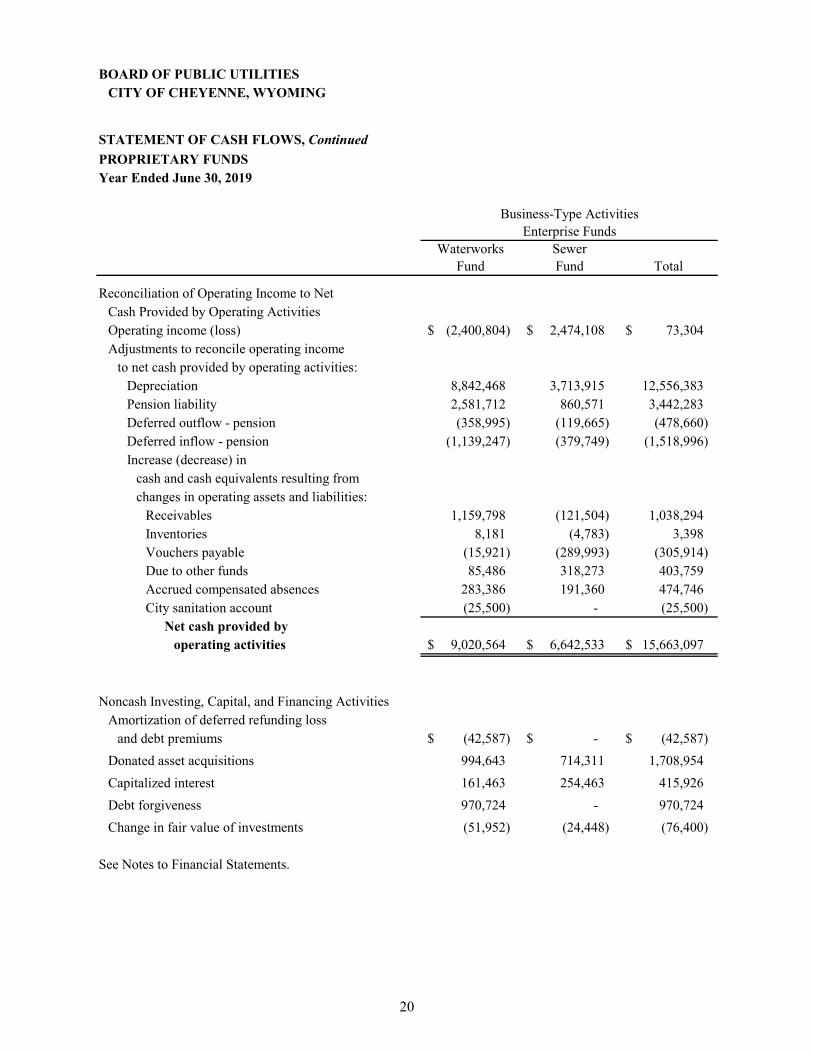
20
BOARD OF PUBLIC UTILITIESCITY OF CHEYENNE, WYOMING
STATEMENT OF CASH FLOWS, Continued
PROPRIETARY FUNDSYear Ended June 30, 2019
Waterworks SewerFund Fund Total
Reconciliation of Operating Income to Net Cash Provided by Operating ActivitiesOperating income (loss) (2,400,804) $ 2,474,108 $ 73,304 $ Adjustments to reconcile operating income
to net cash provided by operating activities:Depreciation 8,842,468 3,713,915 12,556,383 Pension liability 2,581,712 860,571 3,442,283 Deferred outflow - pension (358,995) (119,665) (478,660) Deferred inflow - pension (1,139,247) (379,749) (1,518,996) Increase (decrease) in
cash and cash equivalents resulting fromchanges in operating assets and liabilities:
Receivables 1,159,798 (121,504) 1,038,294 Inventories 8,181 (4,783) 3,398 Vouchers payable (15,921) (289,993) (305,914) Due to other funds 85,486 318,273 403,759 Accrued compensated absences 283,386 191,360 474,746 City sanitation account (25,500) - (25,500)
Net cash provided byoperating activities 9,020,564 $ 6,642,533 $ 15,663,097 $
Noncash Investing, Capital, and Financing ActivitiesAmortization of deferred refunding loss
and debt premiums (42,587) $ -$ (42,587) $
Donated asset acquisitions 994,643 714,311 1,708,954
Capitalized interest 161,463 254,463 415,926
Debt forgiveness 970,724 - 970,724
Change in fair value of investments (51,952) (24,448) (76,400)
See Notes to Financial Statements.
Business-Type ActivitiesEnterprise Funds
BOARD OF PUBLIC UTILITIES CITY OF CHEYENNE, WYOMING NOTES TO FINANCIAL STATEMENTS
21
Note 1. Nature of Operations and Significant Accounting Policies Nature of operations: The City of Cheyenne, Wyoming Board of Public Utilities (the “Board”) provides all water and sewer services for the City of Cheyenne, Wyoming (the “City”), Warren Air Force Base, and the South Cheyenne Water and Sewer District. These services include obtaining an adequate source of water supply, water treatment, wastewater collection, and water reclamation. These activities are accounted for in the Waterworks and Sewer Funds.
A summary of the Board’s significant accounting policies follows:
Reporting entity: The Board is comprised of the Waterworks and Sewer Enterprise Funds of the City, the primary government, which is financially accountable for the Board. These financial statements present only the Waterworks and Sewer Enterprise Funds and are not intended to present fairly the financial position and results of operations of the City, in conformity with accounting principles generally accepted in the United States of America.
The Board is not financially accountable for any other organizations and, thus, includes only the financial activity of the various funds of the Board. The following Wyoming State Statutes were considered in defining the reporting entity:
§15-7-401. Establishment; powers and duties generally.
Any city or town in Wyoming, which owns and operates a municipal waterworks, a sanitary sewer system, a sewage disposal plant or an electric utility distribution system may establish a board of commissioners to be known as the board of public utilities. The board of public utilities shall manage, operate, maintain and control such plants and make all rules and regulations necessary for their safe, economical and efficient operation and management. The board may also improve, extend or enlarge the plants as provided in this article.
§15-7-404. Specific powers and duties; vouchers, etc.; civil service or pension system.
The Board of Public Utilities has exclusive control of all municipally owned waterworks, sanitary sewer systems and sewage disposal plants, as specified by ordinance. The Board is charged with producing and supplying the city or town and its inhabitants with water for domestic and industrial purposes, and for public use, and may sell and dispose of any surplus outside of the city or town. The Board may also furnish surplus sanitary sewer facilities to persons outside of the city or town.
Measurement focus, basis of accounting, and financial statement presentation: The financial statements are reported using the economic resources measurement focus and the accrual basis of accounting. Revenues are recorded when earned and expenses are recorded when a liability is incurred, regardless of the timing of related cash flows. Grants and similar items are recognized as revenue as soon as all eligibility requirements imposed by the provider have been met.
BOARD OF PUBLIC UTILITIES CITY OF CHEYENNE, WYOMING NOTES TO FINANCIAL STATEMENTS
22
Major proprietary funds: The waterworks and sewer funds account for the activities of the Board. The Board operates the water reclamation plant, sewage pumping stations and collection systems, and the water distribution system.
Proprietary funds distinguish operating revenues and expenses from nonoperating items. Operating revenues and expenses generally result from providing services and producing and delivering goods in connection with a proprietary fund’s principal ongoing operations. The principal operating revenues of the Board’s enterprise funds (the waterworks fund and sewer fund) are charges to customers for sales and services. The Board also recognizes as operating revenue the portion of tap fees intended to recover the cost of connecting new customers to the system. Operating expenses for enterprise funds include the cost of sales and services, administrative expenses, and depreciation on capital assets. All revenues and expenses not meeting this definition are reported as nonoperating revenues and expenses. Net Position: Net position represents the difference between assets, deferred outflow of resources, liabilities, and deferred inflow of resources. Net investment in capital assets consists of capital assets and capital-related deferred outflow of resources, net of accumulated depreciation, reduced by the outstanding balances of any borrowings used for the acquisition, construction, or improvement of those assets. Net position is reported as restricted when there are limitations imposed by creditors, grantors, or laws or regulations of other governments. The remaining net position is reported as unrestricted.
The Board applies restricted resources first when an expense is incurred for purposes for which both restricted and unrestricted net position is available. Deposits and investments: The Board’s cash and cash equivalents are considered to be cash on hand, demand deposits, and short-term investments with original maturities of three months or less from the date of acquisition. Additionally, investments in the State Treasurer’s Investment Pool (WYO-STAR) are considered to be cash equivalents due to the Board’s ability to withdraw the investments at any time.
Investments consist of non-negotiable certificates of deposit, which are reported at cost, and participation in WYO-STAR, which is reported at fair value at June 30, 2019. The Board categorizes its fair value measurements within the fair value hierarchy established by generally accepted accounting principles. The hierarchy is based on the valuation inputs used to measure the fair value of the asset. Level 1 inputs are quoted prices in active markets for identical assets; Level 2 inputs are significant other observable inputs; Level 3 inputs are significant unobservable inputs. The Board considers fair value measurements as of June 30, 2019 for WYO-STAR to be completed by the pool using matrix pricing model and the market approach (Level 2). Restricted assets: Restricted assets include assets held for the City sanitation, as well as amounts due from the State of Wyoming on requested loan advances. In addition, cash required to be set aside for the repair and maintenance of capital assets that were funded by State of Wyoming loans are deemed restricted. Due to other City of Cheyenne funds: Regarding the City of Cheyenne sanitation account, the Board bills and collects the City’s fees for sanitation services. The funds collected are remitted to the treasury of the City twice per month. Accounts receivable: Accounts receivable are shown on the Statement of Net Position, net of allowances for doubtful accounts of $51,239.
BOARD OF PUBLIC UTILITIES CITY OF CHEYENNE, WYOMING NOTES TO FINANCIAL STATEMENTS
23
Estimated unbilled usage: Unbilled utility usage represents the unbilled utility services that have been provided but not billed. Inventories: Inventories of supplies are accounted for at cost on the first-in, first-out method. Capital assets: Capital assets, which include property, plant, equipment, and infrastructure assets (e.g., water and sewer lines), are reported in the applicable business-type activities columns in the Statement of Net Position. Capital assets are defined by the Board as assets with an initial, individual cost of more than $5,000 and an estimated useful life in excess of three years. Assets such as land, buildings and improvements, equipment, and utility plant in service are reported at an estimated historical cost, as determined by an independent study as of June 30, 1973, plus additions since that time have been recorded at historical cost. Property and equipment donated by developers is recorded at its acquisition value at the date of donation.
Depreciation has been provided over the following estimated useful lives computed by the straight-line method: Years Utility plant in service: Waterworks system 10 - 50 Sewer system 10 - 40 Machinery and equipment 5 - 10 Transportation equipment 5 Structures and improvements 40 Office furniture and equipment 3 - 5 Unearned fees and deposits: The Board charges new customers a tap fee for water and sewer services. In addition, the Board assesses a system development fee for each service. These fees are paid in advance and recorded as unearned before the service is active. Once the new connections are inspected and service begins, the tap and system development fees become earned and recognized. Accrued compensated absences: Nonexempt full-time and part-time employees are eligible to earn and use compensatory time upon employment. Compensatory time may be earned in lieu of overtime wages and call back wages. Compensatory time is earned at 1½ hours for time worked in excess of 40 in a work week and for call-back hours. The maximum accumulation of compensatory time is 120 hours. A full-time or part-time exempt employee may earn administrative time at a rate of one-for-one for hours worked above 40 in a work week, up to a maximum of 120 hours. Upon termination, an employee is paid for his or her accrued unused compensatory or administrative time, not to exceed 120 hours. Payment is calculated using the rate of pay at the time of termination.
BOARD OF PUBLIC UTILITIES CITY OF CHEYENNE, WYOMING NOTES TO FINANCIAL STATEMENTS
24
The liability for compensated absences is accrued as these benefits are accumulated. Vacation leave accumulates as follows: Vacation Hours Months of Service Accrued per Month
0 to 48 8 49 to 96 10 97 to 144 12 145 to 192 14 Over 192 16
Accumulated vacation leave in excess of 30 days shall be deemed forfeited at the end of the December pay period.
Employees accrue sick leave up to a maximum of 480 hours for a full-time employee and 240 hours for a part-time employee on the basis of the number of hours worked in the month at the following rates:
Sick Leave Hours Hours Worked per Month Accrued per Month
160 or more 10 120 to 159 7.5 80 to 119 5 40 to 79 2.5 39 or less No accrual
Upon termination of employment, an employee is paid for his or her other accrued unused vacation leave and one-half of his or her accrued unused sick leave. Water and sewer services used by the City: The City is not billed for water or sewer services used. Estimates: The preparation of financial statements in conformity with accounting principles generally accepted in the United States of America requires management to make estimates and assumptions that affect the reported amounts of assets, deferred outflows of resources, liabilities, deferred inflows of resources, and disclosure of contingent assets and liabilities at the date of the financial statements and the reported amounts of revenue and expenses during the reporting period. Actual results could differ from those estimates. Deferred outflows/inflows of resources: In addition to assets, the Statement of Net Position will sometimes report a separate section for deferred outflows of resources. This separate financial statement element, deferred outflows of resources, represents a consumption of net position that applies to a future period(s), and thus will not be recognized as an outflow of resources (expense/expenditure) until then. In addition to liabilities, the Statement of Net Position will sometimes report a separate section for deferred inflows of resources. This separate financial statement element, deferred inflows of resources, represents an acquisition of net position that applies to a future period(s) and thus will not be recognized as an inflow of resources (revenue) until that time.
The Board has recognized deferred outflows of resources and deferred inflows of resources in the financial statements in accordance with presentation requirements for Governmental Accounting Standards Board (GASB) Statement No. 68, Accounting and Financial Reporting for Pensions – An Amendment of GASB Statement No. 27. The Board also recognizes a deferred outflow of resources for its loss on refunding, which is amortized over the life of the related debt.
BOARD OF PUBLIC UTILITIES CITY OF CHEYENNE, WYOMING NOTES TO FINANCIAL STATEMENTS
25
Defined benefit pensions: For purposes of measuring the net pension liability, deferred outflows of resources and deferred inflows of resources related to pensions, and pension expense, information about the fiduciary net position of the Wyoming Retirement System (WRS), and additions to/deductions from the WRS’s fiduciary net position have been determined on the same basis as they are reported by the WRS. For this purpose, benefit payments (including refunds of employee contributions) are recognized when due and payable in accordance with the benefit terms. Investments are reported at fair value. Note 2. Cash, Cash Equivalents, and Investments Cash and cash equivalents, investments, and restricted cash and cash equivalents as of June 30, 2019, as classified in the accompanying financial statements, consist of the following:
Statement of Net Position:Deposits with financial institutions:
Cash 1,746,875 $ Certificates of deposit 4,550,000
Deposits with Wyoming State Treasurer:WYO-STAR 40,946,654
47,243,529 $
Cash and cash equivalents 45,096,436 $ Investments 2,000,000 Restricted cash and cash equivalents 147,093
47,243,529 $
Investments authorized by the Board’s investment policy: The Board follows the guidelines set forth in Wyoming State Statute § 9-4-831 as it relates to the investment of public funds. The Board’s investment policy requires investments to comply with Wyoming State Statutes, which generally allows the Board to invest in U.S., state and local government securities, and accounts of any bank and savings associations which are Federally insured or secured by a pledge of assets including bonds, debentures, and other securities in which the State Treasurer may by law invest. All investments made during the year were made within these statutory limits. Credit risk: Generally, credit risk is the risk that an issuer of an investment will not fulfill its obligation to the holder of the investment. The Board’s investment policy does not contain any specific provisions intended to limit the Board’s exposure to credit risk. Credit risk is measured by the assignment of a rating by a nationally recognized statistical rating organization. Under the investment agreement with WYO-STAR, the Board has invested monies at a variable and fixed contract rate of interest, respectively. There is no rating available for the WYO-STAR investment; however, under Wyoming State Statutes underlying providers are required to have the highest rating from at least one of the nationally recognized rating organizations.
BOARD OF PUBLIC UTILITIES CITY OF CHEYENNE, WYOMING NOTES TO FINANCIAL STATEMENTS
26
Custodial credit risk: Custodial credit risk for deposits and certificates of deposit is the risk that, in the event of the failure of a depository financial institution, the Board will not be able to recover its deposits or will not be able to recover collateral securities that are in the possession of an outside party. Certain deposits held in Board bank accounts are insured by Federal deposit insurance or are collateralized with securities held by the custodian bank under safekeeping or Federal Reserve receipts in the name of the Board and the financial institution. As of June 30, 2019, the Board had bank balances on deposit and certificates of deposit of $7,771,222. These deposits and certificates of deposit were fully collateralized or insured, as required by Wyoming State Statutes.
In addition to the applicable Wyoming State Statutes, the Board’s policy requires all deposits to be collateralized at 105% of the amount invested including accrued interest to further reduce its exposure to custodial credit risk. At June 30, 2019, the Board’s deposits were fully collateralized as required by Board policy.
For an investment, this is the risk that in the event of the failure of the counterparty (e.g., broker-dealer) to a transaction, the Board will not be able to recover the value of its investments or collateral securities that are in the possession of an outside party. Wyoming State Statutes limit the type of investments the Board can use. Wyoming State Statutes limit investments primarily to securities issued or guaranteed by the U.S. Treasury or agencies of the United States Government; therefore, reducing the Board’s exposure to custodial credit risk for its investments. Concentration of credit risk: The Board’s policy does not allow more than 50% of the total investment portfolio to be invested in any one single security type and to 5% in any one single obligor, with the exception of funds held in WYO-STAR. Therefore, no further disclosure regarding concentrations of credit risk is required. Interest rate risk: Interest rate risk is the risk that changes in market interest rates will adversely affect the fair value of an investment. The Board’s investments are held in external pooled investment accounts and in bank certificates of deposit, and as a means of limiting its exposure to fair value losses arising from rising interest rates, the Board attempts to match its investment maturities to expected cash flow needs. The Board’s investment policy requires that the investment portfolio have a minimum level of three months of budgeted operating expenditures in short-term investment to be maintained to provide sufficient liquidity for expected disbursements. With this investment focus, investments are expected to reach maturity with limited gains or losses. At June 30, 2019, the Board’s investments met this policy.
The maturities and applicable interest rates of the Board’s investments are displayed in the following Interest Rate Risk Table.
InvestmentMaturities
Fair Interest Less ThanInvestment Type Value Rate One Year
Certificates of deposit 4,550,000 $ 0.28% - 0.37% 4,550,000 $ State Treasurer's Investment Pool (WYO-STAR) 40,946,654 2.32% 40,946,654
45,496,654 $ 45,496,654 $
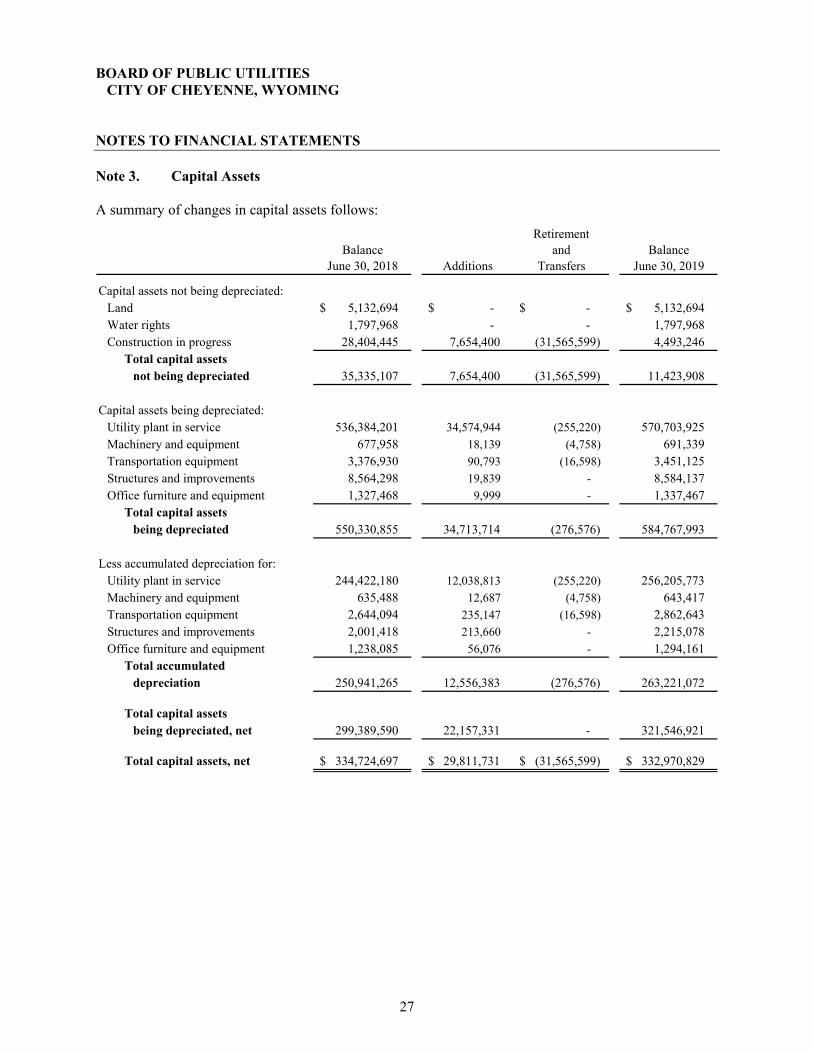
BOARD OF PUBLIC UTILITIES CITY OF CHEYENNE, WYOMING NOTES TO FINANCIAL STATEMENTS
27
Note 3. Capital Assets A summary of changes in capital assets follows:
RetirementBalance and Balance
June 30, 2018 Additions Transfers June 30, 2019
Capital assets not being depreciated:Land 5,132,694 $ -$ -$ 5,132,694 $ Water rights 1,797,968 - - 1,797,968 Construction in progress 28,404,445 7,654,400 (31,565,599) 4,493,246
Total capital assetsnot being depreciated 35,335,107 7,654,400 (31,565,599) 11,423,908
Capital assets being depreciated:Utility plant in service 536,384,201 34,574,944 (255,220) 570,703,925 Machinery and equipment 677,958 18,139 (4,758) 691,339 Transportation equipment 3,376,930 90,793 (16,598) 3,451,125 Structures and improvements 8,564,298 19,839 - 8,584,137 Office furniture and equipment 1,327,468 9,999 - 1,337,467
Total capital assetsbeing depreciated 550,330,855 34,713,714 (276,576) 584,767,993
Less accumulated depreciation for:Utility plant in service 244,422,180 12,038,813 (255,220) 256,205,773 Machinery and equipment 635,488 12,687 (4,758) 643,417 Transportation equipment 2,644,094 235,147 (16,598) 2,862,643 Structures and improvements 2,001,418 213,660 - 2,215,078 Office furniture and equipment 1,238,085 56,076 - 1,294,161
Total accumulated depreciation 250,941,265 12,556,383 (276,576) 263,221,072
Total capital assetsbeing depreciated, net 299,389,590 22,157,331 - 321,546,921
Total capital assets, net 334,724,697 $ 29,811,731 $ (31,565,599) $ 332,970,829 $

BOARD OF PUBLIC UTILITIES CITY OF CHEYENNE, WYOMING NOTES TO FINANCIAL STATEMENTS
28
Note 4. Bonds and Loans The following is a summary of debt transactions of the Board for the year ended June 30, 2019:
Balance Balanceas of as of Current Long-Term
June 30, 2018 Issued Retired June 30, 2019 Portion PortionWaterworks Fund:
CWSRF081 Phase II Reuse 2008 840,557 $ -$ 61,117 $ 779,440 $ 62,606 $ 716,834 $ 084 Administrative Building 2007 210,936 - 12,782 198,154 13,088 185,066 115 Administrative Building 2009 1,394,786 - 84,522 1,310,264 86,540 1,223,724 143 Holliday Reuse 2015 712,500 - 37,500 675,000 37,500 637,500
DWSRF023 RLS Refinance 2002 2,981,349 - 567,142 2,414,207 581,141 1,833,066 034 Water Main Rehabilitation 2003 303,152 - 40,171 262,981 41,156 221,825 056 Western Hills 2005 541,741 - 48,342 493,399 49,553 443,846 065 Southern Water Main 2007 3,187,026 - 255,998 2,931,028 262,250 2,668,778 079 30" Water Main/WAFB 3,834,820 - 234,525 3,600,295 238,741 3,361,554 106 Administrative Building 2009 1,394,786 - 84,522 1,310,264 86,540 1,223,724 120 Southern Water Main Ph II 2012 6,276,994 - 324,277 5,952,717 331,956 5,620,761 133 RLS Hydroelectric Project 2013 155,865 532,880 - 688,745 - 688,745 177 Southern Water Main Ph III 2016 3,836,112 46,785 1,084,927 2,797,970 117,836 2,680,134
2013 Water Revenue Note 6,710,000 - 830,000 5,880,000 850,000 5,030,000 Stage I Rehabilitation Loan 1993 1,312,416 - 253,851 1,058,565 264,005 794,560 Sherard Plant State WDWRF Loan 2000 1,199,447 - 228,171 971,276 233,803 737,473
Total Waterworks Fund 34,892,487 579,665 4,147,847 31,324,305 3,256,715 28,067,590
Sewer Fund:CWSRF
046 CWSRF Loan 2004 16,768,393 - 1,920,102 14,848,291 1,967,015 12,881,276 060 WAFB/Parsley 2006 1,664,888 - 133,845 1,531,043 137,087 1,393,956 084 Administrative Building 2007 70,312 - 4,261 66,051 4,363 61,688 115 Administrative Building 2009 464,929 - 28,174 436,755 28,847 407,908 133 Crow Creek Plant Improvements 2013 4,398,328 - 211,079 4,187,249 216,055 3,971,194 144 Southern Sewer Interceptor 2016 1,300,000 - - 1,300,000 51,336 1,248,664 159 Southern Sewer Interceptor 2018 8,279,037 1,620,963 - 9,900,000 - 9,900,000
DWSRF106 Administrative Building 2009 464,929 - 28,174 436,755 28,847 407,908
Total Sewer Fund 33,410,816 1,620,963 2,325,635 32,706,144 2,433,550 30,272,594
Total Waterworks and Sewer Funds 68,303,303 $ 2,200,628 $ 6,473,482 $ 64,030,449 $ 5,690,265 $ 58,340,184 $
Debt
On December 21, 2007, the Board issued $12,330,000 in Refunding Revenue Water Bonds with an average interest rate of 4.368% in order to refinance two Wyoming Water Development Commission loans totaling $8,043,330 and one Permanent Mineral Trust Fund loan for $3,567,231 bearing substantially higher interest rates between 5.5% and 7.25%. The proceeds of the Series 2007 Bonds, together with other available monies of the Board, were used to: (i) refinance the above-referenced loans in the amount of $11,610,561, (ii) pay expenses incurred in connection with the issuance of the Bonds in the amount of $102,636, and (iii) establish a debt service reserve fund for the Bonds in the amount of $989,594.
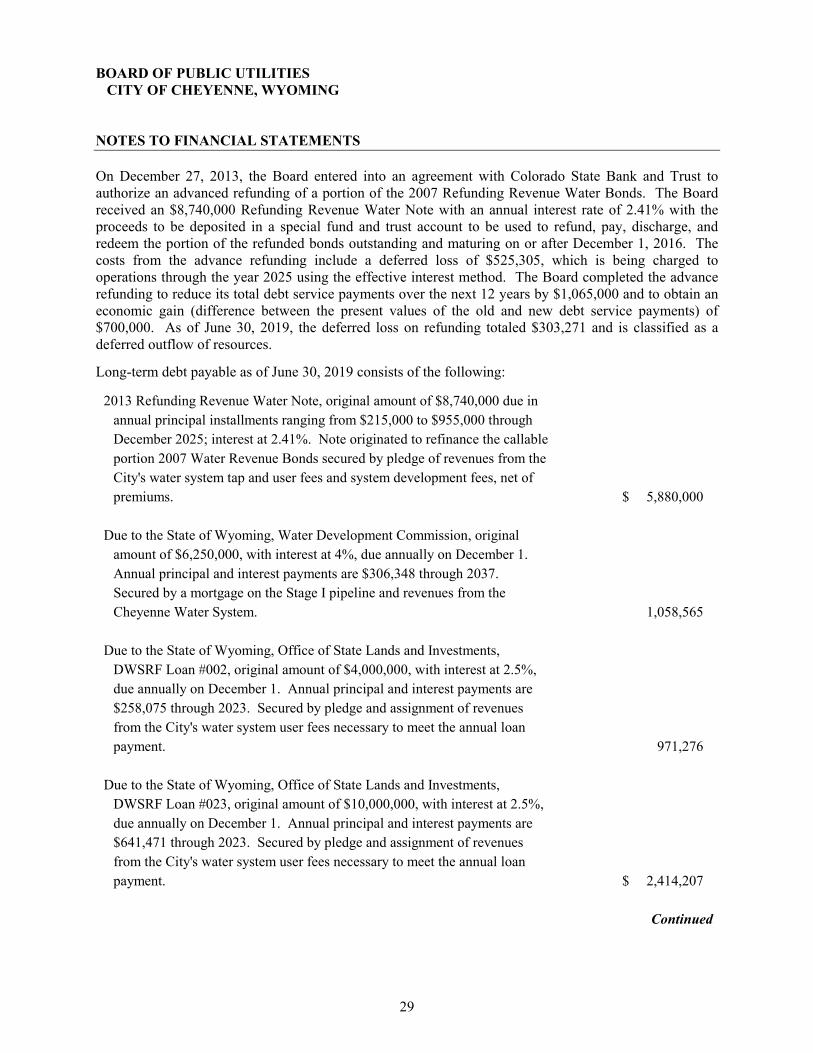
BOARD OF PUBLIC UTILITIES CITY OF CHEYENNE, WYOMING NOTES TO FINANCIAL STATEMENTS
29
On December 27, 2013, the Board entered into an agreement with Colorado State Bank and Trust to authorize an advanced refunding of a portion of the 2007 Refunding Revenue Water Bonds. The Board received an $8,740,000 Refunding Revenue Water Note with an annual interest rate of 2.41% with the proceeds to be deposited in a special fund and trust account to be used to refund, pay, discharge, and redeem the portion of the refunded bonds outstanding and maturing on or after December 1, 2016. The costs from the advance refunding include a deferred loss of $525,305, which is being charged to operations through the year 2025 using the effective interest method. The Board completed the advance refunding to reduce its total debt service payments over the next 12 years by $1,065,000 and to obtain an economic gain (difference between the present values of the old and new debt service payments) of $700,000. As of June 30, 2019, the deferred loss on refunding totaled $303,271 and is classified as a deferred outflow of resources.
Long-term debt payable as of June 30, 2019 consists of the following:
2013 Refunding Revenue Water Note, original amount of $8,740,000 due inannual principal installments ranging from $215,000 to $955,000 throughDecember 2025; interest at 2.41%. Note originated to refinance the callableportion 2007 Water Revenue Bonds secured by pledge of revenues from theCity's water system tap and user fees and system development fees, net ofpremiums. 5,880,000 $
Due to the State of Wyoming, Water Development Commission, originalamount of $6,250,000, with interest at 4%, due annually on December 1.Annual principal and interest payments are $306,348 through 2037. Secured by a mortgage on the Stage I pipeline and revenues from the Cheyenne Water System. 1,058,565
Due to the State of Wyoming, Office of State Lands and Investments,DWSRF Loan #002, original amount of $4,000,000, with interest at 2.5%,due annually on December 1. Annual principal and interest payments are$258,075 through 2023. Secured by pledge and assignment of revenuesfrom the City's water system user fees necessary to meet the annual loanpayment. 971,276
Due to the State of Wyoming, Office of State Lands and Investments, DWSRF Loan #023, original amount of $10,000,000, with interest at 2.5%,due annually on December 1. Annual principal and interest payments are$641,471 through 2023. Secured by pledge and assignment of revenuesfrom the City's water system user fees necessary to meet the annual loanpayment. 2,414,207 $
Continued
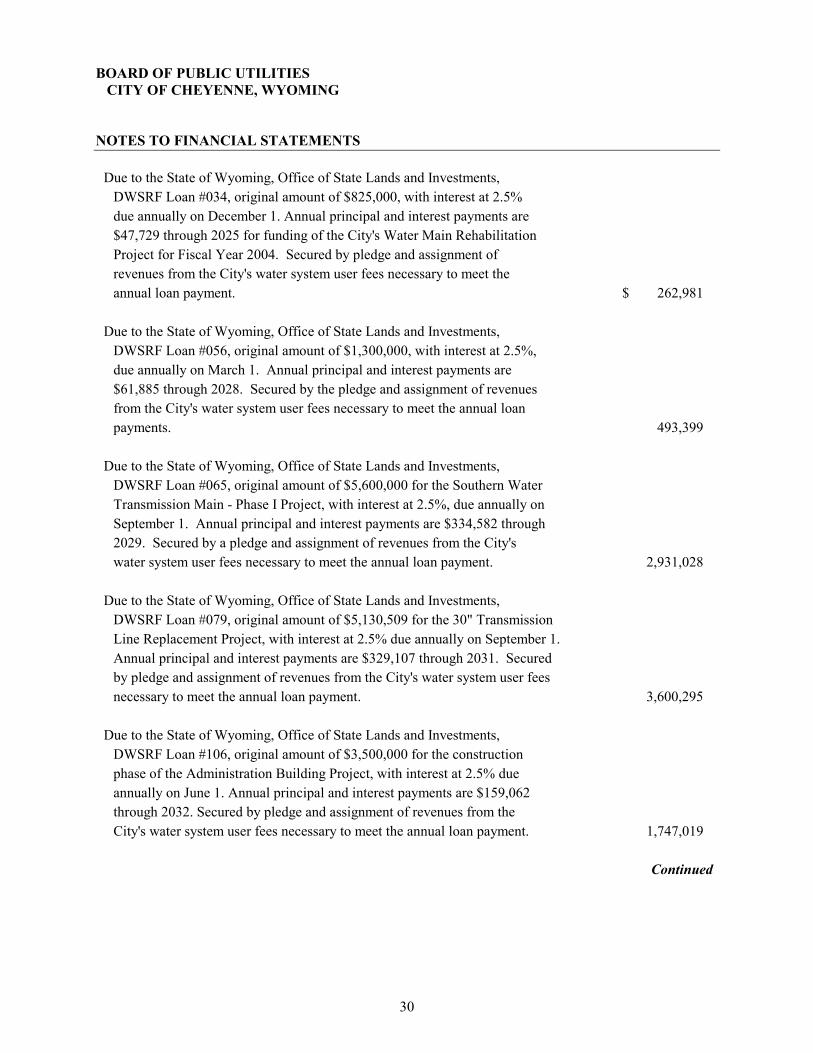
BOARD OF PUBLIC UTILITIES CITY OF CHEYENNE, WYOMING NOTES TO FINANCIAL STATEMENTS
30
Due to the State of Wyoming, Office of State Lands and Investments,DWSRF Loan #034, original amount of $825,000, with interest at 2.5%due annually on December 1. Annual principal and interest payments are$47,729 through 2025 for funding of the City's Water Main RehabilitationProject for Fiscal Year 2004. Secured by pledge and assignment ofrevenues from the City's water system user fees necessary to meet theannual loan payment. 262,981 $
Due to the State of Wyoming, Office of State Lands and Investments,DWSRF Loan #056, original amount of $1,300,000, with interest at 2.5%,due annually on March 1. Annual principal and interest payments are$61,885 through 2028. Secured by the pledge and assignment of revenuesfrom the City's water system user fees necessary to meet the annual loanpayments. 493,399
Due to the State of Wyoming, Office of State Lands and Investments,DWSRF Loan #065, original amount of $5,600,000 for the Southern WaterTransmission Main - Phase I Project, with interest at 2.5%, due annually onSeptember 1. Annual principal and interest payments are $334,582 through2029. Secured by a pledge and assignment of revenues from the City'swater system user fees necessary to meet the annual loan payment. 2,931,028
Due to the State of Wyoming, Office of State Lands and Investments,DWSRF Loan #079, original amount of $5,130,509 for the 30" TransmissionLine Replacement Project, with interest at 2.5% due annually on September 1.Annual principal and interest payments are $329,107 through 2031. Securedby pledge and assignment of revenues from the City's water system user feesnecessary to meet the annual loan payment. 3,600,295
Due to the State of Wyoming, Office of State Lands and Investments,DWSRF Loan #106, original amount of $3,500,000 for the constructionphase of the Administration Building Project, with interest at 2.5% dueannually on June 1. Annual principal and interest payments are $159,062through 2032. Secured by pledge and assignment of revenues from theCity's water system user fees necessary to meet the annual loan payment. 1,747,019
Continued
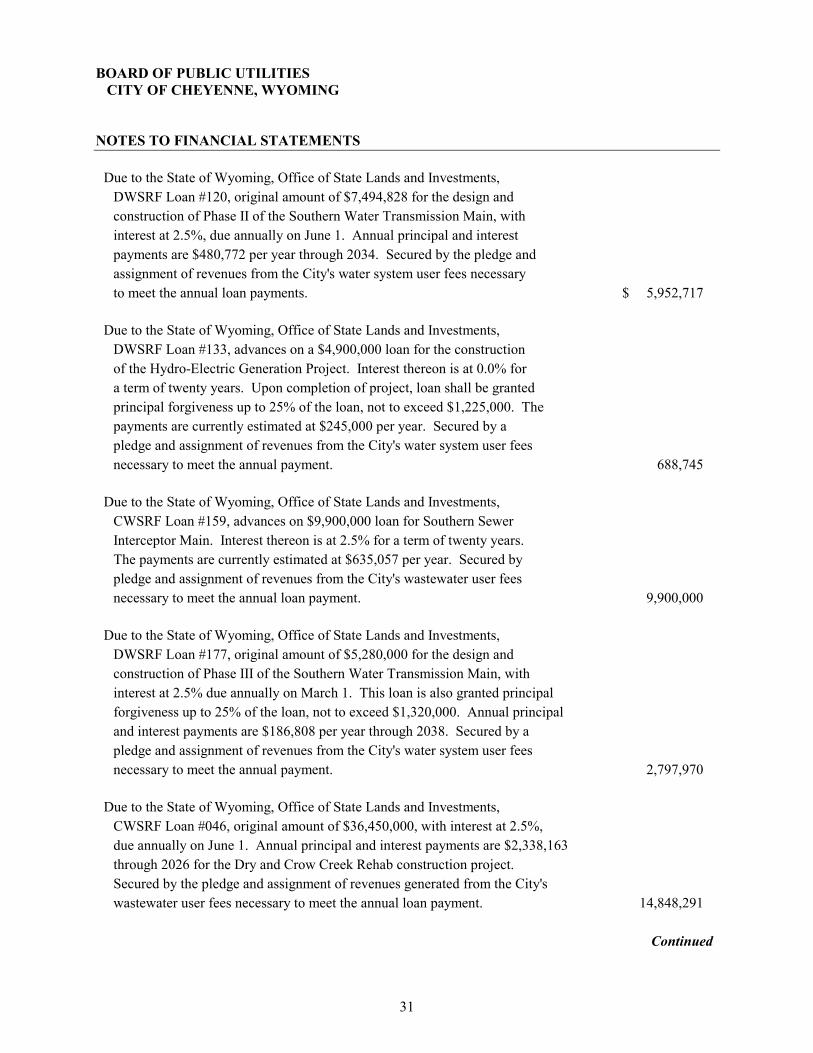
BOARD OF PUBLIC UTILITIES CITY OF CHEYENNE, WYOMING NOTES TO FINANCIAL STATEMENTS
31
Due to the State of Wyoming, Office of State Lands and Investments,DWSRF Loan #120, original amount of $7,494,828 for the design and construction of Phase II of the Southern Water Transmission Main, withinterest at 2.5%, due annually on June 1. Annual principal and interestpayments are $480,772 per year through 2034. Secured by the pledge andassignment of revenues from the City's water system user fees necessaryto meet the annual loan payments. 5,952,717 $
Due to the State of Wyoming, Office of State Lands and Investments,DWSRF Loan #133, advances on a $4,900,000 loan for the constructionof the Hydro-Electric Generation Project. Interest thereon is at 0.0% fora term of twenty years. Upon completion of project, loan shall be grantedprincipal forgiveness up to 25% of the loan, not to exceed $1,225,000. Thepayments are currently estimated at $245,000 per year. Secured by apledge and assignment of revenues from the City's water system user feesnecessary to meet the annual payment. 688,745
Due to the State of Wyoming, Office of State Lands and Investments,CWSRF Loan #159, advances on $9,900,000 loan for Southern SewerInterceptor Main. Interest thereon is at 2.5% for a term of twenty years.The payments are currently estimated at $635,057 per year. Secured by pledge and assignment of revenues from the City's wastewater user feesnecessary to meet the annual loan payment. 9,900,000
Due to the State of Wyoming, Office of State Lands and Investments,DWSRF Loan #177, original amount of $5,280,000 for the design andconstruction of Phase III of the Southern Water Transmission Main, with interest at 2.5% due annually on March 1. This loan is also granted principalforgiveness up to 25% of the loan, not to exceed $1,320,000. Annual principaland interest payments are $186,808 per year through 2038. Secured by apledge and assignment of revenues from the City's water system user feesnecessary to meet the annual payment. 2,797,970
Due to the State of Wyoming, Office of State Lands and Investments,CWSRF Loan #046, original amount of $36,450,000, with interest at 2.5%,due annually on June 1. Annual principal and interest payments are $2,338,163through 2026 for the Dry and Crow Creek Rehab construction project.Secured by the pledge and assignment of revenues generated from the City'swastewater user fees necessary to meet the annual loan payment. 14,848,291
Continued

BOARD OF PUBLIC UTILITIES CITY OF CHEYENNE, WYOMING NOTES TO FINANCIAL STATEMENTS
32
Due to the State of Wyoming, Office of State Lands and Investments,CWSRF Loan #060, original amount of $2,900,000 loan, with interest at 2.5%,due annually on September 1. Annual principal and interest payments are$174,898 through 2029. Secured by the pledge and assignment of revenuesfrom the City's wastewater user fees necessary to meet the annual loanpayment. 1,531,043 $
Due to the State of Wyoming, Office of State Lands and Investments,CWSRF Loan #081, original amount of $1,280,000 for the extension ofCheyenne's Recycled Water System Project, with interest at 2.5%, dueannually on September 1. Annual principal and interest payments are $81,843through 2030. Secured by a pledge and assignment of revenues from theCity's water system user fees necessary to meet the annual loan payment. 779,440
Due to the State of Wyoming, Office of State Lands and Investments,CWSRF Loan #084, original amount of $375,000 loan for the planning phaseof the Administration Building Project, with interest at 2.5% due annually onJune 1. Annual principal and interest payments are $24,055 through 2032.Secured by pledge and assignment of revenues from the City's wastewateruser fees necessary to meet the annual loan payment. 264,205
Due to the State of Wyoming, Office of State Lands and Investments,CWSRF Loan #115, original amount of $3,500,000 for the construction phaseof the Administration Building Project, with interest at 2.5% due annually onJune 1. Annual principal and interest payments are $159,062 through 2032.Secured by pledge and assignment of revenues from the City's wastewateruser fees necessary to meet the annual loan payment. 1,747,019
Due to the State of Wyoming, Office of State Lands and Investments,CWSRF Loan #133, original amount of $5,000,000 for Crow Creek PlantImprovements Project with interest at 2.5% due annually on June 15. Annualprincipal and interest payments are $320,736 through 2039. Secured by pledgeand assignment of revenues from the City's wastewater user fees necessaryto meet the annual loan payment. 4,187,249
Due to the State of Wyoming, Office of State Lands and Investments,CWSRF Loan #143, original amount of $875,000 or Holliday Park ReuseProject with interest at 0.0%. Principal payments of $37,500 are due annuallyin September through 2037. Secured by pledge and assignment of revenuesfrom the City's wastewater user fees necessary to meet the annual loanpayment. 675,000 $
Continued
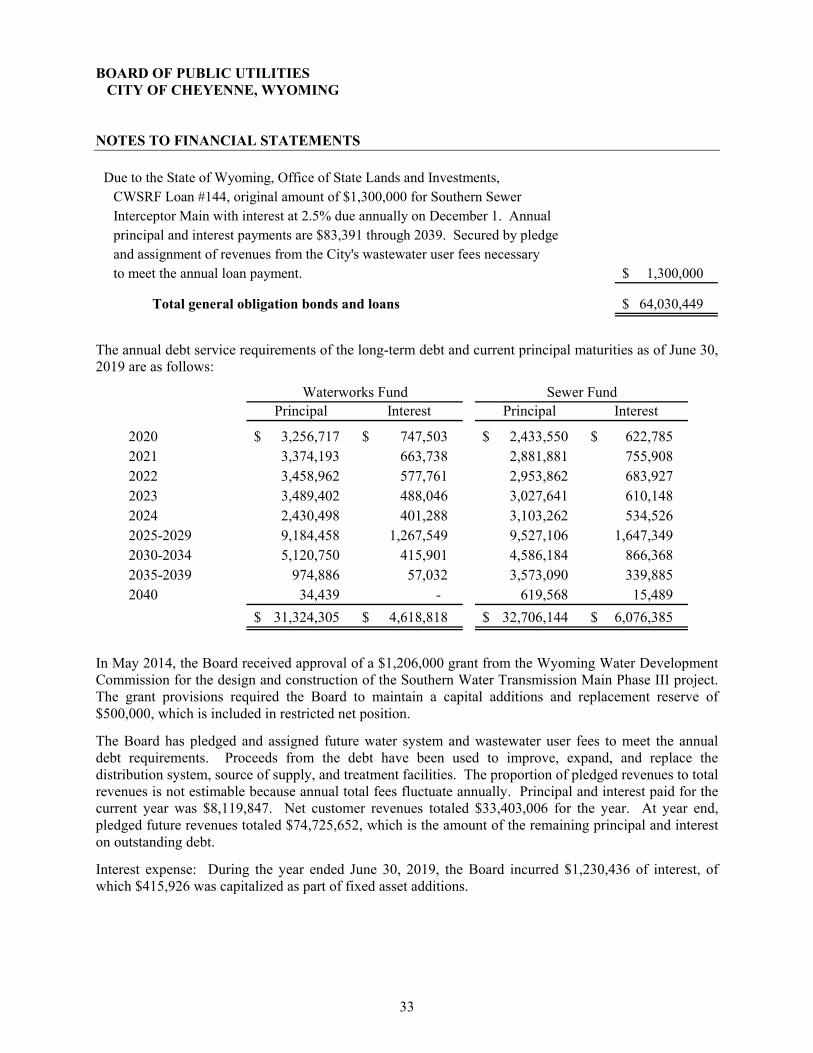
BOARD OF PUBLIC UTILITIES CITY OF CHEYENNE, WYOMING NOTES TO FINANCIAL STATEMENTS
33
Due to the State of Wyoming, Office of State Lands and Investments,CWSRF Loan #144, original amount of $1,300,000 for Southern SewerInterceptor Main with interest at 2.5% due annually on December 1. Annualprincipal and interest payments are $83,391 through 2039. Secured by pledgeand assignment of revenues from the City's wastewater user fees necessaryto meet the annual loan payment. 1,300,000 $
Total general obligation bonds and loans 64,030,449 $
The annual debt service requirements of the long-term debt and current principal maturities as of June 30, 2019 are as follows:
Principal Interest Principal Interest
2020 3,256,717 $ 747,503 $ 2,433,550 $ 622,785 $ 2021 3,374,193 663,738 2,881,881 755,908 2022 3,458,962 577,761 2,953,862 683,927 2023 3,489,402 488,046 3,027,641 610,148 2024 2,430,498 401,288 3,103,262 534,526 2025-2029 9,184,458 1,267,549 9,527,106 1,647,349 2030-2034 5,120,750 415,901 4,586,184 866,368 2035-2039 974,886 57,032 3,573,090 339,885 2040 34,439 - 619,568 15,489
31,324,305 $ 4,618,818 $ 32,706,144 $ 6,076,385 $
Waterworks Fund Sewer Fund
In May 2014, the Board received approval of a $1,206,000 grant from the Wyoming Water Development Commission for the design and construction of the Southern Water Transmission Main Phase III project. The grant provisions required the Board to maintain a capital additions and replacement reserve of $500,000, which is included in restricted net position.
The Board has pledged and assigned future water system and wastewater user fees to meet the annual debt requirements. Proceeds from the debt have been used to improve, expand, and replace the distribution system, source of supply, and treatment facilities. The proportion of pledged revenues to total revenues is not estimable because annual total fees fluctuate annually. Principal and interest paid for the current year was $8,119,847. Net customer revenues totaled $33,403,006 for the year. At year end, pledged future revenues totaled $74,725,652, which is the amount of the remaining principal and interest on outstanding debt.
Interest expense: During the year ended June 30, 2019, the Board incurred $1,230,436 of interest, of which $415,926 was capitalized as part of fixed asset additions.
BOARD OF PUBLIC UTILITIES CITY OF CHEYENNE, WYOMING NOTES TO FINANCIAL STATEMENTS
34
Note 5. Retirement Commitments Plan description: Substantially all employees of the Board are provided with pensions through the Public Employee Pension Plan – a statewide cost-sharing multiple-employer defined benefit pension plan administered by the Wyoming Retirement System (WRS). The authority to establish and amend benefits and contributions rates rests with the Legislature of the State of Wyoming. WRS is granted the authority to administer the Plan by Wyoming State Statutes § 9-3-401 through 432. WRS issues a publicly available financial report that can be obtained through the WRS website, located at http://retirement.state.wy.us/About/Reports?Label=Financial#categories. Benefits provided: The determination of retirement benefits is dependent upon the employee’s initial employment date.
Service Retirement Tier 1: Full retirement at age 60 or qualifies for the Rule of 85. Early retirement is permitted at age 50 or 25 years of service. Formula for retirement equals 2.125% times the number of years of service times the three-year highest average salary for the first 15 years and 2.25% times the number of years of service times the three-year highest average over 15 years.
Service Retirement Tier 2: Full retirement at age 65 or qualifies for the Rule of 85. Early retirement is permitted at age 55 or 25 years of service. Formula for retirement equals 2% times the number of years of service times the five-year highest average salary.
Disability Benefits: Partial or total disability retirement is available to any member who becomes incapacitated, mentally or physically, and cannot continue in the performance of his/her duties. To qualify, the member must have at least 10 years of service and must be “in service” at the time of application for disability retirement. Upon retirement for a partial disability, the member receives a monthly disability retirement benefit for the period of her/her disability equal to 50% of the normal benefit payable to the member, as if the member was eligible for normal retirement benefits. Upon retirement for a total disability, the member receives a monthly disability benefit equal to 100% of his service retirement benefit as if the member was eligible for normal retirement benefits. Disability benefits are payable for the life of the member or until death.
Survivor’s Benefits: Certain surviving dependents receive benefits based on the deceased member’s compensation and their relationship to the deceased, as well as the benefit option selected by the member at the date of retirement.
Contributions: Per Title § 9-3-412 and 413 of Wyoming State Statutes, for the year ended June 30, 2019, member contributions were required to be 8.50% of compensation and employer contributions were required to be 8.62% of compensation. These contributions increased September 1, 2018. Previously, the member and employee contribution percentages were 8.25% and 8.37%, respectively. In accordance with Title § 9-3-412(c)(ii) of Wyoming State Statutes, the Board has elected to pay 6% of the member’s contribution subsequent to the change and 5.75% prior to the change in addition to the employer’s contribution. Total contributions to the pension plan from the Board were $1,085,411 for the year ended June 30, 2019.

BOARD OF PUBLIC UTILITIES CITY OF CHEYENNE, WYOMING NOTES TO FINANCIAL STATEMENTS
35
Pension liabilities, pension expense, and deferred outflows of resources and deferred inflows of resources related to pensions: At June 30, 2019, the Board reported a liability of $12,722,850 for its proportionate share of the net pension liability. The net pension liability was measured as of December 31, 2018, and the total pension liability used to calculate the net pension liability was determined by an actuarial valuation as of January 1, 2018 and incorporated assumption changes adopted by the Board effective August 23, 2017. The Board’s proportion of the net pension liability was based on the relationship of the Board’s total contributions to the plan for the year ended December 31, 2018 to the contributions of all participating employers for the same period. At December 31, 2018, the Board’s proportion was 0.4178%, which was an increase from its December 31, 2017 proportion of 0.4072%.
For the year ended June 30, 2019, the Board recognized pension expense of $2,061,418. At June 30, 2019, the Board reported deferred outflows of resources and deferred inflows of resources related to pensions from the following sources:
Deferred DeferredOutflows of Inflows ofResources Resources
Differences between expected and actual experience -$ (314,425) $
Changes of assumptions 619,493 -
Net difference between projected and actual earningson pension plan investments 1,898,192 -
Changes in proportion and differences betweencontributions and proportionate share of contributions 372,668 -
Contributions subsequent to the measurement date 325,395 -
3,215,748 $ (314,425) $
The amount of $325,395 reported as deferred outflows of resources related to pensions resulting from Board contributions subsequent to the measurement date will be recognized as a reduction of the net pension liability in the year ended June 30, 2020. Other amounts reported as deferred outflows of resources and deferred inflows of resources related to pensions will be recognized in pension expense as follows:
Year ended June 30:2020 1,050,336 $ 2021 572,927 2022 318,639 2023 634,026
2,575,928 $
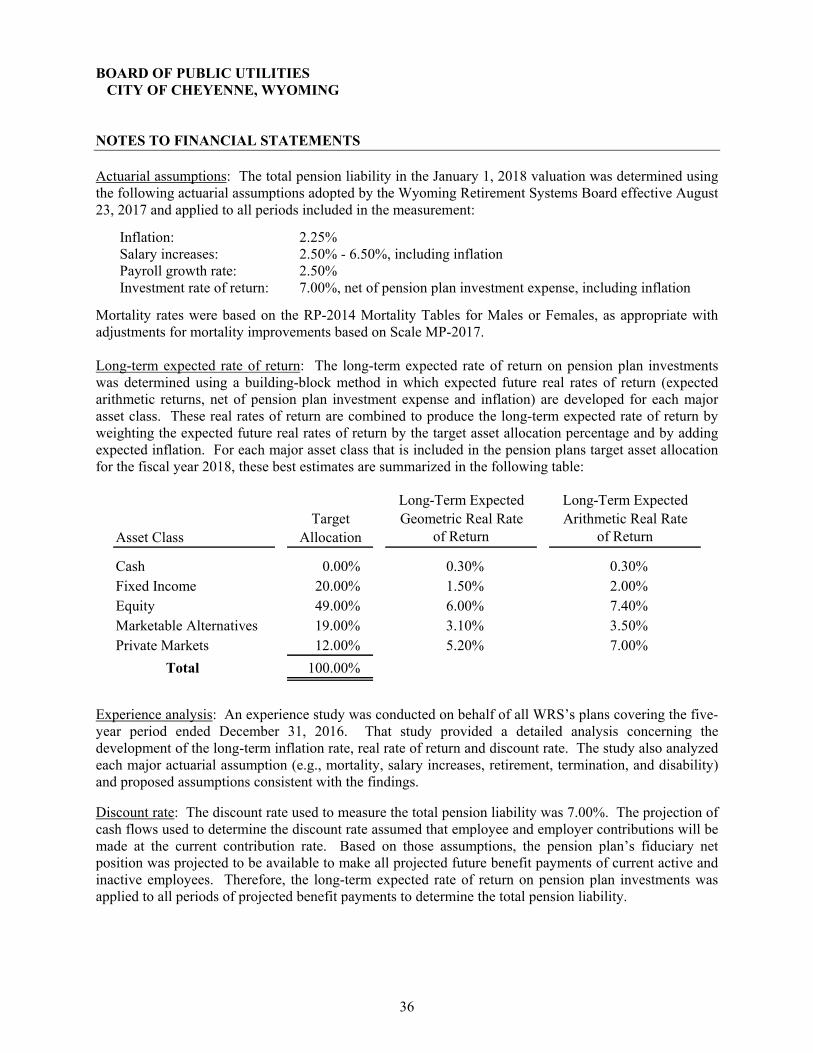
BOARD OF PUBLIC UTILITIES CITY OF CHEYENNE, WYOMING NOTES TO FINANCIAL STATEMENTS
36
Actuarial assumptions: The total pension liability in the January 1, 2018 valuation was determined using the following actuarial assumptions adopted by the Wyoming Retirement Systems Board effective August 23, 2017 and applied to all periods included in the measurement:
Inflation: 2.25% Salary increases: 2.50% - 6.50%, including inflation Payroll growth rate: 2.50% Investment rate of return: 7.00%, net of pension plan investment expense, including inflation
Mortality rates were based on the RP-2014 Mortality Tables for Males or Females, as appropriate with adjustments for mortality improvements based on Scale MP-2017. Long-term expected rate of return: The long-term expected rate of return on pension plan investments was determined using a building-block method in which expected future real rates of return (expected arithmetic returns, net of pension plan investment expense and inflation) are developed for each major asset class. These real rates of return are combined to produce the long-term expected rate of return by weighting the expected future real rates of return by the target asset allocation percentage and by adding expected inflation. For each major asset class that is included in the pension plans target asset allocation for the fiscal year 2018, these best estimates are summarized in the following table:
Long-Term Expected Long-Term ExpectedTarget Geometric Real Rate Arithmetic Real Rate
Asset Class Allocation of Return of Return
Cash 0.00% 0.30% 0.30%Fixed Income 20.00% 1.50% 2.00%Equity 49.00% 6.00% 7.40%Marketable Alternatives 19.00% 3.10% 3.50%Private Markets 12.00% 5.20% 7.00%
Total 100.00%
Experience analysis: An experience study was conducted on behalf of all WRS’s plans covering the five-year period ended December 31, 2016. That study provided a detailed analysis concerning the development of the long-term inflation rate, real rate of return and discount rate. The study also analyzed each major actuarial assumption (e.g., mortality, salary increases, retirement, termination, and disability) and proposed assumptions consistent with the findings. Discount rate: The discount rate used to measure the total pension liability was 7.00%. The projection of cash flows used to determine the discount rate assumed that employee and employer contributions will be made at the current contribution rate. Based on those assumptions, the pension plan’s fiduciary net position was projected to be available to make all projected future benefit payments of current active and inactive employees. Therefore, the long-term expected rate of return on pension plan investments was applied to all periods of projected benefit payments to determine the total pension liability.

BOARD OF PUBLIC UTILITIES CITY OF CHEYENNE, WYOMING NOTES TO FINANCIAL STATEMENTS
37
Sensitivity of the employer’s proportionate share of the net pension liability to changes in the discount rate: The following presents the Board’s proportionate share of the net pension liability calculated using the discount rate of 7.00%, as well as what the Board’s proportionate share of the net pension liability would be if it were calculated using a discount rate that is 1-percentage-point lower (6.00%) or 1 percentage-point higher (8.00%) than the current rate:
1% Discount 1%Decrease Rate Increase(6.00%) (7.00%) (8.00%)
Board's proportionate share of the net pension liability 17,644,879 $ 12,722,850 $ 8,615,464 $
Sensitivity of Net Pension Liability to the Single Discount Rate Assumption
Pension plan fiduciary net position: Detailed information about the pension plan’s fiduciary net position is available in the separately issued WRS financial report available from the Wyoming Retirement System, at 6101 Yellowstone Road, Cheyenne, Wyoming 82002, or may be accessed through the WRS website at http://retirement.state.wy.us/home/About/Reports?Label=Financial#categories Defined Contributions Plans. Board employees have the option to participate in one of two defined contribution plans. These defined contribution plans include the Wyoming Deferred Compensation Program (457 Plan) administered by the Wyoming Retirement System and a defined contribution plan administered by VALIC Financial Advisors. Employees are allowed to contribute the maximum amount per Internal Revenue Service guidelines. The total employee contributions for the years ended June 30, 2019 and 2018 were $221,864 and $180,961, respectively. Beginning July 1, 2008, the Board elected to match an employee’s contribution up to $25 per month. The total matching contributions for the years ended June 30, 2019 and 2018 were $30,625 and $31,650, respectively. Note 6. Due from Other Governments Amounts due from other governments of $20,935 as of June 30, 2019 are from other governmental entities in connection with the construction of various projects. The amount due represents pay requests received from contractors for work done through June 2019. Upon receipt of these pay requests, the Board applies to other governmental entities for grant and/or loan monies to pay contractors.
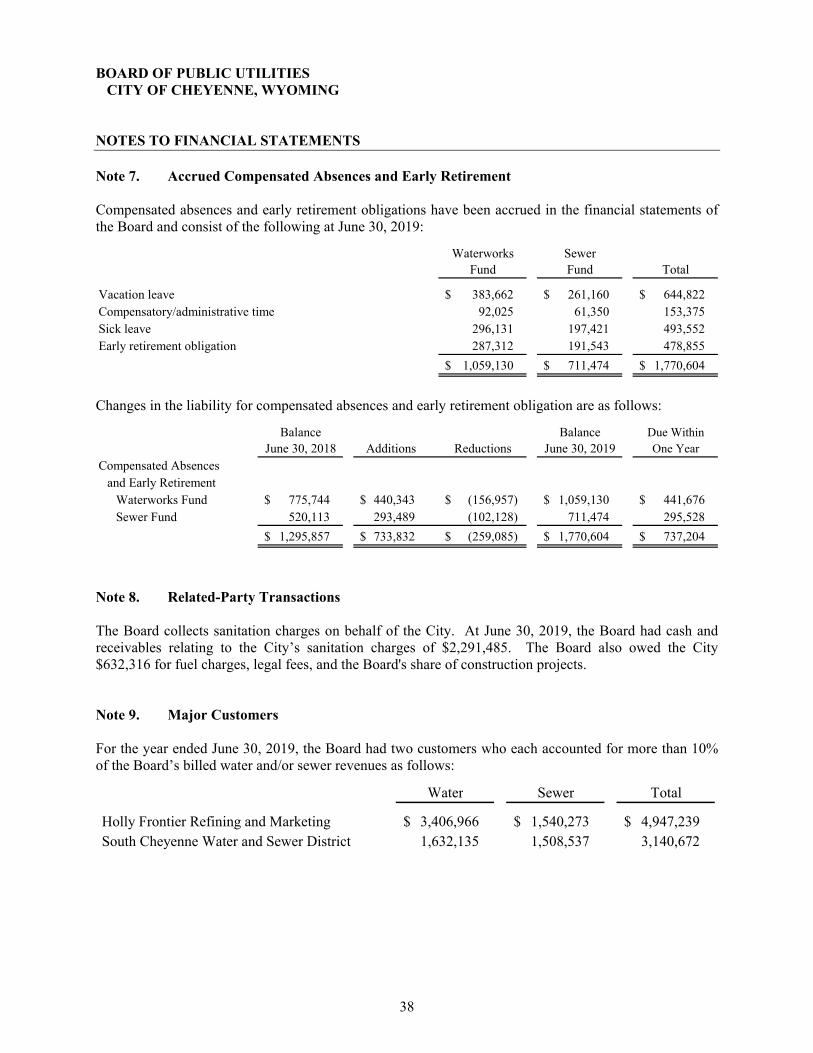
BOARD OF PUBLIC UTILITIES CITY OF CHEYENNE, WYOMING NOTES TO FINANCIAL STATEMENTS
38
Note 7. Accrued Compensated Absences and Early Retirement Compensated absences and early retirement obligations have been accrued in the financial statements of the Board and consist of the following at June 30, 2019:
Waterworks SewerFund Fund Total
Vacation leave 383,662 $ 261,160 $ 644,822 $ Compensatory/administrative time 92,025 61,350 153,375 Sick leave 296,131 197,421 493,552 Early retirement obligation 287,312 191,543 478,855
1,059,130 $ 711,474 $ 1,770,604 $
Changes in the liability for compensated absences and early retirement obligation are as follows:
Balance Balance Due WithinJune 30, 2018 Additions Reductions June 30, 2019 One Year
Compensated Absencesand Early Retirement
Waterworks Fund 775,744 $ 440,343 $ (156,957) $ 1,059,130 $ 441,676 $ Sewer Fund 520,113 293,489 (102,128) 711,474 295,528
1,295,857 $ 733,832 $ (259,085) $ 1,770,604 $ 737,204 $
Note 8. Related-Party Transactions The Board collects sanitation charges on behalf of the City. At June 30, 2019, the Board had cash and receivables relating to the City’s sanitation charges of $2,291,485. The Board also owed the City $632,316 for fuel charges, legal fees, and the Board's share of construction projects. Note 9. Major Customers For the year ended June 30, 2019, the Board had two customers who each accounted for more than 10% of the Board’s billed water and/or sewer revenues as follows:
Water Sewer Total
Holly Frontier Refining and Marketing 3,406,966 $ 1,540,273 $ 4,947,239 $ South Cheyenne Water and Sewer District 1,632,135 1,508,537 3,140,672
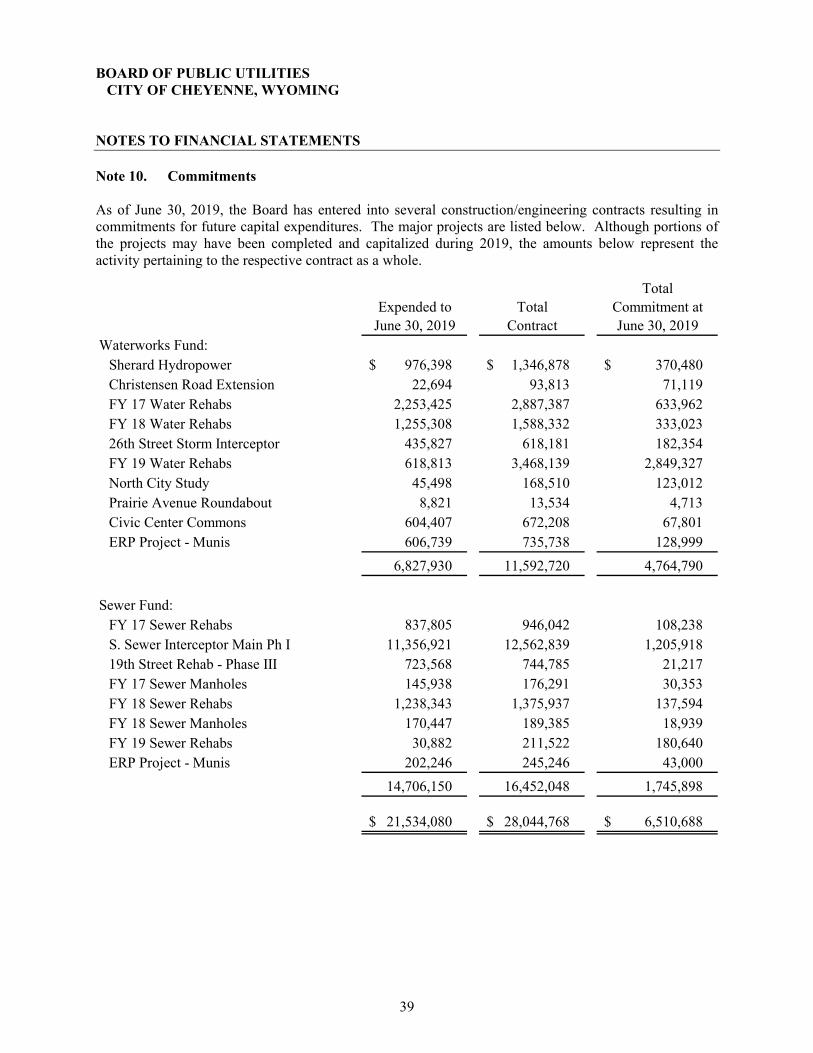
BOARD OF PUBLIC UTILITIES CITY OF CHEYENNE, WYOMING NOTES TO FINANCIAL STATEMENTS
39
Note 10. Commitments As of June 30, 2019, the Board has entered into several construction/engineering contracts resulting in commitments for future capital expenditures. The major projects are listed below. Although portions of the projects may have been completed and capitalized during 2019, the amounts below represent the activity pertaining to the respective contract as a whole.
TotalExpended to Total Commitment at
June 30, 2019 Contract June 30, 2019Waterworks Fund:
Sherard Hydropower 976,398 $ 1,346,878 $ 370,480 $ Christensen Road Extension 22,694 93,813 71,119 FY 17 Water Rehabs 2,253,425 2,887,387 633,962 FY 18 Water Rehabs 1,255,308 1,588,332 333,023 26th Street Storm Interceptor 435,827 618,181 182,354 FY 19 Water Rehabs 618,813 3,468,139 2,849,327 North City Study 45,498 168,510 123,012 Prairie Avenue Roundabout 8,821 13,534 4,713 Civic Center Commons 604,407 672,208 67,801 ERP Project - Munis 606,739 735,738 128,999
6,827,930 11,592,720 4,764,790
Sewer Fund:FY 17 Sewer Rehabs 837,805 946,042 108,238 S. Sewer Interceptor Main Ph I 11,356,921 12,562,839 1,205,918 19th Street Rehab - Phase III 723,568 744,785 21,217 FY 17 Sewer Manholes 145,938 176,291 30,353 FY 18 Sewer Rehabs 1,238,343 1,375,937 137,594 FY 18 Sewer Manholes 170,447 189,385 18,939 FY 19 Sewer Rehabs 30,882 211,522 180,640 ERP Project - Munis 202,246 245,246 43,000
14,706,150 16,452,048 1,745,898
21,534,080 $ 28,044,768 $ 6,510,688 $

BOARD OF PUBLIC UTILITIES CITY OF CHEYENNE, WYOMING NOTES TO FINANCIAL STATEMENTS
40
Note 11. Risk Management The Board is exposed to various risks of loss related to torts; theft of, damage to, and destruction of assets; errors and omissions; injuries to employees and natural disasters.
As of June 30, 2019, the Board is a member of the Wyoming Association of Risk Management (WARM), which is a separate legal agency created under Wyoming State Statutes for the purpose of establishing a shared risk pool and/or jointly purchasing insurance coverage. The participating entities are responsible for paying premiums into the pool, which are calculated annually and are based upon actuarially sound and recognized pooling practices. The pool is responsible for determining the amounts of the premiums charged to the entities and is also responsible for managing the pool’s assets. The entities have the right to submit claims for losses incurred. The pool has the right to collect premiums and admit or terminate members for nonpayment of premiums. The Board management considers the assets of WARM to be sufficient to cover any claims that may be incurred by its members.
The Board has not had significant settlements exceeding insurance coverage in any of the past three fiscal years. The Board has had no significant reductions in insurance coverage from coverage in the prior year.
The Board pays into the State Worker’s Compensation System a premium based on a rate per covered payroll. This rate is calculated based on accident history and administrative costs.
REQUIRED SUPPLEMENTARY INFORMATION

41
BOARD OF PUBLIC UTILITIESCITY OF CHEYENNE, WYOMING
SCHEDULE OF THE BOARD'S PROPORTIONATE SHARE OF THE NET PENSION LIABILITYPUBLIC EMPLOYEE PENSION PLANLast 6 Fiscal Years*
Board's PlanBoard's Board's proportionate share fiduciary
proportion proportionate of the net pension net positionof the share of the liability as a as a percentage
net pension net pension Board's percentage of its of the totalliability liability covered payroll covered payroll pension liability
2014 0.3772% 5,735,039 $ 6,463,729 $ 88.73% 81.10%2015 0.3621% 6,390,668 6,307,367 101.32% 79.08%2016 0.3838% 8,940,291 6,855,922 130.40% 73.40%2017 0.3979% 9,619,011 7,127,606 134.95% 73.42%2018 0.4072% 9,280,567 7,177,501 129.30% 76.35%2019 0.4178% 12,722,850 7,409,311 171.71% 69.17%
See Notes to Required Supplementary Information.
* The amounts presented for each fiscal year were determined as of the calendar year-end that occurredwithin the fiscal year. This schedule is to be built prospectively until it contains ten years of data.

42
BOARD OF PUBLIC UTILITIESCITY OF CHEYENNE, WYOMING
SCHEDULE OF THE BOARD'S CONTRIBUTIONSPUBLIC EMPLOYEE PENSION PLANLast 6 Fiscal Years*
Contributions Contributionsin relation to as a
Statutorial the statutorily Contribution percentage ofrequired required deficiency Covered covered
contribution contribution (excess) payroll payroll
2014 465,964 $ 465,964 $ $ - 6,544,388 $ 7.12%2015 512,031 512,031 - 6,719,564 7.62%2016 586,407 586,407 - 7,006,054 8.37%2017 602,689 602,689 - 7,200,585 8.37%2018 608,519 608,519 - 7,270,239 8.37%2019 645,547 645,547 - 7,524,834 8.58%
See Notes to Required Supplementary Information.
* This schedule is to be built prospectively until it contains ten years of data.
BOARD OF PUBLIC UTILITIES CITY OF CHEYENNE, WYOMING NOTES TO REQUIRED SUPPLEMENTARY INFORMATION
43
Changes in benefit terms: There were no changes in benefit terms between the December 31, 2017 measurement date and the December 31, 2018 measurement date. Changes in assumptions: There were no changes in assumptions between the December 31, 2017 measurement date and the December 31, 2018 measurement date.
SUPPLEMENTARY INFORMATION

44
BOARD OF PUBLIC UTILITIESCITY OF CHEYENNE, WYOMING
BUDGETARY COMPARISON SCHEDULEYear Ended June 30, 2019
Actual Budget Variance withOriginal Final Basis Final Budget
Operating RevenuesSales and charges for services 20,621,900 $ 20,621,900 $ 19,383,845 $ (1,238,055) $ Fees and miscellaneous 403,800 403,800 407,754 3,954
Total operating revenues 21,025,700 21,025,700 19,791,599 (1,234,101)
Nonoperating RevenuesInvestment income 195,500 195,500 694,793 499,293 Gain on sale of assets - - 4,000 4,000 System development fees 1,868,800 1,868,800 2,005,813 137,013 Capital grants - 3,652,683 1,065,740 (2,586,943) Donated utilities - - 994,643 994,643
Total nonoperating revenues 2,064,300 5,716,983 4,764,989 (951,994)
Total revenues 23,090,000 26,742,683 24,556,588 (2,186,095)
Operating ExpensesSource of supply 1,626,200 1,814,200 1,444,920 (369,280) Water treatment 2,210,200 2,352,200 2,018,472 (333,728) Transmission and distribution 2,483,100 2,661,325 2,524,185 (137,140) Sewer collection lines - - - - Water reclamation - - - - Engineering and water resources 1,089,200 1,182,785 1,069,714 (113,071) Administrative and general 4,524,600 4,712,600 5,284,890 572,290 Information technology
and customer service 1,045,800 1,156,787 1,007,754 (149,033)
Total operations 12,979,100 13,879,897 13,349,935 (529,962)
Nonoperating ExpendituresCapital purchases 732,100 1,009,566 697,091 (312,475) Construction work in progress 6,240,700 19,146,276 4,157,618 (14,988,658) Debt service, interest 846,700 846,700 800,721 (45,979) Debt service, principal 3,272,300 3,272,300 3,177,126 (95,174)
Total other expenditures 11,091,800 24,274,842 8,832,556 (15,442,286)
Total expenditures 24,070,900 38,154,739 22,182,491 (15,972,248)
Excess (deficiency) ofrevenues over expenditures (980,900) $ (11,412,056) $ 2,374,097 $ 13,786,153 $
Waterworks FundBudgeted Amounts

45
Actual Budget Variance withOriginal Final Basis Final Budget
12,567,900 $ 12,567,900 $ 13,008,656 $ 440,756 $ 432,500 432,500 602,751 170,251
13,000,400 13,000,400 13,611,407 611,007
95,600 95,600 336,132 240,532 - - 3,000 3,000
894,100 894,100 488,320 (405,780) - - - - - - 714,311 714,311
989,700 989,700 1,541,763 552,063
13,990,100 13,990,100 15,153,170 1,163,070
- - - - - - - - - - - -
1,522,400 1,746,397 1,543,025 (203,372) 2,547,050 2,809,550 2,614,490 (195,060)
363,200 368,000 329,974 (38,026) 2,324,600 2,424,100 2,594,620 170,520
349,300 386,296 341,275 (45,021)
7,106,550 7,734,343 7,423,384 (310,959)
568,300 908,533 319,145 (589,388) 2,336,700 8,991,186 3,496,781 (5,494,405)
744,100 744,100 845,641 101,541 2,325,300 2,325,300 2,325,635 335
5,974,400 12,969,119 6,987,202 (5,981,917)
13,080,950 20,703,462 14,410,586 (6,292,876)
909,150 $ (6,713,362) $ 742,584 $ 7,455,946 $
Sewer FundBudgeted Amounts
BOARD OF PUBLIC UTILITIES CITY OF CHEYENNE, WYOMING NOTES TO BUDGETARY COMPARISON SCHEDULE
46
Budget control: The Board procedures for establishing the budget each year are as follows:
1. Operational budgets are submitted by the Division Managers to the Director in February of each year.
2. During April of each year, these budgets are reviewed and refined as necessary by the Division Managers and the Director.
3. The Director submits the proposed budget to the Board the first of May of each year. The overall budget includes proposed expenses and the means of financing them.
4. In early May, the Board approves the tentative budget and submits it to the Cheyenne City Council.
5. During May, the tentative budget is reviewed by the City of Cheyenne Financial Committee and revisions are made, if necessary.
6. Public hearings are conducted at City Hall to obtain taxpayer comments during June of each year.
7. Prior to June 30, the budget is legally enacted through passage of an ordinance for the fiscal year beginning July 1 of each year.
8. The Division Managers are authorized to transfer budgeted amounts between expense classifications within their divisions. The Director is authorized to approve transfers of less than $25,000 affecting capital accounts. All other transfers must be approved by the Board and any revisions that alter the total expenditures of any fund must be approved by the City Council.
9. Formal budgetary integration is employed as a management control device during the year for all funds of the Board. Budgets are legally adopted for all funds. Expenses cannot exceed budgeted amounts at the individual department level based upon original and/or supplemental appropriations as approved by the City Council. All appropriations lapse at year end.
Budgets are prepared for Board funds on the accrual basis of accounting. Budgets are prepared in accordance with accounting principles generally accepted in the United States of America except that depreciation, pension expense, and change in fair value of investments are not budgeted and capital purchases and principal payments are budgeted as an expense.
47
STATISTICAL SECTION (UNAUDITED)
This part of the City of Cheyenne, Wyoming Board of Public Utilities’ comprehensive annual financial report presents detailed information as a context for understanding what the information in the financial statements, note disclosures, and required supplementary information says about the government’s overall financial health. Financial Trends
These schedules contain trend information to help the reader understand how the government’s financial performance and well-being have changed over time. Revenue Capacity
These schedules contain information to help the reader assess the government’s most significant local revenue source, the water and sewer fees. Debt Capacity
These schedules present information to help the reader assess the affordability of the government’s current levels of outstanding debt and the government’s ability to issue additional debt in the future. Demographic and Economic Information
These schedules offer demographic and economic indicators to help the reader understand the environment within which the government’s financial activities take place. Operating Information
These schedules contain service data to help the reader understand how the information in the government’s financial report relates to the services the government provides and the activities it performs.
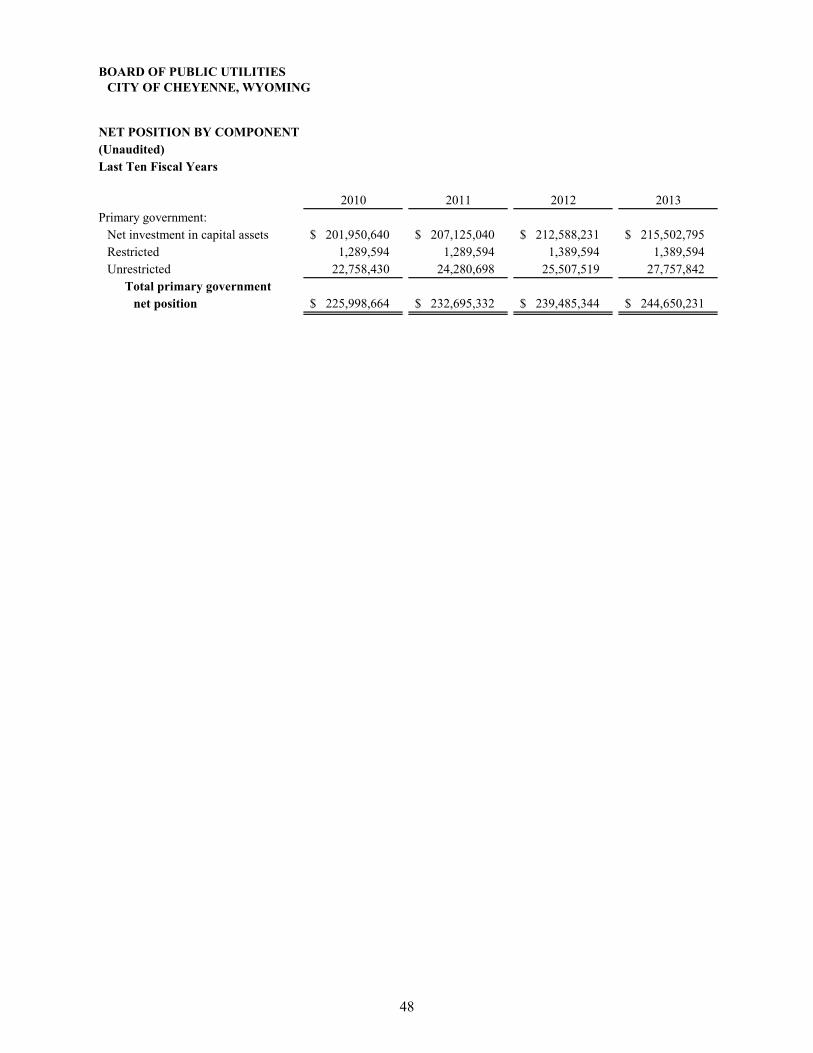
48
BOARD OF PUBLIC UTILITIESCITY OF CHEYENNE, WYOMING
NET POSITION BY COMPONENT(Unaudited)Last Ten Fiscal Years
2010 2011 2012 2013Primary government:
Net investment in capital assets 201,950,640 $ 207,125,040 $ 212,588,231 $ 215,502,795 $ Restricted 1,289,594 1,289,594 1,389,594 1,389,594 Unrestricted 22,758,430 24,280,698 25,507,519 27,757,842
Total primary governmentnet position 225,998,664 $ 232,695,332 $ 239,485,344 $ 244,650,231 $
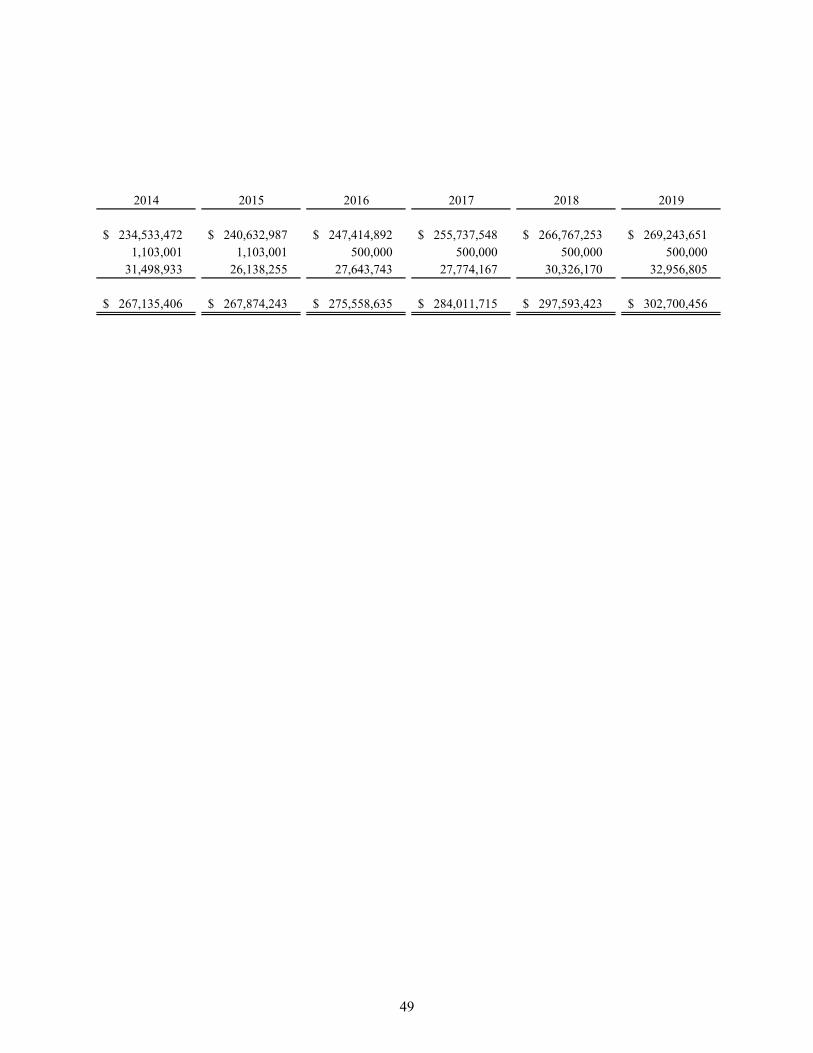
49
2014 2015 2016 2017 2018 2019
234,533,472 $ 240,632,987 $ 247,414,892 $ 255,737,548 $ 266,767,253 $ 269,243,651 $ 1,103,001 1,103,001 500,000 500,000 500,000 500,000
31,498,933 26,138,255 27,643,743 27,774,167 30,326,170 32,956,805
267,135,406 $ 267,874,243 $ 275,558,635 $ 284,011,715 $ 297,593,423 $ 302,700,456 $
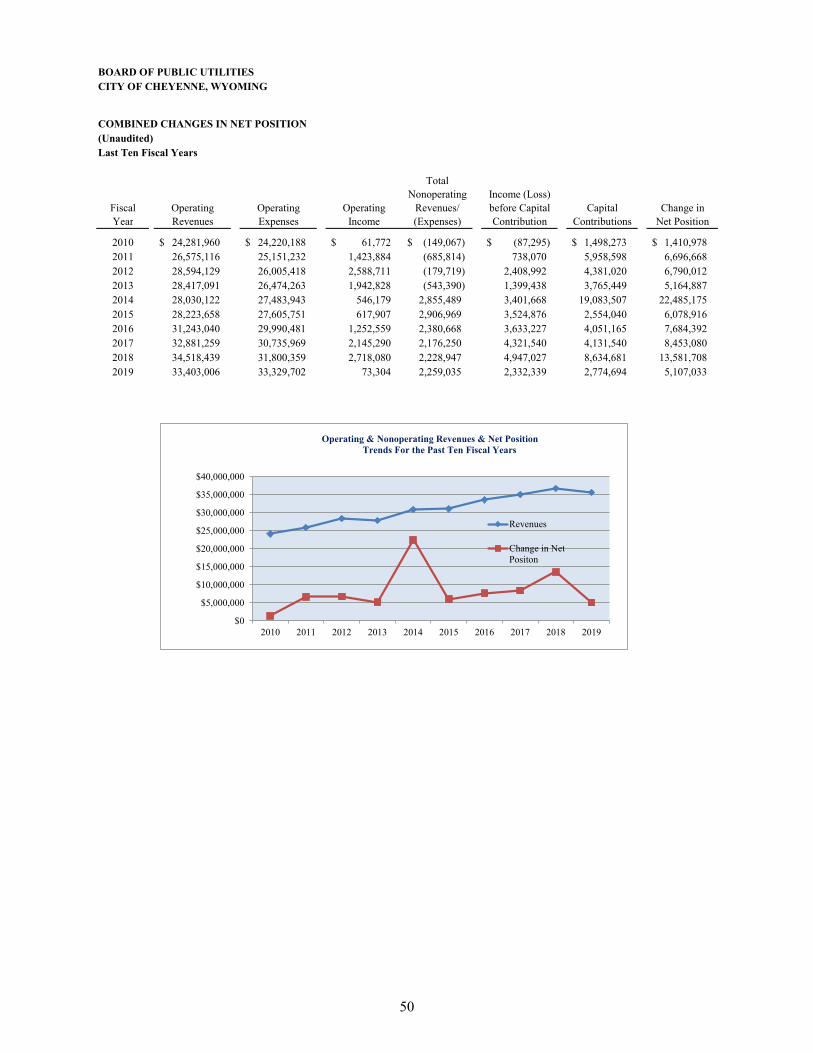
50
BOARD OF PUBLIC UTILITIESCITY OF CHEYENNE, WYOMING
COMBINED CHANGES IN NET POSITION(Unaudited)Last Ten Fiscal Years
TotalNonoperating Income (Loss)
Fiscal Operating Operating Operating Revenues/ before Capital Capital Change inYear Revenues Expenses Income (Expenses) Contribution Contributions Net Position
2010 24,281,960 $ 24,220,188 $ 61,772 $ (149,067) $ (87,295) $ 1,498,273 $ 1,410,978 $ 2011 26,575,116 25,151,232 1,423,884 (685,814) 738,070 5,958,598 6,696,668 2012 28,594,129 26,005,418 2,588,711 (179,719) 2,408,992 4,381,020 6,790,012 2013 28,417,091 26,474,263 1,942,828 (543,390) 1,399,438 3,765,449 5,164,887 2014 28,030,122 27,483,943 546,179 2,855,489 3,401,668 19,083,507 22,485,175 2015 28,223,658 27,605,751 617,907 2,906,969 3,524,876 2,554,040 6,078,916 2016 31,243,040 29,990,481 1,252,559 2,380,668 3,633,227 4,051,165 7,684,392 2017 32,881,259 30,735,969 2,145,290 2,176,250 4,321,540 4,131,540 8,453,080 2018 34,518,439 31,800,359 2,718,080 2,228,947 4,947,027 8,634,681 13,581,708 2019 33,403,006 33,329,702 73,304 2,259,035 2,332,339 2,774,694 5,107,033
$0
$5,000,000
$10,000,000
$15,000,000
$20,000,000
$25,000,000
$30,000,000
$35,000,000
$40,000,000
2010 2011 2012 2013 2014 2015 2016 2017 2018 2019
Revenues
Change in NetPositon
Operating & Nonoperating Revenues & Net PositionTrends For the Past Ten Fiscal Years
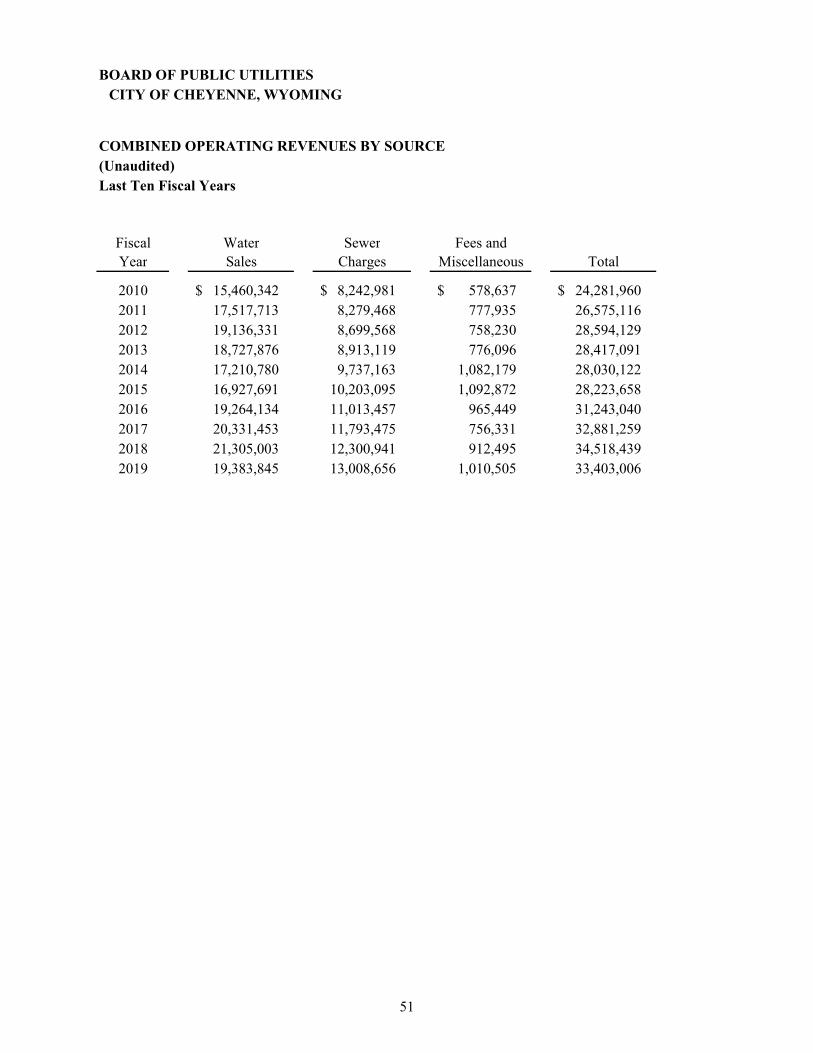
51
BOARD OF PUBLIC UTILITIESCITY OF CHEYENNE, WYOMING
COMBINED OPERATING REVENUES BY SOURCE(Unaudited)Last Ten Fiscal Years
Fiscal Water Sewer Fees andYear Sales Charges Miscellaneous Total
2010 15,460,342 $ 8,242,981 $ 578,637 $ 24,281,960 $ 2011 17,517,713 8,279,468 777,935 26,575,116 2012 19,136,331 8,699,568 758,230 28,594,129 2013 18,727,876 8,913,119 776,096 28,417,091 2014 17,210,780 9,737,163 1,082,179 28,030,122 2015 16,927,691 10,203,095 1,092,872 28,223,658 2016 19,264,134 11,013,457 965,449 31,243,040 2017 20,331,453 11,793,475 756,331 32,881,259 2018 21,305,003 12,300,941 912,495 34,518,439 2019 19,383,845 13,008,656 1,010,505 33,403,006
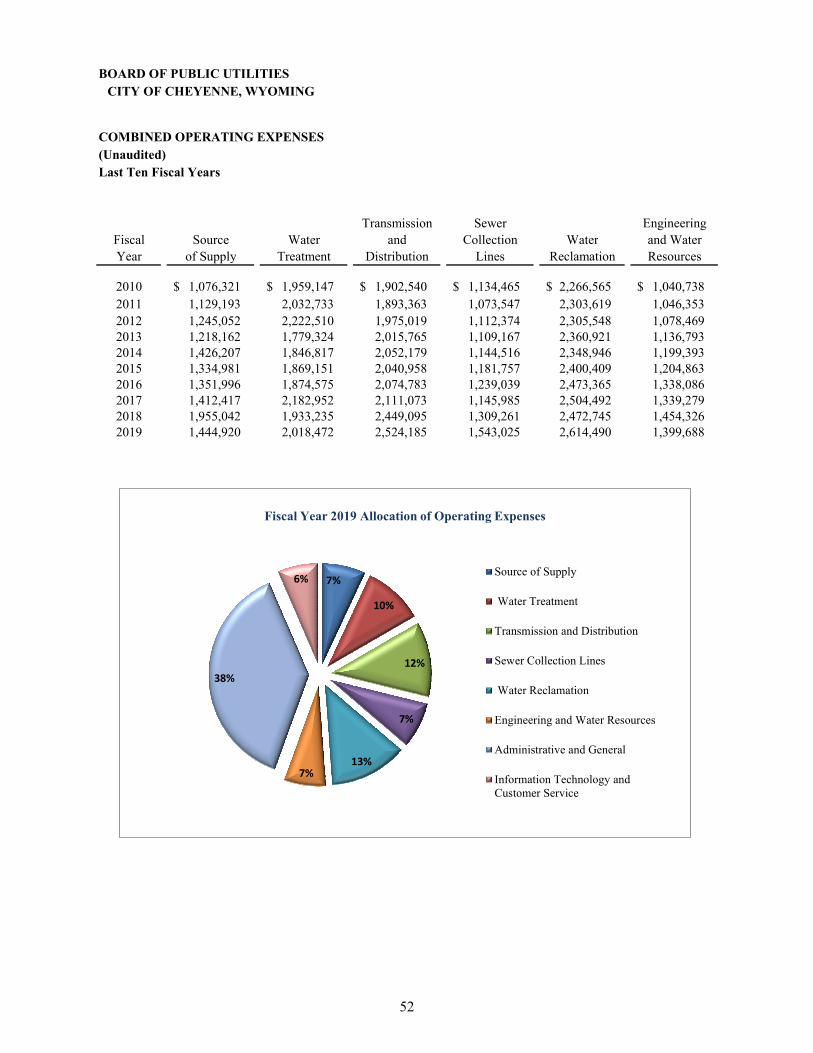
52
BOARD OF PUBLIC UTILITIESCITY OF CHEYENNE, WYOMING
COMBINED OPERATING EXPENSES(Unaudited)Last Ten Fiscal Years
Transmission Sewer EngineeringFiscal Source Water and Collection Water and WaterYear of Supply Treatment Distribution Lines Reclamation Resources
2010 1,076,321 $ 1,959,147 $ 1,902,540 $ 1,134,465 $ 2,266,565 $ 1,040,738 $ 2011 1,129,193 2,032,733 1,893,363 1,073,547 2,303,619 1,046,353 2012 1,245,052 2,222,510 1,975,019 1,112,374 2,305,548 1,078,469 2013 1,218,162 1,779,324 2,015,765 1,109,167 2,360,921 1,136,793 2014 1,426,207 1,846,817 2,052,179 1,144,516 2,348,946 1,199,393 2015 1,334,981 1,869,151 2,040,958 1,181,757 2,400,409 1,204,863 2016 1,351,996 1,874,575 2,074,783 1,239,039 2,473,365 1,338,086 2017 1,412,417 2,182,952 2,111,073 1,145,985 2,504,492 1,339,279 2018 1,955,042 1,933,235 2,449,095 1,309,261 2,472,745 1,454,326 2019 1,444,920 2,018,472 2,524,185 1,543,025 2,614,490 1,399,688
7%
10%
12%
7%
13%7%
38%
6%Source of Supply
Water Treatment
Transmission and Distribution
Sewer Collection Lines
Water Reclamation
Engineering and Water Resources
Administrative and General
Information Technology andCustomer Service
Fiscal Year 2019 Allocation of Operating Expenses
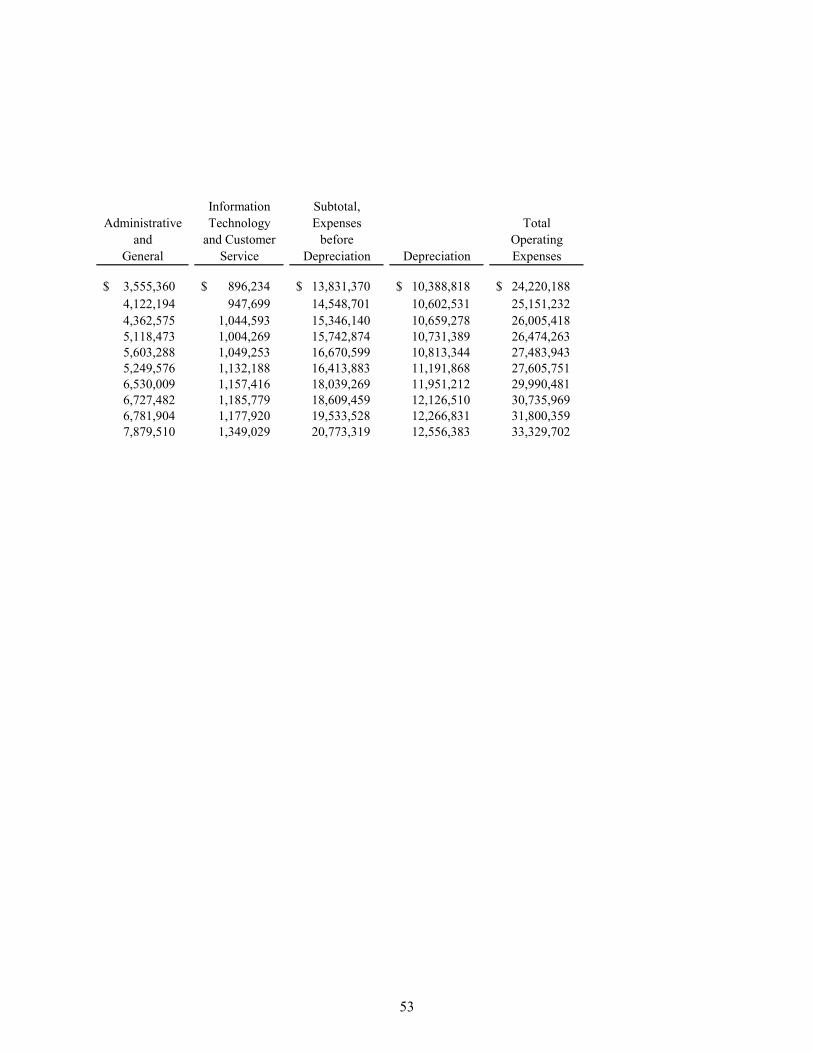
53
Information Subtotal,Administrative Technology Expenses Total
and and Customer before OperatingGeneral Service Depreciation Depreciation Expenses
3,555,360 $ 896,234 $ 13,831,370 $ 10,388,818 $ 24,220,188 $ 4,122,194 947,699 14,548,701 10,602,531 25,151,232 4,362,575 1,044,593 15,346,140 10,659,278 26,005,418 5,118,473 1,004,269 15,742,874 10,731,389 26,474,263 5,603,288 1,049,253 16,670,599 10,813,344 27,483,943 5,249,576 1,132,188 16,413,883 11,191,868 27,605,751 6,530,009 1,157,416 18,039,269 11,951,212 29,990,481 6,727,482 1,185,779 18,609,459 12,126,510 30,735,969 6,781,904 1,177,920 19,533,528 12,266,831 31,800,359 7,879,510 1,349,029 20,773,319 12,556,383 33,329,702
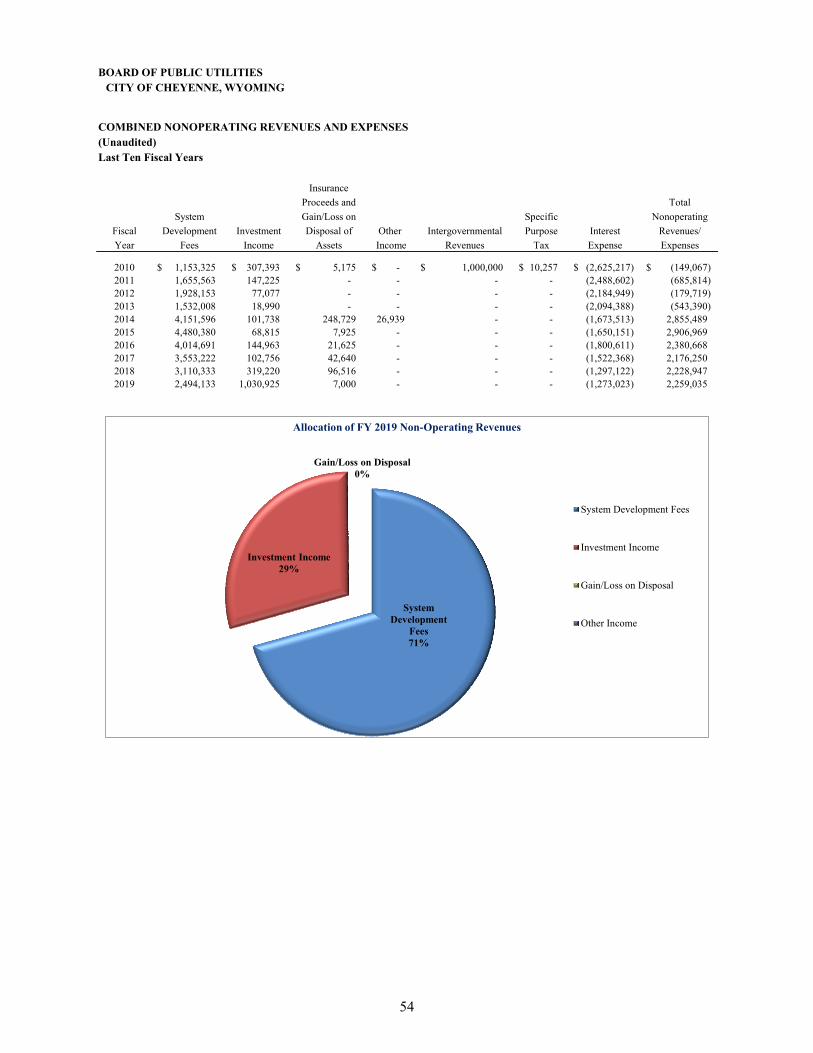
54
BOARD OF PUBLIC UTILITIESCITY OF CHEYENNE, WYOMING
COMBINED NONOPERATING REVENUES AND EXPENSES(Unaudited)Last Ten Fiscal Years
Insurance
Proceeds and Total
System Gain/Loss on Specific Nonoperating
Fiscal Development Investment Disposal of Other Intergovernmental Purpose Interest Revenues/
Year Fees Income Assets Income Revenues Tax Expense Expenses
2010 1,153,325 $ 307,393 $ 5,175 $ -$ 1,000,000 $ 10,257 $ (2,625,217) $ (149,067) $ 2011 1,655,563 147,225 - - - - (2,488,602) (685,814) 2012 1,928,153 77,077 - - - - (2,184,949) (179,719) 2013 1,532,008 18,990 - - - - (2,094,388) (543,390) 2014 4,151,596 101,738 248,729 26,939 - - (1,673,513) 2,855,489 2015 4,480,380 68,815 7,925 - - - (1,650,151) 2,906,969 2016 4,014,691 144,963 21,625 - - - (1,800,611) 2,380,668 2017 3,553,222 102,756 42,640 - - - (1,522,368) 2,176,250 2018 3,110,333 319,220 96,516 - - - (1,297,122) 2,228,947 2019 2,494,133 1,030,925 7,000 - - - (1,273,023) 2,259,035
System Development
Fees71%
Investment Income29%
Gain/Loss on Disposal0%
System Development Fees
Investment Income
Gain/Loss on Disposal
Other Income
Allocation of FY 2019 Non-Operating Revenues
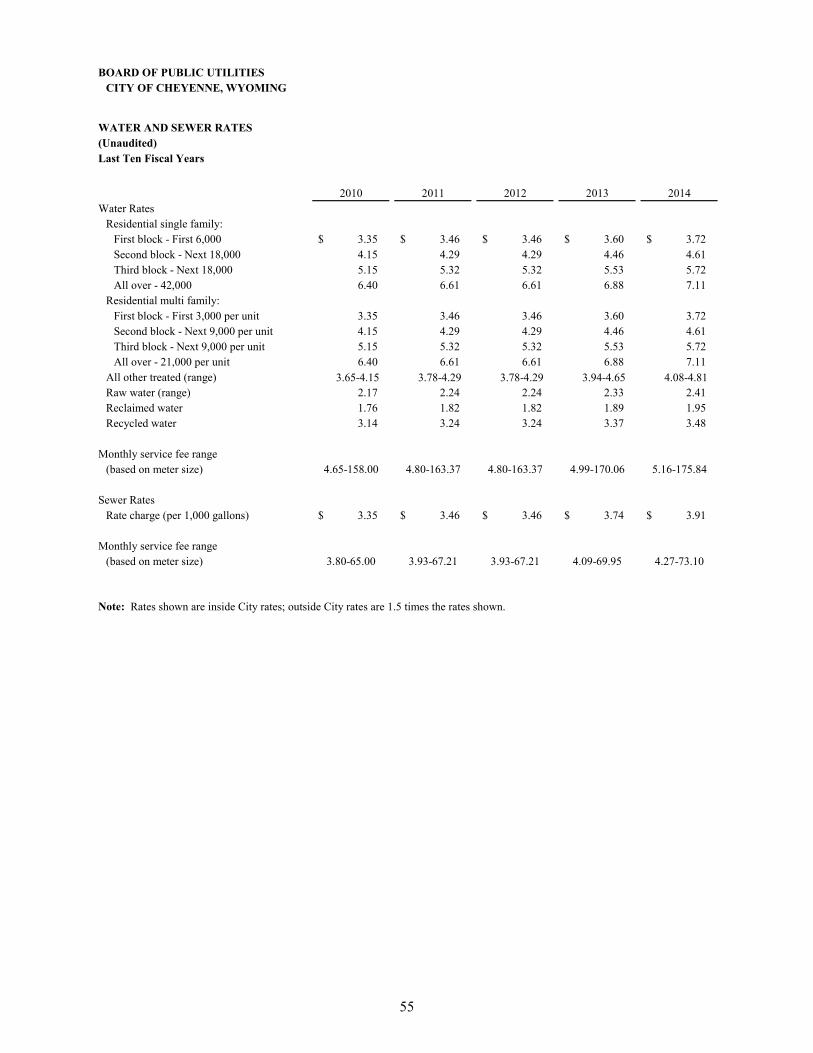
55
BOARD OF PUBLIC UTILITIESCITY OF CHEYENNE, WYOMING
WATER AND SEWER RATES(Unaudited)Last Ten Fiscal Years
2010 2011 2012 2013 2014Water Rates
Residential single family:First block - First 6,000 3.35 $ 3.46 $ 3.46 $ 3.60 $ 3.72 $ Second block - Next 18,000 4.15 4.29 4.29 4.46 4.61 Third block - Next 18,000 5.15 5.32 5.32 5.53 5.72 All over - 42,000 6.40 6.61 6.61 6.88 7.11
Residential multi family:First block - First 3,000 per unit 3.35 3.46 3.46 3.60 3.72 Second block - Next 9,000 per unit 4.15 4.29 4.29 4.46 4.61 Third block - Next 9,000 per unit 5.15 5.32 5.32 5.53 5.72 All over - 21,000 per unit 6.40 6.61 6.61 6.88 7.11
All other treated (range) 3.65-4.15 3.78-4.29 3.78-4.29 3.94-4.65 4.08-4.81Raw water (range) 2.17 2.24 2.24 2.33 2.41 Reclaimed water 1.76 1.82 1.82 1.89 1.95 Recycled water 3.14 3.24 3.24 3.37 3.48
Monthly service fee range(based on meter size) 4.65-158.00 4.80-163.37 4.80-163.37 4.99-170.06 5.16-175.84
Sewer RatesRate charge (per 1,000 gallons) 3.35 $ 3.46 $ 3.46 $ 3.74 $ 3.91 $
Monthly service fee range(based on meter size) 3.80-65.00 3.93-67.21 3.93-67.21 4.09-69.95 4.27-73.10
Note: Rates shown are inside City rates; outside City rates are 1.5 times the rates shown.
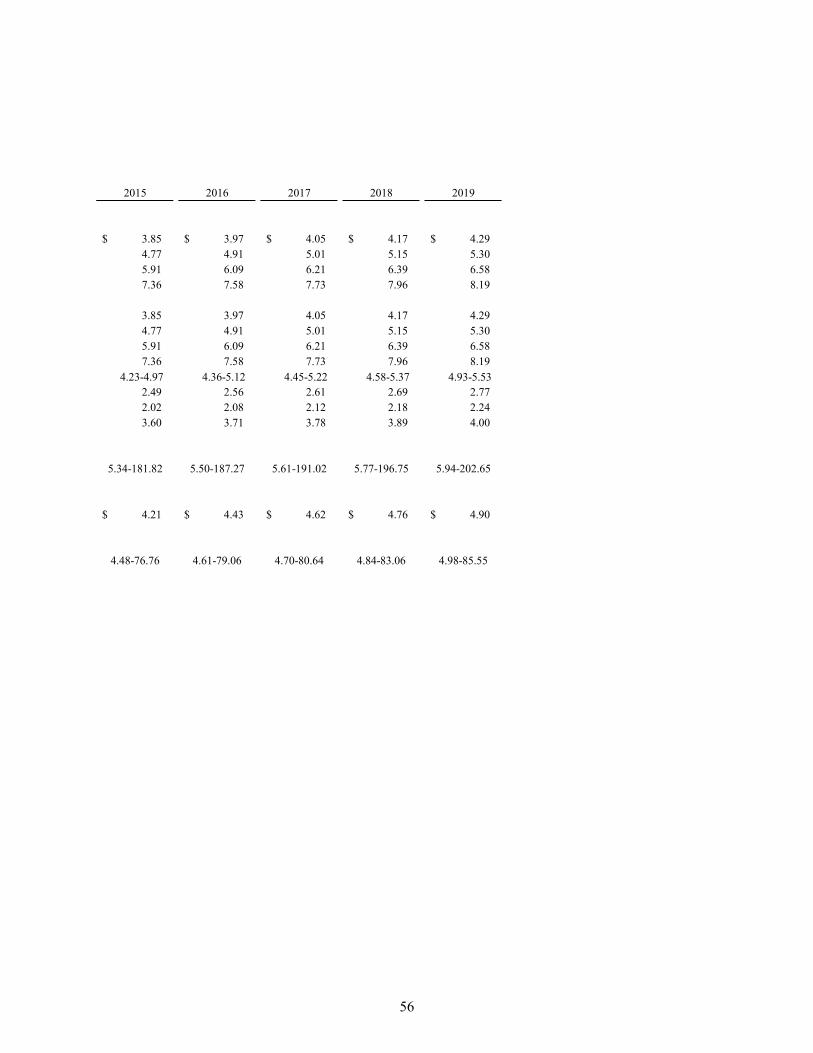
56
2015 2016 2017 2018 2019
3.85 $ 3.97 $ 4.05 $ 4.17 $ 4.29 $ 4.77 4.91 5.01 5.15 5.30 5.91 6.09 6.21 6.39 6.58 7.36 7.58 7.73 7.96 8.19
3.85 3.97 4.05 4.17 4.29 4.77 4.91 5.01 5.15 5.30 5.91 6.09 6.21 6.39 6.58 7.36 7.58 7.73 7.96 8.19
4.23-4.97 4.36-5.12 4.45-5.22 4.58-5.37 4.93-5.532.49 2.56 2.61 2.69 2.77 2.02 2.08 2.12 2.18 2.24 3.60 3.71 3.78 3.89 4.00
5.34-181.82 5.50-187.27 5.61-191.02 5.77-196.75 5.94-202.65
4.21 $ 4.43 $ 4.62 $ 4.76 $ 4.90 $
4.48-76.76 4.61-79.06 4.70-80.64 4.84-83.06 4.98-85.55
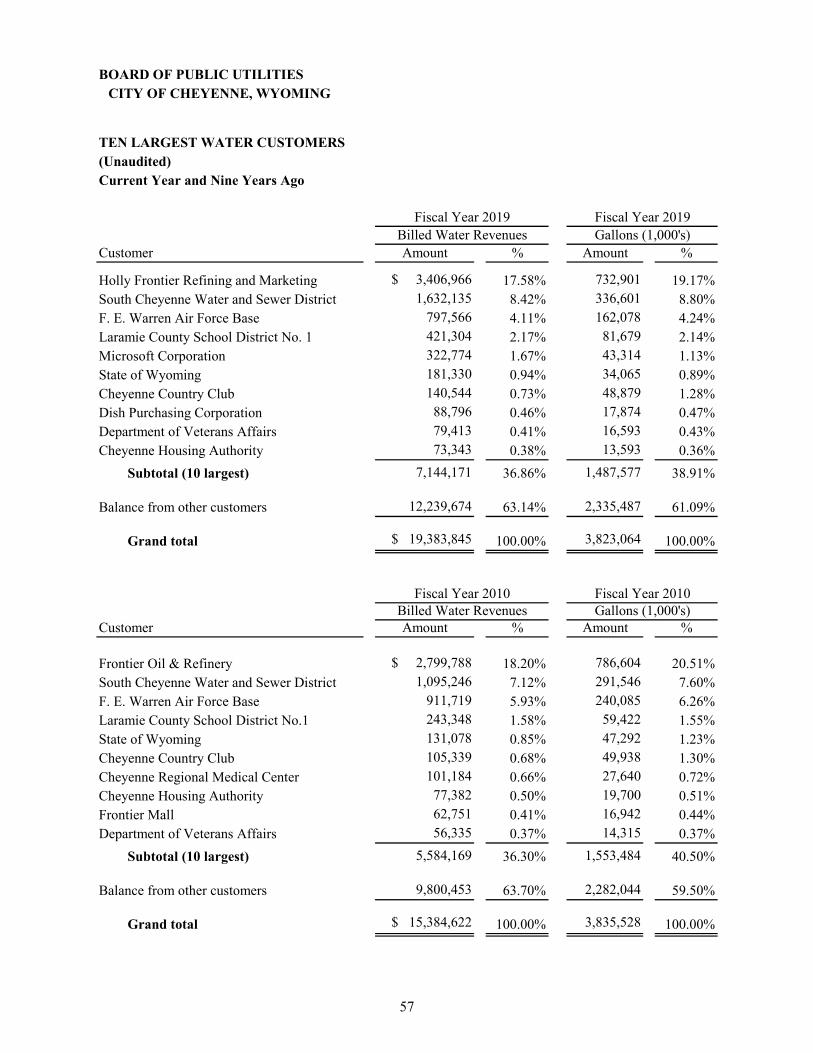
57
BOARD OF PUBLIC UTILITIESCITY OF CHEYENNE, WYOMING
TEN LARGEST WATER CUSTOMERS(Unaudited)Current Year and Nine Years Ago
Customer Amount % Amount %
Holly Frontier Refining and Marketing $ 3,406,966 17.58% 732,901 19.17%South Cheyenne Water and Sewer District 1,632,135 8.42% 336,601 8.80%F. E. Warren Air Force Base 797,566 4.11% 162,078 4.24%Laramie County School District No. 1 421,304 2.17% 81,679 2.14%Microsoft Corporation 322,774 1.67% 43,314 1.13%State of Wyoming 181,330 0.94% 34,065 0.89%Cheyenne Country Club 140,544 0.73% 48,879 1.28%Dish Purchasing Corporation 88,796 0.46% 17,874 0.47%Department of Veterans Affairs 79,413 0.41% 16,593 0.43%Cheyenne Housing Authority 73,343 0.38% 13,593 0.36%
Subtotal (10 largest) 7,144,171 36.86% 1,487,577 38.91%
Balance from other customers 12,239,674 63.14% 2,335,487 61.09%
Grand total $ 19,383,845 100.00% 3,823,064 100.00%
Customer Amount % Amount %
Frontier Oil & Refinery $ 2,799,788 18.20% 786,604 20.51%South Cheyenne Water and Sewer District 1,095,246 7.12% 291,546 7.60%F. E. Warren Air Force Base 911,719 5.93% 240,085 6.26%Laramie County School District No.1 243,348 1.58% 59,422 1.55%State of Wyoming 131,078 0.85% 47,292 1.23%Cheyenne Country Club 105,339 0.68% 49,938 1.30%Cheyenne Regional Medical Center 101,184 0.66% 27,640 0.72%Cheyenne Housing Authority 77,382 0.50% 19,700 0.51%Frontier Mall 62,751 0.41% 16,942 0.44%Department of Veterans Affairs 56,335 0.37% 14,315 0.37%
Subtotal (10 largest) 5,584,169 36.30% 1,553,484 40.50%
Balance from other customers 9,800,453 63.70% 2,282,044 59.50%
Grand total $ 15,384,622 100.00% 3,835,528 100.00%
Fiscal Year 2019Billed Water Revenues
Fiscal Year 2010Billed Water Revenues
Fiscal Year 2019Gallons (1,000's)
Fiscal Year 2010Gallons (1,000's)
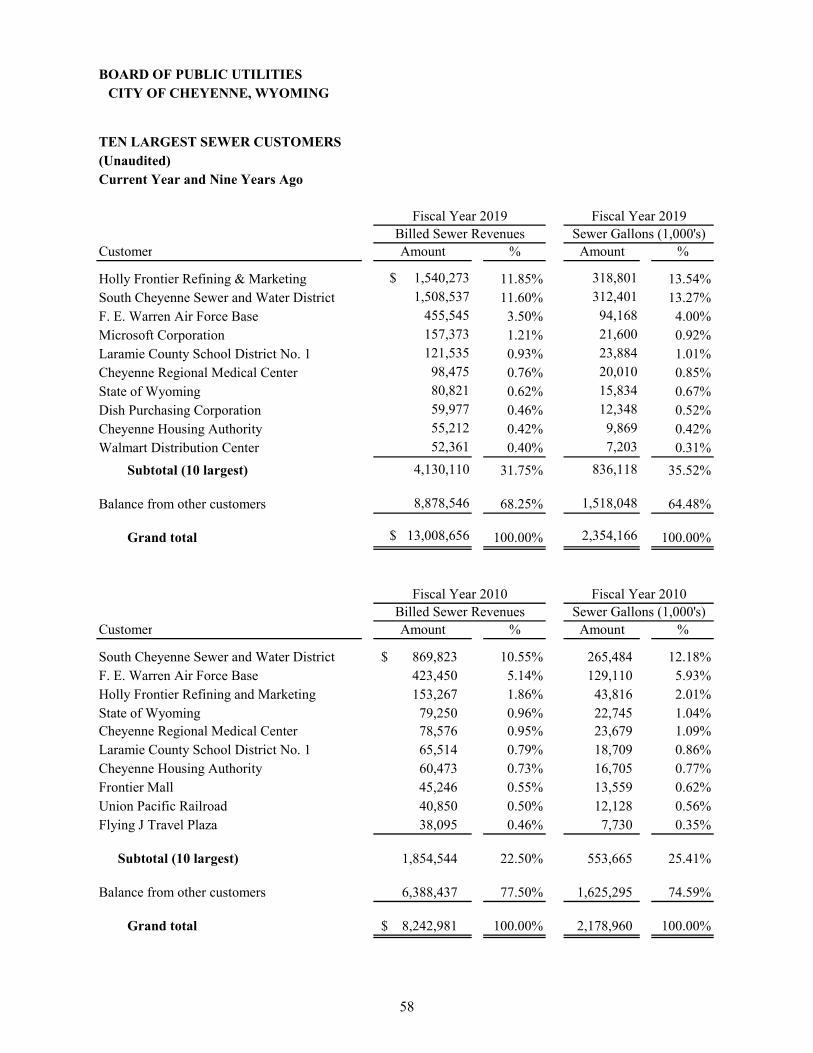
58
BOARD OF PUBLIC UTILITIESCITY OF CHEYENNE, WYOMING
TEN LARGEST SEWER CUSTOMERS(Unaudited)Current Year and Nine Years Ago
Customer Amount % Amount %
Holly Frontier Refining & Marketing $ 1,540,273 11.85% 318,801 13.54%South Cheyenne Sewer and Water District 1,508,537 11.60% 312,401 13.27%F. E. Warren Air Force Base 455,545 3.50% 94,168 4.00%Microsoft Corporation 157,373 1.21% 21,600 0.92%Laramie County School District No. 1 121,535 0.93% 23,884 1.01%Cheyenne Regional Medical Center 98,475 0.76% 20,010 0.85%State of Wyoming 80,821 0.62% 15,834 0.67%Dish Purchasing Corporation 59,977 0.46% 12,348 0.52%Cheyenne Housing Authority 55,212 0.42% 9,869 0.42%Walmart Distribution Center 52,361 0.40% 7,203 0.31%
Subtotal (10 largest) 4,130,110 31.75% 836,118 35.52%
Balance from other customers 8,878,546 68.25% 1,518,048 64.48%
Grand total $ 13,008,656 100.00% 2,354,166 100.00%
Customer Amount % Amount %
South Cheyenne Sewer and Water District 869,823 $ 10.55% 265,484 12.18%F. E. Warren Air Force Base 423,450 5.14% 129,110 5.93%Holly Frontier Refining and Marketing 153,267 1.86% 43,816 2.01%State of Wyoming 79,250 0.96% 22,745 1.04%Cheyenne Regional Medical Center 78,576 0.95% 23,679 1.09%Laramie County School District No. 1 65,514 0.79% 18,709 0.86%Cheyenne Housing Authority 60,473 0.73% 16,705 0.77%Frontier Mall 45,246 0.55% 13,559 0.62%Union Pacific Railroad 40,850 0.50% 12,128 0.56%Flying J Travel Plaza 38,095 0.46% 7,730 0.35%
Subtotal (10 largest) 1,854,544 22.50% 553,665 25.41%
Balance from other customers 6,388,437 77.50% 1,625,295 74.59%
Grand total 8,242,981 $ 100.00% 2,178,960 100.00%
Fiscal Year 2019Billed Sewer Revenues
Fiscal Year 2010Billed Sewer Revenues
Fiscal Year 2019Sewer Gallons (1,000's)
Fiscal Year 2010Sewer Gallons (1,000's)
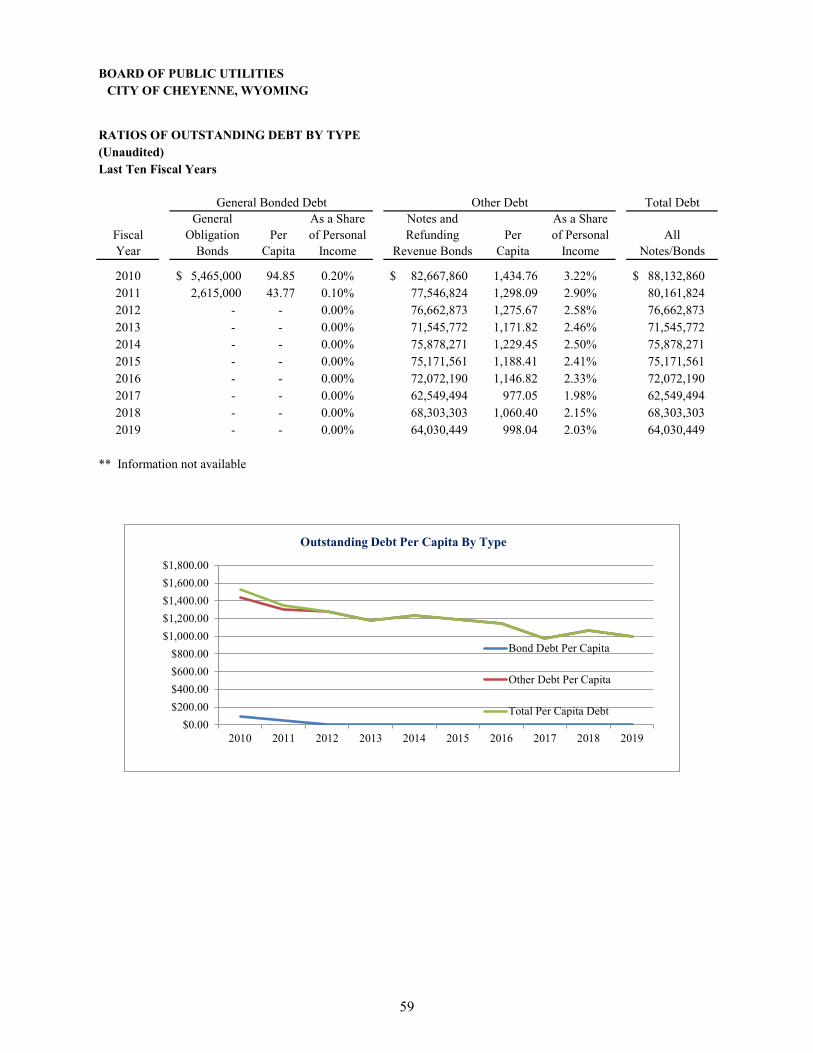
59
BOARD OF PUBLIC UTILITIESCITY OF CHEYENNE, WYOMING
RATIOS OF OUTSTANDING DEBT BY TYPE(Unaudited)Last Ten Fiscal Years
Total DebtGeneral As a Share Notes and As a Share
Fiscal Obligation Per of Personal Refunding Per of Personal AllYear Bonds Capita Income Revenue Bonds Capita Income Notes/Bonds
2010 5,465,000 $ 94.85 0.20% 82,667,860 $ 1,434.76 3.22% 88,132,860 $ 2011 2,615,000 43.77 0.10% 77,546,824 1,298.09 2.90% 80,161,824 2012 - - 0.00% 76,662,873 1,275.67 2.58% 76,662,873 2013 - - 0.00% 71,545,772 1,171.82 2.46% 71,545,772 2014 - - 0.00% 75,878,271 1,229.45 2.50% 75,878,271 2015 - - 0.00% 75,171,561 1,188.41 2.41% 75,171,561 2016 - - 0.00% 72,072,190 1,146.82 2.33% 72,072,190 2017 - - 0.00% 62,549,494 977.05 1.98% 62,549,494 2018 - - 0.00% 68,303,303 1,060.40 2.15% 68,303,303 2019 - - 0.00% 64,030,449 998.04 2.03% 64,030,449
** Information not available
General Bonded Debt Other Debt
$0.00
$200.00
$400.00
$600.00
$800.00
$1,000.00
$1,200.00
$1,400.00
$1,600.00
$1,800.00
2010 2011 2012 2013 2014 2015 2016 2017 2018 2019
Bond Debt Per Capita
Other Debt Per Capita
Total Per Capita Debt
Outstanding Debt Per Capita By Type

60
BOARD OF PUBLIC UTILITIESCITY OF CHEYENNE, WYOMING
SEWER FUNDLEGAL DEBT MARGIN INFORMATION(Unaudited)Last Ten Fiscal Years
Total NetTotal Debt Applicable
Net Debt Legal to Limit as aFiscal Debt Applicable Debt Percentage ofYear Limit to Limit Margin Debt Limit
2010 20,413,427 $ -$ 20,413,427 $ 0.00%2011 20,900,257 - 20,900,257 0.00%2012 21,327,661 - 21,327,661 0.00%2013 21,847,014 - 21,847,014 0.00%2014 23,105,605 - 23,105,605 0.00%2015 24,088,253 - 24,088,253 0.00%2016 25,325,684 - 25,325,684 0.00%2017 26,553,503 - 26,553,503 0.00%2018 27,429,211 - 27,429,211 0.00%2019 23,389,951 - 23,389,951 0.00%
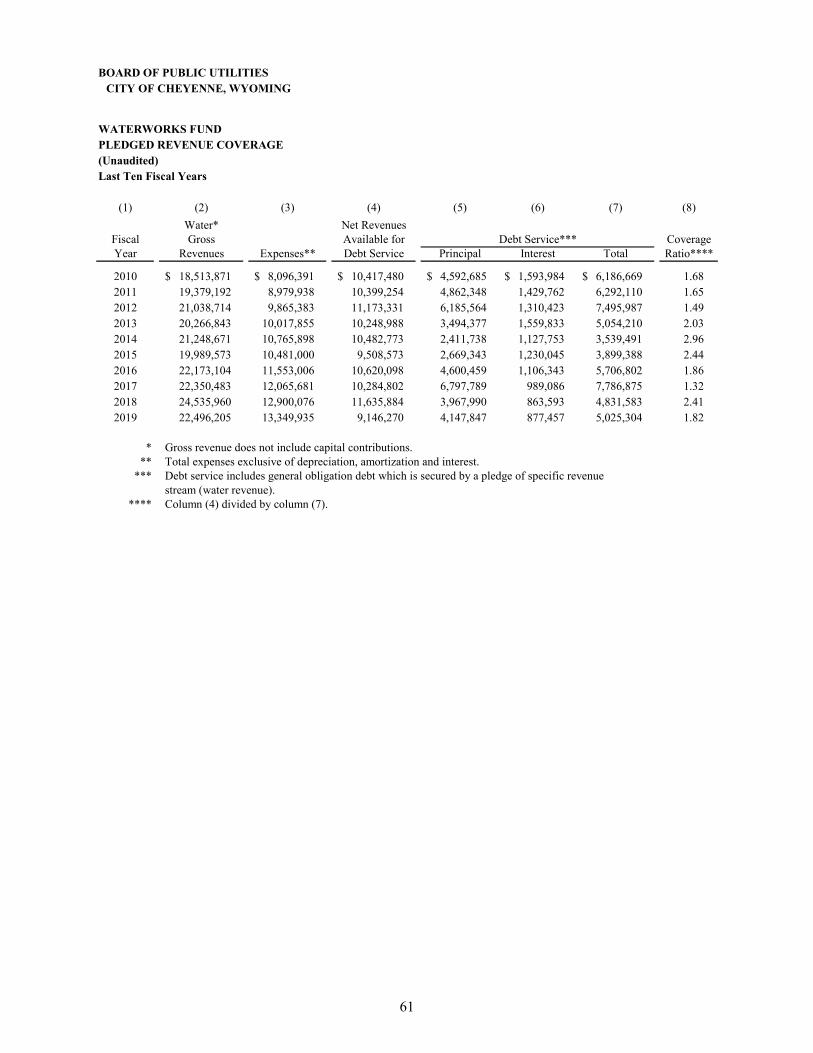
61
BOARD OF PUBLIC UTILITIESCITY OF CHEYENNE, WYOMING
WATERWORKS FUNDPLEDGED REVENUE COVERAGE(Unaudited)Last Ten Fiscal Years
(1) (2) (3) (4) (5) (6) (7) (8)
Water* Net RevenuesFiscal Gross Available for CoverageYear Revenues Expenses** Debt Service Principal Interest Total Ratio****
2010 18,513,871 $ 8,096,391 $ 10,417,480 $ 4,592,685 $ 1,593,984 $ 6,186,669 $ 1.682011 19,379,192 8,979,938 10,399,254 4,862,348 1,429,762 6,292,110 1.652012 21,038,714 9,865,383 11,173,331 6,185,564 1,310,423 7,495,987 1.492013 20,266,843 10,017,855 10,248,988 3,494,377 1,559,833 5,054,210 2.032014 21,248,671 10,765,898 10,482,773 2,411,738 1,127,753 3,539,491 2.962015 19,989,573 10,481,000 9,508,573 2,669,343 1,230,045 3,899,388 2.442016 22,173,104 11,553,006 10,620,098 4,600,459 1,106,343 5,706,802 1.862017 22,350,483 12,065,681 10,284,802 6,797,789 989,086 7,786,875 1.322018 24,535,960 12,900,076 11,635,884 3,967,990 863,593 4,831,583 2.412019 22,496,205 13,349,935 9,146,270 4,147,847 877,457 5,025,304 1.82
* Gross revenue does not include capital contributions.** Total expenses exclusive of depreciation, amortization and interest.
*** Debt service includes general obligation debt which is secured by a pledge of specific revenuestream (water revenue).
**** Column (4) divided by column (7).
Debt Service***

62
BOARD OF PUBLIC UTILITIESCITY OF CHEYENNE, WYOMING
SEWER FUNDPLEDGED REVENUE COVERAGE(Unaudited)Last Ten Fiscal Years
(1) (2) (3) (4) (5) (6) (7) (8)
Sewer* Net RevenuesFiscal Gross Available for CoverageYear Revenues Expenses** Debt Service Principal Interest Total Ratio***
2010 8,866,790 $ 5,734,979 $ 3,131,811 $ 1,894,563 $ 1,013,491 $ 2,908,054 $ 1.082011 9,062,959 5,568,763 3,494,196 1,941,889 916,115 2,858,004 1.222012 9,560,645 5,480,757 4,079,888 1,990,398 875,883 2,866,281 1.422013 9,701,246 5,725,019 3,976,227 2,095,725 887,892 2,983,617 1.332014 11,310,453 5,904,701 5,405,752 2,211,174 807,121 3,018,295 1.792015 12,791,205 5,932,883 6,858,322 2,199,687 757,339 2,957,026 2.322016 13,251,215 6,486,263 6,764,952 2,451,648 854,584 3,306,232 2.052017 14,229,394 6,543,778 7,685,616 4,436,586 724,348 5,160,934 1.492018 13,508,548 6,633,452 6,875,096 2,267,475 651,867 2,919,342 2.362019 14,438,859 7,423,384 7,015,475 2,325,635 593,705 2,919,340 2.40
* Gross revenue does not include capital contributions.** Total expenses exclusive of depreciation, amortization and interest.
*** Column (4) divided by column (7).
Debt Service
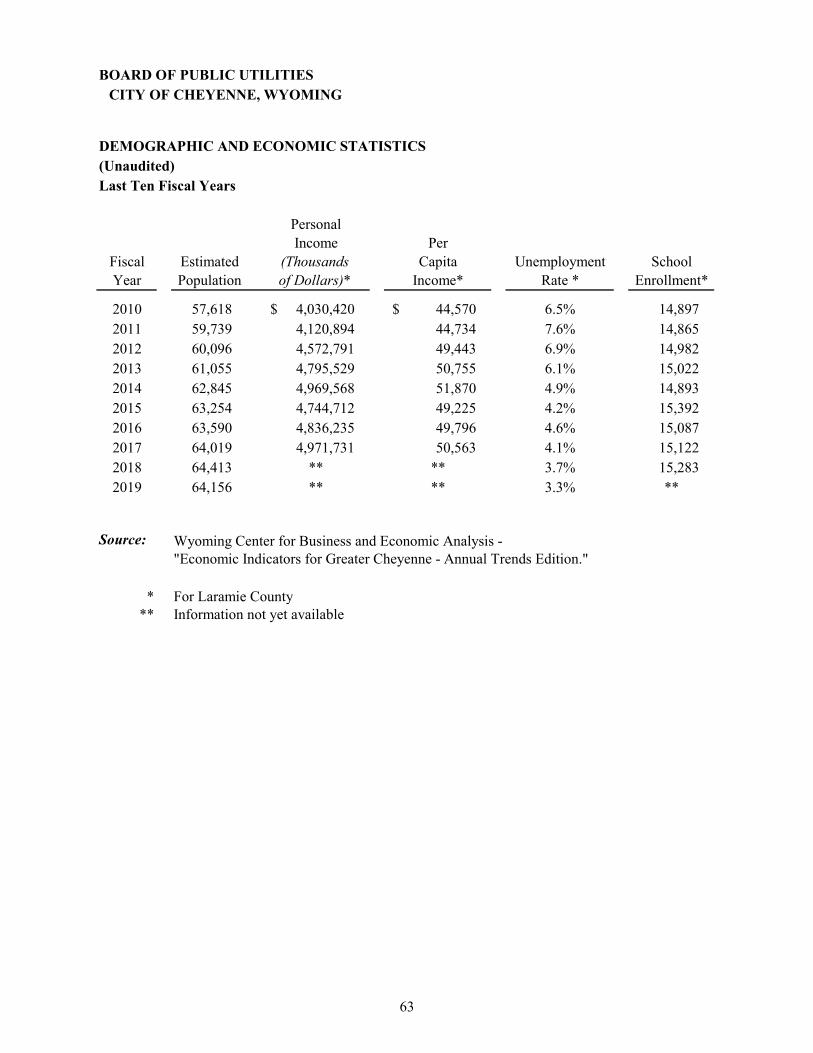
63
BOARD OF PUBLIC UTILITIESCITY OF CHEYENNE, WYOMING
DEMOGRAPHIC AND ECONOMIC STATISTICS(Unaudited)Last Ten Fiscal Years
PersonalIncome Per
Fiscal Estimated (Thousands Capita Unemployment SchoolYear Population of Dollars)* Income* Rate * Enrollment*
2010 57,618 4,030,420 $ 44,570 $ 6.5% 14,897 2011 59,739 4,120,894 44,734 7.6% 14,865 2012 60,096 4,572,791 49,443 6.9% 14,982 2013 61,055 4,795,529 50,755 6.1% 15,022 2014 62,845 4,969,568 51,870 4.9% 14,893 2015 63,254 4,744,712 49,225 4.2% 15,392 2016 63,590 4,836,235 49,796 4.6% 15,087 2017 64,019 4,971,731 50,563 4.1% 15,122 2018 64,413 ** ** 3.7% 15,283 2019 64,156 ** ** 3.3% **
Source: Wyoming Center for Business and Economic Analysis -"Economic Indicators for Greater Cheyenne - Annual Trends Edition."
* For Laramie County** Information not yet available

64
BOARD OF PUBLIC UTILITIESCITY OF CHEYENNE, WYOMING
PRINCIPAL EMPLOYERS(Unaudited)Current Year and Nine Years Ago
PercentageEmployer Product Employees of Total
F. E. Warren A.F.B. Military 4,177 6.15%State of Wyoming Government Services 3,755 5.53%Laramie County School District No. 1 Education K-12 2,289 3.37%Cheyenne Regional Medical Center Health Care 1,900 2.80%Federal Government Government Services 1,728 2.54%Wyoming National Guard Military 1,130 1.66%Veterans Affairs Medical Center Health Care 980 1.44%Sierra Trading Post Outlet Catalog/Retail 878 1.29%Union Pacific Railroad Transportation, Rail 660 0.97%City of Cheyenne Municipal 568 0.84%
18,065 26.59%
All other employers 49,874 73.41%
Total employees 67,939 100.00%
PercentageEmployer Product Employees of Total
F. E. Warren A.F.B. Military 3,694 6.07%State of Wyoming Government Services 3,372 5.54%Laramie County School District No.1 Education K-12 2,102 3.46%Federal Government Government Services 1,874 3.08%Cheyenne Regional Medical Center Health Care 1,700 2.79%Wyoming National Guard Military 744 1.22%Sierra Trading Post Government Services 622 1.02%City of Cheyenne Government Services 601 0.99%Veterans Affairs Medical Center Health Care 586 0.97%Union Pacific Railroad Transportation, Rail 572 0.94%
15,867 26.08%
All other employers 44,971 73.92%
60,838 100.00%
Total employees
Source: Wyoming Center for Business and Economic Analysis -
"Economic Indicators for Greater Cheyenne - Annual Trends Edition."
2019
2010
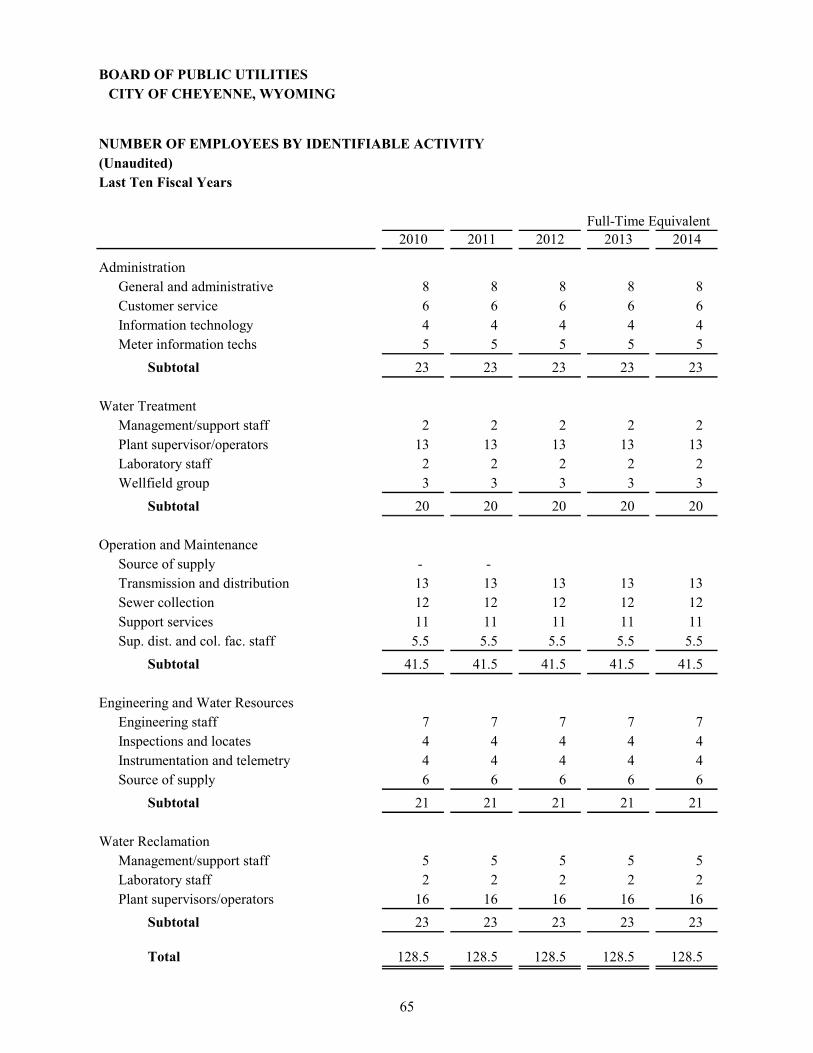
65
BOARD OF PUBLIC UTILITIESCITY OF CHEYENNE, WYOMING
NUMBER OF EMPLOYEES BY IDENTIFIABLE ACTIVITY(Unaudited)Last Ten Fiscal Years
2010 2011 2012 2013 2014
AdministrationGeneral and administrative 8 8 8 8 8 Customer service 6 6 6 6 6 Information technology 4 4 4 4 4 Meter information techs 5 5 5 5 5
Subtotal 23 23 23 23 23
Water TreatmentManagement/support staff 2 2 2 2 2 Plant supervisor/operators 13 13 13 13 13 Laboratory staff 2 2 2 2 2 Wellfield group 3 3 3 3 3
Subtotal 20 20 20 20 20
Operation and MaintenanceSource of supply - - Transmission and distribution 13 13 13 13 13 Sewer collection 12 12 12 12 12 Support services 11 11 11 11 11 Sup. dist. and col. fac. staff 5.5 5.5 5.5 5.5 5.5
Subtotal 41.5 41.5 41.5 41.5 41.5
Engineering and Water ResourcesEngineering staff 7 7 7 7 7 Inspections and locates 4 4 4 4 4 Instrumentation and telemetry 4 4 4 4 4 Source of supply 6 6 6 6 6
Subtotal 21 21 21 21 21
Water ReclamationManagement/support staff 5 5 5 5 5 Laboratory staff 2 2 2 2 2 Plant supervisors/operators 16 16 16 16 16
Subtotal 23 23 23 23 23
Total 128.5 128.5 128.5 128.5 128.5
Full-Time Equivalent
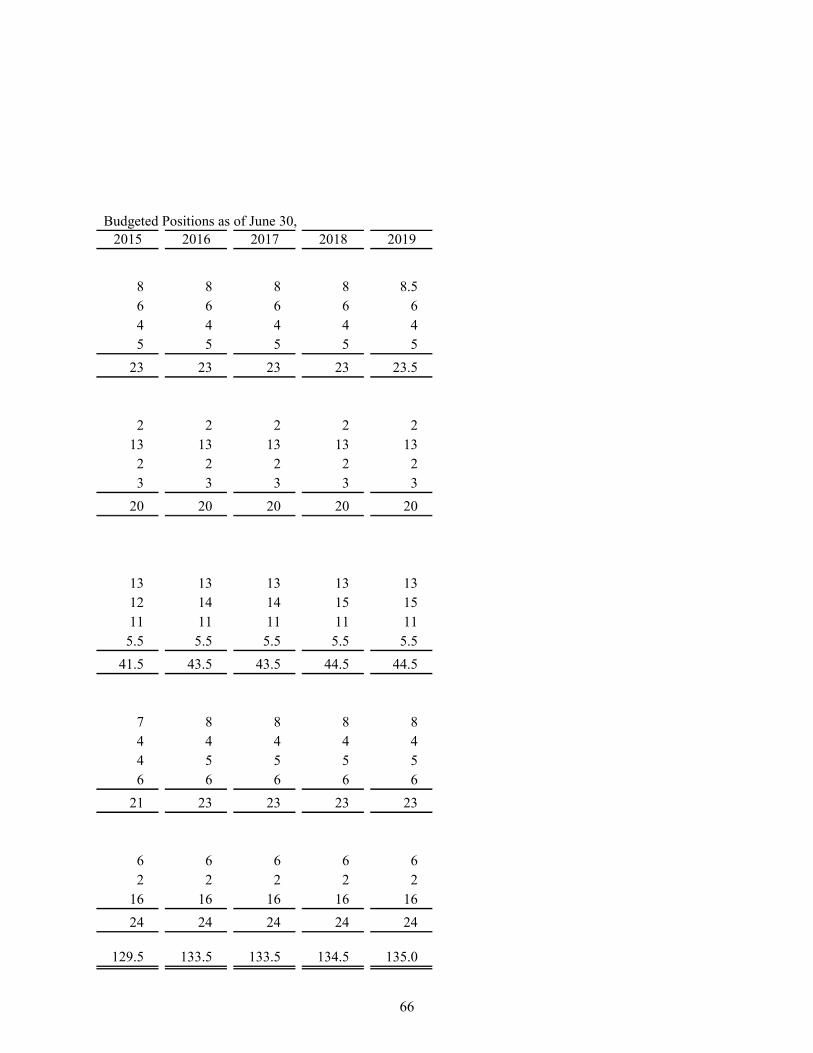
66
2015 2016 2017 2018 2019
8 8 8 8 8.5 6 6 6 6 6 4 4 4 4 4 5 5 5 5 5
23 23 23 23 23.5
2 2 2 2 2 13 13 13 13 13
2 2 2 2 2 3 3 3 3 3
20 20 20 20 20
13 13 13 13 13 12 14 14 15 15 11 11 11 11 11
5.5 5.5 5.5 5.5 5.5
41.5 43.5 43.5 44.5 44.5
7 8 8 8 8 4 4 4 4 4 4 5 5 5 5 6 6 6 6 6
21 23 23 23 23
6 6 6 6 6 2 2 2 2 2
16 16 16 16 16
24 24 24 24 24
129.5 133.5 133.5 134.5 135.0
Budgeted Positions as of June 30,
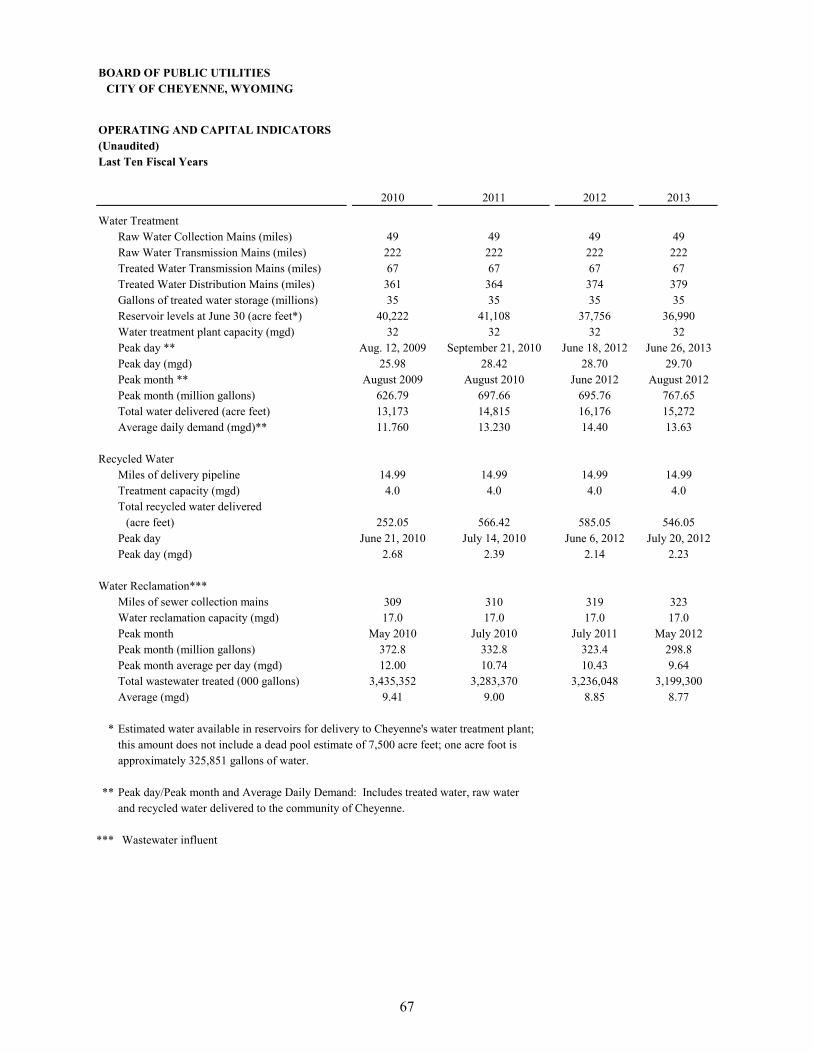
67
BOARD OF PUBLIC UTILITIESCITY OF CHEYENNE, WYOMING
OPERATING AND CAPITAL INDICATORS(Unaudited)Last Ten Fiscal Years
2010 2011 2012 2013
Water TreatmentRaw Water Collection Mains (miles) 49 49 49 49Raw Water Transmission Mains (miles) 222 222 222 222Treated Water Transmission Mains (miles) 67 67 67 67Treated Water Distribution Mains (miles) 361 364 374 379Gallons of treated water storage (millions) 35 35 35 35Reservoir levels at June 30 (acre feet*) 40,222 41,108 37,756 36,990Water treatment plant capacity (mgd) 32 32 32 32Peak day ** Aug. 12, 2009 September 21, 2010 June 18, 2012 June 26, 2013Peak day (mgd) 25.98 28.42 28.70 29.70Peak month ** August 2009 August 2010 June 2012 August 2012Peak month (million gallons) 626.79 697.66 695.76 767.65Total water delivered (acre feet) 13,173 14,815 16,176 15,272Average daily demand (mgd)** 11.760 13.230 14.40 13.63
Recycled WaterMiles of delivery pipeline 14.99 14.99 14.99 14.99Treatment capacity (mgd) 4.0 4.0 4.0 4.0Total recycled water delivered
(acre feet) 252.05 566.42 585.05 546.05Peak day June 21, 2010 July 14, 2010 June 6, 2012 July 20, 2012Peak day (mgd) 2.68 2.39 2.14 2.23
Water Reclamation***Miles of sewer collection mains 309 310 319 323Water reclamation capacity (mgd) 17.0 17.0 17.0 17.0Peak month May 2010 July 2010 July 2011 May 2012Peak month (million gallons) 372.8 332.8 323.4 298.8Peak month average per day (mgd) 12.00 10.74 10.43 9.64Total wastewater treated (000 gallons) 3,435,352 3,283,370 3,236,048 3,199,300Average (mgd) 9.41 9.00 8.85 8.77
* Estimated water available in reservoirs for delivery to Cheyenne's water treatment plant;this amount does not include a dead pool estimate of 7,500 acre feet; one acre foot isapproximately 325,851 gallons of water.
** Peak day/Peak month and Average Daily Demand: Includes treated water, raw water and recycled water delivered to the community of Cheyenne.
*** Wastewater influent
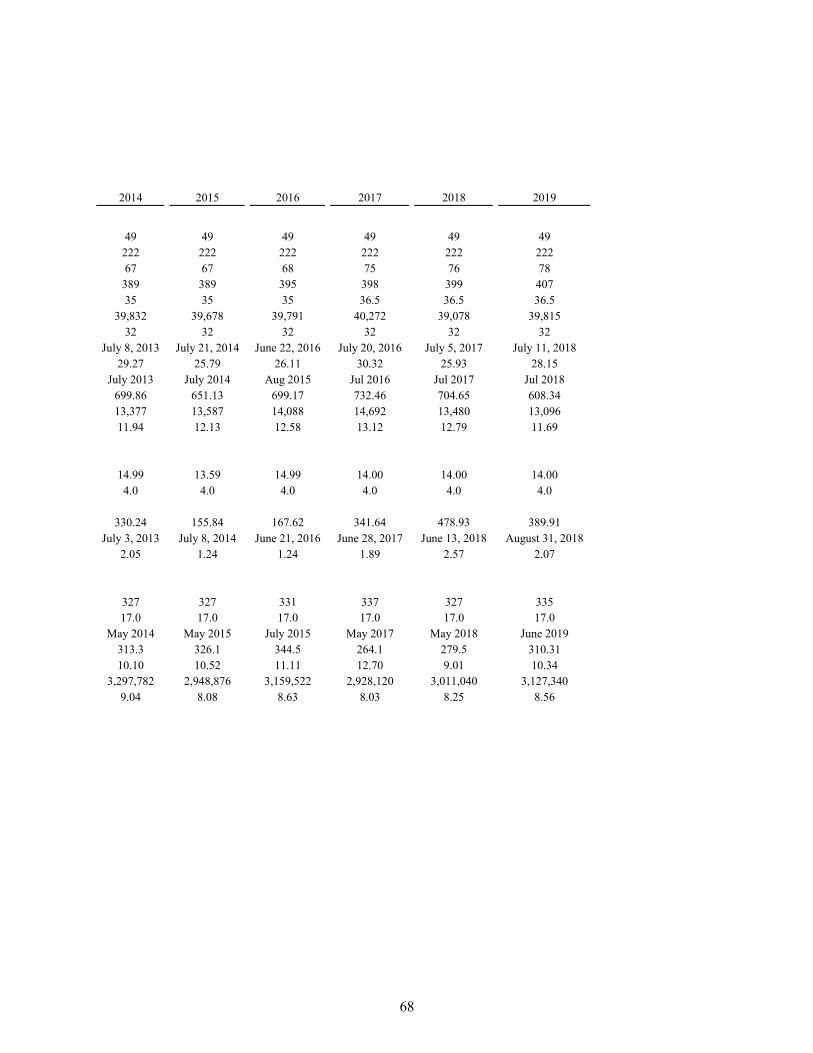
68
2014 2015 2016 2017 2018 2019
49 49 49 49 49 49222 222 222 222 222 22267 67 68 75 76 78
389 389 395 398 399 40735 35 35 36.5 36.5 36.5
39,832 39,678 39,791 40,272 39,078 39,81532 32 32 32 32 32
July 8, 2013 July 21, 2014 June 22, 2016 July 20, 2016 July 5, 2017 July 11, 201829.27 25.79 26.11 30.32 25.93 28.15
July 2013 July 2014 Aug 2015 Jul 2016 Jul 2017 Jul 2018699.86 651.13 699.17 732.46 704.65 608.3413,377 13,587 14,088 14,692 13,480 13,09611.94 12.13 12.58 13.12 12.79 11.69
14.99 13.59 14.99 14.00 14.00 14.004.0 4.0 4.0 4.0 4.0 4.0
330.24 155.84 167.62 341.64 478.93 389.91July 3, 2013 July 8, 2014 June 21, 2016 June 28, 2017 June 13, 2018 August 31, 2018
2.05 1.24 1.24 1.89 2.57 2.07
327 327 331 337 327 33517.0 17.0 17.0 17.0 17.0 17.0
May 2014 May 2015 July 2015 May 2017 May 2018 June 2019313.3 326.1 344.5 264.1 279.5 310.3110.10 10.52 11.11 12.70 9.01 10.34
3,297,782 2,948,876 3,159,522 2,928,120 3,011,040 3,127,3409.04 8.08 8.63 8.03 8.25 8.56
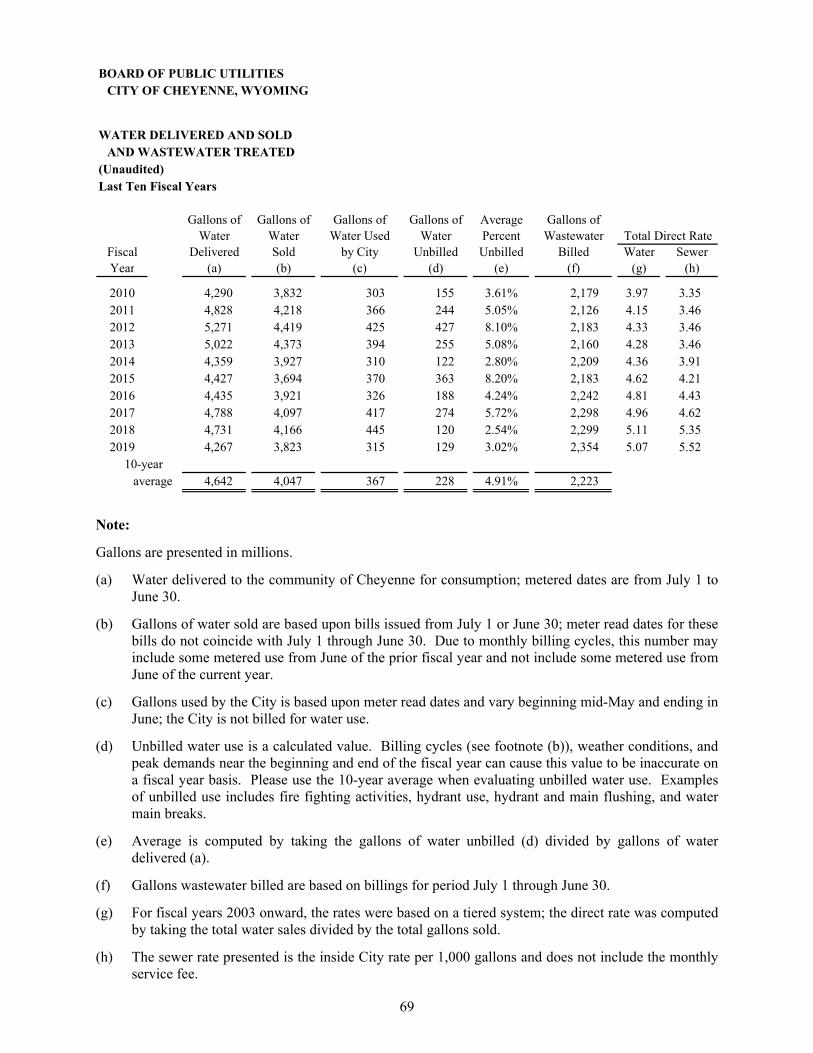
69
BOARD OF PUBLIC UTILITIESCITY OF CHEYENNE, WYOMING
WATER DELIVERED AND SOLDAND WASTEWATER TREATED
(Unaudited)Last Ten Fiscal Years
Gallons of Gallons of Gallons of Gallons of Average Gallons ofWater Water Water Used Water Percent Wastewater
Fiscal Delivered Sold by City Unbilled Unbilled Billed Water SewerYear (a) (b) (c) (d) (e) (f) (g) (h)
2010 4,290 3,832 303 155 3.61% 2,179 3.97 3.352011 4,828 4,218 366 244 5.05% 2,126 4.15 3.462012 5,271 4,419 425 427 8.10% 2,183 4.33 3.462013 5,022 4,373 394 255 5.08% 2,160 4.28 3.462014 4,359 3,927 310 122 2.80% 2,209 4.36 3.912015 4,427 3,694 370 363 8.20% 2,183 4.62 4.212016 4,435 3,921 326 188 4.24% 2,242 4.81 4.432017 4,788 4,097 417 274 5.72% 2,298 4.96 4.622018 4,731 4,166 445 120 2.54% 2,299 5.11 5.352019 4,267 3,823 315 129 3.02% 2,354 5.07 5.52
average 4,642 4,047 367 228 4.91% 2,223
Total Direct Rate
10-year
Note:
Gallons are presented in millions.
(a) Water delivered to the community of Cheyenne for consumption; metered dates are from July 1 to June 30.
(b) Gallons of water sold are based upon bills issued from July 1 or June 30; meter read dates for these bills do not coincide with July 1 through June 30. Due to monthly billing cycles, this number may include some metered use from June of the prior fiscal year and not include some metered use from June of the current year.
(c) Gallons used by the City is based upon meter read dates and vary beginning mid-May and ending in June; the City is not billed for water use.
(d) Unbilled water use is a calculated value. Billing cycles (see footnote (b)), weather conditions, and peak demands near the beginning and end of the fiscal year can cause this value to be inaccurate on a fiscal year basis. Please use the 10-year average when evaluating unbilled water use. Examples of unbilled use includes fire fighting activities, hydrant use, hydrant and main flushing, and water main breaks.
(e) Average is computed by taking the gallons of water unbilled (d) divided by gallons of water delivered (a).
(f) Gallons wastewater billed are based on billings for period July 1 through June 30.
(g) For fiscal years 2003 onward, the rates were based on a tiered system; the direct rate was computed by taking the total water sales divided by the total gallons sold.
(h) The sewer rate presented is the inside City rate per 1,000 gallons and does not include the monthly service fee.
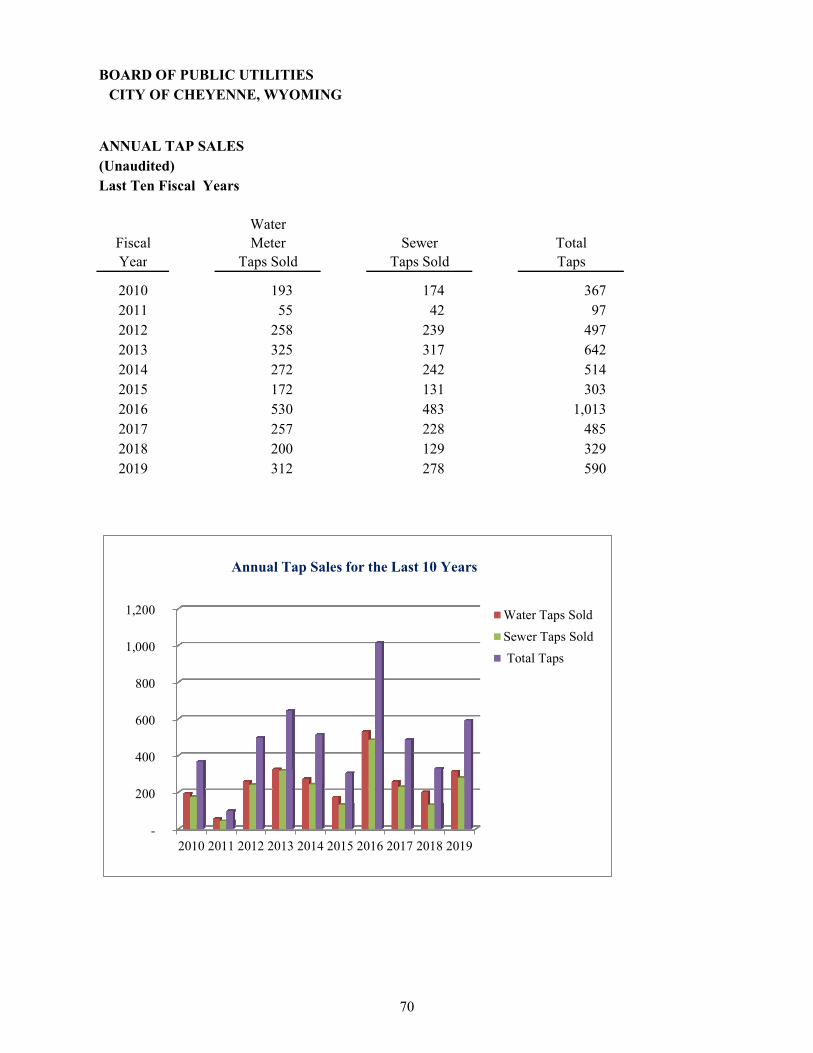
70
BOARD OF PUBLIC UTILITIESCITY OF CHEYENNE, WYOMING
ANNUAL TAP SALES(Unaudited)Last Ten Fiscal Years
WaterFiscal Meter Sewer TotalYear Taps Sold Taps Sold Taps
2010 193 174 3672011 55 42 972012 258 239 4972013 325 317 6422014 272 242 5142015 172 131 3032016 530 483 1,0132017 257 228 4852018 200 129 3292019 312 278 590
-
200
400
600
800
1,000
1,200
2010 2011 2012 2013 2014 2015 2016 2017 2018 2019
Water Taps Sold
Sewer Taps Sold
Total Taps
Annual Tap Sales for the Last 10 Years
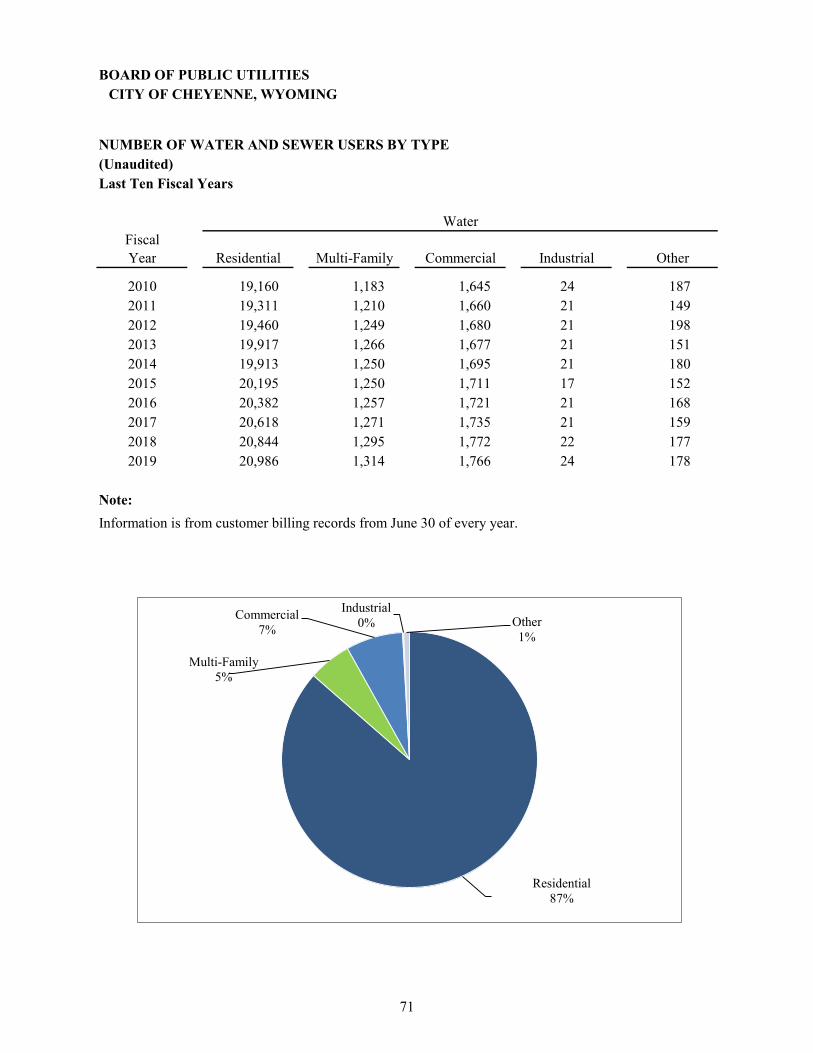
71
BOARD OF PUBLIC UTILITIESCITY OF CHEYENNE, WYOMING
NUMBER OF WATER AND SEWER USERS BY TYPE(Unaudited)Last Ten Fiscal Years
FiscalYear Residential Multi-Family Commercial Industrial Other
2010 19,160 1,183 1,645 24 1872011 19,311 1,210 1,660 21 1492012 19,460 1,249 1,680 21 1982013 19,917 1,266 1,677 21 1512014 19,913 1,250 1,695 21 1802015 20,195 1,250 1,711 17 1522016 20,382 1,257 1,721 21 1682017 20,618 1,271 1,735 21 1592018 20,844 1,295 1,772 22 1772019 20,986 1,314 1,766 24 178
Note:
Information is from customer billing records from June 30 of every year.
Water
Residential87%
Multi-Family5%
Commercial7%
Industrial0% Other
1%
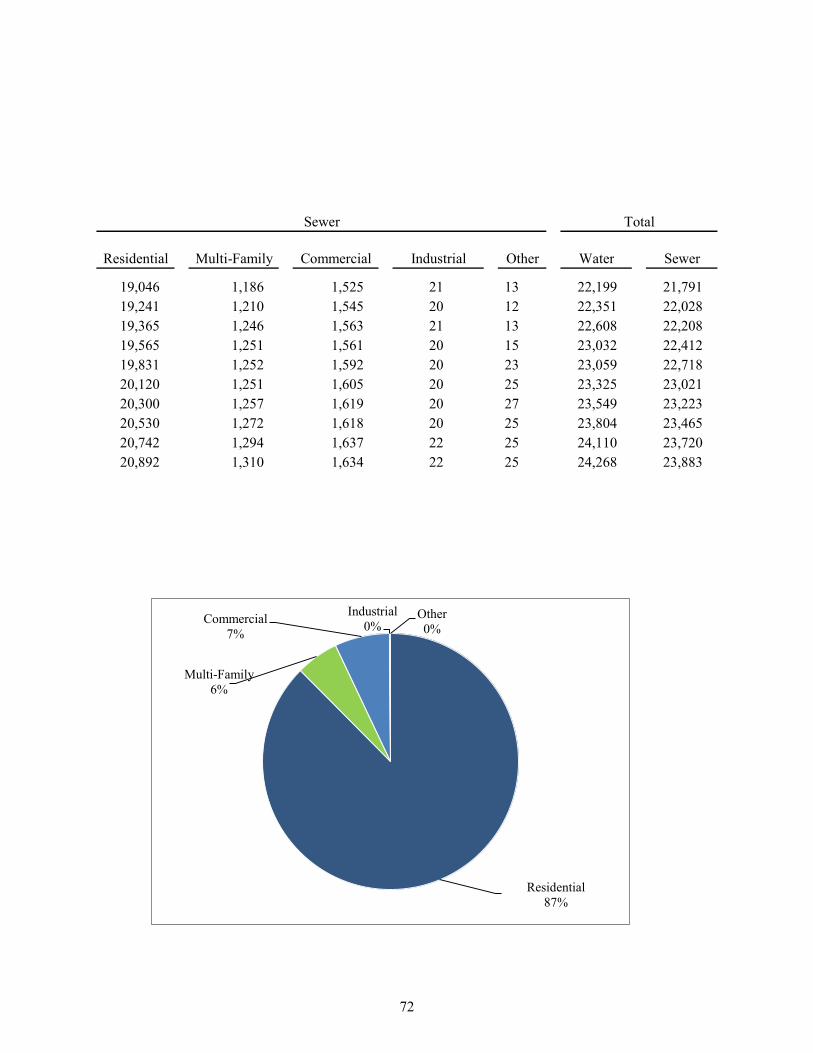
72
Residential Multi-Family Commercial Industrial Other Water Sewer
19,046 1,186 1,525 21 13 22,199 21,791 19,241 1,210 1,545 20 12 22,351 22,028 19,365 1,246 1,563 21 13 22,608 22,208 19,565 1,251 1,561 20 15 23,032 22,412 19,831 1,252 1,592 20 23 23,059 22,718 20,120 1,251 1,605 20 25 23,325 23,021 20,300 1,257 1,619 20 27 23,549 23,223 20,530 1,272 1,618 20 25 23,804 23,465 20,742 1,294 1,637 22 25 24,110 23,720 20,892 1,310 1,634 22 25 24,268 23,883
Sewer Total
Residential87%
Multi-Family6%
Commercial7%
Industrial0%
Other0%
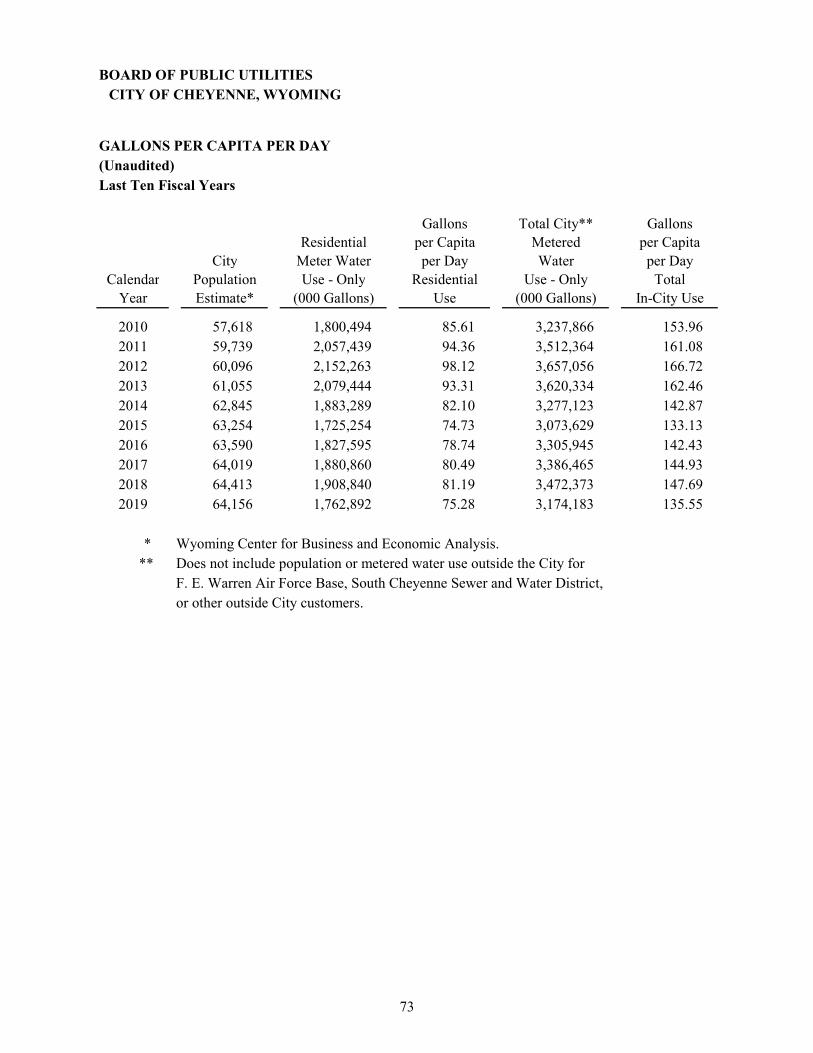
73
BOARD OF PUBLIC UTILITIESCITY OF CHEYENNE, WYOMING
GALLONS PER CAPITA PER DAY(Unaudited)Last Ten Fiscal Years
Gallons Total City** GallonsResidential per Capita Metered per Capita
City Meter Water per Day Water per DayCalendar Population Use - Only Residential Use - Only Total
Year Estimate* (000 Gallons) Use (000 Gallons) In-City Use
2010 57,618 1,800,494 85.61 3,237,866 153.96 2011 59,739 2,057,439 94.36 3,512,364 161.08 2012 60,096 2,152,263 98.12 3,657,056 166.72 2013 61,055 2,079,444 93.31 3,620,334 162.46 2014 62,845 1,883,289 82.10 3,277,123 142.87 2015 63,254 1,725,254 74.73 3,073,629 133.13 2016 63,590 1,827,595 78.74 3,305,945 142.43 2017 64,019 1,880,860 80.49 3,386,465 144.93 2018 64,413 1,908,840 81.19 3,472,373 147.69 2019 64,156 1,762,892 75.28 3,174,183 135.55
* Wyoming Center for Business and Economic Analysis.** Does not include population or metered water use outside the City for
F. E. Warren Air Force Base, South Cheyenne Sewer and Water District,or other outside City customers.
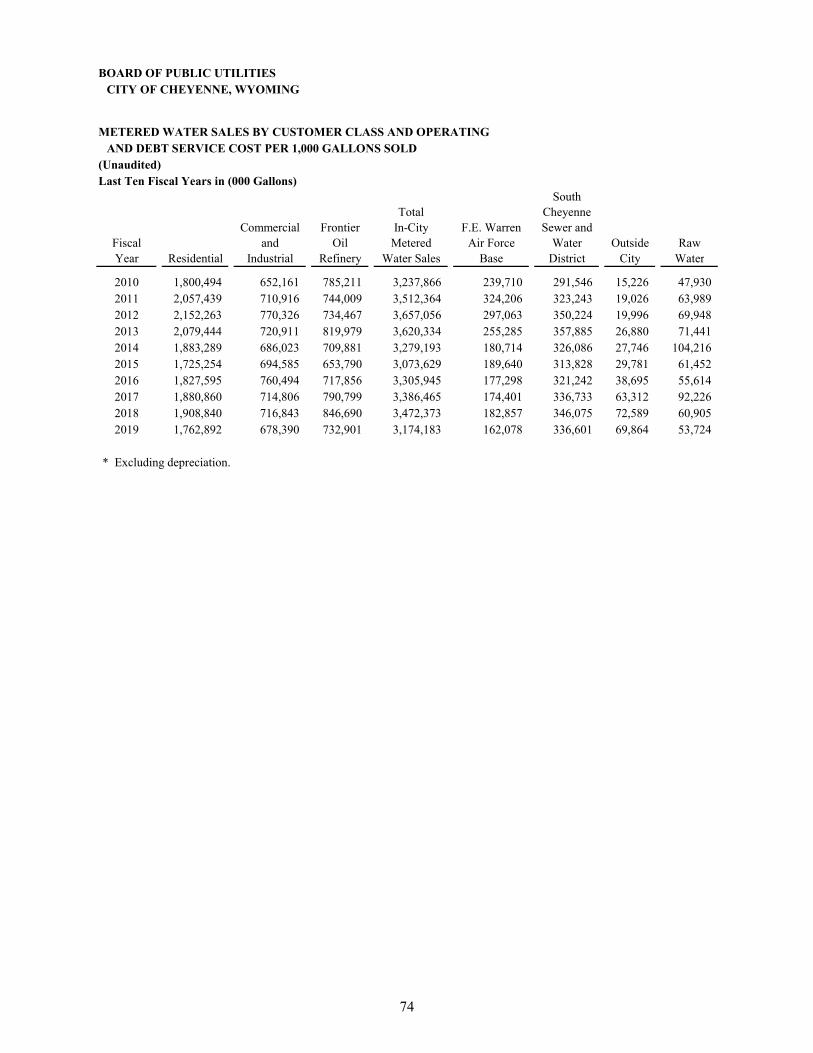
74
BOARD OF PUBLIC UTILITIESCITY OF CHEYENNE, WYOMING
METERED WATER SALES BY CUSTOMER CLASS AND OPERATINGAND DEBT SERVICE COST PER 1,000 GALLONS SOLD
(Unaudited)Last Ten Fiscal Years in (000 Gallons)
SouthTotal Cheyenne
Commercial Frontier In-City F.E. Warren Sewer andFiscal and Oil Metered Air Force Water Outside RawYear Residential Industrial Refinery Water Sales Base District City Water
2010 1,800,494 652,161 785,211 3,237,866 239,710 291,546 15,226 47,930 2011 2,057,439 710,916 744,009 3,512,364 324,206 323,243 19,026 63,989 2012 2,152,263 770,326 734,467 3,657,056 297,063 350,224 19,996 69,948 2013 2,079,444 720,911 819,979 3,620,334 255,285 357,885 26,880 71,441 2014 1,883,289 686,023 709,881 3,279,193 180,714 326,086 27,746 104,216 2015 1,725,254 694,585 653,790 3,073,629 189,640 313,828 29,781 61,452 2016 1,827,595 760,494 717,856 3,305,945 177,298 321,242 38,695 55,614 2017 1,880,860 714,806 790,799 3,386,465 174,401 336,733 63,312 92,226 2018 1,908,840 716,843 846,690 3,472,373 182,857 346,075 72,589 60,905 2019 1,762,892 678,390 732,901 3,174,183 162,078 336,601 69,864 53,724
* Excluding depreciation.

75
Total Total TotalWater Water Operating Water Debt
Recycled Oil and Sales Operating Cost Debt CostWater Gas Construction (Gallons) Expenses* per 1,000 Service per 1,000
3,250 - - 3,835,528 8,096,391 $ 2.11 6,186,669 $ 1.61 20,205 1,909 3,093 4,268,035 8,979,938 2.10 6,292,110 1.47 20,008 54 4,972 4,419,321 9,865,383 2.23 7,495,987 1.70 21,320 19 19,447 4,372,611 10,017,855 2.29 5,054,210 1.16 17,122 515 13,235 3,948,827 10,765,898 2.73 3,539,491 0.90 16,032 2,099 7,732 3,694,193 10,481,000 2.84 3,899,388 1.06 13,348 936 8,606 3,921,684 11,553,006 2.95 5,706,802 1.46 18,380 - 25,903 4,097,420 12,065,681 2.94 7,786,875 1.90 14,284 3,144 13,444 4,165,671 12,900,076 3.10 4,831,583 1.16 17,313 48 10,041 3,823,852 13,349,936 3.49 5,025,304 1.31
COMPLIANCE SECTION

76
INDEPENDENT AUDITOR’S REPORT ON INTERNAL CONTROL OVER FINANCIAL REPORTING AND ON COMPLIANCE AND
OTHER MATTERS BASED ON AN AUDIT OF FINANCIAL STATEMENTS PERFORMED IN ACCORDANCE WITH
GOVERNMENT AUDITING STANDARDS To the Honorable Mayor, Members of the City Council, and Members of the Board of Public Utilities City of Cheyenne, Wyoming Board of Public Utilities Cheyenne, Wyoming We have audited, in accordance with the auditing standards generally accepted in the United States of America and the standards applicable to financial audits contained in Government Auditing Standards issued by the Comptroller General of the United States, the financial statements of the business-type activities and each major fund of the City of Cheyenne, Wyoming Board of Public Utilities (the “Board”), as of and for the year ended June 30, 2019, and the related notes to the financial statements, which collectively comprise the Board’s basic financial statements, and have issued our report thereon dated October 21, 2019.
Internal Control Over Financial Reporting
In planning and performing our audit of the financial statements, we considered the Board’s internal control over financial reporting (internal control) to determine the audit procedures that are appropriate in the circumstances for the purpose of expressing our opinions on the financial statements, but not for the purpose of expressing an opinion on the effectiveness of the Board’s internal control. Accordingly, we do not express an opinion on the effectiveness of the Board’s internal control.
A deficiency in internal control exists when the design or operation of a control does not allow management or employees, in the normal course of performing their assigned functions, to prevent, or detect and correct, misstatements on a timely basis. A material weakness is a deficiency, or a combination of deficiencies, in internal control such that there is a reasonable possibility that a material misstatement of the Board’s financial statements will not be prevented, or detected and corrected, on a timely basis. A significant deficiency is a deficiency, or a combination of deficiencies, in internal control that is less severe than a material weakness, yet important enough to merit attention by those charged with governance.
Our consideration of internal control was for the limited purpose described in the first paragraph of this section and was not designed to identify all deficiencies in internal control that might be material weaknesses or significant deficiencies. Given these limitations, during our audit we did not identify any deficiencies in internal control that we consider to be material weaknesses. However, material weaknesses may exist that have not been identified.
77
Compliance and Other Matters
As part of obtaining reasonable assurance about whether the Board’s financial statements are free from material misstatement, we performed tests of its compliance with certain provisions of laws, regulations, contracts, and grant agreements, noncompliance with which could have a direct and material effect on the determination of financial statement amounts. However, providing an opinion on compliance with those provisions was not an objective of our audit and, accordingly, we do not express such an opinion. The result of our tests disclosed no instances of noncompliance or other matters that are required to be reported under Government Auditing Standards.
Purpose of this Report
The purpose of this report is solely to describe the scope of our testing of internal control and compliance and the results of that testing, and not to provide an opinion on the effectiveness of the Board’s internal control or on compliance. This report is an integral part of an audit performed in accordance with Government Auditing Standards in considering the Board’s internal control and compliance. Accordingly, this communication is not suitable for any other purpose. Cheyenne, Wyoming October 21, 2019