Innovation methods, algorithms, and software for analysis of reinsurance contracts
Upload
khangminh22Category
view
3download
0
2018 ANNUAL REPORT

TABLE OF CONTENTS
02 Our Mission, Vision, and Values
04 Chairman’s and CEO’s Message to Stockholders
10 Financial Highlights and Key Metrics
12 Management’s Discussion and Analysis of Financial Condition and Results of Operations
16 Timeline of Milestones
20 The Board of Directors
22 The Management Team
24 Profiles of the Board of Directors and Senior Leaders
28 Financial Statements

The National Reinsurance Corporation of the Philippines
or Nat Re (PSE: NRCP) provides life and non-life reinsurance capacity, and, in relation to this, offers consultancy, technical, and advisory services to its clients _ the direct insurers _ in emerging markets. Its services allow direct insurers to better manage their retentions and capital, to maximize their net premiums given their risk appetites, and to execute their roadmaps to competitiveness.
Nat Re also stimulates know-how transfer in the industry by helping build its clients’ capabilities in underwriting, product development, pricing, retention setting, and reinsurance program analysis. It continuously derives insights from experience and shares with its partners its knowledge of emerging markets, particularly of the Philippine insurance market, and curated global best practices in reinsurance.
1A N N U A L R E P O R T 2 0 1 8 1A N N U A L R E P O R T 2 0 1 8

OUR MISSIONNat Re exists to promote and develop a strong national insurance industry and to provide for its integration in the country’s economic and social development.
OUR VISIONNat Re strives to be the champion of insurers and reinsurers in emerging markets.
WE HELP:Independent insurers seeking a competitive edge to defend their home markets by helping manage their retentions and capital by providing reinsurance capacity, consulting and capacity-building services as well as by sharing curated global best practices.
Our workforce to develop leaders and mentors in reinsurance and insurance.
Government to realize sustainable financial inclusion through reinsurance and insurance public-private partnerships.
We undertake this mission while providing a fair return to our shareholders.
2 N A T I O N A L R E I N S U R A N C E C O R P O R A T I O N O F T H E P H I L I P P I N E S

OUR VALUES
DEPENDABILITYYou can rely on us to deliver on our promises and take responsibility for our actions and results. We are here for you for the long term.
INTEGRITYWe hold ourselves to the highest standards of ethics, professionalism, trustworthiness, and honor. We are committed to protect you and safeguard the privacy of your information.
SERVICE EXCELLENCEWe are fast, responsive, reliable and empathetic in meeting your needs. We aspire for the best quality in all that we do.
COLLABORATIONWe believe in the synergy in working with other stakeholders to achieve our goals.
EMPIRICISMWe make sound decisions and recommendations based on credible data or empirical evidence. We continuously derive knowledge and insights from experience.
SUSTAINABILITYIn all that we do, we consider not only the long-term impact on our business and the domestic insurance industry but also our shared responsibility to the larger society, national economy, and global environment.
3A N N U A L R E P O R T 2 0 1 8

Dear stockholders,
It is our pleasure to present to you the
financial statements and achievements of
your Company Nat Re for the year 2018 under
the leadership of your new President and Chief
Executive Officer, Mr. Allan Santos. This year is
particularly noteworthy for your Company as
we celebrated forty years of Nat Re serving as a
partner for growth of the Philippines’ insurance
industry.
To put some context behind our performance
in this milestone year, allow us first to report on
developments in the Philippine national economy
and the domestic and international reinsurance
and insurance sectors.
The Philippines’ GDP expanded 6.2% in 2018,
outpacing the growth of most ASEAN nations,
India, and China. The economy’s expansion
was once again driven by the boom in the
industry and service sectors, and the national
government’s spending on infrastructure. Under
the P8-9 trillion Build Build Build program which
runs until the year 2022, the government has
lined up seventy-five big-ticket infrastructure
projects to help promote interconnectivity,
generate jobs, and spur greater growth.
While our economy’s performance was bright in
2018, the reinsurance industry globally did not
fare as well. Fitch Ratings determined 2018 to be
a challenging year for the industry, particularly
non-life, due to high losses from catastrophes,
competitive premium rates, and an unfavorable
interest rate environment1. Globally, 2018 turned
out to be the fourth most costly year for the
insurance industry2 with cyclones in the US and
Japan, the earthquake in Indonesia, and wildfires
in California contributing to worldwide losses.
The year 2018 also marks the third consecutive
year of catastrophe losses exceeding USD200
billion3.
CHAIRMAN'S AND CEO'SMESSAGE TO STOCKHOLDERS
Cezar P. Consing Chairman
1 Fitch Ratings. (August 2017). Global Reinsurance Guide 2018. Retrieved from https://www.intelligentinsurer.com2 Aon Benfield. (2019). Weather, Climate & Catastrophe Insight. Retrieved from http://thoughtleadership.aonbenfield.com3 Ibid.
4 N A T I O N A L R E I N S U R A N C E C O R P O R A T I O N O F T H E P H I L I P P I N E S

Philippine insurers were not spared from large
losses. Natural disasters such as super typhoon
Mangkhut (Ompong) and several large fires in
commercial establishments inflicted substantial
losses on our non-life industry.
However, despite 2018 being very costly for
insurers, we are pleased to report that Nat
Re delivered favorable operating results.
Through more prudent underwriting and risk
management, we minimized the negative effects
of the year’s biggest natural catastrophes.
We are pleased to report that in 2018 we
generated P149 million in net income, an 80%
increase over 2017; this marks our fifth straight
year of delivering positive net income. These
results are on the back of underwriting profit of
P153 million, making 2018 our fourth straight year
of positive underwriting profits. Financial results
were also buoyed up by P389 million in realized
investment income, up 53% year-on-year despite
a volatile period for the global economy and the
financial industry.
We recorded a total combined ratio4 of 108%,
higher than last year’s due to a slightly elevated
technical combined ratio. However, we registered
an expense ratio of only 14%, the lowest your
Company has had in the last five years.
For 2018, our top-line figures also improved
and even exceeded their targets. Gross written
premiums totaled P3.68 billion, up 15% from 2017,
while net written premiums reached P2.58 billion,
growing at 9.0%.
Our net worth of P4.8 billion as of end-2018
is significantly higher than the Insurance
Commission’s minimum requirement of P3.0
billion by the end of 2022. Our Capital Adequacy
Ratio as of the end of the year was 288%, well-
beyond the 100% minimum required by the
regulator.
The credit rating agency A.M. Best rated your
Company’s Enterprise Risk Management
“Appropriate”, recognizing that our risk
management capabilities have strengthened in
recent years. To build our capabilities further,
we launched a Risk and Control Assessment
exercise, a process for us to better understand
our operating environment, and identify, assess,
mitigate, and monitor our risks and controls.
On governance, the Institute of Corporate
Directors recognized Nat Re as among the top-
performing Philippine publicly-listed companies
under the 2017 ASEAN Corporate Governance
Scorecard (ACGS). Less than 20% of the two
hundred and forty-five companies listed on
the local bourse were given this prestigious
4 The ratio of share in losses (net), commissions (net), and general and administrative expenses to net earned premiums
NET INCOME Up 80% over 2017
Net worth of P4.8 billionBEYOND THE END-2022 REQUIREMENT
A top publicly-listed companyUNDER THE ASEAN CORPORATE GOVERNANCE SCORECARD
5A N N U A L R E P O R T 2 0 1 8

IN 2018, WE GENERATED P149 MILLION IN NET
INCOME; THIS MARKS OUR FIFTH STRAIGHT YEAR
OF DELIVERING POSITIVE NET INCOME.
recognition for exemplary corporate governance
practices.
This year, we infused valuable talent into almost
every level of our organization. The Nat Re Board
appointed Allan Santos as the new CEO, Christian
Ladoux as the Chief Underwriting Officer, and
Tisha Darvin as the Head of Data Administration
and Analytics. Mr. Ladoux oversees the life and
non-life reinsurance business lines while Ms.
Darvin oversees the pricing, reserving, capital
modelling, catastrophe risk management, and
data administration functions. We also hired
two new members of the analytics team, three
underwriters, and an internal auditor.
Non-life gross written premiums expanded 15.6%
to P2.6 billion owing to our fast-growing foreign
business. We have improved our bottom line by
exiting or reducing shares in unprofitable treaties
and growing the proportion of profitable non-fire
lines from 49% to 57% of our non-life domestic
portfolio.
Overall, we now have a portfolio heavily weighted
towards more profitable treaties from small
and medium-sized companies with relatively
lower catastrophe exposures. To improve our
geographic diversification, we entered into a
reciprocal arrangement with an A-rated global
reinsurer where we are able to participate in their
treaties covering risks all over the globe.
Our non-life team pursued other initiatives which
well positions our non-life business for future
profitable growth. We signed a bond treaty with
a global reinsurer which will allow Nat Re to tap
into the growing demand for bonds capacity in
the Philippines. We also initiated discussions with
industry representatives on the creation of the
first reinsurance facility for sabotage & terrorism
insurance.
NON-LIFE GROSS WRITTEN PREMIUMS Up 15.6% toP2.6 billion
6 N A T I O N A L R E I N S U R A N C E C O R P O R A T I O N O F T H E P H I L I P P I N E S

Allan R. Santos President and CEO
Gross written premiums from our life business
breached the billion-peso mark in 2018. This
represents a 13.4% growth from a year ago and is
almost double the premiums we generated four
years ago. This expansion was driven by the fast
growth of mortgage redemption insurance, credit
life and employee benefits, and by our deliberate
efforts to serve mutual benefit associations and
cooperatives and to better support inclusive
insurance. A notable milestone this year is our
treaty with an Egyptian life insurance firm, which
is our first direct life reinsurance transaction
outside the Philippines in more than a decade.
Our life business also ended the year with strong
bottom-line figures, with underwriting income
exceeding P200 million.
We continued to develop value-added services
for our life clients and launched the Nat Re
Online Risk Manual, the first and only web-based
life underwriting tool that accounts for unique
Philippine market conditions. We also offered
various training seminars on underwriting, claims,
and pricing.
Both our life and non-life teams organized
Nat Re’s 4th Annual Technical Forum, or ATF,
which was again very well-received. Attended
by over a hundred representatives from our
client companies, the ATF was an avenue for
discourse on the emerging agriculture, sabotage
& terrorism, and financial lines and on the global
and local trends on medical insurance. We also
hosted our CEO Forum which encouraged
discussions on talent and technology among
CEOs and Chairpersons of our client companies.
LIFE GROSS WRITTEN PREMIUMS Almost double the premiums generated four years ago
7A N N U A L R E P O R T 2 0 1 8

Nat Re’s support divisions continued to provide
invaluable support to our business units.
We enhanced our performance management
system and developed a performance-based
incentive program. We implemented new
communication channels as well to encourage
more open communication between employees
and senior management.
We bolstered the operational efficiency of our
life reinsurance division by implementing SICS,
a globally standardized, end-to-end solution for
assumed and ceded reinsurance administration.
We also improved the efficiency of our cash
collections, leading to cash and cash equivalents
reaching P1.16 billion, almost double that of 2013.
Lastly, we completed your Company’s rebranding
and unveiled the new Nat Re brand, a tangible
representation of our new aspirations for Nat Re.
As the country’s national reinsurer, we
understand the important part we play in the
development of the Philippines’ insurance
industry. With this in mind, we pursued various
initiatives in 2018 to further deliver on this very
important role.
We formally launched the Oasis project which
will develop the first open-access catastrophe
model for flood in the Philippines. Nat Re is
the project manager of this pioneering project,
which involves stakeholders from industry, the
academe, and government.
Improved efficiency of cash collections2018 CASH AND CASH EQUIVALENTS ALMOST DOUBLE THAT OF 2013
LAUNCHED THE PROJECT DEVELOPING THE First open-accesscatastrophe model for flood in the Philippines
8 N A T I O N A L R E I N S U R A N C E C O R P O R A T I O N O F T H E P H I L I P P I N E S

The Board of Trustees of the Philippine Insurers
and Reinsurers Association, or PIRA, also elected
Nat Re CEO Allan Santos as its Chairman for
2019, providing another avenue for us to play
a more impactful role in pursuing industry
initiatives. To foster collaboration among
reinsurers in ASEAN, our CEO also chaired the
first Reinsurance Working Committee meeting of
the ASEAN Insurance Council or AIC.
We re-evaluated our corporate social
responsibility priorities and decided to engage
new partners. This year, for instance, we co-
funded the development of the earthquake alert
mobile application of the AIC's Catastrophe and
Risk Management in ASEAN (CARMA).
We are very proud of our achievements in
2018. Our gains challenge us to see how we can
achieve more in the coming years.
Moving forward, we will set our sights on
stepping up as the Philippines’ national reinsurer.
We will foster stronger relationships with our
clients, especially the domestic insurance
companies, and endeavor to deliver relevant
reinsurance solutions and value-added services.
We will aim to develop profitable growth
opportunities in the domestic market by
developing new products and by maximizing our
entitlement to a 10% mandatory offer. We will
also create reinsurance facilities for the sharing of
risks within the local industry, thereby increasing
national retention and improving self-reliance.
To allow us to better manage this expected
growth in our business, we will continue to
develop internal capabilities and encourage a
high-performance culture in our organization.
We will continue to refine our pricing and
portfolio management capabilities to encourage
growth, reduce portfolio volatility, and lower the
costs of obtaining protection for our portfolio.
As always, we thank you, our stockholders, for
putting your trust in your Board of Directors,
your management, and your workforce over the
past forty years. We would also like to take this
opportunity to thank our employees for their
hard work and commitment to continue to build
Nat Re.
We look forward to your continued support for
our various initiatives in the coming years.
CEZAR P. CONSING Chairman
ALLAN R. SANTOS President and CEO
Stepping up as the Philippines' national reinsurer
9A N N U A L R E P O R T 2 0 1 8

FINANCIAL HIGHLIGHTS
P2.576B Net Written Premiums
214% growth from 2013
108% Combined Ratio
Improvement of 33 percentage points from the 141% average in
2013-2017
EXPANDING BUSINESS
P3.682B Gross Written
Premiums44% growth from 2013
IMPROVING PROFITABILITY
P149M Net Profit
higher than the P2.1M average in
2013-2017
POSITIVE UNDERWRITING
RESULTS
P153MFourth straight year
of positive underwriting
income
Non-LifeDomestic 24.6%
Life 30.1%
Non-LifeForeign 45.3%
GROSSWRITTENPREMIUMS
IN 2018
10 N A T I O N A L R E I N S U R A N C E C O R P O R A T I O N O F T H E P H I L I P P I N E S

P1.4Bworth of gross
claims paid in 2018
2018 2017(as
restated)
2016(as
restated)
2015 2014 2013
Gross written premiums 3,682 3,205 3,384 2,182 2,747 2,561
Net written premiums 2,576 2,364 1,693 928 1,022 820
Underwriting income (loss) 153 237 119 229 (72) (428)
Investment & other income 389 255 282 507 433 664
Net profit (loss) 149 83 27 179 8 (288)
Total assets 13,871 14,175 14,074 13,439 14,188 15,443
Stockholders’ equity 4,827 5,288 4,854 4,907 5,114 4,952
Book value per share (in pesos) 2.27 2.49 2.29 2.31 2.41 2.33
Return on average equity 2.95% 1.64% 0.56% 3.58% 0.17% -5.50%
Expense ratio1 14% 15% 27% 56% 36% 56%
Commission ratio2 30% 27% 30% 28% 35% 35%
Loss ratio3 64% 62% 60% 46% 74% 117%
Combined ratio4 108% 104% 117% 130%* 145%* 208%*
1 Ratio of general and administrative expenses to net earned premiums2 Ratio of commissions (net) to net earned premiums3 Ratio of share in losses (net) to net earned premiums4 Represents total combined ratio which is the ratio of share in losses (net), commissions (net), and general and administrative expenses to net earned premiums* based on undiscounted premiums and loss reserves
KEY METRICSAmounts in million pesos unless otherwise specified
STRONG CAPITAL
POSITION
288%End-2018 capital adequacy
ratio, well beyond the 100% minimum at 97.5% level of sufficiency set
by the regulator
DIVERSIFIED BUSINESS
We have
374 treaties with 109 partners
globally**Life and non-life cedants
for underwriting year 2018
RELIABLESERVICE
5 to 7 daysAverage turnaround
time for cash call payments (for claims with
complete documents)
11A N N U A L R E P O R T 2 0 1 8

MANAGEMENT’S DISCUSSION AND ANALYSIS OF FINANCIAL CONDITION AND RESULTS OF OPERATIONS
REVIEW OF 2018 VERSUS 2017
RESULTS OF OPERATIONS
For the years ended Inc(dec)
In Millions PhP 31 Dec 2018 31 Dec 2017 Amount %
REINSURANCE PREMIUM INCOME
Reinsurance premiums, net of returns P3,682.9 P3,205.1 P477.8 14.9%
Retroceded premiums (1,106.7) (841.4) 265.3 31.5%
Net written premiums 2,576.2 2,363.7 212.5 9.0%
Increase in premium reserves - net (9.9) (209.2) 199.3 -95.3%
2,566.3 2,154.5 411.8 19.1%
UNDERWRITING DEDUCTIONS
Share in reported losses – net 1,051.5 1,026.4 (25.1) 2.4%
Share in unreported loss reserves – net 588.6 308.2 (280.4) 91.0%
Commissions – net 773.3 583.3 (190.0) 32.6%
2,413.4 1,917.9 (495.6) 25.8%
NET UNDERWRITING INCOME 152.7 236.6 (83.8) -35.4%
Interest 224.7 192.5 32.2 16.7%
Gain on sale of AFS 131.1 120.8 10.3 8.5%
Foreign currency gain (losses) 43.2 (30.7) 73.9 -240.8%
Others (9.5) (27.8) 18.3 -65.8%
INVESTMENT AND OTHER INCOME AND EXPENSES– Net 389.5 254.8 134.7 52.9%
PROFIT AFTER INVESTMENT AND OTHER INCOME AND EXPENSES 542.2 491.4 50.8 10.3%
GENERAL AND ADMINISTRATIVE EXPENSES 350.3 317.4 (33.0) 10.4%
PROFIT BEFORE TAX 191.9 174.0 17.9 10.3%
TAX EXPENSE 42.7 91.0 48.4 -53.1%
NET PROFIT P149.2 P83.0 P66.2 79.8%
The Company recorded a net profit of P149.2 million for the year ended December 31, 2018, P66.2 million or 79.8% higher than the net profit recognized in 2017. The Net Profit resulted from generating Net Underwriting Income of P152.7 million, and Investment and Other Income and Expenses of P389.5 million negated by General and Administrative Expenses of P350.3 million and Tax Expense of P42.7 million.
12 N A T I O N A L R E I N S U R A N C E C O R P O R A T I O N O F T H E P H I L I P P I N E S

Underwriting Results
Net underwriting income amounted to P152.7 million, lower by P83.8 million or 35.4% compared to 2017. Lower net underwriting income is mainly due to large fire losses incurred in the first quarter of 2018. This is partially negated by the increase in Earned premium by P411.8 million or 19.1%. The increase in Earned premium can be mainly attributed to higher retention of premiums written in 2018 by P212.5 million or 9.0% from P2.4 billion in 2017 to P2.6 billion in 2018. Higher premiums earned in 2018 primarily resulted from the growth in foreign business where net written premiums grew by P394 million or 33% from P1.2 billion in 2017 to P1.6 billion in 2018 as the company continued to diversify risks generated from non-life business. Net earned premiums from foreign non-life business grew by P555 million or 60% from P931 million to P1.4 billion in 2018.
Share in reported losses, net is higher by P25.1 million or 2.4% in 2018, while Share in unreported loss reserves, net is higher by P280.4 million or 91% in 2018. These increases resulted mainly from the growth in the Company’s underwriting operations and exposure to large property losses in the Philippines. Commissions, net amounted to P773.3 million or P190 million or 32.6% higher from P583.3 million in 2017, resulting mainly from higher premiums earned and from assuming contracts with higher acquisition cost. Investment and Other income and expenses, net amounting to P389.5 million is higher by P134.7 million or 52.9% from 2017. This is mainly due to higher foreign exchange gain by P73.9 million from P30.7 foreign exchange loss in 2017 to P43.2 million foreign exchange gain in 2018, higher interest income by P32.2 million from P192.5 million in 2017 to P224.7 million in 2018 and higher gain on sale of AFS by P10.3 million from P120.8 million in 2017 to P131.1 million in 2018.
General and administrative expenses amounting to P350.3 million is higher by P33 million or 10.4% mainly due to higher manpower cost as the Company started to fill some of its vacancies and higher other tax expense. However, expense ratio decreased from 15% in 2017 to 14% in 2018 due to economies of scale. Tax expense amounting to P42.7 million is lower by P48.4 million or 53.1% from P91 million in 2017 as the Company recognized deferred tax assets from a portion of its loss reserves.
NET PREMIUMS FROM FOREIGNNON-LIFE BUSINESS
EXPENSE RATIORatio of general and administrative expenses to net earned premiums
P1.2B IN 2017
P1.6B IN 2018
33% GROWTH
38% AVERAGE IN
2013-2017
14% IN 2018
24 PERCENTAGE
POINTS IMPROVEMENT
13A N N U A L R E P O R T 2 0 1 8

FINANCIAL CONDITION
Audited Audited Inc(dec)
In Millions PhP 31 Dec 2018 31 Dec 2017 Amount %
CASH AND CASH EQUIVALENTS P1,161.9 P1,310.5 (148.6)
-11.3%
REINSURANCE BALANCES RECEIVABLE - Net 2,280.1 1,949.9 330.2 16.9%
AVAILABLE-FOR-SALE FINANCIAL ASSETS 4,580.0 5,527.1 (947.2) -17.1%
HELD-TO-MATURITY INVESTMENTS 1,848.7 1,034.7 814.0 78.7%
LOANS AND RECEIVABLES 112.5 201.9 (89.4) -44.3%
PROPERTY AND EQUIPMENT - Net 76.6 80.0 (3.4) -4.3%
REINSURANCE RECOVERABLE ON REPORTED LOSSES 2,374.5 2,748.4 (373.9)
-13.6%
REINSURANCE RECOVERABLE ON CLAIMS RESERVES 319.0 500.0 (180.9) -36.2%
DEFERRED ACQUISITION COSTS 405.1 280.9 124.2 44.2%
DEFERRED REINSURANCE PREMIUMS 331.5 202.9 128.6 63.4%
OTHER ASSETS 381.3 338.9 42.4 12.5%
TOTAL ASSETS P13,871.3 P14,175.3 (P304.0) -2.1%
LIABILITIES AND EQUITY
REINSURANCE BALANCES PAYABLE P1,154.2 P1,269.6 (P115.4) -9.1%
ACCOUNTS PAYABLE AND ACCRUED EXPENSES 90.6 75.3 15.4 20.4%
LOSSES AND CLAIMS PAYABLE 4,519.3 4,802.6 (283.3) -5.9%
CLAIMS RESERVES 1,715.5 1,307.8 407.7 31.2%
PREMIUM RESERVES 1,564.6 1,426.1 138.5 9.7%
DEFERRED REINSURANCE COMMISSIONS 0.5 5.4 (4.9) -90.3%
TOTAL LIABILITIES 9,044.8 8,886.9 157.9 1.8%
CAPITAL STOCK 2,182.0 2,182.0 - 0.0%
TREASURY STOCK (100.5) (100.5) - 0.0%
ADDITIONAL PAID-IN CAPITAL 3,019.2 3,019.2 - 0.0%
REMEASUREMENT OF DEFINED BENEFIT LIABILITY (67.6) (71.5) 3.9 -5.5%
REVALUATION RESERVES (454.1) 160.9
(615.0) -382.2%
RETAINED EARNINGS 247.5 98.3
149.2 151.7%
TOTAL EQUITY 4,826.5 5,288.4 (461.8) -8.7%
TOTAL LIABILITIES AND EQUITY P13,871.3 P14,175.3 (P304.0) -2.1%
14 N A T I O N A L R E I N S U R A N C E C O R P O R A T I O N O F T H E P H I L I P P I N E S

The Company’s shareholders’ equity as at December 31, 2018 declined by P461.8 million or 8.7% from P5.2 billion in December 31, 2017 to P4.8 billion in 2018. The 8.7% decrease resulted mainly from the other comprehensive loss as a result of market value movements amounting to P613.4 million, this was partially negated by positive operating results of P149.2 million. Cash and cash equivalents amounting to P1.1 billion was P148.6 million or 11.3% lower than the 2017 balance of P1.3 billion. The decrease in Cash and cash equivalents resulted mainly from the net cash used in the Company’s operating and investing activities amounting to P89.8 million and P64.1 million, respectively. Reinsurance balances receivables amounting to P2.2 billion increased by P330.2 million or 16.9% from the 2017 balance of P1.9 billion. The increase in this account is consistent with the growth the Company’s underwriting operations discussed in the Results of Operations. AFS financial assets and Held-to-maturity (HTM) investmentsInvestments in AFS financial assets amounting to P4.6 billion as at December 31, 2018 decreased by P947.2 million or 17.1% from P5.5 billion as at December 31, 2017. The decrease in these investments mainly resulted from the reclassification of certain corporate bonds to HTM investments and other assets amounting to P563.3 million and decline in fair value of P492 million. The impact of the transfer and changes in fair value were partially negated by the net acquisition of new securities amounting to P141 million. HTM Investments amounting to P1.8 billion as at December 31, 2018 increased by P814 million or 78.7% from P1.0 billion as at December 31, 2017. The increase in these investments mainly resulted from the transfer from AFS amounting to P473.1 million and additions amounting to P340 million. Loans and receivables amounting to P112.5 million as at December 31, 2018 decreased by P89.4 million or 44.3% due to the collection and maturity of certain loans receivable. Reinsurance recoverable on reported losses amounting to P2.4 billion as at December 31, 2018 decreased by P373.9 million from P2.7 billion as at December 31, 2017. The decline in the account balance was mainly due to the collection of these receivables and downward adjustment of the related claims. Reinsurance recoverable on reserves amounting to P319 million as at December 31, 2018 decreased by P180.9 million from P500 million as at December 31, 2017. The decline in the account balance was mainly due to adjustment of claims reserves. Deferred acquisition costs amounting to P405.1 million as at December 31, 2018 increased by P124.2 million from the balance as at December 31, 2017 of P280.9 million is consistent with the growth experienced in the Company’s reinsurance operations. Deferred reinsurance premiums amounting to P331.5 million as at December 31, 2018 increased by P128.6 million or 63.4% from P202.9 million as at December 31, 2017. The increase in Deferred reinsurance premiums is consistent with the increase in retroceded premiums in 2018, as a result of the shift in accounting for retrocession premiums to align with the accounting for premiums assumed. Reinsurance balances payable amounting to P1.1 billion as at December 31, 2018 decreased by P115.4 million or 9.1% from P1.3 billion as at December 31, 2017 due to timing differences as the due dates of certain premiums are spread throughout the year. Accounts payable and accrued expenses amounting to P90.6 million as at December 31, 2018 increased by P15.4 million or 20.4% from P75.3 million as at December 31, 2017. The increase was mainly due to increase in accounts payable due to our service providers. Premium reserves amounting to P1.6 billion increased by P138.5 million or 9.7% from the balance as at December 31, 2017 of P1.4 billion. The increase is consistent with the increase in gross written premiums in 2018. Losses and claims payable amounting to P4.5 billion decreased by P283.3 million or 5.9% from the balance as at December 31, 2017 of P4.8 billion due to payment and downward adjustment of the related claims. Claims reserves amounting to P1.7 billion increased by P407.7 million or 31.2% from the balance as at December 31, 2017 of P1.3 billion. The increase is expected due to the growth in foreign non-life business where actual losses are normally reported at a later date versus contracts written locally.
15A N N U A L R E P O R T 2 0 1 8

JANUARY The Board of Directors appoints Mr. Cezar Consing as the Chairman of the Board of Nat Re. Mr Consing, the President and CEO of the Bank of the Philippine Islands, brings with him over thirty years of experience in international banking and private equity.
Nat Re implements an enhanced performance management system for its workforce. Under the new system, the performance of each employee is evaluated based on their achievement of performance objectives and their demonstration of the company’s values. Complementing this, senior management also develops a performance-based incentive program aimed at reinforcing the values of meritocracy and service excellence.
Nat Re is recognized by an A-rated (re)insurance company as an acceptable reinsurance security for its 2018 treaty renewal. Nat Re is able to diversify geographically by participating in the (re)insurance company’s treaties which have risks all over the globe.
FEBRUARY
As part of its rebranding, the company registers “Nat Re” as one of its official business names.
MARCH
The company launches the Nat Re Online Risk Manual (NORM), the first and only web-based life underwriting tool that accounts for unique Philippine conditions.
APRIL AM Best affirms Nat Re’s B++ (Good) credit rating, which reflects the company’s strong balance sheet, adequate operating performance, neutral business profile, and appropriate enterprise risk management.
TIMELINE OF MILESTONES
Nat Re completes its major office renovation. The new workspace encourages greater collaboration among employees and reflects the new Nat Re brand.
Nat Re completes the documentation of its major processes using SIPOC (suppliers, inputs, process, outputs, customers), a tool used to document business processes from beginning to end.
MAY The Philippine Insurers and Reinsurers Association (PIRA) and the Philippine Life Insurance Association (PLIA), together with Nat Re as the official administrator of the conference funds and TeamAsia as the events management partner, hold the 29th East Asian Insurance Congress (EAIC) at the Marriott Grand Ballroom in Manila. The EAIC, established to develop international collaboration among insurers, has been billed as the premier biennial non-life insurance event of the region.
JUNE Nat Re hosts its CEO Forum focusing on how business leaders can harness the power of digital transformation, and retain millennials in their organizations. Speakers include the Chief Technology Officer for AMEA of DXC Technology, the Area Leader for the Asia-Pacific of People Advisory Services of EY, and select CEOs of Nat Re’s client companies.
Nat Re celebrates forty years being of service to its client companies and the insuring public—and the next forty years of being more customer-focused.
16 N A T I O N A L R E I N S U R A N C E C O R P O R A T I O N O F T H E P H I L I P P I N E S

JULY
Nat Re obtains a license to solicit business in Egypt and enters into a treaty with Egyptian Life Takaful Company, marking the company’s first direct life reinsurance transaction outside the Philippines in more than a decade.
Nat Re’s investments and accounting departments complete the streamlining of certain functions to ensure proper checks and balances and to minimize operational risks. The processes of portfolio maintenance and reporting to regulatory bodies are now fully transferred to the accounting department.
AUGUST Nat Re is recognized by the Institute of Corporate Directors (ICD) as among the top-performing Philippine publicly-listed companies (PLCs) under the 2017 ASEAN Corporate Governance Scorecard (ACGS). ICD confers this merit to PLCs who have garnered an ACGS score of 80 or above. Out of the two hundred and forty-five companies listed on the local bourse, only Nat Re and forty-one other companies are given this prestigious recognition for exemplary corporate governance practices.
Nat Re beefs up its management team and technical expertise by appointing Christian Ladoux as its Chief Underwriting Officer and Tisha Darvin as its Head of Data Administration and Analytics. Ladoux has thirty-five years of international experience in reinsurance underwriting, having handled proportional and non-
proportional treaties covering risks in France, Germany, Japan, Australia, Belgium, East and Southeast Asia, and the Indian subcontinent.
Darvin is an actuary by profession with over twenty-five years of experience in product development, mergers and acquisitions, demutualization, distribution channels compensation, financial planning and analysis, employee benefits valuation, and actuarial studies, among others.
Allan R. Santos is appointed as Nat Re’s new President and Chief Executive Officer. Prior to his appointment, Santos was the company’s Executive Vice President and Chief Operating Officer overseeing Finance, Investments, Data and Analytics, Technology, Human Resources and Office Services.
Nat Re holds the kick-off workshop for the Catastrophe and Climate Change Risk Assessment for the Philippines or the Oasis Project. The event, attended by implementing partners and representatives from various government agencies, provided an avenue for initial discussions on expectations and next steps for the project. The two-year initiative, of which Nat Re is the local project manager, aims to develop the first open-access catastrophe model for flood in the Philippines and build capacity among Philippine stakeholders.
Nat Re joins PIRA’s Data Privacy Council, the non-life insurance and reinsurance industry representative to the National Privacy Commission. The members of the council are the champions in raising awareness on privacy laws, requirements, and regulations within the insurance industry.
Nat Re formally launches its new logo which contains elements that signify strength, stability, peace of mind, guidance, and insight. Throughout the year, the company also launches a tagline, a revamped website, a new brochure, and other marketing collateral as part of its rebranding effort.
17A N N U A L R E P O R T 2 0 1 8

TIMELINE OF MILESTONES
SEPTEMBER
Nat Re holds the 4th Life and Non-life Annual Technical Forum (ATF) with over a hundred actuaries and underwriting and marketing officers of the company’s client companies in attendance. The life session focused on trends in health financing/insurance while the non-life portion covered agriculture, sabotage & terrorism, and financial lines.
The configuration of the administration platform SICS for Nat Re’s life business goes live. SICS is expected to bring many benefits to the company’s life reinsurance division, including improving operational efficiency, enabling business process automation, enhancing business intelligence, strengthening business and financial controls, and augmenting overall decision-making processes.
OCTOBER To protect its growing life portfolio business against potential catastrophes, Nat Re purchases a Catastrophe XOL cover from a reputable retrocessionaire with an A credit rating. It covers all individual life, group life, credit life, and personal accident policies.
Nat Re conducts a training session on basic insurance, reinsurance, and catastrophe modeling for over sixty representatives from various government stakeholders of the Oasis Project.
Nat Re convenes a meeting among non-life insurance industry players to discuss the creation of a reinsurance facility for sabotage & terrorism insurance, slated for launching in 2019.
Nat Re’s Head of Catastrophe Risk Management Cherry Lorenzo is nominated by PIRA to represent the Philippines in the 9th ASEAN School for Young Insurance Managers (AYIM) in Bangkok, Thailand. The AYIM, one of the initiatives of the ASEAN Insurance Education Committee, aims to develop promising, high-potential young managers in the industry into multi-faceted leaders.
NOVEMBER The implementing partners of the Oasis Project, namely Nat Re, Oasis Loss Modelling Framework, KatRisk, the University of the Philippines, and the Philippine Atmospheric, Geophysical and Astronomical Services Administration (PAGASA), and Willis Towers Watson, formally launch the start of the project. The launch event drove fruitful discussions on catastrophe modeling and disaster risk financing and insurance among 150 participants from the insurance industry, the academe, the government, and the non-profit sector.
CEO Allan Santos chairs the first ASEAN Reinsurance Working Committee meeting of the ASEAN Insurance Council. In the meeting, the Committee members (composed of representatives from reinsurance companies in the ASEAN region) formulated its charter and identified its near-term initiatives and actions.
Nat Re sponsors the Fellowship Night of the 59th Annual Convention of the Actuarial Society of the Philippines.
18 N A T I O N A L R E I N S U R A N C E C O R P O R A T I O N O F T H E P H I L I P P I N E S

DECEMBER Nat Re is among the first sponsors of the development of the mobile phone application of CARMA or Catastrophe And Risk Management in ASEAN. CARMA, a non-profit media portal initiated by the ASEAN Natural Disasters Research Works Sharing (ANDREWS) Committee, is an online portal for sharing disaster risk management information, including earthquake alerts, in the region. The mobile application version of CARMA will send earthquake alerts via smartphone in real time.
Nat Re renews its Certificate of Authority with the Insurance Commission. The renewed certificate, valid until December 31, 2021, reaffirms the company’s financial stability and its ability to continue to serve and pay claims to its client companies. As of the end of 2018, Nat Re’s net worth was already well beyond the end-2022 regulatory minimum requirement of PHP 3 billion.
The Board of Trustees of PIRA, the trade association of the country’s non-life insurance industry, elects Nat Re CEO Allan Santos as its Chairman in 2019.
PhilRatings grants Nat Re a PRS A rating, which reflects the company’s solid market franchise, shareholders of good standing, experienced management, sound investment portfolio, and the expectations of continued industry growth.
Nat Re launches its Risk and Control Assessment exercise, a process for Nat Re’s management to understand the company’s operating environment, and identify, assess, mitigate, and monitor its risks and controls.
Swiss Re agrees to provide Nat Re a bonds facility. This will allow Nat Re to tap into the growing demand for bonds capacity fueled by the Philippine government’s aggressive infrastructure spending.
To ensure a strong balance sheet, Nat Re assesses the reinsurance receivables and losses recoverables for any possible impairment on a regular basis, while also considering its retrocessionaire’s financial capacity and credit rating. Nat Re then recognizes an allowance for impairment when such evidence exists.
YEAR-ROUND
Nat Re implements various new employee engagement activities, such as health and wellness activities, and communications channels for its employees, such as a revamped town hall format and an online suggestion box. It also continues to provide its employees with learning and development opportunities in the Philippines and abroad.
19A N N U A L R E P O R T 2 0 1 8

THE BOARD OF DIRECTORS
Cezar P. Consing Chairman Wilfredo C. Maldia Vice Chairman Allan R. Santos President/CEO/Director
Antonio M. Rubin Director Yvonne S. Yuchengco DirectorJoli Co Wu Director/Treasurer
20 N A T I O N A L R E I N S U R A N C E C O R P O R A T I O N O F T H E P H I L I P P I N E S

Romeo L. Bernardo Independent Director
Jocelyn DG Cabreza Director Rafael G. Ayuste, Jr. Director
Lt. Gen. Alan R. Luga, AFP (Ret) Director
Medel T. Nera Independent DirectorErmilando D. Napa Independent Director
Ma. Consuelo A. Lukban Director
Noel A. Laman Corporate Secretary
Ma. Pilar M. Pilares-GutierrezAssistant Corporate Secretary
Punongbayan & Araullo External Auditor
Castillo Laman Tan Pantaleon & San Jose Law Offices External Legal Counsel
21A N N U A L R E P O R T 2 0 1 8

THE MANAGEMENT TEAM
EXECUTIVE SERVICES
ALLAN R. SANTOSPresident/CEO
CHRISTIAN LADOUXSenior Vice President
Chief Underwriting Officer
REGINA S. RAMOSVice President
Head of Risk and Compliance
LIFE REINSURANCE
VICTOR R. TANJUAKIOFirst Vice President
Head of Life Reinsurance
BLESILDA S. BESABESenior Assistant Vice President
ANELISA TRINIDAD M. MERIDAAssistant Vice President
VON EDWARD M. EBRONAssistant Vice President
NON-LIFE REINSURANCE
ALEXANDER L. REYESSenior Vice President
Head of Non-life Reinsurance
SHARED SERVICES
INVESTMENTS
DAISY C. SALONGAVice President
Head of Investments
DATA ADMINISTRATION AND ANALYTICS
TISHA T. DARVINVice President
Head of Data Administration
and Analytics
CHERRY LOU R. LORENZOAssistant Vice President
Head of Catastrophe Risk
Management
FINANCE
SANTINO U. SONTILLANOSenior Assistant Vice President
Head of Finance
HONORATA S. LUCOSAssistant Vice President
Head of Collections and Account
Settlement
HUMAN RESOURCES AND OFFICE SERVICES
REGINA LOURDES D. PAPASenior Assistant Vice President
Head of Human Resources
and Office Services
INTERNAL AUDIT
MARK QUINTIN G. NUÑEZAssistant Vice President
Head of Internal Audit
22 N A T I O N A L R E I N S U R A N C E C O R P O R A T I O N O F T H E P H I L I P P I N E S

From left: Victor R. Tanjuakio, Regina Lourdes D. Papa, Santino U. Sontillano, Daisy C. Salonga Allan R. Santos, Christian Ladoux, Tisha T. Darvin, Alexander L. Reyes, Regina S. Ramos
23A N N U A L R E P O R T 2 0 1 8
PROFILES OF THE BOARD OF DIRECTORS AND SENIOR LEADERS
THE BOARD OF DIRECTORS
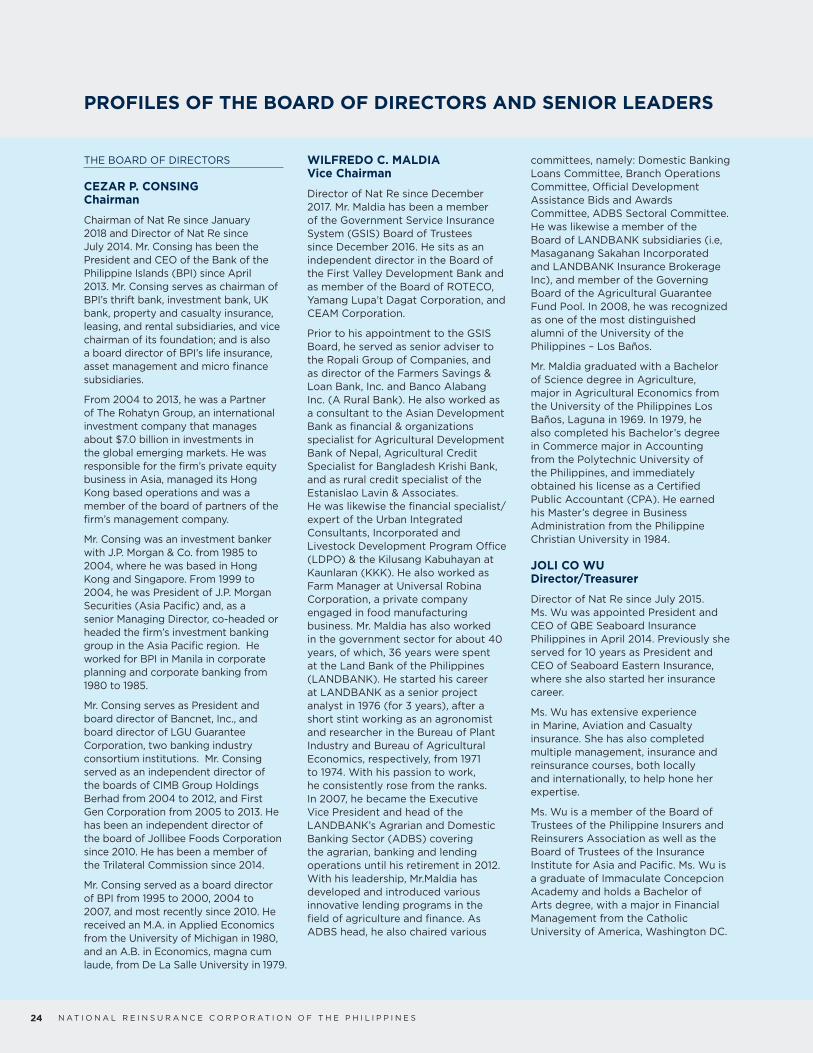
CEZAR P. CONSING Chairman
Chairman of Nat Re since January 2018 and Director of Nat Re since July 2014. Mr. Consing has been the President and CEO of the Bank of the Philippine Islands (BPI) since April 2013. Mr. Consing serves as chairman of BPI’s thrift bank, investment bank, UK bank, property and casualty insurance, leasing, and rental subsidiaries, and vice chairman of its foundation; and is also a board director of BPI’s life insurance, asset management and micro finance subsidiaries. From 2004 to 2013, he was a Partner of The Rohatyn Group, an international investment company that manages about $7.0 billion in investments in the global emerging markets. He was responsible for the firm’s private equity business in Asia, managed its Hong Kong based operations and was a member of the board of partners of the firm’s management company.
Mr. Consing was an investment banker with J.P. Morgan & Co. from 1985 to 2004, where he was based in Hong Kong and Singapore. From 1999 to 2004, he was President of J.P. Morgan Securities (Asia Pacific) and, as a senior Managing Director, co-headed or headed the firm’s investment banking group in the Asia Pacific region. He worked for BPI in Manila in corporate planning and corporate banking from 1980 to 1985.
Mr. Consing serves as President and board director of Bancnet, Inc., and board director of LGU Guarantee Corporation, two banking industry consortium institutions. Mr. Consing served as an independent director of the boards of CIMB Group Holdings Berhad from 2004 to 2012, and First Gen Corporation from 2005 to 2013. He has been an independent director of the board of Jollibee Foods Corporation since 2010. He has been a member of the Trilateral Commission since 2014. Mr. Consing served as a board director of BPI from 1995 to 2000, 2004 to 2007, and most recently since 2010. He received an M.A. in Applied Economics from the University of Michigan in 1980, and an A.B. in Economics, magna cum laude, from De La Salle University in
WILFREDO C. MALDIA Vice Chairman
Director of Nat Re since December 2017. Mr. Maldia has been a member of the Government Service Insurance System (GSIS) Board of Trustees since December 2016. He sits as an independent director in the Board of the First Valley Development Bank and as member of the Board of ROTECO, Yamang Lupa’t Dagat Corporation, and CEAM Corporation.
Prior to his appointment to the GSIS Board, he served as senior adviser to the Ropali Group of Companies, and as director of the Farmers Savings & Loan Bank, Inc. and Banco Alabang Inc. (A Rural Bank). He also worked as a consultant to the Asian Development Bank as financial & organizations specialist for Agricultural Development Bank of Nepal, Agricultural Credit Specialist for Bangladesh Krishi Bank, and as rural credit specialist of the Estanislao Lavin & Associates. He was likewise the financial specialist/expert of the Urban Integrated Consultants, Incorporated and Livestock Development Program Office (LDPO) & the Kilusang Kabuhayan at Kaunlaran (KKK). He also worked as Farm Manager at Universal Robina Corporation, a private company engaged in food manufacturing business. Mr. Maldia has also worked in the government sector for about 40 years, of which, 36 years were spent at the Land Bank of the Philippines (LANDBANK). He started his career at LANDBANK as a senior project analyst in 1976 (for 3 years), after a short stint working as an agronomist and researcher in the Bureau of Plant Industry and Bureau of Agricultural Economics, respectively, from 1971 to 1974. With his passion to work, he consistently rose from the ranks. In 2007, he became the Executive Vice President and head of the LANDBANK’s Agrarian and Domestic Banking Sector (ADBS) covering the agrarian, banking and lending operations until his retirement in 2012. With his leadership, Mr.Maldia has developed and introduced various innovative lending programs in the field of agriculture and finance. As ADBS head, he also chaired various
committees, namely: Domestic Banking Loans Committee, Branch Operations Committee, Official Development Assistance Bids and Awards Committee, ADBS Sectoral Committee. He was likewise a member of the Board of LANDBANK subsidiaries (i.e, Masaganang Sakahan Incorporated and LANDBANK Insurance Brokerage Inc), and member of the Governing Board of the Agricultural Guarantee Fund Pool. In 2008, he was recognized as one of the most distinguished alumni of the University of the Philippines – Los Baños.
Mr. Maldia graduated with a Bachelor of Science degree in Agriculture, major in Agricultural Economics from the University of the Philippines Los Baños, Laguna in 1969. In 1979, he also completed his Bachelor’s degree in Commerce major in Accounting from the Polytechnic University of the Philippines, and immediately obtained his license as a Certified Public Accountant (CPA). He earned his Master’s degree in Business Administration from the Philippine Christian University in 1984.
JOLI CO WU Director/Treasurer
Director of Nat Re since July 2015. Ms. Wu was appointed President and CEO of QBE Seaboard Insurance Philippines in April 2014. Previously she served for 10 years as President and CEO of Seaboard Eastern Insurance, where she also started her insurance career.
Ms. Wu has extensive experience in Marine, Aviation and Casualty insurance. She has also completed multiple management, insurance and reinsurance courses, both locally and internationally, to help hone her expertise.
Ms. Wu is a member of the Board of Trustees of the Philippine Insurers and Reinsurers Association as well as the Board of Trustees of the Insurance Institute for Asia and Pacific. Ms. Wu is a graduate of Immaculate Concepcion Academy and holds a Bachelor of Arts degree, with a major in Financial Management from the Catholic University of America, Washington DC.
1979.
24 N A T I O N A L R E I N S U R A N C E C O R P O R A T I O N O F T H E P H I L I P P I N E S

ANTONIO M. RUBIN Director
Director of Nat Re since January 2018. Mr. Rubin is the Executive Vice President of Malayan Insurance Company, the Chairman of the Board of Directors of Bankers Assurance Corporation (BAC), and the President of the First Nationwide Assurance Corporation (FNAC). Mr. Rubin is a seasoned underwriter in the insurance industry, having been in the practice of insurance for more than twenty-five years. Prior to his current role as EVP of Malayan Insurance Company, he headed various divisions in the company namely the Risk Analysis Department, the Fire and Motor Car Underwriting Divisions, the Sales Division, and finally, the entire Underwriting Division. He was also the Chairman of the Board of Directors of the Philippine Insurance Rating Association (PIRA) and Philippine Machinery Management Services Corporation (MacPool), and Head of Risk Management Group of the National Steel Corporation.
His expertise in the industry was further solidified and reinforced by the various specialized seminars, conventions and trainings he attended locally and abroad. Mr. Rubin went to Mindanao State University in 1974 for his degree in Bachelor of Science in Mechanical Engineering and Ateneo De Manila University for his MBA.
YVONNE S. YUCHENGCO Director
Director of Nat Re since June 2006. Ms. Yuchengco is the President and Director of Malayan Insurance Company, Inc. and MICO Equities, Inc. since 1995, Alto Pacific Corporation, and Philippine Integrated Advertising Agency, Inc. She is currently the Chairperson and Director of the RCBC Capital Corporation; Chairperson and President of Yuchengco Tower Office Condominium Corporation, Y Tower II Office Condominium Owners Asso. Inc. and Malayan Securities Corp; Chairperson of First Nationwide Assurance Corporation and XYZ Assets Corporation; Advisory Board Member of Rizal Commercial Banking Corporation; Director, Vice President and Treasurer of Pan Managers, Inc.; Treasurer and Director of Pan
Malayan Management & Investment Corporation, Honda Cars Kalookan, Inc, Mona Lisa Development Corp., Malayan High School of Science, Inc. and Petroenergy Resources Corporation; Director of Pan Malayan Realty Corporation, Malayan Insurance (H.K), Malayan International Insurance Corporation, Manila Memorial Park, Inc., La Funeraria Paz Sucat Inc., iPeople Inc., Seafront Resources Corporation, House of Investments, Inc., HYDee Management and Resource Corporation, Malayan Colleges, Inc. (operating under the name Mapua Institute of Technology), Luisita Industrial Park Corporation, Malayan Colleges Laguna, Inc., Asia-Pac Reinsurance Co., Ltd., AY Holdings, Inc., Pan Malayan Express, Inc., Pan Pacific Computer, Inc., Shayamala Corporation, and YGC Corporate Services, Inc.; Trustee of AY Foundation, and Philippine Asia Assistance Foundation, Inc.; Trustee and Chairperson of the Malayan Plaza Condominium Owners Asso., Inc.; Trustee and Vice Chairperson of Yuchengco Museum, Inc.; and Assistant Treasurer of Enrique T. Yuchengco Inc. She was also formerly President of the PIA/Phil-Asia Assistance Foundation, Inc. She graduated with a Bachelor of Arts degree from Ateneo de Manila University in 1977 and took up further studies in UAP under SBEP program.
JOCELYN DG CABREZA Director
Director of Nat Re since December 2016. Ms. Cabreza is a member of the Board of Trustees of the Government Service Insurance System (GSIS) and chairs its Audit Committee. She is also a member of GSIS Board’s Risk Oversight Committee, Corporate Governance Committee, Legal Oversight Committee and GSIS Provident Fund Committee of Trustees and is a director of Banco Laguna, Inc. Ms. Cabreza was a former Executive Vice President of Land Bank of the Philippines, Director of Land Bank Resources Development Corp and Land Bank Countryside Development Foundation. She is a certified public accountant, a master’s degree holder and a seasoned banker with 37 years of extensive experience in different areas of banking and finance, internal audit and operations and strategic policy formulation and implementation.
RAFAEL G. AYUSTE, JR. Director
Director of Nat Re since June 2012. Mr. Ayuste is a Senior Vice President and Group Head of Trust and Investments Group of BDO Unibank, Inc. Prior to this, he was Senior Vice President and Group Head of the Wealth Advisory and Trust Group Head of BDO Private Bank, Inc. from July 2013 to April 2017; First Senior Vice President and Head of the Trust Banking Group of Philippine National Bank from 2009 to 2013; Vice President and Head of Retail Branch Business, Citibank Savings of Citibank N.A. Philippines from August 2008 to November 2009; Senior Vice President/Deputy Group Head of Trust Banking of the Metropolitan Bank and Trust Company through merger with Global Business Bank from 2000 to 2008; Vice President/Head- Securities Distribution of the Banco Santander Philippines, Inc. from 1999 to 2000; Vice President/Head- Trust Division, Security Bank Corporation from 1996 to 1999; Assistant Vice President and Head of Peso and Dollar Trading Desks of Citibank, N.A., Citibank Global Asset Management (CGAM) from 1989 to 1996. He is also a four-term President of the Trust Officers Association of the Philippines (TOAP) and a former Director of the association for nine terms. He has attended various seminars such as Risk Management, Citibank Phils., 1995; Financial Risk Management, Pi Eta Singapore, 2004; Risk Management, BNP Paribas, 2006; Corporate Governance, Bankers Association of the Philippines (BAP), 2007. He obtained his Bachelor of Science degree major in Business Administration from the University of Sto. Tomas in 1986 and a nominee for both Executive Master in Business Economics from the University of the Asia & the Pacific and Masters in Business Administration from the De la Salle University.
25A N N U A L R E P O R T 2 0 1 8

MA. CONSUELO A. LUKBAN Director
Director of Nat Re since October 2018. Ms. Lukban is the Head of the Strate-gic and Corporate Planning Depart-ment of Bank of the Philippine Islands (BPI). She is primarily responsible for financial planning and capital manage-ment, investor relations and enterprise development projects. She has over 30 years of banking experience, taking on various senior roles within BPI in its asset management and trust business, insurance business, corporate bank-ing marketing and deposit product management. Ms. Lukban completed her MBA at the University of Chicago in 1992 and BS Management Engineer-ing in 1986 at the Ateneo de Manila University.
LT. GEN. ALAN R. LUGA, AFP Director
Director of Nat Re from December 2016 to January 2019. Alan R. Luga (Lt. Gen, Ret., AFP) is a Trustee of the Government Service Insurance System (GSIS) and also sits as a Director in the Philippine National Construction Corporation (PNCC) as one of GSIS’ representatives. He was formerly the President and CEO of AFP General Insurance Corporation and the Vice Chief of Staff of the Armed Forces of the Philippines. From 2012 to 2013, he served as Commander of the AFP Southern Luzon Command. He was also the Commander of two Infantry Brigades (the 802nd Infantry BDE and the 1001st Infantry Bde) from 2008 to 2011 and the Commander for the 7th Infantry Division of the Philippine Army in 2012. He was a member of the GRP Peace Panel for the GRP-MILF Peace Talks and as the Chairman of the ADHOC Joint Action Group, OPAPP in 2011 to 2012. In 2005 to 2006, he was the Chief of the AFP Command Center as well as the Secretary, Army General Staff. He was deployed as Deputy Commander of the Philippine Battalion for the International Forces in East Timor and later as Chief Plans of the Peace Keeping Force of UNTAET in East Timor from 1999 to 2001. He was the Chairman of the Board of the Camp Aguinaldo Golf and Country Club from 2013 to 2014 and of the AFP Housing Board on the same years. He was also a member of the Board of Directors of the Riviera Sports & Country Club, Inc. from 2014 to 2016, and served as a member of the AFP Board of Generals from 2013 to 2014. He obtained his Bachelor of Science
Degree from the Philippine Military Academy in 1981. In 1994, he acquired his MBA units from the Ateneo De Manila University Graduate School of Business. He completed a Master’s Degree in Military Arts and Science at the US Army Command and General Staff College in 2002.
ROMEO L. BERNARDO Independent Director
Independent Director of Nat Re since June 2006. Mr. Bernardo is the Managing Director of Lazaro Bernardo Tiu and Associates (LBT), a financial advisory firm based in Manila. He is also a GlobalSource economist in the Philippines. He is Chairman of ALFM Family of Funds. He is likewise an Independent Director of several companies and organizations including Aboitiz Power, BPI, RFM Corporation, Philippine Investment Management, Inc. (PHINMA), BPI-Philam Life Assurance Corporation and BPI/MS Insurance Corporation. Mr. Bernardo is also the Director of Globe Telecom Inc. He previously served as Undersecretary of Finance and as Alternate Executive Director of the Asian Development Bank. He was an Advisor of the World Bank and the IMF (Washington D.C.). Mr. Bernardo holds a degree in Bachelor of Science in Business Economics from the University of the Philippines (magna cum laude) and a Masters degree in Development Economics at Williams College from Williams College in Williamstown, Massachusetts.
ERMILANDO D. NAPA Independent Director
Independent Director of Nat Re since June 2011. Mr. Napa is the Founding CEO of Manila Consulting & Management Co., Inc., and Catanauan Resources and Development Corporation. Currently, Mr. Napa is also an Independent Director at the House of Investments Inc. (HOI) and iPeople Inc. He is the Chairman of the Audit Committee of Nat Re and Chairman of the Risk Oversight Committee of HOI as well as the Chairman of the Interim Governance Board of the National Life Insurance Company of the Philippines (NLIC). He is also the Chairman of the Court Appointed Board of Liquidators of Capitol Hills Golf and Country Club Inc. His previous professional experience includes being a President and CEO, and Vice Chairman of the Board of Trade and Investment
Development Corporation (Philippine Export–Import Credit Agency), Partner of SyCip Gorres & Velayo Company (Philippines), a Principal of Kassim Chan & Company in Kuala Lumpur, Malaysia (a former member firm of SGV Group and Delloite Haskins & Sells International), and a Manager of Arthur Andersen in New York. In 2013, he was appointed as Conservator of the National Life Insurance Company (NLIC) and spearheaded its rehabilitation. Mr. Napa has attended special trainings and various courses such as Strategic Management and IMPACT Productivity Improvement in Chicago and Corporate Finance in New York and various corporate governance courses. He holds a bachelor’s degree in Business Management from Aquinas University (1970) and a master’s degree in Management from the Asian Institute of Management (1980).
MEDEL T. NERA Independent Director
Independent Director of Nat Re since July 2011. Mr. Medel T. Nera is the President and CEO of House of Investments, Inc. He serves as Director of House of Investments, iPeople, inc., EEI Corp. and Seafront Resources Corp., among others. His past experience includes Director of Rizal Commercial Banking Corporation and Partner at Sycip Gorres Velayo & Co. Mr. Nera holds a degree in Bachelor of Science in Commerce from Far Eastern University. He obtained his Master of Business Administration degree from New York University. Mr. Nera is a Certified Public Accountant.
SENIOR LEADERS
ALLAN R. SANTOS President/CEO
Mr. Allan R. Santos has 25+ years of experience in local and international insurance/reinsurance markets in the US, Asia and Europe. Prior to his current role, he was Nat Re’s Chief Operating Officer, overseeing Finance, Investments, Data and Analytics, HR, and Technology. He has held various leadership positions in several companies including Chief Operating Officer for the Affiliate Companies of Philam Life, Regional Chief Financial Officer for Europe at Cigna, Global Head of Product Development at Cigna, and Chief Actuary for Asia at Allied World Assurance Company.
(RET)
26 N A T I O N A L R E I N S U R A N C E C O R P O R A T I O N O F T H E P H I L I P P I N E S

Mr. Santos holds a Master’s Degree in Applied Math and Bachelor of Science in Math both from the University of the Philippines. He is a Fellow of both the Actuarial Society of Philippines and the Society of Actuaries (US), and is a Member of the American Academy of Actuaries.
CHRISTIAN LADOUX Senior Vice President and Chief Underwriting Officer
Mr. Christian Ladoux has over thirty-five years of international experience in reinsurance underwriting, having handled proportional and non-proportional treaties covering risks in France, Germany, Japan, Australia, Belgium, East and South East Asia, and the Indian subcontinent. As General Manager and Chief Executive of the Arab Insurance Group (ARIG) Singapore Branch, Mr. Ladoux managed the underwriting claims (for both treaty and facultative), accounting, administration, and compliance functions. He played a strategic role in planning for and implementing operational enhancements in ARIG; in recruiting and training of its Singapore branch personnel; and, in helping the company earn its AM Best credit rating upgrade to A-minus.
Mr. Ladoux also had a stint as Senior Underwriter at R+V Versicherung AG Reinsurance in Germany where he was responsible for underwriting and marketing strategies in the major markets of Japan and Australia/New Zealand.
ALEXANDER L. REYES Senior Vice President and Head of Non-Life Reinsurance
Mr. Alexander Reyes has held various senior management positions covering Marketing, Sales, Underwriting, and Claims operations in leading non-life insurance direct-writing companies in the Philippines. He graduated from the University of the Philippines, Diliman with a B.S. in Business Administration.
VICTOR R. TANJUAKIO First Vice President and Head of Life Reinsurance
Mr. Victor Tanjuakio is an actuary and a Fellow of the Actuarial Society of the Philippines (ASP). He worked as Chief Actuary of Maxicare Healthcare Corporation, Asian Life and General Assurance, and Great Pacific Life (now Sunlife Grepa). Before joining Nat Re in 2014, he was Head of Corporate Solutions of Philippine AXA Life. He specializes in Group and Health insurance and he serves as industry lecturer for actuaries wishing to practice in HMO and medical insurance. He has served as Technical Committee chairman of the Philippine Life Insurance Association (PLIA) in the early 2000s. He earned his B.S. Mathematics degree from the Ateneo de Manila University in 1988.
TISHA T. DARVIN Vice President and Head of Data Administration and Analytics
Ms. Tisha Darvin is an actuary by profession with over twenty-five years of experience in product development, mergers and acquisitions, demutualiza-tion, distribution channels compensa-tion, financial planning, employee ben-efits valuation, and actuarial studies, among others. She was previously the Chief Actuary of Philippine American Life Insurance Company and its af-filiates and Pricing Head of Manulife Philippines. She managed the profit-ability of the company’s product lines, product pricing, reserving and report-ing processes.
She is a Fellow of the Actuarial Society of Philippines (FASP), an Associate of the Society of Actuaries (ASA) and a Fellow of Life Management Institute (FLMI).
REGINA S. RAMOS Vice President and Head of Risk and Compliance
Ms. Regina Ramos is a Certified Public Accountant and a Certified Internal Auditor. Prior to joining Nat Re in July 2000, Ms. Ramos held positions in various capacities in Accounting, Finance and Operations in a non-life direct insurer. She was also with the SyCip, Gorres, Velayo & Co., CPAs (SGV), the largest professional services firm in the Philippines. She obtained her degree in Bachelor of Science in Commerce, major in Accounting from St. Paul College Manila.
DAISY C. SALONGA Vice President and Head of Investments
Ms. Daisy Salonga has held various executive positions in treasury covering foreign exchange, fixed income, sales and market studies in leading financial institutions like Citibank N.A. Manila, Credit Agricole Indosuez Offshore Bank Manila, China Banking Corporation, and Greenwich Associates. She was nominated as one of the Most Astute Investors in the Philippine Peso Bonds by The Asset Benchmark Research for three consecutive years from 2012 to 2014. She earned her degree in Bachelor of Science in Commerce, major in Business Management from De La Salle University.
SANTINO U. SONTILLANO Senior Assistant Vice Presidentand Head of Finance
Mr. Santino Sontillano is a Certified Public Accountant. Prior to joining Nat Re in January 2016 as Head of Internal Audit, Mr. Sontillano worked with various big 4 auditing firms in the Philippines, Singapore and Bermuda. He obtained his degree in Bachelor of Science in Accountancy from Ateneo de Zamboanga.
REGINA LOURDES D. PAPA Senior Assistant Vice President and Head of Human Resources and Office Services
Ms. Regina Lourdes D. Papa has over twenty-five years of experience in Human Resources Talent Acquisi-tion, Learning and Development, Compensation Planning and Admin-istration, Performance Management and Employee Relations. Prior to her current role in Nat Re, she served as Treasurer and Managing Director of Integral Consultants, Inc., spearhead-ing business planning and overseeing the company’s career management group operations. She also designed and conducted Management and soft skills training programs as a Human Resources Management Consultant. As an Assistant Vice President at Mapfre Asian Insurance Corpora-tion, she was responsible for formally setting up the company’s Human Resources Management Department as well as providing strategic advice on organization development initiatives.
27A N N U A L R E P O R T 2 0 1 8

FINANCIAL STATEMENTS
28 N A T I O N A L R E I N S U R A N C E C O R P O R A T I O N O F T H E P H I L I P P I N E S28 N A T I O N A L R E I N S U R A N C E C O R P O R A T I O N O F T H E P H I L I P P I N E S

29A N N U A L R E P O R T 2 0 1 8
30 Report of the Audit Committee
31 Statement of Management’s Responsibility for Financial Statements
32 Certificate on the Compilation Services for the Preparation of the Financial Statements and Notes to the Financial Statements
34 Report of Independent Auditors
39 Statements of Financial Position
40 Statements of Income
41 Statements of Comprehensive Income
42 Statements of Changes in Equity
44 Statements of Cash Flows
45 Notes to Financial Statements
102 Report of Independent Auditors to Accompany Supplementary Information Required by the Securities and Exchange Commission
Filed Separately from the Basic Financial Statements
103 List of Supplementary Information
124 Contact Information
CONTENTS

N A T I O N A L R E I N S U R A N C E C O R P O R A T I O N O F T H E P H I L I P P I N E S30
In line with Article V. Board Committees of the Amended By-Laws of the National Reinsurance Corporation of the Philippines (Nat Re, the "Company") the Audit Committee assists the Board of Directors in carrying out its responsibilities as they relate to the oversight of the Company's internal control, internal audit function, independent auditors, legal or regulatory compliance, and corporate governance.
The Audit Committee's roles and responsibilities are likewise defined in the Audit Committee Charter approved by the Company's Board of Directors (Board).
In compliance with the Audit Committee Charter, we confirm that:
• The Audit Committee is composed of three (3) independent directors;
• We had nine (9) meetings during the year. The Company's President & Chief Executive Officer and other members of the Management attended the Committee meetings. External subject experts, such as the appointed Independent External Auditors and other consultants, were also invited to the meetings;
• The Committee met with the Internal Audit Head and the Independent External Auditors in private sessions during the year;
• We have reviewed and discussed the quarterly unaudited financial statements and the audited financial statements of the Company, including the Management's Discussion and Analysis of Financial Condition and Results of Operations, with the Management, who has the primary responsibility for the financial statements and the financial reporting process, Internal Audit, and Punongbayan & Araullo (P&A), the Independent External Auditor, who is responsible for expressing an opinion on the conformity of the Company's audited financial statements with Philippine Financial Reporting Standards;
• We have reviewed the effectiveness of the system for monitoring compliance with laws and regulations and the results of the Management's investigation and follow-up (including disciplinary action) of any instances of noncompliance;
• We have discussed and approved the overall scope and plans for the respective audit reviews of the Internal and Independent External Auditors. We have also discussed the results of their audits and their assessments of the Company's internal controls and the overall quality of the financial reporting process;
• We have reviewed and discussed the reports of the Internal and Independent External Auditors ensuring that the Management is taking appropriate corrective actions in a timely manner, including addressing internal control and any regulatory compliance issues;
• We have reviewed the effectiveness of the internal audit function, ensuring compliance with the International Standards for the Professional Practice of Internal Auditing, and the Internal Audit's annual and quarterly reports to the Audit Committee covering:
- Work plan and Key Performance Indicators (KPI) accomplishments- Critical Risk Areas, including investigative reviews and resolutions- Organizational Structure, Resource Utilization and Staff Competencies
• We have reviewed and recommended for Board approval the audit services of P &A and non-audit services of SyCip Gorres Velayo & Co to the Company and the related fees for such services, in accordance with existing policies, standards and regulatory requirements; and
• We have evaluated the performance of the Committee, for the year ended December 31, 2018 and benchmarked the practices against the expectations set out in the Audit Committee Charter. We have ascertained that the Audit Committee continues to fulfill its responsibilities in accordance with global best practices and in compliance with the Manual of Corporate Governance and other relevant regulatory requirements.
Based on the reviews and discussion undertaken, and subject to the limitation of our roles and responsibilities, the Audit Committee recommended to the Board the inclusion of the audited financial statements in the December 31, 2018 Annual Report, filed with the Securities and Exchange Commission.
Considering the independent auditor's performance and qualifications, we recommended to the Board, subject for ratification of the Stockholders during the annual stockholders meeting, the re-appointment of P&A as the Company’s Independent Auditors for the year 2019.
By the Audit Committee:
Ermilando D. Napa Romeo L. Bernardo Medel T. Nera Chairman Member Member
REPORT OF THE AUDIT COMMITTEEFor the Year Ended December 31, 2018

31A N N U A L R E P O R T 2 0 1 8
The management of National Reinsurance Corporation of the Philippines (the Company), is responsible for the preparation and fair presentation of the financial statements including the schedules attached therein, for the years ended December 31, 2018 and 2017 in accordance with the prescribed financial reporting framework indicated therein, and for such internal control as management determines is necessary to enable the preparation of financial statements that are free from material misstatement, whether due to fraud or error.
In preparing the financial statements, management is responsible for assessing the Company's ability to continue is a going concern, disclosing, as applicable matters related to going concern and using the going concern basis of accounting unless management either intends to liquidate the Company or to cease operations, or has no realistic alternative but to do so.
The Board of Directors reviews and approves the financial statements including the schedules attached therein, and submits the same to the stockholders.
Punongbayan & Araullo, the independent auditors appointed by the stockholders, has audited the financial statements of the Company in accordance with Philippine Standards on Auditing, and in its report to the stockholders, has expressed its opinion on the fairness of presentation upon completion of such audit.
CEZAR P. CONSING ALLAN R. SANTOSChairperson of the Board President & Chief Executive Officer
JOLI CO WU SANTINO U. SONTILLANOTreasurer Senior Assistant Vice President & Head of Finance
Signed this 26th day of March 2019.
SUBSCRIBED AND SWORN TO before me this 26th day of March 2018 at Makati City, Affiants exhibited to me their passport numbers.
NAMECEZAR P. CONSINGJOLI CO WUALLAN R. SANTOSSANTINO U. SONTILLANO
Doc. No. 732Page No. 47Book No. XVISeries of 2019.
STATEMENT OF MANAGEMENT’S RESPONSIBILITY FOR FINANCIAL STATEMENTS

N A T I O N A L R E I N S U R A N C E C O R P O R A T I O N O F T H E P H I L I P P I N E S32
CERTIFICATE ON THE COMPILATION SERVICES FOR THE PREPARATION OF THE FINANCIAL STATEMENTS AND
NOTES TO THE FINANCIAL STATEMENTS
I hereby certify that I am the Certified Public Accountant (CPA) who performed the compilation services related to the preparation and presentation of financial information of an entity in accordance with an applicable financial reporting framework and reports as required by accounting and auditing standards for the NATIONAL REINSURANCE CORPORATION OF THE PHILIPPINES for the period ending December 31, 2018.
In discharging this responsibility, I hereby declare that (check one (1 )):
I, am the SR. ASSISTANT VICE PRESIDENT & HEAD OF FINANCE of the NATIONAL REINSURANCE CORPORATION OF THE PHILIPPINES.
I, am the (position) of (name of organization/person) and was contracted to perform this service.
Furthermore, in my compilation services for the preparation of the Financial Statements and Notes to the Financial Statements, I was not assisted by or did not avail of the services of PUNONGBAYAN & ARAULLO who/which is the external auditor who rendered the audit opinion for the said Financial Statements and Notes to the Financial Statements.
I hereby declare, under penalties of perjury and violation of Republic Act No. 9298, that my statements are true and correct.
SIGNATURE OVER PRINTED NAME: SANTINO U. SONTILLANO
PROFESSIONAL IDENTIFICATION CARD 009819NO VALID UNTIL: September 20, 2020
ACCREDITATION NUMBER: 5994VALID UNTIL: September 20, 2021
NOTARY PUBLIC
SUBSCRIBE AND SWORN TO BEFORE ME, a Notary Public for and in the City of Makati, Philippines, this __ day of April 2019, by the affiant whose identity I have confirmed through Passport No. EC4590974 issued on March 4, 2017 at DFA-NCR Central bearing the affiant's photograph and signature.
Doc. No. 151Page No. 31Book No. XVIIISeries of 2019.

33A N N U A L R E P O R T 2 0 1 8
Financial Statements and
Independent Auditors’ Report
National Reinsurance Corporation of the Philippines
December 31, 2018, 2017 and 2016(With Corresponding Figures as at January 1, 2017)

N A T I O N A L R E I N S U R A N C E C O R P O R A T I O N O F T H E P H I L I P P I N E S34
REPORT OF INDEPENDENT AUDITORS
The Board of Directors and the StockholdersNational Reinsurance Corporation of the Philippines31st floor BPI-Philam Life Makati6811 Ayala Avenue, Makati City
Report on the Audit of the Financial Statements
Opinion
We have audited the financial statements of National Reinsurance Corporation of the Philippines (the Company), which comprise the statements of financial position as at December 31, 2018 and 2017, and the statements of income, statements of comprehensive income, statements of changes in equity and statements of cash flows for each of the three years ended December 31, 2018, and notes to the financial statements, including a summary of significant accounting policies.
In our opinion, the accompanying financial statements present fairly, in all material respects, the financial position of the Company as at December 31, 2018 and 2017, and its financial performance and its cash flows for each of the three years in the period ended December 31, 2018 in accordance with Philippine Financial Reporting Standards (PFRS).
Basis for Opinion
We conducted our audits in accordance with Philippine Standards on Auditing {PSA). Our responsibilities under those standards are further described in the Auditors' Responsibilities for the Audit of the Financial Statements section of our report. We are independent of the Company in accordance with the Code of Ethics for Professional Accountants in the Philippines {Code of Ethics) together with the ethical requirements that are relevant to our audits of the financial statements in the Philippines, and we have fulfilled our other ethical responsibilities in accordance with these requirements and the Code of Ethics. We believe that the audit evidence we have obtained is sufficient and appropriate to provide a basis for our opinion.
Key Audit Matters
Key audit matters are those matters that, in our professional judgment, were of most significance in our audit of the financial statements of the current period. These matters were addressed in the context of our audit of the financial statements as a whole, and in forming our opinion thereon, and we do not provide a separate opinion on these matters.
(a) Recognition of Reinsurance Premiums and the Related Commission Expense, and Retroceded Premiums and the Related Commission Income
Description of the Matter
Revenue is one of the key performance measures used to assess business performance. There is a risk that the amount of revenue presented in the financial statements is higher than what has been actually generated by the Company. The Company recognizes premiums from short duration insurance contracts over the period of the contracts using the "24th method". The related commission expense is deferred and charged to profit or loss in proportion to premium revenue recognized. Retroceded premium and the related commission income are also recognized using the "24th method". For the year ended December 31, 2018, the reinsurance premium and retroceded premium accounts and the related commission expense and income accounts recognized in the 2018 statement of income amounted to P3,682.9 million, P1,106.8 million, P777.9 million and P4.5 million, respectively. Based on the possible effects of misstatement in the recording of revenue transactions and the related expense accounts, and the materiality of the amounts involved to the financial statements, we have concluded that the Company's revenue and expense recognition is considered to be a matter of audit significance.
Further, in 2018, the Company modified the method in determining premium reserves in compliance with the requirements of the Insurance Commission (IC) and PFRS 4, Insurance Contracts. Accordingly, the Company restated its financial statements for the year ended December 31, 2017 and 2016 to reflect the effects of the change in its policy. The restatement resulted in material adjustments to certain accounts in the financial statements, hence, we consider this matter as significant in our audit.

35A N N U A L R E P O R T 2 0 1 8
The Company's policies and related disclosures on recognition of reinsurance premiums and the related commission expense, and retroceded premiums and the related commission income are discussed in Notes 2, 13, 18, 19 and 21. The change in the Company's method of determining premium reserves and its effects in the Company's financial statements is presented in Note 2.
How the Matter was Addressed in the Audit
Our audit procedures to address the risk of material misstatement on the recognition of premium revenue and related direct expense, which was considered to be a significant risk, included:
• testing the design and operating effectiveness of internal controls related to the Company's process of recognition and measurement of reinsurance premiums assumed, retroceded premiums, commission expense and commission income;
• testing the existence and validity of premium income and the related receivables by sending positive confirmation on sample basis, and testing the subsequent collections and reviewing originating documents for non-responding cedants:
• testing the reasonableness of the balances of reserves for unexpired risks on both premiums assumed and ceded by validating the propriety of the data used by the independent actuary in computing the unexpired risk reserves (URR);
• validating the reasonableness of the Company's liability adequacy test in compliance with the requirements of the Insurance Commission (IC) and PFRS 4;
• testing the reasonableness of the premium income recognized and the related outstanding unearned premium reserves, deferred reinsurance premiums, deferred acquisition costs and deferred reinsurance commissions using the "24th method";
• testing the reasonableness of recorded accruals of reinsurance premiums assumed and retroceded premiums for treaty contracts and analysis of assumptions used in order to determine the proprietary of recorded accrual balances;
• performing detailed analysis of reinsurance premiums, commission expense, retroceded premiums and commission income by appropriate measures, such as, but not limited to, premiums assumed and retroceded by source (life and non-life) and by major line of business (treaty and facultative); and,
• performing premium cut-off test, including, among others, examining date of approval and receipt date for insurance contracts near period-end and subsequent to period-end.
In respect of the Company's change in the method of determining premium reserves, our audit procedures included obtaining an understanding of the Company's restatement process, testing the accuracy of the data used and reasonableness of the Company's restatement adjustments in compliance with the requirements of the IC and PFRS 4, and reviewing the sufficiency of the related disclosures on the 2018 financial statements.
(b) Impairment of Reinsurance Balances Receivable
Description of the Matter
Reinsurance balances receivable is measured at amortized cost and the carrying amount is reduced by the amount of allowance for impairment. In determining impairment, the Company first assesses whether objective evidence of impairment exists individually for reinsurance balances receivable that are individually significant, and individually or collectively for reinsurance balances receivable that are not significant. If there is objective evidence that an impairment loss on reinsurance balances receivable carried at amortized cost exists, the amount of the loss is measured as the difference between the asset's carrying amount and the present value of estimated future cash flows (excluding future credit losses that have not been incurred), discounted at the financial asset's original effective interest rate. The allowance for impairment of reinsurance balances receivable is considered to be a matter of significance as it requires the application of judgment and use of subjective assumptions by management. In addition, the outstanding balance of reinsurance receivable amounting to P2,280.1 million as of December 31, 2018 is material to the financial statements.
The Company’s policy on impairment of reinsurance balances receivable is discussed in Note 2, while the disclosures on the movements in the account and reconciliation of the allowance for impairment in Note 6.
How the Matter was Addressed in the Audit
Our audit procedures to address the risk of material misstatement relating to the impairment of reinsurance balances receivable included:
• evaluating the appropriateness of the Company's accounting policy on impairment and the method to compute for the allowance for impairment on receivables;
• testing the reasonableness of the amount recognized as allowance for impairment using the criteria and method used by management, including testing of the basis of estimates and judgments;

N A T I O N A L R E I N S U R A N C E C O R P O R A T I O N O F T H E P H I L I P P I N E S36
• determining the consistency of the application of the method and criteria used throughout the period and from prior periods; and,
• performing analysis of the adequacy of the balance by testing the aging of reinsurance balances receivable and identifying potential troubled accounts considering, among others, past due accounts, accounts under litigation, accounts from closed companies, and customers with prior credit issues, and whether changes should be made to reflect a more accurate estimate of allowance for impairment.
(c) Valuation of Claims Liabilities
Description of the Matter
The valuation of the Company's losses and claims payable and claims reserves was a key focus area in our audit due to the degree of complexity involved in valuing these liabilities and the significance of the judgments and estimates made by management. Claims reserves include the provisions for incurred but not reported (IBNR) losses which are estimated through the use of past claims settlement trends to predict future claims settlement trends and the estimate of the ultimate loss. These estimates are ascertained by an independent actuary with the use of additional qualitative judgments to assess the extent to which the full tail of the claim development is influenced by the different internal and external factors. In addition, in compliance with an IC circular, the Company's claims liabilities include certain percentage of margin for adverse deviation (MfAD) to allow for inherent uncertainty of the best estimate of the policy reserves arising from the variability of claims experience, the diversification between classes of business and conservatism in the best estimate.
Further, in 2018, the Company changed its method of measuring reinsurance contract liabilities from undiscounted to discounted basis, as allowed by PFRS 4, using the discount rates provided by the IC. Accordingly, the Company restated its financial statements for the year ended December 31, 2017 and 2016. The restatement resulted in material adjustments to certain accounts in the financial statements, hence, we consider this matter as significant in our audit.
The Company's policies on valuation of claims liabilities and the change in the Company's method of measuring reinsurance liabilities are discussed in Note 2 while the related disclosures are presented in Note 17.
How the Matter was Addressed In the Audit
Our audit procedures to address the risk of material misstatement relating to the valuation of losses and claims payable and claims reserves included:
• testing of design and operating effectiveness internal controls related to the Company’s process of recognition and measurement of claims liabilities;
• evaluating the appropriateness and sufficiency of the data used by the independent actuary in computing the IBNR, and evaluating the reasonableness of the assumptions and methodologies used in the determination of IBNR;
• testing the reasonableness of the amount of IBNR following the methodology applied by the actuary;
• performing detailed analysis of claims and loss adjustment expenses by appropriate measures, such as, but not limited to, claims liability by source (life and non-life) and by major line of business (treaty and facultative);
• examining relevant reports and documents to establish the propriety of the outstanding claims; and,
• testing subsequent disbursements and performing cut-off tests to determine whether disbursements represent previously unrecorded losses and claims payable.
In respect of the Company's change in method of measuring reinsurance contract liabilities, our audit procedures included obtaining an understanding of the Company's restatement process, testing the accuracy of the data used and reasonableness of the Company's restatement adjustments in compliance with the requirements of the IC and PFRS 4, and reviewing the sufficiency of the related disclosures on the 2018 financial statements.
(d) Valuation of Available-for-sale Financial Assets
Description of the Matter
The fair valuation of the Company's available-for-sale (AFS) financial assets was a key focus area in our audit because the outstanding balance amounting to P4,580 million as of December 31 , 2018 is material to the financial statements. The Company's AFS financial assets comprise a portfolio of debt and equity investments measured at fair value with the corresponding fair value change recognized in other comprehensive income. The fair value of majority of these financial instruments is determined based on their quoted market prices, while a portion is measured by reference to the investee's book value using the most recent available financial data.

37A N N U A L R E P O R T 2 0 1 8
Moreso, impairment assessment on the Company's AFS financial assets requires significant judgment when determining whether the decline in market value is considered significant or prolonged.
The Company's disclosures about AFS financial assets and the basis of fair value measurement are included in Notes 7 and 30, respectively.
How the Matter was Addressed in the Audit
Our audit procedures to address the risk of material misstatement relating to valuation of AFS financial assets included:
• evaluating the appropriateness of the valuation process of investments and tested the inputs against reliable market sources and the valuation formulas used in fair market valuation;
• evaluating whether fair value prices used were appropriate;
• recomputing the fair values based on the inputs and comparing with the market values used by the Company;
• testing the validity of the Company's assessment on whether there is any objective evidence that AFS financial assets are impaired; and,
• evaluating the appropriateness of the Company's basis in determining whether the decline in value of the AFS financial assets is significant or prolonged.
Other Information
Management is responsible for the other information. The other information comprises the information included in the Company's Securities and Exchange Commission (SEC) Form 20-IS (Definitive Information Statement) and SEC Form 17-A, both of which do not include the financial statements and our auditors' report thereon, and the Annual Report for the year ended December 31, 2018. The SEC Form 20-IS (Definitive Information Statement), SEC Form 17-A and Annual Report for the year ended December 31, 2018 are expected to be made available to us after the date of this auditors' report.
Our opinion on the financial statements does not cover the other information and we will not express any form of assurance conclusion thereon.
In connection with our audits of the financial statements, our responsibility is to read the other information identified above when it becomes available and, in doing so, consider whether the other information is materially inconsistent with the financial statements or our knowledge obtained in the audits, or otherwise appears to be materially misstated.
Responsibilities of Management and Those Charged with Governance for the Financial Statements
Management is responsible for the preparation and fair presentation of the financial statements in accordance with PFRS, and for such internal control as management determines is necessary to enable the preparation of financial statements that are free from material misstatement, whether due to fraud or error.
In preparing the financial statements, management is responsible for assessing the Company's ability to continue as a going concern, disclosing, as applicable, matters related to going concern and using the going concern basis of accounting unless management either intends to liquidate the Company or to cease operations, or has no realistic alternative but to do so.
Those charged with governance are responsible for overseeing the Company's financial reporting process.
Auditors' Responsibilities for the Audit of the Financial Statements
Our objectives are to obtain reasonable assurance about whether the financial statements as a whole are free from material misstatement, whether due to fraud or error, and to issue an auditors' report that includes our opinion. Reasonable assurance is a high level of assurance, but is not a guarantee that an audit conducted in accordance with PSA will always detect a material misstatement when it exists. Misstatements can arise from fraud or error and are considered material if, individually or in the aggregate, could reasonably be expected to influence the economic decisions of users taken on the basis of these financial statements.

N A T I O N A L R E I N S U R A N C E C O R P O R A T I O N O F T H E P H I L I P P I N E S38
As part of an audit in accordance with PSA, we exercise professional judgment and maintain professional skepticism throughout the audit. We also:
• Identify and assess the risks of material misstatement of the financial statements, whether due to fraud or error, design and perform audit procedures responsive to those risks, and obtain audit evidence that is sufficient and appropriate to provide a basis for our opinion. The risk of not detecting a material misstatement resulting from fraud is higher than for one resulting from error, as fraud may involve collusion, forgery, intentional omissions, misrepresentations, or the override of internal control.
• Obtain an understanding of internal control relevant to the audit in order to design audit procedures that are appropriate in the circumstances, but not for the purpose of expressing an opinion on the effectiveness of the Company's internal control.
• Evaluate the appropriateness of accounting policies used and the reasonableness of accounting estimates and related disclosures made by management.
• Conclude on the appropriateness of management's use of the going concern basis of accounting and, based on the audit evidence obtained, whether a material uncertainty exists related to events or conditions that may cast significant doubt on the Company's ability to continue as a going concern. If we conclude that a material uncertainty exists, we are required to draw attention in our auditors' report to the related disclosures in the financial statements or, if such disclosures are inadequate, to modify our opinion. Our conclusions are based on the audit evidence obtained up to the date of our auditors' report. However, future events or conditions may cause the Company to cease to continue as a going concern.
• Evaluate the overall presentation, structure and content of the financial statements, including the disclosures, and whether the financial statements represent the underlying transactions and events in a manner that achieves fair presentation.
We communicate with those charged with governance regarding, among other matters, the planned scope and timing of the audit and significant audit findings, including any significant deficiencies in internal control that we identify during our audit.
We also provide those charged with governance with a statement that we have complied with relevant ethical requirements regarding independence, and communicate with them all relationships and other matters that may reasonably be thought to bear on our independence, and where applicable, related safeguards.
From the matters communicated with those charged with governance, we determine those matters that were of most significance in the audit of the financial statements of the current period and are therefore the key audit matters. We describe these matters in our auditors' report unless law or regulation precludes public disclosure about the matter or when, in extremely rare circumstances, we determine that a matter should not be communicated in our report because the adverse consequences of doing so would reasonably be expected to outweigh the public interest benefits of such communication.
Report on Other Legal and Regulatory Requirements
Our audits were conducted for the purpose of forming an opinion on the basic financial statements taken as a whole. The supplementary information for the year ended December 31, 2018 required by the Bureau of Internal Revenue as disclosed in Note 35 to the financial statements is presented for purposes of additional analysis and is not a required part of the basic financial statements prepared in accordance with PFRS; neither it is a required disclosure under Securities Regulation Code Rule 68, as amended, of the SEC. Such supplementary information is the responsibility of management. The supplementary information has been subjected to the auditing procedures applied in the audit of the basic financial statements and, in our opinion, is fairly stated in all material respects in relation to the basic financial statements taken as a whole.
The engagement partner on the 2018 audit resulting in this independent auditors' report is Anthony L. Ng.
PUNONGBAYAN & ARAULLO
By: Anthony L. Ng Partner
CPA Reg. No. 0109764 TIN 230-169-270 PTR No. 7333699, January 3, 2019, Makati City SEC Group A Accreditation Partner - No. 1638-A (until May 29, 2020) Firm - No. 0002-FR-5 (until Mar. 26, 2021} BIR AN 08-002511-38-2016 (until Oct. 3, 2019} Firm’s BOA/PRC Cert. of Reg. No. 0002 (until Jul. 24, 2021)
March 26, 2019

39A N N U A L R E P O R T 2 0 1 8
NATIONAL REINSURANCE CORPORATION OF THE PHILIPPINES
STATEMENTS OF FINANCIAL POSITIONDecember 31, 2018 and 2017
(With Corresponding Figures as at January 1, 2017)(Amounts in thousands)
Notes 2018
2017 (As Restated –
See Note 2)
January 1, 2017 (As Restated – See Note 2)
ASSETSCash and cash equivalents 5 P1,161,899 P1,310,539 P920,427Reinsurance balances receivable – net 6 2,280,122 1,949,930 1,445,938Available-for-sale (AFS) financial assets 7 4,579,952 5,527,119 5,857,571Held-to-maturity (HTM) investments 8 1,848,693 1,034,687 –Loans and receivables 9 112,543 201,887 464,887Property and equipment – net 10 76,563 80,011 65,977Reinsurance recoverable on reported losses 11 2,374,542 2,748,350 3,601,292Reinsurance recoverable on claims reserves 11 319,048 499,995 497,417Deferred acquisition costs 12 405,104 280,947 258,617Deferred reinsurance premiums 13 331,545 202,935 394,816Other assets – net 14 381,300 338,881 567,105TOTAL ASSETS P13,871,311 P14,175,281 P14,074,047
LIABILITIES AND EQUITYLiabilitiesReinsurance balances payable 15 P1,154,233 P1,269,638 P1,086,930Accounts payable and accrued expenses 16 90,649 75,292 128,793Losses and claims payable 17 4,519,271 4,802,609 5,556,808Claims reserves 17 1,715,474 1,307,798 997,041Premium reserves 18 1,564,635 1,426,138 1,408,832Deferred reinsurance commissions 19 526 5,435 41,201
Total Liabilities 9,044,788 8,886,910 9,219,605 Equity 24 4,826,523 5,288,371 4,854,442TOTAL LIABILITIES AND EQUITY P13,871,311 P14,175,281 P14,074,047
See Notes to the Financial Statements.

N A T I O N A L R E I N S U R A N C E C O R P O R A T I O N O F T H E P H I L I P P I N E S40
NATIONAL REINSURANCE CORPORATION OF THE PHILIPPINES
STATEMENTS OF INCOMEFor the years ended December 31, 2018, 2017 and 2016
(Amounts in thousands, except Earnings Per Share)
Notes 2018
2017 (As Restated –
See Note 2)
2016 (As Restated –
See Note 2)Reinsurance premium income 4Reinsurance premiums – net of returns P3,682,906 P3,205,114 P3,383,940Retroceded premiums (1,106,771) (841,429) (1,690,722)Net premiums retained 2,576,135 2,363,685 1,693,218Increase in premium reserves – net 13, 18 (9,887) (209,188) (475,887)
2,566,248 2,154,497 1,217,331Underwriting deductionsShare in reported losses – net 21.1 1,051,522 1,026,415 497,971Share in unreported loss reserves – net 21.2 588,623 308,179 235,698Commissions – net 21.3 773,369 583,329 364,341
2,413,514 1,917,923 1,098,010
Net underwriting income 152,734 236,574 119,321
Investment and Other income and expenses – net 20 389,488 254,807 281,570
Profit after Investment and Other income and expenses 542,222 491,381 400,891
General and administrative expenses 22 350,328 317,342 322,930
Profit before tax 191,894 174,039 77,961
Tax expense 23 42,678 91,043 50,726
Net profit P149,216 P82,996 P27,235
Earnings Per Share - Basic and Diluted 27 P0.070 P0.039 P0.013
See Notes to the Financial Statements.

41A N N U A L R E P O R T 2 0 1 8
NATIONAL REINSURANCE CORPORATION OF THE PHILIPPINES
STATEMENTS OF COMPREHENSIVE INCOMEFor the years ended December 31, 2018, 2017 and 2016
(Amounts in thousands)
Notes 2018
2017 (As Restated –
See Note 2)
2016 (As Restated –
See Note 2)
Net profit P149,216 P82,996 P27,235Other comprehensive income (loss)Items that will not be reclassified subsequently to profit or loss
Remeasurement of defined benefit liability 22.2 3,933 3,613 (11,779)Items that are and will be reclassified subsequently to profit or loss
Fair value gains (losses) during the year 7 (492,442) 407,025 (98,496)
Amortization of unrealized gains (losses) on reclassified HTM securities to profit or loss 1,065 (1,519) –
Fair value gains on disposal of AFS financial assets reclassified to profit or loss 7 (131,059) (120,783) (25,562)
Fair value losses on impairment of AFS financial assets reclassified to profit or loss 7 7,810 64,873 3,304
Income tax effect (371) (2,276) –
(614,997) 347,320 (120,754)
Total other comprehensive income (loss) (611,064) 350,933 (132,533)
Total comprehensive income (loss) (P461,848) P433,929 (P105,298)
See Notes to the Financial Statements.

N A T I O N A L R E I N S U R A N C E C O R P O R A T I O N O F T H E P H I L I P P I N E S42
NATIONAL REINSURANCE CORPORATION OF THE PHILIPPINES
STATEMENTS OF CHANGES IN EQUITYFor the years ended December 31, 2018, 2017 and 2016
(Amounts in thousands)
Additional Paid-in Capital
Treasury Shares at Cost
Revaluation ReservesCapital Stock
AFS Financial Assets
HTM Investments
Defined Benefit Liability
Retained Earnings (Deficit)
NotesNo. of shares (in thousands) Amount Appropriated Unappropriated Total Equity
Balance at January 1, 2018
As previously reported 2,181,955 P2,181,955 P3,019,218 (P100,525) P157,671 P3,256 (P71,534) P12,815 P50,934 P5,253,790
Prior period restatements 2 – – – – – – – – 34,581 34,581
As restated 2,181,955 2,181,955 3,019,218 (100,525) 157,671 3,256 (71,534) 12,815 85,515 5,288,371
Net income – – – – – – – – 149,216 149,216Other comprehensive income:
Items that will not be reclassified subsequently to profit or loss – – – – – – 3,933 – – 3,933Item that are and will be reclassified subsequently to profit or loss – – – – (616,062) 1,065 – – – (614,997)Reclassification 89,368 (89,368) – – – –
Total comprehensive income 7, 22 – – – – (526,694) (88,303) 3,933 – 149,216 (461,848)
Appropriated for contingencies 24 – – – – – – – 14,921 (14,921) –
Balance at December 31, 2018 2,181,955 P2,181,955 P3,019,218 (P100,525) (P369,023) (P85,047) (P67,601) P27,736 P219,810 P4,826,523
Balance at January 1, 2017
As previously reported 2,181,955 P2,181,955 P3,019,218 (P100,525) (P186,393) P– (P75,147) P7,805 P5,845 P4,852,758
Prior period restatements 2 – – – – – – – – 1,684 1,684
As restated 2,181,955 2,181,955 3,019,218 (100,525) (186,393) – (75,147) 7,805 7,529 4,854,442
Net income – – – – – – – – 82,996 82,996Other comprehensive income:
Items that will not be reclassified subsequently to profit or loss – – – – – – 3,613 – – 3,613Item that are and will be reclassified subsequently to profit or loss – – – – 348,840 (1,520) – – – 347,320Reclassification – – – – (4,776) 4,776 – – – –
Total comprehensive income 7, 22 – – – – 344,064 3,256 3,613 – 82,996 433,929
Appropriated for contingencies 24 – – – – – – – 5,010 (5,010) –
Balance at December 31, 2017 2,181,955 P2,181,955 P3,019,218 (P100,525) P157,671 P3,256 (P71,534) P12,815 P85,515 P5,288,371
Balance at January 1, 2016As previously reported 2,181,955 P2,181,955 P3,019,218 (P100,525) (P65,639) P– (P63,368) P– (P64,403) P4,907,238Prior period restatements 2 – – – – – – – – 52,502 52,502
As restated 2,181,955 2,181,955 3,019,218 (100,525) (65,639) P– (63,368) (11,901) 4,959,740
Net income – – – – – – – – 27,235 27,235 Other comprehensive income:
Items that will not be reclassified subsequently to profit or loss – – – – – – (11,779) – – (11,779)Item that are and will be reclassified subsequently to profit or loss – – – – (120,754) – – – – (120,754)
Total comprehensive income 7, 22 – – – – (120,754) – (11,779) – 27,235 (105,298)
Appropriated for contingencies 24 – – – – – – – 7,805 (7,805) –
Balance at December 31, 2016 2,181,955 P2,181,955 P3,019,218 (P100,525) (P186,393) P– (P75,147) P7,805 P7,529 P4,854,442
See Notes to the Financial Statements.

43A N N U A L R E P O R T 2 0 1 8
NATIONAL REINSURANCE CORPORATION OF THE PHILIPPINES
STATEMENTS OF CHANGES IN EQUITYFor the years ended December 31, 2018, 2017 and 2016
(Amounts in thousands)
Additional Paid-in Capital
Treasury Shares at Cost
Revaluation ReservesCapital Stock
AFS Financial Assets
HTM Investments
Defined Benefit Liability
Retained Earnings (Deficit)
NotesNo. of shares (in thousands) Amount Appropriated Unappropriated Total Equity
Balance at January 1, 2018
As previously reported 2,181,955 P2,181,955 P3,019,218 (P100,525) P157,671 P3,256 (P71,534) P12,815 P50,934 P5,253,790
Prior period restatements 2 – – – – – – – – 34,581 34,581
As restated 2,181,955 2,181,955 3,019,218 (100,525) 157,671 3,256 (71,534) 12,815 85,515 5,288,371
Net income – – – – – – – – 149,216 149,216Other comprehensive income:
Items that will not be reclassified subsequently to profit or loss – – – – – – 3,933 – – 3,933Item that are and will be reclassified subsequently to profit or loss – – – – (616,062) 1,065 – – – (614,997)Reclassification 89,368 (89,368) – – – –
Total comprehensive income 7, 22 – – – – (526,694) (88,303) 3,933 – 149,216 (461,848)
Appropriated for contingencies 24 – – – – – – – 14,921 (14,921) –
Balance at December 31, 2018 2,181,955 P2,181,955 P3,019,218 (P100,525) (P369,023) (P85,047) (P67,601) P27,736 P219,810 P4,826,523
Balance at January 1, 2017
As previously reported 2,181,955 P2,181,955 P3,019,218 (P100,525) (P186,393) P– (P75,147) P7,805 P5,845 P4,852,758
Prior period restatements 2 – – – – – – – – 1,684 1,684
As restated 2,181,955 2,181,955 3,019,218 (100,525) (186,393) – (75,147) 7,805 7,529 4,854,442
Net income – – – – – – – – 82,996 82,996Other comprehensive income:
Items that will not be reclassified subsequently to profit or loss – – – – – – 3,613 – – 3,613Item that are and will be reclassified subsequently to profit or loss – – – – 348,840 (1,520) – – – 347,320Reclassification – – – – (4,776) 4,776 – – – –
Total comprehensive income 7, 22 – – – – 344,064 3,256 3,613 – 82,996 433,929
Appropriated for contingencies 24 – – – – – – – 5,010 (5,010) –
Balance at December 31, 2017 2,181,955 P2,181,955 P3,019,218 (P100,525) P157,671 P3,256 (P71,534) P12,815 P85,515 P5,288,371
Balance at January 1, 2016As previously reported 2,181,955 P2,181,955 P3,019,218 (P100,525) (P65,639) P– (P63,368) P– (P64,403) P4,907,238Prior period restatements 2 – – – – – – – – 52,502 52,502
As restated 2,181,955 2,181,955 3,019,218 (100,525) (65,639) P– (63,368) (11,901) 4,959,740
Net income – – – – – – – – 27,235 27,235 Other comprehensive income:
Items that will not be reclassified subsequently to profit or loss – – – – – – (11,779) – – (11,779)Item that are and will be reclassified subsequently to profit or loss – – – – (120,754) – – – – (120,754)
Total comprehensive income 7, 22 – – – – (120,754) – (11,779) – 27,235 (105,298)
Appropriated for contingencies 24 – – – – – – – 7,805 (7,805) –
Balance at December 31, 2016 2,181,955 P2,181,955 P3,019,218 (P100,525) (P186,393) P– (P75,147) P7,805 P7,529 P4,854,442
See Notes to the Financial Statements.

N A T I O N A L R E I N S U R A N C E C O R P O R A T I O N O F T H E P H I L I P P I N E S44
NATIONAL REINSURANCE CORPORATION OF THE PHILIPPINES
STATEMENTS OF CASH FLOWSFor the years ended December 31, 2018, 2017 and 2016
(Amounts in thousands)
Notes 2018
2017 (As Restated –
See Note 2)
2016 (As Restated –
See Note 2)
CASH FLOWS FROM OPERATING ACTIVITIESProfit before tax P191,894 P174,039 P77,961Adjustments for:
Increase in share in loss reserves – net 21 588,623 308,179 235,698 Interest income 20 (224,676) (192,510) (196,697)Gain on sale of AFS financial assets 20 (131,059) (120,783) (25,562)Increase in deferred acquisition costs – net 12, 19 (129,066) (58,095) (113,898)Impairment losses – net 20, 22 86,550 147,391 77,433Decrease in share in reported losses – net (67,319) (25,700) (26,071)Dividend income 20 (43,672) (55,885) (47,895)Depreciation and amortization 22 15,904 12,139 18,605Unrealized foreign currency loss (gain) (14,341) 35,458 (6,021)Increase in premium reserves – net 13, 18 9,887 209,188 475,887Loss on asset retirement 20 244 8,179 227Gain on sale of non-financial assets 20 (11) (202) (750)
Operating income before working capital changes 282,958 441,398 468,917Decrease (Increase) in:
Reinsurance balances receivable (321,747) (454,267) (123,845)Loans and receivables 39,486 (35,992) 5,855Reinsurance recoverable on unpaid losses 193,325 726,269 (170,133)Other assets 4,100 (33,530) (228,678)
Increase (Decrease) in:Reinsurance balances payable (123,606) 186,489 21,868Accounts payable and accrued expenses 15,332 13,159 4,360Losses and claims payable (123,078) (621,906) 63,095
Cash generated from (used in) operations (33,230) 221,620 41,439Cash paid for income taxes (56,460) (36,602) (35,152)
Net Cash From (Used in) Operating Activities (P89,690) 185,018 6,287
CASH FLOWS FROM INVESTING ACTIVITIESProceeds from disposal/maturities of:
AFS financial assets 7 2,519,925 2,428,510 2,358,965Other investments 9 50,000 305,070 –HTM investments 8 – 73,000 –Property and equipment 10 65 3,030 1,791Investment properties – – 704
Interest received 223,247 193,168 197,408Dividends received 47,873 51,798 46,974Acquisitions of:
AFS financial assets 7 (2,526,482) (2,789,783) (2,733,008)Property and equipment 10 (7,657) (35,047) (7,084)HTM investments 8 (340,830) (15,100) –Intangible assets 14 (25,226) (5,786) (1,598)Other investments 9 (5,000) – –
Net Cash from (Used in) Investing Activities (64,085) 208,860 (135,848)
NET INCREASE (DECREASE) IN CASH AND CASH EQUIVALENTS (153,775) 393,878 (129,561)
EFFECTS OF FOREIGN CURRENCY REVALUATION ON CASH AND CASH EQUIVALENTS 5,135 (3,766) 2,515
CASH AND CASH EQUIVALENTS - January 1 1,310,539 920,427 1,047,473CASH AND CASH EQUIVALENTS - December 31 P1,161,899 P1,310,539 P920,427
Supplemental Information on Noncash Investing Activity –In 2018 and 2017, the Company reclassified certain investments previously classified under AFS financial assets to HTM investments amounting to P473.13 million and P1.09 billion, respectively, and to Other assets amounting to P0.88 million and P0.14 million, respectively (see Note 7).
See Notes to the Financial Statements.

45A N N U A L R E P O R T 2 0 1 8
NATIONAL REINSURANCE CORPORATION OF THE PHILIPPINES
NOTES TO FINANCIAL STATEMENTSDECEMBER 31, 2018, 2017 AND 2016
(Amounts in thousands)
1. CORPORATE INFORMATION
National Reinsurance Corporation of the Philippines (the Company) was incorporated on June 7, 1978 by virtue of Presidential Decree No. 1270 (the Decree), as a domestic professional reinsurance firm to provide life and non-life reinsurance capacity to the Philippines and neighboring insurance markets. Under the Decree, it became the vehicle for the Philippine insurance industry’s participation in the Asian Reinsurance Corporation (ARC), a multi-government-initiated reinsurance entity, based in Bangkok, Thailand, which was established to foster regional cooperation among insurance companies doing business in Asia. The Company’s shares are listed in the Philippine Stock Exchange (PSE).
The Company’s registered office and principal place of business is located at 31st floor BPI-Philam Life Makati, 6811 Ayala Avenue, Makati City.
The financial statements of the Company as at and for the year ended December 31, 2018 (including the comparative financial statements as at December 31, 2017 and for the years ended December 31, 2017 and 2016, and the corresponding figures as at January 1, 2017) were authorized for issue by the Company’s Board of Directors (BOD) on March 26, 2019.
2. SUMMARY OF SIGNIFICANT ACCOUNTING POLICIES
The significant accounting policies that have been used in the preparation of these financial statements are summarized below and in the succeeding pages. The policies have been consistently applied to all the years presented, unless otherwise stated.
2.1 Basis of Preparation of Financial Statements
(a) Statement of Compliance with Philippine Financial Reporting Standards
The financial statements of the Company have been prepared in accordance with Philippine Financial Reporting Standards (PFRS). PFRS are adopted by the Financial Reporting Standards Council (FRSC) from the pronouncements issued by the International Accounting Standards Board and approved by the Philippine Board of Accountancy. The financial statements have been prepared using the measurement bases specified by PFRS for each type of asset, liability, income and expense. The measurement bases are more fully described in the accounting policies that follow.
(b) Presentation of Financial Statements
The financial statements are presented in accordance with Philippine Accounting Standard (PAS) 1, Presentation of Financial Statements. The Company presents the statement of comprehensive income in two statements: a statement of income and a statement of comprehensive income.
The Company presents a third statement of financial position as at the beginning of the preceding period when it applies a policy retrospectively or makes a retrospective restatement or reclassification of items that have a material effect on the information in the statement of financial position at the beginning of the preceding period. The related notes to the third statement of financial position are not required to be disclosed.

N A T I O N A L R E I N S U R A N C E C O R P O R A T I O N O F T H E P H I L I P P I N E S46
As allowed by PFRS 4, Insurance Contracts, the Company changed its method of measuring reinsurance contract liabilities, including related recoverable amounts from retrocessionaires. The changes include measuring these liabilities and related assets from undiscounted to discounted basis, using the discount rates prescribed by the Insurance Commission (IC), and modifying the method in determining premium reserves to align with the requirements of the IC and PFRS 4. This resulted in the restatement of its financial statements affecting certain accounts as of December 31, 2017 and 2016.
Accordingly, the Company presents a third statement of financial position as of January 1, 2017, without the related notes as allowed by PAS 1, except for disclosures required under PAS 8, Accounting Policies, Changes in Accounting Estimates and Errors. The effects of the foregoing restatements on the affected accounts in the statements of financial position as at December 31, 2017 and January 1, 2017 are shown below and in the succeeding page.
December 31, 2017As Previously
ReportedPrior Period
RestatementsAs Restated
Change in assetsReinsurance recoverable on reported
losses P2,833,594 (P85,244) P2,748,350Reinsurance recoverable on claim reserves 527,031 (27,036) 499,995
Change in liabilitiesLosses and claims payable (4,964,958) 162,349 (4,802,609)Claims reserves (1,378,611) 70,813 (1,307,798)Premium reserves (1,339,837) (86,301) (1,426,138)
Net increase in equity P34,581
Change in equityEquity P5,253,791 P34,581 P5,288,371
January 1, 2017As Previously
ReportedPrior Period
RestatementsAs Restated
Change in assetsReinsurance recoverable on reported losses P3,682,008 (P80,716) P3,601,292Reinsurance recoverable on claim reserves 518,397 (20,980) 497,417
Change in liabilitiesLosses and claims payable (5,685,540) 128,732 (5,556,808)Claims reserves (1,043,266) 46,225 (997,041)Premium reserves (1,337,255) (71,577) (1,408,832)
Net increase in equity P1,684
Change in equityEquity P4,852,759 P1,684 P4,854,443
The effects of the changes in measuring reinsurance contract liabilities, including recoverable amounts from retrocessionaires to each financial line item in the statements of income for the years ended December 31, 2017 and 2016 is shown below.
For the year ended December 31, 2017As Previously
ReportedPrior Period
Restatements As RestatedIncrease in premium reserves – net P194,464 P14,724 P209,188Share in reported losses 1,055,504 (29,089) 1,026,415Share in loss reserves 326,711 (18,532) 308,179
Net increase in net profit P32,897

47A N N U A L R E P O R T 2 0 1 8
For the year ended December 31, 2016As Previously
ReportedPrior Period
Restatements As RestatedIncrease in premium reserves – net P404,310 P71,577 P475,887Share in reported losses 504,897 (6,926) 497,971Share in loss reserves 249,530 (13,832) 235,698
Net decrease in net profit P50,819
The changes in the method of measuring reinsurance contract liabilities, including the recoverable amounts from retrocessionaires, has increased retained earnings by P34.58 million, P1.68 million and P52.50 million as at December 31, 2017, December 31, 2016 and January 1, 2016, respectively.
The above restatements also affected the earnings per share from P0.024 earnings per share (EPS) to P0.039 EPS in 2017 and P0.037 EPS to P0.013 EPS in 2016.
In addition, the effects of the changes in measuring reinsurance contract liabilities, including recoverable amounts from retrocessionaires, on the relevant assets, liabilities and equity of the Company as of December 31, 2018 are as follows:
Assets Liabilities EquityChange in measurement of reinsurance contract
liabilitiesReinsurance recoverable on reported losses (P119,208) P– (P119,208)Reinsurance recoverable on claims reserves (29,050) – (29,050)Losses and claims payable – (246,401) 246,401 Claims reserves – (182,840) 182,840
Change in method of determining premium reservesPremium reserves – 67,976 (67,976)
Net increase (decrease) (P148,258) (P361,265) P213,007
On the other hand, the effects of the changes in measuring reinsurance contract liabilities, including recoverable amounts from retrocessionaires, on the relevant financial line item on the statement of income for the year ended December 31, 2018 are as follows:
Revenues Expenses Net ProfitChange in measurement of reinsurance contract liabilities
Share in reported losses – net P– (P50,087) P50,087Share in unreported loss reserves – net – (110,013) 110,013
Change in method of determining premium reservesIncrease in premium reserves – net 18,325 – 18,325
Net increase (decrease) P18,325 (P160,100) P178,425
(c) Functional and Presentation Currency
These financial statements are presented in Philippine peso, the Company’s functional and presentation currency, and amounts are presented in thousands except when otherwise indicated.
Items included in the financial statements of the Company are measured using its functional currency. Functional currency is the currency of the primary economic environment in which the entity operates.
N A T I O N A L R E I N S U R A N C E C O R P O R A T I O N O F T H E P H I L I P P I N E S48
2.2 Adoption of New and Amended PFRS
(a) Effective in 2018 that are Relevant to the Company
The Company has adopted the following amendments, standard and interpretation starting January 1, 2018. The adoption of these amendments to standards did not have any significant impact on the Company’s financial statements.
§ PFRS 4 (Amendments), Insurance Contracts – Applying PFRS 9 with PFRS 4. The amendments address the temporary accounting consequences of the different effective dates of PFRS 9, Financial Instruments, and the anticipated new insurance contracts standard by introducing the following options: (a) overlay approach, which is an option for all entities that issue insurance contracts to adjust profit or loss for eligible financial assets by removing any additional accounting volatility that may arise as a result of PFRS 9; or, (b) an optional temporary exemption from applying PFRS 9 for entities whose activities are predominantly connected with insurance. These entities will be permitted to continue to apply the existing financial instrument requirements of PAS 39, Financial Measurements: Recognition and Measurement. The Company has selected to apply the second option as allowed by this amendment since the Company was able to meet the following criteria:
• it has not previously applied any version of PFRS 9; and,
• its activities are predominantly connected with insurance at its annual reporting date that immediately precedes April 1, 2016, and no reassessment is required as the activities of the Company did not change at subsequent dates after initial assessment and before the effective date of PFRS 9.
Based on the management’s assessment, liabilities arising from insurance contracts represents 99% of the total carrying amount of all the Company’s total liabilities. These liabilities include reinsurance balances payable, losses and claims payable, premium reserves and deferred reinsurance commissions.
§ PFRS 40 (Amendments), Investment Property – Reclassification to and from Investment Property. The
amendments state that an entity shall transfer a property to, or from, investment property when, and only when, there is evidence of a change in use. A change of use occurs if property meets, or ceases to meet, the definition of investment property. A change in management’s intentions for the use of a property by itself does not constitute evidence of a change in use. The amendment provide a non-exhaustive list of examples constituting change in use. The application of these amendments have no impact on the Company’s financial statements.
§ PFRS 15, Revenue from Contract with Customers, together with the Clarifications to PFRS 15 (herein referred to as PFRS 15). This standard will replace PAS 18, Revenue, and PAS 11, Construction Contracts, the related Interpretations on revenue recognition: International Financial Reporting Interpretations Committee (IFRIC) 13, Customer Loyalty Programmes, IFRIC 15, Agreement for the Construction of Real Estate, IFRIC 18, Transfers of Assets from Customers, and Standing Interpretations Committee 31, Revenue – Barter Transactions Involving Advertising Services. This new standard establishes a comprehensive framework for determining when to recognize revenue and how much revenue to recognize. The core principle in the said framework is for an entity to recognize revenue to depict the transfer of promised goods or services to the customer in an amount that reflects the consideration to which the entity expects to be entitled in exchange for those goods or services.
The Company’s significant sources of revenue are generated from its insurance and investment activities which are covered by PFRS 4 and PAS 39, respectively. Significant amount of the Company’s revenues are out of scope of PFRS 15. Recognition and measurement of revenue streams within the scope of PFRS 15 did not vary from PAS 18.
§ IFRIC 22, Foreign Currency Transactions and Advance Consideration – Interpretation on Foreign Currency Transactions and Advance Consideration. The interpretation provides more detailed guidance on how to account for transactions that include the receipt or payment of advance consideration in a foreign currency. The interpretation states that the date of the transaction, for the purpose of determining the exchange rate, is the date of initial recognition of the non-monetary asset (arising from advance payment) or liability (arising from advance receipt). If there are multiple payments or receipts in advance, a date of transaction is established for each payment or receipt. Management has initially assessed that this interpretation has no material impact on the Company’s financial statements.

49A N N U A L R E P O R T 2 0 1 8
(b) Effective Subsequent to 2018 but not Adopted Early There are new PFRS, amendments and interpretation to existing standards effective for annual periods subsequent to 2018, which were adopted by the FRSC. Management will adopt the following relevant pronouncements in accordance with their transitional provisions:
§ PFRS 16, Leases (effective from January 1, 2019). The new standard will eventually replace PAS 17, Leases.
For lessees, it requires to account for leases “on-balance sheet” by recognizing a “right of use” asset and a lease liability. The lease liability is initially measured as the present value of future lease payments. For this purpose, lease payments include fixed, non-cancellable payments for lease elements, amounts due under residual value guarantees, certain types of contingent payments and amounts due during optional periods to the extent that extension is reasonably certain. In subsequent periods, the “right-of-use” asset is accounted for similarly to a purchased asset and depreciated or amortized. The lease liability is accounted for similarly to a financial liability using the effective interest method.
However, the new standard provides important reliefs or exemptions for short-term leases and leases of low value assets. If these exemptions are used, the accounting is similar to operating lease accounting under PAS 17 where lease payments are recognized as expenses on a straight-line basis over the lease term or another systematic basis (if more representative of the pattern of the lessee’s benefit).
The Company has reviewed all of the Company’s leasing arrangements that are still active as of December 31, 2018 in light of the new lease accounting rules in PFRS 16 and concluded that its impact will not be significant to the Company’s financial statements.
The Company will apply the standard from its mandatory adoption date of January 1, 2019. The Company intends to apply the simplified transition approach and will not restate comparative amounts for the year prior to first adoption. Right-of-use assets for property leases will be measured on transition as if the new rules had always been applied. All other right-of-use assets will be measured at the amount of the lease liability on adoption (adjusted for any prepaid or accrued lease expenses).
§IFRIC 23, Uncertainty over Income Tax Treatments (effective from January 1, 2019). The interpretation provides clarification on the determination of taxable profit, tax bases, unused tax losses, unused tax credits, and tax rates when there is uncertainty over income tax treatments. The core principle of the interpretation requires the Company to consider the probability of the tax treatment being accepted by the taxation authority. When it is probable that the tax treatment will be accepted, the determination of the taxable profit, tax bases, unused tax losses, unused tax credits, and tax rates shall be on the basis of the accepted tax treatment. Otherwise, the Company has to use the most likely amount or the expected value, depending on the surrounding circumstances, in determining the tax accounts identified immediately above.
Management is currently assessing the impact of this interpretation on the Company’s financial statements.
§ PFRS 9 (2014). This new standard on financial instruments will replace PAS 39 and PFRS 9 (2009, 2010 and 2013 versions). This standard contains, among others, the following:
• three principal classification categories for financial assets based on the business model on how an entity is managing its financial instruments;
• an expected loss model in determining impairment of all financial assets that are not measured at fair value through profit or loss (FVTPL), which generally depends on whether there has been a significant increase in credit risk since initial recognition of a financial asset; and,
• a new model on hedge accounting that provides significant improvements principally by aligning hedge accounting more closely with the risk management activities undertaken by entities when hedging their financial and non-financial risk exposures.
In accordance with the financial asset classification principle of PFRS 9 (2014), a financial asset is classified and measured at amortized cost if the asset is held within a business model whose objective is to hold financial assets in order to collect the contractual cash flows that represent solely payments of principal and interest (SPPI) on the principal outstanding. Moreover, a financial asset is classified and subsequently measured at fair value through other comprehensive income if it meets the SPPI criterion and is held in a business model whose objective is achieved by both collecting contractual cash flows and selling the financial assets. All other financial assets are measured at FVTPL.

N A T I O N A L R E I N S U R A N C E C O R P O R A T I O N O F T H E P H I L I P P I N E S50
In addition, PFRS 9 (2014) allows entities to make an irrevocable election to present subsequent changes in the fair value of an equity instrument that is not held for trading in other comprehensive income.
The accounting for embedded derivatives in host contracts that are financial assets is simplified by removing the requirement to consider whether or not they are closely related, and, in most arrangements, does not require separation from the host contract.
For liabilities, the standard retains most of the PAS 39 requirements which include amortized cost accounting for most financial liabilities, with bifurcation of embedded derivatives. The amendment also requires changes in the fair value of an entity’s own debt instruments caused by changes in its own credit quality to be recognized in other comprehensive income rather than in profit or loss.
Management exercised the second option provided by PFRS 4 (Amendments) effectively deferring application of PFRS 9 (2014) to periods beyond January 2022. Consequently, the Company will continue to apply its existing accounting policy on financial instruments.
§PFRS 17, Insurance Contracts (effective January 1, 2022). The new standard will solve the comparison problems created by International Financial Reporting Standards (IFRS) 4 by requiring all insurance contracts to be accounted for in a consistent manner, benefiting both investor and insurance companies. Insurance obligations will be accounted for using current values instead of historical cost, ending the practice of using data from when a policy was taken out.
The standard introduces insurance contract measurement principles requiring current, explicit and unbiased estimates of future cash flows, discount rates that reflect the characteristics of the contracts’ cash flows, and explicit adjustment for non-financial risk.
Management is currently assessing the impact of this new standard on the Company’s financial statements.
2.3 Reinsurance Contracts
Product ClassificationReinsurance contracts are those contracts under which the Company (the reinsurer) has accepted significant insurance risk from another party (the cedants) by agreeing to compensate the cedants if a specified uncertain future event (the insured event) adversely affects the cedants. As a general guideline, the Company determines whether it has significant insurance risk, by comparing benefits paid when an insured event occurs with benefits payable if the insured event did not occur. Reinsurance contracts can also transfer financial risks.
Once a contract has been classified as reinsurance contract, it remains reinsurance contract for the remainder of its lifetime, even if the insurance risk reduces significantly during the period, unless all rights and obligations are extinguished or expired.
Retrocession Contracts HeldContracts entered into by the Company with retrocessionaires under which the Company is compensated for losses on one or more contracts issued by the Company and that meet the classification requirements for reinsurance contracts above are classified as retroceded contracts held. Contracts that do not meet those classification requirements are classified as financial assets.
The Company retrocedes insurance risk in the normal course of business. Reinsurance recoverable on unpaid losses represents balances due from retrocessionaires for its share on the unpaid losses incurred by the Company. Recoverable amounts are estimated in a manner consistent with the outstanding claims provision and are in accordance with the retroceded contract. Reinsurance recoverable on paid losses are included as part of Reinsurance balances receivable.
Reinsurance receivables are reviewed for impairment at the end of each reporting period or more frequently when an indication of impairment arises during the reporting year. Impairment occurs when objective evidence exists that the Company may not recover outstanding amounts under the terms of the contract and when the impact on the amounts that the Company will receive from the cedants and retrocessionaires can be measured reliably.
The impairment loss is recognized as part of General and administrative expenses in the statements of income.
Ceded insurance risk does not relieve the Company from its obligations to ceding companies.

51A N N U A L R E P O R T 2 0 1 8
The Company also assumes insurance risks in the normal course of business for reinsurance contracts. Premiums and claims on assumed reinsurance are recognized as income and expenses in the same manner as they would be if the reinsurance were considered direct business, taking into account the product classification of the reinsured business. Reinsurance liabilities represent balances due to ceding companies and retrocessionaires. Amounts payable are estimated in a manner consistent with the associated reinsurance contract.
Premiums and claims are presented on a gross basis for both ceded and assumed reinsurance.
Reinsurance assets or liabilities are derecognized when the contractual rights are extinguished or expired or when the contract is transferred to another party.
2.4 Financial Assets
Financial assets are recognized when the Company becomes a party to an agreement and agrees to sell goods or services for a fixed amount of money. Purchases or sales of financial assets that require delivery of assets within the time frame established by regulation or convention in the marketplace are recognized on the trade date, i.e., the date that the Company commits to purchase the asset.
For purposes of classifying financial assets, an instrument is considered as an equity instrument if it is non-derivative and meets the definition of equity for the issuer in accordance with the criteria of PAS 32, Financial Instruments: Presentation. All other non-derivative financial instruments are treated as debt instruments.
(a) Classification and Measurement of Financial Assets
Financial assets other than those designated and effective as hedging instruments are classified into the following categories: financial assets at FVTPL, loans and receivables, HTM investments and AFS financial assets. Financial assets are assigned to the different categories by management on initial recognition, depending on the purpose for which the investments were acquired.
Financial assets are recognized initially at fair value of the consideration given. Except for financial assets at FVTPL, the initial measurement of financial assets includes transaction costs.
As at December 31, 2018 and 2017, the Company has no financial assets classified as FVTPL.
(i) Loans and Receivables
Loans and receivables are non-derivative financial assets with fixed or determinable payments that are not quoted in an active market. These arise when the Company provides money or services directly to a debtor with no intention of trading the receivables.
The Company’s financial assets categorized as loans and receivables are presented as cash and cash equivalents, loans and receivables, and funds at Lloyd’s, deposits and security fund (presented under Other assets – net account in the statements of financial position). Cash and cash equivalents include cash on hand, demand deposits and short-term, highly liquid investments with original maturities of three months or less, readily convertible to known amount of cash and which are subject to insignificant risk of changes in value.
Loans and receivables are subsequently measured at amortized cost using the effective interest method subject to any impairment loss.
(ii) HTM Investments
This category includes non-derivative financial assets with fixed or determinable payments and fixed maturity, and that the Company has the intention and ability to hold to maturity other than: (a) those that Company designates as financial assets at FVTPL upon initial recognition; (b) those that the Company designates as AFS; and, (c) those that meet the definition of loans and receivables. This category includes corporate bonds and government securities which the Company has the intent and ability to hold until maturity.
HTM investments are subsequently measured at amortized cost using the effective interest method subject to any impairment loss.

N A T I O N A L R E I N S U R A N C E C O R P O R A T I O N O F T H E P H I L I P P I N E S52
(iii) AFS Financial Assets
This category includes non-derivative financial assets that are designated as AFS financial assets or are not classified as loans and receivables, HTM investments or financial assets at FVTPL. The Company’s AFS financial assets include listed and unlisted equity securities, and government and corporate bonds.
All financial assets within this category are subsequently measured at fair value, except for certain equity instruments that do not have a quoted market price in an active market and whose fair value cannot be reliably measured which are measured at cost less any impairment loss. Fair value gains and losses are recognized in other comprehensive income, and are reported as part of the Revaluation reserves account in the statements of changes in equity except for interest and dividend income, impairment losses and foreign exchange differences on monetary assets, which are recognized in the statements of income.
When the financial asset is disposed of or is determined to be impaired, that is, when there is a significant or prolonged decline in the fair value of the security below its cost, the cumulative fair value losses recognized in other comprehensive income is reclassified from equity to statements of income and is presented as reclassification adjustment within other comprehensive income even though the financial asset has not been derecognized.
(b) Impairment of Financial Assets
The Company assesses at the end of each reporting period whether there is an objective evidence that a financial asset or group of financial assets is impaired. The Company recognizes impairment loss based on the category of financial assets as follows:
(i) Carried at Amortized Cost – Loans and Receivables and HTM Investments
If there is objective evidence that an impairment loss on financial assets carried at cost has been incurred, the amount of the impairment loss is determined as the difference between the asset’s carrying amount and the present value of estimated future cash flows (excluding future credit losses that have not been incurred), discounted at the financial asset’s original effective interest rate or current effective interest rate determined under the contract if the loan has a variable interest rate.
The carrying amount of the asset shall be reduced either directly or through the use of an allowance account. The amount of the loss shall be recognized in the statements of income.
If, in a subsequent period, the amount of the impairment loss decreases and the decrease can be related objectively to an event occurring after the impairment was recognized (such as an improvement in the debtor’s credit rating), the previously recognized impairment loss is reversed by adjusting the allowance account. The reversal shall not result in a carrying amount of the financial asset that exceeds what the amortized cost would have been had the impairment not been recognized at the date of the impairment is reversed.
The amount of the reversal is recognized in the statements of income.
(ii) Carried at Fair Value – AFS Financial Assets
When a decline in the fair value of an AFS financial asset has been recognized in other comprehensive income and there is objective evidence that the asset is impaired, the cumulative loss – measured as the difference between the acquisition cost (net of any principal repayment and amortization) and current fair value, less any impairment loss on that financial asset previously recognized in statements of income – is reclassified from Revaluation reserves to statements of income as a reclassification adjustment even though the financial asset has not been derecognized.
Impairment losses recognized in statements of income on equity instruments are not reversed through profit or loss. Reversal of impairment losses is recognized in other comprehensive income, except for financial assets that are debt securities which are recognized in profit or loss only if the reversal can be objectively related to an event occurring after the impairment loss was recognized.
(c) Items of Income and Expense Related to Financial Assets
All income and expenses, except for recognition and reversal of impairment loss on reinsurance balances receivable, relating to financial assets that are recognized in the statements of income are presented as part of Investment and Other income and expenses. Provision for and reversal of impairment losses on reinsurance balances receivable are presented at net as part of Impairment losses – net under General and administrative expenses account in the statements of income.

53A N N U A L R E P O R T 2 0 1 8
Non-compounding interest, dividend income and other cash flows resulting from holding financial assets are recognized in the statements of income when earned, regardless of how the related carrying amount of financial assets is measured.
(d) Derecognition of Financial Assets
The financial assets (or where applicable, a part of a financial asset or part of a group of financial assets) are derecognized when the contractual rights to receive cash flows from the financial instruments expire, or when the financial assets and all substantial risks and rewards of ownership have been transferred to another party. If the Company neither transfers nor retains substantially all the risks and rewards of ownership and continues to control the transferred asset, the Company recognizes its retained interest in the asset and an associated liability for amounts it may have to pay. If the Company retains substantially all the risks and rewards of ownership of a transferred financial asset, the Company continues to recognize the financial asset and also recognizes a collateralized borrowing for the proceeds received.
2.5 Deferred Acquisition Costs (DAC)
Commissions are recognized as expense over the coverage period of the policy using the 24th method [see Note 2.17 (b)]. The portion of the commissions that relates to the unexpired periods of the policies at the end of the reporting period is accounted for as DAC and is presented in the Assets section of the statements of financial position. The net change in the account between each end of reporting periods are recognized as Increase (decrease) in DAC under Commissions – net account in the statements of income.
2.6 Deferred Reinsurance Premiums (DRP)
The ceded reinsurance premiums that pertain to the unexpired period of the policies at the end of the reporting period are accounted for as DRP and presented in the Assets section of the statements of financial position. Subsequent to initial recognition, the amount is amortized using the 24th method [see Note 2.16 (a)]. The net change in the account between each end of reporting periods are recognized as Increase (decrease) in DRP under Increase in premium reserves – net in the statements of income.
2.7 Reinsurance Recoverable on Reported Losses and Reinsurance Recoverable on Claims Reserves
Reinsurance recoverable on reported losses and reinsurance recoverable on claims reserves represent the amount recoverable from retrocessionaires under retroceded contracts as their share on unpaid losses, including unreported losses and loss adjustment expenses, net of salvage of recoveries.
2.8 Property and Equipment
Property and equipment represents tangible items that are held for use in the Company’s business operations or for administrative purposes and are expected to be used more than one year. An item of property and equipment that qualifies for recognition as an asset shall be measured at its cost less any accumulated depreciation, and any accumulated impairment losses.
The cost of an asset comprises its purchase price and directly attributable costs of bringing the asset to working condition for its intended use. Expenditures for additions, major improvements and renewals are capitalized, while expenditures for repairs and maintenance are charged to expense as incurred.
Depreciation is computed on the straight-line basis over the estimated useful lives of the assets as follows:
Condominium unit 40 years Office improvements 10 years Office furniture and equipment 5 years Transportation equipment 5 years Electronic data processing (EDP) equipment 5 years
Fully depreciated assets are retained in the accounts until these are no longer in use. No further charge of depreciation is made in respect of those assets.
An asset’s carrying amount is written down immediately to its recoverable amount if the asset’s carrying amount is greater than its estimated recoverable amount (see Note 2.21).
The residual values, estimated useful lives and method of depreciation of property and equipment are reviewed, and adjusted if appropriate, at the end of each reporting period.
N A T I O N A L R E I N S U R A N C E C O R P O R A T I O N O F T H E P H I L I P P I N E S54
An item of property and equipment, including the related accumulated depreciation and impairment losses, is derecognized upon disposal or when no future economic benefits are expected to arise from the continued use of the asset. Any gain or loss arising from the derecognition of the asset (calculated as the difference between the net disposal proceeds and the carrying amount of the item) is included as part of Investment and Other income and expenses account in the statements of income in the period the item is derecognized.
2.9 Other Assets
Other assets pertain to other resources controlled by the Company as a result of past events. They are recognized in the financial statements when it is probable that the future economic benefits will flow to the entity and the asset has a cost or value that can be measured reliably. They may include the following accounts:
(a) Investment Properties
Investment properties are property held either to earn rental income or for capital appreciation or for both, but not for sale in the ordinary course of business, use in the supply of services or for administrative purposes.
Except for land, investment properties are stated at cost less accumulated depreciation and any impairment in value. Land is stated at cost less any impairment in value. The cost of the investment properties comprise their purchase price and directly attributable costs incurred such as legal fees, transfer taxes and other transaction costs.
Depreciation is computed using the straight-line basis over the estimated useful life of the property which is 10 years.
The carrying amount of investment properties is written down immediately to its recoverable amount if the asset’s carrying amount is greater than its estimated recoverable amount (see Note 2.21).
Investment properties are derecognized upon disposal or when permanently withdrawn from use and no future economic benefit is expected from its disposal. Any gain or loss on the retirement or disposal of the investment properties are recognized in the statements of income in the period of retirement or disposal.
(b) Intangible Assets
Intangible assets include acquired software licenses which are accounted for under the cost model. The cost of the asset is the amount of cash or cash equivalents paid or the fair value of other considerations given up to acquire the asset at the time of its acquisition. Capitalized costs are amortized on a straight-line basis over five years as the lives of these intangible assets are considered finite. In addition, intangible assets are subject to impairment testing as described in Note 2.21.
Acquired computer software licenses are capitalized on the cost incurred to acquire and install the specific software. Costs associated with maintaining computer software and those costs associated with research activities are recognized as expense in the statements of income as incurred.
When an intangible asset is disposed of, the gain or loss on disposal is determined as the difference between the proceeds and the carrying amount of the asset and is recognized in the statements of income.
(c) Creditable Withholding Tax (CWT)
CWT mainly arises from taxes withheld by the ceding companies upon payment of reinsurance premiums to the Company.
CWT is recorded at cost. It can either be used to offset against future income tax liabilities or be claimed as a tax refund from the Bureau of Internal Revenue (BIR).
(d) Input Value-added Tax (VAT)
The input VAT pertains to the 12% tax paid by the Company on commissions and local purchase of goods or services.
The input VAT is recorded at cost. It is used to offset against output VAT due to the BIR. Excess input VAT is recorded under the Other assets – net account in the statements of financial position.

55A N N U A L R E P O R T 2 0 1 8
(d) Deferred Input VAT
Deferred input VAT pertains to the 12% tax arising from acquisition of capital assets exceeding P1.00 million. Deferred input VAT arising from capital assets is amortized to input VAT over the useful lives of the capital assets or 60 months, whichever is shorter.
(e) Deferred Withholding VAT
Deferred withholding VAT pertains to the unapplied input VAT on unpaid premiums from a certain government entity.
(f) Prepayments
Prepayments pertain to expenditure paid for in one (1) accounting period, but for which the underlying asset will not be consumed until a future period. When the asset is eventually consumed, it is charged to expense. If consumed over multiple periods, there may be a series of corresponding charges to expense.
2.10 Financial Liabilities
Financial liabilities, which include Accounts payable and accrued expenses (excluding deferred output VAT and other taxes payable), are recognized when the Company becomes a party to an agreement and agrees to purchase goods or services for a fixed amount of money. All interest-related charges are recognized as expense in the statements of income.
Accounts payable and accrued expenses are initially recognized at their fair value and subsequently measured at amortized cost, using the effective interest method for those with maturities beyond one (1) year, less settlements.
Dividend distributions to shareholders are recognized as financial liabilities upon declaration by the Company.
Financial liabilities are derecognized from the statements of financial position only when the obligations are extinguished either through discharge, cancellation or expiration. The difference between the carrying amount of the financial liability derecognized and the consideration paid or payable is recognized in the statements of income.
2.11 Losses and Claims Payable and Claims Reserves
Losses and claims payable represent the present value of the estimated ultimate cost of all reported claims at the end of the reporting period, together with related claims handling costs and reduced for the expected value of salvage and other recoveries. This includes outstanding claim reserves, loss adjustment expenses payable plus a Margin for Adverse Deviation (MfAD) based on a certain percentage of the total outstanding claim reserves and loss adjustment expenses payable to allow for inherent uncertainty of the best estimate of the policy reserves.
Claims reserves represent the estimated ultimate cost of all incurred but not reported claims (IBNR), including incurred but not enough reported claims plus MfAD at the end of the reporting period.
2.12 Premium Reserves
Premium reserves refer to unearned premium reserves (UPR) plus any deficiency resulting from the liability adequacy test.
UPR refers to the portion of the premiums attributable to the unexpired risks at the balance sheet date and is recognized as revenue over the coverage period of the policy using the 24th method [see Note 2.16 (a)].
Liability Adequacy Test
Liability adequacy tests are performed at end of each reporting period, to ensure the adequacy of premium reserves. The test is performed by comparing the UPR, net of related DAC, and the present value of the current best estimates of future cash flows including claims handling and policy administration expenses. Any deficiency is charged to the statements of income and is recognized as premium reserves.
2.13 Deferred Reinsurance Commissions (DRC)
Commissions earned from reinsurance contracts are recognized as revenue over the coverage period of the policy using the 24th method [see Note 2.16 (a)]. The portion of the commissions that relates to the unexpired periods of the policies at end of the reporting period is accounted for as Deferred reinsurance commissions and is presented in the Liabilities section of the statements of financial position. The net change in the account between each end of reporting periods are recognized as Increase (decrease) in Deferred reinsurance commissions under Commissions – net in the statements of income.

N A T I O N A L R E I N S U R A N C E C O R P O R A T I O N O F T H E P H I L I P P I N E S56
2.1 Other Liabilities
These represent other liabilities which cannot be appropriately classified under the foregoing liability accounts. These comprise, among others, the following accounts:
(a) Provisions and Contingencies
Provisions are recognized when present obligations will probably lead to an outflow of economic resources and they can be estimated reliably even if the timing or amount of the outflow may still be uncertain. A present obligation arises from the presence of a legal or constructive commitment that has resulted from past events.
Provisions are measured at the estimated expenditure required to settle the present obligation, based on the most reliable evidence available at the end of the reporting period, including the risks and uncertainties associated with the present obligation. Where there are a number of similar obligations, the likelihood that an outflow will be required in settlement is determined by considering the class of obligations as a whole. When time value of money is material, long-term provisions are discounted to their present values using pre-tax rate that reflects market assessments and the risks specific to the obligation. Provisions are reviewed at the end of each reporting period and adjusted to reflect the current best estimate.
In those cases, where the possible outflow of economic resource as a result of present obligations is considered improbable or remote, or the amount to be provided for cannot be measured reliably, no liability is recognized in the financial statements. Similarly, possible inflows of economic benefits that do not yet meet the recognition criteria of an asset are considered contingent assets, hence, are not recognized in the financial statements. On the other hand, any reimbursement that the Company can be virtually certain to collect from a third party with respect to the obligation is recognized as a separate asset not exceeding the amount of the related provision.
(b) Deferred Output VAT
Deferred output VAT, presented as part of Accounts payable and accrued expenses, represents the 12% tax due on commission income on retroceded premiums and other goods based on amounts still to be collected from counterparties. Such amounts are still not due for remittance to the BIR until the receivables are collected.
2.15 Offsetting Financial Instruments
Financial assets and financial liabilities are offset and the resulting net amount is reported in the statements of financial position when there is a legally enforceable right to offset the recognized amounts and there is an intention to settle on a net basis, or realize the asset and settle the liability simultaneously. The right to offset must be available at the end of the reporting period, that is, it is not contingent on future event. It must also be enforceable in the normal course of business, in the event of default, and in the event of insolvency or bankruptcy; and must be legally enforceable for both entity and all counterparties to the financial instruments.
2.16 Revenue and Income Recognition
Revenue is recognized only when (or as) the Company satisfies a performance obligation by transferring control of the promised services to the customer. Expenses and costs, if any, are recognized in the statement of income upon utilization of the resources or services or at the date these are incurred. All finance costs are reported on an accrual basis.
The Company’s significant revenues pertain to net reinsurance premiums and investment income (loss) which are accounted for by the Company in accordance with PFRS 4 and PAS 39, respectively. The Company also earns other income from sale of non-financial assets, which is recognized as income once the Company transferred the goods. These are accounted for by the Company in accordance with PFRS 15.
The following provides information about the specific recognition criteria of revenues recognized in accordance with PFRS 4, PAS 39 and PFRS 15:
(a) Reinsurance premiums – Premiums are recognized over the coverage period of the contracts using the 24th method. The 24th method assumes that the average date of issue of all policies written during any one month is the middle of that month. Accordingly, 1/24th of the net premiums are considered earned in the month the reinsurance contracts are issued and 2/24th for every month thereafter (or 1/24th for every 15-day period after the issue month). The portion of the gross reinsurance premiums that relates to the unexpired periods of the policies at the end of the reporting period is accounted for as Premium reserves and is presented in the Liabilities section of the statements of financial position while the portion of the retroceded reinsurance premiums that relates to the unexpired periods of the policies at the end of the reporting period is accounted for as Deferred reinsurance premiums and is presented in the Assets section of the statements of financial position.

57A N N U A L R E P O R T 2 0 1 8
The net changes in the Unearned premium reserves and Deferred reinsurance premiums accounts between the end of the reporting periods are recognized in the statements of income.
(b) Commission on retrocession – Commission is deferred and is subjected to the same amortization as the retroceded reinsurance premiums. Deferred portion is presented in the statements of financial position as Deferred reinsurance commissions.
(c) Interest income – Interest income for all interest-bearing financial instruments are recognized using the effective interest rate method.
(d) Dividend income – Revenue is recognized when the Company’s right to receive the dividend is established.
(e) Gain on sale of assets – Revenue is recognized when the risks and rewards of ownership of the investments have passed to the buyer or at a point in time when the control of the non-financial assets transfers to the customer.
2.17 Expense Recognition
Expenses are decreases in economic benefits during the accounting period in the form of outflows or depletions of assets or incurrence of liabilities that result in decrease in equity, other than those relating to distribution to equity participants.
(a) Claims and Losses Recognition
Share in claims and losses relating to insurance contracts are accrued when insured events occur. These arise from events that have occurred up to reporting date even if these have not yet been reported to the Company. The share in claims (including those for IBNR losses) are based on the estimated ultimate cost of settling the claims and are discounted for time value of money. The method of determining such estimates and establishing reserves are continually reviewed and updated. Changes in estimates of claims and losses resulting from the continuous review process and differences between estimates and payments for claims are recognized as income or expense in the period in which the estimates are changed or payments are made.
Share in recoveries on claims are evaluated in terms of the aggregate share of the retrocessionaire on the claims and losses and adjustment expenses of the Company on business ceded under reinsurance arrangements. Recoveries on paid and unpaid claims are recognized in statements of income in the period the claims are made. Uncollected balances are presented as part of Reinsurance balances receivable account in the statements of financial position.
(b) Acquisition Costs
Costs that vary with and are primarily related to the acquisition of new and renewal reinsurance contracts such as commissions and certain underwriting costs, are recognized as expense over the period of the contracts using the 24th method. Unamortized acquisition costs are presented in the statements of financial position as Deferred acquisition costs (see Note 2.5).
(c) General and Administrative Expenses
Costs and expenses are recognized in the statements of income upon utilization of goods or services at the date they are incurred.
2.18 Leases – Company as Lessee
Leases which do not transfer to the Company substantially all the risks and benefits of ownership of the asset are classified as operating leases. Operating lease payments are recognized as expense in the statements of income on a straight-line basis over the lease term. Associated costs, such as maintenance and insurance, are expensed as incurred.
The Company determines whether an arrangement is, or contains a lease based on the substance of the arrangement. It makes an assessment of whether the fulfillment of the arrangement is dependent on the use of a specific asset or assets and the arrangement conveys a right to use the asset.

N A T I O N A L R E I N S U R A N C E C O R P O R A T I O N O F T H E P H I L I P P I N E S58
2.19 Foreign Currency Transactions and Translation
The accounting records of the Company are maintained in Philippine peso. Foreign currency transactions during the year are translated into the functional currency at exchange rates which approximate those prevailing on transaction dates.
Foreign currency gains and losses resulting from the settlement of such transactions and from the translation at closing exchange rates of monetary assets and liabilities denominated in foreign currencies are recognized in the statements of income as part of Investment and Other income and expenses (see Note 20).
2.21 Impairment of Non-financial Assets
The Company’s property and equipment, investment properties, intangible assets and other non-financial assets are subject to impairment testing. All other individual assets are tested for impairment whenever events or changes in circumstances indicate that the carrying amount may not be recoverable.
For purposes of assessing impairment, assets are grouped at the lowest levels for which there are separately identifiable cash flows (cash-generating units). As a result, assets are tested for impairment either individually or at the cash-generating unit level.
Impairment loss is recognized in the statements of income for the amount by which the asset’s or cash-generating unit’s carrying amount exceeds its recoverable amount which is the higher of its fair value less costs to sell and its value-in-use. In determining value-in-use, management estimates the expected future cash flows from each cash-generating unit and determines the suitable interest rate in order to calculate the present value of those cash flows. Discount factors are determined individually for each cash-generating unit and reflect management’s assessment of respective risk profiles, such as market and asset-specific risk factors.
All assets are subsequently reassessed for indications that an impairment loss previously recognized may no longer exist. An impairment loss is reversed if the asset’s or cash generating unit’s recoverable amount exceeds its carrying amount.
2.22 Employee Benefits
The Company provides post-employment benefits to employees through a defined benefit plan.
(a) Defined Benefit Plan
A defined benefit plan is a post-employment plan that defines an amount of post-employment benefit that an employee will receive on retirement, usually dependent on one or more factors such as age, years of service and salary. The legal obligation for any benefits from this kind of post-employment plan remains with the Company, even if plan assets for funding the defined benefit plan have been acquired. Plan assets may include assets specifically designated to a long-term benefit fund, as well as qualifying insurance policies. The Company’s defined benefit post-employment plan covers all regular full-time employees. The pension plan is tax-qualified, non-contributory and administered by a trustee.
The asset recognized in the statements of financial position for a defined benefit plan is the fair value of plan assets less the present value of the defined benefit obligation at the end of the reporting period. The defined benefit obligation (asset) is calculated annually by an independent actuary using the projected unit credit method. The present value of the defined benefit obligation is determined by discounting the estimated future cash outflows for expected benefit payments using a discount rate derived from the interest rates of a zero coupon government bonds [using the reference rates as published by Bloomberg using its valuation technology, Bloomberg Valuation (BVAL) and by Philippine Dealing & Exchange Corp. for 2018 and 2017, respectively], that are denominated in the currency in which the benefits will be paid and that have terms to maturity approximating to the terms of the related post-employment liability. BVAL provides evaluated prices that are based on market observations from contributed sources.
Remeasurements, comprising of actuarial gains and losses arising from experience adjustments and changes in actuarial assumptions and the return on plan assets (excluding amount included in net interest), are reflected immediately in the statements of financial position with a charge or credit recognized in other comprehensive income in the period in which they arise. Net interest is calculated by applying the discount rate at the beginning of the period, taking account of any changes in the net defined benefit liability or asset during the period as a result of contributions and benefit payments. Net interest is reported as part of Interest income under Investment and Other income and expenses in the statements of income.

59A N N U A L R E P O R T 2 0 1 8
Past service costs are recognized immediately in the statements of income in the period of plan amendment and curtailment.
(b) Compensated Absences
Compensated absences are recognized for the number of paid leave days remaining at the end of the reporting period. These are included in the Accounts payable and accrued expenses account in the statements of financial position at the undiscounted amount that the Company expects to pay as a result of the unused entitlement.
2.23 Income Taxes
Tax expense recognized in the statements of income comprises the sum of final tax, current tax and deferred tax not recognized in other comprehensive income or directly in equity, if any.
Current tax assets or liabilities comprise those claims from, or obligations to, fiscal authorities relating to the current or prior reporting period, that are uncollected or unpaid at the end of the reporting period. They are calculated using the tax rates and tax laws applicable to the fiscal periods to which they relate, based on the taxable profit for the year. All changes to current tax assets or current tax liabilities are recognized as a component of tax expense in the statements of income.
Deferred tax is accounted for using the liability method, on temporary differences at the end of the reporting period between the tax base of assets and liabilities and their carrying amounts for financial reporting purposes. Under the liability method, with certain exceptions, deferred tax liabilities are recognized for all taxable temporary differences and deferred tax assets are recognized for all deductible temporary differences and the carryforward of unused tax losses and unused tax credits to the extent that it is probable that taxable profit will be available against which the deductible temporary differences can be utilized. Unrecognized deferred tax assets are reassessed at the end of each reporting period and are recognized to the extent that it has become probable that future taxable profit will be available to allow such deferred tax assets to be recovered.
Deferred tax assets and deferred tax liabilities are measured at the tax rates that are expected to apply in the period when the asset is realized or the liability is settled provided such tax rates have been enacted or substantively enacted at the end of the reporting period.
The carrying amount of deferred tax assets is reviewed at the end of each reporting period and reduced to the extent that it is probable that sufficient taxable profit will be available to allow all or part of the deferred tax asset to be utilized.
The measurement of deferred tax liabilities and deferred tax assets reflects the tax consequences that would follow from the manner in which the Company expects, at the end of the reporting period, to recover or settle the carrying amount of its assets and liabilities.
Most changes in deferred tax assets or deferred tax liabilities are recognized as a component of tax expense in the statements of income, except to the extent that it relates to items recognized in other comprehensive income or directly in equity. In this case, the tax is also recognized in other comprehensive income or directly in equity, respectively.
Deferred tax assets and deferred tax liabilities are offset if the Company has a legally enforceable right to set off current tax assets against current tax liabilities and the deferred taxes relate to the same entity and the same taxation authority.
2.24 Related Party Transactions and Relationships
Related party transactions are transfers of resources, services or obligations between the Company and its related parties, regardless whether a price is charged.
Parties are considered to be related if one party has the ability, directly or indirectly, to control the other party or exercise significant influence over the other party in making financial and operating decisions. These parties include: (a) individuals owning, directly or indirectly through one or more intermediaries, control or are controlled by, or under common control with the Company; (b) associates; (c) individuals owning, directly or indirectly, an interest in the voting power of the Company that gives them significant influence over the Company and close member of the family of any such individual; and, (d) the Company’s funded retirement plan.

N A T I O N A L R E I N S U R A N C E C O R P O R A T I O N O F T H E P H I L I P P I N E S60
In considering each possible related party relationship, attention is directed to the substance of the relationship and not merely on the legal form.
2.25 Equity
Capital stock represents the nominal value of shares that have been issued.
Additional paid-in capital includes any premiums received on the initial issuance of capital stock. Any transaction costs associated with the issuance of shares are deducted from additional paid-in capital, net of any related income tax benefits.
Treasury shares are stated at the cost of reacquiring such shares and are deducted from equity attributable to the Company’s holders until the shares are cancelled, reissued or disposed of.
Revaluation reserves comprise gains and losses due to the revaluation of AFS financial assets, unamortized fair value gains and losses from HTM investments, and remeasurements of defined benefit plan.
Retained earnings represent all current and prior period results of operations as reported in the statements of income, reduced by the amounts of dividends declared. The appropriated portion of the retained earnings is intended as additional reserve for contingencies (see Note 24.2).
2.26 Earnings Per Share
Basic earnings per share is determined by dividing net profit by the weighted average number of shares issued, adjusted for stock dividends and stock split, less shares held in treasury during the period.
Diluted earnings per share is computed by adjusting the weighted average number of ordinary shares outstanding to assume conversion of dilutive potential shares.
2.27 Segment Reporting
For purposes of segment reporting, the Company does not have other reportable segments. The Company has one reportable business segment which is the reinsurance market. The financial information about the sole business segment is presented in the financial statements.
The management monitors the operating results of its business segment for the purpose of making decisions about resource allocation and performance assessment. The segment performance is evaluated based on operating profit or loss and is measured consistently with the income before income tax in the financial statements.
2.28 Events After the End of the Reporting Period
Any event subsequent to the balance sheet date that provides additional information about the Company’s financial position at the end of the reporting period (adjusting event) is reflected in the financial statements. Events subsequent to the balance sheet date that are not adjusting events, if any, are disclosed when material to the financial statements.
3. SIGNIFICANT ACCOUNTING JUDGMENTS AND ESTIMATES
The preparation of the Company’s financial statements in accordance with PFRS requires management to make judgments and estimates that affect the amounts reported in the financial statements and related notes.
Judgments and estimates are continually evaluated and are based on historical experience and other factors, including expectations of future events that are believed to be reasonable under the circumstances. Actual results may ultimately differ from these estimates.

61A N N U A L R E P O R T 2 0 1 8
3.1 Critical Management Judgments in Applying Accounting Policies
In the process of applying the Company’s accounting policies, management has made the judgments as presented below and in the succeeding pages, apart from those involving estimation, which have the most significant effect on the amounts recognized in the financial statements.
(a) Impairment of Financial Assets
Financial Assets at Fair Value – AFS Financial AssetsThe Company considers that investments are impaired when there has been a significant or prolonged decline in the fair value below their cost. The determination of what is significant or prolonged decline requires judgment. In making this judgment, the Company evaluates among other factors, the normal volatility in share/market price. In addition, impairment may be appropriate when there is evidence of deterioration in the financial health of the investee, industry and sector performance, changes in technology, and operational and financing cash flows.
Based on the recent evaluation of information and circumstance affecting the Company’s AFS financial assets, management concluded that decline in fair value of certain AFS financial assets amounting to P7.81 million and P64.87 million are considered impairment in value as at December 31, 2018 and 2017, respectively (see Note 7). Future changes in those information and circumstance might significantly affect the carrying amount of the assets.
Financial Assets at Amortized CostThe Company reviews its financial assets at amortized cost to assess impairment at least on an annual basis, or as the need arises due to significant movements on certain accounts. These financial assets that are individually significant are assessed to determine whether objective evidence of impairment exists on an individual basis, while those that are not individually significant are assessed for objective evidence of impairment either on an individual or on collective basis.
In determining whether an impairment loss should be recorded in the statements of income, the Company makes judgment as to whether there are any observable data indicating that there is a measurable decrease in the estimated future cash flows from a portfolio of financial assets before the decrease can be identified with an individual financial asset in that portfolio.
As at December 31, 2018 and 2017, the Company has recognized allowance for impairment loss amounting to P637.44 million and P630.34 million, respectively (see Note 6).
(b) Classification of Financial Instruments
The Company exercises judgment in classifying a financial instrument, or its component parts, on initial recognition as a financial asset, financial liability or an equity instrument in accordance with the substance of the contractual arrangement and the definitions of a financial asset or liability. The substance of a financial instrument, rather than its legal form, governs its classification in the statements of financial position. In addition, the Company classifies assets by evaluating among others, whether the asset is quoted or not in an active market. Included in the evaluation on whether a financial asset is quoted in an active market is the determination on whether the quoted prices are readily and regularly available and whether those prices represent actual and regularly occurring market transactions on an arm’s length basis.
As at December 31, 2018 and 2017, the Company classified its financial instruments as AFS financial assets, HTM investments, loans and receivables, and other financial liabilities.
(c) Recognition of Provisions and Contingencies
Judgment is exercised by management to distinguish between provisions and contingencies. Policies on recognition and disclosure of provision and contingencies are discussed in Note 2.14(a) and relevant disclosures are presented in Note 28.

N A T I O N A L R E I N S U R A N C E C O R P O R A T I O N O F T H E P H I L I P P I N E S62
3.2 Key Sources of Estimation Uncertainty
The following are the key assumptions concerning the future, and other key sources of estimation uncertainty at the end of the reporting period, that have a significant risk of causing a material adjustment to the carrying amount of assets and liabilities within the next reporting period:
(a) Impairment of Financial Assets
Management uses estimates based on historical loss experience for assets with credit risk characteristics. Adequate amount of allowance for impairment is made for specific and groups of accounts, where objective evidence of impairment exists. The Company evaluates the amount of allowance for impairment based on available facts and circumstances, including, but not limited to, the length of the Company’s relationship with the counterparties, the counterparties’ current credit status based on known market forces, average age of accounts, collection experience and historical loss experience.
The methodology and assumptions used for estimating both the amount and timing of future cash flows are reviewed regularly to reduce any differences between loss estimates and actual loss experience.
The carrying value of reinsurance balances receivable and the analysis of allowance for impairment on such financial assets are shown in Note 6.
The carrying values of HTM investments and loans and receivables are shown in Notes 8 and 9, respectively.
(b) Fair Value Measurement of AFS Financial Assets
The Company carries certain financial assets at fair value, which requires the extensive use of accounting estimates and judgment. In cases when active market quotes are not available, fair value is determined by reference to the current market value of another instrument which is substantially the same or is calculated based on the expected cash flows of the underlying net base of the instrument. The amount of changes in fair value would differ if the Company utilized different valuation methods and assumptions. Any change in fair value of these financial assets and liabilities would affect profit or loss and other comprehensive income.
The carrying value of the Company’s AFS financial assets and the amounts of fair value changes recognized are disclosed in Note 7.
(c) Estimation of Useful Lives of Property and Equipment, Investment Properties and Intangible Assets
The Company estimates the useful lives of property and equipment, investment properties and intangible assets based on the period over which the assets are expected to be available for use. The estimated useful lives of property and equipment, investment properties and intangible assets are reviewed periodically and are updated if expectations differ from previous estimates due to physical wear and tear, technical or commercial obsolescence and legal or other limits on the use of the assets.
The carrying amount of property and equipment is analyzed in Note 10, and of investment properties and intangible assets in Note 14. Based on management’s assessment as at December 31, 2018 and 2017, there is no change in the estimated useful lives of those assets during these years. Actual results, however, may vary due to changes in estimates brought about by the changes in factors mentioned above.
(d) Impairment of Non-financial Assets
The Company’s policy on estimating the impairment of non-financial assets is discussed in Note 2.21. Though management believes that the assumptions used in the estimation of fair value reflected in the financial statements are appropriate and reasonable, significant changes in these assumptions may materially affect the assessment of recoverable values and any resulting impairment loss could have a material adverse effect on the results of operations.
(f) Determination of Realizable Amount of Deferred Tax Assets
The Company reviews its deferred tax assets at each reporting period and reduces the carrying amount to the extent that it is no longer probable that sufficient taxable profit will be available to allow all or part of the deferred tax assets to be utilized. Any deferred tax asset will be re-measured if it might result to derecognition where the expected tax law to be enacted has a possible risk on the realization.

63A N N U A L R E P O R T 2 0 1 8
As at December 31, 2018, the Company recognized net deferred tax assets amounting to P113.91 million, as management has assessed that it is probable that sufficient taxable profit will be available to allow the benefit of the deferred tax assets to be utilized. However, unrecognized deferred tax assets amounted to P593.20 million and P535.52 million as at December 31, 2018 and 2017, respectively (see Note 23).
(g) Valuation of Post-employment Defined Benefit Obligation
The determination of the Company’s obligation and cost of post-employment defined benefit is dependent on the selection of certain assumptions used by an independent actuary in calculating such amounts. Those assumptions include, among others, discount rates, salary rate increase and employee turnover rate.
A significant change in any of these actuarial assumptions may generally affect the recognized expense and the carrying amount of the post-employment benefit obligation in the next reporting period.
The amounts of post-employment benefit obligation and expense and an analysis of the movements in the estimated present value of post-employment benefit obligation, as well as the significant assumptions used in estimating such obligation, are presented in Note 22.2.
(h) Valuation of Reinsurance Contract Liabilities
The Company’s Reinsurance contract liabilities are composed of premium liabilities and claim liabilities. Premium liabilities are the premium reserves while claim liabilities are equal to the present value of Losses and claims payable and Claims reserves accounts in the statements of financial position which include outstanding losses, IBNR losses, loss adjustment expenses payable plus the MfAD. Claim liabilities are discounted for the time value of money.
The Company estimates the present value of future cash flows, used in performing the liability adequacy test and in determining claims liabilities, through the use of historical claims experience and claims settlement patterns.
The principal assumption underlying the claim liability estimates is that the Company’s future claims development will depend on the estimate of the ultimate loss during a period of time for a particular risk exposure and then estimate the percentage of this ultimate loss that was not reported as of the reporting date.
The Company’s claim liability estimates, as ascertained by an independent actuary, are determined by calculating the estimated ultimate losses as the sum of reported losses plus IBNR losses. Ultimate losses were estimated using generally accepted actuarial methods such as the Chain Ladder Method, Bornhuetter-Ferguson Method and the Expected Loss Ratio Method. The Company also included MfAD as a percentage of the total outstanding losses, IBNR best estimate and loss adjustment expenses payable, to allow for inherent uncertainty of the best estimate of the policy reserves.
Additional qualitative judgments are used by the independent actuary to assess the extent to which the full tail of the claims development is influenced by the different factors, for example, changes in market factors such as public attitude to claiming, economic conditions, as well as internal factors such as portfolio mix and policy conditions. Judgment is further used to assess the extent to which external factors such as juridical decisions and government legislation affect the estimates.
As at December 31, 2018 and 2017, the carrying value of provision for claims reported and IBNR losses are recognized as Losses and claims payable and Claims reserves accounts, respectively, in the statements of financial position (see Note 17).
4. RISK MANAGEMENT OBJECTIVES AND POLICIES
The Company is exposed to a variety of financial risks from both its operating and investing activities. The Company’s main risk mitigation strategies generally include adoption of underwriting and investment policies and guidelines, annual budget provision and internal audit checks and assessments.
The Company has implemented an Enterprise Risk Management Process, which is an organization-wide approach to the identification, assessment, communication and management of enterprise risks which are, defined as issues which may prevent the Company from achieving its strategic objectives. This process has been fully integrated into the Company’s operations and is overseen by a Risk Management Team, who reports the results of the review and risk assessment to members of senior management. At the same time, a Risk Oversight Committee

N A T I O N A L R E I N S U R A N C E C O R P O R A T I O N O F T H E P H I L I P P I N E S64
has been established by the Company’s BOD to assist them in the development and oversight of the Company’s risk management program. The Risk Oversight Committee is required to provide the BOD with a comprehensive enterprise risk assessment at least annually and to establish plans to ensure that risks are being managed and monitored effectively. The Risk Oversight Committee’s main task is to oversee that risk management is an integral part of the planning and operations of the Company in order to meet corporate goals and objectives.
The Company’s risk management, in close cooperation with the respective duly constituted Board Committees on Underwriting, Investment and Budget, Risk Oversight and Audit, focuses on implementing risk control measures addressing underwriting acceptances, catastrophe exposures, retrocession programs, claims control, and securing short to medium-term cash flows by minimizing financial market risks while managing long-term financial investments to generate expected returns.
The most significant financial risks to which the Company may be exposed to are described in the succeeding pages.
4.1 Underwriting Risk
As a reinsurer, the Company underwrites reinsurance business from life and non-life insurance companies and intermediaries, with the objective of realizing profits and being a dependable partner to its clients. To attain this objective, it is essential for the Company to have a balanced portfolio, wherein there is diversification of risks. For non-life business, each risk that is accepted or treaty arrangement entered into is carefully evaluated based on the Company’s underwriting guidelines, such as maximum limits per type of risk, existing exposures, premium adequacy and financial condition of the client.
The Company’s retention on the larger risks that the Company accepts, or possible accumulation of the same in a given area, including losses that could arise from catastrophes such as earthquakes and typhoons, is protected by an excess of loss coverage to limit the Company’s exposure up to a specified amount. Significant risk concentrations may result in potential losses not only in certain areas but also within a particular type of business such as property, motor and casualty. The Company monitors and controls its exposures in various lines.
Retrocession or reinsuring what the Company had earlier accepted as reinsurance is resorted to enable the Company to write risk with amounts in excess of its retention, and to reduce the volatility of its results and protect its capital. In doing so, the Company also sets minimum requirements and standards in determining with whom it retrocedes to, foremost of which is the rating of the retrocessionaires by international rating agencies such as Standard and Poor’s and A.M. Best.
On the other hand, life business, which constitutes about 30% of gross premium written, follows a schedule of retention per life or group life as set by the Underwriting Committee. Any amount in excess of this is retroceded with reputable foreign reinsurers whose ratings from the same rating agencies are above par and meet the Company’s standards.
Starting 2015, the Company repositioned itself as a lead-role reinsurer. Consequently, this triggered a reevaluation of company retention. The retention limits appropriate for mandatory 10% share are not advantageous to the Company when applied to lead contracts where share is 80% or 100%.
As a lead reinsurer, the Company is pushing for the adoption of underwriting guidelines which may be accessed through the Company’s web portal.
Also, the Company continues to practice prudent claims management control. In evaluating a claim, the Company follows set of guidelines such as setting up of reserves upon its receipt of a preliminary loss advice, and requiring the cedant-claimant to submit other necessary documents such as the adjuster’s report, affidavits and proof of loss, among others. In addition, the Company establishes claim reserves to provide for losses that have been incurred but not yet paid. At the end of each reporting date, the Company assesses the adequacy of reserves for future claims that are not yet reported by setting up IBNR best estimate and inclusion of MfAD as ascertained by an independent actuary.

65A N N U A L R E P O R T 2 0 1 8
Concentration of Insurance Risk
The tables below set out the concentration of premiums by line of risk.
December 31, 2018Gross Written
PremiumsRetroceded
PremiumsNet Written
PremiumsFire P1,355,115 P453,449 P901,666
Casualty 638,415 31,703 606,712Motor 538,443 14,896 523,547Life 1,108,980 600,836 508,144Marine and aviation 41,953 5,887 36,066
P3,682,906 P1,106,771 P2,576,135
December 31, 2017Gross Written
PremiumsRetroceded
PremiumsNet Written
PremiumsFire P1,194,578 P286,671 P907,907
Casualty 635,959 93,009 542,950Life 977,938 475,081 502,857Motor 340,909 10,262 330,647Marine and aviation 55,730 7,333 48,397Adjustments – (30,927) 30,927
P3,205,114 P841,429 P2,363,685
December 31, 2016Gross Written
PremiumsRetroceded
PremiumsNet Written
PremiumsFire P1,512,211 P1,052,906 P459,305Casualty 873,747 176,253 697,494Life 727,965 389,701 338,264Motor 170,180 6,632 163,548Marine and aviation 99,837 65,230 34,607
P3,383,940 P1,690,722 P1,693,218
Claims Development
The Company aims to maintain strong reserves in respect of its insurance business in order to protect against adverse future claims experience and developments. As claims develop and the ultimate cost of claims becomes more certain, adverse claims experiences are eliminated which results in the release of reserves from earlier accident/underwriting years. In order to maintain strong reserves, the Company transfers much of this release to current accident/underwriting year reserves when the development of claims is less mature and there is much greater uncertainty attaching to the ultimate cost of claims.
The risks vary significantly in relation to the location of the risk insured by the Company, type of risks insured and in respect of commercial and business interruption by industry.

N A T I O N A L R E I N S U R A N C E C O R P O R A T I O N O F T H E P H I L I P P I N E S66
The following tables shows the estimates of cumulative incurred claims, gross of retrocession, for each underwriting year at each reporting date, together with cumulative claims paid at December 31, 2018 and 2017, net of foreign exchange revaluation of P87.78 million and P70.38 million, respectively.
December 31, 2018
Underwriting Year2010 and
prior 2010 2011 2012 2013 2014 2015 2016 2017 2018 Total
At the end of the financial year P– P364,594 P446,197 P846,131 P1,517,806 P278,093 P720,430 P900,312 P1,138,057 P1,156,134 P1,156,134
One year later – 742,276 2,285,183 1,479,571 2,474,672 692,265 1,286,124 1,659,396 1,936,767 1,936,767
Two years later – 870,396 2,444,928 1,553,907 2,756,250 663,639 1,239,501 1,541,089 1,541,089
Three years later – 908,425 3,754,928 1,676,474 2,643,911 605,379 1,221,244 1,221,244
Four years later – 996,770 3,837,886 1,701,021 2,559,103 538,642 538,642
Five years later – 1,040,042 3,821,055 1,654,200 2,400,590 2,400,590
Six years later – 1,022,502 3,796,121 1,609,999 1,609,999
Seven years later – 943,528 3,806,755 3,806,755
Eight years later – 917,084 917,084
Estimate of cumulative claims 2,087,688 917,084 3,806,755 1,609,999 2,400,590 538,642 1,221,244 1,541,089 1,936,767 1,156,134 17,215,992
Cumulative payments to date 399,213 844,042 3,622,767 1,384,353 1,597,720 451,098 1,119,192 645,908 841,755 162,976 11,069,024
Total current estimate of loss reserves
P1,688,475 P73,042 P183,988 P225,646 P802,870 P87,544 P102,052 P895,181 P1,095,012 P993,158 P6,146,968
December 31, 2017 (As Restated – See Note 2)
Underwriting Year2010 and
prior 2010 2011 2012 2013 2014 2015 2016 2017 Total
At the end of the financial year P P364,594 P446,197 P846,131 P1,517,806 P278,093 P720,430 P900,312 P1,138,057 P1,138,057
One year later – 742,276 2,285,183 1,479,571 2,474,672 692,265 1,286,124 1,659,396 1,659,396
Two years later – 870,396 2,444,928 1,553,907 2,756,250 663,639 1,239,501 1,239,501
Three years later – 908,425 3,754,928 1,676,474 2,643,911 605,379 605,379
Four years later – 996,770 3,837,886 1,701,021 2,559,103 2,559,103
Five years later – 1,040,042 3,821,055 1,654,200 1,654,200
Six years later – 1,022,502 3,796,121 3,796,121
Seven years later – 943,528 943,528
Estimate of cumulative claims 2,315,743 943,528 3,796,121 1,654,200 2,559,103 605,379 1,239,501 1,659,396 1,138,057 15,911,028
Cumulative payments to date 362,311 845,280 3,657,616 1,376,530 1,586,200 442,443 1,056,808 440,239 103,570 9,870,997
Total current estimate of loss reserves P1,953,432 P98,248 P138,505 P277,670 P972,903 P162,936 P182,693 P1,219,157 P1,034,487 P6,040,031

67A N N U A L R E P O R T 2 0 1 8
The following tables shows the estimates of cumulative incurred claims, net of retrocession, for each underwriting year at each reporting date, together with cumulative claims paid at December 31, 2018 and 2017, net of foreign exchange revaluation of P87.78 million and P70.38 million, respectively.
December 31, 2018
Underwriting Year2010 and
prior 2010 2011 2012 2013 2014 2015 2016 2017 2018 Total
At the end of the financial year P– P304,021 P388,456 P752,041 P871,508 P213,369 P408,903 P611,372 P1,019,477 P974,497 P974,497
One year later – 482,633 580,212 1,166,414 1,316,239 530,461 633,978 1,300,749 1,892,067 1,892,067
Two years later – 507,762 587,782 1,233,206 1,058,624 540,712 609,307 1,298,378 1,298,378
Three years later – 482,904 1,257,465 1,127,832 1,083,323 517,872 602,258 602,258
Four years later – 566,961 1,256,110 1,149,516 1,162,020 484,850 489,320
Five years later – 596,987 1,279,786 1,088,884 1,140,621 1,196,386
Six years later – 585,752 1,287,779 1,067,683 1,153,127
Seven years later – 489,932 1,298,717 1,319,916
Eight years later – 462,883 463,007
Estimate of cumulative claims 920,020 462,883 1,298,717 1,067,683 1,140,621 484,850 602,258 1,298,378 1,892,067 974,497 10,141,974
Cumulative payments to date 195,878 410,868 1,188,003 1,058,972 1,040,033 411,797 534,244 961,339 781,985 84,507 6,667,626
Total current estimate of loss reserves P724,142 P52,015 P110,714 P8,711 P100,588 P73,053 P68,014 P337,039 P1,110,082 P889,990 P3,951,973
December 31, 2017 (As Restated – See Note 2)
Underwriting Year2010 and
prior 2010 2011 2012 2013 2014 2015 2016 2017 Total
At the end of the financial year P P304,021 P388,456 P752,041 P871,508 P213,369 P408,903 P611,372 P1,019,477 P1,019,477
One year later – 482,633 580,212 1,166,414 1,316,239 530,461 633,978 1,300,749 1,300,749
Two years later – 507,762 587,782 1,233,206 1,058,624 540,712 609,307 609,307
Three years later – 482,904 1,257,465 1,127,832 1,083,323 517,872 523,594
Four years later – 566,961 1,256,110 1,149,516 1,162,020 1,269,203
Five years later – 596,987 1,279,786 1,088,884 1,188,429
Six years later – 585,728 1,287,779 1,305,250
Seven years later – 489,932 490,049
Estimate of cumulative claims 975,514 489,932 1,287,779 1,088,884 1,162,020 517,872 609,307 1,300,749 1,019,477 8,451,534
Cumulative payments to date 189,645 413,989 1,223,766 1,051,029 1,028,602 404,845 471,892 780,681 62,856 5,627,305
Total current estimate of loss reserves P785,869 P75,943 P64,013 P37,855 P133,418 P113,027 P137,415 P520,068 P956,621 P2,824,229
Sensitivities
As a reinsurer, the insurance contract liabilities of the Company are sensitive to key factors such as claims experience, the observed claims reporting and payment patterns, and the occurrence of catastrophic events as observed in the historical loss ratios of the Company.
The analysis below is performed for reasonably possible movements in key assumptions with all other assumptions held constant, showing the impact on the Company’s income before income tax. The correlation of assumptions will have a significant effect in determining the ultimate claims liabilities, but to demonstrate the impact due to changes in assumptions, assumptions had to be changed on an individual basis. It should be noted that movements in these variables are nonlinear.

N A T I O N A L R E I N S U R A N C E C O R P O R A T I O N O F T H E P H I L I P P I N E S68
Change in Assumption
Impact on Income before Income Tax
Increase (Decrease)
2018
2017 (As Restated –
See Note 2)
Loss ratio +5% (P128,312) (P107,725)
-5% 128,312 107,725
4.2 Credit Risk
Credit risk is the risk of financial loss to the Company if a counterparty to a reinsurance contract or financial instrument fails to meet its contractual obligations. The Company is exposed to credit risk primarily through its cash and cash equivalents, investments, reinsurance receivables, loans and receivables, funds at Lloyd’s, deposits and security fund. The carrying amounts of reinsurance receivables and financial assets best represent the maximum credit risk exposure at the reporting date.
The table below and in the succeeding page provides information regarding the credit risk exposure of the Company as at December 31, 2018 and 2017 by classifying assets according to the Company’s credit grading of counterparties.
December 31, 2018Neither Past Due nor Impaired
Investment High Grade
Non-investment Grade
Past Due but not Impaired Impaired Total
Cash and cash equivalents P1,161,899 P– P– P– P1,161,899Reinsurance balances
receivable 1,528,292 636,861 114,969 637,438 2,917,560AFS financial assets - debt
securities 2,494,960 – – – 2,494,960HTM investments 1,848,693 – – – 1,848,693Loans and receivables 55,000 57,543 – – 112,543Funds at Lloyd’s 196,557 – – – 196,557Other assets 1,364 – – – 1,364
P7,286,765 P694,404 P114,969 P637,438 P8,733,576
December 31, 2017Neither Past Due nor Impaired
Investment High Grade
Non-investment Grade
Past Due but not Impaired Impaired Total
Cash and cash equivalents P1,310,539 P– P– P– P1,310,539Reinsurance balances
receivable 888,529 924,051 137,350 630,344 2,580,274AFS financial assets - debt
securities 3,124,823 – – – 3,124,823HTM investments 1,034,687 – – – 1,034,687Loans and receivables 193,744 8,143 – – 201,887Funds at Lloyd’s 186,115 – – – 186,115Other assets 1,487 – – – 1,487
P6,736,924 P932,194 P137,350 P630,344 P8,439,812
The Company uses a credit grading system based on the borrowers and counterparties overall credit worthiness, as described below.
Investment High Grade – This pertains to accounts with a very low probability of default as demonstrated by the borrower’s strong financial position and reputation. The borrower has the ability to raise substantial amounts of funds through credit facilities with financial institutions. The borrower has a strong debt service record and a moderate use of leverage.

69A N N U A L R E P O R T 2 0 1 8
Non-investment Grade - Satisfactory – This pertains to current accounts with no history of default or which may have defaulted in the past, but the conditions and circumstances directly affecting the borrower’s ability to pay has abated already. The borrower is expected to be able to adjust to the cyclical downturns in its operations. Any prolonged adverse economic conditions would however ostensibly create profitability and liquidity issues. The use of leverage may be above industry or credit standards but remains stable.
Past Due but not Impaired – Rating given to borrowers and counterparties where outstanding obligation is already past due without impairment indicator.
Impaired – This pertains to accounts with impairment indicator and uncertain collectability. Allowance for impairment losses were recognized by the Company for these accounts.
The Company continuously monitors defaults of ceding companies and other counterparties, identified either individually or by group, and incorporates this information into its credit risk controls. Where available at a reasonable cost, external credit ratings and/or reports on ceding companies and other counterparties are obtained and used. The Company’s policy is to deal only with creditworthy counterparties.
As part of Company’s policy, substantially all bank deposits are only maintained with reputable financial institution having high quality external credit ratings. Cash in banks which are insured by the Philippine Deposit Insurance Corporation (PDIC) up to a maximum coverage of P0.50 million per depositor per banking institution, as provided for under Republic Act (RA) No. 9576, Amendment to Charter of PDIC, are still exposed to credit risk. However, the credit risk for cash and cash equivalents is considered negligible, since the majority of the counterparties are reputable banks with high quality external credit ratings.
The reinsurance balances receivable that are past due but not impaired are as follows:
2018 2017More than six months but not
more than one year P36,627 P74,307More than one year 76,342 63,043
P114,969 P137,350
None of the Company’s reinsurance receivables and financial assets are secured by collateral or other credit enhancements, except for cash and cash equivalents as described in the preceding page. Further, the Company’s reinsurance balances are subject to enforceable master netting agreements, each agreement between the Company and counterparties allows for net settlement of the relevant reinsurance liabilities when both elect to settle on a net basis.
Reinsurance balances as at December 31 are as follows.
Notes 2018 2017Reinsurance balances receivable 6 P2,280,122 P1,949,930Reinsurance balances payable 15 1,154,233 1,269,638
4.3 Liquidity Risk
Liquidity risk is the risk that the Company will encounter difficulty in meeting its obligations associated with its reinsurance contracts and financial liabilities that are settled by delivering cash or another financial asset.
The Company manages its cash and investment position to meet its obligations arising from reinsurance agreements and other financial liabilities. Currently, the Company’s excess cash is invested in short-term placements and AFS financial assets.
As at December 31, 2018 and 2017, the Company’s obligations arising from reinsurance agreements totaling P1.15 billion and P1.27 billion, respectively, have contractual maturities within the normal operating cycle of the business. In addition, as at December 31, 2018 and 2017, other financial liabilities included as part of Accounts payable and accrued expenses account in the statements of financial position amounted to P56.02 million and P35.54 million, respectively, and have contractual maturities within one year after the end of the reporting period.
As at December 31, 2018 and 2017, the Company has a current ratio of 2.96:1.00 and 2.15:1.00, respectively, which does not include losses and claims payable and claims reserves.

N A T I O N A L R E I N S U R A N C E C O R P O R A T I O N O F T H E P H I L I P P I N E S70
4.4 Market Risk
Market risk embodies potential losses due to market fluctuations and includes foreign exchange risk, equity price risk and interest rate risk.
The Company’s market risk is managed on a daily basis in accordance with internal and regulatory policies and procedures while overall market positions are reported to the Investment Committee of the Company.
The market risks to which the Company may be exposed are as follows:
(a) Foreign Exchange Risk
Foreign currency risk is the risk that fluctuations in foreign exchange rates will adversely affect the fair value or cash flow of a recognized financial instrument. The Company may invest in financial instruments and enter into transactions denominated in currencies other than its functional currency. Consequently, the Company is exposed to risk that the exchange rate of its currency relative to other foreign currencies may change in a manner that has an adverse effect on the value of that portion of the Company’s assets or liabilities denominated in currencies other than in Philippine peso.
Exposures to currency exchange rates arise from the foreign currency denominated short-term placements, investments, receivables and payables. The Company recognized net foreign currency gains of P43.22 million and P21.27 million in 2018 and 2016, respectively, and net foreign currency losses P30.70 million in 2017 (see Note 20).
To mitigate the Company’s exposure to foreign exchange risk, foreign-currency denominated cash flows and positions are monitored and hedged as it deems necessary.
2018 2017U.S.
DollarsOther
CurrenciesU.S.
DollarsOther
CurrenciesFinancial assets P1,989,994 P35,801 P1,311,057 P78,541Financial liabilities (1,306,288) (190,517) (839,584) (158,243)Total net exposure P683,706 (P154,716) P471,473 (P79,702)
The table below illustrates the sensitivity of the Company’s profit before tax with respect to changes on Philippine peso (Php) against foreign currencies exchange rates. The percentage changes in rates have been determined based on the average market volatility rates, using standard deviation, in the previous 12 months. If the Philippine peso had strengthened against the foreign currencies, the effect is presented below.
2018 2017
Reasonably Possible
Change in RateEffect in Profit
Before Tax Effect in Equity
Reasonably Possible
Change in RateEffect in Profit
Before Tax Effect in EquityPhp - U.S. Dollars 4.70% P32,101 P22,471 4.07% P19,179 P13,425Php - Indian Rupee 6.85% (15,970) (11,179) 5.55% (1,204) (843)Php - Singaporean Dollars 6.48% (1,728) (1,209) 4.04% (1,137) (796)Php - Hong Kong Dollars 4.81% (849) (594) 4.02% (802) (562)Php – Euro 9.57% 1,640 1,147 6.85% (468) (328)Php - South Korean Won 5.12% (1,083) (758) 7.82% (414) (290)Php – Thailand Baht 9.71% (476) (333) 4.21% (269) (188)Php - Malaysian Ringgit 9.53% 904 633 2.51% 262 183Php - Vietnamese Dong 5.24% (59) (41) 4.59% (231) (162)Php - Indonesian Rupiah 7.47% (4,618) (3,233) 5.57% 99 69
Php - Nepalese Rupee 8.83% 149 105 5.65% 79 56Php - Japanese Yen 13.93% (106) (74) 6.34% (46) (32)Php - China Yuan 8.71% (20) (14) 5.32% (13) (9)Php - Sri Lankan Rupee 5.61% (10) (7) 4.95% (3) (2)Php - British Pound 11.08% (5,525) (3,868) 5.63% (1) (1)Php – Bhutanese Ngulkrum 3.43% (50) (35) – – –Php - Lao Kip 5.69% – – 5.27% (0) (0)
Total P4,300 P3,011 P15,031 P10,520

71A N N U A L R E P O R T 2 0 1 8
If the Philippine peso had weakened against the foreign currencies, the effect would be the reverse of the amounts presented.
Exposures to foreign currency rates vary during the year depending on the volume of foreign currency denominated transactions. Nonetheless, the analysis is considered to be a representative of the Company’s currency risk.
(b) Equity Price Risk
Equity price risk is the probability that the value of an equity investment would deteriorate due to changes in market prices, whether caused by factors specific to an individual investment, its issuer or all factors affecting all instruments traded in the market.
The Company, through its Investment Committee, has established conservative guidelines and policies and constantly reviews them to align with the Company’s risk appetite, business profile, targets, and better control the risks inherent in equity investments.
The Company’s own investment policy requires that it invests only in shares of common stock of companies listed in the PSE. Also, these listed companies must have profitable business operations and market capitalizations supportive of the overall strategic direction of the Company.
The Investment Committee regularly reviews and approves a list of publicly traded stocks authorized for investments on the basis of the foregoing considerations. Furthermore, the Investment Committee seeks to avoid unwarranted concentration of funds in a single asset class by regularly monitoring and limiting the proportion of equity investments to the Company’s total investment portfolio. Further, exposure limits to a group of entities and single entities are established and monitored regularly.
As at December 31, 2018 and 2017, investments in listed equities amounted to 24% and 27% of the Company’s total investment portfolio, respectively.
The observed volatility rates of the fair value of the Company’s AFS financial assets held at fair value and their impact on the Company’s other comprehensive income for the years ended December 31, 2018 and 2017 are summarized as follows:
2018 2017
Observed Volatility Rates
Effect in Other Comprehensive
IncomeObserved Volatility
Rates
Effect in Other Comprehensive
IncomeCommon shares 14.45% P252,640 10.55% P213,600Preferred shares 17.34% 49,218 9.70% 31,646
P301,858 P245,246
(c) Interest Rate Risk
There are two types of interest rate risk:
• Fair Value Interest Rate Risk - the probability that the value of a financial instrument would deteriorate due to changes in market interest rates; and
• Cash Flow Interest Rate Risk - the probability that future cash flows of a financial instrument would deteriorate due to changes in market interest rates.
Significant portion of the Company’s investments is composed mainly of fixed interest-bearing debt instruments carried at fair value. Its total consolidated bond holdings amounted to 62% of its total investment portfolio. As a result, the Company is exposed to fair value interest rate risk.
The Company does not carry debt instruments with variable interest rate and, thus, is not exposed to cash flow interest rate risk.
Risk limits on issuer exposure, credit ratings, duration, and gapping of its portfolio are being monitored and managed to ensure protection of capital and address the Company’s liquidity needs as they arise.

N A T I O N A L R E I N S U R A N C E C O R P O R A T I O N O F T H E P H I L I P P I N E S72
The analysis below details the impact of changes in market interest rate to the fair value of the Company’s investment in fixed-rate debt instruments. This analysis assumes that all other variables, in particular foreign currency rates, remain constant.
2018
Observed Volatility
Rates
Effect in Other Comprehensive IncomeIncrease in
variableDecrease in
variablePeso-denominated securities:
Government bonds 11.31% (P68,061) P80,954U.S. Dollar-denominated securities:
Government bonds 26.49% (10,371) 4,627Corporate bonds 16.93% (1,758) 798
(P80,190) P86,379
2017
Observed Volatility
Rates
Effect in Other Comprehensive IncomeIncrease in
variableDecrease in
variablePeso-denominated securities:
Government bonds 20.06% (P57,692) P60,277U.S. Dollar-denominated securities:
Government bonds 6.71% (1,648) 1,678Corporate bonds 11.43% (792) 808
(P60,132) P62,763
In 2018 and 2017, the Company determined the reasonably possible change in interest rate based on the historical percentage changes in weighted average yield rates of outstanding investments of the Company.
5. CASH AND CASH EQUIVALENTS
This account consists of:
2018 2017Cash on hand and in banks P117,928 P328,506Short-term placements 1,043,971 982,033 P1,161,899 P1,310,539
Cash in banks generally earn interest at rates based on daily bank deposit rates.
Short-term placements include time deposits and special deposit accounts made for varying periods of up to three months depending on the liquidity requirements of the Company.
Interest income recognized from cash in banks and short-term placements is presented as part of the Investment and Other income and expenses account in the statements of income (see Note 20).
Peso short-term placements earn annual interest ranging from 0.13% to 7.15% in 2018, from 0.50% to 2.63% in 2017 and from 0.25% to 2.63% in 2016, while U.S. dollar short-term placements earn annual interest ranging from 0.13% to 2.25% in 2018, from 0.50% to 1.38% in 2017 and from 1.50% to 1.60% in 2016.
The Cash and cash equivalents account includes cash denominated in U.S. dollar amounting to $6.30 million or P331.98 million in 2018 and $6.79 million or P338.96 million in 2017.

73A N N U A L R E P O R T 2 0 1 8
6. REINSURANCE BALANCES RECEIVABLE
The details of this account are as follows:
2018 2017Due from ceding companies P2,444,102 P1,998,132Due from reinsurers 25,568 –Reinsurance recoverable on paid losses 372,202 477,897Funds held by ceding companies 75,688 104,245
2,917,560 2,580,274Allowance for impairment (637,438) (630,344)
P2,280,122 P1,949,930
The movements in these accounts are as follows:
2018Reinsurance
Due from ceding
Due from
recoverable on
Funds held by ceding
companies reinsurers paid losses companies TotalBalance at beginning of year P1,998,132 P– P477,897 P104,245 P2,580,274Loss recoveries during the year – – 176,069 – 176,069Premiums written net of funds held
during the year 3,506,872 – – – 3,506,872Funds held during the year – – – 77,158 77,158Reclassified to due from ceding
companies 98,876 – (98,876) –Collections during the year (3,106,749) – (283,484) – (3,390,233)Write-off during the year (37,829) – – (4,689) (42,518)Reclassified to due from reinsurers (25,568) 25,568 – – –Revaluation adjustment 10,368 – 1,720 (2,150) 9,938
2,444,102 25,568 372,202 75,688 2,917,560Allowance for impairment (265,287) – (348,020) (24,131) (637,438)Balance at end of year P2,178,815 P25,568 P24,182 P51,557 P2,280,122
2017Reinsurance
Due from ceding
recoverable on
Funds held by ceding
companies paid losses companies TotalBalance at beginning of year P1,524,450 P535,885 P114,758 P2,175,093Loss recoveries during the year – 211,492 – 211,492Premiums written net of funds held
during the year 3,143,451 – – 3,143,451Funds held during the year – – 61,663 61,663Reclassified to due from ceding companies 73,107 – (73,107) –Collections during the year (2,735,255) (227,085) – (2,962,340)Write-off during the year (1,683) (40,570) – (42,253)Revaluation adjustment (5,938) (1,825) 931 (6,832) 1,998,132 477,897 104,245 2,580,274Allowance for impairment (303,314) (302,000) (25,030) (630,344)Balance at end of year P1,694,818 P175,897 P79,215 P1,949,930
The Company’s collections of these reinsurance receivable include collections equivalent to underwriting costs and claims deducted by cedants from their statements of accounts.
All of the Company’s reinsurance balances receivables have been reviewed for indicators of impairment. Certain reinsurance balances receivable was found to be impaired and provisions have been recorded accordingly.

N A T I O N A L R E I N S U R A N C E C O R P O R A T I O N O F T H E P H I L I P P I N E S74
A reconciliation of the allowance for impairment at the beginning and end of 2018 and 2017 is shown below.
2018
Due from ceding
companies
Reinsurance recoverable
onpaid losses
Funds held by ceding companies Total
Balance at beginning of year P303,314 P302,000 P25,030 P630,344Write-off during the year (37,829) – (4,689) (42,518)Impairment 21,174 24,672 7,406 53,252Reclassification (15,584) 21,184 – 5,600Revaluation (5,788) 164 (3,616) (9,240)Balance at end of year P265,287 P348,020 P24,131 P637,438
2017
Due from ceding
companies
Reinsurance recoverable
onpaid losses
Funds held by ceding companies Total
Balance at beginning of year P314,315 P390,841 P23,998 P729,154Write-off loss during the year (1,684) (40,569) – (42,253)Reversal during the year (15,884) (45,167) (2,585) (63,636)Revaluation 6,567 (3,105) 3,617 7,079Balance at end of year P303,314 P302,000 P25,030 P630,344
The fair value of these short-term financial assets is not individually determined as the carrying amount is considered reasonable approximation of their fair value.
7. AVAILABLE-FOR-SALE FINANCIAL ASSETS
This account is composed of the following:
2018 2017Bonds P2,494,960 P3,124,823Equity securities - net 2,049,801 2,369,748Investment in ARC shares 35,191 32,548
P4,579,952 P5,527,119
Bonds include investments in corporate bonds and government securities.
Bonds earn interest at annual rates ranging from 2.13% to 8.00% in 2018 and 2017 and 1.63% to 9.13% in 2016. Interest income is presented as part of Investment and Other income and expenses account in the statements of income (see Note 20).
The following presents the fair value of investment in bonds by contractual maturity dates:
2018 2017Due within one year P335,957 P319,342Due after one year through five years 1,196,614 1,014,187Due after five years through ten years 732,972 1,528,448Due after ten years 229,417 262,846 P2,494,960 P3,124,823

75A N N U A L R E P O R T 2 0 1 8
The balance of equity securities classified as AFS financial assets consists of:
2018 2017Cost:
Quoted in the stock exchange P2,151,650 P2,132,928Not quoted in the stock exchange 33,416 34,296
2,185,066 2,167,224Unrealized foreign currency losses 590 (111)Fair value gains (losses):
Quoted in the stock exchange (119,659) 219,047Not quoted in the stock exchange (16,196) (16,412)
(135,855) 202,635 P2,049,801 P2,369,748
Equity securities consist mainly of investment in companies listed in the PSE.
Dividend income from these equity securities is presented under the Investment and Other income and expenses account in the statements of income (see Note 20).
The shares of ARC have been issued in the name of the Government of the Philippines (GoP) as the Philippine government’s participation in the joint undertaking of Asian countries to organize a reinsurance company that will service the needs of the region. The GoP assigned such shares, including any interest accruing thereon, to the Company. The GoP designated the Company as the national institution authorized to subscribe and pay for the said shares of stock. The shares of stock of ARC, while not for sale, were classified under this category since these do not qualify for inclusion in any other categories of financial assets. The fair value of investment in ARC shares amounted to P35.19 million and P32.55 million as at December 31, 2018 and 2017, respectively.
The reconciliation of the carrying amount of AFS financial assets is as follows:
2018 2017CostBalance at beginning of year P5,367,174 P6,043,964Acquisitions 2,526,482 2,789,783Reclassification (563,380) (1,090,077)Disposals/maturities (2,385,525) (2,307,728)Impairment losses (7,810) (64,873)Unrealized foreign currency gains (losses) 9,388 (3,896)
4,946,329 5,367,173Fair value adjustmentBalance at beginning of year 159,946 (186,393)Changes in fair value (492,442) 407,025Fair value gains on disposal (131,059) (120,783)Impairment losses 7,810 64,873Reclassification 89,368 (4,776)
(366,377) 159,946Balance at end of year P4,579,952 P5,527,119
Fair value gains or losses recognized in the statements of comprehensive income amounted to a fair value losses of P492.44 million and P98.50 million in 2018 and 2016, respectively, and fair value gains of P407.03 million in 2017.
In 2018 and 2017, the Company reclassified certain investments classified under AFS financial assets to HTM investments amounting to P473.13 million and P1.09 billion, respectively and to Other assets amounting to P0.88 million and P0.14 million, respectively.
The Company recognized an impairment loss amounting to P7.81 million, P64.87 million and P3.30 million in 2018, 2017 and 2016, respectively, which pertains to certain investments in equity securities with significant or prolonged decline in fair values. These were recorded as part of Investment and Other income and expenses account in the statements of income (see Note 20) after transferring the same amount of fair value losses on AFS financial assets from the Other comprehensive income account.

N A T I O N A L R E I N S U R A N C E C O R P O R A T I O N O F T H E P H I L I P P I N E S76
The Company sold AFS financial assets with carrying amount of P2.39 billion in 2018, P2.31 billion in 2017 and P1.15 billion in 2016. Accordingly, the Company recognized gain on sale of AFS financial assets amounting to P131.06 million, P120.78 million and P25.56 million in 2018, 2017 and 2016, respectively. These are presented as part of Investment and Other income and expenses account in the statements of income (see Note 20).
Fair value gains reclassified to profit or loss, as presented in the statements of comprehensive income, amounted to P131.06 million in 2018, P120.78 million in 2017 and P25.56 million in 2016.
The fair value of majority of the AFS financial assets has been determined directly by reference to published prices in active market (see Note 30.2).
8. HELD-TO-MATURITY INVESTMENTS
In September 2018, the Company reclassified certain government securities from AFS financial assets to HTM investments amounting to P473.13 million with face value of P562.5 million. These are earmarked as security for the benefit of cedants and creditors of the Company in accordance with the provisions of the Insurance Code. The new effective interest rate at the date of reclassification is 7.13%.
In May 2017, the Company’s BOD approved the reclassification of certain investment in corporate bonds amounting to P1.09 billion previously classified as AFS financial assets to HTM investments due to change in intention to collecting interest coupons until maturity. New effective interest rates at the date of reclassification range from 2.36% to 6.24%.
The Company recognized interest income of P59.90 million and P55.14 million in 2018 and 2017, respectively, (see Note 20) and nil fair value gain or loss as a result of the reclassification. If the reclassification had not been made, a decrease of P4.74 million and P130.00 million on the fair value of the bonds as at December 31, 2018 and 2017, respectively, would have been recognized directly in other comprehensive income.
The reconciliation of the carrying amount of HTM investment is as follows:
2018 2017Balance at beginning of year P1,034,687 P–Reclassification 473,132 1,094,714Additions 340,830 15,100Maturities – (73,000)Amortization 44 (2,127)Balance at end of year P1,848,693 P1,034,687
The following presents the carrying value of corporate bonds and government securities by contractual maturity dates:
2018 2017Due within one year P170,878 P-Due after one year through five years 978,712 824,321Due after five years through ten years 699,103 210,366
P1,848,693 P1,034,687
9. LOANS AND RECEIVABLES
This account is comprised of the following:
2018 2017Current:
Loans and notes receivable P8,073 P50,636Time deposits 5,000 50,000Dividend and interest receivable 42,190 45,006 55,263 145,642
Non-current:Loans and notes receivable 57,280 56,245
P112,543 P201,887

77A N N U A L R E P O R T 2 0 1 8
Loans and notes receivable mainly pertain to bank notes with original maturities of 10 years and an effective interest rate of 5.38%.
Loans and notes receivable also include car loans extended to certain officers as part of their benefits. These loans are collected through salary deductions for a period of five years with an annual effective interest rate of 8.00%.
Time deposits are not subject to any restrictions or covenants and have original maturity dates of 140 days and five years in 2018 and 2017, respectively. The annual interest rate of these deposits is 4.50% and 5.00% in 2018 and 2017, respectively.
Interest income on Time deposits and Loans and notes receivable are presented as part of Investment and Other income and expenses account in the statements of income (see Note 20).
The carrying value of these financial assets approximate their fair value as the interest rates approximate the prevailing market interest rates. No impairment loss was recorded for loans and receivables in 2018 and 2017.
10. PROPERTY AND EQUIPMENT
A reconciliation of the carrying amount at the beginning and end of 2018 and 2017 of property and equipment is shown below.
2018 Condominium Office Office Furniture Transportation EDP Unit Improvements and Equipment Equipment Equipment Total
Cost Balance at beginning of
year P101,310 P25,154 P10,940 P9,516 P11,730 P158,650Additions – 80 308 4,530 2,739 7,657Disposals/retirement – – (65) (2,140) (63) (2,268) Balance at end of year 101,310 25,234 11,183 11,906 14,406 164,039 Accumulated Depreciation Balance at beginning of
year 61,349 227 4,126 3,820 9,117 78,639Depreciation 3,377 2,405 1,487 2,154 1,387 10,810Disposals/retirement – – (65) (1,880) (28) (1,973)Balance at end of year 64,726 2,632 5,548 4,094 10,476 87,476Net Book Value P36,584 P22,602 P5,635 P7,811 P3,930 P76,563
2017
Condominium OfficeOffice
Furniture Transportation EDP Unit Improvements and Equipment Equipment Equipment Total
Cost Balance at beginning of
year P101,310 P10,027 P9,039 P10,473 P41,621 P172,470Additions – 25,136 6,707 2,810 394 35,047Reclassification – – – – (20,695) (20,695)Disposals/retirement – (10,009) (4,806) (3,767) (9,590) (28,172) Balance at end of year 101,310 25,154 10,940 9,516 11,730 158,650 Accumulated Depreciation Balance at beginning of
year 57,972 5,162 8,541 2,761 32,055 106,491Depreciation 3,377 973 362 2,003 2,687 9,402Reclassification – – – – (16,037) (16,037)Disposals/retirement – (5,908) (4,777) (944) (9,588) (21,217)Balance at end of year 61,349 227 4,126 3,820 9,117 78,639Net Book Value P39,961 P24,927 P6,814 P5,696 P2,613 P80,011
In 2017, the Company reclassified certain software application from EDP equipment under Property and equipment account to Intangible assets (see Note 14).

N A T I O N A L R E I N S U R A N C E C O R P O R A T I O N O F T H E P H I L I P P I N E S78
The Company sold and retired certain assets with book value of P0.30 million, P6.95 million and P1.97 million in 2018, 2017 and 2016, respectively, and recognized net loss amounting to P0.23 million and P3.92 million in 2018 and 2017, respectively, and net gains of P0.05 million in 2016, and is presented as part of Gain on sale of non-financial assets and Loss on asset retirement under Investment and Other income and expenses account in the statements of income (see Note 20).
The original cost of fully depreciated property and equipment that are still in use amounted to P10.30 million and P10.23 million as at December 31, 2018 and 2017, respectively.
11. REINSURANCE RECOVERABLE ON REPORTED LOSSES AND REINSURANCE RECOVERABLE ON CLAIMS RESERVES
The movement in the accounts follow:
Reinsurance recoverable on reported losses
Reinsurance recoverable on claims reserves
December 31, 2018Balance at beginning of year P2,748,350 P499,995Claims reported during the year (133,581) –Transferred to reinsurance recoverable on paid losses (176,069) –Claims incurred but not reported, net of adjustments – (180,947)Revaluation adjustment 3,848 –
2,442,548 319,048Allowance for impairment (68,006) –Balance at end of year P2,374,542 P319,048
December 31, 2017 (As Restated – see Note 2) Balance at beginning of year P3,601,292 P497,417Claims reported during the year (591,931) –Transferred to reinsurance recoverable on paid losses (211,492) –Claims incurred but not reported, net of adjustments – 2,578Revaluation adjustment (49,519) –Balance at end of year P2,748,350 P499,995
All of the Company’s reinsurance recoverable on reported losses and claims reserves have been reviewed for indicators of impairment. In 2018, the Company recognized an impairment loss amounting to P68.01 million which was recorded as part of Impairment loss under General and administrative expenses in the 2018 statement of income (see Note 22).
12. DEFERRED ACQUISITION COSTS
The movements in this account is as follows:
2018 2017Balance at beginning of year P280,947 P258,617Cost deferred 902,034 674,046Cost recognized (777,877) (651,716)Balance at end of year P405,104 P280,947
The increase or decrease of deferred acquisition costs for the year is presented as part of Commissions – net under Underwriting deductions in the statements of income (see Note 21.3).

79A N N U A L R E P O R T 2 0 1 8
13. DEFERRED REINSURANCE PREMIUMS
The movements in this account are as follows:
2018 2017Balance at beginning of year P202,935 P394,816Premiums retroceded during the year 1,106,771 841,429Premiums amortized during the year (978,161) (1,033,310)Balance at end of year P331,545 P202,935
The increase or decrease in deferred reinsurance premiums for the year is presented as part of Increase in premium reserves – net account in the statements of income.
14. OTHER ASSETS
This account is composed of the following:
Notes 2018 2017Input VAT P210,085 P215,233Funds at Lloyd’s 196,557 186,115Deferred tax assets – net 23 113,905 –Intangible assets – net 30,013 9,882Defined benefit asset 22.2 13,627 9,240Deferred withholding VAT 9,203 9,203Deferred creditable tax 7,092 7,666Prepayments 4,712 9,107Investment properties - net 3,705 2,825Deposit 720 843Security fund 644 644Deferred input VAT 35(b) 532 447Creditable withholding tax – 102,771Others 138 138
590,933 554,114Allowance for impairment (209,633) (215,233) P381,300 P338,881
Input VAT
The reconciliation of the allowance for impairment of input VAT is as follows:
2018 2017Balance at beginning of year P215,233 P–Impairment loss during the year – 146,153Reclassification (5,600) 69,080Balance at end of year P209,633 P215,233
In 2017, the Company provided allowance for impairment on its input VAT as management assessed that the amount may not be realizable. Impairment loss recognized in 2017 is presented as part of Impairment losses – net under General and administrative expenses account in the statements of income (see Note 22).
Funds at Lloyd’s
In December 2016, the Company entered into a quota share reinsurance treaty contract with a member of the Lloyd’s effective January 1, 2017, whereby the Company was required to establish its share of the Funds at Lloyd’s amounting to U.S. $3.00 million.

N A T I O N A L R E I N S U R A N C E C O R P O R A T I O N O F T H E P H I L I P P I N E S80
In 2017, the Company deposited additional funds amounting to £0.56 million. As at December 31, 2018 and 2017, Funds at Lloyd’s amounted to U.S. $3.89 million.
Intangible Assets
Intangible assets pertain to acquired computer software licenses used in operation and administration. The gross carrying amount and accumulated amortization of intangible assets as at December 31, 2018 and 2017 are as follows:
2018 2017Cost P163,881 P138,657Accumulated amortization (133,868) (128,775)Balance at end of year P30,013 P9,882
A reconciliation of the carrying amount at the beginning and end of 2018 and 2017, of intangible assets is shown below.
2018 2017Balance at beginning of year,
net of accumulated amortization P9,882 P6,229Additions 25,226 5,786Reclassification – 4,658Retirement – (4,054)Amortization (5,095) (2,737)Balance at end of year,
net of accumulated amortization P30,013 P9,882
In 2017, the Company retired part of intangible assets with a carrying amount of P4.05 million and is presented as part of Loss on asset retirement under Investment and Other income and expenses account in the statements of income (see Note 20).
Prepayments
Prepayments pertain to software licenses and support maintenance costs and prepaid health and group life insurance premiums of the Company.
Investment Properties
Investment properties consist mainly of land, with improvements, which are owned for capital appreciation. The reconciliation of the carrying amount of the investment properties at the beginning and end of 2018 and 2017 is shown below:
2018 2017Balance at beginning of year P2,825 P2,825Additions 880 –Balance at end of year P3,705 P2,825
These properties are classified as Level 3 in the fair value hierarchy. The total estimated fair value based on the latest available selling price of the properties obtained by the Company amounted to P12.20 million and P7.20 million as at December 31, 2018 and 2017, respectively (see Note 30.4).
Security Fund
Security fund represents amount deposited with the IC, as required by the IC, and in instances of the Company becoming insolvent, can be used as payment for valid claims against the Company. The balance of the fund earns interest at rates determined by the IC annually.

81A N N U A L R E P O R T 2 0 1 8
15. REINSURANCE BALANCES PAYABLE
The details of this account are as follows:
2018 2017Due to retrocessionaires P1,128,331 P1,235,348Funds held for retrocessionaires 23,559 34,290Due to cedant 2,343 –
P1,154,233 P1,269,638
Due to retrocessionaires are unpaid retroceded premiums of retrocessionaires. Funds held for retrocessionaires represent portion of the reinsurance premium ceded to retrocessionaires, which were withheld by the Company in accordance with reinsurance agreements. The Company’s payments of these reinsurance liabilities are netted by the retrocessionaires’ share in underwriting costs and losses paid.
The movements in these accounts are shown below.
2018Due to Funds held for Due to
retrocessionaires retrocessionaires cedant TotalBalance at beginning of year P1,235,348 P34,290 P– P1,269,638Retroceded premiums net of
funds held during the year 1,106,565 – – 1,106,565Funds held during the year – 206 – 206Funds released during the year 11,315 (11,315) – –Payments made during the
year (1,230,377) – – (1,230,377)Reclassified to due to cedant (2,316) – 2,316 –Revaluation adjustment 7,796 378 27 8,201Balance at end of year P1,128,331 P23,559 P2,343 P1,154,233
2017Due to Funds held for
retrocessionaires retrocessionaires TotalBalance at beginning of year P1,029,493 P57,437 P1,086,930Retroceded premiums net of funds
held during the year 828,269 – 828,269Funds held during the year – 13,160 13,160Funds released during the year 36,307 (36,307) –Payments made during the year (655,318) – (655,318)Revaluation adjustment (3,403) – (3,403)Balance at end of year P1,235,348 P34,290 P1,269,638
16. ACCOUNTS PAYABLE AND ACCRUED EXPENSES
This account includes the following:
Note 2018 2017Accounts payable P45,332 P15,287Deferred output VAT 35(b) 24,003 30,724Accrued expenses 8,148 17,711Income tax payable 6,553 –Withholding taxes payable 4,070 6,751Dividends payable 24.3 2,543 2,543Deferred tax liability – net 23 – 2,276 P90,649 P75,292
Deferred output VAT pertains to VAT from the sale of goods and services that are still outstanding as at year-end. These amounts are not due for remittance to the BIR until the receivables are collected.

N A T I O N A L R E I N S U R A N C E C O R P O R A T I O N O F T H E P H I L I P P I N E S82
Accrued expenses include amounts pertaining to accruals of outside services, utilities, uniforms, membership dues and meeting expenses.
Accounts payable includes non-interest bearing amounts that are already due to suppliers and advances received for services to be rendered in the future.
Management considers the carrying amount of accounts payable and accrued expenses recognized in the statements of financial position to be a reasonable approximation of their fair value due to their short duration.
17. LOSSES AND CLAIMS PAYABLE AND CLAIMS RESERVES
Losses and claims payable and claims reserves are losses due to ceding companies under reinsurance agreements inclusive of reserves for IBNR losses, loss adjustment expenses payable and MfAD as shown below.
Losses and ClaimsDecember 31, 2018 Claims Payable Reserves Balance at beginning of year P4,802,609 P1,307,798 Claims incurred during the year – net 1,089,076 – Claims incurred but not reported, net of adjustments – 407,676 Claims paid during the year (1,389,814) – Revaluation adjustment 17,400 – Balance at end of year P4,519,271 P1,715,474
December 31, 2017 (As Restated – See Note 2) Balance at beginning of year P5,556,808 P997,041 Claims incurred during the year - net 434,481 – Claims incurred but not reported, net of adjustments – 310,757 Claims paid during the year (1,159,242) – Revaluation adjustment (29,438) – Balance at end of year P4,802,609 P1,307,798
18. PREMIUM RESERVES
The movements in Premium reserves are as follows:
2018
2017 (As Restated –
See Note 2)Balance at beginning of year P1,426,138 P1,408,832Premium written 3,682,906 3,205,114Premiums earned (3,544,409) (3,187,808)Balance at end of year P1,564,635 P1,426,138
The increase or decrease in Premiums reserves for the year is presented as part of Increase in premium reserves - net account in the statements of income.
19. DEFERRED REINSURANCE COMMISSIONS
The movements in Deferred reinsurance commissions are as follows:
2018 2017
Balance at beginning of year P5,435 P41,201
Income deferred (401) 32,621Income recognized (4,508) (68,387)Balance at end of year P526 P5,435
The increase or decrease in Deferred reinsurance commissions for the year is presented as part of Commissions – net under Underwriting deductions in the statements of income (see Note 21.3).

83A N N U A L R E P O R T 2 0 1 8
20. INVESTMENT AND OTHER INCOME AND EXPENSES
The details of this account follows:
Notes 2018 2017 2016
Interest income5,7,8,9
22.2,25.2 P224,676 P192,510 P196,697Gain on sale of AFS 7, 25.2 131,059 120,783 25,562Dividend income 7, 25.2 43,672 55,885 47,895Foreign currency gains (losses) 43,221 (30,698) 21,270Gain on sale of non-financial assets 10 11 202 750 Loss on asset retirement 10,14 (244) (8,179) (227)Impairment loss on AFS financial assets 7 (7,810) (64,873) (3,304)Other charges 25.2 (45,097) (10,823) (7,073)
P389,488 P254,807 P281,570
21. UNDERWRITING DEDUCTIONS
The accounts below represent the aggregate amount of the Company’s share in net losses and claims relative to its acceptances under reinsurance agreements.
21.1 Share in Reported Losses – Net
2018
2017 (As Restated –
See Note 2)
2016 (As Restated –
See Note 2)Gross claims paid P1,389,814 P1,159,242 P1,113,003Retrocessionaires’ share in losses paid (176,069) (211,492) (481,922)Gross change in provision for claims reported (485,039) (724,760) (99,603)Retrocessionaires’ share in change in provision for claims reported 322,816 803,425 (33,507)
P1,051,522 P1,026,415 P497,971
21.2 Share in Loss Reserves – Net
2018
2017(As Restated –
See Note 2)
2016(As Restated –
See Note 2)Gross change in provision for IBNR P407,676 P310,757 P349,785Retrocessionaires’ share in change in provision for IBNR 180,947 (2,578) (114,087)
P588,623 P308,179 P235,698
21.3 Commissions – Net
This account consists of the following:
2018 2017 2016Commission expense P777,877 P651,716 P493,226Commission income (4,508) (68,387) (128,885)
P773,369 P583,329 P364,341
Commission expense refers to fees deducted by ceding companies from reinsurance premiums assumed under reinsurance agreements, while commission income pertains to fees charged by the Company related to reinsurance premiums retroceded under retrocession agreements.

N A T I O N A L R E I N S U R A N C E C O R P O R A T I O N O F T H E P H I L I P P I N E S84
22. GENERAL AND ADMINISTRATIVE EXPENSES
The details of this account are as follows:
Notes 2018 2017 2016Salaries and employee benefits 22.1 P152,279 P128,145 P130,507Impairment losses - net 6,11,14 78,740 82,517 74,128Professional fees 28,973 29,835 24,421Depreciation and amortization 10,14 15,904 12,139 18,605Data, licenses and subscriptions 13,272 9,177 6,642Outsourced functions 10,416 13,547 17,942Taxes, licenses and fees 35(f) 8,634 6,962 6,486Communication and postages 7,430 7,221 6,053Repairs and maintenance 5,650 5,533 7,220Advertising and publicity 3,321 1,954 2,158Dues and fees 3,308 2,896 3,446Meetings, conferences and conventions 3,182 3,274 3,477Light and water 2,106 2,095 2,256Insurance 1,356 1,529 1,014Rental 28.1 1,120 1,309 3,082Representation and entertainment 995 850 581Printing and office supplies 891 572 1,379Miscellaneous 12,751 7,787 13,533
P350,328 P317,342 P322,930
22.1 Salaries and Employee Benefit Expense
The details of salaries and employee benefits are presented below.
2018 2017 2016Short-term employee benefits P139,697 P113,648 P116,779Post-employment defined benefit 8,413 9,050 8,078Compensated absences 4,169 5,447 5,650
P152,279 P128,145 P130,507
22.2 Post-employment Defined Benefit
(a) Characteristics of the Defined Benefit Plan
The Company maintains a wholly-funded, tax-qualified, non-contributory post-employment defined benefit plan retirement plan that is being administered by a trustee covering all regular full-time employees.
The normal retirement age is 60 with a minimum of 10 years of credited service. The plan also provides for an early retirement at age 50 with a minimum of 10 years of credited service. Normal retirement benefit is an amount equivalent to 175% of the final monthly covered compensation (average monthly basic salary during the last 12 months of credited service) for every year of credited service.
(b) Explanation of Amounts Presented in the Financial Statements
Actuarial valuations are made annually to update the retirement benefit costs and the amount of contributions. All amounts presented below and in the succeeding pages are based on the actuarial valuation reports obtained from an independent actuary in 2018 and 2017. The amount of defined benefit asset presented as part of Other assets - net (see Note 14) and recognized in the statements of financial position are determined as follows:
2018 2017Fair value of the plan assets P64,704 P60,165Present value of the obligation (51,077) (50,925) P13,627 P9,240

85A N N U A L R E P O R T 2 0 1 8
The movements in the fair value of plan assets is presented below.
2018 2017Balance at beginning of year P60,165 P67,521Interest income 2,954 2,917Return on plan assets (6,383) (1,373)Contributions paid into the plan 8,413 –Benefits paid by the plan (445) (8,900)Balance at end of year P64,704 P60,165
The movements in the present value of the retirement benefit obligation are as follows:
2018 2017Balance at beginning of year P50,925 P53,452Current service cost 8,413 9,050Interest expense 2,500 2,309Remeasurements – actuarial gains arising from: Experience adjustments (1,712) (2,630) Changes in financial assumptions (8,604) (2,356)
Benefits paid by the plan (445) (8,900)Balance at end of year P51,077 P50,925
The composition of the fair value of plan assets at the end of the reporting period by category and risk characteristics is shown below:
2018 2017Cash and cash equivalents P4,310 P3,425Philippine government securities 25,998 28,444Corporate notes 34,934 36,269Equity securities 7,317 7,978Loans and receivables 1,477 1,333Accounts payable (9,332) (17,284)
P64,704 P60,165
The fair value of the equity and government bonds are determined based on quoted market prices in active markets.
The plan assets incurred a loss of P3.43 million in 2018, and earned a return of P1.54 million, and P5.72 million in 2017 and 2016, respectively.
Plan assets do not comprise any of the Company’s own financial instruments or any of its assets occupied and/or used in its operations.
The components of amounts recognized in the statements of income and in other comprehensive income in respect of the defined benefit post-employment plan are as follows:
2018 2017 2016Reported in statements of income:
Current service cost P8,413 P9,050 P8,078Net interest income (454) (608) (1,507)
P7,959 P8,442 P6,571
2018 2017 2016Reported in other comprehensive loss (income): Actuarial losses (gains) arising from:
Experience adjustments (P1,712) (P2,630) P12,379Changes in financial assumptions (8,604) (2,356) 1,262
Return on plan assets (excluding amounts included in net interest) 6,383 1,373 (1,862)
(P3,933) (P3,613) P11,779

N A T I O N A L R E I N S U R A N C E C O R P O R A T I O N O F T H E P H I L I P P I N E S86
Current service cost and settlement gain, if any, are presented as part of Salaries and employee benefits; while net interest income or expense is presented as part of Interest income under Investment and Other income and expenses, respectively (see Note 20).
Amounts recognized in other comprehensive income were included within items that will not be reclassified subsequently to profit or loss.
In determining the amounts of the defined benefit post-employment obligation, the following significant actuarial assumptions were used:
2018 2017 2016Discount rate 8.2% 4.9% 4.3%Expected rate of salary increase 6.0% 5.0% 5.0%Employee turn-over rate 10.0% 10.0% 10.0%
Assumptions regarding future mortality experience are based on published statistics and mortality tables. The average remaining working lives of an individual retiring at the age of 65 is 39. These assumptions were developed by management with the assistance of an independent actuary. Discount factors are determined close to the end of each reporting period by reference to the interest rates of a zero coupon government bond with terms to maturity approximating to the terms of the post-employment obligation. Other assumptions are based on current actuarial benchmarks and management’s historical experience.
(c) Risks Associated with the Retirement Plan
The plan exposes the Company to actuarial risks such as investment risk, interest rate risk, longevity risk, salary risk and inflation risk.
(i) Investment and Interest Risks
The present value of the defined benefit obligation is calculated using a discount rate determined by reference to market yields of government bonds. Generally, a decrease in the interest rate of reference government bonds will increase the plan obligation. However, this will be partially offset by an increase in the return on the plan’s investments in debt securities and if the return on plan asset falls below this rate, it will create a deficit in the plan. Currently, the plan has relatively balanced investment in equity securities, debt securities, cash and cash equivalents, and loans and receivables. Due to the long-term nature of the plan obligation, a level of continuing equity and debt investments is an appropriate element of the Company’s long-term strategy to manage the plan efficiently.
(ii) Longevity and Salary Risks
The present value of the defined benefit obligation is calculated by reference to the best estimate of the mortality of the plan participants both during and after their employment, and to their future salaries. Consequently, increases in the life expectancy and salary of the plan participants will result in an increase in the plan obligation.
(iii) Inflation Risk
A significant proportion of the defined benefit obligation is linked to inflation. The increase in inflation will increase the Company’s liability. A portion of the plan assets are inflation-linked debt securities which will mitigate some of the effects of inflation.
(d) Other Information
The information on the sensitivity analysis for certain significant actuarial assumptions, the Company’s asset-liability matching strategy, and the timing and uncertainty of future cash flows related to the retirement plan are described below and in the succeeding page.

87A N N U A L R E P O R T 2 0 1 8
(i) Sensitivity Analysis
The following table summarizes the effects of changes in the significant actuarial assumptions used in the determination of the defined benefit asset:
December 31, 2018 Impact on Defined Benefit Asset
Change in
AssumptionIncrease in Assumption
Decrease in Assumption
Discount rate +/- 1.0% P3,163 (P3,482)Salary growth +/- 1.0% (3,561) 3,349Turn-over rate +/- 10.0% 199 (199)
December 31, 2017 Impact on Defined Benefit Asset
Change in AssumptionIncrease in
AssumptionDecrease in Assumption
Discount rate +/- 1.0% P3,644 (P4,114)Salary growth +/- 1.0% (4,049) 3,691Turn-over rate +/- 10.0% 395 (395)
The sensitivity analysis is based on a change in an assumption while holding all other assumptions constant. This analysis may not be representative of the actual change in the defined benefit obligation as it is unlikely that the change in assumptions would occur in isolation of one another as some of the assumptions may be correlated. Furthermore, in presenting the sensitivity analysis, the present value of the defined benefit obligation has been calculated using the projected unit credit method at the end of the reporting period, which is the same as that applied in calculating the defined benefit asset recognized in the statements of financial position.
The methods and types of assumptions used in preparing the sensitivity analysis did not change compared to the previous years.
(ii) Asset-liability Matching Strategies
The Company applies asset-liability matching techniques to maximize investment returns at the least risk to reduce contribution requirements while maintaining a stable retirement fund. Retirement funds are invested to ensure that liquid funds are available when benefits become due, to minimize losses due to investment pre-terminations, and maximize opportunities for higher potential returns at the least risk.
The Company is guided by a formal Asset-Liability Management Study conducted by an independent actuary. In the study, expected benefit payments are projected and classified into short-term, medium-term or long-term liabilities. Investment instruments that would match the liabilities are identified. Finally, the investment mixes that would yield the maximum returns at certain risk levels are identified.
The study is conducted annually to capture changes in the demographic profile of the employees and changes in the economic environment affecting the amounts of maturing obligations and rates of return of available investment instruments.
In view of this, investments are made in reasonably diversified portfolio, such that the failure of any single investment would not have a material impact on the overall level of assets.
A large portion of the plan assets as at December 31, 2018 and 2017 consists of debt and equity securities, although the Company also invests in cash equivalents, mutual fund and loans and receivables. The Company believes that debt securities offer the most secure returns over the long term as they have the least acceptable level of risk which is in line with their asset-liability matching techniques.
There has been no change in the Company’s strategies to manage its risks from previous periods.
(iii) Funding Arrangements and Expected Contributions
The plan is currently overfunded by P13.63 million based on the latest actuarial valuation. Therefore, the Company is not expected to make any contribution to the plan during the next reporting period, unless the plan becomes underfunded.

N A T I O N A L R E I N S U R A N C E C O R P O R A T I O N O F T H E P H I L I P P I N E S88
As at December 31, 2018 and 2017, the maturity profile of undiscounted expected benefit payments from the plan for the next 20 years follows.
2018 2017Within one year P3,075 P2,687More than one year to five years 33,006 31,935More than five years to 10 years 93,432 80,213More than 10 years to 15 years 35,186 19,889More than 15 years to 20 years 168,572 97,738
P333,271 P232,462
The weighted average duration of the defined benefit obligation at the end of the reporting period is 14 years.
23. CURRENT AND DEFERRED TAXES
The components of tax expense as reported in statements of income.
2018 2017 2016Current tax expense:
Regular corporate income tax (RCIT) P116,553 P74,581 P10,099Final tax at 20% and 7.5% 42,678 36,602 35,152Excess of minimum corporate income tax (MCIT) over RCIT – – 5,475Application of MCIT – (20,140) –
Deferred tax benefit (116,553) – – P42,678 P91,043 P50,726
The reconciliation of the tax on pretax profit computed at the applicable statutory rates to tax expense in the statements of income is as follows:
2018 2017 2016Tax on pretax profit at 30% P57,568 P52,212 P23,389Non-deductible expenses 2,704 63,458 83,946Non-taxable income (13,102) (52,507) (13,762)Adjustment for income subjected to lower tax rates (63,344) (19,954) (27,598)Tax effects of:
Movements in unrecognized deferred tax assets:Claims reserves 61,345 92,455 70,709Losses and claims payable (20,195) (7,710) (7,822)Allowance for impairment of
receivables 23,622 – –Accrued expense 4,044 14,402 (158)Premium reserves (5,498) 4,417 21,473Amortized past service cost (4,466) (4,466) (4,466)Application of MCIT – (20,140) –Reversal of allowance for impairment – (19,091) 10,238Write-off of receivables – (12,033) – Excess of MCIT over RCIT – – 5,475Utilization of deferred tax asset on net operating loss carry-over (NOLCO) – – (110,698)
Tax expense reported in statements of income P42,678 P91,043 P50,726

89A N N U A L R E P O R T 2 0 1 8
Below is the movement of the deferred tax asset and deferred tax liabilities recognized as at December 31, 2018 and 2017.
2018 2017 Tax Base Tax Amount Tax Base Tax Amount
Profit or loss:Claims reserves P774,721 P232,416 P571,529 P171,459 Losses and claims payable 53,071 15,922 169,398 50,819 Accrued commission expense, net of
deferred acquisition costs 39,113 11,734 24,346 7,304 Defined benefit asset (81,228) (24,368) (80,774) (24,232)Prepaid expenses (4,712) (1,414) (9,107) (2,732)Unrealized foreign currency gains (20,340) (6,102) (5,999) (1,800)Reinsurance recoverable on claims
reserves (319,048) (95,714) (499,995) (149,999)Reinsurance recoverable on reported
losses (53,071) (15,921) (169,398) (50,819)388,506 116,553 – –
Other comprehensive income:Revaluation reserves on AFS
financial assets (8,829) (2,648) (7,586) (2,276)Net deferred tax asset (liabilities) P379,677 P113,905 (P7,586) (P2,276)
In accordance with the applicable accounting standards, the Company has taken a conservative position of not recognizing the deferred tax assets on the following temporary differences as at December 31, 2018 and 2017:
2018 2017 Tax Base Tax Amount Tax Base Tax Amount
Deferred tax assets:Claims reserves P940,753 P282,226 736,269 220,881 Losses and claims payable 71,396 21,419 138,713 41,614 Premium reserves 67,976 20,393 86,301 25,890 Allowance for impairment 702,004 210,601 623,264 186,979 Unamortized past service cost 60,908 18,272 75,793 22,738 Accrued commission expense, net of deferred acquisition costs
50,767 15,230 50,767 15,230
Accrued expense 15,920 4,776 2,440 732 Defined benefit liability 67,601 20,280 71,534 21,460
Unrecognized deferred tax assets P1,977,325 P593,197 P1,785,081 P535,524
In 2016, the Company fully utilized its NOLCO amounting to P368.99 million.
The Company is subject to MCIT which is computed at 2% of gross income, or RCIT, whichever is higher. MCIT incurred in 2016 and 2015 were all applied against RCIT due in 2017.
In 2018, 2017 and 2016, the Company opted to claim itemized deductions in determining its tax expense.
24. EQUITY
24.1 Capital Stock
As at December 31, 2018, 2017 and 2016, the Company has authorized shares of 3,000,000,000 and has issued and outstanding shares amounting to P2.08 billion net of treasury shares, which is divided into 2,123,605,600 shares with a par value of P1 per share.
On April 27, 2007, the Securities and Exchange Commission (SEC) approved the listing of the Company’s shares totalling 741,902,600. The shares were initially issued at an offer price of P3.80 per share.

N A T I O N A L R E I N S U R A N C E C O R P O R A T I O N O F T H E P H I L I P P I N E S90
As at December 31, 2018 and 2017, there are 271 and 277 holders of the listed shares, respectively. Such listed shares closed at P0.91 and P0.96 per share, as at those dates, respectively.
As at December 31, 2018, 2017 and 2016, total treasury shares amounted to P100.53 million representing 58,349,000 shares. There were no treasury stock transactions in 2018, 2017 and 2016.
24.2 Appropriation for Special Reserve
In 1989, the BOD approved the establishment of a special reserve for extraordinarily high loss occurrences or severe catastrophic losses. As such, 10% of profit is set aside as special reserve provided there is no deficit. For the years ended December 31, 2018, 2017 and 2016, the Company appropriated P14.92 million, P5.01 million and P7.81 million, respectively, for special reserve.
24.3 Retained Earnings
There was no declaration of cash dividends in 2018, 2017 and 2016. The total outstanding dividends payable amounted to P2.54 million as at December 31, 2018 and 2017. These are presented as Dividends payable under Accounts payable and accrued expenses account in the statements of financial position (see Note 16).
The Company’s retained earnings are restricted to the extent of the cost of the treasury shares as of the end of the reporting periods.
25. RELATED PARTY TRANSACTIONS
The Company’s related parties include its stockholders, related parties under common ownership, retirement plan and the Company’s key management personnel with which the Company had transactions as described below and in the succeeding pages.
25.1 Reinsurance Contracts with Related Parties
The Company accepts and cedes insurance business under various reinsurance contracts with related parties. The details of which are presented as follows:
2018 2017
Stockholders
Related Parties Under Common
Ownership Stockholders
Related Parties Under Common
OwnershipPremiums P131,137 P41,521 P257,157 P71,058,724Retrocessions (19) 13,765 1,097 1,921,578Commission income – – 15 –Commission expense 34,560 (5) 64,272 –Losses incurred 5,673 137,692 121,172 – Loss recoveries 1,842 – 12,214 –
Reinsurance balances receivable from and payable to related parties arising from above transactions are presented as follows:
2018 2017
Stockholders
Related Parties Under Common
Ownership Stockholders
Related Parties Under Common
OwnershipDue from ceding companies P39,777 P31,247 P173,310 P61,799Reinsurance recoverable on
losses 19,183 – 54,851 981Funds held by ceding
companies 14,879 – 25,105 – Claims payable 172,811 870,716 1,138,127 99Due to retrocessionaires – – 7,529 3,242Funds held for
retrocessionaires – – 1,059 –

91A N N U A L R E P O R T 2 0 1 8
The balance of Reinsurance balances receivable which is noninterest-bearing, unsecured and is expected to be settled in cash within twelve months, is presented net of P75.42 million and P145.61 million allowance for impairment as at December 31, 2018 and 2017, respectively.
25.2 Other Transactions
The Company’s other transactions with related parties are presented as follows:
2018 2017 Amount of Outstanding Amount of Outstanding Transactions Balance Transactions BalanceStockholder: Cash and cash equivalents (a) P19,756 P79,939 (P112,163) P60,183AFS financial assets (b) 4,245 118,606 76,754 122,851Loans and receivables (c) – – 45 139Interest income - bank accounts (a) 2,324 246 1,533 12Dividend income - AFS financial
assets (b) – – 1,132 1,082Gain on sale of AFS financial assets (b) – – 1,529 –Service fees (d) 989 – 4,377 926 Related Party Under Common
Ownership: Cash and cash equivalent (a) (118,181) 648,854 (273,752) 767,035AFS financial assets (b) 290,679 315,882 (9,849) 25,203Loans and receivables (c) (40) 50,000 (65,609) 50,040Interest income - bank accounts (a) 20,472 – 14,374 1,233Interest income - loans and
receivables (c) – – 4,585 24Interest income - AFS financial
assets (b) – – 919 141Service fees (d) – – 1,388 266
(a) Cash and Cash Equivalents
The Company maintains several savings and current accounts with a stockholder and related party under common ownership. Interest income recognized is presented as part of Interest income under Investment and Other income and expenses account in the statements of income (see Note 20).
(b) AFS Financial Assets
The Company has investment in shares of stock of a stockholder and fixed income securities of a related party under common ownership classified as AFS financial assets. Relative to these transactions, the Company recognized dividend income, interest income and trading gains which are presented as part of Investment and Other income and expenses account in the statements of income (see Note 20).
(c) Loans and Receivables
The Company has long-term negotiable certificate of deposit (LTNCD) and note receivables with certain related parties under common ownership. Relative to this, the Company recognized interest income which is presented as part of Interest income under Investment and Other income and expenses account in the statements of income (see Note 20). The LTNCD and notes receivable are unsecured and earn interest of 5.00% in 2018, 5.00% in 2017 and 5.00% to 5.375% in 2016. As at December 31, 2018 and 2017, management assessed that these receivables are not impaired.
(d) Investment Management and Custodianship
The Company has entered into “Investment Management Agreement” and “Custodianship Agreement” with a stockholder and an entity under common ownership for the management and custodianship of certain investible funds of the Company subject to terms and conditions in the said agreements. In consideration for the services rendered, the Company pays the stockholder and the affiliate bank service fees equivalent to a certain percentage of the market value of the investments.

N A T I O N A L R E I N S U R A N C E C O R P O R A T I O N O F T H E P H I L I P P I N E S92
Total service fees paid is charged against Other charges under Investment and Other income and expenses account (see Note 20) in the statements of income. As at December 31, 2018 and 2017, outstanding liabilities from these transactions amounted to nil and P1.19 million, respectively. Such payables are noninterest-bearing, unsecured, and settled in cash within twelve months.
25.3 Investment Management of Retirement Fund
In 2007, the Company entered into a “Retirement Fund Investment Management Agreement” with a certain stockholder for the management of the investments of the Company’s retirement funds subject to the terms and conditions in the said agreement.
25.4 Transactions with Retirement Fund
As discussed in Note 22.2, the Company maintains a wholly-funded, tax-qualified, non-contributory retirement plan that is being administered by a trustee covering all regular full-time employees. The Company has no transactions with its retirement fund in 2018 and 2017. Equity securities of the retirement fund consist of investments in corporations listed in the PSE. The retirement fund does not hold any shares of stock of the Company as at December 31, 2018 and 2017.
25.5 Key Management Personnel Compensation
Key management personnel are those persons having authority and responsibility for planning, directing and controlling the activities of the entity, directly or indirectly, including director, whether executive or otherwise, of the Company.
The compensation of key management personnel is presented as follows:
2018 2017 2016Short-term benefits P85,346 P44,729 P52,082Post-employment defined benefit 2,953 12,415 4,130
P88,299 P57,144 P56,212
26. SOLVENCY
Under the New Insurance Code, an insurance company doing business in the Philippines shall at all times maintain the minimum paid-up capital, and net worth requirements as prescribed by the IC Commissioner. Such solvency requirements shall be based on internationally accepted solvency frameworks and adopted only after due consultation with the insurance industry associations.
Whenever the aforementioned requirement is found to be less than the required to be maintained, the IC Commissioner shall direct the Company to make good any such deficiency by cash, to be contributed by all stockholders of record in proportion with their respective interests, and paid to the treasurer of the Company, within 15 days from receipt of the order. Provided, that the Company in the interim shall not be permitted to take any new risk of any kind or character unless and until it makes good any such deficiency.
In case that a stockholder pays the contribution due from another stockholder by reason of failure or refusal of the latter to do so, shall have a lien on the certificates of stock of the Company appearing in its books in the name of the defaulting stockholder on the date of default, as well as on any interests or dividends that have accrued or will accrue to the said certificates of stocks, until the corresponding payment or reimbursement is made by the defaulting stockholder.
27. EARNINGS PER SHARE
The earnings per share are presented as follows:
2018
2017(As Restated – See
Note 2)
2016(As Restated – See
Note 2)Net profit available to
common shareholders P149,216 P82,996 P27,235Divided by the average
number of outstandingcommon shares (in thousands) 2,123,606 2,123,606 2,123,606
P0.070 P0.039 P0.013

93A N N U A L R E P O R T 2 0 1 8
Diluted earnings per share is not determined since the Company does not have dilutive shares as at December 31, 2018, 2017 and 2016.
28. COMMITMENTS AND CONTINGENCIES
The following are the significant commitments and contingencies involving the Company:
28.1 Operating Lease Commitments – Company as Lessee
The Company is a lessee under various operating leases covering warehouse and parking lots having a term of one year with renewal options. The future minimum rentals payable under this non-cancellable operating lease as at December 31, 2018 and 2017 is P1.17 million.
Rental expense recognized amounted to P1.12 million, P1.31 million, and P3.08 million in 2018, 2017 and 2016, respectively, and is presented in the statements of income as Rental under General and administrative expenses (see Note 22).
28.2 Legal Claims
The Company is currently involved in various legal proceedings. In consultation with the legal counsel, the related risk has been analyzed as to likelihood of occurrence and amount of future obligation. The Company believes that the outcome of these proceedings as at December 31, 2018 will not have a material adverse effect on the Company’s financial position.
28.3 Deficiency Tax Assessments
The Company is in receipt of certain final deficiency tax assessment covering taxable period July 1, 2012 to December 31, 2012, pursuant to which the BIR has sought to investigate a certain tax period against the Company and consequently examine certain books, records and accounts that relate to transactions in the ordinary course of business. Pursuant to the Company’s policy of addressing such actions and in line with prudent business practice, the Company has engaged tax counsel in relation to this matter.
As at December 31, 2018, the final deficiency tax assessment is still under protest. Management believes that the Company has enough basis in law and evidence to support their claim that the Company is not liable for any tax deficiency; hence, no provisions were recognized in the financial statements.
28.4 Others
In the normal course of business, the Company makes various commitments and incurs certain contingent liabilities that are not given recognition in the accompanying financial statements. Management believes that losses as at December 31, 2018, if any, that may arise from these commitments and contingencies will not have any material effect on the financial statements.
29. CATEGORIES AND OFFSETTING OF FINANCIAL ASSETS AND LIABILITIES
29.1 Comparison of Carrying Amounts and Fair Values
The carrying amounts and fair values of the categories of financial assets and financial liabilities presented in the statements of financial position are shown below.
2018 2017 Carrying Values Fair Values Carrying Values Fair Values
Financial assets:Loans and receivables:Cash and cash equivalents P1,161,899 P1,161,899 P1,310,539 P1,310,539Funds at Lloyd‘s 196,557 196,557 186,115 186,115Loans and receivables 112,543 112,543 201,888 201,888Other assets 1,364 1,364 1,487 1,487
P1,472,363 PP1,472,363 P1,700,029 P1,700,029
(Forward)

N A T I O N A L R E I N S U R A N C E C O R P O R A T I O N O F T H E P H I L I P P I N E S94
2018 2017 Carrying Values Fair Values Carrying Values Fair Values
AFS financial assets:Debt securities P2,494,960 P2,494,960 P3,124,823 P3,124,823Equity securities 2,049,801 2,049,801 2,369,749 2,369,749Investment in ARC 35,191 35,191 32,548 32,548
P4,579,952 P4,579,952 P5,527,120 P5,527,120
HTM investments P1,848,693 P1,864,766 P1,034,687 P1,027,030
Financial liabilities –Accounts payable and other accrued expenses P62,577 P62,577 P35,541 P35,541
Due to the short-term duration, management considers the carrying value of the Company’s loans and receivables and financial liabilities at amortized cost approximate their fair value as at the end of the reporting periods.
See Notes 2.4 and 2.10 for a description of the accounting policies for each category of financial instrument including the determination of fair value. A description of the Company’s risk management objectives and policies for financial instruments is provided in Note 4.
29.2 Offsetting of Financial Assets and Financial Liabilities
For financial assets and financial liabilities, subject to enforceable master netting agreements or similar arrangements, each agreement between the Company and counterparties, including related parties, allows for net settlement of the relevant financial assets and liabilities when both elect to settle on a net basis.
30. FAIR VALUE MEASUREMENT AND DISCLOSURES
30.1 Fair Value Hierarchy
In accordance with PFRS 13, Fair Value Measurement, the fair value of financial assets and financial liabilities and non-financial assets which are measured at fair value on a recurring or non-recurring basis and those assets and liabilities not measured at fair value but for which fair value is disclosed in accordance with other relevant PFRS, are categorized into three levels based on the significance of inputs used to measure the fair value. The fair value hierarchy has the following levels:
• Level 1: quoted prices (unadjusted) in active markets for identical assets or liabilities that an entity can access at the measurement date;
• Level 2: inputs other than quoted prices included within Level 1 that are observable for the asset or liability, either directly (i.e., as prices) or indirectly (i.e., derived from prices); and,
• Level 3: inputs for the asset or liability that are not based on observable market data (unobservable inputs).
The level within which the asset or liability is classified is determined based on the lowest level of significant input to the fair value measurement.
For purposes of determining the market value at Level 1, a market is regarded as active if quoted prices are readily and regularly available from an exchange, dealer, broker, industry group, pricing service, or regulatory agency, and those prices represent actual and regularly occurring market transactions on an arm’s length basis.

95A N N U A L R E P O R T 2 0 1 8
30.2 Financial Instruments Measured at Fair Value
The table below shows the fair value hierarchy of the Company’s financial assets measured at fair value in the statements of financial position on a recurring basis (amounts in thousands Philippine Peso).
Level 1 Level 2 Level 3 TotalDecember 31, 2018
AFS financial assets P4,527,541 P17,220 P35,191 P4,579,952
December 31, 2017 AFS financial assets 5,476,686 17,885 32,548 5,527,119
The movements of the AFS financial assets classified under Level 3 in the fair value hierarchy is shown below:
2018 2017Balance at beginning of year P32,548 P31,336Fair value gains 1,242 1,157Foreign currency gains 1,401 55Balance at end of year P35,191 P32,548
The Company has no financial liabilities measured at fair value as at December 31, 2018 and 2017.
Described below are the information about how the fair value of the Company’s classes of financial assets are determined.
a) Equity securities
As at December 31, 2018 and 2017, instruments included in Level 1 comprise equity securities classified as AFS financial assets. These securities were valued based on their market prices quoted in the PSE at the end of each reporting period.
Golf club shares classified as AFS financial assets are included in Level 2 as their prices are not derived from market considered as active due to lack of trading activities among market participants at the end or close to the end of the reporting period. Moreover, investment in equity securities held in a private company is included in Level 3 since its market value is not quoted in an active market, hence, measured by reference to the private company’s book value using the most recent available financial data. The estimated fair value will increase (decrease) if the book value increases (decreases).
b) Debt securities
The fair value of the Company’s debt securities, which consist of government and corporate bonds, is estimated by reference to quoted bid price in active market at the end of the reporting period and is categorized within Level 1.
c) Mutual funds
The fair value of the Company’s investment in mutual funds which consist of money market placements and minimal equity securities is estimated by reference to the net asset value provided by the fund managers and is categorized within Level 2.
30.3 Financial Instruments Measured at Amortized Cost for which Fair Value is Disclosed
The table below summarizes the fair value hierarchy of the Company’s financial assets and financial liabilities which are not measured at fair value in the statements of financial position but for which fair value is disclosed.
Level 1 Level 2 Level 3 TotalDecember 31, 2018
Financial assets: Cash and cash equivalents P1,161,899 P– P– P1,161,899HTM investments 1,864,766 – – 1,864,766Loans and receivables – – 112,543 112,543Funds at Lloyd’s – – 196,557 196,557Other assets – – 1,364 1,364
P3,026,665 P– P310,464 P3,337,129
(Forward)

N A T I O N A L R E I N S U R A N C E C O R P O R A T I O N O F T H E P H I L I P P I N E S96
Level 1 Level 2 Level 3 TotalFinancial liabilities –
Accounts payable and other accrued expenses P– P– P62,577 P62,577
December 31, 2017 Financial assets: Cash and cash equivalents P1,310,539 P– P– P1,310,539HTM investments 1,027,030 – – 1,027,030Loans and receivables – – 201,888 201,888Funds at Lloyd’s – – 186,115 186,115Other assets – – 1,487 1,487
P2,337,569 P– P389,490 P2,727,059
Financial liabilities –Accounts payable and other accrued expenses P– P– P35,541 P35,541
For financial assets other than AFS investments with fair value included in Level 1 and HTM investments, management considers that the carrying amount of those short-term financial instruments approximate their fair value.
30.4 Fair Value Measurement for Non-financial Assets
The Company used market comparable approach as a valuation technique in measuring the fair value of its investment properties to arrive at fair value that is more representative of the investment properties’ highest and best use. As at December 31, 2018 and 2017, the fair value of the investment properties is P12.20 million and P7.20 million, respectively, classified under Level 3 of the fair value hierarchy (see Note 14). The most significant input into this valuation approach is the price per square meter, hence, the higher the price per square meter, the higher the fair value.
30.5 Fair Value Measurement for Financial Assets Grouped Based on Nature of Cash Flows
As at December 31, 2018, the fair value of financial assets with contractual terms that give rise to cash flows that are solely for payments of principal and interest on the principal amounted to P5.73 billion with decrease in fair value during the year amounting to P319.34 million. Fair value of other financial assets amounted to P2.08 billion with decrease in fair value amounting to P293.58 million.
31. CAPITAL MANAGEMENT OBJECTIVES, POLICIES AND PROCEDURES
The Company’s capital management objectives are (a) to ensure the Company’s ability to continue as a going concern; and, (b) to provide an adequate return to shareholders by complying with the capital requirements and limitation enforced by the IC and by aligning the Company’s operational strategy to its corporate goals. The capital requirements and limitations are as follows:
31.1 Minimum Capitalization
Under Section 289 of the RA No. 10607 (The New Insurance Code), any partnership, association, or corporation authorized to transact solely reinsurance business must have a capitalization of at least P3,000,000,000 paid in cash of which at least 50% is paid-up capital and the remaining portion thereof is contributed surplus, which in no case shall be less than P400,000,000 or such capitalization as may be determined by the Secretary of Finance, upon the recommendation of the IC Commissioner.
The IC issued Circular Letter (CL) No. 2015-02-A dated January 13, 2015, to clarify the minimum capitalization requirements under Sections 194, 197, 200 and 289 of RA No. 10607. Under the said CL, all existing reinsurance companies authorized to transact solely reinsurance business must have a networth of at least P2.25 billion by December 31, 2016. The minimum networth of the said companies shall remain unimpaired at all times and shall increase to the amounts as follows:
Minimum Networth Compliance Date
P 2,500,000,000 December 31, 2019 3,000,000,000 December 31, 2022
As at December 31, 2018 and 2017, the Company has complied with the minimum capital requirements.

97A N N U A L R E P O R T 2 0 1 8
31.2 Risk-Based Capital Requirements
As per IC CL No. 2016-68, Amended Risk-Based Capital (RBC2) Framework, all insurance companies must satisfy the annual minimum statutory RBC Ratio set at 100%. RBC ratio is computed by dividing the Company’s Total Available Capital (TAC) by the RBC requirement. TAC is the aggregate of Tier 1 and Tier 2, minus deductions, subject to applicable limits and determinations. Tier 1 capital represents capital that is fully available to cover losses of the insurer at all times on a going-concern and winding up basis and is considered to be the highest quality capital available to the insurer. Tier 2 refers to capital not having the same high quality characteristics of Tier 1, but can provide additional buffer to the insurer. RBC requirement or the total required capital of an insurance company is the capital that is required to be held appropriately to the risks an insurance company is exposed to.
31.3 Limitation on Dividend Declaration
The Company’s BOD is authorized to declare dividends. A cash dividend declaration does not require any further approval from the stockholders. However, a stock dividend declaration requires further approval of the stockholders holding or representing not less than two-thirds of the Company’s outstanding capital stock. Dividends may be declared and paid out of the unrestricted retained earnings which shall be payable in cash, property, or stock to all stockholders on the basis of outstanding stock held by them, as and at such times as the BOD may determine and in accordance with law.
Section 201 of the New Insurance Code provides that no domestic insurance company shall declare or distribute dividends on its outstanding stock unless it has met the minimum paid-up capital and net worth requirements under Section 194 and except from profits attested in a sworn statement to the Commissioner by the president or treasurer of the corporation to be remaining on hand after retaining unimpaired:
• the entire paid-up capital stock;• the solvency requirements defined by Section 200;• the legal reserve fund required by Section 219; and,• a sum sufficient to pay all net losses reported, or in the course of settlement, and all liabilities for expenses
and taxes.
The Company is required to report such dividend declaration or distribution to the IC within 30 days from the date of such declaration. Moreover, the SEC, through its Memorandum Circular 11 dated December 5, 2008 has set guidelines in determining the appropriate amount of Retained Earnings available for dividend distribution. This shall be based on the net profit for the year based on the audited financial statements, adjusted for unrealized items which are considered not available for dividend declaration. These unrealized items consist of the following:
• share/equity in net income of the associate or joint venture;• unrealized foreign currency gains, except those attributable to cash and
cash equivalents;• unrealized actuarial gains arising from the exercise of the option of recognizing actuarial gains or losses
directly to the statements of comprehensive income;• fair value adjustment arising only from marked-to-market valuation which are not yet realized; • the amount of deferred tax asset that reduced the amount of income tax expense;• adjustment due to deviation from PFRS/Generally Accepted Accounting Principles which results to gain; and,• other unrealized gains or adjustments to the retained earnings.
31.4 Non-admitted Assets
Various assets, included on the enumeration of Section 203 of RA 10607,are considered non-admitted assets for the purposes of determining the Company’s financial condition.
The estimated non-admitted assets as defined in the Insurance Code are measured in accordance with PFRS and included in the statements of financial position. These assets, which are subject to final determination by the IC, are as follows:
2018 2017Goodwill, trade names, and other like intangible assets P30,013 P9,882Prepaid or deferred charges for expenses and commissions paid by
such insurance company 758,641 613,076Advances to officers (other than policy loans), which are not
adequately secured and which are not previously authorized by the Commissioner, as well as advances to employees, agents, and other persons on mere personal security 8,587 19,410
Furniture, furnishing, fixtures, safes, equipment, library, stationery, literature, and supplies 17,378 15,122
Other non-admitted assets as determined by IC 13,627 9,240Total Non-admitted Assets P828,246 P666,730

N A T I O N A L R E I N S U R A N C E C O R P O R A T I O N O F T H E P H I L I P P I N E S98
32. SELECTED FINANCIAL PERFORMANCE INDICATORS
The following basic ratios measure the financial performance of the Company:
2018
2017(As Restated –
See Note 2) Current ratio* 2.96 : 1.00 2.15 : 1.00Asset-to-equity 2.87 : 1.00 2.68 : 1.00Liability-to-equity 1.87 : 1.00 1.68 : 1.00
*Excluding claims reserves.
33. CURRENT AND NON-CURRENT CLASSIFICATION
The Company expects that the following asset or liability line item is expected to be recovered or settled no more than twelve months after December 31, 2018 and 2017.
2018 2017Current Assets:
Cash and cash equivalents P1,161,899 P1,310,539Reinsurance balances receivable - net 1,371,150 1,335,460AFS financial assets 2,098,035 1,332,506HTM investments 170,878 –Loans and receivables 55,263 145,642Reinsurance recoverable on reported losses 791,787 856,554Reinsurance recoverable on claim reserves 99,610 155,829Deferred acquisition costs 198,556 263,179Deferred reinsurance premiums 316,163 202,896Other assets 12,256 119,544
Total Current Assets P6,275,597 P5,722,149
Current Liabilities:Reinsurance balances payable P1,146,481 P1,152,004Accounts payable and accrued expenses 66,646 42,292Losses and claims payable 1,537,725 1,496,787Claims reserves 535,590 407,589Premium reserves 906,160 1,425,499Deferred reinsurance commissions 526 5,411
Total Current Liabilities P4,193,128 P4,529,582

99A N N U A L R E P O R T 2 0 1 8
On the other hand, the Company expects that the following asset or liability item is expected to be recovered or settled more than twelve months after December 31, 2018 and 2017.
2018 2017Non-current Assets:
Reinsurance balances receivable - net P908,972 P614,470AFS financial assets 2,481,917 4,194,613HTM investments 1,677,815 1,034,687Loans and receivables 57,280 56,245
Property and equipment – net 76,563 80,011Reinsurance recoverable on reported losses 1,582,755 1,891,796Reinsurance recoverable on claim reserves 219,438 344,166Deferred acquisition costs 206,548 17,768Deferred reinsurance premiums 15,382 39Other assets 369,044 219,337
Total Non-current Assets P7,595,714 P8,453,132
Non-current Liabilities:Reinsurance balances payable P7,752 P117,634Accounts payable and
accrued expenses 24,003 30,724Losses and claims payable 2,981,546 3,305,822Claims reserves 1,179,884 900,209Premium reserves 658,475 639Deferred tax liability – 2,276Deferred reinsurance
commissions – 24
Total Non-current Liabilities P4,851,660 P4,357,328
34. EVENTS AFTER THE REPORTING PERIOD
On February 20, 2019, Republic Act No. 11232, An Act Providing for the Revised Corporation Code of the Philippines (RCC) was signed into law and published in the Official Gazette on February 21, 2019. The RCC took effect on February 23, 2019. The significant provision, among others, of the RCC that would have financial reporting impact on the Company, is the removal of the maximum 50-year corporate term for stock corporations. The RCC states that corporations shall now have perpetual existence unless their articles of incorporation provide otherwise. Further, it clarifies that even corporations with certificates of incorporation issued prior to the effectivity of the RCC, and which continue to exist, shall have perpetual existence, unless the corporation, upon a vote of its stockholders representing majority of its outstanding capital stock, notifies SEC that it elects to retain its specific corporate term pursuant to its articles of incorporation. Provided, that any change in the corporate term is without prejudice to the appraisal right of dissenting stockholders in accordance with the provisions of the RCC.
35. SUPPLEMENTARY INFORMATION REQUIRED BY THE BUREAU OF INTERNAL REVENUE (BIR)
Presented below and in the succeeding pages are the supplementary information which is required by the BIR under its existing Revenue Regulation (RR) No. 15-2010 to be disclosed as part of the notes to financial statements. This supplementary information is not a required disclosure under PFRS.

N A T I O N A L R E I N S U R A N C E C O R P O R A T I O N O F T H E P H I L I P P I N E S100
The information on taxes, duties and license fees paid or accrued during the taxable year required under RR No. 15-2010 are presented below and in the succeeding page.
(a) Output VAT
In 2018, the Company declared output VAT amounting to P11,045,767, which is set off against input VAT, based on the following gross receipts:
Tax Base Output VATExempt receipts P2,003,682,705 P–Zero rated receipts 128,440,667 –Commission earned on retrocession 42,276,298 5,073,156Sale of ordinary assets 445,965 53,516Interest income on loans 551,753 66,210Other miscellaneous income 48,774,043 5,852,885
P2,224,171,431 P11,045,767
Pursuant to RR No. 04-07 effective April 6, 2007, “Non-life insurance premiums are subject to VAT whereas non-life reinsurance premiums are not subject to VAT, the latter being already subject to VAT upon receipt of the insurance premiums.”
The tax bases of commission earned on retrocession are included as net of Underwriting deductions account in the 2018 statements of income. The tax bases for commission are based on the Company’s gross receipts for the year, hence, may not be the same with the amounts accrued in the 2018 statements of income.
As at December 31, 2018, the Company also has deferred output VAT amounting to P24,003,191 pertaining to uncollected commission income from retrocessionaires (see Note 16).
(b) Input VAT The movements in input VAT in 2018 are summarized below.
Balance at beginning of year P163,018,864Services lodged under other accounts 12,283,777Goods other than for resale or manufacture 738,257Capital goods subject to amortization 273,559Applied against output VAT (11,045,767)Input VAT on exempt sales (9,136,055)Balance at end of year P156,132,635
The balance of input VAT as at December 31, 2018 is recorded under Other assets - net account in the statements of financial position (see Note 14).
As at December 31, 2018, the Company also has deferred input VAT amounting to P532,244 pertaining to VAT on capital assets, and deferred withholding VAT amounting to P9,202,886 representing VAT on unapplied input VAT on unpaid premiums on ceded out transactions to the Company from a certain government entity.
(c) Taxes on Importation The Company does not have any customs duties or tariff fees in 2018 since it does not have any importation.
(d) Excise Tax
The Company does not have excise tax in 2018 since it does not have any transactions which are subject to excise tax.

101A N N U A L R E P O R T 2 0 1 8
(e) Documentary Stamp Tax (DST)
Total DST accrued and paid in 2018 amounted to P13,295 which pertains to car loan transactions of the Company. The Company is also liable to DST when it issues original shares of stocks or transfer certificate of stock. The Company did not issue original shares of stocks nor transfer certificate of stocks for the year ended December 31, 2018. Reinsurance contracts are not subject to DST.
(f) Taxes and Licenses
The details of taxes and licenses for 2018, which is presented under General and administrative expenses account in the statements of income is presented as follows:
Municipal licenses and permits P5,540,279Fringe benefit tax 2,526,609Registration 176,750Real estate taxes 295,092DST 13,295Miscellaneous 82,327
P8,634,352
(g) Withholding Taxes
The details of total withholding taxes for the year ended December 31, 2018 are shown below.
Compensation and benefits P30,659,014Expanded 11,870,204Final 773,503
P43,302,721
(h) Deficiency Tax Assessments and Tax Cases
The Company has final deficiency tax assessment on VAT amounting to P32,693,611 for the taxable period July 1, 2012 to December 31, 2012.
As at December 31, 2018, the final deficiency tax assessment is still under protest. Management believes that the Company has enough basis in law and evidence to support their claim that the Company is not liable for any tax deficiency; hence, no provisions were recognized in the financial statements.
As at December 31, 2018, the Company does not have any other final deficiency tax assessments with the BIR or tax cases outstanding or pending in courts or bodies outside of the BIR in any of the open taxable years.

N A T I O N A L R E I N S U R A N C E C O R P O R A T I O N O F T H E P H I L I P P I N E S102
Report of Independent Auditors to Accompany Supplementary Information Required by the Securities and Exchange Commission Filed Separately from the Basic Financial Statements
The Board of Directors and the StockholdersNational Reinsurance Corporation of the Philippines31st floor BPI-PhilAm Life Makati6811 Ayala Avenue, Makati City
We have audited, in accordance with Philippine Standards on Auditing, the financial statements of National Reinsurance Corporation of the Philippines for the year ended December 31, 2018, on which we have rendered our report dated March 26, 2019. Our audit was made for the purpose of forming an opinion on the basic financial statements taken as a whole. The applicable supplementary information (see List of Supplementary Information) are presented for purposes of additional analysis in compliance with the requirements of the Securities Regulation Code Rule 68, as amended, of the Philippine Securities and Exchange Commission, and are not a required part of the basic financial statements prepared in accordance with Philippine Financial Reporting Standards. Such supplementary information are the responsibility of management. The supplementary information have been subjected to the auditing procedures applied in the audit of the basic financial statements and, in our opinion, are fairly stated in all material respects in relation to the basic financial statements taken as a whole.
PUNONGBAYAN & ARAULLO
By: Anthony L. Ng Partner
CPA Reg. No. 0109764 TIN 230-169-270 PTR No. 7333699, January 3, 2019, Makati City SEC Group A Accreditation Partner- No. 1638-A (until May 29, 2020) Firm - No. 0002-FR-5 (until Mar. 26, 2021) BIR AN 08-002511-38-2016 (until Oct. 3, 2019)
Firm’s BOA/PRC Cert. of Reg. No. 0002 (until Jul. 31, 2024)
March 26, 2019

103A N N U A L R E P O R T 2 0 1 8
NATIONAL REINSURANCE CORPORATION OF THE PHILIPPINESList of Supplementary Information
December 31, 2018
Statement of Management’s Responsibility for the Financial Statements
Independent Auditor’s Report on the SEC Supplementary SchedulesFiled Separately from the Basic Financial Statements
Supplementary Schedules to Financial Statements(Form 17-A, item 7)
No. ofSchedule Pages
A Financial Assets 3
BAmounts Receivable from Directors, Officers, Employees, Related Parties & Principal stockholders other than related parties 2
C Amounts Receivable from Related Parties which are eliminated during the consolidation of financial statements N/A
D Intangible Assets/Other Assets 1E Long-term Debt N/A
FIndebtedness to related parties (Long-term loans from related companies) N/A
G Guarantees of securities of other Issuers N/AH Capital Stock 5
Supplementary Schedule to Financial Statements(SEC Circular 11)
Reconciliation of Retained Earnings for Dividend Declaration 1
Schedule of Philippine Financial Reporting Standards and Interpretations Adopted by the Security and Exchange Commission and the Financial Reporting Standards Council as of December 31, 2018 4

N A T I O N A L R E I N S U R A N C E C O R P O R A T I O N O F T H E P H I L I P P I N E S104
NATIONAL REINSURANCE CORPORATION OF THE PHILIPPINESSCHEDULE A. Financial Assets
Name of Issuingentity andassociation
of each issue(i)
Number of shares
or principalamount ofbonds andnotes (ii)
Amountshown in
thebalance
sheet (ii)
Valued based onmarket
quotation atend of
reporting
Income received
and accrued
AVAILABLE FOR SALE SECURITIES
STOCKS:
Aboitiz Equity Ventures, Inc. 1,510,240 83,063,200 83,063,200 1,483,405 Aboitiz Power Corporation 1,369,500 48,069,450 48,069,450 1,584,044 Alliance Global Group, Inc. 2,350,840 27,974,996 27,974,996 239,134 Ayala Corp. Class “B” Series 1 Pref. 100,000 44,500,000 44,500,000 2,625,000
Ayala Corporation 155,295 139,765,500 139,765,500 1,004,853 Ayala Land, Inc. 3,607,400 146,460,440 146,460,440 1,662,444 Bank of the Philippine Islands 1,261,769 118,606,286 118,606,286 1,056,986 BDO Unibank, Inc. 900,539 117,790,501 117,790,501 1,219,943 Cebu Air, Inc. 69,980 5,122,536 5,122,536 114,390 Century Pacific Food, Inc. 180,100 2,737,520 2,737,520 30,942 D and L Industries, Inc. 633,900 6,960,222 6,960,222 164,814 DMCI Holdings, Inc. 1,551,120 19,823,314 19,823,314 1,223,683 DoubleDragon Properties Corp 500,000 49,400,000 49,400,000 2,429,175 First Gen Corporation 46,000 919,080 919,080 47,565 First Gen Corporation - Series G Pref. 200,000 20,240,000 20,240,000 778,080 Globe Telecom, Inc. 1,745 3,315,500 3,315,500 1,643,005 Globe Telecom, Inc. - Perpetual Pref. 100,000 48,000,000 48,000,000 2,600,300 GT Capital Holdings, Inc. 30,753 29,984,175 29,984,175 90,810 GT Capital Holdings, Inc. - Series A Perpetual 37,120 33,408,000 33,408,000 1,288,964 Int’l Container Terminal Services, Inc. 525,120 52,512,000 52,512,000 1,149,325 JG Summit Holdings, Inc. 1,656,070 92,243,099 92,243,099 354,690 Jollibee Foods Corporation 102,730 29,976,614 29,976,614 200,406 LT Group, Inc. 595,400 9,883,640 9,883,640 131,760 Manila Electric Company 16,700 6,346,000 6,346,000 1,238,591 Megaworld Corporation 6,171,860 29,316,335 29,316,335 596,539 Metro Pacific Investments Corporation 11,510,500 53,408,720 53,408,720 1,469,988 Metropolitan Bank and Trust Company 1,102,035 89,209,733 89,209,733 797,390 Petron Corporation 2,371,060 18,280,873 18,280,873 350,259 Phil. Long Distance Telephone Co. 59,750 67,218,750 67,218,750 3,494,160 Puregold Price Club, Inc. 772,840 33,232,120 33,232,120 - Robinson Land Corporation 1,729,470 34,848,821 34,848,821 564,253 Robinsons Retail Holdings, Inc. 525,170 42,013,600 42,013,600 378,122 San Miguel Corporation 74,120 10,895,640 10,895,640 50,299 San Miguel Corporation Series 2-B Pref. 133,000 9,975,000 9,975,000 570,445 San Miguel Corporation Series 2-C Pref. 133,000 10,108,000 10,108,000 598,500 San Miguel Corporation Series 2-D Pref. 67,000 5,021,650 5,021,650 223,981 San Miguel Food and Beverage, Inc. Preferred 2 50,000 49,850,000 49,850,000 2,828,450 Security Bank Corporation 211,870 32,839,850 32,839,850 660,420 Semirara Mining and Power Corporation 487,120 11,228,116 11,228,116 1,247,395 SM Investments Corporation 187,980 172,471,650 172,471,650 1,615,728 SM Prime Holdings, Inc. 4,526,600 162,052,280 162,052,280 1,328,702 Universal Robina Corporation 395,240 50,195,480 50,195,480 1,084,419

105A N N U A L R E P O R T 2 0 1 8
NATIONAL REINSURANCE CORPORATION OF THE PHILIPPINESSCHEDULE A. Financial Assets
Name of Issuingentity andassociation
of each issue(i)
Number of shares
or principalamount ofbonds andnotes (ii)
Amountshown in
thebalance
sheet (ii)
Valued based onmarket
quotation atend of
reporting
Income received
and accrued
Cirtek Holdings Philippines Corporation - USD perpetua pref. series $250,000 13,312,810 13,312,810 807,381
Investment in ARC $980.00 35,190,567 35,190,567
Makati Sports Club “A” 1 600,000 600,000 - Calatagan Golf Club, Inc. 1 25,000 25,000 Benguet Consolidated 18 62 62 - Orchard Golf Club - C 1 370,000 370,000 - Batangas Venture(BAC) 2,200,000 845,725 845,725 - Phil. Hotel C (Hot) 750 96,972 96,972 - Phil. Nuclear (PN) 200 20,000 20,000 - Roxas 2,628 2,628 2,628 - Roxas C 110,490 4,921,612 4,921,612 - Roxas Pref. others C (RXC-1) 189,305 8,432,329 8,432,329 - Shell Co. (SHEP) 660 1,905,974 1,905,974 DISPOSED 643,420
SUB-TOTAL FOR INVESTMENTS IN STOCKS 2,084,992,369 2,084,992,369 43,672,160
BONDSNRCP-MANAGEDFixed Rate Treasury Notes
FXTN 10-60 416,721,213 354,031,121 354,031,121 15,022,221 FXTN 7-57 40,000,000 37,717,211 37,717,211 1,478,273 RTB3-8 501,000,000 488,075,050 488,075,050 18,660,327 RTB5-11 200,000,000 187,095,619 187,095,619 9,150,462 MATURED/SOLD 1,719,855
1,157,721,213 1,066,919,001 1,066,919,001 46,031,139
ROP BondsROP 24 3,200,000 173,344,697 173,344,697 6,039,095
Corporate BondsSMIC 2019 200,000 10,568,104 10,568,104 453,606 RCBC Bond - 2021 500,000 25,886,430 25,886,430 910,889 BDO 2023 200,000 9,984,766 9,984,766 315,141 SMC US$ 500,000 25,338,364 25,338,364 1,309,478 MATURED 1,724,865
TOTAL DOLLAR BONDS 4,600,000 245,122,360 245,122,360 10,753,074
BPI-MANAGED Fixed Rate Treasury Notes
FXTN 10-54 15,632,706 15,448,130 15,448,130 862,028 FXTN 10-60 109,464,475 92,997,019 92,997,019 3,920,887 FXTN 10-61 10,000,000 8,715,858 8,715,858 472,333 FXTN 20-17 169,000,000 180,853,242 180,853,242 10,046,422 FXTN 25-11 67,344,100 48,564,395 48,564,395 3,097,361 FXTN 5-73 30,000,000 28,696,968 28,696,968 987,389 FXTN 5-74 50,000,000 46,689,044 46,689,044 2,036,504 FXTN 7-56 60,000,000 58,752,693 58,752,693 1,930,988

N A T I O N A L R E I N S U R A N C E C O R P O R A T I O N O F T H E P H I L I P P I N E S106
NATIONAL REINSURANCE CORPORATION OF THE PHILIPPINESSCHEDULE A. Financial Assets
Name of Issuingentity andassociation
of each issue(i)
Number of shares
or principalamount ofbonds andnotes (ii)
Amountshown in
thebalance
sheet (ii)
Valued based onmarket
quotation atend of
reporting
Income received
and accrued
FXTN 7-57 60,000,000 56,575,817 56,575,817 1,827,066 FXTN 7-58 135,000,000 120,592,516 120,592,516 4,813,973 FXTN 7-59 39,290,000 35,591,313 35,591,313 1,721,029 RTB5-11 50,000,000 46,773,905 46,773,905 2,299,653 MATURED/SOLD 597,927
TOTAL PESO BONDS 795,731,281 740,250,899 740,250,899 34,613,561
RCBC-MANAGEDFixed Rate Treasury Notes
FXTN 03-23 10,000,000 9,585,844 9,585,844 278,082 FXTN 05-74 1,500,000 1,400,671 1,400,671 43,550 FXTN 10-59 50,000,000 44,385,653 44,385,653 1,790,981 FXTN 5-73 23,000,000 22,001,009 22,001,009 847,974 FXTN 7-56 18,000,000 17,625,808 17,625,808 594,808 FXTN 7-57 30,000,000 28,287,908 28,287,908 970,994 FXTN 7-58 22,000,000 19,652,114 19,652,114 696,816 FXTN 7-61 5,000,000 4,742,793 4,742,793 14,239 RTB 10-04 25,000,000 21,941,158 21,941,158 808,091 RTB 15-1 20,000,000 19,163,409 19,163,409 1,013,449 RTB 3-8 5,000,000 4,871,008 4,871,008 197,536 MATURED/SOLD 553,893
TOTAL PESO BONDS 209,500,000 193,657,376 193,657,376 7,810,413
SUB-TOTAL FOR INVESTMENTIN BONDS 2,245,949,635 2,245,949,635 99,208,186
TREASURY BILLSNRCP-MANAGED
TBILL 01.23.19 50,000,000 49,848,934 49,848,934 710,727 TBILL 04.10.19 50,000,000 49,383,484 49,383,484 472,531 TBILL 09.18.19 50,000,000 48,149,680 48,149,680 547,264
150,000,000 147,382,098 147,382,098 1,730,522
BPI-MANAGEDTBILL 04.03.19 20,000,000 19,774,793 19,774,793 195,232 TBILL 04.17.19 20,000,000 19,717,277 19,717,277 181,539 TBILL 05.22.19 35,000,000 34,310,146 34,310,146 154,740 MATURED/SOLD 473,042
75,000,000 73,802,216 73,802,216 1,004,553
RCBC-MANAGEDTBILL 08.20.19 10,000,000 9,672,304 9,672,304 127,487 TBILL 09.04.19 4,396,000 4,241,221 4,241,221 50,518 TBILL 09.11.19 2,500,000 2,407,103 2,407,103 27,567 TBILL 10.02.19 5,000,000 4,799,895 4,799,895 49,327 TBILL 10.23.19 7,000,000 6,705,363 6,705,363 57,510 MATURED/SOLD 8,399
28,896,000 27,825,887 27,825,887 320,809
TOTAL AVAILABLE FOR SALE SECURITIES 4,579,952,205 4,579,952,205 145,936,230

107A N N U A L R E P O R T 2 0 1 8
NATIONAL REINSURANCE CORPORATION OF THE PHILIPPINESSCHEDULE A. Financial Assets
Name of Issuingentity andassociation
of each issue(i)
Number of shares
or principalamount ofbonds andnotes (ii)
Amountshown in
thebalance
sheet (ii)
Valued based onmarket
quotation atend of
reporting
Income received
and accrued
HELD-TO-MATURITY INVESTMENTSCORPORATE BONDS
AC 23 R22 25,000,000 23,436,927 23,436,927 974,556 AC 25 R23 27,500,000 25,860,746 25,860,746 1,318,136 AEV 11-20 50,000,000 50,239,092 50,239,092 2,223,677 AEV 22 R20 50,000,000 49,927,475 49,927,475 2,488,896 ALI 19 R17 50,000,000 50,019,561 50,019,561 2,796,875 ALI 28 R23 60,000,000 60,000,000 60,000,000 2,387,854 EDC 20 R18 60,000,000 59,506,932 59,506,932 2,481,119 ES SMC 05-20 50,000,000 50,000,000 50,000,000 1,560,417 FDC 24 R21 20,000,000 20,452,391 20,452,391 1,222,331 FLI 19 R17 20,000,000 20,167,758 20,167,758 1,247,650 FLI 20 R19 50,000,000 49,961,375 49,961,375 2,414,611 FLI 22 R20 50,000,000 50,010,898 50,010,898 2,663,470 JGS 08-19 50,000,000 50,346,788 50,346,788 2,601,318 MBT 11-20 50,000,000 50,104,293 50,104,293 119,167 PCOR 21 R19 75,000,000 74,216,895 74,216,895 2,985,720 PCORPM 7.8183 04/19/24 50,000,000 50,000,000 50,000,000 760,113 ROCK 21 R19 65,000,000 65,059,837 65,059,837 3,267,613 SM 19 R17 50,000,000 50,343,927 50,343,927 2,983,333 SM 22 R19 80,000,000 85,475,460 85,475,460 4,532,446 SM 23 R21 122,000,000 123,939,453 123,939,453 6,089,390 SMB 22 R19 70,000,000 72,503,570 72,503,570 4,594,333 SMC 24 R22 67,000,000 66,999,471 66,999,471 3,520,612 SMCGP 21 R19 45,000,000 44,098,413 44,098,413 1,944,746 SMPH 02-21 50,000,000 49,731,247 49,731,247 2,242,224 SMPH 23 R21 30,500,000 30,500,000 30,500,000 1,429,750 UBP 20 50,000,000 50,000,000 50,000,000 215,753 FXTN 10-60 562,500,000 475,790,434 475,790,434 20,277,344 MATURED
TOTAL HELD-TO-MATURITY INVESTMENTS 1,929,500,000 1,848,692,939 1,848,692,939 81,343,452
LOANS AND RECEIVABLE
LONG TERM TIME DEPOSIT & INVESTMENTPHILTRUST 5,000,000 5,000,000 5,000,000 80,625
Matured 979,167 BANK NOTE
RCBC Tier2 50,000,000 50,000,000 50,000,000 2,672,569 ACCRUED INTEREST RECEIVABLE 41,383,311 41,383,311 DIVIDENDS RECEIVABLE 806,989 806,989 OTHER ACCOUNTS RECEIVABLE 7,867,476 7,867,476
TOTAL LOANS AND RECEIVABLE 105,057,777 105,057,777 3,732,361
OTHER ASSETFUNDS AT LLOYDS 196,556,956 196,556,956 2,032,249
TOTAL OTHER ASSET 196,556,956 196,556,956 2,032,249
GRAND TOTAL FINANCIAL ASSETS 6,730,259,877 6,730,259,877 233,044,292

N A T I O N A L R E I N S U R A N C E C O R P O R A T I O N O F T H E P H I L I P P I N E S108
NATIONAL REINSURANCE CORPORATION OF THE PHILIPPINESSchedule B - Amounts Receivable from Directors, Officers, Employees, Related Parties
and Principal Stockholders’ (Other than Related Parties)December 31, 2018
Deductions Ending Balance Bal. at Amounts Balance at
Name of employee DesignationDate of
Availmentbeg. of period Additions
Amounts collected
Written off Current
Non-Current
end of period
A. Emergency Loans1 Avila, Lylibeth Rank & File 05/23/2018 7,782 20,000 19,214 - 8,568 - 8,568 2 Castillo, Jocelyn Rank & File 02/02/2017 2,542 20,000 15,607 - 6,934 - 6,934 3 Cruz, Bethzayda Rank & File 05/23/2018 13,598 20,000 25,013 - 8,585 - 8,585
4 Fidelino, Claudia Karen SSenior Asst. Vice President 10/16/2017 64,114 64,114 - - - -
5 Magalona, Natalie Manager 04/12/2018 17,336 50,000 52,129 - 15,207 - 15,207 6 Magtalas, Ivy I. Senior Manager 11/07/2017 44,072 50,000 50,000 - 44,072 - 44,072 7 Malana, Jackilyn Rank & File 11/15/2016 - 20,000 10,536 - 9,464 - 9,464 8 Ortiz, Maria Carmen Manager 09/06/2018 - 50,000 13,970 - 36,030 - 36,030 9 Relota, Eireen Asst. Manager 04/10/2017 6,083 6,083 - - - -
10 Tabiola, Sean Rank & File 11/19/2018 - 20,000 2,371 - 17,629 - 17,629 11 Tumangday, Raul Senior Manager 04/18/2017 38,055 50,000 56,108 - 31,948 - 31,948 12 Velasquez, Rolly Manager 02/02/2017 6,582 6,582 - - - - 13 Villamer, Rubylen Rank & File 06/16/2017 10,299 20,000 13,394 - 16,905 - 16,905 14 Yap, Michellle Rank & File 05/23/2018 8,625 20,000 18,279 - 10,346 - 10,346
219,087 340,000 353,399 - 205,688 - 205,688
B. Car Facility Loan1 Agustin, Russel Manager 07/18/2018 - 420,000 28,955 391,045 391,045 2 Agsaway, April Rose Manager 06/27/2018 - 420,000 34,862 385,138 385,138 3 Alvarez, Francis Albert Senior Manager 12/28/2018 - 480,000 - 480,000 480,000 4 Balajadia, Marites Senior Manager 11/28/2017 473,470 81,851 391,619 391,619
5 Besabe, Blesilda Santos Senior Asst. Vice President 07/29/2015 339,752 123,273 216,479 216,479
6 Camince, Enrico Manager 10/30/2015 261,723 84,304 177,419 177,419 8 Dela Paz, Marilyn Manager 03/31/2015 209,825 88,619 121,206 121,206 9 Ebron, Von Edward Asst. Vice President 12/20/2018 - 592,800 - 592,800 592,800
10 Fidelino, KarenSenior Asst. Vice President 08/29/2014 227,132 227,132 -
11 Lorenzo, Cherry Lou R. Asst. Vice President 08/31/2016 452,464 110,568 341,896 341,896 12 Lucos, Honarata S. Asst. Vice President 06/21/2017 550,197 105,776 444,421 444,421 13 Magalona, Natalie Manager 09/18/2017 402,743 72,579 330,164 330,164 14 Magtalas, Ivy I. Senior Manager 08/17/2016 323,850 79,139 244,711 244,711 15 Merida, Anelisa Trinidad M. Asst. Vice President 10/24/2016 480,623 111,560 369,062 369,062 16 Ortiz, Maria Carmen Manager 11/13/2018 - 420,000 8,585 411,415 411,415
17 Papa, Regina Senior Asst. Vice President 09/28/2016 471,662 112,305 359,357 359,357
18 Parungao, Sherwin Senior Manager 08/30/2018 - 480,000 26,384 453,616 453,616 19 Ramos, Regina S. Vice President 01/31/2017 371,909 80,194 291,715 291,715
20 Salonga, Daisy Cua Vice President 02/20/2017 344,153 71,626 272,527 272,527 21 Suyo, Edilita Manager 10/13/2017 405,643 72,338 333,305 333,305 22 Tanjuakio, Viktor First Vice President 09/12/2014 170,450 96,944 73,507 73,507 23 Tumangday, Raul Senior Manager 06/29/2016 348,404 89,817 258,587 258,587 24 Velasquez, Rolly Manager 11/07/2017 411,415 71,858 339,556 339,556
6,245,415 2,812,800 1,778,670 - - 7,279,544 7,279,544

109A N N U A L R E P O R T 2 0 1 8
NATIONAL REINSURANCE CORPORATION OF THE PHILIPPINESSchedule B - Amounts Receivable from Directors, Officers, Employees, Related Parties
and Principal Stockholders’ (Other than Related Parties)December 31, 2018
Deductions Ending Balance Bal. at Amounts Balance at
Name of employee DesignationDate of
Availmentbeg. of period Additions
Amounts collected
Written off Current
Non-Current
end of period
C. Receivables from Employee (HMO & Car Insurance)1 Agsaway, April Rose R Manager - 14,072 7,036 7,036 7,036 2 Alvarez, Francis Albert J Senior Manager - 26,188 9,648 16,540 16,540
3 Besabe, Blesilda Santos Senior Asst. Vice President 21,105 58,452 54,495 25,062 25,062
4 Balajadia, Marites B Senior Manager 23,410 48,677 40,930 31,158 31,158 5 Basobas, Patrick S Asst. Manager - 27,393 21,158 6,235 6,235 6 Bueno, Evelyn N Manager - 22,197 11,937 10,260 10,260 7 De Guzman, Darius M Asst. Manager 37,275 82,078 87,550 31,802 31,802 8 Dela Paz, M. Manager 2,636 8,615 9,285 1,966 1,966 9 Ebron, Von Edward M Asst. Vice President - 41,140 24,877 16,263 16,263
10 Fidelino, KarenSenior Asst. Vice President 14,651 14,651 - -
11 Ignes, Nikkos Josef L Asst. Vice President 35,910 61,560 74,460 23,010 23,010
12 Ladoux, Christian Andre Fran -Chief Underiting Officer - 64,449 23,174 41,275 41,275
13 Lorenzo, Cherry Lou R. Asst. Vice President 28,649 97,258 58,629 67,279 67,279 14 Lucos, Honorata S Asst. Vice President 11,064 19,033 20,581 9,516 9,516 15 Magalona, Nathalie S Manager 30,519 39,502 45,860 24,161 24,161 16 Magtalas, Ivy I. Senior Manager 2,726 9,936 6,038 6,624 6,624 17 Melendez, Jackilyn M Rank & File 10,260 20,520 20,520 10,260 10,260 18 Mendoza, Rojane C Asst. Manager 10,914 150,307 109,837 51,384 51,384 19 Merida, Anelisa Trinidad M. Asst. Vice President 44,777 46,529 55,638 35,669 35,669
20 Ortiz, Maria Carmen C Manager - 17,143 1,337 15,806 15,806 21 Parungao, Sherwin T Senior Manager - 13,438 3,919 9,519 9,519 22 Ramos, Regina S Vice President 23,347 77,463 67,249 33,560 33,560 23 Reyes, Alexander Dominador L Senior Vice President 13,534 13,534 - 24 Santos, Allan R CEO and President - 38,482 19,985 18,496 18,496 25 Salonga, Daisy C Vice President 2,096 11,926 12,055 1,966 1,966 26 Suyo, Edelita P Manager - 36,566 19,327 17,239 17,239 27 Tanjuakio, Viktor First Vice President 467 11,140 4,067 7,539 7,539 28 Tumangday, Raul Senior Manager 4,765 9,706 9,618 4,853 4,853 29 Velasquez, Rolly M Manager 11,519 11,519 - 30 Villamer, Rubylen T Rank & File 10,260 41,040 41,040 10,260 10,260
339,884 1,094,809 899,954 - 534,739 - 534,739
GRAND TOTAL 6,804,386 4,247,609 3,032,023 - 740,427 7,279,544 8,019,972

N A T I O N A L R E I N S U R A N C E C O R P O R A T I O N O F T H E P H I L I P P I N E S110
NATIONAL REINSURANCE CORPORATION OF THE PHILIPPINESSchedule C - Amounts Receivable from Related Parties which are
eliminated during the consolidation of financial statementsDecember 31, 2018
Deductions Ending Balance
Name of employee Designation
Bal. at beg. of period
Additions
Amounts collected
Amounts Written
off Current Non-
Current Balance at end
of period
NA

111A N N U A L R E P O R T 2 0 1 8
NATIONAL REINSURANCE CORPORATION OF THE PHILIPPINES Schedule D - Intangible Assets/Other Assets
December 31, 2018
Deduction Beginning Additions Charged to Charged to Other charges Ending
Description (i) Balance at cost (ii) cost & exp. other accts. add’l.(deductions) (iii) Balance
A. Intangible Assets 1 SICS Life License - 22,336,961 1,489,131 20,847,830 2 Risk Explorer 2,475,753 1,320,500 1,051,669 2,744,584
3 SAP Materials Management
Implementation 2,887,175 577,435 2,309,740
4 Document Management System-Archive
One 8 2,651,426 1,325,713 1,325,713
5 Software License for Investment
Management System - 1,287,500 1,287,500
6 Microsoft Volume License - Servers 905,892 197,649 708,243 7 RMS Dashboard Software 381,849 190,924 190,924
8 Proportional Reinsurance Treaty Pricing
Tool 247,228 80,182 167,046 9 Microsoft Office 2016 105,692 69,286 49,466 125,512
10 Universal Telephony License - OXO
Connect System - 80,190 14,701 65,488
11 IP channel software license - 75,473 13,837 61,636
12 Microsoft SQL Server Standard with 5
user CALS 66,732 26,429 40,304 13 SAP Software Licences 48,971 10,494 38,477
14 OXO Connect software assurance for
3 years - 35,378 6,486 28,892 15 MS Visio Pro 2013 SNGL OLP NL 34,013 12,268 21,745
16 MS Visio Professional 2013 Single OLP 26,759 11,893 14,866
17 Microsoft OS Windows 2012
R2-Standard Edition 21,643 8,571 13,071
18 Software license migration from
OmniPCX Office - 14,413 2,642 11,771
19 1Yr Partner SUPPORT for all OS6350
models - 5,153 945 4,208 20 Windows 8.1 Pro SNGL OLP NL 23,562 19,554 4,008
21 Adobe PDF Converter Acrobat
Professional 11 4,600 4,098 502 22 MS Office Home & Business 111 111 0 23 Able2Extract Professional Converter 63 63 0 24 Windows 7 Professional Edition License 348 348 (0)
9,881,816 25,224,854 5,094,608 - - 30,012,062
B Other Assets 1 Input VAT 215,233,064 14,094,549 9,935,011 9,307,430 210,085,172 2 Funds at Lloyds 186,114,728 10,442,228 196,556,956 3 Deferred tax assets 113,904,612 113,904,612 4 Defined benefit asset 9,239,837 4,386,797 13,626,634 5 Deferred Withholding VAT (GSIS) 9,202,886 9,202,886 6 Deferred expanded withholding tax 7,666,232 2,338,313 2,912,392 7,092,154 7 Prepayments 9,107,318 4,712,357 9,107,318 4,712,357 8 Investment properties 2,824,909 880,000 3,704,909 9 Deposit 842,861 82,546 205,559 719,848
10 Security Fund 643,925 643,925 11 Deferred Input Vat 446,607 380,351 294,713 532,244 12 Others 138,011 138,011 13 Creditable Expanded withholding Tax 102,771,245 102,771,245 - 14 Allowance for Impairment (215,233,061) (5,600,553) (209,632,508)
Sub-Total 328,998,562 151,221,753 125,226,237 9,307,430 (5,600,553) 351,287,200
GRAND TOTAL 338,880,378 176,446,607 130,320,846 9,307,430 (5,600,553) 381,299,262

N A T I O N A L R E I N S U R A N C E C O R P O R A T I O N O F T H E P H I L I P P I N E S112
NATIONAL REINSURANCE CORPORATION OF THE PHILIPPINESSchedule E - Long-term Debt
December 31, 2018
Amount shown under Amount shown under Title of Issue and type of Amount Authorized caption “Current caption “Long-Term
obligation by Indenture portion of long-term Debt” in related (i) debt” in related balance sheet
balance sheet (iii)
NA

113A N N U A L R E P O R T 2 0 1 8
NATIONAL REINSURANCE CORPORATION OF THE PHILIPPINESSchedule F - Indebtedness to Related Parties (Long-Term Loans from Related Companies)
December 31, 2018
Name of related party Balance at beginning of period Balance at end of period (i) (ii)
NA

N A T I O N A L R E I N S U R A N C E C O R P O R A T I O N O F T H E P H I L I P P I N E S114
NATIONAL REINSURANCE CORPORATION OF THE PHILIPPINESSchedule G - Guarantees of Securities of Other Issuers
Name of issuing Title of issue of Total amount Amount owned Nature of guarantee entity of securities each class guaranteed by person for (ii) guaranteed by the
companyof securities and which
for which this statement is file
guaranteed outstanding(i)
statement is file
NA

115A N N U A L R E P O R T 2 0 1 8
No. of shares No. of shares issued & outstanding reserved for Number of shares held by as shown under the options, Directors,
related balance sheet
warrants, conversion Related
officers and
Name of Stockholders Title of Issue caption and other rights parties employees Others
1 ALEGAR CORPORATION Common 32,600 NIL 32,600 2 ALPHA INSURANCE & SURETY CO., INC. Common 1,578,900 NIL 1,578,900 3 AP MADRIGAL STEAMSHIP CO. INC. Common 3,300 NIL 3,300 4 ARAVAL, INC Common 77,100 NIL 77,100 5 ASIA UNITED INSURANCE, INC Common 1,252,300 NIL 1,252,300 6 BANCOM DEVELOPMENT CORP. Common 8,300 NIL 8,300 7 BENEFICIAL LIFE INSURANCE COMPANY INC. Common 3,193,500 NIL 3,193,500 8 B.F. GENERAL INSURANCE CO., INC. Common 36,900 NIL 36,900 9 BF LIFE INSURANCE CORP. Common 397,300 NIL 397,300 10 BPI/MS INSURANCE CORP. Common 3,347,500 NIL 3,347,500 - 11 CENTENNIAL GUARANTEE ASSURANCE CORP. Common 14,500 NIL 14,500 12 CONSOLIDATED INSURANCE CO., INC. Common 144,600 NIL 144,600 13 COOPERATIVE INSURANCE SYSTEM OF THE PHILS. Common 72,900 NIL 72,900 14 COUNTRY BANKERS INS. CORP. Common 2,220,300 NIL 2,220,300 15 COUNTRY BANKERS LIFE INSURANCE CORP. Common 30,000 NIL 30,000 16 EASTERN ASSURANCE & SURETY CORPORATION Common 1,872,400 NIL 1,872,400 17 FEDERAL PHOENIX ASSURANCE COMPANY INC. Common 3,786,300 NIL 3,786,300 18 FGU INSURANCE CORPORATION Common 36,126,000 NIL 36,126,000 - 19 FIDELITY INSURANCE COMPANY INC. Common 818,800 NIL 818,800 20 FIRST INTEGRATED BONDING & INS. CO INC. Common 275,300 NIL 275,300 21 GREAT DOMESTIC INS. CO. OF THE PHILS. Common 544,700 NIL 544,700 22 INSURANCE CO. OF NORTH AMERICA Common 705,600 NIL 705,600 23 INSURANCE OF THE PHIL. ISLANDS CO., INC. Common 59,100 NIL 59,100 24 INVESTOR’S ASSURANCE CORP. Common 99,000 NIL 99,000 25 LUZON INSURANCE & SURETY CO., INC. Common 32,300 NIL 32,300 26 MAA GENERAL ASSURANCE PHILS., INC. Common 271,800 NIL 271,800 27 MABASA & COMPANY, INC. Common 36,500 NIL 36,500 28 MALAYAN INSURANCE CO., INC. Common 21,600 NIL 21,600 - 29 MANILA INSURANCE COMPANY INC. Common 1,148,400 NIL 1,148,400 30 MANILA SURETY & FIDELITY CO., INC. Common 3,168,400 NIL 3,168,400 31 MONARCH INSURANCE CO., INC. Common 1,674,000 NIL 1,674,000 32 NEW INDIA ASSURANCE CO., LTD. Common 4,168,300 NIL 4,168,300 33 ORIENTAL ASSURANCE CORPORATION Common 3,560,800 NIL 3,560,800 34 PACIFIC UNION INSURANCE CO. Common 1,351,600 NIL 1,351,600 35 PARAMOUNT LIFE & GENERAL INS. CORP. Common 940,900 NIL 940,900 36 PEOPLE’S TRANS-EAST ASIA INS. CORP. Common 2,435,300 NIL 2,435,300 37 PHILIPPINE AMERICAN LIFE INSURANCE CO. Common 8,628,600 NIL 8,628,600 38 PHILIPPINE BRITISH ASSURANCE CO., INC. Common 590,400 NIL 590,400 39 PHIL. PHOENIX SURETY & INS. INC. Common 134,900 NIL 134,900 40 PHIL. PRUDENTIAL LIFE INS. CO., INC. Common 1,771,900 NIL 1,771,900 41 PHILIPPINE REMNANTS CO., INC. Common 399,300 NIL 399,300 42 PHILIPPINES FIRST INSURANCE CO., INC. Common 11,075,200 NIL 11,075,200 43 PHIL. INT’L LIFE INSURANCE CO., INC. Common 4,450,200 NIL 4,450,200 44 PLARIDEL SURETY & INSURANCE COMPANY INC. Common 162,500 NIL 162,500 45 THE PREMIER INSURANCE & SURETY
CORPORATION Common 2,456,100 NIL 2,456,100 46 REPUBLIC SURETY & INSURANCE COMPANY INC. Common 542,300 NIL 542,300 47 RITA LEGARDA., INC. Common 13,700 NIL 13,700 48 RIVARA, INC. Common 8,700 NIL 8,700 49 SOUTH SEA SURETY & INS. CO., INC. Common 4,152,700 NIL 4,152,700 50 STERLING INSURANCE CO., INC. Common 2,453,900 NIL 2,453,900
NATIONAL REINSURANCE CORPORATION OF THE PHILIPPINESSchedule H- Capital Stock
December 31, 2018

N A T I O N A L R E I N S U R A N C E C O R P O R A T I O N O F T H E P H I L I P P I N E S116
No. of shares No. of shares issued & outstanding reserved for Number of shares held by as shown under the options, Directors,
related balance sheet
warrants, conversion Related
officers and
Name of Stockholders Title of Issue caption and other rights parties employees Others
51 STRONGHOLD INSURANCE CO., INC. Common 2,817,600 NIL 2,817,600 52 SUN LIFE ASSURANCE CO. OF CANADA Common 305,700 NIL 305,700 53 SUSANA REALTY Common 600 NIL 600 54 TABACALERA INSURANCE CO. INC. Common 1,278,700 NIL 1,278,700 55 TIMES SURETY & INSURANCE CO., INC. Common 7,500 NIL 7,500 56 TRAVELLER’S INSURANCE & SURETY CORP. Common 696,100 NIL 696,100 57 UNION BANK OF THE PHILIS. Common 5,000 NIL 5,000 58 UNION INSURANCE SOCIETY OF CANTON LTD. Common 2,197,300 NIL 2,197,300 59 UNITED INSURANCE CO., INC Common 2,006,600 NIL 2,006,600 60 UNITED LIFE ASSURANCE CORP. Common 2,518,100 NIL 2,518,100 61 UTILITY ASSURANCE CORP. Common 1,837,900 NIL 1,837,900 62 VISAYAN SURETY & INSURANCE CORP. Common 3,545,500 NIL 3,545,500 63 WORLDWIDE INSURANCE & SURETY COMPANY Common 100 NIL 100 64 ZENITH INSURANCE CORPORATION Common 805,800 NIL 805,800 65 MAMERTA ANDAYA Common 2,100 NIL 2,100 66 NORMANDO ANTONIO S. AGUILAR Common 16,900 NIL 16,900 67 CONCEPCION S. ARANETA Common 700 NIL 700 68 BASCO, AMERFIL V. Common 11,800 NIL 11,800 69 JAYMERLI C. BAUTISTA Common 298,100 NIL 298,100 70 FRANCISCO M. BAYOT Common 1,100 NIL 1,100 71 VICENTE M. BAYOT Common 1,100 NIL 1,100 72 VICTORIANO G. BELIZARIO Common 300 NIL 300 73 PEDRO P. BENEDICTO JR. Common 15,800 NIL 15,800 74 CONRADO BENITEZ Common 7,400 NIL 7,400 75 ISABELITA M. CABANGUNAY Common 14,500 NIL 14,500 76 DANILO J. CABERO Common 7,200 NIL 7,200 77 NATIVIDAD CANTAJAL Common 4,800 NIL 4,800 78 ANTONIO ROXAS CHUA Common 1,089,500 NIL 1,089,500 79 JACQUELINE M. HALILI CO Common 293,800 NIL 293,800 80 MANUEL U. CO Common 100 NIL 100 81 FRANCISCO CORPUS Common 100 NIL 100 82 DAVID C. COYUKIAT Common 200 NIL 200 83 ALICIA S. CRUZ Common 6,400 NIL 6,400 84 LUZ NER CRUZ Common 13,400 NIL 13,400 85 ADELITA VERGEL DE DIOS Common 171,500 NIL 171,500 86 MANUEL DYTOC Common 900 NIL 900 87 EDUARDO ECHAUZ Common 100 NIL 100 88 ROMEO ECHAUZ Common 400 NIL 400 89 MANUEL B. ENRIQUEZ Common 500 NIL 500 90 LILY VICTORIA G. GALO Common 2,800 NIL 2,800 91 RAFAEL C. GALLAGA Common 13,500 NIL 13,500 92 GARCIA, WINSTON F. Common 442,300 NIL 442,300 93 EDITHA B. GERONIMO Common 15,000 NIL 15,000 94 MERCEDES U. GONZALES Common 200 NIL 200 95 LUCINA OCAMPO LEGASPI Common 3,800 NIL 3,800 96 LUCITA R.C. LIMPE Common 13,400 NIL 13,400 97 ROSARIO M. LLORA Common 7,100 NIL 7,100 98 HONORATA S. LUCOS Common 15,000 NIL 15,000 99 ANTONIO P. MADRIGAL Common 4,200 NIL 4,200 100 CONSUELO P. MADRIGAL Common 1,200 NIL 1,200 101 GERARDO A.S. MADRIGAL Common 1,600 NIL 1,600 102 MACARIA P. MADRIGAL Common 2,300 NIL 2,300 103 VICENTE A.S. MADRIGAL Common 1,600 NIL 1,600 104 NELIA M. MALUBAY Common 54,000 NIL 54,000 105 JENNIFER C. MARTIN Common 294,000 NIL 294,000 106 HANS MENZI Common 2,100 NIL 2,100 107 DAVID C. MERCADO Common 27,300 NIL 27,300 108 SUSANA B. ORTIGAS Common 1,100 NIL 1,100 109 MAURO PRIETO Common 11,600 NIL 11,600 110 ANGELITA U. REYES Common 2,800 NIL 2,800

117A N N U A L R E P O R T 2 0 1 8
No. of shares No. of shares issued & outstanding reserved for Number of shares held by as shown under the options, Directors,
related balance sheet
warrants, conversion Related
officers and
Name of Stockholders Title of Issue caption and other rights parties employees Others
111 JOSE R. RODAS Common 100 NIL 100 112 LOURDES S. RODAS Common 1,100 NIL 1,100 113 PAZ VDA. DE RODAS Common 6,200 NIL 6,200 114 ROSARIO RODAS Common 900 NIL 900 115 PACITA RODRIGUEZ Common 13,400 NIL 13,400 116 PETER T. ROXAS-CHUA Common 13,400 NIL 13,400 117 TAN KIM CHIONG DE ROXAS-CHUA Common 92,300 NIL 92,300 118 ANTONIO S. ROXAS-CHUA JR. Common 24,900 NIL 24,900 119 SEVERINO T. ROXAS-CHUA Common 13,400 NIL 13,400 120 ANDRES E. SIOCHI Common 11,700 NIL 11,700 121 EUGENIA G. SILVA Common 2,800 NIL 2,800 122 MANUEL A. TORRES JR. Common 79,100 NIL 79,100 123 MA. LUISA MADRIGAL VASQUEZ Common 400 NIL 400 124 VICENTE B. VILLARAMA JR. Common 2,800 NIL 2,800 125 BETTY RC YAO Common 13,400 NIL 13,400 126 FRANCISCO JOSE ELIZALDE YTURRALDE Common 75,700 NIL 75,700 127 MACROHON JR., IGNACIO Common 100 NIL 100 128 LIM, PEDRO C. Common 3,000 NIL 3,000 129 YAO, WILSON A. Common 30,000 NIL 30,000 130 TAN, LOZANO A. Common 100,000 NIL 100,000 131 VALENCIA, JESUS SAN LUIS Common 2,100 NIL 2,100 132 PA, ANA GO &/OR GO KIM Common 7,500,000 NIL 7,500,000 133 CRUZ, NAPOLEON D. CRUZ SR. &/OR LUISA I. &/OR
NAPOLEON I. CRUZ JR. Common 5,000 NIL 5,000 134 GALLAGA, RAFAEL C. Common 100 NIL 100 135 LA’O, LUIS C. Common 100 NIL 100 136 YAO, BONIFACIO N. Common 100 NIL 100 137 JACINTO JR., FERNANDO P. Common 100 NIL 100 138 SALVADOR, BIENVENIDO C. Common 100 NIL 100 139 BERNARDO, ROMEO L. Common 100 NIL 100 - 140 CASTANEDA JR., CONSTANCIO T. Common 100 NIL 100 141 KO PIO, RUFINO H. Common 100 NIL 100 142 FRANCISCO, ROLANDO B. Common 100 NIL 100 143 DESIDERIO JR., JOSE O. Common 100 NIL 100 144 DESIDERIO, RODOLFO O. Common 100 NIL 100 145 ONGKINGCO, FLORENCIO N. Common 100 NIL 100 146 MARIANO JR., JORGE T. Common 100 NIL 100 147 SAUCO, NORBERTO V. Common 100 NIL 100 148 JUAN, FRISCO F. SAN Common 100 NIL 100 149 CORPUS, SERGIO Common 100 NIL 100 150 GO, GEORGE L. Common 1,000 NIL 1,000 151 UY JR., CARLOS F. Common 100 NIL 100 152 SALCEDO JR., ALFONSO L. Common 100 NIL 100 153 ARAGON, BIENVENIDO M. Common 200 NIL 200 154 CABANGON CHUA, ANTONIO L. Common 100 NIL 100 155 TRINIDAD, ARMANDO C. Common 100 NIL 100 156 BUENO, FRANCIS EDWIN I. Common 100 NIL 100 157 HARI, ABDON M. Common 100 NIL 100 158 REMO JR., JOSE H. Common 100 NIL 100 159 CRUZ JR., ROMAN A. Common 100 NIL 100 160 FRANCISCO, CLEOTILDE B. Common 100 NIL 100 161 BELTRAN, AURELIO M. Common 100 NIL 100 162 YUCHENGCO, YVONNE S. Common 100 NIL 100 - 163 DEE, HELEN Y. Common 100 NIL 100 164 PUYAT, ALFONSO G. Common 100 NIL 100 165 FERNANDEZ, VICENTE T. Common 100 NIL 100 166 LEON, JAIME S. DE Common 100 NIL 100 167 RAMAJO, HONORIO J. Common 100 NIL 100 168 UNSON, MA. ANICIA F. Common 100 NIL 100 169 UNSON JR., ALEJANDRO F. Common 100 NIL 100 170 VILLAMAYOR, ANTONIO S. Common 100 NIL 100

N A T I O N A L R E I N S U R A N C E C O R P O R A T I O N O F T H E P H I L I P P I N E S118
No. of shares No. of shares issued & outstanding reserved for Number of shares held by as shown under the options, Directors,
related balance sheet
warrants, conversion Related
officers and
Name of Stockholders Title of Issue caption and other rights parties employees Others
171 CHENG, GEMA O. Common 100 NIL 100 172 JUNTEREAL JR., FILEMON A. Common 100 NIL 100 173 COTOCO, NAZARIO Common 100 NIL 100 174 COTOCO, DOMINGO Common 100 NIL 100 175 PADIERNOS, GAY G. Common 100 NIL 100 176 UNSON JR., EDMUNDO L. Common 100 NIL 100 177 LIM, JAMES ORTEGA Common 100 NIL 100 178 CUYEGKENG, ROSARIO W. Common 100 NIL 100 179 FERNANDEZ, JAIME C. Common 100 NIL 100 180 ALVENDIA, JOSE P. Common 100 NIL 100 181 MERCADO JR., DANIEL M. Common 100 NIL 100 182 ROMAN, VICTOR B. Common 100 NIL 100 183 TANCO, EUSEBIO H. Common 100 NIL 100 184 LEE, JOSE C. Common 100 NIL 100 185 MORALES, RHODORA B. Common 100 NIL 100 186 LOCSIN, JULIAN J. Common 100 NIL 100 187 CARREDO, RAMON M. Common 200 NIL 200 188 KOH, ANTONIO M. Common 100 NIL 100 189 INDON, REYNALDO P. Common 100 NIL 100 190 LICAROS, ABELARDO B. Common 100 NIL 100 191 LICAROS JR., GREGORIO B. Common 100 NIL 100 192 DOMINO, JUAN Common 100 NIL 100 193 REYES, OSCAR C. Common 200 NIL 200 194 MALONG, ALEJANDRO V. Common 100 NIL 100 195 MERCADO JR., DAVID P. Common 100 NIL 100 196 WONGAIHAM, ANTHONY T. Common 200 NIL 200 197 MALLILLIN, MELECIO C. Common 100 NIL 100 198 ROMUALDEZ, FERDINAND MARTIN G. Common 3,000,000 NIL 3,000,000 199 OLIVA, DULCE MARIA S. Common 20,000 NIL 20,000 200 BANK OF THE PHILIPPINE ISLANDS Common 290,795,500 NIL 290,795,500 - 201 KO PIO, RODERICK C. Common 100 NIL 100 202 KO PIO, RUFFY C. Common 100 NIL 100 203 TEO, STEPHEN T. TEO &/OR TERESITA R. Common 29,000 NIL 29,000 204 TURNER, PHILIP &/OR ELNORA Common 1,000 NIL 1,000 205 PNB GENERAL INSURERS CO., INC. Common 1,000 NIL 1,000 206 HYDEE MANAGEMENT & RESOURCE CORPORATION Common 264,000 NIL 264,000 207 SM SAVINGS & LOAN ASSOCIATION Common 70,000 NIL 70,000 208 SUDHAKAR, RANIPETA RANI Common 100 NIL 100 209 REYES, CARLOS, R. Common 12,000 NIL 12,000
210 GILI JR., GUILLERMO F. Common 38,000 NIL 38,000 211 LIM, IAN VINCENT &/OR FLORA &/OR
ERNESTO Common 86,000 NIL 86,000 212 MENDIOLA, JORGE T. Common 20,000 NIL 20,000 213 LIM, ROQUE A. Common 66,000 NIL 66,000 214 CRISOL, ROBERTO B. Common 1,000 NIL 1,000 215 CALLAR, CYRIL C. DEL CALLAR &/OR
JOSEPHINE S. DEL Common 1,896,000 NIL 1,896,000 216 SUNGA, PROSPERO S. SUNGA &/OR
CLARITA J. Common 375,000 NIL 375,000 217 YAN, LUCIO W. YAN &/OR CLARA Y. Common 50,000 NIL 50,000 218 SUNGA, PETER EDWIN J. SUNGA &/OR
ROSANNA MARIE S. Common 300,000 NIL 300,000 219 GO, IRENE CHAN Common 185,000 NIL 185,000 220 LO, JOSEPHINE NG Common 71,000 NIL 71,000

119A N N U A L R E P O R T 2 0 1 8
No. of shares No. of shares issued & outstanding reserved for Number of shares held by as shown under the options, Directors,
related balance sheet
warrants, conversion Related
officers and
Name of Stockholders Title of Issue caption and other rights parties employees Others
221 LEE, LEA B. Common 250,000 NIL 250,000 222 ALMEDA, VALERIANO &/OR TITA JANE &/OR
RAYMOND JOSEPH ALMEDA Common 40,000 NIL 40,000 223 PHILIPPINE GENERAL INSURANCE CORP. Common 750,000 NIL 750,000 224 MANANSALA, CONSUELO D. Common 1,000 NIL 1,000 225 VERGARA, ROBERT G. Common 1,000 NIL 1,000 226 LEON, BEATRIZ P. DE Common 1,933 NIL 1,933 227 PRIETO, MERCEDES R. Common 1,933 NIL 1,933 228 PRIETO JR., BENITO R. Common 1,933 NIL 1,933 229 PRIETO, MAURO R. Common 1,934 NIL 1,934 230 TEODORO, MONICA P. Common 967 NIL 967 231 PRIETO, MARTIN L. Common 967 NIL 967 232 GOZO, DANILO A. Common 1,000 NIL 1,000 233 NAPA, ERMILANDO D. Common 1,000 NIL 1,000 - 234 NERA, MEDEL T. Common 1,000 NIL 1,000 - 235 STERLING INSURANCE COMPANY, INC. Common 300,000 NIL 300,000 236 TIU, ALFONSO SY Common 6,000 NIL 6,000 237 CHUA, VICKY B. Common 1,000 NIL 1,000 238 LAO, EDMUND Y. Common 6,000 NIL 6,000 239 UY, ALVIN CHRIS SY Common 6,000 NIL 6,000 240 WU, JOLI CO Common 344,100 NIL 344,100 - 241 BANZON JR., JOSE G. Common 54,000 NIL 54,000 242 DIZON, VLADEMIR S. Common 26,000 NIL 26,000 243 CRUZ, MARY ANN PINEDA DELA Common 3,000 NIL 3,000 244 AYUSTE JR., RAFAEL G. Common 100,000 NIL 100,000 - 245 CASTRO, WILLIAM Y. Common 15,000 NIL 15,000 246 REGINA CAPITAL DEV. CORP.018414 Common 3,000 NIL 3,000 247 REGINA CAPITAL DEV. CORP. 018400 Common 6,000 NIL 6,000 248 VISAYAN SURETY & INSURANCE
CORPORATION Common 200,000 NIL 200,000 249 CHENG, BERCK Y. Common 500,000 NIL 500,000 250 REYES, ROMAN FELIPE S. Common 1,000 NIL 1,000 251 KAWSEK, PAUL L. Common 80,000 NIL 80,000 252 MARILEX REALTY DEVELOPMENT
CORPORATION Common 1,933 NIL 1,933 253 HIDALGO, AUGUSTO PEDROSA III Common 1,000 NIL 1,000 254 CHAVEZ, RAMON NONATO D. Common 5,000 NIL 5,000 255 CONSING, CEZAR P. Common 50 NIL 50 - 256 GONZALEZ, GIZELA M. Common 600 NIL 600 257 ESTATE OF VICENTE M. WARNS Common 600 NIL 600 258 OWEN NATHANIEL S. AU ITF LI
MARCUS M. AU Common 200 NIL 200 259 CUA, PAMELA S. Common 6,000 NIL 6,000 260 FIRST LIFE FINANCIAL COMPANY INC. Common 485,700 NIL 485,700 261 CABREZA, JOCELYN DE GUZMAN Common 1 NIL 1 - 262 LUGA, ALAN R. Common 1 NIL 1 263 ANTONIO M. RUBIN Common 1,000 NIL 1,000 - 264 ELIAS BENIZA DULALIA Common 1,000 NIL 1,000 265 WILFREDO C. MALDIA Common 1 NIL 1 - 266 MAR M. TANGLAO I Common 180,000 NIL 180,000 267 SECOR HOLDINGS INC. Common 50,000 NIL 50,000 268 ALLAN ROSSI SANTOS Common 5,000 NIL 5,000 - 269 MARIA CONSUELO A. LUKBAN Common 50 NIL 50 - 270 PCD NOMINEE CORP (FILIPINO) Common 1,667,004,187 NIL 822,468,500 844,535,687 271 PCD NOMINEE CORP (NON-FILIPINO) Common 14,631,610 NIL 14,631,610
Total 2,123,605,600 1,152,759,100 452,402 970,394,098

N A T I O N A L R E I N S U R A N C E C O R P O R A T I O N O F T H E P H I L I P P I N E S120
NATIONAL REINSURANCE CORPORATION OF THE PHILIPPINES31st floor BPI-Philam Life Makati, 6811 Ayala Avenue, Makati City
Reconciliation of Retained Earnings Available for Dividend DeclarationFor the Year Ended December 31, 2018
Unappropriated Retained Earnings at Beginning of Year as reported P 50,935,398 Prior period restatements 34,580,780
Less Prior Years’ Outstanding Reconciling Items, net of tax –
Net Profit Realized during the YearNet profit per audited financial statements P 149,215,975 Unrealized foreign exchange gain ( 9,205,930) 140,010,045
Other Transactions During the YearAppropriated for contingencies ( 14,921,598)
Unappropriated Retained Earnings Available for Dividend Declaration at End of Year P 125,088,447
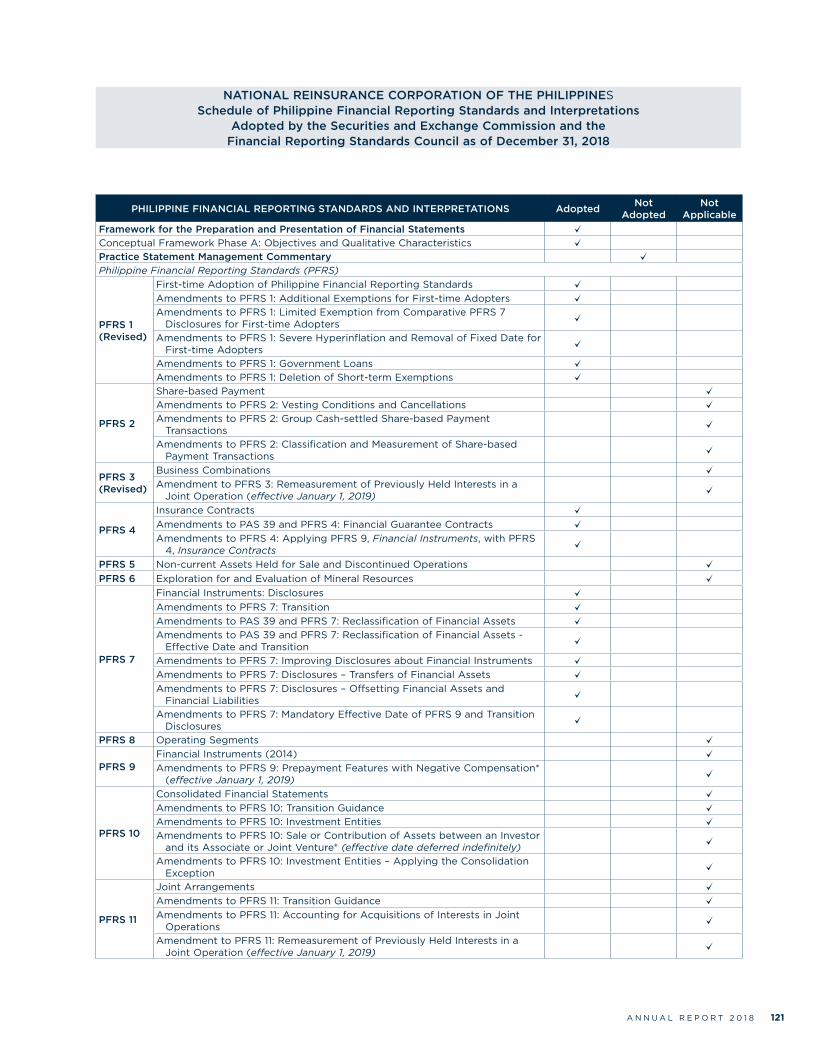
121A N N U A L R E P O R T 2 0 1 8
NATIONAL REINSURANCE CORPORATION OF THE PHILIPPINESSchedule of Philippine Financial Reporting Standards and Interpretations
Adopted by the Securities and Exchange Commission and the Financial Reporting Standards Council as of December 31, 2018
PHILIPPINE FINANCIAL REPORTING STANDARDS AND INTERPRETATIONS Adopted Not Adopted
Not Applicable
Framework for the Preparation and Presentation of Financial Statements Conceptual Framework Phase A: Objectives and Qualitative Characteristics Practice Statement Management Commentary Philippine Financial Reporting Standards (PFRS)
PFRS 1 (Revised)
First-time Adoption of Philippine Financial Reporting Standards Amendments to PFRS 1: Additional Exemptions for First-time Adopters Amendments to PFRS 1: Limited Exemption from Comparative PFRS 7
Disclosures for First-time Adopters
Amendments to PFRS 1: Severe Hyperinflation and Removal of Fixed Date for First-time Adopters
Amendments to PFRS 1: Government Loans Amendments to PFRS 1: Deletion of Short-term Exemptions
PFRS 2
Share-based Payment Amendments to PFRS 2: Vesting Conditions and Cancellations Amendments to PFRS 2: Group Cash-settled Share-based Payment
Transactions
Amendments to PFRS 2: Classification and Measurement of Share-based Payment Transactions
PFRS 3 (Revised)
Business Combinations Amendment to PFRS 3: Remeasurement of Previously Held Interests in a
Joint Operation (effective January 1, 2019)
PFRS 4
Insurance Contracts Amendments to PAS 39 and PFRS 4: Financial Guarantee Contracts Amendments to PFRS 4: Applying PFRS 9, Financial Instruments, with PFRS
4, Insurance Contracts
PFRS 5 Non-current Assets Held for Sale and Discontinued Operations PFRS 6 Exploration for and Evaluation of Mineral Resources
PFRS 7
Financial Instruments: Disclosures Amendments to PFRS 7: Transition Amendments to PAS 39 and PFRS 7: Reclassification of Financial Assets Amendments to PAS 39 and PFRS 7: Reclassification of Financial Assets -
Effective Date and Transition
Amendments to PFRS 7: Improving Disclosures about Financial Instruments Amendments to PFRS 7: Disclosures – Transfers of Financial Assets Amendments to PFRS 7: Disclosures – Offsetting Financial Assets and
Financial Liabilities
Amendments to PFRS 7: Mandatory Effective Date of PFRS 9 and Transition Disclosures
PFRS 8 Operating Segments
PFRS 9 Financial Instruments (2014) Amendments to PFRS 9: Prepayment Features with Negative Compensation*
(effective January 1, 2019)
PFRS 10
Consolidated Financial Statements Amendments to PFRS 10: Transition Guidance Amendments to PFRS 10: Investment Entities Amendments to PFRS 10: Sale or Contribution of Assets between an Investor
and its Associate or Joint Venture* (effective date deferred indefinitely)
Amendments to PFRS 10: Investment Entities – Applying the Consolidation Exception
PFRS 11
Joint Arrangements Amendments to PFRS 11: Transition Guidance Amendments to PFRS 11: Accounting for Acquisitions of Interests in Joint
Operations
Amendment to PFRS 11: Remeasurement of Previously Held Interests in a Joint Operation (effective January 1, 2019)

N A T I O N A L R E I N S U R A N C E C O R P O R A T I O N O F T H E P H I L I P P I N E S122
PHILIPPINE FINANCIAL REPORTING STANDARDS AND INTERPRETATIONS Adopted Not Adopted
Not Applicable
PFRS 12
Disclosure of Interests in Other Entities Amendments to PFRS 12: Transition Guidance Amendments to PFRS 12: Investment Entities Amendments to PFRS 10: Investment Entities – Applying the Consolidation
Exception
PFRS 13 Fair Value Measurement PFRS 14 Regulatory Deferral Accounts PFRS 15 Revenue from Contracts with Customers PFRS 16 Leases* (effective January 1, 2019) PFRS 17 Insurance Contracts* (effective January 1, 2021) Philippine Accounting Standards (PAS)
PAS 1 (Revised)
Presentation of Financial Statements Amendments to PAS 32 and PAS 1: Puttable Financial Instruments and
Obligations Arising on Liquidation
Amendments to PAS 1: Presentation of Items of Other Comprehensive Income
Amendments to PAS 1: Disclosure Initiative PAS 2 Inventories
PAS 7 Statement of Cash Flows Amendments to PAS 7: Disclosure Initiative
PAS 8 Accounting Policies, Changes in Accounting Estimates and Errors PAS 10 Events After the Reporting Period
PAS 12
Income Taxes Amendments to PAS 12 - Deferred Tax: Recovery of Underlying Assets Amendments to PAS 12 - Recognition of Deferred Tax Assets for Unrealized
Losses
Amendment to PAS 12 - Tax Consequences of Dividends* (effective January 1, 2019)
PAS 16
Property, Plant and Equipment Amendments to PAS 16: Bearer Plants Amendments to PAS 16: Clarification of Acceptable Methods of Depreciation
and Amortization
PAS 17 Leases PAS 19 (Revised)
Employee Benefits Amendments to PAS 19: Defined Benefit Plans - Employee Contributions
PAS 20 Accounting for Government Grants and Disclosure of Government Assistance
PAS 21 The Effects of Changes in Foreign Exchange Rates Amendments: Net Investment in a Foreign Operation
PAS 23 (Revised)
Borrowing Costs Amendment to PAS 23: Eligibility for Capitalization
PAS 24 (Revised) Related Party Disclosures
PAS 26 Accounting and Reporting by Retirement Benefit Plans
PAS 27 (Revised)
Separate Financial Statements Amendments to PAS 27: Investment Entities Amendments to PAS 27: Equity Method in Separate Financial Statements
PAS 28 (Revised)
Investments in Associates and Joint Ventures Amendments to PFRS 10: Sale or Contribution of Assets between an Investor
and its Associate or Joint Venture* (effective date deferred indefinitely)
Amendments to PAS 28: Investment Entities - Applying the Consolidation Exception
Amendment to PAS 28: Measurement of Investment in Associates at Fair Value through Profit or Loss
Amendment to PAS 28: Long-term Interest in Associates and Joint Venture (effective January 1, 2019)
PAS 29 Financial Reporting in Hyperinflationary Economies
PAS 32
Financial Instruments: Presentation Amendments to PAS 32 and PAS 1: Puttable Financial Instruments and
Obligations Arising on Liquidation
Amendments to PAS 32: Classification of Rights Issues Amendments to PAS 32: Offsetting Financial Assets and Financial Liabilities

123A N N U A L R E P O R T 2 0 1 8
PHILIPPINE FINANCIAL REPORTING STANDARDS AND INTERPRETATIONS Adopted Not Adopted
Not Applicable
PAS 33 Earnings Per Share PAS 34 Interim Financial Reporting
PAS 36 Impairment of Assets Amendment to PAS 36: Recoverable Amount Disclosures for
Non-financial Assets
PAS 37 Provisions, Contingent Liabilities and Contingent Assets
PAS 38 Intangible Assets Amendments to PAS 38: Clarification of Acceptable Methods of Depreciation
and Amortization
PAS 40 Investment Property Amendment to PAS 40: Reclassification to and from Investment Property
PAS 41 Agriculture Amendments to PAS 41: Bearer Plants
Philippine Interpretations - International Financial Reporting Interpretations Committee (IFRIC)IFRIC 1 Changes in Existing Decommissioning, Restoration and Similar Liabilities** IFRIC 2 Members’ Share in Co-operative Entities and Similar Instruments IFRIC 4 Determining Whether an Arrangement Contains a Lease
IFRIC 5 Rights to Interests Arising from Decommissioning, Restoration and Environmental Rehabilitation Funds**
IFRIC 6 Liabilities Arising from Participating in a Specific Market - Waste Electrical and Electronic Equipment
IFRIC 7 Applying the Restatement Approach under PAS 29, Financial Reporting in Hyperinflationary Economies
IFRIC 9 Reassessment of Embedded Derivatives** Amendments to Philippine Interpretation IFRIC–9 and PAS 39: Embedded
Derivatives**
IFRIC 10 Interim Financial Reporting and Impairment IFRIC 12 Service Concession Arrangements
IFRIC 14
PAS 19 - The Limit on a Defined Benefit Asset, Minimum Funding Requirements and their Interaction
Amendments to Philippine Interpretations IFRIC - 14, Prepayments of a Minimum Funding Requirement and their Interaction**
IFRIC 16 Hedges of a Net Investment in a Foreign Operation IFRIC 17 Distributions of Non-cash Assets to Owners** IFRIC 19 Extinguishing Financial Liabilities with Equity Instruments** IFRIC 20 Stripping Costs in the Production Phase of a Surface Mine** IFRIC 21 Levies IFRIC 22 Foreign Currency Transactions and Advance Consideration IFRIC 23 Uncertainty Over Income Tax Treatments (effective January 1, 2019) Philippine Interpretations - Standing Interpretations Committee (SIC)SIC-7 Introduction of the Euro SIC-10 Government Assistance - No Specific Relation to Operating Activities SIC-13 Jointly Controlled Entities - Non-Monetary Contributions by Venturers SIC-15 Operating Leases - Incentives SIC-25 Income Taxes - Changes in the Tax Status of an Entity or its Shareholders** SIC-27 Evaluating the Substance of Transactions Involving the Legal Form of a Lease SIC-29 Service Concession Arrangements: Disclosures SIC-31 Revenue - Barter Transactions Involving Advertising Services** SIC-32 Intangible Assets - Web Site Costs**
* These standards will be effective for periods subsequent to 2018 and are not early adopted by the Company.
** These standards have been adopted in the preparation of financial statements but the Company has no significant transactions covered in both years presented.

N A T I O N A L R E I N S U R A N C E C O R P O R A T I O N O F T H E P H I L I P P I N E S124
CONTACT INFORMATION
Main Office
31ST Floor, BPI-Philam Life Makati6811 Ayala Avenue, Makati City, 1227, Philippines
Trunk line: (+632) 988-7400 (Connecting all departments)E-mail: [email protected]
Investor Services
Mr. Santino U. SontillanoHead of Finance
Phone: (+632) 988-7495E-mail: [email protected]
Non-Life Business
Mr. Alexander L. Reyes Head of Non-life Reinsurance
Phone: (+632) 988-7435E-mail: [email protected]
Life Business
Mr. Victor R. Tanjuako Head of Life ReinsurancePhone: (+632) 988-7412
E-mail: [email protected]

31st Floor, BPI-Philam Life Makati, 6811 Ayala Avenue
Makati City, 1227 Philippines
Trunk Line: +63 (2) 988 7400
Fax: +63 (2) 988 7497
E-mail Address: [email protected]
www.nat-re.com
Copyright © 2022 FDOKUMEN