2018-19 Budget Report - Brock University
53
18- 19 Budget Report Including key performance metrics
-
Upload
khangminh22 -
Category
Documents
-
view
1 -
download
0
Transcript of 2018-19 Budget Report - Brock University
18-19 Budget ReportIncluding key performance metrics
2017
-18
Bud
get
Repo
rt
Our
fina
ncia
l hea
lthFinancial results
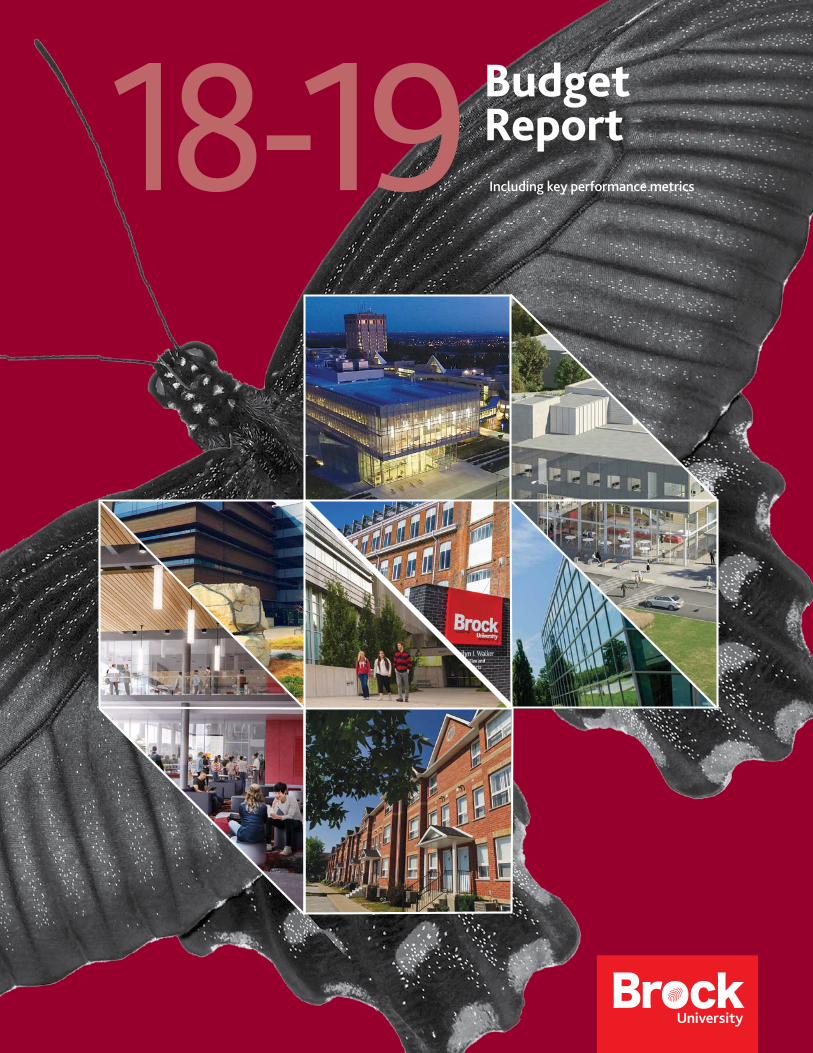
The funding budget for fiscal 2018-19 is illustrated in Figure 1. It identifies a balanced budget, consistent with 2017-18. At the time of preparing the budget report, fiscal 2017-18 has not been completed; however, we are projecting through our second trimester reporting (T2) for fiscal 2017-18 a funding surplus of $3.0 million. The information below speaks to our financial health and compares several of our financial metrics to other comprehensive universities. This budget report addresses actions being taken and next steps that will need to be considered to improve these metrics.
1
Financial health metrics
Refer to page 82 for explanations of the debt-related financial health metrics and Appendix G for metric definitions.
Statement of operations metricsThe following metrics were developed to identify areas of strength as well as improvement.
Figure 2
By student headcount ($000s)Brock(1) Median(2) Average(2)
April 2017 April 2016 April 2017 April 2016 April 2017 April 2016
Student fees (primarily tuition) 8.47 8.20 8.96 8.59 8.79 8.30 Grant 5.92 5.87 9.68 9.69 10.92 10.79 Personnel costs 10.75 10.60 13.78 13.47 14.06 13.69 Scholarships 1.05 0.99 1.34 1.28 1.43 1.37 Interest on long-term debt 0.39 0.40 0.26 0.27 0.27 0.27 Investment income 0.12 0.06 0.81 0.42 0.82 0.50
(1) Brock’s 2016 metrics have been adjusted to account for reclassifications. (2) Calculated using financial information from 14 other comprehensive universities. Certain 2016 metrics have been updated due to revisions in certain universities’ financial statements.
Brock’s tuition is in line with the average; however, grant revenue per student continues to be well below the sector average and represents an area of ongoing attention for the University. Naturally, Brock must operate more efficiently with below-average funding and this is seen in the lower personnel costs per student. Brock continues to invest in students through increasing scholarships. Interest and investment income metrics are in line with Brock’s comparatively weak financial health metrics, as detailed below.
Figure 3 Brock (1) Median (2) Weighted average (2)
April 2017 April 2016 April 2017 April 2016 April 2017 April 2016
Primary reserve ratio 14.6% 11.7% 26.4% 24.1% 38.5% 36.1%
Debt burden ratio 3.0% 3.1% 2.6% 2.5% 2.9% 3.0%Interest burden % 2.5% 2.6% 1.7% 1.7% 1.5% 1.6%Interest coverage 3.70 3.35 7.89 3.68 7.21 5.93 Viability ratio 31.9% 24.5% 177.4% 189.9% 127.0% 120.1%Net operating revenues ratio 5.1% 7.5% 7.1% 8.2% 9.1% 8.6%Employee future benefits per student headcount ($000s) $(0.53) $(1.12) $(3.03) $(3.27) $(2.36) $(3.24) Endowment per student headcount ($000s) $5.01 $4.50 $8.75 $6.96 $7.56 $6.89
(1) Certain ratios have been restated to align with the Council of Ontario Universities’ (COU) metrics to improve comparability across various reporting agencies.(2) Calculated using financial information from 14 other comprehensive universities. Certain 2016 metrics have been updated due to revisions in certain Universities' financial statements.
Figure 1: Funding budget
($000s) 2018-19Budget
2017-18Budget
2016-17Actual
Revenue
Student fees 178,091 167,875 158,341
Grant revenue 97,575 96,326 95,009
Internal chargebacks 8,994 8,792 9,703
Inter-fund revenue 5,416 3,138 4,859
Other revenue 49,130 47,826 46,182
Total revenues 339,206 323,957 314,094
Operating costs
Personnel costs (219,568) (212,939) (196,994)
Inter-fund expense (25,293) (18,590) (20,965)
Other operating costs (94,345) (92,428) (90,611)
Total operating costs (339,206) (323,957) (308,570)
Funding surplus - - 5,524
2018
-19
Bud
get
Repo
rt
Executive summary
This budget report has once again been prepared with the collaboration of a significant number of individuals throughout Brock University in support of the academic mission and overall operations. It continues to represent a step in an ongoing and iterative process of making the financial operations of the University increasingly open, transparent and financially sustainable. This report was designed to encourage thought, discussion and recommendations for future planning purposes. Input and recommendations for the budget are encouraged and can be emailed to [email protected]
Revenue is budgeted to increase by $15.2 million over the 2017-18 budget, a 4.7 per cent increase over 2017-18. Student fees represent 53 per cent of Brock’s revenue in the budget (52 per cent in 2017-18). Global tuition is increasing by $8.7 million, with 22 per cent of this increase attributed to planned enrolment growth, 61 per cent attributed to planned rate increases, 13 per cent attributed to a retention target ($1.1 million) and 5 per cent attributed to expected enrolment exceeding the prior 2017-18 budget. Government grants represent 29 per cent of Brock’s revenue budget (30 per cent in 2017-18). Government grants are increasing by $1.2 million as a result of additional graduate student funding ($0.4 million) and special purpose grants ($0.8 million). Other revenues are increasing by $3.8 million, which represents 19 per cent of Brock’s revenue in the budget (18 per cent in 2017-18).
Consistent with the balanced budget, expenses are increasing in tandem with revenues by $15.2 million. Personnel costs are increasing by $6.6 million and non personnel by $8.6 million. These investments support the many academic, research, community and support activities. To name a few, this budget supports enhancing areas of Indigenous content, international master’s student support through a tuition freeze on research – based programs, an investment for international PhD students to reduce their net cost of tuition to zero and attract high calibre graduate students, classroom modernization projects and infrastructure renewal.
Our budget environment remains similar to recent years. In 2017-18, the Ontario government launched a new grant funding formula. Overall, with the changes to the operating grants, Brock remains the lowest funded University in the province, which challenges our operations to remain lean and still support all of the activities of the University. Brock’s Differentiation Grant, as a per cent of the combined Core and Differentiation Grant Envelope, is 4 per cent based on preliminary 2017-18 actuals. The 2018-19 budget includes a target to increase funded eligible graduate enrolment by 40 master’s FTE and 16.1 PhD FTE. If achieved, this will increase Brock’s differentiation grant proportion of the Core and Differentiation grant envelope to 5.8 per cent. Increasing Brock’s Differentiation grant to the provincial average of 9.3 per cent would represent total differentiation funding of $8.4 million, an additional $3.3 million increase beyond this budget.
As the budget environment continues to develop, we remind readers of this report that we have a $339-million budget to deploy, and to achieve great results, we need to capitalize on the opportunities and meet the challenges that are ahead. We are Brock – one community – the sum of its students, faculty, staff, volunteers, supporters and external community partners. Let’s continue to all work together to make 2018-19 another year to be proud of.
This report contains certain forward-looking information. In preparing the Budget Report, certain assumptions and estimates were necessary. They are based on information available to management at the time of preparing the budget. Users are cautioned that actual results may vary. Throughout the text in this report, financial values have been rounded to the nearest thousand unless otherwise stated.
ContentsOur financial health Financial results 1About Brock Message from leadership 2Governance at Brock University 3
Board of Trustees 3Senate 4
Brock’s Mission Statement (Pullout 1) iiBrock’s values iiIntegrated Strategic Plan and Strategic Mandate Agreement iiThe big picture ivBudget development Process and objectives 9Framework Budget environment 17
Government policy 17Enrolment 18Ourselves – the decisions we make 19
Review Financial update 21Space considerations (Pullout 2) iHistorical timeline iiiBudget details Funding budget 25
Revenue assumptions 25Operating cost assumptions 37Funding budget by responsibility centre 42Funding budget by responsibility centre leader 44
Snapshots Responsibility centre snapshots 46Teaching Faculties 48Academic support 54Student specific 57Shared services 62Ancillary 66Space 69Global 71Capital Capital and related projects budget 75
Background 752018-19 capital and related projects overview 75
Treasury Financing 81Endowment summary 83Next steps Looking forward 85
Revenue and expense allocation model 85Five-year financial forecast 88
Appendices Appendix A 89Appendix B 90Appendix C 91Appendix D 92Appendix E 94Appendix F 95Appendix G 96

Message from leadership
Brock University aims to advance its academic mission in support of meeting students’ needs; advancing regional community and economic growth and development; and fostering national prominence in post-secondary education. For two consecutive years, Brock has achieved balanced budgets in pursuit of these goals by developing a plan crafted out of thoughtful consultation across the University community. The 2018-19 budget invests in key strategic priority areas relating to supporting student success; promoting Brock’s academic programming; advancing research, scholarly, and creative activities; and contributing to regional and community development. The entire Brock community was instrumental in making decisions to develop the financially sustainable plan reflected in the budget that supports Brock’s academic mission and facilitates the University’s contributions to the advancement of knowledge and understanding, as well as the betterment of communities and society.
This document outlines all the budgetary allocations and supports the teaching, research, scholarly and creative activities, and university service activities, conducted by the talented faculty and staff at Brock. Specifically, this budget supports advances in Indigenous education and community engagement, undergraduate and graduate scholarships and fellowships, international master’s student assistance through a tuition freeze on research-based programs, investment for international PhD students to reduce their net cost of tuition to zero, full-time faculty and support staff, library acquisitions and support, information technology improvements through a new human resources system and capital improvements, such as dedicated funds for classroom modernization.
Brock is strongly rooted in the Niagara region. We aim to partner across the region to support community and economic development. Brock’s research cultivates healthy
communities and our faculty and students support local institutions through co-op and experiential learning. We are committed to working with community leaders to enhance the overall well-being of the Niagara region.
This budget supports the initiatives established through the Province of Ontario 2017-20 Strategic Mandate Agreement (SMA2) process. Our SMA2 aims to continuously improve our contributions to the students and communities we serve. Brock’s SMA2 aspires to enhance our academic excellence, as well as our established strengths in experiential education, transdisciplinary programming and research activities.
At Brock, we are engaged in the development of a new University Strategic Plan that will further assist in refining the key priorities and budget alignment of the University over the next five years. The Strategic Plan will involve a full environmental scan and consultation to support the establishment of shared academic and administrative priorities across the University, which will inform the Fiscal Framework and Revenue and Expense Allocation Model to facilitate long-term sustainable budgets in support of the academic mission of the University.
Looking forward, we will be establishing the core priorities to guide the strategic direction, choices and actions of the University. Our future budgets will evolve and be informed by our new strategic plan. The Strategic Plan will support pedagogy, programs in liberal arts/science and professional fields, experiential learning, entrepreneurship and knowledge dissemination, while also noting the University has a strong existing commitment to transdisciplinary studies and research. Enrolment through considerations of undergraduate, graduate, and continuing-adult professional education will support these activities. Furthermore, Brock aims to contribute to Niagara regional development through excellence, partnerships and innovative initiatives at the local and national levels.
2018
-19
Bud
get
Repo
rt
ABO
UT
BRO
CK
3
2018
-19
Bud
get
Repo
rt
ABO
UT
BRO
CK
2
Governance at Brock University
The University was incorporated in 1964 through The Brock University Act (the Act), a Statute of the Province of Ontario. The Act provides that except as otherwise specifically assigned to the Senate, the government, conduct, management and control of the University’s property and the conduct of its business and affairs is vested in the Board of Trustees (the Board). The Act provides that the Senate is responsible for the education policy of the University. This bicameral system of governance, consisting of two governing bodies – the Board and the Senate – is shown below.
Board of TrusteesThe Board consists of 26 members, including 17 community members elected by the Board, as well as two Brock students, three faculty members and two staff members elected by their respective constituencies. The Chancellor and the President and Vice-Chancellor are ex officio members of the Board.
2017-18 Board of Trustees members• Sophia Aggelonitis (community member – AC and HRC)• Mark Arthur (Chair – SPC; community member – EC, AC and PC)• Michele-Elise Burnett (community member – CIC and HRC)• Shirley Cheechoo (Chancellor) • Gary Comerford (Chair of the Board) • Mario De Divitiis (Vice-Chair – GNC; community member – SPC)• Mary De Sousa (community member – AC and GNC)• Gervan Fearon (President and Vice-Chancellor) • John Fisher (Vice-Chair – FPIC; community member – SPC)• Giulia Forsythe (staff member – SPC)• Kristine Freudenthaler (Vice-Chair of the Board; Chair – CIC;
community member – AC) • Faisal Hejazi (undergraduate student member – CIC)• Dennis Hewko (Chair – FPIC; community member – EC and CIC)• Shannon Kitchings (graduate student member – EC and SPC) • Diane Miller (faculty member – EC and SPC) • Beverley Morden (community member – FPIC and SPC)• Chris Phillips (community member and Alumni Association – CIC
and SPC)• Miriam Richards (faculty member – SPC) • William (Bill) Rickers (Vice-Chair – CIC; community member – FPIC)• Kristen Smith (staff member – EC and CIC)• Leanne Standryk (Chair – HRC; community member – EC and GNC)• John Suk (Immediate Past Chair of the Board) • David Whitehead (Chair, Senate – CIC) • Dr. Robin Williams (Vice-Chair – SPC and HRC)• Elisabeth Zimmermann (Chair – GNC; community member – EC
and FPIC)• John Zoccoli (Chair – AC; community member – EC and CIC)
26
Board of Trustees
committees
Executive Committee
(EC)
Strategic Planning
Committee (SPC)
Capital Infrastructure
Committee (CIC)
Financial Planning, Investment Committee
(FPIC)
Pension Committee
(PC)
Audit Committee
(AC)
Human Resources Committee
(HRC)
Governance/Nominating Committee
(GNC)
Figure 5
Tim Kenyon, Vice-President, Research
Brian Hutchings, Vice-President, Administration
Thomas Dunk, Provost and Vice-President, Academic
Gervan Fearon, President and Vice-Chancellor
The bicameral system of governance
Board of Trustees
Senate
Standing committees and ad hoc or
special committees
Standing committees and ad hoc or
special committees
Figure 4

2018
-19
Bud
get
Repo
rt
ABO
UT
BRO
CK
4 i
2016
-17
Fis
cal F
ram
ewor
k
ABO
UT
BRO
CK
i
2016
-17
Fis
cal F
ram
ewor
k
ABO
UT
BRO
CK
i
2017-18 Senate membersMembers ex officio• Shirley Cheechoo (Chancellor)• Gervan Fearon (President and Vice-Chancellor)• Thomas Dunk (Interim Provost and Vice-President, Academic)• Tim Kenyon (Vice-President, Research)• Greg Finn (Vice-Provost and Associate Vice-President, Academic)• Anna Lathrop (Vice-Provost, Teaching, Learning and Student Success)• James Mandigo (Vice-Provost, Enrolment Management and
International)• Ejaz Ahmed (Dean, Faculty of Mathematics and Science)• Diane Dupont (Interim Dean, Faculty of Graduate Studies)• Andrew Gaudes (Dean, Goodman School of Business)• Ingrid Makus (Dean, Faculty of Social Sciences)• Carol Merriam (Dean, Faculty of Humanities)• Michael Owen (Dean, Faculty of Education)• Peter Tiidus (Dean, Faculty of Applied Health Sciences)• Geraldine Jones (Registrar)• Mark Robertson (University Librarian)• Gary Comerford (Chair, Board of Trustees)• Aidan Hibma (BUSU, Vice-President, Finance and Administration)• Thomas Winger (President, Concordia Seminary)• Brian Hutchings (Vice-President, Administration)• James O’Brien (Alumni Association Representative)• Michele-Elise Burnett (Indigenous Representative)
Full-time teaching staff/professional librarian representatives
3822
67
2
2
• Kate Bezanson (FOSS)• Michael Berman (FOH)• Irene Blayer (FOH)• Jonah Butovsky (FOSS)• Poling Bork (FMS)• Christene Carpenter-Cleland
(FMS)• June Corman (FOSS)• Don Cyr (GSB)• Spy Dénommé-Welch (FOE)• Tamara El-Hoss (FOH)• Fayez Elayan (GSB)• Nancy Francis (AHS)• Allison Glazebrook (FOH)• Ian Gibson (Library)• David Hutchison (FOE)• Nota Klentrou (AHS)• Linda Lowry (Library)• Phillip Mackintosh (FOSS)• Lynn McCleary (AHS)
• Bozidar Mitrovic (FMS)• Christie Milliken (FOSS)• Laurie Morrison (Library)• Roberto Nickel (FOH)• Shauna Pomerantz (FOSS)• Lynn Rempel (AHS)• Tim Ribaric (Library)• Matthew Royal (FOH)• Miriam Richards (FMS)• Barbara Sainty (GSB)• Larry Savage (FOSS)• Dennis Soron (FOSS)• Susan Sydor (FOE)• Donna Szoke (FOH)• Tek Thongpapanl (GSB)• David Whitehead (GSB)• Michelle Webber (FOSS)• Terrance Wade (AHS)• Vera Woloshyn (FOE)
Representatives of the Board of Trustees• William Rickers• Elisabeth Zimmermann
Undergraduate student representatives• Kingsley Nwogu• Mickey Calder• David Stark
Graduate student representatives• Emily Guertin• Charissa Sanche
3
SenateAs of April 1, 2018, the Senate consists of 67 members, including 38 elected full-time teaching staff and professional librarians, two members of the Board, three undergraduate students and two graduate students elected by their respective constituencies. There are also 22 ex officio members of the Senate.
Note:Faculty of Applied Health Sciences (AHS);Goodman School of Business (GSB);Faculty of Education (FOE);Faculty of Humanities (FOH);Faculty of Mathematics and Science (FMS) and Faculty of Social Sciences (FOSS).
Governance Committee
Graduate Studies
Committee
Information Technology
and Infrastructure
Committee
Research and Scholarship
Policy Committee
Teaching and Learning
Policy Committee
Undergraduate Student Affairs
Committee
Student Appeals
Board
Undergraduate Program
Committee
Planning, Priorities
and Budget Advisory
Committee
Senate standing
committees
Academic Review (special
committee)
Figure 6
Planning, Priorities andBudget Advisory CommitteeThe Senate’s Planning, Priorities and Budget Advisory Committee (PPBAC) defines its terms as follows: It undertakes the responsibility to advise Senate regarding advice to the Board of Trustees in respect to the consistency of the budgets, policies, plans and prioritization processes with academic policy, as well as their consonance with the goals of the University. The PPBAC advises Senate regarding the following:a) The principles of allocation of the University budget and
determination of strategic objectives and prioritization processes.
b) The academic and fiscal priorities of the University.c) The academic and fiscal challenges of the University.d) The budget system and strategic planning processes, and
any proposed changes in the budget system and strategic planning processes of the University.
e) Matters requiring institutional advocacy.f) Any other matters referred to it by the Senate or Senate
Governance Committee.
The following are the 2017-18 PPBAC members:
Elected members• Nota Klentrou (AHS) – Chair, Information Technology and
Infrastructure• Lynn Rempel (AHS) – Chair, Undergraduate Student Affairs• Lynn McCleary (AHS) – Chair, Graduate Studies• Don Cyr (GSB) – Vice-Chair, Governance• June Corman (FOSS) – Chair, Research and Scholarship Policy• Laurie Morrison (Library) – Chair, Teaching and Learning Policy• Susan Sydor (FOE) – Chair, Undergraduate Program
Students• Christopher Yendt – graduate student• Aidan Hibma – undergraduate student
Ex officio• David Whitehead (GSB) – Senate Chair• Gervan Fearon – President and Vice-Chancellor• Tom Dunk– Interim Provost and Vice-President, Academic• Tim Kenyon – Vice-President, Research• Greg Finn – Vice-Provost and Associate Vice-President, Academic• Carol Merriam (FOH) – Faculty Dean• Peter Tiidus (AHS) – Faculty Dean• Linda Rose-Krasnor (FOSS) – BUFA observer (non-voting)
2
7
8
17
Pullout 1/i

2018
-19
Bud
get
Repo
rt
ABO
UT
BRO
CK
ii
Brock’s Mission StatementBrock University flourishes through the scholarly, creative, and professional achievements of its students, faculty and staff. Offering a range of undergraduate and graduate programs, Brock fosters teaching and research of the highest quality. As a diverse and inclusive community, we contribute positively to Canada and beyond through our imagination, innovation and commitment.
Brock’s valuesBrock is committed to seven core values that inform and strengthen our actions.1. Integrity and respect2. Freedom of thought and expression coupled
with academic responsibility3. Unique student experience4. Innovation5. Accountability and stewardship6. Sustainability7. Generation and mobilization of knowledge
Integrated Strategic Plan and Strategic Mandate AgreementBrock University’s 2010 Integrated Strategic Plan, which has been endorsed by both the Board and the Senate, sets out the University’s strategic priorities, representing the principles of allocation of the University. The full Integrated Strategic Plan can be viewed at brocku.ca/webfm_send/18651
Strategic priorities• Ensure Brock is a preferred place to work and study.• Support Brock’s undergraduate student-centred focus while
maintaining excellence in graduate education.• Foster excellence in research, scholarship and creativity.• Serve the social, cultural and economic well-being of
the University, as well as the local, national and global communities.
• Encourage transdisciplinary initiatives.• Promote internationalization.• Practise accountability, fiscal responsibility and stewardship.
Brock University’s 2017-20 Strategic Mandate Agreement (SMA2) responds to the Ministry of Advanced Education and Skills Development’s (MAESD) request that every college and university in Ontario prepare a document that would articulate the mandate and vision of each institution. Guidelines set out by the MAESD call for SMAs to be updated every three years. Brock signed its first Strategic Mandate Agreement with the government in 2014. Following a period of negotiation with the MASED over the summer of 2017, SMA2 was signed on Feb. 7, 2018. The 2017-2020 SMA can be viewed at brocku.ca/vp-academic/wp-content/uploads/sites/65/Brock-University-SMA-Signed-Final-Feb-7.pdf. The SMA2 outlines the following shared objectives and priorities for differentiation:
Objectives/priorities1. Student Experience: Brock committed to increase the
quality, breadth and diversity of co-op programs, and to extend it’s commitment to a broader array of curricular and co-curricular experiential learning in undergraduate and graduate program offerings.
2. Innovation in Teaching and Learning Excellence: Brock is expanding its experiential education opportunities, recently becoming the first Canadian university to have its experiential education definitions adopted by its Senate, allowing such opportunities to be recognized through program outcomes and on the student co-curricular record.
3. Access and Equity: Brock’s recruitment efforts encourage a wide and diverse spectrum of potential undergraduate and graduate students, including under-represented groups such as Indigenous peoples, new Canadians, persons with disabilities, first-generation students, students with low income and mature students.
4. Research Excellence and Impact: Brock researchers are strengthening our international reputation through partnerships that create the knowledge, services and infrastructure required for the Niagara region’s success in a globalized economy through a transdisciplinary approach. The University has worked to challenge traditional disciplinary boundaries, encouraging the application of multiple theoretical and methodological approaches in the completion of a range of unique programs.
5. Innovation, Economic Development and Community Engagement: Brock is responding to local needs by capitalizing on and developing the community’s own intellectual property, resulting in two-way knowledge exchange, commercialization of intellectual property, the creation of spinoff companies in partnership with the Niagara Regional Innovation Centre and joint-venture activity between the University, industry and community organizations.
Pullout 1/ii
Construction in progress on the Rankin Family Pavilion.
Pullout 1/iii
http://brocku.ca/vp-academic/wp-content/uploads/sites/65/Brock-University-SMA-Signed-Final-Feb-7.pdf

Stud
ent h
eadc
ount
by
Facu
lty
of m
ajor
Stud
ent f
ull-
tim
e eq
uiva
lent
by
teac
hing
Fac
ulty
(1) Figures in the table include undeclared Arts, letter of permission, non-degree students and auditors, which are not included in any of the Faculties in the above charts.
Fall student headcount full-time (FT) and part-time (PT) by Faculty of major.
Applied Health Sciences
Education Humanities* Mathematics and Science Social Sciences*Goodman School of Business
17-1816-1715-1614-1513-14 17-1816-1715-1614-1513-14 17-1816-1715-1614-1513-14 17-1816-1715-1614-1513-14 17-1816-1715-1614-1513-14 17-1816-1715-1614-1513-14
3,322 3,425 3,515 3,750 3,8373,432 3,4573,334 3,334 3,338
1,742 1,6991,682 1,819 1,5371,878 1,878 2,0461,774 1,7861,927 1,794 1,794
2,289 2,073
5,118
5,023 4,843 5,295 5,232
Year
Full-time equivalent (FTE) student by teaching department/program.
*2013-14 FTE were adjusted due to the Department of Applied Linguistics' move from the Faculty of Humanities to the Faculty of Social Science in 2014-15 in order to make the year-to-year comparison more relevant.
Applied Health Sciences
Education Humanities* Mathematics and Science
Social Sciences*Goodman School of Business
17-1816-1715-1614-1513-14 17-1816-1715-1614-1513-14 17-1816-1715-1614-1513-14 17-1816-1715-1614-1513-14 17-1816-1715-1614-1513-14 17-1816-1715-1614-1513-14
2,6412,282 2,321 2,372 2,557 2,622 2,5692,519 2,448 2,466
1,7572,098 2,230 1,959 1,750
2,841 3,0432,696 2,836 2,787
2,160 2,2462,446 2,218 2,223
5,170
5,1645,099 5,164 5,151
Year
2674 37 543188 2 44511 14 70 3856516
2017 international student headcount by Faculty
Total undergraduate students 1,386 Total graduate students 634
Faculty of Applied Health Sciences (FAHS) Goodman School of Business (GSB)Faculty of Education (FOE)Faculty of Humanities (FOH)Faculty of Mathematics and Science (FMS)Faculty of Social Sciences (FOSS)Other
.
2013-14 2014-15 2015-16 2016-17 2017-18Undergraduate (FT) 14,853 14,911 14,656 14,840 14,766 Undergraduate (PT) 2,146 2,243 2,157 2,178 2,289 Graduate (FT) 1,298 1,259 1,264 1,336 1,381 Graduate (PT) 391 411 385 354 352 Total(1) 18,688 18,824 18,462 18,708 18,788
2013-14 2014-15 2015-16 2016-17 2017-18Undergraduate 15,712 15,831 15,578 15,666 15,862 Graduate 1,428 1,387 1,380 1,434 1,558 Total 17,140 17,218 16,958 17,100 17,420
2017 headcount of undergraduate students (%)
InternationalChinaNigeriaIndiaUnited KingdomGermanyOther(includes 88 countries)
Domestic (Ontario)InternationalDomestic (outside Ontario)
90
82
4.8
2.1
.3.6
.2 .2
2017 headcount of graduate students (%)
Domestic (Ontario)InternationalDomestic (outside Ontario)
InternationalChinaIndiaIranGhanaBangladeshOther(includes 47 countries)
60
373
20.8
8.0
4.31.7
.9.9
As the budget report continues to evolve, we once again provide data points to assist users of this report to draw relationships between financial and non-financial data.
The goal is to continue the process of providing meaningful data points to help establish a foundation to explain the “why” behind the revenue and expense values and the outcomes the budget supports. The data points presented in this report were chosen in consultation with Institutional Analysis (IA), with an emphasis on points which have a financial impact. The data points were made available from IA as well as other Units throughout the University. Your suggestions for future budget reports and key data points are always welcome at [email protected]
The second “pullout” after page 22 presents a timeline that includes some major events impacting our financial experience since 1999-2000, when the move to a comprehensive university was proposed and endorsed.
We hope that you find these data points useful and that they encourage constructive and collegial discussion.
Introducing the data points
Students that received OSAP in 2017-18 (%)
Yes: 53 No: 47
Full course equivalents (FCE) offered in 2017-18 (%)
82.8 17.2Spring/SummerFall/Winter
Total 119,638
Total 111,018
15,089
8,623
9,867
8,549
19,696
4,845
6,533
25,293
21,143
13,469
8,929
9,926
9,276
18,981
4,260
6,803
18,590
20,784
Budgeted operating costs ($000s)
Other operating costs
Inter-fund expense
Cost of sales
Library acquisitions
Scholarships and student awards
Financial expenditures
Utilities and taxes
Purchased services
2017-18 Budget
Other operating costs
Inter-fund expense
Cost of sales
Library acquisitions
Scholarships and student awards
Financial expenditures
Utilities and taxes
Purchased services
Repair and maintenance and capital replacement
Repair and maintenance and capital replacement
2018-19 Budget
13%
7%
8%
7%
4%
5%
18%
21%
16%
9%
8%
12%
8%
17%
3%
6%
17%
20%
2018-19 Budget 2017-18 Budget
Personnel group(1) ($000s) Salary/wage Benefits Total personnel costs Salary/wage Benefits Total personnel
costs
Faculty and professional librarians 91,119 19,613 110,732 88,194 19,448 107,642
Admin/professional 42,319 11,336 53,655 40,146 10,445 50,591
CUPE 4207 – Unit 1 13,990 1,527 15,517 13,461 1,394 14,855
OSSTF 8,164 2,633 10,797 8,305 2,521 10,826
CUPE 1295 FT 6,882 2,349 9,231 6,803 2,240 9,043
SAC 4,928 963 5,891 4,627 929 5,556
Other 12,939 1,706 14,645 13,632 1,694 15,326
Total 180,341 40,127 220,468 175,168 38,671 213,839
Transfer to employee future benefits reserve (EFB) (900) (900) (900) (900)
Total personnel 180,341 39,227 219,568 175,168 37,771 212,939
(1) Faculty and professional librarians – BUFA members, Associate Deans, Associate Vice-Presidents of Research and Associate Librarian; Admin/Professional-administrative/professional and exempt staff; CUPE 4207 – Unit 1 instructors, teaching assistants, lab demonstrators, course co-ordinators and marker/graders; OSSTF – support and technical staff; CUPE 1295 FT – full-time maintenance, trades and custodial staff; SAC – Senior Administrative Council; Other – all other union groups, part-time teaching and non-teaching positions and stipend transfers.
Number of undergraduate applicants from 2013 to 2017 self-identified as Indigenous: 979Number of undergraduate registrations from 2013 to 2017 self-identified as Indigenous: 337
The
big
pict
ure
Stu
dent
s dire
ctly
from
se
cond
ary s
choo
l S
tude
nts n
ot di
rect
ly
from
seco
ndar
y sch
ool
<75 75-84 85-89 90-95 >95
<75 75-84 85-89 90-95 >95
2017-18 undergraduate programsentering average grade (%)
4917 20 12
19 48 21 210
2
20172016201520142013
Brock mean entering average of newstudents directly from secondary school (%)
81.5 81.881.280.8 80.9
Year
1 to
Yea
r 2 fl
ow-t
hrou
gh
Class size by year (Full course equivalent).Overall average class size.
Applied Health Sciences
EducationGoodman School of Business
Year 4Year 3Year 2Year 1 Year 4Year 3Year 2Year 1
Mathematics and Science
Year 4Year 3Year 2Year 1
Social Sciences
Year 4Year 3Year 2Year 1Year 4Year 3Year 2Year 1
Humanities
Year 4Year 3Year 2Year 1
110
6062 67
242
3017
88
252
103
25
82
404778
702530 36 18 11
32
71
174
343867
50 42 72
65 6364 62 62
Overall average
2017-182016-172015-162014-152013-14
Class averages are based on 2017-18 Fall/Winter enrolment. The average class size is the lowest it has been in the past five years.
FOSSFMSFOHGSBFAHS
2017-18 undergraduate programs entering average grade (%) by Faculty
79.080.5
81.184.382.3 81.5
Within Faculty (%) Outside of Faculty (%) Source: November 1, Ministry USER-PFIS Files
Applied Health Sciences
EducationGoodman School of Business
Mathematics and Science Social SciencesHumanities
2016201520142013201620152014201320162015201420132016201520162015201420132016201520142013
80.571.6
8.614.3
13.7 12.7
76.376.1
11.617.9
14.117.5
78.071.1 75.8
69.8
56.368.0 65.3 66.7
16.6
8.6
69.7 71.1 74.2 69.8
8.5 6.57.4
3.7 2.7 4.6 5.8
68.370.473.875.6
12.3 12.5 14.3
95.4 97.3
89.185.9
89.8 89.0 89.6 89.0 89.987.3
95.4 97.3
72.9
80.3 77.881.0
78.3 79.6 80.777.2 79.3
76.5 75.0 74.1
Figures represent the tracking of Year 1 students seeking a bachelor’s degree or a first professional degree. The figures represent the percentage of students returning the following November, regardless of year of study.
Parking revenue 2014 to 2019
Parking Services revenue ($000s) Number of permits issued
Note: Starting in 2018-19, permits are no longer required in Zones 1 and 2 for the months of May, June, July and August.
18-19Budget
17-18Budget
16-1715-1614-15
6,614
8,747 8,973
9,199 8,823
3,994 4,091
3,270 3,262
3,727
Campus Store revenue 2014 to 2019
Campus Store revenue ($000s) Sales per student headcount ($)
18-19Budget
17-18Budget
16-1715-1614-15
453
514
9,659 468
496
8,559
9,529 9,344
8,760
516
Residence revenue 2014 to 2019
Residence revenue ($000s) Occupancy (%)
18-19Budget
17-18Budget
16-1715-1614-15
16,439
17,560
18,696
98.70
96.75
98.21
16,08616,473
97.3497.50
Donations 2012 to 2017 ($000s)
Cash donations (includes stock and property) Gifts in kindEndowment donations
Provided by: Development and Alumni Relations.
16-1715-1614-1513-1412-13
117 445
6,510
254
18,978
2,957 2,875 3,105
4,431
158 938
383
1,453
4,7964,150
2012-13 2013-14 2014-15 2015-16 2016-17
2012 to 17 external research grants by Faculty ($000s)
Other unitsSocial SciencesMathematics and ScienceHumanitiesEducationGoodman School of BusinessApplied Health Sciences
3,084 2,9433,422
2,711
468 180
2,670
672 568103 289 389 365322 413 481 250 151
806 481
4,151 3,870 3,9454,450
6,491
2,131 2,289
3,242
1,902 2,199
3,417 3,4943,081
4,0063,567
Other units mainly represent Research Support Funds.
Provided by: Office of Research Services. Grants are presented on a cash basis.
2016-172015-162014-152013-142012-13
14,38515,243
16,389
13,516 13,471 559 5,8447,982
4937,840 6,910
3169,8606,213 1,022
5,5646,930
6466,0086,817
2012 to17 external research grants ($000s)
Tri-council* Other grants Contracts * CIHR, SSHRC, NSERC, CRCs
2017-182016-172015-162014-152013-142012-13
6 6 7 7 8
27 2832 32 31
9
31
Undergraduate co-op programs Graduate co-op programs Total co-op student enrolment
Co-op programs and enrolment
2,293
1,7941,939
2,146 2,1722,273
Und
ergr
adua
te c
lass
siz
e
91% of Brock undergraduate students were employed within six months of graduation.Source: 2016 Ontario UniversityGraduate Survey.
96% of Brock undergraduate students were employed within two years of graduation.Source: 2016 Ontario UniversityGraduate Survey.
83% of fourth-year Brock undergraduate students rated the quality of their overall experience at Brock as very good or excellent (vs. Ontario average of 78 per cent).Source: 2017 National Survey of Student Engagement.
60% of Brock graduate students rated the quality of their overall experience at Brock as very good or excellent (vs. Ontario average of 58 per cent in 2013).Source: 2016 Canadian Graduate and Professional Student Survey.
Pullout 1/iv Pullout 1/v Pullout 1/vi Pullout 1/vii

2018
-19
Bud
get
Repo
rt
BUD
GET
DEV
ELO
PMEN
T
9
2016
-17
Bud
get
Repo
rt
BUD
GET
DEV
ELO
PMEN
T
viii
The budget is a plan to allocate resources in advance for the maximum benefit of stakeholders. It is a method to authorize spending authority and establish revenue targets of units within Brock University.
The 2018-19 budget process was one of consultation with the Senior Administrative Council (multiple updates); the Finance Committee of the Council of Academic Deans (multiple meetings); the Senate Planning, Priorities and Budget Advisory Committee (multiple meetings); in addition to numerous unit-specific meetings. Every effort was made to ensure the budget was consistent with the academic policy of the University, and that it supported the 2010 Integrated Strategic Plan and the 2017-20 Strategic Mandate Agreement (SMA2).
This budget was developed under the direction of the May 7, 2015 Board of Trustees two-part motion: “That the President be given a mandate to:1. Ensure the University funding budget for 2015-16
and all subsequent years are prepared and presented as balanced. If a balanced funding budget cannot be achieved when presented to the Board of Trustees for approval, the deficit can be presented as a mitigation target provided a plan to achieve the mitigation target is included.
2. Manage the affairs of the University in order for it to achieve, or do better than, the funding budget.”
We thank all units that reviewed their operations and submitted their budgets to bring the 2018-19 budget together.
As established three years ago, the timeline for the budget process allows the budget to be completed for approval at the cycle 4 meeting of the Board of Trustees in May to coincide with the start of our fiscal year – running from May 1 to April 30. We thank all units for meeting the requirements of the timeline.
The approach taken to establish the 2018-19 budget was similar to the prior year; incorporating the following objectives:1. Support the Integrated Strategic Plan and the SMA2.2. Provide new investment where critically needed.3. Support ongoing initiatives.4. Continue to simplify the budget and bring financial
and non-financial information together to enhance accountability, understandability and transparency.
1. Support the Integrated Strategic Plan and Strategic Mandate AgreementThis budget was developed to support the 2010 Integrated Strategic Plan and the 2017-20 Strategic Mandate Agreement (SMA2).
2. Provide new investment where critically neededAlthough the 2018-19 budget is balanced, given the risks identified and explained in the Budget Environment section of this report, the mitigation measures of fiscal 2017-18 will remain in effect. However, the long-term growth and development of the University should not be limited to the mitigation actions. Certain areas will need investment for the University to continue to develop. Thus, this section provides additional information in areas where new investment is critically needed. This section provides no priority to any of the functions, tasks or programs identified.
OperationsSome critical and significant University investments have been included as part of the 2018-19 budget. Examples of these investments include continued and increased Indigenous support, additional Library acquisitions, additional support for the Teaching Faculties and service units, support for student wellness and accessibility, and innovative funding for students.
Process and objectives
Pullout 1/viii

Funding for Students
• New to 2018-19, increasing international doctoral fellowships to match the tuition costs.
• New to 2018-19, tuition freeze for international students in research-based master’s and PhD programs.
• Continuation of tuition freeze for domestic continuing master’s and PhD students.
Student Wellness and Accessibility
• Net direct operating budget(1): $1.53 million
• OG FTE(2): 31.1 vs. 26.4 in 2017-18 budget
• Additional grant funding: $0.25 million
brocku.ca/swac/
Library acquisitions
• Net direct operating budget(1): $4.8 million
• Strategic Investment: $0.63 million
• Where is this budgeted: Library
brocku.ca/library
2018
-19
Bud
get
Repo
rt
BUD
GET
DEV
ELO
PMEN
T
11
2018
-19
Bud
get
Repo
rt
BUD
GET
DEV
ELO
PMEN
T
10
Operating funding support for all six of the Teaching Faculties, student awards and services, as well as infrastructure renewal remain key priorities in the 2018-19 budget. In April of 2018, the Senate passed the following motion “THAT the 2018-19 Budget is consistent with the academic policy of the University.” Senate passed this motion subsequent to a year of ongoing consultation and review of academic and fiscal matters relevant to the budget with the Council of Academic Deans and the Senate Planning, Priorities and Budget Advisory Committee.
A sample of some of the investments in the Teaching Faculties are highlighted below.
Brock continues to make inroads into ensuring the University’s affordability through a number of funding initiatives for students.
Brock University’s 2017-20 Strategic Mandate Agreement (SMA2) specifically identifies Indigenous student outreach as one of Brock’s institutional initiatives. This initiative aims “to improve the University experience for Indigenous students and scholars, while also increasing awareness of Indigenous issues and perspectives across campus.” In an effort to support this initiative, the 2018-19 budget provides additional funding for a number of Indigenous areas in the University, as noted below.
The Library acquisition budget was increased by $629,000 in 2018-19. We know the Library is important to both teaching and research, and for this reason, in order to ensure Brock’s Library remains competitive with our peers, the Fiscal Framework establishes a goal of benchmarking our acquisitions on a per student basis against our peers in the Canadian Association of Research Libraries (CARL).
(1) Net direct operating budget equals revenue minus expenses for 2018-19 fiscal year. These budgets do not allocate overhead costs (i.e. support services, space etc.). (2) OG FTE represents 2018-19 budgeted ongoing staff and faculty full-time equivalent positions – excludes temporary contract workers and includes any budgeted but unfilled position.
Brock’s Student Wellness and Accessibility net funding increased by $253,000 from MAESD grants, which facilitated a total increase in spending on their support services by $364,000.
Indigenous support
• New Vice-Provost Indigenous Education and Community Engagement• Continued support of Tecumseh Centre, Aboriginal Student Services,
the Aboriginal stream of Adult Education and the Northern Nishnawbe Education Council
• A tenure-track position in Indigenous Sociology• Targeted scholarship support for Indigenous students• Development of an Aboriginal Governance program with Weengushk Film
Institute• Certificate program with Weekgushk in Film Studies• Three new courses in Indigenous languages
Teaching Faculties
• Total net direct operating budget(1): $137.1 million• Investment in personnel: $2.9 million increase – over 2017-18 budget• Increased work-related placements for students in numerous programs• Innovative I-EQUIP program, which provides students with opportunities to
develop health quality related projects with numerous community partners• Enhanced laboratory experiences for Kinesiology and Health Sciences
students with human cadaver anatomy laboratories, and improved equipment for wet labs
• Opportunities to work with and/or research various populations, such as older adults, cardiac rehabilitation patients, children and youth, and spinal cord injured individuals in clinical, rehabilitation and community settings
• Goodman School of Business use of a new cloud-based admissions platform to streamline the assessment process
• Faculty of Education offering extra cohort of Master’s Preparation Certificate in Education courses
• Faculty of Education continuing teacher education experiential learning in China.
• New string orchestra in Music• New stream in Music – Paths to Music Therapy• Faculty of Mathematics and Science continues the development of lab
experiences for students, field trips, and other key sources of experiential learning
• Tenure-track position in Applied Disability Studies to promote increased graduate spaces, enhancing experiential learning opportunities for students and responding to increased student demand for professional programs.
• Support for both undergraduate and graduate student travel to present research and academic conferences
• Development of an Aboriginal Governance program to be delivered on Manitoulin Island in partnership with Weengushk Film Institute.
• Additional investments in marketing and communications for brand-building initiatives.
• Offering more Indigenous-language courses university-wide through Tecumseh
• Adult education enhancements including online offerings
brocku.ca/academics
InfrastructureSome critical and significant infrastructure investments include the Rankin Family Pavilion project and the Brock District Energy Efficiency Project (DEEP) – Phase 1 funded in part from the Government of Canada’s Post-Secondary Institutions Strategic Investment Fund (SIF) and Phase 2 funded from the Ministry of Advanced Education and Skills Development (MAESD) Greenhouse Gas Campus Retrofits Program (GGCRP) – deferred maintenance across campus including residences, the new Human Resources information system, classroom modernization projects, and improvement of several areas of Brock’s information technology.
The Rankin Family Pavilion project will transform the outdoor space in front of the Schmon Tower, with an enclosed atrium that includes collaborative and digital innovation space, as well as a second level to house and expand commercialization activities. This project will be completed in the summer of 2018.
Rankin Family Pavilion
• Total construction budget: $19.3 million• Funding sources: $8.5 million SIF, $4.9 million from the 2018-19 capital and
related project budget, $3.0 million in donations, $1.5 million of surplus from previous years’ capital and related project budgets, and $1.4 million from the 2017-18 capital and related project budget.
brocku.ca/brock-news/2017/03/board-of-trustees-meeting-highlights-atrium-and-upgraded-power-projects-moving-forward/

Workday Human Resources
• Total project budget: $7.2 million• Assessment and pre-implementation budget: $0.8 million• Implementation budget: $6.4 million• Funding sources: $0.8 million 2016-17 capital and related projects budget,
$2.3 million 2017-18 capital and related projects budget, $3.5 million of the 2018-19 capital and related project budget and $0.6 million of pre-encumbrance of the 2019-20 capital and related projects budget.
brocku.ca/brock-news/2017/11/brock-human-resources-preparing-to-launch-new-system/ 20
18-1
9 B
udge
t Re
port
BU
DG
ET D
EVEL
OPM
ENT
13
2018
-19
Bud
get
Repo
rt
BUD
GET
DEV
ELO
PMEN
T
12
The first phase of Brock’s District Energy Efficiency Project (DEEP) project is replacing half of the existing natural gas-powered co-gen engines with state-of-the-art, high-efficiency, electronically controlled units. The project is expected to be completed this summer. DEEP Phase 2, which is being funded entirely through the GGCRP, will replace the remaining co-gen engines and install a new high-efficiency electric chiller unit. Work is expected to be wrapped up by March 2019.
The completed DEEP project will result in Brock’s annual NOx (nitrogen oxide) gas emissions dropping by 85 per cent and reducing the non-methane hydrocarbons by 73 per cent. The new co-generation engines will also consume 26 per cent less fuel and result in hundreds of thousands of dollars in utility cost saving each year.
The 2018-19 capital and related projects budget also includes a new investment of $500,000 toward classroom modernization.
Also included in the 2018-19 capital and related projects budget is $2,070,000 of investment in residences, which includes $1,115,000 of deferred maintenance projects. The investments range from proximity card upgrades to Village residence renewal.
Human Resources (HR) currently runs on old legacy systems and applications that are beyond end of life and considered high risk. Replacement is required as soon as possible. The HR component of Workday, which will replace the current HR system, is a modern cloud-based system that will provide an integrated system with Workday Finance, improved access to information and better HR service delivery. This project is scheduled to be live with Phase 1 on July 1, 2018.
The full 2018-19 capital and related projects plan can be found starting on page 75.
Brock DEEP Phase 1 and 2
Brock DEEP Phase 1• Total construction budget: $10.8 million• Funding sources: $5.2 million SIF, $1.3 million from the 2018-19 capital and
related project budget, $2.6 million from the 2017-18 capital and related project budget ($1.3 million of which is Facilities Renewal Program Funds), $1.0 million of one-time Facilities Renewal Program Funds received in 2016-17, $0.3 million of the general 2016-17 Facilities Renewal Program Funds (reallocated mid-year from other projects), $0.3 million from the sale of equipment and $0.1 million reallocated from a 2015-16 capital project.
Brock DEEP Phase 2• Total construction budget: $7.9 million• Funding sources: $7.9 million from GGCRP
brocku.ca/brock-news/2018/03/7-9-million-in-provincial-funding-means-green-light-for-brocks-green-energy-project/
3. Support ongoing initiativesAs part of the Budget Details section of this report, Figure 38 provides a high-level overview of where budget dollars are allocated by detailing the net revenue and expenses of the following areas: Teaching Faculties, Academic Support, Student Specific, Shared Services, Ancillary, Space and Global. In addition to this high-level information, this budget report has additional information on each of the individual units grouped into these categories in the section of responsibility centres on pages 46 to 73. These pages provide information on the various units of the University and the Faculties, and specifically provide links to their strategic plans and accomplishments.
This section serves to highlight some specific ongoing initiatives supported by the budget. There is no priority to any of the functions, tasks or programs identified.
The Cool Climate Oenology and Viticulture Institute (CCOVI) at Brock University is an internationally recognized research institute focused on the research priorities of the Canadian grape and wine industry, and the continuing educational and outreach-service needs of that community.
CCOVI is currently embarking on a $2.4-million project that expands and enhances its fermentation, wine flavour and consumer behaviour facilities as a result of a $960,000 grant from Canadian Foundation for Innovation (CFI), announced in Oct. 2017, a matching grant from the Ontario Research Fund, announced in Jan. 2018, plus contributions from the grape and wine industry. This project will help CCOVI establish the world’s first mediated-reality wine consumer laboratory that will combine sights, smells and sounds to help researchers study the science of consumer choice in the wine industry. The project also includes expanding the capacity of CCOVI’s research winery to include a state-of-the-art fermentation facility, as well as the purchase of several advanced analytical instruments required for grape and wine flavour and aroma analysis.
The 2018-19 budget continues to support the Human Rights and Equity Services unit. The 2018-19 budget increased by $0.13 million. The Human Rights and Equity Services unit is a resource for all Brock community members to provide information, education, assistance and advice on issues related to human rights harassment and discrimination.
Human Rights and Equity Services
• Net direct operating budget(1): $0.6 million
• Where this is budgeted: Shared Services Support
• OG FTE(2): 4.0
brocku.ca/human-rights/
(1) Net direct operating budget equals revenue minus expenses for 2018-19 fiscal year. These budgets do not allocate overhead costs (i.e. support services, space etc.). (2) OG FTE represents 2018-19 budgeted ongoing staff and faculty full-time equivalent positions – excludes temporary contract workers and includes any budgeted but unfilled position.
CCOVI
• Net direct operating budget(1): $0.5 million
• Where this is budgeted: transfer from Research Services to the Research With no External Obligations Fund.
brocku.ca/ccovicuvee.ca

2018
-19
Bud
get
Repo
rt
BUD
GET
DEV
ELO
PMEN
T
14
2018
-19
Bud
get
Repo
rt
BUD
GET
DEV
ELO
PMEN
T
15
4. Continue to simplify the budget and bring financial and non-financial information together to enhance accountability, understandability and transparency.
The Department of Development and Alumni Relations is responsible for Brock’s philanthropic activity, alumni engagement and capital fundraising campaigns.
The mission statement of Brock athletics is to enrich the overall student life experience by providing quality sport programs and leadership in the pursuit of athletic excellence. It provides students with the opportunity to take part in athletics both as participants and fans.
The majority of the utilities are shown in the Utilities, Taxes and Insurance responsibility centre on page 70.
Development and Alumni Relations
• Net direct operating budget (1): $1.6 million
• Five-year average annual funds raised (2013-14 to 2017-18 as of April 9, 2018) $6.2 million
• OG FTE (2): 18.5
brocku.ca/bold-new-brock
Brock Athletics and Intramurals
• Number of athletic teams and athletes: 45 teams and 910 athletes
• Number of intramurals and athletes: 741 teams and 3,328 athletes
• Net direct operating budget of Brock Sports and Recreation(1): $1.4 million
gobadgers.ca
The majority of the scholarships, bursaries and student awards are shown in the Scholarships, Bursaries and Student Awards responsibility centre on page 71. These funds represent six per cent of total revenue.
Scholarships, Bursaries and Student Awards
• Undergraduate $13.2 million• Graduate:$8.3 million• Funding sources: $19.7 million (91%) operating costs and $1.8 million (9%)
endowment.
brocku.ca/international-recruitment/funding-costs/
brocku.ca/safa/awards
brocku.ca/graduate-studies/fgs-awards
To everyone involved in the budget development, congratulations and thank you for making this balanced budget possible. Furthermore, this year’s report continues the linkage of financial and non-financial data through a strong partnership with Financial Services and Institutional Analysis. We suspect this information will generate discussion, which is encouraged.
It is anticipated that future budget reports will continue to build and add to the financial and non-financial data disclosed herein. Discussing both financial and non-financial
data together will help support ongoing efforts to ensure a fiscally responsible budget while paying close attention to quality and academic outcomes.
It is hoped that the efforts made throughout the development of this budget have enhanced its accountability, understandability and transparency. Feedback is always encouraged and welcomed, and can be directed to [email protected]
Utilities (in $millions)
brocku.ca/facilities-management/maintenance-operations/utilities
2.2 1.44.020
17-18
2.7
Hydro WaterHeating and cooling
Hydro WaterHeating and cooling
1.33.3
2018
-19
Utilities ($millions)
(1) Net direct operating budget equals revenue minus expenses for 2018-19 fiscal year. These budgets do not allocate overhead costs (i.e. support services, space etc.). (2) OG FTE represents 2018-19 budgeted ongoing staff and faculty full-time equivalent positions – excludes temporary contract workers and includes any budgeted but unfilled position.

2018
-19
Bud
get
Repo
rt
FRA
MEW
ORK
17
2018
-19
Bud
get
Repo
rt
FRA
MEW
ORK
16
The budget environment for the University is dominated by government policy, enrolment and the decisions we as a University make. These same factors were identified in last year’s budget report, the 2018-19 Fiscal Framework Update, and continue today.
The topics identified in this section should not detract from the emphasis put on the 2017-20 Strategic Mandate (SMA2) Agreement or 2010 Integrated Strategic Plan. This discussion on the budget environment only serves to highlight three areas that significantly impact the fiscal framework and budget development.
Government policyBrock continues to appreciate its strong and collaborative relationship with the Province of Ontario through the Ministry of Advanced Education and Skills Development (MAESD). Despite the MAESD’s fiscal constraint, they continue to add to the list of Brock projects they back with funding support, most recently through a commitment of $7.9 million to complete Phase 2 of Brock’s District Energy Efficiency Project (DEEP), funded by the MAESD’s Greenhouse Gas Campus Retrofits Program (GGCRP) Innovation Grant Fund. The DEEP project will significantly upgrade and modernize Brock’s co-generation facility. See page 12 for more details on this project.
As described in the 2017-18 Budget Report, entering 2017-18, the MAESD released a redesigned funding model for universities. The new university funding model has three major categories of funding:• A Core Operating Grant (COG), where institutions will
receive a base level of operating funding based on a specific level of eligible university enrolment or Weighted Grant Units (WGU). The COG will be governed by an enrolment corridor mechanism (see pages 32-33 in the 2017-18 Budget Report for a more detailed explanation of the new government grant model);
• A new Differentiation Envelope with a performance portion to allow funding to be allocated based on performance against metrics in priority areas, as well as mission-related funding; and
• Special Purpose Grants to address government and system-wide priorities such as improving access for Indigenous learners and students with disabilities.
Despite this funding reform, Brock remains the lowest funded university in the province on a per student basis, which is demonstrated through the level of differentiation funding Brock received relative to our peers, as shown in Figure 7. The MAESD has achieved its goal of creating an equal portion of funding per eligible enrolment through the Core Operating Grant; however, variations in the system still persist and are now captured within the Differentiation Grant Envelope. While this demonstrates an ongoing fiscal challenge for Brock to compete against higher funded universities, we do recognize that Brock has the lowest proportion of grant at risk compared to those with higher differentiation funding.
Budget environment
Weighted average top 10 Ontario universities
Weighted average all Ontario universities
Brock
Differentiation Grant per WGUCore Operating Grant per WGU
$112$293
$378
$2,912 $2,912 $2,912
2015-16 Core Operating and Differentiation Grants Envelopeper weighted grant unit (WGU)
Brock vs Ontario universities
Figure 7
Source: MAESD's Feb. 2017 technical release of the funding model.
The Province has also removed automatic funding for enrolment growth of undergraduate students, previously funded through the Undergraduate Accessibility Grant. That said, the Province did increase the number of funded master’s and PhD students through Brock’s SMA2 negotiations. Overall increases in funded graduate spaces included 14.7 per cent in 2017-18, 7.8 per cent in 2018-19 and 5.2 per cent in 2019-20. This was an important investment Brock achieved in the SMA2 negotiations as in 2016-17, 60.7 master’s FTEs went unfunded.
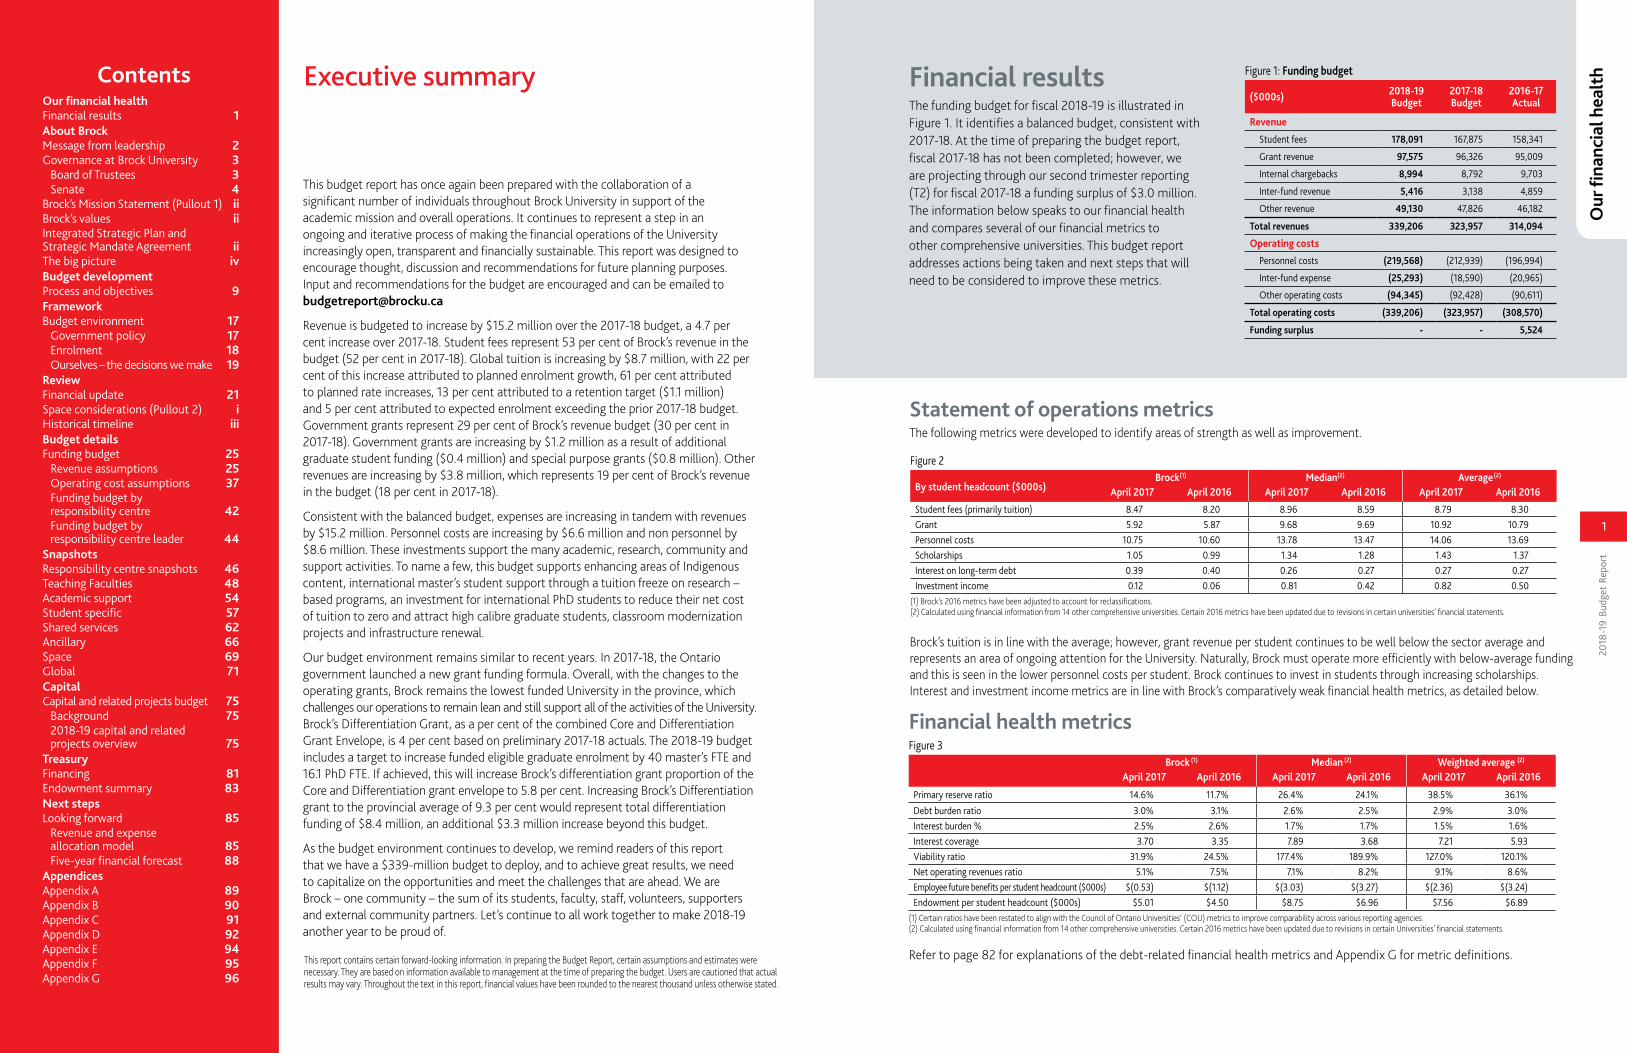
EnrolmentThe 2017-18 Budget Report discussed the Statistics Canada (Stats Can) forecast for 18 to 20 year olds, suggesting a decline in this demographic group in the order of 10 per cent over 10 years. Stats Can has recently revised their projection for this demographic group and the change is significant. The new forecast for 18 to 20 year olds is relatively flat over the next 10 years, as shown in Figure 8. Projections by region increased for all regions, with the highest increases in Toronto and the GTA, see Figure 9 for updated population projections by region.
2018
-19
Bud
get
Repo
rt
FRA
MEW
ORK
18
2018
-19
Bud
get
Repo
rt
FRA
MEW
ORK
19
See Figure 10 for historical headcount enrolment and 2018-19 forecasts for all-in enrolment and degree seeking students.
Figure 10
University funding is heavily dependant on student enrolment; therefore, universities will naturally compete to maintain or increase their enrolment. Looking forward, we know that competition for students will only increase; therefore, we must continue to challenge ourselves to find
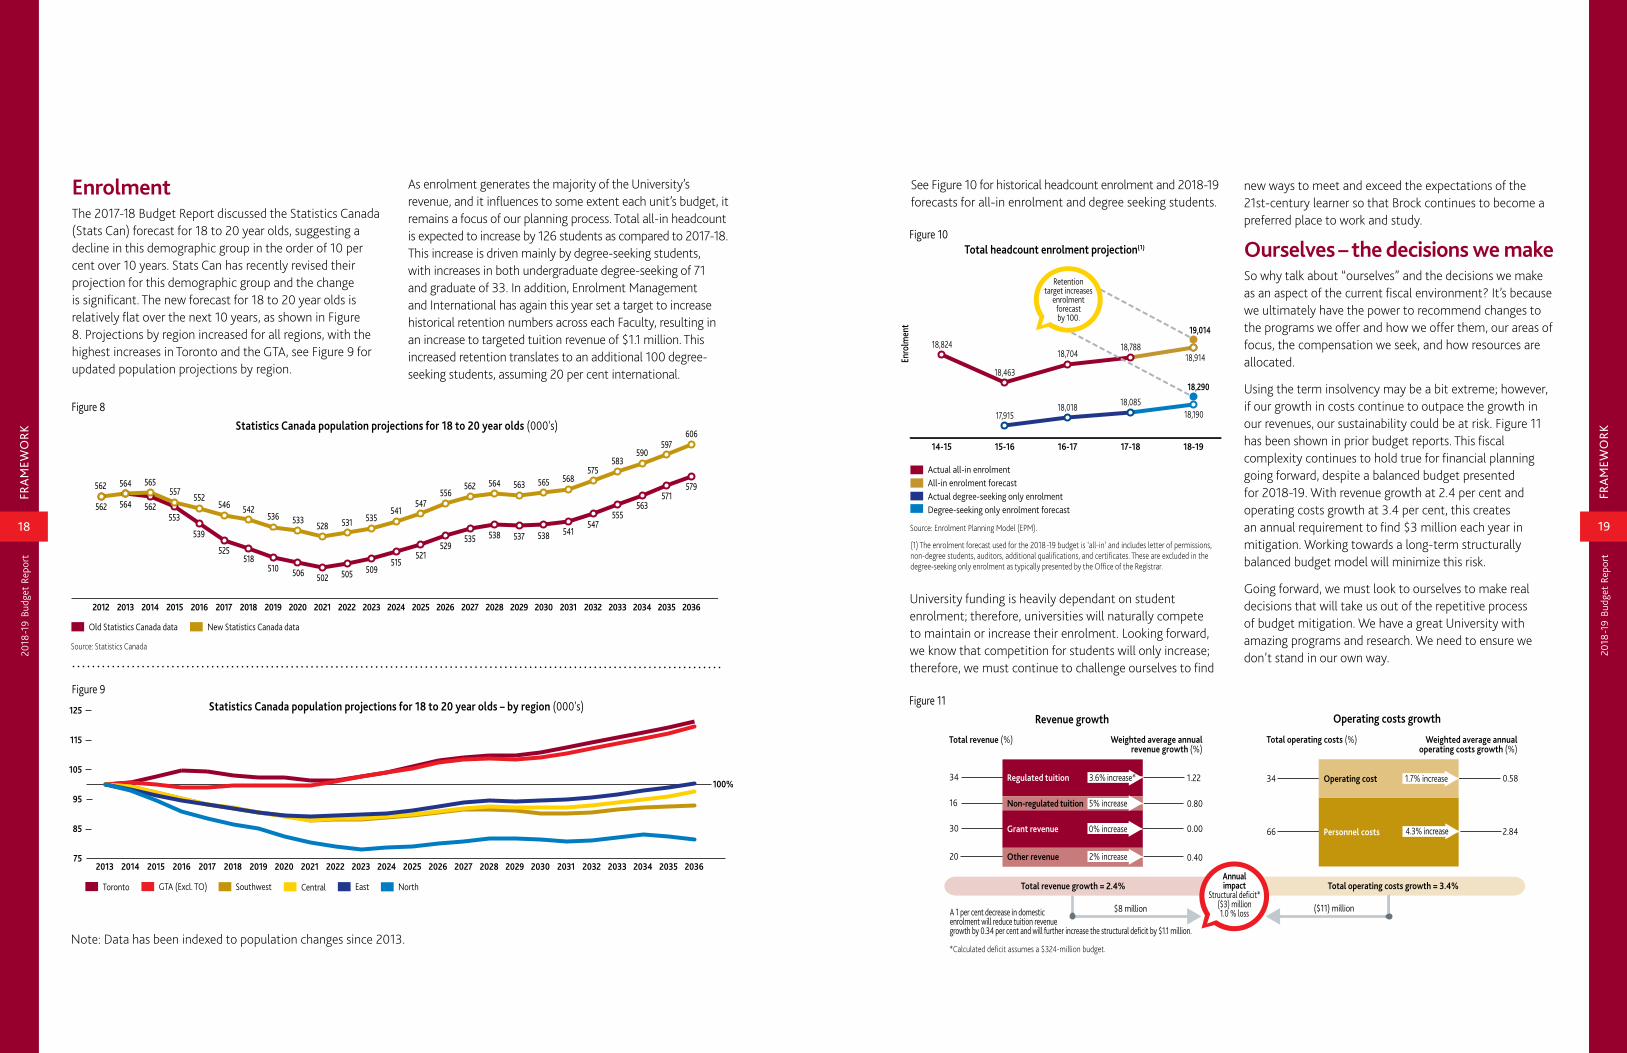
34
16
30
20
Regulated tuition
Non-regulated tuition
Grant revenue
Other revenue
Total revenue (%) Weighted average annual revenue growth (%)
Total revenue growth = 2.4% Total operating costs growth = 3.4%
Revenue growth
5% increase
0% increase
3.6% increase* 1.22
0.80
0.00
0.40
34
66
Operating cost
Personnel costs
Total operating costs (%) Weighted average annual operating costs growth (%)
Operating costs growth
0.58
2.84
$8 million
Annualimpact
Structural deficit*($3) million1.0 % loss
*Calculated deficit assumes a $324-million budget.
A 1 per cent decrease in domesticenrolment will reduce tuition revenuegrowth by 0.34 per cent and will further increase the structural deficit by $1.1 million.
($11) million
2% increase
1.7% increase
4.3% increase
Figure 11
As enrolment generates the majority of the University’s revenue, and it influences to some extent each unit’s budget, it remains a focus of our planning process. Total all-in headcount is expected to increase by 126 students as compared to 2017-18. This increase is driven mainly by degree-seeking students, with increases in both undergraduate degree-seeking of 71 and graduate of 33. In addition, Enrolment Management and International has again this year set a target to increase historical retention numbers across each Faculty, resulting in an increase to targeted tuition revenue of $1.1 million. This increased retention translates to an additional 100 degree-seeking students, assuming 20 per cent international.
new ways to meet and exceed the expectations of the 21st-century learner so that Brock continues to become a preferred place to work and study.
Ourselves – the decisions we makeSo why talk about “ourselves” and the decisions we make as an aspect of the current fiscal environment? It’s because we ultimately have the power to recommend changes to the programs we offer and how we offer them, our areas of focus, the compensation we seek, and how resources are allocated.
Using the term insolvency may be a bit extreme; however, if our growth in costs continue to outpace the growth in our revenues, our sustainability could be at risk. Figure 11 has been shown in prior budget reports. This fiscal complexity continues to hold true for financial planning going forward, despite a balanced budget presented for 2018-19. With revenue growth at 2.4 per cent and operating costs growth at 3.4 per cent, this creates an annual requirement to find $3 million each year in mitigation. Working towards a long-term structurally balanced budget model will minimize this risk.
Going forward, we must look to ourselves to make real decisions that will take us out of the repetitive process of budget mitigation. We have a great University with amazing programs and research. We need to ensure we don’t stand in our own way.
New Statistics Canada dataOld Statistics Canada data
Source: Statistics Canada
2036203520342033203220312030202920282027202620252024202320222021202020192018201720162015201420132012
562
562 562553
539
525518
510 506 502 505 509515
521529
535 538 537 538 541547
555563
571579
564
564 565557
552546 542
536 533528 531 535
541547
556562 564 563 565 568
575583
590597
606Statistics Canada population projections for 18 to 20 year olds (000's)
Figure 8
Figure 9
Toronto GTA (Excl. TO) Southwest Central East North
75
85
95
105
115
125
North
East
Central
Southwest
GTA (Excl. TO)
Toronto
203620352034203320322031203020292028202720262025202420232022202120202019201820172016201520142013
Statistics Canada population projections for 18 to 20 year olds – by region (000's)
100%
Note: Data has been indexed to population changes since 2013.
Actual all-in enrolmentAll-in enrolment forecastActual degree-seeking only enrolmentDegree-seeking only enrolment forecast
Source: Enrolment Planning Model (EPM).
(1) The enrolment forecast used for the 2018-19 budget is ‘all-in’ and includes letter of permissions, non-degree students, auditors, additional qualifications, and certificates. These are excluded in the degree-seeking only enrolment as typically presented by the Office of the Registrar.
18-1917-1816-1715-1614-15
18,824
18,463
18,704 18,788
18,914
17,915 18,018 18,085
18,190
19,014
18,290
Enr
olm
ent
Total headcount enrolment projection(1)
Retention target increases
enrolment forecast by 100.
2018
-19
Bud
get
Repo
rt
REV
IEW
21
2018
-19
Bud
get
Repo
rt
REV
IEW
20
At the time of writing this budget report, we are projecting through our second trimester reporting (T2) for fiscal 2017-18 a funding surplus of $3.0 million. The T2 reporting can be found at brocku.ca/about/university-financials/#reports-2017-18. The majority of the surplus was driven by lower than budgeted salary and benefit costs as a result of positions included in the budget but not filled during the year either partially or entirely. At year end, this projection will be updated to actual results in the 2017-18 Annual Report.
After a challenging year of prioritizing spending and reducing costs where possible, we are showing a balanced budget for the second year in a row, after more than a decade of deficit budgets.
The 2018-19 budget was established with certain key assumptions:1. The initial enrolment forecast shows a 71-student
headcount increase in degree-seeking undergraduate students, and an increase of 33 degree-seeking graduate students, or 126 overall, including non-degree seeking students.
2. In addition, an incremental tuition target of $1.1 million was added to the budget driven by Enrolment Management and International’s ongoing retention strategies. This tuition could translate into an additional increase to undergraduate headcount of 100 students, with 20 per cent being international students.
3. The budgeted investment income increased by $0.3 million, which represents a risk depending on interest rates into 2018-19.
4. No further change in the Province’s tuition policy.5. Grants in 2018-19, will be consistent with those
budgeted in 2017-18 plus an additional $0.4 million increase related to graduate students. More information is available on this in the grant section starting on page 32.
6. Although we are budgeting to have a balanced budget again in 2018-19, the mitigation measures of fiscal 2017-18 will remain in effect due to the risk inherent in the longer-term budget forecast.
These measures will assist us in meeting our target of a year-end balanced result, or better. Steps are also required to find a way to permanently eliminate the need for these mitigation measures and ensure we remain financially
sustainable where revenues naturally grow in harmony with the rate of growth in our expenditures. The “Looking forward” section can be found on page 85, which further reviews this topic and links future planning to the Fiscal Framework.
The Looking forward section also describes the next phase of the University’s budget – a revenue and expense allocation model which is integrated as a component of the Fiscal Framework.
Financial update

2018
-19
Bud
get
Repo
rt
TEX
T TE
XT
i
e
2018
-19
Bud
get
Repo
rt
REV
IEW
22 i
2015
-16
Budg
et R
epor
t RE
VIE
W
Historical timelineIn planning for the future, it can be useful to look back and ask “how did we get here?” The chart and historical timeline provided here attempts to rewind the clock and identify some key decisions with significant financial impact that have occurred since 1999-2000. These key decisions have been identified on the timeline along with an undergraduate and graduate student headcount and a faculty, professional librarian and staff headcount. The chart begins in 1999-2000, as this is when Institutional Analysis began publishing these data points (brocku.ca/institutional-analysis/brock-facts). It also closely coincides with when the move to a comprehensive university was proposed and endorsed. An interesting observation is that the student to faculty and librarians, and the staff to faculty and librarians ratios are the same level or lower in 2017-18 as they were in 1999-2000.
Note: The faculty and professional librarians headcount figures accumulated and presented by Institutional Analysis as part of Brock Facts, represent roster data (i.e. all employees holding a faculty position in the academic year). The staff headcount figures are from the Human Resources Information System (HRIS) and represent headcount as of Oct. 1 of each year.
Revenue Expense Surplus/(deficit)
Historical audited financial results ($ millions)
0
(1.4)
1.42.9
(1.7)
13.2
10.2
7.3 7.4
(4.6)
(16.1)
(7.6)(5.8)
(1.9) (2.2)
1.0
6.4
8.8
16.9
1999-00 2000-01 2001-02 2002-03 2003-04 2004-05 2005-06 2006-07 2007-08 2008-09 2009-10 2010-11 2011-12 2012-13 2013-14 2014-15 2015-16 2016-17
95 105 119 133 174 198 204 224 221 229 245 260 271 286 299 313 313 324 94 106 116 134 161 188 197 217 226 245 253 266 273 288 298 296 307 315
Note: The figures were obtained from the audited financial statements of Brock University, which were prepared in accordance with the Canadian generally accepted accounting principles for not-for-profit organizations (1999-00 to 2010-11) and in accordance with Canadian accounting standards for not-for-profit organizations (2011-12 to 2016-17).
Figure 12
Space usage
CategoryEstimate 2017 (1) Actual 2016 (1)
Metres 2 % Metres 2 %
Classroom facilities 13,061 6% 13,098 6%
Laboratory – undergraduate 10,117 5% 10,370 5%
Research laboratory space 12,803 6% 12,866 6%
Academic departmental office and related 19,571 9% 19,636 9%
Library facilities and library study space 6,700 3% 6,584 3%
Athletic/recreation space 9,382 4% 9,164 4%
Food service 5,206 2% 5,206 2%
Bookstore and other merchandising facilities 1,409 1% 1,436 1%
Plant maintenance 2,523 1% 2,538 1%
Central administrative office and related 9,310 4% 9,729 4%
Non-library study space 4,329 2% 4,446 2%
Central services 2,226 1% 3,571 1%
Health service facilities 815 0% 902 0%
Common use and student activity space 1,433 1% 1,494 1%
Assembly and exhibition facilities 2,608 1% 2,573 1%
Residential space 48,288 22% 48,239 22%
Animal space 169 0% 169 0%
Other University facilities 2,219 1% 2,219 1%
Health science clinical facilities 708 0% 687 0%
Net non-assignable square metres (NNASM) (2) 69,864 31% 68,270 31%
Total 222,742 100% 223,198 100%
(1) The 2016 data was prepared for submission to the Council of Ontario Universities’ Triennial report that takes place every three years. The data is as of Nov. 1, 2016, but was updated after the original submission, so some of the numbers may be different than what was shown in the 2017-18 Budget Report. 2017 estimate data is included as an updated comparison to the 2016 data.(2) NNASM includes items such as central utilities plants, corridors, stairwells, elevators, service tunnels and parking structures. Deferred maintenance ($ millions) – Total $167
Facilities condition index (1) – Total 0.18
Total 99,376
Replacement value ($ millions) – Total $925
Deferred maintenance 2017
Cairnsbuilding
MackenzieChown
Complex
Central Utilitiesbuilding (2)
Eastbuildings
Electricaldistribution
Infrastructure (3)
Main – other (4)
MIWSFPA
Plazabuilding
Residencebuildings
Satellitebuildings (5)
Schmon Tower
Servicetunnels
Thistle
WalkerComplex
Welch Hallbuilding
0
37
332
362
206
16
11
280
260
349
2067
61
48
81
132
1
5213
4815
296
29
111
119
0.00
0.31
0.05
0.07
0.29
0.34
0.14
0.00
0.02
0.22
0.25
0.30
0.02
0.26
0.31
0.20
Source: VFA Asset List Report, 2010-2017(1) Facilities Condition Index (FCI): Represents replacement value divided by deferred maintenance backlog. (2) Central Utilities Building: Mainly relates to the Cogeneration Facility and also includes Facilities Management offices. (3) Infrastructure: Includes many of the non-building assets such as parking lots, storm sewers and roadways. (4) Main – other: All buildings on the main campus that are not specifically identified. (5) Satellite buildings: Includes Brock Research and Innovation Centre, Hamilton campus and Rodman Hall Art Centre.
Spac
e co
nsid
erat
ions
Figure 14 Figure 15
The following charts present two different ways of examining space at the University. Figure 14 details the space usage by category as of 2016, which was prepared for the Council of Ontario Universities’ Survey of Physical Facilities, as well as an updated estimate for 2017. Only 69 per cent of the University’s space is assignable to specific functions, while 31 per cent is non-assignable, meaning that it relates to items such as utility plants, corridors and hallways. Figure 15 details the deferred maintenance backlog by asset type and compares this to the replacement value of those assets. This information was obtained from the condition assessment performed by VFA Inc. (through Council of Ontario Universities) in October 2017, which determined that Brock has $167 million in deferred maintenance requirements that have accumulated over a number of years of under-investing. In addition, the chart details the Facility Condition Index (FCI) (deferred maintenance divided by the current replacement value), which determines the relative condition of the asset. The lower the FCI, the better the condition of the asset. For example, MIWSFPA has the lowest FCI and is the newest building, while buildings with higher FCIs are generally older, such as the Thistle building and the Schmon Tower. Brock’s overall FCI is 0.18, which translates to “poor.”
Pullout 2/i

Alan Earp Residence construction completed
Scotia Bank Hall construction completed
Academic South construction
completed
Walker Complex construction
completed
Rodman Hall Art Centre acquired
Plaza Buildingconstruction
completed
Welch Hall expansion completed
International Centre construction
completed
Cairns construction
completed
Goodman School of Business expansion and Rankin Family Pavilion construction started
MIWSFPA construction
completed
His
toric
al ti
mel
ine
Faculty and LibrariansPermanent Staff
Graduate HeadcountUndergraduate Headcount
Facu
lty
and
staf
f he
adco
unt
Stud
ent
head
coun
t
Double cohort ended
Union groupCUPE 4207– Unit 2 (ESL
Co-ordinators)was certified
Union group CUPE 2220 (Rodman Hall Art Centre)
was assumed
44 graduateprograms
49 graduateprograms
40 graduateprograms25 graduate
programs8 graduateprograms
Union group OSSTF (support staff) was certified
Union group CUPE 4207–Unit 3 (ESL Instructors) and
IATSE (Theatre Technicians, etc.) was certified
Required full-course
load for facultychanged from 3 to 2.5
Required full-course load for
faculty changed from 2.5 to 2
Double cohort began
1,130 full-course equivalents offered
1,489 full-course equivalents
offered
1,588 full-course equivalents
offered
1,741 full-course equivalents
offered
1,718 full-course equivalents
offered
1,746 full-course equivalents
offered
1999-00 2000-01 2001-02 2002-03 2003-04 2004-05 2005-06 2006-07 2007-08 2008-09 2009-10 2010-11 2011-12 2012-13 2013-14 2014-15 2015-16 2016-17 2017-18
Figure 13
Faculty and librarians 348 380 399 449 507 533 560 609 595 614 596 603 599 608 616 611 603 607 614
Ongoing staff 506 552 580 606 637 708 766 816 831 915 923 895 922 961 964 919 912 921 938
Staff to faculty and librarians ratio 1.5 1.5 1.5 1.3 1.3 1.3 1.4 1.3 1.4 1.5 1.5 1.5 1.5 1.6 1.6 1.5 1.5 1.5 1.5
Graduate headcount 638 639 647 671 858 1,065 1,053 1,169 1,259 1,419 1,544 1,536 1,534 1,630 1,689 1,670 1,649 1,690 1,733
Undergraduate headcount 10,346 10,777 11,269 12,458 14,669 15,532 16,356 16,284 15,747 15,431 15,949 16,341 16,656 16,882 16,999 17,154 16,813 17,014 17,055
Student to faculty and librarians ratio 32 30 30 29 31 31 31 29 29 27 29 30 30 30 30 31 31 31 31
Source: Brock Facts. Visit brocku.ca/institutional-analysis/brock-facts
Pullout 2/iiiPullout 2/ii

2018
-19
Bud
get
Repo
rt
TEX
T TE
XT
iv
2018
-19
Bud
get
Repo
rt
BUD
GET
DET
AIL
S
25iv
The funding budget is used to communicate revenue targets and expense approvals. It fundamentally tracks where cash has been allocated. Figure 16 details the funding budget for 2018-19 in comparison to the 2017-18 budget and 2016-17 actual. Some reclassifications were made to the 2017-18 budget for comparison purposes when the overall funding budget was not impacted. See Appendix C for reconciliation of these reclassifications.
Figure 16
($000s) 2018-19Budget
2017-18Budget
2016-17Actual
Revenue
Student fees 178,091 167,875 158,341
Grant revenue 97,575 96,326 95,009
Internal chargebacks 8,994 8,792 9,703
Inter-fund revenue 5,416 3,138 4,859
Other revenue 49,130 47,826 46,182
Total revenues 339,206 323,957 314,094
Operating costs
Personnel costs (219,568) (212,939) (196,994)
Inter-fund expense (25,293) (18,590) (20,965)
Other operating costs (94,345) (92,428) (90,611)
Total operating costs (339,206) (323,957) (308,570)
Funding surplus - - 5,524
Tuition revenueTuition revenue, defined as a fee charged for educational instruction, is budgeted to be $170.3 million, $9.8 million over the 2017-18 budget and $20.1 million over 2016-17 actual. Of the total tuition revenue, $150.4 million ($141.7 million in 2017-18) is budgeted in the University Global responsibility centre, the remaining $19.9 million ($18.9 million in 2017-18) is budgeted in the Faculties as well as Brock International. Figure 18 details the tuition revenue by program type, separated by where the tuition is reported. Overall, international student programs (ISPs) are budgeted to generate an increase of $1.8 million over the 2017-18 budget, while other self-funded programs are budgeted to experience a decrease of $0.8 million over the 2017-18 budget. See Appendix B for approved tuition fee increases.
Figure 17
($000s) 2018-19Budget
2017-18Budget
2016-17Actual
Tuition 170,332 160,558 150,272
Fee revenue 7,759 7,317 8,069
Total student fees 178,091 167,875 158,341
2015
-16
Budg
et R
epor
t BU
DG
ET D
ETA
ILS
Funding budget
Revenue assumptions Student fees Student fees include both tuition and fee revenue, and represent 53 per cent of total revenue (52 per cent in 2017-18). Student fees are budgeted to be $178.1 million for 2018-19, which is detailed in Figure 17. Student fees are projected to increase by $10.2 million over the 2017-18 budget and $19.8 million as compared to 2016-17 actual.
Pullout 2/iv

2018
-19
Bud
get
Repo
rt
BUD
GET
DET
AIL
S
27
2018
-19
Bud
get
Repo
rt
BUD
GET
DET
AIL
S
26
Figure 18
($000s) 2018-19 Budget
2017-18 Budget
2016-17Actual
Total tuition revenue budgeted in University Global 150,439 141,667 134,397 (1)
Tuition revenue budgeted in respective departments
Professional Master’s Preparation Certificate (Business) (PMPC) 757 801 801 (2)
International Master of Business Administration (IMBA) 8,516 7,763 6,895 (2)
International Master of Professional Accounting (MPAcc) 2,653 1,835 1,461 (2)
Master’s Preparation Certificate in Education (MPCE) 586 419 451 (3)
International Master of Education (MEd) 1,219 1,161 870 (3)
Master of Arts Applied Linguistics (MA LING) 149 147 57 (4)
International Master of Science in Materials Science 140 105 39 (5)
Total international student programs (ISP)s 14,020 12,231 10,574
Continuing Teacher Education – Additional Qualifications (AQ) 636 950 623 (3)
Center for Adult Education and Community Outreach (CAECO) * 871 920 941 (3)
Other Education programs 12 199 (3)
Intensive English Language Program (IELP) 3,944 4,230 3,286 (6)
Summer English Language Program (SELP) 410 361 451 (6)
Total other self-funded programs 5,873 6,660 5,301
Tuition revenue budgeted in respective department 19,893 18,891 15,875
Total tuition revenue 170,332 160,558 150,272
* Includes Aboriginal Adult Education.Departments the Tuition Revenue is reported in: (1) University Global; (2) Goodman School of Business; (3) Faculty of Education; (4) Faculty of Social Sciences; (5) Faculty of Mathematics and Science; (6) Brock International.
Figure 19
($000s) 2018-19Budget
2017-18Budget
2016-17Actual
Tuition revenue budgeted in University Global
Undergraduate – domestic
Faculty of Applied Health Sciences 25,160 23,486 21,910
Goodman School of Business 21,802 19,700 18,977
Faculty of Education 6,288 5,802 6,007
Faculty of Humanities 10,647 9,809 10,267
Faculty of Mathematics and Science 12,438 11,170 11,135
Faculty of Social Sciences and undeclared arts 30,196 30,605 30,236
Other (1) 277 451 264
Total undergraduate – domestic 106,808 101,023 98,796
Graduate – domestic
Faculty of Applied Health Sciences 1,526 1,268 1,175
Goodman School of Business 1,413 1,508 1,289
Faculty of Education 1,347 1,179 1,245
Faculty of Humanities 554 493 520
Faculty of Mathematics and Science 993 693 711
Faculty of Social Sciences 2,630 2,699 2,592
Total graduate – domestic 8,463 7,840 7,532
Total domestic 115,271 108,863 106,328
Undergraduate – international
Faculty of Applied Health Sciences 1,515 1,420 1,319
Goodman School of Business 12,440 11,479 10,755
Faculty of Education 73 47 43
Faculty of Humanities 810 425 523
Faculty of Mathematics and Science 4,438 2,757 2,837
Faculty of Social Sciences and undeclared arts 11,189 9,640 9,095
Other (1) 69 130 119
Total undergraduate – international 30,534 25,898 24,691
Graduate – international
Faculty of Applied Health Sciences 184 182 141
Goodman School of Business 1,792 1,379 1,378
Faculty of Education 78 120 66
Faculty of Humanities 133 141 107
Faculty of Mathematics and Science 864 1,392 1,118
Faculty of Social Sciences 483 692 568
Total graduate – international 3,534 3,906 3,378
Total international 34,068 29,804 28,069
Retention target 1,100 3,000
Total tuition revenue budgeted in University Global 150,439 141,667 134,397
(1) Includes letter of permission, non-degree students and auditors.
Figure 19 details Global tuition by Faculty of major, segregated by graduate/undergraduate and domestic/international. Note: although Figure 19 details global tuition by Faculty of major, the revenue and expense allocation model explained in the Looking Forward section of this report has been adopted and records tuition based on where students take their courses (i.e. teaching Faculty). Figure 20 reconciles the 2018-19 budgeted tuition from 2017-18. The increase in budgeted Global tuition of $8.8 million over the 2017-18 budget is mainly a result of tuition rate increases.
Figure 20
2017-18 Budget $141.7 million
• $0.4 million – 2017-18 Budget to 2017-18 Actual (Note: actual tuition was not yet finalized at the time of writing)
• $5.3 million – Rate impact ($3.5 million domestic and $1.8 million international)
• $1.9 million – Enrolment impact ($1.6 million domestic and $0.3 million international)
• $1.1 million – Retention target tuition
2018-19 Budget $150.4 million

2018
-19
Bud
get
Repo
rt
BUD
GET
DET
AIL
S
28
2018
-19
Bud
get
Repo
rt
BUD
GET
DET
AIL
S
29
The process for budgeting tuition revenue consists of two key considerations – student enrolment and tuition rates. Forecasting student enrolment differs for undergraduate and graduate students, as such, the following section describes each method.
i. Enrolment projections – undergraduate
There are two key assumptions in projecting undergraduate enrolment: intake targets for Year 1 and the retention behaviour of current students. For intake purposes, students are classified on the basis of their admission status. In addition, based on observation, each group behaves differently in terms of their retention status: (1) domestic students directly from secondary school, (2) domestic students not directly from secondary school and (3) international students. Figure 21 displays the undergraduate Year 1 (full-time) intake headcount projections for 2018-19 as compared to prior years.
Faculty of Mathematics and Science where these applications increased 11.2 per cent and the Faculty of Social Sciences with an increase of 4.2 per cent. Increases were seen in all other Faculties, with the exception of the Faculty of Humanities. Another promising trend is that with a conscious shift in the timing of confirmations, they are up 84.9 per cent compared to the same time last year (as of Feb. 25, 2018). Given the applications experience, mix of programs offered, mix of students offered (domestic and international), recruiting techniques and timing of offers, Brock’s overall yield rate will have to increase to hit the intake targets for 2018-19.
Figure 22: Applications directly from secondary school
Faculty 2018-19 2017-18 % Change
Applied Health Sciences 4,365 4,340 0.58%
Goodman School of Business 3,251 3,136 3.67%
Humanities 1,566 1,627 -3.75%
Mathematics and Science 2,486 2,236 11.18%
Social Sciences 4,260 4,090 4.16%
Total applications 15,928 15,429 3.23%
Offer rate (offers/applications) 71%
Yield rate (registrations/offers) 27%
Resulting intake – domestic 2,941
Source: Data was extracted from the PowerBI application details as of April 2018.
Institutional Analysis’ Enrolment Planning Management (EPM) tool establishes the intake targets through collaboration and consultation with units across the University, including the Faculties. 2018-19 year 1 intake is projected to increase 6.9 per cent over 2017-18. Year 1 intake headcount is dependant on the applications received. As shown in Figure 22, Brock’s undergraduate applications directly from secondary school are up 3.2 per cent over the same time last year, with the most notable increases in the
Year 1 intake headcount (undergraduate)
International studentsDomestic students not directly from secondary school Domestic students directly from secondary school
Year 1 intake is forecast to
increase 6.9% since 2017-18.
Figure 21
Source: Enrolment Planning Model (EPM).
2013-14 Actual
2014-15 Actual
2015-16 Actual
2016-17 Actual
2017-18 Actual
2018-19 Forecast
200 207 226 233 224 250 597 670 681 737 657 678
3,104 2,990 2,915 2,690 2,941 3,159 Total 3,901 3,867 3,822 3,660 3,822 4,087
The Year 1 intake figures are then combined with retention and progression rates, as well as movement to and from full-time and part-time status (retention behaviour), to determine a total returning undergraduate headcount. This retention behaviour is determined by reviewing historical enrolment patterns. As an example, Figure 23 shows the return or retention rates of students who entered the University directly from secondary school in 2016 into the 2017-18 year.
Figure 23
2016-17 domestic directly from secondary school cohort # students % students
Entered in 2016 as Year 1(1) 2,650 Activity in 2017-18
Returned as full-time as year 1 711 27%
Returned as full-time as year 2 1,535 58%
Returned as part-time year 1 40 1%
Returned as part-time year 2 16 1%
Not registered 348 13%
Total 2,650 100%
Source: PFIS – USER 2016 and 2017 Nov. 1 enrolment files.(1) Total 2016-17 domestic directly from secondary school enrolment differs from Figure 21 as this figure only represents Nov. 1 entry versus all term entry in Figure 21.

2018
-19
Bud
get
Repo
rt
BUD
GET
DET
AIL
S
31
2018
-19
Bud
get
Repo
rt
BUD
GET
DET
AIL
S
30
Figure 24: Degree-seeking undergraduate headcount
Faculty 2018-19 Forecast
2017-18 Actual Change %
Change
Faculty of Applied Health Sciences 3,821 3,623 198 5.5%
Goodman School of Business 2,870 2,821 49 1.7%
Faculty of Education 1,069 1,053 16 1.5%
Faculty of Humanities 1,675 1,718 (43) (2.5%)
Faculty of Mathematics and Science 1,931 1,933 (2) (0.1%)
Faculty of Social Sciences 5,057 5,204 (147) (2.8%)
Total 16,423 16,352 71 0.4%
Adjusted enrolment forecast (20% international)
16,523 171 1.0%
Once the total forecasted headcount is determined, it is then translated into full-time equivalents (FTE) based on average course load, which is then combined with the tuition rates to calculate tuition. See Appendix A for definitions of measures of enrolment.
ii. Enrolment projections – graduate
Overall, graduate degree-seeking headcount is forecast to increase by 33 students, with 22 additional master’s and 11 additional PhDs. The largest growth is seen in the Goodman School of Business, with headcount forecasted to increase by 11. All other Faculties are also forecasting increases – Faculty of Social Sciences with eight, Faculty of Education with six, Faculty of Applied Health Sciences with four, Faculty of Mathematics and Science with three and Faculty of Humanities with one. Figure 25 details graduate enrolment forecast as well as the historical enrolment by Faculty.
iii. Fee and rate setting
See Appendix B for an explanation of the tuition fee policies for both government-funded programs and non government-funded programs as well as the approved tuition fee increases for 2018-19.
Fee revenueFee revenue is budgeted to be $7.8 million, which is $0.4 million higher than the 2017-18 budget. Student fee revenue includes both ancillary fees and other student fees.
Ancillary fees are established by student referendum, according to the ancillary fee protocol and agreed to with the Brock University Students’ Union (BUSU). Some existing fees can increase automatically (i.e. only after the Consumer Price Index [CPI] has accumulated to five per cent since the last fee increase), or fees are system-wide and applicable to all Ontario university students. Ancillary fees are all assessed and collected by the University, and are either administered by the University, BUSU or the GSA (Graduate Students’ Association). Note: only the University administered ancillary fees are included as part of the funding budget. The setting of ancillary and administrative fees was delegated to the President and Vice-President, Administration at the December 1, 2016 Board of Trustees meeting.
University administered ancillary fees are budgeted to be $4.1 million in 2018-19, which is higher than the 2017-18 budget by $0.1 million, due mainly to rate increases. University administered ancillary fees include the following:• Undergraduate Brock University Student Life Fee of $1.7
million ($1.7 million in 2017-18), of which $1.2 million is reported as part of Brock Sports and Recreation and $0.5 million in Student Wellness and Accessibility.
Master’s PhDTotal graduate (master's and PhD)forecasted enrolment.
2018
2017
2016
2015
2014
Social Sciences2018
2017
2016
2015
2014Mathematics and Science
2018
2017
2016
2015
2014
Humanities2018
2017
2016
2015
2014
Education2018
2017
2016
2015
2014
2018
2017
2016
2015
2014
Graduate student headcount Applied Health
Sciences
Goodman Schoolof Business
115
122
160
186
217
528
493
549
550
561
318
288
250
256
306
27
26
25
27
43
41
41
44
19
19
21
15
51
58
63
65
81
54103
45111
44110
43132
178
384 28
423 23
399 28
379 36
423
368
99
160
Figure 25After these considerations, total undergraduate degree-seeking headcount for 2018-19 is forecast to increase by 71 students or 0.4 per cent for 2018-19, as shown in Figure 24. In addition, an incremental tuition target of $1.1 million was added to the budget driven by Enrolment Management and International’s ongoing retention strategies. This tuition translates into an additional undergraduate headcount of 100 students, with 20 per cent being international.
Note: Consolidated total graduate student headcount is shown in the “Student headcount by faculty of major,” section in “The big picture” pullout of this report.
• Undergraduate athletic, intramural and recreational program fee (separate from the Student Life Fee) of $1.5 million ($1.5 million in 2017-18), which is reported in Brock Sports and Recreation.
• Undergraduate health services fee of $0.4 million($0.4 million in 2017-18), which is reported in Student Wellness and Accessibility.
• Undergraduate recreation facilities fee of $0.2 million ($0.2 million in 2017-18), which is reported in Brock Sports and Recreation.
• Graduate Health Service fee of $0.04 million ($0.04 million in 2017-18), which is reported in Student Wellness and Accessibility.
• Graduate Students’ Mental Health and Wellness fee of $0.04 million ($0.04 million in 2017-18), which is reported in Student Wellness and Accessibility
• Graduate Zone Fitness Centre Fee of $0.08 million ($0.10 million in 2017-18), which is reported in Brock Sports and Recreation.
• Graduate Athletics Fee of $0.05 million ($0.07 million in 2017-18), which is reported in Brock Sports and Recreation.
• Graduate Recreation Facilities Fee of $0.02 million ($0.01 million in 2017-18), which is reported in Brock Sports and Recreation.

2018
-19
Bud
get
Repo
rt
BUD
GET
DET
AIL
S
33
2018
-19
Bud
get
Repo
rt
BUD
GET
DET
AIL
S
32
Other student fees of $3.7 million were included as part of fee revenue in the 2018-19 budget ($3.3 million in 2017-18). Included as part of other student fees is the International Student Recovery Fee, which was introduced by the MAESD in 2013-14 as a reduction in the Basic Operating Grant by $750 per international student. Starting in 2015-16, this fee is charged to international students and results in $1.1 million of revenue in 2018-19 ($1.0 million in 2017-18). This fee is directly offset by a reduction in the Basic Operating Grant and is reported as part of the University Global responsibility centre. Also included in other student fees are program-specific fees charged by the program in which a student is enrolled. Included in this figure are $1.6 million ($1.4 million in 2017-18) of co-op fees (reported in Co-op Career and Experiential Education), $0.7 million ($0.7 million in 2017-18) of ESL ancillary fees for international students (reported in Brock International) and $0.3 million ($0.2 million in 2017-18) related to the Business English and Skill Transition fee for International Student Program students in the Goodman School of Business.
Grant revenueGrant revenue, including operating grants and specific purpose grants, represents 29 per cent of total revenue (30 per cent in 2017-18 budget), and is budgeted to be $97.6 million for 2018-19, which is detailed in Figure 26. Grant revenue increased $1.2 million over the 2017-18 budget and $2.6 million over actual 2016-17.
Operating grants Operating grants represent 26 per cent of total revenue (27 percent in 2017-18). As described in the 2017-18 Budget Report, the Ministry of Advanced Education and Skills Development (MAESD) introduced a new university funding model in 2017-18. Under this funding model, a number of grants were re-allocated into two new grants – the Core Operating Grant (COG) and the Differentiation Grant Envelope. For further details on the background of this transition, refer to the 2017-18 Budget Report.
Core Operating Grant (COG) and Differentiation Grant Envelope
MAESD has asserted that the COG will deliver a predictable and stable level of funding for each institution through a corridor system, beginning in 2017-18. This corridor system means that changes to enrolment within a range of +3 per cent and -3 per cent will not change the base funding level for at least three years, representing the terms of the 2017-2020 Strategic Mandate Agreement (SMA2). At this point, a new Strategic Mandate Agreement will be set and changes to this grant can be negotiated. Therefore, it is important to understand that this means there is no automatic additional funding for incremental increases in enrolment for at least the next two years.
The base-level funding was initially set at the amount actually received in 2016-17. Brock was able to negotiate, through the SMA2 process, additional funding related to graduate students. For purposes of the 2017-18 grant budget, the eligible master’s enrolment was forecast at 736.1 FTEs and 93.4 for PhDs. This resulted in a grant of $86.6 million (both Core operating and Differentiation) for the 2017-18 budget, which was $0.9 million higher than 2016-17 Actual. In addition, the funded master’s and PhD allocations were further increased for 2018-19 and 2019-20 to the end of SMA2, as shown in Figure 27 and 28. However, currently it is forecast that 2017-18 enrolment will fall short of the budget, with an expected shortfall of 36 master’s FTE (91.9 unfilled allotments); offset by 13.5 additional PhD FTEs (1.1 unfilled allotments), resulting in an expected shortfall of $0.5 million versus the 2017-18 budget. For purposes of the 2018-19 grant budget, it is forecasted that eligible enrolment will increase over 2017-18 actuals, with master’s at 740.1 and PhDs at 125. This represents an increase of $0.4 million over the 2017-18 budget and $0.9 million over the currently forecasted 2017-18 actuals.
Note: The split between the COG and the Differentiation Grant Envelope was determined using a new measure of enrolment for each program type, termed weighted grant units (WGUs). Each university’s WGUs are then multiplied by a rate per WGU to determine the COG. The difference between this calculated COG and the funding base represents the university’s Differentiation Grant Envelope. The COG and the Differentiation Grant Envelope are both reported in the University Global responsibility centre.
International Student Recovery
In 2013-14, the MAESD introduced the International Student Recovery that reduced the operating grants by $750 for every undergraduate and master’s-level international student, and commenced with new student admissions. This reduction continues in the updated University funding model. The reduction budgeted for 2018-19 is $1.4 million, which is $0.07 million lower than the 2017-18 budget and is reported in the University Global responsibility centre.
Nursing Collaborative and Completion Grant
The Nursing Grant is separately funded through the college system. Brock receives its grant through Loyalist College and is paid on a slip-year basis (based on enrolment in the prior year). The grant is expected to be $2.8 million in 2018-19, which is $0.03 million less than budgeted in 2017-18 and $0.07 million less than what was actually received in 2016-17. This grant is reported in the University Global responsibility centre.
Specific-purpose grantsThe University receives a number of grants, mainly funded by the provincial or federal governments, for specific purposes which are detailed in Figure 29.
MAESD funding allocation
*Figures include winter Master of Accountancy FTEs.
Actual (forecast – 2018-19) enrolment MAESD funding allocation Actual (forecast – 2018-19) enrolment
634.6
634 585.6
589.4 589.4607.9
613.4 616.2
693.6
734.1
792
847
673.4700.1
740.1
643.4
Eligible master’s FTEs (Fall + Summer*): MAESD allocation vs. actual
19-2018-1917-1816-1715-1614-1513-1412-1311-1210-11
87.9 91.4
106.9
125135
123
99.075.9
111.3 108.0
Eligible PhD FTEs (Fall + Summer): MAESD allocation vs. actual
19-2018-1917-1816-1715-1614-1513-1412-1311-1210-11
50.8
85.3
85.3
103.9 99.5
85.7
105.198.8
85.7
619
885
SMA 2SMA 1SMA 2SMA 1
Figure 27
Figure 26
($000s) 2018-19 Budget
2017-18 Budget
2016-17 Actual
Operating grants
Core Operating Grant 82,000 82,000
Differentiation Grant Envelope 5,067 4,633
Basic Operating Grant (including Teacher Education) 71,471
Undergraduate Accessibility Fund 7,250
Graduate Expansion Grant 2,415
General Access and Quality Grant 3,722
Performance Fund 706
Provincial Research Overhead Infrastructure Envelope
147
International Student Recovery (1,400) (1,465) (1,254)
Nursing Grant 2,787 2,813 2,861
Total operating grants 88,454 87,981 87,318
Specific purpose grants 9,121 8,345 7,691
Total grant revenue 97,575 96,326 95,009
Figure 28
Research Support Fund
The Research Support Fund is a Government of Canada funding program to assist Canadian post-secondary institutions in offsetting the cost of administering research awards from the three federal granting councils (Natural Sciences and Engineering Research Council, Social Sciences and Humanities Research Council and the Canadian Institute of Health Research). Brock receives funding to support the indirect costs incurred on Tri-Council-funded research through the program. These costs can include maintenance and utilities of libraries and laboratories, salaries for staff or students who provide research administration support, training costs for workplace health and safety or the administrative costs associated with getting a patent.
Figure 29
($000s) 2018-19 Budget
2017-18 Budget
2016-17 Actual
Specific-purpose grants
Research Support Fund 1,850 1,750 1,790
Facilities Renewal Program Funds 1,761 1,298 864
Grant in Lieu of Municipal Taxation 1,081 1,081 1,081
Graduate Enrolment Capital Expansion Grant 750 750 750
Access Fund for Students with Disabilities 565 515 592
First Generation Project Grant 440 440 428
Other grants 2,674 2,511 2,186
Total specific purpose grants 9,121 8,345 7,691

2018
-19
Bud
get
Repo
rt
BUD
GET
DET
AIL
S
34
2018
-19
Bud
get
Repo
rt
BUD
GET
DET
AIL
S
35
The amount is determined by a formula that incorporates a base amount and the average of the last three years of research funding from the three agencies. Brock’s funding is estimated to be $1,850,000 for 2018-19, which is $100,000 more than the 2017-18 budget and is reported as part of the Office of Research Services.
Note: The funding budget does not include research grants for restricted purposes or the offsetting research expenses; they are, however, included in the NFPS financial statements. An adjustment was made to the funding budget as part of the reconciliation to NFPS financial statements in Appendix D of this report.
Facilities Renewal Program Funds
The provincial Facilities Renewal Program (FRP) funds are meant to help ensure that academic spaces and supporting infrastructure are maintained in good repair to provide a safe environment to work and study. To address deferred maintenance at colleges and universities, in April 2014, it was announced that the Province intended to increase funding for facilities renewal beginning in 2015-16. The plan includes phasing in additional renewal funding – growing to a total investment of $100 million to colleges and universities annually by 2019-20.
The distribution of the university sector FRP funds is determined based on the university’s share of the theoretical space entitlement calculated in accordance with the Council of Ontario Universities’ space standards. The data used in the formula is taken from the Inventory of Physical Facilities of Ontario Universities, which is updated every three years. The formula also includes a floor so that no institution receives less than 0.5 per cent of the total university sector allocation.
Brock’s projected funding level for 2018-19 is $1,761,000, which is $463,000 greater than the 2017-18 budget and $897,000 greater than the amount received in 2016-17. The specific items that the facilities renewal funds are being used for are detailed as part of the capital and related project budget, starting on page 75.
The grant revenue related to the Facilities Renewal Program Funds is reported in the Capital responsibility centre.
Grant in Lieu of Municipal Taxation
The MAESD provides subsidies to universities to pay their municipal taxes. The municipal tax (payment in lieu of property taxes) is based on a charge of $75 per domestic FTE; however, the related grant does not increase with enrolment. The 2018-19 tax payments are budgeted to be $1,282,000 (2017-18 actual payment was $1,216,000) and the grant is budgeted to be $1,081,000 (2017-18 actual grant received was $1,096,000); therefore, $201,000 is budgeted to be unfunded through this grant. Both the grant revenue related to the Grant in Lieu of Municipal Taxation and the offsetting payment in lieu of property taxes, are reported as part of the Utilities, Taxes and Insurance responsibility centre.
Graduate Enrolment Capital Expansion Grant
The MAESD provides capital funding to support the expansion of graduate education. The value of the grant is determined based on the graduate enrolment growth (two-year slip) up to a maximum number of master’s and PhD FTEs. In 2018-19, the grant is expected to be $750,000, based on projected FTEs. The grant revenue related to the Graduate Enrolment Capital Expansion Grant is shown as part of the University Global responsibility centre.
Access Fund for Students with Disabilities
The MAESD provides funding to support a wide range of services for students with disabilities, through the Access Fund for Students with Disabilities (AFSD). These services include access to adaptive computer and software learning technology; arranging note-taking for students who are visually impaired; and interpreter services for students who are deaf, deafened and hard of hearing. Brock’s funding for 2018-19 is expected to be $565,000, which is an increase of $50,000 over the 2017-18 budget. The grant revenue related to the Access Fund for Students with Disabilities is shown as part of Student Wellness and Accessibility.
First Generation Project Grant
The MAESD provides funding for the First Generation Project (FGP) through the First Generation Project Grant. The purpose of the FGP is to provide service and support to enrolled first-generation students (parents/guardians who have not attended a post-secondary institution) through orientation, peer support, mentoring, academic workshops and other unique academic services tailored for first-generation students. The funding level is budgeted to remain unchanged at $440,000. The revenue related to the FGP Grant is shown as part of the Student Success Centre.
Other specific-purpose grants
Included in other specific-purpose grants are a number of special grants including the following: • The Aboriginal Student Success Funding from the MAESD
supports Aboriginal students through funding for student support initiatives, academic enrichment and partnership initiatives. The 2018-19 budget for this funding is $336,000, which is reported in Student Success Centre.
• The Career Ready Fund: University Kick Start Grant from the MAESD supports the creation of more experiential learning opportunities for students. The 2018-19 budget for this funding is $279,000, which is reported in the Co-op, Career and Experiential Education unit.
• The Credit Transfer Institutional Grant, also funded by the MAESD, funds support for post-secondary education transfer mobility initiatives. The 2018-19 budget for this funding is $211,000, which is reported in The Office of the Registrar.
• The Mental Health Support for Post-Secondary Education Students Grant and Mental Health Workers Grant from MAESD funds support for mental health initiatives for students. The 2018-19 budget for this funding is $138,000 and $100,000 respectively, both are reported in the Student Wellness and Accessibility.
• Also included in other specific-purpose grants are the following: funding from the Government of Ontario’s On-campus Entrepreneurship Activities program, Disabilities Interpreters Grant (MAESD), provincial student bursaries, Women’s Campus Safety Grant (MAESD) and other smaller special grants. The revenue related to these grants is shown as part of a number of departments, including the Goodman School of Business, Student Wellness and Accessibility, the Scholarship, Bursaries and Student Awards responsibility centre, Brock International, Faculty of Humanities, etc.
In addition to the grants detailed above, the MAESD provides two-third funding for the following scholarships: • Ontario Trillium Scholarships in the amount of $213,000
in 2018-19. • Queen Elizabeth II Ontario Graduate Scholarships in the
amount of $580,000 in 2018-19. • Note: These two grants and their offsetting scholarship
expenses are included in the Scholarship, Bursaries and Student Awards responsibility centre.
Internal chargebacksInternal chargebacks represent revenue received by units within the University for services performed or goods received from other units. The offsetting expenses are within operating costs of those units that received the service. Internal chargeback revenue is budgeted to be $8.99 million in 2018-19 and includes the following:• Charges for Utilities mainly to the Department of
Residence of $1,471,000 ($1,455,000 in 2017-18).• Printing and binding of $938,000 ($1,015,000 in 2017-18).
In addition, the 2017-18 budget included $285,000 of photocopying chargebacks. These chargebacks have been eliminated starting in 2018-19 as per the Fiscal Framework guidance to eliminate chargebacks where appropriate.
• Information Technology Services of $366,000 ($364,000 in 2017-18), mainly to the Department of Residence.
• Postage services of $200,000 ($234,000 in 2017-18).• Facilities Management Services of $585,000 ($569,000
in 2017-18).• Stationary chargebacks $280,000 ($256,000 in
2017-18)• Parking services chargebacks $55,000 ($86,000 in
2017-18)• Faculty of Mathematics and Science charges for
Machine and Electronic Shop and Mass Spectrometer/Nuclear Magnetic Resonance charges of $48,000 ($74,000 in 2017-18).
• Campus Security chargebacks $100,000 ($0 in 2017-18), mainly to the Department of Residence.
Also included in internal chargebacks are inter-departmental transfers of funds to support operations. Included in the 2018-19 budgeted internal chargebacks are the following:• Funding of the Department of Residence and Parking
Services’ portion of the capital budget in the amount of

2018
-19
Bud
get
Repo
rt
BUD
GET
DET
AIL
S
36
2018
-19
Bud
get
Repo
rt
BUD
GET
DET
AIL
S
37
$2,865,000 and $420,000 respectively ($2,795,000 and $410,000 in 2017-18). See page 75 for details of the capital budget.
• Funding of the Goodman Career Development Office from the Goodman School of Business to Co-op, Career and Experiential Education of $410,000 ($417,000 in 2017-18).
• Transfer to University Global from the Faculties in the amount of $379,500 ($335,000 in 2017-18) relating to the International Student Recovery Fee for international student programs.
• Additional inter-departmental transfers include a number of smaller transfers within and between units related to specific projects and initiatives.
Inter-fund revenueInter-fund revenue represents transfers from various funds, including reserves, to support operating activities. Inter-fund revenue is budgeted to be $5.42 million in 2018-19 and includes the following:• Spending allocations from Marilyn I. Walker School
of Fine and Performing Arts Endowment Fund of $463,000 ($417,000 in 2017-18), shown in the Faculty of Humanities and the Goodman Family Foundation’s donation of $300,000 ($729,000 in 2017-18), shown in Goodman School of Business.
• Transfers from Canada Research Chairs’ grants from the Government of Canada to fund a portion of the salaries of the chair holders of $930,000 ($997,000 in 2017-18), shown in the Faculty of Mathematics
and Science, the Faculty of Social Sciences, the Faculty of Applied Health Sciences and the Faculty of Education.
• Transfer from the Provost Strategic Initiative Fund for recruitment, relocation and start-up costs for new faculty members of $856,000 ($699,000 in 2017-18), shown in University Global.
• Additional transfers from the Provost Strategic Initiative Fund to support the Library with the Ontario Council of University Librarians’ (OCUL) Collaborative Futures of $300,000 and the Faculty of Applied Health Sciences to support faculty positions of $450,000.
• Endowment funding supporting scholarships, bursaries and student awards of $1,842,000, this revenue is offset by inter-fund expenses for the same amount. For further information on this transfer, see page 83.
Other revenueOther revenue represents revenue from ancillary operations, including residence fees, investment income and sales and services, and represents 14 per cent of total revenue. As detailed in Figure 30, other revenue is budgeted to be $49.1 million, an increase of $1.3 million over the 2017-18 budget and $2.9 million over 2016-17 actual. Revenue from ancillary operations and residence fees will be discussed in the snapshot section of this report on pages 66 and 68, respectively.
Figure 30
($000s) 2018-19 Budget
2017-18 Budget
2016-17 Actual
Residence fees 18,257 17,317 16,174
Other ancillary revenue 16,095 17,559 15,155
Total ancillary revenue 34,352 34,876 31,329
Investment income 1,516 1,201 1,137
Sales and services 13,262 11,749 13,716
Total other revenue 49,130 47,826 46,182
Sales and servicesIncome generated from sales and services represents a wide variety of sources, including the following: Ontario University Application Centre revenue; recreation and youth program revenue, including aquatic centre instructional fees; various service fees charged on student accounts; health insurance reimbursement; intramural fees and Brock Sports Performance Centre fees; affinity revenue; administrative “fees-for-service,” including transcript printing fees, applications to graduate to cover gown rentals, letters of permission and graduate studies application fees; rental income (e.g. Heritage Place Plaza); chargebacks to external units, including utilities; contributions from the pension plan for pension-related expenses; contributions from the endowment fund for endowment-related expenses; revenue from programs such as Centre for Innovation, Management and Enterprise Education (CIMEE), Smart Start, BOOST, and international learning programs; student printing fees; funds from the Niagara Catholic District School Board to run their Outdoor Education Program; as well as donation revenue.
Investment incomeInvestment income represents the interest that the University receives on short-term investments of $1,200,000 ($900,000 in 2017-18). The increase in short-term investment income over the 2017-18 budget is a stretch goal to balance the budget as explained on page 21. Also included is the investment income on the Mawer balanced fund investments of $316,000 ($301,000 in 2017-18). This investment income net of administration fees, is transferred to an internally restricted reserve as part of inter-fund expenses to support the repayment of the 2045 $93-million debenture (i.e. sinking fund) and the employee future benefits reserve.
Figure 31
2018-19 Budget 2017-18 Budget
Personnel group(1) ($000s) Salary/wage Benefits Total personnel costs Salary/wage Benefits Total personnel
costsFaculty and professional librarians 91,119 19,613 110,732 88,194 19,448 107,642
Admin/professional 42,319 11,336 53,655 40,146 10,445 50,591
CUPE 4207 – Unit 1 13,990 1,527 15,517 13,461 1,394 14,855
OSSTF 8,164 2,633 10,797 8,305 2,521 10,826
CUPE 1295 FT 6,882 2,349 9,231 6,803 2,240 9,043
SAC 4,928 963 5,891 4,627 929 5,556
Other 12,939 1,706 14,645 13,632 1,694 15,326
Total 180,341 40,127 220,468 175,168 38,671 213,839
Transfer to employee future benefits reserve (EFB) (900) (900) (900) (900)
Total personnel 180,341 39,227 219,568 175,168 37,771 212,939
(1) Faculty and professional librarians – BUFA members, Associate Deans, Associate Vice-Presidents of Research and Associate Librarian; Admin/Professional-administrative/professional and exempt staff; CUPE 4207 – Unit 1 instructors, teaching assistants, lab demonstrators, course co-ordinators and marker/graders; OSSTF – support and technical staff; CUPE 1295 FT – full-time maintenance, trades and custodial staff; SAC – Senior Administrative Council; Other – all other union groups, part-time teaching and non-teaching positions and stipend transfers.
Operating cost assumptionsPersonnel costsPersonnel costs include both salaries/wages and benefits and known impacts of Bill 148, and represent 65 per cent of the total budgeted costs. Personnel costs are budgeted to be $219.6 million, an increase of $6.6 million from the 2017-18 budget and $22.6 million from 2016-17 actual.
Benefit costs include employer contributions to the Brock University Pension Plan, dental, medical and statutory taxes (CPP, EI, EHT and WSIB). Also included in the benefit costs is funding of the University’s pension plan deficit obligation. Furthermore, the allocation of $900,000 to the employee future benefits reserve is also shown in the benefit figures in Figure 31. Due to the fact that funding of this reserve is actually reported as an inter-fund expense (rather than as part of personnel), it is then removed from the total in Figure 31. Both the pension plan obligation and the employee future benefits reserve are more fully described in the Employee Future Benefits section of this report (page 38).

2018
-19
Bud
get
Repo
rt
BUD
GET
DET
AIL
S
38
2018
-19
Bud
get
Repo
rt
BUD
GET
DET
AIL
S
39
Figures 32 and 33 show personnel costs for part-time teaching by Faculty and by type of spending. Note: the amounts in Figure 32 and 33 include stipend transfers, which in some cases would have an offsetting amount in another unit of the University.
(1) Represents figures prepared in accordance with Canadian generally accepted accounting principles for not-for-profit organizations (2009-10 to 2010-11), in accordance with Canadian accounting standards for not-for-profit organizations (2011-12 to 2016-17), and have been audited by KPMG LLP (independent auditors). 2015-16 figure includes a reclassification between operating expenses and salaries and benefits made for comparative purposes.(2) Represents trimester two forecast figures converted to NFPS.(3) Represents budget figures converted to NFPS.
7% increase
5% increase
3% increase
no change
1% increase
3% increase
3% increase
5% increase
2010-11 to 2018-19 NFPS personnel costs ($000s)
Personnel costs Personnel cost as a % of operating expenses
10-11(1) 11-12(1) 12-13(1) 13-14(1) 14-15(1) 15-16(1) 16-17(1) 17-18(2) 18-19(3)
166,475 178,800 187,253 193,048 193,041 195,754 201,124 208,099 219,193 63% 66% 65% 66% 65% 64% 64% 63% 64%
Figure 34
Figure 34 shows NFPS personnel costs and personnel costs as a percentage of operating costs since 2010-11.
The increased going concern deficit required the special payments into the plan to increase by $1.53 million and the current service cost payments for the defined benefit component of the plan to increase by $0.44 million for a total increase in University contributions of $1.97 million annually. For 2018-19, the annual budgeted contribution is $3.6 million. There was no increase to the 2018-19 budget as a result of proactive test valuations performed in 2016-17 to estimate the impact of this valuation. Those tests suggested a $2.0 million increase in pension contributions would be required by the University and as a result, the increase was funded in the 2017-18 budget.
It should be noted that the Ontario Pension Benefits Act has recently changed to allow for a 12-month deferral on changing required payments into the pension plan. The Financial Planning and Investment Committee approved a recommendation to take advantage of this deferral and invest the 2017-18 budgeted savings of $1.6
Figure 35
Pension Plan as of June 30 pension year end ($000s)
2011 2012 2013 2014 2015 2016 2017 2018(1)
Assets 283,889 301,612 341,391 402,252 438,141 449,900 481,842 502,888 Return 13.8% 3.0% 11.1% 16.7% 10.3% 3.7% 10.4% 5.8%
(1) Represents the 8- month period ending December 28, 2017.
based on industry best practices guided by the Canadian Institute of Actuaries. The University has no control or influence over the assumptions used by the actuary. The largest contributor to the going concern deficit is active members (65 per cent of the total deficit). The University contribution ratio – that is the amount the University contributes to the plan for every dollar put into the plan by the employee – is 2.09 (1.82 as at July 2014), which remains high. The Province is working on a joint-sponsored pension plan (JSPP) where one of the requirements to join this plan would be a 50/50 cost sharing ratio with plan members.
Figure 32: Part-time teaching by Teaching Faculty
($000s) 2018-19 Budget
2017-18Budget
2016-17 Actual
Faculty of Applied Health Science 3,574 3,072 2,451
Goodman School of Business 3,425 3,528 3,421
Faculty of Education 3,711 4,437 3,628
Faculty of Humanities 3,281 3,625 2,969
Faculty of Mathematics and Science 2,707 2,607 2,506
Faculty of Social Science 5,663 6,462 5,244
Total 22,361 23,731 20,219
Includes salaries and benefits in Teaching Faculties for the following: CUPE 4207 – Unit 1, non-union instructors, BUFA overload, stipend transfers and CUPE 4207 – Unit 3.
Figure 33: Part-time teaching by spend category
($000s) 2018-19 Budget
2017-18Budget
2016-17 Actual
CUPE 4207 – Unit 1 15,387 15,390 13,364
Non-union instructors 4,079 4,644 3,977
BUFA overload 3,115 3,740 3,298
CUPE 4207 – Unit 3 62 140 113
Stipend transfers (282) (183) (533)
Total 22,361 23,731 20,219
Note: the figure above includes part-time teaching costs reported in the Teaching Faculties only. Budgets related to the personnel groups noted above reported outside the Teaching Faculties are not reported in these figures.
Employee future benefits Employee future benefits comprise both the University’s pension and the non-pension retirement benefits received by employees post retirement.
i. Pension
The pension plan continues to be a topic of interest at our University and for many universities across the province. Our plan has continued to experience positive returns over the past couple of years as illustrated in Figure 35. Every three years, the financial health of the plan is recalculated through an actuarial valuation. This actuarial valuation on the pension plan was recently completed as at July 1, 2017, indicating the plan was 96 per cent funded on a going-concern basis (99 per cent as at July 2014) and 105 per cent on a solvency basis (105 per cent as at July 2014). Through the valuation, the going concern deficit was determined to be $17.88 million ($3.56 million as at July 2014). The main contributor to the increase in the going concern deficit was a reduction in the pension plan discount rate to 5.45 per cent (6.0 per cent as at July 2014). The actuary sets the expected rates of returns
million into a pension stabilization reserve as at April 30, 2018, to be drawn upon at the next valuation in July 2020, should the funded status of the pension plan deteriorate.
Pension plans with a solvency ratio of 85 per cent or less are required to file annual valuations instead of triennial valuations. As the pension plan had a solvency ratio of 105 per cent, the next valuation will be required by July 1, 2020. For more information on the Brock University Pension Plan, visit brocku.ca/human-resources/pension/
ii. Post-retirement benefits
Brock University’s non-pension post-retirement benefits liability as at April 30, 2017 was $24.5 million. Figure 36 describes the nature of these future obligations.
Figure 36
Employee future benefits (as at April 30, 2017) ($000s)
Retiree benefits 3,296
Health-care spending account 14,904
Retirement allowance benefits 1,259
Sick leave 361
Disability 4,710
Total 24,530
Brock has traditionally had a “pay as you go” model to fund immediate requirements. For example, in 2017-18 Brock paid an estimated $0.17 million related to BUFA’s health-care spending account. As the institution ages, continuation of this practice would impact Brock’s financial sustainability. This would occur as people retire, become sick or disabled, and the University becomes obligated to pay these benefits, in addition to the benefits of the replacement employee. The reality is these post-retirement costs are similar to Brock’s pension liability, which is funded while employees earning the benefit perform their employment responsibilities. It is in the interest of Brock and its employees that these post-retirement benefits are funded in a similar manner as the pension liability to ensure these future obligations can also be met.
For these reasons, starting in 2015-16, the budget includes an annual allocation of $900,000 to begin setting aside assets for this obligation. This amount is in addition to the “pay as you go” funds already in the budget. It is important to note that in DBRS’s most recent credit rating they noted, ‘Brock’s decision to begin reserving for

2018
-19
Bud
get
Repo
rt
BUD
GET
DET
AIL
S
41
2018
-19
Bud
get
Repo
rt
BUD
GET
DET
AIL
S
40
Total 119,638
Total 111,018
15,089
8,623
9,867
8,549
19,696
4,845
6,533
25,293
21,143
13,469
8,929
9,926
9,276
18,981
4,260
6,803
18,590
20,784
Budgeted operating costs ($000s)
Other operating costs
Inter-fund expense
Cost of sales
Library acquisitions
Scholarships and student awards
Financial expenditures
Utilities and taxes
Purchased services
2017-18 Budget
Other operating costs
Inter-fund expense
Cost of sales
Library acquisitions
Scholarships and student awards
Financial expenditures
Utilities and taxes
Purchased services
Repair and maintenance and capital replacement
Repair and maintenance and capital replacement
2018-19 Budget
13%
7%
8%
7%
4%
5%
18%
21%
16%
9%
8%
12%
8%
17%
3%
6%
17%
20%
Figure 37
non-pension post-employment benefits is viewed as a prudent practice, which will gradually address growth in these obligations over time.”
Ontario universities vary on how they fund post-retirement benefits. There are some that have a reserve balance that equals the total liability, and others with no reserve. This said, most Ontario universities are implementing funding strategies for these liabilities, if they have not done so already.
Operating costsNon-personnel operating costs (operating costs), including inter-fund expenses, represent 35 per cent of the total budgeted expenditures of the University. Operating costs increased $8.6 million over the 2017-18 budget and $8.1 million over 2016-17 actual. Operating costs have been segregated into nine categories. See Figure 37 for a breakdown by category for both the 2018-19 and 2017-18 budgets.
Purchased services Purchased services include the following: international recruitment agent commissions; residence annual lease payments (Quarryview and Gateway); security services; the payment to the FirstOntario Performing Arts Centre; custodial, maintenance and grounds outside contractors; foodservice; physician and counselling services; the payment to Niagara College for the Gaming program; consulting, legal and audit fees; liability and property insurance; internet, mobile phones and external information technology services; and other professional fees and contracted services.
Utilities and taxes Utilities and taxes include the cost of heating and cooling, hydro and water, as well as municipal taxes (payment in lieu of property taxes). The majority of the University’s utilities expenses, $6.80 million ($7.01 million in 2017-18), are reported in the Utilities, Taxes and Insurance responsibility centre. In addition, utility expenses of $0.54 million ($0.62 million in 2017-18) are directly reported in specific units, the majority of which is reported in the Department of Residence ($0.48 million in 2018-19 and $0.57 million in 2017-18) as well as Heritage Plaza and Rodman Hall. See page 14 for a breakdown of the net utilities costs by type.
Utilities and taxes includes $1.28 million ($1.29 million in 2017-18) related to municipal tax, of which the majority is reported in the Utilities, Taxes and Insurance responsibility centre. See page 34 for further discussion on property taxes and the offsetting Grant in Lieu of Municipal Taxation.
Financial expenditures The financial expenditures included in the 2018-19 budget represent both the interest and principal payments of the University’s external debt, of which $4.43 million ($4.43 million in 2017-18) is reported in the Department of Residence and $5.13 million ($5.14 million in 2017-18) is reported in the Financing responsibility centre. Refer to the Financing section on page 70 for a detailed discussion. Also included as part of financial expenditures are banking charges and payment card fees of $0.3 million ($0.3 million in 2017-18), which are reported in units throughout in the University.
Repairs and maintenance and capital replacement Repairs and maintenance and capital replacement costs include $4.70 million ($4.91 million in 2017-18) of costs related to performing routine activities as well as the repairs and maintenance of devices, buildings and grounds and
their related supplies. Also included are $3.85 million ($4.36 million in 2017-18) of furniture, equipment and software, and license purchases that are not included in any projects within the capital and related project budget. Note: funding of the Capital and Related Project budget is not included in repairs and maintenance and capital replacement, but is reported as part of inter-fund expenses.
Scholarships and student awardsUndergraduate entrance scholarship funding, financial-need bursaries and other student awards are budgeted to be $11.76 million in 2018-19 ($11.45 million in 2017-18). The majority of these undergraduate student awards, $10.02 million ($9.68 million in 2017-18), are reported in the Scholarships, Bursaries and Student Awards (SBSA) responsibility centre. In addition, included in the undergraduate student awards are $1.49 million ($1.49 million in 2017-18) of student tuition waivers, also budgeted SBSA responsibility centre. Refer to page 71 for further discussion. The remaining $0.25 million ($0.28 million in 2017-18) is reported in a number of units throughout the University, with the majority in the Goodman School of Business.
Graduate student scholarships and student awards, mainly in the form of fellowships, are budgeted to be $7.94 million ($7.53 million in 2017-18), the majority of which – $7.44 million ($7.00 million in 2017-18), is reported in the SBSA responsibility centre. In addition, included in the graduate student awards are $0.15 million ($0.15 million in 2017-18) of student tuition waivers, also budgeted SBSA responsibility centre. Refer to page 72 in the Responsibility Centre snapshots section for further discussion. The remaining $0.35 million ($0.38 million in 2017-18) is reported in a number of units throughout the University, including the Goodman School of Business.
Note: Starting in 2018-19, the funding budget now includes the endowment allocated spend related to scholarships and student awards of $1.84 million for 2018-19 – $1.49 million undergraduate and $0.35 million graduate. This support is reported in the funding budget as a funding source (inter-fund revenue), with the offsetting expense (inter-fund expense) in the SBSA responsibility centre. The 2017-18 budget for scholarships and student awards does not include scholarships and awards available from endowments, estimated at $1.79 million.
Library acquisitions The budgeted library acquisitions represent the funding to purchase critical information resources (ejournals, books, ebooks, geospatial data, music, full text databases, etc.) and discovery/access/dissemination technologies to support teaching and research.
Cost of sales Cost of sales represents the cost of purchasing the items for resale by Ancillary Operations.
Inter-fund expenseInter-fund expenses represent transfers from the operating budget to other funds within the University. Included in this category is the funding related to the capital and related project budget of $16.01 million ($12.13 million in 2017-18) as outlined on pages 75-79 of this report. The related interest and principal payments are included as part of the financial expenditures category. Also included in this category are transfers from the Financing responsibility centre to the debt repayment reserve of $1.30 million ($1.02 million in 2017-18) and to the sinking fund of $0.32 million ($0.30 million in 2017-18); transfers of $1.31 million ($1.24 million 2017-18) from Research Services to the research with no external obligation fund for funding of transdisciplinary hubs, CCOVI, the Centre for Lifespan Development, the Niagara Community Observatory and the Match of Minds program; transfers of $2.70 million ($2.01 million in 2017-18) from the Faculties, the Library and other units for professional expense reimbursements (PER), accountable allowances and start-up accounts; transfers of $1.84 million to endowment fund for scholarships (this is offset by inter-fund revenue from the endowment fund); a transfer of $0.9 million ($0.9 million in 2017-18) to the employee future benefits reserve; and transfers of $0.5 million ($0.5 million in 2017-18) from the Teaching Faculties to operating project accounts and internally restricted research funds with no external obligations.
Other operating costs Other operating costs represent all other costs not included in the above eight categories, including internal chargeback expenses, travel costs, marketing and advertising expenses, other materials and supplies, membership dues and subscriptions, hospitality costs, postage and courier charges, professional development and training, practicum payments, printing and duplicating costs, conference fees, bad debt expense and other costs.

2018-19 Budget Report BUDGET DETAILS
43
2018-19 Budget Report BUDGET DETAILS
42
Funding budget by responsibility centreFigure 38 details the funding budget by responsibility centre, where all personnel costs, operating costs and revenue have been grouped by their responsibility centre, which in turn are grouped into one of the following categories: Teaching Faculties, Academic Support, Student Specific, Shared Services, Ancillary, Space and Global. Each responsibility centre is described in the Responsibility centre snapshots section of this report, starting on page 46. (Note: Certain reclassifications were made to the 2017-18 budget as compared to the figures presented in the 2017-18 Budget Report. See Appendix C for the details of these reclassifications.)
Figure 38: Funding budget by responsibility centre
($000s) 2018-19 Budget 2017-18 Budget
Difference of “Net” amounts
Page ref. Revenue Personnel
costs Non-personnel
costs Net Revenue Personnel costs
Non-personnel costs Net
Teaching Faculties
Faculty of Applied Health Sciences 875 (22,008) (876) (22,009) 340 (20,790) (896) (21,346) (663) 48
Goodman School of Business 13,048 (27,718) (4,258) (18,928) 11,870 (26,563) (4,085) (18,778) (150) 49
Faculty of Education 3,736 (16,679) (1,624) (14,567) 4,021 (17,185) (1,922) (15,086) 519 50
Faculty of Humanities 616 (21,447) (1,211) (22,042) 616 (21,010) (1,255) (21,649) (393) 51
Faculty of Mathematics and Science 641 (22,184) (818) (22,361) 658 (21,482) (811) (21,635) (726) 52
Faculty of Social Sciences 459 (36,326) (1,287) (37,154) 432 (36,464) (1,287) (37,319) 165 53
Total Teaching Faculties 19,375 (146,362) (10,074) (137,061) 17,937 (143,494) (10,256) (135,813) (1,248)
Academic Support
Faculty of Graduate Studies 360 (1,332) (230) (1,202) 310 (1,291) (256) (1,237) 35 54
Library 507 (5,600) (5,550) (10,643) 78 (4,977) (4,802) (9,701) (942) 54
Research Services 2,136 (1,531) (1,745) (1,140) 1,986 (1,563) (1,636) (1,213) 73 55
Centre for Pedagogical Innovation 233 (825) (279) (871) 280 (858) (316) (894) 23 56
Total Academic Support 3,236 (9,288) (7,804) (13,856) 2,654 (8,689) (7,010) (13,045) (811)
Student Specific
The Office of the Registrar 2,039 (3,910) (1,184) (3,055) 2,034 (3,962) (1,115) (3,043) (12) 57
Student Life and Community Experience 185 (758) (191) (764) 219 (696) (228) (705) (59) 57
Student Wellness and Accessibility 2,684 (2,911) (1,301) (1,528) 2,409 (2,703) (1,145) (1,439) (89) 58
Student Success Centre 1,042 (1,332) (158) (448) 962 (1,335) (163) (536) 88 59
Brock International 5,631 (4,691) (2,301) (1,361) 5,760 (4,934) (2,273) (1,447) 86 59
Co-op, Career and Experiential Education 2,516 (3,223) (692) (1,399) 1,924 (3,031) (387) (1,494) 95 60
Brock Sports and Recreation 6,935 (5,119) (3,209) (1,393) 6,872 (4,773) (2,833) (734) (659) 61
Total Student Specific 21,032 (21,944) (9,036) (9,948) 20,180 (21,434) (8,144) (9,398) (550)
Figure 38 continued
($000s) 2018-19 Budget 2017-18 Budget
Difference of “Net” amounts
Page ref. Revenue Personnel
costs Non-personnel
costs Net Revenue Personnel costs
Non-personnel costs Net
Shared Services
Leadership (2,827) (508) (3,335) (2,617) (526) (3,143) (192) 62
Information Technology Services 444 (6,107) (2,109) (7,772) 458 (5,953) (2,224) (7,719) (53) 62
Financial Services 493 (2,996) (661) (3,164) 437 (3,014) (691) (3,268) 104 63
Human Resources 263 (3,278) (667) (3,682) 257 (3,413) (782) (3,938) 256 63
Marketing and Communications 1,552 (1,596) (2,088) (2,132) 1,789 (1,568) (2,183) (1,962) (170) 64
Development and Alumni Relations 740 (1,790) (573) (1,623) 655 (1,705) (619) (1,669) 46 64
Shared Services Support (2,104) (251) (2,355) (1,972) (216) (2,188) (167) 65
Total Shared Services 3,492 (20,698) (6,857) (24,063) 3,596 (20,242) (7,241) (23,887) (176)
Ancillary
Ancillary Operations 15,765 (2,744) (9,023) 3,998 17,540 (2,475) (9,448) 5,617 (1,619) 66-67
Department of Residence 18,696 (3,746) (13,303) 1,647 17,560 (2,880) (13,549) 1,131 516 68
Total Ancillary 34,461 (6,490) (22,326) 5,645 35,100 (5,355) (22,997) 6,748 (1,103)
Space
Facilities Management 731 (12,543) (3,686) (15,498) 659 (12,292) (3,405) (15,038) (460) 69
Campus Security Services 122 (1,477) (1,169) (2,524) 59 (1,468) (1,104) (2,513) (11) 69
Campus Development Services and Community Agreements 341 (8) (1,150) (817) 345 (962) (617) (200) 69
Utilities, Taxes and Insurance 2,857 (10,298) (7,441) 2,833 (10,332) (7,499) 58 70
Financing 316 (6,744) (6,428) 301 (6,490) (6,189) (239) 70
Total Space 4,367 (14,028) (23,047) (32,708) 4,197 (13,760) (22,293) (31,856) (852)
Global
Scholarships, Bursaries and Student Awards 2,842 (20,940) (18,098) 1,007 (18,348) (17,341) (757) 71-72
Capital 5,046 (16,008) (10,962) 4,503 (12,127) (7,624) (3,338) 72
University Global 245,355 (758) (3,546) 241,051 234,783 35 (2,602) 232,216 8,835 73
Total Global 253,243 (758) (40,494) 211,991 240,293 35 (33,077) 207,251 4,740
Total University 339,206 (219,568) (119,638) - 323,957 (212,939) (111,018) - -

2018-19 Budget Report BUDGET DETAILS
45
2018-19 Budget Report BUDGET DETAILS
44
Funding budget by responsibility centre leaderFigure 39 details the funding budget by responsibility centre, where all personnel costs, operating costs and revenue have been grouped by their responsibility centre, which in turn have been grouped to whom they report: President; Vice-President, Academic; Vice-President, Administration; Vice-President, Research and Global. Each responsibility centre is described in the Responsibility centre snapshots section of this report, starting on page 46. (Note: Certain reclassifications were made to the 2017-18 budget as compared to the figures presented in the 2017-18 Budget Report. See Appendix C for the details of these reclassifications.)
Figure 39: Funding budget by responsibility centre leader
($000s) 2018-19 Budget 2017-18 Budget
Difference of “Net” amounts
Page ref. Revenue Personnel
costs Non-personnel
costs Net Revenue Personnel costs
Non-personnel costs Net
President
Development and Alumni Relations 740 (1,790) (573) (1,623) 655 (1,705) (619) (1,669) 46 64
Leadership (Split)(1) (1,818) (449) (2,267) (1,730) (465) (2,195) (72) 62
Marketing and Communications 1,552 (1,596) (2,088) (2,132) 1,789 (1,568) (2,183) (1,962) (170) 64
Shared Services Support (Split)(2) (281) (18) (299) (265) (17) (282) (17) 65
Total President 2,292 (5,485) (3,128) (6,321) 2,444 (5,268) (3,284) (6,108) (213)
Vice-President, Academic
Faculty of Applied Health Sciences 875 (22,008) (876) (22,009) 340 (20,790) (896) (21,346) (663) 48
Goodman School of Business 13,048 (27,718) (4,258) (18,928) 11,870 (26,563) (4,085) (18,778) (150) 49
Faculty of Education 3,736 (16,679) (1,624) (14,567) 4,021 (17,185) (1,922) (15,086) 519 50
Faculty of Humanities 616 (21,447) (1,211) (22,042) 616 (21,010) (1,255) (21,649) (393) 51
Faculty of Mathematics and Science 641 (22,184) (818) (22,361) 658 (21,482) (811) (21,635) (726) 52
Faculty of Social Sciences 459 (36,326) (1,287) (37,154) 432 (36,464) (1,287) (37,319) 165 53
Faculty of Graduate Studies 360 (1,332) (230) (1,202) 310 (1,291) (256) (1,237) 35 54
Library 507 (5,600) (5,550) (10,643) 78 (4,977) (4,802) (9,701) (942) 54
Centre for Pedagogical Innovation 233 (825) (279) (871) 280 (858) (316) (894) 23 56
Co-op, Career and Experiential Education 2,516 (3,223) (692) (1,399) 1,924 (3,031) (387) (1,494) 95 60
The Office of the Registrar 2,039 (3,910) (1,184) (3,055) 2,034 (3,962) (1,115) (3,043) (12) 57
Student Life and Community Experience 185 (758) (191) (764) 219 (696) (228) (705) (59) 57
Student Wellness and Accessibility 2,684 (2,911) (1,301) (1,528) 2,409 (2,703) (1,145) (1,439) (89) 58
Student Success Centre 1,042 (1,332) (158) (448) 962 (1,335) (163) (536) 88 59
Brock International 5,631 (4,691) (2,301) (1,361) 5,760 (4,934) (2,273) (1,447) 86 59
Leadership (Split)(3) (1,009) (59) (1,068) (887) (61) (948) (120) 62
Shared Services Support (Split)(4) (380) (20) (400) (366) (48) (414) 14 65
Total Vice-President, Academic 34,572 (172,333) (22,039) (159,800) 31,913 (168,534) (21,050) (157,671) (2,129)
Figure 39 continued
($000s) 2018-19 Budget 2017-18 Budget
Difference of “Net” amounts
Page ref. Revenue Personnel
costs Non-personnel
costs Net Revenue Personnel costs
Non-personnel costs Net
Vice-President, Administration
Brock Sports and Recreation 6,935 (5,119) (3,209) (1,393) 6,872 (4,773) (2,833) (734) (659) 61
Information Technology Services 444 (6,107) (2,109) (7,772) 458 (5,953) (2,224) (7,719) (53) 62
Financial Services 493 (2,996) (661) (3,164) 437 (3,014) (691) (3,268) 104 63
Human Resources 263 (3,278) (667) (3,682) 257 (3,413) (782) (3,938) 256 63
Ancillary Operations 15,765 (2,744) (9,023) 3,998 17,540 (2,475) (9,448) 5,617 (1,619) 66-67
Department of Residence 18,696 (3,746) (13,303) 1,647 17,560 (2,880) (13,549) 1,131 516 68
Facilities Management 731 (12,543) (3,686) (15,498) 659 (12,292) (3,405) (15,038) (460) 69
Campus Security Services 122 (1,477) (1,169) (2,524) 59 (1,468) (1,104) (2,513) (11) 69
Shared Services Support (Split)(5) (1,443) (213) (1,656) (1,341) (151) (1,492) (164) 65
Total Vice-President, Administration 43,449 (39,453) (34,040) (30,044) 43,842 (37,609) (34,187) (27,954) (2,090)
Vice-President, Research
Research Services 2,136 (1,531) (1,745) (1,140) 1,986 (1,563) (1,636) (1,213) 73 55
Total Vice-President, Research 2,136 (1,531) (1,745) (1,140) 1,986 (1,563) (1,636) (1,213) 73
Global
Campus Development Services and Community Agreements 341 (8) (1,150) (817) 345 (962) (617) (200) 69
Utilities, Taxes and Insurance 2,857 (10,298) (7,441) 2,833 (10,332) (7,499) 58 70
Financing 316 (6,744) (6,428) 301 (6,490) (6,189) (239) 70
Scholarships, Bursaries and Student Awards 2,842 (20,940) (18,098) 1,007 (18,348) (17,341) (757) 71-72
Capital 5,046 (16,008) (10,962) 4,503 (12,127) (7,624) (3,338) 72
University Global 245,355 (758) (3,546) 241,051 234,783 35 (2,602) 232,216 8,835 73
Total Global 256,757 (766) (58,686) 197,305 243,772 35 (50,861) 192,946 4,359
Total University 339,206 (219,568) (119,638) - 323,957 (212,939) (111,018) - -
(1) Includes the offices of the President; Vice-President, Administration; the Provost and Vice-President, Academic; and the Vice-President, Research.(2) Includes the Office of Government Relations.(3) Includes the offices of the Vice-Provost and Associate Vice-President, Academic; Vice-Provost Teaching and Learning; and the Vice-Provost Enrolment Management and International.(4) Includes Institutional Analysis and Planning.(5) Includes the Office of University Secretariat, Internal Audit Department and Human Rights and Equity Services.

The following “snapshots” present the budgeted revenue and total costs of each of the University’s responsibility centres. Revenue shown in the Faculties does not include an allocation of global tuition (shown on page 27) or operating grant revenue. Revenue shown by the responsibility centre only reflects the tuition, fee and grant revenue specifically reported in the respective centres, as well as any other revenue generated within each centre.
Total costs, as shown in the responsibility centres, include salaries, benefits and direct non-personnel costs (operating costs). Support service costs have not been allocated in these figures. For example, the majority of utility costs are shown collectively as part of the Utilities, Taxes and Insurance responsibility centre on page 70, and the majority of scholarships, bursaries and student awards are reported as part of the Scholarships, Bursaries and Student Awards responsibility centre on page 71. As detailed in the “Looking forward” section, the revenue and expense allocation model has been developed and allocates all budgeted net operating costs of the University, including support service costs to each for the six teaching Faculties. The Provost, working with Financial Services, will utilize this model as a planning tool. Refer to page 85 for a full discussion of this model.
It should also be noted that direct research revenue and matching expenses are not included in the budget.
The following “snapshots” also detail the ongoing (OG) faculty and staff full-time equivalent (FTE) positions within each unit. The FTE of an ongoing faculty/staff member is calculated based on whether they are full-time, part-time, seasonal, etc. For example, an ongoing part-time position that works 17.5 hours per week would be counted as 0.5 FTE; whereas a full-time position would be counted as 1 FTE. In addition, the FTE figures represent each ongoing position included in the budget (i.e. the salary and benefits related to this position are included in the budget) and represent both filled and unfilled positions.
The “Notes” at the end of write-ups for certain snapshots detail revenues and expenses by type included in the units’ budgets where the value is $100,000 or over in 2018-19.
During 2017-18, there have been a number of reorganizations of units across the University. Reclassifications were made to the 2017-18 budget as reported in the 2017-18 Budget Report for comparison purposes to the 2018-19 Budget, when the overall funding budget was not impacted. See Appendix C for details of these adjustments.
Responsibility centre snapshots
2018
-19
Bud
get
Repo
rt
SNA
PSH
OTS
46
2018
-19
Bud
get
Repo
rt
SNA
PSH
OTS
47
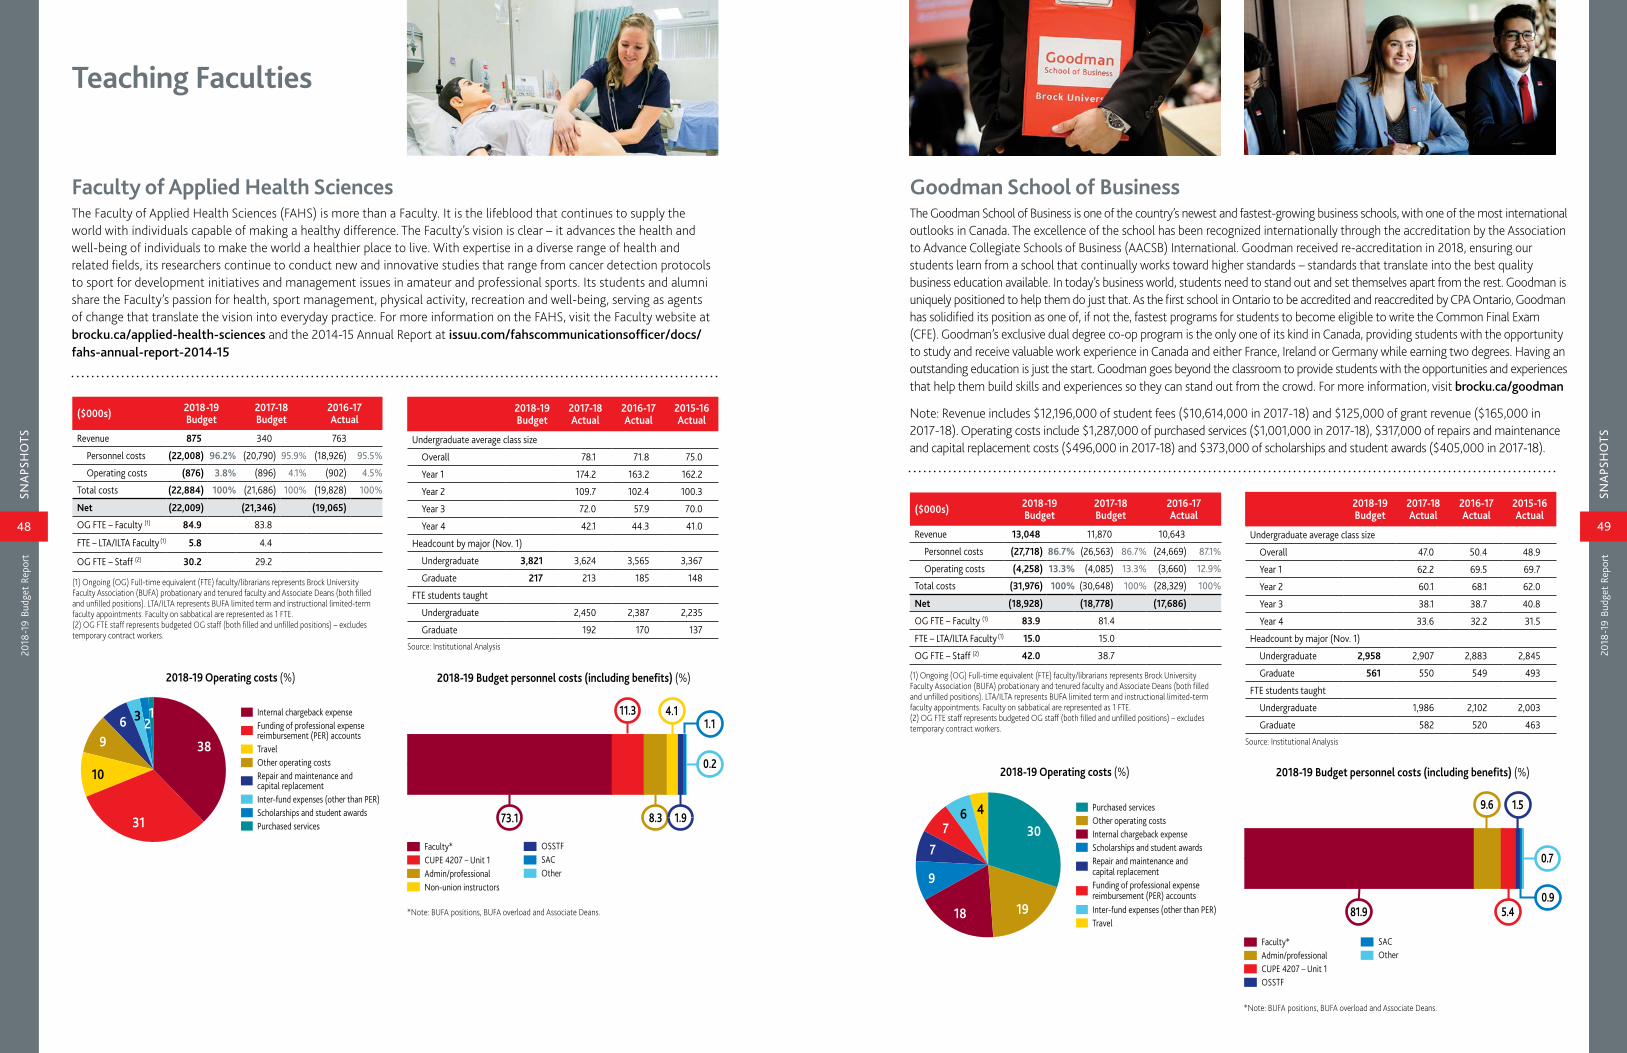
2018
-19
Bud
get
Repo
rt
SNA
PSH
OTS
48
2018
-19
Bud
get
Repo
rt
SNA
PSH
OTS
49
Faculty of Applied Health SciencesThe Faculty of Applied Health Sciences (FAHS) is more than a Faculty. It is the lifeblood that continues to supply the world with individuals capable of making a healthy difference. The Faculty’s vision is clear – it advances the health and well-being of individuals to make the world a healthier place to live. With expertise in a diverse range of health and related fields, its researchers continue to conduct new and innovative studies that range from cancer detection protocols to sport for development initiatives and management issues in amateur and professional sports. Its students and alumni share the Faculty’s passion for health, sport management, physical activity, recreation and well-being, serving as agents of change that translate the vision into everyday practice. For more information on the FAHS, visit the Faculty website at brocku.ca/applied-health-sciences and the 2014-15 Annual Report at issuu.com/fahscommunicationsofficer/docs/fahs-annual-report-2014-15
2018-19 Operating costs (%)
Internal chargeback expenseFunding of professional expense reimbursement (PER) accountsTravelOther operating costsRepair and maintenance andcapital replacementInter-fund expenses (other than PER)Scholarships and student awards Purchased services
38
31
10
96 3 2
1
($000s) 2018-19Budget
2017-18Budget
2016-17Actual
Revenue 875 340 763
Personnel costs (22,008) 96.2% (20,790) 95.9% (18,926) 95.5%
Operating costs (876) 3.8% (896) 4.1% (902) 4.5%
Total costs (22,884) 100% (21,686) 100% (19,828) 100%
Net (22,009) (21,346) (19,065)
OG FTE – Faculty (1) 84.9 83.8
FTE – LTA/ILTA Faculty (1) 5.8 4.4
OG FTE – Staff (2) 30.2 29.2
(1) Ongoing (OG) Full-time equivalent (FTE) faculty/librarians represents Brock University Faculty Association (BUFA) probationary and tenured faculty and Associate Deans (both filled and unfilled positions). LTA/ILTA represents BUFA limited term and instructional limited-term faculty appointments. Faculty on sabbatical are represented as 1 FTE.(2) OG FTE staff represents budgeted OG staff (both filled and unfilled positions) – excludes temporary contract workers.
2018-19Budget
2017-18Actual
2016-17 Actual
2015-16 Actual
Undergraduate average class size
Overall 78.1 71.8 75.0
Year 1 174.2 163.2 162.2
Year 2 109.7 102.4 100.3
Year 3 72.0 57.9 70.0
Year 4 42.1 44.3 41.0
Headcount by major (Nov. 1)
Undergraduate 3,821 3,624 3,565 3,367
Graduate 217 213 185 148
FTE students taught
Undergraduate 2,450 2,387 2,235
Graduate 192 170 137
Source: Institutional Analysis
Faculty*CUPE 4207 – Unit 1Admin/professionalNon-union instructors
OSSTFSACOther
7
0.2
8.3
11.31.1
1.9
4.1
73.1
2018-19 Budget personnel costs (including benefits) (%)
*Note: BUFA positions, BUFA overload and Associate Deans.
Teaching Faculties
Goodman School of BusinessThe Goodman School of Business is one of the country’s newest and fastest-growing business schools, with one of the most international outlooks in Canada. The excellence of the school has been recognized internationally through the accreditation by the Association to Advance Collegiate Schools of Business (AACSB) International. Goodman received re-accreditation in 2018, ensuring our students learn from a school that continually works toward higher standards – standards that translate into the best quality business education available. In today’s business world, students need to stand out and set themselves apart from the rest. Goodman is uniquely positioned to help them do just that. As the first school in Ontario to be accredited and reaccredited by CPA Ontario, Goodman has solidified its position as one of, if not the, fastest programs for students to become eligible to write the Common Final Exam (CFE). Goodman’s exclusive dual degree co-op program is the only one of its kind in Canada, providing students with the opportunity to study and receive valuable work experience in Canada and either France, Ireland or Germany while earning two degrees. Having an outstanding education is just the start. Goodman goes beyond the classroom to provide students with the opportunities and experiences that help them build skills and experiences so they can stand out from the crowd. For more information, visit brocku.ca/goodman
Note: Revenue includes $12,196,000 of student fees ($10,614,000 in 2017-18) and $125,000 of grant revenue ($165,000 in 2017-18). Operating costs include $1,287,000 of purchased services ($1,001,000 in 2017-18), $317,000 of repairs and maintenance and capital replacement costs ($496,000 in 2017-18) and $373,000 of scholarships and student awards ($405,000 in 2017-18).
($000s) 2018-19Budget
2017-18Budget
2016-17Actual
Revenue 13,048 11,870 10,643
Personnel costs (27,718) 86.7% (26,563) 86.7% (24,669) 87.1%
Operating costs (4,258) 13.3% (4,085) 13.3% (3,660) 12.9%
Total costs (31,976) 100% (30,648) 100% (28,329) 100%
Net (18,928) (18,778) (17,686)
OG FTE – Faculty (1) 83.9 81.4
FTE – LTA/ILTA Faculty (1) 15.0 15.0
OG FTE – Staff (2) 42.0 38.7
(1) Ongoing (OG) Full-time equivalent (FTE) faculty/librarians represents Brock University Faculty Association (BUFA) probationary and tenured faculty and Associate Deans (both filled and unfilled positions). LTA/ILTA represents BUFA limited term and instructional limited-term faculty appointments. Faculty on sabbatical are represented as 1 FTE.(2) OG FTE staff represents budgeted OG staff (both filled and unfilled positions) – excludes temporary contract workers.
Purchased servicesOther operating costsInternal chargeback expenseScholarships and student awards Repair and maintenance andcapital replacementFunding of professional expensereimbursement (PER) accountsInter-fund expenses (other than PER)Travel
2018-19 Operating costs (%)
30
1918
9
76
7
4
Faculty*Admin/professionalCUPE 4207 – Unit 1OSSTF
SACOther 7
81.9 5.4
9.6
0.7
0.9
1.5
2018-19 Budget personnel costs (including benefits) (%)
2018-19Budget
2017-18Actual
2016-17 Actual
2015-16 Actual
Undergraduate average class size
Overall 47.0 50.4 48.9
Year 1 62.2 69.5 69.7
Year 2 60.1 68.1 62.0
Year 3 38.1 38.7 40.8
Year 4 33.6 32.2 31.5
Headcount by major (Nov. 1)
Undergraduate 2,958 2,907 2,883 2,845
Graduate 561 550 549 493
FTE students taught
Undergraduate 1,986 2,102 2,003
Graduate 582 520 463
Source: Institutional Analysis
*Note: BUFA positions, BUFA overload and Associate Deans.

2018
-19
Bud
get
Repo
rt
SNA
PSH
OTS
50
2018
-19
Bud
get
Repo
rt
SNA
PSH
OTS
51
Faculty of EducationThe Faculty of Education offers programs for students wanting to teach in all environments using a variety of delivery mechanisms. Our programs encompass early childhood education, K-12 teachers and adult education. We use all sorts of delivery modes, ranging from the traditional face-to-face to the most modern digital techniques. For information on the Faculty of Education, visit brocku.ca/education
Note: Revenue includes $3,324,000 of student fees ($3,649,000 in 2017-18). Operating costs include $177,000 of purchased services ($215,000 in 2017-18).
Faculty of HumanitiesStudying in the Faculty of Humanities inoculates against extremism by examining the cultural and intellectual frameworks of the world from ancient times to the present. We work on figuring out what has really happened or is really happening, how we can know, and what we can do about it. Along the way, our students develop excellent problem-solving and communication skills that serve them well in their future careers in law, business, education, government, culture or tech industries, or any area where imagination, reason and passion can serve. For more information on The Faculty of Humanities and its programs, visit brocku.ca/humanities/
Note: Revenue includes $463,000 of spending allocations from the MIWSFPA Endowment Fund ($417,000 in 2017-18). Operating costs include $195,000 of purchased services ($167,000 in 2017-18) and $106,000 of repairs and maintenance and capital replacement costs ($113,000 in 2017-18).
Funding of professional expensereimbursement (PER) accountsOther operating costsPurchased servicesTravelRepair and maintenance andcapital replacementInternal chargeback expenseInter-fund expenses (other than PER)Utilities and taxes
2018-19 Operating costs (%)
25
2516
10
9
36
6
($000s) 2018-19Budget
2017-18Budget
2016-17Actual
Revenue 616 616 845
Personnel costs (21,447) 94.7% (21,010) 94.4% (19,980) 94.3%
Operating costs (1,211) 5.3% (1,255) 5.6% (1,201) 5.7%
Total costs (22,658) 100% (22,265) 100% (21,181) 100%
Net (22,042) (21,649) (20,336)
OG FTE – Faculty (1) 91.4 86.6
FTE – LTA/ILTA Faculty (1) 3.5 5.8
OG FTE – Staff (2) 31.4 32.0
(1) Ongoing (OG) Full-time equivalent (FTE) faculty/librarians represents Brock University Faculty Association (BUFA) probationary and tenured faculty and Associate Deans (both filled and unfilled positions). LTA/ILTA represents BUFA limited-term and instructional limited-term faculty appointments. Faculty on sabbatical are represented as 1 FTE.(2) OG FTE staff represents budgeted OG staff (both filled and unfilled positions) – excludes temporary contract workers.
OtherSACNon-union instructors
Faculty*CUPE 4207 – Unit 1Admin/professionalOSSTF
74
0.5
4.92.4
13.9
74.0
6 3.31.0
2018-19 Budget personnel costs (including benefits) (%)
2018-19Budget
2017-18Actual
2016-17 Actual
2015-16 Actual
Undergraduate average class size
Overall 35.7 36.6 39.3
Year 1 71.2 72.7 73.3
Year 2 32.4 31.7 35.7
Year 3 17.6 20.9 22.4
Year 4 11.4 11.6 13.9
Headcount by major (Nov. 1)
Undergraduate 1,677 1,712 1,713 1,850
Graduate 81 80 84 77
FTE students taught
Undergraduate 2,166 2,079 2,148
Graduate 80 81 76
Source: Institutional Analysis
*Note: BUFA positions, BUFA overload and Associate Deans.
2018-19 Operating costs (%)
42
17
8
11
11
25 4 Other operating costsTravelFunding of professional expensereimbursement (PER) accountsPurchased servicesInternal chargeback expenseScholarships and student awards Repair and maintenance andcapital replacementInter-fund expenses (other than PER)
($000s) 2018-19Budget
2017-18Budget
2016-17Actual
Revenue 3,736 4,021 3,369
Personnel costs (16,679) 91.1% (17,185) 89.9% (15,986) 92.2%
Operating costs (1,624) 8.9% (1,922) 10.1% (1,343) 7.8%
Total costs (18,303) 100% (19,107) 100% (17,329) 100%
Net (14,567) (15,086) (13,960)
OG FTE – Faculty (1) 45.5 47.3
FTE – LTA/ILTA Faculty (1) 12.0 9.3
OG FTE – Staff (2) 38.5 39.8
(1) Ongoing (OG) Full-time equivalent (FTE) faculty/librarians represents Brock University Faculty Association (BUFA) probationary and tenured faculty and Associate Deans (both filled and unfilled positions). LTA/ILTA represents BUFA limited term and instructional limited-term faculty appointments. Faculty on sabbatical are represented as 1 FTE.(2) OG FTE staff represents budgeted OG staff (both filled and unfilled positions) – excludes temporary contract workers.
2018-19Budget
2017-18Actual
2016-17 Actual
2015-16 Actual
Undergraduate average class size (ABST, EDUC and ADED Year 1-3 courses)
Overall 39.9 31.7 34.6
Year 1 66.5 72.1 33.4
Year 2 30.3 24.1 20.5
Year 3 70.2 55.7 43.5
Year 4 24.5 21.3 43.5
Headcount by major (Nov. 1)
Undergraduate 1,420 1,399 1,451 1,208
Graduate 306 300 291 329
FTE students taught
Undergraduate 1,557 1,563 1,747
Graduate 201 187 212
Source: Institutional Analysis
CUPE 4207 – Unit 1Other SAC
Faculty*Non-union instructorsAdmin/professionalOSSTF
58.4 11.0 4.2
5.82.6
16.4
1.6
2018-19 Budget personnel costs (including benefits) (%)
($000s)
*Note: BUFA positions, BUFA overload and Associate Deans.

2018
-19
Bud
get
Repo
rt
SNA
PSH
OTS
52 53
Faculty of Mathematics and ScienceThe Faculty of Mathematics and Science develops and delivers programs (many with a co-op option) and courses to provide knowledge and hands-on experiences that serve as a strong foundation for its students. It also promotes science awareness and provides outreach activities. For information on the Faculty of Mathematics and Science, visit brocku.ca/mathematics-science and the Faculty Strategic Plan (2008) at brocku.ca/webfm_send/1036
Note: Revenue includes $140,000 of student fees ($105,000 in 2017-18). Operating costs include $280,000 of repairs and maintenance and capital replacement costs ($280,000 in 2017-18).
Faculty of Social SciencesBrock’s largest Faculty offers cutting-edge programs and diverse experiential learning opportunities, providing students with opportunities to push boundaries while developing the tools required to succeed in an ever-changing world. Home to both new and emerging fields of study, such as environmental sustainability, politics, economics, psychology, labour studies, communication theory and business communications, applied disability studies, child and youth studies, social justice, applied linguistics, popular culture and film studies, geography and tourism, gender studies, and sociology, the Faculty of Social Sciences prepares students for multiple career paths. An emphasis on understanding complex phenomena through a variety of lenses helps students become innovative, engaged citizens ready to tackle the problems that matter most to them. Visit brocku.ca/social-sciences/ for additional information about the Faculty, or browse through recent issues of our annual review at brocku.ca/social-sciences/wp-content/uploads/sites/27/FOSSreview2017forweb.pdf
Note: Revenue includes $149,000 of student fees ($147,000 in 2017-18).
Repair and maintenance andcapital replacementFunding of professional expensereimbursement (PER) accountsOther operating costsTravelInternal chargeback expensePurchased servicesScholarships and student awards
2018-19 Operating costs (%)
34
30
20
15 28
($000s) 2018-19Budget
2017-18Budget
2016-17Actual
Revenue 641 658 722
Personnel costs (22,184) 96.4% (21,482) 96.4% (20,571) 95.8%
Operating costs (818) 3.6% (811) 3.6% (893) 4.2%
Total costs (23,002) 100% (22,293) 100% (21,464) 100%
Net (22,361) (21,635) (20,742)
OG FTE – Faculty (1) 69.9 68.3
FTE – LTA/ILTA Faculty (1) 4.9 5.0
OG FTE – Staff (2) 47.0 48.5
(1) Ongoing (OG) Full-time equivalent (FTE) faculty/librarians represents Brock University Faculty Association (BUFA) probationary and tenured faculty and Associate Deans (both filled and unfilled positions). LTA/ILTA represents BUFA limited term and instructional limited-term faculty appointments. Faculty on sabbatical are represented as 1 FTE.(2) OG FTE staff represents budgeted OG staff (both filled and unfilled positions) – excludes temporary contract workers.
2018-19Budget
2017-18Actual
2016-17 Actual
2015-16 Actual
Undergraduate average class size
Overall 87.8 89.5 89.5
Year 1 242.0 234.1 232.4
Year 2 67.3 66.2 66.0
Year 3 29.8 27.7 28.7
Year 4 17.2 17.0 15.1
Headcount by major (Nov. 1)
Undergraduate 1,936 1,871 1,724 1,722
Graduate 178 175 154 156
FTE students taught
Undergraduate 2,867 2,691 2,634
Graduate 176 150 153
Source: Institutional Analysis
Faculty*Admin/professionalCUPE 4207 – Unit 1OSSTF
SACOther
74
7
0.1
69.5 11.9 1.1
14.7 6 2.7
2018-19 Budget personnel costs (including benefits) (%)
*Note: BUFA positions, BUFA overload and Associate Deans.
($000s) 2018-19Budget
2017-18Budget
2016-17Actual
Revenue 459 432 428
Personnel costs (36,326) 96.6% (36,464) 96.6% (34,404) 96.5%
Operating costs (1,287) 3.4% (1,287) 3.4% (1,241) 3.5%
Total costs (37,613) 100% (37,751) 100% (35,645) 100%
Net (37,154) (37,319) (35,217)
OG FTE – Faculty (1) 153.0 152.5
FTE – LTA/ILTA Faculty (1) 4.7 3.7
OG FTE – Staff (2) 38.6 38.3
(1) Ongoing (OG) Full-time equivalent (FTE) faculty/librarians represents Brock University Faculty Association (BUFA) probationary and tenured faculty and Associate Deans (both filled and unfilled positions). LTA/ILTA represents BUFA limited term and instructional limited-term faculty appointments. Faculty on sabbatical are represented as 1 FTE.(2) OG FTE staff represents budgeted OG staff (both filled and unfilled positions) – excludes temporary contract workers.
Faculty*CUPE 4207 – Unit 1Admin/professional
OSSTFSAC
6
74
7
1.1
76.3
15.1 3.2
4.3
2018-19 Budget personnel costs (including benefits) (%)
2018-19Budget
2017-18Actual
2016-17 Actual
2015-16 Actual
Undergraduate average class size
Overall 81.7 83.0 85.5
Year 1 251.7 245.6 242.2
Year 2 103.3 109.8 109.4
Year 3 49.8 52.2 55.9
Year 4 24.9 22.5 21.9
Headcount by major (Nov. 1)
Undergraduate 4,348 4,428 4,596 4,672
Graduate 423 415 427 446
FTE students taught
Undergraduate 4,836 4,843 4,811
Graduate 329 327 340
Source: Institutional Analysis
*Note: BUFA positions, BUFA overload and Associate Deans.
2018-19 Operating costs(%)
Funding of professional expensereimbursementp (PER) accountsTravelOther operating costsScholarships and student awards Inter-fund expenses (other than PER)Internal chargeback expenseRepair and maintenance andcapital replacementPurchased services
38
1712
8
7
67
5
2018
-19
Bud
get
Repo
rt
SNA
PSH
OTS

2018
-19
Bud
get
Repo
rt
SNA
PSH
OTS
54
2018
-19
Bud
get
Repo
rt
SNA
PSH
OTS
55
Academic support
Faculty of Graduate Studies
Brock embraces integrative graduate education as a pathway to independence and a breadth of career options built on a foundation of collegial mentorship, collaboration, transparency and merit. Accordingly, our graduate programs embrace contemporary issues, highlighting and pushing the boundaries of current thought, ongoing progress, and future developments across and between disciplines. The Faculty of Graduate Studies (the Faculty) has a critical role in positioning Brock as a key comprehensive university for the 21st century.
The Faculty is the centralized administrative and academic entity for the University’s 49 graduate programs. We therefore operate across all Faculties and we are intimately involved in integrative recruitment and retention efforts for both undergraduate and graduate levels.
The Faculty oversees all graduate applications, admissions and registration, ongoing enrolment and records, funding, internal and external graduate scholarships and awards, and graduate student essential skills and professional development (VITAE) programming.
In collaboration with Brock’s Graduate Council and Senate Graduate Studies Committee, the Faculty ensures the development and enforcement of all relevant rules, regulations and policies concerning graduate studies.
In collaboration with the Graduate Students’ Association, the Faculty also advocates for graduate student needs and issues on campus.
Note: Graduate scholarships and student awards, including bursaries, are shown as part of the Scholarships, Bursaries and Student Awards responsibility centre. In addition, the above costs do not reflect the cost of teaching graduate students. These costs are reflected in the Teaching Faculties.
($000s) 2018-19Budget
2017-18Budget
2016-17Actual
Revenue 360 310 347
Personnel costs (1,332) 85.3% (1,291) 83.5% (1,223) 85.5%
Operating costs (230) 14.7% (256) 16.5% (207) 14.5%
Total costs (1,562) 100% (1,547) 100% (1,430) 100%
Net (1,202) (1,237) (1,083)
OG FTE – staff (1) 15.0 14.5
(1) Ongoing (OG) FTE staff represents budgeted OG staff (both filled and unfilled positions) – excludes temporary contract workers.
Library
The Brock University Library enriches teaching, learning and research at Brock through collaborative expertise, rich content and inclusive spaces. The Library supports student success by providing the competencies, tools and resources that learners need to excel in a changing environment; advances knowledge by providing access to scholarly information and through active engagement in the research lifecycle; and inspires discovery by developing new and reimagined physical and virtual experiences, and by fostering creative engagement with technology. The Brock University Library includes the James A. Gibson Library; the Map, Data and GIS Library; and Archives and Special Collections. The Library comprises six departments, and a staff of 53, of whom 19 are professional librarians. In fall 2018, the Brock Library will be launching a new Digital Scholarship Lab and expanded Makerspace in a newly built facility adjacent to the James A. Gibson Library. The Brock Library has a new strategic plan with five strategic pillars highlighting student success; the research lifecycle; the library experience; community engagement; and strengthening capacity. For more information, visit brocku.ca/library
Note: Operating costs include $4,845,000 of library acquisitions ($4,216,000 in 2017-18) and $495,000 of purchased services ($371,000 in 2017-18).
The Centre for Lifespan Development is a multidisciplinary collaboration effort dedicated to studying human development across the lifespan, with special strengths in childhood and adolescence. For information on the Centre for Lifespan Development, visit brocku.ca/lifespan-development-research. The Niagara Community Observatory works with partners across the Niagara community to foster, produce and disseminate evidence-based research on current and emerging issues. For information on the Niagara Community Observatory, visit brocku.ca/niagara-community-observatory
Brock’s five transdisciplinary hubs are incubators of innovation and bridges to the community. They cross disciplinary boundaries and integrate methods and theoretical approaches in order to better tackle pressing contemporary issues and generate knowledge breakthroughs for our 21st century reality. For more information, visit brocku.ca/research-at-brock/institutes-and-centres/
Note: Revenue includes $1,850,000 of grant revenue related to the Research Support Fund ($1,750,000 in 2017-18). Operating costs include $168,000 of purchased services ($139,000 in 2017-18), $250,000 of funding for transdisciplinary hubs ($250,000 in 2017-18) and $569,000 of funding for the Cool Climate Oenology and Viniculture Institute, the Centre for Lifespan Development and the Niagara Community Observatory ($626,000 in 2017-18).
The above costs do not reflect the direct revenue or expenses of research. Nor do they reflect the research portion of Faculty members’ salary and benefits (standardly 40 per cent) and other overhead related costs. Faculty members’ salary and benefits are reflected in the Teaching Faculties.
Research ServicesFunding of CCOVI, Centre for Lifespan Development, NCO and transdisciplinary hubsAnimal careCuvée
2018-19 total costs by cost centre (%)
5925
97
Research Services
Research Services, as defined in the 2018-19 budget, includes the Office of Research Services (ORS), costs related to research involving animals, the Cuvée Grand Tasting event and funding of the Cool Climate Oenology and Viticulture Institute (CCOVI), the Jack and Nora Walker Canadian Centre for Lifespan Development Research (Centre for Lifespan Development), the Niagara Community Observatory (NCO), as well as Brock’s five transdisciplinary hubs. (Note: Costs related to the office of the Vice-President, Research are included in the Leadership responsibility centre.)
ORS brings together a multitude of services to support a culture rooted in pervasive research and creative activity by assisting researchers with advice and administrative support, including application processes and financial management. For information on the ORS, visit brocku.ca/research. For information on research involving animals, visit brocku.ca/research-at-brock/office-of-research-services/research-ethics-office/#animal-care
The Cuvée Grand Tasting event, hosted by CCOVI, helps attendees discover Ontario’s best VQA wines while also raising thousands of dollars to fund academic scholarships and research. Visit cuvee.ca/grand-tasting/
CCOVI is Brock’s flagship transdisciplinary institute. It defines a place, not only within the University, to network faculty, students and staff dedicated to advancing the Canadian grape and wine industry. It extends to partnering academic communities, federal and provincial government research organizations, and regional grape and wine industry groups across Canada, as well as cool climate wine regions around the world. For information on CCOVI, visit brocku.ca/ccovi
($000s) 2018-19Budget
2017-18Budget
2016-17Actual
Revenue 2,136 1,986 1,998
Personnel costs (1,531) 46.7% (1,563) 48.9% (1,421) 36.0%
Operating costs (1,745) 53.3% (1,636) 51.1% (2,522) 64.0%
Total costs (3,276) 100% (3,199) 100% (3,943) 100%
Net (1,140) (1,213) (1,945)
OG FTE – staff (1) 18.0 19.0
(1) Ongoing (OG) FTE staff represents budgeted OG staff (both filled and unfilled positions) – excludes temporary contract workers.
($000s) 2018-19Budget
2017-18Budget
2016-17Actual
Revenue 507 78 51
Personnel costs (5,600) 50.2% (4,977) 50.9% (4,778) 52.7%
Operating costs (5,550) 49.8% (4,802) 49.1% (4,295) 47.3%
Total costs (11,150) 100% (9,779) 100% (9,073) 100%
Net (10,643) (9,701) (9,022)
OG FTE – Faculty (1) 17.6 16.6
FTE – LTA/ILTA Faculty (1) 1.0 0.3
OG FTE – staff (2) 34.7 30.9
(1) Ongoing (OG) Full-time equivalent (FTE) faculty/librarians represents Brock University Faculty Association (BUFA) probationary and tenured faculty and Associate Deans (both filled and unfilled positions). LTA/ILTA represents BUFA limited-term and instructional limited term faculty appointments. Faculty on sabbatical are represented as 1 FTE.(2) Ongoing (OG) FTE staff represents budgeted OG staff (both filled and unfilled positions) – excludes temporary contract workers.
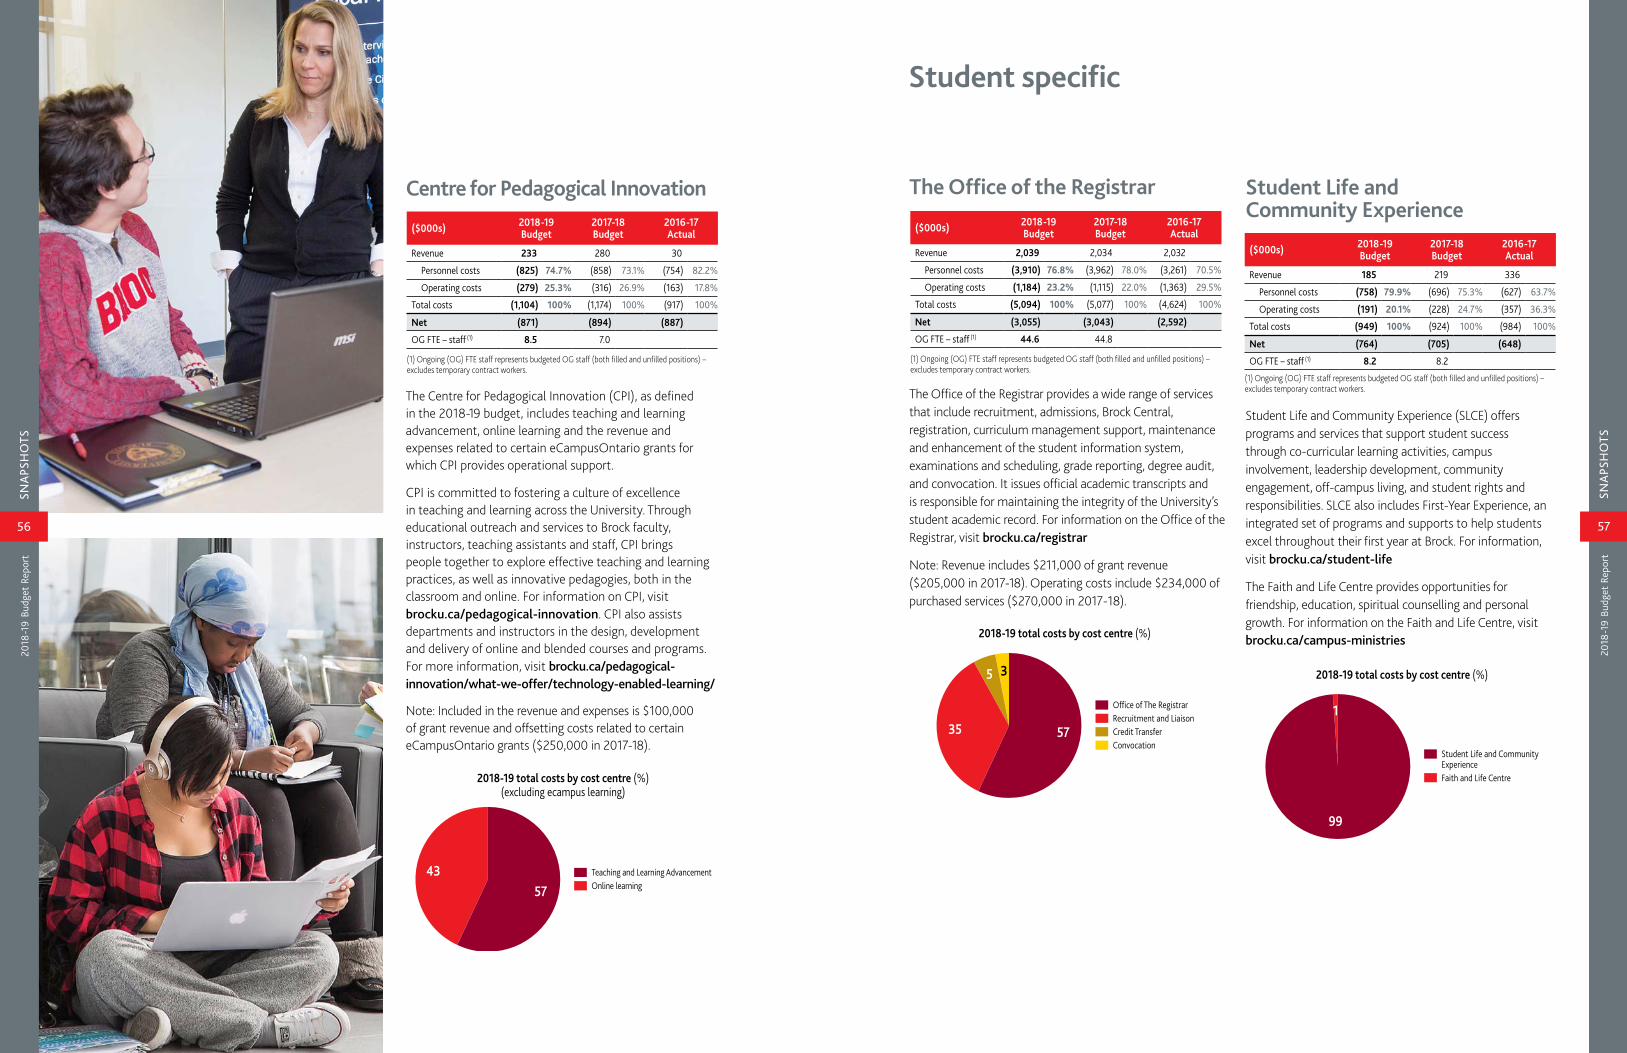
2018
-19
Bud
get
Repo
rt
SNA
PSH
OTS
56
2018
-19
Bud
get
Repo
rt
SNA
PSH
OTS
57
Centre for Pedagogical Innovation
The Centre for Pedagogical Innovation (CPI), as defined in the 2018-19 budget, includes teaching and learning advancement, online learning and the revenue and expenses related to certain eCampusOntario grants for which CPI provides operational support.
CPI is committed to fostering a culture of excellence in teaching and learning across the University. Through educational outreach and services to Brock faculty, instructors, teaching assistants and staff, CPI brings people together to explore effective teaching and learning practices, as well as innovative pedagogies, both in the classroom and online. For information on CPI, visit brocku.ca/pedagogical-innovation. CPI also assists departments and instructors in the design, development and delivery of online and blended courses and programs. For more information, visit brocku.ca/pedagogical-innovation/what-we-offer/technology-enabled-learning/
Note: Included in the revenue and expenses is $100,000 of grant revenue and offsetting costs related to certain eCampusOntario grants ($250,000 in 2017-18).
Teaching and Learning AdvancementOnline learning
2018-19 total costs by cost centre (%)(excluding ecampus learning)
4357
($000s) 2018-19Budget
2017-18Budget
2016-17Actual
Revenue 233 280 30
Personnel costs (825) 74.7% (858) 73.1% (754) 82.2%
Operating costs (279) 25.3% (316) 26.9% (163) 17.8%
Total costs (1,104) 100% (1,174) 100% (917) 100%
Net (871) (894) (887)
OG FTE – staff (1) 8.5 7.0
(1) Ongoing (OG) FTE staff represents budgeted OG staff (both filled and unfilled positions) – excludes temporary contract workers.
The Office of the Registrar
The Office of the Registrar provides a wide range of services that include recruitment, admissions, Brock Central, registration, curriculum management support, maintenance and enhancement of the student information system, examinations and scheduling, grade reporting, degree audit, and convocation. It issues official academic transcripts and is responsible for maintaining the integrity of the University’s student academic record. For information on the Office of the Registrar, visit brocku.ca/registrar
Note: Revenue includes $211,000 of grant revenue ($205,000 in 2017-18). Operating costs include $234,000 of purchased services ($270,000 in 2017-18).
Student Life and Community Experience
Student Life and Community Experience (SLCE) offers programs and services that support student success through co-curricular learning activities, campus involvement, leadership development, community engagement, off-campus living, and student rights and responsibilities. SLCE also includes First-Year Experience, an integrated set of programs and supports to help students excel throughout their first year at Brock. For information, visit brocku.ca/student-life
The Faith and Life Centre provides opportunities for friendship, education, spiritual counselling and personal growth. For information on the Faith and Life Centre, visit brocku.ca/campus-ministries
($000s) 2018-19Budget
2017-18Budget
2016-17Actual
Revenue 2,039 2,034 2,032
Personnel costs (3,910) 76.8% (3,962) 78.0% (3,261) 70.5%
Operating costs (1,184) 23.2% (1,115) 22.0% (1,363) 29.5%
Total costs (5,094) 100% (5,077) 100% (4,624) 100%
Net (3,055) (3,043) (2,592)
OG FTE – staff (1) 44.6 44.8
(1) Ongoing (OG) FTE staff represents budgeted OG staff (both filled and unfilled positions) – excludes temporary contract workers.
($000s) 2018-19Budget
2017-18Budget
2016-17Actual
Revenue 185 219 336
Personnel costs (758) 79.9% (696) 75.3% (627) 63.7%
Operating costs (191) 20.1% (228) 24.7% (357) 36.3%
Total costs (949) 100% (924) 100% (984) 100%
Net (764) (705) (648)
OG FTE – staff (1) 8.2 8.2
(1) Ongoing (OG) FTE staff represents budgeted OG staff (both filled and unfilled positions) – excludes temporary contract workers.
Student specific
Office of The RegistrarRecruitment and LiaisonCredit TransferConvocation
2018-19 total costs by cost centre (%)
5735
5 3 2018-19 total costs by cost centre (%)
99
1
Student Life and CommunityExperienceFaith and Life Centre

5958
2018
-19
Bud
get
Repo
rt
SNA
PSH
OTS
2018
-19
Bud
get
Repo
rt
SNA
PSH
OTS
2018-19 total costs by cost centre (%)
52
25
16
7
ESL ServicesIMDInternational ServicesBrock International – Administration
Student Wellness and Accessibility
The team at the Student Wellness and Accessibility Centre (SWAC) are driven by the vision of health, wellness and personal success for all students. The team consists of Student Health, Counselling and Accessibility Services.
Student Health Services offers a diverse range of health-care services. A psychiatrist and primary care physicians are available to students at the main campus in two locations – Campus Pharmacy and Harrison Hall; services include physical exams, sexual and reproductive health, first aid for injuries, mental health, wellness counselling, injections, prescriptions, and referrals to other health professionals and services.
Student Accessibility Services supports students with medical conditions (physical and mental), as well as learning and sensory disabilities during their time at the University. Staff work with students to develop individualized accommodation
plans based on documented disability-related needs. They also provide individualized and group support to build students’ self-advocacy skills and learning strategies in keeping with their strengths.
Personal Counselling Services offers students individual, group and crisis counselling. These services are provided by professional therapists contracted through a purchase of service agreement with a local service provider as well as a small team of Brock staff including a psychologist.
The Health Promotion team provides information, programming and outreach for students in important aspects of student life, such as stress management, healthy relationships and physical and mental wellness.
Note: Revenue includes $977,000 of student fees ($954,000 in 2017-18) and $923,000 of grant revenue ($670,000 in 2017-18). Operating costs include $1,063,000 of purchased services ($845,000 in 2017-18).
Brock International
Brock International, as defined in the 2018-19 budget, includes English as a Second Language (ESL) Services, the Office of International Market Development (IMD) and Brock International Services.
ESL Services offers English courses to students from all over the world through a mixture of formal classroom settings (including IELP and SELP programs) and sociocultural activities. For information on ESL Services, visit brocku.ca/esl-services
IMD offers international student recruitment, including identifying market needs and new opportunities. For information on IMD, visit brocku.ca/international/future/connect/
The mission of Brock International Services is to provide services and support to all international and Canadian students, visiting international scholars, Brock faculty and researchers, institutional partners and visitors by offering a wide range of high-quality programs, activities and international opportunities. For information on Brock International Services, visit brocku.ca/international-services
Note: Revenue includes $5,105,000 of student fees ($5,270,000 in 2017-18) and $100,000 of grant revenue ($99,000 in 2017-18). Operating costs include $995,000 of purchased services ($998,000 in 2017-18).
($000s) 2018-19Budget
2017-18Budget
2016-17Actual
Revenue 5,631 5,760 5,021
Personnel costs (4,691) 67.1% (4,934) 68.5% (3,912) 66.2%
Operating costs (2,301) 32.9% (2,273) 31.5% (1,993) 33.8%
Total costs (6,992) 100% (7,207) 100% (5,905) 100%
Net (1,361) (1,447) (884)
OG FTE – staff (1) 59.3 57.3
(1) Ongoing (OG) FTE staff represents budgeted OG staff (both filled and unfilled positions) – excludes temporary contract workers.
($000s) 2018-19Budget
2017-18Budget
2016-17Actual
Revenue 2,684 2,409 2,590
Personnel costs (2,911) 69.1% (2,703) 70.2% (2,268) 63.0%
Operating costs (1,301) 30.9% (1,145) 29.8% (1,332) 37.0%
Total costs (4,212) 100% (3,848) 100% (3,600) 100%
Net (1,528) (1,439) (1,010)
OG FTE – staff (1) 31.1 26.4
(1) Ongoing (OG) FTE staff represents budgeted OG staff (both filled and unfilled positions) – excludes temporary contract workers.
Health ServicesStudent Accessibility ServicesPersonal CounsellingStudent Wellness and AccessibilityAdministration
2018-19 total costs by cost centre (%)
41
36
203
A-Z Learning ServicesStudent Success Centre Administration(including academic advising)Aboriginal Student Services
2018-19 total costs by cost centre (%)
3535
30
Student Success Centre
The Student Success Centre, as defined in the 2018-19 budget, includes A-Z Learning Services, Academic Advising, and Aboriginal Student Services.
A-Z Learning Services helps Brock students with a broad range of challenges as they transition to and progress through their University life. Workshops and drop-in services are available throughout the year to help students with time management, note-taking, writing, math and science, exam preparation and more.
Academic Advising provides one-on-one advice for students to help them achieve their academic goals. This service is helpful for students who are considering changing their major and/or exploring adding a minor, students who are undeclared/undecided, students without a specific major, students returning to studies following an absence, and students on academic probation.
Aboriginal Student Services is dedicated to helping all Aboriginal students, including First Nations, Métis and Inuit, to make the transition to the Brock University community, and to be successful in their program of study. Support and resources are provided to enhance students’ academic, cultural, personal and spiritual life at Brock in a culturally sensitive manner.
For more information, visit brocku.ca/student-success-centre/
Note: Revenue includes $776,000 of grant revenue ($776,000 in 2017-18).
($000s) 2018-19Budget
2017-18Budget
2016-17Actual
Revenue 1,042 962 991
Personnel costs (1,332) 89.4% (1,335) 89.1% (1,243) 84.7%
Operating costs (158) 10.6% (163) 10.9% (225) 15.3%
Total costs (1,490) 100% (1,498) 100% (1,468) 100%
Net (448) (536) (477)
OG FTE – staff (1) 15.5 13.5
(1) Ongoing (OG) FTE staff represents budgeted OG staff (both filled and unfilled positions) – excludes temporary contract workers.

2018
-19
Bud
get
Repo
rt
SNA
PSH
OTS
61
2018
-19
Bud
get
Repo
rt
SNA
PSH
OTS
60
Brock Sports and Recreation
Brock Sports takes a leadership role and engages the community through sporting events and activities, tournaments, community partnerships, and the Badgers Sports Camp programs. Badgers men’s and women’s teams provide more than 900 students with the opportunity to participate in OUA and U SPORTS competitions. Brock Sports also runs the Athletic Therapy Clinic, Brock Sports Performance Centre and the Zone fitness centre. For more information, visit gobadgers.ca
Providing community and campus programming through student experiential learning opportunities defines the Brock Recreation department. The Brock Recreation department offers community-based programming that includes aquatic programs, camps for children and youth, school-based learning programs, and job skill certification programs. Brock Recreation also provides an environment that engages students in inclusive and diverse intramural activities. In 2018-19, Brock Recreation
2018-19 total costs by cost centre (%)
69
31Brock SportsBrock Recreation
2018-19 total costs by cost centre (%)
Co-op EducationCampus Career EducationCo-op, Career and Experiential Education – AdministrationExperiential EducationGoodman Career Development Office
34
2120
14
11
($000s) 2018-19Budget(2)
2017-18Budget
2016-17Actual
Revenue 6,935 6,872 6,501
Personnel costs (5,119) 61.5% (4,773) 62.8% (4,618) 61.3%
Operating costs (3,209) 38.5% (2,833) 37.2% (2,920) 38.7%
Total costs (8,328) 100% (7,606) 100% (7,538) 100%
Net (1,393) (734) (1,037)
OG FTE – staff (1) 26.6 22.8
(1) Ongoing (OG) FTE staff represents budgeted OG staff (both filled and unfilled positions) – excludes temporary contract workers. (2) 2018-19 Figures include an overhead allocation from the Ancillary Services shared services unit.
Co-op, Career and Experiential Education
Co-op, Career and Experiential Education is the overarching department for all things related to student and new graduate employment, curricular experiential education and career development on campus – both for undergraduate and graduate students. The department consists of the following operational areas: Co-operative Education, Career Education (Campus and Goodman Career Education) and Experiential Education. A team of dedicated human resources, career development and experiential professionals work with students, employers, faculty and community members in their employment and/or experiential needs. For more information, visit brocku.ca/ccee
Co-operative education offers a valuable opportunity for students to enhance their education by acquiring career-related work experience before graduation. Undergraduate and graduate students gain practical experience, develop a network of contacts and obtain a better understanding of careers in their field.
Career Education offers career exploration and development information, as well as resources to support students and alumni. Career Education provides employers and community members with information and services about on-campus recruiting and talent brand opportunities. Included in the Career Education department is also Goodman Career Education, which operates within this unit. The funding is provided through the Goodman School of Business as well as student levies. This office helps business and accounting students navigate the career planning process from first year to graduation.
Experiential Education promotes faculty, staff, students and community partners working together to provide opportunities for students to apply their classroom learning
($000s) 2018-19Budget
2017-18Budget
2016-17Actual
Revenue 2,516 1,924 2,179
Personnel costs (3,223) 82.3% (3,031) 88.7% (2,527) 85.4%
Operating costs (692) 17.7% (387) 11.3% (432) 14.6%
Total costs (3,915) 100% (3,418) 100% (2,959) 100%
Net (1,399) (1,494) (780)
OG FTE – staff (1) 38.0 35.0
(1) Ongoing (OG) FTE staff represents budgeted OG staff (both filled and unfilled positions) – excludes temporary contract workers.
through hands-on, real-world experience. Undergraduate and graduate students reflect on their experiences in order to build skills, realize competencies and contribute to the community, both within Niagara and beyond, in order to prepare for their careers and build beneficial connections that will help along the way. Experiential opportunities include internships, placements, field courses, service-learning, labs and more, and are available in every Faculty at Brock.
Note: Revenue includes $1,576,000 of student fees ($1,407,000 in 2017-18), and $279,000 of grant revenue ($0 in 2017-18). Co-operative education students pay tuition (applicable half-credit fee for each work term). However, like the Faculties, the revenue reported in this unit does not include an allocation of the Global tuition. Revenue does include $410,000 of internal chargeback revenue from the Goodman School of Business to support the Goodman Career Development Office ($417,000 in 2017-18). Operating costs include $107,000 of repairs and maintenance and capital replacement costs ($107,000 in 2017-18).
plans for 23,100 participants across all programs offered. For information on programming, visit brocku.ca/recreation
Brock Sports and Recreation experienced notable year-over-year increases driven predominately by recent changes in minimum wage, competitive pricing pressures for programs, the implementation of a professional development program for the department and overhead allocations from the Ancillary Services shared service unit. These overhead allocations are new to Brock Sports and Recreation as a result of the department joining the newly created Ancillary Services. See page 66 for further details. The department has set a goal of being cost neutral within five years.
Note: Revenue includes $3,087,000 of student fees ($3,032,000 in 2017-18) and program fees of $1,874,000 ($1,021,000 in 2017-18). Operating costs include $417,000 of purchased services ($505,000 in 2017-18) and $575,000 of repairs and maintenance and capital replacement costs ($513,000 in 2017-18).

2018
-19
Bud
get
Repo
rt
SNA
PSH
OTS
62
2018
-19
Bud
get
Repo
rt
SNA
PSH
OTS
63
Leadership
Leadership, as defined in the 2018-19 budget, represents a number of the offices of senior administration as well as the operating costs of the Board of Trustees and Senate. The senior administrative offices included are: the President; the Vice-President, Administration; the Provost and Vice-President, Academic; the Vice-President, Research (Note: See the Research Services responsibility centre for revenue and costs of the rest of the Research Department); the Vice-Provost and Associate Vice-President, Academic; Vice-Provost Teaching and Learning; and the Vice-Provost Enrolment Management and International.
Note: Operating costs include $138,000 of purchased services ($148,000 in 2017-18).
Information Technology Services
ITS (Information Technology Services) works closely with students, faculty and staff to support the academic and administrative work in our community. Its mission is to provide top-quality service and technology solutions to enable you to study, research and work more effectively and efficiently. ITS is comprised of four teams – Enterprise Systems Support, Client Services, Infrastructure and the Project and Administrative Support Office (PASO). The Enterprise Systems
Support team provides support for Workday, Student and Administrative Systems, Data Decision Support, as well as software development. Client Services provides support to the Brock community through a centralized Help Desk, desktop support, cyber security awareness, classroom technology, audio-visual support, and video/teleconferencing. Infrastructure support manages a centralized data centre, virtual servers, network access across campus, infrastructure security and the telephone system. PASO supports the ITS department for all administrative day-to-day operations and projects, including planning, procurement, maintenance schedules and budgeting. For more information on ITS, visit brocku.ca/information-technology
Note: Revenue includes $366,000 of internal chargeback revenue ($364,000 in 2017-18). Operating costs include $525,000 of purchased services ($416,000 in 2017-18) and $1,334,000 of repairs and maintenance and capital replacement costs ($1,512,000 in 2017-18).
In addition to the budget reported in the ITS responsibility centre, $5,138,000 in Information Technology Services projects are budgeted in the Capital responsibility centre. Details on these expenditures can be found on page 77.
Financial Services
Financial Services is responsible for the efficient control of all financial activities of the University, including budgeting, accounting, financial reporting and treasury functions, as well as shared responsibility for various operating units. Procurement services, the Student Accounts and Financial Aid (SAFA) office, and Central Receiving and Mail Services are also part of Financial Services. For more information on Financial Services, visit brocku.ca/finance
Note: Revenue includes $200,000 of internal chargeback revenue related to Central Receiving and Mail Services ($234,000 in 2017-18). Operating costs include $190,000 of purchased services ($188,000 in 2017-18) and $101,000 of financial expenditures ($78,000 in 2017-18).
Note: The majority of scholarships and student awards are shown as part of the Scholarships, Bursaries and Student Awards responsibility centre, including the offsetting grant revenue related to grant-funding scholarships and student awards.
Human Resources
Human Resources provides leadership and supports University operations through the promotion of personal, professional and organizational development, building strategic partnerships and fostering a respectful, healthy and safe environment for Brock employees and students. Key portfolios include Organizational Development and Talent Acquisition; Total Rewards (including the Brock Pension Plan); Faculty and Staff Relations; Health, Safety and Wellness and Systems and Special Projects. For information on Human Resources, visit brocku.ca/hr
Note: Operating costs include $407,000 of purchased services ($482,000 in 2017-18).
($000s) 2018-19Budget
2017-18Budget
2016-17Actual
Revenue 493 437 463
Personnel costs (2,996) 81.9% (3,014) 81.3% (3,134) 81.7%
Operating costs (661) 18.1% (691) 18.7% (701) 18.3%
Total costs (3,657) 100% (3,705) 100% (3,835) 100%
Net (3,164) (3,268) (3,372)
OG FTE – staff (1) 37.0 37.0
(1) Ongoing (OG) FTE staff represents budgeted OG staff (both filled and unfilled positions) – excludes temporary contract workers.
($000s) 2018-19Budget
2017-18Budget
2016-17Actual
Revenue 263 257 223
Personnel costs (3,278) 83.1% (3,413) 81.4% (3,035) 81.0%
Operating costs (667) 16.9% (782) 18.6% (711) 19.0%
Total costs (3,945) 100% (4,195) 100% (3,746) 100%
Net (3,682) (3,938) (3,523)
OG FTE – staff (1) 34.3 35.8
(1) Ongoing (OG) FTE staff represents budgeted OG staff (both filled and unfilled positions) – excludes temporary contract workers.
($000s) 2018-19Budget
2017-18Budget
2016-17Actual
Revenue 25
Personnel costs (2,827) 84.8% (2,617) 83.3% (2,571) 79.1%
Operating costs (508) 15.2% (526) 16.7% (680) 20.9%
Total costs (3,335) 100% (3,143) 100% (3,251) 100%
Net (3,335) (3,143) (3,226)
OG FTE – staff (1) 14.8 14.0
(1) Ongoing (OG) FTE staff represents budgeted OG staff (both filled and unfilled positions) – excludes temporary contract workers.
Shared services
($000s) 2018-19Budget
2017-18Budget
2016-17Actual
Revenue 444 458 556
Personnel costs (6,107) 74.3% (5,953) 72.8% (5,627) 73.5%
Operating costs (2,109) 25.7% (2,224) 27.2% (2,030) 26.5%
Total costs (8,216) 100% (8,177) 100% (7,657) 100%
Net (7,772) (7,719) (7,101)
OG FTE – staff (1) 61.2 61.0
(1) Ongoing (OG) FTE staff represents budgeted OG staff (both filled and unfilled positions) – excludes temporary contract workers.
2018-19 total costs by cost centre (%)
Client ServicesInfrastructureEnterprise Systems SupportPASO
33
29
26
12
2018-19 total costs by cost centre (%)
Financial ServicesProcurement ServicesCentral Receiving and Mail ServicesSAFAFinance – University Wide
39
21
17
15
8

2018
-19
Bud
get
Repo
rt
SNA
PSH
OTS
64
2018
-19
Bud
get
Repo
rt
SNA
PSH
OTS
65
Development and Alumni Relations
The Department of Development and Alumni Relations is responsible for Brock’s philanthropic activity, alumni engagement and maintaining records to stay in touch with Brock’s more than 100,000 alumni. The department works with donors who provide philanthropic support for University priorities, including capital projects, teaching and learning, technology and student support, and with the volunteer Brock University Alumni Association Board of Directors. For more information, visit brocku.ca/bold-new-brock and brocku.ca/alumni
Note: Operating costs include $122,000 of repairs and maintenance and capital replacement costs ($122,000 in 2017-18).
Shared Services Support
Shared Services Support, as defined in the 2018-19 budget, represents the Office of Government Relations, the Office of the University Secretariat, the Internal Audit Department, Human Rights and Equity Services, and Institutional Analysis and Planning.
The University Secretariat works to ensure that the University’s two governing bodies (Board of Trustees and Senate) and their committees operate effectively and efficiently by providing administrative services, research and analysis, and general support. The Office of the University Secretariat also has primary responsibility for the administration of the Freedom of Information and Protection of Privacy Act (FIPPA), and overseeing and managing the legal services provided to the University by the University’s legal counsel. The Secretariat also manages the University’s policy framework and processes as well as the University’s record management program. For more information on the University Secretariat, visit brocku.ca/university-secretariat
The Office of Government Relations builds relationships at all levels of government to advance Brock University’s strategic priorities and to raise awareness about the University’s unique areas of strength. The office is responsible for supporting Brock’s strategic priorities with all levels of government by:• Monitoring and providing advice on public policy and
programs• Building relationships with elected representatives and
non-elected officials• Supporting Brock’s government advocacy• Acting as a liaison and central point of contact• Co-ordinating strategic communications and engagement• Facilitating government visits to Brock’s campus• Engaging with sector associations including Universities
Canada and the Council of Ontario Universities (COU)
($000s) 2018-19Budget
2017-18Budget
2016-17Actual
Revenue 740 655 676
Personnel costs (1,790) 75.8% (1,705) 73.4% (1,656) 71.7%
Operating costs (573) 24.2% (619) 26.6% (653) 28.3%
Total costs (2,363) 100% (2,324) 100% (2,309) 100%
Net (1,623) (1,669) (1,633)
OG FTE – staff (1) 18.5 18.0
(1) Ongoing (OG) FTE staff represents budgeted OG staff (both filled and unfilled positions) – excludes temporary contract workers.
University Marketing and Communications
The University Marketing and Communications unit, represents the Office of University Marketing and Communications (UMC) as well as Printing and Digital Services. UMC provides the strategic direction for Brock University’s brand, marketing, and communications efforts. As stewards of Brock’s brand and reputation, UMC tells the Brock story to the University’s many and varied audiences, including students, prospective students, staff and faculty, the community, industry and the government. UMC’s key responsibilities include brand management, integrated marketing and communications, media relations and public affairs, social media, web and digital content development, and community engagement. Learn more about UMC at brocku.ca/marketing-communications
Printing and Digital Services is the official on-campus provider for printing, stationery and the management of the fleet of multifunction copiers across campus. The department provides a full in-house manufacturing facility to produce a wide range of print materials for academic, administrative and student print requirements. For information, visit brocku.ca/printing
Note: Revenue includes $1,205,000 of Printing Services internal chargeback revenue ($1,563,000 in 2017-18). Operating costs include $296,000 of purchased services ($360,000 in 2017-18).
($000s) 2018-19Budget
2017-18Budget
2016-17Actual
Revenue 1,552 1,789 1,975
Personnel costs (1,596) 43.3% (1,568) 41.8% (1,479) 38.0%
Operating costs (2,088) 56.7% (2,183) 58.2% (2,417) 62.0%
Total costs (3,684) 100% (3,751) 100% (3,896) 100%
Net (2,132) (1,962) (1,921)
OG FTE – staff (1) 20.0 18.5
(1) Ongoing (OG) FTE staff represents budgeted OG staff (both filled and unfilled positions) – excludes temporary contract workers.
For more information on the Office of Government Relations, visit brocku.ca/government-relations
Institutional Analysis and Planning gathers, processes, interprets and translates campus data into useful information for University decision-makers, the government and the general public, focusing on enrolment, retention and graduation statistics, institutional characteristics, survey analysis and support, and ad hoc requests. For information on Institutional Analysis and Planning, visit brocku.ca/institutional-analysis
The Internal Audit Department independently assesses the strength of the University’s risk and control processes. The department performs consulting engagements, value-for-money reviews and traditional risk-and-control-based audits. For information on the Internal Audit Department, visit brocku.ca/internal-audit
Human Rights and Equity is a resource for all members of the Brock community that provides information, education and complaint resolution related to harassment, discrimination and bullying. For more information on Human Rights and Equity, visit brocku.ca/human-rights
Note: Operating costs include $163,000 of purchased services ($93,000 in 2017-18).
2018-19 total costs by cost centre (%)
Development and Donor RelationsAlumni RelationsDevelopment and Alumni OperationsAnnual Fund from TelegradPresidential EventsAlumni Association
42
29
18
8 21
2018-19 total costs by cost centre (%)
59
41 Office of University Marketing and CommunicationsPrinting and Digital Services
($000s) 2018-19Budget
2017-18Budget
2016-17Actual
Personnel costs (2,104) 89.3% (1,972) 90.1% (1,461) 81.9%
Operating costs (251) 10.7% (216) 9.9% (322) 18.1%
Total costs (2,355) 100% (2,188) 100% (1,783) 100%
Net (2,355) (2,188) (1,783)
OG FTE – staff (1) 20.5 20.5
(1) Ongoing (OG) FTE staff represents budgeted OG staff (both filled and unfilled positions) – excludes temporary contract workers.
Office of University SecretariatHuman Rights and Equity ServicesInstitutional AnalysisOffice of Government RelationsInternal Audit Department
2018-19 total costs by cost centre (%)
35
17
13
24
11
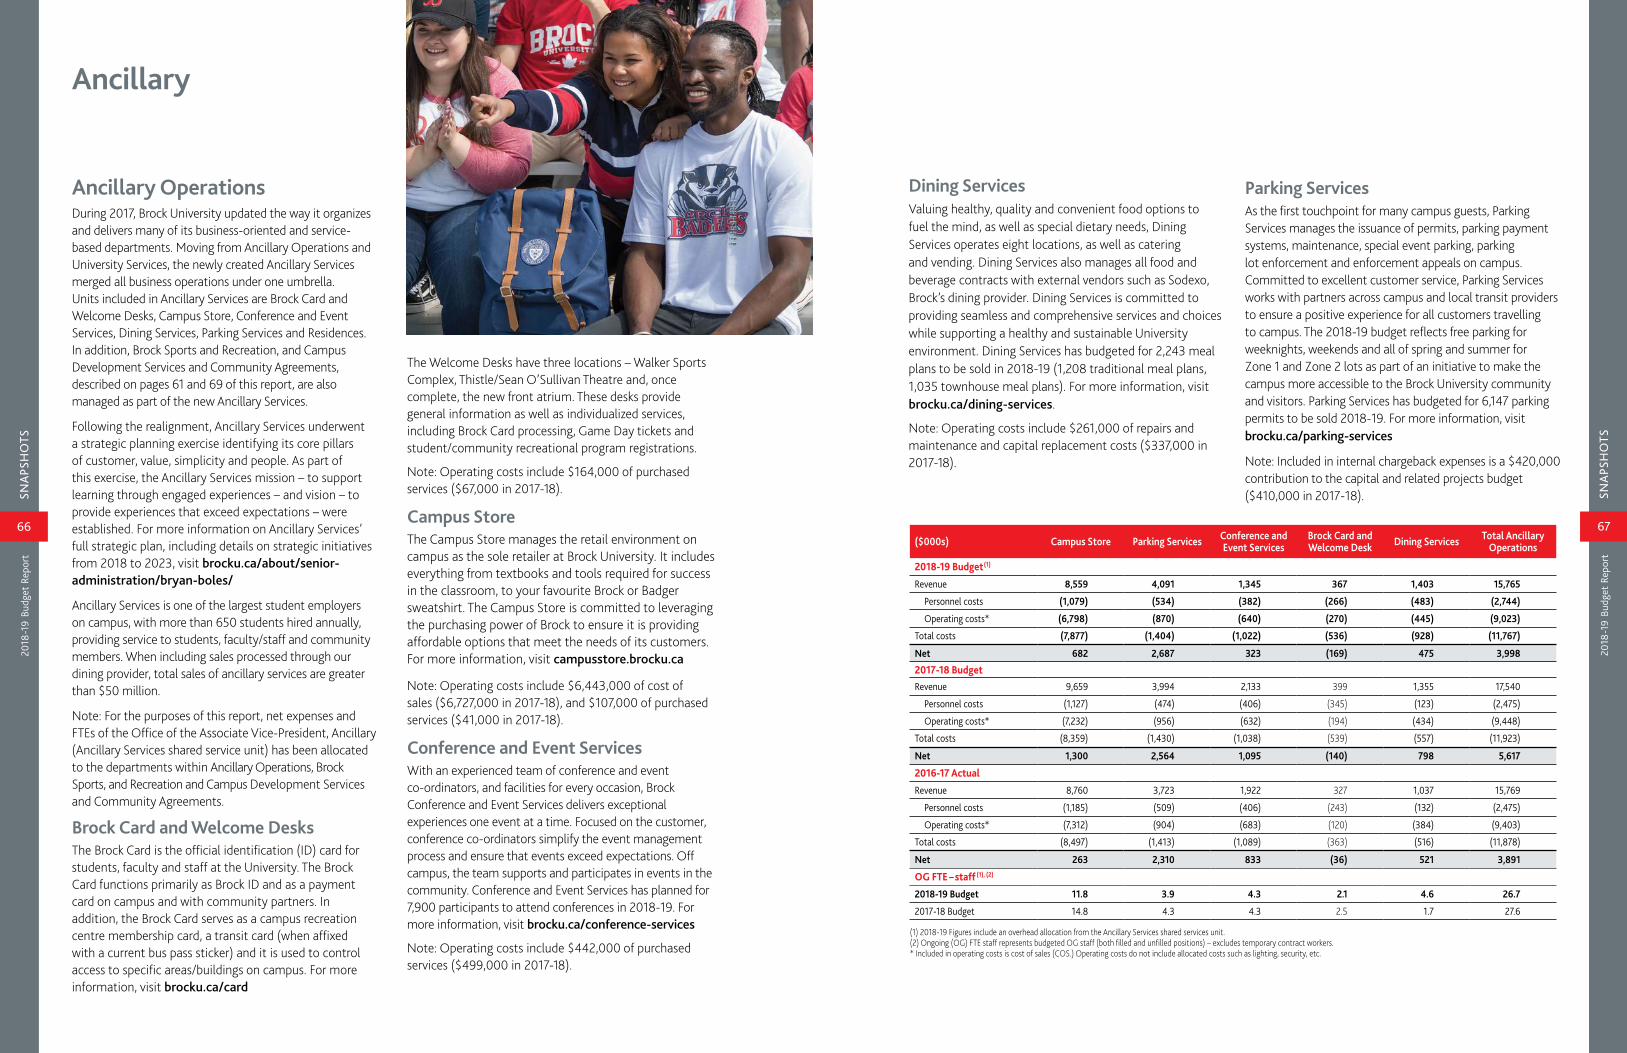
2018
-19
Bud
get
Repo
rt
SNA
PSH
OTS
66
2018
-19
Bud
get
Repo
rt
SNA
PSH
OTS
67
Ancillary OperationsDuring 2017, Brock University updated the way it organizes and delivers many of its business-oriented and service-based departments. Moving from Ancillary Operations and University Services, the newly created Ancillary Services merged all business operations under one umbrella. Units included in Ancillary Services are Brock Card and Welcome Desks, Campus Store, Conference and Event Services, Dining Services, Parking Services and Residences. In addition, Brock Sports and Recreation, and Campus Development Services and Community Agreements, described on pages 61 and 69 of this report, are also managed as part of the new Ancillary Services.
Following the realignment, Ancillary Services underwent a strategic planning exercise identifying its core pillars of customer, value, simplicity and people. As part of this exercise, the Ancillary Services mission – to support learning through engaged experiences – and vision – to provide experiences that exceed expectations – were established. For more information on Ancillary Services’ full strategic plan, including details on strategic initiatives from 2018 to 2023, visit brocku.ca/about/senior-administration/bryan-boles/
Ancillary Services is one of the largest student employers on campus, with more than 650 students hired annually, providing service to students, faculty/staff and community members. When including sales processed through our dining provider, total sales of ancillary services are greater than $50 million.
Note: For the purposes of this report, net expenses and FTEs of the Office of the Associate Vice-President, Ancillary (Ancillary Services shared service unit) has been allocated to the departments within Ancillary Operations, Brock Sports, and Recreation and Campus Development Services and Community Agreements.
Brock Card and Welcome DesksThe Brock Card is the official identification (ID) card for students, faculty and staff at the University. The Brock Card functions primarily as Brock ID and as a payment card on campus and with community partners. In addition, the Brock Card serves as a campus recreation centre membership card, a transit card (when affixed with a current bus pass sticker) and it is used to control access to specific areas/buildings on campus. For more information, visit brocku.ca/card
The Welcome Desks have three locations – Walker Sports Complex, Thistle/Sean O’Sullivan Theatre and, once complete, the new front atrium. These desks provide general information as well as individualized services, including Brock Card processing, Game Day tickets and student/community recreational program registrations.
Note: Operating costs include $164,000 of purchased services ($67,000 in 2017-18).
Campus StoreThe Campus Store manages the retail environment on campus as the sole retailer at Brock University. It includes everything from textbooks and tools required for success in the classroom, to your favourite Brock or Badger sweatshirt. The Campus Store is committed to leveraging the purchasing power of Brock to ensure it is providing affordable options that meet the needs of its customers. For more information, visit campusstore.brocku.ca
Note: Operating costs include $6,443,000 of cost of sales ($6,727,000 in 2017-18), and $107,000 of purchased services ($41,000 in 2017-18).
Conference and Event ServicesWith an experienced team of conference and event co-ordinators, and facilities for every occasion, Brock Conference and Event Services delivers exceptional experiences one event at a time. Focused on the customer, conference co-ordinators simplify the event management process and ensure that events exceed expectations. Off campus, the team supports and participates in events in the community. Conference and Event Services has planned for 7,900 participants to attend conferences in 2018-19. For more information, visit brocku.ca/conference-services
Note: Operating costs include $442,000 of purchased services ($499,000 in 2017-18).
($000s) Campus Store Parking Services Conference and Event Services
Brock Card and Welcome Desk Dining Services Total Ancillary
Operations
2018-19 Budget(1)
Revenue 8,559 4,091 1,345 367 1,403 15,765
Personnel costs (1,079) (534) (382) (266) (483) (2,744)
Operating costs* (6,798) (870) (640) (270) (445) (9,023)
Total costs (7,877) (1,404) (1,022) (536) (928) (11,767)
Net 682 2,687 323 (169) 475 3,998
2017-18 BudgetRevenue 9,659 3,994 2,133 399 1,355 17,540
Personnel costs (1,127) (474) (406) (345) (123) (2,475)
Operating costs* (7,232) (956) (632) (194) (434) (9,448)
Total costs (8,359) (1,430) (1,038) (539) (557) (11,923)
Net 1,300 2,564 1,095 (140) 798 5,617
2016-17 Actual
Revenue 8,760 3,723 1,922 327 1,037 15,769
Personnel costs (1,185) (509) (406) (243) (132) (2,475)
Operating costs* (7,312) (904) (683) (120) (384) (9,403)
Total costs (8,497) (1,413) (1,089) (363) (516) (11,878)
Net 263 2,310 833 (36) 521 3,891
OG FTE – staff (1), (2)
2018-19 Budget 11.8 3.9 4.3 2.1 4.6 26.7
2017-18 Budget 14.8 4.3 4.3 2.5 1.7 27.6
(1) 2018-19 Figures include an overhead allocation from the Ancillary Services shared services unit.(2) Ongoing (OG) FTE staff represents budgeted OG staff (both filled and unfilled positions) – excludes temporary contract workers.* Included in operating costs is cost of sales (COS.) Operating costs do not include allocated costs such as lighting, security, etc.
Ancillary
Dining Services Valuing healthy, quality and convenient food options to fuel the mind, as well as special dietary needs, Dining Services operates eight locations, as well as catering and vending. Dining Services also manages all food and beverage contracts with external vendors such as Sodexo, Brock’s dining provider. Dining Services is committed to providing seamless and comprehensive services and choices while supporting a healthy and sustainable University environment. Dining Services has budgeted for 2,243 meal plans to be sold in 2018-19 (1,208 traditional meal plans, 1,035 townhouse meal plans). For more information, visit brocku.ca/dining-services.
Note: Operating costs include $261,000 of repairs and maintenance and capital replacement costs ($337,000 in 2017-18).
Parking Services As the first touchpoint for many campus guests, Parking Services manages the issuance of permits, parking payment systems, maintenance, special event parking, parking lot enforcement and enforcement appeals on campus. Committed to excellent customer service, Parking Services works with partners across campus and local transit providers to ensure a positive experience for all customers travelling to campus. The 2018-19 budget reflects free parking for weeknights, weekends and all of spring and summer for Zone 1 and Zone 2 lots as part of an initiative to make the campus more accessible to the Brock University community and visitors. Parking Services has budgeted for 6,147 parking permits to be sold 2018-19. For more information, visit brocku.ca/parking-services
Note: Included in internal chargeback expenses is a $420,000 contribution to the capital and related projects budget ($410,000 in 2017-18).

2018
-19
Bud
get
Repo
rt
SNA
PSH
OTS
68
2018
-19
Bud
get
Repo
rt
SNA
PSH
OTS
69
Residences
As students’ home away from home, the Residences team supports the University experience by providing safe living and positive learning experiences in seven complexes on campus for 2,475 students. There are three semi-suite style residences, two townhouses complexes, one traditional style residence and one apartment style building. Two of the seven residences are part of Brock Suites, which are geared towards upper-year and graduate students. The Brock Residences team delivers student-centred services in a supportive living environment that embraces diversity, fosters mutual respect and promotes accountability and good citizenship. For more information, visit brocku.ca/residence
Note: Revenue includes $18,155,000 of residence fees ($17,068,000 in 2017-18). Operating costs include $1,916,000 of purchased services ($1,907,000 in 2017-18), $482,000 of utility costs ($567,000 in 2017-18), $4,433,000 of financial expenditures ($4,433,000 in 2017-18) and $1,032,000 of repairs and maintenance and capital replacement costs ($1,530,000 in 2017-18). Residence’s internal chargeback expense includes a contribution to the capital and related projects budget of $2,865,000 ($2,795,000 in 2017-18).
Facilities Management
Facilities Management’s mandate is to provide a safe, clean, accessible and well-maintained physical environment for the University community by planning and delivering services that are sustainable and supportive of academic excellence, including: management of campus utilities and the co-generation plant; facility maintenance; grounds maintenance; capital planning, design and construction; project management; code and bylaw compliance; and cleaning and non-hazardous waste management. For more information, visit brocku.ca/facilities-management
Note: Revenue includes $585,000 of internal chargeback revenue ($569,000 in 2017-18). Operating costs include $2,191,000 of repairs and maintenance and capital replacement costs ($1,942,000 in 2017-18) and $1,395,000 of purchased services ($1,344,000 in 2017-18). Utilities costs are not included in the Facilities Management budget and are reported as part of the Utilities, Taxes and Insurance responsibility centre on page 70.
In addition to the budget above, $10,870,000 ($8,719,000 in 2017-18) in Facilities Management projects are budgeted in the Capital responsibility centre. Details on these expenditures can be found on page 78.
Campus Security Services
Campus Security Services is a dedicated team of experienced, skilled professionals who provide a safe and secure environment for the Brock community and all University campuses and properties. They are a special constable service responsible for community policing, enforcing federal and provincial statutes, assisting and supporting any victims of crime, and apprehending offenders. They work closely with all University departments and are responsible for emergency preparedness and life safety in partnership with external emergency agencies and responders. For more information on Campus Security, visit brocku.ca/campus-security
Note: Revenue includes $109,000 of internal chargeback revenue ($2,000 in 2017-18). Operating costs include $1,061,000 of purchased services ($950,000 in 2017-18).
Campus Development Services and Community Agreements
Campus Development Services includes Heritage Plaza, which houses McDonald’s, Tim Hortons, the Campus Pharmacy and Medical Clinic and Spiice Chinese Express and Tea Lounge. Community Agreements include payments for an on-campus art collection, community events, the payment to the FirstOntario Performing Arts Centre and a $150,000 payment to BUSU for transit funding (shown in Parking Services in 2017-18).
($000s) 2018-19Budget
2017-18Budget
2016-17Actual
Revenue 122 59 70
Personnel costs (1,477) 55.8% (1,468) 57.1% (1,376) 55.9%
Operating costs (1,169) 44.2% (1,104) 42.9% (1,086) 44.1%
Total costs (2,646) 100% (2,572) 100% (2,462) 100%
Net (2,524) (2,513) (2,392)
OG FTE – staff (1) 18.0 18.0
(1) Ongoing (OG) FTE staff represents budgeted OG staff (both filled and unfilled positions) – excludes temporary contract workers.
($000s) 2018-19Budget
2017-18Budget
2016-17Actual
Revenue 731 659 774
Personnel costs (12,543) 77.3% (12,292) 78.3% (12,138) 75.7%
Operating costs (3,686) 22.7% (3,405) 21.7% (3,889) 24.3%
Total costs (16,229) 100% (15,697) 100% (16,027) 100%
Net (15,498) (15,038) (15,253)
OG FTE – staff (1) 147.5 147.0
(1) Ongoing (OG) FTE staff represents budgeted OG staff (both filled and unfilled positions) – excludes temporary contract workers.
Space
2018-19 total costs by cost centre (%)
Maintenance – buildingsCustodial servicesMaintenance – groundsCFHBRC operating costsCampus planning design and constructionFacilities Management administrationMIWSFPA operating costsHamilton campus operating costs
34
32
8
8
75 5 1
($000s) 2018-19Budget(2)
2017-18Budget
2016-17Actual
Revenue 18,696 17,560 16,439
Personnel costs (3,746) 22.0% (2,880) 17.5% (2,064) 13.6%
Operating costs (13,303) 78.0% (13,549) 82.5% (13,124) 86.4%
Total costs (17,049) 100% (16,429) 100% (15,188) 100%
Net 1,647 1,131 1,251
OG FTE – staff (1) 39.6 31.6
(1) Ongoing (OG) FTE staff represents budgeted OG staff (both filled and unfilled positions) – excludes temporary contract workers.(2) 2018-19 Figures include an overhead allocation from the Ancillary Services shared services unit.
($000s) 2018-19Budget(1)
2017-18Budget
2016-17Actual
Revenue 341 345 298
Personnel costs (8) 0.7% 0.0% 0.0%
Operating costs (1,150) 99.3% (962) 100.0% (944) 100.0%
Total costs (1,158) 100% (962) 100% (944) 100%
Net (817) (617) (646)
(1) 2018-19 Figures include an overhead allocation from the Ancillary Services shared services unit..2018-19 total revenue by cost centre (%)
Village ResidenceDeCew ResidenceQuarryview ResidenceLowenberger ResidenceEarp ResidenceVallee ResidenceGateway ResidenceCentral Residence Administration
34
1513
12
11
1014

2018
-19
Bud
get
Repo
rt
SNA
PSH
OTS
70
2018
-19
Bud
get
Repo
rt
SNA
PSH
OTS
71
Utilities, Taxes and Insurance
The Utilities, Taxes and Insurance responsibility centre includes all centrally billed utility costs of $6,799,000 ($7,013,000 in 2017-18), which represents the majority of the University’s total utility costs of $7,341,000 ($7,637,000 in 2017-18). Note: The remaining $542,000 ($624,000 in 2017-18) of utility costs is billed directly to operating units. As detailed in the chart below, offsetting these utility costs are chargebacks to both internal units, mainly the Department of Residence and external units to the University.
Also included in operating costs are municipal taxes (payment in lieu of property taxes) of $1,211,000 ($1,216,000 in 2017-18), offset by the Grant in Lieu of Municipal Taxes of $1,081,000 ($1,081,000 in 2017-18). For more details, see page 34.
The remaining operating costs are made up of repairs and maintenance and capital replacement costs of $1,126,000 ($1,122,000 in 2017-18), the majority of which is related to the University’s central utilities building; insurance costs of $913,000 ($781,000 in 2017-18), and other operating costs of $249,000 ($199,000 in 2017-18).
Financing
Along with the Department of Residence, the Financing responsibility centre includes all of the interest and principal payments of the University’s external debt, as well as the investment towards the debt reduction strategy. See details below:
The 2018-19 revenue of $316,000 ($301,000 in 2017-18) represents investment income on the Mawer balanced fund investments, which is transferred to an internally restricted reserve as part of inter-fund expenses to support the repayment of the 2045 $93-million debenture (i.e. sinking fund) and the employee future benefits reserve. In 2017-18, $25,000 of sinking fund administration fees were included in this responsibility centre, which is shown in the Financial Services responsibility centre in 2018-19.
See page 81 for further discussion of Brock’s financing strategies and debt outstanding.
Scholarships, Bursaries and Student Awards
This unit represents the majority of Brock’s undergraduate and graduate scholarships, bursaries and student awards (SBSAs). Of the total SBSAs reported in this unit, $12,998,000 ($11,167,000 in 2017-18) relates to support for undergraduate students and $7,942,000 ($7,152,000 in 2017-18) relates to support for graduate students.
UndergraduateThe undergraduate SBSAs can be segregated into four main types: University-funded, those funded by government grants, student tuition waivers and those funded by endowments.
Total budgeted undergraduate University-funded SBSAs of $9,818,000 ($9,478,000 in 2017-18) are either merit-based or need-based. • Merit-based awards are budgeted to be $7,706,000
($7,254,000 in 2017-18). Merit-based awards include Brock Entrance Scholars Awards of $3,200,000 ($3,038,000 in 2017-18) and renewals of those scholarships of $2,655,000 ($2,570,000 in 2017-18), as well as a number of other awards, including course-based scholarships, the International Education Fund, the Principal’s Awards, etc.
• Need-based awards are budgeted to be $2,112,000 ($2,224,000 in 2017-18). This includes funding related to the requirements of the Student Access Guarantee (SAG), a MAESD initiative that states that no qualified Ontario student should be prevented from attending post-secondary education because of a lack of financial support programs. The MAESD requires all colleges and universities that receive public funding to provide enough financial aid to cover a student’s assessed needs for expenses directly related to his or her program that are not fully met by OSAP. Also included in need-based awards is Brock’s bursary assistance of $553,000 ($760,000 in 2017-18), as well as Brock’s entrance
bursaries of $500,000 ($500,000 in 2017-18) and a number of other specialty awards including the Student International Mobility Awards, Emergency Bursaries, etc.
Undergraduate student tuition waivers for Brock faculty and staff and their dependents are budgeted to be $1,490,000 ($1,490,000 in 2017-18).
Total grant-funded undergraduate SBSAs for 2018-19 are budgeted to be $199,000 ($199,000 in 2017-18), which is directly offset in grant revenue.
Starting in 2018-19, the funding budget now includes the endowment allocated spend related to scholarships and student awards. The undergraduate portion for 2018-19 is $1,491,000. This support is shown in the budget as an inter-fund expense, with an offsetting inter-fund revenue of the same amount.
Also included in revenue is $8,000 ($3,000 in 2017-18) of interdepartmental transfers to fund certain scholarships budgeted in this responsibility centre.
The following chart details the proportion of the total undergraduate SBSAs (in this unit) by type – merit-based, needs-based, tuition waivers, endowment funded and grant funded. Another way to analyze the University-funded undergraduate SBSAs is by primary purpose – recruitment, retention and recognition – which is also detailed in the following chart.
($000s)
2018-19 Budget 2017-18 Budget
Financingunit
Department of
Residence
Financingunit
Department of
Residence
Bond – interest 2,137 2,483 2,137 2,483
Cairns – interest 1,114 1,150
Cairns – principal 790 754
Residence – interest 1,002 1,067
Residence – principal 948 883
MIWSFPA building – interest 364 381
MIWSFPA building – principal 720 720
Debt reduction strategy 1,303 1,022
Total 6,428 4,433 6,164 4,433
2018-19 operating costs vs. offseting revenue ($000s)
Operating costsOffsetting revenue
Utilities Municipal taxes
Repairs and maintenance,
and capital replacement
Insurance Other
6,799
1,7761,211 1,081 1,126
913249
Grant in Lieu of Municipal
Taxation
Internal chargebacks ($1,471) and
external chargebacks
($305)
Global
2018-19 undergraduate scholarships and student awards (%)
RecruitmentRetentionRecognition
122
59
16
11
83
125
Merit-basedNeeds-basedTuition waiversEndowment fundedGrant-funded
($000s) 2018-19Budget
2017-18Budget
2016-17Actual
Revenue 2,842 1,007 1,031
Operating costs (20,940) 100% (18,348) 100% (16,356) 100%
Total costs (20,940) 100% (18,348) 100% (16,356) 100%
Net (18,098) (17,341) (15,325)
($000s) 2018-19Budget
2017-18Budget
2016-17Actual
Revenue 2,857 2,833 2,805
Operating costs (10,298) 100% (10,332) 100% (9,327) 100%
Total costs (10,298) 100% (10,332) 100% (9,327) 100%
Net (7,441) (7,499) (6,522)
($000s) 2018-19Budget
2017-18Budget
2016-17Actual
Revenue 316 301
Operating costs (6,744) 100% (6,490) 100% (7,147) 100%
Total costs (6,744) 100% (6,490) 100% (7,147) 100%
Net (6,428) (6,189) (7,147)

2018
-19
Bud
get
Repo
rt
SNA
PSH
OTS
72
2018
-19
Bud
get
Repo
rt
SNA
PSH
OTS
73
GraduateThe majority of graduate SBSAs are in the form of University-funded fellowships of $5,665,000 ($4,756,000 in 2017-18). Other graduate SBSAs of $589,000 ($1,059,000 in 2017-18) include University-funded entrance scholarships and awards for excellence and research awards. In the 2017-18 budget, there was $30,000 for graduate student travel support, this was moved to the Graduate Studies budget in 2018-19. In addition, there are scholarships funded two-thirds by the MAESD, in the amount of $1,190,000 ($1,190,000 in 2017-18), with an offsetting grant revenue of $793,000 ($793,000 in 2017-18).
Also included in graduate SBSAs are student tuition waivers for Brock faculty and their dependents and Brock staff, which are budgeted to be $147,000 ($147,000 in 2017-18).
As previously mentioned, starting in 2018-19, the funding budget now includes the endowment allocated spend related to scholarships and student awards. The graduate portion for 2018-19 is $351,000. This support is shown in the budget as an inter-fund expense, with an offsetting inter-fund revenue of the same amount.
Also included in revenue in 2017-18 was $12,000 of interdepartmental transfers to fund certain scholarships budgeted in this responsibility centre. The budget for 2018-19 is nil.
Note: Additional scholarships and awards of $0.60 million are included in other units throughout the University.
It should also be noted that there has been a one-time funding commitment of $485,000 from the anticipated 2017-18 surplus for support for international PhD students and Graduate Studies’ matching fellowships. This funding will have to be built into the 2019-20 budget.
Capital
The Capital responsibility centre represents the total funding of both the Facilities Management projects of $10,870,000 ($8,719,000 in 2017-18) and the Information Technology Services projects of $5,138,000 ($3,408,000 in 2017-18) in the capital and related project budget. Offsetting these costs is the contribution of the Department of Residences to the capital and related project budget of $2,865,000 ($2,795,000 in 2017-18) – to fund the facilities management and information technology services projects, and the $420,000 ($410,000 in 2017-18) transfer from Parking Services – to fund facilities management projects. Also included in revenue is Facilities Renewal Program Funds of $1,761,000 ($1,298,000 in 2017-18). See page 34 for a discussion of these funds. See pages 75 to 79 for details of the capital and related project budget.
($000s) 2018-19Budget
2017-18Budget
2016-17Actual
Revenue 5,046 4,503 5,502
Operating costs (16,008) 100% (12,127) 100% (14,581) 100%
Total costs (16,008) 100% (12,127) 100% (14,581) 100%
Net (10,962) (7,624) (9,079)
University Global
University Global represents those costs and revenue that are University-wide and have not been allocated to any specific Faculty or department.
Revenue for University Global includes the following:• Global tuition of $150,439,000 ($141,667,000 in 2017-18)
as detailed in Figure 19 on page 27.• Grant revenue of $89,244,000 ($88,882,000 in 2017-18)
as follows:– Core operating grant of $82,000,000 ($82,000,000 in
2017-18) – see page 32.– Differentiation grant envelope of $5,067,000
($4,633,000 in 2017-18) – see page 32. – Nursing grant of $2,787,000 ($2,813,000 in 2017-18)
– see page 33.– Graduate Enrolment Capital Expansion grant of
$750,000 ($750,000 in 2017-18) – see page 34.– An offset to grant revenue of $1,400,000 ($1,465,000
in 2017-18) due to International Student Recovery Fee – see page 33.
• International Student Recovery Fee of $1,100,000 ($1,030,000 in 2017-18), which offsets the reduction mentioned above in grant revenue – see page 33.
• Investment income of $1,200,000 ($900,000 in 2017-18) – see page 36.
• Inter-fund revenue of $856,000 ($699,000 in 2017-18) – see page 36.
• Internal chargebacks of $380,000 ($335,000 in 2017-18) from the Faculties relating to the International Student Recovery Fee for international student programs.
• Other revenue of $2,135,000 ($1,271,000 in 2017-18), which mainly represents interest charged on student accounts.
Personnel costs for University Global include $1,210,000 ($5,098,000 in 2017-18) related to salary and wage increases that are anticipated but not yet awarded or negotiated. Note: The salary and wage increases that were anticipated but not yet awarded or negotiated included in the Global responsibility unit in the 2017-18 Budget Report have since been allocated to the respective units and are therefore reported as such in this Budget Report. See Appendix C for further details. Offsetting these costs are budgeted savings from voluntary reduction of $304,000 ($300,000 in 2017-18).
Operating costs for University Global include the following: • Recruitment, relocation and start-up funds for faculty
members and librarians of $856,000 ($699,000 in 2017-18), which is funded by a transfer from the Provost Strategic Initiative Fund (included in inter-fund revenue).
• Other operating costs of $1,489,000 ($1,000,000 in 2017-18), which include University memberships, allowances for uncollectable funds and other University-wide expense items.
University Global also includes an adjustment between personnel costs and operating costs (inter-fund expenses) of $900,000 ($900,000 in 2017-18) related to the employee future benefits reserve transfer, which is reported in each unit as a benefit expense; however, overall, is recorded as an inter-fund expense.
($000s) 2018-19Budget
2017-18Budget
2016-17Actual
Revenue 245,355 234,783 228,641
Personnel costs (758) 17.6% 35 -1.4% 1,191 -16.0%
Operating costs (3,546) 82.4% (2,602) 101.4% (8,656) 116.0%
Total costs (4,304) 100% (2,567) 100% (7,465) 100%
Net 241,051 232,216 221,176

2018
-19
Bud
get
Repo
rt
CA
PITA
L
74
2018
-19
Bud
get
Repo
rt
CA
PITA
L
75
BackgroundThe capital and related project budget was approved on Nov. 30, 2017 by the Board of Trustees after input-gathering from the Brock community. The process to develop this capital and related project budget began in the summer of 2017, when Facilities Management and Information Technology Services first published proposed projects and sought input. Further discussions were held at committee levels, including the Senate Information Technology and Infrastructure Committee and the Senate Planning, Priorities Budget Advisory Committee.
Approving the capital and related projects budget in late November or December allows Facilities Management and Information Technology Services time to start planning the projects so, where possible, they can be accomplished in the spring and summer when the campus is less busy, as well as to ensure there is sufficient time to obtain appropriate pricing.
Information and updates on the 2017-18 capital and related projects can be found in the 2017-18 trimester reporting at brocku.ca/about/university-financials. A key feature of this capital and related project planning is that any unspent funds of the 2017-18 capital and related projects budget will be reserved at April 30, 2018, and be moved into fiscal 2018-19 so the projects can be completed.
2018-19 capital and related projects overviewThe 2018-19 capital and related projects budget (capital plan) approved by the Board of Trustees was $15,508,000 (Information Technology Services Projects – $5,138,000; Facilities Management Projects – $10,370,000). Since its approval, there have been a number of additions to the plan.
Additional funding to the capital plan of $500,000 for classroom modernization has been built into the operating budget. Furthermore, on March 27, 2018, it was announced that Brock will receive $7.9 million from the Ministry of Advanced Education and Skills Development (MAESD) Greenhouse Gas Campus Retrofits Program (GGCRP) to fully fund the District Energy Efficiency Project (DEEP) Phase 2. This project has also been added to the plan. Finally, at the end of March, a Brock University Students’ Union (BUSU) referendum was passed in favour of funding a $6.8 million expansion to the Zone fitness centre, which includes all construction costs, information technology
Capital and related projects budget
equipment and initial fitness equipment requirements. This project will initially be internally financed, and the University will be reimbursed by BUSU through student fees charged to students once the project is complete. Spending on the project of $1.36 million is expected in 2018-19 and has been added to the capital plan.
The total capital plan, including the additions as described, are shown in Figures 42 and 43 is $25,268,000. As shown in Figure 40, the funding is made up as follows: $16,008,000 is funded by the 2018-19 operating budget – both ancillary and non-ancillary contributions (this includes an additional $500,000 for classroom modernization), $7.9 million is funded from the GGCRP for the DEEP Phase 2 and $1.36 million is internally financed for the Zone expansion. Ancillary units contribute $3.3 million to the budget, with spending on ancillary projects at $2.4 million for 2018-19.
We have made significant progress in recent years in providing funding to support our infrastructure going forward. The 2018-19 capital and related projects budget identifies key areas of investment, including the Rankin Family Pavilion ($4.9 million), Brock DEEP project Phase 1 ($1.3 million), Brock DEEP project Phase 2 ($7.9 million), residence projects ($2.1 million), classroom modernization and renewal ($0.5 million), and human resource system replacement ($3.5 million). In addition, the capital plan includes $4.6 million in deferred maintenance spending.
The primary driver informing much of the Facilities Management campus planning regarding deferred maintenance has been the condition assessment performed by VFA Inc. VFA, through the Council of Ontario Universities (COU), maintains a common reporting tool to track facilities conditions across Ontario universities for deferred maintenance reporting.
Non-ancillary contribution – $10,962,000GGCRP – $7,900,000Ancillary contribution fundingAncillary projects – $2,370,000Facilities Renewal Program – $1,761,000Internally financed – 1,360,000Ancillary contribution funding otherprojects – $915,000
Capital Budget funding source (%)
4310
7
31
5 4
Figure 40

2018
-19
Bud
get
Repo
rt
CA
PITA
L
76
2018
-19
Bud
get
Repo
rt
CA
PITA
L
77
The condition assessment report (May 2017) by VFA Inc. determined the University has $167 million in deferred maintenance requirements (including residences) that have accumulated over a number of years of under-investing. Although this level of maintenance is not obviously apparent when walking the halls of the University, the reality is that much of the deferred maintenance is related to roofs, HVAC, electrical, plumbing and accessibility. An important observation is that this deferred maintenance figure does not include information technology. The specific classifications of areas of deferred maintenance are included in Figure 41.
The Facility Condition Index (FCI) metric provides a methodology to determine the relative condition of a single building, group of buildings or total facilities and is calculated by dividing the deferred maintenance backlog by the current replacement value. The lower the FCI, the better the condition. Brock’s backlog of deferred maintenance items, as described above, results in the FCI for Brock of 0.18, which translates to “Poor” (an FCI>0.15).
Looking back over the past couple of years, the turning point of the capital program really occurred when the Board of Trustees endorsed a motion to invest $6 million in deferred maintenance in the 2014-15 budget. The intent of the $6-million contribution was to at least maintain deferred maintenance and FCI at its current level. Looking forward, the funding model, as detailed in the 2018-19 Fiscal Framework Update, forecasts a deferred maintenance funding envelope greater than $6 million in future years, up to $8.6 million in 2021-22, in order to take into account future maintenance needs as well.
Recognizing some of the challenges in the current budget environment, Facilities Management continues to take a deeper dive into the deferred maintenance numbers. While the methods used and values obtained in the VFA report are appropriate, they are done at a fairly high level. At the time of writing this report, multi-year deferred maintenance reviews at a detailed level are being performed with external engineers. These reviews will help ensure projects chosen now and in the future will have the desired impact on the deferred maintenance backlog, help prioritize projects, and in some cases cause us to rethink the future uses of some infrastructure. This information will be useful and informative when developing future capital and related budgets.
In addition to the 2018-19 capital and related projects budget, other units maintain capital replacement and significant repairs and maintenance budgets. The Facilities Management budget (page 69) has $2,191,000 in capital replacement and repairs and maintenance costs and the Utilities, Taxes and Insurance budget (page 70) has $1,126,000 included as part of its operating costs. These budgets support building, mechanical, electrical and grounds maintenance, projects ranging from elevator maintenance to door repairs to annual repair and maintenance on the co-gen plant. The Information Technologies Services budget (page 62) also maintains a capital replacement and repairs and maintenance budget of $1,334,000.
Figure 42: Capital and related project budget – Information Technology Services projects
Project Facilities renewal program Other Total project
costs Rationale Category
IT infrastructure
Call pilot and CC7 risk mitigation – telephone system 75,000 75,000 Enhancement Campus-wide
IPV6 2018 deployment planning/proof of concept 50,000 50,000 Enhancement Campus-wide
Hamilton campus internet redundancy 50,000 50,000 Enhancement Hamilton
Total IT infrastructure - 175,000 175,000
IT hardware evergreening
End of life core switches – administrative 120,000 120,000 Enhancement Campus-wide
End-of-life core switches – residences 25,000 25,000 Enhancement Residence
End-of-life applicances – administrative 30,000 30,000 Enhancement Residences
Wireless – administrative 68,000 68,000 Enhancement Campus-wide
UPS – administrative 30,000 30,000 Enhancement Campus-wide
UPS – residence 10,000 10,000 Enhancement Residence
Isonas door readers – administrative 90,000 90,000 Enhancement Residences
CCTV camera – Plaza 54,000 54,000 Enhancement Campus-wide
Computer purchase and redeployment program 150,520 150,520 Enhancement Campus-wide
Surplus projectors 15,000 15,000 Enhancement Campus-wide
Servers for Goodman School of Business 60,000 60,000 Enhancement Campus-wide
Disk storage 75,000 75,000 Enhancement Campus-wide
Data back-up 61,216 63,784 125,000 Enhancement Campus-wide
Proxy card upgrade – residence 387,680 387,680 Enhancement Residence
Total IT hardware evergreening 91,216 1,148,984 1,240,200
IT hardware growth
Wireless – administrative 164,800 164,800 Enhancement Campus-wide
Video conference system – Plaza 600F 15,000 15,000 Enhancement Campus-wide
Total IT hardware growth - 179,800 179,800
Enterprise software
Human Resources system replacement (Mosaic) 3,523,000 3,523,000 Planned renewal Campus-wide
Develop/proof of concept Azure 20,000 20,000 Planned renewal Campus-wide
Total enterprise software - 3,543,000 3,543,000
Total 91,216 5,046,784 5,138,000
Figure 41: COU VFA Data (as at May 2017)
Deferred maintenance
($000s)
Current replacement
value ($000s)FCI
Academic and administrative
Main campus 103,674 565,767 0.18
East campus 2,422 35,457 0.07
Satellite campuses 8,482 62,296 0.14
Total academic and administrative 114,578 663,520 0.17
Site and utility infrastructure
Roadways 1,091 5,188 0.21
Parking lots 1,334 8,533 0.16
Water supply mains 2,213 5,654 0.39
Storm sewer 2,758 8,353 0.33
Electrical distribution 5,711 19,968 0.29
Service tunnels 1,035 60,910 0.02
Other 8,849 20,558 0.43
Total site and utility infrastructure 22,991 129,164 0.18
Residence
Total residence 29,234 132,324 0.22
Total 166,803 925,008 0.18
Source: VFA Facility Asset Condition Database.
The proposed expansion would increase the Zone to 15,600 square feet, and include two storeys of workout space along with a BUSU meeting space.

Figure 43: Capital and related project budget – Facilities Management projects (continued)
ProjectDM –
Deferred Maintenance
DM –Facilities Renewal Program
Non-DM – Facilities Renewal Program
OtherGrant funded/
Internally financed
Total project costs Rationale Category
Above surface/sub-surface utilities, drainage, roads and parking lots, sidewalks
University Rd. West lot P to Alphie's 214,784 214,784 Deferred Maintenance Exterior
Parking lot renewal-A, E1, E2, S and P 252,150 168,100 420,250 Deferred Maintenance Exterior
Total above-surface/sub-surface utilities, etc. 252,150 214,784 - 168,100 635,034
Residence
Lowenberger residence – riser waterpipe replacement 400,000 400,000 Deferred Maintenance Exterior
Residence proximity card access system Phase 2 200,000 412,320 612,320 Accessibility Exterior
Village residence renewal 514,529 514,529 Improvements Interior
Total residence 1,114,529 - - 412,320 1,526,849
Audits and studies
Annual facility condition audits (VFA Inc.) 50,000 50,000 Planning Interior
Total audits and studies - 50,000 - - 50,000
Vehicles
Vehicle – replace unit 70 (2006 Econoline Van) 100,000 100,000 Planned Renewal Vehicle
Total vehicles - - - 100,000 100,000
Total 3,019,484 1,609,784 60,000 6,180,732 9,260,000 20,130,000
Deferred Maintenance = $4,629,268
Total projects funded by the funding budget = $10,870,000 (1) AODA – Accessibility for Ontarians with Disabilities(2) CRTTC – Classroom Renewal Teaching and Technology Committee
2018-19 Budget Report CAPITAL
79
2018-19 Budget Report CAPITAL
78
Figure 43: Capital and related project budget – Facilities Management projects
Project DM – Deferred Maintenance
DM – Facilities Renewal Program
Non-DM – Facilities Renewal Program
OtherGrant funded/
Internally financed
Total project costs Rationale Category
Major capital projects
Rankin Family Pavilion 4,875,312 4,875,312 Grant application Major capital
Brock DEEP Phase 1 1,271,610 1,271,610 Grant application Major capital
Brock DEEP Phase 2 7,900,000 7,900,000 Grant application Major capital
Zone expansion 1,360,000 1,360,000 Student referendum Major capital
Total major capital projects 1,271,610 - - 4,875,312 9,260,000 15,406,922
Buildings
Annual high-voltage maintenance 100,000 100,000 Deferred maintenance Interior
Annual building automation system controls conversion 50,000 50,000 Deferred maintenance Interior
Flooring renewal 60,000 60,000 Deferred maintenance Interior
Interior and exterior door replacements 60,000 60,000 Deferred maintenance Renovations
Miscellaneous painting of common areas 65,000 65,000 Deferred maintenance Interior
Roof replacement (Hamilton Campus, Walker Complex, 573 Glenridge Ave.) 1,010,000 1,010,000 Deferred maintenance Roof
Pool floor adjustment cylinder rebuild 173,515 173,515 Deferred maintenance Interior
Total buildings 173,515 1,345,000 - - 1,518,515
Adaptations, renovations and major renewal projects
Space moves prioritization 125,000 125,000 250,000 Deferred maintenance Interior
Classroom modernization 500,000 500,000 CRTTC(2) priority Classroom modernization
Prioritized minor projects 82,680 82,680 Deferred maintenance Interior
Total adaptations, renovations and major renewal projects 207,680 - - 625,000 832,680
AODA(1) accessible built environment (ABE)
Washroom upgrades AODA 60,000 60,000 Accessibility AODA(1)
Total AODA(1) accessible built environment - - 60,000 - 60,000

2018
-19
Bud
get
Repo
rt
TREA
SURY
80
2018
-19
Bud
get
Repo
rt
TREA
SURY
81
Figure 44 details the current and projected external debt of the University. It does not reflect any new external debt past 2014-15. At the time of writing this report, there are no approved projects that would require additional debt financing. As set out in the Fiscal Framework document, any new debt requirements are highly dependent on donations and/or other incremental sources of funding.
In March 2015, the Board of Trustees approved a debt reduction strategy that would see $475,000 set aside each year starting in 2014-15. As presented in the Fiscal Framework document, a revised debt reduction strategy was established to repay the loan on the Marilyn I. Walker School of Fine and Performing Arts (MIWSFPA) by its renewal date in 2019-20; the loan on the Cairns Family Health and Bioscience Research Complex (Cairns) building by 2024-25 and the debt (other than the bond) on residence loans by 2029-30.
This model combines the funding envelopes of deferred maintenance and debt repayment, and increases the total contribution equal to the construction price index (currently factored at 2.5 per cent). The rationale for this combination is that both envelopes relate to infrastructure, since current spending results in new infrastructure and the debt originally issued allowed for new infrastructure to be built at that time. As the debt is
paid off, the infrastructure that was once new now requires deferred maintenance work. It makes sense to repurpose those debt payments to maintain infrastructure.
This enhanced debt reduction strategy causes the debt repayment reserve contribution to increase each year, with the contribution of $1,303,000 in 2018-19 ($1,022,000 2017-18).
Also included in the Fiscal Framework document is a funding plan for the 40-year bullet bond taken out in 2005 for $93 million. In 2045, this debt will need to be repaid. The funding plan is based on an annualized rate of return on the sinking fund of 5 per cent plus additional payments starting when the debt on residence loans (other than the bond) is fully paid in 2029-30.
The next maturity of external debt is June 3, 2019, related to the debt of $18 million financed in fiscal 2014-15. The amount due at maturity will be $14.46 million. Other future debt maturities can be found in the audited financial statements of the University.
The requirement for the debt reduction strategy is supported by Brock’s key debt metrics found in Figure 45, which also compare these metrics to that of the median and average of other universities in our comprehensive category.
Financing
Figure 44: Outstanding debt
($000s) (unless otherwise noted)
Actual Budget Forecast
April 30, 2015
April 30, 2016
April 30, 2017
April 30, 2018
April 30, 2019
April 30, 2020
April 30, 2021
April 30, 2022
April 30, 2023
Bond 93,000 93,000 93,000 93,000 93,000 93,000 93,000 93,000 93,000
Cairns building 26,269 25,583 24,863 24,109 23,319 22,491 21,623 20,714 10,154
Residence 16,801 16,037 15,215 14,333 13,385 12,366 11,271 10,095 8,931
Marilyn I. Walker School of Fine and Performing Arts (MIWSFPA) 17,400 16,680 15,960 15,240 14,520
Total debt 153,470 151,300 149,038 146,682 144,224 127,857 125,894 123,809 112,086
Total student FFTE (1) 20,056 19,885 20,086 19,983 20,780 21,309 21,822 22,368 22,848
Total debt/FFTE (in dollars)(1) 7,652 7,609 7,420 7,340 6,941 6,000 5,769 5,535 4,906
Debt reduction strategy
Sinking fund 5,462 5,647 6,413 6,322 6,639 6,970 7,319 7,685 8,069
Debt repayment reserve 475 950 2,895 3,917 5,220 2,937 6,159
M. Walker donation – MIWSFPA 5,045 5,181 5,326 5,465 5,612
Other donations – MIWSFPA 250 324 399 473 548
Total assets for debt reduction 11,232 12,102 15,033 16,177 18,019 6,970 10,256 13,844 8,069
Net debt 142,238 139,198 134,005 130,505 126,205 120,887 115,638 109,965 104,017
Net debt/FFTE (in dollars)(1) 7,092 7,000 6,672 6,531 6,073 5,673 5,299 4,916 4,553
(1) See Appendix A for a definition of fiscal full-time enrolment (FFTE).

2018
-19
Bud
get
Repo
rt
TREA
SURY
82
2018
-19
Bud
get
Repo
rt
TREA
SURY
83
Appendix G provides full definitions of each financial health metric. The following details a high-level explanation of the debt metrics:1. The primary reserve ratio refers to the amount of cash
available to cover operations. It identifies at April 2017 Brock has approximately 53 days of expendable reserves.
In past years, the University endowment activity has not been integrated into the University funding budget (with the exception of certain operating endowments, such as the MIWSFPA endowment spending). Starting in 2018-19, the funding budget now includes the full endowment allocated spend related to undergraduate and graduate scholarships and student awards of $1.84 million for 2018-19. This support is shown in the funding budget as a funding source (inter-fund revenue) with the offsetting expense (inter-fund expense). The endowment fund policy can be found at brocku.ca/university-secretariat/university-policies.
The full activity of the endowment for the past three years is shown in Figure 46. Figure 47 details the 2018-19 approved endowment spending of $2.5 million, which includes both the student awards spending allocations as well as the operating and capital.
Figure 48 details the Top 10 endowments from 2016-17. Due to the timing of preparing and approving this budget, the information presented is as of April 30, 2017. This information will be updated for April 30, 2018 and incorporated into the University’s 2017-18 Annual Report.
Figure 45: Financial health metricsBrock (1) Median (2)
April 2017 April 2016 April 2017 April 2016Primary reserve ratio 14.6% 11.7% 26.4% 24.1%
Debt burden ratio 3.0% 3.1% 2.6% 2.5%
Interest burden % 2.5% 2.6% 1.7% 1.7%
Interest coverage 3.70 3.35 7.89 3.68
Viability ratio 31.9% 24.5% 117.4% 189.9%
(1) Certain ratios have been restated to align with the Council of Ontario Universities (COU) metrics to improve comparability across various reporting agencies.(2) Calculated using financial information from 14 other comprehensive universities. Certain 2016 metrics have been updated due to revisions in certain universities’ financial statements.
Endowment summary
Figure 46
($000s) 2016-17 Actual
2015-16 Actual
2014-15 Actual
Opening Endowment 83,098 81,695 74,527
Spending (1,999) (1,995) (6,915)*
Investment Income 11,145 2,460 9,933
New Endowments 1,453 938 4,150
Ending Endowment 93,697 83,098 81,695
* Figure includes $5 million un-endowment of a fund to be allocated to a capital project in accordance with donor wishes.
Figure 48: Top 10 endowments (2016-17 Actual)
Amount ($000s) Name Purpose
16,667 Marilyn I. Walker SFPA Fund Supports the MIWSFPA
7,360 Harrison-Thompson Bursary Trust Supports Undergraduate Awards
2,335 VP Research Discretionary Fund VP Research Discretionary
1,812 Dr. and Mrs. Moriyama Graduate Fellowship Fund Supports Graduate Awards
1,777 Bluma Appel Enterance Scholarship For Excellence Supports Graduate Awards
1,737 Ontario Graduate Fellowship Program Supports Graduate Awards
1,409 Luigi and Amalia Setacci Award Supports Undergraduate Awards
1,313 Ruth Evely Williamson Estate Supports Undergraduate Awards
1,278 Provost Discretionary Enhancement Fund Provost Discretionary
1,151 The Joyce Foundation Bursary Supports Undergraduate Awards
Figure 47
EndowmentApproved spending ($000s)
2018-19 2017-18 (1)
Undergraduate Scholarships 660 653
Undergraduate Bursaries 668 634
Undergraduate Prizes 163 156
Graduate Awards 351 329
Operating 209 235
Capital 468 582
Total 2,519 2,589
(1) The 2017-18 approved spending has been adjusted for certain corrections since the 2017-18 Budget Report.
2. The next two ratios describe how Brock utilizes a greater proportion of its annual operating expense to fund debt obligations.
3. The interest coverage ratio measures the ability to fund interest charges from cash generated through operations. It remains above the guidance of 2.00 set by the Board of Trustees and above the ratio of 2.50 considered to be the standard by the University’s credit rating agency, DBRS, for Brock’s current credit rating of A high.
4. The viability ratio is essentially how much of the institution’s debt could be paid off with expendable resources. The average institution in our category could pay almost all its debt with expendable resources, whereas Brock can only pay off 32 per cent and, therefore, is vulnerable to unplanned events.
These metrics highlight the need to pay down the debt so, in time, we can reduce the debt and interest burden on the University.
Includes the MIWSFPA endowment spending allocation, which can be used
for both capital and operating.

2018
-19
Bud
get
Repo
rt
NEX
T ST
EPS
85
2018
-19
Bud
get
Repo
rt
NEX
T ST
EPS
84
The budget for fiscal 2018-19, like the budget for 2017-18, is balanced, and we should take a moment to reflect on the hard work and decisions made to achieve this outcome for a second consecutive year, following many years of financial uncertainty. Looking forward, the budget development process will evolve out of the institutional strategic plan that is being finalized over the coming months.
Demands on the University are unlimited, but the resources available to meet them are not. The University must therefore have some means of deciding how much it can afford to spend, what to spend on, and how to get the most for the money spent. As we envision a productive and sustainable future for Brock, the Fiscal Framework, with the newly adopted Revenue and Expense Allocation Model, will assist in implementing Brock’s strategic goals and objectives. Figure 49 has been shown in previous budget reports and was recently updated for the 2018-19 Fiscal Framework Update. The 2018-19 balanced budget, assumes one-time employee benefits savings of $1.0 million and one-time revenue enhancements of $1.4 million (student retention $1.1 million, $0.3 million investment income). Relying on mitigation targets or one-time budget enhancements will become more challenging as we move forward if we do not address the reality – our expense inflation continues to outpace our revenue inflation (excluding enrolment growth). As mapped out in the 2018-19 Fiscal Framework update, our ideal state would be a fiscal model where revenues (excluding enrolment growth) grow at the same
Looking forward
rate as expenses. This model would expedite our ability to implement our strategic goals and objectives. In order to successfully unlock the funding from enrolment growth or new revenue streams to be used on enhancing the academic and research activities at the University, we will need to continue our work towards aligning our core operations within the guidance of the Fiscal Framework.
Revenue and expense allocation modelWe have come a long way in budget development and the challenges ahead should not detract from the improvements we have made on fiscal planning. This year’s budget development began with the introduction of a revenue and expense allocation model. Figure 50 is a visual representation of the 2018-19 budget, using the Revenue and Expense Allocation Model shown in Figure 51. This model reports the full operating budget and the chart portrays expenses as a percentage of revenues allocated by each Faculty and in total. The model identifies three Faculties generating net positive contributions and three Faculties requiring additional funding from these positive contributions to support their operations. Through guidance from the Council of Academic Deans, this model now reports all tuition based on students in seats. Regardless of a student’s home Faculty, all tuition is allocated to the course students take and the Faculty the course belongs to.
34
16
30
20
Regulated tuition
Non-regulated tuition
Grant revenue
Other revenue
Total revenue (%) Weighted average annual revenue growth (%)
Total revenue growth = 2.4% Total operating costs growth = 3.4%
Revenue growth
5% increase
0% increase
3.6% increase* 1.22
0.80
0.00
0.40
34
66
Operating cost
Personnel costs
Total operating costs (%) Weighted average annual operating costs growth (%)
Operating costs growth
0.58
2.84
$8 million
Annualimpact
Structural deficit*($3) million1.0 % loss
*Calculated deficit assumes a $324-million budget.
A 1 per cent decrease in domesticenrolment will reduce tuition revenuegrowth by 0.34 per cent and will further increase the structural deficit by $1.1 million.
($11) million
2% increase
1.7% increase
4.3% increase
Figure 49

2018
-19
Bud
get
Repo
rt
NEX
T ST
EPS
87
2018
-19
Bud
get
Repo
rt
NEX
T ST
EPS
86
Figur
e 51:
Full
Reve
nue
and
Expe
nse A
lloca
tion
Mod
el –
base
d on
the
2018
-19
Budg
et
($00
0s)
Facu
lty
of A
pplie
d H
ealt
h Sc
ienc
es
Goo
dman
Sch
ool
of B
usin
ess
Facu
lty
of
Educ
atio
n Fa
cult
y of
H
uman
ities
Fa
culty
of M
athe
mat
ics
and
Scie
nce
Facu
lty
of S
ocia
l Sc
ienc
es
Tota
l
Reve
nue
Glo
bal t
uitio
n by
teac
hing
Facu
lty (u
nder
grad
uate
)(1)
18,4
09
23,
962
8,4
17
17,9
64
26,
708
41,8
82
137,3
42
Glo
bal t
uitio
n by
teac
hing
Facu
lty (g
radu
ate)
1,
668
3,0
01
1,44
7 7
29
2,0
52
3,10
0 11
,997
Dire
ct re
venu
e
875
13
,048
3
,736
6
16
641
4
59
19,3
75
Gra
nt
26,
736
13,4
42
7,35
4 8
,228
10
,469
2
4,45
4 9
0,68
3
Tota
l rev
enue
4
7,688
5
3,45
3 2
0,95
4 2
7,537
3
9,87
0 6
9,89
5 2
59,3
97
Cont
ribut
ion
mar
gins
Dire
ct o
ngoi
ng p
erso
nnel
cost
s 18
,346
2
4,17
4 12
,526
17
,947
19
,403
3
0,57
6 12
2,97
2
Dire
ct te
mpo
rary
per
sonn
el co
sts
3,6
62
3,5
44
4,15
3 3
,500
2
,781
5,7
50
23,
390
Dire
ct o
pera
ting
cost
s 8
76
4,2
58
1,62
4 1,
211
818
1,
287
10,0
74
Cont
ribut
ion
mar
gin
(bef
ore
scho
lars
hips
and
bur
sarie
s)
24,
804
21,
477
2,6
51
4,8
79
16,8
68
32,
282
102,
961
Fello
wsh
ips,
scho
lars
hips
, bur
sarie
s and
stud
ent a
war
ds
3,9
03
3,5
41
590
2
,262
3
,586
4
,214
18
,096
Cont
ribut
ion
mar
gin
(aft
er sc
hola
rshi
ps a
nd b
ursa
ries)
2
0,90
1 17
,936
2
,061
2
,617
13
,282
2
8,06
8 8
4,86
5
Spac
e co
sts
Spac
e co
sts
3,5
48
1,62
4 2
,672
3
,845
5
,380
3
,843
2
0,91
2
Net
con
trib
utio
n (a
fter
spac
e co
sts)
17
,353
16
,312
(6
11)
(1,2
28)
7,90
2 2
4,22
5 6
3,95
3
Acad
emic
and
stud
ent-
spec
ific
supp
ort u
nits
Rese
arch
Ser
vice
s (in
clud
es TD
Is, C
COVI
, etc
.) 6
04
50
69
59
797
5
10
2,0
89
Facu
lty o
f Gra
duat
e St
udie
s 16
0 4
15
226
6
0 13
2 3
13
1,30
6
Libra
ry
2,9
20
2,5
58
1,26
1 1,
310
1,54
8 3
,485
13
,082
Cent
re fo
r Ped
agog
ical I
nnov
atio
n 2
16
190
95
98
116
258
9
73
Stud
ent S
pecifi
c (2)
3,3
09
2,8
84
1,41
4 1,
441
1,73
2 3
,909
14
,689
Net
con
trib
utio
n (b
efor
e ov
erhe
ad a
lloca
tions
) 10
,144
10,2
15
(3,6
76)
(4,19
6) 3
,577
15
,750
3
1,81
4
Ove
rhea
d al
loca
tions
Shar
ed se
rvice
s 4
,853
5
,227
2
,517
3
,730
3
,146
6,2
48
25,
721
Ancil
lary
ope
ratio
ns co
ntrib
utio
n (8
66)
(755
) (3
70)
(377
) (4
54)
(1,0
23)
(3,8
45)
Capi
tal
2,4
34
2,14
2 1,
066
1,10
3 1,
309
2,9
07
10,9
61
Univ
ersit
y G
loba
l (4
67)
(348
) (1
04)
321
11
6 (5
41)
(1,0
23)
Net
con
trib
utio
n 4
,190
3,9
49
(6,7
85)
(8,9
73)
(540
) 8
,159
-
Tran
sfer
rece
ipts
/(pa
ymen
ts)
(4,19
0) (3
,949
) 6
,785
8
,973
5
40
(8,15
9) -
(1) G
loba
l tui
tion
does
not
inclu
de th
e re
tent
ion
targ
et o
f $1.1
milli
on. T
his a
mou
nt is
inclu
ded
in U
nive
rsity
Glo
bal.
(2) I
nclu
des B
rock
Spo
rts, B
rock
Inte
rnat
iona
l, Co-
op, C
aree
r and
Exp
erie
ntia
l Edu
catio
n, R
egist
rar,
Stud
ent L
ife a
nd C
omm
unity
Exp
erie
nce,
Stud
ent S
ucce
ss C
entre
and
Stu
dent
Wel
lnes
s and
Acc
essib
ility.
Previously, the model allocated all tuition to a student’s home Faculty, then allocated 50 per cent of the course tuition to the Faculty that provides a context credit to the student outside of their home Faculty. This change recognizes that there is currently a greater level of major discipline requirements in certain programs. Taking a student-centric approach, allocating tuition based on a 100 per cent students-in-seats model would facilitate the ongoing review of academic program requirements and support increased flexibility in programs for students to take additional elective credits.
Figure 50
100%
2018-19 Budget costs as a per cent of total revenue
0
20
40
60
80
100
120
140
Total FOSS FMS FOH FOE GSB FAHS
1212
11
7
60
3
3
87
15
15
13 12
13
87
60
15
78
48
Space costs Direct costs
90 93
133 132
101 100
88
Scholarships Academic and student support Overhead
82
17
11
8
14 10
11
9
13
58
11
12
56
54

2018
-19
Bud
get
Repo
rt
NEX
T ST
EPS
88
Five-year financial forecastThis year we are presenting a five-year financial forecast in an effort to enhance the understandability of Brock’s fiscal challenges as outlined in the Fiscal Framework. Brock is currently developing a strategic plan; therefore, it is premature to begin modelling a comprehensive five-year budget forecast before final goals and objectives are approved.
Before delving into the forecast, some context is necessary. Enrolment growth is shown as flat and existing cost structures such as staffing levels and support services remain as they are today. The intent of this forecast is to demonstrate the current need to increase enrolment to cover existing cost increases. The forecast in Figure 52 is consistent with the budget development process over the past two years, where prior to achieving balanced
Figure52: Five-year financial forecast
($000s) 2018-19 Budget 2019-20 Forecast 2020-21 Forecast 2021-22 Forecast 2022-23 Forecast
Revenue
Student fees 178,091 184,474 191,115 198,025 205,216
Grant revenue 97,575 99,221 99,221 99,221 99,221
Ancillary revenue 34,352 35,265 36,196 37,146 38,115
Other revenue 29,188 29,827 30,482 31,153 31,840
Total revenue 339,206 348,787 357,014 365,545 374,392
Operating costs
Personnel costs (219,568) (229,009) (238,856) (249,127) (259,839)
Non-personnel costs (119,638) (124,033) (125,882) (127,862) (130,281)
Total operating costs (339,206) (353,042) (364,738) (376,989) (390,120)
Funding deficit - (4,255) (7,724) (11,444) (15,728)
Funding deficit as a % of revenue 1.2% 2.2% 3.1% 4.2%
Appendix AEnrolment definitionsThe following are measures of enrolment used in this budget report.
• All-in enrolment: Includes degree-seeking, non-degree-seeking, additional qualifications and certificate programs.
• Degree-seeking: Someone seeking either a bachelor’s degree, a first professional degree or a graduate master’s or PhD degree.
• Fiscal full-time equivalent (FFTE) enrolment: FFTE is represented by a student whose study load in the fiscal year is equal to the normal full-time study load for their program and level of registration in the academic year. Graduate FFTE is calculated based on the registration level, full-time or part-time. Full-time = 1.000 FFTEs, part-time = 0.300 FFTEs. Undergraduate and graduate FFTEs are calculated for each academic term.
• Full-time equivalent (FTE) enrolment: FTEs are used to provide enrolment, expressed as the equivalence to full-time students. For undergraduate students, FTEs are calculated by dividing total course enrolments by five (the nominal load of a full-time student). Graduate students are calculated as only Fall FTEs (Fall full-time headcount plus Fall part-time headcount * 0.3).
• Headcount enrolment: A “snapshot” of the number of individuals who are attending the University at a particular point in time, usually Nov. 1, and the response to the commonly asked question: “How many students does Brock have?”
• Non-degree-seeking undergraduate: Those enrolled in the Undeclared Arts program on a Letter of Permission, those auditing a course/program, or someone enrolled in undergraduate courses but with no program declaration.
• Weighted grant units (WGUs): WGUs are used in reporting enrolment to the Ontario government for funding purposes and represent a weighted enrolment measure. The WGUs for Brock University range from 1, for General Arts, and 2.782 for Nursing and Science upper-year honours.
Eligible FTEs are those that are associated with programs approved by the Ontario government for funding purposes. Also, certain categories of students are “ineligible” (international, additional qualification and co-op on work term being the three largest groups).
2018
-19
Bud
get
Repo
rt
APP
END
ICES
89
budgets, efficiency targets were required to cover our cost escalations and subsequent revenue shortfalls. As outlined in the 2018-19 Fiscal Framework Update, enrolment growth of 2 per cent is required to balance our budget if we do not increase our faculty and support staff levels. There is no one solution to achieve long-term financial balance; however, as we move forward there will be consultation and commitment to enhancing academic programs through the academic program review, research, enrolments and revenue targets, cost savings, fundraising and infrastructure. The institutional strategic plan will prioritize these goals and objectives, and will be supported by the Fiscal Framework and the Revenue and Expense Allocation model. Through these efforts, we plan to develop and present updates to this budget forecast that will portray future balanced budgets in support of the strategic plan.
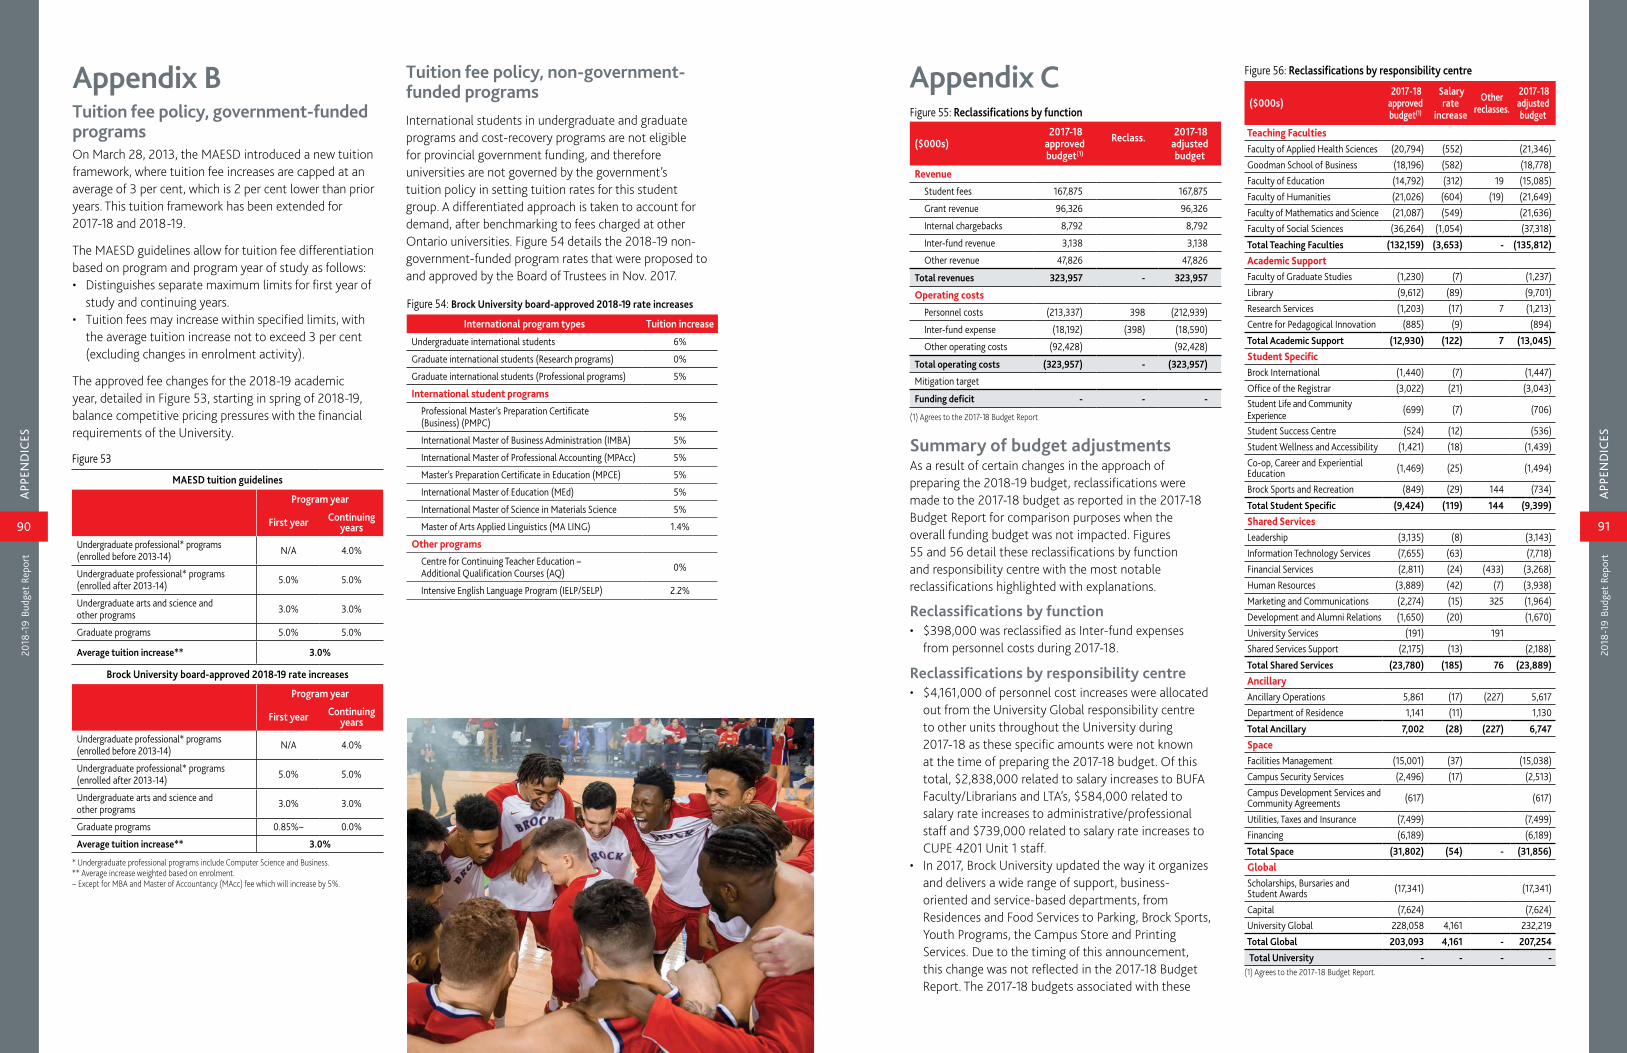
2018
-19
Bud
get
Repo
rt
APP
END
ICES
91
2018
-19
Bud
get
Repo
rt
APP
END
ICES
90
Appendix BTuition fee policy, government-funded programsOn March 28, 2013, the MAESD introduced a new tuition framework, where tuition fee increases are capped at an average of 3 per cent, which is 2 per cent lower than prior years. This tuition framework has been extended for 2017-18 and 2018-19.
The MAESD guidelines allow for tuition fee differentiation based on program and program year of study as follows:• Distinguishes separate maximum limits for first year of
study and continuing years.• Tuition fees may increase within specified limits, with
the average tuition increase not to exceed 3 per cent (excluding changes in enrolment activity).
The approved fee changes for the 2018-19 academic year, detailed in Figure 53, starting in spring of 2018-19, balance competitive pricing pressures with the financial requirements of the University.
Tuition fee policy, non-government-funded programsInternational students in undergraduate and graduate programs and cost-recovery programs are not eligible for provincial government funding, and therefore universities are not governed by the government’s tuition policy in setting tuition rates for this student group. A differentiated approach is taken to account for demand, after benchmarking to fees charged at other Ontario universities. Figure 54 details the 2018-19 non-government-funded program rates that were proposed to and approved by the Board of Trustees in Nov. 2017.
Figure 53
MAESD tuition guidelines
Program year
First year Continuing years
Undergraduate professional* programs (enrolled before 2013-14) N/A 4.0%
Undergraduate professional* programs (enrolled after 2013-14) 5.0% 5.0%
Undergraduate arts and science and other programs 3.0% 3.0%
Graduate programs 5.0% 5.0%
Average tuition increase** 3.0%
Brock University board-approved 2018-19 rate increases
Program year
First year Continuing years
Undergraduate professional* programs (enrolled before 2013-14) N/A 4.0%
Undergraduate professional* programs (enrolled after 2013-14) 5.0% 5.0%
Undergraduate arts and science and other programs 3.0% 3.0%
Graduate programs 0.85%~ 0.0%
Average tuition increase** 3.0%
* Undergraduate professional programs include Computer Science and Business.** Average increase weighted based on enrolment.~ Except for MBA and Master of Accountancy (MAcc) fee which will increase by 5%.
Figure 54: Brock University board-approved 2018-19 rate increases
International program types Tuition increase
Undergraduate international students 6%
Graduate international students (Research programs) 0%
Graduate international students (Professional programs) 5%
International student programs
Professional Master’s Preparation Certificate (Business) (PMPC) 5%
International Master of Business Administration (IMBA) 5%
International Master of Professional Accounting (MPAcc) 5%
Master’s Preparation Certificate in Education (MPCE) 5%
International Master of Education (MEd) 5%
International Master of Science in Materials Science 5%
Master of Arts Applied Linguistics (MA LING) 1.4%
Other programs
Centre for Continuing Teacher Education – Additional Qualification Courses (AQ) 0%
Intensive English Language Program (IELP/SELP) 2.2%
Appendix C Figure 56: Reclassifications by responsibility centre
($000s) 2017-18 approved budget(1)
Salary rate
increase
Other reclasses.
2017-18 adjusted budget
Teaching FacultiesFaculty of Applied Health Sciences (20,794) (552) (21,346)
Goodman School of Business (18,196) (582) (18,778)
Faculty of Education (14,792) (312) 19 (15,085)
Faculty of Humanities (21,026) (604) (19) (21,649)
Faculty of Mathematics and Science (21,087) (549) (21,636) Faculty of Social Sciences (36,264) (1,054) (37,318)
Total Teaching Faculties (132,159) (3,653) - (135,812)
Academic SupportFaculty of Graduate Studies (1,230) (7) (1,237)
Library (9,612) (89) (9,701)
Research Services (1,203) (17) 7 (1,213) Centre for Pedagogical Innovation (885) (9) (894)
Total Academic Support (12,930) (122) 7 (13,045)
Student SpecificBrock International (1,440) (7) (1,447)
Office of the Registrar (3,022) (21) (3,043) Student Life and Community Experience (699) (7) (706)
Student Success Centre (524) (12) (536)
Student Wellness and Accessibility (1,421) (18) (1,439)
Co-op, Career and Experiential Education (1,469) (25) (1,494)
Brock Sports and Recreation (849) (29) 144 (734)
Total Student Specific (9,424) (119) 144 (9,399)
Shared ServicesLeadership (3,135) (8) (3,143)
Information Technology Services (7,655) (63) (7,718)
Financial Services (2,811) (24) (433) (3,268)
Human Resources (3,889) (42) (7) (3,938)
Marketing and Communications (2,274) (15) 325 (1,964)
Development and Alumni Relations (1,650) (20) (1,670)
University Services (191) 191 Shared Services Support (2,175) (13) (2,188)
Total Shared Services (23,780) (185) 76 (23,889)
AncillaryAncillary Operations 5,861 (17) (227) 5,617 Department of Residence 1,141 (11) 1,130
Total Ancillary 7,002 (28) (227) 6,747
SpaceFacilities Management (15,001) (37) (15,038)
Campus Security Services (2,496) (17) (2,513)
Campus Development Services and Community Agreements (617) (617)
Utilities, Taxes and Insurance (7,499) (7,499) Financing (6,189) (6,189)
Total Space (31,802) (54) - (31,856)
GlobalScholarships, Bursaries and Student Awards (17,341) (17,341)
Capital (7,624) (7,624) University Global 228,058 4,161 232,219
Total Global 203,093 4,161 - 207,254
Total University - - - - (1) Agrees to the 2017-18 Budget Report.
Figure 55: Reclassifications by function
($000s) 2017-18
approved budget(1)
Reclass. 2017-18 adjusted budget
Revenue
Student fees 167,875 167,875
Grant revenue 96,326 96,326
Internal chargebacks 8,792 8,792
Inter-fund revenue 3,138 3,138
Other revenue 47,826 47,826
Total revenues 323,957 - 323,957
Operating costs
Personnel costs (213,337) 398 (212,939)
Inter-fund expense (18,192) (398) (18,590)
Other operating costs (92,428) (92,428)
Total operating costs (323,957) - (323,957)
Mitigation target
Funding deficit - - -
(1) Agrees to the 2017-18 Budget Report
Summary of budget adjustmentsAs a result of certain changes in the approach of preparing the 2018-19 budget, reclassifications were made to the 2017-18 budget as reported in the 2017-18 Budget Report for comparison purposes when the overall funding budget was not impacted. Figures 55 and 56 detail these reclassifications by function and responsibility centre with the most notable reclassifications highlighted with explanations.
Reclassifications by function• $398,000 was reclassified as Inter-fund expenses
from personnel costs during 2017-18.
Reclassifications by responsibility centre• $4,161,000 of personnel cost increases were allocated
out from the University Global responsibility centre to other units throughout the University during 2017-18 as these specific amounts were not known at the time of preparing the 2017-18 budget. Of this total, $2,838,000 related to salary increases to BUFA Faculty/Librarians and LTA’s, $584,000 related to salary rate increases to administrative/professional staff and $739,000 related to salary rate increases to CUPE 4201 Unit 1 staff.
• In 2017, Brock University updated the way it organizes and delivers a wide range of support, business-oriented and service-based departments, from Residences and Food Services to Parking, Brock Sports, Youth Programs, the Campus Store and Printing Services. Due to the timing of this announcement, this change was not reflected in the 2017-18 Budget Report. The 2017-18 budgets associated with these

2018
-19
Bud
get
Repo
rt
APP
END
ICES
92
2018
-19
Bud
get
Repo
rt
APP
END
ICES
93
a liability. The 2018-19 budgeted principal debt payments have been eliminated in the NFPS adjustments.
7. Non-capital purchases of $2.184 million expected to be made in the capital fund should be reported as an expense in the NFPS financial statements. Conversely, capital purchases made as part of operating spend (ie. not from the capital and related projects budget) are recorded as an asset in the Statement of Financial Position for NFPS purposes. The University expects purchases of $1.695 million in the 2018-19 budget to actually be capitalized. This net amount has been included as part of the NFPS adjustments.
8. The 2018-19 funding budget includes funding transfers to the employee future benefit reserve of $0.9 million, $16.008 million to the capital and related projects budget, $1.303 million to the debt reduction strategy reserve and $0.3 million to the contingency reserve. These transfers are eliminated as part of the NFPS adjustments, as they would not be recorded as expenses for NFPS financial statement purposes.
9. Investment income on the sinking fund is recorded as a net zero in the funding budget, as the investment income earned on the fund is offset with a transfer to the sinking fund reserve. However, the investment income is required to be reflected in the NFPS financial statements. The 2018-19 budgeted investment income related to the sinking fund is included as part of the NFPS adjustments.
10. Post-retirement benefits represent health, dental and in some cases health-care spending accounts paid to faculty and staff in retirement. The $1.31 million is the net actuarially calculated benefit that current faculty and staff earned in 2016-17 plus a growth rate for 2017 to 2019. Since this amount is not included in the funding budget because it is non-cash, it is therefore included as part of the NFPS adjustments.
11. The annual pension liability payment of $3.56 million calculated by the University’s actuary is recorded as an expense in the funding budget, as it represents a cash outflow. However, $1.685 million of the $3.56 million represents
Figure 57
($000s)2018-19 Funding Budget
NFPS adjustments Notes
Reclass of inter- fundtransfers
Eliminate internal
chargebacks
2018-19 NFPS
budget
RevenueStudent fees 178,091 178,091
Grant revenue 97,575 (1,761) 1 95,814
Internal chargebacks 8,994 (8,994) -
Inter-fund revenue 5,416 (1,801) 2 (3,615) -
Other revenue 49,130 20,497 3-5 3,615 73,242
Total revenue 339,206 16,935 - (8,994) 347,147
Operating costs
Personnel costs (219,568) 375 10-11 (219,193)
Inter-fund expense (25,293) 18,827 8-9 6,466 -
Other operating costs (94,345) (31,005) 3-7 (6,466) 8,994 (122,822)
Total costs (339,206) (11,803) - 8,994 (342,015)
Funding surplus - 5,132 - - 5,132
Figure 58
Notes Reconciliation of NFPS adjustments ($000s)
1 Capital grants (1,761)
2 Funding from reserves (1,801)
3 Amortization of deferred capital contributions 8,009
4 Research, including fellowships 11,031
5 Endowment and trust spending 1,457
Total revenue adjustments 16,935
3 Amortization of capital assets (20,486)
4 Research, including fellowships (11,031)
5 Endowment and trust spending (1,457)
6 Principal payments 2,458
7
Non-capital purchases in capital and infrastructure project reserves net of capital purchases from operating
(489)
8 Funding of capital and reserves 18,511
9 Sinking fund 316
10 Post-retirement benefits (1,310)
11 Pension 1,685
Total costs adjustments (11,803)
the estimated “paydown” of the pension liability if the actuarial assumptions are met. The NFPS financial statements require only $1.90 million to be expensed and the remaining $1.685 million is shown as reduction to the pension liability and therefore adjusted in the NFPS adjustments.
Explanation of reclassifications Reclass of inter-fund transfers (Revenue) – Included as part of the total budgeted inter-fund revenue is funding from endowments of $2.340 million, $0.967 million from the research fund and $0.308 million from the non-endowed trust internally restricted fund. These transfers will be recorded as revenue in the NFPS financial statements and have therefore been reclassified to other revenue.
Reclass of inter-fund transfers (Expenses) – Included as part of the total budgeted expenses, as part of inter-fund expenses, are transfers to internally restricted research funds with no external obligations of $1.437 million, transfers to the professional expense reimbursements internally restricted fund of $1.845 million, transfers to the endowments fund of $1.842 million, transfers to internally restricted start-up funds of $0.855 million, transfers to the operating projects internally restricted fund of $0.445 million and a $0.042-million transfer to the research fund. These transfers will be recorded as operating expenses in the NFPS financial statements and have therefore been reclassified to operating costs.
Elimination of internal chargebacks – Included as part of total 2018-19 budgeted revenue is $8.994 million of internal charges between departments within the University. The NFPS reclassification removes these charges, as they are not included as part of the NFPS financial statements.
changes were reclassified for comparative purposes. As such, the University Services responsibility centre (as reported in the 2017-18 Budget Report) was divided and their budgets moved to these respective departments: $325,000 (net surplus) for Printing Services moved to Marketing and Communications; $433,000 for Central Receiving and Mail Services moved to Financial Services as part of Procurement Services; $82,000 Visitor Services moved to Ancillary Operations. In addition, the $145,000 related to the Walker Welcome Desk moved from Brock Sports and Recreation to Ancillary Operations.
Appendix DReconciliation of funding budget to financial statementsThe University’s funding budget was also prepared in accordance with Canadian accounting standards for not-for-profit organizations (NFPS). In order to accomplish this task, certain accounting entries and reclassifications are required. Figures 57 and 58 detail these entries, with the following explanations.
Explanation of adjustments 1. Grants received by the University to be used for future
capital purchases are included as part of deferred capital contributions in the NFPS financial statements, and later amortized over the useful life of the capital item it funded. The NFPS adjustment represents the elimination of this type of grant (Facilities Renewal Program funds) included in the 2018-19 budget.
2. Funding from the Strategic Initiative Fund ($1.751 million) and from the operating project accounts ($0.05 million) have been included as revenue in the 2018-19 budget. These transfers from reserves are eliminated as part of the NFPS adjustments, as they would not be recorded as revenue for the NFPS financial statement purposes.
3. Amortization of deferred capital contributions and capital assets, while not cash inflows or outflows, are required for NFPS financial statements. The 2018-19 forecasted amortization figures are included as part of the NFPS adjustments.
4. Research grants for restricted purposes and the offsetting research expenses, including fellowships, have not been included as part of the funding budget due to the limited line of sight regarding spending patterns on the funds to which they are related; however, they are included as part of the NFPS financial statements. An estimate has been included as part of the NFPS adjustments, based on the average of the prior three years’ actual figures (2014-15 to 2016-17) less the portion already included in the funding budget.
5. Endowment and trust spending (mainly in the form of scholarships) is included as an expense, with an offsetting revenue as part of the NFPS financial statements. Starting in 2018-19, the approved endowment spending related to scholarships was included as revenue (inter-fund) in the operating budget. Therefore, only the portion of the 2018-19 approved endowment spending not related to scholarships ($0.179 million) has been included as part of the NFPS adjustments, along with the offsetting revenue. Unless trust spending results in a direct offset to the funding budget, this spending is not recorded as part of the funding budget. An estimate of the 2018-19 trust spending, less the portion already included in the funding budget ($1.278 million), has been included as part of the NFPS adjustments, along with the offsetting revenue.
6. Principal debt payments, while they represent a cash outflow, are not considered an expense in the operating statement of the NFPS financial statements, as they reduce

Figure 60
($000s) 2015-16 Actual 2016-17 Actual 2017-18 Budget 2017-18 Forecast 2018-19 Budget
Revenue
Student fees 151,382 158,341 167,875 167,116 178,091
Grant revenue 93,201 95,009 96,326 96,926 97,575
Internal chargebacks 7,522 9,703 8,792 8,985 8,994
Inter-fund revenue 2,585 4,859 3,138 3,150 5,416
Other revenue 46,728 46,182 47,826 47,107 49,130
Total revenue 301,418 314,094 323,957 323,284 339,206
Operating costs
Personnel costs (193,777) (196,994) (212,939) (207,233) (219,568)
Inter-fund expenses (17,700) (20,965) (18,590) (21,443) (25,293)
Other operating costs (85,431) (90,611) (92,428) (91,580) (94,345)
Total operating costs (296,908) (308,570) (323,957) (320,256) (339,206)
Mitigation target
Funding surplus 4,510 5,524 - 3,028 -
Appendix FMulti-year financial results on a funding basis
2018
-19
Bud
get
Repo
rt
APP
END
ICES
94
2018
-19
Bud
get
Repo
rt
APP
END
ICES
95
Figure 59
Unit Efficiency Estimated savings
Information Technology Services (ITS)
During 2017-18, Information Technology Services negotiated a new vendor of record with Roger’s for mobile use. This negotiation resulted in annual savings.
$37,000 annually
Brock International ESL Services’ contract negotiation for class coverage changed from 1.5 overtime hours to straight time.
$40,000 annually
The ESL Services application of a per-student budget for student activities has reduced the activity spending budget.
$30,000 annually
International Market Development made changes to the commission structure, from a flat fee to a percentage of actual tuition paid, and payment date deadlines.
$40,000 annually
Facilities Management (FM)
During 2017-18, FM installed Variable Frequency Drives (VFDs) on a large HVAC system in Schmon Tower. Operating the system with the VFDs in place allows for greater control and significant energy savings.
$80,000 annually
FM Installed an Energy Transfer Skid (ETS) to better control heating (hot water) supplied to Schmon Tower from the main Campus District Energy Loop. The ETS allows for a much more efficient transfer of heat energy required to heat the tower and increases the heating capacity of the District Energy Loop.
$12,000 annually
During 2017-18, FM installed LED Lighting on the first and fifth Floors of Schmon Tower and throughout the service tunnels, replacing less efficient fluorescent lighting.
$5,000 annually
FM made modifications to piping and control valves to enable the Campus District Energy Loop to supply chilled water to the Plaza building. The changes to the operation prior to the 2017 cooling season eliminated the need to operate the electric chiller which would normally provide cooling to the Plaza building.
$75,000 annually
Financial Services Financial Services is responsible for Finance, Procurement, Student Accounts and Financial Aid and Central Receiving and Mail. During 2017-18, Financial Services restructured its management and support staff model. This reallocation of resources was done to increase the capacity for decision support and financial analysis needs of Brock’s various units and stakeholders. As we move forward with a new Revenue and Expense Allocation model, Financial Services will have resources available to provide timely, accurate and valuable decision support analyses for units to use in their decision-making process. This internal client support model, which evolved out of this restructuring, also allowed for the addition of a new position to manage the University Risk Management responsibilities, identified as a priority of the Board of Trustees through the Audit Committee. With the addition of this new risk management position and additional professional analysts, Financial Services was still able to reduce their overall budget.
$104,000 annually
Appendix ETracking efficienciesThis appendix was designed to highlight some of the efficiency work done in-year by units throughout the University. This work was undertaken with an understanding that quality would be maintained or improved. The list below is not exhaustive, but it does serve to highlight and document some of the more widely discussed changes. The efficiency projects identified can be summarized as follows:

2018
-19
Bud
get
Repo
rt
APP
END
ICES
96
Appendix GFinancial health metrics definitionsFigure 61
Metric Definition Formula
Primary reserve ratio The primary reserve ratio compares expendable net assets to total expenses and provides an indication of an institution’s financial strength and flexibility by determining how long the institution could function using its expendable reserves without relying on additional net assets generated by operations.
Expendable Net Assets include: unrestricted surplus (deficit), internally restricted net assets and internally restricted endowments, adjusted for the non-cash component of employee future benefits.
Primary reserve ratio = expendable net assets/total expenses
Debt burden ratio (Non-cash basis)
The debt burden ratio measures how an institution utilizes a greater portion of its annual expenditures to fund debt obligations. The ratio is calculated by dividing total current debt obligations, which include interest expenses and principal payments, by operating expenses.
Debt burden ratio = (interest expense + principal payments)/total expenses
Interest burden % The Interest burden ratio compares the level of current debt service with the institution's total expenses. It is an indicator of debt affordability, as it examines the percentage of total expenses used to cover an institution’s cost of servicing its debt. The ratio is calculated as interest expense over total expenses (adjusted for amortization of capital assets).
Interest burden ratio = interest expense/(total expenses – amortization)
Interest coverage ratio Interest coverage ratio measures how many times an institution could pay its current interest payment with its available earnings. The ratio is calculated by dividing earnings before interest, depreciation and amortization (EBIDA) during a given period by the amount an institution must pay in interest on its debts during the same period.
Interest coverage ratio = EBIDA/interest expense
Viability ratio The viability ratio is a basic determinant of an institution’s financial health, as it provides an indication of the funds on hand to settle its long-term obligations. It is calculated as expendable net assets over long-term debt.
Expendable net assets include: unrestricted surplus (deficit), internally restricted net assets and internally restricted endowments, adjusted for the non-cash component of employee future benefits.
Long-term debt is total external long-term debt as disclosed in the institution’s financial statements without adding the current portion that may be included in accounts payable.
Viability ratio = expendable net assets/long-term debt
Net operating revenues ratio
The net operating revenues ratio provides an indication of the extent to which institutions are generating positive cash flows in the long run to be financially sustainable. The ratio is calculated as cash flow from operating activities over total revenues.
Net operating revenues ratio = cash flow from operating activities/total revenues
On the cover: The butterfly image used on the cover symbolizes transformation, growing and evolving into something new. This past summer, Brock welcomed a new President. In addition, Brock's budget is beginning the process of being transformed through the revenue and expense allocation model. Also, the Rankin Family Pavilion and the Goodman School of Business expansion are two major construction projects underway this year. The use of geometric shapes form one shape/one Brock and building blocks reflect the construction at Brock. The other sections in the shapes represent the many facets of the University. They morph from flat design to 3D design, creating movement that evokes a feeling of the ever-changing and ongoing innovation and emergence of Brock as a leading-edge university.
Inside back cover: Close-up photo of the Mormon butterfly wing, which is also shown as a ghosted image on the cover.

Brock UniversityNiagara Region 1812 Sir Isaac Brock Way St. Catharines, ON L2S 3A1 Canada 905 688 5550
brocku.ca/finance
black0.125” bleed
black0.125” bleed
black0.125” bleed
cmyk0.125” bleed
cmyk0.125” bleed
cmyk0.125” bleed