*Proposed Budget Attachment 1* MWD - 2018/19 & 2019/20 Final ...
153
-
Upload
khangminh22 -
Category
Documents
-
view
0 -
download
0
Transcript of *Proposed Budget Attachment 1* MWD - 2018/19 & 2019/20 Final ...


This page intentionally left blank.

TABLE OF CONTENTS
Biennial Budget Summary 1
Departmental Operating Budgets 17
Understanding the Layout 17
Office of the General Manager 19
Water System Operations 27
Water Resource Management 35
Engineering Services 41
Office of Chief Administrative Officer 49
Information Technology 57
Human Resources 65
Real Property 73
Office of Chief Financial Officer 81
External Affairs 89
General Counsel Department 97
General Auditor Department 103
Ethics Office 107
Operating Equipment Summary 113
Non–Departmental Budgets 115
State Water Project 115
CRA Power 119
Supply Programs 123
Demand Management 133
Capital Financing 137
Glossary 143
Organization Chart 149
2018/19 and 2019/20 Proposed Biennial Budget i Table of Contents

This page intentionally left blank.
2018/19 and 2019/20 Proposed Biennial Budget ii Table of Contents
BIENNIAL BUDGET SUMMARY
2018/19 and 2019/20 Proposed Biennial Budget 1 Biennial Budget Summary
APPROPRIATIONS
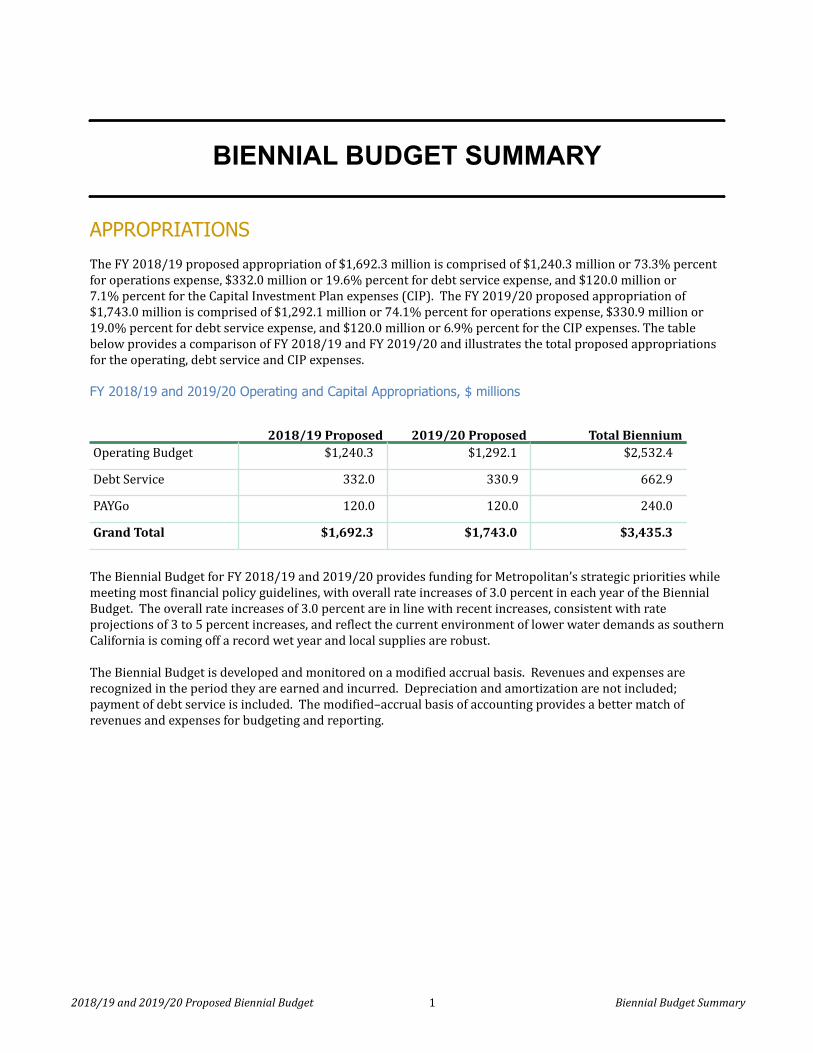
The FY 2018/19 proposed appropriation of $1,692.3 million is comprised of $1,240.3 million or 73.3% percentfor operations expense, $332.0 million or 19.6% percent for debt service expense, and $120.0 million or7.1% percent for the Capital Investment Plan expenses (CIP). The FY 2019/20 proposed appropriation of$1,743.0 million is comprised of $1,292.1 million or 74.1% percent for operations expense, $330.9 million or19.0% percent for debt service expense, and $120.0 million or 6.9% percent for the CIP expenses. The tablebelow provides a comparison of FY 2018/19 and FY 2019/20 and illustrates the total proposed appropriationsfor the operating, debt service and CIP expenses.
FY 2018/19 and 2019/20 Operating and Capital Appropriations, $ millions
2018/19 Proposed 2019/20 Proposed Total BienniumOperating Budget $1,240.3 $1,292.1 $2,532.4
Debt Service 332.0 330.9 662.9
PAYGo 120.0 120.0 240.0
Grand Total $1,692.3 $1,743.0 $3,435.3
The Biennial Budget for FY 2018/19 and 2019/20 provides funding for Metropolitan’s strategic priorities whilemeeting most financial policy guidelines, with overall rate increases of 3.0 percent in each year of the BiennialBudget. The overall rate increases of 3.0 percent are in line with recent increases, consistent with rateprojections of 3 to 5 percent increases, and reflect the current environment of lower water demands as southernCalifornia is coming off a record wet year and local supplies are robust.
The Biennial Budget is developed and monitored on a modified accrual basis. Revenues and expenses arerecognized in the period they are earned and incurred. Depreciation and amortization are not included;payment of debt service is included. The modified–accrual basis of accounting provides a better match ofrevenues and expenses for budgeting and reporting.

FUND SUMMARY
The following tables show fund balance, and projected revenues and expenditures for Metropolitan for eachfiscal year of the Biennial Budget.
2018/19 and 2019/20 Proposed Biennial Budget 2 Biennial Budget Summary
FY 2018/19 Fund Summary, $ millions
Fiscal Year Ending June 30th, 2019 Debt Service and
($ in Millions) All Funds Operating Funds Construction Funds Reserve Funds (1) Other Funds (2)
Beginning of Year Balance 1,151.6 373.9 283.9 401.4 92.4USES OF FUNDS
ExpensesState Water Contract 566.7 566.7 — — —Supply Programs 61.2 61.2 — — —Colorado River Power 45.8 45.8 — — —Debt Service 332.0 6.5 325.5 — —Demand Management 89.1 89.1 — — —Departmental O&M 441.9 441.9 — — —Treatment Chemicals, Sludge & Power 27.1 27.1 — — —Other O&M 8.5 8.5 — — —Sub-total Expenses 1,572.2 1,246.8 325.5 — —
Capital Investment Plan 200.0 20.0 180.0 — —Fund Deposits
R&R and General Fund 120.0 20.0 100.0 — —Treatment Surcharge Stabilization Fund 6.6 — — — 6.6Interest for Construction & Trust Funds 0.2 — 0.2 — —Increase in Required Reserves 31.6 28.8 3.2 (0.4) —Increase in Rate Stabilization Fund 14.2 — — 14.2 —Sub-total Fund Deposits 172.7 48.8 103.4 13.8 6.6
TOTAL USES OF FUNDS 1,944.9 1,315.6 608.9 13.8 6.6SOURCES OF FUNDS
RevenuesTaxes 116.6 102.3 14.4 — —Interest Income 16.9 5.9 4.3 5.4 1.3Hydro Power 20.9 20.9 — — —Fixed Charges (RTS & Capacity Charge) 170.3 170.3 — — —Water Revenue (3) 1,395.5 1,395.5 — — —Miscellaneous Revenue 11.1 11.1 — — —Bond Proceeds 79.4 — 79.4 — —Sub-total Revenues 1,810.8 1,705.9 98.1 5.4 1.3
Fund WithdrawalsR&R and General Fund 120.0 20.0 100.0 — —Bond Funds for Construction 0.6 — 0.6 — —Water Stewardship Fund 13.6 — — — 13.6Sub-total Fund Withdrawals 134.1 20.0 100.6 — 13.6
TOTAL SOURCES OF FUNDS 1,944.9 1,725.9 198.7 5.4 14.9Inter-Fund Transfers — (410.4) 410.2 8.4 (8.3)End of Year Balance 1,190.2 402.7 286.8 415.2 85.5Totals may not foot due to rounding.(1) includes Water Rate Stabilization Fund and Revenue Remainder Fund.(2) includes Water Stewardship, Water Management, Water Treatment Stabilization and Trust Funds.(3) includes revenues from water sales, exchanges and wheeling

FY 2019/20 Fund Summary, $ millions
Fiscal Year Ending June 30th, 2020 Debt Service and
($ in Millions) All Funds Operating Funds Construction Funds Reserve Funds (1) Other Funds (2)
Beginning of Year Balance 1,190.2 402.7 286.8 415.2 85.5USES OF FUNDS
ExpensesState Water Contract 602.5 602.5 — — —Supply Programs 54.4 54.4 — — —Colorado River Power 52.9 52.9 — — —Debt Service 330.9 6.9 324.0 — —Demand Management 85.8 85.8 — — —Departmental O&M 461.7 461.7 — — —Treatment Chemicals, Sludge & Power 27.7 27.7 — — —Other O&M 7.0 7.0 — — —Sub-total Expenses 1,623.0 1,299.0 324.0 — —
Capital Investment Plan 200.0 20.0 180.0 — —
Fund DepositsR&R and General Fund 120.0 20.0 100.0 — —Water Stewardship Fund 4.8 — — — 4.8Treatment Surcharge Stabilization Fund 16.5 — — — 16.5Interest for Construction & Trust Funds 0.2 — 0.2 — —
Increase in Required Reserves 41.3 31.8 (3.1) 12.6 —Increase in Rate Stabilization Fund 55.2 — — 55.2 —Sub-total Fund Deposits 238.0 51.8 97.1 67.8 21.2
TOTAL USES OF FUNDS 2,060.9 1,370.8 601.1 67.8 21.2SOURCES OF FUNDS
RevenuesTaxes 118.1 103.7 14.3 — —Interest Income 18.1 6.3 4.3 6.0 1.5Hydro Power 19.1 19.1 — — —Fixed Charges (RTS & Capacity Charge) 165.8 165.8 — — —Water Revenue (3) 1,528.5 1,528.5 — — —Miscellaneous Revenue 11.5 11.5 — — —Bond Proceeds 79.4 — 79.4 — —Sub-total Revenues 1,940.4 1,834.9 98.1 6.0 1.5
Fund WithdrawalsR&R and General Fund 120.0 20.0 100.0 — —Bond Funds for Construction 0.6 — 0.6 — —Sub-total Fund Withdrawals 120.6 20.0 100.6 — —
TOTAL SOURCES OF FUNDS 2,060.9 1,854.9 198.6 6.0 1.5Inter-Fund Transfers — (484.0) 402.5 61.8 19.8End of Year Balance 1,307.5 434.5 283.3 483.0 106.7Totals may not foot due to rounding.(1) includes Water Rate Stabilization Fund and Revenue Remainder Fund.(2) includes Water Stewardship, Water Management, Water Treatment Stabilization and Trust Funds.(3) includes revenues from water sales, exchanges and wheeling
2018/19 and 2019/20 Proposed Biennial Budget 3 Biennial Budget Summary

SOURCES OF FUNDS
2018/19 and 2019/20 Proposed Biennial Budget 4 Biennial Budget Summary
Total Sources of FY 2018/19 and FY 2019/20 Funds, $ millions
2018/19ProposedCompared
to
2019/20ProposedCompared
to2017/18Budget
2018/19Proposed
2019/20Proposed
2017/18Budget
2018/19Proposed
SOURCES OF FUNDS
RevenuesTaxes 100.5 116.6 118.1 16.1 1.4Interest Income 12.4 16.9 18.1 4.5 1.2Hydro Power 21.6 20.9 19.1 (0.7) (1.9)
Fixed Charges (RTS & Capacity Charge) 172.7 170.3 165.8 (2.4) (4.5)Water Revenues (1) 1,375.5 1,395.5 1,528.5 20.0 133.0Miscellaneous Revenue 12.1 11.1 11.5 (1.1) 0.4Bond Proceeds and Reimbursements 79.7 79.4 79.4 (0.2) —Working Capital Borrowing 47.4 — — (47.4) —Sub-total Revenues 1,822.0 1,810.8 1,940.4 (11.2) 129.6
Fund WithdrawalsR&R and General Fund 120.0 120.0 120.0 — —Bond Funds for Construction 0.3 0.6 0.6 0.2 —Water Stewardship Fund — 13.6 — 13.6 (13.6)
Treatment Surcharge Stabilization Fund 3.2 — — (3.2) —
Decrease in Water Rate Stabilization Fund 23.0 — — (23.0) —Sub-total Fund Withdrawals 146.5 134.1 120.6 (12.4) (13.6)
TOTAL SOURCES OF FUNDS 1,968.5 1,944.9 2,060.9 (23.6) 116.1
Totals may not foot due to rounding.(1) includes revenues from water sales, exchanges and wheeling
OPERATING REVENUE
Estimated revenues from water rates, fixed charges (Readiness–To–Serve Charge and Capacity Charge), taxesand annexation fees, and other miscellaneous income (interest income, power recovery, etc.) are projected to be$1.73 billion for FY 2018/19 and $1.86 billion for FY 2019/20. For FY 2018/19, this is $36.4 million more thanthe FY 2017/18 budget, and for FY 2019/20, this is $129.6 million more than FY 2018/19. The increase inrevenues for FY 2018/19 is due to higher tax revenues and higher water rates and charges in Calendar Year2019. For FY 2019/20, the revenue is higher due to higher water rates and charges in calendar year 2019 andcalendar year 2020. In addition, the forecast assumes the ad valorem tax rate is maintained at .0035 percent ofassessed valuations. A description of each revenue source is included in the Glossary of Terms.

Sources of Funds FY 2018/19 and FY 2019/20, $ millions
Water Revenue* Fixed Charges
Taxes Other Revenue
Bond Proceeds & Other Fund Withdraws Working Capital Borrowing
R&R & General Fund
2,2002,0001,8001,6001,4001,2001,000
800600400200
0
Mill
ion
Dol
lars
2017/18Budget
2018/19Proposed
2019/20Proposed
* includes revenues from water sales, exchanges and wheeling
2018/19 and 2019/20 Proposed Biennial Budget 5 Biennial Budget Summary
Water Revenues
Revenues from water transactions are budgeted at $1,395.5 million in FY 2018/19 and $1,528.5 million in FY2019/20. Water rates and charges are proposed to increase by 3.0 percent overall effective January 1, 2019 and3.0 percent overall effective January 1, 2020. Water transactions for FY 2018/19 are estimated to be 1.65million acre–feet (MAF), a decrease of 50 thousand acre-feet (TAF) from the FY 2017/18 budget. Watertransactions for FY 2019/20 are estimated to be 1.75 million acre-feet (MAF), an increase of 100 thousand acre-feet (TAF) from the FY 2018/19 budget. Water transactions are forecasted to be lower than the FY 2017/18budget as southern California is coming off a record wet year and local supplies are robust.

Water Transactions Trend, MAF
2.5
2.0
1.5
1.0
0.5
0.0
Mil
lion
Acr
e-Fe
et
Actual2011
Actual2012
Actual2013
Actual2014
Actual2015
Actual2016
Actual2017
Proj'ed2018
Budget2019
Budget2020
Fiscal Year Ending
1.60 1.70 1.86 2.06 1.91 1.63 1.54 1.55 1.65 1.75
The FY 2018/19 fiscal year water transactions include 1.42 MAF of firm sales and 227 TAF of exchange water tothe San Diego County Water Authority (SDCWA) pursuant to the 2003 Amended and Restated ExchangeAgreement (exchange water). Treated water sales are estimated at 839 TAF, or 51 percent of total watertransactions in FY 2018/19. The FY 2019/20 fiscal year water transactions include 1.49 MAF of firm sales and258 TAF of exchange water. Treated sales are estimated at 884 TAF, or 51 percent of total water transactions inFY 2019/20. The figure above shows the trend of water transactions.
Taxes and Annexation Fees
Revenues from taxes, which will be used to pay voter–approved debt service on general obligation bonds and aportion of the capital costs of the SWP, are estimated to be $116.6 million in FY 2018/19 and $118.1 million inFY 2019/20.
The ad valorem tax rate is assumed to remain at the current level of .0035 percent of assessed value in bothfiscal years; assessed valuations are projected to increase by 2.5 percent each fiscal year.
Fixed Charges
Fixed charges include the Capacity Charge and Readiness–to–Serve Charge. In FY 2018/19, these charges areestimated to generate $33.8 million and $136.5 million, respectively. In FY 2019/20, these charges areestimated to generate $31.3 million and $134.5 million, respectively. In total this represents a $2.4 milliondecrease from the FY 2017/18 to FY 2018/19 budget, and a $4.5 million decrease from the FY 2018/19 to theFY 2019/20 budget. Fixed charges are decreasing due to lower peak demands on the distribution system, andlower SWP transportation capital costs.
All Other Revenue
Revenues from hydroelectric and CRA power sales are estimated to be $20.9 million for FY 2018/19 and $19.1million for FY 2019/20. FY 2018/19 is lower than the FY 2017/18 budgeted amount of $21.6 million due tolower deliveries through the distribution system and lower wholesale prices.
Miscellaneous revenues, including interest income and lease revenues, are estimated to total $28.2 million forFY 2018/19 and $29.8 million for FY 2019/20 (including trust accounts and construction funds), higher thanthe FY 2017/18 budgeted amounts of $24.6 million, mainly due to higher assumed interest rates.
A summary of operating revenues is shown in the graph below.
2018/19 and 2019/20 Proposed Biennial Budget 6 Biennial Budget Summary

Operating Revenues, $ millions
Water Revenues * Taxes & Annexation Fee
Readiness-to-Serve Interest Income
Capacity Charge Lease, Late Fees, etc
Power Generation
2,500
2,000
1,500
1,000
500
0
Mill
ion
Dol
lars
2017/18Budget
2018/19Proposed
2019/20Proposed
* includes revenues from water sales, exchanges and wheeling
2018/19 and 2019/20 Proposed Biennial Budget 7
CAPITAL FUNDING
The FY 2018/19 and FY 2019/20 Capital Investment Plan (CIP) will be funded with bond proceeds and currentoperating revenues (PAYGo). It is anticipated that Metropolitan will issue $80 million in new revenue bonds inFY 2018/19 and $80 million in new revenue bonds in FY 2019/20. Combined with revenue funded capital of$120.0 million in FY 2018/19 and $120.0 million in FY 2019/20, Metropolitan will be able to fully fund the CIP.
Please refer to the section on debt financing for additional details on debt funding of capital projects.
Capital Funding Source Descriptions
New Bond Issues
Metropolitan has the ability to issue long–term bonds to fund its capital programs. The proceeds of the bondsales can be used to pay for capital expenses over several years. The repayment of the bonds is generally over30 years and is paid from water rate revenues.
Revenue Funded Capital
Annual capital expenses that are not paid from debt funding, grants, or loans must be paid from revenues, eitherfrom current year revenues or from the R&R fund, if funds exist.

USES OF FUNDS
Total uses of funds are $1.94 billion for FY 2018/19 and $2.06 billion for FY 2019/20. The table and graphbelow show the breakdown of expenditures and other obligations that make up the Uses of Funds.
2018/19 and 2019/20 Proposed Biennial Budget 8 Biennial Budget Summary
Total Uses of FY 2018/19 and FY 2019/20 Funds, $ millions
2018/19ProposedCompared
to
2019/20ProposedCompared
to2017/18Budget
2018/19Proposed
2019/20Proposed
2017/18Budget
2018/19Proposed
USES OF FUNDS
ExpensesState Water Contract 599.4 566.7 602.5 (32.7) 35.8Supply Programs 81.7 61.2 54.4 (20.6) (6.8)Colorado River Power 54.4 45.8 52.9 (8.5) 7.1Debt Service 344.1 332.0 330.9 (12.1) (1.0)Demand Management 75.9 89.1 85.8 13.1 (3.2)Departmental O&M 388.7 441.9 461.7 53.2 19.8Treatment Chemicals, Sludge & Power 24.6 27.1 27.7 2.5 0.6Other O&M 6.4 8.5 7.0 2.1 (1.6)Sub-total Expenses 1,575.3 1,572.2 1,623.0 (3.1) 50.8
Capital Investment Plan 200.0 200.0 200.0 — —Fund Deposits
R&R and General Fund 120.0 120.0 120.0 — —Water Stewardship Fund — — 4.8 — 4.8Exchange Agreement Set-aside 47.4 — — (47.4) —Treatment Surcharge Stabilization Fund — 6.6 16.5 6.6 9.9Interest for Construction & Trust Funds 0.4 0.2 0.2 (0.1) —Increase in Required Reserves 25.4 31.6 41.3 6.2 9.7Increase in Water Rate Stabilization Fund — 14.2 55.2 14.2 41.0Sub-total Fund Deposits 193.2 172.7 238.0 (20.5) 65.3
TOTAL USES OF FUNDS 1,968.5 1,944.9 2,060.9 (23.6) 116.1
Totals may not foot due to rounding.

Total Uses of FY 2018/19 and FY 2019/20 Funds, $ millions
SWP Construction O&M
Debt Service PAYGO Fund Deposits
Supply Programs Demand Management CRA Power
2,200
2,000
1,800
1,600
1,400
1,200
1,000
800
600
400
200
0
Mill
ion
Dol
lars
2017/18Budget
2018/19Proposed
2019/20Proposed
Colorado River Aqueduct Power
CRA power costs are projected to be $45.8 million in FY 2018/19 and $52.9 million in FY 2019/20 based ondiversions of approximately 838 TAF in FY 2018/19 and 915 TAF in FY 2019/20. FY 2018/19 is lower than theFY 2017/18 budget due to lower diversions at Intake. FY 2019/20 is $7.1 million higher due to higher costs forHoover and Parker federal contracts and more supplemental power purchases and associated costs.
Please refer to the section on the CRA for additional details on this expense.
State Water Project
State Water Project (SWP) expenditures are budgeted at $566.7 million for FY 2018/19 and $602.5 million in FY2019/20. This is based on Metropolitan's supplies of 908 TAF in FY 2018/19 and 907 TAF in FY 2019/20. SWPpower costs are expected to be $167.3 million for FY 2018/19 and $174.8 million for FY 2019/20. Power costsare lower due to favorable markets for wholesale power and natural gas, and renewable solar and wind projects.
The forecasted amount for SWP expenditures reflects incorporation of rate management credits into theforecast. Rate management credits result from a provision of the State Water Contract that provides for thereduction of capital charges based on differences between the Department of Water Resources’ collections fromthe SWP contractors and the actual amounts paid for capital–related charges.
Please refer to the section on the SWP for additional details on this expense.
2018/19 and 2019/20 Proposed Biennial Budget 9 Biennial Budget Summary

Demand Management Costs
Metropolitan provides financial incentives to its member agencies for the development of local water recyclingand groundwater recovery projects through the Local Resource Program (LRP). Metropolitan also providesfinancial incentives for the development of conservation programs through the Conservation Credits Program(CCP). Total expenditures are budgeted at $89.1 million for FY 2018/19 and $85.8 million in FY 2019/20.
Please refer to the section on Demand Management for additional details on this expense.
Supply Programs
Metropolitan’s two principal sources of supply draw from two different watersheds. This has allowedMetropolitan to draw more heavily on one source in the event the other is experiencing a drought. To furtherensure regional supply reliability, Metropolitan has developed a portfolio of additional supply programs on bothwatersheds. Total expenditures are budgeted at $61.2 million for FY 2018/19 and $54.4 million in FY 2019/20.
Please refer to the section on the Supply Programs for additional details on this expense.
2018/19 and 2019/20 Proposed Biennial Budget 10 Biennial Budget Summary
OPERATIONS AND MAINTENANCE
The FY 2018/19 O&M budget, including operating equipment purchases, is $477.5 million. This is$57.7 million, or 13.8% percent, higher than the FY 2017/18 budget of $419.8 million. The FY 2019/20 O&Mbudget is $496.4 million, an increase of $18.9 million, or 3.9% percent, over the FY 2018/19 budget.
Departmental Budget by Organization (without operating equipment and overhead credit), $ millions
Water System Operations Information Technology Engineering Services
Water Resource Management External Affairs Chief Financial Officer
Real Property Legal, Audit and Ethics Office of Chief Administrative Officer
General Manager's Office Human Resources
550
500
450
400
350
300
250
200
150
100
50
0
Mill
ion
Dol
lars
2017/18 Budget 2018/19 Proposed 2019/20 Proposed

Operations and Maintenance Budget by Organization, $ thousands
Departmental Units 2017/18Budget
2018/19Proposed
2019/20Proposed
2017/18Budget vs.2018/19Proposed
%Change
2018/19Proposed vs.
2019/20Proposed
%Change
Office of the General Manager $13,430.9 $18,083.1 $17,470.3 $4,652.2 34.6% ($612.8) (3.4%)
Water System Operations w/o Variable Treatment 204,657.0 218,696.1 228,606.7 14,039.1 6.9% 9,910.6 4.5%
Water Resource Management 22,040.6 23,946.2 25,066.0 1,905.6 8.6% 1,119.8 4.7%
Engineering Services 25,312.4 32,937.7 33,865.0 7,625.3 30.1% 927.3 2.8%
Office of Chief Administrative Officer 16,448.1 21,648.0 21,428.7 5,199.9 31.6% (219.3) (1.0%)
Information Technology 31,359.8 38,009.1 43,261.5 6,649.3 21.2% 5,252.4 13.8%
Real Property 18,262.7 26,338.3 28,209.3 8,075.6 44.2% 1,871.0 7.1%
Human Resources 10,221.3 12,342.4 12,881.5 2,121.2 20.8% 539.1 4.4%
Chief Financial Officer 23,082.3 24,561.4 25,198.1 1,479.1 6.4% 636.7 2.6%
External Affairs 24,335.1 27,604.6 27,752.2 3,269.5 13.4% 147.7 0.5%
Subtotal - General Manager's Dep. 389,150.3 444,167.0 463,739.3 55,016.7 14.1% 19,572.3 4.4%
General Counsel 13,777.0 14,211.0 15,202.3 433.9 3.1% 991.4 7.0%
Office of the General Auditor 3,140.8 3,620.8 3,855.0 480.0 15.3% 234.2 6.5%
Ethics Department 1,376.0 1,396.0 1,448.4 20.0 1.5% 52.4 3.8%
Overhead Credit from Construction (20,427.4) (21,510.2) (22,554.0) (1,082.8) 5.3% (1,043.8) 4.9%
Total Departmental Budget 387,016.7 441,884.5 461,691.0 54,867.8 14.2% 19,806.5 4.5%
Operating Equipment 6,426.0 8,522.1 6,955.4 2,096.1 32.6% (1,566.7) (18.4%)
Variable Treatment 26,317.6 27,098.3 27,713.9 780.8 3.0% 615.6 2.3%
GRAND TOTAL $419,760.2 $477,504.9 $496,360.3 $57,744.7 13.8% $18,855.4 3.9%
Totals may not foot due to rounding
The graph above depicts the distribution of the departmental O&M by organization without the overhead creditand operating equipment. Including treatment costs, the Water System Operations (WSO) group accounts for 50percent of the total departmental budget for FY 2018/19 and FY 2019/20. Information Technology is thesecond largest departmental expenditure area, accounting for 8 percent of the total departmental budget for FY2018/19 and FY 2019/20. A summary of the O&M budget by organization is shown in the table above. The tablebelow summarizes the O&M budget by expenditure type. A more detailed discussion of significant factorsimpacting the O&M budget follows.
2018/19 and 2019/20 Proposed Biennial Budget 11 Biennial Budget Summary
FY 2018/19 and FY 2019/20 Operations & Maintenance Annual Budget by Expenditure Type, $ thousands
2017/18Budget vs.
2018/19Proposed vs.
2017/18Budget
2018/19Proposed
2019/20Proposed
2018/19Proposed
2019/20Proposed
Salaries & Benefits (1) $273,061.3 $303,703.7 $322,637.6 $30,642.5 $18,933.9Chemicals, Sludge and Power (2) 26,317.6 27,098.3 27,713.9 780.8 615.6Outside Services 38,996.1 50,908.0 53,025.3 11,912.0 2,117.3Materials & Supplies (3) 23,738.4 27,418.5 27,278.8 3,680.1 (139.7)Other 51,221.0 59,854.3 58,749.3 8,633.3 (1,105.0)Operating Equipment 6,426.0 8,522.1 6,955.4 2,096.1 (1,566.7)Total $419,760.2 $477,504.9 $496,360.3 $57,744.7 $18,855.4
Totals may not foot due to rounding(1) Includes overhead credit for construction.(2) Costs associated with treatment only.(3) Without chemicals associated with treatment plants.

FY 2018/19 O&M Budget
The FY 2018/19 O&M budget includes $477.5 million for labor and benefits, water treatment chemicals, power,and solids handling, materials and supplies, professional services, and operating equipment purchases. This is$57.7 million, or 13.8 percent, higher than the FY 2017/18 budget of $419.8.
Salaries and Benefits: Labor costs, not including those charged to construction are $303.7 million. This is$30.6 million, or 11.2 percent, higher than the FY 2017/18 budget of $273.1 million. Negotiated labor increasesrepresent $18.7 million, or 61.1 percent of the increase. Increases in retirement, medical and other benefitsrepresent $7.3 million, or 23.7 percent of the increase. The remaining $4.6 million increase, or 15.2 percent, isprimarily attributable to funding 14 new and 8 previously unfunded regular full time positions in the FY2017/18 budget.
The total authorized personnel complement for the FY 2018/19 budget is 1,927 authorized positions, including27 agency and district temporary full–time equivalents (FTEs), and reflects an increase of 14 net regularfull‑time positions and 3 net temporary positions from the FY 2017/18 budget. Incorporating unfundedpositions and positions that are planned to be vacant for portions of the year, the total funded positions are1,862 FTEs.
Over the biennium a total of 19 regular full-time positions will be added to accommodate increased recruitment,Board and Bay Delta support, enhanced security and land management efforts, SWP and CRA program support,increased outreach, environmental planning and business technology support, and succession planning forfuture vacancies.
Outside Services and Materials & Supplies: Outside Services are anticipated to increase by $11.9 million andMaterials & Supplies by $3.7 million primarily as a result of the potential Regional Recycled Water Program,Seismic Headquarters Relocation Project and Bay Delta science studies, grants and sponsorships.
Other O&M and Operating Equipment: Chemicals, solids, and power reflect the cost of the water treatmentprocess and are anticipated to increase by $0.8 million in FY 2018/19, driven by an increase in treated waterdeliveries. Environmental remediation and mitigation costs are anticipated to be $3.0 million higher due to theFoothill Feeder Dewatering project and Diemer Basin Rehabilitation project. Property taxes are increasing by$1.5 million for the previously unbudgeted Delta Islands and PVID properties. The FY 2018/19 budget reflectsfunds of $1.2 million, which were not previously budgeted, contributed by Metropolitan to advance efforts oncollaborative science through various State, Federal and other agencies. In addition, the FY 2018/19 budgetreflects an anticipated increase of $1.0 million in tuition reimbursement and professional development costs.Operating equipment is higher by $2.1 million primarily due to the purchase of analytical instrumentation insupport of the Regional Recycled Water Program and the replacement of critical IT infrastructure for Districtfacilities.
FY 2019/20 O&M Budget
The FY 2019/20 O&M budget is $496.4 million, an increase of $18.9 million, or 3.9% percent, compared to theFY 2018/19 budget. This increase is primarily due to negotiated labor increases and increases in retirement,medical and other benefits. The increase in outside services is offset by a decrease in environmentalremediation and operating equipment costs.
Salaries and Benefits: The FY 2019/20 O&M labor budget is about $18.9 million or 6.2 percent higher than theFY 2018/19 budget. Negotiated labor increases represent $12.5 million, or 66.2 percent of the increase.Increases in retirement, medical and other benefits represent $5.9 million, or 31.4 percent of the increase. Theremaining $0.5 million increase, or 2.4 percent, is primarily attributable to funding 5 new and 1 previouslyunfunded regular full time position in the FY 2018/19 budget.
2018/19 and 2019/20 Proposed Biennial Budget 12 Biennial Budget Summary

The total authorized personnel complement for FY 2019/20 is increased by 5 net regular full-time positions to1,932 positions. Incorporating unfunded positions and positions that are planned to be vacant for portions ofthe year, the total funded positions are 1,868 FTEs.
Outside Services: Outside Services are anticipated to increase by $2.1 million due to the first year of a ten-yearplanned effort to refurbish all of the floors at Metropolitan's headquarters.
Other O&M and Operating Equipment –The cost of chemicals, power, and sludge disposal incurred in thewater treatment process is anticipated to increase slightly by $0.6 million in FY 2019/20 due primarily to highertreated water deliveries. Other O&M is lower primarily due to the one time environmental remediation cost of$1.5 million in FY 2018/19 for the Foothill Feeder Dewatering project. Operating equipment is lower by $1.6million from FY 2018/19. FY 2019/20 includes $2.7 million for the replacement of a plane that has reached endof life but decreases in heavy equipment, trucks, monitoring equipment and IT infrastructure more than offsetsthis purchase.
2018/19 and 2019/20 Proposed Biennial Budget 13 Biennial Budget Summary
Departmental Budget by Expenditure Type, $ millions
Salaries & Benefits (1) Chemicals, Sludge and Power (2)
Outside Services Materials & Supplies (3)
Operating Equipment & Other
550
500
450
400
350
300
250
200
150
100
50
0
Mill
ion
Dol
lars
2017/18 Budget 2018/19 Proposed 2019/20 Proposed
(1) Includes overhead credit for construction. (2) Costs associated with treatment only. (3) Without chemicals associated with treatment plants.
The figure above summarizes the total departmental O&M budget by expenditure type, of which about64 percent is for salaries and benefits in both FY 2018/19 and 2019/20.

STAFFING PLAN
Total authorized positions (including temporary workers) for FY 2018/19 and FY 2019/20 are 1,927 and 1,932positions respectively. Total personnel are up by 14 new full time positions and 2 district temporary positions(rounded) to 1,927 in 2018/19 and increase by 5 regular full time positions and 1 district temporary position(rounded) to a total of 1,932 in FY 2019/20.
Over the biennium, positions dedicated to O&M work are expected to increase by 28 regular full time positionsin large part to support the Regional Recycled Water Program, California WaterFix, dam safety monitoring,enhanced security and land management efforts, environmental planning and business technology, andincreased recruitment efforts. Positions dedicated to capital work are expected to decrease slightly over thebiennium.
The FY 2018/19 and FY 2019/20 budget includes unfunded positions and positions that are planned to bevacant for portions of the year in order to manage O&M labor costs. Therefore, funded positions are lower thanthe authorized complement. The personnel complement is shown in the following tables.
2018/19 and 2019/20 Proposed Biennial Budget 14 Biennial Budget Summary
Regular and Temporary Positions
2016/17Budget
2017/18Budget
2018/19Proposed
2019/20Proposed
2017/18Budget vs.2018/19Proposed
2018/19Proposed vs.
2019/20Proposed
Regular Full Time Positions 1,886 1,886 1,900 1,905 14 5District Temporary Positions 22 20 22 23 2 1Agency Temporary Positions 4 4 5 4 1 —Total 1,912 1,910 1,927 1,932 17 5Totals may not foot due to rounding.
O&M and Capital Staffing Levels
2017/18Budget
2018/19Proposed
2019/20Proposed
O&M Positions
Regular Full Time Positions 1,592 1,618 1,620District & Agency Temporary Positions 23 25 25Total O&M 1,615 1,643 1,645
Capital Positions
Regular Full Time Positions 294 282 285District & Agency Temporary Positions 1 2 2Total Capital 295 284 287
GRAND TOTAL 1,910 1,927 1,932
Totals may not foot due to rounding.

CAPITAL INVESTMENT PLAN
The CIP budget for FY 2018/19 and 2019/20 is forecasted at $200.0 million in both fiscal years. It is anticipatedto be funded by current operating revenues (i.e., PAYGo) and by issuing new revenue bonds. The FY 2019/20capital budget is flat with the FY 2017/18 budget.
The two largest areas of expenditures in the FY 2018/19 and 2019/20 CIP are Infrastructure Reliability andWater Quality. It is currently anticipated that infrastructure expenditures will continue to grow as morefacilities reach the end of their service life and require rehabilitation and refurbishment.
The CIP is discussed in more detail in the CIP supplemental volume.
Cash Funded Capital
Overall, the CIP is anticipated to be funded 60 percent by current operating revenues (PAYGo). The PAYGOfunding for FY 2018/19 and 2019/20 is budgeted at $120.0 million in each fiscal year.
2018/19 and 2019/20 Proposed Biennial Budget 15 Biennial Budget Summary
Debt Funded Capital
Overall, the CIP is anticipated to be funded 40 percent by revenue bond proceeds. New debt issues are plannedin FY 2018/19 in the amount of $80 million, and in FY 2019/20 in the amount of $80 million. Givenconstruction funds expected to be available at the beginning of the biennial budget period and planned PAYGoamounts, these bond issues should provide sufficient funds to meet CIP expenditures over the two years.
Debt Service
For FY 2018/19 and FY 2019/20 Metropolitan plans to issue new revenue bond debt as described above. Debtservice payments in FY 2018/19 are budgeted at $332.0 million and $330.9 million in FY 2019/20.Please refer to the section on Capital Financing for additional details on this expense.
FUND BALANCES AND RESERVES
Metropolitan operates as a single enterprise fund for financial statements and budgeting purposes. Through itsadministrative code, Metropolitan identifies a number of accounts, which are referred to as funds, to separatelytrack uses of monies for specific purposes as summarized in the table below.
The FY 2018/19 budget forecasts a $13.8 million increase in reserves by June 30, 2019 and includes the WaterRate Stabilization Fund (WRSF) and the Revenue Remainder Fund. In addition, required reserves and increasesto the Treatment Surcharge Stabilization Fund (TSSF), Water Management Fund (WMF) and the WaterStewardship Fund (WSF) are projected to decrease by $7.0 million.
The FY 2019/20 budget forecasts a $67.8 million increase in reserves by June 30, 2020 and includes the WRSFand the Revenue Remainder Fund. In addition, required reserves and changes to the TSSF and WSF are expectedto increase by a net of $21.2 million.
Fund balances are budgeted to be $1.19 billion at June 30, 2019. Of that total, $683.6 million is restricted bybond covenants, contracts, or board policy, and $506.6 million is unrestricted. Fund balances are budgeted to be$1.31 billion at June 30, 2020. Of that total, $712.0 million is restricted by bond covenants, contracts, or boardpolicy, and $595.6 million is unrestricted.
On June 30, 2019, the targets for the minimum and target reserve funds are estimated to be $256.9 million and$626.4 million, respectively. Based on projected revenues and expenditures, it is estimated that the balance inthe WRSF and Revenue Remainder Fund will total about $415.2 million, about $158.3 million over the minimumlevel.

On June 30, 2020, the targets for the minimum and target reserve funds are estimated to be $269.5 million and$654.4 million, respectively. Based on projected revenues and expenditures, it is estimated that the balance inthe WRSF and Revenue Remainder Fund will total about $483.0 million, about $213.5 million over the minimumlevel.
2018/19 and 2019/20 Proposed Biennial Budget 16 Biennial Budget Summary
Projected Fund Balances, $ millions
Restricted Designated Unrestricted Total
2018/19 Proposed
Operating Funds 332.7 0.0 0.0 332.7Debt Service Funds 264.3 0.0 0.0 264.3Construction Funds 15.6 6.8 0.0 22.4
Reserve Funds (1) 0.0 0.0 415.2 415.2Rate Stabilization Funds (2) 0.0 84.6 0.0 84.6
Trust and Other Funds 70.9 0.0 0.0 70.9Total June 30, 2019 683.6 91.3 415.2 1,190.2
2019/20 Proposed
Operating Funds 364.5 0.0 0.0 364.5Debt Service Funds 261.2 0.0 0.0 261.2Construction Funds 15.3 6.8 0.0 22.1
Reserve Funds (1) 0.0 0.0 483.0 483.0Rate Stabilization Funds (2) 0.0 105.8 0.0 105.8
Trust and Other Funds 70.9 0.0 0.0 70.9Total June 30, 2020 712.0 112.6 483.0 1,307.5
Totals may not foot due to rounding.(1) includes Water Rate Stabilization Fund and Revenue Remainder Fund.(2) includes Water Stewardship Fund and Treatment Surcharge Stabilization Fund

UNDERSTANDING THE LAYOUT OF THE DEPARTMENTAL BUDGET
2018/19 and 2019/20 Proposed Biennial Budget 17 Understanding the Layout
DEPARTMENTAL/GROUP BUDGET
The Departmental Section provides detailed information about the Operations and Maintenance (O&M) budgetof each group and department and consists of the following:
Mission
Describes, at a high level, the scope of the organization’s functions.
Programs
Describes the organizations roles and responsibilities by program or section and provides a summaryorganizational chart.
Goals & Objectives
Summarizes the goals & objectives each organization proposes to accomplish in the upcoming fiscal years.
O&M Financial Summary
Provides a summary of the organization’s O&M budgets. For FY 2018/19 and FY 2019/20, O&M expendituresare identified by expense categories such as salaries and benefits, professional services, and “other”expenditures and incorporate the group objectives.
Expense Category
Category DescriptionSalaries and Benefits Labor costs and fringe benefits for Metropolitan’s regular, district
temporary, and agency temporary employees. Total salaries and benefits,direct charges to capital, and O&M salaries are shown.
Professional Services All costs associated with work performed by outside contractors andconsultants.
Operating Equipment Costs associated with the purchase of capitalized portable equipment,including automobiles, trucks, servers, and other applicable portableequipment.
Other Cost of purchasing chemicals, materials and supplies, reprographics,travel, telephone, and other necessary items for effective operation ofMetropolitan. A breakdown has been provided to itemize those expensecategories that are five percent or more of the “other” category.

O&M Budget by Section
Provides a summary of the organization’s O&M budget and personnel count by section or program.
Personnel Summary
Provides a breakdown for the organization of total personnel involved in O&M and capital work.
Budget Highlights
Identifies the major factors of the budget variance over the biennium as well as any significant changes bybudget year.
2018/19 and 2019/20 Proposed Biennial Budget 18 Understanding the Layout

OFFICE OF THE GENERAL MANAGERThe Office of the General Manager manages and administers all
Metropolitan activities except those functions specifically delegated bystatutes and Board order to the General Counsel, General Auditor, or Ethics
Officer.
2018/19 and 2019/20 Proposed Biennial Budget 19 Office Of The General Manager
PROGRAMS The Office of the General Manager provides overallleadership and management of Metropolitan’smission. This includes the management of allmatters pertaining to the business of the Board andresearch on actions and policies of the Board bystaff for directors, member agencies, and the public.
The General Manager’s Business Plan outlines thestrategic priorities that this office and Metropolitanwill focus on for the period covered by the BiennialBudget.
The Office of the General Manager accomplishes itsmission through the following programs orsections:
Office of the General Manager is responsiblefor the management and administration ofMetropolitan’s activities including the management
of all matters pertaining to the business of theBoard and research on actions and policies of theBoard by staff for directors, member agencies, andthe public.
Bay–Delta Initiatives spearheads efforts towardadvancement of the State’s Proposed DeltaImprovements, including the California WaterFixand EcoRestore and the pursuit of the bestscientific research to protect and restore fish,wildlife, and the Delta’s ecosystem while ensuringwater supply reliability.
Board of Directors provides policy and directionas the governing body of the Metropolitan WaterDistrict. The Board Support Team providesadministrative support to the business of theBoard.

GOALS AND OBJECTIVES
2018/19 and 2019/20 Proposed Biennial Budget 20 Office Of The General Manager
The following strategic priorities in the GeneralManager’s Business Plan reflect the fundingemphasis in the proposed budget and highlightitems that will be the focus of Board and staffattention over the next two years.
Strategic Priority #1: Enhance InfrastructureSafety, Security and Resiliency
Metropolitan’s vast network of aqueducts,pipelines, pumps and treatment facilities are thebackbone of Southern California’s regional watersystem. Metropolitan’s flexible and adaptablesystem enables Metropolitan to move water acrosssix counties from where it is sourced to where it isneeded. Our robust treatment and deliveryinfrastructure allowed Metropolitan to supplySouthern California almost entirely with ColoradoRiver water in 2015 and then flip to deliveringalmost all Northern California water in 2017.However, this vital infrastructure is aging andheightened reinvestment in this system is essentialto ensure Metropolitan can continue to deliver onits promise of reliability in the coming decades.
In the past, the bulk of Metropolitan’s CapitalInvestment Program was focused on large‑scaleprojects such as Diamond Valley Lake, the InlandFeeder and the Ozone Retrofit Program with repairand replacement projects being secondary. Thefocus of our CIP has now shifted largely toreinvestment in our existing infrastructure. Theseprojects will ensure the long‑term reliability ofMetropolitan’s critical infrastructure and buildseismic resilience into our facilities. In 2000,Metropolitan’s annual CIP was nearly $600 millionfor approximately100 projects. Over the nextbudget cycle, Metropolitan will be managing nearly400 individual capital projects for a $200 millionCIP. This requires changes in organization andmanagement of our capital program and isreflected in our budgeting actions and staffingplans.
The four critical areas of focus will be the ongoingrehabilitation of the Colorado River Aqueduct, pre-stressed concrete cylinder pipe replacement,system seismic hardening and physical and cybersecurity. Staff will be bringing numerous actionitems to the Board in these areas and will bediscussing with the Board strategies on best
management techniques for handling the shiftingnature of our CIP.
Strategic Priority #2: Prepare for MoreExtreme Hydrology
Maximize Storage Opportunities: The recenthistoric drought cycle sequence highlighted theenormous value of Metropolitan’s regional storageinvestments. Over the past decade, California hashad eight drought years with two wet years. Tomeet regional demands, Metropolitan drew onstorage heavily in most years over this period butwas able to take full advantage of the wetter yearsto restore storage reserves. But for Metropolitan’srobust storage portfolio and conveyancecapabilities, Southern California would have facedsevere shortages this past decade. Regional storagehas become increasingly critical to maintainingwater supply reliability in the face of increasingwater supply volatility due to climate change. Staffwill work closely with the Board to assessMetropolitan’s storage capabilities, currentstrategies and review future needs to identifywhether new strategies and/or new investmentsare needed.
Promote Innovation and Efficiency in Water Use: Water use efficiency and conservation investmentswere also essential to managing through thehistoric drought by reducing regional demandsnearly 25 percent. Metropolitan is a nationalleader in water conservation and reached asignificant milestone in 2017 by achieving morethan one million acre‑feet per year in annual watersavings. Most of this progress was built onMetropolitan’s successful rebate programs andadvocacy to change codes and standards. To buildon that success, Metropolitan will examine newopportunities to leverage technology andinnovation to promote conservation, efficient wateruse and water stewardship through acomprehensive demand management program thatincludes investments in research, innovation andpublic education along with targeted incentives forthe residential, commercial, industrial andinstitutional sectors.

Strategic Priority #3: Ensure ImportedSupply Reliability
Southern California’s foundational water supplyremains the Colorado River and the State WaterProject and their ongoing reliability is critical forthe region. Important decisions on both suppliesneed to be made over the next two years.
The emphasis for the State Water Project will be onmaintaining the momentum of the decisions bywater contractors regarding financing CaliforniaWaterFix and beginning the logistical andmanagement work for project construction.Simultaneously, staff will be working with the stateto extend the State Water Project Contract,complete repairs at Oroville reservoir and reviewthe status and upkeep of all SWP facilities. Alsoessential will be strategic investments regardingscience and restoration of the Delta ecosystem insupport of the co-equal goals of water supplyreliability and environmental restoration. Thisincludes support for California EcoRestore projects,salmon and smelt resiliency plans, anddevelopment of a multiuse, long‑term plan forMetropolitan’s Delta Islands.
On the Colorado River, the emphasis over the nextyear will be on completing the DroughtContingency Plan to provide stability on theColorado River while protecting Metropolitan’ssupplies and access to storage in Lake Mead.Additionally, staff will analyze the combinedimpacts of long‑term hydrological conditions andvarious competing demands, including pendingtribal water rights litigation and environmentalinterests, such as the Salton Sea, to ensureMetropolitan’s Colorado River water suppliesremain protected and reliable. Finally,Metropolitan will continue to work proactively tomanage its Palo Verde lands in a way that supportslong-term water supply goals and a vibrantagricultural economy in the region.
2018/19 and 2019/20 Proposed Biennial Budget 21 Understanding the Layout
Strategic Priority #4: Maximize LocalResources
In 2018, construction of the Regional RecycledWater Advanced Purification Center demonstrationfacility in partnership with the Sanitation Districtsof Los Angeles County will be completed. WhileMetropolitan learns about the technical and waterquality aspects of the project to optimize design oftreatment processes for a full‑scale facility, staff
will begin work with the Board and memberagencies on a review of the institutional issuesassociated with the Regional Recycled WaterProgram and its relationship to Metropolitan’songoing Local Resources Program. This review willaddress a variety of issues related to the Programand seek Board policy direction. The issuesaddressed will include how project costs would beallocated, how revenues would be collected, whatform water delivery would take to local agencies,cooperation and cost sharing with non-memberagencies, and other policy issues.
Strategic Priority #5: Promote EnvironmentalStewardship and Sustainability
Metropolitan has undertaken a comprehensiveprogram of environmental stewardship bothinternally and externally. In the course ofaccomplishing its mission and mitigating forimpacts of its projects and operations, Metropolitanestablishes and manages open space, and partnerswith other organizations to preserve and supportnative species and habitat. In the coming years,Metropolitan will continue to lead with programsthat promote actions that support sustainablepractices, reduce greenhouse gas emissions andprotect natural habitat and water quality. Acomprehensive risk management strategy isneeded to address the uncertainty and threatassociated with climate change. As understandingof climate change impacts advances, Metropolitanwill develop and implement strategies to improveresiliency, reduce risk and increase sustainabilityfor infrastructure, water systems and theecosystems.
Strategic Priority #6: Foster Leadership andStrengthen Workforce Capabilities
More than half of Metropolitan’s workforce hasreached retirement age, including many membersof Metropolitan’s executive management team. Theretirement rate at Metropolitan is now slightlymore than 100 employees a year and will remain atthat level through this budget cycle. This is achallenge to the District’s capacity to adequatelytrain and prepare its workforce but is also anopportunity to build a workforce geared for thechallenges of the future. To retain essential agencyknowledge capture and ensure smooth leadershiptransitions, Metropolitan will expedite internalpromotions and recruitment processes, andaugment employee development training programs

to ensure employees have the knowledge andtechnological skills to compete in today’scompetitive job environment. Succession planningactions will be enhanced to increase the availabilityof experienced and capable employees prepared toassume critical roles as they become available,building on Metropolitan’s current successfulapprenticeship program and managementacademies. While Metropolitan’s workforce isbecoming increasingly more diverse, Metropolitanwill continue to foster an inclusive workplace,promoting a safe and discrimination-free workenvironment, and provide opportunities for allemployees to use their diverse talents to supportthe District’s mission.
2018/19 and 2019/20 Proposed Biennial Budget 22 Understanding the Layout
Strategic Priority #7: Maintain SoundBusiness Practices and Fiscal Integrity
Metropolitan will continue its longstandingpractice of operating in a productive, cost‑effective,transparent and efficient manner to ensure soundfinancial stability. Metropolitan holds some of thenation’s highest credit ratings for governmentagencies by maintaining strong reserves andlimiting its use of debt. Long‑term investments willbe made through a prudent combination oflong‑term funding sources as well as annual raterevenues. Capital expenses will continue to befunded at a significant level on a pay as‑you‑go(PAYGO) basis per Board policy. Potentialinvestments such as modernizing the State WaterProject with California WaterFix would be phasedin over time and have been prudently built intoMetropolitan’s rate projections. Staff will ensurethat expenditures on WaterFix will be regularlyreported to the Board and the public in a clear andtransparent manner.
After a decade of virtually no rate increases, then afew steep catch up years in 2009 and 2010,Metropolitan’s overall rate increases havestabilized over the past four years to close to therate of inflation. Thanks to prudent management ofMetropolitan’s capital program, reduction in debtload and management of labor costs, the proposedbudget limits overall rate increases to three percentin each year while it continues fundingMetropolitan’s PAYGO policy, paying downMetropolitan’s Pension and Other PostEmployment Benefit liability, and expandingMetropolitan’s conservation and demandmanagement programs. Most importantly, due tothe continued sound financial management
practices of Metropolitan, the ten-year financialforecast predicts overall rate increases will remainwithin the three to five percent range over the nextdecade.

O&M FINANCIAL SUMMARY
2016/17Actual
2017/18Budget
2018/19Proposed
Change from2017/18
2019/20Proposed
Change from2018/19
Total Salaries and Benefits 9,346,100 9,169,600 10,381,400 1,211,800 10,980,400 599,000Direct Charges to Capital 0 0 (87,900) (87,900) (93,100) (5,200)
Total Salaries and Benefits 9,346,100 9,169,600 10,293,500 1,123,900 10,887,300 593,800
% Change (1.9%) 12.3% 5.8%Professional Services 3,522,900 3,353,600 5,337,500 1,983,900 4,920,000 (417,500)Conferences & Meetings 100,000 108,400 115,200 6,800 114,800 (400)Grant / Donation Expense 423,300 — 1,225,000 1,225,000 525,000 (700,000)Materials & Supplies 52,300 33,600 269,300 235,700 261,100 (8,200)Travel Expenses 476,700 571,900 573,100 1,200 508,400 (64,700)Other Accounts 157,800 193,900 269,500 75,600 253,700 (15,800)
Total O&M 14,079,100 13,431,000 18,083,100 4,652,100 17,470,300 (612,800)
% Change (4.6%) 34.6% (3.4%)
Note – Totals may not foot due to rounding.
FY 2018/19 BUDGET BY EXPENDITURE
Total Salaries andBenefits: 56%
ProfessionalServices: 30%
Grant / DonationExpense: 7%
Travel Expenses: 3%
Other Accounts: 4%
FY 2019/20 BUDGET BY EXPENDITURE
Total Salaries andBenefits: 62%
ProfessionalServices: 28%
Grant / DonationExpense: 3%
Travel Expenses: 3%
Other Accounts: 4%
2018/19 and 2019/20 Proposed Biennial Budget 23 Office Of The General Manager
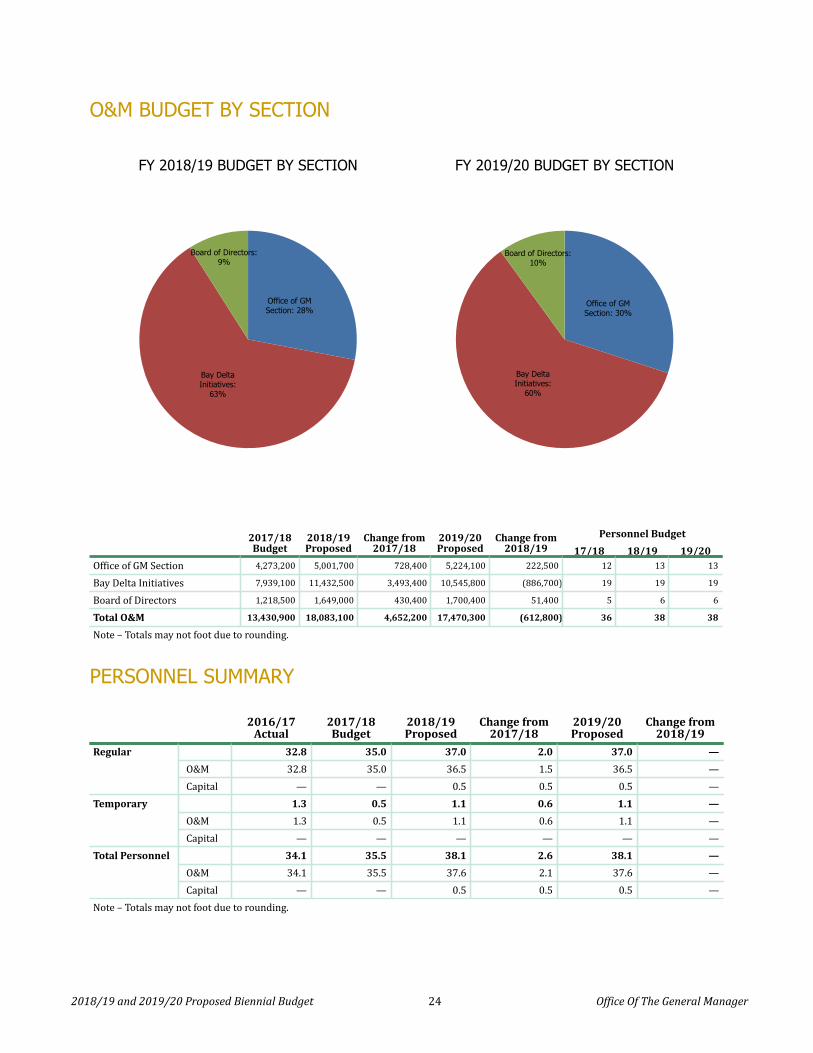
O&M BUDGET BY SECTION
FY 2018/19 BUDGET BY SECTION
Office of GMSection: 28%
Bay DeltaInitiatives:
63%
Board of Directors:9%
FY 2019/20 BUDGET BY SECTION
Office of GMSection: 30%
Bay DeltaInitiatives:
60%
Board of Directors:10%
2017/18Budget
2018/19Proposed
Change from2017/18
2019/20Proposed
Change from2018/19
Personnel Budget
17/18 18/19 19/20Office of GM Section 4,273,200 5,001,700 728,400 5,224,100 222,500 12 13 13
Bay Delta Initiatives 7,939,100 11,432,500 3,493,400 10,545,800 (886,700) 19 19 19
Board of Directors 1,218,500 1,649,000 430,400 1,700,400 51,400 5 6 6
Total O&M 13,430,900 18,083,100 4,652,200 17,470,300 (612,800) 36 38 38
Note – Totals may not foot due to rounding.
2018/19 and 2019/20 Proposed Biennial Budget 24 Office Of The General Manager
PERSONNEL SUMMARY
2016/17Actual
2017/18Budget
2018/19Proposed
Change from2017/18
2019/20Proposed
Change from2018/19
Regular 32.8 35.0 37.0 2.0 37.0 —
O&M 32.8 35.0 36.5 1.5 36.5 —Capital — — 0.5 0.5 0.5 —
Temporary 1.3 0.5 1.1 0.6 1.1 —
O&M 1.3 0.5 1.1 0.6 1.1 —Capital — — — — — —
Total Personnel 34.1 35.5 38.1 2.6 38.1 —
O&M 34.1 35.5 37.6 2.1 37.6 —Capital — — 0.5 0.5 0.5 —
Note – Totals may not foot due to rounding.

BUDGET HIGHLIGHTS
The Office of the General Manager’s O&M Biennial Budget is $18.1 million in FY 2018/19 and $17.5 million inFY 2019/20 or an increase of 34.6% and a decrease of 3.4% respectively from the prior budget years. The mainfactors affecting these changes:
• Increase in staffing by two positions to accommodate increased support for the Board and Bay Deltaefforts.
• Professional services reflect ramped up activities related to Bay Delta science, Delta Islands operations,regulatory activities and Colorado River supply activities.
• Grant expense reflects funds, which were not previously budgeted, contributed by Metropolitan toadvance efforts on collaborative science through various State, Federal and other agencies.
The following are the significant changes by budget year.
2018/19 and 2019/20 Proposed Biennial Budget 25 Office Of The General Manager
FY 2018/19
Personnel–related issues
Total personnel count increased by one regularposition in the Board Support Team and oneregular position for Bay Delta efforts.
Capital labor (one regular FTE) is budgeted forDelta Islands projects.
Salaries and Benefits reflect negotiated laborincreases.
Professional Services
The budget reflects ramped up activities related toBay Delta science, Delta Islands operations,regulatory activities and Colorado River supplyactivities.
Grant Expense
Contributions to various agencies were notbudgeted in FY 2017/18 but since 2016,Metropolitan has been contributing funds toadvance efforts on collaborative science throughagencies such as SFCWA (State and FederalContractors Water Authority), NCWA (NorthernCalifornia Water Association), USGS (United StatesGeological Study) and others. Staff foreseesincreased funding requirements during FY2018/19.
Materials & Supplies
The budget reflects purchase of software for Boardsupport team and electronic equipment for Boardmembers.FY 2019/20
Personnel–related issues
Total personnel count remains flat withFY 2019/20.
Salaries and benefits reflect negotiated laborincreases.
Professional Services
The budget reflects a reduction in Bay Delta sciencestudies, data management and modeling efforts.
Grant Expense
The budget reflects a reduction in Metropolitanfunding of science grants due to anticipatedcompletion of some efforts.

This page intentionally left blank.
2018/19 and 2019/20 Proposed Biennial Budget 26 Office Of The General Manager

WATER SYSTEM OPERATIONSWater System Operations (WSO) reliably treats and delivers high–qualitywater to Metropolitan’s member agencies in an efficient, sustainable, and
environmentally responsible manner.
2018/19 and 2019/20 Proposed Biennial Budget 27 Water System Operations
PROGRAMS
Water System Operations treats and delivers waterfrom the Colorado River and the State WaterProject (SWP) through a raw water conveyancesystem, five treatment plants, and an extensivetreated water distribution network. This flexiblesystem provides reliable deliveries to the memberagencies and moves available supplies and storagereserves to meet Metropolitan’s mission. Waterquality remains paramount and all functions focuson surpassing drinking water standards.
WSO accomplishes its mission through thefollowing programs or sections:
Office of Manager provides day–to–dayoperational management as well as strategic andorganizational leadership, directing all initiativesand core business efforts of WSO. The office alsoprovides support functions such as budgeting,administration, and District wide support throughtheir Security and Fleet Services units. Thesecurity function ensures that Metropolitan’semployees, water infrastructure, and equipmentare adequately protected, and provides emergencymanagement support. The fleet function acquiresand maintains vehicles, equipment, aircraft, andemergency generators.
Operations Support Services provides a diverserange of support to Metropolitan’s core operationalreliability functions and, on a reimbursable basis, topublic entities such as DWR and member agencies.The Manufacturing Services unit performsfabrication, machining, coating, valve and pumprefurbishment, underwater maintenance, and cranesafety and certification. Construction Services unitperforms general construction, large equipmenttransportation, equipment installation, andemergency response. The Power & EquipmentReliability unit provides maintenance services
which include: predictive, preventive, andcorrective maintenance analysis for criticalequipment, including all treatment plants, pumpingplants, hydroelectric power plants, pressure controlstructures, high voltage equipment, and heating,ventilation, and air conditioning (HVAC) systems.Additionally, the section helps member agencieswith service connection requests.
Water Treatment operates and maintains fivewater treatment plants with a combined capacity ofover 2.3 billion gallons per day. The sectionoversees treatment processes to ensurehigh‑quality water is reliably produced thatcomplies with drinking water regulations. All five treatment plants are staffed and operated24 hours a day, seven days a week to meet abouthalf of Metropolitan’s annual deliveries. All five ofthe treatment plants (Jensen, Mills, Skinner,Weymouth and Diemer) have been retrofitted touse ozone as the primary disinfectant. Water Conveyance and Distribution meetsdelivery requirements of member agencies bymoving water throughout Metropolitan’s5,200 square mile service area and performing a wide range of operations and maintenanceactivities to ensure system reliability. The section'swork encompasses the Colorado River Aqueductsystem and its five pumping plants as well as thedistribution system of about 830 miles of pipelines,approximately 350 service connections to memberagencies, 16 hydroelectric plants, and 9 storage andregulatory reservoirs that help Metropolitan meetpeak flow periods and provide dry year andemergency supply reliability.

Water Quality ensures that Metropolitan providessafe and aesthetically pleasing water through thefollowing activities: conducting chemical andbiological analyses; optimizing existing treatmentprocesses; testing new technologies to assurecompliance with current and future regulations;and providing technical expertise, laboratoryservices, and troubleshooting of water qualityissues for Metropolitan and its member agencies.Water Quality also works to preserve and improvesource water quality through rigorous watershedsurveys and advocate for measures to reduce therisk of point and non-point source pollution.
Water Operations and Planning plans andimplements the movement and use of waterresources. These plans incorporate infrastructureand supply limitations, agency demands, changingwater quality requirements, and storage programeconomics. Operational scenarios that encompassa broad range of potential supplies and demandsare developed and refined on a weekly basisthroughout the year. This process prepares WSOfor a wide variety of possible outcomes as the yeardevelops while maintaining reliable deliveries andbalancing water storage reserves at reasonablecost.
In addition, the section programs and maintainsMetropolitan’s control system, known as theSupervisory Control and Data Acquisition (SCADA)system.
Operational Safety and EnvironmentalRegulatory Services is responsible for ensuring asafe working environment for employees throughprograms and training, ensuring business
operations are conducted in an environmentallyresponsible way, and complying with all regulatory and occupational health and safety rules andrequirements. The section integratesenvironmental, health and safety practices intoMetropolitan’s operations and culture with the goalof achieving a safe work place and eliminatingregulatory incidents.
In addition, the section manages technical skillstraining for maintenance craft employees andsponsors an accredited apprenticeship programwhich is a cornerstone of WSO’s proactivesuccession planning efforts; by training industrialmechanics and electricians over a four-year periodof classroom and hands‑on instruction.
Power Operations and Planning plans, acquiresand accounts for the energy required to operate theColorado River Aqueduct (CRA). This activityincludes energy transactions with electric utilitiesand marketers. The section also negotiates andmanages the contracts and energy accounting ofRenewable Energy Credits and Greenhouse GasAllowances for 16 small hydroelectric power plantsand the CRA.
In addition, the section is responsible for mostwholesale energy activities including evaluation ofproposed energy-related regulations andlegislation; analysis of state and regionaltransmission plans and impacts to the CRAtransmission system; and reporting on compliancewith regional and national electric reliabilitystandards. Finally, the section works closely withenergy staff at DWR on energy and transmissionissues for the SWP.
2018/19 and 2019/20 Proposed Biennial Budget 28 Water System Operations
GOALS AND OBJECTIVES
2018/19 and 2019/20 Proposed Biennial Budget 29 Water System Operations
In FY 2018/19 and FY 2019/2020, WSO will focuson the following key issues:
System Reliability
Manage and maintain the water system to ensureoperational reliability for all reasonably expecteddemands.
Develop and distribute the annual operating planand rebuild water storage where possible intoaccounts that provide the greatest deliveryflexibility and cost effectiveness. Build on strategiessuch as employing operational flexibility to mitigatedrought condition impacts on water availability.
Plan, schedule, and execute the Annual ShutdownPlan to ensure reliable operation of the waterdelivery system, including a strategy to managelonger shutdowns to support the refurbishment ofpre-stressed concrete cylinder pipelines.
Maintain eight-pump flow readiness and managestorage accounts to capture all availableColorado River supplies and balanced with watersupplies from other sources.
With member agency and regional partners,develop new water supplies to supplement the coreSWP and Colorado River supplies includinggroundwater recovery, ocean desalination, andindirect potable reuse.
Support the Regional Recycled Water Program byachieving regulatory acceptance for the processdesign. Develop demonstration testing plan andperform optimization studies.
Participate with the California Department of WaterResources (DWR) on value-engineering efforts toensure cost-effective rehabilitation of SWPconveyance, pumping, and generation facilities.
Fully utilize the manufacturing shops in La Verne tomaintain Metropolitan’s infrastructure reliabilityand support projects for DWR and the memberagencies.
Implement vibration-based predictive maintenanceprogram for all large electric motors, verticalturbine pumps, and emergency generators to
improve equipment reliability and reduceunnecessary maintenance.
Provide secure facilities through employee training,incident monitoring, and response for criticalinfrastructure sites and office locations.
Upgrade physical security features and accesscontrol equipment at headquarters and selectedfield facilities.
Conduct emergency response exercises involvinginternal operational groups and member agencies.
Control System Replacement Project
Complete conceptual design phase for replacementproject to modernize the control system for thewater treatment plants and distribution system.
Energy Management
Manage and limit price exposure for wholesaleenergy to support CRA pumping. Implement newenergy and transmission agreements for the CRA230K transmission system.
Negotiate and execute new agreements for energygeneration at Metropolitan’s Foothill, LakeMathews, San Dimas, and Yorba Linda hydroelectricplants when the energy sale agreement with DWRfor these plants expires in 2019.
Workforce Development & SuccessionPlanning
Conduct annual Management Academy to improveinternal recruitment pool for entry-levelsupervisors.
Recruit and begin training a new apprentice classeach year for the mechanical and electrical trades.
Provide continuing education classes for licensedwater treatment and distribution operators that aretailored to Metropolitan's procedures and facilities.

Water Quality, Environmental Protection, andSafety
Meet or surpass all drinking water standards andensure delivery of aesthetically pleasing water.
Engage in the regulatory process to ensure fullconsideration of technical and economic feasibilityfor drinking water and environmental regulations.
Engage watershed stakeholders and regulators toensure effective control of source watercontaminants such as uranium, perchlorate,chromium, pharmaceuticals, nutrients, and algaltoxins.
Provide safety and regulatory services to ensuresafe work practices and adhere to environmentaland workplace health and safety regulations.
Increase monitoring of quagga mussels in the westand east branches of the State Water Project andprepare quagga mussel action plans.
2018/19 and 2019/20 Proposed Biennial Budget 30 Water System Operations

O&M FINANCIAL SUMMARY
2016/17Actual
2017/18Budget
2018/19Proposed
Change from2017/18
2019/20Proposed
Change from2018/19
Total Salaries and Benefits 161,349,900 164,188,300 174,056,500 9,868,200 184,595,100 10,538,600Direct Charges to Capital (7,870,600) (7,161,700) (7,326,400) (164,700) (7,718,200) (391,800)
Total Salaries and Benefits 153,479,300 157,026,600 166,730,100 9,703,500 176,876,900 10,146,800
% Change 2.3% 6.2% 6.1%Professional Services 1,057,700 1,044,500 1,494,000 449,500 1,541,200 47,200Materials & Supplies 35,798,800 37,336,500 38,475,300 1,138,800 38,330,400 (144,900)Outside Services - NonProfessional / Mainte
14,099,600 14,894,200 15,134,200 240,000 15,442,300 308,100
Utilities Charges 12,643,700 12,502,000 14,316,500 1,814,500 14,868,200 551,700Other Accounts 9,272,300 8,170,700 9,644,400 1,473,700 9,261,600 (382,800)Total O&M 226,351,400 230,974,500 245,794,500 14,820,000 256,320,600 10,526,100
% Change 2.0% 6.4% 4.3%Operating Equipment 4,564,857 5,039,400 5,655,200 615,800 6,000,000 344,800
Total O&M and OperatingEquipment
226,351,400 236,013,900 251,449,700 15,435,800 262,320,600 10,870,900
% Change 4.3% 6.5% 4.3%
Note – Totals may not foot due to rounding.
FY 2018/19 BUDGET BY EXPENDITURE
Total Salaries andBenefits: 67%
Materials &Supplies: 16%
Outside Svcs -Non Prof: 6%
Utilities Charges: 6%
Other Accounts: 5%
FY 2019/20 BUDGET BY EXPENDITURE
Total Salaries andBenefits: 69%
Materials &Supplies: 15%
Outside Svcs -Non Prof: 6%
Utilities Charges: 6%
Other Accounts: 4%
2018/19 and 2019/20 Proposed Biennial Budget 31 Water System Operations

O&M BUDGET BY SECTION
FY 2018/19 BUDGET BY SECTION
Office of theManager: 11%
Water Ops &Planning: 5%
Ops Safety &Reg Svs: 6%
Ops SupportSvs: 10%
Power Ops &Planning: 1%Water Conveyance
and Distn: 25%Water Quality:
9%
Water Treatment:33%
FY 2019/20 BUDGET BY SECTION
Office of theManager: 11%
Water Ops &Planning: 5%
Ops Safety &Reg Svs: 6%
Ops SupportSvs: 10%
Power Ops &Planning: 1%Water Conveyance
and Distn: 25%Water Quality:
10%
Water Treatment:33%
2017/18Budget
2018/19Proposed
Change from2017/18
2019/20Proposed
Change from2018/19
Personnel Budget
17/18 18/19 19/20
Office of the Manager 23,152,500 26,177,000 3,024,500 27,107,500 930,500 61 60 60
Water Operations and Planning 10,990,100 11,528,000 537,900 12,056,900 528,900 43 42 42
Operational Safety and RegulatoryServices 14,228,500 15,238,300 1,009,800 15,884,300 646,000 55 55 55
Operations Support Services 22,630,000 23,717,500 1,087,500 24,899,800 1,182,300 120 120 120
Power Operations and Planning 2,852,900 3,343,500 490,600 3,518,800 175,300 11 12 12
Water Conveyance and Distn 60,745,100 62,272,400 1,527,300 64,486,200 2,213,800 270 264 264
Water Quality 20,118,100 22,944,400 2,826,300 24,570,000 1,625,600 93 95 96
Water Treatment 76,257,400 80,573,200 4,315,800 83,797,200 3,223,900 273 277 277
Total O&M 230,974,600 245,794,400 14,819,800 256,320,600 10,526,200 926 925 926
Note – Totals may not foot due to rounding.
2018/19 and 2019/20 Proposed Biennial Budget 32 Water System Operations
PERSONNEL SUMMARY2016/17
Actual2017/18Budget
2018/19Proposed
Change from2017/18
2019/20Proposed
Change from2018/19
Regular Total 866 951 948 (3) 948 —
O&M 828 907 906 (1) 906 —Capital 38 44 43 (2) 43 —
Temporary Total 34 19 20 1 21 1
O&M 32 19 20 1 21 1Capital 1 — — — — —
Total Personnel Total 900 970 968 (2) 969 1
O&M 860 926 925 0 926 1Capital 39 44 43 (2) 43 —

BUDGET HIGHLIGHTS
WSO’s O&M and Operating Equipment Biennial Budget is $251.4 million in FY 2018/19 and $262.3 million in FY2019/20 or a increase of 6.5% and an increase of 4.3%, respectively from the prior year budgets. The increaseis due primarily to the following factors:
• Following the severe drought, a combination of increased treated water flows, increased chemicalcommodity prices and higher chemical dosages needed to treat the more abundant State Water Projectsupplies raised the expected chemical costs for water treatment.
• An increase in hazardous waste disposal costs expensed to O&M as a result of capital improvementprojects.
• An increase in temporary labor and an increase in materials and supplies to support the RegionalRecycled Water Program.
• The increases are offset in part by a reduction in non-professional services by improved brush controlthrough precise chemical application.
The following are the significant changes by budget year.
2018/19 and 2019/20 Proposed Biennial Budget 33 Water System Operations
FY 2018/19
Personnel–related issues
For O&M work, the overall number of positionsdecreased by three which reflects a transfer of fouremployees to Real Property for employee housingsupport in the desert and an increase of oneemployee to fulfill new electrical transmission tasksfor the CRA electrical system.
Salaries and Benefits reflect negotiated laborincreases.
Non Professional Services
A reduction in brush clearing services by improvedbrush control through precise chemical application.
Materials and Supplies
The budget reflects increased chemical costsfor water treatment due to higher treated waterflows, some increase in commodity prices andhigher chemical dosages needed to treat themore abundant State Water Project supplies.
Utilities Charges
The budget reflects an increase in waste disposalcosts from facility R&R projects and an increase inexpected electrical rates.
FY 2019/20
Personnel–related issues
Overall personnel count for both O&M and capitalwork remains flat from the FY 2018/19 budget.
Salaries and Benefits reflect negotiated laborincreases.
Materials and Supplies
The budget reflects inflationary pressureanticipated on chemicals and other materials andsupplies.
Utilities Charges
The budget reflects an anticipated four percentincrease in electricity rates from FY 2018/19.
Other
Outside Services–Non Professional/Maintenancebudget reflects increased cost anticipated forannual security guard contract.

Operating Equipment – FY 2018/19 and FY2019/20
The operating equipment budget is maintained toreplace aging fleet and heavy equipment. In FY2018/19, the budget was increased to procureanalytical instrumentation in support of theRegional Recycled Water Program. In FY 2019/20,the operating equipment was also increased to planfor the replacement of one aircraft for securitypatrols and employee transportation to remotefacilities.
2018/19 and 2019/20 Proposed Biennial Budget 34 Water System Operations

WATER RESOURCE MANAGEMENTWater Resource Management (WRM) plans, secures, and manages waterresources that Metropolitan supplies to its member agencies in a reliable,
cost–effective, and environmentally responsible manner.
2018/19 and 2019/20 Proposed Biennial Budget 35 Water Resource Management
PROGRAMS
Water Resource Management protects andoptimally manages imported water quantity andquality; advances water-use efficiency; providessupply and demand forecasts that are thefoundation for resource planning; and develops andimplements timely resource planning, programs,and projects.
In addition, Water Resource Management assistsmember agencies in optimizing their use of localresources to benefit the entire Metropolitan servicearea, and ensures Metropolitan receives a fairreturn on contractual investments in local andimported resources.
Water Resource Management accomplishes itsmission through the following programs orsections:
Office of Manager directs the group’s efforts inplanning, securing, and managing Metropolitan’swater resources; monitors and tracks the group’sbusiness plan, financial and budgetary initiatives;and provides administrative and business processsupport.
Resource Planning & Development isresponsible for providing an integrated watersupply and demand forecast that will meet theneeds of member agencies and reflect their long-range planning efforts for local supplies, which sets the foundation for Metropolitan’s resource mix andlocal supplies needed to meet demands. Thissection also supports the development of resourceprograms, projects, and infrastructure to meetprojected resource targets; administers theplanning process; defines strategies for meetingservice area water needs, including the IntegratedResource Plan (IRP) and Water Surplus andDrought Management (WSDM) plan; and develops
resource options, such as groundwater conjunctiveuse, regional recycling and seawater desalination;as well as alternatives for short-range planning andimplementation through joint action with WaterSystem Operations.
Resource Implementation develops andadministers water resource programs andcontracts, and pursues application of newtechnologies and innovation for the Colorado River, State Water Project, waterrecycling, groundwater recovery, and conservation.This section also monitors and responds toregulatory, legislative, and operational activitiesthat may influence Metropolitan’s rights andbenefits related to the quality, reliability and cost ofwater.

GOALS AND OBJECTIVES
2018/19 and 2019/20 Proposed Biennial Budget 36 Water Resource Management
In FY 2018/19 and FY 2019/20, WRM will focus onthe following key issues:
Colorado River
Evaluate continuing challenges to theQuantification Settlement Agreement (QSA) anddevelop strategies to respond to changedconditions.
Protect Colorado River resources, Metropolitan’sColorado River rights, and optimize the use ofavailable Colorado River water.
Continue participation in the Colorado RiverSalinity Control Forum and facilitate salinitymanagement projects and other actions thatprotect and improve source water quality.
Partner with other Colorado River water deliverycontractors to develop new Metropolitan supplies,including cross-border water supply programs.
Administer Imperial Irrigation District (IID) andPalo Verde Irrigation District (PVID) agriculturalconservation programs.
Work with representatives of the InternationalBoundary and Water Commission and United StatesBureau of Reclamation (USBR) to continueimplementation of Minute 319 and coordinateemergency deliveries for Tijuana.
Continue administration of pilot system waterprojects that help keep Lake Mead levels aboveshortage triggers.
Develop strategy and tools for managing newagricultural land purchases in the Palo Verde Valley.
Groundwater Storage Program
Continue management of nine approvedconjunctive use programs to store water fordry‑year yield.
Continue facilitation of dialogue among agencies ingroundwater management, recycled waterproduction, and stormwater and flood managementto enhance groundwater basin recharge.
Legislative Review
Continue to review and provide comments andinform member agencies on proposed state andfederal legislation on water resources issuesrelated to Metropolitan’s mission and WRMfunctions.
Regional Resources and Water Conservation
Implement Long-Term Water Conservation Planand new LRP initiatives to meet 20x2020 urbanwater use reduction target.
Pursue grant funding supplement implementationof regional water conservation program initiatives.
Participate in activities leading to expanded use ofrecycled water and increased water-use efficiency.
Administer agreements that provide incentives forconservation, recycled water, recoveredgroundwater production, and support developmentof local resource development projects.
Conduct research to advance local resource andconservation program effectiveness.
Seawater Desalination
Continue to support member agencies developmentefforts and actively participate in CalDesalregulatory and legislative initiatives.
State Water Project
Execute the SWP contract extension, extending thecontract term by 50 years from 2035 to 2085. As aresult the terms of the supply agreement and therepayment period for DWR bonds will be extendedas well.
Ensure accurate billings and influence soundfinancial decisions by DWR, including effectiveDWR energy management practices with regard torenewable energy, emissions reductions,transmission strategies, and energy acquisitions.
Continue to discuss and resolve disputed chargesfor the SWP.

Protect SWP water, power, and financial positionsunder the Oroville Federal Energy RegulatoryCommission (FERC) relicensing process as well asassociated litigation and upcoming FERCrelicensing and several DWR facilities in SouthernCalifornia.
Support Metropolitan’s interests in anySWP‑related litigation.
Coordinate major rehabilitations and new SWPcapital improvements to ensure cost-effective andreliable water supply, energy generation, and use.
Promote water quality monitoring and forecastingactivities through the Municipal Water QualityInvestigations program and raise awareness ofpotential water quality impacts from operationaldecisions.
Develop and implement strategies to access SWPconveyance facilities to optimize use ofMetropolitan water transfer and banking programsin light of scheduled and forced infrastructureoutages.
Continue participation in State Water Contractors,Inc., State Water Project Contractors Authority, andState and Federal Water Contractors Authority tocoordinate activities at a statewide level.
2018/19 and 2019/20 Proposed Biennial Budget 37 Water Resource Management
Future Supply Actions
Consider future supply action programs to promoteinnovation and remove barriers to local resourcedevelopment.
Continue participation in the Southern CaliforniaWater Committee Stormwater Task Force toidentify opportunities and remove obstacles toincreases in stormwater capture and infiltration formeasurable groundwater yield.
Water Supply and System Planning
Complete annual progress reports on IRPimplementation and Metropolitan’s water suppliesand achievements in conservation, recycling, andgroundwater recharge (SB 60 report).
Complete the annual forecast of Metropolitandemands to support revenue requirements andbudget process.
Continue to pursue development of the full scaleRegional Recycled Water Program to increase waterreuse and enhance opportunities for groundwaterrecharge within Metropolitan’s service area.Upgrade and enhance planning tools, such ascomputer models for demand forecasting, resourceprogram evaluation, and distribution system.
Participate in state agency water energy nexusprocesses and data access initiatives.
Continue to collaborate with various agencies andstakeholders in statewide and regional waterresource planning efforts, such as the CaliforniaWater Plan Updates and the Integrated RegionalWater Management Plans.
Continue work with the Water Utility ClimateAlliance to perform case studies on climate dataapplications to water resources planning.
Water Transfers, Exchanges, and StoragePrograms
Continue to manage existing water transfer,exchange, and storage programs along theCalifornia Aqueduct and Colorado River Aqueductand implement approved water transfers.
Continue to evaluate the need for additionalreliability by either developing new programs ormodifying existing programs. Pursue additionalwater transfers, exchanges, and storage programsas needed.
Work with other State Water Contractors on a long-term water transfer permitting process.
Workforce Development & SuccessionPlanning
Continue to develop staff expertise in critical areasto prepare for employee retirements or departures.

O&M FINANCIAL SUMMARY
2016/17Actual
2017/18Budget
2018/19Proposed
Change from2017/18
2019/20Proposed
Change from2018/19
Total Salaries and Benefits 13,343,700 14,376,200 15,676,000 1,299,800 16,651,600 975,600Direct Charges to Capital (1,500) — — — — —
Total Salaries and Benefits 13,342,200 14,376,200 15,676,000 1,299,800 16,651,600 975,600
% Change 7.7% 9.0% 6.2%Professional Services 1,712,300 1,740,000 1,940,000 200,000 1,986,500 46,500Memberships &Subscriptions
4,014,800 5,365,000 5,767,500 402,500 5,844,900 77,400
Other Accounts 276,300 559,400 562,700 3,300 583,000 20,300Total O&M 19,345,600 22,040,600 23,946,200 1,905,600 25,066,000 1,119,800
% Change 13.9% 8.6% 4.7%
Note – Totals may not foot due to rounding.
FY 2018/19 BUDGET BY EXPENDITURE
Total Salaries andBenefits: 66%
ProfessionalServices: 8%
Memberships &Subscriptions: 24%
Other Accounts: 2%
FY 2019/20 BUDGET BY EXPENDITURE
Total Salaries andBenefits: 67%
ProfessionalServices: 8%
Memberships &Subscriptions: 23%
Other Accounts: 2%
2018/19 and 2019/20 Proposed Biennial Budget 38 Water Resource Management

O&M BUDGET BY SECTION
FY 2018/19 BUDGET BY SECTION
Office ofthe Manager:
13%
ResourceImplementation:
69%
Resource Planningand Development:
18%
FY 2019/20 BUDGET BY SECTION
Office ofthe Manager:
13%
ResourceImplementation:
69%
Resource Planningand Development:
18%
2017/18Budget
2018/19Proposed
Change from2017/18
2019/20Proposed
Change from2018/19
Personnel Budget
17/18 18/19 19/20
Office of the Manager 2,871,000 3,026,700 155,700 3,209,300 182,600 14 13 13
Resource Implementation 15,233,800 16,675,000 1,441,200 17,299,800 624,800 37 40 40
Resource Planning andDevelopment 3,935,900 4,244,600 308,700 4,556,900 312,300 16 16 16
Total O&M 22,040,600 23,946,200 1,905,600 25,066,000 1,119,800 67 69 69
Note – Totals may not foot due to rounding.
2018/19 and 2019/20 Proposed Biennial Budget 39 Water Resource Management
PERSONNEL SUMMARY
2016/17Actual
2017/18Budget
2018/19Proposed
Change from2017/18
2019/20Proposed
Change from2018/19
Regular Total 60 67 68 1 68 —
O&M 60 67 68 1 68 —Capital — — — — — —
Temporary Total 1 — 1 1 1 —
O&M 1 — 1 1 1 —Capital — — — — — —
Total Personnel Total 61 67 69 2 69 —
O&M 61 67 69 2 69 —Capital — — — — — —
Note – Totals may not foot due to rounding.

BUDGET HIGHLIGHTS
WRM’s Biennial Budget is $23.9 million in FY 2018/19 and $25.1 million in FY 2019/20, or an increase of 8.6%and 4.7%, respectively from the prior budget years. The increase is primarily due to the following factors:
• Increase in staffing by one regular position and one district temporary position for SWP and CRA programsupport.
• The increase in Memberships and Subscriptions budget enhances Metropolitan's ability to collaboratewith other boards or agencies on statewide and federal issues.
• Net increase in professional services includes resource analysis studies for on-going resource anddemand management assessment; SWP audit fee increase and consulting assistance for SWP contractextension issues; and technical studies for infrastructure related to water supply impacts.
The following are the significant changes by budget year.
2018/19 and 2019/20 Proposed Biennial Budget 40 Water Resource Management
FY 2018/19
Personnel–related issues
Personnel count increased by one regularposition and one District Temporary positionfrom FY 2017/18 budget for water reliabilitysupport related to SWP and CRA programs.
Salaries and Benefits reflect negotiated laborincreases offset by vacancies filled at lower leveljob classifications.
Professional Services
Budget reflects increase in State Water Projectaudit fee and consulting services for assessingSWP contract extension issues; technicalstudies for infrastructure related to watersupply impacts; research studies associatedwith new conservation planning model andwater saving estimates update.
Memberships and Subscriptions
Budget includes increase in State WaterContractors dues and legal services related toCA WaterFix; membership dues for WesternUrban Water Coalition, California UrbanWater Agencies, and new membership forCalifornia Data Collaboration.
Other
Budget reflects net increase in materials andsupplies for resource planning model software;travel associated with SWP, CRA, conservation, andlocal resources program; a reduction in graphicand reprographic for utilizing in-house services.
FY 2019/20
Personnel–related issues
Total personnel count remains flat with the FY2018/19 budget.
Salaries and Benefits reflect negotiated laborincreases.
Professional Services
Budget reflects increase in the SWP audit fee andadditional research studies in desalination andsalinity management.
Memberships and Subscriptions
Budget reflects SWC membership dues increase.
Other
Budget reflects increase in materials and suppliesfor acquiring water forecast demographic data.

ENGINEERING SERVICESEngineering Services provides innovative, high-quality, and cost-effective solutions
to meet our customers’ needs and to ensure the long-term reliability andsuccessful operation of Metropolitan’s infrastructure.
2018/19 and 2019/20 Proposed Biennial Budget 41 Engineering Services
PROGRAMS
Engineering Services manages projects, performsdesign, construction management, infrastructurecondition assessments, and facility planning, andmanages Metropolitan’s Capital Investment Plan(CIP).
Engineering Services accomplishes its missionthrough the following programs and services:
Office of the Group Manager oversees theEngineering Services group and provides strategicleadership on engineering initiatives and corebusiness efforts, to ensure the continued reliabilityand quality of water deliveries. The office alsoprovides technical support for special initiativesincluding the California WaterFix andMetropolitan's Regional Recycled Water Program.
Engineering Planning is responsible for thefunctions of facility planning, hydraulic analysis andmodeling, protection of Metropolitan'ssubstructures, construction contractadministration, technical control and oversight ofengineering standards, support to capital projects,business process management and budgeting, andmanagement of the CIP.
Design is responsible for the preparation oftechnical assessments, conceptual and preliminarydesigns for new facilities and for rehabilitation ofexisting facilities, final design drawings andspecifications for construction, and technicalsupport during the construction and operation offacilities.
Program Management is responsible for overallproject delivery of capital and O&M projects fortreatment plants, distribution, conveyance andstorage systems; and serves as Metropolitan’s“Owner’s Engineer.”
Infrastructure Reliability is responsible for themanagement of construction contracts, fieldinspection, and factory fabrication inspection,management of Metropolitan's dams, surveying andmapping, and corrosion and materials engineering.

GOALS AND OBJECTIVES
2018/19 and 2019/20 Proposed Biennial Budget 42 Engineering Services
In FY 2018/19 and FY 2019/20, EngineeringServices will focus on the following key issues:
California WaterFix
Provide engineering and program managementleadership in support of the California WaterFixand EcoRestore programs as team members onboth of those initiatives. Additionally, represent theState Water Contractors as an Owner'srepresentative providing oversight of the CaliforniaWaterFix project office in Sacramento by providingtechnical reviews of work product developed by theproject team.
New Water Supply Initiatives
Complete construction of the Advanced WaterTreatment Demonstration Plant and providetechnical support for start-up and testing, insupport of Metropolitan's Regional Recycled WaterProgram.
Continue to support opportunities to collaboratewith other agencies to enhance local watersupplies.
Infrastructure Reliability
Manage and complete Board–authorized projectswithin the CIP to ensure the reliable delivery ofwater to Metropolitan’s member agencies.
Provide engineering and technical services tosupport the operation and maintenance ofMetropolitan’s water conveyance, delivery,treatment, and support facilities.
Protect public safety, minimize future costs ofinfrastructure maintenance and repairs, and avoidunplanned outages by monitoring Metropolitan’sfacilities and right–of–way, and performingessential technical assessments.
CIP Management
Prioritize and execute capital projects to addressMetropolitan’s short–term needs and long–termobjectives in a cost-effective manner.
Evaluate project performance to identify and takeadvantage of improvements in project delivery.
Employee Development
Lead workforce development and successionplanning activities to optimally maintain technicalexpertise and skills needed in the future to ensureinfrastructure reliability, meet regulations, respondto emergencies, and support Metropolitaninitiatives.
Customer Service
Provide technical leadership and services tointernal and external customers to meetMetropolitan’s business needs.

O&M FINANCIAL SUMMARY
2016/17Actual
2017/18Budget
2018/19Proposed
Change from2017/18
2019/20Proposed
Change from2018/19
Total Salaries and Benefits 65,783,000 70,313,500 77,056,200 6,742,700 81,444,400 4,388,200Direct Charges to Capital (39,757,000) (47,170,300) (47,991,100) (820,800) (51,301,500) (3,310,400)
Total Salaries and Benefits 26,026,000 23,143,200 29,065,100 5,921,900 30,142,900 1,077,800
% Change (11.1%) 25.6% 3.7%Professional Services 3,367,600 301,000 1,775,800 1,474,800 1,552,800 (223,000)Materials & Supplies 673,600 600,000 704,600 104,600 734,200 29,600Memberships &Subscriptions 177,100 183,000 223,600 40,600 237,000 13,400
Taxes & Permits 321,400 320,000 440,000 120,000 484,000 44,000Travel Expenses 136,100 95,300 170,600 75,300 172,100 1,500Other Accounts 1,189,600 669,900 558,000 (111,900) 542,000 (16,000)Total O&M 31,891,400 25,312,400 32,937,700 7,625,300 33,865,000 927,300
% Change (20.6%) 30.1% 2.8%Operating Equipment 539,903 258,800 989,600 730,800 174,800 (814,800)
Total O&M and OperatingEquipment
31,891,400 25,571,200 33,927,300 8,356,100 34,039,800 112,500
% Change (19.8%) 32.7% 0.3%
Note – Totals may not foot due to rounding.
FY 2018/19 BUDGET BY EXPENDITURE
Total Salaries andBenefits: 89%
ProfessionalServices: 5%
Materials & Supplies: 2%
Other Accounts: 4%
FY 2019/20 BUDGET BY EXPENDITURE
Total Salaries andBenefits: 89%
ProfessionalServices: 5%
Materials & Supplies: 2%
Other Accounts: 4%
2018/19 and 2019/20 Proposed Biennial Budget 43 Engineering Services

O&M BUDGET BY SECTION
FY 2018/19 BUDGET BY SECTION
Office of theManager: 8%
Design: 14%
InfrastructureReliability: 41%
Planning: 30%
Program Management:8%
FY 2019/20 BUDGET BY SECTION
Office of theManager: 6%
Design: 14%
InfrastructureReliability: 42%
Planning: 31%
Program Management:8%
2017/18Budget
2018/19Proposed
Change from2017/18
2019/20Proposed
Change from2018/19
Personnel Budget17/18 18/19 19/20
Office of the Manager 703,500 2,528,400 1,825,000 1,865,200 (663,200) 1 4 2
Design 3,381,100 4,537,700 1,156,600 4,817,400 279,700 32 16 16
Infrastructure Reliability 11,397,700 13,415,700 2,018,000 14,213,100 797,400 56 58 58
Planning 7,948,000 9,771,600 1,823,600 10,346,100 574,500 0 41 41
Program Management 1,882,200 2,684,200 802,100 2,623,100 (61,100) 29 11 10
Total O&M 25,312,400 32,937,700 7,625,300 33,865,000 927,300 118 129 127
Note – Totals may not foot due to rounding.
2018/19 and 2019/20 Proposed Biennial Budget 44 Engineering Services
PERSONNEL SUMMARY
2016/17Actual
2017/18Budget
2018/19Proposed
Change from2017/18
2019/20Proposed
Change from2018/19
Regular Total 331 355 355 — 355 —
O&M 124 118 129 12 127 (3)Capital 206 238 226 (12) 228 3
Temporary Total 2 — — — — —
O&M 1 — — — — —Capital 1 — — — — —
Total Personnel Total 332 355 355 — 355 —
O&M 125 118 129 12 127 (3)Capital 207 238 226 (12) 228 3
Note – Totals may not foot due to rounding.

BUDGET HIGHLIGHTS
Engineering Services' O&M budget is $32.9 million in FY 2018/19 and $33.9 million in FY 2019/20. As detailedbelow, Engineering Services’ budget is influenced significantly by Metropolitan's strategic initiatives, whichinclude the California WaterFix, Regional Recycled Water Program, and Dam Safety Initiatives as well as staffrelocation efforts for the improvements at Metropolitan's Headquarters Building at Union Station.
Total planned O&M expenditures for FY 2019/20 are approximately $7.6 million or 30.1% more than in FY2017/18, due to salaries and benefits reflecting negotiated labor increases and the addition of Major O&Msupport for California WaterFix, Regional Recycled Water Program, and Dam Safety Initiatives. For FY 2019/20, planned O&M expenditures are approximately $0.9 million or 2.8% more than in FY 2018/19,due mainly to salaries and benefits reflecting negotiated labor increases and staff relocation efforts for theHeadquarters Building improvements.
O&M FY 2017/18 FY 2018/19 FY 2019/20
Labor $23,143,200 $26,622,400 $28,202,300
Non–labor $2,169,200 $2,153,600 $2,202,100
Total O&M $25,312,400 $28,776,000 $30,404,400
Regional Recycled Water Program(labor & non-labor)
$0 $2,206,000 $801,200
Dam Safety Initiatives (labor & non-labor)
$0 $1,140,700 $1,215,500
CA WaterFix (labor & non–labor) $0 $815,000 $841,300
Headquarters Building staff relocation $0 $0 $602,600
Total O&M & Special Initiatives $25,312,400 $32,937,700 $33,865,000
% Change 30.1% 2.8%
Note: Excludes Operating Equipment
The following are the significant changes by budget year.
2018/19 and 2019/20 Proposed Biennial Budget 45 Engineering Services
FY 2018/19
Personnel–Related Issues
Total personnel levels remain consistent with theprevious fiscal year. However, the O&M and capitalstaffing complement differs from the FY 2017/18budget. This is primarily due to Major O&Msupport required for special initiatives includingthe California WaterFix, Regional Recycled WaterProgram, and Dam Safety Initiatives, therebyresulting in a shift of staff from capital work toO&M in FY 2018/19.
Planned capital expenditures for FY 2018/19 willremain steady with a district-wide capital budgetestimated to be approximately $250 million (see
details in CIP Appendix). Planned expendituresreflect project budgets and schedules to meetMetropolitan’s overall biennial budgetary goals.High priority projects that will continue during thefiscal year include the Prestressed ConcreteCylinder Pipe (PCCP) Rehabilitation Program; theColorado River Aqueduct (CRA) ReliabilityProgram; the Distribution System ReliabilityProgram; and the Right of Way and InfrastructureProtection Program.

Salaries & Benefits
Salaries and benefits reflect negotiated laborincreases and dedicated support for the CaliforniaWaterFix, Regional Recycled Water Program, andDam Safety Initiatives.
Professional Services
The budget primarily reflects increases to supportthe California WaterFix, Regional Recycled WaterProgram, and Dam Safety Initiatives.
Materials and Supplies
The budget reflects an increase in design–relatedsoftware maintenance costs.
Memberships & Subscriptions
The budget reflects anticipated increases inUnderground Service Alert requests.
Taxes & Permits
The budget reflects an increase in annual damsafety fees paid to the state Division of Safety ofDams.
Travel Expenses
The budget primarily reflects increases to supportthe California WaterFix.
Other
Other non–labor budget items include anticipateddecreases in graphics and reprographics charges;lower lease costs for Xerox copiers; and lowerutility costs at the La Verne site.
2018/19 and 2019/20 Proposed Biennial Budget 46 Engineering Services
FY 2019/20
Personnel–related issues
Total personnel levels remain consistent with theprevious fiscal year. However, the O&M and capitalstaffing complement differs from the FY 2018/19budget. This is primarily due to the anticipatedcompletion of construction of the Advanced WaterTreatment Demonstration Plant for the RegionalRecycled Water Program, resulting in a shift ofO&M staffing to capital work in FY 2019/20.
Planned capital expenditures for FY 2019/20 willremain steady with a district-wide capital budgetestimated to be approximately $250 million (seedetails in CIP Appendix). Planned expendituresreflect project budgets and schedules to meetMetropolitan’s overall biennial budgetary goals.High priority projects that will continue during thefiscal year include the Prestressed ConcreteCylinder Pipe (PCCP) Rehabilitation Program; theColorado River Aqueduct (CRA) ReliabilityProgram; the Distribution System ReliabilityProgram; and the Right of Way and InfrastructureProtection Program.
Salaries & Benefits
Salaries and benefits reflect negotiated laborincreases and an increase for staff relocation effortsfor Metropolitan's Headquarters Buildingimprovements.
Professional Services
The budget primarily reflects slightly decreasingsupport required for the Regional Recycled WaterProgram.
Materials and Supplies
The budget reflects anticipated increases in design–related software maintenance costs.
Memberships and Subscriptions
The budget reflects anticipated increases inUnderground Service Alert requests.
Taxes & Permits
The budget reflects anticipated increases in annualdam safety fees paid to the state Division of Safetyof Dams.
Travel Expenses
The budget reflects ongoing support to theCalifornia WaterFix initiative and general travelexpenses in support of core work.

Operating Equipment – FY 2018/19 andFY 2019/20
The operating equipment budget reflects anincrease from FY 2017/18 to FY 2018/19 and thena decrease in FY 2019/20 primarily due to themajority of requested vehicle replacementsoccurring in FY 2018/19. Other equipment to bereplaced in FY 2018/19 includes a weatherometer,CAD plotters, and other engineering testequipment.
2018/19 and 2019/20 Proposed Biennial Budget 47 Engineering Services

This page intentionally left blank.
2018/19 and 2019/20 Proposed Biennial Budget 48 Engineering Services

OFFICE OF CHIEF ADMINISTRATIVE OFFICERThe Office of the Chief Administrative Officer (CAO) provides outstanding
value to its customers for a wide range of administrative and environmentalplanning services
2018/19 and 2019/20 Proposed Biennial Budget 49 Office of Chief Administrative Officer
PROGRAMS
Office of the Chief Administrative Officeraccomplishes its mission through the followingprograms or sections:
Administrative Services provides a range ofservices including contracting, inventorymanagement, warehousing, reprographics,technical writing, grant management, recordsmanagement, EForms management, EnterpriseContent Management, Spring Green Expo and ECOInnovators Showcase, and administration ofMetropolitan's Rideshare Program.
Environmental Planning (EPS) providesexpertise for environmentally responsible decision-making and compliance with environmental laws
and regulations. EPS ensures Metropolitanactivities comply with the California EnvironmentalQuality Act (CEQA); obtains permits or approvalsfrom federal and state environmental regulatoryagencies for Metropolitan activities; conductsstudies, monitoring and training; and participatesin management of Metropolitan reserves andcoordination with other non-Metropolitan reserveplanning efforts. EPS also provides technicalenvironmental planning support to Metropolitancustomers, member agencies and outside agencies.
Please see the separate group budget sections forInformation Technology, Human Resources andReal Property.

GOALS AND OBJECTIVES
2018/19 and 2019/20 Proposed Biennial Budget 50 Office of Chief Administrative Officer
In FY 2018/19 and FY 2019/2020, the Office of theChief Administrative Officer will focus on thefollowing key issues:
Support Proposed Delta Improvements
Provide environmental and technical services tosupport long-term Delta solutions to improve watersupply reliability and water quality, and protect andenhance Delta ecosystem and associated species.
Provide technical and regulatory support forMetropolitan’s Delta Island holdings.
Support Development of Water Supplies andManagement of Water Reserves
Provide planning, California Environmental QualityAct/National Environmental Policy Act (CEQA/NEPA), and regulatory support for development ofnew water supplies, including continued planningsupport for the proposed Regional Recycled WaterProgram (RRWP).
Prepare CEQA/NEPA and environmental permittingdocumentation for supplemental water suppliesand water conservation measures, includingsupport of Local Resources Programs with memberagencies.
Provide strategic environmental compliance inputand services to obtain supplemental supplies ofwater through transfers, banking and innovativecrop and land management practices.
Sustainability and Climate Action Planning
Coordinate sustainability and climate actionplanning.
Assess and evaluate climate action planning,reporting, and measures currently underway in theorganization. These include Greenhouse Gas (GHG)emissions tracking, climate change planning andadaptation to protect infrastructure and watersupply, water conservation programs, andinfrastructure improvements.
Collaborate with other departments to develop asuite of options for executive managementconsideration regarding the potential development
of a Sustainability and Climate Action Plan (CAP) tomitigate the significant effects of greenhouse gasemissions.
Continue the quarterly Our Legacy E-Newsletterseries to raise employee awareness onsustainability issues and encourage positive “green”behavior.
Continue the annual Spring Green Expo and ECOInnovators Showcase highlighting innovative ideasand productive partnerships between students andbusinesses to solve environmental problems anddemonstrate actions individuals can take to live andwork sustainably.
Ensure Metropolitan’s Rideshare Program remainseffective for employees and compliant withregulatory requirements.
Cultural Resources Planning
Continue cultural resources planning and educationto preserve the historic legacy of Metropolitan.
Complete the historic record documentation forthe Colorado River Aqueduct (CRA) and develop atreatment plan for the CRA and its facilities. Thetreatment plan will provide guidance on how toidentify, evaluate, treat, and manage culturalresources associated with the CRA.
Collaborate with External Affairs on culturalresources exhibitions and provide continuedsupport for traditional and social media outreach.Work closely with Engineering Services and WaterSystem Operations to ensure preservation orreproduction, whenever feasible, of Metropolitan’shistoric built environment, including buildingsstructures, objects and certain sites.
Regulatory Compliance
Provide timely and professional planning servicesand CEQA and regulatory support for all capital andO&M projects in an environmentally responsiblemanner.
Represent Metropolitan and the State WaterContractors on the Ecological Committee andRecreational Advisory Committee for FederalEnergy Regulatory Commission license

requirements.
Provide support on federal and state legislativereview and identify bills and regulations thatshould be supported or opposed based onMetropolitan’s legislative priorities and policyprinciples.
2018/19 and 2019/20 Proposed Biennial Budget 51 Office of Chief Administrative Officer
Reserve Management
Manage Metropolitan’s four large-scale multi-species reserves and participate in several otherregional conservation and multi-species reserveprograms. Management of these reserves isrequired to satisfy regulatory requirements forcontinued delivery of imported water andconstruction and operation of major O&M andcapital projects.
Serve as Metropolitan’s representative on theSouthwestern Riverside County Multi-SpeciesReserve Committee, administer a reservemanagement agreement with Riverside CountyParks (Parks) and actively manage reserve lands toensure compliance with state and federal permitsand multi-agency cooperative managementagreements, including the Memorandum of Intent(MOI) between Metropolitan, Parks, and othermembers of the Diamond Valley Lake Ad HocCommittee.
Serve as Metropolitan’s representative on theReserve Management Committee for the LakeMathews Multi-Species Reserve, administer areserve management agreement with RiversideCounty Habitat Conservation Agency, and activelymanage Lake Mathews reserve lands to ensurecompliance with state and federal permits. Thisactive participation includes updating the draftmanagement plan.
Represent Metropolitan on the Lower ColoradoRiver Multi-Species Conservation Program and theOrange County Central and Coastal NaturalCommunities Conservation Plan as voting membersof the respective governance committees.
Facilitate collaboration among Metropolitan, Parks,and the Reserve Management Committee towardsdevelopment of a Trails Plan, to include multi-useconnecting trails between Diamond Valley Lake andLake Skinner and between the Reserve and theCounty’s Regional Trail System.
Work collaboratively with Real Property,Engineering Services, and Parks to facilitate fieldcoordination among stakeholders. Providetechnical review of all studies andrecommendations pertaining to natural andcultural resources, review and provide input for allrecommendations of design and use of trails andtrail heads, and provide all other environmentalplanning support to fulfill provisions of the MOI.
Coordinate capital and O&M projects, as necessary,with reserve management committees, steeringcommittees and boards.
Innovative Solutions
Enhance procurement training methods byexpanding online training modules in key areassuch as requisition processing, agreementadministration and warehouse ordering to furtherthe customer’s knowledge.
Collaborate with management to automate theOperating Policy process to increase collaboration,productivity, and operational efficiency. Centralizeadministrative functions to promotestandardization, ensure consistency, and improveefficiency in key areas such as grant management,and document management.
Implement Information Governance / EnterpriseContent Management (ECM) to improve existingstorage, retrieval and control of physical andelectronic records in line with fiscal, legal, andregulatory requirements. Enhance efficiency ofcore business processes by moving to a digitalrecords environment while protecting Metropolitanby reducing risk of exposure in litigation.
Utilize Metropolitan’s EForm Management programto improve business processes, increaseproductivity and enhance overall user experienceby incorporating mobile technology and adoptinginnovative and efficient business practices.
Employee Development/Succession Planning
Lead and manage employee development,recruitment, knowledge capture, cross-training,and succession planning.
Continue to cross-train staff to promoteorganizational adaptability, institutional

knowledge, experience, and expertise, particularlyin the Desert area and Metropolitan’s reserves.
Formalize mentoring for entry-level staff andcontinue the successful utilization ofMetropolitan’s student internship program toprovide collegiate students hands-on workexperience while giving Metropolitan access tofuture candidates in recruitment.
2018/19 and 2019/20 Proposed Biennial Budget 52 Office of Chief Administrative Officer

O&M FINANCIAL SUMMARY
2016/17Actual
2017/18Budget
2018/19Proposed
Change from2017/18
2019/20Proposed
Change from2018/19
Total Salaries and Benefits 14,822,200 15,191,400 17,237,000 2,045,600 18,559,400 1,322,400Direct Charges to Capital (559,000) (743,600) (1,589,000) (845,400) (1,795,200) (206,200)
Total Salaries and Benefits 14,263,200 14,447,800 15,648,000 1,200,200 16,764,200 1,116,200
% Change 1.3% 8.3% 7.1%Professional Services 914,400 573,900 876,900 303,000 798,900 (78,000)Materials & Supplies 140,400 140,500 211,800 71,300 202,500 (9,300)Outside Services - NonProfessional / Mainte 273,200 322,600 1,402,300 1,079,700 1,598,000 195,700
Rent & Leases 420,700 593,000 658,600 65,600 658,600 —Subsidies & Incentives 485,000 516,300 1,012,400 496,100 1,012,400 —Taxes & Permits 32,300 13,900 1,553,600 1,539,700 173,600 (1,380,000)Other Accounts 44,200 (160,000) 284,400 444,400 220,400 (64,000)
Total O&M 16,573,400 16,448,000 21,648,000 5,200,000 21,428,600 (219,400)
% Change (0.8%) 31.6% (1.0%)Operating Equipment — — 195,200 195,200 — (195,200)
Total O&M and OperatingEquipment 16,573,400 16,448,000 21,843,200 5,395,200 21,428,600 (414,600)
% Change (0.8%) 32.8% (1.9%)
Note – Totals may not foot due to rounding.
FY 2018/19 BUDGET BY EXPENDITURE
Total Salaries andBenefits: 73%
ProfessionalServices: 4%
Outside Svcs -Non Prof: 6%
Rent &Leases: 3%
Subsidies &Incentives: 5%
Taxes & Permits: 7%
Other Accounts: 2%
FY 2019/20 BUDGET BY EXPENDITURE
Total Salaries andBenefits: 78%
ProfessionalServices: 4%
Outside Svcs -Non Prof: 7%
Rent &Leases: 3%
Subsidies &Incentives: 5%
Taxes & Permits: 1%Other Accounts: 2%
2018/19 and 2019/20 Proposed Biennial Budget 53 Office of Chief Administrative Officer
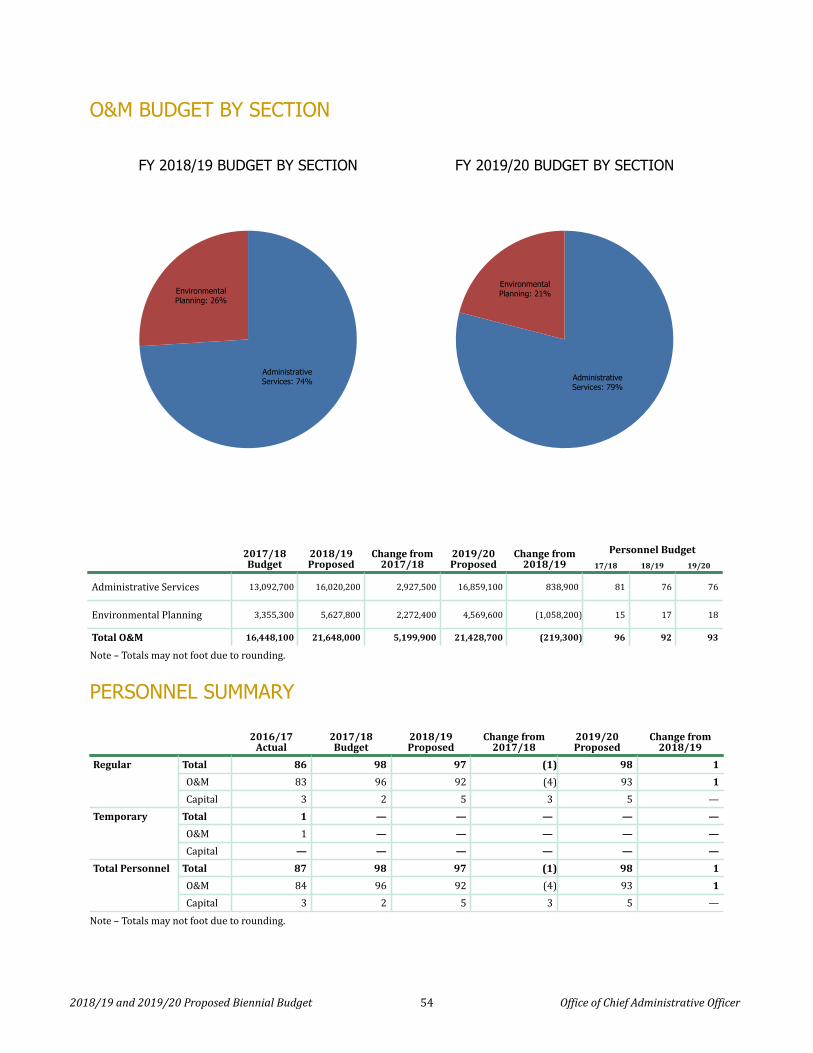
O&M BUDGET BY SECTION
FY 2018/19 BUDGET BY SECTION
AdministrativeServices: 74%
EnvironmentalPlanning: 26%
FY 2019/20 BUDGET BY SECTION
AdministrativeServices: 79%
EnvironmentalPlanning: 21%
2017/18Budget
2018/19Proposed
Change from2017/18
2019/20Proposed
Change from2018/19
Personnel Budget17/18 18/19 19/20
Administrative Services 13,092,700 16,020,200 2,927,500 16,859,100 838,900 81 76 76
Environmental Planning 3,355,300 5,627,800 2,272,400 4,569,600 (1,058,200) 15 17 18
Total O&M 16,448,100 21,648,000 5,199,900 21,428,700 (219,300) 96 92 93
Note – Totals may not foot due to rounding.
2018/19 and 2019/20 Proposed Biennial Budget 54 Office of Chief Administrative Officer
PERSONNEL SUMMARY
2016/17Actual
2017/18Budget
2018/19Proposed
Change from2017/18
2019/20Proposed
Change from2018/19
Regular Total 86 98 97 (1) 98 1
O&M 83 96 92 (4) 93 1
Capital 3 2 5 3 5 —Temporary Total 1 — — — — —
O&M 1 — — — — —
Capital — — — — — —
Total Personnel Total 87 98 97 (1) 98 1
O&M 84 96 92 (4) 93 1
Capital 3 2 5 3 5 —
Note – Totals may not foot due to rounding.

BUDGET HIGHLIGHTS
The Office of the CAO’s O&M and Operating Equipment Biennial Budget is $21.8 million in FY 2018/19 and$21.4 million in FY 2019/20 or an increase of 32.8% and a decrease of 1.9%, respectively from the prior budgetyears. The increase is due to the following factors:
• Salaries and Benefits reflect the addition of three positions in the Environmental Planning section overthe biennium to support increased workload, succession planning and the need for in-house technicalspecialists.
• Taxes and Permits reflect the environmental mitigation costs associated with the Foothill Feeder
Dewatering project.
• Professional services reflects an increased need for specialized technical expertise related toenvironmental planning and remediation efforts, and support for inventory management services.
• Non Professional services reflects an increase for Metropolitan's Enterprise Content Management backfile conversion which cannot be capitalized.
The following are the significant changes by budget year.
2018/19 and 2019/20 Proposed Biennial Budget 55 Office of Chief Administrative Officer
FY 2018/19
Personnel–related issues
Total personnel count decreased by one FTE fromthe FY 2017/18 budget. The budget reflects thetransfer of three positions (from AdministrativeServices section) to Real Property and the additionof two positions in Environmental Planning.
Salaries and Benefits reflect the funding of threepositions (in Administrative Services section),negotiated labor increases and merit increases forqualified employees.
Professional Services
The budget reflects an increased need forspecialized technical expertise related toenvironmental planning. It also includesremediation efforts and support for inventorymanagement services.
Taxes & Permits
The budget reflects $1.5 million for environmental mitigation for the Foothill FeederDewatering Project.
Non Professional Services
The budget increase is due to costs associated withscanning and digitizing documents District-wide aspart of the Enterprise Content Management project.
Other Accounts
The budget for rideshare incentives was increasedto reflect the increase in the maximum monthlyMOU allowance.
FY 2019/20
Personnel–related issues
Total personnel count increased by one FTE fromthe FY 2018/19 budget with the addition of aposition in the Environmental Planning section.
Salaries and Benefits reflect negotiated laborincreases and merit increases for qualifiedemployees.
The budget also includes an increase in capitallabor for the potential Regional Recycled WaterProgram, Cal WaterFix and the Enterprise ContentManagement system.

Professional Services
The budget decreases slightly due to thecompletion of the Foothill Feeder Dewateringproject.
Taxes & Permits
The budget decreases due to the completion of theFoothill Feeder Dewatering Project.
Non-Professional Services
The budget increase is due to costs associated withscanning and digitizing documents District-wide aspart of the Enterprise Content Management project.
Operating Equipment - FY 2018/19 and FY2019/20
The operating equipment budget reflects thereplacement of vehicles, forklifts, scanners andmicrofiche readers.
2018/19 and 2019/20 Proposed Biennial Budget 56 Office of Chief Administrative Officer

INFORMATION TECHNOLOGYInformation Technology provides innovation and outstanding value to its
customers for a wide range of technical services and enterprise businesssolutions.
2018/19 and 2019/20 Proposed Biennial Budget 57 Information Technology
PROGRAMS
Information Technology accomplishes its missionby delivering comprehensive technology servicesand solutions in water systems and businessapplications (e.g. laboratory informationmanagement system, financial and human resourcesystems, maintenance management system, etc.),geographic information systems,telecommunications/networks, SCADA,programming, network communications, andcomputer hardware and software, and cybersecurity.
Office of Group Manager oversees themanagement of the Information Technology (IT)group by providing strategic leadership oninitiatives and capital investments to improveoperational efficiencies, enhance reliability & cybersecurity capabilities, and deliver innovative optionsand solutions.
IT Enterprise Architecture is responsible forleading the efforts to develop the application, data,and technology architectures for Metropolitan’sInformation Technology.
Service Desk / Desktop Services manages andsupports IT business and service functions.
IT Infrastructure / Cyber Security isresponsible for the management oftelecommunications, network services, servers,storage, data center operations and cyber securityoperations.
Enterprise Business Systems provides servicesand solutions in the areas of enterprise andbusiness applications.
Enterprise Water Systems is responsible forservices and solutions in the areas of EngineeringServices and Water System Operations applications.
Project Planning oversees project control anddelivery of capital and O&M technology projects.

GOALS AND OBJECTIVES
2018/19 and 2019/20 Proposed Biennial Budget 58 Information Technology
In FY 2018/19 and FY 2019/20, InformationTechnology will focus on the following key areas:
Business Technology & Process Enhancement
Implement projects in support of Metropolitan’sstrategic initiatives including continued migrationto mobile technology and implementation of cloudsolutions to enhance productivity, streamlinebusiness processes, and cost mitigation.
During the past fiscal year, Information Technologyunderwent an organizational change from sectionto group that included the filling of the IT groupmanager position and the formation of a new ITExecutive Governance Council. The council wasestablished as an advisory committee to theGeneral Manager to implement IT policies andstrategies in alignment with Metropolitan’sbusiness goals and priorities. In addition, theestablishment of an Operation TechnologyGovernance Committee will provide executiveleadership, oversight and collaboration for SCADAOT/IT operations, maintenance, andenhancements. Emerging technology in thebusiness environment will continue to be evaluatedand prioritized to determine their application forMetropolitan.
Key areas of focus within Metropolitan’s cybersecurity capabilities include continuousenforcement of security standards to ensureprotection against evolving threats andparticipation in local and national efforts aimed atenhancing security for water utilities.
Information Systems Upgrades and Projects
IT continues to improve partnerships with otherbusiness areas to enhance the capabilities ofsystems that achieve Metropolitan’s operationalgoals and objectives. The following key projectsinclude IT deliverables that add value to the group’sbusiness customers:
Engineering and Water System Operations
The Water Systems Control Master Plan aims tofully coordinate and further protect the operationaland business investments of Metropolitan’s SCADAsystems. The master plan includes multi-phasedprojects already underway starting with
preliminary investigations to achieving final designand construction of a new control system.
Continue to upgrade the control and electricalprotection systems at the Wadsworth PumpingPlant to ensure continued reliability of the facility.
AMR System RTUs and Radio Modem Upgrade -Project phases include the upgrade of theAutomatic Meter Reader (AMR) system andreplacement of the Remote Terminal Units (RTUs)and supporting radio equipment.
Maximo Mobile Computing Upgrade aims to replaceexisting mobile hardware devices that are pasttheir service life and cannot be integrated withcurrent versions of software used for WSOmaintenance management.
Energy Management System (EMS) Upgrade - Theproject’s objective is to replace the current systemsoftware which is no longer being supported andits functionality is compromised due to thesystem’s age (10+ years).
Partner with the Engineering Services and WaterSystem Operations groups to begin deployment of aWater Systems Asset Information Program that willsupport ongoing and future planning, engineering,operations, maintenance, and asset management.As part of the infrastructure reliability objective,the Asset Monitoring and Management Systemproject seeks to develop a common framework tomanage condition monitoring across Metropolitan’soperations.
Engineering Information System Upgrades -Thisproject involves the installation and configurationof the latest version of ProjectWise softwarefeaturing additional modules and the ability tointegrate with other Metropolitan systems.
Fuel Management System Upgrade seeks toupgrade the system at 13 Metropolitan facilities asa continuation of the refurbishment initiative.
Hydraulic Model Water Quality Calibration Projectand Analysis Toolkit Development Project - Theseprojects aim to enable and optimize the use ofsoftware that will support hydraulic modelinganalysis more efficiently.

Flow Scheduler (WSO) project includes thedevelopment of a software tool that will streamlinemember agency flow change requests and also saveMetropolitan operators time when logging flowdemand data.
Office of the CAO
Continue to partner with Administrative Serviceson phase I of the Enterprise Content Management(ECM) project for the design of an ECMapplication and for the optimization of digitalassets on Metropolitan’s network storage devices.
Initiate Phase II of the ECM system to provide aframework for collaboration and automation whileprotecting Metropolitan by reducing risk ofexposure in litigation, enhancing efficiency of corebusiness processes, and supporting the enterprisebusiness continuity plan.
Upgrade Metropolitan’s Disaster Recovery Data Center. This project upgrades key information technology disaster recovery infrastructure components for continued reliability of systems that support core business applications.
Board Room Technology Upgrade - Deploy theupgrade of audio, video and informationtechnology-related equipment in the main boardroom and all committee rooms in Metropolitan'sheadquarters building.
Deploy upgrades to improve the reliability,performance, and capacity of Metropolitan'swireless network infrastructure comprising ofmicrowave radio wide-area networks (WANs) andwireless access point local-area-networks (LANs).
Initiate replacement of the Learning ManagementSystem to provide enhanced functionality andaccess to information and reports in support ofHuman Resources.
CFO, External Affairs, Legal and RiskManagement
The Budget System Replacement Project willsupport the capital & O&M budget process andBoard deliverables. The current system hasreached end of life and cannot be upgraded.
The MWDH2o.com Redesign will updateMetropolitan’s current external-facing website withan improved website that is optimized forintegration with current technology and socialmedia.
The Incident Reporting System Project willreevaluate the current incident tracking andreporting process to determine requirements for anew system. The current system has reached endof life.
2018/19 and 2019/20 Proposed Biennial Budget 59 Information Technology

O&M FINANCIAL SUMMARY
2016/17Actual
2017/18Budget
2018/19Proposed
Change from2017/18
2019/20Proposed
Change from2018/19
Total Salaries and Benefits 25,194,400 24,818,200 28,334,100 3,515,900 30,810,000 2,475,900Direct Charges to Capital (1,211,100) (1,363,100) (1,375,300) (12,200) (1,400,800) (25,500)
Total Salaries and Benefits 23,983,300 23,455,100 26,958,800 3,503,700 29,409,200 2,450,400
% Change (2.2%) 14.9% 9.1%Professional Services 286,400 483,200 1,283,200 800,000 1,841,000 557,800Communication Expenses 1,620,200 1,470,100 1,609,500 139,400 1,609,500 —Equipment Expensed 16,000 57,400 116,000 58,600 2,306,600 2,190,600Materials & Supplies 4,234,700 4,444,000 6,092,700 1,648,700 6,163,700 71,000Repairs & Maintenance -Outside Services 514,000 888,500 1,332,500 444,000 1,310,500 (22,000)
Other Accounts 319,800 561,500 616,500 55,000 621,100 4,600Total O&M 30,974,400 31,359,800 38,009,200 6,649,400 43,261,600 5,252,400
% Change 1.2% 21.2% 13.8%Operating Equipment 698,749 627,800 1,631,200 1,003,400 748,400 (882,800)
Total O&M and OperatingEquipment 30,974,400 31,987,600 39,640,400 7,652,800 44,010,000 4,369,600
% Change 3.3% 23.9% 11.0%
Note – Totals may not foot due to rounding.
FY 2018/19 BUDGET BY EXPENDITURE
Total Salaries andBenefits: 71%
Professional Services: 3%
Communication Expenses: 4%
Materials &Supplies: 16%
Repairs & Maintenance -Outside Services: 4%
Other Accounts: 2%
FY 2019/20 BUDGET BY EXPENDITURE
Total Salaries andBenefits: 68%Professional Services: 4%
Communication Expenses: 4%
Materials &Supplies: 14%
Repairs & Maintenance -Outside Services: 3%
Other Accounts: 7%
2018/19 and 2019/20 Proposed Biennial Budget 60 Information Technology

PERSONNEL SUMMARY
2016/17Actual
2017/18Budget
2018/19Proposed
Change from2017/18
2019/20Proposed
Change from2018/19
Regular Total 118 130 130 — 134 4
O&M 114 123 123 0 127 4Capital 4 7 7 0 7 —
Temporary Total 6 1 2 1 2 0
O&M 5 — — — — —Capital 1 1 2 1 2 0
Total Personnel Total 124 131 132 1 136 4
O&M 119 123 123 0 127 4Capital 5 8 9 1 9 0
Note – Totals may not foot due to rounding.
2018/19 and 2019/20 Proposed Biennial Budget 61 Information Technology

BUDGET HIGHLIGHTS
At the General Manager’s direction, Information Technology was reorganized from section to group. Thisbiennial O&M budget reflects the following:
• Establishment of Office of IT Group Manager• Alignment of the organization and functions• Strategic IT initiatives and operational expenses (i.e., enterprise software) related to new capital
investments
Information Technology’s biennial O&M and Operating Equipment budget is $39.6 million in FY 2018/19 and$44.0 million in FY 2019/20, or an increase of 23.9% and 11.0% respectively from the prior budget years. Theincrease is due to the following key factors:
• Salaries and Benefits reflect negotiated labor increases and the increase of four positions in FY 2019/20with the formation of a new Business Analysis Team.
• The PC Replacement Project will take a phased approach at replacing aging PCs and related equipment.The estimated project cost of $5.1 million will be spread over three fiscal years. The approximate costover the two years of this biennial budget is $3.6 million.
• As part of the Headquarters Seismic Retrofit project, IT will be responsible for coordinating the move of ITequipment (e.g., PCs) during the temporary relocation of staff. Costs are estimated at approximately $0.4million for the two fiscal years combined.
• Software maintenance cost increases for new corporate/business applications, escalating industry costsand operating expenses related to new capital projects.
The following are the significant changes by budget year
2018/19 and 2019/20 Proposed Biennial Budget 62 Information Technology
FY 2018/19
Personnel–related matters
Total Personnel count remains flat with FY2017/18 budget.
Salaries and Benefits reflect negotiated laborincreases.
Capital labor budget remains flat in scheduleddemands for ongoing rehabilitation and upgradesof IT facilities and application systems. Theseinclude upgrades to the DVL Controls at theWadsworth Pumping Plant, the Water SystemsControl Master Plan, Cyber Security Enhancementsand Communications Infrastructure Upgrade.
Professional Services
The budget reflects IT support for the PCReplacement project, seismic relocation, on-call
services for application enhancements, and otherstrategic IT priorities.
Materials and Supplies
The budget reflects increased levels of softwarelicensing/support agreements as a result ofprojects associated with Enterprise ContentManagement, Emergency Radio Communications,Cyber Security, IT infrastructure, and costescalations associated with agreements forenterprise software.
Outside Services – Non Professional andRepairs/Maintenance
The budget reflects an increase within this categorydue to maintenance associated with new andexisting IT equipment.

FY 2019/20
Personnel–related issues
Total regular personnel for O&M increased from130 to 134 FTE, reflecting the formation of aBusiness Analysis Team. The capital work remainsflat from the FY 2018/19 budget.
Salaries and Benefits reflect negotiated laborincreases for 134 FTEs and the refunding of oneposition from the FY 2018/19 budget.
Professional Services
The budget reflects IT support for the PCReplacement project and seismic relocation.
Equipment Expensed
The budget reflects IT equipment for the PCReplacement project.
2018/19 and 2019/20 Proposed Biennial Budget 63 Information Technology
Operating Equipment – FY 2018/19 and FY2019/20
The operating equipment budget reflects thecritical replacement of IT load balancers, servers,storage devices, service vehicles, unmanned aerialvehicles (Drone), 3D printer, and videoconferencing monitors used for Metropolitanapplications.
The operating equipment budget is decreasingbetween budget years FY 2018/19 and FY 2019/20primarily as a result of fewer IT equipmentreplacements.

This page intentionally left blank.
2018/19 and 2019/20 Proposed Biennial Budget 64 Information Technology

HUMAN RESOURCESHuman Resources (HR) strategically, and cost effectively, recruits, retains,
motivates, rewards, and develops Metropolitan’s employees.
2018/19 and 2019/20 Proposed Biennial Budget 65 Human Resources
PROGRAMS
The focus of Human Resources is to work closelywith management to foster effective management;prepare to meet future workforce challenges;partner with customers on solutions; and provideexcellent HR services that ensure compliance tonumerous HR laws, regulations, andresponsibilities.
HR services include employee and labor relations,recruitment and selection, equal employmentopportunity (EEO), HR Information Systems,benefits, retirement, leave administration,classification and compensation administration,medical screening, workers' compensation,training, organizational development, workforceand career development, and HR business supportservices.
HR accomplishes its mission through the followingprograms or sections:
Office of Human Resource Group Managerprovides strategic leadership and direction forMetropolitan’s Human Resources functions.Organizations reporting directly to it includeEmployee Relations and Human ResourcesServices.
Employee Relations is responsible for fosteringharmonious labor relations between Metropolitanand its four certified bargaining units, and plays akey role in contract negotiations, including workingas a partner with senior management in developingMetropolitan’s collective bargaining strategy. Thestaff also serves as a resource to managers andsupervisors on such matters as grievances,
disciplinary actions, and workplace conflicts. Thesection also provides ongoing training to managerson all facets of employer-employee relations.
The section also has responsibility for diversity andinclusion and investigating internal complaints ofunlawful discrimination. Diversity and inclusionincludes partnering with Employee Resourcegroups and external affinity groups to outreach tofuture applicants. EEO investigations staff meetwith complainants, interview witnesses, and issuefindings as to whether allegations of unlawfuldiscrimination can be substantiated. This work iscritical in ensuring that Metropolitan maintains aworkplace free of discrimination and harassment.
Finally, Human Resources Information Systemsstaff administer Metropolitan’s MyHR system, andserve as a critical liaison between HR and theInformation Technology Group.
Human Resources Services is responsible forthe strategic design and implementation ofMetropolitan’s compensation, benefits,recruitment, training and workers compensationand medical screening functions. The sectionleads and participates in continuous processimprovement and cost optimization studies for allplans. Responsibilities include job analysis,market assessments, recruitment, activeemployee and retiree benefit programadministration, partnering with management onnew initiatives, compliance, claim administration,medical screening and implementing newprograms and agreements.

2018/19 and 2019/20 Proposed Biennial Budget 66 Human Resources

GOALS AND OBJECTIVES
2018/19 and 2019/20 Proposed Biennial Budget 67 Human Resources
In FY 2018/19 and FY 2019/20, HR will focus onthe following key issues that support the GM’sobjective of Employee Development and additionalHR priorities:
Ensure Effective People Management
Strong people management skills are essential tomeeting Metropolitan’s future challenges andsuccesses. HR will ensure that the role ofmanagement is defined and that current managershave the tools and training needed to provideeffective management.
A formal, multi-tiered Management and LeadershipDevelopment program will help managers betterunderstand their roles and responsibilities as theyprogress through management.
Learning opportunities will be provided toemployees to prepare for future managementpositions from the entry level manager all the wayto the executive level.
Ongoing events, workshops and forums willprovide opportunities to deliver consistentexpectations and tools for management includingmotivating and valuing employee contributions.
Strengthen Partnerships with HR Customers
Effective people solutions require that HR partnerwith its customers which includes management,unions, employees, retirees and others. HR mustunderstand the customer’s business needs andthen build working relationships that developeffective solutions to people-related challenges.This working partnership will minimizemisdirected efforts, speed decision-making, reducerework and, ultimately, produce a better workplaceat a reduced cost.
Strengthened HR/customer partnerships andcommunications will identify areas forimprovement in HR products, services, support andmessaging.
Ensure Risk Management, Employee Relations, EEOand the Legal Department coordinate to effectivelydefend against litigation of liability claims, and tocost-effectively resolve claims.
Prepare to Meet Challenges of FutureWorkforce Changes
On average, about 100 employees per year areretiring and this trend is expected to continuethrough the next budget cycle. As experiencedand knowledgeable employees retire, HR willcontinue to support and expand upon on-goingsuccession planning efforts underway. Efforts will include a focus on learning,development, knowledge capture, cross-trainingopportunities, and building pipelines for futurevacancies.
HR will develop new strategies, support existingefforts and ensure Metropolitan remainscompetitive when compared to other organizations.
HR will support career development activityundertaken by employees to enhance knowledge,skills, and abilities for future work and promotionalopportunities, including support of internship andmentoring initiatives.
Provide Excellent Human Resources Services
HR provides a wide range of services and supportfrom pre–hire to retirement and impacts almostevery aspect of the organization. To makemaximum contribution, all HR functions must serveas trusted advisors that speak with one voice, listenwell and provide consistent guidance on people–related matters.
HR will continue to simplify policies, processes, andprocedures to reduce the costs of HRadministration by utilizing technology, reducingredundancies or implementing new approaches toexisting services.
HR will develop standard reports to enhancemanagement access to employee data and assistwith decision–making.
HR will administer a full range of benefit servicesfor health, leave, deferred compensation andretirement programs.
HR will continue to review the recruitment processand procedures to improve quality of hire andtime–to–fill.

2018/19 and 2019/20 Proposed Biennial Budget 68 Human Resources
Ensure Compliance with Laws andRegulations
HR manages compliance to four MOUs and theAdministrative Code, and addresses many sensitiveand confidential personnel issues.
HR will continue to monitor a wide array ofchanging legal and regulatory requirements whileadapting HR processes and systems to conform tothese changing requirements.
HR will ensure Metropolitan meets EqualEmployment Opportunity requirements andnumerous Federal, State, and Local laws andregulations and Public Sector codes and rulings.
HR will maintain fiduciary responsibilities in themanagement of financial and retirement programsand comply with the Affordable Care Act and withall privacy and data security requirements.

O&M FINANCIAL SUMMARY
2016/17Actual
2017/18Budget
2018/19Proposed
Change from2017/18
2019/20Proposed
Change from2018/19
Total Salaries and Benefits 8,120,500 7,829,300 9,445,100 1,615,800 9,973,600 528,500Direct Charges to Capital — — — — — —
Total Salaries and Benefits 8,120,500 7,829,300 9,445,100 1,615,800 9,973,600 528,500
% Change (3.6%) 20.6% 5.6%Professional Services 578,400 885,400 1,104,100 218,700 1,126,700 22,600Advertising 117,800 150,000 140,000 (10,000) 140,000 —Outside Services - NonProfessional / Mainte 313,600 202,000 231,500 29,500 231,500 —
Subsidies & Incentives 772,300 687,300 960,300 273,000 961,500 1,200Training & Seminars Costs 222,400 158,200 177,800 19,600 177,700 (100)Other Accounts 297,200 309,100 283,500 (25,600) 270,500 (13,000)
Total O&M 10,422,200 10,221,300 12,342,300 2,121,000 12,881,500 539,200
% Change (1.9%) 20.8% 4.4%
Note – Totals may not foot due to rounding.
FY 2018/19 BUDGET BY EXPENDITURE
Total Salaries andBenefits: 76%
ProfessionalServices: 9%
Outside Svcs- Non Prof:
2%
Subsidies &Incentives: 8%
Other Accounts: 5%
FY 2019/20 BUDGET BY EXPENDITURE
Total Salaries andBenefits: 77%
ProfessionalServices: 9%
Outside Svcs- Non Prof:
2%
Subsidies &Incentives: 7%
Other Accounts: 5%
2018/19 and 2019/20 Proposed Biennial Budget 69 Human Resources
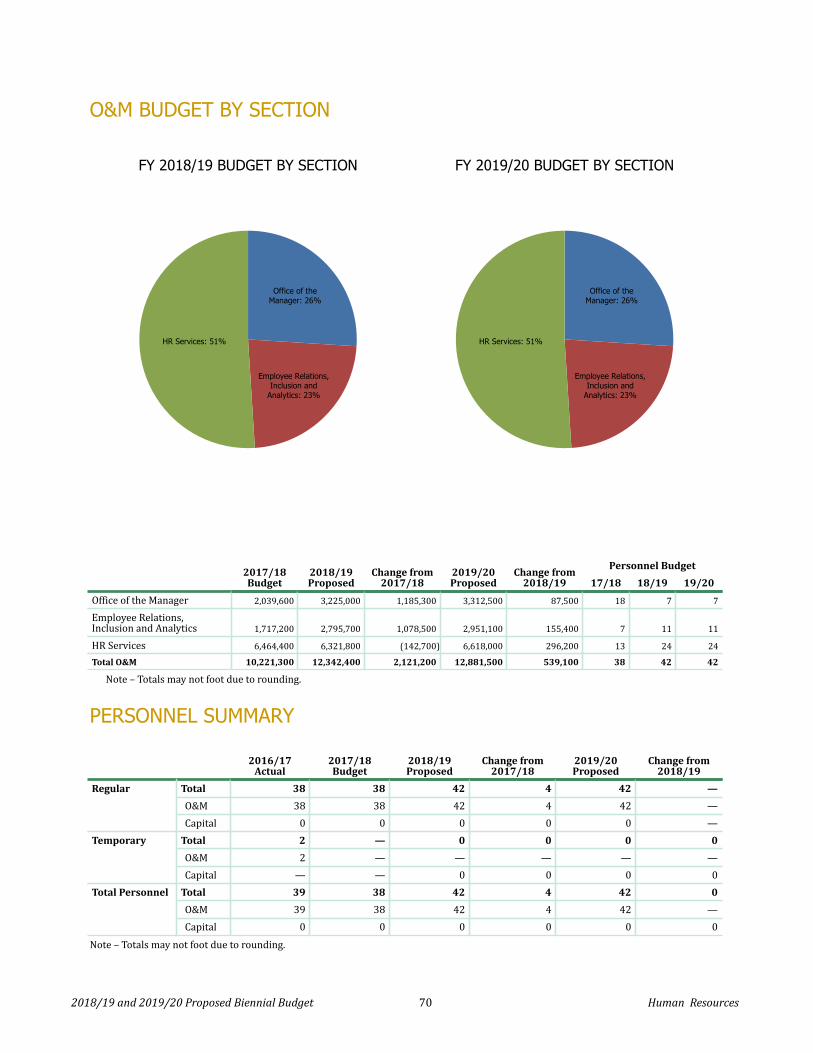
O&M BUDGET BY SECTION
FY 2018/19 BUDGET BY SECTION
Office of theManager: 26%
Employee Relations,Inclusion and
Analytics: 23%
HR Services: 51%
FY 2019/20 BUDGET BY SECTION
Office of theManager: 26%
Employee Relations,Inclusion and
Analytics: 23%
HR Services: 51%
2017/18Budget
2018/19Proposed
Change from2017/18
2019/20Proposed
Change from2018/19
Personnel Budget
17/18 18/19 19/20
Office of the Manager 2,039,600 3,225,000 1,185,300 3,312,500 87,500 18 7 7
Employee Relations,Inclusion and Analytics 1,717,200 2,795,700 1,078,500 2,951,100 155,400 7 11 11
HR Services 6,464,400 6,321,800 (142,700) 6,618,000 296,200 13 24 24
Total O&M 10,221,300 12,342,400 2,121,200 12,881,500 539,100 38 42 42
Note – Totals may not foot due to rounding.
2018/19 and 2019/20 Proposed Biennial Budget 70 Human Resources
PERSONNEL SUMMARY
2016/17Actual
2017/18Budget
2018/19Proposed
Change from2017/18
2019/20Proposed
Change from2018/19
Regular Total 38 38 42 4 42 —
O&M 38 38 42 4 42 —Capital 0 0 0 0 0 —
Temporary Total 2 — 0 0 0 0
O&M 2 — — — — —Capital — — 0 0 0 0
Total Personnel Total 39 38 42 4 42 0
O&M 39 38 42 4 42 —Capital 0 0 0 0 0 0
Note – Totals may not foot due to rounding.
BUDGET HIGHLIGHTS
HR’s Biennial Budget is $12.3 million in FY 2018/19 and $12.9 million in FY 2019/20 or an increase of20.8% and an increase of 4.4% respectively from the prior budget years. The changes are due primarily tothe following factors:
• Increase in staffing by four positions to accommodate increased recruitment and classificationworkload, succession planning for future vacancies and new initiatives such as the Wellness program.
• Professional services increase in both years due to General Manager Initiatives such as the Wellness andRecognition Programs and increased organizational and employee development training and programs.Additionally, there were increases in our Workers' Compensation third party Contract.
• Subsidies and Incentives increased in both years due to MOU contractual agreements as well asincreasing the Tuition Reimbursement budget to accurately reflect the five year usage trends.
The following are the significant changes by budget year.
2018/19 and 2019/20 Proposed Biennial Budget 71 Human Resources
FY 2018/19
Personnel–related issues
Personnel count increased by four from the FY2017/18 budget with the addition of a BusinessSupport Team Manager and three HR Analysts inthe Office of the Group Manager, ClassCompensation and Recruitment and HumanResources Information Systems Team.
Salaries and Benefits reflect negotiated laborincreases and merit increases for qualifiedemployees.
Professional Services
The budget reflects increases as a result ofbargaining unit negotiations as well as newWellness and Employee Recognition Programs. Thebudget also reflects increases in Organizational andEmployee Training Programs, as well as an increasein the Workers' Compensation agreement.
Subsidies & Incentives
The budget reflects increases as a result of MOUcontractual agreements as well as increasing theTuition Reimbursement budget to accurately reflectthe five year usage trends.
FY 2019/20
Personnel–related issues
Personnel count remains flat from FY 18/19.Salaries and Benefits reflect negotiated laborincreases.
Professional Services
The budget is anticipated to increase due toWorkers' Compensation and Organization andDevelopment Program contractual increases.

This page intentionally left blank.
2018/19 and 2019/20 Proposed Biennial Budget 72 Human Resources

REAL PROPERTYReal Property applies strategic approaches to the acquisition, management
and protection of Metropolitan's real property assets, and seeks to effectivelyoptimize revenues and control land management costs.
2018/19 and 2019/20 Proposed Biennial Budget 73 Real Property
PROGRAMS
The Real Property group accomplishes its missionthrough the following programs or organizations:
Office of the Group Manager includes BusinessManagement, Planning & Acquisition, PropertyManagement, and Asset Management. The GroupManager directs the group’s efforts in planningacquiring, and managing Metropolitan’s realproperty assets; is responsible for the developmentof real property policies and strategies to centralizeMetropolitan’s land activities to ensure propertiesare maintained, secured, and protected for presentand future needs.
Business Management monitors and tracks thegroup’s business plan, financial and budgetaryinitiatives; and provides administrative andbusiness process support. In addition, the Teamhandles property tax payments, lease payments,provides contract support, and board letter andreport coordination.
Planning & Acquisition Unit is responsible forthe planning and acquisition of property and property rights for O&M and capital projects, which include the Right of Way and InfrastructureProtection Program, Regional Recycled WaterProgram, and Bay Delta Initiatives.
Property Management is responsible formanaging Metropolitan’s real property assets,processing requests for secondary uses of realproperty and handling surplus propertydisposition. In addition, the Unit is responsible forthe protection of Metropolitan’s real propertyincluding site inspections, trespass andencroachment resolution.
Asset Management is responsible formanagement of Metropolitans’ headquartersfacility, the DVL Visitor Center and providesmanagement and maintenance of employeehousing.

GOALS AND OBJECTIVES
In FY 2018/19 and FY 2019/20, Real Property will focus on the following key issues:
2018/19 and 2019/20 Proposed Biennial Budget 74 Real Property
Centralized Management of Metropolitan'sReal Property Assets
Metropolitan’s properties have traditionally beenmaintained by various Groups within theorganization. A centralized management approachwill ensure properties are regularly maintained,secured and protected for present and futureneeds.
Transition the managerial responsibility ofemployee housing to the Real Property Group.
Prepare a programmatic approach, a staffing plan,a maintenance/replacement schedule and costestimates for the property management ofapproximately 100 desert housing units.
Budget, administer, and provide property andfacility management services for the leased officespace in Sacramento, Washington DC, and SanDiego.
Provide facility management direction andlogistical support throughout MetropolitanHeadquarters Building Improvement Project.
Real Property Asset Protection & Stewardship
Monitor legislation regarding eminent domain,relocation assistance, and public agency real estateacquisition and appraisal practices.
Provide timely and suitable responses to propertyadjacent projects, land developments, andenvironmental proceedings.
Complete property management and right-of-wayoperating policies to reflect contemporary bestpractices.
Continue to improve processes to monitor financialcompliance with terms and conditions of licensingand leasing agreements such as invoicing,insurance coverage, accounts receivable.
Develop an implementation plan to detect andaddress right-of-way encroachments uponMetropolitan properties with a collaborative cross-
functional approach to prioritize and remediate thehighest risk conditions.
Develop a qualitative/quantitative approach toidentify properties that are surplus toMetropolitan’s needs.
Coordinate a monthly cross-functional PropertyReview Council to review land-use requests bypublic and private entities to ensure Metropolitan’srights-of-way, facilities, and water quality areprotected for optimal operating conditions.
Complete annual site inspections of conveyedproperty to identify and correct any conditions inconflict with terms and conditions of theconveyance agreements.
File possessory tax reports and tax payments toappropriate counties on time.
Bay Delta Properties
Develop a specific comprehensive LandManagement Plan to optimize use and best landowner management practices.
Maximize utilization of the 20,400 acres ofagricultural lands/revenue-leases purchased in theDelta to offset costs of land ownership.
Provide support to the California Water Fix and EcoRestore efforts.
Ensure Water Reclamation District assessments,local property taxes and coalition fees are paid ontime.
Palo Verde Valley Properties
Develop a specific comprehensive LandManagement Plan to optimize use and best landowner management practices.
Manage Metropolitan’s 29,000 acres ofagricultural lands/revenue-leases to encourage avibrant farming economy, water conservation, andto offset costs of land ownership.
Ensure Palo Verde Irrigation District water tolls,

local property taxes, and coalition fees are paid bythe farmers/lease-holders on time.
2018/19 and 2019/20 Proposed Biennial Budget 75 Real Property
Diamond Valley Lake Recreation andManagement
Identify infrastructure improvements as part ofthe Diamond Valley Lake Recreation capitalappropriation. These projects will enhancerecreational opportunities and promote economicself-sustainability.
Explore marina opportunities to expand leaserevenues, and collaborate with the stakeholders ofthe DVL Recreation Area Memorandum of Intent.
Identify additional DVL land for surplus.
Property & Right of Way Acquisition
Provide real property and right-of-way acquisition,negotiations, and relocation services for the Rightof Way and Infrastructure Protection and theConveyance and Distribution System Rehabilitationprojects.
Conduct real property valuation, feasibility and coststudies for proposed and planned infrastructureand water reliability projects such as thePrestressed Concrete Cylinder Pipe (PCCP)Rehabilitation and the Regional Recycled WaterProgram.
Facility & Energy Management
Continue to optimize the cost of maintainingMetropolitan’s headquarters building and DVLVisitors Center while supporting Metropolitan’ssustainability initiatives established by theBuilding Owners and Managers Association andEPA’s voluntary ENERGY STAR program.
Execute a multi-year strategic approach to managecritical rehabilitation projects at Metropolitan’sHeadquarters as the equipment, components, andfurnishings reach the end of their useful life cycle.
Initiate a plan to paint, carpet, and replace cubicle/modular furniture on all floors of the HeadquartersFacility.
Prepare the wing space and manage employeerelocations during the construction phase ofMetropolitan Headquarters Building
Improvements Project. Also, develop analternative plan for food service options while thecafeteria is out of service during the retrofit.
Initiate a multi-year plan to replace asphalt andpavement at the Diamond Valley Lake Recreationareas and roads.
Workforce Development & SuccessionPlanning
Expand knowledge, skills, and abilities of staffthrough training, succession planning, andeducational workshops.
Engage with local universities and professionalsocieties to promote Metropolitan employmentopportunities.
Collaborate with public agencies to identify areaswhere consistent real property best practices canbe applied.

O&M FINANCIAL SUMMARY
2016/17Actual
2017/18Budget
2018/19Proposed
Change from2017/18
2019/20Proposed
Change from2018/19
Total Salaries and Benefits 6,178,800 7,356,900 9,482,200 2,125,300 10,165,300 683,100Direct Charges to Capital (300,800) (596,300) (108,700) 487,600 (117,900) (9,200)
Total Salaries and Benefits 5,878,000 6,760,600 9,373,500 2,612,900 10,047,400 673,900
% Change 15.0% 38.6% 7.2%Professional Services 372,500 354,600 934,600 580,000 934,600 —Outside Services - NonProfessional / Mainte 3,120,900 2,608,500 4,120,500 1,512,000 4,782,100 661,600
Rent & Leases 709,700 749,200 916,700 167,500 950,900 34,200Repairs & Maintenance -Outside Services 504,700 558,000 1,904,700 1,346,700 3,311,200 1,406,500
Taxes & Permits 4,107,100 5,288,300 6,214,000 925,700 5,796,000 (418,000)Utilities Charges 1,178,300 1,356,100 1,411,100 55,000 1,464,800 53,700Other Accounts 666,300 587,400 1,463,200 875,800 922,200 (541,000)Total O&M 16,537,500 18,262,700 26,338,300 8,075,600 28,209,200 1,870,900
% Change 10.4% 44.2% 7.1%Operating Equipment — — 20,200 20,200 — (20,200)
Total O&M and OperatingEquipment
16,537,500 18,262,700 26,358,500 8,095,800 28,209,200 1,850,700
% Change 10.4% 44.3% 7.0%
Note – Totals may not foot due to rounding.
FY 2018/19 BUDGET BY EXPENDITURE
Total Salaries andBenefits: 36%
Outside Svcs- Non Prof:
16%
Repairs & Maintenance- Outside Services: 7%
Taxes &Permits:
24%
OtherAccounts: 18%
FY 2019/20 BUDGET BY EXPENDITURE
Total Salaries andBenefits: 36%
Outside Svcs- Non Prof:
17%
Repairs & Maintenance- Outside Services:
12%
Taxes &Permits:
21%
OtherAccounts: 15%
2018/19 and 2019/20 Proposed Biennial Budget 76 Real Property

PERSONNEL SUMMARY
2016/17Actual
2017/18Budget
2018/19Proposed
Change from2017/18
2019/20Proposed
Change from2018/19
Regular Total 34 40 50 10 50 —
O&M 32 37 49 12 49 —Capital 2 3 1 (2) 1 —
Temporary Total 1 1 1 0 1 —
O&M 1 1 1 0 1 —Capital — — — — — —
Total Personnel Total 35 41 51 10 51 —
O&M 33 38 50 12 50 —Capital 2 3 1 (2) 1 —
Note – Totals may not foot due to rounding.
2018/19 and 2019/20 Proposed Biennial Budget 77 Real Property

BUDGET HIGHLIGHTS
Real Property’s O&M and Operating Equipment Biennial Budget is $26.4 million in FY 2018/19 and $28.2million in FY 2019/20 or an increase of 44.3% and an increase of 7.0% respectively from the prior budget years.The Biennial Budget includes property taxes and rents & leases previously budgeted in Other O&M. As a resultof significant increases in security, trespassing, dumping, illegal land use and increased risk and liabilityexposure, the Biennial Budget reflects a strategic, centralized, and structured approach to managingMetropolitan’s property assets. A centralized approach ensures properties are regularly maintained, secured,and protected for Metropolitan’s present and future needs. As a result of this proactive approach, the mostsignificant factors contributing to the overall increase in the budget are outlined below.
• Six new staff positions are required to manage property surveillance and security presence for all vacantproperties, property clean-up efforts, landscaping maintenance, roadway development and maintenance,directional signage, marketing plans for surplus properties, encroachment identification/remediationand other miscellaneous items.
• In addition to new staffing requests, four vacant positions are being transferred from Water SystemOperations to transition the management and maintenance of employee desert housing.
• Additional outside vendors, services, and supplies will be required in the following areas:
• Support transition of employee housing from Water System Operations;
• Weed abatement, maintenance of emergency and environmental systems, general repairs andpaving for DVL buildings and recreation areas;
• Services for encroachment assessments and abatement/remediation, fencing, signage, andengaging local law enforcement where required;
• Planned maintenance and repairs at the Metropolitan's Headquarters Facility;
• Office relocation services during the Metropolitan Headquarters Building Improvements;
• Services for maintenance of vacant farmland in Palo Verde;
• General appraisal and marketing services for the surplus property program.
• Additional taxes and water reclamation district assessments will be incurred as a result of land purchasesoutside Metropolitan's service area.
The following are the significant changes by budget year.
2018/19 and 2019/20 Proposed Biennial Budget 78 Real Property
FY 2018/19
Personnel–related issues
Total personnel count reflects an addition of tenregular positions from FY 2017/18. Six are newlyplanned for property management and landacquisition and four are transfers to starttransitioning the management of employee housingfrom WSO to Real Property.
Salaries and Benefits are increasing due to newposition requests and negotiated labor increases.
Taxes & Permits
The budget reflects an increase associated withthe land purchases outside Metropolitan’s servicearea. There are new costs for additional propertytaxes, assessments from water reclamationdistricts, and a special one-time assessment to paydown bridge loans of the districts.

Repairs and Maintenance - Outside Services
The budget reflects increases for DVL Recreation,Headquarters, and housing facilities. At DVL,repairs and maintenance are required for fire, life,environmental safety, solar power, and HVACsystems. Also at DVL, a three-year program forrepaving at the marina, viewpoint, and roadwayswill be initiated. At Headquarters, repairs andmaintenance is required for the data center, fire, lifeand environmental safety and building automationsystems. Employee housing requests will requiregeneral repairs and maintenance services.
Professional and Non Professional Services
The budget reflects an increase in professionalconsulting services anticipated for architectural/space planning, appraisal services for surplusproperty, and law enforcement for trespassing andencroachment remediation.
Non-professional services will be required forscheduled weed abatement at the DVL recreationbasin, encroachment remediation projects, andnon-capital components of the MetropolitanHeadquarters Building Improvement project.
Other
The budget for other accounts include logisticalsupport contracts, equipment and suppliesnecessary for the relocation of employees in thewings of the headquarter facility during theMetropolitan Headquarters BuildingImprovements project.
2018/19 and 2019/20 Proposed Biennial Budget 79 Real Property
FY 2019/20
Personnel–related issues
Personnel count remains flat from FY 2018/19budget.
Salaries and Benefits reflect negotiated laborincreases.
Professional Services
The budget reflects the reduced need for lawenforcement due to lower lake elevations and theresulting decrease in visitors.
Non Professional Services
The budget reflects an increase for physicallymoving employee offices in and out of the wingsection of the headquarters facility during theseismic retrofit.
Repairs and Maintenance - Outside Services
The budget reflects a planned effort for paintingand replacing of carpet, and cubicle/modularfurniture for one floor of the headquarters facility.Staff’s strategy is to refurbish all the floors atheadquarters over a ten-year period.
Taxes & Permits
The budget reflects a decrease due to the specialone-time Bay Delta reclamation districts’assessment in FY 2018/19.
Other
The budget for other accounts reflects a decreasedue to completion of repairs and maintenanceprojects at DVL and headquarters in FY 2018/19.
Operating Equipment – FY 2018/19 and FY2019/20
FY 2018/19 reflects the replacement ofHeadquarters Building equipment at end of life.

This page intentionally left blank.
2018/19 and 2019/20 Proposed Biennial Budget 80 Real Property

OFFICE OF CHIEF FINANCIAL OFFICERThe Office of the Chief Financial Officer (CFO) provides innovative,
proactive, and strategic financial direction in support of the mission ofMetropolitan, the Board of Directors, management, and employees.
2018/19 and 2019/20 Proposed Biennial Budget 81 Office Of Chief Financial Officer
PROGRAMS
The Office of the Chief Financial Officer isresponsible for maintaining Metropolitan’s strongfinancial position and high credit ratings andhelping to achieve equitable water rates andcharges that generate sufficient revenues.
In addition, the Office of the CFO assists in theefficient management of Metropolitan’s financialresources, and ensures that adequate financialcontrols are in place to accurately record financialtransactions, communicate financial results, andprotect Metropolitan’s assets.
The Office of the CFO accomplishes its missionthrough the following programs or sections:
Chief Financial Officer is responsible for theoverall administration of finance and accountingfunctions for Metropolitan including debt andinvestment management; financial planning andanalysis including rate setting and budgeting;accounting and control including financialreporting, payroll, accounts payable, accountsreceivable; and risk management and businesscontinuity.
The business continuity program ensures thatMetropolitan takes the necessary steps to identifythe impacts of potential losses and maintain viablerecovery strategies, recovery plans, and continuityof operations.
Business Continuity Management Programensures that Metropolitan takes the necessarysteps to identify potential business impacts,mitigation strategies, and effectively recover criticaloperations following a major emergency orbusiness disruption. This is accomplished throughthe development of recovery plans and strategiesalong with ongoing maintenance, testing, training
and awareness. In addition, emergencycommunications are also spearheaded using theMIR3 mass notification system.
Risk Management reports directly to the ChiefFinancial Officer section, is responsible formanaging all aspects of Metropolitan’s casualtyinsurance and risk management programs tominimize exposure to loss; access risk andrecommend strategies to minimize or transfercontract risk on all Metropolitan and agreements,and procure excess and specialty insurance policiesto supplement the self-insured property andliability claims program.
Budget and Financial Planning is responsiblefor Metropolitan’s Biennial Budget, revenuerequirements, and rates and chargesrecommendations; cost monitoring and analysis;short and long term financial analysis; planning andfinancial modeling; the water standby chargeprogram; and the annual tax levy and annexationfee calculations.
Controller is responsible for maintaining internalcontrols that safeguard Metropolitan’s assets, aswell as recording and maintaining its officialaccounting records via the billing, accountspayable, payroll, and financial reporting functions.
Treasury/Debt Management is responsible forMetropolitan’s investment and treasury obligationsincluding receipt, safekeeping, and disbursement ofMetropolitan’s funds; preparation of security salesdocuments; and all commercial banking activities,including receipts and payment processing, such aswires, checks, and automatic deposits; andadministration of debt obligations including allissuance of bonds, and investor and bond ratingagency relations.

2018/19 and 2019/20 Proposed Biennial Budget 82 Office Of Chief Financial Officer

GOALS AND OBJECTIVES
2018/19 and 2019/20 Proposed Biennial Budget 83 Office Of Chief Financial Officer
In FY2018/19 and FY 2019/2020 the Office of theCFO will focus on the following key issues:
Cost of Service and Budget
Complete the biennial cost–of–service analysis forrates and charges. Complete and implement theBiennial Budget.
Financial Forecasts and Analysis
Provide an updated Ten-Year Financial Forecast inthe Biennial Budget.
Continue to provide the Board with variousanalyses to manage financial performance for long–term rate stability, given the future potentialimplementation of the California WaterFix and theRegional Recycled Water Program.
Analyze the funding of financial initiatives asidentified.
Annexation/Tax Levy
Complete the annual annexation calculation and taxlevy assessment.
Rates and Charges
Manage and effectively administer rates andcharges to recover costs consistent with Boardpolicy and objectives.
Financial Reporting/Internal Controls
Continue to record and report the financialactivities of Metropolitan in a timely andtransparent manner to the Board and memberagencies.
Continue to ensure that internal controls are inplace to provide assurance that assets aresafeguarded and financial information is fairlystated.
Continue to improve communications of financialinformation to the Board, member agencies,management, and the financial community.
Continue to improve communications of financialinformation to the Board, member agencies,management, and the financial community.
Capital Financing
Update capital financing plans and work with ratingagencies and investors to communicate financialneeds and capabilities, ensure cost–effective accessto capital markets, and maintain long–term bondratings of AA or better.
Work with Metropolitan’s underwriting team,financial advisors, and swap advisors to identifyfinancing opportunities to prudently manage theoverall cost of financing Metropolitan’s capitalinvestment program.Manage investor relations to ensure clearcommunications, accuracy of information, andintegrity.
Continue to manage debt service to mitigate thevolatility of debt service payments over time andreduce debt service costs through re–financingsand the prudent use of interest rate swaps, inaccordance with Metropolitan’s interest rate swappolicy.
Maintain relationships with the financialcommunity and bond rating agencies to maintainMetropolitan’s high credit ratings and access tovarious aspects of the financial markets tomaximize financial flexibility.
Investment
Prudently invest Metropolitan’s funds with theobjective of safety of principal, liquidity, and yield.
Manage the short term portfolio to provide thenecessary liquidity to fund in excess of $3.0 billionover the biennium in expenditures for Operationsand Maintenance, debt service, and constructionprojects.
Measure the performance of the short–termportfolio, and manage the portfolio to meet orexceed the short–term benchmark consistentwithin established investment codes and policy.

Manage outside portfolio managers to ensurecompliance with Metropolitan’s investment policy,and to monitor investment performance.
2018/19 and 2019/20 Proposed Biennial Budget 84 Office Of Chief Financial Officer
Risk Management
Continue to effectively manage Metropolitan’scasualty insurance and risk management programsto minimize exposure to loss.
Business Continuity
Continue to refine the Business Continuity Plantemplate and FUsion system to capture betterinformation and produce actionable and easy tofollow recovery plans.
Collaborate with the business users to performannual plan updates and approvals using Fusionsoftware.
Conduct biannual application recovery exerciseswill be with the business users to ensureaccessibility, data integrity, and functionality ofcritical applications and data as indicated in theBusiness Impact Analysis (BIA). InformationTechnology is enhancing the disaster recoveryinfrastructure at the Lake Mathews backup datacenter that will provide a robust and safe testenvironment for the business users.
Conduct tabletop exercises for Metropolitan’sbusiness continuity plan to validate recoverystrategies and identify areas in need of updating.
Test emergency communications using MetAlert(the MIR3 mass notification system) on a regularfrequency to all employees as well as the Board toensure effective communications in the eventnormal methods are impacted.
Workforce Development & SuccessionPlanning
Continue to examine and consider the challengesassociated with succession planning and futurestaffing requirements in light of the compositionand age of the workforce.
Work with each section within the Office of the CFOto establish staff back-up responsibilities forvarious work processes.

O&M FINANCIAL SUMMARY
2016/17Actual
2017/18Budget
2018/19Proposed
Change from2017/18
2019/20Proposed
Change from2018/19
Total Salaries and Benefits 8,911,600 8,770,400 10,153,100 1,382,700 10,763,100 610,000Direct Charges to Capital — — — — — —
Total Salaries and Benefits 8,911,600 8,770,400 10,153,100 1,382,700 10,763,100 610,000
% Change (1.6%) 15.8% 6.0%Professional Services 1,250,500 1,234,100 1,076,600 (157,500) 1,076,600 —Insurance Claims (3,180,400) 11,537,300 11,529,000 (8,300) 11,547,600 18,600Insurance Premiums 1,116,100 1,300,000 1,300,000 — 1,300,000 —Other Accounts 272,600 240,600 502,700 262,100 510,900 8,200
Total O&M 8,370,400 23,082,400 24,561,400 1,479,000 25,198,200 636,800
% Change 175.8% 6.4% 2.6%
Note – Totals may not foot due to rounding.
FY 2018/19 BUDGET BY EXPENDITURE
Total Salaries andBenefits: 34%
ProfessionalServices: 3%
Insurance Claims: 57%
InsurancePremiums: 4%
Other Accounts: 2%
FY 2019/20 BUDGET BY EXPENDITURE
Total Salaries andBenefits: 35%
ProfessionalServices: 3%
Insurance Claims: 56%
InsurancePremiums: 4%
Other Accounts: 2%
2018/19 and 2019/20 Proposed Biennial Budget 85 Office Of Chief Financial Officer

O&M BUDGET BY SECTION
FY 2018/19 BUDGET BY SECTION
Chief FinancialOfficer: 60%
Budget andFinancialPlanning:
11%
Controller: 21%
Treasury/DebtMgmt: 8%
FY 2019/20 BUDGET BY SECTION
Chief FinancialOfficer: 59%
Budget andFinancialPlanning:
11%
Controller: 22%
Treasury/DebtMgmt: 8%
2017/18Budget
2018/19Proposed
Change from2017/18
2019/20Proposed
Change from2018/19
Personnel Budget17/18 18/19 19/20
Chief Financial Officer 14,403,300 14,734,300 331,000 14,847,600 113,400 6 6 6
Budget and FinancialPlanning 1,931,800 2,670,600 738,800 2,822,600 152,000 8 10 10
Controller 4,602,700 5,184,300 581,600 5,487,800 303,500 28 28 28
Treasury/Debt Mgmt 2,144,500 1,972,200 (172,200) 2,040,100 67,900 7 5 5
Total O&M 23,082,300 24,561,400 1,479,100 25,198,100 636,700 49 49 49
Note – Totals may not foot due to rounding.
2018/19 and 2019/20 Proposed Biennial Budget 86 Office Of Chief Financial Officer
PERSONNEL SUMMARY
2016/17Actual
2017/18Budget
2018/19Proposed
Change from2017/18
2019/20Proposed
Change from2018/19
Regular Total 46 49 49 — 49 —
O&M 46 49 49 — 49 —
Capital 0 0 — — — —Temporary Total 0 — — — — —
O&M 0 — — — — —
Capital — — — — — —
Total Personnel Total 46 49 49 — 49 —
O&M 46 49 49 — 49 —
Capital 0 0 — — — —Note – Totals may not foot due to rounding.

BUDGET HIGHLIGHTS
The Office of the CFO’s O&M and Operating Equipment Biennial Budget is $24.6 million in FY 2018/19 and$25.2 million in FY 2019/20 or an increase of 4.5% and an increase of 2.6% respectively from the prior budgetyears.
The change is primarily due to the following factors:
• The increase in Salaries and Benefits is a result of three positions being funded, negotiated laborincreases, promotions and merit increases for qualified employees.
• Professional Services and other non–labor costs excluding insurance increased by 0.9% over thebiennium.
The following are the significant changes by budget year.
2018/19 and 2019/20 Proposed Biennial Budget 87 Office Of Chief Financial Officer
FY 2018/19
Personnel–related issues
Total personnel count remains flat with the FY2017/18 budget.
Salaries and Benefits reflect the funding of threepositions, promotions, negotiated labor increasesand merit increases for qualified employees.
Professional Services
The decrease in the budget is the result of therealignment of some of the budget fromprofessional services to memberships andsubscriptions. The result is a $80K increase in thebudget for professional services and memberships& subscriptions combined from the FY 2017/18budget.
Insurance Claims
Third party liability claims budget is anticipated toremain relatively flat.
FY 2019/20
Personnel–related issues
Total personnel count remains flat from theFY 2018/19 budget.
Salaries and Benefits reflect negotiated laborincreases.
Insurance Claims
Third party liability claims budget is anticipated toremain relatively flat.

This page intentionally left blank.
2018/19 and 2019/20 Proposed Biennial Budget 88 Office Of Chief Financial Officer

EXTERNAL AFFAIRSExternal Affairs builds awareness and support for Metropolitan's mission and
programs by directing media and stakeholder communications, publicoutreach and education projects, legislative activities, business outreach and
innovation programs, and member agency support services.
2018/19 and 2019/20 Proposed Biennial Budget 89 External Affairs
PROGRAMS
External Affairs is responsible for advancingMetropolitan’s policy objectives andcommunicating with large and diverse audienceson behalf of the district. A strong portfolio ofcommunication tools, public outreach andsponsorship programs, education, legislative andinnovation activities is used to build positiveworking relationships and increase awareness ofMetropolitan's programs and initiatives with thepublic, news media, legislators, regulators,educators, community groups, businesses, labororganizations, Metropolitan's public memberagencies and other stakeholders.
Staff at the Union Station headquarters office andregional representatives give voice toMetropolitan's policy priorities and projectsthroughout Southern California. External Affairsalso manages strategic activities and regionaloutreach in Metropolitan's offices in Sacramento,Washington, D.C. and San Diego.
Office of Group Manager directs the activities ofBusiness Outreach, Conservation and CommunityServices, Legislative Services, Media Services andthe Member Services and Public Outreach sections,and the Business Management team. The GroupManager provides strategic leadership tocommunicate Metropolitan’s policy objectives incoordination with the board, executivemanagement and other groups within theorganization.
Business Outreach Team actively encouragesthe participation of small, locally-owned, women-owned, minority-owned, disabled veteran-ownedand economically disadvantaged businessenterprises, business in the solicitation andprocurement of construction contracts,
professional services agreements, equipment andother materials and supplies. Through participationand collaboration with emerging companies,entrepreneurs, innovation hubs and other agencies,the Business Outreach section enhancesinvolvement in new technologies and positionsMetropolitan as an international leader in waterinnovation.
Legislative Services promotes and protects theinterests of Metropolitan and its member agenciesbefore executive, legislative, and regulatoryagencies of the state and federal governments. Thesection advances Metropolitan’s policy objectivesand board–adopted legislative priorities withlegislators and other water policymakers, andsupports an effective and growing outreachprogram with member agencies and stakeholdersto mobilize and sustain support for Metropolitan'skey initiatives.
Conservation and Community Servicesadvances public awareness of Metropolitan andimportant water and conservation issues throughadvertising, education and community outreach.The section promotes and helps marketconservation programs and activities, and managesMetropolitan’s sponsorships for education andresearch programs, water forums, events andcommunity partnerships.
The Education Unit supports comprehensive,standards-based water education curriculum andworks with educational associations, institutionsand teachers to provide water education resourcesfor elementary and secondary schools, colleges anduniversities.

Member Services and Public Outreachprovides support services to Metropolitan’smember agencies and manages outreach efforts forMetropolitan’s facility operations, constructionactivities and other water resource initiatives. Thesection works with and supports local government,business, agriculture and community organizations,and directs research efforts to supportMetropolitan programs.
The Inspection Trip Team conducts board-sponsored field inspections of Metropolitan andrelated facilities to educate and inform businessand community leaders with firsthand knowledgeof Metropolitan’s operations.
Media Services develops, coordinates andcommunicates messages, information andachievements to support Metropolitan’s keyobjectives and programs. The section isresponsible for media inquiries, press releases andconferences, informational resources including factsheets, talking points, brochures and opinion piecesand videos, and managing Metropolitan’s websites,e–newsletters, blogs and a growing presence onsocial media platforms and digital platforms.
2018/19 and 2019/20 Proposed Biennial Budget 90 External Affairs

GOALS AND OBJECTIVES
2018/19 and 2019/20 Proposed Biennial Budget 91 External Affairs
In FY 2018/19 and FY 2019/20, External Affairswill continue to focus on the following key issuesand objectives:
Communications and Outreach Efforts
Expand and continue to improve the use ofstrategic, impactful and creative communicationplans and programs to inform the public,businesses, environmental and other stakeholdergroups about Metropolitan’s initiatives andleadership to ensure safe, reliable and sustainablewater supplies now and into the future.
Update content and informational resources oncurrent websites, develop new microsites asneeded, and manage the mwdh2o.com websiteredesign project to improve the functionality,content management, security and end-userexperience.
Develop in-house management of social mediaactivities, search engine optimization andmarketing functions to meet business and outreachgoals.
Strengthen the capacity of sponsorship andpartnership programs, including the CommunityPartnering Program, legislative sponsorships andmemberships, and business outreach sponsorships,to enhance information-sharing on water issuesand stewardship and relationships with non-governmental organizations, business groups, localelected officials, community organizations andother stakeholder groups throughout SouthernCalifornia.
Engage in research and related activities thatprovide accurate and timely information on publicopinions, consumer attitudes and awareness toinform future outreach activities with memberagencies, stakeholders and the public.
Water Supply Reliability, Conservation andSustainability
Develop and implement an effective and well-managed multimedia, multilingual advertising andoutreach campaign to increase public awareness ofwater supply conditions, Metropolitan and memberagency rebate programs, and support for long-termconservation strategies.
Provide communication support for Metropolitanprograms, planning activities and projects thatensure water supply reliability, including existingwater operations, imported supplies from theColorado River and State Water Project, localresource programs that diversify the region’s waterportfolio, conservation actions and innovativewater supply technologies.
Increase awareness of Metropolitan’s long-standingefforts to promote environmental stewardshipthrough actions and investments for projects,programs, research and collaborative activities thatprotect, restore and enhance habitat andecosystems, watersheds, and water quality.
Promote public awareness of climate changeimpacts on water supply conditions and reliabilityusing a range of community and outreach tools tosupport Metropolitan’s current and futureinitiatives with climate change adaptation andactions.
Bay-Delta and Local Supply Initiatives
Provide information and secure support ofstakeholders, the public and legislators forMetropolitan’s positions on policies that promotewater supply reliability and an environmentallysustainable Bay-Delta. This includes programs andpolicies related to the California WaterFix,California EcoRestore and Metropolitan-ownedproperties in the Delta.
Ensure strong coordination and consistentmessaging with state and federal agencies, StateWater Contractors, JPA participating agencies, andmember agencies on activities related to CaliforniaWaterFix.
Provide communication and community outreachto increase public awareness of and support fornew and proposed projects to advance local supplydevelopment, including the Regional RecycledWater Project demonstration facility.
Legislative Policy Objectives
Work with the board, member agencies andexecutive management to secure support for and/or sponsor federal and state legislation andregulatory policies that advance Metropolitan’s

policy objectives, including strategic water qualityand supply initiatives, conservation, Deltasolutions, regional water resources projects, andsustainable water and energy management.
Conduct briefings, presentations and tours forelected officials and government leaders, andcommunity-based environmental and businessorganizations to increase understanding of keywater infrastructure systems and investments andkey legislative and regulatory policies.
2018/19 and 2019/20 Proposed Biennial Budget 92 External Affairs
Member Agency Support
Facilitate ongoing communication and coordinationbetween Metropolitan and its member agenciesthrough regular meetings with general managers,legislative and education coordinators, and publicinformation officers.
Effectively manage the inspection trip program toeducate the public, business and communityleaders, elected officials, news media, members ofthe public about Metropolitan and encourage adialogue about the state’s water supply andinfrastructure, environmental issues and climatechange impacts, agriculture and urban waterinterface and future challenges.
Provide primary support to the Communicationsand Legislation Committee and the Agriculture andIndustry Relations Committee, and ensure thatcommittee presentations, board letters andassociated activities provide timely, accurate andrelevant information on programs, trends andactivities to help inform board actions and ensuretransparency.
Business Outreach
Maintain an effective Business Outreach programfor regional small businesses and veterans toensure broad participation while achieving board-adopted goals of 25 percent or better for
contracting dollars to small business and 3 percentto disabled veteran-owned enterprises.
Partner with member agencies in hosting “Connect2 Met” and other business opportunity forums toeducate local businesses on how to conductbusiness with public agencies and their purchasingdepartments.
Provide leadership and collaborate withMetropolitan’s member agencies, other publicagencies and innovative programs to identify,develop and promote emerging water technologies.
Educational Programs
Update and expand distribution of Metropolitan’scomprehensive K-12 water education curriculum inthe areas of science, math, language arts and socialstudies.
In coordination with member agencies and theeducational community, explore opportunities toexpand educational services through the use of newtechnologies to reach more students, teachers andclassrooms, including underserved and culturallydiverse populations.
Support and manage Metropolitan’s uniqueeducational programs, including Solar Cupcompetition, World Water Forum and the StudentArt Contest.
Emergency Management and CrisisCommunication
Support Metropolitan’s emergency preparednesswith a responsive crisis communications plan, well-trained staff, and the use of social media and othercommunications technologies to provide essentialservices during times of emergency and inresponse to disasters.

O&M FINANCIAL SUMMARY
2016/17Actual
2017/18Budget
2018/19Proposed
Change from2017/18
2019/20Proposed
Change from2018/19
Total Salaries and Benefits 14,861,500 14,816,600 16,756,100 1,939,500 17,783,900 1,027,800Direct Charges to Capital — — — — — —
Total Salaries and Benefits 14,861,500 14,816,600 16,756,100 1,939,500 17,783,900 1,027,800
% Change (0.3%) 13.1% 6.1%Professional Services 2,123,700 2,921,700 3,828,700 907,000 3,306,300 (522,400)Advertising 3,175,800 2,200,000 1,312,200 (887,800) 1,320,800 8,600Community OutreachActivities 289,200 220,000 400,000 180,000 400,000 —Memberships & Subscriptions 347,600 440,600 459,100 18,500 474,100 15,000Outside Services - NonProfessional / Mainte 579,300 631,200 1,511,700 880,500 1,178,200 (333,500)Sponsorships 386,800 411,300 559,300 148,000 559,300 —Travel Expenses 1,448,000 1,726,900 1,840,400 113,500 1,831,400 (9,000)Other Accounts 909,300 966,900 937,100 (29,800) 898,100 (39,000)Total O&M 24,121,200 24,335,200 27,604,600 3,269,400 27,752,100 147,500
% Change 0.9% 13.4% 0.5%Operating Equipment 37,210 — 30,800 30,800 32,300 1,500
Total O&M and OperatingEquipment
24,121,200 24,335,200 27,635,400 3,300,200 27,784,400 149,000
% Change 0.9% 13.6% 0.5%
Note – Totals may not foot due to rounding.
FY 2018/19 BUDGET BY EXPENDITURE
Total Salaries andBenefits: 60%Professional
Services: 14%
Advertising: 5%
Outside Svcs -Non Prof: 5%
TravelExpenses:
7%
Other Accounts: 9%
FY 2019/20 BUDGET BY EXPENDITURE
Total Salaries andBenefits: 64%
ProfessionalServices: 12%
Advertising: 5%
Outside Svcs -Non Prof: 4%
TravelExpenses:
7%
Other Accounts: 8%
2018/19 and 2019/20 Proposed Biennial Budget 93 External Affairs

O&M BUDGET BY SECTION
FY 2018/19 BUDGET BY SECTION
Office of theManager: 11%
BusinessOutreach:
8%
Conservation andCommunity Services:
18%
LegislativeServices: 22%
MediaServices: 24%
Member Servicesand Public
Outreach: 16%
FY 2019/20 BUDGET BY SECTION
Office of theManager: 12%
BusinessOutreach:
9%
Conservation andCommunity Services:
19%
LegislativeServices: 23%
MediaServices: 21%
Member Servicesand Public
Outreach: 16%
2017/18Budget
2018/19Proposed
Change from2017/18
2019/20Proposed
Change from2018/19
Personnel Budget17/18 18/19 19/20
Office of the Manager 2,979,700 3,089,100 109,400 3,213,800 124,700 10 9 9
Business Outreach 1,874,800 2,332,000 457,200 2,421,400 89,300 7 7 7
Conservation and CommunityServices 5,789,000 5,055,300 (733,700) 5,275,400 220,000 11 11 11
Legislative Services 5,828,200 6,118,600 290,400 6,351,900 233,300 14 14 14
Media Services 3,948,300 6,571,100 2,622,800 5,963,700 (607,400) 18 20 20
Member Services and PublicOutreach 3,915,100 4,438,500 523,400 4,526,200 87,600 10 10 10
Total O&M 24,335,100 27,604,600 3,269,500 27,752,200 147,700 70 71 71
Note – Totals may not foot due to rounding.
2018/19 and 2019/20 Proposed Biennial Budget 94 External Affairs
PERSONNEL SUMMARY2016/17
Actual2017/18Budget
2018/19Proposed
Change from2017/18
2019/20Proposed
Change from2018/19
Regular Total 67 70 71 1 71 —
O&M 67 70 71 1 71 —Capital — — — — — —
Temporary Total 1 — 0 0 — 0
O&M 1 — 0 0 — 0Capital — — — — — —
Total Personnel Total 67 70 71 1 71 0
O&M 67 70 71 1 71 0Capital — — — — — —
Note – Totals may not foot due to rounding.

BUDGET HIGHLIGHTS
External Affairs’ O&M and Operating Equipment Biennial Budget is $27.6 million in FY 2018/19 and $27.8million in FY 2019/20 or an increase of 13.6% and an increase of 0.5%, respectively from the prior budgetyears. In an effort to achieve budget savings, advertising and outreach efforts have been reexamined andredistributed with the following impacts:
• Advertising: External Affairs will manage a new three-year multi-media multilingual advertisementcampaign in continued efforts to promote conservation as a way of life for Southern California. In FY2018/19, the board authorized $5.5 million for the campaign. For FY 2019/20 the campaign will befunded in coordination with WRM from the water conservation budget and will include enhancedresearch, optimization and program benchmark measurement. Management has redirected previouslybudgeted advertising funds to in-house social media and search-engine optimization/marketing;innovation-directed studies, Colorado River exhibition, capital project outreach and legislative andbusiness outreach efforts and retains adequate funding for future outreach and advertising on policyinitiatives and key issues.
• Capital Projects Outreach: External Affairs will continue to provide communications and public outreachsupport for capital improvements and other major initiatives, including California WaterFix, the RegionalRecycled Water Program demonstration and visitors center, construction, and refurbishment of existinginfrastructure, such as Colorado River, Second Lower Feeder, and other pipe rehabilitation projects, withfunding from the capital projects.
• The Board and Executive Management have identified website redesign as a priority to keep up withelectronic media needs for Metropolitan’s service area and all potential site visitors. To meet this priority,$1.2 million has been budgeted in FY 2018/19 and $500,000 in FY 2019/20 to redesign the mwdh2o.comwebsite.
• Diamond Valley Lake: External Affairs has budgeted $25,000 for various exhibit restoration andmaintenance costs in FY 2018/19 and FY 2019/20 to bring the exhibits at the DVL Visitors Center to alevel of quality consistent with Metropolitan’s standards and to provide cutting-edge innovation andinformation that engages audiences to discover more about the history and future of water supplymanagement in Southern California.
The following are the significant changes by budget year:
2018/19 and 2019/20 Proposed Biennial Budget 95 External Affairs
FY 2018/19
Personnel–related issues
The budget for Salary and Benefits reflectsnegotiated labor increases somewhat offset byanticipated vacancies from retirements andunfilled positions. One additional regularposition has been added to provide support forcapital projects outreach and communicationsand succession planning for the MemberServices and Public Outreach Section.
Fiscal years 2016/17 and 2017/18 budget wasrestated to reflect movement of the InspectionTrip and Graphic Design teams and theBusiness Outreach Section to External Affairs asdirected by the General Manager.
The Inspection Trip Team was assigned withCustomer Service Unit under the newly formedMember Service and Public Outreach Section.
Other
The budget reflects reductions in funding forrents and leases, which will be managed byReal Property; and advertising, which reflectsthe Board-approved coordination with WRM.These changes have been carefully evaluatedto ensure External Affairs will be able tosuccessfully carry out its core mission andobjectives in these areas effectively and efficiently.
The budget reflects increases consistent withBoard and General Manager initiatives andpriorities for website and electronic media

enhancements, community outreach efforts, andinnovation and research-related professional andnon-professional services. The budget redirectsexisting advertising funding for new research andrelated activities that provide accurate and timelyinformation on public opinions, consumer andcustomer attitudes and awareness to help informfuture outreach activities with member agencies,stakeholders and the public.
2018/19 and 2019/20 Proposed Biennial Budget 96 External Affairs
FY 2019/20
Personnel–related issues
Total Personnel count remains flat with the FY2018/19 budget. Salaries and Benefits reflectnegotiated labor increases.
Other
The budget reflects a decrease across materials andsupplies, professional and non-professionalservices based on completion of the initial stages ofthe website and electronic media enhancementprojects.
Operating Equipment – FY 2018/19 and FY2019/20
The budget reflects replacement vehicles forDirector- and GM-sponsored inspection trips andMetropolitan special events and activities.

GENERAL COUNSEL DEPARTMENTThe Legal Department provides a full range of legal services in a
professional, timely, cost–effective, and creative manner.
2018/19 and 2019/20 Proposed Biennial Budget 97 General Counsel Department
PROGRAMS
The General Counsel is the chief legal spokespersonfor Metropolitan and the Board of Directors andoversees the Legal Department’s administrativefunctions.
The General Counsel represents Metropolitan inlitigation and other proceedings to whichMetropolitan is a party; provides legal advice to theBoard, its committees, and to Metropolitan’s staff;drafts, reviews, and negotiates contracts,documents, and other agreements; consults withrepresentatives of other public and private entitieson matters of mutual concern; and monitors andanalyzes pending and enacted legislations and,when appropriate, drafts legislativerecommendations.
The Office of the General Counsel provides legalservices to the Board, its committees, and toMetropolitan staff in the following areas:
• Represents Metropolitan interests relating towater supply matters, including Bay Deltaresources, Colorado River supply, the StateWater Contract, groundwater and watertransfer issues, California EnvironmentalQuality Act and Endangered Species Actissues, energy issues, and water delivery andtreatment.
• Represents Metropolitan’s interest withregard to claims and litigation by or againstMetropolitan.
• Provides legal advice with respect to theacquisition, management, and disposal ofMetropolitan property and theadministration of annexations, and provideslegal assistance in Metropolitan’sprocurement and construction contractprograms.
• Provides legal advice with respect toMetropolitan’s financial activities, includingMetropolitan’s rates and charges, taxation,bond issuance, legality of investments, andfiscal administration.
• Provides legal advice related to labor andpersonnel matters.
• Reviews, analyzes, and monitors pendingstate and federal legislation and draftslegislative recommendations.

GOALS AND OBJECTIVES
In FY 2017/18 and FY 2018/19, the Office of theGeneral Counsel will focus on the following keyissues:
2018/19 and 2019/20 Proposed Biennial Budget 98 General Counsel Department
Water Supply Reliability
Pursue a comprehensive legal strategy thatproactively addresses legal issues associated withthe comprehensive solutions in the proposedCalifornia WaterFix while vigorously asserting anddefending Metropolitan’s interest in litigation andadministrative proceedings.
Provide legal advice in support of the developmentand implementation of the California WaterFix andthe California EcoRestore, including the associatedenvironmental documentation and implementingagreements in a manner supportive ofMetropolitan’s goals and objectives.
Provide legal advice regarding implementation,financing, and governance of the CaliforniaWaterFix including agreements with theDepartment of Water Resources and others.
Represent Metropolitan, as a separate party orworking through the State Water Contractors, inlitigation and regulatory proceedings relating tooperation of the State Water Project (SWP), waterdiversions in and affecting the Delta or SWPsupplies, construction of new conveyance facilities,and other matters relating to the Delta.
Provide legal advice and support relative to watersupply, delivery and water quality issues resultingfrom the drought and the reduced allocation fromthe SWP.
Provide legal advice and support for initiatives toaddress the proclaimed emergency due to droughtconditions. Provide legal advice and support forproposed water transfers and exchanges anddevelopment of local resources, desalination andconservation projects and programs. Provide legaladvice and support with respect to implementationof Metropolitan’s Water Supply Allocation Plan,water delivery and other issues related to droughtconditions. Provide legal support for capitalprojects required to provide additional flexibility inthe operation of Metropolitan’s distribution system.
Provide legal advice and support for update andimplementation of Metropolitan’s Integrated WaterResources Plan Update and Urban WaterManagement Plan, including development of theLong–Term Conservation Plan and resourceprograms to assist the region in meeting the goal ofreducing retail water consumption by 20 percentby the year 2020.
Provide legal advice and support in connectionwith the proposed extension and amendment of theState Water Contract (SWC) and preparation ofsupporting environmental documents under theCalifornia Environmental Quality Act (CEQA) andany separate amendment of the SWC relating to thedevelopment and operation of new or additionalconveyance facilities.
Continue to defend and enforce the terms of theQuantification Settlement Agreement and relatedagreements among the participating agencies andother agencies with Colorado River contracts.
Assist in developing, negotiating and documentingnew water conservation and augmentation projectsto address the long–term supply and demandissues identified in the Bureau of Reclamation’s2012 Colorado River Basin Water Supply andDemand Study.
Provide legal support for Metropolitan’s efforts toprotect and make optimal use of its Colorado Riverrights and related water transfer, storage, andexchange programs. Provide legal support forinitiatives to identify and obtain new watersupplies on the Colorado River, and to protectexisting Colorado River water supplies againsterosion by unlawful or unreasonable uses.
Finance
Provide legal advice regarding adoption of ratesand charges. Continue to defend Metropolitanagainst challenges to its rate structure.
Provide legal advice and assist with amendments toexisting bond resolutions and the development of asubordinate lien bond resolution.

Operations
Negotiate and prepare service connectionagreements for new or modified member agencyconnections. Provide legal assistance on regulatoryand real estate issues, including CEQA issues,arising from service connection requests.
2018/19 and 2019/20 Proposed Biennial Budget 99 General Counsel Department
District Governance
Continue to provide timely advice to the board andcommittees on governance and legal compliancematters.
Serve as the point of contact and coordinateMetropolitan responses to Public Records Actrequests (PRAs).
Corporate Resources/District Infrastructure
Provide legal support for capital investment andrepair and replacement plans, includingprofessional services and procurement contracts.
Provide legal support for environmental analysisunder CEQA of Metropolitan’s projects and otherdiscretionary actions, in addition to analyzingpotential environmental impacts of other agencies’projects on Metropolitan properties and facilities.
Workforce /Human Resources
Provide proactive counsel and advice on workforceissues.
Continue to defend Metropolitan in PERB matters,as well as grievance and disciplinary matters.
Real Property
Assist Real Property group in the negotiation anddocumentation of real property acquisitions andthe surplusing of real property. Negotiate andprovide legal support for the lease and licensing ofMetropolitan property. Provide legal support forthe grant and acceptance of easements and entrypermits.
Support the expanded work efforts of .
Technology
Collaborate on Information Governance Policieswith Business Technology Group, External Affairs,and Human Resources.
Energy Costs and Management
Assist with implementation of the EnergyManagement Plan, including providing advice onwholesale energy transactions, renewable energyprojects and energy–related contracts andlegislation.
Provide legal support to ensure that SWP energyneeds are met in a cost–effective and sustainablemanner.
Legal Department Administration
Continue to aggressively manage outside counselcosts, while obtaining effective representation toprotect Metropolitan’s interests. Provide on-goingtraining opportunities and develop and implementsuccession planning.

O&M FINANCIAL SUMMARY
2016/17Actual
2017/18Budget
2018/19Proposed
Change from2017/18
2019/20Proposed
Change from2018/19
Total Salaries and Benefits 9,790,900 9,744,000 10,767,000 1,023,000 11,308,300 541,300Direct Charges to Capital — — — — — —
Total Salaries and Benefits 9,790,900 9,744,000 10,767,000 1,023,000 11,308,300 541,300
% Change (0.5%) 10.5% 5.0%Professional Services 821,300 3,625,000 3,010,000 (615,000) 3,460,000 450,000Materials & Supplies 56,300 50,000 55,000 5,000 55,000 —Memberships &Subscriptions 103,100 100,000 110,000 10,000 110,000 —
Outside Services - NonProfessional / Mainte 29,300 30,000 35,000 5,000 35,000 —
Subsidies & Incentives 48,800 55,000 55,000 — 55,000 —Travel Expenses 97,000 120,000 120,000 — 120,000 —Other Accounts 47,500 53,000 59,000 6,000 59,000 —
Total O&M 10,994,200 13,777,000 14,211,000 434,000 15,202,300 991,300
% Change 25.3% 3.2% 7.0%
Note – Totals may not foot due to rounding.
FY 2018/19 BUDGET BY EXPENDITURE
Total Salaries andBenefits: 76%
ProfessionalServices: 21%
Other Accounts: 3%
FY 2019/20 BUDGET BY EXPENDITURE
Total Salaries andBenefits: 74%
ProfessionalServices: 23%
Other Accounts: 3%
2018/19 and 2019/20 Proposed Biennial Budget 100 General Counsel Department

PERSONNEL SUMMARY
2016/17Actual
2017/18Budget
2018/19Proposed
Change from2017/18
2019/20Proposed
Change from2018/19
Regular Total 34 36 36 — 36 —
O&M 34 36 36 — 36 —
Capital — — — — — —
Temporary Total 2 2 2 — 2 —
O&M 2 2 2 — 2 —
Capital — — — — — —
Total Personnel Total 36 38 38 — 38 —
O&M 36 38 38 — 38 —
Capital — — — — — —
Note – Totals may not foot due to rounding.
2018/19 and 2019/20 Proposed Biennial Budget 101 General Counsel Department
BUDGET HIGHLIGHTS
The Office of the General Counsel’s Biennial Budget is $14.2 million in FY 2018/19 and $15.2 million in FY2019/20 or an increase of 3.2% and 7.0% respectively from the prior budget years. The increase is primarilydue to the following factors:
• Professional services costs increase reflects anticipated expenses for Bay Delta legal costs, water qualitylitigation, employment litigation and water rates litigation.
• Salaries and Benefits costs reflect negotiated labor increases and merit increases for qualified employees.

This page intentionally left blank.
2018/19 and 2019/20 Proposed Biennial Budget 102 General Counsel Department

GENERAL AUDITOR DEPARTMENTThe Audit Department provides independent, professional, and objectiveassurance and consulting services designed to add value to and improve
Metropolitan’s operations.
2018/19 and 2019/20 Proposed Biennial Budget 103 General Auditor Department
PROGRAMS
The Audit Department helps the organizationaccomplish its objectives by using a proactive,systematic approach to evaluate and improve theeffectiveness of risk management, control, andgovernance processes.
The scope of work of the Audit Department is todetermine whether Metropolitan’s network of riskmanagement, internal control, and governanceprocesses, as designed and represented bymanagement, is adequate and functioning in amanner to ensure:
• Risks are appropriately identified, managed,and monitored
• Significant financial, managerial, andoperating information is accurate, reliable,and timely
• Employees’ actions are in compliance withpolicies, standards, procedures, andapplicable laws and regulations.
• Resources are acquired economically, usedefficiently, and protected adequately
• Programs, plans, and objectives are achieved
• Quality and continuous improvement arefostered in the organization’s controlprocesses
• Significant legislative or regulatory issuesimpacting the organization are recognizedand addressed appropriately
Opportunities for strengthening internal controls,improving efficiency, and protecting theorganization’s image may be identified duringaudits. They will be communicated to theappropriate level of management.

GOALS AND OBJECTIVES
2018/19 and 2019/20 Proposed Biennial Budget 104 General Auditor Department
In FY 2018/2019 and FY 2019/20, the AuditDepartment will focus on the following key issues:
Risk Analysis, Risk Mitigation and InternalControls
Provide risk perspective and auditing advice andcounsel to the Board and management inoperational and financial activities.
Publish risk–focused audit reports designed toclearly communicate the General Auditor’s opinionregarding the internal control structure, significantcontrol issues, and recommendations to mitigatenoted risk.
Improve the completion time for audits andevaluate the adequacy and timeliness ofmanagement’s responses to, and corrective actionstaken on, all significant control issues noted inaudit reports.
Emphasize test work of significant projects.
Workforce Development
Encourage training opportunities for AuditDepartment staff to enhance competencies in riskassessment and broaden knowledge ofMetropolitan operations. Utilize this knowledge infine–tuning the Annual Audit Risk Assessment andAudit Plan.
Management and Leadership
Efficiently manage the department’s budget formaximum effectiveness of state budgetaryobjectives.
Uphold the mission, roles, and responsibilities ofthe Audit Department.

O&M FINANCIAL SUMMARY
2016/17Actual
2017/18Budget
2018/19Proposed
Change from2017/18
2019/20Proposed
Change from2018/19
Total Salaries and Benefits 2,434,900 2,721,300 3,100,300 379,000 3,283,500 183,200Direct Charges to Capital — — — — — —
Total Salaries and Benefits 2,434,900 2,721,300 3,100,300 379,000 3,283,500 183,200
% Change 11.8% 13.9% 5.9%Professional Services 380,100 350,000 450,000 100,000 500,000 50,000Materials & Supplies 13,400 15,000 16,000 1,000 16,000 —Memberships &Subscriptions 4,600 5,500 5,500 — 5,500 —
Rent & Leases 3,700 5,500 4,500 (1,000) 4,500 —Subsidies & Incentives 16,600 15,000 15,000 — 15,000 —Training & Seminars Costs 3,500 15,000 16,000 1,000 17,000 1,000Travel Expenses 3,000 5,000 5,000 — 5,000 —Other Accounts 1,400 8,500 8,500 0 8,500 —
Total O&M 2,861,200 3,140,800 3,620,800 480,000 3,855,000 234,200
% Change 9.8% 15.3% 6.5%
Note – Totals may not foot due to rounding.
FY 2018/19 BUDGET BY EXPENDITURE
Total Salaries andBenefits: 86%
ProfessionalServices: 12%
Other Accounts: 2%
FY 2019/20 BUDGET BY EXPENDITURE
Total Salaries andBenefits: 85%
ProfessionalServices: 13%
Other Accounts: 2%
2018/19 and 2019/20 Proposed Biennial Budget 105 General Auditor Department

PERSONNEL SUMMARY
2016/17Actual
2017/18Budget
2018/19Proposed
Change from2017/18
2019/20Proposed
Change from2018/19
Regular Total 10 12 12 — 12 —
O&M 10 12 12 — 12 —Capital — — — — — —
Temporary Total — — — — — —
O&M — — — — — —Capital — — — — — —
Total Personnel Total 10 12 12 — 12 —
O&M 10 12 12 — 12 —Capital — — — — — —
Note – Totals may not foot due to rounding.
2018/19 and 2019/20 Proposed Biennial Budget 106 General Auditor Department
BUDGET HIGHLIGHTS
The Audit Department’s Biennial Budget is $3.6 million in FY 2018/19 and $3.9 million in FY 2019/20 or anincrease of 15.3% and 6.5% respectively from the prior budget years.
• Salaries and Benefits costs reflect negotiated labor increases and merit increases for qualified employees.
• Professional Services reflects a recently negotiated agreement with external auditors.

ETHICS OFFICEThe Ethics Office promotes an ethical culture at Metropolitan by
administering and advising Metropolitan’s ethics policies and reviewingpotential ethics violations.
2018/19 and 2019/20 Proposed Biennial Budget 107 Ethics Office
PROGRAMS
Metropolitan’s Ethics Office was established byspecial legislation enacted in 2000. In doing so, itwas with a conviction that a strong ethical cultureis the foundation of good governance. Moreover, itwas based on the belief that an ethical culture iscreated through a robust ethics program that setsclear expectations for conducting business withinthe organization and with external parties.
An ethical culture is based on the following:effective board oversight, strong tone-at-the-top,senior management involvement, organization-wide commitment, a customized code of conduct,ethics training, communications, and ongoingmonitoring system.
It also involves the administration of financialdisclosure reports, an anonymous incidentreporting system, timely investigation of reportedincidents, publication of summary investigationfindings, and, where appropriate, referrals toDepartment managers for consistent disciplinaryaction.
These processes promote transparency andaccountability, allowing the public insight into howthe district conducts its business and holdingdistrict officials accountable for meeting internaland state ethics standards. The Ethics OfficeAccomplishes its mission through the followingprograms and services, each of which is critical toachieving the ultimate goal of internal ethics andcompliance - maintaining an ethics-centeredculture.
Ethics Compliance The Ethics Office services asthe filing officer for state-mandated financialinterest disclosure reports for directors andemployees. These filings are required forindividuals who make or participate in making
decisions in their official capacity that could affecttheir personal financial interests. To date, allDirectors and over 600 employees have beenidentified as mandatory filers.
The Ethics Office also maintains and updatesMetropolitan's conflict of interest code, designatingemployee reporting positions and disclosurecategories. These requirements are tailored to theunique responsibilities of each designated positionand are reviewed on a periodic basis forcompliance with evolving standards.
Advice and Education The Ethics Office advisesemployees, directors, and contractors onMetropolitan's ethic policies and standards. Theseinclude the areas of conflicts of interest and properuse of authority. Advice and education are providedthrough consultations, training programs, andreference materials. The Ethics Office addressesrequests for advice and training and recommendsconsultations where appropriate.
The Ethics Office also facilitates state-mandatedAB1234 and sexual harassment training fordirectors and provides orientations for newdirectors and employees about Metropolitan'sinternal ethic provisions.
Policy Analysis and Program DevelopmentThe Ethics Office proposes ethic rules andmodifications to existing rules, performs riskassessment, and analyzes investigation procedureto maintain best practices in the field.
Investigation Investigations are undertaken bothto promote accountability and to identifysystematic changes needed in order to avoidfurther missteps. Performing comprehensiveinvestigations, including investigation planning,

gathering of evidence, document review, witnessinterviews, comparative analysis of facts, drafting ofreports, and organization and indexing of evidence.
The Ethics Officer reviews the investigationfindings, determines whether ethics violations
occurred, and makes recommendations toexecutive management.
2018/19 and 2019/20 Proposed Biennial Budget 108

GOALS AND OBJECTIVES
2018/19 and 2019/20 Proposed Biennial Budget 109 Ethics Office
In FY 2018/19 and FY 2019/20, the Ethics Officewill focus on the following key issues andinitiatives:
Ethics Consultation
Provide ethics risk perspective and advisoryservices to directors, officers, and employeesneeding input on ethics related issues.In specific requests for assistance, providethorough analysis and prompt responses.Continue to review board agendas and preparememorandum for directors to help identifypotential sources of conflicts of interest in matterscoming before them. Review conflict of interestdisclosures from potential contractors for theprofessional services contracting unit and makerecommendations for resolving potential conflictsPerform outreach to Group Managers to proactivelyengage in the program and project process to helpmaintain ethics-centered decision-making.
Policy Development
Continue to assess the scope and content ofMetropolitan’s ethics policies and provisions.Develop new ideas for improvements and work toachieve consensus among stakeholders.
Follow developments in legislation and FairPolitical Practices Commission proceedings toidentify emerging issues that may affect theMetropolitan community.
Ethics Office performs objective andcomprehensive investigations of ethics complaints,which entails investigation planning, gatheringevidence, document review, witness interviews,comparative analysis of facts, drafting of reports,and organization and indexing of evidence.
The Ethics Officer reviews the investigationfindings, determines whether ethics violationsoccurred, and makes recommendations toexecutive management.
Investigations
Evaluate opportunities to streamline theinvestigation process. These efforts includeestablishing reasonable guidelines to ensure thatinquiries proceed in an efficient and responsible
manner. Improve the effectiveness and timelinessof communication to interested parties on theprogress of investigations. Define accountabilitystandards for investigations that address the needto discontinue or close inquires whensubstantiating evidence cannot be obtained withina reasonable time period. Survey best practices inthe field and recommend improvements toInvestigation Guidelines.
Education and Outreach
Design accessible and understandable ethicseducation programs focused on needs of differentwork groups. Increase number of in-personpresentations.
Update employee orientation materials, websitecontent, and online training program and createnew fact sheets and pamphlets on the mostcommon ethics topics facing Metropolitan.
Workforce Development
Encourage training opportunities for EthicsDepartment staff to enhance competencies ingovernmental ethics and to broaden knowledge ofMetropolitan operations. Utilize this knowledge infine-tuning Ethics consultation, policy developmentand outreach efforts.
Management and Leadership
Efficiently manage the Ethics Office’s budget formaximum effectiveness. Uphold the missions,roles, and responsibilities of the Ethics Office.

2018/19 and 2019/20 Proposed Biennial Budget 110 Ethics Office
O&M FINANCIAL SUMMARY
2016/17Actual
2017/18Budget
2018/19Proposed
Change from2017/18
2019/20Proposed
Change from2018/19
Total Salaries and Benefits 1,167,700 1,227,900 1,247,300 19,400 1,299,700 52,400Direct Charges to Capital — — — — — —
Total Salaries and Benefits 1,167,700 1,227,900 1,247,300 19,400 1,299,700 52,400
% Change 5.2% 1.6% 4.2%Professional Services 47,400 85,000 85,000 — 85,000 —Memberships &Subscriptions 13,400 15,000 15,000 — 15,000 —
Outside Services - NonProfessional / Mainte — 15,000 16,700 1,700 16,700 —
Rent & Leases 2,700 3,500 3,500 — 3,500 —Subsidies & Incentives 10,000 13,000 13,000 — 13,000 —Training & Seminars Costs 2,600 6,000 6,000 — 6,000 —Travel Expenses 4,700 6,000 6,000 — 6,000 —Other Accounts 16,900 4,600 3,500 (1,100) 3,500 —
Total O&M 1,265,400 1,376,000 1,396,000 20,000 1,448,400 52,400
% Change 8.7% 1.5% 3.8%
Note – Totals may not foot due to rounding.
FY 2018/19 BUDGET BY EXPENDITURE
Total Salaries andBenefits: 89%
ProfessionalServices: 6%
Other Accounts: 5%
FY 2019/20 BUDGET BY EXPENDITURE
Total Salaries andBenefits: 90%
ProfessionalServices: 6%
Other Accounts: 4%

PERSONNEL SUMMARY
2016/17Actual
2017/18Budget
2018/19Proposed
Change from2017/18
2019/20Proposed
Change from2018/19
Regular Total 4 5 5 0 5 —
O&M 4 5 5 0 5 —Capital — — — — — —
Temporary Total 1 — — — — —
O&M 1 — — — — —Capital — — — — — —
Total Personnel Total 5 5 5 0 5 —
O&M 5 5 5 0 5 —Capital — — — — — —
Note – Totals may not foot due to rounding.
2018/19 and 2019/20 Proposed Biennial Budget 111 Ethics Office
BUDGET HIGHLIGHTS
The Ethics Office’s Biennial Budget is $1.4 million in FY 2018/19 and $1.4 million in FY 2019/20 or an increaseof 1.5% and 3.8% respectively from the prior budget years. The increase is due primarily to the following:
• Salaries and Benefits reflect negotiated labor increases and merit increases for qualified employees.
• Professional Services and non-labor budgets remain flat over the biennium.

This page intentionally left blank.
2018/19 and 2019/20 Proposed Biennial Budget 112 Ethics Office

OPERATING EQUIPMENT SUMMARY
Classification2018/19Quantity
2018/19Amount
2019/20Quantity
2019/20Amount
Aircraft 0 0 1 2,700,000
Audio Visual 0 0 19 130,772
Automobiles 3 98,112 4 129,199
Boats 0 0 1 39,330
Communication Equipment 4 393,300 0 0
Construction/Shop/Maint Equip 27 509,914 7 803,761
CPU's, Laptops & Servers 26 790,680 23 542,973
Heavy Equipment 12 2,271,732 7 855,013
Lab Equipment 13 601,203 3 358,551
Monitoring Equipment 28 767,084 0 0
Office Equipment 3 33,167 0 0
Other Equipment 11 468,573 2 479,967
Printers 5 186,455 0 0
Trucks 53 2,401,857 19 915,850
Grand Total 185 8,522,076 86 6,955,417
Note – Totals may not foot due to rounding.
2018/19 and 2019/20 Proposed Biennial Budget 113 Operating Equipment Summary

This page intentionally left blank.
2018/19 and 2019/20 Proposed Biennial Budget 114 Operating Equipment Summary

STATE WATER PROJECT
2018/19 and 2019/20 Proposed Biennial Budget 115
OVERVIEW
The State Water Project (SWP), which is managed and operated by the Department of Water Resources (DWR),is the largest state–built, multipurpose, user–financed water project in the country. It was designed and builtprimarily to deliver water, but also provides flood control, generates power for pumping, is used for recreation,and enhances habitat for fish and wildlife. The SWP provides irrigation water to 750,000 acres of farmland,mostly in the San Joaquin Valley, and provides municipal and industrial water to approximately 25 million ofCalifornia’s estimated 39.2 million residents.
The SWP consists of a complex system of dams, reservoirs, power plants, pumping plants, canals and aqueductsto deliver water. Water from rainfall and snowmelt runoff is captured and stored in SWP conservation facilitiesand then delivered through SWP transportation facilities to water agencies and districts located throughout theUpper Feather River, Bay Area, Central Valley, Central Coast, and Southern California. Metropolitan receiveswater from the SWP through the California Aqueduct, which is 444 miles long. The budgeted costs for the SWPare as follows:
SWP Cost Summary, $ millions1
2017/18Budget
2018/19Budget
Change from2017/18
2019/20Budget
Change from2018/19
Delta Water Charge: Capital $39.4 $38.1 ($1.3) $38.7 $0.6
Delta Water Charge: OMP&R 105.3 91.6 (13.7) 96.2 4.6
Transportation Capital 139.8 130.9 (8.9) 125.3 (5.6)
Transportation OMP&R 184.0 175.3 (8.7) 195.4 20.1
Power, Variable 162.8 163.7 0.9 172.4 8.7
Power, OAPF 5.8 3.6 (2.2) 2.4 (1.2)
Credits (37.9) (40.2) (2.3) (41.0) (0.8)
CA WaterFix — $3.6 $3.6 $13.0 $9.5
SWP Total1 $599.2 $566.7 ($32.6) $602.5 $35.9
SWC Dues $4.4 $4.7 $0.3 $4.7 $0.1
Acre–feet delivered 767,675 907,920 140,245 906,675 (1,245)
1 Does not include Departmental costs reflected elsewhere in this Budget.

Annually, the DWR reviews and redetermines the water supply and financial aspects of the SWP as required bythe SWC. This results in the annual Statement of Charges to the Contractors for each calendar year. Theinformation that supports the Statement of Charges is published by the DWR as Appendix B to the appropriateBulletin 132 (i.e., the Statement of Charges for Calendar Year 2018 is supported by Appendix B to Bulletin132-17). DWR does not charge rates for water service. It does not develop a revenue requirement and thendevelop rates based on projected billing determinants for a calendar year. Rather, DWR apportions its costs tothe Contractors based on their proportionate share of estimated supply costs (Delta Water Charge) andtransportation costs (Transportation Charge).
Metropolitan’s budgeted SWP costs are based on the 2018 Statement of Charges and supporting Appendix B.Power costs are estimated by Metropolitan assuming a 50 percent allocation and use of the Central Valleystorage programs.
2018/19 and 2019/20 Proposed Biennial Budget 116 State Water Project
STATE WATER CONTRACT
All water supply–related capital expenditures and operations, maintenance, power and replacement (OMP&R)costs associated with the SWP conservation and transportation facilities are paid for by 29 agencies anddistricts, known collectively as the State Water Contractors (Contractors). Through Calendar Year 2016,Metropolitan has paid about 60 percent of the total payments to DWR by all Contractors. Metropolitan’sfinancial records show that total accumulated amounts paid under the SWC are $12.2 billion through fiscal year2016/17. Metropolitan’s SWC expires on December 31, 2035.
The Contractors have long–term contracts with DWR for the delivery of SWP water and use of the SWPtransportation facilities. Metropolitan signed the first State Water Contract (SWC) on November 4, 1960, andreceived its first delivery of SWP water in 1972. Metropolitan has a contractual right to a proportionate share ofthe project water that DWR determines is available for allocation to the Contractors. This determination ismade each year based on existing supplies in storage, forecasted hydrology, and other factors. Available projectwater is then allocated to the Contractors in proportion to the amounts set forth in Table A of their SWCs (TableA Allocation). Under its SWC, Metropolitan is entitled to roughly 46% of the annual Table A Allocation. Since inception, the SWC provided Contractors the ability to use the SWP to convey non–SWP water undercertain circumstances. Specifically, Article 18(c)(2) of the original SWC addresses situations where there is ashortage in the supply of water made available under the contract and states “[T]he District, at its option, shallhave the right to use any of the project transportation facilities which by reason of such permanent shortage inthe supply of project water to be made available to the District are not required for delivery of project water tothe District, to transport water procured by it from any other source: [p]rovided, [t]hat such use shall be withinthe limits of the capacities provided in the project transportation facilities for service to the District under thiscontract ….”. However, Article 18(c)(2) only applied in the event a permanent shortage was declared by DWRand it was unclear on how costs would be charged for using SWP facilities to transport nonproject water. In1994, the Contractors and DWR negotiated the Monterey Amendment to the SWC, including Article 55, whichmade explicit that the Contractors’ rights to use the portion of the SWP conveyance system necessary to deliverwater to them (their “reaches”) also includes the right to convey non–SWP water at no additional cost as long ascapacity exists. Power for the conveyance of non–SWP water is charged at the SWP melded power rate. TheMonterey Amendments also expanded the ability to carryover SWP water in SWP storage facilities, allowedContractors to store water in groundwater storage facilities outside a Contractor’s service area for later use, andpermitted certain Contractors to borrow water from terminal reservoirs. These amendments, approved byMetropolitan’s Board in 1995, offered the means for individual Contractors to increase supply reliabilitythrough water transfers and storage outside their service areas.
The SWC is predominantly a ‘take–or–pay’ agreement, with Contractors paying most water conservation andtransportation costs regardless of the amount of water delivered. The charges to the Contractors include a SWPsupply charge (Delta Water Charge) and a SWP transportation charge (Transportation Charge). The DeltaWater Charge recovers both Capital and OMP&R costs for those facilities that conserve and create the actual

water supply of the SWP. The Delta Water Charge is based on Contractors’ cumulative Table A Allocations, andis paid regardless of whether Contractors receive any Table A Allocations in a given year.
The Transportation Charge recovers the costs associated with the various aqueduct reaches that deliver projectwater to the Contractors. The Capital and fixed OMPR portions of the SWP Transportation Charge recover costsfrom the Contractors based on their proportionate use of facilities. Unlike the Delta Water Charge, which isuniform for a unit of Table A water, the allocation of these portions of the Transportation Charge will vary basedon the aqueduct segments needed to deliver water to a specific Contractor. The further a Contractor is from theDelta and the greater its capacity in the transportation facilities, the greater its allocation of the Capital andfixed OMPR Transportation Charges. The capacity of the SWP to deliver water decreases with distance from theBanks Pumping Plant, located in the Sacramento–San Joaquin Delta, as water is delivered to Contractors throughthe South Bay Aqueduct and the Coastal Branch Aqueduct, and to turnouts in the San Joaquin Valley andSouthern California. Payment of the Transportation Charge entitles Contractors to the right to use their capacityin the SWP facilities for transportation of SWP or non–SWP water, on a space available basis, under the SWC. AContractor that participates in the repayment of a particular reach, or segment of the SWP, has already paid thecosts of using that reach for the conveyance of water supplies through the Transportation Charge. On average,Metropolitan pays about 63 percent of SWP transportation costs.
In addition to the charges for water supply and transportation facilities discussed above, DWR also charges forthe power needed to deliver project water throughout the system. Two charges recover these power costs: thevariable OPMR portion of the Transportation Charge (Variable Charge) and the Off Aqueduct Power Facilities(OAPF) charge. Because the SWC are cost recovery contracts, DWR invoices Contractors on an estimated basisfor any calendar year, and then provides credits in later years once cost true–ups are finished.
The Variable Charge includes the annually estimated cost of purchased power including capacity and energy,cost of SWP power generation facilities, program costs to offset annual fish losses at the Banks Pumping Plant,purchased transmission services, and credits for sales of ancillary services and excess SWP system power sales.The Variable Charge is calculated on the basis of the energy required to pump an acre–foot of water to its take–out point multiplied by the system energy rate, less energy from the recovery generation plants. The systemenergy rate is a system–wide average rate calculated as the net cost of energy––total costs less revenues––divided by the net energy required to pump all water. That rate is applied to each acre–foot of water deliveredto SWP customer based on the power required to pump the water to designated delivery points on the system.DWR can adjust the system energy rate as the calendar year progresses in order to reflect actual costs
The OAPF charge recovers the debt service and environmental remediation costs of power generation facilitiesnot on the aqueduct, namely Reid Gardner Unit 4 and debt service associated with the South Geysers and BottleRock geothermal plants. The OAPF rate is calculated as the total annual estimated costs divided by the totalenergy required to pump all water. Recovery energy is not considered in this calculation. Each contractor’scharge is the OAPF rate times the energy required to pump the contractor’s water order.
The SWP uses low–cost hydroelectric and recovery generation resources, but they only provide about50 percent of the SWP energy needs in an average water year. The SWP relies on the wholesale market andcontractual resources with exposure to market price volatility for as much as 30 to 35 percent of its needs, usingother contractual resources to fill in the difference.
The SWP energy required to move water to Metropolitan is related to the transportation on the East Branchthrough Devil Canyon and on the West Branch through Castaic. Because Metropolitan moves the largest amountof water on the SWP and Metropolitan’s delivery points on the East and West Branch are at or near the southernextreme of the SWP, Metropolitan pays approximately 70 percent of the SWP power costs.
2018/19 and 2019/20 Proposed Biennial Budget 117 State Water Project
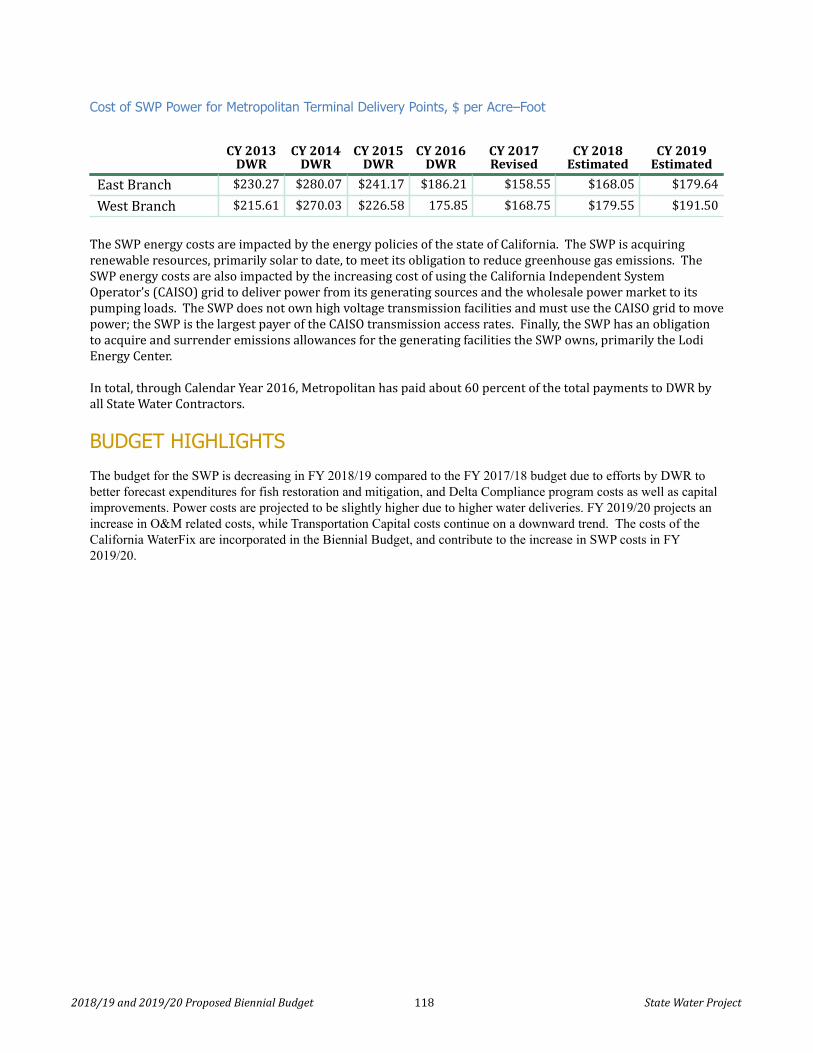
Cost of SWP Power for Metropolitan Terminal Delivery Points, $ per Acre–Foot
CY 2013DWR
CY 2014DWR
CY 2015DWR
CY 2016DWR
CY 2017Revised
CY 2018Estimated
CY 2019Estimated
East Branch $230.27 $280.07 $241.17 $186.21 $158.55 $168.05 $179.64
West Branch $215.61 $270.03 $226.58 175.85 $168.75 $179.55 $191.50
The SWP energy costs are impacted by the energy policies of the state of California. The SWP is acquiringrenewable resources, primarily solar to date, to meet its obligation to reduce greenhouse gas emissions. TheSWP energy costs are also impacted by the increasing cost of using the California Independent SystemOperator’s (CAISO) grid to deliver power from its generating sources and the wholesale power market to itspumping loads. The SWP does not own high voltage transmission facilities and must use the CAISO grid to movepower; the SWP is the largest payer of the CAISO transmission access rates. Finally, the SWP has an obligationto acquire and surrender emissions allowances for the generating facilities the SWP owns, primarily the LodiEnergy Center.
In total, through Calendar Year 2016, Metropolitan has paid about 60 percent of the total payments to DWR byall State Water Contractors.
2018/19 and 2019/20 Proposed Biennial Budget 118 State Water Project
BUDGET HIGHLIGHTS
The budget for the SWP is decreasing in FY 2018/19 compared to the FY 2017/18 budget due to efforts by DWR tobetter forecast expenditures for fish restoration and mitigation, and Delta Compliance program costs as well as capitalimprovements. Power costs are projected to be slightly higher due to higher water deliveries. FY 2019/20 projects anincrease in O&M related costs, while Transportation Capital costs continue on a downward trend. The costs of theCalifornia WaterFix are incorporated in the Biennial Budget, and contribute to the increase in SWP costs in FY2019/20.

COLORADO RIVER AQUEDUCT
2018/19 and 2019/20 Proposed Biennial Budget 119 Colorado River Aqueduct
OVERVIEW
Metropolitan was established to obtain an allotment of Colorado River water, and its first mission was toconstruct and operate the Colorado River Aqueduct (CRA). The CRA consists of 5 pumping plants, 450 miles ofhigh voltage power lines, 1 electric switching station, 4 regulating reservoirs, and 242 miles of aqueducts,siphons, canals, conduits and pipelines terminating at Lake Mathews in Riverside County. Metropolitan firstdelivered CRA water in 1941 to its member agencies.
Metropolitan owns, operates, and manages the Colorado River Aqueduct. Metropolitan is responsible foroperating, maintaining, rehabilitating, and repairing the CRA, and is responsible for obtaining and schedulingenergy resources adequate to power pumps at the CRA’s five pumping stations.
Under its contracts with the federal government, Metropolitan has a fourth priority to 550,000 acre–feet peryear of Colorado River water, less certain use by higher priority holders and Indian tribes. Metropolitan alsoholds a fifth priority for an additional 662,000 acre–feet per year that exceeds California’s 4.4 million acre–footper year basic apportionment, 38,000 acre–feet under the sixth priority during the term of the Colorado RiverWater Delivery Agreement, and another 180,000 acre–feet per year when surplus flows are available.Metropolitan can obtain water under the fourth, fifth, and sixth priorities from:
• Water unused by the California holders of priorities 1 through 3;
• Water saved by extraordinary conservation programs, crop rotation, and water supply program; or,
• When the U.S. Secretary of the Interior makes available:
o Surplus water, Intentionally Created Surplus water, and/or
o Water apportioned to, but unused by, Arizona and Nevada.
CRA Cost Summary1, $ millions
2017/18Budget
2018/19Budget
Change from2017/18
2019/20Budget
Change from2018/19
CRA Power $54.4 $45.8 ($8.6) $52.9 $7.1
CRA Dues2 $0.7 $0.7 — $0.7 —
Acre–feet 1,040,976 837,900 (203,076) 915,550 77,650
1Does not include Departmental costs reflected elsewhere in this Budget
2Six Agency and Colorado River Authority of California
Budgeted CRA Power costs represent expenditures for the Hoover and Parker contracts and market powerpurchases to support budgeted CRA water deliveries.

CRA COSTS FOR TRANSPORTATION AND SUPPLY
Metropolitan incurs capital and operations and maintenance expenditures to support the CRA activities. Thedirect costs of the CRA activities include labor, materials and supplies, outside services to provide repair andmaintenance, and professional services. The CRA activities benefit from Water System Operations supportservices and management supervision, as well as Administrative and General activities of Metropolitan.Metropolitan finances past, current and future capital improvements on the CRA, and capitalizes thoseimprovements as assets. The costs of Metropolitan’s capital financing activities are apportioned to servicefunctions, such as the CRA.
The costs of the CRA supply portfolio developed by Metropolitan are paid by Metropolitan. The CRA supplyportfolio is supported by Water Resource Management labor, materials and supplies. The CRA supply portfolioactivities benefit from Water Resource Management support services and management supervision, as well asAdministrative and General activities of Metropolitan. Metropolitan finances past, current and future capitalimprovements associated with the CRA supply portfolio capital assets and has capitalized these investments asParticipation Rights.
Accordingly, the CRA costs for transportation and supply are reflected in the Departmental and General DistrictRequirements budgets.
2018/19 and 2019/20 Proposed Biennial Budget 120 Colorado River Aqueduct
CRA COST FOR POWER
Metropolitan currently has three basic sources of power available to meet CRA energy requirements: HooverPower, Parker Power, and wholesale purchases from entities in the Western United States. Each source isobtained at different unit prices.
Cost of CRA Power Sources, $ per Megawatt-hour (MWh)
FY 2013 FY 2014 FY 2015 FY 2016 FY 2017
Hoover¹ $18.60 $29.74 $15.84 $15.36 $17.86
Parker¹ $9.33 $12.41 $13.55 $12.58 $15.40
SP15, off–peak² $33.15 $40.24 $33.15 $24.97 $26.48
SP15, on–peak³ $45.38 $50.90 $40.68 $30.13 $33.46
¹Information from Annual Reports for years 2013, 2014, 2015, 2016, and 2017
²SP15, off-peak price, described below, is used to determine Metropolitan’s off–peak energy costs.
³SP15, on–peak, described below, is used to determine the market value of Metropolitan’s sales of excess energy,if any. SP15 on–peak is also used to determine the pumping costs associated with pumping non–Metropolitanwater through the CRA system, unless otherwise provided by contract.
Under a contract between the United States, Department of Energy, Western Area Power Administration, andMetropolitan, Metropolitan currently has a right to approximately 250 megawatts (MW) of capacity at theHoover Power Plant, which is about 12 percent of the total generating capacity. Metropolitan has an annual firmenergy entitlement of 1,227 megawatt–hours (MWh), which is about 27 percent of the total Boulder CanyonProject (Hoover) firm energy allocations. Hoover Power Plant generation is cost–based. Metropolitan acquiredthe benefits of the low–cost, federally funded hydroelectric plant in order to cost–effectively deliverMetropolitan’s Colorado River water to its member agencies.

Under a contract among the United States, Department of the Interior, Bureau of Reclamation (Reclamation) andMetropolitan, Metropolitan funded the total cost of construction of Parker Dam and incidental facilities, and 50percent of the construction cost of the Parker Powerplant. By providing the funding contribution, Metropolitanis entitled in perpetuity to 50 percent of the capacity and energy of the four Parker generating units, which isapproximately 60 MW of capacity. Parker power is also cost–based. Like Hoover power, Metropolitan acquiredthe benefits of the low–cost, federally funded hydroelectric plant in order to cost–effectively deliverMetropolitan’s Colorado River water to its member agencies.
Metropolitan’s current basic resource mix is very cost effective but is not sufficient to pump Metropolitan’sColorado River water supplies in all years. For that reason, Metropolitan is required to purchase supplementalpower to transport Colorado River water supplies in some years. As a result, Metropolitan requires that anyparty seeking to transport non–Metropolitan water through its Colorado River Aqueduct to purchase, or arrangefor Metropolitan to purchase, the power supplies required to pump that water. The amount of power requiredto pump an acre–foot of water through the CRA is 2,000 kilowatt–hours. Any Colorado River water that ispumped through Metropolitan’s CRA is diverted above Parker Dam and cannot generate energy forMetropolitan’s use at the Parker Powerplant. To compensate for this loss, an additional 32 kilowatt–hours peracre–foot are required to make Metropolitan whole for undertaking to pump non–Metropolitan water throughthe CRA that would otherwise have flowed through the Parker Powerplant. In total, 2,032 kilowatt–hours (or2.032 megawatt–hours) of energy must be provided to Metropolitan to convey each acre–foot of non–Metropolitan water supplies through the CRA.
Supplemental power can be purchased and transmitted to Metropolitan to pump non–Metropolitan waterthrough the CRA. The market rate for electric energy prices is regularly tracked and published for variousregions in California. Metropolitan uses the California Independent System Operator (CAISO) Open AccessSame–time Information System (OASIS) Day–Ahead Locational Marginal Price as reflective of the supplementalpower costs for electric energy used for its pumping plants on the CRA. The regional index applicable to energysold for use on the CRA is designated as “South–of–Path 15”, or SP15, and is reflective of Southern Californiamarket energy prices.
Any party seeking to pump non–Metropolitan water through the CRA would have to purchase, or arrange forMetropolitan to purchase on its behalf, supplemental power. The market cost for purchases of power for theCRA is reflected in the CAISO OASIS Day–Ahead Locational Marginal Price. Because Metropolitan utilizes thepumping capacity on the CRA for its own water supplies during off–peak hours to minimize its costs, thepumping of non–Metropolitan water would occur during on–peak hours and the on–peak price index publishedon the CAISO OASIS Day–Ahead Locational Marginal Price is indicative of the price that would be paid to pumpnon–Metropolitan water.
Metropolitan from time to time sells excess energy into the wholesale market and realizes revenues, whichoffset the total cost of energy as reflected in the System Power Rate. If Metropolitan were to deliver additionalwater through the CRA, these sales become a lost opportunity. The on–peak price index published on the CAISOOASIS Day–Ahead Locational Marginal Price is indicative of the price that Metropolitan could realize by sellingexcess energy.
2018/19 and 2019/20 Proposed Biennial Budget 121 Colorado River Aqueduct

South–of–Path 15 On–Peak Energy Prices, $/MWh
CY 2013 CY 2014 CY 2015 CY 2016 CY 2017
January $46.15 $49.53 $35.70 $30.14 $36.22February $46.45 $71.85 $31.88 $24.47 $28.52March $51.39 $52.06 $30.73 $19.61 $23.97April $56.34 $51.19 $29.03 $18.92 $26.71May $51.49 $51.85 $28.11 $23.06 $32.08June $47.77 $50.90 $37.01 $33.41 $38.14July $51.74 $53.18 $39.27 $39.03 $41.49August $45.44 $50.47 $39.02 $38.57 $54.96September $48.91 $51.49 $38.00 $35.55 $43.18October $42.82 $49.06 $35.55 $35.45 $47.86November $44.13 $49.28 $30.22 $30.67 $44.82December $52.14 $41.80 $29.83 $36.40 $44.21
MWh = megawatt–hour, or 1,000 kilowatt–hours
Metropolitan has an obligation to acquire and surrender emissions allowances for the fossil-fuel energygenerated out-of-state and imported into California through its 230,000 volt transmission system. Alternatively,Metropolitan can purchase power in California, which already incorporates any necessary emissionsallowances, but must pay to use the California Independent System Operator transmission network.Metropolitan has contracted with Arizona Electric Power Cooperative (AEPCO) to provide energy managementand scheduling services on a per Megawatt-hour basis. AEPCO also provides operational services forMetropolitan’s CRA transmission system, assuring compliance with federal reliability requirements. Finally,Metropolitan’s CRA power system is within the Balancing Authority Area of the CAISO; Metropolitan incurs GridManagement Charges from the CAISO on a per Megawatt-hour basis, and may realize a Resource Adequacyobligation depending on its pumping load and available firm resources.
2018/19 and 2019/20 Proposed Biennial Budget 122
BUDGET HIGHLIGHTS
The budget for the CRA power is decreasing in FY 2018/19 and FY 2019/20 compared to FY 2017/18 due tolower diversions at Intake. In FY 2019/20, costs are slightly higher due to the increase in diversions over FY2018/19 and higher projected wholesale costs.

SUPPLY PROGRAMS
2018/19 and 2019/20 Proposed Biennial Budget 123 Supply Programs
OVERVIEW
Metropolitan’s principal sources of water supplies are the State Water Project (SWP) and the Colorado River.Metropolitan receives water delivered from the SWP under State Water Contract (SWC) provisions, includingcontracted supplies, use of carryover storage in San Luis Reservoir, and surplus supplies. Metropolitan alsoholds rights to a basic apportionment of Colorado River water and has priority rights to an additional amountfrom the Colorado River depending on availability of surplus supplies. The Supply Programs supplement theseSWP and Colorado River supplies. The budgeted costs for the Supply Programs are as follows:
Supply Programs Cost Summary, $ millions
— 2017/18Budget
2018/19Budget
Change from2017/18
2019/20Budget
Change from2018/19
PVID Program $18.0 $12.6 ($5.4) $6.2 ($6.4)IID/MWD Conservation 11.0 9.2 (1.8) 9.5 0.3Other CRA 23.6 10.8 (12.8) 9.3 (1.5)In Basin 1.6 1.6 0.0 1.6 0.0SWP Programs 27.5 27.0 (0.5) 27.8 0.8Total Supply Programs1 $81.7 $61.2 ($20.5) $54.4 ($6.8)
1 Does not include Departmental costs reflected elsewhere in this Budget.
Budgeted Supply Programs costs represent opportunities and actions associated with a 50 percent SWPallocation and diversions on the CRA of 838 to 916 thousand acre–feet (TAF). On the SWP, Supply Programexpenditures support maximizing storage capabilities of the Central Valley storage programs, utilizing transferand exchange programs recently executed, and bringing the balance into the region. On the CRA, theexpenditures support the Palo Verde Irrigation District land fallowing program and the Imperial IrrigationDistrict/Metropolitan Conservation Program, as well as other programs to conserve and develop supplies.
SUPPLY PROGRAMS HAVE BEEN DEVELOPED TO CONVEY ON THE SWPTRANSPORTATION SYSTEM
Since inception, the SWC provided Contractors the ability to use the SWP to convey non–SWP water undercertain circumstances. Specifically, Article 18(c)(2) of the original SWC addresses situations where there is ashortage in the supply of water made available under the SWC and states, “[T]he District, at its option, shall havethe right to use any of the project transportation facilities which by reason of such permanent shortage in thesupply of project water to be made available to the District are not required for delivery of project water to theDistrict, to transport water procured by it from any other source: [p]rovided, [t]hat such use shall be within thelimits of the capacities provided in the project transportation facilities for service to the District under thiscontract ….”. However, Article 18(c)(2) only applied in the event a permanent shortage was declared by DWRand it was unclear on how costs would be charged for using SWP facilities to transport nonproject water. In1994, the Contractors and DWR negotiated the Monterey Amendment to the SWC, including Article 55, whichmade explicit that the Contractors’ rights to use the portion of the SWP conveyance system necessary to deliverwater to them (their “Reaches”) also includes the right to convey non–SWP water at no additional cost as long ascapacity exists. Power for the conveyance of non–SWP water is charged at the SWP melded power rate. The

Monterey Amendment also expanded the ability to carry over SWP water in SWP storage facilities, allowedparticipating Contractors to borrow water from terminal reservoirs, and allowed Contractors to store water ingroundwater storage facilities outside a Contractor’s service area for later use.
These amendments, approved by Metropolitan’s Board in 1995, offered the means for individual Contractors toincrease supply reliability through water transfers, and storage outside their service areas.
Since adoption of the 1996 Integrated Resources Plan (IRP) and subsequent updates, Metropolitan hasdeveloped and actively managed a portfolio of supplies to convey through the California Aqueduct.Metropolitan submits delivery schedules to DWR for these supplies, and alters these schedules throughout theyear based on changes in the availability of SWP and Colorado River water. The figure below shows thegeographic location of the portfolio of supplies that Metropolitan has developed to be conveyed through theSWP since adoption of the Monterey Amendment and the 1996 IRP. These resources extend from north of theDelta to Southern California.
Since the Monterey Amendment, Metropolitan has secured one–year water transfer supplies throughMetropolitan–only purchases, buyer coalition–purchases, and Governor Drought Water Banks. The most recentyears in which these one–year transactions occurred were 2008 through 2010, 2013 and 2015. No purchaseswere made in 2011, 2012, or 2016 due to favorable water supply conditions. Most of the sellers wereSacramento Valley water users who are not Contractors. Other Contractors obtained one–year water transfersduring this timeframe as well.
In addition to the one–year water transfers, Metropolitan purchases long–term water transfer supplies throughthe Yuba Accord. The Yuba Accord has provided water to enhance SWP and CVP water supply reliability byoffsetting Delta export reductions and providing dry year water supplies for participating SWP and CVPcontractors. This water is Yuba River water developed by Yuba County Water Agency (YCWA) making reservoirreleases or by YCWA’s member units substituting groundwater for their surface water supplies; it is not SWPwater.
2018/19 and 2019/20 Proposed Biennial Budget 124 Supply Programs
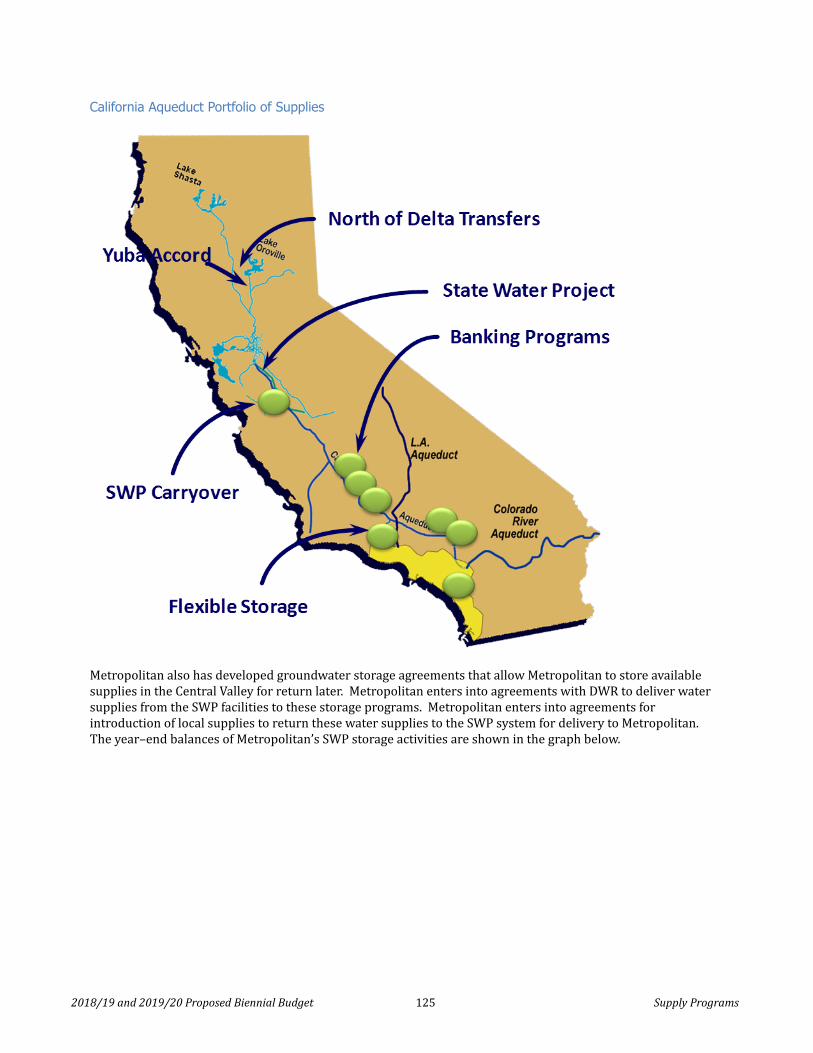
California Aqueduct Portfolio of Supplies
Metropolitan also has developed groundwater storage agreements that allow Metropolitan to store availablesupplies in the Central Valley for return later. Metropolitan enters into agreements with DWR to deliver watersupplies from the SWP facilities to these storage programs. Metropolitan enters into agreements forintroduction of local supplies to return these water supplies to the SWP system for delivery to Metropolitan.The year–end balances of Metropolitan’s SWP storage activities are shown in the graph below.
2018/19 and 2019/20 Proposed Biennial Budget 125 Supply Programs

SWP Groundwater Storage Programs year–end balance, acre–feet
• Mojave Storage Program: under the agreement, Mojave Water Agency provides groundwater bankingand exchange transfers to allow Metropolitan to store up to 390,000 acre–feet for later return. The agreementallows Metropolitan to annually withdraw Mojave Water Agency’s SWP contractual amounts, after accountingfor local needs. • Kern Delta Storage Program: under the agreement, Kern Delta Water District provides groundwaterbanking and exchange transfer to allow Metropolitan to store up to 250,000 acre–feet of SWP water in wet yearsand take up to 50,000 acre–feet annually during droughts. The water is returned by direct groundwater pump–in or by exchange of surface water supplies.
• Arvin–Edison Storage Program: under the agreement, Arvin–Edison Water Storage District stores wateron behalf of Metropolitan. Up to 350,000 acre–feet can be stored; Arvin–Edison is obligated to return up to75,000 acre–feet of stored water in any year to Metropolitan, upon request. The water is returned by directgroundwater pump–in and exchange of SWP supplies.
• Semitropic Storage Program: under the agreement, Metropolitan stores water in the groundwater basinunderlying land within the Semitropic Water Storage District. The maximum storage capacity is 350,000 acre–feet. As of December 2014, the minimum annual yield to Metropolitan is 34,700 acre–feet, and the maximumannual yield is 236,200 acre–feet depending on the available unused capacity and the SWP allocation. Thewater is returned by direct groundwater pump–in and exchange of SWP supplies.
2018/19 and 2019/20 Proposed Biennial Budget 126 Supply Programs

• Antelope Valley East Kern (AVEK) Storage and Exchange Program: under the agreement, AVEK providesat least 30,000 acre–feet over ten years of its unused SWP Table A amount to Metropolitan and Metropolitan, atits discretion, would return half of the exchange water to AVEK at the Banks pumping plant. Under the StorageProgram, Metropolitan, at its discretion, could store at least 30,000 acre–feet of its SWP Table A amount or othersupplies in the Antelope Valley Groundwater Basin in an account designated for Metropolitan.
Metropolitan has developed exchanges and transfers with other Contractors to enhance supply flexibility. Someof these agencies have extensive groundwater supplies and are willing to exchange their SWP supplies.
• San Gabriel Valley Water District: under this agreement, Metropolitan delivers treated water to aSan Gabriel Valley Water District subagency in exchange for twice as much untreated SWP supplies deliveredinto the groundwater basin that supplies this agency and Metropolitan subagencies. Metropolitan can purchaseat least 5,000 acre–feet per year, in excess of the unbalanced exchange amount. There are no fees to put waterinto storage, or take water out of the storage account. This program has the potential to increase Metropolitan’sreliability by providing 115,000 acre–feet through 2035.
• Desert Water Agency/Coachella Valley Water District Advance Delivery Program: under this program,Metropolitan delivers Colorado River water to the Desert Water Agency (DWA) and Coachella Valley WaterDistrict (CVWD) in exchange for those agencies’ SWP Contract Table A allocations to be delivered toMetropolitan at a later date. In addition to their Table A supplies, DWA and CVWD can take delivery of SWPsupplies available under Article 21 of the SWC and the Turn–back Pool Program, and non–SWP suppliesseparately acquired by each agency. These non–SWP supplies have included Yuba Accord water, drought waterbank water, and San Joaquin Valley water. Thus the availability of other water sources allows DWA and CVWD toexchange their Table A supplies with Metropolitan. By delivering enough water in advance to coverMetropolitan’s exchange obligations, Metropolitan is able to receive DWA and CVWD’s available SWP supplies inyears in which Metropolitan’s supplies are insufficient without having to deliver an equivalent amount ofColorado River water.
2018/19 and 2019/20 Proposed Biennial Budget 127 Supply Programs
SUPPLY PROGRAMS HAVE BEEN DEVELOPED TO CONVEY ON THE CRA
Since adoption of the 1996 Integrated Resources Plan (IRP) and subsequent updates, Metropolitan hasdeveloped and actively manages a portfolio of supplies to convey through the CRA, and as owner and operator,determines the delivery schedule of those resources throughout the year based on changes in the availability ofSWP and Colorado River water. The figure below shows the geographic location of the portfolio of supplies thatMetropolitan has developed for diversion into the CRA since adoption of the 1996 IRP. These resources extendfrom Lake Mead to Southern California.

Colorado River Aqueduct Portfolio of Supplies
• Imperial Irrigation District/Metropolitan Conservation Program: Under a 1988 ConservationAgreement, Metropolitan has funded water efficiency improvements within the Imperial Irrigation District’s(IID) service area in return for the right to divert the water conserved by those investments. Metropolitanprovided funding for IID to construct and operate a number of conservation projects that have conserved up to109,460 acre–feet of water per year that has been provided to Metropolitan. In 2015, 107,820 acre–feet ofconserved water is being made available by IID to Metropolitan. Execution of the Quantification SettlementAgreement (QSA) and other agreement amendments resulted in changes in the availability of water under theprogram. As a result of a 2014 IID–Metropolitan letter agreement, the amount to be made available by IID hasbeen quantified at 105,000 acre–feet per year beginning in 2016. Metropolitan is guaranteed at least85,000 acre–feet per year, with the remainder of the conserved water being made available to CVWD, if neededunder the 1989 Approval Agreement as amended.
• Palo Verde Land Management, Crop Rotation, and Water Supply Program: Under this program,participating landowners in the Palo Verde Irrigation District (PVID) are paid to reduce water use by notirrigating a portion of their land. A maximum of 29 percent of the participating lands within the Palo VerdeValley can be fallowed in any given year. This program saves up to 133,000 acre–feet of water in certain years,and a minimum of 33,000 acre–feet per year. The term of the program is 35 years. Fallowing began on January1, 2005. In March 2009, Metropolitan and PVID entered into a supplemental emergency fallowing programwithin PVID that provided for the fallowing of additional acreage in 2009 and 2010. Since 2005, as much as148,600 acre–feet of water was saved. The volume of water that becomes available to Metropolitan is governedby the QSA and the Colorado River Water Delivery Agreement. Under these agreements:
2018/19 and 2019/20 Proposed Biennial Budget 128 Supply Programs

o Metropolitan must reduce its consumptive use of Colorado River water by that volume ofconsumptive use by PVID and holders of Priority 2 that is greater than 420,000 acre–feet in a calendaryear, or
o Metropolitan may increase its consumptive use of Colorado River water by that volume ofconsumptive use by PVID and holders of Priority 2 that is less than 420,000 acre–feet in a calendar year.
In both cases, each acre–foot of reduced consumptive use by PVID is an additional acre–foot that becomesavailable to Metropolitan.
• All–American and Coachella Canal Lining Projects: Metropolitan has historically taken delivery of16,000 acre–feet of water annually as a result of the All–American and Coachella Canal Lining Projects. Underthe San Luis Rey Indian Water Rights Settlement Agreement, that water will be made available for the benefit ofthe La Jolla, Pala, Pauma, Rincon and San Pasqual Bands of Mission Indians, the San Luis Rey River Indian WaterAuthority, the City of Escondido and the Vista Irrigation District. Beginning in 2018, the settlement parties willreceive 16,000 acre-feet of water under the agreement.
• Southern Nevada Water Authority and Metropolitan Storage and Interstate Release Agreement: Underthis 2004 agreement and a related Operational Agreement, additional Colorado River water supplies are madeavailable to Metropolitan when there is space available in the CRA to receive the water, subject to a request bySouthern Nevada Water Authority (SNWA) for Metropolitan to reduce its Colorado River water order to return aportion of this water. In 2009, 2012, and 2015, Metropolitan, the Colorado River Commission of Nevada, andSNWA amended the related Operational Agreement. The agreements can be terminated upon 90 days’ noticefollowing the return of the water stored by Metropolitan.
• Lower Colorado Water Supply Project: Under a contract among Metropolitan, the City of Needles, andthe United States Bureau of Reclamation, Metropolitan receives annually exchange water unused by the City ofNeedles and other entities who have no rights or insufficient rights to use Colorado River water in California.The beneficiaries of the project, including the City of Needles, receive water exchanged for groundwaterpumped from wells into the All–American Canal. Metropolitan makes payments to a trust fund to develop areplacement project or to desalt the groundwater should the groundwater become too saline for discharge intothe All–American Canal.
• Lake Mead Storage Program: In December 2007, Metropolitan entered into agreements to set forth theguidelines under which Intentionally Created Surplus (ICS) water is developed, and stored in and delivered fromLake Mead. The amount of water stored in Lake Mead, created through extraordinary conservation, systemefficiency, or tributary conservation methods, is available for delivery in a subsequent year, with extraordinaryconservation ICS subject to a one–time deduction and evaporation losses. Extraordinary conservation methodsused by Metropolitan to date are water saved by fallowing in the Palo Verde Valley, projects implemented withIID in its service area, and groundwater desalination. The guidelines concerning the operation of the ColoradoRiver system reservoirs provide the ability for agencies to create “System Efficiency ICS” through thedevelopment and funding of system efficiency projects that save water that would otherwise be lost from theColorado River. Metropolitan has participated in two projects to create System Efficiency ICS:
o Drop 2 (Warren H. Brock) Reservoir: Metropolitan contributed funds toward the Bureau ofReclamation’s construction of an 8,000 acre–foot off–stream regulating reservoir near Drop 2 of theAll–American Canal in Imperial County. This reservoir conserves about 70,000 acre–feet of water peryear by capturing and storing otherwise non–storable flow. In return for its funding, Metropolitanreceived 100,000 acre–feet of water that was stored in Lake Mead, and has the ability to receive up to25,000 acre–feet of water in any single year. Besides the additional water supply, the new reservoiradds to the flexibility of Colorado River operations.
o In November 2012, Metropolitan executed agreements in support of a program to augmentMetropolitan’s Colorado River supply between 2013 and 2017 through an international pilot project in
2018/19 and 2019/20 Proposed Biennial Budget 129 Supply Programs

Mexico. Metropolitan’s total share of costs will be $5 million for 47,500 acre–feet of project supplies.The costs will be paid between 2015 and 2017, and the conserved water will be credited toMetropolitan’s intentionally–created surplus water account no later than 2017. In December 2013,Metropolitan and IID executed an agreement under which IID will pay half of Metropolitan’s programcosts, or $2.5 million, in return for half of the project supplies, 23,750 acre–feet.
• Hayfield Groundwater Storage Program: This program will allow Metropolitan to store Colorado Riverwater in the Hayfield Groundwater Basin in eastern Riverside County for future withdrawal and delivery to theCRA. Drought conditions in the Colorado River watershed have resulted in a lack of surplus supplies for storage.When water supplies become more plentiful, Metropolitan may pursue this program and develop storagecapacity of about 400,000 acre–feet.
• Desert Water Agency/Coachella Valley Water District/Metropolitan Water Exchange and AdvanceDelivery Programs: under these programs, Metropolitan delivers Colorado River water to the DWA and CVWD,in advance of the exchange for their SWP supplies. By delivering enough water in advance to coverMetropolitan’s exchange obligations, Metropolitan is able to receive DWA and CVWD’s available SWP supplies inyears in which Metropolitan’s supplies are insufficient without having to deliver an equivalent amount ofColorado River water.
The year–end balances of Metropolitan’s CRA storage programs are shown in the graph below.
2018/19 and 2019/20 Proposed Biennial Budget 130 Supply Programs
CRA Storage Programs year-end balance, acre-feet

BUDGET HIGHLIGHTS
The budget for the Supply Programs decreases over the budget period compared to FY 2017/18, primarily dueto lower expenditures for Supply Programs on the Colorado River. This reflects the assumption of a 50 percentallocation on the SWP and approximately 838 to 916 TAF of deliveries on the CRA.
2018/19 and 2019/20 Proposed Biennial Budget 131 Supply Programs

This page intentionally left blank.
2018/19 and 2019/20 Proposed Biennial Budget 132 Supply Programs

DEMAND MANAGEMENT
2018/19 and 2019/20 Proposed Biennial Budget 133 Demand Management
OVERVIEW
Demand Management costs are Metropolitan’s expenditures for funding local water resource developmentprograms and water conservation programs. These demand management programs incentivize thedevelopment of local water supplies and the conservation of water to reduce the reliance on imported water.These programs are implemented after the service connection between Metropolitan and its member agenciesand, as such, do not add any water to the quantity Metropolitan obtains from other sources or to Metropolitan’sown supply. Rather, the effect of these downstream programs is to produce a local supply of water for the localagencies.
Demand Management programs reduce the use of and burden on Metropolitan’s distribution and conveyancesystem, which, in turn, helps reduce and avoid capital, operating, maintenance and capital improvement costsassociated with these facilities. For example, local water resource development and conservation has deferredthe need to build additional infrastructure such as the Central Pool Augmentation Project and the San DiegoPipeline No. 6. Overall, the decrease in demand resulting from these projects is estimated to defer the need forprojects between four and twenty–five years at a savings of approximately $2.9 billion in 2017 dollars. Theprograms also free up capacity in Metropolitan’s system to convey both Metropolitan water and water fromother non–Metropolitan sources.
The budgeted costs for Demand Management are as follows:
Demand Management Cost Summary1, $ millions
2017/18Budget
2018/19Budget
Change from2017/18
2019/20Budget
Change from2018/19
Conservation Credits Program $32.0 $43.0 $11.0 $43.0 —
Local Resources Program $41.9 $44.1 $2.2 $40.8 ($3.3)
Future Supply Actions $2.0 $2.0 — $2.0 —
1 Does not include Departmental costs reflected elsewhere in this Budget.
Budgeted Demand Management costs reflect increasing the financial commitment for the Conservation CreditsProgram, conservation messaging, and maintaining the financial incentives for existing contracts under theLocal Resources Program.
In addition to Metropolitan’s own objectives, Metropolitan also pursues local water resource developmentbecause it has uniquely been directed to do so by the state Legislature. In 1999, then Governor Davis signedSenate Bill (SB) 60 (Hayden) into law. SB 60 amended the Metropolitan Water District Act to directMetropolitan to increase conservation and local resource development. No other water utility in California,public or private, has been specifically identified by the state Legislature and directed to pursue waterconservation and local water resource development.
Metropolitan’s Demand Management programs also support the region’s compliance with the requirements ofSB X7–7. In 2009, the state Legislature passed SB X7–7, which was enacted to reduce urban per capita wateruse by 20 percent by December 31, 2020. Urban retail water suppliers are not eligible for state water grants or
loans unless they comply with the water conservation requirements of the legislation. Demand Managementprograms help the region achieve urban per capita water use reductions. Demand Management costs also support the Strategic Plan Policy Principles approved by Metropolitan’s Boardon December 14, 1999. These principles embody the Board’s vision that Metropolitan is a regional provider ofwholesale water services. In this capacity, Metropolitan is the steward of regional infrastructure and theregional planner responsible for coordinated drought management and the collaborative development ofadditional supply reliability and necessary capacity expansion. Through these regional services, Metropolitanensures a baseline level of reliability and quality for service in its service area.
2018/19 and 2019/20 Proposed Biennial Budget 134 Demand Management
DEMAND MANAGEMENT PROGRAMS REDUCE RELIANCE ON IMPORTEDWATER
Metropolitan increased the emphasis on Demand Management programs after the devastating drought of theearly 1990’s. Metropolitan’s 1996 Integrated Resources Plan identified the Preferred Resource Mix as theresource plan that achieved the region’s reliability goal of providing the full capability to meet all retail–leveldemands during all foreseeable hydrologic events, represented the least–cost sustainable resources plan, metthe region’s water quality objectives, was balanced and diversified and minimized risks, and was flexible,allowing for adjustments should future conditions change.
The Preferred Resource Mix included locally developed water supplies and conservation, and recognized thatregional participation was important to achieve their development. Additional imported supplies frequentlyhave relatively lower development costs, but can create a large cost commitment for regional infrastructure totransport and store those imported supplies. On the other hand, local projects, like those designed to recyclewater or increase groundwater production, may have higher development costs but require little or noadditional infrastructure to distribute water supplies to customers. This trade–off between relatively lower–costimported supplies requiring large regional infrastructure investments and relatively higher–cost local supplydevelopment requiring less additional local infrastructure was an important consideration in the developmentof the Preferred Resource Mix. A strategy of aggressively investing in imported water supply would lead tohigher costs for the region because of the larger investments required in infrastructure. Since 1996, theIntegrated Resources Plan has been updated in 2004, 2010, and 2015 reaffirming long–term sustainability ofthe region’s water supply through implementation of conservation and local resource development.
DEMAND MANAGEMENT PROGRAMS REDUCE DEMANDS ANDBURDENS ON METROPOLITAN’S SYSTEM
Demand Management programs decrease and avoid operating and maintenance and capital improvement costs,such as costs for repair of and construction of additional or expanded water conveyance, distribution, andstorage facilities. The programs also free up capacity in Metropolitan’s system to convey both Metropolitanwater and water from other non–Metropolitan sources.
The purpose of Demand Management is to generate additional local resources or reduce consumption throughconservation, which reduces the amount of water that must otherwise be transported through Metropolitan’ssystem. Investments in Demand Management programs like conservation, water recycling and groundwaterrecovery help defer the need for additional conveyance, distribution, and storage facilities. DemandManagement is an important part of Metropolitan’s resource management efforts. Metropolitan’s incentives inthese areas contribute to savings for all users of the system in terms of lower capital costs that would otherwisehave been required to expand and maintain the system.

SB 60 DIRECTED METROPOLITAN TO EXPAND DEMAND MANAGEMENTPROGRAMS
In September 1999, Governor Gray Davis signed SB 60 (Hayden) into law. SB 60 amended the MetropolitanWater District Act to direct Metropolitan to increase “sustainable, environmentally sound, and cost–effectivewater conservation, recycling, and groundwater storage and replenishment measures.” SB 60 also requiresMetropolitan to hold an annual public hearing to review its urban water management plan for adequacy inachieving an increased emphasis on cost–effective conservation and local water resource development, and toinvite knowledgeable persons from the water conservation and sustainability fields to these hearings. Finally,Metropolitan is required to annually prepare and submit to the Legislature a report on it progress in achievingthe goals of SB 60. SB 60 specifically indicated that no reimbursement was required by legislation becauseMetropolitan, as a local agency, has the authority to levy service charges, fees or assessments sufficient to payfor the program or level of service mandated by SB 60. No other water utility in California, public or private, hasbeen specifically identified by the state Legislature and directed to pursue water conservation and local waterresource development.
In FY 2016/17 alone, Metropolitan’s service area achieved 1.6 million acre–feet of water savings fromconservation, recycled water and groundwater recovery programs. The 1.6 million acre–feet of water savingsfrom water management activities in fiscal year 2016/17 exceeded actual water transactions in the same periodof 1.54 million acre–feet. These savings derived from programs for which Metropolitan paid incentives, as wellas code–based conservation achieved through legislation, building and plumbing codes and ordinances, andreduced consumption resulting from changes in water pricing. Cumulatively, since 1982 Metropolitan hasinvested almost $1.4 billion and Metropolitan's service area has achieved 6.1 million acre-feet of water savings.
Metropolitan’s Conservation Credits Program provides incentives to residents and businesses for use of water–efficient products and qualified water–saving activities. Rebates have been provided to residential customersfor turf removal and purchasing of high–efficiency clothes washers and toilets. Rebates are also provided tobusinesses and institutions for water–saving devices. In fiscal year 2016/17, the Conservation Credits Programachieved 1.0 million acre–feet of saved water through new and existing conservation initiatives funded withincentives and maintained through plumbing codes. Cumulatively, through fiscal year 2016/17 theConservation Credits Program has achieved over 2.6 million acre–feet of water savings.
Metropolitan provides financial incentives through its Local Resources Program for the development and use ofrecycled water and recovered groundwater. The Local Resources Program consists of 85 recycling projects and28 groundwater recovery projects located throughout Metropolitan’s service area, of which 107 projects are inoperation. From the Local Resources Program’s inception in 1982 through FY 2016/17, Metropolitan has paidout about $488 million in incentives to produce about 2.6 million acre–feet of recycled water. Metropolitan alsoprovided approximately $151 million to produce 893,000 acre–feet of recovered degraded groundwater formunicipal use.
2018/19 and 2019/20 Proposed Biennial Budget 135 Demand Management

Local Resources Program Projects
2018/19 and 2019/20 Proposed Biennial Budget 136 Demand Management
SB X7–7 REQUIRES INCREASED CONSERVATION
SBX7–7 mandated a new requirement to lower urban per capita water use 20 percent by December 31, 2020.Enacted by the state Legislature and signed into law by Governor Schwarzenegger as part of a historic packageof water reforms in November 2009, the “20x2020” plan gave local communities flexibility in meeting thistarget while accounting for previous efforts in conservation and recycling. The Legislature found that reducingwater use through conservation and regional water resources management would result in protecting andrestoring fish and wildlife habitats, reducing dependence on water through the Delta, and providing significantenergy and environmental benefits. Metropolitan coordinates closely with its member agencies to achieve thesetargets both at a retail agency level in compliance with legislative requirements, and as a region in achieving atrue 20 percent reduction in per–capita water use.
BUDGET HIGHLIGHTS
The budget for the Demand Management costs is increasing when comparing the Biennial Budget to FY2017/18, due primarily to increased expenditures for the Conservation Credits Program and conservationmessaging.
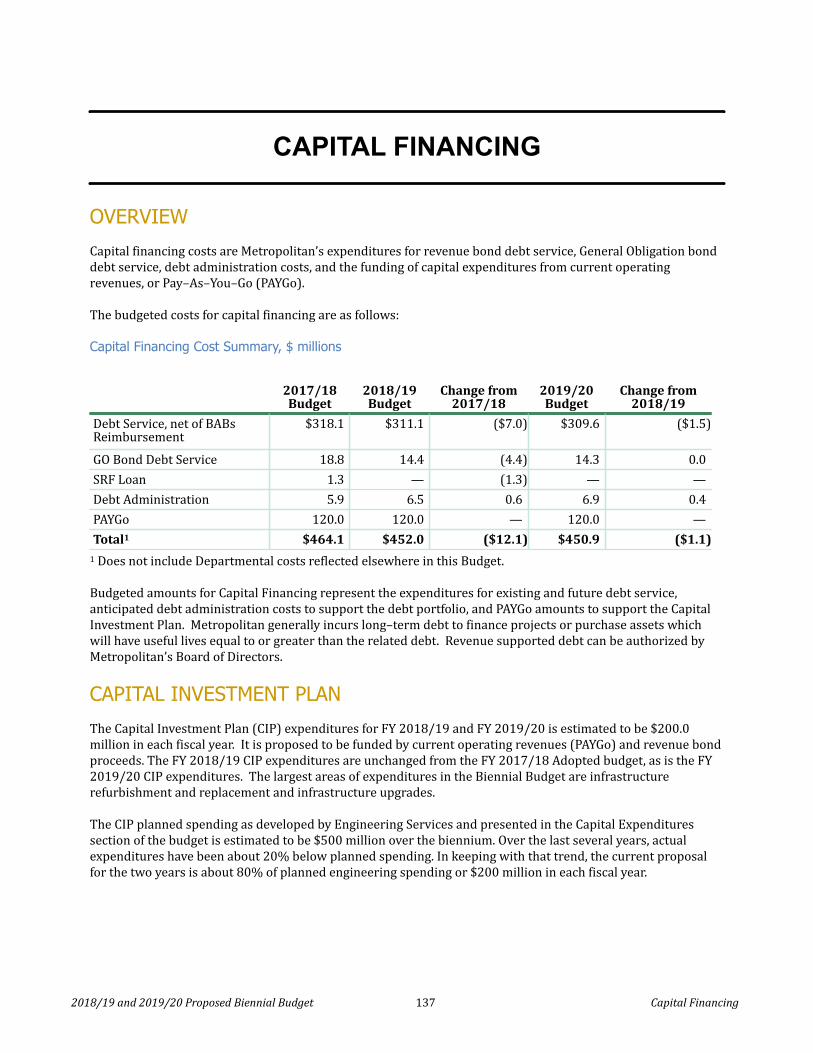
CAPITAL FINANCING
2018/19 and 2019/20 Proposed Biennial Budget 137 Capital Financing
OVERVIEW
Capital financing costs are Metropolitan’s expenditures for revenue bond debt service, General Obligation bonddebt service, debt administration costs, and the funding of capital expenditures from current operatingrevenues, or Pay–As–You–Go (PAYGo).
The budgeted costs for capital financing are as follows:
Capital Financing Cost Summary, $ millions
— 2017/18Budget
2018/19Budget
Change from2017/18
2019/20Budget
Change from2018/19
Debt Service, net of BABsReimbursement
$318.1 $311.1 ($7.0) $309.6 ($1.5)
GO Bond Debt Service 18.8 14.4 (4.4) 14.3 0.0SRF Loan 1.3 — (1.3) — —Debt Administration 5.9 6.5 0.6 6.9 0.4PAYGo 120.0 120.0 — 120.0 —Total1 $464.1 $452.0 ($12.1) $450.9 ($1.1)
1 Does not include Departmental costs reflected elsewhere in this Budget.
Budgeted amounts for Capital Financing represent the expenditures for existing and future debt service,anticipated debt administration costs to support the debt portfolio, and PAYGo amounts to support the CapitalInvestment Plan. Metropolitan generally incurs long–term debt to finance projects or purchase assets whichwill have useful lives equal to or greater than the related debt. Revenue supported debt can be authorized byMetropolitan’s Board of Directors.
CAPITAL INVESTMENT PLAN
The Capital Investment Plan (CIP) expenditures for FY 2018/19 and FY 2019/20 is estimated to be $200.0million in each fiscal year. It is proposed to be funded by current operating revenues (PAYGo) and revenue bondproceeds. The FY 2018/19 CIP expenditures are unchanged from the FY 2017/18 Adopted budget, as is the FY2019/20 CIP expenditures. The largest areas of expenditures in the Biennial Budget are infrastructurerefurbishment and replacement and infrastructure upgrades.
The CIP planned spending as developed by Engineering Services and presented in the Capital Expendituressection of the budget is estimated to be $500 million over the biennium. Over the last several years, actualexpenditures have been about 20% below planned spending. In keeping with that trend, the current proposalfor the two years is about 80% of planned engineering spending or $200 million in each fiscal year.

PAYGo Percentage of Funding, $ millions
2017/18
Budget
2018/19
Budget
2019/20
Budget
Capital Investment Plan expenses $200.0 $200.0 $200.0
Project Funding:New Bond Issues 80.0 80.0 80.0Prior Bond Funds/Construction FundGrants and Loans FundsOperating Revenues (PAYGo) 120.0 120.0 120.0PAYGo Percentage of Funding 60.0% 60.0% 60.0%
In FY 2018/19 and FY 2019/20, the percentage of capital that is funded by debt will be set at 40 percent,consistent with the FY 2016/17 and FY 2017/18 ten–year forecast for this time period. The projected averagepercentage of capital funded from debt will be 40 percent over the ten years of the long–range forecast.
2018/19 and 2019/20 Proposed Biennial Budget 138 Capital Financing
OUTSTANDING DEBT
Metropolitan has total debt outstanding of $4.3 billion as of December 31, 2017. Metropolitan’s debt issues aresummarized below and discussed in detail thereafter.

Outstanding Debt, $’s, as of December 31, 2017
Issue Debt Outstanding1993 Series A, Water Revenue Refunding Bonds 21,840,0001993 Series A, Water Revenue Refunding Bonds 27,300,0002000 Series B-3, Authorization Water Revenue Bonds (1) 88,800,0002008 Series A, Authorization Water Revenue Bonds 174,530,0002008 Series B, Authorization Water Revenue Bonds 7,905,0002008 Series B, Water Revenue Refunding Bonds 112,345,0002008 Series C, Authorization Water Revenue Bonds (2) 78,385,0002008 Series C, Water Revenue Refunding Bonds 19,470,0002008 Series D, Authorization Water Revenue Bonds (2) 250,000,0002009 Series B, Water Revenue Refunding Bonds 106,690,0002009 Series C, Water Revenue Refunding Bonds 91,165,0002009 Series D, Water Revenue Refunding Bonds 40,740,0002009 Series E, Water Revenue Refunding Bonds 9,730,0002010 Series A, Authorization Water Revenue Bonds (2) 250,000,0002010 Series B, Water Revenue Refunding Bonds 69,155,0002011 Series B, Water Revenue Refunding Bonds 3,885,0002011 Series C, Water Revenue Refunding Bonds 138,280,0002012 Series A, Water Revenue Refunding Bonds 181,180,0002012 Series C, Water Revenue Refunding Bonds 104,930,0002012 Series F, Water Revenue Refunding Bonds 59,335,0002012 Series G, Water Revenue Refunding Bonds 111,890,0002013 Series D, Special Variable Rate Water Revenue Refunding Bonds (1) 87,445,0002014 Series A, Water Revenue Refunding Bonds 95,935,0002014 Series B, Water Revenue Refunding Bonds 10,575,0002014 Series C-1, Water Revenue Refunding Bonds 13,505,0002014 Series C-2, Water Revenue Refunding Bonds 14,020,0002014 Series C-3, Water Revenue Refunding Bonds 2,810,0002014 Series D, Special Variable Rate Water Revenue Refunding Bonds (1) 38,465,0002014 Series E, Water Revenue Refunding Bonds 86,060,0002014 Series G-3, Water Revenue Refunding Bonds 11,165,0002014 Series G-4, Water Revenue Refunding Bonds 11,605,0002014 Series G-5, Water Revenue Refunding Bonds 6,205,0002015 Series A, Authorization Water Revenue Bonds 208,255,0002015 Series A-1, Special Variable Rate Water Revenue Refunding Bonds (1) 94,450,0002015 Series A-2, Special Variable Rate Water Revenue Refunding Bonds (1) 94,450,0002016 Series A, Water Revenue Refunding Bonds 239,455,0002016 Series A, Authorization Subordinate Water Revenue Bonds (Taxable) (1) 175,000,0002016 Series B-1, Special Variable Rate Water Revenue Refunding Bonds (1) 51,835,0002016 Series B-2, Special Variable Rate Water Revenue Refunding Bonds (1) 51,835,0002017 Series A, Authorization Water Revenue Bonds (1) 80,000,0002017 Series A, Subordinate Water Revenue Refunding Bonds 238,015,0002017 Series B, Subordinate Water Revenue Refunding Bonds 178,220,0002017 Series C, Subordinate Water Revenue Bonds (1) 80,000,0002017 Series D, Subordinate Water Revenue Refunding Bonds (1) 95,630,0002017 Series E, Subordinate Water Revenue Refunding Bonds (1) 95,625,000Total Revenue Bonds 4,008,115,000
2009 Series A, WaterWorks General Obligation Refunding Bonds 27,000,0002010 Series A, WaterWorks General Obligation Refunding Bonds 18,735,0002014 Series A, WaterWorks General Obligation Refunding Bonds 29,170,000Total General Obligation Bonds 74,905,000
2016 Series B-2, Tax-Exempt Flexible Rate Revolving Notes (1) 198,265,000Total Revolving Note Program 198,265,000
Total Debt: $4,281,285,000(1) Outstanding variable rate obligation. (2) Designated as “Build America Bonds” pursuant to the American Recovery and Reinvestment Act of 2009.
2018/19 and 2019/20 Proposed Biennial Budget 139 Capital Financing

DEBT SERVICE
Debt Service payments in FY 2018/19 are budgeted at $332.0 million and includes $14.4 million in GeneralObligation bond debt service, $311.1 million in revenue bond debt service, and $6.5 million for debtadministration costs.
Debt Service payments in FY 2019/20 are budgeted at $330.9 million and include $14.3 million in GeneralObligation bond debt service, $309.6 million in revenue bond debt service, and $6.9 million for debtadministration costs. Total debt service costs in FY 2019/20 are expected to be $1.0 million less than the FY2018/19 payments as principal on existing debt is paid down and less new obligations are issued. Interestpayments on synthetic fixed rate debt were calculated at their associated swap rates plus any spread (if known).Interest rates on variable rate debt were calculated at 1.70 percent for FY 2018/19 and FY 2019/20.
Outstanding variable rate debt on December 31, 2017 was approximately $1,231.8 million, including bondsbearing interest in the Index Mode, special variable rate bonds initially designated as self–liquidity bonds,variable rate demand obligations supported by standby bond purchase agreements between Metropolitan andvarious liquidity providers, and direct purchase obligations. Of the $1,231.8 million, $493.6 million are treatedby Metropolitan as fixed rate debt by virtue of interest rate swap agreements. The remaining $738.2 million ofvariable rate obligations represent approximately 17.5 percent of total outstanding water revenue bonds andrevolving notes.
Going forward, Metropolitan will finance its construction program through a combination of fixed–rate debt andvariable rate debt. Metropolitan intends to issue approximately $80 million of new debt in FY 2018/19 and FY2019/20.
2018/19 and 2019/20 Proposed Biennial Budget 140 Capital Financing
DEBT RATINGS
Credit risk is the risk that a financial loss will be incurred if a counterparty to a transaction does not fulfill itsfinancial obligations in a timely manner. This is measured by the assignment of a rating by a nationallyrecognized statistical credit rating organization. Strong credit ratings provide tangible benefits to ratepayers inthe form of reduced debt service cost. A strong credit rating provides better access to capital markets, lowerinterest rates and better terms on debt, and access to a greater variety of debt products. Prudent financialmanagement policies have resulted in Metropolitan's senior lien bond ratings of AAA from Standard & Poor’s,Aa1 from Moody’s, and AA+ from Fitch.
DEBT POLICY AND COVERAGE
Metropolitan is subject to limitations on additional revenue bonds. Resolution 8329 (the “Master Revenue BondResolution”), adopted by Metropolitan’s Board in 1991 and subsequently supplemented and amended, providesfor the issuance of Metropolitan’s revenue bonds. The Master Revenue Bond Resolution limits the issuance ofadditional obligations payable from Net Operating Revenues, among other things, through the requirement that Metropolitan must meet an Additional Bonds Test, as defined in the Master Revenue Bond Resolution.Metropolitan's Master Subordinate Bond Resolution, Resolution 9199, adopted by the Board in March 2016, andsubsequently supplemented and amended, also incorporates limitations on additional revenue bonds.
The Metropolitan Act also provides two additional limitations on indebtedness. The Act provides for a limit ongeneral obligation bonds, water revenue bonds and other indebtedness at 15 percent of the assessed value of alltaxable property within Metropolitan’s service area. As of December 31, 2017, outstanding general obligationbonds, water revenue bonds and other evidences of indebtedness in the amount of $4.3 billion representedapproximately 0.16 percent of the FY 2017/18 taxable assessed valuation of $2,741 billion. The secondlimitation under the Act specifies that no revenue bonds may be issued, except for the purpose of refunding,unless the amount of net assets of Metropolitan as shown on its balance sheet as of the end of the last fiscal yearprior to the issuance of the bonds equals at least 100 percent of the aggregate amount of revenue bonds

outstanding following the issuance of the bonds. The net position of Metropolitan at June 30, 2017 was $6.8billion. The aggregate amount of revenue bonds outstanding as of December 31, 2017 was $4.0 billion.
Metropolitan has also established its own policy regarding debt management. The purpose is to maintain abalance between current funding sources and debt financing to retain Metropolitan’s financing flexibility.Flexibility allows Metropolitan to use a variety of revenue or debt–financing alternatives, including issuing low–cost variable rate and other revenue supported obligations.
Metropolitan’s debt management policy is to:
• Maintain an annual senior/subordinate lien revenue bond debt coverage ratio of at least 2.0 timescoverage;
• Maintain an annual fixed charge coverage ratio of at least 1.2 times coverage;
• Limit debt–funded capital to no more than 40 percent of the total capital program over the ten–yearplanning period; and
• Limit variable rate debt such that the net interest cost increase due to interest rate changes is no morethan $5 million, and limit the maximum amount of variable rate bonds to 40 percent of outstandingrevenue bond debt (excluding variable rate bonds associated with interest rate swap agreements).
In order to comply with the debt management policy, Metropolitan has taken the following measures:
2018/19 and 2019/20 Proposed Biennial Budget 141 Capital Financing
Revenue Bond Debt Coverage Ratio
This policy ensures that Metropolitan has sufficient annual operating revenues to pay its operating expensesand meet its debt service obligations on its revenue bonds and other senior debt. The revenue bond debtcoverage ratio is defined as Metropolitan’s net operating revenue (current year’s operating revenue less thecurrent year’s operating expenses) divided by the current year’s senior/subordinated lien debt service on allrevenue bonds and other senior debt. The target is 2.0 times. In FY 2018/19 and FY 2019/20, the projecteddebt coverage ratio is 1.6 and 1.9 times, respectively.
Fixed Charge Coverage Ratio
In addition to revenue bond debt service coverage, Metropolitan also measures total coverage of all fixedobligations after payment of operating expenditures. This additional measure is used to account forMetropolitan's recurring capital costs for the State Water Contract, which are funded after debt service onrevenue bonds and other parity obligations. Rating agencies expect that a financially sound utility consistentlydemonstrate an ability to fund all recurring costs, whether they are operating expenditures, debt servicepayments or other contractual payments. Metropolitan's fixed charge coverage ratio target is 1.2 times. In FY2018/19 and FY 2019/20, the projected debt coverage ratio is 1.5 and 1.7, respectively. These levels helpmaintain strong credit ratings and access to the capital markets at low cost.
BUDGET HIGHLIGHTS
The FY 2018/19 and FY 2019/20 Capital Financing budget is decreasing from the FY 2017/18 budget due tolower debt service expenditures overall. Lower overall Capital Financing costs provide increased financialflexibility and resiliency.
2018/19 and 2019/20 Proposed Biennial Budget 142 Capital Financing

GLOSSARY OF TERMS
20 x 2020 — 2009 Water Conservation Act goal of twenty percent reduction in per capita regional water use by2020.
ACE — Association of Confidential Employees; an employee bargaining unit at Metropolitan.
Accrual — An accounting method that records revenues when earned and expenses when incurred regardless ofthe timing of when the cash is actually paid or received.
Acre–Foot — A unit of measure equivalent to 325,851.4 gallons of water and weighs approximately 62.4pounds, which meets the needs of two average families in and around the home for one year.
ACWA — Association of California Water Agencies.
AFSCME — American Federation of State, County, and Municipal Employees, Local 1902.
Appropriation — Money set aside for a specific purpose. The designation of the use to which a fund of money isto be applied.
Bay Delta — An environmentally sensitive area of the Sacramento/San Joaquin River Delta through and fromwhich water flows to reach portions of California from the San Francisco Bay Area to San Diego. Moving wateracross the delta during the high–demand summer months is becoming more difficult as additional water is setaside to mitigate for environmental impacts.
Budget — A report of all anticipated expenditures and required reserves and the source of moneys to be used tomeet such expenditures and provide such reserves.
Budgeted Position — A staff position approved by the Board of Directors for the fiscal year.
California WaterFix (CA WaterFix) — California WaterFix is a comprehensive science-based solution proposedby the state to modernize critical water delivery infrastructure of the State Water Project. The CaliforniaWaterFix proposes construction of new water intakes in the north Delta and two 40-foot diameter tunnelsunder the Delta terminating at a forebay in the South Delta. This would fulfill the requirement of the 2009 DeltaReform Act to contribute toward meeting the coequal goals of providing a more reliable water supply forCalifornia and protecting, restoring and enhancing the Delta ecosystem.
Capital Investment Plan (CIP) — Metropolitan's CIP is designed to refurbish existing facilities needed to ensurea reliable distribution system, expand treatment facilities to meet current and future water quality regulations,and expand storage and conveyance facilities to meet current and future storage requirements.
Capital Project — A project that results in a new asset (e.g., a facility, betterment, replacement, equipment, etc.)that has a total cost of at least $50,000 and a useful life of at least five years. Computer software can becapitalized if it costs $250,000 or more and has a useful life of at least three years.
The California Environmental Quality Act (CEQA) — A statute that requires state and local agencies to identifythe significant environmental impacts of their actions, and to avoid or mitigate those impacts, if feasible.
2018/19 and 2019/20 Proposed Biennial Budget 143 Glossary of Terms

Colorado River Aqueduct (CRA) — The 242‑mile–long water conveyance system built by Metropolitan to carrywater from the Colorado River to its Southern California service area.
Conservation Credits Program (CCP) — A program where Metropolitan provides financial assistance for thedevelopment of conservation programs at the local level (e.g. energy efficient washing machines, low flushtoilets, etc.).
CUWCC — California Urban Water Conservation Council, a non–profit 501c3 formed as a partnership of watersuppliers, environmental groups, and others interested in conserving California’s greatest natural resource,water.
Debt Service — The annual cost of repaying outstanding debt.
Department of Water Resources (DWR) — A department within the California Resources Agency which isresponsible for the state’s management and regulation of water usage.
Distribution System — Refers to the network of pipelines and canals used for the conveyance of water fromMetropolitan's terminal reservoirs to member agency service connections.
DVL — Diamond Valley Lake. A reservoir built by Metropolitan with a capacity of 800,000 AF.
EIR — Environmental Impact Report.
EMS — Energy Management System.
Endangered Species Act (ESA) — An act of the federal government enacted in 1973 that provides for theconservation of species that are endangered or threatened and the conservation of the ecosystems on whichthey depend. A species is considered endangered if it is in danger of extinction throughout all or a significantportion of its range. A species is considered threatened if it is likely to become an endangered species withinthe foreseeable future.
Enterprise Fund — To account for operations that are financed and operated where the intent is that the costs(expenses, including depreciation) of providing goods or services to the general public on a continuing basis befinanced or recovered primarily through user charges.
Ethics Program — State law (SB 60) mandates that Metropolitan maintain a program to address and seek toavoid potential ethical abuses relating to business relationships, solicitation and/or receipt of campaigncontributions, and public notice and approval procedures for contracts of $50K or more. This program includeson–going training for board members and employees regarding ethics in the workplace.
FERC — Federal Energy Regulatory Commission.
Fund — A self– balancing set of accounts recording cash and other financial resources, together with all relatedliabilities and residual equities or balances, and changes therein, which are segregated for the purpose ofcarrying on specific activities or attaining certain objective in accordance with special regulations, restrictions,or limitations.
Fund Balance — Created from excess revenues over expenditures. This can be a combination of collections/revenues being higher than budget and actual expenditures being lower than budget.
IID/Metropolitan Conservation Agreement — Water conservation agreement with the Imperial IrrigationDistrict (IID) that allows for the development of certain water conservation capital structures by Metropolitanin the Imperial Valley. Metropolitan, in turn, gets the quantity of water conserved during the term of thisagreement, four years during construction, and 35 years after completion. It encompasses both the operating
2018/19 and 2019/20 Proposed Biennial Budget 144 Glossary of Terms

and maintenance, in direct, and capital cost of developing and implementing the program. This agreement isrenewable.
IRWMP — Integrated Regional Water Management Plan.
Integrated Resources Plan (IRP) — An open and participatory planning process that takes a broad view of allwater resource options available to the region and searches for the right combination of investments to achievewater supply objectives in a cost–conscious and environmentally responsible manner.
Local Resources Program (LRP) — A program in which Metropolitan provides financial assistance to itsmember agencies for the development of local groundwater recycling and groundwater recovery projects.
MAPA — Management and Professional Employees Association, Local 1001.
Member Agency — Refers to any of the 26 cities or public water agencies that comprise the Metropolitan WaterDistrict and whose representatives constitute the Board of Directors of Metropolitan.
MAF (million acre–feet) — A unit measure of water.
Minute 319 — Agreement that amends the 1944 Treaty between Mexico and the United States by establishingnew rules in sharing Colorado River water and provides immediate plans to address current challenges. Partiesto the agreement include Metropolitan Water District of Southern California, Southern Nevada Water Authority,Central Arizona Water Conservation District. Minute 319 allows Mexico to store water in Lake Mead asIntentionally Created Mexican Apportionment for future delivery and environmental flows. Stored water will beexchanged among the parties to the agreement.
MWDOC — Municipal Water District of Orange County; one of 26 member agencies that comprise Metropolitan.
MOU (Memorandum of Understanding) — Legal agreements entered into between Metropolitan and any of thefour employee bargaining units that dictate terms and conditions of employment.
Operating Equipment — Any portable equipment costing $5,000 or more and having a useful life of five yearsor more.
Operations Maintenance Power & Recovery (OMP&R) — A component of the State Water Contract that is billedto the contracting agencies to maintain the system.
OPEB — Other Post Employment Benefits.
ORP — Oxidation Retrofit Program.
Ozone — It is an unstable form of oxygen composed of three–atom molecules that break down readily to normaloxygen and nascent oxygen. The latter is a powerful oxidizing agent and has germicidal action. Ozone is usuallyproduced with on–site generators by passing high–voltage electricity through dry atmospheric air or pureoxygen between stationary electrodes. This process converts a small percentage of the oxygen in the air intoozone. It is usually injected into the water to be treated in a highly baffled mixing chamber.
PAYGO — The practice of funding construction expenditures from current operating revenues in lieu of usingdebt proceeds.
PVID — Palo Verde Irrigation District.
Palo Verde Land Management and Water Supply Program — Calls for the development of a flexible watersupply of between 25,000 and 111,000 acre–feet per year for 35 years through a land management and crop
2018/19 and 2019/20 Proposed Biennial Budget 145 Glossary of Terms

rotation program to be implemented by participating farmers in the Palo Verde Valley. The maximum watersupply that could be developed would be about 3.63 million acre–feet during the 35–year term while theminimum water supply required to be developed would be 1.76 million acre–feet.
Performance Measure — An indicator of progress toward completing an initiative, achieving a goal, orimplementing a strategy. Performance measures are quantifiable and tracked over time. Measures can indicateproblem areas that need attention or be a guide for continual performance improvement through specificinitiatives and actions.
PCCP — Pre–stressed Concrete Cylinder Pipe.
Power Recovery — Energy generated from the operation of sixteen Metropolitan–owned hydroelectricgenerating facilities. The term "recovery" derives from the capture of potentially wasted electrical energy fromMetropolitan’s water distribution system.
Quagga Mussel — A destructive non–native species of mussel from the Ukraine region that could clog pipes andwater line.
Quantification Settlement Agreement (QSA) — The Quantification Settlement Agreement (QSA), executed byCoachella Valley Water District (CVWD), Imperial Irrigation District (IID) and Metropolitan in October 2003,establishes Colorado River water use limits for IID and CVWD, and provides for specific acquisitions ofconserved water and water supply arrangements for up to 75 years. The QSA and related agreements provide aframework for Metropolitan to enter into other cooperative Colorado River supply programs and set asideseveral disputes among California’s Colorado River water agencies.
Regional Recycled Water Program (RRWP) — An advanced water treatment demonstration facility that willtake treated wastewater and purify it through various advanced treatment technologies to produce a safe, high-quality water source; the project is a partnership between Metropolitan and the Sanitation Districts of LosAngeles County.
Replacement and Refurbishment (R&R) — Capital projects that invest in Metropolitan’s aging infrastructure byrestoring them to optimal operating status.
Reserves — Funds set aside to comply with bond covenants, working capital policy, or other board policies aspart of a prudent financial strategy.
Revenue Remainder Fund — See Financial Policies for description.
SCADA — Supervisory Control and Data Acquisition; automated systems that are used to monitor, operate, andcontrol Metropolitan’s water conveyance, treatment, and distribution systems.
SDCWA — San Diego County Water Authority; one of 26 member agencies that make up Metropolitan.
Senate Bill 60 (SB 60) — This bill requires Metropolitan to place increased emphasis on sustainable,environmentally sound, and cost–effective water conservation, recycling, and groundwater storage andreplenishment measures and, commencing February 1, 2001, to prepare and submit to the Legislature aprescribed annual report relating to water conservation.
State Water Contract (SWC) — State Water Contracts are the basis for all SWP construction and ongoingoperations. As the largest of the now 29 contractors, Metropolitan is entitled to slightly less than half of all SWPsupplies. Water supplies from the SWP are conveyed to Metropolitan via the SWP’s 444–mile CaliforniaAqueduct, which was made possible pursuant to Metropolitan’s State Water Contract.
2018/19 and 2019/20 Proposed Biennial Budget 146 Glossary of Terms

State Water Project (SWP) — The SWP is the largest state–built, user–financed water supply andtransportation project in the country. The SWP serves urban and agricultural agencies from the San FranciscoBay area to Southern California. Its facilities were constructed with several general types of financing, therepayment of which is made by the 29 agencies and districts that participate in the SWP through long–termcontracts (the State Water Contractors). The State Water Contractors also pay for the operations, maintenance,power, and replacement costs of the SWP.
System Overview Study — An analysis of Metropolitan’s current delivery and treatment capacities versusprojected needs during the planning horizon. The System Overview Study, coupled with the Integrated AreaStudy, analyzes various portfolios of projects that could be used to meet future demand and then develops apotential CIP. Finally, the System Overview Study analyzes the potential impact to rates from the proposedfacilities.
TAF (thousand acre–feet) — A unit of measure of water.
Total Dissolved Solids (TDS) — Refers to the total organic carbon concentration in water. Measurement of TDSremoval is used as a surrogate for disinfection by-product precursor removal.
Treatment Plants — Facilities used by Metropolitan for the treatment of water to remove contaminants or totaldissolved solids thus ensuring that such water is potable before it is distributed to member agencies.
U.S. Department of the Interior, Bureau of Reclamation (USBR) — Largest wholesaler of water and secondlargest supplier of hydroelectric power in the American West. Promotes water conservation, recycling, andreuse.
Vacancy Factor — A calculated reduction to the O&M labor budget that attempts to account for vacancies thatoccur within organizations throughout the year. Budgeted labor dollars assume that budgeted positions will befilled for the entire fiscal year (2,080 hours). However, positions routinely become vacant throughoutMetropolitan for part of the year as staff transfer to other positions or leave employment in the company andtime elapses during the recruitment period to refill the vacated positions.
WRSF — Water Rate Stabilization Fund. See Financial Policies for description.
WRM — Water Resource Management (group); an organization within Metropolitan that focuses on waterresource planning and management, including conservation.
WSF — Water Stewardship Fund. See Financial Policies for description.
Water Supply Allocation Plan (WSAP) — This plan is intended to be implemented during periods of regionalwater shortages to promote conservation of scarce water supplies. The WSAP was created to approach limitingsupplies in a manner that is regionally fair and minimizes impacts by establishing accurate and fair baselines foreach of Metropolitan’s 26 member agencies.
Water Supply Programs — Water transfer and storage programs that supplement Colorado River and StateWater Project supplies.
Water Surplus Drought Management Plan (WSDM Plan) — This plan directs Metropolitan’s resourceoperations to help attain the region’s reliability goal. The WSDM Plan recognizes the interdependence of surplusand shortage actions and is a coordinated plan that utilizes all available resources to maximize supply reliability.The overall objective is to ensure that shortage allocation of Metropolitan’s imported water supplies isminimized.
Working Capital — A measure of both a company's efficiency and its short–term financial health. The workingcapital ratio is calculated as: Working Capital = Current Assets - Current Liabilities.
2018/19 and 2019/20 Proposed Biennial Budget 147 Glossary of Terms

WSO — Water System Operations (group); an organization within Metropolitan responsible for operating andmaintaining Metropolitan’s water conveyance, treatment, and distribution system and its appurtenant systems.
2018/19 and 2019/20 Proposed Biennial Budget 148 Glossary of Terms