
2016_AM_PhD_Khetrapal_S 25.8.2016.pdf - LSHTM ...
450
LSHTM Research Online Khetrapal, S; (2016) Public-Private Partnerships in the Health Sector The Case of a National Health Insurance Scheme in India. PhD thesis, London School of Hygiene & Tropical Medicine. DOI: https://doi.org/10.17037/PUBS.03141184 Downloaded from: https://researchonline.lshtm.ac.uk/id/eprint/3141184/ DOI: https://doi.org/10.17037/PUBS.03141184 Usage Guidelines: Please refer to usage guidelines at https://researchonline.lshtm.ac.uk/policies.html or alternatively contact [email protected]. Available under license: http://creativecommons.org/licenses/by-nc-nd/3.0/ https://researchonline.lshtm.ac.uk
-
Upload
khangminh22 -
Category
Documents
-
view
0 -
download
0
Transcript of 2016_AM_PhD_Khetrapal_S 25.8.2016.pdf - LSHTM ...

LSHTM Research Online
Khetrapal, S; (2016) Public-Private Partnerships in the Health Sector The Case of a National HealthInsurance Scheme in India. PhD thesis, London School of Hygiene & Tropical Medicine. DOI:https://doi.org/10.17037/PUBS.03141184
Downloaded from: https://researchonline.lshtm.ac.uk/id/eprint/3141184/
DOI: https://doi.org/10.17037/PUBS.03141184
Usage Guidelines:
Please refer to usage guidelines at https://researchonline.lshtm.ac.uk/policies.html or alternativelycontact [email protected].
Available under license: http://creativecommons.org/licenses/by-nc-nd/3.0/
https://researchonline.lshtm.ac.uk

1
Public-Private Partnerships in the Health Sector
The Case of a National Health Insurance Scheme in India
SONALINI KHETRAPAL
Thesis submitted in accordance with the requirements for the degree of
Doctor of Philosophy of the
University of London
2016
Department of Global Health and Development
Faculty of Public Health and Policy
LONDON SCHOOL OF HYGIENE & TROPICAL MEDICINE
Funded by a Wellcome Trust Capacity Strengthening Award
Research group affiliation: Public Health Foundation of India

2
Declaration of Own Work
I, Sonalini Khetrapal, confirm that the work presented in this thesis is my own. Where
information has been derived from other sources, I confirm that this has been
indicated in the thesis.
Sonalini Khetrapal

3
Abstract
Public-Private Partnerships (PPPs) in the health sector are essential in light of the
challenges the public sector is facing in healthcare finance, provision and
management. Recognizing the need to provide insurance coverage to those below the
poverty line (BPL), Rashtriya Swasthya Bima Yojana (RSBY) was introduced in
2008 by the Ministry of Labour and Employment in India. RSBY is a social health
insurance scheme for the informal sector, where health care delivery and management
involves a multitude of stakeholders from both public and private sectors who are
governed by contractual agreements. A family of up to five pays INR 30/- (£0.30)
annually for enrolment for a coverage of INR 30,000/- (£302). The balance of the
premium is subsidized and shared by the Central (75%) and the State (25%)
governments.
This research aims to evaluate the availability, provision and management of health
services under RSBY Public-Private Partnership contracts and factors that might
influence them in order to inform policy makers on how to improve scheme
implementation for the BPL beneficiary. The study was conducted in the districts of
Patiala and Yamunanagar, in the States of Punjab and Haryana respectively. The
study has both qualitative and quantitative components using primary and secondary
data. The results of the study can be broadly categorized under the main pillars of
scheme design and implementation. These include political, regulatory and
institutional capacity; stakeholder contracting; enrolment of beneficiaries;
empanelment of health facilities; and finally provision and utilization of services.
RSBY has clearly attempted to address the existing gaps in the provision of health
services by offering a balanced Public-Private Partnership model that provides some
degree of financial protection to the end user. Despite the weaknesses identified, it is a
robust and evolving model that needs to be continuously developed, on the basis of
lessons learnt from implementation of the scheme.

4
Contents
ABSTRACT .................................................................................................................................... 3
ABBREVIATIONS ...................................................................................................................... 16
ACKNOWLEDGEMENTS ......................................................................................................... 19
CHAPTER 1 – INTRODUCTION ............................................................................................. 21
1.1 AIM .................................................................................................................................. 26
1.2 OBJECTIVES ................................................................................................................... 26
1.3 METHODOLOGY ........................................................................................................... 26
1.4 LAYOUT .......................................................................................................................... 28
CHAPTER 2 – LITERATURE REVIEW ................................................................................. 29
2.1 NEW PUBLIC MANAGEMENT – A HISTORICAL PERSPECTIVE .......................... 30
2.2 PUBLIC–PRIVATE PARTNERSHIPS ........................................................................... 36
2.3 HEALTH INSURANCE .................................................................................................. 46
2.4 CONCLUSIONS .............................................................................................................. 63
CHAPTER 3 – INDIA – BACKGROUND AND CONTEXT .................................................. 66
3.1 THE INSURANCE SECTOR IN INDIA – HISTORICAL CONTEXT .......................... 71
3.2 HEALTH INSURANCE IN INDIA ................................................................................. 73
3.3 CURRENT STATUS OF HEALTH INSURANCE ......................................................... 79
3.4 IDENTIFYING BELOW POVERTY LINE POPULATION .......................................... 80
3.5 RASHTRIYA SWASTHYA BIMA YOJANA (RSBY) .................................................. 87
3.6 NEED FOR RESEARCH ............................................................................................... 103
CHAPTER 4 – RESEARCH PROTOCOL ............................................................................. 106
4.1 AIMS AND OBJECTIVES ............................................................................................ 107
4.2 CONCEPTUAL FRAMEWORK ................................................................................... 108
4.3 STUDY SETTING ......................................................................................................... 108
4.4 ACCESS AND ETHICAL APPROVAL ....................................................................... 112
4.5 METHODS FOR OBJECTIVE 1 ................................................................................... 112
4.6 METHODS FOR OBJECTIVE 2 ................................................................................... 116
4.7 METHODS FOR OBJECTIVE 3 ................................................................................... 120
4.8 METHODS FOR OBJECTIVE 4 ................................................................................... 125
4.9 AMENDMENTS IN METHODOLOGY ....................................................................... 126
CHAPTER 5 – ANALYSIS OF EXTERNAL ENVIRONMENT AND CONTRACTS ...... 127
5.1 INTRODUCTION .......................................................................................................... 128
5.2 EXTERNAL ENVIRONMENT ..................................................................................... 129
5.3 INSTITUTIONAL FRAMEWORK AND CAPACITY ................................................ 135
5.4 FORMULATION OF POLICY AND GUIDELINES FOR IMPLEMENTATION ...... 141
5.5 ROLES AND RESPONSIBILITIES .............................................................................. 142
5.6 CONTRACT ANALYSIS .............................................................................................. 146
5.7 DISCUSSION ................................................................................................................. 160
5.8 CONCLUSIONS ............................................................................................................ 164

5
CHAPTER 6 – ASSESSMENT OF ACCESSIBILITY, AVAILABILITY AND
UTILIZATION PATTERNS UNDER RSBY ............................................................ 166
6.1 INTRODUCTION .......................................................................................................... 167
6.2 ACCESS TO SERVICES UNDER RSBY ..................................................................... 168
6.3 AVAILABILITY OF SERVICES UNDER RSBY-EMPANELLED HOSPITALS...... 179
6.4 ANALYSIS OF ENROLMENT UNDER RSBY ........................................................... 182
6.5 UTILIZATION PATTERNS .......................................................................................... 187
6.6 DISCUSSION ................................................................................................................. 208
6.7 CONCLUSIONS ............................................................................................................ 215
CHAPTER 7 – HEALTH CARE ACROSS PUBLIC AND PRIVATE PROVIDER .......... 216
7.1 INTRODUCTION .......................................................................................................... 217
7.2 DESCRIPTIVE INFORMATION OF EXIT INTERVIEW PARTICIPANTS ............. 218
7.3 STRUCTURAL ASPECTS OF CARE ACROSS PUBLIC AND PRIVATE
PROVIDERS FOR RSBY BENEFICIARIES IN SELECTED DISTRICTS................. 222
7.4 PROCESS OF SERVICE DELIVERY FOR RSBY PARTICIPANTS BY
PUBLIC AND PRIVATE PROVIDERS ........................................................................ 229
7.5 COMPARISON OF RSBY AND NON-RSBY PARTICIPANTS ON CHOICE OF
HOSPITAL, TRANSPORT AND DIAGNOSIS ............................................................ 253
7.6 USER SATISFACTION IN PRIVATE AND PUBLIC FACILITIES – RSBY AND
NON-RSBY PATIENTS ................................................................................................ 265
7.7 FINANCIAL BURDEN ................................................................................................. 289
7.8 DISCUSSION ................................................................................................................. 292
7.9 CONCLUSIONS ............................................................................................................ 300
CHAPTER 8 – OVERVIEW OF FINDINGS .......................................................................... 302
8.1 OBJECTIVE 1 ................................................................................................................ 303
8.2 OBJECTIVE 2 ................................................................................................................ 313
8.3 OBJECTIVE 3 ................................................................................................................ 318
8.4 STUDY LIMITATIONS ................................................................................................ 323
CHAPTER 9 – DISCUSSION, CONCLUSIONS AND RECOMMENDATIONS .............. 326
9.1 GOVERNMENT FAILURE .......................................................................................... 327
9.2 EQUITY CONCERNS IN HEALTH INSURANCE ..................................................... 334
9.3 GAPS IN RSBY AS A PPP MODEL............................................................................. 338
9.4 RSBY – INFLUENCE OF CONTRACTUAL ARRANGEMENTS ............................. 348
9.5 CONCLUSIONS AND RECOMMENDATIONS ......................................................... 354
REFERENCES ........................................................................................................................... 361
ANNEXURES ............................................................................................................................. 398

6
List of Tables
Table 2.1 Keywords used for literature review
Table 2.2 Key elements of NPM
Table 3.1 Keywords used for literature review (India - background
and context)
Table 3.2 Comparison between general insurance and health
insurance
Table 3.3 Poverty ratio and number of poor in India
Table 3.4 Pros and cons of collaborating with the private sector in
health
Table 3.5 Nodal agency for RSBY implementation
Table 3.6 List of insurance companies contracted in various states
(2013–14)
Table 3.7 Enrolment and empanelment under the scheme in
various states
Table 4.1 In-depth interviews conducted
Table 6.1 Health facilities in the selected districts
Table 6.2 Block-wise total BPL population at sub-district level in
Patiala
Table 6.3 Block-wise total BPL population at the sub-district level
in Yamunanagar
Table 6.4 Facility wise total availability of services
Table 6.5 Facilities among hospitals empanelled under RSBY
scheme and availability of care
Table 6.6 Proportion of enrolled beneficiaries in RSBY Scheme in
Patiala district (similar data for Yamunanagar district
was not available)
Table 6.7 Off-target and leakage categories
Table 6.8 Binary Logistic regression analysis for determinants of
off-target population
Page No.
30
35
67
73
82
91
94
96
100
114
169
170
174
180
181
184
185
186

7
Table 6.9 Binary logistic regression analysis for determinants of
leakage
Table 6.10 Utilization Pattern (Patiala Vs Yamunanagar)
Table 6.11 Claims distribution in private and public hospitals
Table 6.12 Distribution of claims in public and private hospitals
over the year
Table 6.13 Herfindahl-Hirschman Index of hospitals
Table 6.14 Background characteristics of hospitals where a majority
of the claims were reported
Table 6.15 Age and gender distribution of patients (Patiala vs
Yamunanagar) by claims
Table 6.16 Age and gender distribution of patients (private vs
public facilities) by claims
Table 6.17 Relationship of claimant to the head of the household
Table 6.18 Relationship of claimant to the head of the household
(private vs public)
Table 6.19 Mean amount claimed by hospitals and reimbursed by
the insurance company (Patiala vs Yamunanagar)
Table 6.20 Mean amount reimbursed by the insurance company to
the hospital (private vs public)
Table 6.21 Mean amount claimed from the insurance company by
the hospitals (Private vs public)
Table 6.22 Difference between claimed and reimbursed amount
(Patiala vs Yamunanagar)
Table 6.23 Difference between claimed and reimbursed amount
(private vs public hospitals)
Table 6.24 Multivariate analysis for determinants of reimbursed
amount
Table 6.25 Difference between premium collected and amount
reimbursed
Table 6.26 Frequency of claims by the same household (Patiala vs
Yamunanagar)
187
187
189
190
191
192
193
193
194
194
196
196
196
200
201
202
203
204

8
Table 6.27 Distribution of claims in both the districts by diagnosis
(Patiala vs Yamunanagar)
Table 6.28 Distribution of claims in both the districts by diagnosis
(private vs public)
Table 6.29 Length of stay (public vs private hospitals)
Table 6.30 Time taken to settle the claim amount by the insurance
company (Yamunanagar)
205
206
207
208
Table 7.1: Socio-demographic characteristics (Patiala vs
Yamunanagar)
219
Table 7.2 Socio-demographic characteristics (Private vs Public)
220
Table 7.3 Socio-demographic characteristics (RSBY vs non RSBY)
221
Table 7.4 Health provider checklist (self-assessment)
226
Table 7.5 Observation checklist by the interviewers
227
Table 7.6 Availability of records
228
Table 7.7 RSBY help desk in hospitals (Patiala vs Yamunanagar)
231
Table 7.8 RSBY help desk in private and public hospitals
232
Table 7.9 Waiting period for RSBY participants (Patiala vs
Yamunanagar)
233
Table 7.10 Waiting period for RSBY participants (Private vs Public
hospitals)
234
Table 7.11 Registration through fingerprint scan of RSBY
participants (Patiala vs Yamunanagar)
235
Table 7.12 Registration through fingerprint scan of RSBY
participants(Private vs Public)
236
Table 7.13 Information received from RSBY help desk regarding
cost of treatment (Patiala vs Yamunanagar)
238
Table 7.14 Information received from RSBY help desk across
districts regarding cost of treatment (Private vs Public)
239
Table 7.15 Diagnostics and medicines from outside the hospital
(Patiala and Yamunanagar)
241
Table 7.16 Diagnostics and medicines from outside the hospital
(Private vs Public)
242

9
Table 7.17 Provision of food to RSBY participants during hospital
stay (Patiala vs Yamunanagar)
244
Table 7.18 Provision of food to RSBY participants during hospital
stay (Private vs Public)
245
Table 7.19 Process followed during discharge of RSBY beneficiary
from the hospital (Patiala vs Yamunanagar)
247
Table 7.20 Process during discharge of RSBY beneficiary from the
hospital (Private vs Public)
248
Table 7.21 Reimbursement of transportation cost to the RSBY
beneficiary (Patiala vs Yamunanagar)
249
Table 7.22 Reimbursement of transportation cost to the RSBY
beneficiary (Private vs Public)
250
Table 7.23 Knowledge of post-hospitalization expenses and
provision of medicines and diagnostics (Patiala and
Yamunanagar)
251
Table 7.24 Knowledge of post-hospitalization expenses and
provision of medicines and diagnostics (Private vs
Public)
252
Table 7.25 Reasons for choosing the health facility for treatment
(Patiala vs Yamunanagar)
253
Table 7.26 Reasons for choosing the present health facility for
treatment (Private vs Public hospitals)
254
Table 7.27 Reasons for choosing the present health facility for
treatment (RSBY vs Non-RSBY patients)
255
Table 7.28 Health facility contacted by the patient (Patiala vs
Yamunanagar)
256
Table 7.29 Health facility contacted by the patient (Private vs Public
hospitals)
257
Table 7.30 Health facility contacted by the patient (RSBY vs non-
RSBY patients)
258
Table 7.31 Mode of transportation to hospital (Patiala vs
Yamunanagar)
259
Table 7.32 Mode of transportation to hospital (Private vs Public
hospitals)
260
10
Table 7.33 Mode of transportation to hospital (RSBY vs Non-RSBY
patients)
261
Table 7.34 Diagnosis of study participants (Private vs Public
hospitals)
263
Table 7.35 Diagnosis of study participants (RSBY vs non-RSBY
patients)
264
Table 7.36 Beneficiaries’ experiences during hospital admission
(Patiala vs Yamunanagar)
266
Table 7.37 Beneficiaries’ experiences with hospital admission
(Private vs Public hospitals)
267
Table 7.38 Beneficiaries’ experiences with hospital admission
(RSBY vs Non-RSBY patients)
268
Table 7.39 Care from nurses (Patiala vs Yamunanagar)
269
Table 7.40 Care from nurses (Private vs Public hospitals)
270
Table 7.41 Care from nurses (RSBY vs Non-RSBY patients )
271
Table 7.42 Care from doctors (Patiala vs Yamunanagar)
272
Table 7.43 Care from doctors (Private vs Public hospitals)
273
Table 7.44 Care from doctors (RSBY vs non-RSBY patients)
274
Table 7.45 Hospital environment (Patiala vs Yamunanagar)
275
Table 7.46 Hospital environment (Private vs Public hospitals)
276
Table 7.47 Hospital environment (RSBY vs Non-RSBY patients)
277
Table 7.48 Experiences in the hospital (Patiala vs Yamunanagar)
279
Table 7.49 Experiences in the hospital (Private vs Public hospitals)
280
Table 7.50 Experiences in the hospital (RSBY vs non-RSBY
patients)
281
Table 7.51 Experiences at the time of discharge (Patiala vs
Yamunanagar)
282
Table 7.52 Experiences at the time of discharge interviews (Private
vs Public hospitals)
283

11
Table 7.53 Experiences at the time of discharge interviews (RSBY
vs Non-RSBY)
284
Table 7.54 Overall rating of the hospitals
285
Table 7.55 Recommend hospital to friends and family? (Patiala vs
Yamunanagar)
285
Table 7.56
Recommend hospital to friends and family? (Private vs
Public hospitals)
286
Table 7.57 Recommend hospital to friends and family? (RSBY vs
non-RSBY patients)
286
Table 7.58 Aggregated analysis of the user satisfaction
288
Table 7.59 Total out-of-pocket expenditure (mean) by the
participants
289
Table 7.60
Determinants of OOP expenditure 291
Table 8.1 Roles and responsibilities of Central and State
government, insurance companies and TPAs.
Table 8.2 Contract design analysis
Table 8.3 Scheme utilization comparison between districts and
types of facilities
Table 8.4 Service delivery across district and private vs public
Table 8.5 Comparison for choice of hospital, transport and
diagnosis
Table 8.6 User satisfaction
307
309
317
320
321
322

12
List of Figures
Page No.
Figure 3.1 Financing and benefits under the health insurance
scheme (Jharkhand)
Figure 3.2 Population coverage under various health schemes in
India
Figure 3.3 Literature review search strategy for RSBY documents
Figure 3.4 Use of contracts in the implementation of RSBY
Figure 3.5 Partners involved in implementation of RSBY
77
80
90
92
93
Figure 4.1 Conceptual framework
Figure 4.2a Map of India showing the states of Punjab and Haryana
Figure 4.2b Map of Yamunanagar district (Haryana)
Figure 4.2c Map of Patiala district (Punjab)
Figure 4.3 Enrolled participants for exit interviews
Figure 5.1 Institutional and organization structures at Central level
Figure 5.2 Institutional and organization structures at state and
district level – Punjab
Figure 5.3 Institutional and organization structures at state and
district level – Haryana
Figure 6.1 Patiala – empanelled facilities – public and private
Figure 6.2 Patiala – empanelled and non-empanelled facilities
Figure 6.3 Patiala – all facilities
Figure 6.4 Yamunanagar – empanelled facilities – public and
private
Figure 6.5 Yamunanagar – empanelled and non-empanelled
facilities
Figure 6.6 Yamunanagar – all facilities
Figure 6.7 Enrolment under RSBY (Patiala Vs Yamunanagar)
109
109
110
110
124
140
140
141
171
172
173
175
176
177
183

13
Figure 6.8 Trend in number of claims per month made in Patiala
and Yamunanagar districts
Figure 6.9 Distribution of claims in different hospitals empanelled
in private and public sectors of Yamunanagar and
Patiala districts
Figure 6.10 Kernel density estimates for reimbursed amount (private
vs public hospitals)
Figure 6.11 Kernel Density estimates for reimbursed amount in
Patiala district (private vs public hospitals)
Figure 6.12 Kernel density estimates for reimbursed amount in
Yamunanagar district (private vs public hospitals)
Figure 6.13 Kernel density estimates for claimed amount (private vs
public hospitals)
Figure 6.14 Kernel density estimates for claimed amount in Patiala
district (private vs public hospitals)
Figure 6.15 Kernel density estimates for claimed amount in
Yamunanagar district (private vs public hospitals)
Figure 6.16 Mean amount reimbursed under various categories with
±2SD
Figure 7.1 Kernel density diagram for RSBY and non-RSBY
participants for age
188
191
197
197
198
198
199
199
200
222

14
List of Annexures
Page No
Annexure 1 List of Packages covered under RSBY 399
Annexure 2 In-depth Interview Guide for Key Stakeholders 413
Annexure 3 Questionnaire for availability of services offered at 419
empanelled facilities
Annexure 4 Observational and Facility Records Checklist 420
Annexure 5 Health Provider Checklist (Self-assessment) 423
Annexure 6 RSBY Exit Patient Interview Questionnaire 426

15
Currency Equivalent
As of 1st October 2015
Currency Unit – Indian Rupees (INR)
UK £ 1.00 = INR 99.31
US$ 1.00 = INR 65.62
16
Abbreviations
ADB Asian Development Bank
ADC Additional Deputy Commission
ANM Auxiliary Nurse Midwife
APL Above Poverty Line
ArcGIS A Geographic Information System
ARHQ Agency for Healthcare Research and Quality
ARS Administradoras del Regimen Subsidiado
ASHA Accredited Social Health Activist
AYUSH Ayurveda, Yoga, Unani, Siddha and Homoeopathy
BDO Block Development Officer
BJP Bharatiya Janata Party
BMHS Bachelor of Homeopathic Medicine
BoCW Building and other Construction Workers
BPL Below Poverty Line
BRICS Brazil, Russia, India, China and South Africa
CBHI Community-based Health Insurance
CEO Chief Executive Officers
CGHS Central Government Health Scheme
CGRMS Central Grievance Redressal Management System
CHAS Community Health Assist Scheme
CHC Community Health Centre
CHCS Co-operative Health Care System
CI Confidence Interval
CKGA Central Key Generating Authority
CSMBS Civil Servant Medical Benefit Scheme
CSR Corporate Social Responsibility
DFID Department for International Development
DGLW Director General Labour Welfare
DPRO District Panchayati Raj Officer
ESI Employees’ State Insurance
ESIC Employees’ State Insurance Corporation
ESIS Employees’ State Insurance Scheme
FDA Food and Drug Administration
FKO Field Key Officer
GDP Gross Domestic Product
GIZ (nee GTZ) German Agency for International Cooperation
GoI Government of India
GTZ Deutsche Gesellschaft für Technische Zusammenarbeit
HCAHPS Hospital Consumer Assessment of Healthcare Providers and Systems
HCFP Health Care Fund for the Poor
HDI Human Development Index
17
ICDS Integrated Child Development Services
ICMR Indian Council of Medical Research
ICT Information and Communication Technology
IEC Information, Education and Communication
IEG Independent Evaluation Group
ILO International Labour Organization
IMA Indian Medical Association
IPHA Indian Public Health Standards
IRDA Insurance Regulatory and Development Authority
JSY Janani Suraksha Yojana
KMS Key Management System
LIC Life Insurance Corporation of India
LMIC Low- and Middle-Income Country
LSHTM London School of Hygiene and Tropical Medicine
MAP Medical Assistance Programme
MBBS Bachelor of Medicine and Bachelor of Surgery
MDG Millennium Development Goal
MMD Medically Managed Diseases
MoHFW Ministry of Health and Family Welfare
MoLE Ministry of Labour and Employment
MoLHSA Ministry of Labour, Health and Social Welfare
MoPH Ministry of Public Health
MoU Memorandum of Understanding
MPCE Monthly Per Capita Consumption Expenditure
NaNOs National Nodal Officers
NFHS National Family Health Survey
NGO Non-Governmental Organization
NHIP National Health Insurance Programme
NHIS National Health Insurance Scheme
NHRC National Human Rights Commission
NIC National Informatics Centre
NPM New Public Management
NRHM National Rural Health Mission
OBC Other Backward Classes
OECD Organisation for Economic Cooperation and Development
OOP Out-of-Pocket
OPD Out Patient Department
PACS Poorest Area Civil Society
PEPSU Patiala and East Punjab States Union
PHC Primary Health Centre
PHFI Public Health Foundation of India
PHI Private Health Insurance
PHSC Punjab Health Systems Corporation
PI Principal Investigator

18
PPP Public–private Partnership
PRI Panchayati Raj Institution
RA Research Assistant
RCMS Rural Co-operative Medical System
RNTCP Revised National Tuberculosis Control Programme
RSBY Rashtriya Swasthya Bima Yojana
SC Scheduled Caste
SHG Self-help Group
SHI Social Health Insurance
SISBEN Sistema de Selección de Beneficiarios
SNA State Nodal Agency
SOP Standard Operating Procedure
SSS Social Security Scheme
ST Scheduled Tribe
STOC Smart Card Testing and Certificate
TPA Third Party Administrator
UCS Universal Coverage Scheme
UHC Universal Health Coverage
UHIS Universal Health Insurance Scheme
UID Unique Identification Number
UNDP United Nations Development Programme
UPA United Progressive Alliance
UT Union Territory
WHO World Health Organization
19
Acknowledgements
First and foremost, I have no words to express my sincere gratitude to my research
guide, Professor Anne Mills, Vice Director & Provost and Professor of Health
Economics and Policy, LSHTM, for her invaluable and inspirational guidance,
consistent encouragement and exhaustive inputs that I received throughout the
research work. Her unconditional support made this accomplishment possible. A
person with an amiable and positive disposition, she has always made herself
available to demystify my doubts despite her busy schedules, and I consider myself
fortunate to undertake my doctoral programme under her guidance and to benefit from
her vast research expertise. Her guidance and support made my PhD experience
thought- provoking and stimulating. Her enthusiasm was contagious and motivational
for me. I am also impressed with the excellent example she sets as a successful
woman who is a role model for me and many others round the world.
I thank Dr Arnab Acharya, Senior Lecturer, Public Health Policy, LSHTM for his
constructive guidance, valuable comments and useful suggestions on my successive
drafts. He was always forthcoming with his support in a timely manner and his deep
and vast knowledge and understanding of concepts went a long way in helping me to
understand the issues I was grappling with. His expertise in research and his special
interest in the subject of my study were of immense value to me.
The facilities provided to carry out the research work by my Institute, LSHTM and
the vibrant academic environment where I met fellow doctoral scholars, were great
sources of encouragement in themselves. No research is possible without a library, the
centre of learning and knowledge. I take this opportunity to express my gratitude to
the library staff for all the help they rendered to me.
My thanks are due to the Wellcome Trust for funding my research. I thank Dr Sanjay
P. Zodpey, Director, IIPH, Public Health Foundation of India for his valuable support.
He was always forthcoming with effective solutions whenever bottlenecks appeared.
My special thanks to Mr Anil Swaroop, the prime mover and shaker of the scheme,
for his valuable inputs. My thanks also to Mr Nishant Jain from GTZ for the time he
made available for constructive discussions.

20
I would like to acknowledge the nodal agency of the Department of Health and
Family Welfare, Government of Punjab, and chiefly its Project Manager, for her
patience in sharing the endless information I sought and clarifying the numerous
questions I had. I would like to place on record my thanks to the Chief Secretary of
Haryana who made it possible for me to access the much-needed data from Haryana. I
would be remiss if I did not thank the Statistical Officer of Yamunanagar who went
out of his way to provide relevant data.
My thanks are due to key stakeholders, including policymakers, district officials,
scheme implementers, private and public providers and the insurance company
representative. I would also like to thank the participants of exit interviews.
Special thanks to my Research Assistant who extended unstinted support in statistical
data analysis. The strenuous efforts made by my data collectors can hardly be
overemphasized. They made my field study possible.
My colleagues and friends have all extended their support in a very special way, and I
gained a lot from their personal and scholarly interactions. I acknowledge their
support with thanks.

21
Chapter 1
INTRODUCTION
22
Chapter 1
INTRODUCTION
In view of the challenges governments are facing in the provisioning, financing and
managing health care (Department of Economic Affairs, 2010), public–private
partnerships (PPPs) in the health sector are both important and timely. Development
of infrastructure and delivery of basic health services are important roles of any
government; in some countries, these roles are even mandated by their Constitution.
However, with the pressures of increasing population and urbanisation, and the ability
of governments to adequately address these needs through traditional means has been
severely constrained. This has led governments across the world to increasingly look
to the private sector to supplement public investments and provide health services
through PPPs. Engagement with the private sector, when appropriately structured and
executed, can help address specific cost and investment challenges and increase
efficiency through improved service provision and management at reduced costs. It
can also enhance service quality through enhanced expertise, more rapid and
substantial investments in infrastructure and latest medical technologies, which have
the potential to attract and retain better-performing staff (Nikolic and Maikisch,
2006).
For the purpose of this research, a broad definition of PPP has been adopted, similar
to that of the United Kingdom (UK) government where PPPs are defined as
‘Arrangements typified by joint working between the public and private sector’ (HM
Treasury, 2008). According to the Government of India (GoI), PPPs can cover all
types of collaboration across the interface between the public and private sectors to
deliver policies, services and infrastructure.
A study by Perrot is of the view that with the increasing complexity of health systems,
there was a realization that they could not function in isolation. The need to forge
partnerships in a multi-sectoral environment became clear to the diverse stakeholders
involved in health care (Perrot, 2006). The simplest way to do that was through
interaction. This interaction took various forms and could be on different levels. This
resulted in various types of contractual relations-some based on the nature of the
23
contract (public or private), others on the parties involved and yet others on the scope
of the contract (Perrot, 2006).
Various studies/surveys have proposed conflicting views on the efficacy and cost–
effectiveness of the PPP model in health care. Palmer reviewed theories and evidence
relating to public–private contracts for the delivery of primary care services in low-
and middle-income countries, and concluded that reform packages in these countries
promote the use of contracts to make publicly funded services more accountable,
transparent and efficient, despite the weak capacity of governments and markets to
manage them (Palmer, 2000).
A questionnaire survey among public and private stakeholders in Malaysia, which
aimed to capture the perceptions of the public and private sectors on the rationale for
implementation of PPPs concluded that ‘to enhance private sector involvement in
economic development was the only rationale rated (for PPP implementation) as most
important by all respondents’ (Ismail and Haris, 2014). There is an increasing interest
in the model of Australia, Spain and the UK, where a public authority contracts a
private company to design, build and operate an entire hospital.
On the basis of round-table discussions held in Nigeria, Stallworthy et al. concluded
that the private sector is a pragmatic necessity in a government-dominant system
(Stallworthy et al., 2014). Van Den Heever agreed that private markets for health care
are inevitable (Heever, 2012). Ejughemre sees the private sector as a key player in
delivering health services through supplementing scarce resources of the public sector
(Ejughemre, 2014). Shin recommends the right balance between private health
insurance and a publicly funded system (Shin, 2012).
However, McKee et al. concluded that ‘a PPP further complicates the already difficult
task of building and operating a hospital’ (McKee et al., 2006). In its analysis of 45
countries, the Independant Evaluation Group (IEG) of the World Bank concludes that
‘there was not much evidence whether private sector involvement was the best option’
(Romero, 2014). Oxfam estimated that PPP hospitals in Lesotho consumed more than
half of the total government health budget and at least three times of what the old
public hospital would have cost today (Chefa, 2014). The European Network on Debt
and Development (Eurodad) surmised that ‘PPPs are by far the most expensive way to
fund projects’ (Romero, 2014).

24
Sood and Higgins reviewed inititives in payment reform in the public and private
sectors, and concluded that the optimal role of the public sector in such reforms is
debatable (Sood and Higgins, 2012). Mills believes that ‘the debate continues on the
best mix of financing mechanisms outside the formal employment sector’ (Mills et al.,
2012).
Amid all the conflicting evidence as detailed above, the GoI was of the view that there
was significant untapped potential for the use of a PPP model in the health sector; and
towards that end developed enabling tools and activities to encourage private sector
investment (Government of India, 2011). The PPP India database indicates that 758
PPP projects costing INR 3833 billion (GBP 38.6 billion) are operational, under
construction or in stages where implementation is imminent (Department of
Economic Affairs, 2012). The Asian Development Bank (ADB) has been assisting the
GoI through a memorandum of understanding (MoU) in mainstreaming PPPs in the
health sector since 2007 in 15 states and six line ministries through creating ADB PPP
cells with the objective of providing equity, quality and sustainability in health
services (Barua, 2012).
India spends 3.7% of its gross domestic product (GDP) on health care. Over 60% of
health expenditure is private, of which 61.7% is financed out of pocket, making this
one of the highest out-of-pocket spending rates globally (World Health Organization,
2013). High out-of-pocket expenditure indicates a lack of consumption smoothing; a
one-time high expenditure on health care can deplete resources dramatically to induce
impoverishment (Gertler and Gruber, 2002). Cohen estimated that medical costs
impoverished 24% of hospitalized Indians (Cohen, 2006).
To redress this situation, inter alia, the GoI adopted a health insurance programme
called the Rashtriya Swasthya Bima Yojana (RSBY) in 2008. The RSBY is a national
health insurance scheme under the Ministry of Labour and Employment for below
poverty line (BPL) families in the unorganized sector, to provide protection from
financial liabilities arising out of health problems that involve hospitalization. Every
BPL family, which can include five persons - the head of the household, spouse and
three dependent children or parents, holding a ration card, is eligible for this scheme.
On paying INR 30 (£ 0.30) annually, the family gets a biometric-enabled smart card

25
containing their fingerprints and photographs. This makes them eligible as inpatients
for more than 700 health-care packages specified under 15 categories.
RSBY is India’s first social security scheme for BPL families. It involves a multitude
of stakeholders from both the public and private sectors who are governed by
contractual agreements. The insurer is contracted by the government and is paid a
premium (by the Central Government and state governments) for each household
enrolled under RSBY. A hospital (public or private) is contracted by the insurance
company to provide inpatient services to the enrolled beneficiaries as and when
required. For these services, the insurance company reimburses a fixed amount per
service type to the hospitals. The scheme also has provision for contracting private
partners, i.e. third party administrators (TPAs) to help in smart card implementation
and other intermediaries, such as nongovernmental organizations (NGOs) that assist
in enrolment and awareness generation. This is an unprecedented development in the
Indian health-care financing market for providing financial protection to vulnerable
groups.
Although RSBY was introduced in 2008, there is little independent evidence on
whether the use of contracts and the PPP model has necessarily led to better service
delivery for the poor. Criticisms of RSBY relate to inadequate and ineffective
awareness campaigns, power inequity among stakeholders, weak governance structure
and poor implementation of the scheme (Narayana, 2010, Das and Leino, 2011,
Seshadri et al., 2011). The Centre for Policy Research and Reddy et al. (2011) have
supplemented the issues of low enrolment, poor hospitalization, inadequate uptake of
the scheme, empanelment and accessibility, as well as noting positive out-of-pocket
expenditure incurred by the beneficiaries (Das, 2011, Reddy et al., 2011b).
Those in support of the scheme are of the view that RSBY has catered to the health
needs of millions of BPL persons in the unorganized sector. The scheme has enabled
households to choose between private and public health-care services for inpatient
services of up to INR 30,000 (£ 302) per year, which has not varied since its inception
in 2008. As the scheme is cashless, it has the potential of being relatively corruption
free; and more importantly, the poor do not have to make payments upfront.

26
1.1 Aim
The research aims to study the provision, availability and use of health services under
PPP contracts in the implementation of RSBY and the factors that can influence such
health services, in order to inform policymakers on how to improve the scheme design
for the BPL beneficiary.
1.2 Objectives
The objectives of this research were:
1) to analyse the external environment (regulatory, institutional, political, etc.)
and the contract design of the RSBY scheme in order to understand strengths
and weaknesses of the scheme design and the incentive structures created by
the assigned roles, responsibilities and relationships within the contracts;
2) to evaluate the availability of services by mapping the health-care providers
including the packages offered by the empanelled health-care providers, and
analysing the utilization patterns;
3) to compare the provision of health care across both public and private
providers for RSBY beneficiaries and between RSBY and non-RSBY
beneficiaries for a specific type of provider;
4) to inform policy on the findings and make recommendations in order to
address any problems in the scheme and help improve provision of health care
to the target population.
1.3 Methodology
The study was conducted in the districts of Patiala and Yamunanagar in the states of
Punjab and Haryana, respectively. The study population comprised both RSBY and
non-RSBY beneficiaries (used as control group for RSBY beneficiaries). The study
had both qualitative and quantitative components.
To study the first objective, 20 in-depth interviews of various key stakeholders of the
RSBY scheme were conducted. These included policy-makers, state representatives,
representatives from insurance companies, representatives from TPAs, and public and
private providers.
27
For the second objective, mapping of empanelled and non-empanelled facilities
within the districts was undertaken to assess the availability of services in each
district. ArcGIS was used as the mapping software. Primary data were collected on
availability of services from almost all empanelled facilities. Secondary data analysis
was also conducted to address the second objective. Secondary data included the
database containing the BPL census data of the population eligible for RSBY and the
data on enrolment of households under RSBY sourced from the State Nodal Agency
(SNA). Secondary data also included claims data, which contain information on
claimants, diseases, transaction details and transaction amounts. This was sourced
from the insurance companies via the SNAs.
For the third objective, a total of 12 facilities were selected, with three public and
three private facilities in each of the two chosen districts, Patiala and Yamunanagar.
An observational and health provider checklist (self-assessment) was prepared and
piloted. This checklist was used to address the structural evaluation of provision of
care in the 12 selected facilities. Another source of primary data was the exit
interviews of RSBY and non-RSBY participants from selected empanelled hospitals.
This group mostly comprised poor people, who visited the empanelled hospitals for
their health needs. Consecutive interviews (consecutive sampling) were conducted in
the selected empanelled hospitals till the desired sample size was achieved in each
hospital. Standardization was not actively addressed at the time of planning the study.
As the standard comparable group would have been BPL population not enrolled
under the scheme, this would have required huge resources in terms of funds and
time. However, it was assumed that recruiting participants (RSBY and non-RSBY)
from the same facility and same time would yield recruitment of almost similar
participants. Socio-economic status of RSBY and non-RSBY participant cannot be
matched and this would certainly vary because the classification of RSBY and non-
RSBY is based on SES only. A total of 751 exit interviews were conducted with 399
participants interviewed in Patiala district and 352 in Yamunanagar district. These
comprised 387 RSBY beneficiaries and 364 non-RSBY beneficiaries. All statistical
analyses were performed with STATA Version 9.0. Appropriate tests of significance
(chi-square test, student t-test) and linear regression analysis were used at places
where required.

28
1.4 Layout
Present thesis is divided into nine chapters. In this first chapter, an attempt has been
made to sequentially set a background of PPPs in health care and in India, taking
RSBY as a case study. The second chapter consists of a literature review where
various articles have been reviewed in the context of New Public Management –
historical perspective, PPPs, health insurance and various aspects of health insurance
such as adverse selection, cream skimming, moral hazard, risk pooling, equity etc.
The third chapter focuses on India and its background. It deals with the health status
of India as well as health economics, health systems and the insurance sector in India.
The chapter contains a comprehensive review of RSBY – its need, partnerships,
regulatory framework, private partners, contracting and scheme design. The chapter
ends with a section elaborating the need for research on PPPs using management or
contracts for delivery of health services. The fourth chapter details the methodology
of the present research. It specifically focuses on the conceptual framework of the
study and individual methodology adopted for each objective. It also describes the
amendments made in the study protocol during the process of data collection. The
fifth chapter presents the results of the first objective of the study, which is to review
the external environment looking at, inter alia, the regulatory, institutional and
political aspects of the RSBY scheme. It also analyses the contract design and its
implementation in order to understand the incentive structures created by roles,
responsibilities and relationships within the contracts. The sixth chapter deals with the
second objective of the study, which is to evaluate the availability of services by
mapping the health-care providers, packages offered by the empanelled health-care
providers and analyse the utilization patterns. Chapter seven details the third
objective, which is to evaluate the delivery of services across both public and private
empanelled facilities for RSBY and non-RSBY beneficiaries. This chapter primarily
deals with evaluating the provision of care as adapted from the Donabedian
Framework (Donabedian, 2005, Donabedian, 1988). Chapter 8 gives an objective
wise overview of the findings. Next chapter, chapter 9, is on discussion of the
findings of the present study with regard to their practical feasibility. This is followed
by conclusions and policy recommendations derived from the findings of the present
study.

29
Chapter 2
LITERATURE REVIEW

30
Chapter 2
LITERATURE REVIEW
The aim of the literature review is to understand the evolution, development and
factors affecting PPPs, both in general and in the context of health insurance in India.
The search engines used for the literature review were Google Scholar, PubMed and
Embase. The keywords used for the review in this chapter are listed in Table 2.1.
Articles were filtered based on their title and abstract. Various peer-reviewed articles,
reviews, reports and letters were studied. Apart from using search engines, cross-
references were also used to find relevant literature. Contact with experts, and
snowballing technique was adopted to identify the grey literature.
Table 2.1: Keywords used for literature review
Sections Keywords used
New Public Management –
historical perspective
Public management, historical perspective, health,
government
Public–private partnership Public–private partnership, PPP, definition, models,
contract, theories, advantages, disadvantages, India
Health insurance Health insurance, revenue, risk pooling, purchase,
PPP, public–private partnership
Note: Keywords were used in various combinations.
2.1 New Public Management – a historical perspective
2.1.1 Role of the State
The role of the State in the provision of public goods and services has long been a
source of debate. The roots of this debate can be traced back to the need for
improvement in ways in which governance is managed and services delivered, with
an emphasis on efficiency, economy and effectiveness (Metcalfe and Richards, 1987).
In this section, evolvement of new public management in some of the countries has
been discussed.

31
United Kingdom
The period 1945–1980 is considered as the classical period of the welfare state in the
UK (Osborne and McLaughlin, 2002) where the government was expected to meet all
the needs of its citizens ‘from the cradle to the grave’ (Beveridge, 2000) by providing
at least a minimum standard of living and service to all. The basic argument for
government production of goods and services is that in certain circumstances, the
market fails; and that planning, collective decision and public provision are more
effective in carrying forward certain social purposes than processes of individual
exchange (Walsh, 1995). However, dissatisfaction with the welfare model, especially
with its inefficient and ineffective public officialdom, brought about a change in the
UK from the late 1970s onwards (Osborne and McLaughlin, 2002).
People’s Republic of China
China’s health-care system has also witnessed several transitions since the early
1950s. From the 1940s to the 1980s, in a command economy, the Ministry of Health
financed and managed Chinese health service facilities, which basically performed a
social welfare function (Hu et al., 2013). In urban areas, health care was administered
through two publicly financed schemes, the Labor Insurance System (LIS), which
covered workers in state-run enterprises, and the Public Insurance System (PIS),
which looked after employees in government, academic and political institutions. In
rural areas, a three-tier health-care system operated under the Rural Cooperative
Medical System (RCMS), which relied on contributions from the welfare funds of the
brigade and the commune (Lennart et al., 1996). Over-utilization and abuse of free
medical care was widespread (Guo, 2003). There was no control over costs, either on
the supply side or on the demand side. As a result, health-care spending under LIS
and PIS increased 28 times between 1978 and 1996, while the fiscal income of the
government increased only 6.6 times (Wang, 1999). This disproportional increase in
expenditure imposed considerable fiscal burden on government treasuries.
Consequently, funding for hospitals from the government declined.
China launched its economic reforms (which included the health institution reforms)
in 1978 through the introduction of market competition. The medical establishments
were decentralized. The Ministry of Health (MoH) no longer ‘managed’ hospitals.
Instead, it ‘supervised’ hospitals. The new health-care insurance system consolidated

32
PIS and LIS into one insurance programme where government, employer and
employee share the cost of health care (Peng, 1996). In rural areas, under the new-
style Cooperative Health Care System (CHCS), individuals, economic entities in
villages as well as the Central Government contribute to the fund and the local
treasury manages the trust fund (Wong et al., 2006). The reform shifted part of the
health-care financing burden to individuals. The poor were hit the hardest. In this
context, the World Bank commented that ‘Health is a sector that cannot simply be left
to market forces’ (William et al., 1997). Government needs to intervene in health care
to address the so called ‘market failure’ (Smith et al., 2005). However, there has been
very substantial growth in the private medical sector in China.
Myanmar and Mongolia
In the past 20 years, due to the government’s failure in provision of health-care
services, Myanmar and Mongolia have transitioned from the first category of
centralism1 to the third category.
2 Previously, their administrations were highly
centralized, with no civil or private sector space for operations and limited
engagement with the international community (Grundy et al., 2014).
Over time, health-care costs seem to have an unsustainably increasing trajectory,
which can be attributed to growing technology, ageing and demographics, health
status of the population, rising personal income, administrative costs, increasing
health-care costs and medical malpractice and liability (Schieber et al., 2009). With
such increasing health-care costs, it is unlikely that governments will be able to
finance health care in totality on a long-term basis. Therefore, the trend now is
towards more decentralized models of governance with multiple funding sources to
include the civil and private sector, and a corresponding trend of moving away from
monolithic and centralized models of administration (Grundy et al., 2014).
1 This is at one end of the continuum of health system classification, where leadership, management,
decision-making and financing are all restricted functions of central-level planners. 2 In this category, reforms have moved beyond concept and policy commitment to nationwide scale-up
and implementation, but with limited levels of middle-level decentralization and delegation, and
limited development of private and civil society constituencies.

33
2.1.2 Theoretical perspective
From a theoretical perspective, two main theories that seek to explain government
failure in providing services to its citizens are public choice theory and property
rights theory (Bennett et al., 1997). Public choice theory rests on the belief that public
sector bureaucrats have no incentive to promote technical efficiency (Bennett et al.,
1997). They are self-seeking, motivated only by such factors as ‘salary, prerequisites
of the office, public reputation, power, and patronage. ’ (Niskanen, 1973). As a result,
the public sector is wasteful. The property rights theory rests on the belief that the
source of inefficiency in the public system is the weakening of property rights and the
lack of any obvious threat to the employment of the staff, resulting in a lack of
incentive for efficient performance.
In contrast, in the private sector, the basic motivation of the stakeholders is profit,
resulting in a strong thrust on the efficient use of resources (Bennett et al., 1997).
2.1.3 New Public Management
Over the years, the organization of health systems has changed significantly. Most
countries initiated reforms that resulted in major institutional changes, such as
decentralization of health services, autonomy for public service providers,
advancement of the profit and non-profit private sectors, separation of funding entities
and service providers and expansion of health financing options. These institutional
reshuffles led to multiplication and diversification of the actors involved and greater
separation of service provision and administrative functions (Perrot, 2006). The vision
of the enabling state emerged, where the state, at the central and local levels, planned
and (at least partly) financed public services, but where provision was located within
the ‘independent sector’ comprising both voluntary and community sectors and the
for-profit sector (Rao, 1991). The state also retained the role to regulate, oversee
quality and standards, and provide stewardship and oversight (Kula and Fryatt, 2014).
According to Osborne and Gaebler, the key to reinventing government is changing the
incentives that drive public institutions, or changing the markets that operate within
the public sector. They use the phrase entrepreneurial government to describe this
concept (Osborne and Gaebler, 1992). This new approach adopted competition as
central to the provision of public services (Walsh, 1995) and laid greater emphasis on
standards and measures of performance (Osborne et al., 1995). Increasing pressure to

34
improve health services led to a trend towards contracting the private sector to
provide traditionally government-run services. Such contracting is perceived as an
opportunity to combine the advantages of contracting with the efficiency of the
private sector (Heard et al., 2011).
This wave of reforms that has engulfed public sector management in certain parts of
the world has conventionally been labelled as the New Public Management (NPM) or
the new managerialism (Dunleavy and Hood, 1994, Ferlie, 1996, Hood, 1991, Pollitt,
1993). As Moore et al. point out, ‘The central feature of NPM is the attempt to
introduce or simulate, within those sections of the public service that are not
privatized, the performance incentives and the disciplines that exist in a market
environment’ (Moore et al., 1995).
Critics argue that this approach is concerned more with economy and cost cutting than
with effective service provision, and that it assumes the superiority of the private
sector and private sector management techniques above those of the public sector and
public administration (Metcalfe, 1988). Supporters of the approach have claimed that
the movement towards NPM ‘has been striking because of the number of nations that
have taken up the reform agenda in such a short time and because of how similar their
basic strategies have been’ (Kettl, 2000). Others suggest that there are dangers
associated with ‘viewing NPM as a coherent and unified set of ideas and practices’
(Newman, 2001) when research on the implementation of NPM reforms illustrates
diversity and a complex body of ideas and practices (Lowndes, 1997).
2.1.4 Key elements of New Public Management
New Public Management (NPM) is currently the most dominant paradigm in the
discipline of public administration (Arora, 2003). It conjures up an image of a
minimal government, debureaucratization, decentralization, market orientation of
public service, contracting out, privatization, performance management, etc
(Kalimullah et al., 2012). These features signify a marked contrast with the traditional
model of administration, which embodies a dominant role of the government in the
provision of services, hierarchical structure of organization, centralization and so forth
(Kalimullah et al., 2012). The key elements of NPM have been detailed in Table 2.2.

35
Table 2.2: Key elements of NPM
Doctrine Meaning Justification
Hands-on professional
management of public
organization.
Visible managers at the top
of the organization, free to
manage by use of
discretionary power.
Accountability requires clear
assignment of responsibility,
not diffusion of power.
Explicit standards and
measures of
performance.
Goals and targets defined
and measurable as indicators
of success.
Accountability means clearly
stated aims; efficiency
requires a ‘hard look’ at
objectives.
Greater emphasis on
output controls.
Resource allocation and
rewards are linked to
performance.
Need to stress results rather
than procedures.
Shift to disaggregation
of units in the public
sector.
Disaggregate public sector
into corporatized units of
activity, organized by
products, with devolved
budgets. Units dealing at
arm’s length with each
other.
Make units manageable;
split provision and
production, use contracts or
franchises inside as well as
outside the public sector.
Shift to greater
competition in the
public sector.
Move to term contracts and
public tendering procedures;
introduction of market
disciplines in public sector.
Rivalry via competition as
the key to lower costs and
better standards.
Stress on private-sector
styles of management
practice.
Move away from traditional
public service ethics to more
flexible pay, hiring, rules,
etc.
Need to apply ‘proven’
private sector management
tools in the public sector.
Stress on greater
discipline and
economy in public
sector resource use.
Cutting direct costs, raising
labour discipline, limiting
compliance costs to
business.
Need to check resource
demands of the public
sector, and do more with
less.
Source: (Hood, 1994)

36
2.2 Public–Private Partnerships
2.2.1 Definition
The principles of NPM encouraged the establishment of PPPs as a new tool. There
has been much confusion around the use of the term PPP. Linder noted that there
exists multiple grammars of PPPs, with governments avoiding the terms
‘privatization’ or ‘contracting out’ in favour of ‘partnerships’ (Linder, 1999).
However, Mitchell-Weaver and Manning point out that ‘privatization is privatization
and subsidies are subsidies; public private partnerships they are not’ (Mitchell-
Weaver and Manning, 1991). They define PPP as ‘primarily a set of institutional
relationships between the government and various actors in the private sector and civil
society’. Dutch public-management scholars van Ham and Koppenjan define PPPs as
‘co-operation of some sort of durability between public and private actors in which
they jointly develop products and services and share risks, costs and resources which
are connected with these products’ (Van Ham and Koppenjan, 2001). The World
Bank (Independent Evaluation Group - IEG) looks at PPPs as ‘long-term contracts
between a private party and a government agency for providing a public asset or
service in which the private parties bear significant risks and management
responsibility’ (Stallworthy et al., 2014, Romero, 2014). For the Canadian Council for
Public-Private Partnerships, PPPs are ‘a cooperative venture between the public and
private sectors, built on the expertise of each partner that best meets clearly defined
public needs through appropriate allocation of resources, risks and rewards’
(Canadian Council for Public-Private Partnerships, n.d., Ejughemre, 2014). The
European Commission defines PPPs as ‘the provision, finance, long-term operation
and maintenance of public infrastructure and/or provision of public services by the
private sector. A PPP should have been initiated by the public sector, involve a clearly
defined project with specification of outputs or outcomes, the sharing of risks with the
private sector, be based on a contractual relationship which is limited in time, and
have a clear separation between the public sector and the borrower’ (European
Commision, 2013, Mitchell, 2000). The European Union (EU) is of the view that
‘PPP can provide effective ways to deliver infrastructure projects, to provide public
services and to innovate more widely in the context of recovery efforts.’
There is thus no single definition of PPP. For the purpose of this research, a broad
definition of PPP has been adopted, similar to that of the United Kingdom (UK)

37
government where PPPs are defined as ‘Arrangements typified by joint working
between the public and private sector’ (HM Treasury, 2008). The Government of
India (GoI) also defines PPPs as all types of collaboration between public and private
sectors to deliver policies, services and infrastructure.
2.2.2 PPP models
A PPP arrangement consists of three main elements - the participating partners; the
different roles these partners might play, depending on their different interests; and
the different forms of partnership from among the spectrum of forms that the
partnership may take, due to the differing roles each might want to play. The
following roles are usually common (Jütting, 1999):
a. Provision and management: Partners supply the desired service or facilitate
management of activities, e.g. provision of health care, management of funds,
facilities, etc.
b. Financing: In the health sector, public financing means financing by the
central or local government and state-owned enterprises. Private financing
includes private out-of-pocket payments, private insurance premiums and
services provided by the private corporate sector.
c. Regulation and monitoring: The setting of standards regarding price, buildings
and quality in the provision of services is a precondition for a functioning PPP.
Choosing among various roles that partners might play, the resulting PPP arrangement
could depend on a number of factors, including (a) the degree of control desired by
the government; (b) the government’s capacity to provide the desired services; (c) the
capacity of private parties to provide the services; (d) the legal framework for
monitoring and regulation; and (e) the availability of financial resources from public
or private sources (Gentry and Fernandez, 1998). Ideally, a PPP model would
constitute shared responsibility between the parties involved, along with an
appropriate distribution of the assumed risk.
2.2.3 Contracting
In the health sector, PPPs can take a variety of forms, with varying levels of
distribution of responsibilities and risks between the public and the private sector.
However, they are characterized by the sharing of common objectives, as might be

38
defined in a contract or manifested through a different arrangement so as to
effectively deliver a service or facility to the public (Nikolic and Maikisch, 2006).
From an economic perspective, the replacement of direct, hierarchical management
structures by contractual relationships between purchasers and providers is said to
promote increased transparency of prices, volumes and quality in trading, as well as
managerial decentralization, both of which should enhance efficiency (Mills and
Broomberg, 1998). International development agencies have been advocating for an
open competitive contracting of goods and services. With the increase in funding for
the health sector for Millennium Development Goals (MDGs), contracting private
purchasers and providers of health services could help provide an alternative option to
channel funds when the government’s absorptive capacity is weak and there is local
resistance to changing resource allocation patterns (Mills and Palmer, 2006). It can
also be argued that resources already exist within the private sector that can be rapidly
mobilized through contracts.
Perrot believes that ‘contracting is one of the tools increasingly being used to
enhance the performance of health systems in both developed and developing
countries’ (Perrot, 2006). Experience from around the world shows a growing
tendency in the public sector in both developed and developing countries to
contract the non-state sector to improve access, efficiency and quality of health
services. Mills and Palmer are of the view that this is more so in developing
countries, where contracting may act less as an enabling agent to promote
competition and more as a resource to fill in a functional gap, that in its absence
could not have been filled by the public sector. Evidence indicates that the
majority of care-seeking behaviour in developing countries such as India, Sri
Lanka, Nepal and Bangladesh is within the private sector, therefore involving these
existing resources through the use of contracts may help improve health outcomes
(Mills and Palmer, 2006).
2.2.4 Contracting theories
Contracting is inherently an issue of changing organizational form; and much of
neoclassical economics fails to comprehensively analyse the effects of contracting,
given its standard assumptions of costless transactions, perfect foresight and complete
information (Hart and Moore, 1990). This realization that neoclassical economics is
insufficient to accommodate a number of important economic phenomena has resulted

39
in economists turning to other approaches to study contracts that might offer a better
understanding of how economic institutions and incentives inherent in such structures
can affect performance and efficiency. Other ‘conscious’ factors of institutional
arrangement and organizational integration are important in bringing about
coordination besides the price mechanism. The term new institutional economics
affords recognition to factors such as uncertainty and bounded rationality, giving rise
to a more useful analysis of markets, hierarchies and networks as alternative modes of
economic organization.
MacNeil classified contracts as classical, neoclassical and relational contracts
(MacNeil, 1974). Classical contracts are discrete transactions between strangers
brought together by chance, who may never see each other again. Such an event could
involve only a barter of goods. All that is of relevance to the transaction will be
contained within the act of exchange, implying that discrete transactions can be
planned with complete accuracy. Neoclassical contracts face some limitations in their
planning for different contingencies (third party determination of performance and
single party control of terms) and therefore utilize a range of techniques and processes
within the contract to create flexibility over the long term. Relational contracts move
beyond the bounds of both classical or neoclassical contracts and the primary need is
of harmonizing conflict and preserving the relationship. The reference point ceases to
be the contract itself and becomes the entire relationship as it has developed through
time (MacNeil, 1974, MacNeil, 1978).
The principal–agent theory is a theory that helps shed light on contractual
relationships. The argument for contracting to the private sector hinges on the issue of
whether it is better to produce goods and services within the public sector
organization or to purchase them in the market, which, in the industrial context would
be seen as a ‘make or buy’ decision (Walsh, 1995). It involves a move from the
hierarchical to a market based approach in the organization of public services,
wherein the roles of the principal and agent are clearly separated and property rights
are more explicit (Walsh, 1995).
The role of the public sector or the principal is to define what is needed and to
monitor the implementation, whereas the role of the non-state agent is to deliver the
goods and services. But a standard problem for principal agent theorists is how to

40
incentivize the agent (informed) to act in the best interests of the principal
(uninformed) when the agent has an informational advantage over the principal and
often has conflicting interests over the latter (Walsh, 1995, Mills and Broomberg,
1998). Solutions usually involve a self-enforcing mechanism which relies on
observable actions by the economic agents and which can be verified by each actor or
by a court of law. The conditions under which self-enforcing contracts are possible
may not always hold, as relationships are usually complex and the focal point solution
may require unrealistic assumptions about the economic agents (Hart and Moore,
1990). The problem of asymmetry of information lends itself to an emphasis on the
degree of trust between the principal and the agent as a factor of how efficiently
asymmetries of information are dealt with. The distribution of risk and responsibility
between the principal and the agent, the role of incentives as a means of remuneration
and the level of trust lead to variations in contractual design. According to Walsh,
contracts can be grouped into two broad categories: outcome/performance based and
methods based. Outcome based contracts lay more emphasis on specifying the final
outcomes rather than the process adopted in achieving that output. In other cases,
outcomes can be far less specific and more difficult to articulate. Therefore, in such
scenarios the purchaser may choose to design a contract that lays more emphasis on
the method to be adopted in delivering the service (Walsh, 1995).
The price of the contract can depend on various factors, including the kind of service
to be contracted and uncertainty of the workload. Similarly, payment methods and
incentives put in place for the agent can vary from solely salary (little incentive to
apply effort), to fee-for-service, to capitation/block contracts. Block and capitation
approaches have the advantage from the point of view of the purchaser of placing a
cap on total contract cost, unlike cost per case or per unit of service which may
represent an open-ended commitment and thus shift the financial risk to the contractor
and lead to higher risk premiums (Mills, 1995). However, this is a double-edged
sword, and by placing a cap on the total contract cost, the incentive is reduced and the
quality of service or products could suffer (Walsh, 1995). The contract design will
depend partly upon who can most effectively bear the risks that are involved, and also
upon the relative power of the purchaser and provider in addition to the nature of the
service being delivered (Walsh, 1995).

41
The work of Williamson (Williamson, 1985) went one step further in recognizing the
costs of writing, monitoring and managing contracts and observing that transactions
that are not costed, as often assumed in neoclassical theory, are a logical construction
rather than something encountered in real life. Contracting out services will increase
transaction costs, e.g. costs involved in negotiating and monitoring contracts and
servicing of contractual commitments (Saltman and Otter, 1992, Robinson, 1990).
Relational contracting is seen as a response to the increasing duration and complexity
of contracts where the idea of a sharp firm-based hierarchy has become blurred and is
being modified towards network relations, which are neither markets nor hierarchy,
but rather hybrids.
2.2.5 The contracting milieu
The cooperation implied by increasingly complex and relational contracts relies upon
the presence of a social, institutional and organizational framework within which to
operate, and to some extent the nature of contracts will be determined by this
framework. In the case of developing countries, where well-functioning judiciary
systems are usually absent, some argue that NPM could lead to higher corruption
rather than greater accountability, because the tendering for service delivery and
separation of purchasers from providers may lead to increased rent-seeking
behaviours (Batley, 1999).
MacNeil termed this as ‘socio-economic support’, or the ‘social matrix’, noting that it
may be moral, legal, economic, social or otherwise. Norms and conventions
embedded in the social, institutional and organizational arrangements of the
contracting environment allow the generation of trust, enhance the operation of the
system and may determine how widespread and successful the use of contracts is
(Burchell and Wilkinson, 1997, Deakin and Wilkinson, 1995).
Sources of institutional norms include the legal system, mechanisms of economic
management directly available to the state (taxation, public spending, industrial and
macro-economic policy), other forms of regulation and non-state bodies of various
kinds, including trade associations. Organizations, including firms, network relations
and also markets themselves are less stable and operate within the general framework
set by institutional norms, while themselves also operating as structures for the
governance of exchange (Deakin and Wilkinson, 1995).

42
The classical theory of contract places legal enforcement at centre stage. However,
both Williamson and McNeil comment on the assumption in classical contracting
theory that every contract is accompanied by effective laws which will be resorted to
where necessary (Williamson, 1985, MacNeil, 1974). While some studies argue that
the role of the legal system in underpinning relational contracting is arguably greater
than has been previously allowed for (Arrighetti et al., 1996), many theoretical and
empirical studies question any emphasis on the role of the law in underpinning
contractual relations. This is both on account of the difficulty for the courts to be able
to assess the values of parties’ ex-ante contractual expectations and, more
importantly, because taking recourse to court orders is very harmful to long-term
relations (Deakin and Wilkinson, 1995, Arrighetti et al., 1996, Williamson, 1985).
There are also other institutional factors that influence the contracting environment.
These include those related to labour legislation, norms of employment, income
protection and the activities of trade associations and other professional bodies
(Deakin and Wilkinson, 1995). The norms established by these means serve to
minimize the risk to firms in trusting other firms and in entering into long-term asset-
specific relationships. Efficiency and effectiveness of the regulatory environment is
another key influence upon the contractual environment. Mackintosh (Mackintosh,
1997) highlights the desirability of a cooperative rather than controlling approach to
regulation, as well as the importance of social and professional norms and reputation
in influencing contractual behaviour.
It has been argued that the key role of external factors determining a contractual
environment is the role which they play in fostering and maintaining trust between
contracting parties (Burchell and Wilkinson, 1997). Trust plays an essential role in
underpinning efficient contractual relationships, reducing the need for complex and
expensive information and monitoring inherent in principal–agent relationships
(Arrow, 1974, Deakin and Wilkinson, 1995). Therefore, the capacity of the
contractual environment to engender trust is vital to the success of long-term
cooperative relationships. Mackintosh emphasizes the learning process in the
development of trust and the important link between the expectations of another’s
behaviour and the determination of one’s own (Mackintosh, 1997).

43
2.2.6 Evidence on contractual relationships
Evidence on existing contractual relationships in health systems in developing
countries and the advantages and disadvantages of the approach are still scarce. Some
potential difficulties with contracting in the health sector in developing countries
include concerns that: (i) contracts will not be feasible on a sufficiently large scale to
make a difference at the country level; (ii) contracts will be more expensive than
government provision of the same services, partly because of greater transaction
costs; (iii) contracts might increase inequities in health service delivery; (iv)
governments will have limited capacity to manage contracts effectively; and (v) even
if successful, contracting will not be sustainable (Loevinsohn and Harding, 2005).
According to a recent report by the United Nations Development Programme
(UNDP), the experience of governments and sub-national governments in developing
countries that have contracted services demonstrates a widespread lack of capacity on
the part of governments to handle relatively new and complex functions such as
making contracts, regulating private providers and making relationships (Batley and
Scott, 2010). In the case of contracting private health providers, a delicate
combination of trust and the ability to monitor and control are also needed (Batley and
Mcloughlin, 2010). Additionally, a strong legislative framework and guidelines and
tools for managing partnerships are important (Kula and Fryatt, 2014). Moreover,
without adequate capacities such as budgeting, raising and managing resources, basic
administration, information gathering and analysis, together with a lack of transparent
governance and a proper degree of oversight by other parts of government, local
contracting can slip into cronyism (Batley and Scott, 2010). A study in South Africa
by Palmer and Mills states that organizational and institutional capacity are likely to
influence a contractual outcome (Palmer and Mills, 2005). Another consideration is
that the notion of contracting being superimposed on an existing hierarchy of
traditional relationships and interdependency can also influence outcomes (Palmer,
2000). A study in South Africa on scaling up of public–private relationships by Kula
and Fryatt concludes that even though there is a long-standing relationship between
the public and private sector, experience is still limited and poorly documented (Kula
and Fryatt, 2014). Reform packages often promote the use of contracts despite the
weak capacity of markets and governments to manage them (Palmer, 2000).

44
Sall et al., who contributed significantly to the development and implementation of
national policies on contracting in their own countries, namely Chad, Madagascar and
Senegal emphasized the need for regulation in contracting practices (Sall et al., 2006,
Kadaï et al., 2006, Mills, 1998). The review of literature confirms the need for the
state to have effective regulation in order to oversee quality and to provide oversight
(Kula and Fryatt, 2014).
Lönnroth reviewed 15 initiatives of private providers engaged through contractual
arrangements in tuberculosis control efforts and concluded that for-profit providers
can be effectively involved in TB control through informal, but well defined drugs-
for-performance contracts (Lönnroth et al., 2006). The drugs-for-performance
contracts minimized the complexities of handling the legal and financial aspects of
classical contracting. However, contractual relationships, their operation, and the
nature of cooperative behaviour within them get influenced by the degree of market
competition. It may lead to cooperation within contractual relationships due to lack of
alternative providers, or a higher degree of competition may encourage purchasers to
move away from relational contracting to a more transactional approach.
The World Health Organization (WHO) conducted a multi-country study in countries
of the Eastern Mediterranean Region to assess the range of health services contracted
out, the process of contracting with the private sector and its influencing factors
(Siddiqi et al., 2006). While Jordan, Lebanon and Tunisia outsourced hospital and
ambulatory care services, Afghanistan, Egypt, Iran and Pakistan outsourced primary
care services and Bahrain, Morocco and Syria outsourced non-clinical services. The
findings reveal that most countries promoted contracting with the private sector, with
governments looking at it as an opportunity to have greater control over the private
sector and the private sector being content with the regular source of revenue and
enhanced credibility (Siddiqi et al., 2006). It also identified three main risks in
contracting: the limited number of providers in rural areas, parties with vested
interests gaining control over the contracting process and poor monitoring and
evaluation mechanisms (Siddiqi et al., 2006).
Although the channels through which contracting out increases service delivery are
unclear, it seems to be an effective option in settings where the government is unable
to reach populations adequately (Ekman et al., 2008, Lagarde and Palmer, 2009). A
45
number of other experiences, including some reviewed here, underline the usefulness
of contracting out to private providers where the public sector is absent or too weak.
This is the case for under-served areas or post-conflict settings (Marek et al., 1999). In
such settings, it might be quicker to re-deploy public funds to private providers than
to build up a public health system (Ekman et al., 2008, Lagarde and Palmer, 2009).
There is limited understanding of the preconditions for the successful use of
contracting and the resources needed for their appropriate use and sustainability. A
study of large-scale contracting of NGOs in Pakistan (Zaidi et al., 2012) concluded
that the origin and implementation of contracting was an inherently political process
affected by the wider policy context. This necessarily needed to match the capacity of
the partner, which was an important determinant in contract implementation. Another
study in India provides valuable information on large-scale contracting which can
guide policy of other governments choosing to contract for such services (see
following chapter). A careful approach is needed in contracting of NGOs (Tuan et al.,
2005, Zaidi et al., 2012), taking into account acceptance of contracting NGOs, local
NGO capacities and potential distancing of NGOs from their traditional attributes
under contracts (Zaidi et al., 2012).
2.2.7 Challenges in partnerships
While the health system as a whole has common objectives of equity, efficiency,
quality and accessibility, public and private providers interpret the contents of these
objectives differently (Wagstaff, 2010, Raman and Björkman, 2008). The intention
of the government is usually to provide health-care services to all, but this cannot be
done by the government alone. Moreover, the private sector can be present in the
form of non-qualified rural practitioners, not-for-profit private organizations, e.g.
NGOs and for-profit private organizations.
Bennett et al. and Rosenthal reported problems associated with delivering of public
health services by private for-profit organizations. Some of the issues they identified
were unethical means to maximize profit, less concern about public health goals, lack
of interest in sharing clinical information, creating ‘brain drain’ among public sector
health staff and lack of regulatory control over their practices (Bennett et al., 1994,
Rosenthal, 2000). However, Bloom et al. suggested that the private sector is neither
so easy to characterize nor easy to neglect (Bloom et al., 2000). The strength of the

46
private sector lies in its innovativeness, efficiency and learning from competition.
Management standards are generally higher in the private sector. The private sector
can play an important role in transferring management skills and best practices to the
public sector.
2.3 Health insurance
Financial constraint is one of the major barriers of access to health care for
marginalized sections of the society in many countries (Peters et al., 2002, Ranson
and John, 2002, Wagstaff and van Doorslaer, 2003, Garg and Karan, 2009, Pradhan
and Prescott, 2002, Xu et al., 2003). It has been estimated that a high proportion of the
world’s 1.3 billion poor have no access to health services simply because they cannot
afford to pay for the needed health services (Dror and Preker, 2002). Many of those
who do use services and pay for them suffer financial hardship, or even
impoverishment (WHO, 2010). Over the past decades, many low- and middle-income
countries (LMICs) have found it increasingly difficult to sustain sufficient financing
for health care, particularly for the poor. As a result, international policy-makers and
other stakeholders have been recommending a range of measures, including
conditional cash transfers, cost-sharing arrangements and a variety of health insurance
schemes, including social health insurance (SHI) (Ekman et al., 2008, Lagarde and
Palmer, 2009).
Moving away from out-of-pocket payments for health care at the time of use to
prepayment (health insurance) is an important step towards averting the financial
hardship associated with paying for health services. Financing a basic package of
health services is accomplished through revenue collection, pooling of revenue and
risk and purchasing services; while the role of policy-makers is to ensure that these
financing mechanisms are efficient, equitable and sustainable (Gottret et al., 2008).
Health insurance can be defined as a way to distribute the financial risk associated
with the variation of individuals’ health-care expenditures by pooling costs over time
through prepayment, and over people by risk pooling (Organisation for Economic
Cooperation and Development, 2004). For classifying health insurance models, the
Organisation for Economic Cooperation and Development (OECD) taxonomy
(Organisation for Economic Cooperation and Development, 2004) uses four broad

47
criteria: i) sources of financing; ii) level of compulsion of the scheme; iii) group or
individual scheme; and iv) method of premium calculation in health insurance, i.e. the
extent to which premiums may vary according to health risk, health status or health
proxies, such as age. Based on the criteria of ‘main source of financing’, there are
principally two types of health insurance - private and public. Both have further sub-
classifications. According to this criterion, public schemes are those mainly financed
through the tax system, including general taxation and mandatory payroll levies, and
through income-related contributions to social security schemes. All other insurance
schemes that are predominantly financed through private premiums can be defined as
private.
2.3.1 Revenue generation, risk pooling and purchasing
To expand coverage to promote health outcomes and to ensure financial protection,
countries need to raise sufficient and sustainable revenues efficiently and equitably
and manage these revenues to pool health risks (Gottret et al., 2008). They also need
to ensure the purchase of health services in an allocative and technically efficient
manner (Gottret et al., 2008, World Health Organization, 2000).
In many countries, revenue collection is often challenging because of their large rural
and informal sector population which limits the taxation capacity of their
governments (Preker and Carrin, 2004). For the health system as a whole, out-of-
pocket payment as a percentage of total health spending offers a rough estimate of
financial protection (Gottret et al., 2008). However, the extent of out-of-pocket
financing alone does not give a complete picture because the distribution of out-of-
pocket payments among population income groups, the severity of catastrophic
spending and the impoverishing effect of out-of-pocket payments on households are
all also important to assess (Gottret et al., 2008). According to the International
Labour Organization (ILO), ensuring financial protection means that no household
should spend so much on health that it falls into a level of poverty that it cannot
overcome (Baeza et al., 2002).
Purchasing is a process by which pooled funds are paid to providers in return for
delivering services. This can be performed passively or strategically. Passive
purchasing implies following a predetermined budget or simply paying bills when
presented, whereas strategic purchasing involves a continuous search for the best

48
ways to maximize health system performance by deciding which interventions should
be purchased, how, and from whom (World Health Organization, 2000).
The different types of health insurance schemes include voluntary health insurance or
private health insurance (PHI), social health insurance (SHI) and community-based
health insurance (CBHI) or insurance offered by NGOs. In PHI, buyers are willing to
pay a premium to an insurance company that pools risk and insures them for health
expenses. The key distinction is that the premiums are set at a level based on an
assessment of the risk status of the consumer and the level of benefits provided, rather
than as a proportion of the consumer’s income (Sein et al., 2004). SHI, which is often
government run, could include an earmarked fund set up by the government with
explicit benefits in return for payment of premium. It is usually compulsory for
certain groups in the population with premiums determined by income (and hence
ability to pay) rather than related to health risk (Sein et al., 2004). The benefit
packages are standardized and contributions are earmarked for spending on health
services. In CBHI schemes, members usually prepay a set amount each year for
specified services and the premium is usually a flat rate (not income-related) (Sein et
al., 2004).
2.3.2 Aspects of Voluntary Health Insurance
Health Insurance can thus be of varying types depending on risk sharing, financing,
benefits, premium and nature (voluntary or mandatory). Details of different types of
health insurance (Social, Voluntary, Employer-based, Community-based, and State-
subsidized Health Insurance) are given in the next chapter. This section provides a
review of the various aspects of voluntary health insurance such as adverse selection,
cream skimming, moral hazard, risk pooling, etc. followed by aspects of social health
insurance.
Adverse selection
Adverse selection can be defined as strategic behavior by the more informed partner
in a contract against the interest of the less informed partner(s) (Belli, 2001). In the
health insurance field, this manifests itself through healthy people choosing managed
care with lower premia and less healthy people choosing more generous plans (Belli,
49
2001). Adverse selection is a situation where an individual's demand for insurance is
positively correlated to the risk of loss associated with it.
In health insurance markets, with regard to adverse selection, asymmetry of
information lies between the consumer (patient) and the seller, where the consumer,
rather than the seller, has an advantage of having more information pertaining to the
quality of their own health. If the clients hide their poor health status from the insurer,
the actual number of claims and payouts will be higher than presumed by the insurer,
thus leading to a loss to the insurer. In order to ensure profit, the insurer increases the
premium. Further, an increased premium would inhibit a healthy population from
getting insured, thus increasing the average risk of those remaining in the insured
pool. This would further force the insurer to increase the premium and thereafter a
vicious circle of increasing average risk and increasing premia ensues (Belli, 2001).
To summarize, adverse selection is likely to be a problem in all health insurance
schemes based on voluntary membership, whether motivated by profit or social
concerns. In a private market, the insurer may eventually go out of business if adverse
selection is not dealt with and, typically, will further price discriminate in response. In
non-profit schemes, such discrimination is rarely used as a policy tool, often creating
pressures for greater public subsidy (Belli, 2001).
Adverse selection is perceived to be a major source of market failure in insurance
markets. Adverse selection may also lead to three classes of inefficiencies, i.e. on a
benefit-cost basis individuals select the wrong health plans; desirable risk spreading is
lost; and health plans manipulate their offerings to deter the sick and attract the
healthy (Cutler and Zeckhauser, 1998).
Dynamic Adverse selection
Dynamic models of adverse selection differ in a way that the passing time is
introduced in the model and its effect is also modelled (Zryumov, 2014). In health
insurance, dynamic adverse selection can be stated as - over the time, the low risk
individuals opt out (lapse) from the health insurance (as they perceive premium to be
high for them) and high risk individuals are more inclined towards health insurance,
which increases adverse selection over time. Dynamic adverse selection primarily

50
occurs in social health insurances where the premium is not dependent on the risk and
in long term care insurance (Konetzka, 2014).
Cream Skimming
The provision of health care services is characterized by uncertainty and asymmetry
of information with regard to cost of treatment. Asymmetry of information exists
where the purchaser and the provider share the same information set, but the
purchaser can find some relevant information (free or at a cost) before taking a
decision. On the other hand, the ability to observe patients’ severity can be used for an
advantage by the hospital (principal-agent) through two alternative behaviours:
- They can choose to treat only patients with specific diseases (‘horizontal’
cream skimming)
- They can affect the state-of-the-world probability distribution opting for
specific ‘patient type’ within the same ailment group (‘vertical’ cream
skimming)
These behaviours, defined as ‘market cream skimming’, alter the competition among
hospitals causing relevant effects in the whole market system (Ellis, 1997, Lewis and
Sappington, 1999). Horizontal cream skimming arises because of poor regulations,
i.e. the regulator or policy makers have not capped the prices of services correctly and
the hospital finds it convenient to specialize in some specific outputs (which may
produce profit). Vertical cream skimming, on the other hand, offers health care only
to the patients that have low cost. It is an illegal behavior which might be solved
through control and sanctions rather than incentives.
In health systems where private hospitals coexist with tax-funded public hospitals,
cream skimming arises not just because of their different roles but also of differences
in how work in the public and private sectors is remunerated (Gonz´alez, 2005).
Consequently, a high risk patient will be rejected by the private hospitals and will
have to be treated by the public hospitals. Consequences of vertical cream skimming:
- Public hospitals will usually have a deficit since they will treat a higher
proportion of patients with higher cost;
- Welfare is reduced;

51
- Private hospitals make a surplus that is not related to a higher degree of
efficiency;
- The cost to provide health care is higher than in first-best.
The empirical evidence of cream skimming is relatively thin. Duggan (2000), for
example, exploits a policy change in Californian hospitals where the reimbursement
of poor patients became more generous, and finds evidence that private non-profit and
for-profit hospitals cream skim profitable patients, leaving unprofitable patients to
public hospitals. In a UK study, Street et al. (2010) investigate whether patients
treated in English public hospitals differ in complexity compared to those in (private)
treatment centres and find that patients in the former setting are more likely to be
from deprived areas, have more diagnoses, and received significantly more medical
procedures (Street et al., 2010). Using Italian hospital data, Berta et al. (2010)
quantify the extent of treatment selection by developing a cream skim index, and find
that private hospitals cream skim at a much higher intensity than public or non-profit
hospitals (Levaggi and Montefiori, 2003, Berta et al., 2010).
Moral Hazard
Moral hazard is the tendency of an individual to behave differently with regard to a
particular event depending on the presence of insurance (Arrow, 1974). In the context
of health insurance, moral hazard is manifested in the tendency of individuals to
increase utilization of medical services paid for by insurance compared to those
services not covered. As insurance coverage increases, demand for services covered
by such insurance likewise increases. Specifically, moral hazard has been shown to
vary with copayment, or portion of the medical bill paid by the insured-patient.
There are several economic principle theories for moral hazard. First, economic
theory is based primarily on the assumption that individuals act in their own best
economic interest. It is, therefore, completely rational that for insured services, as the
marginal cost of medical services is reduced the patient will tend to consume more. In
fact, studies have consistently shown that those who have health insurance consume
more medical services than those without insurance. A second cause of moral hazard
in health insurance is the inequity of information between patients and providers. By
the nature of their specialized training and experience, physicians have an enormous
amount of information regarding treatment options, risks, and prognoses, none of

52
which is completely shared with patients. Patients may not possess sufficient
information to even determine whether an episode of care is appropriate or whether
self-care will be adequate. This contributes to moral hazard in that patients who are
understandably ignorant regarding their options must put substantial trust in the
physician (Glied, 1992). The third related cause of moral hazard in health insurance is
the inequity of information between the insurer and individual insured. The insurer
cannot know going in, the risks involved with insuring a given individual (Vera-
Hemandez, 2003). The insurer may, and generally does, have greater information
relating to which providers have better medical outcomes for specific diagnoses and
treatments, as well as which treatment options have proven most successful (French
and Kamboj, 2002). A fourth cause of moral hazard is the fact that insured patient is
insulated from the costs involved with treatment decisions. Even if there was perfect
information sharing regarding the treatment options and their efficacy, the insured
patient is not price-sensitive to these options (Cheah and Doessel, 1985).
Risk Pooling
The extent to which health risks are pooled varies, based on the type of health
insurance purchased. The first distinction is between (1) large group coverage and (2)
individual and small group coverage (Monahan, 2008). Large group coverage, offered
by an employer, provides a high level of risk sharing (Abraham, 1986). In such plans,
all eligible employees typically pay identical premiums, regardless of age or health
status (HIPAA, 1996). With respect to covered benefits, risks are both pooled and
cross-subsidized (Abraham, 1986). The extent of the risk pooling and cross-
subsidization varies based on the size of the group. The larger the group, the more
heterogeneous it is likely to be in terms of risk, providing a greater amount of risk
pooling and cross-subsidization (Hyman and Hall, 2001). Individuals and small
groups are susceptible to two related risk-pooling problems. The individual market is
particularly susceptible to adverse selection. Small groups are at a disadvantage in
risk-pooling because they lack a diversified pool of purchasers (Brennan, 1993).
Small groups, while endogenous, do not have size sufficient to reflect community-
wide risk levels and therefore are susceptible to poor experience rating and resulting
high premiums (Enthoven and Singer, 1995).

53
Health insurance protects against two primary types of risks: macro level risk and
micro-level risk. Macro-level risk is the risk associated with medical expenses
generally (Aaron et al., 2005), while micro-level risk is the risk associated with
incurring losses associated with particular medical treatments or services (Monahan,
2008). While individuals with health insurance pool their macro-level risks, the
particular scope of their insurance contracts determines which micro level risks are
pooled. For example, if an individual’s health insurance policy does not cover cancer
treatments, risk of loss associated with cancer treatments is retained at the individual
level and not pooled.
At the macro-level, the goal is easy. As the coverage increases, the risk-sharing and
therefore social solidarity increases. But with increase to macro-level risk sharing, it is
important to guard against stripping away the micro-level coverage provisions
(Monahan, 2008). To decrease the cost of coverage, there may be a temptation to
exclude more and more services from health insurance contracts. Even if such efforts
do increase health insurance coverage, they will reduce social solidarity by
eliminating the sharing of risk associated with the treatments at issue. We therefore
cannot have effective macro-level risk pooling without effective micro-level risk
pooling (Monahan, 2008).
Enrolment
Adequate enrolment is a major concern in social health insurance schemes. For
voluntary social health insurance schemes, even an enrolment rate of two-thirds is
considered to be a fair enrolment (Acharya, 2012). In most of the voluntary social
health insurance schemes in the LMICs, low enrolment rate is noticeable.
The Vietnamese insurance offered before 2002 with co-payment of 20 percent had a
very low uptake of about 20% (Jowett et al., 2004). However, the insurance offered
after 2002, the Vietnam Health Care Fund for the Poor (VHCFP), had no co-payment,
and was seen to have varied rates of enrolment, varying from 20-60% across areas
(Axelson et al. 2009; Wagstaff 2007). In Mexico (King et al., 2009) and Nicargua
(Thornton and Field, 2010), the enrolment was again poor, and even educating the
public did not result in better enrolment.

54
The factors that play a role in enrolment are the degree of risk aversion, education,
wealth and trust. Families headed by the more educated head of households are the
ones that are more likely to participate in insurance schemes (Chankova et al., 2008,
Xavier et al., 2008). Also, families with higher per capita expenditure (richer families)
are more likely to get enrolled in insurance schemes (Acharya et al., 2012). Acharya
et al. (2012) reported that the families residing in villages at a distance from health
facilities are not likely to get enrolled, nor are individuals from hard to reach areas.
Scheme Utilization
Social Health Insurance does not necessarily mean higher scheme utilization (Acharya
et al., 2012). Evidence from social health insurance schemes of Mexico (King et al.
2009) and Georgia (Bauhoff et al., 2011) do not show higher scheme utilization when
compared to non-insured. A study by King et al. (2009) on a large sample in Mexico
found no difference in utilisation between those insured under Seguro Popular (SP)
and uninsured for a period of 10 months after the insurance was rolled out through a
campaign. Bauhoff et al. (2011) report no effect on utilisation from the Georgian
insurance for the poor.
However, there are several evidences of increased health care utilization by the
insured in Egypt, Ghana, Vietnam and other LMICs. Egyptian insurance for children
yielded higher usage of medical care for the insured among the lower income groups
(Yip and Berman, 2001). Similarly in the Ghanaian SHI, Mensah et al. (2010) find
higher utilization for the insured. For the earlier Vietnamese insurance, pre-2002, with
co-payment as a feature of the insurance, Jowett et al. (2004) report that insurance
yields higher usage of inpatient services; this value is lower for the wealthier insured.
Overall, the result for SHI scheme utilization is mixed among various countries.
Out-of-pocket expenditure
It is not always the case that insurance is able to reduce OOP expenditure for the
insured (Acharya et al., 2012). The results are highly mixed for social health
insurance schemes from LMICs. Significantly, two large studies, one from China and
other from Mexico, show a decline in OOP expenditure (refs) Yip and Berman (2001)
from Egypt report higher utilization rates across income class and savings in OOP
expenditure was reported for only the middle classes. In Vietnam, Axelson et al.

55
(2009) and Wagstaff (2010) show lower OOP expenditure for the insured. It is
difficult to conclude that SHIs have helped uniformly in reducing OOP expenditure,
neither has it always engendered higher utilization. Acharya et al. (2012) reported that
both OOP expenditure and healthcare utilization could be higher for the insured. They
further stated that increase in utilization may not be an indicator for better health
(Acharya et al., 2012).
Equity
Guaranteeing equity for the poor is a major challenge for health care systems in
developed countries. Overall, equity is an ethical issue related to judgments about
health care accessibility. At the same time, an economic concept of horizontal equity
deals with “an equal treatment for equal need” (Wagstaff et al., 1991, Culyer and
Wagstaff, 1993) and “means that persons in equal need of medical care should receive
the same treatment, irrespective of whether they happen to be poor or rich” (Wagstaff
et al., 1991b). In practical terms, there is a general agreement about striving for
“minimal variation of [health care] use with income” (Newhouse et al., 1981) and
ensuring equity for the poor (Cutler, 2002). According to theoretical predictions, a
well-designed social health insurance system may provide an equitable redistribution
of medical care between the rich and the poor (Zweifel and Breyer, 2006).
Equity has different dimensions, such as equity in access, financing, and health
outcomes. A report published by DFID in 2004 reports that equity can be effectively
addressed with three strategies (1) establishing contractual arrangements that
specifically encourage providers to serve the poor and underserved; (2) contracting
with private providers in areas that are predominantly poor (geographic targeting);
and (3) contracting out services that are of most benefit to the poor and underserved
(England, 2004). Many countries consider health insurance to be a useful component
of social protection policies designed to achieve UHC. However, there is need for
caution against taking a too narrow focus on health insurance as the sole means for
reducing financial risk, and as the lynchpin for achieving UHC. Ridde and Haddad
(2009) note that protection against household impoverishment, catalyzing more
equitable distribution of social welfare benefits across society, and complementary
effects to education and other welfare measures from health maintenance are all
equally valuable outcomes.

56
Liu et al. (2004) assessed 18 different contractual arrangements of government with
the private sector to deliver primary health services in LMICs and amongst them only
three had the clear objective of improving the poor’s access to basic health care (Liu
et al., 2004). All these three projects showed significant improvement in access by the
targeted poor, indicating improvement in equity in access. In Georgia, the case study
indicates that it is feasible to set up a contract for specified services and to target the
poor with a larger subsidy than for the non-poor.
Liu et al. (2004) have concluded that contracting out has the potential to improve
equity in both access to care and financing if the poor and the services that mostly
benefit the poor are well targeted in the contracting-out initiative.
Some findings also suggest that policies intended to promote equity can lead to a
reduction in quality of services and that adverse selection (of higher risk participants)
is often a feature due to the voluntary nature of CBHI (Carrin et al., 2005).
Quality of care
Perceptions of quality have been increasingly accepted as valid and important
measures of health care quality (Blendon et al., 2007, Cleary and Edgman-Levitan,
1997). Furthermore, perceptions of quality have been associated with health outcomes
(Cleary and Edgman-Levitan, 1997, Cleary, 1999). Perception of quality of care
depends on various aspects. Presumably, consumers are more likely to perceive a
lower quality of care if they experience inadequate care due to their inability to cover
medical care costs, or if they have other pressing financial obligations that must be set
aside to cover these costs (Schoen et al., 2008).
A considerable body of health policy research has documented differences in hospital
characteristics as contributing factors to differences in the quality of care (Parson,
2013). An article by Gaskin et al., (2009) examines the extent to which a patient’s
type—or lack—of insurance may play a role (Gaskin et al., 2009). Authors had
compared hospital quality for patients according to their insurance status using pooled
2006-08 State Inpatient Database records from the Agency for Healthcare Research
and Quality (AHRQ). They concluded that within-hospital differences in quality exist
across payer types. In particular, patients with Medicare appear to receive notably
worse care than patients with private insurance on the majority of Inpatient Quality

57
Indicators. Mortality rates are also influenced by the characteristics of both hospitals
and patients, which suggests that specific policy interventions should vary by
Inpatient Quality Indicator, type of hospital, and type of payer (Parson, 2013).
Another study from Latin America examines the effects of insurance on perceptions
of quality of care received using a national Latino population sample. The results
conclusively demonstrated the consistent effects of health insurance for improving
perceived quality of care in Latino patients (Perez et al., 2009). However, Devadasan
et al. (2011) from India showed that user satisfaction was almost similar between the
insured and uninsured group. The main reason for satisfaction was the outcome of the
treatment. Patients who were cured or healed had a higher probability of being
satisfied (Devadasan et al., 2011).
Conclusively, it can be said that perception of quality of care is multi factorial and
examples from across the world show that insurance status may or may not affect user
satisfaction.
Capacity Challenges
SHI schemes should provide assurance of promised health insurance benefits to the
insured. In order to achieve this, healthcare facilities should not only be part of the
health insurance benefit package but these should be created by the authorities where
these do not exist. This is possible only with the availability of adequate human
resources, healthcare services infrastructure, and the other essential basic elements of
provision of health services. These are vital to the success of an SHI scheme. In their
absence, government can lose trust of the people which can result in reluctance to pay
health insurance contributions (Carrin, 2002). Also, there may be a situation where
services are existent in principle but providers do not comply with the new SHI
scheme (Carrin, 2002). The chief reason for such a situation may be the uncertainty of
the providers about the impact of health insurance on their income. This lack of
collaboration was initially observed in Vietnam, where a few doctors refused to
provide health services to beneficiaries (Axelson et al., 2009; Wagstaff, 2010). It was
mainly because the doctors were hoping to continue to receive under-the-table
payments keeping in mind the meagre level of their official salaries. On the contrary,
the beneficiaries thought that after making their contributions, there was no need to

58
give such payments to doctors. When doctors observed this behavior, some of them
did not want to treat the insured patients (Axelson et al., 2009).
Governments may neither have the required level of managerial or administrative
capacity to design a suitable health insurance scheme nor thereafter implement the
same (Ron and Adlung, 2001). Moreover, the chances of success to manage health
insurance schemes are greater with better knowledge of the fundamental principles of
health insurance. This enables the government to explain these principles to the
people (Carrin, 2002). The scheme should explain well that those healthy now may
not get immediate or regular benefit from the scheme now but they may need these
facilities later when they suffer from any serious illnesses or accident. At times it is
difficult for the governments to introduce compulsory membership for all population
in one go and it is easier to start insuring the salaried working class in public and
private sectors (Carrin, 2002). Normally, health insurance contributions are levied on
wages. Information on wages should in principle facilitate the collection of these
contributions. However, there always remains the risk of low compliance with agreed
contribution rules and other arrangements, certainly at the start of a health insurance
scheme (Carrin, 2002). This is why monitoring by the scheme itself of members’
wages and contributions is indispensable. In one province in Vietnam, a chapter of a
bank stated that all employees, from the senior manager to the janitor, had the same
nationally defined minimum wage (Axelson et al., 2009). Obviously this led to a
serious underestimation of the contributions that were due. One explanation for this
behaviour is that the required solidarity and the level of health insurance contributions
exceeded what the population would accept, which made both employers and
employees misrepresent reality. Still, enrolment of the population in the agricultural
and informal sectors is likely to be even more difficult. Income for this population
fluctuates and spontaneous willingness to declare true income and pay regular
contributions is low (Axelson et al., 2009). Often, then, health insurance remains
voluntary for this group. This means that in order to secure or increase enrolment,
extra marketing efforts are needed (Carrin, 2002).
2.3.3 The role of PPPs in health insurance
The partnership between for-profit bodies and the government has been widely
discussed (Mitchell, 2000, Bennett, 1991). PPPs have been used in health insurance
for a variety of roles ranging from service provision to financing and management.
59
The role of a majority of PPPs in developing countries is service provision. We take a
look at PPP arrangements within health insurance schemes, or those that have a
component for the benefit of low-income individuals
Country experiences
Vietnam introduced a Health Care Fund for the Poor (and other underprivileged
groups) at the taxpayers’ expense in 2003. The poor were fully subsidized and made
no copayment (Dao, 2012). In 2005, Vietnam reformed its health insurance
programme to improve private sector participation to achieve universal coverage by
2020 (Dao, 2012). Initially, health care under the HCFP scheme could be obtained at
public facilities including public hospitals and commune health centres, but following
a 2005 government directive, the social health insurance agency contracted private
providers giving HCFP beneficiaries access to private providers (Wagstaff, 2007).
HCFP increased both outpatient and inpatient utilization and substantially increased
inpatient care. It has also succeeded in reducing out-of-pocket health spending among
the insured group (Wagstaff, 2010). In 2009, Vietnam passed the Health Insurance
Law (HIL) which created a national SHI program thus making a policy choice to
finance health care primarily through SHI (Rousseau, 2014). It was an important law
because it integrated the existing health insurance program with the program for the
poor, thus bringing together all groups in one program. In June 2014, Vietnam made
participation compulsory by categorizing membership of health insurance into 5
groups based on contribution responsibility (Rousseau, 2014). The revenues of HI
funds come from employee, employers, social health insurance fund, and state budget.
The government is responsible for fully subsidizing the health insurance premium for
children under six, the elderly, and the poor, and for partially subsidizing premiums
for the near-poor (70% of the premium) and students.(Rousseau, 2014). Health care
providers include public and non-public providers. All public providers had been
automatically approved to participate in social health insurance prior to November
2011, while private providers needed certification and permission (Rousseau, 2014).
In Philippines, National Health Insurance Programme (NHIP) and PhilHealth as the
corporation that managed the Social Health Insurance programme was established in
1995. Its charter was to provide all citizens of the Philippines with the mechanism to
gain financial access to health services. The government would spend for public

60
health and the essential health package; the other remaining services would be
financed privately or by social insurance (Republic of the Philippines, 1995). Since
government resources were limited, diversity and competition in provision of health
services and insurance was encouraged through social or private insurance for clinical
services outside of the essential package. A distinction was made between public
health services and personal health services with the government being responsible
for providing public health services for all groups such as women, children and
indigenous people, while PhilHealth focused on the provision of personal health
services. Within PhilHealth, eligibility was limited to households whose members
have a per capita income of US$ 250 per annum or lower. In the absence of an
accredited public health service provider, indigent families could avail services at
private sector facilities (Tobe et al., 2013). In June 2013, the president of the
Philippines signed a law (Republic Act 10606) that mandated PhilHealth enrollment
for all Filipinos, including workers in the informal sector (Chiu, 2013). This is
considered a move from social health insurance towards universal healthcare
coverage(Viswanathan and Avanceña, 2015).
After the 1993 health sector reform, Colombian citizens are entitled to health care
access via mandatory health insurance through a benefits plan. (Vargas-Zea et al.,
2012). In Colombia, the role of the private sector is more expansive. It includes
management as well as service provision for the subsidized health insurance scheme
for the poor, referred to as the ‘subsidized regime’. The identification of beneficiaries
is through a six-level scaled system called Sistema de Selección de Beneficiarios
(SISBEN), and households classified at the first or second level (considered poor) are
eligible to receive total subsidies to health insurance paid by local governments
(Vecino-Ortiz, 2008). Local governments contract not-for-profit insurance companies
(Vecino-Ortiz, 2008). Insurers can avail medical services from both public and private
providers based on their ability to offer the government-defined health package at the
lowest costs. There are also supplementary (voluntary) health insurance schemes
known as prepaid medicine, all of which offer additional coverage to the basic
benefits plan. These plans are completely funded from private spending (Vargas-Zea
et al., 2012).

61
In South Africa, the private sector doctors are efficiently and effectively used to treat
public sector patients to target key populations, address specific health concerns,
serve as a stop-gap measure to meet urgent health needs or maintain treatment
outcomes over time (Igumbor et al., 2014). Van den Heever studied South Africa’s
private health systems to ascertain the role of health insurance in deepening health
coverage through mobilizing revenue from wage earners (Heever, 2012). He was of
the view that measures to enhance risk pooling expands coverage and becomes
increasingly fair and sustainable. Without such risk pooling, the system becomes less
stable and fair as costs rise and people with poor health status are systematically
excluded from cover. Therefore health insurance ‘presents an opportunity to
policymakers to achieve social protection objectives through the strategic
management of markets rather than exclusively through less responsive systems based
on tax-funded direct provision. This is especially relevant as private markets for
health care are inevitable, with policy discretion reduced to a choice between
functional or dysfunctional regimes’ (Heever, 2012).
South Africa is in the process of introducing an innovative system of healthcare
financing (Department of Health, 2015) - the National Health Insurance. This is a
health financing system that is designed to pool funds and will ensure that everyone
has access to affordable, efficient and quality health services for their health needs,
irrespective of their socioeconomic status. The government’s white paper was
released in December 2015, which proposed that NHI would be implemented over a
period of 14 years. 11 Pilot districts were established in all nine provinces (Matsoso
and Fryatt, 2013). National Health Insurance (NHI) proposes a single,
compulsory medical scheme for all, with private medical schemes being reduced to
offering “complementary services” only (Department of Health, 2015). Possibilities
of raising these funds, according to reports from 2012, include a pay roll levy for all
employed South Africans, and increase in VAT, or an income tax surcharge. A central
NHI Fund will buy health services from accredited healthcare providers, both public
and private (Department of Health, 2015)
The Government of Ghana established a National Health Insurance Scheme (NHIS) in
2003 to provide a basic package of services to the poor. It covers both public and
private health-care providers at all levels of the health system. NHIS has yielded some

62
verifiable positive outcomes such as higher utilization of health-care services by the
insured population (Mensah et al., 2010). Seddoh et al., while highlighting the aspect
of equity, state that the NHIS has ‘brought on board private sector participation and
allowed it access to government funding’ (Seddoh et al., 2011). The Ghanaian
government has made it known that it would like the share of private health-care
provision in total provision to increase from 35% to 65% by 2017 (Gyapong et al.,
2007). In the medium to long term, enforcement of the National Health Insurance Act
which makes membership in the NHIS mandatory for residents of the country would
be a positive step towards achieving universal coverage (Kusi et al., 2015).
Netherlands has a dual-level health system. All primary and curative care (i.e. the
family doctor service and hospitals and clinics) is financed from private obligatory
insurance. Long term care for the elderly, the dying, the long term mentally ill etc. is
covered by social insurance funded from earmarked taxation. It is a socially organized
system with substantial private involvement and stringent regulations. Private
insurance companies must offer a core universal insurance package for the universal
primary curative care, which includes the cost of all prescription medicines. The same
premium is paid whether young or old, healthy or sick. Risk variances between
private health insurance companies due to the different risks presented by individual
policy holders are compensated through risk equalization and a common risk pool.
Funding for all short-term health care is 50% from payroll taxes paid by employers,
45% from the insured person and 5% by the government. Those on low incomes
receive compensation from government to help them pay their insurance. All
insurance companies also receive additional funding from the regulator's fund. It is
illegal in The Netherlands for insurers to refuse an application for health insurance or
to impose special conditions (e.g., exclusions, deductibles, co-payments, or refuse to
fund doctor-ordered treatments). Therefore, in Netherlands, a compulsory insurance
package is available to all citizens at affordable cost without the need for the insured
to be assessed for risk by the insurance company. The public insurance system is
implemented by non-profit health funds, and financed by premiums taken directly out
of the wages (together with income taxes). Hospitals in the Netherlands are mostly
privately run and not for profit, as are the insurance companies. Most insurance

63
packages allow patients to choose where they want to be treated. To help patients to
choose, the government discloses information about provider performance.
In Netherlands, given the system of managed competition in which market forces play
an increasingly important role, policy makers are facing new challenges regarding
quality, costs and access (Berg et al., 2010). Insurance companies mainly compete on
the price of health insurance policies and the cost of health care services and not on
the quality of care. One of the underlying problems is that quality of care lacks
transparency. Easy access to health services is an important achievement. However,
there might be a trade-off between access and quality (Berg et al., 2010). There is
evidence that concentration of especially highly complex surgery improves quality
and critical purchasers of care are looking for high quality providers and may
selectively contract with those providers, which are few, that may lead to access
issues for the insurers. The same is true for the tradeoff between prices and access.
Health insurers can offer cheap policies that restrict freedom of choice. By contracting
only a limited number of health care providers, health insurers are able to negotiate
for cheaper care for many services, thus leading to access issues (Berg et al., 2010).
2.4 Conclusions
In this chapter, the evolution, development and factors affecting PPPs and their role in
health insurance have been reviewed. With the increasing complexity of health
systems, there is a realization that the public sector can no longer fulfil the needs of
the population by itself. The need to forge partnerships is clear. These partnerships
can take different forms and be at different scales, depending on the needs of a
country. Each country, therefore, has to look for its most optimal solution based on
the nature and scope of the need.
New Public Management points to contracts as an efficient tool for implementation by
introducing elements of increased competition, managerial decentralization and an
increase in transparency and accountability. However, there is limited evidence to
support the above, especially in the case of developing countries; and examples where
introduction of contracts has led to genuine competition among health service
providers are rare. New institutional economics helps us to understand the motivation

64
for the tendency towards relational contracting as opposed to a purely market-driven
competitive approach.
A review of the literature points to the fact that while policymakers are focused on
discussion of competition and choice, empirical findings on contractual relationships
tell a different story, reflecting the existence of an infinite variety of contract forms in
a myriad of settings. Moreover, with respect to empirical studies on contracts for
health-care provision, review of the literature has highlighted the lack of clarity on the
nature of contracts and their implementation in terms of classical contracting. This is
usually the basis of policy reforms and actual relationships that emerge, which lean
more towards relational contracting.
Review of the literature on contractual theory, new public management and new
institutional economics points to the use of contracts as a potentially effective method
to improve performance of public health systems. However, empirical evidence to
support its use in insurance arrangements is limited and the results have been mixed,
especially for developing countries where the regulatory frameworks are weak and
there is a constraint on the resources available.
The contracting milieu is mainly governed by the social, institutional and
organizational framework within which to operate. In the case of service delivery,
specifically for health care, there are a number of factors that make information
asymmetry particularly acute on the part of the beneficiary. Therefore, long-term
contractual arrangements and other external factors such as trust are important in
delivery of health services. The institutional and organizational environment also
plays a vital role in determining the nature of contracts and their implementation.
PPPs have been used in health insurance primarily for service provision, and to a
much lesser extent for financing and management. The PPP model has been used for
service delivery by a number of countries like Vietnam, Philippines, Colombia, South
Africa, Ghana, and Netherlands, as described earlier. Colombia and Philippines,
however, have also used the model for health-care management. Although there is
some description of the role of PPPs within state-sponsored health insurance, there is
very little evaluation of their role, especially where the private sector acts as financial
intermediary rather than just a health-care provider. Further analysis would help to
65
determine the equity of utilization and the impact of reforms on fairness of the health-
care system.
There is insufficient literature to understand the dynamics of PPPs in social health
insurance, especially where enrolment is voluntary. Adverse selection, cream
skimming, risk pooling, moral hazard, equity and out of pocket expenditures may lead
to undue profit and market failure. From the limited evidence observed in the review,
the case for social health insurance for the poor in developing countries is mixed.
Further research would be required to understand the nature of PPP, the contracting
milieu and how it affects accessibility and utilization. Specifically, it is important to
explore the distribution of roles, responsibilities and risks among stakeholders of PPPs
with management or service delivery contracting.
Against this backdrop, RSBY is therefore a very apt topic for further research.

66
Chapter 3
INDIA - BACKGROUND AND CONTEXT

67
Chapter 3
INDIA – BACKGROUND AND CONTEXT
This chapter looks at India in the context of PPPs and health insurance. It summarises
the health-care status, financing and infrastructure of India. It looks at health
insurance in its historical context and in the context of the existing health regulatory
framework. The chapter then examines the RSBY scheme, its design, the use of
contracts in its implementation, the challenges faced, what is currently known about
the functioning of the scheme, and the need for further research. Google India was
used as a search engine. The keywords used for the literature review are given in
Table 3.1.
Table 3.1: Keywords used for literature review
Domains Keywords used
India – background and
context of the RSBY scheme
India – health status, health economics, social
factors, expenditure, insurance, government,
private, PPP, public–private partnership, history,
commercial, situational analysis, ESI, employee
state insurance scheme, Rashtriya Swasthya Bima
Yojana, RSBY, community-based health insurance,
CBHI, private providers, contracts, scheme design
Note: Keywords are used in various combinations
Over the past several years, India has made considerable progress in improving the
health status of its people. The current death rate stands at 7 per thousand, birth rate at
21.4 per thousand, infant mortality rate at 40 per thousand live births (Registrar
General of India, 2013) and life expectancy for men at 67.3 years and women at 69.6
years (Ministry of Health and Family Welfare, 2014). However, many challenges
remain - elimination/eradication of communicable diseases; increasing incidence of
non-communicable diseases; neglect of maternal and neonatal health and
environmental degradation. Only 35% of the people use improved sanitation facilities
(WHO and UNICEF, 2013). All this is marked by considerable regional variations.
India spends about 3.7% of its GDP on health. Government expenditure on health is
1.04% of its GDP. Government expenditure on health as a percentage of total health

68
expenditure is 28.2%. The OOP expenditure on health as a percentage of total health
expenditure is as high as 61.7% (World Health Organization, 2013). The high level of
OOP expenditure often leads to financial impoverishment of the people, trying to
meet their health-care needs. Public funding is focused on preventive, promotive,
curative and rehabilitative care, while private expenditure is primarily for curative
care. Despite a significantly higher gross national income than other countries in the
region, India’s ranking remains low in the Human Development Index (Malik, 2014).
Health finance and delivery in India has developed along four main co-existing lines –
out-of-pocket expenditures, tax-financed public delivery, social insurance and
voluntary private insurance. The first and by far the largest is OOP spending by
households. Nearly all this spending is directed to fee-for-service private providers,
but some is for user fees collected at public facilities (La Forgia and Nagpal, 2012).
In the latest Human Development Report 2014 released on 24 July 2014, India stands
at 135 in Human Development Index (HDI) out of 187 countries (Malik, 2014).
Smaller countries like Sri Lanka (73) and Maldives (103) are above India in their
rankings. Among all the BRICS countries, India has the lowest HDI with its life
expectancy higher only than South Africa (which is still grappling with second
generation HIV/AIDS patients). Russia, Brazil and China are in the high HDI
category with rankings of 57, 79 and 91, respectively (Malik, 2014). The Human
Development Report 2014 shows that while human development levels continue to
rise globally, they do so at a slower pace than before. This deceleration is due to a
slowdown in economy, slow growth in expected years of schooling and declining
growth rates of life expectancy, particularly in Asia (Ghosh, 2014).
The Gender Inequality Index (GII) (which measures gender disparity, using three
dimensions – reproductive health, empowerment, and labour market participation)
ranges between 0 and 1, with 0 representing 0% inequality, indicating that women
fare equally in comparison to men, and 1 representing 100% inequality, indicating
that women fare poorly in comparison to men (Malik, 2014). At 0.563, India’s GII is
the highest in South Asia. In HDI, India fares even worse once adjustments are made
for all inequalities that are a result of social and economic disparities (Malik, 2014).
Discounted for inequality, India’s HDI falls to 0.418 – a loss of 28.6%. The average
loss for inequality for medium HDI countries is 25.6% (Malik, 2014). For South Asia,
the average loss is 28.7%. Among Brazil, Russia, India, China and South Africa

69
(BRICS), Brazil comes second in terms of inequality losses with its HDI reduced by
26.3%(Malik, 2014). Among 145 countries, India ranks 98 in inequality-adjusted HDI
as against 95 for Brazil and 45 for Russia (Malik, 2014).
During the past six decades, India has developed a large public health infrastructure
with 355 medical colleges (Medical Council of India, 2012) and 605 district hospitals.
As of March 2012, there were 605 district hospitals, 4,833 community health centres
(CHCs), 24,049 primary health centres (PHCs) and 148,366 sub centres functioning in
the country (Ministry of Health and Family Welfare, 2012). In addition, there exists a
large number of private health facilities scattered throughout the country.
The growth in infrastructure in the last few years can be assessed from the
comparative figures of 2005 and 2012:
At the national level, there was an increase of 1,487 CHCs between 2005 and
2012. The number of CHCs functioning in government buildings has
increased from 91.6% to 97% during the same period.
PHCs have increased by 813. The percentage of PHCs functioning in
government buildings has increased significantly from 78% to 90.2%.
The number of sub centres has increased from 146,026 to 148,366.
There is ample information on the predominance of the private for-profit health-care
sector in India (Raman and Björkman, 2009). The private sector dominates service
provision of high-end curative services (Selvaraj and Karan, 2009). Evidence from
national household surveys demonstrates the expanding role of the private sector over
the last two decades and its emergence as the predominant provider of inpatient care
(Selvaraj and Karan, 2009). About 63% of the total beds for inpatients are with the
private sector, which created over 70% of the new beds during the period 2002–2010
(Gudwani et al., 2012). Data from the National Family Health Survey (NFHS) III also
confirms that the private medical sector remains the primary source of health care for
the majority of households in urban (70%) as well as those in rural areas (63%). The
number of government hospital beds in urban areas is more than twice the number in
rural areas (Central Bureau of Health Intelligence, 2010), and the rapid development
of the private sector in urban areas has resulted in an unplanned and unequal
geographical distribution of services (De Costa et al., 2009). The doctor-to-population
70
ratio in India is 1:1,800 (Deo, 2013) in contrast to other neighbouring countries such
as Thailand (4:2500) or Sri Lanka (1:1250) (World Bank, 2010).
A study led by a World Bank economist Jishnu Das published in Health Affairs
(2012) examined the quality of primary care delivered by private and public health-
care providers in rural and urban India. The study found that many providers do not
have medical degrees; the quality of medical training is low; and less than half of
them provide correct diagnoses (Das et al., 2012).
Against this backdrop, government intervention in making health-care available,
accessible and affordable is essential to meet the objectives of universal coverage and
effective health-care delivery. The Government is also focusing on strengthening the
rural health architecture, especially through the National Rural Health Mission
(NRHM) and the Janani Suraksha Yojana (JSY).
The NRHM was launched in April 2005, aimed at strengthening public health
management and enhancing service delivery to provide accessible, affordable and
quality health care to the rural population, especially the vulnerable and underserved
groups. The mission is intended to adopt a synergistic approach by relating health to
determinants of good health such as nutrition, sanitation, hygiene and safe drinking
water. The Mission attempts to achieve these through a set of core strategies including
enhancement in budgetary outlays for public health, decentralized village- and
district-level health planning and management, appointment of accredited social
health activists (ASHAs) to facilitate access to health services, strengthening the
public health service delivery infrastructure – particularly at village, primary and
secondary levels, improved management capacity to organize health systems and
services in public health, promoting the non-profit sector to increase social
participation, community empowerment, inter-sectoral convergence, upgrading public
health facilities to Indian Public Health Standards (IPHS) and reduction of infant and
maternal mortality through the JSY (Ministry of Health and Family Welfare, 2005,
Ministry of Health and Family Welfare, 2015).
JSY was given emphasis as its objective is to reduce maternal and neonatal mortality
by promoting institutional deliveries among poor pregnant women. A cash incentive
is provided to mothers who deliver their babies in public or private health facilities
rather than at home. There is also a provision for cost reimbursement for transport and

71
incentives to ASHAs to encourage mothers to go in for institutional deliveries. JSY is
a 100% Centrally-sponsored scheme, which integrates cash assistance with delivery
and post-delivery care (Ministry of Health and Family Welfare, 2015).
3.1 The insurance sector in India – historical context
In India, insurance has a deep-rooted history. It finds mention in the ancient writings
of Manu (Manusmrithi), Yagnavalkya (Dharmasastra) and Kautilya (Arthasastra)
(Insurance Regulatory and Development Authority, 2007b). These writings mention
pooling of resources that could be redistributed in times of calamities such as fire,
floods, epidemics and famine (Newar, 2013). This was probably a precursor to
modern day insurance. It evolved over time, drawing from other countries’
experiences, particularly the United Kingdom. It came to India as a legacy of the
British occupation.
Formal insurance in India commenced in 1850 with the establishment of the Triton
Insurance Company Ltd. in Calcutta by the British (Insurance Regulatory and
Development Authority, 2007b). In 1907, the Indian Mercantile Insurance Ltd. was
set up. This was the first company to transact all classes of general insurance business.
The General Insurance Council, a wing of the Insurance Association of India, was
formed in 1957 (Insurance Regulatory and Development Authority, 2007b). The
General Insurance Council framed a code of conduct for ensuring fairness and sound
business practices.
The General Insurance Business (Nationalization) Act, which was notified in 1972,
nationalized the insurance market. A total of 107 existing insurers were amalgamated
and grouped into four companies—the National Insurance Company Ltd., the New
India Assurance Company Ltd., the Oriental Insurance Company Ltd., and the United
India Insurance Company Ltd. In 1993, the Government set up a committee under the
chairmanship of RN Malhotra, former Governor RBI to propose recommendations for
reforms in the insurance sector in keeping with the reforms in the financial sector. The
committee submitted its report in 1994 wherein it recommended, inter alia, that the
private sector be permitted to enter the insurance industry by floating Indian
companies, preferably joint ventures with Indian partners (Law Commission of India,
2003).

72
Following the recommendations of the Malhotra Committee report of 1994, the
Insurance Regulatory and Development Authority (IRDA) was constituted in 1999 as
an autonomous body to regulate and develop the insurance industry. The IRDA was
incorporated as a statutory body in April 2000 (The Gazette of India, 2001). The key
objective of the IRDA was enhancement of competition so as to improve customer
satisfaction through increased consumer choices and lower premiums, while ensuring
the financial security of the insurance market.
Once approved by Parliament, insurers including health insurance companies will be
able to raise the much-needed capital from foreign partners and expand their business.
According to estimates, the raising of the cap could bring in as much as US$ 6 billion
in funds to the country (Singh, 2014a).
The term ‘insurance’ is primarily associated with life insurance – the most popular
form of insurance in India (around 570 million insured lives in 2011) (Ministry of
Finance, 2011). There are two reasons for this – first, with the low life expectancy (37
years in 1951) and a tightly knit family structure, people primarily sought financial
security. Second, life insurance has been traditionally positioned as a tax-planning
tool. Health insurance evolved slowly in tandem with general insurance, with both
sharing key landmarks. The historical development of insurance and health insurance
is summarized in Table 3.2.

73
Table 3.2: Comparison between general insurance and health insurance
General insurance Health insurance
Pre
-in
dep
end
ence
1818: Life insurance in its current form was
introduced in 1818 when the Oriental Life
Insurance Company began its operations in
India.
1850: General insurance was however a
comparatively late entrant in 1850 when the
Triton Insurance Company set up its base in
Calcutta.
1912: Health insurance introduced when the
first insurance act was passed.
1947: In 1947, the Bhore Committee Report
made recommendations for the improvement
of health-care services in India.
1948: The Central Government introduced the
Employees’ State Insurance Scheme (ESIS)
for blue-collar workers employed in the
private sector.
Na
tio
na
liza
tio
n
1956: Life insurance was the first to be
nationalized in 1956. Life Insurance
Corporation of India was formed by
consolidating the operations of various
insurance companies.
1973: General Insurance followed suit and
was nationalized in 1973. General Insurance
Corporation of India was set up as the
controlling body with New India, United
India, National and Oriental companies as its
subsidiaries.
1954: The Central Government Health
Scheme (CGHS) was set up for Central
Government employees and their families.
1986: Mediclaim was introduced by
government insurance companies in 1986.
Lib
era
liza
tio
n
1991: The process of opening up the
insurance sector was initiated against the
background of the economic reforms process.
Malhotra Committee was formed during this
year that submitted its report in 1994.
1999: Insurance Regulatory Development
Act (IRDA) was passed.
2001: Indian insurance was opened for
private companies and private insurance
companies effectively started operations.
1999: Marked the beginning of a new era for
health insurance in the Indian context. With
IRDA, the insurance sector was opened to
private and foreign participation.
2003: Introduction of UHIS – early attempts
by government to introduce health insurance
for informal sector. Universal Health
Insurance Scheme (UHIS) was a
hospitalization indemnity product voluntarily
purchased from any state-owned insurer at a
heavily subsidized price (INR165, less than
US$ 4 a year).
Source: Health Insurance Evolution in India: An Opportunity to Expand Access (Shetty,
2014)
3.2 Health insurance in India
The health insurance industry was launched in 1986 and has grown significantly,
mainly due to the liberalization of the economy and general awareness of the
population (Jacob, 2013).

74
The Indian health insurance scenario is a mixed bag. The existing schemes can be
categorized as follows:
SHI schemes, which are mandatory or government-run schemes;
voluntary health insurance schemes or private for-profit schemes;
employer-based schemes;
community based health insurance (CBHI) or insurance offered by NGOs;
subsidized voluntary health insurance schemes for the poor.
3.2.1 Social health insurance
SHI is based on income-determined contributions from the mandatory membership
and can be an effective risk-pooling mechanism that allocates services according to
need and distributes the financial burden according to the ability to pay (thereby
ensuring equity in access). As Rao points out, in India with its large rural and
informal sector accounting for 90% of the population, lack of cohesion and solidarity
and poor institutional capacity, such schemes are difficult and expensive to implement
(Rao, 2005). The existing mandatory health insurance schemes in India such as the
Employees’ State Insurance Scheme (ESIS) and the Central Government Health
Scheme (CGHS) were first started as pilot projects in 1948 and 1954, respectively in
the context of achieving universal coverage via the SHI.
Under the ESI Act, 1948 the ESIS provides protection to employees against loss of
wages due to inability to work because of sickness, disability or death due to an
employment-related injury. It also provides medical care to employees and their
family members without any fee for service. The Employee’s State Insurance
Corporation (ESIC) is a corporate semi-government body headed by the Union
Minister of Labour and Employment as its Chairman. The Act compulsorily covers
(1) all power-using non-seasonal factories employing 10 or more persons; (2) all non-
power using factories with 20 or more employees; and (3) service establishments like
shops, hotels, restaurants, cinemas, road transport and newspapers. The scheme is
compulsory and contributory in nature and provides a uniform package of medical
and cash benefits to the insured persons. The scheme is implemented through special
ESI hospitals and diagnostic centres, dispensaries and empanelled doctors.

75
3.2.2 Voluntary health insurance schemes or private for-profit schemes
The IRDA legislation in 2000 served as a key milestone in health-care insurance. It
opened up the health insurance industry to private players. Health insurance
membership quadrupled between 2007 and 2011 (300 million in 2011) and is
expected to be 600 million by 2015 (Shetty, 2014). There are stand-alone health
insurers (private for-profit) along with government sponsored health insurance
providers. To improve awareness, the General Insurance Corporation of India and the
IRDA have held several awareness campaigns for all segments of the population
(Jacob, 2013).
In private insurance, buyers are willing to pay premiums to an insurance company that
pools people with similar risks and insures them for health expenses. Premiums are
based on an assessment of the risk status of the consumer (or of the group of
employees) and the level of benefits provided, rather than as a proportion of the
consumer’s income (Sein et al., 2004). Prior to liberalization, the insurance sector
consisted of the government-owned Life Insurance Corporation of India (LIC) that
had a monopoly on life insurance business and the General Insurance Corporation of
India and its four non-life subsidiaries namely, National Insurance Co., New India
Assurance Co., Oriental Insurance Co. and United India Insurance Co. Health
insurance was first introduced in November 1986 under a product called Mediclaim,
offered by the General Insurance Corporation of India and its four non-life
subsidiaries (BearingPoint, 2008). As a part of its financial sector reform agenda, the
GoI liberalized the Indian insurance industry through the enactment of the Insurance
Regulatory and Development Authority Act, 1999 which led to the opening up of the
sector to private insurance companies (BearingPoint, 2008). According to the IRDA
Annual Report 2009, IRDA has licensed 36 private insurance companies and eight
public sector insurance companies.
3.2.3 Employer-based schemes
Employers in both the public and private sector offer employer-based insurance
schemes through their own employer-managed facilities by way of lump sum
payments, reimbursement of employee’s health expenditure for outpatient care and
hospitalization, fixed medical allowance (monthly or annual, irrespective of actual
expenses), or covering them under the group health insurance policy (Sein et al.,
2004). The population coverage under these schemes is minimal, about 30–50 million
people in all (Sein et al., 2004).

76
3.2.4 Community-based health insurance
CBHI schemes are small-scale, voluntary health insurance programmes, organized
and managed in a participatory manner, which are designed to be simple and
affordable and to draw on resources of social solidarity and cohesion to overcome
problems of small risk pools, moral hazard, fraud, exclusion and cost-escalation
(Tabor, 2005). The efficacy of the programme is based on two implicit principles:
one, that the community has adequate homogeneity or social coherence that gets
easily translated to a capacity to mobilize resources; and two, that the willingness to
prepay will be influenced by self-interest when each individual perceives his marginal
benefit exceeding his costs, i.e. accessing something of value which can be obtained
easily and better in quality through prepayment (Rao, 2005). Often, there is a problem
of adverse selection because of a large number of high-risk members whose premiums
are not based on an assessment of individual risk status. Exemptions made as a means
of assisting the poor might also have an adverse effect on the ability of the insurance
fund to meet the cost of benefits (Conn and Walford, 2002). There are two types of
CBHI schemes in India. In the first type, an NGO acts as an intermediary between a
formal insurance provider and the insured community, e.g. Self Employed Women’s
Association (SEWA) in Ahmedabad. In the second type, the NGO itself provides
insurance to the target community (Ahuja, 2004).
3.2.5 State-subsidized voluntary health insurance schemes for the poor
India has a few examples of state-subsidized voluntary health insurance schemes for
the poor. The largest of them is the RSBY, which is considered separately later since
it is the subject of this thesis. A few other examples are mentioned below.
The Government of Andhra Pradesh has set up the Aarogyasri Health Care Trust and
formulated a voluntary health insurance scheme for BPL families called the Rajiv
Aarogyasri Community Health Insurance Scheme. The Star Health and Allied
Insurance Co. Ltd., a private insurance firm which was selected through a competitive
bidding process, has been contracted to implement the scheme and a MoU was signed
with the company in April 2008 (Mallipeddi et al., 2009). The scheme began as a pilot
in the three most backward districts of Andhra Pradesh and now covers the entire
State. It provides coverage for meeting the expenses of hospitalization and surgical
procedures of beneficiary members up to USD 4,000 per family per year in any of the
network hospitals (Mallipeddi et al., 2009). Moreover, the network hospitals provide
the following additional benefits to the BPL beneficiaries: (i) free outpatient

77
consultation; (ii) free tests and medical treatment for beneficiaries who might not
avail any surgery or therapy procedures; (iii) a minimum of 24–26 free health camps
per year in villages for screening of the BPL suffering from identified ailments; and
(iv) free transport to the patient identified for surgery or therapy. The Government
covers the insurance premium and the entire scheme is cashless for the patients. As of
May 2009, this scheme has covered over 250,000 operations, over 1.5 million patients
have been screened and US$ 168 million have been claimed (Mallipeddi et al., 2009).
In 1988, the Government of Goa along with the New India Assurance Company
developed a medical reimbursement mechanism. This scheme can be availed by all
permanent residents of Goa with an income below INR 50,000 (£ 504) per annum for
hospitalization care, which is not available within the government system (Sein et al.,
2004). The non-availability of services requires certification from the dean of the
hospital or Director Health Services. The overall limit is INR 30,000 (£ 302) for the
insured person for a period of one year (Sein et al., 2004).
The Government of Jharkhand launched a health insurance scheme in April 2008,
targeting BPL families. The scheme has no exclusion clauses. It is an all-disease
inclusive scheme and extends its coverage to people living with HIV. It was designed
to be a mandatory scheme for BPL families and covers the whole family without any
age bar. One of the innovative features of the scheme is to involve, on a long-term
basis, all industrial groups in the financing of the insurance component under the
corporate social responsibility (CSR) principle. Figure 3.1 shows the financing
structure and the benefits under the scheme.
Fig. 3.1: Financing and benefits under the health insurance scheme (Jharkhand)
Source: India: State government sponsored health protection programme (ILO Subregional
Office for South Asia, 2008)
The premium to be paid by each member of the family is INR 20 (£ 0.2) per year,
with an INR 170 (£ 1.8) subsidy (ILO Subregional Office for South Asia, 2008). The

78
scheme is managed by a public–private trust and engages both public and private
providers in delivery of care.
The Government of Kerala started the Comprehensive Health Insurance Scheme
(CHIS) in 2008 to cover the non-BPL population. This complements the RSBY
scheme (Government of Kerala, 2008). The non-RSBY population is divided into two
categories: (i) those belonging to the BPL list of the State Government but not to the
list as defined by the Planning Commission,3 and (ii) the above poverty line (APL)
families that belong neither to the State Government list nor to the list prepared as per
guidelines of the Planning Commission (Government of Kerala, 2008). In the case of
families of the first category, the beneficiaries pay INR 100 (£ 1) per annum per
family as beneficiary contribution, and the State Government meets all the remaining
expenses including the cost of the smart card. In the case of families of the second
category, the beneficiary contribution covers the entire amount of the premium plus
the cost of the smart card. In other words, the beneficiary contribution is INR 30 (£
0.3) per family per annum for RSBY families, INR 100 (£ 1) for families belonging to
category (i) and the entire amount for families belonging to category (ii) (Government
of Kerala, 2008).
The Chief Minister's Relief Fund in Madhya Pradesh was set up to provide immediate
financial assistance to the victims of natural calamities such as flood, fire, earthquakes
and accidents, and also to people suffering from various ailments. The Rajasthan
Chief Minister's Relief Fund gives assistance to accident victims.
Gujarat has the Mukhyamantari Amrutam Yojana, which addresses the key
vulnerability faced by the BPL population, that of catastrophic health expenditure.
Kerala has the Chief Minister’s Distress Relief Fund which provides financial
assistance for distressed people affected by major natural calamities such as flood and
drought. It also provides financial assistance to individuals in need of treatment for
major diseases such as cancer, cardiac surgery, kidney transplant, brain tumour, liver
disease and multi organ failure.
In Tamil Nadu, the Chief Minister's Comprehensive Health Insurance Scheme is an
insurance scheme launched by the Tamil Nadu State Government through the United
India Insurance Company Ltd. (a public sector insurer headquartered at Chennai)
3 Since replaced by NITI Aayog
79
which provides free medical and surgical treatment in government and private
hospitals to the members of any family whose annual family income is less than INR
72,000 (£ 725) (as certified by the Village Administrative Officer).
3.2.6 National Universal Health Insurance Scheme
The national UHIS was launched by the GoI in July 2003 for providing financial risk
protection to the poor. The scheme offered health insurance via four public insurance
companies, and was managed with the help of TPAs (discussed later). It was initially
designed as a group insurance scheme with membership of at least 100 families and
only covered those who were members of some group such as cooperative societies,
handloom weavers, etc. The premium for joining the scheme varied according to
family size 1) Individual Person INR 365/- (£ 3.7) per annum; 2) Family (not
exceeding five members) consisting of Insured, Spouse and first 3 dependent children
Rs.548/- (£ 5.5) per annum; 3) Family not exceeding 7 members consisting of
Insured, Spouse, first 3 dependent children and dependent parents Rs.730/- (£ 7.4) per
annum. In case of hospitalization, the scheme provided medical expenses up to INR
30,000 (£ 302) per family and the Government provided a fixed subsidy of INR 100
(£ 1), irrespective of family size. Due to poor enrolment in the first nine months
(Ahuja, 2006), the scheme was redesigned in May 2004 with a higher subsidy
(increased to INR 200 (£ 2), INR 300 (£ 3) and INR 400 (£ 4) to individuals, families
of five and seven, respectively) and restricting eligibility to BPL families only (Rao,
2005).
Building on the experience of UHIS in 2008, the GoI launched yet another state-
managed national health insurance scheme targeting the BPL informal sector workers
called Rashtriya Swasthya Bima Yojana (RSBY) with certain design changes from
the UHIS. This scheme is the focus of the present research. Under RSBY, the role of
the private sector is much wider and a lot of the responsibility for scheme
implementation rests outside the public sector.
3.3 Current status of health insurance
It is estimated that only 25% of the Indian population is under some form of health
insurance (Reddy et al., 2011a). Currently, Centre-funded insurance schemes cover an
estimated population of 181 million through the following schemes: ESIS – 60
million, CGHS – 3 million, and RSBY – 118 million (World Health Statistics 2013)

80
(Figure 3.2). While ESIS and CGHS provide for comprehensive health care, RSBY
only provides for hospitalization cover with a benefit limit of INR 30,000 (£ 302) per
enrolled household per year (United Nations, 2014). In addition, 110 million people in
the southern states (70 million in Andhra Pradesh, 35 million in Tamil Nadu and five
million in Karnataka) receive coverage under health insurance schemes funded by the
state governments. However, most of these schemes cover only inpatient care, and
mainly at the tertiary level.
Fig. 3.2: Population coverage under various health schemes in India
Source: World Health Statistics 2013 (http://www.in.one.un.org/task-teams/universal-health-
coverage)
Most health insurance products offered by private entities are similar to the
government-defined product, Mediclaim, and are indemnity-based. Given its high
premiums, most Mediclaim and similar policy holders belong to the middle and upper
classes.
While the urban population has witnessed a proliferation in the means of health-care
financing and delivery over the past two decades, the rural population lacks basic
health-care delivery and financing. Though community health insurance schemes
managed by non-governmental organizations (NGOs) are evolving to cater to the
needs of the rural population, health-care delivery and finance still leave much to be
desired (Planning Commission, 2011).
3.4 Identifying below poverty line population
The Planning Commission defines poverty lines on the basis of monthly per capita
consumption expenditure (MPCE). The parameters used for estimating poverty are -
0 20 40 60 80 100 120
Rashtriya Swasthya Bima Yojana
State Government funded health insurance(Tertiary care focus)
Employee State Insurance Scheme(Primary +Secondary + Tertiary)
Central Government Health Scheme(Primary + Secondary+Tertiary)
118
110
60
3
Population in Millions

81
land holdings, type of house, availability of clothing, food security, sanitation,
ownership of consumer durables (TV, electric fan, kitchen appliances, cooker, radio,
etc.), literacy status of highest literate, status of household labour, means of
livelihood, status of children, type of indebtedness, reasons for migration and
preference for assistance. For each of these parameters, households are awarded
scores. A low score indicates a higher level of poverty and deprivation and vice-versa.
The Planning Commission decides on a cut-off score for identifying the BPLs.
However, the states have also been given the liberty to decide on the cut-off score of
their own for determining the total number of BPL households, either uniformly
across the districts or even below the district level, depending on their budget
allocation. It is the responsibility of the state to identify the households who fulfil the
BPL criteria. Table 3.3 shows the poverty ratio and number of poor in India.
In December 2005, the Planning Commission constituted an expert group under the
Chairmanship of Prof. Suresh D. Tendulkar to review the methodology for estimation
of poverty. This was the basis on which estimates of poverty for 2009–10 were made.
Based on the Suresh Tendulkar panel's (Tendulkar et al., 2009) recommendations, in
2011–12, the poverty line was fixed at INR 27/day for rural areas and INR 33/day for
urban areas.
Another expert group was constituted in June 2013 under the Chairmanship of Dr. C.
Rangarajan (ex-Governor, Reserve Bank of India) to once again review the
methodology for the measurement of poverty. The report by the Rangarajan
Committee came up with a new BPL criteria, according to which those spending over
INR 32 (£ 0.3) a day in rural areas and INR 47 (£ 0.5) in urban areas should not be
considered as BPL (Singh, 2014b).

82
Table 3.3: Poverty ratio and number of poor in India
Poverty ratio (%) Number of poor (million)
Rural Urban Total Rural Urban Total
1. 1993–94 50.1 31.8 45.3 328.6 74.5 403.7
2. 2004–05 41.8 25.7 37.2 326.3 80.8 407.1
3. 2011–12 25.7 13.7 21.9 216.5 52.8 269.3
Annual average decline:
1993–94 to 2004–05
(percentage points/annum)
0.75 0.55 0.74 – – –
Annual average decline:
2004–05 to 2011–12
(percentage points/ annum)
2.32 1.69 2.18 – – –
Source: Press note on poverty estimates (2011–12). Planning Commission, GoI; 2013
(accessed 30 December 2014)
3.4.1 Regulatory framework
Health regulation in India encompasses a variety of actors and issues. These include
promulgation of legislation for health facilities and services, disease control and
medical care, human resources (education, licensing and professional responsibility),
ethics and patients’ rights, pharmaceuticals and medical devices, radiation protection,
poisons and hazardous substances, occupational health and accident prevention,
elderly, disabled and rehabilitation, family, women and child health, mental health,
tobacco control, social security and health insurance, environmental protection,
nutrition and food safety, health information and statistics, custody and civil and
human rights, to enumerate a few. However, given the scope of this research, the
focus is on the regulatory environment around private providers/clinical
establishments and the insurance companies/TPAs, keeping in mind the PPP
arrangements under the RSBY scheme design.
The preamble to the Constitution of India, coupled with the Directive Principles of
State Policy, enjoins the State to make ‘improvement of public health’ its primary
responsibility. Furthermore, Articles 38, 42, 43 and 47 of the Constitution provide for
promotion of health of individuals as well as health care (Planning Commission,
2006). The Constitution of India also enumerates the separate and shared legislative

83
powers of Parliament and state legislatures in three separate lists—the Union List,
State List and Concurrent List. For the Concurrent List, which includes criminal law,
marriage, divorce and all other personal law matters, economic and social planning,
population control and family planning, social security and social insurance,
employment, education, legal and medical professions, and prevention of transmission
of infectious or contagious diseases, the Parliament and state legislatures share
authority. However, laws passed by Parliament with respect to matters on the
Concurrent List supersede laws passed by state legislatures. The Parliament generally
has no power to legislate on items from the State List, including public health,
hospitals and sanitation. However, two-thirds of the Rajya Sabha may vote to allow
Parliament to pass binding legislation on any state issue if ‘necessary or expedient in
the national interest’. In addition, two or more states may ask Parliament to legislate
on an issue that is otherwise reserved for the states. Other states may then choose to
adopt the resulting legislation (Planning Commission, 2006). Thus, for RSBY
stakeholders, the regulatory frameworks that influence social security, social
insurance and the medical profession are under the Concurrent List, though public
health and hospitals are under the State List.
3.4.2 Private providers and clinical establishments regulation
The private health sector in India consists of, on the one hand, private general
practitioners, consultants of different systems [allopathic medicine and AYUSH
(Ayurveda, Yoga and Naturopathy, Unani, Siddha and Homoeopathy)] and a variety
of non-qualified practitioners; and on the other hand hospitals, nursing homes,
maternity homes, specialty hospitals, etc. (Duggal and Nandraj, 1991). Besides this,
there are the pharmaceutical and medical equipment manufacturing industries, which
are overwhelmingly private and predominantly multinational. There are also
laboratories, which conduct tests from the basic blood testing to CAT scans (Duggal
and Nandraj, 1991).
Post-independence, the private health sector in India has grown greatly and is
thriving. At the time of Independence, the private health sector accounted for only 5%
to 10% of total patient care (Rao, 2012). In 2004, the share of the private sector in
total hospitalized treatment was estimated at 58.3% in rural areas and 61.8% in urban
areas (Planning Commission, 2008). Data from the National Family Health Survey
(NFHS) III confirms that the private medical sector remains the primary health-care

84
source for the majority of households in urban areas (70%) as well as in rural areas
(63%) (Rao, 2012).
Legislation exists with respect to licensing of medical professionals such as doctors,
nurses, dentists and pharmacists with a view to control their entry into the market.
Important among these national level laws are the Indian Medical Council Act, 1956;
the Indian Nursing Council Act, 1947; the Indian Medicine Central Council Act,
1970; the Homoeopathy Central Council Act, 1973 and the Pharmacy Act, 1948.
Almost all of these laws mandate establishing of statutory regulatory councils to
monitor the standards of medical education, promote medical training and research
activities and oversee the qualifications, registration and professional conduct of
doctors, dentists, nurses, pharmacists, and practitioners of other systems of medicine
such as ayurveda, yoga, unani, siddha and homoeopathy (AYUSH). In addition, each
statute directs establishment of a central registry for individuals certified to practice in
the field of medicine. Councils also often prescribe standards of professional conduct
and determine which actions amount to professional misconduct (Planning
Commission, 2006).
As regulation of clinical facilities is a state subject, some state legislation was
introduced by union territories/states for regulation of clinical establishments such as
The Bombay Nursing Homes Registration Act, 1949; Delhi Nursing Homes
Registration Act, 1953 and the Tamil Nadu Private Clinical Establishments Act, 1997.
In 1996, the death of a patient in a private hospital due to medical negligence was
reported to the National Human Rights Commission (NHRC). This led to the
Planning Commission directing the GoI, Medical Council of India and the Delhi
Government to examine the registration of private hospitals to ensure availability of
minimum facilities, with violation to be made a cognizable offence (Planning
Commission, 2006). Thereafter, the Central Council of Health and Family Welfare at
its Fifth Conference held in January 1997 recommended that the National Institute of
Health and Family Welfare be assigned the responsibility of drafting model
legislation. At its Sixth Conference held in 1998, the Central Council examined the
matter afresh and resolved that the Central Government may frame norms and
standards for ensuring proper health care for different categories of institutions in
consultation with the state governments for private hospitals/nursing homes/clinical
establishments, to be followed by all the state governments. These norms would

85
prescribe the minimum standards of staff and infrastructure for all such institutions.
The Central Council further resolved that state governments may enact laws to
provide for compulsory registration of private hospitals, nursing homes and clinical
establishments in order to ensure minimum facilities for different forms of treatment.
Since it would also be necessary to regulate fees charged by the private health
institutions, the laws could also provide for compulsory exhibition of fees,
qualification of doctors, equipment available, etc. To implement the above mandate, a
national workshop was organized by the GoI at New Delhi in 1999 with the assistance
of WHO and the Medical Council of India. The aim was to provide a platform for
discussion among the service providers of nursing homes and hospitals for the
purpose of presenting the minimum standards for their registration. It was, however,
felt that uniform enforcement of minimum standards would require Central
legislation. Therefore, in 2000, another draft bill was prepared, called Clinical
Establishments Regulation and Accreditation Bill. During this entire period, various
states also enacted their own legislations for regulating clinical establishments.
The Clinical Establishments (Registration and Regulation) Act, 2010 was passed by
the Parliament of India amidst much opposition from the Indian Medical Association
(IMA), which proposed that the regulatory powers rest in the hands of the
autonomous Hospital Authority of India. The primary reason for this was the
perception in the medical community that licensing of health-care institutions by the
Government will lead to harassment, corruption and nepotism (Indian Medical
Association, 2013). In 2012, the Act was notified by the Union Government which
made it mandatory for all clinical establishments to provide medical care and
treatment necessary to stabilize any individual who comes or is brought to the clinical
establishment in an emergency medical condition, particularly accident cases and
women who come for deliveries (The Hindu, 2012). It provides for mandatory
registration of all clinical establishments including diagnostic centres and single-
doctor clinics across all recognized systems of medicine, both in the public and
private sector, except those run by the defence forces. The Act lays down standard
treatment guidelines for common disease conditions. All states were asked by the
MoHFW to adopt the law by passing resolutions in their respective assemblies.
National Council for Clinical Establishments, which is a multi-member body under
the Chairmanship of the Director General of Health Services with representatives of

86
various stakeholder institutions, is under notification. Work on the categorization of
clinical establishments and development of minimum standards has been initiated in
association with the Quality Council of India and the Indian Medical Association. A
committee has also been formed for the development of standards for electronic
records maintenance systems, to be adopted in the hospitals.
3.4.3 Insurance regulations
The IRDA was constituted by an Act of Parliament called the Insurance Regulatory
and Development Authority Act, 1999 (The Gazette of India, 1999) and duly passed
by the GoI (Rediff News, 1999). IRDA regulates and promotes the insurance industry
in India and protects the interests of holders of insurance policies.
One of the main responsibilities of the Authority is to regulate, promote and ensure
the proper growth of the insurance business in India. The Authority has been entrusted
with several powers and functions relating to regulations on investment of funds by
insurance companies, regulating maintenance of the margin of solvency, settlement of
disputes between insurers and intermediaries, overseeing the functioning of the Tariff
Advisory Committee, specifying the percentage of premium income of the insurer, to
finance schemes for promoting and regulating professional organizations and
identifying the percentage of life insurance business and general insurance business to
be undertaken by the insurer in the rural or social sector. The Authority provides a
certificate of registration to life insurance companies and is responsible for the
renewal, modification, withdrawal, suspension or cancellation of this certificate of
registration. It also specifies the requisite qualifications, code of conduct and practical
training for insurance intermediaries and agents (Insurance Regulatory and
Development Authority, 2007a, Nagree-Mahtani, 2002).
The IRDA opened up the market in August 2000. Foreign companies were allowed
ownership of up to 26% of the total market. From 2000 onwards, the IRDA has
framed various regulations ranging from registration of companies for carrying on
insurance business to protection of policyholders’ interests under Section 114A of the
Insurance Act 1938.
In December 2000, the subsidiaries of the General Insurance Corporation of India
were restructured as independent companies. At the same time, GIC was converted
into a national reinsurer. In 2002, the four subsidiaries of GIC were delinked from

87
GIC by an Act of Parliament. GIC with its four subsidiary companies and Life
Insurance Corporation of India (LIC) provide various health insurance products. In a
decision of the Cabinet Committee on 25 July 2014, the GoI cleared 49% foreign
direct investment in the insurance sector from the earlier 26%.
The IRDA, which licenses and regulates the TPAs, has specified that a TPA should be
a commercial entity with a minimum capital of INR 10 million in equity shares and a
working capital amounting to INR 10 million. One of the directors of the TPA should
be a qualified medical doctor registered with the Medical Council of India. A
participating foreign company’s equity shares cannot at any time exceed 26% of the
paid-up equity capital of the TPA. The licence is usually granted to a TPA for a
period of three years and the licence fee is INR 30,000 (£ 302). A TPA whose
application has been once rejected by the Authority cannot apply again for a period of
two years from the date of such rejection.
The other bodies, which also play roles in regulation of insurance schemes, are the
Tariff Advisory Committee and the Life Insurance and General Insurance Council.
The Tariff Advisory Committee is a body corporate that controls and regulates the
rates, advantages, terms and conditions offered by insurers in the general insurance
business. It has the authority to require any insurer to supply such information or
statements necessary for discharge of its functions. The Life Insurance and General
Insurance Council conducts examinations for individuals wishing to qualify as
insurance agents (Nagree-Mahtani, 2002).
3.5 Rashtriya Swasthya Bima Yojana (RSBY)
Despite the expansion in health facilities, illness remains one of the most prevalent
causes of human deprivation in India. About 94% of the Indian workforce or 400
million people are working in the informal sector (Birdsall, 2015). The informal or
unorganized sector in India refers to those enterprises whose activities or collection of
data are not regulated under any legal provision, or those who do not maintain any
regular accounts (Bhardwaj et al., 2004).
Apart from deteriorating infrastructure, a lack of awareness and low literacy levels,
and a widespread lack of health insurance as outlined above compounds the health-

88
care challenges that India’s poor face. The rapidly increasing gap between demand
and availability of affordable health care makes health care an expensive proposition
and insurance a pertinent need. As at present, the majority of the informal sector lacks
access to effective social protection systems. The vulnerability of the poor in the
informal sector increases when they have to pay fully for their medical care, with no
subsidy or support. On one hand, such workers do not have the financial resources to
undertake medical treatment; and on the other, the health infrastructure leaves a lot to
be desired.
Thus, there is ample justification for introducing health insurance (Ahuja, 2004).
Firstly, even low-income people can make small periodic contributions, thereby
taking some financial burden off from the already strained state revenues. Secondly,
the insured individuals could be given the option of going to either public or private
service providers, which in turn would generate competition among providers for
better services. Finally, health insurance can be used to promote certain desirable
behaviour such as family planning, immunization, reduction of tobacco and alcohol
consumption, etc.
In December 2008, the Indian Parliament passed a legislation called the Unorganised
Workers Social Security Bill that mandated the Union Government to ‘formulate,
from time to time, suitable welfare schemes for the unorganized workers.’ This
legislation has a schedule which includes the RSBY as a new scheme (Department of
Labour & Employment and Jharkhand State Labour Welfare Society, 2010).
RSBY is a GoI initiative that uses contracts as a PPP tool. The objective of RSBY is
to provide protection to BPL households from financial liabilities arising out of health
shocks that involve hospitalization. Every BPL family holding a ration card is eligible
for this scheme and can include in the scheme up to five family members – the head
of the household and four others who may be the spouse, children and parents. The
family is issued with a biometric-enabled smart card on a payment of INR 30 (£ 0.3).
This card contains their fingerprints and photographs and entitles them to inpatient
services consisting of more than 700 packages under 15 categories, up to a limit of
INR 30,000 (£ 302).
The RSBY is a flagship programme of the Central Government. It aims to increase
the scope and extent of coverage of the scheme, so that ultimately UHC is achieved.

89
The focus of the scheme is specifically on the BPL population. At the same time, by
covering over 700 hospitalization packages, RSBY aims to protect the poor from
major health shocks and increase the depth of coverage. Finally, by introducing a
cashless mechanism through a smart card, the number of beneficiaries is also
enhanced as the poor will not have to pay OOP at the time of hospitalization
(Narayana, 2010, Das and Leino, 2011, Seshadri et al., 2011). RSBY is thus a big step
towards UHC.
A systematic review was conducted to study and analyze the RSBY documents. The
search strategy is given in detail in Figure 3.3. Various peer reviewed articles,
reviews, reports and letters were considered for the review. The review was conducted
through electronic search, contact with experts and manual search in libraries. The
objective of this review was to identify all documents (published and unpublished)
that could provide some insight into the background, launch and sustainability of the
RSBY scheme, its situational analysis, contract design, contract milieu, external
environment, stakeholders and implementation.

90
Fig. 3.3: Literature review search strategy for RSBY documents
$ – Wild card; MoHFW – Ministry of Health and Family Welfare; MoLE – Ministry of
Labour and Employment
3.5.1 RSBY and partnership with the private sector
Health care is one of India’s largest sectors, which had a total worth of more than
US$ 34 billion before the launch of RSBY (Pate et al., 2007). The private sector
accounts for more than 80% of total health-care spending, providing about 60% of all
outpatient care and as much as 40% of all inpatient care (Pate et al., 2007). It is
estimated that nearly 70% of all hospitals and 40% of hospital beds in the country are
in the private sector (Pate et al., 2007). In the Indian market, these private sector
providers contribute to provider competition, which may help enhance efficiency. A
resource-rich and expanding private sector in health care makes it an important
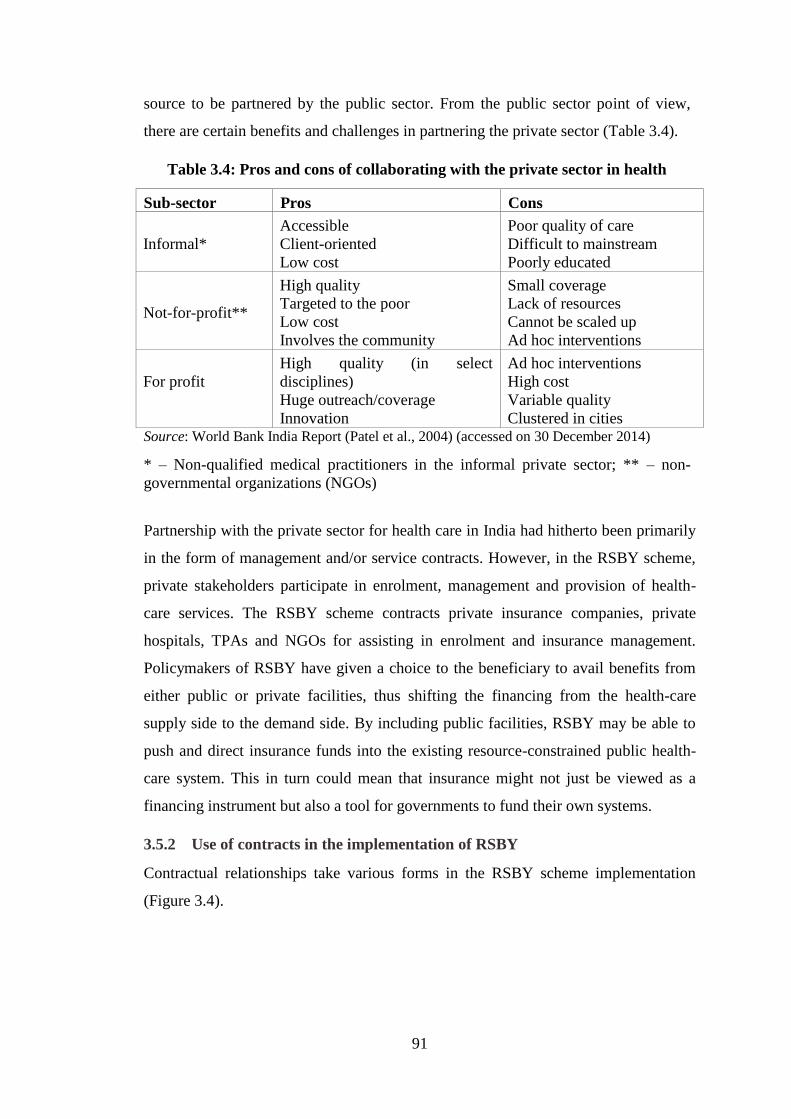
91
source to be partnered by the public sector. From the public sector point of view,
there are certain benefits and challenges in partnering the private sector (Table 3.4).
Table 3.4: Pros and cons of collaborating with the private sector in health
Sub-sector Pros Cons
Informal*
Accessible
Client-oriented
Low cost
Poor quality of care
Difficult to mainstream
Poorly educated
Not-for-profit**
High quality
Targeted to the poor
Low cost
Involves the community
Small coverage
Lack of resources
Cannot be scaled up
Ad hoc interventions
For profit
High quality (in select
disciplines)
Huge outreach/coverage
Innovation
Ad hoc interventions
High cost
Variable quality
Clustered in cities Source: World Bank India Report (Patel et al., 2004) (accessed on 30 December 2014)
* – Non-qualified medical practitioners in the informal private sector; ** – non-
governmental organizations (NGOs)
Partnership with the private sector for health care in India had hitherto been primarily
in the form of management and/or service contracts. However, in the RSBY scheme,
private stakeholders participate in enrolment, management and provision of health-
care services. The RSBY scheme contracts private insurance companies, private
hospitals, TPAs and NGOs for assisting in enrolment and insurance management.
Policymakers of RSBY have given a choice to the beneficiary to avail benefits from
either public or private facilities, thus shifting the financing from the health-care
supply side to the demand side. By including public facilities, RSBY may be able to
push and direct insurance funds into the existing resource-constrained public health-
care system. This in turn could mean that insurance might not just be viewed as a
financing instrument but also a tool for governments to fund their own systems.
3.5.2 Use of contracts in the implementation of RSBY
Contractual relationships take various forms in the RSBY scheme implementation
(Figure 3.4).

92
Fig. 3.4: Use of contracts in the implementation of RSBY
Contracts between the states and insurance companies: State governments set up a
competitive bidding process and select a public or private insurance company licensed
to provide health insurance by the IRDA. An insurance company that fulfils technical
criteria and has the lowest premium is usually chosen (officials at the Ministry of
Labour and Employment (MoLE) and MoHFW) . While more than one insurer can
operate in a particular state, only one insurer can operate in a single district at any
given point in time. The period of the contract with the successful bidder is three
years from the effective date subject to renewal on a yearly basis, based on parameters
(performance indicators) fixed by the state government/nodal agency.
Contracts between the insurance companies and TPAs: According to the GoI
guidelines, the process is required to be completely cashless for the beneficiary, which
in turn requires the use of smart cards that need to be issued to all members. Thus, the
insurance company needs to arrange sub-contracts with qualified smart card providers
who are referred to as TPAs. The role of the TPAs can also include establishing
provider networks, collection and analysis of data, negotiating rates for procedures
with providers, contracting providers, processing claims and making direct payments
to them. They can arbitrate on any dispute between the subscriber and the provider.
For the services provided by a TPA, the insurance companies pay between 5.2% to
5.4% of the total amount of premium collected under the policy (BearingPoint, 2008).
The insurer also engages intermediaries with local presence (such as NGOs) in order
to provide grass roots outreach and assist members in utilizing the services after
enrolment. The insurance company is tasked with empanelling/certifying both public
and private care providers. The process is based on prescribed criteria that the service
providers need to possess, such as specified basic facilities. For example, the service
PPP INSTRUMENT – CONTRACTS
States and
districts
Insurance
companies NGOs, SHGs, etc.
Private & public
providers
TPAs Contracts
Contracts
Contracts
Contracts

93
provider may be required to have at least 10 inpatient medical beds, or have specified
medical, surgical facilities and diagnostic facilities, etc.
3.5.3 RSBY Scheme design and implementation
Figure 3.5 helps identify the various partners involved in the implementation of the
RSBY scheme. The arrows represent the interaction between partners.
Fig. 3.5: Partners involved in implementation of RSBY
Benefits: RSBY provides the beneficiary a total benefit of up to INR 30,000 (£ 302)
per BPL family per annum, on a family floater basis, whereby the total benefit can be
availed individually or collectively by a maximum of up to five enrolled members of
the family. The ‘family’ would comprise of the household head, spouse and up to
three dependents. The scheme covers pre-existing conditions subject to minimal
exclusions, coverage of health services related to hospitalization and services of a
surgical nature that can be provided on a day care basis. Though OPD facilities are
not covered under the scheme, OPD consultation fees are almost negligible in public
hospitals. There is also a provision for pre- and post-hospitalization expenses for one
day prior to and five days after hospitalization. The scheme includes a transport

94
allowance (actual, limited to £ 1.65 per visit) but subject to an annual ceiling of £ 16.5
(Ministry of Labour and Employment, 2010).
Funding: The GoI contributes 75% of the estimated annual premium of £ 12.5,
subject to a maximum of £ 9.2 per family per annum. Additionally, the cost of a smart
card (see below) is also borne by the Central Government at £ 1 per card.
Contribution by the state governments is 25% of the annual premium, as well as any
additional premium in cases where the total premium exceeds £ 12.5. The beneficiary
pays £ 0.5 per annum as registration/renewal fee. Any administrative and other related
costs of administering the scheme in each state, not otherwise included in the
premium cost, are borne by the state governments (Ministry of Labour and
Employment, 2010).
State nodal agency: The scheme as designed at present has a number of stakeholders.
At the apex is the Union Government represented by the Ministry of Labour and
Employment (MoLE), followed by the concerned state government as the next tier
which sets up an independent state nodal agency (SNA) for implementation of the
scheme. Different state governments have chosen different departments under which
to place the SNAs. Therefore, the impact of RSBY may vary from state to state,
depending on the efficiency of the SNA and its controlling department (Table 3.5).
Table 3.5: Nodal agency for RSBY implementation
Name of state State nodal agency
Delhi, Goa, Jharkhand, Karnataka, Kerala,
Maharashtra, Manipur, Nagaland, Orissa,
Tamil Nadu, Tripura
Department of Labour
Arunachal Pradesh, Uttar Pradesh Department of Rural Development
Assam, Uttarakhand National Rural Health Mission
Bihar, Haryana, West Bengal Directorate ESI
Chhattisgarh, Gujarat, Meghalaya, Punjab Department of Health and Family
Welfare
Jammu and Kashmir Directorate of Family Welfare
Himachal Pradesh H.P. Swasthya Bima Yojana Society
Mizoram Mizoram State Health Care Society Source: Based on RSBY’s official website http://www.rsby.gov.in (Ministry of Labour and
Employment, n.d.) (accessed on 15 February 2015)
95
Management of the scheme and smart cards: There are many stakeholders involved in
the oversight and execution of RSBY at national, state and district levels. One key
stakeholder for administrative functions is the insurance company. The nodal agency
seeks bids from registered public or private insurance companies. Each contract is
district specific, with the insurer agreeing to establish a separate project office for
implementing the scheme and coordinating activities with the state nodal agency in
the state capital. The insurer must agree to cover the benefit package prescribed by the
Central MoLE through a cashless facility. Annually, an electronic list of eligible BPL
households is provided to insurers by each participating state’s MoLE. The insurance
company prepares an enrolment schedule for each village, along with dates, with the
help of district officials. The insurance companies are provided a maximum of four
months to enrol BPL families in each district. Insurers are compensated on the basis
of the number of smart cards issued, i.e. households covered. Smart cards enable
foolproof biometric identification of the beneficiary and make the scheme completely
cashless. The eligible beneficiary, whose information is included in the district BPL
list, needs to come to the enrolment station (in remote areas the insurance company
travels to the beneficiaries to make the card) and the identity of the household head
needs to be confirmed by the authorized official in order to issue the smart card. The
card is personalized and delivered on the spot, along with an information packet
describing the benefits, hospitals in the network and other relevant information. There
is also a provision for insurance coverage across states by providing split cards under
the scheme at the time of first issue, or subsequently at the district kiosk. The split
value can be decided by the head of the family, provided the total amount on both the
cards is equivalent to the total amount available on the primary card before the split.
This could prove useful to a large number of unorganized sector workers in India who
migrate from one state to the other in search of employment.
Insurance companies: The unit of implementation under RSBY is a district. There can
be more than one insurance company operational within a state. Under the IRDA,
there are 27 health insurance companies listed for the year 2013–14 (Insurance
Regulatory and Development Authority, 2014). Some of these health insurance
companies are providing health insurance under RSBY scheme. The list of insurance
companies contracted in various states of India in 2013–14 is at Table 3.6.

96
Table 3.6: List of insurance companies contracted in various states (2013–14)
S
No. State Insurance companies (districts)
No. of districts
for which data
was available
1 Andhra Pradesh Reliance General Insurance (1) 1
2 Arunachal Pradesh Royal Sundaram Alliance Insurance (10) 10
3 Assam National Insurance Company (23) 23
4 Bihar
ICICI Lombard(10); HDFC (5); Cholamandalam MS General
Insurance (6); National Insurance (1); Tata AIG General Insurance (4); Max Bupa Health Insurance (2); United India Insurance (5);
Reliance General Insurance (1); Apollo Munich Health Insurance (2) 36
5 Chandigarh ICICI Lombard 6
6 Chhatisgarh Oriental Insurance Company (27) 27
7 Delhi Oriental Insurance Company (9) 9
8 Goa New India Insurance (2) 2
9 Gujarat
Oriental Insurance Company (8); National Insurance Company (3);
Tata AIG General Insurance (6); Star Health Insurance (5) 22
10 Haryana National Insurance Company (9); United India Insurance (12) 21
11 Himachal Pradesh New India Assurance (12) 12
12 Jammu and Kashmir United India Insurance (1) 1
13 Jharkhand
IFFCO-TOKIO General Insurance (1); Tata AIG General Insurance
(2); Cholamandalam MS General Insurance (7); Star Health and Allied Insurance (8); ICICI Lombard (6) 24
14 Karnataka
IFFCO-TOKIO General Insurance (14); Tata AIG General Insurance
(10) 24
15 Kerala Reliance General Insurance (13) 13
16 Madhya Pradesh IFFCO-TOKIO General Insurance (3) 3
17 Manipur New India Assurance (6) 6
18 Meghalaya ICICI Lombard (10) 10
19 Mizoram National Insurance Company (8) 8
20 Nagaland New India Assurance (11) 11
21 Orissa Star Health Insurance (5); IFFCO-TOKIO General Insurance (8); ICICI Lombard (4) 17
22 Punjab Reliance General Insurance (18); Star Health Insurance (3) 21
23 Rajasthan National Insurance Company (22); Land T (8) 30
24 Tamil Nadu United India Insurance (2) 2
25 Tripura Royal Sundaram Alliance Insurance (7) 7
26 Uttar Pradesh
United India Insurance Co. Ltd. (13), National Insurance Company
(10); ICICI Lombard (13); Religare Health Insurance Company
Limited (6); The Oriental Insurance Co. Ltd. (7); Royal Sundaram Alliance Insurance (8); HDFC ERGO General Insurance (17); 74
27 Uttarakhand United India Insurance (13) 13
28 West Bengal
United India Insurance (4), National Insurance Company (8); ICICI
Lombard (1); Cholamandalam MS General Insurance (3); The New
India Assurance (2) 18
Source: Adopted from RSBY Website (Ministry of Labour and Employment, 2014) (accessed on 20 March 2015)
Note: Data was not available for the following states/UTs - Andaman and Nicobar, Dadra and Nagar Haveli, Daman and Diu, Lakshadweep, Maharashtra, Pondicherry and Sikkim

97
Management information system: The scheme’s management information system is
built centrally for all state-led RSBY schemes to enable the collection of standardized
information on all daily transactions at hospitals. This information is uploaded
through an internet/phone line to a database on a district server. Data from all districts
flow to the Central Government at periodic intervals.
Service provision: The insurance company is tasked with empanelling/certifying both
public and private care providers in the programme. The empanelled facilities must
agree to set up a specific RSBY desk with smart card reader and trained staff. RSBY
has negotiated a package rate for all expenses, e.g. medicine, tests, bed charges,
materials, food etc. related to the treatment of covered services, and payments are
made to the provider on a case‐based payment system. An empanelled hospital should
not charge anything from the patient for treatment related to the list of diseases under
package rates. Under RSBY, a list of 727 package rates has been developed
(Annexure 1). To get empanelled under the scheme, a facility needs to sign a MoU
with the insurance company.
A prerequisite for empanelling is to have appropriate infrastructure for inpatient and
day care services. This process is carried out by the insurer. However, states may
assist to complete the task.
All government hospitals (including PHCs and CHCs) and ESI hospitals can be
empanelled. The criteria for empanelling private hospitals and health facilities are as
follows:
– at least 10 inpatient medical beds for primary inpatient health care;
– fully equipped and engaged in providing medical and surgical facilities,
including diagnostic facilities, i.e. pathology testing, X-ray, ECG, etc. for
the care and treatment of injured or sick persons as inpatients;
– fully equipped operating theatre where surgical operations are carried out;
– fully qualified doctors and nursing staff under its employment round the
clock;
– maintaining of necessary records as required to provide necessary
information on the insured patient to the insurer or his
representative/government/trust as and when required;
– registration with the Income Tax Department;

98
– telephone/fax and internet facilities;
– machine to read and manage smart card transactions.
As of October 2014, 10,311 hospitals (6,093 private hospitals and 4,218 public
hospitals) were included in the RSBY delivery network (Ministry of Labour and
Employment, 2014). To avail benefits, a RSBY beneficiary visits a provider and goes
to the RSBY help desk where the patient’s identity is verified through fingerprints.
The patient then visits the doctor who assesses his/her health condition and prescribes
a treatment. The assistant at the RSBY help desk checks whether the procedure is in
the list of pre‐specified packages. If the procedure is on the list, an appropriate
prescribed package is selected, the patient is scheduled for the procedure, and the
amount to be paid is blocked on the smart card. If the procedure is not on the list, the
help desk checks with the insurer regarding the price and gets approval to conduct the
procedure. At the time of discharge of the beneficiary from the hospital, the smart
card is swiped again with fingerprint verification for the amount spent and the amount
remaining and the beneficiary is paid INR 100 (£ 1.0) by the hospital as transportation
expense. The pre‐specified cost of procedure is deducted from the amount available
on the card and the hospital sends an electronic report and claim to the insurer/TPA.
The insurer/TPA reviews the records and information and makes payment to the
hospital (electronically) within a specified time period (agreed upon between
insurer/TPA and hospital). The funds received get into the user fee revenue of public
hospitals and are utilized as per the guidelines of the user fee and for private hospitals,
the amount reimbursed is a fee for the service provided by the facility.
3.5.4 Challenges associated with the RSBY scheme
Several evaluations have been conducted by the state governments and various other
organizations in recent years to assess the process and outcome of the RSBY scheme.
As far as has been ascertained, these state-level evaluations have been conducted in
Jharkhand, Bihar, Uttar Pradesh, Kerala, Karnataka, Himachal Pradesh and Gujarat.
The Centre for Development Studies in Trivandrum and the Amsterdam Institute for
Social Science Research, with support from the Hivos Knowledge Programme,
monitor the implementation of the scheme in the states of Punjab, Gujarat, Odisha,
Andhra Pradesh and Kerala – states sufficiently distinct from each other in their
political, economic and social configurations and also situated in different parts of the
country (Kannan and Varinder, 2012).

99
The RSBY scheme is considered by some as a success (Swaroop, 2012). But
according to other sources, the scheme offers limited financial protection, suffers
from corruption, abuse and cost escalation; and has skewed public resources to
curative rather than preventive care (Balooni et al., 2012, Sinha, 2012, Shivakumar,
2013, La Forgia and Nagpal, 2012).
Out of a total of 29 states and 6 UTs, 26 states and 3 UTs are implementing this
scheme. A district-wise study in 2013–14 shows that out of a total of 505 districts (in
the RSBY implementing states), 416 (82.4%) districts have been covered (Ministry of
Labour and Employment, 2014). A total of 37.5 million (approximately 55% coverage
of total poor households) card holders provide coverage to a total of 112.5 million
beneficiaries at an average premium of approximately INR 400 (£ 4). For the year
2013–14, a total of 2.5 million beneficiaries have availed hospitalization services at an
average claim payout of approximately INR 5000 (£ 50.3) (RSBY Committee, 2014).
The real test of coverage lies in the number of people actually enrolled. Even after the
completion of about four years, the fact that eight states have achieved a coverage of
less than half of the estimated BPL families should have been a matter of concern,
both to the concerned states as well as the Union Government (Kannan and Varinder,
2012). A review of the present status of RSBY reflects a huge disparity in uptake of
RSBY at the state level. States like Delhi and Karnataka have less than 20%
enrolment, while Himachal Pradesh has more than 85% of its BPL population covered
under the scheme (Ministry of Labour and Employment, 2012a). The overall
enrolment coverage of the scheme in 2012 was around 42.2% of the BPL population
(Kannan and Varinder, 2012). This has grown slowly and reached only 55% in 2014
(Table 3.7).

100
Table 3.7: Enrolment and empanelment under the scheme in various states
BPL population Empanelled hospitals
State BPL
population
(%)
% BPL
population
Enrolled
Private
hospitals
Public
hospitals
Total
hospitals
Share of
public in
total
hospitals
(%)
Empanelled
hospitals per
10,000 RSBY
cards
Empanelled
hospitals per
10,000 RSBY
poor
households
Andhra
Pradesh
9.2 - 3 4 7 42.9 - -
Arunachal
Pradesh
34.6 - - 11 11 - 0.5 0.28
Assam 31.9 52.4 28 134 162 17.3 2.4 0.27
Bihar 33.7 54.6 865 100 965 89.6 1.12 1
Chandigarh 21.8 61.3 4 4 8 50.0 - -
Chhattisgarh 39.9 59.2 349 279 628 55.6 5.45 3.5
Delhi 9.9 - 35 - 35 - - -
Gujarat 16.6 42.3 937 487 1424 65.8 8.47 4.7
Haryana 11.1 30.7 429 33 462 92.9 12.25 7.39
Himachal
Pradesh
8 71.6 23 171 194 11.9 8.85 7.08
Jammu and
Kashmir
10.3 5 15 20 25.0 2.31 0.14
Jharkhand 36.9 50.8 217 220 437 49.7 4.38 2.15
Karnataka 20.9 546 328 874 62.5 9.1 2.03
Kerala 7 84.8 146 161 307 47.6 2.02 2.57
Maharashtra* - - 1181 15 1196 1.25 5.49 1.51
Madhya
Pradesh
31.6 49.6 76 44 120 63.3 - -
Manipur 36.8 48.2 6 - 6 100.0 1.25 0.28
Meghalaya 11.8 40.9 10 188 198 5.1 10.81 10.29
Mizoram 20.4 21.7 15 78 93 16.1 20.11 30.68
Nagaland 18.8 20.7 6 1 7 85.7 1.03 2.57
Orissa 32.5 65.0 137 408 545 25.1 3.3 0.86
Pondicherry 9.6 34.5 4 - 4 100.0
Punjab 8.2 51.6 175 161 336 52.1 23.54 5.41
Rajasthan 14.7 72.1 229 453 682 33.6 - -
Tripura 14 64.2 1 53 54 1.9 1.12 1.02
Uttar Pradesh 29.4 37.8 1254 729 1983 63.2 4.99 1.81
Uttarakhand 11.2 38.3 49 94 143 34.3 5.39 2.91
West Bengal 19.9 55.3 544 62 606 89.8 1.08 0.85
Total 21.9 55 6093 4218 10311 59.1 3.8 1.4
Source: RSBY Website, and Kannan and Varinder (Ministry of Labour and Employment, 2014, Kannan and Varinder, 2012)(accessed on 20 February 2015)
*Recent data regarding hospitals empanelled was not available for Maharashtra on the RSBY website
Physical access to hospital treatment is another important aspect of the assessment of
the success or otherwise of RSBY. Card holders are entitled to get inpatient treatment
only in empanelled hospitals, which could be either public or private hospitals, thus
giving the beneficiaries a choice of selection of a health facility. Narayana (2010) in a
review of the scheme states that the percentage of public hospitals out of those
empanelled in the sample states varies from 45.8% in Kerala to 4.95% in Haryana to
none in Maharashtra (a situation slightly different in 2014 as indicated above).
Nationally, 70% of the empanelled hospitals are from the private sector while the
remaining 30% are public sector hospitals (Narayana, 2010). Only eight out of 22
states show a higher number of empanelled public hospitals than private hospitals in

101
more recent years than the Narayana study. However, the process of empanelment is
not transparent and remains independent of the public domain. Hospitals with highly
inadequate facilities were reported to be empanelled under the scheme (Nandi et al.,
2012). Distribution of the empanelled hospitals mainly in the urban areas makes
accessibility a major concern for the RSBY beneficiaries. The absolute number of
empanelled hospitals is not a sufficient condition to gauge the physical access to
inpatient treatment (Table 3.7). There are many other details that need to be
marshalled to make a proper assessment, some of which can only be gathered through
case studies. In terms of the number of empanelled hospitals per 10,000 RSBY cards,
most of the states are lagging behind (Ministry of Labour and Employment, 2014,
Kannan and Varinder, 2012) (Table 3.7).
One of the pre-requisites for a scheme to function reasonably well is the level of
awareness and capabilities of the persons who are entitled for inclusion in such
schemes. Despite the scheme being managed from the state level, many beneficiaries
are unaware of its benefits (Das and Leino, 2011). Ineffective information, education
and communication (IEC) has been reported in the scheme (Trivedi and Saxena,
2013). The case of Punjab is aptly reported by Gill et al. (2013) who state that ‘most
of the BPL families which the study team met did not know the benefits of RSBY’
(Gill et al., 2013). Das (2012) narrates the statement of a sarpanch of a village from
Orissa: ‘although people have received the card, they do not know how to use it.
Similarly, they do not have any information about the hospitals empanelled under the
RSBY scheme and how money is to be claimed using this card’ (Das, 2013). In the
absence of this important information, there was no effective communication of
benefits. Two instances are quoted by Das and Leino to illustrate the ignorance of the
beneficiaries. In one, the card holder did not get benefits due to non-empanelment of
the hospital where he was rushed for treatment; and in the other, only partial benefit
could be reimbursed as the smart card expired during the course of the treatment. Poor
enrolment, limited empanelment and low hospitalization rates are indicative of the
poor awareness of the scheme among RSBY beneficiaries. Research undertaken by
Das and Leino in 2011 indicates that although spreading awareness through IEC did
not have a major impact on scheme enrolment, it did nevertheless have an impact on
the utilization rates for those who finally became enrolled (Das and Leino, 2011).

102
Surveys of the health-care industry in India have shown that the quality of service
provided in different facilities varies considerably and that many hospitals do not
follow standard operating procedures (SOPs). In a study by the National Labour
Institute, only one third of the study population reported the services to be satisfactory
while the remaining were not satisfied (Kannan and Varinder, 2012).
A report by Amicus Advisory as well as several media reports have flagged the issue
of a large number of ghost cards (Singh, 2010). There are also cases of suspect
procedures being performed needlessly without treatment protocols. There is no way
to judge if there is any truth in these charges (Shivakumar, 2013).
It is reported by Kunhikannan and Aravindan (2012) that in the state of Kerala, there
are cases where hospitals have retained patients for longer periods than necessary to
claim a higher amount (Kunhikannan and Aravindan, 2012). It is understood that a
usual practice of hospitals is to hold patients’ cards, which they can then freely
manipulate until the transaction is completed in the system. Many of the hospitals
keep their patients in the dark by not informing them of the amount availed from the
card and the remaining balance, in spite of the stipulation of giving a printout of these
details to the patients. Some of the malpractices give a clear indication of
unreasonable rates being charged under the scheme. Kunhikannan and Aravindan
point out several worrisome instances that clearly indicate the rigidity in operations,
which negates the effective implementation of this scheme (Kunhikannan and
Aravindan, 2012).
The scheme is designed to be cashless at the time of utilization. However, not
infrequently, the difficulties in using the card have resulted in cardholders paying for
the treatment themselves (Seshadri et al., 2011). Lack of knowledge of procedures
and services, with doctors and hospitals being guarded in accepting cards only for
claims regarding which they are certain of the coverage, has led to many beneficiaries
having to pay for their treatment themselves despite the fact that RSBY does indeed
provide coverage (Seshadri et al., 2011). One of the major problems reported is that
while the scheme incentivizes hospital treatment, it has no incentives for medical
management since OPD costs are not covered. Many evaluations have reported high
use of surgical packages when other options could have been taken (RSBY
Committee, 2014).

103
An RSBY committee constituted by the MoLE, GoI reported that RSBY has been
faced with multiple weaknesses on the operational front. Some of the key weaknesses
pointed out were (RSBY Committee, 2014):
– There is a conflict of interest with the insurance company conducting
enrolments, empanelment/de-empanelment of hospitals as well as the
insurance claims settlements, in some cases through the TPAs.
– The transaction management software at the field level is flawed, leading
to no data or inaccurate data being reported.
– No key performance indicators were defined for monitoring the scheme.
– Lack of checks and balances at the operational level has led to multiple
frauds in the scheme.
– The TPAs have been operating the scheme in various states whereas the
contract was signed with the insurance company. This has led to instances
where the states have had to coordinate with the TPAs, who have no direct
stake in the RSBY.
– Inadequate staffing of the SNAs is another issue. This has led to negligible
or a low level of involvement of the SNAs in the states.
3.6 Need for research
RSBY affords the ideal setting for exploring the role of PPPs in insurance. It is an
innovative health insurance scheme targeting the BPL beneficiary to the extent that it
uses contracts with the private sector at different levels of implementation. Although
RSBY was introduced in 2008, there is little independent evidence on how well the
use of contracts has worked. Moreover, because this is a Central Government scheme,
with the unit of implementation being the district within the states, the scheme design
allows for flexibility in implementation to the states right down to the district level,
which lends itself to different structures with a varying role of different elements in
the design of contracts.
Research should aim at providing data required by policy makers at all levels –
Central, state and district, to decide between different mechanisms of scheme design.
This research should directly address various data needs to help improve scheme
104
design and implementation. Particular areas that have been neglected and deserve
attention are discussed below.
3.6.1 Areas for research
Four areas of research motivate this thesis.
Firstly, in PPPs using management or service delivery contracts, it is crucial to
understand the allocated roles and responsibilities of partners and the division of risk
and responsibility between them, including the incentive structures for different
partners that are built into the scheme design. It is also crucial to understand the role
of external factors.
Secondly, since insurance companies are one of the key stakeholders in the
implementation of RSBY, it is important to understand their objectives and the
incentives they function under. For example, insurance companies receive a fixed
income from the premium; and if they are for-profit, they may wish to minimize
expenditure by empanelling a limited number of facilities, empanelling facilities that
offer a limited range of services/packages, or empanelling facilities which are not
within close proximity to a high percentage of the BPL population in order to make it
difficult for the beneficiaries to avail the benefits they are entitled to. Moreover, an
initial review of the policy documents reveals the loose language used in contractual
arrangements as is evident from statements of the following type: ‘The insurer shall
empanel enough hospitals in the district so that beneficiaries need not travel very far
to get the health-care services’, or ‘adequate network of hospitals/health facilities
which meets minimum standards for service delivery and operation’, which leaves
scope for variation in empanelment of facilities. The criterion for empanelment of
facilities makes no mention of the packages to be offered at the facility or within the
district. Additionally, the enrolment in the scheme currently stands at an average of
3.5 members per family (as against the maximum permissible limit of 5 persons for
the same fixed premium) and the marketing of the scheme rests with the insurance
companies (personal communication with the RSBY policy unit in the Central
Government). The insurance companies have an incentive to encourage enrolment of
the family but it adds to their profit margin to minimize the number of members
enrolled per family.

105
Thirdly, the scheme design entitles a RSBY beneficiary to a package of 727 number
of treatments (the number of treatments for each package on the list being pre-
negotiated) but it is possible that the empanelled private sector facilities, for cost
considerations, would take on only the simpler cases or chose to treat only selected
packages (due to inadequate reimbursement through capitation for some of the
treatments within the package).
Fourthly, pre-negotiated capitation rates for treatments within the package could
result in reduced provision of adequate services. This indicates a continuing trade-off
between risk/responsibility and the price of the contract between the principal and the
agent. Thus, an important question to address regarding the pre-negotiated payment
for an RSBY beneficiary is whether the quality of care differs for RSBY patients from
that delivered to non-RSBY patients. In addition, does this differ across different
types of providers, both public and private, since motivation to maximize income
from the contracts may vary by type of provider?

106
Chapter 4
RESEARCH PROTOCOL

107
Chapter 4
RESEARCH PROTOCOL
4.1 Aims and objectives
4.1.1 Aim
To study the provision, availability and use of health services under PPP contracts in
the implementation of RSBY and the factors that can influence such health services,
in order to inform policymakers on how to improve the scheme design for the BPL
beneficiary.
To meet this aim, all objectives have been examined through contractual
arrangements in two different districts belonging to different states. The focus is not
to look for attribution of findings to types of contracts, but to report on the use and
provision of health services under contractual arrangements for factors such as range
of services, patterns of utilization and provision of care; and to seek explanations for
the patterns seen.
4.1.2 Objectives
The objectives of the study are:
1) to analyse the external environment (regulatory, institutional, political, etc.)
and the contract design of the RSBY scheme in order to understand strengths
and weaknesses of the scheme design and the incentive structures created by
the assigned roles, responsibilities and relationships within the contracts;
2) to evaluate the availability of services by mapping the health-care providers
including the packages offered by the empanelled health-care providers, and
analysing the utilization patterns;
3) to compare the provision of health care across both public and private
providers for RSBY beneficiaries and between RSBY and non-RSBY
beneficiaries for a specific type of provider;
4) to inform policy on the findings and make recommendations in order to
address any problems in the scheme and help improve provision of health care
to the target population.

108
4.2 Conceptual framework
The RSBY scheme follows a top-down approach. Policies are decided at higher levels
(Central Government, flowing down to state governments and districts) and are
communicated to partners at subordinate levels who are then charged with the
technical, managerial and administrative tasks of putting policy into practice (Figure
4.1). Different partners such as insurance companies, TPAs, NGOs, self-help groups
(SHGs) and private and public providers are contracted to deliver the services to the
RSBY beneficiaries. It was expected that the contract design would have an influence
on three elements - availability, utilization and service provision, which in turn would
affect service delivery and equity and efficiency under the scheme.
This research thus focused on studying service delivery in terms of availability,
utilization and provision of health services under PPP contracts in the implementation
of RSBY and the factors that might influence it. Means of influence include payment
methods, incentive structures, stipulation for sanctions, etc. Other external factors
such as organization and institutional capacity, and the political and regulatory
environment that could influence implementation, were also studied. Transaction
costs, the market and degree of competition, and degree of trust have not been
formally considered as a part of the analysis due to constraints of resources and
accessibility to information.
4.3 Study setting
The study focused on one district in the state of Haryana (Yamunanagar) and one
district in the state of Punjab (Patiala) (Figure 4.2a, 4.2b, 4.2c).

109
Fig. 4.1: Conceptual framework
TPA – third party administrator; NGO – non-governmental organization; SHG – self-
help group; PPP – public–private partnership
Fig. 4.2a: Map of India showing the states of Punjab and Haryana

110
Fig. 4.2b: Map of Yamunanagar district (Haryana)
Source: http://www.mapsofindia.com/maps/haryana/railways/yamunanagar.htm (Yamunanagar)
Fig. 4.2c: Map of Patiala district (Punjab)
Source: http://www.jnvpatiala.org.in/MainMenu/Location.html (Patiala)

111
4.3.1 Choice of states/districts
The reasons for selection of these states and districts were:
Buy-in from various stakeholders at the national and state level, including
the TPAs and insurance companies involved in the implementation of the
scheme.
Choosing two different states helped capture the various elements relating
to capacity, governance, regulation, etc. across states, as states are the
primary implementers of the RSBY scheme, with the unit of
implementation being the district.
RSBY had greater than two years of implementation in the districts at the
start of the study, which helped in collection of reliable data.
RSBY had a different set of partners involved in each district and it was
hoped that choosing one district each in two different states would capture
variations, if any. It also afforded the opportunity to explore various design
and local (non-contract) factors that might influence implementation in
terms of availability, utilization and provision.
4.3.2 District profiles
Yamunanagar, Haryana state (Government of Haryana, 2010)
Yamunanagar district came into existence on 01 November 1989. It has an area of
1,756 sq km, in which there are 655 villages, 10 towns, two subdivisions, three tehsils
and three sub-tehsils. Before being named as Yamunanagar, it was known as
Abdullapur. A large part of the district lies in the Shiwalik foothills. Sugarcane, wheat
and rice are the main crops. Yamunanagar is an important industrial district and has
metal, utensil and plywood industries.
Patiala, Punjab state (Governmnet of Punjab, 2010)
Patiala is an erstwhile princely state. It was the capital of Patiala and East Punjab
States Union (PEPSU), which was a state of India between 1948 and 1956. It is a
district headquarters and is situated in the Malwa region of Punjab. Malwa has the
largest number of districts in the reorganized Punjab, and antiquity of some of the
cities goes back to the ancient and early medieval period. Patiala is a relatively young

112
city, a few years more than two centuries old. It is surrounded by the districts of
Fatehgarh Sahib, Mohali and the UT of Chandigarh to the north, Sangrur district to
the west, Ambala and Kurukshetra districts of the neighbouring state of Haryana to
the east and Kaithal district of Haryana to the south. Patiala is a predominantly rural
district.
4.4 Access and ethical approval
The aim of the research was first shared with the policymakers in the GoI and state
governments. Discussions were held with the TPAs and insurance companies at the
state level. Thereafter, the proposal was submitted to the Ethics Committee at the
London School of Hygiene and Tropical Medicine. In addition, the proposal was
submitted to the Institutional Ethics Committee (IEC) at the Public Health Foundation
of India (PHFI), which undertook a full review of the proposal as recommended in the
Indian Council of Medical Research (ICMR) 2006 guidelines. Strict confidentiality
was maintained for all the data collected including facility data, hospital claim data
and exit patient interview data.
The study used both qualitative and quantitative methods to study the use and
provision of health services under contract. In addition, both primary and secondary
data were used for quantitative research, with multiple methods employed to allow for
the triangulation of data in order to enhance the rigour of the research and help
improve the validity of the data. All data, both primary and secondary, were collected
under the supervision of the principal investigator (PI) with the assistance of research
assistants (RAs). Review of the existing documents and reports was carried out by the
PI with support from the RAs.
4.5 Methods for Objective 1
Objective 1: To analyse the external environment (regulatory, institutional, political
etc.) and contract design of the RSBY scheme in order to understand the strengths and
weaknesses of the RSBY scheme design and incentive structures created by
roles, responsibilities and relationships within the contracts.

113
Research questions
What is the political environment in the selected states with regard to RSBY?
What regulations govern the contracts within and across different states?
What is the institutional capacity in the selected states for implementation of
RSBY?
What is the allocation of roles and responsibilities to different partners within
the states? How does this vary across states?
What is the contract design including the incentive structure for various
partners/stakeholders? Do these vary across states?
Data sources and study tools: Data for Objective 1 was collected using key informant
interviews and review of key documents. The key informants included the key
personnel at national, state and district levels, key personnel from insurance
companies operating at district levels, NGO representatives, TPAs and public and
private sector health-care providers (Table 4.1). Key documents reviewed included
contracts, programmatic reports, policy documents, evaluations etc. These documents
were retrieved through the RSBY and Ministry of Labour and Employment website.
Other sources of these key documents were Government offices, including state nodal
agencies of the studied states, and personal communication with the central level
policy makers. The contract between the Central Government and the state
government, and between the SNA and the insurance company were obtained from
the SNA. The contracts between the providers and the insurance company were made
available by the providers. In most cases, the actual signed contractual agreement was
available; in some others, a draft contract was shared with the understanding that the
signed document was exactly similar.

114
Table 4.1: In-depth interviews conducted
SNo. Key personnel interviewed Number of
interviews
1 RSBY implementers at the national level 3
Punjab
2 Special Secretary RSBY heading the SNA 1
3 Representative of the SNA 1
4 Representative of the insurance company 1
5 NGO representative at the district level 1
6 Third party administrators 1
7 Public sector health-care providers 1
8 Private sector health-care providers 1
Haryana
9 Director Employees State Insurance (ESI) heading the Nodal
Agency (Nodal Agency: Directorate of ESI Health Care)
1
10 Representative of the insurance company 1
11 Representative of the SNA 1
12 NGO representative at the district level 1
13 Third party administrators 1
14 Public sector health-care providers 1
15 Private sector health-care providers 1
16 Other stakeholders (key personnel involved in the
implementation of the scheme)
3
Total 20
A semi-structured in-depth interview guide (for key stakeholder interview) was
developed by the PI with valuable feedback from the Advisory Committee (Annex 2).
The Advisory Committee included experts in various fields of study who, in addition
to having knowledge of prevalent global and India-related issues relevant to RSBY
specifically and social health insurance broadly, provided valuable feedback on
design of the study tool. In addition, expert local advice was sought to ascertain the
nuances in scheme implementation at district level. The interview guide was pilot
tested on stakeholders. These stakeholders were subsequently not included among the
study participants. The guide included questions on the political and regulatory
environment, institutional and organizational capacity, roles and responsibilities and
contract details.
Methods
Interviews were done in a mix of languages—English, Hindi and Punjabi, and lasted
from 20 to 60 minutes. The interviews were conducted by the PI. Permission was

115
sought from key stakeholders to audio record the interviews for ease of reference and
transcription. The audio recordings were reviewed and transcribed in English. A
transcription agency was used in the initial phases to facilitate the process of
transcription. However, due to the technical nature of the responses, requiring an
understanding of the scheme design and the implementation process, transcription
was later done by the PI.
The data was evaluated using thematic analysis (Braun and Clarke, 2006). Two
members of the research team (PI and one RA) coded each transcript independently,
with discrepancies being resolved through consensus. The codes were generated
based on data in relation to the research question. The codes for each interview were
entered in the Microsoft excel sheet. Thereafter, identification of key themes was
done based on various categories of questions in key stakeholder’s interview guide.
The codes were then grouped together under appropriate themes and conclusions were
drawn on the basis of the responses under each theme.
Key documents (contracts between various stakeholders, programmatic reports, policy
documents, ongoing or previous evaluations, bidding documents as well as the
promotional material used by the insurance companies, TPAs and NGOs) were
systematically reviewed by the PI and RA independently. Relevant data pertaining to
the following themes were extracted: external environment (political and regulatory),
institutional framework and capacity; policy and guidelines for implementation; and
roles and responsibilities. Any discrepancy noted was resolved through consensus. .
The PI and RA critically reviewed the contract documents under the following heads -
ownership; objective; length of the contract; payment mechanism; completeness and
comprehensiveness; monitoring mechanisms; specification of sanctions; and
incentives structure. In case of any discrepancy, inputs from supervisors were sought.
To assess the market competition, SNA of Punjab provided the list of insurance
companies who had participated in the bidding process over the years (2008-12) under
the RSBY scheme. A similar list was not available for Yamunanagar district.

116
4.6 Methods for Objective 2
Objective 2: To evaluate the availability of services by mapping the health-care
providers including the packages offered by the empanelled health-care providers, and
analyzing the utilization patterns.
Research questions
Is there a clustering of facilities within the district?
What is the range of services/packages offered by the empanelled facilities?
What is the utilization pattern including utilization by/from a specific
population group (gender, medical condition), provider (public or private),
patterns for imparting care, etc.?
Data sources and study tools
Primary data was used for assessment of availability of services and certain category
of enrolment. While devising the methodology it was anticipated that secondary data
on availability of services might be lacking, and hence it was planned that primary
data be collected through personal interviews with the health-care providers. A
checklist for availability of services in empanelled hospitals was used. This checklist
consisted of availability of 20 services which were based on categories defined under
the list of package rates of RSBY scheme.
For assessment of access to services, a secondary database of empanelled facilities
was sourced from the insurance companies. Information was also requested from the
district medical officers regarding the total number of registered medical facilities in
the chosen districts. Thereafter, a comprehensive list of facilities eligible for
enrolment was compiled. Secondary data of BPL census (block-wise) was also used
for assessment of access to services. This database was retrieved from SNAs of both
the states. The BPL population is the population eligible for enrolment under the
RSBY scheme. The SNA procured the data for eligible candidates (BPL population)
from the office of Registrar General of India. Line listing of the individuals (BPL
population) was available for both the districts and contained the following
information – name, age, gender and address (blocks).
For assessment of enrollment, a secondary database was analysed which was retrieved
from the SNAs of both the states. SNA procured the enrolled data from the insurance

117
company. For Patiala district, line listing of enrolled individuals with the following
information - name, age, gender was available. Also, line listing at household level
with the following information - name, age and gender of HoH and number of
individuals enrolled was available. However, in Yamunanagar district, line listing of
enrolled individuals was not available though line listing at household level was
available which included information on name, age and gender of HoH and number of
individuals enrolled. To analyze off-target and leakages under the enrolment, primary
data (Exit interview) was used. Information on BPL status and RSBY enrolment of
the studied participants during the exit interviews was used to assess off-target and
leakages.
To assess the utilization pattern under the scheme, secondary data on claims made by
the providers was used. This secondary data comprised of information on the
claimant, disease, transaction details and transaction amounts. These were sourced
from the insurance companies via the SNA. The SNA does not store claims data
itself; hence, data for utilization of the scheme by beneficiaries for the selected study
period was obtained from the empanelled insurance companies. Claims data set was
sourced for one complete annual cycle of enrolment, from September 2011 to
December 2012. However, extension for the enrolment cycle was sought in both
selected states, which took the enrolment period to the beginning of 2013. A total of
992 claims from Patiala district and 6,043 claims from Yamunanagar district were
made during the study period. The claims data had the following information:
Unique identity of the smart card
Date of enrolment
Dates of admission and discharge
Amounts claimed and reimbursed
Relationship of the claimant with the head of the household
Diagnosis
Age and sex of the beneficiary
Type of hospital
Name of the hospital.

118
Methods
Assessment of possible clustering of facilities to assess the level of access within the
district was undertaken by mapping the empanelled and non-empanelled facilities
within the district. Based on the criteria used for empanelment formulated by the state
governments, a methodology was devised to only include facilities in the mapping
that would be eligible for enrolment (as stated in chapter 3). For public facilities,
CHCs, subdivisional hospitals and civil hospitals were considered. Primary Health
Centres and Sub-centres were not included as they do not have sufficient in-patient
facilities to make them eligible for empanelled under RSBY scheme. For private
facilities, diagnostic centres were not included. Tele-communication was used to
ensure the absence of in-patient facilities in these diagnostic centres. ArcGIS®, a
geographic information system, was used as the mapping software and three types of
maps were generated for both Patiala and Yamunanagar. These included maps of
empanelled facilities (Public and Private), empanelled and non-empanelled facilities,
and all eligible facilities (Private Empanelled, Private Non-empanelled, Public
empanelled, and Public Non-empanelled). In addition, available data on the volume
of BPL enrolled families at block level was used to colour code blocks based on BPL
family density. Four different categories were used: <50000, 50000-60000, 60000-
70000, and >70000.
To assess the availability of services, the 20 sub categories included were - Neonatal
care; Burns; Snake bite; Oncology; Urology; Endocrinology; Paediatrics;
Orthopaedics; Ophthalmology; Neurosurgery; Hysteroscopy; Endoscopic procedures;
Gynaecology; General surgery; ENT; Dental; Medical general ward – ICU; Medical
general ward – nonsurgical; Medical general ward – surgical. The checklist was filled
by trained interviewers in consensus with the providers. There were some instances
where the provider refused to release information on availability of services within the
agreed package and therefore had to be excluded from the data set. Data was collected
in English and was entered into Microsoft excel sheet customized for this purpose.
Descriptive analysis was performed for availability of services. An assessment was
made of the total services available in the private and public hospitals by summing the
total number of services available in each facility and dividing it by the maximum
possible services available (20 multiplied by number of facility available for analysis

119
in the present study). Data for availability of services was entered in Microsoft excel
and STATA was used for analysis.
Descriptive analysis was performed for enrolment using STATA software. For both
the districts, enrolment at individual level and family level was calculated. Apart from
this, the average number of individuals enrolled per family and the gender of the HoH
was also calculated. For Patiala district, age and gender-wise (individual level)
enrolment status was also analysed, however, this could not be done for Yamunanagar
district as line listing of enrolled individuals was not available. Exit interview was
used for assessment of off-target and leakages under the scheme. Off target was
defined as the BPL population which was not enrolled under the scheme while
leakage was defined as RSBY enrolled population but not BPL. STATA was used to
run binary logistic regression analysis to find the determinants for off-target and
leakages. The factors (independent variables) which were adjusted were education
status; caste; age; gender and district. All the information available in the exit
interviews was studied carefully and possible factors which could determine off-target
or leakage were identified for in discussion with supervisors. Correlation among these
independent variables was assessed and finally put in the regression model. Amongst
the selected independent variables; the exposed groups considered were illiterate or
literate up to primary level; females; SC/ST population; and Yamunanagar. The
association was represented in the form of p-value and adjusted odds ratio. A p-value
of less than 0.05 was considered to be statistically significant.
For assessment of utilization pattern, the claim data was analysed using STATA.
Initially the data was screened and cleaned for any outliers. Outliers were noticed for
amount claimed and reimbursed and duration of admission. Descriptive analysis was
performed for volume of claims stratified over time, type of hospital, district, and
gender. Clustering of claims over selected hospital was also assessed. Herfindahl-
Hirschman Index (HHI) was used for assessment of clustering of claims in hospitals.
It is a commonly accepted measure of market concentration, calculated by squaring
the market share of each firm competing in a market, and then summing the resulting
numbers. The HHI number could range from close to zero to 10,000. Mean and
standard deviations were calculated for reimbursed and claimed amount. Kernel’s
density diagram was also plotted for reimbursed and claimed amount for type of
hospital and district. Multivariate regression analysis was done to assess the

120
determinant of reimbursement amount taking relationship to HoH, type of hospital,
duration of stay, age, district and gender as independent factors. These factors were
selected on the basis of their being possible confounder and was discussed with
supervisors keeping in view all the information available in the claims data. Before
running the regression model, correlation was assessed among these independent
variables. Other factors analysed in the claims data were duration of stay, diagnosis
and time taken to settle the claims. While running the regression model, each
independent variable was entered in the regression model at each step and hence five
models were created.
4.7 Methods for Objective 3
Objective 3: To compare the provision of health care across both public and private
providers for RSBY beneficiaries and between RSBY and non-RSBY beneficiaries
for a specific type of provider.
Research questions
Does provision differ across both public and private providers for RSBY
beneficiaries?
Is there any variation in user satisfaction between the private and public
facilities, and between RSBY and non-RSBY patients, across the selected
states?
A total of 12 facilities were selected with three public and three private facilities in
each of the two chosen districts (Patiala and Yamunanagar). Two key factors in
selection of the facilities were the volume of RSBY patients coming to the facility,
and the management’s willingness to participate in the research, i.e. a purposive
sampling strategy was used for the selection of the RSBY empanelled facilities. In
addition, an attempt was made to include both urban and rural facilities of each type
in the selected districts to try and account for variations in delivery of care. One
possible reason for variation could be a lower level of accountability on the part of the
health provider in a less urban location due to remoteness from the district
management (for public facilities) or a less aware patient from a lower socio-
economic background (for both private and public facilities).

121
Evaluation of provision of services was categorized into three sequential stages which
were adapted from the Donabedian Framework (Donabedian, 2005, Donabedian,
1988):
1. Structure: Evaluation of structural aspects of care via a standard checklists (health
provider checklist, and observational and facility record checklist) e.g. clinic opening
hours, access for disabled people, adequacy and state of repair of buildings, adequate
emergency equipment, adequacy of toilets, etc.
2. Process: Evaluation of process of care via patient time spent in the clinic, adequacy
and comfort of waiting area, patient privacy during the consultation, display of health
education materials, etc.
3. Outcome: User satisfaction/perceived quality assessed via patient exit interviews.
Measurement of scheme outcome (effects of health care on the health status of
patients and population) requires large sample size and long term follow up, which is
beyond the scope of this study and hence quality of care provided in the scheme
instead of scheme outcome has been selected.
Technical quality of care usually included in the Donabedian Framework was
excluded from evaluation due to resource constraints and difficulty in measuring the
quality level.
Data sources and study tools
Observational and Facility Record Checklist (Annex 4) and Health Provider Checklist
(Self-assessment) (Annex 5): These checklists addressed the structural evaluation of
provision of care in the 12 selected facilities. Checklists were prepared by a group of
experienced individuals in the field of hospital administration and RSBY
implementation on the basis of the study objectives. The checklists were piloted by
trained interviewers in hospitals that were not selected for the study.
All observations on the observational and facility record checklist were documented
by trained data collectors with a degree in medicine. The health provider checklist
was completed by the providers (hospital staff) in the selected facilities. Responses to
all the questions were in the format of the Likert scale. The information gathered in
the observational checklists and health provider checklists mainly fell under the
following headings:

122
o access and physical facilities;
o patient rights;
o health and safety;
o operating department
o radiology services;
o labour room (if providing maternity services);
o facility records.
Exit interviews with patients (Annex 6): Patients from selected empanelled hospitals
were interviewed during their discharge from the hospitals or during the follow-up
visits on their inpatient experience. Consent was sought for participation in the study
after which a semi-structured, pre-tested questionnaire was used by the trained
interviewers. The information collected from the study participants belonged to the
following heads:
o socio-demographic characteristics of the study participants;
o amount paid to be registered in the scheme;
o RSBY help desk and signages in the selected empanelled hospital;
o waiting time for being attended to by the hospital staff;
o process for hospital registration;
o cost of treatment;
o diagnostics and medicines from outside the hospital;
o food served in the hospital and its quality;
o discharge from the hospital;
o reimbursement of transportation cost;
o expense reimbursement during post hospitalization period;
o reason/s for choosing the particular health facility;
o previous health facility contacted;
o transportation to hospital;
o family members accompanying the patient.
123
To assess user satisfaction during the hospital stay, a questionnaire was developed
based on the structure of the Hospital Consumer Assessment of Healthcare Providers
and Systems (HCAHPS, 2012) questionnaire. A modified version of this
questionnaire was adapted for the local settings. The HCAHPS survey is the first
national, standardized, publicly reported survey of patients’ perspective of hospital
care. This section of the exit interview questionnaire had seven categories to assess
the quality of care given in the hospitals, viz. care during admission, care from the
nursing staff, care from the doctors, hospital environment, experiences in the hospital,
care during discharge and overall rating by the beneficiaries. There were several
questions asked under each category, with various possible responses. The responses
to the questions were mainly in an ordinal format.
Sample size and Sampling Technique
The estimated sample size for the exit interview was 752 (376 RSBY beneficiaries
and 376 non-RSBY patients), considering it to be a case control study design, with
95% confidence interval (CI), 80% power, expected frequency of exposure (scheme
implementation) in the control group 20% and percentage exposure among the cases
as 10%. Epi Info 6 was used for the estimation of sample size.
Consecutive interviews were conducted (consecutive sampling) in the selected
empanelled hospitals till the desired sample size was achieved in each facility. The
exclusion criteria for the study were – being enrolled in any other insurance scheme,
and patient not agreeing to give written consent for the study. A total of 751 exit
interviews were conducted with 399 participants interviewed from Patiala district and
352 from Yamunanagar district. A total of 387 RSBY beneficiaries and 364 non-
RSBY beneficiaries were interviewed. Private hospitals contributed with 398 exit
interviews while 353 exit interviews were conducted in public hospitals (Figure 4.3).
The initial aim of the study was to interview an equal number of RSBY and non-
RSBY patients at each facility; however, due to lack of volume of patients in certain
facilities and due to financial and time constraints, a more pragmatic approach was
adopted.

124
Fig. 4.3: Enrolled participants for exit interviews
Data analysis
Data collected in the format of observational checklists, health provider and facility
record checklist, and exit interviews were entered in Microsoft excel sheet. All
statistical analyses were performed with STATA.
In the context of both the checklists, the responses were primarily in the form of five
point Likert scale (strongly agree, agree, difficult to judge, disagree, strongly
disagree) or in a few cases the responses were bivariate (Yes/No). For the purpose of
analysis, scores were given to the responses. A score of one meant ‘strongly agree’
while a score of five meant ‘strongly disagree’. Extreme scores were given to
bivariate responses, i.e. either one or five. Therefore, lower the score, the better was
the structural aspect of health care. For each category mentioned under the checklist
(stated above), mean score of all questions (within the category) were calculated so as
to get a consolidated score for each category. Finally, mean scores were calculated for
the consolidated score of each category and an intra-district comparison of public and
private hospitals was conducted. Mann-Whitney U test was used, data being non-
parametric, to assess the statistical difference between the scores of public and private
hospitals. However, this statistical test was not applied for intra-district comparison
since the sample size of hospitals was very small (only three hospitals in each group).
For exit interviews, descriptive analysis was performed for socio-demographic
profile, process of services delivery and user satisfaction. Appropriate statistical tests

125
were used to assess the statistical difference between the variables. Chi square test
was used where the comparisons were made between categorical variables and
student’s t-test was used to compare continuous variables in two groups. The
objective of this analysis was to compare the independent variables between RSBY
and non-RSBY participants, between participants from private and public hospitals,
and between participants from Patiala and Yamunanagar districts. Data was entered in
Microsoft excel sheet and all the analysis were carried out using STATA. Data was
cleaned and screened for outliers after the data entry. Determinants of out-of-pocket
expenditure were also calculated through multivariate regression analysis (binary
logistic regression). The factors adjusted in the regression analysis were gender
(male/female), type of facility (public/private), age, district (Patiala/Yamunanagar),
BPL status (Yes/No) and RSBY enrolment (Yes/No). The association was
represented in the form of p-value and adjusted odds ratio. A p-value of less than 0.05
was considered to be statistically significant.
For analysis of quality of care provided by the health facilities, two different type of
analysis was done. Firstly, simple descriptive analysis was done in the form of
proportions. Secondly the ordinal responses were converted to scores. The score of
the converted responses ranged from one to five. For ordinal responses in the
questionnaire a score of one was given to the worst response while a score of five was
given to the best response. For the few questions with binary responses, a score of one
was given for a negative response while a score of 5 was given for a positive
response. The responses were scaled to a five-point scale for questions where the
responses were in four-point scale with one being worst and four being the best
response. Mean scores were calculated for each of the seven categories stated above
so as to get a consolidated score for each category. A comparison was made between
the scores of private and public hospitals, between RSBY and non-RSBY
beneficiaries, and between Patiala and Yamunanagar. Student’s t-test (comparison of
means) was used for statistical comparison as the outcome was continuous and the
data was parametric.
4.8 Methods for Objective 4
Objective 4: To inform policy based on the findings and make recommendations in
order to address any problems in the scheme and to help improve provision of health
care to the target population.

126
Data collection and method
Data collected under other objectives was drawn together and related to the design of
the arrangements and the motivation of partners. This helped to explore relationships
between observed pattern and design in implementation of contracts as a PPP
instrument under RSBY. Triangulation was used as a qualitative data tool by
gathering different perspectives from various stakeholders involved in implementation
of the scheme. An exploratory qualitative approach was adopted to capture the subtle
nuances that might influence the long-term success of the scheme.
4.9 Amendments in methodology
Non-availability of certain information proposed in the initial protocol led to changes
in the methodology of the study. Certain data could not be retrieved from the nodal
offices, nor was not available with the primary source. The changes were made in
consensus with all supervisors of the study. The amendments made in the methods
section of the protocol consisted of a change in the number of exit interviews
conducted in each facility due to a lack of volume in the number of patients, and
financial and time constraints in finishing the data collection process. It was initially
envisioned that a total of 752 exit interviews (376 RSBY and 376 non-RSBY
beneficiaries) would be conducted. This had to be reduced to planning for 62 exit
interviews in each facility, with consecutive patients being interviewed till completion
of 31 RSBY and 31 non-RSBY patient interviews. Ultimately, exit interview numbers
conducted at each facility varied slightly from this initial number proposed due to a
lack in the requisite number of patients in the same facility.

127
Chapter 5
ANALYSIS OF EXTERNAL ENVIORNMENT
AND CONTRACT

128
Chapter 5
ANALYSIS OF EXTERNAL ENVIRONMENT
AND CONTRACT
5.1 Introduction
This chapter presents the results of the first objective of this study, i.e. to study the
external environment (political, regulatory, institutional, etc.) of RSBY and to analyse
the contract design and implementation in order to understand the strengths and
weaknesses of the RSBY design and the incentive structures created by
roles, responsibilities and relationships within the contracts.
The external environment relates to the contracting milieu at the time of the launch of
RSBY. The roles and responsibilities of various stakeholders were assessed in order
to better understand the incentive structures that are inherent in the scheme design and
how these might affect implementation. The institutional framework and capacity was
analysed at the central, state and district levels in light of these discussions; the
regulatory framework was ascertained from key stakeholders. The key informants
included the national, state and district level bureaucrats assigned to oversee the
running of RSBY, personnel from insurance companies operating at the district level,
NGO representatives, TPAs and public and private sector health-care providers.
Data was drawn from the following sources –interviews with key stakeholders and
review of key documents. Details of each database and the methodology adopted have
been described in Chapter 4.
The results are described under five headings:
– external environment;
– institutional framework and capacity;
– policy and guidelines for implementation;
– roles and responsibilities; and
– contract analysis

129
5.2 External environment
The external environment includes those factors that directly or indirectly influenced
the launch and sustainability of the RSBY scheme. It includes opportunities and
threats that are outside the organization and are not within the control of the
management. As Babatunde and Abdebisi state, the management of any organization
has little or no influence on the external environment (Babatunde and Adebisi, 2012).
The external environmental factors considered are the political environment and the
regulatory framework.
5.2.1 Political environment
It is important to understand the political environment under which the RSBY scheme
was launched in 2008, considering that it was one of the flagship initiatives of the
political party in power, the Congress-led United Progressive Alliance (UPA). In May
2004, the Government presented its National Common Minimum Programme
(NCMP), which included a national scheme for health insurance for poor families
(Bajpai and Sachs, 2004). Thereafter, the Rashtriya Swasthya Bima Yojana (RSBY)
was formally introduced by the Prime Minister on 15 August 2007, aimed at
providing health insurance to BPL families. The scheme was launched in April 2008
under a PPP arrangement, driven primarily by formal and informal contracts with a
variety of stakeholders. Central level policymakers were of the view that health care
was being given this increasing importance mainly due to political reasons. This led to
a significant push to launch the scheme without adequate planning, in view of the
general elections in 2009. The Congress-led UPA won these elections.
RSBY was projected as a state-managed national health insurance scheme targeting
workers in the informal sector living below the poverty line, with certain design
changes from the previous scheme, the UHIS. After the challenges faced by the
MoHFW in implementing the UHIS scheme, the Ministry was hesitant to take the
responsibility of implementing yet another health insurance scheme. Thus, RSBY was
initially located in the Ministry of Finance. Considering the complexity of the task, it
was later decided to place the scheme with the MoLE.
An important difference between the UHIS and the RSBY is that in the latter, the
responsibility for scheme implementation also rests with the private sector in addition
to the public sector. Before formulating the scheme, the MoLE researched existing

130
health schemes in other countries such as the Philippines and Thailand, as well as
insurance schemes operational in various states of India. A Central level policymaker
stated that ‘Many NGO schemes like SEWA in Gujarat, Arogyashri in Andhra
Pradesh, 30 Baht Scheme of Thailand and PhilHealth Scheme of Philippines were
reviewed. It is not easy to specifically mention which scheme was taken the most into
account…’ Several positive features from other schemes were included in the RSBY
design, while also paying critical attention to the negative aspects of these schemes.
The biggest challenge during the initial phase of the scheme was getting a buy-in from
various implementation levels of government. It was difficult to run the scheme in the
initial two years, the biggest hurdle being the government itself, since many people
within the government perceived it as a politically-driven scheme with questionable
sustainability.
The scheme was designed to be implemented as a PPP. Since the design of the
scheme required a high level of participation from the private sector, it was important
to actively engage the private players. However, it was initially very difficult to
convince the private sector to participate in the scheme, which questioned the
sustainability of the scheme asserting that ‘the government keeps coming with weird
ideas and after sometime they vanish’ (private provider). To get a buy-in from the
private sector, the Central Government ensured a collaborative process so as not to
impose the programme on the private sector.
Support from other ministries and external agencies are crucial in launching and
sustaining a mass-scale health insurance scheme like the RSBY. A Central-level
policymaker stated that while the Planning Commission4 was not of much help during
the launch of the scheme, the World Bank played a substantive role in providing
technical assistance. The MoHFW was part of the approval committee for RSBY and
was supportive in allowing the funds coming from the claims reimbursement under
the RSBY to the empanelled public hospitals to be retained by the public health
facilities under their user-fee fund.
The opinion of policymakers at the Central level was sought to understand the role the
political environment at the state level would play in the implementation of the
scheme, and if having the same or different ruling parties at the Central and state
4 Since superseded by the NITI Aayog

131
levels would have an effect on the success of the scheme. They felt that this would not
make much of a difference in the implementation of the scheme. Examples were cited
of Congress-ruled states like Andhra Pradesh and Maharashtra which had not done
well, while states such as Chattisgarh where the main opposition party (the Bharatiya
Janata Party [BJP]) was in power had done well. Further, the state of Delhi, housing
the national capital of India and led by the Congress party, had not adopted the
Scheme. Over the years, the Scheme had transcended political boundaries, and
different political parties at the Central and state levels had minimal or no impact on
the success of the scheme in any particular state. However, as at the Central level, it
was initially a challenge to convince the various implementers at the state levels to
participate in the RSBY model. The primary reason for this was that the states did not
take the responsibility and did not dedicate enough time to the implementation of the
scheme, which is a fairly complex model involving a multitude of partners. Initially,
at the state level, there was no ownership of the scheme and the partnership between
the public and private sector was less collaborative.
In the chosen states of Punjab and Haryana that this thesis examines, during the
period from the latter part of 2011 to the beginning of 2013, Haryana had a Congress-
led government while the ruling party in Punjab was the Akali Dal, which was
strongly in opposition to the Congress. Both the states decided to adopt the scheme in
2008 in a phased manner by staggering the enrolment, starting with a few of the
districts and progressively adding districts each year. Both the selected districts,
Yamunanagar in Haryana and Patiala in Punjab, have been associated with the
programme from the start of the implementation period. The design of the RSBY
requires political commitment at the state level, since the state government is the key
player in the implementation of the scheme and a variety of players from the public
and the private sector need to be coordinated.
The state-level implementers were also interviewed to understand their perspectives
on the political environment and its impact on implementation. In Punjab, it was
acknowledged that despite the ruling party having changed, the basic schemes and
policies, especially the ones that relate to public welfare, often do not change. The
policymakers at the SNA, which is the primary implementing authority at the state
level and operates under the Department of Health and Family Welfare, affirmed that
for a scheme of this kind to succeed, political support was critical. The MoLE at the

132
state level did not play much of a role in the progress of the scheme. There were a few
hiccups in the phasing-in period of the scheme, but political support within the state
helped.
At the district level, the implementers were of the view that the scheme had improved
over the years and that political support had facilitated its successful implementation.
The insurance companies’ representative opined that as private players, the insurance
companies had faced no political problems. This could be due to fact that they
primarily dealt with the SNA; hence, their exposure to political bottlenecks was
limited. A related factor is that a decision had already been taken at the Central level
to engage the insurance companies in state-wide implementation of RSBY, thus
rendering their work at the state level less exposed to political interference. He was of
the view that engagement with the private sector was vital since the demand for
quality health care was high and the government would not be able to address that
solely through the public sector in a resource-constrained environment.
In Haryana, an implementer from the SNA believed that because the scheme was
formulated at the Central level, the State Government was initially unwilling to take
responsibility for scheme implementation. In the pilot phase only a few districts were
included. However, subsequently all districts in the State were covered. While
political commitment for the scheme was present in Haryana, higher political
engagement could have been possible if the Central Government had allowed the
states to change the name of the scheme to get more political mileage, which the
current model for RSBY did not allow. It was felt that the partnership arrangement
with the private sector should continue, because in its absence ‘the 10% of RSBY
work which is going on right now will also halt’. Haryana implementers were of the
opinion that the Punjab Government was sceptical about the scheme since there were
different political parties at the Centre and state. An official from the SNA in Haryana
further commented that in Punjab ‘the present State Government is using RSBY to
gain political mileage. They are trying to add 10 lakh (one million) BPL people in the
scheme’.
5.2.2 Regulatory framework
To understand the regulatory environment, data collected from various sources was
triangulated. The sources of data included key stakeholder interviews, and review of

133
documents Preker et al. believed that health-care services require a strong regulatory
environment before governments can rely on obtaining services from the private
sector (Preker et al., 2000). If private sector models are to succeed, there would be a
need for a strong regulatory, managerial and information capacity (Regional
Committee for Europe - WHO, 2002). As noted earlier in Chapter 3 (Sec 3.4.1),
regulatory frameworks that influence social security and social insurance including
medical professions is under the Concurrent List of the Constitution of India, while
public health and hospitals are under the State List.
Medical professionals, facilities and drugs
One of the state nodal agency representatives was of the opinion that despite all
legislation, there is hardly any regulation of practitioners’ clinics, nursing homes and
hospitals even though the Medical Council of India (that sets the standards of medical
practice) is mandated to 'discipline' the professionals, monitor their activities and
check any malpractices. Doctors who set up clinics, hospitals, nursing homes, etc.
have to register with the respective local bodies.5 However, the controlling bodies are
virtually non-functional. This is not only due to lack of interest, but also weak
provisions in the various acts, in addition to the heavy influence wielded by the
private health sector as well as their political affinities. Representatives from state
nodal agencies also pointed out that at present the national body is preoccupied with
accreditation of medical colleges while the state bodies function primarily as
registrars for issuing licenses for practicing medicine. The medical councils did not
even update the lists of registered medical practitioners properly.
Due to bureaucratic procedures, the public sector is forced to comply with some
minimum requirements, e.g. employ qualified technical staff, follow certain set
procedures for the purchase and use of equipment/stores, etc. and is subject to public
audit. On the other hand, the private health sector operates without any significant
controls and restrictions. There is a considerably large presence of private institutional
providers in the country. However, information about their numbers, role, nature,
structure, functioning, type and quality of care remains grossly inadequate. This has
led to questions regarding the quality of care provided by private health-care services.
Till recently, clinical establishments were not monitored in the vast majority of the
5Municipalities, zilla parishads, panchayat samitis, offices of civil surgeons, etc.

134
states in India. Only a few states had requirements for registration of private facilities
such as hospitals and nursing homes. However, with the passing of the Clinical
Establishments (Registration and Regulation) Act, 2010, it was hoped that things
would change.
The Food and Drug Administration (FDA) has the jurisdiction to control and regulate
the manufacturing, trading and sale of all pharmaceutical products. Although this was
the singular authority that had been provided some teeth by law, a private provider
stated that its performance was much below expectations, besides being ridden with
corruption.
Key stakeholders in the SNAs in Punjab and Haryana were of the view that most
medical practitioners of repute would have been registered with the Medical Council.
However, it was difficult for them to conclusively state the thoroughness of the
registration process, since it was outside the purview of their direct responsibility. At
the district level as well, the necessity of registration with the Medical Council was
confirmed. However, during data collection, when the study team requested for a
comprehensive list of private sector providers at the district level, the response was
that the list may not be comprehensive and up–to-date.
Regulation of clinical establishments is directly under the purview of the states. Some
States like Delhi, Tamil Nadu, Orissa and Manipur, among others, have successfully
introduced regulatory legislation of clinical establishments. Punjab passed the Punjab
Nursing Home Registration Act in 1991, which was later repealed due to the influence
of the medical lobby. A review of the minutes of the Punjab Indian Medical
Association (IMA) presidential address in early 2009 shows the cancellation of the
Punjab Nursing Home Registration Act being mentioned as a major achievement of
the IMA (Sharma, n.d.). In Haryana, a panel was constituted in 2005 to develop the
Registration of Nursing Home Act to curb the mushrooming of illegal nursing homes
and keep a check on the quality of health services being provided to the people of the
State (Kapur, 2008). The Haryana clinical establishment (registration and regulation)
Act was finally passed in 2014 (Haryana Government Gazette, 2014).
Insurance Companies and TPAs
State governments engage in a competitive public bidding process to select a public or
private insurance company licensed to provide health insurance by the IRDA or

135
enabled by a Central legislation, for RSBY implementation. Unlike the regulations for
providers, which appeared to be weak and had certain gaps, regulations for Insurance
companies and TPAs exist. Both, the insurance companies and TPAs, are regulated by
IRDA. There are specific guidelines mandated by the IRDA for insurance companies
and TPAs to provide health insurance. Insurance companies can only participate in
the bidding process by the state governments, once they have been licenced by the
IRDA for provision of health insurance.
5.3 Institutional framework and capacity
To comprehend the impact of institutional capacity on contract implementation, it is
imperative to first understand the institutional framework in place and analyse the
functioning of various contracts and the role of different institutions in their
implementation. The institutional and organizational structure was assessed at all
levels – Central, state and district.
According to Central-level policy makers, the RSBY was launched without putting in
place any formal organizational structure. The existing structure of the Director
General Labour Welfare at the Central level was used to roll out the scheme. It was
believed that since RSBY involved a multitude of stakeholders, both public and
private, the initial absence of institutional and organizational structures would provide
the flexibility to build institutions suited to the needs of the scheme.
5.3.1 Central level
Core Group. Central-level policymakers affirmed that at the Central level the scheme
was being driven by a Core Group consisting of representatives of Director General
Labour Welfare (DGLW), World Bank, GTZ, MoHFW (in the initial phase of the
scheme) and National Informatics Centre (NIC). The Core Group meets once a week
and the agenda is need-based, focusing on conceptual and operational issues and the
future course of action. A technical cell has been set up in the office of DGLW with
the primary responsibilities of piloting projects at the state-level, conducting
monitoring and evaluation and providing oversight for effective implementation of the
scheme, for which it had an allocated budget.

136
Key Management System. A Key Management System (KMS) was set up by the NIC
to ensure accountability of the beneficiary smart card – its issuance and usage. This
entailed setting up a Central Key Generating Authority (CKGA) that regulates and
issues keys for use by field key officers (FKOs), hospital functionaries and district
kiosk functionaries.
Approval and Monitoring Committee. The Approval and Monitoring Committee was
the first formal institution to be set up at the Central level with member
representatives from the Ministry of Finance, MoHFW and the Planning Commission,
with the DGLW in the MoLE as the convener. The role of the Committee was to
periodically monitor and review the progress of the scheme and approve proposals
submitted by the state governments.
Health Committee. A Health Committee, with the Secretary, Labour and Employment
as its Chairman was the second formal institution created at the national level to
deliberate upon and take decisions relating to health and insurance issues. This
committee is supported by a group of experts to aid and advice in analysing various
health-related technical issues.
Information Technology Committee. A third committee, the Information Technology
Committee, was constituted under the Chairmanship of the Secretary Labour and
Employment with representatives from Ministry of Information Technology, Ministry
of Finance (Smart Card Association of India) and several other experts. This
committee gradually evolved as an authority on all technology-related issues. It deals
with the implications of software- and hardware-related decisions. For the purpose of
certifying various software prepared by the insurance companies, Smart Card Testing
and Certification (STQC) was engaged as a testing agency. Certificates were issued
by a sub-committee based on its reports.
National nodal officers. Additionally, there are national nodal officers (NaNOs) who
are nominees of the insurance companies for single-point interface with the Central
Government. A joint meeting is held once a month with the Central Government for
discussion and feedback. Quarterly dinner meetings with CEOs of insurance
companies have been institutionalized. According to Central-level policymakers,
NaNOs have evolved as an important instrument of review of implementation at the

137
field level and are gradually being empowered by the respective insurance company
CEOs to take decisions on their behalf.
Grievance Redressal Committee. In view of the possible frauds under the scheme and
to resolve disputes between stakeholders, a Grievance Redressal Committee has been
constituted under the Chairmanship of the Deputy Director General in DGLW. This
institution, besides being the final reference point for disputes between various
stakeholders, also undertakes field visits to take stock of the situation on the ground.
Policymakers were of the view that as in the case of other institutions under the
RSBY, the role of the Grievance Redressal Committee is also likely to evolve over a
period of time.
5.3.2 State level
The policy guidelines issued by the Central Government to the state governments on
setting up the SNA6 state that ‘there must be a clearly defined institution capable of
organizing a health insurance programme. It can be an autonomous body, state
government department, a cooperative society or even an NGO. The organization
should have the technical skills to understand the concept of health insurance, should
be able to design a programme that is technically sound, should have skills to be able
to discuss with the community and should have the administrative capacity to
organize the programme’ (Ministry of Labour and Employment, 2011a). It is felt that
the SNAs have facilitated the flow of premium-related funds from the Central
Government to the insurance companies through these societies.
Punjab
In Punjab, the RSBY was launched on 19 July 2008 under the Department of Health
and Family Welfare and is being implemented through the Punjab Health Systems
Corporation (PHSC), which is the designated SNA under the scheme. PHSC was
constituted through a Special Act in 1996 that provided for a corporation for
establishing, expanding, improving and administering medical care in the State of
Punjab. The Managing Director is the executive officer of the Corporation. He
implements the decisions of the Board of Directors and exercises general control and
supervision over the hospitals under PHSC. The Board of Directors consists of
6The states implementing RSBY have either used an existing institution in the form of an independent
legal entity, or have registered a new society that is wholly funded by the state government but operates
independently.

138
secretaries of the Departments of Health and Family Welfare, Finance, Rural
Development, Local Government and a representative of the MoHFW, GoI as well as
six independent experts, chaired by a distinguished public or medical person.
There are 176 health institutions under the PHSC, which include 21 district hospitals,
two speciality hospitals, 34 subdivisional hospitals and 119 CHCs (Punjab Health
Systems Corporation, n.d.). PHSC has a health management information systems
(HMIS) division in addition to procurement, finance, civil work and IT divisions for
implementation of the RBSY. In addition, PHSC has also been able to engage experts
with assistance from the Central Government for the implementation of the scheme in
the State. A State Coordination Committee has been set up at the state level, which
includes members from the State Departments of Labour, Planning, Finance, Rural
Development and Panchayats and Local Government. The committee mainly
participates in the evaluation of the tender processes and reviews progress of the
scheme.
Haryana
In Haryana, the scheme was launched under the MoLE and is being implemented
through the Directorate of Employees’ State Insurance (ESI) Health Care, which is
the designated SNA. As stated by state-level implementers in the SNA, the ESI
Directorate and health institutions that fall under it are completely independent of the
MoHFW. Policymakers at the state level informed that to facilitate the
implementation of the RSBY, an RSBY Society had been registered under the
Societies Registration Act, 1860 chaired by the Principal Secretary, Labour, with
Director ESI as the Secretary and the Labour Commissioner as a member. The RSBY
Society in turn hires consultants for effective implementation, based on need.
The insurance company representatives stated that each insurance company is
represented at the state level through its regional level office situated in Chandigarh,
the capital city of both Punjab and Haryana and is responsible for implementation and
overall coordination. ICICI Lombard General Insurance Company is the contracted
insurance company for both Patiala in Punjab and Yamunanagar in Haryana and has
its regional office in Chandigarh. It was opined that it was easier to work in Punjab
than in Haryana. This was because implementation was under the MoHFW in Punjab
as against the ESI in Haryana, which was supervised by the MoLE. The latter

139
organization had limited authority over the entire health service delivery network in
the State.
5.3.3 District level
State level policymakers in Punjab confirmed that at the district level, the Deputy
Medical Commissioners (senior doctors) had been designated as district nodal
officers, with managerial responsibility for the scheme. These district nodal officers
were also the district key managers responsible for electronic security through the key
management system (KMS) and the FKOs, who are government officials deputed to
identify and verify the BPL families and issue smart cards.
In Haryana, however, as stated by state level implementers, implementation was
different. Under the ESI Directorate, there were four civil surgeons7 for the whole
State, each responsible for a cluster of districts. For Yamunanagar, the civil surgeon
was stationed in Yamunanagar and was also responsible for the four adjoining
districts of Ambala, Karnal, Panipat and Panchkula. The district level policymakers
were of the view that given the physical presence of the civil surgeon in the district,
he was the de facto District Nodal Officer. They further mentioned that since ESI has
hospitals and dispensaries dispersed around the State, the responsibilities of the
district nodal officer were taken on either by civil surgeons stationed in a district or by
medical officers posted in various ESI dispensaries.
In addition, in both selected districts, there is a District Level Committee, which
includes the Additional Deputy Commissioner (ADC), Civil Surgeon, Deputy
Medical Commissioner, block development officers (BDOs), District Panchayati Raj
Officer (DPRO) and an insurance company representative/TPA. The primary task of
this Committee is to monitor enrolment and facilitate in local problem-solving on a
day-to-day basis.
The insurance company also reported the presence of an Insurance Company District
Project Officer at the district level. ICICI Lombard had designated project officers
catering to multiple districts within each state. On an average, each project officer was
looking after three to four districts, depending on the volume. In addition, the
insurance company had also hired TPAs in both selected districts to facilitate the
7 Civil Surgeon is a senior medical doctor who is the head of the medical department at the district/state
level and exercises supervisory and administrative control over all government medical institutions
within the district/state.

140
implementation of RSBY. TPA representatives at the district level informed that at
the district level there is an assistant director who reports to the TPA regional officer
in Chandigarh who in turn reports to the head office in Delhi. Their main duties
include facilitating enrolment, supervision and conducting random reviews.
Institutional and organizational structures at the Centre, Punjab State and Haryana
State are given in Figures 5.1, 5.2 and 5.3, respectively.
Fig. 5.1: Institutional and organization structures at Central level
Fig. 5.2: Institutional and organization structures at state and district level –
Punjab

141
Fig. 5.3: Institutional and organization structures at state and district level –
Haryana
5.4 Formulation of policy and guidelines for implementation
The RSBY scheme delivered to the state authorities for implementation had a fixed
all-India design. Although there was room for innovations and additions in the
existing framework, this could only be done with the prior permission of the DGLW
in the GoI. Designing the scheme, standardizing processes and preparing policy
guidelines was the responsibility of the Central Government.
State level implementers from both Punjab and Haryana confirmed that the state
governments adopted the policy guidelines formulated by the Central Government.
Though state governments had the flexibility to amend these and introduce
innovations, this was rarely done, as it needed the prior approval of the central
government. Since RSBY has been an evolving model, some of the policy guidelines
have been formulated after its launch in April 2008. Depending on the feedback from
the state level implementers, additional policy guidelines or changes to previous
guidelines have also been introduced in subsequent years. One such example is the
enrolment criteria where a household headed by a woman was originally not eligible
to be included in the Scheme. State level implementers confirmed that policy
guidelines were updated with each subsequent insurance cycle.

142
The policymakers at the Central level were of the opinion that state-level politicians
recognised the political mileage the scheme provided since they could reach more
people at a relatively low level of cost. State governments had to allocate a separate
budget to fund the innovations that the states proposed. In Punjab, the SNA was of the
view that RSBY was the best scheme for BPL families. The State was willing to carry
it forward and added 1,500,000 families, which included 450,000 families that were
blue-card holders (beneficiaries of the ‘Atta–dal’ scheme, launched in Punjab in
August 2007).Teachers and domestic workers have also been included at the State's
cost. The SNA of Punjab stated that ‘...Punjab piloted the scheme with new benefits in
three districts – Firozepur, Bhatinda and Rupnagar, by introducing OPD services and
free medicines apart from hospitalization…’(State Nodal Agency, 3).
The Haryana Labour Commissioner indicated that in Haryana, there were issues
related to the BPL list available for enrolment, in that the BPL list from the 2001
census was differed from the list of beneficiaries in other schemes. A survey had to be
conducted on behalf of the Central Government to identify the BPL families. The
scheme has been extended to other segments of the unorganized population through
the Health Insurance Plan for Building and Other Construction Workers (BoCW) in
the State, where the premium for construction workers is funded by levying 1% tax on
the construction cost. It has also been extended to the Anganwadi workers and to
street vendors in nine districts of the State. The extension of RSBY is under
consideration for beneficiaries of other schemes, although some of them may already
be classified as BPL (The Hindu, 2013).
5.5 Roles and responsibilities
RSBY has a whole network of individuals who are experts in their own fields and
who together manage the scheme. It was opined that RSBY is more a partnership
model than a contractual model.
In the initial stages of the scheme, there were organizations such as the World Bank
and the German Agency for International Cooperation (GIZ) that supported the
development of the design and process. There are six primary stakeholders in the
scheme - the Central Government, state governments, insurance companies, TPAs,

143
hospitals and NGOs. The roles and responsibilities of each of the stakeholders are
clearly defined in the contract documents.
5.5.1 Central level
At the Central level, the Central Government has various responsibilities such as
oversight of the scheme, financing the scheme, setting up parameters (benefits
package, empanelment criteria, BPL criteria), hardware specifications (systems and
smart card), financing management/training, setting rate schedules for
services/reimbursement rates, developing clinical information, developing systems for
monitoring/evaluation, monitoring state level use and other patient information and
monitoring national RSBY information and training.
Since the scheme was under the MoLE at the Central level, the Director General
Labour Welfare, GoI has overall responsibility for the scheme. In addition, the holder
of the post is the Chief Executive of the Employee ESI scheme.
During an in-depth interview, the Director General Labour Welfare stated that his
work was only to ensure the coordination of the scheme. He further clarified that the
role of the Central Government was to design the scheme and standardize it for all
states. The Ministry of Labour was supported by several other ministries, such as the
Ministry of Rural Development which helped in recruiting field staff at the village
level for information, education and communication (IEC) purposes and the MoHFW,
which mobilizes government hospitals for the scheme.
5.5.2 State governments and state nodal agencies
The state government, along with the Central Government, also looks at the financing
of the scheme and the setting up of parameters like the benefits package,
empanelment criteria and BPL criteria. Additionally, the state government has the
responsibility of setting up the SNA, which has the overall responsibility of
implementing the scheme. The specific role of SNAs are—contract management with
the insurer, enrolment, training outreach and marketing to beneficiaries, financial
planning and management, setting rate schedules for services and reimbursement,
developing clinical information systems for monitoring/evaluation, monitoring state
level use and other patient information and training. Some of these functions are done
in conjunction with the Central Government.

144
The head of the SNA varies from state to state depending on which department of the
government is implementing the scheme in that state. If the Health Department looks
after implementation as in Punjab, then it is the Health Secretary who is the head of
the SNA. If the Labour Department takes over implementation of the scheme as in
Haryana, then it is the Labour Commissioner or the State Labour Secretary who is in
charge.
In Punjab, the SNA head indicated that he was so heavily occupied with the prime
responsibilities of the Health Department that he could not devote much time to the
RSBY scheme. In fact, according to him he spent only 5% of his time on RSBY. In
RSBY his responsibilities included reporting to the Central level and attending to
grievances within the State as the Head of the State Grievance Cell. His other
responsibilities were related to IEC, enrolment and monitoring of the scheme. He
further clarified that the Deputy Commissioner of Patiala district was in charge of the
implementation of RSBY and enrolment at the district level.
In Yamunanagar, the Civil Surgeon informed that at the district level, a District
Committee is constituted which is chaired by the Additional District Commissioner,
with the Civil Surgeon as secretary and the Nodal Officer, BDO and Panchayat as a
member. The District Committee’s responsibility centred on overseeing, monitoring,
enrolment, empanelment, data collection and data transfer. The role of the Nodal
Officer is to monitor patients and hospitals, reporting, organizing workshops and
assisting the insurance company in terms of enrolment.
The Nodal Officer explained that his work lay exclusively with the RSBY scheme. He
indicated that his responsibility included collecting data, organizing workshops and
appointing FKOs such as ASHAs and auxiliary nurse midwives (ANMs).8
The District Nodal Officer further informed that initially, much of the logistics
required for interacting with the private provider were handled solely by the insurance
company. However, the state and district authorities have adopted a wider role and
therefore now health-care providers maintain the equipment (card reader, printer,
computer, etc) as required for successful implementation of the scheme.
8ANMs are regarded as the first contact persons between people and the organization. They are female
multipurpose workers and are posted at sub-centres.

145
5.5.3 Insurance companies and third party administrators (TPAs)
The roles and responsibilities of the insurance companies and TPAs were
accreditation/empanelment of providers, collecting registration fees, enrolment,
actuarial analysis, claims processing and payment, outreach/marketing to
beneficiaries, monitoring at provider level and other patient information, customer
service and training of hospital staff.
The representative from the insurance company indicated that the role of the
insurance company was to enrol participants under the RSBY scheme. While
enrolling the participants, the insurance company was assisted by the FKOs such as
ASHAs and ANMs. Other activities of the insurance company included customer
services and monitoring.
He further informed that the TPA was contracted by the management of the insurance
company. Usually, there was one TPA for the entire state who covered all districts for
the purposes of enrolment. However, ICICI Lombard General Insurance Company
had contracted one TPA for the entire country. He also clarified that there was no
bidding for TPA contracts; they were contracted on the basis of their previous
association and reputation. During the contract agreement, TPAs are reminded that
they need to provide good services at the agreed premium. Their major role is
enrolment of participants in the district and processing claims.
TPAs support the insurance companies during the process of enrolment and
empanelment. They create awareness among beneficiaries and hospitals and assist in
the claims settlement and billing processes, obtaining the essential medical documents
and disseminating other relevant guidelines for trouble-free treatment of beneficiaries.
They also supervise and monitor the treatment of the patient during hospitalization
and conduct post-discharge audits by patient home visits to audit for transportation
allowance and post-discharge medication.
5.5.4 NGOs and providers of care
The role of NGOs was primarily to assist the insurance company in raising awareness
about scheme while the role of the health-care providers was customer service and
service delivery.

146
5.6 Contract analysis
Contract analysis was done in two phases. First, the contract documents between
various stakeholders (Central Government, state governments, insurance companies,
public and private providers) were reviewed and critically analysed. Thereafter, the
key stakeholders’ interviews were analysed to assess the issues related to contract
implementation.
5.6.1 Contract design
The RSBY is implemented through both formal and informal contractual
arrangements between various partners. This section deals with the study of contracts
in the two selected states of Punjab and Haryana at three levels of implementation: (i)
between the centre and state; (ii) between the state and insurance company; and (iii)
between the insurance company and service provider
The contract between the Central Government and the state government and between
the SNA and the insurance company were obtained from the SNA. The contracts
between the providers and the insurance company were made available by the
providers. In most cases the actual signed contractual agreement was available; in
some others, a draft contract was shared with the understanding that the signed
document was exactly similar.
A critical appraisal of the contracts was conducted along the following parameters:
ownership
objective
length of the contract
payment mechanism
completeness and comprehensiveness
monitoring mechanisms
specification of sanctions
incentives structure.
Contract between the Central Government and states
The contractual agreement between the Central Government and the states was
identical for Haryana and Punjab.

147
The signatories of the contractual arrangement were explicitly mentioned as the
Central Government represented by the DGLW, MoLE, GoI and the state government
represented by the state authority signing the contract, referred to as the SNA. The
contract was not specific regarding which state authority would be signing the
contract agreement and allowed flexibility to the states to assign a state implementing
agency.
The purpose of the contract was clearly outlined - to provide social security to the
BPL workers and their families in the unorganized sector. The contract did not
mention any additions or innovations on the part of the state government for either of
the selected states that the scheme design allows.
The period of contractual agreement is not mentioned in the contract document.
However, it was stated in the contract document that the Central Government reserved
the right to discontinue the funding at any stage on being satisfied that the funds
sanctioned were not being utilized for the purpose for which they were granted.
The contract states that the Central Government would pay a fixed sum per
beneficiary as contribution to the health insurance premium for implementation of
RSBY in the selected districts. This amount would be transferred to the SNA when
the state government gave its contribution (of premium) to the SNA. The exact
schedule of release of payments from the Central to the state government is not
mentioned.
The state government could pay a higher amount of premium to accommodate any
additional beneficiaries that the state might wish to enrol in the scheme. In addition,
the state would bear any administrative costs in implementing the scheme.
The contract clearly defines the roles and responsibilities of both parties involved, the
Central Government and the SNA. The Central Government would provide technical
assistance to the SNA in facilitating implementation of the scheme. It would review,
monitor and determine the information required from the states, though no reporting
schedule and format has been prescribed. However, the monitoring mechanism and
monitoring parameters of the central government have not been stated in the contract
document.

148
The state government also has a wide mandate of responsibilities. This entails
providing the insurance company with a complete list of BPL households (including
details of household members) and providing assistance to the insurance company in
the registration of scheme participants and the issuing of smart cards through joint
visits to each location where smart cards are to be issued. It is also the responsibility
of the state government to set up separate legal entities in the form of a
society/trust/agency so as to enable them to administer funds in implementation of the
scheme.
The state government is required to facilitate, monitor and evaluate the
implementation of the scheme as per the guidelines issued by the Central
Government. They would also provide information as and when requested by the
Central Government.
There was no mention of the empanelment criterion of the health care providers in the
contract document. Also there was no mention of the incentive structure under the
scheme.
Contract between the state government and the insurance company
The contractual agreement between the state government and the insurance company
for the chosen districts was almost identical. Coincidentally, the insurance company
for the selected year of study in the chosen districts was ICICI Lombard General
Insurance Company for both states.
The contract between the state government and insurance company is the most formal
and comprehensive contract in the RSBY scheme. This is due to the large share of
responsibility that the insurance company undertakes in the implementation of the
scheme. There are 32 articles listed in the contract document, supplemented by 16
annexures. The contract is legally binding and goes into specific details regarding
time periods of actionable steps.
The ICICI Lombard General Insurance Company had a contract agreement in Punjab
with the Department of Health and Family Welfare through the SNA, namely the
PHSC; and in Haryana, with the Department of Labour and Employment through the
Directorate of ESI Health Care, which was the nominated SNA.

149
The contract clearly cites the benefits to be provided on a cashless basis to the
beneficiaries and the limit of their annual coverage, subject to other terms and
conditions outlined in the contract.
The contract duration is specified and the dates of commencement and termination of
the policy are mentioned in the agreement. In case of renewal of contracts, the period
of the insurance contract would be for two years, depending on the period for which
the insurance company already had a contract with the SNA. Renewal of the policy at
the end of the year would automatically happen only when both parties agreed to the
same.
The contract mentions the exact amount of payment of premium that the state
government has accepted per enrolled BPL household, which includes the cost of the
smart card issued to each household. The contract details the method of payment
including the specific amount of payment to be released to the insurer under three
defined instalment schedules. The premium is to be paid in three instalments - the first
instalment of INR 30 (£ 0.3) is paid by the beneficiary, followed by a second
premium by the SNA (25% of the total premium) and the last instalment (the
remaining premium) by the Central Government.
A coordination committee, under the chairmanship of the SNA, is formed within
seven days of signing of the agreement to review performance on a periodic basis.
District key managers (DKMs) and field key officers (FKOs) are then recruited. The
insurer establishes a state and district project office, call centres and district kiosks
within 15 days.
Empanelment is the responsibility of the insurer who ensures that the eligible private
health-care providers and government hospitals up to the level of CHCs are
empanelled under the scheme. The empanellement criterion for the health care
providers has been clearly stated in the contract document.
The state government provides the insurer with the updated list of BPL households for
enrolment. It is the responsibility of the insurance company to provide the smart cards
to the beneficiaries. The SNA ensures the availability of a sufficient number of FKOs
to accompany the enrolment teams. The insurance company is also responsible for all
IEC activity at the time of enrolment.

150
The scheme provides coverage for meeting expenses of hospitalization for medical or
surgical procedures including maternity benefit to the enrolled BPL families up to
INR 30,000 (£ 302) per family per year on a floater basis. There is pre-authorization
for cashless access in case no package is fixed. The scheme also covers pre-existing
diseases.
The insurance company conducts training and orientation programmes jointly
developed by the SNA and the insurance company for health-care providers, members
of the hospital management societies, district programme managers, doctors, General
practitioner members, intermediaries and field agents.
The monitoring strategy was loosely stated in the contract document and the monitoring
mechanism and parameters were not defined. There was also no mention of the resources
required for monitoring and supervision at district level.
The agreement also refers to claims management, dispute resolution, grievance
redressal and termination. There was no mention of the incentive structure for the
insurance companies under the scheme.
Contract between the insurance company and the health provider
Two contracts were analysed (between the insurance company and the health
provider), one for Patiala district in Punjab state and the other for Yamunanagar
district in Haryana state.
In both cases, the contract agreements were drawn between a public hospital and
ICICI Lombard General Insurance Company Ltd. The designation of the signatories
was not mentioned in the contract document. The contract stated that the insurer had
been registered under Section 3 of the Insurance Act, 1938 (Act 4 of 1938) and had to
have an official license for functioning.
The objectives of the contracts were not clearly stated. However, the contracts clearly
mentioned the benefits for the purposes of the agreement as provided on a cashless
basis to the beneficiaries up to the limit of their annual coverage, subject to other
terms and conditions outlined in the contract.
The duration of the contract was clearly mentioned in the contract document. In
Haryana it was for a period of two years whereas in Punjab it was for a period of one
year. Further, both parties reserved the right to inform the public at large of the date of

151
commencement as well as termination. This clause was mentioned in the contract for
Punjab but not in the case of Haryana.
There was no mention of the payment mechanism or the premium in the contract
between the insurance company and the health provider. However, the ways that
claims would be processed while admitting a RSBY beneficiary were stated clearly.
Roles and responsibilities of both the parties and specifications of sanctions were
clearly defined in the contract document. Monitoring and supervision strategy was
absent and there was no mention of the incentive structure for the insurance company
and the providers . In Punjab, the cost of hospital registration fees, documentation, TV
and phone usage were to be charged from the beneficiary.9 No payment terms were
mentioned in the corresponding contract in Haryana.
5.6.2 Contract implementation
Human resources
It was reported in various key informant interviews that human resources were not
sufficient for implementation of the scheme at the state and district levels. Starting
from the higher administrative positions, which had various other responsibilities
apart from the RSBY scheme, the state level nodal officers concurred that dedicated
staff were lacking under the Scheme. A Haryana district nodal officer remarked that
the only direct employee of the RSBY was the nodal officer. He alone does dedicated
work for RSBY and hence was overloaded with work. There is no other permanent
employee under the RSBY scheme. He further stated that at the grass roots level, the
ASHAs (community workers) were the leading persons who coordinate with families
(District nodal officer, 11). This was, however, a part-time activity for them and not
their primary responsibility. At hospitals, 24/7 availability of support staff was
necessary for RSBY work, but it was not available. Even the insurance companies
lacked manpower, with just one officer at district level looking after 2-3 districts at a
time, in addition to responsibility for other schemes. A representative of the insurance
company confirmed ‘I am looking at other schemes also, apart from RSBY… I am in
charge of the state and there are number of people reporting to me…’ (Insurance
company, 4).
9TV and Phone services are optional facilities available in in-patient private rooms or wards of the
hospitals. Availing such facilities are chargeable.

152
Insurance companies and market competition
A total of 27 health insurance companies are present in the market, providing health
insurance coverage to the population of India. Of these, 21 are from the private sector
and six belong to the public sector. To analyse the market competition in the RSBY
scheme, a list of insurance companies involved in the bidding process (2008-12) was
made available by the SNA for Patiala. Similar data was not available for
Yamunanagar district. The analysis shows some degree of market competition in
Patiala for recruitment of insurance companies. There were 12 (44.4% of total number
of health insurance companies) insurance companies who had bid at least once during
the five-year period 2008-12. The number of insurance companies involved in the
bidding process has fluctuated over the years with seven, six, ten, seven and eight
companies bidding in the years 2008, 2009, 2010, 2011 and 2012, respectively.
Looking at the bidding status of individual companies, it was observed that there were
four companies who had bid for the scheme for all five years, of which three belonged
to public sector. There was another insurance company, again from the public sector,
who had bid for four years (2008-11). In terms of participation of the insurance
companies from the private sector, there was one company that had bid for all five
years, two companies that had bid for three years, three companies that had bid for
two years, and two companies that had bid for one year only.
From the above, we can conclude that some degree of market competition was present
for the insurance companies in Patiala district and this competition, in terms of
numbers, varied over the years. Though there were less public sector health insurance
companies present in the market, their involvement in the bidding was comparable to
the private sector in terms of number of bids made. Also, public sector insurance
companies were more consistent in terms of their participation.
Financial resources
Premiums were paid by the Central and state governments in the ratio of 3:1. The
premiums varied from state to state, depending on the insurance company. The
premium collected by the insurance company from each family was INR 30 (£ 0.3).
In both states, the total premium collected was around INR 750 (£ 7.6) per family.10
10
The premium for RSBY varies slightly in different states depending upon the bidding process.

153
The representatives of the insurance company stated that this INR 30 (£ 0.30) was
used to pay the first instalment to the insurance company.
A declining trend of premiums was observed in most of the states and national
average fell from INR600 (£ 6) to INR350 (£ 3.5) (RSBY Connect, 2012). The reason
could be that there is realistic premium now with availability of data on eligible
families. Moreover, there is competition amongst insurance companies for bidding.
Another significant reason could be the decrease in technology costs for smart cards.
Furthermore, new insurance companies consider lower premiums as an entry point for
participating in a national social health insurance scheme (RSBY Connect, 2012).
Enrolment
Enrolment is a prime responsibility of the insurance company. Insurance company
representatives in Punjab mentioned that the insurance company contracts the TPA,
which in turn looks after the enrolment. The TPA involves functionaries from
panchayats, temples and gurdwaras to enrol eligible people in the scheme. The
government also gets involved in enrollement by providing FKOs (ASHAs and
ANMs), who facilitated enrolment.
Enrolment of beneficiaries is done every year. Starting from the state level
policymakers down to the district level officials, all expressed their dissatisfaction
with this high frequency of enrolment. Policymakers at the state level suggested that
the enrolment could be done once every three years. The district nodal officer of
Patiala believed that yearly enrolment was a waste of human and financial resources.
The district level officials from Yamunanagar believed that enrolment was a difficult
task and was labour and finance intensive.
Obtaining an accurate list of BPL families was also a challenge for the insurance
companies. A representative from the SNA of Punjab stated that the updated list of
BPL families was not available. The census 2001 list of BPL families, which was
used for enrolment, was a decade old. It was a challenge to reach the beneficiaries, as
the list did not have complete addresses. Another issue during enrolment was the lack
of provision for addition of names in the families already enrolled.

154
Empanelment of health facilities
Empanelment of health facilities is done by the insurance company in consultation
with the state nodal officers. There were several issues raised by various stakeholders
regarding the process of enrolment. A Central level policymaker stated that the
health-care providers that were empanelled in the RSBY were not certified by any
authority for their services and the quality of care provided by them before getting
empanelled could not be assessed. He confirmed that ‘…right now we are not doing
the certification. We need to do that…’ (Central level policymaker, 1). Moreover,
empanelment of private facilities was difficult as the exact number of private facilities
present in the district was not available with any authority. However, empanelment
criterion was clearly defined in the contract document between the state and the
insurance company.
Fixed package rates
Under RSBY, there is a fixed capitation for every treatment in a package of care. The
rates within the package (package rates) are predetermined by the Central
Government and are supposed to get revised from time to time. The state government
has the authority to revise the rate at the state level after approval from the Central
Government. However, such amendments were rarely practised.
There were differences in opinion regarding the fixed package rates by different
stakeholders. Central level policymakers, SNAs and insurance companies were of the
view that the package rates were reasonable and also that the authority with the state
government to modify them was sufficient. The private providers felt strongly that
package rates were not realistic and were set far too low. They also suggested that it
was unviable to have the same package rates across the entire country and that these
should be based on the situation in each state. Both individual providers and
representatives of the providers’ associations were of the opinion that package rates
needed revision. Private providers in Yamunanagar emphatically stated that the set
rates for high-cost procedures were too low, especially for complicated cases that
entail a high cost to the provider. A private provider in Patiala district stated that ‘I
think package rates should be more realistic…’ (Private provider, 8). For example, it
was very difficult to treat a patient in the ICU for INR 1000(£ 10.1) per day and pay
taxes as well. Public providers in Patiala indicated that private hospitals turned away

155
patients saying that INR 30,000 (£ 302) was not enough for certain treatments,
suggesting that patients should claim RSBY benefits from government institutions.
The representatives of the medical association agreed that due to low package rates,
quality gets diluted. A representative from an NGO was however of the opinion that
increase in package rates will not improve the quality of services. However, this
would increase the participation of providers for empanelment.
Payment mechanism
The insurance company indicated that it processed and reimbursed claims to the
provider within 14 days in most cases. In the contract between the SNA and the
insurance company, a time limit of 21 days is indicated for the process to be
completed. This, however, becomes 26 days or more for issues relating to claim
processing. In Punjab and Haryana, the payment was made by the insurance company
(after receiving the final docket from the provider) through a cheque/electronic fund
transfer, since the contract between the SNA and the insurance company makes
electronic payments mandatory. The interviewee from the insurer insisted that the
provider recovers non-covered treatment/investigation costs from the beneficiary. It is
stated in the contract document that the beneficiaries have to pay OOP for treatments
that are not covered under the scheme.
The Punjab SNA indicated that ASHAs were getting monetary incentives in order to
bring up enrolment. They were of the view that incentives should be given for other
purposes as well but this was not done because of budget constraints. The district
nodal officer confirmed that incentives were being given to field-level workers to
encourage them to enrol families under the RSBY scheme. This incentive was raised
from INR 2 (£ 0.02) per card to INR 5 (£ 0.05) per card during the course of the
scheme. However, the district nodal officer in Patiala stated that incentives to ASHAs
were never paid.
Monitoring and supervision
Monitoring and supervision plays a key role in the success of any scheme. However,
in the RSBY scheme, monitoring and supervision appeared to be very weak. There
were no financial or human resources allocated for these tasks nor was there any
strategic framework for monitoring and supervision, specifically in the context of
periodicity, accountability, task allocation, and performance indicators. At central
156
level, a technical cell was engaged in overall monitoring and supervision including
data handling and management. The Labour Commissioner from Haryana stated that
‘…government doesn’t have resources for monitoring…’ (Labour Commissioner, 9).
Monitoring and supervision was left to the insurance companies, which had their
vested interests. The civil surgeon in Yamunanagar indicated that there were by-laws
to monitor the expenditure of funds under RSBY. However, a separate management
team for RSBY was necessary. ‘…there are internal checks and balances to look for
fraudulent billing…’ (SNA, 11). One SNA indicated that there was no budget
earmarked for monitoring in RSBY.
In the contract between the SNA and the insurer, it is specified that the insurer will
have qualified and experienced medical staff (as a part of its medical investigation
services) who will ascertain the nature of ailment and verify the eligibility of the
services. However, inadequately qualified staff was being used by the insurance
company for monitoring of the scheme for private providers in Haryana. For example,
doctors with a degree of Bachelor in Homeopathic Medicine and Surgery (BHMS)
were being used instead of MBBS doctors.
Training
According to a Central level policymaker, training at the Central level was primarily
learning by doing. He stated ‘Training is a weak point in RSBY. At the national level,
the individuals were not trained initially in insurance. They had to learn on the job’
(Central level policymaker, 1). He further added that DGLW also learnt on the job
while implementing RSBY. Technical assistance at central level was provided by the
World Bank and GIZ. The situation was better at the state level where training was
satisfactory and was aimed at specific aspects of RSBY. Inputs from the field proved
useful while planning new training workshops ‘…consequent to this effort, we have a
series of workshops at villages, at block level…’ (Central level policymaker, 1).
The District informatics officer in Yamunanagar confirmed that state level workshops
were organized to train staff regarding implementation of the scheme. The District
nodal officer in Patiala stated that district and block level workshops had been
conducted where staff of all hospitals had been trained. The district level workshops
involved the business process outsourcing, public relations officer, deputy
commissioner and sarpanch (village headman), all of whom corroborated that they

157
had been given training several times. The insurance company in Patiala stated that
they had trained both private and public providers regarding scheme implementation
and claim reimbursements.
Issues with equipment
The providers reported that there were several issues related to equipment at the
health facilities provided by the insurance company for verification of RSBY
beneficiaries. Frequent breakdown of the machinery was common and repairs were
not immediate. Due to a lack of confidence in the equipment, some providers had a
parallel system for record maintenance in the form of record registers. A private
provider stated that in his facility, the insurance company did not rectify the faulty
machine even after several complaints. Thus, they could not admit patients under
RSBY scheme for several months.
Awareness
The state nodal agency of Patiala and Yamunanagar district reported that awareness
among the beneficiaries regarding the services available in the scheme was not
adequate. There were many instances where the beneficiary did not know how to
locate the empanelled hospital. One of the providers also stated that private providers
were not aware of the scheme and that is why they were not available for
empanelment.
5.6.3 Incentive structures
Incentives for stakeholders are not specifically mentioned in the contract document.
However, according to a senior policymaker at the Centre, the scheme had been
designed as a business model for a social sector scheme with incentives built-in for
each stakeholder. This business model was designed to be conducive to expanding the
scheme as well as ensuring long-term sustainability. In fact, the scheme was moving
forward because of the in-built incentives. He further added that ‘the scheme is
working on autopilot. As each body involved benefits from the scheme, it forces them
to keep a check on one another. They give their best as there is a sense of competition
involved’. The SNA in Punjab agreed that RSBY, ‘… had to be a sustainable model, a
proper business model so incentives are there…’ (SNA, 4).

158
Various stakeholders and implementers had different levels of incentives in different
forms. Monetary incentives varied across stakeholders. For some, the incentives lay in
enhanced reputation and recognition.
Central and state governments
A Central level policymaker stated that ‘By a BPL family paying only a maximum
yearly sum of INR 750 (£ 7.5) per family, the Government is able to provide access to
health care to the poorest of the poor’ (Central level policymaker). The single most
important incentive for the Central Government was to design a scheme which would
win the goodwill of the informal sector, which comprised a large proportion of the
country’s population and hence a large vote bank. The Scheme was also a major step
towards UHC to bring equity in health care, which is an important agenda for the
Government. As far as the Central Government is concerned, contributing financially
towards the payment of premium to provide health insurance for the beneficiaries
gives it a say in various aspects of implementation, which would normally fall outside
the Central mandate as health is a state subject in the Indian Constitution.
State governments appeared pleased to be able to cover their BPL population (the
poorest of the poor) with health insurance at a fraction of the cost. Providing social
security to the BPL population in the state was expected to help in building political
mileage for the ruling party. It would also help the state in building technical capacity
for procurement, monitoring and training with support from the Central Government.
Another key incentive for state governments is to tap human and financial resources
and good business principles from the private and civil society sector to address
service delivery challenges and extend services to the needy, especially in poor
neighbourhoods.
Insurance companies
Insurance companies look at RSBY as an opportunity to penetrate a segment of the
population which they had not netted before. A new market was created for them
through providing health insurance coverage to the weakest section of the population.
One Central level policymaker explained it as a ‘fortune lying at the bottom of the
pyramid’.

159
The insurance companies were getting premiums at a single point. They organized
insurance camps to which families came for insurance coverage. Such a strategy can
also be considered as a cost-saving innovation initiated by the insurance company.
Otherwise, the insurance companies would have had to go from house to house to
approach each individual and this would not only incur transportation costs but would
be time and manpower intensive. ‘The insurance companies saw it as a reduction in
transaction costs and the cost-saving strategy is a strong incentive for them’
(Central level policymaker).
Since the premium is a fixed amount per household, insurance companies would like
to enrol a large number of households as the number of persons enrolled in many
households could be less than five. This would result in low utilization within a
household while the insurers are still paid the fixed amount.
Health-care providers
A central level policy maker stated that the incentive for a health-care provider is to
provide treatment to the maximum number of beneficiaries, as payment is made on
the basis of the number of beneficiaries treated. This is a great incentive to the
provider even at lower package rates, because of the economies of scale. He further
stated that both public and private providers were part of the scheme, which result in a
healthy competition between the providers, which in turn was expected to improve the
functioning of the public health-care providers.
The public providers see it as an opportunity to raise funds that could then be utilized
to enhance the services in public hospitals. The private providers see it as an increase
in business since the government is paying the premium for a poor section of society.
Even if the number of RSBY patients visiting hospital is very low, still the providers
have an incentive to be part of the scheme as this would help in capacity building of
the staff member in management of health insurance. It would also help in publicity
of the hospital. Moreover, package rates are defined, so there is a margin of profit in
every case. From the contract document, it can be assessed that there is no fixed cost
to get empanelled under the scheme.
A Central level policymaker was of the view that the private sector was not profit
driven but did this with an altruistic motive. The district nodal officer in Patiala and a

160
private provider also had similar views. However, the SNA representative believed
that private providers are business-oriented and public hospitals are charitable because
they work for free. He further stated that the primary reason for high private provider
engagement was their drive to build a reputation in the market to capture a new
patient base.
Beneficiaries
A Central level policymaker was of the view that the scheme has given health-care
access to the poorest of the poor. The scheme design provides a great incentive to the
beneficiaries and that is the option to choose. It has afforded the poor an opportunity
to select the type of provider (public/private) they want for treatment. They can go to
a high-quality private provider (if empanelled) without having to pay anything. The
scheme has planned a sum of INR 30,000 (£ 302) per year per BPL family for serious
health care morbidities that could be life threatening. A representative from the SNA
stated that the poorest of the poor can now live in the belief that in dire health
situations they can protect themselves from catastrophic health expenditures and save
their lives. The scheme is believed to be changing the health-seeking behaviour of the
poor. As stated by a Central level policymaker, they are now making an effort to get
treated for illness which they would ordinarily have neglected in the past.
5.7 Discussion
5.7.1 Methodological issues
Contracts between the insurance company and TPAs could not be retrieved and hence
a complete contract design analysis could not be done. The bidding and the
negotiation process could not be evaluated while analysing the contract design
because of the limitation in availability of information.
5.7.2 Findings and discussion
RSBY was launched just before the 2009 Lok Sabha elections. It appears that the
programme was launched in a rush and was more a political expediency than a well
thought out plan for improvement of the health of the poor. The developers of the
scheme introduced an innovation through the PPP model. Including private health
facilities to augment health services being provided by the public health facilities was

161
expected to enlarge the number of facilities providing health care as well as generate
competition among public and private providers.
As to whether experiences from other schemes had been reviewed during the
preparatory phase of the RSBY scheme, it transpired that only schemes from Thailand
and the Philippines had been reviewed. These schemes were not similar to the RSBY
scheme. The RBSY scheme that was launched did not resemble other schemes and
did not completely spell out the implementation process. However, with periodic
feedback, ongoing changes have been made in the scheme. One such example is the
enrolment criteria, where originally a household headed by a woman (for example a
widow) was not enrolled in the scheme. Frequent changes in the programme led to
confusion among the programme implementers. Changes specifying the treatment
package to be offered have inconvenienced providers. On retrospect it is clear that the
RSBY scheme required more careful and thoughtful planning at the initial stage
before its launch. This was all the more necessary after the failure of a similar
insurance scheme in India, namely, the UHIS.
Weak regulatory framework
In India, the regulatory framework in healthcare sector is still very weak, especially
for the private providers. Although it is now compulsory for all private providers to
get registered as mandated via the Clinical Establishments (Regulation and
Registration) Rules, 2010, still there are gaps in registration. Previously it was not the
case and this act was only notified in 2012 and hence as a result, a comprehensive list
of all private practitioners or the private service delivery providers was not available.
Further, the record of services being provided in these private hospitals is also not
available.
RSBY is a scheme that is heavily reliant on the private sector. It is a model that
demonstrates a PPP at various levels. The success of the scheme depends on how well
these private providers can be identified, enrolled and regulated. Currently, the model
is failing at two levels - firstly, as an interviewee stated, the private sector is very
reluctant to be part of the scheme as they do not have confidence in the functioning of
the government; and secondly, there is no robust mechanism under which these
private hospitals can be governed.

162
Supervision by ministries other than the Health Ministry
The SNA in Punjab is the PHSC, which is supervised by the Department of Health
and Family Welfare. In Haryana, the implementing body is the ESIC, which is
supervised by the Department of Labour and Employment. Linkages between the
Department of Labour and Employment and the Department of Health are negligible.
With its level of expertise and experience, it would be easier for the Department of
Health to manage the scheme as compared to the Department of Labour. An insurance
company representative stated that it was easy to work in Patiala as Punjab had its
own health system through which the scheme was being implemented but it was very
difficult to work with the ESI in Haryana. Although the Ministry of Labour and
Employment was enthusiastic at being involved in providing health care to the poor,
the Ministry mostly likely lacked the insight to deliver services to the BPL population
as it was not their prime responsibility.
Weak monitoring and supervision
Monitoring and supervision is one of the main pillars of any programme for efficiency
and effectiveness. However, it appears that monitoring and supervision under the
RSBY scheme is weak. In the initial contract documents for 2008 and 2009 (between
the insurance company and TPAs), there was minimal mention of monitoring and
supervision of the scheme. No extra budget was allocated for this component. The
clauses mentioning monitoring and evaluation were not clear and were overlapping.
Clear-cut roles and responsibilities for monitoring and supervision are required to be
detailed in the contract agreement.
Monitoring and supervision is chiefly carried out by the insurance companies;
however, there is no strategy to monitor the insurance companies. The importance of
monitoring and supervision is evident from an examination of other national health
programmes. As stated by a senior public health expert in India, the programmes
which have a very robust mechanism of monitoring and supervision have flourished
and done very well, e.g. the Revised National Tuberculosis Control Programme
(RNTCP), whereas schemes such as the Integrated Child Development Services
(ICDS) are not able to produce the desired result because of poor monitoring and
evaluation.

163
Poor IEC
Awareness generation and IEC is the responsibility of the insurance companies, both
at the time of enrolment and thereafter. It is evident from interviews of the officials
that IEC activities are severely lacking, especially in regard to beneficiaries being
aware of the contents of the packages and the location of empanelled hospitals. There
appears to be a conflict of interest with regard to the insurance companies. They are
responsible for IEC activities; however greater awareness could generate more
demand for health care, resulting in increase in the number of claims as well as the
claim amount. This is not in the interest of the insurance companies as lower numbers
of claims and consequently claim amounts would make for higher profits.
The states or the SNAs have to be in the forefront for creating awareness among the
people regarding the scheme.
Distribution of Roles and Responsibilities
Most of the roles and responsibilities were lying with the central government and the
insurance companies. There were various conflicts of interest in terms of distribution
of roles for insurance companies; for example, they were responsible for IEC
activities, however poor IEC activity will be an incentive for the insurance companies
as it will lead to less utilization.
Enrolment process
As per the policy guidelines, enrolment of the eligible population should occur every
year. This is not cost-effective as considerable manpower and time is invested during
the process of enrolment. The process of enrolment takes three months to complete.
The scheme is thus effectively providing protection to some of the families, who are
enrolled in the later part of enrolment process by the insurance companies, for a
period less than stipulated (i.e. less than 12 months). The reasons given by the
Central Government for yearly enrolment is that this will ensure improvement in the
data quality, the people’s interest will be sustained regarding the existence of the
scheme and also that INR 30 (£ 0.30) gets collected during the process of registration.
This, however, defeats the very purpose for which the Scheme was created which was
to provide effective health care to BPL beneficiaries.

164
Modification of Central Government policy by state governments
India is a very diverse and heterogeneous country and therefore one size does not fit
all. A single scheme with a standard implementation procedure may not be effective
in all states. Hence, the Central Government had the provision for states to modify
this scheme according to their requirements before implementing it in their respective
states. However, the states under study implemented the scheme as envisaged by the
Central Government without any change. The barrier in making modifications and
introducing innovations could be that for doing so they have to take the permission of
the Central Government.
5.8 Conclusions
This chapter has reviewed the external environment, contract design and its
implementation through in-depth interviews of key stakeholders of the RSBY scheme
and analysing the key documents. Findings of the in-depth interviews relate to various
issues dealing with the political environment, regulatory framework, empanelment,
enrolment, monitoring and supervision. It was noted that initially the Scheme was
politically motivated and initiated for political gain. Over time, frequent changes have
been incorporated in the Scheme and now it is more robust, but there still are gaps
that need to be addressed. Examples are the need for monitoring and supervision with
specified timelines, clear distribution of roles and responsibilities among the
stakeholders, and accountability. The regulatory framework is also very weak,
especially for private health facilities. Even the line listing of the private health
facilities in the district was not available. Roles and responsibilities of various
stakeholders were clearly defined. Majority of the Scheme implementation activities
were undertaken by insurance companies. State governments were mainly playing a
facilitators’ role. For the Scheme to achieve its aim, state governments have to be
more accountable for scheme implementation. Formal contract existed between
central and state government, state government and insurance company, and insurance
company and providers. However, contract between insurance company and TPAs
was informal. The contract between the state government and insurance company was
the most comprehensive contract of all. For renewal of contracts, the parameters have
not been defined nor was there a ‘quality of service’ criterion. There were issues with

165
the annual enrolment procedure as it consumes a great deal of manpower and
financial resources. Monitoring and supervision is not adequate as there is no strategic
framework for monitoring and supervision, specifically in relation to periodicity,
accountability, task allocation, and performance indicators.
The scheme has in-built incentives for all stakeholders. The Central Government
fulfils its larger objective of improving the health of the people, though the immediate
objective at the time of launch had been political, i.e. to win a forthcoming general
election. The state government is happy to cover its poor population, which hitherto
would only visit public facilities for free health care where they would be treated with
scant respect (Tandon, 2013, Clwyd and Hart, 2013). The insurance companies look
at it as a profit-making business on the basis of premiums received, more so when
there are fewer than five beneficiaries per family. The public provider can retain the
extra amounts they receive which is a great augmentation in a resource-starved
environment. Private providers can break into a segment of society that hitherto they
could not reach. The success of the scheme depends on these incentives and the
scheme caters to the interests of different stakeholders. However, incentive structure
has not been mentioned in the contract document.

166
Chapter 6
ASSESSMENT OF ACCESSIBILITY,
AVAILABILITY AND UTILIZATION PATTERNS
UNDER RSBY

167
Chapter 6
ASSESSMENT OF ACCESSIBILITY,
AVAILABILITY AND UTILIZATION
PATTERNS UNDER RSBY
6.1 Introduction
The second objective of the study is to evaluate the availability of services by
mapping the health-care providers, the treatment packages offered by the empanelled
health-care providers and analysing utilization patterns. This chapter describes the
assessment of accessibility and availability of services under the RSBY scheme which
was measured in terms of physical access to services and availability and range of
services, i.e. the various departments available in the empanelled hospitals.
Assessments of utilization patterns are based on the claims submitted by the
empanelled hospitals under the scheme. The results of this chapter are presented
under the following headings:
– Access to services under RSBY – evaluating access by assessing the
geographical distribution of facilities within the chosen districts;
– Availability of services under RSBY empanelled hospitals – evaluating
availability of services under empanelled providers by assessing the medical
services offered at the facility;
– Enrolment – assessing the coverage of the scheme beneficiaries;
– Utilization patterns – assessing the utilization pattern of RSBY beneficiaries.
The methodological issues are then discussed and the chapter ends with a discussion
on findings and conclusions.
Both primary and secondary data sets were analysed. Secondary data analysis was
done to assess the access to services under the RSBY scheme. The secondary data
included the database containing BPL census data of population eligible for RSBY
and the data on enrolment of households under RSBY sourced from the SNA.
Secondary database of empanelled facilities was sourced from the insurance
companies and the district medical officers provided the data on the total number of
registered medical facilities in the chosen districts. Evaluation of possible clustering

168
of facilities to ascertain access within the district was undertaken by mapping the
empanelled facilities and the non-empanelled facilities within the district. To assess
the utilization of the scheme by the RSBY beneficiaries, secondary data on claims
was analysed, sourced from the insurance companies through the SNA.
Primary data was collected on availability of services offered from almost all
empanelled facilities. As a criterion for availability of services (RSBY scheme), at
least one empanelled facility within the district should offer all pre-defined packages
to RSBY beneficiaries.
6.2 Access to services under RSBY
RSBY beneficiaries are free to choose their preferred provider among private and
public empanelled providers within the region where they live. The cost of care is
likely to be a small factor in choosing a provider and factors other than cost may come
into prominence. Among factors that determine their choice could be the perceived
quality level, technical expertise and spatial location of the provider. In this chapter,
the focus has been on evaluating access by assessing the geographical distribution of
facilities within the chosen districts.
The contract document between the insurance company and state government clearly
states that the insurer shall ensure that the beneficiaries under the scheme are provided
with the option of choosing treatment from a list of empanelled providers. The
minimum criteria for empanelment of a facility are drawn by the SNA and are
included in the contract. It is the responsibility of the insurer to ensure that all the
eligible private health-care providers and all government hospitals up to the level of
CHCs willing to get enrolled under the scheme are empanelled before the start of the
enrolment process (Ministry of Labour and Employment, 2011b).
This research aimed at exploring two issues: the possibility that insurance companies
could be empanelling a limited number of facilities out of the available health
facilities in the district; and whether or not empanelled facilities are within close
proximity to a high density of the BPL population. These questions are linked to the
concern raised in the previous chapter that insurance companies have an incentive to

169
minimise the claims. By not empanelling hospitals in high-density BPL areas, poor
people would find difficulty in accessing care.
Evaluation was undertaken by mapping the empanelled facilities and the non-
empanelled facilities within the district. Sources of data included the database of
empanelled and non-empanelled facilities as well as BPL census data of population
enrolled under the RSBY, obtained from the SNA.
Based on the criteria developed by the state governments that were used for
empanelment, a methodology was devised to only include facilities in the mapping
that would be eligible for enrolment. For public facilities, CHCs, sub-divisional and
civil hospitals were included. For private facilities, diagnostic centres included in the
list sourced from the Medical Council of India were excluded from mapping because
they did not fit in the criteria for empanelment. Since the public facilities in India
have clear guidelines for the services to be made available at each functioning level of
service delivery, it can be concluded that all public facilities included in the analysis
were eligible for empanelment. However, the same cannot be said for all private
facilities. It could not be conclusively established that all private facilities included in
the analysis were eligible for empanelment, since no personal contact was established
to confirm the number of inpatient beds available at each facility. Table 6.1 lists the
various types of health facilities in the selected districts.
Table 6.1: Health facilities in the selected districts
Provider Patiala Yamunanagar
Private 95 104
Public 20 19
Private empanelled 7 33
Private non-empanelled 88 71
Public empanelled 10 4
Public non empanelled 10 15
Total facilities 115 123
The geographic coordinates of each facility were calculated using Google Earth, as it
was the most economical and user-friendly resource available. Three types of maps
were generated for both Patiala and Yamunanagar - all possible eligible facilities,
empanelled facilities and empanelled vs non-empanelled facilities in the district. In
addition, available data on the volume of total BPL population residing at block level

170
was used to colour code blocks based on BPL density. It was assumed that the density
of total BPL population at the sub-district level would be somewhat reflective of the
density of the enrolled RSBY BPL population.
6.2.1 Patiala
Table 6.2: Block-wise total BPL population at sub-district level in Patiala
District Sub-district Block Population
Patiala
Nabha Nabha 19,857
Urban Nabha 23,444
Patiala BhunerHeri 30,734
Patiala 8,554
Sanour 32,768
Urban Banur 1,277
Urban Ghaga 3,140
Urban Patiala 13,760
Urban Sanaur 4,631
Rajpura Ghanaur 29,658
Rajpura 20,813
Urban Ghanaur 2,529
Urban Rajpura 4,416
Samana
Patran 32,165
Samana 15,646
Urban Patran 2,878
Urban Samana 1,728
Total 247,998
As seen from Table 6.2 and Figures 6.1–6.3, the sub-district with the least BPL
population in Patiala is Nabha, followed by Samana, Rajpura and Patiala. Public
empanelled facilities are more equitably distributed throughout the district as opposed
to private facilities, which are geographically clustered around pockets at the sub-
district level. A majority of the private facilities are clustered around Patiala sub-
district.
Many eligible facilities are not empanelled under the RSBY scheme. A majority of
the non-empanelled private facilities are clustered in Patiala sub-district and some in
other sub-districts. However, there are several public non-empanelled facilities that
are dispersed around the district. The volume of empanelment of facilities seems to be
aligned to BPL population density.

171
Fig. 6.1: Patiala – empanelled facilities – public and private

172
Fig. 6.2: Patiala – empanelled and non-empanelled facilities

173
Fig. 6.3 – Patiala: all facilities

174
6.2.2 Yamunanagar
Table 6.3: Block-wise total BPL population at the sub-district level in
Yamunanagar
District Sub-district Blocks Population
Yamunanagar Bilaspur Bilaspur 35,314
Chhachhrauli Chhachhrauli 70,416
Jagadhri Jagadhri 69,540
MC Jagadhri 66,691
MC Yamunanagar 88,555
Mustafabad 23,585
Radaur Radaur 25,589
Sadhaura Sadhaura 13,614
Total 393,304
As reflected in Table 6.3 and Figures 6.4–6.6, sub-districts Bilaspur, Radaur and
Sadhaura each have a BPL population of less than 50,000. Sub-district Chhachhrauli
has a BPL population close to 70,000 but the majority of the BPL population in the
district resides in Jagadhri sub-district. As seen from the maps, there are very few
public facilities empanelled under the RSBY. Almost all the empanelled facilities in
the district are from the private sector and are clustered around Jagadhri sub-district.
There are several eligible facilities that are not empanelled under the RSBY scheme.
The map shows that there are several public non-empanelled facilities that are
dispersed around the district. The private non-empanelled facilities are again clustered
around Jagadhri sub-district. The volume of empanelment of facilities seems to be
aligned to population density with the highest BPL population and a majority of the
empanelled facilities were in Jagadhri area.

175
Fig. 6.4: Yamunanagar – empanelled facilities – public and private

176
Fig. 6.5 – Yamunanagar: empanelled and non-empanelled facilities

177
Fig. 6.6 – Yamunanagar: all facilities

178
The above analysis points to the following findings and points of discussion:
The clustering of private facilities in the district could point towards
Hotelling’s Law. This law states that in many markets it is rational for
producers to make their products as similar as possible. This is also referred to
as the principle of minimum differentiation as well as Hotelling's ‘linear city
model’ (Hotelling, 1929). Application of Hotelling's Law in the current
context would assume two private health facilities at opposite corners of the
district with an invisible line drawn between them. If patients’ behaviour is
assumed to be rational with enough demand along the invisible line, it would
be plausible to assume that each facility would get half the patients divided
along an invisible line equidistant from the facilities. But, each provider would
be tempted to relocate his facility slightly towards the other, in order to move
the invisible line so that it encompasses more than half of the distance. Thus, a
street with two facilities will find both facilities right next to each other at the
same halfway point. Each facility will serve half the market; one will draw
customers from one direction, the other will draw customers from the other
direction.
Hotelling’s Law would predict the clustering of private hospitals according to
the entire population and not just the BPL population, as private hospitals
serve all populations. Thus, whether or not an insurance company fails to
empanel a private hospital to induce lower attendance by the insured
population cannot really be answered, as there are very few private hospitals
outside the densely populated areas. However, it is shown here that reliance
on the private sector leads to those in more remote areas being underserved.
Hotelling’s Law predicts the clustering away from the remote areas; if the
poor live in more remote areas then they are more likely to be underserved.
Besides the lack of sufficient empanelled public facilities in Yamunanagar,
they are not widely dispersed across the district. This could create issues
around access and increased transportation costs.
In Yamunanagar, there would most likely be more empanelled hospitals in
sparse areas if more public hospitals were empanelled.

179
6.3 Availability of services under RSBY-empanelled hospitals
Evaluating the availability of services under empanelled providers is done by
assessing the medical services offered at the facility. An RSBY beneficiary is entitled
to the whole list of pre-defined inpatient treatment packages included in the contract
with the insurance company. However, the assumption is that not all empanelled
facilities would offer all packages. This section explores the options available to the
patient to seek treatment for a particular medical condition.
Primary data was collected regarding the availability of services under all RSBY-
empanelled hospitals in the selected districts. Information was collected regarding the
number of inpatient beds and the services enlisted under RSBY package rates,
available in the hospitals. In Patiala district, out of 17 (seven private and 10 public)
empanelled hospitals, only 12 (seven private and five public) hospitals agreed to
provide the information while the remaining hospitals refused. In Yamunanagar
district, out of 37 (33 private and four public) empanelled hospitals, only 19 (17
private and two public) hospitals agreed to provide the information while the
remaining hospitals were not forthcoming.
6.3.1 Health facilities among RSBY-empanelled hospitals
In both the districts, all the RSBY empanelled hospitals were surveyed regarding the
availability of services. Table 6.4 shows facility wise total availability of services. It is
to be noted that none of the facilities in Patiala provided all (20) services categorized
under the RSBY package rates, though there were three private hospitals in
Yamunanagar which provided all services. Another important finding is that there was
no single public hospital in either Patiala or Yamunanagar district that offered the
complete range of specified treatment packages to the beneficiary.
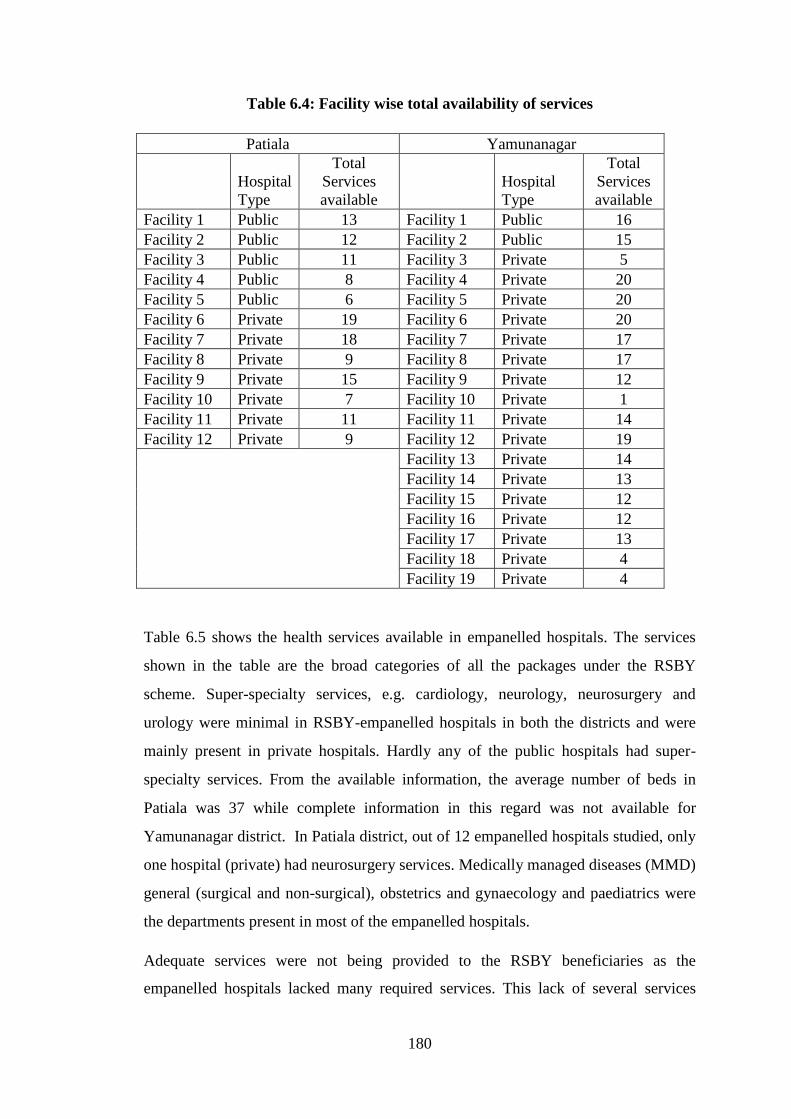
180
Table 6.4: Facility wise total availability of services
Patiala Yamunanagar
Hospital
Type
Total
Services
available
Hospital
Type
Total
Services
available
Facility 1 Public 13 Facility 1 Public 16
Facility 2 Public 12 Facility 2 Public 15
Facility 3 Public 11 Facility 3 Private 5
Facility 4 Public 8 Facility 4 Private 20
Facility 5 Public 6 Facility 5 Private 20
Facility 6 Private 19 Facility 6 Private 20
Facility 7 Private 18 Facility 7 Private 17
Facility 8 Private 9 Facility 8 Private 17
Facility 9 Private 15 Facility 9 Private 12
Facility 10 Private 7 Facility 10 Private 1
Facility 11 Private 11 Facility 11 Private 14
Facility 12 Private 9 Facility 12 Private 19
Facility 13 Private 14
Facility 14 Private 13
Facility 15 Private 12
Facility 16 Private 12
Facility 17 Private 13
Facility 18 Private 4
Facility 19 Private 4
Table 6.5 shows the health services available in empanelled hospitals. The services
shown in the table are the broad categories of all the packages under the RSBY
scheme. Super-specialty services, e.g. cardiology, neurology, neurosurgery and
urology were minimal in RSBY-empanelled hospitals in both the districts and were
mainly present in private hospitals. Hardly any of the public hospitals had super-
specialty services. From the available information, the average number of beds in
Patiala was 37 while complete information in this regard was not available for
Yamunanagar district. In Patiala district, out of 12 empanelled hospitals studied, only
one hospital (private) had neurosurgery services. Medically managed diseases (MMD)
general (surgical and non-surgical), obstetrics and gynaecology and paediatrics were
the departments present in most of the empanelled hospitals.
Adequate services were not being provided to the RSBY beneficiaries as the
empanelled hospitals lacked many required services. This lack of several services

181
raises a question on the process of empanelment. Further, limited availability of
super-specialty hospitals contributed to access issues. If all services are not being
provided to the beneficiaries, those who are sick may not find it attractive enrolling
into the scheme very attractive.
Table 6.5: Facilities among hospitals empanelled under RSBY scheme and
availability of care
Symbol
Patiala Yamunanagar
Public
hospitals
Private
hospitals Total
Public
hospitals
Private
hospitals Total
A Number of empanelled
hospitals 10 7 17 4 33 37
B Number of hospitals which
participated in the study 5 7 12 2 17 19
C Total No. of beds available 300 146 446 NA 205 (8)* NA
D Mean No. of beds per hospital 60 21 37 NA 25.6 NA
E Neonatal care 4 6 10 2 15 17
F Burns 3 3 6 2 6 8
G Snake bite 3 3 6 2 12 14
H Oncology 0 3 3 2 4 6
I Urology 1 6 7 0 9 9
J Endocrinology 0 2 2 0 13 13
K Paediatrics 4 6 10 1 9 10
L Orthopaedics 4 4 8 2 9 11
M Ophthalmology 4 2 6 2 15 17
N Neurosurgery 0 1 1 1 8 9
O Hysteroscopy 0 4 4 0 7 7
P Endoscopic procedures 0 6 6 1 12 13
Q Gynaecology 5 6 11 2 13 15
R General surgery 5 7 12 2 12 14
S ENT 3 3 6 2 8 10
T Dental 4 2 6 2 9 11
U Medical general ward – ICU 0 5 5 2 12 14
V Medical general ward –
nonsurgical 5 7 12 2 14 16
W Medical general ward –
surgical 5 7 12 2 16 18
X Intensive care unit 0 5 5 2 13 15
Y Total possible types of care
(B x 20) 100 140 240 40 340 380
Z Actual total care
sum E to X 50 88 138 31 216 247
Percentage of actual care
available
(Zx100)/Y
50% 63% 58% 78% 64% 65%
*Only eight hospitals reported the number of beds available
The last row of Table 6.4 gives the percentage of actual care (packages) in relation to
possible care available in the district. In Patiala there is a shortfall in the total
availability of services by 42% (100% – 58%); the shortfall is greater in the public
facilities. In Yamunanagar the shortfall is 35% and the public facilities fare better.

182
However, though there were four empanelled public facilities, data could be obtained
from only two of them.
6.4 Analysis of enrolment under RSBY
Prior to analysis of utilization of services, enrolment under the RSBY scheme was
assessed. Firstly, enrolment in the scheme was analysed as an initial measure of
access under the RSBY. The data for the eligible BPL population and enrolled BPL
population was retrieved from the SNAs of the respective states for the years 2011
and 2012. For Patiala district, line listing of the eligible and enrolled population with
age and gender was provided. However, for Yamunanagar district, the line listing of
the eligible population along with their age and sex was available, but was not
available for the enrolled population. Secondly, to assess the off-targeting and
leakages in the scheme, the data set of the exit interviews from the selected
empanelled hospitals was used.
6.4.1 Eligible and enrolled participants
In Patiala district of Punjab, of the 247,998 BPL population eligible for enrolment
under the RSBY scheme, 38,278 (15.4%) were enrolled. In terms of families, 16,144
(40.4%) of BPL families were enrolled. The average number of individuals enrolled
per family was 2.37. Amongst the enrolled families in Patiala, 40% of them were
headed by females (Figure 6.7).
In Yamunanagar district of Haryana, of the 393,304 BPL population eligible for
enrolment under the RSBY scheme, 165,809 (42.2%) were actually enrolled. In terms
of families, 46,546 (64.3%) of BPL families were enrolled. The average number of
individuals enrolled per family was 3.56. Amongst the enrolled families in
Yamunanagar, 23% of them were headed by females (Figure 6.7).

183
Fig. 6.7: Enrolment under RSBY scheme (Patiala and Yamunanagar)
In Patiala district, amongst the total enrolled population, 51% were males and 49%
were females. Table 6.6 shows the breakdown by age group and sex. The percentage
of under-5 BPL children enrolled under the scheme (out of total under-5 BPL
children) was very low. The highest enrolment occurred in the age group of 45 to 64
years followed by the elderly group (>64 years), 25-44 years and 15-24 years. The
elderly group was the second highest group in terms of enrolment. Looking at the
enrolment rate in various age groups, it can be concluded that there was no adverse
selection in Patiala district. While comparing the enrolment rates among males and
females, it was seen that enrolment was slightly higher for females in the age groups
25-44 years and 45-64 years. However, enrolment of females was slightly lower in
age groups 5-14 years and >64 years. Age and gender-wise enrolment analysis could
not be conducted for Yamunanagar as similar database was not present.

184
Table 6.6: Proportion of enrolled beneficiaries in RSBY Scheme in Patiala
district (similar data for Yamunanagar district was not available)
Under-5 5 to 14
yrs
15 to
24 yrs
25 to
44 yrs
45 to
64 yrs >64 yrs
Total
population
Male 1,101,207 188,359 187,462 299,791 164,773 62,894
Female 975,969 147,421 161,995 283,727 158,504 58,282
Eligible
population
(BPL)
Male 9,200 50,013 18,785 26,349 11,787 6,219
Female 9,400 49,880 18,802 26,420 11,758 6,227
Enrolled
population
Male 184 3,601 3,156 6,403 4,102 1,984
Female 235 2,494 3,140 7,292 4,292 1,395
% enrolled of
eligible
population
Male 2.0% 7.2% 16.8% 24.3% 34.8% 31.9%
Female 2.5% 5.0% 16.7% 27.6% 36.5% 22.4%
All 2.25% 6.10% 16.75% 25.95% 35.65% 27.15%
In understanding the process of enrolment under the scheme, it is important to analyse
data to discern any factors that may contribute to higher family coverage. This is done
through examination of off-targeting and leakage.
6.4.2 Off-targeting and leakage
Since the coverage of RSBY scheme is still not 100%, there are BPL families that are
not enrolled under the scheme. To assess the off-targeting and leakage, the exit
interview data set was analysed.
Under the off-target category, only the BPL population was analysed and a
comparison was made between the RSBY-enrolled BPL participants and non-RSBY
BPL participants. The data was extracted from the exit interviews of 751 participants
from both the districts (Patiala and Yamunanagar). A total of 462 BPL participants
were analysed in the off-target category (Table 6.7). Amongst the study participants
who belonged to the BPL category, 331 were enrolled in the RSBY scheme while the
remaining 131 (28%) were not enrolled.
For leakage, only the RSBY-enrolled population was studied and the characteristics of
the BPL population enrolled for the RSBY scheme and non-BPL population enrolled
for the RSBY scheme were compared. As the RSBY scheme is only for the BPL
population, those who are not BPL are not eligible for the scheme. But if they are
enrolled under the scheme, it would be considered as ‘leakage’ from the scheme. The
data was extracted from the exit interviews of 751 participants from the selected
empanelled facilities in both the districts (Patiala and Yamunanagar). A total of 387

185
participants enrolled under the RSBY scheme were studied in this section (Table 6.7).
Out of 387 RSBY participants, 331 belonged to the BPL category while the remaining
56 were non-BPL; or 14.5% among the enrolled did not meet the eligibility criteria.
The percentage for off-target is larger in comparison to that for leakage.
Table 6.7: Off-target and leakage categories
RSBY
Yes No Total
BPL
Yes 331 131 462 Off target (28%)
No 56 233 289
Total 387 364 751
Leakage
(14.5%)
6.4.3 Determinants of off-targeting
Analysis was done to assess the determinants of off-targeting, i.e. BPL population not
getting enrolled in the RSBY scheme. If a BPL person is identified among those
enrolled in RSBY, it is referred to as proper targeting. If we examine only the BPL
persons, we can determine why an off-targeting may have taken place. Binary logistic
regression analysis was done using the relation below for only the BPL people in the
sample, since off-targeting can occur only among the BPL populace.
Off-target (Yes/No) = function (caste, education, district, age, gender)
(Only BPL population was studied for determinants of off-targeting)
Binary logistic regression analysis shows that off-targeting was more likely to occur
in Yamunanagar, in the SC/ST population, and in the illiterate (or literate up to
primary level). However, the latter was statistically non-significant. Off-targeting was
also less likely to occur for females. The RSBY scheme was aimed at bringing social
equity in the community by giving equal priority in health care to the underprivileged
section of society. However, our analysis shows that the underprivileged section
(illiterates or literate up to primary level and SC/ST) were still less likely to benefit
from enrolment under the scheme (Table 6.8).
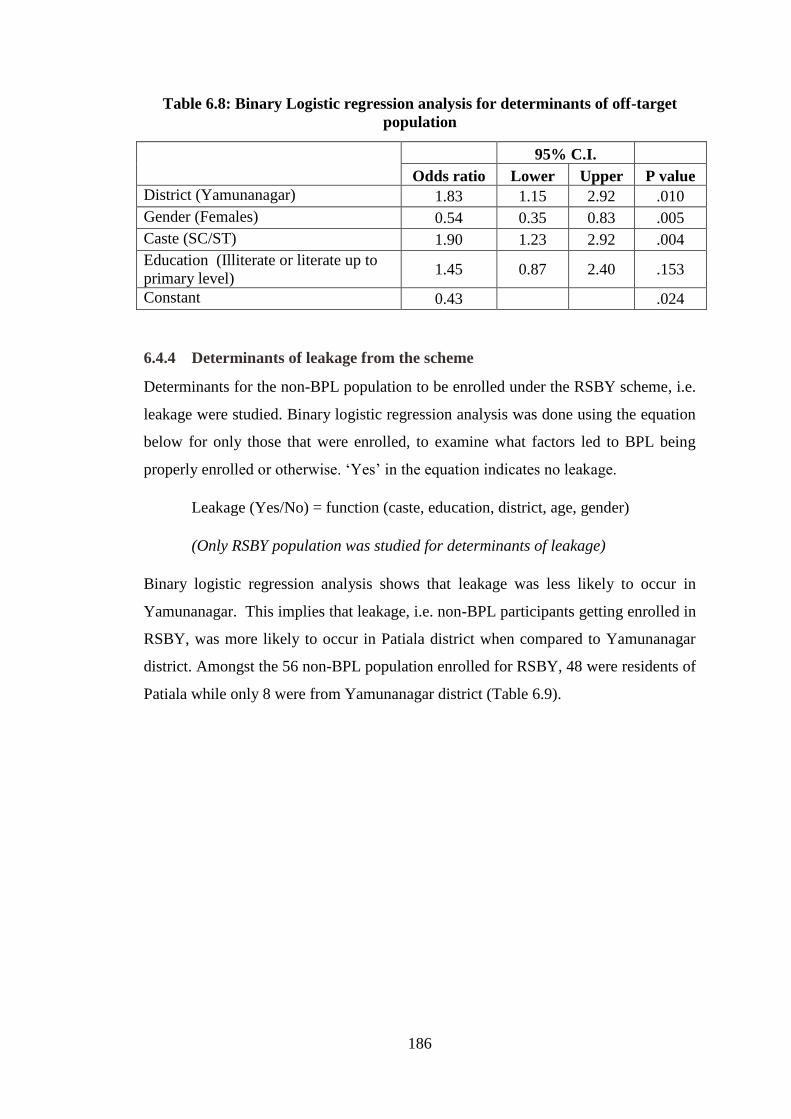
186
Table 6.8: Binary Logistic regression analysis for determinants of off-target
population
95% C.I.
Odds ratio Lower Upper P value
District (Yamunanagar) 1.83 1.15 2.92 .010
Gender (Females) 0.54 0.35 0.83 .005
Caste (SC/ST) 1.90 1.23 2.92 .004
Education (Illiterate or literate up to
primary level) 1.45 0.87 2.40 .153
Constant 0.43 .024
6.4.4 Determinants of leakage from the scheme
Determinants for the non-BPL population to be enrolled under the RSBY scheme, i.e.
leakage were studied. Binary logistic regression analysis was done using the equation
below for only those that were enrolled, to examine what factors led to BPL being
properly enrolled or otherwise. ‘Yes’ in the equation indicates no leakage.
Leakage (Yes/No) = function (caste, education, district, age, gender)
(Only RSBY population was studied for determinants of leakage)
Binary logistic regression analysis shows that leakage was less likely to occur in
Yamunanagar. This implies that leakage, i.e. non-BPL participants getting enrolled in
RSBY, was more likely to occur in Patiala district when compared to Yamunanagar
district. Amongst the 56 non-BPL population enrolled for RSBY, 48 were residents of
Patiala while only 8 were from Yamunanagar district (Table 6.9).

187
Table 6.9: Binary logistic regression analysis for determinants of leakage
95% C.I.
Odds
ratio Lower Upper
P
Value
District (Yamunanagar) 0.12 0.06 0.27 .00
Gender (Females) 1.19 0.61 2.31 .60
Caste (SC/ST) 1.52 0.83 2.78 .17
Education (Illiterate or literate up to
primary level) 0.64 0.32 1.26 .19
Constant .28 .01
6.5 Utilization patterns
This section primarily deals with analysing the utilization of services under the RSBY
scheme by enrolled beneficiaries to explore trends in the utilization patterns. Claims-
related data of the selected districts for the period September 2011 to December 2012
were analysed. During this period, a total of 992 claims were made in Patiala and
6,043 in Yamunanagar.
6.5.1 Volume of claims
Claims made in Yamunanagar district were six times more than those made in Patiala
district. However, claims per 1000 family enrolled in Yamunanagar were almost two
times of Patiala (Table 6.10). The number of claims per 1000 individuals enrolled
under the scheme was 25.9 for Patiala district while it was 36.4 for Yamunanagar
district (total number of claims x 100/total population enrolled).
Table 6.10: Utilization Pattern (Patiala Vs Yamunanagar)
Patiala Yamunanagar
Claims in 14 months 992 6043
Enrolment population 38278 165809
Enrolled families 16144 46546
Empanelled facilities 17 37
Claims/month 70.9 431.6
Claims/facility/month 4.2 11.7
Claims/1000 family/month 4.4 9.3
Claims/1000 population/month 1.9 2.6
In terms of the trend of number of claims made per month, it was observed that in
Patiala district the claims gradually increased from 1% (of the total claims in the
district) in October 2011 and peaked to 13% in September 2012, but then declined to

188
2% in December 2012. In Yamunanagar district, initially the number of claims made
per month was as high as 11% of total claims but declined to 4% over the next few
months, though a second peak was observed in July 2012. Thereafter, the number of
claims also declined in this district to 2.5% in November 2012 (Figure 6.8). Linear
trend line showed an increasing trend of claims in Patiala while a declining trend in
Yamunanagar.
Fig. 6.8: Trend in number of claims per month made in Patiala and
Yamunanagar districts
6.5.2 Number of claims by private and public hospitals
In Patiala district, seven private hospitals and 10 public hospitals were empanelled. In
Yamunanagar district, 33 private hospitals and only four public hospitals were
empanelled (Table 6.11). More private hospitals were empanelled in Yamunanagar as
against more public hospitals in Patiala. In both the districts, more claims per hospital
were made in private hospitals. However, this was significantly higher in
Yamunanagar district.

189
Table 6.11: Claims distribution in private and public hospitals
District Type of
hospital
No. of claims
(%)
Total No. of
empanelled
hospitals
Average no.
of claims per
hospital
(Claims/total
No. of
empanelled
hospitals)
Patiala
Private 669 (67.4) 7 95.6
Public 323 (32.6) 10 32.3
Total 992 (100) 17 58.4
Yamunanagar
Private 5,658 (93.6) 33 171.5
Public 385 (6.4) 4 96.3
Total 6,043 (100) 37 163.3
In both the districts, fluctuating trends were observed, both in public and private
hospitals. In Patiala (both public and private hospital), claims started very low and
gradually peaked in September 2012, thereafter they declined. In Yamunanagar
district, a declining trend was observed in private hospitals. No definite trend was
observed for public hospitals (Table 6.12).

190
Table 6.12: Distribution of claims in public and private hospitals over the year
Month
Patiala Yamunanagar Across districts
Private
(%)
Public
(%)
Private
(%)
Public
(%)
Private
(%)
Public
(%)
(N=669) (N=323) (N=5,658) (N=385) (N=6,327) (N=708)
Sep 11 0.0 0.0 11.5 4.9 10.2 2.7
Oct 11 0.9 0.0 8.4 6.0 7.6 3.2
Nov 11 2.1 0.0 7.5 11.2 6.9 6.1
Dec 11 7.0 0.9 7.2 1.8 7.2 1.4
Jan 12 5.2 4.3 6.1 0.5 6.0 2.3
Feb 12 7.0 2.8 5.8 6.8 5.9 4.9
Mar 12 6.6 4.6 5.5 4.7 5.6 4.7
Apr 12 5.4 4.0 4.7 6.0 4.8 5.1
May 12 9.4 8.4 5.2 12.7 5.6 10.7
Jun 12 7.6 5.0 4.2 2.1 4.5 3.4
Jul 12 6.4 10.5 8.1 11.4 7.9 11.0
Aug 12 6.9 6.5 6.3 10.4 6.4 8.6
Sep 12 11.1 8.4 7.2 6.0 7.6 7.1
Oct 12 3.9 5.6 5.3 2.9 5.1 4.1
Nov 12 4.9 6.8 3.0 2.1 3.2 4.2
Dec 12 0.1 5.0 4.2 10.6 3.7 8.1
6.5.3 Clustering of claims in selected hospitals
During the claims analysis it was observed that there was a clustering of the number
of claims in certain hospitals, i.e. number of claims was much more in some hospitals
as compared to other hospitals. Figure 6.9 gives a stacked column diagram where
every hospital has one colour and the height of the column is proportional to the
number of claims. In both the districts, it can be observed that the height of a few
colours covers most of the portion of the stacked column. In Patiala district, clustering
was observed in private as well as public hospitals, whereas in Yamunanagar district
clustering was more in private hospitals.
Looking at the Herfindahl-Hirschman Index (HHI), it appears that in Patiala district
the claims were significantly concentrated in both selected private and public
hospitals (when HHI was calculated individually for private and public hospitals).
However, in Yamunanagar district, significant concentration of claims was observed
in public hospitals only (Table 6.13).

191
Fig. 6.9: Distribution of claims in different hospitals empanelled in private and
public sectors of Yamunanagar and Patiala districts
Table 6.13: Herfindahl-Hirschman Index* of hospitals
Private hospitals Public hospitals Total
Patiala 3,058 3,468 1,758
Yamunanagar 1,078 5,222 967
*Interpretation: Below 1500 – un-concentrated; 1500–2500 – moderately
concentrated; above 2500 – highly concentrated
In Yamunanagar district, about half of the claims were accounted for by four out of 37
empanelled hospitals. All these four hospitals were private hospitals. In Patiala
district, about two thirds of the claims were accounted for by three out of 17
empanelled hospitals, two of which were private hospitals and one a public hospital.
Background characteristics of these hospitals are given in Table 6.14. Looking at
these, it appears that patients were more likely to visit hospitals that had maximum
facilities under one roof or provided services that were in highest demand. For
example cataract, which reportedly has a high burden in India (Murthy et al., 2008);
and its correction is a low-cost procedure. The RSBY scheme appears to further

192
facilitate the dynamics. This might be the probable reason for high ophthalmological
claims.
Table 6.14: Background characteristics of hospitals where a majority of the
claims were reported
SNo. Name of the hospital Bed strength No. of
claims
Departments in the
hospital
Yamunanagar
1 Private hospital 1 100 1539 All 20 services
available
2 Private hospital 2 11 608 Ophthalmology
3 Private hospital 3 5 324 Ophthalmology
4 Private hospital 4 NA 320 NA
Patiala
1 Private hospital 1 NA 299 Total services available
were 19
2 Private hospital 2 50 202 Total services available
were 11
3 Public hospital 3 100 172 Total services available
were 12
NA– not available
6.5.4 Age and gender distribution of patients
The number of claims for under-5 children were fewer as compared to other age
groups. Probably, this could be because the proportion of under-5 children enrolled
under the scheme was small as compared to enrolment in other age groups.
Most of the claims belonged to the age group 25–44 years followed by the 45–64
years age group in both the districts (Table 6.15), which can be attributed to the major
chunk of the population enrolled under the scheme belonging to this age group.
While making a comparison between private and public hospitals, it is observed that
more males were going to private hospitals (51.2% of total claims in private hospitals)
whereas more females were going to public hospitals (53.2% of total claims in public
hospitals). This difference is statistically significant (Table 6.16). This could be
because women found it easier to visit a facility close to home.

193
Table 6.15: Age and gender distribution of patients (Patiala vs Yamunanagar) by
claims
Patiala Yamunanagar
Male Female Total Male Female Total
N % N % N % N % N % N %
Under-5 2 0.5 9 1.6 11 1.1 7 0.2 8 0.3 15 0.2
5 to 14 yrs 22 5.2 45 8.0 67 6.8 232 7.4 154 5.3 386 6.4
15 to 24 yrs 39 9.2 38 6.7 77 7.8 388 12.3 262 9.0 650 10.8
25 to 44 yrs 135 31.7 260 45.9 395 39.8 1,020 32.4 1,116 38.5 2,136 35.3
45 to 64 yrs 141 33.1 137 24.2 278 28.0 930 29.6 830 28.6 1,760 29.1
> 64 yrs 87 20.4 77 13.6 164 16.5 568 18.1 528 18.2 1,096 18.1
Total 426 100.0 566 100.0 992 100.0 3,145 100.0 2,898 100.0 6,043 100.0
Table 6.16: Age and gender distribution of patients (private vs public facilities)
by claims
Private facilities Public facilities
Male Female Male Female
N % N % N % N %
Under-5 8 38.1 13 61.9 1 20.0 4 80.0
5 to 14 yrs 227 55.8 180 44.2 27 58.7 19 41.3
15 to 24 yrs 376 58.9 262 41.1 51 57.3 38 42.7
25 to 44 yrs 1,081 47.2 1,209 52.8 74 30.7 167 69.3
45 to 64 yrs 946 52.1 870 47.9 125 56.3 97 43.7
> 64 yrs 602 52.1 553 47.9 53 50.5 52 49.5
Total 3,240 51.2 3,087 48.8 331 46.8 377 53.2
6.5.5 Relationship of the claimant with the head of the household
In both the districts, the highest number of claims were made by the head of the
households followed by the spouse (Table 6.17). While comparing private and public
hospitals, opposite trends were observed in Patiala and Yamunanagar district In
Patiala, significant difference was observed in terms of the claimant’s relationship to
the head of the household except that in Yamunanagar district the heads of the
households visited private hospitals more in comparison to public hospitals (Table
6.18). This could be because more private hospitals were enrolled in Yamunanagar.
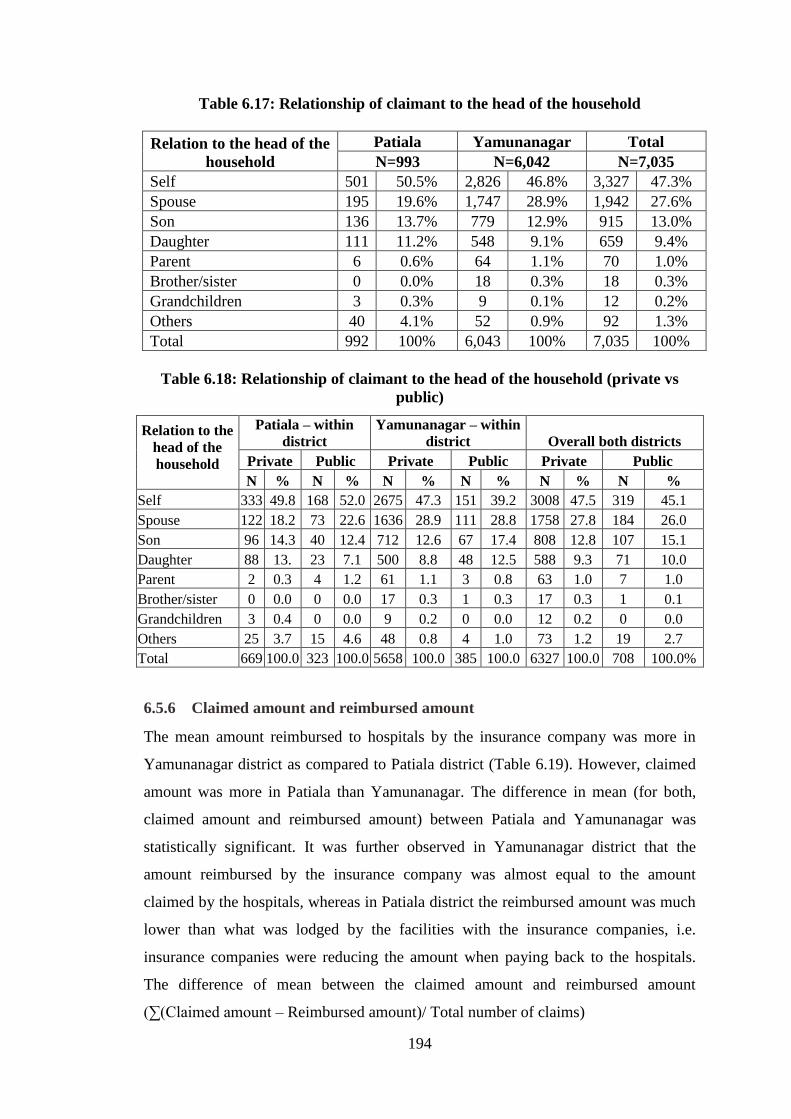
194
Table 6.17: Relationship of claimant to the head of the household
Relation to the head of the
household
Patiala Yamunanagar Total
N=993 N=6,042 N=7,035
Self 501 50.5% 2,826 46.8% 3,327 47.3%
Spouse 195 19.6% 1,747 28.9% 1,942 27.6%
Son 136 13.7% 779 12.9% 915 13.0%
Daughter 111 11.2% 548 9.1% 659 9.4%
Parent 6 0.6% 64 1.1% 70 1.0%
Brother/sister 0 0.0% 18 0.3% 18 0.3%
Grandchildren 3 0.3% 9 0.1% 12 0.2%
Others 40 4.1% 52 0.9% 92 1.3%
Total 992 100% 6,043 100% 7,035 100%
Table 6.18: Relationship of claimant to the head of the household (private vs
public)
Relation to the
head of the
household
Patiala – within
district
Yamunanagar – within
district Overall both districts
Private Public Private Public Private Public
N % N % N % N % N % N %
Self 333 49.8 168 52.0 2675 47.3 151 39.2 3008 47.5 319 45.1
Spouse 122 18.2 73 22.6 1636 28.9 111 28.8 1758 27.8 184 26.0
Son 96 14.3 40 12.4 712 12.6 67 17.4 808 12.8 107 15.1
Daughter 88 13. 23 7.1 500 8.8 48 12.5 588 9.3 71 10.0
Parent 2 0.3 4 1.2 61 1.1 3 0.8 63 1.0 7 1.0
Brother/sister 0 0.0 0 0.0 17 0.3 1 0.3 17 0.3 1 0.1
Grandchildren 3 0.4 0 0.0 9 0.2 0 0.0 12 0.2 0 0.0
Others 25 3.7 15 4.6 48 0.8 4 1.0 73 1.2 19 2.7
Total 669 100.0 323 100.0 5658 100.0 385 100.0 6327 100.0 708 100.0%
6.5.6 Claimed amount and reimbursed amount
The mean amount reimbursed to hospitals by the insurance company was more in
Yamunanagar district as compared to Patiala district (Table 6.19). However, claimed
amount was more in Patiala than Yamunanagar. The difference in mean (for both,
claimed amount and reimbursed amount) between Patiala and Yamunanagar was
statistically significant. It was further observed in Yamunanagar district that the
amount reimbursed by the insurance company was almost equal to the amount
claimed by the hospitals, whereas in Patiala district the reimbursed amount was much
lower than what was lodged by the facilities with the insurance companies, i.e.
insurance companies were reducing the amount when paying back to the hospitals.
The difference of mean between the claimed amount and reimbursed amount
(∑(Claimed amount – Reimbursed amount)/ Total number of claims)

195
was INR 4,134 (£ 41.6) in Patiala and only INR 2 (£ 0.02) in Yamunanagar.
The mean reimbursed amount was higher for public hospitals in Patiala district while
it was slightly higher for private hospitals in Yamunanagar (Table 6.20). Similar
observations were also noted for the mean claimed amount (Table 6.21). During
overall comparison of public hospitals and private hospitals, the mean reimbursed
amount was more for public hospitals.
In Patiala, the difference of mean between the claimed amount and reimbursed
amount was INR 4,451 (£ 44) for private hospitals and INR 3,474 (£ 34) for public
hospitals; whereas in Yamunanagar, this difference was only INR 3 (£ 0.03) in private
hospitals and nil in public hospitals. (Table 6.20 and 6.21.)
Kernel density estimates shows that the highest density for reimbursed and claimed
amount (both, private and public) was around INR 3,000 (£ 30) (Figure 6.10 and
6.13). Findings of Table 6.20 can be seen in kernels plot in Figure 6.11 and 6.12,
where the highest density of reimbursed amount is high for public hospitals when
compared to private hospitals in Patiala. In Yamunanagar, it was the opposite where
the highest density for reimbursed amount was higher for private hospitals when
compared to public hospitals. The difference between the density of private and
public hospitals was more pronounced for the claimed amount (Figure 6.13) when
compared to reimbursed amount (Figure 6.10). Similar to reimbursed amount,
findings of claimed amount in Table 6.21 can be seen in kernels plot in Figure 6.14
and 6.15, where the highest density of claimed amount is high for public hospitals
when compared to private hospitals in Patiala. However, in Yamunanagar, it was the
opposite where the highest density for claimed amount was higher for private
hospitals when compared to public hospital The highest amount was reimbursed
under the neurosurgery package followed by endocrine and oncology. Neurosurgery
and orthopaedic packages had wide variations in terms of the amount reimbursed
(Figure 6.16).

196
Table 6.19: Mean amount claimed by hospitals and reimbursed by the insurance
company (Patiala vs Yamunanagar)
District —>
Reimbursed amount Claimed amount
Patiala Yamunanagar* Patiala Yamunanagar*
N 992 5,903 992 5,903
Mean (INR) 4,210 5,138 8,344 5,140
Std. deviation 3,992 4,175 6,520 4,175
P value, H0 -
mean 0 0.001 0.001
*140 claims were rejected in Yamunanagar district
Table 6.20: Mean amount reimbursed by the insurance company to the hospital
(private vs public)
Hospital
type —
>
Patiala Yamunanagar Both districts
consolidated
Private Public Private Public Private* Public**
N 669 323 5,538 365 6,207 688
Mean
(INR) 3708 5250 5,140 5,105 4,985 5,173
SD 3793 4193 4,164 4,339 4,150 4,269
Difference
0.001 .005 0.39
*120 claims from private hospitals were rejected
**20 claims from public hospitals were rejected
Table 6.21: Mean amount claimed from the insurance company by the hospitals
(Private vs public)
Hospital
type
Patiala Yamunanagar Both districts consolidated
Private Public Private Public Private* Public**
N 669 323 5,538 365 6,207 688
Mean
(INR) 8,159 8,724 5,143 5,105 5,468 6,804
SD 6,532 6,487 4,165 4,339 4,577 5,742
P Value 0.287 0.005 <0.01
*120 claims from private hospitals were rejected
**20 claims from public hospitals were rejected

197
Fig. 6.10: Kernel density estimates for reimbursed amount (private vs public
hospitals)
Fig. 6.11: Kernel Density estimates for reimbursed amount in Patiala district
(private vs public hospitals)

198
Fig. 6.12:Kernel density estimates for reimbursed amount in Yamunanagar
district (private vs public hospitals)
Fig. 6.13: Kernel density estimates for claimed amount (private vs public
hospitals)

199
Fig. 6.14:Kernel density estimates for claimed amount in Patiala district (private
vs public hospitals)
Fig. 6.15:Kernel density estimates for claimed amount in Yamunanagar district
(private vs public hospitals)

200
Fig. 6.16: Mean amount reimbursed under various categories with ±2SD
In Yamunanagar, the amount reimbursed for 5,900 (99.9%) claims was exactly the
same as the claimed amount (Table 6.22). Only three claims were reimbursed a lesser
amount than what was claimed by the health facilities. In Patiala district, 49% of the
claims were reimbursed with a lesser amount than what was claimed by the hospitals
(Table 6.22). The reimbursed amount was less than the claimed amount for about 5%
of claims in private hospitals and 20% claims in public hospitals (Table 6.23).
Table 6.22: Difference between claimed and reimbursed amount (Patiala vs
Yamunanagar)
Difference between
claimed and reimbursed
amount
Patiala Yamunanagar Total
No. % No. % No. %
No difference 507 51.1 5,900 99.9 6,407 92.9
<INR 1000 15 1.5 1 0.0 16 0.2
INR 1,001 to 5,000 210 21.2 0 0.0 210 3.0
INR 5,001 to 10,000 114 11.5 2 0.1 116 1.7
INR 10001 to 15000 62 6.3 0 0.0 62 0.9
>INR 15,000 84 8.5 0 0.0 84 1.2
Total 992 100.0 5,903 100.0 6,895 100.0
0
5000
10000
15000
20000
25000
30000R
eim
bu
rsed
am
ou
nt
in R
s

201
Table 6.23. Difference between claimed and reimbursed amount (private vs public hospitals)
Patiala Yamunanagar Across districts
Difference between claimed
and reimbursed amount
Private hospital Public hospital Private hospital Public hospital Private hospital Public hospital
N % N % N % N % N % N %
No difference 327 48.9 180 55.7 5,535 99.9 365 100 5,862 94.4 545 79.2
<INR 1000 10 1.5 5 1.5 1 0.0 0 0.0 11 0.2 5 0.7
INR 1,001 to 5,000 142 21.2 68 21.1
142 2.3 68 9.9
INR 5,001 to 10,000 79 11.8 35 10.8 2 0.1 0 0.0 81 1.3 35 5.1
INR 10001 to 15000 50 7.5 12 3.7
50 0.8 12 1.7
>INR 15,000 61 9.1 23 7.1
61 1.0 23 3.3
669 100. 323 100 5,538 100 365 100 6,207 100 688 100
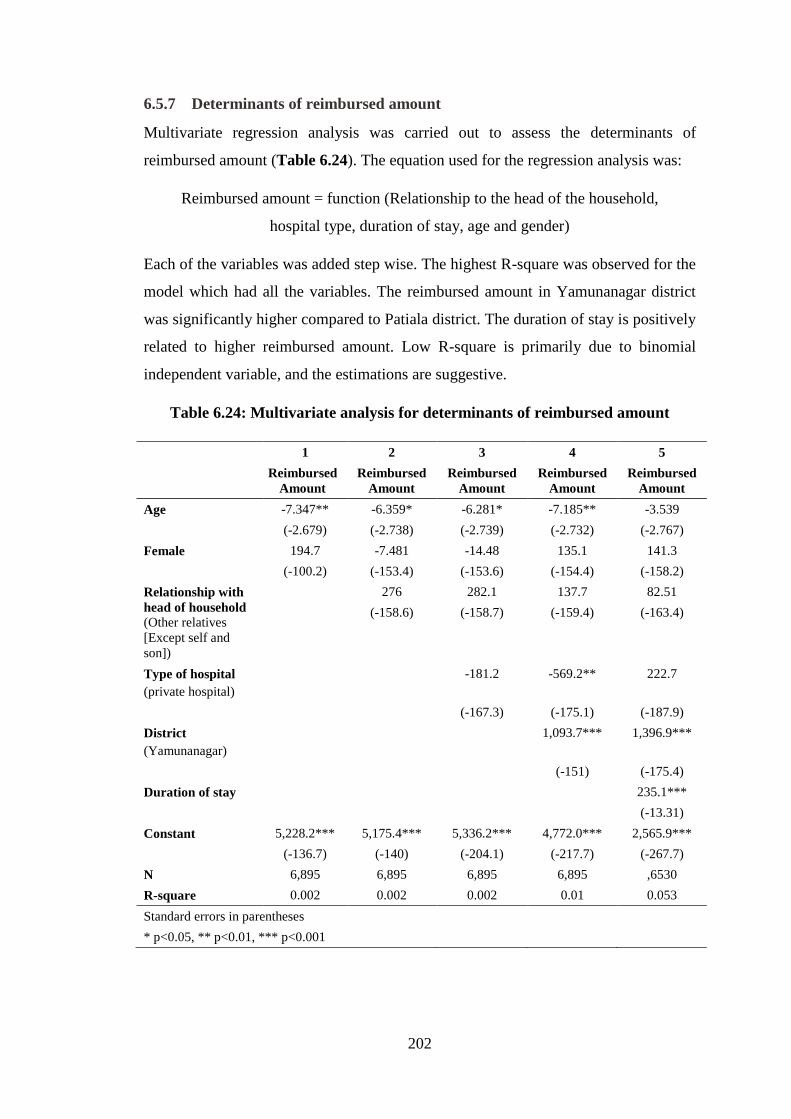
202
6.5.7 Determinants of reimbursed amount
Multivariate regression analysis was carried out to assess the determinants of
reimbursed amount (Table 6.24). The equation used for the regression analysis was:
Reimbursed amount = function (Relationship to the head of the household,
hospital type, duration of stay, age and gender)
Each of the variables was added step wise. The highest R-square was observed for the
model which had all the variables. The reimbursed amount in Yamunanagar district
was significantly higher compared to Patiala district. The duration of stay is positively
related to higher reimbursed amount. Low R-square is primarily due to binomial
independent variable, and the estimations are suggestive.
Table 6.24: Multivariate analysis for determinants of reimbursed amount
1 2 3 4 5
Reimbursed
Amount
Reimbursed
Amount
Reimbursed
Amount
Reimbursed
Amount
Reimbursed
Amount
Age -7.347** -6.359* -6.281* -7.185** -3.539
(-2.679) (-2.738) (-2.739) (-2.732) (-2.767)
Female 194.7 -7.481 -14.48 135.1 141.3
(-100.2) (-153.4) (-153.6) (-154.4) (-158.2)
Relationship with
head of household
(Other relatives
[Except self and
son])
276 282.1 137.7 82.51
(-158.6) (-158.7) (-159.4) (-163.4)
Type of hospital
(private hospital)
-181.2 -569.2** 222.7
(-167.3) (-175.1) (-187.9)
District
(Yamunanagar)
1,093.7*** 1,396.9***
(-151) (-175.4)
Duration of stay 235.1***
(-13.31)
Constant 5,228.2*** 5,175.4*** 5,336.2*** 4,772.0*** 2,565.9***
(-136.7) (-140) (-204.1) (-217.7) (-267.7)
N 6,895 6,895 6,895 6,895 ,6530
R-square 0.002 0.002 0.002 0.01 0.053
Standard errors in parentheses
* p<0.05, ** p<0.01, *** p<0.001

203
6.5.8 Premiums and amount reimbursed
In Patiala district, the total amount reimbursed by the insurance company was INR
4,177,006 (£ 42065), i.e. the average amount reimbursed per family enrolled was INR
258.7 (£ 2.6). The premium collected per family by the insurance company in Patiala
district was approximately INR 740 (£ 7.4). Thus, a huge gap of INR 482 (£ 4.9)
(premium paid to insurance company but amount not utilized) existed in Patiala
district (Table 6.25).
In Yamunanagar district, the total amount reimbursed by the insurance company was
INR 30,385,202 (£ 305993), i.e. the average amount reimbursed per family enrolled
was INR 652.8 (£ 6.8). The premium collected per family by the insurance company
in Yamunanagar district was INR 750 (£ 7.6). Thus, a gap of INR 98 (£ 1.0)
(premium paid to insurance company but amount not utilized) existed in
Yamunanagar district (Table 6.25).
Table 6.25: Difference between premium collected and amount reimbursed
Patiala Yamunanagar
Premium Collected INR 11946450 (£120306) INR 34909500 (£351555)
Reimbursed INR 4,177,006 (£ 42,065) INR 30,385,202 (£ 305994)
Premium-Reimbursed INR 77,69,554 (£78243) INR 4524298 (£45,561)
Difference per family
enrolled
INR 740 (£ 7.4) INR 98 (£1)
6.5.9 Frequency of claims by the same household
In Patiala district, 298 beneficiaries used the service only once during the period of
eligibility while 104, 67, 15 and 10 beneficiaries used the service twice, 3–4 times, 5–
9 times, and more than 9 times, respectively. In Yamunanagar district, 3,167
beneficiaries used the service only once during the period of eligibility while 726,
299, 42 and 11 beneficiaries used the claim twice, 3–4 times, 5–9 times and more than
9 times, respectively (Table 6.26).
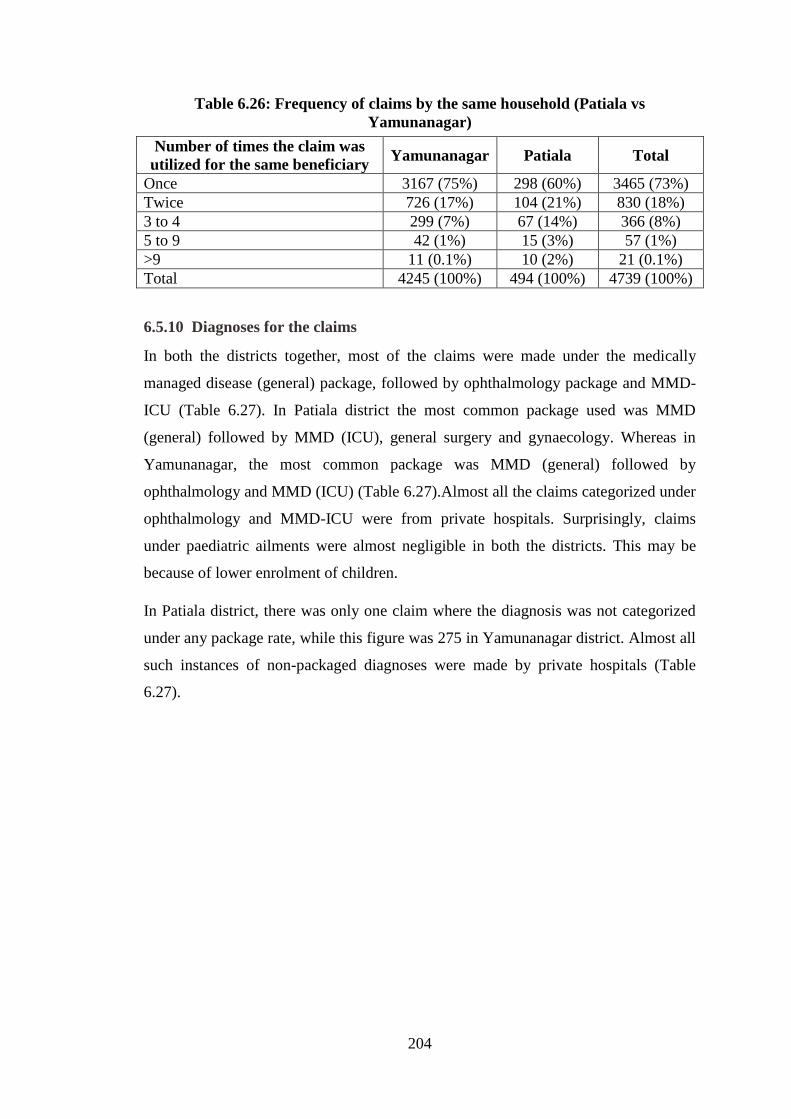
204
Table 6.26: Frequency of claims by the same household (Patiala vs
Yamunanagar)
Number of times the claim was
utilized for the same beneficiary Yamunanagar Patiala Total
Once 3167 (75%) 298 (60%) 3465 (73%)
Twice 726 (17%) 104 (21%) 830 (18%)
3 to 4 299 (7%) 67 (14%) 366 (8%)
5 to 9 42 (1%) 15 (3%) 57 (1%)
>9 11 (0.1%) 10 (2%) 21 (0.1%)
Total 4245 (100%) 494 (100%) 4739 (100%)
6.5.10 Diagnoses for the claims
In both the districts together, most of the claims were made under the medically
managed disease (general) package, followed by ophthalmology package and MMD-
ICU (Table 6.27). In Patiala district the most common package used was MMD
(general) followed by MMD (ICU), general surgery and gynaecology. Whereas in
Yamunanagar, the most common package was MMD (general) followed by
ophthalmology and MMD (ICU) (Table 6.27).Almost all the claims categorized under
ophthalmology and MMD-ICU were from private hospitals. Surprisingly, claims
under paediatric ailments were almost negligible in both the districts. This may be
because of lower enrolment of children.
In Patiala district, there was only one claim where the diagnosis was not categorized
under any package rate, while this figure was 275 in Yamunanagar district. Almost all
such instances of non-packaged diagnoses were made by private hospitals (Table
6.27).

205
Table 6.27: Distribution of claims in both the districts by diagnosis (Patiala vs
Yamunanagar)
Disease category Patiala Yamunanagar Total
N % N % N %
No package opted 1 0.1 275 4.6 276 3.9
Dental 1 0.1 4 0.1 5 0.1
Ear 12 1.2 5 0.1 17 0.2
Endocrine 2 0.2 9 0.1 11 0.2
Endoscopic 9 0.9 133 2.2 142 2.0
General surgery 117 11.8 668 11.1 785 11.2
Gynaecology 114 11.5 379 6.3 493 7.0
Hysteroscopy 1 0.1 13 0.2 14 0.2
MMD-general 445 44.9 1,916 31.7 2,361 33.6
MMD-ICU 191 19.3 843 14.0 1034 14.7
Neurosurgery 0 0.0 7 0.1 7 0.1
Nose 9 0.9 11 0.2 20 0.3
Oncology 1 0.1 2 0.0 3 0.0
Ophthalmology 34 3.4 1,143 18.9 1,177 16.7
Orthopaedic 43 4.3 425 7.0 468 6.7
Paediatric 0 0.0 9 0.1 9 0.1
Throat 0 0.0 6 0.1 6 0.1
Urology 12 1.2 195 3.2 207 2.9
Total 992 100.0 6043 100.0 7035 100.0

206
Table 6.28: Distribution of claims in both the districts by diagnosis (private vs public)
Disease category
Patiala Yamunanagar Both Districts
Private Public Private Public Private Public
N % N % N % N % N % N %
No package opted 0 0.0 1 0.3 270 4.8 5 1.3 270 4.3 6 0.8
Dental 0 0.0 1 0.3 4 0.1 0 0.0 4 0.1 1 0.1
Ear 3 0.4 9 2.8 1 0.0 4 1.0 4 0.1 13 1.8
Endocrine 1 0.1 1 0.3 9 0.2 0 0.0 10 0.2 1 0.1
Endoscopic procedures 9 1.3 0 0.0 125 2.2 8 2.1 134 2.1 8 1.1
General surgery 54 8.1 63 19.5 589 10.4 79 20.5 643 10.2 142 20.1
Gynaecology 82 12.3 32 9.9 323 5.7 56 14.5 405 6.4 88 12.4
Hysteroscopy 1 0.1 0 0.0 13 0.2 0 0.0 14 0.2 0 0.0
MMD-general 272 40.7 173 53.6 1,759 31.1 157 40.8 2,031 32.1 330 46.6
MMD-ICU 191 28.6 0 0.0 843 14.9 0 0.0 1,034 16.3 0 0.0
Neurosurgery 0 0.0 0 0.0 7 0.1 0 0.0 7 0.1 0 0.0
Nose 4 0.6 5 1.5 3 0.1 8 2.1 7 0.1 13 1.8
Oncology 1 0.1 0 0.0 2 0.0 0 0.0 3 0.0 0 0.0
Ophthalmology 21 3.1 13 4.0 1,122 19.8 21 5.5 1,143 18.1 34 4.8
Orthopaedic 22 3.3 21 6.5 388 6.9 37 9.6 410 6.5 58 8.2
Paediatric 0 0.0 0 0.0 9 0.2 0 0.0 9 0.1 0 0.0
Throat 0 0.0 0 0.0 5 0.1 1 0.3 5 0.1 1 0.1
Urology 8 1.2 4 1.2 186 3.3 9 2.3 194 3.1 13 1.8
Total 669 100.0 323 100.0 5,658 100.0 385 100.0 6,327 100.0 708 100.0

207
6.5.11 Length of stay in the hospital
While analysing the length of stay in the hospital (both private and public), outliers
were noticed in the data set for Patiala district with lengths of stay as high as 300
days. This could probably have been due to errors in data entry and hence were
removed from the analysis. All entries with a length of stay of more than 50 days in
hospitals of Patiala district were deleted after discussion, on pragmatic grounds. A
total of 162 (2.4%) such entries were noticed in the data set.
The mean length of stay was significantly more in public hospitals compared to
private hospitals. There were similar observations for intra-district analysis as well.
The difference in stay between private and public hospitals was more in Patiala
district when compared to Yamunanagar district (Table 6.29).
Table 6.29: Length of stay (public vs private hospitals)
N Mean SD P Value
Patiala Private 454 5.47 6.77
0.65 Public 218 9.39 8.25
Yamunanagar Private 5,615 4.21 2.88
0.03 Public 383 6.51 5.80
Both districts Private 6,069 4.31 3.35
0.03 Public 601 7.55 6.92
6.5.12 Time taken to settle the claim
As per the contract document, the insurer has to settle all eligible claims and pay the
sum to the provider within21 working days of receipt of the electronic claim bills. To
assess this term of the contract, the claims database was analysed in terms of the date
of issue of the cheque to the hospital by the insurance company and the date of
booking the amount by the hospital. However, this data was available only for
Yamunanagar district. About three fourths of the hospitals were not getting the
reimbursed amount in time. There were 166 claims from private hospitals and only
two claims from public hospitals where the claim settlement took more than six
months (Table 6.30).

208
Table 6.30: Time taken to settle the claim amount by the insurance company
(Yamunanagar)
Claim settlement timings
Private hospital Public hospital Total
N % N % N %
Within 21 working days 1,436 26.4% 105 28.8% 1,541 26.5%
Within six months 3,846 70.6% 257 70.6% 4,103 70.6%
More than six months 166 3.0% 2 0.5% 168 2.9%
Total 5,448 100.0% 364 100.0% 5,812 100.0%
6.6 Discussion
6.6.1 Methodological issues
Detailed locational information of the households enrolled under the RSBY scheme
for the year 2011–12 could not be obtained and hence mapping of each enrolled
household could not be done. Availability of such information could have helped in
understanding the dynamics of scheme utilization in terms of access and distance.
Mapping of the population was done at sub-district level and not at block level, since
details of BPL population at block level were not available for mapping. Block level
mapping would have helped in matching population to availability of health facilities.
Many empanelled hospitals, more so the private hospitals, refused to participate in the
study or provide information regarding the services available in their hospitals. They
probably felt that providing such information might raise questions regarding their
empanelment status. Information regarding the services available in non-empanelled
hospitals was also not available. This information could have helped in better
classifying the hospitals on their eligibility for empanelment under the RSBY scheme
and in understanding the process of empanelment by the insurance companies.
Another problem on accessibility to data pertained to availability of the enrolment
data set. The line listing of the BPL population was not available for Yamunanagar
district and therefore age- and sex-wise coverage of the scheme could not be assessed
for Yamunanagar as it was done for Patiala.
There were concerns around the quality of data. Some data were practically not
feasible under the scheme, e.g. length of stay in the hospital of more than 300 days.
Such data was deleted on pragmatic grounds. Since the data set used was secondary

209
data, little could be done to assess the quality of the data and improve it. The claims
data set received from the insurance company of Patiala and Yamunanagar districts
differed in terms of variables available for analysis. The information regarding the
dispatch date of the cheque by the insurance companies to reimburse the claimed
amount by the hospital was not available for Patiala district. Therefore, timely
settlement by the insurance company of the claimed amount could not be assessed for
Patiala district.
6.6.2 Summary of findings and discussion
Hospital empanelment
Most of the RSBY beneficiaries (BPL population) are daily wage earners. Hence,
having to visit a health facility that is far from their place of residence burdens them
with transportation costs and loss of wages. Therefore, one important criterion for
selecting hospitals for empanelment under the RSBY scheme is equitable
geographical distribution within the district. In the present study, public hospitals
were seen to be more equitability distributed throughout the district as compared to
private facilities, which are geographically clustered around pockets at the sub-district
level. In Patiala district, a majority of the private facilities are clustered around Patiala
sub-district; and in Yamunanagar district, almost all the empanelled facilities were
from the private sector and were clustered around Jagadhri sub-district. There
appeared to be several cases of eligible facilities that were dispersed around the
district but were not empanelled under the RSBY scheme. Such an observation raises
questions on the selection criteria of the insurance company in terms of empanelment.
Empanelment of more public hospitals in Patiala district and more private hospitals in
Yamunanagar district could be due to the different regulatory authorities in the
respective states. The regulatory body in Punjab (for Patiala) is the PHSC, which is
under the Department of Health, while in Haryana (for Yamunanagar) the regulatory
body is the ESIC, which is supervised by the Department of Labour and Employment.
Since public hospitals are under the Department of Health, more public hospitals may
have been empanelled in Patiala district. However, in Haryana the Department of
Labour and Employment is independent of the Department of Health, which may
have led to more private hospitals being empanelled in Yamunanagar.
210
In terms of availability of services, as per the criterion that at least one empanelled
facility within the district should offer all pre-defined packages to RSBY
beneficiaries, none of the public hospitals had all such facilities. In fact in Patiala
district, not even a single empanelled facility provided all the services. In
Yamunanagar, there were empanelled private hospitals which were providing all the
services.
Enrolment
Enrolment was poor in both districts and more so for Patiala district as compared to
Yamunanagar. The average number of family members enrolled in Patiala was also
lower as compared to Yamunanagar (Patiala 2.37, Yamunanagar 3.56). Off-targetting
was more likely to occur for SC/ST, illiterate or literate up to primary level and
Yamunanagar, while it was likely for females. Leakage (non-BPL population getting
enrolled in the RSBY scheme) was more likely to occur in Patiala district. However, it
has to be noted that for estimation of off-target and leakage, sampled population from
health facility was taken which may not be the ideal setting for such estimation. The
analysis of the off-target group raised further questions on achieving of social equity
by the scheme in relation to access to health services. The population that is ‘more
deprived among the deprived’, i.e. lower classes and illiterate BPL population, are
still unlikely to get enrolled under the scheme, which results in social inequality.
The coverage of the scheme was low in Patiala district as compared to Yamunanagar.
Only 15% of the eligible population was enrolled in the RSBY scheme in Patiala
district compared to 40% in Yamunanagar district. There could be multiple
explanations for this. One probable reason for low enrolment in Patiala district could
be the overlap of the harvesting season and the enrolment period (September to
November). During the harvesting period, entire families go to the fields in the
morning hours and return to their homes only in the evening, by which time the
process of enrolment by the TPAs in the villages is over. Moreover, in Patiala district
there are more public hospitals as compared to Yamunanagar district. Public hospitals
provide services that are either free of cost or minimal in cost. Hence the populace
may have assumed that the RSBY scheme would not provide any added advantage to
them as they already had relatively good access to health services at no/minimal cost.
The difference could also be attributed to the different regulatory environment in the

211
two districts. The MoHFW may not be as efficient as MoLE in identifying and
recording the informal sector. Enrolment may also be affected by the fact that in
Haryana, the State BPL list was added to the BPL list provided by the Centre, due to
which the eligible BPL population got inflated. In Patiala only the BPL population list
provided by the Central Government was used. The difference may also be due to the
fact that in India, governance issues are very personality-oriented and not system
dependent. Hence, a strong leader may provide better results at the ground level.
The coverage of enrolment was more for the age groups above 25 years but was poor
for below 15 years. Usually in the case of health insurance, it is assumed that both age
groups, i.e. those at higher risk (elderly and under-5 children) and those at lower risk
(adult population) would be enrolled. This would contribute to a sustainable and an
effective health insurance scheme. More enrolment of the high-risk population would
lead to adverse selection while more numbers of adults would lead to greater profit for
the insurance companies as a high premium collection would occur against low
utilization. Findings of the present study indicate that there was no adverse selection
in terms of elderly enrolment in the scheme. Another interesting finding in the
enrolment of Patiala was that the number of females getting enrolled under the
scheme was comparable to males, in fact in the age group of 25-64 years, they were
more than males. The same was reflected in scheme utilization where more females
were using the scheme in this age group. However, one reason for higher utilization of
the scheme in this age group by females could be that this is the reproductive age
group and females were using facilities more for gynaecological services.
The low number of members enrolled per family is likely to be a result of the fact that
under the scheme, payment of premiums to insurance firms is based on the total
number of households enrolled. Within each household, the attempt by insurance
firms is to minimize the number of members and keep it lower than the maximum
allowed to lower the probability of use of health care.
Trends in claims
Looking at the population enrolled under the scheme in both the districts, it appears
that this difference in claims is largely due to the number of people enrolled in the two
districts. The population enrolled in Patiala is less than one third of the population
enrolled in Yamunanagar. But when the claims per 100 enrolled population were
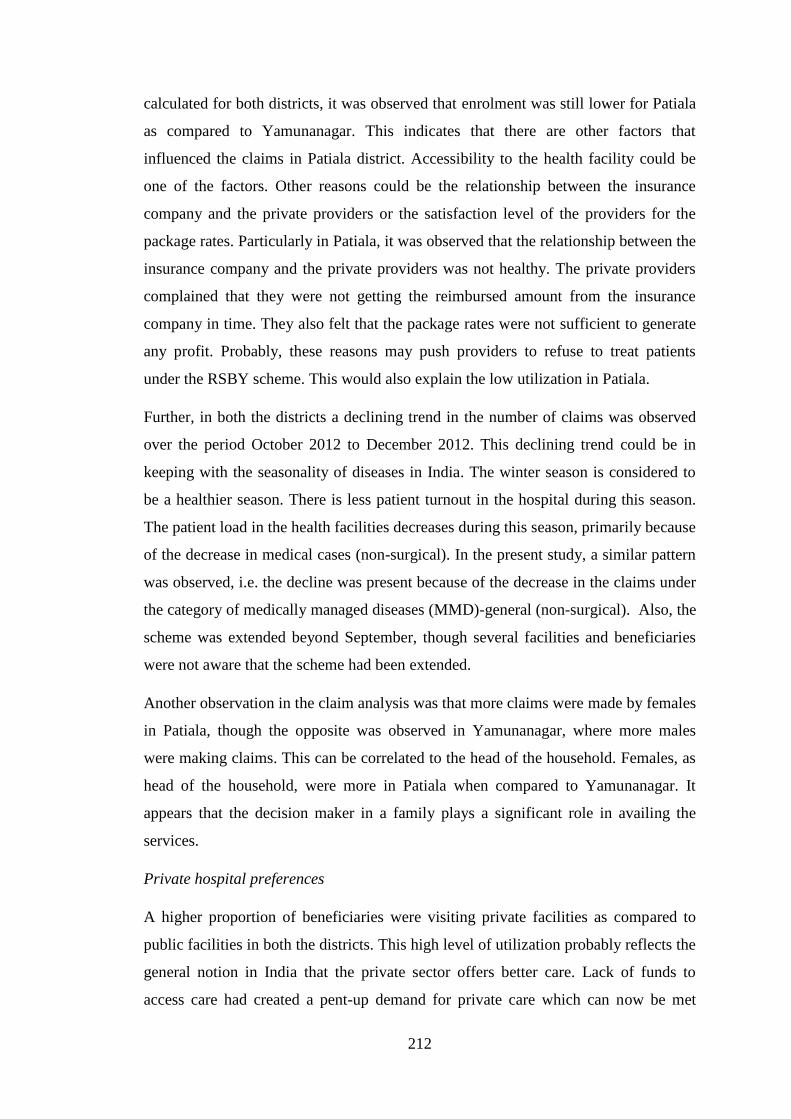
212
calculated for both districts, it was observed that enrolment was still lower for Patiala
as compared to Yamunanagar. This indicates that there are other factors that
influenced the claims in Patiala district. Accessibility to the health facility could be
one of the factors. Other reasons could be the relationship between the insurance
company and the private providers or the satisfaction level of the providers for the
package rates. Particularly in Patiala, it was observed that the relationship between the
insurance company and the private providers was not healthy. The private providers
complained that they were not getting the reimbursed amount from the insurance
company in time. They also felt that the package rates were not sufficient to generate
any profit. Probably, these reasons may push providers to refuse to treat patients
under the RSBY scheme. This would also explain the low utilization in Patiala.
Further, in both the districts a declining trend in the number of claims was observed
over the period October 2012 to December 2012. This declining trend could be in
keeping with the seasonality of diseases in India. The winter season is considered to
be a healthier season. There is less patient turnout in the hospital during this season.
The patient load in the health facilities decreases during this season, primarily because
of the decrease in medical cases (non-surgical). In the present study, a similar pattern
was observed, i.e. the decline was present because of the decrease in the claims under
the category of medically managed diseases (MMD)-general (non-surgical). Also, the
scheme was extended beyond September, though several facilities and beneficiaries
were not aware that the scheme had been extended.
Another observation in the claim analysis was that more claims were made by females
in Patiala, though the opposite was observed in Yamunanagar, where more males
were making claims. This can be correlated to the head of the household. Females, as
head of the household, were more in Patiala when compared to Yamunanagar. It
appears that the decision maker in a family plays a significant role in availing the
services.
Private hospital preferences
A higher proportion of beneficiaries were visiting private facilities as compared to
public facilities in both the districts. This high level of utilization probably reflects the
general notion in India that the private sector offers better care. Lack of funds to
access care had created a pent-up demand for private care which can now be met

213
through RSBY enrolment. Earlier, the only option available to the BPL population
was public hospitals, but with the introduction of the scheme, they have access to
private hospitals as well.
Availing benefits
Children and the elderly population are at a higher risk of developing diseases and
therefore are more likely to require admission in hospitals. A similar situation was
observed for the paediatric age group, where services availed by children was almost
negligible. The services were mostly utilized by the 25–60 years age group who are
the bread-earners of the family and also comprise a major chunk of the populaltion.
Most of the claims were for the head of the household. The lower claims observed in
the paediatric age group is an issue of both enrolment and utilization. Probably, the
limitation of INR 30,000 (£ 302) as a maximum benefit under the scheme prioritizes
the use of the insured amount for the important and productive members of the
family.
Further, the lower number of claims in the paediatric age group could be due to the
mother’s ID being used for sick infants and neonates. This was reported by one of the
SNA interviewees. Such an observation questions the enrolment process by the
insurance companies, which leave out small children from being enrolled in the
scheme despite the fact that the number of enrolled persons per family is not
achieved.
Clustering of patients in selected hospitals
The clustering effect, i.e. beneficiaries going to only a few selected hospitals in the
district was observed in both the districts. Certain hospitals may develop a reputation
over time because of the quality of services that they deliver. The scheme has enabled
the poor to choose the hospital based on their preference and hence it could be that a
majority of the beneficiaries visit the most reputed hospital of the district. Also,
clustering is observed in the hospitals that have all facilities available under one roof.
The health-care system in India is designed so that the patients are referred from
primary centres to secondary centres and from secondary centres to tertiary centres.
The burden of the patient is highest at tertiary centres, followed by secondary and
primary centres, primarily because of a poor referral system.

214
Facilities available in the hospital may enhance the confidence of the patient in that
hospital. The availability of larger number of treatments provided by a single facility
would also reduce the transportation cost and inconvenience to the patients if they
require advice from other specialists. In the present study, clustering was observed in
big hospitals (more than 50 beds) that had almost all the specialized facilities.
It was observed that enrolled men were more likely to visit private hospitals rather
than public hospitals. In both districts, public hospitals were scattered throughout the
district and hence easily accessible even in peripheral areas. However, private
hospitals were concentrated in certain sub-districts, hence population from peripheral
areas would have to travel a longer distance to reach these hospitals. It is
comparatively easier for men to access the facilities that are far off from their
residence as compared to women. This is because of the independence of males in
terms of transportation. They may own their own transport when compared to females
who have to depend on public transport, which may be infrequent and erratic.
Claim amount by health facilities
In Patiala, the amount claimed by public hospitals was more than what was claimed
by private hospitals, whereas in Yamunanagar, the amount claimed by the private
hospitals was more than public hospital. The reason for this could be the greater
length of stay in public hospitals as compared to private hospitals.
As can be observed from Table 6.22, once the duration of stay is taken into account in
the regression model, the coefficient for private care changes sign from reducing
claims to increasing claims. However, this sign change is accompanied by the
coefficient becoming insignificant. The sign for duration of stay is positive in Table
6.22 and is significant.
In Patiala, the difference between the claimed and reimbursed amount was higher as
compared to Yamunanagar. Further, this difference was higher for private hospitals
compared to public hospitals in Patiala. The average number of claims per hospital
was lower in Patiala because of lower level of enrolment which was accompanied by
lower utilization rate. Such circumstances may push the providers to inflate the claim
amount to achieve the desired level of profit from the limited number of cases
reimbursable through RSBY. In Yamunanagar, the average number of cases per

215
hospital was high; therefore, meeting a profit target from the volume of the claims
was easier, thus making any inflation of costs unnecessary.
6.7 Conclusions
This chapter has provided an assessment of accessibility, availability and utilization
patterns of health-care services under the RSBY scheme. Primary data was collected
for accessibility and availability assessment, while secondary data was analysed for
utilization patterns.
Mapping of the health facilities showed that access to health facilities should be a
concern for the beneficiaries as the number of empanelled hospitals were relatively
few. Moreover, the geographical distribution of private facilities was clustered around
selected sub-districts.
The empanelment of health facilities was not adequate as most of the empanelled
hospitals were providing limited services to the beneficiaries. In both the districts
there were only three hospitals (all private hospitals in Yamunanagar), which were
providing all service packages.
Enrolment of beneficiaries is one of the most important pillars contributing to the goal
of the scheme. However, in the present study it was found that both the coverage of
the enrolment and the process of enrolment were inadequate, and that beneficiary
enrolment within enrolled households was poor. Also, signs of inequity were seen
with the presence of off-targetting for certain under privileged deprived group.
Utilization patterns showed that most of the claims were from private hospitals and
were clustered in a few selected hospitals. Further, few claims were made by the most
vulnerable groups (children and elderly population). Analysis of the claims data set
also pointed towards breach in contract by the insurance companies as they were not
settling the claim amount of the providers in time. Moreover, in one district, overall
income from premiums collected by the insurance company exceeded the total value
of claims paid by a significantly large amount.

216
Chapter 7
HEALTH CARE ACROSS PUBLIC AND
PRIVATE PROVIDERS

217
Chapter 7
HEALTH CARE ACROSS PUBLIC AND
PRIVATE PROVIDERS
7.1 Introduction
This chapter deals with evaluating the delivery of services across both public and
private empanelled facilities for RSBY and non-RSBY beneficiaries. The questions
asked here are: Has the pluralization of access at near-zero cost led to satisfaction
with the care received? Did the cashless system actually provide near-free care
through the use of private providers? Was the RSBY implementation framework in
accordance with the contract design? Which type of facility provided better services
to RSBY beneficiaries?
Considering that RSBY uses contractual arrangements with a variety of stakeholders
to facilitate implementation, it is imperative to understand the outcome of these
arrangements by evaluating the services being provided to beneficiaries. Moreover,
due to asymmetry of information between the health provider and BPL beneficiary, it
is important to assess structural, process and quality aspects of care to understand the
experience of the beneficiary while availing services in both public and private
facilities and the implication of this for contract design. Additionally, non-RSBY
participants were included in the sample to serve as controls.
This chapter primarily deals with evaluating the provision of care as adapted from the
Donabedian Framework (Donabedian, 2005, Donabedian, 1988). The aim is to assess
various aspects of service delivery, focusing specifically on the policy guidelines and
implementation of the contractual arrangements.
The methodology has been discussed in detail in Chapter 4. A total of 12 facilities
were selected, with three public and three private facilities in each of the two chosen
districts (Patiala and Yamunanagar). Evaluation was undertaken of structural aspects
of care, process of care and user satisfaction/perceived quality. Technical quality of
care was excluded due to resource constraints and difficulty in accessing patient
records, especially at private facility.

218
Data were collected from an Observational and Facility Record Checklist, Health
Provider Checklist (self-assessment) and exit interviews with patients. A total of 751
exit interviews were conducted. The break-up by various parameters was - 399
participants interviewed from Patiala district and 352 from Yamunanagar district.
Taking the two districts together, 387 were RSBY participants and 364 non-RSBY
participants and 398 exit interviews were from private hospitals and 353 from public
hospitals. The low number of cases in Yamunanagar was because the number of
patients coming to hospitals, both public and private, was lessesser than expected
during that period of time.
7.2 Descriptive information of exit interview participants
In analysing the social and demographic characteristics of the participants included in
the study, it was observed that in both the districts the majority of study participants
were in the age group 25–44 years (Table 7.1). The mean age of the study participants
utilizing facilities in private hospitals was 39.8 years while it was 42.7 years for
public hospitals. The age difference between participants utilizing private and public
hospitals was statistically significant (on Student’s t-test, with age as a continuous
variable), and younger ones were more likely to go to private hospitals while the older
ones went to public hospitals (Table 7.2). It was noted that the mean age of RSBY
participants was 43.5 years when compared to non-RSBY participants where the
mean age was 38.7 years (Table 7.3). On Kernel Density diagram as well, the highest
density for age was greater RSBY participants when compared to non-RSBY
participants (Figure 7.1).
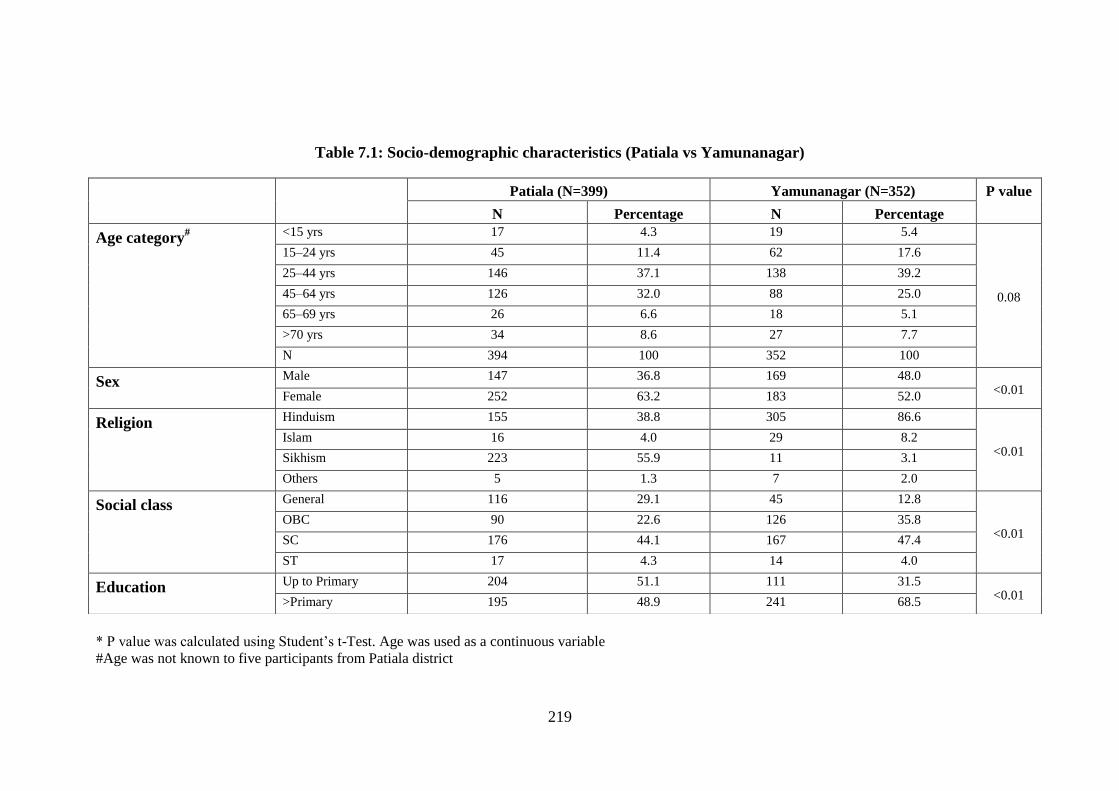
219
Table 7.1: Socio-demographic characteristics (Patiala vs Yamunanagar)
* P value was calculated using Student’s t-Test. Age was used as a continuous variable
#Age was not known to five participants from Patiala district
Patiala (N=399) Yamunanagar (N=352) P value
N Percentage N Percentage
Age category# <15 yrs 17 4.3 19 5.4
0.08
15–24 yrs 45 11.4 62 17.6
25–44 yrs 146 37.1 138 39.2
45–64 yrs 126 32.0 88 25.0
65–69 yrs 26 6.6 18 5.1
>70 yrs 34 8.6 27 7.7
N 394 100 352 100
Sex Male 147 36.8 169 48.0 <0.01
Female 252 63.2 183 52.0
Religion Hinduism 155 38.8 305 86.6
<0.01 Islam 16 4.0 29 8.2
Sikhism 223 55.9 11 3.1
Others 5 1.3 7 2.0
Social class General 116 29.1 45 12.8
<0.01 OBC 90 22.6 126 35.8
SC 176 44.1 167 47.4
ST 17 4.3 14 4.0
Education Up to Primary 204 51.1 111 31.5 <0.01
>Primary 195 48.9 241 68.5

220
Table 7.2: Socio-demographic characteristics (private vs public) Patiala – intra-district Yamunanagar – intra-district Both districts
Private
(N=203)
Public
(N=196) P
value
Private
(N=195)
Public
(N=157)
P
value
Private
(N=398)
Public
(N=353)
P value
N % N % N % N %
N % N %
Age
category#
<15 yrs 9 4.5 8 4.1
0.50*
12 6.2 7 4.5
0.02*
21 5.3 15 4.3
0.03*
15–24 yrs 21 10.6 24 12.3 36 18.5 26 16.6 57 14.5 50 14.2
25–44 yrs 76 38.2 70 35.9 82 42.1 56 35.7 158 40.1 126 35.8
45–64 yrs 65 32.7 61 31.3 44 22.6 44 28.0 109 27.7 105 29.8
65–69 yrs 13 6.5 13 6.7 11 5.6 7 4.5 24 6.1 20 5.7
>70 yrs 15 7.5 19 9.7 10 5.1 17 10.8 25 6.3 36 10.2
Total 199 100 195 100 195 100 157 100 394 100 352 100
Sex Male 75 36.9 72 36.7
0.97 83 42.6 86 54.8
0.02 158 39.7 158 44.8
0.16 Female 128 63.1 124 63.3 112 57.4 71 45.2 240 60.3 195 55.2
Religion
Hinduism 61 30.0 94 48.0
<0.01
171 87.7 134 85.4
0.45
232 58.3 228 64.6
0.02 Islam 6 3.0 10 5.1 13 6.7 16 10.2 19 4.8 26 7.4
Sikhism & others 136 67.0 92 46.9 11 5.6 7 4.5 147 36.9 99 28.0
Social class
General 86 42.4 30 15.3
<0.01
28 14.4 17 10.8
0.05
114 28.6 47 13.3
<0.01 OBC 51 25.1 39 19.9 75 38.5 51 32.5 126 31.7 90 25.5
SC and ST 66 32.5 127 64.8 92 47.1 89 56.7 158 39.7 216 61.2
Education Up to Primary 90 44.3 114 58.2
<0.01 56 28.7 55 35.0
0.20 146 36.7 169 47.9
0.02 >Primary 113 55.7 82 41.8 139 71.3 102 65.0 252 63.3 184 52.1
* P value was calculated using Student’s t-Test. Age was used as a continuous variable
#Age was not known to five participants from Patiala district; Mean age – Participants from private facility (39.8 years), public facility (42.7 years)

221
Table 7.3: Socio-demographic characteristics (RSBY vs non-RSBY)
Patiala – intra-district Yamunanagar – intra-district Both districts
RSBY N=196
Non-RSBY
N=203 P value
RSBY N=191 Non-RSBY
N=161 P value
RSBY
N=387
Non-RSBY
N=364
P value
N % N % N % N %
N % N %
Age
category#
<15 yrs 6 3.1 11 5.5
0.01*
11 5.8 8 5.0
0.18*
17 4.4 19 5.3
<0.01*
15–24 yrs 16 8.2 29 14.5 24 12.6 38 23.6 40 10.4 67 18.6
25–44 yrs 63 32.5 83 41.5 78 40.8 60 37.3 141 36.6 143 39.6
45–64 yrs 74 38.1 52 26.0 52 27.2 36 22.4 126 32.7 88 24.4
65–69 yrs 16 8.2 10 5.0 12 6.3 6 3.7 28 7.3 16 4.4
>70 yrs 19 9.8 15 7.5 14 7.3 13 8.1 33 8.6 28 7.8
N 194 100 200 100 191 100 161 100 385 100 361 100
Sex Male 70 35.7 77 37.9
0.64
79 41.4 90 55.9 <0.01
149 38.5 167 45.9 0.04
Female 126 64.3 126 62.1 112 58.6 71 44.1 238 61.5 197 54.1
Religion
Hinduism 68 34.7 87 42.9
0.17
163 85.3 142 88.2
0.72
231 59.7 229 62.9
0.42 Islam 10 5.1 6 3.0 17 8.9 12 7.5 27 7.0 18 4.9
Sikhism Other 118 60.2 110 54.2 11 5.7 7 4.3 129 33.3 117 32.1
Social Class
General 64 32.7 52 25.6 0.45
21 11.0 24 14.9
0.04
85 22.0 76 20.9
0.16 OBC 43 21.9 47 23.2 73 38.2 53 32.9 116 30.0 100 27.5
SC 89 45.4 104 51.2 97 50.8 84 52.1 186 48.0 188 51.6
Education Up to Primary 110 56.1 94 46.3
0.05 69 36.1 42 26.1
0.04 179 46.3 136 37.4
0.14 >Primary 86 43.9 109 53.7 122 63.9 119 73.9 208 53.7 228 62.6
* P value was calculated using Student’s t-Test. Age was used as a continuous variable
# Age was not known to five participants from Patiala district; Mean age – RSBY Participants (43.5 years), Non-RSBY participants (38.7.7 years)

222
Fig. 7.1: Kernel density diagram for RSBY and non-RSBY participants for age
By gender, more females were enrolled in the study (exit interview) compared to
males in both districts. Female participants were also more in both RSBY and non-
RSBY groups.
Muslims constitute a minority in the selected districts. It was observed that a higher
percentage of Muslims were availing facilities in public hospitals. In terms of social
class, a majority of study participants belonging to the general and Other Backward
Class (OBC) were utilizing private hospitals, whilst Scheduled Caste (SC) and
Scheduled Tribe (ST) participants made up a higher share of those using public
hospitals. More literate people (literacy more than primary level) were going to
private hospitals.
7.3 Structural aspects of care across public and private providers
for RSBY beneficiaries in selected districts
This section covers the structural aspects of the 12 selected empanelled hospitals in
the two chosen districts. Structural aspect analysis was conducted with the help of the
following tools: (i) Health Provider Checklist (self-assessment); and (ii) Observation

223
Facility Record Checklist. Observation and Facility Record Checklists were
administered by trained data collectors with a degree in medicine while the Health
Provider Checklist (self-assessment) was done by the hospital staff themselves.
The Health Provider self-assessment tool and observational checklist had the
following categories for assessment:
Access and facilities – whether facility could be easily reached taking into
account distance, condition of roads, signboards, etc. and the condition of the
facility.
Availability of staff – staff strength (doctors, nurses, on call specialists and
other paramedics)
Hospital waste management – is biomedical waste disposed of in accordance
with guidelines? Does the health facility have a valid license from the
Pollution Control Board?
Operating department – adequacy of lighting, air conditioning, ventilation,
sterilization and availability of OT instruments
Labour room – availability of instruments and proper sterilization
Evaluation and care of inpatients – whether patient was examined, written
consent was taken, frequency of evaluation, prescriptions, etc.
The Facility records had the following categories:
Mopping records (including toilet sanitation)
Records of carbolisation of OT and Labour Room after every procedure
Records of autoclaving of instruments and linen
Grievance redressal mechanism (presence of documented grievance redressal
mechanism which is practiced)
List of available procedures during informed patient consent, pre-operative
assessment and post-operative care
Records of laboratory services (system for registration of patients exists)
Records of radiology services (availability of records of protection of staff
conforming to the BARC guidelines, information on request forms and fee
charged)

224
Records of evaluation and care of inpatient services (physical examination and
its frequency, consent, availability of prescription summary)
Blood bank records (blood bank meets the licensing requirement of the Drugs
and Cosmetic Act and Supreme Court rules, labelling on blood products,
record of procurement, transfusion of blood, cross-matching, etc.).
The observations were recorded in accordance with the Likert scale. Later, the scale
was converted to scores. A score of one meant ‘strongly agree’ while a score of five
meant ‘strongly disagree’. Mann-Whitney U test was used to assess the statistical
difference between the scores of public and private hospitals as the data was non
parametric and the outcome was taken as continuous variable. However, this
statistical test was not applied for intra-district comparison since the sample size of
hospitals was very small (only three hospitals in each category). A detailed analysis of
checklists has been done in chapter 4.
From the Health Provider Checklist assessment (self-assessment), private hospitals
self-reported a better score than public hospitals under all categories of structural-
aspect evaluation in both districts. Private hospitals were significantly better under the
access and facilities category, i.e. private hospitals had adequate logistics and
equipment required for treatment (Table 7.4).In the inter-district comparison, in
Patiala district private hospitals were again reported to be better in all structural
aspects whereas in Yamunanagar district, public hospitals had a better score for
labour room and care of inpatients.
From the Observation and Facility Record Checklist, private hospitals scored better
than public hospitals in all aspects of structural evaluation (overall). As in the
provider self-assessment evaluation, the observation checklist also indicated a
significantly better access to facilities in private hospitals (Table 7.5). In terms of
availability of records, private hospitals had better records available than public
hospitals (overall). No difference was observed in the mean score for private and
public facilities under the categories ‘blood bank records’ ‘laboratory services’ and
‘available procedures’ (Table 7.6). In Yamunanagar district, Observational and
Facility Record Checklist reported almost similar structural aspect for private and
public hospitals.

225
On triangulation of various results from the Observation and Facility Record
Checklist, and Health Provider Checklist, it emerged that private hospitals had better
structural aspects compared to public hospitals both in Patiala district and when
looked at in totality. However, in Yamunanagar district, public and private hospitals
were comparable. However, this should be cautiously interpreted as almost none of
these comparisons were statistically significant.
In conclusion, private hospitals were found to be better than public hospitals in
totality and in Patiala district specifically. However, private hospitals were quite
similar to public hospitals in Yamunanagar district.

226
Table 7.4: Health provider checklist (self-assessment)
Patiala Yamunanagar Total
Private
(N=3)
Public
(N=3)
Private
(N=3)
Public
(N=3)
Private
(N=6)
Public
(N=6) P
value
Mean SD Mean SD Mean SD Mean SD Mean SD Mean SD
Access and facilities 1.11 0.10 1.61 0.79 1.11 0.19 2.00 -a 1.11 0.14 1.81 0.54 0.03
Availability of staff 1.06 0.10 1.22 0.25 1.17 0.29 1.50 -a 1.11 0.20 1.36 0.22 0.07
Hospital waste management 1.00 -a 1.33 0.58 1.00 -a 1.00 -a 1.00 -a 1.17 0.41 0.32
Operating department 1.21 0.24 1.51 0.57 1.14 0.08 1.15 0.13 1.17 0.16 1.33 0.42 0.57
Labour room 1.00 -a 1.33 0.58 1.11 0.19 1.00 -a 1.06 0.14 1.17 0.41 0.90
Evaluation and care of
inpatient 1.00
-a 1.38 0.41 1.10 0.16 1.00 -a 1.05 0.12 1.19 0.33 0.29
Averaged over the categories 1.06 -a 1.40 -a 1.10 -a 1.28 -a 1.08 0.10 1.34 0.34 0.04
-a Standard deviation could not be calculated as individual score for all facilities were same

227
Table 7.5: Observation checklist by the interviewers
Patiala Yamunanagar Across districts
Private
(N=3)
Public
(N=3)
Private
(N=3)
Public
(N=3)
Private
(N=6)
Public
(N=6) P
Value Mean SD Mean SD Mean SD Mean SD Mean SD Mean SD
Access & physical facilities 1.06 0.04 1.58 0.86 1.06 0.09 1.5 -a 1.06 0.06 1.54 0.55 0.02
Patient rights 2.08 0.14 2.17 0.28 1.08 0.14 1.0 -a 1.58 0.56 1.58 0.66 0.87
Health & safety 1.61 0.38 2.06 0.38 1.0 0.09 1.0 -a 1.28 0.44 1.53 0.62 0.49
Operating department 1.17 0.14 1.42 0.28 1.25 0.43 1.0 -a 1.21 0.29 1.21 0.29 0.99
Radiology services 1.5 -a 1.67 0.28 1.83 0.76 2.5 0.85 1.67 0.51 2.08 0.49 0.17
Labour room 1.0 -a 1.33 0.58 1.0 -a 1.0 -a 1.0 -a 1.17 0.41 0.32
Averaged over the categories 1.4 0.07 1.73 0.45 1.19 0.17 1.33 -a 1.29 0.16 1.51 1.51 0.10
-a Standard deviation could not be calculated as the individual score for all facility was the same

228
Table 7.6: Availability of records
Patiala Yamunanagar Total
Private
(N=3)
Public
(N=3)
Private
(N=3)
Public
(N=3)
Private
(N=6)
Public
(N=6) P
Value Mean SD Mean SD Mean SD Mean SD Mean SD Mean SD
Mopping of all areas 1.00 -a 1.33 0.58 1.00 -a 1.00 -a 1.00 -a 1.17 0.41 0.32
Carbolisation of the OT, Labour room 2.00 -a 2.00 -a 1.00 -a 1.00 -a 1.50 0.55 1.50 0.55 1.00
Mechanisms to ensure toilet sanitation 1.67 0.58 2.00 -a 1.00 -a 1.00 -a 1.33 0.52 1.50 0.55 0.58
Autoclaving of instruments & linen 1.00 -a 1.33 0.58 1.00 -a 1.00 -a 1.00 -a 1.17 0.41 0.32
Grievance redressal mechanism 1.67 0.58 2.00 -a 1.00 -a 1.00 -a 1.33 0.52 1.75 0.50 0.06
Available procedures 1.00 -a 1.00 -a 1.00 -a 1.00 -a 1.00 -a 1.00 -a -
Laboratory services 1.00 -a 1.00 -a 1.00 -a 1.00 -a 1.00 -a 1.00 -a -
Radiology services 1.53 0.69 1.76 0.50 1.13 0.33 1.13 -a 1.33 0.53 1.44 0.47 0.49
Evaluation & care of inpatients 1.14 0.14 1.43 0.50 1.14 0.25 1.00 -a 1.14 0.18 1.21 0.39 0.93
Blood bank 1.00 -a 1.00 -a 1.00 -a 1.00 -a 1.00 -a 1.00 -a -a
-a standard deviation could not be calculated as individual score for all facilities were same

229
7.4 Process of service delivery for RSBY participants by public
and private providers
This section deals with the process of delivery of care to RSBY participants, focusing
on the features specifically included in the policy guidelines contract document and in
official statements issued by the Central Government. In addition, certain key aspects
relevant to delivery have also been evaluated. The aim was to assess differences in
delivery of care between private and public facilities and between the two selected
districts for RSBY beneficiaries.
What the participants experienced and reported was compared against prescribed
actions/standards. In the first part of this section, the exit interviews of only RSBY-
enrolled participants were analysed to assess the provision of services under the
contractual arrangement, since they specifically dealt with scheme-related questions.
A total of 387 RSBY participants were interviewed, 196 from Patiala district and 191
from Yamunanagar district. The distribution to private and public hospitals was 193
interviewed in public hospitals and 194 in private hospitals. One participant from
Patiala (private hospital) did not respond to the questions and hence was removed
from the denominator while calculating the proportions, thus, making the total
number 195 (N=195 for Patiala and 193 for private hospitals).
In the second part of the analysis, the entire data set of exit interviews collected (both
RSBY and non-RSBY) was analysed. A total of 751 participants were interviewed,
which included 387 RSBY participants and 364 non-RSBY participants.
7.4.1 Amount paid for registration under the scheme
As per the guidelines of the RSBY scheme, every family has to pay INR 30 (£ 0.3) to
get registered in the RSBY scheme. The tender document states that ‘the insurer or its
representative(s) shall collect the registration fee of INR 30 (£ 0.3) from each RSBY
Beneficiary Family Unit, at the time of enrolment and on delivery of the Smart Card’
(Ministry of Labour and Employment, 2008).
In both the districts, all participants were registered with the scheme by paying INR
30 (£ 0.3) as registration amount.

230
7.4.2 RSBY help desk and signage in hospitals
As per the guidelines of the RSBY health insurance scheme and as stated in the draft
tender document in Appendix 5 Article 3 (which relates to the MoU between the
providers and the insurance company), it is clearly stated that ‘for the ease of the
beneficiary, the hospital shall display the recognition and promotional material,
network status and procedures for admission supplied by the insurer at prominent
locations, preferably including but not limited to outside the hospital, at the reception
and admission counter and casualty/emergency departments. The format for signage
outside the hospital and at the reception counter will be provided by the insurance
company.’ In addition, the tender document also states that ‘the hospital will set up a
help desk for RSBY beneficiaries. The RSBY help desk shall be easily accessible and
will have all the necessary hardware and software required to identify the patients.’
The equipments required for this were fingerprint scanner, smart card reader,
computer and printer.
Based on the responses of the patients during the exit interviews, it appears that
RSBY help desk (separate RSBY help desk or common hospital help desk) was in
place in all selected empanelled facilities. When patient’s response to the presence of
separate RSBY help desk was analysed for each facility independently, it was
observed that the majority of participants from the two selected empaneled facilities
reported presence of separate RSBY help desk (Table 7.7). Therefore, it can be
concluded that a separate RSBY help desk for RSBY beneficiaries as stipulated in the
contract tender document was present in only two of the 12 selected facilities (one
private hospital and one public hospital in Patiala). The instruments required
(computer, printer, smart card reader and finger print scanner) for RSBY patient
verification and registration were present at the help desk in all the hospitals, either at
separate RSBY help desk or the common help desk.
About three fourths of RSBY participants in Yamunanagar reported that they were
guided to the RSBY help desk (hospital helpdesk or separate RSBY helpdesk) by the
signage in the hospital; whereas in Patiala district, about two-thirds of RSBY
participants were guided to the RSBY help desk by the hospital staff (Table 7.7).
Almost all the hospitals were found to be satisfactory in terms of the presence of a
help desk, the required instruments at the RSBY help desk and behaviour of staff at
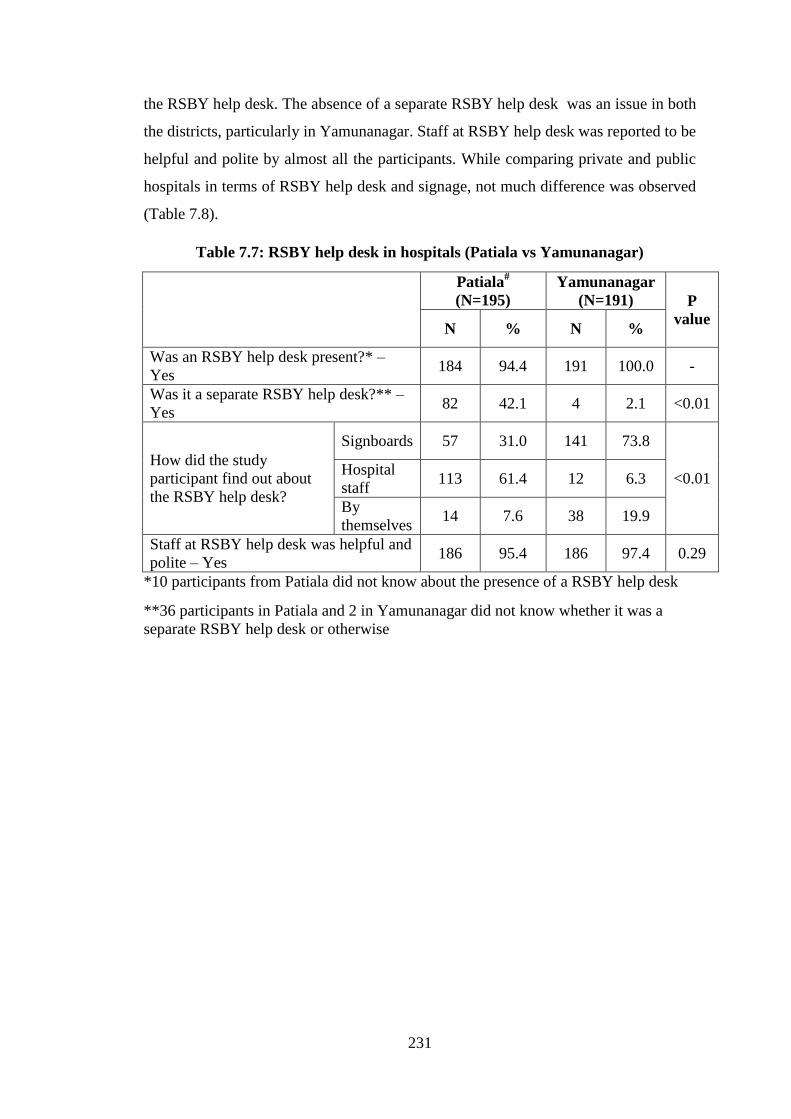
231
the RSBY help desk. The absence of a separate RSBY help desk was an issue in both
the districts, particularly in Yamunanagar. Staff at RSBY help desk was reported to be
helpful and polite by almost all the participants. While comparing private and public
hospitals in terms of RSBY help desk and signage, not much difference was observed
(Table 7.8).
Table 7.7: RSBY help desk in hospitals (Patiala vs Yamunanagar)
Patiala#
(N=195)
Yamunanagar
(N=191) P
value N % N %
Was an RSBY help desk present?* –
Yes 184 94.4 191 100.0 -
Was it a separate RSBY help desk?** –
Yes 82 42.1 4 2.1 <0.01
How did the study
participant find out about
the RSBY help desk?
Signboards 57 31.0 141 73.8
<0.01 Hospital
staff 113 61.4 12 6.3
By
themselves 14 7.6 38 19.9
Staff at RSBY help desk was helpful and
polite – Yes 186 95.4 186 97.4 0.29
*10 participants from Patiala did not know about the presence of a RSBY help desk
**36 participants in Patiala and 2 in Yamunanagar did not know whether it was a
separate RSBY help desk or otherwise

232
Table 7.8: RSBY help desk in private and public hospitals
*10 participants from Patiala did not know about the presence of RSBY help desk
**36 participants in Patiala and two in Yamunanagar did not know whether there was a separate RSBY help desk or not
Patiala – intra-district Yamunanagar – intra-district Across districts
Private Public P
value
Private Public P
value
Private Public P
value N
(97) %
N
(98) %
N
(96) %
N
(95) %
N
(193) %
N
(193) %
Was an RSBY help desk
present?* – Yes 94 96.9 90 91.8 96 100 95 100 190 98.4 185 95.9 -
** Was it a separate RSBY
help desk?** – Yes 53 54.6 29 29.6 <0.01 2 2.1 2 2.1 55 28.5 31 16.1 <0.01
How
RSBY help
desk was
found by
participants
Signboards 31 33.0 26 28.9
0.73
69 71.9 72 75.8
0.78
100 52.6 98 53.0
0.99 Hospital staff 57 60.6 56 62.2 7 7.3 5 5.3 64 33.7 61 33.0
By themselves 6 6.4 8 8.9 20 20.8 18 18.9 26 13.7 26 14.0
Staff at RSBY help desk was
helpful and polite – Yes 93 95.9 93 94.9 0.99 92 95.8 94 98.9 0.36 185 95.9 187 96.9 0.58
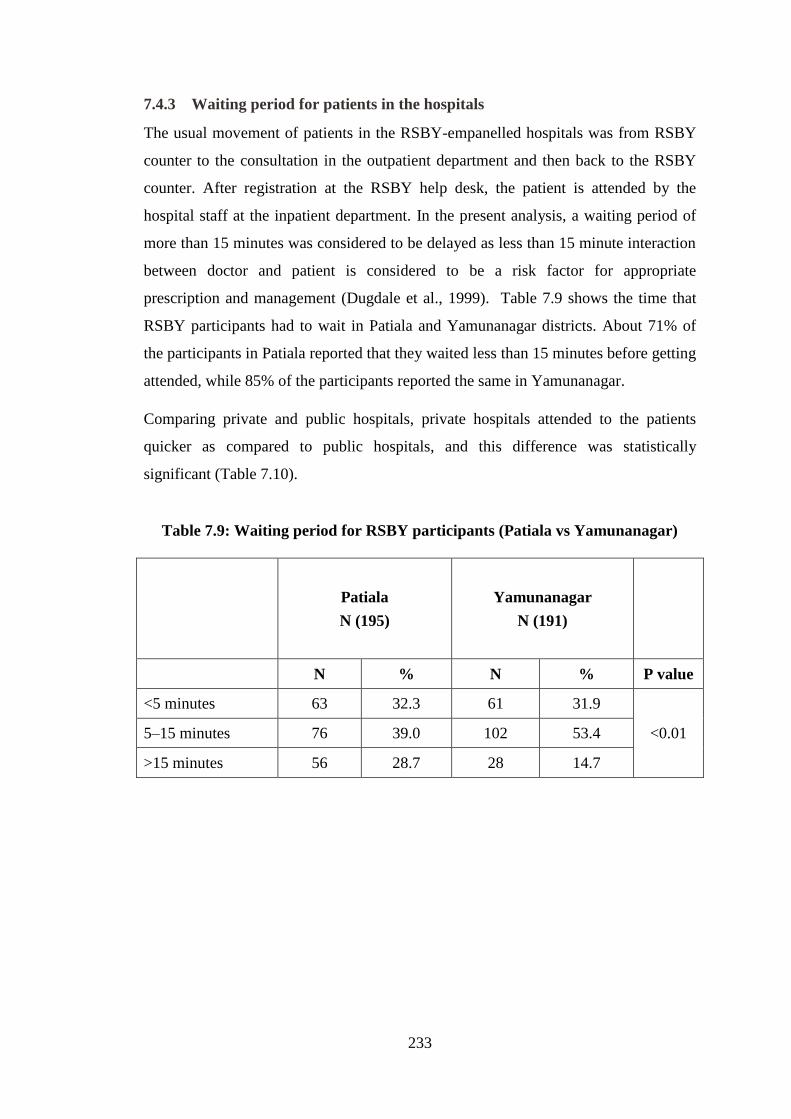
233
7.4.3 Waiting period for patients in the hospitals
The usual movement of patients in the RSBY-empanelled hospitals was from RSBY
counter to the consultation in the outpatient department and then back to the RSBY
counter. After registration at the RSBY help desk, the patient is attended by the
hospital staff at the inpatient department. In the present analysis, a waiting period of
more than 15 minutes was considered to be delayed as less than 15 minute interaction
between doctor and patient is considered to be a risk factor for appropriate
prescription and management (Dugdale et al., 1999). Table 7.9 shows the time that
RSBY participants had to wait in Patiala and Yamunanagar districts. About 71% of
the participants in Patiala reported that they waited less than 15 minutes before getting
attended, while 85% of the participants reported the same in Yamunanagar.
Comparing private and public hospitals, private hospitals attended to the patients
quicker as compared to public hospitals, and this difference was statistically
significant (Table 7.10).
Table 7.9: Waiting period for RSBY participants (Patiala vs Yamunanagar)
Patiala
N (195)
Yamunanagar
N (191)
N % N % P value
<5 minutes 63 32.3 61 31.9
<0.01 5–15 minutes 76 39.0 102 53.4
>15 minutes 56 28.7 28 14.7

234
Table 7.10: Waiting period for RSBY participants (private vs public hospitals)
7.4.4 Process of patient registration in hospital
As stated in the tender document, ‘service provided by the insurer subject to
responsibilities of the insurer as detailed in clause 12 is collectively referred to as the
Cashless Access Service. Each empanelled hospital shall install the requisite
machines and software to authenticate and validate the smart card, the beneficiary and
the insurance cover. The services have to be provided to the beneficiary based on
smart card and fingerprint authentication only with the minimum of delay for pre-
authorization (if necessary)’ (Ministry of Labour and Employment, 2011c).
Additionally, the tender document also states that ‘in case the patient is not in a
position to give a fingerprint, any other member of the family who is enrolled under
the scheme can verify the patient’s identity by giving his/her fingerprint’ (Ministry of
Labour and Employment, 2011c). The patient’s fingerprint needs to be scanned each
time before admission to the hospital for verification and registration.
A total of 10 patients were registered in the hospitals under the RSBY scheme without
fingerprint scan of the patient or their relatives, five each in Patiala and Yamunanagar
(Table 7.11). In Patiala, patients’ fingerprint was taken in 96% of the cases while in
Yamunanagar it was 77%. The major reason for not taking patients’ fingerprint was
that that patient was not in a condition to give fingerprints (Table 7.11). In both,
public and private hospitals, 97.4% of the participants reported that fingerprints were
taken at the time of registration (Table 7.12)
Patiala N=195 Yamunanagar N=191 Across districts
Private
N=97
Public
N=98
Private
N=96
Public
N=95
Private
N=193
Public
N=193 P
N % N % P N % N % P N % N %
<5 mins 33 34.0 30 30.6
0.17
26 27.1 35 36.8
0.15
59 30.6 65 33.7
0.05
5–15
mins 42 43.3 34 34.7 58 60.4 44 46.3 100 51.8 78 40.4
>15
mins 22 22.7 34 34.7 12 12.5 16 16.8 34 17.6 50 25.9
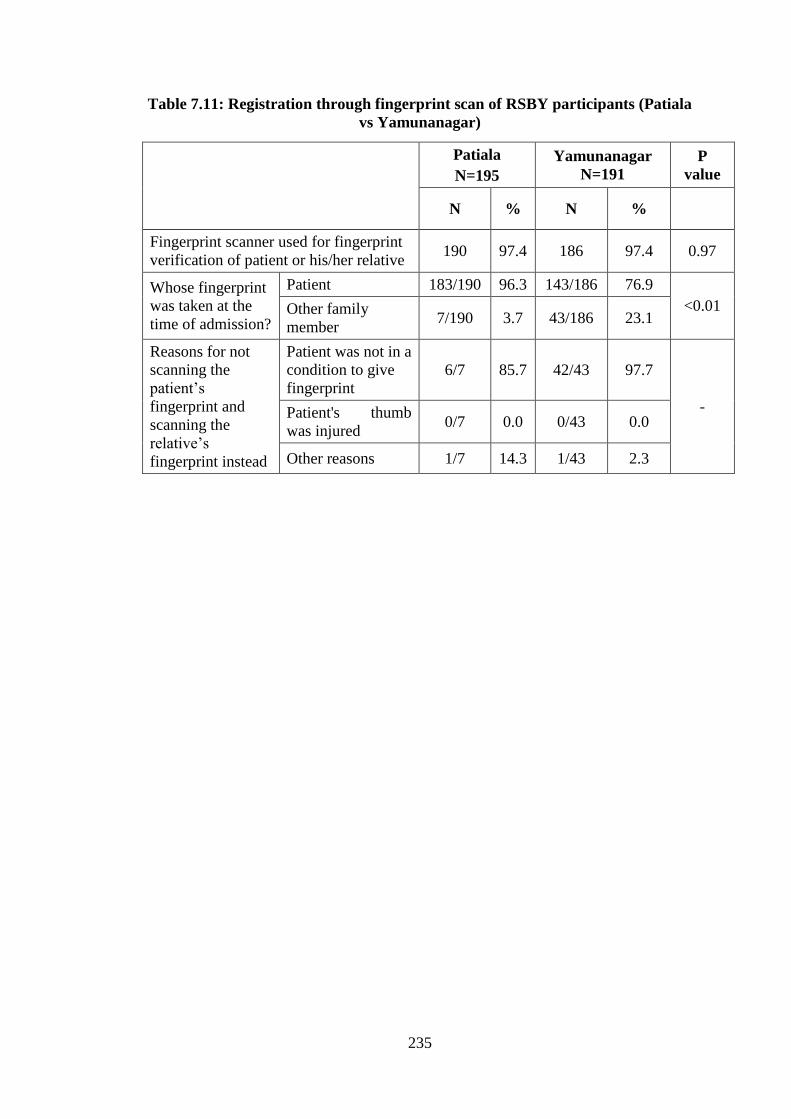
235
Table 7.11: Registration through fingerprint scan of RSBY participants (Patiala
vs Yamunanagar)
Patiala
N=195
Yamunanagar
N=191
P
value
N % N %
Fingerprint scanner used for fingerprint
verification of patient or his/her relative 190 97.4 186 97.4 0.97
Whose fingerprint
was taken at the
time of admission?
Patient 183/190 96.3 143/186 76.9
<0.01 Other family
member 7/190 3.7 43/186 23.1
Reasons for not
scanning the
patient’s
fingerprint and
scanning the
relative’s
fingerprint instead
Patient was not in a
condition to give
fingerprint
6/7 85.7 42/43 97.7
- Patient's thumb
was injured 0/7 0.0 0/43 0.0
Other reasons 1/7 14.3 1/43 2.3

236
Table 7.12: Registration through fingerprint scan of RSBY participants (private vs public)
Patiala(N=195) Yamunanagar (N=191) Across districts
Private Public
P
Private Public
P
Private Public
P N (97) % N (98) % N (96) % N (95) % N (193) % N (193) %
Fingerprint scanner used for fingerprint
verification of patient or his/her relative 96 99.0 94 95.9 0.18 92 95.8 94 98.9 0.18 188 97.4 188 97.4 0.99
Whose fingerprint
was taken at the
time of admission?
Patient 90/96 93.7 93/94 98.9
0.15
69/92 75.0 74/94 78.7
0.52
159/188 84.6 167/188 88.2
0.18
Relative 6/96 6.3 1/94 1.1 23/92 25.0 20/94 21.3 29/188 15.4 21/188 11.8
Reasons for not
scanning the
patient’s fingerprint
Patient was not in a
condition to give
fingerprint
5/6 83.3 1/1 100.0
-
22/23 95.6 20/20 100
-
27/29 93.1 21/21 100
- Patient's thumb was
injured 0/6 0.0 0/1 0.0 0/23 0 0/20 0.0 0/29 0.0 0/21 0.0
Other reasons 1/6 16.7 0/1 0.0 1/23 4.4 0/20 0.0 2/29 6.9 0/21 0.0

237
7.4.5 Informing enrollee of treatment costs
The contract document between the insurance company and the empanelled hospital
states 'both public and private empanelled hospitals should agree the cost of packages
for each identified medical/surgical intervention/procedure as approved under the
scheme. These package rates will include expenses incurred for consultation,
diagnostic tests and medicines from one day before the admission of the patient and
cost of diagnostic tests and medicine up to five days after the discharge from the
hospital for the same ailment/surgery’ (Ministry of Labour and Employment, 2011b).
This information needs to be conveyed to the beneficiary along with the information
on the cost of the package for which the patient is to be booked in the hospital. The
beneficiary also needs to be informed about the amount remaining in the card at the
RSBY help desk. Also, if sufficient amount is not available the beneficiary needs to
be informed in advance that the extra cost incurred would have to be paid by the
family.
Information dissemination (cost of package, money left in the card and the sufficiency
of the amount) to the participants was poor in both the districts, and particularly very
poor in Yamunanagar (Table 7.13). In Patiala district, information dissemination was
better in public hospitals compared to private hospitals. Further, in Patiala district,
about half the participants from private hospitals did not have sufficient balance left in
their card for the present treatment, i.e. they had exhausted the limit of INR 30,000 (£
302) (Table 7.14). Slightly more participants from public hospitals were informed
about cost involved in treatment and amount left in the card, whereas slightly more
participants in private hospitals were informed amount insufficient amount in the
card. In private hospitals of Patiala, among those who had exhausted their limit, about
one-fifth had received this information beforehand whereas the remaining had to pay
OOP for the treatment without any prior information.

238
Table 7.13: Information received from RSBY help desk regarding cost of
treatment (Patiala vs Yamunanagar)
Patiala
N=195
Yamunana
gar N=191 P
value N % N %
Information about the cost involved for
the treatment was given to the patient 94 48.2 16 8.4 <0.01
Patient was informed about the money left
in the smart card 80 41.0 20 10.5 <0.01
Money left in the smart card was sufficient
for the treatment 130 66.7 185 96.9 <0.01
If money left in the smart card was not
sufficient, was the beneficiary informed
by the hospital staff –Yes
13/65 20.0 0/6 0.0 0.23

239
Table 7.14: Information received from RSBY help desk across districts regarding cost of treatment (private vs public)
Patiala Yamunanagar Across districts
Private N=97 Public N=98
P Private N=96 Public N=95
P Private N=193 Public N=193
P
N % N % N % N % N % N %
Information about the
cost involved for the
treatment was given to
the patient
37 38.1 57 58.2 <0.01 11 11.5 5 5.3 0.12 48 24.9 62 32.1 0.11
Patient was informed
about the money left in
the smart card
34 35.1 46 46.9 0.09 9 9.4 11 11.6 0.62 43 22.3 57 29.5 0.10
Money left in the smart
card was sufficient for
the treatment
52 53.6 78 79.6 <0.01 95 99.0 90 94.7 0.09 147 76.2 168 87.0 <0.01
If money left in the
smart card was not
sufficient, was the
beneficiary informed by
the hospital staff – Yes
10/45 22.2 3/20 15.0 0.50 0/1 0.0 0/5 0.0 -- 10/46 21.7 3/25 12.0 0.31

240
7.4.6 Diagnostics and medicines from outside the hospital
As stated in the contract, both public and private empanelled hospitals need to agree
on the cost of packages for each identified medical/surgical intervention/procedure as
approved under the scheme. These package rates would include:
– bed charges (general ward)
– nursing and boarding charges
– fees of surgeons, anesthetists, medical practitioners and consultants
– anesthesia, blood, oxygen, operation theatre charges, cost of surgical
appliances
– medicines and drugs
– cost of prosthetic devices, implants
– X-ray and other diagnostic tests
– food to patient
– expenses incurred for consultation, diagnostic tests and medicines from one
day before the admission of the patient and cost of diagnostic tests and
medicines up to five days of discharge from the hospital for the same
ailment/surgery
– transportation charge of INR 100 (£ 1) payable to the beneficiary at the time of
discharge.
Thus, the package should cover the entire cost of treatment of the patient from the
date of reporting up to discharge from the hospital and five days thereafter, including
any complication while in hospital, making the transaction truly cashless to the patient
(Ministry of Labour and Employment, 2011b).
In both the districts together, 46 (12%) of RSBY participants were paying OOP for
medicines and 68 (17%) of RSBY participants were paying for diagnostic tests,
despite the stipulation of cashless transaction in the contract (Table 7.15). More
participants from Yamunanagar were asked to get medicines and diagnostics from
outside. Further, in Yamunanagar, all (100%) of the participants who were getting
medicines and diagnostic tests from outside had to pay for it (Table 7.15).

241
Within the districts and across the districts, more participants from private hospitals
were asked to get medicines and diagnostics from outside the hospitals (Table 7.16).
Table 7.15: Diagnostics and medicines from outside the hospital (Patiala and
Yamunanagar)
Patiala Yamunanagar
P
value
Total
N(195) %
N
(191) %
N
(196)
%
Patient was asked to get the
diagnostic test done from
outside the hospital
27 13.8 41 21.5 0.05 68 17.0
Family paid for the
diagnostic test done outside
the hospital
18/27 66.7 41/41 100.0 <0.01 59/68 86.8
Patient asked to get the
medicines from outside the
hospital
15 7.7 31 16.2 0.01 46 11.9
Family paid for the
medicines brought from
outside the hospital
11/15 73.3 31/31 100.0 <0.01 42/46 91.3

242
Table 7.16: Diagnostics and medicines from outside the hospital (private vs public)
Patiala Yamunanagar Across districts
Private Public
Private Public
Private Public
N (97) % N (98) % P N (96) % N (95) % P N (193) % N (193) % P
Patient was asked to
get the diagnostic
done from outside the
hospital
16 16.5 11 11.2 0.29 26 27.1 15 15.8 0.06 42 21.8 26 13.5 0.03
Family paid for the
diagnostic test done
from outside the
hospital
11/16 68.8 7/11 63.6 0.78 26/26 100.0 15/15 100.0 -- 37/42 88.1 22/26 84.6 0.68
Patient asked to get
the medicines from
outside the hospital
10 10.3 5 5.1 0.17 20 20.8 11 11.6 0.08 30 15.5 16 8.3 0.03
Patient’s family paid
for the medicines
brought from outside
the hospital
7/10 70.0 4/5 80.0 0.68 20/20 100.0 11/11 100.0 -- 27/30 90.0 15/16 93.8 0.67

243
7.4.7 Food and its quality
As stated in the contract document ‘the empanelled hospital has to provide food to the
patients during the period of admission in the hospital and the cost borne is part of the
package’ (Ministry of Labour and Employment, 2011b).
In both the districts together, about one-fourth of RSBY participants got food in the
hospital (Table 7.17). When patient’s response to the provision of food was analysed
for each facility independently, it was observed that a majority of the patients from
the three selected empaneled facilities (out of 12) reported that they were provided
food during their hospital stay. Therefore we can conclude that of the selected
empanelled facilities, food was not provided to the RSBY beneficiaries in nine out of
12 facilities. Amongst these three hospitals providing food services, one was in
Patiala (private) and two were in Yamunanagar (one private and one public). The
most common cause for not serving food in the hospital was that ‘food services were
not present in the hospital’. The food quality was rated as very good or good by a
majority of the participants from one private hospital in Patiala whereas it was rated
average by a majority of the participants of both the hospitals (one private and one
public) in Yamunanagar. It appears that the insurance company was not ensuring that
the facility to be empanelled had a provision for supply of food to the patients (Table
7.18).

244
Table 7.17: Provision of food to RSBY participants during hospital stay
(Patiala vs Yamunanagar)
Patiala
N=195
Yamunanagar
N=191
P
value N % N %
Whether patient provided with food
during hospital stay 40 20.5 69 36.1 <0.01
Reason for
not providing
food to
patients in
hospitals*
Hospital staff said it
was not a part of the
RSBY scheme
2/143 1.4 0/122 0.0
- Hospital did not have
food-serving facility 115/143 80.4 121/122 99.2
Hospital paid cash to
patient to buy food 2/143 1.4 1/122 0.8
Others 24/143 16.8 0/122 0.0
Quality of
food**
Very good 9/34 26.5 0/68 0.0
- Good 19/34 55.9 12/68 17.6
Average 6/34 17.6 55/68 80.9
Poor 0/34 0.0 1/68 1.5
*12 participants from Patiala did not respond to the question
**Six participants from Patiala and one from Yamunanagar did not respond to the
question

245
Table 7.18: Provision of food to RSBY participants during hospital stay (private vs public)
Patiala N=195 Yamunanagar N=191 Across districts N=386
Private Public
Private Public
Private Public
N (97) % N (98) % P N (96) % N (95) % P N (193) % N (193) % P
Patients provided with food
during hospital stay 35 36.1 5 5.1 <0.01 32 33.3 37 38.9 0.41 67 34.7 42 21.8 <0.01
Reason for
not
providing
food to
patient in
hospitals*
Hospital staff said
it was not a part of
the RSBY scheme
1/52 1.9 1/91 1.1
-
0/64 0.0 0/58 0.0
-
1/116 0.9 1/149 0.7
-
Hospital did not
have facilities for
providing food
46/52 88.5 69/91 75.8 63/64 98.4 58/58 100.0 109/116 94.0 127/149 85.2
Hospital paid cash
to patient to buy
food
0/52 0.0 2/91 2.2 1/64 1.6 0/58 0.0 1/116 0.9 2/149 1.3
Others 5/52 9.6 19/91 20.9 0/64 0.0 0/58 0.0 5/116 4.3 19/149 12.8
Quality of
food**
Very good 9/33 27.3 0/1 0.0
-
0/31 0.0 0/37 0.0
-
9/64 14.1 0/38 0.0
-
Good 19/33 57.6 0/1 0.0 8/31 25.8 4/37 10.8 27/64 42.2 4/38 10.5
Average 5/33 15.2 1/1 100.0 22/31 71.0 33/37 89.2 27/64 42.2 34/38 89.5
Poor 0/33 0.0 0/1 0.0 1/31 3.2 0/37 0.0 1/64 1.6 0/38 0.0
Very bad 0/33 0.0 0/1 0.0 0/31 0.0 0/37 0.0 0/64 0.0 0/38 0.0
*12 participants from Patiala did not respond to the question (10 from private and 2 from public)
** Six participants from Patiala and one from Yamunanagar did not respond to the question

246
7.4.8 Process followed during discharge of the RSBY beneficiary from hospital
At the time of discharge of the beneficiary from the hospital, the following activities
need to be monitored by the hospital staff (Ministry of Labour and Employment,
2011b):
– Original discharge summary, counterfoil generated at the time of discharge,
original investigation reports, all original prescriptions and pharmacy receipts,
etc. must not be given to the patient. These are to be forwarded to the billing
department who will compile and keep them in the hospital.
– The discharge card/summary must mention the duration of ailment, duration of
other disorders like hypertension or diabetes and operative notes in case of
surgeries.
– Signature or thumb impression of the patient/beneficiary on the final hospital bill
must be obtained.
– Claim form of the insurer must be presented to the beneficiary for signing, and
identification of the patient/beneficiary is to be confirmed again.
A fingerprint verification of the patient is again done at the help desk so that the task
is registered as complete. Only then can the health facility file a claim with the
insurance company. The smart card is returned to the patient along with the
information of the balance amount left in the card.
Ideally, all patients must get a discharge slip at the time of discharge. Few of the
RSBY participants (16%) in Patiala district did not receive the discharge slips (Table
7.19), whereas all received discharge slips in Yamunanagar.
Fingerprint verification was not done for a few participants from private (3%) and
public (5%) hospitals at the time of discharge. In such conditions, as per the contract,
the amount is claimed by the provider using manual mode, but to do so prior
permission is required from the insurance company.
Fingerprints of the family members (instead of patients) were taken in 28% cases in
Yamunanagar district (not much difference was observed between private and public
hospitals) (Table 7.20) as the patients were not in a condition to give their
fingerprints.

247
The smart card was held back in more cases by public hospitals (13%) than private
hospitals (5%). This may be because of breakdown in the equipment required for
completion of the transaction process. In terms of information regarding the balance
left in the card, public hospitals in Patiala were disseminating information slightly
better as compared to private hospitals. In Yamunanagar, the overall (both private and
public) dissemination of information was very low (Table 7.20). Information
dissemination was almost the same in public and private hospitals with only one third
of the participants in each group receiving information regarding the amount left in
the card at the time of discharge.
Table 7.19: Process followed during discharge of RSBY beneficiary from the
hospital (Patiala vs Yamunanagar)
Patiala Yamunanagar P
value N (195) % N (191) %
Discharge summary given to patient at
the time of discharge 164 84.1 191 100.0 -
Fingerprint verification was done at
time of discharge 184 94.4 187 97.9 0.71
Whose
fingerprint
was taken?
Patient 176/184 95.7 135/187 72.2
<0.01 Relative* 8/184 4.3 52/187 27.8
Card was given back at the time of
discharge 177 90.8 175 91.6 0.76
Reason for
not
returning
the card at
the time of
discharge**
Staff wanted money 1/17 5.9 0/16 0.0
-
Keep the card till
insurance money
claimed
4/17 23.5 2/16 12.5
Staff said it will remain
deposited 7/17 41.2 0/16 0.0
Others 5/17 29.4 14/16 87.5
Patient was informed about the
balance amount in the card at the time
of discharge
92 47.7 39 20.4 <0.01
* Regarding reasons for not taking patient’s fingerprint and rather using relative’s
fingerprint for verification, only five participants responded to the question while the
rest did not answer
** One beneficiary from Patiala did not respond to the question

248
Table 7.20: Process during discharge of RSBY beneficiary from the hospital (private vs public)
Patiala# Yamunanagar Across districts
Private Public
Private Public
Private Public
N (97) % N (98) % P N (96) % N (95) % P N (193) % N(193) % P
Discharge summary given at
the time of discharge 77 79.4 87 88.8 0.07 96 100.0 95 100.0 --- 173 89.6 182 94.3 0.09
Fingerprint verification was
done at time of discharge 91 93.8 93 94.9 0.74 96 100.0 91 95.8 0.04 187 96.9 184 95.3 0.43
Whose
fingerprint
was taken?
Patient 86/91 94.5 90/93 96.8
0.45
68/96 70.8 67/91 73.6
0.67
154/187 82.4 157/184 85.3
0.43 Relative* 5/91 5.5 3/93 3.2 28/96 29.2 24/91 26.4 33/187 17.6 27/184 14.7
Card was given back at the time
of discharge
89 91.8 88 89.8 0.64 95 99.0 80 84.2 <0.01 184 95.3 168 87.0 <0.01
Reason for
not returning
the card at the
time of
discharge**
Staff wanted
money 1/8 12.5 0/9 0.0
0.73
0/1 0.0 0/15 0.0
-
1/9 11.1 0/24 0.0
0.05
Keep the card
till insurance
money claimed
2/8 25.0 2/9 22.2 1/1 100.0 1/15 6.7 3/9 33.3 3/24 12.5
Staff said it will
remain
deposited
3/8 37.5 4/9 44.4 0/1 0.0 0/15 0.0 3/9 33.3 4/24 16.7
Others 2/8 25.0 3/9 33.3 0/1 0.0 14/15 93.3 2/9 22.2 17/24 70.8
Patient was informed about the
balance amount in the card at
the time of discharge
43 44.8 49 50.50 0.43 22 22.9 17 17.9 0.39 65 33.9 66 34.4 0.91
* Regarding reasons for not taking patient’s fingerprint and using relative’s fingerprint instead for verification – only five participants responded
to the question while remaining participants did not answer
** One beneficiary from Patiala did not respond to the question

249
7.4.9 Reimbursement of transportation cost to the RSBY beneficiary
Under the RSBY scheme, all patients should be reimbursed with an amount of
INR100 (£ 1) at the time of discharge from the hospital.
In Yamunanagar district, none of the beneficiaries received any reimbursement for
transportation. However, in Patiala district about half of the participants received the
transportation amount (Table 7.21). More participants from public hospitals were
reimbursed the transportation amount as compared to private hospitals, where about
82% of the participants were not reimbursed (Table 7.22). The median amount of
reimbursement was INR 100 (£ 1). Lack of information among the participants was
the most common reason reported for the amount not being reimbursed in Patiala;
whereas in Yamunanagar the reason reported for not reimbursing the transportation
cost was that that the beneficiaries did not ask for it (Table 7.21).
Those hospitals that did not pay the patient this amount could claim that they did
more within the procedure. However, it can also be assumed that the amount was
taken as profit. Profit seeking has remained one of the pitfalls in PPP framework
(Alexandersson and Hultén, 2007).
Table 7.21: Reimbursement of transportation cost to the RSBY beneficiary
(Patiala vs Yamunanagar)
Patiala
(N=195)
Yamunanagar
(N=191)
N % N %
Hospital did not reimburse the cost of
transportation 107 54.9 191 100
Reason for not
reimbursing the
cost of
transportation*
Hospital refused to reimburse 3/99 3.0 3/187 1.6
Beneficiary did not know that
there was such a provision 23/99 23.2 184/187 98.4
Beneficiary was informed
that hospital will give later 1/99 1.0 0/187 0.0
Beneficiary did not ask for it 70/99 70.7 0/187 0.0
Others 2/99 2.0 0/187 0.0
*Eight participants from Patiala and four from Yamunanagar did not respond to the
question
Note: P value was not calculated as value in one of the cell was zero

250
Table 7.22: Reimbursement of transportation cost to RSBY beneficiaries (private vs public)
Patiala – intra-district Yamunanagar – intra-district Both districts
Private
(N=97)
Public
(N=98)
Private
(N=96)
Public
(N=95)
Private
(N=193)
Public
(N=193)
N % N % N % N % N % N %
Hospital did not reimburse
the cost of transportation 62 63.9 45 45.9 96 100.0 95 100.0 158 81.9 140 72.5
Reason
for not
reimbursi
ng the
cost of
transport
ation*
Hospital refused
to reimburse 3/58 5.2 0/41 0.0 3/95 3.2 0/92 0.0 6/153 3.9 0/133 0.0
Beneficiary did
not know that
there was such a
provision
16/58 27.6 7/41 17.1 92/95 96.8 92/92 100.0 108/153 70.6 99/133 74.4
Beneficiary was
informed that the
hospital will
give later
0/58 0.0 1/41 2.4 - - - - 0/153 0.0 1/133 0.8
Beneficiary did
not ask for it 38/58 65.5 32/41 78.0 - - - - 38/153 24.8 32/133 24.1
Others 1/58 1.7 1/41 2.4 - - - - 1/153 0.7 1/133 0.8
*Eight participants from Patiala and four from Yamunanagar did not respond to the question

251
7.4.10 Knowledge about post-hospitalization expenses and provision of
medicines and diagnostics
Under the RSBY scheme, expenses incurred for consultation, diagnostic tests and
medicines from one day before the admission of the patient, and cost of diagnostic
tests and medicines up to five days after discharge from the hospital for the same
ailment/surgery, are covered.
Information provided to the participants regarding five-day post-hospitalization
expenses by the hospital was not adequate in both the districts and was poorer in
Yamunanagar (Table 7.23).
Post-hospitalization services were almost similar in public and private hospitals,
except that slightly more were getting medicines and diagnostics from public
hospitals (Table 7.24).
Table 7.23: Knowledge of post-hospitalization expenses and provision of
medicines and diagnostics (Patiala vs Yamunanagar)
Patiala Yamunanagar P value
N (195) % N (191) %
Knew about 5-day post-
hospitalization expenses 59 30.3 13 6.8 <0.01
Medicines were prescribed at the
time of discharge 176 90.3 180 94.2 0.14
Medicines were provided by the
hospital 153 86.9 180 100.0 -
Reasons cited
for not
providing
medicine from
the hospital*
Family did not
ask 3/22 13.6 0 0.0
-
No reason
provided by
hospital
15/22 68.2 0 0.0
It is not part of
RSBY 3/22 13.6 0 0.0
Others 1/22 4.5 0 0.0
Prescribed test after discharge 12 6.2 2 1.0 -
Diagnostic test was done free of
cost** 1/9 11.1 0/2 0.0 -
*One participant from Patiala did not respond to the question
**Three participants from Patiala did not respond to the question

252
Table 7.24: Knowledge of post-hospitalization expenses and provision of medicines and diagnostics (private vs public hospitals)
Patiala – intra-district Yamunanagar – intra-district Both districts
Private
(N=97)
Public
(N=98)
P
valu
e
Private
(N=96)
Public
(N=95)
P
value
Private
(N=193)
Public
(N=193)
P
value
N % N % N % N % N % N %
Knew about 5-day post-hospitalization
expenses 32 33.0 27 27.6 0.41 5 5.2 8 8.4 0.37 37 19.2 35 18.1 0.79
Medicines were prescribed at the time of
discharge 85 87.6 91 92.9 0.21 85 88.5 95 100.0 - 170 88.1 186 96.4 0.05
Medicines were provided by the hospital 67/85 78.8 86/91 94.5 - 85/85 100.0 95/95 100.0 - 152/170 89.4 181/1
86 97.3 -
Reasons
cited for not
providing
medicines
from the
hospital*
Family did not ask 2/17 11.8 1/5 20.0
-
- - - -
-
2/17 11.8 1/5 20.0
-
No reason provided by
hospital 11/17 64.7 4/5 80.0 - - - - 11/17 64.7 4/5 80.0
It is not part of RSBY 3/17 17.6 0/5 0.0 - - - - 3/17 17.6 0/5 0.0
Others 1/17 5.9 0/5 0.0 - - - - 1/17 5.9 0/5 0.0
Prescribed test after discharge – Yes 5 5.2 7 7.1 - 0 0.0 2 2.1 - 5 2.6 9 4.7 -
Diagnostic test was done free of cost** –
Yes 0/2 0.0 1/7 14.3 - - - 0/2 0 - 0/2 0.0 1/9 11.1 -
*One participant from Patiala did not respond to the question
**Three participants from Patiala did not respond to the question

253
7.5 Comparison of RSBY and non-RSBY participants on choice of
hospital, transport and diagnosis
For this section, information was also collected from non-RSBY patients from the exit
interviews. Hence, the total sample size was 751. Amongst them, 387 were RSBY
participants and 364 were non-RSBY participants. A comparison was made between
the participants of public and private hospitals, and also between RSBY and non-
RSBY participants.
7.5.1 Reasons for choosing a health facility for treatment
The prime reason given by the participants for choosing a hospital for treatment was
proximity to their home, in the case of public hospitals (this could be due to
transportation costs); and reputation, in the case of private hospitals (Table 7.26). It
was observed during the intra-district analysis that in Yamunanagar district, public
hospitals were primarily chosen because of suggestions from relatives and friends,
whereas private hospitals were chosen because of their reputation (Table 7.26).
The most common reason for selecting the hospital for RSBY participants was
suggested by relatives/friends followed by preferred hospital (i.e. always go to the
same hospital) and reputation. Whereas, the non-RSBY participants selected the
hospital based on reputation followed by relative/friend suggestion and proximity
(Table 7.27).
Table 7.25: Reasons for choosing a health facility for treatment (Patiala vs
Yamunanagar)
Reasons for choosing the health facility
Patiala Yamunanagar
N=399 % N=352 %
Near to the patient’s home 152 38.1 21 6.0
Good reputation of the facility 136 34.1 88 25.0
On relative/friend’s suggestion 49 12.3 137 38.9
Referred by a doctor 12 3.0 21 6.0
Always go to this hospital 45 11.3 82 23.3
No other RSBY-empanelled hospitals nearby 2 0.5 1 0.3
Other reasons 3 0.8 2 0.6

254
Table 7.26: Reasons for choosing a health facility for treatment (private vs public hospitals)
Patiala – intra-district Yamunanagar–intra-district Both districts
Private
(N=203)
Public
(N=196)
Private
(N=195)
Public
(N=157)
Private
(N=398)
Public
(N=353)
N % N % N % N % N % N %
Near to patient’s home 63 31.0 89 45.4 4 2.1 17 10.8 67 16.8 106 30.0
Good reputation 98 48.3 38 19.4 80 41.0 8 5.1 178 44.7 46 13.0
Relative/friend’s suggestion 28 13.8 21 10.7 68 34.9 69 43.9 96 24.1 90 25.5
Referred by a doctor 6 3.0 6 3.1 11 5.6 10 6.4 17 4.3 16 4.5
Always go to this hospital 7 3.4 38 19.4 32 16.4 50 31.8 39 9.8 88 24.9
No other RSBY-empanelled hospitals nearby 0 0.0 2 1.0 0 0.0 1 0.6 0 0.0 3 0.8
Other reasons 1 0.5 2 1.0 0 0.0 2 1.3 1 0.3 4 1.1

255
Table 7.27: Reasons for choosing the present health facility for treatment (RSBY vs non-RSBY patients)
Patiala – intra-district Yamunanagar–intra-
district Both districts
RSBY
(N=196)
Non-RSBY
(N=203)
RSBY
(N=191)
Non-RSBY
(N=161)
RSBY
(N=387)
Non-RSBY
(N=364)
N % N % N % N % N % N %
Near patient’s home 73 37.2 79 38.9 13 6.8 8 5.0 86 22.2 87 23.9
Good reputation 56 28.6 80 39.4 35 18.3 53 32.9 91 23.5 133 36.5
Relative/friend’s suggestion 23 11.7 26 12.8 74 38.7 63 39.1 97 25.1 89 24.5
Referred by a doctor 4 2.0 8 3.9 11 5.8 10 6.2 15 3.9 18 4.9
Always go to this hospital 36 18.4 9 4.4 57 29.8 25 15.5 93 24.0 34 9.3
No other RSBY-empanelled hospitals nearby 2 1.0 0 0.0 1 0.5 0 0.0 3 0.8 0 0.0
Other reasons 2 1.0 1 0.5 0 0.0 2 1.2 2 0.5 3 0.8

256
7.5.2 Referrals – health facility contacted previously
In Patiala district, a majority of the participants had not contacted any health facility
before coming to the present one; whereas in Yamunanagar, a high percentage of the
participants had first contacted a health facility, many of them were individual private
practitioners (Table 7.28). Data on previous contact with a health facility across both
districts separately for public and private facilities is given in Table 7.29. While
comparing usage across RSBY and non-RSBY participants, it was observed in Patiala
that slightly more than half of the participants in both groups had not contacted a
health facility prior to being admitted to the current one. However, in Yamunanagar,
while close to half of the non-RSBY participants had not previously contacted a
health facility, a very large percentage of RSBY participants had in fact previously
done so (Table 7.30).
A direct visit to an empanelled public health-care facility at the secondary level of
care without contacting any facility at primary level could be indicative of a weak
referral system in the district of Patiala. Ideally, those seeking health care in public
health facilities should first visit primary care facilities closer to their homes, which
would refer them to secondary care hospitals, rather than directly approaching
empanelled hospitals at the secondary level.
Table 7.28: Health facility contacted previously by the patient (Patiala vs
Yamunanagar)
Patiala Yamunanagar
N=399 % N=352 %
Did not contact any health facility
before coming to the current hospital 220 55.1 98 27.8
Contacted another public facility 59 14.8 28 8.0
Contacted another private facility 73 18.3 72 20.5
Contacted an individual practitioner 29 7.3 142 40.3
Contacted a drug seller 15 3.8 8 2.3
Contacted a traditional healer/others 3 0.8 4 1.2

257
Table 7.29: Health facility contacted previously by the patient (private vs public hospitals)
Patiala – intra-district Yamunanagar – intra-
district Both the districts
Private
(N=203)
Public
(N=196)
Private
(N=195)
Public
(N=157)
Private
(N=398)
Public
(N=353)
N % N % N % N % N % N %
Did not contact any health facility before
coming to the current hospital 88 43.3 132 67.3 60 30.8 38 24.2 148 37.2 170 48.2
Contacted another public facility 18 8.9 41 20.9 21 10.8 7 4.5 39 9.8 48 13.6
Contacted another private facility 64 31.5 9 4.6 39 20.0 33 21.0 103 25.9 42 11.9
Contacted an individual practitioner 23 11.3 6 3.1 69 35.4 73 46.5 92 23.1 79 22.4
Contacted a drug seller 7 3.4 8 4.1 4 2.1 4 2.5 11 2.8 12 3.4
Contacted a traditional healer/others 3 1.5 0 0.0 2 1.0 2 1.2 5 1.3 2 0.6

258
Table 7.30: Health facility previously contacted by the patient (RSBY vs non-RSBY patients)
Patiala – intra-district Yamunanagar – intra-
district Both districts
RSBY
(N=196)
Non-RSBY
(N=203)
RSBY
(N=191)
Non-RSBY
(N=161)
RSBY
(N=387)
Non-RSBY
(N=364)
N % N % N % N % N % N %
Did not contact any health facility before
coming to the current hospital 102 52.0 118 58.1 28 14.7 70 43.5 130 33.6 188 51.6
Contacted another public facility 31 15.8 28 13.8 11 5.8 17 10.6 42 10.9 45 12.4
Contacted another private facility 31 15.8 42 20.7 53 27.7 19 11.8 84 21.7 61 16.8
Contacted an individual practitioner 15 7.7 14 6.9 93 48.7 49 30.4 108 27.9 63 17.3
Contacted a drug seller 14 7.1 1 0.5 3 1.6 5 3.1 17 4.4 6 1.6
Contacted a traditional healer/others 3 1.5 0 0.0 3 1.6 1 0.6 6 1.6 1 0.3

259
7.5.3 Mode of transportation to hospital
The largest share of the study participants in both the districts used three-wheelers to
reach the hospital (Table 7.31). A bus was used more by the participants of public
hospital when compared to private, both within the district and across the district
(Table 7.32). A car was used more commonly by the Non-RSBY participants (Table
7.33).
Table 7.31: Mode of transportation to hospital (Patiala vs Yamunanagar)
Patiala Yamunanagar
N=397 % N=350 %
Bus 93 23.4 77 22.0
Metro 2 0.5 5 1.4
Rickshaw 43 10.8 7 2.0
Two-wheeler 28 7.1 69 19.7
Three-wheeler 154 38.8 157 44.9
Car 38 9.6 27 7.7
Other 39 9.8 8 2.3
Note: Two participants from Patiala and two from Yamunanagar did not respond to
the question

260
Table 7.32: Mode of transportation to hospital (private vs public hospitals)
Patiala – intra-district Yamunanagar – intra-district Both the districts
Private
(N=202)
Public
(N=195)
Private
(N=195)
Public
(N=155)
Private
(N=397)
Public
(N=350)
N % N % N % N % N % N %
Bus 40 19.8 53 27.2 38 19.5 39 25.2 78 19.6 92 26.3
Metro 1 0.5 1 0.5 5 2.6 0 0.0 6 1.5 1 0.3
Rickshaw 22 10.9 21 10.8 5 2.6 2 1.3 27 6.8 23 6.6
Two-wheeler 11 5.4 17 8.7 40 20.5 29 18.7 51 12.8 46 13.1
Three-wheeler 96 47.5 58 29.7 84 43.1 73 47.1 180 45.3 131 37.4
Car 16 7.9 22 11.3 20 10.3 7 4.5 36 9.1 29 8.3
Other 16 7.9 23 11.8 3 1.5 5 3.2 19 4.8 28 8.0
Note: Two participants from Patiala and two from Yamunanagar did not respond to the question

261
Table 7.33: Mode of transportation to hospital (RSBY vs non-RSBY patients)
Patiala – intra-district Yamunanagar – intra-district Both the districts
RSBY
(N=195)
Non RSBY
(N=202)
RSBY
(N=189)
Non RSBY
(N=161)
RSBY
(N=384)
Non RSBY
(N=363)
N % N % N % N % N % N %
Bus 51 26.2 42 20.8 43 22.8 34 21.1 94 24.5 76 20.9
Metro 0 0.0 2 1.0 5 2.6 0 0.0 5 1.3 2 0.6
Rickshaw 17 8.7 26 12.9 3 1.6 4 2.5 20 5.2 30 8.3
Two-wheeler 12 6.2 16 7.9 37 19.6 32 19.9 49 12.8 48 13.2
Three-wheeler 82 42.1 72 35.6 88 46.6 69 42.9 170 44.3 141 38.8
Car 10 5.1 28 13.9 11 5.8 16 9.9 21 5.5 44 12.1
Other 23 11.8 16 7.9 2 1.1 6 3.7 25 6.5 22 6.1
Note: Two participants from Patiala and two from Yamunanagar did not respond to the question

262
7.5.4 Diagnosis of disease
This section focuses on the diagnosis of the disease for which the participants sought
hospital admission. The diagnosis was classified based on the 20 categories of
packages under the RSBY scheme.
Overall medically managed disease (general) was the most commonly used package
followed by general surgery and gynaecology. While comparing the diagnosis of the
participants in private and public hospitals, an almost similar pattern of diagnosis was
observed, except for slightly more cases of orthopaedics in public hospitals and
slightly more cases of urology in private hospitals (Table 7.34). Similarly, the
diagnosis pattern of RSBY and non-RSBY participants was also almost the same
except for slightly more cases of orthopaedics in non-RSBY and general surgery in
RSBY (Table 7.35).

263
Table 7.34: Diagnosis of study participants (private vs public hospitals)
Patiala Yamunanagar Both districts
Private Public Private Public Private Public
N =203 % N=196 % N=195 % N=157 % N=398 % N=353 %
Oncology 3 1.5 5 2.6 4 2.1 1 0.6 7 1.8 6 1.7
Urology 10 4.9 2 1.0 15 7.7 2 1.3 25 6.3 4 1.1
Endocrinology 4 2.0 6 3.1 4 2.1 1 0.6 8 2.0 7 2.0
Orthopaedics 6 3.0 37 18.9 31 15.9 17 10.8 37 9.3 54 15.3
Ophthalmology 1 0.5 8 4.1 1 0.5 2 1.3 2 0.5 10 2.8
Gynaecology 48 23.6 39 19.9 15 7.7 26 16.6 63 15.8 65 18.4
General surgery 45 22.2 42 21.4 42 21.5 24 15.3 87 21.9 66 18.7
Ear 1 0.5 3 1.5 0 0.0 0 0.0 1 0.3 3 0.8
Nose 0 0.0 1 0.5 0 0.0 0 0.0 0 0.0 1 0.3
Throat 0 0.0 1 0.5 0 0.0 0 0.0 0 0.0 1 0.3
MMD- ICU 1 0.5 2 1.0 4 2.1 0 0.0 5 1.3 2 0.6
MMD general 84 41.4 50 25.5 79 40.5 84 53.5 163 41.0 134 38.0

264
Table 7.35: Diagnosis of study participants (RSBY vs non-RSBY patients)
Patiala Yamunanagar Both districts
RSBY Non-RSBY RSBY Non-RSBY RSBY Non-RSBY
N=196 % N=203 % N=191 % N=161 % N=387 % N=364 %
Oncology 5 2.6 3 1.5 3 1.6 2 1.2 8 2.1 5 1.4
Urology 4 2.0 8 3.9 11 5.8 6 3.7 15 3.9 14 3.8
Endocrinology 6 3.1 4 2.0 1 0.5 4 2.5 7 1.8 8 2.2
Orthopaedics 13 6.6 30 14.8 25 13. 23 14.3 38 9.8 53 14.6
Ophthalmology 5 2.6 4 2.0 2 1.0 1 0.6 7 1.8 5 1.4
Gynaecology 39 19.9 48 23.6 23 12.0 18 11.2 62 16.0 66 18.1
General surgery 48 24.5 39 19.20 43 22.5 23 14.3 91 23.5 62 17.0
Ear 4 2.0 0 0.0 0 0.0 0 0.0 4 1.0 0 0.0
Nose 1 0.5 0 0.0 0 0.0 0 0.0 1 0.3 0 0.0
Throat 0 0.0 1 0.5 0 0.0 0 0.0 0 0.0 1 0.3
MMD – ICU 1 0.5 2 1.0 1 0.5 3 1.9 2 0.5 5 1.4
MMD- general 70 35.7 64 31.5 82 42.9 81 50.3 152 39.3 145 39.8

265
7.6 User satisfaction in private and public facilities – RSBY and
non-RSBY patients
This section primarily relates to user satisfaction with health-care facilities, both
private and public, as well as for RSBY and non-RSBY patients in the two selected
districts. The information collected was analysed under the following categories:
experiences during admission
care from nurses
care from doctors
hospital environment
experiences in the hospital
experiences at the time of discharge
overall rating of the hospital.
Experiences of 399 participants in Patiala and 352 in Yamunanagar were analysed.
One participant from Yamunanagar did not respond to any question on the user
satisfaction, thus the total number (N) was 351 in Yamunanagar.
7.6.1 Experiences during admission
Questions asked to assess the experiences of the participants at the time of admission
were on the availability of bed at the time of admission, availability of a wheelchair
(for those who required it) and the time taken by the nurses and doctors to attend to
the patient.
In both the districts, beds were made available to almost all patients at the time of
admission to the hospital. Also, almost all patients who required a wheelchair or
stretcher were provided with it (Table 7.36). In Patiala, a wheel chair was pushed by
hospital staff in 88% cases while it was 65% in Yamunanagar. Taking the cut-off of
15 minutes for delay (as discussed in section 7.4.3), nursing staff was taking less time
in Yamunanagar when compared to Patiala, as 59% of participants were attended by
nursing staff in <15 minutes compared to 48% in Patiala (Table 7.36). Doctors were
taking almost similar time in both the districts. Overall, the hospital experience was
almost similar in Patiala and Yamunanagar with Patiala was better in a wheelchair
being pushed by staff and Yamunanagar was better in time taken by nursing staff to
attend to the patients.
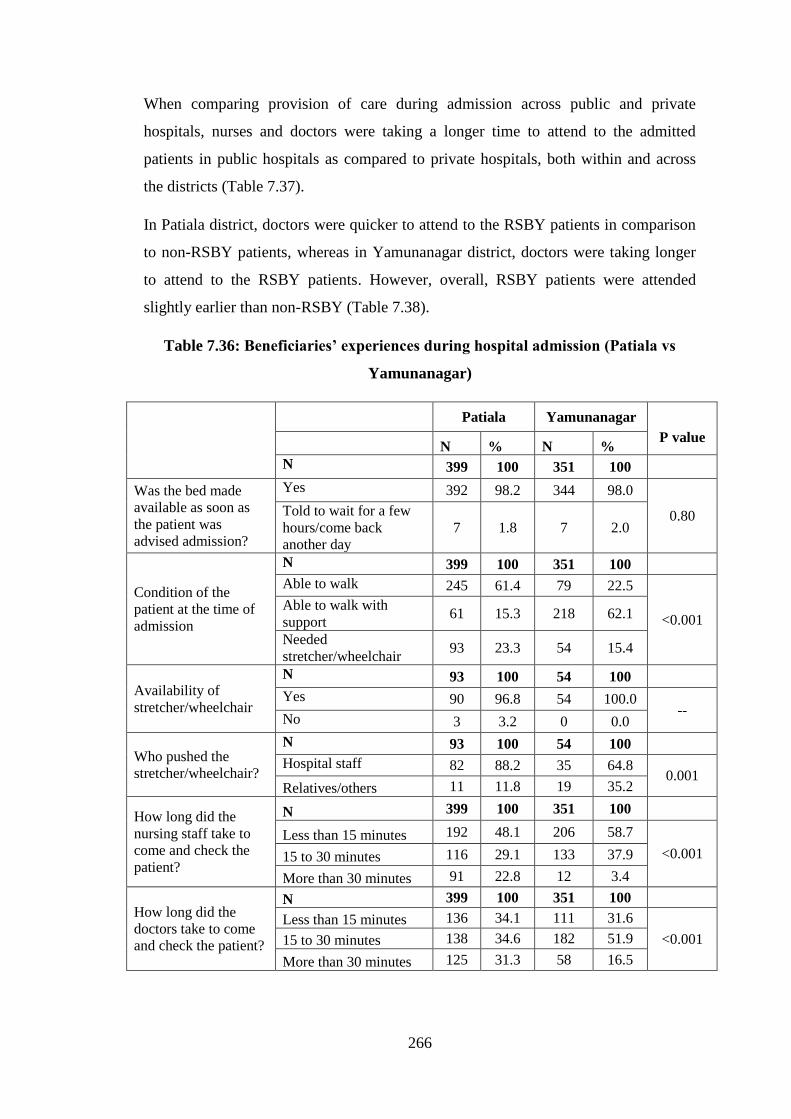
266
When comparing provision of care during admission across public and private
hospitals, nurses and doctors were taking a longer time to attend to the admitted
patients in public hospitals as compared to private hospitals, both within and across
the districts (Table 7.37).
In Patiala district, doctors were quicker to attend to the RSBY patients in comparison
to non-RSBY patients, whereas in Yamunanagar district, doctors were taking longer
to attend to the RSBY patients. However, overall, RSBY patients were attended
slightly earlier than non-RSBY (Table 7.38).
Table 7.36: Beneficiaries’ experiences during hospital admission (Patiala vs
Yamunanagar)
Patiala Yamunanagar
P value N % N %
N 399 100 351 100
Was the bed made
available as soon as
the patient was
advised admission?
Yes 392 98.2 344 98.0
0.80 Told to wait for a few
hours/come back
another day
7 1.8 7 2.0
Condition of the
patient at the time of
admission
N 399 100 351 100
Able to walk 245 61.4 79 22.5
<0.001 Able to walk with
support 61 15.3 218 62.1
Needed
stretcher/wheelchair 93 23.3 54 15.4
Availability of
stretcher/wheelchair
N 93 100 54 100
Yes 90 96.8 54 100.0 --
No 3 3.2 0 0.0
Who pushed the
stretcher/wheelchair?
N 93 100 54 100
Hospital staff 82 88.2 35 64.8 0.001
Relatives/others 11 11.8 19 35.2
How long did the
nursing staff take to
come and check the
patient?
N 399 100 351 100
Less than 15 minutes 192 48.1 206 58.7
<0.001 15 to 30 minutes 116 29.1 133 37.9
More than 30 minutes 91 22.8 12 3.4
How long did the
doctors take to come
and check the patient?
N 399 100 351 100
Less than 15 minutes 136 34.1 111 31.6
<0.001 15 to 30 minutes 138 34.6 182 51.9
More than 30 minutes 125 31.3 58 16.5

267
Table 7.37: Beneficiaries’ experiences with hospital admission (private vs public hospitals)
N
Patiala – intra-district Yamunanagar – intra-district Both districts
Private Public P
value
Private Public P
value
Private Public P
value N % N % N % N % N % N %
203 100 196 100
194 100 157 100
397 100 353 100
Was the bed made
available as soon as
the patient was
advised admission?
Yes 197 97.0 195 99.5
0.122
188 96.9 156 99.4
0.136
385 97.0 351 99.4
0.013 Told to wait for few hrs/ come
back another day 6 3.0 1 0.5 6 3.1 1 0.6 12 3.0 2 0.6
Condition of the
patient at the time of
admission
N 203 100 196 100 194 100 157 100 397 100 353 100
Able to walk 117 57.6 128 65.3
0.277
35 18.0 44 28.0
0.076
152 38.3 172 48.7
0.016 Able to walk with support 35 17.2 26 13.3 126 64.9 92 58.6 161 40.6 118 33.4
Needed stretcher/wheelchair 51 25.1 42 21.4 33 17.0 21 13.4 84 21.2 63 17.8
Availability of
stretcher/wheelchair
N 51 100 42 100
33 100 21 100
84 100 63 100
Yes 50 98.0 40 95.2 0.59
33 100 21 100 -
83 98.8 61 96.8 0.58
No 1 2.0 2 4.8 0 0.0 0 0.0 1 1.2 2 3.2
Who pushed the
stretcher/wheelchair?
N 51 100 42 100
33 100 21 100
84 100 63 100
Hospital staff 46 90.2 36 85.7 0.54
23 69.7 12 57.1 0.39
69 82.1 48 76.2 0.41
Relatives/others 5 9.8 6 14.3 10 30.3 9 42.9 15 17.9 15 23.8
How long did the
nursing staff take to
come and check the
patient?
N 203 100 196 100
194 100 157 100
397 100 353 100
<15 minutes 103 50.7 89 45.4
0.02
125 64.5 81 51.6
0.01
228 57.4 170 48.2
0.001 15–30 minutes 65 32.0 51 26.0 66 34.0 67 42.7 131 33.0 118 33.4
>30 minutes 35 17.2 56 28.6 3 1.5 9 5.7 38 9.6 65 18.4
How long did the
doctors take to come
and check the
patient?
N 203 100 196 100
194 100 157 100
397 100 353 100
<15 minutes 74 36.5 62 31.6
0.01
73 37.6 38 24.2
0.03
147 37.0 100 28.3
0.005 15–30 minutes 79 38.9 59 30.1 91 46.9 91 58.0 170 42.8 150 42.5
>30 minutes 50 24.6 75 38.3 30 15.5 28 17.8 80 20.2 103 29.2

268
Table 7.38: Beneficiaries’ experiences with hospital admission (RSBY vs non-RSBY patients)
Patiala – intra-district Yamunanagar – intra-district Both districts
RSBY Non RSBY P
value
RSBY Non RSBY P
value
RSBY Non RSBY P
value N % N % N % N % N % N %
Was the bed made
available as soon as
the patient was
advised admission?
N 196 100 203 100
190 100 161 100
386 100 364 100
Yes 193 98.5 199 98.0
1.00
189 99.5 155 96.3
0.05
382 99.0 354 97.3
0.11 Told to wait for few
hrs/come back another day 3 1.5 4 2.0 1 0.5 6 3.7 4 1.0 10 2.7
Condition of the
patient at the time of
admission
N 196 100 203 100
190 100 161 100
386 100 364 100
Able to walk 136 69.4 109 53.7
<0.01
45 23.7 34 21.1
<0.01
181 46.9 143 39.3
<0.01 Able to walk with support 34 17.3 27 13.3 128 67.4 90 55.9 162 42.0 117 32.1
Needed a
stretcher/wheelchair 26 13.3 67 33.0 17 8.9 37 23.0 43 11.1 104 28.6
Availability of
stretcher/wheelchair
N 26 100 67 100
17 100 37 100
43 100 104 100
Yes 26 100 64 95.5 -
17 100.0 37 100.0 -
43 100.0 101 97.1 0.56
No 0 0.0 3 4.5 0 0.0 0 0.0 0 0.0 3 2.9
Who pushed the
stretcher/wheelchair?
N 26 100 67 100
17 100 37 100
43 100 104 100
Hospital staff 22 84.6 60 89.6 0.49
14 82.4 21 56.8 0.12
36 83.7 81 77.9 0.50
Relatives/ Others 4 15.4 7 10.4 3 17.6 16 43.2 7 16.3 23 22.1
How long did the
nursing staff take to
come and check the
patient?
N 196 100 203 100
190 100 161 100
386 100 364 100
<15 minutes 104 53.1 88 43.3
0.12
106 55.8 100 62.1
0.40
210 54.4 188 51.6
0.33 15 to 30 minute 54 27.6 62 30.5 76 40.0 57 35.4 130 33.7 119 32.7
More than 30 minutes 38 19.4 53 26.1 8 4.2 4 2.5 46 11.9 57 15.7
How long did the
doctors take to come
and check the
patient?
N 196 100 203 100
190 100 161 100
386 100 364 100
<15 minutes 80 40.8 56 27.6
0.01
53 27.9 58 36.0
0.01
133 34.5 114 31.3
0.22 15–30 minutes 57 29.1 81 39.9 112 58.9 70 43.5 169 43.8 151 41.5
>30 minutes 59 30.1 66 32.5 25 13.2 33 20.5 84 21.8 99 27.2

269
7.6.2 Care from nurses
To assess the quality of nursing care, RSBY and non-RSBY participants were
questioned regarding the courtesy and care shown to them by nurses, whether the
nurses listened to them, whether nurses explained things in a way that they could
understand and whether they received help from nurses when it was required.
Care from nurses appeared to be better in Patiala district when compared to
Yamunanagar district (Table 7.39). When comparing private with public hospitals, in
Patiala district, nursing care was slightly better in private hospitals compared to public
hospitals, whereas in Yamunanagar, the quality of nursing care was significantly
better in all aspects in private hospitals compared to public hospitals (Table 7.40).
When comparing RSBY with non-RSBY participants, nursing care was better for
RSBY participants in Patiala district with regard to courtesy shown to patients and for
listening more carefully to the patients. In Yamunanagar district, not much difference
was seen except with regard to getting help as soon as it was required, where non-
RSBY participants fared better in comparison with RSBY patients (Table 7.41).
Conclusively, nursing care was better in Patiala when compared to Yamunanagar.
Private hospitals provided better nursing care than public hospitals. Slightly better
nursing care was given to RSBY patients in comparison with non-RSBY participants.
Table 7.39: Care from nurses (Patiala vs Yamunanagar)
Patiala Yamunanagar
P
value
N
(399) %
N
(351) %
How often did nurses treat
patients with courtesy and
respect?
Never/ sometimes 59 14.8 69 19.7 0.07
Usually/Always 340 85.2 282 80.3
How often did nurses listen
carefully to the patients?
Never/ sometimes 50 12.5 59 16.8 0.10
Usually/ always 349 87.5 292 83.2
How often did nurses explain
things in a way that patients
could understand?
Never/ sometimes 55 13.8 86 24.5 <0.01
Usually/ always 344 86.2 265 75.5
How often did a patient get help
as soon as he/she wanted it?*
Never/ sometimes 64 16.4 126 45.2 <0.01
Usually/ always 327 83.6 153 54.8
*For Patiala N=391 and for Yamunanagar N=279, as only these many patients required help

270
Table 7.40: Care from nurses (private vs public hospitals)
Patiala – intra-district Yamunanagar – intra-district Both districts
Private Public P value
Private Public P value
Private Public P value
N(203) % N(196) % N(194) % N(157) % N(397) % N(353) %
How often did
nurses treat
patients with
courtesy and
respect?
Never/ sometimes 27 13.3 32 16.3
0.40
26 13.4 43 27.4
<0.01
53 13.4 75 21.2
<0.01 Usually/ always 176 86.7 164 83.7 168 86.6 114 72.6 344 86.6 278 78.8
How often did
nurses listen
carefully to the
patients?
Never/ sometimes 21 10.3 29 14.8
0.18
20 10.3 39 24.8
<0.01
41 10.3 68 19.3
<0.01 Usually/ always 182 89.7 167 85.2 174 89.7 118 75.2 356 89.7 285 80.7
How often did
nurses explain
things in a way
that patients could
understand?
Never/ sometimes 19 9.4 36 18.4
<0.01
37 19.1 49 31.2
<0.01
56 14.1 85 24.1
<0.01 Usually/ always 184 90.6 160 81.6 157 80.9 108 68.8 341 85.9 268 75.9
How often did a
patient get help as
soon as he/she
wanted it?*
Never/ sometimes 29 14.4 35 18.4
0.29
60 37.3 66 55.9
<0.01
89 24.6 101 32.8
0.02 Usually/ always 172 85.6 155 81.6 101 62.7 52 44.1 273 75.4 207 67.2
*For Patiala N=391and for Yamunanagar N=279, as only these many patients required help
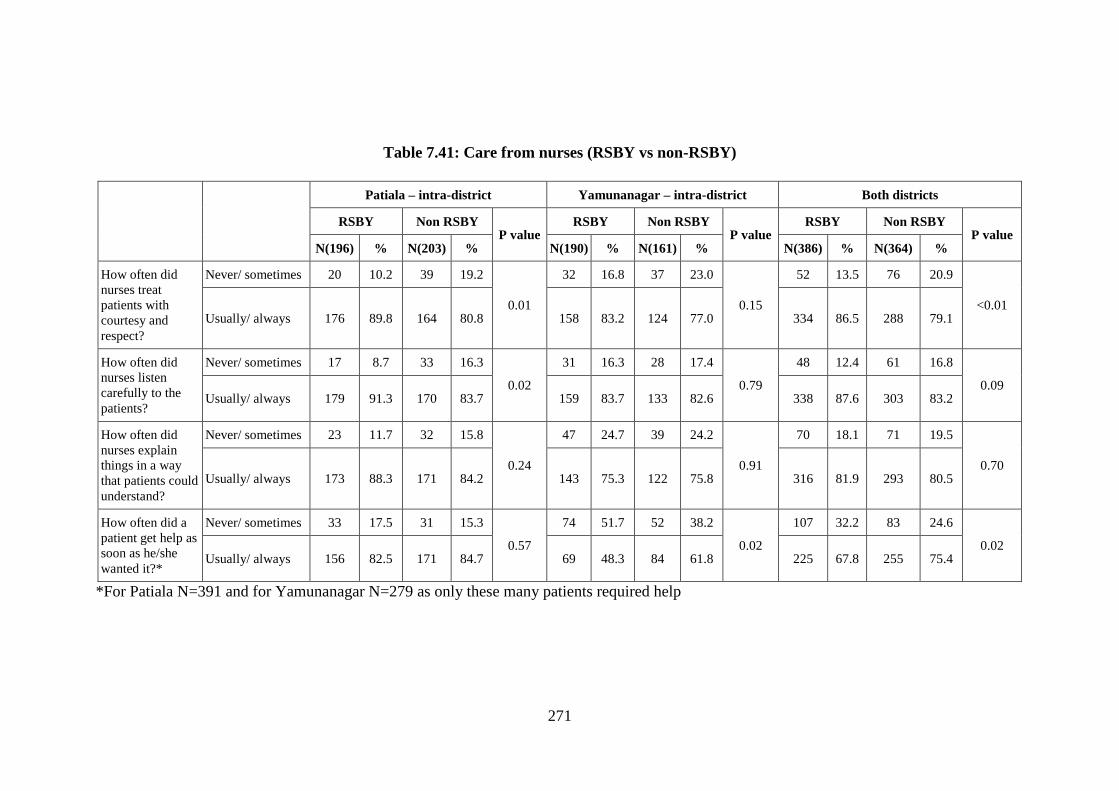
271
Table 7.41: Care from nurses (RSBY vs non-RSBY)
Patiala – intra-district Yamunanagar – intra-district Both districts
RSBY Non RSBY P value
RSBY Non RSBY P value
RSBY Non RSBY P value
N(196) % N(203) % N(190) % N(161) % N(386) % N(364) %
How often did
nurses treat
patients with
courtesy and
respect?
Never/ sometimes 20 10.2 39 19.2
0.01
32 16.8 37 23.0
0.15
52 13.5 76 20.9
<0.01 Usually/ always 176 89.8 164 80.8 158 83.2 124 77.0 334 86.5 288 79.1
How often did
nurses listen
carefully to the
patients?
Never/ sometimes 17 8.7 33 16.3
0.02
31 16.3 28 17.4
0.79
48 12.4 61 16.8
0.09 Usually/ always 179 91.3 170 83.7 159 83.7 133 82.6 338 87.6 303 83.2
How often did
nurses explain
things in a way
that patients could
understand?
Never/ sometimes 23 11.7 32 15.8
0.24
47 24.7 39 24.2
0.91
70 18.1 71 19.5
0.70 Usually/ always 173 88.3 171 84.2 143 75.3 122 75.8 316 81.9 293 80.5
How often did a
patient get help as
soon as he/she
wanted it?*
Never/ sometimes 33 17.5 31 15.3
0.57
74 51.7 52 38.2
0.02
107 32.2 83 24.6
0.02 Usually/ always 156 82.5 171 84.7 69 48.3 84 61.8 225 67.8 255 75.4
*For Patiala N=391 and for Yamunanagar N=279 as only these many patients required help

272
7.6.3 Care from doctors
The quality of doctors’ care for patients was assessed in terms of courtesy and respect
given to patients by the doctors, listening carefully to the patients and responding to
their concerns.
Care from doctors was reported to be better from participants of Patiala district
compared to Yamunanagar district (Table 7.42). Doctors from private hospitals
showed significantly better care in terms of courtesy and respect, listening carefully to
patients, and explaining things carefully compared to doctors of public hospitals
(Table 7.43).
While comparing doctors’ care across RSBY and non-RSBY participants, in both the
districts, doctors’ care was reported to be slightly better for RSBY participants in
comparison to non-RSBY participants but this difference was statistically non-
significant (Table 7.44).
Table 7.42: Care from doctors (Patiala vs Yamunanagar)
Patiala Yamunanagar
P
value N
(399) %
N
(351) %
How often did
doctors treat the
patients with
courtesy and
respect?
Never/ sometimes 55 13.8 46 13.1
0.79 Usually/ always 344 86.2 305 86.9
How often did
doctors listen
carefully to the
patients?
Never/ sometimes 50 12.5 63 17.9
0.04 Usually/ always 349 87.5 288 82.1
How often did
doctors explain
things in a way
that the patient
could understand
easily?
Never/ sometimes 58 14.5 95 27.1
<0.01 Usually/ always 341 85.5 256 72.9
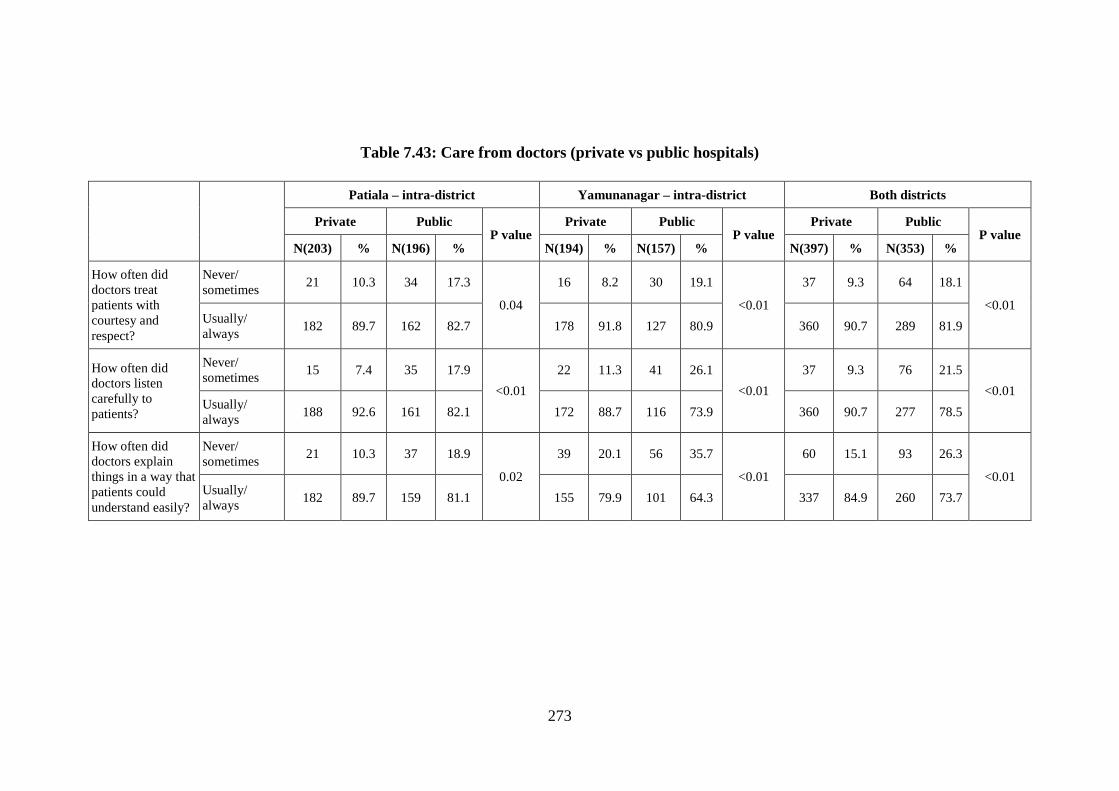
273
Table 7.43: Care from doctors (private vs public hospitals)
Patiala – intra-district Yamunanagar – intra-district Both districts
Private Public P value
Private Public P value
Private Public P value
N(203) % N(196) % N(194) % N(157) % N(397) % N(353) %
How often did
doctors treat
patients with
courtesy and
respect?
Never/
sometimes 21 10.3 34 17.3
0.04
16 8.2 30 19.1
<0.01
37 9.3 64 18.1
<0.01 Usually/
always 182 89.7 162 82.7 178 91.8 127 80.9 360 90.7 289 81.9
How often did
doctors listen
carefully to
patients?
Never/
sometimes 15 7.4 35 17.9
<0.01
22 11.3 41 26.1
<0.01
37 9.3 76 21.5
<0.01 Usually/
always 188 92.6 161 82.1 172 88.7 116 73.9 360 90.7 277 78.5
How often did
doctors explain
things in a way that
patients could
understand easily?
Never/
sometimes 21 10.3 37 18.9
0.02
39 20.1 56 35.7
<0.01
60 15.1 93 26.3
<0.01 Usually/
always 182 89.7 159 81.1 155 79.9 101 64.3 337 84.9 260 73.7

274
Table 7.44: Care from doctors (RSBY vs non-RSBY patients)
Patiala – within district Yamunanagar – intra-district Both districts
RSBY Non-RSBY P
value
RSBY Non-RSBY P
value
RSBY Non-RSBY P
value N
(196) %
N
(203) %
N
(190) %
N
(161) %
N
(386) %
N
(364) %
How often did
doctors treat
the patients
with courtesy
and respect?
Never/
sometimes 22 11.2 33 16.3
0.14
24 12.6 22 13.7
0.78
46 11.9 55 15.1
0.20 Usually/
always 174 88.8 170 83.7 166 87.4 139 86.3 340 88.1 309 84.9
How often did
doctors listen
carefully to the
patients?
Never/
sometimes 20 10.2 30 14.8
0.17
35 18.4 28 17.4
0.80
55 14.2 58 15.9
0.52 Usually/
always 176 89.8 173 85.2 155 81.6 133 82.6 331 85.8 306 84.1
How often did
doctors explain
things in a way
that the patient
could
understand
easily?
Never/
sometimes 25 12.8 33 16.3
0.32
51 26.8 44 27.3
0.92
76 19.7 77 21.2
0.62 Usually/
always 171 87.2 170 83.7 139 73.2 117 72.7 310 80.3 287 78.8

275
7.6.4 Hospital environment
Hospital environment was assessed in terms of cleanliness of the surroundings as well
as the bathrooms, and the noise level near patients’ beds at night.
Hospitals in Yamunanagar district were found to be quieter during the night and
cleaner when compared to hospitals in Patiala district (Table 7.45). Hospital
environment was significantly better in private hospitals in comparison to public
hospitals. Similar results were observed during the intra-district comparison of
private and public hospitals (Table 7.46).
Overall, hospital environment was perceived slightly better by RSBY participants
when compared to non-RSBY participants. However, the difference was statistically
non-significant (Table 7.47).
Conclusively, private hospitals demonstrated a better hospital environment in both the
districts. Hospital environment was slightly better for RSBY participants when
compared to non-RSBY participants.
Table 7.45: Hospital environment (Patiala vs Yamunanagar)
Patiala Yamunanagar P value
N(399) % N(351) %
How often was
patients’
surroundings and
bathroom area
kept clean?
Never/
sometimes 77 19.3 52 14.8
0.11
Usually/always 322 80.7 299 85.2
How often the
area around
patients’ beds was
found quiet at
night?
Never/
sometimes 87 21.8 48 13.7
<0.01
Usually/always 312 78.2 303 86.3

276
Table 7.46: Hospital environment (private vs public hospitals)
Patiala – intra-district Yamunanagar – intra-district Both districts
Private Public P
value
Private Public P
value
Private Public P
value N
(203) %
N
(196) %
N
(194) %
N
(157) %
N
(397) %
N
(353) %
How often were
patients’
surroundings &
bathroom areas
kept clean?
Never/
sometimes 17 8.4 60 30.6
<0.01
12 6.2 40 25.5
<0.01
29 7.3 100 28.3
<0.01 Usually/
always 186 91.6 136 69.4 182 93.8 117 74.5 368 92.7 253 71.7
How often the
area around
patients’ beds
was found quiet
at night?
Never/
sometimes 23 11.3 64 32.7
<0.01
15 7.7 33 21.0
<0.01
38 9.6 97 27.5
<0.01 Usually/
always 180 88.7 132 67.3 179 92.3 124 79.0 359 90.4 256 72.5

277
Table 7.47: Hospital environment (RSBY vs non-RSBY patients)
Patiala – intra-district Yamunanagar – intra-district Both districts
RSBY Non RSBY P
value
RSBY Non RSBY P
value
RSBY Non RSBY P
value N
(196) %
N
(203) %
N
(190) %
N
(161) %
N
(386) %
N
(364) %
How often were
patients’
surroundings &
bathroom area
kept clean?
Never/
sometimes 39 19.9 38 18.7
0.76
19 10.0 33 20.5
<0.01
58 15.0 71 19.5
0.10 Usually/
always 157 80.1 165 81.3 171 90.0 128 79.5 328 85.0 293 80.5
How often the
area around
patients’ beds
was found quiet
at night?
Never/
sometimes 42 21.4 45 22.2
0.86
23 12.2 25 15.5
0.35
65 16.8 70 19.2
0.39 Usually/
always 154 78.6 158 77.8 167 87.9 136 84.5 321 83.2 294 80.8

278
7.6.5 Experiences in the hospital
Experiences during the hospital stay were assessed by asking questions in relation to
help received from nurses to go to the bathroom or use a bedpan, assisting with pain
relief and providing information to the patients about the drugs administered and their
side-effects.
Almost similar experiences were reported by participants from Patiala and
Yamunanagar, except for explaining medicine and its side effects, which was
significantly better in Patiala. When comparing public and private hospitals in the two
districts, participants from private hospitals in Patiala district reported a better
experience compared to public hospitals.
Intra-district comparison of experiences during hospital stay did not show much
difference between the RSBY and non-RSBY participants in Patiala district. In
Yamunanagar district, RSBY patients had better experiences than non-RSBY patients
(Table 7.49).

279
Table 7.48: Experiences in the hospital (Patiala vs Yamunanagar)
Patiala Yamunanagar
P value
N % N %
Did the patient need help from nurses or other hospital staff to go to
the bathroom or use a bedpan?
N 399 351
Yes 273 68.4 116 33.0 <0.01
No 126 31.6 235 67.0
How often did the patient get help to go to the bathroom or use a bedpan as soon as the patient required?
N 273 116
Never/ sometimes 75 27.5 34 29.3 0.71
Usually/ always 198 72.5 82 70.7
During the hospital stay, did the patient need medicine for pain?
N 399 351
Yes 374 93.7 298 84.9 <0.01
No 25 6.3 53 15.1
During the hospital stay, how often was patient’s pain well
controlled?
N 374 298
Never/ sometimes 50 13.4 22 7.4 0.01
Usually/ always 324 86.6 276 92.6
How often did the hospital staff do everything they could to help
the patient with his pain?
N 373 298
Never/ sometimes 39 10.5 30 10.1 0.86
Usually/ always 334 89.5 268 89.9
Before giving patient any new medicine, how often did hospital
staff inform the patient what the medicine was for?
N 399 351
Never/ sometimes 92 23.1 244 69.5 <0.01
Usually/ always 307 76.9 107 30.5
Before giving the patient any new medicine, how often did hospital
staff describe possible side effects in a way that the patient could
understand?
N 399 351
Never/ sometimes 112 28.1 266 75.8 <0.01
Usually/ always 287 71.9 85 24.2

280
Table 7.49: Experiences in the hospital (private vs public hospitals)
Patiala – intra-district Yamunanagar – intra-district Both districts
Private Public
P value
Private Public
P value
Private Public
P value N
N % N % N % N % N % N %
203 196 194 157 397 353
Did the patient require
help from the hospital staff
to go to the bathroom?
Yes 147 72.4 126 64.3
0.08
77 39.7 39 24.8
0.03
224 56.4 165 46.7
<0.01 No 56 27.6 70 35.7 117 60.3 118 75.2 173 43.6 188 53.3
How often did the patient
get help to go to the
bathroom or use a bedpan
as soon as required?
N 147 126
77 39
224 165
Never/ sometimes 31 21.1 44 34.9 0.01
17 22.1 17 43.6 0.16
48 21.4 61 37.0 <0.01
Usually/ always 116 78.9 82 65.1 60 77.9 22 56.4 176 78.6 104 63.0
Did the patient need
medicine for pain?
N 203 196
194 157
397 353
Yes 197 97.0 177 90.3 <0.01
168 86.6 130 82.8 0.32
365 91.9 307 87.0 0.02
No 6 3.0 19 9.7 26 13.4 27 17.2 32 8.1 46 13.0
During the hospital stay,
how often was patient’s
pain well controlled?
N 197 177
168 130
365 307
Never/ sometimes 11 5.6 39 22.0 <0.01
4 2.4 18 13.8 <0.01
15 4.1 57 18.6 <0.01
Usually/ always 186 94.4 138 78.0 164 97.6 112 86.2 350 95.9 250 81.4
How often did the hospital
staff provide help to
reduce the patient’s pain?
197 176
168 130
Never/ sometimes 11 5.6 28 15.9
<0.01 15 8.9 15 11.5
0.49 26 7.1 43 14.1
<0.01 Usually/ always 186 94.4 148 84.1 153 91.1 115 88.5 339 92.9 263 85.9
Before giving the patient
any new medicine, how
often did hospital staff
explain about the medicine
and its side effects?
203 196
194 157
397 353
Never/ sometimes 26 12.8 66 33.7
<0.01
124 63.9 120 76.4
0.01
150 37.8 186 52.7 <0.01
Usually/ always 177 87.2 130 66.3 70 36.1 37 23.6 247 62.2 167 47.3

281
Table 7.50: Experiences in the hospital (RSBY vs non-RSBY patients)
Patiala – within district Yamunanagar – intra-district Both districts
RSBY Non-RSBY
P value
RSBY Non-RSBY
P value
RSBY Non-RSBY
P value N
N % N % N % N % N % N %
196 203 190 161 386 364
Did the patient require help
from the hospital staff to go to
the bathroom?
Yes 125 63.8 148 72.9 0.05
66 34.7 50 31.1 0.47
191 49.5 198 54.4 0.17
No 71 36.2 55 27.1 124 65.3 111 68.9 195 50.5 166 45.6
How often did the patient get
help to go to the bathroom or
use a bedpan as soon as
required?
N 125 148
66 50
191 198
Never/ sometimes 34 27.2 41 27.7 0.93
18 27.3 16 32.0 0.58
52 27.2 57 28.8 0.73
Usually/ always 91 72.8 107 72.3 48 72.7 34 68.0 139 72.8 141 71.2
Did the patient require
medicine for pain?
N 196 203
190 161
386 364
Yes 179 91.3 195 96.1 0.05
153 80.5 145 90.1 0.01
332 86.0 340 93.4 <0.01
No 17 8.7 8 3.9 37 19.5 16 9.9 54 14.0 24 6.6
During the hospital stay, how
often was the patient’s pain
well controlled?
N 179 195
153 145
332 340
Never/ sometimes 18 10.1 32 16.4 0.07
6 3.9 16 11.0 0.02
24 7.2 48 14.1 <0.01
Usually/ always 161 89.9 163 83.6 147 96.1 129 89.0 308 92.8 292 85.9
How often did the hospital
staff help to reduce the
patient’s pain?
N 178 195
153 145
331 340
Never/ sometimes 17 9.6 22 11.3 0.58
12 7.8 18 12.4 0.19
29 8.8 40 11.8 0.20
Usually/ always 161 90.4 173 88.7 141 92.2 127 87.6 302 91.2 300 88.2
Before giving the patient any
new medicine, how often did
hospital staff explain about the
medicine and its side effects?
N 196 203
190 161
386 364
Never/ sometimes 50 25.5 42 20.7 0.25
122 64.2 122 75.8 0.02
172 44.6 164 45.1 0.89
Usually/ always 146 74.5 161 79.3 68 35.8 39 24.2 214 55.4 200 54.9

282
7.6.6 Experiences at the time of discharge
Care at the time of discharge was assessed in terms of the place the patient would go
to after discharge, help during discharge, health status at the time of discharge and
follow-up suggestions given by the hospital staff.
Overall, the discharge experiences were found to be satisfactory in all groups. In
Patiala district, experience at the time of discharge was slightly better than
Yamunanagar district (Table 7.51). While making an intra-district and inter-district
comparison of private and public hospitals, private hospitals were slightly better than
public hospitals (Table 7.52). Also, in RSBY and non-RSBY comparison, RSBY
participants reported a slightly better experience at the time of discharge (Table 7.53).
However, most of these differences were statistically non significant
Table 7.51: Experiences at the time of discharge (Patiala vs Yamunanagar)
Patiala Yamunanagar
P
value N
(399) %
N
(351) %
Was the patient advised where
to go after leaving the
hospital?
Own home 397 99.5 347 98.9
0.43 Someone else’s
home/another health
facility
2 0.5 4 1.1
Did doctors, nurses or other
hospital staff enquire from the
patient if any help was
required by him/her at the time
of discharge?
Yes 396 99.2 338 96.3
<0.01
No 3 0.8 13 3.7
Upon discharge, was the
present health status of the
patient recorded/noted?
Improved completely/
partially 383 96.0 333 94.9
0.46 No improvement/
passed away 16 4.0 18 5.1
Was there a suggestion for any
follow-up?
Yes 394 98.7 327 93.2 <0.01
No 5 1.3 24 6.8

283
Table 7.52: Experiences at the time of discharge interviews (private vs public hospitals)
Patiala – intra-district Yamunanagar – intra-district Both districts
Private Public
P value
Private Public
P value
Private Public
P value N
203 %
N
196 %
N
194 %
N
157 %
N
397 %
N
353 %
Was the patient advised
where to go after leaving
the hospital?
Own home 203 100 194 99.0
0.24
194 100.0 153 97.5
0.04
397 100 347 98.3
0.01 Someone else’s home/
another health facility 0 0.0 2 1.0 0 0.0 4 2.5 0 0.0 6 1.7
Did doctors, nurses or other
hospital staff enquire from
the patient if any help was
required by him/her at the
time of discharge?
Yes 202 99.5 194 99.0
0.62
192 99.0 146 93.0
<0.01
394 99.2 340 96.3
<0.01
No 1 0.5 2 1.0 2 1.0 11 7.0 3 0.8 13 3.7
Upon discharge whether the
present health status of
patient was recorded/noted?
Improved completely/
partially 193 95.1 190 96.9
0.34
189 97.4 144 91.7
0.02
382 96.2 334 94.6
0.29 No
improvement/passed
away
10 4.9 6 3.1 5 2.6 13 8.3 15 3.8 19 5.4
Was there a suggestion for
any follow-up?
Yes 201 99.0 193 98.5 0.68
185 95.4 142 90.4 0.09
386 97.2 335 94.9 0.13
No 2 1.0 3 1.5 9 4.6 15 9.6 11 2.8 18 5.1

284
Table 7.53: Experiences at the time of discharge interviews (RSBY vs non-RSBY patients)
Patiala – intra-district Yamunanagar – intra-district Both districts
RSBY Non-RSBY
P value
RSBY Non-RSBY
P value
RSBY Non-RSBY
P value N
(196) %
N
(203) %
N
(190) %
N
(161) %
N
(386) %
N
(364) %
Was the patient
advised where to go
after leaving the
hospital?
Own home 196 100 201 99.0
0.50
189 99.5 158 98.1
0.34
385 99.7 359 98.6
0.11 Someone else’s
home/ another health
facility
0 0.0 2 1.0 1 0.5 3 1.9 1 0.3 5 1.4
Did doctors, nurses
or other hospital staff
enquire from the
patient if any help
was required by
him/her at the time of
discharge?
Yes
194 99.0 202 99.5
0.61
186 97.9 152 94.4
0.10
380 98.4 354 97.3
0.32
No
2 1.0 1 0.5 4 2.1 9 5.6 6 1.6 10 2.7
Upon discharge
whether the present
health status of
patient was
recorded/noted?
Improved
completely/ partially 186 94.9 197 97.0
0.28
180 94.7 153 95.0
0.90
366 94.8 350 96.2
0.38 No improvement/
passed away 10 5.1 6 3.0 10 5.3 8 5.0 20 5.2 14 3.8
Was there a
suggestion for any
follow-up?
Yes 193 98.5 201 99.0
0.68
183 96.3 144 89.4
0.02
376 97.4 345 94.8
0.09
No 3 1.5 2 1.0 7 3.7 17 10.6 10 2.6 19 5.2

285
7.6.7 Overall rating of the hospitals
Study participants across various groups were asked for overall rating of the hospital
with a score ranging between 0 and 10, 0 being the lowest (poorest) and 10 being the
highest (best) score.
Intra-district comparison of private and public hospitals showed a better rating for
public hospitals in Patiala whereas in Yamunanagar private hospitals were rated better
(Table 7.54). Overall (public and private together), RSBY participants gave a lower
rating when compared to non-RSBY participants. Almost all the participants across
all the groups reported that they would recommend the hospital to others in future
(Tables 7.55, 7.56 and 7.57).
Table 7.54: Overall rating of the hospitals
N Mean SD P value
Patiala 399 7.9 1.36 <0.01
Yamunanagar 351 5.5 1.53
Patiala Private 203 7.7 1.42
<0.01 Public 196 8.1 1.27
Yamunanagar Private 194 6.1 1.40
<0.01 Public 157 4.8 1.36
Both districts Private 397 6.9 1.60
0.05 Public 353 6.7 2.11
Patiala RSBY 196 7.8 1.50
0.10 Non-RSBY 203 8.0 1.22
Yamunanagar RSBY 190 5.2 1.32
<0.01 Non-RSBY 165 5.9 1.66
Both districts RSBY 386 6.5 1.91
<0.01 Non-RSBY 364 7.1 1.76
Table 7.55: Recommend hospital to friends and family (Patiala vs
Yamunanagar)
Patiala Yamunanagar P value
N(399) % N(351) %
No 5 1.3 7 2.0 0.42
Yes 394 98.7 344 98.0

286
Table 7.56: Recommend hospital to friends and family (private vs public hospitals)
Patiala – intra-district Yamunanagar – intra-district Both districts
Private Public
P value
Private Public
P value
Private Public
P value N
(203) %
N
(196) %
N
(194) %
N
(157) %
N
(397) %
N
(353) %
No 3 1.5 2 1.0 0.99
2 1.0 5 3.2 0.25
5 1.3 7 2.0 0.56
Yes 200 98.5 194 99.0 192 99.0 152 96.8 392 98.7 346 98.0
Table 7.57: Recommend hospital to friends and family (RSBY vs non-RSBY patients)
Patiala – intra-district Yamunanagar – intra-district Both districts
RSBY Non-RSBY
P value
RSBY Non-RSBY
P value
RSBY Non-RSBY
P value N
(196) %
N
(203) %
N
(190) %
N
(161) %
N
(386) %
N
(364) %
No 2 1.0 3 1.5 0.99
1 0.5 6 3.7 0.05
3 0.8 9 2.5 0.08
Yes 194 99.0 200 98.5 189 99.5 155 96.3 383 99.2 355 97.5

287
7.6.8 Aggregated analysis of user satisfaction
Aggregated analysis was done by converting the ordinal responses of the questions in
the Hospital Consumer Assessment of Healthcare Providers and Systems (HCAHPS)
section of exit interviews to scores. The categories covered were—experience during
admission, care from nurses, care from doctors, hospital environment, experience
during stay, experience during discharge and overall rating of the hospital. Details of
the scoring pattern have been elaborated under the data analysis plan in Chapter 4.
The higher the score, the better was the hospital. Scores obtained under different
heads were compared between private and public hospitals, RSBY and non-RSBY
participants and between districts. Mean score was reported for each category.
Student’s t-Test was applied to assess statistical differences across the groups.
User satisfaction was better in private hospitals when compared to public hospitals. A
higher score for private hospitals was observed in all aspects of quality of care.
Further, the difference between the scores of private and public hospitals was also
statistically significant for all categories of care except for experience during
discharge and overall rating. Comparing RSBY and non-RSBY participants, the care
to RSBY participants was judged to be slightly better compared to non-RSBY
participants. A better score was obtained for RSBY participants in all aspects, except
for overall rating (Table 7.58).

288
Table 7.58: Aggregated analysis of user satisfaction
Private (392) Public
(364) P value
RSBY
(392) Non-RSBY (364)
P value
Patiala (399) Yamunanagar
(357) P value
Mean SD Mean SD Mean SD Mean SD Mean SD Mean SD
During admission 4.23 0.75 4.06 0.81 <0.01 4.18 0.76 4.11 0.82 0.20 4.08 0.85 4.22 0.70 0.02
Care from nurses 3.76 0.94 3.46 1.07 <0.01 3.67 1.00 3.56 1.03 0.13 3.54 0.90 3.71 1.13 0.02
Care from doctors 3.84 0.98 3.50 1.17 <0.01 3.75 1.08 3.59 1.09 0.04 3.49 0.90 3.88 1.25 <0.01
Hospital environment 3.96 0.96 3.28 1.11 <0.01 3.73 1.06 3.52 1.10 0.01 3.30 0.98 4.00 1.08 <0.01
Experience during stay 3.26 0.83 2.83 0.93 <0.01 3.13 0.94 2.97 0.86 0.02 3.22 0.79 2.87 0.99 <0.01
Experience during discharge 4.76 0.38 4.72 0.57 0.17 4.78 0.41 4.70 0.55 0.03 4.84 0.39 4.63 0.54 <0.01
Overall rating of the hospital 4.12 0.56 4.01 0.79 0.29 4.03 0.61 4.11 0.75 0.11 4.40 0.51 3.69 0.66 <0.01
Total 27.9 3.52 25.7 4.38 <0.01 27.2 3.90 26.6 4.26 0.02 26.9 3.61 26.9 4.59 0.81

289
7.7 Financial burden
This section brings together information on OOP expenditures collected during the
exit interviews. The information on expenditures consists of any expenditure in the
facility and also expenditure made elsewhere for the present illness.
Not much difference was observed in terms of OOP expenditure between the districts.
Expenditure in private hospitals was almost double that in public hospitals, both
within the district and across the districts. It was expected that OOP expenditures of
RSBY participants would be significantly less than non-RSBY participants. This was
indeed the case in Patiala; and overall, however, in Yamunanagar the difference was
less pronounced (Table 7.59).
Table 7.59: Total out-of-pocket expenditure (mean) by participants
N Mean SD P value
Patiala 397 7559.9 14626.9 0.23
Yamunanagar 349 8747.5 12642.5
Patiala Private 201 9909.4 16209.6
<0.01 Public 196 5150.5 12388.1
Yamunanagar Private 192 11927.1 15810.6
<0.01 Public 157 4859.0 4778.2
Both districts Private 393 10895.1 16027.3
<0.01 Public 353 5020.9 9754.8
Patiala RSBY 196 3760.1 11280.5
<0.01 Non-RSBY 201 11265.2 16480.3
Yamunanagar RSBY 191 7788.2 5788.3
0.12 Non-RSBY 158 9907.0 17642.6
Both districts RSBY 387 5748.1 9211.0
<0.01 Non-RSBY 359 10667.5 16990.9
7.7.1 Determinants of out-of-pocket expenditure
Along with the test for quality of care for those enrolled in RSBY, it is important to
question the extent to which insurance serves to reduce the financial burden of care.
Due to time and cost constraints, a large survey was not conducted to study the
determinants of OOP expenditure. However, some conclusions can be derived from
Table 7.60. As the survey was not done at the household level, any selection

290
equations would be difficult to construct without detailed household information. The
suggestive results show the following:
Households spent more on the aged and females, although neither of these factors was
significant. It is likely that BPL status is correlated with RSBY status; thus this
variable was taken out in Equation 2. Enrolment in RSBY helped reduce expenditure;
since the variable is dichotomous the coefficient was large. For the sample of only
BPL patients, the contribution RSBY makes towards reducing OOP expenditure falls
while still being significant. RSBY was not statistically significant in reducing the
expenditure in Yamunanagar, while it was so in Patiala. Even when considering only
RSBY participants (who were insured), and restricting the sample to only BPL cases,
availing care from public sector facilities resulted in significant reduction in OOP
expenditure, except in the case of BPL participants from Patiala district. The result for
Patiala when including only BPL patients may be due to a smaller sample, as the
adjusted R-square falls dramatically from the overall sample. Although the adjusted
R-Square is small, much of it is due to running an ordinary least square against
dichotomous variables.
The main conclusion drawn is that the use of public sector contributes to reduction in
OOP expenditure, while enrolling in RSBY has some limitations in reducing OOP
expenditure. The data shows that the non-RSBY BPL participants use the public
sector twice as much as the private sector, while the RSBY BPL participants seem to
use public and private sector at the same rate. For the general sample, the odds ratio of
1.23 for RSBY use of private sector is significant at p <0.05; the odds ratio is
statistically significant and higher for Yamunanagar (1.53). For Patiala, the odds ratio
for use of private sector for those in RSBY is 1.05 and is not significant.

291
Table 7.60: Determinants of OOP expenditure
All
Total exp
(Eq. 1)
BPL not included
All Total exp
(Eq. 2)
Only BPL
Total exp
(Eq. 3)
All/Patiala
Total exp
(Eq. 4)
Only BPL
Patiala
Total exp
(Eq. 5)
All
Yamunanagar
Total exp
(Eq. 6)
Only BPL
Yamunanagar
Total exp
(Eq. 7)
Gender (Male) -870.4 -881.3 -1239.9 415.2 408.1 -1840.7 -1973.8
(-0.87) (-0.88) (-1.02) (0.28) (0.21) (-1.38) (-1.25)
Facility (Public) -5599.7*** -5699.4*** -5101.4*** -4889.4*** -1551.1 -6599.5*** -7279.9***
(-5.58) (-5.81) (-4.25) (-3.48) (-0.85) (-4.94) (-4.60)
Age 47.86 47.44 15.42 114.8** 73.77 -14.38 -18.16
(1.75) (1.74) (0.46) (2.88) (1.42) (-0.40) (-0.42)
District (Patiala) -1482.0 -1299.2 -3190.8**
(-1.40) (-1.32) (-2.61)
RSBY (Yes) -4704.1*** -4988.2*** -2906.1* -8303.1*** -4446.7* -1655.8 -2493.4
(-4.07) (-5.04) (-2.16) (-5.79) (-1.94) (-1.24) (-1.50)
BPL (Yes) -606.9
(-0.48)
_cons 12810.4*** 12554.6*** 12860.3*** 9179.0*** 5723.0 14081.7*** 15492.0***
(8.25) (8.62) (6.75) (4.64) (1.84) (7.63) (6.47)
N 741 741 459 392 184 349 275
Adj. R-squared 0.0736 0.0746 0.0515 0.1036 0.0091 0.756 0.0757
t statistics in parentheses
="* p<0.05 ** p<0.01 *** p<0.001" RSBY= 387 RSBY (Patiala) = 184 RSBY (Y. Nagar) = 275
Not RSBY = 359 Non-RSBY (Patiala) = 208 Non-RSBY (Yamunanagar) = 184
Exp: Expenditure; Eq: Equation

292
7.8 Discussion
7.8.1 Methodological issues
Due to logistical constraints of the study, a purposive sampling was used to select the
RSBY empanelled hospitals in both the districts. The result of the study should hence
be cautiously interpreted and generalized. Regarding the exit interview dataset, the
number of exit interviews conducted was slightly less than what was planned during
the protocol development stage. This happened because the number of non-RSBY
patients visiting the selected empanelled hospitals in Yamunanagar was fewer than
what had been assumed at the protocol development stage. Another issue with the
methodology of the present chapter is that the tool used for assessing the care given in
hospitals was a modified version of HCAHPS. Since the tool was developed in USA
and was not validated for Indian settings, it was modified to suit the local
environment, though the modified version was not validated in the local setting.
As RSBY and non-RSBY participants belong to different strata of society, perception
of the quality of care by them may differ and this could be another limitation of the
study. Murray and Chen reported that poor people tend to express greater satisfaction
with health care when they get it and also that poor people say they are sick less often
(Murray and Lincoln, 1992, Sen, 2002). Based on this, we can assume that RSBY
beneficiaries might have given a better report for user satisfaction when compared to
non-RSBY participants for the same type of facility.
7.8.2 Summary of findings
This chapter dealt with the third objective of the study, which relates to the evaluation
of the delivery of services across both public and private empanelled facilities for
RSBY and non-RSBY beneficiaries.
Socio-demographic profile
The socio-demographic profile of the study participants (exit interviews) suggests that
it was likely that more young patients were going to private hospitals and old ones to
public hospitals; and more women were utilizing private facilities. In terms of social
class, general and OBC population were mainly using private hospitals, while a
majority of the SCs and STs were utilizing the public sector. More of Muslims and
illiterate (or literate up to primary level) were using public hospitals. The mean age of
the RSBY participants was higher when compared to non-RSBY participants.
293
Structural aspects
From the Health Provider Checklist Assessment (self-assessment), private hospitals
self-reported a better score than public hospitals under all categories of structural-
aspect evaluation in both districts. From the Observation and Facility Record
Checklist, private hospitals scored better than public hospitals in all aspects. In terms
of availability of records, private hospitals were almost similar to public hospitals,
except for six categories (out of ten categories) where private hospitals were slightly
better than public hospitals. Overall, structural evaluation was found to be better for
private, however, it should be cautiously interpreted as none of these differences were
statistically significant.
Service delivery
Patiala vs Yamunanagar: In terms of presence of separate RSBY help desk, there were
two hospitals (both in Patiala) which were having separate RSBY help desk. Waiting
period was less in Yamunanagar when compared to Patiala. Not much difference was
observed across both the districts in terms of process of registration. With regard to
information provided to the participants from the RSBY help desk, Patiala was
significantly better than Yamunanagar. Also, Patiala fared better than Yamunanagar
in terms of diagnostics and medicines from outside since a lesser number of
participants from Patiala were asked to get diagnostic and medicines from outside.
Yamunanagar was better with regard to providing food to the RSBY beneficiaries, as
there were two hospitals in Yamunanagar which were providing food as compared to
one hospital in Patiala. Patiala district was again significantly better in terms of
informing patients regarding the balance amount in the card. Half of the participants
were receiving the transportation cost in Patiala as compared to none in
Yamunanagar. In terms of post hospitalization knowledge, Patiala was better in
providing information regarding 5 day post hospitalization services, however,
Yamunanagar was better in terms of providing medicines from hospital. Conclusively,
it can be interpreted that a mixed response was observed for various service delivery
categories studied, however, overall Patiala was found to be better in most of these
categories.
Private vs Public: In terms of presence of a separate RSBY help desk, only one
private and one public hospital (both in Patiala) had a separate RSBY help desk. In

294
both the hospitals (public and private), staffs were helpful and polite to almost all the
participants. Participants had to wait less in private hospitals for being attended by the
hospital staff. Private hospitals fared better with regard to the process of registration
as a fingerprint scanner was used in 97% of participants in comparison to 74% in
Public hospitals. With regard to information dissemination from RSBY help desk, a
mixed response was observed with public hospitals fairing better in terms of
providing information regarding treatment cost and amount left in the card, whereas
private hospitals were better in terms of providing information regarding insufficient
amount in the smart card. More of private hospitals were asking for diagnostics and
medicines from outside the hospital when compared to public hospitals. Two of the
private hospitals were providing food as compared to one public hospital. Almost
similar observations were noted for public and private hospitals with regard to the
process followed during discharge, however, in terms of discharge slip, public
hospitals were slightly better. More participants from public hospitals were
reimbursed with transportation cost when compared to private hospitals. In terms of
post hospitalization knowledge and expenses, public hospitals were slightly better for
medicines provided by the hospital. Conclusively, a mixed observation was noted
between public and private hospitals in terms of service delivery with public hospitals
being better in some aspects and private hospitals being better in others.
Comparison of choice of hospital, transport and diagnosis
Patiala vs Yamunanagar: In Patiala, hospitals were primarily chosen by the
participants because of proximity whereas in Yamunanagar they were chosen on
relatives and friends advice. In Patiala, majority of the participants had not contacted
any health facility before coming to the present one; whereas in Yamunanagar, a high
percentage of the participants had first contacted a health facility, many of which were
individual private practitioners. Both in Patiala and Yamunanagar, the most common
mode of transport was three wheelers.
Private vs Public: Private hospitals were chosen primarily because of the reputation of
the hospital whereas public hospitals were chosen because of proximity. About one
third participants from private hospitals and half of the participants from public
hospitals did not contact any health facility before coming to the current facility. For
mode of transportation, a bus was used more commonly by the participants of public

295
hospitals when compared to private hospitals, both within the district and across the
district. Almost similar pattern of diagnosis was observed in private and public
hospitals, except for slightly more cases of orthopaedics in public hospitals and
slightly more cases of urology in private hospitals.
RSBY vs non-RSBY: The most common reason for selecting a hospital for RSBY
participants was relative/friend suggestions followed by preferred hospital (always go
to the same hospital) and reputation. Whereas non-RSBY participants selected the
hospital based on reputation followed by relative/friend suggestion and proximity.
About one third RSBY participants and half of non-RSBY participants did not contact
any health facility before coming to the current facility. Bus and three wheelers were
used more by the RSBY participants while car was used more by non-RSBY
participants. The diagnosis pattern of RSBY and non-RSBY participants was almost
the same, except for slightly more cases of orthopaedics in non-RSBY and general
surgery in RSBY.
User satisfaction
Patiala vs Yamunanagar: Out of the five aspects used to assess experiences during the
hospital admission (availability of bed, availability of wheel chair, hospital staff
pushing wheel chair, time taken by nursing staff and doctor), Yamunanagar was better
in terms of taking less time to attend to the patient whereas Patiala was better in terms
of wheel chair being pushed by hospital staff. In the remaining aspect of experiences
during admission, Patiala and Yamunanagar were almost similar. Patiala was found to
be better in almost all the aspects of care from nurses and doctors. Yamunanagar fared
better in terms of hospital environment. With regard to experiences during hospital
stay, almost similar experiences were reported by participants from Patiala and
Yamunanagar, except for one aspect (explaining medicine and its side effects) which
was significantly better in Patiala. Overall, the discharge experiences were found to be
better in all groups. In Patiala district, experience at the time of discharge was slightly
better than Yamunanagar district. Overall ratings provided to the hospitals were better
in Patiala when compared to Yamunanagar.
Private vs Public: Out of the five aspects used to assess experiences during the
hospital admission (availability of bed, availability of wheel chair, hospital staff
pushing wheel chair, time taken by nursing staff and doctor), private hospitals were

296
found to be significantly better in terms of time taken by doctors and nurses to attend
to the patient, including wheel chair being pushed by hospital staff. Whereas, for the
remaining two aspects, private and public hospitals were almost similar. Private
hospitals provided better nursing care than public hospitals. Doctors from private
hospitals showed significantly better care in terms of courtesy and respect, listening
carefully to patients, and explaining things carefully when compared to doctors of
public hospitals. The hospital environment was significantly better in private hospitals
in comparison to public hospitals. Participants from private hospitals in Patiala district
reported better experience during stay when compared to public hospitals. While
making an intra-district and inter-district comparison of private and public hospitals
with regard to experience at the time of discharge, private hospitals were slightly
better than public hospitals. Intra-district comparison of private and public hospitals
showed a better rating for public hospitals in Patiala whereas in Yamunanagar private
hospitals were rated better. Overall, almost similar ratings were given to public and
private hospitals.
RSBY vs Non-RSBY participants: In Patiala district, doctors were quicker to attend to the
RSBY patients in comparison with non-RSBY patients, whereas in Yamunanagar district,
doctors were taking longer to attend to the RSBY patients. However, overall, RSBY patients
were attended slightly earlier than non-RSBY. The rest of the aspects of experiences during
hospital admission was almost similar for RSBY and non-RSBY participants. Nursing care
was better for RSBY participants in Patiala district with regard to courtesy shown to
patients and for listening more carefully to the patients. In Yamunanagar district, not
much difference was seen except with regard to getting help as soon as it was
required, where non-RSBY participants fared better in comparison with RSBY
patients. Overall, slightly better nursing care was given to RSBY participants in
comparison with non-RSBY participants. In both the districts and across the districts,
doctors’ care was reported to be slightly better for RSBY participants in comparison
to non-RSBY participants. Hospital environment was perceived slightly better by
RSBY participants when compared to non-RSBY participants. Not much difference
was observed in terms of experiences during hospital stay between RSBY and non-
RSBY participants. RSBY participants reported a slightly better experience at the
time of discharge when compared to non-RSBY participants. RSBY participants gave
a lower rating to the hospitals when compared to non-RSBY participants.

297
Financial Burden
Expenditure in private hospitals was almost double the expenditure in public
hospitals. Not much difference was observed in OOP expenditure of RSBY
beneficiaries and non-RSBY beneficiaries in Yamunanagar, whereas in Patiala district
OOP expenditure of a RSBY beneficiary was significantly less when compared to a
non-RSBY beneficiary. In terms of determinants of OOP, use of public sector
contributes to reduction in OOP expenditure, while enrolling in RSBY has some
limitations in reducing OOP expenditure.
7.8.3 Discussion of findings
Characteristics of the study participants
Children and the geriatric population, the two extremes of age, are expected to be
more vulnerable to diseases and hence more likely to be admitted to hospital as
compared to the adult population. Therefore, the elderly and children were expected
to comprise a majority of study participants in the exit interviews, but it was observed
that most of the study participants belonged to the adult age group. It is to be kept in
mind that as per census 2011 report (Registrar General of India, 2013), under 15 and
elderly, together comprise 38% of the total population. However, the referenced
population (under 15 and elderly) in the exit interviews was only 20%. If we assume
equal risk for all age groups and equal utilization by all age groups, the proportion of
under 15 and elderly should be around 38%. However, in the study, it was almost half
of this. Also to be noted is that the enrolment of the elderly population under the
scheme is comparable to the productive population. This suggests that the scheme
could be primarily used by the productive age groups who are considered to be
important members of the family as they are the bread winners. Further, when this
pattern of scheme utilization by under 15 and elderly was compared to non-RSBY
group, no difference was observed. This could lead to the view that this usage pattern
reflects societal factors regarding geriatric population. Regarding paedatric and
maternal care and maternal care, it is possible that schemes under NRHM may have
affected the enrolment of children in RSBY. Under NRHM, there are specific
schemes for children and pregnant mothers (Janani Suraksha Yojana and Janani
Shishu Suraksha Karyakaram) that provide free care to them and do not have any
upper cap.

298
People of the working age group are more likely to go to private hospitals as
compared to those of older age groups, who were more likely to go to public
hospitals. The working age group, being the earning members in the family, have
greater command of family resources and are more aware that RSBY provides access
to private care at near-free costs. This preference for RSBY scheme shows that care
provided by this scheme is perceived to be better (as shown in the survey). RSBY
scheme enables them to use private services that they could not have afforded without
the scheme. People generally avail services that are better unless there are certain
perceived barriers. Access and transportation are the major determining factors in
selecting the type of facility and this is more so for the elderly because they are likely
to have more limited transportation facilities available to them in comparison with the
young.
Amongst the study participants, more females were using the scheme in comparison
to males. A few justifications can be assumed. It is clear that the scheme has enabled
women, who are likely to be excluded from receiving care when care is costly (see
Table 7.3), to utilize health-care services. The assumption is that the higher number of
females may be utilizing care because of two reasons. First, women do not have
access to health-care services in the initial phases of the disease (probably because it
is not affordable to them within the weak public health system where insurance
generally does not cover outpatient and primary care services) and therefore more
women reach advanced stages of the disease which leads to higher utilization of
RSBY scheme by women as it covers inpatient services. Therefore, women are
getting access to health-care services when the disease has spread and requires
inpatient treatment. Using South African data, Irving and Kingdon reported a
significant pro-female bias among prime age persons (ages 16–40), i.e. their health
expenditure was high but they received care later (Irving and Kingdon, 2008). A
second probable reason for high usage of the scheme by women could be the fact that
most of the selected empanelled health facilities had gynaecology services. In terms
of social class, among the majority groups, a significant number of the general and
OBC participants were utilizing the private hospitals, while a majority of the SC and
ST participants were availing services from public sector facilities.
Such a pattern of scheme utilization where the objective of the scheme is empowering
the poor to access private facilities, but still Muslims, SC/ST and illiterate or literate

299
up to primary level are using more of public hospitals than private hospitals may point
towards social inequity under the scheme (indeed if private hospitals are considered to
be better than public hospital).
Process of service delivery
Information to participants regarding cost of treatment and facilities available under
the scheme was poor in both the districts and it was poorer in Yamunanagar district.
In the present study, it appears that the implementers have simply failed to comply
with the contract clause that specifically requires such information to be provided to
the participants at the time of admission.
In the present study, very few hospitals provided food to the RSBY participants and
only a few study participants received transportation reimbursement. As perceived by
the participants, the main reason was that the hospitals did not have the facilities to
prepare food. At the time of empanelment, information regarding availability of such
services was not ascertained, as this was not part of the selection criteria for
empanelling hospitals. Moreover, accounting procedures do not require reporting of
provision for food or transport although these costs are included in the capitation costs
for treatment. Monitoring of the quality of food and reimbursement of costs incurred
would require a strong monitoring and supervision mechanism. Non-existence of such
a mechanism has been questioned in the present study.
Facilities were selected by the participants on the basis of access and not on the basis
of the type of care provided. Access played an important role that superseded the kind
of care given to the beneficiaries, as the beneficiaries had limited availability of
transportation. Proximity to the facility is an important consideration for the
beneficiaries due to the opportunity cost of being away from work, since most of the
beneficiaries are daily wage earners for whom a visit to the hospital may result a loss
of daily wages.
While making inter district comparison, Patiala was found to be doing better than
Yamunanagar with regard to most of the aspects of service delivery. This may be
more likely due to the difference in organizational structure of RSBY scheme in both
the districts. SNA in Punjab is led by PHSC, whereas SNA of Haryana is led by
ESIC. Moreover in Haryana, the scheme is implemented through hired consultants of
the RSBY society. Since, it is the department of health in Punjab which is

300
implementing the scheme; it enables them to better manage the scheme when
compared to Yamunanagar where management is basically contracted out to the
Department of Labour and Employment. During Private and Public comparison, it
was observed that public and private hospitals did not differ much in terms of service
delivery which is a contradiction to the general perception of private being better.
User satisfaction
Participants from Patiala, private hospitals and RSBY reported a better user
satisfaction. Probably, as the assessment of quality of hospital care was self-reported,
RSBY beneficiaries who are generally deprived of care are grateful for whatever
facilities are provided to them. This segment of the population is unaware of the
dynamics of insurance schemes. Therefore, in terms of user satisfaction, a perception
bias may exist for RSBY participants. This is reflected in the present study as the
RSBY beneficiaries reported greater satisfaction for aspects that would have been the
same as for non-RSBY participants (e.g. cleanliness, as all the patients would have
access to the same areas in the hospitals).
Financial protection
Despite having enrolled into a cashless insurance scheme, RSBY beneficiaries
incurred OOP expenditure. This was pronounced in Yamunanagar but not so in
Patiala. The evidence of increased OOP is consistent with findings from other
countries with regard to health insurance schemes for the poor (Acharya et al., 2012).
The RSBY insurance scheme, an example of a PPP, was designed to take advantage
of provider pluralisms; but it is important that the private sector does not induce
higher costs in comparison with the public sector.
7.9 Conclusions
Socio-demographic characteristics of the participants indicate that there could be
certain aspects of inequity in the scheme with the Muslim population, illiterates and
SC/STs using more of public hospitals when compared to private hospitals. Private
hospitals were better in terms of structural aspects; however the results were
statistically non-significant. In terms of service delivery, Patiala was found to be
slightly better when compared to Yamunanagar. Public and private hospital

301
comparison showed that both the hospitals were almost similar in terms of service
delivery. For user satisfaction, participants from Patiala, and private hospitals were
more satisfied in terms of services offered. User satisfaction was also reported to be
slightly better for RSBY participants when compared to non-RSBY participants.
Finally, it was observed that in spite of the scheme being a cashless scheme, RSBY
beneficiaries incurred OOP expenditure, though this expenditure was less than non-
RSBY participants. Moreover, OOP expenditure was relatively high in private
hospitals when compared to public hospitals.

302
Chapter 8
OVERVIEW OF FINDINGS
303
Chapter 8
OVERVIEW OF FINDINGS
This study focused on studying the availability, provision and use of health services in
the implementation of RSBY and the factors that might influence it, in order to inform
policy for improvement in scheme design. Specifically, the research focused on
analysing the external environment (regulatory and political), institutional capacity
and contract design of the scheme to understand its strengths and weaknesses and the
incentive structures created by division of roles, responsibilities and relationships
within the contracts. In addition, the research evaluated the availability and
accessibility of services and analysed the utilization patterns. Lastly, the research
compared the provision of health care across both public and private providers for
RSBY beneficiaries and between RSBY and non-RSBY beneficiaries for a specific
type of provider.The findings of the study from key stakeholder’s interviews, exit
interviews, checklists and secondary data analysis are presented in this chapter. These
findings are presented in accordance with the three objectives of the study.
8.1 Objective 1
To analyse the external environment (political, regulatory), institutional framework
and contract design of the RSBY scheme, in order to understand the strengths and
weaknesses of the RSBY scheme design and incentive structures created by roles,
responsibilities and relationships within the contracts.
8.1.1 External environment
Political scenario: The findings of the study indicate that the launch of RSBY scheme
was politically driven, introduced by the then ruling party in a rush for quick political
gains before the General Elections in India in 2009. Consequently, the scheme was
poorly planned and may have lacked the careful attention to detail needed to sustain
the programme and make it highly successful. The design of RSBY also requires
political commitment at the state level, since the state government has a key role as a
facilitator in the implementation of the scheme with a variety of players from the
public and private sectors.

304
A comprehensive evaluation of existing schemes scattered across the states was not
carried out. Lessons from a similar scheme, the failed UHIS, do not seem to have
been incorporated. Some similar schemes implemented in various other countries
such as Vietnam, Thailand and Philippines were reviewed; however, the lessons of
these reviews do not seem to have served as guides in defining this scheme.
In the chosen States of Punjab and Haryana that this thesis examines, for the period
from the latter part of 2011 to the beginning of 2013, Haryana had a Congress-led
government while the ruling party in Punjab was the Akali Dal which frequently sees
itself as a party strongly in opposition to the Congress. It was observed in the present
study that having the same or different ruling parties at the Central and State level did
not affect the implementation of the scheme.
Though changes have been introduced over time to make RSBY more functional,
gaps still exist which need to be addressed. Interviews with key stakeholders indicate
lapses in contract design, conflict of interest, lack of monitoring and supervision and
accountability.
Regulatory framework: The regulatory framework is very weak, particularly for
private health facilities. There is minimal regulation of private practitioners, nursing
homes and hospitals. Even that minimal regulation, as seen in Chapter 5, is not
followed. Despite a substantial presence of private institutional providers in the
country, information regarding their number, structure, functioning, type and quality
of care remains grossly inadequate. Neither a listing of private health facilities nor a
record of services being provided by them is available. On the other hand, the public
health sector, being subject to public audit, is obliged to comply with some minimum
requirements. For regulation of the insurance companies and the TPAs, IRDA was the
regulating body. Guidelines for insurance companies and TPAs were mandatory,
without which they would not get the license to provide health insurance in the
country. A License was also necessary for an insurance company to participate in the
bidding process of the scheme.
8.1.2. Institutional Framework
The study shows that no formal organizational structure supporting RSBY was put in
place. The existing structure of the Directorate General Labour Welfare was used to
roll out the scheme with existing government functionaries being assigned additional

305
responsibilities. This again was more a matter of expediency. The MoHFW was
hesitant to take up the responsibility of implementing yet another health insurance
scheme after the earlier failure of the UHIS. Thereafter, RSBY was initially located in
the Ministry of Finance, and then moved to the MoLE, which lacked the experience to
implement a health scheme of such complexity.
The agencies responsible for RSBY in the two states under study are supervised by
different government departments. In Punjab the PSHC has responsibility for the
scheme, which is supervised by the Department of Health and Family Welfare, while
in Haryana it is the ESIC, which is supervised by the Department of Labour and
Employment. The Department of Health will always remain an important stakeholder
of the scheme, as it primarily deals with health. The scheme becomes challenging in
states like Haryana, where the implementing authority is other than the Department of
Health. Very few human resources from the government have been provided for
RSBY in either of the states; the existing staffs of the relevant departments have been
assigned additional responsibilities for RSBY.
8.1.3. Policy and Guidelines
Designing the scheme, standardizing processes and preparing policy guidelines is the
responsibility of the Central Government. Though state governments had the
flexibility to amend these and introduce innovations, this was rarely done, as it needed
the prior approval of the central government. Since RSBY has been an evolving
model, some of the policy guidelines have been formulated after its launch in April
2008. Depending on the feedback from the state level implementers, additional policy
guidelines or changes to previous guidelines have also been introduced in subsequent
years. One such example is the enrolment criteria where a household headed by a
woman was originally not eligible to be included in the scheme. State level
implementers confirmed that policy guidelines were updated with each subsequent
insurance cycle.
8.1.4. Roles and Responsibilities
At the Central level, the Central Government has various responsibilities such as
oversight of the scheme, financing the scheme, setting up parameters (benefits
package, empanelment criteria, BPL criteria), hardware specifications (systems and
smart card), financing management/training, setting rate schedules for

306
services/reimbursement rates, developing clinical information, developing systems for
monitoring/evaluation, monitoring state level use, other patient information and
monitoring national RSBY information and training.
The state government, along with the Central Government, also looks at the financing
of the scheme and the setting up of parameters like the benefits package,
empanelment criteria and BPL criteria. Additionally, the state government has the
responsibility of setting up the SNA, which has the overall responsibility of
implementing the scheme. The specific role of SNAs are—contract management with
the insurer, enrolment, training outreach and marketing to beneficiaries, financial
planning and management, setting rate schedules for services and reimbursement,
developing clinical information systems for monitoring/evaluation, monitoring state
level use and other patient information and training. Some of these functions are done
in conjunction with the Central Government (Table 8.1).
The roles and responsibilities of the insurance companies and TPAs relates to
accreditation/empanelment of providers, collecting registration fees, enrolment,
actuarial analysis, claims processing and payment, outreach/marketing to
beneficiaries, monitoring at provider level and other patient information, customer
service and training of hospital staff (Table 8.1).
While enrolling the participants, the insurance company is assisted by the FKOs such
as ASHAs and ANMs. Other activities of the insurance company include customer
services and monitoring (Table 8.1). TPAs primarily support the insurance companies
during the process of enrolment, empanelment and claim settlement.
It is evident that most of the roles and responsibilities are with the central government
and the insurance companies; while the state government plays a facilitators role.

307
Table 8.1: Roles and responsibilities of Central and State government, insurance
companies and TPAs.
Central State Insurer/
TPA
Oversight of scheme X X
Financing X X
Setting parameters (benefits package, empanelment criteria,
etc.)
X
Hardware specifications (IT Systems, Smart Card, etc.) X
Accreditation/Empanelment of providers X
Collecting Registration Fees X
Enrollment X X
Setting rate schedules for services/reimbursement rates X
Claims processing and payment X
IEC, Outreach, Marketing to beneficiaries X
Monitoring and Evaluation X X X
Training X X X
The contracts between the state governments and insurance companies do not mention
the role of the TPAs. However, insurance companies in both states hired TPAs to
facilitate enrolment and also to help with disputes arising from the management of the
enrolment process. Notably, the TPAs did not play a role in the processing of claims.
This could be because ICICI Lombard is a large insurance company with a high
annual turnover of revenues and adequate human resources and could therefore
process claims in-house. It was, however, seen in other states where there were public
insurance companies that the role of the TPAs was significant in claim management
as well as enrolment.
Conclusively, RSBY is independent of the usual governance bodies that seek to
address health and poverty issues. As most of the responsibilities were contracted to
the insurance companies, SNAs became weak, which led to RSBY being considered
to be more of a hospital-centric and insurer-centric scheme rather than a beneficiary-
oriented scheme.
8.1.5 Contract Design analysis
Formal or informal contracts exist between the six stakeholders namely, Central
Government and state government; state government and the insurance company;

308
insurance company and public and private providers; insurance company and TPAs.
Contracts under RSBY were standardized and states used the same contract.
Although there is room for innovation and additions in the existing framework of
RSBY in the agreement of the Central Government, the states under study had not
exercised that flexibility.
Contract design analysis was done at three levels of implementation: (i) between the
centre and state; (ii) between the state and insurance company; and (iii) between the
insurance company and service provider. These were part of the formal contract
which existed in the scheme. However, an informal contract also existed between the
insurance company and TPAs.
The contractual agreement between the Central Government and the states was
identical for Haryana and Punjab. The contract was not specific regarding which state
authority would be signing the contract agreement and allowed flexibility to the states
to assign a state implementing agency. The purpose of the contract was clearly
outlined - to provide social security to the BPL workers and their families in the
unorganized sector. The period of contractual agreement is not mentioned in the
contract document. The contract clearly defines the roles and responsibilities of both
parties involved, the Central Government and the SNA. Monitoring mechanism and
monitoring parameters by the central government has not been stated in the contract
document. Also, there was no mention of the empanelment criterion of the health care
providers in the contract document. Also there was no mention of the incentive
structure under the scheme (Table 8.2).
The contractual agreement between the state government and the insurance company
for the chosen districts was almost identical. Coincidentally, the insurance company
for the selected year of study in the chosen districts was ICICI Lombard General
Insurance Company for both states. The contract between the state government and
the insurance company was the most comprehensive contract in RSBY with details of
contract commencement, duration and termination clearly specified, unlike the
contract of the Central and State Governments where the period of the contractual
agreement was not specified. This is due to the large share of responsibility that the
insurance company undertakes in the implementation of the scheme. There are 32
articles listed in the contract document, supplemented by 16 annexures. The

309
empanellement criterion for the health care providers has been clearly stated in the
contract document. One major gap in the contract design was – the monitoring
strategy which was loosely stated in the contract document wherein the monitoring
mechanism and parameters were not defined. There was no mention of the resources
required for monitoring and supervision at district level and the incentive structure for
the insurance companies under the scheme.
Contract between the insurance company and the health provider: Two contracts were
analysed (between the insurance company and the health provider), one for Patiala
district in Punjab state and the other for Yamunanagar district in Haryana state. Roles
and responsibilities of both the parties and specifications of sanctions were clearly
defined. However, the monitoring and supervision strategy was missing, also there
was no mention of the incentive structure for the insurance company and the
providers in the contract document (Table 8.2).
The contract agreement between the insurance companies and the TPAs was finalised
without undergoing any bidding process. The TPAs were selected based on their
reputation and previous experience with the insurance company. No parameters were
defined for renewal of contract.
Table 8.2: Contract design analysis
Central &
state
government
State &
insurance
company
Insurance
company &
provider
Ownership √ √ √
Objective √ √ √
Length of the contract X √ √
Payment mechanism √ √ √
Roles & Responsibilities √ √ √
Empanelment Criterion X √ NA
Monitoring mechanisms X X X
Specification of Sanctions X √ √
Incentive Structure X X X

310
Contract Implementation
Human resources: Human resources were not sufficient for implementation of the
scheme at the state and district levels. At the district level, the nodal officer is the only
dedicated RSBY staff from the state government for scheme implementation. At
hospitals, round the clock availability of support staff was necessary for RSBY work,
which was lacking. Even the insurance companies lacked manpower, with just one
officer at district level looking after 2-3 districts at a time, in addition to responsibility
for other schemes.
Insurance companies and market competition: A total of 27 health insurance
companies were present in the market, offering health insurance coverage to the
population. Of these, 21 were from the private sector and six belonged to the public
sector. Some degree of market competition was present for the insurance companies
in Patiala district and this competition, in terms of numbers, varied over the years.
Though there were less public sector health insurance companies present in the
market, their involvement in the bidding was comparable to the private sector in terms
of number of bids made. Also, public sector insurance companies were more
consistent in terms of their participation.
Financial resources: Premiums were paid by the Central and state governments in the
ratio of 3:1. The premiums varied from state to state, depending on the insurance
company. The premium collected by the insurance company from each family was
INR 30 (£ 0.3). A declining trend of premiums was observed at the national level and
state level.
Enrolment: The entire responsibility of enrolment of beneficiaries was outsourced by
the state government to the insurer. The contract between the state and insurance
company is for one year and hence enrolment of the beneficiaries needs to be done
every year. Yearly enrolment of the beneficiaries requires additional human and
financial resources. This process is considered flawed by all stakeholders for several
reasons, the primary one being that BPL listings do not change yearly. Even in 2011,
the 2001 census list, which was the most recent year of census, was used for
enrolment since an updated list of BPL families was not available. Secondly, due to
the time consuming process of re-enrolment, which results in delays, a family is often
short on enrolment cycles and loose access even though they pay for whole year.

311
Empanelment of health facilities: Empanelment of public and private facilities was
done by the insurance company in consultation with the state nodal officers. Several
issues were raised by various stakeholders regarding the process of enrolment. It
appeared that the insurance firms did not start with a list of hospitals available for
empanelment; indeed, such a list may not even have been available. Quality of care
that a potential empanelled hospital was required to provide was not among the
selection criteria.
Fixed package rates: Under RSBY, there is a fixed capitation for every treatment in a
package of care. The rates within the package (package rates) are predetermined by
the Central Government. The state government has the authority to revise the rate at
the state level after approval from the Central Government. However, such
amendments were rarely practised. Private providers, especially from Patiala, were
not satisfied with the package rates. The private providers felt strongly that package
rates were not realistic and were set far too low. They also suggested that it was
unviable to have the same package rates across the entire country and that these
should be based on the local situation in each state. The programme managers were of
the view that the process for deciding the package rates was well thought out and that
the package rates of services provided under the scheme by the health facilities were
at the appropriate level. On the other hand, service providers, especially private
providers, were of the view that package rates were meagre and good quality services
could not be provided at such rates. Package rates may have serious implications for
the scheme. On one hand this may affect the premium, making it too expensive for the
government; on the other, it may affect the level of incentive for the providers, which
can further affect the quality of services.
Monitoring and supervision: Monitoring and supervision was a weak component
under the scheme. There were no separate financial or human resources allocated for
these tasks nor was there any strategic framework for monitoring and supervision,
specifically in the context of periodicity, accountability, task allocation, and
performance indicators. The contract between the state government and the insurance
company did not lay down a reporting schedule or a format. Monitoring and
supervision was mainly carried out by the insurance companies (where there is likely
to be a conflict of interest) while there was no strategy to monitor the insurance
312
company. Proper oversight was a glaring gap. At the central level, a technical cell was
engaged in overall monitoring and supervision including data handling and
management.
Training: Training at the Central level was weak and the staff was mainly trained on
the job. State level workshops were organized to train staff regarding implementation
of the scheme. District and block level workshops were conducted where staff of all
hospitals had been trained. The district level workshops involved the business process
outsourcing, public relations officer, deputy commissioner and sarpanch (village
headman), all of who confirmed that they had been given training several times. The
insurance company in Patiala stated that they had trained both private and public
providers regarding scheme implementation and claim reimbursements.
Issues with equipment: The providers reported that there were several issues related to
registration equipment at the health facilities provided by the insurance company.
Break down were reported and repairs were not immediate.
Awareness: The beneficiaries were not fully aware of the services available in the
scheme or at various health facilities. The Beneficiaries did not know how to locate
the empanelled hospitals. A different kind of absence of information was apparent
when a provider stated that private providers were not aware of the scheme; that is
why they were not available for empanelment.
RSBY was meant to be a cashless scheme so that beneficiaries did not have to make
any payment if they were admitted to a health facility as an RSBY beneficiary. Even
the cost incurred before and after the admission (for a certain period) is to be covered
under the scheme. However, the study shows that OOP expenditures of the
participants were high. The families of beneficiaries were paying for medicines,
diagnostics, food and transportation, items that are provisioned in the contract to be
paid for by the caregiver.
The scheme is not entirely a paperless scheme, since a parallel system of hard copies
along with electronic copies exists (Chapter 5). Hard copies are more susceptible to
changes by health service providers and they also run the risk of being replaced.
Being paperless can be an advantage, as records once entered and updated in the
electronic version cannot be altered later, thus preventing service providers from

313
indulging in fraudulent activities. On the other hand, in case of an electronic machine
breakdown, insurance companies would gain by not getting the equipment repaired,
which would lead to a drop in claims, since the providers would be unable to admit a
patient under RSBY in the absence of an electronic check of the patient’s biometrics.
Paperless schemes, if strictly implemented, can increase transparency.
8.2 Objective 2
To evaluate the availability of services through mapping the health-care providers
including the packages offered by the empanelled health-care providers, and
analysing the utilization patterns.
8.2.1. Access to services under RSBY
It is to be kept in mind that beneficiaries of the scheme are BPL families. Generally,
these families survive on daily wages. Therefore, geographical accessibility of
services is a priority for beneficiaries, as availing the RSBY services from a far-flung
location would entail long travel time and affect their daily wages.
In Patiala, the public empanelled facilities seem to be more equitably distributed
throughout the district as opposed to private facilities, which seem to be
geographically clustered around pockets at the sub-district level, mainly around
Patiala sub-district. Seven private hospitals and 10 public hospitals were empanelled
in Patiala district.
A majority of the private facilities are clustered around Patiala sub-district. Non-
empanelled private facilities are clustered in Patiala sub-district and some in other
sub-districts. However, there are several public non-empanelled facilities that are
dispersed around the district. The volume of empanelment of facilities seems to be
aligned to BPL population density.
In Yamunanagar, very few public facilities were empanelled under RSBY. Almost all
the empanelled facilities in the district are from the private sector and were clustered
around the Jagadhri sub-district.
There are several public non-empanelled facilities that are dispersed around the
district. The private non-empanelled facilities are again clustered around Jagadhri
sub-district. The volume of empanelment of facilities seems to be aligned to

314
population density with the highest BPL population. Therefore a majority of the
empanelled facilities were in Jagadhri area.
The current process of empanelment has resulted in the majority of hospitals being
empanelled from urban areas. This is primarily because of a fewer number of
hospitals in rural areas, and even these rarely meet the eligibility criteria. Health
facilities providing only primary care were not empanelled under the scheme. The
rural population therefore had to travel long distances to avail health services.
Even in urban areas, distributions of the empanelled hospitals in the two districts were
found to be clustered in one or two sub-districts, thereby aggravating the accessibility
issue. Moreover, the number of hospitals empanelled under RSBY was very few. Due
to this gap, accessibility is likely to be a major challenge for the rural population.
8.2.2. Availability of services
Empanelled hospitals lacked many required departments. Super-speciality
departments were negligible in public hospitals. None of the public hospitals in either
of the districts provided all the packages of the RSBY scheme. A few private
hospitals in Yamunanagar provided all facilities but none of the private hospitals in
Patiala provided all facilities. Medically managed diseases (MMD) general (surgical
and non-surgical), obstetrics and gynaecology, and paediatrics were the departments
available in most of the empanelled hospitals.
8.2.3. Enrolment under RSBY Scheme
In the present study, those enrolled under the RSBY scheme amounted to,
respectively, 15% and 40% of the total BPL population in Patiala district and in
Yamunanagar district. Issues such as non-availability of an accurate list of eligible
candidates and the process of re-enrolment by the insurance companies aggravated the
situation. The maximum number of individuals that can be enrolled per family under
the scheme is five. The average number of individuals enrolled per family in the
present study was slightly more than half of this. This confirms that adequate
enrolment per family is not being done. Either the insurance company is deliberately
not enrolling all the family members, or the family is hesitant to enrol all its members.
It was found during the course of the research (as reflected in Chapter 6) that the
population enrolled under the scheme mainly belong to the economically productive
315
age group. In Patiala district, the highest enrolment rate was for the age group 25–64
years (62% of the population of this age group), while the enrolment for the elderly
age group (>64 years of age) was only 27%. Similar data was not available for
Yamunanagar.
Off-targeting was more likely for SC/ST, illiterate or literate up to primary level and
Yamunanagar, while it was likely for females. Leakage (non-BPL population getting
enrolled in the RSBY scheme) was more likely in Patiala district. However, it is to be
noted that for estimation of off-target and leakage, the sampled population from
health facility was taken (exit interview) which may not be the ideal setting for such
estimation. In Patiala district, the enrolment rate for the age group 25–64 years, and
elderly was comparable and hence there were no signs of adverse selection. Also, the
proportion of children enrolled under the scheme was very low. Similar data was not
available for Yamunanagar district. Enrolment of females under the scheme was
almost similar to the enrolment of males across all the age groups, though, it was
slightly more than males for the age group 25 to 64 years.
8.2.4 Scheme Utilization
The major findings of scheme utilization are summarized in Table 8.3. A comparison
of scheme utilization was made between the districts of study (Patiala and
Yamunanagar) and between the providers in those districts (private vs public
hospitals). The number of claims in Yamunanagar was almost six times the number of
claims in Patiala district. The number of claims per 100 population enrolled was also
twice in Yamunanagar as compared to Patiala. Higher claims in Yamunanagar may be
attributed to better accessibility in the district because of higher number of
empanelled hospitals. Other factors contributing to the low service utilization in
Patiala could be the relationship between the insurance company and the private
providers and the satisfaction level of the providers with the package rates. It was
noted in Chapter 5 that in Patiala district, the relationship between the insurance
company and the private providers was not healthy. Their resentment stemmed from
the feeling that the package rates were not sufficient.
In order to assess the effectiveness of state-level implementation, consistency across
public and private hospitals was checked. The findings for public and private
hospitals varied across the parameters studied in the present study. In terms of service

316
delivery, Yamunanagar was more consistent with the presence of a RSBY helpdesk,
information received from the RSBY helpdesk, provision of food and transportation
reimbursement. Patiala was more consistent in diagnostics and medicines organized
from outside the hospital, the process of discharge, OOP expenditures and overall
rating of the hospital. The high discrepancy observed in the difference of claimed
amount and reimbursed amount in Patiala (particularly in private hospitals) is a matter
of concern. It is noteworthy that the numbers of claims in Patiala district were low;
however, the claimed amounts were high. Such a situation raises the possibility of
providers trying to compensate losses due to low service utilization with higher claim
amounts.

317
Table 8.3: Scheme utilization comparison between districts and type of facilities
Patiala vs Yamunanagar Private vs public hospitals
Claims Claims made in Yamunanagar district were six
times more than those made in Patiala district.
However, claims per 1000 family enrolled in
Yamunanagar were almost two times of Patiala. The
number of claims per 1000 individuals enrolled
under the scheme was 25.9 for Patiala district while
it was 36.4 for Yamunanagar district. Most of the
claims belonged to the age group 25–44 years,
followed by the age group 45–64 years in both the
districts. In Patiala, more females have used the
services while in Yamunanagar, more males have
used the services.
Services availed the paediatric age group was very
less.
Most of the claims were made for the head of the
households or their immediate relatives—spouse,
son or daughter.
In both the districts, more
claims were made in private
hospitals. This was
significantly very high in
Yamunanagar district.
More males were going to
private hospitals whereas
more females were going to
public hospitals. In terms of
trend of claims over the
month, a fluctuating trend
was observed.
Clustering of
claims
In Yamunanagar district, about half of the claims were from four hospitals (out of
37 empanelled hospitals), all private. In Patiala district, about two thirds of the
claims were from 3 hospitals (out of 17 empanelled hospitals) – 2 private, 1 public.
Reimbursed
amount by
insurance
companies to
providers
The mean amount per case reimbursed to hospitals
by the insurance company was more in
Yamunanagar district as compared to Patiala
district.
In Yamunanagar district, reimbursed amount by the
insurance company was almost equal to the amount
claimed by the hospitals; whereas in Patiala district,
the reimbursed amount was much less than what
was lodged by the facilities with the insurance
companies
In Yamunanagar, about three fourths of the
hospitals were not getting the reimbursed amount in
time. Data was not available for Patiala.
The reimbursed amount was
higher for public than
private hospitals in Patiala
district while it was
marginally higher for private
hospitals in Yamunanagar.
Difference in claim amount
and reimbursed amount was
primarily observed in public
hospitals.
Difference
between
premium and
claim
The difference between the premium collected and
claims disbursed was higher for Patiala as compared
to Yamunanagar
Not relevant
Diagnosis In Patiala district the most common package used
was MMD (general) followed by MMD (ICU),
general surgery and gynaecology. Whereas in
Yamunanagar, the most common package was
MMD (general) followed by ophthalmology and
MMD (ICU).
In private hospitals, the most
common package was MMD
(general) followed by
ophthalmology and MMD
(ICU). In public hospitals
the most common package
used was MMD (general)
followed by general surgery
and gynaecology.
Length of stay Mean length of stay of the beneficiaries in the
hospitals was higher for Patiala district as compared
to Yamunanagar district.
The mean length of stay was
significantly more in public
hospitals when compared to
private hospitals. The
difference in stay between
private and public hospitals
was more in Patiala district
as compared to
Yamunanagar district.

318
8.3 Objective 3
To compare the provision of health care across both public and private providers for
RSBY beneficiaries and between RSBY and non-RSBY beneficiaries for a specific type
of provider.
8.3.1 Socio-demographic characteristics
Most of the study participants were in the age group of 25 to 44 years. It appears that
younger patients tend to go to private hospitals and older ones to public hospitals.
More females were utilizing facilities as compared to males in both public and private
hospitals. Muslims, SC/ST, and illiterate or literate up to primary level were using
more of the public facilities as compared to the private.
8.3.2. Structural aspects
From the self-assessment tool - Health Provider Checklist, private hospitals reported a
better score than public hospitals under all categories of structural-aspect evaluation
in both districts. These were confirmed by the Observation and Facility Record
Checklist. For availability of records, private hospitals were almost similar to public
hospitals, except for six categories (mopping, toilet sanitation, autoclaving, grievance
redressal, radiology services and in-patient evaluation) where private hospitals were
better than public hospitals. Overall, structural evaluation was found to be better for
private hospitals. However, this should be cautiously interpreted as none of these
differences were statistically significant.
8.3.3. Service delivery
The major findings of service delivery are summarized in Table 8.4, with a
comparison between the districts (Patiala vs Yamunanagar) and between the providers
(private vs public). A mixed response was observed for various service delivery
categories studied, though, Patiala seemed to fare better in most of these categories
(Table 8.4). Between public and private hospitals, service delivery in public hospitals
was better in some aspects and private hospitals in other aspects. Registration fees
were paid by all participants; however, the use of this registration fee was unclear.
Insurance companies considered the registration fees to be a part of their first
instalment, while the policymakers considered it to be for administrative charges. As
all the participants had paid registration fees, it could be possible that insurance

319
companies ignored those eligible people who could not pay this amount. In the
present study, most of the hospitals were not providing food to the RSBY participants,
despite this being clearly stipulated in the contract document. Since the cost of the
food is included in the package rate, the providers could be retaining that amount, or
using it for cost-offsetting purposes. It was also observed that where food was not
provided, hospitals did not have facilities to prepare food. Such a situation is
indicative of a flaw in the empanelment process, since availability of catering services
should have been a factor in the empanelment process or identified during monitoring
and supervision.
Reimbursement of transportation cost is another service that is included in the
package rate but was not given to any participant in Yamunanagar, while only half of
the participants in Patiala received it. This is another lacuna which works to the
advantage of providers, and adds to their profit.
Access to facilities played an important role in the selection of a service provider, and
superseded the kind of care given to the beneficiaries. Proximity to the facility was an
important consideration for the beneficiaries due to the opportunity cost of being
away from work, since most of the beneficiaries are daily wage earners for whom a
visit to the hospital could result in a loss of that day’s wages.

320
Table 8.4: Service delivery across district and private vs public
Patiala Yamunanagar Private Public
RSBY Help desk
Separate RSBY help desk 42.1 2.1 28.5 16.1
Staff at RSBY help desk was helpful
and polite 95.4
97.4 95.9 96.9
Waiting Period (<15 Min) 71.3 85.3 82.4
74.1
Process of
Registration
Fingerprint scanner used for
fingerprint verification 97.4 97.4
97.4 97.4
Information
received from
RSBY help desk
Information about treatment cost given
to the patient 48.2 8.4
24.9 32.1
Patient was informed about the money
left in the smart card 41.0
10.5 22.3 29.5
Patient was informed about
insufficient money in the card 20.0
0.0 21.7 12.0
Diagnostics and
medicines (OOP)
Patient asked to get diagnostic test
from outside the hospital 13.8 21.5
21.8 13.5
Patient asked to get the medicines
from outside the hospital 7.7
16.2 15.5 8.3
Food provided to patients during hospital stay 20.5 36.1 34.7
21.8
Process followed
during discharge
Discharge summary given to patient at
the time of discharge 84.1
100.0 89.6 94.3
Fingerprint verification at time of
discharge 94.4 97.9
96.9 95.3
Patient informed about balance amount
in card at discharge 47.7
20.4 33.9 34.4
Transportation cost reimbursed by hospital 45.1 0 18.1
27.5
Post-
hospitalization
knowledge &
expenses
Knew about 5-day post-
hospitalization expenses 30.3 6.8
19.2 18.1
Medicines were provided by the
hospital 86.9
100.0 89.4 97.3
Diagnostic test was done free of cost 11.1 0
0.0 11.1
8.3.4. Comparison for choice of hospital, transport and diagnosis
A comparison was made between the district, across private and public hospitals and
RSBY and non-RSBY participants. Table 8.5 details the comparison including the
reason for choosing the hospital, previous facility contacted, transportation and
diagnosis of the participants. In Patiala district, a majority of the participants did not
contact any health facility before coming to the present one, whereas in Yamunanagar
a high percentage of the participants had contacted a health facility before getting
admitted to the present one. A direct visit to an empanelled public health-care facility
at the secondary level of care without contacting any facility at the primary level
could be indicative of a weak referral system in the district of Patiala, or it could be

321
due to lack of information. Ideally, those seeking health care in public health
facilities should first visit primary care facilities closer to their homes, which would
refer them to secondary care hospitals as needed.
Table 8.5: Comparison for choice of hospital, transport and diagnosis
Patiala Vs Yamunanagar Private vs Public RSBY vs Non-RSBY
Reason for
choosing hospital
In Patiala, hospitals were
primarily chosen by the
participants because of proximity
whereas in Yamunanagar they
were chosen on relatives and
friends advice.
Private hospitals were chosen
primarily because of the
reputation of the hospital
whereas public hospitals were
chosen because of the proximity.
Most common reason for
selecting the hospital for RSBY
participants were relative/friend
suggestions followed by
preferred hospital (always go to
the same hospital) and
reputation. Whereas non-RSBY
participants selected the hospital
based on reputation followed by
relative/friend suggestion and
proximity.
Previous facility
contacted
In Patiala district, majority of the
participants had not contacted
any health facility before coming
to the present one; whereas in
Yamunanagar, a high percentage
of the participants had first
contacted a health facility, many
of them were individual private
practitioners.
About one third participants
from private hospital and half of
the participants from public
hospital did not contact any
health facility before coming to
the current facility.
About one third RSBY
participants and half of non-
RSBY participants did not
contacted any health facility
before coming to the current
facility.
Transport
Both in Patiala and
Yamunanagar, most common
mode of transport was three
wheelers.
In terms of mode of
transportation, bus was used
more commonly used by the
participants of public hospital
when compared to private
hospitals, both within the district
and across the district.
Bus and three wheelers were
used more by the RSBY
participants while car was used
more by non-RSBY participants.
Diagnosis
Almost similar pattern of
diagnosis was observed in
private and public hospitals,
except for slightly more cases of
orthopaedics in public hospitals
and slightly more cases of
urology in private hospitals.
The diagnosis pattern of RSBY
and non-RSBY participants was
also almost the same, except for
slightly more cases of
orthopaedics in non-RSBY and
general surgery in RSBY.
8.3.5 User Satisfaction
User satisfaction relating to experience during admission, hospital stay and discharge
including availability of wheelchair and care from nurses and doctors, was better
among the participants of Patiala district when compared to Yamunanagar. User
satisfaction seemed to be significantly better among the participants from private

322
facilities when compared to participants from public facilities. When comparing user
satisfaction of RSBY participants with non-RSBY participants, the former was
slightly better. Table 8.6 makes a comparison of user satisfaction across various
groups studied.
Table 8.6: User satisfaction
Process Patiala Yamunanagar Private Public RSBY Non
RSBY
Experiences
during
admission
Bed made available at time
of admission 98.2 98.0 97.0 99.4 99.0 97.3
Availability of Wheel chair 96.8 100 98.8 96.8 100 97.1
Hospital Staff Pushed
wheelchair 88.2 64.8 82.1 76.2 83.7 77.9
Time taken by nursing staff
(Less than 30 min) 77.2 96.6 90.4 81.6 88.1 84.3
Time taken by doctors 68.7 83.5 79.8 70.8 78.2 72.8
Care from
nurses
Nurses treat patients with
courtesy and respect 85.2 80.3 86.6 78.8 86.5 79.1
Nurses listen carefully to
the patients 87.5 83.2 89.7 80.7 87.6 83.2
Nurses explain things
nicely 86.2 75.5 85.9 75.9 81.9 80.5
Patients get help as soon as
he/she wanted it 83.6 54.8 75.4 67.2 67.8 75.4
Care from
doctors
Doctors treat the patients
with courtesy and respect 86.2 86.9 90.7 81.9 88.1 84.9
Doctors listen carefully to
the patients 87.5 82.1 90.7 78.5 85.8 84.1
Doctors explain things
nicely 85.5 72.9 84.9 73.7 80.3 78.8
Hospital
environment
Patients’ surroundings &
bathroom clean 80.7 85.2 92.7 71.7 85.0 80.5
Patients’ beds found quiet
at night 78.2 86.3 90.4 72.5 83.2 80.8
Experiences
in Hospital
Patients’ get help to go to
the bathroom or for bedpan 72.5 70.7 78.6 63.0 72.8 71.2
Hospital staff help to
reduce the patient’s pain 89.5 89.9 92.9 85.9 91.2 88.2
Hospital staff explain about
the medicine & SE 71.9 24.2 62.2 47.3 55.4 54.9
Discharge
Experience
Staff enquire from the
patient if any help required 99.2 96.3 99.2 96.3 98.4 97.3
Suggestion for any follow-
up 98.7 93.2 97.2 94.9 97.4 94.8
Hospital Rating (out of 10) 7.9 5.5 6.9 6.7 6.5 7.1
Recommend Hospital to Friends 98.7 98.0 98.7 98.0 99.2 97.5
8.3.6. Out-of-pocket expenditures
OOP expenditure incurred in private hospitals was almost double that of public
hospitals. It was expected that OOP expenditure of RSBY beneficiaries would be

323
significantly less than non-RSBY beneficiaries. However, not much difference was
observed in the OOP expenditure of RSBY beneficiaries and non-RSBY beneficiaries
in Yamunanagar district, whereas in Patiala district, OOP expenditure of a RSBY
beneficiary was significantly less when compared to a non-RSBY beneficiary. Use of
the public sector facilities contributed to reduction in OOP expenditure. Data showed
that non-RSBY BPL persons used the public sector at a rate twice that of the use of
private sector, while the RSBY BPL populations seemed to use public and private
sector at the same rate. A more detailed examination, than is possible here, would be
required to yield a more nuanced illustration of whether the use of the public sector
would lead to a greater reduction in OOP expenditure than being enrolled in RSBY.
The present study points out certain gaps in the design of the scheme. Roles and
responsibilities of various stakeholders were not judiciously assigned in the contract
document. The insurance companies were responsible for empanelment of health
facility and IEC activities which is questionable as it has a direct relationship with the
revenue generation. The onus of scheme implementation is on the insurance company,
and the state government played more of a facilitating role. The Contract design also
lacked a robust ‘monitoring and supervision’ framework. There are in-built incentives
for various stakeholders under the scheme. Regulation for private providers in India is
very week which leads to variation in quality of care, in some case with little to no
oversight. RSBY at the time of empanelment has attempted to introduce an inspection
mechanism. However, follow up and monitoring post inspection is poor. Gaps were
also noticed in implementation as there was shortage of designated manpower,
package rates were debatable, accessibility to health facility was poor, and coverage
of the scheme was inadequate.
8.4. Study Limitations
Results of the study need to be cautiously interpreted as there were certain limitations
associated with the study. These limitations can be divided into two types. Firstly,
limitations associated with the data and secondly limitations associated with the study
design.
Data limitations: Complete contract analysis could not be undertaken because the
contract document between the insurance company and TPAs could not be retrieved.

324
Information regarding the bidding and the negotiation process was also not available.
The line listing of the BPL population was not available for Yamunanagar district and
therefore age- and sex-wise coverage of the scheme could not be assessed for
Yamunanagar as it was done for Patiala. About 43% of the empanelled hospitals
(Patiala 5, Yamunanagar 18) did not provide any data on the services available in
their hospitals. This information would have helped in understanding their eligibility
and the process of empanelment. The beneficiaries were mapped at sub-district level
and not below that because of the limitation of availability of GIS data at block level,
which was a further limitation. Market analysis could not be done for Yamunanagar
district as the insurance bidding information, over the years, was missing for
Yamunanagar district.
Secondary data analysis was carried out for the second objective; however, the quality
of the data available for the secondary data analysis could not be verified in the
present study. There was no separate source available to cross-check the data. In
India, private hospitals range from small nursing homes to big super-speciality centres
with varying degrees of quality of services (Thamba et al., 2012). One of the
limitations associated with the study was in the context of data analysis. While
making a public vs private comparison, data from all private facilities was managed
irrespective of the type of private facility with regard to quality, bed strength,
availability of services, etc.
Study design limitations: In relation to the design of the study, the RSBY beneficiaries
were identified from selected hospitals, though ideally both RSBY and non-RSBY
beneficiaries should have been identified through household surveys. Moreover, the
views of the beneficiaries regarding the scheme design were not collected in the
present study. Feedback information from the beneficiaries would have taken us
closer to the gaps. Qualitative methods (focus group discussions or in-depth
interviews) to obtain in-depth perceptions of the beneficiaries would have better
reflected the gaps in the scheme. Due to logistical constraints of the study, a purposive
sampling was used to select the RSBY empaneled hospitals in both the districts. The
result of the study should hence be cautiously interpreted and generalized.
Another limitation relates to the study area, since the study was conducted only in two
states. Moreover, the insurance company (ICICI Lombard) was the same in both the

325
selected districts and hence a comparison of the impact of the insurance company on
scheme implementation could not be studied. Majority of the RSBY participants
belong to the BPL population while non-RSBY participants may or may not. The
RSBY participants avail services without paying, while non-RSBY participants need
to pay for the same services. For these reasons, perceptions of the quality of care by
them may differ. It is likely that RSBY beneficiaries may be more favourable in their
judgement of the quality of care compared to non-RSBY participants, for the same
facility.

326
Chapter 9
DISCUSSION, CONCLUSIONS AND
RECOMMENDATIONS

327
Chapter 9
DISCUSSION, CONCLUSIONS AND
RECOMMENDATIONS
The findings of the study in accordance with the three objectives have been
enumerated in the previous chapter. This chapter takes the discussion further on
government failure including New Public Management and PPPs, and market failure
and PPPs (9.1), response of RSBY to equity concerns (9.2), examining the gaps in
RSBY as a PPP model (9.3), influence of contractual arrangements in meeting
RSBY’s aims (9.4) and concluding with recommendations for policy (9.5).
9.1 Government Failure
By 2000, several sources suggested that the public delivery of health services in India
was in crisis (Hammer et al., 2007). High absenteeism, low quality of clinical care,
low satisfaction level, corruption, high out-of-pocket expenditures, poorly maintained,
understaffed and ill equipped buildings, long waiting hours and indifferent attitude of
the health workforce in public facilities resulted in inefficiency, ineffectiveness, and
underutilization of services. As the public health delivery system failed, a private
sector emerged which could meet the demands for those better off. The inefficiencies
of the public sector affected particularly the poor.
This section broadly highlights four important aspects where the role of the public
sector was less than satisfactory which RSBY helped address through adopting
several different strategies. These strategies were: engaging heavily with the private
sector and thus bringing in market forces, providing subsidized health insurance for
the BPL population of India, and attempts to improve quality of services for the poor
through introduction of competition. The intention was to curtail catastrophic out of
pocket expenditure for health care though cashless provision of services and to
increase accessibility to care which the public sector had become unable to ensure.

328
New Public Management and PPPs
The need for reforms in India’s health sector has been widely discussed and addressed
by successive plan documents, the national health policy and by several national and
international experts and agencies. Reform proposals would include greater
decentralization and autonomy for the providers of health care, with the government
providing an enabling environment through planning, financing and regulating health
services and involving the private or non-state sector in provision of services. This
new approach, as discussed below, reflects New Public Management (NPM)
elements, elaborated in the Chapter 2 literature review, which advocates inter alia
competition (Walsh, 1995), efficiency through contracting the private sector (Heard et
al., 2011) minimal government, de-bureaucratization, decentralization and
privatization (Kalimullah et al., 2012). Some of these elements of New Public
Management were implemented in RSBY which includes the private sector in health
care delivery in an innovative way through a public private partnership model.
Partnership with the private sector has emerged as a favored approach to reforms, in
part due to this “new managerialism” and also because of resource constraints in the
public sector across the world (Michell-Weaver and Manning, 1992). There is a
growing realization that public and private sectors in health can potentially gain from
one another (Bloom et al., 2000, Raman and Björkman, 2008, Agha et al., 2003).
Involvement of the private sector is, in part, linked to the wider belief that public
sector bureaucracies are inefficient and unresponsive and that market mechanisms
will promote efficiency and ensure cost effective, good quality services (Diarra,
2001). RSBY reduces public sector engagement through a PPP model, harnessing the
private sectors’ energy and creating competition for the public sector.
Polidano rightly reports that many developing countries have taken up elements of the
NPM agenda, but have not adopted anything remotely near the entire package
(Polidano, 1999). There are arguments that the new public management (NPM) is not
appropriate to developing countries on account of problems such as corruption and
low administrative and regulative capacity (Polidano, 1999). The outcome of
individual initiatives depends on localized contingency factors rather than any general

329
national characteristics (Kumar, 2013). Though RSBY is modelled on a Public-
Private Partnership, which is reminiscent of NPM, the design of the scheme has not
completely adopted the NPM principles.
Hood (1994) has outlined seven principles of new public management for the public
sector, which are: professional management of public organizations; private-sector
styles of management practice; greater competition; explicit standards and measures
of performance; greater emphasis on output controls; greater discipline and economy
in public sector resource use and a shift to disaggregation of units in the public sector
(Hood, 1994). NPM envisages hands-on professional management of a public
organization where managers at the top level have clear assigned responsibilities
while limiting or eliminating vague diffusion of power. Such an arrangement can lead
to processes where those assigned responsibilities can be made accountable. However,
the present study on RSBY shows that managers ostensively held responsible for
implementation (head of the state nodal agencies) did not have complete authority.
For any change in the scheme, permission of the central government had to be taken.
This diffusion of power led to erosion of accountability. Accountability was also
compromised due to an absence of fixing clear roles and responsibilities of various
stakeholders. The state governments had outsourced most of their responsibilities to
the insurance firms and had thus reduced their own role.
RSBY was launched without putting in place any formal organizational structure. A
key element of NPM, disaggregation of the public sector into corporatized units of
activity, with devolved budgets, was not seen. Though the RSBY design allowed a
separate entity/structure for scheme implementation, this flexibility was left to the
states. Certain states adopted an independent trust to manage the scheme. But in the
two states of the present study, Punjab and Haryana, there was no separate
institutional structure established for implementation of the scheme. The existing
structure at the central level (the Directorate General Labour Welfare) and state levels
was used to roll out the scheme. This added extra work to the existing responsibilities
of the public servants, with no shifting of existing responsibilities or creation of
additional posts. The Nodal officer was the only dedicated RSBY staff at the district
level for implementation. This resulted in overloading the staff with new

330
responsibilities, for which no extra remuneration or any other incentive was given to
them. This was done more as a matter of expediency.
An important principle of NPM is performance management (Kalimullah et al., 2012).
However, RSBY does not have explicit standards and measures of performance.
Defined and measurable goals and targets are missing in the scheme. No monitoring
indicators have been included rendering it difficult to measure performance in a
quantitative or qualitative manner. In fact, quality of care was not taken into
consideration at any stage of the contractual engagement nor was it envisaged as an
outcome, although one of the objectives of the scheme was to provide quality care to
the poor. Monitoring of the scheme with regard to out-of-pocket expenditures, quality
of care and accessibility to services was missing. There was no mention of incentive
structures, based on performance, for any of the stakeholders (public or private) in the
contract document. The emphasis was more on implementation aspects such as
enrolment, empanelment of hospitals, IEC, service utilization, etc.
A model of bureaucracy is offered within public choice theory, resting on the belief
that public sector bureaucrats have little or no incentive to promote technical
efficiency (Bennett et al., 1997). They are seen as self-seeking, motivated only by
such factors as ‘salary, prerequisites of the office, public reputation, power, and
patronage’ (Niskanen, 1973). Public system actors, the property rights theorists argue,
lack ownership, as within the public system there is weakening of property rights.
There is lack of any obvious threat to the employment of the staff, resulting in a lack
of incentive for efficient performance. It is to be noted that the public cadre in India
is based on fixed salary, where employment is permanent. The property rights is
further weakened also in the state governments’ contracting most of the activities to
the insurance company with themselves primarily playing a facilitators’ role.
However, a shift to greater competition in the public sector, a key aspect of NPM, was
built in the scheme. Competition was introduced in the market within the private
providers and also with the public providers. There was a move towards term
contracts, public tendering procedures and introduction of market disciplines in the
public sector. This aspect of NPM brings in competition which is seen as a key
strategy to lower costs and provide better standards. Partnerships were based on

331
contractual arrangements. Some of them were fixed term. The bidding process for
contracting an insurance company was also based on public tendering.
In the states the study found that market competition, although weak, was present.
There were four public sector insurance companies who bid for the scheme
continuously for four years. The participation of the private sector varied and there
was only one private company which participated in the bidding process for all the
five years. As far as the providers were concerned, especially private providers, most
of them were concentrated in certain areas.
There was some degree of attention to private-sector styles of management in the
scheme as advocated by NPM. RSBY applied private sector management tools to a
publicly financed scheme. The scheme was designed so as to allow the private
insurance companies and TPAs (Third Party Administrators) to manage the process of
enrolment, empanelment and IEC. The insurance company had flexibility for
contracting the TPAs. The scheme, in reality, was managed by private insurance
companies and TPAs. The private providers managed the medical cases as per their
own protocols.
Stress on greater discipline and achieving economy in public sector resource use was
partially visible in the scheme. Payments to the providers were standardized. Based on
the package rates, a fixed payment was reimbursed to the providers for the services
provided by them to the beneficiaries of the scheme.
Package rates under the scheme were extensively discussed with various stakeholders
during the course of the study (chapter 5). Package rates are like a double edged
sword – high package rates would mean more profit for the providers, but higher
premiums from the government to insurance companies would adversely affect the
affordability of the scheme. On the other hand, low package rates would be a poor
incentive to provide adequate services to the poor by the private providers. Incorrect
fixing of package rates is a risk factor which can adversely affect the scheme. A
balance is, therefore, essential so that the providers are satisfied and the burden of
premium on government is sustainable. However, in the present study, it was apparent
that the two states have not yet found the best balance.

332
RSBY has thus adopted some of the elements of the NPM but where adopted, this has
been done only to some extent. Certain key elements of NPM were missing, as
reflected in diffusion of power with no clear lines of authority for managers; unclear
roles and responsibilities and lack of complete authority; lack of corporatized units of
activity with devolved budgets; no explicit standards and measure of performance,
and lack of monitoring. If these were present, it could have enhanced implementation
performance.
Financial protection for the poor
Even though health outcomes in India have improved over time, distribution of health
achievements continue to be strongly patterned along such dimensions as gender,
caste, wealth, education, and geography (Joe et al., 2009, Balarajan and Villamor,
2009, Sen et al., 2002). Amongst these, difference in health care services between rich
and poor has been a major concern for the government. In India, many among the
poor experience bad health, not infrequently as result of the low-level of income and
social marginalization (Deogankar, 2004).
It has been widely recognized that health insurance is one way of providing protection
to poor households against the risk of health spending leading to poverty. The poor
are usually unable or unwilling to take up un-subsidized health insurance because of
its cost, or lack of perceived benefits (RSBY, 2014b). Organizing and administering
health insurance, especially in rural areas, is also difficult. RSBY was introduced to
fill this gap and provide security from such risks to the poor. The scheme has made
provisions to take care of the health needs of a much neglected section of the
population which had limited access to care. BPL beneficiaries now have a choice to
obtain services with a fixed amount of subsidy from a private or public facility. The
exit interviews of the participants show satisfaction with the care and attention meeted
out to them in health facilities (Chapter 7). It is noteworthy that it is not the poor who
have to reach out to the insurance company; but it is the insurance company which
reaches out to the poor, although somewhat imperfectly as we noted. RSBY has
therefore helped to address the deficiencies of the public sector with respect to
helping the poor to access care.

333
Quality of care
Quantity rather than quality of health services has been the focus historically in
developing countries. Ample evidence suggests that quality of care (or the lack of it)
must be at the center of every discussion about better health (Peabody et al., 2006). In
India, nearly 30% at families are below the poverty line. Hence they can only access
government hospitals due to the free treatment provided. But Government hospitals
are known for their lack of sanitation and basic infrastructure like beds, qualified
doctors, sufficient medicines, inadequate quantity and quality of staff, underpaid and
unhappy staff, etc (Ramya, 2012). The attitude of employees is also not up to standard
in some hospitals. Timely services and presence of staff is one of the major concerns
in these hospitals. Infrastructure and the 3M (Material, Manpower & Money supply)
in Government hospitals is also a big concern. Although the government provides free
medicines, improper storage in unhygienic conditions is commonly seen (Ramya,
2012). Quantitative improvements in service provision have been achieved in a
majority of the states; but quality of care still needs improvement. A disproportionate
increase in quantity without a proportionate increase in human resources and
adherence to acceptable standards has led to a compromise in quality (Sharma, 2012).
RSBY provided an opportunity for healthcare in the private sector to serve the poor.
The strength of the scheme lies in the fact that it is a social welfare scheme in the PPP
mode with inbuilt incentives for various stakeholders to motivate them to provide
quality services to the poor. The scheme has enabled the beneficiaries to use private
facilities, which are perceived to provide more services and better quality care, at no
extra cost. However, it is to be kept in mind that there are variations in levels of cost,
pricing, transactional conveniences and quality of services among private health
facilities. The scheme is so designed, that the beneficiary has the option to choose the
facility based on the quality of services, although there may be some practical barriers
to exercise such a choice. This study has shown that RSBY, according beneficiaries’
perception, has provided acceptable quality of health care, especially in private
facilities.

334
Out-of-pocket expenditures
Many low-income countries in all regions spend much less on health care than higher-
income countries and depend much more on private expenditures, mostly directly out
of pocket. The basic pattern of low health spending, heavy reliance on out-of-pocket
financing, and limited domestic resource mobilization holds for India as well (Gottret
and Schieber, 2006).
Several studies of Indian villages to determine why households descend into poverty
(Krishna et al., 2005, Krishna, 2006) have found that in a majority of cases of decline
into poverty, three principal factors are at work: health expenses, high-interest private
debt, and social and customary expenses. Despite a government owned free health
care delivery chain, 64% of the poorest populations in India are in debt every year to
pay for the medical care they need (Basu, 2011). During the period of the launch of
the scheme, national health accounts data revealed that the government sector (centre,
state and local) together accounted for only 20% of all health expenditures and 78%
were out-of-pocket payments – one of the highest percentages in the world (Ministry
of Health and Family Welfare, 2006).
Health Insurance is one way of providing protection to poor households by reducing
OOPs and improving access to health care. One of the objectives of RSBY was to
provide financial protection to BPL families against catastrophic health costs by
reducing out of pocket expenditures for hospitalization. The scheme was meant to be
cashless so that beneficiaries did not have to make payments while admitted.
However, families of beneficiaries were paying for medicines, diagnostics, food and
transportation items that are provisioned in the contract to be paid by the care giver.
Thus RSBY did not fully meet its financial protection aim.
9. 2 Equity Concerns in Health Insurance
Access to health care in an unregulated market depends on ability and willingness to
pay which leads to distributional inequity (Wolfe, 1993). The vulnerable and the
disadvantaged would suffer on the basis of age, disability, and gender. The
egalitarians argue that it is inappropriate that health care should be determined by
ability to pay. A strong profit making motive can create supplier induced demand

335
which can involve paying for a great deal of unneeded care. Given that the poor are
already stretched, the impact of a profit making health sector can be devastating.
Bennett et al. and Rosenthal identified unethical practices among private organization
to maximize profit, and lack of concerns regarding public health goals (Bennett et al.,
1994, Rosenthal, 2000). In the private sector, the basic motivation of the stakeholders
is profit, resulting theoretically in a strong thrust on the efficient use of resources
(Bennett et al., 1997). While private insurance companies can, at times, be overly
motivated by profit and therefore be subject to legitimate criticism, it is also necessary
to objectively look at the capacities of government agencies for enforcement of any
norm under political pressure (RSBY Committee, 2014). As a general rule, the private
sector is less interested in the poor who are not able to pay the full cost of services and
focus their attention on the wealthy. Although this should not be a concern when the
government forms a partnership with the private sector through purchase of services,
there remains a concern that the private sector may attempt to maximize its profits by
providing lesser quality services to the poor (Mitchell, 2000)
Generally when markets fail to achieve efficiency economists note such occurrences
as market failure. Due to asymmetric information health insurance markets may fail to
materialize, requiring second best solutions either initiated by the government or some
other institutions. In the context of health insurance, there are several types of
problem relevant to equity: accessibility specially failure to reach remote places;
equality - poorest population excluded from private health insurance and
ineffectiveness - cream skimming by the insurance companies where those ill may go
untreated.
Failure to reach remote places: Rural residents often experience barriers to healthcare
that limit their ability to get the care they need. Governments at various levels have
not been very successful in providing appropriate infrastructure in the rural areas
which sustain 70% of the Indian population. There are also other social and
environmental factors such as inadequate sanitation, unsafe water, unhealthy
environment, illiteracy etc., which result in poor health outcomes. Moreover,
ineffectiveness of the primary health care system which should serve as an entry point
in the rural areas results in a breach in the referral system (Singh and Badaya, 2014).
Utilization of services has been shown to be educational level and residence

336
dependent, with 70% of illiterates receiving no ANC care; and 43% of rural women
less likely to receive ANC services when compared with their urban counterparts
(Singh and Badaya, 2014).
In addition to having an inadequate supply of healthcare services in the community,
lack of health insurance or availability of quality free care further reduces access to
healthcare services. According to a 2008 report on health disparities, there are a larger
percentage of rural residents who do not have health insurance compared to urban
residents (Bennett et al., 2008). Rural uninsured are more likely to delay or forgo
medical care because of the cost of care compared to those with insurance (Rural
Health Information Hub, 2014). RSBY, by providing health insurance to the BPL
population, has increased access to healthcare services for the rural poor. However,
findings of the study show that, even though it was hoped that the new market of
entitled BPL beneficiaries available in the rural areas would incentivize the private
providers to open shop in remote areas that has not yet been the case. Most of the
private providers are clustered around urban areas.
Private Health Insurance and the poor
The private health sector in India has grown in an unregulated fashion, as there has
been virtually no effective guidance on the location, scope of practice, and effective
standards for quality of care or public disclosure on practices and pricing (Desai,
2011). Development of health insurance should result in an improvement in the
services provided by the private sector. As part of the liberalisation of the economy in
the early 1990s, the Indian government opened insurance (including health insurance)
to the private sector. With the advent of Private Health Insurance, the possibility to
access quality care from private tertiary care facilities opened for the higher income
groups. This provided financial risk protection to a relatively small segment of the
society. However, on the flip side, private health insurance resulted in cost escalation,
inequity in health financing patterns and raised questions on the cost-effectiveness of
healthcare. This is likely to be the case in a country that depends heavily on fee-for-
service and a large and unregulated private sector (Reddy et al., 2011b). Private
insurance also leaves out the low-income individuals, who may not be able to afford
the premium (Ahuja, 2004). The poor population had not been part of private health
insurance schemes, especially in developing countries, for a long time (Sekhri and

337
Savedoff, 2004). Providing health insurance to the poor, who are considered to be at
high risk of disease, at a low premium, would mean a loss to the private insurance
companies. Such gaps can only be filled by social security schemes of the
government, such as RSBY. The strength of the RSBY lies in the fact that it is a
social welfare scheme, which offers financial protection while at the same time using
the profit made by the various stakeholders acts as a catalyst (Swaroop, 2012). It is a
scheme in which private partners have as much a stake as the government.
Cream Skimming and Provider Induced Payment
Adequate risk pooling is necessary for market sustenance of health insurance. Two
forms of cream skimming can be seen in health insurance. One is cream skimming by
the insurance company, where the insurance company would enroll the healthier
population (Acharya et al., 2012). In such situations there needs to be the second
best solution of mandated risk-pooling through compulsory enrolment of all in a
population pool. Another form of cream skimming occurs when medical
professionals, under capitation payment systems, favor easier caseloads over more
complicated cases (Levaggi and Montefiori, 2003).
The poor rarely can afford to pay for insurance; and further the likelihood of
becoming ill may be greater among the poor. Thus, RSBY sought to rectify the
inherent cream skimming that leads to non-existence of insurance markets for the
poor. Elderly, children, females and lower caste population are at higher risk of health
ailments and can under RSBY use the scheme. In the present study, cream skimming
by the insurer was partially evident as the enrolment of children and lower caste was
relatively lower when compared to their share of the population. However, enrolment
of elderly and females were comparable to other age groups and males respectively.
The enrolment of these high risk groups is discussed in detail in later part of this
section. Das and Leino have also showed little evidence of “cream-skimming” by the
insurer in RSBY (Das and Leino, 2011).
In this study there was some suggestive evidence that private providers were focusing
on some conditions with higher profit margins. For example it was clearly evident that
private hospitals were treating more ophthalmology cases, particularly in Patiala. The
cost involved in ophthalmological interventions (which primarily consists of cataract

338
surgery) is low with a high profit margin (Shiva, 2010). Another high profit margin
intervention was ICU care, which again was high for the private sector in the present
study. Both of the above findings indicate providers might have induced services that
are unlikely to be needed. This may point towards possible horizontal cream
skimming, i.e. treating only patients with specific diseases. Further, there is evidence
in the present study that the regulations for the private sector were weak and providers
(private) were not happy with the fixed package rates. Thus, they had an incentive for
choosing easier caseloads and recommending unneeded services where little work
would be undertaken. This could point towards vertical cream skimming, i.e. opting
for specific patient types within the same ailment group. However, this study was not
able to examine vertical cream skimming.
9.3 Gaps in RSBY as a PPP model
This section covers scheme inception including external environment (political and
regulatory) and the institutional structure. It also examines the gaps in scheme design
and implementation.
Scheme Inception: External Environment and Institutional Structure
The external environment that has an implication on the effective implementation of
RSBY primarily constitutes the political environment and regulatory framework.
India is a federal parliamentary democratic republic, wherein the President is the head
of the state and Prime Minister is the executive head of the government. India follows
a federal system, which consists of a strong government at the centre, and state
governments at the secondary level. The political environment plays a significant role
in the outcome of any scheme. The RSBY Committee report of 2014 mentions
political interference as one of the most important reasons why the social welfare
schemes flounder and lose track (RSBY Committee, 2014). Key stakeholder
interviewers in the study stated that since RSBY was one of the flagship initiatives of
the then political party in power, the Congress-led United Progressive Alliance
(UPA), there was a significant push to launch the scheme before the General Elections
in 2009 to garner votes. A similar conclusion was drawn by a study in Maharashtra,
which surmised that such schemes are usually announced during the election time for

339
political gains (Thakur, 2015).This research also confirms that since the scheme was
launched in a great rush due to political pressure, adequate attention was not given to
efficient design of the scheme. Best practices from around the world were not
adequately reviewed. The design of RSBY requires political commitment at the state
level, since the state government has a key role as a facilitator in the implementation
of the scheme with a variety of players from the public and private sectors. Rai (2012)
from the Asian Development Bank reported that one of the strengths of RSBY was
that it was implemented by states with different political parties at the helm of affairs.
Another study by Rai and Rai observed that even though the scheme was politically
motivated (as the hurried roll-out of the scheme suggests), it had not been inhibited by
political ideologies (Rai and Rai, 2010). In the present study, during the period from
the latter part of 2011 to the beginning of 2013, Haryana had a Congress-led
government while the ruling party in Punjab was the Akali Dal, which strongly
opposed the ruling party at the Centre, the Congress. However, it was extremely clear
during key stakeholder interviews that the political differences in ruling parties at the
Central and state level did not affect the implementation of the scheme.
The RSBY Committee report points out that there is enormous pressure on politicians
from their constituencies asking for favours, because of which governments are
increasingly looking for external private agencies to act as a buffer against such
pressures. The Committee pointed out that several state governments have initiated
health insurance schemes through private insurance companies, which act as the
interface with the public at large. While private insurance companies can, at times, be
overly motivated by profit and therefore be subject to legitimate criticism, it is also
necessary to objectively look at the capacities of government agencies for
enforcement of any norm under political pressure (RSBY Committee, 2014).
Strong regulation is crucial for good governance. The literature review stated that
PPPs do not necessarily decrease the work of government, but on the contrary, they
may well increase the workload since they entail a greater need for regulation
(Regional Training Institute, 2014). Regulation often entails a mechanism of checks
and balances in order to create the right incentives and penalties to ensure successful
implementation of a scheme. At its most basic level, regulation seeks to manage
behaviour in order to produce desired outcomes (Coglianese, 2012). In the present

340
study, it was observed that even though a complex regulatory framework exists in
India, with an extensive set of legal instruments such as the Indian Penal Code, the
Indian Contract Act and the Law of Torts, effective enforcement and implementation
remains problematic (Gupta and Rani, 2004, Peters and Muraleedharan, 2008). The
regulatory framework for the Insurance companies and TPAs under IRDA is robust;
however, the regulation of private providers and nursing homes remains challenging,
both politically and practically. A weak regulatory framework of health providers has
a serious impact on RSBY implementation, which was evident in the findings of the
present study. Firstly, the voluntary nature of registration of the private health
facilities under the state registering authority limits the pool of health facilities that
can be empanelled under the scheme, as there are many hospitals that do not get
themselves registered. This results in low-level empanelment, which in turn
exacerbates accessibility to health care by the beneficiaries. Secondly, a weak
regulatory framework can also result in a poor monitoring and supervision structure
that leads to inaction against the erring health facilities. This affects successful
implementation, as is evident in the present study. Although there were several
incidences of breach in contract, there was still no evidence of any action being taken
against the errant stakeholder.
The impact of the institutional framework in scheme implementation is enormous and
can be seen in the present study. RSBY was launched without putting in place any
formal organizational structure, and the existing structure of the Directorate General
Labour Welfare at the central level was used to roll out the scheme. Again, this was
more a matter of expediency. The agencies responsible for RSBY in the two states
under study are supervised by different government departments. In Punjab, the
PSHC has responsibility for the scheme, which is supervised by the Department of
Health and Family Welfare, while in Haryana it is the ESIC, which is supervised by
the Department of Labour and Employment. The effect of the difference in
organizational structure in the two states can be perceived in scheme implementation.
Since the Department of Health engages closely with hospitals and health issues, it is
likely to be better placed to deliver health care services than the Department of
Labour. However, the Department of Labour is better equipped to enrol the poor for
deeper penetration of the scheme as it deals more closely with the functioning of the
informal sector. The need for engagement across Ministries for more efficient scheme

341
implementation is shown by a study in the state of Gujarat where an interdepartmental
task force consisting of Labour, Health and Rural Development Ministries has been
set up (Seshadri et al., 2011). The results from the present study show that the
Department of Health in Punjab was better in terms of service delivery, transportation
reimbursement, higher empanelment of public facilities and over all user satisfaction
(Table 7.61). In addition, overall user satisfaction by the participants for the hospital
in Patiala was 7.9 (out of 10), while it was 5.5 in Yamunanagar. However, the
Department of Labour and Employment in Haryana was better at enrolment,
empanelment and number of claims. Key stakeholders interviewed felt that it was
easier to work with the Health Department (Punjab) rather than the Labour
Department (Haryana).
Interestingly, on 1st April 2015 the Central Government has transferred RSBY from
the MoLE to the MoHFW. This could have been done pursuant to the Government’s
decision to make RSBY a part of the National Health Assurance Mission (Press Trust
of India, 2015), which falls under the mandate of the MoHFW. The Government
believes that the provision of health services is the core competence of the MoHFW
and the issuance of insurance cards has to be separated from service delivery to
capitalize on expertize of different ministries.
Scheme Design and Implementation
The first major challenge with the scheme is the design of the scheme itself. There are
certain glaring gaps in the design which were apparent after review of key documents
in addition to key stakeholder and exit interviews. As pointed out previously,
immense political pressure to launch the scheme on a hurried timeline is the possible
reason for these gaps. Major gaps that exist primarily relate to the allocation of roles
and responsibilities, enrollment of beneficiaries, empanelment of hospitals and
monitoring and evaluation. We have already discussed the challenges that presented
due to the institutional frameworks or lack thereof. In retrospect, this institutional
flexibility afforded to states, on where to house the scheme, could be viewed as a
double edged sword. On the one hand, it afforded easier buy-in from the states to
absorb the scheme within existing structures thus increasing adoption of the scheme
pan India and promoting a more integrative approach. On the other hand, the weak
capacity of the states to handle such a sophisticated scheme was never addressed from

342
the start by providing supporting institutional frameworks with associated budgets and
training.
Allocation of roles and responsibilities was done loosely for the various stakeholders
involved and compromised accountability. The understanding of contracting model
and the responsibilities associated with it was lacking on the part of the regulators at
the state and the district level especially relating to the transaction costs. Various
literature has reported that contracting out services increases transaction costs, e.g.
costs involved in negotiating and monitoring contracts and servicing of contractual
commitments (Saltman and Otter, 1992, Robinson, 1990). In the present study, it was
found that the transaction costs were not considered in depth in terms of planning and
implementation. It is worth noting that the scheme was designed by the central
government and was presented to the state governments for implementation with the
responsibility to make changes as per the needs of the differing states. But the state
governments rarely practised any such authorization, primarily because of the
transaction costs involved and the lack of capacity at state level to introduce changes.
One glaring example of this concerned the revision of package rates. During key
stakeholder interviews with the private providers it was evident that the private
providers were extremely dissatisfied with the package rates and insisted that annual
cost of inflation and variation in cost of care between states and within rural and
urban areas be considered in determining package rates. However, probably due to the
high transaction costs involved, the state governments did not actively engage in
revision of package rates at the state level and adopted the centrally determined
package rates.
In terms of scheme design vis-à-vis enrolment, there are two aspects that need to be
considered. First is the frequency of enrolment i.e. annual enrolment and the problems
associated with it and second is the coverage of enrolment relating to adoption of the
scheme. Findings of the present study validate the conclusions of Das, who believes
that a major factor that affects regular access to health care is the yearly renewal of
the contracts of insurance companies (Kannan and Varinder, 2012). The contract
between the state and insurance company is for one year and hence enrolment of the
beneficiaries needs to be done every year. Key Stakeholders when interviewed clearly
stated that yearly enrolment of the beneficiaries requires immense human and

343
financial resources and is considered burdensome and redundant because BPL listings
do not change yearly. In addition, the enrolment cycle is interrupted annually because
it takes three months to reissue the insurance smart cards and this process becomes
more challenging when the insurance contract is given to different companies in
successive years. Das supports this finding and states that in Orissa considerable time
was wasted in implementing the insurance contract for a new company (Kannan and
Varinder, 2012). Moreover, the entire enrolment process has to be repeated when a
different company is given a contract for the second year and results in the
beneficiaries being deprived of coverage during that time. It is likely that awarding
longer-term contracts with insurance firms with proven track records and moving
away from contracting annually would reduce a large amount of transaction costs. As
pointed out by Das (Kannan and Varinder, 2012), this arrangement will also provide
coverage to those patients whose card expires while they are in the hospital.
Coverage of RSBY in terms of enrolment of the beneficiaries is the primary
responsibility of the insurance company. The low state wide enrolment rate of 60%
and 28% in the states of Haryana and Punjab, respectively, reported by Kannan and
Varinder (2012) is similar to the findings of the present study which only looks at one
district in each state and confirms an enrolment under the scheme at 42% in
Yamunanagar (Haryana) and 15% in Patiala (Punjab). Even though the scheme had
been operational in the selected districts for several years, the enrolment stood at less
than half in both districts. Evidence from other studies show that awareness of public
programmes and trust in them, distance to health-care facilities and institutional
rigidities within the health-care system can play a major role in limiting insurance
enrolment (Basinga et al., 2010, Wagstaff, 2007). Review of literature on the
assessment of IEC activities points to other studies, that show that there was
ineffective IEC under the RSBY scheme (Trivedi and Saxena, 2013, Mahadevia,
2012). In the present study, interviews with the stakeholders also confirm that
possible reasons behind this poor enrolment could be poor IEC activity by the
insurance company or non-engagement of the local bodies such as Panchayats or self-
help groups. Other literature supports this finding and points out that the enrolment
could be better if some of the activities were delegated to the Panchayats such as
provision of suitable place for registration, crowd management, standby arrangement
344
in case of power failure, late delivery of smart cards, etc. (Kunhikannan and
Aravindan, 2012).
In terms of scheme design vis-à-vis empanelment of facilities, the main issues
concern the lack of sufficient empanelment of hospitals, geographical clustering of
facilities in the district and availability of few services at the empaneled hospitals.
In studying the empanelment under the scheme, poor access to health facilities due to
low empanelment, is noticeable in both districts. Literature shows that non-
availability of RSBY empaneled hospitals in the vicinity has reduced the scheme’s
acceptance in some areas (Health Inc Consortium, 2014). In the present study the
data shows that in Patiala, out of the total number of 115 facilities only 17 were
empanelled and in Yamunanagar, out of 123 facilities only 37 got empanelled. Of the
empanelled hospitals, the 37 empanelled hospitals in Yamunanagar district were to
provide services to a population of 165,809 enrolled under RSBY and in Patiala, only
17 hospitals were empaneled to serve a population of 38,278 enrolled under the
scheme. Similar findings have also been reported from other states such as Karnataka
(Rajasekhar et al., 2011). There could be several reasons for the low number of
empaneled hospitals observed under the scheme. Misalignment of incentives might be
a plausible reason where insurance companies are empaneling fewer hospitals in order
to reduce accessibility and thus hope to minimize claims in order to increase their
profit. Review of other studies show that insurance companies try to suspend or de-
empanel hospitals for small infractions, and even for unintentional mistakes (Khurana
and Dave, 2016). Another reason for low number of empaneled hospitals could be the
poor understanding of empanelment guidelines by the doctors or administrative heads
as was the case in Chhattisgarh in a study done by the Council of Tribal and Rural
Development (Council of Tribal and Rural Development, 2013).
Moreover, the current process of empanelment has resulted in the majority of
hospitals being empaneled from urban areas. This is primarily because the number of
hospitals in rural areas is small, and these hospitals rarely meet the eligibility criteria
of empanelment under the scheme. This raises concerns around the strong possibility
of the rural population having to travel long distances to reach urban areas in order to
avail health services under the scheme. It would also be prudent to keep in mind that

345
beneficiaries of the scheme are BPL families who generally survive on daily wages.
Therefore, geographical accessibility of services is a priority for the beneficiaries as
commuting from a far flung location would entail longer travel time and affect their
daily wages. Other studies confirm that reduced accessibility due to unequal
geographic distribution of hospitals and quality health care facilities is a strong reason
for reduced claim and utilization rates of the scheme (Mayberry et al., 2006).
However, it is also important to keep in mind that in enhancing people’s geographical
access to hospital care, one also needs to balance the need to empanel hospitals that
provide quality care and are properly managed (Devadasan et al., 2013).
Turning to capacity of empanelled facilities, we find empaneled hospitals lacked
many required departments. Super-specialty departments were negligible in public
hospitals. None of the public hospitals in either of the districts provided all the
packages of the RSBY scheme. A few private hospitals (only 3) in Yamunanagar
provided facilities for all the care provisions within RSBY, but none of the private
hospitals in Patiala provided all required services. Similar findings have also been
reported by a study by Sethi et al. (2011)
In studying empanelment relating to accessibility and availability, attention is drawn
to another finding of the study, which deals with clustering of claims in a few selected
hospitals. In Yamunanagar district, about half (2,791) of the claims were reported by
four (all private) out of 37 empaneled hospitals, whereas in Patiala district, about two
thirds (673) of the claims were reported by three out of 17 empaneled hospitals. This
clustering of claims in a few selected hospitals may also be indicative of poor
availability and accessibility to healthcare services under the RSBY. However, there
could be several other reasons for such clustering, such as preference for private
hospitals, preference for treatment from bigger hospitals, etc.
Monitoring and supervision is one of the pillars of effective implementation of a
public private partnership through contracting. Williamson (1985) clearly points out
that weak monitoring and supervision will certainly hamper the implementation of
any kind of social scheme by the government (Williamson, 1985). Examination of
the contract documents under the present study clearly shows that the contract lacked
a comprehensive plan for monitoring and supervision at the design stage, both at the

346
state and district level. The process for monitoring and supervision was not clearly
articulated and there was no mention of the periodicity of monitoring or
accountability of the stakeholders. There were no dedicated human resources for
monitoring and neither was there any earmarked budget for it. Effective oversight
from the state governments is crucial to implementation of the scheme, but results
from the study show that it was conspicuously lacking, especially during the process
of enrolment of beneficiaries, empanelment of health facilities, awareness building
and facilitating implementation. Most of the activities were undertaken primarily by
the insurance company, where the incentives might have been misaligned or even in
conflict. Additionally the importance of monitoring is further heightened in the
contractual arrangements, where the contracts are of short duration and trust is an
issue between the stakeholders (Ojo, 2014). Inputs from key informants clearly point
to the fact that trust was still developing between the stakeholders and was in nascent
stages, given these new public private partnerships that came into play. Yet, it is
possible if there is to be renewal of contracts they are honored more strictly.
Results of the study show that weak monitoring was apparent in several instances
where there was a clear breach of contract, for example, delayed reimbursement of the
claimed amount by the insurance company, non-payment of transportation cost to the
beneficiaries, no provision of food to the beneficiaries in the hospitals, and lack of
information dissemination to the beneficiaries in the hospitals. The cashless system
somehow further managed to induce high OOP expenditure for the beneficiaries. In
addition, a separate RSBY helpdesk was observed in only 2 of the 12 selected
hospitals which were in direct breach of the contractual document. Also, signage for
RSBY at the facility level could be improved. The present study also shows that
providers, both public and private, are not sharing information regarding the cost of
treatment, money remaining on the smart card during admission and discharge, in
addition to pre and post hospitalizations benefits etc. Further, exit interview analysis
clearly shows that some ‘leakages’ were happening in the scheme, i.e. 15% of the
participants enrolled under the scheme were non-BPL.
Extensive literature review points towards the importance of relational contracting
which views contracts as relations rather than transactional (MacNeil, 1974). Such
contracts are “based on a relationship of trust between the parties. The explicit terms

347
of the contract are an outline as there are implicit terms and understandings which
determine the behavior of the parties”. In the present study, the contracts lean towards
relational contracting as part of the PPP framework. They adopt an approach of
harmonizing conflict and preserving relationships between the insurance companies
and the SNA’s and TPAs. Even though there were several instances of breach of
contract - this did not lead to sanctions. This is in concordance with what MacNeil
had stated regarding relational contracts that “…the primary need is of harmonizing
conflict and preserving the relationship (MacNeil, 1974, MacNeil, 1978). To take
recourse to legal proceedings for failings of stakeholders is perceived to be very
harmful to long-term relations between the stakeholders (Deakin and Wilkinson,
1995, Arrighetti et al., 1996, Williamson, 1985). In the present study, central level
policy makers were keenly aware of the need to nurture and build trust amongst
stakeholders for the long term success of the scheme. But the downside of this was
that contract observance was not well monitored or regulated, and monitoring and
supervision was very weak. A critical point is that the implementation of contracts in
India is very different from where the institutional and regulatory environment is
much stronger. Monitoring and supervision systems are likely to be more critical, the
weaker is the institutional and regulatory environment.
Finally, we need to consider effective risk pooling in the interest of long term
sustainability of the scheme. Risk pooling in a voluntary social health insurance
scheme such as RSBY can prove to be a challenge because it involves both the poor
and the less educated. Individuals from the low income strata may opt out of the
scheme as they have to pay a registration fee, even though it may be a small amount.
There is evidence that shows that even getting photographs can be a substantial
financial burden for poor families, as in the case of Indonesia (Sparrow, 2008). It is
also likely that the beneficiaries of the scheme, because of their poor educational
status, may not fully appreciate the full entitlement that the scheme offers and hence
may not get enrolled. There is evidence that shows that families headed by the more
educated households are the ones that are more likely to participate in insurance
schemes (Chankova et al., 2008, Giné et al., 2008). However, there can also be
adverse selection into the insurance with higher risk individuals making up the most
of the enrolees.
348
Results around effective risk pooling under RSBY are mixed. In the present study, out
of 247,998 and 393,304 eligible BPL population in Patiala and Yamunanagar
(respectively), only 38,278 in Patiala (15%) and 165,809 in Yamunanagar (42%) were
enrolled under the scheme.
According to this study in Patiala, enrollment pools of individuals under RSBY were
made up of the elderly population (> 64 years) which was 27.2% of the eligible
population in that age group. Those enrolled aged 25 – 44 years and 45 – 64 years
were 25.95% and 35.65% of the eligible population in that age group. Enrolment of
females was comparable to that of males (Chapter 6). These numbers by themselves
are of concern; the enrolment role is low for all age groups. However, the utilization
rates for the enrolled elderly population i.e. > 64 years (chapter 8) was less when
compared to other groups aged 25 – 44 years and 45 – 64 years. In addition, taking
scheme utilization into context, out of 38,278 and 165,809 individuals enrolled in
Patiala and Yamunanagar (respectively), 494 (1%) individuals in Patiala and 4252
(3%) individuals in Yamunanagar filed claims under RSBY. At least in terms of
claims, we do not find adverse selection. Further, it was observed in the present study
that there seems to be financial viability to the insurance company after all claims
have been paid.
9.4 RSBY – influence of contractual arrangements in meeting its
aims
This section summarizes to what extent contractual arrangements help RSBY to meet
the aims it might have been expected to achieve. This is considered under the
headings of equity, efficiency and incentives.
Equity
A report published by DFID in 2004 (England, 2004) mentions equity can be
effectively addressed with three strategies (1) establishing contractual arrangements
that specifically encourage providers to serve the poor and underserved; (2)
contracting with private providers in areas that are predominantly poor (geographic

349
targeting); and (3) contracting out services that are of most benefit to the poor and
underserved.
RSBY addresses the first issue through contractual arrangements with providers to
address the health needs of the poor. RSBY, as we show below, through its
contracting mechanism has improved equity; yet, much more can be done. The
scheme does enroll the most vulnerable sections of society though it leaves out the
non BPL population. Some states, however, like Kerala and Himachal Pradesh are
providing services to non BPL families which primarily include migrants, who are
vulnerable to a fall below the poverty line in case of catastrophic expenditures (Das,
2012).
Taking into account the goal of universal health coverage and a robust private sector
providing a majority of services in India, the scheme is playing a vital role in shifting
a proportion of burden of the public hospitals to the private hospitals mostly likely
without reducing the former’s allocations from the government. This controlled
burden, along with the funds generated through the scheme, may further help in
enhancing the quality of services in public hospitals, thereby addressing the equity
dimension in service delivery for those not qualifying for RSBY.
However, there are certain gaps in scheme implementation such as low enrolment,
low package rates, low claim rate, poor quality and range of services, some charging
of services, and OOP expenditures which could affect the equity factor.
The scheme showed poor enrolment with illiterates and SC/ST population less likely
to get enrolled.
Private providers are incentivized to make profits and lack of motivation regarding
patient well-being might lead them to turn away patients under the scheme.
The minority groups (SC/STs and Muslims) were using public facilities more when
compared to private facilities, even though the scheme makes it possible for
beneficiaries to use private facilities, which are perceived to provide a greater range of
services and better quality care. So the most vulnerable group among the BPL
population continues to use facilities which are perceived not to be of very high
standards, raising questions regarding equity under the scheme. Similar findings were

350
also reported by Thakur (2015) where through qualitative means, the author observed
that the scheme did not reach the intended beneficiaries in some areas, mainly,
illiterates, and excluded groups such as SC/ST and minorities, for example, the
Muslim population (Thakur, 2015).
In addition, due to many empanelled facilities not having the complete set of required
services, the poor may have had to turn to non-empanelled private facilities and incur
out-of-pocket expenditure.
With regard to contracting private providers in predominantly poor areas, RSBY did
not perform well which led to poor accessibility. The hospitals present in the rural
areas primarily consist of small private hospitals or primary health centres. The
empanelment criterion under RSBY is such that the hospitals present in the rural area
or in the hard to reach areas are not eligible to get enrolled, as it is very unlikely for
such hospitals to have laboratory facilities or in-patient facilities. As a result, hospitals
are clustered around the urban and sub-urban areas. Also, the exit interview data
suggests that about one-fourth of the participants would choose a health facility based
on distance from their homes, so access may have discouraged enrolment and use
(Itoli, 2013).
With regard to contracting out services that are of most beneficial to the poor as
propounded by DFID (three strategies stated above), RSBY contracted for in-patient
care only. Out-patient care was completely omitted from the contract. Literature
shows that most out-of-pocket expenditures are incurred for out-patient care,
particularly from purchasing drugs (Saksena et al., 2010). Though the scheme has
succeeded, to some extent, in providing quality services to the vulnerable groups,
clearly more needs to be done.
Efficiency in service delivery
Contracts in RSBY helped ensure efficiency by contracting private providers at a
fixed price and enabled rapid scaling up of health care services and user satisfaction.
Package rates were defined in the contract document between the insurance company
and the provider. Thus, enabling the provision of private services at a fixed price.
Since, the providers have to give services within the same package rates, variation in

351
quality of services was observed. Rigorous monitoring and supervision could have
ensured greater standardization of quality of services under the scheme.
The RSBY insurance scheme, as a PPP arrangement, was designed to take advantage
of provider pluralism; but in involving the private sector, care has to be taken that this
does not induce higher costs to beneficiaries when compared with the public sector.
The study findings show that RSBY beneficiaries did incur OOP expenditure; though
it was less than incurred by the non-RSBY beneficiaries most of whom were non
BPL. This is consistent with findings from the literature review in Chapter 2, where
there is mixed evidence of OOP expenditures from other countries with regard to
health insurance schemes for the poor (Acharya et al., 2012).
Within the country, findings from this study are consistent with what was reported by
Selvaraj et al. in a study conducted in Andhra Pradesh and Tamil Nadu for RSBY and
Rajiv Aarogyasri Scheme. It can be surmised that RSBY and other state government
based insurance schemes have failed to provide adequate financial risk protection
(Selvaraj and Karan, 2012). Reasons for incurring OOP could be that providers
sought payments that they were not supposed to, not many procedures are covered
and, further that, many of the expenditures that families incur during hospitalization
of a family member such as staying nearby the ill person are not covered.
The private health sector is growing rapidly across the developing world. People
increasingly rely on private health care organizations to address their health needs
(International Finance Group, 2011), making it important for the public sector to
engage with the private sector in order to rapidly scale up services. It was observed in
the present study that the private hospitals outnumbered the public hospitals. Thus
contracting with the private facilities under the scheme had rapidly enhanced access to
services. However, this was only up to a certain extent, as it was observed -
particularly in Patiala - that the number of hospitals contracted under the scheme was
few.
For user satisfaction, RSBY participants reported slightly better satisfaction when
compared to non-RSBY participants. There could be two reasons for better user
satisfaction expressed by RSBY participants. Firstly, as the assessment of quality of
hospital care was self-reported, RSBY beneficiaries who are generally deprived of

352
care may be grateful for whatever facilities are provided to them. This is reflected in
the present study as the RSBY beneficiaries reported greater satisfaction for aspects
that would have been the same for non-RSBY participants (e.g. cleanliness, as all the
patients would have access to the same areas in the hospitals). The second reason
could be in conformity with what was stated by Devadasan et al. that the insurance
scheme might have negotiated for better quality of care for its members and so the
insured would have received better quality of care and thereby would be more
satisfied (Devadasan et al., 2011).
Incentives
RSBY extensively relied on incentives within its various contracts to ensure desired
outcomes. However, the study shows that at times there was absence of proper
incentives within the contractual arrangement, and in some instances, there were
disincentives with respect to assignment of roles and responsibilities built into the
design.
According to the centre - state contract in RSBY, the states were responsible for
paying 25% of premium. This could deter some poorer states from participation.
Most of the responsibilities for implementing the scheme lay with insurance
companies, while the state government played merely a facilitation role, with limited
accountability. This also acted as an incentive for the state governments to adopt the
scheme. The insurance companies were also clearly incentivized to capture a large
segment of the previously untapped market. In addition, the premiums were collected
per family regardless of the number of family members enrolled. The incentive for the
service providers was clearly monetary by being presented with an additional revenue
stream. The additional revenue, coming from patients who did not generate revenue
before, has helped public providers in supplementing their under-resourced budgets,
thus maintaining their equipment or meeting day to day expenditures in running the
facility. The private providers have captured a new segment of the market, resulting in
increased volume of patients and in turn higher profits. This is said to have resulted in
smaller hospitals adding rooms and new hospitals being established due to increased
demand (Swaroop, 2012).

353
In the contracts of RSBY, there were omissions of certain types of incentives for the
stakeholders. These posed challenges. RSBY responsibilities were additional
responsibilities for state and district officials without any incentive for this increased
workload. This directly affected scheme implementation. Absence of sanctions for
poor implementation and similarly lack of incentives for effective scheme
implementation led to poor monitoring and supervision of the scheme.
Price was the only contractual arrangement with providers; rarely was any quantity
target associated either with enrolment or with claims filed vis-à-vis premium
collected in the contract document. A standard approach in principal agent theory is
to offer a schedule of price and quantity (or even quality) to which the agent
responds (Biglaiser and Ma, 1995). This approach was clearly missing when
incentivizing the agent in many of the principal-agent interactions.
Enrolment of beneficiaries and issuance of smart cards was the responsibility of the
insurance company. However, insurance companies were disincentivized to enroll up
to a maximum of five members in a beneficiary family, as allowed under the scheme
design, because the premium is determined per family and not on an individual basis.
An increase in enrolled individuals could lead to higher number of claims thus
reducing the profits of the insurance companies. This has also been documented in a
study by Sethi (2015).
There are also disincentives for adequate IEC by the insurance companies, which is
one of their primary responsibilities according to the contract document. Better
awareness of the scheme among the community could increase claims, which would
lead to a higher reimbursed amount. There was alarming evidence of poor
understanding of empaneled hospitals by the beneficiaries, knowledge of services
covered under the scheme and the facilities therein, which calls for an examination of
the strategies adopted by the enrolling agencies in the states with respect to RSBY
(Health Inc Consortium, 2014).

354
9.5 Conclusions and Recommendations
RSBY has provided heavily subsidized health insurance to more than 110 million
people (almost 10% of India’s population) (Ministry of Labour and Employment,
2014) and has become one of the world’s largest health insurance schemes (Ministry
of Labour and Employment, 2012b). The scheme is based on a Public-Private
Partnerships model governed through a series of contracts which enables the poor to
access private health services, which otherwise were unaffordable for them. The
strength of the scheme lies in the fact that it is a social welfare scheme with inbuilt
incentives for various stakeholders to motivate them to provide quality services to the
poor. Another feature of the scheme is that there is no age limit for beneficiaries of
the scheme. The fact that private service providers are interested in participating in
RSBY indicates that it is also a successful business model. RSBY today is also seen
as a successful PPP model in the context of its outreach and sustainability.
The present study identified certain gaps in scheme design, its implementation
relating to enrolment of beneficiaries, empanelment of health facilities, role of
insurance companies, contracting and regulation which affect the implementation of
the scheme. It also needs to be borne in mind that though the interviews were
conducted at national and state levels, the empirical data comes from just two districts
and the recommendations are on the basis of those findings.
RSBY is based on a PPP model and all the stakeholders, public and private, are
equally important for successful implementation of the scheme. Health care is an
important concern of the people of the country and is enshrined in the Constitution of
India (Articles 38, 39 and 47) and listed in the Directive Principles of State Policy
(Jacob, 2012). Provision of universal health care should be the mandate of the
government and not just of a ruling party. There has to be political unanimity for
health-care provision. Welfare of the beneficiaries has to be a top priority rather than
a means of political opportunism.
The MoHFW appears to be the most appropriate department for implementation of
the scheme, since RSBY is primarily concerned with providing good quality of
health-care services to the poor. MoLE is more oriented towards the identification of
the informal sector; enrolment of the beneficiaries by them could complement

355
MoHFW. An interdepartmental task force could be set up to enhance this
coordination.
State governments rarely make modifications to the contract design provided to them
by the Central Government. It has to be realized by the state governments that one
size does not fit all. The contract needs to be modified at the state level and if
possible, even at the district level in order to meet the requirements of local
conditions, which might vary from one setting to another. For this to occur, the states
need to commit additional manpower at a high level of administration; perhaps
capacity development may also be needed for pricing, monitoring and improving
contract specifications.
The functioning of RSBY should be more transparent. Important documents,
including contract documents, must be available in the public domain and there
should be an opportunity for the public to comment on the contract design. The role
of civil society has not been noted in most studies. Citizen health system monitoring
capacity may be an important missing element.
Fixing of roles and responsibilities of various stakeholders is an absolute necessity.
The state governments have outsourced most of their responsibilities to the insurance
firms and have thus reduced their own role. They presently only identify the insurance
companies on the basis of competitive bidding and provide them with a list of BPL
households. More active participation is required from the state governments,
especially during the process of enrolment, empanelment and awareness building.
Engaging Panchayat members (PRIs) and NGOs in the scheme could enhance
accountability (Whinney and Madiath, 2011) and boost the process of community
mobilization. Here, citizen monitoring may play an important role.
Since the process of enrolment consumes considerable time and manpower, yearly
enrolment of the same beneficiaries should be abandoned; instead, a provision for
addition or subtraction of a family member’s name from the smart card can be
initiated. Further, enrolment coverage should be strictly monitored so that there is an
increase in persons being covered under the scheme.
There should be a thorough appraisal and periodic revision of the BPL list by the
Government, although this issue goes beyond RSBY. The BPL database should be

356
centrally available. This would eliminate discrepancies in the BPL lists that are
provided to insurance companies at the time of enrolment and would enable better
identification of households. India’s rollout of the unique identification number (UID)
can also help in the process of enrollment. Since UID contains biometric
identification, it could speed up the process of enrolment and would also strengthen
the accuracy of the information. Additionally, it can supplement the centrally
available BPL records.
A provision for inclusion of individuals just above the poverty line should be formally
incorporated in the scheme. This section of the population cannot be neglected as they
are at high risk of slipping below the poverty line due to catastrophic medical illness.
The state governments can extend the coverage to the APL population by using their
own resources for providing cover over and above the RSBY cap. Perhaps there can
be some graduated premium payment from the users near the poverty line; such
schemes always need to be balanced by weighing implementation costs and costs
recovery.
Empanelled hospitals are few in number and are clustered in urban areas. There needs
to be a larger review as to whether this is a general problem or an issue in the studied
districts. In the case of rural areas, the eligibility criteria are such that many hospitals
cannot be empanelled under the scheme. A conscious effort needs to be made to
empanel more hospitals under the scheme without affecting the quality of services.
Inclusion of primary health-care facilities under the scheme could be helpful for
access and cost cutting. Rural facilities, mostly public, need to be strengthened to
secondary level facilities, so that they can be empanelled. Such a policy could be cost-
prohibitive and it may not be possible to include in the current health budget.
An awareness drive regarding the scheme, which highlights the benefits of the
business model, is warranted. It has to be ensured that coverage of the packages, that
is the services offered as part of the insurance package, are more comprehensive. This
can be done by empanelling more multi-specialty hospitals that have a track record of
good quality service. Care should be taken that the empanelled hospitals are spread
throughout the district rather than being clustered together in a sub-district.

357
Providers, especially private providers, expressed dissatisfaction with the package
rates, which calls for a revision. Annual cost inflation needs to be factored in while
estimating the package rates. It is also suggested that it may not be necessary to have
a uniform pan-India package rate. Package rates may vary from place to place
depending on the local settings. Uniform pricing can be a deterrent for providers to
participate in metropolitan areas where operating costs are likely to be higher.
To encourage improvements in quality, package rates could be linked to the
evaluation of the empanelled hospitals. One of the important components of this
evaluation could be the quality of service provided by the provider. By doing so,
package rates can be linked to the quality of services provided, i.e. higher rates for
higher quality of services. This will also enable and motivate multi-specialty private
hospitals with the highest quality of services to seek empanelment under the scheme.
One should caution that quality indicators are difficult to enumerate as well as being
difficult to observe.
The process of claim settlement should be streamlined so that private partners can
develop trust in the government process and are motivated to participate. The gap
between the date of claim application and reimbursement date should be strictly
monitored. Insurance companies should be penalized for failing to reimburse the
claimed amount to providers within the stipulated time period. There needs to be
transparency with respect to the amounts reimbursed to the providers. The reasons for
not reimbursing the claimed amounts must be provided as this would help in
reviewing the facilities of the provider.
The public hospitals have access to the reimbursed funds under RSBY. However,
there are no clear cut guidelines for the use of these funds. Hence, guidelines should
be established for the public hospitals to use the reimbursed amount in the interest of
improving the quality of services provided at these hospitals.
In order to provide adequate access to health care along with good quality of services
at different levels of health care, complementary approaches and inter linkages are
needed. An appropriate referral mechanism can be considered. These linkages and
referrals could also help to reduce the clustering of utilization in specific higher-level
facilities. There is an important lesson here from Thailand’s Universal Coverage

358
Scheme (UCS). If a beneficiary does not respect the referral system s/he loses the
right to free services. Use of a referral system should be encouraged and incentivized.
In the implementation cycle, defining, designing and planning of the programme
holds the key to successful implementation for achieving desired outcomes. A strong
monitoring and evaluation framework and plan needs to be incorporated in the
contract design with a separate financial budget and dedicated human resources. Third
party monitoring would be helpful and can bring significant quality improvements.
Provision for action against the erring companies/individuals should be included as
part of the monitoring and supervision plan. This could entail blacklisting of erring
companies for certain periods of time and termination of contracts, if found guilty.
Key indicators should be developed for regular monitoring. These indicators could be
based on the inputs, processes and outputs of the scheme. MIS data generated by the
providers must be regularly monitored. Regular internal and external audits of
insurance companies as well as the health service providers would add value. Regular
external evaluation of the scheme should become a part of the contract design.
For regulation of private sector hospitals stricter enforcement is required. Moreover,
clear guidelines are needed to register and monitor the quality of services being
provided by the health facilities. Hospitals can be graded in different categories
depending on the quality of services provided by them. This categorization will not
only be helpful at different levels of scheme implementation of RSBY, but will also
be helpful to the beneficiaries in selecting health-care facilities. It is recommended
that regular medical and social audits of the providers be conducted and sanctions be
imposed on the providers who do not follow the norms. A transparent public bidding
of contracts would be prudent. Contracts need to be signed after the bidding process,
which would include contracting of TPAs. The evaluation of quality of services being
offered by the providers (care from doctors and staff, hospital environment, admission
and discharge facility, and information dissemination) must be an important factor in
the process of contracting. This would ensure better quality of services from private
stakeholders. Given the problems with monitoring in health care, it would be better to
work with trusted insurance companies for a longer duration rather than signing a new
contract with a new company every year. There is a strong case for moving away
from an annual contract system to a longer term contract with insurance companies

359
who have a proven track record of good services. Penalties for failure to meet
contract requirements should be a part of these contracts. In case of breach of contract
by the stakeholders, appropriate penalties in the form of refund of premium or other
such fines can be imposed. Such penalties can be levied and welfare enhancing only if
there are clear monitoring indicators which actually reflect performance. It was
observed in the present study that mostly the monitoring indicators were not clear and
when clear, enforcement was difficult.
Capacity building of the lower level staff, who are in direct contact with the
beneficiaries, is highly recommended. Better training of lower health functionaries
can reduce barriers for the poor visiting a private facility. Capacity building of various
other staff, such as staff of SNAs, nodal officers, FKOs and others on different
aspects of the process of RSBY would be helpful.
IEC activities must be strengthened. Awareness about the benefits of social health
insurance and what constitutes good quality of health care should be imparted to the
entire community by means of an effective communication campaign. Capacity
building for those delivering IEC can be strengthened through enhancement of IEC
communication material, as this is crucial for spreading awareness among the
marginalized sections of the population. Socio-cultural issues need to be kept in mind.
For example, banners and posters will not benefit a population that is illiterate.
Therefore, a move away from the traditional methods of IEC to innovative strategies –
one that takes into account alternate media channels for targeting the poor and other
vulnerable groups, is recommended. Awareness among beneficiaries would also
improve the quality of services rendered by health service providers as the informed
beneficiary will demand better service.
RSBY is a scheme that promises cashless transaction for the beneficiaries. However,
this remains an unfulfilled goal, considering the high OOP expenditures incurred by
beneficiaries. Strict monitoring and supervision of providers would play a significant
role in cutting down the OOP expenditures of RSBY beneficiaries.
Increasing the reimbursement cap to more than INR 30,000 (£ 302) may play a
significant role in providing adequate social security and also increase the enrolment
rate. This may well be possible given the government spending on health is among the

360
lowest level of public spending in the world at less than 2% of GDP. Further, the
present cap under RSBY appears quite low when compared to other schemes such as
Rajiv Aarogyasri, which offers benefits to the extent of over five times that of RSBY.
However, these state level schemes are more focused on providing tertiary care while
completely omitting primary and secondary levels of care. Increasing of the cap above
INR 30,000 (£ 302) and incorporation of outpatient care can be tried on a pilot basis.
If the pilot is financially viable, it can be scaled up.
In terms of facilities under the scheme, the inclusion of outpatient care could
significantly increase the financial protection of households. Most of the OOP
expenditure is incurred on outpatient care, and particularly on medicines (Saksena et
al., 2010). If it is not feasible to take care of the entire outpatient care, then it is
desirable to cover at least the cost of medicines under the scheme. This is because
empirical evidence suggests that almost 60% of outpatient care costs are on drugs
(Saksena et al., 2010).
A well-functioning health system has a need of a balanced mix of both public and
private health care delivery facilities. This increases people’s choices. The World
Development Report 1991 argued that “competitive markets are the best way yet
found for efficiently organizing the production of goods and services” (World Bank,
1991). However it goes on to say that the State must step in where markets prove
inadequate or fail altogether. The equity issue can remain unaddressed by markets.
Public goods can get ignored. The preventive and promotive aspects of health care
can be neglected.
Realities of development make it relevant to explore effective PPP models that
introduce market principles in public services to provide effective healthcare for the
poor. RSBY was initiated by Government of India as one such model which explores
a new partnership paradigm between markets and government to provide quality
health care. While it has had marked successes, the recommendations here would
further improve it.

361
REFERENCES

362
REFERENCES
AARON, H. J., WILLIAM, B., COX, M.A. 2005. Schwartz with Melissa cox, can we
say no? The challenge of rationing health care. Washington D.C., Brookings
Institution Press. 95.
ABRAHAM, K. S. 1986. Distribution of Risk: Insurance, Legal Theory, and Public
Policy. Yale University Press, New Haven, Conn. 1-2.
ACHARYA, A., VELLAKKAL, S., TAYLOR, F., MASSET, E., SATIJA, A.,
BURKE, M. & EBRAHIM, S. 2012. Impact of national health insurance for the poor
and the informal sector in low- and middle-income countries: a systematic review.
EPPI-Centre, Social Science Research Unit, Institute of Education, University of
London. London. 110.
AGHA, S., KARIM, A. M., BALAL, A. & SOSSLER, S. 2003. A Quasi
Experimental Study to Assess the Performance of a Reproductive Health Franchise in
Nepal. Commercial Market Strategies (CMS). Country Research Series Paper No.14.
Washington D.C.
AHUJA, R. 2004. Health Insurance for the Poor in India. Working Paper No. 123.
Indian Council for Research on International Economic Relations. New Delhi.
Available: http://www.icrier.org/pdf/wp123.pdf[Accessed 12 June 2015].
AHUJA, R. 2006. Health Insurance for the Poor - India. Inter-Regional Inequality
Facility: Sharing ideas and policies across Africa, Asia and Latin America. Policy
Brief 12. UK Department for International Development. London. 4. Available:
http://www.odi.org/sites/odi.org.uk/files/odi-assets/publications-opinion-
files/4076.pdf[ Accessed 12 June 2015].
ALEXANDERSSON, G. & HULTÉN, S. 2007. Prospects and Pitfalls of Public-
Private Partnerships in the Transportation Sector – Theoretical Issues and Empirical
Experience. International Conference Series on Competition and Ownership in Land
Passenger Transport – 2007 – Hamilton Island, Queensland, Australia – Thredbo 10.
Stockholm School of Economics. Sweden. 4-6.
ALLEN, P. 2002. A socio-legal and economic analysis of contracting in the NHS
internal market using a case study of contracting for district nursing. Social Science &
Medicine, 54(2), 255–266.
ARORA, R.K. 2003. New Public Management: Emerging Concerns. Prashasnika,
XXX, 2.

363
ARRIGHETTI, A., BACHMANN, R. & DEAKIN, S. 1996. Contract law, social
norms and inter-firm cooperation. Cambridge J Econ, 21, 171-195.
ARROW, K. J. 1974. Authority and Responsibility. Chapter 4, New York and
London, W.W. Norton and Company. 81-82.
ASHTON, T. 1998. Contracting for health services in New Zealand: a transaction cost
analysis. Social Science & Medicine,46(3), 357–367.
AXELSON, H., BALES, S., MINH, P. D., EKMAN, B. & GERDTHAM, U.-G. 2009.
Health Financing for the poor produces promising short-term effects on utilization
and out-of- pocket expenditure: evidence from Vietnam. Int J Equity Health, 8, 1-17.
BABATUNDE, B. O. & ADEBISI, A. O. 2012. Strategic Environmental Scanning
and Organization Performance in a Competitive Business Environment. Economic
Insights – Trends and Challenges, LXIV, 24–34.
BAEZA, C., MONTENEGRA, F. & NUNEZ, M. 2002. Extending Social Protection
in Health through Community Based Health Organizations: Evidences and
Challenges. International Labour Organization (ILO) and Strategies and Tools against
Exclusion and Poverty (STEP). Geneva. 2-3. Available:
http://www.ilo.org/public/english/protection/socsec/step/download/101p1.pdf[Access
ed 10 June 2015].
BAJPAI, N. & SACHS, J. D. 2004. National Common Minimum Programme of the
Congress Led United Progressive Alliance: Policy Reform and Public Investment
Requirements. Working Papers Series: CGSD. Working Paper No. 22 Center on
Globalization & Sustainable Development and the Earth Institute at Columbia
University 18.
BALARAJAN, Y. & VILLAMOR, E. 2009. Nationally representative surveys show
recent increases in the prevalence of overweight and obesity among women of
reproductive age in Bangladesh, Nepal, and India. J Nutr.2009;139(11):2139–2144.
BALOONI, K., GANGOPADHYAY, K., TURAKHIA, S. & KARTHIK, R. G. 2012.
Challenges in the Sustainability of a Targeted Health Care Initiative in India’. IIM
Kozhikode Society & Management Review, 1, 21-32.
BARUA, S. 2012. Public Private Partnership in Health Sector, Uttarakhand – A
Success Story. Government of India and ADB Initiative. Mainstreaming PPPs in
India. Department of Planning, Government of Uttarakhand. Uttarakhand. 11-24.
Available:
http://cell.upppc.org/index.php?option=com_docman&task=doc_download&gid=107
&It emid=6[Accessed 10 June 2015].

364
BASINGA, P., GERTLER, P. J., BINAGWAHO, A., SOUCAT, A. L. B., STURDY,
J. R. & VERMEERSCH, C. M. J. 2010. Paying primary health care centers for
performance in Rwanda. Policy Research Working Paper 5190. The World Bank,
Human Development Network, Chief Economist’s Office and Africa Region Health,
Nutrition & Population Unit. 8-21.
BATLEY, R. 1999. The Role of Government in Adjusting Economies: An Overview
of Findings. International Development Department and University of Birmingham.
Birmingham, United Kingdom.
BATLEY, R. & MCLOUGHLIN, C. 2010. Engagement with Non-State Service
Providers in Fragile States: Reconciling State-Building and Service Delivery.
Development Policy Review, 28, 131-154.
BATLEY, R. & SCOTT, Z. 2010. Capacities for Local Service Delivery: The Policy
Link. Global Event Working Paper. United Nations Development Programme. New
York. 1314.
BAUHOFF, S., HOTCHKISS & SMITH, O. 2011. The impact of medical insurance
for the poor in Georgia: a regression discontinuity approach. Health Economics
20(11): 1362–1378.
BAUM, F., BÉGIN, M., HOUWELING, T. A. J. & TAYLOR, S. 2009. Changes Not
for the Fainthearted: Reorienting Health Care Systems toward Health Equity through
Action on the Social Determinants of Health. Am J Public Health, 99, 1967-74.
BEARINGPOINT, I. 2008. Private health insurance in India: Promise and reality.
United States Agency for International Development. 45. Available:
http://pdf.usaid.gov/pdf_docs/pnadl304.pdf[Accessed 10 June 2015].
BELLI, P. 2001. How Adverse Selection Affects the Health Insurance Market. Policy
Research Working Paper Series 2574. Development Research Group, The World
Bank.
BENNETT, S. 1991. The mystique of markets: public and private health care in
developing countries, London, Health Economics and Financing Programme, Health
Policy Unit, Dept. of Public Health and Policy, London School of Hygiene and
Tropical Medicine.
BENNETT, S., DAKPALLAH, G., GARNER, P., GILSON, L.,
NITTAYARAMHONG, S., B ZURITA, B. & ZWI, A. 1994. Carrot and Stick: State
Mechanisms to Influence Private Provider Behavior. Health Policy Plan, 9, 1-13.
BENNETT, S., MCPAKE, B. & MILLS, A. 1997. Private Health Providers in
Developing Countries: Serving the Public Interest, London and New York, Zed
Books Ltd.

365
BENNET, K.J., OLASTOSI, B., PROBST, J.C. 2008. Health Disparities: A Rural-
Urban Chartbook. South Carolina Rural Health Research Centre. Available:
http://rhr.sph.sc.edu/report/(7-
3)%20Health%20Disparities%20A%20Rural%20Urban%20Chartbook%20-
%20Distribution%20Copy.pdf [Accessed 16 July 2016]
BERG, M. V., HEIJINK, R., ZWAKHALS, L., VERKLEIJ, H. & WESTERT, G.
2010. Health care performance in the Netherlands: Easy access, varying quality, rising
costs. Health Policy Developments, 16, 27-29.
BERTA, P., CALLEA, G., MARTINI, G. & VITTADINI, G. 2010. The effects of
upcoding, cream skimming and readmissions on the Italian hospitals efficiency: A
population-based investigation. Economic Modelling, 27(4), 812-21.
BEVERIDGE, W. 2000. Social Insurance and Allied Services. 1942. Bull World
Health Organ, 78, 847–855.
BHARDWAJ, G., DAVE, S. A. & PALACIOS, R. J. 2004. Informal sector in India:
Approaches for Social Security. Social Security Division, Ministry of Labour and
Employment. New Delhi: Government of India.
BIGLAISER, G., and MA, A. 1995. “Regulating a Dominant Firm: Unknown
Demand and Industry Structure,” Rand Journal of Economics, 26(1), 1–19.
BIRDSALL, K. 2015. Health insurance for India’s poor: Meeting the challenge with
information technology. Health; population policy. Federal Ministry for Economic
Cooperation & Development (BMZ) and Deutsche Gesellschaft für Internationale
Zusammenarbeit (GIZ) GmbH. Germany. 2.
BLENDON, R. J., BUHR, T. & CASSIDY, E. F. 2007. Disparities in health:
perspectives of a multi-ethnic, multi-racial America. Health Affairs. 26:1437–47.
BLOOM, D. E., CRAIG, P. & MITCHELL, M. 2000. Public and Private Roles in
Providing and Financing Social Services: Health and Education. In: WANG, Y. (ed.)
Public Private Partnerships in the Social Sector: Issues and Country Experiences in
Asia and the Pacific. 2. Tokyo, Japan: Asian Development Bank Institute. 17-29.
BRAUN, V. & CLARKE, V. 2006. Using thematic analysis in psychology. Qual Res
Psychol, 3, 77-101.
BRENNAN, T. A. 1993. An Ethical Perspective on Health Care Insurance Reform,
19. AM. J.L. & MED. 37, 39-40.
BURCHELL, B. & WILKINSON, F. 1997. Trust, business relationships and the
contractual environment. Cambridge J Econ, 21, 217-237.

366
CAG INDIA. 2012. The comptroller and auditor-general's (duties, powers and
conditions of service) act, 1971. New Delhi: Government of India.
CANADIAN COUNCIL FOR PUBLIC-PRIVATE PARTNERSHIPS. n.d. Definition
- Public-Private Partnership [Online]. Canadian Council for Public-Private
Partnerships. Available: http://www.pppcouncil.ca/resources/about-
ppp/definitions.html[Accessed 10 June 2015].
CARRIN, G. 2002. Social health insurance in developing countries: A continuing
challenge. World Health Organization, Geneva. International Social Security Review,
55.
CARRIN, G., WAELKENS, M.-P. & CRIEL, B. 2005. Community-based health
insurance in developing countries: a study of its contribution to the performance of
health financing systems. Trop Med Int Health.2005;10:799–811.
CENTRAL BUREAU OF HEALTH INTELLIGENCE. 2010. National Health
Profile of India 2010 (January - December) [Online]. New Delhi, India: Ministry of
Health and Family Welfare, Government of India. Available:
http://cbhidghs.nic.in/index2.asp?slid=1125&sublinkid=929[Accessed 6 December
2014].
CHANKOVA, S., SULZBACH, S., & DIOP, F. 2008. Impact of mutual health
organizations: evidence from West Africa, Health Policy and Planning, 23(4), 264-
276.
CHANTURIDZE, T., UGULAVA, T., DURÁN, A., ENSOR, T. & RICHARDSON,
E. 2009. Georgia: health system review. Health Syst Transit, 11, 1–116.
CHAUDHURY, N., HAMMER, J., KREMER, M., MULARIDHARAN, K. &
ROGERS, H. 2008. Health Personnel Absenteeism in India: Descriptive Statistics and
Correlations. The World Bank, Princeton University (Center for Health and
Wellbeing), and Harvard University. 37-38.
CHEAH & DOESSEL 1985. Information and Economic Behaviour, in 4 collected
papers of Kennfth J. Arrow. Harvard University Press eds, The Economics of
Information,148.
CHEFA, L. 2014. World Bank private financing scheme bleeds Lesotho's health
system dry. The Bretton Woods Bulletin. (3)3.
CHIU, P. D. 2013. New law provides PhilHealth coverage to all. GMA News.
[Online].Available:
http://www.gmanetwork.com/news/story/313936/news/nation/new-law-provides-
philhealth-coverage-to-all[Accessed 16 July 2016].

367
CLEARY, P. D. 1999. The increasing importance of patient surveys. BMJ.319:720–1.
CLEARY, P. D. & EDGMAN-LEVITAN, S. 1997. Health care quality. Incorporating
consumer perspectives. JAMA;278:1608–12.
CLWYD, A. M. P. & HART, T. 2013. A Review of the NHS Hospitals Complaints
System Putting Patients Back in the Picture. NHS hospitals complaints system review:
Treating patients and service users with respect, dignity and compassion. NHS
Hospital. England. 16-43. Available:
https://www.gov.uk/government/uploads/system/uploads/attachment_data/file/255615
/N HS_complaints_accessible.pdf[Accessed 12 March 2015].
COGLIANESE, C. 2012. Measuring Regulatory Performance - Evaluating the impact
of regulation and regulatory policy. Expert Paper No. 1. Organization for Economic
Cooperation and Development: 9. Available:
http://www.oecd.org/gov/regulatoryhttp://www.oecd.org/gov/regulatory-
policy/1_coglianese web.pdfpolicy/1_coglianese%20web.pdf[Accessed 5 December
2014].
COHEN, M. 2006. Community Based Health Insurance Shows Promise in India.
Population Reference Bureau; 3.
CONN, C. P. & WALFORD, V. 2002. An introduction to Health Insurance for Low
Income Countries. DFID Health Systems Resource Centre. London. 22. Available:
http://www.heart-resources.org/wp-content/uploads/2012/10/An-introduction-to-
Healthhttp://www.heart-resources.org/wp-content/uploads/2012/10/An-introduction-
to-Health-Insurance.pdfInsurance.pdf[Accessed 10 June 2015].
COUNCIL OF TRIBAL AND RURAL DEVELOPMENT 2013. Independent
assessment study on process of enrollment under Rashtriya Swasthya Bima Yojana &
Mukhyamantri Swasthya Bima Yojana in Chhattisgarh. Government of Chattisgarh.
92.
CULYER, A. & WAGSTAFF, A. 1993. Equity and equality in health and health care.
Journal of Health Economics.12:431–57.
CUTLER, D. M. & ZECKHAUSER, R. J. 1998. Adverse Selection in Health
Insurance. In: GARBE, A. M. (ed.) Frontiers in Health Policy Research, volume 1.
MIT.
CUTLER, D. M. 2002. Health care and the public sector. In: AUERBACH A.J., &
FELDSTEIN, M., (eds.) Handbook of Public Economics, Elsevier Science, 4, 2145-
2243.
DAO, A. 2012. Health Insurance in Vietnam: Health Care Reform in a Post-socialist
Context. WEAI Columbia University, 1-5.

368
DAS, A. 2012. The Long Road to Social Security: Implementation of social security
schemes in Odisha - A Study of Rashtriya Swasthya Bima Yojana. CENTRE FOR
DEVELOPMENT STUDIES, Trivandrum, Kerala, India and University of
Amsterdam. Available:
www.hivos.nl/content/.../file/The%20long%20road_paper%2019x.pdf [Accessed 12
December 2014].
DAS, A. 2013. Social Health Insurance for Poor in Odisha: A study of Rashtriya
Swasthya Bima Yojana. In: KUNHIKANNAN, T. P. & BREMAN, J. (eds.) The Long
Road to Social Security: Assessing the Implementation of National Social Security
Initiatives for the Working Poor in India. 11. New Delhi, India: Oxford University
Press. Commissioned Study under the Centre for Development Studies (Kerala),
Amsterdam Institute for Science Research (University of Amsterdam) and Humanist
Institute for Co-operation with Developing Country (Netherlands). 439-466.
DAS, J. 2011. Lessons from an experimental information campaign for evaluating the
RSBY. In: PALACIOS, R. J., DAS, J. & SUN, C. (eds.) India's health insurance
scheme for the poor: evidence from the early experience of the Rashtriya Swasthya
Bima Yojana. 1. New Delhi: Centre for Policy Research. 280.
DAS, J., HOLLA, A., DAS, V., MOHANAN, M., TABAK, D. & CHAN, B. 2012. In
urban and rural India, a standardized patient study showed low levels of provider
training and huge quality gaps. Health Aff (Millwood), 31, 2774-84.
DAS, J. & LEINO, J. 2011. Evaluating the RSBY: Lessons from an Experimental
Information Campaign. Economic and Political Weekly; 46, 32.
DE COSTA, A., AL-MUNIRI, A., DIWAN, V. K. & ERIKSSON, B. 2009. Where
are healthcare providers? Exploring relationships between context and human
resources for health Madhya Pradesh province, India. Health Policy Plan, 93, 7.
DEAKIN, S. & WILKINSON, F. 1995. Contracts, cooperation and trust: the role of
the institutional framework, Cambridge, UK, ESRC Centre for Business Research.
DEO, M. G. 2013. “Doctor Population ratio for India - The reality”. Indian J Med
Res, 137, 632635.
DEOGANKAR, M. D. 2004. Socio-economic inequality and its effect on healthcare
delivery in India: Inequality and healthcare. Electronic Journal of Sociology; 2004.
Available at URL: http://www.sociology.org/content/vol8.1/deogaonkar.html.
DEPARTMENT OF ECONOMIC AFFAIRS. 2010. Approach paper on defining
Public Private Partnerships: Discussion Note. Discussion Note. Ministry of Finance,
Government of India. New Delhi. 6. Available:
http://www.pppinindia.com/pdf/ppp_definition_approach_paper.pdf[Accessed 5
December 2014].

369
DEPARTMENT OF ECONOMIC AFFAIRS. 2012. Master list of PPPs in India
[Online]. New Delhi. Available:
http://www.pppindiadatabase.com/uploads/master%20list%20ppp%20projects%20in
%20 indi%20a%20as%20on%20january%2031,2011.pdf[Accessed 4 June 2015].
DEPARTMENT OF HEALTH. 2015. National Health Insurance for South Africa.
Towards Universl Health Coverage. Version 40. Republic of South Africa. Available:
https://www.health-e.org.za/wp-content/uploads/2015/12/National-Health-Insurance-
for-South-Africa-White-Paper.pdf[Accessed 16 July 2016]
DEPARTMENT OF LABOUR & EMPLOYMENT & JHARKHAND STATE
LABOUR WELFARE SOCIETY 2010. State level Evaluation Study of “Rashtriya
Swasthya Bima Yojana” Jharkhand. Government of Jharkhand. Tender Document.
Ranchi; 13.
DESAI, V. 2011. Do We Need Stringent Regulation for Private Healthcare?. Express
Healthcare. Available:
http://archivehealthcare.financialexpress.com/200805/awards02.shtml [Accessed 10
July 2016]
DEVADASAN, N., CRIEL, B., VAN DAMME, W., LEFEVRE, P., MANOHARAN,
S. & VAN DER STUYFT, P. 2011. Community health insurance schemes & patient
satisfaction--evidence from India. Indian J Med Res, 133, 40-9.
DEVADASAN, N., SESHADRI, T., TRIVEDI, M. & CRIEL, B. 2013. Promoting
universal financial protection: evidence from the Rashtriya Swasthya Bima Yojana
(RSBY) in Gujarat, India. Health Research Policy and Systems, 11.
DIARRA, A. 2001. Making a public-private partnership work--an insider's view.
Interview by John Maurice. Bull World Health Organ, 79, 795-6.
DOHERTY, J. 2011. Expansion of the private health sector in east and Southern
Africa. Equinet Discussion Paper 87. School of Public Health, University of the
Witwatersrand and EQUINET. Harare. 12-16.
DONABEDIAN, A. 1988. The Quality of Care: How Can It Be Assessed? JAMA,
260, 17431748.
DONABEDIAN, A. 2005. Evaluating the Quality of Medical Care. The Milbank
Quarterly, 83, 691–729.
DREZE, J. & SEN, A. 2013. India’s Health Care Crisis. An Uncertain Glory: India
and its Contradictions, New Delhi. Princeton University Press: Allen Lane (Penguin).
370
DROR, D. M. & PREKER, A. S. 2002. Social reinsurance: a new approach to
sustainable community health financing. The World Bank and International Labour
Office. Washington, D.C.: 1. 1.
DUGDALE, D.C., EPSTEIN, R., PANTILAT, S.Z. 1999. Time and the Patient–
Physician Relationship. Journal of General Internal Medicine. 14 (S1) 34-40.
DUGGAL, R. & NANDRAJ, S. 1991. Regulating the Private Health Sector, Medico
Friend Circle. Bulletin No 173-174. CEHAT. 6.
DUNLEAVY, P. & HOOD, C. 1994. From old public administration to new public
management. Public Money and Management. 9 - 16.
ELLIS, R. & McGUIRE, T. 1986. Provider behaviour under prospective
reimbursement: cost sharing and supply, Journal of Health Economics 5, 129-152.
EJUGHEMRE, J. 2014. Accelerated reforms in healthcare financing: the need to scale
up private sector participation in Nigeria. Int J Health Policy and Management, 2, 13-
20.
EKMAN, B., LIEM, N. T., DUC, H. A. & AXELSON, H. 2008. Health insurance
reform in Vietnam: a review of recent developments and future challenges. Health
Policy Plan, 23, 252-263.
ELLIS, R. 1997. Creaming, skimping and dumping: provider competition on intensive
and extensive margins, Journal of Health Economics, vol.17, 537-555.
ENGLAND, R. 2004. Experience of contracting with the private sector: a selective
review. DFID Health Systems Resource Centre. London. Available:
http://hdrc.dfid.gov.uk/wp-content/uploads/2012/10/Experience-of-contracting-with-
the-Private-sector.pdf [Accessed 16 July 2016]
ENTHOVEN, A. C. & SINGER, S. J. 1995. Market-Based Reform: What to Regulate
and by Whom, HEALTH AFF., Spring 1995, at 109. Available:
http://content.healthaffairs.org/cgi/reprint/14/1/105[Accessed 4 June 2015].
EUROPEAN COMMISION. 2013. Health and Economics Analysis for an evaluation
of the Public Private Partnerships in health care delivery across EU.
EAHC/2011/Health/20. EPOS Health Management. United Kingdom. 6. Available:
http://ec.europa.eu/health/expert_panel/documents/publications/docs/ppp_finalreport_
en. pdf[Accessed 4 June 2015].
EVANS, T. G., CHOWDHURY, A. M. R., EVANS, D. B., FIDLER, A. H.,
LINDELOW, M., MILLS, A. & SCHEIL-ADLUNG, X. 2012. Thailand's Universal
Coverage Scheme: Achievements and Challenges - An independent assessment of the
first 10 years (20012010) Nonthaburi, Thailand, Health Insurance System Research
Office.

371
FERLIE, E. 1996. The new public management in action, Oxford, Oxford University
Press.
FRENCH, E. & KAMBOJ, K. 2002. Analyzing the Relationship Between Health
Insurance, Health Costs, and Health Care Utilization, 26 ECON. PERSP. 60, 60.
GAMKRELIDZE, A., ATUN, R., GOTSADZE, G. & MACLEHOSE, L. 2002.
Health Care Systems in Transition: Georgia. European Observatory on Health Care
Systems. Copenhagen, European Observatory on Health Care Systems. Volume 4.
Georgia: 4. 6165.
GARG, C. & KARAN, A. 2009. Reducing out-of-pocket expenditures to reduce
poverty: a disaggregated analysis at rural-urban and state level in India. Health Policy
Plan, 24, 116-128.
GASKIN, D. J., PRICE, A., BRANDON, D. T. & LAVEIST, T. A. 2009. Segregation
and disparities in health services use.Medical Care Research and Review.
2009;66(5):578–89.
GENTRY, B. & FERNANDEZ, L. 1998. Evolving Public-Private Partnerships:
General themes and examples from the urban water sector. Globalisation and the
Environment: perspectives from OECD and Dynamic Non-Member Economies. Paris:
OECD. 99-125.
GERTLER, P. & GRUBER, J. 2002. Insuring consumption against illness. American
Economic Review 92, 51–70.
GHOSH, A. 2014. Social indicators: India moves forward but crawls compared
to neighbours. The Indian Express. 25th
July 2014
GILL, S. S., SINGH, S. & BRAR, J. S. 2013. Social Security Schemes in Punjab: A
Blend of State and Central Schemes. In: KUNHIKANNAN, T. P. & BREMAN, J.
(eds.) The Long Road to Social Security: Assessing the Implementation of National
Social Security Initiatives for the Working Poor in India. 13. New Delhi, India:
Oxford University Press. Commissioned Study under the Centre for Development
Studies (Kerala), Amsterdam Institute for Science Research (University of
Amsterdam) and Humanist Institute for Cooperation with Developing Countries
(Netherlands). 504-538.
GINÉ, X., TOWNSEND, R. & VICKERY, J. 2008. Patterns of rainfall insurance
participation in rural India, in: The World Bank Economic Review, 22(3), 539-566.
GODDARD, M. & MANNION, R. From competition to co-operation: new economic
relationships in the National Health Service. Health Economics. 7(1998), 105–119.

372
GOLUBNITSCHAJA, O. 2012. Time for new guidelines in advanced healthcare: the
mission of The EPMA Journal to promote an integrative view in predictive,
preventive and personalized medicine. EPMA J, 3, 5.
GONZ´ALEZ, P. 2005. On a policy of transferring public patients to private practice.
Health Economics, 14, 513-27.
GOTTRET, P. E., SCHIEBER, G. & WATERS, H. 2008. Good practices in health
financing: Lessons from reforms in low- and middle-income countries. Lessons from
reforms in low and middle income countries. World Bank. Washington, D.C. 504.
GOTTRET, P. & SCHIEBER, G. 2006. Financing health in low-income countries.
Chapter 7. Health Financing Revisited: A practitioner’s guide. The World Bank.
2006. 209-36.
GOVERNMENT OF HARYANA. 2010. Home: District Yamunanagar [Online].
Available: http://yamunanagar.nic.in/ynr/default.asp[Accessed 4 June 2015].
GOVERNMENT OF INDIA 2011. Inaugural Address of the Prime Minister at the
Conference on Public-Private Partnership in National Highways New Delhi: Press
Information Bureau.
GOVERNMENT OF KERALA 2008. Rashtriya Swasthya Bima Yojana and
Comprehensive Health Insurance Scheme - Implementation of the schemes in all the
14 districts of Kerala. Labour & Rehabilitation (J) Department. Thiruvananthapuram:
Government of Kerala.
GOVERNMNET OF PUNJAB. 2010. Home: District Patiala [Online]. Available:
http://patiala.nic.in/[Accessed 4 June 2015].
GOVINDARAJ, R., NAVARATNE, K., CAVAGNERO, E. & SESHADRI, S. R.
2014. Health Care in Sri Lanka: what can be the private health sector offer?
Washington DC: Human Development Network, the World Bank Discussion Paper.
World Bank, Human Development Network. 6-10.
GRUNDY, J., HOBAN, E. & ALLENDER, S. 2014. The social and political
construction of health-care systems – historical observations from selected countries
in Asia. Health Systems, 1-14.
GUDWANI, A., MITRA, P., PURI, A. & VAIDYA, M. 2012. India Healthcare:
Inspiring Possibilities, challenging journey. Confederation of Indian Industry.
McKinskey and Comp., Mumbai. 14.
GUO, B. 2003. Transforming China's Urban Health Care System. Asian Survey, 43,
385-403.

373
GUPTA, M. D. & RANI, M. 2004. India's Public Health System: How Well Does it
Function at the National Level? Social Science Research Network, World Bank Policy
Research Working Paper No. 3447, 23.
GYAPONG, J., GARSHONG, B., AKAZILI, J., AIKINS, M., AGYEPONG, I. &
NYONATOR, F. 2007. Critical Analysis of Ghana’s Health System with a Focus on
Equity Challenges and the National Health Insurance. Shield Work package 1 report
Ghana. 22. Available: http://uct-heu.s3.amazonaws.com/wp-
content/uploads/2012/05/Ghana1.pdf[Accessed 16 December 2014].
HAMMER, J., AIYAR, Y. & SAMJI, S. 2007. Understanding the Government
Failure in Public Health Services. Economic and Political weekly. 2007; Special
Articles; 4049-57.
HART, O. & MOORE, J. 1990. The new palgrave: allocation, information and
markets. In: EATWELL, J., MILGATE, M. & NEWMAN, P. (eds.). Macmillan:
Basingstoke. 310.
HARYANA GOVERNMENT GAZETTE. 2014. Haryana clinical establishments
(regulations and registration) Act, 2014. Law and Legistative Department,
Government of Haryana. Haryana Act no. 6 of 2014 Availabale:
http://www.imahbi.in/imahbi-rules/2.pdf [Accessed 12 December 2014].
HCAHPS. 2012. Hospital Consumer Assessment of Healthcare Providers and
Systems Hospital Survey Fact Sheet. USA. 1-3. Available:
http://www.hcahpsonline.org/files/HCAHPS%20Fact%20Sheet%20May%202012.pdf
[Accessed 30 May 2015].
HEALTH INC CONSORTIUM. 2014. Towards equitable coverage and more
inclusive social protection in health. Studies in Health Services Organisation and
Policy (SHSOP), 32. ITG Press, Antwerp, Belgium.
HEARD, A., AWASTHI, M. K., ALI, J., SHUKLA, N. & FORSBERG, B. C. 2011.
Predicting performance in contracting of basic health care to NGOs: experience from
large-scale contracting in Uttar Pradesh, India. Health Policy Plan, 26 Suppl 1, i13-9.
HEEVER, V. D. 2012. The role of insurance in the achievement of universal coverage
within a developing country context: South Africa as a case study. BMC Public
Health, 12 Suppl 1, S5.
HIPAA 1996. The Health Insurance Portability and Accountability Act of 1996
(HIPAA) prohibits an employer from varying premiums based on health status. See
29 U.S.C. 1182.
HM TREASURY. 2008. Public private partnerships [Online]. United Kingdom.
Available:

374
http://webarchive.nationalarchives.gov.uk/20130129110402/http://www.hmhttp://web
archive.nationalarchives.gov.uk/20130129110402/http:/www.hm-
treasury.gov.uk/ppp_index.htmtreasury.gov.uk/ppp_index.htm[Accessed 15 March
2015].
HOOD, C. 1991. A Public Management for All Seasons? Public Administration, 69,
3-19. HOTELLING, H. 1929. Stability in Competition. Economic Journal 39, 41-57.
HOOD, C. 1994. Explaining Economic Policy Reversals, Buckingham: Open
University Press.
HOTELLING, H. 1929. Stability in Competition. Economic Journal 39, 41-57.
HOU, X. & CHAO, S. 2008. An Evaluation of the Initial Impact of the Medical
Assistance Program for the Poor in Georgia. Policy Research Working Paper 4588.
The World Bank. Washington D.C. 31.
HU, R., SHEN, C. & ZOU, H. 2013. Health Care System Reform in China: Issues,
Challenges and Options. Annals of Economics and Finance, 14, 279-98.
HYMAN, D. A. & HALL, M. 2001. Two Cheers for Employment-Based Health
Insurance, 2 YALE J. Health Policy & Ethics 23, 32.
IGUMBOR, J., PASCOE, S., RAJAP, S., TOWNSEND, W., SARGENT, J. &
DARKOH, E. 2014. A South African Public-Private Partnership HIV Treatment
Model: Viability and Success Factors PLoS ONE, 9, e110635.
ILO SUBREGIONAL OFFICE FOR SOUTH ASIA. 2008. India: State government
sponsored health protection programme (Jharkhand). Social security extension
initiatives in South Asia. International Labour Organization and Asian Decent Work
Decade. Geneva, Switzerland. 6.
INDIAN MEDICAL ASSOCIATION. 2013. IMA opposes the Clinical
Establishments (Registration and Regulation) Act 2010. Available:
http://www.google.co.uk/url?sa=t&rct=j&q=&esrc=s&source=web&cd=35&ved=0C
EU
QFjAEOB4&url=http%3A%2F%2Fwww.imahbi.org%2Fadmin%2Fimages%2Fuploa
d%2FIMA%2520viewpoint%2520on%2520Clinical%2520Establishment%2520Act%
25202
010.doc&ei=kK4kU4y8KcyshQeCwIBo&usg=AFQjCNGRPkZ1lTBbVHoUO_Eh7q
Z5 wTK9DA&bvm=bv.62922401,d.bGQ. [Accessed 2 January 2015]
INSURANCE REGULATORY AND DEVELOPMENT AUTHORITY. 2007a.
Duties, powers and functions of IRDAI: Section 14 of IRDA Act, 1999 lays down the
duties, powers and functions of IRDA [Online]. New Delhi: Government of India.
Available:

375
https://www.irda.gov.in/ADMINCMS/cms/NormalData_Layout.aspx?page=PageNo1
01 &mid=1.2[Accessed 30 May 2015].
INSURANCE REGULATORY AND DEVELOPMENT AUTHORITY. 2007b.
History of insurance in India [Online]. New Delhi: IRDA, Government of India.
Available:
https://www.irda.gov.in/ADMINCMS/cms/NormalData_Layout.aspx?page=PageNo4
&m id=2[Accessed 30 May 2015].
INSURANCE REGULATORY AND DEVELOPMENT AUTHORITY. 2014. Health
Insurance: Health Products of 2013-14 [Online]. New Delhi: Government of India.
Available:
https://www.irda.gov.in/ADMINCMS/cms/NormalData_Layout.aspx?page=PageNo2
430 &mid=27.3.1[Accessed 20 March 2015].
INTERNATIONAL FINANCE GROUP. 2011. IFC Guide for Investors in Private
Health Care in Emerging Markets. Available:
http://www.banyanglobal.com/pdf/Guide_for_Investors_in_Private_Health_Care_in_
Emerging_Markets.pdf
IRVING, M. & KINGDON, G. G. 2008. Gender patterns in household health
expenditure allocation: A study of South Africa. Centre for the Study of African
Economies Series (Ref: CSAE WPS/2008-32). Department of Economics, University
of Oxford. London: CSAE WPS/2008-32. 17. Available:
http://www.csae.ox.ac.uk/workingpapers/pdfs/2008http://www.csae.ox.ac.uk/working
papers/pdfs/2008-32text.pdf32text.pdf[Accessed 21 December 2014].
ISMAIL, S. & HARIS, F. A. 2014. Rationales for public private partnership (PPP)
implementation in Malaysia. Journal of Financial Management of Property and
Construction, 19, 188-200.
ITOLI. 2013. Village progress report, About the Community, Itoli. [Online].
Available: https://www.magicbus.org/cms/village_progress_reports/itoli [Accessed
July 12 2016].
JACOB, A. 2013. Four factors that impacted health insurance industry in 2013. The
Financial Express, 30 December 2013.
JACOB, J. S. 2012. Health care for all. The Hindu, 26 January 2012.
JINDAL, D. 2014. Challenges in RSBY Enrollment. International Research Journal
of Management Science & Technology 5, 54-68.
JOE, W., MISHRA, U. S. & NAVANEETHAM, K. 2009. Socio-economic
inequalities in child health: Recent evidence from India. Glob Public Health. 2009:1–
16.
376
JOWETT, M., DEOLALIKAR, A. & MATTINSSON, P. 2004. Health insurance and
treatment seeking behaviour: evidence from a low-income country, Health Economics
13: 845-857.
JÜTTING, J. 1999. Public-private-partnership and social protection in developing
countries: The case of the health sector. Paper presented at the ILO workshop on
“The extension of social protection”. Geneva: Center for Development Research
(ZEF), University of Bonn.
JUTTING, J. P. 2004. Do community-based health insurance schemes improve poor
people's access to health care? Evidence from rural Senegal. World Development,
32(2), 273-288.
KADAÏ, A., SALL, F. L., ANDRIANTSARA, G. & PERROT, J. 2006. The benefits
of setting the ground rules and regulating contracting practices. Bull World Health
Organ, 84, 897902.
KALIMULLAH, N. A., ALAM, K. M. A. & NOUR, M. M. A. 2012. New Public
Management: Emergence and Principles. BUP Journal, 1, 1-22.
KANNAN, K. P. & VARINDER, J. 2012. National Health Insurance Initiative for the
Poor. In: KUNHIKANNAN, T. P. & BREMAN, J. (eds.) The Long Road to Social
Security: Assessing the Implementation of National Social Security Initiatives for the
Working Poor in India. 2. New Delhi, India: Oxford University Press. Commissioned
Study under the Centre for Development Studies (Kerala), Amsterdam Institute for
Science Research (University of Amsterdam) and Humanist Institute for Co-operation
with Developing Countries (Netherlands). 13-25.
KAPUR, A. 2008. State awaits passing of Nursing Home Act Haryana Edition ed.
Gurgaon: Tribune News Service, Haryana Edition.
KETTL, D. F. 2000. The global public management revolution: a report on the
transformation of governance. Washington, D.C., Brookings Institution Press.
KHURANA, D. & DAVE, K. K. 2016. Medical Practitioner perception regarding
Rashtriya Swasthiya Bima Yojna in Jaipur. IOSR Journal Of Humanities And Social
Science (IOSR-JHSS) 21, 74-80.
KING, G., GAKIDOU, E., IMAI, K., LAKIN, K., MOORE, T., NALL, C.,
RAVISHANKAR, N., VARGAS, M., TÉLLEZ-ROJO, M., HERNÁNDEZ, Á. J.,
HERNÁNDEZ, Á. M. & HERNÁNDEZ, L. H. 2009. Public policy for the poor? A
randomised assessment of the Mexican universal health insurance programme. The
Lancet 373(9673):1447-1454.
KONETZKA, J. 2014. Long Term Care Insurance. Encyclopedia of Healt Economics,
Elsevier.

377
KRISHNA, A. 2006. Pathways Out of and Into Poverty in 36 Villages of Andhra
Pradesh,India. World Development, 34, 2, 271-288. .
KRISHNA, A., KAPILA, M., PORWAL, M. & SINGH, V. 2005. Why Growth is not
Enough:Household Poverty Dynamics in Northeast Gujarat, India. Journal of
Development Studies,41, 7.
KULA, N. & FRYATT, R. J. 2014. Public-private interactions on health in South
Africa: opportunities for scaling up. Health Policy Plan, 29, 560-569.
KUMAR, N. 2013. New Public Management in Developing Countries. Global
Journal of Management and Business Studies, 3, 639-644.
KUMAR, A. K. S. 2014. Confronting Health Challenges. In: DEBROY, B., TELLIS,
A. J. & TREVOR, R. (eds.) Getting India Back on track: An action agenda for
reform. New Delhi: Random house India. 121-134.
KUMAR, A. K. S., CHEN, L. C., CHOUDHURY, M., GANJU, S., MAHAJAN, V.,
SINHA, A. & SEN, A. 2011. Financing health care for all: Challenges and
opportunities. Lancet, 377, 668-680.
KUNHIKANNAN, T. P. & ARAVINDAN, K. P. 2012. Functioning of Contingent
Social Security Schemes in Kerala: The Social and Institutional Context of Delivery
at the Local Level. In: KUNHIKANNAN, T. P. & BREMAN, J. (eds.) The Long
Road to Social Security: Assessing the Implementation of National Social Security
Initiatives for the Working Poor in India. . 5. New Delhi, India: Oxford University
Press. Commissioned Study under the Centre for Development Studies (Kerala),
Amsterdam Institute for Science Research (University of Amsterdam) and Humanist
Institute for Co-operation with Developing Countries (Netherlands) 207-246.
KUSI, A., ENEMARK, U., HANSEN, K. S. & ASANTE, F. A. 2015. Refusal to
enrol in Ghana's National Health Insurance Scheme: is affordability the problem? Int
J Equity Health, 14, 2.
LA FORGIA, G. & NAGPAL, S. 2012. Government-Sponsored Health Insurance in
India: Are You Covered? Directions in development: Human Development. Policy
Note. The World Bank. Washington, D.C.: 1. 25.
LAGARDE, M. & PALMER, N. 2009. The impact of health financing strategies on
access in low and middle income countries (Review). LSHTM and Bill and Melinda
Gates Foundation. London: Protocol Issue 4. 8-10.
LAW COMMISSION OF INDIA. 2003. Consultation Paper on Revision of the
Insurance Act 1938 and the Insurance Regulatory and Development Act 1999. Law
Commission of India, Government of India. New Delhi. 7. Available:

378
http://lawcommissionofindia.nic.in/consult_papers/insurance%201-27.pdf[Accessed
30 May 2015].
LENNART, B., HENGJIN, D., KELI, W., WENWEI, C. & DIWAN, V. 1996. The
cost of coverage: rural health insurance in China Health Policy and Plan, 11, 238-
252.
LEVAGGI, R. & MONTEFIORI, M. 2003. Horizontal and vertical cream skimming
in the health care market. DISEFIN Working Paper No. 11/2003.
LEWIS, T. R. & SAPPINGTON, D. E. M. 1999. Cream skimming, cost sharing, and
subjective risk adjusting in the health industry, Journal of Economics and
Management, vol.8(3), pp.351-382.
LIMWATTANANON, S., TANGCHAROENSATHIEN, V., TISAYATICOM, K.,
BOONYAPAISARNCHAROEN, T. & PRAKONGSAI, P. 2012. Why has the
Universal Coverage Scheme in Thailand achieved a pro-poor public subsidy for
health care? BMC Public Health, 12, S6.
LINDER, S. 1999. Coming to terms with the public–private partnership: a grammar
of multiple meanings. American Behavioral Scientist, 43, 35-51.
LIU, X., HOTCHKISS, D. R., BOSE, S., BITRAN, R. & GIEDLON, U. 2004.
Contracting for Primary Health Services: Evidence on its effects and a framework for
evaluation. Partners for Health Reformplus.
LOEVINSOHN, B. & HARDING, A. 2005. Buying results? Contracting for health
service delivery in developing countries. Lancet, 366, 676-81.
LÖNNROTH, K., UPLEKAR, M. & BLANC, L. 2006. Hard Gains through Soft
Contracts: Productive Engagement of Private Providers in TB Control. Bull World
Health Organ, 84, 876-83.
LOWNDES, V. 1997. We are learning to accommodate mess: Four propositions
about management change in local governance. Public Policy and Administration, 12,
80-94.
MACKINTOSH, M. 1997. Informal regulation: a conceptual framework and
application to decentralized mixed health care systems. In: MACKINTOSH, M. &
ROY, R. (eds.) Economic decentralization and public management reform.
Manchester: Paper prepared for the conference on Public Sector Management for the
Next Century, IDPM. 149-175.
MACNEIL, I. R. 1974. Many Futures of Contracts. Southern Calif Law R, 47, 691-
816.

379
MACNEIL, I. R. 1978. Contracts: exchange transactions and relations: cases and
materials, New York, Foundation Press.
MAHADEVIA, D. 2012. Social Security for the Urban Poor: A Case Study in
Gujarat. In: KUNHIKANNAN, T. P. & BREMAN, J. (eds.) The Long Road to Social
Security: Assessing the Implementation of National Social Security Initiatives for the
Working Poor in India. 8. New Delhi, India: Oxford University Press. Commissioned
Study under the Centre for Development Studies (Kerala), Amsterdam Institute for
Science Research (University of Amsterdam) and Humanist Institute for Co-operation
with Developing Countries (Netherlands). 335-360.
MALIK, K. 2014. Sustaining Human Progress: Reducing Vulnerabilities and Building
Resilience. Human Development Report 2014. United Nations Development
Programme. New York. 159-223.
MALLIPEDDI, R., PERNEFELDT, H. & BERGKVIST, S. 2009. Andhra Pradesh
Health Sector Reform: A Narrative Case Study. Sponsored Initiative on the Role of
the Private Sector in Health Systems in Developing Countries: Technical partner
paper 7. The Rockefeller Foundation and ACCESS Health Initiative Hyderabad. 86.
MANN, N. 2012. Bigger Hospitals: Better Care. Health Occupations Students of
America (HOSA); Washington, D.C. 1-4. Available:
http://hosa.org/sites/default/files/RPS2_0.pdf [Accessed 30 May 2015].
MAREK, T., DIALLO, I., NDIAYE, B. & RAKOTOSALAMA, J. 1999. Successful
contracting of prevention services: fighting malnutrition in Senegal and Madagascar.
Health Policy Plan, 14, 382–389.
MARINI G. & STREET A. A transaction costs analysis of changing contractual
relations in the English NHS. Health Policy,83(2007), 17–26.
MAYBERRY, R.M., NICEWANDER, D.A., QIN, H., & BALLARD,D.J. Improving
quality and reducing inequities: a challenge in achieving best care. Proc (Bayl Univ
Med Cent). 2006; 19(2): 103–118.
MATSOSO, M. P. & FRYATT, R. 2013. National Health Insurance: The first 16
months. South African Medical Journal 2013;103(3):156-158.
MCKEE, M., EDWARDS, N. & ATUN, R. 2006. Public-private partnerships for
hospitals. Bull World Health Organ, 84, 890-896.
MEDICAL COUNCIL OF INDIA. 2012. Annual Report of Medical Council of India
(2011-12). MCI. New Delhi. Available:
http://www.mciindia.org/annual_report_2012.pdf[Accessed 10 January 2015].

380
MENSAH, J., OPPONG, J. R. & SCHMIDT, C. M. 2010. Ghana's National Health
Insurance Scheme in the context of the health MDGs: an empirical evaluation using
propensity score matching. Health Econ, 19 Suppl, 95-106.
METCALFE, L. 1988. Accountable Public Management: UK Concepts and
Experience. In: KAKABADSE, A., BROVETTO, P. R. & HOLZER, R. (eds.)
Management Development and the Public Sector: A European Perspective. 2. Hants,
England: Gower Pub Co. 223.
METCALFE, L. & RICHARDS, S. 1987. Improving public management, European
Institute of Public Administration; Sage Publications.
MICHELL-WEAVER, C. & MANNING, B. 1992. Public-Private Partnerships in
Third World Development: A Conceptual Overview.Studies in Comparative
International Development, 26, 45-67.
MILLS, A. 1995. Improving the Efficiency of Public Sector Health Services in
Developing Countries - Bureaucratic versus Market Approaches. HEFP working
paper 01/95. Health Economics and Financing Programme. London. 37.
MILLS, A. 1998. To contract or not to contract? Issues for low and middle income
countries. Health Policy and Plan, 13, 32-40.
MILLS, A., ATAGUBA, J. E., AKAZILI, J., BORGHI, J., GARSHONG, B.,
MAKAWIA, S., MTEI, G., HARRIS, B., MACHA, J., MEHEUS, F. & MCINTYRE,
D. 2012. Equity in financing and use of health care in Ghana, South Africa, and
Tanzania: implications for paths to universal coverage. Lancet, 380, 126-33.
MILLS, A. & BROOMBERG, J. 1998. Experiences of contracting: An overview of
the literature. Macroeconomics, health and development series; no. 33, World Health
Organization. Geneva. 40.
MILLS, A. & PALMER, N. 2006. Contracting-out Health Service Provision in
Resource- and Information-poor Settings. In: JONES, A. M. (ed.) The Elgar
Companion To Health Economics. 23. Cheltenham: Edward Elgar Publishers. 250-
258.
MINISTRY OF FINANCE 2011. Population of the Country under Insurance Net.
New Delhi, India: Press Information Bureau, Government of India.
MINISTRY OF HEALTH AND FAMILY WELFARE. 2005. National Rural Health
Mission (2005-2012) - Mission Document. Government of India. New Delhi. 1-17.
Available:
http://www.nird.org.in/brgf/doc/Rural%20HealthMission_Document.pdf[Accessed 15
February 2015].

381
MINISTRY of HEALTH & FAMILY WELFARE. 2006. National Health Accounts,
New Delhi: Government of India, 2006: 1-79.
MINISTRY OF HEALTH AND FAMILY WELFARE 2012. Rural Health Statistics
in India. Part 1 - Rural Health System. New Delhi: Statistics Division, Ministry of
Health and Family Welfare, Government of India.
MINISTRY OF HEALTH AND FAMILY WELFARE 2014. Life expectancy and
increases in Health sector allocation (12th five year plan). New Delhi: Press
Information Bureau, Ministry of Health and Family Welfare, Government of India.
MINISTRY OF HEALTH AND FAMILY WELFARE. 2015. National Health
Mission: Janani Suraksha Yojana: Background [Online]. New Delhi: Ministry of
Health and Family Welfare, Government of India. Available:
http://nrhm.gov.in/nrhm-components/rmnchhttp://nrhm.gov.in/nrhm-
components/rmnch-a/maternal-health/janani-suraksha-
yojana/background.htmla/maternal-health/janani-suraksha-
yojana/background.html[Accessed 15 February 2015].
MINISTRY OF LABOUR AND EMPLOYMENT. 2008. Rashtriya Swasthya Bima
Yojana: Implementation of Rashtriya Swasthya Bima Yojana [Online]. Government of
India, New Delhi. Available:
http://www.rsby.gov.in/Documents.aspx?id=25[Accessed 30 May 2015].
MINISTRY OF LABOUR AND EMPLOYMENT. 2010. Rashtriya Swasthya Bima
Yojana [Online]. New Delhi: Government of India. Available:
http://www.rsby.gov.in/Index.aspx[Accessed 30 May 2015].
MINISTRY OF LABOUR AND EMPLOYMENT. 2011a. Annual Report 2009-2010.
Ministry of Labour and Employment, Government of India. New Delhi. Available:
http://labour.nic.in/upload/uploadfiles/files/Reports/Annual%20Report%202009http://
labour.nic.in/upload/uploadfiles/files/Reports/Annual Report 2009-10
English.pdf10%20English.pdf[Accessed 30 May 2015].
MINISTRY OF LABOUR AND EMPLOYMENT 2011b. Contract between the SNA
and the insurance company. Rashtriya Swasthya Bima Yojana. New Delhi: Ministry
of Labour and Employment, Government of India.
MINISTRY OF LABOUR AND EMPLOYMENT 2011c. Tender Document -
Implementation of Rashtriya Swasthya Bima Yojana. New Delhi: Government of
India.
MINISTRY OF LABOUR AND EMPLOYMENT. 2012a. Rashtriya Swasthya Bima
Yojana: Enrollment of beneficiaries [Online]. Available:
www.rsby.gov.in/overview.aspx[Accessed 30 May 2015].

382
MINISTRY OF LABOUR AND EMPLOYMENT 2012b. RSBYConnect. New
Delhi: Produced jointly by Ministry of Labour and Employment, Government of India
and Deutsche Gesellschaft für Internationale Zusammenarbeit (GIZ) GmbH as part of
Indo-German Social Security Programme (IGSSP).
MINISTRY OF LABOUR AND EMPLOYMENT. 2014. Rashtriya Swasthya Bima
Yojana: Overview: Empanelment of Health Care Providers [Online]. Available:
http://www.rsby.gov.in/Overview.aspx[Accessed 30 May 2015].
MINISTRY OF LABOUR AND EMPLOYMENT. 2014b. RSBY: Health Insurance
for the Poor [Online]. Available: http://www.rsby.gov.in/about_rsby.aspx[Accessed
30 May 2015].
MINISTRY OF LABOUR AND EMPLOYMENT. n.d. Rashtriya Swasthya Bima
Yojana: Nodal agency for RSBY implementation [Online]. Available:
http://www.rsby.gov.in[Accessed 30 May 2015].
MITCHELL-WEAVER, C. & MANNING, B. 1991. Public-private partnerships in
Third World development: a conceptual overview, University of Reading, Department
of Geography.
MITCHELL, M. 2000. An Overview of Public Private Partnerships in Health. Asian
Development Bank, Institute Working Paper Series. Harvard School of Public Health.
Boston. 1-27. Available: http://www.hsph.harvard.edu/ihsg/publications/pdf/PPP-
finalhttp://www.hsph.harvard.edu/ihsg/publications/pdf/PPP-final-
MDM.pdfMDM.pdf[Accessed 30 May 2015].
MONAHAN, A. B. 2008. Health insurance risk Pooling and social solidarity: A
response to professor David Hyman. Connecticut Insurance Law Journal; 14:2. 340.
MOORE, M., STEWART, S. & HUDOCK, A. 1995. Institution building as a
development assistance method: A Review of Literature and Ideas. In: BENNEDICH,
C. (ed.) SIDA Evaluation Report. Stockholm: The Institute of Development Studies at
the University of Sussex and Swedish International Development Authority (SIDA).
109.
MSUYA, J. 2004. Impacts of community health insurance schemes on health care
provision in rural Tanzania. ZEF-Discussion Papers on Development Policy, 82.
MURRAY, C. J. L. & LINCOLN, C. C. 1992. Understanding morbidity change.
Popul Dev Rev, 18, 481-503.
MURTHY, G., GUPTA, S. K., JOHN, N. & VASHIST, P. 2008. Current status of
cataract blindness and Vision 2020: the right to sight initiative in India. Indian J
Ophthalmol, 56, 489-94.

383
NAGREE-MAHTANI, P. 2002. Insurance Law and Regulations in India. Nishith
Desai Associates, Legal & Tax Counseling Worldwide. Mumbai, Silicon Valley. 19-
20. Available:
http://unpan1.un.org/intradoc/groups/public/documents/APCITY/UNPAN021309.pdf
[Accessed 30 May 2015].
NAIR, K. S., NANDAN, D., PIANG, L. K., TIWARI, V. K., RAJ, S., GOEL, T. &
SINGH, B. 2013. Implementing Rashtriya Swasthya Bima Yojana: Experience from
Delhi. Journal of Health Management, 15, 127-140.
NANDI, S., NUNDY, M., PRASAD, V., KANUNGO, K., KHAN, H., HARIPRIYA,
S., MISHRA, T. & GARG, S. 2012. The Implementation of RSBY in Chhattisgarh,
India: A study of the Durg district. Health Culture and Society, 2, 41-70.
NARAYANA, D. 2010. Review of the Rashtriya Swasthya Bima Yojana. Econ Polit
Wkly, 45, 13-14.
NEWAR, L.R. 2013. Understanding Reforms in the Life Insurance Sector of India.
IJCAES SPECIAL ISSUE ON BASIC, APPLIED & SOCIAL SCIENCES,
VOLUME III. Available: http://www.caesjournals.org/spluploads/IJBASS-2013-
006.pdf [Accessed 15 March 2015].
NEWMAN, J. 2001. The new public management, modernization and institutional
change: Disruptions, disjuncture and dilemmas. In: MCLAUGHLIN, K., OSBORNE,
S. & FERLIE, E. (eds.) The New Public Management: Current Trends and Future
Prospects. 5. USA and Canada: Routledge. 77-92.
NIKOLIC, I. A. & MAIKISCH, H. 2006. Public-Private Partnership and
Collaboration in the Health Sector - An Overview with Case Studies from Recent
European Experience. Health, Nutrition and Population (HNP) Discussion Paper. The
World Bank. Washington, D.C. 27. Available:
http://siteresources.worldbank.org/INTECAREGTOPHEANUT/Resources/HNPDiscu
ssionSeriesPPPPaper.pdf[Accessed 30 May 2015].
NISKANEN, W. 1973. Bureaucracy: Servant or Master?. Hobert Paperbacks. The
Institute of Economic Affairs. 116
NITAYARUMPHONG, S. 2012. Struggling Along the Path to Universal Health Care
for All, Bangkok, Thailand, National Health Security Office (NHSO).
OJO, M. 2014. Why The Traditional Principal Agent Theory May No Longer Apply
To Concentrated Ownership Systems And Structures. International Conference on
Law, Humanities, Entrepreneurship and Education. Johannesburg, South Africa
ORGANISATION FOR ECONOMIC COOPERATION AND DEVELOPMENT.
2004. Proposal for a Taxonomy of Health Insurance. OECD Study on Private Health

384
Insurance, OECD Health Project New York. 5-21. Available:
http://www.oecd.org/els/healthhttp://www.oecd.org/els/health-
systems/31916207.pdfsystems/31916207.pdf[Accessed 30 May 2015].
OSBORNE, A. & GAEBLER, T. 1992. Market-Oriented Government: Leveraging
Change through the Market: Chapter 10. Reinventing Government: How the
Entrepreneur Spirit is transforming the Public Sector, Reading, MA, Addison-Wesley
Publishing Company, Inc.
OSBORNE, S., BOVAIRD, T., MARTIN, S., TRICKER, M. & WATERSTON, P.
1995. Performance management and accountancy in complex public programmes.
Financial Accountability and Management, 11, 19-38.
OSBORNE, S. P. & MCLAUGHLIN, K. 2002. The New Public Management in
Context. In: MCLAUGHLIN, K., OSBORNE, S. P. & FERLIE, E. (eds.) New Public
Management: Current Trends and Future Prospects. 1. London: Routledge. 7-14.
PALACIOS, R. J., DAS, J. & SUN, C. 2011. India's health insurance scheme for the
poor : evidence from the early experience of the Rashtriya Swasthya Bima Yojana,
New Delhi, Centre for Policy Research.
PALMER, N. 2000. The use of private-sector contracts for primary health care:
theory, evidence and lessons for low-income and middle-income countries. Bull
World Health Organ, 78, 821-829.
PALMER, N. & MILLS, A. 2005. Contracts in the real world: case studies from
Southern Africa. Soc Sci Med, 60, 2505-2514.
PARSON, T. 2013. Does a Patient’s Type of Medical Insurance Impact their Quality
of Care in Hospitals? Press Release [Online] Bloomberg School of Public Health.
Johns Hopkins. Available: http://www.jhsph.edu/news/news-
releases/2013/gaskin_quality_care.html [Accessed 16 July 2016]
PATE, R. P., OOSTEROM, W., SENGUPTA, R., PURANDARE, J., HALL, T. W. &
SCHULMAN, C. 2007. Health in India: Emerging Market Report 2007.
PricewaterhouseCoopers. USA. 20.
PATEL, P. C., GRIFFIN, C., ABREU, A. & RADWAN, I. 2004. India: Private
Health Services for the Poor. The World Bank. Washington D.C. 58.
PEABODY, J. W., TAGUIWALO, M. M., ROBALINO, D. A. & FRENK, J. 2006.
Improving the Quality of Care in Developing Countries. CHapter 70. Jamison DT,
Breman JG, Measham AR, et al., editors. Disease Control Priorities in Developing
Countries. 2nd edition. Washington (DC): The International Bank for Reconstruction
and Development / The World Bank; New York: Oxford University Press; 2006.

385
PENG, P. 1996. Opening Speech at the National Conference on the Expansion of
Trial Work for the Reform of Health Care System for Employees the Reform of the
Health Care System for Employees, Distribution and Social Security Department of
the State Structural Reform Commission.
PEREZ, D., A., A. & VEGA, W. A. 2009. Effects of Health Insurance on Perceived
Quality of Care Among Latinos in the United States. J Gen Intern Med. 24(Suppl 3):
555-560.
PERROT, J. 2006. Different approaches to contracting in health systems. Bull World
Health Organ, 84, 859-866.
PETERS, D. H. & MURALEEDHARAN, V. R. 2008. Regulating India's health
services: to what end? What future? Soc Sci Med, 66, 2133–2144.
PETERS, D. H., YAZBECK, A. S., SHARMA, R. R., RAMANA, G. N. V.,
PRITCHETT, L. H. & WAGSTAFF, A. 2002. Better health systems for India's poor:
findings, analysis, and options, Washington, D.C., The World Bank.
PLANNING COMMISION. 2013. Press Note on Poverty Estimates, 2011-12
[Online]. New Delhi: Government of India. Available:
http://planningcommission.nic.in/news/pre_pov2307.pdf[Accessed 30 December
2014].
PLANNING COMMISSION. 2006. Clinical Establishments, Professional Services
Regulation and Accreditation of Health Care Infrastructure. Planning Commission,
Government of India. New Delhi. 6. Available:
http://planningcommission.nic.in/aboutus/committee/wrkgrp11/wg11_hclinic.pdf[Acc
essed 30 May 2015].
PLANNING COMMISSION. 2008. “Health and Family Welfare.” In Eleventh Five-
Year Plan, 2002–2007. Planning Commission, Government of India. New Delhi: 3(3).
57-127. Available:
http://planningcommission.gov.in/plans/planrel/fiveyr/11th/11_v2/11v2_ch3.pdf[Acc
essed 30 May 2015].
PLANNING COMMISSION. 2011. Health Financing and Financial Protection. High
level expert group report on universal health coverage for India. Planning
Commission, Government of India. New Delhi. 95-118. Available:
http://planningcommission.nic.in/reports/genrep/rep_uhc0812.pdf[Accessed 30 May
2015].
PLANNING COMMISSION OF INDIA. 2011. High level expert group report on
universal health coverage for India. Planning Commission of India. Available:
http://planningcommission.nic.in/reports/genrep/rep_uhc0812.pdf[Accessed 30 May
2015].

386
POLIDANO, C. 1999. The new public management in developing countries. IDPM
Public Policy and Management Working Paper no. 13. Institute for Development
Policy and Management, University of Manchester.
POLLITT, C. 1993. Managerialism and the public services: The Anglo-American
Experience, Oxford, OX, UK; Cambridge, Mass., USA, Blackwell Business.
PRADHAN, M. & PRESCOTT, N. 2002. Social risk management options for medical
care in Indonesia. Health Econ, 11, 431-446.
PREKER, A., HARDING, A. & TRAVIS, P. 2000. “Make or Buy” decisions in the
production of health care goods and services: new insights from institutional
economics and organizational theory. Bull World Health Organ, 78, 779-790.
PREKER, A. S. & CARRIN, G. 2004. Experience of Community Health Financing in
the Asian Region: Health Financing for Poor People: Resource Mobilization and Risk
Sharing The International Bank for Reconstruction and Development/The World
Bank. Washington, D.C.: xxi. 119-156.
PRESS INFORMATION BUREAU 2011a. Inaugural Address of the Prime Minister
at the Conference on Public-Private Partnership in National Highways New Delhi:
Government of India.
PRESS INFORMATION BUREAU 2011b. Population of the Country Under
Insurance Net. New Delhi, India: Ministry of Finance, Government of India.
PRESS TRUST OF INDIA. 2014. Extend CAG Audit to All PPP, Joint Ventures. The
New Indian Express, 19 April 2014.
PRESS TRUST OF INDIA. 2015. Labour Min to transfer RSBY to Health Ministry
from April. Business Standard, 9 March 2015.
PUBLIC HEALTH FOUNDATION OF INDIA. 2011. A Critical Assessment of the
Existing Health Insurance Models in India. New Delhi. Available:
http://planningcommission.nic.in/reports/sereport/ser/ser_heal1305.pdf[Accessed 30
May 2015].
PUNJAB HEALTH SYSTEMS CORPORATION. n.d. Home: Punjab Health
Systems Corporation (PHSC), Department of Health and Family Welfare,
Government of Punjab [Online]. Punjab Health Systems Corporation. Available:
http://www.punjabhealth.co.in/index.aspx?ID=82dqWALIQqI=[Accessed 30 May
2015].
RAI, S. & RAI, N. 2010. Rashtriya Swasthya Bima Yojana (RSBY): Panacea for the
poor (National Health Insurance Plan) [Online]. Available:

387
http://www.adbi.org/files/2010.12.11.cpp.sess3.c18.rai.paper.rsby.panacea.poor.pdf[A
ccessed 28 December 2014].
RAJASEKHAR, D., BERG, E., GHATAK, M., MANJULA, R. & ROY, S. 2011.
Implementing health insurance: The roll out of Rashtriya Swasthya Bima Yojana in
Karnataka Econ Polit Wkly, 46, 56-63.
RAMAKRISHNAN, R. 2012. Public Private Partnership (PPP) in Indian Health Care.
Agni School of Business Excellence. Dindigul (Tamil Nadu, India). 10. Available:
http://papers.ssrn.com/sol3/papers.cfm?abstract_id=2186897[Accessed 30 May
2015].
RAMAN, A. V. & BJÖRKMAN, J. W. 2008. Public-Private partnership in health
care services in India. Indo-Dutch Progamme on Alternatives in Development.
Institute of Social Studies, Hague, Netherlands. 73-98.
RAMAN, A. V. & BJÖRKMAN, J. W. 2009. Public-private partnerships in health
care in India: lessons for developing countries, Abingdon, Routledge.
RAMYA, R. 2012. Pathetic Condition of Government Hospitals. Impact Together.
2012. [Online]. Available:
https://mentortogethersocent.wordpress.com/2012/09/20/pathetic-conditions-of-
government-hospitals-2/ [Accessed 12 July 2016].
RANNAN-ELIYA, R. P. & SIKURAJAPATHY, L. 2009. Sri Lanka: “Good
Practice” in Expanding Health Care Coverage. Research Studies Series 3. Institute of
Health Policy. Colombo. 38.
RANSON, M. K. & JOHN, K. R. 2002. Quality of hysterectomy care in rural Gujarat:
the role of community-based health insurance. Reprod Health Matters, 10, 70-81.
RAO, N. 1991. From Providing to Enabling: Local Authorities and Community Care
Planning, New York, Joseph Rowntree Foundation.
RAO, P. H. 2012. The Private Health Sector in India: A Framework for Improving the
Quality of Care. ASCI Journal of Management, 41, 14–39.
RAO, S. K. 2005. Financing of Health Care in India: Health Insurance in India. In:
LAL, P. G. & BYWORD EDITORIAL CONSULTANTS (eds.) Financing and
Delivery of Health Care Services in India: Background Papers of the National
Commission on Macroeconomics and Health. 4. New Delhi: National Commission on
Macroeconomics and Health, Ministry of Health & Family Welfare, Government of
India. 275-296.
RASHTRIYA SWASTHYA BIMA YOJANA. 2011. Study of Rashtriya Swasthya
Bima Yojana Health Insurance in India Available:

388
http://www.iphindia.org/v2/wphttp://www.iphindia.org/v2/wp-
content/uploads/2013/01/RSBY-
report_2013_Jan_02.pdfcontent/uploads/2013/01/RSBY-
report_2013_Jan_02.pdf[Accessed 30 May 2015].
REDDY, K. S., PATEL, V., JHA, P., PAUL, V. K., KUMAR, A. K., DANDONA, L.
& LANCET India Group For Universal health. 2011a. Towards achievement of
universal health care in India by 2020: a call to action. Lancet, 377, 760-768.
REDDY, K. S., SELVARAJA, S., RAO, K. D., CHOKSHI, M., KUMAR, P.,
ARORA, V., BHOKARE, S. & GANGULY, I. 2011b. A critical assessment of the
existing health insurance models in India. Public Health Foundation of India. New
Delhi. 115. Available:
http://planningcommission.nic.in/reports/sereport/ser/ser_heal1305.pdf[Accessed 30
May 2015].
REDIFF NEWS. 1999. Lok Sabha passes insurance bill with 4 amendments. Rediff on
the net, 2 December 1999.
REGIONAL COMMITTEE FOR EUROPE - WHO. The role private sector and
privatization in European health systems. Fifty-second session of Regional
Committee for Europe, 16– 19 September 2002 2002 Copenhagen. World Health
Organization. Regional Office for Europe, 11.
REGIONAL TRAINING INSTITUTE. 2014. News Clippings on Public Private
Partnership. Reading Material. Regional Training Institute. Chennai. 2-3. Available:
http://rtichennai.cag.gov.in/rti-website/rtihttp://rtichennai.cag.gov.in/rti-website/rti-
chennai/download/PPPnewsBookletMarch2014.pdfchennai/download/PPPnewsBookl
etMarch2014.pdf[Accessed 30 December 2014].
REGISTRAR GENERAL OF INDIA 2013. SRS Bulletin. Office of the Registrar
General. New Delhi: Sample Registration System, Ministry of Home Affairs,
Government of India.
REPUBLIC OF THE PHILIPPINES 1995. National Health Insurance Act of 1995.
REPUBLIC ACT No. 7875. Metro Manila: Congress of the Philippines. Available
http://www.philhealth.gov.ph/about_us/ra7875.pdf[Accessed 28 April 2015].
REYES, E. A. C. 2007. The Phil-Health Indigent Program: A Locality-Based Health
Insurance Program for the Poor in the Philippines. Health Insurance in the Philippines
Theme: Social Safety Nets & Micro Finance. Available:
http://www.undprcc.lk/ext/mdgi_regional_workshop_2007/pdf/Social%20Safety%20
Net s%20and%20Micro%20Finance/Philhealth.pdf[Accessed 30 May 2015].
ROBINSON, R. 1990. Competition and health care: a comparative analysis of UK
plans and US experience, King's Fund Institute.

389
ROMERO, M. J. 2014. Where is the public in PPPs? Analysing the World Bank’s
support for public-private partnerships. Bretton wood Project [Online]. Available:
http://www.brettonwoodsproject.org/2014/09/public-ppps-analysing-world-
bankshttp://www.brettonwoodsproject.org/2014/09/public-ppps-analysing-world-
banks-support-public-private-partnerships/support-public-private-
partnerships/[Accessed 30 May 2015].
RON, A. & ADLUNG, S.X. (eds.). 2001. Recent health policy innovations in social
security (chap. 2). New Brunswick, NJ, Transaction Publishers; Geneva, ISSA.
ROSENTHAL, G. 2000. State of the Practice: Public-NGO Partnerships for Quality
Assurance USAID and LAC Health Sector Reform Initiative (Family Planning
Management Development). Boston. 23. Available: http://www.paho.org/PAHO-
USAID/index.php?gid=10048&option=com_docman&task=doc_download[Accessed
16 December 2014].
ROUSSEAU, T. 2014. Social health insurance. Report of study visit 21 - 24 October
2014. Project collaborator COOPAMI; Vietnam. Available:
http://www.coopami.org/en/expertise/realisation/2014/pdf/2014120101.pdf [Accessed
16 July 2016]
RSBY. 2014a. Overview: Empanelment of Health Care Providers [Online].
Available: http://www.rsby.gov.in/Overview.aspx[Accessed 18 December 2014.
RSBY. 2014b. Health Insurance for the Poor [Online]. Available:
http://www.rsby.gov.in/about_rsby.aspx [Accessed 6 December 2014]
RSBY COMMITTEE. 2014. RSBY Committee Final Report. Ministry of Labour and
Employment, Government of India. New Delhi. 63. Available:
http://rsby.gov.in/Docs/RSBY%20Committee%20Final%20Draft%20Report%20for%
20 Comments.pdf[Accessed 30 December 2014].
RSBY CONNECT. 2012. RSBY Connect. Ministry of Labour and Employment.,
Government of India Available:
http://www.in.undp.org/content/dam/india/docs/pubhttp://www.in.undp.org/content/d
am/india/docs/pub-
povertyreduction/06_RSBY_Connect_No6_July2012.pdfpovertyreduction/06_RSBY
_Connect_No6_July2012.pdf.
RUITERS, G. & POINTER, R. 2010. ‘Private sector involvement in funding and
providing health services in South Africa. Implications for equity and access to health
care,’ EQUINET Discussion Paper Series 84. Health Economics Unit (UCT), ISER
Rhodes University, EQUINET: Harare. 50.

390
RUKHADZE, T. 2012. In: Healthcare Overview: New Perspectives. COSTIGLIOLA
V, editor. New York: Springer. An overview of the healthcare system in Georgia;
133–152.
INFORMATION HUB. 2014. Healthcare Access in Rural Communities [Online].
Available: https://www.ruralhealthinfo.org/topics/healthcare-access [Accessed 12 July
2016].
SAKSENA, P., XU, K., DURAIRAJ, V. 2010. The drivers of catastrophic
expenditure: outpatient services, hospitalization or medicines? World Health Report
(2010) Background Paper, 21. HEALTH SYSTEMS FINANCING. The path to
universal coverage. Available:
http://www.who.int/healthsystems/topics/financing/healthreport/21whr-bp.pdf
[Accessed 6 December 2014]
SALL, F. L., KADAÏ, A., ANDRIANTSARA, G. & PERROT, J. 2006. The benefits
of setting the ground rules and regulating contracting practices. Bull World Health
Organ, 84, 80.
SALTMAN, R. B. & OTTER, C. 1992. Planned markets and public competition:
strategic reform in northern European health systems, Buckingham, Open University
Press.
SCHIEBER, S. J., BILYEU, D. K., HARDY, D. R., KATZ, M. R., KENNELLY, B.
B. & WARSHAWSKY, M. J. 2009. The Unsustainable Cost of Health Care. Social
Security Advisory Board. USA. 57. Available:
http://www.ssab.gov/documents/TheUnsustainableCostofHealthCare_508.pdf[Access
ed 30 May 2015].
SCHOEN, C., OSBORN, R., HOW, S. K., DOTY, M. M. & PEUGH, J. 2008. In
chronic condition: experiences of patients with complex health care needs, in eight
countries. Health Affairs. 2008;1:1–16.
SCHWIND, B. 2010. Barriers to health care for the poor and ethnic minorities in
Northwest Vietnam. Discussion Papers on Social Protection. Deutsche Gesellschaft
für Technische Zusammenarbeit (GTZ) GmbH German Technical Cooperation. 2,2
SEDDOH, A., ADJEI, S. & NAZZAR, A. 2011. Ghana’s National Health Insurance
Scheme: Views on Progress, Observations, and Commentary. Centre for Health and
Social Services, the Rockefeller Foundation. Ghana. 104. Available: http://www.ch-
ghana.org/documents/Publication/Report%20on%20observations%20and%20comme
ntar y%20on%20NHIS.pdf[Accessed 30 May 2015].
SEIN, T., GANI, A., HASBULLAH, T., GUPTA, I., SIRIPEN, S., HONG, P. K.,
WIDYASTUTI, W., VIROJ, T., PIYA, H., PONGPISUT, PANDE, B., KYAING, A.,
URVASHI, S. & RAO, S. 2004. Social Health Insurance - Health Insurance in India:

391
Current Scenario. Regional Overview of Social Health Insurance in South-East Asia.
World Health Organization, Regional Office for South-East Asia. New Delhi. 79-100.
SEKHRI, N. & SAVEDOFF, W. 2004. Private Health Insurance: Implications for
Developing Countires. Discussion Paper 3. World Health Organization, Geneva.
2004.
SELVARAJ, S. & KARAN, A. 2009. Deepening Health Insecurity in India: Evidence
from National Sample Surveys since 1980s. Econ Polit Wkly, 44, 55-60.
SELVARAJ, S. & KARAN, A. 2012. Why Publicly-Financed Health Insurance
Schemes Are Ineffective in Providing Financial Risk Protection. Econ Polit Wkly, 47.
SEN, A. K. 2002. Health: perception versus observation. BMJ, 324, 860-861.
SEN, G., GEORGE, A. & Ã-STLIN, P. 2002. Engendering international health : the
challenge of equity. Cambridge, Mass.: MIT Press; 2002.
SESHADRI, T., TRIVEDI, M., SAXENA, D., NAIR, R., SOORS, W., CRIEL, B. &
DEVADASAN, N. 2011. Study of Rashtriya Swasthya Bima Yojana (RSBY) Health
Insurance in India Alliance for Health Policy & Systems Research (AHPSR) and
World Health Organization.
SETHI, S. 2010. Can Rashtriya Swasthya Bima Yojana help bridge the quality
chasm? Working Paper. Centre for Public Research. New Delhi. 22. Available:
http://www.idfresearch.org/pdf/RSBY_Hospital_quality_paper.pdf[Accessed 30 May
2015].
SHARMA, K. D. 2012. Implementing Quality Process in Public Sector Hospitals in
India: The Journey Begins. Indian J Community Med, 37(3): 150–152.
SHARMA, S. K. 2014. CAG to audit new PPP projects, report on telecom, gas sectors
soon. The Times of India, 14 May 2014.
SHARMA, Y. n.d. Indian Medical Association, Punjab - Presidential Message
[Online]. Jalandhar: Indian Medical Association, Punjab. Available:
http://webcache.googleusercontent.com/search?q=cache:VlLvvaIm0zYJ:imapunjab.or
g/p resident-message.doc+&cd=1&hl=en&ct=clnk&gl=in[Accessed 30 May 2015].
SHETTY, G. 2014. Health Insurance Evolution in India: An Opportunity to Expand
Access. Cognizant 20-20 Insight. Chennai. 7. Available:
http://www.cognizant.com/InsightsWhitepapers/Healthcare-Insurance-Evolution-
inhttp://www.cognizant.com/InsightsWhitepapers/Healthcare-Insurance-Evolution-in-
India-An-Opportunity-to-Expand-Access.pdfIndia-An-Opportunity-to-Expand-
Access.pdf [Accessed 30 May 2015].

392
SHIN, J. 2012. Private health insurance in South Korea: an international comparison.
Health Policy, 108, 76-85.
SHIVA, 2012. Burden of the health care expenditures in Gujarat: View point.
Government of Gujarat. 23
SHIVAKUMAR, G. 2013. Government paid private insurer crores in premium for
ghost beneficiaries. The Hindu, 2nd September 2013.
SIDDIQI, S., MASUD, T. I. & SABRI, B. 2006. Contracting but not without caution:
experience with outsourcing of health services in countries of the Eastern
Mediterranean Region. Bull World Health Organ, 84, 867-875.
SINGH, D. K. 2014a. Cabinet clears 49% insurance FDI. Indian Express, 25th July
2014.
SINGH, H. 2010. Rapid Assessment of to map out Situational Realities in Jaunpur,
Mirzapur and Sant Ravidas Nagar: Rashtriya Swasthya Bima Yojana: Study
commissioned by UNDP. Available:
http://www.amicusadvisory.com/pdf/RSBYhttp://www.amicusadvisory.com/pdf/RSB
Y-Jaunpur-SR Nagar-Mirzapur.pdfJaunpur-SR%20Nagar-Mirzapur.pdf[Accessed 16
December 2014].
SINGH, M. K. 2014b. New poverty line: Rs 32 in villages, Rs 47 in cities. The Times
of India, 7th July 2014.
SINGH, S. & BADAYA, S. 2014. Health care in rural India: A lack between need and
feed. South Asian J Cancer. 3(2): 143–144.
SINHA, K. 2012. Unnecessary procedures on the rise in government hospitals too:
Report Kounteya Sinha. The Times of India, 15th October 2012.
SMITH, K. V. & SULZBACH, S. 2008. Community-based health insurance and
access to maternal health services: evidence from three West African countries. Social
Science & Medicine, 66(12), 2460-2473.
SMITH, P., WONG, C. & YUXIN, Z. ANALYTICAL AND ADVISORY
ACTIVITIES TEAM. 2005. Public Expenditure and the Role of Government in the
Chinese Health Sector. Brief note no. 5. Rural Health in China: Briefing Notes Series.
The World Bank and Ministry of Health, China. May 2005. 1-2. Available:
http://siteresources.worldbank.org/INTEAPREGTOPHEANUT/Resources/502734htt
p://siteresources.worldbank.org/INTEAPREGTOPHEANUT/Resources/502734-
1129734318233/BN5-publicexpenditure-final.pdf1129734318233/BN5-
publicexpenditure-final.pdf [Accessed 28 May 2015].

393
SOOD, N. & HIGGINS, A. 2012. Posing a framework to guide government's role in
payment and delivery system reform. Health Aff (Millwood), 31, 2043-2050.
SPARROW, R. S. A., WIDAYANTI W. 2008. Public health insurance for the poor:
targeting and impact of Indonesia’s Asheskin Programme The Hague: Institute of
Social Studies. Mimeo. Available:
http://www.smeru.or.id/report/workpaper/askeskin/askeskin_eng.pdf [Accessed 30
May 2015].
STALLWORTHY, G., BOAHENE, K., OHIRI, K., PAMBA, A. & KNEZOVICH, J.
2014. Roundtable discussion: what is the future role of the private sector in health?
Global Health, 24, 55.
STREET, A., P., S., MASON, A., MIRALDO, M. & SICILIANI, L. 2010. Are
English treatment centres treating less complex patients. Health Policy, 94(2), 150–
157.
SWAROOP, A. 2012. Under RSBY poor get better attention in government hospitals.
In: ONLINE, C. S. (ed.). Civil Society Online.
TABOR, S. R. 2005. Community-Based Health Insurance and Social Protection
Policy. Social Protection Discussion Paper Series. Social Protection Unit, Human
Development Network, The World Bank. Washington, D.C.
TANDON, S. 2013. Of poor patients and callous doctors. Indian Journal of Medical
Ethics, 10, 68-69.
TANIA, N. T. L. 2013. Enhancing Universal Health Coverage through Public-Private
Partnerships in Primary Care - The Case of Community Health Assist Scheme in
Singapore. Lee Kuan Yew School of Public Policy. Singapore. 13.
TEISMAN, G. & KLIJN, E. 2001. Public–private partnerships in the European
Union: official suspect, embraced in daily practice. In: OSBORNE, S. P. (ed.) Public–
Private Partnerships: Theory and practice in international perspective. 10. New
York: Routledge. 165-186.
TEISMAN, G. & KLIJN, E. 2002. Partnership Arrangements: Governmental Rhetoric
or Governance Scheme? PAR, 62, 197-205.
TENDULKAR, S. D., RADHAKRISHNA, R. & SENGUPTA, S. 2009. Report of the
expert group to review the methodology for estimation of poverty Planning
Commission, Government of India. New Delhi. 32. Available:
http://planningcommission.nic.in/reports/genrep/rep_pov.pdf[Accessed 30 May
2015].

394
THAMBA, V., GUPTA, V., IBRAHIM, S., KUMAR, M.J. 2012. Demand forecasting
of hospitals in India. Available:
http://www.slideshare.net/arokiamanojkumar/demand-forecast-of-hospitals-in-india
[Accessed 20 December 2015].
THAKUR, H. 2015. Study of Awareness, Enrollment, and Utilization of Rashtriya
Swasthya Bima Yojana (National Health Insurance Scheme) in Maharashtra, India.
Front Public Health, 3, 282.
THE GAZETTE OF INDIA 1999. Insurance Regulatory and Development Authority
Act, 1999. New Delhi: Government of India.
THE GAZETTE OF INDIA 2001. Insurance Regulatory and Development Authority
(Third Party Administrators – Health Services) Regulations In: INDIA, G. O. (ed.)
2883_GI_2001_ENG. New Delhi: Insurance Regulatory and Development Authority
Notification.
THE HINDU. 2012. Clinical establishments brought under Act. The Hindu, 23 March
2012.
THE HINDU. 2013. Janashree Bima Yojana and Aam Aadmi Bima Yojana merged.
The Hindu, 22nd August 2013.
THORNTON, R. & FIELD, E. 2010. Social security health insurance for the informal
sector in Nicaragua: a randomized evaluation. Health Economics 19: 181-206.
TOBE, M., STICKLEY, A., ROSARIO, R. B. J. & SHIBUYA, K. 2013. Out-of-
pocket medical expenses for inpatient care among beneficiaries of the National Health
Insurance Program in the Philippines. Health Policy Plan, 28, 536-548.
TRIVEDI, M. & SAXENA, D. B. 2013. Third Angle of RSBY: Service Providers'
Perspective to RSBY-operational Issues in Gujarat. J Family Med Prim Care, 2, 169–
172.
TUAN, T., DUNG, V. T., NEU, I. & M.J., D. 2005. Comparative quality of private
and public health services in rural Vietnam. Health Policy Plan, 20, 319-28.
UNITED NATIONS. 2014. Universal Health Coverage [Online]. India: United
Nations. Available: http://www.in.one.un.org/task-teams/universal-health-
coverage[Accessed 30 May 2015].
VAN HAM, H. & KOPPENJAN, J. 2001. BUILDING PUBLIC–PRIVATE
PARTNERSHIPS: Assessing and managing risks in port development. Public
Management Review, 3, 593 - 616.
VARGAS-ZEA, N., CASTRO, H., RODRıGUEZ-PA-EZ, F., TELLEZ, D. &
SALAZAR-ARIAS, R. 2012. Colombian Health System on its Way to Improve

395
Allocation Efficiency—Transition from a Health Sector Reform to the Settlement of
an HTA Agency. Value in Health Regional., 218-222.
VECINO-ORTIZ, A. I. 2008. Determinants of demand for antenatal care in
Colombia. Health Policy, 86, 363-372.
VENKATRAMAN, A. & BJÖRKMAN, J. W. 2009. Public-private partnerships in
health care in India: lessons for developing countries. : 2009., Abingdon, Routledge.
VERA-HEMANDEZ, M. 2003. Structural Estimation of a Principal-Agent Model:
Moral Hazard in Medical Insurance, 34 RAND J. ECON. 670.
VISWANATHAN, R. & AVANCEÑA, A. L. V. 2015. Social franchises: the bridge
between healthcare providers and national health insurance programs | Lessons
learned from two initiatives in the Philippines. San Francisco: Global Health Group,
Global Health Sciences, University of California, San Francisco.
WAGSTAFF, A. 2007. Health insurance for the poor: initial impacts of Vietnam‘s
health care fund for the poor. The World Bank, Policy Research Working Paper
Series: 4134 2007. The World Bank. Washington D.C. 33.
WAGSTAFF, A. 2010. Estimating health insurance impacts under unobserved
heterogeneity: the case of Vietnam's health care fund for the poor. Health Econ, 19,
189-208.
WAGSTAFF A, L. M. 2008. Can insurance increase financial risk? The curious case
of health insurance in China. Journal of Health Economics, 27, 990-1005.
WAGSTAFF, A. & LINDELOW, M. 2008. Can insurance increase financial risk?
The curious case of health insurance in China. J Health Economics, 27(4), 990-1005
WAGSTAFF, A. & VAN DOORSLAER, E. 2003. Catastrophe and impoverishment
in paying for health care: with applications to Vietnam 1993-98. Health Econ, 12,
921-934.
WAGSTAFF, A., VAN DOORSLAER, E. & PACI, P. 1991. Horizontal inequity in
the delivery of health care. Journal of Health Economics, 10(2): 251-256.
WALSH, K. 1995. Public Services and Market Mechanism: Competition Contracting
and the new Public Management, New York, Palgrave Macmillan.
WANG, D. 1999. The Importance and Urgency of Sufficiently Understanding the
Reform of the Health Insurance System for Urban Staff and Workers China Labor,
158, 4-7.
WHINNEY, C. & MADIATH, J. 2001. Enabling the poorest to benefit from de-
centralisation: Gram Vikas’ Model. Available:

396
http://www.gramvikas.org/docs/The_Power_of_Decentralization.pdf [Accessed 16
July 2016].
WHO 2010. The world health report: health systems financing: the path to universal
coverage. Available: http://www.who.int/whr/2010/en/index.html [Accessed 23 April
2012].
WHO & UNICEF. 2013. Progress on Drinking Water and Sanitation. WHO/UNICEF
Joint Monitoring Programme (JMP) for Water and Sanitation. WHO and UNICEF.
Luxemberg. 78.
WILLIAM, H., DEAN, J. T., WILLIAM, M. P. & WINNIE, Y. 1997. Financing
Health Care: Issues and options for China, Washington D.C., The World Bank.
WILLIAMSON, O. 1983. The Free Press; New York: Markets and hierarchies:
Analysis and antitrust implications.
WILLIAMSON, O. E. 1985. Firms, markets, relational contracting, China, Social
sciences publishing house: Chengcheng books ltd.
WOLFE, A. 1993. Profit from Strategic Marketing: How to Succeed in Business
Markets, FT Pitman Publishing, London
WONG, C. K., LO, V. I. & TANG, K. L. 2006. Healthcare in China. China's Urban
Health Care Reform: From State Protection to Personal Responsibility. 2. Lanham:
Lexington Books; division of Rowman and Littlefield Publishers Ltd. 11-30.
WORLD BANK. 1991. World Development Report 1991: The Challenge of
Development. The World Bank.
WORLD BANK. 2010. The World Bank Data; Physicians per 1000 population.
[Online]. Available: http://data.worldbank.org/indicator/SH.MED.PHYS.ZS
[Accessed 15 March 2015].
WORLD HEALTH ORGANIZATION. 2000. Health Systems — Improving
Performance. World Health Report 2000. World Health Organization. Geneva,
Switzerland: xix. 215.
WORLD HEALTH ORGANIZATION. 2013. Health expenditure (Health
expenditure ratios and per capita health expenditure). World Health Statistics 2013.
World Health Organization. Geneva, Switzerland. 131-142.
XAVIER, G., TOWNSEND, R. & VICKERY, J. 2008. Patterns of rainfall insurance
participation in rural India, in: The World Bank Economic Review, 22(3): 539-566.
397
XU, K., EVANS, D., KAWABATA, K., ZERAMDINI, R., KLAVUS, J. &
MURRAY, C. 2003. Household catastrophic health expenditure: a multi-country
analysis. Lancet, 362, 111117.
YIP, W. & BERMAN, P. 2001. Targeted health insurance in a low income country
and its impact on access and equity in access: Egypt's school health insurance. Health
Economics 10(3): 207-220.
YIP, W. & MAHAL, A. 2008. The Health Care Systems of China and India:
Performance and Future Challenges. Health Aff (Millwood), 27, 921-932.
ZAIDI, S., MAYHEW, S. H., CLELAND, J. & GREEN, A. T. 2012. Context matters
in NGO– government contracting for health service delivery: a case study from
Pakistan. Health Policy and Plan, 27, 570-581.
ZRYUMOV, P. 2014. Dynamic Adverse Selection Time Varying Market Conditions
and Endogenous Entry. Job Market Paper. Graduate School of Business, Stanford
University.
ZWEIFEL, P. & BREYER, F. 2006. The economics of social health insurance. In:
Jones AM, ed. The Elgar Companion to Health Economics, Edward Elgar Publishing,
126-135.

398
ANNEXURES

399
ANNEXURE 1: LIST OF PACKAGES
COVERED UNDER RSBY

400

401

402
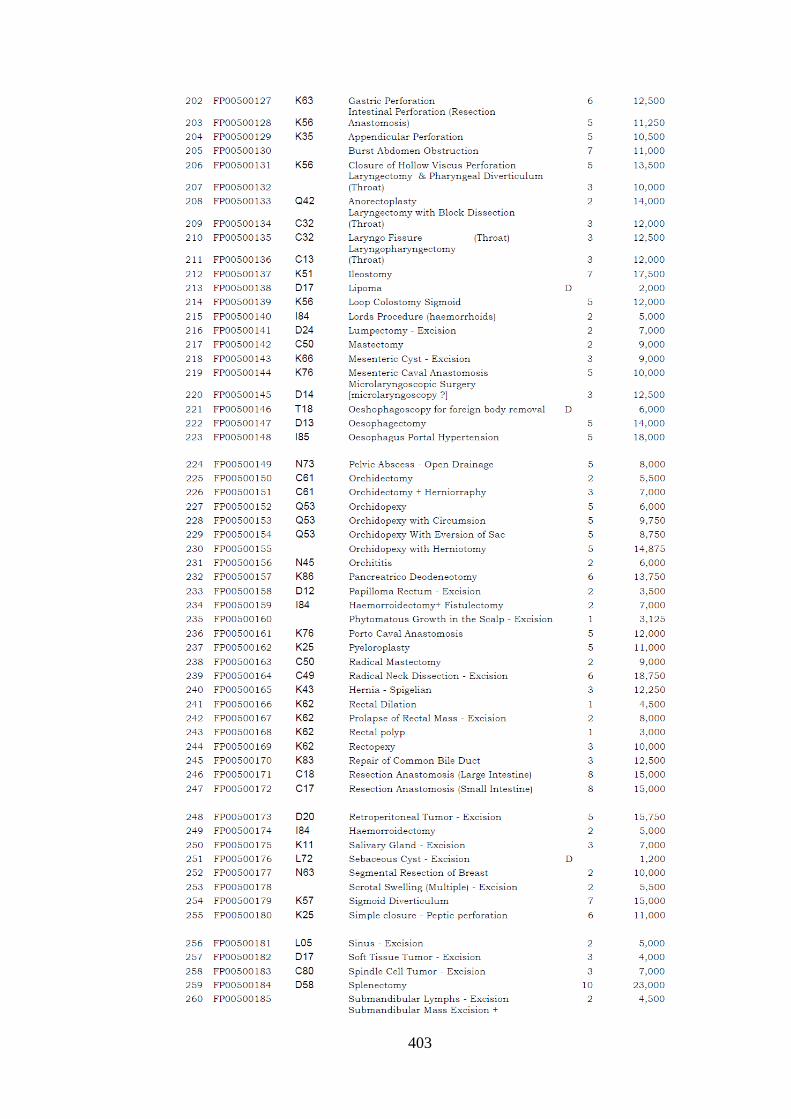
403

404

405

406

407

408

409

410

411

412

413
ANNEXURE 2: IN-DEPTH INTERVIEW
GUIDE FOR KEY STAKEHOLDERS
IN-DEPTH INTERVIEW GUIDE FOR KEY STAKEHOLDER
PART I – POLITICAL AND REGULATORY ENVIRONEMNT
Formal policy guidelines for PPP (Request copy of any government notification,
circulars, orders, policy document etc.?)
- Central level
- State level
- If already promulgated, salient features of the policy
- If there is no such policy and if the Government proposes to have formal
policy, salient features of the proposed policy
While formulating your policy guidelines towards public-private partnerships in
RSBY, have you considered or reviewed or studied similar policies? What are the
unique features or improvisations you have made
- Incentives
- Eligibility conditions
- Risk etc
How has been the support from other Ministries in launching and sustaining RSBY?
Political environment in launching and sustaining the RSBY
- Central Level
- State Level
- Private Sector Engagement
- Budget Allocation
- Coalition Government
What regulations govern the contractsat central level?
Insurance companies
NGO
TPA
Providers (public and private)
What is the regulatory environment at the state level?
Insurance Companies
NGO
TPA
Providers (public and private)
What is the regulatory environment at the district level?
Insurance Companies
NGO
TPA
Providers (public and private)
Based on your experience in the form of such partnerships, how would you assess the
overall benefits of such partnerships?

414
PART II – INSTITUTIONAL AND ORGANIZATIONAL CAPACITY
1. Human Resources solely dedicated to RSBY
Permanent Contract Specialist Training
Number of administrative staff
Number of technical staff
Number of support [including translators,
secretarial, and other staff]
2. Physical Resources solely dedicated to RSBY
For each item below please describe the location, extent/number, age, suitability and
condition
Premises
Utilities: Power/Water/Phone
Vehicles
Communications Equipment
Computer Equipment
Specialist Equipment
3. Annual Financial Resources (Please provide whatever information is available)
2009 2010 2011
Pay/Salaries Permanent
Pay/Salaries Contract
Pensions
Total
Building/repairs
Utility Bills
Transportation/travel
Equipment
Training
Publications
Consultants
Supplies
Other
Total
Total Liabilities
Central government
State government
Other income sources
Total income

415
4. What is the allocation of role and responsibility
Position/title:
Office or Department:
Reporting relationship to supervisor
Principal areas of responsibility:
Who reports directly to you? How often? About what?
Principal documents referred to for:
Legislation
Policies
Objectives
Strategies
Procedures
What are the main administrative tasks that occupy the majority of your
time?
What are the main technical activities [if any] that your section
administers?
What are the other ministries and agencies that you communicate with
about RSBY issues?
What are the most urgent/important tasks that you believe should be
addressed by your section?
What do you anticipate will be the biggest new challenges for your
section over the next five years?
What are the biggest difficulties encountered by your section? Are they:
Insufficient legal authority? [Do you work with out-of-date legislation
that does not address the realities of your main challenges? What is
missing? What needs to be improved?]
Poorly defined standards/guidelines? [Are there clear criteria that allow
you to make decisions?]
Poorly Defined Administrative Roles? [such as need for clearer roles or
responsibilities, better communications or reporting structure]
Insufficient Information? [Is there sufficient data available for your
section? Is it incomplete? Is it out of date? Be as specific as possible]
Insufficient Resources? Human Resources [what additional staff are
required? What are they needed for? What additional skills or training are
needed?]
Physical Resources? [what additional/improved premises, utilities,
equipment are needed to allow your section to perform more effectively.
What improvements would occur?]
Financial Resources? [What are the five biggest financial obstacles that
reduce the effectiveness of your section?]
5. Training: Have you received any specific training for your job? If so when did you
last receive training? What additional training would help you to do your job better?
6. Is there any independent body which supervises the functions and the effectiveness of
RSBY?
PART III – MARKET AND DEGREE OF COMPETITION
Refer to Section VI - Contract Details

416
PART IV – DEGREE OF TRUST
1. What role does trust play in selection and provision of services? (Insurance
companies → health providers, TPA, Smart card provider, NGO etc? State →
insurance company for contract renewal? Beneficiary → Provider)
PART V – SERVICE DELIVERY
1. How do you feel about case-based pre-negotiated fixed payment for an RSBY
beneficiary?
2. Can the pre-negotiated payments for RSBY for certain procedures lead to higher
profit margins? (cataract as opposed to complicated c-section)
3. Are beneficiaries availing facilities outside the district or state? Why?
4. In your opinion, is BPL population utilizing facilities which are closest to them, or are
they having or choosing to travel further to avail benefits and the reasons behind that
choice?
5. How are facilities empanelled by the insurance company and what criterion are used
for empanelment? (Proximity to BPL population)
6. Is attention paid to insure that a beneficiary has access to all packages he is entitled to
under scheme and the range of services/packages covered by the empanelled
facilities?
PART VI – CONTRACT DETAILS (Questionnaire)
1. Type and nature of services under partnership (on contract)
2. Who initiated and when was the decision taken for partnership?
3. Steps followed (from initiating stages till operational implementation)?
4. Time taken for installation and commencement of operations?
5. No. of bidders (who applied for this contract)? Was the market contestable and what
was competition in awarding contracts?
6. Pre Bid Seminar – Purpose of the seminar/what information was provided to private
agency? Collect a copy of advertisement/notification
7. Criteria laid out; no. of bidders; open or closed screening meeting?
8. Criteria for short listing the final list of private agencies?
9. Items negotiated, if any
10. Finalization of contract clauses: Legal consultation, if any?
11. Whether in legal affidavit/whether in front of witnesses, and other procedures
followed?
12. Who gave the final approval for contracting partnership?
13. What is the incentive structure for various partners/stakeholders in design of the
contract?
14. Are there any specific pre conditions for renewal of the contract?
15. Is there a limit on the maximum no. of contracts allowed to the private agency?
16. Billing and reimbursement procedures for the services provided
A. Reimbursed (claim) amount as revenue for the last 3 years.
(a) Year I
(b) Year II
(c) Year III
B. Verification of claims (who verifies/certifies? Before reimbursement)
17. What is the composition of the board that oversees the contracts, who are they?
18. Does the contract specify the periodicity of performance review and the parameters of
performance review?

417
19. What approach is adopted for cost overruns, overuse and disputes that may involve
legal costs for the parties involved?
20. What mechanisms exist for settling disputes between parties? Is there a governing
body for these transactions?
21. Is there a system to periodically evaluate the feedback/complaints from the patients?
22. Could provision on sanctions in contract design influence outcome of contracts? (If
any, in the contract design in the selected states)
23. What are some of the actual conflicts going on currently?
DETAILS COLLECTED FROM REVIEW OF BID NOTIFICATION/CONTRACT
A. Private Agency Details
i) Eligibility conditions for the private agency:
(a) Required legal status of the private agency (whether registered
society/foundation/trust, etc)
(b) Bidding (through single bid or bids on technical and financial bid
separately)
(c) Eligibility conditions (e.g. minimum capital or turnover of the agency)
ii) Minimum experience of the private agency (in the related area of services)
(a) In other services/business
(b) In health sector
iii) Infrastructure related pre conditions (including staff)
iv) Minimum financial or material surety (in the form of movable/immovable assets)
v) Explicit non eligible conditions (for those agencies that does not qualify)
vi) Any other eligibility conditions/criteria
B. Tender application procedure followed - Pre-bid briefing/formalities (if any)
C. Contract details (Information to be collected from TOR contract deed/agreement
document)
a. List of service (s) covered under partnership (including timing of the
services)
b. Minimum and maximum duration of the contract offer
c. Technical bid details to be submitted (details to be enclosed)
i. Earnest money for the bid
ii. Technical details to be compiled from agreement
d. Financial commercial bid details
i. Rate/tariffs per service
ii. Validity period for the offered tariff
e. Maximum period with in which the agency must commence the service
operations
f. Time limit to accept or reject the contract and execute the contract
g. Penalty for the delay (or) if the agency do not commence the operations at all.
h. How service charges (tariff/fee has been fixed, calculated)
i. Monitoring and supervising mechanisms to oversee the functioning of the
private agency
j. Terms and conditions of performance standards, quality control, etc.
k. If the contract is to be terminated prematurely, under what circumstances it
could be done?
l. Under what circumstances the private agency may withdraw/exit/terminate
the services?
m. The penalties for non performance or penalties for non adherence to the
contract clauses
n. Pre-conditions, if the private agency wishes to exit or terminate the contract
i. Minimum notification period
ii. Obligation / penalties of the private agency if exit is premature.
iii. Obligation of the parties if the termination is mutually agreed

418
iv. Penalty for the private agency if the contractor unilaterally
suspends/terminates, based on performance deficiency
v. Recourse to either of the agency, if any grievance/complaint

419
ANNEXURE 3: QUESTIONNAIRE FOR
AVAILABILITY OF SERVICES OFFERED
AT EMPANELLED FACILITIES SNo. 1 2 3 4 5
Hospital Name
Distt
Bed Size
Neo Natal Care
Burns
Snake Bite
Oncology
Urology
Endocrine
Paediatric
Orthopaedic
Ophthalmology
Neurosurgery
Hysteroscopic
Endoscopic Procedures
Gynaecology
General Surgery
Throat
Nose
Ear
Dental
Medical General Ward ICU
Medical General Ward Non Surgical
Medical General Ward Surgical(Not included in package rates)
ICU

420
ANNEXURE 4: OBSERVATIONAL AND
FACILITY RECORDS CHECKLIST

421

422

423
ANNEXURE 5: HEALTH PROVIDER
CHECKLIST

424

425
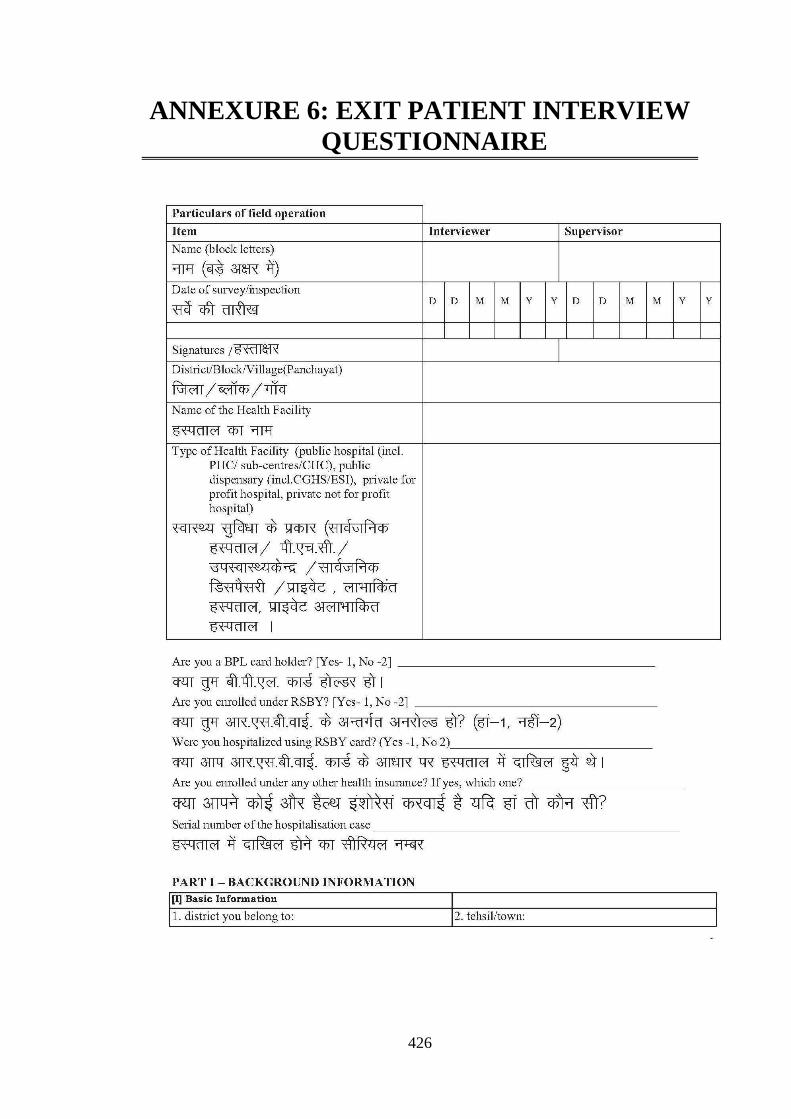
426
ANNEXURE 6: EXIT PATIENT INTERVIEW
QUESTIONNAIRE
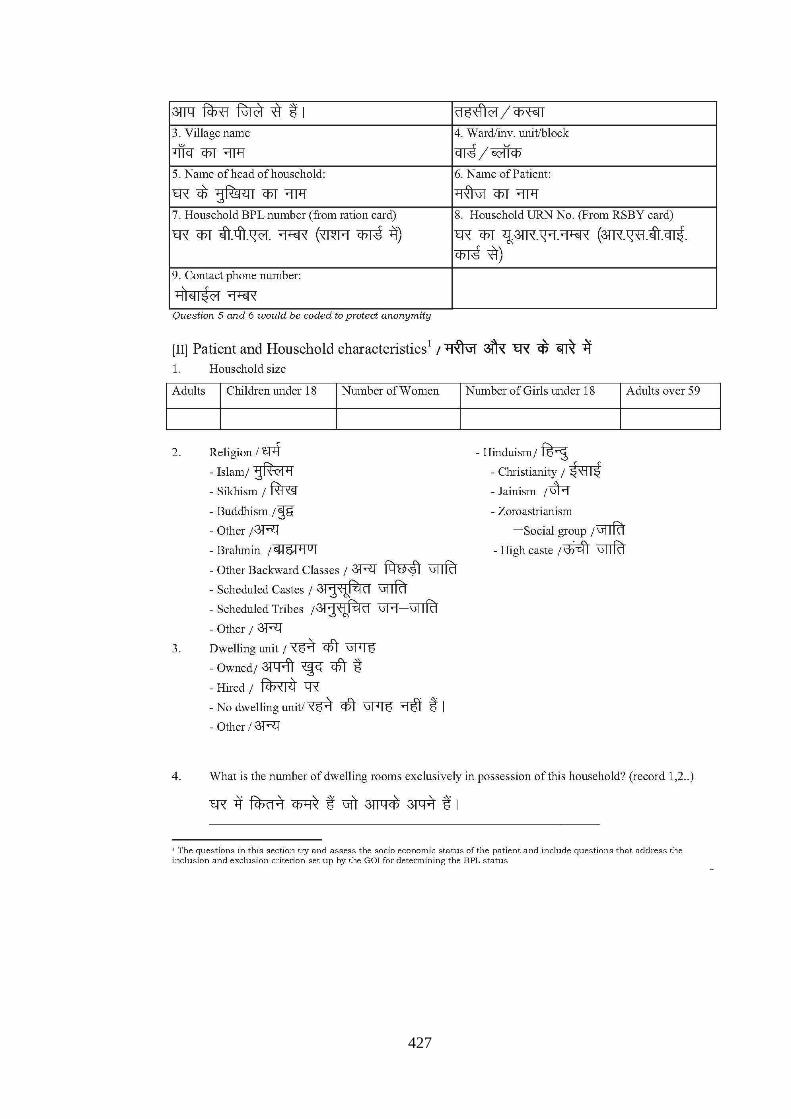
427

428

429

430

431
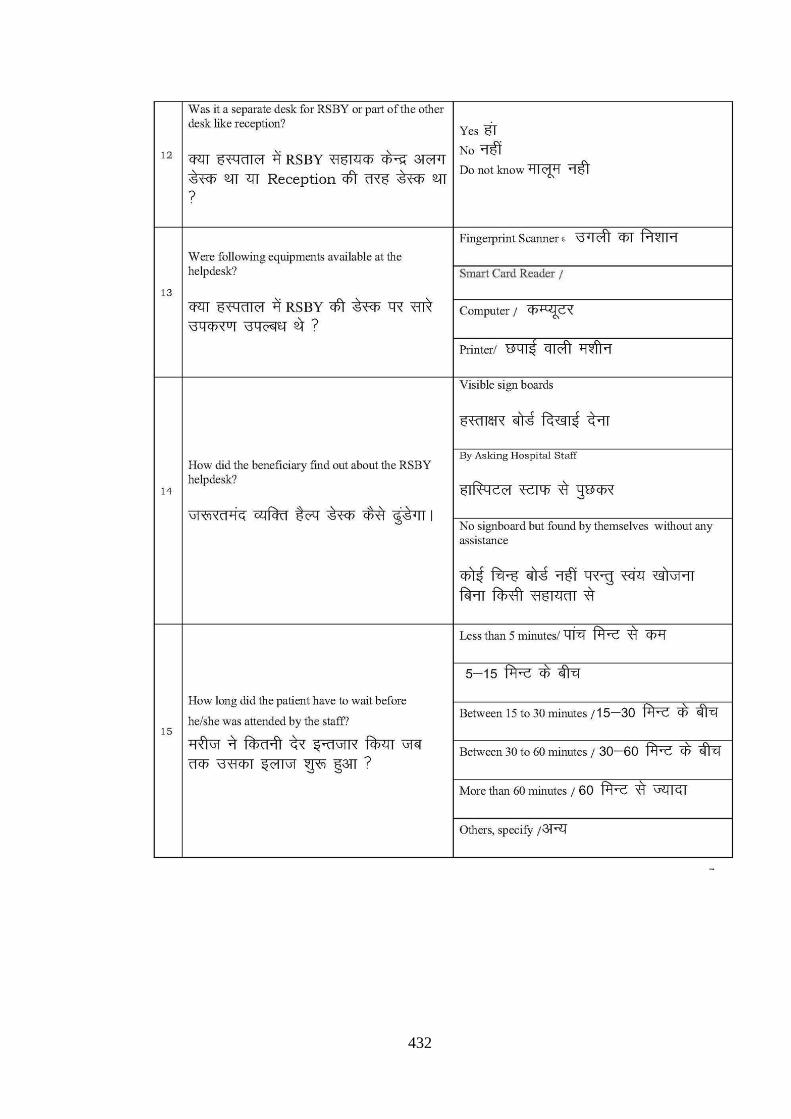
432

433

434

435

436

437
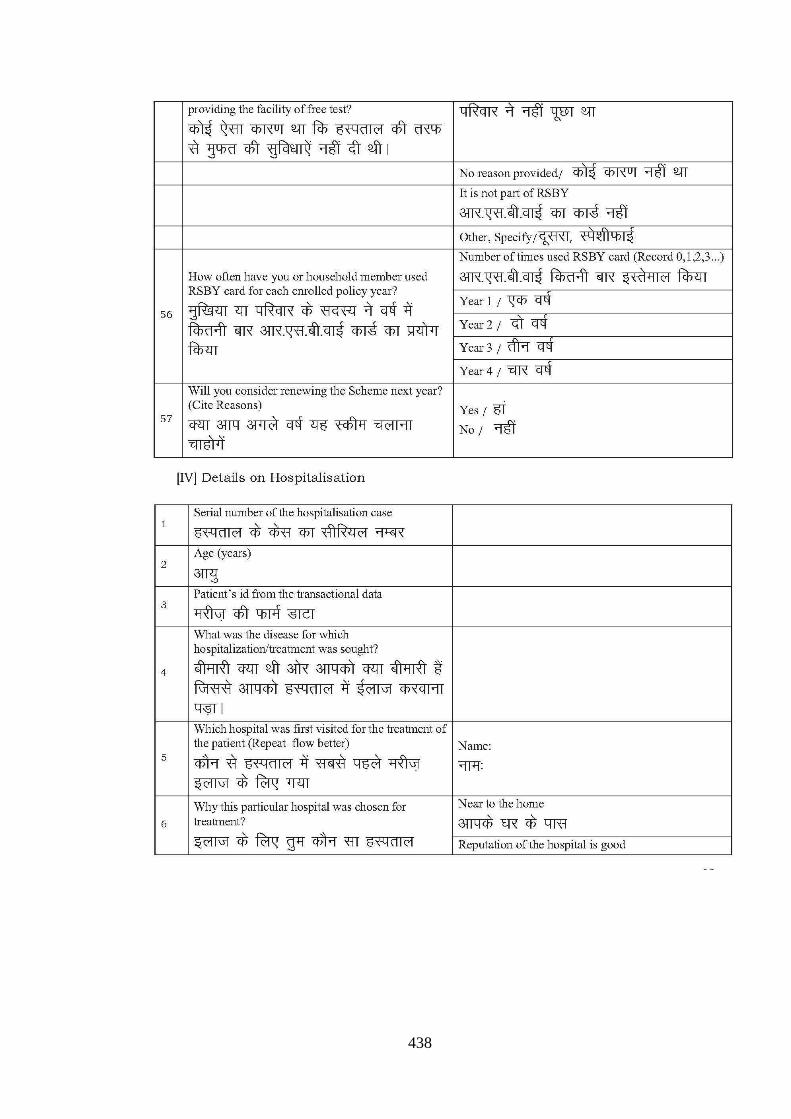
438

439

440

441

442

443
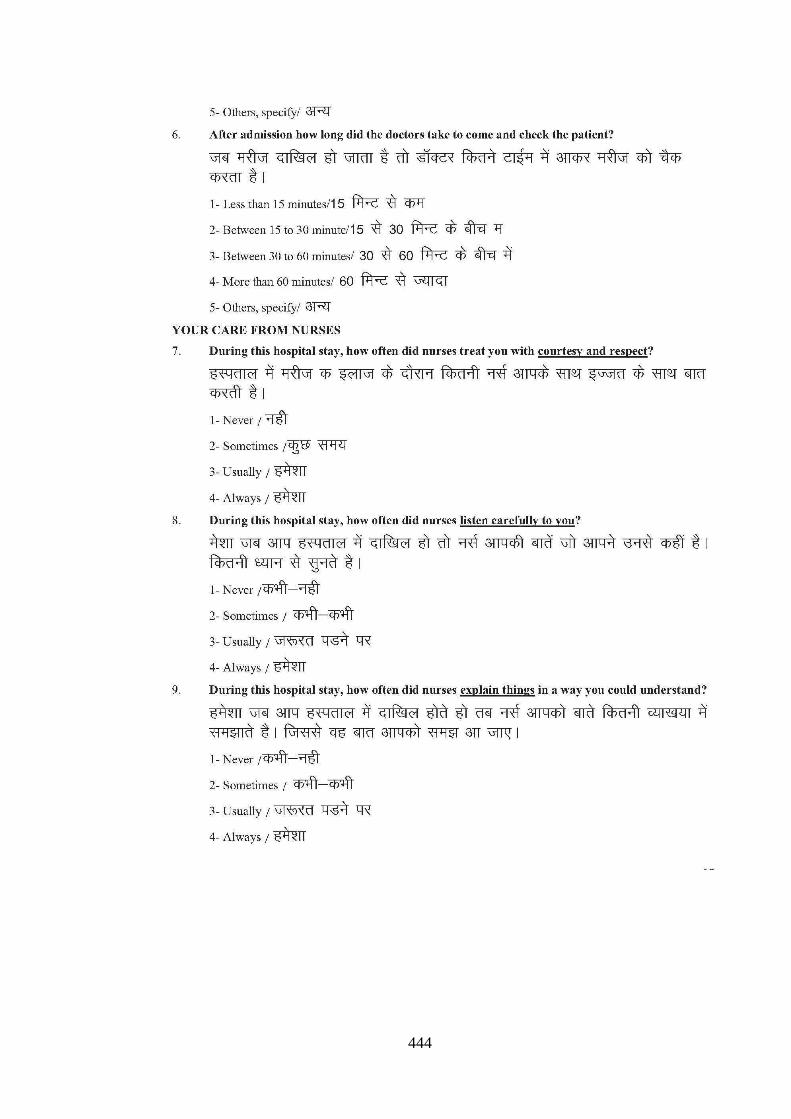
444

445

446

447

448

449