
Impact of P4P on Structural Quality - LSHTM Research Online
318
LSHTM Research Online Das, A; (2017) Effect of pay for performance on the quality of antenatal care in Zimbabwe: a controlled before-after study. PhD thesis, London School of Hygiene & Tropical Medicine. DOI: https://doi.org/10.17037/PUBS.04539376 Downloaded from: https://researchonline.lshtm.ac.uk/id/eprint/4539376/ DOI: https://doi.org/10.17037/PUBS.04539376 Usage Guidelines: Please refer to usage guidelines at https://researchonline.lshtm.ac.uk/policies.html or alternatively contact [email protected]. Available under license: http://creativecommons.org/licenses/by-nc-nd/3.0/ https://researchonline.lshtm.ac.uk
-
Upload
khangminh22 -
Category
Documents
-
view
0 -
download
0
Transcript of Impact of P4P on Structural Quality - LSHTM Research Online

LSHTM Research Online
Das, A; (2017) Effect of pay for performance on the quality of antenatal care in Zimbabwe: acontrolled before-after study. PhD thesis, London School of Hygiene & Tropical Medicine. DOI:https://doi.org/10.17037/PUBS.04539376
Downloaded from: https://researchonline.lshtm.ac.uk/id/eprint/4539376/
DOI: https://doi.org/10.17037/PUBS.04539376
Usage Guidelines:
Please refer to usage guidelines at https://researchonline.lshtm.ac.uk/policies.html or alternativelycontact [email protected].
Available under license: http://creativecommons.org/licenses/by-nc-nd/3.0/
https://researchonline.lshtm.ac.uk

Effect of pay for performance on the quality of antenatal care in Zimbabwe: a controlled before-after study
Ashis Kumar Das
Thesis submitted in accordance with the requirements for the degree of Doctor of Philosophy of the University of London
May 2017
Department of Disease Control Faculty of Infectious and Tropical Diseases
London School of Hygiene and Tropical Medicine
No funding received

2
Declaration
I, Ashis Kumar Das, confirm that the work presented in this thesis is my own. Where
information has been derived from other sources, I confirm that this has been indicated
in the thesis.
May 15, 2017

3
Acknowledgements
Several individuals have supported my pursuit of doctoral research. My supervisor Prof.
Daniel Chandramohan has provided valuable guidance at every stage of this research.
His attitude has been very supportive and constructive. I am extremely grateful to his
advice and support throughout my PhD. I am indebted to Jed Friedman, Senior
Economist at The World Bank. As the co-supervisor for my doctoral research, he guided
drafting the analytic plans and methods chapter with his exceptional skills and insight
in econometrics and impact evaluation. The technical advice from my Academic
Research Committee has been quite instrumental in shaping this research outline. I
express my sincere gratitude towards Kara Hanson, Jayne Webster and Jane Bruce for
their great support and advice for this study. I am also indebted to Helen White for the
immense administrative support rendered to me during my doctoral course work and
research.
I highly appreciate constant support (technical and emotional) from my colleagues at
the World Bank, especially Jed Friedman and Ronald Mutasa. Two other colleagues –
Bernadette Sobuthana and Chenjerai Sisimayi were extremely helpful in implementing
the impact evaluation of the performance-based financing project.
I express my deepest gratitude to the officials of the Ministry of Health in Zimbabwe,
who assisted the evaluation of the performance-based financing project. This work
would not have been possible if I was not able to get adequate support from the
performance-based financing project implementation and evaluation team in
Zimbabwe. There were several personnel involved in data collection and initial data
cleaning; their contribution has tremendously supported me in timely undertaking data
analysis during this research.

4
Abstract
Background: Pay for Performance (P4P) mechanisms to health facilities and providers
are currently being tested in several low- and middle-income countries (LMIC) to
improve maternal and child health (MCH). Though quality of care is necessary to
improve MCH, the prevailing evidence on P4P’s effect on MCH quality is limited.
Zimbabwe implemented a P4P program from April 2012 to September 2014 to improve
its adverse scenario on MCH indicators. This study explores the effect of the P4P
program on the quality of antenatal care (ANC) on the following three dimensions –
structural quality, process quality and client satisfaction.
Methods: The study design was a controlled before-after implementation evaluation in
16 matched pairs of rural districts. Intervention facilities (n=374) received P4P, while
control facilities (n=331) continued with the routine government program. Out of these,
a subset of 77 randomly selected health facilities and the ANC clients attending these
facilities were surveyed before implementation of P4P (385 clients) and after
implementation (374 clients) to measure the impact of the program. The impact of P4P
was estimated on an intention-to-treat basis by comparing the difference-in-difference
in the indices of impact between the two arms of the study. Multilevel regression
analyses were used to account for the hierarchical study design.
Results: All dimensions of quality showed significant improvements in the P4P arm –
structural index was 0.595 standard deviations (SD) higher (p=0.023), process index
0.556 SD (p=0.001) and client satisfaction index 0.6 SD (p=0.001) higher than the mean
of the respective index in the control group. Clients consulting a nurse or a male
healthcare provider reported higher process quality and satisfaction, whereas those
visiting a nurse midwife had lower process quality and client satisfaction. Women with
lower levels of wealth and education reported lower process quality but higher
satisfaction in the P4P arm.
Discussion: The Zimbabwe P4P showed improvements in the quality of ANC. However,
there is a need for further exploration of the contextual factors to understand the
mechanisms of these improvements.

5
Table of Contents Declaration ....................................................................................................................................................... 2
Acknowledgements ....................................................................................................................................... 3
Abstract ............................................................................................................................................................. 4
List of tables ................................................................................................................................................... 12
List of figures ................................................................................................................................................. 16
Acronyms ........................................................................................................................................................ 18
Chapter 1: Introduction ............................................................................................................................. 20
1.1 Overview .................................................................................................................................................. 20
1.2 Pay for performance: an overview ................................................................................................ 20
1.2.1 Economic Theory behind financial incentives ................................................................. 21
1.2.2 Context and target for P4P in health systems .................................................................. 23
1.2.3 Functioning of P4P ...................................................................................................................... 25
1.2.4 Limitations of P4P ....................................................................................................................... 26
1.3 Quality of healthcare ........................................................................................................................... 27
1.3.1 Structural quality ......................................................................................................................... 27
1.3.2 Process quality ............................................................................................................................. 27
1.3.3 Outcomes ........................................................................................................................................ 28
1.4 Measuring Quality of care ................................................................................................................. 28
1.5 Measuring quality of antenatal care .............................................................................................. 29
1.5.1 Structure Measures ..................................................................................................................... 30
Table 1.1: Quality elements in antenatal care from published literature .............................. 31
1.5.2 Process quality of care ............................................................................................................... 33
1.5.3 Client Satisfaction ........................................................................................................................ 34
1.6 Summary of the background and overview of the thesis .................................................... 36
Chapter 2: Review of Literature ............................................................................................................. 38
2.1 Overview .................................................................................................................................................. 38
2.2 P4P’s effect on quality of care in high-income countries ...................................................... 38
2.3 P4P in Low- and Middle-Income Countries................................................................................ 40
2.4 Effect of pay for performance to improve quality of maternal and child care in low-
and middle-income countries: a systematic review ....................................................................... 42

6
2.4.1 Background .................................................................................................................................... 42
2.4.2 Methods ........................................................................................................................................... 43
2.4.2.1 Selection of studies ............................................................................................................. 43
2.4.2.2 Information Sources and Search ................................................................................... 45
2.4.2.3 Data items and Extraction ................................................................................................ 46
2.4.2.4 Summary measures and Data Synthesis ..................................................................... 46
2.4.2.5 Appraising methodological and reporting quality of included studies .......... 46
2.4.3 Results ............................................................................................................................................. 47
2.4.3.1 Study selection...................................................................................................................... 47
2.4.3.2 Study characteristics and Settings ................................................................................ 49
2.4.3.3 Characteristics of performance measures and payments on quality of care 49
2.4.3.4 Reporting of quality of care in studies ........................................................................ 51
2.4.3.5 Risk of bias across studies................................................................................................ 51
2.4.3.6 Effects of interventions ..................................................................................................... 54
2.4.4 Discussion....................................................................................................................................... 59
2.4.4.1 Summary of evidence ......................................................................................................... 59
2.4.4.2 Implications for Policy and Research .......................................................................... 59
2.5 Rationale .................................................................................................................................................. 62
2.6 Research Question ............................................................................................................................... 64
2.7 Objectives ................................................................................................................................................ 64
Chapter 3: Study Setting ............................................................................................................................ 65
3.1 Overview .................................................................................................................................................. 65
3.2 Geography, climate and administrative units ........................................................................... 65
3.3 Demographic Characteristics ........................................................................................................... 66
3.4 Economic Context ................................................................................................................................. 68
3.5 Zimbabwe Health System .................................................................................................................. 68
3.6 Human Resource Scenario ................................................................................................................ 72
3.7 Health Status .......................................................................................................................................... 73
3.8 Maternal health in Zimbabwe .......................................................................................................... 74
3.9 Quality of maternal care in Zimbabwe ......................................................................................... 77

7
3.10 Pay for performance in the context of Zimbabwe’s health system ................................ 78
3.11 Description of the intervention .................................................................................................... 79
3.12 Incentive Scheme ............................................................................................................................... 81
3.12.1 Quantity Bonus .......................................................................................................................... 81
3.12.2 Quality Bonus ............................................................................................................................. 82
Chapter 4: Methods ..................................................................................................................................... 86
4.1 Overview .................................................................................................................................................. 86
4.2 Conceptual framework ....................................................................................................................... 86
4.3 Study design ........................................................................................................................................... 93
4.4 Sampling and sample size ................................................................................................................. 95
4.5 Data collection ....................................................................................................................................... 97
4.6 Data entry ................................................................................................................................................ 98
4.7 Quality assurance ................................................................................................................................. 99
4.8 Measurement of key outcomes – quality measures ................................................................ 99
4.9 Data analysis ....................................................................................................................................... 101
4.9.1 Descriptive analysis .................................................................................................................. 101
4.9.2 Baseline balance ........................................................................................................................ 102
4.9.3 Correlation analysis .................................................................................................................. 102
4.9.4 Impact estimate analysis ........................................................................................................ 102
4.9.5 Subgroup analysis ..................................................................................................................... 106
4.9.6 Sensitivity and robustness checks ...................................................................................... 106
4.10 Ethical considerations ................................................................................................................... 107
4.11 Role of the candidate ..................................................................................................................... 107
Chapter 5: Impact of P4P on Structural Quality – Findings from the health facility survey110
5.1 Overview ............................................................................................................................................... 110
5.2 Methods ................................................................................................................................................. 110
5.2.1 Data collection ............................................................................................................................ 111
5.2.2 Sampling ....................................................................................................................................... 111
5.2.3 Data analysis ............................................................................................................................... 111
5.2.4 Outcome measures ................................................................................................................... 112

8
5.3 Results – Part 1 (Indices by Equal Weighting) ....................................................................... 117
5.3.1 Descriptive statistics ................................................................................................................ 117
5.3.1.1 General health facility characteristics ....................................................................... 117
5.3.1.2 Physical infrastructure and staff ................................................................................. 118
5.3.1.3 Availability of drugs, vaccines and diagnostic tests ............................................. 119
5.3.1.4 Availability of equipment ............................................................................................... 120
5.3.2 Baseline sample balance ......................................................................................................... 121
5.3.2.1 General health facility characteristics ....................................................................... 121
5.3.2.2 Physical infrastructure .................................................................................................... 122
5.3.2.3 Availability of drugs, vaccines and diagnostic tests ............................................. 122
5.3.2.4 Availability of equipment ............................................................................................... 123
5.3.2.5 Comparison of quality indices by index construction ......................................... 124
5.3.3 Correlation analysis .................................................................................................................. 125
5.3.4 Structural Quality ...................................................................................................................... 128
5.3.5 Impact estimates ........................................................................................................................ 129
5.3.5.1 Estimates for individual quality items ...................................................................... 129
5.3.5.2 Estimates for quality indices ......................................................................................... 135
5.3.5.3 Subgroup analysis ............................................................................................................. 137
5.3.5.4 Sensitivity and robustness checks .............................................................................. 138
5.3.5.5 Regression diagnostics .................................................................................................... 142
5.4 Results – Part 2 (Indices by differential weighting) ............................................................ 145
5.4.1 Baseline sample balance ......................................................................................................... 145
5.4.1.1 Medicines stock management ...................................................................................... 145
5.4.1.2 Outpatient department ................................................................................................... 145
5.4.1.3 Family and Child Health .................................................................................................. 145
5.4.1.4 Infection control and waste management ............................................................... 146
5.4.2 Impact estimates ........................................................................................................................ 147
5.4.2.1 Estimates for individual quality items ...................................................................... 148
5.4.2.2 Estimates for quality indices ......................................................................................... 152
5.4.2.3 Subgroup analysis ............................................................................................................. 153
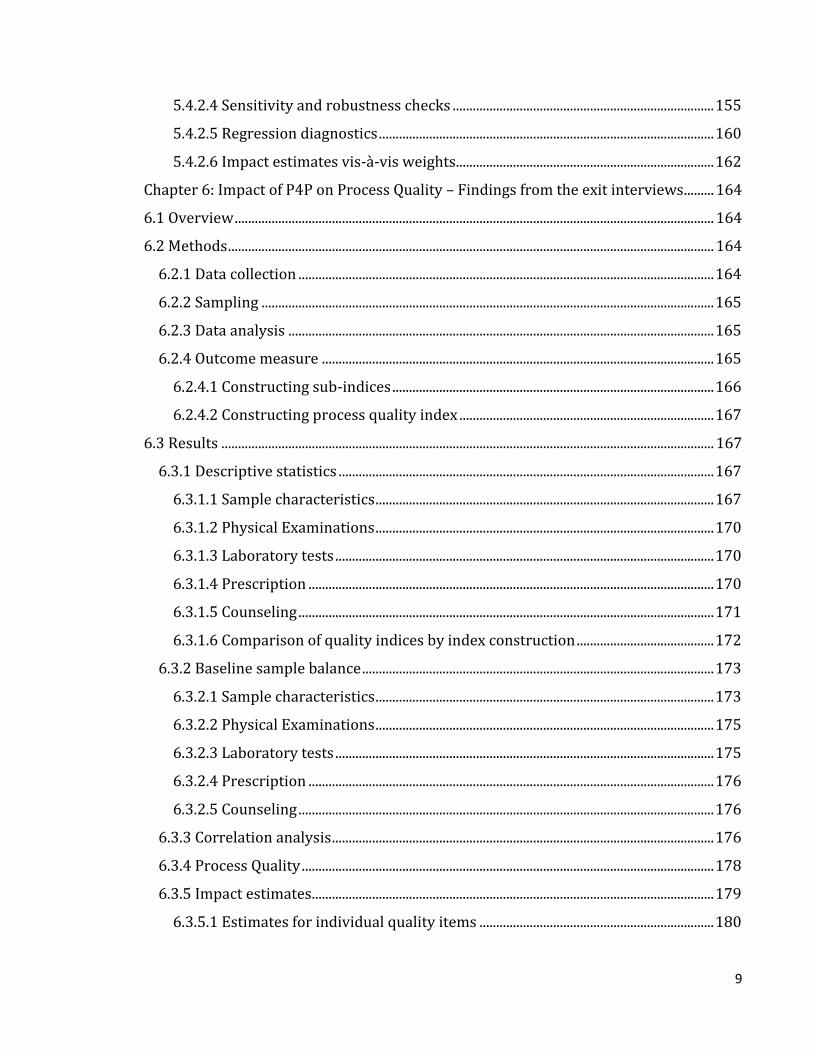
9
5.4.2.4 Sensitivity and robustness checks .............................................................................. 155
5.4.2.5 Regression diagnostics .................................................................................................... 160
5.4.2.6 Impact estimates vis-à-vis weights............................................................................. 162
Chapter 6: Impact of P4P on Process Quality – Findings from the exit interviews ......... 164
6.1 Overview ............................................................................................................................................... 164
6.2 Methods ................................................................................................................................................. 164
6.2.1 Data collection ............................................................................................................................ 164
6.2.2 Sampling ....................................................................................................................................... 165
6.2.3 Data analysis ............................................................................................................................... 165
6.2.4 Outcome measure ..................................................................................................................... 165
6.2.4.1 Constructing sub-indices ................................................................................................ 166
6.2.4.2 Constructing process quality index ............................................................................ 167
6.3 Results ................................................................................................................................................... 167
6.3.1 Descriptive statistics ................................................................................................................ 167
6.3.1.1 Sample characteristics ..................................................................................................... 167
6.3.1.2 Physical Examinations ..................................................................................................... 170
6.3.1.3 Laboratory tests ................................................................................................................. 170
6.3.1.4 Prescription ......................................................................................................................... 170
6.3.1.5 Counseling ............................................................................................................................ 171
6.3.1.6 Comparison of quality indices by index construction ......................................... 172
6.3.2 Baseline sample balance ......................................................................................................... 173
6.3.2.1 Sample characteristics ..................................................................................................... 173
6.3.2.2 Physical Examinations ..................................................................................................... 175
6.3.2.3 Laboratory tests ................................................................................................................. 175
6.3.2.4 Prescription ......................................................................................................................... 176
6.3.2.5 Counseling ............................................................................................................................ 176
6.3.3 Correlation analysis .................................................................................................................. 176
6.3.4 Process Quality ........................................................................................................................... 178
6.3.5 Impact estimates ........................................................................................................................ 179
6.3.5.1 Estimates for individual quality items ...................................................................... 180

10
6.3.5.2 Estimates for quality indices ......................................................................................... 186
6.3.5.3 Sub group analysis ............................................................................................................ 188
6.3.5.4 Sensitivity and robustness checks .............................................................................. 193
6.3.5.5 Regression diagnostics .................................................................................................... 198
Chapter 7: Impact of P4P on Client Satisfaction – Findings from the exit interviews ... 200
7.1 Overview ............................................................................................................................................... 200
7.2 Methods ................................................................................................................................................. 200
7.2.1 Data collection ............................................................................................................................ 200
7.2.2 Sampling ....................................................................................................................................... 201
7.2.3 Data analysis ............................................................................................................................... 201
7.2.4 Outcome measure ..................................................................................................................... 201
7.3 Results ................................................................................................................................................... 202
7.3.1 Descriptive statistics ................................................................................................................ 202
7.3.1.1 Comparison of satisfaction index by index construction ................................... 203
7.3.2 Baseline sample balance ......................................................................................................... 205
7.3.3 Correlation analysis .................................................................................................................. 205
7.3.4 Impact estimates ........................................................................................................................ 206
7.3.4.1 Estimates for individual items...................................................................................... 206
7.3.4.2 Estimates for satisfaction index ................................................................................... 208
7.3.4.3 Sub group analysis ............................................................................................................ 208
7.3.4.4 Sensitivity and robustness checks .............................................................................. 214
7.3.4.5 Regression diagnostics .................................................................................................... 222
Chapter 8: Discussion .............................................................................................................................. 224
8.1 Overview ............................................................................................................................................... 224
8.2 Summary of results ........................................................................................................................... 224
8.2.1 Structural quality ....................................................................................................................... 225
8.2.2 Process quality ........................................................................................................................... 226
8.2.3 Client satisfaction ...................................................................................................................... 228
8.3 Effectiveness of P4P on ANC quality in Zimbabwe vis-à-vis evidence from other P4P
programs in LMICs ................................................................................................................................... 229

11
8.3.1 Structural Quality ...................................................................................................................... 229
8.3.2 Process Quality ........................................................................................................................... 233
8.3.3 Client Satisfaction ...................................................................................................................... 237
8.4 Strengths and Limitations .............................................................................................................. 240
8.5 Implications for research ............................................................................................................... 245
8.6 Implications for policy ..................................................................................................................... 246
8.7 Conclusion ............................................................................................................................................ 248
Bibliography ............................................................................................................................................... 249
Annex ............................................................................................................................................................. 265
Annex A: Calculation of individual staff incentives ................................................................. 265
Annex B: Systematic Review Paper ......................................................................................... 266
Annex C: Study instruments ....................................................................................................... 278
12
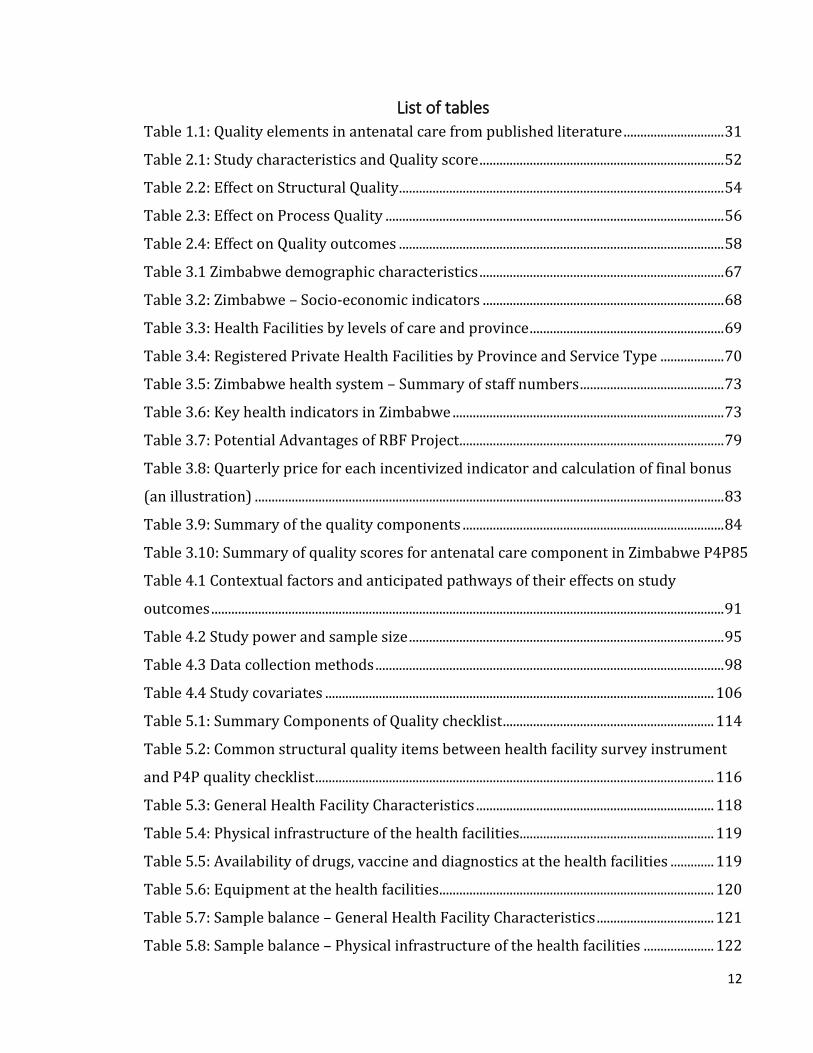
List of tables Table 1.1: Quality elements in antenatal care from published literature .............................. 31
Table 2.1: Study characteristics and Quality score ......................................................................... 52
Table 2.2: Effect on Structural Quality................................................................................................. 54
Table 2.3: Effect on Process Quality ..................................................................................................... 56
Table 2.4: Effect on Quality outcomes ................................................................................................. 58
Table 3.1 Zimbabwe demographic characteristics ......................................................................... 67
Table 3.2: Zimbabwe – Socio-economic indicators ........................................................................ 68
Table 3.3: Health Facilities by levels of care and province .......................................................... 69
Table 3.4: Registered Private Health Facilities by Province and Service Type ................... 70
Table 3.5: Zimbabwe health system – Summary of staff numbers ........................................... 73
Table 3.6: Key health indicators in Zimbabwe ................................................................................. 73
Table 3.7: Potential Advantages of RBF Project ............................................................................... 79
Table 3.8: Quarterly price for each incentivized indicator and calculation of final bonus
(an illustration) ............................................................................................................................................ 83
Table 3.9: Summary of the quality components .............................................................................. 84
Table 3.10: Summary of quality scores for antenatal care component in Zimbabwe P4P85
Table 4.1 Contextual factors and anticipated pathways of their effects on study
outcomes ......................................................................................................................................................... 91
Table 4.2 Study power and sample size .............................................................................................. 95
Table 4.3 Data collection methods ........................................................................................................ 98
Table 4.4 Study covariates .................................................................................................................... 106
Table 5.1: Summary Components of Quality checklist ............................................................... 114
Table 5.2: Common structural quality items between health facility survey instrument
and P4P quality checklist ....................................................................................................................... 116
Table 5.3: General Health Facility Characteristics ....................................................................... 118
Table 5.4: Physical infrastructure of the health facilities .......................................................... 119
Table 5.5: Availability of drugs, vaccine and diagnostics at the health facilities ............. 119
Table 5.6: Equipment at the health facilities .................................................................................. 120
Table 5.7: Sample balance – General Health Facility Characteristics ................................... 121
Table 5.8: Sample balance – Physical infrastructure of the health facilities ..................... 122

13
Table 5.9: Sample balance – Availability of drugs, vaccine and diagnostics at the health
facilities ......................................................................................................................................................... 122
Table 5.10: Sample balance – Equipment at the health facilities ........................................... 123
Table 5.11: Correlation matrix – Structural quality index and sub-indices ....................... 126
Table 5.12: Impact estimates – availability of physical infrastructure ................................ 130
Table 5.13: Impact estimates – availability of skilled staff ....................................................... 131
Table 5.14: Impact estimates – availability of drugs and vaccine .......................................... 132
Table 5.15: Impact estimates – availability of diagnostic tests ............................................... 133
Table 5.16 A: Impact estimates – availability of equipment .................................................... 134
Table 5.16 B: Impact estimates – availability of equipment .................................................... 135
Table 5.17: Impact estimates – structural quality indices ........................................................ 136
Table 5.18: Subgroup impact estimates – structural quality indices by facility ownership137
Table 5.19: Subgroup impact estimates – structural quality indices by facility type .... 138
Table 5.20: Impact estimates – creating the quality index by principal component
analysis and equal weighting ............................................................................................................... 139
Table 5.21: Sensitivity of impact estimates by levels and covariates ................................... 140
Table 5.22: Sensitivity of impact estimates by district pair matching ................................. 141
Table 5.23: Sensitivity of impact estimates by robust SE ......................................................... 141
Table 5.24: Sensitivity of impact estimates by fully interacted model ................................ 142
Table 5.25: Tests for model goodness-of-fit ................................................................................... 142
Table 5.26: Baseline sample balance................................................................................................. 146
Table 5.27: Impact estimates – Medicines stock management ............................................... 149
Table 5.28: Impact estimates – Outpatient department ............................................................ 150
Table 5.29: Impact estimates – Family and Child Health .......................................................... 151
Table 5.30: Impact estimates – Infection control and waste management ........................ 152
Table 5.31: Impact estimates – structural quality indices ........................................................ 153
Table 5.32: Subgroup impact estimates – structural quality indices by facility ownership154
Table 5.33: Subgroup impact estimates – structural quality indices by facility type .... 155
Table 5.34: Impact estimates – creating the quality index by standardization ................ 156
Table 5.35: Sensitivity of impact estimates by levels and covariates ................................... 157
Table 5.36: Sensitivity of impact estimates by district pair matching ................................. 158

14
Table 5.37: Sensitivity of impact estimates by robust SE ......................................................... 158
Table 5.38: Sensitivity of impact estimates by fully interacted model ................................ 159
Table 5.39: Tests for model goodness-of-fit ................................................................................... 159
Table 6.1 Client Characteristics ........................................................................................................... 168
Table 6.2 Facility Characteristics ........................................................................................................ 169
Table 6.3 Provider Characteristics ..................................................................................................... 169
Table 6.4: Physical examinations during ANC visit ..................................................................... 170
Table 6.5: Laboratory tests during ANC visit ................................................................................. 170
Table 6.6: Prescriptions during ANC visit ....................................................................................... 171
Table 6.7: Counseling during ANC visit ............................................................................................ 171
Table 6.8 Sample balance – Sample Characteristics.................................................................... 173
Table 6.9 Sample balance – Facility Characteristics ................................................................... 174
Table 6.10 Sample balance – Provider Characteristics .............................................................. 174
Table 6.11: Sample balance – Physical examinations during ANC visit .............................. 175
Table 6.12: Sample balance – Laboratory tests during ANC visit .......................................... 175
Table 6.13: Sample balance – Prescriptions during ANC visit ................................................ 176
Table 6.14: Sample balance – Counseling during ANC visit ..................................................... 176
Table 6.15: Correlation matrix – Process quality index and sub-indices ............................ 177
Table 6.16: Impact estimates – physical examinations .............................................................. 180
Table 6.17: Impact estimates – laboratory tests........................................................................... 181
Table 6.18: Impact estimates – prescription .................................................................................. 183
Table 6.19: Impact estimates – counseling ..................................................................................... 185
Table 6.20: Impact estimates – process quality indices ............................................................ 187
Table 6.21: Subgroup impact estimates – process quality indices by facility ownership188
Table 6.22: Subgroup impact estimates – process quality indices by facility type ......... 189
Table 6.23: Subgroup impact estimates – process quality indices by provider cadre... 190
Table 6.24: Subgroup impact estimates – process quality indices by provider gender 190
Table 6.25: Subgroup impact estimates – process quality indices by client
characteristics ............................................................................................................................................ 191
Table 6.26: Subgroup impact estimates – process quality indices by wealth quintile .. 192

15
Table 6.27: Impact estimates – creating the quality index by principal component
analysis and equal weighting ............................................................................................................... 193
Table 6.28: Sensitivity of impact estimates by levels and covariates ................................... 194
Table 6.29: Sensitivity of impact estimates by district pair matching ................................. 195
Table 6.30: Sensitivity of impact estimates by robust SE ......................................................... 195
Table 6.31: Sensitivity of impact estimates by adjusting structural quality ...................... 196
Table 6.32: Sensitivity of impact estimates by fully interacted model ................................ 196
Table 6.33: Tests for model goodness-of-fit ................................................................................... 197
Table 7.1: Proportion of clients reporting satisfaction .............................................................. 203
Table 7.2: Sample balance – satisfaction ......................................................................................... 205
Table 7.3: Correlation matrix – Satisfaction index ...................................................................... 205
Table 7.4: Impact estimates – satisfaction ...................................................................................... 207
Table 7.5: Impact estimates – satisfaction index .......................................................................... 208
Table 7.6: Subgroup impact estimates – satisfaction by facility ownership ...................... 209
Table 7.7: Subgroup impact estimates – satisfaction by facility type................................... 210
Table 7.8: Subgroup impact estimates – satisfaction by provider cadre ............................ 211
Table 7.9: Subgroup impact estimates – satisfaction by provider gender ......................... 211
Table 7.10: Subgroup impact estimates – satisfaction by client characteristics .............. 213
Table 7.11: Subgroup impact estimates – satisfaction by wealth quintile ......................... 214
Table 7.12: Impact estimates – creating the satisfaction index by principal component
analysis and equal weighting ............................................................................................................... 215
Table 7.13: Sensitivity of impact estimates by levels and covariates ................................... 217
Table 7.14: Sensitivity of impact estimates by district pair matching ................................. 218
Table 7.15: Sensitivity of impact estimates by robust SE ......................................................... 218
Table 7.16: Sensitivity of impact estimates by adjusting structural and process quality220
Table 7.17: Sensitivity of impact estimates by fully interacted model ................................ 221
Table 7.18: Tests for model goodness-of-fit ................................................................................... 221
Table 8.1: Summary of effects .............................................................................................................. 224

16
List of figures
Figure 2.1 Flow diagram for selection of articles ............................................................................ 48
Figure 3.1: Map of Zimbabwe .................................................................................................................. 66
Figure 3.2: Trends in maternal mortality ratio in Zimbabwe ..................................................... 75
Figure 3.3: Causes of maternal death in Zimbabwe ....................................................................... 76
Figure 3.4: Receipt of antenatal services components in Zimbabwe ...................................... 78
Figure 3.5: Districts implementing RBF Project in Zimbabwe ................................................... 80
Figure 3.6: Incentive Calculation Mechanism in RBF Project, Zimbabwe ............................. 83
Figure 4.1: Conceptual framework on the pathways of effect of P4P on quality of
antenatal care ................................................................................................................................................ 87
Figure 4.2: Selection of study districts ................................................................................................ 94
Figure 4.3 Study design and timelines ................................................................................................. 97
Figure 5.1: Constructing structural quality index and sub-indices ....................................... 113
Figure 5.2: Distribution of structural quality estimates by index construction ............... 124
Figure 5.3: Agreement of structural quality indices by index construction ...................... 125
Figure 5.4: Unadjusted changes in structural quality indices ................................................. 128
Figure 5.5: Normality of residuals ...................................................................................................... 143
Figure 5.6: Homoscedasticity of residuals ...................................................................................... 144
Figure 5.7: Unadjusted changes in structural quality indices ................................................. 148
Figure 5.8: Distribution of structural quality estimates by index construction ............... 156
Figure 5.9: Normality of residuals ...................................................................................................... 160
Figure 5.10: Homoscedasticity of residuals ................................................................................... 161
Figure 5.11: Plotting impact estimates of sub-indices by weight .......................................... 162
Figure 5.12: Plotting impact estimates of items by weight ...................................................... 163
Figure 6.1: Constructing process quality index and sub-indices ........................................... 166
Figure 6.2: Distribution of process quality indices by index construction ......................... 172
Figure 6.3: Agreement of process quality indices by index construction ........................... 173
Figure 6.4: Unadjusted changes in process quality indices ...................................................... 179
Figure 6.5: Normality of residuals ...................................................................................................... 198
Figure 6.6: Homoscedasticity of residuals ...................................................................................... 199
Figure 7.1: Constructing satisfaction index .................................................................................... 201

17
Figure 7.2: Distribution of client satisfaction estimates by index construction ............... 204
Figure 7.3: Agreement of client satisfaction estimates by index construction ................. 204
Figure 7.4: Normality of residuals ...................................................................................................... 222
Figure 7.5: Homoscedasticity of residuals ...................................................................................... 223

18
Acronyms
AIC – Akaike Information Criterion ANC – Antenatal care BIC – Bayesian Information Criterion BP – Blood pressure CBA – Controlled before-after studies CCT – Controlled clinical trials c-RCT – Clustered randomized controlled trials df – degrees of freedom DH – District hospital DHE – District Health Executive DHS – Demographic and Household Survey DO – Direct clinical observations DRC – Democratic Republic of Congo EmONC – Emergency obstetric and neonatal care EPOC – Cochrane Effective Practice and Organization of Care group FANC – Focused antenatal care GDP – Gross domestic product GoZ – Government of Zimbabwe Hb – Hemoglobin HIV – Human immunodeficiency virus ICC – Intra cluster correlation coefficient IoM – Institute of medicine IPT – Intermittent preventive treatment for malaria ISCTRN – International Standard Randomized Controlled Trial Number LMIC – Low- and middle-income countries LMP – Last menstrual period LSHTM – London School of Hygiene and Tropical Medicine MCH – Maternal and child health MDG – Millennium development goals MeSH – Medical subject heading MICS – Multiple Indicator Cluster Survey MLM – Multi-level modeling MMR – Maternal mortality ratio MoHCC – Ministry of Health and Child Care NCD – Non-communicable diseases NGO – Non-governmental organizations NHS – National Health Strategy NIHFA – National Integrated Health Facility Assessment OOPS – Out-of-pocket payments P4P – Pay for performance PCA – Principal component analysis PHC – Primary healthcare PhD – Doctorate of philosophy PMTCT – Prevention of mother to child transmission of HIV/AIDS

19
PNC – Postnatal care PPP – Purchasing power parity QoC – Quality of care QoF – Quality and Outcomes Framework RBF – Results based financing RCT – Randomized controlled trials RDT – Rapid diagnostic test for malaria RH – Rural hospital RHC – Rural health center RPR – Rapid plasma reagin for syphilis SD – Standard deviation SE – Standard error SP – Standardized patients SSA – Sub-Saharan African TT – Tetanus toxoid vaccine UNDP – United Nations Development Program WHO – World Health Organization

20
Chapter 1: Introduction
1.1 Overview
This chapter explains key concepts related to pay for performance (P4P) and quality of
health care. It gives an overall conceptual understanding, goals, functioning, impact and
challenges of P4P, and describes the concept of quality of care across various
dimensions and methods to measure quality of care.
1.2 Pay for performance: an overview
P4P has been experimented as an innovative strategy to improve availability, quality,
utilization and cost-effectiveness of essential healthcare services in both low- and high-
income countries.1 P4P is a supply-side mechanism in which financial incentives are
provided to facilities and/or providers conditional upon meeting certain performance
targets.2 Results to be achieved and incentives to be received are usually mutually
agreed upon and laid down in contractual agreements between different actors in the
health system.2,3 For example, the Ministry of Health at the national level (purchaser)
can have contracts with health facilities (providers) to deliver a set of services with pre-
defined prices, incentives and measurements for those services.4
This type of purchasing healthcare services through ‘output-based financing’ differs
from the classic type of ‘input based financing’ in which participants (health facilities
and providers) receive funding based on pre-defined annual plans and budgets.4 P4P
belongs to the category of innovative financing mechanisms that includes similar type
of performance-oriented payment systems such as results-based financing,
performance-based financing, performance-based contracting and output-based aid.1
The approach to define P4P varies upon the context, especially on the goal of programs,
stakeholders involved, type of contract for providers, and purchase and payment for
services.5 Box 1 gives different definitions of P4P from a few development agencies who
were pioneers in experimenting with P4P programs globally.

21
Source: Allen, T et al. 20145
1.2.1 Economic Theory behind financial incentives
Financial incentives, especially P4P is postulated to solve the principal-agent problem
in the health system functioning.5 In a situation where the principal–agent problem
prevails, one party (the agent) is required to act on behalf of another (the principal),
with varying utility-maximizing objectives for each party.5–10 Typically, it is postulated
that the principal tries to win over the situation if there are uncertainties for profit gain
and there are likelihoods of the agent loosing.9 Thus, there are possibilities of persistent
conflicts and uncertainties in the routine healthcare system functioning.5 For instance,
the main objective of a Provincial Health Authority may be reducing maternal death,
while providers would like to retain their salary regardless of the level of maternal
mortality. Providers may also want to retain their workload.9 When it comes to
assessing providers’ effort, health outcomes are only a proxy for their effort or
behavior.9 This is because health outcomes are also affected by certain unobservable
phenomena.9 Health outcomes are not purely within the control of providers.9 For
Box-1.1
Definitions of P4P
“The use of payment methods and other incentives to encourage quality
improvement and patient focused high value care.” (Centers for Medicare
and Medicaid Services, USA)
“The general strategy of promoting quality improvement by rewarding
providers (physicians, clinics or hospitals) who meet certain performance
expectations with respect to health care quality or efficiency.” (RAND
Corporation, USA)
“A range of mechanisms designed to enhance the performance of the
health system through incentive- based payments.” (The World Bank)
“P4P introduces incentives (generally financial) to reward attainment of
positive health results.” (USAID)

22
example, patient behavior is a key determinant of health outcomes.5,9 This situation
where it is not easy to identify provider’s effort may lead to potential misalignment of
provider behavior.9 Finally, there can be conflicts between the health authorities and
the providers as a principal-agent problem.5
P4P tries to solve this principal-agent problem by providing the agent (providers) with
a financial incentive to perform the delegated duties.5,8,10 Since the agent intends to
maximize utility, P4P tries to meet certain conditionalities.8,10 For instance, the utility of
the agent created by the incentives needs to be larger than the decrease in the agent’s
utility resulting from performing the delegated workload. This situation is called the
“incentive compatibility constraint”.5 Also, the increment in the agent’s utility created
by the incentive needs to be more than the utility obtained from not performing the
delegated work. This situation is known as the “participation constraint”.7 P4P in
principle, through the incentive tries to align the interests of both the agent and the
principal.
As per Allen et al. 2014, in the health sector, the underlying theories of P4P cannot be
applied without adaptation.5 This limited application of the mainstream theories is due
to four reasons; 1) dual agency, 2) measurement difficulties, 3) team production, and 4)
intrinsic motivation.5
Dual agency occurs as the agent (physician) needs to act on behalf of two principals,
who are the patient and the health authority.5 Since the interests of the principals differ
from each other, it is necessary for the physician to please both.5 Similarly, measuring
the level of physician effort is difficult in health care.5,9 In P4P, it is essential to measure
certain outcomes such as patient health, but this is often a combined effect of the
provider effort and the patient compliance. Provision of health care is more of a team
effort and not solely by an individual provider.5,8 Therefore, performance payment is
often targeted at teams, mainly with a purpose that incentive structure should not
induce free-riding.5 In free-riding, there is a possibility of an individual provider
reducing the effort because performance is measured at the group level.8 Intrinsic
motivators such as altruism or professionalism can be important under P4P, as
providers receive utility from their own salary, incentive and the reputation.9

23
Theories also postulate a few potential unintended consequences for financial
incentives.5,10 P4P allocates risks across both the principal and the agent, and faces the
problem of observability.5 However, since providers (agents) are required to perform
multiple tasks, they may narrow-down their focus to a few measurable tasks (e.g.
waiting time) than non-measurable duties (e.g. patient compliance or experience).5
Under P4P, there is also chance for diversion of effort, but this can be prevented if
different tasks can be easily delegated to separate agents.10 The other postulated
harmful effects of P4P are as follows – (1) tunnel vision (diversion of effort away from
non-incentivized activities); (2) sub-optimization (disconnect between agents’ objective
from overall organizational objectives); (3) myopia (short-termism); (4) measure
fixation (focus on measures of success and not underlying objectives); (5)
misrepresentation (manipulation of measures such that reported performance exceeds
actual performance); (6) gaming (changing actual behavior to make the scheme suitable
for the agent): e.g. carefully choosing patients who need less P4P procedures to reduce
providers’ effort; and (7) ossification (organizational paralysis and innovation stifling
caused by narrow targets).5,10
1.2.2 Context and target for P4P in health systems
Countries have experimented several strategies to improve the coverage, quality and
efficiency of healthcare services from time to time, such as input based financing, global
budgeting and grant-based financing for health facilities and providers.11 P4P is a new
strategy in the category of innovative health sector reforms which is multi-pronged in
its aims and trajectory, unlike the conventional strategies of financing health services.12
For instance, P4P envisages a strict monitoring of the performance of health facilities
and providers.13 However, its target performance indicators are not focused on
provider performance alone.14 On the contrary, P4P also considers provider
performance indicators which are linked to patient-side such as client satisfaction.13
Thus, in a way P4P intends to integrate both demand- and supply-sides by using
appropriate indicators to monitor performance. P4P aims at close interaction with
different levels of health system, as it involves each of them with different roles.13 For

24
instance, health facilities and physicians are usually the providers, higher level
authorities at the national or provincial levels in the healthcare system are purchasers
of care, while a third party (e.g. community-based organizations) can be the verifier of
performance.14
One of the major reasons for introducing P4P was the sup-optimal performance of
healthcare delivery system, especially on its productivity and efficiency dimensions.12
For example, in high-income countries, coverage had increased considerably, yet the
services were delivered at low quality and at higher costs.5,12 Therefore, it was
necessary to ensure the quality of services along with cost minimizations and optimal
provider motivation.12 In low-income countries, due to the weak status of healthcare
system (e.g. limited infrastructure, supplies and skilled providers), coverage of services
has been a key challenge.14 In addition, providers were less motivated to perform
mainly due to the limited financial capacity with the Government leading to under-
payment and inferior working environment.15 Thus, it was necessary to improve the
status of healthcare system along with provider performance to improve the usage and
quality of services.14 Governments in these countries felt the need for a comprehensive
strategy such as P4P to address the essential health goals such as millennium
development goals (MDG).16
Although P4P has been operational since the 1990s, it gained more world-wide
popularity only once it obtained a bigger scale across the USA during the 2000s.17
Another break-through for P4P was the implementation of the large-scale Quality and
Outcomes Framework (QOF) for primary care in the UK in the 2000s.18 Although P4P is
currently being implemented in countries of all income levels, the primary target of P4P
mechanisms varies between low- and high-income countries. In high-income countries,
the focus is predominantly on improving quality of services along with efficiency
indicators.19,20 In contrast, targets of P4P can be primarily multipronged in low- and
middle-income countries (LMICs), as they aim to achieve unmet goals such as
millennium development goals (MDG) 4 and 5 on maternal and child health (MCH)
while focusing on coverage, quality and out-of-pocket expenditure for services.3,13,21 In
short, irrespective of their level of income, under P4P, countries can aim at systematic

25
improvements and health gains by improving provider and health facility performance
through a number of ways. As explained in Box-2, P4P incentivizes broadly the
following aspects in a healthcare system.
Source: Cashin et al. 20144
1.2.3 Functioning of P4P
P4P envisages a strict distribution of the three categories of functions, i.e. purchase,
service provision and regulation.4,12 In other words, purchaser, provider and regulator
of services are different in a P4P program. Usually the Ministry of Health, insurer or
equivalent is the purchaser in P4P programs, while regulator is a Ministry approved
independent agency. Providers are health facilities, group of physicians or individual
physicians from public and private sectors. This separation of functions and split of
responsibilities aim at transparency and build in sufficient checks and balances to
guarantee high quality service delivery.4 All parties involved have an independent role
that comes with own tasks and responsibilities. Typically, in most of the existing P4P
Box -1.2
Targets of P4P programs
Pay for quality – Under this, P4P program aims at improved quality of care.
Quality elements are assessed in multiple ways through structure, process and
outcome or coordination of care measures. They can also use composite measures
to quantitatively combine measures into metrics.
Pay for reporting – Here, P4P programs pay providers for accurate reporting of
service usage and quality. The program may also develop checklist for data
collection and reporting.
Pay for efficiency – In this, P4P rewards providers for cost reduction or cost
containment. Multiple cost reduction measures such as reducing usage of
secondary and tertiary services and expensive services can be applied.
Pay for value – Under this, P4P targets both quality and cost measures. In other
words, providers are rewarded if they improve the quality of services while
keeping the cost constant or reduced.

26
programs, especially in LMICs there is a separate verification mechanism under the
Regulator to monitor the purchase and payment of services.22
1.2.4 Limitations of P4P
The major noted challenge with P4P is that lack of valid and reliable performance
indicators can adversely affect the measurement of performance in the program.23 For
instance, often, physicians, patients, healthcare system and environmental factors can
influence quality of care.10 Therefore, it is difficult to assess the marginal contribution of
a provider organization or physician to a given process or outcome.10 Availability of
reliable data also limits the accurate measurement of performance.23 P4P programs
often lack comprehensive performance indicators.12 Therefore, providers may cherry
pick incentivized indicators alone by neglecting non-incentivized services.12 If such
non-incentivized services are essential for the population, it may adversely affect the
overall population health gains.5
P4P is projected to fetch certain unintended consequences such as motivating
unintended behaviors, distortions, gaming, corruption, cherry-picking, widening the
resource gap between rich and poor, dependency on financial incentives,
demoralization, and bureaucratization.24 Distortions mean ignoring important tasks
that are not rewarded with incentives, gaming implies improving or cheating on
reporting rather than improving performance and cherry-picking indicates picking
patients that make it easier to reach targets and earn bonuses and ignoring more
difficult patients.24–26 For example, in order to meet process quality performance
targets, providers can ignore high-risk patients.24 Further, for the same reason,
providers can undertake expensive treatment procedures, incurring higher costs for the
patients.24
Behavioral economic assessments indicate that P4P in the long run may reduce health
workers’ intrinsic motivation as incentives will excessively motivate them to perform
for financial gains.8 Gradually, quality of care can be adversely affected under P4P.27

27
Evaluations of existing P4P programs in LMICs (explained further in chapter 2) also
reflect that incentives can motivate providers to perform more on incentivized
indicators.
As far as quality of care is concerned, the evidence from high-income countries suggests
that P4P can have positive externality, i.e. it can improve the overall quality of services
in a facility than only that of incentivized services.28 The literature shows that though
provider incentives can fetch unintended effects, ultimately these undesirable effects
depend on the design, package of services and implementation of programs.24
1.3 Quality of healthcare
The concept and definition of ‘quality of health care’ (QoC) vary among different studies
and context. Institute of Medicine (IOM) defines quality in healthcare as the “degree to
which health services for individuals and populations increase the likelihood of desired
health outcomes and are consistent with current professional knowledge”.29
Donabedian describes healthcare service delivery as a continuum which includes
structures, processes, and outcomes, and asserts quality of care is an end product when
the structures are translated to outcomes through the processes.30
1.3.1 Structural quality
It consists of human and key material resources such as infrastructure, equipment,
drugs, commodities, communication, and transport.30 To deliver optimal QoC, material
resources need to be put to practice by adequately skilled and motivated human
resources.30
1.3.2 Process quality
Process quality means whether services are provided optimally and safely following the
standards of service delivery through technical and non-technical performance.30
Technical performance entails delivering technologically and scientifically proven
services at the appropriate time. For instance, during routine antenatal visit, a woman
should undergo certain necessary procedures such as weighing and testing of blood and
urine samples, and remedial action should be taken if any abnormality is detected. Non-

28
technical performance relates to interpersonal relationship, provider behavior, privacy,
and confidentiality.6,31–33
1.3.3 Outcomes
Key consequences of service delivery such as morbidity, mortality, out-of-pocket
expenses, and client satisfaction constitute the outcomes.34 Morbidity and mortality are
difficult to attribute to QoC delivered, as many factors such as severity and pre-existing
illnesses, delayed care seeking, and non-adherence to treatment would affect these
outcomes.35 Settings where the cost of health care is not completely covered either
through a prepayment mechanism such as insurance or completely made free by the
provider, patients do incur costs on consultation, diagnosis, treatment procedures,
and/or medicines.36 In addition, there could be indirect expenses related to travel to the
health care provider, caring for the sick and loss of wages.36 Patient satisfaction is a
summary of their different perceptions and values.37 These perceptions are patients'
beliefs about occurrences i.e. how they are being examined, diagnosed with a health
condition, treated, counseled and respected in the continuum of care.38 Patients reflect
the extent to which they consider a given occurrence is worthy, anticipated, or
essential.38
1.4 Measuring Quality of care
Several methods have been reported to assess technical and non-technical quality of
care as explained further below.39
a. Vignettes: Vignettes are used to assess knowledge of health workers on various
aspects of care through a case scenario description and administered through written
tests or direct elicitation from the provider.39,40 Vignette is a tool for measuring
technical quality of physician care through competence assessment in terms of history
taking, physical examination, ordering tests, diagnosis, and prescribing treatment.41
b. Direct Observation (DO): DO enables an assessment of both structural and process
elements of QoC in the presence of a silent observer through a checklist.41–43 Through
this checklist, it is possible to compare what is present against what physicians are
supposed to do and what structural elements (e.g. equipment and infrastructure) are

29
necessary.41–43 On process quality (both technical and non-technical elements), there
is a possibility of physicians becoming aware of being observed and change their
behavior (i.e. Hawthorne effect), leading to a bias in measurement.44
c. Exit interviews: Patient exit interviews are used to assess both technical and non-
technical aspects of quality.45,46 They can reduce the potential response bias as patients
are interviewed immediately upon receiving the care and relatively cheaper than
household surveys.
d. Chart abstraction (Register/Record Reviews): A review of hospital patient records
and registers can provide information on the treatment practices, time for treatment
and cost of care to assess technical QoC.42 If a chart abstraction is intended, ideally a
clinical expert would be required to collect data.
e. Simulated or standardized patients (SP) Methods: An SP is an individual who is
extensively coached to portray historical, physical and emotional features of an actual
patient accurately and in a standardized and consistent manner.47,48 Simulated or
standardized patients are considered to be the ‘gold standard’ method of assessing
provider communication skills and behavior.39 However, a standardized patient cannot
simulate crucial signs of certain illnesses and health conditions such as pregnancy,
heart murmurs or lung sounds.39
f. Combination approaches: As mentioned earlier, since no method is absolute to
measure the technical quality of care, a combination of different approaches can give
more reliable measures for QoC, especially in P4P programs.49
1.5 Measuring quality of antenatal care
As the focus of this study is on quality of antenatal care, the following section gives an
account of measuring this aspect, based on the existing literature. When it is restricted
to assessing quality of antenatal care, existing studies have utilized the three elements
of quality, i.e. structure, process and client satisfaction (an element of outcome) in
various combinations.30 Majority of studies have focused on process element,50–59 while
studies in Uganda and Sri Lanka considered all three elements,50,55 and studies in
Indonesia and Tanzania have used the structure and process elements.51,56,57 Table 1.1

30
presents the ANC quality elements mentioned in these studies. The following sections
describe the measures in details by element of quality.
1.5.1 Structure Measures
Level of structural quality of care is directly related to the levels of process quality of
care.60 Structural measures assess the infrastructure of health care facilities.59,61 These
measures broadly include availability and capacities of staff and availability of
resources (e.g. drugs, equipment and other amenities) within facilities. However, the
specific factors to be assessed under these broad measures are usually context-specific,
depending upon country context and health condition under consideration as
equipment and drugs required for each health condition could be different.59 The
existing literature on quality of ANC shows certain structural measures are necessary to
ensure a minimum level of process quality of ANC.50,51,55–57,59–64 They are classified
broadly into five elements.

Table 1.1: Quality elements in antenatal care from published literature Quality elements Tanzania
200351 Indonesia 200756
Sri Lanka 200755
Mexico 200753
India 200854
Mexico 200952
Brazil 200958
Tanzania 201157
Uganda 201250
Zambia 201259
Structure Human resources ✓
Infection control facilities ✓
Physical infrastructure ✓ ✓
Equipment ✓ ✓ ✓ ✓
Essential drugs ✓ ✓ ✓
Furniture ✓ ✓
Vaccines ✓ ✓
Linen ✓
Stationery ✓
Record keeping ✓
Toilets ✓
Electricity ✓
Water ✓ ✓
Waste disposal ✓
Process History taking ✓ ✓ ✓ ✓ ✓
Physical examination ✓ ✓ ✓ ✓ ✓ ✓ ✓ ✓ ✓ ✓ Lab tests for blood and urine
✓ ✓ ✓ ✓ ✓ ✓ ✓ ✓
Counselling for risk factors ✓ ✓ ✓ ✓ ✓ ✓ ✓ ✓ Prescribing drugs ✓ ✓ ✓ ✓ ✓ ✓ ✓ ✓ TT vaccination ✓ ✓ ✓ ✓ ✓ ✓ ✓ Explanation about treatment offered
✓ ✓

32
Satisfaction Distance ✓
Infrastructure ✓
Waiting time ✓
Cleanliness ✓
Privacy ✓
Availability of medicines ✓ ✓
Cost of service ✓
Provider attitude ✓ ✓
Time spent with provider ✓
Note: ticked cells indicate inclusion of element in the study

33
First, physical infrastructure including waiting area, examination room with privacy,
toilet with provision of water, wash basin with soap and water, availability of electricity
and light and cleanliness. Second, availability of trained staff to provide the essential
components of ANC. Third, availability of diagnostics including urine dipsticks for
protein and glucose, RPR test, blood grouping, and HIV test kits. Fourth, availability of
drugs mainly iron tablets, folic acid tablets, antimalarials, tetanus toxoid, one broad
spectrum antibiotic, and PMTCT drugs. Lastly, availability of functional equipment
including tape measure, adult weighing scale, couch, fetoscope, stethoscope,
sphygmomanometer, thermometer, speculum, and hemoglobin meter.
1.5.2 Process quality of care
Generally, measures to assess process quality of antenatal care are context-specific.65
This is due to the fact that clinical standards for ANC are usually based on causes of
maternal morbidity and mortality, ante natal care seeking patterns, competence and
skills of providers and status of service delivery.65 However, certain clinical practice
standards on ANC are already set globally by the World Health Organization, which are
also essentially prescribed guidelines for any country setting.66 Thus, the currently used
focused ante natal care (FANC) guideline is prescribed by WHO based on the results of a
multi-center clinical trial that tested the effectiveness of a new model (i.e. visits are less
in numbers, but at regular intervals) versus the standard model of ANC (i.e. frequent
visits) in Argentina, Cuba, Saudi Arabia and Thailand.67,68 The concept of FANC was
developed based on three key findings from this trial; 1) frequent ANC visits without
proper adherence to clinical guidelines will not benefit women, rather fetch physical
and financial distress, 2) as majority of pregnancies do not develop complications,
providers should treat all pregnant women and help reduce complications, and 3) high-
risk women may not often develop complications, while low-risk women may often do
so without much preparations.67,68 FANC was recommended based on the trial finding
suggesting that even with fewer ANC visits, by following the protocol of FANC, maternal
and perinatal outcomes can be improved.66,69 With the assumption that every pregnant
woman is at risk for complications, FANC aims at ensuring the same basic care and
monitoring for complications for every woman.67,68 The earlier standard ANC focuses

34
on risk assessment and more frequent visits. FANC focuses on quality, help women in
maintaining normal pregnancy, prevent complications and facilitate early detection and
treatment of complications with a maximum of four ANC visits.67,68
FANC has five components as part of ANC provision. They are (1) history taking; (2)
physical examinations; (3) laboratory investigations (screening and testing); (4) health
promotion; and (5) prophylaxis and treatment.70 History taking mostly includes
collecting history on medical procedures, surgery, pregnancy, sexually transmitted
diseases and last menstrual period. Physical examinations primarily include
measurement of weight, height, blood pressure, fundal height and abdominal palpation,
and fetal heart monitoring. Laboratory investigations are for blood and urine to assess
hemoglobin, syphilis and blood grouping, and screening for HIV and malaria depending
on the epidemiological setting. Health promotion is usually counseling on family
planning, pregnancy complications, institutional delivery, preparations for delivery,
diet and voluntary testing for HIV. Prophylaxis and treatment involves prescribing iron
tablets and folic acid to prevent and/or treat anemia, preventive care and vaccination
for tetanus, presumptive treatment for hookworm and prevention of mother to child
transmission of HIV (PMTCT) and preventive treatment for malaria depending on the
epidemiological context.
In the literature, several studies have used these FANC indicators to measure process
quality of antenatal care. Studies in Tanzania and Mexico have collected information on
all five FANC components.51–53 While other studies have used a lesser comprehensive
list of FANC components.50,54–59
1.5.3 Client Satisfaction
The existing literature affirms a direct relationship between the level of client
satisfaction and levels of quality of care.71,72 However, there is no consensus on defining
the concept of client satisfaction in healthcare.37 Donabedian defines patient
satisfaction as primarily a patient reported outcome measure, however patient’s
experience on elements of structural and process quality can be measured as well.30
There is another concept that patient satisfaction represents patient’s attitude towards

35
care or particular aspects of care.71 Patient satisfaction also can be based on patients’
emotions, feelings and their perception of received care.73 There is also a belief that
patient satisfaction is a judgment between patient’s expectations of ideal care and
perceptions of what he/she received in practice.71 Kravitz defines patient satisfaction as
a distillation of perceptions and values.37 Perceptions are typically what a patient
believes about occurrences, while values are the weights a patient gives for
occurrences. Values express the degree to which a patient thinks occurrences to be
desirable, expected, or necessary.
Although measures to assess client satisfaction in general and that on ANC in specific
are context-specific, certain structural and process quality of care elements such as
inter-personal communication ability of providers, provider competence, health
outcomes, and cost of care have been used as the measures of client satisfaction.71–74
Some authors believe that satisfaction measures should include dimensions of
technical, interpersonal, social, and moral aspects of care.71,73,74 There are wide
variations in the literature on variables incorporated under the above mentioned broad
measures.71 For instance, under satisfaction on structural quality some included only
availability of drugs and equipment, while some also considered other infrastructure
(e.g. living room amenities in the hospital and toilet facilities). As per the existing client
satisfaction surveys reported in the literature, operation hours, cleanliness, privacy,
waiting time, availability of medicines and equipment are necessary to assess patient’s
satisfaction on structural quality.71,73,74 Similarly, how much a patient spent out-of-
pocket on services is also a common component of client satisfaction surveys.37 On
provider aspects, interpersonal communication skills of physicians in terms of their
attitude towards patient, history taking, explanation of conditions, respect of patient
preferences, duration of consultation, emotional support and counselling, are usually
assessed.71–74 Waiting time including the time needed for outpatient registration is also
reported as a measure of client satisfaction by some authors.71,73,74
Client satisfaction assessments are predominantly quantitative in nature.71
Standardized questionnaires (either self-reported or interviewer-administrated or by
telephone) are the most used tools in quantitative assessments. However, certain

36
subjective experience and patient’s suggestions are explored in qualitative manner as
well.
The existing literature poses several challenges in the reliability of client satisfaction
measures in assessing quality of care elements. First of all, client satisfaction
assessments can be complex as they have multiple cross-cutting dimensions
(satisfaction, engagement, perceptions, and preferences).75
Patient satisfaction can be subjective as it depends on each patient’s expectations,
current state of mind and normative judgments.75 For a question directly asking if the
patient is satisfied with a specific aspect of care (e.g. time a provider spent with you),
the responses may be in relation to the patient’s expected standards of care. In this
case, even if the provider behavior was perfect, but the patient’s expected standards
were high, then the level of patient satisfaction will be low and vice versa. Several
studies suggest that assessing health outcomes with an exclusive focus on client
satisfaction measurement may be biased.37,73,74 This bias may be due to the fact that
health outcomes also depend on patients’ basic health status and adherence to
treatment. Manary et al. argue that patient feedback on process quality measures may
not be credible as most patients lack formal medical training.76 Patient experience
measures may also reflect fulfillment of patients' immediate desires.76
As far as measuring client satisfaction on antenatal care is concerned, only two studies
report these.50,56 The components of satisfaction they present are the following –
satisfaction on distance, infrastructure, waiting time, cleanliness, privacy, availability of
medicines, cost of service, provider attitude and time spent with provider.
1.6 Summary of the background and overview of the thesis
This chapter shed light on the key concepts of P4P, its functioning and limitations.
Further, it presented the definition of quality of care and its measurement methods in
general and specifically for antenatal care. The rest of the thesis is structured in the
following manner.

37
Chapter 2 presents a review of literature on the effects of P4P in high income countries
followed by low- and middle-income countries in general and on maternal and child
health care in particular including quality of care. This chapter concludes with the
rationale of this study, research question and objectives.
Chapter 3 explains the study setting with key social, demographic and health systems
characteristics. It also describes the intervention along with relevant stakeholders and
incentives.
Building on to the literature and description of intervention, the methods chapter
(Chapter 4) begins with a conceptual framework. The framework describes the causal
pathways of the intervention and how is the research placed within the context. This
chapter also describes the study design, sampling, data collection, data analysis plan,
ethical considerations and the role of the doctoral candidate in this research.
Chapters 5, 6 and 7 present the results addressing the three research objectives set out
in the conceptual framework. Each results chapter explains the research objective,
methodology, descriptive and inferential statistics (impact estimates). Chapter 5 deals
with structural quality, while chapters 6 and 7 present process quality and client
satisfaction respectively.
The concluding chapter (Chapter 8) reflects on the summary of findings, strengths and
limitations of the research, contributions to the global evidence base, implications for
policy and areas of future research.

38
Chapter 2: Review of Literature
2.1 Overview
This chapter presents the existing evidence including those from systematic reviews
showcasing P4P programs’ effects on healthcare and quality in high, middle and low
income countries. Then, it presents a systematic review of the literature that was
conducted as part of this doctoral research to assess the effects of P4P on quality of
MCH care in low- and middle-income countries. Finally, it presents the rationale for this
doctoral research followed by study objectives.
2.2 P4P’s effect on quality of care in high-income countries
The prevailing evidence of P4P in the high income countries primarily emanates from
the evaluations of P4P programs in the UK and the USA.5,12 In high-income countries
quality of care has been primarily assessed in terms of providers’ adherence to
standardized clinical guidelines.5 In some studies intermediary outcomes such as
changes in blood pressure that indicate changes in population health status were
included.5 Patient experience and provider responsiveness were also considered as
elements of quality, though measuring them was found to be expensive and difficult at
times.5 This review by Allen and colleagues highlight lack of reliable data on quality of
care.5 The findings of the studies of the effect of P4P on quality of care had mixed
results.5,12,25,77,78,98,99 P4P has been effective to improve quality of care on chronic
conditions, but not consistently.12,25 Prevailing higher quality of care before the
introduction of P4P programs has been suggested as a possible reason for the lack of
P4P’s positive effect on quality.5,12 However, there is some evidence suggesting that P4P
has the potential to improve quality, only at higher costs to health system.12 There is
also evidence of cherry-picking and gaming within P4P programs, reported from the UK
and USA.25,26,77 An evaluation study of a P4P program in Spain did not show any
significant improvement in patient satisfaction.79
A systematic review of 44 studies on P4P program in the UK showed that quality of
managing chronic diseases and preventive care had improved under P4P.5 However,

39
the overall positive effect varied with the baseline medical quality and practice size. P4P
also brought in issues such as inequity, patients’ dissatisfaction and increasing medical
cost. Performance increases on quality were accelerated in the first year of the scheme,
however gradually returned to pre-P4P rates. In the first year of P4P, quality of care
improved more in deprived areas indicating that P4P could address inequity initially as
there were more scope for improvement in such areas. Performance on quality
remained at the same level, even after incentives were removed. This reflects that
investments during P4P would have improved structural quality and it would have
motivated providers to perform better. There was evidence of risk selection and gaming
by providers. There were mixed results on provider motivation – some studies reflected
no effect on intrinsic motivation. On the contrary, a few studies have reported that
under P4P, providers’ autonomy came down and it undermined providers’ sense of
professionalism. Results also indicate the better performance of P4P if incentives are
directed at individuals compared to large groups. P4P was also effective if it adopted
absolute targets instead of relative ones. P4P also fetched better results if there was a
higher level of provider engagement. One of the reasons for P4P not considerably
improving quality of hypertension care was that pre-P4P quality was already high. A
systematic review conducted by Langdown et al. on 11 studies also establishes that P4P
could improve quality of care for certain health conditions initially, but it fell gradually
to the pre-existing trend.80 Another systematic review by Gillam found that nurses and
physicians reportedly felt a decrease in the person-centeredness of consultations and
treatment continuity.78 Also, patients' satisfaction with continuity fell down with little
change in other domains of patient experience.
Houle et al. conducted a systematic review of four randomized controlled trials, five
interrupted time series, three controlled before-after studies; one nonrandomized
controlled study; 15 uncontrolled before-after studies; and two uncontrolled cohort
studies in the UK.81 This review showed that the effects of P4P on quality of care among
individual practitioners are uncertain.

40
The experiences of P4P in the USA also show a mixed picture with studies giving
contradicting conclusions. Rosenthal et al., 2007 remarked that there was only a little
association between the amount of incentives paid and the success of the schemes.20 A
WHO report asserts that the evidence is not robust enough to conclude that financial
incentives might enhance documentation of processes of care such as immunization
status.12 However, there are indications of patients’ experience of primary care services
improved with incentivized providers. An evaluation by Glickman in 2007 revealed that
P4P hospitals outperformed non-P4P hospitals on achieving improvement in clinical
outcomes of chronic conditions.82
In summary, there is inconclusive evidence of the effects of P4P on quality of care in
high-income countries. Most of the evidence is centered on process quality of chronic
conditions. While, quality improved initially for certain services, it gradually came down
to baseline values. There was a perceived reduction in the person-centeredness and
continuity of treatment practices, and patient satisfaction under P4P.
2.3 P4P in Low- and Middle-Income Countries
Several LMICs in Asia and Africa have experimented P4P in the last few decades. P4P
programs in LMIC have predominantly aimed at improving maternal and child health
(MCH).14,20 The key objectives of these P4P programs were improving coverage and
quality of services by incentivizing health facilities and providers. Health systems in
these LMICs face challenges in funding, skilled human resources and managerial
capacities resulting into poor quality of care, lower utilization of services and dismal
health indicators.83–85 Staffs’ performance is sub-optimal and disproportionate to their
qualifications and skill set.43,86 Not linking results with payments to health centers and
salaries to health workers is one of the major reasons for low productivity and poor
quality of services.87 In this context, P4P is expected to potentially enhance productivity
based on the notion that incentives motivate individuals towards better performance.13
Experimental and quasi-experimental evaluations in Cambodia, Democratic Republic of
Congo (DRC), Burundi, Rwanda and Haiti have shown that P4P could enhance service

41
utilization, and financial and management capacities.2,88–93 P4P programs in DRC and
Cambodia have shown improvements in utilization of antenatal care (ANC).88,89 In Haiti,
there was a quarterly increase in utilization of consultations for infants by 9.4% points
over 12 quarters.91 In Rwanda and Burundi institutional delivery increased by 8%
points and 21% points respectively.90,94 The P4P program in Rwanda improved the
probability of a pregnant woman receiving tetanus vaccination by 5% points.94 In
Burundi, pregnant women had more chance of having institutional delivery by 21%
points, ANC access by 7% points, and utilization of modern family planning services by
5% points.95 In the Philippines, P4P program enhanced patient reported health
measure for under-five children by 7.37% points.96
In contrast, the Rwandan P4P program did not impact on the utilization of ANC.14 In the
DRC program, under-five children did not experience any improvements in their
weight-for-height z-score and longevity.89 In the Philippines, the program did not
observe any significant changes in acute infection or reduction in anemia among sick
children after 6 to 10 weeks of discharge from hospital.96
As regards to unintended effects, a systematic review of P4P programs in LMICs found
some evidence on P4P’s unintended effects but concluded that there is lack of rigorous
evaluation of unintended effects.24 In Taiwan, the providers in a P4P program neglected
elderly and high-risk diabetes patients.97 In DRC, providers reported reduced intrinsic
motivation under the P4P program.98 However, this happened in a setting where the
overall facility income went down. Thus, attributing reduced motivation only on the
P4P program might not be justified. In the Rwandan P4P program, provider
performance was the highest on incentivized indicators or on those services requiring
the least effort.99 Institutional deliveries had relatively higher incentives than ante-natal
care, eventually, the former increased by more than 20 percentage points. In a Kenyan
school meal program, incentivizing improved pupil malnutrition rates, subsidized meal
preparation crowded out teaching time by 15%.22 In a Chinese P4P program, giving
incentives to primary school principals for reductions in student anemia reduced
teaching effort, leading to lower test scores in some cases.100

42
2.4 Effect of pay for performance to improve quality of maternal and child care in
low- and middle-income countries: a systematic review
This systematic review was conducted by the PhD candidate as part of the doctoral
research.
2.4.1 Background
The literature from high-income settings shows that the effects of P4P on quality of care
is varied. The evidence of P4P’s effect on quality of care is in LMIC settings is very
limited .14 However there are number of reports of P4P programs in LMICs that have
evaluated the effect of P4P on maternal and child health. Thus, a systematic review of
the effects P4P quality of MCH care in LMIC was needed. There were particularly two
compelling reasons to undertake a systematic review as part of this PhD thesis. First,
the earlier systematic reviews did not comprehensively explore the effects of P4P on
quality of care by its various dimensions (e.g. structure, process and outcomes).
Secondly, results from several new studies were available to enrich the evidence base.
Therefore, a systematic review of literature was conducted to explore the effect of P4P
on quality of maternal and child healthcare in LMICs.101
Clinical evidence shows that quality of MCH care is a pre-requisite to reduce maternal
and child mortalities.102 An increased uptake of MCH services such as skilled birth
attendance and newborn care without adequate quality cannot guarantee an improved
MCH status.34 Studies conducted in Cambodia, Democratic Republic of Congo, Burundi,
Rwanda, Haiti have demonstrated improvements in maternal and child healthcare
service utilization and to some extent better financial and management capacities with
health facilities. However, there is no synthesized evidence supporting the positive
effect of P4P on quality of care in LMIC. In addition, a systematic review conducted on
P4P in LMICs asserts that the evidence is weak to conclude the impact of provider
incentives on quality of care.14 Specifically, most studies had inappropriate design to
account for contextual factors and inadequate power to assess the effects of P4P on
health outcomes.14 If P4P positively impacts only service utilization without
corresponding improvements in quality of care, current investments on P4P in low-
income countries may not be cost-effective to improve MDGs 4 and 5.103 This systematic

43
review assessed the effect of supply-side pay for performance on the quality of
maternal and child health services in LMICs. While identifying the knowledge gaps in
this area, it also explored the appropriateness of methods adopted by different studies
to measure quality of MCH care under P4P.
2.4.2 Methods
2.4.2.1 Selection of studies
Studies from low- and middle-income countries as defined by the World Bank income
criteria were included.104 I (AD) and a colleague, Saji Gopalan (SG) from the Department
of Global Health and Development, LSHTM independently searched the literature,
screened abstracts and retrieved full papers. Final selection of studies against the
inclusion criteria was done independently by SG and me, and disagreements were
resolved through a consultative process.
Inclusion criteria
1. Evaluation reporting results of any supply-side (i.e. facility/provider) P4P on a
quantitative measure of MCH care quality
2. Study conducted in low- and middle-income countries
3. Published in English between January, 1990 and June, 2014. This selection is
based on the fact that P4P programs started from the 1990s.
4. Presence of at least one comparison group
5. Study reporting statistical significance of the intervention than only descriptive
analysis
6. Study meeting a minimum quality score of six, defined by the two reviewers
Exclusion criteria
1. Study presenting the impact of P4P on only access to and usage of MCH care
without any quality of care measures
2. Qualitative study or review
3. Study on P4P presenting non-MCH care
4. Study reporting only descriptive analysis
5. Study with a quality score of less than six

44
Type of studies
Studies were selected if they met the criteria used by the Cochrane Effective Practice
and Organization of Care group (EPOC).105 The EPOC study designs are: randomized
controlled trials (RCTs), clustered randomized controlled trials (c-RCT), controlled
clinical trials (CCT), controlled before-after studies (CBAs) and quasi-experimental
studies including interrupted time series. Given the dearth of literature on P4P and
quality of MCH care, in addition studies having at least one intervention and one
comparison group were included.
Types of participants
Study population comprised of women during pregnancy and post-partum period;
children younger than five years; and health workers under assessment for a P4P
program.
Type of interventions
P4P interventions in public or private sector, providing conditional financial incentives
to facilities and/or providers to achieve certain performance measures on MCH services
including quality were selected.
Operational definitions
Maternal health care included any routine or illness care received during the antenatal,
delivery and postpartum period. Child health care included any care received from birth
up to five years of age for any routine or illness conditions. Health workers were
defined as medically trained personnel (doctors, clinical officers, midwives, and nurses)
working at a primary or secondary care level in LMIC settings.
Outcomes of Interest
Primary outcome of interest was quality of MCH disaggregated into structural quality,
process quality and outcomes. Under structural quality, the following elements were
considered – availability of health facility infrastructure, skilled staff, equipment,
commodities, and drugs. For process quality, adherence to standard protocols and
guidelines for management of health conditions were included. Morbidity, mortality,
out-of-pocket expenses for medical services in the healthcare facility, and client
satisfaction constituted the outcomes.

45
2.4.2.2 Information Sources and Search
Records were searched in several electronic search engines and databases namely
MEDLINE, EMBASE, Global Health, PsycINFO, Econlit and Web of Science. Additionally,
Google Scholar was searched electronically. Websites of key organizations involved in
P4P programs (World Bank, DFID and NORAD) were purposively searched for
published articles or working papers. A hand search enabled to retrieve certain relevant
papers from the selected records. Contacts were made to authors and scholars in the
field of P4P to identify additional studies.
The literature search was conducted during May-August 2014. Records published
between January, 1990 and June, 2014 were selected. Each database had different
search words as a combination of MeSH (medical subject heading) and non-MeSH terms
using Boolean operators “AND” and “OR”. The search algorithm was developed based
on a preliminary search in PubMed and Google Scholar. The thematic search words are
given in box 2.1.
Box 2.1 Search strategy
Thematic Search
“provider performance” OR “provider incentives” OR “pay for performance” OR
“performance-based financing” OR “performance-based incentives” OR “ supply-side
incentive” OR “provider performance” OR “results-based financing”
AND
“quality of care” OR “clinical standards’’ OR “structural quality’’ OR “process quality”
AND
“Maternal health/” [MeSH] OR “ante natal/pre natal” OR “post natal/postpartum” OR
“child birth/delivery/institutionalized” OR “newborn/neonatal” OR
“immunization/vaccination” OR “children/child” OR “nutrition/stunting/anemia”
Adjunct Search
“Developing countries/less developed nations/third world countries”[MeSH] OR
“developing health Systems” [MeSH] OR Africa/sub-Saharan Africa” [MeSH]
“Central/south/latin america”[MeSH] OR “asia/central/south east Asia”[MeSH] OR
“commonwealth of independent states”[MeSH] OR “indian ocean islands”[MeSH] OR
“eastern europe”[MeSH] OR “south asia” OR “low income countries/low and middle
income Countries”

46
2.4.2.3 Data items and Extraction
Country and year of study, study settings and design, sample size, type of incentive
(recipient, conditionality and frequency), comparison groups, outcome measures, and
quality element of the outcome measures were extracted using data extraction form. I
extracted the data and SG validated the process.
2.4.2.4 Summary measures and Data Synthesis
Where possible either odds ratio or coefficient along with the confidence interval are
presented. Net effects of the interventions were calculated as the difference between
intervention and control groups at baseline and follow up, and presented as percentage
points, coefficients or absolute numbers in natural units. An outcome was considered
statistically significant at 5% level (p<0.05). The reported outcomes were presented by
the elements of quality, i.e. structure, process and outcomes. Due to heterogeneity of
studies and presentation of results, no meta-analysis could be performed.
2.4.2.5 Appraising methodological and reporting quality of included studies
A customized quality assessment tool for appraising methodological quality of studies
was developed by adapting the tool used by Downs and Black.106 The quality tool takes
into account methodological quality (randomization, baseline balance of key variables),
external validity (representativeness of study sample, contamination of interventions),
and reporting quality (clear description of objectives, interventions, outcomes, power
calculations, findings). The primary changes made were reflected in scoring various
types of studies with the highest score assigned to RCTs, replacing representativeness
of patients with facilities, and removal of items related to blinding of randomization and
patient adverse events. There were eighteen quality indicators for RCTs and seventeen
for CBAs and each indicator had an indicative score. Wherever the description did not
include a particular item mentioned in the quality assessment tool or it was unclear,
then that item was scored zero. Because of the variation in scoring between studies (i.e.
RCT and CBA), the absolute scores were standardized to percentage to ensure
comparability. Based on the aggregate quality score, studies were ranked as low
(<34%), moderate (34-66%) and high (>66%). SG and I independently assessed the
quality of studies, with any disagreements resolved through discussions.

47
2.4.3 Results 2.4.3.1 Study selection
Search from the databases identified 4535 records, and an additional 113 records were
retrieved from other sources and personal communications with researchers. Screened
records were 188 after removing duplicates and excluding records that did not mention
P4P and quality. From 13 articles eligible for full-text assessment, only eight were
included in the review. Details of the study selection are given in the Figure 2.1.

48
Figure 2.1 Flow diagram for selection of articles

49
2.4.3.2 Study characteristics and Settings
There were four CBAs, three cluster RCT and one case control with post-intervention
comparison of P4P programs on MCH care in Burundi, Democratic Republic of Congo
(DRC), Egypt, the Philippines, and Rwanda (Table 2.1). 15,89,96,98,107–110 Five studies took
place in primary care health centers, 15,89,107,110 two reported results from district level
hospitals 96,109 and one was conducted in both primary and secondary level facilities.98
Two cluster randomized trials of performance based salary bonus to health care
providers were reported from the Philippines.96,109 In these two RCTs, 30 district
hospitals from districts matched by socio-economic, demographic and health profile
were randomized to one of the two intervention arms or to the control arm. In the
cluster randomized trial in DRC,96 health facilities in one district were randomly
assigned to intervention and control arms;98 the intervention arm received
performance-based incentives, while control arms only input-based financing.
The CBA in Rwanda randomly assigned 80 health facilities from 12 districts to receive a
P4P intervention and 86 health facilities from seven districts to receive an equivalent
input-based financing.15 The CBA of a P4P program in DRC allocated two districts to
receive performance-based incentives and compared the outcomes with another two
districts having similar socio-economic characteristics.89 From Egypt, a post-test only
comparison study that assessed a P4P program in primary health centers, who received
incentives for more than two years was reported.110 Comparison groups received
equivalent additional incentives as salary top-off without any performance
conditionality. Two studies of P4P program were reported from Burundi. One study
used a CBA for the pilot phase95 and the second study compared population level
outcomes on quality of antenatal care between P4P and non-P4P provinces in the
nation-wide roll-out phase.107
2.4.3.3 Characteristics of performance measures and payments on quality of care
Studies described diverse performance measurement and payment mechanisms for
quality of care. Performance mechanisms included achieving a certain level of volume

50
and quality of MCH services. Three programs incentivized quality of care with limited
set of indices.15,96,111 Three others utilized a composite index including availability of
human and material resources, compliance to national standards, proper record
keeping, and client satisfaction.89,98,110
Payment systems included payment for individual health workers 96,109,110 or for
facilities.15,89,95,107 Incentives accounted for 5% of physician’s salary in the Philippines96
and 275% times the base salary of a primary health facility staff in Egypt.110 In DRC, the
monthly payments to facilities ranged from $200 to $4000.89
In DRC, apart from incentivizing utilization of MCH services, the program offered a
bonus of up to 15% of the subsidies to facilities on quality of care.89 Performance
indicators in Egypt consisted of preventive, curative and quality of care measures
(completeness of medical records, patient satisfaction and waiting time) on MCH.110 The
Rwandan program incentivized facilities on a combination of service volume and
quality for MCH.15 The P4P facilities in the Philippines received incentives linked with
the average clinical competence scores of physicians, facility caseload, and average
utilization of services (quantity) and adherence to national standards and protocols
(quality).109 This adherence to P4P guidelines was assessed for vaccinations, family
planning, tuberculosis, HIV and antenatal care.
Huntington et al. examined receipt of particular MCH services in Egypt from exit
interviews of clients.110 Soeters et al. illustrated patient perceived quality of care (e.g.
staff behavior, availability of drugs and waiting time) from household surveys whereas
professional quality of health centers was assessed from quality surveys.89 Peabody et
al. presented physician knowledge measured through clinical performance vignettes
and health status of under-five children hospitalized for diarrhea or pneumonia.96,109
Basinga et al. reported a composite prenatal quality index based on receipt of services
(reported in the household surveys) according to the national clinical guidelines.94
Bonfrer et al. demonstrated patient’s perceptions on the quality of services and facility
quality score.95,107 Huillery and Seban assessed patient perceived technical quality of
care, patient understanding on managing health conditions and patient satisfaction
through exit interviews.98 In addition, this study examined quality of facility
infrastructure and equipment through direct observation.

51
2.4.3.4 Reporting of quality of care in studies
Studies adopted different methods to report quality of care outcomes. Generally, quality
was reported either objectively (direct observation of availability and receipt of
services as per national standards of care) or reported by patients (e.g. receipt of
services, perceptions on staff attitude, waiting time, quality of services). Means of
verification of quality were through exit and household interviews (patient perception
and experiences), review of records, direct observation (infrastructure, drugs and
equipment) and vignettes. Six studies utilized household interviews to measure quality,
15,89,95,96,98,107 while two studies each employed exit interviews,98,110 review of
records,89,95 and direct observations.89,95 Only one study applied vignettes as a means of
verification.109
2.4.3.5 Risk of bias across studies
The mean quality of studies score was 63.8% with a range of 41% to 88%. Two RCTs
were of high quality with a score of 78%96,98 and one RCT had score of 72% (Table 1).109
Among the five CBA studies, only one was of high quality, scoring 88%.15 Two studies
were of medium quality with a score of 53% and 59%.95,107 Two CBA studies were of
low quality with a score of 41%.89,110
Five studies did not report baseline participant characteristics, representativeness of
the participants or facilities, estimates of random variability and actual probability
values.89,95,98,110 Three CBAs did not mention the matching criteria for control and
intervention sites.111,89,15 Studies with selection bias did not consider the use of
instrumental variable techniques to identifying P4P effects. Seasonality might have
confounded the outcomes in the DRC study as the surveys were conducted at two
different seasons.89

52
Table 2.1: Study characteristics and Quality score

53

54
2.4.3.6 Effects of interventions
Structural quality
Studies gathered results on structural quality from direct observation and review of
records. Four studies described the effect of P4P on elements of structural quality
(Table 2.2). The availability of qualified staff increased by 15% points and patient
perceived availability of drugs improved by 37% points in DRC89 compared to pre-
intervention period. In the Philippines, P4P improved physicians’ knowledge to
manage under-five diarrhea and pneumonia (coefficient 1.6; p < 0.001).96 However,
another study showed some negative effects of P4P on structural quality in DRC.98
These negative effects were observed on overall structural quality index and availability
of drugs and vaccines in the facility. Patient perceived availability of drugs decreased
(coefficient -308.33; p<0.001). There was a decline in structural quality index based on
interviewers' observation (coefficient -0.525; p= 0.014), equipment index (coefficient -
0.639; p=0.026) and vaccine availability (coefficient -0.744; p=0.034). In this study, P4P
did not show any effect on patient perceived equipment quality, infrastructure index
and the number of types of drug currently available. Patient perceived availability of
drugs in Burundi (coefficient 0.04; p=0.492) and equipment quality in DRC (coefficient
0; p=0.997) did not change under the P4P program.95,98
Table 2.2: Effect on Structural Quality Variable Net P4P
effect P value
Qualified staff in facilities£ 15 <0.05
Sufficient drug availability (patient perceived)$ 0.04 0.492 Provider clinical knowledge on child health (Mean Vignette score)*
1.6 <0.001
Patient perceived availability of drugs (%)£ 37 <0.001 Patient perceived equipment quality@ 0 0.997 Structural quality index based on interviewers' observation@
-0.525 0.014
Infrastructure index@ 0.184 0.372 Equipment index@ -0.639 0.026 Number of types of vaccine currently available@ -0.744 0.034 Number of types of drug currently available@ 0.236 0.646 £ Soeters et al. 2011; $ Bonfrer et al. 2014; * Peabody et al. 2011; @ Huillery and Seban 2014

55
Process Quality
Studies reported process quality results from direct observation and review of records.
Four studies presented P4P’s impact on various elements of process quality (Table 2.3).
One study reported P4P’s effect on history taking and examination of pregnant women
during ANC.110 Two studies reported the effect on prescription and treatment of
pregnant women and under-five children.98,110 Three studies mentioned about patient
reported process quality on MCH services.96,107,112 The study in Egypt showed the P4P
increased the chances of a provider asking about parity (coefficient 11.4; p < 0.05) and
past illness (coefficient 16.4; p<0.01) during ANC visits.110 But, the treatment did not
significantly influence the chance of a provider enquiring about a pregnant women’s
name, age and last menstrual cycle. In this study, P4P increased likelihood of measuring
blood pressure (coefficient 8.4; p<0.01), testing blood (coefficient 12; p<0.01) and urine
(coefficient 20; p<0.01) during ANC visits. However, P4P program did not influence the
chances of being weighed or fetal heart rate checked. The P4P increased providers’
adherence to explaining medicine intake for children under five years (coefficient 11.1;
p<0.05), follow-up treatment (coefficient 24.2; p<0.05) and medicines (coefficient 10.5;
p<0.05). Yet, the program could not improve provider practices on treatment,
prescribing iron, injections, vitamins, and tetanus toxoid for ANC visits. In Rwanda P4P
increased the ANC quality index in primary health centers (coefficient 0.157; p =
0.02).15 In DRC P4P improved patient’s perceived quality of care index (coefficient 15;
p<0.05) and professional quality score of facilities on MCH services (coefficient 26;
P<0.001).89 Patient perceived overall quality of care index is the aggregate score given
by the patient for various dimensions of provider behavior and competence (e.g. how
provider explores the case scenario, how provider explains the health condition, how
much respect a provider gives for the patient, etc.) Professional quality score of the
facility is a composite score consisting of structural and process elements as shown by
both studies in DRC and Burundi. However, P4P program did not influence provider’s
adherence to standardized medical procedure for any MCH service (coefficient -0.015;
p=0.695).98

56
Table 2.3: Effect on Process Quality
Variable Net P4P effect
P value
History taking
Asked name during ANC visit@ 4.3 NS Asked age during ANC visit@ 4.5 NS Asked parity during ANC visit@ 11.4 <0.01 Asked date of last menses during ANC visit@ 2.9 NS Asked past illnesses during ANC visit@ 16.4 <0.01 Examination Examined weight during ANC visit@ 5.8 NS Examined blood pressure during ANC visit@ 8.4 <0.01 Examined fetal heart rate during ANC visit@ 10.9 NS Prescription and treatment Asked for blood test during ANC visit@ 12 <0.01 Asked for urine analysis during ANC visit@ 20 <0.01 Explained intake of tetanus toxoid during ANC visit@ -8.4 NS Explained intake of Vitamins during ANC visit@ 5 NS Explained medicine intake for under-five (%)@ 11.1 p<0.05 Overall treatment procedures (patient perceived) during ANC visit@
-5.5 NS
Drugs prescribed to pregnant women without examination$
0.02 0.66
Children received injection (%)@ -6 p<0.05 Children received follow up (%)@ 2.4 p<0.05 Children given medicine (%)@ 24.2 p<0.05 Overall process quality Compliance rate with medical procedure, any service$
-0.015 0.695
ANC process quality score£ 0.157 <0.001 NS – Not significant; @ Huntington et al. 2010; $ Huillery and Seban 2014; £ Basinga et al., 2011
Quality outcomes
Studies obtained results on quality outcomes from review of records, exit interviews,
household interviews and vignettes. Five studies demonstrated the effect of P4P on
patient knowledge on managing health conditions, morbidity, mortality, out-of-pocket
expense and client satisfaction (Table 2.4).89,96,98,110

57
Patient Knowledge: Number of pregnant women knowing the usage of pre-natal drugs
increased in Egypt (coefficient 12; p<0.05), while patient’s knowledge on drug intake
decreased in DRC (coefficient -0.072; p=0.039).98,110
Health outcomes: In the Philippines there was a small improvement in patient reported
health measure for under-five (coefficient 7.37; p = 0.001).96 However, P4P had no
effect on the prognosis of acute infections or on the incidence of anemia among sick
children after 6 to 10 weeks of discharge from hospital. Under-five children did not
experience any improvements in their weight-for-height z-score (coefficient -0.347;
p=0.306), longevity (coefficient -0.012; p=0.55) or infants’ survival (coefficient -0.01;
p=0.093) in the DRC program.98
Out-of-pocket expenses: In DRC,98 P4P reduced patient out-off-pocket expenses on
purchase of drugs at facilities (coefficient -1106.16, p = 0.005). On the contrary, there
was no significant effect on fee paid for immunization, delivery and ANC and PNC visits.
Client satisfaction: Three studies reported how P4P could influence patient satisfaction
on consultation time, provider behavior, waiting time, user fee, welcome quality, overall
quality of care and cure. In the DRC program, no improvement on provider attitude
towards patients (coefficient 12; p <0.10) was observed.89 Patients’ chance of feeling
cured was higher under P4P program in Burundi (coefficient 0.09; p=0.012).95 The DRC
P4P program did not affect the level of client satisfaction on adequacy of consultation
time, overall quality of care, user fee and welcome quality.98
Overall quality of care
Two studies demonstrated the effect of P4P on overall quality of care of MCH services
considering structure, process and outcome measures (Table 4). The P4P program in
DRC could enhance the total professional quality score of health centers (coefficient 26;
p<0.001) and patient perceived overall quality index (coefficient 25; p<0.05).89
However, the facility quality score in Burundi though improved, it was not statistically
significant (coefficient 17.24; p =0.062).95

58
Table 2.4: Effect on Quality outcomes
Variable Net P4P effect P value
Patient Knowledge Women knew medicine-use in prenatal period@ 12 <0.05 Women knew medicine-use in prenatal period$ -0.072 0.039 Health outcomes CRP negative for under-five£ 0.84 0.497 Not anemic under-five£ -4.87 0.253 Good GSRH for under-five£ 7.37 0.001 Weight-for-height z-score of under-five$ -0.347 0.306 Number of under-five deaths last year in households$
12 0.55
Out-of-pocket expenses Fee paid for the delivery$ 301.24 0.762 Fee paid for the last postnatal visit$ -71.637 0.35 Fee paid for the last prenatal visit$ -112.969 0.125 Fee paid for the last immunization shot$ -22.096 0.237 Cost of drugs purchased by the patient at facilities$ -1106.16 0.005 Client Satisfaction Felt cured (pp)* 11 NS Acceptable waiting time (pp) * 7 NS Respect by staff (pp) * 12 <0.10 Felt cured (coefficient)# 0.09 0.012 Waiting time reasonable (coefficient) # -0.12 0.318 Personnel respectful (coefficient) # -0.02 0.718 Adequate consultation time (minutes) $ 1.028 0.422 Pregnant women satisfied on user fees$ 0.012 0.48 Pregnant women satisfied on welcome quality$ -0.027 0.442 Pregnant women dissatisfied on user fees$ 0 0 Pregnant women dissatisfied on welcome quality$ 0 0.946 Pregnant women satisfied on total care quality$ -0.005 0.671 Patient overall satisfied$ 0.013 0.359 Overall quality of care Overall patient perceived quality score on ANC (pp) *
25 <0.05
Overall professional quality score of health centers (pp) *
26 <0.001
Total facility quality score (coefficient) # 17.24 0.062 Patient perceived quality of care (coefficient) # 0 0.924
NS – Not significant; @ Huntington et al. 2010; $ Huillery and Seban 2014; £ Peabody et al., 2014; * Soeters et al 2011; # Bonfrer et al.2014; pp – percentage points

59
2.4.4 Discussion
2.4.4.1 Summary of evidence
This systematic review found that the current evidence indicating P4P’s effect on
quality of MCH in LMICs is skewed towards process quality and antenatal care. Feeble
evidence showing P4P’s impact on quality of MCH care was mainly due to three
reasons; 1) program evaluations did not adequately explore quality of care; 2)
evaluations were mostly not powered enough to examine quality elements; and 3) P4P
could not affect quality of care to a large extent.
The positive effect of P4P was observed only on limited aspects of MCH quality
elements. Studies focused predominantly on antenatal care than delivery, EmONC, post-
natal care and under-five child care. Strength of evidence on maternal and neonatal
health outcomes and out-of-pocket expenses was also limited. P4P program fetched a
few negative outcomes on structural quality such as a reduction in the level of
availability of drugs and equipment.
Despite targeting to improve structural quality of facilities, P4P programs could only
improve availability of skilled staff, drugs and provider’s clinical knowledge. On the
contrary, P4P negatively affected availability of equipment and vaccines.98 The evidence
was considerably positive on provider adherence to treatment protocols on ANC and
child care. Patient out-of-pocket expenses on MCH did not reduce under P4P programs,
though out-of-pocket costs on drugs were reduced. However, client satisfaction did not
substantially improve under P4P.
2.4.4.2 Implications for Policy and Research
As P4P programs intend to reduce maternal and child deaths in LMICs, it is essential to
demonstrate their potential to improve quality of MCH care comprehensively than
process quality alone. Improving provider adherence to P4P guidelines on ANC alone
cannot guarantee an improved maternal and child health. Clinical evidence suggests
that quality of skilled birth attendance, EmONC and post-natal care are necessary to

60
reduce maternal and neonatal deaths.102 There could be a possibility of insufficient
provider skills affecting the process quality on delivery, EmONC and post-natal care.102
Thus, adequate attention should be given to evaluate the evidence on other aspects of
MCH care.
Ensuring structural quality such as facility infrastructure, equipment, drugs and
supplies is equally pertinent to offer quality care on MCH.102 Absence of these minimum
standards can affect patient satisfaction and in turn reduce demand for services in the
long term.102 Inadequate structural quality could be a reason for the poor client
satisfaction in the studies.102 Several P4P programs provided autonomy and funds to
facilities to enhance structural quality. P4P programs in Egypt, Burundi, Rwanda and
DRC also had routinely monitored structural quality. However, the prevailing positive
evidence on structural quality is minimal. The DRC program faced negative effects on
structural quality index, as facilities could not spend on infrastructure and equipment
due to their reduced revenue under P4P. The adequacy of funds for infrastructural
innovations under P4P programs needs to be investigated. Evaluations of P4P programs
in high-income settings reflect that proportion of facility revenue is significant to
improve quality of care.78
There could be also a possibility of limited motivation and capacity among health
workers and managers restricting innovations on strengthening structural quality, as
evident in many LMICs.98 Currently, it is unknown if the prevailing complex
procurement system and managerial bottlenecks in the service delivery system to
improve structural quality are better under P4P programs. Otherwise, these
inefficiencies could retard structural quality improvements under P4P.98 In addition, if
there was no incentive for structural quality improvement, it could have been neglected
with a preference for other incentivized indicators (known as cherry picking).98
Studies reflect that providers are motivated to improve process quality of care by
adhering to treatment guidelines. There could be numerous reasons for their elevated
motivation such as financial incentives, regular supervision, patient feedback and

61
improved facility functioning.112 Several demand-side financing programs proved that
increased patient load negatively affects provider efficiency to handle high volume of
patients and this could potentially reduce process quality of care in due course of
time.112 Thus, specific attention to retain process quality under P4P programs through
optimum provider-patient ratio is needed.
Some P4P programs did not intend to charge user fee, but patient out-of-pocket
expense was not reported to be lesser under P4P. Additional research is needed to
explore specific cost drivers for out-of-pocket expenses under P4P. In DRC, facilities
could not offset the revenue loss from reduced user fee as there was not sufficient
demand generation, negatively affecting quality of care.98 Design of P4P programs need
to approach the issue of utilization and quality of services comprehensively by
addressing both demand- and supply-side challenges.
Partial positive effect of P4P on quality of MCH care asks for a deeper investigation into
role of design, implementation and evaluation of P4P program. According to a review of
P4P in high income countries, quality of care is the final outcome of the changes brought
in by incentives at provider level, provider group level and health system level.78
However, P4P programs in LMICs do not provide any similar evidence. Further, there
could also be a possibility of preferential attention to P4P services at the cost of non-
incentivized services or positive spillover from incentivized to non-incentivized
services.113,114 None of the studies reported effects on non-P4P services.
Morbidity and mortality are difficult to attribute to the quality of care delivered because
various factors such as severity and pre-existing illnesses, delayed care seeking, and
non-adherence to treatment would affect these outcomes.14 Since most of the P4P
programs were less than two years, their evaluations did not potentially have adequate
statistical power to explore the impact on mortality. Also, results need to be interpreted
considering contextual factors e.g. duration and design of interventions, size of
incentives, frequency of payment, timing of evaluation, representativeness of
intervention areas and presence of private providers. Study sites were small and in

62
some, were not representative of the country. Effectiveness can be different if
intervention is implemented exclusively on quality of care than many performance
targets as shown in the studies.
A few studies with CBAs utilized matching of administrative areas such as provinces or
districts.89,98 However, within these administrative areas there were gross
heterogeneity among facilities in terms of infrastructure, staffing, catchment population
and service volume. These differences can be minimized during the analysis if further
matching of facilities could be performed. Matching technique such as propensity score
matching which allows for comparison of effects between similar units can be tried to
strengthen the rigor of evidence.115 Studies in Rwanda, Egypt and DRC have tried to
balance the financial resource effect across intervention arms by providing equivalent
financing.15,98,110 However, none has attempted to balance the effects of additional
supportive interventions such as supportive supervision, continuous quality
measurement, and consistent use of checklists and operational plans that might have
led to overestimation of P4P’s effects. There could be a possibility of publication bias in
this systematic review as studies with more positive results and/or statistically
significant findings are more likely to get published.116
This systematic review showed that P4P is effective to improve process quality of ante
natal care but not so effective on improving structural quality, customer satisfaction,
out-of-pocket expenses and maternal and child health status. Several studies neither
explored the effect of P4P on quality of MCH in-depth, nor were powered enough
statistically. Further research is needed to understand P4P’s impact on EmONC,
delivery and post-natal care and their causal pathways in LMICs.
2.5 Rationale
One of the key objectives of P4P is to improve quality of services to improve population
health. Several studies and systematic reviews have illustrated the effects of pay for
performance in enhancing the quality of health care.114,117,118 However, most of the
studies have been conducted in high-income country settings focusing on the effect of

63
P4P on quality of care for chronic diseases and health conditions.19,78,114,117 The existing
evidence reflecting P4P’s effect on quality of maternal and child health is limited. On the
contrary, P4P is currently a widely experimented strategy to improve maternal and
child health, especially in LMICs.14
Given the primary focus of P4P on improving usage of services, the attention on quality
of care can be diluted in LMICs. The prevailing evaluation of P4P on maternal and child
health in LMICs have primarily attempted to showcase its effectiveness on utilization of
services.94,96 A few studies also have reported that P4P’s effect on quality of maternal
and child care services is limited in LMICs.15,40,119
Maximizing utilization of services alone without any corresponding improvement in
quality of care does not necessarily guarantee improved maternal health outcomes in
any circumstance.119 The evidence shows that if maternal healthcare interventions do
not specifically address the quality of antenatal care, the subsequent effect on maternal
health will be sub-optimal.119 Quality of ANC is necessary to reduce premature birth and
several pregnancy related complications.119 However, only a few studies in LMICs show
the effect of P4P on quality of ANC.101 Further, none of the studies brings in P4P’s effect
on all dimensions of quality (structure, process and outcome) in ANC. The P4P program
in Zimbabwe was chosen to study in-depth as it was one of the novel P4P interventions
incentivizing both the health facility and individual health workers to improve coverage
and quality of maternal and child health services.120 Hence, the anticipated effects of
P4P on quality of ANC in Zimbabwe were multi-faceted and this provides an
opportunity to evaluate the effects of pay for performance on quality of ANC in an LMIC
setting.

64
2.6 Research Question
What is the effect of pay for performance on quality of antenatal care in rural health
facilities of Zimbabwe?
2.7 Objectives
The specific objectives of this thesis are:
1. To measure the effect of pay for performance on structural quality of antenatal
care
2. To measure the effect of pay for performance on process quality of antenatal
care
3. To measure the effect of pay for performance on client satisfaction of antenatal
care

65
Chapter 3: Study Setting
3.1 Overview
This chapters presents the geographic, climatic and administrative features;
demographic characteristics and economic context of Zimbabwe, the study setting.
Then it describes Zimbabwe’s health system, scenario of human resources for health,
and key health indicators. Further, it presents the situation of maternal healthcare and
its quality. Finally, it describes the pay for performance intervention including the
incentives offered as part of this intervention.
3.2 Geography, climate and administrative units
Zimbabwe is a sub-Saharan African country situated between the Limpopo and Zambezi
rivers.121 Zimbabwe is a land-locked country, bordering to South Africa on the South,
Mozambique on the East, Zambia on the North and North-West and Botswana on the
West (Figure 3.1). The country possesses a land area of 390,757 square kilometers,121
including 8.6 million hectares of potentially arable land and more than 5 million
hectares of forests. Zimbabwe has plenty of natural resources, especially minerals and
wild life. It has a mixed climate with dryness, cool winter, and warm and rainy
summer.121 The three distinct seasons are the cool dry winter from May to August, a hot
dry season during September and October, and a warm wet season from November to
April.122
Administratively, Zimbabwe has a decentralized and deconcentrated system with eight
provinces at the top, followed by several districts, wards and villages.122 A district is the
main body of direct service delivery to populations at the local level. Wards are the
planning and implementation units of the district. Villages are the smallest
administrative units with more direct representation to peoples’ voice.122

66
Figure 3.1: Map of Zimbabwe
Source: National Health Profile, 2013123
3.3 Demographic Characteristics
Table 3.1 gives an account of Zimbabwe’s key demographic characteristics. As per the
Zimbabwe Population Census 2012,121 Zimbabwe is inhabited by 13.06 million people
with females representing a slightly higher proportion at 52%, while the sex ratio is 93
Males/100 Females. About 65% of the population resides in rural areas and the rest
lives in urban settings. The population density is 33 persons per square kilometer.121
More than half of the population (55%) is 15 to 64 years of age, 41% is under 15 years
(41%), while only 4% are in the 65+ age group.121
The average household size is 4.2 with the majority households being headed by men
(65%).121 Among the economically active population, a majority come from the “other

67
employed” category (52%), followed by communal farmers and workers 37%, while
only 11% remaining unemployed.121 Less than a half of the households have electricity
(44%), while two-thirds of the households have access to safe water (75%) and toilet
facilities (76%).121
Zimbabwe’s crude birth rate as estimated by the direct method is 32 per 1000
population while crude death rate is 10.2.121 Total fertility rate is 3.8 and average life
expectancy at birth is 38 years.121 The country’s annual average intercensal population
growth rate is 1.1%.121
Table 3.1 Zimbabwe demographic characteristics
Population Size Total 13,061,239 Males 6,280,539 (48%) Females 6,780,700 (52%) Sex Ratio (Males/ 100 Females) 93 Urban/ Rural Population Population in Urban Areas 4,284,145 (33%) Population in Rural Areas 8,777,094 (67%) Area (Sq. km) 390,757 Density (Persons/ Sq.Km) 33 Age Composition/ Percent Under 15 years 41 15 –64 55 65+ years 4 Households Number of Private Households 3,059,016 Average Household Size 4.2 Percent Male Headed Households 65 Activity and Labor Force (Economically Active) Communal Farmers/ Workers (%) 37 Other Employed (%) 52 Unemployed (%) 11 Housing Conditions Households with electricity (%) 44 Households with Safe water (%) 75 Households with Toilet facilities (%) 76 Crude Birth Rate (Direct Method) (Births/ 1000 Population) 32 Total Fertility Rate (Direct Method) 3.8 Crude Death Rate (Deaths/1000 Population) 10.2 Average Life Expectancy at Birth 38 Average Annual Inter-Censal Population Growth Rate 1.1 Source: Zimbabwe Population Census 2012121

68
3.4 Economic Context
Zimbabwe was a better performing economy before the start of the decade long
economic recession during the 2000s.124 This economic depression had a severe
negative effect on the country’s economy, especially, fiscal conditions, macro-economic
stability and balance of payments.124 The annual economic growth reflected a negative
trend at -5.4% between 2000 and 2008. The year 2008 had a low GDP per capita at
US$392.124 Despite the commencement of the Zimbabwe Program for Economic and
Social Transformation (ZIMPREST) to seek international help for economic growth, the
direct development assistance has declined from US$71 million in 1997 to US$7 million
in 2002.124 Currently, agriculture is the primary source of government’s revenue, while
manufacturing and tourism sectors also contribute significantly to national budget.124
During the 2000s, population growth rate was constant at 1%, while economic growth
slowed down drastically and even reached -10% in 2008.124 According to UNDP, a
majority of population (73%) was living below the total consumption poverty line in
2003.125
However, adoption of a multicurrency regime has instilled in macroeconomic stability
and positive economic growth.125 As shown in table 3.2, Zimbabwe’s GDP was 14.2
billion USD in 2014 with per capita GDP at $1773 (PPP).126 The country’s human
development index ranking has also improved from 173 in 2011 to 155 in 2014.125
Table 3.2: Zimbabwe – Socio-economic indicators
Indicators 2014 GDP (Billion USD) 14.2 GDP per capita (in PPP) $1773 Unemployment rate 5% Human development index rank 155 Poverty headcount ratio at national poverty lines 72.3%
Source: Human Development Report 2015125 and World Development Indicators 2016126
3.5 Zimbabwe Health System
Ministry of Health and Child Care (MoHCC) anchors the activities in the Zimbabwe
health sector with the support of Finance Ministry, other allied ministries and
development partners.122 Zimbabwe’s health system is decentralized at four levels

69
namely central, provincial, district and community levels.122 The healthcare provision
is done by the public sector facilities and privately registered physicians or group of
providers. The public healthcare sector consists of the Ministry of Health and Child
Welfare (MoHCC), Local Authorities (municipalities), and other allied Ministries.122
More than a half of the healthcare services are provided by this public health sector.
Private for-profit hospitals, nursing homes, maternity homes, industrial clinics and
general practitioners, private laboratories and imaging facilities constitute the private
for-profit sector.127 The non-profit sector includes faith-based organizations and other
non-governmental organizations (NGOs).127
As reported by the ‘Access to Health Care Services Study (2008)’, majority of the
communities reside within 5 kilometer radius from their nearest health facilities.128
However, around 20% of the communities live 10 kilometers far from a health
facility.128 As shown in table 3.3, health facilities have a four tier referral system.123
There are 1,231 primary healthcare (PHC) facilities as first point of care units. These
facilities are public, faith-based and rural council health centers.123 At the secondary
referral, there are 179 referral facilities.123 There are seven provincial hospitals at the
tertiary level and 15 quaternary facilities at the quaternary level. Both secondary and
tertiary level facilities provide curative and rehabilitative care including long term care
services.
Table 3.3: Health Facilities by levels of care and province
Province Primary Secondary (1st
Referral) Level
Tertiary (2nd
Referral) Level
Quaternary (3rd
Referral) Level
Total
Harare 45 0 0 8 53 Manicaland 253 36 1 0 290 Mashonaland Central
130 13 1 0 144
Mashonaland East
168 22 1 0 191
Mashonaland West
128 22 1 0 151
Matabeleland North
92 17 0 0 109
Matabeleland 105 18 1 0 124

70
South Midlands 106 28 1 0 135 Masvingo 170 23 1 0 194 Bulawayo 34 0 0 7 41 Total 1231 179 7 15 1432
Source: National Health Profile 2013123
The existing 1,920 private facilities, mostly based in urban Harare, Bulawayo and
provincial headquarters also provide curative, long term and rehabilitative services
(table 3.4).129 There are 126 hospitals and 582 rural health centers run by NGOs, mostly
faith-based missions.
Table 3.4: Registered Private Health Facilities by Province and Service Type Category HR BW ME MW MC MN MS MV ML MC Total
Dental 89 18 2 7 3 2 - 2 8 10 141 Medical laboratories
52 14 2 8 3 - - 4 7 7 97
Speech and Occup.
11 - - - - - - - 1 - 12
Physiotherapy 40 14 4 3 2 2 - 1 4 7 77 Nursing homes 12 9 - 5 - - - 4 3 1 34 Consulting 347 147 27 55 15 8 3 17 49 48 716 Nurses' consulting
29 6 14 16 1 - 1 12 7 24 110
Maternity homes
12 3 2 1 - - - 1 1 - 20
Special clinics 15 8 1 5 2 1 1 6 6 6 51 Pharmacies 132 36 4 16 4 1 1 4 16 15 229 Private 13 1 1 4 1 4 5 4 33 Industrial clinics
91 34 - 13 5 16 5 9 23 12 208
Estate clinics - 3 - - - - 3 - 4 10 Psychological services
51 9 - - 1 - - 1 1 1 64
Operating theatres
4 1 - - - - - - - - 5
Dietetics 4 1 - - - - - - - 1 6 Natural therapy 8 2 - - - - - - - - 10 Emergency services
12 6 1 1 1 2 1 3 1 28
Radiology services
25 9 2 1 - - 2 - 2 2 43
Optical 15 8 - - - - - - 2 1 26 Total 962 325 63 132 41 33 13 69 138 144 1920
Source: Health Professions Authority Register 2009;129 Note: HR – Harare, BW – Bulawayo, ME – Mashonaland East, MW – Mashonaland West, MC – Mashonaland Central, MN – Matabeleland North, MS – Matabeleland South, MV – Masvingo, ML – Midlands, MC – Manicaland

71
Public health units within the national, district health offices, rural councils and urban
councils provide preventive health services.122 The major preventive services in the
country include family health services, HIV/AIDS preventive services, epidemiological
surveillance services and environmental health services.122
While a number of interventions have been rolled out to strengthen the health system
since 2009, they: (i) are more input-focused than results-oriented; and (ii) lack focused,
measurable and well-designed clinical quality improvement interventions.130 As a
result, Zimbabwe’s public health system has been heavily focused on basic quantity
coverage of health interventions with isolated quality improvement and measurement
interventions across various programs—mainly HIV/AIDS, TB and malaria through
PEPFAR and Global Fund support.130
The prolonged economic depression has adversely affected Zimbabwe’s fiscal capacity
to finance the envisaged activities under the National Health Strategy.130 Although
Government is the largest source of financing through the tax-based system, currently,
the major health sector programs are largely funded by international development
partners.130 Other key sources of financing are out-of-pocket payments, private
voluntary organizations and insurance schemes.130
It is estimated that Zimbabwe needs to spend at least US$34 per capita per annum on
health, mainly to achieve MDGs 4 and 5.124 However, in 2009 the Government allocation
on health was US$27 per capita per annum. Between 2001 and 2010, public health
spending declined from 39% to 18% of the total health expenditure. This shift resulted
in households making the largest contribution (39%) to total health expenditures
through out-of-pocket payments (OOPs) — which are regressive and
disproportionately affect poor households.124 The historical focus on curative care has
shifted the budget away from the primary health care approach and has resulted in
disproportionately higher shares of expenditure for central and tertiary hospitals at the
expense of the community and primary levels.130 Allocation for curative care remained
above 80% in 2013.130 This leaves 7% of health budget to be spent on preventive
services. On account of the economic difficulties the external funders have largely borne
the financing of drugs and other preventive services.130 In 2010 the Government of
Zimbabwe (GoZ) had allocated 12.7% of the total budget to health.124 This was a decline

72
from previous years, with a budget allocation for health 13% in 2006 and 14% in
2008.124
3.6 Human Resource Scenario
The Health human resource scenario has been in crisis in Zimbabwe ever since the
Economic crisis of 2000s.131 Sup-optimal production of technical staff, shortage of
skilled workers due to migration to other better remunerating peer countries, poor
retention capacity with the Government and low productivity of workers are the critical
issues.131 Economic crisis has left the Government with limited financial capacity to
train and retain staff.132 Currently, the government depends largely on international
development partners to finance its staff retention strategies.131 In addition, health
workers face several challenges in service provision. The most discussed issues among
them are limited infrastructure and equipment demotivating health workers to
perform; low salaries, limited supervision and Human Resource Management
capacity.131 The National Integrated Health Facility Assessment (2012) reported that
health workers are dissatisfied with salary, employment benefits, opportunities for
promotion and the general state of health facilities.133
Table 3.5 illustrates the current status of health workforce numbers by staff category as
reported by the National Health Profile of 2013.123 As a whole, total vacancy rate is
15%. However, for some positions, closer to a half are vacant. Most positions with
higher vacancy rates pertain to technician categories – hospital equipment (55%),
radiography (49%), orthopedic (47%), laboratory (47%), research officer (44%), and
top management (40%).123 Among the primary service providers, 37% of doctor
positions are vacant, whereas 10% nurses’ positions are not filled in.

73
Table 3.5: Zimbabwe health system – Summary of staff numbers
Staff category Establishment In position as of Dec 2013
Vacant
Top Management 83 50 40% Doctors 1767 1114 37% Nurses 20735 18722 10%
Environmental Health 2495 1885 24% Pharmacy 589 394 33% Radiography 471 239 49% Physiotherapy 472 419 11%
Nutrition 980 858 12% Orthopedic 49 26 47% Oral Health 327 236 28% Laboratory 644 343 47%
Research Officers 25 14 44% Health Information 227 187 18% Health Promotion 73 55 25% Hospital Equipment 197 88 55%
Admin. General 6049 5334 12% Program Managers 3 3 0%
Total 35186 29954 15%
Source: Zimbabwe National Health Profile, 2013123
3.7 Health Status
As reported by the National Health Strategy (NHS) 2009-2013, there is considerable
mortality from preventable and treatable conditions due to the weak state of the public
health system.127 As it can be seen from table 3.6, Zimbabwe’s key health indicators
remain low. Although births delivered by a skilled health care provider is relatively high
at 80% compared to the sub-Saharan African (SSA) levels, the maternal mortality ratio
is higher (Zimbabwe 614; SSA 547).134
Table 3.6: Key health indicators in Zimbabwe
Indicator Zimbabwe Sub-Saharan Africa
Maternal mortality ratio (per 100,000 live births) 614 (506 - 722)
547
Births delivered by a skilled provider (%) 80 47.9 HIV prevalence in 15 – 49 age group (%) 16.7
(15.9 - 17.5) 4.5
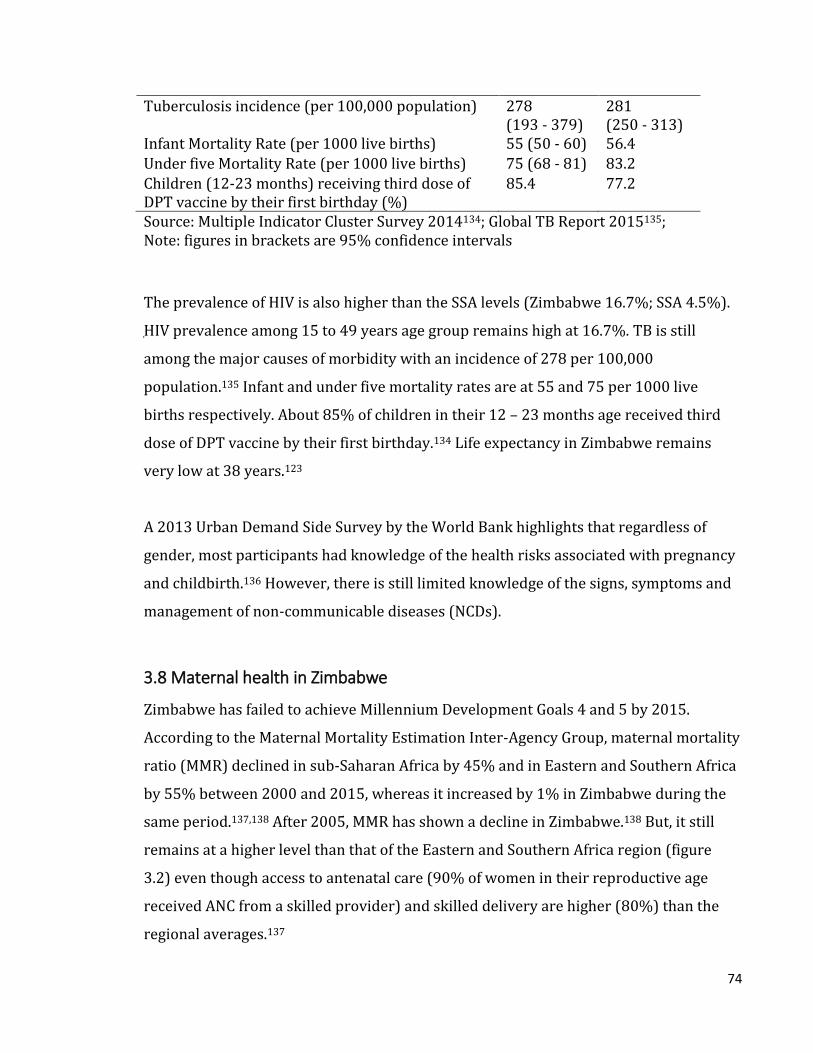
74
Tuberculosis incidence (per 100,000 population) 278 (193 - 379)
281 (250 - 313)
Infant Mortality Rate (per 1000 live births) 55 (50 - 60) 56.4 Under five Mortality Rate (per 1000 live births) 75 (68 - 81) 83.2 Children (12-23 months) receiving third dose of DPT vaccine by their first birthday (%)
85.4 77.2
Source: Multiple Indicator Cluster Survey 2014134; Global TB Report 2015135; Note: figures in brackets are 95% confidence intervals
The prevalence of HIV is also higher than the SSA levels (Zimbabwe 16.7%; SSA 4.5%).
HIV prevalence among 15 to 49 years age group remains high at 16.7%. TB is still
among the major causes of morbidity with an incidence of 278 per 100,000
population.135 Infant and under five mortality rates are at 55 and 75 per 1000 live
births respectively. About 85% of children in their 12 – 23 months age received third
dose of DPT vaccine by their first birthday.134 Life expectancy in Zimbabwe remains
very low at 38 years.123
A 2013 Urban Demand Side Survey by the World Bank highlights that regardless of
gender, most participants had knowledge of the health risks associated with pregnancy
and childbirth.136 However, there is still limited knowledge of the signs, symptoms and
management of non-communicable diseases (NCDs).
3.8 Maternal health in Zimbabwe
Zimbabwe has failed to achieve Millennium Development Goals 4 and 5 by 2015.
According to the Maternal Mortality Estimation Inter-Agency Group, maternal mortality
ratio (MMR) declined in sub-Saharan Africa by 45% and in Eastern and Southern Africa
by 55% between 2000 and 2015, whereas it increased by 1% in Zimbabwe during the
same period.137,138 After 2005, MMR has shown a decline in Zimbabwe.138 But, it still
remains at a higher level than that of the Eastern and Southern Africa region (figure
3.2) even though access to antenatal care (90% of women in their reproductive age
received ANC from a skilled provider) and skilled delivery are higher (80%) than the
regional averages.137

75
Figure 3.2: Trends in maternal mortality ratio in Zimbabwe
Source: WHO, UNICEF, UNFPA and The World Bank estimates. Trends in maternal mortality:
1990 to 2015138
Over 60% of the maternal mortality cases occur in the post-partum period and almost a
half outside institutions.139 As shown in figure 3.3, the primary clinical causes of
maternal mortality in Zimbabwe are AIDS related illness (21%), septicemia (19%),
post-partum hemorrhage (10%) and malaria (10%).123
0
200
400
600
800
1000
1200
1990 1995 2000 2005 2010 2015
MM
R
Year
Zimbabwe Sub-Saharan Africa Eastern and Southern Africa

76
Figure 3.3: Causes of maternal death in Zimbabwe
Source: National Health Profile, 2013123
Key challenges to maternal health are lack of access to and use of midwives and higher
user charges.128 The shortage of midwives was 30% at the national level in 2012,
whereas for some rural provinces it was as high as 60%.140 The largest demand-side
barrier to care is the client’s inability to pay for care – a result of poverty and user fees
at the point of care in both rural and urban areas.128 A World Bank study indicates that
the minimum OOPs by a household in urban areas (Bulawayo and Harare) for maternal
and newborn care was around US$200 per pregnancy.136 Zimbabwe’s inadequate and
expensive transportation system is another barrier, even in urban areas.128 Ambulance
fees average $20 per trip irrespective of the distance to the health facility. For these and
other reasons, including poor quality of care, mothers in rural settings generally deliver
at home unless there is a health center within 10 KMs.128 In addition, long waiting
times, shortages of staff, drugs and supplies, and improper provider attitudes towards
clients were also reported to be affecting the utilization of care negatively.133 There is

77
marked disparity in access to maternal care between rural and urban areas. Women in
rural areas deliver less with skilled birth assistance (51.7%) compared to those in
urban areas (94.2%).137 The former also has lower uptake of modern family planning
methods (60.7%) compared to the latter (67.3%).137
3.9 Quality of maternal care in Zimbabwe
Quality of maternal care services specifically antenatal care quality is sub-optimal. As
per the household surveys such as the Demographic and Household Survey (DHS) and
Multiple Indicator Cluster Survey (MICS), quality of ANC remains low (figure 3.4).134,137
For instance, collection of urine sample (at least once during the pregnancy) was
reported only by a half of the respondents (52.9%), whereas measurement of blood
pressure and collection of blood sample were closer to 90%, even though the national
and international guidelines recommend them to be universal. These household
surveys collected information from women in their reproductive age group who
reported having a birth outcome in the two years preceding the survey.
The National Integrated Health Facility Assessment was undertaken in 2012 that visited
the health facilities and collected information through exit interviews and direct clinical
observations during the provision of antenatal care.133 The assessment found that
during the last ANC visit to the health centers, only half of the pregnant women had
their blood sample taken, and less than 10% had their urine sample taken.133 During the
observation of service delivery, only 2% were screened for pre-eclampsia signs during
ANC, less than half (46%) health workers provided all routine preventive medicines;
whereas a little more than a third (36%) provided counselling on birth preparation and
only 12% provided adequate counselling on danger signs in pregnancy.133

78
Figure 3.4: Receipt of antenatal services components in Zimbabwe
Note: Values are in percentages.
Source: Demographic and Health Surveys 1999, 2005, 2010137; Multiple Indicator Cluster Survey 2014134
3.10 Pay for performance in the context of Zimbabwe’s health system
In order to reduce the prevailing high level of adverse maternal and child health
outcomes, the Government of Zimbabwe introduced the pay for performance project in
2012 with the support of the World Bank. The project locally known as Results Based
Financing (RBF) Project was meant to support the Ministry of Health and Child Care
(MOHCC) in its effort to increase the availability, accessibility and utilization of quality
health care to improve maternal and child health.120 The project was in line with the
Investment Case for Health 2010-2012 that recommended for high impact
interventions to improve maternal and child health based on selected indicators.130 The
RBF project directly contributed to the implementation of the Government of
Zimbabwe’s Results Based Management approach.120 In addition, the RBF project
provided support for implementation of MOHCC’s National Health Strategy 2009 -
2013.127 The RBF project was overseen by Steering Committees consisting of central
government, local government, community health council, non-government and
88
.9
80
.4
75
.1
92
.6
68
.6
67
.8
88
.0
60
.0
83
.889
.4
52
.9
92
.3
B L O O D P R E S S U R E M E A S U R E D
U R I N E S A M P L E T A K E N B L O O D S A M P L E T A K E N
1999 2005 2010 2014

79
community based organizations at the National, Provincial and District levels.120 The
expected benefits of the RBF project are shown in Table 3.7.
Table 3.7: Potential Advantages of RBF Project 1. For the population and local communities Higher Quality of Care because health care providers are motivated by
RBF to improve the quality of services Better access to health care because RBF payments to facilities will lower
the service fees Involvement in quality and quantity verification and able to report to
independent body (purchaser) 2. For the Ministry of Health and Child Welfare, Ministry of Finance and
Economic Development, other policy makers and Governmental bodies
Increased control (power) and better outcomes of the health system Increased legitimacy and acceptance as a result of better quality and
accessibility of health care More transparency (through checks and balances) and efficiency and thus
better opportunities to attract donor funding 3. For health facilities (hospitals, health centers and their staff) Better working conditions (more feedback, professional supervision) Increased acceptance by the population / communities More flexibility and space for “social entrepreneurship” within certain
boundaries, objectives and conditions Initiatives and creative solutions are rewarded 4. For aid agencies and donors Better health system outcomes Efficient spending of funds More transparencies through checks and balances in the system
Source: RBF Project Implementation Manual, Zimbabwe120
3.11 Description of the intervention
The RBF project incentivized health facilities in 16 rural districts for selected maternal
and child care services (figure 3.5).120 For impact evaluation purposes, 16 matched
control districts were also selected. The project was implemented from April, 2012 to
September, 2014. A few key incentivized services were ante natal care, post-natal care,
and institutionalized skilled birth attendance. These indicators were selected based on
the country’s dismal performance during the previous years and to achieve MDGs 4 and
5.128

80
Figure 3.5: Districts implementing RBF Project in Zimbabwe
Source: RBF Project Implementation Manual, Zimbabwe120
Performance incentives were provided to facilities every quarter based on verification
of performance. RBF introduced a strict separation of functions of provider – purchaser
– regulator.120 The Ministry of Health was the purchaser of services from health
facilities, which were the providers. Provincial government, which was the local health
authority was the regulator of the purchasing and paying activities.120 An international
NGO internally verified the performance of facilities based on management information
system and random spot checks. University of Zimbabwe was the external verifier of
performance through random spot checks and client tracer surveys.120
Apart from the incentives, the RBF project also provided autonomy to health facilities
on planning and utilizing the performance incentives; supervision of quantity
performance through monthly visits by the NGO; and supervision of quality

81
performance through quarterly visits by the District Health Management Team.120 As
the Zimbabwe RBF project introduced elements of supportive supervision, reforms in
the payment, autonomy to health facilities, and continuous quality improvement
through supervision of quality, it can be considered a broader health systems
improvement intervention rather than just providing performance-based incentives. As
noted earlier, health worker performance is one of the leading causes of poor health
care system performance and quality of care, leading to underutilization of services and
poor health outcomes. This low health worker performance on the other hand is also
driven by certain health system challenges such as lack of supportive supervision and
issues with infrastructure and supplies in health centers. RBF project was intended to
improve health worker performance and bring in multi-faceted changes in healthcare
system (e.g. improved infrastructure and supplies).
3.12 Incentive Scheme
The health facilities were incentivized on their performance towards maternal and child
health services.120 A quarter (25%) of the total income from P4P at the facility level had
to be reinvested at the facility level to improve and maintain the infrastructure,
equipment, and supplies. The rest 75% had to be shared among the staff according to a
guideline designed considering their qualifications and experience (Annex-A Table
A1).120
Incentives were disbursed every quarter under three dimensions of service delivery, i.e.
1) Quantity of services (quantity bonus); 2) Quality of services (quality bonus); and 3)
Client satisfaction (satisfaction bonus).
3.12.1 Quantity Bonus
The amount of quantity bonus was based on a pre-fixed fee schedule for each selected
indicator and was calculated by multiplying the utilization of each service with its unit
price as shown in the equation below.120
Quantity bonus = ∑ 𝑎𝑖𝑏𝑖16𝑖=1
where ai = Unit Price for indicator i;
bi = Quantity achieved for indicator i

82
For instance, the unit price for institutional delivery was US$ 12.50. If in a quarter, there
were 5 deliveries in the facility, then the income from this particular indicator would be
$62.50 (illustration in figure 3.6 and table 3.8). Finally, the income from all indicators
was added to create the final quantity bonus.
3.12.2 Quality Bonus
Quality bonus was a composite of quality of services (75%) and client satisfaction
(25%).120 Quality of services was verified by the District Health Management Team
through a balanced score card (quality checklist – shown in table 3.9) consisting of
structural, administrative, financing, and clinical elements. For instance, availability of
blood pressure equipment to conduct ANC check ups constituted a quality parameter
for incentives. Balanced score cards have been applied to measure the performance and
progress of health systems in several LMIC settings successfully.141–143
Client satisfaction was assessed by community based organizations in the health facility
catchment areas through household visits. Only one community based organization was
selected for each health facility. These community based organizations were chosen
based on their long term presence in the facility catchment areas and experience of
undertaking community surveys. Community based organizations visited a random
sample of 25 clients from the health facility records every month.120 The clients were
sampled from the facility records following a systematic random sampling method. The
sampling unit was a client. They validated the authenticity of the clients accessing care
from the particular health facilities as well as their satisfaction. The health facilities
were paid a start-up amount for the first quarter of implementation.120 Afterwards,
based on the achievements in each quarter, the facilities were been paid as per the
following table (table 3.8). There were no capping of the incentives, i.e. facilities could
potentially earn as much they provided services for.

83
Figure 3.6: Incentive Calculation Mechanism in RBF Project, Zimbabwe
Source: RBF Project Implementation Manual, Zimbabwe120
Table 3.8: Quarterly price for each incentivized indicator and calculation of final
bonus (an illustration)
Indicator Price in US$
(A)
Verified data (B)
Subsidy in US$ (A X B)
1 OPD new consultations 0.15 670 100.50 2 1st ANC Visit during first 16 weeks 3.00 13 39.00 3 ANC 4+ visits completed 3.00 5 15.00 4 HIV VCT in ANC 2.00 8 16.00 5 ARVs to HIV+ pregn. Women (PMTCT) 2.00 3 6.00 6 Tetanus TT2+ 0.45 11 4.95 7 Syphilis RPR test 0.45 14 6.30 8 IPT (x2 doses) 0.45 8 3.60 9 Normal deliveries 12.50 5 62.50 10 High risk perinatal referrals. 3.00 2 6.00 11 PN visits 2 or more 3.00 4 12.00 12.a Family planning, short term methods 2.50 34 85.00 12.b Family planning, long term methods 50.00 8 400.00 13 Pri. course completed, immunization 3.50 3 10.50
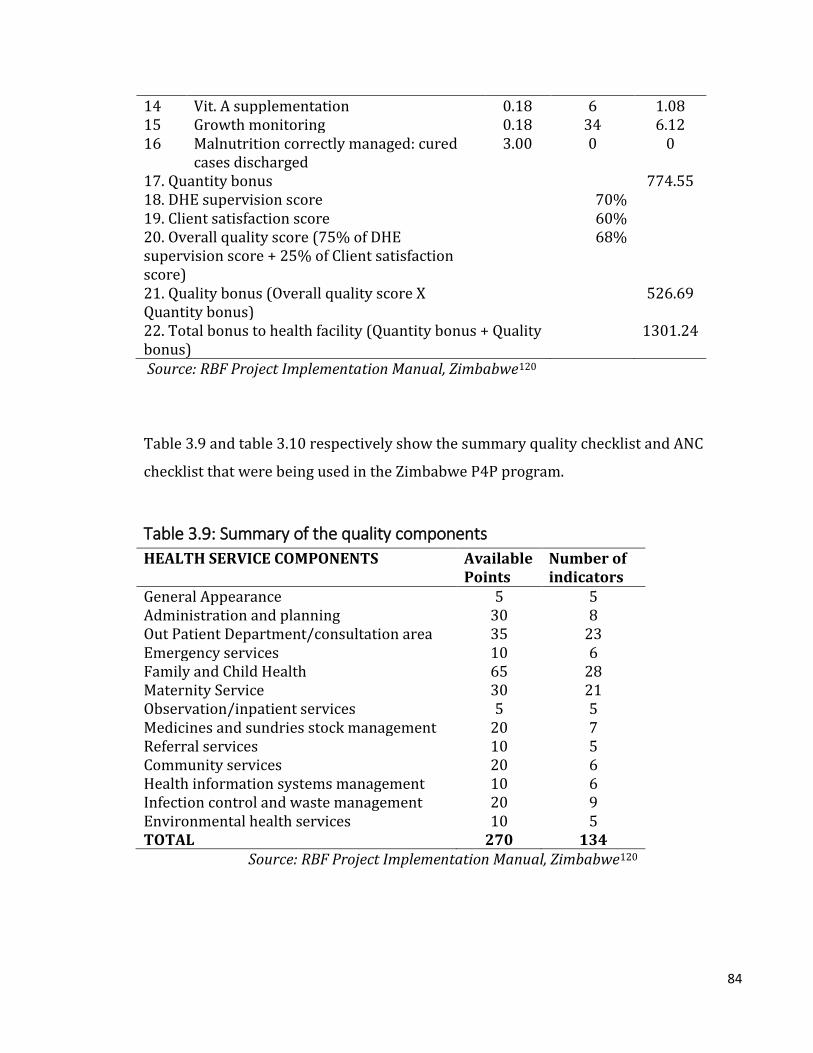
84
14 Vit. A supplementation 0.18 6 1.08 15 Growth monitoring 0.18 34 6.12 16 Malnutrition correctly managed: cured
cases discharged 3.00 0 0
17. Quantity bonus 774.55 18. DHE supervision score 70% 19. Client satisfaction score 60% 20. Overall quality score (75% of DHE supervision score + 25% of Client satisfaction score)
68%
21. Quality bonus (Overall quality score X Quantity bonus)
526.69
22. Total bonus to health facility (Quantity bonus + Quality bonus)
1301.24
Source: RBF Project Implementation Manual, Zimbabwe120
Table 3.9 and table 3.10 respectively show the summary quality checklist and ANC
checklist that were being used in the Zimbabwe P4P program.
Table 3.9: Summary of the quality components
HEALTH SERVICE COMPONENTS Available Points
Number of indicators
General Appearance 5 5 Administration and planning 30 8 Out Patient Department/consultation area 35 23 Emergency services 10 6 Family and Child Health 65 28 Maternity Service 30 21 Observation/inpatient services 5 5 Medicines and sundries stock management 20 7 Referral services 10 5 Community services 20 6 Health information systems management 10 6 Infection control and waste management 20 9 Environmental health services 10 5 TOTAL 270 134
Source: RBF Project Implementation Manual, Zimbabwe120
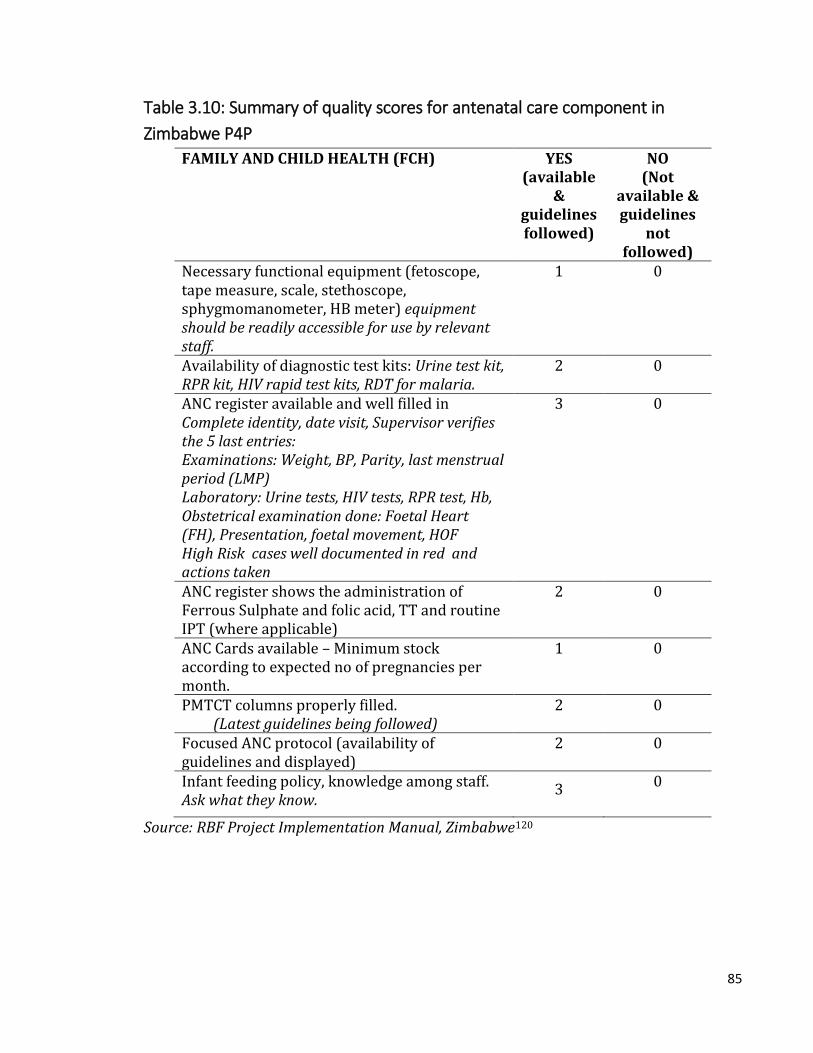
85
Table 3.10: Summary of quality scores for antenatal care component in
Zimbabwe P4P
FAMILY AND CHILD HEALTH (FCH) YES (available
& guidelines followed)
NO (Not
available & guidelines
not followed)
Necessary functional equipment (fetoscope, tape measure, scale, stethoscope, sphygmomanometer, HB meter) equipment should be readily accessible for use by relevant staff.
1 0
Availability of diagnostic test kits: Urine test kit, RPR kit, HIV rapid test kits, RDT for malaria.
2 0
ANC register available and well filled in Complete identity, date visit, Supervisor verifies the 5 last entries: Examinations: Weight, BP, Parity, last menstrual period (LMP) Laboratory: Urine tests, HIV tests, RPR test, Hb, Obstetrical examination done: Foetal Heart (FH), Presentation, foetal movement, HOF High Risk cases well documented in red and actions taken
3 0
ANC register shows the administration of Ferrous Sulphate and folic acid, TT and routine IPT (where applicable)
2 0
ANC Cards available – Minimum stock according to expected no of pregnancies per month.
1 0
PMTCT columns properly filled. (Latest guidelines being followed)
2 0
Focused ANC protocol (availability of guidelines and displayed)
2 0
Infant feeding policy, knowledge among staff. Ask what they know.
3 0
Source: RBF Project Implementation Manual, Zimbabwe120

86
Chapter 4: Methods
4.1 Overview
This chapter presents the methods of the study that forms the basis of the thesis. It
describes the conceptual framework, study design, sampling and sample size, data
collection, data entry and quality control of the research. Further, it describes the key
outcomes and data analysis. The role of the PhD candidate in the design, data collection,
analysis and dissemination of the study is also described in this chapter.
4.2 Conceptual framework
Pathways of the effects of P4P on quality of antenatal care
Pay for performance is expected to affect quality of antenatal care through incentivizing
rural health centers and providers in Zimbabwe. As explained earlier in Chapter 3,
incentives were split between health facility development and individual staff
bonuses.120 There are several pathways through which P4P would improve quality of
ANC services. As shown in figure 4.1, P4P is expected to bring in changes mainly at two
levels – (1) health facility and (2) health worker – to improve quality of ANC.
At the health center level, the main pathways to improve ANC quality are enhancements
in – financial and managerial autonomy, revenues, supervision and support from higher
authorities, team work, technical and managerial capacity development, and efficiency
in planning, management and monitoring.120 In other words, the trajectory of P4P is
expected to augment the above to enhance facility’s working status (e.g. physical
infrastructure, staff remuneration, skill development and overall management and
functioning). This improved ‘working status’ would ultimately lead to better ‘facility
productivity’ (i.e. higher utilization and quality of services). For instance, health centers
get autonomy to function and spend their additional revenue coming out of P4P. With
the additional autonomy and revenue, health centers get better opportunities to
improve their working status. This improvement in working status would naturally lead
to an increment in utilization and quality of services.

87
Figure 4.1: Conceptual framework on the pathways of effect of P4P on quality of
antenatal care
Note: Contextual factors work at four levels – health systems, health facility, health worker and
client (detailed description is given in table 4.1)
At the health worker or provider level, the main pathways to augment health worker
motivation are betterment in – remuneration through incentives, working status of
facilities, team work, technical and managerial capacity of staff and supportive
supervision.120,144 These improvements are likely to enhance worker motivation
(intrinsic and extrinsic) and job satisfaction towards better productivity. Increased
productivity can be reflected through increased staff availability, attendance to
optimum number of patients and compliance to clinical protocols (i.e. process

88
quality).144 In addition, certain incentives to health centers are also conditional on
providers achieving quality of ANC indicators.120 This would further motivate the
facility staff to achieve pre-defined targets on quality of care. Motivated health workers
would enhance the teamwork in an attempt to increase their incentives by being more
innovative and collaborative. They are more likely to follow the guidelines on provision
of services as the quality of service delivery is incentivized along with utilization of
services.
The postulated effect of P4P on health facility status and health worker performance is
expected to influence the pathways of quality of ANC care through the following three
quality dimensions.
1) Structural quality: Under the structural elements, P4P directly incentivizes
availability of relevant equipment, drugs and diagnostic kits, protocols and
registers.120 In addition, the health centers can reinvest their incomes from P4P to
improve their working conditions.120 In the context of ANC, for instance, the revenue
generated through incentives can be utilized to purchase and maintain relevant
medical equipment such as weighing scales, tape measures, stethoscope, fetoscope,
hemoglobinometer and sphygmomanometer. Incentives can also be utilized to
ensure the stock of diagnostic kits (urine test kits for protein and sugar, rapid
diagnostic kits for malaria and HIV), surgical gloves, and disinfectants. Availability of
these structural quality elements in good working condition will reward further the
health centers under P4P. Incentives related to structural quality are measured
through direct observation.
2) Process quality: P4P incentivizes compliance to the standard guidelines on ANC such
as physical examinations (weight, blood pressure, abdominal examination) and
laboratory diagnosis (urine test for protein and sugar; blood tests for anemia,
syphilis and HIV) performed, drugs (iron-folic acid, antimalarials) and vaccines
(tetanus toxoid) administered.120 Incentives related to process quality are measured
through the review of records. Enhanced supervision by peers and autonomy are
components of P4P. A motivated health worker along with the availability of

89
required resources (achieved through the structural element) and technical feedback
from peers would comply with the guidelines while providing ANC services as well as
maintaining an acceptable level of inter-personal relationship with the client.
3) Client satisfaction: Client satisfaction (an element of health outcomes as explained
in section 1.3.1) is one of the key factors to decide the amount of the incentive in this
project. Along with the volume and quality of services, the incentives take in to
account the satisfaction among recipients elicited through a household based
satisfaction survey conducted during every payment cycle.120 It is expected that the
health workers at the health centers through provision of basic amenities (seating
place, cleanliness, and privacy), equipment, drugs (structural quality), and
appropriate behavior would try to minimize the discomfort and waiting time to the
clients and hence, increase their satisfaction. Compliance of the health workers
(process quality) to performing recommended procedures relevant for ANC such as
physical examinations, screening for pre-eclampsia and sexually transmitted
diseases including HIV, and counselling on diet and birth preparedness would also
enhance the client satisfaction. Further, as the motivation of providers increases,
their inter-personal relations with the clients would also improve. Client satisfaction
is likely to be affected under the following dimensions – waiting time, operating
hours, availability of medicines and cleanliness of the facility, privacy during
examination, provider attitude and cost of care.
In summary, since P4P is aiming to reward every element of quality of ANC (structure,
process and client satisfaction), there is an incentive for the health centers to improve
on these elements to enhance their incomes. Apart from P4P influencing each of the
quality elements separately through health center and staff incentives, these elements
also affect each other as shown in figure 4.1.
There could be a possibility of P4P influencing health outcomes. As this research
focuses on P4P’s effect on ANC, health outcomes are not within the purview of this
study. Health outcome such as maternal mortality would need a massive sample size to
measure an effect of any intervention.44 Similarly, measuring the effect of improved

90
quality of ANC on maternal and neonatal health outcomes is also complex in a multi-
faceted intervention such as P4P.44 Thus, this research focuses on client satisfaction as
an element of outcome and does not attempt to measure P4P’s impact on health
outcomes.
In the above mentioned causal pathway of P4P affecting the ANC quality, there are
certain contextual factors which determine the direction and magnitude of effectiveness
(Table 4.1). These contextual factors are at four levels, i.e. health system, health facility,
providers and clients. Certain health system factors such as timeliness of disbursement
of incentives to facilities, regularity of supervision and monitoring, and presence of
other MCH programs can also have an impact on performance of facilities towards ANC
quality.
At the facility level, the contextual factors are ownership type, levels of care and
catchment population. For example, facilities owned by public sector may have a
different approach towards earning incentives due to the facility management structure
in comparison with a private mission health facility. Similarly, facilities with a
secondary level of care would have a different case-mix (patient profile) than a primary
level facility. Consequently, the focus may be more on curative care than preventive. A
larger catchment population size can give a higher work load and performance bonus,
which may trigger improved structural quality. However, with the higher patient load,
there will be possibilities for reduced process quality in those facilities with limited
staff size.
At the provider level, mainly their quantity and qualification (including level of cadre)
have an impact on ANC quality. For instance, if the provider-population ratio is high,
there is a higher chance of giving improved quality of services and vice versa. The
higher the qualification and cadre of providers, the better skills they may possess in
order to provide optimum quality of services.
Certain client level characteristics such as socio-economic, residential, demographic
and health profile can have an impact on ANC quality. For example, some providers can

91
be discriminatory, and thus they may provide sub-optimal quality services to clients
from socially disadvantaged groups. Receiving sub-optimal services would lead to
dissatisfaction among clients.
Unintended consequences such as cherry picking, cream skimming or a decline in
intrinsic motivation (driven by provider characteristics) may affect the quality
outcomes under P4P (shown in table 4.1).12,24–26 For instance, there could be selective
efforts to improve the services only on a limited set of indicators (e.g. more emphasis on
institutional delivery than antenatal care) due to their perceived importance or a higher
bonus. Similarly, within a service, there could be differential preference to an element
(e.g. structure vs. process). As a result, the study outcomes could show improvements
only related to those limited set of services. These unintended consequences mainly
affect at the provider level to drive quality of ANC.
In addition to contextual factors, program design features are potential to impact ANC
quality.101,145 Program design features pertain to the way the P4P program has been
designed including implementation arrangements, stakeholders involved, funds
disbursement mechanism, selection and pricing of indicators. For example, if incentives
are intended for ANC quality in the program design, then naturally there will be a
higher chance of improved ANC quality. Similarly, relative weight (or price) of
incentives for a particular quality area would also impact provider performance on such
service.
Table 4.1 Contextual factors and anticipated pathways of their effects on study
outcomes
Factor Level Anticipated Pathway Study Outcomes
Contextual
1. Timeliness of disbursement
Health systems characteristics
Delays in funds disbursement may reduce-ability to enhance structure quality, motivation of the health workers and hence
Structure, process, client satisfaction

92
the facility level performance.
2. Catchment population
Health facility A facility with a larger catchment population would be able to raise better quantitative performance bonuses compared to a facility with a smaller population- this will lead to better quality of services; a higher patient load may lead to poor quality of services, if staff availability is limited in a particular facility
Structure, process, client satisfaction
3. Ownership Health facility Facilities with different ownership, i.e. public vs. private may perform differently.
Structure, process, client satisfaction
4. Level of care Health facility Facilities with different levels of care, i.e. primary vs. secondary may perform differently.
Structure, process, client satisfaction
5. Other MCH programs
Health facility Facilities where other health specifically MCH programs are being implemented may show better outcomes due to aggregated effects of multiple programs.
Structure, process, client satisfaction
6. Socio-economic, residential, demographic and health profile of clients
Client Providers can be inequitable and thus provide sub-optimal quality services to poor and backward population; well-off population may demand superior quality services
Process, client satisfaction
7. Quantity and qualification (or cadre) of health workers
Health worker Facilities with inadequate number of skilled staff may achieve low performance bonus
Structure, process, client satisfaction
Unintended consequences
8. Cherry picking Health worker Selecting patients with conditions that are incentivized may lead to better outcomes for those at the expense of
Process, client satisfaction

93
other services.
9. Cream skimming
Health worker Predetermined selection of patients with less critical condition may end up showing better outcomes for the facility.
Process, client satisfaction
10. Reduced intrinsic motivation
Health worker Incentives may reduce intrinsic motivation of the health worker.
Process, client satisfaction
This research had attempted to validate the study findings on causal pathway
mechanisms (shown in figure 4.1) from relevant studies on P4P program in Zimbabwe
and similar settings. However, as the scope of this doctoral research was primarily
quantitative in nature by using secondary data, there were limitations in exploring the
role of all of the contextual determinants (as shown in table 4.1) and design features in
driving the effect of P4P on quality of ANC in Zimbabwe.
4.3 Study design
Data for this PhD research comes from the impact evaluation of the Zimbabwe RBF
project. The impact evaluation was a comprehensive health systems evaluation that
assessed the effects of the RBF project at the health facility and household levels. This
evaluation consisted of health facility and household surveys. Households were selected
from the catchment area of the health facilities that had a pregnancy related outcome in
the previous two years of the survey. Health facility survey consisted of five modules,
i.e. (1) health facility checklist, (2) health worker interviews, (3) exit interviews of
antenatal clients, (4) exit interview of child care clients, and (5) review of clinical
records. In addition, a cost effectiveness evaluation, analysis of the health management
information systems (HMIS) data and a process monitoring and evaluation were
undertaken. This PhD research utilizes data from two health facility survey modules –
health facility checklist and exit interviews of antenatal clients.
The study is a controlled before-after design consisting of eight provinces. The
provinces were purposively sampled with rural as the selection criterion. As Zimbabwe

94
has a total of eight rural provinces, all were included in the sample. In each province
(figure 4.2), two pairs of districts were selected – one pair of matched high capacity and
another pair of matched low capacity districts. Classification of high or low capacity was
based on the pair matching score that was obtained by matching of districts through a
principal component analysis considering the following key characteristics.
a. average catchment size (per facility)
b. proportion of staff posts filled
c. whether a district medical officer is present
d. utilization rates of ANC coverage for 2008, 2009, and 2010
e. utilization rates of in-facility delivery rates for 2008, 2009, and 2010
f. utilization rates of postnatal coverage for 2008, 2009, and 2010
g. utilization rates of vaccinations (BCG and penta3) for 2008, 2009, and 2010
Thus, the pair of districts that topped the list in the province after ranking by principal
component analysis scores were selected as high capacity district pairs and the bottom
two as low capacity district pairs.
One district in each matched pair was assigned by MoHCC to the intervention arm, i.e.
P4P and the other was then assigned to the control arm i.e. business-as-usual, resulting
in a total of 16 intervention and 16 control districts for the whole study. Intervention
facilities received P4P, while control facilities did not receive any additional incentives
or other intervention.
Figure 4.2: Selection of study districts

95
4.4 Sampling and sample size
A study with 32 districts (16 matched pairs), 64 health facilities (32 in each arm) and 3
clients per health facility should be able to detect a difference of 0.53, 0.39 and 0.37
standard deviations respectively in standardized structural quality, process quality, and
client satisfaction indices. These power calculations shown in table 4.2 were performed
using Optimal Design software for a three-level evaluation design with P4P variation at
the third (district) level, and with 5% significance, 80% power and explained variance
through the baseline covariate at 5%.146 Based on a similar study conducted in
Zimbabwe, the intra-cluster correlation coefficient (ICC) was estimated to be 0.16, 0.2
and 0.12 for structural quality, process quality and client satisfaction respectively.133
While estimating the ICCs, health facilities were considered as clusters. This is also true
for this study where the districts are the units of intervention, facilities are clusters
within intervention units and clients are the observations within clusters. Details about
the quality measures are presented in section 4.8 and in results chapters 5, 6 and 7.
Table 4.2 Study power and sample size Outcome D N n Power Significance ICC Baseline
covariate variance
Difference detectable (SD)
Structural quality
32 66 3 0.80 0.05 0.16 0.05 0.53
Process quality
32 66 3 0.80 0.05 0.20 0.05 0.39
Client satisfaction
32 66 3 0.80 0.05 0.12 0.05 0.37
Notes: D – Number of districts; N – Number of health facilities; n – Number of clients per health facility; ICC – Intra-cluster correlation coefficient; SD – Standard deviation
Health facilities were randomly selected based on a simple random sampling method.
The sampling frame was all rural health facilities from 32 study districts. Up to five ANC
clients were sampled in each health facility for exit interviews through systematic
random sampling. Systematic random sampling was based on ANC case load for the
same day (as that of the day of survey) from the previous week. Thus, every ‘n’th
woman was selected. Figure 4.3 shows the timeline of the survey and distribution of

96
sample across P4P arms. As part of the broader evaluation, a survey was conducted
before the intervention of P4P (baseline survey) to capture the pre-intervention status
of the facilities between December 2011 and February 2012. In this baseline survey,
there were a total of 189 facilities (105 P4P and 84 control) and 1011 antenatal clients
(565 P4P and 446 control). P4P intervention was implemented in 374 health facilities
in the P4P arm for about two and half years (April 2012 through September 2014),
whereas 331 health facilities in the control arm continued business-as-usual, i.e.
without any additional incentives or supervision mechanism. Another survey was
conducted towards the end of the intervention (follow up survey) to ascertain the
progress and changes as a result of the intervention. This follow up survey utilizing the
same instruments as in the baseline survey included 198 health facilities (116 P4P and
82 control) and 750 antenatal clients (414 P4P and 336 control). The follow up survey
targeting the wider study retained few of the baseline survey facilities, but added other
facilities as the interest of the next phase of the RBF project was towards implementing
continuous quality improvement within P4P. This follow up survey served as the
baseline for the next phase of P4P project.That is how there were only 77 health
facilities that were common among both survey rounds (i.e. visited twice) and they had
both survey instruments completely administered. Thus, due to completeness of
information, this subset of 77 health facilities was chosen to answer the research
question addressed by this thesis. The panel (subset) health facilities yielded 385
clients (208 P4P and 177 control) in the baseline survey and 374 (200 P4P and 174
control) in the follow up.

97
Figure 4.3 Study design and timelines
4.5 Data collection
Data were collected in two phases, i.e. baseline and follow up by a local survey firm. The
baseline study was conducted during December 2011 to February 2012. This involved
health facility assessment (health facility instrument) and exit interviews for ANC (exit
interview instrument). In the follow up survey, the health facility assessment and
interviews of clients were conducted using the same instruments during May to August
2014. The health facility instrument collected information about: assessment of human
resources (quantity and qualifications), infrastructure, availability of drugs,
commodities and equipment. Health facility records were verified to ascertain the
number of health workers that were designated to provide ANC services. A section of
the health facility instrument validated the number of health workers present on the

98
day of the survey against their number of sanctioned positions in the facility. The health
facility in-charge was the primary respondent for most sections; whereas other staff
responded to specific sections (e.g. pharmacist on drugs). Some details such as on
equipment needed direct observations by the enumerator. The health facility in-charge
was informed at least a week prior about the purpose and expected date of visit. The
health facility interviews were conducted during a time which would not interfere with
the routine activities of the health facility staff. In exit interviews, background socio-
economic information about the client (e.g. age, marital status, education, household
structure and assets, distance of residence from the health center); experiences with
the provider (e.g. questions asked about medical history, diagnostic and physical
examinations performed, medications and counseling provided during the
consultation); and satisfaction with the provider and services received, were collected.
The client interviews were conducted in the vicinity of the health facility, but away from
the providers or general public to maintain privacy of the respondent and
confidentiality of the information. The data collection instruments for each objective of
the study are summarized in table 4.3 and presented in Annex C.
Table 4.3 Data collection methods
Objective Data collection instrument
Respondent
To understand the effect of pay for performance on structural quality of antenatal care
Health facility instrument
Health facility in-charge or most informed staff for specific sections
To examine the effect of pay for performance on process quality of antenatal care
ANC exit interview instrument
ANC client
To assess the effect of pay for performance on client satisfaction of antenatal care
ANC exit interview instrument
ANC client
4.6 Data entry
The survey team was provided with hand held devices containing the data entry
program in CS Pro. The candidate programmed the data entry program with inbuilt

99
consistency and validity checks to reduce potential data entry errors. The data entry
was verified by the PhD candidate (AD) for consistency and data entry ranges.
4.7 Quality assurance
A local research firm was selected for fieldwork based on extensive experience of
conducting health surveys in Zimbabwe and the presence of qualified survey
professionals on the team. A one week class-room based training was provided by the
candidate (AD) for all enumerators followed by pre-testing of the instruments in the
field. All survey instruments were translated into local languages (Shona and Ndebele).
The translated instruments were back-translated to verify the accuracy of translations.
The candidate (AD) provided a sampling strategy with the list of health facilities to
enable it to plan for the selection of clients. The health facilities were oversampled to
account for any unforeseen events, such as inclement weather, poor road connectivity,
or refusals. Replacement of facilities was to be done only if there were strong reasons
and it would need approval from the field supervisors. Coding lists with unique
identifiers for each facility were generated by the candidate to allow for efficient data
entry and merging of datasets. Announced and unannounced supervisions were
undertaken by the candidate (AD) to ensure compliance to data collection guidelines
and quality of data.
4.8 Measurement of key outcomes – quality measures
The key study outcome is the quality of ANC which was categorized across three
dimensions, i.e. structure, process and client satisfaction following the conceptual
framework shown in Fig 4.1. These three dimensions were converted to quantitative
measures known as indices. The primary motivation of converting a dimension of
quality to a quantitative measure was to reduce various components (items) of care to
one single measure. A single measure (index) better enables comparative assessment
between intervention units. The impact on individual items are also presented along
with the composite measure (index).
Indices were calculated for each of the elements separately and compared between P4P
and control arms. Equal weighting was applied to compute the indices as the initial

100
method. Other alternative ways of creating indices such as principal component
analysis (PCA) was also explored for robustness. As individual indices had variations in
the number of sub-indices, after deriving the indices out of the data through the equal
weighting method, the indices were further standardized on a ‘0 to 1’ scale to enable
comparison between them. On the other hand, as PCA index is dependent on the sample
distribution, separate indices were created for baseline and follow up data. However,
the method of estimating PCA index was uniform across both rounds. The indices were
continuous variables.
Comparisons between both techniques of creating indices were tested with kernel
density and Bland-Altman plots. Bland-Altman plot is a graphical way of comparing two
quantitative measurements techniques.147 In this method, the differences between the
two techniques are plotted against the averages of the two techniques.148 Horizontal
lines are drawn at the mean difference, and at the limits of agreement. The limits of
agreement are defined as the mean difference and 1.96 times the standard deviation of
the differences in both directions, i.e. plus and minus. It is recommended that 95% of
the data points should lie within the limits of agreement (± 1.96 SD of the mean
difference).
Kernel density estimation is a non-parametric technique for estimating the probability
density (alternatively a kernel) function of a random variable.149 Essentially, it helps to
visualize the underlying distribution of a continuous variable by placing a kernel (or
probability density) over each observation point in the sample.150 Observations closer
to a point of estimate tend to contribute more to the estimate than the farther ones. Due
to variations in the number of observations, the density estimate will be high in certain
areas (with many observations), and low in others (with fewer observations).150
Structural quality index was derived out of the health facility data, whereas process
quality index and client satisfaction index came out of the client exit interview data.
Details about construction of the indices have been presented in the chapters 5, 6 and 7
for structural quality, process quality and client satisfaction respectively.

101
4.9 Data analysis
Data analysis was undertaken in the following sequence – (a) descriptive analysis, (b)
baseline balance, (c) correlation among items (d) impact estimate through multilevel
modeling, (e) subgroup analysis, and (f) robustness and sensitivity checks. Details
about all analyses are presented in the following section. Data were transferred from
CSPro to Stata. All data analyses including cleaning were performed in Stata software –
version 13.151
4.9.1 Descriptive analysis
Descriptive analysis was performed for the study sample with key considerations for
socio-demographic variables. For health facilities, this entailed facility type and
ownership, distances to the nearest higher level facilities, catchment population,
physical infrastructure, availability of drugs, vaccines, diagnostics and equipment. For
exit clients, variables included age, education, socio-economic status, duration and
order of pregnancy, distance and travel time from home and waiting time, and key
activities during the antenatal visit (physical examinations, laboratory tests, counseling
and prescription). Socio-economic background of the clients was estimated as wealth
quintiles derived from the housing quality and household asset data. Household quality
and asset variables in the survey questionnaire were aligned with the most recent
Zimbabwe Demographic and Household Survey questionnaire so that they reflect the
local context. Using the method proposed by Filmer and Pritchett, the housing quality
and assets data were converted to a wealth index through a principal component
analysis. 152 The entire sample based on their household wealth index was then
grouped under five equally-sized groups to create the wealth quintiles – first (most
poor), second (poorer), third (middle), fourth (less poor), and fifth (least poor).
Scores were developed for each element of quality through appropriate weighting of
the underlying items and sub-indices. Description of the construction of indices is
mentioned under the results chapters as follows – structural quality (Chapter 5),
process quality (Chapter 6) and client satisfaction (Chapter 7). Continuous variables
were summarized with means.

102
4.9.2 Baseline balance
Balance of key socio-demographic characteristics between the P4P and control arms at
baseline was tested with normalized mean tests (Wilcoxon Rank Sum test for
satisfaction scores).
4.9.3 Correlation analysis
Since the indices and sub-indices may be interdependent (correlated), the degree of
correlation was tested using correlation coefficients (Pearson’s for continuous data,
tetrachoric for binary data and polychoric for ordinal data). The analysis planned to
drop highly correlated items defined by a correlation coefficient of more than 0.8153
unless there was a strong scientific evidence from the literature to retain the items for
construction of indices.
4.9.4 Impact estimate analysis
The impact estimate analysis was carried out as intention-to-treat with difference-in-
difference estimates (through multilevel linear regression analyses as explained below)
for key outcome variables between the P4P and control arms for two rounds of data
adjusting for covariates.
Multilevel model: This analysis was done where the units of analysis were
hierarchical. For instance, clients are nested within health facilities, health facilities are
nested within districts and districts are nested within provinces. Due to this
hierarchical nature of data, conventional linear regression models that do not account
for these multiple levels would underestimate the standard errors of the effect sizes.
Underestimation of standard errors increases Type I error where obtained results are
considered significant when they may not actually be significant.154
Also, in hierarchical data, observation units tend to be clustered under the same higher
level unit, i.e. showing similar characteristics.155 For example, clients visiting the same
health facility may be more similar to each other than clients elsewhere. However,
conventional linear regression models operate under the assumptions that
observations are independent and variances are equal across the clusters.155 Due to
clustering of observations, these assumptions are violated in hierarchical data. As
public health research specifically health systems research delves more in to

103
investigating the impact of contextual factors on key health outcomes (e.g. state or
district influences), there is a need to explore analytic methods that allow explorations
of variance both within and between clusters.156–159 Thus, multilevel regression models
(also known as mixed effects models, hierarchical models or nested models) were
developed to account for the clustered data and correct the dependency of observations
in a cluster.160,161 By acknowledging the hierarchical nature of data, multilevel models
provide more appropriate estimates of observation and higher-level effect sizes and
their variances.162,163 Multilevel models can separately estimate the effect sizes of an
individual independent variable (direct effect) and its group-level mean (contextual
effect).164 These models split the analysis in to two parts – fixed part and random part.
The fixed part is a linear function of individual- and contextual-level factors, whereas
the random part presents variance components between its several multiple levels.
Thus, due to hierarchical nature of the data and obvious advantages of multilevel
models, multilevel modeling was used in the analysis of the effect of P4P on key
outcomes. The levels of analysis depends on the outcome variable. For instance,
structural quality is an outcome at the health facility level. Therefore, the effects sizes
on structural quality are observed on a three level model, i.e. health facility (level 1),
district (level 2) and province (level 3). While, process quality and client satisfaction are
outcomes at the client level. So, the impact is estimated on a four level model, i.e. client
(level 1), health facility (level 2), district (level 3) and province (level 4).
The difference-in-difference equation for the three level model can be explained as
follows
Yijktd =∝ + βPijkd + γTijkt + δ (P. T)ijkdt + θDPd + β1X1ijktd + ⋯ + βnXnijktd + σktd +
μjktd + εijktd …………………………………………………………………………………………………….. (1)
where
Y is the outcome for health facility i (level 1) under district j (level 2) and
province k (level 3) at time t for district pair d. The outcome is the standardized
structural quality score;
α is a constant;

104
P is a binary variable for the intervention where it is 1 for P4P sample and 0
otherwise;
T is a binary variable for the time period where it is 1 for post-intervention
sample and 0 otherwise;
β and γ are the coefficients for intervention (P4P) and period respectively;
the interaction term is P.T and δ is the intervention (P4P) effect;
DP represents district pair stratification dummy with its coefficient θ – these
stratification variables are included to improve precision;
X1ijk ……. Xnijk are the covariates with β1 …… βn as their coefficients;
σ, µ and ε are the error terms at province, district and facility levels respectively
While, the four-level model can be described as follows.
Yijkltd =∝ + βPijkld + γTijklt + δ (P. T)ijkltd + θDPd + β1X1ijkltd + ⋯ + βnXnijkltd + πltd +
σkltd + μjkltd + εijkltd …………………………………………………………………………………….. (2)
where
Y is the outcome for client i (level 1) under health facility j (level 2) in district k
(level 3) and province l (level 4) at time t for district pair d. The outcomes are
the standardized quality scores for process quality and client satisfaction;
α is a constant;
P is a binary variable for the intervention where it is 1 for P4P sample and 0
otherwise;
T is a binary variable for the time period where it is 1 for post-intervention
sample and 0 otherwise;
β and γ are the coefficients for intervention and period respectively;
the interaction term is P.T and δ is the intervention effect;
DP represents district pair stratification dummy with its coefficient θ – these
stratification variables are included to improve precision;
X1ijkltd ……. Xnijkltd are the covariates with β1 …… βn as their coefficients;
π, σ, µ and ε are the error terms at province, district, facility and client levels
respectively

105
Additionally, sensitivity results to individual covariates at the facility and client level
were tested with a fully interacted model as follows for the three level model.165
Yijktd =∝ + βPijkd + γTijkt + δ (P. T)ijktd + θDPd + φXijktd + π(Tt. Xijktd) +
ρ(Pd. Xijktd ) + τ{(P. T)dt. Xijktd } + σktd + μjktd +
εijktd………………………………………………………….. (3)
where
Y is the outcome for sample unit i at time t for district pair d;
α is a constant;
P is a binary variable for the intervention where it is 1 for P4P sample and 0
otherwise;
T is a binary variable for the time period where it is 1 for post-intervention
sample and 0 otherwise;
β and γ are the coefficients for intervention and period respectively;
the interaction term is P.T and δ is the intervention effect;
DP represents district pair stratification dummy with its coefficient θ;
X is the covariate at facility and client levels (table 4.4) with coefficient φ;
Here the covariate X was interacted with the period, intervention and interaction
variable with their respective coefficients π, ρ, and τ.
σ, µ and ε are the error terms at province, district and facility levels respectively
The fully interacted notation for the four level model is as follows.165
Yijkltd =∝ + βPijkld + γTijklt + δ (P. T)ijkltd + θDPd + φXijkltd + π(Tt. Xijkltd) +
ρ(Pd. Xijkltd ) + τ{(P. T)dt. Xijkltd } + τltd + σkltd + μjkltd + εijkltd……………………….. (4)
where
Y is the outcome for sample unit i at time t for district pair d;
α is a constant;
P is a binary variable for the intervention where it is 1 for P4P sample and 0
otherwise;

106
T is a binary variable for the time period where it is 1 for post-intervention
sample and 0 otherwise;
β and γ are the coefficients for intervention and period respectively;
the interaction term is P.T and δ is the intervention effect;
DP represents district pair stratification dummy with its coefficient θ;
X is the covariate at facility and client levels (table 4.4) with coefficient φ;
Here the covariate X was interacted with the period, intervention and interaction
variable with their respective coefficients π, ρ, and τ.
τ, σ, µ and ε are the error terms at province, district, facility and client levels
respectively
Table 4.4 Study covariates
Level Covariates Study outcomes (Quality domain)
Health facility level, ownership, catchment population, distance from the nearest higher level health facility
Structure, process, satisfaction
Health worker sex, and cadre Process, satisfaction ANC clients age, education, wealth quintile,
distance from home to health facility, parity, number of visit, gestational age
Process, satisfaction
4.9.5 Subgroup analysis
Analyses were performed among various subgroups to observe effect sizes within each
and ascertain if any particular subgroup had different estimates compared to that of the
full sample. The following subgroup analyses were conducted by level.
1. Facility level – ownership (public and private) and type (rural hospital and rural
health center)
2. Provider level - provider gender, provider cadre (nurse and nurse midwife)
3. Client level – age group (<20 and 20-34 years), education (primary and
secondary), wealth quintile, gravidity (primigravida and multigravida), trimester
(second and third)
4.9.6 Sensitivity and robustness checks
Sensitivity to alterations of model parameters was checked. These model parameters
were – alternate ways of constructing indices (equal weighting vs. principal component

107
analysis), varying levels of analysis i.e., replacing the highest level province with district
(three-level vs. two-level), empty model (without any covariate vs. full model, i.e. with
covariates), without district pair matching dummy, and fully interacted model. Robust
standard errors were also calculated at the province level to account for clustering.
Goodness of fit tests for the regression models were used to see how close the predicted
values are to the observed values. Akaike Information Criterion (AIC) and Bayesian
Information Criterion (BIC) were estimated to select the best fitting model with the
least information loss, i.e. lowest values of AIC and BIC.166 Finally, regression
diagnostics were conducted for the outcomes of interest to check for normality and
homoscedasticity of residuals.
4.10 Ethical considerations
The survey was approved by the Medical Research Council of Zimbabwe. The study
obtained written informed consent from all the respondents, after receiving
explanations about the objectives and intended purpose of the surveys. Individual
responses were coded before entry for anonymity and sufficient efforts were taken to
safeguard confidentiality. Additional ethical approval for analysis of secondary data was
obtained from the London School of Hygiene and Tropical Medicine (LSHTM Ethics Ref
# 11201).
4.11 Role of the candidate
This thesis utilizes data from impact evaluation of pay for performance (locally known
as Results Based Financing) project for maternal and child health in Zimbabwe. The
impact evaluation was undertaken by the World Bank in collaboration with the Ministry
of Health and Child Care in Zimbabwe. While working at the World Bank, the candidate
served as the Co-Principal Investigator. The candidate’s role in the project as well as in
the PhD specific work at various stages are described below.
Conception and Design: The candidate was part of conceptualization and design of
this impact evaluation. Along with other team members of the evaluation, he initiated
dialogue with relevant stakeholders such as the Ministry of Health and Child Care
(MoHCC) including various departments, local and international survey firms and

108
experts, local ethics approval entity, development partners working on health (Unicef,
WHO, DFID, USAID, EU), and academic and research organizations. He drafted the
concept note, protocol, survey instruments, and submitted the application for ethical
approval from the local ethics committee in Zimbabwe. The candidate obtained
approvals from the government and Medical Research Council of Zimbabwe (ethical
approval). After obtaining the approvals, he worked with senior officials from the
MoHCC to develop an evaluation design consisting of type of design, intervention
package, selection of provinces and districts, thematic areas, sampling, sample
selection, timelines for data collection, analysis and dissemination. He also registered
this evaluation in the International Standard Randomized Controlled Trial Number
(ISCTRN) registry (reg# ISRCTN16392613).
The candidate was the team leader for the selection of the survey firm, which followed
an international competitive selection process. This selection process entailed drafting
of terms of references, inviting request for proposals, reviewing technical and financial
proposals of the firms, and interacting with the team leaders of the short-listed firms.
Date collection: After selection of the firm, the candidate provided training to the data
collection team through a combination of workshops and field practices. He took the
supervisors (n=10) and enumerators (n=30) through a series of sessions on effective
data collection methods, understanding the concepts of health facility survey, and its
various components. He led the team on pretesting of the instruments and subsequent
adaptations. The candidate sampled the health facilities for both rounds of surveys
(baseline and follow up). Along with the survey firm and MoHCC, he developed a plan
for data collection with detailed timelines and contingency plan. He accompanied the
data collection team for the first two weeks of data collection in each round.
Quality control: During the data collection process, the candidate made random
supervision visits to the sites to ensure necessary protocols were being adhered to. He
developed the data entry template in CS Pro software considering data logic based on
the skip patterns in the instruments, out of range and missing values. He trained the
data entry personnel from the survey firm and further performed data cleaning to

109
verify the inconsistencies in the data. The candidate ensured the data collection and
entry follow the agreed timelines through regular supervision and feedback.
Data analysis: The candidate drafted the analysis plan and undertook extracting data
from the impact evaluation datasets, identified coherent sampling units, split, and
merged extracted datasets by survey and rounds. In terms of manipulating the
variables, he undertook the following steps – labeling, relabeling, naming, renaming,
reformatting, generating, and transformation (e.g. continuous to categorical, string to
numerical). The candidate generated outcome indices through various means of
weighting. He performed descriptive analysis, balance of sample at baseline, inferential
analysis through multi-level modeling, subgroup analysis, sensitivity and robustness
checks.
Dissemination: The candidate presented the systematic review out of this doctoral
research as an oral presentation in a session titled “Performance based Incentives to
improve quality of health care: experimental evidence from low- and middle-income
countries” at the conference of International Health Economics Association in Milan,
Italy (July 2015). The same systematic review has been published in the BMC Public
Health Journal (full paper is provided in Annex B). The candidate has drafted another
manuscript detailing the main results of this research. In all these dissemination
materials (powerpoint presentation and journal articles/manuscripts), he wrote the
first version and incorporated feedback from the coauthors and peer reviewers.

110
Chapter 5: Impact of P4P on Structural Quality – Findings from the health facility
survey
5.1 Overview
Building on to the conceptual framework presented in Chapter 3 and using data from
the Zimbabwe P4P impact evaluation, this chapter presents the effects of P4P on the
first of the three quality components under antenatal care, i.e. structural quality.
Structural quality pertains to availability of elements that are necessary to carry out
essential antenatal care functions. These elements are physical infrastructure, skilled
human resources, equipment, drugs, and diagnostics. The chapter begins with a
methods section specific to structural quality. It explains the construction of structural
quality index. Overall, the findings are divided in to two parts based on the way the
indices were constructed. The first part (section 5.4) presents findings from the health
facility survey using equal weighting of structural components. The second part
(section 5.5) however utilizes weights from the quality checklist (a balanced score card)
that was administered during the Zimbabwe P4P program to calculate quality bonuses.
As all structural components described in the quality checklist could not be extracted
from the facility survey data, the weights were only applied on a few structural
components. The results are presented in the following sequence – descriptive
statistics, sample balance at baseline, correlation among sub-indices, impact estimates,
subgroup analysis, sensitivity and robustness verifications and regression diagnostics.
Finally, impact estimates are mapped against their incentive prices to observe if
components with higher prices show higher gains.
5.2 Methods
A detailed description of the methods used for this evaluation is given in Chapter 4. A
summary of the methods is thus given in this section along with some specific
information on the objective that pertains to the effects of P4P on structural quality.
This study had a controlled before-after design consisting of eight provinces with four
districts in each province. Out of the 32 districts, half implemented the pay for
performance program (16 P4P districts with 374 health facilities) and the other half

111
continued without any P4P program, i.e. business-as-usual (16 control districts with
331 health facilities). To assess the impact of P4P program, two rounds of surveys were
conducted – one each before (baseline) and after (follow up) the program’s
implementation.
5.2.1 Data collection
The baseline survey was conducted during Dec, 2011 to Feb, 2012 and the follow up
survey during May-August of 2014. Two survey instruments were administered during
these surveys – health facility and client exit interviews. Both rounds of survey utilized
the same instruments and the same set of health facilities, thus, creating a panel of
health facilities for this research.
During the health facility interviews, information was collected on – (a) facility
infrastructure; (b) human resources; (c) facility’s available and functional equipment;
(d) laboratory services available at the facility; (e) stock of key drugs, diagnostics and
vaccines in the last 30 days for general health conditions, malaria, family planning,
tuberculosis, obstetric, and vaccination services; and (f) catchment area population
characteristics. The respondent for this interview was the facility in-charge. In some
health facilities, the pharmacists were interviewed for the medicines section. The data
collection instruments are presented in Annex C.
5.2.2 Sampling
During the baseline survey, health facilities were randomly selected based on a simple
random sampling method. The sampling frame was all rural health facilities from 32
study districts. The same baseline survey facilities were revisited during the follow up
survey two years after the implementation of the P4P intervention. Thus, a panel of
same health facilities was created with data for two survey rounds. The panel yielded
77 health facilities with 41 from P4P and 36 from control districts.
5.2.3 Data analysis
Data analysis was undertaken in the following sequence – (a) descriptive analysis, (b)
baseline balance, (c) correlation among items (d) impact estimate through multilevel
modeling, (e) subgroup analysis, and (f) robustness and sensitivity checks. In the

112
impact estimate analysis, the effect sizes were adjusted for health facility, provider and
client determinants. Details about all analyses are presented in the methods chapter
(Chapter 4).
5.2.4 Outcome measures
The primary outcome measure – structural quality index – is explained in the methods
chapter (Chapter 4). Structural quality index was created broadly in two ways – (a)
applying equal weighting of sub-indices, (b) applying differential weighting of sub-
indices, where the weights of items were derived from the quality checklist.
5.2.4.1 Constructing sub-indices Part 1 (Equal weighting)
Structural quality index was generated from five quality sub-indices and each sub-index
in turn utilized a set of items for construction (shown in Figure 5.1). Equal weighting of
components was applied while constructing sub-indices from the items, and the
composite structural index from the sub-indices. Since the sub-indices had variations in
the number of their items, all sub-indices were converted to a ‘zero to one’ scale by
arithmetic means of the underlying items. All item variables were binary. For example,
if a facility reported to have a functional equipment, this variable would score ‘1’ for
that particular facility and ‘0’ otherwise. Selection of items on structural quality is based
on the existing literature and the P4P program’s adherence to the country’s clinical
protocols on ANC.51–54,56–59 This has been explained in detail in the review of literature
(Chapter 2).

113
Figure 5.1: Constructing structural quality index and sub-indices
There were five sub-indices – (a) physical infrastructure, (b) staff, (c) diagnostic test,
(d) drugs and vaccines, and (e) equipment. Scores were computed for this element by
considering the following items as per their sub-indices on structural quality of
antenatal care.
A. Infrastructure sub-index consisted of seven items – waiting area, examination
room with couch, toilet with provision of water, wash basin with soap and water,
sharp and biomedical waste disposal. Due to equal weighting of one point per
item, the maximum possible score for this sub-index was “7”.
B. Staff sub-index had only one item – at least one staff trained to undertake ANC,
i.e. primary care nurse and higher qualifications.
C. Diagnostics sub-index comprised of five items – urine dipsticks for protein and
glucose, syphilis (RPR) test, blood grouping, HIV test kits, and hemoglobin test.
With equal weighting of one point per item, the maximum possible score for this
sub-index was “5”.
D. Drugs sub-index was constructed from four items and with due consideration of
the fact that the drugs were available during the day of survey with no stock outs
within previous three weeks. The items were iron and folic acid, antimalarials,

114
tetanus toxoid, one broad spectrum antibiotic. Equal weighting of one point per
item led to a maximum possible score of “4” for this sub-index.
E. Equipment sub-index took in to account availability of at least one functional
equipment/supplies each needed for ANC with 10 items. The items were tape
measure, adult weighing scale, fetoscope, stethoscope, sphygmomanometer,
vaginal speculum, surgical gloves, thermometer, refrigerator,
hemoglobinometer. Equal weighting thus gave a maximum possible score of “10”
for this sub-index.
5.2.4.2 Constructing sub-indices Part 2 (Differential weighting)
RBF facilities were supervised every quarter by the district health executive (DHE),
which monitored quality of services using a quality checklist. This checklist had 13
dimensions, each consisting of several items, weighted differently depending on their
perceived importance to service delivery. This quality checklist with differential
weighting was designed by experts through a Delphi method. The quality checklist used
by the district health executive and the facility survey instrument used during data
collection for this impact evaluation contained a few common items with respect to
antenatal care. These common items were extracted from the facility survey and the
weights from the quality checklist applied, to construct a quality index similar to that
used by the DHEs. Table 5.1 shows the summary components of the quality checklist
with its thirteen quality dimensions.
Table 5.1: Summary Components of Quality checklist
HEALTH SERVICE COMPONENTS Available
Points Number of composite indicators
1. General Appearance 5 5 2. Administration and planning 30 8 3. Out Patient Department/consultation area 35 23 4. Emergency services 10 6 5. Family and Child Health 65 28 6. Maternity Service 30 21 7. Observation/inpatient services 5 5 8. Medicines and sundries stock management 20 7 9. Referral services 10 5

115
10. Community services 20 6 11. Health information systems management 10 6 12. Infection control and waste management 20 9 13. Environmental health services 10 5
TOTAL 270 134 Source: RBF Project Implementation Manual, Zimbabwe120
However, only four out of these thirteen health service components could be extracted
from the health facility survey data (table 5.2). These four health service components
(sub-indices) were (1) medicines and sundries stock management, (2) outpatient
department/consultation area, (3) family and child health, and (4) infection control and
waste management. Maximum possible points from these four health service
components were 67 in the checklist. However, only 33 points could be available based
on the health service items that were present in the survey data. The scores by
components (sub-indices) are given below.
A. Medicines and sundries stock management sub-index: This component had two
items – Staff maintains stock cards and correct storage of drugs, each with two
points if the facilities met the criteria. Thus, the maximum possible score was
four points.
B. Outpatient department/consultation area sub-index: Four items with equal
weighting of one point made up this sub-index with a maximum possible score of
four. The items were availability of functional stethoscope and
sphygmomanometer, thermometer, otoscope, adult weighing scale.
C. Family and child health sub-index: This sub-index utilized seven items of
differential weighting. The items were assured cold chain and availability of key
vaccines (5 points each); and availability of diagnostic test kits, focused ANC
protocol, and sharp boxes (2 points each). Availability of functional equipment
(fetoscope, tape measure, scale, stethoscope, sphygmomanometer, HB meter)
and baby scale – one point each. Thus, the maximum possible score for this sub-
index was 18 points.
D. Infection control and waste management sub-index: Three items were combined
to create this sub-index. They were availability and use of infection control
policy (3 points), sterilization of instruments as per standards (2 points) and

116
availability and appropriate use of disinfectants (2 points). Maximum possible
score for this sub-index was seven.
Table 5.2: Common structural quality items between health facility survey
instrument and P4P quality checklist
Health service
components Health service items Score
Medicines and sundries stock management
Staff maintains stock cards 2
Drugs are stored correctly 2
Out Patient Department/consultation area
Stethoscope & Sphygmomanometer available and functional
1
Thermometer available and functional 1
Otoscope available and functional 1
Adult Weighing Scale available and functional 1
Family and child health Necessary functional equipment (fetoscope, tape measure, scale, stethoscope, sphygmomanometer, HB meter)
1
Availability of diagnostic test kits (Urine, RPR, malaria, HIV)
2
Focused ANC protocol 2
Cold Chain Assured 5
Availability of vaccines (BCG, measles, polio, DPT, Hep B, HiB, tetanus, vitamin A, pneumococcal and rotavirus vaccines)
5
Availability of sharps boxes 2
Salter scale (baby scale) available and in good state 1
Infection control and waste management
Infection control policy, available and being used 3
Staff sterilizes instruments according to standards 2
Disinfectants available and being used according to guidelines
2
Total 33
5.2.4.3 Constructing structural quality index
The sub-indices explained in the previous section were first standardized on a scale of 0
to 1 so that all sub-indices could be equally weighted. This standardization of the sub-
indices was performed by applying the “rowmean” command of Stata. The standardized
sub-indices were combined with equal weighting to generate the composite process
quality index (continuous variable) separately for parts 1 and 2. This composite index

117
was further standardized to enable comparison between other quality outcomes (i.e.
objectives 2 and 3). Standardized structural quality index (z-score) was constructed
based on the following equation.
𝑍 = 𝑋 − 𝜇
𝜎
Where Z – standard score, X – each value in the data, µ – sample mean, and σ – standard
deviation
5.3 Results – Part 1 (Indices by Equal Weighting)
This section describes the findings from the health facility survey with indices
construction by equal weighting.
5.3.1 Descriptive statistics
5.3.1.1 General health facility characteristics
As shown in table 5.3, there were two types of health facilities in the sample, i.e. rural
health center and rural hospital. Rural health centers were the predominant facility
type with 81% representation in the full baseline sample (P4P = 83% and control =
78%), whereas rural hospitals constituted only 19% (P4P = 17% and control = 22%).
Majority of the facilities were government owned (P4P = 56% and control = 58%)
followed by local government (P4P = 34% and control = 33%) and faith based
organization (P4P = 10% and control = 8%). The predominant source of electricity was
the main grid (P4P = 61% and control = 58%), whereas 26% of the facilities (P4P =
20% and control = 33%) did not have any source of electricity. A third of facilities
reported electricity outages within the week preceding the survey (P4P = 32% and
control = 36%).
More than half of the facilities had a piped water supply (P4P = 63% and control = 44%)
followed by water from boreholes (P4P = 29% and control = 44%). A large proportion
of the facilities experienced water outage during a week preceding the survey (P4P =
80% and control = 92%). Around 90% of the facilities reported some kind of functional
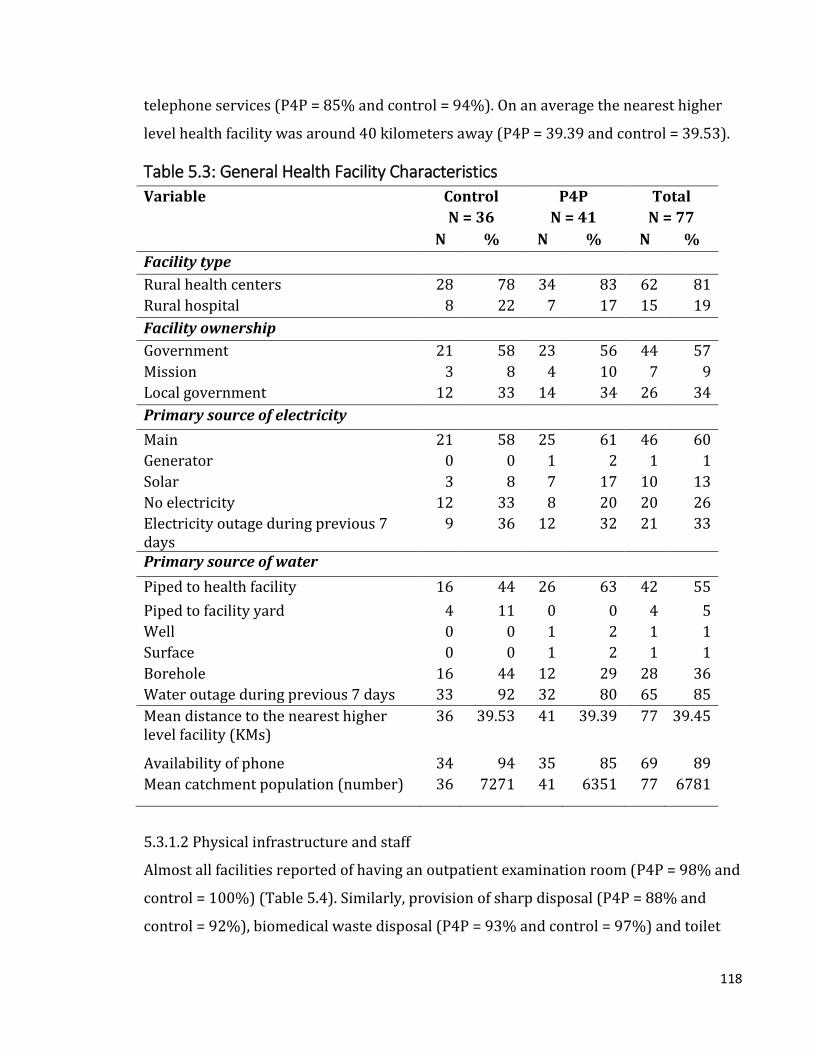
118
telephone services (P4P = 85% and control = 94%). On an average the nearest higher
level health facility was around 40 kilometers away (P4P = 39.39 and control = 39.53).
Table 5.3: General Health Facility Characteristics
Variable Control P4P Total
N = 36 N = 41 N = 77
N % N % N %
Facility type
Rural health centers 28 78 34 83 62 81
Rural hospital 8 22 7 17 15 19
Facility ownership
Government 21 58 23 56 44 57
Mission 3 8 4 10 7 9
Local government 12 33 14 34 26 34
Primary source of electricity
Main 21 58 25 61 46 60
Generator 0 0 1 2 1 1
Solar 3 8 7 17 10 13
No electricity 12 33 8 20 20 26
Electricity outage during previous 7 days
9 36 12 32 21 33
Primary source of water
Piped to health facility 16 44 26 63 42 55
Piped to facility yard 4 11 0 0 4 5
Well 0 0 1 2 1 1
Surface 0 0 1 2 1 1
Borehole 16 44 12 29 28 36
Water outage during previous 7 days 33 92 32 80 65 85
Mean distance to the nearest higher level facility (KMs)
36 39.53 41 39.39 77 39.45
Availability of phone 34 94 35 85 69 89
Mean catchment population (number) 36 7271 41 6351 77 6781
5.3.1.2 Physical infrastructure and staff
Almost all facilities reported of having an outpatient examination room (P4P = 98% and
control = 100%) (Table 5.4). Similarly, provision of sharp disposal (P4P = 88% and
control = 92%), biomedical waste disposal (P4P = 93% and control = 97%) and toilet

119
with running water (P4P = 98% and control = 97%) were also high. A third of the
facilities had a wash basin with water (P4P = 71% and control = 81%) and examination
couch (P4P = 85% and control = 64%) in the outpatient room. Only half of the facilities
reported of having a waiting area for the patients (P4P = 54% and control = 50%).
A high proportion of facilities had at least one skilled staff, defined as a health worker
who has been trained to conduct antenatal checkups (P4P = 95% and control = 100%).
Table 5.4: Physical infrastructure of the health facilities
Variable Control N = 36
P4P N = 41
Total N = 77
N % N % N % Availability of examination room 36 100 40 98 76 98 Provision of sharp disposal 33 92 36 88 69 89 Availability of wash basin with water 29 81 29 71 58 75 Provision of biomedical waste disposal 35 97 38 93 73 95 Availability of waiting area 18 50 22 54 40 52 Availability of examination couch 23 64 35 85 58 75 Provision of toilet with running water 35 97 40 98 75 97 Availability of skilled staff 36 100 39 95 75 97
5.3.1.3 Availability of drugs, vaccines and diagnostic tests
Almost all facilities reported availability of iron and folic acid (P4P = 93% and control =
97%), antimalarial (P4P = 90% and control = 97%), at least one broad spectrum
antibiotic (P4P = 93% and control = 97%) and tetanus toxoid (P4P = 98% and control =
89%) (Table 5.5).
Relatively lower proportion of facilities reported provision of diagnostic tests at
baseline. Among these, testing for HIV (P4P = 71% and control = 67%) and syphilis
(P4P = 68% and control = 72%) were higher, while only a few provided hemoglobin
tests (P4P = 10% and control = 14%) and urine dipstick tests (P4P = 2% and control =
3%). None had the provision of blood grouping and cross matching tests.
Table 5.5: Availability of drugs, vaccine and diagnostics at the health facilities
Variable Control N = 36
P4P N = 41
Total N = 77
N % N % N % Iron and folic acid 35 97 38 93 73 95

120
Antimalarial 35 97 37 90 72 94 Broad spectrum antibiotic 35 97 38 93 73 95 Tetanus toxoid 32 89 40 98 72 94 Hemoglobin testing 5 14 4 10 9 12 Blood grouping and cross matching 0 0 0 0 0 0 HIV testing 24 67 29 71 53 69 Syphilis testing 26 72 28 68 54 70 Urine testing 1 3 1 2 2 3
5.3.1.4 Availability of equipment
Availability of equipment is shown in table 5.6. A vast majority of health facilities (>
90%) reported having functional medical equipment – tape measure (P4P = 95% and
control = 100%), adult weighing scale (P4P = 88% and control = 92%),
sphygmomanometer (P4P = 85% and control = 94%), thermometer (P4P = 98% and
control = 100%), stethoscope (P4P = 98% and control = 100%), fetoscope (P4P = 93%
and control = 94%), refrigerator (P4P = 85% and control = 100%), surgical gloves (P4P
= 90% and control = 92%).
However, only about two-thirds of the facilities had a functional vaginal speculum (P4P
= 68% and control = 61%), whereas none of the facilities reported having a
hemoglobinometer.
Table 5.6: Equipment at the health facilities
Variable Control N = 36
P4P N = 41
Total N = 77
N % N % N % Tape measure 36 100 39 95 75 97 Adult weighing scale 33 92 36 88 69 90 Sphygmomanometer 34 94 35 85 69 90 Thermometer 36 100 40 98 76 99 Stethoscope 36 100 40 98 76 99 Fetoscope 34 94 38 93 72 94 Refrigerator 36 100 35 85 71 92 Vaginal speculum 22 61 28 68 50 65 Surgical gloves 33 92 37 90 70 91 Hemoglobinometer 36 0 41 0 77 0

121
5.3.2 Baseline sample balance
5.3.2.1 General health facility characteristics
Table 5.7 shows the P4P arm had a slightly higher proportion of rural health centers
(83% in P4P vs. 78% in control), whereas the control arm had a larger proportion of
rural hospitals (22% control vs. 17% P4P). In terms of facility ownership, both arms
had fairly similar representation (government – 56% P4P vs. control 58%; local
government - P4P 34% vs. control 33%; mission – P4P 10% vs. control 8%).
The sources of electricity and outages were similar in both arms (main grid – P4P 61%
vs. control 58%; outage – P4P 32% vs. control 36%). Almost two-thirds of P4P facilities
(63%) reported piped water to facility, compared to 44% for control facilities. None of
the P4P facilities had piped water to the facility yard, but 11% of the control facilities
did so (p value = 0.028).
There were no significant differences in the distance to the nearest higher level facility,
having a phone in the facility and catchment population between the two arms.
Table 5.7: Sample balance – General Health Facility Characteristics
Variable Control %
P4P %
Normalized difference
p value
Facility type Rural health centers 78 83 9 0.575
Rural hospital 22 17 -9 0.575
Facility ownership Government 58 56 -3 0.846
Mission 8 10 3 0.831
Local government 33 34 1 0.941
Primary source of electricity
Main 58 61 4 0.816
Generator 0 2 15 0.352
Solar 8 17 18 0.261
No electricity 33 20 -22 0.172
Electricity outage during previous 7 days
36 32 -5 0.775
Primary source of water
Piped to health facility 44 63 26 0.098*
Piped to facility yard 11 0 -33 0.028**

122
Well 0 2 15 0.352
Surface 0 2 15 0.352
Borehole 44 29 -22 0.172
Water outage during previous 7 days
92 80 -23 0.153
Distance to the nearest higher level facility (KMs)
39.53 39.39 0.00 0.981
Availability of phone 94 85 -21 0.198
Catchment population (number) 7271 6351 -0.11 0.468 *** p<0.01, ** p<0.05, * p<0.1; sample size 77 facilities (P4P 41 and control 36)
5.3.2.2 Physical infrastructure
In terms of physical infrastructure (table 5.8), both arms were similar except for having
an examination couch (P4P 85% vs. control 64%; p value = 0.029).
Table 5.8: Sample balance – Physical infrastructure of the health facilities
Variable Control %
P4P %
Normalized difference
p value
Availability of examination room 100 98 -15 0.352 Provision of sharp disposal 92 88 -9 0.585 Availability of wash basin with water 81 71 -16 0.325 Provision of biomedical waste disposal 97 93 -14 0.377 Availability of waiting area 50 54 5 0.752 Availability of examination couch 64 85 33 0.029** Provision of toilet with running water 97 98 1 0.927 Availability of skilled staff 100 95 -22 0.184 *** p<0.01, ** p<0.05, * p<0.1; sample size 77 facilities (P4P 41 and control 36)
5.3.2.3 Availability of drugs, vaccines and diagnostic tests
A large proportion of facilities in both arms reported to have similar levels of stocks on
drugs, and vaccines (Table 5.9). Even though relatively lower proportion of facilities
had the provision of diagnostic tests, the situation was similar across both arms.
Table 5.9: Sample balance – Availability of drugs, vaccine and diagnostics at the
health facilities
Variable Control %
P4P %
Normalized difference
p value
Iron 97 93 -14 0.377 Tetanus toxoid 97 90 -20 0.220 Antimalarial 89 98 24 0.127 Broad spectrum antibiotic 97 93 -14 0.377

123
Hemoglobin testing 14 10 -9 0.579 Blood grouping and cross matching
0 0 - -
HIV test kit 67 71 6 0.705 Syphilis test kit 72 68 -6 0.711 Urine test kit 3 2 -1 0.927 *** p<0.01, ** p<0.05, * p<0.1; sample size 77 facilities (P4P 41 and control 36)
5.3.2.4 Availability of equipment
Table 5.10 shows except for refrigerator, reported equipment availability was similar.
All control facilities had a refrigerator, whereas it was reported only among 85% of the
P4P facilities (p value = 0.017).
Table 5.10: Sample balance – Equipment at the health facilities
Variable Control %
P4P %
Normalized difference
p value
Tape measure 100 95 -22 0.184 Adult weighing scale 92 88 -9 0.585 Sphygmomanometer 94 85 -21 0.198 Thermometer 100 98 -15 0.352 Stethoscope 100 98 -15 0.352 Fetoscope 94 93 -5 0.758 Refrigerator 100 85 -38 0.017** Vaginal speculum 61 68 10 0.516 Surgical gloves 92 90 -3 0.831 *** p<0.01, ** p<0.05, * p<0.1; sample size 77 facilities (P4P 41 and control 36)

124
5.3.2.5 Comparison of quality indices by index construction
Apart from applying equal weighting, the composite structural quality index was also
created using principal component analysis. As explained in the methods chapter
(Chapter 4), comparisons between both techniques of creating indices were tested with
kernel density and Bland-Altman plots. The kernel density distribution of both indices
can be seen from figure 5.2. Indices constructed by PCA and equal weighting show
similar distribution within each survey round, i.e. baseline and follow up.
Figure 5.2: Distribution of structural quality estimates by index construction

125
The Bland-Altman plots comparing the differences in both ways of index construction
by survey rounds (figure 5.3), show that majority of the data points fall within the
recommended limits of agreement (within ± 1.96 SD of the mean difference). This
means the indices are in high agreement and they can be used interchangeably.
Figure 5.3: Agreement of structural quality indices by index construction
5.3.3 Correlation analysis
Correlation analyses were performed for each process quality sub-index as well as the
composite index. As it can be seen from table 5.11, none of the correlation coefficients
was above the threshold of 0.8 except for the correlation between syphilis and HIV
tests. As explained earlier in Chapter 2, literature shows both syphilis and HIV tests are
useful for identifying key risk factors during pregnancy. Thus, all sub-index items as
well as the sub-indices themselves were retained for the index construction.

126
Table 5.11: Correlation matrix – Structural quality index and sub-indices Physical infrastructure sub-index items
exam. room
sharp disposal
washbasin with water
waste disposal
waiting area
exam. couch
toilet with water
examination room 1.00
sharp disposal -0.02 1.00
washbasin with water -0.05 -0.12 1.00
waste disposal -0.02 0.07 -0.05 1.00
waiting area 0.10 -0.15 0.02 -0.04 1.00
Examination couch -0.05 0.11 0.06 0.04 0.12 1.00 toilet with water -0.02 0.04 -0.14 -0.05 0.10 0.20 1.00
Diagnostic test sub-index items Hb Blood
grouping and cross matching
HIV test Syphilis Urine
Hemoglobin (Hb) 1.00
Blood grouping and cross matching 0.24 1.00
HIV test 0.53 0.30 1.00
Syphilis 0.51 0.31 0.96 1.00 Urine 0.46 0.23 0.75 0.75 1.00
Drugs and vaccines sub-index items Iron Tetanus
toxoid Antimalarial
BSA
Iron 1.00
Tetanus toxoid 0.35 1.00
Antimalarial 0.12 0.06 1.00 Broad spectrum antibiotic (BSA) 0.54 0.51 0.13 1.00
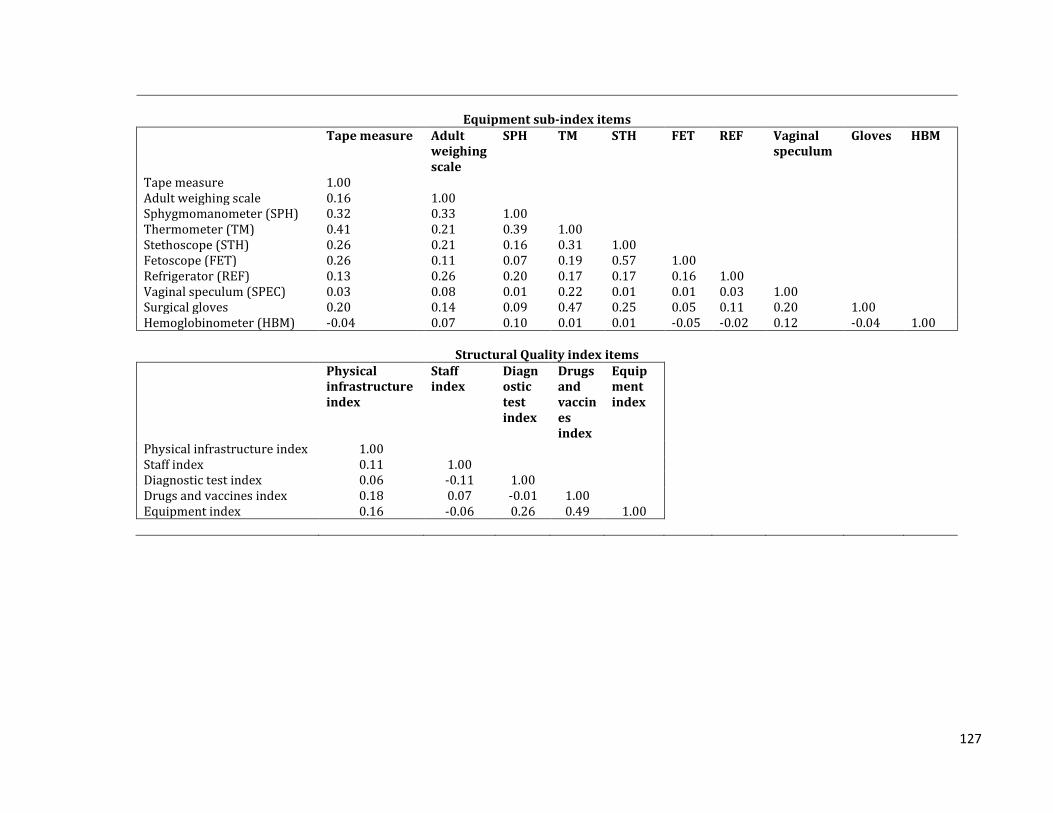
127
Equipment sub-index items
Tape measure Adult weighing scale
SPH TM STH FET REF Vaginal speculum
Gloves HBM
Tape measure 1.00
Adult weighing scale 0.16 1.00
Sphygmomanometer (SPH) 0.32 0.33 1.00
Thermometer (TM) 0.41 0.21 0.39 1.00
Stethoscope (STH) 0.26 0.21 0.16 0.31 1.00
Fetoscope (FET) 0.26 0.11 0.07 0.19 0.57 1.00
Refrigerator (REF) 0.13 0.26 0.20 0.17 0.17 0.16 1.00
Vaginal speculum (SPEC) 0.03 0.08 0.01 0.22 0.01 0.01 0.03 1.00
Surgical gloves 0.20 0.14 0.09 0.47 0.25 0.05 0.11 0.20 1.00 Hemoglobinometer (HBM) -0.04 0.07 0.10 0.01 0.01 -0.05 -0.02 0.12 -0.04 1.00
Structural Quality index items Physical
infrastructure index
Staff index
Diagnostic test index
Drugs and vaccines index
Equipment index
Physical infrastructure index 1.00 Staff index 0.11 1.00 Diagnostic test index 0.06 -0.11 1.00 Drugs and vaccines index 0.18 0.07 -0.01 1.00 Equipment index 0.16 -0.06 0.26 0.49 1.00

128
5.3.4 Structural Quality
A comparison of unadjusted standardized structural quality indices pre- and post-
intervention between the control arm and P4P arm is shown in figure 5.4. The
infrastructure index rose from 0.836 to 0.857 points in the P4P arm, while it went down
from 0.829 to 0.825 points in the control arm with a difference-in-difference of 0.024
points. The relative differences (difference-in-difference) for other indices were also
better in the P4P arm as follows – staff index 0.052 points, diagnostic test index 0.12
points, drugs index 0.035 points, equipment index 0.036 points and finally the
composite structural quality index was 0.535 standard deviation points.
Figure 5.4: Unadjusted changes in structural quality indices
0.857
0.825
0.836
0.829
0 .2 .4 .6 .8Infrastructure index
Post
Pre
P4P
Control
P4P
Control
0.976
0.972
0.951
1.000
0 .2 .4 .6 .8 1Staff index
Post
Pre
P4P
Control
P4P
Control
0.444
0.333
0.302
0.311
0 .1 .2 .3 .4 .5Diagnostic index
Post
Pre
P4P
Control
P4P
Control
0.884
0.868
0.933
0.951
0 .2 .4 .6 .8 1Drugs index
Post
Pre
P4P
Control
P4P
Control
0.844
0.842
0.800
0.833
0 .2 .4 .6 .8Equipment index
Post
Pre
P4P
Control
P4P
Control
0.127
-0.145
-0.115
0.131
-.2 -.1 0 .1 .2Structural quality index
Post
Pre
P4P
Control
P4P
Control

129
5.3.5 Impact estimates
Impact of the P4P program on structural quality was estimated as intention-to-treat
with difference-in-difference estimates (using multilevel modelling regression)
adjusting for facility characteristics. Here the multilevel model considered three levels
of analysis, i.e. health facility, district and province. The individual quality items were
binary, thus multilevel mixed-effects logistic regression was carried out. Whereas,
multilevel mixed-effects linear regression was undertaken for quality indices as they
were continuous variables. The models ran the regressions while adjusting for
contextual factors at the facility level, such as ownership, type of facility, catchment
population and distance to the nearest higher level facility.
The impact estimates are difference-in-difference values, i.e. the relative difference
between changes in P4P arm and control arm across two rounds of survey. For
instance, an impact estimate of 0.231 for an index means the relative gain in the P4P
arm was 0.231 units higher than that of the control arm between the baseline and
follow up time periods. The impact of P4P was estimated using three different units of
measurement. For the individual items, the unit of measurement was percentage
points; while it was points for sub-indices; and it was standard deviations for the
composite index as it was standardized.
5.3.5.1 Estimates for individual quality items
5.3.5.1.1 Physical infrastructure
Most of the quality items related to infrastructure showed a positive relative increment
in the P4P facilities (table 5.12). Having a wash basin with running water posted the
maximum relative gain (22.4% points; SE 0.13; p value = 0.086), followed by provision
of waste disposal (10% points; SE 0.059; p value = 0.092), waiting area (3% points; SE
0.143; p value = 0.834), toilet with water (2% points; SE 0.069; p value = 0.816), and
examination room by (0.4% points; SE 0.035; p value = 0.911). On the contrary, there
were higher gains for control facilities on provision of sharp disposal (1% point; SE
0.079; p value = 0.89) and examination couch (1.4% point; SE 0.12; p value = 0.909).
None of these indicators was statistically significant.
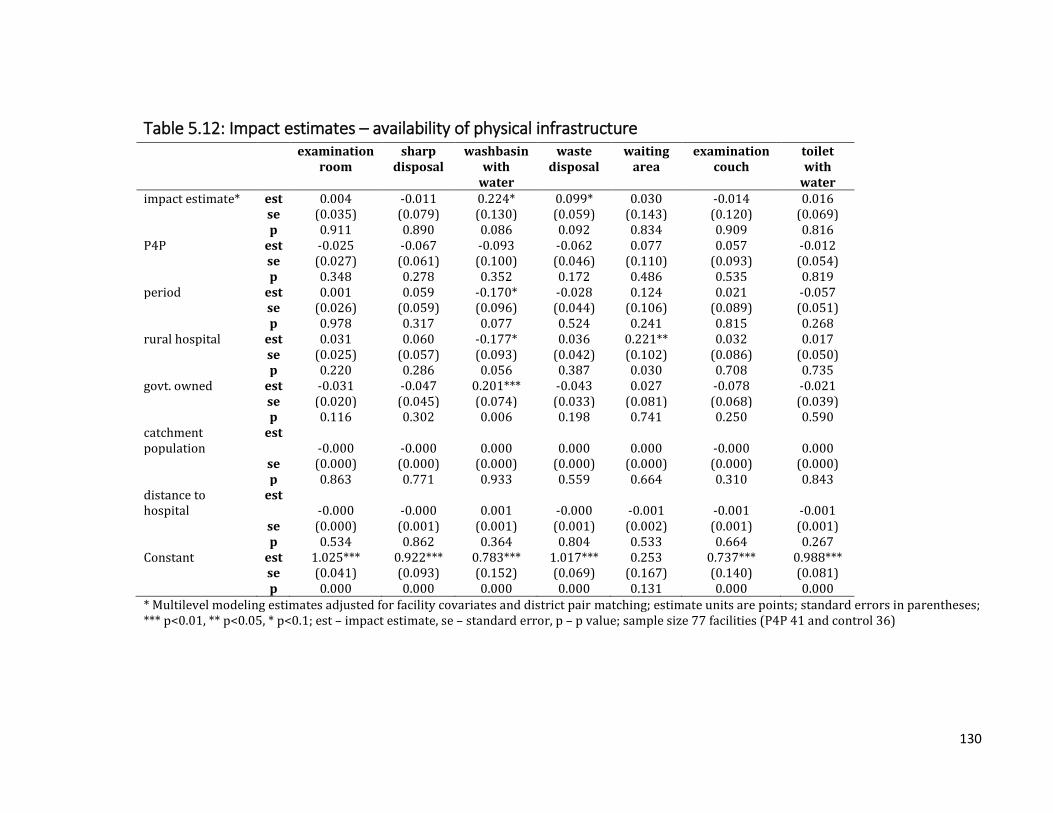
130
Table 5.12: Impact estimates – availability of physical infrastructure examination
room sharp
disposal washbasin
with water
waste disposal
waiting area
examination couch
toilet with
water impact estimate* est 0.004 -0.011 0.224* 0.099* 0.030 -0.014 0.016
se (0.035) (0.079) (0.130) (0.059) (0.143) (0.120) (0.069) p 0.911 0.890 0.086 0.092 0.834 0.909 0.816
P4P est -0.025 -0.067 -0.093 -0.062 0.077 0.057 -0.012 se (0.027) (0.061) (0.100) (0.046) (0.110) (0.093) (0.054) p 0.348 0.278 0.352 0.172 0.486 0.535 0.819
period est 0.001 0.059 -0.170* -0.028 0.124 0.021 -0.057 se (0.026) (0.059) (0.096) (0.044) (0.106) (0.089) (0.051) p 0.978 0.317 0.077 0.524 0.241 0.815 0.268
rural hospital est 0.031 0.060 -0.177* 0.036 0.221** 0.032 0.017 se (0.025) (0.057) (0.093) (0.042) (0.102) (0.086) (0.050)
p 0.220 0.286 0.056 0.387 0.030 0.708 0.735 govt. owned est -0.031 -0.047 0.201*** -0.043 0.027 -0.078 -0.021 se (0.020) (0.045) (0.074) (0.033) (0.081) (0.068) (0.039) p 0.116 0.302 0.006 0.198 0.741 0.250 0.590 catchment population
est -0.000 -0.000 0.000 0.000 0.000 -0.000 0.000
se (0.000) (0.000) (0.000) (0.000) (0.000) (0.000) (0.000) p 0.863 0.771 0.933 0.559 0.664 0.310 0.843
distance to hospital
est -0.000 -0.000 0.001 -0.000 -0.001 -0.001 -0.001
se (0.000) (0.001) (0.001) (0.001) (0.002) (0.001) (0.001) p 0.534 0.862 0.364 0.804 0.533 0.664 0.267
Constant est 1.025*** 0.922*** 0.783*** 1.017*** 0.253 0.737*** 0.988*** se (0.041) (0.093) (0.152) (0.069) (0.167) (0.140) (0.081) p 0.000 0.000 0.000 0.000 0.131 0.000 0.000
* Multilevel modeling estimates adjusted for facility covariates and district pair matching; estimate units are points; standard errors in parentheses; *** p<0.01, ** p<0.05, * p<0.1; est – impact estimate, se – standard error, p – p value; sample size 77 facilities (P4P 41 and control 36)

131
5.3.5.1.2 Availability of skilled staff
The P4P facilities had a relative increase of skilled staff by 5.4% points (SE 0.048)
(Table 5.13). However, there was no statistically significant effect (p value = 0.262).
Table 5.13: Impact estimates – availability of skilled staff
Staff
impact estimate* est 0.054
se (0.048)
p 0.262
P4P est -0.039
se (0.037)
p 0.297
period est -0.029
se (0.036)
p 0.422
rural hospital est 0.055
se (0.035)
p 0.111
govt. owned est -0.017
se (0.027)
p 0.526
catchment population est 0.000*
se (0.000)
p 0.050
distance to hospital est -0.000
se (0.001)
p 0.836
Constant est 0.899***
se (0.056)
p 0.000
* Multilevel modeling estimates adjusted for facility covariates and district pair matching; estimate units are points; standard errors in parentheses; *** p<0.01, ** p<0.05, * p<0.1; est – impact estimate, se – standard error, p – p value; sample size 77 facilities (P4P 41 and control 36)
5.3.5.1.3 Availability of drugs and vaccine
The availability of select drugs improved in the P4P arm (Table 5.14). Among those
however, only availability of iron was significant (21% points; SE 0.076; p value =
0.006). There was a 9% point relative increase in antimalarials (SE 0.069; p value =
0.193) and a 3% point relative increase in having at least one broad spectrum antibiotic
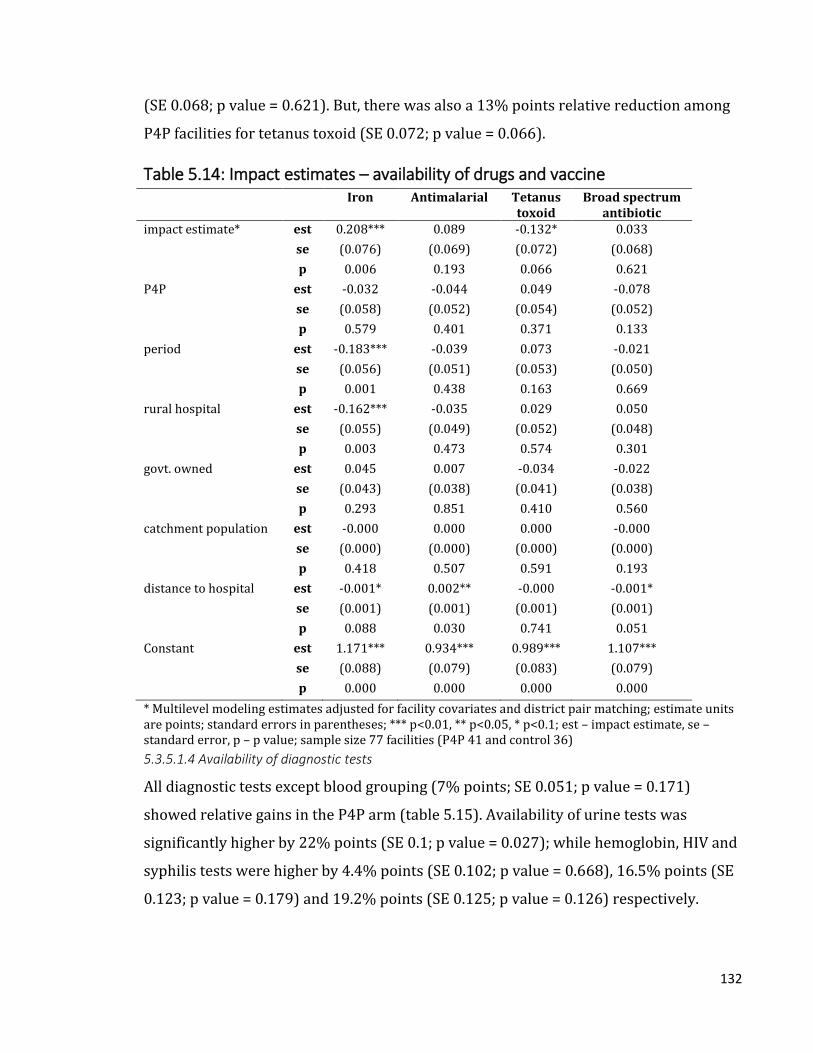
132
(SE 0.068; p value = 0.621). But, there was also a 13% points relative reduction among
P4P facilities for tetanus toxoid (SE 0.072; p value = 0.066).
Table 5.14: Impact estimates – availability of drugs and vaccine Iron Antimalarial Tetanus
toxoid Broad spectrum
antibiotic impact estimate* est 0.208*** 0.089 -0.132* 0.033
se (0.076) (0.069) (0.072) (0.068)
p 0.006 0.193 0.066 0.621
P4P est -0.032 -0.044 0.049 -0.078
se (0.058) (0.052) (0.054) (0.052)
p 0.579 0.401 0.371 0.133
period est -0.183*** -0.039 0.073 -0.021
se (0.056) (0.051) (0.053) (0.050)
p 0.001 0.438 0.163 0.669
rural hospital est -0.162*** -0.035 0.029 0.050
se (0.055) (0.049) (0.052) (0.048)
p 0.003 0.473 0.574 0.301
govt. owned est 0.045 0.007 -0.034 -0.022
se (0.043) (0.038) (0.041) (0.038)
p 0.293 0.851 0.410 0.560
catchment population est -0.000 0.000 0.000 -0.000
se (0.000) (0.000) (0.000) (0.000)
p 0.418 0.507 0.591 0.193
distance to hospital est -0.001* 0.002** -0.000 -0.001*
se (0.001) (0.001) (0.001) (0.001)
p 0.088 0.030 0.741 0.051
Constant est 1.171*** 0.934*** 0.989*** 1.107***
se (0.088) (0.079) (0.083) (0.079)
p 0.000 0.000 0.000 0.000
* Multilevel modeling estimates adjusted for facility covariates and district pair matching; estimate units are points; standard errors in parentheses; *** p<0.01, ** p<0.05, * p<0.1; est – impact estimate, se – standard error, p – p value; sample size 77 facilities (P4P 41 and control 36)
5.3.5.1.4 Availability of diagnostic tests
All diagnostic tests except blood grouping (7% points; SE 0.051; p value = 0.171)
showed relative gains in the P4P arm (table 5.15). Availability of urine tests was
significantly higher by 22% points (SE 0.1; p value = 0.027); while hemoglobin, HIV and
syphilis tests were higher by 4.4% points (SE 0.102; p value = 0.668), 16.5% points (SE
0.123; p value = 0.179) and 19.2% points (SE 0.125; p value = 0.126) respectively.

133
Table 5.15: Impact estimates – availability of diagnostic tests hemoglobin blood
group HIV syphilis urine
impact estimate* est 0.044 -0.070 0.165 0.192 0.220** se (0.102) (0.051) (0.123) (0.125) (0.100) p 0.668 0.171 0.179 0.126 0.027
P4P est -0.073 0.019 -0.049 -0.127 -0.055 se (0.079) (0.039) (0.095) (0.097) (0.077) p 0.354 0.633 0.609 0.189 0.473
period est 0.057 0.112*** -0.178** -0.235** 0.265*** se (0.075) (0.038) (0.091) (0.093) (0.074) p 0.445 0.003 0.050 0.011 0.000
rural hospital est 0.099 -0.069* 0.174** 0.080 0.162** se (0.073) (0.036) (0.088) (0.089) (0.071)
p 0.171 0.056 0.047 0.370 0.023 govt. owned est 0.029 0.043 0.057 0.066 0.121** se (0.057) (0.029) (0.069) (0.071) (0.056) p 0.612 0.131 0.412 0.355 0.032 catchment population est 0.000*** 0.000** 0.000 0.000 -0.000 se (0.000) (0.000) (0.000) (0.000) (0.000)
p 0.005 0.044 0.504 0.624 0.478 distance to hospital est 0.003*** 0.001 -0.001 -0.000 -0.001
se (0.001) (0.001) (0.001) (0.001) (0.001) p 0.005 0.244 0.598 0.846 0.214
Constant est 0.376*** -0.112* 0.907*** 0.883*** 0.175 se (0.119) (0.060) (0.143) (0.146) (0.116) p 0.002 0.060 0.000 0.000 0.133
* Multilevel modeling estimates adjusted for facility covariates and district pair matching; estimate units are points; standard errors in parentheses; *** p<0.01, ** p<0.05, * p<0.1; est – impact estimate, se – standard error, p – p value; sample size 77 facilities (P4P 41 and control 36)
5.3.5.1.5 Availability of equipment
Among all relevant medical equipment, the availability was relatively higher in the P4P
arm for most (table 5.16 A and B). Major gains was observed for refrigerator with a
22.6% point increment (SE 0.086; p value = 0.009). Statistically insignificant gains were
observed for hemoglobinometer at 16.7% points (SE 0.088; p value = 0.058),
sphygmomanometer at 12.9% points (SE 0.086; p value = 0.133), tape measure 8%
points (SE 0.067; p value = 0.236), adult weighing scale 5.4% points (SE 0.078; p value =
0.487), thermometer 4.2% points (SE 0.053; p value = 0.423), surgical gloves 1.4%
points (SE 0.088; p value = 0.869), and stethoscope 0.7% points (SE 0.059; p value =
0.905)

134
However, there was a statistically insignificant decline in the availability of vaginal
speculum 7.2% points (SE 0.133; p value = 0.589) and fetoscope 2.3% points (SE 0.081;
p value = 0.78).
Table 5.16 A: Impact estimates – availability of equipment Tape
measure Adult weighing scale
SPMmeter Thermometer Stethoscope
impact estimate*
est 0.080 0.054 0.129 0.042 0.007
se (0.067) (0.078) (0.086) (0.053) (0.059)
p 0.236 0.487 0.133 0.423 0.905
P4P est -0.072 0.005 -0.063 -0.003 -0.021
se (0.052) (0.060) (0.066) (0.041) (0.046)
p 0.167 0.934 0.342 0.936 0.652
period est -0.086* 0.054 -0.030 -0.053 -0.056
se (0.050) (0.057) (0.064) (0.039) (0.044)
p 0.083 0.349 0.633 0.174 0.204
rural hospital
est 0.066 0.074 0.102* 0.087** -0.066
se (0.048) (0.056) (0.061) (0.038) (0.042)
p 0.170 0.184 0.097 0.020 0.120
govt. owned est -0.053 -0.023 -0.041 -0.050* -0.021
se (0.038) (0.044) (0.049) (0.030) (0.034)
p 0.161 0.595 0.403 0.091 0.533
catchment population
est -0.000 0.000 -0.000 -0.000 0.000
se (0.000) (0.000) (0.000) (0.000) (0.000)
p 0.397 0.205 0.416 0.319 0.603
distance to hospital
est -0.001 -0.002** -0.002* -0.001*** -0.001
se (0.001) (0.001) (0.001) (0.001) (0.001)
p 0.224 0.019 0.059 0.009 0.424
Constant est 0.945*** 0.917*** 0.920*** 1.101*** 1.084***
se (0.079) (0.091) (0.100) (0.061) (0.069)
p 0.000 0.000 0.000 0.000 0.000
* Multilevel modeling estimates adjusted for facility covariates and district pair matching; estimate units are points; standard errors in parentheses; *** p<0.01, ** p<0.05, * p<0.1; est – impact estimate, se – standard error, p – p value; SPMmeter – Sphygmomanometer; sample size 77 facilities (P4P 41 and control 36)

135
Table 5.16 B: Impact estimates – availability of equipment Fetoscope Refrigerator Vaginal
speculum Surgical gloves
Hb meter
impact estimate*
est -0.023 0.226*** -0.072 0.014 0.167*
se (0.081) (0.086) (0.133) (0.088) (0.088)
p 0.780 0.009 0.589 0.869 0.058
P4P est -0.045 -0.162** 0.186* 0.059 -0.065
se (0.063) (0.067) (0.102) (0.068) (0.068)
p 0.471 0.015 0.070 0.380 0.337
period est -0.008 -0.141** 0.096 -0.029 0.260***
se (0.060) (0.064) (0.098) (0.065) (0.065)
p 0.892 0.026 0.326 0.649 0.000
rural hospital
est -0.033 0.070 0.106 0.079 0.031
se (0.058) (0.062) (0.095) (0.063) (0.063)
p 0.569 0.256 0.263 0.209 0.626
govt. owned est 0.015 0.009 0.089 -0.061 0.022
se (0.046) (0.049) (0.075) (0.050) (0.050)
p 0.737 0.851 0.235 0.216 0.653
catchment population
est 0.000 -0.000 -0.000 0.000 0.000
se (0.000) (0.000) (0.000) (0.000) (0.000)
p 0.964 0.637 0.303 0.136 0.288
distance to hospital
est 0.000 -0.001 -0.001 -0.002* 0.001
se (0.001) (0.001) (0.001) (0.001) (0.001)
p 0.781 0.224 0.296 0.062 0.500
Constant est 0.762*** 1.099*** 0.849*** 0.965*** 0.329***
se (0.095) (0.101) (0.155) (0.102) (0.103)
p 0.000 0.000 0.000 0.000 0.001
* Multilevel modeling estimates adjusted for facility covariates and district pair matching; estimate units are points; standard errors in parentheses; *** p<0.01, ** p<0.05, * p<0.1; est – impact estimate, se – standard error, p – p value; sample size 77 facilities (P4P 41 and control 36)
5.3.5.2 Estimates for quality indices
Individual quality items were combined to create quality sub-indices and these sub-
indices further gave rise to the composite structural quality index (table 5.17). The
changes in the sub-indices were statistically insignificant. There was a 0.048 points
relative increase in the physical infrastructure index for the P4P arm (SE 0.039; p value
= 0.226). The diagnostic test index demonstrated a relative increase by 0.11 points in
the P4P arm (SE 0.071; p value = 0.12). Drugs and equipment indices showed 0.051

136
points (SE 0.062; p value = 0.405) and 0.063 points (SE 0.039; p value = 0.109) relative
increments respectively.
The composite structural quality index showed a relative improvement of 0.595
standard deviations in the P4P arm (SE 0.262; p value = 0.023) above the mean of the
control arm, which was statistically significant.
Table 5.17: Impact estimates – structural quality indices physical
infra index
diagnostic test index
drugs index
equipment index
composite structural
quality index impact estimate*
est 0.048 0.110 0.051 0.063 0.595**
se (0.039) (0.071) (0.062) (0.039) (0.262) p 0.226 0.120 0.405 0.109 0.023
P4P est -0.017 -0.057 -0.041 -0.018 -0.374* se (0.030) (0.055) (0.048) (0.030) (0.202) p 0.567 0.298 0.387 0.546 0.065
period est -0.007 0.004 -0.076* 0.001 -0.304 se (0.029) (0.052) (0.046) (0.029) (0.194) p 0.800 0.935 0.097 0.985 0.117
rural hospital est 0.032 0.089* -0.015 0.052* 0.428** se (0.028) (0.051) (0.044) (0.028) (0.187)
p 0.253 0.078 0.734 0.065 0.022 govt. owned est -0.001 0.063 -0.016 -0.011 0.033 se (0.022) (0.040) (0.035) (0.022) (0.148) p 0.970 0.115 0.652 0.606 0.826 catchment population
est -0.000 0.000 -0.000 0.000 0.000
se (0.000) (0.000) (0.000) (0.000) (0.000) p 0.901 0.196 0.450 0.998 0.264
distance to hospital
est -0.000 0.000 -0.001 -0.001** -0.003
se (0.000) (0.001) (0.001) (0.000) (0.003) p 0.581 0.709 0.217 0.016 0.288
Constant est 0.820*** 0.446*** 1.105*** 0.897*** 0.503* se (0.046) (0.083) (0.072) (0.046) (0.306) p 0.000 0.000 0.000 0.000 0.100
* Multilevel modeling estimates adjusted for facility covariates and district pair matching; estimate units are standard deviations for the composite index and points for others; standard errors in parentheses; *** p<0.01, ** p<0.05, * p<0.1; est – impact estimate, se – standard error, p – p value; sample size 77 facilities (P4P 41 and control 36)
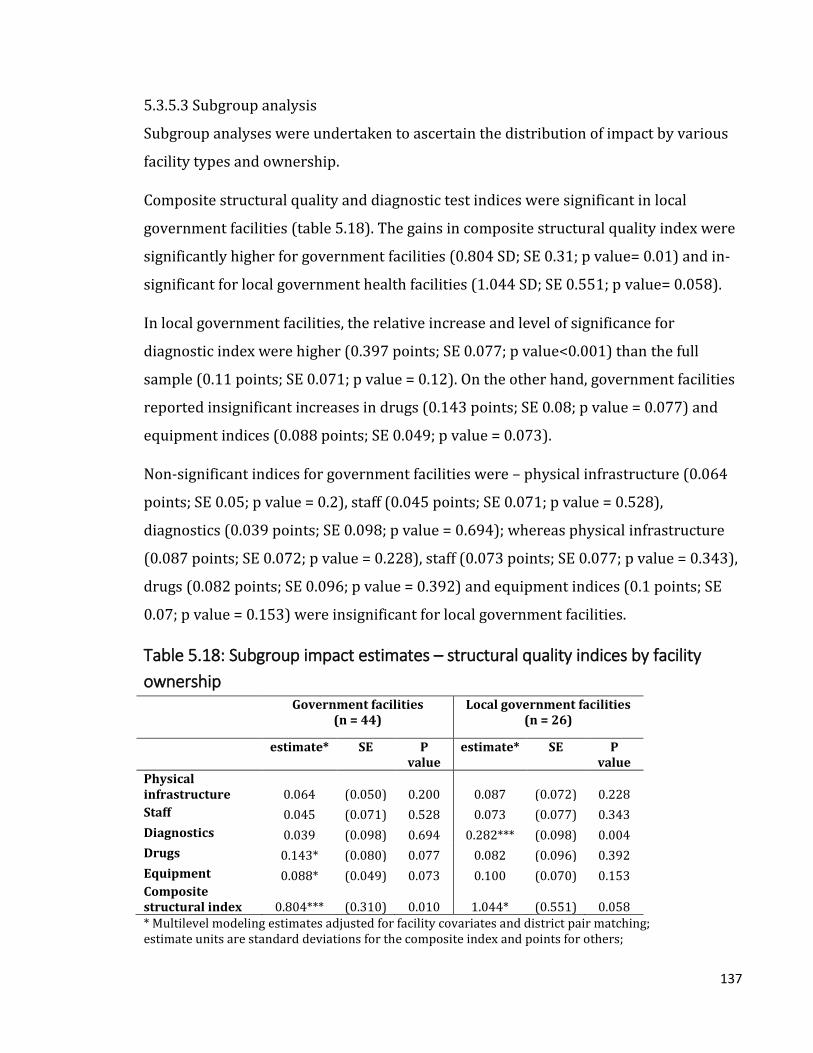
137
5.3.5.3 Subgroup analysis
Subgroup analyses were undertaken to ascertain the distribution of impact by various
facility types and ownership.
Composite structural quality and diagnostic test indices were significant in local
government facilities (table 5.18). The gains in composite structural quality index were
significantly higher for government facilities (0.804 SD; SE 0.31; p value= 0.01) and in-
significant for local government health facilities (1.044 SD; SE 0.551; p value= 0.058).
In local government facilities, the relative increase and level of significance for
diagnostic index were higher (0.397 points; SE 0.077; p value<0.001) than the full
sample (0.11 points; SE 0.071; p value = 0.12). On the other hand, government facilities
reported insignificant increases in drugs (0.143 points; SE 0.08; p value = 0.077) and
equipment indices (0.088 points; SE 0.049; p value = 0.073).
Non-significant indices for government facilities were – physical infrastructure (0.064
points; SE 0.05; p value = 0.2), staff (0.045 points; SE 0.071; p value = 0.528),
diagnostics (0.039 points; SE 0.098; p value = 0.694); whereas physical infrastructure
(0.087 points; SE 0.072; p value = 0.228), staff (0.073 points; SE 0.077; p value = 0.343),
drugs (0.082 points; SE 0.096; p value = 0.392) and equipment indices (0.1 points; SE
0.07; p value = 0.153) were insignificant for local government facilities.
Table 5.18: Subgroup impact estimates – structural quality indices by facility
ownership Government facilities
(n = 44) Local government facilities
(n = 26)
estimate* SE P value
estimate* SE P value
Physical infrastructure 0.064 (0.050) 0.200 0.087 (0.072) 0.228
Staff 0.045 (0.071) 0.528 0.073 (0.077) 0.343
Diagnostics 0.039 (0.098) 0.694 0.282*** (0.098) 0.004
Drugs 0.143* (0.080) 0.077 0.082 (0.096) 0.392
Equipment 0.088* (0.049) 0.073 0.100 (0.070) 0.153 Composite structural index 0.804*** (0.310) 0.010 1.044* (0.551) 0.058 * Multilevel modeling estimates adjusted for facility covariates and district pair matching; estimate units are standard deviations for the composite index and points for others;

138
standard errors in parentheses; *** p<0.01, ** p<0.05, * p<0.1
Among the two types of health facilities, none echoed the findings from the full sample
in terms of the quality components (composite and diagnostic test indices), their
magnitude and significance (table 5.19). Composite structural quality index rose
significantly by 0.589 standard deviations (SE 0.297; p value = 0.048) in the rural health
centers, whereas equipment index went up insignificantly by 0.079 points (SE 0.043; p
value = 0.067). Other not significant changes were physical infrastructure index rose by
0.065 points (SE 0.043; p value = 0.137), diagnostic test index 0.088 points (SE 0.078; p
value = 0.255), staff index 0.067 points (SE 0.059; p value = 0.255) and drugs index
0.046 points (SE 0.066; p value = 0.483).
Rural hospitals however, reported significant increase in the composite index (0.869
points; SE 0.359; p value = 0.015). Other non-significant indices were diagnostic index
(0.26 points; SE 0.135; p value = 0.053), physical infrastructure (0.034 points; SE 0.073;
p value = 0.645), drugs (0.074 points; SE 0.068; p value = 0.276) and equipment indices
(0.01 point; SE 0.045; p value = 0.82).
Table 5.19: Subgroup impact estimates – structural quality indices by facility type Rural hospitals
(n = 15) Rural health centers
(n = 62)
estimate* SE P value
estimate* SE P value
Physical infrastructure 0.034 (0.073) 0.645 0.065 (0.043) 0.137
Staff ISS ISS ISS 0.067 (0.059) 0.255
Diagnostics 0.260* (0.135) 0.053 0.088 (0.078) 0.255
Drugs 0.074 (0.068) 0.276 0.046 (0.066) 0.483
Equipment 0.010 (0.045) 0.820 0.079* (0.043) 0.067 Composite structural index 0.869** (0.359) 0.015 0.589** (0.297) 0.048 * Multilevel modeling estimates adjusted for facility covariates and district pair matching; estimate units are standard deviations for the composite index and points for others; standard errors in parentheses; ISS – insufficient sample size; *** p<0.01, ** p<0.05, * p<0.1
5.3.5.4 Sensitivity and robustness checks
Alternative ways of generating the composite structural quality index was explored
through a principal component analysis (PCA). In this analysis, the composite index was

139
obtained from the five sub-indices (physical infrastructure, staff, diagnostics, drugs, and
equipment) and only one principal component was considered.
Based on the PCA (table 5.20), the structural quality index shows 0.955 standard
deviation relative increase in the P4P arm at similar levels of significance to the equal
weighted index (SE 0.43; p value = 0.026).
Table 5.20: Impact estimates – creating the quality index by principal component analysis and equal weighting
Composite structural
quality index (PCA)
Composite structural
quality index (equal weights)#
impact estimate* est 0.955** 0.595** se (0.430) (0.262) p 0.026 0.023
P4P est -0.547* -0.374* se (0.332) (0.202) p 0.100 0.065
period est -0.466 -0.304 se (0.318) (0.194) p 0.143 0.117
rural hospital est 0.593* 0.428** se (0.307) (0.187)
p 0.054 0.022 govt. owned est 0.051 0.033 se (0.243) (0.148) p 0.835 0.826 catchment population est 0.000 0.000 se (0.000) (0.000)
p 0.511 0.264 distance to hospital est -0.006 -0.003
se (0.005) (0.003) p 0.212 0.288
Constant est 0.966* 0.503* se (0.502) (0.306) p 0.055 0.100
* Multilevel modeling estimates adjusted for facility covariates and district pair matching; estimate units are points for the PCA index and standard deviations otherwise; standard errors in parentheses; *** p<0.01, ** p<0.05, * p<0.1; est – impact estimate, se – standard error, p – p value, # - final model; sample size 77 facilities (P4P 41 and control 36)

140
Model specification parameters were altered to observe the changes in the impact
estimates. For example, the level parameters were three levels (facility, district, and
province) or two levels (facility and district). Models were also built without covariates.
Table 5.21 shows impact estimates for these various models. Though the impact
estimates remain similar across all models, there were no changes by altering the levels.
However, models with covariates show a higher level of significance.
Table 5.21: Sensitivity of impact estimates by levels and covariates Physical
infrastructure Staff Diagnostics Drugs Equipment Composite
structural index
Two levels without covariates
Estimate 0.036 0.058 0.098 0.029 0.043 0.497* SE (0.039) (0.049) (0.072) (0.066) (0.040) (0.271)
P value 0.354 0.234 0.172 0.656 0.281 0.067 Two levels and covariates
Estimate 0.048 0.054 0.110 0.051 0.063 0.595** SE (0.039) (0.048) (0.071) (0.062) (0.039) (0.262)
P value 0.226 0.262 0.120 0.405 0.109 0.023 Three levels without covariates
Estimate 0.036 0.058 0.098 0.029 0.043 0.497* SE (0.039) (0.049) (0.072) (0.066) (0.040) (0.271)
P value 0.354 0.234 0.172 0.656 0.281 0.067 Three levels and covariates (final model)
Estimate 0.048 0.054 0.110 0.051 0.063 0.595** SE (0.039) (0.048) (0.071) (0.062) (0.039) (0.262)
P value 0.226 0.262 0.120 0.405 0.109 0.023 * Multilevel modeling estimates adjusted for district pair matching; estimate units are standard
deviations for the composite index and points for others; standard errors in parentheses; *** p<0.01, **
p<0.05, * p<0.1; sample size 77 facilities (P4P 41 and control 36)
Sensitivity of the regression models were also tested for district pair matching. Table
5.22 shows that the impact estimate for the model without accounting for district pair
matching was marginally higher than the final model, which considered the pair
matching. For instance, composite structural index was 0.081 standard deviations
higher (SE 0.273; p value = 0.013) than the final model. In addition, the diagnostic tests
index was 0.051 points higher and statistically significant (SE 0.077; p value = 0.036).

141
Table 5.22: Sensitivity of impact estimates by district pair matching Without adjusting for
district pair-matching Accounting for district pair-
matching (final model)
estimate* SE P value
estimate* SE P value
Physical infrastructure 0.036 (0.042) 0.392 0.048 (0.039) 0.226
Staff 0.049 (0.050) 0.328 0.054 (0.048) 0.262
Diagnostics 0.161** (0.077) 0.036 0.110 (0.071) 0.120
Drugs 0.059 (0.064) 0.358 0.051 (0.062) 0.405
Equipment 0.064 (0.041) 0.120 0.063 (0.039) 0.109 Composite structural index 0.676** (0.273) 0.013 0.595** (0.262) 0.023 * Multilevel modeling with three levels (facility, district and province) and with covariates; estimate units are standard deviations for the composite index and points for others; standard errors in parentheses; *** p<0.01, ** p<0.05, * p<0.1; sample size 77 facilities (P4P 41 and control 36)
Estimating the impact along with its robust clustered standard errors generated an
impact estimate for the composite structural index, which was insignificant (table 5.23).
Table 5.23: Sensitivity of impact estimates by robust SE With robust standard
errors Without robust standard
errors (final model)
estimate* SE P value
estimate* SE P value
Physical infrastructure 0.048 (0.064) 0.456 0.048 (0.039) 0.226
Staff 0.054 (0.051) 0.289 0.054 (0.048) 0.262
Diagnostics 0.110 (0.075) 0.143 0.110 (0.071) 0.120
Drugs 0.051 (0.054) 0.339 0.051 (0.062) 0.405
Equipment 0.063 (0.039) 0.107 0.063 (0.039) 0.109 Composite structural index 0.595 (0.373) 0.111 0.595** (0.262) 0.023 * Multilevel modeling estimates adjusted for facility covariates and district pair matching; estimate units are standard deviations for the composite index and points for others; standard errors in parentheses; *** p<0.01, ** p<0.05, * p<0.1; sample size 77 facilities (P4P 41 and control 36)
Sensitivity of the model was tested with a fully interacted model. In this model, apart
from the specifications mentioned in the “final model”, all covariates were interacted
separately with the P4P, period and interaction of P4P and period. As shown in table
5.24, the fully interacted model returns higher impact estimates at higher levels of
significance and an additional index of significance than the final model. The fully
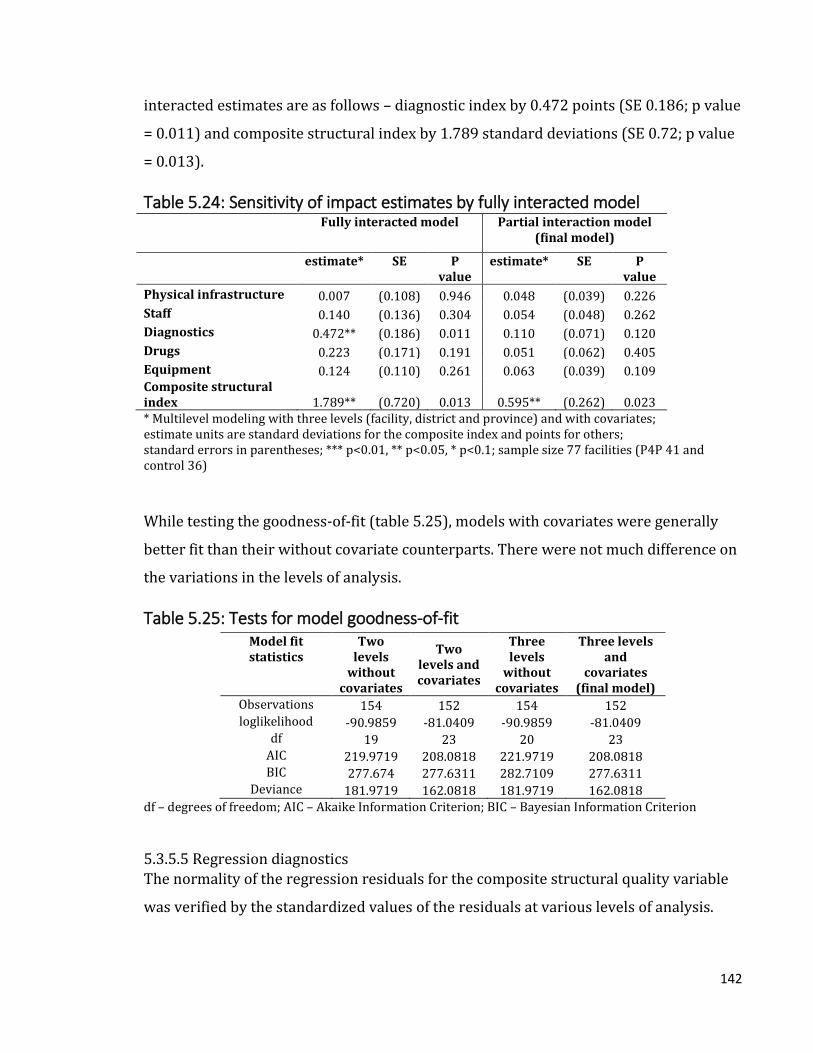
142
interacted estimates are as follows – diagnostic index by 0.472 points (SE 0.186; p value
= 0.011) and composite structural index by 1.789 standard deviations (SE 0.72; p value
= 0.013).
Table 5.24: Sensitivity of impact estimates by fully interacted model Fully interacted model Partial interaction model
(final model)
estimate* SE P value
estimate* SE P value
Physical infrastructure 0.007 (0.108) 0.946 0.048 (0.039) 0.226
Staff 0.140 (0.136) 0.304 0.054 (0.048) 0.262
Diagnostics 0.472** (0.186) 0.011 0.110 (0.071) 0.120
Drugs 0.223 (0.171) 0.191 0.051 (0.062) 0.405
Equipment 0.124 (0.110) 0.261 0.063 (0.039) 0.109 Composite structural index 1.789** (0.720) 0.013 0.595** (0.262) 0.023 * Multilevel modeling with three levels (facility, district and province) and with covariates; estimate units are standard deviations for the composite index and points for others; standard errors in parentheses; *** p<0.01, ** p<0.05, * p<0.1; sample size 77 facilities (P4P 41 and control 36)
While testing the goodness-of-fit (table 5.25), models with covariates were generally
better fit than their without covariate counterparts. There were not much difference on
the variations in the levels of analysis.
Table 5.25: Tests for model goodness-of-fit Model fit statistics
Two levels
without covariates
Two levels and covariates
Three levels
without covariates
Three levels and
covariates (final model)
Observations 154 152 154 152 loglikelihood -90.9859 -81.0409 -90.9859 -81.0409
df 19 23 20 23 AIC 219.9719 208.0818 221.9719 208.0818 BIC 277.674 277.6311 282.7109 277.6311
Deviance 181.9719 162.0818 181.9719 162.0818 df – degrees of freedom; AIC – Akaike Information Criterion; BIC – Bayesian Information Criterion
5.3.5.5 Regression diagnostics The normality of the regression residuals for the composite structural quality variable
was verified by the standardized values of the residuals at various levels of analysis.

143
Though there is a slight deviation from normality at the tails, the residuals overall seem
closer to normal distribution at all levels (Figure 5.5).
Figure 5.5: Normality of residuals

144
Homogeneity of variance of the residuals was checked through graphs plotting
residuals against the fitted values. The residuals could be said as homoscedastic as the
plot (figure 5.6) shows no particular pattern of the distribution of the residuals.
Figure 5.6: Homoscedasticity of residuals

145
5.4 Results – Part 2 (Indices by differential weighting)
This section describes the findings from the health facility survey with select quality
components assigned variable weighting as per the quality checklist.
5.4.1 Baseline sample balance
Balance of sample characteristics was tested with normalized mean differences. Out of
total 16 indicators under four health service components, control facilities scored
higher in 11 compared to the P4P facilities (table 5.26).
5.4.1.1 Medicines stock management
Under medicines and sundries stock management component, control facilities
reported a higher score for proper storage of drugs (1.22 P4P vs. 1.67 control; p value =
0.03). Proper storage of drugs was defined as storing in a clean place, well ventilated
with cupboards, labelled shelves, and medicines stored in alphabetical order. There was
no significant difference with the other indicator on maintaining drug stock cards (1.95
P4P vs. 2 control; p value = 0.352).
5.4.1.2 Outpatient department
All indicators under outpatient department component were balanced at baseline.
Control facilities scored higher on all indicators except one. These indicators were –
displaying National Malaria guidelines (0.88 P4P vs. 0.97 control; p value = 0.127),
having functional stethoscope and sphygmomanometer (0.83 P4P vs. 0.94 control; p
value = 0.12), thermometer (0.98 P4P vs. 1 control; p value = 0.352), otoscope (0.1 P4P
vs. 0.08 control; p value = 0.831), and adult weighing scale (0.88 P4P vs. 0.92 control; p
value = 0.585).
5.4.1.3 Family and Child Health
Control facilities scored significantly higher in two out of seven indicators. These
unbalanced indicators were necessary functional equipment, i.e. fetoscope, tape
measure, scale, stethoscope, sphygmomanometer, HB meter (0.44 P4P vs. 0.67 control;
p value = 0.046), and display of focused ANC protocol (1.46 P4P vs. 1.83 control; p value
= 0.036).

146
Balanced variables were availability of diagnostic test kits (0.1 P4P vs. 0.06 control; p
value = 0.64), cold chain assured (4.76 P4P vs. 4.86 control; p value = 0.64), availability
of vaccines (3.78 P4P vs. 4.31 control; p value = 0.251), availability of sharps boxes
(1.76 P4P vs. 1.83 control; p value = 0.585), salter scale available and in good state (1
P4P vs. 0.97 control; p value = 0.289).
5.4.1.4 Infection control and waste management
Utilizing an available infection control policy was unbalanced in favor of the control
facilities (1.32 P4P vs. 2.08 control; p value = 0.024). However, scores for sterilization of
instruments (0.15 P4P vs. 0 control; p value = 0.1) and disinfectants (0.63 P4P vs. 0.56
control; p value = 0.711) were in favor of P4P facilities even though not statistically
significant.
Table 5.26: Baseline sample balance Health service
component Variable Control
Mean P4P
Mean Normalized
mean difference
p value
Medicines and sundries stock management
Staff maintains stock cards
2.00 1.95 -0.15 0.352
Drugs are stored correctly
1.67 1.22 -0.34 0.03**
Out Patient Department/consultation area
Stethoscope & Sphygmomanometer available and functional
0.94 0.83 -0.25 0.120
Thermometer available and functional
1.00 0.98 -0.15 0.352
Otoscope available and functional
0.08 0.10 0.03 0.831
Adult Weighing Scale available and functional
0.92 0.88 -0.09 0.585
Family and Child Health
Necessary functional equipment
0.67 0.44 -0.31 0.046**
Availability of diagnostic test kits
0.06 0.10 0.08 0.640
Focused ANC protocol 1.83 1.46 -0.33 0.036** Cold Chain Assured 4.86 4.76 -0.08 0.640 Availability of vaccines 4.31 3.78 -0.18 0.251 Availability of sharps boxes
1.83 1.76 -0.09 0.585
Salter scale available and in good state
0.97 1.00 0.16 0.289
Infection control policy, available and
2.08 1.32 -0.35 0.024**

147
Infection control and waste management
being used Staff sterilizes instruments according to standards
0.00 0.15 0.27 0.100
Disinfectants available and being used according to guidelines
0.56 0.63 0.06 0.711
*** p<0.01, ** p<0.05, * p<0.1; sample size 77 facilities (P4P 41 and control 36)
5.4.2 Impact estimates
Absolute unadjusted values of the standardized structural quality indices by P4P arm
and control arm are shown in figure 5.7 for both pre- and post-intervention. Though all
indices showed relative gains for the P4P arm, the highest gain was observed for the
composite structural quality index. The P4P arm registered an increase from -0.311 to
0.017 points whereas it declined in the control arm from 0.354 to -0.02 points – a
difference-in-difference of 0.702 points. Similarly, family and child health index went up
by 0.641 points, infection control index by 0.415 points, outpatient index by 0.279
points, and medicines index by 0.005 points.

148
Figure 5.7: Unadjusted changes in structural quality indices
5.4.2.1 Estimates for individual quality items
5.4.2.1.1 Medicines stock management
There was no significant impact on the variables for medicines stocks management
(table 5.27). In fact, the P4P facilities reported a relative decline (statistically
insignificant) in the scores – stock cards updated by 0.01 points (SE 0.133; p value =
0.942) and drugs stored correctly by 0.118 points (SE 0.28; p value = 0.673).
-0.250
0.284
-0.252
0.287
-.2 0 .2 .4Medicine index
Post
Pre
treatment
control
treatment
control
0.038
-0.043
-0.133
0.151
-.2 -.1 0 .1 .2Outpatient index
Post
Pre
treatment
control
treatment
control
0.072
-0.082
-0.228
0.259
-.2-.1 0 .1 .2 .3FCH index
Post
Pre
treatment
control
treatment
control
0.058
-0.066
-0.136
0.155
-.2 -.1 0 .1 .2Inf control index
Post
Pre
treatment
control
treatment
control
0.017
-0.020
-0.311
0.354
-.4 -.2 0 .2 .4Structural quality index
Post
Pre
treatment
control
treatment
control

149
Table 5.27: Impact estimates – Medicines stock management
Stock cards updated Drugs stored correctly
impact estimate* est -0.010 -0.118 se (0.133) (0.280) p 0.942 0.673
P4P est -0.128 -0.628*** se (0.104) (0.219) p 0.221 0.004
period est -0.169* -0.405** se (0.096) (0.202) p 0.079 0.045
rural hospital est 0.072 0.203 se (0.093) (0.196) p 0.438 0.300
govt. owned est 0.034 0.070 se (0.074) (0.155) p 0.646 0.649
catchment population est -0.000 0.000 se (0.000) (0.000) p 0.579 0.971
distance to hospital est -0.002* -0.004 se (0.001) (0.003) p 0.085 0.134
Constant est 2.215*** 1.838*** se (0.153) (0.321) p 0.000 0.000
* Multilevel modeling estimates adjusted for facility covariates and district pair matching; estimate units are points; standard errors in parentheses; *** p<0.01, ** p<0.05, * p<0.1; est – impact estimate, se – standard error, p – p value; sample size 77 facilities (P4P 41 and control 36)
5.4.2.1.2 Outpatient department
Scores for the P4P facilities showed a relative enhancement though not statistically
significant (table 5.28). Having a functional stethoscope and sphygmomanometer
(blood pressure instrument) was up by 0.12 points (SE 0.1; p value = 0.228),
thermometer by 0.048 points (SE 0.054; p value = 0.375), otoscope by 0.104 points (SE
0.101; p value = 0.302), and adult weighing scale by 0.042 points (SE 0.08; p value =
0.601).

150
Table 5.28: Impact estimates – Outpatient department Stethoscope &
BP instrument Thermometer Otoscope Adult
weighing scale
impact estimate* est 0.120 0.048 0.104 0.042 se (0.100) (0.054) (0.101) (0.080) p 0.228 0.375 0.302 0.601
P4P est -0.093 -0.007 0.054 0.009 se (0.078) (0.042) (0.079) (0.062) p 0.236 0.859 0.495 0.882
period est -0.057 -0.055 0.009 0.061 se (0.072) (0.039) (0.073) (0.057) p 0.428 0.155 0.899 0.288
rural hospital est 0.009 0.088** 0.120* 0.074 se (0.070) (0.038) (0.070) (0.056) p 0.902 0.020 0.087 0.183
govt. owned est -0.070 -0.051* -0.071 -0.024 se (0.055) (0.030) (0.056) (0.044) p 0.205 0.087 0.204 0.579
catchment population
est -0.000 -0.000 -0.000 0.000
se (0.000) (0.000) (0.000) (0.000) p 0.676 0.318 0.795 0.204
distance to hospital est -0.001 -0.001*** 0.001 -0.002** se (0.001) (0.001) (0.001) (0.001) p 0.337 0.008 0.313 0.020
Constant est 0.953*** 1.103*** -0.000 0.916*** se (0.114) (0.062) (0.116) (0.091) p 0.000 0.000 1.000 0.000
* Multilevel modeling estimates adjusted for facility covariates and district pair matching; estimate units are points; standard errors in parentheses; *** p<0.01, ** p<0.05, * p<0.1; est – impact estimate, se – standard error, p – p value; sample size 77 facilities (P4P 41 and control 36)
5.4.2.1.3 Family and Child Health
Five out of seven family and child health variables reported higher gains in P4P
facilities (table 5.29). P4P facilities showed significant improvements in scores for
diagnostic kits by 0.413 points (SE 0.198; p value = 0.037). Similarly, display of focused
antenatal care protocol was 0.874 points higher (SE 0.214; p value<0.001). Though not
statistically significant, there was relative increase for functional equipment by 0.152
points (SE 0.15; p value = 0.309), assurance of cold chain by 0.618 points (SE 0.528; p
value = 0.241) and availability of vaccines by 0.26 points (SE 0.611; p value = 0.671).

151
However, scores on availability of sharp boxes went down by 0.054 points (SE 0.17; p
value = 0.751) and by 0.014 points for functional baby scale SE 0.054; p value = 0.792).
Table 5.29: Impact estimates – Family and Child Health Equipmen
t functional
Diagnostic kits
FANC protocol
Cold chain
assured
Vaccines
available
Sharp boxes
available
Baby scale
functional
impact estimate*
est 0.152 0.413** 0.874*** 0.618 0.260 -0.054 -0.014
se (0.150) (0.198) (0.214) (0.528) (0.611) (0.170) (0.054) p 0.309 0.037 <0.001 0.241 0.671 0.751 0.792
P4P est -0.256** -0.047 -0.346** -0.144 -0.550 -0.125 0.012 se (0.117) (0.155) (0.167) (0.413) (0.478) (0.133) (0.042) p 0.029 0.761 0.038 0.727 0.250 0.345 0.776
period est
-0.131 0.169 -0.527***
-1.441**
* -0.722 0.110 -0.027 se (0.108) (0.142) (0.154) (0.380) (0.440) (0.122) (0.039) p 0.224 0.236 0.001 0.000 0.101 0.369 0.493
rural hospital
est 0.085 0.150 0.354** -0.025 0.080 0.132 -0.016
se (0.104) (0.138) (0.149) (0.368) (0.427) (0.118) (0.038) p 0.417 0.276 0.018 0.945 0.851 0.265 0.680
govt. owned est -0.008 0.007 0.121 -0.034 0.026 -0.129 -0.022 se (0.083) (0.109) (0.118) (0.291) (0.337) (0.094) (0.030) p 0.921 0.952 0.303 0.907 0.938 0.169 0.461
catchment population
est -0.000 0.000 0.000 0.000 -0.000 -0.000 -0.000
se (0.000) (0.000) (0.000) (0.000) (0.000) (0.000) (0.000) p 0.377 0.935 0.347 0.507 0.231 0.722 0.274
distance to hospital
est -0.002 0.001 -0.003 -0.003 -0.002 -0.000 -0.001
se (0.002) (0.002) (0.002) (0.005) (0.006) (0.002) (0.001) p 0.129 0.478 0.219 0.627 0.723 0.855 0.107
Constant est 0.553*** -0.146 1.719***
4.522*** 5.753*** 1.876*** 1.090***
se (0.171) (0.226) (0.245) (0.604) (0.700) (0.194) (0.062) p 0.001 0.519 0.000 0.000 0.000 0.000 0.000
* Multilevel modeling estimates adjusted for facility covariates and district pair matching; estimate units are points; standard errors in parentheses; *** p<0.01, ** p<0.05, * p<0.1; est – impact estimate, se – standard error, p – p value; sample size 77 facilities (P4P 41 and control 36)
5.4.2.1.4 Infection control and waste management
Use of infection control policy score went up significantly by 1.118 points in P4P
facilities (SE 0.425; p value = 0.009) (Table 5.30). Statistically insignificant changes

152
were observed in sterilization as per standards score - down by 0.213 points (SE 0.122;
p value = 0.08) and availability of disinfectants - down by 0.105 points (SE 0.247; p
value = 0.672).
Table 5.30: Impact estimates – Infection control and waste management Infection
control policy used
Sterilization according to
standards
Disinfectants available
impact estimate* est 1.118*** -0.213* -0.105 se (0.425) (0.122) (0.247) p 0.009 0.080 0.672
P4P est -0.991*** 0.161* 0.243 se (0.333) (0.095) (0.193) p 0.003 0.090 0.209
period est -0.186 0.120 -0.220 se (0.306) (0.088) (0.178) p 0.544 0.170 0.216
rural hospital est 0.481 0.036 0.054 se (0.297) (0.085) (0.172) p 0.105 0.676 0.754
govt. owned est 0.081 0.131* 0.411*** se (0.235) (0.067) (0.136) p 0.730 0.052 0.003
catchment population
est 0.000** -0.000 -0.000
se (0.000) (0.000) (0.000) p 0.033 0.931 0.671
distance to hospital est -0.001 -0.001 0.001 se (0.004) (0.001) (0.003) p 0.907 0.399 0.644
Constant est 1.142** 0.072 0.312 se (0.487) (0.139) (0.283) p 0.019 0.607 0.270
* Multilevel modeling estimates adjusted for facility covariates and district pair matching; estimate units are points; standard errors in parentheses; *** p<0.01, ** p<0.05, * p<0.1; est – impact estimate, se – standard error, p – p value; sample size 77 facilities (P4P 41 and control 36)
5.4.2.2 Estimates for quality indices
Scores of individual health service item indicators were combined to create health
service component indices (table 5.31). Family and child health index was higher in the
P4P facilities by 0.754 standard deviations (SE 0.264; p value = 0.004) than the mean of
the control arm. Though not statistically significant, medicines score increased by 0.039

153
standard deviations (SE 0.281; p value = 0.89), outpatient department index by 0.479
(SE 0.291; p value = 0.1), and infection control score by 0.462 standard deviations (SE
0.299; p value = 0.122). Finally, the overall structural quality index showed a significant
relative increase in P4P facilities by 0.83 standard deviations (SE 0.266; p value =
0.002).
Table 5.31: Impact estimates – structural quality indices Medicines Outpatient Family and
Child Health
Infection Control
Composite index
impact estimate*
est 0.039 0.479 0.754*** 0.462 0.830***
se (0.281) (0.291) (0.264) (0.299) (0.266) p 0.890 0.100 0.004 0.122 0.002
P4P est -0.787*** -0.091 -0.584*** -0.325 -0.770*** se (0.220) (0.228) (0.206) (0.234) (0.208) p 0.000 0.691 0.005 0.164 0.000
period est -0.016 -0.171 -0.339* -0.173 -0.357* se (0.202) (0.210) (0.190) (0.215) (0.192) p 0.935 0.415 0.074 0.421 0.063
rural hospital est 0.285 0.435** 0.244 0.345* 0.450** se (0.196) (0.204) (0.184) (0.208) (0.186) p 0.146 0.032 0.186 0.098 0.015
govt. owned est 0.067 -0.323** 0.004 0.354** 0.125 se (0.155) (0.161) (0.146) (0.165) (0.147) p 0.666 0.044 0.978 0.032 0.394
catchment population
est -0.000 -0.000 -0.000 0.000 0.000
se (0.000) (0.000) (0.000) (0.000) (0.000) p 0.909 0.987 0.948 0.159 0.501
distance to hospital
est -0.005* -0.005 -0.002 0.000 -0.004
se (0.003) (0.003) (0.003) (0.003) (0.003) p 0.081 0.118 0.433 0.974 0.149
Constant est 0.615* 0.167 0.419 -0.545 0.328 se (0.322) (0.334) (0.302) (0.342) (0.305) p 0.056 0.616 0.166 0.111 0.282
* Multilevel modeling estimates adjusted for facility covariates and district pair matching; estimate units are standard deviations; standard errors in parentheses; *** p<0.01, ** p<0.05, * p<0.1; est – impact estimate, se – standard error, p – p value; sample size 77 facilities (P4P 41 and control 36)
5.4.2.3 Subgroup analysis
Subgroup analyses were undertaken to ascertain the distribution of impact by various
facility types and ownership.
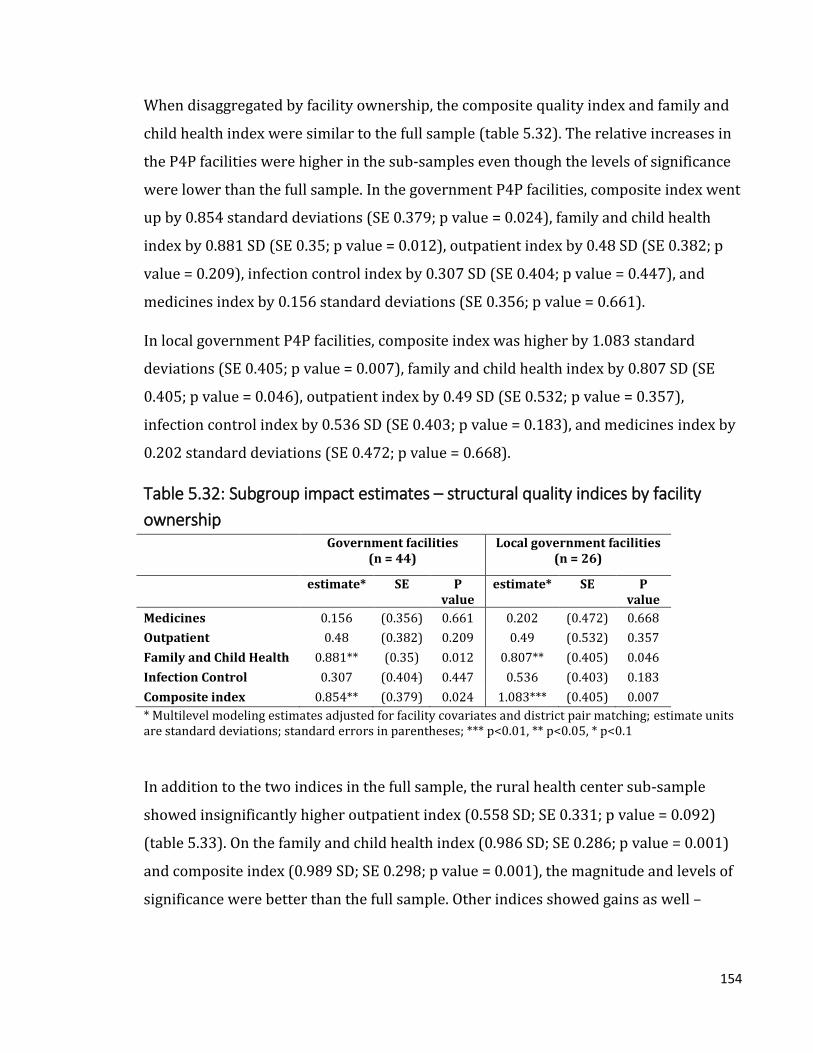
154
When disaggregated by facility ownership, the composite quality index and family and
child health index were similar to the full sample (table 5.32). The relative increases in
the P4P facilities were higher in the sub-samples even though the levels of significance
were lower than the full sample. In the government P4P facilities, composite index went
up by 0.854 standard deviations (SE 0.379; p value = 0.024), family and child health
index by 0.881 SD (SE 0.35; p value = 0.012), outpatient index by 0.48 SD (SE 0.382; p
value = 0.209), infection control index by 0.307 SD (SE 0.404; p value = 0.447), and
medicines index by 0.156 standard deviations (SE 0.356; p value = 0.661).
In local government P4P facilities, composite index was higher by 1.083 standard
deviations (SE 0.405; p value = 0.007), family and child health index by 0.807 SD (SE
0.405; p value = 0.046), outpatient index by 0.49 SD (SE 0.532; p value = 0.357),
infection control index by 0.536 SD (SE 0.403; p value = 0.183), and medicines index by
0.202 standard deviations (SE 0.472; p value = 0.668).
Table 5.32: Subgroup impact estimates – structural quality indices by facility
ownership Government facilities
(n = 44) Local government facilities
(n = 26)
estimate* SE P value
estimate* SE P value
Medicines 0.156 (0.356) 0.661 0.202 (0.472) 0.668
Outpatient 0.48 (0.382) 0.209 0.49 (0.532) 0.357
Family and Child Health 0.881** (0.35) 0.012 0.807** (0.405) 0.046
Infection Control 0.307 (0.404) 0.447 0.536 (0.403) 0.183
Composite index 0.854** (0.379) 0.024 1.083*** (0.405) 0.007
* Multilevel modeling estimates adjusted for facility covariates and district pair matching; estimate units are standard deviations; standard errors in parentheses; *** p<0.01, ** p<0.05, * p<0.1
In addition to the two indices in the full sample, the rural health center sub-sample
showed insignificantly higher outpatient index (0.558 SD; SE 0.331; p value = 0.092)
(table 5.33). On the family and child health index (0.986 SD; SE 0.286; p value = 0.001)
and composite index (0.989 SD; SE 0.298; p value = 0.001), the magnitude and levels of
significance were better than the full sample. Other indices showed gains as well –
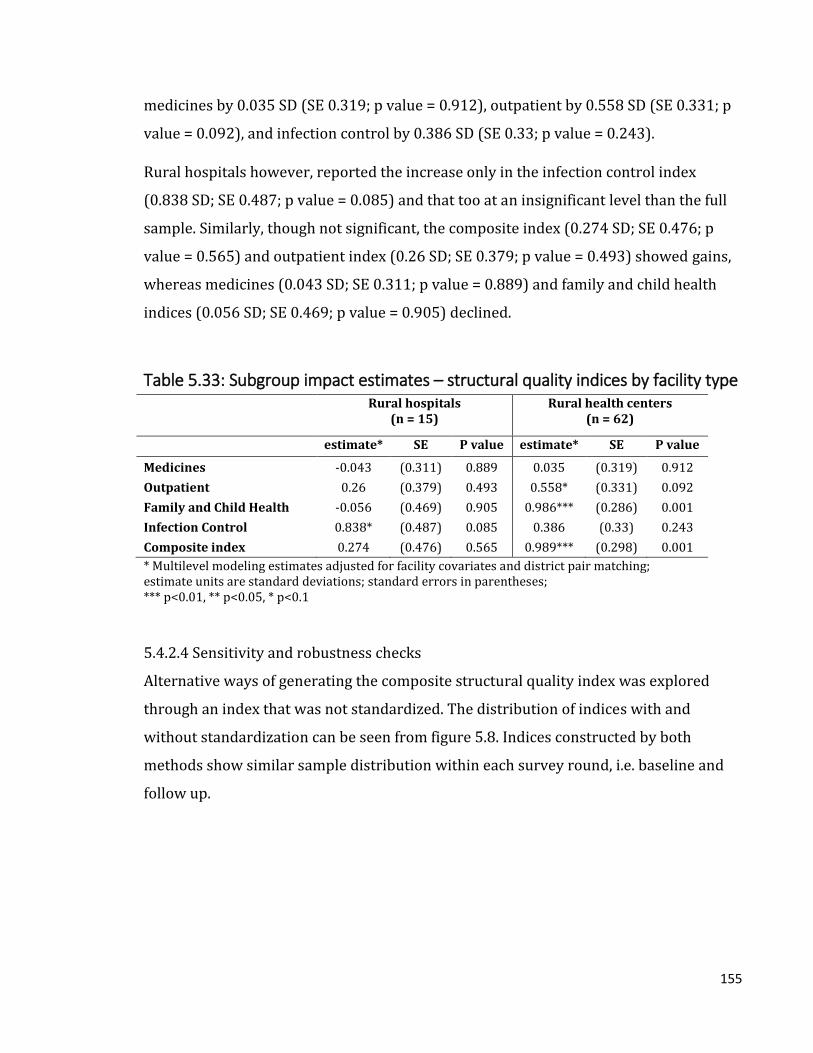
155
medicines by 0.035 SD (SE 0.319; p value = 0.912), outpatient by 0.558 SD (SE 0.331; p
value = 0.092), and infection control by 0.386 SD (SE 0.33; p value = 0.243).
Rural hospitals however, reported the increase only in the infection control index
(0.838 SD; SE 0.487; p value = 0.085) and that too at an insignificant level than the full
sample. Similarly, though not significant, the composite index (0.274 SD; SE 0.476; p
value = 0.565) and outpatient index (0.26 SD; SE 0.379; p value = 0.493) showed gains,
whereas medicines (0.043 SD; SE 0.311; p value = 0.889) and family and child health
indices (0.056 SD; SE 0.469; p value = 0.905) declined.
Table 5.33: Subgroup impact estimates – structural quality indices by facility type Rural hospitals
(n = 15) Rural health centers
(n = 62)
estimate* SE P value estimate* SE P value
Medicines -0.043 (0.311) 0.889 0.035 (0.319) 0.912
Outpatient 0.26 (0.379) 0.493 0.558* (0.331) 0.092
Family and Child Health -0.056 (0.469) 0.905 0.986*** (0.286) 0.001
Infection Control 0.838* (0.487) 0.085 0.386 (0.33) 0.243
Composite index 0.274 (0.476) 0.565 0.989*** (0.298) 0.001
* Multilevel modeling estimates adjusted for facility covariates and district pair matching; estimate units are standard deviations; standard errors in parentheses; *** p<0.01, ** p<0.05, * p<0.1
5.4.2.4 Sensitivity and robustness checks
Alternative ways of generating the composite structural quality index was explored
through an index that was not standardized. The distribution of indices with and
without standardization can be seen from figure 5.8. Indices constructed by both
methods show similar sample distribution within each survey round, i.e. baseline and
follow up.

156
Figure 5.8: Distribution of structural quality estimates by index construction
Without standardization, the structural quality index also shows 3.235 point relative
increase in the P4P arm at similar levels of significance to the standardized index (SE
1.177; p value = 0.006) as shown in table 5.34.
Table 5.34: Impact estimates – creating the quality index by standardization Composite index
unstandardized Composite index
standardized# impact estimate* est 3.235*** 0.830***
se (1.177) (0.266) p 0.006 0.002
P4P est -2.835*** -0.770*** se (0.920) (0.208) p 0.002 0.000
period est -3.471*** -0.357* se (0.848) (0.192) p 0.000 0.063
rural hospital est 1.897** 0.450** se (0.821) (0.186) p 0.021 0.015
govt. owned est 0.472 0.125 se (0.649) (0.147) p 0.467 0.394
catchment population est 0.000 0.000 se (0.000) (0.000) p 0.804 0.501
distance to hospital est -0.020* -0.004 se (0.012) (0.003)

157
p 0.097 0.149 Constant est 23.918*** 0.328
se (1.348) (0.305) p 0.000 0.282
* Multilevel modeling estimates adjusted for facility covariates and district pair matching; estimate units are standard deviations for the standardized index and points otherwise; standard errors in parentheses; *** p<0.01, ** p<0.05, * p<0.1; est – impact estimate, se – standard error, p – p value, # - final model; sample size 77 facilities (P4P 41 and control 36)
Model specification parameters were altered to observe the changes in the impact
estimates. Models were fitted with three levels (facility, district, and province) or two
levels (facility and district); and with or without covariates. Table 5.35 shows impact
estimates for these various models. Though the impact estimates remain similar across
all models, there were no changes by altering the levels. However, models with
covariates show higher impact estimates with higher levels of significance.
Table 5.35: Sensitivity of impact estimates by levels and covariates Medicines Outpatient Family and
Child Health Infection Control
Composite index
Two levels without covariates
impact estimate* 0.004 0.364 0.641** 0.417 0.703**
SE (0.295) (0.317) (0.281) (0.318) (0.295) P value 0.989 0.251 0.023 0.190 0.017
Two levels and covariates
impact estimate* 0.039 0.479 0.754*** 0.462 0.830***
SE (0.281) (0.291) (0.264) (0.299) (0.266) P value 0.890 0.100 0.004 0.122 0.002
Three levels without covariates
impact estimate* 0.004 0.364 0.641** 0.417 0.703**
SE (0.295) (0.317) (0.280) (0.318) (0.289) P value 0.989 0.251 0.022 0.190 0.015
Three levels and covariates (final model)
impact estimate* 0.039 0.479 0.754*** 0.462 0.830***
SE (0.281) (0.291) (0.264) (0.299) (0.266) P value 0.890 0.100 0.004 0.122 0.002
* Multilevel modeling estimates adjusted for district pair matching; estimate units are standard deviations; standard errors in parentheses; *** p<0.01, ** p<0.05, * p<0.1; sample size 77 facilities (P4P 41 and control 36)

158
Sensitivity of the regression models were also tested for district pair matching. Table
5.36 shows the impact estimates for the model without accounting for district pair
matching were marginally lower than the final model that considered the pair matching
for the two significant variables. Composite structural index was 0.047 standard
deviation lower (SE 0.276; p value = 0.005), and family and child health index was 0.04
standard deviations lower (SE 0.272; p value = 0.009).
Table 5.36: Sensitivity of impact estimates by district pair matching Without adjusting for district
pair-matching Accounting for district pair-
matching (final model)
estimate* SE P value estimate* SE P value
Medicines 0.034 (0.294) 0.908 0.039 (0.281) 0.890
Outpatient 0.460 (0.304) 0.130 0.479 (0.291) 0.100
Family and Child Health 0.714*** (0.272) 0.009 0.754*** (0.264) 0.004
Infection Control 0.430 (0.308) 0.163 0.462 (0.299) 0.122
Composite index 0.783*** (0.276) 0.005 0.830*** (0.266) 0.002 * Multilevel modeling estimates with three levels (facility, district and province) and with covariates; estimate units are standard deviations; standard errors in parentheses; *** p<0.01, ** p<0.05, * p<0.1; sample size 77 facilities (P4P 41 and control 36)
Estimating the impact along with its robust clustered standard errors generated similar
significance for the composite structural index along with the same estimates (table
5.37). However, with robust SEs, only outpatient index (0.479 SD; SE 0.204; p value =
0.019) came out to be statistically significant.
Table 5.37: Sensitivity of impact estimates by robust SE With robust standard errors Without robust standard
errors (final model)
estimate* SE P value estimate* SE P value
Medicines 0.039 (0.281) 0.890 0.039 (0.281) 0.890
Outpatient 0.479** (0.204) 0.019 0.479 (0.291) 0.100
Family and Child Health 0.754*** (0.242) 0.002 0.754*** (0.264) 0.004
Infection Control 0.462* (0.260) 0.076 0.462 (0.299) 0.122
Composite index 0.830*** (0.252) 0.001 0.830*** (0.266) 0.002 * Multilevel modeling estimates adjusted for facility covariates and district pair matching; estimate units are standard deviations; standard errors in parentheses; *** p<0.01, ** p<0.05, * p<0.1; sample size 77 facilities (P4P 41 and control 36)

159
Sensitivity of the model was tested with a fully interacted model. In this model, apart
from the specifications mentioned in the “final model”, all covariates were interacted
separately with the P4P, period and interaction of P4P and period. As shown in table
5.38, the fully interacted model returns higher impact estimates with similar levels of
significance for composite structural quality (1.831 SD; SE 0.74; p value = 0.013) index.
Table 5.38: Sensitivity of impact estimates by fully interacted model Fully interacted model Partial interacted model
(final model)
estimate* SE P value
estimate* SE P value
Medicines 0.276 (0.779) 0.724 0.039 (0.281) 0.890
Outpatient 1.107 (0.825) 0.180 0.479 (0.291) 0.100
Family and Child Health 1.224* (0.737) 0.097 0.754*** (0.264) 0.004
Infection Control 1.506* (0.826) 0.068 0.462 (0.299) 0.122
Composite index 1.831** (0.740) 0.013 0.830*** (0.266) 0.002 * Multilevel modeling estimates adjusted for facility covariates and district pair matching; estimate units
are standard deviations; standard errors in parentheses; *** p<0.01, ** p<0.05, * p<0.1; sample size 77
facilities (P4P 41 and control 36)
While testing the goodness-of-fit (table 5.39), models with covariates and additional
levels were generally better fit than their without covariate or lower level counterparts.
The final model chosen was in fact the best fit.
Table 5.39: Tests for model goodness-of-fit Model fit statistics Two
levels without
covariates
Two levels and covariates
Three levels
without covariates
Three levels and
covariates (final model)
Observations 154 152 154 152 loglikelihood -210.701 -200.082 -207.077 -196.269
df 6 10 7 11 AIC 433.4019 420.1638 428.1547 414.537 BIC 451.6237 450.4026 449.4134 447.7997
Deviance 421.402 400.1638 414.1548 392.537 df – degrees of freedom; AIC – Akaike Information Criterion; BIC – Bayesian Information Criterion

160
5.4.2.5 Regression diagnostics
The normality of the regression residuals for the composite structural quality variable
was verified by the standardized values of the residuals at various levels of analysis.
Though there is a slight deviation from normality at the lower tail, the residuals overall
seem closer to normal distribution at all levels (Figure 5.9).
Figure 5.9: Normality of residuals

161
Homogeneity of variance of the residuals was checked through graphs plotting
residuals against the fitted values. The residuals could be said as homoscedastic as the
plot (figure 5.10) shows no particular pattern of the distribution of the residuals.
Figure 5.10: Homoscedasticity of residuals

162
5.4.2.6 Impact estimates vis-à-vis weights
Impact estimates of individual quality items were plotted against their weights to
observe if there was any relationship between these two – for instance items with
higher weights showing higher estimates. The motivation behind this type of analysis
was to diagnose if there was selective preference for the facilities on certain items
because they were weighted heavily versus others (cherry picking). Quality sub-indices
and their items were plotted separately. Among the sub-indices (figure 5.11), family
and child health showed the highest impact estimate along with statistical significance,
which was also the heavily weighted sub-index among the sub-indices that could be
picked up from the facility survey data.
Figure 5.11: Plotting impact estimates of sub-indices by weight

163
When the items are plotted individually (figure 5.12), the highest estimates along with
statistical significance come from moderately weighted services. These services were –
availability and utilization of infection control policy (weighted 3 points), availability of
ANC protocol and diagnostic kits (weighted 2 points each). Although moderately
weighted at 2 points, sterilization of instruments according to standards showed
significant negative gains.
Figure 5.12: Plotting impact estimates of items by weight

164
Chapter 6: Impact of P4P on Process Quality – Findings from the exit interviews
6.1 Overview
This chapter presents the effects of P4P on process quality of antenatal care. Here
process quality implies adherence to standard national P4P guidelines with respect to
antenatal care. Adherence to the standard guidelines has been elicited from the clients
visiting the health facility through the client exit interviews data. The national
standards on antenatal care consist of counseling, physical examinations, laboratory
tests and prescription. Under the methods section (specific to process quality),
construction of process quality index has been explained out of various sub-indices and
items. Results are presented in the following sequence – descriptive statistics, sample
balance at baseline, correlation among sub-indices, impact estimates, subgroup
analysis, sensitivity and robustness verifications and finally, regression diagnostics.
6.2 Methods
The detailed description of the methods is given in Chapter 4. A summary of the
methods and some specific information pertaining to the effects of P4P on process
quality is described here. This study had a before-after design involving 32 districts,
half implemented the pay for performance program (16 P4P districts with 374 health
facilities) and the other half continued without any P4P program, i.e. business-as-usual
(16 control districts with 331 health facilities).
6.2.1 Data collection
Data were collected at base line and two years after implementing P4P program by a
local survey firm. The baseline survey was conducted during Dec, 2011 to Feb, 2012
and the follow up survey during May-August of 2014. Two survey instruments were
administered during these surveys – health facility and client exit interviews. Both
rounds of survey utilized the same instruments and the same set of health facilities,
thus, creating a panel of health facilities for this research.
During the exit interviews, information was collected on – (a) background socio-
economic information about the client (e.g. age, marital status, education, household

165
structure and assets, distance of residence from the health center); (b) experiences with
the provider (e.g. questions asked about medical history, diagnostic and physical
examinations performed, medications and counseling provided during the
consultation); and (c) satisfaction with the provider and services received. The client
interviews were conducted in the vicinity of the health facility, but away from the
providers or general public to maintain privacy of the respondent and confidentiality of
the information. The data collection instruments are presented in Annex C.
6.2.2 Sampling
During the baseline survey, health facilities were randomly selected based on a simple
random sampling method. The sampling frame was all rural health facilities from 32
study districts. The same baseline survey facilities were revisited during the follow up
survey two years after the implementation of the P4P intervention. Thus, a panel of
same health facilities was created with data for two survey rounds. Up to five ANC
clients were sampled in each health facility for exit interviews through systematic
random sampling. Systematic random sampling was based on ANC case load for the
same week day (as that of the day of survey) from the previous week. Thus, every ‘n’th
woman was selected. The panel health facilities yielded 385 clients (208 P4P and 177
control) in the baseline survey and 374 (200 P4P and 174 control) in the follow up.
6.2.3 Data analysis
The following analyses were conducted: (a) descriptive analysis, (b) baseline balance,
(c) correlation among items (d) impact estimate through multilevel modeling, (e)
subgroup analysis, and (f) robustness and sensitivity checks. In the impact estimate
analysis, the effect sizes were adjusted for health facility, provider and client
determinants. Details about all analyses have been presented in the methods chapter
(Chapter 4).
6.2.4 Outcome measure
The primary outcome measure is the process quality index. Process quality index was
constructed from four process quality sub-indices and each sub-index in turn utilized a
set of items to be built up (Figure 6.1). Equal weighting of components was applied
while constructing sub-indices from the items, while both equal and differential

166
weighting methods (PCA) were utilized to create process quality index from the sub-
indices. All item variables were binary. For example, if a client reported to have been
weighed, this variable would score ‘1’ for that particular client and ‘0’ otherwise.
Selection of items/components on process quality is based on the existing literature
and the P4P program’s adherence to the country’s clinical protocols on ANC.51–54,56–59
This has been explained in detail in the review of literature (Chapter 2).
Figure 6.1: Constructing process quality index and sub-indices
6.2.4.1 Constructing sub-indices
Four sub-indices (continuous variables) were created from their quality of antenatal
care items/components.
1. Physical examination sub-index consisted of four items – measurement of
weight, blood pressure, fundal height and abdominal palpation. Due to equal
weighting of one point per item, the maximum possible score for this sub-index
was “4”.
2. Laboratory test sub-index was made out of tests for blood and urine (two items).
Since the subjects of data were antenatal women, the items were broad-based
than specific, i.e. blood test for HIV or syphilis. With equal weighting of one point
per item, the maximum possible score for this sub-index was “2”.

167
3. Prescription sub-index came out of three items – prescription of iron and folic
acid, antimalarial and tetanus toxoid. Equal weighting of one point per item led
to a maximum possible score of “3” for this sub-index.
4. Counseling sub-index was constructed from six items – counseling on family
planning, pregnancy complications, institutional delivery, preparations for
delivery, diet and voluntary testing for HIV. Due to equal weighting of one point
per item, the maximum possible score for this sub-index was “6”.
6.2.4.2 Constructing process quality index
The four sub-indices were first standardized on a scale of 0 to 1 so that all sub-indices
could be equally weighted. The standardized sub-indices were combined with equal
weighting to generate the composite process quality index (continuous variable). A
standardized process quality index (z-score) was constructed based on the following
equation.
𝑍 = 𝑋 − 𝜇
𝜎
Where Z – standard score, X – each value in the data, µ – sample mean, and σ – standard
deviation
A standardized process quality index using variable weighting through principal
component analysis (PCA) was also undertaken.
6.3 Results
6.3.1 Descriptive statistics
6.3.1.1 Sample characteristics
ANC exit interview client characteristics are shown in table 6.1. The mean age for the
clients in the P4P arm was 25.05 years and in control arm was 24.05 years. The
majority of the clients were educated up to secondary level in both arms (P4P = 63.46%
and control = 66.1%), and a third had primary level of education (P4P = 33.65% and
control = 32.77%). The P4P arm had a relatively higher representation from the most
poor quintile group while the control arm had relatively higher proportion from the
least poor quintile group.

168
About two-thirds (65.71%) were in their third trimester (P4P = 67.31% and control =
63.84%) with the rest being in their second trimester. There were almost no women
(except one in the P4P arm) in their first trimester. A majority (67.01%) of women had
come for their first antenatal visit (P4P = 66.83% and control = 67.23%). The mean
gestational age was 30.65 weeks (P4P = 30.6 and control = 30.71) and mean number of
visits for ANC was 3.36 (P4P = 3.37 and control = 3.36).
Average distance travelled by the women for the ANC visit was 8.44 kilometers. Women
in the control arm reported a longer distance travelled (P4P= 7.73 and control = 9.27).
The mean duration to travel to the health facility was 74.36 minutes (P4P = 73.89 and
control = 74.91). Most of the women (80.52%) walked to the health facility (P4P =
79.81% and control = 81.36%). The clients had to wait for 52.22 minutes before being
attended to by a provider. Women in the P4P arm had a longer waiting time (P4P =
56.06 and control = 47.71).
Table 6.1 Client Characteristics
Variable Control N=177
P4P N=208
Total N=385
N % N % N % Mean age (years) 177 24.05 208 25.05 385 24.59
Education Primary 58 32.77 70 33.65 128 33.25 Secondary 117 66.1 132 63.46 249 64.68
Wealth quintile Lowest 33 18.64 44 21.15 77 20 Second 35 19.77 43 20.67 78 20.26 Third 33 18.64 43 20.67 76 19.74 Fourth 36 20.34 40 19.23 76 19.74 Highest 40 22.6 38 18.27 78 20.26
Trimester First 0 0 1 0.48 1 0.26 Second 64 36.16 67 32.21 131 34.03 Third 113 63.84 140 67.31 253 65.71
Gravidity First time 119 67.23 139 66.83 258 67.01 Multiple 58 32.77 69 33.17 127 32.99 Mean gestational age (weeks) 177 30.71 208 30.6 385 30.65 Mean ANC visit 125 3.36 128 3.37 253 3.36

169
number Mean distance (kilometers) 177 9.27 208 7.73 385 8.44 Mean travel time (minutes) 177 74.91 208 73.89 385 74.36 Travel by foot 144 81.36 166 79.81 310 80.52 Mean waiting time (minutes) 177 47.71 208 56.06 385 52.22
Table 6.2 shows that a greater share of clients came from government facilities (total =
62.34%; P4P = 62.5% and control = 62.15%) as the majority of the sampled facilities
were owned by the government. Local government facilities represented 31.43% of
clients (P4P = 28.85% and control = 34.46%). A higher proportion of clients visited
rural health centers (P4P = 85.1% and control = 78.53%).
Table 6.2 Facility Characteristics
Variable Control N=177
P4P N=208
Total N=385
N % N % N % Facility ownership Government 110 62.15 130 62.5 240 62.34 Mission 6 3.39 18 8.65 24 6.23 Local government 61 34.46 60 28.85 121 31.43 Facility type Rural health centers 139 78.53 177 85.1 316 82.08 Rural hospital 38 21.47 31 14.9 69 17.92
Nurses were the most consulted providers with 82.34% of the clients visiting them
(P4P = 84.62% and control = 79.66%) (Table 6.3). The second most visited providers
were midwives at 15.84% (P4P = 15.38% and control = 16.38%). Providers were
mostly females (P4P = 80.29% and control = 61.02%).
Table 6.3 Provider Characteristics
Variable Control N=177
P4P N=208
Total N=385
N % N % N % Cadre Midwife 29 16.38 32 15.38 61 15.84 Nurse 141 79.66 176 84.62 317 82.34 Nurse aid 6 3.39 0 0 6 1.56 Gender

170
Male 69 38.98 41 19.71 110 28.57 Female 108 61.02 167 80.29 275 71.43
6.3.1.2 Physical Examinations
Abdominal palpation was performed on almost all women with a coverage of 98% (P4P
= 99% and control = 98%) (Table 6.4). Measuring weight (P4P = 90% and control =
91%), blood pressure (P4P = 85% and control = 96%), and fundal height (P4P = 88%
and control = 80%) were also high in both arms. However, only 20% of the clients had
their height measured (P4P = 16% and control = 25%).
Table 6.4: Physical examinations during ANC visit
Variable Control N=177
P4P N=208
Total N=385
N % N % N % Weight 177 91 208 90 385 91 Height 177 25 208 16 385 20 Blood pressure 177 96 208 85 385 90 Fundal height 177 80 208 88 385 84 Abdominal palpation 177 98 208 99 385 98
6.3.1.3 Laboratory tests
During the ANC visit, 42% of clients had a blood test (P4P= 46% and control = 38%)
(Table 6.5). However, only 4% of the clients had their urine sample tested (P4P= 3%
and control = 5%).
Table 6.5: Laboratory tests during ANC visit
Variable Control N=177
P4P N=208
Total N=385
N % N % N % Urine test 177 5 208 3 385 4 Blood test 177 38 208 46 385 42
6.3.1.4 Prescription
Almost all women received a prescription of tetanus vaccine (P4P= 98% and control =
97%), and prescription for iron and folic acid (P4P = 96% and control = 98%) (Table

171
6.6). However, only 69% of clients (P4P = 66% and control = 72%) received a
prescription for an antimalarial.
Table 6.6: Prescriptions during ANC visit
Variable Control N=177
P4P N=208
Total N=385
N % N % N % Iron and folic acid 177 98 208 96 385 97 Antimalarial 177 72 208 66 385 69 Tetanus vaccine 177 97 208 98 385 98
6.3.1.5 Counseling
Women during the ANC visit are supposed to receive counselling on a myriad of healthy
life styles, identifying danger signs of pregnancy, and making preparations for delivery
(table 6.7). A high proportion of women (P4P= 98% and control = 97%) received
counselling on voluntary testing for HIV. Over half of the women received counselling
on delivering at a health facility (P4P = 61% and control = 57%) and preparing for
delivery (P4P = 53% and control = 56%). However, only over a third of women received
counselling on identifying danger signs of pregnancy (P4P = 37% and control = 39%),
family planning (P4P = 36% and control = 38%), and a healthy diet (P4P = 35% and
control = 29%).
Table 6.7: Counseling during ANC visit
Variable Control N=177
P4P N=208
Total N=385
N % N % N % Family planning 176 38 208 36 384 37 Pregnancy complication 177 39 208 37 385 38 Institutional delivery 177 57 208 61 385 59 Preparations for delivery 177 56 208 53 385 55 Diet 177 29 208 35 385 32 Voluntary testing for HIV 176 97 208 98 384 97

172
6.3.1.6 Comparison of quality indices by index construction
The estimates of quality indices determined by PCA and equal weighting were
compared using kernel density and Bland-Altman plots. The kernel density distribution
of both indices are shown in figure 6.2. Indices constructed by PCA and equal weighting
show similar distribution in the baseline and post-intervention surveys.
Figure 6.2: Distribution of process quality indices by index construction
As shown in the Bland-Altman plots comparing the differences in both ways of index
construction by survey rounds (figure 6.3), majority of the data points fall within the
recommended limits of agreement (within ± 1.96 SD of the mean difference). This
means the indices are in high agreement and they can be used interchangeably.

173
Figure 6.3: Agreement of process quality indices by index construction
6.3.2 Baseline sample balance
6.3.2.1 Sample characteristics
Clients’ characteristics were similar in both arms and none of these was significantly
different between the arms (Table 6.8). Clients from the P4P arm were slightly older
than that of the control arm (normalized mean difference 0.11), whereas control arm
had a higher proportion of primary level educated clients (normalized mean difference
– 4).
Table 6.8 Sample balance – Sample Characteristics
Variable Control %
P4P %
Normalized difference
p value
Mean age (years) 24.05 25.05 0.11 0.120 Education
Primary 66 63 -4 0.590 Secondary 1 1 3 0.660
Wealth quintile Lowest 19 21 4 0.541 Second 20 21 2 0.827 Third 19 21 4 0.619 Fourth 20 19 -2 0.786 Highest 23 18 -8 0.293
Trimester First 0 0 7 0.357

174
Second 36 32 -6 0.417 Third 64 67 5 0.477
Gravidity First time 67 67 -1 0.933 Multiple 33 33 1 0.933 Mean gestational age (weeks)
30.71 30.60 -0.01 0.880
Mean ANC visit number 3.36 3.37 0 0.968 Mean distance (kilometers)
9.27 7.73 -0.07 0.349
Mean travel time (minutes)
74.91 73.89 -0.01 0.887
Travel by foot 81 80 -3 0.703 Mean waiting time (minutes)
47.71 56.06 0.10 0.185
*** p<0.01, ** p<0.05, * p<0.1; sample size 385 women (P4P 208 and control 177)
The P4P arm had a significantly higher proportion of clients visiting mission owned
health facilities (p value 0.033) (Table 6.9).
Table 6.9 Sample balance – Facility Characteristics
Variable Control %
P4P %
Normalized difference
p value
Facility ownership Government 62 63 1 0.943 Mission 3 9 16 0.033** Local government 34 29 -9 0.238 Facility type
Rural health centers 79 85 12 0.095* Rural hospital 21 15 -12 0.095* *** p<0.01, ** p<0.05, * p<0.1; sample size 385 women (P4P 208 and control 177)
Table 6.10 shows a significantly higher proportion of clients visited nurse aid in the
control arm (p value 0.007), whereas more clients visited female providers in P4P
facilities (p value <0.001).
Table 6.10 Sample balance – Provider Characteristics
Variable Control %
P4P %
Normalized difference
p value
Cadre Midwife 16 15 -2 0.790 Nurse 80 85 9 0.205 Nurse aid 3 0 -18 0.007*** Gender

175
Male 39 20 -29 <0.001*** Female 61 80 29 <0.001*** *** p<0.01, ** p<0.05, * p<0.1; sample size 385 women (P4P 208 and control 177)
6.3.2.2 Physical Examinations
A significantly higher proportion of clients got their blood pressure (p value <0.001)
and height (p value 0.028) measured in the control arm, whereas measuring fundal
height was higher in the P4P arm (p value 0.037) (Table 6.11). There were no
differences in measuring weight (p value 0.847) and abdominal palpation (p value
0.842).
Table 6.11: Sample balance – Physical examinations during ANC visit
Variable Control %
P4P %
Normalized difference
p value
Weight 91 90 -1 0.847 Height 25 16 -16 0.028** Blood pressure 96 85 -27 <0.001*** Fundal height 80 88 15 0.037** Abdominal palpation 98 99 1 0.842 *** p<0.01, ** p<0.05, * p<0.1; sample size 385 women (P4P 208 and control 177)
6.3.2.3 Laboratory tests
There were no significant differences with regard to receipt of laboratory tests during
the ANC visit among the study arms (table 6.12).
Table 6.12: Sample balance – Laboratory tests during ANC visit Variable Control
% P4P % Normalized
difference p value
Urine test 5 3 -8 0.267 Blood test 38 46 11 0.122 *** p<0.01, ** p<0.05, * p<0.1; sample size 385 women (P4P 208 and control 177)

176
6.3.2.4 Prescription
The proportion of clients receiving prescriptions for medicines and tetanus vaccine
were similar between the two arms (table 6.13).
Table 6.13: Sample balance – Prescriptions during ANC visit Variable Control
% P4P %
Normalized difference
p value
Iron and folic acid 98 96 -6 0.373 Antimalarial 72 66 -10 0.174 Tetanus vaccine 97 98 4 0.561 *** p<0.01, ** p<0.05, * p<0.1; sample size 385 women (P4P 208 and control 177)
6.3.2.5 Counseling
Similar proportions of clients from both arms received counselling services and there
were no significant differences (table 6.14).
Table 6.14: Sample balance – Counseling during ANC visit
Variable Control %
P4P %
Normalized difference
p value
Family planning 38 36 -4 0.615 Pregnancy complication 39 37 -3 0.693 Institutional delivery 57 61 5 0.486 Preparations for delivery 56 53 -5 0.479 Diet 29 35 9 0.190 Voluntary testing for HIV 97 98 4 0.557 *** p<0.01, ** p<0.05, * p<0.1; sample size 385 women (P4P 208 and control 177)
6.3.3 Correlation analysis
Correlation analyses were performed for each process quality sub-index as well as the
composite index. None of the correlation coefficients was above the threshold of 0.8
(Table 6.15). The highest correlation coefficient was 0.27. Thus, all sub-index items as
well as the sub-indices themselves were retained for the index construction.

177
Table 6.15: Correlation matrix – Process quality index and sub-indices Physical examination sub-index items
Weight Height Blood pressure
Fundal height
Abdominal palpation
Weight 1.00
Height 0.07 1.00
Blood pressure
0.04 0.07 1.00
Fundal height 0.06 0.08 0.14 1.00
Abdominal palpation
-0.03 0.03 0.05 0.14 1.00
Laboratory test sub-index items
Urine Blood
Urine 1
Blood 0.09 1
Prescription sub-index items
Iron folic acid
Antimalarial Tetanus toxoid
Iron folic acid 1
Antimalarial 0.15 1
Tetanus toxoid
0.12 0.11 1
Counseling sub-index items
Fam plan Pregnancy complications
Inst delivery
Delivery preps
Diet VCT for HIV
Family planning
1.00
Pregnancy complications
0.22 1.00
Institutional delivery
0.07 0.09 1.00
Delivery preparations
0.20 0.27 0.11 1.00
Diet 0.17 0.25 0.02 0.21 1.00 VCT for HIV 0.11 0.12 0.07 0.13 0.10 1.00 Process quality sub-indices
Physical examination index
Lab test index Prescription index
Counselling index
Physical examination index
1.00
Lab test index 0.16 1.00
Prescription index
-0.10 -0.01 1.00
Counseling index
0.05 0.01 0.10 1.00

178
6.3.4 Process Quality
A comparison of the absolute unadjusted values of the standardized process quality
indices between the P4P and control arms pre- and post-implementation of P4P is
shown in Figure 6.4. Physical examination and laboratory test went up for both arms,
whereas prescription index came down in both. The physical examination index rose
from 0.754 to 0.830 points in the P4P arm, while it increased from 0.780 to 0.855 points
in the control arm with a difference-in-difference of 0.001 points. Similarly, the
difference-in-difference for laboratory test index was -0.022 points indicating a higher
increment in the control arm. Both arms registered fall in the prescription index with a
relative difference of 0.036 points. The relative difference for counselling index was
0.121 points where P4P arm showed an increase against a fall in the control arm.
Finally, the composite process quality index went up in the P4P arm by 0.122 standard
deviation (SD) points whereas it fell by 0.32 SD points in the control arm with a relative
increase of 0.442 in favor of the P4P arm.

179
Figure 6.4: Unadjusted changes in process quality indices
6.3.5 Impact estimates
Impact of the P4P program on process quality was estimated as intention-to-treat with
difference-in-difference estimates using multilevel modelling regression. Here the
multilevel model considered four levels of analysis, i.e. client, health facility, district and
province. The individual quality items were binary, thus multilevel mixed-effects
logistic regression was carried out. Whereas, multilevel mixed-effects linear regression
was undertaken for quality indices as they were continuous variables. The models ran
the regressions while adjusting for covariates at the facility (ownership, type of facility,
catchment population and distance to the nearest higher level facility, provider (gender
and cadre), and client levels (age, education, wealth quintile, distance from home to
health facility, parity, number of visit, and gestational age).
0.830
0.855
0.754
0.780
0 .2 .4 .6 .8Physical exam index
Post
Pre
P4P
Control
P4P
Control
0.270
0.264
0.243
0.215
0 .1 .2 .3Lab test index
Post
Pre
P4P
Control
P4P
Control
0.793
0.782
0.867
0.891
0 .2 .4 .6 .8 1Prescription index
Post
Pre
P4P
Control
P4P
Control
0.570
0.444
0.531
0.527
0 .2 .4 .6Counselling index
Post
Pre
P4P
Control
P4P
Control
0.105
-0.120
-0.017
0.020
-.1-.05 0 .05 .1Process quality index
Post
Pre
P4P
Control
P4P
Control

180
The impact estimates are difference-in-difference values, i.e. the relative difference
between changes in P4P arm and control arm across two rounds of survey. For
instance, an impact estimate of 0.231 for an index means the relative gain in the P4P
arm was 0.231 units higher than that of the control arm between the baseline and post-
implementation time points. The unit of measurement for estimating impact for the
individual items was percentage points; for sub-indices it was absolute points; and for
the composite index it was standard deviations.
6.3.5.1 Estimates for individual quality items
6.3.5.1.1 Physical Examinations
The impact of P4P on physical examinations during the ANC visit varied (table 6.16).
While reported measurement of weight and blood pressure showed relative gains in the
P4P facilities, the likelihood of abdominal palpation and measuring fundal height
declined. All these changes were not statistically significant. Measuring weight
increased by 4.3% points (SE 0.039; p value 0.272), and blood pressure by 1.4% points
(SE 0.058; p value 0.815) in the P4P arm, while abdominal palpation decreased by 4.6%
points (SE 0.026; p value 0.078) and measuring fundal height by 2% points (SE 0.053; p
value 0.708).
Table 6.16: Impact estimates – physical examinations Weight Blood
pressure Fundal height
Abdominal palpation
impact estimate* est 0.043 0.014 -0.020 -0.046* se (0.039) (0.058) (0.053) (0.026) p 0.272 0.815 0.708 0.078
P4P est -0.018 -0.163*** -0.001 0.012 se (0.034) (0.056) (0.046) (0.022) p 0.600 0.004 0.976 0.576
Period est 0.033 -0.054 0.111*** 0.006 se (0.029) (0.043) (0.040) (0.019) p 0.255 0.213 0.006 0.767
rural health center est 0.009 -0.076 -0.018 0.021 se (0.036) (0.063) (0.049) (0.022) p 0.795 0.228 0.712 0.355
owner govt. est 0.065** -0.071 -0.015 -0.021 se (0.029) (0.050) (0.039) (0.018) p 0.023 0.151 0.707 0.230
catch population est 0.000 -0.000 -0.000 -0.000 se (0.000) (0.000) (0.000) (0.000) p 0.233 0.949 0.777 0.322
distance from est 0.001 0.001 0.000 0.001*

181
hospital se (0.001) (0.001) (0.001) (0.000) p 0.120 0.385 0.562 0.064
Provider-nurse est -0.010 -0.165 1.037*** 0.019 se (0.151) (0.222) (0.205) (0.100) p 0.947 0.458 0.000 0.849
Provider-female est 0.019 0.060* 0.000 0.012 se (0.023) (0.035) (0.031) (0.015) p 0.402 0.084 0.997 0.413
age est 0.001 -0.003 -0.002 -0.002* se (0.002) (0.002) (0.002) (0.001) p 0.700 0.174 0.282 0.081
primary education est 0.059*** 0.087*** -0.069** -0.010 se (0.020) (0.029) (0.027) (0.013) p 0.003 0.003 0.010 0.468
gravidity est -0.007 -0.024 0.001 -0.050*** se (0.024) (0.035) (0.033) (0.016) p 0.770 0.486 0.973 0.002
gestational age est 0.001 0.001 0.006** 0.006*** se (0.002) (0.002) (0.002) (0.001) p 0.574 0.694 0.014 0.000
#anc visit est -0.005 -0.014 -0.002 0.002 se (0.007) (0.010) (0.009) (0.004) p 0.424 0.154 0.821 0.709
distance from house
est -0.000 0.000 0.001 0.000
se (0.001) (0.001) (0.001) (0.000) p 0.874 0.933 0.499 0.455
wealth quintile-lowest
est 0.011 -0.034 0.015 -0.008
se (0.023) (0.033) (0.031) (0.015) p 0.640 0.306 0.635 0.614
Constant est 0.842*** 1.097*** -0.242 0.836*** se (0.186) (0.280) (0.253) (0.122) p 0.000 0.000 0.339 0.000
* Multilevel modeling estimates adjusted for facility, provider, client covariates and district pair matching; estimate units are points; standard errors in parentheses; *** p<0.01, ** p<0.05, * p<0.1; est – impact estimate, se – standard error, p – p value; sample size 759 women
6.3.5.1.2 Laboratory tests
Blood tests went up by 14.1% points (SE 0.072; p value 0.051) and urine tests were
marginally lower by 0.9% points (SE 0.048; p value 0.851) in the P4P arm (Table 6.17).
Table 6.17: Impact estimates – laboratory tests Urine test Blood test
impact estimate* est -0.009 0.141* se (0.048) (0.072) p 0.851 0.051
P4P est -0.029 -0.040 se (0.056) (0.062) p 0.605 0.526

182
period est 0.109*** -0.088 se (0.036) (0.054) p 0.003 0.103
rural health center est 0.076 0.124* se (0.066) (0.066) p 0.249 0.061
owner govt. est 0.009 0.009 se (0.052) (0.052) p 0.870 0.867
catch population est -0.000* -0.000 se (0.000) (0.000) p 0.076 0.233
distance from hospital est -0.000 0.002** se (0.001) (0.001) p 0.929 0.011
Provider-nurse est 0.143 -0.824*** se (0.185) (0.279) p 0.440 0.003
Provider-female est -0.018 0.059 se (0.030) (0.042) p 0.558 0.156
age est 0.002 -0.000 se (0.002) (0.003) p 0.314 0.922
primary education est 0.046* 0.003 se (0.024) (0.037) p 0.056 0.928
gravidity est 0.002 -0.017 se (0.029) (0.044) p 0.942 0.710
gestational age est 0.003* 0.005 se (0.002) (0.003) p 0.087 0.117
#anc visit est -0.000 0.005 se (0.008) (0.013) p 0.990 0.717
distance from house est -0.000 0.000 se (0.001) (0.001) p 0.861 0.930
wealth quintile-lowest est -0.012 -0.067 se (0.028) (0.042) p 0.661 0.112
Constant est -0.244 0.689**

183
se (0.241) (0.344) p 0.311 0.045
* Multilevel modeling estimates adjusted for facility, provider, client covariates and district pair matching; estimate units are points; standard errors in parentheses; *** p<0.01, ** p<0.05, * p<0.1; est – impact estimate, se – standard error, p – p value; sample size 759 women
6.3.5.1.3 Prescription
Table 6.18 shows that prescription of antimalarial drugs was higher in the P4P facilities
by 19.9% points (SE 0.07; p value 0.004). However, the prescription of iron and folic
acid increased by just 0.1% points (SE 0.037; p value 0.983) and the proportion of
women receiving prescriptions for tetanus vaccine decreased (2.3% points; SE 0.04; p
value 0.56) in the P4P arm.
Table 6.18: Impact estimates – prescription Iron & folic acid Antimalarial Tetanus vaccine impact estimate* est 0.001 0.199*** -0.023
se (0.037) (0.070) (0.040) p 0.983 0.004 0.560
P4P est -0.019 0.152** 0.025 se (0.029) (0.071) (0.033) p 0.515 0.032 0.437
period est -0.031 -0.336*** -0.057* se (0.028) (0.052) (0.030) p 0.259 0.000 0.054
rural health center est -0.035 0.241*** -0.007 se (0.029) (0.080) (0.034) p 0.230 0.003 0.841
owner govt. est -0.031 0.038 -0.018 se (0.023) (0.063) (0.027) p 0.184 0.547 0.507
catch population est 0.000 0.000* -0.000 se (0.000) (0.000) (0.000) p 0.931 0.079 0.620
distance from hospital
est 0.000 0.000 -0.000
se (0.000) (0.001) (0.000) p 0.712 0.740 0.444
Provider-midwife est -0.133 0.350 -0.017 se (0.146) (0.275) (0.156) p 0.360 0.204 0.911
Provider-nurse est -0.113 0.406 -0.074 se (0.142) (0.268) (0.153) p 0.425 0.130 0.626
Provider-female est 0.011 0.017 -0.006 se (0.021) (0.042) (0.022) p 0.603 0.689 0.798
age est 0.000 -0.003 -0.001 se (0.002) (0.003) (0.002) p 0.793 0.380 0.659

184
primary education est -0.010 0.023 -0.020 se (0.019) (0.035) (0.020) p 0.578 0.510 0.323
gravidity est 0.054** 0.037 -0.054** se (0.023) (0.042) (0.024) p 0.019 0.374 0.028
gestational age est -0.000 -0.000 0.003* se (0.002) (0.003) (0.002) p 0.898 0.966 0.091
#anc visit est -0.011* -0.014 0.019*** se (0.006) (0.012) (0.007) p 0.097 0.245 0.005
distance from house
est -0.001 -0.002 -0.000
se (0.001) (0.001) (0.001) p 0.280 0.145 0.960
wealth quintile-lowest
est -0.045** -0.057 -0.022
se (0.022) (0.040) (0.023) p 0.036 0.153 0.337
Constant est 1.137*** -0.065 0.950*** se (0.173) (0.340) (0.187) p 0.000 0.849 0.000
* Multilevel modeling estimates adjusted for facility, provider, client covariates and district pair matching; estimate units are points; standard errors in parentheses; *** p<0.01, ** p<0.05, * p<0.1; est – impact estimate, se – standard error, p – p value; sample size 759 women
6.3.5.1.4 Counseling
Except for counselling on diet, all other services showed gains in the P4P arm (table
6.19) and few were significantly higher. Counselling on delivery preparations moved up
by 30.6% point (SE 0.084; p value <0.001) and family planning by 22.2% points (SE
0.085; p value 0.009). Though not significant, counselling on pregnancy danger signs (
15.7% points; SE 0.092; p value 0.087), institutional delivery (10.4% points; SE 0.082; p
value 0.203) and voluntary testing for HIV (5% points; SE 0.044; p value 0.254) were
higher, whereas that of diet was marginally lower (1% points; SE 0.084; p value 0.902)
in the P4P arm.

185
Table 6.19: Impact estimates – counseling
Family planning
Pregnancy complication
Institutional delivery
Preparations for delivery
Diet Voluntary testing HIV
impact estimate*
est 0.222*** 0.157* 0.104 0.306*** -0.010 0.050
se (0.085) (0.092) (0.082) (0.084) (0.084) (0.044) p 0.009 0.087 0.203 <0.001 0.902 0.254
P4P est -0.073 -0.153** 0.031 -0.053 -0.030 -0.043 se (0.070) (0.078) (0.063) (0.065) (0.071) (0.034) p 0.299 0.050 0.623 0.415 0.677 0.209
period est -0.164** -0.137** 0.091 -0.173*** -0.055
-0.116***
se (0.064) (0.069) (0.061) (0.063) (0.063) (0.033) p 0.010 0.046 0.137 0.006 0.383 0.000
rural health center
est 0.209*** 0.131 0.008 0.002 -0.070 -0.046
se (0.073) (0.082) (0.061) (0.063) (0.075) (0.033) p 0.004 0.109 0.893 0.971 0.350 0.160
owner govt. est 0.052 0.039 -0.039 -0.045 -0.011 0.002 se (0.057) (0.065) (0.048) (0.049) (0.059) (0.026) p 0.360 0.549 0.414 0.367 0.850 0.944
catch population
est 0.000** 0.000 -0.000 0.000** 0.000* 0.000
se (0.000) (0.000) (0.000) (0.000) (0.000) (0.000) p 0.031 0.252 0.507 0.017 0.052 0.356
distance from hospital
est
-0.000 -0.000 -0.002* -0.001 0.001 0.001 se (0.001) (0.001) (0.001) (0.001) (0.001) (0.001) p 0.642 0.854 0.058 0.163 0.624 0.104
Provider-midwife
est 0.423 0.497 -0.215 0.660** 0.218 -0.149
se (0.338) (0.363) (0.323) (0.334) (0.333) (0.175) p 0.210 0.171 0.507 0.048 0.514 0.395
Provider-nurse
est 0.306 0.366 -0.220 0.548* 0.013 -0.201
se (0.329) (0.355) (0.316) (0.326) (0.326) (0.171) p 0.354 0.303 0.486 0.093 0.969 0.241
Provider-female
est 0.110** 0.048 0.032 0.006 0.043 -0.011
se (0.049) (0.053) (0.045) (0.046) (0.048) (0.024) p 0.024 0.359 0.479 0.897 0.380 0.664
age est 0.007* 0.003 0.007* 0.003 0.002 0.001 se (0.004) (0.004) (0.004) (0.004) (0.004) (0.002) p 0.057 0.417 0.069 0.470 0.634 0.671
primary education
est 0.012 0.027 -0.065 0.024 0.038 0.017
se (0.044) (0.047) (0.042) (0.043) (0.043) (0.023) p 0.776 0.568 0.120 0.578 0.373 0.461
gravidity est -0.209*** -0.089 -0.084 0.019 0.034 -0.023 se (0.053) (0.057) (0.052) (0.053) (0.052) (0.028) p 0.000 0.116 0.101 0.723 0.512 0.405
gestational est 0.004 0.004 0.021*** 0.012*** 0.001 0.000

186
age se (0.004) (0.004) (0.004) (0.004) (0.004) (0.002) p 0.223 0.262 0.000 0.001 0.868 0.984
#anc visit est 0.006 0.018 0.017 0.006 0.009 0.013* se (0.015) (0.016) (0.014) (0.015) (0.015) (0.008) p 0.665 0.253 0.226 0.707 0.525 0.096
distance from house
est -0.001 0.003 0.001 0.002 0.002 -0.001
se (0.002) (0.002) (0.002) (0.002) (0.002) (0.001) p 0.702 0.143 0.727 0.337 0.222 0.390
wealth quintile-lowest
est
-0.017 -0.019 0.052 0.010 0.002 -0.018 se (0.050) (0.054) (0.048) (0.050) (0.049) (0.026) p 0.737 0.722 0.280 0.839 0.971 0.483
Constant est -0.472 -0.415 0.052 -0.449 0.112 1.193*** se (0.403) (0.436) (0.383) (0.395) (0.400) (0.207) p 0.242 0.341 0.892 0.256 0.780 0.000
* Multilevel modeling estimates adjusted for facility, provider, client covariates and district pair matching; standard errors in parentheses; estimate units are points; *** p<0.01, ** p<0.05, * p<0.1; est – impact estimate, se – standard error, p – p value; sample size 759 women
6.3.5.2 Estimates for quality indices
Individual quality items were combined to create quality sub-indices and these sub-
indices further merged to generate the composite process quality index (table 6.20).
Three out of four indices showed relative gains in the P4P arm. The highest increment
was noted in counseling index at 13.9% points (SE 0.043; p value 0.001), followed by
prescription index by 7% points (SE 0.033; p value 0.034), and laboratory test index by
6% points (SE 0.044; p value 0.173). However, physical examination index though not
statistically significant showed a small relative decline of 0.2% points in P4P facilities
(SE 0.026; p value 0.948).
There was a statistically significant increase of 0.556 standard deviation for the
composite process quality index (SE 0.162; p value 0.001) in the P4P arm than the mean
of the control arm.

187
Table 6.20: Impact estimates – process quality indices Physical
exam Lab test Prescription Counseling Process
quality index
impact estimate* est -0.002 0.060 0.070** 0.139*** 0.556*** se (0.026) (0.044) (0.033) (0.043) (0.162) p 0.948 0.173 0.034 0.001 0.001
P4P est -0.077*** -0.023 0.051* -0.054 -0.217 se (0.027) (0.039) (0.028) (0.035) (0.148) p 0.004 0.558 0.072 0.128 0.141
period est 0.035* 0.020 -0.154*** -0.094*** -0.399*** se (0.020) (0.033) (0.025) (0.032) (0.121) p 0.080 0.550 0.000 0.003 0.001
rural health center est -0.017 0.115*** 0.067** 0.039 0.415*** se (0.030) (0.042) (0.030) (0.036) (0.161) p 0.568 0.006 0.027 0.290 0.010
owner govt. est -0.051** 0.023 -0.003 -0.001 -0.081 se (0.024) (0.033) (0.024) (0.029) (0.127) p 0.034 0.478 0.915 0.982 0.523
catch population est -0.000 -0.000** 0.000 0.000** 0.000 se (0.000) (0.000) (0.000) (0.000) (0.000) p 0.700 0.028 0.102 0.015 0.673
distance from hospital
est 0.000 0.001** 0.000 -0.000 0.003
se (0.000) (0.001) (0.000) (0.001) (0.002) p 0.225 0.034 0.875 0.466 0.134
Provider-midwife est 0.104 -0.295* 0.058 0.244 0.203 se (0.105) (0.174) (0.130) (0.169) (0.639) p 0.319 0.090 0.658 0.149 0.751
Provider-nurse est 0.092 -0.325* 0.064 0.135 -0.116 se (0.102) (0.170) (0.127) (0.165) (0.623) p 0.364 0.056 0.615 0.414 0.853
Provider-female est 0.033** 0.009 0.001 0.034 0.188** se (0.016) (0.026) (0.019) (0.024) (0.095) p 0.041 0.724 0.951 0.160 0.049
age est -0.002** 0.001 -0.001 0.004** 0.003 se (0.001) (0.002) (0.001) (0.002) (0.007) p 0.038 0.748 0.507 0.042 0.712
primary education est 0.022 0.025 0.002 0.007 0.107 se (0.013) (0.022) (0.017) (0.022) (0.082) p 0.105 0.271 0.924 0.750 0.190
gravidity est -0.018 -0.011 0.010 -0.056** -0.135 se (0.016) (0.027) (0.020) (0.026) (0.099) p 0.270 0.690 0.609 0.036 0.170
gestational age est 0.002* 0.005** 0.001 0.007*** 0.029*** se (0.001) (0.002) (0.001) (0.002) (0.007) p 0.094 0.014 0.489 0.000 0.000
#anc visit est -0.004 0.002 -0.002 0.012 0.016

188
se (0.005) (0.008) (0.006) (0.007) (0.028) p 0.434 0.760 0.733 0.107 0.557
distance from house est -0.000 0.000 -0.001 0.001 -0.000 se (0.000) (0.001) (0.001) (0.001) (0.003) p 0.805 0.986 0.223 0.296 0.972
wealth quintile-lowest
est 0.013 -0.047* -0.043** 0.002 -0.145
se (0.015) (0.026) (0.019) (0.025) (0.094) p 0.411 0.066 0.026 0.952 0.123
Constant est 0.740*** 0.181 0.686*** 0.007 -1.575** se (0.129) (0.210) (0.156) (0.202) (0.776) p 0.000 0.388 0.000 0.974 0.042
* Multilevel modeling estimates adjusted for facility, provider, client covariates and district pair matching; standard errors in parentheses; estimate units are standard deviations for the index and points for others; *** p<0.01, ** p<0.05, * p<0.1; est – impact estimate, se – standard error, p – p value; sample size 759 women
6.3.5.3 Sub group analysis
Subgroup analyses were undertaken to ascertain the distribution of impact by various
facility, provider and client characteristics.
Government facilities reported significant gains in laboratory test (0.124 points; SE
0.057; p value 0.028) and composite process quality (0.469 SD; SE 0.212; p value 0.027)
indices in the P4P arm (Table 6.21). This differs from that was observed in the non-
stratified analysis of the total sample including all facilities irrespective of their
ownership. The gains in the laboratory test index was not significant and the composite
quality index gains were higher (0.556 SD at p value 0.001) in the P4P arm in the total
(non-stratified) sample. Local government facilities on the other hand reported higher
increments in the counseling index at 0.217 points in the P4P arm (vs 0.139 points in
the total sample at 1% level of significance), and smaller increments in the composite
quality index at 0.511 SD (p=0.072) compared to the total sample (0.556 SD).
Table 6.21: Subgroup impact estimates – process quality indices by facility
ownership Government facilities
(n=450) Local government facilities
(n=253)
estimate* SE P value
estimate* SE P value
Physical exam 0.006 0.031 0.849 -0.061 0.055 0.267
Lab test 0.124** 0.057 0.028 0.037 0.072 0.605

189
Prescription 0.015 0.042 0.726 0.05 0.062 0.423
Counseling 0.084 0.056 0.128 0.217*** 0.081 0.007
Process quality index 0.469** 0.212 0.027 0.511* 0.284 0.072
* Multilevel modeling estimates adjusted for facility, provider, client covariates and district pair matching; estimate units are standard deviations for the index and points for others; *** p<0.01, ** p<0.05, * p<0.1
Rural hospital did not have any significant gains on any of the quality indices for the
P4P arm (table 6.22), whereas rural health centers showed significant gains for all
indices except physical examination at higher magnitudes. Rural health centers in the
P4P arm had significant increase in many quality indices. The highest increase was in
the composite quality index by 0.691 SD (SE 0.181; p value <0.001) followed by
counseling index (0.149 points; SE 0.048; p value 0.002), laboratory test index (0.097
points; SE 0.049; p value 0.048) and prescription index (0.081 points; SE 0.038; p value
0.032).
Table 6.22: Subgroup impact estimates – process quality indices by facility type Rural hospital
(n=143) Rural health center
(n=616)
estimate* SE P value estimate* SE P value
Physical exam 0.015 0.052 0.77 0.003 0.03 0.919
Lab test -0.025 0.097 0.794 0.097** 0.049 0.048
Prescription 0.037 0.06 0.539 0.081** 0.038 0.032
Counseling 0.083 0.074 0.259 0.149*** 0.048 0.002
Process quality index 0.252 0.327 0.441 0.691*** 0.181 <0.001
* Multilevel modeling estimates adjusted for facility, provider, client covariates and district pair matching; estimate units are standard deviations for the index and points for others; *** p<0.01, ** p<0.05, * p<0.1
Clients those visited nurses as provider reported higher gains (even more than that was
observed in the total sample) for all indices except physical examination in the P4P arm
(table 6.23), On the other hand, results from the clients visiting a nurse midwife showed
declines in all indices except physical examination. However, among these declining
indices, only laboratory test was statistically significant (0.69 points; SE 0.192; p value
<0.001).

190
Table 6.23: Subgroup impact estimates – process quality indices by provider
cadre Nurse midwife
(n=83) Nurse
(n=667)
estimate* SE P value estimate* SE P value
Physical exam 0.179 0.151 0.238 -0.02 0.029 0.483
Lab test -0.690*** 0.192 <0.001 0.119** 0.048 0.013
Prescription 0.232 0.186 0.214 0.087** 0.036 0.015
Counseling -0.257 0.22 0.243 0.211*** 0.045 <0.001
Process quality index -0.846 0.78 0.278 0.818*** 0.172 <0.001
* Multilevel modeling estimates adjusted for facility, provider, client covariates and district pair matching; estimate units are standard deviations for the index and points for others; *** p<0.01, ** p<0.05, * p<0.1
Clients visiting male providers reported higher relative gains in quality indices (except
for prescription) for the P4P arm, more so with greater magnitudes and significance
than the total sample (table 6.24). Whereas clients visiting female providers reported
higher indices only for prescription (0.132 points; SE 0.04; p value 0.001) and
counseling indices (0.13 points; SE 0.051; p value 0.011) in the P4P arm.
Table 6.24: Subgroup impact estimates – process quality indices by provider
gender Male
(n=230) Female (n=529)
estimate* SE P value estimate* SE P value
Physical exam 0.175*** 0.057 0.002 -0.029 0.031 0.356
Lab test 0.342*** 0.092 <0.001 -0.068 0.053 0.202
Prescription -0.066 0.065 0.313 0.132*** 0.04 0.001
Counseling 0.272*** 0.086 0.002 0.130** 0.051 0.011
Process quality index 1.451*** 0.314 <0.001 0.321 0.203 0.114
* Multilevel modeling estimates adjusted for facility, provider, client covariates and district pair matching; estimate units are standard deviations for the index and points for others; *** p<0.01, ** p<0.05, * p<0.1
Among women in various stages of pregnancy from the P4P arm (table 6.25), clients in
the second trimester (0.75 SD; p value 0.043) had a higher relative gain in the
composite process quality index, though clients in their third trimester (0.398 SD; p
value 0.026) also had a significant gain. However, gains in counseling index (0.101
points; p value 0.037) remained significant only for the third trimester, while women in

191
second trimester (0.129 SD; p value 0.033) posed higher gains in physical examination
index.
Women pregnant for the first time in the P4P arm reported higher impact estimates
(magnitude and significance) than women pregnant for multiple times. The impact on
counseling index was not significant among women pregnant multiple times even
though it was significant in the total sample in the P4P arm.
Women aged 20 to 34 years had a better gain in the P4P arm for prescription,
counseling and the composite indices. Women with secondary level of education
reported higher gains in all indices except physical examination in the P4P arm. The
estimates were as follows – laboratory test index by 0.138 points (SE 0.057; p value
0.015); prescription index by 0.095 points (SE 0.041; p value 0.019); counseling index
by 0.179 points (SE 0.053; p value 0.001); and finally, the composite process quality
index by 0.839 SD (SE 0.196; p value <0.001). However, no gains were observed in any
index among the clients with primary education.
Table 6.25: Subgroup impact estimates – process quality indices by client characteristics
Physical exam Lab test Prescription Counseling Process quality index
Trimester
est 0.129** 0.019 0.090 0.079 0.750** Second se (0.061) (0.081) (0.085) (0.089) (0.372)
(n=255) p 0.033 0.810 0.291 0.369 0.043 est -0.006 0.042 0.049 0.101** 0.398**
Third se (0.030) (0.051) (0.036) (0.048) (0.178) (n=495) p 0.830 0.416 0.174 0.037 0.026
Gravidity
est 0.019 0.060 0.075* 0.146*** 0.658*** First time se (0.031) (0.054) (0.041) (0.050) (0.194) (n=526) p 0.535 0.269 0.066 0.003 0.001
est -0.011 0.111 0.101** 0.049 0.493* Multiple se (0.051) (0.069) (0.051) (0.076) (0.268) (n=233) p 0.830 0.108 0.046 0.521 0.066
Age
est -0.046 0.117 0.118** -0.005 0.496 < 20 se (0.054) (0.083) (0.049) (0.088) (0.313)
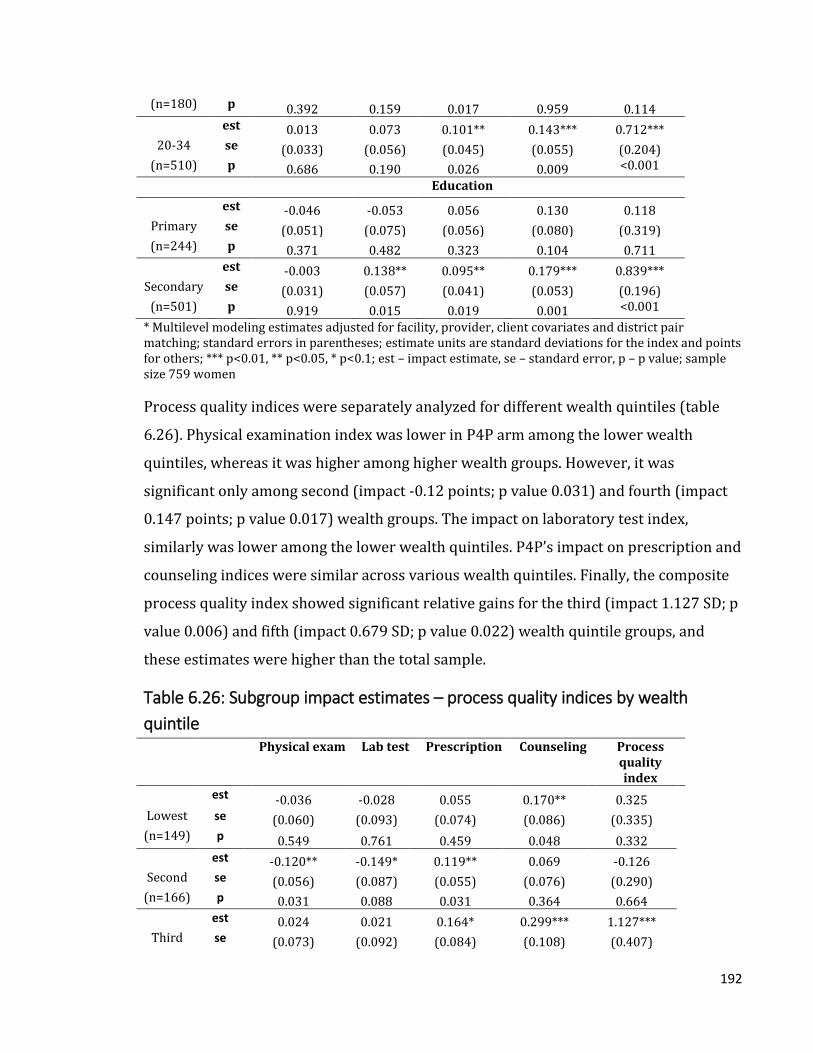
192
(n=180) p 0.392 0.159 0.017 0.959 0.114 est 0.013 0.073 0.101** 0.143*** 0.712***
20-34 se (0.033) (0.056) (0.045) (0.055) (0.204) (n=510) p 0.686 0.190 0.026 0.009 <0.001
Education
est -0.046 -0.053 0.056 0.130 0.118 Primary se (0.051) (0.075) (0.056) (0.080) (0.319) (n=244) p 0.371 0.482 0.323 0.104 0.711
est -0.003 0.138** 0.095** 0.179*** 0.839*** Secondary se (0.031) (0.057) (0.041) (0.053) (0.196)
(n=501) p 0.919 0.015 0.019 0.001 <0.001
* Multilevel modeling estimates adjusted for facility, provider, client covariates and district pair matching; standard errors in parentheses; estimate units are standard deviations for the index and points for others; *** p<0.01, ** p<0.05, * p<0.1; est – impact estimate, se – standard error, p – p value; sample size 759 women
Process quality indices were separately analyzed for different wealth quintiles (table
6.26). Physical examination index was lower in P4P arm among the lower wealth
quintiles, whereas it was higher among higher wealth groups. However, it was
significant only among second (impact -0.12 points; p value 0.031) and fourth (impact
0.147 points; p value 0.017) wealth groups. The impact on laboratory test index,
similarly was lower among the lower wealth quintiles. P4P’s impact on prescription and
counseling indices were similar across various wealth quintiles. Finally, the composite
process quality index showed significant relative gains for the third (impact 1.127 SD; p
value 0.006) and fifth (impact 0.679 SD; p value 0.022) wealth quintile groups, and
these estimates were higher than the total sample.
Table 6.26: Subgroup impact estimates – process quality indices by wealth
quintile Physical exam Lab test Prescription Counseling Process
quality index
est -0.036 -0.028 0.055 0.170** 0.325 Lowest se (0.060) (0.093) (0.074) (0.086) (0.335) (n=149) p 0.549 0.761 0.459 0.048 0.332
est -0.120** -0.149* 0.119** 0.069 -0.126 Second se (0.056) (0.087) (0.055) (0.076) (0.290)
(n=166) p 0.031 0.088 0.031 0.364 0.664 est 0.024 0.021 0.164* 0.299*** 1.127***
Third se (0.073) (0.092) (0.084) (0.108) (0.407)

193
(n=138) p 0.745 0.817 0.051 0.006 0.006 est 0.147** 0.095 0.137 0.231** 0.738
Fourth se (0.061) (0.113) (0.087) (0.100) (0.451) (n=152) p 0.017 0.399 0.113 0.021 0.101
est 0.008 0.276*** 0.016 0.074 0.679** Fifth se (0.054) (0.058) (0.061) (0.090) (0.296)
(n=154) p 0.875 <0.001 0.789 0.409 0.022 * Multilevel modeling estimates adjusted for facility, provider, client covariates and district pair matching; standard errors in parentheses; estimate units are standard deviations for the index and points for others; *** p<0.01, ** p<0.05, * p<0.1; est – impact estimate, se – standard error, p – p value
6.3.5.4 Sensitivity and robustness checks
Alternative ways of generating the composite process quality index was explored
through a principal component analysis (PCA). In this analysis, the composite index was
obtained from the four sub-indices (physical examination, laboratory tests, prescription
and counseling), and only one principal component was considered. The process quality
index shows 0.123 point relative increase in the P4P arm but is not statistically
significant (SE 0.179; p value = 0.493) (Table 6.27).
Table 6.27: Impact estimates – creating the quality index by principal component
analysis and equal weighting Composite process
quality index (PCA) Composite process
quality index (equal weights)#
impact estimate* est 0.123 0.556*** se (0.179) (0.162) p 0.493 0.001
P4P est -0.508*** -0.217 se (0.157) (0.148) p 0.001 0.141
period est -0.443*** -0.399*** se (0.134) (0.121) p 0.001 0.001
rural health center est 0.330* 0.415*** se (0.169) (0.161) p 0.050 0.010
Provider-female est 0.257** 0.188** se (0.104) (0.095) p 0.014 0.049
gestational age est 0.028*** 0.029*** se (0.008) (0.007) p 0.000 0.000
Constant est -0.183 -1.575** se (0.853) (0.776) p 0.830 0.042

194
Observations 515 515 * Multilevel modeling estimates adjusted for facility, provider, client covariates and district pair matching; standard errors in parentheses; estimate units are points for the PCA index and standard deviations otherwise; *** p<0.01, ** p<0.05, * p<0.1; est – impact estimate, se – standard error, p – p value, # - final model; sample size 759 women
Model specification parameters were altered to observe the changes in the impact
estimates. Models were fitted with four levels (client, facility, district, and province) or
three levels (client, facility and district). Models were also built without covariates.
Table 6.28 shows impact estimates determined by these various models. The impact
estimates remain similar across all models and there were no changes by altering the
levels. However, models with covariates show higher impact estimates with higher
levels of significance.
Table 6.28: Sensitivity of impact estimates by levels and covariates Physical exam Lab test Prescription Counseling Process
quality index
Three levels without covariates
estimate* -0.005 -0.013 0.041 0.115*** 0.299** SE (0.021) (0.044) (0.028) (0.034) (0.139)
P value 0.797 0.768 0.133 0.001 0.032 Three levels and covariates
estimate* -0.002 0.060 0.070** 0.139*** 0.556*** SE (0.026) (0.044) (0.033) (0.043) (0.162)
P value 0.948 0.173 0.034 0.001 0.001 Four levels without covariates
estimate* -0.005 -0.013 0.041 0.115*** 0.299** SE (0.021) (0.044) (0.028) (0.034) (0.139)
P value 0.797 0.768 0.133 0.001 0.032 Four levels and covariates (final model)
estimate* -0.002 0.060 0.070** 0.139*** 0.556*** SE (0.026) (0.044) (0.033) (0.043) (0.162)
P value 0.948 0.173 0.034 0.001 0.001 * Multilevel modeling estimates adjusted for district pair matching; standard errors in parentheses; estimate units are standard deviations for the index and points for others; *** p<0.01, ** p<0.05, * p<0.1; sample size 759 women

195
Sensitivity of the regression models were also tested for district pair matching. Table
6.29 shows the impact estimate from the model without accounting for district pair
matching was lower than the final model that considered the pair matching for the two
significant variables. For instance, the gain in the P4P arm for the composite quality
index was 0.556 standard deviations (0.47 SD for without district pair match) and
prescription index was 0.07 points (0.068 points for without district pair match).
Table 6.29: Sensitivity of impact estimates by district pair matching Without adjusting for district
pair-matching Accounting for district pair-
matching (final model)
estimate* SE P value estimate* SE P value
Physical exam -0.018 0.026 0.482 -0.002 0.026 0.948
Lab test 0.049 0.044 0.268 0.06 0.044 0.173
Prescription 0.068** 0.033 0.041 0.070** 0.033 0.034
Counseling 0.139*** 0.042 0.001 0.139*** 0.043 0.001
Process quality index 0.470*** 0.162 0.004 0.556*** 0.162 0.001
* Multilevel modeling estimates adjusted for facility, provider, client covariates and district pair matching; estimate units are standard deviations for the index and points for others; *** p<0.01, ** p<0.05, * p<0.1; sample size 759 women
Estimating the impact along with its robust clustered standard errors generated similar
significance for the process quality indices (table 6.30). However, the statistical
significance of the gain in the P4P arm was higher for prescription (p value 0.034 vs.
0.067) and composite quality indices (p value 0.001 vs. 0.005).
Table 6.30: Sensitivity of impact estimates by robust SE With robust standard errors Without robust standard
errors (final model)
estimate* SE P value estimate* SE P value
Physical exam -0.002 0.034 0.959 -0.002 0.026 0.948
Lab test 0.06 0.078 0.442 0.06 0.044 0.173
Prescription 0.070* 0.038 0.067 0.070** 0.033 0.034
Counseling 0.139*** 0.042 0.001 0.139*** 0.043 0.001
Process quality index 0.556*** 0.2 0.005 0.556*** 0.162 0.001
* Multilevel modeling estimates adjusted for facility, provider, client covariates and district pair matching; estimate units are standard deviations for the index and points for others; *** p<0.01, ** p<0.05, * p<0.1; sample size 759 women

196
When the status of structural quality is inadequate, despite having necessary
knowledge and skills the providers may not be able adhere to the care standards. For
instance, if there is no functional weighing scale in the health facility, the providers will
not be able to weigh the clients during the ANC consultation. The impact on the
measures of process quality was estimated by adjusting the levels of structural quality
in the health facilities. However, the impact estimates remained similar in terms of both
magnitude and statistical significance even after linearly adjusting for structural quality
(Table 6.31).
Table 6.31: Sensitivity of impact estimates by adjusting structural quality Adjusting for structural quality Without adjusting for
structural quality (final model)
estimate* SE P value estimate* SE P value
Physical exam -0.014 0.027 0.596 -0.002 0.026 0.948
Lab test 0.066 0.045 0.142 0.06 0.044 0.173
Prescription 0.071** 0.034 0.035 0.070** 0.033 0.034
Counseling 0.120*** 0.043 0.005 0.139*** 0.043 0.001
Process quality index 0.502*** 0.164 0.002 0.556*** 0.162 0.001
* Multilevel modeling estimates adjusted for facility, provider, client covariates and district pair matching; estimate units are standard deviations for the index and points for others; *** p<0.01, ** p<0.05, * p<0.1; sample size 759 women
Sensitivity of the model was tested with a fully interacted model. In this model, apart
from the specifications mentioned in the “final model”, all covariates were interacted
separately with the study groups, period of implementation of P4P and interaction of
study groups and period. As shown in table 6.32, the fully interacted model returns
higher impact estimates at lower levels of significance for counseling (0.803 points; SE
0.379; p value = 0.034) and composite process quality (2.796 SD; SE 1.402; p value =
0.046) indices, whereas gives a non-significant estimate for prescription index.
Table 6.32: Sensitivity of impact estimates by fully interacted model Fully interacted model Partial interacted model
(final model)
estimate* SE P value estimate* SE P value
Physical exam 0.081 0.248 0.743 -0.002 0.026 0.948
Lab test 0.257 0.380 0.498 0.06 0.044 0.173

197
Prescription 0.341 0.298 0.253 0.070** 0.033 0.034
Counseling 0.803** 0.379 0.034 0.139*** 0.043 0.001
Process quality index 2.796** 1.402 0.046 0.556*** 0.162 0.001
* Multilevel modeling estimates adjusted for facility, provider, client covariates and district pair matching; estimate units are standard deviations for the index and points for others; *** p<0.01, ** p<0.05, * p<0.1; sample size 759 women
While testing the goodness-of-fit (table 6.33), models with covariates were generally
better fit than their without covariate counterparts. There were not much difference on
the variations in the levels of analysis.
Table 6.33: Tests for model goodness-of-fit Model fit statistics
Three levels without covariates
Three levels and covariates
Four levels without covariates
Four levels and covariates (final model)
Observations 759 515 759 515 loglikelihood 571.0168 451.653 571.0168 451.653
df 19 33 20 33 AIC -1104.03 -837.306 -1102.03 -837.306 BIC -1016.03 -697.248 -1009.39 -697.248
Deviance -1142.03 -903.306 -1142.03 -903.306 df – degrees of freedom; AIC – Akaike Information Criterion; BIC – Bayesian Information Criterion

198
6.3.5.5 Regression diagnostics
The normality of the regression residuals for the composite process quality variable
was verified by the standardized values of the residuals at various levels of analysis. As
it can be seen from figure 6.5, the residuals seem closer to normal distribution at all
levels.
Figure 6.5: Normality of residuals

199
Homogeneity of variance of the residuals was checked through graphs plotting
residuals against the fitted values. The residuals could be said as homoscedastic as the
plot (figure 6.6) shows no particular pattern of the distribution of the residuals.
Figure 6.6: Homoscedasticity of residuals

200
Chapter 7: Impact of P4P on Client Satisfaction – Findings from the exit
interviews
7.1 Overview
This chapter presents the effects of P4P on client satisfaction. Results are presented in
the following sequence – descriptive statistics, sample balance at baseline, correlation
among items, impact estimates, subgroup analysis, sensitivity and robustness
verifications and finally, regression diagnostics.
7.2 Methods
Methods used for this analysis have been explained in detail in Chapter 4. A summary of
the methodology is thus given in this section along with some specific information on
the objective that pertains to the effects of P4P on client satisfaction. This is a controlled
before-after design consisting of eight provinces with four districts in each province.
Out of the 32 districts, half implemented the pay for performance program (16 P4P
districts with 374 health facilities) and the other half continued without any P4P
program, i.e. business-as-usual (16 control districts with 331 health facilities). To assess
the impact of P4P program, two rounds of surveys were conducted – one at baseline
and the second one after the program’s implementation.
7.2.1 Data collection
The baseline survey was conducted during Dec, 2011 to Feb, 2012 and the post-
implementation survey during May-August of 2014. Client exit interviews were
administered during these surveys. Both rounds of survey utilized the same
instruments and the same set of health facilities, thus, creating a panel of health
facilities for this research.
During the exit interviews, information was collected on – (a) background socio-
economic information about the client (e.g. age, marital status, education, household
structure and assets, distance of residence from the health center); (b) experiences with
the provider (e.g. questions asked about medical history, diagnostic and physical
examinations performed, medications and counseling provided during the
consultation); and (c) satisfaction with the provider and services received. The client

201
interviews were conducted in the vicinity of the health facility, but away from the
providers or general public to maintain privacy of the respondent and confidentiality of
the information. The data collection instruments are presented in Annex C.
7.2.2 Sampling
During the baseline survey, health facilities were randomly selected based on a simple
random sampling method. The sampling frame was all rural health facilities from 32
study districts. The same baseline survey facilities were revisited during the follow up
survey two years after the implementation of the P4P intervention. Thus, a panel of
same health facilities was created with data for two survey rounds. Up to five ANC
clients were sampled in each health facility for exit interviews through systematic
random sampling. Systematic random sampling was based on ANC case load for the
same week day (as that of the day of survey) from the previous week. Thus, every ‘n’th
woman was selected. The panel health facilities yielded 385 clients (208 P4P and 177
control) in the baseline survey and 374 (200 P4P and 174 control) in the follow up.
7.2.3 Data analysis
Data analysis was undertaken in the following sequence – (a) descriptive analysis, (b)
baseline balance, (c) correlation among items (d) impact estimate through multilevel
modeling, (e) subgroup analysis, and (f) robustness and sensitivity checks. In the
impact estimate analysis, the effect sizes were adjusted for health facility, provider and
client determinants. Details about all analyses are presented in the methods chapter
(Chapter 4).
7.2.4 Outcome measure
The primary outcome measure, client satisfaction index was created out of individual
satisfaction items applying equal weighting. As shown in figure 7.1, the individual
satisfaction items were - satisfaction with operating hours, cleanliness, privacy, waiting
time, provider attitude, time spent with provider, and availability of medicines. Though
cost of care was initially planned to be included as a satisfaction item in the index, it
was dropped because of too many missing values (72%). Selection of items for client
satisfaction is based on the existing literature. This has been explained in detail in the
review of literature (Chapter 2).

202
Client satisfaction items were collected against a four-point Likert Scale where the
scores ranged from 1 (least satisfied) to 4 (most satisfied). While estimating the
composite index, the values of individual satisfaction items were treated as continuous
variables. For instance, if a client reported highest satisfaction (value 4 in the Likert
Scale) in all seven items, the composite index will be 28 points. Thus, the composite
index turned out to be a continuous variable.
This composite index was further standardized to enable comparison between other
quality outcomes (i.e. research questions 1 and 2). Standardized satisfaction index (z-
score) was constructed based on the following equation.
𝑍 = 𝑋 − 𝜇
𝜎
Where Z – standard score, X – each value in the data, µ – sample mean, and σ – standard
deviation
Generating the index using variable weighting through principal component analysis
(PCA) was also undertaken.
Figure 7.1: Constructing satisfaction index
7.3 Results
7.3.1 Descriptive statistics Table 7.1 presents reported clients’ satisfaction from the baseline survey on various
elements of service delivery. A very high proportion of clients reported satisfaction on

203
operating hours (P4P = 96% and control = 96%), privacy during consultation (P4P=
95% and control = 98%), time taken for consultation (P4P= 94% and control = 97%),
attitude of staff (P4P = 94% and control = 93%), availability of medicines (P4P= 93%
and control = 93%) and cleanliness (P4P = 85% and control = 85%). Clients reported
relative lower levels of satisfaction on waiting time in both arms (P4P = 76% and
control = 79%) and registration fee (P4P= 63% and control = 62%).
Table 7.1: Proportion of clients reporting satisfaction
Variable Control N=177
P4P N=208
Total N=385
N % N % N % Operating hours 177 96 207 96 384 96
Cleanliness 177 85 208 85 385 85 Privacy 177 98 208 95 385 96
Waiting time 175 79 205 76 380 77 Staff attitude 177 93 208 94 385 94
Consultation time 177 97 208 94 385 95 Medicine 164 93 197 93 361 93
Registration fee 55 62 98 63 153 63
7.3.1.1 Comparison of satisfaction index by index construction
Alternative ways of generating the composite satisfaction index was explored through a
principal component analysis (PCA), and converting ordinal satisfaction variables to
binary (lower satisfaction values 1 and 2 were treated as unsatisfied, while higher
satisfaction values 3 and 4 were considered as satisfied) and then constructing the
composite index out of the binary variables. With the principal component analysis, the
composite satisfaction index was obtained from the seven sub-indices (operating hours,
cleanliness, privacy, waiting time, staff attitude, consultation time, and medicine) and
only one principal component was considered. Figure 7.2 shows the distribution of
indices constructed in three ways – PCA, equally weighted continuous index and equally
weighted binary index. Indices constructed through different methods show similar
sample distribution within each survey round, i.e. baseline and follow up.

204
Figure 7.2: Distribution of client satisfaction estimates by index construction
As shown in the Bland-Altman plots comparing the differences in both ways of index
construction by survey rounds (figure 7.3), majority of the data points fall within the
recommended limits of agreement (within ± 1.96 SD of the mean difference). This
means the indices are in high agreement and they can be used interchangeably.
Figure 7.3: Agreement of client satisfaction estimates by index construction

205
7.3.2 Baseline sample balance
Balance of sample characteristics was tested with Wilcoxon Rank Sum Test for ordinal
variables. As shown in table 7.2, clients’ reported satisfaction on various dimensions of
service delivery were similar in both arms. Only one variable – staff attitude was
statistically significant.
Table 7.2: Sample balance – satisfaction
Variable Control N=177
P4P N=208
Adjusted variance*
p value
Operating hours 177 207 461061.05 0.822 Cleanliness 177 208 942789.93 0.205
Privacy 177 208 216000.27 0.060 Waiting time 175 205 816390.40 0.391 Staff attitude 177 208 635272.11 0.042
Consultation time 177 208 470305.35 0.058 Medicine 164 197 568982.51 0.338
Registration fee 55 98 62968.51 0.131 * Adjusted variance obtained through Wilcoxon Rank Sum test for ordinal variables
7.3.3 Correlation analysis
Correlation analyses was performed for the satisfaction index (table 7.3). None of the
correlation coefficients was above the threshold of 0.8, the highest being 0.57 between
privacy and consultation time. Thus, all index items were retained for the index
construction.
Table 7.3: Correlation matrix – Satisfaction index Work
hours Cleanliness Privacy Waiting
time Staff attitude
Consultation time
Medicine Reg. fee
Work hours 1.00 Cleanliness 0.23 1.00
Privacy 0.30 0.25 1.00
Waiting time
0.22 0.27 0.17 1.00
Staff attitude
0.30 0.51 0.35 0.25 1.00
Consultation time
0.31 0.31 0.57 0.25 0.51 1.00
Medicine 0.05 0.17 0.04 0.14 0.25 0.04 1.00
Registration fee
0.11 0.21 0.16 0.29 0.22 0.12 0.25 1.00

206
7.3.4 Impact estimates
Impact of the P4P program on client satisfaction was estimated as intention-to-treat
with difference-in-difference estimates using multilevel modelling regression. Here the
multilevel model considered four levels of analysis, i.e. client, health facility, district and
province. Since the individual items were collected on a Likert Scale, the analysis
followed a multilevel mixed-effects ordered logistic regression. The composite index,
however was analyzed with a multilevel mixed-effects linear regression adjusting for
contextual factors at the facility, provider and client levels as it was a continuous
variable. The models ran the regressions while adjusting for covariates at the facility
(ownership, type of facility, catchment population and distance to the nearest higher
level facility, provider (gender and cadre), and client levels (age, education, wealth
quintile, distance from home to health facility, parity, number of visit, and gestational
age).
The impact estimates are difference-in-difference values, i.e. the relative difference
between changes in P4P arm and control arm across two rounds of survey. For
instance, an impact estimate of 0.231 for an index means the relative gain in the P4P
arm was 0.231 units higher than that of the control arm between the baseline and
follow up time periods. There are two different units of measurement as far as the
impact estimates are concerned. For the individual items, the unit of measurement was
points, whereas it was standard deviations for the composite index as it was
standardized.
7.3.4.1 Estimates for individual items
As shown in table 7.4, all individual satisfaction items showed gains in the P4P arm with
five out of total seven showing statistically significant impact. Among all individual
items, satisfaction on privacy showed the highest gain with a relative increase by 1.785
points (SE 0. 785; p value = 0. 023), followed by waiting time at 1.291 points (SE 0. 385;
p value = 0. 001), and cleanliness at 0.78 points (SE 0. 374; p value = 0. 037). There
were no significant gains for satisfaction on – facility operating hours (effect size 0.985;
SE 0.536), staff attitude (effect size 0.874; SE 0.479), consultation time (effect size

207
0.093; SE 0.609) and medicine (effect size 0.254; SE 0.42) also posed relative gains
though at non-significant levels
Table 7.4: Impact estimates – satisfaction Operating
hours Cleanliness Privacy Waiting
time Staff
attitude Consultation
time Medicine
impact estimate*
est 0.985* 0.780** 1.785** 1.291*** 0.874* 0.093 0.254
se (0.536) (0.374) (0.785) (0.385) (0.479) (0.609) (0.420)
p 0.066 0.037 0.023 0.001 0.068 0.879 0.546
P4P est 0.509 0.077 -0.845 -0.389 -0.060 -0.516 0.094
se (0.474) (0.390) (0.673) (0.396) (0.427) (0.474) (0.308)
p 0.283 0.843 0.209 0.326 0.888 0.276 0.760
period est -0.055 0.310 -0.776
-0.966*** 0.154 1.158** 0.252
se (0.351) (0.278) (0.550) (0.277) (0.366) (0.482) (0.325)
p 0.876 0.265 0.158 0.000 0.673 0.016 0.438
rural health center
est 0.321 -0.524 1.255* -0.190 -0.088 0.235 -0.305
se (0.560) (0.488) (0.664) (0.476) (0.521) (0.544) (1.393)
p 0.566 0.283 0.059 0.690 0.865 0.666 0.826
owner govt. est -0.738 0.099 -0.863 -0.408 -0.227 -0.703 0.671
se (0.489) (0.379) (0.648) (0.364) (0.411) (0.488) (0.542)
p 0.131 0.793 0.183 0.262 0.581 0.149 0.215
catch population
est -0.000 -0.000 -0.000 -0.000 -0.000 -0.000 -0.000
se (0.000) (0.000) (0.000) (0.000) (0.000) (0.000) (0.000)
p 0.166 0.600 0.444 0.772 0.851 0.507 0.993
Provider-female
est -0.327 -0.349 -0.718 0.121 -0.328 -0.623* -0.132
se (0.363) (0.249) (0.506) (0.249) (0.319) (0.359) (0.413)
p 0.368 0.160 0.156 0.629 0.304 0.083 0.750
age est 0.024 0.013 0.027 0.024 0.002 0.056** 0.034*
se (0.024) (0.016) (0.035) (0.016) (0.021) (0.027) (0.019)
p 0.317 0.399 0.435 0.140 0.909 0.037 0.076
distance from house
est 0.003 -0.002 -0.017* -0.012* -0.002 -0.002 -0.001
se (0.011) (0.007) (0.009) (0.007) (0.010) (0.009) (0.012)
p 0.790 0.768 0.070 0.058 0.824 0.862 0.926
wealth quintile-lowest
est
0.239 0.006 -0.759* 0.166 -0.485* 0.151 0.221 se
(0.342) (0.217) (0.429) (0.232) (0.267) (0.340) (0.273) p
0.484 0.978 0.077 0.476 0.069 0.657 0.418
* Multilevel modeling estimates adjusted for facility, provider, client covariates and district pair matching; estimate units are points; standard errors in parentheses; *** p<0.01, ** p<0.05, * p<0.1; est – impact estimate, se – standard error, p – p value; sample size 759 women

208
7.3.4.2 Estimates for satisfaction index
Individual satisfaction items were combined to create composite satisfaction index
(table 7.5). The composite satisfaction index showed a relative improvement of 0.6
standard deviations in the P4P arm (SE 0.182; p value = 0.001) above the mean of the
control arm, which was statistically significant.
Table 7.5: Impact estimates – satisfaction index estimate* SE P value
impact estimate* 0.600*** 0.182 0.001
P4P -0.24 0.171 0.16
period -0.433*** 0.137 0.002
rural health center 0.189 0.188 0.316
owner govt. 0.046 0.149 0.756
catch population 0 0 0.75
distance from hospital -0.002 0.003 0.361
Provider-midwife 1.310* 0.72 0.069
Provider-nurse 1.103 0.702 0.116
Provider-female 0.034 0.108 0.755
age 0.014* 0.008 0.075
primary education 0.161* 0.092 0.081
gravidity 0.059 0.111 0.596
gestational age 0.013* 0.008 0.084
#anc visit 0.01 0.031 0.758
distance from house -0.001 0.003 0.79
wealth quintile-lowest 0.134 0.106 0.205
Constant -2.392*** 0.878 0.006
* Multilevel modeling estimates adjusted for facility, provider, client covariates and district pair matching; estimate units are standard deviations; *** p<0.01, ** p<0.05, * p<0.1; sample size 759 women
7.3.4.3 Sub group analysis
Subgroup analyses were undertaken to ascertain the distribution of impact by various
facility, provider and client characteristics.
As shown in table 7.6, clients visiting local government facilities reported higher
satisfaction compared to the clients visiting government facilities. Reported satisfaction
among local government facility clients was also similar to the satisfaction results from
the full sample. However, the magnitude and significance levels were higher than the
full sample except for the satisfaction on privacy.

209
The effect sizes for the satisfaction variables among local government facility clients
were as follows – operating hours 0.346 points (SE 0.113; p value 0.002), waiting time
2.976 points (SE 0.946; p value 0.002), provider attitude 2.227 points (SE 1.13; p value
0.049), and the composite satisfaction index 0.844 standard deviations (SE 0.269; p
value 0.002). Significant gains were not observed for satisfaction on cleanliness,
privacy, consultation time and medicines.
Clients from the government facilities, on the other hand reported significant
satisfaction only on one area –waiting time (effect size 1.586 points; p value 0.002). The
rest (satisfaction on operating hours, cleanliness, privacy, staff attitude, consultation
time, medicines and the composite satisfaction index) did not show any significant
changes.
Table 7.6: Subgroup impact estimates – satisfaction by facility ownership Government facilities
(n=450) Local government facilities
(n=253)
estimate* SE P value estimate* SE P value
Operating hours 0.552 0.648 0.394 0.346*** 0.113 0.002
Cleanliness 0.920* 0.515 0.074 1.346* 0.741 0.07
Privacy 0.105 0.925 0.91 0.076* 0.039 0.051
Waiting time 1.586*** 0.507 0.002 2.976*** 0.946 0.002
Staff attitude 0.669 0.637 0.294 2.227** 1.13 0.049
Consultation time -0.68 0.765 0.374 2.222 1.722 0.197
Medicine 0.247 0.601 0.681 -1.21 0.83 0.145
Satisfaction index 0.413* 0.239 0.084 0.844*** 0.269 0.002
* Multilevel modeling estimates adjusted for facility, provider, client covariates and district pair matching; estimate units are standard deviations for the index and points for others; *** p<0.01, ** p<0.05, * p<0.1
In terms of the types of facilities (table 7.7), clients from the rural hospitals reported
higher gains in satisfaction on all but three of the dimensions (operating hours, privacy
and staff attitude). Those with significant effect sizes were satisfaction on cleanliness by
0.519 points (SE 0.195; p value 0.008), waiting time by 2.241 points (SE 0.326; p value
<0.001), consultation time by 0.494 points (SE 0.224; p value 0.027), and medicines by
0.506 points (SE 0.188; p value 0.007). The composite satisfaction index also showed
gains (effect size 1.593 SD; p value <0.001), higher than that of the full sample.

210
Clients from rural health centers however, reported lower gains on satisfaction overall
compared to their counterparts from the rural hospitals. Effect size on operating hours
(1.482 points at p value 0.013) was significant. No significant gains were noted for
satisfaction on cleanliness, privacy, waiting time, staff attitude, consultation time,
medicine and the composite satisfaction index.
Table 7.7: Subgroup impact estimates – satisfaction by facility type Rural hospital
(n=143) Rural health center
(n=616)
estimate* SE P value estimate* SE P value
Operating hours -0.04 0.261 0.879 1.482** 0.593 0.013
Cleanliness 0.519*** 0.195 0.008 0.393 0.424 0.354
Privacy 0.376 0.241 0.119 1.401 1.086 0.197
Waiting time 2.241*** 0.326 <0.001 0.691* 0.417 0.097
Staff attitude 0.261 0.227 0.249 0.663 0.544 0.223
Consultation time 0.494** 0.224 0.027 -0.635 0.781 0.416
Medicine 0.506*** 0.188 0.007 0.075 0.498 0.880
Satisfaction index 1.593*** 0.353 <0.001 0.351* 0.199 0.078
* Multilevel modeling estimates adjusted for facility, provider, client covariates and district pair matching; estimate units are standard deviations for the index and points for others; *** p<0.01, ** p<0.05, * p<0.1
Table 7.8 shows reported satisfaction by cadre of providers. Overall, clients visiting
nurses for consultation reported higher satisfaction than those consulting nurse
midwives. Reported satisfaction was high in all dimensions except for consultation time
and medicines. However, declines in satisfaction were observed among clients visiting
nurse midwives. Satisfaction on privacy declined by 2.924 points (p value <0.001), staff
attitude by 3.194 points (p value <0.001), whereas for the composite satisfaction index
a decline of 1.959 SD was noticed (p value 0.004).

211
Table 7.8: Subgroup impact estimates – satisfaction by provider cadre Nurse midwife
(n=83) Nurse
(n=667)
estimate* SE P value estimate* SE P value
Operating hours -0.542 0.481 0.26 1.132** 0.551 0.04
Cleanliness 0.719 0.775 0.353 0.950** 0.405 0.019
Privacy -2.924*** 0.633 <0.001 2.752*** 0.909 0.002
Waiting time 1.697** 0.764 0.026 1.451*** 0.415 <0.001
Staff attitude -3.194*** 0.72 <0.001 1.267** 0.519 0.015
Consultation time -0.398 0.541 0.462 0.344 0.639 0.59
Medicine -1.519 1.001 0.129 -0.001 0.478 0.998
Satisfaction index -1.959*** 0.687 0.004 0.683*** 0.204 0.001
* Multilevel modeling estimates adjusted for facility, provider, client covariates and district pair matching; estimate units are standard deviations for the index and points for others; *** p<0.01, ** p<0.05, * p<0.1
Higher gains in satisfaction was observed among clients visiting male providers (table
7.9). Significant effect sizes among clients visiting male providers were observed on
cleanliness (effect size 2.259; p value 0.016), waiting time (effect size 3.832; p value
<0.001) and staff attitude (effect size 4.549; p value 0.007). Effect size on the composite
index was 0.914 standard deviations (p value 0.01), which was higher than that of the
full sample. Clients visiting female providers reported gains in satisfaction only on the
composite satisfaction index, whereas no significant changes were observed for the
remaining dimensions (satisfaction on operating hours, cleanliness, privacy, waiting
time, staff attitude, consultation time and medicine).
Table 7.9: Subgroup impact estimates – satisfaction by provider gender Male
(n=230) Female (n=529)
estimate* SE P value estimate* SE P value
Operating hours 1.603 1.371 0.242 1.085* 0.652 0.096
Cleanliness 2.259** 0.942 0.016 0.565 0.465 0.224
Privacy 0.028 0.162 0.862 1.361 0.937 0.146
Waiting time 3.832*** 0.971 <0.001 0.586 0.485 0.227
Staff attitude 4.549*** 1.697 0.007 0.44 2.249 0.845
Consultation time 2.37 1.984 0.232 -0.711 0.795 0.371
Medicine 0.239 1.337 0.858 -0.057 0.495 0.908
Satisfaction index 0.914*** 0.354 0.01 0.523** 0.236 0.027

212
* Multilevel modeling estimates adjusted for facility, provider, client covariates and district pair matching; estimate units are standard deviations for the index and points for others; *** p<0.01, ** p<0.05, * p<0.1
As shown in table 7.10, subgroup analyses were undertaken by clients’ duration of
pregnancy, gravidity, age and education. Women in their third trimester reported
higher gains in satisfaction on privacy, waiting time, and the composite satisfaction
index. On the other hand, no effect was observed on any satisfaction dimension among
second trimester clients.
Women pregnant for the first time in the P4P arm reported higher gains in satisfaction
in all dimensions except cleanliness and medicine; while those pregnant multiple times
reported no significant gains in any dimension.
The effect sizes were higher among clients of 20 to 34 age group specifically with
satisfaction on waiting time (effect size 1.288; p value 0.009), staff attitude (effect size
1.277; p value 0.037) and the composite index (effect size 0.568; p value 0.013).
Apart from the composite satisfaction index, clients with primary level of education
reported higher gains in satisfaction on waiting. On the other hand, higher gains in
satisfaction on privacy, waiting time and the composite index were reported by clients
with secondary education.

213
Table 7.10: Subgroup impact estimates – satisfaction by client characteristics Operating
hours Cleanliness Privacy Waiting
time Staff
attitude Consultation
time Medicine Satisfaction
index Trimester
est 0.583 -0.102 3.394 1.112 0.471 -1.438 1.645* 0.004 Second se (0.966) (0.829) (2.404) (0.718) (0.917) (1.224) (0.990) (0.566)
(n=255) p 0.546 0.902 0.158 0.122 0.608 0.240 0.097 0.994 est 1.266* 0.935* 2.205** 1.537*** 1.132* 0.718 -0.337 0.663***
Third se (0.698) (0.490) (1.092) (0.489) (0.634) (0.774) (0.554) (0.175) (n=495) p 0.070 0.056 0.043 0.002 0.074 0.353 0.544 <0.001
Gravidity est 1.286** 0.587 2.932*** 1.735*** 1.397** 1.586** 0.640 0.704***
First time se (0.654) (0.459) (1.037) (0.467) (0.615) (0.792) (0.796) (0.214) (n=526) p 0.049 0.201 0.005 <0.001 0.023 0.045 0.421 0.001
est 0.016 1.021 2.530 0.281 0.040 -0.232 -0.720 0.541 Multiple se (1.093) (0.693) (1.819) (0.740) (0.891) (0.185) (0.948) (0.342) (n=233) p 0.988 0.141 0.164 0.704 0.964 0.208 0.447 0.114
Age est 0.536 1.712* 0.285 -0.010 -0.529 -0.432 -0.451 0.668*
< 20 se (0.979) (0.884) (0.180) (0.886) (1.048) (0.231) (1.025) (0.386) (n=180) p 0.584 0.053 0.113 0.991 0.613 0.061 0.660 0.083
est 1.248 0.646 1.696* 1.288*** 1.277** 1.156 0.563 0.568** 20-34 se (0.778) (0.474) (1.000) (0.491) (0.611) (0.779) (0.518) (0.229)
(n=510) p 0.109 0.172 0.090 0.009 0.037 0.138 0.277 0.013 Education est 2.005* 1.763* 0.027 1.655** 1.642* -1.072 1.435 1.167***
Primary se (1.112) (0.922) (0.088) (0.764) (0.903) (1.403) (2.845) (0.350) (n=244) p 0.071 0.056 0.758 0.030 0.069 0.444 0.614 0.001
est 0.848 0.386 2.781*** 1.477*** 0.583 0.040 0.109 0.538** Secondary se (0.689) (0.480) (1.040) (0.492) (0.603) (0.783) (0.644) (0.222)
(n=501) p 0.219 0.421 0.008 0.003 0.333 0.960 0.865 0.015 * Multilevel modeling estimates adjusted for facility, provider, client covariates and district pair matching; standard errors in parentheses; estimate units are standard deviations for the index and points for others; *** p<0.01, ** p<0.05, * p<0.1; est – impact estimate, se – standard error, p – p value

214
Clients from lower socio-economic quintiles reported higher gains in satisfaction in
waiting time, and staff attitude (table 7.11). Higher wealth groups reported declines in
satisfaction. The composite satisfaction posted higher effect sizes among the lower
three wealth quintiles with estimates higher than the full sample, whereas the same
was lower in the higher two wealth quintiles without any statistical significance.
Table 7.11: Subgroup impact estimates – satisfaction by wealth quintile
Operating
hours Cleanliness Privacy
Waiting time
Staff attitude
Consultation time
Medicine Satisfaction
index
Lowest (n=149)
est 0.257 2.050* 0.189 4.737*** 3.844*** 0.218 2.725* 1.492***
se -0.182 -1.083 -0.187 -1.28 -1.359 -0.183 -1.465 -0.319
p 0.158 0.058 0.312 <0.001 0.005 0.231 0.063 <0.001
Second (n=166)
est 0.365 2.493* 0.348 1.247 2.743* 0.295 -0.642 1.349***
se -0.14 -1.333 -0.102 -0.881 -1.466 -0.104 -1.078 -0.331
p 0.009 0.061 0.001 0.157 0.061 0.005 0.551 <0.001
Third (n=138)
est 0.19 1.441 -0.365 3.149*** 6.665 0.011 -1.883 1.040***
se -0.159 -1.249 -0.127 -1.202 -4.156 -0.231 -1.509 -0.349
p 0.232 0.249 0.004 0.009 0.109 0.961 0.212 0.003
Fourth (n=152)
est -0.753 -0.341 -0.113 1.403 1.98 0.02 1.707 0.17
se -1.373 -0.835 -0.131 -1.216 -1.282 -0.163 -1.167 -0.428
p 0.583 0.683 0.388 0.249 0.123 0.904 0.144 0.692
Fifth (n=154)
est 3.357** -2.276* 8.524** -0.808 -2.723 -3.123* 0.635 0.293
se -1.522 -1.181 -3.95 -1.111 -1.967 -1.869 -1.617 -0.514
p 0.027 0.054 0.031 0.467 0.166 0.095 0.695 0.569
* Multilevel modeling estimates adjusted for facility, provider, client covariates and district pair matching; standard errors in parentheses; estimate units are standard deviations for the index and points for others; *** p<0.01, ** p<0.05, * p<0.1; est – impact estimate, se – standard error, p – p value
7.3.4.4 Sensitivity and robustness checks
Alternative ways of generating the composite satisfaction index was explored through a
principal component analysis (PCA), and converting ordinal satisfaction variables to
binary (lower satisfaction values 1 and 2 were treated as unsatisfied, while higher
satisfaction values 3 and 4 were considered as satisfied) and then constructing the

215
composite index out of the binary variables. With the principal component analysis, the
composite satisfaction index was obtained from the seven sub-indices (operating hours,
cleanliness, privacy, waiting time, staff attitude, consultation time, and medicine) and
only one principal component was considered.
Based on the alternate ways of creating composite index (table 7.12), the satisfaction
index shows lower effect sizes of 0.255 (PCA) and 0.464 (binary) at similar levels of
significance.
Table 7.12: Impact estimates – creating the satisfaction index by principal
component analysis and equal weighting Composite
index (PCA) Composite index (equal weights)
continuous [final model]
Composite index (equal weights)
binary impact estimate*
est 0.255*** 0.600*** 0.464***
se (0.076) (0.182) (0.179) p 0.001 0.001 0.010
P4P est -0.104 -0.240 -0.223 se (0.072) (0.171) (0.168) p 0.148 0.160 0.187
period est -0.085 -0.433*** -0.363*** se (0.057) (0.137) (0.135) p 0.137 0.002 0.007
rural health center
est 0.080 0.189 0.132
se (0.079) (0.188) (0.185) p 0.310 0.316 0.476
Provider-female
est 0.014 0.034 0.097
se (0.045) (0.108) (0.107) p 0.751 0.755 0.362
gestational age
est 0.005* 0.013* 0.010
se (0.003) (0.008) (0.008) p 0.089 0.084 0.208
Constant est 2.617*** -2.392*** -2.652*** se (0.367) (0.878) (0.864) p 0.000 0.006 0.002
* Multilevel modeling estimates adjusted for facility, provider, client covariates and district pair
matching; standard errors in parentheses; estimate units are points for the PCA index and standard
deviations for others; *** p<0.01, ** p<0.05, * p<0.1; est – impact estimate, se – standard error, p – p
value; sample size 759 women

216
Model specification parameters were altered to observe the changes in the effect sizes.
For example, the level parameters were fixed at four levels (client, facility, district, and
province) or three levels (client, facility and district). Models were also built without
covariates. Table 7.13 shows impact estimates for these various models. Among
individual variables, adding covariates reduces the effects sizes of satisfaction on
operating hours, cleanliness and staff attitude; whereas increases marginally the effect
sizes of privacy and waiting time. The changes were minimal after altering the levels.

217
Table 7.13: Sensitivity of impact estimates by levels and covariates Operating
hours Cleanliness Privacy Waiting
time Staff
attitude Consultation
time Medicine Satisfaction
index Three levels without covariates
est 1.324*** 1.000*** 1.419** 1.203*** 1.028** 0.352 0.303 0.513*** se (0.505) (0.355) (0.675) (0.354) (0.446) (0.586) (0.396) (0.143) p 0.009 0.005 0.036 0.001 0.021 0.548 0.444 <0.001
Three levels and covariates est 0.988* 0.780** 1.785** 1.293*** 0.875* 0.094 0.251 0.600*** se (0.524) (0.373) (0.775) (0.385) (0.473) (0.607) (0.410) (0.182) p 0.059 0.036 0.021 0.001 0.064 0.877 0.540 0.001
Four levels without covariates est 1.319** 0.999*** 1.416** 1.202*** 1.026** 0.349 0.299 0.513*** se (0.513) (0.356) (0.671) (0.356) (0.453) (0.588) (0.392) (0.143) p 0.010 0.005 0.035 0.001 0.023 0.553 0.446 <0.001
Four levels and covariates (final model) est 0.985* 0.780** 1.785** 1.291*** 0.874* 0.093 0.254 0.600*** se (0.536) (0.374) (0.785) (0.385) (0.479) (0.609) (0.420) (0.182) p 0.066 0.037 0.023 0.001 0.068 0.879 0.546 0.001
* Multilevel modeling estimates adjusted for district pair matching; standard errors in parentheses; estimate units are standard deviations for the index
and points for others; *** p<0.01, ** p<0.05, * p<0.1; est – impact estimate, se – standard error, p – p value; sample size 759 women

218
Sensitivity of the multilevel models were also tested by adjusting district pair matching.
As far as the composite satisfaction index is concerned, table 7.14 shows that the impact
estimate for the model without accounting for district pair matching was slightly lower
than the final model that considered the pair matching.
Table 7.14: Sensitivity of impact estimates by district pair matching Without adjusting for district
pair-matching Accounting for district pair-
matching (final model)
estimate* SE P value estimate* SE P value
Operating hours 1.111** 0.535 0.038 0.985* 0.536 0.066
Cleanliness 0.631* 0.369 0.087 0.780** 0.374 0.037
Privacy 1.813** 0.742 0.015 1.785** 0.785 0.023
Waiting time 1.305*** 0.369 <0.001 1.291*** 0.385 0.001
Staff attitude 0.802* 0.458 0.08 0.874* 0.479 0.068
Consultation time 0.287 0.591 0.627 0.093 0.609 0.879
Medicine 0.256 0.398 0.52 0.254 0.42 0.546
Satisfaction index 0.587*** 0.18 0.001 0.600*** 0.182 0.001
* Multilevel modeling estimates adjusted for facility, provider and client covariates; estimate units are
standard deviations for the index and points for others; *** p<0.01, ** p<0.05, * p<0.1; sample size 759
women
Models were also built with robust clustered standard errors (table 7.15). Significance
level of variables was lower, i.e. higher p values and SEs with robust standard errors.
Table 7.15: Sensitivity of impact estimates by robust SE With robust standard errors Without robust standard
errors (final model) estimate* SE P value estimate* SE P value
Operating hours 0.985 0.853 0.248 0.985* 0.536 0.066 Cleanliness 0.78 0.574 0.174 0.78** 0.374 0.037 Privacy 1.785 1.271 0.16 1.785** 0.785 0.023 Waiting time 1.291** 0.582 0.027 1.291*** 0.385 0.001 Staff attitude 0.874** 0.418 0.037 0.874* 0.479 0.068 Consultation time 0.093 0.911 0.919 0.093 0.609 0.879 Medicine 0.254 0.857 0.767 0.254 0.42 0.546 Satisfaction index 0.600* 0.316 0.058 0.600*** 0.182 0.001 * Multilevel modeling estimates adjusted for facility, provider, client covariates and district pair
matching; estimate units are standard deviations for the index and points for others; *** p<0.01, **
p<0.05, * p<0.1; sample size 759 women
219
Impact on satisfaction was estimated after adjusting for structural and process quality
as they could influence the former. For example, if there was no functional blood
pressure measuring equipment (structural quality) in the health facility, the providers
would not be able to measure the client’s blood pressure (process quality) during the
ANC consultation and this might have led to the dissatisfaction of the client through the
“staff attitude” dimension. As it can be seen from table 7.16, the effects sizes are similar
even after adjusting for structural and process quality.

220
Table 7.16: Sensitivity of impact estimates by adjusting structural and process quality Operating
hours Cleanliness Privacy Waiting
time Staff
attitude Consultation
time Medicine Satisfaction
index Adjusting for structural quality
estimate* 0.996* 0.725* 2.201*** 1.155*** 0.751 0.290 0.104 0.552***
SE (0.560) (0.386) (0.834) (0.395) (0.508) (0.625) (0.433) (0.185)
P value 0.075 0.060 0.008 0.003 0.139 0.642 0.810 0.003
Adjusting for process quality
estimate* 0.952* 0.783** 1.737** 1.293*** 0.881* 0.090 0.223 0.642***
SE (0.540) (0.374) (0.792) (0.385) (0.479) (0.611) (0.420) (0.184)
P value 0.078 0.036 0.028 0.001 0.066 0.883 0.595 <0.001
Adjusting for structural and process quality
estimate* 0.958* 0.728* 2.140** 1.157*** 0.757 0.288 0.070 0.593***
SE (0.563) (0.386) (0.838) (0.395) (0.508) (0.626) (0.435) (0.186)
P value 0.089 0.059 0.011 0.003 0.136 0.645 0.872 0.001
No adjustment for structural or process quality (final model)
estimate* 0.985* 0.780** 1.785** 1.291*** 0.874* 0.093 0.254 0.600***
SE (0.536) (0.374) (0.785) (0.385) (0.479) (0.609) (0.420) (0.182)
P value 0.066 0.037 0.023 0.001 0.068 0.879 0.546 0.001
* Multilevel modeling estimates adjusted for district pair matching; standard errors in parentheses; estimate units are standard deviations for the index
and points for others; *** p<0.01, ** p<0.05, * p<0.1; sample size 759 women

221
Sensitivity of the model was tested with a fully interacted model. In this model, apart
from the specifications mentioned in the “final model”, all covariates were interacted
separately with the P4P intervention, period and interaction of intervention and period.
As shown in table 7.17, the fully interacted model returns higher effect sizes for
satisfaction on waiting time (5.218 points; p value = 0.004) and composite satisfaction
index (4.528 SD; p value = 0.005). While, it produces higher effect sizes at non-
significance levels for satisfaction on cleanliness (2.631 points; p value = 0.071) and
privacy (1.358 points; p value = 0.077).
Table 7.17: Sensitivity of impact estimates by fully interacted model Fully interacted model Partial interacted model
(final model)
estimate* SE P value estimate* SE P value
Operating hours 1.356 1.009 0.179 0.985* 0.536 0.066
Cleanliness 2.631* 1.457 0.071 0.780** 0.374 0.037
Privacy 1.358* 0.767 0.077 1.785** 0.785 0.023
Waiting time 5.218*** 1.814 0.004 1.291*** 0.385 0.001
Staff attitude 0.307 0.978 0.753 0.874* 0.479 0.068
Consultation time -0.483 0.883 0.585 0.093 0.609 0.879
Medicine 0.505 1.175 0.668 0.254 0.42 0.546
Satisfaction index 4.528*** 1.628 0.005 0.600*** 0.182 0.001
* Multilevel modeling estimates adjusted for facility, provider, client covariates and district pair
matching; estimate units are standard deviations for the index and points for others; *** p<0.01, **
p<0.05, * p<0.1; sample size 759 women
While testing the goodness-of-fit (table 7.18), models with covariates were generally
better fit than their without covariate counterparts. There were no differences after
altering the levels of analysis, i.e. three levels versus four.
Table 7.18: Tests for model goodness-of-fit Model fit statistics
Three levels without covariates
Three levels and covariates
Four levels without covariates
Four levels and covariates (final model)
Observations 757 515 757 515 loglikelihood -376.461 -238.764 -376.461 -238.764
df 19 33 19 33 AIC 790.9222 543.5282 790.9222 543.5282 BIC 878.8801 683.5857 878.8801 683.5857
Deviance 752.9222 477.5282 752.9222 477.5282 df – degrees of freedom; AIC – Akaike Information Criterion; BIC – Bayesian Information Criterion

222
7.3.4.5 Regression diagnostics The normality of the regression residuals for the composite satisfaction index variable
was verified by the standardized values of the residuals at various levels of analysis.
Though there is a slight deviation from normality at the tails, the residuals overall seem
closer to normal distribution at all levels (Figure 7.4).
Figure 7.4: Normality of residuals

223
Homogeneity of variance of the residuals was checked through graphs plotting
residuals against the fitted values. The residuals could be said as homoscedastic as the
plot (figure 7.5) shows no particular pattern of the distribution of the residuals.
Figure 7.5: Homoscedasticity of residuals

224
Chapter 8: Discussion
8.1 Overview
This chapter first presents the summary of the effectiveness of P4P program on all
three dimensions of the quality of antenatal care observed in Zimbabwe and
triangulates the findings by comparing and contrasting with the experience of P4P
programs reported from other LMICs. Further, it discusses the contextual determinants
of P4P program’s effectiveness on quality of ANC in Zimbabwe and compares these
observations with the relevant evidence reported from other LMICs. Finally, it describes
potential research and policy implications for P4P programs, and suggests the way
forward.
8.2 Summary of results
Table 8.1 summarizes key findings from the study. Indicators that reported statistically
significant changes are presented in the table. There was no indicator in the study that
had a statistically significant relative decline. The following sections describe the results
in detail by the element of quality.
Table 8.1: Summary of effects Quality element Item
Structural quality
Availability of iron and folic acid tablets Availability of urine tests Availability of refrigerator Composite structural quality index
Process quality
Prescription of antimalarials Counseling on family planning Counseling for delivery preparations Prescription index Counseling index Composite process quality index
Satisfaction Cleanliness Waiting time Privacy Composite satisfaction index
Note: indicators presented in the table report statistically significant improvements for the P4P arm

225
8.2.1 Structural quality
Individual structural quality items that showed gains for the P4P facilities were –
availability of iron (component of drugs and vaccines index), availability of urine tests
(component of diagnostic test index), and availability of functional refrigerator
(components of equipment index).
P4P facilities had a relative increase in skilled staff. However, this increment was not
statistically significant. There was a relative reduction in the availability of tetanus
toxoid among P4P facilities.
All five sub-indices (physical infrastructure, staff, diagnostic test, drugs and vaccines,
and equipment) showed relative gains in the P4P arm, but none demonstrated a
significant gain. However, the composite structural quality index in the P4P arm
showed a statistically significant relative improvement of 0.595 standard deviations
above the mean in the control arm.
In the subgroup analyses though the composite structural quality was significantly
better in both Ministry of Health (MoHCC) and local government facilities, the
improvement was higher among local government facilities. In addition, MoHCC
facilities reported increases in the availability of drugs and equipment indices; whereas
the local government facilities showed enhancements in the diagnostic index, which
was not observed in the total sample. Among the two types of health facilities by level
(rural health centers and rural hospitals), both echoed the findings from the total
sample. In addition, rural health centers reported a higher relative increase in
equipment index, whereas rural hospitals on diagnostic index.
Another composite structural quality index that included (a) medicines stock
management, (b) outpatient department, (c) family and child health, and (d) infection
control and waste management also showed gains in the P4P arm (by 0.83 standard
deviations above the mean in the control arm). Among individual quality items for this
composite index, significant increments were noticed in availability of diagnostic kits,
display of focused antenatal care protocol, and use of infection control policy, whereas
sterilization as per standards score went down.
226
The improvements in the composite quality index and family and child health sub-index
among the MoHCC and local government facilities were similar to the total sample. In
addition to these two indices (composite quality and FCH indices), the outpatient index
was also higher in the rural health center sub-sample than the total sample. The
magnitude of improvement and the level of significance of the family and child health
index and the composite index were better in the rural health center sub-sample than
the total sample. Rural hospitals however, reported the increase only in the infection
control index and that too at a lower level of significance and magnitude than the total
sample.
8.2.2 Process quality
Among the individual process quality items, P4P facilities showed relative gains in
prescription of antimalarial drugs (component of prescription index), counselling on
delivery preparations and family planning (components of counseling index). None of
the items from physical examination index had a significant increase in the P4P
facilities. Three out of four sub-indices showed relative gains, however only two were
statistically significant. The highest increase was noted in counseling index, followed by
prescription index. Laboratory test and physical examination indices though not
statistically significant the former showed a relative increase and latter showed a
decline for P4P facilities. Finally, the composite process quality index in the P4P arm
registered a statistically significant increase of 0.556 standard deviations above the
mean in the control arm.
MoH facilities reported significant gains in laboratory test and composite process
quality indices for the P4P arm. Local government facilities on the other hand reported
higher increments in the counseling index, and smaller increments in the composite
quality index. Rural hospitals did not record any significant gains on any of the quality
indices for the P4P arm, whereas rural health centers showed significant gains for all
indices similar to the total sample.

227
In the P4P arm, all process quality indices except for the physical examination index
were higher when clients were seen by nurses. On the other hand, all indices except
physical examination index were lower when seen by a nurse midwife. However,
among these declining indices, only laboratory test was statistically significant. Clients
visiting male providers reported higher relative gains in quality indices for the P4P arm,
more so with greater magnitudes and significance than the total sample.
Subgroup analyses showed that women in the second trimester had a higher relative
gain in the composite process quality index, though clients in their third trimester also
had a significant gain. However, gains in counseling index remained significant only for
women in the third trimester, while women in second trimester had higher gains in
physical examination index. In the P4P arm, primigravida women reported higher
effects than multigravida. The increase in counseling index was not significant among
multigravida even though it was significant in the total sample. The age and level of
education of women were associated with the reported effects of P4P program. All
indices were higher for women between 20 and 34 years of age than in the total sample.
Women with secondary level of education reported higher gains in all indices except
physical examination.
Physical examination index was lower in P4P arm among the lower wealth quintiles,
whereas it was higher among higher wealth groups. However, it was significant only
among second and fourth wealth groups. The increase in laboratory test index, similarly
was lower among the lower wealth quintiles. P4P’s effect on prescription and
counseling indices were similar across various wealth quintiles. Finally, the composite
process quality index showed significant relative gains for the third and fifth wealth
quintile groups, and these estimates were higher than the total sample.
The effect of P4P on process quality index estimated by adjusting the levels of structural
quality in the health facilities was similar between the study arms in terms of both
magnitude and significance.

228
8.2.3 Client satisfaction
All individual satisfaction items showed gains in the P4P arm with three items out of
total seven showing statistically significant effect. Among all individual items,
satisfaction on privacy showed the highest gain, followed by waiting time and
cleanliness.
The P4P program did not have any effect on satisfaction on facility operating hours,
staff attitude, consultation time and availability of medicines. The composite
satisfaction index in the P4P arm showed a relative improvement of 0.6 standard
deviations above the mean in the control arm, which was statistically significant.
Clients visiting local government facilities reported higher satisfaction compared to the
clients visiting MoH facilities. Specifically, clients in local government facilities reported
a higher satisfaction level on operating hours, cleanliness, privacy, waiting time and
provider attitude. These facilities did not show any improvement on consultation time,
while although not statistically significant, there was a decline in the client satisfaction
for medicine availability. Clients from the MoH facilities, on the other hand reported
significant satisfaction on cleanliness and waiting time, and the composite satisfaction
index.
Clients from the rural hospitals reported higher satisfaction on cleanliness, waiting
time, consultation time, medicine availability, while their reported satisfaction on staff
attitude and operating hours did not improve. The composite satisfaction index was
also higher among clients seen at rural hospitals than that of the total sample.
Clients from rural health centers however, reported lower gains on satisfaction overall
compared to their counterparts from the rural hospitals. The effect of P4P on operating
hours and waiting time was statistically significant though lower in magnitude. For
rural health centers, client satisfaction on operating hours and waiting time had
improved, while there was a negative trend for consultation time.
Overall, clients visiting nurses for consultation reported higher satisfaction than those
consulting nurse midwives. Reported satisfaction was high in all dimensions except the
availability of medicines. However, declines in satisfaction were observed among clients
visiting nurse midwives specifically on privacy and staff attitude. Higher gains in

229
satisfaction on cleanliness, waiting time and staff attitude were observed where clients
were seen by male health workers, while those visiting female providers were satisfied
on operating hours only. Although not statistically significant, ANC clients’ visiting
female providers reported a lower satisfaction on consultation time.
Women in their third trimester reported higher gains in satisfaction on operating hours,
cleanliness, privacy, waiting time, staff attitude and the composite satisfaction index. On
the other hand, among women in their second trimester a higher effect of P4P was
observed only on satisfaction related to medicine. Primigravida women in the P4P arm
reported higher gains in satisfaction whereas multigravida reported no significant gains
in any dimension. Women in the 20 to 34 age group reported higher satisfaction
specifically on waiting time, staff attitude and the composite index.
Clients from lower socio-economic quintiles reported higher gains in satisfaction in
cleanliness, waiting time, and staff attitude. However, higher wealth quintiles reported
declines in the composite satisfaction index. The lower three wealth quintiles reported
a higher composite satisfaction index than the total sample, whereas the two higher
wealth quintiles reported a lower satisfaction index though not statistically significant.
The effect size of satisfaction did not change after adjusting for structural and process
quality.
8.3 Effectiveness of P4P on ANC quality in Zimbabwe vis-à-vis evidence from
other P4P programs in LMICs
8.3.1 Structural Quality
The P4P program in Zimbabwe showed a positive effect on the aggregate structural
quality index (0.595 SDs; p=0.023). Evaluations of P4P program in Burundi (17.24%
points; p=0.062), DRC (26% points; p<0.001) and Cambodia (12% points; p<0.1) also
showed that P4P improved the facility structural quality score.89,95,167 In Zimbabwe,
irrespective of the type of ownership (MoH, local government and mission) and level
(primary vs. secondary) of facilities there was improvement in the overall structural
quality index. The existing evaluations of P4P programs in several LMICs also reflect

230
that irrespective of the type of ownership of facilities, P4P programs are effective to
improve structural quality of maternal and child healthcare.89,95,96,98,109,168–171 While
there are similarities in the effects of P4P on structural quality, the differences in effect
sizes are likely due to variations in context, organization of local healthcare delivery
system including decentralization and capacity of health facilities, program design,
evaluation methods and measurement of effects.24,101,172,173 For instance, in the
Zimbabwe P4P study, the focus was on antenatal care. Thus, the structural quality index
was constructed out of ANC related elements. The list of equipment, drugs and
diagnostics included those items that were pertinent to delivering ANC services.
In Zimbabwe, the P4P program significantly improved the overall structural quality for
ANC services. It could be due to the fact that the primary aim of the P4P program in the
country was to improve maternal (including ANC) and child health and hence the
program was structured or designed to improve the quality for MCH services.174 Also,
these elements of structural quality were part of the incentive mechanism where it was
a pre-condition to achieve gains for these elements to receive P4P incentives. The P4P
evaluation in Burundi also reflects that if improving quality of a particular service (e.g.
maternal health) is an objective of the program, then there is a higher possibility of
improving any element of quality under a P4P even partially.95 On the contrary, if the
program does not target improvements in quality other than service usage, then the
probability of enhancing quality is limited as shown in the P4P programs of Rwanda
and Cambodia.15,167 Another major reason for increased structural quality under P4P in
Zimbabwe could be regular monitoring and supervision of health facility performance
by the higher authority. Similar findings have been reported by Bangladesh, Tanzania
and Rwanda in their P4P programs.15,169,173 These supportive supervision and regular
feedback led to constant democratic planning and implementation of performance
targets of facilities towards structural quality improvements.169 Provision of autonomy
and local level decision making for the health facilities could be two more reasons for
these positive changes.
On the contrary, another P4P program in the Democratic Republic of Congo had a
negative effect on the structural quality index (-0.53 SDs; p=0.014). The negative effect

231
in DRC comes out of a lower resource situation in the P4P arm.98 As the P4P was
introduced in DRC, the user fees were withdrawn in an attempt to attract clients.
However, the P4P incentives could not make up for the losses on the facility income due
to the removal of user fees. Thus, the P4P facilities encountered difficulties in investing
in infrastructure, equipment, and drugs for routine service provision.
P4P did not show any effect on the availability of qualified staff in Zimbabwe (5.4%
points; p=0.262), which was also the case in the Democratic Republic of Congo (-0.92
points; p=0.309).98 This could again be dependent on the autonomy at the level of the
health facility to recruit new staff, availability of adequate funds and skilled health
workers. A P4P pilot program in Zambia showed local level recruitment of data clerks,
volunteers and midwives utilizing the incentives.175 However, the health facilities in
Zimbabwe did not have the autonomy to recruit health workers using the P4P
incentives. As such the incentives were too small to hire an additional health worker.
The P4P program in Zimbabwe enhanced the availability of urine tests (22% points; p
value = 0.027). In contrast, two studies from Burundi reported that P4P did not have
any effect on the availability of overall diagnostic services (9% points and p=0.539 in
Rudasingwa et al; 0.32 points and p=0.452 in Bonfrer et al).95,176 The equipment index
did not change significantly in the Zimbabwe P4P program (0.063 points; p value =
0.109). This is similar to the situation in Tanzania (3.8 % points; p=0.391) and
Afghanistan (-1.4 % points; p=0.1), where no significant improvement in the availability
of medical equipment was observed.173,177 In contrast, a P4P program in DRC reported a
negative effect on the availability of equipment (-0.64 SDs; p=0.026).98 Similar to
Zimbabwe (0.051 points and p=0.4 for availability of drugs; 0.048 points and p=0.226
for physical infrastructure), the P4P program in Afghanistan did not show any
improvement in the availability of drugs (-4 % points; p=0.4) and physical
infrastructure (-11.2 % points; p=0.3).177 Health managers and staff in Rwanda and
Afghanistan reported that P4P had limited effect on infrastructure improvements for
ante natal care and other maternal care services.170,171 Qualitative evaluations from
several countries have reported that centralization in the functioning of healthcare
system and bureaucratic procedures in the procurement systems delay timely

232
procurement of drugs and equipment in facilities.15,95,169,172 These delays often lead to
drug stock out and inadequate availability of equipment and supplies. Sometimes,
procurement of drugs and equipment is beyond the complete authority of particular
health facilities, rather a higher authority (e.g. district or provincial level authority) may
be authorizing the process.172 Hence, there can be delays in the ultimate availability of
these items at the health facility. These findings are consistent with the observation in
the Zimbabwe P4P program that not all types of facilities had gains on equipment and
drug indices, although there were not any declines in their availability. A mid-term
review evaluation of the Zimbabwe program indicated that although local government-
owned facilities are supposed to have more autonomy, yet they followed a centralized
procurement system to purchase drugs to comply with the local standards.174 This
could be the reason that they did not report considerable gains on the availability of
drugs and equipment. In LMIC settings, there are serious concerns on the quality of
available drugs.178,179 Even though one obtains the autonomy to procure drugs and
equipment at a decentralized level, real availability and quality of commodities could be
questionable. On the contrary, P4P improved availability of drugs (8.4 % points;
p=0.002) in Tanzania.173 The availability of medicines was a precondition to achieve
certain performance targets in the Tanzania P4P. Secondly, facilities were able to use
incentives to procure drugs and supplies. Thirdly, district health officials were also
incentivized to minimize drug stock-outs.
The financial capacity of health facilities can determine their ability to build or renovate
physical infrastructures such as waiting area and toilets.13,95,172 As reported by other
P4P programs, financial capacity of the facilities depends to a large extent on the
revenue they get from the performance incentive program.13,95,169,172 Thus, it can be said
that the amount of incentives for each service indicator or performance indicator can
influence a health facility’s scope to improve structural quality. Under the Zimbabwe
P4P program, facilities had shown improvement on building small physical
infrastructure. The mid-term evaluation of the P4P program in Zimbabwe indicated that
the P4P program had improved the facility’s financial capacity to build physical
infrastructure (small waiting area, water supply, electricity) for maternal and child

233
health services.174 However, qualitative evaluations of several P4P programs including
that in Zimbabwe show that the revenue generated through the performance incentives
alone may not be sufficient for large improvements in physical infrastructure such as
building an operation theater or buying an expensive medical equipment.95,172,174 In the
design of the programs, incentives are developed in such a way that the amount of
performance incentive does not seem to be high enough to give large revenues to
facilities.172
The literature mentions about cherry picking in P4P programs where more attention is
given to indicators with higher incentives.25,26,77 However, these findings confine to only
high income settings. For diabetes care in Taiwan, older patients and patients with
severe conditions were more likely to be excluded from the P4P programs.97 In the
Zimbabwe P4P, a comparative analysis of the impact estimates of the indicators vis-à-
vis indicator weights could be performed only for the structural quality (figure 5.12).
The highest estimates along with statistical significance came from moderately
weighted services. Although moderately weighted, one indicator (sterilization of
instruments according to standards) showed significant negative gains. Thus, it can be
said that there was no cherry-picking among the structural quality indicators.
8.3.2 Process Quality
The evaluations of P4P programs in several LMICs have shown that they are effective to
improve process quality of antenatal care considerably similar to that observed in
Zimbabwe.15,98,110,176 However, there were also some negative results from these
evaluations where the procedures of P4P for a pregnant woman during her antenatal
visit either did not improve or came down under P4P program as explained further in
this section. Similar to this Zimbabwe study that showed an increase in the process
quality index (0.556 standard deviations; p = 0.001), there was a considerable but
lower increase in the overall process quality score for ANC care (0.157 standard
deviations; p = 0.02) in the Rwandan P4P program.15 A study in Burundi as well
reported an improvement in overall process quality of ANC (66% points; p<0.001).176
In DRC, however, providers’ compliance with the standardized clinical standards in the
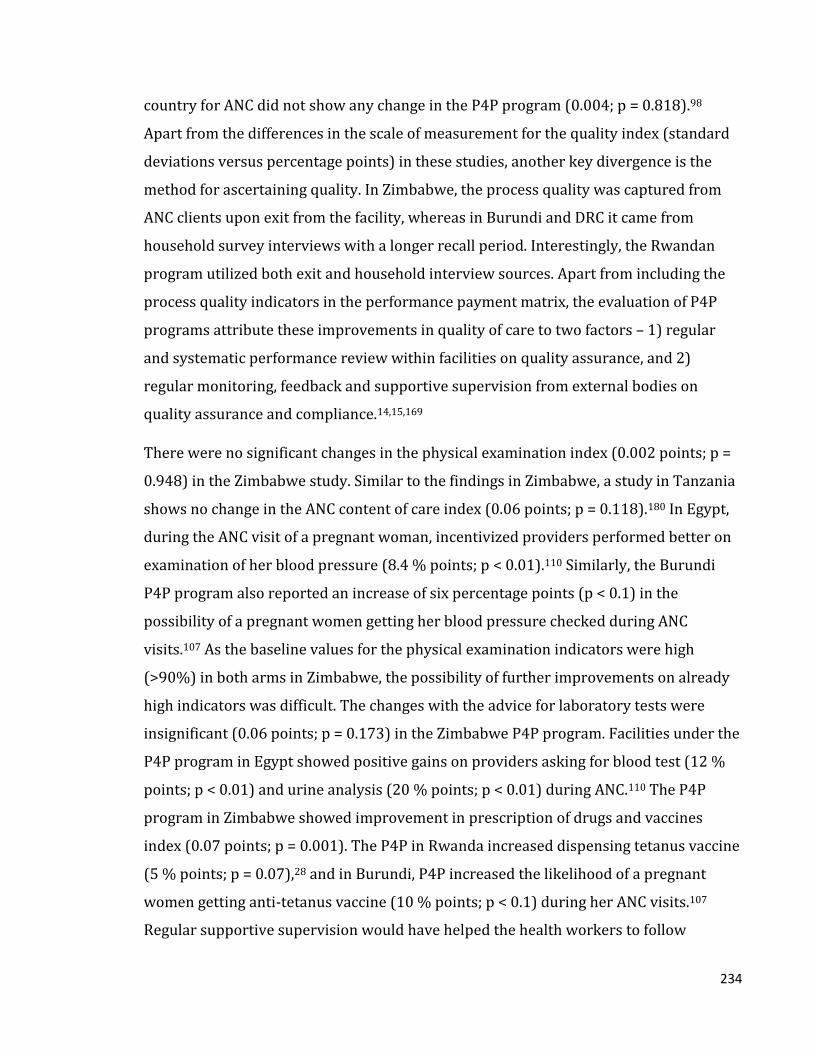
234
country for ANC did not show any change in the P4P program (0.004; p = 0.818).98
Apart from the differences in the scale of measurement for the quality index (standard
deviations versus percentage points) in these studies, another key divergence is the
method for ascertaining quality. In Zimbabwe, the process quality was captured from
ANC clients upon exit from the facility, whereas in Burundi and DRC it came from
household survey interviews with a longer recall period. Interestingly, the Rwandan
program utilized both exit and household interview sources. Apart from including the
process quality indicators in the performance payment matrix, the evaluation of P4P
programs attribute these improvements in quality of care to two factors – 1) regular
and systematic performance review within facilities on quality assurance, and 2)
regular monitoring, feedback and supportive supervision from external bodies on
quality assurance and compliance.14,15,169
There were no significant changes in the physical examination index (0.002 points; p =
0.948) in the Zimbabwe study. Similar to the findings in Zimbabwe, a study in Tanzania
shows no change in the ANC content of care index (0.06 points; p = 0.118).180 In Egypt,
during the ANC visit of a pregnant woman, incentivized providers performed better on
examination of her blood pressure (8.4 % points; p < 0.01).110 Similarly, the Burundi
P4P program also reported an increase of six percentage points (p < 0.1) in the
possibility of a pregnant women getting her blood pressure checked during ANC
visits.107 As the baseline values for the physical examination indicators were high
(>90%) in both arms in Zimbabwe, the possibility of further improvements on already
high indicators was difficult. The changes with the advice for laboratory tests were
insignificant (0.06 points; p = 0.173) in the Zimbabwe P4P program. Facilities under the
P4P program in Egypt showed positive gains on providers asking for blood test (12 %
points; p < 0.01) and urine analysis (20 % points; p < 0.01) during ANC.110 The P4P
program in Zimbabwe showed improvement in prescription of drugs and vaccines
index (0.07 points; p = 0.001). The P4P in Rwanda increased dispensing tetanus vaccine
(5 % points; p = 0.07),28 and in Burundi, P4P increased the likelihood of a pregnant
women getting anti-tetanus vaccine (10 % points; p < 0.1) during her ANC visits.107
Regular supportive supervision would have helped the health workers to follow

235
national guidelines on prescription of drugs and vaccines. In contrast, the evaluation of
a P4P program in Egypt did not show any improvement in prescription of iron, vitamins
and tetanus toxoid to pregnant women.110
In Zimbabwe, both MoH facilities and rural health centers had significant gains on
process quality of ANC compared to that of local government-owned facilities and rural
hospitals respectively. In Bangladesh, the effect of P4P on process quality of maternal
care was better in district hospitals than other lower levels of facilities.169 In Burundi,
there was no difference in the process quality of care between the government and
private facilities.95 Under the Egyptian P4P program, there were differences in the
performance of facilities based on geographies.110 Facilities with a low baseline for
quality had a better room for improvement under P4P in Burundi.95 In line with this
finding from Burundi, it could also be true for Zimbabwe that MoH facilities and rural
health centers had relatively lower level of quality for ANC before the intervention.174
Therefore, their relative gains were prominent compared to that in local government
and rural hospitals.
The heterogeneity of effects of P4P on the facility by ownership and level was reverse
for improvements on structural quality in Zimbabwe, i.e. both MoH facilities and rural
health centers had lower gains compared to that of local government-owned facilities
and rural hospitals respectively. As reported by other studies from elsewhere,
increased work load with the providers and the resultant ‘burn-out’ could be the
reasons for this low gains on process quality in rural hospitals and local government-
owned facilities, despite high gains on structural quality.15,98 In some studies, increased
patient load under P4P had a negative effect on providers’ job satisfaction and their
ability to comply with the clinical guidelines.15,98 These studies have also indicated that
with more patient load, staff felt ‘burnt out’. In DRC, there was a 14% reduction in staff
job satisfaction and around 60% of the staff reported increased work load and being
tired.98

236
There are few studies that report any association between process quality and types of
providers under P4P. 28,95,169 A study from Burundi reported that process quality of care
was not different across types of providers such as doctor, nurse and nurse midwife.95
In Zimbabwe, process quality was better with male providers and nurses. Based on the
professional training nurse midwives receive compared to that of nurses, there is a
possibility for nurse midwives possessing higher knowledge, skills and confidence on
ANC in Zimbabwe.133 However, this increased knowledge and skill did not translate to
higher gains on process quality with nurse midwives. This resonates with the findings
from an evaluation of P4P program in Rwanda.28 This evaluation had shown that
although knowledge gain for providers on ANC protocol was higher (0.40 standard
deviation increase) in the P4P facilities, this knowledge gain did not have any positive
relation with the improvement in their performance on ANC.28 Therefore, this study
attributes improved provider performance on quality to incentives.28 It is worth noting
that in the sharing of incentives among staff, nurse midwives had a higher share as per
the structure of incentive scheme in Zimbabwe.120 Above all, the P4P program had the
mandate to enforce adherence to the clinical practice guidelines on ANC. Nurse
midwives are higher in terms of education and hierarchy with more responsibilities.
However, a study looking at the health workforce effects of P4P in Zimbabwe reports
lower motivation for nurse midwives in the P4P arm compared to nurses.144This
reduced motivation comes out of a relatively higher patient load and lower supportive
supervision. As nurse midwives were higher in terms of skills and experience, the
facility heads directed more clients towards them leading to burnout.144 Similarly, the
supportive supervision teams from the district health office spent considerably more
time with the nurses as they needed more technical support than the midwives.144 A
higher process quality by male providers in Zimbabwe could be due to the fact that the
male providers had better training and experience.144 A point to note here is that most
of the male providers in the study sample were nurses.144 A process evaluation of P4P
program in the Gambia also reported higher competence and performance from male
providers.172

237
Women in the second and third trimesters had higher gains on process quality in
Zimbabwe. This finding is due to the fact that all the interviewed women for assessing
process quality were either in second or third trimesters and none in the first trimester.
Process quality gain on ANC was higher for wealthier and educated women in
Zimbabwe. Other studies from elsewhere also had reported that wealthier and
educated women obtained better quality of care in P4P programs.15,107 In Burundi,
there was increased possibility of richer pregnant women to have their blood pressure
measurement done compared to poorer women. This inequitable practice under P4P
reflects that P4P program is not able to address the existing practices on addressing
equity.13 Despite being incentivized on the performance targets equally, providers seem
to offer better care towards the well-off.28
8.3.3 Client Satisfaction
In this study, the client satisfaction index showed significant improvement in the P4P
arm (0.6 standard deviations higher than the mean of control arm at p = 0.001). This is
consistent with that has been reported from a P4P evaluation in DRC. The P4P program
in DRC improved the overall quality of ANC perceived by clients (15 % points; p =
0.05).89 The elements of satisfaction index in this study included – operating hours,
cleanliness, privacy, waiting time, staff attitude, consultation time and medicine. While,
in the DRC study, the elements were – medicine, waiting time, staff attitude, felt cured
and perceived quality. Apart from the variations in the construction of the satisfaction
index, the DRC evaluation included only post-test case control comparison for client
satisfaction. Compared to the sample in the DRC study (22 health facilities in two
districts) for the evaluation, the sample in this research was larger and spread across
the country (consisting of 77 health facilities in 32 districts).
Among all individual items in the Zimbabwe P4P that were used to construct the
composite satisfaction index, satisfaction on privacy showed the highest gain (1.8
points; p = 0.023), followed by waiting time (1.3 points; p = 0.001) and cleanliness (0.8
points; p = 0.037). Improvements on staff attitude (0.87 points) and operating hours
(0.98 points) were marginal with statistical significance at the 10% level. As far as
evaluating pregnant women’s satisfaction within a P4P program is concerned, this

238
Zimbabwe P4P study is the first to investigate and show positive effects on privacy and
cleanliness aspects of facilities. As mentioned in chapter 3, health facilities in the
Zimbabwe P4P were incentivized based on the service utilization (quantity) and quality
of services (figure 3.6). The quality further consisted of a quality bonus measured
through a quality checklist (75% weightage) and client satisfaction (25% weightage).
As client satisfaction was a determining factor in the facility earning from P4P, this
Zimbabwe P4P study shows a positive effect on satisfaction – on the composite index as
well as on the individual elements satisfaction. Moreover, cleanliness of the facilities
was one of the incentivized indicators under the quality checklist. Unlike this Zimbabwe
P4P study (1.3 points; p value = 0.001), P4P facilities in DRC and Burundi did not show
increased satisfaction on reasonable waiting time.89,95 Increase in the efficiency of the
health workers and longer facility operating hours in Zimbabwe are two possible
reasons for higher satisfaction on waiting time.174 In this Zimbabwe P4P study, reported
satisfaction on medicine availability did not improve (0.3 points; p value = 0.546), so as
in Burundi (4 % points; p = 0.492). On the contrary, patient reported availability of
drugs improved in the Democratic Republic of Congo (37 % points; p < 0.001).89 Under
the structural quality, this Zimbabwe P4P study does not show any improvement in the
availability of drugs due to factors beyond the control of the health facilities. Reported
client satisfaction on medicine availability reinforces the finding from the structural
quality. The effect of P4P on patient perceived attitude of providers varied in two
different P4P programs, while this Zimbabwe P4P study showed marginal improvement
in this dimension (0.87 points; p value = 0.068). The P4P evaluations in Burundi and
Tanzania did not find any change on satisfaction with provider attitude. However,
patients perceived an increase in the providers’ respect for patients in DRC (12 %
points; p < 0.1).89
With respect to the type of health facilities, this study found a variety of results on client
satisfaction. Client satisfaction was high for rural hospitals and local government-
owned health facilities. The existing literature shows that client satisfaction can be
subjective as it is based on patient’s perceptions.181 Patient perceptions are often based
on their existing knowledge, expectations and judgments.96 However, as both these

239
types of facilities had significant gains on structural quality improvements, there could
be also a possibility that while reporting their satisfaction, clients would have thought
of structural quality in particular than process quality. In Bangladesh, women who
rated structural quality for ANC as high (waiting area, drinking water and clean toilet)
were more satisfied with the overall quality of ANC.169
The existing evidence also shows that pregnant women visiting higher cadres or staff
with higher education and training had better satisfaction on ANC. A study from
Ethiopia had reported a relatively higher client satisfaction for doctors compared to
nurses on ANC.182 In India, pregnant women were more satisfied with nurses with
higher cadres during their ANC visit.183 However, in this Zimbabwe P4P study the
situation was reverse. Clients reported more satisfaction with the nurses than the nurse
midwives. As already explained in the previous section (section 8.3.2), nurse midwives
reported lower motivation to perform.144 This lower motivation is also reflected in
lower process quality and client satisfaction. Clients were perhaps able to perceive the
sub-optimal delivery of process quality from the midwives, thus resulting in lower
satisfaction.
Unlike the findings from Zimbabwe, studies elsewhere had shown higher satisfaction
with female providers for ANC. Pregnant women in countries such as Nigeria, Lebanon,
Senegal, India, Saudi Arabia and Thailand were more satisfied with female
providers.63,181,184–186 This higher satisfaction could be due to women’s gender-based
comfort in communications with females than males.181 On the contrary, it can be said
that in Zimbabwe, women as clients would have looked more at the competence and
skills of providers while reporting their level of satisfaction. A qualitative study on the
quality of care undertaken in Zimbabwe has shown women trust male providers more
as they have higher confidence on their skills than the women providers.187
One could expect client satisfaction to be lower among highly educated and richer
women as far as MCH services are concerned in an LMIC setting.186 As the levels of
education and wealth increase, women’s expectations from a provider increase.
Therefore, they are less likely to be satisfied on different elements of ANC in reality.188 A

240
study from Ethiopia showed that patient satisfaction on ANC decreased with increasing
levels of education and income.189 The same situation was observed in the P4P program
in Zimbabwe. Though satisfaction improved in all wealth quintiles, it was higher and
significant only among the lower three quintiles.
Women’s satisfaction had increased in Zimbabwe along with the gestational age. This
could be due to the fact that they experienced more physical examinations and
procedures related to screening of high risk cases in the second and third trimesters.
Women in the third trimester reported higher satisfaction. In addition, almost all
respondent women were from either second or third trimesters in this study. A patient
satisfaction survey on ANC in Bangladesh found that there was no association between
patient’s age, parity and trimester on their satisfaction with care.190 Studies from
Ethiopia and Iran had shown that mothers in the age group 25-34 were more likely to
be satisfied on ANC.182,191
8.4 Strengths and Limitations
This study is probably the first one that examined the impact of P4P on the three
dimensions of antenatal care quality elements in a low income country setting.
Although quality of maternal care has been a performance indicator for most of the
evaluations of P4P programs in LMIC settings, the existing evidence focus more on
program’s impact on usage of services than quality of care.101
The existing literature exploring the impact of any health system intervention in
general and P4P in particular in LMICs so far did not investigate comprehensively into
the intervention’s effect on all three dimensions of quality of care i.e. structure, process
and outcome quality. The structured analysis of quality elements of these dimensions
presented is relatively robust and relevant to understand how an intervention can
effectively contribute towards quality of maternal care. Such a thematic examination of
quality elements under P4P program can also reveal which aspect of the intervention
needs to be improved further. For example, if the effect of a P4P program on process

241
quality of care is less, the program needs to pay additional attention to the competence
and performance motivation of health workers.
To enhance the rigor of the findings, multilevel modelling was undertaken to account
for the hierarchical nature of the data. Even though many evaluations of P4P programs
in LMICs involved hierarchical data (for instance – health facilities implementing P4P
nested under districts and districts nested under provinces), none of the evaluations
utilized multilevel modeling analysis. Multilevel modelling is currently known as one of
the best techniques to adjust for hierarchy of data to ensure appropriate estimation of
impact estimate.159 Further, robustness and sensitivity checks were undertaken to
ensure the internal validity of the findings. Thematic selection of quality elements in the
study and application of multilevel modelling are potential for adaptation in evaluations
of similar P4P programs on MCH in other LMICs.
To quantitatively measure quality of care, indices were constructed. The quality indices
were created using various means to collapse the multiple dimensions to one tangible
quantitative measure. Collapsing multiple dimensions to one quantitative measure
helped to compare across various elements of quality. However, the dimensions were
also analyzed individually so as not to lose capturing the effects of the intervention on
them.
Finally, this study assessed quality of antenatal care in a country-wide maternal health
intervention in Zimbabwe by the Government. P4P program is considered to be a
leading approach by the Government to improve maternal and neonatal health in the
country. Study findings are potential to inform relevant changes in the program design
and implementation. In particular, the observation of less gains on specific structural
quality elements such as equipment can lead to a review of the prevailing procurement
systems for equipment, adequacy of incentives to purchase equipment and managerial
efficiency of facilities in procurement. Other areas for strengthening the
implementation are building capacity of the health workers and ensuring adherence to
clinical protocols.

242
Despite its novelty and contribution to the global knowledge base, this thesis has a few
limitations. These limitations are pertaining to the program design, evaluation design,
data collection, recall and misclassification bias, and analytic methods.
Although randomized controlled trial (RCT) is considered as a gold standard to assess
the effectiveness of health systems interventions,192 an RCT was not feasible in this
study as the intervention districts were selected non-randomly by the MoH. Health
system interventions are sometimes country-wide like the Zimbabwe P4P program,
restricting a counterfactual. However, in this evaluation, there is an attempt to match
the districts to create valid counterfactuals to enhance the robustness of the evaluation.
As this study analyzed several outcomes simultaneously, there could be a possibility for
a few outcomes showing statistically significant values merely by chance. Accounting
for multiple hypotheses testing during the analyses would have taken care of this
limitation.
While estimating the wealth index, the exit interview sample was considered as the
universe. The principal component analysis created asset weights based on the exit
interview clients only. This estimation may be biased as the socio-economic profile of
the exit interview clients could be different from that of the entire population. It would
have been ideal to apply the asset weights from the most recent demographic and
health survey that takes in to account the socio-economic profile of the entire
population while estimating the wealth index.
Client satisfaction was analyzed through the four-point Likert Scale responses with the
highest satisfaction being valued at four times more than the least satisfaction.
Alternate ways of quantifying the responses could have been explored such as assigning
negative values to responses with lower levels of satisfaction. For instance, highly
satisfied could be scored 2, slightly satisfied 1, slightly dissatisfied -1, and highly
dissatisfied -2.
Even though P4P rewards performance, in essence it increases the funding to health
centers. Some improvements in service delivery can be observed merely by increasing
the amount of funds. It would have been ideal to balance the effect of this additional

243
financing by creating an intervention arm where P4P equivalent financing would have
been provided to health centers without any conditionality. In this way the actual effect
of financing tied with performance could have been measured. It was not feasible in the
context of this intervention to create such an intervention arm. Similarly, P4P by nature
of the intervention includes stringent verification of the achievements to ensure the
program is rewarding genuine performance. This can be perceived as another layer of
supervision in addition to the routine supervision. In the context of the intervention in
Zimbabwe, it was not feasible to create another intervention arm of enhanced
supervision without additional financial rewards to balance out the effect of additional
supervision.
Several contextual factors and unintended consequences have been identified from the
literature and presented in the conceptual framework. However, all of the contextual
factors could not be validated within this study considering the focus was only on
quality of care aspects of P4P and quantitative nature of the data. Lack of qualitative
data also limits the implications of findings to a deeper understanding of ‘why’ and
‘how’ the quality of care improved as a result of the P4P intervention. Other
interventions in the study districts could have influenced the outcomes. It was not
possible to ascertain the influence of other interventions from the health facility survey
data.
Process quality was measured through exit interviews. Exit interviews might be prone
to recall bias. It could have been strengthened with other methods such as direct
observation or review of records. However, the short duration (up to 20 mins approx.)
between receipt of services and exit interviews might in fact have reduced the bias due
to recall. There is a possibility of misclassification of certain elements in the quality
domains, specifically for structural quality. For instance, the enumerators might have
failed to accurately distinguish between medical equipment. First of all, most
enumerators were trained nurses or midwives with substantial experience in the public
health system. Further, the enumerators were rigorously trained in classroom and
health facility settings. Thus, any misclassification related to the structural elements
would be insignificant. There is also the possibility of misclassification of the performed

244
physical examinations on the part of the exit interview respondents. However, this
misclassification would be very minimal because of translation of the data collection
instruments to the local language and relatively lesser number of questions on physical
examinations.
Certain quality elements were available only in the follow up survey data such as
checking for fetal heart rate, anemia, and edema during the receipt of service. Due to the
nature of the analysis where differences in the outcome elements were compared
between the P4P and control arms over two rounds of data (difference-in-difference),
these elements of quality had to be dropped from the analysis. Considering the focused
antenatal care (FANC) protocol of Zimbabwe, some elements of quality related to HIV
and AIDS would have added value to the research. These HIV and AIDS related elements
are testing of HIV, CD4 count if found positive, counseling on HIV prevention,
prevention of mother to child transmission, dispensing anti-retroviral treatment and
condoms.193
This PhD research hinges on to the overall evaluation of the Zimbabwe RBF project. As
mentioned earlier, the RBF project was a complex health systems intervention. While,
the overall evaluation was comprehensive considering various health systems
elements, the PhD research was limited in its scope as it focused only on assessing the
effects on quality of care. Various components of the overall evaluation were managed
by different research teams and not all of them followed the same timeline. For
instance, the research component on costs was delayed due to availability of data. Lack
of timely data and completeness of information echo with the findings from a
systematic review of the effects of P4P on the quality of maternal and child health
care.101 The systematic review highlighted the challenges of evaluating P4P programs in
the context of complex health systems interventions in low- and middle-income country
settings.
It would have been ideal to delve deeper in to the financial data on quality of care along
with the timeliness of incentives disbursements. For instance, facilities’ overall earning
vis-à-vis income from quality and within that share of various quality items. Similarly,

245
linking the results from this research with that of the overall impact evaluation study
would have allowed to view them in a broader perspective. Unfortunately, data related
to cost and overall impact evaluation outcomes were not available for the PhD research.
8.5 Implications for research
This study examined the effect of P4P on quality of ANC alone. It tried to look into the
available information to ascertain if there was a higher utilization among certain quality
elements versus others considering their unit price. However, due to limited
information, it was inconclusive to say if cherry picking existed in the Zimbabwean P4P
program. Only a few variables could be extracted from the facility survey which had
unit prices for the P4P program. In addition, all these extracted variables with unit
prices were related to structural quality only. Similarly, this study could not explore
other unintended consequence – cream skimming (selecting patients with less critical
health conditions) as the clients were homogenous in terms of the services they
received, i.e. antenatal care. Also, this study did not attempt to either classify or select
clients with health conditions of varied severity under routine ANC. Therefore, it is
beyond the purview of this research to demonstrate performance incentives could
result in unintended consequences.14,98 However, it may be worth to examine this
element in the Zimbabwe P4P program after enlarging the scope of the study and
obtaining relevant information.
This study found that process quality was reportedly higher among women with better
education and wealth status. As observed by another study from Burundi, this situation
raises a concern if P4P is effective among the most needy to improve maternal and child
health in resource-constraint settings to address MDG 4 and 5.107 It is however, not
possible to identify the exact cause of this distortion. For instance, women with higher
socio-economic status might be aware of the available package of services in the health
facilities during ANC and thus could be demanding relevant services. Alternatively, the
health workers might be discriminating against clients of lower socio-economic groups.

246
In this context, further research needs to explore the effects of P4P on equity and
demand-side barriers in Zimbabwe.
In order to assess quality of care, there are multiple methods and each has its own
merits and demerits.39 Since no method is absolute, it may be worth applying multiple
methods on the same component of care (e.g. structure, process and satisfaction) and
validate the findings.39 For instance, process quality can be measured through direct
clinical observations, clinical vignettes, exit interviews and clinical chart abstraction.
Depending on the context, availability of data and local capacity, it may be wise for the
impact evaluation of P4P programs to apply multiple methods for triangulation.
Similarly, quantitative studies are limited in explaining the contextual factors for the
findings beyond ascertaining causality. It will be worthwhile to implement mixed-
methods study in these evaluations. By supplementing the quantitative studies with
deeper explorations of qualitative methods, one would understand the contextual
determinants.101 Specifically, more evidence is needed on contextual factors such as
role of user fees on quality of care, especially on patient satisfaction. In addition, it is
worth exploring how the revenue of facilities affected the level of quality of ANC. P4P
was supposed to enhance revenue of facilities through incentives, while there was an
equal chance of revenue loss through user fee removal.120
8.6 Implications for policy
Women with better education and wealth status reported of higher process quality. The
study, thus urges policy makers to address equity and demand-side barriers under P4P,
while simultaneously working with the health workers to ensure standard clinical
practice guidelines are followed to all clients regardless of their socio-economic status.
Further, in collaboration with the health center committees and community based
organizations, awareness generation activities can be undertaken in the facility
catchment areas about the availability of services in the facilities. Learning lessons from
the Zimbabwe RBF project, the government has started the implementation of a P4P
program in the urban areas that includes components of both supply and demand sides.

247
Reported process quality and client satisfaction for ANC were higher for nurses than
nurse midwives in this study. A process evaluation of P4P program in the Gambia also
reported similar findings.172 A Zimbabwean nurse midwife has one more year of
specialized training on maternal and child health than the nurse apart from the
common three-year basic nurse training. Given the fact that nurse midwives have
higher formal training, it is necessary to explore their practices on adherence to
national clinical guidelines specifically on maternal and child health.174 It is also
prudent to initiate on-the-job training along with supportive supervision to improve
their competence.169 In a resource-constraint setting like Zimbabwe, it would be
difficult to get adequate number of physicians and nurses, especially in rural areas in
the short-run.133 Therefore, optimally enhancing the skills of existing health workers
will be a feasible strategy to improve quality of antenatal care.
Findings from Zimbabwe indicate that without any considerable improvements in the
supply of skilled staff, quality of ANC services has improved across the structure,
process and satisfaction dimensions. This could potentially be the effect of performance
based payments in this case. It also shows within the current limitations of supply of
skilled health workers, P4P has the ability to improve quality of services in a low
income country setting. However, one should consider the relatively short timeframe
(two year) of implementation that is covered in this evaluation. In most innovative
health systems interventions, it takes a while to establish the systems of
implementation (e.g. capacity, supervision, verification, funds flow) considering the low
income country setting.194 As time passes, the short spike in quality improvement can
really plateau or decline. Further, with enhancement in demand generation, utilization
of services is likely to increase along with workload for the health workers.195 This
increased work-load can gradually reach a point where staff would feel burnt-out to
perform, adversely affecting the quality of ANC (mostly process) and other components
of maternal health.195 Continuous burn-out can demotivate staff to perform, leading to
further reductions in quality of care.195 It has to be explored if increased workload
leading to burn-out was the reason for the non-compliance of nurse midwives in this
context. If indeed this was the case, then the program needs to ensure that there is
adequate supply of skilled staff to meet the increased workload under P4P.

248
8.7 Conclusion
Zimbabwe, a country with adverse maternal and child health indicators, implemented a
P4P program in 2012. This controlled before – after study of P4P’s effect on structural
quality, process quality and client satisfaction of antenatal care showed that although
the P4P program had significant improvements in the structural quality, process quality
and client satisfaction indices, certain elements within these indices such as equipment,
drugs, and physical examination did not show much improvements. Remarkably, the
improvements in the quality of antenatal care has been achieved without any inputs in
the supply of skilled staff. However, the P4P did not address the issue of inequity in the
perceived quality of antenatal care. Further research is needed to understand the
mechanisms through which P4P had led to the observed improvements in the quality of
antenatal care in order to replicate and scale up in similar settings. Thus, there is a need
for further exploration of the contextual factors that would explain the mechanisms of
these improvements.

249
Bibliography
1 Musgrove BYP. Financial and Other Rewards for Good Performance or Results : A Guided
Tour of Concepts and Terms and a Short Glossary. 2011; : 1–12.
2 Soeters R, Habineza C, Peerenboom PB. Performance-based financing and changing the
district health system: experience from Rwanda. Bull World Health Organ 2006; 84: 884–9.
3 Eldridge C, Palmer N. Performance-based payment: Some reflections on the discourse,
evidence and unanswered questions. Health Policy Plan. 2009; 24: 160–6.
4 Cashin, C, Chi Y-Ling, Smith P, Borowitz M TS. Paying for Performance in Health Care
Implications for health system performance and accountability. Neywork, USA, 2014.
5 Allen T, Mason T, Whittaker W. Impacts of pay for performance on the quality of primary
care. Risk Manag. Healthc. Policy. 2014; 7: 113–20.
6 Grossmann-Kendall F, Filippi V, De Koninck M, Kanhonou L. Giving birth in maternity hospitals
in Benin: testimonies of women. Reprod Health Matters 2001; 9: 90–8.
7 Burgess S. The Role of Incentives in the Public Sector: Issues and Evidence. Oxford Rev Econ
Policy 2003; 19: 285–300.
8 Ellis RP, McGuire TG. Provider behavior under prospective reimbursement. Cost sharing and
supply. J Health Econ 1986; 5: 129–51.
9 Iversen T, Ma CA. Market conditions and general practitioners’ referrals. Int J Health Care
Finance Econ 2011; 11: 245–65.
10 Smith P. On the unintended consequences of publishing performance data in the public
sector. Int J Public Adm 1995; 18: 277–310.
11 Bassani DG, Arora P, Wazny K, Gaffey MF, Lenters L, Bhutta ZA. Financial incentives and
coverage of child health interventions: a systematic review and meta-analysis. BMC Public
Health 2013; 13 Suppl 3: S30.
12 Elovainio R. Performance incentives for health in high-income countries key issues and
lessons learned. Geneva, 2010.
13 Witter S, Toonen J, Meessen B, Kagubare J, Fritsche G, Vaughan K. Performance-based

250
financing as a health system reform: mapping the key dimensions for monitoring and
evaluation. BMC Health Serv Res 2013; 13: 367.
14 Witter S, Fretheim A, Kessy FL, Lindahl AK. Paying for performance to improve the delivery of
health interventions in low- and middle-income countries . Cochrane database Syst Rev 2012;
2: CD007899.
15 Basinga P, Gertler PJ, Binagwaho a, Soucat a L, Sturdy J, Vermeersch CM. Effect on maternal
and child health services in Rwanda of payment to primary health-care providers for
performance: an impact evaluation. Lancet 2011; 377: 1421–8.
16 Skiles MP, Curtis SL, Basinga P, Angeles G, Thirumurthy H. The effect of performance-based
financing on illness, care-seeking and treatment among children: an impact evaluation in
Rwanda. BMC Health Serv Res 2015; 15: 375.
17 Gemmill M. Pay-for-Performance in the US: What lessons for Europe? Eurohealth (Lond); 13.
18 Kristensen SR, McDonald R, Sutton M. Should pay-for-performance schemes be locally
designed? Evidence from the Commissioning for Quality and Innovation (CQUIN) Framework.
J Health Serv Res Policy 2013; 18: 38–49.
19 Roland M. Linking physicians’ pay to the quality of care--a major experiment in the United
kingdom. N Engl J Med 2004; 351: 1448–54.
20 Rosenthal MB, Fernandopulle R, Song HR, Landon B. Paying for quality: Providers’ incentives
for quality improvement. Health Aff 2004; 23: 127–41.
21 Meessen B, Soucat A, Sekabaraga C. Performance-based financing: just a donor fad or a
catalyst towards comprehensive health-care reform? Bull World Health Organ 2011; 89: 153–
6.
22 Vermeersch C, Kremer M. School Meals , Educational Achievement and School Competition :
Evidence from a Randomized Evaluation. World Bank Policy Res Work Pap 2004; 3523.
23 Cromwell J, Trisolini M, Pope G, Mitchell J, Greenwald L. Pay for Performance in Health Care:
Methods and Approaches. Research Triangle Park, NC, 2011
DOI:10.3768/rtipress.2011.bk.0002.1103.
24 Miller G, Babiarz K. Pay-for-Performance Incentives in Low- and Middle-Income Country

251
Health Programs. 2013.
25 Roski J, Jeddeloh R, An L, et al. The impact of financial incentives and a patient registry on
preventive care quality: Increasing provider adherence to evidence-based smoking cessation
practice guidelines. Prev Med (Baltim) 2003; 36: 291–9.
26 Shen Y. Selection incentives in a performance-based contracting system. Health Serv Res
2003; 38: 535–52.
27 Himmelstein DU, Ariely D, Woolhandler S. Pay-for-performance: toxic to quality? Insights
from behavioral economics. Int J Health Serv 2014; 44: 203–14.
28 Gertler P, Vermeersch C. Using Performance Incentives to Improve Medical Care Productivity
and Health Outcomes. Natl Bur Econ Res Work Pap Ser 2013; No. 19046.
29 Lohr KN, Donaldson MS, Harris-Wehling J. Medicare: a strategy for quality assurance, V:
Quality of care in a changing health care environment. QRB Qual Rev Bull 1992; 18: 120–6.
30 Donabedian A. The quality of care. How can it be assessed? JAMA; 260: 1743–8.
31 Sitzia J, Wood N. Patient satisfaction: a review of issues and concepts. Soc Sci Med 1997; 45:
1829–43.
32 Koblinsky M, Matthews Z, Hussein J, et al. Going to scale with professional skilled care.
Lancet 2006; 368: 1377–86.
33 Pittrof R, Campbell OMR, Filippi VGA. What is quality in maternity care? An international
perspective. Acta Obstet Gynecol Scand 2002; 81: 277–83.
34 Berenson RA, Pronovost PJ K. Achieving the Potential of Health Care Performance Measures.
2013.
35 The world health report 2005 - make every mother and child count. Geneva, 2005.
36 Gopalan SS, Das A. Household economic impact of an emerging disease in terms of
catastrophic out-of-pocket health care expenditure and loss of productivity: investigation of
an outbreak of chikungunya in Orissa, India. J Vector Borne Dis 2009; 46: 57–64.
37 Kravitz R. Patient satisfaction with health care: critical outcome or trivial pursuit? J Gen Intern
Med 1998; 13: 280–2.

252
38 Kravitz R. Patient Satisfaction with Health Care. J Gen Intern Med 1998; 13: 280–2.
39 Das J, Gertler PJ. Variations in practice quality in five low-income countries: A conceptual
overview. Health Aff. 2007; 26. DOI:10.1377/hlthaff.26.3.w296.
40 Peabody JW, Luck J, Glassman P, et al. Measuring the quality of physician practice by using
clinical vignettes: A prospective validation study. Ann Intern Med 2004; 141.
DOI:10.7326/0003-4819-141-10-200411160-00008.
41 Das J, Sohnesen TP. Variations in doctor effort: Evidence from Paraguay. Health Aff 2007; 26.
DOI:10.1377/hlthaff.26.3.w324.
42 Peabody JW, Luck J, Glassman P, Dresselhaus TR, Lee M. Comparison of vignettes,
standardized patients, and chart abstraction: a prospective validation study of 3 methods for
measuring quality. JAMA 2000; 283: 1715–22.
43 Leonard KL, Masatu MC. The use of direct clinician observation and vignettes for health
services quality evaluation in developing countries. Soc Sci Med 2005; 61: 1944–51.
44 Leonard K, Masatu MC. Outpatient process quality evaluation and the Hawthorne Effect. Soc
Sci Med 2006; 63: 2330–40.
45 Glick P. How reliable are surveys of client satisfaction with healthcare services? Evidence
from matched facility and household data in Madagascar. Soc Sci Med 2009; 68: 368–79.
46 Pbert L, Adams A, Quirk M, Hebert JR, Ockene JK, Luippold RS. The patient exit interview as
an assessment of physician-delivered smoking intervention: a validation study. Health
Psychol 1999; 18: 183–8.
47 Das J, Holla A, Das V, Mohanan M, Tabak D, Chan B. In urban and rural India, a standardized
patient study showed low levels of provider training and huge quality gaps. Health Aff 2012;
31: 2774–84.
48 Rethans JJ, Gorter S, Bokken L, Morrison L. Unannounced standardised patients in real
practice: A systematic literature review. Med. Educ. 2007; 41: 537–49.
49 Leonard KL, Masatu MC. Professionalism and the know-do gap: Exploring intrinsic motivation
among health workers in Tanzania. Health Econ 2010; 19: 1461–77.

253
50 Tetui M, Ekirapa EK, Bua J, Mutebi A, Tweheyo R, Waiswa P. Quality of Antenatal care
services in eastern Uganda: implications for interventions. Pan Afr Med J 2012; 13: 27.
51 Boller C, Wyss K, Mtasiwa D, Tanner M. Quality and comparison of antenatal care in public
and private providers in the United Republic of Tanzania. Bull World Health Organ 2003; 81:
116–22.
52 Barber SL, Gertler PJ. Empowering women to obtain high quality care: Evidence from an
evaluation of Mexico’s conditional cash transfer programme. Health Policy Plan 2009; 24: 18–
25.
53 Barber SL, Bertozzi SM, Gertler PJ. Variations in prenatal care quality for the rural poor in
Mexico. Health Aff 2007; 26. DOI:10.1377/hlthaff.26.3.w310.
54 Rani M, Bonu S, Harvey S. Differentials in the quality of antenatal care in India. Int J Qual Heal
Care 2008; 20: 62–71.
55 Pinidiyapathirage MJ, Wickremasinghe AR. Antenatal care provided and its quality in field
clinics in Gampaha District, Sri Lanka. Asia Pac J Public Health 2007; 19: 38–44.
56 Barber SL, Gertler PJ, Harimurti P. Differences in access to high-quality outpatient care in
Indonesia. Health Aff 2007; 26. DOI:10.1377/hlthaff.26.3.w352.
57 Magoma M, Requejo J, Merialdi M, Campbell OMR, Cousens S, Filippi V. How much time is
available for antenatal care consultations? Assessment of the quality of care in rural
Tanzania. BMC Pregnancy Childbirth 2011; 11. DOI:http://dx.doi.org/10.1186/1471-2393-11-
64.
58 Victora CG, Matijasevich A, Silveira M, Santos I, Barros AJD, Barros FC. Socio-economic and
ethnic group inequities in antenatal care quality in the public and private sector in Brazil.
Health Policy Plan 2010; 25: 253–61.
59 Kyei NNA, Chansa C, Gabrysch S. Quality of antenatal care in Zambia : a national assessment.
BMC Pregnancy Childbirth 2012; 12: 1.
60 Ajayi IO, Osakinle DC, Osakinle EO. Quality assessment of the practice of focused antenatal
care (FANC) in rural and urban primary health centres in Ekiti State. Open J Obstet Gynaecol
2013; 3: 319–26.

254
61 DEGLEY JK. Assessing the quality of antenatal care services in the Nkwanta south district,
Volta region, Ghana. 2012.
62 Atinga R, Baku A, Adongo P. Drivers of prenatal care quality and uptake of supervised
delivery services in Ghana. Ann Med Health Sci Res 2014; 4: 264.
63 Oladapo OT, Iyaniwura C a, Sule-Odu AO. Quality of antenatal services at the primary care
level in southwest Nigeria. Afr J Reprod Health 2008; 12: 71–92.
64 Manithip C, Edin K, Sihavong A, Wahlström R, Wessel H. Poor quality of antenatal care
services-Is lack of competence and support the reason? An observational and interview study
in rural areas of Lao PDR. Midwifery 2013; 29: 195–202.
65 Nyarko P, Birungi H, Armar-Klemes M, et al. Acceptability and feasibility of introducing the
WHO focused antenatal care package in Ghana. Popul Counc Front Reprod Heal 2006; : 17.
66 Carroli G, Rooney C, Villar J. How effective is antenatal care in preventing maternal mortality
and serious morbidity? An overview of the evidence. Paediatr Perinat Epidemiol 2001; 15
Suppl 1: 1–42.
67 Dowswell T, Carroli G, Duley L, et al. Alternative versus standard packages of antenatal care
for low-risk pregnancy. Cochrane database Syst Rev 2010; : CD000934.
68 von Both C, Flessa S, Makuwani A, Mpembeni R, Jahn A. How much time do health services
spend on antenatal care? Implications for the introduction of the focused antenatal care
model in Tanzania. BMC Pregnancy Childbirth 2006; 6: 22.
69 Villar J, Ba’aqeel H, Piaggio G, et al. WHO antenatal care randomised trial for the evaluation
of a new model of routine antenatal care. Lancet (London, England) 2001; 357: 1551–64.
70 Villar J, Bergsjo P. WHO Antenatal Care Randomized Trial: Manual for the Implementation of
the New Model. Geneva, 2003.
71 Al-Abri R, Al-Balushi A. Patient satisfaction survey as a tool towards quality improvement.
Oman Med. J. 2014; 29: 3–7.
72 Jenkinson C, Coulter a, Bruster S, Richards N, Chandola T. Patients’ experiences and
satisfaction with health care: results of a questionnaire study of specific aspects of care. Qual
Saf Health Care 2002; 11: 335–9.
255
73 Nguyen Thi PL, Briançon S, Empereur F, Guillemin F. Factors determining inpatient
satisfaction with care. Soc Sci Med 2002; 54: 493–504.
74 Otani K, Waterman B, Faulkner KM, Boslaugh S, Burroughs TE, Dunagan WC. Patient
satisfaction: focusing on ‘excellent’. J Healthc Manag 2009; 54: 93.
75 LaVela S, Gallan A. Evaluation and Measurement of Patient Experience. Patient Exp J 2014; 1:
28–36.
76 Manary MP, Boulding W, Staelin R, Glickman SW. The Patient Experience and Health
Outcomes. N Engl J Med 2013; 368: 201–3.
77 Steel N, Maisey S, Clark A, Fleetcroft R, Howe A. Quality of clinical primary care and targeted
incentive payments: An observational study. Br J Gen Pract 2007; 57: 449–54.
78 Gillam SJ, Siriwardena AN, Steel N. Pay-for-performance in the United Kingdom: impact of
the quality and outcomes framework: a systematic review. Ann Fam Med; 10: 461–8.
79 Gené-Badia J, Escaramis-Babiano G, Sans-Corrales M, et al. Impact of economic incentives on
quality of professional life and on end-user satisfaction in primary care. Health Policy 2007;
80: 2–10.
80 Langdown C, Peckham S. The use of financial incentives to help improve health outcomes: is
the quality and outcomes framework fit for purpose? A systematic review. J Public Health
(Oxf) 2014; 36: 251–8.
81 Houle SKD, McAlister FA, Jackevicius CA, Chuck AW, Tsuyuki RT. Does performance-based
remuneration for individual health care practitioners affect patient care?: a systematic
review. Ann Intern Med 2012; 157: 889–99.
82 Glickman SW, Ou F-S, DeLong ER, et al. Pay for performance, quality of care, and outcomes in
acute myocardial infarction. JAMA 2007; 297: 2373–80.
83 Eichler R, Levine R. Using Performance Incentives. In: Performance incentives for global
health: potential and pitfalls. 2009.
84 Filmer D. The Incidence of Public Expenditures on Health and Education. Background Note for
World Development Report 2004: Making Services Work for Poor People. Washington DC,
USA, 2003.

256
85 Gwatkin DR, Wagstaff A, Yazbeck AS. Reaching the Poor with Health, Nutrition and
Population Services. 2005 DOI:10.1596/978-0-8213-5961-7.
86 Supratikto G, Wirth ME, Achadi E, Cohen S, Ronsmans C. A district-based audit of the causes
and circumstances of maternal deaths in South Kalimantan, Indonesia. Bull. World Health
Organ. 2002; 80: 228–34.
87 Eichler R, De S. Paying for Performance in Health: A Guide to Developing the Blueprint. .
Bethesda, MD, 2008.
88 Matsuoka S, Obara H, Nagai M, Murakami H, Chan Lon R. Performance-based financing with
GAVI health system strengthening funding in rural Cambodia: a brief assessment of the
impact. Health Policy Plan 2014; 29: 456–65.
89 Soeters R, Peerenboom PB, Mushagalusa P, Kimanuka C. Performance-based financing
experiment improved health care in the Democratic Republic of Congo. Health Aff (Millwood)
2011; 30: 1518–27.
90 Falisse J-B, Meessen B, Ndayishimiye J, Bossuyt M. Community participation and voice
mechanisms under performance-based financing schemes in Burundi. Trop Med Int Health
2012; 17: 674–82.
91 Zeng W, Cros M, Wright KD, Shepard DS. Impact of performance-based financing on primary
health care services in Haiti. Health Policy Plan 2013; 28: 596–605.
92 Meessen B, Musango L, Kashala JPI, Lemlin J. Reviewing institutions of rural health centres:
The Performance Initiative in Butare, Rwanda. Trop Med Int Heal 2006; 11: 1303–17.
93 Meessen B, Kashala JPI, Musango L. Output-based payment to boost staff productivity in
public health centres: Contracting in Kabutare district, Rwanda. Bull World Health Organ
2007; 85. DOI:10.2471/BLT.06.032110.
94 Basinga P, Gertler PJ, Binagwaho A, Soucat ALB, Sturdy J, Vermeersch CMJ. Effect on
maternal and child health services in Rwanda of payment to primary health-care providers
for performance: an impact evaluation. Lancet 2011; 377: 1421–8.
95 Bonfrer I, Soeters R, Van de Poel E, et al. Introduction of performance-based financing in
burundi was associated with improvements in care and quality. Health Aff (Millwood) 2014;

257
33: 2179–87.
96 Peabody JW, Shimkhada R, Quimbo S, Solon O, Javier X, McCulloch C. The impact of
performance incentives on child health outcomes: results from a cluster randomized
controlled trial in the Philippines. Health Policy Plan 2014; 29: 615–21.
97 Chen TT, Chung KP, Lin IC, Lai MS. The unintended consequence of diabetes mellitus pay-for-
performance (P4P) program in Taiwan: Are patients with more comorbidities or more severe
conditions likely to be excluded from the P4P program? Health Serv Res 2011; 46: 47–60.
98 Huillery E, Seban J. Pay-for-Performance, Motivation and Final Output in the Health Sector:
Experimental Evidence from the Democratic Republic of Congo. 2014.
99 Vermeersch C, Gertler PJ. Using Performance Incentives to Improve Health Outcomes. World
Bank Policy Res Work Pap 2012; 6100.
100 Sylvia S, Luo R, Zhang L, Shi Y, Medina A, Rozelle S. Do you get what you pay for with school-
based health programs? Evidence from a child nutrition experiment in rural China. Econ Educ
Rev 2013; 37: 1–12.
101 Das A, Gopalan SS, Chandramohan D. Effect of pay for performance to improve quality of
maternal and child care in low- and middle-income countries: a systematic review. BMC
Public Health 2016; 16: 321.
102 Dhaher E, Mikolajczyk RT, Maxwell AE, Krämer A. Factors associated with lack of postnatal
care among Palestinian women: a cross-sectional study of three clinics in the West Bank.
BMC Pregnancy Childbirth 2008; 8: 26.
103 Eichler. Can "pay for performance’’ increase utilization by the poor and improve quality of
health services. Washington DC, USA, 2006.
104 The World Bank. HARMONIZED LIST OF FRAGILE SITUATIONS FY14 a/. 2014.
105 Effective Practice and Organisation of Care (EPOC). EPOC Resources for review authors. Oslo,
2014.
106 Downs SH, Black N. The feasibility of creating a checklist for the assessment of the
methodological quality both of randomised and non-randomised studies of health care
interventions. J Epidemiol Community Health 1998; 52: 377–84.

258
107 Bonfrer I, Van de Poel E, Van Doorslaer E. The effects of performance incentives on the
utilization and quality of maternal and child care in Burundi. Soc Sci Med 2014; 123C: 96–104.
108 Bonfrer I, Soeters R, Poel E Van De, Basenya O, Longin G. Incentives to improve performance
of health care providers in Burundi. ; : 1–24.
109 Peabody J, Shimkhada R, Quimbo S, et al. Financial incentives and measurement improved
physicians’ quality of care in the Philippines. Health Aff (Millwood) 2011; 30: 773–81.
110 Huntington D, Zaky HHM, Shawky S, Fattah FA, El-Hadary E. Impact of a service provider
incentive payment scheme on quality of reproductive and child-health services in Egypt. J
Health Popul Nutr 2010; 28: 273–80.
111 Bonfrer I, Soeters R, Basenya O, Longin G, Doorslaer E Van. The effects of performance based
financing on the use and quality of health care in Burundi : an impact evaluation. ; : 1–16.
112 Gopalan SS, Mutasa R, Friedman J, Das A. Health sector demand-side financial incentives in
low- and middle-income countries: A systematic review on demand- and supply-side effects.
Soc. Sci. Med. 2014; 100: 72–83.
113 Sutton M, Elder R, Guthrie B, Watt G. Record rewards: The effects of targeted quality
incentives on the recording of risk factors by primary care providers. Health Econ 2010; 19:
1–13.
114 Petersen LA, Woodard LD, Urech T, Daw C, Sookanan S. Does pay-for-performance improve
the quality of health care? Ann Intern Med 2006; 145: 265–72.
115 Garrido MM, Kelley AS, Paris J, et al. Methods for constructing and assessing propensity
scores. Health Serv Res 2014; 49: 1701–20.
116 Joober R, Schmitz N, Annable L, Boksa P. Publication bias: what are the challenges and can
they be overcome? J Psychiatry Neurosci 2012; 37: 149–52.
117 Bardach NS, Wang JJ, De Leon SF, et al. Effect of pay-for-performance incentives on quality of
care in small practices with electronic health records: a randomized trial. JAMA 2013; 310:
1051–9.
118 Scott A, Sivey P, Ait Ouakrim D, et al. The effect of financial incentives on the quality of health
care provided by primary care physicians. Cochrane database Syst Rev 2011; : CD008451.

259
119 Gopalan SS, Durairaj V. Addressing maternal healthcare through demand side financial
incentives: experience of Janani Suraksha Yojana program in India. BMC Health Serv. Res.
2012; 12: 319.
120 Project Implementation Manual: Zimbabwe National Results Based Financing program.
Harare, 2011.
121 ZimStat. Zimbabwe Population Census 2012. Harare, 2012.
122 MoHCC. National Child Survival Strategy for Zimbabwe 2010-2015. Harare, 2015.
123 MoHCC. The National Health Profile 2013 Report. Harare, 2013.
124 Osika J, Altman D, Ekbladh L, et al. Health Systems Assessment-Zimbabwe. Bethesda, MD,
2010.
125 UNDP (United Nations Development Programme). Work for human development. New York,
2015 http://hdr.undp.org/sites/default/files/2015_human_development_report.pdf.
126 Bank W. World Development Indicators 2016. Washington, DC, 2016.
127 MoHCC. The National Health Strategy for Zimbabwe (2009 - 2013). Harare, 2009.
128 MoHCC. Access to Health Care Services Study. Harare, 2008.
129 HPA. Health Professions Authority Register. Harare, 2009.
130 MoHCC. The Zimbabwe Health Sector Investment Case (2010 – 2012): Accelerating progress
towards the Millennium Development Goals. Harare, 2010.
131 Dieleman M, Watson M, Sisimayi C. Impact assessment of the Zimbabwe Health Worker
Retention Scheme. Harare, 2012.
132 MoHCC. Human Resources for Health Strategic Plan 2010-2014. Harare, 2010.
133 Zimbabwe National Integrated Health Facility Assessment. Harare, 2012.
134 (ZIMSTAT) ZNSA. Zimbabwe Multiple Indicator Cluster Survey 2014. Harare, 2015.
135 World Health Organization. Global tuberculosis report 2015. Who 2015. DOI:978 92 4 156450
2.

260
136 The World Bank. Situation analysis of maternal and child health care in urban Zimbabwe.
Harare, 2012.
137 Zimbabwe Demographic and Health Survey 2010-11. Calverton, Maryland, 2012.
138 World Health Organization (WHO). Trends in Maternal Mortality: 1990 to 2008 Estimates
developed by WHO, UNICEF, UNFPA and The World Bank. 2010 DOI:15 April 2012.
139 Munjanja S. Maternal and Perinatal Mortality Study. Harare, 2007.
140 Dieleman M, Watson M, Sisimayi C. Impact assessment of the Zimbabwe Health Worker
Retention Scheme. Harare, 2012.
141 Edward A, Kumar B, Kakar F, Salehi AS, Burnham G, Peters DH. Configuring balanced
scorecards for measuring health system performance: Evidence from 5 years’ evaluation in
Afghanistan. PLoS Med 2011; 8. DOI:10.1371/journal.pmed.1001066.
142 Hansen PM, Peters DH, Niayesh H, Singh LP, Dwivedi V, Burnham G. Measuring and managing
progress in the establishment of basic health services: The Afghanistan Heatlh Sector
Balanced Scorecard. Int J Health Plann Manage 2008; 23: 107–17.
143 Mutale W, Godfrey-Fausset P, Mwanamwenge MT, et al. Measuring Health System
Strengthening: Application of the Balanced Scorecard Approach to Rank the Baseline
Performance of Three Rural Districts in Zambia. PLoS One 2013; 8.
DOI:10.1371/journal.pone.0058650.
144 Gopalan SS, Nguyen H, Mutasa R, Friedman J, Das A. How effective are provider performance
incentives on motivation and satisfaction? A quasi-experimental evaluation of Zimbabwe’s
Results-based financing program. Washington, DC, 2015.
145 Olafsdottir AE, Mayumana I, Mashasi I, et al. Pay for performance : an analysis of the context
of implementation in a pilot project in Tanzania. BMC Health Serv Res 2014; 14: 1–9.
146 Raudenbush SW. Optimal Design Software for Multi-level and Longitudinal Research (Version
3.01) [Software]. 2011.
147 Bland JM, Altman DG. Statistical methods for assessing agreement between two methods of
clinical measurement. Lancet 1986; 1: 307–10.

261
148 Giavarina D. Understanding Bland Altman analysis. Biochem medica 2015; 25: 141–51.
149 Rosenblatt M. Remarks on Some Nonparametric Estimates of a Density Function. Ann Math
Stat 1956; 27: 832–7.
150 Erran Seaman D, Powell RA. An evaluation of the accuracy of kernel density estimators for
home range analysis. Ecology 1996; 77: 2075–85.
151 StataCorp. 2013. Stata Statistical Software: Release 13. College Station, TX: StataCorp LP. .
152 Filmer D, Pritchett LH. Estimating wealth effects without expenditure data--or tears: an
application to educational enrollments in states of India. Demography 2001; 38: 115–32.
153 Evans JD. Straightforward statistics for the behavioral sciences. Pacific Grove, CA:
Brooks/Cole Publishing, 1996.
154 Reise SP, Duan N. Multilevel Modeling and its Application in Counseling Psychology Research.
Couns Psychol 1999; 27: 528–51.
155 Garson GD. Fundamentals of Hierarchical Linear and Multilevel Modeling. In: Hierarchical
Linear Modeling: Guide and Applications. 2013: 3–26.
156 Merlo J, Chaix B, Ohlsson H, et al. A brief conceptual tutorial of multilevel analysis in social
epidemiology: using measures of clustering in multilevel logistic regression to investigate
contextual phenomena. J Epidemiol Community Health 2006; 60: 290–7.
157 Pickett KE, Pearl M. Multilevel analyses of neighborhood socioeconomic context and health
outcomes: a critical review. J Epidemiol Community Health 2001; 55: 111–22.
158 Carle AC. Fitting multilevel models in complex survey data with design weights:
Recommendations. BMC Med Res Methodol 2009; 9: 49.
159 Leyland AH, Groenewegen PP. Multilevel modelling and public health policy. Scand J Public
Heal 2003; 31: 267–74.
160 Kreft I, de Leeuw J. Introducing multivlevel modeling. 1998 http://ezp-
prod1.hul.harvard.edu/login?url=http://search.ebscohost.com/login.aspx?direct=true&db=p
syh&AN=1998-08141-000&site=ehost-live&scope=site.
161 Raudenbush SW, Bryk AS. Hierarchical Linear Models: Applications and Data Analysis

262
Methods. 2002.
162 Goldstein H, Browne W, Rasbash J. Multilevel modelling of medical data. Stat Med 2002; 21:
3291–315.
163 Park S, Lake ET. Multilevel modeling of a clustered continuous outcome: nurses’ work hours
and burnout. Nurs Res 2005; 54: 406–13.
164 Gelman A. Multilevel (Hierarchical) Modeling: What It Can and Cannot Do. Technometrics
2006; 48: 432–5.
165 Lin W. Agnostic notes on regression adjustments to experimental data: Reexamining
Freedman’s critique. Ann Appl Stat 2013; 7: 295–318.
166 Burnham KP, Anderson DR. Multimodel Inference. Sociol Methods Res 2004; 33: 261–304.
167 Bloom E, Bhushan I, Clingingsmith D, et al. Contracting for Health: Evidence from Cambodia.
Harvard Univ Cambridge 2006; 34: 0.
168 Jacobs B, Thomé JM, Overtoom R, Sam SO, Indermühle L, Price N. From public to private and
back again: Sustaining a high service-delivery level during transition of management
authority: A Cambodia case study. Health Policy Plan 2010; 25: 197–208.
169 Rahman L, Rob U, Mahmud R, et al. A pay-for-performance innovation integrating the
quantity and quality of care in maternal, newborn and child health services in Bangladesh:
P4P Final Report. Dhaka, 2011.
170 Kalk A, Paul FA, Grabosch E. ‘Paying for performance’ in Rwanda: Does it pay off? Trop Med
Int Heal 2010; 15: 182–90.
171 Sondorp E, Palmer N, Strong L, Wali A. Afghanistan: Paying NGOs for Performance in a
Postconflict Setting. Perform Incent Glob Heal Potential Pitfalls 2009; : 139–64.
172 Gopalan SS. Process evaluation of Gambia maternal and child health results based financing
project. Washington, DC, 2014.
173 Binyaruka P, Borghi J. Improving quality of care through payment for performance:
examining effects on the availability and stock-out of essential medical commodities in
Tanzania. Trop Med Int Health 2017; 22: 92–102.

263
174 Koot J, Manangazira P, Masuka N, et al. Zimbabwe Health Sector Development Support
Project Results Based Financing Project: Mid Term Review. Harare, 2013.
175 Chansa C, Das A, Qamruddin J, Friedman J, Mkandawire A, Vledder M. Linking Results to
Performance: Evidence from a Results Based Financing Pre-Pilot Project in Katete District,
Zambia. Washington, DC, 2015.
176 Rudasingwa M, Soeters R, Bossuyt M. The effect of performance-based financial incentives
on improving health care provision in Burundi: a controlled cohort study. Glob J Health Sci
2015; 7: 15–29.
177 Engineer CY, Dale E, Agarwal A, et al. Effectiveness of a pay-for-performance intervention to
improve maternal and child health services in Afghanistan: A cluster-randomized trial. Int J
Epidemiol 2016; 45: 451–9.
178 Nayyar GML, Breman JG, Newton PN, Herrington J. Poor-quality antimalarial drugs in
southeast Asia and sub-Saharan Africa. Lancet Infect. Dis. 2012; 12: 488–96.
179 Bate R, Jin GZ, Mathur A, Attaran A. Poor-Quality Drugs and Global Trade: A Pilot Study. Am J
Heal Econ 2016; 2: 373–98.
180 Binyaruka P, Patouillard E, Powell-Jackson T, Greco G, Maestad O, Borghi J. Effect of paying
for performance on utilisation, quality, and user costs of health services in Tanzania: A
controlled before and after study. PLoS One 2015; 10. DOI:10.1371/journal.pone.0135013.
181 Banerjee B. A Qualitative Analysis of Maternal and Child Health Services of An Urban Health
Centre, by Assessing Client Perception in Terms of Awareness, Satisfaction and Service
Utilization. Indian J Community Med 2003; XXVIII.
182 Melese T, Gebrehiwot Y, Bisetegne D, Habte D. Assessment of client satisfaction in labor and
delivery services at a maternity referral hospital in Ethiopia. Pan Afr Med J 2014; 17.
DOI:10.11604/pamj.2014.17.76.3189.
183 Das P, Basu M, Tikadar T, Biswas GC, Mridha P, Pal R. Client satisfaction on maternal and child
health services in rural Bengal. Indian J Community Med 2010; 35: 478–81.
184 Chunuan S, Kochapakdee W. Patient satisfaction with nursing care received during the
intrapartum period. Thai J Nurs Res 2003; : 8–9.

264
185 Srivastava A, Avan B, Rajbangshi P, Bhattacharyya S. Determinants of women’s satisfaction
with maternal health care: a review of literature from developing countries. BMC Pregnancy
Childbirth 2015; 15: 97.
186 Ogala V, Avan BI, Roy R, Bhattacharyya S, Srivastava A. Women’s Level of Satisfaction with
Maternal Health Services in Jharkhand. 2012.
187 Makoni K, Gandidzanwa C. Quality of maternal and child health care assessment for rural
health facilities in Zimbabwe. Harare, 2012.
188 Lamadah SM, Elsaba HAHF. Women’s Satisfaction with the Quality of Antenatal Care at the
Primary Health Care Centers in Al-Madinah Al-Menawarh, KSA. Life Sci J 2012; 9: 4291–9.
189 Chemir F, Alemseged F, Workneh D. Satisfaction with focused antenatal care service and
associated factors among pregnant women attending focused antenatal care at health
centers in Jimma town, Jimma zone, South West Ethiopia; a facility based cross-sectional
study triangulated with qualit. BMC Res Notes 2014; 7: 164.
190 Hasan A, Chompikul J, Bhuiyan SU. Patient Satisfaction with Maternal and Child Health
Services among Mothers Attending the Maternal and Child Health Training Institute in Dhaka,
Bangladesh. J Public Heal Dev 2007; 5: 23–33.
191 Abedi G, Dashtian AA, Rostami F, Norrollahi H, Flah M. Maternal Satisfaction with Health and
Healthcare Services: A Survey in Northern Iran. Int J Hosp Res 2013; 2: 45–8.
192 De Savigny D, Adam T. Systems thinking for health systems strengthening. Geneva, 2009
DOI:10.1155/2010/268925.
193 The Focused Antenatal Care Protocol. Harare: Government of Zimbabwe, 2012.
194 Das A, Friedman J, Kandpal E, et al. Strengthening malaria service delivery through supportive
supervision and community mobilization in an endemic Indian setting: an evaluation of
nested delivery models. Malar J 2014; 13: 482.
195 Shen GC, Nguyen HTH, Das A, et al. Incentives to change: effects of performance-based
financing on health workers in Zambia. Hum Resour Health 2017; 15: 20.

265
Annex
Annex A: Calculation of individual staff incentives
Table A1: Calculation of individual staff incentives
A Position % points
1 Nurse in charge 100
2 Nurse 90
3 EHT 90
4 Nurse aide 50
5 General Hand 40
6 Primary Counsellor 30
B Number of years worked % points
1 1 to 5 years 1
2 6-10 years 2
3 11+ years 3
C Responsibility % points
1 Nurse in charge 25
2 Nurse 20
3 EHT 15
4 Nurse Aide 12
5 General Hand 8
6 Primary Counsellor 5
D Extra or less hours worked % points
1 Extra hours nighttime 0.30
2 Less hours worked daytime -0.25

266
Annex B: Systematic Review Paper

267

268

269

270

271

272

273

274

275
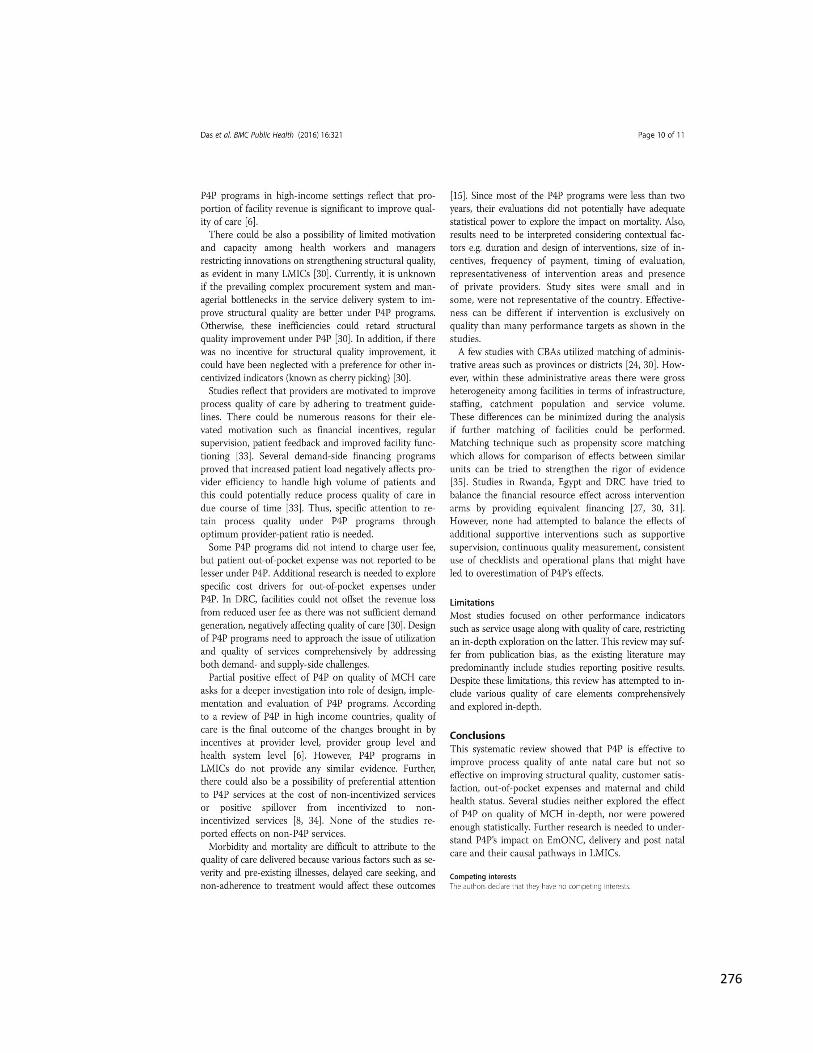
276

277

278
Annex C: Study instruments
RBF Midline Health Facility Survey IDENTIFIER
ZIMBABWE
SURVEY AREA
NUMBER
QUESTIONNAIRE NUMBER
2014
1
HEALTH FACILITY CHECKLIST
GEOGRAPHICAL LOCATION
Province: District:
HEALTH FACILITY NAME:
HEALTH FACILITY CODE:
LOCATION
URBAN 1
RURAL 2
PERI-URBAN
3
HEALTH FACILITY VISITS
INTERVIEWER'S NAME:
CODE:
VISIT # 1: DAY MONTH YEAR
RESULT OF THE INTERVIEW:
INTERVIEW DONE 01
PARTIALLY COMPLETED 02
VISIT # 2: DAY MONTH YEAR
PERSON IN CHARGE REFUSED INTERVIEW 03
PERSON IN CHARGE IS OUT (STAFF THAT IS PRESENT IS NOT AUTHORIZED)
04
FACILITY IS EMPTY (NO STAFF MEMBERS) 05
VISIT # 3: DAY MONTH YEAR
HEALTH FACILITY NOT FOUND 06
OTHER, SPECIFY: _______________________ 96
LANGUAGE USED
…BY THE INTERVIEWER?
TRANSLATOR USED?

279
NEVER 1
… BY THE RESPONDENT?
ENGLISH 01
SOMETIMES 2
OTHER (SPECIFY:__________) 96
ALWAYS 3
VERIFICATION OF QUESTIONNAIRE BY SUPERVISOR
DAY MONTH YEAR
NAME: CODE:
DATA ENTRY OPERATOR
DAY MONTH YEAR
NAME: CODE:
(1) General Information
(A) General RECORD RESPON
SE
RESPONDENT: HEAD OF THE HEALTH FACILITY OR HIS/HER DEPUTY IF ABSENT OR UNAVAILABLE.
(1.01) Are you in charge of this facility today? YES 1
NO 2
(1.02) Are you authorized to represent this facility? YES 1
NO 2
(1.03) What is your job title at this facility? Medical officer 01
Clinical officer 02
State Registered Nurse (SRN) 03
State Certified Nurse (SCN) 04
Primary Care Nurse (PCN) 05
Nurse Midwife 06
Nurse Aid (N.A) 07
Environmental Health Technician (EHT) 08
General Hand (G.H) 09
Rehabilitation technician 10
Other, specify: _________________________
96
(1.04) Is this facility a district hospital, mission or a health center District hospital 01
Clinic 02
Rural Hospital 03
Mission Hospital 04
Other, specify 96
(1.05) Who owns this health facility? Government 01
Private 02
Non Governmental Organization 03
Mission/Faith-based organization 04

280
Local government 05
Other, specify 96
(1.06)
(1.07) When was the last major investment in the infrastructure? INTERVIEWER: RECORD MONTH AND YEAR. INCLUDE MAJOR PAINTING, PLUMBING, EXTENSIONS TO THE BUILDING, ETC.
a. MONTH MM
b. YEAR YYYY
IF INVESTMENT WAS OVER MORE THAN ONE YEAR, ONLY RECORD THE MOST RECENT YEAR OF INVESTMENT
(1.08) Does this facility provide care round-the-clock (i.e. 24 hours)?
YES, FORMALLY/ OFFICIALLY 01 ► (1.11)
YES, INFORMALLY/ IN PRACTICE 02 ► (1.11)
NO 03
(1.09) At what time of the day does outpatient care start? a. Weekdays
INTERVIEWER: RECORD IN 24 HOUR FORMAT THROUGHOUT. E.G. IF IT STARTS AT 0700 or IF IT STARTS 1900.
b. Saturday
c. Sunday
d. Holidays
(1.10) At what time does outpatient care end? a. Weekdays
INTERVIEWER: RECORD IN 24 HOUR FORMAT THROUGHOUT. E.G. ENDS 0700.or ENDS 1900.
b. Saturday
c. Sunday
d. Holidays
(1.11) On what days does the facility offer antenatal care clinics, and for how many hours on those days?
a. Monday
b. Tuesday
c. Wednesday
INTERVIEWER: FOR EACH DAY, RECORD THE NUMBER OF HOURS THE SERVICE IF OFFERED. IF SERVICE IS NOT OFFERED THAT DAY, RECORD "00".
d. Thursday
e. Friday
f. Saturday
g. Sunday
(1.12) On what days does the facility offer under 5 clinics, and for how many hours on those days?
a. Monday
b. Tuesday
c. Wednesday
INTERVIEWER: FOR EACH DAY, RECORD THE NUMBER OF HOURS THE SERVICE IF OFFERED. IF SERVICE IS NOT OFFERED THAT DAY, RECORD "00".
d. Thursday
e. Friday
f. Saturday
g. Sunday
(1.13) What is the distance from the health facility to the nearest higher level health facility one way in kilometers?
KILOMETERS
(1.22) What is the primary source of electricity? Electrical mains/grid
01
Generator 02

281
Solar 03
No source of electricity 04 ► (1.25)
Other (Specify: _______________ ___________________________)
96
(1.23) Were there any electric power outages in the last 7 days? YES 1
NO 2 ► (1.25)
(1.24) How many hours was electric power missing in the last 7 days?
MAXIMUM 168 HOURS
(1.25) What is the primary source of water? Piped into Facility 01
Piped into Yard/Plot 02
Public tap/Standpipe 03
Protected well 04
Unprotected well 05
Protected spring 06
Unprotected spring 07
Rainwater 08
Tanker Truck/Vendor 09
Surface water (lake, river or stream) 10 ► (1.29)
Bottled water 11 ► (1.27)
Other (Specify: _______________ ___________________________)
96
(1.26) Is this primary source of water used only by the facility, or is it shared with other users?
ONLY FACILITY 01
SHARED 02
(1.27) In the last 7 days, was there any time when there was no water available in the facility?
YES 1
NO 2 ► (1.29)
(1.28) In the last 7 days, for how many hours was there no water available at the facility?
MAXIMUM 168 HOURS
(1.29) How long does it take to fetch water from the primary source for the health facility, one way on foot in minutes? IF WATER IN FACILITY, RECORD "0".
MINUTES
(1.30) Does the facility have a functioning two-way radio? YES 1
NO 2
(1.31) Does the health facility have phone line, whether a landline or a mobile line?
YES, LANDLINE 01 ► (1.34)
YES, MOBILE 02 ► (1.34)
YES, BOTH 03 ► (1.34)
NO 04
(1.32) INTERVIEWER: ONLY IF ANSWER TO (1.31) WAS NO: Are there any phone services available in the community apart from the staffs' personal phone that the health facility staff can use if needed?
YES 1
NO 2 ► (1.36)
(1.33) How long does it take to reach those phone services? MINUTES ► (1.36)
(1.34) In the last 7 days, was there any time when the facility did not have any telephone service whether landline or mobile?
YES 1
NO 2 ► (1.36)
(1.35) How many hours was telephone out in the last 7 days? MAXIMUM 168 HOURS
(1.36) Do any of the health facility staff have a mobile phone line? YES 1
NO 2
(1.37) Does this facility refer patients to other facilities? YES 1

282
NO 2 ► (1.40)
(1.38) Where does the facility refer for the following: a. Lab tests
INTERVIEWER: READ ALL OPTIONS ALOUD. FOR EACH OPTION, RECORD THE FOLLOWING CODES:
b. Radiology
c. In-patient
Hospital…………1 d. Specialized care
Clinic…………… 2 e. Surgery
Mission Hospital……. 3 f. Uncomplicated delivery
Does not refer.... 4 g. Complicated delivery
h. Other, specify:_________________________
(1.39) How far is the main referral facility from this facility one way in kilometers?
KILOMETERS
(1.40) Does the facility have access to any kind of transportation (to pick up patients or take them to referral facility)?
YES 1
NO 2 ► (1.44)
(1.41) How many working [VEHICLES] does the facility have access to?
a. Ambulance owned by facility
b. Ambulance owned by District Health Executive
INTERVIEWER: READ OPTIONS ALOUD. FOR EACH OPTION, RECORD NUMBER OF WORKING VEHICLES AVAILABLE. IF ZERO, RECORD 00.
c. Private vehicle rented full time
d. Private vehicle rented part time
e. Other vehicle owned by facility
OWN REFERS TO OWNED BY THE FACILITY OR THE INDIVIDUAL.
f. Private vehicles on call
g. Motorbike owned by facility
h. Rented motorbike
i. Bicycle owned by facility
j. Other, specify:_________________________
(1.42) In the last 7 days, was there any time when there was no transportation available for patients?
YES 1
NO 2 ► (1.44)
(1.43) How many days was transportation unavailable in the last 7 days?
MAXIMUM 7 DAYS
(1.44) Does the facility own a functioning computer? YES 1
NO 2
(1.45) YES 1
NO 2
(B) Universal Precautions
RECORD
RESPONSE
RESPONDENT: HEAD OF THE HEALTH FACILITY OR HIS/HER DEPUTY IF ABSENT OR UNAVAILABLE.
(1.45) Does the facility have a general outpatient consultation room?
YES, SEEN 01
YES, NOT SEEN 02
NO 03 ► (1.49)
(1.46) Is this room equipped with a safety box or closed container present for disposal of used sharps?
YES, SEEN 01
YES, NOT SEEN 02
NO 03

283
(1.47) Does the room have posted procedures for decontamination procedure steps?
YES, SEEN 01
YES, NOT SEEN 02
NO 03
(1.48) Does the room have a basin with a water source and soap?
YES SEEN, 01
YES, NOT SEEN 02
NO 03
(1.49) What disinfectant(s) are being used in the facility? CODE 01 IF MENTIONED AND CODE 02 IF NOT MENTIONED.
Chlorhexidine (gluconate) 01
Sodium Hypochlorite/Chlorine solution/JIK solution
03
Methylated spirit #
Other: _____________ 96
(1.50) In the last 30 days, was there any time when there was a stock-out of disinfectant(s) in the facility?
YES 1
NO 2 ► (1.52)
(1.51) In the last 30 days, for how many days was there a stock-out of disinfectant(s) in the facility? DAYS
(1.52) Is there a functional incinerator for disposing of medical waste?
YES, SEEN 01
YES, NOT SEEN 02
NO 03
(1.53) What procedure is used for INITIAL decontaminating medical equipment after use?
SOAKED IN DISINFECTANT SOLUTION AND THEN BRUSH SCRUBBED WITH SOAP+WATER
01
BRUSH SCRUBBED WITH SOAP AND WATER AND THEN SOAKED IN DISINFECTANT SOLUTION
02
BRUSH SCRUBBED WITH SOAP AND WATER ONLY
03
INTERVIEWER: DO NOT READ OPTIONS ALOUD. RECORD SINGLE RESPONSE. IF SEVERAL DECONTAMINATION TECHNIQUES, RECORD MOST USED ONE.
SOAKED IN DISINFECTANT SOLUTION ONLY
04
CLEANED WITH SOAP & WATER 05
EQUIPMENT NEVER DECONTAMINATED 06
EQUIPMENT NEVER REUSED 07 ► (1.55)
OTHER (SPECIFY: ________ ________________________)
96
(1.54) What procedure is used for sterilizing medical equipment before reuse?
DRY-HEAT STERILIZATION 01
AUTOCLAVING 02
BOILING 03
INTERVIEWER: DO NOT READ OPTIONS ALOUD. RECORD SINGLE RESPONSE. IF SEVERAL STERILIZATION TECHNIQUES, RECORD MOST USED ONE.
STEAM STERILIZATION 04
CHEMICAL METHOD 05
PROCESSED OUTSIDE FACILITY 06
NONE 07
OTHER, SPECIFY: ________ 96
(1.55) Is the protocol for sterilizing equipment displayed? DISPLAYED 01
NOT DISPLAYED 02
(1.56) Is there a provision for the disposal of bio medical waste? YES 1
NO 2 ► (2.01)
(1.57) How is biomedical waste disposed of? BURIED IN PIT 01
BURNED 02
INCINARATOR 03

284
OTOWAY PIT 04
INTERVIEWER: DO NOT READ OPTIONS ALOUD. RECORD SINGLE RESPONSE. IF SEVERAL WASTE DISPOSAL METHODS, RECORD MOST USED ONE.
THROWN OUTSIDE 05
OUTSOURCED 06
OTHER, SPECIFY: ________ 96
(2) Administration and Management RECORD RESPONSE
RESPONDENT: HEAD OF THE HEALTH FACILITY OR HIS/HER DEPUTY IF ABSENT OR UNAVAILABLE.
(2.01) Is there a Hospital/Health Center Committee/Ward Health Team for this health facility?
YES 1
NO 2 ► (2.08)
(2.02) How many members are on this Committee?
(2.03) Is there a representation of any of the following on this Committee?
a. Health facility director/head
b. Health facility staff
INTERVIEWER: READ ALL OPTIONS ALOUD. FOR EACH OPTION, RECORD "1" IF YES, "2" IF NO.
c. Neighborhood health committees
d. Community Health Workers
e. Ministry of Health / District Health Executive Team
f. Non Governmental Organization staff
g. Other, specify: ___________________________
(2.04) In the last 12 months, how many Hospital/Health Center Committee meetings were held?
(2.05) Does the facility have written records of the Hospital/Health Center Committee meetings (minutes, decisions, etc.)?
YES, SEEN 1
YES, NOT SEEN 2
NO 3
(2.06) What initiatives were taken by the Hospital/Health Center Committee and implemented in the last 12 months?
a. ADMINISTRATIVE SUPPORT TO FACILITY, E.G. APPROVING PAYMENTS
b. PROVIDED NEW SUPPLIES OR EQUIPMENT
c. PROVIDED NEW INFRASTRUCTURE
d. PROVIDED REPAIRS TO FACILITY
DO NOT READ OPTIONS ALOUD. FOR EACH OPTION, RECORD "1" IF MENTIONED, "2" IF NOT MENTIONED.
e. PROVIDED DRUGS
f. SENSITIZATION / MOBILIZED COMMUNITY TO USE THE HEALTH FACILITY
g. PROVIDED TRANSPORT TO STAFF FOR HOME VISITS
h. GAVE IN-KIND CONTRIBUTIONS
i. IMPROVED SECURITY AT THE FACILITY
j. IMPROVED WATER QUALITY
k. IMPROVED WATER SUPPLY (QUANTITY)
l. SUPPORTED TRAINING FOR COMMUNITY HEALTH WORKERS
m. SUPPORTED OUTREACH TEAMS
n. VERIFIED HEALTH FACILITY MATERNAL AND CHILD HEALTH-RELATED RESULTS
o. ENVIRONMENTAL SANITATION (E.G. DESTRUCTION OF MOSQUITO BREEDING SITES)
p. INDOOR RESIDUAL SPRAY
q. SCREENING OF DISEASES
r. REPORTED AND COLLECTED DATA FOR RESULTS-BASED FINANCING ACTIVITIES

285
s. DESIGNED THE RESULTS-BASED FINANCING SCHEME
t. PARTICIPATED IN TRAINING AND AWARENESS RAISING OF THE RESULTS-BASED FINANCING SCHEME
u. OTHER, SPECIFY: ______________________
(2.08) Has a facility workplan been developed for the current financial year?
YES, SEEN 01
YES, NOT SEEN 02
ASK TO SEE THE WORKPLAN. NO 03 ► (2.11)
(2.09) Who was involved in setting this operational plan? a. Health facility head/in-charge
b. Health facility staff
c. Non governmental Organization staff
READ ALL OPTIONS ALOUD. FOR EACH OPTION, RECORD "1" IF YES, "2" IF NO.
d. Ministry of Health / District Health Executive Team
e. Wardhealth committees
f. Hospital/Health center committee
g. Hospital management
h. Community Health Worker Cooperative president / leader
i Community Health Workers
j. Community members
k. Health Center Committee
l. Other, specify: _____________________
(2.10) Are priority health-related activities identified in this workplan for the current financial year?
YES 1
NO 2 ► (2.12)
(2.11) Now I will read you a list of services. For each service, please tell me whether this service is a priority or not a priority for this fiscal year.
a. Prenatal care
b. Institutional delivery
c. Postnatal care
d. Immunization
READ ALL OPTIONS ALOUD. FOR EACH OPTION, RECORD "1" IF YES/priority, "2" IF NO/NOT A PRIORITY.
e. Curative consultations
f. Family planning/Reproductive health
g. Nutrition
h. Integrated management of childhood illness
i. Malaria
j. Tuberculosis
k. HIV/AIDS
l. Health promotion and monitoring
m. Other, specify: ______________________
(2.12) How many health facility staff meetings were held in the last 3 months?
(2.13) Do all facility staff have written job descriptions? All have work descriptions 01
Some have work descriptions 02
None have work descriptions 03
(2.14) In the last 3 months, how many visits were made by a district health executive team for supervision or technical assistance? IF ZERO, RECORD "0"
(2.15) In the last 3 months, how many meetings were made by this health facility with Community Health Workers for supervision or technical support? IF ZERO, RECORD "0".

286
(3) Human Resources
RESPONDENT: HEAD OF HUMAN RESOURCES, HEAD OF THE FACILITY OR BEST INFORMED STAFF MEMBER
(A) Human Resources Management RECORD RESPONSE
(3.01) Who has the authority to employ new staff?
a. Health facility manager/in charge
b. Health facility staff
c. Ministry of Health / District Health Executive Teams
READ ALL OPTIONS ALOUD. FOR EACH OPTION, RECORD "1" IF YES, "2" IF NO.
d. Public Service Commission
e. Local government
f. Non Governmental Organization
g. Community Health Workers
h. Community members
i. Health Services Board
j. Other, specify: _________________________
(3.02) Who has the authority to dismiss staff? a. Health facility manager/in charge
b. Health facility staff
c. Ministry of Health / District Health Executive
READ ALL OPTIONS ALOUD. FOR EACH OPTION, RECORD "1" IF YES, "2" IF NO.
d. Public Service Management division at cabinet office
e. Local government
f. Non Governmental Organization
g. Community Health Workers
h. Community members
i. Health Services Board
j. Church
k. Other, specify: _________________________
FOR EACH TYPE OF POSITION LISTED BELOW, ASK QUESTIONS (3.04) TO (3.07). IF ZERO, RECORD 0.
POSITION TYPE
(3.04) (3.05) (3.06) (3.07)
What is the establishment for each staff category for the facility
[POSITION TYPE]s?
How many positions
for [POSITION TYPE] are currently
filled?
In the last 12 months, how
many [POSITION TYPE] have
left the facility
permanently?
How many [POSITION TYPE] work regularly do locums and are not part of the staff
complement

287
Medical officer a.
Clinical officer b.
State Registered Nurse (SRN) c.
State Certified Nurse (SCN) d.
Primary Care Nurse (PCN) e.
Nurse Midwife f.
Nurse Aid (N.A) g.
Environmental Health Technician (EHT)
h.
General Hand (G.H) i.
Rehabilitation technician j.
Other, specify:_________________________
k.
(B) Village Health Workers RECORD RESPONSE
(3.08)
(3.10) Does the health facility catchment area have active Village Health Workers (VHWs)?
YES 1
NO 2 ► (3.14)
(3.11) How many Village Health Workers are currently active in this catchment area?
a. FEMALE
b. MALE
(3.12) Is there any Village Health Worker who has stopped working in the last 12 months?
YES 1
NO 2 ► (3.14)
(3.13) How many Village Health Workers have stopped working in the last 12 months?
a. FEMALE
b. MALE
(3.14) Does the health facility catchment area have active Traditional Birth Attendants (TBA)?
YES 1
NO 2 ► (5.01)
(3.15) How many Traditional Birth Attendants are currently active in this catchment area?
(3.16) Is there any Traditional Birth Attendant who has stopped working in the last 12 months?
YES 1
NO 2 ► (5.01)
(3.17) How many Traditional Birth Attendants have stopped working in the last 12 months?

288
(5) Laboratory
RESPONDENT: LAB TECHNICIAN OR BEST INFORMED STAFF MEMBER
(5.01) Does the facility provide laboratory services? YES 1
NO 2 ► (6.01)
(A) Lab Tests
(5.02) (5.03) (5.04)
For the following tests, please tell me if you are able to perform them today, if you were able to perform them 3 months ago but not today, or if you simply cannot do this test (today or 3 months ago).
How many of the […] tests were conducted in the last 3 months?
INTERVIEWER: RECORD SOURCE OF THE INFORMATION. RECORD ONE RESPONSE FOR EACH TEST.
INTERVIEWER: RECORD ONE RESPONSE FOR EACH TEST.
INTERVIEWER: IF NONE, RECORD "0". RECORD ONE RESPONSE FOR EACH TEST.
Able to do this test today
01 RECORDS 01
Able to do in past 3 months but not today
02 NO RECORDS AVAILABLE, ORAL REPORT
02
Cannot do this test, today or in past 3 months
03
a. White cell and red cell counts
b. Hemoglobin estimation
c. Blood type and cross match
d.
Malaria smears (thick and thin)/ Rapid diagnostic test
e. Tuberculosis smears
f. Gram stains
g. HIV testing
h. Hepatitis B testing
i. Hepatitis C testing
j. Syphilis testing (RPR Test)
k. Urine dipstick tests
l. Pregnancy testing
m. Blood sugar
n. Stool tests for parasites
o. Stool tests for occult blood

289
p . Liver function testing
(B) Lab Equipment RECORD
RESPONSE
(5.05) Where is the lab equipment located? Separate laboratory 01
Room that is also used for other activities
02
Other, specify: _________________
96
(5.06) INTERVIEWER: RECORD QUANTITY OF EACH EQUIPMENT FUNCTIONING. RECORD ONE RESPONSE FOR EACH EQUIPMENT. RECORD 98 IF NOT FUNCTIONING OR NOT AVAILABLE.
a. Microscope
b. Centrifuge
c. Hemoglobinometer
d. Refrigerator for storing reagents
(5.07) Is there a Tuberculosis Laboratory Register? INTERVIEWER: IF YES, ASK TO SEE IT.
YES, SEEN 01
YES, NOT SEEN
02
NO 03
(5.08) How many laboratory technicians are trained in Acid-Fast Bacilli (AFB) microscopy? INTERVIEWER: CHECK THE NUMBER DOES NOT EXCEED THE TOTAL NUMBER OF LABORATORY TECHNICIANS
(6) Services
RESPONDENT: HEAD OF THE FACILITY OR BEST INFORMED STAFF MEMBER
(A) Vaccination Services RECORD
RESPONSE
(6.01) Does this facility provide immunization services? YES 1
NO 2 ► (6.13)
(6.02) Is there a separate room or area for immunizations? YES 1
NO 2
(6.03) Are immunizations regularly given to children at the facility or in outreach activities?
Facility only 01
Outreach only 02
Facility and outreach 03
(6.04) Is there a vaccination outreach work plan for the current year? YES 1
NO 2
(6.05) In the last 30 days, on how many days did the facility staff do vaccination outreach in the community?

290
(6.06) How many of the following storage methods does this site have for storing vaccines? INTERVIEWER: IF ZERO, RECORD '0'. a. Ice Lined Refrigerator (ILR)
b. Cold Box
c. Refrigerator
d. Vaccine Carriers
(6.07) Is a temperature log kept? INTERVIEWER: IF YES, ASK TO SEE IT.
YES, SEEN 01
YES, NOT SEEN 02
NO 03 ► (6.11)
(6.08) In the past 7 days, on how many days was the temperature logged?
(6.09) In the past 7 days, how many times was the temperature logged in total?
(6.10) In the past 7 days, how many days had a measurement of over 80C or under 20C?
(6.11) Are immunization cards issued to every child starting his/her immunization schedule?
YES 1
NO 2 ► (6.13)
(6.12) After a child starts its immunization schedule, where are the immunization cards kept?
Given to caregiver to bring for next visit
01 ► (6.13)
Kept at facility 02
One copy given to caregiver and one kept at facility
03
Other, specify: ___________ 96 ► (6.13)
(B) Antenatal Care Services RECORD
RESPONSE
(6.13) Are antenatal services provided at this facility? YES 1
NO 2 ► 6.24
(6.14) Are pregnant women seen at specific times separate from times for other patients?
YES 1
NO 2
(6.15) In the last 30 days, how many days has antenatal care been available to women? MAXIMUM 30 DAYS
(6.17) In the last 6 months, on how many days did the facility staff do outreach in the community for antenatal care?
(6.18) In the last 6 months, were iron and folate routinely prescribed? INTERVIEWER: CHECK RECORDS. IF NO RECORDS, ASK IN-CHARGE. RECORD ANSWER BASED ON WHETHER RECORDS WERE SEEN OR NOT.
RECORDS SEEN: All the time 01
RECORDS SEEN: Sometimes 02
RECORDS SEEN: Seldom or never
03
RECORDS NOT SEEN, ORAL REPORT: All the time
04

291
RECORDS NOT SEEN, ORAL REPORT: Sometimes
05
RECORDS NOT SEEN, ORAL REPORT: Seldom or never
06
(6.19) Do women who come to the facility for antenatal care get an antenatal or maternal health card? YES 1
NO 2 ► 6.24
(12) Direct Observation
INTERVIEWER: THERE IS NO RESPONDENT FOR THIS SECTION OF THE QUESTIONNAIRE. AFTER SEEKING PERMISSION, YOU SHOULD WALK AROUND THE FACILITY AND OBSERVE THE ITEMS OUTLINED IN THIS SECTION.
(A) General RECORD RESPONSE
(12.01) Is there a reception/registration room in this facility? INTERVIEWER: CONFIRM WITH DIRECT OBSERVATION.
YES 1
NO 2
(12.02) Is there a waiting room in this facility? INTERVIEWER: CONFIRM WITH DIRECT OBSERVATION.
YES 1
NO 2
12.03 Is there privacy in the consultation room? YES 1
NO 2
12.04 Is there privacy in the delivery room? YES 1
NO 2
(12.05) Are there observation beds in this facility? INTERVIEWER: CONFIRM WITH DIRECT OBSERVATION.
YES 1
NO 2 ► (12.10)
(12.06) INTERVIEWER: RECORD HOW MANY OBSERVATION BEDS ARE PRESENT. IF ZERO, RECORD "0".
(12.07) Are there separate wards for men and women in this facility? INTERVIEWER: CONFIRM WITH DIRECT OBSERVATION.
YES 1
NO 2 ► (12.10)
(12.08) Number of beds for Men. INTERVIEWER: CONFIRM WITH DIRECT OBSERVATION.
(12.09) Number of beds for Women. INTERVIEWER: CONFIRM WITH DIRECT OBSERVATION.
(12.10) Is a functional toilet facility available? INTERVIEWER: CONFIRM WITH DIRECT OBSERVATION.
YES 1
NO 2
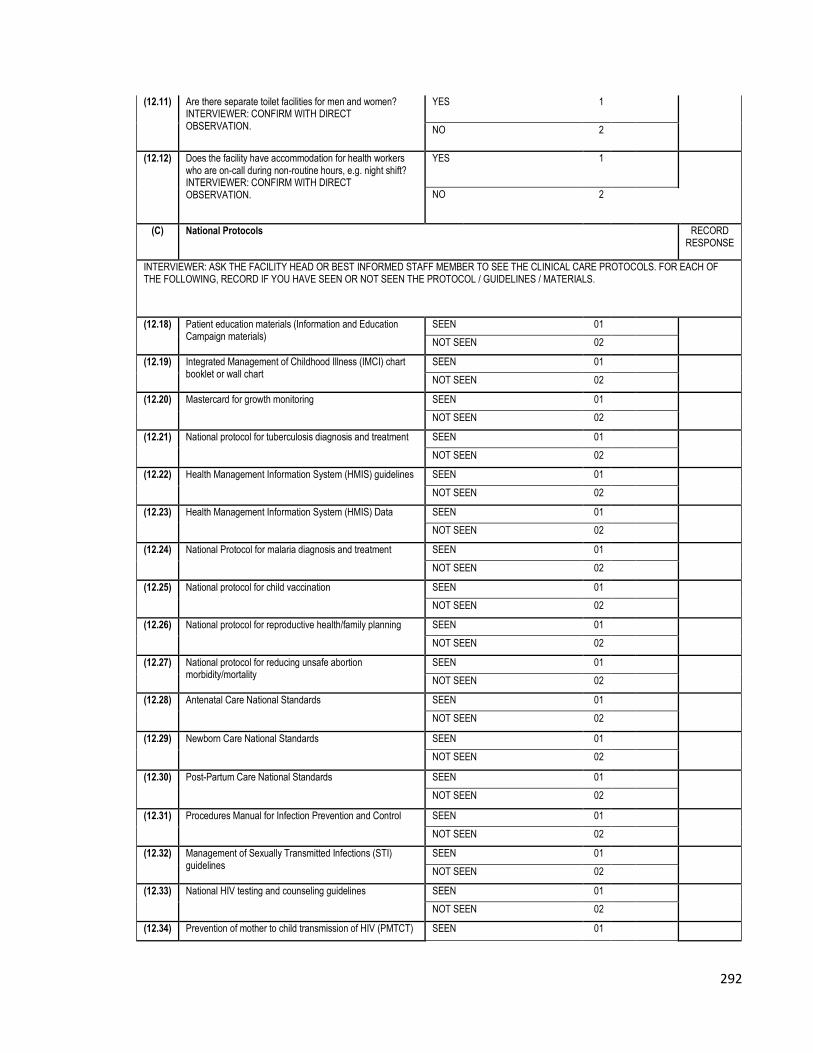
292
(12.11) Are there separate toilet facilities for men and women? INTERVIEWER: CONFIRM WITH DIRECT OBSERVATION.
YES 1
NO 2
(12.12) Does the facility have accommodation for health workers who are on-call during non-routine hours, e.g. night shift? INTERVIEWER: CONFIRM WITH DIRECT OBSERVATION.
YES 1
NO 2
(C) National Protocols RECORD RESPONSE
INTERVIEWER: ASK THE FACILITY HEAD OR BEST INFORMED STAFF MEMBER TO SEE THE CLINICAL CARE PROTOCOLS. FOR EACH OF THE FOLLOWING, RECORD IF YOU HAVE SEEN OR NOT SEEN THE PROTOCOL / GUIDELINES / MATERIALS.
(12.18) Patient education materials (Information and Education Campaign materials)
SEEN 01
NOT SEEN 02
(12.19) Integrated Management of Childhood Illness (IMCI) chart booklet or wall chart
SEEN 01
NOT SEEN 02
(12.20) Mastercard for growth monitoring SEEN 01
NOT SEEN 02
(12.21) National protocol for tuberculosis diagnosis and treatment SEEN 01
NOT SEEN 02
(12.22) Health Management Information System (HMIS) guidelines SEEN 01
NOT SEEN 02
(12.23) Health Management Information System (HMIS) Data SEEN 01
NOT SEEN 02
(12.24) National Protocol for malaria diagnosis and treatment SEEN 01
NOT SEEN 02
(12.25) National protocol for child vaccination SEEN 01
NOT SEEN 02
(12.26) National protocol for reproductive health/family planning SEEN 01
NOT SEEN 02
(12.27) National protocol for reducing unsafe abortion morbidity/mortality
SEEN 01
NOT SEEN 02
(12.28) Antenatal Care National Standards SEEN 01
NOT SEEN 02
(12.29) Newborn Care National Standards SEEN 01
NOT SEEN 02
(12.30) Post-Partum Care National Standards SEEN 01
NOT SEEN 02
(12.31) Procedures Manual for Infection Prevention and Control SEEN 01
NOT SEEN 02
(12.32) Management of Sexually Transmitted Infections (STI) guidelines
SEEN 01
NOT SEEN 02
(12.33) National HIV testing and counseling guidelines SEEN 01
NOT SEEN 02
(12.34) Prevention of mother to child transmission of HIV (PMTCT) SEEN 01

293
guidelines NOT SEEN 02
(12.35) HIV treatment (Antiretroviral therapy, ART) guidelines SEEN 01
NOT SEEN 02
(12.36) HIV treatment (Antiretroviral therapy, ART) for children/infants guidelines
SEEN 01
NOT SEEN 02
(12.37) Essential drugs list (EDLIZ) SEEN 01
NOT SEEN 02
(12.38) National protocol for drug procurement SEEN 01
NOT SEEN 02
(12.39) Detecting and reporting adverse drug or vaccine reaction SEEN 01
NOT SEEN 02
(13) Equipment (Direct Observation)
INTERVIEWER: THERE IS NO RESPONDENT FOR THIS SECTION OF THE QUESTIONNAIRE. AFTER SEEKING PERMISSION, YOU SHOULD WALK AROUND THE FACILITY AND OBSERVE THE ITEMS OUTLINED IN THIS SECTION.
General equipment RECORD
RESPONSE
(13.01) Where is the outpatient equipment located? Separate outpatient room 01
Room that is also used for other activities 02
Other, specify: ___________________ 96
(13.02) PLEASE RECORD THE QUANTITY FOR EACH TYPE OF EQUIPMENT. RECORD 98 IF NOT FUNCTIONING OR NOT AVAILABLE
QUANTITY AVAILABLE
AND FUNCTIONING
a. Timer or clock with seconds hand
b. Children’s weighing scale
c. Height measure
d. Tape measure
e. Adult weighing scale
f. Blood pressure instrument
g. Thermometer
h. Stethoscope
i. Fetoscope
j. Otoscope
k. Suction/aspirating device (Penguin Sucker)
l. Vision chart
m. Oxygen tank
n. Ambubag
o. Incubator
p. Drip Stand
q. Flashlight
r. Stretcher
s. Wheel chair
t. Minor surgical instruments for procedures like incision & drainage and suturing (forceps, scalpel)
u. Oral Rehydration Therapy (ORT) corner with equipment (I liter container, cups and spoons and rehydration guidelines)
v Resuscitare

294
Sterilizing Equipment RECORD
RESPONSE
(13.03) Where is the sterilization equipment located? Separate sterilization room 01
Room that is also used for other activities 02
Other, specify: ___________________ 96
(13.04) PLEASE RECORD THE QUANTITY FOR EACH TYPE OF EQUIPMENT. RECORD 98 IF NOT FUNCTIONING OR NOT AVAILABLE
QUANTITY AVAILABLE
AND FUNCTIONING
a. Electric autoclave (pressure and wet heat)
b. Non-electric autoclave (pressure and wet heat)
c. Electric dry heat sterilizer
d. Electric boiler or steamer (no pressure)
e. Non-electric pot with cover (steam boil)
f. Heat source for non-electric equipment
g. Automatic timer (MAY BE ON EQUIPMENT)
h. Time, Steam and Temperature (TST) Indicator strips or other sterilization indicators
Vaccination Equipment RECORD
RESPONSE
(13.05) Where is the vaccination equipment located? (VACCINATION EQUIPMENT: VACCINE FRIDGE PARRAFIN OR ELECTRIC, COLD BOX, VACCINE CARRIERS)
Separate vaccination room 01
Room that is also used for other activities 02
Other, specify: ___________________ 96
(13.06) PLEASE RECORD THE QUANTITY FOR EACH TYPE OF EQUIPMENT. RECORD 98 IF NOT FUNCTIONING OR NOT AVAILABLE
QUANTITY AVAILABLE
AND FUNCTIONING
a. Main vaccine thermometer
b. Cold box / Vaccine carrier
c. Ice packs
d. Refrigerator
Antenatal Care Equipment RECORD
RESPONSE
(13.07) Where is the antenatal care equipment located? (ANTENATAL CARE EQUIPMENT: FETOSCOPE, BLOOD PRESSURE INSTRUMENT, TAPE MEASURE, ADULT WEIGHING SCALE)
Separate antenatal care room 01
Room that is also used for other activities 02
Other, specify: ___________________ 96
(14) Drug and Vaccine Storage and Availability
RESPONDENT: PHARMACIST, HEAD OF THE FACILITY OR BEST INFORMED STAFF MEMBER.
(14.11) (14.12) (14.13) (14.14)
What is the strength of [DRUGS] that is stocked? IF NONE, RECORD 00
What quantity of [DRUGS] are available at this time?
In the past 30 days, has the item been out of stock at any time?
In the past 30 days, how many days has the item been out of stock?

295
IF NONE, RECORD 00 and ► (14.14)
YES 1
NO 2
►NEXT DRUG
a. Tetracycline ophthalmic ointment _____ %
b. Amoxicillin (tabs or capsule) _____ mg
c. Amoxicillin (syrup) _____ mg
d. Doxycycline capsules _____ mg
e. Cotrimoxazole tabs _____ mg
f. Cotrimoxazole syrup _____ mg/ml
g. Procaine Pen inj _____ IU
h. Penicillin benzathine injection _____ IU
i. Gentamycin _____ mg/ml
j. Metronidazole _____ mg
k. Norfloxacin _____ mg
l. Kanamycin _____ mg
m. Analgesics/Narcotics _____ mg
n. Cloxacillin syrup _____ mg/ml
p. Paracetamol (Panadol) tabs _____ mg
q. Paracetamol syrup _____ mg/ml
u. Morphine inj _____ mg/ml
v. Morphine tabs _____ mg
w. Pethedine im _____ mg/ml
x. Diazepam injection _____ mg/ml
y. Iron tabs (with or without folic acid) 1 tab
z. Folic acid tabs 1 tab
aa. Vitamin A 1 capsule
ak. Chloroquine 1 tab
al. Quinine 1 tab
am. Fansidar / Sulphadoxine-Pyrimethamine (SP) 1 tab
an Artemisinin-Based Combination Therapy ACT (fansidar + artesunate) / Coartem
1 tab
be. Oral Rehydration Solution (ORS) packets 1 packet
bf. Ringers Lactate _____ ml
bg. Normal Saline _____ ml
bh. 5% Dextrose _____ ml
bn. Bacille Calmette-Guérin (BCG) 1 dose
bo. Oral Polio Vaccine (OPV) 1 dose
bp. Tetanus Toxoid (TT) 1 dose
bq. Diphtheria Pertussis Tetanus (DPT) 1 dose
br. Hepatitis B Vaccine (HBV) Tetravalent 1 dose
bs. Measles vaccine 1 dose

296
bt. HiB vaccine 1 dose
bu. Pentavalent (DPT, Hepatitis B, Hemophilus influenzae B)
1 dose
bv. Pneumococcol Vaccine
bw. Malaria rapid diagnostic kits 1 unit
bx. HIV test kit 1 unit
by. Pregnancy testing kit 1 unit
bz. Rapid plasma reagin (RPR) test for syphilis 1 unit
ca. Urine Dip stick 1 unit
Section 1: Identification RECORD
RESPONSE
(1.00) Health Worker Tracking No. [FROM THE ROSTER IN HEALTH FACILITY INSTRUMENT]
(1.01) Health worker sex Male 1
Female 2

297
(1.02) Type of Worker
Doctor 1
Nurse Midwife 2
Nurse 3
Nurse aid 4
Traditional Birth Attendant
5
Village Health Worker 6
Other 96
Specify
(1.03) Type of Facility
Central Hospital 1
Provincial Hospital 2
District Hospital 3
Rural Hospital 4
Urban/Municipal Clinic 5
Rural Health Center 6
Mission Hospital 7
Mission Clinic 8
Private Hospital 9
Specify
Other 96
Specify
(1.04) Patient age (years) Years
(1.05) Can you (the respondent) read and write? Yes 1
No 2
(1.06) What is the highest level of education obtained by you (RESPONDENT)?
Preschool 1
Primary 2
Secondary 3
Tertiary 4
None 5
Other 96
Specify
(1.07)
What is the highest (grade/form/year) completed at that level?
IF COMPLETED LESS THAN ONE YEAR AT THAT LEVEL, RECORD '00'.
2 Treatment and counseling RECORD RESPONSE

298
(2.01) Do you have an antenatal-care card/book? IF YES: ASK TO SEE THE CARD/BOOK.
Yes 1
No, card kept with facility 2 ► (2.06)
No, card/book used 3 ► (2.06)
(2.02) CHECK ANTENATAL-CARE CARD/BOOK, INDICATE WHETHER THERE IS ANY NOTE OR RECORD OF THE CLIENT HAVING RECEIVED TETANUS TOXOID.
Yes, 1 time 1
Yes, 2 or more times 2
No 3
(2.03) HOW MANY WEEKS PREGNANT IS THE CLIENT, ACCORDING TO THE ANC CARD? In WEEKS
Information not available 99
(2.04)
DOES THE CARD INDICATE THE CLIENT HAS RECEIVED IPT? (IF NON MALARIOUS AREA, CHOOSE "NOT APPLICABLE")
Yes, 1 dose 1
Yes, 2 doses 2
No 3
Not applicable 98
(2.05) DOES THE CARD/BOOK MENTION THE CLIENT'S BLOOD GROUP?
YES 1
NO
2
(2.06)
How long have you been pregnant? (Record Months OR Weeks) RECORD 99, IF NOT KNOWN
a. Weeks
b. Months
(2.07) Is this your first pregnancy?
Yes 1
No 2
(2.08) Is this your first Yes 1 ► (2.10)

299
antenatal visit at this facility for this pregnancy?
No 2
(2.09) Including this visit, how many antenatal care visits have you had for this pregnancy to this health facility?
(2.10)
How many antenatal care visits have you had for this pregnancy to other health facilities?
(2.11) Was your medical history taken during the first visit of your ANC booking?
YES 1
NO
2
(2.12) Was your obstestric history taken during the first visit of your ANC booking
YES 1
NO
2
(2.13) During this visit, were you weighed?
YES 1
NO 2
(2.14) During this visit or earlier visit, was your height measured?
YES 1
NO 2
(2.15) During this visit, did someone measure your blood pressure?
YES 1
NO 2
(2.16) During this visit, did you give a urine sample?
YES 1
NO 2
(2.17) During this visit, did you give a blood sample?
YES 1
NO 2
(2.18) During this visit were you checked for anaemia?
YES 1
NO 2
(2.19) During this visit were you checked for oedema of face, hands and legs?
YES 1
NO
2
(2.20) During this visit YES 1

300
was the fetal heart checked?
NO 2
(2.21) During this visit, did you schedule your delivery in the facility?
YES 1
NO 2
(2.22) During this visit, was your abdomen measured with a tape?
YES 1
NO
2
(2.23) During this visit, did the provider palpate your abdomen?
YES 1
NO 2
(2.24) During this visit or earlier visit, did the health worker estimate your delivery or due date?
YES 1
NO
2
(2.25) During this visit, did a health worker ask for your blood type/group?
YES 1
NO
2
(2.26) During this visit, did a health worker give you advice on your diet (this is, what to eat and drink) during pregnancy?
YES 1
NO
2
► (2.28)
(2.27) What types of food did the health worker advise you to eat during pregnancy?
a. GREEN LEAFY VEGETABLES
b. MILK
DO NOT CITE ANSWERS, BUT FOR EACH OPTION RECORD "1" IF MENTIONED, "2" IF NOT MENTIONED. YOU MAY PROBE WITHOUT USING SPECIFIC ANSWERS (E.G., "ANYTHING
c. MEAT AND POULTRY
d. FRUITS AND NUTS
e. SADZA/RICE/POTATOES/KASAVA
f. OTHER (SPECIFY: _____________________)

301
ELSE?")
(2.28)
During this visit, or previous visits, did the provider give you iron pills, folic acid or iron with folic acid, or give you a prescription for them?
Yes, this visit 1
Yes, previous visit 2 ► (2.30)
No 3 ► (2.33)
Don't know 99 ► (2.33)
(2.29)
ASK TO SEE THE CLIENT’S IRON/FOLIC ACID/IRON WITH FOLIC ACID PILLS.
Saw pills 1
Saw prescription 2
No pills or prescription 3
(2.30)
During this visit or previous visits, has a provider explained to you how to take the iron pills?
Yes, this visit 1
Yes, previous visit 2
No 3
(2.31)
During this or previous visits, has a provider discussed with you the side effects of the iron pill?
Yes, this visit 1
Yes, previous visit 2
No 3
(2.32)
Please tell me any side effects of the iron pill that you know of. RECORD "1" IF Mentioned, "2" IF Not mentioned. FOR EACH OPTION. DO NOT READ THE LIST.
a. Nausea
b. Black stools
c. Constipation
d. Other
Specify
(2.33)
During this or previous visits, has a provider given or prescribed any anti-malarial pills for you? SHOW THE CLIENT CAPSULES OF FANSIDAR.
Yes, this visit 1
Yes, previous visit 2
No 3 ► (2.36)
(2.34) ASK TO SEE Yes I have seen the Capsules 1

302
THE CLIENT’S ANTI-MALARIA CAPSULES or PRESCRIPTION
Yes I have seen the prescription 2
I have neither seen the capsules or prescription
3
(2.35) Did a provider explain to you how to take the anti-malarial pills?
Yes, this visit 1
Yes, previous visit 2
No 3
(2.36)
Do you own an ITN, that is a net that has been treated with an insecticide to protect you from mosquito bites?
Yes 1
No 2
(2.37)
During this visit or a previous visit, did a provider offer you an ITN free of charge or offer to sell you one? IF THE CLIENT WILL PICK UP OR BUY THE ITN WITHIN THE FACILITY, THAT COUNTS AS PROVIDER OFFERING THE ITN.
Yes, offered free now 1
Yes, offered free in previous visit 2
Yes, offered for sale now 3
Yes, offered for sale in previous visit
4
No, not offered 5
(2.38) During this visit or a previous visit, did a provider discuss the importance of sleeping under an insecticide treated net?
Yes, this visit 1
Yes, previous visit 2
No 3
(2.39)
Last night, did you sleep under an insecticide treated net?
Yes 1
No 2
(2.40)
During this visit or previous visits, has a provider asked you whether you had ever received a tetanus toxoid (TT) injection?
Yes, this visit 1
Yes, previous visit 2
No 3

303
(2.41)
Have you ever received a tetanus toxoid (TT) injection, including one you may have received today? IF YES: Including any TT injection you received today, how many times in total during your lifetime have received a tetanus toxoid injection? (INJECTION MAY HAVE BEEN RECEIVED EITHER AT THIS FACILITY OR ELSEWHERE.)
Yes 1
Never 2 ► (2.43)
(2.42) NUMBER OF TETANUS INJECTIONS RECEIVED
(2.43) During this visit or previous visits, has a provider discussed things you should have in preparation for your delivery? This may include planning in case of emergency, things you should bring to a facility, or things you should prepare at home for home delivery.
Yes 1
No 2
(2.44) Please tell me any things you know of that you should have in preparation for your delivery. RECORD "1" IF Mentioned, "2"
a. Emergency transport
b. Money
c. Methylated spirit

304
IF Not mentioned. DO NOT READ THE LIST.
d. Sterile blade/ scissors to cut cord
e. Layette
f. Sanitary pads/cotton wool
g. Other
Specify
(2.45)
Do you have money set aside for the delivery? IF YES, PROBE
Yes, enough 1
Yes, but not enough 2
Yes, not sure 3
No 4 ► (2.48)
(2.46)
How much do you currently have set aside for delivery?
a. US Dollar
b. ZA Rand
c. Others (Specify)
(2.47)
How much do you need to have set aside for delivery?
a. US Dollar
b. ZA Rand
c. Others (Specify)
(2.48)
During this visit or previous visits, has a provider talked with you about any signs of complications (danger signs) that should warn you of problems with the pregnancy?
Yes, this visit 1
Yes, previous visit 2
No 3 ► (2.51)
(2.49) Please tell me any signs of complications (danger signs) during pregnancy that you know of.
a. ANY VAGINAL BLEEDING b. FEVER
c. SWOLLEN FACE, HANDS OR LEGS
DO NOT CITE ANSWERS, BUT FOR EACH OPTION RECORD "1" IF MENTIONED, "2" IF NOT MENTIONED. YOU MAY PROBE WITHOUT USING
d. TIREDNESS OR BREATHLESSNESS e. SEVERE HEADACHE F. BLURRED VISION g. CONVULSIONS/FITS h. LIGHTHEADEDNESS/DIZZINESS/BLACKOUT
i. SEVERE PAIN IN LOWER BELLY

305
SPECIFIC ANSWERS (E.G., "ANYTHING ELSE?")
j. BABY STOPS MOVING OR REDUCED FETAL MOVEMENT
k. BAG OF WATER BREAKS OR LEAKS l. DIFFICULTY BREATHING m. OTHER (SPECIFY: ______________________)
(2.50) What did the provider advise you to do if you experienced any of the warning signs? RECORD "1" IF Mentioned, "2" IF Not mentioned FOR ALL RESPONSES THE CLIENT MENTIONS. PROBE WITHOUT USING SPECIFIC ANSWERS.
a. SEEK CARE AT FACILITY
b. DECREASE ACTIVITY
c. CHANGE DIET
d. OTHER (SPECIFY: _____________________)
(2.51) Do you know any danger signs during/after delivery?
Yes 1
No 2 ► (2.53)
(2.52) What danger signs do you know? RECORD "1" IF Mentioned, "2" IF Not mentioned FOR ALL RESPONSES THE CLIENT MENTIONS. PROBE WITHOUT USING SPECIFIC ANSWERS.
a. Bleeding
b. Fever
c. Genital injuries
d. Other
(2.53) During this visit or previous visits, has a provider spoken to you about
Yes, this visit 1
Yes, previous visit 2
No 3 ► (2.57)

306
breastfeeding?
(2.54) During the discussion, did the provider discuss exclusive breastfeeding (giving the baby nothing apart from breast milk)?
Yes 1
No 2 ► (2.57)
(2.55)
When did the provider explain you should start exclusive breastfeeding?
FIRST HOUR 01
FIRST DAY 02
FIRST WEEK 03
FIRST MONTH 04
(2.56)
For how many months did the provider recommend that you exclusively breastfeed, that is, that you do not give your baby liquid or food in addition to your breast milk?
(2.57)
During this visit or previous visits, did the provider talk to you about where you plan to deliver your baby?
Yes, this visit 1
Yes, previous visit 2
No 3
(2.58)
Have you decided where you will go for the delivery of your baby? IF YES: PROBE FOR WHETHER THE PLAN IS TO DELIVER IN A FACILITY OR AT HOME
At this health facility 1
At other health facility 2
In a private home 3
Other 96
Specify
(2.59)
During this or previous visits, did a provider talk with you about using family planning after the birth of your baby?
Yes, this visit 1
Yes, previous visit 2
No 3 ► (2.61)
Don't know 99

307
(2.60) Which methods did the provider discuss?
a. FEMALE STERILIZATION
b. MALE STERILIZATION
RECORD "1" IF Mentioned, "2" IF Not mentioned FOR ALL RESPONSES THE CLIENT MENTIONS. PROBE WITHOUT USING SPECIFIC ANSWERS.
c. CONTRACEPTIVE PILL
d. INTRAUTERINE DEVICE (IUD)
e. INJECTABLE CONTRACEPTIVES
f. IMPLANTS
g. MALE CONDOMS
h. FEMALE CONDOMS
i. DIAPHRAGM
j. FOAM / JELLY
k. LACTATIONAL AMENORRHEA
l. RHYTHM METHOD
m. WITHDRAWAL
(2.61)
During this or previous visits, did a provider talk with you about HIV testing?
Yes, this visit 1
Yes, previous visit 2
No 3
Don't know 99
(2.62)
During this or previous visits, did a provider talk with you about counseling?
Yes, this visit 1
Yes, previous visit 2
No 3
Don't know 99
Section 3: Travel and expenditure
RECORD
RESPONSE
(3.01) How far is your household from this health facility? (Use landmarks to estimate distance)
Kilometers
(3.02) How long did it take you/the patient to reach this health facility from home today? (One way)
a. Minutes
b. Hours
(3.03) What was your primary mode of transportation today? (One way)
By foot 1 ► (3.05)
Bicycle 2 ► (3.05)
Animal drawn cart
3 ►
(3.05)
Private car 4

308
Public car/bus 5
Wheelbarrow 6 ► (3.05)
Other 96
Specify
(3.04)
How much did it cost for you/the patient to travel to the health facility today? (One way)
a. US Dollar b. ZA Rand c. Other (Specify)
(3.05) How long did you/the patient wait in the health facility before being seen in consultation by the health worker?
a. Minutes
b. Hours
(3.06) Do you think this was too long? Yes 1
No 2
(3.07) Was a registration/administration/ consultation/ doctor fee charged?
Yes 1
No 2 ► (3.09)
(3.08) How much was paid for this?
a. US Dollar b. ZA Rand c. Other (Specify)
(3.09) Was a laboratory test done? Yes 1
No 2 ► (3.11)
(3.10) How much was paid for this?
a. US Dollar b. ZA Rand c. Other (Specify)
(3.11) Was an ultrasound done? Yes 1
No 2 ► (3.13)
(3.12) How much was paid for this?
a. US Dollar b. ZA Rand c. Other (Specify)
(3.13) Were medicines dispensed to you at the pharmacy in the health center?
Yes 1
No 2 ► (3.15)
(3.14) How much was paid for this?
a. US Dollar b. ZA Rand c. Other (Specify)
(3.15)
How much was spent in total at the facility for this visit, not including
transportation costs? CHECK TO SEE IF THE TOTAL
a. US Dollar
b. ZA Rand

309
MATCHES WITH THE AMOUNTS GIVEN ABOVE. IF NOT,
RECONCILE THE AMOUNTS UNTIL BOTH ARE CORRECT.
c. Other (Specify)
(3.16)
Where did the money come from that was used to pay for health care
today?
a. Savings or regular household budget
b. Medical aid
DO NOT READ OPTIONS ALOUD. FOR EACH OPTION, RECORD "1"
IF MENTIONED OR "2" IF NOT MENTIONED
c. Selling household possessions
d. Selling crops/ selling livestock
e. From a friend or relative
f. Borrowed from someone other than friend or family
g. Other Specify
(3.17)
Is your family covered under a medical aid scheme?
Yes 1
No 2 ►
Section 4
(3.18) What type of medical aid?
Private 2
Don't know 99
(3.19) How long (in months) has your family been enrolled in the medical aid scheme?
Months
(3.20)
What services are covered under the medical aid scheme?
a. Routine well baby visits (Incl. vaccination)
b. Sick child care
c. Other outpatient care
FOR EACH OPTION, RECORD "1" IF MENTIONED OR "2" IF NOT MENTIONED
d. Antenatal care for pregnant women
e. Delivery care for pregnant women
f. Postpartum care for women and newborns
g. Hospital admission and inpatient care
h. Other
Specify
(3.21) Does your family have to pay the following before using the insurance?
Premium
Deductible
For each option record '1' if 'Yes' or '2' if 'No'
Co-insurance

310
Section 4: Patient satisfaction RECORD
RESPONSE I’m going to read you a series of statements. For instance, the first statement is, “It is convenient to
travel from your house to the health unit.” If you have to walk for 6 hours to get to the facility, you might strongly disagree with the statement and give it a score of only 1 out of 4. If, on the other hand, your
house is right across the street from the facility, you should give 4. If you walk for 3 to 4 hours, you may want to give a score of 2 or 3, depending on how convenient you feel it is to get to the facility.
READ EACH STATEMENT
TO THE RESPONSDENT AND RECORD
THE RESPONSE CODE FOR
EACH QUESTION.
Strong disagreement
Slight Disagreement
Slight agreement
Strong agreement
Not applicable
(4.03)
It is convenient to travel from your house to the health facility.
1 2 3 4 5
(4.04) The health facility is clean.
1 2 3 4 5
(4.05) The health staff are courteous and respectful.
1 2 3 4 5
(4.06)
You trust in the skills and abilities of the health workers.
1 2 3 4 5
(4.07)
The health workers did a good job of explaining your illness.
1 2 3 4 5
(4.08)
The health workers did a good job of explaining your treatment.
1 2 3 4 5
(4.09)
It is easy to get medicine that health workers prescribe.
1 2 3 4 5
(4.10)
The registration fees of this visit to the health facility were reasonable.
1 2 3 4 5
(4.11)
The lab fees of this visit to the health facility were reasonable.
1 2 3 4 5

311
(4.12)
The medication fees of this visit to the health facility were reasonable.
1 2 3 4 5
(4.13)
The transport fees for this visit to the health facility were reasonable.
1 2 3 4 5
(4.14)
The amount of time you spent waiting to be seen by a health provider was reasonable.
1 2 3 4 5
(4.15) You had enough privacy during your visit.
1 2 3 4 5
(4.16)
The health worker spent a sufficient amount of time with the patient.
1 2 3 4 5
(4.17)
The hours the facility is open is adequate to meet the needs of the community.
1 2 3 4 5
(4.18)
The overall quality of services provided was satisfactory
1 2 3 4 5
(4.19) Your overall visit was satisfactory.
1 2 3 4 5
Section 5: Questions about the household RECORD
RESPONSE
“I would now like to ask you some questions about your household.”
(i.e. People cooking and eating from the same pot
(5.01)
What type of dwelling do you live in?
Traditional 1
Mixed 2
Detached 3
Semi-detached 4
Flat/townhome 5
Shack 6
Other 96

312
Specify (5.02) What is the
main material used for Wall
NATURAL WALLS
Cane/trunks 11
Mud 12
RUDIMENTARY WALLS
DO NOT READ CHOICES
Stone with mud 22
RECORD THE RESPONSE FOR EACH SEPARATELY
Plywood
23
Carton 24
Reused wood 25
FINISHED WALLS
Cement 31
Stone with lime/cement 32
Bricks 33
Cement blocks 34
Wood planks/shingles 35
Other 96
Specify (5.03) What is the
main material used for the Rooftop
NATURAL ROOFING
No roof 11
Thatch 12
RUDIMENTARY ROOFING
DO NOT READ CHOICES
Rustic mat 21
RECORD THE RESPONSE FOR EACH SEPARATELY
Wood planks
23
FINISHED ROOFING
Metal 31
Wood planks 32
Asbestos 33
Tiles 34
Cement 35
Other 96
Specify What is the
main material used for the Floor?
NATURAL FLOOR (5.04) Earth/sand/dung 11
RUDIMENTARY FLOOR
Wood planks 21 DO NOT
READ FINISHED FLOOR

313
CHOICES RECORD
THE RESPONSE FOR EACH SEPARATELY
Parquet or polished wood
31
Vinyl or asphalt strips 32 ceramic tiles 33 cement 34 carpet 35 Other 96 Specify What is the
ownership status of your house?
Owner occupied dwelling - with mortgage
1 ► (5.07)
Owner rural home
2 ► (5.07)
Owner resettlement home
3 ► (5.07)
(5.05) DO NOT READ CHOICES
Owner occupied dwelling - without mortgage
4 ► (5.07)
Rented (not tied to the job) 5 Rented (tied to the job) 6
Rent free (not owner occupied) 7 ► (5.09)
Municipality plot 8 ► (5.09) Provided by employer (government) 9 ► (5.09)
Provider by employer (non govt) 10 ► (5.09)
Temporary housing 11 ► (5.09) Other 96 ► (5.09) Specify (5.06) How much
money for rent are you charged per month?
a. US Dollars ► (5.09)
b. ZA Rand ► (5.09)
c. Other (Specify) ► (5.09)
(5.07) If you sold this dwelling today, how much rent would you receive for it?
a. US Dollars
b. ZA Rand
c. Other (Specify)
(5.08) If you rented this dwelling today, how much rent would you receive for it?
a. US Dollars
b. ZA Rand
c. Other (Specify)
(5.09) How many

314
rooms does your household have?
(Including rooms outside the main dwelling, excluding kitchen and bathrooms)
PIPED WATER
(5.10)
What is the main source of water for drinking and food preparation for the household? DO NOT READ CHOICES; Only one answer is allowed.
Piped into dwelling 1 a. Dry season
Piped into Yard/Plot 2
Public tap 3
Tubewell/Borehole 4
DUG WELL
Protected dug well 5 b. Rainy
season
Unprotected dug well 6
WATER FROM SPRING
Protected spring 7
Unprotected spring 8
RAINWATER 9
TANKER TRUCK 10
CART WITH SMALL TANK 11
SURFACE WATER (river/dam/lake/pond/stream/canal/irrigation channel)
12
BOTTLED WATER 13
Other 96
Specify (5.11) How far is this
source from house?
a. Dry season
IF LESS THAN ONE KM, ENTER 00
b. Rainy
season
(5.12) Does your household have electricity?
Yes 1
No
2
(5.13) What is your household's main source of energy for lighting?
Electricity 1
Liquid propane gas 2
"MAIN" IN TERMS OF
Natural gas 3

315
QUANTITY
DO NOT READ CHOICES
biogas 4
Paraffin/kerosene 5
Jelly 6
Coal, Lignite 7
Charcoal 8
Wood 9
Straw/shrubs/grass 10
Maize/other crop waste 11
Animal dung 12
Do not cook 13
Other 96
Specify
(5.14)
What is the main source of energy used for cooking?
Electricity 1
"MAIN" IN TERMS OF QUANTITY
Liquid propane gas 2
DO NOT READ CHOICES
Natural gas 3
biogas 4
Paraffin/kerosene 5
Coal, Lignite 6
Charcoal 7
Wood 8
Straw/shrubs/grass 9
Maize/agricultural crop waste 10
Animal dung 11
No food cooked in household 12
Other 96
Specify
(5.15)
What kind of toilet facility do people in your household mainly use? DO NOT READ CHOICES; Only one answer is allowed.
FLUSH TOILET
Flush to piped sewer system 1
Flush to pit latrine 2
Flush to somewhere else 3
Flush, don't know where 4
PIT LATRINE
Ventilated Improved Pit Latrine (VIP)/blair toilet 5
Pit latrine with slab 6
Pit latrine without slab 7
BUCKET TOILET 8
NO FACILITY BUSH/FIELD 9
Other 96

316
Specify
Section 6: Questions about the household
(6.14) (6.15)
FOR EACH ITEM IN THE LIST BELOW, ASK Q6.14
THEN Q6.15
How many [ASSET]s does your household own?
What is the condition of the
asset?
IF ZERO, GO TO NEXT ASSET
a Battery/generator WORKING
NOT
WORKING
b Solar panel WORKING
NOT
WORKING
c Radio WORKING
NOT
WORKING
d Television WORKING
NOT
WORKING
e Mobile telephone WORKING
NOT
WORKING
f Non-mobile telephone WORKING
NOT
WORKING
g Refrigerator WORKING
NOT WORKING
h Computer WORKING
NOT
WORKING
i Watch WORKING
NOT WORKING
j Bicycle WORKING
NOT WORKING
k Motorcycle/scooter WORKING
NOT WORKING
l Animal-drawn cart WORKING
NOT WORKING
m Car/truck WORKING
NOT WORKING

317
n Tractor WORKING
NOT WORKING
o Boat with motor WORKING
NOT WORKING
p Wheelbarrow WORKING
NOT WORKING